UNITED STATES SECURITIES AND EXCHANGE COMMISSION
Washington, D.C. 20549
FORM 10‑K
(Mark One)
|
☒
|
ANNUAL REPORT PURSUANT TO SECTION 13 or 15(d) OF THE SECURITIES EXCHANGE ACT OF 1934
|
For the fiscal year ended March 31, 2015
or
|
☐
|
TRANSITION REPORT PURSUANT TO SECTION 13 or 15(d) OF THE SECURITIES EXCHANGE ACT OF 1934
|
Commission File Number 000-19720
ABAXIS, INC.
(Exact name of registrant as specified in its charter)
|
California
|
77-0213001
|
|
|
(State or other jurisdiction of incorporation or organization)
|
(I.R.S. Employer Identification No.)
|
|
|
3240 Whipple Road, Union City, California
|
94587
|
|
|
(Address of principal executive offices)
|
(Zip code)
|
Registrant’s telephone number, including area code: (510) 675-6500
Securities registered pursuant to Section 12(b) of the Act:
|
Title of Class
|
Name of Each Exchange on Which Registered
|
|
|
Common Stock, no par value
|
NASDAQ Global Select Market
|
Securities registered pursuant to Section 12(g) of the Act: None
Indicate by check mark if the registrant is a well-known seasoned issuer, as defined in Rule 405 of the Securities Act.
Yes ☒ No ☐
Indicate by check mark if the registrant is not required to file reports pursuant to Section 13 or Section 15(d) of the Act.
Yes ☐ No ☒
Indicate by check mark whether the registrant (1) has filed all reports required to be filed by Section 13 or 15(d) of the Securities Exchange Act of 1934 during the preceding 12 months (or for such shorter period that the registrant was required to file such reports), and (2) has been subject to such filing requirements for the past 90 days.
Yes ☒ No ☐
Indicate by check mark whether the registrant has submitted electronically and posted on its corporate Web site, if any, every Interactive Data File required to be submitted and posted pursuant to Rule 405 of Regulation S-T during the preceding 12 months (or for such shorter period that the registrant was required to submit and post such files).
Yes ☒ No ☐
Indicate by check mark if disclosure of delinquent filers pursuant to Item 405 of Regulation S-K is not contained herein, and will not be contained, to the best of registrant’s knowledge, in definitive proxy or information statements incorporated by reference in Part III of this Form 10-K or any amendment to this Form 10-K. ☐
Indicate by check mark whether the registrant is a large accelerated filer, an accelerated filer, a non-accelerated filer, or a smaller reporting company. See the definitions of “large accelerated filer,” “accelerated filer” and “smaller reporting company” in Rule 12b‑2 of the Exchange Act. (Check one):
|
Large accelerated filer ☒
|
Accelerated filer ☐
|
Non-accelerated filer ☐
|
Smaller reporting company ☐
|
|
|
|
(Do not check if a smaller reporting company)
|
|
Indicate by check mark whether the registrant is a shell company (as defined in Rule 12b-2 of the Exchange Act).
Yes ☐ No ☒
The aggregate market value of the voting stock held by non-affiliates of Abaxis as of September 30, 2014, the last business day of the second fiscal quarter, based upon the closing price of such stock on the NASDAQ Global Select Market on September 30, 2014, was $777,852,000. For purposes of this disclosure, 7,184,000 shares of common stock held by persons who hold more than 10% of the outstanding shares of the registrant’s common stock and shares held by executive officers and directors of the registrant have been excluded because such persons may be deemed to be affiliates. This determination of affiliate status is not necessarily conclusive for any other purpose.
As of May 27, 2015, there were 22,672,000 shares of the registrant’s common stock outstanding.
Abaxis, Inc.
Annual Report on Form 10-K
For The Fiscal Year Ended March 31, 2015
|
Page
|
||
|
PART I
|
||
|
Item 1.
|
3
|
|
|
Item 1A.
|
12
|
|
|
Item 1B.
|
22
|
|
|
Item 2.
|
22
|
|
|
Item 3.
|
22
|
|
|
Item 4.
|
22
|
|
|
PART II
|
||
|
Item 5.
|
23
|
|
|
Item 6.
|
25
|
|
|
Item 7.
|
26
|
|
|
Item 7A.
|
48
|
|
|
Item 8.
|
50
|
|
|
Item 9.
|
82
|
|
|
Item 9A.
|
82
|
|
|
Item 9B.
|
84
|
|
|
PART III
|
||
|
Item 10.
|
84
|
|
|
Item 11.
|
84
|
|
|
Item 12.
|
84
|
|
|
Item 13.
|
84
|
|
|
Item 14.
|
84
|
|
|
PART IV
|
||
|
Item 15.
|
85
|
|
|
87
|
||
|
88
|
||
PART I
FORWARD-LOOKING STATEMENTS
This report contains forward-looking statements within the meaning of Sections 21E of the Securities Exchange Act of 1934, as amended that reflect Abaxis’ current view with respect to future events and financial performance. In this report, the words “will,” “anticipates,” “believes,” “expects,” “intends,” “plans,” “future,” “projects,” “estimates,” “would,” “may,” “could,” “should,” “might,” and similar expressions identify forward-looking statements. These forward-looking statements are subject to certain risks and uncertainties, including but not limited to those discussed below, that could cause actual results to differ materially from historical results or those anticipated. Such risks and uncertainties relate to our manufacturing operations, including the vulnerability of our manufacturing operations to potential interruptions and delays and our ability to manufacture products free of defects, fluctuations in our quarterly results of operations and difficulty in predicting future results, our dependence on Abbott Point of Care, Inc., (“Abbott”) for our U.S. medical sales, the performance of our independent distributors and our ability to manage their inventory levels effectively, market acceptance of our products and services, our dependence on certain sole or limited source suppliers, expansion of our sales, marketing and distribution efforts, the effect of exchange rate fluctuations on international operations, dependence on key personnel, the protection of our intellectual property and claims of infringement of intellectual property asserted by third parties, competition and other risks detailed under “Risk Factors” in this Annual Report on Form 10-K.
Readers are cautioned not to place undue reliance on these forward-looking statements, which speak only as of the date hereof. Abaxis assumes no obligation to update any forward-looking statements as circumstances change. Readers are advised to read this Annual Report on Form 10-K in its entirety, paying careful attention to the risk factors set forth in this and other reports or documents filed by Abaxis from time to time with the Securities and Exchange Commission (“SEC”), particularly the quarterly reports on Form 10-Q and any current reports on Form 8-K, copies of which may be obtained from Abaxis or from the SEC at its website at www.sec.gov.
When used in this report, the terms “we,” “us,” “our,” “the Company” and “Abaxis” refer to Abaxis, Inc. and our subsidiaries. Our fiscal year ends on March 31, and accordingly, the terms “fiscal 2015,” “fiscal 2014” and “fiscal 2013” in this report refer to the years ended March 31, 2015, 2014 and 2013, respectively.
Abaxis, Inc. is a worldwide developer, manufacturer and marketer of portable blood analysis systems that are used in a broad range of medical specialties in human or veterinary patient care to provide clinicians with rapid blood constituent measurements. Our mission is to improve the efficiency of care delivery to and the quality of life of patients in the medical and veterinary markets. We provide leading edge technology, tools and services that support best medical practices, enabling physicians and veterinarians to respond to the health needs of their clients at the point of care while operating economical and profitable practices.
Our primary products are as follows:
|
·
|
point-of-care diagnostic instruments and consumables used in the medical market; and |
|
·
|
point-of-care diagnostic instruments and consumables used in the veterinary market |
In addition, until March 2015, we provided veterinary reference laboratory diagnostic and consulting services for veterinarians through our Abaxis Veterinary Reference Laboratories (“AVRL”) division. In March 2015, we sold our AVRL business to Antech Diagnostics, Inc., the VCA laboratory division (“Antech”). As a result, AVRL is presented as discontinued operations in the consolidated financial statements.
Abaxis is a California corporation and was incorporated in 1989. Since our company’s formation, our sales have increased in part due to the increased installed base of our blood chemistry analyzers and the expansion of test methods that we provide to the medical and veterinary markets. Additionally, over the past several years, we have expanded our diagnostic products and service offerings in the veterinary market. While we offer our direct customers a range of diagnostic products and services, our business and revenue model is focused on recurring revenue. Recurring revenues consist primarily of consumable revenue. We believe that the breadth of our product portfolio enables us to compete in the worldwide healthcare market.
Discontinued Operations
On March 31, 2015, we sold substantially all of the assets of AVRL to Antech Diagnostics, Inc., the VCA laboratory division (“Antech”), for $21.0 million in cash pursuant to an asset purchase agreement as described in more detail in the section of this report entitled “Management’s Discussion and Analysis of Financial Condition and Results of Operations - Discontinued Operations” and Note 3 to the Consolidated Financial Statements in Part II, Item 8 of this report.
We have reclassified the assets and liabilities of AVRL as discontinued operations on our consolidated balance sheets for all periods presented and the results of operations of AVRL as discontinued operations on our consolidated statements of operations for all periods presented.
Business Segments and Products
We manage our business in two reportable business segments, the medical market and the veterinary market, which are based on the diagnostic products sold and services provided by market and customer group. For products that we sell that are not specifically identified to any particular business segment, we categorize the revenue as Other. A description of our business segments is set forth below. Financial information regarding our reportable business segments is included under “Results of Operations” in Item 7 of this report and Note 19 to the Consolidated Financial Statements in Part II, Item 8 of this report.
Medical Market
Customer Base
Our products sold to the medical market are used by a diverse range of medical specialties requiring accurate, real time results to enable rapid clinical decisions in the area of human diagnostics. The current customer focus of our medical products include: physicians’ office practices across multiple specialties, urgent care, outpatient and walk-in clinics (free-standing or hospital-connected), health screening operations, home care providers (national, regional or local), nursing homes, ambulance companies, oncology treatment clinics, dialysis centers, pharmacies, hospital laboratories, military installations (ships, field hospitals and mobile care units) pharmaceutical clinical trials and cruise ship lines. Revenues in the medical market accounted for 17%, 17% and 18% of our total revenues for fiscal 2015, 2014 and 2013, respectively.
Products
Our point-of-care products in the medical market consist of our Piccolo chemistry analyzers and consumable products, as described below.
Piccolo Chemistry Analyzers. We develop, manufacture and sell the Piccolo Xpress chemistry analyzer for use in human patient care to provide clinicians with rapid blood constituent measurements. The Piccolo Xpress chemistry analyzer provides on the spot routine multi-chemistry and electrolyte results using a small patient sample size in any treatment setting. The Piccolo Xpress chemistry analyzer can be operated with minimal training and performs multiple routine general chemistry tests on whole blood, serum or plasma samples. The system provides test results in approximately 12 minutes with precision and accuracy comparable to a clinical laboratory analyzer. The Piccolo Xpress analyzer has a sophisticated Intelligent Quality Control (iQC) system and proprietary algorithms that assure quality and dependable results. We continue to support and service previous versions of our Piccolo chemistry analyzers.
Piccolo Profiles. We manufacture the Piccolo profiles used with the Piccolo chemistry analyzers. The Piccolo profiles are packaged as single-use medical reagents, configured to aid in disease diagnosis or monitor disease treatment. We offer 16 multi-test reagent disc products in the medical market. The reagent discs offered with our Piccolo chemistry analyzers are as follows:
|
Piccolo Profiles
|
Description of the Test Panels
|
|
Basic Metabolic Panel (CLIA waived)
|
BUN, CA, CL-, CRE, GLU, K+, NA+, tCO2.
|
|
Basic Metabolic Panel Plus
|
BUN, CA, CL-, CRE, GLU, K+, LD, MG, NA+, tCO2.
|
|
BioChemistry Panel Plus (1)
|
ALB, ALP, ALT, AMY, AST, BUN, CA, CRE, CRP, GGT, GLU, TP, UA.
|
|
Comprehensive Metabolic Panel (CLIA waived)
|
ALB, ALP, ALT, AST, BUN, CA, CL-, CRE, GLU, K+, NA+, TBIL, tCO2, TP.
|
|
Electrolyte Panel (CLIA waived)
|
CL-, K+, NA+, tCO2.
|
|
General Chemistry 6 (CLIA waived)
|
ALT, AST, BUN, CRE, GGT, GLU.
|
|
General Chemistry 13 (CLIA waived)
|
ALB, ALP, ALT, AMY, AST, BUN, CA, CRE, GGT, GLU, TBIL, TP, UA.
|
|
Hepatic Function Panel
|
ALB, ALP, ALT, AST, DBIL, TBIL, TP.
|
|
Kidney Check (CLIA waived) (1)
|
BUN, CRE.
|
|
Lipid Panel (CLIA waived)
|
CHOL, CHOL/HDL RATIO, HDL, LDL, TRIG, VLDL.
|
|
Lipid Panel Plus (CLIA waived)
|
ALT, AST, CHOL, CHOL/HDL RATIO, GLU, HDL, LDL, TRIG, VLDL.
|
|
Liver Panel Plus (CLIA waived)
|
ALB, ALP, ALT, AMY, AST, GGT, TBIL, TP.
|
|
MetLac 12 Panel (1)
|
ALB, BUN, CA, CL-, CRE, GLU, K+, LAC, MG, NA+, PHOS, tCO2.
|
|
MetLyte 8 Panel (CLIA waived)
|
BUN, CK, CL-, CRE, GLU, K+, NA+, tCO2.
|
|
MetLyte Plus CRP (1)
|
BUN, CK, CL-, CRE, CRP, GLU, K+, NA+, tCO2.
|
|
Renal Function Panel (CLIA waived)
|
ALB, BUN, CA, CL-, CRE, GLU, K+, NA+, PHOS, tCO2.
|
| (1) | The panel is offered only on our Piccolo Xpress. |
“CLIA waived” means the U.S. Food and Drug Administration (“FDA”) has categorized the test as having waived status with respect to the Clinical Laboratory Improvement Amendments of 1988 (“CLIA”). See “Government Regulation” in this section for additional information on CLIA.
Veterinary Market
Customer Base
In the veterinary market, our VetScan products serve a worldwide customer group consisting of companion animal hospitals, animal clinics with mixed practices of small animals, birds and reptiles, equine and bovine practitioners, veterinary emergency clinics, veterinary referral hospitals, universities, government, pharmaceutical companies, biotechnology companies and private research laboratories. Revenues in the veterinary market accounted for 81%, 81% and 80% of our total revenues for fiscal 2015, 2014 and 2013, respectively.
Products
Our product and service offerings in the veterinary market are described below.
VetScan Point-of-Care Blood Chemistry Instruments. We develop, manufacture and sell the VetScan VS2 chemistry analyzers in the veterinary market segment. The VetScan VS2 is a chemistry, electrolyte, immunoassay and blood gas analyzer that delivers results from a sample of whole blood, serum or plasma. The VetScan VS2 chemistry analyzer utilizes Intelligent Quality Control (iQC), consisting of a series of automatic checks that verify the chemistry, optics and electronic functions of the analyzer during each run and ensures that operators in a wide range of environments report only accurate and reliable results. The system can be operated with minimal training and performs multiple routine general chemistry tests on whole blood, serum or plasma samples. We continue to support and service previous versions of our VetScan chemistry analyzers.
VetScan Profiles. The VetScan chemistry analyzers use consumables that we manufacture. The VetScan profiles are packaged as single-use plastic veterinary reagent discs. Each reagent disc contains a diluent and all the profiles necessary to perform a complete multi-chemistry blood analysis. We offer 10 multi-test reagent disc products used in our VetScan chemistry analyzers in the veterinary market as described below.
|
·
|
Avian/Reptilian Profile Plus is ideal for measuring analytes that represent the most important areas of concern in avian and reptilian patients. |
|
·
|
Canine Wellness Profile including Heartworm is ideal for performing a comprehensive wellness chemistry panel and testing for heartworm antigen simultaneously, running wellness exams on canines greater than 7 months of age, implementing a comprehensive wellness program or streamlining existing wellness programs while increasing profit and cost savings and reducing technician time. The panel is offered only on our VetScan VS2. |
|
·
|
Comprehensive Diagnostic Profile is ideal for providing complete chemistry and electrolyte analysis for pre-anesthetic, general health, ill patient, geriatric and wellness testing. |
|
·
|
Critical Care Profile Plus is ideal for serial testing, rechecks, fluid therapy and monitoring hospitalized patients. |
|
·
|
Equine Profile Plus is ideal for routine equine checkups, wellness testing, ill patient diagnostics and prepurchase examinations for equine hospitals, ambulatory practitioners, critical care units and mixed animal hospitals. |
|
·
|
Kidney Profile Plus is ideal for kidney evaluation and monitoring in cats and dogs of all ages, implementing and streamlining renal function monitoring protocol, reducing technician time, and cost savings. The panel is offered only on our VetScan VS2. |
|
·
|
Large Animal Profile is ideal for herd health assessment and monitoring, prognostic indicator and diagnostic tool for beef and dairy cattle. |
|
·
|
Mammalian Liver Profile is ideal for obtaining baseline liver values, diagnosis and monitoring of hepatic disease and monitoring hepatic function while administering nonsteroidal anti-inflammatory drugs (NSAIDs) or other potentially hepatotoxic medications. |
|
·
|
Prep Profile II is a basic health screen for pre-anesthetic evaluation and testing minimal values for baselines of young, healthy patients or recheck profile for some disease states. |
|
·
|
Thyroxine (T4) / Cholesterol Profile is ideal for routine screening of hypothyroidism in dogs and diagnostic for hyperthyroidism in cats, titrating and monitoring patients on thyroid hormone replacement therapy or patients being treated for hyperthyroid disease. |
Hematology Instruments and Consumables. We market and distribute VetScan hematology instruments and related consumables. Our VetScan HM5 is a fully automated five-part cell counter offering a comprehensive 22-parameter complete blood count analysis, including direct eosinophil counts and eosinophil percentage, specifically designed for veterinary applications in veterinary clinics, research laboratories, pharmaceutical and biotech companies.
We currently purchase the VetScan HM5 hematology instruments from Diatron MI PLC (“Diatron”) of Budapest, Hungary. We also continue to support and service our previous versions and current population of hematology instruments comprised of VetScan HM2, VetScan HMII and VetScan HMT. Our VetScan hematology instruments use consumables consisting of hematology reagent kits that we currently purchase from Clinical Diagnostic Solutions, Inc. and Diatron.
VSpro Specialty Analyzers and Consumables. We market and distribute VetScan VSpro, an on-site specialty analyzer, and related consumables. The VSpro specialty analyzer assists in the diagnosis and evaluation of suspected bleeding disorders, toxicity/poisoning, evaluation of disseminated intravascular coagulation, hepatic disease and in monitoring therapy and the progression of disease states. We offer two tests, a PT/aPTT combination test and a fibrinogen test, which are used with the VetScan VSpro specialty analyzer, as described below.
|
·
|
The VetScan VSpro Coagulation Test includes the evaluation of both the prothrombin time (PT) and the Activated Partial Thromboplastin Time (aPTT). A combination assay (PT and aPTT) for canine and feline coagulation testing is used with the VSpro specialty analyzer to provide results from a single drop of citrated whole blood in minutes prior to surgery. |
|
·
|
The VetScan VSpro Fibrinogen Test provides quantitative in-vitro determination of fibrinogen levels in equine platelet poor plasma from a citrated stabilized whole blood sample. Fibrinogen is an important parameter that is commonly tested and evaluated as a marker of inflammation in many species, primarily equine and large animals. |
We currently purchase the specialty analyzers and related consumables from Scandinavian Micro Biodevices APS (“SMB”) of Farum, Denmark.
i-STAT Instruments and Consumables. We market and distribute VetScan i-STAT analyzers and related consumables. Our VetScan i-STAT is a handheld analyzer used to deliver accurate blood gas, electrolyte, chemistry and hematology results in minutes from 2-3 drops of whole blood. The VetScan i-STAT offers a variety of disposable, single-use cartridges (10) including tests for acid/base analysis, blood gases, chemistry, hematology, electrolytes, and some specialty tests including Lactate, ACT and Cardiac Troponin I. These cartridges are configured with parameters that can give a clear patient’s condition depending on the clinical situation. The VetScan i-STAT has reference ranges for cats, dogs and horses. We currently purchase the VetScan i-STAT analyzers and related consumables from Abbott.
Rapid Tests. In the veterinary market, our VetScan Rapid Test product line consists of individual rapid tests that aid in the detection of various specific diseases. The lateral flow immunoassay technology in the rapid tests provides immediate results. We offer the following VetScan Rapid Tests in the veterinary market, as described below.
|
·
|
The VetScan Canine Anaplasma Rapid Test is a highly sensitive and specific test for the detection of antibodies to A. phagocytophilum and/or A. platys in canine whole blood, serum, or plasma. |
|
·
|
The VetScan Canine Ehrlichia Rapid Test is a rapid test for the qualitative detection of antibodies to E. canis, E. chaffeensis, and/or E. ewingii in canines. |
|
·
|
The VetScan Feline FeLV/FIV Rapid Test is a rapid test for the detection of antibodies to Feline Immunodeficiency Virus and Antigen to Feline Leukemia Virus in feline whole blood, serum, or plasma. |
|
·
|
The VetScan Canine Heartworm Rapid Test is a rapid test for the qualitative detection of Dirofilaria immitis in canine or feline whole blood, serum or plasma. |
|
·
|
The VetScan Canine Lyme Rapid Test is a rapid test for the qualitative detection of antibodies to Borrelia burgdorferi in canine whole blood, serum or plasma. |
|
·
|
The VetScan Canine Parvovirus Rapid Test is a rapid test for the qualitative detection of canine parvovirus antigen in feces. |
|
·
|
The VetScan Giardia Rapid Test is a rapid test for the qualitative detection of Giardia cyst antigens in canine feces. |
Services
AVRL. We sold our entire AVRL business, which provided veterinary reference laboratory diagnostic and consulting services for veterinarians in the United States to Antech, which transaction closed on March 31, 2015. In connection with this sale of assets, we terminated our strategic alliance with Kansas State University, K-State Veterinary Diagnostic Lab and Kansas State University Institute for Commercialization (formerly known as National Institute for Strategic Technology Acquisition and Commercialization), to provide veterinary diagnostic and laboratory testing and related services.
Other
We also generate revenues from the sale of products using our patented Orbos Discrete Lyophilization Process (the “Orbos process”) to companies for other applications. The Orbos process involves flash-freezing a drop of liquid reagent to form a solid bead and then freeze-drying the bead to remove water. The Orbos beads are stable in dry form and dissolve rapidly in aqueous solutions. The dry reagents used in our reagent discs are produced using the Orbos process. This process allows the production of a precise amount of active chemical ingredient in the form of a soluble bead. We believe that the Orbos process has broad applications in products where delivery of active ingredients in a stable, pre-metered format is desired.
We have a supply contract with Becton, Dickinson and Company (“BD”) for products using the Orbos process. In January 2011, we entered into a ten year supplier agreement with Becton, Dickinson and Company to supply products using Abaxis’ patented Orbos process. In our agreement, BD will be subject to purchase minimum quantities on an annual basis to maintain specified pricing based on volume purchasing during each calendar year 2011 through 2021. Actual purchases by BD in the future will be based on their demand, and therefore, may vary from period to period. The agreement will expire in January 2021 and can be extended. From time to time, we license the technology underlying the Orbos process to third parties. Revenues from these arrangements, however, are unpredictable.
Sales and Marketing
We market and sell our products worldwide by maintaining direct sales forces and through independent distributors. We primarily sold our veterinary reference laboratory diagnostic and consulting services in the United States through our direct sales force. Our sales force is primarily located in the United States. Abaxis Europe GmbH, our wholly-owned subsidiary in Germany, markets and distributes diagnostic systems for medical and veterinary uses in the European and Asia Pacific markets. Starting in the third quarter of fiscal 2015, Abaxis UK, our wholly-owned subsidiary in the United Kingdom, distributes laboratory instrumentation and consumables to the veterinary profession in the United Kingdom. Abaxis UK was formed by our acquisition of Quality Clinical Reagents Limited and Trio Diagnostics (Ireland) Ltd in November 2014. Sales and marketing expenses were $42.1 million, $34.7 million and $43.8 million, or 21%, 21% and 24% of our total revenues in fiscal 2015, 2014 and 2013, respectively.
Distribution within North America
Medical Market
For our products in the human medical market, we employ primarily independent distributors to market our products. Starting in January 2013, we transitioned the majority of our medical product sales to Abbott as our exclusive distributor in the medical market. Pursuant to our Exclusive Agreement with Abbott (the “Abbott Agreement”), Abbott obtained the exclusive right to sell and distribute our Piccolo Xpress chemistry analyzers and associated consumables in the professionally-attended human healthcare market in the United States and China (including Hong Kong). Effective September 2013, we amended the Abbott Agreement to limit Abbott’s territory under such agreement to the United States. Under the Abbott Agreement, we have certain responsibilities for providing technical support and warranty services to Abbott in support of its marketing and sales efforts. The initial term of the Abbott Agreement ends on December 31, 2017, and after the initial term, the Abbott Agreement renews automatically for successive one-year periods unless terminated by either party based upon a notice of non-renewal six months prior to the then-current expiration date. Abbott accounted for 11% and 10% of our total worldwide revenues in fiscal 2015 and 2014, respectively.
We will continue to sell and distribute these medical products outside of the market segments as to which Abbott has exclusive rights. Under our Abbott Agreement, we will continue to sell and distribute to Catapult Health LLC and specified customer segments in the United States, including pharmacy and retail store clinics, shopping malls, contract research organizations (“CROs”) and cruise ship lines.
Veterinary Market
For our products in the veterinary market, we employ a combination of direct sales and independent distributors. Veterinarians are served typically by local distributors, some with national affiliations. We work with various independent distributors to sell our instruments and consumable products. In the United States, our distributors, include, among others, Henry Schein Animal Health, Lextron, Inc. (d/b/a Animal Health International), Merritt Veterinary Supplies, Inc., MWI Veterinary Supply, Inc. (“MWI”), Northeast Veterinary Supply, Patterson Veterinary Supply, Penn Veterinary Supply, Inc. and Western Medical Supply, Inc. In Canada, our distributors of veterinary products include Associated Veterinary Purchasing Co. Ltd., CDMV, Midwest Veterinary Purchasing Cooperative Ltd., Vet Novations, Veterinary Purchasing Company Limited and Western Drug Distribution Center Limited. In September 2012, we entered into a non-exclusive distributor agreement with MWI. MWI accounted for 19% and 19% of our total worldwide revenues in fiscal 2015 and 2014, respectively.
In addition to selling through distributors, we also directly supply our VetScan products to large group purchasing organizations, hospital networks and other buying groups in the United States, such as Veterinary Centers of America (VCA), a veterinary hospital chain in North America. In May 2014, we entered into a product supply agreement with VCA to supply our VetScan VS2 chemistry analyzers and diagnostic reagent discs for placement at VCA’s animal hospitals located in North America. Additionally, in May 2014, we entered into a non-exclusive co-marketing agreement with VCA’s Antech Diagnostic laboratory services to supply our VetScan VS2 chemistry analyzers in combination with Antech Diagnostic laboratory services as a complete diagnostic solution to serve veterinary practices throughout North America.
Distribution Outside of North America
Our medical and veterinary products are sold worldwide. For reporting purposes, we organize our operations outside of North America as follows: Europe and Asia Pacific and rest of the world. International revenues accounted for approximately 19%, 22% and 18% of our revenues in fiscal 2015, 2014 and 2013, respectively. Maintaining and expanding our international presence is an important component of our long-term growth strategy. Internationally, we use primarily distributors who offer our medical or veterinary diagnostic products in certain countries and markets. Our international sales and marketing objectives include identifying and defining the market segments in each country by product and then focusing on specific objectives for each segment in each country. These specific objectives include modification and expansion of distribution and distributor training and monitoring to ensure the attainment of sales goals.
We currently have distributors that carry either our medical or veterinary products in the following countries: Australia, Austria, Belgium, Czech Republic, Denmark, France, Germany, Hong Kong, India, Indonesia, Ireland, Israel, Italy, Japan, Korea, Macao, the Netherlands, New Zealand, the Philippines, Poland, Portugal, Romania, Russia, Singapore, Spain, Sweden, Switzerland, Turkey, the United Arab Emirates and the United Kingdom. Our distributor in each of these countries is responsible for obtaining the necessary approvals to sell our new and existing products. A discussion of the risks associated with our international revenues is included in Item 1A of this Annual Report. Revenues in Europe accounted for 15%, 17% and 14% of our total revenues for fiscal 2015, 2014 and 2013, respectively. Revenues in Asia Pacific and rest of the world accounted for 4%, 5% and 4% of our total revenues for fiscal 2015, 2014 and 2013, respectively.
Manufacturing and Suppliers
We manufacture our Piccolo and VetScan blood chemistry instruments and the associated reagent discs at our facility located in Union City, California. We utilize standardized manufacturing processes, quality control and cost reduction and inventory management programs for our manufacturing operations. We continue to review our operations and facilities in an effort to reduce costs, increase manufacturing capacity and increase efficiencies. Our manufacturing activities are concentrated in the following three primary areas:
|
·
|
Point-of-Care Blood Chemistry Instruments: Our Piccolo and VetScan systems employ a variety of components designed or specified by us, including a variable speed motor, microprocessors, a liquid crystal display, a printer, a spectrophotometer and other electronic components. These components are manufactured by several third-party suppliers that have been qualified and approved by us and then assembled by our contract manufacturers. The components are assembled at our facility into the finished product and completely tested to ensure that the finished product meets product specifications. Our blood analyzer products use several technologically-advanced components that we currently purchase from a limited number of suppliers, including certain components from our single-source supplier, Hamamatsu Corporation. Our analyzers also use a printer that is primarily made by Advanced Printing Systems. |
|
·
|
Reagent Discs: The molded plastic discs used in the manufacture of the reagent disc are manufactured to our specifications by established injection-molding manufacturers. To achieve the precision required for accurate test results, the discs must be molded to very strict tolerances. To date, we have qualified two injection-molding manufacturers, C. Brewer & Co., a division of Balda AG, and Nypro, Inc., a subsidiary of Jabil Circuit, to make the molded plastic discs that, when loaded with reagents and welded together, form our reagent disc products. We assemble the reagent discs by loading the molded plastic discs with reagents and then ultrasonically welding together the top and bottom pieces. |
|
·
|
Reagent Beads and Reagents: Our reagent discs contain dry reagent chemistry beads and diluents to perform blood analyses. Lateral flow rapid tests contain reagents and diluents necessary to perform blood analyses. We purchase chemicals from third-party suppliers and formulate the raw materials, using proprietary processes, into beads at the proper concentration and consistency to facilitate placement in the reagent disc and provide homogeneous dissolution and mixing when contacted by the diluted sample. We are dependent on the following companies as single source providers of one or more chemicals that we use in the reagent production process: Amano Enzyme USA Co., Ltd., Kikkoman Corporation Biochemical Division, Microgenics Corporation, a division of Thermo Fisher Scientific, Roche Molecular Biochemicals of Roche Diagnostics Corporation, a division of F. Hoffmann-La Roche, Ltd., SA Scientific Co., Sekisui Diagnostics, Sigma Aldrich Inc. and Toyobo Specialties. |
Although we believe that there may be potential alternate suppliers available for these critical components, to date we have not qualified additional vendors beyond those referenced above and cannot assure you that we would be able to enter into arrangements with additional vendors on favorable terms, or at all. We primarily operate on a purchase order basis with most of our suppliers and, therefore, these suppliers are under no contractual obligation to supply us with their products or to do so at specified prices.
In our veterinary market, we also market instruments and consumables that are manufactured by third parties and we rely on third parties to supply us with these specific products. These original manufacturer-supplied products are currently available from limited sources as discussed below.
|
·
|
Hematology Instruments and Reagent Kits: Our VetScan hematology instruments are manufactured by Diatron in Hungary and are purchased by us as a completed instrument. In addition, we currently have qualified two suppliers to produce the reagent kits for our hematology instruments: Clinical Diagnostic Solutions, Inc. and Diatron. |
|
·
|
VSpro Specialty Analyzers and Cartridges: Our VetScan VSpro specialty analyzers and cartridges are manufactured by SMB in Denmark and are purchased by us as completed products. Under our amended equipment manufacturing agreement with SMB effective January 2014, we have annual purchase requirements on the VSpro specialty analyzers and related cartridges during each calendar year from 2014 through 2016. |
|
·
|
i-STAT Analyzers and Cartridges: The VetScan i-STAT 1 analyzers and cartridges are manufactured by Abbott and are purchased by us as completed products. We are subject to minimum purchase and minimum sales requirement if we want to maintain as an exclusive distributor of the related products. The initial term of the agreement ended in December 2014. After this initial term, our agreement continues automatically for successive one-year periods unless terminated by either party. |
|
·
|
Rapid Tests: Substantially all of our VetScan Rapid Tests are manufactured by a single source supplier. |
For the suppliers of original equipment manufactured products with which we have long-term contracts, there can be no assurance that these suppliers will always fulfill their obligations under these contracts, or that any suppliers will not experience disruptions in their ability to supply our requirements for products. In addition, under some contracts with suppliers we have minimum purchase obligations and our failure to satisfy those obligations may result in loss of some or all of our rights under these contracts.
We generally operate with a limited order backlog because our products are typically shipped shortly after orders are received. As a result, product sales in any quarter are generally dependent on orders booked and shipped in that quarter.
Competition
Competition in the human medical and veterinary diagnostic markets is intense. The diagnostic market is a well-established field in which there are a number of competitors that have substantially greater financial resources and larger, more established marketing, sales and service organizations than we do. We compete primarily with the following organizations: commercial clinical laboratories, hospitals’ clinical laboratories and manufacturers of bench top multi-test blood analyzers and other testing systems that health care providers can use at the point of care.
Historically, hospitals and commercial laboratories perform most of the human diagnostic testing, and veterinary specialized commercial laboratories perform most of the veterinary medical testing. We have identified five principal factors that we believe customers typically use to evaluate our products and those of our competitors. These factors include the following: range of tests offered, immediacy of results, cost effectiveness, ease of use and reliability of results. We believe that we compete effectively on each of these factors except for the range of tests offered. Clinical laboratories are effective at processing large panels of tests using skilled technicians and complex equipment. Currently, while our offering of instruments and reagent discs does not provide the same broad range of tests as hospitals and commercial laboratories, we believe that in certain markets, our products provide a sufficient breadth of test menus to compete successfully with clinical laboratories given the advantages of our products with respect to the other four factors.
Our principal competitors in the point-of-care human medical diagnostic market are Inverness Medical Switzerland GmbH, now known as Alere Switzerland GmbH (“Alere”), Alfa Wassermann S.P.A., Johnson & Johnson, Ortho-Clinical Diagnostics, Inc. and F. Hoffmann-La Roche Ltd. Additionally, in certain segments of the human medical diagnostic market, we compete with Abbott’s i-STAT division. Many of our competitors in the human medical diagnostic market have significantly larger product lines to offer and greater financial and other resources than we do. In particular, many of these competitors have large sales forces and well-established distribution channels and brand names.
Our principal competitors in the veterinary diagnostic market are Idexx Laboratories, Inc. and Heska Corporation. Idexx has a larger veterinary product and service offering than we do and a well-established brand name.
Government Regulation
Regulation by governmental authorities in the U.S. and foreign countries is a significant factor in the manufacture and marketing of our current and future products and in our ongoing product research and development activities. We are not required to comply with all of the FDA government regulations applicable to the human medical market when manufacturing our VetScan products; however, we intend for all of our manufacturing operations to be compliant with the Quality System Regulation to help ensure product quality and integrity regardless of end use or patient. As we continue to sell in foreign markets, we may have to obtain additional governmental clearances in those markets. The government regulations for our medical and veterinary products vary.
FDA Regulation of Human Medical Devices
Our Piccolo products are in vitro diagnostic medical devices subject to regulation by the FDA, under the Federal Food, Drug, and Cosmetic Act (“FDCA”). Medical devices, to be commercially distributed in the United States, must receive either 510(k) premarket clearance or Premarket Approval (“PMA”) from the FDA prior to marketing. Devices deemed to pose relatively less risk are placed in either class I or II, which generally requires the manufacturer to submit a premarket notification requesting permission for commercial distribution; this is known as 510(k) clearance. Most lower risk, or class I, devices are exempted from this requirement. Devices deemed by the FDA to pose the greatest risk, such as life-sustaining, life supporting or implantable devices, or devices deemed not substantially equivalent to a previously 510(k) cleared device or a preamendment class III device for which PMA applications have not been called, are placed in class III requiring PMA approval. The FDA has classified our Piccolo products as class I or class II devices, depending on their specific intended uses and indications for use.
To obtain 510(k) clearance, a manufacturer must submit a premarket notification demonstrating that the proposed device is substantially equivalent in intended use, principles of operation, and technological characteristics to a previously 510(k) cleared device or a device that was in commercial distribution before May 28, 1976 for which the FDA has not called for submission of PMA applications. The FDA’s 510(k) clearance pathway usually takes from three to six months, but it can take longer. After a device receives 510(k) clearance, any modification that could significantly affect its safety or effectiveness, or that would constitute a major change in its intended use, requires a new 510(k) clearance or could require a PMA approval.
As of March 31, 2015, we currently have received FDA premarket clearance for our Piccolo chemistry analyzer and 27 reagent tests that we have on 16 reagent discs. We are currently developing additional tests that we will have to clear with the FDA through the 510(k) notification process. The FDA may disagree with our assessment and require us to seek PMA approval or require us to meet significant postmarketing requirements.
Our Piccolo products are also subject to the Clinical Laboratory Improvement Amendments of 1988 (“CLIA”). The current CLIA regulations divide laboratory tests into three categories: “waived,” “moderately complex” and “highly complex.” We currently offer Basic Metabolic Panel, Comprehensive Metabolic Panel, Electrolyte Panel, General Chemistry 6, General Chemistry 13, Kidney Check, Lipid Panel, Lipid Panel Plus, Liver Panel Plus, MetLyte 8 Panel and Renal Function Panel tests under waived status, which permits personnel not subject to CLIA imposed training requirements to run the Piccolo chemistry analyzer using these tests and thus allows for marketing to more sites (doctors’ offices and other point-of-care environments that maintain a CLIA certificate of waiver) than our other products that are subject to the other categories. For example, five of the tests performed using the Piccolo system are in the “moderately complex” category. This category requires that any location in which testing is performed be certified as a laboratory. Hence, we can only sell some Piccolo products to customers who meet the standards of a laboratory, which requires a testing facility to be certified by the Centers for Medicare and Medicaid Services, or CMS, and meet the CLIA regulations. As a result, the market for these non-waived products is more limited.
In March 2014, the FDA granted CLIA waived status for fingerstick draw for total cholesterol, high-density lipoprotein cholesterol and triglycerides blood tests. As a result, combined with existing CLIA waived tests for liver diagnostics and glucose using fingerstick samples, we now have two complete lipid panels that can be used by healthcare professionals to diagnose, treat and monitor hyperlipidemia patients using a sample obtained from either venous blood or a fingerstick draw. This enables U.S. healthcare professionals to perform lipid and liver diagnostics, as well as measure glucose levels with a simple fingerstick using the Piccolo chemistry analyzer.
USDA Licensure of Veterinary Biologics
Our rotor-based Canine Heartworm Antigen Test (“CHW”) and our lateral flow tests, including Canine Borrelia Burgdorferi Antibody Test Kit (rapid test for Lyme disease in dogs), Canine Ehrlichia Antibody Test Kit and Canine Anaplasma Test Kit, are regulated as veterinary biologics under the Virus, Serum, and Toxin Act of 1913. Both tests require licensure of both the product and manufacturing facilities. Biologics products are subject to more extensive testing to establish their purity, safety, potency, and efficacy and any failure to comply with the United States Department of Agriculture’s Animal and Plant Health Inspection Service (APHIS) Center for Veterinary Biologics (CVB) licensure or post-marketing approval requirements can result in the inability to obtain and maintain required licenses for our products and there can be no assurances that our products can be maintained to the required quality levels necessary to continue to market these products. In addition, we are currently developing additional tests that will be subject to CVB licensure as veterinary biologics and licensure under CVB cannot be assured for these products.
Manufacturing and International Regulations
The 1976 Medical Device Amendments also require us to manufacture our Piccolo products in accordance with Good Manufacturing Practices guidelines. Current Good Manufacturing Practice requirements are set forth in the FDA’s Quality System Regulation. These requirements regulate the methods used in, and the facilities and controls used for the design, manufacture, packaging, storage, installation and servicing of our medical devices intended for human use. Our manufacturing facility is subject to periodic inspections. In addition, various state regulatory agencies may regulate the manufacture of our products.
Federal, state, local and international regulations regarding the manufacture and sale of health care products and diagnostic devices may change. In addition, as we continue to sell in foreign markets, we may have to obtain additional governmental clearances in those markets. To date, we have complied with what we believe to be all applicable federal, state, local and international regulatory requirements and standards, including those of the FDA, USDA, State of California Food and Drug Branch and International Organization for Standardization for medical devices.
New Products and Research and Development
We are focused on the development of new products and on improvements to existing products. Research and development activities relate to development of new tests and test methods, clinical trials, product improvements, optimization and enhancement of existing products and expenses related to regulatory and quality assurance.
Our research and development expenses, which consist of personnel costs, consulting expenses and materials and related expenses, were $16.3 million, $13.6 million and $13.6 million, or 8%, 8% and 8% of our total revenues, in fiscal 2015, 2014 and 2013, respectively. Research and development expense as a percentage of total revenues remained consistent over the same periods, reflecting our continued commitment to invest in long-term growth opportunities.
We anticipate that we will continue to make expenditures for research and development as we seek to provide new products to maintain and improve our competitive position. We will continue to develop new products and services that we believe will provide further opportunities for growth in the human medical and veterinary markets. Development of tests for point-of-care diagnostics will be targeted at specific applications based on fulfilling clinical needs.
Patents, Proprietary Technologies and Licenses
Our products sold in both the medical and veterinary markets are based on complex, rapidly-developing technologies. Some of these technologies are covered by patents that we own and others are owned by third-parties and are used by us under license.
We have pursued the development of a patent portfolio to protect our proprietary technology. Our policy is to file patent applications to protect technology, inventions and improvements that are important to the development of our business. We also rely upon trade secrets, trademarks, know-how, continuing technological innovations and licensing opportunities to develop and maintain our competitive position. As of March 31, 2015, 74 patent applications have been filed on our behalf with the United States Patent and Trademark Office, of which 40 patents have been issued and 13 patents are currently active. The expiration dates of our active patents with the United States Patent and Trademark Office range from July 2015 to November 2032. In addition, we have 7 issued and active foreign patents and 38 foreign patent applications pending, of which two are Patent Cooperation Treaty international applications to be filed nationally in foreign countries.
Some of our existing products are manufactured or sold under the terms of license agreements that require us to pay royalties to the licensor based on the sales of products containing the licensed technology. From January 2009 to February 2015, we licensed co-exclusively certain worldwide patent rights related to lateral flow immunoassay technology in the field of animal health diagnostics in the professional marketplace from Alere. The license agreement enabled us to develop and market products under rights from Alere in the animal health and laboratory animal research markets. In exchange for the license rights, we (i) paid an up-front license fee of $5.0 million, (ii) agreed to pay royalties during the term of the agreement, based solely on sales of products in a jurisdiction country covered by valid and unexpired claims in that jurisdiction under the licensed Alere patent rights, and (iii) agreed to pay a yearly minimum license fee of between $0.5 million to $1.0 million per year, which fee was creditable against any royalties due during such calendar year. The royalties, if any, were payable through the date of the expiration of the last valid patent licensed under the agreement that includes at least one claim in a jurisdiction covering products we sell in that jurisdiction. Effective February 2015, we terminated our license agreement with Alere.
Employees
As of March 31, 2015, we had 582 full-time employees. None of our employees is covered by a collective bargaining agreement and we consider our relations with our employees to be good.
Information Available to Investors
The Company’s website is www.abaxis.com. This Annual Report on Form 10-K, our Quarterly Reports on Form 10-Q, our Current Reports on Form 8-K and any amendments hereto and thereto are made available without charge on the Investor Relations section of our website, filed under “SEC Filings”. These materials are available on the website as soon as reasonably practicable after filing these materials with, or furnishing them to, the Securities and Exchange Commission. In addition, copies of our reports, proxy statements and other information filed electronically with the SEC may be accessed at http://www.sec.gov. The public may also submit a written request to the SEC, Office of FOIA/PA Operations, 100 F Street, NE, Washington, DC 20549. This information may also be obtained by calling the SEC at 202-551-8300, by sending an electronic message to the SEC at publicinfo@sec.gov or by sending a fax to the SEC at 202-772-9337.
RISK FACTORS THAT MAY AFFECT OUR PERFORMANCE
Our future performance is subject to a number of risks. If any of the following risks actually occur, our business could be harmed and the trading price of our common stock could decline. In evaluating our business, you should carefully consider the following risks in addition to the other information in this Annual Report on Form 10-K. We note these factors for investors as permitted by the Private Securities Litigation Reform Act of 1995. It is not possible to predict or identify all such factors and, therefore, you should not consider the following risks to be a complete statement of all the potential risks or uncertainties that we face.
Our facilities and manufacturing operations are vulnerable to interruption as a result of natural disasters, system failures and other business disruptions. Any such interruption may harm our business.
Our business depends on the efficient and uninterrupted operation of our manufacturing operations, which are co-located with our corporate headquarters in Union City, California. These manufacturing operations are vulnerable to damage or interruption from earthquakes, fire, floods, power loss, telecommunications failures, break-ins and similar events. A failure of manufacturing operations, be it in the development and manufacturing of our Piccolo or VetScan blood chemistry analyzers or the reagent discs used in the blood chemistry analyzers, could result in our inability to supply customer demand. We do not have a backup facility to provide redundant manufacturing capacity in the event of a system failure or other significant loss or problem. Accordingly, if our manufacturing operations in Union City, California were interrupted, we may be required to bring an alternative facility online, a process that could take several weeks to several months or more. The occurrence of a business disruption could harm our revenue and financial condition and increase our costs and expenses.
We operate and manage our business by relying on several information systems to maintain financial records, process customer orders, manage inventory, process shipments to customers and operate other critical functions. Information technology system failures, network disruptions and breaches of data security could disrupt our operations. If we were to experience a system disruption in the information technology systems that enable us to interact with customers and suppliers, it could result in the loss of sales and customers, delays or cancellation of orders, impeding the manufacture or shipment of products, processing transactions and reporting financial results and significant incremental costs. While management has taken steps to address these concerns by implementing network security and internal control measures, there can be no assurance that a system failure or data security breach will not have an adverse effect on our business, financial condition and results of operations.
Although we carry property and business interruption insurance to insure against the financial impact of certain events of this nature, our coverage may not be adequate to compensate us for all losses that may occur.
We are not able to predict sales in future quarters and a number of factors affect our periodic results, which may result in significant variance in our quarterly results of operations and may negatively impact our stock price.
We are not able to accurately predict our sales in future quarters. Our revenues in the medical and veterinary markets are derived primarily by selling to distributors that resell our products to the ultimate user. While we are better able to predict sales of our reagent discs, as we sell these discs primarily for use with blood chemistry analyzers that we sold in prior periods, we generally are unable to predict with much certainty sales of our blood chemistry analyzers, as we typically sell our blood chemistry analyzers to new users. We generally operate with a limited order backlog, because we ship our products shortly after we receive the orders from our customers. As a result, our product sales in any quarter are generally dependent on orders that we receive and ship in that quarter. Accordingly, our sales in any one quarter or period are not indicative of our sales in any future period.
The sales cycle for our products can fluctuate, which may cause revenue and results of operations to vary significantly from period to period. We believe this fluctuation is primarily due (i) to seasonal patterns in the decision making processes by our independent distributors and direct customers, (ii) to inventory or timing considerations by our distributors and (iii) on the purchasing requirements of the U.S. government to acquire our products. Accordingly, we believe that period to period comparisons of our results of operations are not necessarily meaningful. In the future, our periodic results of operations may vary significantly depending on, but not limited to, a number of factors, including:
|
·
|
new product or service announcements made by us or our competitors;
|
|
·
|
changes in our pricing structures or the pricing structures of our competitors;
|
|
·
|
the sales performance of our independent distributors;
|
|
·
|
excess inventory levels and inventory imbalances at our independent distributors;
|
|
·
|
our ability to develop, introduce and market new products or services on a timely basis, or at all;
|
|
·
|
our manufacturing capacities and our ability to increase the scale of these capacities;
|
|
·
|
the mix of sales among our instruments, consumable products and services;
|
|
·
|
the amount of our research and development and sales, general and administrative expenses; and
|
|
·
|
changes in our strategies.
|
As a result, it is likely that in some periods our operating results will not meet investor expectations or those of public market analysts. Any unanticipated change in revenues or operating results is likely to cause our stock price to fluctuate since such changes reflect new information available to investors and analysts. Any fluctuations in our quarterly results may not accurately reflect the underlying performance of our business and could cause a decline in the trading price of our common stock.
In the United States, we rely on Abbott as our exclusive distributor in certain medical market to sell our products. Our dependency on Abbott means that any failure to successfully develop products and maintain this relationship could adversely affect our business, financial condition and results of operations.
Abbott has the exclusive right to sell and distribute our Piccolo Xpress chemistry analyzer and associated consumables in the United States professionally-attended human healthcare market, excluding sales and distribution to Catapult Health LLC and specified customer segments, which includes pharmacy and retail store clinics, shopping malls, clinical research organizations and cruise ship lines. As a result of the Abbott Agreement, we no longer have control over the marketing and sale of our primary medical products into most of the U.S. medical market and are dependent upon the efforts and priorities of Abbott in promoting and creating a demand for such products in such market. We do not have any control over pricing, inventory levels, distribution efforts and other factors that may impact the level of sales achieved, timing of revenue recognized and other adjustments that may impact our reported sales. Moreover, we are dependent upon Abbott’s forecasts and sales efforts and maintenance of pre-existing sub-distributor agreements that were assigned to Abbott. As a result, if Abbott’s efforts are unsuccessful, our business, financial condition and results of operations are likely to be adversely affected. For example, the transition of this U.S. medical business had an adverse effect on our revenues during fiscal 2014, with respect to lower average selling prices of Piccolo products sold to Abbott and the timing of purchases of our products now sold by Abbott as it integrated our products into its sales process.
In addition, as a result of the Abbott Agreement, we have substantially reduced the size of our United States medical sales force. The initial term of the Abbott Agreement ends on December 31, 2017, and after the initial term, the agreement renews automatically for successive one-year periods unless terminated by either party based upon a notice of non-renewal six months prior to the then-current expiration date. In the event the agreement is terminated, we would be required to invest and re-establish presence and sales capabilities in markets that were served by Abbott and/or identify one or more suitable replacement distribution partner(s), which would require significant time and effort. We could not be assured of replacing the capabilities of Abbott in those markets. New sales personnel and distribution partners take time to train and gain full productivity with customers, and if we are unable to accomplish this successfully, our business, financial condition and results of operations could be adversely affected.
A failure to manage the inventory levels of our distributors effectively could adversely affect our gross margins and results of operations.
We must manage the inventory of our products held by our distributors effectively. Any excess or shortage of inventory held by our distributors could affect our results of operations. Our distributors may increase orders during periods of product shortages and cancel or delay orders if their inventory is too high. They also may adjust their orders in response to the supply of our products, the products of our competitors that are available to them, and in response to seasonal fluctuations in customer demand. Revenues from sales to our distributors generally are recognized based upon shipment of our products to the distributors, net of estimated sales allowances, discounts and rebates. Inventory management remains an area of focus as we balance inventory levels of our instruments and consumables, especially in our United States veterinary market distribution channel, consisting of both national and regional distributors. We must also balance the need to maintain sufficient inventory levels in the distribution channel against the risk of inventory obsolescence because of the shelf life of our consumable products and customer demand. If we ultimately determine that we have excess inventory at our distributors or inventory imbalances in the distribution channel, we may have to reduce our selling prices, which could result in lower gross margins. For example, during the second half of fiscal 2014, as compared to the same period in fiscal 2013, our revenues were adversely impacted in the United States veterinary market by excess channel inventory and inventory imbalances and resulted to a decrease of sales orders from our largest distributors in the veterinary market. The excess channel inventory was the result of our distributors not selling our products to end customers at the same rate as they were purchasing products from us. Should our efforts to monitor and manage channel inventory be unsuccessful, our business, financial condition and results of operations are likely to be adversely affected.
We would fail to achieve anticipated revenues if the market does not accept our products or services.
We believe that our core compact blood chemistry analyzer product differs substantially from current blood chemistry analyzers on the market. We compete with centralized laboratories that offer a greater number of tests than our products, at a lower cost, but require more time. We also compete with other point-of-care analyzers that often require more maintenance and offer a narrower range of tests. However, these point-of-care analyzers are generally marketed by larger companies which have greater resources for sales and marketing, in addition to a recognized brand name and established distribution relationships.
In the human medical market, we believe that our blood chemistry analyzers offer customers many advantages, including substantial improvements in practice efficiencies. However, the implementation of point-of-care diagnostics in physicians’ offices involves changes to current standard practices, such as using large clinical laboratories, and adopting our technology requires a shift in both the procedures and mindset of care providers. The human medical market in particular is highly regulated, structured, difficult to penetrate and often slow to adopt new product offerings. If we or our distribution partner, Abbott, are unable to convince large numbers of medical clinics, hospitals and other point-of-care environments of the benefits of our Piccolo blood chemistry analyzers and our other products, we could fail to achieve anticipated revenue.
Historically, in the veterinary market, we have marketed our VetScan products through both direct sales and distribution channels to veterinarians. We continue to develop new animal blood tests to expand our product offerings; however, we cannot be assured that these products will be accepted by the veterinary market. Any failure to achieve market acceptance with our current or future products or services would harm our business and financial condition. Moreover, we may identify new areas for serving our veterinary market customers that may not be accepted by the market or achieve our financial goals to increase revenues and profitability at acceptable levels. For example, we recently sold our AVRL business, as it failed to perform to our expectations.
We depend on limited or sole suppliers, many of whom we do not have long-term contracts with, and failure of our suppliers to provide the components or products to us could harm our business.
We use several key components that are currently available from limited or sole sources as discussed below.
| · | Blood Chemistry Analyzer Components: Our blood analyzer products use several technologically-advanced components that we currently purchase from a limited number of suppliers, including certain components from our single source supplier, Hamamatsu Corporation. Our analyzers also use a printer that is primarily made by Advanced Printing Systems. The loss of the supply of any of these components could force us to redesign our blood chemistry analyzers. |
| · | Reagent Discs: Two injection-molding manufacturers, C. Brewer Co., a division of Balda AG, and Nypro, Inc., a subsidiary of Jabil Circuit, currently make the molded plastic discs that, when loaded with reagents and welded together, form our reagent disc products. We believe that only a few manufacturers are capable of producing these discs to the narrow tolerances that we require. To date, we have only qualified these two manufacturers to manufacture the molded plastic discs. |
| · | Reagent Chemicals: We currently depend on the following single source vendors for some of the chemicals that we use to produce the reagents and dry reagent chemistry beads that are either inserted in our reagent discs, lateral flow rapid tests or sold as stand-alone products: Amano Enzyme USA Co., Ltd., Kikkoman Corporation Biochemical Division, Microgenics Corporation, a division of Thermo Fisher Scientific, Roche Molecular Biochemicals of Roche Diagnostics Corporation, a division of F. Hoffmann-La Roche, Ltd., SA Scientific Co., Sekisui Diagnostics, Sigma Aldrich Inc. and Toyobo Specialties. |
We market original equipment manufacturer supplied products that are currently available from limited sources as discussed below.
| · | Hematology Instruments and Reagent Kits: Our VetScan hematology instruments are manufactured by Diatron in Hungary and are purchased by us as a completed instrument. In addition, we currently have qualified two suppliers to produce the reagent kits for our hematology instruments: Clinical Diagnostic Solutions, Inc. and Diatron. |
| · | VSpro Specialty Analyzers and Cartridges: Our VetScan VSpro specialty analyzers and cartridges are manufactured by SMB in Denmark and are purchased by us as completed products. |
| · | i-STAT Analyzers and Cartridges: Our VetScan i-STAT 1 analyzers and cartridges are manufactured by Abbott and are purchased by us as completed products. |
| · | Rapid Tests: Substantially all of our VetScan Rapid Tests are manufactured by a single source supplier. |
We currently have purchase obligations with SMB to purchase VSpro specialty analyzers and related cartridges and Diatron to purchase Diatron hematology instruments. However, with our other suppliers, we primarily operate on a purchase order basis and, therefore, these suppliers are under no contractual obligation to supply us with their products or to do so at specified prices. Although we believe that there may be potential alternate suppliers available for these critical components, to date we have not qualified additional vendors beyond those referenced above and cannot assure you we would be able to enter into arrangements with additional vendors on favorable terms, or at all. For the suppliers of original equipment manufactured products with which we have long-term contracts, there can be no assurance that these suppliers will always fulfill their obligations under these contracts, or that any suppliers will not experience disruptions in their ability to supply our requirements for products. In addition, under some contracts with suppliers we have minimum purchase obligations and our failure to satisfy those obligations may result in loss of some or all of our rights under these contracts.
Because we are dependent on a limited number of suppliers and manufacturers for our products, we are particularly susceptible to any interruption in the supply of these products or the viability of our assembly arrangements. The loss of any one of these suppliers or a disruption in our manufacturing arrangements could adversely affect our business, financial condition and results of operations.
We rely primarily on distributors to sell our products and we rely on sole distributor arrangements in a number of countries. Our failure to successfully develop and maintain these relationships could adversely affect our business, financial condition and results of operations..
We sell our medical and veterinary products primarily through a limited number of distributors. As a result, we are dependent upon these distributors to sell our products and to assist us in promoting and creating a demand for our products. We operate on a purchase order basis with the distributors and the distributors are under no contractual obligation to continue carrying our products. Further, many of our distributors may carry our competitors’ products, and may promote our competitors’ products over our own products.
We depend on a number of distributors in North America who distribute our VetScan products. In the United States veterinary market segment, we rely on our distribution network, consisting of both national distributors and independent regional distributors. We depend on our distributors to assist us in promoting our products in the veterinary market, and accordingly, if one or more of our distributors were to stop selling our products in the future, we may experience a temporary sharp decline or delay in our sales revenues until our customers identify another distributor or purchase products directly from us.
Internationally, we rely on only a few distributors for our products in both the medical and veterinary diagnostic markets. We currently rely on distributors that carry either our medical or veterinary products in the following countries: Australia, Austria, Belgium, Canada, Czech Republic, Denmark, France, Germany, Hong Kong, India, Indonesia, Ireland, Israel, Italy, Japan, Korea, Macao, Mexico, the Netherlands, New Zealand, the Philippines, Poland, Portugal, Romania, Russia, Singapore, Spain, Sweden, Switzerland, Turkey, the United Arab Emirates, the United Kingdom and the United States. Our distributors in each of these countries are responsible for obtaining the necessary approvals to sell our new and existing products. These distributors may not be successful in obtaining proper approvals for our new and existing products in their respective countries, and they may not be successful in marketing our products. Furthermore, an inability of, or any delays by, our distributor in receiving the necessary approvals for our new or other products can adversely impact our revenues in a country. We plan to continue to enter into additional distributor relationships to expand our international distribution base and presence. However, we may not be successful in entering into additional distributor relationships on favorable terms, or at all. In addition, our distributors may terminate their relationship with us at any time. Historically, we have experienced a high degree of turnover among our international distributors. This turnover makes it difficult for us to establish a steady distribution network overseas. Consequently, we may not be successful in marketing our Piccolo and VetScan products internationally, and our business and financial condition may be harmed as a result.
We must increase sales of our Piccolo and VetScan products or we may not be able to increase or sustain profitability.
Our ability to continue to be profitable and to increase profitability will depend, in part, on our ability to increase our sales volumes of our Piccolo and VetScan products. Increasing the sales volume of our products will depend upon, among other things:
| · | the sales performance of our independent distributors; |
| · | our ability to improve our existing products and develop new and innovative products; |
| · | our ability to increase our sales and marketing activities; |
| · | our ability to effectively manage our manufacturing activities; and |
| · | our ability to effectively compete against current and future competitors. |
We cannot assure you that we will be able to successfully increase the sales volumes of our products to increase or sustain profitability.
We must continue to increase our sales, marketing and distribution efforts in the human diagnostic market or our business will not grow.
The human diagnostic market is fragmented, heavily regulated and constantly changing. Our limited sales, marketing and distribution capabilities are continually challenged to translate these changes into compelling value propositions for our prospective customers. Accordingly, we cannot assure you that:
|
·
|
we will be able to maintain consistent growth through our independent distributors;
|
|
·
|
the costs associated with sales, marketing and distributing our products will not be excessive; or
|
|
·
|
government regulations or private insurer policies will not adversely affect our ability to be successful.
|
We depend on key members of our management and scientific staff and, if we fail to retain and recruit qualified individuals, our ability to execute our business strategy and generate sales would be harmed.
Our future success depends, to a great degree, on the principal members of our management and scientific staff. The loss of any of these key personnel, including in particular Clinton H. Severson, our President, Chief Executive Officer and Chairman of our Board of Directors, might impede the achievement of our business objectives. We may not be able to continue to attract and retain skilled and experienced marketing, sales and manufacturing personnel on acceptable terms in the future because numerous medical products and other high technology companies compete for the services of these qualified individuals. If we are unable to hire and train qualified personnel, we may not be able to maintain or expand our business. Additionally, if we are unable to retain key personnel, we may not be able to replace them readily or on terms that are reasonable, which also could hurt our business. We currently do not maintain key man life insurance on any of our employees.
We may experience manufacturing problems related to our instruments, which could adversely affect our business, financial condition or results of operations.
We manufacture our blood chemistry analyzers at our manufacturing facility in Union City, California. Should we experience problems related to the manufacture of our blood chemistry analyzer, we could fail to achieve anticipated revenues or we may incur an additional increase in our cost of revenues. These problems may include manufacturing defects and product failures, defects in raw materials acquired from our suppliers, delays in receipt of raw materials from our suppliers, obsolescence, increases in raw materials costs and labor disturbances. There can be no assurance that our efforts to resolve manufacturing difficulties will be successful or that similar problems will not arise in the future. If we are unable to prevent such problems from occurring in the future, we may not be able to manufacture sufficient quantities to meet anticipated demand and, therefore, will not be able to effectively market and sell our blood chemistry analyzers or other instruments that we market and sell; accordingly, our business, financial condition and results of operations could be adversely affected.
We need to successfully manufacture and market additional reagent discs for the human diagnostic market if we are to compete in that market.
We believe that we must develop and obtain regulatory clearance and third-party payor reimbursement for additional series of reagent discs with various tests for use with our Piccolo chemistry analyzers if we are to successfully compete in the human medical market. Our failure to meet these challenges will materially adversely affect our operating results and financial condition.
We rely on patents and other proprietary information, the loss of which would negatively affect our business.
As of March 31, 2015, 74 patent applications have been filed on our behalf with the United States Patent and Trademark Office (“USPTO”), of which 40 patents have been issued and 13 patents are currently active. Additionally, we have filed several international patent applications covering the same subject matter as our domestic applications. The patent position of any medical device manufacturer, including us, is uncertain and may involve complex legal and factual issues. Consequently, we may not be issued any additional patents, either domestically or internationally. Furthermore, our patents may not provide significant proprietary protection because there is a chance that they will be circumvented or invalidated. We cannot be certain that we were the first creator of the inventions covered by our issued patents or pending patent applications, or that we were the first to file patent applications for these inventions, because (1) the USPTO maintains all patent applications that are not filed in any foreign jurisdictions in secrecy until it issues the patents (when a patent application owner files a request for nonpublication) and (2) publications of discoveries in the scientific or patent literature tend to lag behind actual discoveries by several months. We may have to participate in interference proceedings, which are proceedings in front of the USPTO, to determine who will be issued a patent. These proceedings could be costly and could be decided against us.
We also rely upon copyrights, trademarks and unpatented trade secrets. Others may independently develop substantially equivalent proprietary information and techniques that would undermine our proprietary technologies. Further, others may gain access to our trade secrets or disclose such technology. Although we require our employees, consultants and advisors to execute agreements that require that our corporate information be kept confidential and that any inventions by these individuals are property of Abaxis, there can be no assurance that these agreements will provide meaningful protection or adequate remedies for our trade secrets in the event of unauthorized use or disclosure of such information. The unauthorized dissemination of our confidential information would negatively impact our business.
We face significant competition. We may not be able to compete effectively with larger, more established entities or their products, or with future organizations or future products, which could cause our sales to decline.
The diagnostic market is a well-established field in which there are a number of competitors that have substantially greater financial and operational resources and larger, more established marketing, sales and service organizations than we do. We compete primarily with the following organizations: commercial clinical laboratories, hospitals’ clinical laboratories, and manufacturers of bench top multi-test blood analyzers and other testing systems that health care providers can use “on-site” (a listing of our competitors is listed below).
Historically, hospitals and commercial laboratories perform most of the human diagnostic testing, and veterinary specialized commercial laboratories perform most of the veterinary medical testing. We have identified five principal factors that we believe customers typically use to evaluate our products and those of our competitors. These factors include the following: range of tests offered, immediacy of results, cost effectiveness, ease of use, and reliability of results. We believe that we compete effectively on each of these factors except for the range of tests offered. Clinical laboratories are effective at processing large panels of tests using skilled technicians and complex equipment. Currently, while our offering of instruments and reagent discs does not provide the same broad range of tests as hospitals and commercial laboratories, we believe that in certain markets, our products provide a sufficient breadth of test menus to compete successfully with clinical laboratories given the advantages of our products with respect to the other four factors. In addition, we cannot assure you that we will continue to be able to compete effectively on cost effectiveness, ease of use, immediacy of results or reliability of results. We also cannot assure you that we will ever be able to compete effectively on the basis of range of tests offered.
Our principal competitors in the point-of-care human medical diagnostic market are Alere, Alfa Wassermann S.P.A., Johnson & Johnson, Ortho-Clinical Diagnostics, Inc. and F. Hoffmann-La Roche Ltd. Additionally, in certain segments of the human medical diagnostic market, we compete with Abbott’s i-STAT division. Many of our competitors in the human medical diagnostic market have significantly larger product lines to offer and greater financial and other resources than we do. In particular, many of these competitors have large sales forces and well-established distribution channels and brand names.
Our principal competitors in the veterinary diagnostic market are Idexx Laboratories, Inc. and Heska Corporation. Idexx has a larger veterinary product and service offering than we do and a large sales infrastructure network and brand name. Consequently, we must develop our distribution channels and significantly expand our direct sales force in order to compete more effectively in these markets.
Changes in health care regulations and third-party payor reimbursement can negatively affect our business.
By regulating the maximum amount of reimbursement they will provide for blood testing services, third-party payors, such as managed care organizations, pay-per-service insurance plans, and the Centers for Medicare and Medicaid Services (the “CMS”), can indirectly affect the pricing or the relative attractiveness of our human testing products. For example, the CMS set the level of reimbursement of fees for blood testing services for Medicare beneficiaries. If third-party payors decrease the reimbursement amounts for blood testing services, it may decrease the likelihood that physicians and hospitals will adopt point-of-care diagnostics as a viable means of care delivery. Consequently, we would need to charge less for our products. If the government and third-party payors do not provide for adequate coverage and reimbursement levels to allow health care providers to use our products, the demand for our products will decrease and our business and financial condition would be harmed.
The Patient Protection and Affordable Care Act, as amended by the Health Care and Education Reconciliation Act, collectively, PPACA, enacted in March 2010, made changes that are expected to significantly impact the medical device industries and clinical laboratories. Beginning in January 2013, each medical device manufacturer has to pay an excise tax in an amount equal to 2.3% of the price for which such manufacturer sells its medical devices, which applies to sales of taxable medical devices after December 31, 2012. The PPACA also mandates a reduction in payments for clinical laboratory services paid under the Medicare Clinical Laboratory Fee Schedule, or CLFS, of 1.75% for the calendar years 2011 through 2015 and a productivity adjustment to the CLFS, further reducing payment rates. Some commercial payors are guided by the CLFS in establishing their reimbursement rates. Clinicians may decide not to order clinical diagnostic tests if third party payments are inadequate, and we cannot predict whether third-party payors will offer adequate reimbursement for tests utilizing our products to make them commercially attractive. Changes in healthcare policy, such as the creation of test utilization limits for diagnostic products in general or requirements that Medicare patients pay for portions of clinical laboratory tests or services received, could substantially impact the sales of our tests, increase costs and divert management’s attention from our business. In addition, sales of our tests outside of the United States will subject us to foreign regulatory requirements, which may also change over time.
We may be subject, directly or indirectly, to federal and state healthcare fraud and abuse laws and other federal and state laws applicable to our marketing practices. If we are unable to comply, or have not complied, with such laws, we could face substantial penalties.
Our operations are directly, or indirectly through our customers, subject to various federal and state fraud and abuse laws, including, without limitation, the federal and state anti-kickback statutes, physician payment transparency laws and false claims laws. These laws may impact, among other things, our sales and marketing and education programs and require us to implement additional internal systems for tracking certain marketing expenditures and reporting them to government authorities. In addition, we may be subject to patient privacy regulation by both the federal government and the states in which we conduct our business. If our operations are found to be in violation of any of these laws or any other governmental regulations that apply to us, we may be subject to penalties, including civil and criminal penalties, damages, fines and the curtailment or restructuring of our operations, the exclusion from participation in federal and state healthcare programs and imprisonment, any of which could adversely affect our ability to operate our business and our results of operations.
Approval and/or clearance by the FDA, USDA and foreign regulatory authorities for our products requires significant time and expenditures.
Before we may commercialize our human medical diagnostic products in the United States, we are required to obtain either 510(k) clearance or pre-marketing approval (“PMA”) from the FDA, unless an exemption from pre-market review applies. In our veterinary market, certain products that we sell are subject to regulations pertaining to veterinary biologics, for which we must obtain approval from the USDA’s Center for Veterinary Biologics. The process of obtaining regulatory clearances or approvals to market a medical device can be costly and time consuming, and we may not be able to successfully obtain 510(k) clearance from the FDA or may be subject to the more costly and time-consuming PMA process.
In addition, governmental agencies may change their clearance or approval policies, adopt additional regulations or revise existing regulations, or take other actions which may prevent or delay approval or clearance of our products under development or impact our ability to modify our currently approved or cleared products on a timely basis. Any delay in, or failure to receive or maintain, clearance or approval for our products could prevent us from generating revenue from these products and adversely affect our business operations and financial results.
The FDA and other regulatory authorities have broad enforcement powers. For example, the manufacture of medical devices must comply with the FDA’s Quality System Regulation (“QSR”). In addition, manufacturers must register their manufacturing facilities, list the products with the FDA, and comply with requirements relating to labeling, marketing, complaint handling, adverse event and medical device reporting, reporting of corrections and removals, and import and export. The FDA monitors compliance with the QSR and these other requirements through periodic inspections. If our facilities or those of our manufacturers or suppliers are found to be in violation of applicable laws and regulations, or if we or our manufacturers or suppliers fail to take satisfactory corrective action in response to an adverse inspection, the regulatory authority could take enforcement actions that could impair our ability to produce our products in a cost-effective and timely manner in order to meet our customers’ demands, and could have a material adverse effect on our reputation, business, results of operations and financial condition. We may also be required to bear other costs or take other actions that may have a negative impact on our future sales and our ability to generate profits.
Sales of our products outside the United States are subject to foreign regulatory requirements governing vigilance reporting, marketing approval, manufacturing, product licensing, pricing and reimbursement. These regulatory requirements vary greatly from country to country. As a result, the time required to obtain approvals outside the United States may differ from that required to obtain FDA clearance or USDA approval, and we may not be able to obtain foreign regulatory approvals on a timely basis or at all. Clearance or approval by the FDA does not ensure approval by regulatory authorities in other countries, and approval by one foreign regulatory authority does not ensure clearance or approval by regulatory authorities in other countries or by the FDA.
A recall of our products, or the discovery of serious safety issues with our products that leads to corrective actions, could have a significant adverse impact on our business, financial condition or results of operations.
The FDA, USDA and similar foreign governmental authorities have the authority to require the recall of commercialized products in the event of material deficiencies or defects in design or manufacture of a product or in the event that a product poses an unacceptable risk to health. Manufacturers may, under their own initiative, recall a product if any material deficiency in a device is found. A government-mandated or voluntary recall by us or one of our distributors could occur as a result of component failures, manufacturing errors, design or labeling defects or other deficiencies and issues. We are required to report to the FDA any incident in which our product may have caused or contributed to a death or serious injury or in which our product malfunctioned and, if the malfunction were to recur, would likely cause or contribute to death or serious injury. Repeated product malfunctions may result in a voluntary or involuntary product recall. Recalls of any of our products would divert managerial and financial resources and could impair our ability to produce our products in a cost-effective and timely manner in order to meet our customers’ demands, any of which could have an adverse effect on our business, financial condition and results of operations. Moreover, if we do not adequately address problems associated with our devices, we may face additional regulatory enforcement action, including FDA warning letters, product seizure, injunctions, administrative penalties, or civil or criminal fines. We may also be required to bear other costs or take other actions that may have a negative impact on our sales as well as face significant adverse publicity or regulatory consequences, which could harm our business, financial condition or results of operations.
We may inadvertently design or produce defective products, which may subject us to significant warranty liabilities or product liability claims. We may have insufficient product liability insurance to pay uninsured claims.
Our business exposes us to potential warranty and product liability risks that are inherent in the design, testing, manufacturing and marketing of human and veterinary medical products. Although we have established procedures for quality control on both the raw materials that we receive from suppliers as well as the design and manufacturing of our products, these procedures may prove inadequate to detect a design or manufacturing defect. In addition, our Piccolo and VetScan chemistry analyzers may be unable to detect all errors that could result in the misdiagnosis of human or veterinary patients.
We may be subject to substantial claims for defective products under our warranty policy or product liability laws. In addition, our policy is to credit medical providers for any defective product that we produce, including those reagent discs that are rejected by our Piccolo and VetScan chemistry analyzers. Therefore, even if a mass defect within a lot or lots of reagent discs were detected by our Piccolo and VetScan chemistry analyzers, the replacement of such reagent discs free of charge would be costly and could adversely affect our business, financial condition and results of operations. Further, in the event that a product defect is not detected in our Piccolo chemistry analyzer, our expansion into the human medical market greatly increases the risk that the amount of damages involved with just one product defect would adversely impact our business, financial condition and results of operations. Our product liability insurance and cash may be insufficient to cover potential liabilities. In addition, in the future the coverage that we require may be unavailable on commercially reasonable terms, if at all. Even with our current insurance coverage, a mass product defect, product liability claim or recall could subject us to claims above the amount of our coverage and could adversely affect our business, our financial condition or results of operations.
Acquisitions, strategic investments, partnerships, or alliances could be difficult to identify and integrate, divert the attention of management, disrupt our business, dilute stockholder value, and adversely affect our business, financial condition or results of operations.
We have in the past and may in the future seek to acquire or invest in businesses, products, or technologies that we believe could complement or expand our products, enhance our capabilities, or otherwise offer growth opportunities. Any acquisition may divert the attention of management and cause us to incur various expenses in identifying, investigating, and pursuing suitable acquisitions, whether or not the acquisitions are completed, and may result in unforeseen operating difficulties and expenditures. In particular, we may encounter difficulties assimilating or integrating the businesses, technologies, products, personnel, or operations of the acquired companies, particularly if the key personnel of the acquired company choose not to work for us, their products are not easily adapted to work with ours, or we have difficulty retaining the customers of any acquired business due to changes in ownership, management, or otherwise. For example, we only recently completed our acquisitions of Quality Clinical Reagents Limited (“QCR”) and Trio Diagnostics (Ireland) Ltd (“Trio”), and substantially all of the acquisition and integration risks remain. Acquisitions, including our acquisitions of QCR and Trio, may also disrupt our business, divert our resources, and require significant management attention that would otherwise be available for development of our existing business. Any acquisitions we are able to complete may not result in any synergies or other benefits we had expected to achieve, which could result in impairment charges that could be substantial. In addition, we may not be able to find and identify desirable acquisition targets or be successful in entering into an agreement with any particular target. Acquisitions could also result in dilutive issuances of equity securities or the incurrence of debt, which could adversely affect our financial condition or results of operations. In addition, if an acquired business, including QCR or Trio, fails to meet our expectations, our business, financial condition or results of operations may suffer or we may be exposed to risks or liabilities that were unknown to us at the time of the acquisition.
We may be subject to litigation for a variety of claims, which could adversely affect our business, financial condition or results of operations.
In addition to product liability claims, we and our directors and officers may be subject to claims arising from our normal business activities. These may include claims, suits, and proceedings involving shareholder and fiduciary matters, intellectual property, labor and employment, wage and hour, commercial and other matters. For example, in October 2012, the St. Louis Police Retirement System, a purported shareholder of Abaxis, filed a lawsuit against certain officers and each of the directors of the Company in the United States District Court for the Northern District of California alleging, among other things, that the directors violated Section 14(a) of the Securities Exchange Act of 1934 and breached their fiduciary duties by allegedly failing to disclose material information in our 2010 proxy statement, breached their fiduciary duties by allegedly violating the terms of our 2005 Equity Incentive Plan, and breached their fiduciary duties by failing to disclose alleged material information in our 2012 proxy statement regarding (1) the events leading up to our proposal to amend the 2005 Equity Incentive Plan to eliminate the limit on the number of shares that may be issued pursuant to restricted stock units, and (2) the effects of the proposed amendment on certain settled and outstanding restricted stock units. On August 12, 2014, the Court issued a final judgment order, among other things, approving a settlement of the lawsuit, pursuant to which (a) the parties have agreed that the claims against the defendants will be dismissed with prejudice and will be granted the release of certain known or unknown claims that have been or could have been brought later in the court arising out of the same allegations, (b) we have agreed that we will adopt certain corporate governance measures, such measures to be in effect for at least five years and (c) the court awarded $579,430 in attorney’s fees and costs to plaintiff’s counsel, which was paid by our insurance. The outcome of any litigation, regardless of its merits, is inherently uncertain. Any claims and lawsuits, and the disposition of such claims and lawsuits, could be time-consuming and expensive to resolve, divert management attention and resources, and lead to attempts on the part of other parties to pursue similar claims. Any adverse determination related to litigation or settlement or other resolution of a legal matter could adversely affect our business, financial condition or results of operations, harm our reputation or otherwise negatively impact our business.
Our stock price is highly volatile and investing in our stock involves a high degree of risk, which could result in substantial losses for investors.
The market price of our common stock, like the securities of many other medical products companies, fluctuates over a wide range, and will continue to be highly volatile in the future. During the quarter ended March 31, 2015, the closing sale prices of our common stock on the NASDAQ Global Select Market ranged from $56.65 to $66.54 per share and the closing sale price on March 31, 2015, was $64.11 per share. During the last eight fiscal quarters ended March 31, 2015, our stock price closed at a high of $66.54 per share on March 30, 2015 and a low of $32.40 per share on October 23, 2013. Many factors may affect the market price of our common stock, including:
| · | fluctuation in our operating results; |
| · | announcements of technological innovations or new commercial products by us or our competitors; |
| · | changes in governmental regulation in the United States and internationally; |
| · | prospects and proposals for health care reform; |
| · | governmental or third-party payors’ controls on prices that our customers may pay for our products; |
| · | developments or disputes concerning our patents or our other proprietary rights; |
| · | product liability claims and public concern as to the safety of our devices or similar devices developed by our competitors; and |
| · | general market conditions. |
In the past, stockholders have filed securities class action litigation following periods of market volatility. If we were to become involved in such securities litigation, it could subject us to substantial costs, divert resources and the attention of management from our business, and adversely affect our business, financial condition or results of operations. Because our stock price is so volatile, investing in our common stock is highly risky. A potential investor must be able to withstand the loss of his entire investment in our common stock.
Fluctuations in foreign exchange rates could adversely affect our business, financial condition or results of operations.
For our international sales denominated in U.S. dollars, an increase in the value of the U.S. dollar relative to foreign currencies could make our products less competitive in international markets. For our sales denominated in foreign currencies, we are subject to fluctuations in exchange rates between the U.S. dollar and the particular foreign currency and changes in such exchange rates could adversely affect our reported results of operations and distort period to period comparisons. Our business, financial condition or results of operations could also be adversely affected by the seasonality of international sales and the economic conditions of our overseas markets.
We are subject to complex requirements from legislation requiring companies to evaluate internal control over financial reporting.
Rules adopted by the Securities and Exchange Commission pursuant to Section 404 of the Sarbanes-Oxley Act of 2002 require an assessment of internal control over financial reporting by our management and an attestation of the effectiveness of our internal control over financial reporting by an independent registered public accounting firm. We have an ongoing program to perform the assessment, testing and evaluation to comply with these requirements and we expect to continue to incur significant expenses for Section 404 compliance on an ongoing basis.
We cannot predict the outcome of our testing in future periods. In the event that our internal control over financial reporting is not effective as defined under Section 404, or any failure to implement required new or improved controls, or difficulties encountered in implementation could harm results of operations or prevent us from accurately reporting financial results or cause a failure to meet our reporting obligations in the future. If management cannot assess internal control over financial reporting is effective, or our independent registered public accounting firm is unable to provide an unqualified attestation report on such assessment, investor confidence and our share value may be negatively impacted.
Regulations related to conflict minerals could adversely impact our business, financial condition or results of operations.
The Dodd-Frank Wall Street Reform and Consumer Protection Act contains provisions to improve transparency and accountability concerning the supply of tin, tantalum, tungsten and gold, known as conflict minerals, originating from the Democratic Republic of Congo, or the DRC, and adjoining countries. As a result, in August 2012 the SEC adopted annual disclosure and reporting requirements for public companies that use conflict minerals mined from the DRC and adjoining countries in their products. We have determined that we use at least one of these conflict minerals in the manufacture of our products, although we have not yet determined the source of the conflict minerals that we use. These new disclosure requirements require us to use diligent efforts to determine which conflict minerals we use and the source of those conflict minerals, and disclose the results of our findings annually. There are and will be costs associated with complying with these disclosure requirements, including those costs incurred in conducting diligent efforts to determine which conflict minerals we use and the sources of conflict minerals used in our products. Further, the implementation of these rules could adversely affect the sourcing, supply and pricing of materials used in our products. As there may be only a limited number of suppliers offering conflict free conflict minerals, we cannot be sure that we will be able to obtain necessary conflict free conflict minerals in sufficient quantities or at competitive prices. In addition, we may face reputational challenges if we determine that our products contain minerals not determined to be conflict free or if we are unable to sufficiently verify the origins for all conflict minerals used in our products through the procedures we may implement. If we determine to redesign our products to not use conflict minerals, our business, financial condition and results of operations could be adversely affected.
We must comply with strict and potentially costly environmental regulations or we could pay significant fines.
We are subject to stringent federal, state and local laws, rules, regulations and policies that govern the use, generation, manufacture, storage, air emission, effluent discharge, handling and disposal of certain materials and wastes. In particular, we are subject to laws, rules and regulations governing the handling and disposal of biohazardous materials used in the development and testing of our products. Our costs to comply with applicable environmental regulations consist primarily of handling and disposing of human and veterinary blood samples for testing (whole blood, plasma and serum). Although we believe that we have complied with applicable laws and regulations in all material respects and have not been required to take any action to correct any noncompliance, we may have to incur significant costs to comply with environmental regulations if our manufacturing to commercial levels continues to increase. In addition, if a government agency determines that we have not complied with these laws, rules and regulations, we may have to pay significant fines and/or take remedial action that would be expensive and we do not carry environmental-related insurance coverage.
Our financial condition and results of operations could be adversely affected by unanticipated changes in our tax provisions or exposure to additional income tax liabilities.
Our determination of our tax liability is subject to review by applicable tax authorities. Any adverse outcome of such a review could have an adverse effect on our results of operations and financial condition. In addition, the determination of our provision for income taxes and other tax liabilities requires significant judgment including our determination of whether a valuation allowance against deferred tax assets is required. Our ultimate tax liability may differ from the amounts recorded in our consolidated financial statements and may adversely affect our financial condition and results of operations.
Our ability to issue preferred stock may delay or prevent a change of control of Abaxis.
Our board of directors has the authority to issue up to 5,000,000 shares of preferred stock and to determine the price, rights, preferences, privileges and restrictions, including voting rights, of those shares without any further vote or action by the shareholders, except to the extent required by NASDAQ rules. The issuance of preferred stock, while providing flexibility in connection with possible financings or acquisitions or other corporate purposes, could have the effect of making it more difficult for a third party to acquire a majority of our outstanding voting stock and, consequently, negatively affect our stock price.
Not applicable.
We are headquartered in Union City, California, where we lease approximately 126,363 square feet of office, research and development and manufacturing space, pursuant to a lease expiring in February 2021.
Additionally, our facilities include the following:
|
·
|
Approximately 38,856 square feet of leased warehousing space in Union City, California, expiring in fiscal 2017. |
|
·
|
Approximately 32,722 square feet of leased office and warehousing space in Germany. |
|
·
|
Approximately 2,600 square feet of office and warehousing space owned by us in the United Kingdom. |
We believe that our existing facilities are adequate to meet our current requirements, and that we will be able to obtain additional facilities space on commercially reasonable terms, if and when they are required.
We are not currently party to any material pending legal proceedings. We are involved from time to time in various litigation matters in the normal course of business. There can be no assurance that existing or future legal proceedings arising in the ordinary course of business or otherwise will not have a material adverse effect on our business, consolidated financial position, results of operations or cash flows.
Not applicable.
PART II
|
Market for Registrant’s Common Equity, Related Stockholder Matters and Issuer Purchases of Equity Securities
|
Market Information for Common Stock
Our common stock is traded on the NASDAQ Global Select Market under the symbol “ABAX.” The following table sets forth the quarterly high and low intra-day per share sales prices for the common stock from April 1, 2014 through March 31, 2015 as reported on the NASDAQ Global Select Market:
|
Prices
|
||||||||||||||||
|
Fiscal 2015
|
Fiscal 2014
|
|||||||||||||||
|
High
|
Low
|
High
|
Low
|
|||||||||||||
|
Quarter ended June 30
|
$
|
45.20
|
$
|
36.77
|
$
|
49.45
|
$
|
40.48
|
||||||||
|
Quarter ended September 30
|
53.98
|
41.57
|
51.84
|
38.72
|
||||||||||||
|
Quarter ended December 31
|
60.94
|
46.87
|
42.24
|
32.11
|
||||||||||||
|
Quarter ended March 31
|
66.89
|
56.10
|
45.48
|
33.62
|
||||||||||||
Holders
As of May 27, 2015, there were 22,672,000 shares of our common stock outstanding, held by 93 shareholders of record.
Dividends
During fiscal 2015, we paid quarterly cash dividends totaling $9.0 million. We did not pay a cash dividend in fiscal 2014. The amount of quarterly dividends declared with respect to the Company’s common stock during the past two fiscal years appears in Note 21 to the Consolidated Financial Statements in Part II, Item 8 of this report.
Future declarations of quarterly dividends and the establishment of future record and payment dates are subject to the final determination of our Board of Directors.
Issuer Purchases of Equity Securities
Between August 2011 and January 2012, our Board of Directors authorized the repurchase of up to a total of $55.0 million of our common stock. In July 2013, our Board of Directors approved a $12.3 million increase to our existing share repurchase program to a total of $67.3 million. As of March 31, 2015, $37.0 million of our common stock was available for repurchase under our share repurchase program.
Since the share repurchase program began, through March 31, 2015, we have repurchased 1.3 million shares of our common stock at a total cost of $30.3 million, including commission expense. During fiscal 2015, we did not repurchase any shares of our common stock. During fiscal 2014, we repurchased 86,000 shares at a total cost of $3.0 million and an average per share cost including commission expense of $34.58. During fiscal 2013, we did not repurchase any shares of our common stock. The repurchases are made from time to time on the open market at prevailing market prices or in negotiated transactions off the market. Repurchased shares are retired.
Stock Performance Graph (1)
The graph below compares the cumulative total shareholder return on an investment in our common stock, the Russell 2000 Index and the NASDAQ Medical Equipment Securities Index over the past five year period ended March 31, 2015. The shareholder return shown on the graph is not necessarily indicative of future performance, and we do not make or endorse any predictions as to future shareholder returns.
The graph assumes the investment of $100 on March 31, 2010 in our common stock, the Russell 2000 Index and the NASDAQ Medical Equipment Securities Index and assumes dividends, if any, are reinvested.
COMPARISON OF 5 YEAR CUMULATIVE TOTAL RETURN
Among Abaxis, Inc., the Russell 2000 Index,
and the NASDAQ Medical Equipment Securities Index
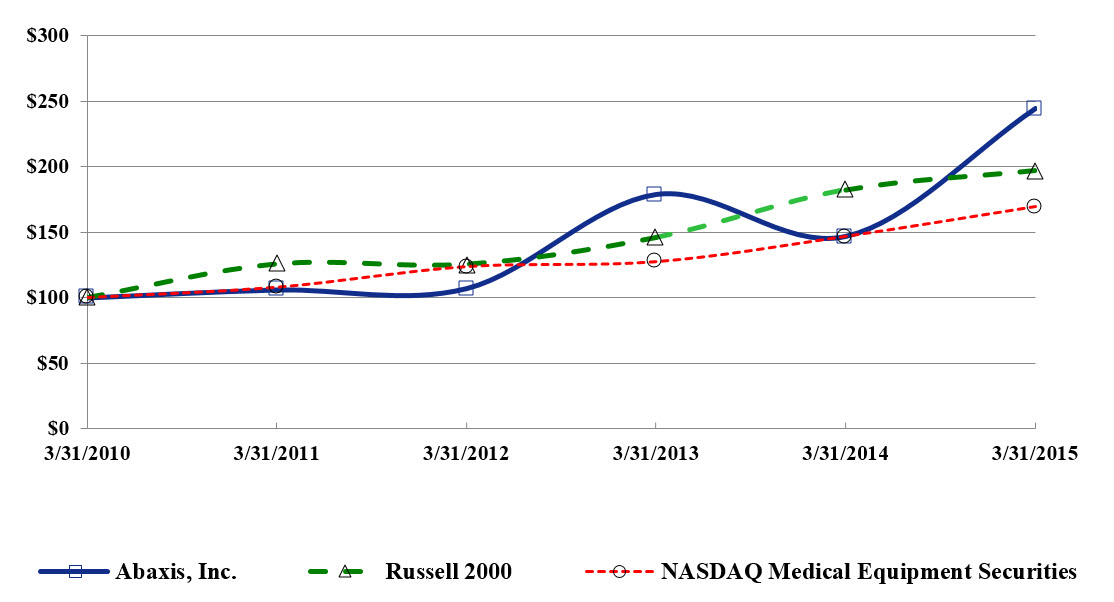
|
3/31/2010
|
3/31/2011
|
3/31/2012
|
3/31/2013
|
3/31/2014
|
3/31/2015
|
|||||||||||||||||||
|
Abaxis, Inc.
|
$
|
100.00
|
$
|
106.07
|
$
|
107.13
|
$
|
178.69
|
$
|
146.82
|
$
|
244.03
|
||||||||||||
|
Russell 2000
|
$
|
100.00
|
$
|
125.79
|
$
|
125.56
|
$
|
146.03
|
$
|
182.39
|
$
|
197.37
|
||||||||||||
|
NASDAQ Medical Equipment Securities
|
$
|
100.00
|
$
|
107.87
|
$
|
123.57
|
$
|
127.33
|
$
|
146.66
|
$
|
169.39
|
||||||||||||
| (1) | This section is not “soliciting material,” is not deemed “filed” with the Securities and Exchange Commission and is not to be incorporated by reference in any filing of Abaxis under the Securities Act of 1933, as amended, or the Securities Exchange Act of 1934, as amended, whether made before or after the date hereof and irrespective of any general incorporation language contained in any such filing. |
The following table sets forth selected consolidated financial data of Abaxis for each year in the five year period ended March 31, 2015. The following selected consolidated financial data is qualified by reference to and should be read in conjunction with “Management’s Discussion and Analysis of Financial Condition and Results of Operations” and with the consolidated financial statements, related notes thereto and other financial information included elsewhere in this Annual Report on Form 10-K.
On March 31, 2015, we completed the sale of our AVRL business to Antech. We have reclassified the assets, liabilities, results of operations and the gain on sale of AVRL in our consolidated balance sheets and statements of income for all periods presented to reflect them as discontinued operations. Previously reported financial information have been revised to reflect the reclassification of AVRL within our veterinary market segment as a discontinued operation. See Note 3 to the Consolidated Financial Statements in Part II, Item 8 of this report for additional information.
|
Year Ended March 31,
|
||||||||||||||||||||
|
2015
|
2014
|
2013
|
2012
|
2011
|
||||||||||||||||
|
(In thousands, except per share data)
|
||||||||||||||||||||
|
Statements of Income Data:
|
||||||||||||||||||||
|
Continuing Operations:
|
||||||||||||||||||||
|
Revenues
|
$
|
202,593
|
$
|
162,031
|
$
|
180,878
|
$
|
155,994
|
$
|
143,676
|
||||||||||
|
Cost of revenues
|
93,623
|
78,081
|
79,903
|
69,898
|
63,884
|
|||||||||||||||
|
Gross profit
|
108,970
|
83,950
|
100,975
|
86,096
|
79,792
|
|||||||||||||||
|
Operating expenses:
|
||||||||||||||||||||
|
Research and development
|
16,327
|
13,647
|
13,577
|
12,246
|
11,973
|
|||||||||||||||
|
Sales and marketing
|
42,147
|
34,742
|
43,800
|
37,987
|
34,207
|
|||||||||||||||
|
General and administrative
|
16,192
|
11,333
|
12,825
|
12,122
|
10,963
|
|||||||||||||||
|
Gain from legal settlement
|
-
|
-
|
(17,250
|
)
|
-
|
-
|
||||||||||||||
|
Total operating expenses
|
74,666
|
59,722
|
52,952
|
62,355
|
57,143
|
|||||||||||||||
|
Income from operations
|
34,304
|
24,228
|
48,023
|
23,741
|
22,649
|
|||||||||||||||
|
Interest and other income (expense), net
|
(1,262
|
)
|
994
|
253
|
610
|
1,099
|
||||||||||||||
|
Income from continuing operations before income tax provision
|
33,042
|
25,222
|
48,276
|
24,351
|
23,748
|
|||||||||||||||
|
Income tax provision
|
12,239
|
8,993
|
17,149
|
8,653
|
9,101
|
|||||||||||||||
|
Income from continuing operations
|
$
|
20,803
|
$
|
16,229
|
$
|
31,127
|
$
|
15,698
|
$
|
14,647
|
||||||||||
|
Net income per share from continuing operations:
|
||||||||||||||||||||
|
Basic
|
$
|
0.92
|
$
|
0.73
|
$
|
1.42
|
$
|
0.71
|
$
|
0.65
|
||||||||||
|
Diluted
|
$
|
0.91
|
$
|
0.72
|
$
|
1.39
|
$
|
0.70
|
$
|
0.64
|
||||||||||
|
Discontinued Operations:
|
||||||||||||||||||||
|
Loss from discontinued operations, net of tax
|
$
|
(1,154
|
)
|
$
|
(2,044
|
)
|
$
|
(3,668
|
)
|
$
|
(2,607
|
)
|
$
|
(110
|
)
|
|||||
|
Gain on sale of discontinued operations, net of tax
|
$
|
7,682
|
$
|
-
|
$
|
-
|
$
|
-
|
$
|
-
|
||||||||||
|
Net income (loss) per share from discontinued operations:
|
||||||||||||||||||||
|
Basic
|
$
|
0.29
|
$
|
(0.09
|
)
|
$
|
(0.17
|
)
|
$
|
(0.12
|
)
|
$
|
-
|
|||||||
|
Diluted
|
$
|
0.29
|
$
|
(0.09
|
)
|
$
|
(0.16
|
)
|
$
|
(0.12
|
)
|
$
|
-
|
|||||||
|
Consolidated Operations:
|
||||||||||||||||||||
|
Net income
|
$
|
27,331
|
$
|
14,185
|
$
|
27,459
|
$
|
13,091
|
$
|
14,537
|
||||||||||
|
Net income per share:
|
||||||||||||||||||||
|
Basic
|
$
|
1.21
|
$
|
0.64
|
$
|
1.25
|
$
|
0.59
|
$
|
0.65
|
||||||||||
|
Diluted
|
$
|
1.20
|
$
|
0.63
|
$
|
1.23
|
$
|
0.58
|
$
|
0.64
|
||||||||||
|
Shares used in the calculation of net income per share:
|
||||||||||||||||||||
|
Weighted average common shares outstanding - basic
|
22,497
|
22,270
|
21,946
|
22,084
|
22,365
|
|||||||||||||||
|
Weighted average common shares outstanding - diluted
|
22,787
|
22,575
|
22,381
|
22,462
|
22,858
|
|||||||||||||||
|
Cash dividends declared per share
|
$
|
0.40
|
$
|
-
|
$
|
1.00
|
$
|
-
|
$
|
-
|
||||||||||
|
Year Ended March 31,
|
||||||||||||||||||||
|
2015
|
2014
|
2013
|
2012
|
2011
|
||||||||||||||||
|
(In thousands)
|
||||||||||||||||||||
|
Consolidated Balance Sheets Data (1):
|
||||||||||||||||||||
|
Cash and cash equivalents
|
$
|
107,015
|
$
|
73,589
|
$
|
54,910
|
$
|
45,843
|
$
|
43,471
|
||||||||||
|
Short-term investments
|
26,109
|
29,102
|
23,354
|
21,689
|
25,981
|
|||||||||||||||
|
Working capital
|
168,576
|
148,553
|
132,944
|
109,966
|
107,542
|
|||||||||||||||
|
Long-term investments
|
24,181
|
18,491
|
17,000
|
23,442
|
36,237
|
|||||||||||||||
|
Total assets
|
269,064
|
217,380
|
201,763
|
181,836
|
188,260
|
|||||||||||||||
|
Non-current liabilities
|
7,585
|
6,205
|
5,550
|
4,620
|
3,090
|
|||||||||||||||
|
Total shareholders' equity
|
$
|
220,194
|
$
|
193,916
|
$
|
176,194
|
$
|
159,785
|
$
|
168,648
|
||||||||||
| (1) | Consolidated balance sheets data reported in the table includes continuing and discontinued operations. |
The following discussion and analysis should be read in conjunction with our consolidated financial statements and related notes thereto included elsewhere in this Annual Report on Form 10-K. This discussion may contain forward-looking statements based upon current expectations that involve risks and uncertainties. Our actual results and the timing of selected events could differ materially from those anticipated in these forward-looking statements as a result of several factors, including those set forth under Item 1A. “Risk Factors” and elsewhere in this Annual Report on Form 10-K.
Business Overview
Abaxis, Inc. is a worldwide developer, manufacturer and marketer of portable blood analysis systems that are used in a broad range of medical specialties in human or veterinary patient care to provide clinicians with rapid blood constituent measurements. Until March 2015, Abaxis also provided veterinary reference laboratory diagnostic and consulting services for veterinarians through AVRL. See the section below entitled “Discontinued Operations” for further information.
Our corporate headquarters are located in Union City, California, from which we conduct our manufacturing, warehousing, research and development, regulatory, sales and marketing and administrative activities. We market and sell our products worldwide primarily through independent distributors, supplemented by our direct sales force. Our sales force is primarily located in the United States. Abaxis Europe GmbH, our wholly-owned subsidiary, markets and distributes diagnostic systems for medical and veterinary uses in the European and Asia Pacific markets.
We manage our business in two operating segments, the medical market and veterinary market, as described below. See “Segment Results” in this section for a detailed discussion of financial results.
Medical Market. We serve a worldwide customer group in the medical market consisting of physicians’ office practices across multiple specialties, urgent care, outpatient and walk-in clinics (free-standing or hospital-connected), health screening operations, home care providers (national, regional or local), nursing homes, ambulance companies, oncology treatment clinics, dialysis centers, pharmacies, hospital laboratories, military installations (ships, field hospitals and mobile care units), pharmaceutical clinical trials and cruise ship lines.
For our products in the human medical market, we employ primarily independent distributors to market our products. Starting in January 2013, we transitioned the majority of our medical product sales to Abbott as our exclusive distributor in the medical market. Pursuant to our Abbott Agreement, Abbott obtained the exclusive right to sell and distribute our Piccolo Xpress chemistry analyzers and associated consumables in the professionally-attended human healthcare market in the United States and China (including Hong Kong). Effective September 2013, we amended the Abbott Agreement to limit Abbott’s territory under such agreement to the United States. Under the Abbott Agreement, we have certain responsibilities for providing technical support and warranty services to Abbott in support of its marketing and sales efforts. The initial term of the Abbott Agreement ends on December 31, 2017, and after the initial term, the Abbott Agreement renews automatically for successive one-year periods unless terminated by either party based upon a notice of non-renewal six months prior to the then-current expiration date.
We will continue to sell and distribute these medical products outside of the market segments as to which Abbott has exclusive rights. Under our Abbott Agreement, we will continue to sell and distribute to Catapult Health LLC and specified customer segments in the United States, including pharmacy and retail store clinics, shopping malls, CROs and cruise ship lines.
Veterinary Market. Our VetScan products serve a worldwide customer group in the veterinary market consisting of companion animal hospitals, animal clinics with mixed practices of small animals, birds and reptiles, equine and bovine practitioners, veterinary emergency clinics, veterinary referral hospitals, universities, government, pharmaceutical companies, biotechnology companies and private research laboratories.
We depend on a number of distributors in North America that distribute our VetScan products. In September 2012, we entered into a distribution agreement with MWI to purchase, market and sell the full line of Abaxis veterinary products throughout the United States. In the United States veterinary market segment, we also rely on various independent regional distributors. We continue to enter into additional distributor relationships to expand our distribution base in North America, In October 2014, we entered into distribution agreements with Henry Schein Animal Health and Patterson Veterinary Supply to sell the full line of Abaxis veterinary products throughout the United States. We depend on our distributors to assist us in promoting our VetScan products, and accordingly, if one or more of our distributors were to stop selling our products in the future, we may experience a temporary sharp decline or delay in our sales revenues until our customers identify another distributor or purchase products directly from us. In addition to selling through distributors, we also directly supply our VetScan products to large group purchasing organizations, hospital networks and other buying groups in the United States, such as Veterinary Centers of America (VCA), a veterinary hospital chain in North America. In May 2014, we entered into a product supply agreement with VCA to supply our VetScan VS2 chemistry analyzers and diagnostic reagent discs for placement at VCA's animal hospitals located in North America. Additionally, in May 2014, we entered into a non-exclusive co-marketing agreement with VCA's Antech Diagnostic laboratory services to supply our VetScan VS2 chemistry analyzers in combination with Antech Diagnostic laboratory services as a complete diagnostic solution to serve veterinary practices throughout North America.
Discontinued Operations
In March 2015, we entered into an asset purchase agreement with Antech pursuant to which we sold substantially all of the assets of our AVRL business to Antech. The transaction closed on March 31, 2015. We determined that our AVRL business met the criteria to be classified as a discontinued operation, which required retrospective application to financial information for all periods presented. Accordingly, the historical financial statements appearing in this report have been revised to reflect this reclassification. Unless otherwise noted, references to revenues and expenses in this report are to our revenues and expenses excluding those from AVRL operations. See Note 3 of the Consolidated Financial Statements included in Part II, Item 8 of this report for more information.
The total purchase price under the asset purchase agreement was $21.0 million in cash. We received $20.1 million in cash proceeds during the fourth quarter of fiscal 2015, while the remaining $0.9 million is being held by Antech until certain conditions are met upon proceeds may be released on the first anniversary of the closing date. In connection with the sale of our AVRL business, we recognized a pre-tax gain of $12.3 million ($7.7 million after-tax) on sale of discontinued operations during fiscal 2015. The pre-tax gain on this sale reflects the excess of the sum of the cash proceeds received over the costs incurred in connection with the sale of AVRL. During the fourth quarter of fiscal 2015, we recorded costs of $7.8 million related to cash payments for employee-related costs, including severance, contract termination and other associated costs. In connection with the transaction, we recorded disposal and an impairment of $1.9 million on long-lived assets. These items partially offset the cash proceeds that we received in accordance with the terms of the asset purchase agreement.
Overview of Financial Results
In fiscal 2015, total revenues were $202.6 million, an increase of 25% from fiscal 2014. The net increase in revenues was primarily attributable to increases in both revenues from instrument sales, which were $11.1 million, an increase of 30% over fiscal 2014, and revenues from consumable sales, which were $26.9 million, an increase of 23% over fiscal 2014. The increases were attributable to an increase in sales of our veterinary products by our national distributors in the United States. Gross profit in fiscal 2015 was $109.0 million, an increase of 30% from fiscal 2014, primarily attributable to higher unit sales of reagent discs in our veterinary market.
Total operating expenses in fiscal 2015 were $74.7 million, an increase of $14.9 million, or 25%, from $59.7 million in fiscal 2014, primarily attributable to an increase in employee bonus compensation expense due to stronger results of operations and company performance targets in fiscal 2015 and significantly lower bonus expense in fiscal 2014 due to generally not meeting company performance targets for the second, third and fourth quarters of fiscal 2014.
Net income for fiscal 2015 was $27.3 million, an increase of 93% from $14.2 million in fiscal 2014, due primarily to (a) gain on the sale of AVRL business, net of tax, of $7.7 million and (b) the increase in revenues of $40.6 million, as described above. For these reasons, diluted net income per share increased to $1.20 in fiscal 2015 from $0.63 in fiscal 2014. Our diluted net income per share from continuing operations increased to $0.91 in fiscal 2015 from $0.72 in fiscal 2014.
Cash, cash equivalents and investments increased by $36.1 million during fiscal 2015 to a total of $157.3 million at March 31, 2015. The primary sources of cash and cash equivalents during fiscal 2015 was operating cash flows of $36.4 million and proceeds from the sale of our AVRL business of $20.1 million. Key non-operating uses of cash during fiscal 2015 included payments of $6.1 million to purchase property and equipment, payments of $3.0 million made for tax withholdings related to net share settlements of restricted stock units and payment of $9.0 million in cash dividends to shareholders. Additionally, in the third quarter of fiscal 2015, we paid $0.6 million, net of cash acquired, to acquire 100% of the outstanding stock of Quality Clinical Reagents Limited (“QCR”) and Trio Diagnostics (Ireland) Ltd (“Trio”), both based in the United Kingdom.
Factors that May Impact Future Performance
Our industry is impacted by numerous competitive, regulatory and other significant factors. Our sales for any future periods are not predictable with a significant degree of certainty, and may depend on a number of factors outside of our control. We are dependent upon the efforts and priorities of our distributors in promoting and creating a demand for our products and as such, we do not have control over the marketing and sale of our products into these markets. Should these efforts be unsuccessful, or should we fail to maintain these relationships, our business, financial condition and results of operations are likely to be adversely affected. We generally operate with a limited order backlog because our products are typically shipped shortly after orders are received. Product sales in any quarter are generally dependent on orders booked and shipped in that quarter. As a result, any shortfall in product sales during a quarter would negatively affect our results of operations and financial condition during that quarter. In addition, our sales may be adversely impacted by pricing pressure from competitors. Our ability to increase our revenues and profitability will depend, in part, on our ability to increase the sales volumes of our products, to increase the sales performance of our independent distributors, and to successfully compete with our competitors.
During the fourth quarter of fiscal 2013, we transitioned the majority of our medical sales to Abbott as our exclusive distributor in the medical market in the United States. As such, we rely on Abbott and we no longer have control over the marketing and sale of our primary medical products into most of the U.S. medical market and we are dependent upon the efforts and priorities of Abbott in promoting and creating a demand for such products in such market. During fiscal 2014, we were adversely impacted by the timing of purchases of our medical products sold to Abbott as it integrated our products into its sales process and sell its inventory.
In the United States veterinary market, we rely on our national and independent regional distributors. During fiscal 2014, our strategy of increasing demand for our veterinary products through the expansion of our distribution partners, did not lead to the increased demand for our products in the veterinary clinics that we had anticipated resulting in excess channel inventory. In response, we took additional steps to more closely monitor and manage channel inventory in an effort to normalize the veterinary product inventories at our distribution partners in the United States. As a result of these efforts, we believe that our distributors’ purchases of our veterinary chemistry analyzers and related reagent discs in fiscal 2015 have been substantially in line with in-clinic sales. For the hematology, i-STAT and VSpro specialty veterinary products that we sell in the United States, sales orders from our largest distributors in the veterinary market decreased during the first half of fiscal 2015 as compared to the same period in fiscal 2014, resulting from excess channel inventory created during the first half of fiscal 2014; however, as a result of our efforts in closely monitoring and managing channel inventory, we believe that these distributors’ purchases of hematology, i-STAT and VSpro specialty veterinary products were substantially in line with in-clinic sales in the third quarter of fiscal 2015. We will continue to closely monitor and manage channel inventory at our distribution partners in the United States.
We are dependent upon the efforts and priorities of our distributors in promoting and creating a demand for our products and as such, we do not have control over the marketing and sale of our products into these markets. Should these efforts be unsuccessful, or should we fail to maintain these relationships, our business, financial condition and results of operations are likely to be adversely affected.
Critical Accounting Policies, Estimates and Judgments
Our consolidated financial statements are prepared in accordance with accounting principles generally accepted in the United States and pursuant to the rules and regulations of the Securities and Exchange Commission. The preparation of these financial statements requires management to make estimates and assumptions that affect the reported amounts of assets and liabilities at the date of the financial statements and revenues and expenses during the reporting period. On an on-going basis, we evaluate our estimates and the sensitivity of these estimates to deviations in the assumptions used in making them. We base our estimates on historical experience and on various other assumptions that are believed to be reasonable under the circumstances. However, there can be no assurance that our actual results will not differ from these estimates.
We have identified the policies below as critical because they are not only important to understanding our financial condition and results of operations, but also because application and interpretation of these policies requires both judgment and estimates of matters that are inherently uncertain and unknown. Accordingly, actual results may differ materially from our estimates. The impact and any associated risks related to these policies on our business operations are discussed below. For a more detailed discussion on the application of these and other accounting policies, see the Notes to Consolidated Financial Statements included in this Annual Report on Form 10-K.
Revenue Recognition. Our primary customers are distributors and direct customers in both the medical and veterinary markets. Service revenues are primarily generated from veterinary reference laboratory diagnostic and consulting services for veterinarians. Revenues from product sales, net of estimated sales allowances, discounts and rebates, are recognized when (i) evidence of an arrangement exists, (ii) upon shipment of the products or rendering of services to the customer, (iii) the sales price is fixed or determinable and (iv) collection of the resulting receivable is reasonably assured. Rights of return are not provided. From time to time, we offered discounts on AVRL services for a specified period as incentives. Discounts were reductions to invoiced amounts within a specified period and were recorded at the time services are performed. Net service revenues were recognized at the time services were performed.
Amounts collected in advance of revenue recognition are recorded as a current or non-current deferred revenue liability based on the time from the balance sheet date to the future date of revenue recognition. We recognize revenues associated with extended maintenance agreements ratably over the life of the contract.
Multiple Element Revenue Arrangements. Our sales arrangements may contain multiple element revenue arrangements in which a customer may purchase a combination of instruments, consumables or extended maintenance agreements. Additionally, we provide incentives in the form of free goods or extended maintenance agreements to customers in connection with the sale of our instruments. We participate in selling arrangements in the veterinary market that include multiple deliverables, such as instruments, consumables and service agreements associated with our veterinary reference laboratory. Judgments as to the allocation of consideration from an arrangement to the multiple elements of the arrangement, and the appropriate timing of revenue recognition are critical with respect to these arrangements.
A multiple element arrangement includes the sale of one or more tangible product offerings with one or more associated services offerings, each of which are individually considered separate units of accounting. We allocate revenues to each element in a multiple element arrangement based upon the relative selling price of each deliverable. When applying the relative selling price method, we determine the selling price for each deliverable using vendor-specific objective evidence (“VSOE”) of selling price, if it exists, or third-party evidence (“TPE”) of selling price. If neither VSOE nor TPE of selling price exist for a deliverable, we use our best estimate of selling price for that deliverable. Revenue allocated to each element is then recognized when all revenue recognition criteria are met for each element.
Revenues from our multiple element arrangements are allocated separately to the instruments, consumables, extended maintenance agreements and incentives based on the relative selling price method. Amounts allocated to each element are based on its objectively determined fair value, such as the sales price for the product or service when it is sold separately. Revenues allocated to each element are then recognized when the basic revenue recognition criteria, as described above, are met for each element. Revenues associated with incentives in the form of free goods are deferred until the goods are shipped to the customer. Revenues associated with incentives in the form of extended maintenance agreements are deferred and recognized ratably over the life of the extended maintenance contract, generally one to three years. Incentives in the form of extended maintenance agreements are our most significant multiple element arrangement.
For our selling arrangements in the veterinary market that include multiple deliverables, such as instruments, consumables and service agreements associated with our veterinary reference laboratory, revenue is recognized upon delivery of the product or performance of the service during the term of the service contract when the basic revenue recognition criteria, as described above, are met for each element. We allocate revenues to each element based on the relative selling price of each deliverable. Amounts allocated to each element are based on its objectively determined fair value, such as the sales price for the product or service when it is sold separately.
Until March 2015, we offered customer incentives consisting of arrangements with customers to include discounts on future sales of services associated with our veterinary reference laboratory. We applied judgment in determining whether future discounts are significant and incremental. When the future discount offered was not considered significant and incremental, we did not account for the discount as an element of the original arrangement. To determine whether a discount was significant and incremental, we looked to the discount provided in comparison to standalone sales of the same product to similar customers, the level of discount provided on other elements in the arrangement, and the significance of the discount to the overall arrangement. If the discount in the multiple element arrangement approximated the discount typically provided in standalone sales, that discount is not considered incremental. During fiscal 2015, 2014 and 2013, our customer incentive programs with future discounts were not significant.
At March 31, 2015 and 2014, the current portion of deferred revenue balances was $1.3 million and $1.2 million, respectively, and the non-current portion of deferred revenue balances was $3.2 million and $4.0 million, respectively. Net current and non-current deferred revenue decreased by $0.7 million from March 31, 2014 to March 31, 2015, primarily attributable to deferred revenue recognized ratably over the life of extended maintenance contracts offered to customers in the form of free services in connection with the sale of our instruments. In October 2013, we changed the standard warranty period on certain instruments from three to five years, which resulted in a decrease in maintenance contracts offered to customers in the form of free services during the second half of fiscal 2014. During fiscal 2014, changes in deferred revenue balances were primarily attributable to extended maintenance contracts offered to customers in the form of free services in connection with the sale of our instruments primarily in the first six months of fiscal 2014, partially offset by deferred revenue recognized ratably over the life of the maintenance contracts.
Customer Programs. From time to time, we offer customer marketing and incentive programs. Our most significant customer programs are described as follows:
Instrument Trade-In Programs. We periodically offer trade-in programs to customers for trading in an existing instrument to purchase a new instrument and we will either provide incentives in the form of free goods or reduce the sales price of the instrument. These incentives in the form of free goods are recorded based on the relative selling price method according to the policies described above.
Instrument Rental Programs. We periodically offer programs to customers whereby certain instruments are made available to customers for rent or on an evaluation basis. These programs typically require customers to purchase a minimum quantity of consumables during a specified period for which we recognize revenue on the related consumables according to the policies described above. Depending on the program offered, customers may purchase the instrument during the rental or evaluation period. Proceeds from such sale are recorded as revenue according to the policies described above. Rental income, if any, is also recorded as revenue according to the policies described above.
Sales Incentive Programs. We periodically offer customer sales incentive programs and we record reductions to revenue related to these programs. Incentives may be provided in the form of rebates to distributors for volume-based purchases or upon meeting other specified requirements, end-user rebates and discounts. A summary of our revenue reductions is described below. Other rebate programs offered to distributors or customers vary from period to period in the medical and veterinary markets and were not significant.
| · | Volume-based Incentives. Volume-based incentives, in the form of rebates, are offered from time to time to distributors and group purchasing organizations upon meeting the sales volume requirements during a qualifying period and are recorded as a reduction to gross revenues during a qualifying period. The pricing rebate program is primarily offered to distributors and group purchasing organizations in the North America veterinary market, upon meeting the sales volume requirements of veterinary products during the qualifying period. Factors used in the rebate calculations include the identification of products sold subject to a rebate during the qualifying period and which rebate percentage applies. Based on these factors and using historical trends, adjusted for current changes, we estimate the amount of the rebate and record the rebate as a deduction to gross revenues when we record the sale of the product. The rebate is recorded as a reserve to offset accounts receivable as settlements are made through offsets to outstanding customer invoices. Settlement of the rebate accruals from the date of sale ranges from one to nine months after sale. Changes in the rebate accrual at the end of each period are based upon distributors and group purchasing organizations meeting the purchase requirements during the quarter. |
| · | Distributor Rebate Incentives. During fiscal 2015, we offered a customer sales incentive program, whereby distributors were offered a rebate upon meeting certain requirements. We recognize the rebate obligation as a reduction of revenue at the later of the date on which we sell the product or the date the program is offered. These customer sales incentive programs require management to estimate the rebate amounts to distributors who will qualify for the incentive during the promotional period. We record the estimated liability in other current accrued liabilities on our consolidated balance sheets. Management’s estimates are based on historical experience and the specific terms and conditions of the incentive programs. |
| · | End-User Rebates and Discounts. From time to time, cash rebates are offered to end-users who purchase certain products or instruments during a promotional period and are recorded as a reduction to gross revenues. Additionally, we periodically offer sales incentives to end-users, in the form of sales discounts, to purchase consumables for a specified promotional period, typically over five years from the sale of our instrument, and we reimburse resellers for the value of the sales discount provided to the end-user. We estimate the amount of the incentive earned by end-users during a quarter and record a liability to the reseller as a reduction to gross revenues. Factors used in the liability calculation of incentives earned by end-users include the identification of qualified end-users under the sales program during the period and using historical trends. Settlement of the liability to the reseller ranges from one to twelve months from the date an end-user earns the incentive. |
The following table summarizes the change in total accrued sales incentive programs (in thousands):
|
Balance at
Beginning
of Year (1)
|
Provisions (2)
|
Payments
|
Balance at
End
of Year (1)
|
|||||||||||||
|
Year Ended March 31, 2015
|
$
|
700
|
$
|
10,230
|
$
|
(5,065
|
)
|
$
|
5,865
|
|||||||
|
Year Ended March 31, 2014
|
$
|
1,043
|
$
|
1,872
|
$
|
(2,215
|
)
|
$
|
700
|
|||||||
|
Year Ended March 31, 2013
|
$
|
696
|
$
|
2,058
|
$
|
(1,711
|
)
|
$
|
1,043
|
|||||||
| (1) | Balance represent reserves related to volume-based incentives, included as an offset to accounts receivables in the consolidated balance sheets, and accruals for distributor rebate incentives and end-user rebates and discounts, included within current accrued liabilities in the consolidated balance sheets. |
| (2) | Provisions are net revenue reductions recorded and includes differences between estimates and actual incentives earned. |
Significant components of our accrued sales incentives programs are as follows: Volume-based incentives charged to gross revenues in fiscal 2015, 2014 and 2013, amounted to $0.6 million, $0.8 million and $1.5 million, respectively. Distributor rebate incentives charged to gross revenues in fiscal 2015, 2014 and 2013, amounted to $4.9 million, $0 and $0, respectively. End-user rebates and discounts charged to gross revenues in fiscal 2015, 2014 and 2013, amounted to $3.7 million, $1.1 million and $0.5 million, respectively.
Royalty Revenues. Royalties are typically based on licensees’ net sales of products that utilize our technology and are recognized as earned in accordance with the contract terms when royalties from licensees can be reliably measured and collectibility is reasonably assured, such as upon the receipt of a royalty statement from the licensee. Our royalty revenue depends on the licensees’ use of our technology, and therefore, may vary from period to period and impact our revenues during a quarter.
Allowance for Doubtful Accounts. We recognize revenue when collection from the customer is reasonably assured. We maintain an allowance for doubtful accounts based on our assessment of the collectibility of the amounts owed to us by our customers. We regularly review the allowance and consider the following factors in determining the level of allowance required: the customer’s payment history, the age of the receivable balance, the credit quality of our customers, the general financial condition of our customer base and other factors that may affect the customers’ ability to pay. An additional allowance is recorded based on certain percentages of our aged receivables, using historical experience to estimate the potential uncollectible. Account balances are charged off against the allowance when we believe it is probable the receivable will not be recovered. If our actual collections experience changes, revisions to our allowances may be required, which could adversely affect our operating income.
Fair Value Measurements. We apply fair value accounting for all financial assets and liabilities and non-financial assets and liabilities that are recognized or disclosed at fair value in the financial statements on a recurring basis. Fair value is defined as the price that would be received to sell an asset or paid to transfer a liability in an orderly transaction between market participants at the measurement date. When determining fair value, we consider the principal or most advantageous market in which we would transact and consider assumptions that market participants would use when pricing the asset or liability. The fair value hierarchy distinguishes between (1) market participant assumptions developed based on market data obtained from independent sources (observable inputs) and (2) an entity’s own assumptions about market participant assumptions developed based on the best information available in the circumstances (unobservable inputs). The fair value hierarchy consists of three broad levels, which gives the highest priority to unadjusted quoted prices in active markets for identical assets or liabilities (Level 1) and the lowest priority to unobservable inputs (Level 3). The three levels of the fair value hierarchy are described below.
Level 1: Quoted prices (unadjusted) in active markets for identical assets or liabilities. As of March 31, 2015, our investments in cash equivalents, which we classified as available-for-sale, totaled $3.1 million, using Level 1 inputs since these investments are traded in an active market. The valuations are based on quoted prices of the underlying security that are readily and regularly available in an active market, and accordingly, a significant degree of judgment is not required.
Level 2: Directly or indirectly observable inputs as of the reporting date through correlation with market data, including quoted prices for similar assets and liabilities in active markets and quoted prices in markets that are not active. Level 2 also includes assets and liabilities that are valued using models or other pricing methodologies that do not require significant judgment since the input assumptions used in the models, such as interest rates and volatility factors, are corroborated by readily observable data from actively quoted markets for substantially the full term of the financial instrument. As of March 31, 2015, our available-for-sale investments in corporate bonds, totaled $4.3 million, using Level 2 inputs, based on market pricing and other observable market inputs for similar securities obtained from various third party data providers.
Level 3: Unobservable inputs that are supported by little or no market data and require the use of significant management judgment. These values are generally determined using pricing models for which the assumptions utilize management’s estimates of market participant assumptions. As of March 31, 2015, we did not have any Level 3 financial assets or liabilities measured at fair value on a recurring basis.
Fair value is a market-based measure considered from the perspective of a market participant who holds the asset or owes the liability rather than an entity-specific measure. Therefore, even when market assumptions are not readily available, our own assumptions are developed to reflect those that market participants would use in pricing the asset or liability at the measurement date. At March 31, 2015, we also had $46.0 million in investments classified as held-to-maturity and carried at amortized cost.
Investment in Unconsolidated Affiliate. In February 2011, we purchased a 15% equity ownership interest in Scandinavian Micro Biodevices APS (“SMB”) for $2.8 million in cash. We use the equity method to account for our investment in this entity because we do not control it, but have the ability to exercise significant influence over it. Equity method investments are recorded at original cost and adjusted periodically to recognize (1) our proportionate share of the investees’ net income or losses after the date of investment, (2) additional contributions made and dividends or distributions received, and (3) impairment losses resulting from adjustments to net realizable value. We eliminate all intercompany transactions in accounting for our equity method investments. We record our proportionate share of the investees’ net income or losses in “Interest and other income (expense), net” on our consolidated statements of income. At March 31, 2015 and 2014, our investment in unconsolidated affiliate totaled $2.7 million and $2.6 million, respectively.
We assess the potential impairment of our equity method investments when indicators such as a history of operating losses, a negative earnings and cash flow outlook, and the financial condition and prospects for the investee’s business segment might indicate a loss in value. To date, since our investment in SMB, we have not recorded an impairment charge on this investment.
Warranty Reserves. We provide for the estimated future costs to be incurred under our standard warranty obligation on our instruments. Our standard warranty obligation on instruments ranges from one to five years, depending on the specific product. The estimated contractual warranty obligation is recorded when the related revenue is recognized and any additional amount is recorded when such cost is probable and can be reasonably estimated. Cost of revenues reflects estimated warranty expense for instruments sold in the current period and any adjustments in estimated warranty expense for the installed base under our standard warranty obligation based on our quarterly evaluation of service experience. While we engage in product quality programs and processes, including monitoring and evaluating the quality of our suppliers, our estimated accrual for warranty exposure is based on our historical experience as to product failures, estimated product failure rates, estimated repair costs, material usage and freight incurred in repairing the instrument after failure and known design changes under the warranty plan. Effective October 2013, we prospectively changed our standard warranty obligations on certain instruments sold from three to five years. The increase in the standard warranty obligation did not result in a material impact on our cost of revenues or our accrued warranty costs during fiscal 2015 and 2014.
We also provide for the estimated future costs to be incurred under our standard warranty obligation on our reagent discs. A provision for defective reagent discs is recorded and classified as a current liability when the related sale is recognized and any additional amount is recorded when such cost is probable and can be reasonably estimated, at which time they are included in cost of revenues. The warranty cost includes the replacement costs and freight of a defective reagent disc.
As of March 31, 2015, our current portion of warranty reserves for instruments and reagent discs totaled $1.4 million and our non‑current portion of warranty reserves for instruments totaled $1.7 million, which reflects our estimate of warranty obligations based on the estimated product failure rates, the number of instruments in standard warranty, estimated repair and related costs of instruments, and an estimate of defective reagent discs and replacement and related costs of a defective reagent disc. Total accrued warranty reserve increased by $1.3 million from March 31, 2014 to March 31, 2015, primarily due to an increase in the number of instruments in standard warranty.
For fiscal 2015, 2014 and 2013, the provision for warranty expense related to instruments was $2.4 million, $1.6 million and $0.9 million, respectively. The increases in the provision for warranty expense related to instruments during fiscal 2015, as compared to fiscal 2014, and during fiscal 2014, as compared to fiscal 2013, were primarily attributable to an increase in the number of instruments under standard warranty. Additionally, during fiscal 2013, we recorded an adjustment to pre-existing warranties of $0.3 million, which reduced our warranty reserves and our cost of revenues, based on both historical and projected product performance rates of instruments.
For fiscal 2015, 2014 and 2013, the provision for warranty expense related to replacement of defective reagent discs was $0.2 million, $0.5 million and $0.4 million, respectively. The changes in the provision for warranty expense related to reagent discs was primarily due to our judgement of the estimated product failure rate of reagent discs under warranty.
Management periodically evaluates the sufficiency of the warranty provisions and makes adjustments when necessary. If an unusual performance rate related to warranty claims is noted, an additional warranty accrual may be assessed and recorded when a failure event is probable and the cost can be reasonably estimated. We review the historical warranty cost trends and analyze the adequacy of the ending accrual balance of warranty reserves each quarter. The determination of warranty reserves requires us to make estimates of the estimated product failure rate, expected costs to repair or replace the instruments and to replace defective reagent discs under warranty. If actual repair or replacement costs of instruments or replacement costs of reagent discs differ significantly from our estimates, adjustments to cost of revenues may be required. Additionally, if factors change and we revise our assumptions on the product failure rate of instruments or reagent discs, then our warranty reserves and cost of revenues could be materially impacted in the quarter of such revision, as well as in following quarters.
Inventories. We state inventories at the lower of cost or market, cost being determined using standard costs which approximate actual costs using the first-in, first-out (FIFO) method. Inventories include material, labor and manufacturing overhead. We establish provisions for excess, obsolete and unusable inventories after evaluation of future demand of our products and market conditions. If future demand or actual market conditions are less favorable than those estimated by management or if a significant amount of the material were to become unusable, additional inventory write-downs may be required, which would have a negative effect on our operating income.
Intangible Assets. Intangible assets, consisted of customer relationships, tradename, licenses and other rights acquired from third parties, are presented at cost, net of accumulated amortization. The intangible assets are amortized using the straight-line method over their estimated useful lives of 2-10 years, which approximates the economic benefit. If our underlying assumptions regarding the estimated useful life of an intangible asset change, then the amortization period, amortization expense and the carrying value for such asset would be adjusted accordingly. During fiscal 2015, 2014 and 2013, our changes in estimated useful life of intangible assets were not significant, except as noted below in “Valuation of Long-Lived Assets.”
Valuation of Long-Lived Assets. We evaluate the carrying value of our long-lived assets, such as property and equipment and amortized intangible assets, whenever events or changes in business circumstances or our planned use of long-lived assets indicate that the carrying amount of an asset may not be fully recoverable or their useful lives are no longer appropriate. We look to current and future profitability, as well as current and future undiscounted cash flows, excluding financing costs, as primary indicators of recoverability. An impairment loss would be recognized when the sum of the undiscounted future net cash flows expected to result from the use of the asset and its eventual disposal is less than the carrying amount. If impairment is determined to exist, any related impairment loss is calculated based on fair value and long-lived assets are written down to their respective fair values. During fiscal 2015, 2014 and 2013, we recognized impairment charges on long-lived assets of $1.9 million, $0 and $0, respectively. The impairment charges on our long-lived assets in fiscal 2015 were in relation to the property and equipment and intangible assets of the AVRL business, which has been offset against the gain from the sale of AVRL on the consolidated statement of income for fiscal 2015.
Income Taxes. We account for income taxes using the liability method under which deferred tax assets and liabilities are determined based on the differences between the financial statement carrying amounts of existing assets and liabilities and their respective tax bases. Deferred tax assets and liabilities are measured using enacted tax rates expected to apply to taxable income in the years in which those temporary differences are expected to be recovered or settled. Valuation allowances are established, when necessary, to reduce deferred tax assets to the amounts expected to be recovered.
We recognize and measure benefits for uncertain tax positions using a two-step approach. The first step is to evaluate the tax position taken or expected to be taken in a tax return by determining if the weight of evidence indicates that it is more likely than not that the tax position will be sustained upon audit, including resolution of any related appeals or litigation processes. For tax positions that are more likely than not to be sustained upon audit, the second step is to measure the tax benefit as the largest amount that is more than 50 percent likely to be realized upon settlement. Significant judgment is required to evaluate uncertain tax positions. At March 31, 2015 and 2014, we had no significant uncertain tax positions. Our policy is to include interest and penalties related to gross unrecognized tax benefits within our provision for income taxes. In fiscal 2015, 2014 and 2013, we did not recognize any interest or penalties related to uncertain tax positions in the consolidated statements of income, and at March 31, 2015 and 2014, we had no accrued interest or penalties.
Share-Based Compensation Expense. We account for share-based compensation arrangements using the fair value method. We recognize share-based compensation expense, net of an estimated forfeiture rate, over the requisite service period of the award to employees and directors. As required by fair value provisions of share-based compensation, employee share-based compensation expense recognized is calculated over the requisite service period of the awards and reduced for estimated forfeitures. The forfeiture rate is estimated based on historical data of our share-based compensation awards that are granted and cancelled prior to vesting and upon historical experience of employee turnover. Changes in estimated forfeiture rates and differences between estimated forfeiture rates and actual experience may result in significant, unanticipated increases or decreases in share-based compensation expense from period to period. To the extent we revise our estimate of the forfeiture rate in the future, our share-based compensation expense could be materially impacted in the quarter of revision, as well as in following quarters.
Prior to fiscal 2007, we granted stock option awards to employees and directors as part of our share-based compensation program. We have not granted any stock options since the beginning of fiscal 2007. We have recognized compensation expense for stock options granted during the requisite service period of the stock option. As of March 31, 2015, we had no unrecognized compensation expense related to stock options granted.
Since fiscal 2007, we have granted restricted stock unit awards to employees and directors as part of our share-based compensation program. Restricted stock unit awards to consultants have been insignificant. Awards of restricted stock units are issued at no cost to the recipient and may have time-based vesting criteria, or a combination of time-based and performance-based vesting criteria, as described below.
Restricted Stock Unit Awards (Time Vesting)
The fair value of restricted stock unit awards with only time-based vesting terms, which we refer to as restricted stock unit awards (time vesting), used in our expense recognition method is measured based on the number of shares granted and the closing market price of our common stock on the date of grant. Share-based compensation expense is recognized net of an estimated forfeiture rate, over the requisite service period of the award. The forfeiture estimate is based on historical data and other factors, and compensation expense is adjusted for actual results. As a result, if factors change and we use different assumptions, our share-based compensation expense could be materially different in the future.
Restricted Stock Unit Awards (Performance Vesting)
We also began granting restricted stock unit awards subject to performance vesting criteria, which we refer to as restricted stock unit awards (performance vesting), to our executive officers starting in fiscal 2013. Restricted stock unit awards (performance vesting) consist of the right to receive shares of common stock, subject to achievement of time-based criteria and certain corporate performance-related goals over a specified period, as established by the Compensation Committee of our Board of Directors (the “Compensation Committee”). For restricted stock units subject to performance vesting, we recognize any related share-based compensation expense ratably over the service period based on the most probable outcome of the performance condition. The fair value of our restricted stock unit awards (performance vesting) used in our expense recognition method is measured based on the number of shares granted, the closing market price of our common stock on the date of grant and an estimate of the probability of the achievement of the performance goals. The amount of share-based compensation expense recognized in any one period can vary based on the attainment or expected attainment of the performance goals. If such performance goals are not ultimately met, no compensation expense is recognized and any previously recognized compensation expense is reversed.
Restricted Stock Unit Awards (Performance Vesting) Granted in Fiscal 2013
In April 2012, the Compensation Committee approved the grant of restricted stock unit awards (performance vesting) for 84,000 shares of common stock to our executive officers that contained both time-based and performance-based vesting terms (the “FY2013 Performance RSUs”). The FY2013 Performance RSUs were subject to vesting in four equal annual increments based upon: (1) achievement of certain pre-established corporate annual performance-related goals, as established by the Compensation Committee; and (2) the grantee’s satisfaction of service requirements through the vesting period. The annual financial performance goals were established at the beginning of each performance period and, accordingly, the portion (or “tranche”) of the FY2013 Performance RSU subject to each goal is treated as a separate grant for accounting purposes. The number of vested restricted stock unit awards (performance vesting) is determined at the end of each annual performance period. The fiscal 2013 performance target for the FY2013 Performance RSUs was established at the grant date following Accounting Standards Codification (“ASC”) 718-10-55-95 and the aggregate estimated grant date fair value of the FY2013 Performance RSUs was $0.8 million, or $35.62 per share, based on the closing market price of our common stock on the date of grant. Only the target for fiscal 2013 performance for the first tranche was set in April 2012, and accordingly, only 25% of the FY2013 Performance RSUs were deemed granted in fiscal 2013 in accordance with ASC 718-10-55-95. In April 2013, in consideration of the grant of the FY2014 Performance RSUs (as defined below) in fiscal 2014, the remaining 75% of the FY2013 Performance RSUs, which consisted of the second, third and fourth tranches, were cancelled. As a result, these restricted stock units are no longer outstanding. The remaining 75% of the FY2013 Performance RSUs were not deemed granted for accounting purposes because each annual performance target was to be set at the start of each respective single-fiscal year performance period in accordance with ASC 718-10-55-95.
On April 29, 2013, 21,000 shares subject to the FY2013 Performance RSUs were issued to our executive officers as a result of achieving performance-related goals for the fiscal year ended March 31, 2013. We fully recognized compensation expense for the FY2013 Performance RSUs during the requisite service period in fiscal 2013.
Restricted Stock Unit Awards (Performance Vesting) Granted in Fiscal 2014, 2015 and 2016
In April 2013, 2014 and 2015, the Compensation Committee approved the grant of restricted stock unit awards (performance vesting) described below. These restricted stock units vest only if both of the following criteria are satisfied: (1) our consolidated income from operations during the fiscal year in which grant occurred, as certified by the Compensation Committee, is in excess of the applicable target amount described below; and (2) the recipient remains in the continuous service of the Company until the applicable vesting date set forth as follows:
|
·
|
25% of the shares subject to an award vest in full upon achieving 90% of the consolidated income from operations target described above and continuous service until the third anniversary of the date of grant; |
|
·
|
25% of the shares subject to an award vest in full upon achieving 90% of the consolidated income from operations target described above and continuous service until the fourth anniversary of the date of grant; |
|
·
|
25% of the shares subject to an award vest in full upon achieving 100% of the consolidated income from operations target described above and continuous service until the third anniversary of the date of grant; and |
|
·
|
25% of the shares subject to an award vest in full upon achieving 100% of the consolidated income from operations target described above and continuous service until the fourth anniversary of the date of grant. |
Fiscal 2014 Performance RSUs. In April 2013, the Compensation Committee approved the grant of restricted stock unit awards (performance vesting) for 129,000 shares of common stock to our executive officers that contained the foregoing time-based and performance-based vesting terms (the “FY2014 Performance RSUs”). The aggregate estimated grant date fair value of the FY2014 Performance RSUs was $5.5 million based on the closing market price of our common stock on the date of grant.
At March 31, 2014, we reviewed each of the underlying performance targets related to the outstanding FY2014 Performance RSUs and determined that it was not probable that the FY2014 Performance RSUs would vest and as a result did not record share-based compensation related to these awards during fiscal 2014. On April 23, 2014, the Compensation Committee determined that the Company’s consolidated income from operations for fiscal 2014 was below 90% of target and, accordingly, the FY2014 Performance RSUs did not vest and were cancelled.
Fiscal 2015 Performance RSUs. In April 2014, the Compensation Committee approved the grant of restricted stock unit awards (performance vesting) for 172,000 shares of common stock to our executive officers that contained the foregoing time-based and performance-based vesting terms (the “FY2015 Performance RSUs”). The aggregate estimated grant date fair value of the FY2015 Performance RSUs was $7.0 million based on the closing market price of our common stock on the date of grant.
During fiscal 2015, we recorded share-based compensation expense ratably over the vesting terms of the FY2015 Performance RSUs, as we determined that the performance targets would be met.
Fiscal 2016 Performance RSUs. In April 2015, the Compensation Committee approved the grant of restricted stock unit awards (performance vesting) for 187,000 shares of common stock to our executive officers and to certain of our employees that contained the foregoing time-based and performance-based vesting terms (the “FY2016 Performance RSUs”). The aggregate estimated grant date fair value of the FY2016 Performance RSUs was $10.3 million based on the closing market price of our common stock on the date of grant.
Share-based compensation expense has had a material impact on our earnings per share and on our consolidated financial statements for fiscal 2015, 2014 and 2013. The impact of share-based compensation expense on our consolidated financial results is disclosed in Note 15 in the Notes to Consolidated Financial Statements in Part II, Item 8 of this report. We expect that share-based compensation will materially impact our consolidated financial statements in the foreseeable future. As of March 31, 2015, our total unrecognized compensation expense related to restricted stock unit awards (time vesting) and restricted stock unit awards (performance vesting) granted to employees and directors totaled $19.0 million, which expense is expected to be recognized over a weighted average service period of 1.5 to 2.6 years. Excluding forfeitures, we estimate expense recognition of restricted stock units with time-based vesting criteria over the requisite service period of the award, for awards granted and unvested as of March 31, 2015 as follows: $8.6 million in fiscal 2016, $7.4 million in fiscal 2017, $6.0 million in fiscal 2018 and $1.2 million in fiscal 2019.
Results of Operations
Previously reported financial information has been revised to reflect the reclassification of the AVRL business within our veterinary market segment as discontinued operations. See Note 3 to the Consolidated Financial Statements in Part II, Item 8 of this report for additional information.
Total Revenues – Continuing Operations
Revenues by Product Category. The following table and the discussion that follows, presents revenues by product category and represents our results from continuing operations during fiscal 2015, 2014 and 2013 (in thousands, except percentages):
|
Year Ended March 31,
|
Change 2014 to 2015
|
Change 2013 to 2014
|
||||||||||||||||||||||||||
|
Revenues by Product Category
|
2015
|
2014
|
2013
|
Dollar
Change
|
Percent
Change
|
Dollar
Change
|
Percent
Change
|
|||||||||||||||||||||
|
Instruments (1)
|
$
|
48,649
|
$
|
37,539
|
$
|
46,034
|
$
|
11,110
|
30
|
%
|
$
|
(8,495
|
)
|
(18
|
)%
|
|||||||||||||
|
Percentage of total revenues
|
24
|
%
|
23
|
%
|
25
|
%
|
||||||||||||||||||||||
|
Consumables (2)
|
144,446
|
117,533
|
127,481
|
26,913
|
23
|
%
|
(9,948
|
)
|
(8
|
)%
|
||||||||||||||||||
|
Percentage of total revenues
|
71
|
%
|
73
|
%
|
71
|
%
|
||||||||||||||||||||||
|
Other products (3)
|
9,348
|
6,809
|
7,213
|
2,539
|
37
|
%
|
(404
|
)
|
(6
|
)%
|
||||||||||||||||||
|
Percentage of total revenues
|
5
|
%
|
4
|
%
|
4
|
%
|
||||||||||||||||||||||
|
Product sales, net
|
202,443
|
161,881
|
180,728
|
40,562
|
25
|
%
|
(18,847
|
)
|
(10
|
)%
|
||||||||||||||||||
|
Percentage of total revenues
|
100
|
%
|
100
|
%
|
100
|
%
|
||||||||||||||||||||||
|
Development and licensing revenues
|
150
|
150
|
150
|
-
|
-
|
%
|
-
|
-
|
%
|
|||||||||||||||||||
|
Percentage of total revenues
|
<1%
|
<1%
|
<1%
|
|||||||||||||||||||||||||
|
Total revenues
|
$
|
202,593
|
$
|
162,031
|
$
|
180,878
|
$
|
40,562
|
25
|
%
|
$
|
(18,847
|
)
|
(10
|
)%
|
|||||||||||||
| (1) | Instruments include chemistry analyzers, hematology instruments, VSpro specialty analyzers and i-STAT analyzers. |
| (2) | Consumables include reagent discs, hematology reagent kits, VSpro specialty cartridges, i-STAT cartridges and rapid tests. |
| (3) | Other products include products using the Orbos process and extended maintenance agreements. |
Revenues by Geographic Region. The following table and the discussion that follows, presents our revenues by geographic region and represents our results from continuing operations during fiscal 2015, 2014 and 2013 (in thousands, except percentages):
|
Year Ended March 31,
|
Change 2014 to 2015
|
Change 2013 to 2014
|
||||||||||||||||||||||||||
|
Revenues by Geographic Region
|
2015
|
2014
|
2013
|
Dollar
Change
|
Percent
Change
|
Dollar
Change
|
Percent
Change
|
|||||||||||||||||||||
|
North America
|
$
|
163,308
|
$
|
126,768
|
$
|
147,627
|
$
|
36,540
|
29
|
%
|
$
|
(20,859
|
)
|
(14
|
)%
|
|||||||||||||
|
Percentage of total revenues
|
81
|
%
|
78
|
%
|
82
|
%
|
||||||||||||||||||||||
|
Europe
|
30,422
|
27,161
|
26,086
|
3,261
|
12
|
%
|
1,075
|
4
|
%
|
|||||||||||||||||||
|
Percentage of total revenues
|
15
|
%
|
17
|
%
|
14
|
%
|
||||||||||||||||||||||
|
Asia Pacific and rest of the world
|
8,863
|
8,102
|
7,165
|
761
|
9
|
%
|
937
|
13
|
%
|
|||||||||||||||||||
|
Percentage of total revenues
|
4
|
%
|
5
|
%
|
4
|
%
|
||||||||||||||||||||||
|
Total revenues
|
$
|
202,593
|
$
|
162,031
|
$
|
180,878
|
$
|
40,562
|
25
|
%
|
$
|
(18,847
|
)
|
(10
|
)%
|
|||||||||||||
Fiscal 2015 Compared to Fiscal 2014
North America. During fiscal 2015, total revenues in North America increased by 29%, or $36.5 million, as compared to fiscal 2014. The change in total revenues in North America was primarily attributable to the following:
|
·
|
Total revenues from our Piccolo chemistry analyzers and medical reagent discs in North America increased by 29%, or $5.4 million, primarily attributable to an increase in the sales volume of Piccolo chemistry analyzers and medical reagent discs sold to Abbott. The increase in the sales volume of medical reagent discs sold was primarily attributable to an expanded installed base of Piccolo chemistry analyzers. |
|
·
|
Total sales of our VetScan chemistry analyzers and veterinary reagent discs in North America increased by 36%, or $22.4 million, primarily attributable to (a) sales of VetScan chemistry analyzers to VCA’s Animal Hospitals resulting from a product supply agreement that we entered into in May 2014, (b) sales of VetScan chemistry analyzers to Henry Schein Animal Health and Patterson Veterinary Supply, both resulting from distribution agreements that we entered in October 2014 and (c) an increase in the sales volume of veterinary reagent discs due to an expanded installed base. These increases were partially offset by distributor rebate incentives programs offered in connection with sales of VetScan chemistry analyzers during fiscal 2015. |
|
·
|
Total sales of our VetScan hematology instruments and hematology reagent kits in North America increased by 36%, or $6.1 million, primarily attributable to (a) sales of VetScan hematology instruments as initial stocking orders to Henry Schein Animal Health and Patterson Veterinary Supply during the second half of fiscal 2015 and (b) an increase in the sales volume of hematology reagent kits due to an expanded installed base. These increases were partially offset by (a) lower unit sales of VetScan hematology instruments in the first half of fiscal 2015 to balance the inventory level in the distribution channel, sales of which were in line with in-clinic sales starting in the third quarter of fiscal 2015 and (b) distributor rebate incentives programs offered in connection with sales of VetScan hematology instruments during fiscal 2015. |
|
·
|
Total sales of our VetScan VSpro specialty analyzers and related consumables, VetScan i-STAT analyzers and related consumables and VetScan rapid tests in North America increased by 3%, or $0.7 million, primarily attributable to (a) sales of two new rapid tests, VetScan Feline FeLV/FIV Rapid Test and VetScan Canine Ehrlichia Rapid Test during fiscal 2015 and (b) sales of VetScan rapid tests to Henry Schein Animal Health and Patterson Veterinary Supply during the second half of fiscal 2015. These increases were partially offset by lower unit sales of VetScan i-STAT analyzers in the first half of fiscal 2015 to balance the inventory level in the distribution channel, sales of which were in line with in-clinic sales starting in the third quarter of fiscal 2015. |
|
·
|
Revenues from other products in North America increased by 32%, or $1.9 million, primarily attributable to deferred revenue recognized ratably over the life of extended maintenance contracts offered to customers in the form of free services in connection with the sale of our instruments. In October 2013, we prospectively changed the standard warranty obligations on certain instruments sold from three to five years, which resulted in a decrease in maintenance contracts offered to customers in the form of free services in connection with the sale of our instruments. |
Europe. During fiscal 2015, total revenues in Europe increased by 12%, or $3.3 million, as compared to fiscal 2014. The change in total revenues in Europe was primarily attributable to the following:
|
·
|
Revenues from Piccolo chemistry analyzers and medical reagent discs increased by 16%, or $1.0 million, primarily attributable to an increase in the sales volume of Piccolo chemistry analyzers to various distributors during fiscal 2015. |
|
·
|
Revenues from VetScan chemistry analyzers and veterinary reagent discs increased by 8%, or $1.4 million, primarily attributable to an increase in the sales volume of veterinary reagent discs due to an expanded installed base, partially offset by (a) lower average selling prices of VetScan chemistry analyzers and (b) the impact of a lower exchange rate between the Euro and U.S. dollar during the second half of fiscal 2015 resulting in a decrease in the dollar value of the Euro sales of veterinary reagent discs compared to the rate effect in fiscal 2014. |
|
·
|
Revenues from other products increased by 80%, or $0.6 million, primarily due to an increase in other veterinary products sold to customers in the United Kingdom. |
Asia Pacific and rest of the world. During fiscal 2015, total revenues in Asia Pacific and rest of the world increased by 9%, or $0.8 million, as compared to fiscal 2014. The change in total revenues in Asia Pacific and rest of the world was primarily attributable to the following:
|
·
|
Revenues from Piccolo chemistry analyzers and medical reagent discs increased by 49%, or $0.5 million, primarily attributable to an increase in the sales volume of Piccolo chemistry analyzers to two distributors and an increase in the sales volume of medical reagent discs to two distributors. |
|
·
|
Revenues from veterinary instruments decreased by 11%, or $0.3 million, primarily attributable to a decrease in the sales volume of VetScan chemistry analyzers to various distributors. Revenues from veterinary consumables increased by 14%, or $0.6 million, primarily attributable to an increase in the sales volume of veterinary reagent discs to a distributor. |
Significant concentrations. Two distributors in the United States, MWI and Abbott, accounted for 19% and 11%, respectively, of our total worldwide revenues in fiscal 2015.
Fiscal 2014 Compared to Fiscal 2013
North America. During fiscal 2014, total revenues in North America decreased by 14%, or $20.9 million, as compared to fiscal 2013. The change in total revenues in North America was primarily attributable to the following:
|
·
|
Total revenues from our Piccolo chemistry analyzers and medical reagent discs in North America (including sales to the U.S. government) decreased by 14%, or $3.1 million, primarily due to a lower average selling pricing of Piccolo chemistry analyzers and medical reagent discs sold to our distributor, Abbott, partially offset by an increase in the sales volume of medical reagent discs sold to Abbott during the fourth quarter of fiscal 2014. |
|
·
|
Total revenues from our VetScan chemistry analyzers and veterinary reagent discs in North America decreased by 18%, or $13.2 million, primarily due to a decrease in the unit volume of VetScan chemistry analyzers and veterinary reagent discs sold during the second half of fiscal 2014 in order to balance the inventory level in the distribution channel. |
|
·
|
Total revenues from our VetScan hematology instruments and hematology reagent kits in North America decreased by 15%, or $3.1 million, primarily due to a decrease in the unit volume of VetScan hematology instruments and hematology reagent kits sold during the second half of fiscal 2014 in order to balance the inventory level in the distribution channel. |
|
·
|
Total revenues from our VetScan VSpro specialty analyzers and related consumables, VetScan i-STAT analyzers and related consumables and VetScan rapid tests in North America decreased by 4%, or $1.0 million, primarily due to a decrease in the unit volume of VetScan VSpro specialty analyzers, VetScan i-STAT analyzers and VetScan rapid tests sold during the second half of fiscal 2014 in order to balance the inventory level in the distribution channel, partially offset by a higher unit volume of VetScan i-STAT analyzers and VetScan rapid tests sold during the first half of fiscal 2014, resulting from our addition of MWI as a nationwide distributor in September 2012. |
|
·
|
Other product revenues in North America decreased by 7%, or $0.4 million, primarily due to a decrease in unit volume of products sold using our Orbos process, partially offset by a decrease in extended maintenance contracts offered to customers as incentives in the form of free services in connection with the sale of our instruments during fiscal 2014, for which revenue is deferred and recognized ratably over the life of the maintenance contract. |
Europe. During fiscal 2014, total revenues in Europe increased by 4%, or $1.1 million, as compared to fiscal 2013. The change in total revenues in Europe was primarily attributable to the following:
|
·
|
Revenues from Piccolo chemistry analyzers and medical reagent discs decreased by 12%, or $0.9 million, primarily due to higher sales of Piccolo chemistry analyzers during fiscal 2013 to an international medical supplies sourcing and support company to support a pharmaceutical clinical trial conducted by a biotechnology company, partially offset by an increase in the unit volume of medical reagent discs sold to various distributors. |
|
·
|
Total VetScan chemistry analyzers and veterinary reagent disc sales increased by 10%, or $1.6 million. Revenues from veterinary reagent discs increased by 22%, or $2.6 million, primarily attributable to (a) an increase in the unit volume of veterinary reagent discs sold to a distributor and (b) higher average selling prices of veterinary reagent discs. The increase was partially offset by a decrease in revenues from VetScan chemistry analyzers of 27%, or $1.0 million, primarily attributable to (a) a decrease in the unit volume of VetScan chemistry analyzers sold to various distributors and (b) lower average selling prices of VetScan chemistry analyzers. |
|
·
|
Revenues from VetScan hematology instruments and hematology reagent kits increased by 16%, or $0.2 million, primarily attributable to an increase in the unit volume of VetScan hematology instruments sold to various distributors. |
Asia Pacific and rest of the world. During fiscal 2014, total revenues in Asia Pacific and rest of the world increased by 13%, or $0.9 million, as compared to fiscal 2013. The change in total revenues in Asia Pacific and rest of the world was primarily attributable to the following:
|
·
|
Revenues from medical instruments and medical reagent discs increased by 32%, or $0.2 million, primarily attributable to a higher unit volume of medical reagent discs sold to a distributor. |
|
·
|
Revenues from veterinary instruments increased by 29%, or $0.7 million, primarily attributable to (a) a higher unit volume of VetScan chemistry analyzers and VetScan hematology instruments sold to a distributor and (b) a higher unit volume of VetScan i‑STAT analyzers sold to a distributor. |
Significant concentrations. Two distributors in the United States, MWI and Abbott, accounted for 19% and 10%, respectively, of our total worldwide revenues in fiscal 2014.
Segment Results – Continuing Operations
Total Revenues, Cost of Revenues and Gross Profit by Segment. We identify our reportable segments as those customer groups that represent more than 10% of our combined revenue or gross profit or loss of all reported operating segments. We manage our business on the basis of the following two reportable segments: (i) the medical market and (ii) the veterinary market, which are based on the products sold by market and customer group.
Fiscal 2015 Compared to Fiscal 2014
The following table and the discussion that follows, presents revenues, cost of revenues, gross profit and percentage of revenues by operating segments and from certain unallocated items and represents our results from continuing operations for fiscal 2015 and 2014 (in thousands, except percentages):
|
Year Ended March 31,
|
Change
|
|||||||||||||||||||||||
|
2015
|
Percent of
Revenues (1)
|
2014
|
Percent of
Revenues (1)
|
Dollar
Change
|
Percent
Change
|
|||||||||||||||||||
|
Revenues:
|
||||||||||||||||||||||||
|
Medical Market
|
$
|
35,364
|
100
|
%
|
$
|
28,134
|
100
|
%
|
$
|
7,230
|
26
|
%
|
||||||||||||
|
Percentage of total revenues
|
17
|
%
|
17
|
%
|
||||||||||||||||||||
|
Veterinary Market
|
164,018
|
100
|
%
|
130,859
|
100
|
%
|
33,159
|
25
|
%
|
|||||||||||||||
|
Percentage of total revenues
|
81
|
%
|
81
|
%
|
||||||||||||||||||||
|
Other (2)
|
3,211
|
3,038
|
173
|
6
|
%
|
|||||||||||||||||||
|
Percentage of total revenues
|
2
|
%
|
2
|
%
|
||||||||||||||||||||
|
Total revenues
|
202,593
|
162,031
|
40,562
|
25
|
%
|
|||||||||||||||||||
|
Cost of revenues:
|
||||||||||||||||||||||||
|
Medical Market
|
18,730
|
53
|
%
|
15,623
|
56
|
%
|
3,107
|
20
|
%
|
|||||||||||||||
|
Veterinary Market
|
74,752
|
46
|
%
|
62,350
|
48
|
%
|
12,402
|
20
|
%
|
|||||||||||||||
|
Other (2)
|
141
|
108
|
33
|
31
|
%
|
|||||||||||||||||||
|
Total cost of revenues
|
93,623
|
78,081
|
15,542
|
20
|
%
|
|||||||||||||||||||
|
Gross profit:
|
||||||||||||||||||||||||
|
Medical Market
|
16,634
|
47
|
%
|
12,511
|
44
|
%
|
4,123
|
33
|
%
|
|||||||||||||||
|
Veterinary Market
|
89,266
|
54
|
%
|
68,509
|
52
|
%
|
20,757
|
30
|
%
|
|||||||||||||||
|
Other (2)
|
3,070
|
2,930
|
140
|
5
|
%
|
|||||||||||||||||||
|
Gross profit
|
$
|
108,970
|
$
|
83,950
|
$
|
25,020
|
30
|
%
|
||||||||||||||||
|
(1)
|
The percentage reported is based on revenues by operating segment.
|
|
(2)
|
Represents unallocated items, not specifically identified to any particular business segment.
|
Medical Market
Revenues for Medical Market Segment
During fiscal 2015, total revenues in the medical market increased by 26%, or $7.2 million, as compared to fiscal 2014. The change in the medical market segment was primarily attributable to the following:
|
·
|
Total revenues from Piccolo chemistry analyzers increased by 75%, or $4.6 million, during fiscal 2015 as compared to fiscal 2014, primarily attributable to an increase in the sales volume of Piccolo chemistry analyzers sold in North America to Abbott, sales to various distributors in Europe and sales to two distributors in Asia Pacific and rest of the world. |
|
·
|
Total revenues from medical reagent discs increased by 12%, or $2.4 million, during fiscal 2015 as compared to fiscal 2014, primarily attributable to an increase in the sales volume of medical reagent discs sold in North America to Abbott as a result of an expanded installed base of Piccolo chemistry analyzers and sales to two distributors in Asia Pacific and rest of the world. |
Gross Profit for Medical Market Segment
Gross profit for the medical market segment increased by 33%, or $4.1 million, during fiscal 2015 as compared to fiscal 2014. Gross profit percentages for the medical market segment during fiscal 2015 and 2014 were 47% and 44%, respectively. In absolute dollars, the increase in gross profit was primarily attributable to an increase in the sales volume of Piccolo chemistry analyzers and medical reagent discs and lower manufacturing costs of Piccolo chemistry analyzers and medical reagent discs. The increase in gross profit percentage was primarily attributable to an increase in the sales volume of Piccolo chemistry analyzers and medical reagent discs.
Veterinary Market
Revenues for Veterinary Market Segment
During fiscal 2015, total revenues in the veterinary market increased by 25%, or $33.2 million, as compared to fiscal 2014. The change in the veterinary market segment was primarily attributable to the following:
|
·
|
Total revenues from veterinary instruments increased by 21%, or $6.5 million, during fiscal 2015 as compared to fiscal 2014, primarily attributable to (a) sales of VetScan chemistry analyzers to VCA’s Animal Hospitals, (b) sales of VetScan chemistry analyzers to two new distributors, Henry Schein Animal Health and Patterson Veterinary Supply and (c) sales of VetScan hematology instruments as initial stocking orders to Henry Schein Animal Health and Patterson Veterinary Supply during the second half of fiscal 2015. These increases were partially offset by (a) distributor rebate incentives programs offered in connection with sales of VetScan chemistry analyzers and VetScan hematology instruments in North America during fiscal 2015, (b) lower average selling prices of VetScan chemistry analyzers sold in Europe, (c) a decrease in the sales volume of VetScan chemistry analyzers to various distributors in Asia Pacific and rest of the world and (d) lower unit sales of VetScan hematology instruments and VetScan i-STAT analyzers in the first half of fiscal 2015 to balance the inventory level in the distribution channel, sales of which were in line with in-clinic sales starting in the third quarter of fiscal 2015. |
|
·
|
Total revenues from consumables in the veterinary market increased by 25%, or $24.6 million, during fiscal 2015 as compared to fiscal 2014, primarily attributable to (a) an increase in the sales volume of veterinary reagent discs and hematology reagent kits, both due to an expanded installed base in North America, (b) an increase in the sales volume of veterinary reagent discs to a distributor in Asia Pacific and rest of the world, (c) sales of two new rapid tests, VetScan Feline FeLV/FIV Rapid Test and VetScan Canine Ehrlichia Rapid Test during fiscal 2015 and (d) sales of VetScan rapid tests to Henry Schein Animal Health and Patterson Veterinary Supply during the second half of fiscal 2015. These increases were partially offset by the impact of a lower exchange rate between the Euro and U.S. dollar during the second half of fiscal 2015 resulting in a decrease in the dollar value of the Euro sales of veterinary reagent discs compared to the rate effect in fiscal 2014. |
|
·
|
Total revenues from other products in the veterinary market increased by 95%, or $2.1 million, during fiscal 2015 as compared to fiscal 2014, primarily attributable to (a) deferred revenue recognized ratably over the life of extended maintenance contracts offered to customers in the form of free services in connection with the sale of our instruments and (b) an increase in other veterinary products sold to customers in the United Kingdom. |
Gross Profit for Veterinary Market Segment
Gross profit for the veterinary market segment increased by 30%, or $20.8 million, during fiscal 2015 as compared to fiscal 2014. Gross profit percentages for the veterinary market segment during fiscal 2015 and 2014 were 54% and 52%, respectively. In absolute dollars, the net increase in gross profit was primarily attributable to an increase in the sales volume of VetScan chemistry analyzers and veterinary reagent discs and lower manufacturing costs of VetScan chemistry analyzers and veterinary reagent discs. The increase in gross profit percentage was primarily attributable to an increase in the sales volume of veterinary reagent discs, which have a higher margin contribution.
Other
Our other category primarily consists of products sold using our patented Orbos Discrete Lyophilization Process. The change in gross profit in our other category was not significant during 2015, as compared to fiscal 2014.
Fiscal 2014 Compared to Fiscal 2013
The following table and the discussion that follows, presents revenues, cost of revenues, gross profit and percentage of revenues by operating segments and from certain unallocated items and represents our results from continuing operations for fiscal 2014 and 2013 (in thousands, except percentages):
|
Year Ended March 31,
|
Change
|
|||||||||||||||||||||||
|
2014
|
Percent of
Revenues (1)
|
2013
|
Percent of
Revenues (1)
|
Dollar
Change
|
Percent
Change
|
|||||||||||||||||||
|
Revenues:
|
||||||||||||||||||||||||
|
Medical Market
|
$
|
28,134
|
100
|
%
|
$
|
31,643
|
100
|
%
|
$
|
(3,509
|
)
|
(11
|
)%
|
|||||||||||
|
Percentage of total revenues
|
17
|
%
|
18
|
%
|
||||||||||||||||||||
|
Veterinary Market
|
130,859
|
100
|
%
|
145,363
|
100
|
%
|
(14,504
|
)
|
(10
|
)%
|
||||||||||||||
|
Percentage of total revenues
|
81
|
%
|
80
|
%
|
||||||||||||||||||||
|
Other (2)
|
3,038
|
3,872
|
(834
|
)
|
(22
|
)%
|
||||||||||||||||||
|
Percentage of total revenues
|
2
|
%
|
2
|
%
|
||||||||||||||||||||
|
Total revenues
|
162,031
|
180,878
|
(18,847
|
)
|
(10
|
)%
|
||||||||||||||||||
|
Cost of revenues:
|
||||||||||||||||||||||||
|
Medical Market
|
15,623
|
56
|
%
|
15,179
|
48
|
%
|
444
|
3
|
%
|
|||||||||||||||
|
Veterinary Market
|
62,350
|
48
|
%
|
64,586
|
44
|
%
|
(2,236
|
)
|
(3
|
)%
|
||||||||||||||
|
Other (2)
|
108
|
138
|
(30
|
)
|
(22
|
)%
|
||||||||||||||||||
|
Total cost of revenues
|
78,081
|
79,903
|
(1,822
|
)
|
(2
|
)%
|
||||||||||||||||||
|
Gross profit:
|
||||||||||||||||||||||||
|
Medical Market
|
12,511
|
44
|
%
|
16,464
|
52
|
%
|
(3,953
|
)
|
(24
|
)%
|
||||||||||||||
|
Veterinary Market
|
68,509
|
52
|
%
|
80,777
|
56
|
%
|
(12,268
|
)
|
(15
|
)%
|
||||||||||||||
|
Other (2)
|
2,930
|
3,734
|
(804
|
)
|
(22
|
)%
|
||||||||||||||||||
|
Gross profit
|
$
|
83,950
|
$
|
100,975
|
$
|
(17,025
|
)
|
(17
|
)%
|
|||||||||||||||
|
(1)
|
The percentage reported is based on revenues by operating segment.
|
|
(2)
|
Represents unallocated items, not specifically identified to any particular business segment.
|
Medical Market
Revenues for Medical Market Segment
During fiscal 2014, total revenues in the medical market decreased by 11%, or $3.5 million, as compared to fiscal 2013. The change in the medical market segment was primarily attributable to the following:
|
·
|
Total revenues from Piccolo chemistry analyzers decreased by 39%, or $3.9 million, during fiscal 2014 as compared to fiscal 2013, primarily attributable to (a) a lower average selling pricing of Piccolo chemistry analyzers sold to Abbott and (b) higher sales of Piccolo chemistry analyzers during fiscal 2013 to an international medical supplies sourcing and support company in Europe to support a pharmaceutical clinical trial conducted by a biotechnology company. |
|
·
|
Total revenues from medical reagent discs increased by 1%, or $0.2 million, during fiscal 2014 as compared to fiscal 2013, primarily attributable to (a) an increase in the sales volume of medical reagent discs sold to Abbott during the fourth quarter of fiscal 2014, (b) an increase in the unit volume of medical reagent discs sold to various distributors in Europe and (c) a higher unit volume of medical reagent discs sold to a distributor in Asia Pacific and rest of the world. The increase was partially offset by a lower average selling pricing of medical reagent discs sold to Abbott. |
|
·
|
Total revenues from other products in the medical market increased by 17%, or $0.2 million, during fiscal 2014 as compared to fiscal 2013, primarily attributable to a decrease in extended maintenance contracts offered to customers as incentives in the form of free services in connection with the sale of our Piccolo chemistry analyzers in North America in fiscal 2014, for which revenue is deferred and recognized ratably over the life of the maintenance contract. |
Gross Profit for Medical Market Segment
Gross profit for the medical market segment decreased by 24%, or $4.0 million, during fiscal 2014 as compared to fiscal 2013. Gross profit percentages for the medical market segment during fiscal 2014 and 2013 were 44% and 52%, respectively. In absolute dollars, the decrease in gross profit was primarily due to (a) lower unit sales of Piccolo chemistry analyzers, (b) lower average selling prices of Piccolo chemistry analyzers and medical reagent discs and (c) higher manufacturing costs of Piccolo chemistry analyzers. These decreases were partially offset by higher unit sales of medical reagent discs. The decrease in gross profit percentage was primarily attributable to (a) lower unit sales of Piccolo chemistry analyzers and (b) lower average selling prices of Piccolo chemistry analyzers and medical reagent discs.
Veterinary Market
Revenues for Veterinary Market Segment
During fiscal 2014, total revenues in the veterinary market decreased by 10%, or $14.5 million, as compared to fiscal 2013. The change in the veterinary market segment was primarily attributable to the following:
|
·
|
Total revenues from veterinary instruments decreased by 13%, or $4.6 million, during fiscal 2014 as compared to fiscal 2013, primarily attributable to (a) a decrease in the unit volume of VetScan chemistry analyzers, VetScan hematology instruments, VetScan VSpro specialty analyzers and VetScan i-STAT analyzers sold in North America during the second half of fiscal 2014 in order to balance the inventory level in the distribution channel and (b) a decrease in the unit volume of VetScan chemistry analyzers sold to various distributors and lower average selling prices of VetScan chemistry analyzers, both in Europe. These decreases were partially offset by (a) an increase in the unit volume of VetScan hematology instruments sold to various distributors in Europe, (b) an increase in the unit volume of VetScan chemistry analyzers and VetScan hematology instruments sold to a distributor in Asia Pacific and rest of the world, (c) an increase in the unit volume of VetScan i-STAT analyzers sold during the first half of fiscal 2014, resulting from our addition of MWI as a nationwide distributor in September 2012 and (d) an increase in the unit volume of VetScan i-STAT analyzers sold to a distributor in Asia Pacific and rest of the world. |
|
·
|
Total revenues from consumables in the veterinary market decreased by 9%, or $10.1 million, during fiscal 2014 as compared to fiscal 2013, primarily attributable to a decrease in the unit volume of veterinary reagent discs, hematology reagent kits and VetScan rapid tests sold in North America during the second half of fiscal 2014 in order to balance the inventory level in the distribution channel. The decrease was partially offset by (a) a higher unit volume of VetScan rapid tests sold during the first half of fiscal 2014, resulting from our addition of MWI as a nationwide distributor in September 2012, (b) an increase in the unit volume of veterinary reagent discs sold to a distributor in Europe and (c) higher average selling prices of veterinary reagent discs sold in Europe. |
|
·
|
Total revenues from other products in the veterinary market increased by 9%, or $0.2 million, during fiscal 2014 as compared to fiscal 2013, primarily attributable to a decrease in extended maintenance contracts offered to customers as incentives in the form of free services in connection with the sale of our veterinary instruments in North America during fiscal 2014, for which revenue is deferred and recognized ratably over the life of the maintenance contract. In October 2013, we changed the standard warranty period on certain instruments from three to five years, which resulted in a decrease in maintenance contracts offered to customers in the form of free services during the second half of fiscal 2014. |
Gross Profit for Veterinary Market Segment
Gross profit for the veterinary market segment decreased by 15%, or $12.3 million, during fiscal 2014 as compared to fiscal 2013. Gross profit percentages for the veterinary market segment during fiscal 2014 and 2013 were 52% and 56%, respectively. In absolute dollars, the decrease in gross profit was due to (a) lower unit sales of veterinary reagent discs and (b) higher manufacturing costs of VetScan chemistry analyzers and veterinary reagent discs. The decrease in gross profit percentage was primarily attributable to lower unit sales of VetScan chemistry analyzers and veterinary reagent discs.
Other
Gross profit in our other category decreased by 22%, or $0.8 million, during fiscal 2014, as compared to fiscal 2013, primarily attributable to a decrease in unit volume of products sold using our Orbos process.
Cost of Revenues – Continuing Operations
The following table and the discussion that follows, presents our cost of revenues and represents our results from continuing operations for fiscal 2015, 2014 and 2013 (in thousands, except percentages):
|
Year Ended March 31,
|
Change 2014 to 2015
|
Change 2013 to 2014
|
||||||||||||||||||||||||||
|
2015
|
2014
|
2013
|
Dollar
Change
|
Percent
Change
|
Dollar
Change
|
Percent
Change
|
||||||||||||||||||||||
|
Cost of revenues
|
$
|
93,623
|
$
|
78,081
|
$
|
79,903
|
$
|
15,542
|
20
|
%
|
$
|
(1,822
|
)
|
(2
|
)%
|
|||||||||||||
|
Percentage of total revenues
|
46
|
%
|
48
|
%
|
44
|
%
|
||||||||||||||||||||||
Cost of revenues includes the cost of materials, direct labor costs, costs associated with manufacturing, assembly, packaging, warranty repairs, test and quality assurance for our instruments and consumables and manufacturing overhead, including costs of personnel and equipment associated with manufacturing support.
Fiscal 2015 Compared to Fiscal 2014
The increase in cost of revenues, in absolute dollars, during fiscal 2015, as compared to fiscal 2014, was primarily attributable to higher unit sales of chemistry analyzers and reagent discs, partially offset by lower manufacturing costs of chemistry analyzers and reagent discs. The decrease in cost of revenues, as a percentage of total revenues, during fiscal 2015 as compared to fiscal 2014, was primarily due to an increase in the sales volume of reagent discs.
Fiscal 2014 Compared to Fiscal 2013
The increase in cost of revenues, in absolute dollars and as a percentage of total revenues, during fiscal 2014 as compared to fiscal 2013, was primarily attributable to higher manufacturing costs of chemistry analyzers and veterinary reagent discs. These increases in cost of revenues were partially offset by lower unit sales of Piccolo chemistry analyzers and veterinary reagent discs.
For our manufacturing operations, while we have an ongoing cost improvement program to reduce material and component costs and are implementing design changes and process improvements, any cost reductions and design and process improvements may be partially offset by increases in other manufacturing costs in subsequent periods.
Gross Profit – Continuing Operations
The following table and the discussion that follows, presents our gross profit and represents our results from continuing operations for fiscal 2015, 2014 and 2013 (in thousands, except percentages):
|
Year Ended March 31,
|
Change 2014 to 2015
|
Change 2013 to 2014
|
||||||||||||||||||||||||||
|
2015
|
2014
|
2013
|
Dollar
Change
|
Percent
Change
|
Dollar
Change
|
Percent
Change
|
||||||||||||||||||||||
|
Total gross profit
|
$
|
108,970
|
$
|
83,950
|
$
|
100,975
|
$
|
25,020
|
30
|
%
|
$
|
(17,025
|
)
|
(17
|
)%
|
|||||||||||||
|
Total gross margin
|
54
|
%
|
52
|
%
|
56
|
%
|
||||||||||||||||||||||
Fiscal 2015 Compared to Fiscal 2014
Gross profit in fiscal 2015 increased by 30%, or $25.0 million, as compared to fiscal 2014, primarily attributable to higher unit sales of chemistry analyzers and reagent discs and lower manufacturing costs of chemistry analyzers and reagent discs. The increase in gross profit percentage was primarily attributable to higher unit sales of chemistry analyzers and reagent discs.
Fiscal 2014 Compared to Fiscal 2013
Gross profit in fiscal 2014 decreased by 17%, or $17.0 million, as compared to fiscal 2013, primarily attributable to the following: (a) lower unit sales of Piccolo chemistry analyzers and veterinary reagent discs, (b) lower average selling prices of Piccolo chemistry analyzers and medical reagent discs, (c) higher manufacturing costs of chemistry analyzers and veterinary reagent discs and (d) a decrease in unit volume of products sold using our Orbos process. These decreases in gross profit were partially offset by higher unit sales of medical reagent discs. The decrease in gross profit percentage was primarily attributable to (a) lower unit sales of chemistry analyzers and veterinary reagent discs and (b) lower average selling prices of Piccolo chemistry analyzers and medical reagent discs.
Research and Development – Continuing Operations
The following table and the discussion that follows, presents our research and development expenses and represents our results from continuing operations for fiscal 2015, 2014 and 2013 (in thousands, except percentages):
|
Year Ended March 31,
|
Change 2014 to 2015
|
Change 2013 to 2014
|
||||||||||||||||||||||||||
|
2015
|
2014
|
2013
|
Dollar
Change
|
Percent
Change
|
Dollar
Change
|
Percent
Change
|
||||||||||||||||||||||
|
Research and development expenses
|
$
|
16,327
|
$
|
13,647
|
$
|
13,577
|
$
|
2,680
|
20
|
%
|
$
|
70
|
1
|
%
|
||||||||||||||
|
Percentage of total revenues
|
8
|
%
|
8
|
%
|
8
|
%
|
||||||||||||||||||||||
Research and development expenses consist of personnel costs (including salaries, benefits and share-based compensation expense), consulting expenses and materials and related expenses associated with the development of new tests and test methods, clinical trials, product improvements and optimization and enhancement of existing products and expenses related to regulatory and quality assurance. Research and development expenses are primarily based on the project activities planned and the level of spending depends on budgeted expenditures. Research and development expenses for the periods presented above are related primarily to new product development and enhancement of existing products in both the medical and veterinary markets.
Fiscal 2015 Compared to Fiscal 2014
Research and development expenses increased by 20%, or $2.7 million, in fiscal 2015 as compared to fiscal 2014. The increase was primarily attributable to (a) an increase in employee bonus compensation expense due to stronger company performance and meeting significantly more company performance targets in fiscal 2015 as compared to fiscal 2014, (b) an increase in share-based compensation expense and (c) expenses related to new product development and enhancement of existing products in both the medical and veterinary markets, including system feasibility testing costs associated with our research and development diagnostic agreement with LamdaGen Corporation, which we entered into in fiscal 2014. Share-based compensation expense included in research and development expenses during fiscal 2015 and 2014 was $1.6 million and $1.1 million, respectively.
Fiscal 2014 Compared to Fiscal 2013
Research and development expenses in fiscal 2014 were flat, as compared to fiscal 2013 primarily due to increased consulting expenses and materials associated with product development, partially offset by decreased personnel-related expenses. Share-based compensation expense included in research and development expenses during fiscal 2014 and 2013 was $1.1 million and $1.2 million, respectively.
We anticipate the dollar amount of research and development expenses to increase in fiscal 2016 from fiscal 2015 but remain consistent as a percentage of total revenues, as we complete new products and enhance existing products for both the medical and veterinary markets.
Sales and Marketing – Continuing Operations
The following table and the discussion that follows, presents our sales and marketing expenses and represents our results from continuing operations for fiscal 2015, 2014 and 2013 (in thousands, except percentages):
|
Year Ended March 31,
|
Change 2014 to 2015
|
Change 2013 to 2014
|
||||||||||||||||||||||||||
|
2015
|
2014
|
2013
|
Dollar
Change
|
Percent
Change
|
Dollar
Change
|
Percent
Change
|
||||||||||||||||||||||
|
Sales and marketing expenses
|
$
|
42,147
|
$
|
34,742
|
$
|
43,800
|
$
|
7,405
|
21
|
%
|
$
|
(9,058
|
)
|
(21
|
)%
|
|||||||||||||
|
Percentage of total revenues
|
21
|
%
|
21
|
%
|
24
|
%
|
||||||||||||||||||||||
Sales and marketing expenses consist of personnel costs (including salaries, benefits and share-based compensation expense), commissions and travel-related expenses for personnel engaged in selling, costs associated with advertising, lead generation, marketing programs, trade shows and services related to customer and technical support.
Fiscal 2015 Compared to Fiscal 2014
Sales and marketing expenses in fiscal 2015 increased by 21%, or $7.4 million, as compared to fiscal 2014. The increase was primarily attributable to increased personnel-related expenses, including an increase in commissions, an increase in employee bonus compensation expense due to stronger company performance and meeting significantly more company performance targets in fiscal 2015 as compared to fiscal 2014 and an increase in share-based compensation expense. Share-based compensation expense included in sales and marketing expenses during fiscal 2015 and 2014 was $2.4 million and $1.9 million, respectively.
Fiscal 2014 Compared to Fiscal 2013
Sales and marketing expenses in fiscal 2014 decreased by 21%, or $9.1 million, as compared to fiscal 2013. The decrease was primarily as a result of the restructuring of our sales and marketing organization within the medical market segment when we entered into a distribution partnership with Abbott in October 2012. The restructuring resulted in a decrease in personnel costs due to a sales force reduction and a decrease in sales and marketing spending in the United States medical market segment. Additionally, personnel-related expenses decreased primarily due to lower veterinary business headcount during fiscal 2014, as compared to fiscal 2013. Share-based compensation expense included in sales and marketing expenses during fiscal 2014 and 2013 was $1.9 million and $2.4 million, respectively.
General and Administrative – Continuing Operations
The following table and the discussion that follows, presents our general and administrative expenses and represents our results from continuing operations for fiscal 2015, 2014 and 2013 (in thousands, except percentages):
|
Year Ended March 31,
|
Change 2014 to 2015
|
Change 2013 to 2014
|
||||||||||||||||||||||||||
|
2015
|
2014
|
2013
|
Dollar
Change
|
Percent
Change
|
Dollar
Change
|
Percent
Change
|
||||||||||||||||||||||
|
General and administrative expenses
|
$
|
16,192
|
$
|
11,333
|
$
|
12,825
|
$
|
4,859
|
43
|
%
|
$
|
(1,492
|
)
|
(12
|
)%
|
|||||||||||||
|
Percentage of total revenues
|
8
|
%
|
7
|
%
|
7
|
%
|
||||||||||||||||||||||
General and administrative expenses consist of personnel costs (including salaries, benefits and share-based compensation expense), and expenses for outside professional services related to general corporate functions, including accounting and legal, and other general and administrative expenses.
Fiscal 2015 Compared to Fiscal 2014
General and administrative expenses in fiscal 2015 increased by 43%, or $4.9 million, as compared to fiscal 2014, primarily attributable to (a) an increase in employee bonus compensation expense due to stronger company performance and meeting significantly more company performance targets in fiscal 2015 as compared to fiscal 2014, (b) costs to acquire QCR and Trio, (c) an increase in share-based compensation expense and (d) other expenses to support our ongoing growth. Share-based compensation expense included in general and administrative expenses during fiscal 2015 and 2014 was $3.6 million and $3.3 million, respectively.
Fiscal 2014 Compared to Fiscal 2013
General and administrative expenses in fiscal 2014 decreased by 12%, or $1.5 million, as compared to fiscal 2013, primarily attributable to a decrease in legal expenses due to the settlement of our Cepheid patent infringement case in the second quarter of fiscal 2013. Share-based compensation expense included in general and administrative expenses during fiscal 2014 and 2013 was $3.3 million and $2.5 million, respectively.
Gain from Legal Settlement
On September 24, 2012, we resolved our patent infringement litigation with Cepheid. As part of the settlement, the parties agreed to terminate all pending and future claims connected with the litigation in exchange for a one-time payment by Cepheid of $17.3 million, which we recognized as an offset to operating expenses during the second quarter of fiscal 2013.
Interest and Other Income (Expense), Net – Continuing Operations
The following table and the discussion that follows, presents our interest and other income (expense), net and represents our results from continuing operations for fiscal 2015, 2014 and 2013 (in thousands, except percentages):
|
Year Ended March 31,
|
Change
|
|||||||||||||||||||
|
2015
|
2014
|
2013
|
2014-2015
|
2013-2014
|
||||||||||||||||
|
Interest and other income (expense), net
|
$
|
(1,262
|
)
|
$
|
994
|
$
|
253
|
$
|
(2,256
|
)
|
$
|
741
|
||||||||
Interest and other income (expense), net consists primarily of interest earned on cash and cash equivalents and investments, foreign currency exchange gains and losses and our equity in net income (loss) of an unconsolidated affiliate.
Fiscal 2015 Compared to Fiscal 2014
Interest and other income (expense), net primarily comprised of foreign currency gains and (losses) of $(1.8 million) and $0.5 million for fiscal 2015 and fiscal 2014, respectively. The foreign currency exchange loss in fiscal 2015 was primarily attributable to net unfavorable foreign currency exchange rates due to the effect of a strong U.S. dollar.
Fiscal 2014 Compared to Fiscal 2013
Interest and other income (expense), net in fiscal 2014 increased as compared to fiscal 2013, primarily attributable to foreign currency exchange rate fluctuations.
Income Tax Provision – Continuing Operations
The following table and the discussion that follows, presents our income tax provision and represents our results from continuing operations for fiscal 2015, 2014 and 2013 (in thousands, except percentages):
|
Year Ended March 31,
|
||||||||||||
|
2015
|
2014
|
2013
|
||||||||||
|
Income tax provision
|
$
|
12,239
|
$
|
8,993
|
$
|
17,149
|
||||||
|
Effective tax rate
|
37
|
%
|
36
|
%
|
36
|
%
|
||||||
Fiscal 2015 Compared to Fiscal 2014
For fiscal 2015, our income tax provision was $12.2 million, based on an effective tax rate of 37%, as compared to $9.0 million, based on an effective tax rate of 36%, for fiscal 2014. The dollar increase in the income tax provision during fiscal 2015, as compared to fiscal 2014, was attributable to higher pre-tax income. The increase in the effective tax rate during fiscal 2015, as compared to fiscal 2014, was primarily attributable to an increase in non-recurring non-deductible expenses.
We expect our effective tax rate will be approximately 36% for federal, foreign and various state tax jurisdictions in fiscal 2016, compared to an effective tax rate of 37% in fiscal 2015. The expected effective tax rate of 36% in fiscal 2016 is primarily due to a reduction in non-recurring non-deductible expenses, partially offset by the expiration of the federal research and development tax credits for expenses incurred after December 31, 2014.
Fiscal 2014 Compared to Fiscal 2013
For fiscal 2014, our income tax provision was $9.0 million, based on an effective tax rate of 36%, and $17.1 million, based on an effective tax rate of 36%, for fiscal 2013. The change in the income tax provision during fiscal 2014, as compared to fiscal 2013, was attributable to a reduction in pre-tax income and income tax resulting from a $17.3 million gain from a legal settlement in fiscal 2013, partially offset by (a) an increase in non-deductible share-based compensation expenses and (b) a reduction in federal research and development tax credits resulting from the expiration of the credit for expenses incurred after December 31, 2013.
We did not have any unrecognized tax benefits as of March 31, 2015. During fiscal 2015, 2014 and 2013, we did not recognize any interest or penalties related to unrecognized tax benefits.
Discontinued Operations
On March 18, 2015, we entered into an asset purchase agreement (“APA”) with Antech pursuant to which we sold substantially all of the assets of our AVRL business. The sale transaction closed on March 31, 2015. The total purchase price under the APA is $21.0 million in cash. We received $20.1 million in cash proceeds during the fourth quarter of fiscal 2015 and we recorded a gain on sale of discontinued operations, net of tax of $7.7 million. The remaining $0.9 million of the purchase price is being held by Antech until certain conditions are met upon which proceeds may be released on the first year anniversary of the closing date. Such additional cash consideration will be accounted for as a gain on sale of discontinued operations, net of taxes, when it is realized or realizable.
Results from discontinued operations, net of tax, were net losses of $1.2 million, $2.0 million and $3.7 million in fiscal 2015, 2014 and 2013, respectively. See Note 3 to the Consolidated Financial Statements in Part II, Item 8 of this report for additional information.
Liquidity and Capital Resources – Continuing and Discontinued Operations
Cash, Cash Equivalents and Investments
The following table summarizes our cash, cash equivalents and short-term and long-term investments at March 31, 2015, 2014 and 2013 (in thousands, except percentages):
|
March 31,
|
||||||||||||
|
2015
|
2014
|
2013
|
||||||||||
|
Cash and cash equivalents
|
$
|
107,015
|
$
|
73,589
|
$
|
54,910
|
||||||
|
Short-term investments
|
26,109
|
29,102
|
23,354
|
|||||||||
|
Long-term investments
|
24,181
|
18,491
|
17,000
|
|||||||||
|
Total cash, cash equivalents and investments
|
$
|
157,305
|
$
|
121,182
|
$
|
95,264
|
||||||
|
Percentage of total assets
|
58
|
%
|
56
|
%
|
47
|
%
|
||||||
At March 31, 2015, we had net working capital of $168.6 million compared to $148.6 million at March 31, 2014.
Cash Flow Changes
Cash provided by (used in) operating, investing and financing activities during fiscal 2015, 2014 and 2013 were as follows (in thousands):
|
Year Ended March 31,
|
||||||||||||
|
2015
|
2014
|
2013
|
||||||||||
|
Net cash provided by operating activities
|
$
|
36,396
|
$
|
35,572
|
$
|
29,197
|
||||||
|
Net cash provided by (used in) investing activities
|
10,093
|
(13,358
|
)
|
(1,657
|
)
|
|||||||
|
Net cash used in financing activities
|
(10,962
|
)
|
(4,045
|
)
|
(18,165
|
)
|
||||||
|
Effect of exchange rate changes on cash and cash equivalents
|
(2,101
|
)
|
510
|
(308
|
)
|
|||||||
|
Net increase in cash and cash equivalents
|
$
|
33,426
|
$
|
18,679
|
$
|
9,067
|
||||||
Cash and cash equivalents at March 31, 2015 were $107.0 million compared to $73.6 million at March 31, 2014. The increase in cash and cash equivalents during fiscal 2015 was primarily due to net cash provided by operating activities of $36.4 million, proceeds from maturities and redemptions of investments of $33.5 million and proceeds from sale of discontinued operations of $20.1 million. The increase was partially offset by purchases of investments of $36.8 million, purchases of property and equipment of $6.1 million, payments made for tax withholdings related to net share settlements of restricted stock units of $3.0 million and payment of cash dividends totaling $9.0 million.
Our consolidated statements of cash flows includes the effect of exchange rate changes on cash and cash equivalents and the net gains (losses) arising from transactions denominated in a currency other than the functional currency of a location and the remeasurement of assets and liabilities of our wholly-owned subsidiaries, using the U.S. dollar as the functional currency.
Cash Flows from Operating Activities
During fiscal 2015, we generated $36.4 million in cash from operating activities, compared to $35.6 million in fiscal 2014. The cash provided by operating activities during fiscal 2015 was primarily the result of net income of $27.3 million during fiscal 2015, adjusted for the effects of non-cash adjustments including depreciation and amortization of $8.5 million and share-based compensation expense of $9.8 million, partially offset by a decrease of $1.0 million related to excess tax benefits from share-based awards.
Other changes in operating activities during fiscal 2015 were as follows:
|
·
|
Receivables, net increased by $1.8 million, from $27.3 million at March 31, 2014 to $29.0 million as of March 31, 2015, primarily attributable to higher sales during the fourth quarter of fiscal 2015, partially offset by the timing of sales and collections activity during the fourth quarter of fiscal 2015. |
|
·
|
Inventories increased by $9.6 million from $26.6 million at March 31, 2014 to $36.2 million as of March 31, 2015, primarily based on our projected sales plan. |
|
·
|
Prepaid expenses and other current assets increased by $0.5 million, from $2.3 million at March 31, 2014 to $2.9 million as of March 31, 2015, primarily attributable to a federal tax refund resulting from the retroactive extension of the research and development tax credit and bonus depreciation. |
|
·
|
Current net deferred tax assets increased by $2.1 million, from $4.5 million at March 31, 2014 to $6.6 million as of March 31, 2015, primarily as a result of the timing for the deduction of reserves and accruals. |
|
·
|
Non-current net deferred tax assets increased by $1.9 million, from $1.6 million at March 31, 2014 to $3.4 million as of March 31, 2015, primarily as a result of the timing for the deduction of share-based compensation, depreciation and amortization. |
|
·
|
Non-current assets of discontinued operations decreased by $3.4 million from $3.4 million at March 31, 2014 to $12,000 as of March 31, 2015, primarily due to disposal and impairment of long-lived assets of $1.9 million, resulting from the sale of our AVRL business in the fourth quarter of fiscal 2015, and book value of net assets sold of $0.6 million to Antech.
|
|
·
|
Accounts payable increased by $1.8 million, from $5.5 million at March 31, 2014 to $7.3 million as of March 31, 2015, primarily due to the timing and payment of services and inventory purchases. |
|
·
|
Accrued payroll and related expenses increased by $6.7 million, from $4.4 million at March 31, 2014 to $11.1 million as of March 31, 2015, primarily attributable to an increase in accrued bonus at March 31, 2015 because qualifiers for bonus payments were met in the fourth quarter of fiscal 2015. |
|
·
|
Accrued taxes increased by $3.7 million, from $1.1 million at March 31, 2014 to $4.8 million as of March 31, 2015, primarily due to the timing of estimated income tax payments. |
|
·
|
Current liabilities of discontinued operations increased by $4.7 million from $0.9 million at March 31, 2014 to $5.5 million as of March 31, 2015, primarily due to our cost obligations accrued for employee-related costs, including severance, contract termination and other associated costs as a result of the sale of our AVRL business in the fourth quarter of fiscal 2015. |
|
·
|
Other accrued liabilities, current, increased by $6.7 million, from $3.1 million at March 31, 2014 to $9.8 million as of March 31, 2015 and other liabilities, non-current, increased by $1.0 million, from $0.8 million at March 31, 2014 to $1.8 million as of March 31, 2015. The net current and non-current other liabilities increased primarily attributable to (a) an increase in liabilities related to customer sales incentive programs and the timing of these obligation payments and (b) installment payment obligations related to the acquisition of QCR and Trio in November 2014. |
|
·
|
As of March 31, 2015 and March 31, 2014, the current portion of deferred revenue was $1.3 million and $1.2 million, respectively, and the non-current portion of deferred revenue was $3.2 million and $4.0 million, respectively. Net current and non-current deferred revenue decreased by $0.7 million from March 31, 2014 to March 31, 2015, primarily attributable to deferred revenue recognized ratably over the life of extended maintenance contracts offered to customers in the form of free services in connection with the sale of our instruments. In October 2013, we prospectively changed the standard warranty obligations on certain instruments sold from three to five years, which resulted in a decrease in maintenance contracts offered to customers in the form of free services in connection with the sale of our instruments. |
|
·
|
As of March 31, 2015 and March 31, 2014, the current portion of warranty reserve was $1.4 million and $1.0 million, respectively, and the non-current portion of warranty reserve was $1.7 million and $0.8 million, respectively. Net current and non‑current warranty reserve increased by $1.3 million. The increase in current and non-current warranty reserve from March 31, 2014 to March 31, 2015 was primarily due to an increase in the number of instruments in standard warranty during fiscal 2015. Warranty reserve is primarily based on (a) the number of instruments in standard warranty, estimated product failure rates and estimated repair costs and (b) an estimate of defective reagent discs and replacement costs of reagent discs. In October 2013, we prospectively changed the standard warranty obligations on certain instruments from three to five years. The increase in the standard warranty obligation did not result in a material impact on our warranty reserves or cost of revenues during the period. Management periodically evaluates the sufficiency of the warranty provisions and makes adjustments when necessary. If an unusual performance rate related to warranty claims is noted, an additional warranty accrual may be assessed and recorded when a failure event is probable and the cost can be reasonably estimated. |
We expect that cash provided by operating activities may fluctuate in future periods as a result of a number of factors, including fluctuations in our operating results, timing of product sales, accounts receivable collections performance, inventory and supply chain management, and the timing and amount of payments. Furthermore, we anticipate that we will incur incremental costs to support our future operations, including further additional pre-clinical testing and clinical trials for our current and future products; research and design costs related to the continuing development of our current and future products; acquisition of capital equipment for our manufacturing facility.
Cash Flows from Investing Activities
Net cash provided by investing activities during fiscal 2015 totaled $10.1 million, compared to net cash used of $13.4 million during fiscal 2014. Cash provided by investing activities during fiscal 2015 primarily resulting from proceeds from maturities and redemptions of investments in certificates of deposit, commercial paper and corporate bonds of $33.5 million and proceeds from the sale of our AVRL business of $20.1 million, partially offset by purchases of investments in certificates of deposit, commercial paper and corporate bonds totaling $36.8 million during fiscal 2015, capital expenditures of $6.1 million and cash payments, net of cash acquired, in our acquisition of QCR and Trio, of $0.6 million during the third quarter of fiscal 2015. The purchase of capital equipment primarily relate to increasing our manufacturing capacity and support our growth in our veterinary business in North America. We expect to continue to make significant capital expenditures as necessary in the normal course of our business.
Cash Flows from Financing Activities
Net cash used in financing activities during fiscal 2015 totaled $11.0 million, compared to net cash used of $4.0 million during fiscal 2014. Cash used in financing activities during fiscal 2015 primarily resulting from payments made for tax withholdings related to net share settlements of restricted stock units of $3.0 million and cash dividend payments of $9.0 million, offset in part by net cash provided by financing activities from excess tax benefits from share-based awards of $1.0 million. During fiscal 2015, we did not purchase any shares pursuant to our share repurchase program described below.
Dividend Payments
During fiscal 2015, we paid quarterly cash dividends totaling $9.0 million. We did not pay a cash dividend in fiscal 2014. The amount of quarterly dividends declared with respect to the Company’s common stock during the past two fiscal years appears in Note 21 to the Consolidated Financial Statements in Part II, Item 8 of this report.
In April 2015, our Board of Directors declared a cash dividend of $0.11 per share on our outstanding common stock to be paid on June 18, 2015 to all shareholders of record as of the close of business on June 4, 2015. Future declarations of quarterly dividends and the establishment of future record and payment dates are subject to the final determination of our Board of Directors.
Share Repurchase Program
Between August 2011 and January 2012, our Board of Directors authorized the repurchase of up to a total of $55.0 million of our common stock. In July 2013, our Board of Directors approved a $12.3 million increase to our existing share repurchase program to a total of $67.3 million. As of March 31, 2015, $37.0 million was available to purchase common stock under our share repurchase program. Since the share repurchase program began, through March 31, 2015, we have repurchased 1.3 million shares of our common stock at a total cost of $30.3 million, including commission expense. During fiscal 2015, we did not repurchase any shares of our common stock. During fiscal 2014, we repurchased 86,000 shares of our common stock for a total cost of $3.0 million and an average per share cost including commission expense of $34.58. During fiscal 2013, we did not repurchase any of our common stock. The repurchases are made from time to time on the open market at prevailing market prices or in negotiated transactions off the market. Repurchased shares are retired.
Financial Condition
We believe that our cash and cash equivalents, investments and expected cash flows from operations will be sufficient to fund our operations, capital requirements, share repurchase program and anticipated quarterly dividends for at least the next twelve months. Our future capital requirements will largely depend upon the increased customer demand and market acceptance of our point-of-care blood analyzer products. However, our sales for any future periods are not predictable with a significant degree of certainty. Regardless, we may seek to raise additional funds to pursue strategic opportunities.
Contractual Obligations
As of March 31, 2015, our contractual obligations for succeeding fiscal years are as follows (in thousands):
|
Payments Due by Period
|
||||||||||||||||||||
|
Total
|
2016
|
2017-2018
|
2019-2020
|
After 2020
|
||||||||||||||||
|
Long-term debt obligations
|
$
|
666
|
$
|
128
|
$
|
241
|
$
|
220
|
$
|
77
|
||||||||||
|
Operating lease obligations
|
12,059
|
1,984
|
3,774
|
3,642
|
2,659
|
|||||||||||||||
|
Purchase obligations
|
4,915
|
2,889
|
2,026
|
-
|
-
|
|||||||||||||||
|
Other long-term liabilities
|
2,213
|
1,111
|
1,102
|
-
|
-
|
|||||||||||||||
|
Total
|
$
|
19,853
|
$
|
6,112
|
$
|
7,143
|
$
|
3,862
|
$
|
2,736
|
||||||||||
Long-term Debt Obligations. Long-term debt obligations include current and non-current portion of long-term debt and interest payments associated with notes payable to the Community Redevelopment Agency of the City of Union City. See Note 11 to the Consolidated Financial Statements in Part II, Item 8 of this report for additional information.
Operating Lease Obligations. Operating lease obligations comprised our principal facility and various leased facilities and equipment under operating lease agreements, which expire on various dates from fiscal 2016 through fiscal 2025. Our principal facilities located in Union City, California is under a non-cancelable operating lease agreement, which expires in fiscal 2021. See Note 13 to the Consolidated Financial Statements in Part II, Item 8 of this report for additional information.
Purchase Obligations. Our purchase commitments comprise of supply and inventory related agreements. See Note 13 to the Consolidated Financial Statements in Part II, Item 8 of this report for additional information.
Other Long-term Liabilities. Other long-term liabilities in the preceding table include the current portion, as recorded on our consolidated balance sheet, of two installment payment obligations payable in fiscal years 2016 to 2017 in connection with our acquisition of QCR and Trio in November 2014. See Note 2 to the Consolidated Financial Statements in Part II, Item 8 of this report for additional information.
Contingencies
We are involved from time to time in various litigation matters in the normal course of business. There can be no assurance that existing or future legal proceedings arising in the ordinary course of business or otherwise will not have a material adverse effect on our business, consolidated financial position, results of operations or cash flows.
Off-Balance Sheet Arrangements
As of March 31, 2015, we did not have any off-balance sheet arrangements, as defined in Item 303 of Regulation S-K promulgated under the Securities Act of 1933. In addition, we identified no variable interests in any variable interest entities.
Recent Accounting Pronouncements
For information with respect to recent accounting pronouncements and the impact of these pronouncements on our consolidated financial statements, see Note 1, “Description of Business and Summary of Significant Accounting Policies,” of the Notes to Consolidated Financial Statements in Part II, Item 8 of this report.
Our financial position is exposed to a variety of risks related to changes in interest rates and foreign currency rates and investment in a privately held company. As a matter of management policy, we do not currently enter into transactions involving derivative financial instruments. In the event we do enter into such transactions in the future, such items will be accounted for in accordance with Accounting Standards Codification 815, “Derivatives and Hedging.”
Interest Rate Risk
Our investment objective is to invest excess cash in cash equivalents and in various types of investments to maximize yields without significantly increased risk. At March 31, 2015, our short-term and long-term investments totaled $26.1 million and $24.2 million, respectively, consisting of investments in certificates of deposit, commercial paper, corporate bonds and municipal bonds. For our securities classified as available-for-sale, we record these investments at fair market value with unrealized gains or losses resulting from changes in fair value reported as a separate component of accumulated other comprehensive income (loss), net of any tax effects, in shareholders’ equity. The fair value of our investment portfolio is subject to change as a result of changes in market interest rates and investment risk related to the issuers’ credit worthiness. Changes in market interest rates would not be expected to have a material impact on the fair value of these assets at March 31, 2015, due to its high liquidity.
We are exposed to the impact of interest rate changes with respect to our short-term and long-term investments. As of March 31, 2015, we had $46.0 million in investments classified as held-to-maturity and carried at amortized cost. We have the ability to hold the investments classified as held-to-maturity in our investment portfolio at March 31, 2015 until maturity and therefore, we believe we have no material exposure to interest rate risk. As of March 31, 2015, our investments classified as available-for-sale totaled $4.3 million, consisting primarily of fixed income securities and thus changes in interest rates would not have a material effect on our business, operating results or financial condition. We have not experienced any significant loss on our investment portfolio during fiscal 2015, 2014 and 2013.
Foreign Currency Rate Fluctuations
We operate primarily in the United States and a majority of our revenues, cost of revenues, operating expenses and capital purchasing activities are transacted in U.S. dollars. However, we are exposed to foreign currency risks that arise from normal business operations. These risks are primarily related to remeasuring local currency balances and results of our foreign subsidiaries, into U.S. dollars and third-party transactions denominated in a currency other than the U.S. dollar.
The functional currency of our wholly-owned subsidiaries is in U.S. dollars. Foreign currency denominated account balances of our subsidiaries are remeasured into U.S. dollars at the end-of-period exchange rates for monetary assets and liabilities, and historical exchange rates for nonmonetary assets. The effects of foreign currency transactions, and of remeasuring the financial condition into the functional currency, resulted in net foreign currency losses during fiscal 2015, which were included in “Interest and other income (expense), net” on our consolidated statements of income. For our sales denominated in foreign currencies, we are exposed to foreign currency exchange rate fluctuations on revenue and collection of receivables.
Our most significant third-party transactions are inventory purchases of hematology products from Diatron MI PLC, which are primarily denominated in Euros. To the extent the U.S. dollar strengthens against the Euro currency, the translation of the foreign currency denominated transactions may result in reduced cost of revenues and operating expenses. Similarly, our cost of revenues and operating expenses will increase if the U.S. dollar weakens against the Euro currency.
Investment in a Privately Held Company
In February 2011, we purchased a 15% equity ownership interest in SMB, for $2.8 million in cash. SMB is a privately-held developer and manufacturer of point-of-care diagnostic products for veterinary use. SMB, based in Farum, Denmark, has been the original equipment manufacturer of the Abaxis VetScan VSpro point-of-care specialty analyzer since 2008. The investment is recorded in “Investment in Unconsolidated Affiliate” in our consolidated balance sheets and we use the equity method to account for our investment in this entity because we do not control it, but have the ability to exercise significant influence over it. As of March 31, 2015, the total carrying amount of our investment in SMB was $2.7 million. The investment is inherently risky and we could lose our entire investment in this company. To date, since our investment in SMB, we have not recorded an impairment charge on this investment.
ABAXIS, INC.
INDEX TO CONSOLIDATED FINANCIAL STATEMENTS
|
Description
|
Page
|
|
Report of Independent Registered Public Accounting Firm
|
51 |
|
Consolidated Balance Sheets at March 31, 2015 and 2014
|
52 |
|
Consolidated Statements of Income for the Years Ended March 31, 2015, 2014 and 2013
|
53 |
|
Consolidated Statements of Comprehensive Income for the Years Ended March 31, 2015, 2014 and 2013
|
54 |
|
Consolidated Statements of Shareholders’ Equity for the Years Ended March 31, 2015, 2014 and 2013
|
55 |
|
Consolidated Statements of Cash Flows for the Years Ended March 31, 2015, 2014 and 2013
|
56 |
|
Notes to Consolidated Financial Statements
|
57 |
REPORT OF INDEPENDENT REGISTERED PUBLIC ACCOUNTING FIRM
To the Board of Directors and Shareholders of
Abaxis, Inc.
We have audited the accompanying consolidated balance sheets of Abaxis, Inc. and its subsidiaries (“the Company”) as of March 31, 2015 and 2014, and the related consolidated statements of income, comprehensive income, shareholders’ equity and cash flows for each of the three years in the period ended March 31, 2015. Our audits also included the financial statement schedule listed in the Index to this Annual Report on Form 10-K at Part IV Item 15(a) 2. These consolidated financial statements and the financial statement schedule are the responsibility of the Company’s management. Our responsibility is to express an opinion on these consolidated financial statements and the financial statement schedule based on our audits.
We conducted our audits in accordance with the standards of the Public Company Accounting Oversight Board (United States). Those standards require that we plan and perform the audit to obtain reasonable assurance about whether the financial statements are free of material misstatement. An audit includes examining, on a test basis, evidence supporting the amounts and disclosures in the financial statements. An audit also includes assessing the accounting principles used and significant estimates made by management, as well as evaluating the overall financial statement presentation. We believe that our audits provide a reasonable basis for our opinion.
In our opinion, the consolidated financial statements referred to above present fairly, in all material respects, the financial position of Abaxis, Inc. and its subsidiaries as of March 31, 2015 and 2014, and the results of their operations and their cash flows for each of the three years in the period ended March 31, 2015, in conformity with accounting principles generally accepted in the United States of America. Also, in our opinion, the related financial statement schedule, when considered in relation to the consolidated financial statements taken as a whole, presents fairly, in all material aspects, the information set forth therein.
We also have audited, in accordance with the standards of the Public Company Accounting Oversight Board (United States), the Company’s internal control over financial reporting as of March 31, 2015, based on criteria established in Internal Control — Integrated Framework (2013 Framework) issued by the Committee of Sponsoring Organizations of the Treadway Commission and our report dated June 1, 2015 expressed an unqualified opinion thereon.
/s/ Burr Pilger Mayer, Inc.
San Jose, California
June 1, 2015
ABAXIS, INC.
CONSOLIDATED BALANCE SHEETS
(In thousands, except share data)
|
March 31,
|
||||||||
|
ASSETS
|
2015
|
2014
|
||||||
|
Current assets:
|
||||||||
|
Cash and cash equivalents
|
$
|
107,015
|
$
|
73,589
|
||||
|
Short-term investments
|
26,109
|
29,102
|
||||||
|
Receivables (net of allowances of $247 in 2015 and $182 in 2014)
|
29,015
|
27,253
|
||||||
|
Inventories
|
36,179
|
26,583
|
||||||
|
Prepaid expenses and other current assets
|
2,893
|
2,347
|
||||||
|
Net deferred tax assets, current
|
6,575
|
4,464
|
||||||
|
Current assets of discontinued operations
|
2,075
|
2,474
|
||||||
|
Total current assets
|
209,861
|
165,812
|
||||||
|
Long-term investments
|
24,181
|
18,491
|
||||||
|
Investment in unconsolidated affiliate
|
2,683
|
2,646
|
||||||
|
Property and equipment, net
|
27,316
|
24,191
|
||||||
|
Intangible assets, net
|
1,491
|
1,200
|
||||||
|
Net deferred tax assets, non-current
|
3,413
|
1,557
|
||||||
|
Non-current assets of discontinued operations
|
12
|
3,431
|
||||||
|
Other assets
|
107
|
52
|
||||||
|
Total assets
|
$
|
269,064
|
$
|
217,380
|
||||
|
LIABILITIES AND SHAREHOLDERS' EQUITY
|
||||||||
|
Current liabilities:
|
||||||||
|
Accounts payable
|
$
|
7,277
|
$
|
5,525
|
||||
|
Accrued payroll and related expenses
|
11,094
|
4,372
|
||||||
|
Accrued taxes
|
4,829
|
1,144
|
||||||
|
Current liabilities of discontinued operations
|
5,536
|
879
|
||||||
|
Other accrued liabilities
|
9,804
|
3,084
|
||||||
|
Deferred revenue
|
1,322
|
1,208
|
||||||
|
Warranty reserve
|
1,423
|
1,047
|
||||||
|
Total current liabilities
|
41,285
|
17,259
|
||||||
|
Non-current liabilities:
|
||||||||
|
Deferred revenue
|
3,219
|
4,035
|
||||||
|
Warranty reserve
|
1,733
|
821
|
||||||
|
Net deferred tax liabilities
|
310
|
-
|
||||||
|
Non-current liabilities of discontinued operations
|
-
|
16
|
||||||
|
Notes payable, less current portion
|
480
|
581
|
||||||
|
Other non-current liabilities
|
1,843
|
752
|
||||||
|
Total non-current liabilities
|
7,585
|
6,205
|
||||||
|
Total liabilities
|
48,870
|
23,464
|
||||||
|
Commitments and contingencies (Note 13)
|
||||||||
|
Shareholders' equity:
|
||||||||
|
Preferred stock, no par value: 5,000,000 shares authorized; no shares issued and outstanding in 2015 and 2014
|
-
|
-
|
||||||
|
Common stock, no par value: 35,000,000 shares authorized; 22,539,000 and 22,308,000 shares issued and outstanding in 2015 and 2014, respectively
|
132,559
|
124,603
|
||||||
|
Retained earnings
|
87,643
|
69,318
|
||||||
|
Accumulated other comprehensive loss
|
(8
|
)
|
(5
|
)
|
||||
|
Total shareholders' equity
|
220,194
|
193,916
|
||||||
|
Total liabilities and shareholders' equity
|
$
|
269,064
|
$
|
217,380
|
||||
See accompanying Notes to Consolidated Financial Statements.
ABAXIS, INC.
CONSOLIDATED STATEMENTS OF INCOME
(In thousands, except per share data)
|
Year Ended March 31,
|
||||||||||||
|
2015
|
2014
|
2013
|
||||||||||
|
Revenues
|
$
|
202,593
|
$
|
162,031
|
$
|
180,878
|
||||||
|
Cost of revenues
|
93,623
|
78,081
|
79,903
|
|||||||||
|
Gross profit
|
108,970
|
83,950
|
100,975
|
|||||||||
|
Operating expenses:
|
||||||||||||
|
Research and development
|
16,327
|
13,647
|
13,577
|
|||||||||
|
Sales and marketing
|
42,147
|
34,742
|
43,800
|
|||||||||
|
General and administrative
|
16,192
|
11,333
|
12,825
|
|||||||||
|
Gain from legal settlement
|
-
|
-
|
(17,250
|
)
|
||||||||
|
Total operating expenses
|
74,666
|
59,722
|
52,952
|
|||||||||
|
Income from operations
|
34,304
|
24,228
|
48,023
|
|||||||||
|
Interest and other income (expense), net
|
(1,262
|
)
|
994
|
253
|
||||||||
|
Income from continuing operations before income tax provision
|
33,042
|
25,222
|
48,276
|
|||||||||
|
Income tax provision
|
12,239
|
8,993
|
17,149
|
|||||||||
|
Income from continuing operations
|
20,803
|
16,229
|
31,127
|
|||||||||
|
Discontinued operations (Note 3)
|
||||||||||||
|
Loss from discontinued operations, net of tax
|
(1,154
|
)
|
(2,044
|
)
|
(3,668
|
)
|
||||||
|
Gain on sale of discontinued operations, net of tax
|
7,682
|
-
|
-
|
|||||||||
|
Net income
|
$
|
27,331
|
$
|
14,185
|
$
|
27,459
|
||||||
|
Net income (loss) per share:
|
||||||||||||
|
Basic
|
||||||||||||
|
Continuing operations
|
$
|
0.92
|
$
|
0.73
|
$
|
1.42
|
||||||
|
Discontinued operations
|
0.29
|
(0.09
|
)
|
(0.17
|
)
|
|||||||
|
Basic net income per share
|
$
|
1.21
|
$
|
0.64
|
$
|
1.25
|
||||||
|
Diluted
|
||||||||||||
|
Continuing operations
|
$
|
0.91
|
$
|
0.72
|
$
|
1.39
|
||||||
|
Discontinued operations
|
0.29
|
(0.09
|
)
|
(0.16
|
)
|
|||||||
|
Diluted net income per share
|
$
|
1.20
|
$
|
0.63
|
$
|
1.23
|
||||||
|
Shares used in the calculation of net income per share:
|
||||||||||||
|
Weighted average common shares outstanding - basic
|
22,497
|
22,270
|
21,946
|
|||||||||
|
Weighted average common shares outstanding - diluted
|
22,787
|
22,575
|
22,381
|
|||||||||
|
Cash dividends declared per share
|
$
|
0.40
|
$
|
-
|
$
|
1.00
|
||||||
See accompanying Notes to Consolidated Financial Statements.
ABAXIS, INC.
CONSOLIDATED STATEMENTS OF COMPREHENSIVE INCOME
(In thousands)
|
Year Ended March 31,
|
||||||||||||
|
2015
|
2014
|
2013
|
||||||||||
|
Net income
|
$
|
27,331
|
$
|
14,185
|
$
|
27,459
|
||||||
|
Other comprehensive income (loss):
|
||||||||||||
|
Net change in unrealized gain (loss) on investments
|
(5
|
)
|
(79
|
)
|
29
|
|||||||
|
Tax provision (benefit) on other comprehensive income (loss)
|
(2
|
)
|
(32
|
)
|
12
|
|||||||
|
Other comprehensive income (loss), net of tax
|
(3
|
)
|
(47
|
)
|
17
|
|||||||
|
Comprehensive income
|
$
|
27,328
|
$
|
14,138
|
$
|
27,476
|
||||||
See accompanying Notes to Consolidated Financial Statements.
ABAXIS, INC.
CONSOLIDATED STATEMENTS OF SHAREHOLDERS’ EQUITY
(In thousands, except share data)
|
Common Stock
|
Retained
|
Accumulated
Other
Comprehensive
Income
|
Total
Shareholders'
|
|||||||||||||||||
|
Shares
|
Amount
|
Earnings
|
(Loss)
|
Equity
|
||||||||||||||||
|
Balances at March 31, 2012
|
21,699,000
|
$
|
110,063
|
$
|
49,697
|
$
|
25
|
$
|
159,785
|
|||||||||||
|
Common stock issued under stock option exercises
|
210,000
|
2,800
|
-
|
-
|
2,800
|
|||||||||||||||
|
Common stock issued in settlement of restricted stock units, net of shares withheld for employee taxes
|
211,000
|
(1,625
|
)
|
-
|
-
|
(1,625
|
)
|
|||||||||||||
|
Dividends to shareholders
|
-
|
-
|
(22,023
|
)
|
-
|
(22,023
|
)
|
|||||||||||||
|
Share-based compensation
|
-
|
7,098
|
-
|
-
|
7,098
|
|||||||||||||||
|
Excess tax benefits from share-based awards and other tax adjustments
|
-
|
2,683
|
-
|
-
|
2,683
|
|||||||||||||||
|
Net income
|
-
|
-
|
27,459
|
-
|
27,459
|
|||||||||||||||
|
Other comprehensive income (loss), net of tax
|
-
|
-
|
-
|
17
|
17
|
|||||||||||||||
|
Balances at March 31, 2013
|
22,120,000
|
121,019
|
55,133
|
42
|
176,194
|
|||||||||||||||
|
Common stock issued under stock option exercises
|
70,000
|
1,455
|
-
|
-
|
1,455
|
|||||||||||||||
|
Common stock issued in settlement of restricted stock units, net of shares withheld for employee taxes
|
204,000
|
(4,683
|
)
|
-
|
-
|
(4,683
|
)
|
|||||||||||||
|
Repurchases of common stock, net
|
(86,000
|
)
|
(2,981
|
)
|
-
|
-
|
(2,981
|
)
|
||||||||||||
|
Share-based compensation
|
-
|
7,629
|
-
|
-
|
7,629
|
|||||||||||||||
|
Excess tax benefits from share-based awards and other tax adjustments
|
-
|
2,164
|
-
|
-
|
2,164
|
|||||||||||||||
|
Net income
|
-
|
-
|
14,185
|
-
|
14,185
|
|||||||||||||||
|
Other comprehensive income (loss), net of tax
|
-
|
-
|
-
|
(47
|
)
|
(47
|
)
|
|||||||||||||
|
Balances at March 31, 2014
|
22,308,000
|
124,603
|
69,318
|
(5
|
)
|
193,916
|
||||||||||||||
|
Common stock issued under stock option exercises
|
2,000
|
31
|
-
|
-
|
31
|
|||||||||||||||
|
Common stock issued in settlement of restricted stock units, net of shares withheld for employee taxes
|
203,000
|
(3,026
|
)
|
-
|
-
|
(3,026
|
)
|
|||||||||||||
|
Warrant exercises
|
26,000
|
78
|
- | - |
78
|
|||||||||||||||
|
Dividends to shareholders
|
-
|
-
|
(9,006
|
)
|
-
|
(9,006
|
)
|
|||||||||||||
|
Share-based compensation
|
-
|
9,759
|
-
|
-
|
9,759
|
|||||||||||||||
|
Compensation expense recognized on accelerated vesting of warrants
|
-
|
168
|
-
|
-
|
168
|
|||||||||||||||
|
Excess tax benefits from share-based awards and other tax adjustments
|
-
|
946
|
-
|
-
|
946
|
|||||||||||||||
|
Net income
|
-
|
-
|
27,331
|
-
|
27,331
|
|||||||||||||||
|
Other comprehensive income (loss), net of tax
|
-
|
-
|
-
|
(3
|
)
|
(3
|
)
|
|||||||||||||
|
Balances at March 31, 2015
|
22,539,000
|
$
|
132,559
|
$
|
87,643
|
$
|
(8
|
)
|
$
|
220,194
|
||||||||||
See accompanying Notes to Consolidated Financial Statements.
ABAXIS, INC.
CONSOLIDATED STATEMENTS OF CASH FLOWS
(In thousands)
|
Year Ended March 31,
|
||||||||||||
|
2015
|
2014
|
2013
|
||||||||||
|
Cash flows from operating activities:
|
||||||||||||
|
Net income
|
$
|
27,331
|
$
|
14,185
|
$
|
27,459
|
||||||
|
Adjustments to reconcile net income to net cash provided by operating activities:
|
||||||||||||
|
Depreciation and amortization
|
8,486
|
7,427
|
6,298
|
|||||||||
|
Investment premium amortization, net
|
635
|
530
|
827
|
|||||||||
|
Gain on sale of discontinued operations, net of tax
|
(7,682
|
)
|
-
|
-
|
||||||||
|
Net loss on disposals of property and equipment
|
8
|
20
|
76
|
|||||||||
|
Foreign exchange (gain) loss
|
1,794
|
(477
|
)
|
401
|
||||||||
|
Share-based compensation expense
|
9,787
|
7,643
|
7,086
|
|||||||||
|
Excess tax benefits from share-based awards
|
(961
|
)
|
(2,164
|
)
|
(2,683
|
)
|
||||||
|
Deferred income taxes
|
(3,954
|
)
|
(785
|
)
|
(1,307
|
)
|
||||||
|
Equity in net (income) loss of unconsolidated affiliate
|
(37
|
)
|
(33
|
)
|
13
|
|||||||
|
Changes in assets and liabilities:
|
||||||||||||
|
Receivables, net
|
(1,306
|
)
|
11,171
|
(9,418
|
)
|
|||||||
|
Inventories
|
(10,135
|
)
|
(2,491
|
)
|
(8,081
|
)
|
||||||
|
Prepaid expenses and other current assets
|
787
|
2,962
|
4,269
|
|||||||||
|
Other assets
|
(55
|
)
|
21
|
(9
|
)
|
|||||||
|
Accounts payable
|
116
|
(2,018
|
)
|
1,746
|
||||||||
|
Accrued payroll and related expenses
|
6,776
|
(1,626
|
)
|
(67
|
)
|
|||||||
|
Accrued taxes
|
(1,294
|
)
|
690
|
610
|
||||||||
|
Other liabilities
|
5,514
|
(98
|
)
|
935
|
||||||||
|
Deferred revenue
|
(702
|
)
|
131
|
1,504
|
||||||||
|
Warranty reserve
|
1,288
|
484
|
(462
|
)
|
||||||||
|
Net cash provided by operating activities
|
36,396
|
35,572
|
29,197
|
|||||||||
|
Cash flows from investing activities:
|
||||||||||||
|
Purchases of available-for-sale investments
|
-
|
(4,384
|
)
|
-
|
||||||||
|
Purchases of held-to-maturity investments
|
(36,804
|
)
|
(27,798
|
)
|
(18,337
|
)
|
||||||
|
Proceeds from maturities and redemptions of available-for-sale investments
|
6,498
|
1,023
|
249
|
|||||||||
|
Proceeds from maturities and redemptions of held-to-maturity investments
|
26,969
|
23,311
|
22,067
|
|||||||||
|
Purchases of property and equipment
|
(6,077
|
)
|
(5,554
|
)
|
(5,640
|
)
|
||||||
|
Proceeds from disposals of property and equipment
|
25
|
44
|
4
|
|||||||||
|
Acquisitions, net of cash acquired
|
(618
|
)
|
-
|
-
|
||||||||
|
Proceeds from sale of discontinued operations
|
20,100
|
-
|
-
|
|||||||||
|
Net cash provided by (used in) investing activities
|
10,093
|
(13,358
|
)
|
(1,657
|
)
|
|||||||
|
Cash flows from financing activities:
|
||||||||||||
|
Proceeds from the exercise of stock options
|
31
|
1,455
|
2,800
|
|||||||||
|
Tax withholdings related to net share settlements of restricted stock units
|
(3,026
|
)
|
(4,683
|
)
|
(1,625
|
)
|
||||||
|
Excess tax benefits from share-based awards
|
961
|
2,164
|
2,683
|
|||||||||
|
Repurchases of common stock
|
-
|
(2,981
|
)
|
-
|
||||||||
|
Proceeds from the exercise of warrants
|
78
|
-
|
-
|
|||||||||
|
Dividends paid
|
(9,006
|
)
|
-
|
(22,023
|
)
|
|||||||
|
Net cash used in financing activities
|
(10,962
|
)
|
(4,045
|
)
|
(18,165
|
)
|
||||||
|
Effect of exchange rate changes on cash and cash equivalents
|
(2,101
|
)
|
510
|
(308
|
)
|
|||||||
|
Net increase in cash and cash equivalents
|
33,426
|
18,679
|
9,067
|
|||||||||
|
Cash and cash equivalents at beginning of year
|
73,589
|
54,910
|
45,843
|
|||||||||
|
Cash and cash equivalents at end of year
|
$
|
107,015
|
$
|
73,589
|
$
|
54,910
|
||||||
|
Supplemental disclosure of cash flow information:
|
||||||||||||
|
Cash paid for income taxes, net of refunds
|
$
|
15,888
|
$
|
4,943
|
$
|
12,330
|
||||||
|
Supplemental disclosure of non-cash flow information:
|
||||||||||||
|
Change in unrealized gain (loss) on investments, net of tax
|
$
|
(3
|
)
|
$
|
(47
|
)
|
$
|
17
|
||||
|
Transfers of equipment between inventory and property and equipment, net
|
$
|
2,295
|
$
|
2,285
|
$
|
904
|
||||||
|
Net change in capitalized share-based compensation
|
$
|
(29
|
)
|
$
|
(14
|
)
|
$
|
12
|
||||
|
Common stock withheld for employee taxes in connection with share-based compensation
|
$
|
3,026
|
$
|
4,683
|
$
|
1,625
|
||||||
|
Repayment of notes payable by credits from municipal agency
|
$
|
101
|
$
|
101
|
$
|
101
|
||||||
|
Settlement of preexisting business relationship in connection with acquisition
|
$
|
931
|
$
|
-
|
$
|
-
|
||||||
|
Installment payment obligation accrued related to acquisition
|
$
|
2,336
|
$
|
-
|
$
|
-
|
||||||
See accompanying Notes to Consolidated Financial Statements.
ABAXIS, INC.
NOTES TO CONSOLIDATED FINANCIAL STATEMENTS
YEARS ENDED MARCH 31, 2015, 2014 AND 2013
NOTE 1. DESCRIPTION OF BUSINESS AND SUMMARY OF SIGNIFICANT ACCOUNTING POLICIES
Description of Business
Abaxis, Inc. (“Abaxis,” the “Company” or “we”), incorporated in California in 1989, develops, manufactures and markets portable blood analysis systems that are used in a broad range of medical specialties in human or veterinary patient care to provide clinicians with rapid blood constituent measurements. We conduct business worldwide and manage our business on the basis of the following two reportable segments: the medical market and the veterinary market.
Basis of Presentation
Principles of Consolidation. The accompanying consolidated financial statements include the accounts of Abaxis and our wholly-owned subsidiaries. Intercompany transactions and balances have been eliminated in consolidation.
Discontinued Operations. On March 18, 2015, we entered into an Asset Purchase Agreement with Antech Diagnostics, Inc. (“Antech”) pursuant to which we sold substantially all of the assets of our Abaxis Veterinary Reference Laboratories (“AVRL”) business. The sale transaction closed on March 31, 2015. The historical operating results of our AVRL business are retrospectively adjusted and presented as discontinued operations in our consolidated balance sheets and consolidated statements of income for all periods presented. See Note 3, “Discontinued Operations” for additional information. Unless noted otherwise, all discussions herein with respect to the Company’s audited consolidated financial statements relate to the Company’s continuing operations.
Reclassifications. Certain reclassifications have been made to prior periods’ financial statements to conform to the current period presentation. These reclassifications did not result in any change in previously reported net income or shareholders’ equity.
Summary of Significant Accounting Policies
Management Estimates. The preparation of these consolidated financial statements in accordance with accounting principles generally accepted in the United States of America requires our management to make estimates and assumptions that affect the reported amounts of assets and liabilities and disclosure of contingent assets and liabilities at the date of the consolidated financial statements, the reported amounts of revenues and expenses during the reporting period, and related disclosures. Significant management estimates made in preparing the consolidated financial statements relate to allowance for doubtful accounts, sales and other allowances, estimated selling price of our products, valuation of inventory, fair value of investments, fair value and useful lives of intangible assets, income taxes, valuation allowance for deferred tax assets, share-based compensation, legal exposures and warranty reserves. Our management bases their estimates on historical experience and on various other assumptions that are believed to be reasonable, the results of which form the basis for making judgments about the carrying values of assets and liabilities. Our actual results may differ materially from these estimates.
Cash and Cash Equivalents. Cash equivalents consist of highly liquid investments with original or remaining maturities of three months or less at the time of purchase that are readily convertible into cash. The fair value of these investments was determined by using quoted prices for identical investments in active markets which are measured at Level 1 inputs under Financial Accounting Standards Board (“FASB”) Accounting Standards Codification (“ASC”) 820, “Fair Value Measurements and Disclosures.” The carrying value of cash equivalents approximates fair value due to their relatively short-term nature.
Investments. We hold both short-term and long-term investments and our portfolio primarily consists of certificates of deposit, commercial paper, corporate bonds and municipal bonds. Short-term investments have maturities of one year or less. All other investments with maturity dates greater than one year are classified as long-term. Our investments are accounted for as either available-for-sale or held-to-maturity. Investments classified as available-for-sale are reported at fair value at the balance sheet date, and temporary differences between cost and fair value are presented as a separate component of accumulated other comprehensive income (loss), net of any related tax effect, in shareholders’ equity. Investments classified as held-to-maturity are based on the Company’s positive intent and ability to hold to maturity and these investments are carried at amortized cost.
Realized gains and losses from investments are included in “Interest and other income (expense), net,” computed using the specific identification cost method. We assess whether an other-than-temporary impairment loss on our investments has occurred due to declines in fair value or other market conditions. Declines in fair value that are determined to be other-than-temporary, if any, are recorded as charges against “Interest and other income (expense), net” in the consolidated statements of income. We did not recognize any impairment loss on investments during fiscal 2015, 2014 or 2013.
Concentration of Credit Risks and Certain Other Risks. Financial instruments that potentially subject us to a concentration of credit risk consist primarily of cash, cash equivalents, investments and receivables. We place our cash, cash equivalents and investments with high credit quality financial institutions that are regularly monitored by management. Deposits held with banks may exceed the amount of the insurance provided by the federal government on such deposits. To date, the Company has not experienced any losses on such deposits. We also have short and long-term investments in certificates of deposit, commercial paper, corporate bonds and municipal bonds, which can be subject to certain credit risk. However, we mitigate the risks by investing in high-grade instruments, limiting our exposure to any one issuer, and monitoring the ongoing creditworthiness of the financial institutions and issuers.
We sell our products to distributors and direct customers located primarily in North America, Europe and other countries. Credit is extended to our customers and we generally do not require our customers to provide collateral for purchases on credit. Credit risks are mitigated by our credit evaluation process and monitoring the amounts owed to us, taking appropriate action when necessary. Collection of receivables may be affected by changes in economic or other industry conditions and may, accordingly, impact our overall credit risk. We maintain an allowance for doubtful accounts, but historically have not experienced any material losses related to an individual customer or group of customers in any particular industry or geographic area. At March 31, 2015, one distributor in the United States accounted for 26% of our total receivables balance. At March 31, 2014, one distributor in the United States accounted for 26% of our total receivables balance.
We are subject to certain risks and uncertainties and believe that changes in any of the following areas could have a material adverse effect on our future financial position or results of operations: continued Food and Drug Administration compliance or regulatory changes; uncertainty regarding health care reforms; fundamental changes in the technology underlying blood testing; the ability to develop new products and services that are accepted in the marketplace; competition, including, but not limited to, pricing and products or product features and services; the adequate and timely sourcing of inventories; foreign currency fluctuations; litigation, product liability or other claims against Abaxis; the ability to attract and retain key employees; stock price volatility due to general economic conditions or future issuances and sales of our stock; changes in legal and accounting regulations and standards; and changes in tax regulations.
Fair Value Measurements. We apply fair value accounting for all financial assets and liabilities and non-financial assets and liabilities that are recognized or disclosed at fair value in the financial statements on a recurring basis. Fair value is defined as the price that would be received to sell an asset or paid to transfer a liability in an orderly transaction between market participants at the measurement date. When determining fair value, we consider the principal or most advantageous market in which we would transact and consider assumptions that market participants would use when pricing the asset or liability. The fair value hierarchy distinguishes between (1) market participant assumptions developed based on market data obtained from independent sources (observable inputs) and (2) an entity’s own assumptions about market participant assumptions developed based on the best information available in the circumstances (unobservable inputs). The fair value hierarchy consists of three broad levels, which gives the highest priority to unadjusted quoted prices in active markets for identical assets or liabilities (Level 1) and the lowest priority to unobservable inputs (Level 3). The three levels of the fair value hierarchy are described below.
Level 1: Quoted prices (unadjusted) in active markets for identical assets or liabilities.
Level 2: Directly or indirectly observable inputs as of the reporting date through correlation with market data, including quoted prices for similar assets and liabilities in active markets and quoted prices in markets that are not active. Level 2 also includes assets and liabilities that are valued using models or other pricing methodologies that do not require significant judgment since the input assumptions used in the models, such as interest rates and volatility factors, are corroborated by readily observable data from actively quoted markets for substantially the full term of the financial instrument.
Level 3: Unobservable inputs that are supported by little or no market data and require the use of significant management judgment. These values are generally determined using pricing models for which the assumptions utilize management’s estimates of market participant assumptions.
Assets and liabilities measured at fair value are classified in their entirety based on the lowest level of input that is significant to the fair value measurement. Our assessment of the significance of a particular input to the fair value measurement in its entirety requires judgment and considers factors specific to the asset or liability. Our financial instruments include cash, cash equivalents, investments, receivables, accounts payable and certain other accrued liabilities. The fair value of cash, cash equivalents, receivables, accounts payable and certain other accrued liabilities are valued at their carrying value, which approximates fair value due to their short maturities. See Note 5, “Fair Value Measurements” for further information on fair value measurement of our financial and nonfinancial assets and liabilities.
Inventories. Inventories include material, labor and manufacturing overhead, and are stated at the lower of standard cost (which approximates actual cost using the first-in, first-out method) or market. Provisions for excess, obsolete and unusable inventories are determined primarily by management’s evaluation of future demand of our products and market conditions.
Investment in Unconsolidated Affiliate. In February 2011, we purchased a 15% equity ownership interest in Scandinavian Micro Biodevices APS (“SMB”) for $2.8 million in cash. We use the equity method to account for our investment in this entity because we do not control it, but have the ability to exercise significant influence over it. Equity method investments are recorded at original cost and adjusted periodically to recognize (1) our proportionate share of the investees’ net income or losses after the date of investment, (2) additional contributions made and dividends or distributions received, and (3) impairment losses resulting from adjustments to net realizable value. We eliminate all intercompany transactions in accounting for our equity method investments. During fiscal 2015, 2014 and 2013, we recorded our proportionate share of the investee’s net income or loss in “Interest and other income (expense), net” on the consolidated statements of income.
We assess the potential impairment of our equity method investments when indicators such as a history of operating losses, a negative earnings and cash flow outlook, and the financial condition and prospects for the investee’s business segment might indicate a loss in value. We did not recognize any impairment loss on investment in unconsolidated affiliate during fiscal 2015, 2014 or 2013.
Property and Equipment. Property and equipment are stated at cost, net of accumulated depreciation and amortization. Depreciation and amortization expense is calculated using the straight-line method using the estimated useful lives of the assets. The table below provides estimated useful lives of property and equipment by asset classification.
|
Asset Classification
|
Estimated Useful Life
|
|
Machinery and equipment
|
2-15 years
|
|
Furniture and fixtures
|
3-8 years
|
|
Computer equipment
|
2-7 years
|
|
Building
|
25 years
|
|
Leasehold improvements
|
Shorter of estimated useful life or remaining lease term
|
Construction in progress primarily consists of purchased material and internal payroll and related costs used in the development of production lines. We did not capitalize interest on constructed assets during fiscal 2015 or 2014 due to immateriality.
Property and equipment includes instruments transferred from inventory and held for loan or evaluation or demonstration purposes to customers. Units held for loan, evaluation or demonstration purposes are carried at cost and depreciated over their estimated useful lives of three to five years. Depreciation expense related to these instruments is recorded in cost of revenues or in the respective operating expense line based on the function and purpose for which it is being used. Proceeds from the sale of evaluation units are recorded as revenue.
Intangible Assets. Intangible assets, consisted of customer relationships, tradename, licenses and other rights acquired from third parties, are presented at cost, net of accumulated amortization. The intangible assets are amortized using the straight-line method over their estimated useful lives of 2-10 years, which approximates the economic benefit. If our underlying assumptions regarding the estimated useful life of an intangible asset change, then the amortization period, amortization expense and the carrying value for such asset would be adjusted accordingly. During fiscal 2015, 2014 and 2013, our changes in estimated useful life of intangible assets were not significant, except as noted below in “Valuation of Long-Lived Assets.”
Valuation of Long-Lived Assets. We evaluate the carrying value of our long-lived assets, such as property and equipment and amortized intangible assets, whenever events or changes in business circumstances or our planned use of long-lived assets indicate that the carrying amount of an asset may not be fully recoverable or their useful lives are no longer appropriate. We look to current and future profitability, as well as current and future undiscounted cash flows, excluding financing costs, as primary indicators of recoverability. An impairment loss would be recognized when the sum of the undiscounted future net cash flows expected to result from the use of the asset and its eventual disposal is less than the carrying amount. If impairment is determined to exist, any related impairment loss is calculated based on fair value and long-lived assets are written down to their respective fair values. During fiscal 2015, 2014 and 2013, we recognized impairment charges on long-lived assets of $1.9 million, $0 and $0, respectively. The impairment charges on our long-lived assets in fiscal 2015 were in relation to the property and equipment and intangible assets of the AVRL business, which has been offset against the gain from the sale of AVRL on the consolidated statement of income for fiscal 2015.
Revenue Recognition. Revenues from product sales and services, net of estimated sales allowances, discounts and rebates, are recognized when the following four criteria are met:
| • | Evidence of an arrangement exists: Persuasive evidence of an arrangement with a customer that reflects the terms and conditions to deliver products or render services must exist in order to recognize revenue. |
| • | Upon shipment of the products or rendering of services to the customer: Delivery is considered to occur at the time of shipment of products to a distributor or direct customer, as title and risk of loss have been transferred to the distributor or direct customer on delivery to the common carrier. Rights of return are not provided. For services, delivery was considered to occur as the service was provided. Service revenues were primarily generated from veterinary reference laboratory diagnostic and consulting services for veterinarians. Net service revenues were recognized at the time services were performed. |
| • | Fixed or determinable sales price: When the sales price is fixed or determinable that amount is recognized as revenue. |
| • | Collection is reasonably assured: Collection is deemed probable if a customer is expected to be able to pay amounts under the arrangement as those amounts become due. Revenue is recognized when collectibility of the resulting receivable is reasonably assured. |
Amounts collected in advance of revenue recognition are recorded as a current or non-current deferred revenue liability based on the time from the balance sheet date to the future date of revenue recognition. We recognize revenue associated with extended maintenance agreements ratably over the life of the contract. From time to time, we offered discounts on AVRL services for a specified period as incentives. Discounts were reductions to invoiced amounts within a specified period and were recorded at the time services are performed.
Multiple Element Revenue Arrangements. Our sales arrangements may contain multiple element revenue arrangements in which a customer may purchase a combination of instruments, consumables or extended maintenance agreements. Additionally, we provide incentives in the form of free goods or extended maintenance agreements to customers in connection with the sale of our instruments. We participate in selling arrangements in the veterinary market that include multiple deliverables, such as instruments, consumables and service agreements associated with our veterinary reference laboratory. Judgments as to the allocation of consideration from an arrangement to the multiple elements of the arrangement, and the appropriate timing of revenue recognition are critical with respect to these arrangements.
A multiple element arrangement includes the sale of one or more tangible product offerings with one or more associated services offerings, each of which are individually considered separate units of accounting. We allocate revenues to each element in a multiple element arrangement based upon the relative selling price of each deliverable. When applying the relative selling price method, we determine the selling price for each deliverable using vendor-specific objective evidence (“VSOE”) of selling price, if it exists, or third-party evidence (“TPE”) of selling price. If neither VSOE nor TPE of selling price exist for a deliverable, we use our best estimate of selling price for that deliverable. Revenue allocated to each element is then recognized when all revenue recognition criteria are met for each element.
Revenues from our multiple element arrangements are allocated separately to the instruments, consumables, extended maintenance agreements and incentives based on the relative selling price method. Amounts allocated to each element are based on its objectively determined fair value, such as the sales price for the product or service when it is sold separately. Revenues allocated to each element are then recognized when the basic revenue recognition criteria, as described above, are met for each element. Revenues associated with incentives in the form of free goods are deferred until the goods are shipped to the customer. Revenues associated with incentives in the form of extended maintenance agreements are deferred and recognized ratably over the life of the extended maintenance contract, generally one to three years. Incentives in the form of extended maintenance agreements are our most significant multiple element arrangement.
For our selling arrangements in the veterinary market that include multiple deliverables, such as instruments, consumables and service agreements associated with our veterinary reference laboratory, revenue is recognized upon delivery of the product or performance of the service during the term of the service contract when the basic revenue recognition criteria, as described above, are met for each element. We allocate revenues to each element based on the relative selling price of each deliverable. Amounts allocated to each element are based on its objectively determined fair value, such as the sales price for the product or service when it is sold separately.
Until March 2015, we offered customer incentives comprising of arrangements with customers to include discounts on future sales of services associated with our veterinary reference laboratory. We applied judgment in determining whether future discounts are significant and incremental. When the future discount offered was not considered significant and incremental, we do not account for the discount as an element of the original arrangement. To determine whether a discount is significant and incremental, we look to the discount provided in comparison to standalone sales of the same product to similar customers, the level of discount provided on other elements in the arrangement, and the significance of the discount to the overall arrangement. If the discount in the multiple element arrangement approximates the discount typically provided in standalone sales, that discount is not considered incremental. During fiscal 2015, 2014 and 2013, our customer incentive programs with future discounts were not significant.
Customer Programs. From time to time, we offer customer marketing and incentive programs. Our most significant customer programs are described as follows:
Instrument Trade-In Programs. We periodically offer trade-in programs to customers for trading in an existing instrument to purchase a new instrument and we will either provide incentives in the form of free goods or reduce the sales price of the instrument. These incentives in the form of free goods are recorded based on the relative selling price method according to the policies described above.
Instrument Rental Programs. We periodically offer programs to customers whereby certain instruments are made available to customers for rent or on an evaluation basis. These programs typically require customers to purchase a minimum quantity of consumables during a specified period for which we recognize revenue on the related consumables according to the policies described above. Depending on the program offered, customers may purchase the instrument during the rental or evaluation period. Proceeds from such sale are recorded as revenue according to the policies described above. Rental income, if any, is also recorded as revenue according to the policies described above.
Sales Incentive Programs. We periodically offer customer sales incentive programs and we record reductions to revenue related to these programs. Incentives may be provided in the form of rebates to distributors for volume-based purchases or upon meeting other specified requirements, end-user rebates and discounts. A summary of our revenue reductions is described below. Other rebate programs offered to distributors or customers vary from period to period in the medical and veterinary markets and were not significant.
| • | Volume-based Incentives. Volume-based incentives, in the form of rebates, are offered from time to time to distributors and group purchasing organizations upon meeting the sales volume requirements during a qualifying period and are recorded as a reduction to gross revenues during a qualifying period. The pricing rebate program is primarily offered to distributors and group purchasing organizations in the North America veterinary market, upon meeting the sales volume requirements of veterinary products during the qualifying period. Factors used in the rebate calculations include the identification of products sold subject to a rebate during the qualifying period and which rebate percentage applies. Based on these factors and using historical trends, adjusted for current changes, we estimate the amount of the rebate and record the rebate as a deduction to gross revenues when we record the sale of the product. The rebate is recorded as a reserve to offset accounts receivable as settlements are made through offsets to outstanding customer invoices. Settlement of the rebate accruals from the date of sale ranges from one to nine months after sale. Changes in the rebate accrual at the end of each period are based upon distributors and group purchasing organizations meeting the purchase requirements during the quarter. |
| • | Distributor Rebate Incentives. During fiscal 2015, we offered a customer sales incentive program, whereby distributors were offered a rebate upon meeting certain requirements. We recognize the rebate obligation as a reduction of revenue at the later of the date on which we sell the product or the date the program is offered. These customer sales incentive programs require management to estimate the rebate amounts to distributors who will qualify for the incentive during the promotional period. We record the estimated liability in other current accrued liabilities on our consolidated balance sheet. Management’s estimates are based on historical experience and the specific terms and conditions of the incentive programs. |
| • | End-User Rebates and Discounts. From time to time, cash rebates are offered to end-users who purchase certain products or instruments during a promotional period and are recorded as a reduction to gross revenues. Additionally, we periodically offer sales incentives to end-users, in the form of sales discounts, to purchase consumables for a specified promotional period, typically over five years from the sale of our instrument, and we reimburse resellers for the value of the sales discount provided to the end-user. We estimate the amount of the incentive earned by end-users during a quarter and record a liability to the reseller as a reduction to gross revenues. Factors used in the liability calculation of incentives earned by end-users include the identification of qualified end-users under the sales program during the period and using historical trends. Settlement of the liability to the reseller ranges from one to twelve months from the date an end-user earns the incentive. |
Royalty Revenues. Royalties are typically based on licensees’ net sales of products that utilize our technology and are recognized as earned in accordance with the contract terms when royalties from licensees can be reliably measured and collectibility is reasonably assured, such as upon the receipt of a royalty statement from the licensee.
Allowance for Doubtful Accounts. We recognize revenue when collection from the customer is reasonably assured. We maintain an allowance for doubtful accounts based on our assessment of the collectability of the amounts owed to us by our customers. We regularly review the allowance and consider the following factors in determining the level of allowance required: the customer’s payment history, the age of the receivable balance, the credit quality of our customers, the general financial condition of our customer base and other factors that may affect the customers’ ability to pay. An additional allowance is recorded based on certain percentages of our aged receivables, using historical experience to estimate the potential uncollectible. Account balances are charged off against the allowance when we believe it is probable the receivable will not be recovered.
Shipping and Handling. In a sale transaction we recognize amounts billed to customers for shipping and handling as revenue. Shipping and handling costs incurred for inventory purchases and product shipments are recorded in cost of revenues.
Research and Development Expenses. Research and development expenses, including internally developed software costs, are expensed as incurred and include expenses associated with new product research and regulatory activities. Our products include certain software applications that are resident in the product. The costs to develop such software have not been capitalized as we believe our current software development processes are completed concurrent with the establishment of technological feasibility of the software.
Advertising Expenses. Costs of advertising, which are recognized as sales and marketing expenses, are generally expensed in the period incurred. Advertising expenses were $0.9 million, $0.8 million and $1.5 million for fiscal 2015, 2014 and 2013, respectively.
Income Taxes. We account for income taxes using the liability method under which deferred tax assets and liabilities are determined based on the differences between the financial statement carrying amounts of existing assets and liabilities and their respective tax bases. Deferred tax assets and liabilities are measured using enacted tax rates expected to apply to taxable income in the years in which those temporary differences are expected to be recovered or settled. Valuation allowances are established, when necessary, to reduce deferred tax assets to the amounts expected to be recovered.
We recognize and measure benefits for uncertain tax positions using a two-step approach. The first step is to evaluate the tax position taken or expected to be taken in a tax return by determining if the weight of evidence indicates that it is more likely than not that the tax position will be sustained upon audit, including resolution of any related appeals or litigation processes. For tax positions that are more likely than not to be sustained upon audit, the second step is to measure the tax benefit as the largest amount that is more than 50 percent likely to be realized upon settlement. Significant judgment is required to evaluate uncertain tax positions. At March 31, 2015 and 2014, we had no significant uncertain tax positions. Our policy is to include interest and penalties related to gross unrecognized tax benefits within our provision for income taxes. For fiscal 2015, 2014 and 2013, we did not recognize any interest or penalties related to uncertain tax positions in the consolidated statements of income, and at March 31, 2015 and 2014, we had no accrued interest or penalties.
Share-Based Compensation Expense. We account for share-based compensation in accordance with ASC 718, “Compensation-Stock Compensation.” We recognize share-based compensation expense, net of an estimated forfeiture rate, over the requisite service period of the award to employees and directors. As required by fair value provisions of share-based compensation, employee share-based compensation expense recognized is calculated over the requisite service period of the awards and reduced for estimated forfeitures. The forfeiture rate is estimated based on historical data of our share-based compensation awards that are granted and cancelled prior to vesting and upon historical experience of employee turnover. For restricted stock units, share-based compensation expense is based on the fair value of our stock at the grant date and recognized net of an estimated forfeiture rate, over the requisite service period of the award.
Net Income Per Share. Basic net income per share is computed by dividing the net income attributable to common shareholders by the weighted average number of common shares outstanding during the period. Diluted net income per share is computed by dividing the net income attributable to common shareholders by the weighted average number of common shares that would have been outstanding during the period assuming the issuance of common shares for all potential dilutive common shares outstanding using the treasury stock method. Dilutive potential common shares outstanding include outstanding stock options, restricted stock units and warrants.
Comprehensive Income. Comprehensive income generally represents all changes in shareholders’ equity during a period, resulting from net income and transactions from non-owner sources. Comprehensive income consists of net income and the net-of-tax amounts for unrealized gain (loss) on available-for-sale investments (difference between the cost and fair market value). For the periods presented, the accumulated other comprehensive income (loss) consisted of the unrealized gains or losses on the Company’s available-for-sale investments, net of tax.
Foreign Currency. The U.S. dollar is the functional currency for our international subsidiaries. Foreign currency transactions of our subsidiaries are remeasured into U.S. dollars at the end-of-period exchange rates for monetary assets and liabilities, and historical exchange rates for nonmonetary assets. Accordingly, the effects of foreign currency transactions, and of remeasuring the financial condition into the functional currency resulted in foreign currency gains and (losses), which were included in “Interest and other income (expense), net” on the consolidated statements of income and were $(1.8 million), $0.5 million and $(0.4 million) for fiscal 2015, 2014 and 2013, respectively.
Recent Accounting Pronouncements
Compensation—Stock Compensation: In June 2014, the FASB issued Accounting Standards Update (“ASU”) No. 2014-12, “Accounting for Share-Based Payments When the Terms of an Award Provide That a Performance Target Could Be Achieved after the Requisite Service Period,” (Topic 718) (“ASU 2014-12”). The accounting standard update clarifies the accounting guidance on how to account for share-based payment awards that require a specific performance target to be achieved in order for employees to become eligible to vest in the awards. ASU 2014-12 requires that a performance target that affects vesting and that could be achieved after the requisite service period be treated as a performance condition. As such, the performance target should not be reflected in estimating the grant-date fair value of the award. Compensation costs should be recognized in the period in which it becomes probable that the performance target will be achieved and should represent the compensation cost attributable to the period(s) for which the requisite service has been rendered. ASU 2014-12 is effective for annual periods and interim periods beginning after December 15, 2015 and early adoption is permitted. This amendment may be applied (a) prospectively to all awards granted or modified after the effective date or (b) retrospectively to all awards with performance targets that are outstanding as of the beginning of the earliest annual period presented in the financial statements and to all new or modified awards thereafter. We are currently in the process of evaluating the impact of adopting this pronouncement.
Revenue from Contracts with Customers: In May 2014, the FASB issued ASU No. 2014-09, “Revenue from Contracts with Customers,” (Topic 606) (“ASU 2014-09”), which supersedes the revenue recognition requirements in Accounting Standards Codification 605, “Revenue Recognition.” ASU 2014-09 is based on the principle that revenue is recognized to depict the transfer of goods or services to customers in an amount that reflects the consideration to which the entity expects to be entitled in exchange for those goods or services. It also requires additional disclosure about the nature, amount, timing and uncertainty of revenue and cash flows arising from customer contracts, including significant judgments and changes in judgments and assets recognized from costs incurred to obtain or fulfill a contract. ASU 2014-09 is effective for fiscal years beginning after December 15, 2016, as well as interim periods within those fiscal years. We are currently in the process of evaluating the impact of adopting this pronouncement.
NOTE 2. ACQUISITIONS
In November 2014, Abaxis, through its wholly-owned subsidiary, entered into Share Purchase Agreements pursuant to which, Abaxis acquired 100% of the outstanding stock of Quality Clinical Reagents Limited (“QCR”) and Trio Diagnostics (Ireland) Ltd (“Trio”), both based in the United Kingdom. QCR and Trio are distributors of laboratory instrumentation and consumables to the veterinary profession in the United Kingdom. Our primary reason for the acquisitions was to continue servicing and supplying Abaxis veterinary products to our customer base. The acquisition date fair value of the purchase consideration was $6.5 million, which included the following (in thousands):
|
Cash
|
$
|
3,196
|
||
|
Installment payment obligations (1)
|
2,336
|
|||
|
Settlement of preexisting business relationship at fair value
|
931
|
|||
|
Total
|
$
|
6,463
|
| (1) | The installment payment obligation is denominated in GBP and the amount in the table above is based on the exchange rate at the acquisition date. |
Based on the period end exchange rate, as of March 31, 2015, $2.2 million was payable in two installments during fiscal years 2016 through 2017. The first installment obligation of GBP 750,000 is payable in fiscal year 2016 and the second installment of GBP 750,000 will be placed in escrow as security for post-closing indemnification obligations of certain of the sellers. Any amounts remaining in escrow after three years following the closing date will be released to these sellers in calendar year 2017, net of any outstanding indemnification claims. The Share Purchase Agreements contain certain customary representations and warranties. Additionally, in connection with the acquisition, we recorded a settlement of the preexisting business relationship related to accounts receivable due from QCR and Trio that existed on the acquisition date. The book value of the accounts receivable approximates their fair value due to their short-term nature and no gain or loss was recorded.
The following table summarizes the acquisition date fair value of net tangible assets acquired and liabilities assumed from QCR and Trio (in thousands):
|
Fair Value
|
||||
|
Net tangible assets acquired
|
$
|
5,248
|
||
|
Intangible assets
|
||||
|
Customer relationships
|
1,535
|
|||
|
Tradename
|
16
|
|||
|
Deferred tax liabilities
|
(336
|
)
|
||
|
Total
|
$
|
6,463
|
||
The useful lives for the customer relationships and tradename intangible assets acquired in the acquisition are ten years and two years, respectively, and are amortized on a straight-line basis.
We continue to evaluate certain assets and liabilities related to the QCR and Trio acquisition during the measurement period, a period not to exceed 12 months from the acquisition date. Changes to amounts recorded as assets or liabilities may result in a corresponding adjustment to the purchase price allocation.
The consolidated financial statements include the operating results of our business combination from the date of acquisition.
NOTE 3. DISCONTINUED OPERATIONS
On March 18, 2015, we entered into an asset purchase agreement (“APA”) with Antech pursuant to which we sold substantially all of the assets of our AVRL business. The sale transaction closed on March 31, 2015. The total purchase price under the APA is $21.0 million in cash. We received $20.1 million in cash proceeds during the fourth quarter of fiscal 2015, while the remaining $0.9 million is being held by Antech until certain conditions are met upon which proceeds may be released on the first year anniversary of the closing date. Such additional cash consideration will be accounted for as a gain on sale of discontinued operations, net of tax, when it is realized or realizable.
In accordance with ASC 205 “Presentation of Financial Statements – Discontinued Operations,” a business is classified as a discontinued operation when: (i) the operations and cash flows of the business can be clearly distinguished and have been or will be eliminated from our ongoing operations; (ii) the business has either been disposed of or is classified as held for sale; and (iii) the Company will not have any significant continuing involvement in the operations of the business after the disposal transactions. In accordance with the accounting guidance, the AVRL business represents a separate asset group and the sale of assets in this business qualifies as a discontinued operation.
In connection with the sale of our AVRL business, we recognized a pre-tax gain of $12.3 million ($7.7 million after-tax) on sale of discontinued operations during fiscal 2015. The pre-tax gain on this sale reflects the excess of the sum of the cash proceeds received over the costs incurred in connection with the sale of AVRL. During the fourth quarter of fiscal 2015, we recorded costs of $7.8 million related to cash payments for employee-related costs, including severance, contract termination and other associated costs. In connection with the transaction, we recorded disposal and an impairment of $1.9 million on long-lived assets. These items partially offset the cash proceeds that we received in accordance with the terms of the APA. The following table summarizes the components of the gain (in thousands):
|
Amount
|
||||
|
Cash proceeds received
|
$
|
20,100
|
||
|
Less: Book value of net assets sold
|
(618
|
)
|
||
|
Less: Costs incurred directly attributable to the transaction
|
(5,211
|
)
|
||
|
Net proceeds from sale of discontinued operations
|
14,271
|
|||
|
Less: Disposal and impairment of long-lived assets
|
(1,941
|
)
|
||
|
Gain on sale of discontinued operations
|
12,330
|
|||
|
Income tax expense
|
4,648
|
|||
|
Net gain on sale of discontinued operations
|
$
|
7,682
|
||
The results from discontinued operations were as follows (in thousands):
|
Year Ended March 31,
|
||||||||||||
|
Discontinued operations:
|
2015
|
2014
|
2013
|
|||||||||
|
Revenues
|
$
|
14,202
|
$
|
9,839
|
$
|
5,147
|
||||||
|
Cost of revenues
|
12,614
|
10,680
|
7,891
|
|||||||||
|
Gross profit (loss)
|
1,588
|
(841
|
)
|
(2,744
|
)
|
|||||||
|
Sales and marketing expense
|
3,442
|
2,588
|
3,143
|
|||||||||
|
Other income (expense), net
|
-
|
150
|
-
|
|||||||||
|
Loss before income tax provision
|
(1,854
|
)
|
(3,279
|
)
|
(5,887
|
)
|
||||||
|
Income tax provision (benefit)
|
(700
|
)
|
(1,235
|
)
|
(2,219
|
)
|
||||||
|
Net loss of discontinued operations
|
$
|
(1,154
|
)
|
$
|
(2,044
|
)
|
$
|
(3,668
|
)
|
|||
|
Gain on sale of discontinued operations, net of tax
|
$
|
7,682
|
$
|
-
|
$
|
-
|
||||||
The current and non-current assets and liabilities of discontinued operations were as follows (in thousands):
|
March 31,
|
||||||||
|
2015
|
2014
|
|||||||
|
Receivables, net
|
$
|
2,075
|
$
|
1,974
|
||||
|
Inventories
|
-
|
395
|
||||||
|
Prepaid expenses and other current assets
|
-
|
105
|
||||||
|
Total current assets of discontinued operations
|
$
|
2,075
|
$
|
2,474
|
||||
|
Property and equipment, net
|
$
|
-
|
$
|
2,985
|
||||
|
Other assets
|
12
|
446
|
||||||
|
Total non-current assets of discontinued operations
|
$
|
12
|
$
|
3,431
|
||||
|
Accounts payable
|
$
|
449
|
$
|
586
|
||||
|
Other current liabilities
|
5,087
|
293
|
||||||
|
Total current liabilities of discontinued operations
|
$
|
5,536
|
$
|
879
|
||||
|
Other non-current liabilities
|
$
|
-
|
$
|
16
|
||||
|
Total non-current liabilities of discontinued operations
|
$
|
-
|
$
|
16
|
||||
NOTE 4. INVESTMENTS
Our investments are classified as either available-for-sale or held-to-maturity. The following table summarizes available-for-sale and held-to-maturity investments as of March 31, 2015 and 2014 (in thousands):
|
Available-for-Sale Investments
|
||||||||||||||||
|
March 31, 2015
|
Amortized
Cost |
Gross
Unrealized |
Gross
Unrealized |
Fair
Value |
||||||||||||
|
Corporate bonds
|
$
|
4,346
|
$
|
-
|
$
|
(14
|
)
|
$
|
4,332
|
|||||||
|
Total available-for-sale investments
|
$
|
4,346
|
$
|
-
|
$
|
(14
|
)
|
$
|
4,332
|
|||||||
|
Held-to-Maturity Investments
|
||||||||||||||||
|
March 31, 2015
|
Amortized
Cost |
Gross
Unrecognized |
Gross
Unrecognized |
Fair
Value |
||||||||||||
|
Certificates of deposit
|
$
|
6,717
|
$
|
4
|
$
|
(1
|
)
|
$
|
6,720
|
|||||||
|
Commercial paper
|
13,484
|
1
|
-
|
13,485
|
||||||||||||
|
Corporate bonds
|
22,773
|
21
|
(71
|
)
|
22,723
|
|||||||||||
|
Municipal bonds
|
2,984
|
21
|
(1
|
)
|
3,004
|
|||||||||||
|
Total held-to-maturity investments
|
$
|
45,958
|
$
|
47
|
$
|
(73
|
)
|
$
|
45,932
|
|||||||
|
Available-for-Sale Investments
|
||||||||||||||||
|
March 31, 2014
|
Amortized
Cost |
Gross
Unrealized |
Gross
Unrealized |
Fair
Value |
||||||||||||
|
Certificates of deposit
|
$
|
498
|
$
|
1
|
$
|
-
|
$
|
499
|
||||||||
|
Corporate bonds
|
10,392
|
32
|
(42
|
)
|
10,382
|
|||||||||||
|
Total available-for-sale investments
|
$
|
10,890
|
$
|
33
|
$
|
(42
|
)
|
$
|
10,881
|
|||||||
|
Held-to-Maturity Investments
|
||||||||||||||||
|
March 31, 2014
|
Amortized
Cost |
Gross
Unrecognized |
Gross
Unrecognized |
Fair
Value |
||||||||||||
|
Certificates of deposit
|
$
|
5,722
|
$
|
-
|
$
|
(8
|
)
|
$
|
5,714
|
|||||||
|
Commercial paper
|
12,991
|
-
|
(1
|
)
|
12,990
|
|||||||||||
|
Corporate bonds
|
14,920
|
65
|
(33
|
)
|
14,952
|
|||||||||||
|
Municipal bonds
|
3,079
|
20
|
(29
|
)
|
3,070
|
|||||||||||
|
Total held-to-maturity investments
|
$
|
36,712
|
$
|
85
|
$
|
(71
|
)
|
$
|
36,726
|
|||||||
The amortized cost of our held-to-maturity investments approximates their fair value. As of March 31, 2015 and 2014, we did not have other-than-temporary impairment in the fair value of any individual security classified as held-to-maturity or available-for-sale. As of March 31, 2015 and 2014, we had unrealized losses on available-for-sale investments, net of related income taxes of $8,000 and $5,000, respectively. Redemptions of investments in accordance with the callable provisions during fiscal 2015, 2014 and 2013 were $1.3 million, $0.6 million and $1.3 million, respectively.
The following table summarizes the amortized cost and fair value of our investments, classified by stated maturity as of March 31, 2015 and 2014 (in thousands):
|
March 31, 2015
|
March 31, 2015
|
|||||||||||||||
|
Available-for-Sale Investments
|
Held-to-Maturity Investments
|
|||||||||||||||
|
Amortized Cost
|
Fair Value
|
Amortized Cost
|
Fair Value
|
|||||||||||||
|
Due in less than one year
|
$
|
-
|
$
|
-
|
$
|
26,109
|
$
|
26,151
|
||||||||
|
Due in 1 to 4 years
|
4,346
|
4,332
|
19,849
|
19,781
|
||||||||||||
|
Total investments
|
$
|
4,346
|
$
|
4,332
|
$
|
45,958
|
$
|
45,932
|
||||||||
|
March 31, 2014
|
March 31, 2014
|
|||||||||||||||
|
Available-for-Sale Investments
|
Held-to-Maturity Investments
|
|||||||||||||||
|
Amortized Cost
|
Fair Value
|
Amortized Cost
|
Fair Value
|
|||||||||||||
|
Due in less than one year
|
$
|
6,509
|
$
|
6,542
|
$
|
22,560
|
$
|
22,571
|
||||||||
|
Due in 1 to 4 years
|
4,381
|
4,339
|
14,152
|
14,155
|
||||||||||||
|
Total investments
|
$
|
10,890
|
$
|
10,881
|
$
|
36,712
|
$
|
36,726
|
||||||||
NOTE 5. FAIR VALUE MEASUREMENTS
The following table summarizes financial assets, measured at fair value on a recurring basis, by level of input within the fair value hierarchy as of March 31, 2015 and 2014 (in thousands):
|
As of March 31, 2015
|
||||||||||||||||
|
Quoted Prices
in Active
Markets for
Identical
Assets
|
Significant
Other
Observable
Inputs
|
Significant
Unobservable
Inputs
|
||||||||||||||
|
Level 1
|
Level 2
|
Level 3
|
Total
|
|||||||||||||
|
Assets
|
||||||||||||||||
|
Cash equivalents
|
$
|
3,053
|
$
|
-
|
$
|
-
|
$
|
3,053
|
||||||||
|
Available-for-sale investments:
|
||||||||||||||||
|
Corporate bonds
|
-
|
4,332
|
-
|
4,332
|
||||||||||||
|
Total assets at fair value
|
$
|
3,053
|
$
|
4,332
|
$
|
-
|
$
|
7,385
|
||||||||
|
As of March 31, 2014
|
||||||||||||||||
|
Quoted Prices
in Active
Markets for
Identical
Assets
|
Significant
Other
Observable
Inputs
|
Significant
Unobservable
Inputs
|
||||||||||||||
|
Level 1
|
Level 2
|
Level 3
|
Total
|
|||||||||||||
|
Assets
|
||||||||||||||||
|
Cash equivalents
|
$
|
5,035
|
$
|
-
|
$
|
-
|
$
|
5,035
|
||||||||
|
Available-for-sale investments:
|
||||||||||||||||
|
Certificates of deposit
|
-
|
499
|
-
|
499
|
||||||||||||
|
Corporate bonds
|
-
|
10,382
|
-
|
10,382
|
||||||||||||
|
Total assets at fair value
|
$
|
5,035
|
$
|
10,881
|
$
|
-
|
$
|
15,916
|
||||||||
As of March 31, 2015 and 2014, our Level 1 financial assets consisted of money market mutual funds. Our cash equivalents are highly liquid instruments with original or remaining maturities of three months or less at the time of purchase that are readily convertible into cash. The fair value of our Level 1 financial assets is based on quoted market prices of the underlying security.
Our Level 2 financial assets primarily consist of certificates of deposit and corporate bonds. For our Level 2 financial assets, we review trading activity and pricing for these investments as of the measurement date. When sufficient quoted pricing for identical securities is not available, we use market pricing and other observable market inputs for similar securities obtained from third party data providers. These inputs represent quoted prices for similar assets in active markets or these inputs have been derived from observable market data.
As of March 31, 2015 and 2014, we did not have any Level 1 and Level 2 financial liabilities or Level 3 financial assets or liabilities measured at fair value on a recurring basis. We did not have any transfers between Level 1 and Level 2 or transfers in or out of Level 3 during fiscal 2015, 2014 and 2013.
NOTE 6. INVENTORIES
Components of inventories at March 31, 2015 and 2014 were as follows (in thousands):
|
March 31,
|
||||||||
|
2015
|
2014
|
|||||||
|
Raw materials
|
$
|
16,436
|
$
|
13,953
|
||||
|
Work-in-process
|
3,984
|
3,463
|
||||||
|
Finished goods
|
15,759
|
9,167
|
||||||
|
Inventories
|
$
|
36,179
|
$
|
26,583
|
||||
NOTE 7. INVESTMENT IN UNCONSOLIDATED AFFILIATE
Our investment in an unconsolidated affiliate consists of an investment in equity securities of Scandinavian Micro Biodevices APS (“SMB”). In February 2011, we purchased a 15% equity ownership interest in SMB, for $2.8 million in cash. SMB is a privately-held developer and manufacturer of point-of-care diagnostic products for veterinary use. SMB, based in Farum, Denmark, has been the original equipment manufacturer of the Abaxis VetScan VSpro point-of-care specialty analyzer since 2008. We accounted for our investment in SMB using the equity method due to our significant influence over SMB’s operations. During fiscal 2015, 2014 and 2013, we recorded our allocated portions of SMB’s net income (loss) of $37,000, $33,000 and $(13,000), respectively.
NOTE 8. PROPERTY AND EQUIPMENT, NET
Property and equipment, net, at March 31, 2015 and 2014 consisted of the following (in thousands):
|
March 31,
|
||||||||
|
2015
|
2014
|
|||||||
|
Property and equipment at cost:
|
||||||||
|
Machinery and equipment
|
$
|
36,296
|
$
|
31,502
|
||||
|
Furniture and fixtures
|
3,162
|
2,216
|
||||||
|
Computer equipment
|
6,356
|
5,536
|
||||||
|
Building and leasehold improvements
|
11,096
|
9,875
|
||||||
|
Construction in progress
|
4,924
|
5,376
|
||||||
|
61,834
|
54,505
|
|||||||
|
Accumulated depreciation and amortization
|
(34,518
|
)
|
(30,314
|
)
|
||||
|
Property and equipment, net
|
$
|
27,316
|
$
|
24,191
|
||||
Depreciation and amortization expense for property and equipment from continuing operations amounted to $6.3 million, $5.1 million and $4.9 million in fiscal 2015, 2014 and 2013, respectively. Depreciation and amortization expense for property and equipment from discontinued operations amounted to $0.9 million, $0.8 million and $0.6 million in fiscal 2015, 2014 and 2013, respectively.
In connection with the sale of assets of our AVRL business in March 2015, we recorded impairment charges of $1.6 million to reduce the carrying value of certain property and equipment to its estimated net realizable value (fair value less costs to sell) during the fourth quarter of fiscal 2015.
NOTE 9. INTANGIBLE ASSETS, NET
Intangible assets, net, at March 31, 2015 and 2014 consisted of the following (in thousands):
|
Balance, March 31, 2015
|
||||||||||||
|
Cost
|
Accumulated
Amortization |
Net Book
Value |
||||||||||
|
Customer relationships
|
$
|
1,535
|
$
|
57
|
$ |
1,478
|
||||||
|
Tradename
|
16
|
3
|
13
|
|||||||||
|
Total intangible assets
|
$
|
1,551
|
$
|
60
|
$
|
1,491
|
||||||
|
Balance, March 31, 2014
|
||||||||||||
|
Cost
|
Accumulated
Amortization |
Net Book
Value |
||||||||||
|
Licenses
|
$
|
5,000
|
$
|
3,800
|
$ |
1,200
|
||||||
|
Total intangible assets
|
$
|
5,000
|
$
|
3,800
|
$
|
1,200
|
||||||
In November 2014, in connection with our acquisition of 100% of the outstanding stock of QCR and Trio, both based in the United Kingdom, we acquired intangible assets related to customer relationships and tradename, which are amortized on a straight-line basis over its useful lives of ten years and two years, respectively.
In January 2009, we entered into a license agreement with Inverness Medical Switzerland GmbH (“Alere”), pursuant to which we licensed co-exclusively certain worldwide patent rights. We paid a $5.0 million up-front license fee to Alere in January 2009, which was recorded as an intangible asset on the consolidated balance sheets. The related intangible asset was fully amortized during the fourth quarter of fiscal 2015. Effective February 2015, we terminated our license agreement with Alere.
In connection with the sale of the assets of our AVRL business in March 2015, we determined that our other intangible assets were impaired and accordingly, we recorded an impairment charge of $0.4 million during the fourth quarter of fiscal 2015. Our other intangible assets were acquired by issuing warrants to Kansas State University Institute for Commercialization (formerly known as National Institute for Strategic Technology Acquisition and Commercialization) in January 2011 and October 2011.
Amortization expense for intangible assets from continuing operations, included in cost of revenues or in the respective operating expense line based on the function and purpose for which it is being used, amounted to $1.2 million, $1.4 million and $0.8 million in fiscal 2015, 2014 and 2013, respectively. Amortization expense for intangible assets from discontinued operations amounted to $0.1 million, $0.1 million and $0.1 million in fiscal 2015, 2014 and 2013, respectively. Based on our intangible assets subject to amortization as of March 31, 2015, the estimated amortization expense for succeeding years is as follows (in thousands):
|
Estimated Future Annual Amortization Expense
|
||||||||||||||||||||||||||||
|
Fiscal Year Ending March 31,
|
||||||||||||||||||||||||||||
|
Total
|
2016
|
2017
|
2018
|
2019
|
2020
|
Thereafter
|
||||||||||||||||||||||
|
Amortization expense
|
$
|
1,491
|
$
|
161
|
$
|
158
|
$
|
154
|
$
|
154
|
$
|
154
|
$
|
710
|
||||||||||||||
NOTE 10. WARRANTY RESERVES
We provide for the estimated future costs to be incurred under our standard warranty obligation on our instruments and reagent discs.
Instruments. Our standard warranty obligation on instruments ranges from one to five years, depending on the specific product. The estimated contractual warranty obligation is recorded when the related revenue is recognized and any additional amount is recorded when such cost is probable and can be reasonably estimated. Cost of revenues reflects estimated warranty expense for instruments sold in the current period and any adjustments in estimated warranty expense for the installed base under our standard warranty obligation based on our quarterly evaluation of service experience. The estimated accrual for warranty exposure is based on historical experience as to product failures, estimated product failure rates, estimated repair costs, material usage and freight incurred in repairing the instrument after failure and known design changes under the warranty plan. Management periodically evaluates the sufficiency of the warranty provisions and makes adjustments when necessary. If an unusual performance rate related to warranty claims is noted, an additional warranty accrual may be assessed and recorded when a failure event is probable and the cost can be reasonably estimated. Effective October 2013, management prospectively changed the standard warranty obligations on certain instruments sold from three to five years. The increase in the standard warranty period did not result in a material impact on our cost of revenues or our accrued warranty costs during fiscal 2015 and 2014.
Reagent Discs. We record a provision for defective reagent discs when the related sale is recognized and any additional amount is recorded when such cost is probable and can be reasonably estimated. The warranty cost includes the replacement costs and freight of a defective reagent disc. For fiscal 2015, 2014 and 2013, the provision for warranty expense related to replacement of defective reagent discs was $0.2 million, $0.5 million and $0.4 million, respectively. The balance of accrued warranty reserve related to replacement of defective reagent discs at March 31, 2015 and March 31, 2014 was $0.5 million and $0.6 million, respectively, which was classified as a current liability on the consolidated balance sheets.
We evaluate our estimates for warranty reserves on an ongoing basis and believe we have the ability to reasonably estimate warranty costs. However, unforeseeable changes in factors may impact the estimate for warranty and such changes could cause a material change in our warranty reserve accrual in the period in which the change was identified.
The change in our accrued warranty reserve during fiscal 2015, 2014 and 2013 is summarized as follows (in thousands):
|
Year Ended March 31,
|
||||||||||||
|
2015
|
2014
|
2013
|
||||||||||
|
Balance at beginning of period
|
$
|
1,868
|
$
|
1,384
|
$
|
1,846
|
||||||
|
Provision for warranty expense
|
2,647
|
2,068
|
1,228
|
|||||||||
|
Warranty costs incurred
|
(1,359
|
)
|
(1,584
|
)
|
(1,400
|
)
|
||||||
|
Adjustment to pre-existing warranties
|
-
|
-
|
(290
|
)
|
||||||||
|
Balance at end of period
|
3,156
|
1,868
|
1,384
|
|||||||||
|
Non-current portion of warranty reserve
|
1,733
|
821
|
389
|
|||||||||
|
Current portion of warranty reserve
|
$
|
1,423
|
$
|
1,047
|
$
|
995
|
||||||
NOTE 11. BORROWINGS
Notes Payable. We have a ten year loan agreement with the Community Redevelopment Agency of the City of Union City (“the Agency”) whereby the Agency provides us with an unsecured loan of up to $1.0 million, primarily to purchase capital equipment. The loan was effective January 2011, bears interest at 5.0% and is payable quarterly. As of March 31, 2015, our short-term and long-term notes payable balances were $0.1 million and $0.5 million, respectively, and as of March 31, 2014, our short-term and long-term notes payable balances were $0.1 million and $0.6 million, respectively. The short-term balance was recorded in “Other accrued liabilities” on the consolidated balance sheets. The entire outstanding balance of the note is payable in full on the earlier of: (i) December 2020, or (ii) the date Abaxis ceases operations in Union City, California. The Agency also has the right to accelerate the maturity date and declare all balances immediately due and payable upon the event of default as defined in the loan agreement. We evaluate covenants in our loan agreement on a quarterly basis, and we were in compliance with such covenants as of March 31, 2015.
In accordance with the terms of the loan agreement, the Agency will provide Abaxis with an annual credit that can be applied against the accrued interest and outstanding principal balance on a quarterly basis. The Agency determines the annual credit based on certain taxes paid by Abaxis to the City of Union City, California for a specified period, as defined in the loan agreement. We anticipate that our annual credits from the Agency will be used to fully repay our notes payable due to the Agency. We may carry forward unused quarterly credits to apply against our outstanding balance in a future period. Credits applied to repay our notes payable and accrued interest are recorded in “Interest and other income (expense), net” on the consolidated statements of income.
NOTE 12. OTHER CURRENT ACCRUED LIABILITIES
Other current accrued liabilities consist of the following (in thousands):
|
March 31,
2015
|
March 31,
2014
|
|||||||
|
Accrued liabilities for customer sales incentive programs
|
$
|
5,507
|
$
|
601
|
||||
|
Installment payment obligation accrued related to acquisition
|
1,111
|
-
|
||||||
|
Other current accrued liabilities
|
3,186
|
2,483
|
||||||
|
Total other current accrued liabilities
|
$
|
9,804
|
$
|
3,084
|
||||
At March 31, 2015, accrued liabilities for customer sales incentive programs consisted primarily of (i) a liability to distributors for cash rebates upon meeting certain requirements during a qualifying period and (ii) a liability to resellers for incentives that we estimate at the time of initial sale and adjust as earned by end-users during a specified promotional period.
At March 31, 2015, we recorded $1.1 million (or GBP 750,000) in other current accrued liabilities related to an installment payment obligation to acquire QCR and Trio in November 2014. The installment payment obligation related to acquisition accrued at March 31, 2015 is based on the GBP exchange rate at period-end. Since the exchange rate can fluctuate in the future, the installment payment obligation related to acquisition in absolute dollars will change accordingly. See Note 2, “Acquisitions” for additional information on our acquisition of QCR and Trio.
Other current accrued liabilities included notes payable and various expenses that we accrued for transaction taxes, royalties and professional costs.
NOTE 13. COMMITMENTS AND CONTINGENCIES
Leases
As of March 31, 2015, our contractual obligations for our operating lease obligations for succeeding years are as follows (in thousands):
|
Payments Due by Period
|
||||||||||||||||||||||||||||
|
Due in Fiscal
|
||||||||||||||||||||||||||||
|
Total
|
2016
|
2017
|
2018
|
2019
|
2020
|
Thereafter
|
||||||||||||||||||||||
|
Operating lease obligations
|
$
|
12,059
|
$
|
1,984
|
$
|
1,944
|
$
|
1,830
|
$
|
1,810
|
$
|
1,832
|
$
|
2,659
|
||||||||||||||
Our operating lease obligations comprised our principal facility and various leased facilities and equipment under operating lease agreements, which expire on various dates from fiscal 2016 through fiscal 2025. Our principal facilities located in Union City, California is under a non-cancelable operating lease agreement, which expires in fiscal 2021. The monthly rental payments on principal facilities lease increase based on a predetermined schedule and accordingly, we recognize rent expense on a straight-line basis over the life of the lease. Rent expense from continuing operations under operating leases was $2.0 million, $2.0 million and $1.9 million for fiscal 2015, 2014 and 2013, respectively. Rent expense from discontinued operations under operating leases was $0.2 million, $0.1 million and $0.1 million for fiscal 2015, 2014 and 2013, respectively.
Commitments
We have purchase commitments, consisting of supply and inventory related agreements, totaling approximately $4.9 million as of March 31, 2015. These purchase order commitments primarily include our purchase obligations to purchase VSpro specialty analyzers and related cartridges from SMB of Denmark through calendar year 2016.
Patent Licensing Agreement. From January 2009 to February 2015, under our license agreement with Alere, we licensed co-exclusively certain worldwide patent rights related to lateral flow immunoassay technology in the field of animal health diagnostics in the professional marketplace. The license agreement enabled us to develop and market products under rights from Alere in the animal health and laboratory animal research markets. In exchange for the license rights, we (i) paid an up-front license fee of $5.0 million to Alere in January 2009, (ii) agreed to pay royalties during the term of the agreement, based solely on sales of products in a jurisdiction country covered by valid and unexpired claims in that jurisdiction under the licensed Alere patent rights, and (iii) agreed to pay a yearly minimum license fee of between $0.5 million to $1.0 million per year, which fee was creditable against any royalties due during such calendar year. The royalties, if any, were payable through the date of the expiration of the last valid patent licensed under the agreement that includes at least one claim in a jurisdiction covering products we sell in that jurisdiction. The yearly minimum fees were payable for so long as we desire to maintain exclusivity under the agreement. Effective February 2015, we terminated our license agreement with Alere. In accordance with the terms of the license agreement, we had no outstanding liabilities related to this license agreement at March 31, 2015.
Litigation
We are involved from time to time in various litigation matters in the normal course of business. There can be no assurance that existing or future legal proceedings arising in the ordinary course of business or otherwise will not have a material adverse effect on our business, consolidated financial position, results of operations or cash flows.
NOTE 14. EMPLOYEE BENEFIT PLAN
We have established the Abaxis 401(k) Plan (the “401(k) Plan”), a tax deferred savings plan, for the benefit of qualified employees. The 401(k) Plan is designed to provide employees with an accumulation of funds at retirement. Qualified employees may elect to have salary reduction contributions made to the plan on a bi-weekly basis. We may make quarterly contributions to the plan at the discretion of our Board of Directors either in cash or in common stock. Our matching contributions, on a consolidated basis, to the tax deferred savings plan totaled $0.7 million, $0.3 million and $0.6 million in fiscal 2015, 2014 and 2013, respectively. In fiscal 2015, 2014 and 2013, our matching contributions were made in cash. We did not have any matching contributions in the form of common stock in fiscal 2015, 2014 and 2013.
NOTE 15. EQUITY COMPENSATION PLANS AND SHARE-BASED COMPENSATION
Equity Compensation Plans
Our share-based compensation plan is described below.
2014 Equity Incentive Plan. Our 2014 Equity Incentive Plan (the “2014 Plan”), which was approved by our shareholders on October 22, 2014, is the successor to and continuation of the 2005 Equity Incentive Plan (the “2005 Plan”). The terms of the 2014 Plan provide for the grant of incentive stock options, nonstatutory stock options, stock appreciation rights, restricted stock awards, restricted stock unit awards, other stock awards and performance awards that may be settled in cash, stock or other property. At its October 22, 2014 effective date, the total number of shares of the Company’s common stock available for issuance under the 2014 Plan was 1,712,409 shares, which was equal to the sum of (i) the shares remaining available for issuance pursuant to the exercise of options or issuance or settlement of stock awards that had not previously been granted under the 2005 Plan, as of the effective date of the 2014 Plan and (ii) the Returning Shares (as defined below), as of the effective date of the 2014 Plan. The “Returning Shares” are shares subject to outstanding stock awards granted under the 2005 Plan (the “2005” Available Pool”), as of the effective date of the 2014 Plan, (i) expire or terminate for any reason prior to exercise or settlement, (ii) are forfeited, cancelled or otherwise returned to us because of the failure to meet a contingency or condition required for the vesting of such shares, or (iii) are reacquired or withheld (or not issued) by us to satisfy a tax withholding obligation in connection with a stock award or to satisfy the purchase price or exercise price of a stock award.
As of March 31, 2015, the 2014 Plan provided for the issuance of a maximum of 1,712,409 shares, of which 875,000 shares of common stock were then available for future issuance pursuant to stock awards that had not previously been granted. Shares that are canceled or forfeited from an award and shares withheld in satisfaction of tax withholding obligations are again available for issue under the 2014 Plan.
2005 Equity Incentive Plan. Our 2005 Plan was originally approved by our shareholders in October 2005 and restated and amended our 1998 Stock Option Plan. Our 2005 Plan allowed for the grant of stock options, stock appreciation rights, restricted stock awards, restricted stock units, performance cash awards, performance shares, performance units, deferred compensation awards or other share-based awards to employees, directors and consultants. Our 2005 Plan was scheduled to terminate in 2015. Upon adoption of our 2014 Plan on October 22, 2014, no additional awards may be made under our 2005 Plan. However, as described above, the 2005 Available Pool became available for issuance under the 2014 Plan and Returning Shares may become available under the 2014 Plan from time to time.
Our current practice is to issue new shares of common stock from our authorized shares for share-based awards upon the exercise of stock options or vesting of restricted stock units.
Share-Based Compensation
Share-based compensation expense and related stock option and restricted stock unit award activity is presented on a consolidated basis, unless otherwise presented as continuing or discontinued operations.
The following table summarizes total share-based compensation expense, net of tax, related to restricted stock units for fiscal 2015, 2014 and 2013, which is included in our consolidated statements of income (in thousands, except per share data):
|
Year Ended March 31,
|
||||||||||||
|
2015
|
2014
|
2013
|
||||||||||
|
Cost of revenues
|
$
|
1,409
|
$
|
1,105
|
$
|
921
|
||||||
|
Research and development
|
1,574
|
1,138
|
1,150
|
|||||||||
|
Sales and marketing
|
3,156
|
2,146
|
2,506
|
|||||||||
|
General and administrative
|
3,648
|
3,254
|
2,509
|
|||||||||
|
Share-based compensation expense before income taxes
|
9,787
|
7,643
|
7,086
|
|||||||||
|
Income tax benefit
|
(3,293
|
)
|
(2,605
|
)
|
(2,557
|
)
|
||||||
|
Total share-based compensation expense after income taxes
|
$
|
6,494
|
$
|
5,038
|
$
|
4,529
|
||||||
|
Net impact of share-based compensation on:
|
||||||||||||
|
Basic net income per share
|
$
|
0.29
|
$
|
0.23
|
$
|
0.21
|
||||||
|
Diluted net income per share
|
$
|
0.28
|
$
|
0.22
|
$
|
0.20
|
||||||
Share-based compensation has been classified in the consolidated statements of income or capitalized on the consolidated balance sheets in the same manner as cash compensation paid to employees. Capitalized share-based compensation costs at March 31, 2015, 2014 and 2013 were $0.1 million, $0.1 million and $0.2 million, respectively, which were included in inventories on our consolidated balance sheets.
Cash Flow Impact
The accounting standard with respect to share-based payment requires cash flows resulting from excess tax benefits to be classified as a part of cash flows from financing activities. Excess tax benefits are realized tax benefits from tax deductions for exercised stock options and vested restricted stock units in excess of the deferred tax asset attributable to share-based compensation expense for such share-based awards. Excess tax benefits are considered realized when the tax deductions reduce taxes that otherwise would be payable. Excess tax benefits classified as a financing cash inflow for fiscal 2015, 2014 and 2013 were $0.9 million, $2.2 million and $2.7 million, respectively.
Stock Options
Prior to fiscal 2007, we granted stock option awards to employees and directors as part of our share-based compensation program. Option awards to consultants were insignificant. Options granted to employees and directors generally expire ten years from the grant date. Options granted to employees generally become exercisable over a period of four years based on cliff-vesting terms and continuous employment. Options granted to non-employee directors generally become exercisable over a period of one year based on monthly vesting terms and continuous service. We have not granted any stock options since the beginning of fiscal 2007. We have recognized compensation expense for stock options granted during the requisite service period of the stock option. As of March 31, 2015, we had no unrecognized compensation expense related to stock options granted. As of March 31, 2015, there were no stock options outstanding.
Stock Option Activity
Stock option activity under all stock plans is summarized as follows:
|
Number of
Shares
|
Weighted
Average
Exercise
Price
Per Share
|
|||||||
|
Outstanding at March 31, 2012
|
||||||||
|
(282,000 shares exercisable at a weighted average exercise price of $15.21 per share)
|
282,000
|
$ |
15.21
|
|||||
|
Granted
|
-
|
-
|
||||||
|
Exercised
|
(210,000
|
)
|
13.38
|
|||||
|
Canceled or forfeited
|
-
|
-
|
||||||
|
Outstanding at March 31, 2013
|
||||||||
|
(72,000 shares exercisable at a weighted average exercise price of $20.50 per share)
|
72,000
|
20.50
|
||||||
|
Granted
|
-
|
-
|
||||||
|
Exercised
|
(70,000
|
)
|
20.74
|
|||||
|
Canceled or forfeited
|
-
|
-
|
||||||
|
Outstanding at March 31, 2014
|
||||||||
|
(2,000 shares exercisable at a weighted average exercise price of $13.24 per share)
|
2,000
|
13.24
|
||||||
|
Granted
|
-
|
-
|
||||||
|
Exercised
|
(2,000
|
)
|
13.24
|
|||||
|
Canceled or forfeited
|
-
|
-
|
||||||
|
Outstanding at March 31, 2015
|
-
|
$
|
-
|
|||||
As of March 31, 2015, there were no stock options outstanding or exercisable. Total intrinsic value of stock options exercised during fiscal 2015, 2014 and 2013 was $92,000, $1.2 million and $5.5 million, respectively. Cash proceeds from stock options exercised during fiscal 2015, 2014 and 2013 were $31,000, $1.5 million and $2.8 million, respectively.
Restricted Stock Units
Since fiscal 2007, we have granted restricted stock unit awards to employees and directors as part of our share-based compensation program. Restricted stock unit awards to consultants were not significant. Awards of restricted stock units are issued at no cost to the recipient and may have time-based vesting criteria, or a combination of time-based and performance-based vesting criteria, as described below. From time to time, restricted stock unit awards granted to employees may be subject to accelerated vesting upon achieving certain performance-based milestones. Additionally, the Compensation Committee of our Board of Directors (the “Compensation Committee”) in its discretion, may provide in the event of a change in control for the acceleration of vesting and/or settlement of the restricted stock unit held by a participant upon such conditions and to such extent as determined by the Compensation Committee. Our Board of Directors has adopted an executive change in control severance plan, which it may terminate or amend at any time, that provides that awards granted to executive officers will accelerate fully on a change of control. The vesting of non-employee director and officer awards granted under the 2014 Plan automatically will also accelerate in full upon a change in control. Beginning in fiscal 2015, the Compensation Committee discontinued the practice of granting such “single trigger” acceleration of vesting benefits to new executive officers pursuant to which an executive officer’s outstanding stock option(s) and other unvested equity-based instruments would accelerate in full upon the occurrence of a change of control. In fiscal 2015, we granted a “double-trigger” acceleration arrangement to an executive officer, which requires both the occurrence of a change of control and the termination by us (or our successor) for any reason other than cause, death or disability within 18 months following such change of control date, with the termination constituting a separation in service and subject to execution of a valid and effective release of claims against us, for the acceleration of vesting of the executive officer’s equity awards in full.
Restricted Stock Unit Awards (Time Vesting)
Restricted stock unit awards with only time-based vesting terms, which we refer to as restricted stock unit awards (time vesting), entitle holders to receive shares of common stock at the end of a specified period of time. For restricted stock unit awards (time vesting), vesting is based on continuous employment or service of the holder. Upon vesting, the equivalent number of common shares are typically issued net of tax withholdings. If the service vesting conditions are not met, unvested restricted stock unit awards (time vesting) will be forfeited. Generally, restricted stock unit awards (time vesting) vest according to one of the following time-based vesting schedules:
| • | Restricted stock unit awards to employees: Four-year time-based vesting as follows: five percent vesting after the first year; additional ten percent after the second year; additional 15 percent after the third year; and the remaining 70 percent after the fourth year of continuous employment with the Company. |
| • | Restricted stock unit awards to non-employee directors: 100 percent vesting after one year of continuous service to the Company. |
The fair value of restricted stock unit awards (time vesting) used in our expense recognition method is measured based on the number of shares granted and the closing market price of our common stock on the date of grant. Such value is recognized as an expense over the corresponding requisite service period. The share-based compensation expense is reduced for an estimate of the restricted stock unit awards that are expected to be forfeited. The forfeiture estimate is based on historical data and other factors, and compensation expense is adjusted for actual results. As of March 31, 2015, the total unrecognized compensation expense related to restricted stock unit awards (time vesting) granted amounted to $15.4 million, which is expected to be recognized over a weighted average service period of 1.5 years.
Restricted Stock Unit Awards (Performance Vesting)
We also began granting restricted stock unit awards subject to performance vesting criteria, which we refer to as restricted stock unit awards (performance vesting), to our executive officers starting in fiscal 2013. Restricted stock unit awards (performance vesting) consist of the right to receive shares of common stock, subject to achievement of time-based criteria and certain corporate performance-related goals over a specified period, as established by the Compensation Committee. For restricted stock units subject to performance vesting, we recognize any related share-based compensation expense ratably over the service period based on the most probable outcome of the performance condition. The fair value of our restricted stock unit awards (performance vesting) used in our expense recognition method is measured based on the number of shares granted, the closing market price of our common stock on the date of grant and an estimate of the probability of the achievement of the performance goals. The amount of share-based compensation expense recognized in any one period can vary based on the attainment or expected attainment of the performance goals. If such performance goals are not ultimately met, no compensation expense is recognized and any previously recognized compensation expense is reversed.
Restricted Stock Unit Awards (Performance Vesting) Granted in Fiscal 2013
In April 2012, the Compensation Committee approved the grant of restricted stock unit awards (performance vesting) for 84,000 shares of common stock to our executive officers that contained both time-based and performance-based vesting terms (the “FY2013 Performance RSUs”). The FY2013 Performance RSUs were subject to vesting in four equal annual increments based upon: (1) achievement of certain pre-established corporate annual performance-related goals, as established by the Compensation Committee; and (2) the grantee’s satisfaction of service requirements through the vesting period. The annual financial performance goals were established at the beginning of each performance period and, accordingly, the portion (or “tranche”) of the FY2013 Performance RSU subject to each goal is treated as a separate grant for accounting purposes. The number of vested restricted stock unit awards (performance vesting) is determined at the end of each annual performance period. The fiscal 2013 performance target for the FY2013 Performance RSUs was established at the grant date following Accounting Standards Codification (“ASC”) 718-10-55-95 and the aggregate estimated grant date fair value of the FY2013 Performance RSUs was $0.8 million, or $35.62 per share, based on the closing market price of our common stock on the date of grant. Only the target for fiscal 2013 performance for the first tranche was set in April 2012, and accordingly, only 25% of the FY2013 Performance RSUs were deemed granted in fiscal 2013 in accordance with ASC 718-10-55-95. In April 2013, in consideration of the grant of the FY2014 Performance RSUs (as defined below) in fiscal 2014, the remaining 75% of the FY2013 Performance RSUs, which consisted of the second, third and fourth tranches, were cancelled. As a result, these restricted stock units are no longer outstanding. The remaining 75% of the FY2013 Performance RSUs were not deemed granted for accounting purposes because each annual performance target was to be set at the start of each respective single-fiscal year performance period in accordance with ASC 718-10-55-95.
On April 29, 2013, 21,000 shares subject to the FY2013 Performance RSUs were issued to our executive officers as a result of achieving performance-related goals for the fiscal year ended March 31, 2013. We fully recognized compensation expense for the FY2013 Performance RSUs during the requisite service period in fiscal 2013.
Restricted Stock Unit Awards (Performance-Vesting) Granted in Fiscal 2014, 2015 and 2016
In April 2013, 2014 and 2015, the Compensation Committee approved the grant of restricted stock unit awards (performance vesting) described below. These restricted stock units vest only if both of the following criteria are satisfied: (1) our consolidated income from operations during the fiscal year in which grant occurred, as certified by the Compensation Committee, is in excess of the applicable target amount described below; and (2) the recipient remains in the continuous service of the Company until the applicable vesting date set forth as follows:
| • | 25% of the shares subject to an award vest in full upon achieving 90% of the consolidated income from operations target described above and continuous service until the third anniversary of the date of grant; |
| • | 25% of the shares subject to an award vest in full upon achieving 90% of the consolidated income from operations target described above and continuous service until the fourth anniversary of the date of grant; |
| • | 25% of the shares subject to an award vest in full upon achieving 100% of the consolidated income from operations target described above and continuous service until the third anniversary of the date of grant; and |
| • | 25% of the shares subject to an award vest in full upon achieving 100% of the consolidated income from operations target described above and continuous service until the fourth anniversary of the date of grant. |
Fiscal 2014 Performance RSUs. In April 2013, the Compensation Committee approved the grant of restricted stock unit awards (performance vesting) for 129,000 shares of common stock to our executive officers that contained the foregoing time-based and performance-based vesting terms (the “FY2014 Performance RSUs”). The aggregate estimated grant date fair value of the FY2014 Performance RSUs was $5.5 million based on the closing market price of our common stock on the date of grant.
At March 31, 2014, we reviewed each of the underlying performance targets related to the outstanding FY2014 Performance RSUs and determined that it was not probable that the FY2014 Performance RSUs would vest and as a result did not record share-based compensation related to these awards during fiscal 2014. On April 23, 2014, the Compensation Committee determined that the Company’s consolidated income from operations for fiscal 2014 was below 90% of target and, accordingly, the FY2014 Performance RSUs did not vest and were cancelled.
Fiscal 2015 Performance RSUs. In April 2014, the Compensation Committee approved the grant of restricted stock unit awards (performance vesting) for 172,000 shares of common stock to our executive officers that contained the foregoing time-based and performance-based vesting terms (the “FY2015 Performance RSUs”). The aggregate estimated grant date fair value of the FY2015 Performance RSUs was $7.0 million based on the closing market price of our common stock on the date of grant.
During fiscal 2015, we recorded share-based compensation expense ratably over the vesting terms of the FY2015 Performance RSUs, as we determined that the performance targets would be met. As of March 31, 2015, the total unrecognized compensation expense related to restricted stock unit awards (performance vesting) granted amounted to $3.6 million, which is expected to be recognized over a weighted average service period of 2.6 years.
Fiscal 2016 Performance RSUs. In April 2015, the Compensation Committee approved the grant of restricted stock unit awards (performance vesting) for 187,000 shares of common stock to our executive officers and to certain of our employees that contained the foregoing time-based and performance-based vesting terms (the “FY2016 Performance RSUs”). The aggregate estimated grant date fair value of the FY2016 Performance RSUs was $10.3 million based on the closing market price of our common stock on the date of grant.
Restricted Stock Unit Activity
The following table summarizes restricted stock unit activity during fiscal 2015, 2014 and 2013:
|
Time-Based Restricted Stock Units
|
Performance-Based Restricted Stock Units
|
|||||||||||||||
|
Number of
Shares
|
Weighted
Average
Grant Date
Fair Value(1)
|
Number of
Shares(2)
|
Weighted
Average
Grant Date
Fair Value(1)
|
|||||||||||||
|
Unvested at March 31, 2012
|
1,120,000
|
$
|
24.06
|
-
|
$
|
-
|
||||||||||
|
Granted
|
192,000
|
36.30
|
21,000
|
35.62
|
||||||||||||
|
Vested(3)
|
(257,000
|
)
|
23.40
|
-
|
-
|
|||||||||||
|
Canceled or forfeited
|
(75,000
|
)
|
26.78
|
-
|
-
|
|||||||||||
|
Unvested at March 31, 2013
|
980,000
|
$
|
26.42
|
21,000
|
$
|
35.62
|
||||||||||
|
Granted
|
175,000
|
41.29
|
129,000
|
42.43
|
||||||||||||
|
Vested(3)
|
(295,000
|
)
|
21.73
|
(21,000
|
)
|
35.62
|
||||||||||
|
Canceled or forfeited
|
(86,000
|
)
|
31.61
|
(16,000
|
)
|
42.43
|
||||||||||
|
Unvested at March 31, 2014
|
774,000
|
$
|
30.98
|
113,000
|
$
|
42.43
|
||||||||||
|
Granted
|
189,000
|
43.85
|
172,000
|
40.82
|
||||||||||||
|
Vested(3)
|
(272,000
|
)
|
27.24
|
-
|
-
|
|||||||||||
|
Canceled or forfeited
|
(12,000
|
)
|
30.37
|
(137,000
|
)
|
42.15
|
||||||||||
|
Unvested at March 31, 2015
|
679,000
|
$
|
36.08
|
148,000
|
$
|
40.82
|
||||||||||
| (1) | The weighted average grant date fair value of restricted stock units is based on the number of shares and the closing market price of our common stock on the date of grant. |
| (2) | The shares granted during fiscal 2013 and unvested at March 31, 2013 related to FY2013 Performance RSUs do not include the awards approved by the Compensation Committee during the fiscal year 2013 that were deemed not to have been granted in accordance with ASC 718-10-55-95. |
| (3) | The number of restricted stock units vested includes shares that we withheld on behalf of our employees to satisfy the statutory tax withholding requirements. |
Total intrinsic value of restricted stock units vested during fiscal 2015, 2014 and 2013 was $11.7 million, $13.2 million and $9.1 million, respectively. The total grant date fair value of restricted stock units vested during fiscal 2015, 2014 and 2013 was $7.4 million, $7.2 million and $6.0 million, respectively.
NOTE 16. SHAREHOLDERS’ EQUITY
Share Repurchase Program
Between August 2011 and January 2012, our Board of Directors authorized the repurchase of up to a total of $55.0 million of our common stock. In July 2013, our Board of Directors approved a $12.3 million increase to our existing share repurchase program to a total of $67.3 million. As of March 31, 2015, $37.0 million was available to purchase common stock under our share repurchase program.
Since the share repurchase program began, through March 31, 2015, we have repurchased 1.3 million shares of our common stock at a total cost of $30.3 million, including commission expense. During fiscal 2014, we repurchased 86,000 shares at a total cost of $3.0 million and an average per share cost including commission expense of $34.58. During fiscal 2013 and 2015, we did not repurchase any shares of our common stock. The repurchases are made from time to time on the open market at prevailing market prices or in negotiated transactions off the market. Repurchased shares are retired.
Dividend Payments
During fiscal 2015, our total quarterly dividend payout was $9.0 million and was made from retained earnings. During fiscal 2014, we did not pay dividends on our outstanding common stock. During fiscal 2013, our total dividend payout was $22.0 million and was made from retained earnings. See Note 21, “Summary of Quarterly Data (Unaudited)” for further information on quarterly dividends declared on our common stock during the past two fiscal years.
Common Stock Warrants
At March 31, 2015, there were warrants to purchase 4,000 shares of common stock outstanding at a weighted average exercise price of $3.00 per share, expiring in fiscal years 2016 through 2017. In March 2015, the terms of our agreement with Kansas State University Institute for Commercialization were amended and accordingly, the vesting of these outstanding warrants was accelerated. During the fourth quarter of fiscal 2015, we recorded expense of $0.2 million related to the vesting acceleration using the Black-Scholes option-pricing model.
At March 31, 2014, there were warrants to purchase 30,000 shares of common stock outstanding, of which 20,000 shares were vested, at a weighted average exercise price of $3.00 per share. At March 31, 2013, there were 30,000 warrants outstanding, of which 14,000 shares were vested, to purchase common stock at a weighted average exercise price of $3.00 per share, expiring in fiscal years 2016 through 2017. The fair value of the warrants issued were determined using the Black-Scholes option-pricing model and were amortized over their estimated useful life, of approximately ten years, as an intangible asset. The warrants vested at a rate of 20% annually from their issuance dates and had a term of five years.
NOTE 17. NET INCOME PER SHARE
The computations for basic and diluted net income from continuing and discontinued operations per share are as follows (in thousands, except share and per share data):
|
Year Ended March 31,
|
||||||||||||
|
2015
|
2014
|
2013
|
||||||||||
|
Income from continuing operations
|
$
|
20,803
|
$
|
16,229
|
$
|
31,127
|
||||||
|
Loss from discontinued operations, net of tax
|
(1,154
|
)
|
(2,044
|
)
|
(3,668
|
)
|
||||||
|
Gain on sale of discontinued operations, net of tax
|
7,682
|
-
|
-
|
|||||||||
|
Net income
|
$
|
27,331
|
$
|
14,185
|
$
|
27,459
|
||||||
|
Weighted average common shares outstanding:
|
||||||||||||
|
Basic
|
22,497,000
|
22,270,000
|
21,946,000
|
|||||||||
|
Effect of dilutive securities:
|
||||||||||||
|
Stock options
|
1,000
|
20,000
|
89,000
|
|||||||||
|
Restricted stock units
|
276,000
|
257,000
|
318,000
|
|||||||||
|
Warrants
|
13,000
|
28,000
|
28,000
|
|||||||||
|
Diluted
|
22,787,000
|
22,575,000
|
22,381,000
|
|||||||||
|
Net income (loss) per share:
|
||||||||||||
|
Basic
|
||||||||||||
|
Continuing operations
|
$
|
0.92
|
$
|
0.73
|
$
|
1.42
|
||||||
|
Discontinued operations
|
0.29
|
(0.09
|
)
|
(0.17
|
)
|
|||||||
|
Basic net income per share
|
$
|
1.21
|
$
|
0.64
|
$
|
1.25
|
||||||
|
Diluted
|
||||||||||||
|
Continuing operations
|
$
|
0.91
|
$
|
0.72
|
$
|
1.39
|
||||||
|
Discontinued operations
|
0.29
|
(0.09
|
)
|
(0.16
|
)
|
|||||||
|
Diluted net income per share
|
$
|
1.20
|
$
|
0.63
|
$
|
1.23
|
||||||
Stock options and warrants are excluded from the computation of diluted weighted average shares outstanding if the exercise price of the stock options and warrants is greater than the average market price of our common stock during the period because the inclusion of these stock options and warrants would be antidilutive to net income per share. There were no stock options and warrants excluded from the computation of diluted weighted average shares outstanding during fiscal 2015, 2014 and 2013.
We excluded the following restricted stock units from the computation of diluted weighted average shares outstanding because the inclusion of these awards would be antidilutive to net income per share:
|
Year Ended March 31,
|
||||||||||||
|
2015
|
2014
|
2013
|
||||||||||
|
Weighted average number of shares underlying antidilutive restricted stock units
|
-
|
5,000
|
2,000
|
|||||||||
For our restricted stock unit awards (performance vesting), if the performance criteria are achieved during the period, these awards will be considered outstanding for the purpose of computing diluted net income per share if the effect is dilutive. The performance criteria for our restricted stock unit awards (performance vesting) related to FY2013 Performance RSUs and FY2015 Performance RSUs were achieved during the applicable performance period, fiscal 2013 and fiscal 2015, respectively, and accordingly, the dilutive effect of the shares were included in the computation of diluted weighted average shares outstanding. Because the performance criteria for restricted stock unit awards (performance vesting) related to FY2014 Performance RSUs were not achieved during fiscal 2014, these awards were not included in the diluted net income per share calculation.
NOTE 18. INCOME TAXES
Income Tax Provision
The components of our income tax provision are summarized as follows (in thousands):
|
Year Ended March 31,
|
||||||||||||
|
2015
|
2014
|
2013
|
||||||||||
|
Continuing operations:
|
||||||||||||
|
Current:
|
||||||||||||
|
Federal
|
$
|
12,065
|
$
|
7,947
|
$
|
16,635
|
||||||
|
State
|
1,657
|
939
|
1,647
|
|||||||||
|
Foreign
|
64
|
892
|
174
|
|||||||||
|
Total current income tax provision
|
13,786
|
9,778
|
18,456
|
|||||||||
|
Deferred:
|
||||||||||||
|
Federal
|
(1,363
|
)
|
(631
|
)
|
(1,219
|
)
|
||||||
|
State
|
(158
|
)
|
(154
|
)
|
(88
|
)
|
||||||
|
Foreign
|
(26
|
)
|
-
|
-
|
||||||||
|
Total deferred income tax provision (benefit)
|
(1,547
|
)
|
(785
|
)
|
(1,307
|
)
|
||||||
|
Total income tax provision - continuing operations
|
$
|
12,239
|
$
|
8,993
|
$
|
17,149
|
||||||
|
Discontinued operations and gain on sale of discontinued operations:
|
||||||||||||
|
Current:
|
||||||||||||
|
Federal
|
$
|
5,923
|
$
|
(1,147
|
)
|
$
|
(2,060
|
)
|
||||
|
State
|
458
|
(88
|
)
|
(159
|
)
|
|||||||
|
Total current income tax provision (benefit)
|
6,381
|
(1,235
|
)
|
(2,219
|
)
|
|||||||
|
Deferred:
|
||||||||||||
|
Federal
|
(2,258
|
)
|
-
|
-
|
||||||||
|
State
|
(175
|
)
|
-
|
-
|
||||||||
|
Total deferred income tax (benefit)
|
(2,433
|
)
|
-
|
-
|
||||||||
|
Total income tax provision (benefit) - discontinued operations and gain on sale of discontinued operations
|
$
|
3,948
|
$
|
(1,235
|
)
|
$
|
(2,219
|
)
|
||||
The components of our income before income tax provision are summarized as follows (in thousands):
|
Year Ended March 31,
|
||||||||||||
|
2015
|
2014
|
2013
|
||||||||||
|
Continuing operations:
|
||||||||||||
|
United States
|
$
|
33,489
|
$
|
22,598
|
$
|
47,630
|
||||||
|
Foreign
|
(447
|
)
|
2,624
|
646
|
||||||||
|
Total - continuing operations
|
$
|
33,042
|
$
|
25,222
|
$
|
48,276
|
||||||
|
Discontinued operations:
|
||||||||||||
|
United States
|
$
|
10,475
|
$
|
(3,279
|
)
|
$
|
(5,887
|
)
|
||||
The income tax provision from continuing operations differs from the amount computed by applying the federal statutory income tax rate (35 percent) to income from continuing operations before income tax provision as follows (in thousands):
|
Year Ended March 31,
|
||||||||||||
|
2015
|
2014
|
2013
|
||||||||||
|
Continuing operations:
|
||||||||||||
|
Income taxes at federal income tax rate
|
$
|
11,565
|
$
|
8,828
|
$
|
16,896
|
||||||
|
State income taxes, net of federal benefits
|
787
|
475
|
1,282
|
|||||||||
|
Non-deductible compensation
|
880
|
260
|
56
|
|||||||||
|
Research and development tax credits
|
(383
|
)
|
(210
|
)
|
(541
|
)
|
||||||
|
Tax-exempt interest income
|
(6
|
)
|
(20
|
)
|
(32
|
)
|
||||||
|
Qualified production activities income benefit
|
(866
|
)
|
(490
|
)
|
(525
|
)
|
||||||
|
Other
|
262
|
150
|
13
|
|||||||||
|
Total income tax provision from continuing operations
|
$
|
12,239
|
$
|
8,993
|
$
|
17,149
|
||||||
During fiscal 2015, 2014 and 2013, we recognized $0.9 million, $2.2 million and $2.7 million, respectively, of tax deductions related to share-based compensation, on a consolidated basis, in excess of recognized share-based compensation expense (“excess benefits”) that was recorded to shareholders’ equity. We record excess benefits to shareholders’ equity when the benefits result in a reduction in cash paid for income taxes.
Our policy is to reinvest earnings of our foreign subsidiaries unless such earnings are subject to U.S. taxation. As of March 31, 2015, the cumulative earnings upon which U.S. income taxes has not been provided is approximately $0.2 million. The U.S. tax liability if the earnings were repatriated is $84,000.
Unrecognized Tax Benefits
During fiscal 2015, we did not recognize any interest and penalties related to unrecognized tax benefits. We file income tax returns in the U.S. federal jurisdiction, Germany, United Kingdom and various state jurisdictions. The statute of limitations is three years for federal and four years for California. Our federal income tax returns are subject to examination for fiscal years 2012 through 2015. Our California income tax returns are subject to examination for fiscal years 2011 through 2015, with the exception of California tax credit carryovers. To the extent there is a research and development tax credit available for carryover to future years, the statute of limitations with respect to the tax credit begins in the year utilized. As a result of the timing for the utilization of California tax credit carryovers, our California research and development tax credits are subject to examination for fiscal years 2007 through 2015. We are subject to examination in Germany for fiscal years 2012 through 2015 and in the United Kingdom for fiscal years 2011 through 2015.
Deferred Tax Assets and Liabilities
The following table presents the breakdown between current and non-current net deferred tax assets (liabilities) (in thousands):
|
March 31,
|
||||||||
|
2015
|
2014
|
|||||||
|
Deferred tax assets, current
|
$
|
6,575
|
$
|
4,464
|
||||
|
Deferred tax assets, non-current
|
3,413
|
1,557
|
||||||
|
Deferred tax liabilities, non-current
|
(310
|
)
|
-
|
|||||
|
Total net deferred tax assets
|
$
|
9,678
|
$
|
6,021
|
||||
Significant components of our deferred tax assets (liabilities) are as follows (in thousands):
|
March 31,
|
||||||||
|
2015
|
2014
|
|||||||
|
Deferred tax assets:
|
||||||||
|
Research and development tax credit carryforwards
|
$
|
717
|
$
|
646
|
||||
|
Capitalized research and development
|
106
|
136
|
||||||
|
Inventory reserves
|
724
|
622
|
||||||
|
Deferred revenue from extended maintenance agreements
|
1,687
|
1,940
|
||||||
|
Warranty reserves
|
1,190
|
704
|
||||||
|
Accrued payroll and other accrued expenses
|
2,904
|
1,269
|
||||||
|
Share-based compensation
|
2,932
|
2,129
|
||||||
|
Alternative minimum tax credits
|
24
|
24
|
||||||
|
Tax on deferred intercompany profit
|
1,161
|
742
|
||||||
|
Other
|
494
|
792
|
||||||
|
Total deferred tax assets
|
11,939
|
9,004
|
||||||
|
Deferred tax liabilities:
|
||||||||
|
Depreciation
|
(1,850
|
)
|
(2,876
|
)
|
||||
|
Other
|
(411
|
)
|
(107
|
)
|
||||
|
Total deferred tax liabilities
|
(2,261
|
)
|
(2,983
|
)
|
||||
|
Net deferred tax assets
|
$
|
9,678
|
$
|
6,021
|
||||
A valuation allowance against deferred tax assets is provided when it is more likely than not that some portion of the deferred tax assets will not be realized. As of March 31, 2015, 2014 and 2013, we did not have a valuation allowance.
As of March 31, 2015, we had no federal or California net operating loss carryforwards. As of March 31, 2015, our California research and development tax credit carryforwards were $1.1 million. The California research and development tax credit will carryforward indefinitely.
NOTE 19. SEGMENT REPORTING INFORMATION
Operating segments are defined as components of an enterprise about which separate financial information is available that is evaluated regularly by our chief operating decision maker, or decision making group, in deciding how to allocate resources and in assessing performance.
Abaxis develops, manufactures and markets portable blood analysis systems for use in human or veterinary patient care setting to provide clinicians with rapid blood constituent measurements. We identify our reportable segments as those customer groups that represent more than 10% of our combined revenue or gross profit or loss of all reported operating segments. We manage our business on the basis of the following two reportable segments: (i) the medical market and (ii) the veterinary market, which are based on the products sold by market and customer group. For the products that we manufacture and sell, each reportable segment has similar manufacturing processes, technology and shared infrastructures. The accounting policies for segment reporting are the same as for the Company as a whole. We do not segregate assets by segments since our chief operating decision maker, or decision making group, does not use assets as a basis to evaluate a segment’s performance.
Medical Market
In the medical market reportable segment, we serve a worldwide customer group consisting of physicians’ office practices across multiple specialties, urgent care, outpatient and walk-in clinics (free-standing or hospital-connected), health screening operations, home care providers (national, regional or local), nursing homes, ambulance companies, oncology treatment clinics, dialysis centers, pharmacies, hospital laboratories, military installations (ships, field hospitals and mobile care units), pharmaceutical clinical trials and cruise ship lines. The products manufactured and sold in this segment primarily consist of Piccolo chemistry analyzers and medical reagent discs.
Veterinary Market
In the veterinary market reportable segment, we serve a worldwide customer group consisting of companion animal hospitals, animal clinics with mixed practices of small animals, birds and reptiles, equine and bovine practitioners, veterinary emergency clinics, veterinary referral hospitals, universities, government, pharmaceutical companies, biotechnology companies and private research laboratories. Our veterinary market product offerings include VetScan chemistry analyzers and veterinary reagent discs, VetScan hematology instruments and related reagent kits, VetScan VSpro specialty analyzers and related consumables, VetScan i-STAT analyzers and related consumables and VetScan rapid tests.
In March 2015, we entered into an asset purchase agreement with Antech pursuant to which we sold substantially all of the assets of our AVRL business to Antech, see Note 3. We have reclassified the assets, liabilities, results of operations and the gain on sale of AVRL in our consolidated balance sheets and statements of income for all periods presented to reflect them as discontinued operations. Previously reported financial information have been revised to reflect the reclassification of AVRL within our veterinary market segment as a discontinued operation.
Total Revenues, Cost of Revenues and Gross Profit by Segment
The table below summarizes revenues, cost of revenues and gross profit from our two operating segments and from certain unallocated items and represents our results from continuing operations for fiscal 2015, 2014 and 2013 (in thousands).
|
Year Ended March 31,
|
||||||||||||
|
2015
|
2014
|
2013
|
||||||||||
|
Revenues:
|
||||||||||||
|
Medical Market
|
$
|
35,364
|
$
|
28,134
|
$
|
31,643
|
||||||
|
Veterinary Market
|
164,018
|
130,859
|
145,363
|
|||||||||
|
Other(1)
|
3,211
|
3,038
|
3,872
|
|||||||||
|
Total revenues
|
202,593
|
162,031
|
180,878
|
|||||||||
|
Cost of revenues:
|
||||||||||||
|
Medical Market
|
18,730
|
15,623
|
15,179
|
|||||||||
|
Veterinary Market
|
74,752
|
62,350
|
64,586
|
|||||||||
|
Other(1)
|
141
|
108
|
138
|
|||||||||
|
Total cost of revenues
|
93,623
|
78,081
|
79,903
|
|||||||||
|
Gross profit:
|
||||||||||||
|
Medical Market
|
16,634
|
12,511
|
16,464
|
|||||||||
|
Veterinary Market
|
89,266
|
68,509
|
80,777
|
|||||||||
|
Other(1)
|
3,070
|
2,930
|
3,734
|
|||||||||
|
Gross profit
|
$
|
108,970
|
$
|
83,950
|
$
|
100,975
|
||||||
| (1) | Represents unallocated items, not specifically identified to any particular business segment. |
NOTE 20. REVENUES BY PRODUCT CATEGORY AND GEOGRAPHIC REGION AND SIGNIFICANT CONCENTRATIONS
Revenue Information
The following is a summary of our revenues by product category and represents our results from continuing operations (in thousands):
|
Year Ended March 31,
|
||||||||||||
|
Revenues by Product Category
|
2015
|
2014
|
2013
|
|||||||||
|
Instruments (1)
|
$
|
48,649
|
$
|
37,539
|
$
|
46,034
|
||||||
|
Consumables (2)
|
144,446
|
117,533
|
127,481
|
|||||||||
|
Other products (3)
|
9,348
|
6,809
|
7,213
|
|||||||||
|
Product sales, net
|
202,443
|
161,881
|
180,728
|
|||||||||
|
Development and licensing revenue
|
150
|
150
|
150
|
|||||||||
|
Total revenues
|
$
|
202,593
|
$
|
162,031
|
$
|
180,878
|
||||||
| (1) | Instruments include chemistry analyzers, hematology instruments, VSpro specialty analyzers and i‑STAT analyzers. |
| (2) | Consumables include reagent discs, hematology reagent kits, VSpro specialty cartridges, i‑STAT cartridges and rapid tests. |
| (3) | Other products include products using the Orbos process and extended maintenance agreements. |
The following is a summary of our revenues by geographic region based on customer location and represents our results from continuing operations (in thousands):
|
Year Ended March 31,
|
||||||||||||
|
Revenues by Geographic Region
|
2015
|
2014
|
2013
|
|||||||||
|
North America
|
$
|
163,308
|
$
|
126,768
|
$
|
147,627
|
||||||
|
Europe
|
30,422
|
27,161
|
26,086
|
|||||||||
|
Asia Pacific and rest of the world
|
8,863
|
8,102
|
7,165
|
|||||||||
|
Total revenues
|
$
|
202,593
|
$
|
162,031
|
$
|
180,878
|
||||||
Significant Concentrations
During fiscal 2015, two distributors in the United States, MWI Veterinary Supply and Abbott Point of Care accounted for 19% and 11%, respectively, of our total worldwide revenues. During fiscal 2014, two distributors in the United States, MWI Veterinary Supply and Abbott Point of Care accounted for 19% and 10%, respectively, of our total worldwide revenues. During fiscal 2013 one distributor in the United States, Animal Health International, accounted for 12% of our total worldwide revenues.
Substantially all of our long-lived assets are located in the United States.
NOTE 21. SUMMARY OF QUARTERLY DATA (UNAUDITED)
The following table is a summary of unaudited quarterly data for fiscal 2015 and 2014 (in thousands, except per share data). Previously reported quarterly amounts have been revised to reflect the reclassification of the AVRL business within our veterinary market segment as discontinued operations. See Note 3, “Discontinued Operations” for additional information.
|
Quarter Ended
|
||||||||||||||||
|
Fiscal Year Ended March 31, 2015:
|
June 30
|
September 30
|
December 31
|
March 31
|
||||||||||||
|
Revenues
|
$
|
44,054
|
$
|
50,471
|
$
|
56,051
|
$
|
52,017
|
||||||||
|
Gross profit
|
23,703
|
28,076
|
28,783
|
28,408
|
||||||||||||
|
Income from continuing operations, net of tax
|
5,074
|
5,712
|
6,215
|
3,802
|
||||||||||||
|
Loss from discontinued operations, net of tax
|
(359
|
)
|
(312
|
)
|
(330
|
)
|
(153
|
)
|
||||||||
|
Gain on sale of discontinued operations, net of tax
|
-
|
-
|
-
|
7,682
|
||||||||||||
|
Net income
|
$
|
4,715
|
$
|
5,400
|
$
|
5,885
|
$
|
11,331
|
||||||||
|
Net income (loss) per share:
|
||||||||||||||||
|
Basic
|
||||||||||||||||
|
Continuing operations
|
$
|
0.23
|
$
|
0.25
|
$
|
0.27
|
$
|
0.17
|
||||||||
|
Discontinued operations
|
(0.02
|
)
|
(0.01
|
)
|
(0.01
|
)
|
0.33
|
|||||||||
|
Basic net income per share
|
$
|
0.21
|
$
|
0.24
|
$
|
0.26
|
$
|
0.50
|
||||||||
|
Diluted
|
||||||||||||||||
|
Continuing operations
|
$
|
0.23
|
$
|
0.25
|
$
|
0.27
|
$
|
0.17
|
||||||||
|
Discontinued operations
|
(0.02
|
)
|
(0.01
|
)
|
(0.01
|
)
|
0.33
|
|||||||||
|
Diluted net income per share
|
$
|
0.21
|
$
|
0.24
|
$
|
0.26
|
$
|
0.50
|
||||||||
|
Cash dividends declared per share
|
$
|
0.10
|
$
|
0.10
|
$
|
0.10
|
$
|
0.10
|
||||||||
|
Quarter Ended
|
||||||||||||||||
|
Fiscal Year Ended March 31, 2014:
|
June 30
|
September 30
|
December 31
|
March 31
|
||||||||||||
|
Revenues
|
$
|
40,956
|
$
|
43,541
|
$
|
38,318
|
$
|
39,216
|
||||||||
|
Gross profit
|
21,370
|
22,176
|
19,415
|
20,989
|
||||||||||||
|
Income from continuing operations, net of tax
|
3,932
|
4,482
|
3,681
|
4,134
|
||||||||||||
|
Loss from discontinued operations, net of tax
|
(703
|
)
|
(486
|
)
|
(459
|
)
|
(396
|
)
|
||||||||
|
Net income
|
$
|
3,229
|
$
|
3,996
|
$
|
3,222
|
$
|
3,738
|
||||||||
|
Net income (loss) per share:
|
||||||||||||||||
|
Basic
|
||||||||||||||||
|
Continuing operations
|
$
|
0.18
|
$
|
0.20
|
$
|
0.16
|
$
|
0.19
|
||||||||
|
Discontinued operations
|
(0.03
|
)
|
(0.02
|
)
|
(0.02
|
)
|
(0.02
|
)
|
||||||||
|
Basic net income per share
|
$
|
0.15
|
$
|
0.18
|
$
|
0.14
|
$
|
0.17
|
||||||||
|
Diluted
|
||||||||||||||||
|
Continuing operations
|
$
|
0.17
|
$
|
0.20
|
$
|
0.16
|
$
|
0.19
|
||||||||
|
Discontinued operations
|
(0.03
|
)
|
(0.02
|
)
|
(0.02
|
)
|
(0.02
|
)
|
||||||||
|
Diluted net income per share
|
$
|
0.14
|
$
|
0.18
|
$
|
0.14
|
$
|
0.17
|
||||||||
|
Cash dividends declared per share
|
$
|
-
|
$
|
-
|
$
|
-
|
$
|
-
|
||||||||
NOTE 22. SUBSEQUENT EVENTS
On April 22, 2015, our Board of Directors declared a cash dividend of $0.11 per share on our outstanding common stock to be paid on June 18, 2015 to all shareholders of record as of the close of business on June 4, 2015.
Not applicable.
Evaluation of Disclosure Controls and Procedures
The Company’s management, with the participation of the Company’s principal executive officer and principal financial officer, has evaluated that the effectiveness of the Company’s disclosure controls and procedures, as defined in Rules 13a-15(e) and 15d-15(e) under the Securities Exchange Act of 1934, as amended, (the “Exchange Act”), as of the end of the period covered by this report. Based on such evaluation, the Company’s principal executive officer and principal financial officer, have concluded that, as of the end of such period, the Company’s disclosure controls and procedures were effective.
Management’s Report on Internal Control Over Financial Reporting
We are responsible for establishing and maintaining adequate internal control over financial reporting as defined in Rules 13a-15(f) and 15d-15(f) under the Exchange Act. Under the supervision and with the participation of the Company’s management, including its principal executive officer and principal financial officer, we conducted an evaluation of the effectiveness of our internal control over financial reporting based on criteria established in the framework in Internal Control—Integrated Framework (2013 Framework) issued by the Committee of Sponsoring Organizations of the Treadway Commission (COSO). Based on this evaluation, our principal executive officer and principal financial officer, have concluded that our internal control over financial reporting was effective as of March 31, 2015.
Because of its inherent limitations, internal control over financial reporting may not prevent or detect misstatements. Also, projections of any evaluation of effectiveness to future periods are subject to the risks that controls may become inadequate because of changes in conditions, or that the degree of compliance with the policies or procedures may deteriorate. Accordingly, even an effective system of internal control will provide only reasonable assurance that the objectives of the internal control system are met.
Attestation Report of the Independent Registered Public Accounting Firm
Burr Pilger Mayer, Inc., our independent registered public accounting firm, has issued an audit report on the effectiveness of our internal control over financial reporting as of March 31, 2015, which report is included elsewhere herein.
Changes in Internal Control over Financial Reporting
There were no changes in our internal control over financial reporting during the fiscal quarter ended March 31, 2015 that have materially affected, or are reasonably likely to materially affect, our internal control over financial reporting, as defined in Rule 13a-15(f) and 15d-15(f) under the Exchange Act.
REPORT OF INDEPENDENT REGISTERED PUBLIC ACCOUNTING FIRM ON
INTERNAL CONTROL OVER FINANCIAL REPORTING
To the Board of Directors and Shareholders
of Abaxis, Inc.
We have audited the internal control over financial reporting of Abaxis, Inc. and its subsidiaries (“the Company”) as of March 31, 2015, based on criteria established in Internal Control — Integrated Framework (2013 Framework) issued by the Committee of Sponsoring Organizations of the Treadway Commission (COSO). The Company’s management is responsible for maintaining effective internal control over financial reporting and for its assessment of the effectiveness of internal control over financial reporting included in the accompanying Management’s Report on Internal Control Over Financial Reporting. Our responsibility is to express an opinion on the Company’s internal control over financial reporting based on our audit.
We conducted our audit in accordance with the standards of the Public Company Accounting Oversight Board (United States). Those standards require that we plan and perform the audit to obtain reasonable assurance about whether effective internal control over financial reporting was maintained in all material respects. Our audit included obtaining an understanding of internal control over financial reporting, assessing the risk that a material weakness exists, testing and evaluating the design and operating effectiveness of internal control based on the assessed risk, and performing such other procedures as we considered necessary in the circumstances. We believe that our audit provides a reasonable basis for our opinion.
A company’s internal control over financial reporting is a process designed to provide reasonable assurance regarding the reliability of financial reporting and the preparation of financial statements for external purposes in accordance with generally accepted accounting principles. A company’s internal control over financial reporting includes those policies and procedures that (1) pertain to the maintenance of records that, in reasonable detail, accurately and fairly reflect the transactions and dispositions of the assets of the company; (2) provide reasonable assurance that transactions are recorded as necessary to permit preparation of financial statements in accordance with generally accepted accounting principles, and that receipts and expenditures of the company are being made only in accordance with authorizations of management and directors of the company; and (3) provide reasonable assurance regarding prevention or timely detection of unauthorized acquisition, use, or disposition of the company’s assets that could have a material effect on the financial statements.
Because of its inherent limitations, internal control over financial reporting may not prevent or detect misstatements. Also, projections of any evaluation of effectiveness to future periods are subject to the risk that controls may become inadequate because of changes in conditions, or that the degree of compliance with the policies or procedures may deteriorate.
In our opinion, Abaxis, Inc. and its subsidiaries maintained, in all material respects, effective internal control over financial reporting as of March 31, 2015, based on criteria established in Internal Controls Integrated Framework (2013 Framework) by COSO.
We also have audited, in accordance with the standards of the Public Company Accounting Oversight Board (United States), the consolidated balance sheets of Abaxis, Inc. and its subsidiaries as of March 31, 2015 and 2014, and the related consolidated statements of income, comprehensive income, shareholders’ equity, and cash flows for each of the three years in the period ended March 31, 2015 and the related financial statement schedule and our report dated June 1, 2015 expressed an unqualified opinion thereon.
/s/ Burr Pilger Mayer, Inc.
San Jose, California
June 1, 2015
Not applicable.
PART III
The information required by Part III is omitted from this report and will be included in an amendment to this report filed no later than 120 days after the end of the fiscal year covered by this Annual Report on Form 10-K.
The information required by this item will be contained in an amendment to this Annual Report on Form 10-K.
The information required by this item will be contained in an amendment to this Annual Report on Form 10-K.
|
Security Ownership of Certain Beneficial Owners and Management and Related Stockholder Matters
|
The information required by this item will be contained in an amendment to this Annual Report on Form 10-K.
The information required by this item will be contained in an amendment to this Annual Report on Form 10-K.
The information required by this item will be contained in an amendment to this Annual Report on Form 10-K.
PART IV
| (a) | The following financial statements, schedules and exhibits are filed as part of this report: |
| 1. | Financial Statements - The Financial Statements required by this item are listed on the Index to Consolidated Financial Statements in Part II, Item 8 of this report, which is incorporated by reference herein. |
| 2. | Financial Statement Schedules - |
| · | Schedule II – Valuation and Qualifying Accounts and Reserves |
| · | Other financial statement schedules are not included because they are not required or the information is otherwise shown in the consolidated financial statements or notes thereto. |
| 3. | Exhibits - The exhibits listed on the accompanying Exhibit Index are filed as part of, or are incorporated by reference into, this report. |
(b) See Item 15(a)(3) above.
(c) See Item 15(a)(2) above.
Abaxis, Inc.
Schedule II
Valuation and Qualifying Accounts and Reserves
Years ended March 31, 2015, 2014 and 2013
|
Description
|
Balance at
Beginning of
Year
|
Additions
Charged to
Expenses
|
Deductions
from Reserves
(a)
|
Balance at
End of Year
|
||||||||||||
|
Total Reserve for Doubtful Accounts and Sales Allowances (b):
|
||||||||||||||||
|
Year ended March 31, 2015
|
$
|
182,000
|
$
|
(24,000
|
)
|
$
|
89,000
|
$
|
247,000
|
|||||||
|
Year ended March 31, 2014
|
$
|
319,000
|
$
|
182,000
|
$
|
(319,000
|
)
|
$
|
182,000
|
|||||||
|
Year ended March 31, 2013
|
$
|
283,000
|
$
|
107,000
|
$
|
(71,000
|
)
|
$
|
319,000
|
|||||||
| (a) | The deductions related to allowances for doubtful accounts represent net balance of accounts receivable which were written off and recovered. |
| (b) | The reserve for doubtful accounts and sales allowance is presented on a consolidated basis. |
Pursuant to the requirements of Section 13 or 15(d) of the Securities Exchange Act of 1934, the registrant has duly caused this report to be signed on its behalf by the undersigned, thereunto duly authorized, on June 1, 2015.
|
ABAXIS, INC.
|
||
|
By:
|
/s/ Clinton H. Severson
|
|
|
Clinton H. Severson
|
||
|
Chairman of the Board, President and Chief Executive Officer
|
||
POWER OF ATTORNEY
KNOW ALL PERSONS BY THESE PRESENT, that each person whose signature appears below constitutes and appoints Clinton H. Severson and Alberto R. Santa Ines, and each of them, acting individually, as his attorney-in-fact, each with full power of substitution and resubstitution, for him and in his name, place and stead, in any and all capacities, to sign any and all amendments to this Annual Report on Form 10-K, and to file the same, with all exhibits thereto, and other documents in connection therewith, with the Securities and Exchange Commission, granting unto said attorneys-in-fact and agents, and each of them, full power and authority to do and perform each and every act and thing requisite and necessary to be done in connection therewith and about the premises, as fully to all intents and purposes as he might or could do in person, hereby ratifying and confirming all that said attorneys-in-fact and agents, or any of them, or their or his substitute or substitutes, may lawfully do or cause to be done by virtue hereof.
Pursuant to the requirements of the Securities Exchange Act of 1934, this report has been signed below by the following persons on behalf of the registrant and in the capacities and on the dates indicated.
|
Signature
|
Title
|
Date
|
||
|
/s/ Clinton H. Severson
|
President, Chief Executive Officer and Director
(Principal Executive Officer)
|
June 1, 2015
|
||
|
Clinton H. Severson
|
||||
|
/s/ Alberto R. Santa Ines
|
Chief Financial Officer and Vice President of Finance
(Principal Financial and Accounting Officer)
|
June 1, 2015
|
||
|
Alberto R. Santa Ines
|
||||
|
/s/ Vernon E. Altman
|
Director
|
June 1, 2015
|
||
|
Vernon E. Altman
|
||||
|
/s/ Richard J. Bastiani, Ph.D.
|
Director
|
June 1, 2015
|
||
|
Richard J. Bastiani, Ph.D.
|
||||
|
/s/ Michael D. Casey
|
Director
|
June 1, 2015
|
||
|
Michael D. Casey
|
||||
|
/s/ Henk J. Evenhuis
|
Director
|
June 1, 2015
|
||
|
Henk J. Evenhuis
|
||||
|
/s/ Prithipal Singh, Ph.D.
|
Director
|
June 1, 2015
|
||
|
Prithipal Singh, Ph.D.
|
|
Exhibit
No.
|
Description of Document
|
|
3.1
|
Amended and Restated Articles of Incorporation, as amended (filed with the Securities and Exchange Commission on May 30, 2014 as Exhibit 3.1 to our Annual Report on Form 10-K for the fiscal year ended March 31, 2014 and incorporated herein by reference).
|
|
3.2
|
By-laws, as amended (filed with the Securities and Exchange Commission on May 30, 2014 as Exhibit 3.2 to our Annual Report on Form 10-K for the fiscal year ended March 31, 2014 and incorporated herein by reference).
|
|
4.1
|
Form of Warrant to Purchase Shares of Common Stock of Abaxis, Inc. issued to the National Institute for Strategic Technology Acquisition and Commercialization (filed with the Securities and Exchange Commission on June 13, 2011 as Exhibit 4.3 to our Annual Report on Form 10-K for the fiscal year ended March 31, 2011 and incorporated herein by reference).
|
|
4.2
|
Reference is made to Exhibit 3.1and Exhibit 3.2.
|
|
10.1
|
Lease Agreement with Principal Development Investors, LLC, dated June 21, 2000 (filed with the Securities and Exchange Commission on January 10, 2001 as Exhibit 10.10 to our Registration Statement on Form S-3 and incorporated herein by reference).
|
|
10.2*
|
Amended and Restated Executive Employment Agreement with Mr. Clinton H. Severson, dated October 27, 2010 (filed with the Securities and Exchange Commission on February 9, 2011 as Exhibit 10.1 to our Quarterly Report on Form 10-Q for the quarter ended December 31, 2010 and incorporated herein by reference).
|
|
10.3*
|
2005 Equity Incentive Plan, as amended and restated through November 8, 2012 (filed with the Securities and Exchange Commission on February 11, 2013 as Exhibit 10.4 to our Quarterly Report on Form 10-Q for the quarter ended December 31, 2012 and incorporated herein by reference).
|
|
10.4*
|
Form of Notice of Grant of Restricted Stock Units (time vesting) under the 2005 Equity Incentive Plan (filed with the Securities and Exchange Commission on June 14, 2013 as Exhibit 10.7 to our Annual Report on Form 10-K for the year ended March 31, 2013 and incorporated herein by reference).
|
|
10.5*
|
Form of Notice of Grant of Restricted Stock Units (performance vesting) under the 2005 Equity Incentive Plan (filed with the Securities and Exchange Commission on June 14, 2013 as Exhibit 10.8 to our Annual Report on Form 10-K for the year ended March 31, 2013 and incorporated herein by reference).
|
|
10.6*
|
2014 Equity Incentive Plan (filed with the Securities and Exchange Commission on October 22, 2014 as Exhibit 99.2 to our Registration Statement on Form S-8 (File No. 333-199518) and incorporated herein by reference).
|
|
10.7*
|
Forms of Restricted Stock Unit (time vesting) Grant Notice and Award Agreements under the Abaxis, Inc. 2014 Equity Incentive Plan (filed with the Securities and Exchange Commission on February 9, 2015 as Exhibit 10.2 to our Quarterly Report on Form 10-Q for the quarter ended December 31, 2014 and incorporated herein by reference).
|
|
10.8*
|
Forms of Restricted Stock Unit (performance vesting) Grant Notice and Award Agreements under the Abaxis, Inc. 2014 Equity Incentive Plan (filed with the Securities and Exchange Commission on February 9, 2015 as Exhibit 10.3 to our Quarterly Report on Form 10-Q for the quarter ended December 31, 2014 and incorporated herein by reference).
|
|
10.9*
|
Abaxis, Inc. Executive Change of Control Severance Plan, as amended as of December 23, 2008 (filed with the Securities and Exchange Commission on February 9, 2009 as Exhibit 10.2 to our Quarterly Report on Form 10-Q for the quarter ended December 31, 2008 and incorporated herein by reference).
|
|
10.10*
|
Fiscal 2016 Base Salary and Target Bonus for the Named Executive Officers (filed with the Securities and Exchange Commission on May 4, 2015 as a part of our Current Report on Form 8-K and incorporated herein by reference).
|
|
10.11*
|
Form of Indemnity Agreement entered into by Abaxis, Inc. with each of its directors and executive officers (filed with the Securities and Exchange Commission on June 13, 2008 as Exhibit 10.22 to our Annual Report on Form 10-K for the fiscal year ended March 31, 2008 and incorporated herein by reference).
|
|
10.12*
|
Transition Agreement between Abaxis, Inc. and Alberto Santa Ines, dated May 1, 2015 (filed with the Securities and Exchange Commission on May 4, 2015 as Exhibit 99.1 to our Current Report on Form 8-K and incorporated herein by reference).
|
|
10.13*
|
Offer Letter Agreement between Abaxis, Inc. and Dean Ross Taylor, dated April 29, 2015 (filed with the Securities and Exchange Commission on May 4, 2015 as Exhibit 99.2 to our Current Report on Form 8-K and incorporated herein by reference).
|
|
10.14*
|
Transition Agreement between Abaxis, Inc. and Vladimir E. Ostoich, Ph.D., dated August 15, 2014 (filed with the Securities and Exchange Commission on August 21, 2014 as Exhibit 10.1 to our Current Report on Form 8-K and incorporated by reference).
|
|
10.15*
|
Executive Employment Agreement, dated as of May 1, 2014, with Craig M. Tockman (filed with the Securities and Exchange Commission on August 11, 2014 as Exhibit 10.1 to our Quarterly Report on Form 10-Q for the quarter ended June 30, 2014 and incorporated herein by reference).
|
|
10.16
|
First Amendment to Lease Agreement with Principal Development Investors, LLC, dated as of August 28, 2000 (filed with the Securities and Exchange Commission on June 14, 2010 as Exhibit 10.23 to our Annual Report on Form 10-K for the fiscal year ended March 31, 2010 and incorporated herein by reference).
|
|
10.17
|
Second Amendment to Lease Agreement with Principal Development Investors, LLC, dated as of November 20, 2000 (filed with the Securities and Exchange Commission on June 14, 2010 as Exhibit 10.24 with our Annual Report on Form 10-K for the fiscal year ended March 31, 2010 and incorporated herein by reference).
|
|
10.18
|
Third Amendment to Lease Agreement with Crossroads Technology Partners and Nearon Crossroads, LLC, as successors in interest to Principal Development Investors, LLC, dated as of April 10, 2002 (filed with the Securities and Exchange Commission on June 14, 2010 as Exhibit 10.25 to our Annual Report on Form 10-K for the fiscal year ended March 31, 2010 and incorporated herein by reference).
|
|
10.19
|
Fourth Amendment to Lease Agreement with Whipple Road Holdings, LLC, SFP Crossroads, LLC and Woodstock Bowers, LLC, dated March 11, 2010 (filed with the Securities and Exchange Commission on June 14, 2010 as Exhibit 10.26 to our Annual Report on Form 10-K for the fiscal year ended March 31, 2010 and incorporated herein by reference).
|
|
10.20+
|
Distributor Agreement by and between Lextron, Inc. including subsidiaries TW Medical Veterinary Supply and VetPham and Abaxis, Inc., dated April 1, 2010 (filed with the Securities and Exchange Commission on June 14, 2012 as Exhibit 10.17 to our Annual Report on Form 10-K for the fiscal year ended March 31, 2012 and incorporated herein by reference).
|
|
10.21+
|
Exclusive Agreement, dated October 26, 2012, by and between Abaxis, Inc. and Abbott Point of Care, Inc. (filed with the Securities and Exchange Commission on July 2, 2013 as Exhibit 10.1 to the Amendment to our Quarterly Report on Form 10-Q for the quarter ended December 31, 2012 and incorporated herein by reference).
|
|
10.22
|
Non-Exclusive Distributor Agreement, dated as of September 28, 2012, by and between MWI Veterinary Supply, Inc. (“MWI”) and Abaxis, Inc. (filed with the Securities and Exchange Commission on November 27, 2012 as Exhibit 10.27 to MWI’s Annual Report on Form 10-K for the fiscal year ended September 30, 2012 and incorporated herein by reference).
|
|
10.23+
|
Letter Agreement, dated as of September 28, 2012, by and between MWI and Abaxis, Inc. (filed with the Securities and Exchange Commission on November 27, 2012 as Exhibit 10.28 to MWI’s Annual Report on Form 10-K for the fiscal year ended September 30, 2012 and incorporated herein by reference).
|
|
10.24
|
Amendment to Exclusive Agreement between Abaxis, Inc. and Abbott Point of Care Inc., dated September 30, 2013 (filed with the Securities and Exchange Commission on November 12, 2013 as Exhibit 10.1 to our Quarterly Report on Form 10-Q for the quarter ended September 30, 2013).
|
|
Asset Purchase Agreement, dated as of March 19, 2015, between Antech Diagnostics, Inc. and Abaxis, Inc.
|
|
|
Subsidiaries of Abaxis, Inc.
|
|
|
Consent of Burr Pilger Mayer, Inc., Independent Registered Public Accounting Firm
|
|
|
24.1
|
Power of Attorney. (included on the Signature Page hereto).
|
|
Certification of Chief Executive Officer pursuant to Section 302 of the Sarbanes-Oxley Act of 2002.
|
|
|
Certification of Chief Financial Officer pursuant to Section 302 of the Sarbanes-Oxley Act of 2002.
|
|
|
Certification of Chief Executive Officer pursuant to Section 906 of the Sarbanes-Oxley Act of 2002.
|
|
|
Certification of Chief Financial Officer pursuant to Section 906 of the Sarbanes-Oxley Act of 2002.
|
|
101.INS
|
XBRL Instance Document.
|
|
101.SCH
|
XBRL Taxonomy Extension Schema Document.
|
|
101.CAL
|
XBRL Taxonomy Extension Calculation Linkbase Document.
|
|
101.LAB
|
XBRL Taxonomy Extension Labels Linkbase Document.
|
|
101.PRE
|
XBRL Taxonomy Extension Presentation Linkbase Document.
|
|
101.DEF
|
XBRL Taxonomy Extension Definition Linkbase Document.
|
|
+
|
Confidential treatment of certain portions of this agreement has been granted by the Securities and Exchange Commission.
|
|
++
|
Confidential treatment of certain portions of this agreement has been requested from the Securities and Exchange Commission.
|
|
*
|
Management contract or compensatory plan or arrangement.
|
|
#
|
This certification is not deemed filed with the Securities and Exchange Commission and is not to be incorporated by reference into any filing of the Registrant under the Securities Act of 1933, as amended, or the Securities Exchange Act of 1934, as amended (whether made before or after the date of the Form 10-K), irrespective of any general incorporation language contained in such filing.
|
90