UNITED STATES
SECURITIES AND EXCHANGE COMMISSION
WASHINGTON, D. C. 20549
FORM N-CSRS
Investment Company Act file number: 811-00043
Deutsche Investment Trust
(Exact Name of Registrant as Specified in Charter)
345 Park Avenue
New York, NY 10154-0004
(Address of Principal Executive Offices) (Zip Code)
Registrant’s Telephone Number, including Area Code: (212) 250-3220
Paul Schubert
60 Wall Street
New York, NY 10005
(Name and Address of Agent for Service)
|
Date of fiscal year end:
|
9/30
|
|
Date of reporting period:
|
3/31/2015
|
|
ITEM 1.
|
REPORT TO STOCKHOLDERS
|

March 31, 2015
Semiannual Report
to Shareholders
Deutsche Small Cap Growth Fund
Contents
|
3 Letter to Shareholders
4 Performance Summary
7 Portfolio Management Team
7 Portfolio Summary
9 Investment Portfolio
15 Statement of Assets and Liabilities
17 Statement of Operations
18 Statement of Changes in Net Assets
19 Financial Highlights
29 Notes to Financial Statements
38 Information About Your Fund's Expenses
40 Advisory Agreement Board Considerations and Fee Evaluation
45 Account Management Resources
47 Privacy Statement
|
This report must be preceded or accompanied by a prospectus. To obtain a summary prospectus, if available, or prospectus for any of our funds, refer to the Account Management Resources information provided in the back of this booklet. We advise you to consider the fund's objectives, risks, charges and expenses carefully before investing. The summary prospectus and prospectus contain this and other important information about the fund. Please read the prospectus carefully before you invest.
The fund may lend securities to approved institutions. Small company stocks tend to be more volatile than medium-sized or large company stocks. Stocks may decline in value. See the prospectus for details.
Deutsche Asset & Wealth Management represents the asset management and wealth management activities conducted by Deutsche Bank AG or any of its subsidiaries, including the Advisor and DeAWM Distributors, Inc.
NOT FDIC/NCUA INSURED NO BANK GUARANTEE MAY LOSE VALUE NOT A DEPOSIT NOT INSURED BY ANY FEDERAL GOVERNMENT AGENCY
Dear Shareholder:
From an economic standpoint, the view seems brighter than it has been for several years. Multiple signs suggest sustainable growth, at least for the near term. Our economists at Deutsche Asset & Wealth Management expect the global economy to accelerate in 2015, led by the United States and China.
That is heartening news. Yet one cannot ignore the complexities of an increasingly interconnected global economy. Low oil prices, a stronger employment picture and consumer spending bode well for the domestic economy, at least in the short term. Yet sluggish growth abroad, falling commodity prices and the strong U.S dollar may be headwinds to global growth and American exports. And, as we have seen time and again, any number of factors can unexpectedly shift the markets and the overall outlook.
The take-away message amidst these mixed signals: Be prepared to stick to your long-term plan, with a portfolio that can help weather short-term fluctuations. When in doubt, or if your individual situation or objectives change, talk with a trusted financial professional before taking action.
For timely information about economic developments and your Deutsche fund investment, we hope you will visit us at deutschefunds.com. There you will find the views of our Chief Investment Officer and economists. It is a resource we are proud to offer to help keep you up-to-date and make informed decisions.
As always, we thank you for your continued investment and the opportunity to put our capabilities to work for you.
Best regards,


Brian Binder
President, Deutsche Funds
|
Class A
|
6-Month‡
|
1-Year
|
5-Year
|
10-Year
|
|
Average Annual Total Returns as of 3/31/15
|
||||
|
Unadjusted for Sales Charge
|
17.82%
|
12.51%
|
17.61%
|
7.23%
|
|
Adjusted for the Maximum Sales Charge (max 5.75% load)
|
11.05%
|
6.04%
|
16.23%
|
6.60%
|
|
Russell 2000® Growth Index†
|
17.36%
|
12.06%
|
16.58%
|
10.02%
|
|
Class B
|
6-Month‡
|
1-Year
|
5-Year
|
10-Year
|
|
Average Annual Total Returns as of 3/31/15
|
||||
|
Unadjusted for Sales Charge
|
17.35%
|
11.65%
|
16.64%
|
6.39%
|
|
Adjusted for the Maximum Sales Charge (max 4.00% CDSC)
|
13.35%
|
8.72%
|
16.54%
|
6.39%
|
|
Russell 2000® Growth Index†
|
17.36%
|
12.06%
|
16.58%
|
10.02%
|
|
Class C
|
6-Month‡
|
1-Year
|
5-Year
|
10-Year
|
|
Average Annual Total Returns as of 3/31/15
|
||||
|
Unadjusted for Sales Charge
|
17.36%
|
11.68%
|
16.72%
|
6.42%
|
|
Adjusted for the Maximum Sales Charge (max 1.00% CDSC)
|
16.36%
|
11.68%
|
16.72%
|
6.42%
|
|
Russell 2000® Growth Index†
|
17.36%
|
12.06%
|
16.58%
|
10.02%
|
|
Class R
|
6-Month‡
|
1-Year
|
Life of Class*
|
|
|
Average Annual Total Returns as of 3/31/15
|
||||
|
No Sales Charges
|
17.70%
|
12.32%
|
17.67%
|
|
|
Russell 2000® Growth Index†
|
17.36%
|
12.06%
|
17.40%
|
|
|
Class R6
|
6-Month‡
|
Life of Class**
|
||
|
Average Annual Total Returns as of 3/31/15
|
||||
|
No Sales Charges
|
18.03%
|
13.24%
|
||
|
Russell 2000® Growth Index†
|
17.36%
|
7.54%
|
||
|
Class S
|
6-Month‡
|
1-Year
|
5-Year
|
10-Year
|
|
Average Annual Total Returns as of 3/31/15
|
||||
|
No Sales Charges
|
17.98%
|
12.84%
|
17.88%
|
7.50%
|
|
Russell 2000® Growth Index†
|
17.36%
|
12.06%
|
16.58%
|
10.02%
|
|
Institutional Class
|
6-Month‡
|
1-Year
|
5-Year
|
10-Year
|
|
Average Annual Total Returns as of 3/31/15
|
||||
|
No Sales Charges
|
18.04%
|
12.87%
|
18.09%
|
7.59%
|
|
Russell 2000® Growth Index†
|
17.36%
|
12.06%
|
16.58%
|
10.02%
|
Performance in the Average Annual Total Returns table above and the Growth of an Assumed $10,000 Investment line graph that follows is historical and does not guarantee future results. Investment return and principal fluctuate, so your shares may be worth more or less when redeemed. Current performance may differ from performance data shown. Please visit deutschefunds.com for the Fund's most recent month-end performance. Fund performance includes reinvestment of all distributions. Unadjusted returns do not reflect sales charges and would have been lower if they had.
The gross expense ratios of the Fund, as stated in the fee table of the prospectus dated February 1, 2015 are 1.41%, 2.26%, 2.19%, 1.63%, 1.02%, 1.16% and 1.11% for Class A, Class B, Class C, Class R, Class R6, Class S and Institutional Class shares, respectively, and may differ from the expense ratios disclosed in the Financial Highlights tables in this report.
The Fund may charge a 2% fee for redemptions of shares held less than 15 days.
Index returns do not reflect any fees or expenses and it is not possible to invest directly into an index.
Performance figures do not reflect the deduction of taxes that a shareholder would pay on fund distributions or the redemption of fund shares.
|
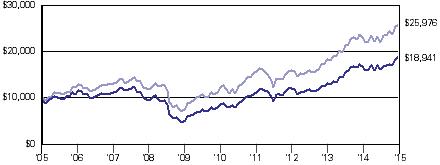
Growth of an Assumed $10,000 Investment (Adjusted for Maximum Sales Charge)
|
 |
 |
|
Yearly periods ended March 31
|
The Fund's growth of an assumed $10,000 investment is adjusted for the maximum sales charge of 5.75%. This results in a net investment of $9,425.
The growth of $10,000 is cumulative.
Performance of other share classes will vary based on the sales charges and the fee structure of those classes.
* Class R shares commenced operations on May 1, 2012. The performance shown for the index is for the time period of April 30, 2012 through March 31, 2015, which is based on the performance period of the life of Class R.
** Class R6 shares commenced operations on August 25, 2014. The performance shown for the index is for the time period of August 31, 2014 through March 31, 2015, which is based on the performance period of the life of Class R6.
† The Russell 2000 Growth Index is an unmanaged, capitalization-weighted measure of 2,000 of the smallest capitalized U.S. companies with a greater-than-average growth orientation and whose common stocks trade on the NYSE, NYSE Alternext US (formerly known as "AMEX") and Nasdaq.
‡ Total returns shown for periods less than one year are not annualized.
|
Class A
|
Class B
|
Class C
|
Class R
|
Class R6
|
Class S
|
Institutional Class
|
||||||||||||||||||||||
|
Net Asset Value
|
||||||||||||||||||||||||||||
|
3/31/15
|
$ | 31.92 | $ | 27.97 | $ | 28.09 | $ | 31.66 | $ | 31.99 | $ | 32.99 | $ | 33.35 | ||||||||||||||
|
9/30/14
|
$ | 30.49 | $ | 27.24 | $ | 27.34 | $ | 30.30 | $ | 30.50 | $ | 31.36 | $ | 31.66 | ||||||||||||||
|
Distribution Information as of 3/3/15
|
||||||||||||||||||||||||||||
|
Capital Gain Distributions, Six Months
|
$ | 3.51 | $ | 3.51 | $ | 3.51 | $ | 3.51 | $ | 3.51 | $ | 3.51 | $ | 3.51 | ||||||||||||||
Joseph Axtell, CFA, Managing Director
Portfolio Manager of the fund. Began managing the fund in 2006.
— Joined Deutsche Asset & Wealth Management in 2001 with 16 years of industry experience; previously, he served as a European Equities Portfolio Manager at Scudder Investments (which was later acquired by Deutsche Bank). Prior to joining, he worked as a Senior Analyst for International Equities at Merrill Lynch Asset Managers, as an International Research Analyst at PCM International and in various investment positions at Prudential Capital Corporation, Prudential-Bache Capital Funding and Prudential Equity Management Associates.
— Portfolio Manager for Global Small Cap and US Small and Mid Cap Equities: New York.
— BS, Carlson School of Management, University of Minnesota.
Rafaelina M. Lee, Managing Director
Portfolio Manager of the fund. Began managing the fund in 2008.
— Joined Deutsche Asset & Wealth Management in 1999 with 15 years of industry experience; previously, she served as a Senior Research Analyst. Prior to joining, she worked as a Latin America Market Strategist at J.P. Morgan Securities. Previously, she was an Equity Strategist at UBS Securities and a Research Analyst in the Portfolio Strategy Group at Goldman Sachs. Her research has been referenced by Harvard University, Duke University, The World Bank, AIMR/CFA publications and in several global finance textbooks.
— Portfolio Manager for US Small and Mid Cap Equities: New York.
— BA in Mathematical Statistics, Columbia University; MBA in Finance, Stern School of Business, New York University; Deutsche Bank Ambassador and member of the DB Philanthropy Committee since 2011.

|
Ten Largest Equity Holdings at March 31, 2015 (16.6% of Net Assets)
|
|
|
1. Providence Service Corp.
Provides privatized family social services
|
1.9%
|
|
2. MAXIMUS, Inc.
Provides program management and consulting services
|
1.8%
|
|
3. Cognex Corp.
Develops and markets machine vision systems
|
1.8%
|
|
4. Centene Corp.
Multi-line managed care organization that provides Medicaid and Medicaid-related programs
|
1.7%
|
|
5. Tyler Technologies, Inc.
Provides end-to-end information management solutions and services for local governments
|
1.6%
|
|
6. Anacor Pharmaceuticals, Inc.
Biopharmaceutical company
|
1.6%
|
|
7. Molina Healthcare, Inc.
Managed care organization
|
1.6%
|
|
8. Ultimate Software Group, Inc.
Designs, markets and supports Web-based and client-servers
|
1.6%
|
|
9. Proofpoint, Inc.
Global provider of enterprise software solutions
|
1.5%
|
|
10. Aspen Technology, Inc.
Provider of prepackaged software
|
1.5%
|
|
Portfolio holdings and characteristics are subject to change.
|
|
|
Shares
|
Value ($)
|
|||||||
|
Common Stocks 92.5%
|
||||||||
|
Consumer Discretionary 15.7%
|
||||||||
|
Auto Components 3.8%
|
||||||||
|
American Axle & Manufacturing Holdings, Inc.*
|
44,957 | 1,161,239 | ||||||
|
Fox Factory Holding Corp.*
|
85,506 | 1,311,662 | ||||||
|
Gentherm, Inc.*
|
35,918 | 1,814,218 | ||||||
|
Tenneco, Inc.*
|
29,597 | 1,699,460 | ||||||
| 5,986,579 | ||||||||
|
Hotels, Restaurants & Leisure 4.6%
|
||||||||
|
Buffalo Wild Wings, Inc.* (a)
|
11,302 | 2,048,374 | ||||||
|
Jack in the Box, Inc.
|
22,072 | 2,117,146 | ||||||
|
Life Time Fitness, Inc.*
|
11,807 | 837,825 | ||||||
|
Red Robin Gourmet Burgers, Inc.* (a)
|
18,319 | 1,593,753 | ||||||
|
Zoe's Kitchen, Inc.*
|
20,633 | 686,873 | ||||||
| 7,283,971 | ||||||||
|
Household Durables 2.4%
|
||||||||
|
iRobot Corp.* (a)
|
52,758 | 1,721,494 | ||||||
|
Ryland Group, Inc.
|
42,748 | 2,083,537 | ||||||
| 3,805,031 | ||||||||
|
Media 0.7%
|
||||||||
|
Sinclair Broadcast Group, Inc. "A" (a)
|
34,213 | 1,074,631 | ||||||
|
Specialty Retail 4.2%
|
||||||||
|
ANN, Inc.*
|
30,974 | 1,270,863 | ||||||
|
DSW, Inc. "A"
|
41,469 | 1,529,377 | ||||||
|
Outerwall, Inc. (a)
|
14,532 | 960,856 | ||||||
|
Penske Automotive Group, Inc.
|
29,616 | 1,524,928 | ||||||
|
The Children's Place, Inc.
|
22,739 | 1,459,616 | ||||||
| 6,745,640 | ||||||||
|
Consumer Staples 3.5%
|
||||||||
|
Food & Staples Retailing 2.5%
|
||||||||
|
Casey's General Stores, Inc.
|
14,959 | 1,347,806 | ||||||
|
The Fresh Market, Inc.* (a)
|
25,393 | 1,031,971 | ||||||
|
United Natural Foods, Inc.*
|
20,118 | 1,549,891 | ||||||
| 3,929,668 | ||||||||
|
Food Products 1.0%
|
||||||||
|
Boulder Brands, Inc.* (a)
|
70,577 | 672,599 | ||||||
|
Hain Celestial Group, Inc.*
|
16,040 | 1,027,362 | ||||||
| 1,699,961 | ||||||||
|
Energy 3.3%
|
||||||||
|
Energy Equipment & Services 0.3%
|
||||||||
|
Dril-Quip, Inc.*
|
5,562 | 380,385 | ||||||
|
Oil, Gas & Consumable Fuels 3.0%
|
||||||||
|
Diamondback Energy, Inc.*
|
20,340 | 1,562,926 | ||||||
|
Gulfport Energy Corp.*
|
17,927 | 823,028 | ||||||
|
Matador Resources Co.* (a)
|
41,150 | 902,008 | ||||||
|
Pacific Ethanol, Inc.* (a)
|
55,233 | 595,964 | ||||||
|
Western Refining, Inc.
|
18,736 | 925,371 | ||||||
| 4,809,297 | ||||||||
|
Financials 5.4%
|
||||||||
|
Banks 3.0%
|
||||||||
|
Banco Latinoamericano de Comercio Exterior SA "E"
|
35,630 | 1,168,308 | ||||||
|
Pinnacle Financial Partners, Inc.
|
33,540 | 1,491,188 | ||||||
|
Talmer Bancorp., Inc. "A"
|
100,715 | 1,542,450 | ||||||
|
TriState Capital Holdings, Inc.*
|
54,252 | 568,019 | ||||||
| 4,769,965 | ||||||||
|
Capital Markets 0.9%
|
||||||||
|
Moelis & Co. "A"
|
46,384 | 1,397,086 | ||||||
|
Consumer Finance 1.5%
|
||||||||
|
Encore Capital Group, Inc.*
|
14,804 | 615,698 | ||||||
|
PRA Group, Inc.* (a)
|
31,720 | 1,723,031 | ||||||
| 2,338,729 | ||||||||
|
Health Care 24.0%
|
||||||||
|
Biotechnology 7.9%
|
||||||||
|
ACADIA Pharmaceuticals, Inc.* (a)
|
32,044 | 1,044,314 | ||||||
|
Anacor Pharmaceuticals, Inc.* (a)
|
43,281 | 2,503,806 | ||||||
|
Bluebird Bio, Inc.*
|
10,484 | 1,266,152 | ||||||
|
Isis Pharmaceuticals, Inc.* (a)
|
21,543 | 1,371,643 | ||||||
|
Neurocrine Biosciences, Inc.*
|
28,624 | 1,136,659 | ||||||
|
Puma Biotechnology, Inc.* (a)
|
6,479 | 1,529,757 | ||||||
|
Retrophin, Inc.*
|
77,029 | 1,845,615 | ||||||
|
Threshold Pharmaceuticals, Inc.* (a)
|
264,118 | 1,072,319 | ||||||
|
Ultragenyx Pharmaceutical, Inc.*
|
11,576 | 718,754 | ||||||
| 12,489,019 | ||||||||
|
Health Care Equipment & Supplies 5.6%
|
||||||||
|
CONMED Corp.
|
28,850 | 1,456,637 | ||||||
|
HeartWare International, Inc.*
|
11,017 | 966,962 | ||||||
|
Sunshine Heart, Inc.*
|
180,881 | 766,935 | ||||||
|
SurModics, Inc.*
|
58,807 | 1,530,746 | ||||||
|
Thoratec Corp.*
|
47,629 | 1,995,179 | ||||||
|
Zeltiq Aesthetics, Inc.*
|
71,805 | 2,213,748 | ||||||
| 8,930,207 | ||||||||
|
Health Care Providers & Services 6.9%
|
||||||||
|
Centene Corp.*
|
38,852 | 2,746,448 | ||||||
|
Kindred Healthcare, Inc.
|
62,893 | 1,496,224 | ||||||
|
Molina Healthcare, Inc.*
|
36,720 | 2,470,889 | ||||||
|
Providence Service Corp.*
|
52,582 | 2,793,156 | ||||||
|
Universal American Corp.*
|
135,315 | 1,445,164 | ||||||
| 10,951,881 | ||||||||
|
Life Sciences Tools & Services 1.0%
|
||||||||
|
PAREXEL International Corp.*
|
23,296 | 1,607,191 | ||||||
|
Pharmaceuticals 2.6%
|
||||||||
|
Flamel Technologies SA (ADR)*
|
126,739 | 2,278,767 | ||||||
|
Pacira Pharmaceuticals, Inc.*
|
20,010 | 1,777,889 | ||||||
| 4,056,656 | ||||||||
|
Industrials 13.8%
|
||||||||
|
Aerospace & Defense 2.2%
|
||||||||
|
DigitalGlobe, Inc.*
|
33,088 | 1,127,308 | ||||||
|
HEICO Corp.
|
37,543 | 2,292,751 | ||||||
| 3,420,059 | ||||||||
|
Airlines 1.1%
|
||||||||
|
JetBlue Airways Corp.* (a)
|
90,376 | 1,739,738 | ||||||
|
Commercial Services & Supplies 0.6%
|
||||||||
|
Team, Inc.*
|
23,834 | 929,049 | ||||||
|
Construction & Engineering 0.7%
|
||||||||
|
Primoris Services Corp.
|
62,209 | 1,069,373 | ||||||
|
Electrical Equipment 1.4%
|
||||||||
|
AZZ, Inc.
|
27,182 | 1,266,409 | ||||||
|
Thermon Group Holdings, Inc.*
|
43,185 | 1,039,463 | ||||||
| 2,305,872 | ||||||||
|
Machinery 2.6%
|
||||||||
|
Altra Industrial Motion Corp.
|
40,800 | 1,127,712 | ||||||
|
Chart Industries, Inc.*
|
11,990 | 420,549 | ||||||
|
Manitex International, Inc.* (a)
|
97,925 | 952,810 | ||||||
|
WABCO Holdings, Inc.*
|
12,911 | 1,586,504 | ||||||
| 4,087,575 | ||||||||
|
Professional Services 3.0%
|
||||||||
|
On Assignment, Inc.*
|
37,113 | 1,424,026 | ||||||
|
TriNet Group, Inc.*
|
37,587 | 1,324,190 | ||||||
|
TrueBlue, Inc.*
|
28,783 | 700,866 | ||||||
|
WageWorks, Inc.*
|
25,138 | 1,340,610 | ||||||
| 4,789,692 | ||||||||
|
Road & Rail 2.2%
|
||||||||
|
Roadrunner Transportation Systems, Inc.*
|
67,991 | 1,718,132 | ||||||
|
Swift Transportation Co.* (a)
|
69,987 | 1,821,062 | ||||||
| 3,539,194 | ||||||||
|
Information Technology 22.9%
|
||||||||
|
Electronic Equipment, Instruments & Components 3.0%
|
||||||||
|
Cognex Corp.*
|
56,803 | 2,816,861 | ||||||
|
IPG Photonics Corp.* (a)
|
20,518 | 1,902,019 | ||||||
| 4,718,880 | ||||||||
|
Internet Software & Services 2.3%
|
||||||||
|
CoStar Group, Inc.*
|
9,687 | 1,916,379 | ||||||
|
WebMD Health Corp.*
|
39,214 | 1,718,946 | ||||||
| 3,635,325 | ||||||||
|
IT Services 4.4%
|
||||||||
|
Cardtronics, Inc.*
|
52,801 | 1,985,318 | ||||||
|
MAXIMUS, Inc.
|
43,563 | 2,908,266 | ||||||
|
Virtusa Corp.*
|
51,627 | 2,136,325 | ||||||
| 7,029,909 | ||||||||
|
Semiconductors & Semiconductor Equipment 4.6%
|
||||||||
|
Advanced Energy Industries, Inc.*
|
55,045 | 1,412,455 | ||||||
|
Cavium, Inc.*
|
30,134 | 2,134,090 | ||||||
|
Qorvo, Inc.*
|
18,555 | 1,478,833 | ||||||
|
SunEdison, Inc.* (a)
|
59,535 | 1,428,840 | ||||||
|
Ultra Clean Holdings, Inc.*
|
110,632 | 791,019 | ||||||
| 7,245,237 | ||||||||
|
Software 8.1%
|
||||||||
|
Aspen Technology, Inc.*
|
60,388 | 2,324,334 | ||||||
|
Proofpoint, Inc.* (a)
|
40,400 | 2,392,488 | ||||||
|
PTC, Inc.*
|
31,113 | 1,125,357 | ||||||
|
TiVo, Inc.*
|
96,649 | 1,025,446 | ||||||
|
Tyler Technologies, Inc.*
|
21,747 | 2,621,166 | ||||||
|
Ultimate Software Group, Inc.*
|
14,523 | 2,468,256 | ||||||
|
Varonis Systems, Inc.*
|
33,889 | 869,592 | ||||||
| 12,826,639 | ||||||||
|
Technology Hardware, Storage & Peripherals 0.5%
|
||||||||
|
Super Micro Computer, Inc.*
|
27,030 | 897,666 | ||||||
|
Materials 3.9%
|
||||||||
|
Chemicals 1.7%
|
||||||||
|
A Schulman, Inc.
|
28,324 | 1,365,217 | ||||||
|
Minerals Technologies, Inc.
|
18,404 | 1,345,332 | ||||||
| 2,710,549 | ||||||||
|
Construction Materials 0.6%
|
||||||||
|
Eagle Materials, Inc.
|
12,037 | 1,005,812 | ||||||
|
Containers & Packaging 0.6%
|
||||||||
|
Berry Plastics Group, Inc.*
|
26,951 | 975,357 | ||||||
|
Metals & Mining 1.0%
|
||||||||
|
Constellium NV "A"*
|
51,392 | 1,044,284 | ||||||
|
Haynes International, Inc.
|
10,244 | 456,985 | ||||||
| 1,501,269 | ||||||||
|
Total Common Stocks (Cost $109,732,696)
|
146,683,092 | |||||||
|
Convertible Preferred Stock 0.2%
|
||||||||
|
Health Care
|
||||||||
|
Providence Service Corp., 5.5%, (Cost $212,100)
|
2,121 | 254,265 | ||||||
|
Rights 0.1%
|
||||||||
|
Health Care
|
||||||||
|
Furiex Pharmaceuticals, Inc.* (Cost $140,756)
|
14,407 | 140,756 | ||||||
|
Exchange-Traded Funds 1.2%
|
||||||||
|
SPDR S&P Biotech ETF (a)
|
5,298 | 1,194,699 | ||||||
|
SPDR S&P Oil & Gas Exploration & Production ETF (a)
|
13,563 | 700,665 | ||||||
|
Total Exchange-Traded Funds (Cost $1,430,104)
|
1,895,364 | |||||||
|
Securities Lending Collateral 16.8%
|
||||||||
|
Daily Assets Fund Institutional, 0.11% (b) (c) (Cost $26,672,072)
|
26,672,072 | 26,672,072 | ||||||
|
Cash Equivalents 4.2%
|
||||||||
|
Central Cash Management Fund, 0.08% (b) (Cost $6,576,555)
|
6,576,555 | 6,576,555 | ||||||
|
% of Net Assets
|
Value ($)
|
|||||||
|
Total Investment Portfolio (Cost $144,764,283)†
|
115.0 | 182,222,104 | ||||||
|
Other Assets and Liabilities, Net
|
(15.0 | ) | (23,725,798 | ) | ||||
|
Net Assets
|
100.0 | 158,496,306 | ||||||
* Non-income producing security.
† The cost for federal income tax purposes was $145,831,530. At March 31, 2015, net unrealized appreciation for all securities based on tax cost was $36,390,574. This consisted of aggregate gross unrealized appreciation for all securities in which there was an excess of value over tax cost of $39,971,056 and aggregate gross unrealized depreciation for all securities in which there was an excess of tax cost over value of $3,580,482.
(a) All or a portion of these securities were on loan. In addition, "Other Assets and Liabilities, Net" may include pending sales that are also on loan. The value of securities loaned at March 31, 2015 amounted to $25,788,910, which is 16.3% of net assets.
(b) Affiliated fund managed by Deutsche Investment Management Americas Inc. The rate shown is the annualized seven-day yield at period end.
(c) Represents collateral held in connection with securities lending. Income earned by the Fund is net of borrower rebates.
ADR: American Depositary Receipt
S&P: Standard & Poor's
SPDR: Standard & Poor's Depositary Receipt
Fair Value Measurements
Various inputs are used in determining the value of the Fund's investments. These inputs are summarized in three broad levels. Level 1 includes quoted prices in active markets for identical securities. Level 2 includes other significant observable inputs (including quoted prices for similar securities, interest rates, prepayment speeds and credit risk). Level 3 includes significant unobservable inputs (including the Fund's own assumptions in determining the fair value of investments). The level assigned to the securities valuations may not be an indication of the risk or liquidity associated with investing in those securities.
The following is a summary of the inputs used as of March 31, 2015 in valuing the Fund's investments. For information on the Fund's policy regarding the valuation of investments, please refer to the Security Valuation section of Note A in the accompanying Notes to Financial Statements.
|
Assets
|
Level 1
|
Level 2
|
Level 3
|
Total
|
||||||||||||
|
Common Stocks (d)
|
$ | 146,683,092 | $ | — | $ | — | $ | 146,683,092 | ||||||||
|
Convertible Preferred Stock
|
— | — | 254,265 | 254,265 | ||||||||||||
|
Rights
|
— | — | 140,756 | 140,756 | ||||||||||||
|
Exchange-Traded Funds
|
1,895,364 | — | — | 1,895,364 | ||||||||||||
|
Short-Term Investments (d)
|
33,248,627 | — | — | 33,248,627 | ||||||||||||
|
Total
|
$ | 181,827,083 | $ | — | $ | 395,021 | $ | 182,222,104 | ||||||||
There have been no transfers between fair value measurement levels during the period ended March 31, 2015.
(d) See Investment Portfolio for additional detailed categorizations.
The accompanying notes are an integral part of the financial statements.
|
as of March 31, 2015 (Unaudited)
|
||||
|
Assets
|
||||
|
Investments:
Investments in non-affiliated securities, at value (cost $111,515,656) — including $25,788,910 of securities loaned
|
$ | 148,973,477 | ||
|
Investment in Daily Assets Fund Institutional (cost $26,672,072)*
|
26,672,072 | |||
|
Investment in Central Cash Management Fund (cost $6,576,555)
|
6,576,555 | |||
|
Total investments, at value (cost $144,764,283)
|
182,222,104 | |||
|
Cash
|
10,000 | |||
|
Foreign currency, at value (cost $672)
|
595 | |||
|
Receivable for investments sold
|
151,742 | |||
|
Receivable for Fund shares sold
|
4,855,182 | |||
|
Dividends receivable
|
20,702 | |||
|
Interest receivable
|
10,354 | |||
|
Other assets
|
69,156 | |||
|
Total assets
|
187,339,835 | |||
|
Liabilities
|
||||
|
Payable upon return of securities loaned
|
26,672,072 | |||
|
Payable for investments purchased
|
1,452,573 | |||
|
Payable for Fund shares redeemed
|
469,080 | |||
|
Accrued management fee
|
83,729 | |||
|
Accrued Trustees' fees
|
90 | |||
|
Other accrued expenses and payables
|
165,985 | |||
|
Total liabilities
|
28,843,529 | |||
|
Net assets, at value
|
$ | 158,496,306 | ||
|
Net Assets Consist of
|
||||
|
Accumulated net investment loss
|
(535,437 | ) | ||
|
Net unrealized appreciation (depreciation) on:
Investments
|
37,457,821 | |||
|
Foreign currency
|
(77 | ) | ||
|
Accumulated net realized gain (loss)
|
2,145,247 | |||
|
Paid-in capital
|
119,428,752 | |||
|
Net assets, at value
|
$ | 158,496,306 | ||
* Represents collateral on securities loaned.
The accompanying notes are an integral part of the financial statements.
|
Statement of Assets and Liabilities as of March 31, 2015 (Unaudited) (continued)
|
||||
|
Net Asset Value
|
||||
|
Class A
Net Asset Value and redemption price(a) per share ($37,662,903 ÷ 1,179,822 outstanding shares of beneficial interest, $.01 par value, unlimited number of shares authorized)
|
$ | 31.92 | ||
|
Maximum offering price per share (100 ÷ 94.25 of $31.92)
|
$ | 33.87 | ||
|
Class B
Net Asset Value, offering and redemption price(a) per share ($124,392 ÷ 4,447 outstanding shares of beneficial interest, $.01 par value, unlimited number of shares authorized)
|
$ | 27.97 | ||
|
Class C
Net Asset Value, offering and redemption price(a) (subject to contingent deferred sales charge) per share ($5,951,772 ÷ 211,885 outstanding shares of beneficial interest, $.01 par value, unlimited number of shares authorized)
|
$ | 28.09 | ||
|
Class R
Net Asset Value, offering and redemption price(a) per share ($2,239,112 ÷ 70,729 outstanding shares of beneficial interest, $.01 par value, unlimited number of shares authorized)
|
$ | 31.66 | ||
|
Class R6
Net Asset Value, offering and redemption price(a) per share ($11,322 ÷ 353.97 outstanding shares of beneficial interest, $.01 par value, unlimited number of shares authorized)
|
$ | 31.99 | ||
|
Class S
Net Asset Value, offering and redemption price(a) per share ($110,482,152 ÷ 3,348,878 outstanding shares of beneficial interest, $.01 par value, unlimited number of shares authorized)
|
$ | 32.99 | ||
|
Institutional Class
Net Asset Value, offering and redemption price(a) per share ($2,024,653 ÷ 60,707 outstanding shares of beneficial interest, $.01 par value, unlimited number of shares authorized)
|
$ | 33.35 | ||
(a) Redemption price per share for shares held less than 15 days is equal to net asset value less a 2% redemption fee.
The accompanying notes are an integral part of the financial statements.
|
for the six months ended March 31, 2015 (Unaudited)
|
||||
|
Investment Income
|
||||
|
Income:
Dividends
|
$ | 232,855 | ||
|
Income distributions — Central Cash Management Fund
|
1,337 | |||
|
Securities lending income, including income from Daily Assets Fund Institutional, net of borrower rebates
|
71,144 | |||
|
Total income
|
305,336 | |||
|
Expenses:
Management fee
|
431,979 | |||
|
Administration fee
|
66,458 | |||
|
Services to shareholders
|
147,211 | |||
|
Distribution and service fees
|
71,589 | |||
|
Custodian fee
|
6,035 | |||
|
Professional fees
|
43,631 | |||
|
Reports to shareholders
|
21,133 | |||
|
Registration fees
|
40,987 | |||
|
Trustees' fees and expenses
|
3,184 | |||
|
Other
|
7,877 | |||
|
Total expenses before expense reductions
|
840,084 | |||
|
Expense reductions
|
(96 | ) | ||
|
Total expenses after expense reductions
|
839,988 | |||
|
Net investment income (loss)
|
(534,652 | ) | ||
|
Realized and Unrealized Gain (Loss)
|
||||
|
Net realized gain (loss) from investments
|
2,899,447 | |||
|
Change in net unrealized appreciation (depreciation) on:
Investments
|
20,265,174 | |||
|
Foreign currency
|
(78 | ) | ||
| 20,265,096 | ||||
|
Net gain (loss)
|
23,164,543 | |||
|
Net increase (decrease) in net assets resulting from operations
|
$ | 22,629,891 | ||
The accompanying notes are an integral part of the financial statements.
|
Increase (Decrease) in Net Assets
|
Six Months Ended March 31, 2015 (Unaudited)
|
Years Ended September 30, 2014
|
||||||
|
Operations:
Net investment income (loss)
|
$ | (534,652 | ) | $ | (988,961 | ) | ||
|
Operations:
Net investment income (loss)
|
$ | (534,652 | ) | $ | (988,961 | ) | ||
|
Net realized gain (loss)
|
2,899,447 | 15,171,695 | ||||||
|
Change in net unrealized appreciation (depreciation)
|
20,265,096 | (9,840,976 | ) | |||||
|
Net increase (decrease) in net assets resulting from operations
|
22,629,891 | 4,341,758 | ||||||
|
Distributions to shareholders from:
Net realized gains:
Class A
|
(3,567,899 | ) | (2,894,895 | ) | ||||
|
Class B
|
(15,640 | ) | (23,789 | ) | ||||
|
Class C
|
(674,211 | ) | (525,996 | ) | ||||
|
Class R
|
(154,366 | ) | (11,725 | ) | ||||
|
Class R6
|
(1,105 | ) | (11,725 | ) | ||||
|
Class S
|
(9,174,512 | ) | (7,624,601 | ) | ||||
|
Institutional Class
|
(217,510 | ) | (80,273 | ) | ||||
|
Total distributions
|
(13,805,243 | ) | (11,161,279 | ) | ||||
|
Fund share transactions:
Proceeds from shares sold
|
39,892,319 | 56,973,782 | ||||||
|
Reinvestment of distributions
|
12,917,650 | 10,126,828 | ||||||
|
Payments for shares redeemed
|
(21,080,290 | ) | (52,184,930 | ) | ||||
|
Redemption fees
|
540 | 2,830 | ||||||
|
Net increase (decrease) in net assets from Fund share transactions
|
31,730,219 | 14,918,510 | ||||||
|
Increase (decrease) in net assets
|
40,554,867 | 8,098,989 | ||||||
|
Net assets at beginning of period
|
117,941,439 | 109,842,450 | ||||||
|
Net assets at end of period (including accumulated net investment loss of $535,437 and $785, respectively)
|
$ | 158,496,306 | $ | 117,941,439 | ||||
The accompanying notes are an integral part of the financial statements.
|
Years Ended September 30,
|
||||||||||||||||||||||||
|
Class A
|
Six Months Ended 3/31/15 (Unaudited)
|
2014
|
2013
|
2012
|
2011
|
2010
|
||||||||||||||||||
|
Selected Per Share Data
|
||||||||||||||||||||||||
|
Net asset value, beginning of period
|
$ | 30.49 | $ | 32.30 | $ | 24.37 | $ | 19.28 | $ | 18.31 | $ | 15.26 | ||||||||||||
|
Income (loss) from investment operations:
Net investment income (loss)a
|
(.14 | ) | (.29 | ) | (.11 | ) | (.21 | ) | (.19 | ) | (.15 | ) | ||||||||||||
|
Net realized and unrealized gain (loss)
|
5.08 | 1.48 | 8.04 | 5.30 | 1.16 | 3.14 | ||||||||||||||||||
|
Total from investment operations
|
4.94 | 1.19 | 7.93 | 5.09 | .97 | 2.99 | ||||||||||||||||||
|
Less distributions from:
Net realized gains
|
(3.51 | ) | (3.00 | ) | — | — | — | — | ||||||||||||||||
|
Increase from regulatory settlements
|
— | — | — | — | — | .06 | d | |||||||||||||||||
|
Redemption fees
|
.00 | *** | .00 | *** | .00 | *** | .00 | *** | .00 | *** | .00 | *** | ||||||||||||
|
Net asset value, end of period
|
$ | 31.92 | $ | 30.49 | $ | 32.30 | $ | 24.37 | $ | 19.28 | $ | 18.31 | ||||||||||||
|
Total Return (%)b
|
17.82 | ** | 3.71 | c | 32.54 | 26.40 | 5.30 | 19.99 | c,d | |||||||||||||||
|
Ratios to Average Net Assets and Supplemental Data
|
||||||||||||||||||||||||
|
Net assets, end of period ($ millions)
|
38 | 32 | 31 | 29 | 25 | 27 | ||||||||||||||||||
|
Ratio of expenses before expense reductions (%)
|
1.42 | * | 1.41 | 1.47 | 1.46 | 1.51 | 1.52 | |||||||||||||||||
|
Ratio of expenses after expense reductions (%)
|
1.42 | * | 1.39 | 1.47 | 1.46 | 1.51 | 1.42 | |||||||||||||||||
|
Ratio of net investment income (loss) (%)
|
(.95 | )* | (.92 | ) | (.41 | ) | (.91 | ) | (.87 | ) | (.91 | ) | ||||||||||||
|
Portfolio turnover rate (%)
|
25 | ** | 72 | 74 | 81 | 67 | 66 | |||||||||||||||||
|
a Based on average shares outstanding during the period.
b Total return does not reflect the effect of any sales charges.
c Total return would have been lower had certain expenses not been reduced.
d Includes a non-recurring payment from the Advisor which amounted to $0.056 per share recorded as a result of the Advisor's settlement with the SEC and NY Attorney General in connection with certain trading arrangements. The Fund also received $0.001 per share of non-affiliated regulatory settlements. Excluding these non-recurring payments, total return would have been 0.38% lower.
* Annualized
** Not annualized
*** Amount is less than $.005.
|
||||||||||||||||||||||||
|
Years Ended September 30,
|
||||||||||||||||||||||||
|
Class B
|
Six Months Ended 3/31/15 (Unaudited)
|
2014
|
2013
|
2012
|
2011
|
2010
|
||||||||||||||||||
|
Selected Per Share Data
|
||||||||||||||||||||||||
|
Net asset value, beginning of period
|
$ | 27.24 | $ | 29.37 | $ | 22.33 | $ | 17.80 | $ | 17.05 | $ | 14.34 | ||||||||||||
|
Income (loss) from investment operations:
Net investment income (loss)a
|
(.23 | ) | (.48 | ) | (.28 | ) | (.37 | ) | (.33 | ) | (.26 | ) | ||||||||||||
|
Net realized and unrealized gain (loss)
|
4.47 | 1.35 | 7.32 | 4.90 | 1.08 | 2.92 | ||||||||||||||||||
|
Total from investment operations
|
4.24 | .87 | 7.04 | 4.53 | .75 | 2.66 | ||||||||||||||||||
|
Less distributions from:
Net realized gains
|
(3.51 | ) | (3.00 | ) | — | — | — | — | ||||||||||||||||
|
Increase from regulatory settlements
|
— | — | — | — | — | .05 | d | |||||||||||||||||
|
Redemption fees
|
.00 | *** | .00 | *** | .00 | *** | .00 | *** | .00 | *** | .00 | *** | ||||||||||||
|
Net asset value, end of period
|
$ | 27.97 | $ | 27.24 | $ | 29.37 | $ | 22.33 | $ | 17.80 | $ | 17.05 | ||||||||||||
|
Total Return (%)b,c
|
17.35 | ** | 2.94 | 31.53 | 25.45 | 4.40 | 18.90 | d | ||||||||||||||||
|
Ratios to Average Net Assets and Supplemental Data
|
||||||||||||||||||||||||
|
Net assets, end of period ($ millions)
|
.12 | .14 | .28 | .28 | .33 | 1 | ||||||||||||||||||
|
Ratio of expenses before expense reductions (%)
|
2.37 | * | 2.26 | 2.39 | 2.47 | 2.46 | 2.56 | |||||||||||||||||
|
Ratio of expenses after expense reductions (%)
|
2.22 | * | 2.14 | 2.23 | 2.26 | 2.35 | 2.21 | |||||||||||||||||
|
Ratio of net investment income (loss) (%)
|
(1.75 | )* | (1.67 | ) | (1.15 | ) | (1.72 | ) | (1.71 | ) | (1.70 | ) | ||||||||||||
|
Portfolio turnover rate (%)
|
25 | ** | 72 | 74 | 81 | 67 | 66 | |||||||||||||||||
|
a Based on average shares outstanding during the period.
b Total return does not reflect the effect of any sales charges.
c Total return would have been lower had certain expenses not been reduced.
d Includes a non-recurring payment from the Advisor which amounted to $0.052 per share recorded as a result of the Advisor's settlement with the SEC and NY Attorney General in connection with certain trading arrangements. The Fund also received $0.001 per share of non-affiliated regulatory settlements. Excluding these non-recurring payments, total return would have been 0.38% lower.
* Annualized
** Not annualized
*** Amount is less than $.005.
|
||||||||||||||||||||||||
|
Years Ended September 30,
|
||||||||||||||||||||||||
|
Class C
|
Six Months Ended 3/31/15 (Unaudited)
|
2014
|
2013
|
2012
|
2011
|
2010
|
||||||||||||||||||
|
Selected Per Share Data
|
||||||||||||||||||||||||
|
Net asset value, beginning of period
|
$ | 27.34 | $ | 29.47 | $ | 22.40 | $ | 17.86 | $ | 17.07 | $ | 14.34 | ||||||||||||
|
Income (loss) from investment operations:
Net investment income (loss)a
|
(.23 | ) | (.48 | ) | (.29 | ) | (.36 | ) | (.31 | ) | (.25 | ) | ||||||||||||
|
Net realized and unrealized gain (loss)
|
4.49 | 1.35 | 7.36 | 4.90 | 1.10 | 2.93 | ||||||||||||||||||
|
Total from investment operations
|
4.26 | .87 | 7.07 | 4.54 | .79 | 2.68 | ||||||||||||||||||
|
Less distributions from:
Net realized gains
|
(3.51 | ) | (3.00 | ) | — | — | — | — | ||||||||||||||||
|
Increase from regulatory settlements
|
— | — | — | — | — | .05 | d | |||||||||||||||||
|
Redemption fees
|
.00 | *** | .00 | *** | .00 | *** | .00 | *** | .00 | *** | .00 | *** | ||||||||||||
|
Net asset value, end of period
|
$ | 28.09 | $ | 27.34 | $ | 29.47 | $ | 22.40 | $ | 17.86 | $ | 17.07 | ||||||||||||
|
Total Return (%)b
|
17.36 | ** | 2.93 | c | 31.56 | 25.42 | 4.63 | 19.04 | c,d | |||||||||||||||
|
Ratios to Average Net Assets and Supplemental Data
|
||||||||||||||||||||||||
|
Net assets, end of period ($ millions)
|
6 | 5 | 5 | 4 | 4 | 4 | ||||||||||||||||||
|
Ratio of expenses before expense reductions (%)
|
2.20 | * | 2.19 | 2.22 | 2.22 | 2.22 | 2.32 | |||||||||||||||||
|
Ratio of expenses after expense reductions (%)
|
2.20 | * | 2.14 | 2.22 | 2.22 | 2.22 | 2.18 | |||||||||||||||||
|
Ratio of net investment income (loss) (%)
|
(1.73 | )* | (1.67 | ) | (1.16 | ) | (1.68 | ) | (1.58 | ) | (1.67 | ) | ||||||||||||
|
Portfolio turnover rate (%)
|
25 | ** | 72 | 74 | 81 | 67 | 66 | |||||||||||||||||
|
a Based on average shares outstanding during the period.
b Total return does not reflect the effect of any sales charges.
c Total return would have been lower had certain expenses not been reduced.
d Includes a non-recurring payment from the Advisor which amounted to $0.053 per share recorded as a result of the Advisor's settlement with the SEC and NY Attorney General in connection with certain trading arrangements. The Fund also received $0.001 per share of non-affiliated regulatory settlements. Excluding these non-recurring payments, total return would have been 0.38% lower.
* Annualized
** Not annualized
*** Amount is less than $.005.
|
||||||||||||||||||||||||
|
Years Ended September 30,
|
||||||||||||||||
|
Class R
|
Six Months Ended 3/31/15 (Unaudited)
|
2014
|
2013
|
Period Ended 9/30/12a
|
||||||||||||
|
Selected Per Share Data
|
||||||||||||||||
|
Net asset value, beginning of period
|
$ | 30.30 | $ | 32.18 | $ | 24.33 | $ | 24.40 | ||||||||
|
Income (loss) from investment operations:
Net investment income (loss)b
|
(.18 | ) | (.37 | ) | (.25 | ) | (.11 | ) | ||||||||
|
Net realized and unrealized gain (loss)
|
5.05 | 1.49 | 8.10 | .04 | ||||||||||||
|
Total from investment operations
|
4.87 | 1.12 | 7.85 | (.07 | ) | |||||||||||
|
Less distributions from:
Net realized gains
|
(3.51 | ) | (3.00 | ) | — | — | ||||||||||
|
Redemption fees
|
.00 | *** | .00 | *** | .00 | *** | .00 | *** | ||||||||
|
Net asset value, end of period
|
$ | 31.66 | $ | 30.30 | $ | 32.18 | $ | 24.33 | ||||||||
|
Total Return (%)
|
17.70 | ** | 3.50 | 32.26 | c | (.29 | )c** | |||||||||
|
Ratios to Average Net Assets and Supplemental Data
|
||||||||||||||||
|
Net assets, end of period ($ thousands)
|
2,239 | 1,084 | 115 | 3 | ||||||||||||
|
Ratio of expenses before expense reductions (%)
|
1.67 | * | 1.63 | 1.81 | 3.46 | * | ||||||||||
|
Ratio of expenses after expense reductions (%)
|
1.67 | * | 1.63 | 1.73 | 1.76 | * | ||||||||||
|
Ratio of net investment income (loss) (%)
|
(1.21 | )* | (1.18 | ) | (.88 | ) | (1.14 | )* | ||||||||
|
Portfolio turnover rate (%)
|
25 | ** | 72 | 74 | 81 | d | ||||||||||
|
a For the period from May 1, 2012 (commencement of operations) to September 30, 2012.
b Based on average shares outstanding during the period.
c Total return would have been lower had certain expenses not been reduced.
d Represents the Fund's portfolio turnover rate for the year ended September 30, 2012.
* Annualized
** Not annualized
*** Amount is less than $.005.
|
||||||||||||||||
|
Class R6
|
Six Months Ended 3/31/15 (Unaudited)
|
Period Ended 9/30/14a
|
||||||
|
Selected Per Share Data
|
||||||||
|
Net asset value, beginning of period
|
$ | 30.50 | $ | 31.79 | ||||
|
Income (loss) from investment operations:
Net investment income (loss)b
|
(.10 | ) | (.02 | ) | ||||
|
Net realized and unrealized gain (loss)
|
5.10 | (1.27 | ) | |||||
|
Total from investment operations
|
5.00 | (1.29 | ) | |||||
|
Less distributions from:
Net realized gains
|
(3.51 | ) | — | |||||
|
Redemption fees
|
.00 | *** | .00 | *** | ||||
|
Net asset value, end of period
|
$ | 31.99 | $ | 30.50 | ||||
|
Total Return (%)
|
18.03 | ** | (4.06 | )** | ||||
|
Ratios to Average Net Assets and Supplemental Data
|
||||||||
|
Net assets, end of period ($ thousands)
|
11 | 10 | ||||||
|
Ratio of expense (%)
|
1.12 | * | 1.02 | * | ||||
|
Ratio of net investment income (loss) (%)
|
(.65 | )* | (.60 | )* | ||||
|
Portfolio turnover rate (%)
|
25 | ** | 72 | c | ||||
|
a For the period from August 25, 2014 (commencement of operations) to September 30, 2014.
b Based on average shares outstanding during the period.
c Represents the Fund's portfolio turnover rate for the year ended September 30, 2014.
* Annualized
** Not annualized
*** Amount is less than $.005.
|
||||||||
|
Years Ended September 30,
|
||||||||||||||||||||||||
|
Class S
|
Six Months Ended 3/31/15 (Unaudited)
|
2014
|
2013
|
2012
|
2011
|
2010
|
||||||||||||||||||
|
Selected Per Share Data
|
||||||||||||||||||||||||
|
Net asset value, beginning of period
|
$ | 31.36 | $ | 33.06 | $ | 24.88 | $ | 19.64 | $ | 18.60 | $ | 15.45 | ||||||||||||
|
Income (loss) from investment operations:
Net investment income (loss)a
|
(.11 | ) | (.22 | ) | (.05 | ) | (.16 | ) | (.14 | ) | (.09 | ) | ||||||||||||
|
Net realized and unrealized gain (loss)
|
5.25 | 1.52 | 8.23 | 5.40 | 1.18 | 3.18 | ||||||||||||||||||
|
Total from investment operations
|
5.14 | 1.30 | 8.18 | 5.24 | 1.04 | 3.09 | ||||||||||||||||||
|
Less distributions from:
Net realized gains
|
(3.51 | ) | (3.00 | ) | — | — | — | — | ||||||||||||||||
|
Increase from regulatory settlements
|
— | — | — | — | — | .06 | c | |||||||||||||||||
|
Redemption fees
|
.00 | *** | .00 | *** | .00 | *** | .00 | *** | .00 | *** | .00 | *** | ||||||||||||
|
Net asset value, end of period
|
$ | 32.99 | $ | 31.36 | $ | 33.06 | $ | 24.88 | $ | 19.64 | $ | 18.60 | ||||||||||||
|
Total Return (%)
|
17.98 | ** | 3.98 | b | 32.88 | b | 26.68 | 5.59 | 20.39 | b,c | ||||||||||||||
|
Ratios to Average Net Assets and Supplemental Data
|
||||||||||||||||||||||||
|
Net assets, end of period ($ millions)
|
110 | 78 | 72 | 63 | 46 | 47 | ||||||||||||||||||
|
Ratio of expenses before expense reductions (%)
|
1.15 | * | 1.16 | 1.23 | 1.24 | 1.26 | 1.19 | |||||||||||||||||
|
Ratio of expenses after expense reductions (%)
|
1.15 | * | 1.14 | 1.23 | 1.24 | 1.26 | 1.04 | |||||||||||||||||
|
Ratio of net investment income (loss) (%)
|
(.69 | )* | (.67 | ) | (.16 | ) | (.69 | ) | (.62 | ) | (.53 | ) | ||||||||||||
|
Portfolio turnover rate (%)
|
25 | ** | 72 | 74 | 81 | 67 | 66 | |||||||||||||||||
|
a Based on average shares outstanding during the period.
b Total return would have been lower had certain expenses not been reduced.
c Includes a non-recurring payment from the Advisor which amounted to $0.057 per share recorded as a result of the Advisor's settlement with the SEC and NY Attorney General in connection with certain trading arrangements. The Fund also received $0.001 per share of non-affiliated regulatory settlements. Excluding these non-recurring payments, total return would have been 0.38% lower.
* Annualized
** Not annualized
*** Amount is less than $.005.
|
||||||||||||||||||||||||
|
Years Ended September 30,
|
||||||||||||||||||||||||
|
Institutional Class
|
Six Months Ended 3/31/15 (Unaudited)
|
2014
|
2013
|
2012
|
2011
|
2010
|
||||||||||||||||||
|
Selected Per Share Data
|
||||||||||||||||||||||||
|
Net asset value, beginning of period
|
$ | 31.66 | $ | 33.33 | $ | 25.04 | $ | 19.72 | $ | 18.62 | $ | 15.47 | ||||||||||||
|
Income (loss) from investment operations:
Net investment income (loss)a
|
(.09 | ) | (.21 | ) | .13 | (.11 | ) | (.08 | ) | (.08 | ) | |||||||||||||
|
Net realized and unrealized gain (loss)
|
5.29 | 1.54 | 8.16 | 5.43 | 1.18 | 3.17 | ||||||||||||||||||
|
Total from investment operations
|
5.20 | 1.33 | 8.29 | 5.32 | 1.10 | 3.09 | ||||||||||||||||||
|
Less distributions from:
Net realized gains
|
(3.51 | ) | (3.00 | ) | — | — | — | — | ||||||||||||||||
|
Increase from regulatory settlements
|
— | — | — | — | — | .06 | c | |||||||||||||||||
|
Redemption fees
|
.00 | *** | .00 | *** | .00 | *** | .00 | *** | .00 | *** | .00 | *** | ||||||||||||
|
Net asset value, end of period
|
$ | 33.35 | $ | 31.66 | $ | 33.33 | $ | 25.04 | $ | 19.72 | $ | 18.62 | ||||||||||||
|
Total Return (%)
|
18.04 | ** | 4.01 | 33.11 | 26.98 | 5.91 | 20.36 | b,c | ||||||||||||||||
|
Ratios to Average Net Assets and Supplemental Data
|
||||||||||||||||||||||||
|
Net assets, end of period ($ millions)
|
2 | 1 | 1 | 10 | 7 | 5 | ||||||||||||||||||
|
Ratio of expenses before expense reductions (%)
|
1.05 | * | 1.11 | 1.03 | .99 | 1.00 | 1.00 | |||||||||||||||||
|
Ratio of expenses after expense reductions (%)
|
1.05 | * | 1.11 | 1.03 | .99 | 1.00 | .98 | |||||||||||||||||
|
Ratio of net investment income (loss) (%)
|
(.59 | )* | (.64 | ) | .49 | (.46 | ) | (.36 | ) | (.47 | ) | |||||||||||||
|
Portfolio turnover rate (%)
|
25 | ** | 72 | 74 | 81 | 67 | 66 | |||||||||||||||||
|
a Based on average shares outstanding during the period.
b Total return would have been lower had certain expenses not been reduced.
c Includes a non-recurring payment from the Advisor which amounted to $0.057 per share recorded as a result of the Advisor's settlement with the SEC and NY Attorney General in connection with certain trading arrangements. The Fund also received $0.001 per share of non-affiliated regulatory settlements. Excluding these non-recurring payments, total return would have been 0.38% lower.
* Annualized
** Not annualized
*** Amount is less than $.005.
|
||||||||||||||||||||||||
A. Organization and Significant Accounting Policies
Deutsche Small Cap Growth Fund (the "Fund") is a diversified series of Deutsche Investment Trust (the "Trust"), which is registered under the Investment Company Act of 1940, as amended (the "1940 Act"), as an open-end management investment company organized as a Massachusetts business trust.
The Fund offers multiple classes of shares which provide investors with different purchase options. Class A shares are subject to an initial sales charge. Class B shares are closed to new purchases, except exchanges and the reinvestment of dividends or other distributions. Class B shares were not subject to an initial sales charge and are subject to higher ongoing expenses than Class A shares and a contingent deferred sales charge payable upon certain redemptions. Class B shares automatically convert to Class A shares six years after issuance. Class C shares are not subject to an initial sales charge and are subject to higher ongoing expenses than Class A shares and a contingent deferred sales charge payable upon certain redemptions within one year of purchase. Class C shares do not automatically convert into another class. Class R shares and Class R6 shares are not subject to initial or contingent deferred sales charges and are generally available only to certain retirement plans. Class S shares are not subject to initial or contingent deferred sales charges and are only available to a limited group of investors. Institutional Class shares are not subject to initial or contingent deferred sales charges and are generally available only to qualified institutions.
Investment income, realized and unrealized gains and losses, and certain fund-level expenses and expense reductions, if any, are borne pro rata on the basis of relative net assets by the holders of all classes of shares, except that each class bears certain expenses unique to that class such as distribution and service fees, services to shareholders and certain other class-specific expenses. Differences in class-level expenses may result in payment of different per share dividends by class. All shares of the Fund have equal rights with respect to voting subject to class-specific arrangements.
The Fund's financial statements are prepared in accordance with accounting principles generally accepted in the United States of America which require the use of management estimates. Actual results could differ from those estimates. The policies described below are followed consistently by the Fund in the preparation of its financial statements.
Security Valuation. Investments are stated at value determined as of the close of regular trading on the New York Stock Exchange on each day the exchange is open for trading.
Various inputs are used in determining the value of the Fund's investments. These inputs are summarized in three broad levels. Level 1 includes quoted prices in active markets for identical securities. Level 2 includes other significant observable inputs (including quoted prices for similar securities, interest rates, prepayment speeds and credit risk). Level 3 includes significant unobservable inputs (including the Fund's own assumptions in determining the fair value of investments). The level assigned to the securities valuations may not be an indication of the risk or liquidity associated with investing in those securities.
Equity securities and exchange-traded funds ("ETFs") are valued at the most recent sale price or official closing price reported on the exchange (U.S. or foreign) or over-the-counter market on which they trade. Securities for which no sales are reported are valued at the calculated mean between the most recent bid and asked quotations on the relevant market or, if a mean cannot be determined, at the most recent bid quotation. Equity securities and ETFs are generally categorized as Level 1.
Investments in open-end investment companies are valued at their net asset value each business day and are categorized as Level 1.
Securities and other assets for which market quotations are not readily available or for which the above valuation procedures are deemed not to reflect fair value are valued in a manner that is intended to reflect their fair value as determined in accordance with procedures approved by the Board and are generally categorized as Level 3. In accordance with the Fund's valuation procedures, factors considered in determining value may include, but are not limited to, the type of the security; the size of the holding; the initial cost of the security; the existence of any contractual restrictions on the security's disposition; the price and extent of public trading in similar securities of the issuer or of comparable companies; quotations or evaluated prices from broker-dealers and/or pricing services; information obtained from the issuer, analysts, and/or the appropriate stock exchange (for exchange-traded securities); an analysis of the company's or issuer's financial statements; an evaluation of the forces that influence the issuer and the market(s) in which the security is purchased and sold; and with respect to debt securities, the maturity, coupon, creditworthiness, currency denomination, and the movement of the market in which the security is normally traded. The value determined under these procedures may differ from published values for the same securities.
Disclosure about the classification of fair value measurements is included in a table following the Fund's Investment Portfolio.
Securities Lending. Deutsche Bank AG, as lending agent, lends securities of the Fund to certain financial institutions under the terms of the Security Lending Agreement. The Fund retains benefits of owning the securities it has loaned and continues to receive interest and dividends generated by the securities and to participate in any changes in their market value. The Fund requires the borrowers of the securities to maintain collateral with the Fund consisting of either cash or liquid, unencumbered assets having a value at least equal to the value of the securities loaned. When the collateral falls below specified amounts, the lending agent will use its best effort to obtain additional collateral on the next business day to meet required amounts under the security lending agreement. The Fund may invest the cash collateral into a joint trading account in an affiliated money market fund pursuant to Exemptive Orders issued by the SEC. The Fund receives compensation for lending its securities either in the form of fees or by earning interest on invested cash collateral net of borrower rebates and fees paid to a lending agent. Either the Fund or the borrower may terminate the loan. There may be risks of delay and costs in recovery of securities or even loss of rights in the collateral should the borrower of the securities fail financially. If the Fund is not able to recover securities lent, the Fund may sell the collateral and purchase a replacement investment in the market, incurring the risk that the value of the replacement security is greater than the value of the collateral. The Fund is also subject to all investment risks associated with the reinvestment of any cash collateral received, including, but not limited to, interest rate, credit and liquidity risk associated with such investments.
As of March 31, 2015, the Fund had securities on loan. The value of the related collateral exceeded the value of the securities loaned at period end.
Federal Income Taxes. The Fund's policy is to comply with the requirements of the Internal Revenue Code, as amended, which are applicable to regulated investment companies, and to distribute all of its taxable income to its shareholders.
From October 1, 2013 through December 31, 2013, the Fund elects to defer qualified late year losses of approximately $785 of net ordinary losses and treat them as arising in the fiscal year ending September 30, 2015.
The Fund has reviewed the tax positions for the open tax years as of September 30, 2014 and has determined that no provision for income tax and/or uncertain tax provisions is required in the Fund's financial statements. The Fund's federal tax returns for the prior three fiscal years remain open subject to examination by the Internal Revenue Service.
Distribution of Income and Gains. Distributions from net investment income of the Fund, if any, are declared and distributed to shareholders annually. Net realized gains from investment transactions, in excess of available capital loss carryforwards, would be taxable to the Fund if not distributed, and, therefore, will be distributed to shareholders at least annually. The Fund may also make additional distributions for tax purposes if necessary.
The timing and characterization of certain income and capital gain distributions are determined annually in accordance with federal tax regulations which may differ from accounting principles generally accepted in the United States of America. These differences primarily relate to net investment losses incurred by the Fund and certain securities sold at a loss. As a result, net investment income (loss) and net realized gain (loss) on investment transactions for a reporting period may differ significantly from distributions during such period. Accordingly, the Fund may periodically make reclassifications among certain of its capital accounts without impacting the net asset value of the Fund.
The tax character of current year distributions will be determined at the end of the current fiscal year.
Redemption Fees. The Fund imposes a redemption fee of 2% of the total redemption amount on Fund shares redeemed or exchanged within 15 days of buying them, either by purchase or exchange (subject to certain exceptions). This fee is assessed and retained by the Fund for the benefit of the remaining shareholders. The redemption fee is accounted for as an addition to paid-in capital.
Expenses. Expenses of the Trust arising in connection with a specific Fund are allocated to that Fund. Other Trust expenses which cannot be directly attributed to a Fund are apportioned among the funds in the Trust based upon the relative net assets or other appropriate measures.
Contingencies. In the normal course of business, the Fund may enter into contracts with service providers that contain general indemnification clauses. The Fund's maximum exposure under these arrangements is unknown as this would involve future claims that may be made against the Fund that have not yet been made. However, based on experience, the Fund expects the risk of loss to be remote.
Other. Investment transactions are accounted for on a trade date plus one basis for daily net asset value calculations. However, for financial reporting purposes, investment transactions are reported on trade date. Interest income is recorded on the accrual basis. Dividend income is recorded on the ex-dividend date net of foreign withholding taxes. Realized gains and losses from investment transactions are recorded on an identified cost basis. Proceeds from litigation payments, if any, are included in net realized gain (loss) from investments.
B. Purchases and Sales of Securities
During the six months ended March 31, 2015, purchases and sales of investment securities (excluding short-term investments) aggregated $44,287,894 and $32,562,034, respectively.
C. Related Parties
Management Agreement. Under the Investment Management Agreement with Deutsche Investment Management Americas Inc. ("DIMA" or the "Advisor"), an indirect, wholly owned subsidiary of Deutsche Bank AG, the Advisor directs the investments of the Fund in accordance with its investment objectives, policies and restrictions. The Advisor determines the securities, instruments and other contracts relating to investments to be purchased, sold or entered into by the Fund. The management fee payable under the Investment Management Agreement is equal to an annual rate (exclusive of any applicable waivers/reimbursement) of 0.65% of the Fund's average daily net assets, computed and accrued daily and payable monthly.
For the period from October 1, 2014 through September 30, 2015, the Advisor has contractually agreed to waive its fees and/or reimburse certain operating expenses of the Fund to the extent necessary to maintain the total annual operating expenses (excluding certain expenses such as extraordinary expenses, taxes, brokerage and interest) of each class as follows:
|
Class A
|
1.47%
|
|
Class B
|
2.22%
|
|
Class C
|
2.22%
|
|
Class R
|
1.72%
|
|
Class R6
|
1.22%
|
|
Class S
|
1.22%
|
|
Institutional Class
|
1.22%
|
For the six months ended March 31, 2015, fees waived and/or expenses reimbursed for Class B are $96.
Administration Fee. Pursuant to an Administrative Services Agreement, DIMA provides most administrative services to the Fund. For all services provided under the Administrative Services Agreement, the Fund pays the Advisor an annual fee ("Administration Fee") of 0.10% of the Fund's average daily net assets, computed and accrued daily and payable monthly. For the six months ended March 31, 2015, the Administration Fee was $66,458, of which $12,882 is unpaid.
Service Provider Fees. DeAWM Service Company ("DSC"), an affiliate of the Advisor, is the transfer agent, dividend-paying agent and shareholder service agent of the Fund. Pursuant to a sub-transfer agency agreement between DSC and DST Systems, Inc. ("DST"), DSC has delegated certain transfer agent, dividend-paying agent and shareholder service agent functions to DST. DSC compensates DST out of the shareholder servicing fee it receives from the Fund. For the six months ended March 31, 2015, the amounts charged to the Fund by DSC were as follows:
|
Services to Shareholders
|
Total Aggregated
|
Unpaid at March 31, 2015
|
||||||
|
Class A
|
$ | 17,855 | $ | 10,497 | ||||
|
Class B
|
208 | 116 | ||||||
|
Class C
|
3,751 | 2,247 | ||||||
|
Class R
|
92 | 28 | ||||||
|
Class R6
|
9 | 2 | ||||||
|
Class S
|
46,607 | 24,093 | ||||||
|
Institutional Class
|
570 | 274 | ||||||
| $ | 69,092 | $ | 37,257 | |||||
Distribution and Service Fees. Under the Fund's Class B, C and R 12b-1 plans, DeAWM Distributors, Inc. ("DDI"), an affiliate of the Advisor, receives a fee ("Distribution Fee") of 0.75% of average daily net assets of each of Class B and C shares and 0.25% of the average daily net assets of Class R shares. In accordance with the Fund's Underwriting and Distribution Service Agreement, DDI enters into related selling group agreements with various firms at various rates for sales of Class B, C and R shares. For the six months ended March 31, 2015, the Distribution Fee was as follows:
|
Distribution Fee
|
Total Aggregated
|
Unpaid at March 31, 2015
|
||||||
|
Class B
|
$ | 478 | $ | 79 | ||||
|
Class C
|
20,862 | 3,790 | ||||||
|
Class R
|
1,865 | 446 | ||||||
| $ | 23,205 | $ | 4,315 | |||||
In addition, DDI provides information and administrative services for a fee ("Service Fee") to Class A, B, C and R shareholders at an annual rate of up to 0.25% of average daily net assets for each such class. DDI in turn has various agreements with financial services firms that provide these services and pays these fees based upon the assets of shareholder accounts the firms service. For the six months ended March 31, 2015, the Service Fee was as follows:
|
Service Fee
|
Total Aggregated
|
Unpaid at March 31, 2015
|
Annualized
Rate
|
|||||||||
|
Class A
|
$ | 39,364 | $ | 13,290 | .24 | % | ||||||
|
Class B
|
158 | 49 | .25 | % | ||||||||
|
Class C
|
6,997 | 2,366 | .25 | % | ||||||||
|
Class R
|
1,865 | 745 | .25 | % | ||||||||
| $ | 48,384 | $ | 16,450 | |||||||||
Underwriting Agreement and Contingent Deferred Sales Charge. DDI is the principal underwriter for the Fund. Underwriting commissions paid in connection with the distribution of Class A shares for the six months ended March 31, 2015 aggregated $1,770.
In addition, DDI receives any contingent deferred sales charge ("CDSC") from Class B share redemptions occurring within six years of purchase and Class C share redemptions occurring within one year of purchase. There is no such charge upon redemption of any share appreciation or reinvested dividends. The CDSC is based on declining rates ranging from 4% to 1% for Class B and 1% for Class C, of the value of the shares redeemed. For the six months ended March 31, 2015, the CDSC for the Fund's Class B and C shares was $5 and $207, respectively. A deferred sales charge of up to 1% is assessed on certain redemptions of Class A shares. For the six months ended March 31, 2015, DDI received $265 for Class A shares.
Typesetting and Filing Service Fees. Under an agreement with DIMA, DIMA is compensated for providing typesetting and certain regulatory filing services to the Fund. For the six months ended March 31, 2015, the amount charged to the Fund by DIMA included in the Statement of Operations under "Reports to shareholders" aggregated $9,318, of which $4,593 was unpaid.
Trustees' Fees and Expenses. The Fund paid retainer fees to each Trustee not affiliated with the Advisor, plus specified amounts to the Board Chairperson and Vice Chairperson and to each committee Chairperson.
Affiliated Cash Management Vehicles. The Fund may invest uninvested cash balances in Central Cash Management Fund and Deutsche Variable NAV Money Fund, affiliated money market funds which are managed by the Advisor. Each affiliated money market fund seeks to provide a high level of current income consistent with liquidity and the preservation of capital. Each affiliated money market fund is managed in accordance with Rule 2a-7 under the 1940 Act, which governs the quality, maturity, diversity and liquidity of instruments in which a money market fund may invest. Central Cash Management Fund seeks to maintain a stable net asset value, and Deutsche Variable NAV Money Fund maintains a floating net asset value. The Fund indirectly bears its proportionate share of the expenses of each affiliated money market fund in which it invests. Central Cash Management Fund does not pay the Advisor an investment management fee. To the extent that Deutsche Variable NAV Money Fund pays an investment management fee to the Advisor, the Advisor will waive an amount of the investment management fee payable to the Advisor by the Fund equal to the amount of the investment management fee payable on the Fund's assets invested in Deutsche Variable NAV Money Fund.
Security Lending Fees. Deutsche Bank AG serves as lending agent for the Fund. For the six months ended March 31, 2015, the Fund incurred lending agent fees to Deutsche Bank AG for the amount of $6,186.
D. Line of Credit
The Fund and other affiliated funds (the "Participants") share in a $400 million revolving credit facility provided by a syndication of banks. The Fund may borrow for temporary or emergency purposes, including the meeting of redemption requests that otherwise might require the untimely disposition of securities. The Participants are charged an annual commitment fee, which is allocated based on net assets, among each of the Participants. Interest is calculated at a rate per annum equal to the sum of the Federal Funds Rate plus 1.25 percent plus if the one-month LIBOR exceeds the Federal Funds Rate, the amount of such excess. The Fund may borrow up to a maximum of 33 percent of its net assets under the agreement. The Fund had no outstanding loans at March 31, 2015.
E. Share Transactions
The following table summarizes share and dollar activity in the Fund:
|
Six Months Ended
March 31, 2015
|
Year Ended
September 30, 2014
|
|||||||||||||||
|
Shares
|
Dollars
|
Shares
|
Dollars
|
|||||||||||||
|
Shares sold
|
||||||||||||||||
|
Class A
|
213,988 | $ | 6,447,295 | 402,580 | $ | 12,836,624 | ||||||||||
|
Class B
|
— | — | 388 | 11,206 | ||||||||||||
|
Class C
|
23,387 | 636,268 | 82,764 | 2,377,190 | ||||||||||||
|
Class R
|
32,294 | 983,726 | 33,575 | 1,044,621 | ||||||||||||
|
Class R6
|
— | — | 315 | * | 10,000 | * | ||||||||||
|
Class S
|
1,008,070 | 31,357,601 | 1,208,715 | 40,048,274 | ||||||||||||
|
Institutional Class
|
14,852 | 467,429 | 19,757 | 645,867 | ||||||||||||
| $ | 39,892,319 | $ | 56,973,782 | |||||||||||||
|
Shares issued to shareholders in reinvestment of distributions
|
||||||||||||||||
|
Class A
|
105,251 | $ | 2,945,962 | 76,357 | $ | 2,319,732 | ||||||||||
|
Class B
|
636 | 15,639 | 846 | 23,107 | ||||||||||||
|
Class C
|
24,933 | 615,345 | 17,638 | 483,290 | ||||||||||||
|
Class R
|
5,557 | 154,366 | 387 | 11,725 | ||||||||||||
|
Class R6
|
39 | 1,105 | — | — | ||||||||||||
|
Class S
|
310,302 | 8,967,724 | 231,124 | 7,208,701 | ||||||||||||
|
Institutional Class
|
7,446 | 217,509 | 2,551 | 80,273 | ||||||||||||
| $ | 12,917,650 | $ | 10,126,828 | |||||||||||||
|
Shares redeemed
|
||||||||||||||||
|
Class A
|
(194,059 | ) | $ | (5,882,899 | ) | (385,506 | ) | $ | (12,205,264 | ) | ||||||
|
Class B
|
(1,423 | ) | (37,579 | ) | (5,439 | ) | (156,044 | ) | ||||||||
|
Class C
|
(30,957 | ) | (847,106 | ) | (78,389 | ) | (2,222,679 | ) | ||||||||
|
Class R
|
(2,891 | ) | (88,157 | ) | (1,770 | ) | (54,729 | ) | ||||||||
|
Class S
|
(448,833 | ) | (13,961,005 | ) | (1,151,754 | ) | (37,487,756 | ) | ||||||||
|
Institutional Class
|
(8,290 | ) | (263,544 | ) | (1,763 | ) | (58,458 | ) | ||||||||
| $ | (21,080,290 | ) | $ | (52,184,930 | ) | |||||||||||
|
Redemption fees
|
$ | 540 | $ | 2,830 | ||||||||||||
|
Net increase (decrease)
|
||||||||||||||||
|
Class A
|
125,180 | $ | 3,510,462 | 93,431 | $ | 2,952,607 | ||||||||||
|
Class B
|
(787 | ) | (21,940 | ) | (4,205 | ) | (121,731 | ) | ||||||||
|
Class C
|
17,363 | 404,507 | 22,013 | 637,957 | ||||||||||||
|
Class R
|
34,960 | 1,049,935 | 32,192 | 1,001,617 | ||||||||||||
|
Class R6
|
39 | 1,105 | 315 | * | 10,000 | * | ||||||||||
|
Class S
|
869,539 | 26,364,756 | 288,085 | 9,770,378 | ||||||||||||
|
Institutional Class
|
14,008 | 421,394 | 20,545 | 667,682 | ||||||||||||
| $ | 31,730,219 | $ | 14,918,510 | |||||||||||||
* For the period from August 25, 2014 (commencement of operations of Class R6) to September 30, 2014.
As an investor of the Fund, you incur two types of costs: ongoing expenses and transaction costs. Ongoing expenses include management fees, distribution and service (12b-1) fees and other Fund expenses. Examples of transaction costs include sales charges (loads), redemption fees and account maintenance fees, which are not shown in this section. The following tables are intended to help you understand your ongoing expenses (in dollars) of investing in the Fund and to help you compare these expenses with the ongoing expenses of investing in other mutual funds. In the most recent six-month period, Class B shares limited these expenses; had they not done so, expenses would have been higher. The example in the table is based on an investment of $1,000 invested at the beginning of the six-month period and held for the entire period (October 1, 2014 to March 31, 2015).
The tables illustrate your Fund's expenses in two ways:
—Actual Fund Return. This helps you estimate the actual dollar amount of ongoing expenses (but not transaction costs) paid on a $1,000 investment in the Fund using the Fund's actual return during the period. To estimate the expenses you paid over the period, simply divide your account value by $1,000 (for example, an $8,600 account value divided by $1,000 = 8.6), then multiply the result by the number in the "Expenses Paid per $1,000" line under the share class you hold.
—Hypothetical 5% Fund Return. This helps you to compare your Fund's ongoing expenses (but not transaction costs) with those of other mutual funds using the Fund's actual expense ratio and a hypothetical rate of return of 5% per year before expenses. Examples using a 5% hypothetical fund return may be found in the shareholder reports of other mutual funds. The hypothetical account values and expenses may not be used to estimate the actual ending account balance or expenses you paid for the period.
Please note that the expenses shown in these tables are meant to highlight your ongoing expenses only and do not reflect any transaction costs. The "Expenses Paid per $1,000" line of the tables is useful in comparing ongoing expenses only and will not help you determine the relative total expense of owning different funds. Subject to certain exceptions, an account maintenance fee of $20.00 assessed once per calendar year for Classes A, B, C and S shares may apply for accounts with balances less than $10,000. This fee is not included in these tables. If it was, the estimate of expenses paid for Classes A, B, C and S shares during the period would be higher, and account value during the period would be lower, by this amount.
|
Expenses and Value of a $1,000 Investment
for the six months ended March 31, 2015 (Unaudited)
|
||||||||||||||||||||||||||||
|
Actual Fund Return
|
Class A
|
Class B
|
Class C
|
Class R
|
Class R6
|
Class S
|
Institutional Class
|
|||||||||||||||||||||
|
Beginning Account Value 10/1/14
|
$ | 1,000.00 | $ | 1,000.00 | $ | 1,000.00 | $ | 1,000.00 | $ | 1,000.00 | $ | 1,000.00 | $ | 1,000.00 | ||||||||||||||
|
Ending Account Value 3/31/15
|
$ | 1,178.20 | $ | 1,173.50 | $ | 1,173.60 | $ | 1,177.00 | $ | 1,180.30 | $ | 1,179.80 | $ | 1,180.40 | ||||||||||||||
|
Expenses Paid per $1,000*
|
$ | 7.71 | $ | 12.03 | $ | 11.92 | $ | 9.06 | $ | 6.09 | $ | 6.25 | $ | 5.71 | ||||||||||||||
|
Hypothetical 5% Fund Return
|
Class A
|
Class B
|
Class C
|
Class R
|
Class R6
|
Class S
|
Institutional Class
|
|||||||||||||||||||||
|
Beginning Account Value 10/1/14
|
$ | 1,000.00 | $ | 1,000.00 | $ | 1,000.00 | $ | 1,000.00 | $ | 1,000.00 | $ | 1,000.00 | $ | 1,000.00 | ||||||||||||||
|
Ending Account Value 3/31/15
|
$ | 1,017.85 | $ | 1,013.86 | $ | 1,013.96 | $ | 1,016.60 | $ | 1,019.35 | $ | 1,019.20 | $ | 1,019.70 | ||||||||||||||
|
Expenses Paid per $1,000*
|
$ | 7.14 | $ | 11.15 | $ | 11.05 | $ | 8.40 | $ | 5.64 | $ | 5.79 | $ | 5.29 | ||||||||||||||
* Expenses are equal to the Fund's annualized expense ratio for each share class, multiplied by the average account value over the period, multiplied by 182 (the number of days in the most recent six-month period), then divided by 365.
|
Annualized Expense Ratios
|
Class A
|
Class B
|
Class C
|
Class R
|
Class R6
|
Class S
|
Institutional Class
|
|
Deutsche Small Cap Growth Fund
|
1.42%
|
2.22%
|
2.20%
|
1.67%
|
1.12%
|
1.15%
|
1.05%
|
For more information, please refer to the Fund's prospectus.
For an analysis of the fees associated with an investment in the Fund or similar funds, please refer to http://apps.finra.org/fundanalyzer/1/fa.aspx.
The Board of Trustees approved the renewal of Deutsche Small Cap Growth Fund’s investment management agreement (the "Agreement") with Deutsche Investment Management Americas Inc. ("DIMA") in September 2014.
In terms of the process that the Board followed prior to approving the Agreement, shareholders should know that:
— In September 2014, all of the Fund’s Trustees were independent of DIMA and its affiliates.
— The Trustees met frequently during the past year to discuss fund matters and dedicated a substantial amount of time to contract review matters. Over the course of several months, the Board’s Contract Committee, in coordination with the Board’s Equity Oversight Committee, reviewed comprehensive materials received from DIMA, independent third parties and independent counsel. These materials included an analysis of the Fund’s performance, fees and expenses, and profitability compiled by a fee consultant retained by the Fund’s Independent Trustees (the "Fee Consultant"). The Board also received extensive information throughout the year regarding performance of the Fund.
— The Independent Trustees regularly meet privately with counsel to discuss contract review and other matters. In addition, the Independent Trustees were advised by the Fee Consultant in the course of their review of the Fund’s contractual arrangements and considered a comprehensive report prepared by the Fee Consultant in connection with their deliberations.
— In connection with reviewing the Agreement, the Board also reviewed the terms of the Fund’s Rule 12b-1 plan, distribution agreement, administrative services agreement, transfer agency agreement and other material service agreements.
— Based on its evaluation of the information provided, the Contract Committee presented its findings and recommendations to the Board. The Board then reviewed the Contract Committee’s findings and recommendations.
In connection with the contract review process, the Contract Committee and the Board considered the factors discussed below, among others. The Board also considered that DIMA and its predecessors have managed the Fund since its inception, and the Board believes that a long-term relationship with a capable, conscientious advisor is in the best interests of the Fund. The Board considered, generally, that shareholders chose to invest or remain invested in the Fund knowing that DIMA managed the Fund, and that the Agreement was approved by the Fund’s shareholders. DIMA is part of Deutsche Bank AG ("DB"), a major global banking institution that is engaged in a wide range of financial services. The Board believes that there are advantages to being part of a global asset management business that offers a wide range of investing expertise and resources, including hundreds of portfolio managers and analysts with research capabilities in many countries throughout the world.
As part of the contract review process, the Board carefully considered the fees and expenses of each Deutsche fund overseen by the Board in light of the fund’s performance. In many cases, this led to the negotiation and implementation of expense caps. As part of these negotiations, the Board indicated that it would consider relaxing these caps in future years following sustained improvements in performance, among other considerations.
In 2012, DB combined its Asset Management (of which DIMA was a part) and Wealth Management divisions into a new Asset and Wealth Management ("AWM") division. DB has advised the Independent Trustees that the U.S. asset management business is a critical and integral part of DB, and that DB will continue to invest in AWM a significant portion of the savings it has realized by combining its Asset and Wealth Management divisions, including ongoing enhancements to AWM’s investment capabilities. DB also has confirmed its commitment to maintaining strong legal and compliance groups within the AWM division.
While shareholders may focus primarily on fund performance and fees, the Fund’s Board considers these and many other factors, including the quality and integrity of DIMA’s personnel and such other issues as back-office operations, fund valuations, and compliance policies and procedures.
Nature, Quality and Extent of Services. The Board considered the terms of the Agreement, including the scope of advisory services provided under the Agreement. The Board noted that, under the Agreement, DIMA provides portfolio management services to the Fund and that, pursuant to a separate administrative services agreement, DIMA provides administrative services to the Fund. The Board considered the experience and skills of senior management and investment personnel, the resources made available to such personnel, the ability of DIMA to attract and retain high-quality personnel, and the organizational depth and stability of DIMA. The Board reviewed the Fund’s performance over short-term and long-term periods and compared those returns to various agreed-upon performance measures, including market index(es) and a peer universe compiled by the Fee Consultant using information supplied by Morningstar Direct ("Morningstar"), an independent fund data service. The Board also noted that it has put into place a process of identifying "Focus Funds" (e.g., funds performing poorly relative to a peer universe), and receives more frequent reporting and information from DIMA regarding such funds, along with DIMA’s plans to address underperformance. The Board believes this process is an effective manner of identifying and addressing underperforming funds. Based on the information provided, the Board noted that for the one-, three- and five-year periods ended December 31, 2013, the Fund’s performance (Class A shares) was in the 2nd quartile, 2nd quartile and 1st quartile, respectively, of the applicable Morningstar universe (the 1st quartile being the best performers and the 4th quartile being the worst performers). The Board also observed that the Fund has outperformed its benchmark in the one-, three- and five-year periods ended December 31, 2013.
Fees and Expenses. The Board considered the Fund’s investment management fee schedule, operating expenses and total expense ratios, and comparative information provided by Lipper Inc. ("Lipper") and the Fee Consultant regarding investment management fee rates paid to other investment advisors by similar funds (1st quartile being the most favorable and 4th quartile being the least favorable). With respect to management fees paid to other investment advisors by similar funds, the Board noted that the contractual fee rates paid by the Fund, which include a 0.10% fee paid to DIMA under the Fund’s administrative services agreement, were lower than the median (1st quartile) of the applicable Lipper peer group (based on Lipper data provided as of December 31, 2013). The Board noted that the Fund’s Class A shares total (net) operating expenses (excluding 12b-1 fees) were expected to be higher than the median (3rd quartile) of the applicable Lipper expense universe (based on Lipper data provided as of December 31, 2013, and analyzing Lipper expense universe Class A (net) expenses less any applicable 12b-1 fees) ("Lipper Universe Expenses"). The Board also reviewed data comparing each share class’s total (net) operating expenses to the applicable Lipper Universe Expenses. The Board considered the Fund’s management fee rate as compared to fees charged by DIMA to comparable funds, noting that DIMA indicated that it does not provide services to any other comparable funds. The Board also considered how the Fund’s total (net) operating expenses compared to the total (net) operating expenses of a more customized peer group selected by Lipper (based on such factors as asset size).
The Board also noted that the expense limitations agreed to by DIMA helped to ensure that the Fund’s total (net) operating expenses would remain competitive.
The information requested by the Board as part of its review of fees and expenses also included information about institutional accounts and funds offered primarily to European investors ("Deutsche Europe funds") managed by DIMA and its affiliates. The Board noted that DIMA indicated that it does not manage any institutional accounts or Deutsche Europe funds comparable to the Fund.
On the basis of the information provided, the Board concluded that management fees were reasonable and appropriate in light of the nature, quality and extent of services provided by DIMA.
Profitability. The Board reviewed detailed information regarding revenues received by DIMA under the Agreement. The Board considered the estimated costs and pre-tax profits realized by DIMA from advising the Deutsche U.S. mutual funds ("Deutsche Funds"), as well as estimates of the pre-tax profits attributable to managing the Fund in particular. The Board also received information regarding the estimated enterprise-wide profitability of DIMA and its affiliates with respect to all fund services in totality and by fund. The Board and the Fee Consultant reviewed DIMA’s methodology in allocating its costs to the management of the Fund. Based on the information provided, the Board concluded that the pre-tax profits realized by DIMA in connection with the management of the Fund were not unreasonable.
Economies of Scale. The Board considered whether there are economies of scale with respect to the management of the Fund and whether the Fund benefits from any economies of scale. In this regard, the Board noted that while the Fund’s current investment management fee schedule does not include breakpoints, the Board intends to consider implementation of one or more breakpoints once the Fund reaches an efficient operating size. The Board concluded that the Fund’s fee schedule represents an appropriate sharing between the Fund and DIMA of such economies of scale as may exist in the management of the Fund at current asset levels.
Other Benefits to DIMA and Its Affiliates. The Board also considered the character and amount of other incidental benefits received by DIMA and its affiliates, including any fees received by DIMA for administrative services provided to the Fund and any fees received by an affiliate of DIMA for distribution services. The Board also considered benefits to DIMA related to brokerage and soft-dollar allocations, including allocating brokerage to pay for research generated by parties other than the executing broker dealers, which pertain primarily to funds investing in equity securities, along with the incidental public relations benefits to DIMA related to Deutsche Funds advertising and cross-selling opportunities among DIMA products and services. The Board concluded that management fees were reasonable in light of these fallout benefits.
Compliance. The Board considered the significant attention and resources dedicated by DIMA to documenting and enhancing its compliance processes in recent years. The Board noted in particular (i) the experience and seniority of both DIMA’s chief compliance officer and the Fund’s chief compliance officer; (ii) the large number of DIMA compliance personnel; and (iii) the substantial commitment of resources by DIMA and its affiliates to compliance matters.
Based on all of the information considered and the conclusions reached, the Board unanimously determined that the continuation of the Agreement is in the best interests of the Fund. In making this determination, the Board did not give particular weight to any single factor identified above. The Board considered these factors over the course of numerous meetings, certain of which were in executive session with only the Independent Trustees and counsel present. It is possible that individual Trustees may have weighed these factors differently in reaching their individual decisions to approve the continuation of the Agreement.
|
For More Information
|
The automated telephone system allows you to access personalized account information and obtain information on other Deutsche funds using either your voice or your telephone keypad. Certain account types within Classes A, B, C and S also have the ability to purchase, exchange or redeem shares using this system.
For more information, contact your financial advisor. You may also access our automated telephone system or speak with a Shareholder Service representative by calling:
(800) 728-3337
|
|
|
Web Site
|
deutschefunds.com
View your account transactions and balances, trade shares, monitor your asset allocation, subscribe to fund and account updates by e-mail, and change your address, 24 hours a day.
Obtain prospectuses and applications, blank forms, interactive worksheets, news about Deutsche funds, retirement planning information, and more.
|
|
|
Written Correspondence
|
Deutsche Asset & Wealth Management
PO Box 219151
Kansas City, MO 64121-9151
|
|
|
Proxy Voting
|
The fund's policies and procedures for voting proxies for portfolio securities and information about how the fund voted proxies related to its portfolio securities during the 12-month period ended June 30 are available on our Web site — deutschefunds.com (click on "proxy voting"at the bottom of the page) — or on the SEC's Web site — sec.gov. To obtain a written copy of the fund's policies and procedures without charge, upon request, call us toll free at (800) 728-3337.
|
|
|
Portfolio Holdings
|
Following the fund's fiscal first and third quarter-end, a complete portfolio holdings listing is filed with the SEC on Form N-Q. This form will be available on the SEC's Web site at sec.gov, and it also may be reviewed and copied at the SEC's Public Reference Room in Washington, D.C. Information on the operation of the SEC's Public Reference Room may be obtained by calling (800) SEC-0330. The fund's portfolio holdings are also posted on deutschefunds.com from time to time. Please see the fund's current prospectus for more information.
|
|
|
Principal Underwriter
|
If you have questions, comments or complaints, contact:
DeAWM Distributors, Inc.
222 South Riverside Plaza
Chicago, IL 60606-5808
(800) 621-1148
|
|
|
Investment Management
|
Deutsche Investment Management Americas Inc. ("DIMA" or the "Advisor"), which is part of Deutsche Asset & Wealth Management, is the investment advisor for the fund. DIMA and its predecessors have more than 80 years of experience managing mutual funds and DIMA provides a full range of investment advisory services to both institutional and retail clients.
DIMA is an indirect, wholly owned subsidiary of Deutsche Bank AG. Deutsche Bank AG is a major global banking institution engaged in a wide variety of financial services, including investment management, retail, private and commercial banking, investment banking and insurance.
Deutsche Asset & Wealth Management is the retail brand name in the U.S. for the wealth management and asset management activities of Deutsche Bank AG and DIMA. Deutsche Asset & Wealth Management is committed to delivering the investing expertise, insight and resources of this global investment platform to American investors.
|
|
|
Class A
|
Class B
|
Class C
|
Class S
|
Institutional Class
|
||
|
Nasdaq Symbol
|
SSDAX
|
SSDBX
|
SSDCX
|
SSDSX
|
SSDIX
|
|
|
CUSIP Number
|
25157M 885
|
25157M 802
|
25157M 703
|
25157M 604
|
25157M 505
|
|
|
Fund Number
|
471
|
671
|
771
|
2314
|
1471
|
|
For shareholders of Class R and Class R6
|
||
|
Automated Information Line
|
DeAWM Flex Plan Access (800) 728-3337
24-hour access to your retirement plan account.
|
|
|
Web Site
|
deutschefunds.com
Click "Retirement Plans" to reallocate assets, process transactions, review your funds, and subscribe to fund updates by e-mail through our secure online account access.
Obtain prospectuses and applications, blank forms, interactive worksheets, news about Deutsche funds, retirement planning information, and more.
|
|
|
For More Information
|
(800) 728-3337
To speak with a service representative.
|
|
|
Written Correspondence
|
DeAWM Service Company
222 South Riverside Plaza
Chicago, IL 60606-5806
|
|
|
Class R
|
Class R6
|
||
|
Nasdaq Symbol
|
SSDGX
|
SSDZX
|
|
|
CUSIP Number
|
25157M 638
|
25157M 596
|
|
|
Fund Number
|
1571
|
1614
|
|
FACTS
|
What Does Deutsche Asset & Wealth Management Do With Your Personal Information?
|
||||
|
Why?
|
Financial companies choose how they share your personal information. Federal law gives consumers the right to limit some but not all sharing. Federal law also requires us to tell you how we collect, share and protect your personal information. Please read this notice carefully to understand what we do.
|
||||
|
What?
|
The types of personal information we collect and share can include:
— Social Security number
— Account balances
— Purchase and transaction history
— Bank account information
— Contact information such as mailing address, e-mail address and telephone number
|
||||
|
How?
|
All financial companies need to share customers' personal information to run their everyday business. In the section below, we list the reasons financial companies can share their customers' personal information, the reasons Deutsche Asset & Wealth Management chooses to share and whether you can limit this sharing.
|
||||
|
Reasons we can share your personal information
|
Does Deutsche Asset & Wealth Management share?
|
Can you limit this sharing?
|
|||
|
For our everyday business purposes — such as to process your transactions, maintain your account(s), respond to court orders or legal investigations
|
Yes
|
No
|
|||
|
For our marketing purposes — to offer our products and services to you
|
Yes
|
No
|
|||
|
For joint marketing with other financial companies
|
No
|
We do not share
|
|||
|
For our affiliates' everyday business purposes — information about your transactions and experiences
|
No
|
We do not share
|
|||
|
For our affiliates' everyday business purposes — information about your creditworthiness
|
No
|
We do not share
|
|||
|
For non-affiliates to market to you
|
No
|
We do not share
|
|||
|
Questions?
|
Call (800) 728-3337 or e-mail us at service@db.com
|
||||
|
Who we are
|
||||
|
Who is providing this notice?
|
DeAWM Distributors, Inc.; Deutsche Investment Management Americas Inc.; DeAWM Trust Company; the Deutsche Funds
|
|||
|
What we do
|
||||
|
How does Deutsche Asset & Wealth Management protect my personal information?
|
To protect your personal information from unauthorized access and use, we use security measures that comply with federal law. These measures include computer safeguards and secured files and buildings.
|
|||
|
How does Deutsche Asset & Wealth Management collect my personal information?
|
We collect your personal information, for example. When you:
— open an account
— give us your contact information
— provide bank account information for ACH or wire transactions
— tell us where to send money
— seek advice about your investments
|
|||
|
Why can't I limit all sharing?
|
Federal law gives you the right to limit only
— sharing for affiliates' everyday business purposes — information about your creditworthiness
— affiliates from using your information to market to you
— sharing for non-affiliates to market to you
State laws and individual companies may give you additional rights to limit sharing.
|
|||
|
Definitions
|
||||
|
Affiliates
|
Companies related by common ownership or control. They can be financial or non-financial companies. Our affiliates include financial companies with the DWS or Deutsche Bank ("DB") name, such as DB AG Frankfurt and DB Alex Brown.
|
|||
|
Non-affiliates
|
Companies not related by common ownership or control. They can be financial and non-financial companies.
Non-affiliates we share with include account service providers, service quality monitoring services, mailing service providers and verification services to help in the fight against money laundering and fraud.
|
|||
|
Joint marketing
|
A formal agreement between non-affiliated financial companies that together market financial products or services to you. Deutsche Asset & Wealth Management does not jointly market.
|
|||
|
Rev. 08/2014
|
||||
Notes
Notes

|
ITEM 2.
|
CODE OF ETHICS
|
|
|
Not applicable.
|
||
|
ITEM 3.
|
AUDIT COMMITTEE FINANCIAL EXPERT
|
|
|
Not applicable
|
||
|
ITEM 4.
|
PRINCIPAL ACCOUNTANT FEES AND SERVICES
|
|
|
Not applicable
|
||
|
ITEM 5.
|
AUDIT COMMITTEE OF LISTED REGISTRANTS
|
|
|
Not applicable
|
||
|
ITEM 6.
|
SCHEDULE OF INVESTMENTS
|
|
|
Not applicable
|
||
|
ITEM 7.
|
DISCLOSURE OF PROXY VOTING POLICIES AND PROCEDURES FOR CLOSED-END MANAGEMENT INVESTMENT COMPANIES
|
|
|
Not applicable
|
||
|
ITEM 8.
|
PORTFOLIO MANAGERS OF CLOSED-END MANAGEMENT INVESTMENT COMPANIES
|
|
|
Not applicable
|
||
|
ITEM 9.
|
PURCHASES OF EQUITY SECURITIES BY CLOSED-END MANAGEMENT INVESTMENT COMPANY AND AFFILIATED PURCHASERS
|
|
|
Not applicable
|
||
|
ITEM 10.
|
SUBMISSION OF MATTERS TO A VOTE OF SECURITY HOLDERS
|
|
|
There were no material changes to the procedures by which shareholders may recommend nominees to the Fund’s Board. The primary function of the Nominating and Governance Committee is to identify and recommend individuals for membership on the Board and oversee the administration of the Board Governance Guidelines. Shareholders may recommend candidates for Board positions by forwarding their correspondence by U.S. mail or courier service to Kenneth C. Froewiss, Independent Chairman, Deutsche Mutual Funds, P.O. Box 390601, Cambridge, MA 02139.
|
||
|
ITEM 11.
|
CONTROLS AND PROCEDURES
|
|
|
(a)
|
The Chief Executive and Financial Officers concluded that the Registrant’s Disclosure Controls and Procedures are effective based on the evaluation of the Disclosure Controls and Procedures as of a date within 90 days of the filing date of this report.
|
|
|
(b)
|
There have been no changes in the registrant’s internal control over financial reporting that occurred during the second fiscal quarter of the period covered by this report that has materially affected, or is reasonably likely to materially affect, the registrant’s internal controls over financial reporting.
|
|
|
ITEM 12.
|
EXHIBITS
|
|
|
(a)(1)
|
Not applicable
|
|
|
(a)(2)
|
Certification pursuant to Rule 30a-2(a) under the Investment Company Act of 1940 (17 CFR 270.30a-2(a)) is filed and attached hereto as Exhibit 99.CERT.
|
|
|
(b)
|
Certification pursuant to Rule 30a-2(b) under the Investment Company Act of 1940 (17 CFR 270.30a-2(b)) is furnished and attached hereto as Exhibit 99.906CERT.
|
|
SIGNATURES
Pursuant to the requirements of the Securities Exchange Act of 1934 and the Investment Company Act of 1940, the registrant has duly caused this report to be signed on its behalf by the undersigned, thereunto duly authorized.
|
Registrant:
|
Deutsche Small Cap Growth Fund, a series of Deutsche Investment Trust
|
|
By:
|
/s/Brian E. Binder
Brian E. Binder
President
|
|
Date:
|
May 29, 2015
|
Pursuant to the requirements of the Securities Exchange Act of 1934 and the Investment Company Act of 1940, this report has been signed below by the following persons on behalf of the registrant and in the capacities and on the dates indicated.
|
By:
|
/s/Brian E. Binder
Brian E. Binder
President
|
|
Date:
|
May 29, 2015
|
|
By:
|
/s/Paul Schubert
Paul Schubert
Chief Financial Officer and Treasurer
|
|
Date:
|
May 29, 2015
|