UNITED STATES
SECURITIES AND EXCHANGE COMMISSION
WASHINGTON, D. C. 20549
FORM N-CSRS
Investment Company Act file number 811-00043
DWS Investment Trust
(Exact Name of Registrant as Specified in Charter)
345 Park Avenue
New York, NY 10154-0004
(Address of Principal Executive Offices) (Zip Code)
Registrant’s Telephone Number, including Area Code: (201) 593-6408
Paul Schubert
100 Plaza One
Jersey City, NJ 07311
(Name and Address of Agent for Service)
|
Date of fiscal year end:
|
9/30
|
|
Date of reporting period:
|
3/31/2011
|
|
ITEM 1.
|
REPORT TO STOCKHOLDERS
|
|
MARCH 31, 2011
Semiannual Report
to Shareholders
|
|
DWS Small Cap Core Fund
|
 |
Contents
|
4 Performance Summary
7 Information About Your Fund's Expenses
9 Portfolio Summary
11 Investment Portfolio
22 Statement of Assets and Liabilities
24 Statement of Operations
25 Statement of Changes in Net Assets
26 Financial Highlights
30 Notes to Financial Statements
39 Summary of Management Fee Evaluation by Independent Fee Consultant
43 Account Management Resources
44 Privacy Statement
|
This report must be preceded or accompanied by a prospectus. To obtain a summary prospectus, if available, or prospectus for any of our funds, refer to the Account Management Resources information provided in the back of this booklet. We advise you to consider the fund's objectives, risks, charges and expenses carefully before investing. The summary prospectus and prospectus contain this and other important information about the fund. Please read the prospectus carefully before you invest.
Investing in derivatives entails special risks relating to liquidity, leverage and credit that may reduce returns and/or increase volatility. Stocks of smaller companies involve greater risk than securities of larger, more established companies. Stocks may decline in value. See the prospectus for details.
DWS Investments is part of Deutsche Bank's Asset Management division and, within the US, represents the retail asset management activities of Deutsche Bank AG, Deutsche Bank Trust Company Americas, Deutsche Investment Management Americas Inc. and DWS Trust Company.
NOT FDIC/NCUA INSURED NO BANK GUARANTEE MAY LOSE VALUE NOT A DEPOSIT NOT INSURED BY ANY FEDERAL GOVERNMENT AGENCY
|
Average Annual Total Returns as of 3/31/11
|
|||||
|
Unadjusted for Sales Charge
|
6-Month‡
|
1-Year
|
3-Year
|
5-Year
|
10-Year
|
|
Class A
|
25.69%
|
24.66%
|
4.72%
|
-1.05%
|
6.62%
|
|
Class B
|
25.17%
|
23.75%
|
3.98%
|
-1.77%
|
5.79%
|
|
Class C
|
25.21%
|
23.70%
|
3.90%
|
-1.79%
|
5.79%
|
|
Adjusted for the Maximum Sales Charge
|
|||||
|
Class A (max 5.75% load)
|
18.47%
|
17.49%
|
2.68%
|
-2.22%
|
5.99%
|
|
Class B (max 4.00% CDSC)
|
21.17%
|
20.75%
|
3.36%
|
-1.91%
|
5.79%
|
|
Class C (max 1.00% CDSC)
|
24.21%
|
23.70%
|
3.90%
|
-1.79%
|
5.79%
|
|
No Sales Charges
|
|||||
|
Class S
|
25.95%
|
25.19%
|
4.94%
|
-0.77%
|
6.92%
|
|
Russell 2000® Index+
|
25.48%
|
25.79%
|
8.57%
|
3.35%
|
7.87%
|
Sources: Lipper Inc. and Deutsche Investment Management Americas Inc.
‡ Total returns shown for periods less than one year are not annualized.
Performance in the Average Annual Total Returns table above and the Growth of an Assumed $10,000 Investment line graph that follows is historical and does not guarantee future results. Investment return and principal fluctuate, so your shares may be worth more or less when redeemed. Current performance may differ from performance data shown. Please visit www.dws-investments.com for the Fund's most recent month-end performance. Performance includes reinvestment of all distributions. Unadjusted returns do not reflect sales charges and would have been lower if they had.
The gross expense ratios of the Fund, as stated in the fee table of the prospectus dated February 1, 2011 are 1.68%, 2.49%, 2.41% and 1.31% for Class A, Class B, Class C and Class S shares, respectively, and may differ from the expense ratios disclosed in the Financial Highlights tables in this report.
The Fund may charge a 2% fee for redemptions of shares held less than 15 days.
Index returns assume reinvestment of dividends and, unlike Fund returns, do not reflect any fees or expenses. It is not possible to invest directly into an index.
Performance figures do not reflect the deduction of taxes that a shareholder would pay on fund distributions or the redemption of fund shares.
Returns shown for Class A, B and C shares for the periods prior to their inception on June 25, 2001 are derived from the historical performance of the Fund's original share class (Class AARP) of the DWS Small Cap Core Fund during such periods and have been adjusted to reflect the higher total annual operating expenses of each specific class. Any difference in expenses will affect performance. Class AARP shares merged into Class S on July 14, 2006.
|
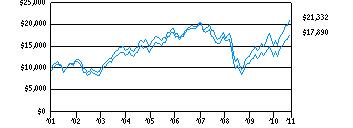
Growth of an Assumed $10,000 Investment (Adjusted for Maximum Sales Charge)
|
|
[] DWS Small Cap Core Fund — Class A
[] Russell 2000 Index+
|
 |
|
Yearly periods ended March 31
|
The Fund's growth of an assumed $10,000 investment is adjusted for the maximum sales charge of 5.75%. This results in a net initial investment of $9,425.
The growth of $10,000 is cumulative.
Performance of other share classes will vary based on the sales charges and the fee structure of those classes.
+ The Russell 2000 Index is an unmanaged, capitalization-weighted measure of approximately 2,000 of the smallest companies in the Russell 3000 Index.
|
Net Asset Value and Distribution Information
|
||||||||||||||||
|
Class A
|
Class B
|
Class C
|
Class S
|
|||||||||||||
|
Net Asset Value:
3/31/11
|
$ | 18.15 | $ | 16.36 | $ | 16.39 | $ | 18.68 | ||||||||
|
9/30/10
|
$ | 14.44 | $ | 13.07 | $ | 13.09 | $ | 14.86 | ||||||||
|
Distribution Information:
Six Months as of 3/31/11:
Income Dividends
|
$ | — | $ | — | $ | — | $ | .03 | ||||||||
|
Lipper Rankings — Small-Cap Core Funds Category as of 3/31/11
|
||||
|
Period
|
Rank
|
Number of Fund Classes Tracked
|
Percentile Ranking (%)
|
|
|
Class A
1-Year
|
465
|
of
|
809
|
58
|
|
3-Year
|
625
|
of
|
725
|
87
|
|
5-Year
|
529
|
of
|
570
|
93
|
|
Class B
1-Year
|
531
|
of
|
809
|
66
|
|
3-Year
|
657
|
of
|
725
|
91
|
|
5-Year
|
539
|
of
|
570
|
95
|
|
Class C
1-Year
|
538
|
of
|
809
|
67
|
|
3-Year
|
659
|
of
|
725
|
91
|
|
5-Year
|
541
|
of
|
570
|
95
|
|
Class S
1-Year
|
397
|
of
|
809
|
50
|
|
3-Year
|
616
|
of
|
725
|
85
|
|
5-Year
|
526
|
of
|
570
|
93
|
|
10-Year
|
280
|
of
|
337
|
83
|
Source: Lipper Inc. Rankings are historical and do not guarantee future results. Rankings are based on total return unadjusted for sales charges with distributions reinvested. If sales charges had been included, rankings might have been less favorable.
As an investor of the Fund, you incur two types of costs: ongoing expenses and transaction costs. Ongoing expenses include management fees, distribution and service (12b-1) fees and other Fund expenses. Examples of transaction costs include sales charges (loads), redemption fees and account maintenance fees, which are not shown in this section. The following tables are intended to help you understand your ongoing expenses (in dollars) of investing in the Fund and to help you compare these expenses with the ongoing expenses of investing in other mutual funds. In the most recent six-month period, Class A, B and C shares limited these expenses; had they not done so, expenses would have been higher. The example in the table is based on an investment of $1,000 invested at the beginning of the six-month period and held for the entire period (October 1, 2010 to March 31, 2011).
The tables illustrate your Fund's expenses in two ways:
•Actual Fund Return. This helps you estimate the actual dollar amount of ongoing expenses (but not transaction costs) paid on a $1,000 investment in the Fund using the Fund's actual return during the period. To estimate the expenses you paid over the period, simply divide your account value by $1,000 (for example, an $8,600 account value divided by $1,000 = 8.6), then multiply the result by the number in the "Expenses Paid per $1,000" line under the share class you hold.
• Hypothetical 5% Fund Return. This helps you to compare your Fund's ongoing expenses (but not transaction costs) with those of other mutual funds using the Fund's actual expense ratio and a hypothetical rate of return of 5% per year before expenses. Examples using a 5% hypothetical fund return may be found in the shareholder reports of other mutual funds. The hypothetical account values and expenses may not be used to estimate the actual ending account balance or expenses you paid for the period.
Please note that the expenses shown in these tables are meant to highlight your ongoing expenses only and do not reflect any transaction costs. The "Expenses Paid per $1,000" line of the tables is useful in comparing ongoing expenses only and will not help you determine the relative total expense of owning different funds. An account maintenance fee of $6.25 per quarter for Class S shares may apply for certain accounts whose balances do not meet the applicable minimum initial investment. This fee is not included in these tables. If it was, the estimate of expenses paid for Class S shares during the period would be higher, and account value during the period would be lower, by this amount.
|
Expenses and Value of a $1,000 Investment for the six months ended March 31, 2011
|
||||||||||||||||
|
Actual Fund Return
|
Class A
|
Class B
|
Class C
|
Class S
|
||||||||||||
|
Beginning Account Value 10/1/10
|
$ | 1,000.00 | $ | 1,000.00 | $ | 1,000.00 | $ | 1,000.00 | ||||||||
|
Ending Account Value 3/31/11
|
$ | 1,256.90 | $ | 1,251.70 | $ | 1,252.10 | $ | 1,259.50 | ||||||||
|
Expenses Paid per $1,000*
|
$ | 8.72 | $ | 12.91 | $ | 12.91 | $ | 6.93 | ||||||||
|
Hypothetical 5% Fund Return
|
Class A
|
Class B
|
Class C
|
Class S
|
||||||||||||
|
Beginning Account Value 10/1/10
|
$ | 1,000.00 | $ | 1,000.00 | $ | 1,000.00 | $ | 1,000.00 | ||||||||
|
Ending Account Value 3/31/11
|
$ | 1,017.20 | $ | 1,013.46 | $ | 1,013.46 | $ | 1,018.80 | ||||||||
|
Expenses Paid per $1,000*
|
$ | 7.80 | $ | 11.55 | $ | 11.55 | $ | 6.19 | ||||||||
* Expenses are equal to the Fund's annualized expense ratio for each share class, multiplied by the average account value over the period, multiplied by the number of days in the most recent six-month period, then divided by 365.
|
Annualized Expense Ratios
|
Class A
|
Class B
|
Class C
|
Class S
|
|
DWS Small Cap Core Fund
|
1.55%
|
2.30%
|
2.30%
|
1.23%
|
For more information, please refer to the Fund's prospectus.
|
Asset Allocation (As a % of Investment Portfolio excluding Securities Lending Collateral)
|
3/31/11
|
9/30/10
|
|
Common Stocks
|
99%
|
100%
|
|
Cash Equivalents
|
1%
|
0%
|
|
100%
|
100%
|
|
Sector Diversification (As a % of Common Stocks)
|
3/31/11
|
9/30/10
|
|
Information Technology
|
19%
|
18%
|
|
Industrials
|
19%
|
15%
|
|
Financials
|
17%
|
19%
|
|
Consumer Discretionary
|
12%
|
15%
|
|
Health Care
|
10%
|
12%
|
|
Energy
|
10%
|
8%
|
|
Materials
|
6%
|
7%
|
|
Consumer Staples
|
4%
|
3%
|
|
Utilities
|
2%
|
2%
|
|
Telecommunication Services
|
1%
|
1%
|
|
100%
|
100%
|
Asset allocation and sector diversification exclude derivatives and are subject to change.
|
Ten Largest Equity Holdings at March 31, 2011 (11.0% of Net Assets)
|
|
|
1. Apache Corp.
Explorer, developer and producer of natural gas and crude oil
|
1.2%
|
|
2. AMERIGROUP Corp.
Provider of health care benefits
|
1.2%
|
|
3. CACI International, Inc.
Provider of information technology products and services
|
1.2%
|
|
4. ViroPharma, Inc.
Pharmaceutical company committed to commercialization, development and discovery of new antiviral medicines
|
1.1%
|
|
5. Marathon Oil Corp.
Provider of oil and gas
|
1.1%
|
|
6. Magellan Health Services, Inc.
Coordinates and manages delivery of behavioral health care treatment
|
1.1%
|
|
7. PNM Resources, Inc.
Holding company that through its subsidiaries generates and distributes electricity
|
1.1%
|
|
8. QLogic Corp.
Supplies high performance storage networking solutions
|
1.0%
|
|
9. Reinsurance Group of America, Inc.
Provides life insurance in North America
|
1.0%
|
|
10. Kindred Healthcare, Inc.
National health care company operating hospitals, nursing centers, institutional pharmacies and rehabilitation services
|
1.0%
|
Portfolio holdings are subject to change.
For more complete details about the Fund's investment portfolio, see page 11. A quarterly Fact Sheet is available upon request. Please see the Account Management Resources section for contact information.
Following the Fund's fiscal first and third quarter-end, a complete portfolio holdings listing is filed with the SEC on Form N-Q. The form will be available on the SEC's Web site at www.sec.gov, and it also may be reviewed and copied at the SEC's Public Reference Room in Washington, D.C. Information on the operation of the SEC's Public Reference Room may be obtained by calling (800) SEC-0330. The Fund's portfolio holdings are also posted on www.dws-investments.com from time to time. Please see the Fund's current prospectus for more information.
|
Shares
|
Value ($)
|
|||||||
|
Common Stocks 98.7%
|
||||||||
|
Consumer Discretionary 11.5%
|
||||||||
|
Auto Components 0.8%
|
||||||||
|
Dana Holding Corp.*
|
32,200 | 559,958 | ||||||
|
Superior Industries International, Inc.
|
1,700 | 43,588 | ||||||
|
Tower International, Inc.*
|
3,900 | 66,027 | ||||||
| 669,573 | ||||||||
|
Distributors 0.0%
|
||||||||
|
Core-Mark Holding Co., Inc.*
|
1,300 | 42,965 | ||||||
|
Diversified Consumer Services 0.8%
|
||||||||
|
Corinthian Colleges, Inc.*
|
28,000 | 123,760 | ||||||
|
ITT Educational Services, Inc.*
|
5,700 | 411,255 | ||||||
|
Mac-Gray Corp.
|
2,900 | 46,777 | ||||||
|
Regis Corp.
|
4,900 | 86,926 | ||||||
| 668,718 | ||||||||
|
Hotels Restaurants & Leisure 1.3%
|
||||||||
|
Ameristar Casinos, Inc.
|
2,700 | 47,925 | ||||||
|
Brinker International, Inc.
|
7,900 | 199,870 | ||||||
|
Domino's Pizza, Inc.*
|
6,800 | 125,324 | ||||||
|
Einstein Noah Restaurant Group, Inc.
|
2,400 | 39,072 | ||||||
|
Isle of Capri Casinos, Inc.*
|
9,300 | 88,350 | ||||||
|
Multimedia Games, Inc.*
|
22,100 | 126,633 | ||||||
|
Red Robin Gourmet Burgers, Inc.*
|
9,100 | 244,790 | ||||||
|
Ruby Tuesday, Inc.*
|
18,200 | 238,602 | ||||||
| 1,110,566 | ||||||||
|
Household Durables 0.6%
|
||||||||
|
CSS Industries, Inc.
|
1,700 | 32,045 | ||||||
|
Furniture Brands International, Inc.*
|
9,300 | 42,315 | ||||||
|
Helen of Troy Ltd.*
|
3,000 | 88,200 | ||||||
|
Jarden Corp.
|
6,700 | 238,319 | ||||||
|
Lifetime Brands, Inc.*
|
10,700 | 160,500 | ||||||
| 561,379 | ||||||||
|
Leisure Equipment & Products 1.0%
|
||||||||
|
Arctic Cat, Inc.*
|
12,800 | 199,040 | ||||||
|
Callaway Golf Co.
|
35,100 | 239,382 | ||||||
|
JAKKS Pacific, Inc.*
|
22,400 | 433,440 | ||||||
|
Johnson Outdoors, Inc. "A"*
|
2,300 | 34,937 | ||||||
| 906,799 | ||||||||
|
Media 0.5%
|
||||||||
|
AH Belo Corp. "A"*
|
13,500 | 112,860 | ||||||
|
Interpublic Group of Companies, Inc.
|
10,700 | 134,499 | ||||||
|
Media General, Inc. "A"*
|
10,700 | 73,616 | ||||||
|
Scholastic Corp.
|
4,100 | 110,864 | ||||||
| 431,839 | ||||||||
|
Multiline Retail 1.4%
|
||||||||
|
Big Lots, Inc.*
|
3,500 | 152,005 | ||||||
|
Dillard's, Inc. "A"
|
16,700 | 670,004 | ||||||
|
Retail Ventures, Inc.*
|
14,100 | 243,225 | ||||||
|
Tuesday Morning Corp.*
|
31,000 | 151,900 | ||||||
| 1,217,134 | ||||||||
|
Specialty Retail 4.0%
|
||||||||
|
Aaron's, Inc.
|
11,600 | 294,176 | ||||||
|
Ann, Inc.*
|
2,200 | 64,042 | ||||||
|
Ascena Retail Group, Inc.*
|
5,000 | 162,050 | ||||||
|
Books-A-Million, Inc.
|
3,400 | 14,042 | ||||||
|
Brown Shoe Co., Inc.
|
5,400 | 65,988 | ||||||
|
Chico's FAS, Inc.
|
12,500 | 186,250 | ||||||
|
Collective Brands, Inc.*
|
13,800 | 297,804 | ||||||
|
Dick's Sporting Goods, Inc.*
|
5,100 | 203,898 | ||||||
|
Foot Locker, Inc.
|
2,600 | 51,272 | ||||||
|
GameStop Corp. "A"*
|
17,700 | 398,604 | ||||||
|
Group 1 Automotive, Inc.
|
1,300 | 55,640 | ||||||
|
New York & Co., Inc.*
|
13,700 | 96,037 | ||||||
|
Rent-A-Center, Inc.
|
3,600 | 125,676 | ||||||
|
Shoe Carnival, Inc.*
|
10,300 | 288,915 | ||||||
|
Stage Stores, Inc.
|
25,200 | 484,344 | ||||||
|
The Finish Line, Inc. "A"
|
13,800 | 273,930 | ||||||
|
The Pep Boys — Manny, Moe & Jack
|
36,600 | 465,186 | ||||||
| 3,527,854 | ||||||||
|
Textiles, Apparel & Luxury Goods 1.1%
|
||||||||
|
Liz Claiborne, Inc.*
|
30,400 | 163,856 | ||||||
|
Perry Ellis International, Inc.*
|
15,200 | 418,304 | ||||||
|
The Jones Group, Inc.
|
14,600 | 200,750 | ||||||
|
Timberland Co. "A"*
|
1,900 | 78,451 | ||||||
|
Volcom, Inc.
|
7,200 | 133,416 | ||||||
| 994,777 | ||||||||
|
Consumer Staples 3.6%
|
||||||||
|
Beverages 0.0%
|
||||||||
|
National Beverage Corp.
|
2,900 | 39,817 | ||||||
|
Food & Staples Retailing 0.1%
|
||||||||
|
Susser Holdings Corp.*
|
1,800 | 23,562 | ||||||
|
The Andersons, Inc.
|
600 | 29,232 | ||||||
| 52,794 | ||||||||
|
Food Products 2.4%
|
||||||||
|
Dole Food Co., Inc.*
|
16,500 | 224,895 | ||||||
|
Fresh Del Monte Produce, Inc.
|
2,700 | 70,497 | ||||||
|
Imperial Sugar Co.
|
6,600 | 88,044 | ||||||
|
John B. Sanfilippo & Son, Inc.*
|
4,100 | 47,970 | ||||||
|
Seneca Foods Corp. "A"*
|
4,000 | 119,480 | ||||||
|
Smithfield Foods, Inc.*
|
27,800 | 668,868 | ||||||
|
Tyson Foods, Inc. "A"
|
44,400 | 852,036 | ||||||
| 2,071,790 | ||||||||
|
Household Products 0.4%
|
||||||||
|
Central Garden & Pet Co. "A"*
|
39,300 | 361,953 | ||||||
|
Oil-Dri Corp. of America
|
1,200 | 25,560 | ||||||
| 387,513 | ||||||||
|
Personal Products 0.4%
|
||||||||
|
Elizabeth Arden, Inc.*
|
10,600 | 318,106 | ||||||
|
Tobacco 0.3%
|
||||||||
|
Universal Corp.
|
6,000 | 261,240 | ||||||
|
Energy 9.8%
|
||||||||
|
Energy Equipment & Services 4.0%
|
||||||||
|
Cal Dive International, Inc.*
|
21,300 | 148,674 | ||||||
|
Dresser-Rand Group, Inc.*
|
1,100 | 58,982 | ||||||
|
Exterran Holdings, Inc.*
|
28,500 | 676,305 | ||||||
|
Key Energy Services, Inc.*
|
7,200 | 111,960 | ||||||
|
Matrix Service Co.*
|
3,100 | 43,090 | ||||||
|
Nabors Industries Ltd.*
|
7,900 | 240,002 | ||||||
|
Newpark Resources, Inc.*
|
31,600 | 248,376 | ||||||
|
Oceaneering International, Inc.*
|
3,400 | 304,130 | ||||||
|
Parker Drilling Co.*
|
16,500 | 114,015 | ||||||
|
PHI, Inc. (Non Voting)*
|
13,000 | 287,560 | ||||||
|
Pioneer Drilling Co.*
|
38,700 | 534,060 | ||||||
|
SEACOR Holdings, Inc.
|
4,700 | 434,562 | ||||||
|
Union Drilling, Inc.*
|
16,700 | 171,175 | ||||||
|
Willbros Group, Inc.*
|
10,700 | 116,844 | ||||||
| 3,489,735 | ||||||||
|
Oil, Gas & Consumable Fuels 5.8%
|
||||||||
|
Apache Corp.
|
8,300 | 1,086,636 | ||||||
|
Bill Barrett Corp.*
|
4,000 | 159,640 | ||||||
|
BreitBurn Energy Partners LP (Limited Partnership)
|
4,500 | 97,785 | ||||||
|
Chevron Corp.
|
3,100 | 333,033 | ||||||
|
Comstock Resources, Inc.*
|
12,100 | 374,374 | ||||||
|
Contango Oil & Gas Co.*
|
1,100 | 69,564 | ||||||
|
Crosstex Energy, Inc.
|
13,000 | 129,350 | ||||||
|
Energy Partners Ltd.*
|
11,600 | 208,800 | ||||||
|
GMX Resources, Inc.*
|
8,100 | 49,977 | ||||||
|
Green Plains Renewable Energy, Inc.*
|
8,500 | 102,170 | ||||||
|
James River Coal Co.*
|
1,900 | 45,923 | ||||||
|
Marathon Oil Corp.
|
18,400 | 980,904 | ||||||
|
Penn Virginia Corp.
|
23,800 | 403,648 | ||||||
|
PetroQuest Energy, Inc.*
|
13,700 | 128,232 | ||||||
|
REX American Resources Corp.*
|
3,200 | 51,072 | ||||||
|
SandRidge Energy, Inc.*
|
9,600 | 122,880 | ||||||
|
Stone Energy Corp.*
|
19,300 | 644,041 | ||||||
|
W&T Offshore, Inc.
|
2,000 | 45,580 | ||||||
|
Western Refining, Inc.*
|
4,900 | 83,055 | ||||||
| 5,116,664 | ||||||||
|
Financials 16.7%
|
||||||||
|
Capital Markets 1.4%
|
||||||||
|
American Capital Ltd.*
|
26,200 | 259,380 | ||||||
|
BGC Partners, Inc. "A"
|
10,500 | 97,545 | ||||||
|
Calamos Asset Management, Inc. "A"
|
4,900 | 81,291 | ||||||
|
E*TRADE Financial Corp.*
|
10,400 | 162,552 | ||||||
|
Oppenheimer Holdings, Inc. "A"
|
5,400 | 180,954 | ||||||
|
Piper Jaffray Companies, Inc.*
|
7,300 | 302,439 | ||||||
|
SWS Group, Inc.
|
9,500 | 57,665 | ||||||
|
Waddell & Reed Financial, Inc. "A"
|
3,100 | 125,891 | ||||||
| 1,267,717 | ||||||||
|
Commercial Banks 5.8%
|
||||||||
|
Cathay General Bancorp.
|
31,400 | 535,370 | ||||||
|
Century Bancorp., Inc. "A"
|
2,200 | 58,894 | ||||||
|
Enterprise Financial Services Corp.
|
4,600 | 64,722 | ||||||
|
First BanCorp. - North Carolina
|
1,900 | 25,194 | ||||||
|
First Merchants Corp.
|
37,900 | 313,433 | ||||||
|
IBERIABANK Corp.
|
7,400 | 444,962 | ||||||
|
Lakeland Bancorp., Inc.
|
4,240 | 44,011 | ||||||
|
MainSource Financial Group, Inc.
|
19,200 | 192,192 | ||||||
|
MB Financial, Inc.
|
16,200 | 339,552 | ||||||
|
MidWestOne Financial Group, Inc.
|
1,800 | 26,712 | ||||||
|
Nara Bancorp., Inc.*
|
11,900 | 114,478 | ||||||
|
National Penn Bancshares, Inc.
|
17,100 | 132,354 | ||||||
|
Peoples Bancorp., Inc.
|
1,700 | 20,434 | ||||||
|
Pinnacle Financial Partners, Inc.*
|
18,300 | 302,682 | ||||||
|
PrivateBancorp., Inc.
|
13,100 | 200,299 | ||||||
|
Prosperity Bancshares, Inc.
|
5,400 | 230,958 | ||||||
|
Southwest Bancorp., Inc.*
|
11,500 | 163,185 | ||||||
|
StellarOne Corp.
|
6,100 | 86,620 | ||||||
|
Susquehanna Bancshares, Inc.
|
84,100 | 786,335 | ||||||
|
Wilshire Bancorp., Inc.*
|
9,200 | 45,080 | ||||||
|
Wintrust Financial Corp.
|
11,100 | 407,925 | ||||||
|
Zions Bancorp.
|
24,100 | 555,746 | ||||||
| 5,091,138 | ||||||||
|
Consumer Finance 0.3%
|
||||||||
|
Capital One Financial Corp.
|
5,200 | 270,192 | ||||||
|
Diversified Financial Services 0.7%
|
||||||||
|
ASTA Funding, Inc.
|
7,700 | 65,912 | ||||||
|
NewStar Financial, Inc.*
|
22,100 | 241,332 | ||||||
|
Portfolio Recovery Associates, Inc.*
|
800 | 68,104 | ||||||
|
The NASDAQ OMX Group, Inc.*
|
8,300 | 214,472 | ||||||
| 589,820 | ||||||||
|
Insurance 4.1%
|
||||||||
|
American Safety Insurance Holdings Ltd.*
|
16,800 | 360,024 | ||||||
|
Aspen Insurance Holdings Ltd.
|
13,700 | 377,572 | ||||||
|
CNO Financial Group, Inc.*
|
14,100 | 105,891 | ||||||
|
Endurance Specialty Holdings Ltd.
|
15,800 | 771,356 | ||||||
|
FBL Financial Group, Inc. "A"
|
3,700 | 113,664 | ||||||
|
First American Financial Corp.
|
8,300 | 136,950 | ||||||
|
Infinity Property & Casualty Corp.
|
3,500 | 208,215 | ||||||
|
Lincoln National Corp.
|
4,900 | 147,196 | ||||||
|
Maiden Holdings Ltd.
|
20,800 | 155,792 | ||||||
|
Reinsurance Group of America, Inc.
|
14,300 | 897,754 | ||||||
|
White Mountains Insurance Group Ltd.
|
800 | 291,360 | ||||||
| 3,565,774 | ||||||||
|
Real Estate Investment Trusts 3.7%
|
||||||||
|
Anworth Mortgage Asset Corp. (REIT)
|
75,900 | 538,131 | ||||||
|
Associated Estates Realty Corp. (REIT)
|
16,400 | 260,432 | ||||||
|
CapLease, Inc. (REIT)
|
8,200 | 44,936 | ||||||
|
Capstead Mortgage Corp. (REIT)
|
35,100 | 448,578 | ||||||
|
Highwoods Properties, Inc. (REIT)
|
10,100 | 353,601 | ||||||
|
Hospitality Properties Trust (REIT)
|
8,100 | 187,515 | ||||||
|
Lexington Realty Trust (REIT)
|
12,600 | 117,810 | ||||||
|
MFA Financial, Inc. (REIT)
|
86,800 | 711,760 | ||||||
|
Piedmont Office Realty Trust, Inc. "A" (REIT)
|
20,200 | 392,082 | ||||||
|
Post Properties, Inc. (REIT)
|
3,200 | 125,600 | ||||||
|
PS Business Parks, Inc. (REIT)
|
1,100 | 63,734 | ||||||
| 3,244,179 | ||||||||
|
Thrifts & Mortgage Finance 0.7%
|
||||||||
|
Bank Mutual Corp.
|
17,500 | 74,025 | ||||||
|
BankFinancial Corp.
|
2,700 | 24,813 | ||||||
|
Berkshire Hills Bancorp., Inc.
|
2,200 | 45,870 | ||||||
|
Capitol Federal Financial, Inc.
|
9,600 | 108,192 | ||||||
|
First Financial Holdings, Inc.
|
14,000 | 158,340 | ||||||
|
Washington Federal, Inc.
|
12,500 | 216,750 | ||||||
|
Westfield Financial, Inc.
|
3,200 | 28,992 | ||||||
| 656,982 | ||||||||
|
Health Care 10.3%
|
||||||||
|
Biotechnology 0.8%
|
||||||||
|
Cephalon, Inc.*
|
6,300 | 477,414 | ||||||
|
Emergent Biosolutions, Inc.*
|
8,900 | 215,024 | ||||||
|
Maxygen, Inc.
|
9,000 | 46,800 | ||||||
| 739,238 | ||||||||
|
Health Care Equipment & Supplies 1.1%
|
||||||||
|
Alere, Inc.*
|
1,700 | 66,538 | ||||||
|
Hologic, Inc.*
|
9,000 | 199,800 | ||||||
|
Invacare Corp.
|
9,900 | 308,088 | ||||||
|
Sirona Dental Systems, Inc.*
|
2,600 | 130,416 | ||||||
|
The Cooper Companies, Inc.
|
2,900 | 201,405 | ||||||
|
TomoTherapy, Inc.*
|
18,300 | 83,631 | ||||||
| 989,878 | ||||||||
|
Health Care Providers & Services 6.1%
|
||||||||
|
AMERIGROUP Corp.*
|
16,800 | 1,079,400 | ||||||
|
Continucare Corp.*
|
41,000 | 219,350 | ||||||
|
Coventry Health Care, Inc.*
|
1,700 | 54,213 | ||||||
|
Five Star Quality Care, Inc.*
|
26,600 | 216,258 | ||||||
|
Health Net, Inc.*
|
18,000 | 588,600 | ||||||
|
Healthspring, Inc.*
|
5,300 | 198,061 | ||||||
|
Kindred Healthcare, Inc.*
|
36,700 | 876,396 | ||||||
|
Magellan Health Services, Inc.*
|
19,300 | 947,244 | ||||||
|
National Healthcare Corp.
|
4,600 | 213,854 | ||||||
|
Owens & Minor, Inc.
|
18,100 | 587,888 | ||||||
|
Providence Service Corp.*
|
5,200 | 77,896 | ||||||
|
PSS World Medical, Inc.*
|
3,200 | 86,880 | ||||||
|
Triple-S Management Corp. "B"*
|
3,500 | 72,030 | ||||||
|
WellCare Health Plans, Inc.*
|
2,300 | 96,485 | ||||||
| 5,314,555 | ||||||||
|
Life Sciences Tools & Services 0.3%
|
||||||||
|
Affymetrix, Inc.*
|
20,800 | 108,368 | ||||||
|
Albany Molecular Research, Inc.*
|
13,700 | 58,362 | ||||||
|
Cambrex Corp.*
|
8,238 | 45,309 | ||||||
| 212,039 | ||||||||
|
Pharmaceuticals 2.0%
|
||||||||
|
Endo Pharmaceuticals Holdings, Inc.*
|
16,200 | 618,192 | ||||||
|
Medicis Pharmaceutical Corp. "A"
|
6,100 | 195,444 | ||||||
|
ViroPharma, Inc.*
|
49,300 | 981,070 | ||||||
| 1,794,706 | ||||||||
|
Industrials 18.3%
|
||||||||
|
Aerospace & Defense 2.8%
|
||||||||
|
AAR Corp.*
|
3,700 | 102,564 | ||||||
|
Aerovironment, Inc.*
|
5,000 | 174,850 | ||||||
|
BE Aerospace, Inc.*
|
11,200 | 397,936 | ||||||
|
Ceradyne, Inc.*
|
14,100 | 635,628 | ||||||
|
Cubic Corp.
|
10,600 | 609,500 | ||||||
|
LMI Aerospace, Inc.*
|
5,600 | 113,176 | ||||||
|
Moog, Inc. "A"*
|
10,000 | 459,100 | ||||||
| 2,492,754 | ||||||||
|
Air Freight & Logistics 0.6%
|
||||||||
|
Atlas Air Worldwide Holdings, Inc.*
|
8,100 | 564,732 | ||||||
|
Airlines 1.0%
|
||||||||
|
Alaska Air Group, Inc.*
|
3,600 | 228,312 | ||||||
|
SkyWest, Inc.
|
37,600 | 636,192 | ||||||
| 864,504 | ||||||||
|
Building Products 0.4%
|
||||||||
|
Gibraltar Industries, Inc.*
|
26,800 | 319,724 | ||||||
|
Commercial Services & Supplies 2.4%
|
||||||||
|
Consolidated Graphics, Inc.*
|
2,000 | 109,260 | ||||||
|
EnergySolutions*
|
9,800 | 58,408 | ||||||
|
G & K Services, Inc. "A"
|
10,200 | 339,150 | ||||||
|
M&F Worldwide Corp.*
|
3,500 | 87,920 | ||||||
|
Metalico, Inc.*
|
5,200 | 32,344 | ||||||
|
R.R. Donnelley & Sons Co.
|
12,200 | 230,824 | ||||||
|
Sykes Enterprises, Inc.*
|
5,500 | 108,735 | ||||||
|
Team, Inc.*
|
1,900 | 49,894 | ||||||
|
Tetra Tech, Inc.*
|
8,200 | 202,458 | ||||||
|
The Brink's Co.
|
14,000 | 463,540 | ||||||
|
UniFirst Corp.
|
2,500 | 132,525 | ||||||
|
United Stationers, Inc.
|
3,900 | 277,095 | ||||||
| 2,092,153 | ||||||||
|
Construction & Engineering 2.6%
|
||||||||
|
Great Lakes Dredge & Dock Co.
|
23,600 | 180,068 | ||||||
|
KBR, Inc.
|
6,000 | 226,620 | ||||||
|
Layne Christensen Co.*
|
3,200 | 110,400 | ||||||
|
Northwest Pipe Co.*
|
4,500 | 103,185 | ||||||
|
Pike Electric Corp.*
|
4,600 | 43,792 | ||||||
|
Sterling Construction Co., Inc.*
|
14,300 | 241,384 | ||||||
|
Tutor Perini Corp.
|
35,200 | 857,472 | ||||||
|
URS Corp.*
|
10,800 | 497,340 | ||||||
| 2,260,261 | ||||||||
|
Electrical Equipment 0.8%
|
||||||||
|
Encore Wire Corp.
|
4,700 | 114,398 | ||||||
|
EnerSys*
|
15,500 | 616,125 | ||||||
| 730,523 | ||||||||
|
Industrial Conglomerates 0.1%
|
||||||||
|
Standex International Corp.
|
2,300 | 87,147 | ||||||
|
Machinery 4.7%
|
||||||||
|
Actuant Corp. "A"
|
10,400 | 301,600 | ||||||
|
Alamo Group, Inc.
|
7,600 | 208,620 | ||||||
|
Altra Holdings, Inc.*
|
11,800 | 278,716 | ||||||
|
Astec Industries, Inc.*
|
2,000 | 74,580 | ||||||
|
Briggs & Stratton Corp.
|
6,800 | 154,020 | ||||||
|
Cascade Corp.
|
1,600 | 71,328 | ||||||
|
Colfax Corp.*
|
4,800 | 110,160 | ||||||
|
EnPro Industries, Inc.*
|
11,900 | 432,208 | ||||||
|
Harsco Corp.
|
9,000 | 317,610 | ||||||
|
Kennametal, Inc.
|
6,900 | 269,100 | ||||||
|
L.B. Foster Co. "A"
|
4,400 | 189,684 | ||||||
|
Lydall, Inc.*
|
2,800 | 24,892 | ||||||
|
Miller Industries, Inc.
|
21,800 | 354,032 | ||||||
|
Mueller Industries, Inc.
|
7,100 | 260,002 | ||||||
|
NACCO Industries, Inc. "A"
|
2,300 | 254,541 | ||||||
|
NN, Inc.*
|
8,700 | 158,862 | ||||||
|
Oshkosh Corp.*
|
3,700 | 130,906 | ||||||
|
Robbins & Myers, Inc.
|
7,100 | 326,529 | ||||||
|
Tecumseh Products Co. "A"*
|
14,800 | 148,296 | ||||||
|
Titan International, Inc.
|
3,800 | 101,118 | ||||||
| 4,166,804 | ||||||||
|
Marine 0.1%
|
||||||||
|
International Shipholding Corp.
|
3,200 | 79,680 | ||||||
|
Professional Services 1.2%
|
||||||||
|
FTI Consulting, Inc.*
|
8,200 | 314,306 | ||||||
|
Kelly Services, Inc. "A"*
|
3,100 | 67,301 | ||||||
|
On Assignment, Inc.*
|
9,500 | 89,870 | ||||||
|
School Specialty, Inc.*
|
6,500 | 92,950 | ||||||
|
SFN Group, Inc.*
|
28,000 | 394,520 | ||||||
|
VSE Corp.
|
1,600 | 47,536 | ||||||
| 1,006,483 | ||||||||
|
Road & Rail 0.4%
|
||||||||
|
AMERCO*
|
1,400 | 135,800 | ||||||
|
P.A.M. Transportation Services, Inc.*
|
1,900 | 23,085 | ||||||
|
Saia, Inc.*
|
4,600 | 75,394 | ||||||
|
Werner Enterprises, Inc.
|
5,400 | 142,938 | ||||||
| 377,217 | ||||||||
|
Trading Companies & Distributors 1.2%
|
||||||||
|
Aceto Corp.
|
9,800 | 78,106 | ||||||
|
Aircastle Ltd.
|
15,100 | 182,257 | ||||||
|
Applied Industrial Technologies, Inc.
|
6,700 | 222,842 | ||||||
|
Beacon Roofing Supply, Inc.*
|
16,200 | 331,614 | ||||||
|
CAI International, Inc.*
|
2,300 | 59,478 | ||||||
|
DXP Enterprises, Inc.*
|
5,600 | 129,248 | ||||||
|
Lawson Products, Inc.
|
3,500 | 80,640 | ||||||
| 1,084,185 | ||||||||
|
Information Technology 19.0%
|
||||||||
|
Communications Equipment 1.8%
|
||||||||
|
Arris Group, Inc.*
|
4,800 | 61,152 | ||||||
|
Brocade Communications Systems, Inc.*
|
87,300 | 536,895 | ||||||
|
Comtech Telecommunications Corp.
|
28,700 | 780,066 | ||||||
|
EchoStar Corp. "A"*
|
1,100 | 41,635 | ||||||
|
Tellabs, Inc.
|
26,900 | 140,956 | ||||||
| 1,560,704 | ||||||||
|
Computers & Peripherals 2.3%
|
||||||||
|
Imation Corp.*
|
39,100 | 435,574 | ||||||
|
Lexmark International, Inc. "A"*
|
5,200 | 192,608 | ||||||
|
QLogic Corp.*
|
48,800 | 905,240 | ||||||
|
Western Digital Corp.*
|
5,400 | 201,366 | ||||||
|
Xyratex Ltd.*
|
24,000 | 268,320 | ||||||
| 2,003,108 | ||||||||
|
Electronic Equipment, Instruments & Components 2.9%
|
||||||||
|
Anixter International, Inc.
|
10,400 | 726,856 | ||||||
|
Brightpoint, Inc.*
|
33,100 | 358,804 | ||||||
|
Electro Rent Corp.
|
2,100 | 36,078 | ||||||
|
Flextronics International Ltd.*
|
66,500 | 496,755 | ||||||
|
Insight Enterprises, Inc.*
|
4,100 | 69,823 | ||||||
|
Newport Corp.*
|
9,800 | 174,734 | ||||||
|
OSI Systems, Inc.*
|
3,800 | 142,614 | ||||||
|
PC Connection, Inc.*
|
12,800 | 113,408 | ||||||
|
Vishay Intertechnology, Inc.*
|
25,600 | 454,144 | ||||||
| 2,573,216 | ||||||||
|
Internet Software & Services 1.9%
|
||||||||
|
AOL, Inc.*
|
7,200 | 140,616 | ||||||
|
EarthLink, Inc.
|
61,700 | 483,111 | ||||||
|
IAC/InterActiveCorp.*
|
27,400 | 846,386 | ||||||
|
ModusLink Global Solutions, Inc.
|
30,200 | 164,892 | ||||||
| 1,635,005 | ||||||||
|
IT Services 3.8%
|
||||||||
|
CACI International, Inc. "A"*
|
16,500 | 1,011,780 | ||||||
|
CIBER, Inc.*
|
23,000 | 154,100 | ||||||
|
Computer Task Group, Inc.*
|
3,500 | 46,515 | ||||||
|
Fiserv, Inc.*
|
10,900 | 683,648 | ||||||
|
Global Cash Access Holdings, Inc.*
|
12,800 | 41,856 | ||||||
|
Jack Henry & Associates, Inc.
|
23,800 | 806,582 | ||||||
|
Online Resources Corp.*
|
19,100 | 72,198 | ||||||
|
SRA International, Inc. "A"*
|
10,000 | 283,600 | ||||||
|
TeleTech Holdings, Inc.*
|
12,800 | 248,064 | ||||||
| 3,348,343 | ||||||||
|
Semiconductors & Semiconductor Equipment 4.5%
|
||||||||
|
Amkor Technology, Inc.*
|
68,200 | 459,668 | ||||||
|
Brooks Automation, Inc.*
|
12,800 | 175,744 | ||||||
|
Entegris, Inc.*
|
36,900 | 323,613 | ||||||
|
Fairchild Semiconductor International, Inc.*
|
8,000 | 145,600 | ||||||
|
GT Solar International, Inc.*
|
4,000 | 42,640 | ||||||
|
Kulicke & Soffa Industries, Inc.*
|
38,600 | 360,910 | ||||||
|
Micron Technology, Inc.*
|
73,400 | 841,164 | ||||||
|
MKS Instruments, Inc.
|
4,400 | 146,520 | ||||||
|
ON Semiconductor Corp.*
|
15,700 | 154,959 | ||||||
|
Photronics, Inc.*
|
65,200 | 584,844 | ||||||
|
SunPower Corp. "A"*
|
34,000 | 582,760 | ||||||
|
Teradyne, Inc.*
|
9,800 | 174,538 | ||||||
| 3,992,960 | ||||||||
|
Software 1.8%
|
||||||||
|
ACI Worldwide, Inc.*
|
1,900 | 62,320 | ||||||
|
CDC Corp. "A"*
|
9,200 | 23,460 | ||||||
|
ePlus, Inc.*
|
3,000 | 79,830 | ||||||
|
Fair Isaac Corp.
|
6,000 | 189,660 | ||||||
|
Manhattan Associates, Inc.*
|
18,700 | 611,864 | ||||||
|
Monotype Imaging Holdings, Inc.*
|
8,200 | 118,900 | ||||||
|
NetScout Systems, Inc.*
|
5,300 | 144,796 | ||||||
|
OPNET Technologies, Inc.
|
6,300 | 245,637 | ||||||
|
Websense, Inc.*
|
4,300 | 98,771 | ||||||
| 1,575,238 | ||||||||
|
Materials 6.1%
|
||||||||
|
Chemicals 2.9%
|
||||||||
|
Arch Chemicals, Inc.
|
7,500 | 311,925 | ||||||
|
Ferro Corp.*
|
24,800 | 411,432 | ||||||
|
Georgia Gulf Corp.*
|
4,600 | 170,200 | ||||||
|
Innophos Holdings, Inc.
|
3,200 | 147,552 | ||||||
|
Minerals Technologies, Inc.
|
4,200 | 287,784 | ||||||
|
OM Group, Inc.*
|
16,000 | 584,640 | ||||||
|
Spartech Corp.*
|
7,500 | 54,375 | ||||||
|
Stepan Co.
|
800 | 58,000 | ||||||
|
TPC Group, Inc.*
|
5,000 | 144,350 | ||||||
|
W.R. Grace & Co.*
|
10,700 | 409,703 | ||||||
| 2,579,961 | ||||||||
|
Containers & Packaging 1.4%
|
||||||||
|
AEP Industries, Inc.*
|
2,200 | 65,384 | ||||||
|
Boise, Inc.
|
57,300 | 524,868 | ||||||
|
Crown Holdings, Inc.*
|
14,200 | 547,836 | ||||||
|
Rock-Tenn Co. "A"
|
1,200 | 83,220 | ||||||
| 1,221,308 | ||||||||
|
Metals & Mining 0.9%
|
||||||||
|
Cliffs Natural Resources, Inc.
|
1,900 | 186,732 | ||||||
|
Materion Corp.*
|
2,000 | 81,600 | ||||||
|
Randgold Resources Ltd. (ADR)*
|
2,700 | 220,158 | ||||||
|
Yamana Gold, Inc.
|
27,200 | 334,832 | ||||||
| 823,322 | ||||||||
|
Paper & Forest Products 0.9%
|
||||||||
|
Buckeye Technologies, Inc.
|
2,500 | 68,075 | ||||||
|
Domtar Corp.
|
700 | 64,246 | ||||||
|
KapStone Paper & Packaging Corp.*
|
8,600 | 147,662 | ||||||
|
Neenah Paper, Inc.
|
11,900 | 261,443 | ||||||
|
P.H. Glatfelter Co.
|
15,400 | 205,128 | ||||||
| 746,554 | ||||||||
|
Telecommunication Services 1.6%
|
||||||||
|
Diversified Telecommunication Services 0.2%
|
||||||||
|
Vonage Holdings Corp.*
|
28,600 | 130,416 | ||||||
|
Wireless Telecommunication Services 1.4%
|
||||||||
|
Telephone & Data Systems, Inc.
|
24,400 | 822,280 | ||||||
|
USA Mobility, Inc.
|
30,800 | 446,292 | ||||||
| 1,268,572 | ||||||||
|
Utilities 1.8%
|
||||||||
|
Electric Utilities 1.2%
|
||||||||
|
PNM Resources, Inc.
|
62,400 | 931,008 | ||||||
|
Portland General Electric Co.
|
6,800 | 161,636 | ||||||
| 1,092,644 | ||||||||
|
Gas Utilities 0.0%
|
||||||||
|
WGL Holdings, Inc.
|
1,000 | 39,000 | ||||||
|
Independent Power Producers & Energy Traders 0.6%
|
||||||||
|
GenOn Energy, Inc.*
|
130,000 | 495,300 | ||||||
|
Total Common Stocks (Cost $76,630,189)
|
86,817,299 | |||||||
|
Cash Equivalents 1.2%
|
||||||||
|
Central Cash Management Fund, 0.17% (a) (Cost $1,099,236)
|
1,099,236 | 1,099,236 | ||||||
|
% of Net Assets
|
Value ($)
|
|||||||
|
Total Investment Portfolio (Cost $77,729,425)+
|
99.9 | 87,916,535 | ||||||
|
Other Assets and Liabilities, Net
|
0.1 | 57,674 | ||||||
|
Net Assets
|
100.0 | 87,974,209 | ||||||
* Non-income producing security.
+ The cost for federal income tax purposes was $77,994,433. At March 31, 2011, net unrealized appreciation for all securities based on tax cost was $9,922,102. This consisted of aggregate gross unrealized appreciation for all securities in which there was an excess of value over tax cost of $10,793,875 and aggregate gross unrealized depreciation for all securities in which there was an excess of tax cost over value of $871,773.
(a) Affiliated fund managed by Deutsche Investment Management Americas Inc. The rate shown is the annualized seven-day yield at period end.
ADR: American Depositary Receipt
REIT: Real Estate Investment Trust
At March 31, 2011, open futures contracts purchased were as follows:
|
Futures
|
Currency
|
Expiration Date
|
Contracts
|
Notional Value ($)
|
Unrealized Appreciation ($)
|
|||||||||
|
Russell E-Mini 2000 Index
|
USD
|
6/17/2011
|
15 | 1,262,550 | 74,655 | |||||||||
|
Currency Abbreviation
|
|
USD United States Dollar
|
For information on the Fund's policy and additional disclosures regarding futures contracts, please refer to Note B in the accompanying Notes to Financial Statements.
Fair Value Measurements
Various inputs are used in determining the value of the Fund's investments. These inputs are summarized in three broad levels. Level 1 includes quoted prices in active markets for identical securities. Level 2 includes other significant observable inputs (including quoted prices for similar securities, interest rates, prepayment speeds and credit risk). Level 3 includes significant unobservable inputs (including the Fund's own assumptions in determining the fair value of investments). The inputs or methodology used for valuing securities are not necessarily an indication of the risk associated with investing in those securities.
The following is a summary of the inputs used as of March 31, 2011 in valuing the Fund's investments. For information on the Fund's policy regarding the valuation of investments, please refer to the Security Valuation section of Note A in the accompanying Notes to Financial Statements.
There have been no significant transfers between Level 1 and Level 2 fair value measurements during the period ended March 31, 2011.
(b) See Investment Portfolio for additional detailed categorizations.
(c) Derivatives include unrealized appreciation on open futures contracts.
The accompanying notes are an integral part of the financial statements.
|
as of March 31, 2011 (Unaudited)
|
||||
|
Assets
|
||||
|
Investments:
Investments in non-affiliated securities, at value (cost $76,630,189)
|
$ | 86,817,299 | ||
|
Investment in Central Cash Management Fund (cost $1,099,236)
|
1,099,236 | |||
|
Total investments, at value (cost $77,729,425)
|
87,916,535 | |||
|
Cash
|
35,075 | |||
|
Deposit with broker for open futures contracts
|
144,230 | |||
|
Receivable for daily variation margin on open futures contracts
|
74,655 | |||
|
Receivable for Fund shares sold
|
24,320 | |||
|
Dividends receivable
|
44,818 | |||
|
Other assets
|
29,227 | |||
|
Total assets
|
88,268,860 | |||
|
Liabilities
|
||||
|
Payable for Fund shares redeemed
|
126,577 | |||
|
Accrued management fee
|
47,968 | |||
|
Other accrued expenses and payables
|
120,106 | |||
|
Total liabilities
|
294,651 | |||
|
Net assets, at value
|
$ | 87,974,209 | ||
|
Net Assets Consist of
|
||||
|
Distributions in excess of net investment income
|
(53,766 | ) | ||
|
Net unrealized appreciation (depreciation) on:
Investments
|
10,187,110 | |||
|
Futures
|
74,655 | |||
|
Accumulated net realized gain (loss)
|
(23,168,526 | ) | ||
|
Paid-in capital
|
100,934,736 | |||
|
Net assets, at value
|
$ | 87,974,209 | ||
The accompanying notes are an integral part of the financial statements.
|
Statement of Assets and Liabilities as of March 31, 2011 (Unaudited) (continued)
|
||||
|
Net Asset Value
|
||||
|
Class A
Net Asset Value and redemption price(a) per share ($7,691,847 ÷ 423,728 outstanding shares of beneficial interest, $.01 par value, unlimited number of shares authorized)
|
$ | 18.15 | ||
|
Maximum offering price per share (100 ÷ 94.25 of $18.15)
|
$ | 19.26 | ||
|
Class B
Net Asset Value, offering and redemption price(a) (subject to contingent deferred sales charge) per share ($1,540,012 ÷ 94,113 outstanding shares of beneficial interest, $.01 par value, unlimited number of shares authorized)
|
$ | 16.36 | ||
|
Class C
Net Asset Value, offering and redemption price(a) (subject to contingent deferred sales charge) per share ($1,015,503 ÷ 61,940 outstanding shares of beneficial interest, $.01 par value, unlimited number of shares authorized)
|
$ | 16.39 | ||
|
Class S
Net Asset Value, offering and redemption price(a) per share ($77,726,847 ÷ 4,161,959 outstanding shares of beneficial interest, $.01 par value, unlimited number of shares authorized)
|
$ | 18.68 | ||
(a) Redemption price per share for shares held less than 15 days is equal to net asset value less a 2% redemption fee.
The accompanying notes are an integral part of the financial statements.
|
for the six months ended March 31, 2011 (Unaudited)
|
||||
|
Investment Income
|
||||
|
Income:
Dividends (net of foreign taxes withheld of $122)
|
$ | 581,740 | ||
|
Income distributions — Central Cash Management Fund
|
1,206 | |||
|
Securities lending income, including income from Daily Assets Fund Institutional, net of borrower rebates
|
11,252 | |||
|
Total income
|
594,198 | |||
|
Expenses:
Management fee
|
263,799 | |||
|
Administration fee
|
39,669 | |||
|
Services to shareholders
|
95,039 | |||
|
Distribution and service fees
|
19,836 | |||
|
Reports to shareholders
|
20,462 | |||
|
Registration fees
|
22,854 | |||
|
Custodian fee
|
7,891 | |||
|
Trustees' fees and expenses
|
2,411 | |||
|
Legal fees
|
9,378 | |||
|
Audit and tax fees
|
27,531 | |||
|
Other
|
5,564 | |||
|
Total expenses before expense reductions
|
514,434 | |||
|
Expense reductions
|
(2,230 | ) | ||
|
Total expenses after expense reductions
|
512,204 | |||
|
Net investment income (loss)
|
81,994 | |||
|
Realized and Unrealized Gain (Loss)
|
||||
|
Net realized gain (loss) from:
Investments
|
13,188,811 | |||
|
Futures
|
375,305 | |||
| 13,564,116 | ||||
|
Change in net unrealized appreciation (depreciation) on:
Investments
|
4,336,977 | |||
|
Futures
|
67,255 | |||
| 4,404,232 | ||||
|
Net gain (loss)
|
17,968,348 | |||
|
Net increase (decrease) in net assets resulting from operations
|
$ | 18,050,342 | ||
The accompanying notes are an integral part of the financial statements.
|
Increase (Decrease) in Net Assets
|
Six Months Ended March 31, 2011 (Unaudited)
|
Year Ended September 30, 2010
|
||||||
|
Operations:
Net investment income (loss)
|
$ | 81,994 | $ | (17,163 | ) | |||
|
Net realized gain (loss)
|
13,564,116 | 11,333,470 | ||||||
|
Change in net unrealized appreciation (depreciation)
|
4,404,232 | (5,180,146 | ) | |||||
|
Net increase (decrease) in net assets resulting from operations
|
18,050,342 | 6,136,161 | ||||||
|
Distributions to shareholders from:
Net investment income:
Class A
|
— | (4,034 | ) | |||||
|
Class S
|
(135,760 | ) | (46,161 | ) | ||||
|
Total distributions
|
(135,760 | ) | (50,195 | ) | ||||
|
Fund share transactions:
Proceeds from shares sold
|
8,037,690 | 9,643,542 | ||||||
|
Reinvestment of distributions
|
130,870 | 47,700 | ||||||
|
Payments for shares redeemed
|
(6,848,542 | ) | (16,722,488 | ) | ||||
|
Redemption fees
|
56 | 176 | ||||||
|
Net increase (decrease) in net assets from Fund share transactions
|
1,320,074 | (7,031,070 | ) | |||||
|
Increase (decrease) in net assets
|
19,234,656 | (945,104 | ) | |||||
|
Net assets at beginning of period
|
68,739,553 | 69,684,657 | ||||||
|
Net assets at end of year (including distributions in excess of net investment income of $53,766 and undistributed net investment income of $0, respectively)
|
$ | 87,974,209 | $ | 68,739,553 | ||||
The accompanying notes are an integral part of the financial statements.
|
Class A
Years Ended September 30,
|
2011 | a | 2010 | 2009 | 2008 | 2007 | 2006 | |||||||||||||||||
|
Selected Per Share Data
|
||||||||||||||||||||||||
|
Net asset value, beginning of period
|
$ | 14.44 | $ | 13.24 | $ | 14.75 | $ | 21.77 | $ | 23.27 | $ | 25.70 | ||||||||||||
|
Income (loss) from investment operations:
Net investment income (loss)b
|
(.00 | )*** | (.04 | ) | .01 | (.02 | ) | (.02 | ) | (.08 | )e | |||||||||||||
|
Net realized and unrealized gain (loss)
|
3.71 | 1.25 | (1.51 | ) | (4.09 | ) | 1.19 | 1.05 | ||||||||||||||||
|
Total from investment operations
|
3.71 | 1.21 | (1.50 | ) | (4.11 | ) | 1.17 | .97 | ||||||||||||||||
|
Less distributions from:
Net investment income
|
— | (.01 | ) | (.01 | ) | — | — | — | ||||||||||||||||
|
Net realized gains
|
— | — | (.00 | )*** | (2.91 | ) | (2.67 | ) | (3.40 | ) | ||||||||||||||
|
Total distributions
|
— | (.01 | ) | (.01 | ) | (2.91 | ) | (2.67 | ) | (3.40 | ) | |||||||||||||
|
Redemption fees
|
.00 | *** | .00 | *** | .00 | *** | .00 | *** | .00 | *** | .00 | *** | ||||||||||||
|
Net asset value, end of period
|
$ | 18.15 | $ | 14.44 | $ | 13.24 | $ | 14.75 | $ | 21.77 | $ | 23.27 | ||||||||||||
|
Total Return (%)c
|
25.69 | d** | 9.14 | d | (10.10 | )d | (21.02 | ) | 4.45 | 4.41 | e | |||||||||||||
|
Ratios to Average Net Assets and Supplemental Data
|
||||||||||||||||||||||||
|
Net assets, end of period ($ millions)
|
8 | 6 | 5 | 6 | 10 | 12 | ||||||||||||||||||
|
Ratio of expenses before expense reductions (%)
|
1.58 | * | 1.68 | 1.91 | 1.58 | 1.48 | 1.57 | |||||||||||||||||
|
Ratio of expenses after expense reductions (%)
|
1.55 | * | 1.64 | 1.52 | 1.58 | 1.48 | 1.57 | |||||||||||||||||
|
Ratio of net investment income (loss) (%)
|
(.05 | )* | (.29 | ) | .14 | (.13 | ) | (.12 | ) | (.37 | )e | |||||||||||||
|
Portfolio turnover rate (%)
|
135 | ** | 297 | 434 | 304 | 202 | 205 | |||||||||||||||||
|
a For the six months ended March 31, 2011 (Unaudited).
b Based on average shares outstanding during the period.
c Total return does not reflect the effect of any sales charges.
d Total return would have been lower had certain expenses not been reduced.
e Includes non-recurring income from the Advisor recorded as a result of an administrative proceeding regarding disclosure of brokerage allocation practices in connection with sales of DWS Funds. The non-recurring income resulted in an increase in net investment income of $0.001 per share. Excluding this non-recurring income, total return would have remained the same.
* Annualized
** Not annualized
*** Amount is less than $.005.
|
||||||||||||||||||||||||
|
Class B
Years Ended September 30,
|
2011 | a | 2010 | 2009 | 2008 | 2007 | 2006 | |||||||||||||||||
|
Selected Per Share Data
|
||||||||||||||||||||||||
|
Net asset value, beginning of period
|
$ | 13.07 | $ | 12.06 | $ | 13.52 | $ | 20.32 | $ | 22.04 | $ | 24.70 | ||||||||||||
|
Income (loss) from investment operations:
Net investment income (loss)b
|
(.04 | ) | (.13 | ) | (.06 | ) | (.13 | ) | (.17 | ) | (.25 | )e | ||||||||||||
|
Net realized and unrealized gain (loss)
|
3.33 | 1.14 | (1.40 | ) | (3.76 | ) | 1.12 | .99 | ||||||||||||||||
|
Total from investment operations
|
3.29 | 1.01 | (1.46 | ) | (3.89 | ) | .95 | .74 | ||||||||||||||||
|
Less distributions from:
Net realized gains
|
— | — | (.00 | )*** | (2.91 | ) | (2.67 | ) | (3.40 | ) | ||||||||||||||
|
Redemption fees
|
.00 | *** | .00 | *** | .00 | *** | .00 | *** | .00 | *** | .00 | *** | ||||||||||||
|
Net asset value, end of period
|
$ | 16.36 | $ | 13.07 | $ | 12.06 | $ | 13.52 | $ | 20.32 | $ | 22.04 | ||||||||||||
|
Total Return (%)c,d
|
25.17 | ** | 8.37 | (10.75 | ) | (21.49 | ) | 3.62 | 3.58 | e | ||||||||||||||
|
Ratios to Average Net Assets and Supplemental Data
|
||||||||||||||||||||||||
|
Net assets, end of period ($ millions)
|
2 | 1 | 1 | 2 | 3 | 3 | ||||||||||||||||||
|
Ratio of expenses before expense reductions (%)
|
2.41 | * | 2.49 | 2.87 | 2.44 | 2.38 | 2.39 | |||||||||||||||||
|
Ratio of expenses after expense reductions (%)
|
2.30 | * | 2.39 | 2.27 | 2.25 | 2.25 | 2.38 | |||||||||||||||||
|
Ratio of net investment income (loss) (%)
|
(.80 | )* | (1.04 | ) | (.60 | ) | (.80 | ) | (.89 | ) | (1.18 | )e | ||||||||||||
|
Portfolio turnover rate (%)
|
135 | ** | 297 | 434 | 304 | 202 | 205 | |||||||||||||||||
|
a For the six months ended March 31, 2011 (Unaudited).
b Based on average shares outstanding during the period.
c Total return does not reflect the effect of any sales charges.
d Total return would have been lower had certain expenses not been reduced.
e Includes non-recurring income from the Advisor recorded as a result of an administrative proceeding regarding disclosure of brokerage allocation practices in connection with sales of DWS Funds. The non-recurring income resulted in an increase in net investment income of $0.001 per share. Excluding this non-recurring income, total return would have remained the same.
* Annualized
** Not annualized
*** Amount is less than $.005.
|
||||||||||||||||||||||||
|
Class C
Years Ended September 30,
|
2011 | a | 2010 | 2009 | 2008 | 2007 | 2006 | |||||||||||||||||
|
Selected Per Share Data
|
||||||||||||||||||||||||
|
Net asset value, beginning of period
|
$ | 13.09 | $ | 12.08 | $ | 13.55 | $ | 20.39 | $ | 22.10 | $ | 24.74 | ||||||||||||
|
Income (loss) from investment operations:
Net investment income (loss)b
|
(.04 | ) | (.13 | ) | (.06 | ) | (.13 | ) | (.17 | ) | (.22 | )e | ||||||||||||
|
Net realized and unrealized gain (loss)
|
3.34 | 1.14 | (1.41 | ) | (3.80 | ) | 1.13 | .98 | ||||||||||||||||
|
Total from investment operations
|
3.30 | 1.01 | (1.47 | ) | (3.93 | ) | .96 | .76 | ||||||||||||||||
|
Less distributions from:
Net realized gains
|
— | — | (.00 | )*** | (2.91 | ) | (2.67 | ) | (3.40 | ) | ||||||||||||||
|
Redemption fees
|
.00 | *** | .00 | *** | .00 | *** | .00 | *** | .00 | *** | .00 | *** | ||||||||||||
|
Net asset value, end of period
|
$ | 16.39 | $ | 13.09 | $ | 12.08 | $ | 13.55 | $ | 20.39 | $ | 22.10 | ||||||||||||
|
Total Return (%)c
|
25.21 | d** | 8.36 | d | (10.80 | )d | (21.64 | )d | 3.66 | 3.70 | e | |||||||||||||
|
Ratios to Average Net Assets and Supplemental Data
|
||||||||||||||||||||||||
|
Net assets, end of period ($ millions)
|
1 | 1 | 1 | 1 | 2 | 2 | ||||||||||||||||||
|
Ratio of expenses before expense reductions (%)
|
2.38 | * | 2.41 | 2.77 | 2.35 | 2.23 | 2.27 | |||||||||||||||||
|
Ratio of expenses after expense reductions (%)
|
2.30 | * | 2.39 | 2.27 | 2.35 | 2.23 | 2.27 | |||||||||||||||||
|
Ratio of net investment income (loss) (%)
|
(.80 | )* | (1.04 | ) | (.60 | ) | (.90 | ) | (.87 | ) | (1.07 | )e | ||||||||||||
|
Portfolio turnover rate (%)
|
135 | ** | 297 | 434 | 304 | 202 | 205 | |||||||||||||||||
|
a For the six months ended March 31, 2011 (Unaudited).
b Based on average shares outstanding during the period.
c Total return does not reflect the effect of any sales charges.
d Total return would have been lower had certain expenses not been reduced.
e Includes non-recurring income from the Advisor recorded as a result of an administrative proceeding regarding disclosure of brokerage allocation practices in connection with sales of DWS Funds. The non-recurring income resulted in an increase in net investment income of $0.001 per share. Excluding this non-recurring income, total return would have remained the same.
* Annualized
** Not annualized
*** Amount is less than $.005.
|
||||||||||||||||||||||||
|
Class S
Years Ended September 30,
|
2011 | a | 2010 | 2009 | 2008 | 2007 | 2006 | |||||||||||||||||
|
Selected Per Share Data
|
||||||||||||||||||||||||
|
Net asset value, beginning of period
|
$ | 14.86 | $ | 13.58 | $ | 15.20 | $ | 22.31 | $ | 23.71 | $ | 26.04 | ||||||||||||
|
Income (loss) from investment operations:
Net investment income (loss)b
|
.02 | .00 | *** | .02 | .04 | .06 | .01 | d | ||||||||||||||||
|
Net realized and unrealized gain (loss)
|
3.83 | 1.29 | (1.59 | ) | (4.18 | ) | 1.21 | 1.06 | ||||||||||||||||
|
Total from investment operations
|
3.85 | 1.29 | (1.57 | ) | (4.14 | ) | 1.27 | 1.07 | ||||||||||||||||
|
Less distributions from:
Net investment income
|
(.03 | ) | (.01 | ) | (.05 | ) | (.06 | ) | — | — | ||||||||||||||
|
Net realized gains
|
— | — | (.00 | )*** | (2.91 | ) | (2.67 | ) | (3.40 | ) | ||||||||||||||
|
Total distributions
|
(.03 | ) | (.01 | ) | (.05 | ) | (2.97 | ) | (2.67 | ) | (3.40 | ) | ||||||||||||
|
Redemption fees
|
.00 | *** | .00 | *** | .00 | *** | .00 | *** | .00 | *** | .00 | *** | ||||||||||||
|
Net asset value, end of period
|
$ | 18.68 | $ | 14.86 | $ | 13.58 | $ | 15.20 | $ | 22.31 | $ | 23.71 | ||||||||||||
|
Total Return (%)
|
25.95 | ** | 9.51 | (10.20 | ) | (20.64 | ) | 4.82 | c | 4.82 | c,d | |||||||||||||
|
Ratios to Average Net Assets and Supplemental Data
|
||||||||||||||||||||||||
|
Net assets, end of period ($ millions)
|
78 | 61 | 62 | 74 | 126 | 138 | ||||||||||||||||||
|
Ratio of expenses before expense reductions (%)
|
1.23 | * | 1.31 | 1.52 | 1.21 | 1.15 | 1.19 | |||||||||||||||||
|
Ration of expenses after expense reductions (%)
|
1.23 | * | 1.31 | 1.52 | 1.21 | 1.09 | 1.17 | |||||||||||||||||
|
Ratio of net investment income (loss) (%)
|
.26 | * | .04 | .15 | .24 | .27 | .03 | d | ||||||||||||||||
|
Portfolio turnover rate (%)
|
135 | ** | 297 | 434 | 304 | 202 | 205 | |||||||||||||||||
|
a For the six months ended March 31, 2011 (Unaudited).
b Based on average shares outstanding during the period.
c Total return would have been lower had certain expenses not been reduced.
d Includes non-recurring income from the Advisor recorded as a result of an administrative proceeding regarding disclosure of brokerage allocation practices in connection with sales of DWS Funds. The non-recurring income resulted in an increase in net investment income of $0.001 per share. Excluding this non-recurring income, total return would have remained the same.
* Annualized
** Not annualized
*** Amount is less than $.005.
|
||||||||||||||||||||||||
A. Organization and Significant Accounting Policies
DWS Small Cap Core Fund (the "Fund") is a diversified series of DWS Investment Trust (the "Trust"), which is registered under the Investment Company Act of 1940, as amended (the "1940 Act"), as an open-end management investment company organized as a Massachusetts business trust.
The Fund offers multiple classes of shares which provide investors with different purchase options. Class A shares are offered to investors subject to an initial sales charge. Class B shares of the Fund are closed to new purchases, except exchanges or the reinvestment of dividends or other distributions. Class B shares were offered to investors without an initial sales charge and are subject to higher ongoing expenses than Class A shares and a contingent deferred sales charge payable upon certain redemptions. Class B shares automatically convert to Class A shares six years after issuance. Class C shares are offered to investors without an initial sales charge but are subject to higher ongoing expenses than Class A shares and a contingent deferred sales charge payable upon certain redemptions within one year of purchase. Class C shares do not automatically convert into another class. Class S shares are not subject to initial or contingent deferred sales charges and are generally not available to new investors except under certain circumstances.
Investment income, realized and unrealized gains and losses and certain fund-level expenses and expense reductions, if any, are borne pro rata on the basis of relative net assets by the holders of all classes of shares, except that each class bears certain expenses unique to that class such as distribution and service fees, services to shareholders and certain other class-specific expenses. Differences in class-level expenses may result in payment of different per share dividends by class. All shares of the Fund have equal rights with respect to voting subject to class-specific arrangements.
The Fund's financial statements are prepared in accordance with accounting principles generally accepted in the United States of America which require the use of management estimates. Actual results could differ from those estimates. The policies described below are followed consistently by the Fund in the preparation of its financial statements.
Security Valuation. Investments are stated at value determined as of the close of regular trading on the New York Stock Exchange on each day the exchange is open for trading.
Various inputs are used in determining the value of the Fund's investments. These inputs are summarized in three broad levels. Level 1 includes quoted prices in active markets for identical securities. Level 2 includes other significant observable inputs (including quoted prices for similar securities, interest rates, prepayment speeds, and credit risk). Level 3 includes significant unobservable inputs (including the Fund's own assumptions in determining the fair value of investments). The inputs or methodology used for valuing securities are not necessarily an indication of the risk associated with investing in those securities.
Equity securities are valued at the most recent sale price or official closing price reported on the exchange (US or foreign) or over-the-counter market on which they trade and are categorized as Level 1 securities. Securities for which no sales are reported are valued at the calculated mean between the most recent bid and asked quotations on the relevant market or, if a mean cannot be determined, at the most recent bid quotation.
Futures contracts are generally valued at the settlement prices established each day on the exchange on which they are traded and are categorized as Level 1.
Money market instruments purchased with an original or remaining maturity of sixty days or less, maturing at par, are valued at amortized cost, which approximates value, and are categorized as Level 2. Investments in open-end investment companies are valued at their net asset value each business day and are categorized as Level 1.
Securities and other assets for which market quotations are not readily available or for which the above valuation procedures are deemed not to reflect fair value are valued in a manner that is intended to reflect their fair value as determined in accordance with procedures approved by the Board and are generally categorized as Level 3. In accordance with the Fund's valuation procedures, factors used in determining value may include, but are not limited to, the type of the security; the size of the holding; the initial cost of the security; the existence of any contractual restrictions on the security's disposition; the price and extent of public trading in similar securities of the issuer or of comparable companies; quotations or evaluated prices from broker-dealers and/or pricing services; information obtained from the issuer, analysts, and/or the appropriate stock exchange (for exchange-traded securities); an analysis of the company's or issuer's financial statements; an evaluation of the forces that influence the issuer and the market(s) in which the security is purchased and sold and with respect to debt securities; the maturity, coupon, creditworthiness, currency denomination, and the movement of the market in which the security is normally traded. The value determined under these procedures may differ from published values for the same securities.
Disclosure about the classification of fair value measurements is included in a table following the Fund's Investment Portfolio.
Federal Income Taxes. The Fund's policy is to comply with the requirements of the Internal Revenue Code, as amended, which are applicable to regulated investment companies, and to distribute all of its taxable income to its shareholders.
At September 30, 2010, the Fund had a net tax basis capital loss carryforward of approximately $36,498,000, which may be applied against any realized net taxable gains of each succeeding year until fully utilized or until September 30, 2017 ($24,146,000) and September 30, 2018, ($12,352,000), the respective expiration dates, whichever occurs first.
On December 22, 2010, the Regulated Investment Company Modernization Act of 2010 (the "Act") was enacted. Under the Act, net capital losses may be carried forward indefinitely, and their character is retained as short-term and/or long-term losses. Previously, net capital losses were carried forward for eight years and treated as short-term losses. As a transition rule, the Act requires that post-enactment net capital losses be used before pre-enactment net capital losses. As a result of this ordering rule, pre-enactment capital loss carryforwards may expire unused, whereas under the previous rules these losses may have been utilized. This change is effective for fiscal years beginning after the date of enactment.
The Fund has reviewed the tax positions for the open tax years as of September 30, 2010 and has determined that no provision for income tax is required in the Fund's financial statements. The Fund's federal tax returns for the prior three fiscal years remain open subject to examination by the Internal Revenue Service.
Distribution of Income and Gains. Net investment income of the Fund, if any, is declared and distributed to shareholders annually. Net realized gains from investment transactions, in excess of available capital loss carryforwards, would be taxable to the Fund if not distributed, and, therefore, will be distributed to shareholders at least annually.
The timing and characterization of certain income and capital gains distributions are determined annually in accordance with federal tax regulations which may differ from accounting principles generally accepted in the United States of America. These differences primarily relate to net investment losses incurred by the Fund and certain securities sold at loss. As a result, net investment income (loss) and net realized gain (loss) on investment transactions for a reporting period may differ significantly from distributions during such period. Accordingly, the Fund may periodically make reclassifications among certain of its capital accounts without impacting the net asset value of the Fund.
The tax character of current year distributions will be determined at the end of the current fiscal year.
Redemption Fees. The Fund imposes a redemption fee of 2% of the total redemption amount on all Fund shares redeemed or exchanged within 15 days of buying them, either by purchase or exchange. This fee is assessed and retained by the Fund for the benefit of the remaining shareholders. The redemption fee is accounted for as an addition to paid-in capital.
Expenses. Expenses of the Trust arising in connection with a specific fund are allocated to that fund. Other Trust expenses which cannot be directly attributed to a fund are apportioned among the funds in the Trust.
Contingencies. In the normal course of business, the Fund may enter into contracts with service providers that contain general indemnification clauses. The Fund's maximum exposure under these arrangements is unknown as this would involve future claims that may be made against the Fund that have not yet been made. However, based on experience, the Fund expects the risk of loss to be remote.
Real Estate Investment Trusts. The Fund periodically recharacterizes distributions received from a Real Estate Investment Trust ("REIT") investment based on information provided by the REIT into the following categories: ordinary income, long-term and short-term capital gains, and return of capital. If information is not available timely from a REIT, the recharacterization will be estimated and a recharacterization will be made in the following year when such information becomes available. Distributions received from REITs in excess of income are recorded as either a reduction of cost of investments or realized gains. The Fund distinguishes between dividends on a tax basis and a financial reporting basis and only distributions in excess of tax basis earnings and profits are reported in the financial statements as a tax return of capital for tax reporting purposes.
Other. Investment transactions are accounted for on a trade date plus one basis for daily net asset valuation calculations. However, for financial reporting purposes, investment transactions are reported on trade date. Interest income is recorded on the accrual basis. Dividend income is recorded on the ex-dividend date net of foreign withholding taxes. Realized gains and losses from investment transactions are recorded on an identified cost basis.
B. Derivative Instruments
Futures Contracts. A futures contract is an agreement between a buyer or seller and an established futures exchange or its clearinghouse in which the buyer or seller agrees to take or make a delivery of a specific amount of a financial instrument at a specified price on a specific date (settlement date). For the six months ended March 31, 2011, the Fund entered into futures contracts to keep cash on hand to meet shareholder redemptions or other needs, while maintaining exposure to the market.
Futures contracts are valued at the most recent settlement price. Upon entering into a futures contract, the Fund is required to deposit with a financial intermediary cash or securities ("initial margin") in an amount equal to a certain percentage of the face value indicated in the futures contract. Subsequent payments ("variation margin") are made or received by the Fund dependent upon the daily fluctuations in the value and are recorded for financial reporting purposes as unrealized gains or losses by the Fund. Gains or losses are realized when the contract expires or is closed. Since all futures contracts are exchange traded, counterparty risk is minimized as the exchange's clearinghouse acts as the counterparty, and guarantees the futures against default.
Certain risks may arise upon entering into futures contracts, including the risk that an illiquid market will limit the Fund's ability to close out a futures contract prior to the settlement date and the risk that the futures contract is not well correlated with the security, index or currency to which it relates. Risk of loss may exceed amounts recognized in the Statement of Assets and Liabilities.
A summary of the open futures contracts as of March 31, 2011 is included in a table following the Fund's Investment Portfolio. For the six months ended March 31, 2011, the investment in futures contracts purchased had a total notional value generally indicative of a range from approximately $270,000 to $1,263,000.
The following tables summarize the value of the Fund's derivative instruments held as of March 31, 2011 and the related location in the accompanying Statement of Assets and Liabilities, presented by primary underlying risk exposure:
|
Asset Derivative
|
Futures Contracts
|
|||
|
Equity Contracts (a)
|
$ | 74,655 | ||
The above derivative is located in the following Statement of Assets and Liabilities account:
(a) Includes cumulative appreciation of futures contracts as disclosed in the Investment Portfolio. Unsettled variation margin is disclosed separately within the Statement of Assets and Liabilities.
Additionally, the amount of unrealized and realized gains and losses on derivative instruments recognized in Fund earnings during the six months ended March 31, 2011 and the related location in the accompanying Statement of Operations is summarized in the following tables by primary underlying risk exposure:
|
Realized Gain (Loss)
|
Futures Contracts
|
|||
|
Equity Contracts (a)
|
$ | 375,305 | ||
The above derivative is located in the following Statement of Operations account:
(a) Net realized gain (loss) from futures
|
Change in Net Unrealized Appreciation (Depreciation)
|
Futures Contracts
|
|||
|
Equity Contracts (a)
|
$ | 67,255 | ||
The above derivative is located in the following Statement of Operations account:
(a) Change in net unrealized appreciation (depreciation) on futures
C. Purchases and Sales of Securities
During the six months ended March 31, 2011, purchases and sales of investment securities (excluding short-term investments) aggregated $105,480,922 and $105,258,062, respectively.
D. Related Parties
Management Agreement. Under the Investment Management Agreement with Deutsche Investment Management Americas Inc. ("DIMA" or the "Advisor"), an indirect, wholly owned subsidiary of Deutsche Bank AG, the Advisor directs the investments of the Fund in accordance with its investment objectives, policies and restrictions. The Advisor determines the securities, instruments and other contracts relating to investments to be purchased, sold or entered into by the Fund or delegates such responsibility to the Fund's subadvisor.
QS Investors, LLC ("QS Investors") serves as subadvisor with respect to the investment and reinvestment of assets in the Fund, and is paid by the Advisor for its services.
Under the Investment Management Agreement with the Advisor, the Fund pays a monthly management fee based on the Fund's average daily net assets computed and accrued daily and payable monthly, at the following annual rates:
|
First $500 million of the Fund's average daily net assets
|
.665 | % | ||
|
Next $500 million of such net assets
|
.615 | % | ||
|
Over $1.0 billion of such net assets
|
.565 | % |
Accordingly, for the six months ended March 31, 2011, the fee pursuant to the management agreement was equivalent to an annualized effective rate of 0.665% of the Fund's average daily net assets.
For the period from October 1, 2010 through September 30, 2011, the Advisor has contractually agreed to waive its fees and/or reimburse certain operating expenses of the Fund to the extent necessary to maintain the operating expenses (excluding certain expenses such as extraordinary expenses, taxes, brokerage and interest) of each class as follows:
|
Class A
|
1.55%
|
|
Class B
|
2.30%
|
|
Class C
|
2.30%
|
|
Class S
|
1.30%
|
Administration Fee. Pursuant to an Administrative Service Agreement, DIMA provides most administrative services to the Fund. For all services provided under the Administrative Services Agreement, the Fund pays the Advisor an annual fee ("Administration Fee") of 0.10% of the Fund's average daily net assets, computed and accrued daily and payable monthly. For the six months ended March 31, 2011, the Administration Fee was $39,669, of which $7,213 is unpaid.
Service Provider Fees. DWS Investments Service Company ("DISC"), an affiliate of the Advisor, is the transfer agent, dividend-paying agent and shareholder service agent of the Fund. Pursuant to a sub-transfer agency agreement between DISC and DST Systems, Inc. ("DST"), DISC has delegated certain transfer agent, dividend-paying agent and shareholder service agent functions to DST. DISC compensates DST out of the shareholder servicing fee it receives from the Fund. For the six months ended March 31, 2011, the amounts charged to the Fund by DISC were as follows:
|
Services to Shareholders
|
Total Aggregated
|
Waived
|
Unpaid at March 31, 2011
|
|||||||||
|
Class A
|
$ | 8,284 | $ | 1,083 | $ | 4,322 | ||||||
|
Class B
|
2,640 | 817 | 1,220 | |||||||||
|
Class C
|
1,229 | 330 | 530 | |||||||||
|
Class S
|
67,127 | — | 35,919 | |||||||||
| $ | 79,280 | $ | 2,230 | $ | 41,991 | |||||||
Distribution and Service Fees. Under the Fund's Class B and C 12b-1 plans, DWS Investments Distributors, Inc. ("DIDI"), an affiliate of the Advisor, receives a fee ("Distribution Fee") of 0.75% of average daily net assets of each of Class B and C shares. In accordance with the Fund's Underwriting and Distribution Services Agreement, DIDI enters into related selling group agreements with various firms at various rates for sales of Class B and C shares. For the six months ended March 31, 2011, the Distribution Fee was as follows:
|
Distribution Fee
|
Total Aggregated
|
Unpaid at March 31, 2011
|
||||||
|
Class B
|
$ | 5,434 | $ | 960 | ||||
|
Class C
|
3,220 | 568 | ||||||
| $ | 8,654 | $ | 1,528 | |||||
In addition, DIDI provides information and administrative services for a fee ("Service Fee") to Class A, B and C shareholders at an annual rate of up to 0.25% of average daily net assets for each such class. DIDI in turn has various agreements with financial services firms that provide these services and pays these fees based upon the assets of shareholder accounts the firms service. For the six months ended March 31, 2011, the Service Fee was as follows:
|
Service Fee
|
Total Aggregated
|
Unpaid at March 31, 2011
|
Annualized Effective Rate
|
|||||||||
|
Class A
|
$ | 8,310 | $ | 4,061 | .24 | % | ||||||
|
Class B
|
1,804 | 920 | .25 | % | ||||||||
|
Class C
|
1,068 | 532 | .25 | % | ||||||||
| $ | 11,182 | $ | 5,513 | |||||||||
Underwriting Agreement and Contingent Deferred Sales Charge. DIDI is the principal underwriter for the Fund. Underwriting commissions paid in connection with the distribution of Class A shares for the six months ended March 31, 2011 aggregated $474.
In addition, DIDI receives any contingent deferred sales charge ("CDSC") from Class B share redemptions occurring within six years of purchase and Class C share redemptions occurring within one year of purchase. There is no such charge upon redemption of any share appreciation or reinvested dividends. The CDSC is based on declining rates ranging from 4% to 1% for Class B and 1% for Class C of the value of the shares redeemed. For the six months ended March 31, 2011, the CDSC for Class B and Class C shares aggregated $288 and $15, respectively. A deferred sales charge of up to 1% is assessed on certain redemptions of Class A shares.
Typesetting and Filing Service Fees. Under an agreement with DIMA, DIMA is compensated for providing typesetting and certain regulatory filing services to the Fund. For the six months ended March 31, 2011, the amount charged to the Fund by DIMA included in the Statement of Operations under "reports to shareholders" aggregated $10,319, of which $5,769 is unpaid.
Trustees' Fees and Expenses. The Fund paid each Trustee not affiliated with the Advisor retainer fees plus specified amounts for various committee services and for the Board Chairperson.
Affiliated Cash Management Vehicle. The Fund may invest uninvested cash balances in Central Cash Management Fund, which is managed by the Advisor. The Fund indirectly bears its proportionate share of the expenses of Central Cash Management Fund. Central Cash Management Fund does not pay the Advisor an investment management fee. Central Cash Management Fund seeks a high level of current income consistent with liquidity and the preservation of capital.
E. Line of Credit
The Fund and other affiliated funds (the "Participants") share in a $450 million revolving credit facility provided by a syndication of banks. The Fund may borrow for temporary or emergency purposes, including the meeting of redemption requests that otherwise might require the untimely disposition of securities. The Participants are charged an annual commitment fee, which is allocated based on net assets, among each of the Participants. Interest is calculated at a rate per annum equal to the sum of the Federal Funds Rate plus 1.25 percent plus if LIBOR exceeds the Federal Funds Rate the amount of such excess. The Fund may borrow up to a maximum of 33 percent of its net assets under the agreement.
F. Share Transactions
The following table summarizes share and dollar activity in the Fund:
|
Six Months Ended
March 31, 2011
|
Year Ended
September 30, 2010
|
|||||||||||||||
|
Shares
|
Dollars
|
Shares
|
Dollars
|
|||||||||||||
|
Shares sold
|
||||||||||||||||
|
Class A
|
78,787 | $ | 1,316,822 | 137,521 | $ | 1,933,654 | ||||||||||
|
Class B
|
1,754 | 26,859 | 15,470 | 189,480 | ||||||||||||
|
Class C
|
11,742 | 180,527 | 9,217 | 117,733 | ||||||||||||
|
Class S
|
392,397 | 6,513,482 | 519,660 | 7,402,675 | ||||||||||||
| $ | 8,037,690 | $ | 9,643,542 | |||||||||||||
|
Shares issued to shareholders in reinvestment of distributions
|
||||||||||||||||
|
Class A
|
— | $ | — | 233 | $ | 3,151 | ||||||||||
|
Class S
|
7,691 | 130,870 | 3,207 | 44,549 | ||||||||||||
| $ | 130,870 | $ | 47,700 | |||||||||||||
|
Shares redeemed
|
||||||||||||||||
|
Class A
|
(63,607 | ) | $ | (1,057,293 | ) | (141,931 | ) | $ | (1,927,720 | ) | ||||||
|
Class B
|
(9,045 | ) | (136,704 | ) | (27,218 | ) | (344,095 | ) | ||||||||
|
Class C
|
(8,589 | ) | (128,131 | ) | (14,613 | ) | (180,271 | ) | ||||||||
|
Class S
|
(325,355 | ) | (5,526,414 | ) | (1,006,397 | ) | (14,270,402 | ) | ||||||||
| $ | (6,848,542 | ) | $ | (16,722,488 | ) | |||||||||||
|
Redemption fees
|
$ | 56 | $ | 176 | ||||||||||||
|
Net increase (decrease)
|
||||||||||||||||
|
Class A
|
15,180 | $ | 259,529 | (4,177 | ) | $ | 9,092 | |||||||||
|
Class B
|
(7,291 | ) | (109,845 | ) | (11,748 | ) | (154,615 | ) | ||||||||
|
Class C
|
3,153 | 52,436 | (5,396 | ) | (62,535 | ) | ||||||||||
|
Class S
|
74,733 | 1,117,954 | (483,530 | ) | (6,823,012 | ) | ||||||||||
| $ | 1,320,074 | $ | (7,031,070 | ) | ||||||||||||
October 3, 2010
Pursuant to an Order entered into by Deutsche Investment Management Americas and affiliates (collectively, "DeAM") with the Attorney General of New York, I, Thomas H. Mack, have been appointed the Independent Fee Consultant for the DWS Funds (formerly the DWS Scudder Funds). My duties include preparing an annual written evaluation of the management fees DeAM charges the Funds, considering among other factors the management fees charged by other mutual fund companies for like services, management fees DeAM charges other clients for like services, DeAM's costs of supplying services under the management agreements and related profit margins, possible economies of scale if a Fund grows larger, and the nature and quality of DeAM's services, including fund performance. This report summarizes my evaluation for 2010, including my qualifications, the evaluation process for each of the DWS Funds, consideration of certain complex-level factors, and my conclusions. I served in substantially the same capacity in 2007, 2008, and 2009.
Qualifications
For more than 35 years I have served in various professional capacities within the investment management business. I have held investment analysis and advisory positions, including securities analyst, portfolio strategist and director of investment policy with a large investment firm. I have also performed business management functions, including business development, financial management and marketing research and analysis.
Since 1991, I have been an independent consultant within the asset management industry. I have provided services to over 125 client organizations, including investment managers, mutual fund boards, product distributors and related organizations. Over the past ten years I have completed a number of assignments for mutual fund boards, specifically including assisting boards with management contract renewal.
I hold a Master of Business Administration degree, with highest honors, from Harvard University and Master of Science and Bachelor of Science (highest honors) degrees from the University of California at Berkeley. I am an independent director and audit committee financial expert for two closed-end mutual funds and have served in various leadership and financial oversight capacities with non-profit organizations.
Evaluation of Fees for each DWS Fund
My work focused primarily on evaluating, fund-by-fund, the fees charged to each of the 118 publicly offered Fund portfolios in the DWS Fund family. For each Fund, I considered each of the key factors mentioned above, as well as any other relevant information. In doing so I worked closely with the Funds' Independent Directors in their annual contract renewal process, as well as in their approval of contracts for several new funds (documented separately).
In evaluating each Fund's fees, I reviewed comprehensive materials provided by or on behalf of DeAM, including expense information prepared by Lipper Analytical, comparative performance information, profitability data, manager histories, and other materials. I also accessed certain additional information from the Lipper and Morningstar databases and drew on my industry knowledge and experience.
To facilitate evaluating this considerable body of information, I prepared for each Fund a document summarizing the key data elements in each area as well as additional analytics discussed below. This made it possible to consider each key data element in the context of the others.
In the course of contract renewal, DeAM agreed to implement a number of fee and expense adjustments requested by the Independent Directors which will favorably impact future fees and expenses, and my evaluation includes the effects of these changes.
Fees and Expenses Compared with Other Funds
The competitive fee and expense evaluation for each fund focused on two primary comparisons:
The Fund's contractual management fee (the advisory fee plus the administration fee where applicable) compared with those of a group of typically 12-15 funds in the same Lipper investment category (e.g. Large Capitalization Growth) having similar distribution arrangements and being of similar size.
The Fund's total expenses compared with a broader universe of funds from the same Lipper investment category and having similar distribution arrangements.
These two comparisons provide a view of not only the level of the fee compared with funds of similar scale but also the total expense the Fund bears for all the services it receives, in comparison with the investment choices available in the Fund's investment category and distribution channel. The principal figure-of-merit used in these comparisons was the subject Fund's percentile ranking against peers.
DeAM's Fees for Similar Services to Others
DeAM provided management fee schedules for all of its US domiciled fund and non-fund investment management accounts in any of the investment categories where there is a DWS Fund. These similar products included the other DWS Funds, non-fund pooled accounts, institutional accounts and sub-advisory accounts. Using this information, I calculated for each Fund the fee that would be charged to each similar product, at the subject Fund's asset level.
Evaluating information regarding non-fund products is difficult because there are varying levels of services required for different types of accounts, with mutual funds generally requiring considerably more regulatory and administrative types of service as well as having more frequent cash flows than other types of accounts. Also, while mutual fund fees for similar fund products can be expected to be similar, there will be some differences due to different pricing conditions in different distribution channels (e.g. retail funds versus those used in variable insurance products), differences in underlying investment processes and other factors.
Costs and Profit Margins
DeAM provided a detailed profitability analysis for each Fund. After making some adjustments so that the presentation would be more comparable to the available industry figures, I reviewed profit margins from investment management alone, from investment management plus other fund services (excluding distribution) provided to the Funds by DeAM (principally shareholder services), and DeAM profits from all sources, including distribution. A later section comments on overall profitability.
Economies of Scale
Economies of scale — an expected decline in management cost per dollar of fund assets as fund assets grow — are very rarely quantified and documented because of inherent difficulties in collecting and analyzing relevant data. However, in virtually every investment category that I reviewed, larger funds tend to have lower fees and lower total expenses than smaller funds. To see how each DWS Fund compares with this industry observation, I reviewed:
The trend in Fund assets over the last five years and the accompanying trend in total expenses. This shows if the Fund has grown and, if so, whether total expense (management fees as well as other expenses) have declined as a percent of assets.
Whether the Fund has break-points in its management fee schedule, the extent of the fee reduction built into the schedule and the asset levels where the breaks take effect, and in the case of a sub-advised Fund how the Fund's break-points compare with those of the sub-advisory fee schedule.
How the Fund's contractual fee schedule compares with trends in the industry data. To accomplish this, I constructed a chart showing how actual latest-fiscal-year contractual fees of the Fund and of other similar funds relate to average fund assets, with the subject Fund's contractual fee schedule superimposed.
Quality of Service — Performance
The quality-of-service evaluation focused on investment performance, which is the principal result of the investment management service. Each Fund's performance was reviewed over the past 1, 3, 5 and 10 years, as applicable, and compared with that of other funds in the same investment category and with a suitable market index.
In addition, I calculated and reviewed risk-adjusted returns relative to an index of similar mutual funds' returns and a suitable market index. The risk-adjusted returns analysis provides a way of determining the extent to which the Fund's return comparisons are mainly the product of investment value-added (or lack thereof) or alternatively taking considerably more or less risk than is typical in its investment category.
I also received and considered the history of portfolio manager changes for each Fund, as this provided an important context for evaluating the performance results.
Complex-Level Considerations
While this evaluation was conducted mainly at the individual fund level, there are some issues relating to the reasonableness of fees that can alternatively be considered across the whole fund complex:
I reviewed DeAM's profitability analysis for all DWS Funds, with a view toward determining if the allocation procedures used were reasonable and how profit levels compared with public data for other investment managers.
I considered whether DeAM and affiliates receive any significant ancillary or "fall-out" benefits that should be considered in interpreting the direct profitability results. These would be situations where serving as the investment manager of the Funds is beneficial to another part of the Deutsche Bank organization.
I considered how aggregated DWS Fund expenses had varied over the years, by asset class and in the context of trends in asset levels.
I reviewed the structure of the DeAM organization, trends in staffing levels, and information on compensation of investment management and other professionals compared with industry data.
Findings
Based on the process and analysis discussed above, which included reviewing a wide range of information from management and external data sources and considering among other factors the fees DeAM charges other clients, the fees charged by other fund managers, DeAM's costs and profits associated with managing the Funds, economies of scale, possible fall-out benefits, and the nature and quality of services provided, in my opinion the management fees charged the DWS Funds are reasonable.

Thomas H. Mack
|
For More Information
|
The automated telephone system allows you to access personalized account information and obtain information on other DWS funds using either your voice or your telephone keypad. Certain account types within Classes A, B, C and S also have the ability to purchase, exchange or redeem shares using this system.
For more information, contact your financial advisor. You may also access our automated telephone system or speak with a DWS Investments representative by calling the appropriate number below:
For shareholders of Classes A, B and C:
(800) 621-1048
For shareholders of Class S:
(800) 728-3337
|
|
|
Web Site
|
www.dws-investments.com
View your account transactions and balances, trade shares, monitor your asset allocation, and change your address, 24 hours a day.
Obtain prospectuses and applications, blank forms, interactive worksheets, news about DWS funds, subscription to fund updates by e-mail, retirement planning information, and more.
|
|
|
Written Correspondence
|
DWS Investments
PO Box 219151
Kansas City, MO 64121-9151
|
|
|
Proxy Voting
|
The fund's policies and procedures for voting proxies for portfolio securities and information about how the fund voted proxies related to its portfolio securities during the 12-month period ended June 30 are available on our Web site — www.dws-investments.com (click on "proxy voting"at the bottom of the page) — or on the SEC's Web site — www.sec.gov. To obtain a written copy of the fund's policies and procedures without charge, upon request, call us toll free at (800) 621-1048.
|
|
|
Principal Underwriter
|
If you have questions, comments or complaints, contact:
DWS Investments Distributors, Inc.
222 South Riverside Plaza
Chicago, IL 60606-5808
(800) 621-1148
|
|
|
Class A
|
Class B
|
Class C
|
Class S
|
||
|
Nasdaq Symbol
|
SZCAX
|
SZCBX
|
SZCCX
|
SSLCX
|
|
|
CUSIP Number
|
23338J 681
|
23338J 673
|
23338J 665
|
23338J 640
|
|
|
Fund Number
|
439
|
639
|
739
|
2339
|
|
FACTS
|
What Does DWS Investments Do With Your Personal Information?
|
|
|
Why?
|
Financial companies choose how they share your personal information. Federal law gives consumers the right to limit some but not all sharing. Federal law also requires us to tell you how we collect, share and protect your personal information. Please read this notice carefully to understand what we do.
|
|
|
What?
|
The types of personal information we collect and share can include:
• Social Security number
• Account balances
• Purchase and transaction history
• Bank account information
• Contact information such as mailing address, e-mail address and telephone number
|
|
|
How?
|
All financial companies need to share customers' personal information to run their everyday business. In the section below, we list the reasons financial companies can share their customers' personal information, the reasons DWS Investments chooses to share and whether you can limit this sharing.
|
|
Reasons we can share your personal information
|
Does DWS Investments share?
|
Can you limit this sharing?
|
|
For our everyday business purposes — such as to process your transactions, maintain your account(s), respond to court orders or legal investigations
|
Yes
|
No
|
|
For our marketing purposes — to offer our products and services to you
|
Yes
|
No
|
|
For joint marketing with other financial companies
|
No
|
We do not share
|
|
For our affiliates' everyday business purposes — information about your transactions and experiences
|
No
|
We do not share
|
|
For our affiliates' everyday business purposes — information about your creditworthiness
|
No
|
We do not share
|
|
For non-affiliates to market to you
|
No
|
We do not share
|
|
Questions?
|
Call (800) 621-1048 or e-mail us at dws-investments.info@dws.com
|
|
Who we are
|
|
|
Who is providing this notice?
|
DWS Investments Distributors, Inc.; Deutsche Investment Management Americas, Inc.; DeAM Investor Services, Inc.; DWS Trust Company; the DWS Funds
|
|
What we do
|
|
|
How does DWS Investments protect my personal information?
|
To protect your personal information from unauthorized access and use, we use security measures that comply with federal law. These measures include computer safeguards and secured files and buildings.
|
|
How does DWS Investments collect my personal information?
|
We collect your personal information, for example. When you:
• open an account
• give us your contact information
• provide bank account information for ACH or wire transactions
• tell us where to send money
• seek advice about your investments
|
|
Why can't I limit all sharing?
|
Federal law gives you the right to limit only
• sharing for affiliates' everyday business purposes — information about your creditworthiness
• affiliates from using your information to market to you
• sharing for nonaffiliates to market to you
State laws and individual companies may give you additional rights to limit sharing.
|
|
Definitions
|
|
|
Affiliates
|
Companies related by common ownership or control. They can be financial or non-financial companies. Our affiliates include financial companies with the DWS or Deutsche Bank ("DB") name, such as DB AG Frankfurt and DB Alex Brown.
|
|
Non-affiliates
|
Companies not related by common ownership or control. They can be financial and non-financial companies.
Non-affiliates we share with include account service providers, service quality monitoring services, mailing service providers and verification services to help in the fight against money laundering and fraud.
|
|
Joint marketing
|
A formal agreement between non-affiliated financial companies that together market financial products or services to you. DWS Investments does not jointly market.
|
|
Rev. 09/2010
|
||

|
ITEM 2.
|
CODE OF ETHICS
|
|
|
Not applicable.
|
||
|
ITEM 3.
|
AUDIT COMMITTEE FINANCIAL EXPERT
|
|
|
Not applicable
|
||
|
ITEM 4.
|
PRINCIPAL ACCOUNTANT FEES AND SERVICES
|
|
|
Not applicable
|
||
|
ITEM 5.
|
AUDIT COMMITTEE OF LISTED REGISTRANTS
|
|
|
Not applicable
|
||
|
ITEM 6.
|
SCHEDULE OF INVESTMENTS
|
|
|
Not applicable
|
||
|
ITEM 7.
|
DISCLOSURE OF PROXY VOTING POLICIES AND PROCEDURES FOR CLOSED-END MANAGEMENT INVESTMENT COMPANIES
|
|
|
Not applicable
|
||
|
ITEM 8.
|
PORTFOLIO MANAGERS OF CLOSED-END MANAGEMENT INVESTMENT COMPANIES
|
|
|
Not applicable
|
||
|
ITEM 9.
|
PURCHASES OF EQUITY SECURITIES BY CLOSED-END MANAGEMENT INVESTMENT COMPANY AND AFFILIATED PURCHASERS
|
|
|
Not applicable
|
||
|
ITEM 10.
|
SUBMISSION OF MATTERS TO A VOTE OF SECURITY HOLDERS
|
|
|
There were no material changes to the procedures by which shareholders may recommend nominees to the Fund’s Board. The primary function of the Nominating and Governance Committee is to identify and recommend individuals for membership on the Board and oversee the administration of the Board Governance Guidelines. Shareholders may recommend candidates for Board positions by forwarding their correspondence by U.S. mail or courier service to Paul K. Freeman, Independent Chairman, DWS Funds, P.O. Box 101833, Denver, CO 80250-1833.
|
||
|
ITEM 11.
|
CONTROLS AND PROCEDURES
|
|
|
(a)
|
The Chief Executive and Financial Officers concluded that the Registrant’s Disclosure Controls and Procedures are effective based on the evaluation of the Disclosure Controls and Procedures as of a date within 90 days of the filing date of this report.
|
|
|
(b)
|
There have been no changes in the registrant’s internal control over financial reporting that occurred during the second fiscal quarter of the period covered by this report that has materially affected, or is reasonably likely to materially affect, the registrant’s internal controls over financial reporting.
|
|
|
ITEM 12.
|
EXHIBITS
|
|
|
(a)(1)
|
Certification pursuant to Rule 30a-2(a) under the Investment Company Act of 1940 (17 CFR 270.30a-2(a)) is filed and attached hereto as Exhibit 99.CERT.
|
|
|
(b)
|
Certification pursuant to Rule 30a-2(b) under the Investment Company Act of 1940 (17 CFR 270.30a-2(b)) is furnished and attached hereto as Exhibit 99.906CERT.
|
|
Form N-CSRS Item F
SIGNATURES
Pursuant to the requirements of the Securities Exchange Act of 1934 and the Investment Company Act of 1940, the registrant has duly caused this report to be signed on its behalf by the undersigned, thereunto duly authorized.
|
Registrant:
|
DWS Small Cap Core Fund, a series of DWS Investment Trust
|
|
By:
|
/s/Michael G. Clark
Michael G. Clark
President
|
|
Date:
|
May 31, 2011
|
Pursuant to the requirements of the Securities Exchange Act of 1934 and the Investment Company Act of 1940, this report has been signed below by the following persons on behalf of the registrant and in the capacities and on the dates indicated.
|
By:
|
/s/Michael G. Clark
Michael G. Clark
President
|
|
Date:
|
May 31, 2011
|
|
By:
|
/s/Paul Schubert
Paul Schubert
Chief Financial Officer and Treasurer
|
|
Date:
|
May 31, 2011
|