UNITED STATES
SECURITIES AND EXCHANGE COMMISSION
WASHINGTON, D. C. 20549
FORM N-CSRS
Investment Company Act file number: 811-00642
DWS International Fund, Inc.
(Exact Name of Registrant as Specified in Charter)
345 Park Avenue
New York, NY 10154-0004
(Address of Principal Executive Offices) (Zip Code)
Registrant’s Telephone Number, including Area Code: (212) 250-3220
Paul Schubert
60 Wall Street
New York, NY 10005
(Name and Address of Agent for Service)
|
Date of fiscal year end:
|
10/31
|
|
Date of reporting period:
|
4/30/2014
|
|
ITEM 1.
|
REPORT TO STOCKHOLDERS
|

April 30, 2014
Semiannual Report
to Shareholders
DWS World Dividend Fund
Contents
|
3 Letter to Shareholders
4 Performance Summary
8 Portfolio Management Team
9 Portfolio Summary
11 Investment Portfolio
15 Statement of Assets and Liabilities
17 Statement of Operations
18 Statement of Changes in Net Assets
19 Financial Highlights
26 Notes to Financial Statements
37 Information About Your Fund's Expenses
39 Advisory Agreement Board Considerations and Fee Evaluation
44 Account Management Resources
46 Privacy Statement
|
This report must be preceded or accompanied by a prospectus. To obtain a summary prospectus, if available, or prospectus for any of our funds, refer to the Account Management Resources information provided in the back of this booklet. We advise you to consider the fund's objectives, risks, charges and expenses carefully before investing. The summary prospectus and prospectus contain this and other important information about the fund. Please read the prospectus carefully before you invest.
Dividends are not guaranteed. If the dividend-paying stocks held by the fund reduce or stop paying dividends, the fund's ability to generate income may be adversely affected. Preferred stocks, a type of dividend-paying stock, present certain additional risks. Any fund that focuses in a particular segment of the market will generally be more volatile than a fund that invests more broadly. Investing in foreign securities, particularly those of emerging markets, presents certain risks, such as currency fluctuations, political and economic changes, and market risks. The fund may lend securities to approved institutions. Stocks may decline in value. See the prospectus for details.
Deutsche Asset & Wealth Management represents the asset management and wealth management activities conducted by Deutsche Bank AG or any of its subsidiaries, including the Advisor and DWS Investments Distributors, Inc.
NOT FDIC/NCUA INSURED NO BANK GUARANTEE MAY LOSE VALUE NOT A DEPOSIT NOT INSURED BY ANY FEDERAL GOVERNMENT AGENCY
Dear Shareholder:
The economic recovery appears to be gaining traction here in the United States and across much of the globe. Still, the data we see on television and the Internet provide a mixed message. Corporate profit growth may be decelerating, but manufacturing and the housing market are strengthening. Employment numbers are not as strong as one would expect, yet consumer confidence is resilient. All in all, economic growth has been sufficient for the Federal Reserve to taper its bond-buying program.
What lies ahead? Randy Brown, co-chief investment officer for Deutsche Asset & Wealth Management, suggests that "despite the slowdown in some emerging economies, global growth is likely to remain solid." And "as a result of stable economic growth and continued tapering, we expect the yields of long U.S. Treasuries to increase eventually."
Does this view suggest the need for a change in strategy? The answer will depend on your current asset allocation as well as whether a change has occurred in your personal circumstances, objectives or investment time horizon. A trusted financial advisor who fully understands your specific situation and goals can be the best resource when weighing any major decisions. In any case, we believe that some measure of diversification across a variety of securities and asset classes makes sense. Although it doesn't insure against loss or guarantee a profit, diversification can help your portfolio weather short-term market fluctuations. And that is a helpful strategy in any environment.
Best regards,


Brian Binder
President, DWS Funds
|
Class A
|
6-Month‡
|
1-Year
|
5-Year
|
10-Year
|
|
Average Annual Total Returns as of 4/30/14
|
||||
|
Unadjusted for Sales Charge
|
6.83%
|
15.54%
|
15.51%
|
6.45%
|
|
Adjusted for the Maximum Sales Charge (max 5.75% load)
|
0.68%
|
8.90%
|
14.15%
|
5.82%
|
|
MSCI World High Dividend Yield Index†
|
7.67%
|
13.49%
|
17.37%
|
N/A
|
|
MSCI World Index††
|
6.32%
|
16.62%
|
16.03%
|
7.17%
|
|
Average Annual Total Returns as of 3/31/14 (most recent calendar quarter end)
|
||||
|
Unadjusted for Sales Charge
|
15.78%
|
17.15%
|
6.05%
|
|
|
Adjusted for the Maximum Sales Charge (max 5.75% load)
|
9.12%
|
15.77%
|
5.42%
|
|
|
MSCI World High Dividend Yield Index†
|
15.25%
|
19.86%
|
N/A
|
|
|
MSCI World Index††
|
19.07%
|
18.28%
|
6.83%
|
|
|
Class B
|
6-Month‡
|
1-Year
|
5-Year
|
10-Year
|
|
Average Annual Total Returns as of 4/30/14
|
||||
|
Unadjusted for Sales Charge
|
6.42%
|
14.64%
|
14.51%
|
5.52%
|
|
Adjusted for the Maximum Sales Charge (max 4.00% CDSC)
|
2.42%
|
11.64%
|
14.39%
|
5.52%
|
|
MSCI World High Dividend Yield Index†
|
7.67%
|
13.49%
|
17.37%
|
N/A
|
|
MSCI World Index††
|
6.32%
|
16.62%
|
16.03%
|
7.17%
|
|
Average Annual Total Returns as of 3/31/14 (most recent calendar quarter end)
|
||||
|
Unadjusted for Sales Charge
|
14.82%
|
16.13%
|
5.12%
|
|
|
Adjusted for the Maximum Sales Charge (max 4.00% CDSC)
|
11.82%
|
16.02%
|
5.12%
|
|
|
MSCI World High Dividend Yield Index†
|
15.25%
|
19.86%
|
N/A
|
|
|
MSCI World Index††
|
19.07%
|
18.28%
|
6.83%
|
|
|
Class C
|
6-Month‡
|
1-Year
|
5-Year
|
10-Year
|
|
Average Annual Total Returns as of 4/30/14
|
||||
|
Unadjusted for Sales Charge
|
6.45%
|
14.73%
|
14.62%
|
5.59%
|
|
Adjusted for the Maximum Sales Charge (max 1.00% CDSC)
|
5.45%
|
14.73%
|
14.62%
|
5.59%
|
|
MSCI World High Dividend Yield Index†
|
7.67%
|
13.49%
|
17.37%
|
N/A
|
|
MSCI World Index††
|
6.32%
|
16.62%
|
16.03%
|
7.17%
|
|
Average Annual Total Returns as of 3/31/14 (most recent calendar quarter end)
|
||||
|
Unadjusted for Sales Charge
|
14.91%
|
16.23%
|
5.19%
|
|
|
Adjusted for the Maximum Sales Charge (max 1.00% CDSC)
|
14.91%
|
16.23%
|
5.19%
|
|
|
MSCI World High Dividend Yield Index†
|
15.25%
|
19.86%
|
N/A
|
|
|
MSCI World Index††
|
19.07%
|
18.28%
|
6.83%
|
|
|
Class S
|
6-Month‡
|
1-Year
|
5-Year
|
10-Year
|
|
Average Annual Total Returns as of 4/30/14
|
||||
|
No Sales Charges
|
6.95%
|
15.77%
|
15.75%
|
6.67%
|
|
MSCI World High Dividend Yield Index†
|
7.67%
|
13.49%
|
17.37%
|
N/A
|
|
MSCI World Index††
|
6.32%
|
16.62%
|
16.03%
|
7.17%
|
|
Average Annual Total Returns as of 3/31/14 (most recent calendar quarter end)
|
||||
|
No Sales Charges
|
16.01%
|
17.40%
|
6.27%
|
|
|
MSCI World High Dividend Yield Index†
|
15.25%
|
19.86%
|
N/A
|
|
|
MSCI World Index††
|
19.07%
|
18.28%
|
6.83%
|
|
|
Institutional Class
|
6-Month‡
|
1-Year
|
5-Year
|
Life of Class*
|
|
Average Annual Total Returns as of 4/30/14
|
||||
|
No Sales Charges
|
7.00%
|
15.90%
|
15.95%
|
4.94%
|
|
MSCI World High Dividend Yield Index†
|
7.67%
|
13.49%
|
17.37%
|
N/A
|
|
MSCI World Index††
|
6.32%
|
16.62%
|
16.03%
|
6.49%
|
|
Average Annual Total Returns as of 3/31/14 (most recent calendar quarter end)
|
||||
|
No Sales Charges
|
16.15%
|
17.62%
|
4.71%
|
|
|
MSCI World High Dividend Yield Index†
|
15.25%
|
19.86%
|
N/A
|
|
|
MSCI World Index††
|
19.07%
|
18.28%
|
6.43%
|
|
Until December 1, 2010, this fund was known as DWS Europe Equity Fund. On December 1, 2010, the fund's objective, strategy and name changed. All returns prior to December 1, 2010 were achieved under the previous objective and strategy.
Performance in the Average Annual Total Returns table(s) above and the Growth of an Assumed $10,000 Investment line graph that follows is historical and does not guarantee future results. Investment return and principal fluctuate, so your shares may be worth more or less when redeemed. Current performance may differ from performance data shown. Please visit dws-investments.com for the Fund's most recent month-end performance. Fund performance includes reinvestment of all distributions. Unadjusted returns do not reflect sales charges and would have been lower if they had.
The gross expense ratios of the Fund, as stated in the fee table of the prospectus dated May 1, 2014 are 1.28%, 2.57%, 2.00%, 1.10% and 0.96% for Class A, Class B, Class C, Class S and Institutional Class shares, respectively, and may differ from the expense ratios disclosed in the Financial Highlights tables in this report.
The Fund may charge a 2% fee for redemptions of shares held less than 15 days.
Index returns do not reflect any fees or expenses and it is not possible to invest directly into an index.
Performance figures do not reflect the deduction of taxes that a shareholder would pay on fund distributions or the redemption of fund shares.
|
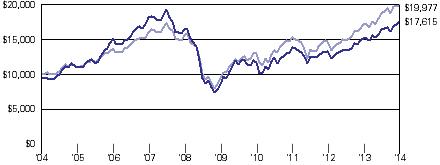
Growth of an Assumed $10,000 Investment (Adjusted for Maximum Sales Charge)
|
 |
 |
|
Yearly periods ended April 30
|
The Fund's growth of an assumed $10,000 investment is adjusted for the maximum sales charge of 5.75%. This results in a net initial investment of $9,425.
The growth of $10,000 is cumulative.
Performance of other share classes will vary based on the sales charges and the fee structure of those classes.
* Institutional Class commenced operations on March 14, 2005. The performance shown for the MSCI World Index is for the time period of March 31, 2005 through April 30, 2014 (through March 31, 2014 for the most recent calendar quarter end returns), which is based on the performance period of the life of Institutional Class.
† The MSCI World High Dividend Yield Index includes securities that offer a meaningfully higher-than-average dividend yield relative to the MSCI World Index and pass dividend sustainability and persistence screens. The index offers broad market coverage, and is free-float market-capitalization-weighted to ensure that its performance can be replicated in institutional and retail portfolios. The index is calculated using closing local market prices and translates into U.S. dollars using the London close foreign exchange rates. The index commenced on October 31, 2006.
†† The Morgan Stanley Capital International (MSCI) World Index is a free float-adjusted market-capitalization-weighted index that is designed to measure the equity market performance of developed markets. The index consists of 24 developed market country indices. The index is calculated using closing local market prices and translates into U.S. dollars using the London close foreign exchange rates.
‡ Total returns shown for periods less than one year are not annualized.
|
Class A
|
Class B
|
Class C
|
Class S
|
Institutional Class
|
||||||||||||||||
|
Net Asset Value
|
||||||||||||||||||||
|
4/30/14
|
$ | 29.83 | $ | 29.55 | $ | 29.61 | $ | 29.87 | $ | 30.13 | ||||||||||
|
10/31/13
|
$ | 28.10 | $ | 27.83 | $ | 27.89 | $ | 28.13 | $ | 28.38 | ||||||||||
|
Distribution Information as of 4/30/14
|
||||||||||||||||||||
|
Income Dividends, Six Months
|
$ | .18 | $ | .06 | $ | .08 | $ | .20 | $ | .22 | ||||||||||
Thomas Schuessler, PhD, Managing Director
Portfolio Manager of the fund. Began managing the fund in 2010.
— Joined Deutsche Asset & Wealth Management in 2001 after five years at Deutsche Bank where he managed various projects and worked in the office of the Chairman of the Management Board.
— Head of Equity Income and Member of the Asset Management CIO Executive Committee: Frankfurt.
— PhD, University of Heidelberg, studies in physics and economics at University of Heidelberg and University of Utah.
Oliver Pfeil, PhD, Director
Portfolio Manager of the fund. Began managing the fund in 2010.
— Joined Deutsche Asset & Wealth Management in 2006 after 3 years as Executive Assistant to the Management Board of Deutsche Bank. Previously, he served as a Research Fellow at the Swiss Institute of Banking and Finance at the University of St. Gallen (2000–2002) and as a Visiting Scholar in Capital Markets Research at MIT Sloan School of Management (2002–2003).
— Portfolio manager for US and Global Value Equity: Frankfurt.
— PhD and MBA in Business Administration from the University of St. Gallen; CEMS Master in International Management from the University of St. Gallen & ESADE, Barcelona; completed bank training program ("Bankkaufmann") at Sal. Oppenheim jr. & Cie. KGaA, Cologne.
Fabian Degen, CFA, Assistant Vice President
Portfolio Manager of the fund. Began managing the fund in 2010.
— Joined Deutsche Asset & Wealth Management in 2007.
— Portfolio manager for US and Global Value Equity: Frankfurt.
— US and Global Fund Management: Frankfurt.
— Bachelor of International Business Administration in Investments and Finance from the International University of Applied Sciences Bad Honnef, Bonn with educational exchanges at the University of Maine (USA).
Peter Steffen, CFA, Vice President
Portfolio Manager of the fund. Began managing the fund in 2010.
— Joined Deutsche Asset & Wealth Management in 2007.
— Portfolio manager for US and Global Value Equity: Frankfurt.
— Master's Degree ("Diplom-Kaufmann") in Finance and Asset Management from International School of Management, Dortmund with educational exchanges at the Université de Neuchâtel (Switzerland) and the University of Colorado (USA).
|
Ten Largest Equity Holdings at April 30, 2014 (48.8% of Net Assets)
|
Country
|
Percent
|
|
1. British American Tobacco PLC
Manufactures, markets and sells cigarettes and other tobacco products
|
United Kingdom
|
6.2%
|
|
2. UGI Corp.
Distributes and markets energy products and services
|
United States
|
6.1%
|
|
3. Procter & Gamble Co.
Manufacturer of diversified consumer products
|
United States
|
5.8%
|
|
4. PepsiCo, Inc.
Provider of soft drinks, snack foods and food services
|
United States
|
5.1%
|
|
5. C.H. Robinson Worldwide, Inc.
Provides multimodal transportation services and logistics solutions
|
United States
|
4.6%
|
|
6. Canadian Oil Sands Ltd.
An oil and gas and gas exploration company
|
Canada
|
4.4%
|
|
7. Unilever NV
Manufactures food, home and personal care products
|
Netherlands
|
4.4%
|
|
8. Microsoft Corp.
Develops, manufactures, licenses, sells and supports software products
|
United States
|
4.1%
|
|
9. Jardine Matheson Holdings Ltd.
A multinational conglomerate with a portfolio of various businesses in the Asia-Pacific region
|
Hong Kong
|
4.1%
|
|
10. Tesco PLC
A multinational grocery and merchandise retailer
|
United Kingdom
|
4.0%
|
|
Portfolio holdings and characteristics are subject to change.
|
||
|
Shares
|
Value ($)
|
|||||||
|
Common Stocks 95.9%
|
||||||||
|
Bermuda 2.9%
|
||||||||
|
PartnerRe Ltd. (a) (Cost $6,514,415)
|
104,762 | 11,041,915 | ||||||
|
Canada 12.5%
|
||||||||
|
Bank of Nova Scotia
|
75,691 | 4,599,262 | ||||||
|
Canadian Natural Resources Ltd.
|
332,292 | 13,539,675 | ||||||
|
Canadian Oil Sands Ltd.
|
767,939 | 16,647,261 | ||||||
|
Enbridge, Inc.
|
33,095 | 1,597,002 | ||||||
|
Franco-Nevada Corp.
|
89,108 | 4,295,037 | ||||||
|
The Toronto-Dominion Bank
|
93,550 | 4,500,608 | ||||||
|
TransCanada Corp.
|
32,904 | 1,533,449 | ||||||
|
(Cost $38,185,475)
|
46,712,294 | |||||||
|
Finland 1.7%
|
||||||||
|
Sampo Oyj "A" (c) (Cost $3,177,351)
|
127,472 | 6,348,353 | ||||||
|
France 3.2%
|
||||||||
|
Air Liquide SA
|
33,518 | 4,799,248 | ||||||
|
Sanofi
|
67,906 | 7,322,017 | ||||||
|
(Cost $7,467,577)
|
12,121,265 | |||||||
|
Germany 1.3%
|
||||||||
|
Wincor Nixdorf AG (Cost $3,949,120)
|
73,612 | 4,809,360 | ||||||
|
Hong Kong 4.1%
|
||||||||
|
Jardine Matheson Holdings Ltd. (Cost $13,555,185)
|
246,098 | 15,377,456 | ||||||
|
Japan 1.2%
|
||||||||
|
NTT DoCoMo, Inc. (Cost $4,649,307)
|
286,558 | 4,546,232 | ||||||
|
Netherlands 7.8%
|
||||||||
|
Koninklijke Philips NV
|
178,909 | 5,743,368 | ||||||
|
Unilever NV (CVA)
|
383,633 | 16,448,536 | ||||||
|
Wolters Kluwer NV (c)
|
246,235 | 6,861,656 | ||||||
|
(Cost $22,061,799)
|
29,053,560 | |||||||
|
Poland 1.2%
|
||||||||
|
Powszechny Zaklad Ubezpieczen SA (Cost $2,979,179)
|
32,577 | 4,626,312 | ||||||
|
Singapore 0.5%
|
||||||||
|
Singapore Post Ltd. (Cost $1,443,087)
|
1,655,551 | 1,870,572 | ||||||
|
Switzerland 4.5%
|
||||||||
|
Nestle SA (Registered)
|
69,274 | 5,357,347 | ||||||
|
Novartis AG (Registered)
|
116,836 | 10,153,665 | ||||||
|
Transocean Ltd. (a) (c)
|
34,360 | 1,479,885 | ||||||
|
(Cost $10,900,017)
|
16,990,897 | |||||||
|
United Kingdom 20.0%
|
||||||||
|
BAE Systems PLC
|
596,174 | 4,046,245 | ||||||
|
British American Tobacco PLC
|
403,154 | 23,241,255 | ||||||
|
CNH Industrial NV (a)
|
558,267 | 6,470,315 | ||||||
|
Imperial Tobacco Group PLC
|
228,672 | 9,888,739 | ||||||
|
National Grid PLC
|
406,550 | 5,769,949 | ||||||
|
Pearson PLC
|
290,196 | 5,439,659 | ||||||
|
Smiths Group PLC
|
172,226 | 3,890,230 | ||||||
|
Tesco PLC
|
3,034,995 | 15,050,962 | ||||||
|
Vodafone Group PLC
|
309,858 | 1,177,632 | ||||||
|
(Cost $63,958,039)
|
74,974,986 | |||||||
|
United States 35.0%
|
||||||||
|
C.H. Robinson Worldwide, Inc. (c)
|
289,429 | 17,047,368 | ||||||
|
Cisco Systems, Inc.
|
420,390 | 9,715,213 | ||||||
|
ConocoPhillips
|
38,441 | 2,856,551 | ||||||
|
Diebold, Inc. (c)
|
176,425 | 6,635,344 | ||||||
|
Leucadia National Corp.
|
223,989 | 5,716,199 | ||||||
|
Microsoft Corp.
|
382,340 | 15,446,536 | ||||||
|
PepsiCo, Inc.
|
224,016 | 19,240,734 | ||||||
|
Procter & Gamble Co.
|
263,359 | 21,740,286 | ||||||
|
Sonoco Products Co.
|
34,155 | 1,437,242 | ||||||
|
Staples, Inc. (c)
|
164,114 | 2,051,425 | ||||||
|
Stryker Corp.
|
73,873 | 5,743,626 | ||||||
|
UGI Corp.
|
488,016 | 22,785,467 | ||||||
|
Verizon Communications, Inc.(b)
|
14,940 | 699,238 | ||||||
|
(Cost $107,653,023)
|
131,115,229 | |||||||
|
Total Common Stocks (Cost $286,493,574)
|
359,588,431 | |||||||
|
Securities Lending Collateral 6.1%
|
||||||||
|
Daily Assets Fund Institutional, 0.09% (d) (e) (Cost $23,064,266)
|
23,064,266 | 23,064,266 | ||||||
|
Cash Equivalents 3.4%
|
||||||||
|
Central Cash Management Fund, 0.05% (d) (Cost $12,595,338)
|
12,595,338 | 12,595,338 | ||||||
|
% of Net Assets
|
Value ($)
|
|||||||
|
Total Investment Portfolio (Cost $322,153,178)†
|
105.4 | 395,248,035 | ||||||
|
Other Assets and Liabilities, Net
|
(5.4 | ) | (20,230,657 | ) | ||||
|
Net Assets
|
100.0 | 375,017,378 | ||||||
† The cost for federal income tax purposes was $323,370,725. At April 30, 2014, net unrealized appreciation for all securities based on tax cost was $71,877,310. This consisted of aggregate gross unrealized appreciation for all securities in which there was an excess of value over tax cost of $75,252,225 and aggregate gross unrealized depreciation for all securities in which there was an excess of tax cost over value of $3,374,915.
(a) Listed on the New York Stock Exchange.
(b) Listed on the London Stock Exchange
(c) All or a portion of these securities were on loan. In addition, "Other Assets and Liabilities, Net" may include pending sales that are also on loan. The value of securities loaned at April 30, 2014 amounted to $22,351,033, which is 6.0% of net assets.
(d) Affiliated fund managed by Deutsche Investment Management Americas Inc. The rate shown is the annualized seven-day yield at period end.
(e) Represents collateral held in connection with securities lending. Income earned by the Fund is net of borrower rebates.
CVA: Certificaten Van Aandelen (Certificate of Deposit)
Fair Value Measurements
Various inputs are used in determining the value of the Fund's investments. These inputs are summarized in three broad levels. Level 1 includes quoted prices in active markets for identical securities. Level 2 includes other significant observable inputs (including quoted prices for similar securities, interest rates, prepayment speeds and credit risk). Level 3 includes significant unobservable inputs (including the Fund's own assumptions in determining the fair value of investments). The level assigned to the securities valuations may not be an indication of the risk or liquidity associated with investing in those securities.
The following is a summary of the inputs used as of April 30, 2014 in valuing the Fund's investments. For information on the Fund's policy regarding the valuation of investments, please refer to the Security Valuation section of Note A in the accompanying Notes to Financial Statements.
There have been no transfers between fair value measurement levels during the period ended April 30, 2014.
(f) See Investment Portfolio for additional detailed categorizations.
The accompanying notes are an integral part of the financial statements.
|
as of April 30, 2014 (Unaudited)
|
||||
|
Assets
|
||||
|
Investments:
Investments in non-affiliated securities, at value (cost $286,493,574) — including $22,351,033 of securities loaned
|
$ | 359,588,431 | ||
|
Investment in Daily Assets Fund Institutional (cost $23,064,266)*
|
23,064,266 | |||
|
Investment in Central Cash Management Fund (cost $12,595,338)
|
12,595,338 | |||
|
Total investments in securities, at value (cost $322,153,178)
|
395,248,035 | |||
|
Cash
|
2,305,896 | |||
|
Foreign currency, at value (cost $283,480)
|
285,333 | |||
|
Receivable for Fund shares sold
|
1,364,547 | |||
|
Dividends receivable
|
2,378,588 | |||
|
Interest receivable
|
27,281 | |||
|
Foreign taxes recoverable
|
428,878 | |||
|
Other assets
|
47,162 | |||
|
Total assets
|
402,085,720 | |||
|
Liabilities
|
||||
|
Payable upon return of securities loaned
|
23,064,266 | |||
|
Payable for investments purchased
|
3,214,392 | |||
|
Payable for Fund shares redeemed
|
275,695 | |||
|
Accrued management fee
|
192,139 | |||
|
Accrued Directors' fees
|
3,297 | |||
|
Other accrued expenses and payables
|
318,553 | |||
|
Total liabilities
|
27,068,342 | |||
|
Net assets, at value
|
$ | 375,017,378 | ||
|
Net Assets Consist of
|
||||
|
Undistributed net investment income
|
1,615,923 | |||
|
Net unrealized appreciation (depreciation) on:
Investments
|
73,094,857 | |||
|
Foreign currency
|
33,084 | |||
|
Accumulated net realized gain (loss)
|
(159,171,447 | ) | ||
|
Paid-in capital
|
459,444,961 | |||
|
Net assets, at value
|
$ | 375,017,378 | ||
* Represents collateral on securities loaned.
The accompanying notes are an integral part of the financial statements.
|
Statement of Assets and Liabilities as of April 30, 2014 (Unaudited) (continued)
|
||||
|
Net Asset Value
|
||||
|
Class A
Net Asset Value and redemption price(a) per share ($113,997,599 ÷ 3,821,094 shares of capital stock outstanding, $.01 par value, 50,000,000 of shares authorized)
|
$ | 29.83 | ||
|
Maximum offering price per share (100 ÷ 94.25 of $29.83)
|
$ | 31.65 | ||
|
Class B
Net Asset Value, offering and redemption price(a) (subject to contingent deferred sales charge) per share ($69,009 ÷ 2,335 shares of capital stock outstanding, $.01 par value, 50,000,000 shares authorized)
|
$ | 29.55 | ||
|
Class C
Net Asset Value, offering and redemption price(a) (subject to contingent deferred sales charge) per share ($37,561,610 ÷ 1,268,481 shares of capital stock outstanding, $.01 par value, 20,000,000 shares authorized)
|
$ | 29.61 | ||
|
Class S
Net Asset Value, offering and redemption price(a) per share ($210,966,423 ÷ 7,061,938 shares of capital stock outstanding, $.01 par value, 100,000,000 of shares authorized)
|
$ | 29.87 | ||
|
Institutional Class
Net Asset Value, offering and redemption price(a) per share ($12,422,737 ÷ 412,279 shares of capital stock outstanding, $.01 par value, 100,000,000 of shares authorized)
|
$ | 30.13 | ||
(a) Redemption price per share for shares held less than 15 days is equal to net asset value less a 2% redemption fee.
The accompanying notes are an integral part of the financial statements.
|
for the six months ended April 30, 2014 (Unaudited)
|
||||
|
Investment Income
|
||||
|
Income:
Dividends (net of foreign taxes withheld of $338,369)
|
$ | 7,098,815 | ||
|
Income distributions — Central Cash Management Fund
|
5,611 | |||
|
Securities lending income, including income from Daily Assets Fund Institutional, net of borrower rebates
|
59,586 | |||
|
Total income
|
7,164,012 | |||
|
Expenses:
Management fee
|
1,167,783 | |||
|
Administration fee
|
178,046 | |||
|
Services to shareholders
|
319,144 | |||
|
Distribution and service fees
|
291,800 | |||
|
Custodian fee
|
27,784 | |||
|
Professional fees
|
45,871 | |||
|
Reports to shareholders
|
30,876 | |||
|
Registration fees
|
36,503 | |||
|
Directors' fees and expenses
|
6,817 | |||
|
Other
|
15,741 | |||
|
Total expenses before expense reductions
|
2,120,365 | |||
|
Expense reductions
|
(27,856 | ) | ||
|
Total expenses after expense reductions
|
2,092,509 | |||
|
Net investment income
|
5,071,503 | |||
|
Realized and Unrealized Gain (Loss)
|
||||
|
Net realized gain (loss) from:
Investments
|
14,856,332 | |||
|
Foreign currency
|
(12,304 | ) | ||
| 14,844,028 | ||||
|
Change in net unrealized appreciation (depreciation) on:
Investments
|
4,222,280 | |||
|
Foreign currency
|
18,596 | |||
| 4,240,876 | ||||
|
Net gain (loss)
|
19,084,904 | |||
|
Net increase (decrease) in net assets resulting from operations
|
$ | 24,156,407 | ||
The accompanying notes are an integral part of the financial statements.
|
Increase (Decrease) in Net Assets
|
Six Months Ended April 30, 2014 (Unaudited)
|
Year Ended October 31, 2013
|
||||||
|
Operations:
Net investment income
|
$ | 5,071,503 | $ | 6,171,552 | ||||
|
Operations:
Net investment income
|
$ | 5,071,503 | $ | 6,171,552 | ||||
|
Net realized gain (loss)
|
14,844,028 | 20,593,838 | ||||||
|
Change in net unrealized appreciation (depreciation)
|
4,240,876 | 37,996,693 | ||||||
|
Net increase (decrease) in net assets resulting from operations
|
24,156,407 | 64,762,083 | ||||||
|
Distributions to shareholders from:
Net investment income:
Class A
|
(678,652 | ) | (2,525,113 | ) | ||||
|
Class B
|
(211 | ) | (2,340 | ) | ||||
|
Class C
|
(91,094 | ) | (475,877 | ) | ||||
|
Class S
|
(1,479,565 | ) | (5,033,763 | ) | ||||
|
Institutional Class
|
(86,926 | ) | (296,495 | ) | ||||
|
Total distributions
|
(2,336,448 | ) | (8,333,588 | ) | ||||
|
Fund share transactions:
Proceeds from shares sold
|
49,965,701 | 71,046,717 | ||||||
|
Reinvestment of distributions
|
2,168,079 | 7,793,139 | ||||||
|
Payments for shares redeemed
|
(47,737,337 | ) | (80,738,644 | ) | ||||
|
Redemption fees
|
223 | 801 | ||||||
|
Net increase (decrease) in net assets from Fund share transactions
|
4,396,666 | (1,897,987 | ) | |||||
|
Increase (decrease) in net assets
|
26,216,625 | 54,530,508 | ||||||
|
Net assets at beginning of period
|
348,800,753 | 294,270,245 | ||||||
|
Net assets at end of period (including undistributed net investment income and distributions in excess of net investment income of $1,615,923 and $1,119,132, respectively)
|
$ | 375,017,378 | $ | 348,800,753 | ||||
The accompanying notes are an integral part of the financial statements.
|
Years Ended October 31,
|
||||||||||||||||||||||||
|
Class A
|
Six Months Ended 4/30/14 (Unaudited)
|
2013
|
2012
|
2011
|
2010
|
2009
|
||||||||||||||||||
|
Selected Per Share Data
|
||||||||||||||||||||||||
|
Net asset value, beginning of period
|
$ | 28.10 | $ | 23.48 | $ | 22.78 | $ | 23.58 | $ | 22.34 | $ | 19.21 | ||||||||||||
|
Income (loss) from investment operations:
Net investment incomea
|
.39 | .50 | .57 | .61 | .30 | .32 | ||||||||||||||||||
|
Net realized and unrealized gain (loss)
|
1.52 | 4.80 | .81 | (.40 | ) | 1.39 | 3.66 | |||||||||||||||||
|
Total from investment operations
|
1.91 | 5.30 | 1.38 | .21 | 1.69 | 3.98 | ||||||||||||||||||
|
Less distributions from:
Net investment income
|
(.18 | ) | (.68 | ) | (.68 | ) | (1.06 | ) | (.66 | ) | (.85 | ) | ||||||||||||
|
Increase from regulatory settlements
|
— | — | — | .05 | c | .21 | c | — | ||||||||||||||||
|
Redemption fees
|
.00 | *** | .00 | *** | .00 | *** | .00 | *** | .00 | *** | .00 | *** | ||||||||||||
|
Net asset value, end of period
|
$ | 29.83 | $ | 28.10 | $ | 23.48 | $ | 22.78 | $ | 23.58 | $ | 22.34 | ||||||||||||
|
Total Return (%)b
|
6.83 | ** | 23.01 | 6.24 | 1.16 | 8.71 | 21.98 | |||||||||||||||||
|
Ratios to Average Net Assets and Supplemental Data
|
||||||||||||||||||||||||
|
Net assets, end of period ($ millions)
|
114 | 102 | 94 | 85 | 42 | 47 | ||||||||||||||||||
|
Ratio of expenses (%)
|
1.24 | * | 1.28 | 1.29 | 1.35 | 1.45 | 1.53 | |||||||||||||||||
|
Ratio of net investment income (%)
|
2.80 | * | 1.95 | 2.51 | 2.63 | 1.37 | 1.70 | |||||||||||||||||
|
Portfolio turnover rate (%)
|
20 | ** | 28 | 19 | 82 | 204 | 92 | |||||||||||||||||
|
a Based on average shares outstanding during the period.
b Total return does not reflect the effect of any sales charges.
c Includes a non-recurring payment from the Advisor, which amounted to $0.093 per share for the period ended October 31, 2010, recorded as a result of the Advisor's settlement with the SEC and NY Attorney General in connection with certain trading arrangements. The Fund also received $0.051 and $0.115 per share of non-affiliated regulatory settlements for the periods ended October 31, 2011 and 2010, respectively. Excluding these non-recurring payments, total return would have been 0.22% and 0.93% lower for the periods ended October 31, 2011 and 2010, respectively.
* Annualized
** Not annualized
*** Amount is less than $.005.
|
||||||||||||||||||||||||
|
Years Ended October 31,
|
||||||||||||||||||||||||
|
Class B
|
Six Months Ended 4/30/14 (Unaudited)
|
2013
|
2012
|
2011
|
2010
|
2009
|
||||||||||||||||||
|
Selected Per Share Data
|
||||||||||||||||||||||||
|
Net asset value, beginning of period
|
$ | 27.83 | $ | 23.23 | $ | 22.54 | $ | 23.19 | $ | 22.03 | $ | 18.89 | ||||||||||||
|
Income (loss) from investment operations:
Net investment incomea
|
.20 | .28 | .37 | .38 | .11 | .19 | ||||||||||||||||||
|
Net realized and unrealized gain (loss)
|
1.58 | 4.77 | .79 | (.39 | ) | 1.38 | 3.61 | |||||||||||||||||
|
Total from investment operations
|
1.78 | 5.05 | 1.16 | (.01 | ) | 1.49 | 3.80 | |||||||||||||||||
|
Less distributions from:
Net investment income
|
(.06 | ) | (.45 | ) | (.47 | ) | (.69 | ) | (.52 | ) | (.66 | ) | ||||||||||||
|
Increase from regulatory settlements
|
— | — | — | .05 | d | .19 | d | — | ||||||||||||||||
|
Redemption fees
|
.00 | *** | .00 | *** | .00 | *** | .00 | *** | .00 | *** | .00 | *** | ||||||||||||
|
Net asset value, end of period
|
$ | 29.55 | $ | 27.83 | $ | 23.23 | $ | 22.54 | $ | 23.19 | $ | 22.03 | ||||||||||||
|
Total Return (%)b,c
|
6.42 | ** | 22.01 | 5.31 | .19 | 7.76 | 21.09 | |||||||||||||||||
|
Ratios to Average Net Assets and Supplemental Data
|
||||||||||||||||||||||||
|
Net assets, end of period ($ millions)
|
.1 | .2 | .1 | .2 | .4 | 1 | ||||||||||||||||||
|
Ratio of expenses before expense reductions (%)
|
2.62 | * | 2.57 | 2.65 | 2.50 | 2.62 | 2.67 | |||||||||||||||||
|
Ratio of expenses after expense reductions (%)
|
2.03 | * | 2.09 | 2.18 | 2.33 | 2.35 | 2.24 | |||||||||||||||||
|
Ratio of net investment income (%)
|
1.41 | * | 1.09 | 1.63 | 1.62 | .46 | .99 | |||||||||||||||||
|
Portfolio turnover rate (%)
|
20 | ** | 28 | 19 | 82 | 204 | 92 | |||||||||||||||||
|
a Based on average shares outstanding during the period.
b Total return does not reflect the effect of any sales charges.
c Total return would have been lower had certain expenses not been reduced.
d Includes a non-recurring payment from the Advisor, which amounted to $0.079 per share for the period ended October 31, 2010, recorded as a result of the Advisor's settlement with the SEC and NY Attorney General in connection with certain trading arrangements. The Fund also received $0.051 and $0.110 per share of non-affiliated regulatory settlements for the periods ended October 31, 2011 and 2010, respectively. Excluding these non-recurring payments, total return would have been 0.22% and 0.93% lower for the periods ended October 31, 2011 and 2010, respectively.
* Annualized
** Not annualized
*** Amount is less than $.005.
|
||||||||||||||||||||||||
|
Years Ended October 31,
|
||||||||||||||||||||||||
|
Class C
|
Six Months Ended 4/30/14 (Unaudited)
|
2013
|
2012
|
2011
|
2010
|
2009
|
||||||||||||||||||
|
Selected Per Share Data
|
||||||||||||||||||||||||
|
Net asset value, beginning of period
|
$ | 27.89 | $ | 23.30 | $ | 22.60 | $ | 23.24 | $ | 21.99 | $ | 18.91 | ||||||||||||
|
Income (loss) from investment operations:
Net investment incomea
|
.30 | .31 | .41 | .37 | .12 | .15 | ||||||||||||||||||
|
Net realized and unrealized gain (loss)
|
1.50 | 4.77 | .80 | (.35 | ) | 1.36 | 3.61 | |||||||||||||||||
|
Total from investment operations
|
1.80 | 5.08 | 1.21 | .02 | 1.48 | 3.76 | ||||||||||||||||||
|
Less distributions from:
Net investment income
|
(.08 | ) | (.49 | ) | (.51 | ) | (.71 | ) | (.44 | ) | (.68 | ) | ||||||||||||
|
Increase from regulatory settlements
|
— | — | — | .05 | d | .21 | d | — | ||||||||||||||||
|
Redemption fees
|
.00 | *** | .00 | *** | .00 | *** | .00 | *** | .00 | *** | .00 | *** | ||||||||||||
|
Net asset value, end of period
|
$ | 29.61 | $ | 27.89 | $ | 23.30 | $ | 22.60 | $ | 23.24 | $ | 21.99 | ||||||||||||
|
Total Return (%)c
|
6.45 | ** | 22.09 | 5.51 | b | .31 | 7.82 | 20.88 | ||||||||||||||||
|
Ratios to Average Net Assets and Supplemental Data
|
||||||||||||||||||||||||
|
Net assets, end of period ($ millions)
|
38 | 30 | 23 | 15 | 2 | 3 | ||||||||||||||||||
|
Ratio of expenses before expense reductions (%)
|
1.95 | * | 2.00 | 2.02 | 2.11 | 2.29 | 2.44 | |||||||||||||||||
|
Ratio of expenses after expense reductions (%)
|
1.95 | * | 2.00 | 2.02 | 2.11 | 2.29 | 2.44 | |||||||||||||||||
|
Ratio of net investment income (%)
|
2.17 | * | 1.22 | 1.81 | 1.66 | .52 | .79 | |||||||||||||||||
|
Portfolio turnover rate (%)
|
20 | ** | 28 | 19 | 82 | 204 | 92 | |||||||||||||||||
|
a Based on average shares outstanding during the period.
b Total return would have been lower had certain expenses not been reduced.
c Total return does not reflect the effect of any sales charges.
d Includes a non-recurring payment from the Advisor, which amounted to $0.093 per share for the period ended October 31, 2010, recorded as a result of the Advisor's settlement with the SEC and NY Attorney General in connection with certain trading arrangements. The Fund also received $0.051 and $0.114 per share of non-affiliated regulatory settlements for the periods ended October 31, 2011 and 2010, respectively. Excluding these non-recurring payments, total return would have been 0.22% and 0.93% lower for the periods ended October 31, 2011 and 2010, respectively.
* Annualized
** Not annualized
*** Amount is less than $.005.
|
||||||||||||||||||||||||
|
Years Ended October 31,
|
||||||||||||||||||||||||
|
Class S
|
Six Months Ended 4/30/14 (Unaudited)
|
2013
|
2012
|
2011
|
2010
|
2009
|
||||||||||||||||||
|
Selected Per Share Data
|
||||||||||||||||||||||||
|
Net asset value, beginning of period
|
$ | 28.13 | $ | 23.50 | $ | 22.81 | $ | 23.66 | $ | 22.42 | $ | 19.27 | ||||||||||||
|
Income (loss) from investment operations:
Net investment incomea
|
.42 | .54 | .61 | .68 | .35 | .37 | ||||||||||||||||||
|
Net realized and unrealized gain (loss)
|
1.52 | 4.81 | .81 | (.42 | ) | 1.41 | 3.67 | |||||||||||||||||
|
Total from investment operations
|
1.94 | 5.35 | 1.42 | .26 | 1.76 | 4.04 | ||||||||||||||||||
|
Less distributions from:
Net investment income
|
(.20 | ) | (.72 | ) | (.73 | ) | (1.16 | ) | (.73 | ) | (.89 | ) | ||||||||||||
|
Increase from regulatory settlements
|
— | — | — | .05 | c | .21 | c | — | ||||||||||||||||
|
Redemption fees
|
.00 | *** | .00 | *** | .00 | *** | .00 | *** | .00 | *** | .00 | *** | ||||||||||||
|
Net asset value, end of period
|
$ | 29.87 | $ | 28.13 | $ | 23.50 | $ | 22.81 | $ | 23.66 | $ | 22.42 | ||||||||||||
|
Total Return (%)
|
6.95 | b** | 23.19 | b | 6.44 | b | 1.37 | 8.95 | 22.35 | |||||||||||||||
|
Ratios to Average Net Assets and Supplemental Data
|
||||||||||||||||||||||||
|
Net assets, end of period ($ millions)
|
211 | 207 | 168 | 167 | 173 | 185 | ||||||||||||||||||
|
Ratio of expenses before expense reductions (%)
|
1.06 | * | 1.10 | 1.13 | 1.15 | 1.21 | 1.24 | |||||||||||||||||
|
Ratio of expenses after expense reductions (%)
|
1.03 | * | 1.09 | 1.13 | 1.15 | 1.21 | 1.24 | |||||||||||||||||
|
Ratio of net investment income (%)
|
2.97 | * | 2.12 | 2.67 | 2.89 | 1.60 | 1.99 | |||||||||||||||||
|
Portfolio turnover rate (%)
|
20 | ** | 28 | 19 | 82 | 204 | 92 | |||||||||||||||||
|
a Based on average shares outstanding during the period.
b Total return would have been lower had certain expenses not been reduced.
c Includes a non-recurring payment from the Advisor, which amounted to $0.093 per share for the period ended October 31, 2010, recorded as a result of the Advisor's settlement with the SEC and NY Attorney General in connection with certain trading arrangements. The Fund also received $0.051 and $0.115 per share of non-affiliated regulatory settlements for the periods ended October 31, 2011 and 2010, respectively. Excluding these non-recurring payments, total return would have been 0.22% and 0.93% lower for the periods ended October 31, 2011 and 2010, respectively.
* Annualized
** Not annualized
*** Amount is less than $.005.
|
||||||||||||||||||||||||
|
Years Ended October 31,
|
||||||||||||||||||||||||
|
Institutional Class
|
Six Months Ended 4/30/14 (Unaudited)
|
2013
|
2012
|
2011
|
2010
|
2009
|
||||||||||||||||||
|
Selected Per Share Data
|
||||||||||||||||||||||||
|
Net asset value, beginning of period
|
$ | 28.38 | $ | 23.71 | $ | 23.03 | $ | 23.95 | $ | 22.72 | $ | 19.52 | ||||||||||||
|
Income (loss) from investment operations:
Net investment incomea
|
.45 | .58 | .65 | .75 | .41 | .42 | ||||||||||||||||||
|
Net realized and unrealized gain (loss)
|
1.52 | 4.86 | .81 | (.45 | ) | 1.43 | 3.72 | |||||||||||||||||
|
Total from investment operations
|
1.97 | 5.44 | 1.46 | .30 | 1.84 | 4.14 | ||||||||||||||||||
|
Less distributions from:
Net investment income
|
(.22 | ) | (.77 | ) | (.78 | ) | (1.27 | ) | (.83 | ) | (.94 | ) | ||||||||||||
|
Increase from regulatory settlements
|
— | — | — | .05 | b | .22 | b | — | ||||||||||||||||
|
Redemption fees
|
.00 | *** | .00 | *** | .00 | *** | .00 | *** | .00 | *** | .00 | *** | ||||||||||||
|
Net asset value, end of period
|
$ | 30.13 | $ | 28.38 | $ | 23.71 | $ | 23.03 | $ | 23.95 | $ | 22.72 | ||||||||||||
|
Total Return (%)
|
7.00 | ** | 23.36 | 6.59 | 1.55 | 9.25 | 22.69 | |||||||||||||||||
|
Ratios to Average Net Assets and Supplemental Data
|
||||||||||||||||||||||||
|
Net assets, end of period ($ millions)
|
12 | 10 | 9 | 8 | 13 | 18 | ||||||||||||||||||
|
Ratio of expenses (%)
|
.95 | * | .96 | .99 | .95 | .96 | .96 | |||||||||||||||||
|
Ratio of net investment income (%)
|
3.15 | * | 2.26 | 2.81 | 3.15 | 1.86 | 2.27 | |||||||||||||||||
|
Portfolio turnover rate (%)
|
20 | ** | 28 | 19 | 82 | 204 | 92 | |||||||||||||||||
|
a Based on average shares outstanding during the period.
b Includes a non-recurring payment from the Advisor, which amounted to $0.098 per share for the period ended October 31, 2010, recorded as a result of the Advisor's settlement with the SEC and NY Attorney General in connection with certain trading arrangements. The Fund also received $0.051 and $0.119 per share of non-affiliated regulatory settlements for the periods ended October 31, 2011 and 2010, respectively. Excluding these non-recurring payments, total return would have been 0.22% and 0.93% lower for the periods ended October 31, 2011 and 2010, respectively.
* Annualized
** Not annualized
*** Amount is less than $.005.
|
||||||||||||||||||||||||
A. Organization and Significant Accounting Policies
DWS World Dividend Fund (the "Fund") is a diversified series of the DWS International Fund, Inc. (the "Corporation"), which is registered under the Investment Company Act of 1940, as amended (the "1940 Act"), as an open-end management investment company organized as a Maryland corporation.
The Fund offers multiple classes of shares which provide investors with different purchase options. Class A shares are offered to investors subject to an initial sales charge. Class B shares of the Fund are closed to new purchases, except exchanges or the reinvestment of dividends or other distributions. Class B shares were offered to investors without an initial sales charge and are subject to higher ongoing expenses than Class A shares and a contingent deferred sales charge payable upon certain redemptions. Class B shares automatically convert to Class A shares six years after issuance. Class C shares are offered to investors without an initial sales charge but are subject to higher ongoing expenses than Class A shares and a contingent deferred sales charge payable upon certain redemptions within one year of purchase. Class C shares do not automatically convert into another class. Institutional Class shares are generally available only to qualified institutions, are not subject to initial or contingent deferred sales charges and generally have lower ongoing expenses than other classes. Class S shares are not subject to initial or contingent deferred sales charges and are only available to a limited group of investors.
Investment income, realized and unrealized gains and losses, and certain fund-level expenses and expense reductions, if any, are borne pro rata on the basis of relative net assets by the holders of all classes of shares, except that each class bears certain expenses unique to that class such as distribution and service fees, services to shareholders and certain other class-specific expenses. Differences in class-level expenses may result in payment of different per share dividends by class. All shares of the Fund have equal rights with respect to voting subject to class-specific arrangements.
The Fund's financial statements are prepared in accordance with accounting principles generally accepted in the United States of America which require the use of management estimates. Actual results could differ from those estimates. The policies described below are followed consistently by the Fund in the preparation of its financial statements.
Security Valuation. Investments are stated at value determined as of the close of regular trading on the New York Stock Exchange on each day the exchange is open for trading.
Various inputs are used in determining the value of the Fund's investments. These inputs are summarized in three broad levels. Level 1 includes quoted prices in active markets for identical securities. Level 2 includes other significant observable inputs (including quoted prices for similar securities, interest rates, prepayment speeds and credit risk). Level 3 includes significant unobservable inputs (including the Fund's own assumptions in determining the fair value of investments). The level assigned to the securities valuations may not be an indication of the risk or liquidity associated with investing in those securities.
Equity securities are valued at the most recent sale price or official closing price reported on the exchange (U.S. or foreign) or over-the-counter market on which they trade. Securities for which no sales are reported are valued at the calculated mean between the most recent bid and asked quotations on the relevant market or, if a mean cannot be determined, at the most recent bid quotation. Equity securities are generally categorized as Level 1. For certain international equity securities, in order to adjust for events which may occur between the close of the foreign exchanges and the close of the New York Stock Exchange, a fair valuation model may be used. This fair valuation model takes into account comparisons to the valuation of American Depository Receipts (ADRs), exchange-traded funds, futures contracts and certain indices and these securities are categorized as Level 2.
Investments in open-end investment companies are valued at their net asset value each business day and are categorized as Level 1.
Securities and other assets for which market quotations are not readily available or for which the above valuation procedures are deemed not to reflect fair value are valued in a manner that is intended to reflect their fair value as determined in accordance with procedures approved by the Board and are generally categorized as Level 3. In accordance with the Fund's valuation procedures, factors considered in determining value may include, but are not limited to, the type of the security; the size of the holding; the initial cost of the security; the existence of any contractual restrictions on the security's disposition; the price and extent of public trading in similar securities of the issuer or of comparable companies; quotations or evaluated prices from broker-dealers and/or pricing services; information obtained from the issuer, analysts, and/or the appropriate stock exchange (for exchange-traded securities); an analysis of the company's or issuer's financial statements; an evaluation of the forces that influence the issuer and the market(s) in which the security is purchased and sold; and with respect to debt securities, the maturity, coupon, creditworthiness, currency denomination and the movement of the market in which the security is normally traded. The value determined under these procedures may differ from published values for the same securities.
Disclosure about the classification of fair value measurements is included in a table following the Fund's Investment Portfolio.
Foreign Currency Translations. The books and records of the Fund are maintained in U.S. dollars. Investment securities and other assets and liabilities denominated in a foreign currency are translated into U.S. dollars at the prevailing exchange rates at period end. Purchases and sales of investment securities, income and expenses are translated into U.S. dollars at the prevailing exchange rates on the respective dates of the transactions.
Net realized and unrealized gains and losses on foreign currency transactions represent net gains and losses between trade and settlement dates on securities transactions, the acquisition and disposition of foreign currencies, and the difference between the amount of net investment income accrued and the U.S. dollar amount actually received. That portion of both realized and unrealized gains and losses on investments that results from fluctuations in foreign currency exchange rates is not separately disclosed but is included with net realized and unrealized gain/appreciation and loss/depreciation on investments.
Securities Lending. Deutsche Bank AG, as lending agent, lends securities of the Fund to certain financial institutions under the terms of the Security Lending Agreement. The Fund retains the benefits of owning the securities it has loaned and continues to receive interest and dividends generated by the securities and to participate in any changes in their market value. The Fund requires the borrowers of the securities to maintain collateral with the Fund consisting of either cash or liquid, unencumbered assets having a value at least equal to the value of the securities loaned. When the collateral falls below specified amounts, the lending agent will use its best efforts to obtain additional collateral on the next business day to meet required amounts under the security lending agreement. The Fund may invest the cash collateral into a joint trading account in an affiliated money market fund pursuant to Exemptive Orders issued by the SEC. The Fund receives compensation for lending its securities either in the form of fees or by earning interest on invested cash collateral net of borrower rebates and fees paid to a lending agent. Either the Fund or the borrower may terminate the loan. There may be risks of delay and costs in recovery of securities or even loss of rights in the collateral should the borrower of the securities fail financially. If the Fund is not able to recover securities lent, the Fund may sell the collateral and purchase a replacement investment in the market, incurring the risk that the value of the replacement security is greater than the value of the collateral. The Fund is also subject to all investment risks associated with the reinvestment of any cash collateral received, including, but not limited to, interest rate, credit and liquidity risk associated with such investments.
As of April 30, 2014, the Fund had securities on loan. The value of the related collateral exceeded the value of the securities loaned at period end.
Taxes. The Fund's policy is to comply with the requirements of the Internal Revenue Code, as amended, which are applicable to regulated investment companies, and to distribute all of its taxable income to its shareholders.
Additionally, the Fund may be subject to taxes imposed by the governments of countries in which it invests and are generally based on income and/or capital gains earned or repatriated. Estimated tax liabilities on certain foreign securities are recorded on an accrual basis and are reflected as components of interest income or net change in unrealized gain/loss on investments. Tax liabilities realized as a result of security sales are reflected as a component of net realized gain/loss on investments.
Under the Regulated Investment Company Modernization Act of 2010, net capital losses incurred post-enactment may be carried forward indefinitely, and their character is retained as short-term and/or long-term. Previously, net capital losses were carried forward for eight years and treated as short-term losses. As a transition rule, the Act requires that post-enactment net capital losses be used before pre-enactment net capital losses.
At October 31, 2013, the Fund had a net tax basis capital loss carryforward of approximately $173,918,000 of pre-enactment losses, which may be applied against any realized net taxable capital gains of each succeeding year until fully utilized or until October 31, 2016 ($36,447,000), October 31, 2017 ($117,464,000) and October 31, 2018 ($20,007,000), the respective expiration dates, whichever occurs first.
The Fund has reviewed the tax positions for the open tax years as of October 31, 2013 and has determined that no provision for income tax and/or uncertain tax provisions is required in the Fund's financial statements. The Fund's federal tax returns for the prior three fiscal years remain open subject to examination by the Internal Revenue Service.
Distribution of Income and Gains. Distributions from net investment income of the Fund are declared and distributed to shareholders quarterly. Net realized gains from investment transactions, in excess of available capital loss carryforwards, would be taxable to the Fund if not distributed, and, therefore, will be distributed to shareholders at least annually. The Fund may also make additional distributions for tax purposes if necessary.
The timing and characterization of certain income and capital gain distributions are determined annually in accordance with federal tax regulations which may differ from accounting principles generally accepted in the United States of America. These differences primarily relate to investments in passive foreign investment companies, investments in foreign denominated investments, recognition of certain foreign currency gains (losses) as ordinary income (loss) and certain securities sold at a loss. As a result, net investment income (loss) and net realized gain (loss) on investment transactions for a reporting period may differ significantly from distributions during such period. Accordingly, the Fund may periodically make reclassifications among certain of its capital accounts without impacting the net asset value of the Fund.
The tax character of current year distributions will be determined at the end of the current fiscal year.
Redemption Fees. The Fund imposes a redemption fee of 2% of the total redemption amount on all Fund shares redeemed or exchanged within 15 days of buying them, either by purchase or exchange. This fee is assessed and retained by the Fund for the benefit of the remaining shareholders. The redemption fee is accounted for as an addition to paid-in capital.
Expenses. Expenses of the Corporation arising in connection with a specific fund are allocated to that fund. Other Corporation expenses which cannot be directly attributed to a fund are apportioned among the funds in the Corporation based upon the relative net assets or other appropriate measures.
Contingencies. In the normal course of business, the Fund may enter into contracts with service providers that contain general indemnification clauses. The Fund's maximum exposure under these arrangements is unknown as this would involve future claims that may be made against the Fund that have not yet been made. However, based on experience, the Fund expects the risk of loss to be remote.
Other. Investment transactions are accounted for on a trade date plus one basis for daily net asset value calculations. However, for financial reporting purposes, investment transactions are reported on trade date. Interest income is recorded on the accrual basis. Dividend income is recorded on the ex-dividend date net of foreign withholding taxes. Certain dividends from foreign securities may be recorded subsequent to the ex-dividend date as soon as the Fund is informed of such dividends. Realized gains and losses from investment transactions are recorded on an identified cost basis. Proceeds from litigation payments, if any, are included in net realized gain (loss) from investments.
B. Purchases and Sales of Securities
During the six months ended April 30, 2014, purchases and sales of investment securities (excluding short-term investments) aggregated $86,545,828 and $66,914,790, respectively.
C. Related Parties
Management Agreement. Under the Investment Management Agreement with Deutsche Investment Management Americas Inc. ("DIMA" or the "Advisor"), an indirect, wholly owned subsidiary of Deutsche Bank AG, the Advisor directs the investments of the Fund in accordance with its investment objectives, policies and restrictions. The Advisor determines the securities, instruments and other contracts relating to investments to be purchased, sold or entered into by the Fund.
Under the Investment Management Agreement with the Advisor, the Fund pays a monthly management fee based on the Fund's average daily net assets, computed and accrued daily and payable monthly, at the following annual rates:
|
First $250 million of the Fund's average daily net assets
|
.665 | % | ||
|
Next $750 million of such net assets
|
.635 | % | ||
|
Next $1.5 billion of such net assets
|
.615 | % | ||
|
Next $2.5 billion of such net assets
|
.595 | % | ||
|
Next $2.5 billion of such net assets
|
.565 | % | ||
|
Next $2.5 billion of such net assets
|
.555 | % | ||
|
Next $2.5 billion of such net assets
|
.545 | % | ||
|
Over $12.5 billion of such net assets
|
.535 | % |
Accordingly, for the six months ended April 30, 2014, the fee pursuant to the Investment Management Agreement was equivalent to an annualized effective rate (exclusive of any applicable waivers/reimbursement) of 0.66% of the Fund's average daily net assets.
For the period from November 1, 2013 through September 30, 2014, the Advisor has contractually agreed to waive its fees and/or reimburse certain operating expenses of the Fund to the extent necessary to maintain the operating expenses (excluding certain expenses such as extraordinary expenses, taxes, brokerage and interest) of each class as follows:
|
Class A
|
1.28%
|
|
Class B
|
2.03%
|
|
Class C
|
2.03%
|
|
Class S
|
1.03%
|
|
Institutional Class
|
1.03%
|
For the six months ended April 30, 2014, fees waived and/or expenses reimbursed for each class are as follows:
|
Class B
|
$ | 332 | ||
|
Class S
|
27,524 | |||
| $ | 27,856 |
Administration Fee. Pursuant to an Administrative Services Agreement, DIMA provides most administrative services to the Fund. For all services provided under the Administrative Services Agreement, the Fund pays the Advisor an annual fee ("Administration Fee") of 0.10% of the Fund's average daily net assets, computed and accrued daily and payable monthly. For the six months ended April 30, 2014, the Administration Fee was $178,046, of which $30,399 is unpaid.
Service Provider Fees. DWS Investments Service Company ("DISC"), an affiliate of the Advisor, is the transfer agent, dividend-paying agent and shareholder service agent of the Fund. Pursuant to a sub-transfer agency agreement between DISC and DST Systems, Inc. ("DST"), DISC has delegated certain transfer agent, dividend-paying agent and shareholder service agent functions to DST. DISC compensates DST out of the shareholder servicing fee it receives from the Fund. For the six months ended April 30, 2014, the amounts charged to the Fund by DISC were as follows:
|
Services to Shareholders
|
Total Aggregated
|
Unpaid at April 30, 2014
|
||||||
|
Class A
|
$ | 23,216 | $ | 8,622 | ||||
|
Class B
|
377 | 140 | ||||||
|
Class C
|
4,309 | 1,457 | ||||||
|
Class S
|
103,782 | 37,499 | ||||||
|
Institutional Class
|
780 | 225 | ||||||
| $ | 132,464 | $ | 47,943 | |||||
Distribution and Service Fees. Under the Fund's Class B and Class C 12b-1 Plans, DWS Investments Distributors, Inc. ("DIDI"), an affiliate of the Advisor, receives a fee ("Distribution Fee") of 0.75% of average daily net assets of each of Class B and C shares. In accordance with the Fund's Underwriting and Distribution Service Agreement, DIDI enters into related selling group agreements with various firms at various rates for sales of Class B and C shares. For the six months ended April 30, 2014, the Distribution Fee was as follows:
|
Distribution Fee
|
Total Aggregated
|
Unpaid at April 30, 2014
|
||||||
|
Class B
|
$ | 421 | $ | 44 | ||||
|
Class C
|
124,052 | 22,499 | ||||||
| $ | 124,473 | $ | 22,543 | |||||
In addition, DIDI provides information and administrative services for a fee ("Service Fee") to Class A, B and C shareholders at an annual rate of up to 0.25% of average daily net assets for each such class. DIDI in turn has various agreements with financial services firms that provide these services and pays these fees based upon the assets of shareholder accounts the firms service. For the six months ended April 30, 2014, the Service Fee was as follows:
|
Service Fee
|
Total Aggregated
|
Unpaid at April 30, 2014
|
Annualized
Rate
|
|||||||||
|
Class A
|
$ | 126,862 | $ | 65,384 | .24 | % | ||||||
|
Class B
|
139 | 50 | .25 | % | ||||||||
|
Class C
|
40,326 | 21,058 | .24 | % | ||||||||
| $ | 167,327 | $ | 86,492 | |||||||||
Underwriting Agreement and Contingent Deferred Sales Charge. DIDI is the principal underwriter for the Fund. Underwriting commissions paid in connection with the distribution of Class A shares for the six months ended April 30, 2014 aggregated $18,370.
In addition, DIDI receives any contingent deferred sales charge ("CDSC") from Class B share redemptions occurring within six years of purchase and Class C share redemptions occurring within one year of purchase. There is no such charge upon redemption of any share appreciation or reinvested dividends. The CDSC is based on declining rates ranging from 4% to 1% for Class B and 1% for Class C, of the value of the shares redeemed. For the six months ended April 30, 2014, the CDSC for Class B and C shares aggregated $365 and $2,109, respectively. A deferred sales charge of up to 1% is assessed on certain redemptions of Class A shares. For the six months ended April 30, 2014, DIDI received $13,523 for Class A shares.
Typesetting and Filing Service Fees. Under an agreement with DIMA, DIMA is compensated for providing typesetting and certain regulatory filing services to the Fund. For the six months ended April 30, 2014, the amount charged to the Fund by DIMA included in the Statement of Operations under "reports to shareholders" aggregated $8,397, of which $6,186 is unpaid.
Directors' Fees and Expenses. The Fund paid retainer fees to each Director not affiliated with the Advisor, plus specified amounts to the Board Chairperson and Vice Chairperson and to each committee Chairperson.
Affiliated Cash Management Vehicles. The Fund may invest uninvested cash balances in Central Cash Management Fund and DWS Variable NAV Money Fund, affiliated money market funds which are managed by the Advisor. Each affiliated money market fund seeks to provide a high level of current income consistent with liquidity and the preservation of capital. Each affiliated money market fund is managed in accordance with Rule 2a-7 under the Investment Company Act of 1940, which governs the quality, maturity, diversity and liquidity of instruments in which a money market fund may invest. Central Cash Management Fund seeks to maintain a stable net asset value, and DWS Variable NAV Money Fund maintains a floating net asset value. The Fund indirectly bears its proportionate share of the expenses of each affiliated money market fund in which it invests. Central Cash Management Fund does not pay the Advisor an investment management fee. To the extent that DWS Variable NAV Money Fund pays an investment management fee to the Advisor, the Advisor will waive an amount of the investment management fee payable to the Advisor by the Fund equal to the amount of the investment management fee payable on the Fund's assets invested in DWS Variable NAV Money Fund.
Security Lending Fees. Deutsche Bank AG serves as lending agent for the Fund. For the six months ended April 30, 2014, the Fund incurred lending agent fees to Deutsche Bank AG in the amount of $5,645.
D. Line of Credit
The Fund and other affiliated funds (the "Participants") share in a $400 million revolving credit facility provided by a syndication of banks. The Fund may borrow for temporary or emergency purposes, including the meeting of redemption requests that otherwise might require the untimely disposition of securities. The Participants are charged an annual commitment fee which is allocated based on net assets, among each of the Participants. Interest is calculated at a rate per annum equal to the sum of the Federal Funds Rate plus 1.25 percent plus if LIBOR exceeds the Federal Funds Rate the amount of such excess. The Fund may borrow up to a maximum of 33 percent of its net assets under the agreement. The Fund had no outstanding loans at April 30, 2014.
E. Share Transactions
The following table summarizes share and dollar activity in the Fund:
|
Six Months Ended April 30, 2014
|
Year Ended October 31, 2013
|
|||||||||||||||
|
Shares
|
Dollars
|
Shares
|
Dollars
|
|||||||||||||
|
Shares sold
|
||||||||||||||||
|
Class A
|
630,407 | $ | 17,801,420 | 959,921 | $ | 24,861,979 | ||||||||||
|
Class B
|
44 | 1,233 | 3,188 | 81,792 | ||||||||||||
|
Class C
|
281,080 | 7,891,776 | 311,731 | 8,137,348 | ||||||||||||
|
Class S
|
725,064 | 20,558,142 | 1,157,715 | 30,462,179 | ||||||||||||
|
Institutional Class
|
128,934 | 3,713,130 | 289,848 | 7,503,419 | ||||||||||||
| $ | 49,965,701 | $ | 71,046,717 | |||||||||||||
|
Shares issued to shareholders in reinvestment of distributions
|
||||||||||||||||
|
Class A
|
22,380 | $ | 632,199 | 95,716 | $ | 2,350,360 | ||||||||||
|
Class B
|
6 | 168 | 89 | 2,125 | ||||||||||||
|
Class C
|
2,788 | 78,290 | 17,208 | 416,171 | ||||||||||||
|
Class S
|
48,472 | 1,370,535 | 192,150 | 4,740,642 | ||||||||||||
|
Institutional Class
|
3,046 | 86,887 | 11,395 | 283,841 | ||||||||||||
| $ | 2,168,079 | $ | 7,793,139 | |||||||||||||
|
Shares redeemed
|
||||||||||||||||
|
Class A
|
(478,931 | ) | $ | (13,509,385 | ) | (1,419,322 | ) | $ | (36,135,699 | ) | ||||||
|
Class B
|
(3,238 | ) | (89,105 | ) | (3,470 | ) | (87,204 | ) | ||||||||
|
Class C
|
(77,373 | ) | (2,174,418 | ) | (255,765 | ) | (6,529,470 | ) | ||||||||
|
Class S
|
(1,055,631 | ) | (29,979,053 | ) | (1,150,555 | ) | (29,336,891 | ) | ||||||||
|
Institutional Class
|
(69,256 | ) | (1,985,376 | ) | (332,825 | ) | (8,649,380 | ) | ||||||||
| $ | (47,737,337 | ) | $ | (80,738,644 | ) | |||||||||||
|
Redemption fees
|
$ | 223 | $ | 801 | ||||||||||||
|
Net increase (decrease)
|
||||||||||||||||
|
Class A
|
173,856 | $ | 4,924,427 | (363,685 | ) | $ | (8,922,594 | ) | ||||||||
|
Class B
|
(3,188 | ) | (87,704 | ) | (193 | ) | (3,274 | ) | ||||||||
|
Class C
|
206,495 | 5,795,661 | 73,174 | 2,024,049 | ||||||||||||
|
Class S
|
(282,095 | ) | (8,050,359 | ) | 199,310 | 5,865,952 | ||||||||||
|
Institutional Class
|
62,724 | 1,814,641 | (31,582 | ) | (862,120 | ) | ||||||||||
| $ | 4,396,666 | $ | (1,897,987 | ) | ||||||||||||
F. Fund Name Change
Effective August 11, 2014, the "DWS Funds" will be rebranded "Deutsche Funds." As a result, DWS World Dividend Fund will be renamed Deutsche World Dividend Fund.
As an investor of the Fund, you incur two types of costs: ongoing expenses and transaction costs. Ongoing expenses include management fees, distribution and service (12b-1) fees and other Fund expenses. Examples of transaction costs include sales charges (loads), redemption fees and account maintenance fees, which are not shown in this section. The following tables are intended to help you understand your ongoing expenses (in dollars) of investing in the Fund and to help you compare these expenses with the ongoing expenses of investing in other mutual funds. In the most recent six-month period, Class B and S shares limited these expenses; had they not done so, expenses would have been higher. The example in the table is based on an investment of $1,000 invested at the beginning of the six-month period and held for the entire period (November 1, 2013 to April 30, 2014).
The tables illustrate your Fund's expenses in two ways:
—Actual Fund Return. This helps you estimate the actual dollar amount of ongoing expenses (but not transaction costs) paid on a $1,000 investment in the Fund using the Fund's actual return during the period. To estimate the expenses you paid over the period, simply divide your account value by $1,000 (for example, an $8,600 account value divided by $1,000 = 8.6), then multiply the result by the number in the "Expenses Paid per $1,000" line under the share class you hold.
—Hypothetical 5% Fund Return. This helps you to compare your Fund's ongoing expenses (but not transaction costs) with those of other mutual funds using the Fund's actual expense ratio and a hypothetical rate of return of 5% per year before expenses. Examples using a 5% hypothetical fund return may be found in the shareholder reports of other mutual funds. The hypothetical account values and expenses may not be used to estimate the actual ending account balance or expenses you paid for the period.
Please note that the expenses shown in these tables are meant to highlight your ongoing expenses only and do not reflect any transaction costs. The "Expenses Paid per $1,000" line of the tables is useful in comparing ongoing expenses only and will not help you determine the relative total expense of owning different funds. Subject to certain exceptions, an account maintenance fee of $20.00 assessed once per calendar year for Classes A, B, C and S shares may apply for accounts with balances less than $10,000. This fee is not included in these tables. If it was, the estimate of expenses paid for Classes A, B, C and S shares during the period would be higher, and account value during the period would be lower, by this amount.
|
Expenses and Value of a $1,000 Investment for the six months ended April 30, 2014 (Unaudited)
|
||||||||||||||||||||
|
Actual Fund Return
|
Class A
|
Class B
|
Class C
|
Class S
|
Institutional Class
|
|||||||||||||||
|
Beginning Account Value 11/1/13
|
$ | 1,000.00 | $ | 1,000.00 | $ | 1,000.00 | $ | 1,000.00 | $ | 1,000.00 | ||||||||||
|
Ending Account Value 4/30/14
|
$ | 1,068.30 | $ | 1,064.20 | $ | 1,064.50 | $ | 1,069.50 | $ | 1,070.00 | ||||||||||
|
Expenses Paid per $1,000*
|
$ | 6.36 | $ | 10.39 | $ | 9.98 | $ | 5.29 | $ | 4.88 | ||||||||||
|
Hypothetical 5% Fund Return
|
Class A
|
Class B
|
Class C
|
Class S
|
Institutional Class
|
|||||||||||||||
|
Beginning Account Value 11/1/13
|
$ | 1,000.00 | $ | 1,000.00 | $ | 1,000.00 | $ | 1,000.00 | $ | 1,000.00 | ||||||||||
|
Ending Account Value 4/30/14
|
$ | 1,018.65 | $ | 1,014.73 | $ | 1,015.12 | $ | 1,019.69 | $ | 1,020.08 | ||||||||||
|
Expenses Paid per $1,000*
|
$ | 6.21 | $ | 10.14 | $ | 9.74 | $ | 5.16 | $ | 4.76 | ||||||||||
* Expenses are equal to the Fund's annualized expense ratio for each share class, multiplied by the average account value over the period, multiplied by 181 (the number of days in the most recent six-month period), then divided by 365.
|
Annualized Expense Ratios
|
Class A
|
Class B
|
Class C
|
Class S
|
Institutional Class
|
|
DWS World Dividend Fund
|
1.24%
|
2.03%
|
1.95%
|
1.03%
|
.95%
|
For more information, please refer to the Fund's prospectus.
For an analysis of the fees associated with an investment in the Fund or similar funds, please refer to http://apps.finra.org/fundanalyzer/1/fa.aspx.
The Board of Directors, including the Independent Directors, approved the renewal of DWS World Dividend Fund's investment management agreement (the "Agreement") with Deutsche Investment Management Americas Inc. ("DIMA") in September 2013.
In terms of the process that the Board followed prior to approving the Agreement, shareholders should know that:
— In September 2013, all of the Fund's Directors were independent of DIMA and its affiliates.
— The Directors met frequently during the past year to discuss fund matters and dedicated a substantial amount of time to contract review matters. Over the course of several months, the Board's Contract Committee, in coordination with the Board's Equity Oversight Committee, reviewed comprehensive materials received from DIMA, independent third parties and independent counsel. These materials included an analysis of the Fund's performance, fees and expenses, and profitability compiled by a fee consultant retained by the Fund's Independent Trustees (the "Fee Consultant"). The Board also received extensive information throughout the year regarding performance of the Fund.
— The Independent Directors regularly meet privately with their independent counsel to discuss contract review and other matters. In addition, the Independent Directors were also advised by the Fee Consultant in the course of their review of the Fund's contractual arrangements and considered a comprehensive report prepared by the Fee Consultant in connection with their deliberations.
— In connection with reviewing the Agreement, the Board also reviewed the terms of the Fund's Rule 12b-1 plan, distribution agreement, administrative services agreement, transfer agency agreement and other material service agreements.
— Based on its evaluation of the information provided, the Contract Committee presented its findings and recommendations to the Board. The Board then reviewed the Contract Committee's findings and recommendations.
In connection with the contract review process, the Contract Committee and the Board considered the factors discussed below, among others. The Board also considered that DIMA and its predecessors have managed the Fund since its inception, and the Board believes that a long-term relationship with a capable, conscientious advisor is in the best interests of the Fund. The Board considered, generally, that shareholders chose to invest or remain invested in the Fund knowing that DIMA managed the Fund, and that the Agreement was approved by the Fund's shareholders. DIMA is part of Deutsche Bank AG, a major global banking institution that is engaged in a wide range of financial services. The Board believes that there are advantages to being part of a global asset management business that offers a wide range of investing expertise and resources, including hundreds of portfolio managers and analysts with research capabilities in many countries throughout the world.
As part of the contract review process, the Board carefully considered the fees and expenses of each DWS fund overseen by the Board in light of the fund's performance. In many cases, this led to a negotiation with DIMA of lower expense caps as part of the 2012 and 2013 contract review processes than had previously been in place. As part of these negotiations, the Board indicated that it would consider relaxing these new lower caps in future years following sustained improvements in performance, among other considerations.
In June 2012, Deutsche Bank AG ("DB"), DIMA's parent company, announced that DB would combine its Asset Management (of which DIMA was a part) and Wealth Management divisions. DB has advised the Independent Trustees that the U.S. asset management business is a critical and integral part of DB, and that it has, and will continue to, reinvest a significant portion of the substantial savings it expects to realize by combining its Asset Management and Wealth Management divisions into the new Asset and Wealth Management ("AWM") division, including ongoing enhancements to its investment capabilities. DB also has confirmed its commitment to maintaining strong legal and compliance groups within the AWM division.
While shareholders may focus primarily on fund performance and fees, the Fund's Board considers these and many other factors, including the quality and integrity of DIMA's personnel and such other issues as back-office operations, fund valuations, and compliance policies and procedures.
Nature, Quality and Extent of Services. The Board considered the terms of the Agreement, including the scope of advisory services provided under the Agreement. The Board noted that, under the Agreement, DIMA provides portfolio management services to the Fund and that, pursuant to a separate administrative services agreement, DIMA provides administrative services to the Fund. The Board considered the experience and skills of senior management and investment personnel, the resources made available to such personnel, the ability of DIMA to attract and retain high-quality personnel, and the organizational depth and stability of DIMA. The Board reviewed the Fund's performance over short-term and long-term periods and compared those returns to various agreed-upon performance measures, including market indices and a peer universe compiled by the Fee Consultant using information supplied by Morningstar Direct ("Morningstar"), an independent fund data service. The Board also noted that it has put into place a process of identifying "Focus Funds" (e.g., funds performing poorly relative to their benchmark or a peer universe compiled by an independent fund data service), and receives more frequent reporting and information from DIMA regarding such funds, along with DIMA's remedial plans to address underperformance. The Board believes this process is an effective manner of identifying and addressing underperforming funds. Based on the information provided, the Board noted that for each of the one-, three- and five-year periods ended December 31, 2012, the Fund's performance (Class A shares) was in the 4th quartile of the applicable Morningstar universe (the 1st quartile being the best performers and the 4th quartile being the worst performers). The Board also observed that the Fund has underperformed its benchmark in each of the one-, three- and five-year periods ended December 31, 2012. The Board noted the disappointing investment performance of the Fund in recent periods and continued to discuss with senior management of DIMA the factors contributing to such underperformance and actions being taken to improve performance. The Board observed that the Fund had experienced improved relative performance during the first seven months of 2013. The Board recognized that DIMA has made changes to its investment personnel and processes in recent years in an effort to enhance its investment platform and improve long-term performance across the DWS fund complex.
Fees and Expenses. The Board considered the Fund's investment management fee schedule, operating expenses and total expense ratios, and comparative information provided by Lipper and the Fee Consultant regarding investment management fee rates paid to other investment advisors by similar funds (1st quartile being the most favorable and 4th quartile being the least favorable). With respect to management fees paid to other investment advisors by similar funds, the Board noted that the contractual fee rates paid by the Fund, which include a 0.10% fee paid to DIMA under the Fund's administrative services agreement, were lower than the median (1st quartile) of the applicable Lipper peer group (based on Lipper data provided as of December 31, 2012). The Board noted that the Fund's Class A shares total (net) operating expenses (excluding 12b-1 fees) were expected to be lower than the median (2nd quartile) of the applicable Lipper expense universe (based on Lipper data provided as of December 31, 2012, and analyzing Lipper expense universe Class A (net) expenses less any applicable 12b-1 fees) ("Lipper Universe Expenses"). The Board also reviewed data comparing each share class's total (net) operating expenses to the applicable Lipper Universe Expenses. The Board considered the Fund's management fee rate as compared to fees charged by DIMA to comparable funds and considered differences between the Fund and the comparable funds. The Board also considered how the Fund's total (net) operating expenses compared to the total (net) operating expenses of a more customized peer group selected by Lipper (based on such factors as asset size).
The Board also noted that the expense limitations agreed to by DIMA helped to ensure that the Fund's total (net) operating expenses would remain competitive.
The information considered by the Board as part of its review of management fees included information regarding fees charged by DIMA and its affiliates to similar institutional accounts and to similar funds offered primarily to European investors ("DWS Europe funds"), in each case as applicable. The Board observed that advisory fee rates for institutional accounts generally were lower than the management fees charged by similarly managed DWS U.S. mutual funds ("DWS Funds"), but also took note of the differences in services provided to DWS Funds as compared to institutional accounts. In the case of DWS Europe funds, the Board observed that fee rates for DWS Europe funds generally were higher than for similarly managed DWS Funds, but noted that differences in the types of services provided to DWS Funds relative to DWS Europe funds made it difficult to compare such fees.
On the basis of the information provided, the Board concluded that management fees were reasonable and appropriate in light of the nature, quality and extent of services provided by DIMA.
Profitability. The Board reviewed detailed information regarding revenues received by DIMA under the Agreement. The Board considered the estimated costs and pre-tax profits realized by DIMA from advising the DWS Funds, as well as estimates of the pre-tax profits attributable to managing the Fund in particular. The Board also received information regarding the estimated enterprise-wide profitability of DWS and its affiliates with respect to all fund services in totality and by fund. The Board and the Fee Consultant reviewed DIMA's methodology in allocating its costs to the management of the Fund. Based on the information provided, the Board concluded that the pre-tax profits realized by DIMA in connection with the management of the Fund were not unreasonable. The Board also reviewed information regarding the profitability of certain similar investment management firms. The Board noted that while information regarding the profitability of such firms is limited (and in some cases is not necessarily prepared on a comparable basis), DIMA and its affiliates' overall profitability with respect to the DWS fund complex (after taking into account distribution and other services provided to the funds by DIMA and its affiliates) was lower than the overall profitability levels of many comparable firms for which such data was available.
Economies of Scale. The Board considered whether there are economies of scale with respect to the management of the Fund and whether the Fund benefits from any economies of scale. The Board noted that the Fund's management fee schedule includes fee breakpoints. The Board concluded that the Fund's fee schedule represents an appropriate sharing between the Fund and DIMA of such economies of scale as may exist in the management of the Fund at current asset levels.
Other Benefits to DIMA and Its Affiliates. The Board also considered the character and amount of other incidental benefits received by DIMA and its affiliates, including any fees received by DIMA for administrative services provided to the Fund and any fees received by an affiliate of DIMA for distribution services. The Board also considered benefits to DIMA related to brokerage and soft-dollar allocations, including allocating brokerage to pay for research generated by parties other than the executing broker dealers, which pertain primarily to funds investing in equity securities, along with the incidental public relations benefits to DIMA related to DWS Funds advertising and cross-selling opportunities among DIMA products and services. The Board concluded that management fees were reasonable in light of these fallout benefits.
Compliance. The Board considered the significant attention and resources dedicated by DIMA to documenting and enhancing its compliance processes in recent years. The Board noted in particular (i) the experience and seniority of both DIMA's chief compliance officer and the Fund's chief compliance officer; (ii) the large number of DIMA compliance personnel; and (iii) the substantial commitment of resources by DIMA and its affiliates to compliance matters.
Based on all of the information considered and the conclusions reached, the Board unanimously determined that the continuation of the Agreement is in the best interests of the Fund. In making this determination, the Board did not give particular weight to any single factor identified above. The Board considered these factors over the course of numerous meetings, certain of which were in executive session with only the Independent Directors and their counsel present. It is possible that individual Directors may have weighed these factors differently in reaching their individual decisions to approve the continuation of the Agreement.
|
For More Information
|
The automated telephone system allows you to access personalized account information and obtain information on other DWS funds using either your voice or your telephone keypad. Certain account types within Classes A, B, C and S also have the ability to purchase, exchange or redeem shares using this system.
For more information, contact your financial advisor. You may also access our automated telephone system or speak with a Shareholder Service representative by calling:
(800) 728-3337
|
|
|
Web Site
|
dws-investments.com
View your account transactions and balances, trade shares, monitor your asset allocation, subscribe to fund and account updates by e-mail, and change your address, 24 hours a day.
Obtain prospectuses and applications, blank forms, interactive worksheets, news about DWS funds, retirement planning information, and more.
|
|
|
Written Correspondence
|
Deutsche Asset & Wealth Management
PO Box 219151
Kansas City, MO 64121-9151
|
|
|
Proxy Voting
|
The fund's policies and procedures for voting proxies for portfolio securities and information about how the fund voted proxies related to its portfolio securities during the 12-month period ended June 30 are available on our Web site — dws-investments.com (click on "proxy voting"at the bottom of the page) — or on the SEC's Web site — sec.gov. To obtain a written copy of the fund's policies and procedures without charge, upon request, call us toll free at (800) 728-3337.
|
|
|
Portfolio Holdings
|
Following the fund's fiscal first and third quarter-end, a complete portfolio holdings listing is filed with the SEC on Form N-Q. This form will be available on the SEC's Web site at sec.gov, and it also may be reviewed and copied at the SEC's Public Reference Room in Washington, D.C. Information on the operation of the SEC's Public Reference Room may be obtained by calling (800) SEC-0330. The fund's portfolio holdings are also posted on dws-investments.com from time to time. Please see the fund's current prospectus for more information.
|
|
|
Principal Underwriter
|
If you have questions, comments or complaints, contact:
DWS Investments Distributors, Inc.
222 South Riverside Plaza
Chicago, IL 60606-5808
(800) 621-1148
|
|
|
Investment Management
|
Deutsche Investment Management Americas Inc. ("DIMA" or the "Advisor"), which is part of Deutsche Asset & Wealth Management, is the investment advisor for the fund. DIMA and its predecessors have more than 80 years of experience managing mutual funds and DIMA provides a full range of investment advisory services to both institutional and retail clients.
DIMA is an indirect, wholly owned subsidiary of Deutsche Bank AG. Deutsche Bank AG is a major global banking institution engaged in a wide variety of financial services, including investment management, retail, private and commercial banking, investment banking and insurance.
Deutsche Asset & Wealth Management is the retail brand name in the U.S. for the wealth management and asset management activities of Deutsche Bank AG and DIMA. Deutsche Asset & Wealth Management is committed to delivering the investing expertise, insight and resources of this global investment platform to American investors.
|
|
|
Class A
|
Class B
|
Class C
|
Class S
|
Institutional Class
|
||
|
Nasdaq Symbol
|
SERAX
|
SERBX
|
SERCX
|
SCGEX
|
SERNX
|
|
|
CUSIP Number
|
23337R 601
|
23337R 700
|
23337R 809
|
23337R 874
|
23337R 866
|
|
|
Fund Number
|
477
|
677
|
777
|
2077
|
1477
|
|
FACTS
|
What Does Deutsche Asset & Wealth Management Do With Your Personal Information?
|
||||
|
Why?
|
Financial companies choose how they share your personal information. Federal law gives consumers the right to limit some but not all sharing. Federal law also requires us to tell you how we collect, share and protect your personal information. Please read this notice carefully to understand what we do.
|
||||
|
What?
|
The types of personal information we collect and share can include:
— Social Security number
— Account balances
— Purchase and transaction history
— Bank account information
— Contact information such as mailing address, e-mail address and telephone number
|
||||
|
How?
|
All financial companies need to share customers' personal information to run their everyday business. In the section below, we list the reasons financial companies can share their customers' personal information, the reasons Deutsche Asset & Wealth Management chooses to share and whether you can limit this sharing.
|
||||
|
Reasons we can share your personal information
|
Does Deutsche Asset & Wealth Management share?
|
Can you limit this sharing?
|
|||
|
For our everyday business purposes — such as to process your transactions, maintain your account(s), respond to court orders or legal investigations
|
Yes
|
No
|
|||
|
For our marketing purposes — to offer our products and services to you
|
Yes
|
No
|
|||
|
For joint marketing with other financial companies
|
No
|
We do not share
|
|||
|
For our affiliates' everyday business purposes — information about your transactions and experiences
|
No
|
We do not share
|
|||
|
For our affiliates' everyday business purposes — information about your creditworthiness
|
No
|
We do not share
|
|||
|
For non-affiliates to market to you
|
No
|
We do not share
|
|||
|
Questions?
|
Call (800) 728-3337 or e-mail us at service@dws.com
|
||||
|
Who we are
|
||||
|
Who is providing this notice?
|
DWS Investments Distributors, Inc.; Deutsche Investment Management Americas Inc.; DeAM Investor Services, Inc.; DWS Trust Company; the DWS Funds
|
|||
|
What we do
|
||||
|
How does Deutsche Asset & Wealth Management protect my personal information?
|
To protect your personal information from unauthorized access and use, we use security measures that comply with federal law. These measures include computer safeguards and secured files and buildings.
|
|||
|
How does Deutsche Asset & Wealth Management collect my personal information?
|
We collect your personal information, for example. When you:
— open an account
— give us your contact information
— provide bank account information for ACH or wire transactions
— tell us where to send money
— seek advice about your investments
|
|||
|
Why can't I limit all sharing?
|
Federal law gives you the right to limit only
— sharing for affiliates' everyday business purposes — information about your creditworthiness
— affiliates from using your information to market to you
— sharing for non-affiliates to market to you
State laws and individual companies may give you additional rights to limit sharing.
|
|||
|
Definitions
|
||||
|
Affiliates
|
Companies related by common ownership or control. They can be financial or non-financial companies. Our affiliates include financial companies with the DWS or Deutsche Bank ("DB") name, such as DB AG Frankfurt and DB Alex Brown.
|
|||
|
Non-affiliates
|
Companies not related by common ownership or control. They can be financial and non-financial companies.
Non-affiliates we share with include account service providers, service quality monitoring services, mailing service providers and verification services to help in the fight against money laundering and fraud.
|
|||
|
Joint marketing
|
A formal agreement between non-affiliated financial companies that together market financial products or services to you. Deutsche Asset & Wealth Management does not jointly market.
|
|||
|
Rev. 09/2013
|
||||
Notes
Notes
Notes
Notes
Notes

|
ITEM 2.
|
CODE OF ETHICS
|
|
|
Not applicable.
|
||
|
ITEM 3.
|
AUDIT COMMITTEE FINANCIAL EXPERT
|
|
|
Not applicable
|
||
|
ITEM 4.
|
PRINCIPAL ACCOUNTANT FEES AND SERVICES
|
|
|
Not applicable
|
||
|
ITEM 5.
|
AUDIT COMMITTEE OF LISTED REGISTRANTS
|
|
|
Not applicable
|
||
|
ITEM 6.
|
SCHEDULE OF INVESTMENTS
|
|
|
Not applicable
|
||
|
ITEM 7.
|
DISCLOSURE OF PROXY VOTING POLICIES AND PROCEDURES FOR CLOSED-END MANAGEMENT INVESTMENT COMPANIES
|
|
|
Not applicable
|
||
|
ITEM 8.
|
PORTFOLIO MANAGERS OF CLOSED-END MANAGEMENT INVESTMENT COMPANIES
|
|
|
Not applicable
|
||
|
ITEM 9.
|
PURCHASES OF EQUITY SECURITIES BY CLOSED-END MANAGEMENT INVESTMENT COMPANY AND AFFILIATED PURCHASERS
|
|
|
Not applicable
|
||
|
ITEM 10.
|
SUBMISSION OF MATTERS TO A VOTE OF SECURITY HOLDERS
|
|
|
There were no material changes to the procedures by which shareholders may recommend nominees to the Fund’s Board. The primary function of the Nominating and Governance Committee is to identify and recommend individuals for membership on the Board and oversee the administration of the Board Governance Guidelines. Shareholders may recommend candidates for Board positions by forwarding their correspondence by U.S. mail or courier service to Kenneth C. Froewiss, Independent Chairman, DWS Mutual Funds, P.O. Box 78, Short Hills, NJ 07078.
|
||
|
ITEM 11.
|
CONTROLS AND PROCEDURES
|
|
|
(a)
|
The Chief Executive and Financial Officers concluded that the Registrant’s Disclosure Controls and Procedures are effective based on the evaluation of the Disclosure Controls and Procedures as of a date within 90 days of the filing date of this report.
|
|
|
(b)
|
There have been no changes in the registrant’s internal control over financial reporting that occurred during the second fiscal quarter of the period covered by this report that has materially affected, or is reasonably likely to materially affect, the registrant’s internal controls over financial reporting.
|
|
|
ITEM 12.
|
EXHIBITS
|
|
|
(a)(1)
|
Not applicable
|
|
|
(a)(2)
|
Certification pursuant to Rule 30a-2(a) under the Investment Company Act of 1940 (17 CFR 270.30a-2(a)) is filed and attached hereto as Exhibit 99.CERT.
|
|
|
(b)
|
Certification pursuant to Rule 30a-2(b) under the Investment Company Act of 1940 (17 CFR 270.30a-2(b)) is furnished and attached hereto as Exhibit 99.906CERT.
|
|
SIGNATURES
Pursuant to the requirements of the Securities Exchange Act of 1934 and the Investment Company Act of 1940, the registrant has duly caused this report to be signed on its behalf by the undersigned, thereunto duly authorized.
|
Registrant:
|
DWS World Dividend Fund, a series of DWS International Fund, Inc.
|
|
By:
|
/s/Brian E. Binder
Brian E. Binder
President
|
|
Date:
|
June 27, 2014
|
Pursuant to the requirements of the Securities Exchange Act of 1934 and the Investment Company Act of 1940, this report has been signed below by the following persons on behalf of the registrant and in the capacities and on the dates indicated.
|
By:
|
/s/Brian E. Binder
Brian E. Binder
President
|
|
Date:
|
June 27, 2014
|
|
By:
|
/s/Paul Schubert
Paul Schubert
Chief Financial Officer and Treasurer
|
|
Date:
|
June 27, 2014
|