UNITED STATES
SECURITIES AND EXCHANGE COMMISSION
WASHINGTON, D. C. 20549
FORM N-CSR
Investment Company Act file number: 811-02021
Deutsche Securities Trust
(Exact Name of Registrant as Specified in Charter)
345 Park Avenue
New York, NY 10154-0004
(Address of Principal Executive Offices) (Zip Code)
Registrant’s Telephone Number, including Area Code: (212) 250-3220
Paul Schubert
60 Wall Street
New York, NY 10005
(Name and Address of Agent for Service)
|
Date of fiscal year end:
|
6/30
|
|
Date of reporting period:
|
6/30/2014
|
|
ITEM 1.
|
REPORT TO STOCKHOLDERS
|

June 30, 2014
Annual Report
to Shareholders
Deutsche Enhanced Commodity Strategy Fund
(formerly DWS Enhanced Commodity Strategy Fund)
Contents
|
3 Letter to Shareholders
4 Portfolio Management Review
12 Performance Summary
14 Consolidated Investment Portfolio
28 Consolidated Statement of Assets and Liabilities
30 Consolidated Statement of Operations
32 Consolidated Statement of Changes in Net Assets
33 Consolidated Financial Highlights
38 Notes to Consolidated Financial Statements
58 Report of Independent Registered Public Accounting Firm
59 Information About Your Fund's Expenses
60 Tax Information
61 Advisory Agreement Board Considerations and Fee Evaluation
66 Board Members and Officers
71 Account Management Resources
|
This report must be preceded or accompanied by a prospectus. To obtain a summary prospectus, if available, or prospectus for any of our funds, refer to the Account Management Resources information provided in the back of this booklet. We advise you to consider the fund's objectives, risks, charges and expenses carefully before investing. The summary prospectus and prospectus contain this and other important information about the fund. Please read the prospectus carefully before you invest.
The fund invests in commodity-linked derivatives which may subject the fund to special risks. Market price movements or regulatory and economic changes will have a significant impact on the fund's performance. Any fund that concentrates in a particular segment of the market will generally be more volatile than a fund that invests more broadly. A counterparty with whom the fund does business may decline in financial health and become unable to honor its commitments, which could cause losses for the fund. Bond investments are subject to interest-rate and credit risks. When interest rates rise, bond prices generally fall. Credit risk refers to the ability of an issuer to make timely payments of principal and interest. Investing in derivatives entails special risks relating to liquidity, leverage and credit that may reduce returns and/or increase volatility. Investing in foreign securities, particularly those of emerging markets, presents certain risks, such as currency fluctuations, political and economic changes, and market risks. The fund may lend securities to approved institutions. See the prospectus for details.
Deutsche Asset & Wealth Management represents the asset management and wealth management activities conducted by Deutsche Bank AG or any of its subsidiaries, including the Advisor and DeAWM Distributors, Inc.
NOT FDIC/NCUA INSURED NO BANK GUARANTEE MAY LOSE VALUE NOT A DEPOSIT NOT INSURED BY ANY FEDERAL GOVERNMENT AGENCY
Dear Shareholder:
I am very pleased to tell you that the DWS funds have been renamed Deutsche funds, aligning more closely with the Deutsche Asset & Wealth Management brand. We are proud to adopt the Deutsche name — a brand that fully represents the global access, discipline and intelligence that support all of our products and services.
Deutsche Asset & Wealth Management combines the asset management and wealth management divisions of Deutsche Bank to deliver a comprehensive suite of active, passive and alternative investment capabilities. Your investment in the Deutsche funds means you have access to the thought leadership and resources of one of the world’s largest and most influential financial institutions.
In conjunction with your fund’s name change, please note that the Deutsche funds’ Web address has changed as well. The former dws-investments.com is now deutschefunds.com.
In addition, key service providers have been renamed as follows:
|
Former Name
|
New name, effective August 11, 2014
|
|
DWS Investments Distributors, Inc.
|
DeAWM Distributors, Inc.
|
|
DWS Trust Company
|
DeAWM Trust Company
|
|
DWS Investments Service Company
|
DeAWM Service Company
|
These changes have no effect on the day-to-day management of your investment, and there is no action required on your part. You will continue to experience the benefits that come from our decades of experience, in-depth research and worldwide network of investment professionals.
Thanks for your continued support. We appreciate your trust and the opportunity to put our capabilities to work for you.
Best regards,


Brian Binder
President, Deutsche Funds
Market Overview and Fund Performance
All performance information below is historical and does not guarantee future results. Returns shown are for Class A shares, unadjusted for sales charges. Investment return and principal fluctuate, so your shares may be worth more or less when redeemed. Current performance may differ from performance data shown. Please visit deutschefunds.com for the most recent month-end performance of all share classes. Fund performance includes reinvestment of all distributions. Unadjusted returns do not reflect sales charges and would have been lower if they had. Please refer to pages 12 through 13 for more complete performance information.
|
Investment Strategy
The fund invests in commodity-linked derivative instruments (a contract whose value is based on a particular commodity), such as commodity-linked swap contracts, commodity-linked structured notes, options and futures contracts, to gain exposure to the investment return of assets that trade in the commodity markets, without investing directly in physical commodities. Physical commodities are assets that have tangible properties, such as gas, heating oil, industrial and other precious metals, livestock or agricultural products.
With respect to the fund’s fixed-income investments, portfolio management seeks to construct a diversified, balanced portfolio of U.S. and non-U.S. fixed-income securities in the government, government agency and corporate sectors. Management normally targets a dollar-weighted average portfolio duration of three years or less. Please see the fund’s prospectus for a complete description of the commodity-linked derivative and other securities in which the fund invests, including a variety of fixed-income securities.
|
While the fund delivered a positive absolute return, it did not fully participate in the rally in commodity prices. The Class A shares of the fund returned 6.20% during the 12 months ended June 30, 2014, underperforming the benchmark. On a longer-term basis, however, the fund continues to compare favorably with the five-year average return for the funds in its Morningstar peer group, Commodities Broad Basket Funds. The fund has delivered an average annual return of 3.58% in this time, outpacing the 2.38% peer group average.
The global commodity markets returned 8.21% during the 12-month period ended June 30, 2014, as measured by the fund’s benchmark, the Bloomberg Commodity Index (formerly known as Dow Jones-UBS Commodity Index). While the end result was positive, the path the markets took to achieve this return was anything but steady. During the first half of the period, commodities came under pressure on concerns that slow global growth would keep a lid on demand. Investors were particularly worried about the outlook for China — the most important source of incremental demand for commodities — and the potential for the country’s economy to experience a "hard landing."
These worries persisted through the early weeks of 2014, but commodities began to rally in February behind a thawing outlook for global growth. Investors grew more optimistic about the longer-term outlook for the U.S., European and Chinese economies, and persistent concerns about the potential for deflation began to abate. These developments led to an improved demand outlook for commodities, causing prices to rally. Additionally, the conflicts in Ukraine and the Middle East boosted energy prices by sparking concerns about potential supply disruptions. Central bank policies also played a part in the rally, as the pro-inflationary strategies of the European Central Bank and the Bank of Japan more than offset concerns about the impact of the U.S. Federal Reserve Board’s (the Fed's) decision to taper its quantitative easing policy. Taken together, these factors propelled the commodity markets to a mid-single-digit gain for the year.
Fund Performance
The fund gains exposure to commodities using commodity-linked swaps and futures, and the remaining portion of the portfolio is invested in a fixed-income strategy. The fund has employed this approach since March 31, 2010. The fund’s approach consists of a tactical element, a relative value strategy and a "roll enhancement" strategy. The roll enhancement strategy made the largest positive contribution to performance during the past year, and the relative value strategy added slightly. However, these positives were offset by the underperformance of our tactical strategy.
Roll enhancement strategy: Commodity investing entails purchasing a contract to buy or sell a specific commodity on a specific date. Since the fund does not want to take physical delivery of the underlying commodity contracts, we "roll" the contracts (i.e., sell one contract and purchase another) on a regular basis. Our roll enhancement strategy seeks to roll into contracts that maximize the fund’s return potential.
This aspect of our strategy was very helpful to performance during the year, given that longer-dated contracts typically outperformed — and did so with a lower-degree of price volatility — than their shorter-dated counterparts. We believe this illustrates the value of being able to invest anywhere on the commodity "curve," rather investing only in short-dated contracts. Further, our use of this strategy means that the fund doesn’t have to incur the cost of perpetually rolling out of the front-month contract and paying the typical premium to move into the next contract.
Relative value strategy: Our relative value strategy actively overweights or underweights each of the most liquid commodities depending on how "cheap" or "expensive" each commodity appears from a quantitative perspective. This portion of our strategy is based on the principle that commodity prices tend to "mean revert" over time. If the short-term, one-year moving average price of a commodity is above its long-term, five-year moving average price, we may underweight the commodity; if the short-term moving average price is below the long-term moving average price, we may overweight the commodity.

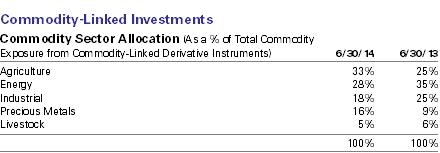
The relative value strategy was modestly helpful to the fund’s 12-month results. While the fund’s positions fluctuate in response to market conditions, performance in general was helped by our average overweights to base metals and agricultural commodities. However, this was offset by our average underweight to energy.
Tactical strategy: This strategy allows us to shift the fund’s effective weighting to the broader commodity market from a low of 50% to a high of 100%. Quantitative momentum models determine the investment level of the portfolio. When the momentum trend in the market is stable or rising, we may maintain or increase the fund’s overall exposure to commodities. When the momentum trend in the market is negative and falling, we may reduce the fund’s overall exposure to commodities.
The goal of this strategy is to help mitigate downside risk, and it has succeeded in this regard during the four-plus years we have managed the fund. In addition, it worked well for the majority of the annual period. However, the fund came into the first calendar quarter with an exposure near the low end of the range. When the market quickly shifted direction to the upside in February, the fund did not fully participate in the rally. The resulting shortfall was the primary factor in the fund’s underperformance for the full year.

"As always, we remain focused on capturing commodities’ upside potential while striving to manage the impact of downside volatility."
Another aspect of our strategy is that we periodically take opportunistic positions that are driven by specific market events. For instance, we added exposure to coffee and sugar during the first calendar quarter, and we were active in shifting the portfolio’s metals exposure between copper and aluminum throughout the year. We also increased the underweight position in energy to a neutral weight late in the period. At a time of constrained global supplies, we saw above-average potential for headlines — especially from the Middle East — to lead to spikes in the oil price. Accordingly, we boosted exposure to this area to mitigate the potential risks of unforeseen developments. On balance, these opportunistic moves added to performance during the past year.
In the fund’s fixed-income portfolio, we emphasize short-term, higher-quality bonds to manage volatility and interest-rate risk, but we also take on a modest degree of credit risk to capture excess yield. This approach worked well during the past the year, adding to relative performance.

Outlook and Fund Positioning
We hold a cautiously optimistic outlook with regard to commodities as we move into the second half of the year. The possible risks from headlines related to the Middle East — and to a lesser extent, Russia — continue to support the outlook for oil prices at a time of constrained supplies. The economic outlook also remains generally positive, with the United States on track for growth above 2% and Europe continuing to emerge from its long recession. Even more important is the stabilization in China’s growth outlook, together with the growing possibility that the government will take steps to loosen credit conditions. In turn, this would fuel stronger economic activity and lead to rising demand for commodities. Global central bank policy is also providing a tailwind to commodity prices. While the United States is gradually tightening policy, Europe and Japan are both easing and have explicitly stated that their goal is to increase inflation from current levels. We believe these pro-inflationary policies can provide a key element of support to commodity prices for an extended period of time. As always, we remain focused on capturing commodities’ upside potential while striving to manage the impact of downside volatility.
Portfolio Management Team
William Chepolis, CFA, Managing Director
Portfolio Manager of the fund. Began managing the fund in 2010.
— Joined Deutsche Asset & Wealth Management in 1998 after 13 years of experience as vice president and portfolio manager for Norwest Bank where he managed the bank's fixed income and foreign exchange portfolios.
— Portfolio Manager for Retail Fixed Income: New York.
— BIS, University of Minnesota.
Eric S. Meyer, CFA, Managing Director
Portfolio Manager of the fund. Began managing the fund in 2010.
— Joined Deutsche Asset & Wealth Management in 2006 after 16 years of experience in positions of increasing responsibility in corporate banking with First Chicago, Credit Agricole, and most recently, Bank of America's subsidiary, Flagship Capital Management. Prior to his corporate banking experience, he worked in trust management operations for 10 years at First Chicago and E.F. Hutton.
— Head of US Loan Portfolio Management, High Yield Strategies: New York.
— BA, State University of New York, Albany; MBA, Pace University.
John D. Ryan, Director
Portfolio Manager of the fund. Began managing the fund in 2010.
— Joined Deutsche Asset & Wealth Management in 2010 from Northern Trust where he served as a senior portfolio manager. Previously, he served as a portfolio manager and head of credit trading for Deutsche Asset Management from 1998–2003.
— Over 19 years of investment industry experience.
— BA in Economics, University of Chicago; MBA, University of Chicago.
Darwei Kung, Director
Portfolio Manager of the fund. Began managing the fund in 2010.
— Joined Deutsche Asset & Wealth Management in 2006; previously has worked as a Director, Engineering and Business Development at Calpoint LLC from 2001–2004.
— Portfolio Manager: New York.
— BS and MS, University of Washington, Seattle; MS and MBA, Carnegie Mellon University.
Steven Zhou, Assistant Vice President
Portfolio Manager of the fund. Began managing the fund in 2011.
— Joined Deutsche Asset & Wealth Management in 2010 with over two years of experience at J.P. Morgan Chase and Freddie Mac. Held summer internship positions at Deutsche Asset Management and AFL-CIO Housing Investment Trust.
— Analyst for Mortgage Backed Securities: New York.
— MS in Computational Finance, Carnegie Mellon University; BA in Economics and BS in Computer Science, University of Maryland, College Park.
The views expressed reflect those of the portfolio management team only through the end of the period of the report as stated on the cover. The management team's views are subject to change at any time based on market and other conditions and should not be construed as a recommendation. Past performance is no guarantee of future results. Current and future portfolio holdings are subject to risk.
Terms to Know
Derivatives are contracts whose values can be based on a variety of instruments, including indices, currencies or securities. They can be utilized for a variety of reasons, including for hedging purposes, for risk management; for non-hedging purposes to seek to enhance potential gains, or as a substitute for direct investment in a particular asset class or to keep cash on hand to meet shareholder redemptions. Investing in derivatives entails special risks relating to liquidity, leverage and credit that may reduce returns and/or increase volatility.
A swap is an exchange of cash flows that are dependent on the price of an underlying commodity.
A structured note is a hybrid security whose return typically tracks the performance of an underlying debt obligation and a derivative that is embedded within it. The characteristics of the underlying debt obligation and derivative embedded within it adjust the securities risk/return profile.
Options are financial derivatives that offer the right, but not the obligation, to buy or sell a security or financial asset at an agreed-upon price and during a certain period of time or on a specific date.
Futures contracts are contractual agreements to buy or sell a particular commodity or financial instrument at a pre-determined price in the future.
The unmanaged Bloomberg Commodity Index (formerly known as Dow Jones UBS Commodity Index) tracks a diversified group of commodities and commodities futures contracts traded on both U.S. and London exchanges. Index returns do not reflect fees or expenses and it is not possible to invest directly into an index.
The Morningstar Commodities Broad Basket Funds category consists of funds that invest in a diversified basket of commodity goods, including but not limited to, grains, minerals, metals, livestock, cotton, oils, sugar, coffee and cocoa. These funds may invest directly in physical assets or commodity-linked derivative instruments, such as commodity swap agreements.
Overweight means the fund holds a higher weighting in a given sector, security, or commodity than the benchmark. Underweight means the fund holds a lower weighting.
Mean reversion is a theory that prices and returns eventually move back toward the mean, or average.
Credit quality is a measure of a bond issuer’s ability to repay interest and principal in a timely manner. Rating agencies assign letter designations, such as AAA, AA and so forth. The lower the rating, the higher the probability of default.
|
Class A
|
1-Year
|
5-Year
|
Life of Fund*
|
|
Average Annual Total Returns as of 6/30/14
|
|||
|
Unadjusted for Sales Charge
|
6.20%
|
3.58%
|
1.43%
|
|
Adjusted for the Maximum Sales Charge (max 5.75% load)
|
0.10%
|
2.36%
|
0.79%
|
|
Bloomberg Commodity Index†
|
8.21%
|
1.99%
|
-0.12%
|
|
Class B
|
1-Year
|
5-Year
|
Life of Fund*
|
|
Average Annual Total Returns as of 6/30/14
|
|||
|
Unadjusted for Sales Charge
|
5.47%
|
2.76%
|
0.63%
|
|
Adjusted for the Maximum Sales Charge (max 4.00% CDSC)
|
2.47%
|
2.58%
|
0.63%
|
|
Bloomberg Commodity Index†
|
8.21%
|
1.99%
|
–0.12%
|
|
Class C
|
1-Year
|
5-Year
|
Life of Fund*
|
|
Average Annual Total Returns as of 6/30/14
|
|||
|
Unadjusted for Sales Charge
|
5.31%
|
2.83%
|
0.66%
|
|
Adjusted for the Maximum Sales Charge (max 1.00% CDSC)
|
5.31%
|
2.83%
|
0.66%
|
|
Bloomberg Commodity Index†
|
8.21%
|
1.99%
|
–0.12%
|
|
Class S
|
1-Year
|
5-Year
|
Life of Fund*
|
|
Average Annual Total Returns as of 6/30/14
|
|||
|
No Sales Charges
|
6.46%
|
3.83%
|
1.61%
|
|
Bloomberg Commodity Index†
|
8.21%
|
1.99%
|
–0.12%
|
|
Institutional Class
|
1-Year
|
5-Year
|
Life of Fund*
|
|
Average Annual Total Returns as of 6/30/14
|
|||
|
No Sales Charges
|
6.48%
|
3.97%
|
1.72%
|
|
Bloomberg Commodity Index†
|
8.21%
|
1.99%
|
–0.12%
|
Performance in the Average Annual Total Returns table above and the Growth of an Assumed $10,000 Investment line graph that follows is historical and does not guarantee future results. Investment return and principal fluctuate, so your shares may be worth more or less when redeemed. Current performance may differ from performance data shown. Please visit deutschefunds.com for the Fund's most recent month-end performance. Fund performance includes reinvestment of all distributions. Unadjusted returns do not reflect sales charges and would have been lower if they had.
The gross expense ratios of the Fund, as stated in the fee table of the prospectus dated October 1, 2013 are 1.46%, 2.37%, 2.26%, 1.29% and 1.14% for Class A, Class B, Class C, Class S and Institutional Class shares, respectively, and may differ from the expense ratios disclosed in the Financial Highlights tables in this report.
The Fund may charge a 2% fee for redemptions of shares held less than 15 days.
Index returns do not reflect any fees or expenses and it is not possible to invest directly into an index.
Performance figures do not reflect the deduction of taxes that a shareholder would pay on fund distributions or the redemption of fund shares.
|
Growth of an Assumed $10,000 Investment (Adjusted for Maximum Sales Charge)
|
 |
 |
|
Yearly periods ended June 30
|
The Fund's growth of an assumed $10,000 investment is adjusted for the maximum sales charge of 5.75%. This results in a net initial investment of $9,425.
The growth of $10,000 is cumulative.
Performance of other share classes will vary based on the sales charges and the fee structure of those classes.
* The Fund commenced operations on February 14, 2005. The performance shown for the index is for the time period of February 28, 2005 through June 30, 2014, which is based on the performance period of the life of the Fund.
† The unmanaged Bloomberg Commodity Index (formerly known as Dow Jones UBS Commodity Index) tracks a diversified group of commodities and commodities futures contracts traded on both U.S. and London exchanges.
|
Class A
|
Class B
|
Class C
|
Class S
|
Institutional Class
|
||||||||||||||||
|
Net Asset Value
|
||||||||||||||||||||
|
6/30/14
|
$ | 15.86 | $ | 14.45 | $ | 14.48 | $ | 16.05 | $ | 16.10 | ||||||||||
|
6/30/13 (a)
|
$ | 14.95 | $ | 13.70 | $ | 13.75 | $ | 15.10 | $ | 15.15 | ||||||||||
|
Distribution Information as of 6/30/14
|
||||||||||||||||||||
|
Twelve Months: Income Dividends
|
$ | .02 | $ | — | $ | — | $ | .03 | $ | .03 | ||||||||||
(a) Net asset value has been updated to reflect the effects of a reverse stock split effective December 6, 2013. (See Note I in Notes to Consolidated Financial Statements.)
as of June 30, 2014
|
Principal Amount ($)
|
Value ($)
|
|||||||
|
Corporate Bonds 29.9%
|
||||||||
|
Consumer Discretionary 3.1%
|
||||||||
|
21st Century Fox America, Inc., 7.6%, 10/11/2015
|
2,000,000 | 2,157,038 | ||||||
|
Amazon.com, Inc., 1.2%, 11/29/2017
|
2,490,000 | 2,475,003 | ||||||
|
Carnival Corp., 1.875%, 12/15/2017
|
1,690,000 | 1,699,775 | ||||||
|
DIRECTV Holdings LLC, 2.4%, 3/15/2017
|
2,000,000 | 2,059,696 | ||||||
|
Ford Motor Credit Co., LLC, 3.984%, 6/15/2016
|
4,000,000 | 4,226,688 | ||||||
|
Hyundai Capital America, 144A, 3.75%, 4/6/2016
|
3,000,000 | 3,139,680 | ||||||
|
Kia Motors Corp., 144A, 3.625%, 6/14/2016
|
1,400,000 | 1,465,943 | ||||||
|
Myriad International Holdings BV, 144A, 6.375%, 7/28/2017
|
1,500,000 | 1,650,000 | ||||||
|
Nissan Motor Acceptance Corp., 144A, 1.8%, 3/15/2018
|
1,240,000 | 1,240,445 | ||||||
|
Time Warner Cable, Inc., 5.85%, 5/1/2017
|
2,500,000 | 2,811,672 | ||||||
| 22,925,940 | ||||||||
|
Consumer Staples 0.5%
|
||||||||
|
ConAgra Foods, Inc., 2.1%, 3/15/2018
|
475,000 | 476,518 | ||||||
|
Safeway, Inc., 3.4%, 12/1/2016
|
2,000,000 | 2,104,638 | ||||||
|
Wesfarmers Ltd., 144A, 1.874%, 3/20/2018
|
1,500,000 | 1,499,145 | ||||||
| 4,080,301 | ||||||||
|
Energy 3.3%
|
||||||||
|
Delek & Avner Tamar Bond Ltd., 144A, 3.839%, 12/30/2018
|
3,000,000 | 3,010,695 | ||||||
|
KazMunayGas National Co. JSC, Series 2, 144A, 9.125%, 7/2/2018
|
3,000,000 | 3,614,550 | ||||||
|
Kinder Morgan Energy Partners LP, 3.5%, 3/1/2016
|
1,700,000 | 1,770,101 | ||||||
|
Odebrecht Drilling Norbe VIII/IX Ltd., 144A, 6.35%, 6/30/2021
|
2,625,000 | 2,821,875 | ||||||
|
Petrobras International Finance Co., 3.875%, 1/27/2016
|
2,710,000 | 2,794,145 | ||||||
|
Petroleos Mexicanos, 3.5%, 7/18/2018
|
3,000,000 | 3,153,000 | ||||||
|
QGOG Atlantic, 144A, 5.25%, 7/30/2019
|
606,800 | 633,348 | ||||||
|
Rosneft Finance SA, Series 6, 144A, 7.875%, 3/13/2018
|
3,000,000 | 3,423,750 | ||||||
|
Transocean, Inc., 4.95%, 11/15/2015
|
3,060,000 | 3,226,348 | ||||||
| 24,447,812 | ||||||||
|
Financials 14.5%
|
||||||||
|
American Express Credit Corp., Series D, 5.125%, 8/25/2014
|
3,000,000 | 3,021,384 | ||||||
|
Asian Development Bank, 1.125%, 3/15/2017
|
2,000,000 | 2,015,924 | ||||||
|
Australia & New Zealand Banking Group Ltd., 144A, 1.0%, 10/6/2015
|
3,335,000 | 3,358,278 | ||||||
|
Banco Continental SA, 144A, 5.75%, 1/18/2017
|
2,700,000 | 2,943,000 | ||||||
|
Banco Nacional de Costa Rica, 144A, 4.875%, 11/1/2018
|
1,000,000 | 1,025,000 | ||||||
|
Bangkok Bank PCL, 144A, 3.3%, 10/3/2018
|
2,000,000 | 2,034,672 | ||||||
|
Bank of America Corp., 2.6%, 1/15/2019
|
2,115,000 | 2,139,879 | ||||||
|
Bank of Baroda, 144A, 4.875%, 7/23/2019
|
3,000,000 | 3,163,731 | ||||||
|
Bank of India, 144A, 3.625%, 9/21/2018
|
2,000,000 | 2,014,860 | ||||||
|
Bank of Nova Scotia, 144A, 1.95%, 1/30/2017
|
5,660,000 | 5,805,773 | ||||||
|
Banque Federative du Credit Mutuel SA, 144A, 2.75%, 1/22/2019
|
4,000,000 | 4,094,900 | ||||||
|
BBVA U.S. Senior SAU, 4.664%, 10/9/2015
|
3,160,000 | 3,303,821 | ||||||
|
BNP Paribas SA, 2.375%, 9/14/2017
|
1,475,000 | 1,510,402 | ||||||
|
BPCE SA, 1.625%, 2/10/2017
|
1,500,000 | 1,511,040 | ||||||
|
Capital One Bank U.S.A. NA, 2.25%, 2/13/2019
|
590,000 | 593,745 | ||||||
|
Citigroup, Inc., 2.65%, 3/2/2015
|
2,275,000 | 2,307,371 | ||||||
|
Commonwealth Bank of Australia, 144A, 1.484%*, 3/31/2017
|
6,000,000 | 6,016,116 | ||||||
|
Cooperatieve Centrale Raiffeisen-Boerenleenbank BA, 1.7%, 3/19/2018
|
1,865,000 | 1,871,035 | ||||||
|
Credit Agricole SA, 144A, 2.125%, 4/17/2018
|
3,000,000 | 3,026,778 | ||||||
|
Development Bank of Kazakhstan JSC, 144A, 5.5%, 12/20/2015
|
4,000,000 | 4,160,000 | ||||||
|
Grupo Aval Ltd., 144A, 5.25%, 2/1/2017
|
1,000,000 | 1,065,000 | ||||||
|
Health Care REIT, Inc., (REIT), 3.625%, 3/15/2016
|
1,898,000 | 1,983,797 | ||||||
|
Hyundai Capital Services, Inc., 144A, 1.031%*, 3/18/2017
|
2,815,000 | 2,823,248 | ||||||
|
Intercontinental Exchange, Inc., 2.5%, 10/15/2018
|
790,000 | 808,110 | ||||||
|
Intesa Sanpaolo SpA:
|
||||||||
|
3.875%, 1/16/2018
|
1,790,000 | 1,886,547 | ||||||
|
3.875%, 1/15/2019
|
1,770,000 | 1,856,240 | ||||||
|
Jefferies Group LLC, 5.125%, 4/13/2018
|
2,500,000 | 2,739,058 | ||||||
|
Lloyds Bank PLC, 2.3%, 11/27/2018
|
750,000 | 761,487 | ||||||
|
Macquarie Group Ltd., 144A, 3.0%, 12/3/2018
|
4,000,000 | 4,103,240 | ||||||
|
Morgan Stanley, 3.8%, 4/29/2016
|
2,500,000 | 2,624,818 | ||||||
|
Navient Corp., 3.875%, 9/10/2015
|
900,000 | 918,000 | ||||||
|
Nomura Holdings, Inc., 2.0%, 9/13/2016
|
2,220,000 | 2,256,230 | ||||||
|
QBE Insurance Group Ltd., 144A, 2.4%, 5/1/2018
|
1,030,000 | 1,028,299 | ||||||
|
Skandinaviska Enskilda Banken AB:
|
||||||||
|
144A, 1.75%, 3/19/2018
|
1,745,000 | 1,743,081 | ||||||
|
144A, 2.375%, 11/20/2018
|
1,020,000 | 1,035,106 | ||||||
|
Sumitomo Mitsui Banking Corp., 2.5%, 7/19/2018
|
715,000 | 731,080 | ||||||
|
Suncorp-Metway Ltd., 144A, 1.7%, 3/28/2017
|
4,500,000 | 4,569,651 | ||||||
|
Swedbank AB, 144A, 1.75%, 3/12/2018
|
2,500,000 | 2,496,540 | ||||||
|
Turkiye Garanti Bankasi AS, 144A, 4.75%, 10/17/2019
|
3,000,000 | 3,022,500 | ||||||
|
Turkiye Halk Bankasi AS, 144A, 4.75%, 6/4/2019
|
2,000,000 | 2,002,098 | ||||||
|
Turkiye Vakiflar Bankasi Tao:
|
||||||||
|
144A, 3.75%, 4/15/2018
|
1,000,000 | 976,000 | ||||||
|
144A, 5.0%, 10/31/2018
|
1,000,000 | 1,018,500 | ||||||
|
UBS AG, 144A, 2.25%, 3/30/2017
|
3,335,000 | 3,434,066 | ||||||
|
Woori Bank Co., Ltd., 144A, 2.875%, 10/2/2018
|
3,000,000 | 3,068,139 | ||||||
|
Yapi ve Kredi Bankasi AS, 144A, 5.25%, 12/3/2018
|
2,000,000 | 2,046,000 | ||||||
| 106,914,544 | ||||||||
|
Health Care 1.1%
|
||||||||
|
AbbVie, Inc., 1.75%, 11/6/2017
|
3,390,000 | 3,408,489 | ||||||
|
Actavis, Inc., 1.875%, 10/1/2017
|
750,000 | 756,689 | ||||||
|
Laboratory Corp. of America Holdings, 2.2%, 8/23/2017
|
1,885,000 | 1,918,802 | ||||||
|
Mallinckrodt International Finance SA, 3.5%, 4/15/2018
|
430,000 | 427,850 | ||||||
|
Mylan, Inc., 2.55%, 3/28/2019
|
1,340,000 | 1,349,821 | ||||||
| 7,861,651 | ||||||||
|
Industrials 0.5%
|
||||||||
|
Ingersoll-Rand Global Holding Co., Ltd., 2.875%, 1/15/2019
|
500,000 | 512,539 | ||||||
|
Mersin Uluslararasi Liman Isletmeciligi AS, 144A, 5.875%, 8/12/2020
|
2,000,000 | 2,113,800 | ||||||
|
Total System Services, Inc., 2.375%, 6/1/2018
|
840,000 | 840,470 | ||||||
| 3,466,809 | ||||||||
|
Information Technology 1.6%
|
||||||||
|
Arrow Electronics, Inc., 3.0%, 3/1/2018
|
3,000,000 | 3,101,700 | ||||||
|
Seagate HDD Cayman, 144A, 3.75%, 11/15/2018
|
500,000 | 511,250 | ||||||
|
Tencent Holdings Ltd.:
|
||||||||
|
144A, 3.375%, 3/5/2018
|
3,000,000 | 3,102,774 | ||||||
|
144A, 3.375%, 5/2/2019
|
2,000,000 | 2,044,742 | ||||||
|
Xerox Corp., 6.4%, 3/15/2016
|
3,000,000 | 3,277,101 | ||||||
| 12,037,567 | ||||||||
|
Materials 3.0%
|
||||||||
|
Airgas, Inc., 2.95%, 6/15/2016
|
1,830,000 | 1,896,506 | ||||||
|
Anglo American Capital PLC, 144A, 2.625%, 9/27/2017
|
2,180,000 | 2,235,154 | ||||||
|
Celulosa Arauco y Constitucion SA, 7.25%, 7/29/2019
|
2,500,000 | 2,930,835 | ||||||
|
CF Industries, Inc., 6.875%, 5/1/2018
|
2,000,000 | 2,351,424 | ||||||
|
Freeport-McMoRan Copper & Gold, Inc., 2.375%, 3/15/2018
|
1,455,000 | 1,476,690 | ||||||
|
Glencore Finance Canada Ltd., 144A, 2.7%, 10/25/2017
|
2,400,000 | 2,463,511 | ||||||
|
Glencore Funding LLC, 144A, 2.5%, 1/15/2019
|
1,660,000 | 1,655,775 | ||||||
|
Goldcorp, Inc., 2.125%, 3/15/2018
|
1,490,000 | 1,494,494 | ||||||
|
Inversiones CMPC SA, 144A, 6.125%, 11/5/2019
|
2,000,000 | 2,249,662 | ||||||
|
Rio Tinto Finance (U.S.A.) PLC, 2.25%, 12/14/2018
|
1,720,000 | 1,753,299 | ||||||
|
Teck Resources Ltd., 3.0%, 3/1/2019
|
1,760,000 | 1,797,335 | ||||||
| 22,304,685 | ||||||||
|
Telecommunication Services 1.1%
|
||||||||
|
CC Holdings GS V LLC, 2.381%, 12/15/2017
|
1,000,000 | 1,018,350 | ||||||
|
GTP Acquisition Partners I LLC, "C", 144A, 4.347%, 6/15/2016
|
3,530,000 | 3,650,867 | ||||||
|
Telefonica Emisiones SAU, 3.192%, 4/27/2018
|
1,340,000 | 1,400,400 | ||||||
|
Verizon Communications, Inc., 3.65%, 9/14/2018
|
1,960,000 | 2,096,183 | ||||||
| 8,165,800 | ||||||||
|
Utilities 1.2%
|
||||||||
|
Centrais Eletricas Brasileiras SA, 144A, 6.875%, 7/30/2019
|
2,000,000 | 2,220,000 | ||||||
|
FirstEnergy Corp., Series A, 2.75%, 3/15/2018
|
2,025,000 | 2,049,233 | ||||||
|
PPL Energy Supply LLC, 5.4%, 8/15/2014
|
4,450,000 | 4,466,173 | ||||||
| 8,735,406 | ||||||||
|
Total Corporate Bonds (Cost $216,770,637)
|
220,940,515 | |||||||
|
Mortgage-Backed Securities Pass-Throughs 4.2%
|
||||||||
|
Federal National Mortgage Association, 3.0%, with various maturities from 5/1/2027 until 6/1/2027 (Cost $31,110,379)
|
29,475,626 | 30,668,857 | ||||||
|
Asset-Backed 5.4%
|
||||||||
|
Automobile Receivables 0.9%
|
||||||||
|
AmeriCredit Automobile Receivables Trust:
|
||||||||
|
"D", Series 2012-5, 2.35%, 12/10/2018
|
5,000,000 | 5,080,430 | ||||||
|
"D", Series 2011-2, 4.0%, 5/8/2017
|
1,280,000 | 1,316,294 | ||||||
| 6,396,724 | ||||||||
|
Credit Card Receivables 0.3%
|
||||||||
|
Citi Holdings Liquidating Unrated Performing Assets, "A", Series 2013-VM, 144A, 3.326%, 8/15/2020
|
2,465,367 | 2,477,274 | ||||||
|
Home Equity Loans 0.1%
|
||||||||
|
PennyMac Loan Trust, "A", Series 2012-NPL1, 144A, 3.422%, 5/28/2052
|
414,905 | 413,900 | ||||||
|
Miscellaneous 4.1%
|
||||||||
|
A Voce CLO Ltd., "A1B", Series 2014-1A, 144A, Zero Coupon, 7/15/2026
|
1,690,000 | 1,687,888 | ||||||
|
Dryden XXXI Senior Loan Fund, "B", Series 2014-31A, 144A, 2.17%, 4/18/2026
|
1,000,000 | 993,820 | ||||||
|
Madison Park Funding XII Ltd., "A", Series 2014-12A, 144A, 1.682%*, 7/20/2026
|
5,000,000 | 5,007,985 | ||||||
|
Magnetite VI Ltd., "A", Series 2012-6A, 144A, 1.731%*, 9/15/2023
|
1,367,000 | 1,370,196 | ||||||
|
Monty Parent, "A", Series 2013-LTR1, 144A, 3.47%, 10/20/2015
|
1,334,834 | 1,336,297 | ||||||
|
North End CLO Ltd., "A", Series 2013-1A, 144A, 1.376%*, 7/17/2025
|
5,000,000 | 4,953,865 | ||||||
|
Oak Hill Credit Partners X Ltd., "A", Series 2014-10A, 144A, 1.724%*, 7/20/2026
|
1,150,000 | 1,150,000 | ||||||
|
Octagon Investment Partners XVI Ltd., "B1", Series 2013-1A, 144A, 1.826%*, 7/17/2025
|
4,000,000 | 3,918,472 | ||||||
|
Venture XVI CLO Ltd., "A1L", Series 2014-16A, 144A, 1.868%*, 4/15/2026
|
5,000,000 | 5,007,475 | ||||||
|
Voya CLO Ltd., "A2", Series 2014-2A, 144A, 2.227%*, 7/17/2026
|
5,000,000 | 4,999,885 | ||||||
| 30,425,883 | ||||||||
|
Total Asset-Backed (Cost $39,507,760)
|
39,713,781 | |||||||
|
Commercial Mortgage-Backed Securities 5.3%
|
||||||||
|
Banc of America Commercial Mortgage Trust, "AM", Series 2006-3, 5.851%*, 7/10/2044
|
3,125,000 | 3,316,566 | ||||||
|
Banc of America Merrill Lynch Commercial Mortgage Securities Trust, "E", Series 2012-CLRN, 144A, 3.352%*, 8/15/2029
|
2,000,000 | 2,004,012 | ||||||
|
Banc of America Merrill Lynch Commercial Mortgage, Inc., "B", Series 2005-2, 5.119%*, 7/10/2043
|
5,000,000 | 5,139,385 | ||||||
|
CGWF Commercial Mortgage Trust, "C", Series 2013-RKWH, 144A, 2.452%*, 11/15/2030
|
2,500,000 | 2,520,317 | ||||||
|
Citigroup Commercial Mortgage Trust, "D", Series 2013-SMP, 144A, 2.911%*, 1/12/2030
|
2,000,000 | 2,023,378 | ||||||
|
Commercial Mortgage Trust, "A1", Series 2012-CR2, 0.824%, 8/15/2045
|
1,626,890 | 1,629,469 | ||||||
|
Credit Suisse Commercial Mortgage Trust, "A1A", Series 2007-C1, 5.361%, 2/15/2040
|
3,044,510 | 3,267,252 | ||||||
|
Credit Suisse First Boston Mortgage Securities Corp., "B", Series 2005-C5, 5.1%, 8/15/2038
|
1,500,000 | 1,545,168 | ||||||
|
Del Coronado Trust, "M", Series 2013-HDMZ, 144A, 5.152%*, 3/15/2018
|
880,000 | 885,544 | ||||||
|
Hilton U.S.A. Trust:
|
||||||||
|
"CFL", Series 2013-HLF, 144A, 2.051%*, 11/5/2030
|
1,040,000 | 1,042,942 | ||||||
|
"DFL", Series 2013-HLF, 144A, 2.901%*, 11/5/2030
|
630,000 | 632,773 | ||||||
|
JPMorgan Chase Commercial Mortgage Securities Corp.:
|
||||||||
|
"A4B", Series 2005-LDP3, 4.996%, 8/15/2042
|
2,800,000 | 2,923,340 | ||||||
|
"AM", Series 2005-LDP4, 4.999%, 10/15/2042
|
3,630,000 | 3,790,511 | ||||||
|
"AM", Series 2006-CB16, 5.593%, 5/12/2045
|
1,000,000 | 1,084,465 | ||||||
|
LB-UBS Commercial Mortgage Trust, "K", Series 2003-C5, 144A, 5.25%, 4/15/2037
|
3,331,000 | 3,335,863 | ||||||
|
Wachovia Bank Commercial Mortgage Trust, "B", Series 2005-C17, 5.287%, 3/15/2042
|
2,000,000 | 2,045,228 | ||||||
|
WFRBS Commercial Mortgage Trust, "A1", Series 2012-C8, 0.864%, 8/15/2045
|
1,675,062 | 1,675,290 | ||||||
|
Total Commercial Mortgage-Backed Securities (Cost $38,563,400)
|
38,861,503 | |||||||
|
Collateralized Mortgage Obligations 0.0%
|
||||||||
|
Credit Suisse Mortgage Capital Certificates, "A1", Series 2011-7R, 144A, 1.401%*, 8/28/2047
|
92,713 | 92,670 | ||||||
|
Federal National Mortgage Association, "FB", Series 1996-44, 0.952%*, 9/25/2023
|
152,724 | 154,539 | ||||||
|
Total Collateralized Mortgage Obligations (Cost $245,723)
|
247,209 | |||||||
|
Government & Agency Obligations 25.3%
|
||||||||
|
Other Government Related (a) 3.5%
|
||||||||
|
Alfa Bank OJSC, 144A, 7.875%, 9/25/2017
|
1,000,000 | 1,086,250 | ||||||
|
Banco de Costa Rica, 144A, 5.25%, 8/12/2018
|
2,500,000 | 2,562,500 | ||||||
|
Bank of Moscow, 144A, 6.699%, 3/11/2015
|
3,000,000 | 3,084,330 | ||||||
|
Fondo MIVIVIENDA SA, 144A, 3.375%, 4/2/2019
|
2,950,000 | 2,979,500 | ||||||
|
Gazprom OAO, 144A, 4.95%, 5/23/2016
|
2,000,000 | 2,100,000 | ||||||
|
Korea Development Bank, 4.0%, 9/9/2016
|
3,000,000 | 3,182,424 | ||||||
|
Russian Agricultural Bank OJSC, 144A, 5.298%, 12/27/2017
|
3,000,000 | 3,074,700 | ||||||
|
Sberbank of Russia, 144A, 4.95%, 2/7/2017
|
3,000,000 | 3,159,000 | ||||||
|
Svensk Exportkredit AB, 2.125%, 7/13/2016
|
2,000,000 | 2,060,484 | ||||||
|
VTB Bank OJSC, 144A, 6.465%, 3/4/2015
|
3,000,000 | 3,078,360 | ||||||
| 26,367,548 | ||||||||
|
Sovereign Bonds 0.7%
|
||||||||
|
Banco Nacional de Desenvolvimento Economico e Social, 144A, 4.0%, 4/14/2019
|
1,000,000 | 1,015,000 | ||||||
|
Province of British Columbia, Canada, 1.2%, 4/25/2017
|
2,855,000 | 2,876,626 | ||||||
|
Republic of Croatia, REG S, 144A, 6.25%, 4/27/2017
|
1,000,000 | 1,083,120 | ||||||
| 4,974,746 | ||||||||
|
U.S. Treasury Obligations 21.1%
|
||||||||
|
U.S. Treasury Inflation-Indexed Note, 0.125%, 4/15/2017
|
12,803,311 | 13,243,425 | ||||||
|
U.S. Treasury Notes:
|
||||||||
|
0.25%, 2/29/2016
|
5,000,000 | 4,995,115 | ||||||
|
1.0%, 8/31/2016 (b)
|
35,000,000 | 35,360,920 | ||||||
|
1.0%, 9/30/2016
|
20,000,000 | 20,193,760 | ||||||
|
1.375%, 7/31/2018
|
15,000,000 | 15,018,750 | ||||||
|
1.375%, 9/30/2018
|
30,500,000 | 30,461,875 | ||||||
|
1.625%, 4/30/2019
|
16,000,000 | 16,030,000 | ||||||
|
2.0%, 4/30/2016
|
20,000,000 | 20,589,060 | ||||||
| 155,892,905 | ||||||||
|
Total Government & Agency Obligations (Cost $186,729,140)
|
187,235,199 | |||||||
|
Loan Participations and Assignments 5.4%
|
||||||||
|
Senior Loans*
|
||||||||
|
Albertson's LLC, Term Loan B2, 4.75%, 3/21/2019
|
498,750 | 502,074 | ||||||
|
Alkermes, Inc., Term Loan, 3.5%, 9/18/2019
|
488,734 | 489,194 | ||||||
|
Alliance Laundry Systems LLC, Term Loan, 4.259%, 12/10/2018
|
448,599 | 451,614 | ||||||
|
American Rock Salt Holdings LLC, First Lien Term Loan, 4.75%, 5/20/2021
|
500,000 | 500,535 | ||||||
|
AmWINS Group LLC, Term Loan, 5.0%, 9/6/2019
|
985,011 | 988,705 | ||||||
|
Answers Corp., Term Loan B, 6.5%, 12/20/2018
|
487,500 | 488,719 | ||||||
|
Asurion LLC, Term Loan B1, 5.0%, 5/24/2019
|
728,150 | 733,688 | ||||||
|
Avaya, Inc., Term Loan B3, 4.727%, 10/26/2017
|
1,609,098 | 1,578,928 | ||||||
|
Berry Plastics Holding Corp., Term Loan E, 3.75%, 1/6/2021
|
498,750 | 497,730 | ||||||
|
Bombardier Recreational Products, Inc., Term Loan B, 4.0%, 1/30/2019
|
754,286 | 755,964 | ||||||
|
Brock Holdings III, Inc., Term Loan B, 6.0%, 3/16/2017
|
932,320 | 935,518 | ||||||
|
Calceus Acquisition, Inc., Term Loan, 5.0%, 1/31/2020
|
745,622 | 742,516 | ||||||
|
California Pizza Kitchen, Inc., Term Loan, 5.25%, 3/29/2018
|
495,000 | 473,965 | ||||||
|
Capital Automotive LP, Term Loan B, 4.0%, 4/10/2019
|
377,039 | 378,723 | ||||||
|
Chrysler Group LLC, Term Loan B, 3.5%, 5/24/2017
|
970,000 | 974,622 | ||||||
|
Crosby U.S. Acquisition Corp., First Lien Term Loan, 4.0%, 11/23/2020
|
497,500 | 497,811 | ||||||
|
Crossmark Holdings, Inc., First Lien Term Loan, 4.5%, 12/20/2019
|
492,500 | 492,500 | ||||||
|
CTI Foods Holding Co., LLC, First Lien Term Loan, 4.5%, 6/29/2020
|
496,250 | 498,113 | ||||||
|
Cumulus Media Holdings, Inc., Term Loan, 4.25%, 12/23/2020
|
492,315 | 494,776 | ||||||
|
Dell, Inc., Term Loan B, 4.5%, 4/29/2020
|
496,253 | 499,496 | ||||||
|
Drillships Financing Holding, Inc., Term Loan B1, 6.0%, 3/31/2021
|
820,437 | 835,311 | ||||||
|
Duff & Phelps Investment Management Co., Term Loan B, 4.5%, 4/23/2020
|
495,003 | 497,787 | ||||||
|
Energy Transfer Equity LP, Term Loan, 3.25%, 12/2/2019
|
500,000 | 495,480 | ||||||
|
Fieldwood Energy LLC, Second Lien Term Loan, 8.375%, 9/30/2020
|
250,000 | 258,281 | ||||||
|
First Data Corp., Term Loan, 4.154%, 9/24/2018
|
1,000,000 | 1,002,320 | ||||||
|
FTS International, Inc., Term Loan B, 5.75%, 4/16/2021
|
472,727 | 479,154 | ||||||
|
Genesys Telecom Holdings U.S., Inc., Term Loan B, 4.0%, 2/7/2020
|
345,625 | 344,545 | ||||||
|
Genpact International, Inc., Term Loan B, 3.5%, 8/30/2019
|
496,250 | 499,227 | ||||||
|
Getty Images, Inc., Term Loan B, 4.75%, 10/18/2019
|
288,504 | 279,488 | ||||||
|
Global Tel*Link Corp., First Lien Term Loan, 5.0%, 5/22/2020
|
406,956 | 405,938 | ||||||
|
Grosvenor Capital Management Holdings LLP, Term Loan B, 3.75%, 1/4/2021
|
497,500 | 495,221 | ||||||
|
Hub International Ltd., Term Loan B, 4.25%, 10/2/2020
|
497,500 | 499,055 | ||||||
|
Ineos U.S. Finance LLC, 6 year Term Loan, 3.75%, 5/4/2018
|
733,675 | 732,945 | ||||||
|
ION Media Networks, Inc., Term Loan, 5.0%, 12/18/2020
|
497,500 | 501,542 | ||||||
|
IQOR U.S., Inc., Term Loan B, 6.0%, 4/1/2021
|
484,127 | 465,972 | ||||||
|
Lands' End, Inc., Term Loan B, 4.25%, 4/2/2021
|
500,000 | 500,207 | ||||||
|
Level 3 Financing, Inc., Term Loan B, 4.0%, 1/15/2020
|
500,000 | 501,147 | ||||||
|
Lineage Logistics Holdings LLC, Term Loan, 4.5%, 4/7/2021
|
498,750 | 496,775 | ||||||
|
Moneygram International, Inc., Term Loan B, 4.25%, 3/27/2020
|
498,737 | 492,660 | ||||||
|
NEP/NCP Holdco, Inc., Term Loan, 4.25%, 1/22/2020
|
498,750 | 499,997 | ||||||
|
New HB Acquisition LLC, Term Loan, 6.75%, 4/9/2020
|
498,750 | 518,077 | ||||||
|
Noranda Aluminum Acquisition Corp., Term Loan B, 5.75%, 2/28/2019
|
488,750 | 471,644 | ||||||
|
Norcraft Companies LP, Term Loan, 5.25%, 12/13/2020
|
248,750 | 250,305 | ||||||
|
NPC International, Inc., Term Loan B, 4.0%, 12/28/2018
|
488,750 | 489,158 | ||||||
|
NTELOS, Inc., Term Loan B, 5.75%, 11/8/2019
|
249,367 | 249,991 | ||||||
|
Nuveen Investments, Inc., Term Loan, 4.15%, 5/15/2017
|
500,000 | 501,527 | ||||||
|
Oberthur Technologies of America Corp., Term Loan B2, 4.5%, 10/18/2019
|
497,500 | 501,045 | ||||||
|
Oxbow Carbon LLC:
|
||||||||
|
Term Loan B, 4.25%, 7/19/2019
|
240,506 | 241,308 | ||||||
|
Second Lien Term Loan, 8.0%, 1/17/2020
|
250,000 | 256,562 | ||||||
|
Ozburn-Hessey Holding Co., LLC, Term Loan, 6.75%, 5/23/2019
|
742,500 | 747,141 | ||||||
|
P2 Upstream Acquisition Co., First Lien Term Loan, 5.0%, 10/30/2020
|
249,375 | 250,934 | ||||||
|
Payless, Inc., First Lien Term Loan, 5.0%, 3/11/2021
|
1,000,000 | 1,004,370 | ||||||
|
Peabody Energy Corp., Term Loan B, 4.25%, 9/24/2020
|
496,250 | 501,007 | ||||||
|
Petco Animal Supplies, Inc., Term Loan, 4.0%, 11/24/2017
|
489,790 | 491,590 | ||||||
|
Polyconcept Investments BV, First Lien Term Loan, 6.0%, 6/27/2019
|
483,610 | 482,401 | ||||||
|
Quikrete Holdings, Inc., First Lien Term Loan, 4.0%, 9/28/2020
|
497,500 | 498,861 | ||||||
|
Remy International, Inc., Term Loan B, 4.25%, 3/5/2020
|
471,123 | 472,890 | ||||||
|
Rexnord LLC, First Lien Term Loan B, 4.0%, 8/21/2020
|
413,784 | 414,070 | ||||||
|
Samson Investment Co., Second Lien Term Loan, 5.0%, 9/25/2018
|
250,000 | 250,094 | ||||||
|
Serena Software, Inc., Term Loan, 7.5%, 4/14/2020
|
500,000 | 505,000 | ||||||
|
Signode Industrial Group U.S., Inc., Term Loan B, 4.0%, 5/1/2021
|
250,000 | 249,609 | ||||||
|
Sophia LP, Term Loan B, 4.0%, 7/19/2018
|
461,771 | 462,679 | ||||||
|
Steak N' Shake Operations, Inc., Term Loan, 4.75%, 3/19/2021
|
498,750 | 500,620 | ||||||
|
STG-Fairway Acquisitions, Inc., Term Loan B, 6.25%, 2/28/2019
|
250,000 | 250,000 | ||||||
|
Sungard Availability Services Capital, Inc, Term Loan B, 6.0%, 3/31/2019
|
249,375 | 248,207 | ||||||
|
Sybil Software LLC, Term Loan, 5.0%, 3/20/2020
|
493,750 | 494,367 | ||||||
|
Toys 'R' Us-Delaware, Inc., Term Loan B2, 5.25%, 5/25/2018
|
470,796 | 383,306 | ||||||
|
TricorBraun, Inc., Term Loan B, 4.0%, 5/3/2018
|
451,042 | 452,169 | ||||||
|
TriNet Group, Inc., Term Loan B1, 3.9%, 8/12/2016
|
353,752 | 353,752 | ||||||
|
U.S. Airways Group, Inc., Term Loan B1, 3.5%, 5/23/2019
|
495,000 | 495,465 | ||||||
|
U.S. Foods, Inc., Term Loan, 4.5%, 3/29/2019
|
485,100 | 486,485 | ||||||
|
Visteon Corp., Term Delay Draw, 3.75%, 5/27/2021
|
500,000 | 497,250 | ||||||
|
Vitera Healthcare Solutions, Inc., First Lien Term Loan, 6.0%, 11/4/2020
|
497,500 | 498,744 | ||||||
|
WASH Multifamily Laundry Systems LLC, Term Loan, 4.5%, 2/21/2019
|
491,259 | 493,716 | ||||||
|
Waste Industries U.S.A., Inc., Term Loan B, 4.25%, 3/17/2017
|
246,250 | 246,763 | ||||||
|
Windsor Quality Food Co., Ltd., Term Loan B, 5.0%, 12/23/2020
|
495,000 | 493,557 | ||||||
|
Zayo Group LLC, Term Loan B, 4.0%, 7/2/2019
|
1,000,000 | 1,002,710 | ||||||
|
Total Loan Participations and Assignments (Cost $39,862,359)
|
39,965,617 | |||||||
|
Short-Term U.S. Treasury Obligations 17.8%
|
||||||||
|
U.S. Treasury Bills:
|
||||||||
|
0.055%**, 12/11/2014 (c)
|
486,000 | 485,890 | ||||||
|
0.065%**, 8/14/2014 (c)
|
12,293,000 | 12,292,668 | ||||||
|
0.065%**, 8/14/2014 (c)
|
159,000 | 158,996 | ||||||
|
0.106%**, 4/2/2015 (d)
|
54,000,000 | 53,975,268 | ||||||
|
0.132%**, 3/5/2015 (d)
|
65,000,000 | 64,974,325 | ||||||
|
Total Short-Term U.S. Treasury Obligations (Cost $131,838,681)
|
131,887,147 | |||||||
|
Contracts
|
Value ($)
|
|||||||
|
Put Options Purchased 0.0%
|
||||||||
|
Options on Exchange-Traded Futures Contracts
|
||||||||
|
Palladium Option, Expiration Date 8/20/2014, Strike Price $800.0 (Cost $420,670)
|
200 | 174,000 | ||||||
|
Shares
|
Value ($)
|
|||||||
|
Cash Equivalents 6.3%
|
||||||||
|
Central Cash Management Fund, 0.06% (e)
|
31,356,929 | 31,356,929 | ||||||
|
Deutsche Variable NAV Money Fund, 0.18% (e)
|
1,501,112 | 15,012,617 | ||||||
|
Total Cash Equivalents (Cost $46,369,546)
|
46,369,546 | |||||||
|
% of Net Assets
|
Value ($)
|
|||||||
|
Total Consolidated Investment Portfolio (Cost $731,418,295)†
|
99.6 | 736,063,374 | ||||||
|
Other Assets and Liabilities, Net
|
0.4 | 3,172,407 | ||||||
|
Net Assets
|
100.0 | 739,235,781 | ||||||
* Floating rate securities' yields vary with a designated market index or market rate, such as the coupon equivalent of the U.S. Treasury Bill rate. These securities are shown at their current rate as of June 30, 2014.
** Annualized yield at time of purchase; not a coupon rate.
† The cost for federal income tax purposes was $731,473,813. At June 30, 2014, net unrealized appreciation for all securities based on tax cost was $4,589,561. This consisted of aggregate gross unrealized appreciation for all securities in which there was an excess of value over tax cost of $5,816,395 and aggregate gross unrealized depreciation for all securities in which there was an excess of tax cost over value of $1,226,834.
(a) Government-backed debt issued by financial companies or government sponsored enterprises.
(b) At June 30, 2014, this security has been pledged, in whole or in part, to cover initial margin requirements for open centrally cleared swap contracts.
(c) At June 30, 2014, this security has been pledged, in whole or in part, to cover initial margin requirements for open futures contracts and exchange-traded options.
(d) At June 30, 2014, this security has been pledged, in whole or in part, as collateral for open commodity-linked swap contracts.
(e) Affiliated fund managed by Deutsche Investment Management Americas Inc. The rate shown is the annualized seven-day yield at period end.
144A: Security exempt from registration under Rule 144A of the Securities Act of 1933. These securities may be resold in transactions exempt from registration, normally to qualified institutional buyers.
CLO: Collateralized Loan Obligation
REG S: Securities sold under Regulation S may not be offered, sold or delivered within the United States or to, or for the account or benefit of, U.S. persons, except pursuant to an exemption from, or in a transaction not subject to, the registration requirements of the Securities Act of 1933.
REIT: Real Estate Investment Trust
Included in the portfolio are investments in mortgage- or asset-backed securities, which are interests in separate pools of mortgages or assets. Effective maturities of these investments may be shorter than stated maturities due to prepayments. Some separate investments in the Federal National Mortgage Association issues which have similar coupon rates have been aggregated for presentation purposes in this investment portfolio.
At June 30, 2014, open futures contracts purchased were as follows:
|
Futures
|
Currency
|
Expiration Date
|
Contracts
|
Notional Value ($)
|
Unrealized Appreciation/ (Depreciation) ($)
|
|||||||||
|
Copper Futures
|
USD
|
9/11/2014
|
25 | 4,390,625 | 221,250 | |||||||||
|
Copper Futures
|
USD
|
9/12/2014
|
20 | 3,512,375 | 188,824 | |||||||||
|
Copper Futures
|
USD
|
9/16/2014
|
20 | 3,512,125 | 160,574 | |||||||||
|
Copper Futures
|
USD
|
9/19/2014
|
20 | 3,509,645 | 124,843 | |||||||||
|
Cotton No.2 Futures
|
USD
|
12/8/2014
|
189 | 6,946,695 | (429,975 | ) | ||||||||
|
Light Sweet Crude Oil Futures
|
USD
|
11/20/2014
|
219 | 22,377,420 | 915,420 | |||||||||
|
LME Copper Futures
|
USD
|
12/17/2014
|
150 | 26,272,500 | (549,910 | ) | ||||||||
|
Total net unrealized appreciation
|
631,026 | |||||||||||||
At June 30, 2014, open futures contracts sold were as follows:
|
Futures
|
Currency
|
Expiration Date
|
Contracts
|
Notional Value ($)
|
Unrealized Appreciation/ (Depreciation) ($)
|
|||||||||
|
2 Year U.S. Treasury Note
|
USD
|
9/30/2014
|
280 | 61,486,250 | 13,125 | |||||||||
|
Aluminum Futures
|
USD
|
9/11/2014
|
100 | 4,720,250 | (35,250 | ) | ||||||||
|
Aluminum Futures
|
USD
|
9/12/2014
|
80 | 3,777,080 | (95,285 | ) | ||||||||
|
Aluminum Futures
|
USD
|
9/16/2014
|
80 | 3,780,620 | (84,826 | ) | ||||||||
|
Aluminum Futures
|
USD
|
9/19/2014
|
80 | 3,781,580 | (13,730 | ) | ||||||||
|
LME Copper Futures
|
USD
|
12/17/2014
|
150 | 26,272,500 | 306,250 | |||||||||
|
WTI Crude Futures
|
USD
|
9/22/2014
|
219 | 22,743,150 | (865,050 | ) | ||||||||
|
Total net unrealized depreciation
|
(774,766 | ) | ||||||||||||
At June 30, 2014, open written option contracts were as follows:
|
Options on Exchange-Traded Futures Contracts
|
|||||||||||||||||
|
Contracts
|
Expiration Date
|
Strike Price ($)
|
Premiums Received ($)
|
Value ($) (f)
|
|||||||||||||
|
Put Options
Palladium Option
|
200 |
8/20/2014
|
780.0 | 279,330 | (95,800 | ) | |||||||||||
(f) Unrealized appreciation on written options on commodity futures contracts at June 30, 2014 was $183,530.
|
Options on Interest Rate Swap Contracts
|
||||||||||||||
|
Swap Effective/
Expiration Date
|
Contract Amount
|
Option Expiration Date
|
Premiums Received ($)
|
Value ($) (g)
|
||||||||||
|
Call Options
Receive Fixed — 5.132% – Pay Floating — LIBOR
|
3/17/2016
3/17/2026
|
2,000,000 | 1 |
3/15/2016
|
14,450 | (5,279 | ) | |||||||
|
Receive Fixed — 5.132% – Pay Floating — LIBOR
|
3/17/2016
3/17/2026
|
2,000,000 | 2 |
3/15/2016
|
23,600 | (5,279 | ) | |||||||
|
Total Call Options
|
38,050 | (10,558 | ) | |||||||||||
|
Put Options
Pay Fixed — 1.132% – Receive Floating — LIBOR
|
3/17/2016
3/17/2026
|
2,000,000 | 1 |
3/15/2016
|
14,450 | (564 | ) | |||||||
|
Pay Fixed — 1.132% – Receive Floating — LIBOR
|
3/17/2016
3/17/2026
|
2,000,000 | 2 |
3/15/2016
|
5,100 | (564 | ) | |||||||
|
Total Put Options
|
19,550 | (1,128 | ) | |||||||||||
|
Total
|
57,600 | (11,686 | ) | |||||||||||
(g) Unrealized appreciation on written options on interest rate swap contracts at June 30, 2014 was $45,914.
At June 30, 2014, open commodity-linked swap contracts were as follows:
|
Bilateral Swaps
|
|||||||||||||
|
Expiration Date
|
Notional Amount ($)
|
Fixed Fee Received/ (Paid) by the Fund
|
Pay/Receive Return of the Reference Index
|
Value ($) (h)
|
|||||||||
|
Long Positions
|
|||||||||||||
|
7/17/2014
|
11,360,000 | 3 | (0.48 | %) |
Barclays-Commodity Strategy 1500 Index
|
(79,254 | ) | ||||||
|
7/17/2014
|
9,700,000 | 3 | (0.57 | %) |
Barclays-Commodity Strategy 1610 Index
|
(67,046 | ) | ||||||
|
7/17/2014
|
12,930,000 | 2 | (0.2 | %) |
BNP Paribas 03 Alpha Index
|
11,763 | |||||||
|
7/15/2014
|
5,000,000 | 4 | (0.25 | %) |
Citi Brent Short Index
|
46,945 | |||||||
|
8/13/2014
|
5,000,000 | 4 | (0.25 | %) |
Citi Brent Short Index
|
(3,014 | ) | ||||||
|
7/17/2014
|
126,700,000 | 4 | (0.12 | %) |
Citi Cubes Dow Jones-UBS Weighted Index
|
(72,971 | ) | ||||||
|
7/17/2014
|
63,170,000 | 5 | (0.16 | %) |
Dow Jones-UBS Commodity Index 3 Month Forward
|
(14,855 | ) | ||||||
|
7/17/2014
|
122,830,000 | 6 | (0.17 | %) |
Dow Jones-UBS Commodity Index 3 Month Forward
|
(29,491 | ) | ||||||
|
7/17/2014
|
42,110,000 | 11 | (0.18 | %) |
Dow Jones-UBS Commodity Index 3 Month Forward
|
(10,318 | ) | ||||||
|
7/17/2014
|
36,200,000 | 2 | (0.24 | %) |
Dow Jones-UBS Commodity Index 3 Month Forward
|
(9,941 | ) | ||||||
|
7/17/2014
|
55,410,000 | 7 | (0.19 | %) |
Dow Jones-UBS Commodity Index 3 Month Forward
|
(13,850 | ) | ||||||
|
7/17/2014
|
13,900,000 | 7 | (0.11 | %) |
Dow Jones-Zinc ER Index
|
870,894 | |||||||
|
7/17/2014
|
63,170,000 | 8 | (0.43 | %) |
Goldman Dow Jones-UBS Commodity Excess Return E177 Strategy Index
|
(33,369 | ) | ||||||
|
7/17/2014
|
36,940,000 | 7 | (0.38 | %) |
JPMorgan Alterative Benchmark Enhanced Beta Select Excess Return Index
|
66,139 | |||||||
|
7/15/2014
|
10,000,000 | 7 | 0.15 | % |
JPMorgan Brent Volement Strategy
|
(41,903 | ) | ||||||
|
7/17/2014
|
12,930,000 | 7 | (0.65 | %) |
JPMorgan Seasonal Commodity Spread Index
|
(30,110 | ) | ||||||
|
7/21/2014
|
10,000,000 | 7 | 0.15 | % |
JPMorgan WTI Volement Strategy
|
90,220 | |||||||
|
7/17/2014
|
87,740,000 | 9 | (0.4 | %) |
Merrill Lynch Commodity Strategy Index
|
(59,234 | ) | ||||||
|
7/17/2014
|
97,220,000 | 10 | (0.159 | %) |
UBS Custom Commodity Index
|
(801,074 | ) | ||||||
|
Total net unrealized depreciation
|
(180,469 | ) | |||||||||||
(h) There are no upfront payments on the commodity-linked swaps listed above, therefore unrealized appreciation (depreciation) is equal to their value.
At June 30, 2014, open interest rate swap contracts were as follows:
|
Centrally Cleared Swaps
|
||||||||||||||
|
Effective/
Expiration Dates
|
Notional Amount ($)
|
Cash Flows Paid by the Fund
|
Cash Flows Received by the Fund
|
Value ($)
|
Unrealized Depreciation ($)
|
|||||||||
|
7/22/2014
7/22/2019
|
100,000,000 |
Fixed — 2.139%
|
Floating — LIBOR
|
(1,987,160 | ) | (2,061,343 | ) | |||||||
|
7/22/2014
7/22/2016
|
90,000,000 |
Fixed — 0.964%
|
Floating — LIBOR
|
(674,154 | ) | (684,446 | ) | |||||||
|
Total unrealized depreciation
|
(2,745,789 | ) | ||||||||||||
Counterparties:
1 Nomura International PLC
2 BNP Paribas
3 Barclays Bank PLC
4 Citigroup, Inc.
5 Credit Suisse
6 Macquarie Bank Ltd.
7 JPMorgan Chase Securities, Inc.
8 Goldman Sachs & Co.
9 Bank of America
10 UBS AG
11 Canadian Imperial Bank of Commerce
LIBOR: London Interbank Offered Rate
|
Currency Abbreviation
|
|
USD United States Dollar
|
For information on the Fund's policy and additional disclosures regarding futures contracts, commodity-linked swap contracts, interest rate swap contracts and written and purchased option contracts, please refer to Note B in the accompanying Notes to Consolidated Financial Statements.
Fair Value Measurements
Various inputs are used in determining the value of the Fund's investments. These inputs are summarized in three broad levels. Level 1 includes quoted prices in active markets for identical securities. Level 2 includes other significant observable inputs (including quoted prices for similar securities, interest rates, prepayment speeds and credit risk). Level 3 includes significant unobservable inputs (including the Fund's own assumptions in determining the fair value of investments). The level assigned to the securities valuations may not be an indication of the risk or liquidity associated with investing in those securities.
The following is a summary of the inputs used as of June 30, 2014 in valuing the Fund's investments. For information on the Fund's policy regarding the valuation of investments, please refer to the Security Valuation section of Note A in the accompanying Notes to Consolidated Financial Statements.
|
Assets
|
Level 1
|
Level 2
|
Level 3
|
Total
|
||||||||||||
|
Fixed-Income Investments (i)
|
||||||||||||||||
|
Corporate Bonds
|
$ | — | $ | 220,940,515 | $ | — | $ | 220,940,515 | ||||||||
|
Mortgage-Backed Securities Pass-Throughs
|
— | 30,668,857 | — | 30,668,857 | ||||||||||||
|
Asset-Backed
|
— | 36,875,893 | 2,837,888 | 39,713,781 | ||||||||||||
|
Commercial Mortgage-Backed Securities
|
— | 38,861,503 | — | 38,861,503 | ||||||||||||
|
Collateralized Mortgage Obligations
|
— | 247,209 | — | 247,209 | ||||||||||||
|
Government & Agency Obligations
|
— | 187,235,199 | — | 187,235,199 | ||||||||||||
|
Loan Participations and Assignments
|
— | 39,471,901 | 493,716 | 39,965,617 | ||||||||||||
|
Short-Term U.S. Treasury Obligations
|
— | 131,887,147 | — | 131,887,147 | ||||||||||||
|
Short-Term Investments
|
46,369,546 | — | — | 46,369,546 | ||||||||||||
|
Derivatives (j)
|
||||||||||||||||
|
Purchased Options
|
174,000 | — | — | 174,000 | ||||||||||||
|
Futures Contracts
|
1,930,286 | — | — | 1,930,286 | ||||||||||||
|
Commodity-Linked Swap Contracts
|
— | 1,085,961 | — | 1,085,961 | ||||||||||||
|
Total
|
$ | 48,473,832 | $ | 687,274,185 | $ | 3,331,604 | $ | 739,079,621 | ||||||||
|
Liabilities
|
Level 1
|
Level 2
|
Level 3
|
Total
|
||||||||||||
|
Derivatives (j)
|
||||||||||||||||
|
Written Options
|
$ | (95,800 | ) | $ | (11,686 | ) | $ | — | $ | (107,486 | ) | |||||
|
Futures Contracts
|
(2,074,026 | ) | — | — | (2,074,026 | ) | ||||||||||
|
Commodity-Linked Swap Contracts
|
— | (1,266,430 | ) | — | (1,266,430 | ) | ||||||||||
|
Interest Rate Swap Contracts
|
— | (2,745,789 | ) | — | (2,745,789 | ) | ||||||||||
|
Total
|
$ | (2,169,826 | ) | $ | (4,023,905 | ) | $ | — | $ | (6,193,731 | ) | |||||
During the year ended June 30, 2014, the amount of transfers between Level 2 and Level 3 was $493,716. The investment was transferred from Level 2 to Level 3 because of the lack of observable market data due to a decrease in market activity.
Transfers between price levels are recognized at the beginning of the reporting period.
(i) See Consolidated Investment Portfolio for additional detailed categorizations.
(j) Derivatives include unrealized appreciation (depreciation) on futures contracts, commodity-linked swap contracts and interest rate swap contracts, and written and purchased options, at value.
The accompanying notes are an integral part of the consolidated financial statements.
|
as of June 30, 2014
|
||||
|
Assets
|
||||
|
Investments:
Investments in non-affiliated securities, at value (cost $685,048,749)
|
$ | 689,693,828 | ||
|
Investment in affiliated Deutsche Funds (cost $46,369,546)
|
46,369,546 | |||
|
Total investments in securities, at value (cost $731,418,295)
|
736,063,374 | |||
|
Cash
|
7,795,646 | |||
|
Foreign currency, at value (cost $14,046)
|
14,156 | |||
|
Deposit from broker on bilateral swap contracts
|
2,721,263 | |||
|
Receivable for investments sold
|
13,468,949 | |||
|
Receivable for Fund shares sold
|
2,755,198 | |||
|
Interest receivable
|
3,269,747 | |||
|
Receivable for variation margin on futures contracts
|
93,794 | |||
|
Unrealized appreciation on bilateral swap contracts
|
1,085,961 | |||
|
Other assets
|
159,244 | |||
|
Total assets
|
767,427,332 | |||
|
Liabilities
|
||||
|
Payable for investments purchased
|
22,169,962 | |||
|
Payable upon return of deposit for bilateral swap contracts
|
2,721,263 | |||
|
Payable for Fund shares redeemed
|
623,774 | |||
|
Options written, at value (premiums received $336,930)
|
107,486 | |||
|
Unrealized depreciation on bilateral swap contracts
|
1,266,430 | |||
|
Payable for variation margin on centrally cleared swaps
|
130,083 | |||
|
Accrued management fee
|
567,377 | |||
|
Accrued Trustees' fees
|
5,682 | |||
|
Other accrued expenses and payables
|
599,494 | |||
|
Total liabilities
|
28,191,551 | |||
|
Net assets, at value
|
$ | 739,235,781 | ||
The accompanying notes are an integral part of the consolidated financial statements.
|
Consolidated Statement of Assets and Liabilities as of June 30, 2014 (continued)
|
||||
|
Net Assets Consist of
|
||||
|
Undistributed net investment income
|
21,231,372 | |||
|
Net unrealized appreciation (depreciation) on:
Investments
|
4,645,079 | |||
|
Swap contracts
|
(2,926,258 | ) | ||
|
Futures
|
(143,740 | ) | ||
|
Foreign currency
|
110 | |||
|
Written options
|
229,444 | |||
|
Accumulated net realized gain (loss)
|
(211,505,096 | ) | ||
|
Paid-in capital
|
927,704,870 | |||
|
Net assets, at value
|
$ | 739,235,781 | ||
|
Net Asset Value
|
||||
|
Class A
Net Asset Value and redemption price(a) per share ($170,928,050 ÷ 10,778,080 outstanding shares of beneficial interest, $.01 par value, unlimited number of shares authorized)
|
$ | 15.86 | ||
|
Maximum offering price per share (100 ÷ 94.25 of $15.86)
|
$ | 16.83 | ||
|
Class B
Net Asset Value, offering and redemption price(a) (subject to contingent deferred sales charge) per share ($341,507 ÷ 23,633 outstanding shares of beneficial interest, $.01 par value, unlimited number of shares authorized)
|
$ | 14.45 | ||
|
Class C
Net Asset Value, offering and redemption price(a) (subject to contingent deferred sales charge) per share ($47,121,910 ÷ 3,254,035 outstanding shares of beneficial interest, $.01 par value, unlimited number of shares authorized)
|
$ | 14.48 | ||
|
Class S
Net Asset Value, offering and redemption price(a) per share ($239,764,951 ÷ 14,941,785 outstanding shares of beneficial interest, $.01 par value, unlimited number of shares authorized)
|
$ | 16.05 | ||
|
Institutional Class
Net Asset Value, offering and redemption price(a) per share ($281,079,363 ÷ 17,454,566 outstanding shares of beneficial interest, $.01 par value, unlimited number of shares authorized)
|
$ | 16.10 | ||
(a) Redemption price per share for shares held less than 15 days is equal to net asset value less a 2% redemption fee.
The accompanying notes are an integral part of the consolidated financial statements.
|
for the year ended June 30, 2014
|
||||
|
Investment Income
|
||||
|
Income:
Interest
|
$ | 13,185,187 | ||
|
Income distributions from affiliated funds
|
33,757 | |||
|
Securities lending income, including income from Daily Assets Fund Institutional, net of borrower rebates
|
3,906 | |||
|
Total income
|
13,222,850 | |||
|
Expenses:
Management fee
|
6,995,018 | |||
|
Administration fee
|
749,446 | |||
|
Services to shareholders
|
909,198 | |||
|
Distribution and service fees
|
986,347 | |||
|
Custodian fee
|
145,324 | |||
|
Professional fees
|
163,471 | |||
|
Reports to shareholders
|
96,583 | |||
|
Registration fees
|
108,823 | |||
|
Trustees' fees and expenses
|
34,503 | |||
|
Other
|
61,375 | |||
|
Total expenses before expense reductions
|
10,250,088 | |||
|
Expense reductions
|
(8,931 | ) | ||
|
Total expenses after expense reductions
|
10,241,157 | |||
|
Net investment income (loss)
|
2,981,693 | |||
|
Realized and Unrealized Gain (Loss)
|
||||
|
Net realized gain (loss) from:
Investments
|
1,036,106 | |||
|
Swap contracts
|
15,495,944 | |||
|
Futures
|
5,659,858 | |||
|
Written options
|
28,278 | |||
|
Foreign currency
|
208 | |||
| 22,220,394 | ||||
|
Change in net unrealized appreciation (depreciation) on:
Investments
|
5,475,088 | |||
|
Swap contracts
|
14,218,554 | |||
|
Unfunded loan commitment
|
10,835 | |||
|
Futures
|
110,164 | |||
|
Written options
|
250,268 | |||
|
Foreign currency
|
110 | |||
| 20,065,019 | ||||
|
Net gain (loss)
|
42,285,413 | |||
|
Net increase (decrease) in net assets resulting from operations
|
$ | 45,267,106 | ||
The accompanying notes are an integral part of the consolidated financial statements.
|
Years Ended June 30,
|
||||||||
|
Increase (Decrease) in Net Assets
|
2014
|
2013
|
||||||
|
Operations:
Net investment income (loss)
|
$ | 2,981,693 | $ | 2,269,300 | ||||
|
Net realized gain (loss)
|
22,220,394 | (20,773,448 | ) | |||||
|
Change in net unrealized appreciation (depreciation)
|
20,065,019 | (32,545,976 | ) | |||||
|
Net increase (decrease) in net assets resulting from operations
|
45,267,106 | (51,050,124 | ) | |||||
|
Distributions to shareholders from:
Net investment income:
Class A
|
(187,406 | ) | (695,533 | ) | ||||
|
Class B
|
— | (3,829 | ) | |||||
|
Class C
|
— | (158,247 | ) | |||||
|
Class S
|
(385,998 | ) | (638,239 | ) | ||||
|
Institutional Class
|
(573,638 | ) | (809,573 | ) | ||||
|
Return of capital:
Class A
|
— | (5,054,289 | ) | |||||
|
Class B
|
— | (27,824 | ) | |||||
|
Class C
|
— | (1,149,949 | ) | |||||
|
Class S
|
— | (4,637,960 | ) | |||||
|
Institutional Class
|
— | (5,883,017 | ) | |||||
|
Total distributions
|
(1,147,042 | ) | (19,058,460 | ) | ||||
|
Fund share transactions:
Proceeds from shares sold
|
312,535,476 | 318,795,229 | ||||||
|
Reinvestment of distributions
|
1,079,584 | 16,487,613 | ||||||
|
Payments for shares redeemed
|
(412,404,750 | ) | (386,820,463 | ) | ||||
|
Redemption fees
|
6,722 | 7,431 | ||||||
|
Net increase (decrease) in net assets from Fund share transactions
|
(98,782,968 | ) | (51,530,190 | ) | ||||
|
Increase (decrease) in net assets
|
(54,662,904 | ) | (121,638,774 | ) | ||||
|
Net assets at beginning of period
|
793,898,685 | 915,537,459 | ||||||
|
Net assets at end of period (including undistributed net investment income of $21,231,372 and $0, respectively)
|
$ | 739,235,781 | $ | 793,898,685 | ||||
The accompanying notes are an integral part of the consolidated financial statements.
|
Years Ended June 30,
|
|||||||||||||||||||||
|
Class A
|
2014
|
2013d | 2012d | 2011d | 2010d | ||||||||||||||||
|
Selected Per Share Data
|
|||||||||||||||||||||
|
Net asset value, beginning of period
|
$ | 14.95 | d | $ | 16.25 | $ | 22.10 | $ | 17.20 | $ | 16.10 | ||||||||||
|
Income (loss) from investment operations:
Net investment income (loss)a
|
.04 | .05 | .00 | * | (.05 | ) | (.10 | ) | |||||||||||||
|
Net realized and unrealized gain (loss)
|
.89 | (1.00 | ) | (2.60 | ) | 4.95 | 1.35 | ||||||||||||||
|
Total from investment operations
|
.93 | (.95 | ) | (2.60 | ) | 4.90 | 1.25 | ||||||||||||||
|
Less distributions from:
Net investment income
|
(.02 | ) | (.05 | ) | (3.25 | ) | — | (.15 | ) | ||||||||||||
|
Return of capital
|
— | (.30 | ) | — | — | — | |||||||||||||||
|
Total distributions
|
(.02 | ) | (.35 | ) | (3.25 | ) | — | (.15 | ) | ||||||||||||
|
Redemption fees
|
.00 | * | .00 | * | .00 | * | .00 | * | .00 | * | |||||||||||
|
Net asset value, end of period
|
$ | 15.86 | $ | 14.95 | $ | 16.25 | $ | 22.10 | $ | 17.20 | |||||||||||
|
Total Return (%)b
|
6.20 | (6.14 | ) | (13.24 | ) | 28.49 | 7.33 | c | |||||||||||||
|
Ratios to Average Net Assets and Supplemental Data
|
|||||||||||||||||||||
|
Net assets, end of period ($ millions)
|
171 | 209 | 302 | 489 | 153 | ||||||||||||||||
|
Ratio of expenses before expense reductions (%)
|
1.50 | 1.46 | 1.51 | 1.50 | 1.66 | ||||||||||||||||
|
Ratio of expenses after expense reductions (%)
|
1.50 | 1.46 | 1.51 | 1.50 | 1.58 | ||||||||||||||||
|
Ratio of net investment income (loss) (%)
|
.27 | .16 | .09 | (.17 | ) | (.60 | ) | ||||||||||||||
|
Portfolio turnover rate (%)
|
93 | 71 | 98 | 116 | 189 | ||||||||||||||||
|
a Based on average shares outstanding during the period.
b Total return does not reflect the effect of any sales charges.
c Total return would have been lower had certain expenses not been reduced.
d On December 6, 2013, the Fund implemented a 1 for 5 reverse stock split. Net asset value and per share information through December 5, 2013 have been updated to reflect the effect of the split. Shareholders received one share for every 5 shares owned and net asset value per share increased correspondingly.
* Amount is less than $.005.
|
|||||||||||||||||||||
|
Years Ended June 30,
|
|||||||||||||||||||||
|
Class B
|
2014
|
2013d | 2012d | 2011d | 2010d | ||||||||||||||||
|
Selected Per Share Data
|
|||||||||||||||||||||
|
Net asset value, beginning of period
|
$ | 13.70 | d | $ | 14.95 | $ | 20.45 | $ | 16.05 | $ | 15.05 | ||||||||||
|
Income (loss) from investment operations:
Net investment income (loss)a
|
(.08 | ) | (.10 | ) | (.15 | ) | (.20 | ) | (.20 | ) | |||||||||||
|
Net realized and unrealized gain (loss)
|
.83 | (.95 | ) | (2.40 | ) | 4.60 | 1.20 | ||||||||||||||
|
Total from investment operations
|
.75 | (1.05 | ) | (2.55 | ) | 4.40 | 1.00 | ||||||||||||||
|
Less distributions from:
Net investment income
|
— | (.00 | )* | (2.95 | ) | — | (.00 | )* | |||||||||||||
|
Return of capital
|
— | (.20 | ) | — | — | — | |||||||||||||||
|
Total distributions
|
— | (.20 | ) | (2.95 | ) | — | (.00 | )* | |||||||||||||
|
Redemption fees
|
.00 | * | .00 | * | .00 | * | .00 | * | .00 | * | |||||||||||
|
Net asset value, end of period
|
$ | 14.45 | $ | 13.70 | $ | 14.95 | $ | 20.45 | $ | 16.05 | |||||||||||
|
Total Return (%)b
|
5.47 | c | (7.09 | )c | (13.94 | ) | 27.41 | c | 6.66 | c | |||||||||||
|
Ratios to Average Net Assets and Supplemental Data
|
|||||||||||||||||||||
|
Net assets, end of period ($ millions)
|
.3 | 1 | 3 | 7 | 8 | ||||||||||||||||
|
Ratio of expenses before expense reductions (%)
|
2.39 | 2.37 | 2.34 | 2.39 | 2.48 | ||||||||||||||||
|
Ratio of expenses after expense reductions (%)
|
2.28 | 2.35 | 2.34 | 2.35 | 2.33 | ||||||||||||||||
|
Ratio of net investment income (loss) (%)
|
(.55 | ) | (.75 | ) | (.74 | ) | (1.09 | ) | (1.35 | ) | |||||||||||
|
Portfolio turnover rate (%)
|
93 | 71 | 98 | 116 | 189 | ||||||||||||||||
|
a Based on average shares outstanding during the period.
b Total return does not reflect the effect of any sales charges.
c Total return would have been lower had certain expenses not been reduced.
d On December 6, 2013, the Fund implemented a 1 for 5 reverse stock split. Net asset value and per share information through December 5, 2013 have been updated to reflect the effect of the split. Shareholders received one share for every 5 shares owned and net asset value per share increased correspondingly.
* Amount is less than $.005.
|
|||||||||||||||||||||
|
Years Ended June 30,
|
|||||||||||||||||||||
|
Class C
|
2014
|
2013d | 2012d | 2011d | 2010d | ||||||||||||||||
|
Selected Per Share Data
|
|||||||||||||||||||||
|
Net asset value, beginning of period
|
$ | 13.75 | d | $ | 14.95 | $ | 20.50 | $ | 16.05 | $ | 15.05 | ||||||||||
|
Income (loss) from investment operations:
Net investment income (loss)a
|
(.07 | ) | (.10 | ) | (.10 | ) | (.20 | ) | (.20 | ) | |||||||||||
|
Net realized and unrealized gain (loss)
|
.80 | (.85 | ) | (2.50 | ) | 4.65 | 1.20 | ||||||||||||||
|
Total from investment operations
|
.73 | (.95 | ) | (2.60 | ) | 4.45 | 1.00 | ||||||||||||||
|
Less distributions from:
Net investment income
|
— | (.05 | ) | (2.95 | ) | — | (.00 | )* | |||||||||||||
|
Return of capital
|
— | (.20 | ) | — | — | — | |||||||||||||||
|
Total distributions
|
— | (.25 | ) | (2.95 | ) | — | (.00 | )* | |||||||||||||
|
Redemption fees
|
.00 | * | .00 | * | .00 | * | .00 | * | .00 | * | |||||||||||
|
Net asset value, end of period
|
$ | 14.48 | $ | 13.75 | $ | 14.95 | $ | 20.50 | $ | 16.05 | |||||||||||
|
Total Return (%)b
|
5.31 | c | (6.68 | ) | (14.13 | ) | 27.73 | 6.66 | c | ||||||||||||
|
Ratios to Average Net Assets and Supplemental Data
|
|||||||||||||||||||||
|
Net assets, end of period ($ millions)
|
47 | 65 | 90 | 110 | 34 | ||||||||||||||||
|
Ratio of expenses before expense reductions (%)
|
2.28 | 2.26 | 2.26 | 2.26 | 2.44 | ||||||||||||||||
|
Ratio of expenses after expense reductions (%)
|
2.26 | 2.26 | 2.26 | 2.26 | 2.33 | ||||||||||||||||
|
Ratio of net investment income (loss) (%)
|
(.51 | ) | (.64 | ) | (.66 | ) | (.92 | ) | (1.35 | ) | |||||||||||
|
Portfolio turnover rate (%)
|
93 | 71 | 98 | 116 | 189 | ||||||||||||||||
|
a Based on average shares outstanding during the period.
b Total return does not reflect the effect of any sales charges.
c Total return would have been lower had certain expenses not been reduced.
d On December 6, 2013, the Fund implemented a 1 for 5 reverse stock split. Net asset value and per share information through December 5, 2013 have been updated to reflect the effect of the split. Shareholders received one share for every 5 shares owned and net asset value per share increased correspondingly.
* Amount is less than $.005.
|
|||||||||||||||||||||
|
Years Ended June 30,
|
|||||||||||||||||||||
|
Class S
|
2014
|
2013c | 2012c | 2011c | 2010c | ||||||||||||||||
|
Selected Per Share Data
|
|||||||||||||||||||||
|
Net asset value, beginning of period
|
$ | 15.10 | c | $ | 16.40 | $ | 22.35 | $ | 17.35 | $ | 16.25 | ||||||||||
|
Income (loss) from investment operations:
Net investment income (loss)a
|
.07 | .05 | .05 | (.00 | )* | (.05 | ) | ||||||||||||||
|
Net realized and unrealized gain (loss)
|
.91 | (1.00 | ) | (2.65 | ) | 5.00 | 1.30 | ||||||||||||||
|
Total from investment operations
|
.98 | (.95 | ) | (2.60 | ) | 5.00 | 1.25 | ||||||||||||||
|
Less distributions from:
Net investment income
|
(.03 | ) | (.05 | ) | (3.35 | ) | — | (.15 | ) | ||||||||||||
|
Return of capital
|
— | (.30 | ) | — | — | — | |||||||||||||||
|
Total distributions
|
(.03 | ) | (.35 | ) | (3.35 | ) | — | (.15 | ) | ||||||||||||
|
Redemption fees
|
.00 | * | .00 | * | .00 | * | .00 | * | .00 | * | |||||||||||
|
Net asset value, end of period
|
$ | 16.05 | $ | 15.10 | $ | 16.40 | $ | 22.35 | $ | 17.35 | |||||||||||
|
Total Return (%)
|
6.46 | (5.92 | ) | (13.23 | ) | 28.82 | 7.81 | b | |||||||||||||
|
Ratios to Average Net Assets and Supplemental Data
|
|||||||||||||||||||||
|
Net assets, end of period ($ millions)
|
240 | 219 | 231 | 328 | 65 | ||||||||||||||||
|
Ratio of expenses before expense reductions (%)
|
1.30 | 1.29 | 1.32 | 1.26 | 1.40 | ||||||||||||||||
|
Ratio of expenses after expense reductions (%)
|
1.30 | 1.29 | 1.32 | 1.26 | 1.38 | ||||||||||||||||
|
Ratio of net investment income (loss) (%)
|
.47 | .35 | .28 | .10 | (.40 | ) | |||||||||||||||
|
Portfolio turnover rate (%)
|
93 | 71 | 98 | 116 | 189 | ||||||||||||||||
|
a Based on average shares outstanding during the period.
b Total return would have been lower had certain expenses not been reduced.
c On December 6, 2013, the Fund implemented a 1 for 5 reverse stock split. Net asset value and per share information through December 5, 2013 have been updated to reflect the effect of the split. Shareholders received one share for every 5 shares owned and net asset value per share increased correspondingly.
* Amount is less than $.005.
|
|||||||||||||||||||||
|
Years Ended June 30,
|
|||||||||||||||||||||
|
Institutional Class
|
2014
|
2013c | 2012c | 2011c | 2010c | ||||||||||||||||
|
Selected Per Share Data
|
|||||||||||||||||||||
|
Net asset value, beginning of period
|
$ | 15.15 | c | $ | 16.45 | $ | 22.40 | $ | 17.35 | $ | 16.25 | ||||||||||
|
Income (loss) from investment operations:
Net investment income (loss)a
|
.09 | .10 | .10 | .05 | (.05 | ) | |||||||||||||||
|
Net realized and unrealized gain (loss)
|
.89 | (1.00 | ) | (2.70 | ) | 5.00 | 1.35 | ||||||||||||||
|
Total from investment operations
|
.98 | (.90 | ) | (2.60 | ) | 5.05 | 1.30 | ||||||||||||||
|
Less distributions from:
Net investment income
|
(.03 | ) | (.10 | ) | (3.35 | ) | — | (.20 | ) | ||||||||||||
|
Return of capital
|
— | (.30 | ) | — | — | — | |||||||||||||||
|
Total distributions
|
(.03 | ) | (.40 | ) | (3.35 | ) | — | (.20 | ) | ||||||||||||
|
Redemption fees
|
.00 | * | .00 | * | .00 | * | .00 | * | .00 | * | |||||||||||
|
Net asset value, end of period
|
$ | 16.10 | $ | 15.15 | $ | 16.45 | $ | 22.40 | $ | 17.35 | |||||||||||
|
Total Return (%)
|
6.48 | (5.78 | ) | (13.02 | ) | 29.11 | 7.87 | b | |||||||||||||
|
Ratios to Average Net Assets and Supplemental Data
|
|||||||||||||||||||||
|
Net assets, end of period ($ millions)
|
281 | 300 | 289 | 320 | 127 | ||||||||||||||||
|
Ratio of expenses before expense reductions (%)
|
1.16 | 1.14 | 1.16 | 1.13 | 1.21 | ||||||||||||||||
|
Ratio of expenses after expense reductions (%)
|
1.16 | 1.14 | 1.16 | 1.13 | 1.20 | ||||||||||||||||
|
Ratio of net investment income (loss) (%)
|
.60 | .51 | .44 | .19 | (.23 | ) | |||||||||||||||
|
Portfolio turnover rate (%)
|
93 | 71 | 98 | 116 | 189 | ||||||||||||||||
|
a Based on average shares outstanding during the period.
b Total return would have been lower had certain expenses not been reduced.
c On December 6, 2013, the Fund implemented a 1 for 5 reverse stock split. Net asset value and per share information through December 5, 2013 have been updated to reflect the effect of the split. Shareholders received one share for every 5 shares owned and net asset value per share increased correspondingly.
* Amount is less than $.005.
|
|||||||||||||||||||||
A. Organization and Significant Accounting Policies
Deutsche Enhanced Commodity Strategy Fund (formerly DWS Enhanced Commodity Strategy Fund) (the "Fund'') is a diversified series of Deutsche Securities Trust (formerly DWS Securities Trust) (the "Trust"), which is registered under the Investment Company Act of 1940, as amended (the "1940 Act"), as an open-end management investment company organized as a Massachusetts business trust.
The Fund offers multiple classes of shares which provide investors with different purchase options. Class A shares are offered to investors subject to an initial sales charge. Class B shares of the Fund are closed to new purchases, except exchanges or the reinvestment of dividends or other distributions. Class B shares were offered to investors without an initial sales charge and are subject to higher ongoing expenses than Class A shares and a contingent deferred sales charge payable upon certain redemptions. Class B shares automatically convert to Class A shares six years after issuance. Class C shares are offered to investors without an initial sales charge but are subject to higher ongoing expenses than Class A shares and a contingent deferred sales charge payable upon certain redemptions within one year of purchase. Class C shares do not automatically convert into another class. Institutional Class shares are generally available only to qualified institutions, are not subject to initial or contingent deferred sales charges and generally have lower ongoing expenses than other classes. Class S shares are not subject to initial or contingent deferred sales charges and are only available to a limited group of investors.
Investment income, realized and unrealized gains and losses, and certain fund-level expenses and expense reductions, if any, are borne pro rata on the basis of relative net assets by the holders of all classes of shares, except that each class bears certain expenses unique to that class such as distribution and service fees, services to shareholders and certain other class-specific expenses. Differences in class-level expenses may result in payment of different per share dividends by class. All shares of the Fund have equal rights with respect to voting subject to class-specific arrangements.
The Fund's consolidated financial statements are prepared in accordance with accounting principles generally accepted in the United States of America which require the use of management estimates. Actual results could differ from those estimates. The policies described below are followed consistently by the Fund in the preparation of its consolidated financial statements.
Principles of Consolidation. The Fund invests indirectly in commodities markets through a wholly owned subsidiary, Cayman Commodity II, Ltd. (formerly DWS Cayman Commodity II, Ltd.), organized under the laws of the Cayman Islands (the "Subsidiary"). Among other investments, the Subsidiary may invest in commodity-linked derivative instruments, such as swaps and futures. The Subsidiary may also invest in debt securities, some of which are intended to serve as margin or collateral for the Subsidiary's derivatives positions. The Subsidiary may also invest available cash in affiliated money market funds. The Subsidiary is managed by the same portfolio managers that manage the Fund. As of June 30, 2014, the Fund's investment in the Subsidiary was $140,464,260, representing 19.0% of the Fund's net assets. The Fund's Investment Portfolio has been consolidated and includes the portfolio holdings of the Fund and the Subsidiary.
The consolidated financial statements include the accounts of the Fund and the Subsidiary. All inter-company transactions and balances have been eliminated.
Security Valuation. Investments are stated at value determined as of the close of regular trading on the New York Stock Exchange on each day the exchange is open for trading.
Various inputs are used in determining the value of the Fund's investments. These inputs are summarized in three broad levels. Level 1 includes quoted prices in active markets for identical securities. Level 2 includes other significant observable inputs (including quoted prices for similar securities, interest rates, prepayment speeds and credit risk). Level 3 includes significant unobservable inputs (including the Fund's own assumptions in determining the fair value of investments). The level assigned to the securities valuations may not be an indication of the risk or liquidity associated with investing in those securities.
Debt securities and loan participations and assignments are valued at prices supplied by independent pricing services approved by the Fund's Board. Such services may use various pricing techniques which take into account appropriate factors such as yield, quality, coupon rate, maturity, type of issue, trading characteristics, prepayment speeds and other data, as well as broker quotes. If the pricing services are unable to provide valuations, debt securities are valued at the average of the most recent reliable bid quotations or evaluated prices, as applicable, obtained from broker-dealers and loan participations and assignments are valued at the mean of the most recent bid and ask quotations or evaluated prices, as applicable, obtained from one or more broker-dealers. These securities are generally categorized as Level 2.
Futures contracts are generally valued at the settlement prices established each day on the exchange on which they are traded and are categorized as Level 1.
Swap contracts are valued daily based upon prices supplied by a Board approved pricing vendor, if available, and otherwise are valued at the price provided by the broker-dealer. Swap contracts are generally categorized as Level 2.
Exchange-traded options are valued at the last sale price or, in the absence of a sale, the mean between the closing bid and asked prices or at the most recent asked price (bid for purchased options) if no bid or asked price are available. Exchange-traded options are generally categorized as Level 1. Over-the-counter written or purchased options are valued at prices supplied by a Board approved pricing vendor, if available, and otherwise are valued at the price provided by the broker-dealer with which the option was traded. Over-the-counter written or purchased options are generally categorized as Level 2.
Securities and other assets for which market quotations are not readily available or for which the above valuation procedures are deemed not to reflect fair value are valued in a manner that is intended to reflect their fair value as determined in accordance with procedures approved by the Board and are generally categorized as Level 3. In accordance with the Fund's valuation procedures, factors considered in determining value may include, but are not limited to, the type of the security; the size of the holding; the initial cost of the security; the existence of any contractual restrictions on the security's disposition; the price and extent of public trading in similar securities of the issuer or of comparable companies; quotations or evaluated prices from broker-dealers and/or pricing services; information obtained from the issuer, analysts, and/or the appropriate stock exchange (for exchange-traded securities); an analysis of the company's or issuer's financial statements; an evaluation of the forces that influence the issuer and the market(s) in which the security is purchased and sold; and with respect to debt securities, the maturity, coupon, creditworthiness, currency denomination and the movement of the market in which the security is normally traded. The value determined under these procedures may differ from published values for the same securities.
Disclosure about the classification of fair value measurements is included in a table following the Fund's Consolidated Investment Portfolio.
Securities Lending. Brown Brothers Harriman & Co., as lending agent, lends securities of the Fund to certain financial institutions under the terms of the Security Lending Agreement. The Fund retains benefits of owning the securities it has loaned and continues to receive interest and dividends generated by the securities and to participate in any changes in their market value. The Fund requires the borrowers of the securities to maintain collateral with the Fund consisting of either cash or liquid, unencumbered assets having a value at least equal to the value of the securities loaned. When the collateral falls below specified amounts, the lending agent will use its best efforts to obtain additional collateral on the next business day to meet required amounts under the security lending agreement. The Fund may invest the cash collateral into a joint trading account in an affiliated money market fund pursuant to Exemptive Orders issued by the SEC. The Fund receives compensation for lending its securities either in the form of fees or by earning interest on invested cash collateral net of borrower rebates and fees paid to a lending agent. Either the Fund or the borrower may terminate the loan. There may be risks of delay and costs in recovery of securities or even loss of rights in the collateral should the borrower of the securities fail financially. If the Fund is not able to recover securities lent, the Fund may sell the collateral and purchase a replacement investment in the market, incurring the risk that the value of the replacement security is greater than the value of the collateral. The Fund is also subject to all investment risks associated with the reinvestment of any cash collateral received, including, but not limited to, interest rate, credit and liquidity risk associated with such investments. The Fund had no securities on loan at June 30, 2014.
When-Issued/Delayed Delivery Securities. The Fund may purchase or sell securities with delivery or payment to occur at a later date beyond the normal settlement period. At the time the Fund enters into a commitment to purchase or sell a security, the transaction is recorded and the value of the transaction is reflected in the net asset value. The price of such security and the date when the security will be delivered and paid for are fixed at the time the transaction is negotiated. The value of the security may vary with market fluctuations. At the time the Fund enters into a purchase transaction it is required to segregate cash or other liquid assets at least equal to the amount of the commitment. Additionally, the Fund may be required to post securities and/or cash collateral in accordance with the terms of the commitment.
Certain risks may arise upon entering into when-issued or delayed delivery transactions from the potential inability of counterparties to meet the terms of their contracts or if the issuer does not issue the securities due to political, economic, or other factors. Additionally, losses may arise due to changes in the value of the underlying securities.
Loan Participations and Assignments. Loan Participations and Assignments are portions of loans originated by banks and sold in pieces to investors. These floating rate loans ("Loans") in which the Fund invests, are arranged between the borrower and one or more financial institutions ("Lenders"). These Loans may take the form of Senior Loans, which are corporate obligations often issued in connection with recapitalizations, acquisitions, leveraged buy-outs and refinancing. The Fund invests in such Loans in the form of participations in Loans ("Participations") or assignments of all or a portion of Loans from third parties ("Assignments"). Participations typically result in the Fund having a contractual relationship only with the Lender, not with the borrower. The Fund has the right to receive payments of principal, interest and any fees to which it is entitled from the Lender selling the Participation and only upon receipt by the Lender of the payments from the borrower. In connection with purchasing Participations, the Fund generally has no right to enforce compliance by the borrower with the terms of the loan agreement relating to the Loan, or any rights of set-off against the borrower, and the Fund will not benefit directly from any collateral supporting the Loan in which it has purchased the Participation. As a result, the Fund assumes the credit risk of both the borrower and the Lender that is selling the Participation. Assignments typically result in the Fund having a direct contractual relationship with the borrower, and the Fund may enforce compliance by the borrower with the terms of the loan agreement. Loans held by the Fund are generally in the form of Assignments but the Fund may also invest in Participations. All Loans involve interest rate risk, liquidity risk and credit risk, including the potential default or insolvency of the borrower.
Federal Income Taxes. The Fund's policy is to comply with the requirements of the Internal Revenue Code, as amended, which are applicable to regulated investment companies and to distribute all of its taxable income to its shareholders.
Income from certain commodity-linked derivatives does not constitute "qualifying income" to the Fund. Receipt of such income could cause the Fund to be subject to tax at the Fund level. The IRS has issued a private letter ruling to the Fund stating that such income earned through its wholly-owned Subsidiary constitutes qualifying income. The Fund is required to increase its taxable income by its share of the Subsidiary's income, including net gains from commodity-linked transactions. Net investment losses of the Subsidiary cannot be deducted by the Fund in the current period nor carried forward to offset taxable income for future periods.
Under the Regulated Investment Company Modernization Act of 2010, net capital losses incurred post-enactment may be carried forward indefinitely, and their character is retained as short-term and/or long-term. Previously, net capital losses were carried forward for eight years and treated as short-term losses. As a transition rule, the Act requires that post-enactment net capital losses be used before pre-enactment net capital losses.
At June 30, 2014, the Fund had net tax basis capital loss carryforwards of approximately $211,405,000, including $194,920,000 of pre-enactment losses, which may be applied against any realized net taxable capital gains of each succeeding year until fully utilized or until June 30, 2016 ($6,708,000), June 30, 2017 ($102,120,000), June 30, 2018 ($77,997,000) and June 30, 2019 ($8,095,000), the respective expiration dates, whichever occurs first; and approximately $16,485,000 of post-enactment losses, which may be applied against realized net taxable capital gains indefinitely, including short-term losses ($13,821,000) and long-term losses ($2,664,000).
The Fund has reviewed the tax positions for the open tax years as of June 30, 2014 and has determined that no provision for income tax and/or uncertain tax provisions is required in the Fund's consolidated financial statements. The Fund's federal tax returns for the prior three fiscal years remain open subject to examination by the Internal Revenue Service.
Distribution of Income and Gains. Distributions from net investment income of the Fund, if any, are declared and distributed to shareholders quarterly. Net realized gains from investment transactions, in excess of available capital loss carryforwards, would be taxable to the Fund if not distributed and, therefore, will be distributed to shareholders at least annually. The Fund may also make additional distributions for tax purposes if necessary.
The timing and characterization of certain income and capital gain distributions are determined annually in accordance with federal tax regulations which may differ from accounting principles generally accepted in the United States of America. These differences primarily relate to investments in futures and swap contracts and investment in the Subsidiary. As a result, net investment income (loss) and net realized gain (loss) on investment transactions for a reporting period may differ significantly from distributions during such period. Accordingly, the Fund may periodically make reclassifications among certain of its capital accounts without impacting the net asset value of the Fund.
At June 30, 2014, the Fund's components of distributable earnings (accumulated losses) on a tax basis were as follows:
|
Undistributed ordinary income
|
$ | 21,231,372 | ||
|
Capital loss carryforward
|
$ | (211,405,000 | ) | |
|
Unrealized appreciation (depreciation) on investments
|
$ | 4,589,561 |
In addition, the tax character of distributions paid to shareholders by the Fund is summarized as follows:
|
Years Ended June 30,
|
||||||||
|
2014
|
2013
|
|||||||
|
Distributions from ordinary income*
|
$ | 1,147,042 | $ | 2,305,421 | ||||
|
Return of capital distributions
|
$ | — | $ | 16,753,039 | ||||
* For tax purposes, short-term capital gain distributions, and income and net realized gains from certain commodity-linked derivative instruments are considered ordinary income distributions.
Redemption Fees. The Fund imposes a redemption fee of 2% of the total redemption amount on all Fund shares redeemed or exchanged within 15 days of buying them, either by purchase or exchange. This fee is assessed and retained by the Fund for the benefit of the remaining shareholders. The redemption fee is accounted for as an addition to paid-in capital.
Expenses. Expenses of the Trust arising in connection with a specific fund are allocated to that fund. Other Trust expenses which cannot be directly attributed to a fund are apportioned among the funds in the Trust based upon the relative net assets or other appropriate measures.
Contingencies. In the normal course of business, the Fund may enter into contracts with service providers that contain general indemnification clauses. The Fund's maximum exposure under these arrangements is unknown as this would involve future claims that may be made against the Fund that have not yet been made. However, based on experience, the Fund expects the risk of loss to be remote.
Other. Investment transactions are accounted for on a trade date plus one basis for daily net asset value calculations. However, for financial reporting purposes, investment transactions are reported on trade date. Interest income is recorded on the accrual basis. Realized gains and losses from investment transactions are recorded on an identified cost basis. Proceeds from litigation payments, if any, are included in net realized gain (loss) from investments. All discounts and premiums are accreted/amortized for both tax and financial reporting purposes.
B. Derivative Instruments
Swaps. A swap is a contract between two parties to exchange future cash flows at periodic intervals based on the notional amount of the swap. A bilateral swap is a transaction between the fund and a counterparty where cash flows are exchanged between the two parties. A centrally cleared swap is a transaction executed between the fund and a counterparty, then cleared by a clearing member through a central clearinghouse. The central clearinghouse serves as the counterparty, with whom the fund exchanges cash flows.
The value of a swap is adjusted daily, and the change in value, if any, is recorded as unrealized appreciation or depreciation in the Consolidated Statement of Assets and Liabilities. Gains or losses are realized when the swap expires or is closed. Certain risks may arise when entering into swap transactions including counterparty default; liquidity; or unfavorable changes in interest rates or the value of the underlying reference security, commodity or index. In connection with bilateral swaps, securities and/or cash may be identified as collateral in accordance with the terms of the swap agreement to provide assets of value and recourse in the event of default. The maximum counterparty credit risk is the net present value of the cash flows to be received from or paid to the counterparty over the term of the swap, to the extent that this amount is beneficial to the Fund, in addition to any related collateral posted to the counterparty by the Fund. This risk may be partially reduced by a master netting arrangement between the Fund and the counterparty. Upon entering into a centrally cleared swap, the Fund is required to deposit with a financial intermediary cash or securities ("initial margin") in an amount equal to a certain percentage of the notional amount of the swap. Subsequent payments ("variation margin") are made or received by the Fund dependent upon the daily fluctuations in the value of the swap. In a cleared swap transaction, counterparty risk is minimized as the central clearinghouse acts as the counterparty.
Interest Rate Swaps. Interest rate swaps are agreements in which the Fund agrees to pay to the counterparty a fixed rate payment in exchange for the counterparty agreeing to pay to the Fund a variable rate payment, or the Fund agrees to receive from the counterparty a fixed rate payment in exchange for the counterparty agreeing to receive from the Fund a variable rate payment. The payment obligations are based on the notional amount of the swap. For the year ended June 30, 2014, the Fund entered into interest rate swap agreements to gain exposure to different parts of the yield curve while managing overall duration.
A summary of the open interest rate swap contracts as of June 30, 2014 is included in a table following the Fund's Consolidated Investment Portfolio. For the year ended June 30, 2014, the investment in interest rate swap contracts had a total notional amount generally indicative of a range from $190,000,000 to $260,000,000.
Commodity-Linked Swaps. Commodity-linked swap agreements involve a commitment to pay interest in exchange for a commodity-linked return based on a notional amount. To the extent the return of the reference commodity or commodity index underlying the commodity-linked swap exceeds or falls short of the offsetting interest rate obligation, the Fund will receive a payment or make a payment to the counterparty, respectively. For the year ended June 30, 2014 the Fund entered into commodity-linked swap agreements to gain exposure to the investment return of assets that trade in the commodity markets, without investing directly in physical commodities.
A summary of the open commodity-linked swap contracts as of June 30, 2014 is included in a table following the Fund's Consolidated Investment Portfolio. For the year ended June 30, 2014, the investment in long commodity-linked swap contracts had a total notional amount generally indicative of a range from approximately $777,295,000 to $926,685,000, and the investment in short commodity-linked swap contracts had a total notional value generally indicative of a range from $0 to approximately $117,865,000.
Options. An option contract is a contract in which the writer (seller) of the option grants the buyer of the option, upon payment of a premium, the right to purchase from (call option), or sell to (put option), the writer a designated instrument at a specified price within a specified period of time. The Fund may write or purchase interest rate swaption agreements which are options to enter into a pre-defined swap agreement. The interest rate swaption agreement will specify whether the buyer of the swaption will be a fixed-rate receiver or a fixed-rate payer upon exercise. Certain options, including options on indices, will require cash settlement by the Fund if exercised. For the year ended June 30, 2014, the Fund entered into options on interest rate swaps in order to hedge against potential adverse interest rate movements of portfolio assets and options on commodity futures contracts to gain exposure to the investment return of assets that trade in the commodity markets, without investing directly in physical commodities.
If the Fund writes a covered call option, the Fund foregoes, in exchange for the premium, the opportunity to profit during the option period from an increase in the market value of the underlying security above the exercise price. If the Fund writes a put option it accepts the risk of a decline in the value of the underlying security below the exercise price. Over-the-counter options have the risk of the potential inability of counterparties to meet the terms of their contracts. The Fund's maximum exposure to purchased options is limited to the premium initially paid. In addition, certain risks may arise upon entering into option contracts including the risk that an illiquid secondary market will limit the Fund's ability to close out an option contract prior to the expiration date and that a change in the value of the option contract may not correlate exactly with changes in the value of the securities or currencies hedged.
A summary of open purchased option contracts as of June 30, 2014 is included in the Fund's Investment Portfolio. A summary of open written option contracts is included in the table following the Fund's Investment Portfolio. For the year ended June 30, 2014, the investment in written option contracts had a total value generally indicative of a range from approximately $31,000 to $107,000, and purchased option contracts had a total value generally indicative of a range from $0 to approximately $421,000.
Futures Contracts. A futures contract is an agreement between a buyer or seller and an established futures exchange or its clearinghouse in which the buyer or seller agrees to take or make a delivery of a specific amount of a financial instrument at a specified price on a specific date (settlement date). For the year ended June 30, 2014, the Fund entered into commodity futures contracts to gain exposure to the investment return of assets that trade in the commodity markets, without investing directly in physical commodities and interest rate futures contracts to gain exposure to different parts of the yield curve while managing overall duration.
Upon entering into a futures contract, the Fund is required to deposit with a financial intermediary cash or securities ("initial margin") in an amount equal to a certain percentage of the face value indicated in the futures contract. Subsequent payments ("variation margin") are made or received by the Fund dependent upon the daily fluctuations in the value and are recorded for financial reporting purposes as unrealized gains or losses by the Fund. Gains or losses are realized when the contract expires or is closed. Since all futures contracts are exchange traded, counterparty risk is minimized as the exchange's clearinghouse acts as the counterparty, and guarantees the futures against default.
Certain risks may arise upon entering into futures contracts, including the risk that an illiquid market will limit the Fund's ability to close out a futures contract prior to the settlement date and the risk that the futures contract is not well correlated with the security, index or currency to which it relates. Risk of loss may exceed amounts disclosed in the Consolidated Statement of Assets and Liabilities.
A summary of the open futures contracts as of June 30, 2014 is included in the table following the Fund's Consolidated Investment Portfolio. For the year ended June 30, 2014, the investment in futures contracts purchased had a total notional value generally indicative of a range from approximately $68,314,000 to $89,788,000, and the investment in futures contracts sold had a total notional value generally indicative of a range from approximately $13,690,000 to $144,830,000.
The following tables summarize the value of the Fund's derivative instruments held as of June 30, 2014 and the related location in the accompanying Consolidated Statement of Assets and Liabilities, presented by primary underlying risk exposure:
|
Asset Derivatives
|
Purchased Options
|
Futures Contracts
|
Swap Contracts
|
Total
|
||||||||||||
|
Interest Rate Contracts (a)
|
$ | — | $ | 13,125 | $ | — | $ | 13,125 | ||||||||
|
Commodity Contracts (a) (b)
|
174,000 | 1,917,161 | 1,085,961 | 3,177,122 | ||||||||||||
| $ | 174,000 | $ | 1,930,286 | $ | 1,085,961 | $ | 3,190,247 | |||||||||
|
Each of the above derivatives is located in the following Consolidated Statement of Assets and Liabilities accounts:
(a) Includes cumulative appreciation of futures as disclosed in the Consolidated Investment Portfolio. Unsettled variation margin is disclosed separately within the Consolidated Statement of Assets and Liabilities.
(b) Investments in securities, at value (includes purchased options) and unrealized appreciation on bilateral swap contracts
|
||||||||||||||||
|
Liability Derivatives
|
Written Options
|
Futures Contracts
|
Swap Contracts
|
Total
|
||||||||||||
|
Interest Rate Contracts (a) (b)
|
$ | (11,686 | ) | $ | — | $ | (2,745,789 | ) | $ | (2,757,475 | ) | |||||
|
Commodity Contracts (a) (b)
|
(95,800 | ) | (2,074,026 | ) | (1,266,430 | ) | (3,436,256 | ) | ||||||||
| $ | (107,486 | ) | $ | (2,074,026 | ) | $ | (4,012,219 | ) | $ | (6,193,731 | ) | |||||
|
Each of the above derivatives is located in the following Consolidated Statement of Assets and Liabilities accounts:
(a) Includes cumulative depreciation of futures and centrally cleared swap contracts as disclosed in the Consolidated Investment Portfolio. Unsettled variation margin is disclosed separately within the Consolidated Statement of Assets and Liabilities.
(b) Written options, at value and unrealized appreciation on bilateral swap contracts
|
||||||||||||||||
Additionally, the amount of unrealized and realized gains and losses on derivative instruments recognized in Fund earnings during the year ended June 30, 2014 and the related location on the accompanying Consolidated Statement of Operations is summarized in the following tables by primary underlying risk exposure:
|
Realized Gain (Loss)
|
Purchased Options
|
Written Options
|
Futures Contracts
|
Swap Contracts
|
Total
|
|||||||||||||||
|
Interest Rate Contracts (a)
|
$ | (29,718 | ) | $ | 28,278 | $ | (843,055 | ) | $ | 562,147 | $ | (282,348 | ) | |||||||
|
Commodity Contracts (a)
|
— | — | 6,502,913 | 14,933,797 | 21,436,710 | |||||||||||||||
| $ | (29,718 | ) | $ | 28,278 | $ | 5,659,858 | $ | 15,495,944 | $ | 21,154,362 | ||||||||||
|
Each of the above derivatives is located in the following Consolidated Statement of Operations accounts:
(a) Net realized gain (loss) from investments (includes purchased options), written options, futures and swap contracts, respectively
|
||||||||||||||||||||
|
Change in Net Unrealized Appreciation (Depreciation)
|
||||||||||||||||||||
|
Purchased Options
|
Written Options
|
Swap Contracts
|
Futures Contracts
|
Total
|
||||||||||||||||
|
Interest Rate Contracts (a)
|
$ | — | $ | 66,738 | $ | (6,143,267 | ) | $ | 13,125 | $ | (6,063,404 | ) | ||||||||
|
Commodity Contracts (a)
|
(246,670 | ) | 183,530 | 20,361,821 | 97,039 | 20,395,720 | ||||||||||||||
| $ | (246,670 | ) | $ | 250,268 | $ | 14,218,554 | $ | 110,164 | $ | 14,332,316 | ||||||||||
|
Each of the above derivatives is located in the following Consolidated Statement of Operations accounts:
(a) Change in net unrealized appreciation (depreciation) from investments (includes purchased options), written options, swap contracts and futures, respectively
|
||||||||||||||||||||
As of June 30, 2014, the Fund has transactions subject to enforceable master netting agreements. A reconciliation of the gross amounts on the Consolidated Statement of Assets and Liabilities to the net amounts by derivative type, including any collateral exposure, is included in the following tables:
|
Counterparty
|
Gross Amounts of Assets Presented in the Consolidated Statement of Assets and Liabilities
|
Financial Instruments and Derivatives Available for Offset
|
Non-Cash Collateral Received (a)
|
Cash Collateral Received
|
Net Amount of Derivative Assets
|
|||||||||||||||
|
BNP Paribas
|
$ | 11,763 | $ | (11,763 | ) | $ | — | $ | — | $ | — | |||||||||
|
Citigroup, Inc.
|
46,945 | (46,945 | ) | — | — | — | ||||||||||||||
|
JPMorgan Chase Securities, Inc.
|
1,027,253 | (85,863 | ) | — | — | 941,390 | ||||||||||||||
| $ | 1,085,961 | $ | (144,571 | ) | $ | — | $ | — | $ | 941,390 | ||||||||||
|
Counterparty
|
Gross Amounts of Liabilities Presented in the Consolidated Statement of Assets and Liabilities
|
Financial Instruments and Derivatives Available for Offset
|
Non-Cash Collateral Pledged (a)
|
Cash Collateral Pledged
|
Net Amount of Derivative Liabilities
|
|||||||||||||||
|
Bank of America
|
$ | 59,234 | $ | — | $ | (59,234 | ) | $ | — | $ | — | |||||||||
|
Barclays Bank PLC
|
146,300 | — | (146,300 | ) | — | — | ||||||||||||||
|
BNP Paribas
|
15,784 | (11,763 | ) | (4,021 | ) | — | — | |||||||||||||
|
Canadian Imperial Bank of Commerce
|
10,318 | — | (10,318 | ) | — | — | ||||||||||||||
|
Citigroup, Inc.
|
75,985 | (46,945 | ) | (29,040 | ) | — | — | |||||||||||||
|
Credit Suisse
|
14,855 | — | (14,855 | ) | — | — | ||||||||||||||
|
Goldman Sachs & Co.
|
33,369 | — | (33,369 | ) | — | — | ||||||||||||||
|
JPMorgan Chase Securities, Inc.
|
85,863 | (85,863 | ) | — | — | — | ||||||||||||||
|
Macquarie Bank Ltd.
|
29,491 | — | (29,491 | ) | — | — | ||||||||||||||
|
Nomura International PLC
|
5,843 | — | — | — | 5,843 | |||||||||||||||
|
UBS AG
|
801,074 | — | (801,074 | ) | — | — | ||||||||||||||
| $ | 1,278,116 | $ | (144,571 | ) | $ | (1,127,702 | ) | $ | — | $ | 5,843 | |||||||||
(a) The actual collateral pledged may be more than the amount shown.
C. Purchases and Sales of Securities
During the year ended June 30, 2014, purchases and sales of investment securities (excluding short-term investments and U.S. Treasury obligations) aggregated $322,754,302 and $383,800,711, respectively. Purchases and sales of U.S. Treasury obligations aggregated $222,616,448 and $211,399,186, respectively.
For the year ended June 30, 2014, transactions for written options on futures and interest rate swap contracts were as follows:
|
Contracts/
Contract Amount
|
Premiums
|
|||||||
|
Outstanding, beginning of period
|
8,000,000 | $ | 57,600 | |||||
|
Options written
|
366 | 328,864 | ||||||
|
Options closed
|
(166 | ) | (49,534 | ) | ||||
|
Outstanding, end of period
|
8,000,200 | $ | 336,930 | |||||
D. Related Parties
Management Agreement. Under the Investment Management Agreement with Deutsche Investment Management Americas Inc. ("DIMA" or the "Advisor"), an indirect, wholly owned subsidiary of Deutsche Bank AG, the Advisor directs the investments of the Fund in accordance with its investment objectives, policies and restrictions. The Advisor determines the securities, instruments and other contracts relating to investments to be purchased, sold or entered into by the Fund.
Under the Investment Management Agreement with the Advisor, the Fund pays a monthly management fee based on the Fund's average daily net assets, computed and accrued daily and payable monthly, at the following annual rates:
|
First $500 million of the Fund's average daily net assets
|
.950 | % | ||
|
Next $500 million of such net assets
|
.900 | % | ||
|
Next $500 million of such net assets
|
.850 | % | ||
|
Over $1.5 billion of such net assets
|
.825 | % |
Accordingly, for the year ended June 30, 2014, the fee pursuant to the Investment Management Agreement was equivalent to an annual effective rate (exclusive of any applicable waivers/reimbursements) of 0.93% of the Fund's average daily net assets.
For the period from July 1, 2013 through September 30, 2013, the Advisor had contractually agreed to waive its fees and/or reimburse certain operating expenses of the Fund to the extent necessary to maintain the operating expenses (excluding certain expenses such as extraordinary expenses, taxes, brokerage and interest) for certain classes as follows:
|
Class A
|
1.60%
|
|
Class B
|
2.35%
|
|
Class C
|
2.35%
|
|
Class S
|
1.40%
|
|
Institutional Class
|
1.35%
|
Effective October 1, 2013 through September 30, 2014, the Advisor has contractually agreed to waive all or a portion of its fees and/or reimburse certain operating expenses of the Fund to the extent necessary to maintain the operating expenses (excluding certain expenses such as extraordinary expenses, taxes, brokerage and interest) of each class as follows:
|
Class A
|
1.50%
|
|
Class B
|
2.25%
|
|
Class C
|
2.25%
|
|
Class S
|
1.30%
|
|
Institutional Class
|
1.25%
|
For the year ended June 30, 2014, fees waived and/or expenses reimbursed for each class are as follows:
|
Class B
|
$ | 796 | ||
|
Class C
|
8,135 | |||
| $ | 8,931 |
Administration Fee. Pursuant to an Administrative Services Agreement, DIMA provides most administrative services to the Fund. For all services provided under the Administrative Services Agreement, the Fund pays the Advisor an annual fee ("Administration Fee") of 0.10% of the Fund's average daily net assets, computed and accrued daily and payable monthly. For the year ended June 30, 2014, the Administration Fee was $749,446, of which $60,248 is unpaid.
Service Provider Fees. DeAWM Service Company ("DSC"), an affiliate of the Advisor, is the transfer agent, dividend-paying agent and shareholder service agent for the Fund. Pursuant to a sub-transfer agency agreement between DSC and DST Systems, Inc. ("DST"), DSC has delegated certain transfer agent, dividend-paying agent and shareholder service agent functions to DST. DSC compensates DST out of the shareholder servicing fee it receives from the Fund. For the year ended June 30, 2014, the amounts charged to the Fund by DSC were as follows:
|
Services to Shareholders
|
Total Aggregated
|
Unpaid at June 30, 2014
|
||||||
|
Class A
|
$ | 39,429 | $ | 6,105 | ||||
|
Class B
|
1,319 | 207 | ||||||
|
Class C
|
16,275 | 1,373 | ||||||
|
Class S
|
52,695 | 15,836 | ||||||
|
Institutional Class
|
12,076 | 2,377 | ||||||
| $ | 121,794 | $ | 25,898 | |||||
Distribution and Service Fees. Under the Fund's Class B and Class C 12b-1 Plans, DeAWM Distributors, Inc. ("DDI"), an affiliate of the Advisor, receives a fee ("Distribution Fee") of 0.75% of average daily net assets of each of Class B and C shares. In accordance with the Fund's Underwriting and Distribution Services Agreement, DDI enters into related selling group agreements with various firms at various rates for sales of Class B and C shares. For the year ended June 30, 2014, the Distribution Fee was as follows:
|
Distribution Fee
|
Total Aggregated
|
Unpaid at June 30, 2014
|
||||||
|
Class B
|
$ | 5,462 | $ | 225 | ||||
|
Class C
|
409,061 | 29,261 | ||||||
| $ | 414,523 | $ | 29,486 | |||||
In addition, DDI provides information and administrative services for a fee ("Service Fee") to Class A, B, and C shareholders at an annual rate of up to 0.25% of average daily net assets for each such class. DDI in turn has various agreements with financial services firms that provide these services and pays these fees based upon the assets of shareholder accounts the firms service. For the year ended June 30, 2014, the Service Fee was as follows:
|
Service Fee
|
Total Aggregated
|
Unpaid at June 30, 2014
|
Annual
Rate
|
|||||||||
|
Class A
|
$ | 433,976 | $ | 68,496 | .23 | % | ||||||
|
Class B
|
1,728 | 177 | .24 | % | ||||||||
|
Class C
|
136,120 | 20,400 | .25 | % | ||||||||
| $ | 571,824 | $ | 89,073 | |||||||||
Underwriting Agreement and Contingent Deferred Sales Charge. DDI is the principal underwriter for the Fund. Underwriting commissions paid in connection with the distribution of Class A shares for the year ended June 30, 2014 aggregated $142.
In addition, DDI receives any contingent deferred sales charge ("CDSC") from Class B share redemptions occurring within six years of purchase and Class C share redemptions occurring within one year of purchase. There is no such charge upon redemption of any share appreciation or reinvested dividends. The CDSC is based on declining rates ranging from 4% to 1% for Class B and 1% for Class C, of the value of the shares redeemed. For the year ended June 30, 2014, the CDSC for the Fund's Class B and C shares was $3,205 and $4,894, respectively. A deferred sales charge of up to 1% is assessed on certain redemptions of Class A shares. For the year ended June 30, 2014, DDI received $915 for Class A shares.
Typesetting and Filing Service Fees. Under an agreement with DIMA, DIMA is compensated for providing typesetting and certain regulatory filing services to the Fund. For the year ended June 30, 2014, the amount charged to the Fund by DIMA included in the Consolidated Statement of Operations under "reports to shareholders" aggregated $24,195, of which $9,263 is unpaid.
Trustees' Fees and Expenses. The Fund paid retainer fees to each Trustee not affiliated with the Advisor, plus specified amounts to the Board Chairperson and Vice Chairperson and to each committee Chairperson.
Affiliated Cash Management Vehicles. The Fund may invest uninvested cash balances in Central Cash Management Fund and Deutsche Variable NAV Money Fund, affiliated money market funds which are managed by the Advisor. Each affiliated money market fund seeks to provide a high level of current income consistent with liquidity and the preservation of capital. Each affiliated money market fund is managed in accordance with Rule 2a-7 under the Investment Company Act of 1940, which governs the quality, maturity, diversity and liquidity of instruments in which a money market fund may invest. Central Cash Management Fund seeks to maintain a stable net asset value, and Deutsche Variable NAV Money Fund maintains a floating net asset value. The Fund indirectly bears its proportionate share of the expenses of each affiliated money market fund in which it invests. Central Cash Management Fund does not pay the Advisor an investment management fee. To the extent that Deutsche Variable NAV Money Fund pays an investment management fee to the Advisor, the Advisor will waive an amount of the investment management fee payable to the Advisor by the Fund equal to the amount of the investment management fee payable on the Fund's assets invested in Deutsche Variable NAV Money Fund.
E. Line of Credit
The Fund and other affiliated funds (the "Participants") share in a $400 million revolving credit facility provided by a syndication of banks. The Fund may borrow for temporary or emergency purposes, including the meeting of redemption requests that otherwise might require the untimely disposition of securities. The Participants are charged an annual commitment fee which is allocated based on net assets, among each of the Participants. Interest is calculated at a rate per annum equal to the sum of the Federal Funds Rate plus 1.25 percent plus if LIBOR exceeds the Federal Funds Rate the amount of such excess. The Fund may borrow up to a maximum of 33 percent of its net assets under the agreement. The Fund had no outstanding loans at June 30, 2014.
F. Investing in Commodities-Related Investments
The Fund invests in commodity-linked derivative instruments such as commodity-linked swaps, structured notes and futures contracts that are designed to provide exposure to the investment return of assets that trade in the commodity markets, without investing directly in physical commodities. The commodities-linked derivatives instruments in which the Fund invests are more volatile than many other types of securities and may subject the Fund to special risks that do not apply to all derivatives transactions. The value of a commodity-linked derivative investment generally is based upon the price movements of a physical commodity (such as energy, minerals, or agricultural products), a futures contract, swap or commodity index, or other economic variables based upon changes in the value of commodities or the commodities markets. The value of commodity-linked derivative instruments may be affected by changes in overall market movements, commodity index volatility, changes in interest rates, or factors affecting a particular industry or commodity, such as drought, floods, weather, livestock disease, changes in storage costs, embargoes, tariffs, policies of commodity cartels and international economic, political and regulatory developments. Also, a liquid secondary market may not exist for the types of commodity-linked derivative instruments the Fund buys, which may make it difficult for the Fund to sell them at an acceptable price.
G. Share Transactions
The following table summarizes share and dollar activity in the Fund:
|
Year Ended June 30, 2014
|
Year Ended June 30, 2013
|
|||||||||||||||
|
Shares*
|
Dollars
|
Shares*
|
Dollars
|
|||||||||||||
|
Shares sold
|
||||||||||||||||
|
Class A
|
5,833,369 | $ | 88,903,019 | 3,892,134 | $ | 63,464,562 | ||||||||||
|
Class B
|
— | — | 2,434 | 36,792 | ||||||||||||
|
Class C
|
430,853 | 6,067,620 | 634,974 | 9,611,101 | ||||||||||||
|
Class S
|
9,309,981 | 144,890,684 | 9,071,146 | 149,493,902 | ||||||||||||
|
Institutional Class
|
4,683,832 | 72,674,153 | 5,786,234 | 96,188,872 | ||||||||||||
| $ | 312,535,476 | $ | 318,795,229 | |||||||||||||
|
Shares issued to shareholders in reinvestment of distributions
|
||||||||||||||||
|
Class A
|
11,441 | $ | 183,403 | 322,704 | $ | 5,419,900 | ||||||||||
|
Class B
|
— | — | 1,796 | 28,128 | ||||||||||||
|
Class C
|
— | — | 63,243 | 989,632 | ||||||||||||
|
Class S
|
19,935 | 323,348 | 211,251 | 3,572,634 | ||||||||||||
|
Institutional Class
|
35,208 | 572,833 | 383,141 | 6,477,319 | ||||||||||||
| $ | 1,079,584 | $ | 16,487,613 | |||||||||||||
|
Shares redeemed
|
||||||||||||||||
|
Class A
|
(9,078,800 | ) | $ | (138,966,015 | ) | (8,790,450 | ) | $ | (143,087,565 | ) | ||||||
|
Class B
|
(52,968 | ) | (747,603 | ) | (112,741 | ) | (1,694,945 | ) | ||||||||
|
Class C
|
(1,897,704 | ) | (26,603,421 | ) | (2,016,658 | ) | (30,159,658 | ) | ||||||||
|
Class S
|
(8,875,085 | ) | (137,021,679 | ) | (8,899,542 | ) | (145,929,436 | ) | ||||||||
|
Institutional Class
|
(7,050,347 | ) | (109,066,032 | ) | (3,956,438 | ) | (65,948,859 | ) | ||||||||
| $ | (412,404,750 | ) | $ | (386,820,463 | ) | |||||||||||
|
Redemption fees
|
$ | 6,722 | $ | 7,431 | ||||||||||||
|
Net increase (decrease)
|
||||||||||||||||
|
Class A
|
(3,233,990 | ) | $ | (49,876,696 | ) | (4,575,612 | ) | $ | (74,199,646 | ) | ||||||
|
Class B
|
(52,968 | ) | (747,603 | ) | (108,511 | ) | (1,630,025 | ) | ||||||||
|
Class C
|
(1,466,851 | ) | (20,535,627 | ) | (1,318,441 | ) | (19,558,904 | ) | ||||||||
|
Class S
|
454,831 | 8,195,846 | 382,855 | 7,140,149 | ||||||||||||
|
Institutional Class
|
(2,331,307 | ) | (35,818,888 | ) | 2,212,937 | 36,718,236 | ||||||||||
| $ | (98,782,968 | ) | $ | (51,530,190 | ) | |||||||||||
* Shares for the year ended June 30, 2013, and through December 5, 2013 have been adjusted to reflect the effects of a reverse stock split effective December 6, 2013. See Note I.
H. Transactions with Affiliates
The Underlying Deutsche Funds in which the Fund invests are considered to be affiliated investments. A summary of the Fund's transactions with affiliated Underlying Deutsche Funds for the year ended June 30, 2014 is as follows:
|
Affiliate
|
Value ($) at 6/30/2013
|
Purchases Cost ($)
|
Sales
Cost ($)
|
Realized Gain/
(Loss) ($)
|
Income Distributions ($)
|
Value ($) at 6/30/2014
|
||||||||||||||||||
|
Deutsche Variable NAV Money Fund
|
5,001,407 | 10,011,210 | — | — | 13,702 | 15,012,617 | ||||||||||||||||||
|
Central Cash Management Fund
|
38,148,293 | 663,765,342 | 670,556,706 | — | 20,055 | 31,356,929 | ||||||||||||||||||
|
Total
|
43,149,700 | 673,776,552 | 670,556,706 | — | 33,757 | 46,369,546 | ||||||||||||||||||
I. Reverse Stock Split
On December 6, 2013, the Fund implemented a 1 for 5 reverse stock split for each class of shares of the Fund. The net effect of the reverse stock split was to decrease the number of outstanding shares and increase the net asset value per share by a proportionate amount for each class of shares of the Fund. The reverse stock split had no impact on the overall value of a shareholder's investment in the Fund. Capital share activity referenced in Note G (Share Transactions) and per share and net asset value data in the Consolidated Financial Highlights tables have been restated to reflect the reverse stock split.
J. Concentration of Ownership
From time to time, the Fund may have a concentration of several shareholders, including affiliated DWS Funds, holding a significant percentage of shares outstanding. Investment activities of these shareholders could have a material impact on the Fund.
At June 30, 2014, DWS Alternative Asset Allocation Fund held approximately 10% of the outstanding shares of the Fund.
K. Fund Name Change
Effective August 11, 2014, the "DWS Funds" were rebranded "Deutsche Funds."
To the Trustees of Deutsche Securities Trust and Shareholders of Deutsche Enhanced Commodity Strategy Fund:
In our opinion, the accompanying consolidated statement of assets and liabilities, including the consolidated investment portfolio, and the related consolidated statements of operations and of changes in net assets and the financial highlights present fairly, in all material respects, the financial position of Deutsche Enhanced Commodity Strategy Fund (formerly DWS Enhanced Commodity Strategy Fund) (the "Fund") at June 30, 2014, and the results of its operations, the changes in its net assets and the financial highlights for each of the periods indicated therein, in conformity with accounting principles generally accepted in the United States of America. These consolidated financial statements and financial highlights (hereafter referred to as "financial statements") are the responsibility of the Fund's management. Our responsibility is to express an opinion on these financial statements based on our audits. We conducted our audits of these financial statements in accordance with the standards of the Public Company Accounting Oversight Board (United States). Those standards require that we plan and perform the audit to obtain reasonable assurance about whether the financial statements are free of material misstatement. An audit includes examining, on a test basis, evidence supporting the amounts and disclosures in the financial statements, assessing the accounting principles used and significant estimates made by management, and evaluating the overall financial statement presentation. We believe that our audits, which included confirmation of securities at June 30, 2014 by correspondence with the custodian, agent banks and brokers, provide a reasonable basis for our opinion.
|
Boston, Massachusetts
August 22, 2014
|
PricewaterhouseCoopers LLP
|
As an investor of the Fund, you incur two types of costs: ongoing expenses and transaction costs. Ongoing expenses include management fees, distribution and service (12b-1) fees and other Fund expenses. Examples of transaction costs include sales charges (loads), redemption fees and account maintenance fees, which are not shown in this section. The following tables are intended to help you understand your ongoing expenses (in dollars) of investing in the Fund and to help you compare these expenses with the ongoing expenses of investing in other mutual funds. In the most recent six-month period, Class B shares limited these expenses; had it not done so, expenses would have been higher. The example in the table is based on an investment of $1,000 invested at the beginning of the six-month period and held for the entire period (January 1, 2014 to June 30, 2014).
The tables illustrate your Fund's expenses in two ways:
—Actual Fund Return. This helps you estimate the actual dollar amount of ongoing expenses (but not transaction costs) paid on a $1,000 investment in the Fund using the Fund's actual return during the period. To estimate the expenses you paid over the period, simply divide your account value by $1,000 (for example, an $8,600 account value divided by $1,000 = 8.6), then multiply the result by the number in the "Expenses Paid per $1,000" line under the share class you hold.
—Hypothetical 5% Fund Return. This helps you to compare your Fund's ongoing expenses (but not transaction costs) with those of other mutual funds using the Fund's actual expense ratio and a hypothetical rate of return of 5% per year before expenses. Examples using a 5% hypothetical fund return may be found in the shareholder reports of other mutual funds. The hypothetical account values and expenses may not be used to estimate the actual ending account balance or expenses you paid for the period.
Please note that the expenses shown in these tables are meant to highlight your ongoing expenses only and do not reflect any transaction costs. The "Expenses Paid per $1,000" line of the tables is useful in comparing ongoing expenses only and will not help you determine the relative total expense of owning different funds. Subject to certain exceptions, an account maintenance fee of $20.00 assessed once per calendar year for Classes A, B, C and S shares may apply for accounts with balances less than $10,000. This fee is not included in these tables. If it was, the estimate of expenses paid for Classes A, B, C and S shares during the period would be higher, and account value during the period would be lower, by this amount.
|
Expenses and Value of a $1,000 Investment for the six months ended June 30, 2014 (Unaudited)
|
||||||||||||||||||||
|
Actual Fund Return
|
Class A
|
Class B
|
Class C
|
Class S
|
Institutional Class
|
|||||||||||||||
|
Beginning Account Value 1/1/14
|
$ | 1,000.00 | $ | 1,000.00 | $ | 1,000.00 | $ | 1,000.00 | $ | 1,000.00 | ||||||||||
|
Ending Account Value 6/30/14
|
$ | 1,056.40 | $ | 1,051.70 | $ | 1,051.60 | $ | 1,056.90 | $ | 1,057.20 | ||||||||||
|
Expenses Paid per $1,000*
|
$ | 7.44 | $ | 11.45 | $ | 11.45 | $ | 6.53 | $ | 5.92 | ||||||||||
|
Hypothetical 5% Fund Return
|
Class A
|
Class B
|
Class C
|
Class S
|
Institutional Class
|
|||||||||||||||
|
Beginning Account Value 1/1/14
|
$ | 1,000.00 | $ | 1,000.00 | $ | 1,000.00 | $ | 1,000.00 | $ | 1,000.00 | ||||||||||
|
Ending Account Value 6/30/14
|
$ | 1,017.55 | $ | 1,013.64 | $ | 1,013.64 | $ | 1,018.45 | $ | 1,019.04 | ||||||||||
|
Expenses Paid per $1,000*
|
$ | 7.30 | $ | 11.23 | $ | 11.23 | $ | 6.41 | $ | 5.81 | ||||||||||
* Expenses are equal to the Fund's annualized expense ratio for each share class, multiplied by the average account value over the period, multiplied by 181 (the number of days in the most recent six-month period), then divided by 365.
|
Annualized Expense Ratios
|
Class A
|
Class B
|
Class C
|
Class S
|
Institutional Class
|
|
Deutsche Enhanced Commodity Strategy Fund
|
1.46%
|
2.25%
|
2.25%
|
1.28%
|
1.16%
|
For more information, please refer to the Fund's prospectus.
For an analysis of the fees associated with an investment in the Fund or similar funds, please refer to http://apps.finra.org/fundanalyzer/1/fa.aspx.
A total of 5.0% of the dividends distributed during the fiscal year was derived from interest on U.S. government securities, which is generally exempt from state income tax.
Please consult a tax advisor if you have questions about federal or state income tax laws, or on how to prepare your tax returns. If you have specific questions about your account, please call (800) 728-3337.
The Board of Trustees approved the renewal of DWS Enhanced Commodity Strategy Fund's investment management agreement (the "Agreement") with Deutsche Investment Management Americas Inc. ("DIMA") in September 2013.
In terms of the process that the Board followed prior to approving the Agreement, shareholders should know that:
— In September 2013, all of the Fund's Trustees were independent of DIMA and its affiliates.
— The Trustees met frequently during the past year to discuss fund matters and dedicated a substantial amount of time to contract review matters. Over the course of several months, the Board's Contract Committee, in coordination with the Board's Equity Oversight Committee, reviewed comprehensive materials received from DIMA, independent third parties and independent counsel. These materials included an analysis of the Fund's performance, fees and expenses, and profitability compiled by a fee consultant retained by the Fund's Independent Trustees (the "Fee Consultant"). The Board also received extensive information throughout the year regarding performance of the Fund.
— The Independent Trustees regularly meet privately with their independent counsel to discuss contract review and other matters. In addition, the Independent Trustees were also advised by the Fee Consultant in the course of their review of the Fund's contractual arrangements and considered a comprehensive report prepared by the Fee Consultant in connection with their deliberations.
— In connection with reviewing the Agreement, the Board also reviewed the terms of the Fund's Rule 12b-1 plan, distribution agreement, administrative services agreement, transfer agency agreement and other material service agreements.
— Based on its evaluation of the information provided, the Contract Committee presented its findings and recommendations to the Board. The Board then reviewed the Contract Committee's findings and recommendations.
In connection with the contract review process, the Contract Committee and the Board considered the factors discussed below, among others. The Board also considered that DIMA and its predecessors have managed the Fund since its inception, and the Board believes that a long-term relationship with a capable, conscientious advisor is in the best interests of the Fund. The Board considered, generally, that shareholders chose to invest or remain invested in the Fund knowing that DIMA managed the Fund. DIMA is part of Deutsche Bank AG, a major global banking institution that is engaged in a wide range of financial services. The Board believes that there are advantages to being part of a global asset management business that offers a wide range of investing expertise and resources, including hundreds of portfolio managers and analysts with research capabilities in many countries throughout the world.
As part of the contract review process, the Board carefully considered the fees and expenses of each DWS fund overseen by the Board in light of the fund's performance. In many cases, this led to a negotiation with DIMA of lower expense caps as part of the 2012 and 2013 contract review processes than had previously been in place. As part of these negotiations, the Board indicated that it would consider relaxing these new lower caps in future years following sustained improvements in performance, among other considerations.
In June 2012, Deutsche Bank AG ("DB"), DIMA's parent company, announced that DB would combine its Asset Management (of which DIMA was a part) and Wealth Management divisions. DB has advised the Independent Trustees that the U.S. asset management business is a critical and integral part of DB, and that it has, and will continue to, reinvest a significant portion of the substantial savings it expects to realize by combining its Asset Management and Wealth Management divisions into the new Asset and Wealth Management ("AWM") division, including ongoing enhancements to its investment capabilities. DB also has confirmed its commitment to maintaining strong legal and compliance groups within the AWM division.
While shareholders may focus primarily on fund performance and fees, the Fund's Board considers these and many other factors, including the quality and integrity of DIMA's personnel and such other issues as back-office operations, fund valuations, and compliance policies and procedures.
Nature, Quality and Extent of Services. The Board considered the terms of the Agreement, including the scope of advisory services provided under the Agreement. The Board noted that, under the Agreement, DIMA provides portfolio management services to the Fund and that, pursuant to a separate administrative services agreement, DIMA provides administrative services to the Fund. The Board considered the experience and skills of senior management and investment personnel, the resources made available to such personnel, the ability of DIMA to attract and retain high-quality personnel, and the organizational depth and stability of DIMA. The Board reviewed the Fund's performance over short-term and long-term periods and compared those returns to various agreed-upon performance measures, including market indices and a peer universe compiled by the Fee Consultant using information supplied by Morningstar Direct ("Morningstar"), an independent fund data service. The Board also noted that it has put into place a process of identifying "Focus Funds" (e.g., funds performing poorly relative to their benchmark or a peer universe compiled by an independent fund data service), and receives more frequent reporting and information from DIMA regarding such funds, along with DIMA's remedial plans to address underperformance. The Board believes this process is an effective manner of identifying and addressing underperforming funds. Based on the information provided, the Board noted that for the one-, three- and five-year periods ended December 31, 2012, the Fund's performance (Class A shares) was in the 3rd quartile, 1st quartile and 2nd quartile, respectively, of the applicable Morningstar universe (the 1st quartile being the best performers and the 4th quartile being the worst performers). The Board also observed that the Fund has outperformed its benchmark in the three-year period and has underperformed its benchmark in the one- and five-year periods ended December 31, 2012.
Fees and Expenses. The Board considered the Fund's investment management fee schedule, operating expenses and total expense ratios, and comparative information provided by Lipper Inc. ("Lipper") and the Fee Consultant regarding investment management fee rates paid to other investment advisors by similar funds (1st quartile being the most favorable and 4th quartile being the least favorable). With respect to management fees paid to other investment advisors by similar funds, the Board noted that the contractual fee rates paid by the Fund, which include a 0.10% fee paid to DIMA under the Fund's administrative services agreement, were higher than the median (3rd quartile) of the applicable Lipper peer group (based on Lipper data provided as of December 31, 2012). The Board noted that the Fund's Class A shares total (net) operating expenses (excluding 12b-1 fees) were expected to be higher than the median (3rd quartile) of the applicable Lipper expense universe (based on Lipper data provided as of December 31, 2012, and analyzing Lipper expense universe Class A (net) expenses less any applicable 12b-1 fees) ("Lipper Universe Expenses"). The Board also reviewed data comparing each share class's total (net) operating expenses to the applicable Lipper Universe Expenses. The Board considered the Fund's management fee rate as compared to fees charged by DIMA to comparable funds and considered differences between the Fund and the comparable funds. The Board also considered how the Fund's total (net) operating expenses compared to the total (net) operating expenses of a more customized peer group selected by Lipper (based on such factors as asset size).
The Board also noted that the expense limitations agreed to by DIMA helped to ensure that the Fund's total (net) operating expenses would remain competitive.
The information considered by the Board as part of its review of management fees included information regarding fees charged by DIMA and its affiliates to similar institutional accounts and to similar funds offered primarily to European investors ("DWS Europe funds"), in each case as applicable. The Board observed that advisory fee rates for institutional accounts generally were lower than the management fees charged by similarly managed DWS U.S. mutual funds ("DWS Funds"), but also took note of the differences in services provided to DWS Funds as compared to institutional accounts. In the case of DWS Europe funds, the Board observed that fee rates for DWS Europe funds generally were higher than for similarly managed DWS Funds, but noted that differences in the types of services provided to DWS Funds relative to DWS Europe funds made it difficult to compare such fees.
The Board noted that, in connection with the 2011 contract renewal process, DIMA agreed to implement a new management fee breakpoint.
On the basis of the information provided, the Board concluded that management fees were reasonable and appropriate in light of the nature, quality and extent of services provided by DIMA.
Profitability. The Board reviewed detailed information regarding revenues received by DIMA under the Agreement. The Board considered the estimated costs and pre-tax profits realized by DIMA from advising the DWS Funds, as well as estimates of the pre-tax profits attributable to managing the Fund in particular. The Board also received information regarding the estimated enterprise-wide profitability of DWS and its affiliates with respect to all fund services in totality and by fund. The Board and the Fee Consultant reviewed DIMA's methodology in allocating its costs to the management of the Fund. Based on the information provided, the Board concluded that the pre-tax profits realized by DIMA in connection with the management of the Fund were not unreasonable. The Board also reviewed information regarding the profitability of certain similar investment management firms. The Board noted that while information regarding the profitability of such firms is limited (and in some cases is not necessarily prepared on a comparable basis), DIMA and its affiliates' overall profitability with respect to the DWS fund complex (after taking into account distribution and other services provided to the funds by DIMA and its affiliates) was lower than the overall profitability levels of many comparable firms for which such data was available.
Economies of Scale. The Board considered whether there are economies of scale with respect to the management of the Fund and whether the Fund benefits from any economies of scale. The Board noted that the Fund's management fee schedule includes fee breakpoints. The Board concluded that the Fund's fee schedule represents an appropriate sharing between the Fund and DIMA of such economies of scale as may exist in the management of the Fund at current asset levels.
Other Benefits to DIMA and Its Affiliates. The Board also considered the character and amount of other incidental benefits received by DIMA and its affiliates, including any fees received by DIMA for administrative services provided to the Fund and any fees received by an affiliate of DIMA for distribution services. The Board also considered benefits to DIMA related to brokerage and soft-dollar allocations, including allocating brokerage to pay for research generated by parties other than the executing broker dealers, which pertain primarily to funds investing in equity securities, along with the incidental public relations benefits to DIMA related to DWS Funds advertising and cross-selling opportunities among DIMA products and services. The Board concluded that management fees were reasonable in light of these fallout benefits.
Compliance. The Board considered the significant attention and resources dedicated by DIMA to documenting and enhancing its compliance processes in recent years. The Board noted in particular (i) the experience and seniority of both DIMA's chief compliance officer and the Fund's chief compliance officer; (ii) the large number of DIMA compliance personnel; and (iii) the substantial commitment of resources by DIMA and its affiliates to compliance matters.
Based on all of the information considered and the conclusions reached, the Board unanimously determined that the continuation of the Agreement is in the best interests of the Fund. In making this determination, the Board did not give particular weight to any single factor identified above. The Board considered these factors over the course of numerous meetings, certain of which were in executive session with only the Independent Trustees and their independent counsel present. It is possible that individual Trustees may have weighed these factors differently in reaching their individual decisions to approve the continuation of the Agreement.
The following table presents certain information regarding the Board Members and Officers of the fund. Each Board Member's year of birth is set forth in parentheses after his or her name. Unless otherwise noted, (i) each Board Member has engaged in the principal occupation(s) noted in the table for at least the most recent five years, although not necessarily in the same capacity; and (ii) the address of each Independent Board Member is c/o Kenneth C. Froewiss, Chairman, Deutsche Mutual Funds, P.O. Box 390601, Cambridge, MA 02139. Except as otherwise noted below, the term of office for each Board Member is until the election and qualification of a successor, or until such Board Member sooner dies, resigns, is removed or as otherwise provided in the governing documents of the fund. Because the fund does not hold an annual meeting of shareholders, each Board Member will hold office for an indeterminate period. The Board Members may also serve in similar capacities with other funds in the fund complex.
|
Independent Board Members
|
||||
|
Name, Year of Birth, Position with the Fund and Length of Time Served1
|
Business Experience and Directorships During the Past Five Years
|
Number of Funds in Deutsche Fund Complex Overseen
|
Other Directorships Held by Board Member
|
|
|
Kenneth C. Froewiss (1945)
Chairperson since 2013, and Board Member since 2001
|
Adjunct Professor of Finance, NYU Stern School of Business (September 2009–present; Clinical Professor from 1997–September 2009); Member, Finance Committee, Association for Asian Studies (2002–present); Director, Mitsui Sumitomo Insurance Group (US) (2004–present); prior thereto, Managing Director, J.P. Morgan (investment banking firm) (until 1996)
|
104
|
—
|
|
|
William McClayton (1944)
Vice Chairperson since 2013, and Board Member since 2004
|
Private equity investor (since October 2009); previously, Managing Director, Diamond Management & Technology Consultants, Inc. (global consulting firm) (2001–2009); Directorship: Board of Managers, YMCA of Metropolitan Chicago; formerly: Senior Partner, Arthur Andersen LLP (accounting) (1966–2001); Trustee, Ravinia Festival
|
104
|
—
|
|
|
John W. Ballantine (1946)
Board Member since 1999
|
Retired; formerly, Executive Vice President and Chief Risk Management Officer, First Chicago NBD Corporation/The First National Bank of Chicago (1996–1998); Executive Vice President and Head of International Banking (1995–1996); former Directorships: Director and former Chairman of the Board, Healthways, Inc.2 (provider of disease and care management services) (2003–2014); Stockwell Capital Investments PLC (private equity); First Oak Brook Bancshares, Inc. and Oak Brook Bank; Prisma Energy International
|
104
|
Portland General Electric2 (utility company) (2003– present)
|
|
|
Henry P. Becton, Jr. (1943)
Board Member since 1990
|
Vice Chair and former President, WGBH Educational Foundation. Directorships: Public Radio International; Public Radio Exchange (PRX); North Bennett Street School (Boston); former Directorships: Belo Corporation2 (media company); The PBS Foundation; Association of Public Television Stations; Boston Museum of Science; American Public Television; Concord Academy; New England Aquarium; Mass. Corporation for Educational Telecommunications; Committee for Economic Development; Public Broadcasting Service; Connecticut College
|
104
|
Lead Director, Becton Dickinson and Company2 (medical technology company)
|
|
|
Dawn-Marie Driscoll (1946)
Board Member since 1987
|
Emeritus Executive Fellow, Center for Business Ethics, Bentley University; formerly: President, Driscoll Associates; Partner, Palmer & Dodge (1988–1990); Vice President of Corporate Affairs and General Counsel, Filene's (1978–1988). Directorships: Director of ICI Mutual Insurance Company (since 2007); Advisory Board, Center for Business Ethics, Bentley University; Trustee and former Chairman of the Board, Southwest Florida Community Foundation (charitable organization); former Directorships: Sun Capital Advisers Trust (mutual funds) (2007–2012), Investment Company Institute (audit, executive, nominating committees) and Independent Directors Council (governance, executive committees)
|
104
|
—
|
|
|
Keith R. Fox, CFA (1954)
Board Member since 1996
|
Managing General Partner, Exeter Capital Partners (a series of private investment funds) (since 1986). Directorships: Progressive International Corporation (kitchen goods importer and distributor); The Kennel Shop (retailer); former Chairman, National Association of Small Business Investment Companies; former Directorships: BoxTop Media Inc. (advertising); Sun Capital Advisers Trust (mutual funds) (2011–2012)
|
104
|
—
|
|
|
Paul K. Freeman (1950)
Board Member since 1993
|
Consultant, World Bank/Inter-American Development Bank; Executive and Governing Council of the Independent Directors Council (Chairman of Education Committee); formerly: Project Leader, International Institute for Applied Systems Analysis (1998–2001); Chief Executive Officer, The Eric Group, Inc. (environmental insurance) (1986–1998); Directorships: Denver Zoo Foundation (December 2012–present); former Directorships: Prisma Energy International
|
104
|
—
|
|
|
Richard J. Herring (1946)
Board Member since 1990
|
Jacob Safra Professor of International Banking and Professor, Finance Department, The Wharton School, University of Pennsylvania (since July 1972); Co-Director, Wharton Financial Institutions Center; Co-Chair, U.S. Shadow Financial Regulatory Committee; Executive Director, Financial Economists Roundtable; formerly: Vice Dean and Director, Wharton Undergraduate Division (July 1995–June 2000); Director, Lauder Institute of International Management Studies (July 2000–June 2006)
|
104
|
Director, Aberdeen Singapore and Japan Funds (since 2007); Independent Director of Barclays Bank Delaware (since September 2010)
|
|
|
Rebecca W. Rimel (1951)
Board Member since 1995
|
President and Chief Executive Officer, The Pew Charitable Trusts (charitable organization) (1994 to present); formerly: Executive Vice President, The Glenmede Trust Company (investment trust and wealth management) (1983–2004); Board Member, Investor Education (charitable organization) (2004–2005); Trustee, Executive Committee, Philadelphia Chamber of Commerce (2001–2007); Director, Viasys Health Care2 (January 2007–June 2007); Trustee, Thomas Jefferson Foundation (charitable organization) (1994–2012)
|
104
|
Director, Becton Dickinson and Company2 (medical technology company) (2012– present); Director, BioTelemetry Inc.2 (health care) (2009– present)
|
|
|
William N. Searcy, Jr. (1946)
Board Member since 1993
|
Private investor since October 2003; formerly: Pension & Savings Trust Officer, Sprint Corporation2 (telecommunications) (November 1989–September 2003); Trustee, Sun Capital Advisers Trust (mutual funds) (1998–2012)
|
104
|
—
|
|
|
Jean Gleason Stromberg (1943)
Board Member since 1997
|
Retired. Formerly, Consultant (1997–2001); Director, Financial Markets U.S. Government Accountability Office (1996–1997); Partner, Norton Rose Fulbright, L.L.P. (law firm) (1978–1996). Directorships: The William and Flora Hewlett Foundation; former Directorships: Service Source, Inc., Mutual Fund Directors Forum (2002–2004), American Bar Retirement Association (funding vehicle for retirement plans) (1987–1990 and 1994–1996)
|
104
|
—
|
|
|
Robert H. Wadsworth
(1940)
Board Member since 1999
|
President, Robert H. Wadsworth & Associates, Inc. (consulting firm) (1983 to present); Director, The Phoenix Boys Choir Association
|
107
|
—
|
|
|
Officers4
|
||
|
Name, Year of Birth, Position with the Fund and Length of Time Served5
|
Business Experience and Directorships During the Past Five Years
|
|
|
Brian E. Binder8 (1972)
President and Chief Executive Officer, 2013–present
|
Managing Director3 and Head of Fund Administration, Deutsche Asset & Wealth Management (2013–present); formerly: Head of Business Management and Consulting at Invesco, Ltd. (2010–2012); Chief Administrative Officer, Van Kampen Funds Inc. (2008–2010); and Chief Administrative Officer, Morgan Stanley Investment Management Americas Distribution (2003–2008)
|
|
|
John Millette7 (1962)
Vice President and Secretary, 1999–present
|
Director,3 Deutsche Asset & Wealth Management
|
|
|
Paul H. Schubert6 (1963)
Chief Financial Officer, 2004–present
Treasurer, 2005–present
|
Managing Director,3 Deutsche Asset & Wealth Management (since July 2004); formerly: Executive Director, Head of Mutual Fund Services and Treasurer for UBS Family of Funds (1998–2004); Vice President and Director of Mutual Fund Finance at UBS Global Asset Management (1994–1998)
|
|
|
Caroline Pearson7 (1962)
Chief Legal Officer,
2010–present
|
Managing Director,3 Deutsche Asset & Wealth Management; formerly: Assistant Secretary for DWS family of funds (1997–2010)
|
|
|
Melinda Morrow6 (1970)
Vice President,
2012–present
|
Director,3 Deutsche Asset & Wealth Management
|
|
|
Hepsen Uzcan7 (1974)
Assistant Secretary, 2013–present
|
Director,3 Deutsche Asset & Wealth Management
|
|
|
Paul Antosca7 (1957)
Assistant Treasurer, 2007–present
|
Director,3 Deutsche Asset & Wealth Management
|
|
|
Jack Clark7 (1967)
Assistant Treasurer, 2007–present
|
Director,3 Deutsche Asset & Wealth Management
|
|
|
Diane Kenneally7 (1966)
Assistant Treasurer, 2007–present
|
Director,3 Deutsche Asset & Wealth Management
|
|
|
Wayne Salit6,9 (1967)
Anti-Money Laundering Compliance Officer, 2014–present
|
Director,3 Deutsche Asset & Wealth Management; formerly: Managing Director, AML Compliance Officer at BNY Mellon (2011–2014); and Director, AML Compliance Officer at Deutsche Bank (2004–2011)
|
|
|
Robert Kloby6 (1962)
Chief Compliance Officer, 2006–present
|
Managing Director,3 Deutsche Asset & Wealth Management
|
|
1 The length of time served represents the year in which the Board Member joined the board of one or more Deutsche funds currently overseen by the Board.
2 A publicly held company with securities registered pursuant to Section 12 of the Securities Exchange Act of 1934.
3 Executive title, not a board directorship.
4 As a result of their respective positions held with the Advisor, these individuals are considered "interested persons" of the Advisor within the meaning of the 1940 Act. Interested persons receive no compensation from the fund.
5 The length of time served represents the year in which the officer was first elected in such capacity for one or more Deutsche funds.
6 Address: 60 Wall Street, New York, NY 10005.
7 Address: One Beacon Street, Boston, MA 02108.
8 Address: 222 South Riverside Plaza, Chicago, IL 60606.
9 Effective as of June 16, 2014.
The fund's Statement of Additional Information ("SAI") includes additional information about the Board Members. The SAI is available, without charge, upon request. If you would like to request a copy of the SAI, you may do so by calling the following toll-free number: (800) 728-3337.
|
For More Information
|
The automated telephone system allows you to access personalized account information and obtain information on other Deutsche funds using either your voice or your telephone keypad. Certain account types within Classes A, B, C and S also have the ability to purchase, exchange or redeem shares using this system.
For more information, contact your financial advisor. You may also access our automated telephone system or speak with a Shareholder Service representative by calling:
(800) 728-3337
|
|
|
Web Site
|
deutschefunds.com
View your account transactions and balances, trade shares, monitor your asset allocation, subscribe to fund and account updates by e-mail, and change your address, 24 hours a day.
Obtain prospectuses and applications, blank forms, interactive worksheets, news about Deutsche funds, retirement planning information, and more.
|
|
|
Written Correspondence
|
Deutsche Asset & Wealth Management
PO Box 219151
Kansas City, MO 64121-9151
|
|
|
Proxy Voting
|
The fund's policies and procedures for voting proxies for portfolio securities and information about how the fund voted proxies related to its portfolio securities during the 12-month period ended June 30 are available on our Web site — deutschefunds.com (click on "proxy voting"at the bottom of the page) — or on the SEC's Web site — sec.gov. To obtain a written copy of the fund's policies and procedures without charge, upon request, call us toll free at (800) 728-3337.
|
|
|
Portfolio Holdings
|
Following the fund's fiscal first and third quarter-end, a complete portfolio holdings listing is filed with the SEC on Form N-Q. This form will be available on the SEC's Web site at sec.gov, and it also may be reviewed and copied at the SEC's Public Reference Room in Washington, D.C. Information on the operation of the SEC's Public Reference Room may be obtained by calling (800) SEC-0330. The fund's portfolio holdings are also posted on deutschefunds.com from time to time. Please see the fund's current prospectus for more information.
|
|
|
Principal Underwriter
|
If you have questions, comments or complaints, contact:
DeAWM Distributors, Inc.
222 South Riverside Plaza
Chicago, IL 60606-5808
(800) 621-1148
|
|
|
Investment Management
|
Deutsche Investment Management Americas Inc. ("DIMA" or the "Advisor"), which is part of Deutsche Asset & Wealth Management, is the investment advisor for the fund. DIMA and its predecessors have more than 80 years of experience managing mutual funds and DIMA provides a full range of investment advisory services to both institutional and retail clients.
DIMA is an indirect, wholly owned subsidiary of Deutsche Bank AG. Deutsche Bank AG is a major global banking institution engaged in a wide variety of financial services, including investment management, retail, private and commercial banking, investment banking and insurance.
Deutsche Asset & Wealth Management is the retail brand name in the U.S. for the wealth management and asset management activities of Deutsche Bank AG and DIMA. Deutsche Asset & Wealth Management is committed to delivering the investing expertise, insight and resources of this global investment platform to American investors.
|
|
|
Class A
|
Class B
|
Class C
|
Class S
|
Institutional Class
|
||
|
Nasdaq Symbol
|
SKNRX
|
SKBRX
|
SKCRX
|
SKSRX
|
SKIRX
|
|
|
CUSIP Number
|
25159L 877
|
25159L 869
|
25159L 851
|
25159L 844
|
25159L 836
|
|
|
Fund Number
|
485
|
685
|
785
|
2085
|
817
|

|
ITEM 2.
|
CODE OF ETHICS
|
|
As of the end of the period covered by this report, the registrant has adopted a code of ethics, as defined in Item 2 of Form N-CSR, that applies to its Principal Executive Officer and Principal Financial Officer.
There have been no amendments to, or waivers from, a provision of the code of ethics during the period covered by this report that would require disclosure under Item 2.
A copy of the code of ethics is filed as an exhibit to this Form N-CSR.
|
|
|
ITEM 3.
|
AUDIT COMMITTEE FINANCIAL EXPERT
|
|
The fund’s audit committee is comprised solely of trustees who are "independent" (as such term has been defined by the Securities and Exchange Commission ("SEC") in regulations implementing Section 407 of the Sarbanes-Oxley Act (the "Regulations")). The fund’s Board of Trustees has determined that there are several "audit committee financial experts" (as such term has been defined by the Regulations) serving on the fund’s audit committee including Mr. Paul K. Freeman, the chair of the fund’s audit committee. An “audit committee financial expert” is not an “expert” for any purpose, including for purposes of Section 11 of the Securities Act of 1933 and the designation or identification of a person as an “audit committee financial expert” does not impose on such person any duties, obligations or liability that are greater than the duties, obligations and liability imposed on such person as a member of the audit committee and board of directors in the absence of such designation or identification.
|
|
|
ITEM 4.
|
PRINCIPAL ACCOUNTANT FEES AND SERVICES
|
DEUTSCHE ENHANCED COMMODITY STRATEGY FUND
FORM N-CSR DISCLOSURE RE: AUDIT FEES
The following table shows the amount of fees that PricewaterhouseCoopers, LLP (“PWC”), the Fund’s independent registered public accounting firm, billed to the Fund during the Fund’s last two fiscal years. The Audit Committee approved in advance all audit services and non-audit services that PWC provided to the Fund.
Services that the Fund’s Independent Registered Public Accounting Firm Billed to the Fund
|
Fiscal Year Ended June 30,
|
Audit Fees Billed to Fund
|
Audit-Related
Fees Billed to Fund
|
Tax Fees Billed to Fund
|
All
Other Fees Billed to Fund
|
||||||||||||
|
2014
|
$ | 91,122 | $ | 0 | $ | 0 | $ | 0 | ||||||||
|
2013
|
$ | 89,889 | $ | 0 | $ | 0 | $ | 0 | ||||||||
Services that the Fund’s Independent Registered Public Accounting Firm Billed to the Adviser and Affiliated Fund Service Providers
The following table shows the amount of fees billed by PWC to Deutsche Investment Management Americas Inc. (“DeIM” or the “Adviser”), and any entity controlling, controlled by or under common control with DeIM (“Control Affiliate”) that provides ongoing services to the Fund (“Affiliated Fund Service Provider”), for engagements directly related to the Fund’s operations and financial reporting, during the Fund’s last two fiscal years.
|
Fiscal Year Ended Jne 30,
|
Audit-Related
Fees Billed to Adviser and Affiliated Fund Service Providers
|
Tax Fees Billed to Adviser and Affiliated Fund Service Providers
|
All
Other Fees Billed to Adviser and Affiliated Fund Service Providers
|
|||||||||
|
2014
|
$ | 0 | $ | 66,535 | $ | 0 | ||||||
|
2013
|
$ | 0 | $ | 51,500 | $ | 0 | ||||||
The “Tax Fees Billed to the Advisor” were billed for services associated with foreign tax filings.
Non-Audit Services
The following table shows the amount of fees that PWC billed during the Fund’s last two fiscal years for non-audit services. The Audit Committee pre-approved all non-audit services that PWC provided to the Adviser and any Affiliated Fund Service Provider that related directly to the Fund’s operations and financial reporting. The Audit Committee requested and received information from PWC about any non-audit services that PWC rendered during the Fund’s last fiscal year to the Adviser and any Affiliated Fund Service Provider. The Committee considered this information in evaluating PWC’s independence.
|
Fiscal Year Ended June 30,
|
Total
Non-Audit Fees Billed to Fund
(A)
|
Total Non-Audit Fees billed to Adviser and Affiliated Fund Service Providers (engagements related directly to the operations and financial reporting of the Fund)
(B)
|
Total Non-Audit Fees billed to Adviser and Affiliated Fund Service Providers (all other engagements)
(C)
|
Total of (A), (B)
and (C)
|
||||||||||||
|
2014
|
$ | 0 | $ | 66,535 | $ | 0 | $ | 66,535 | ||||||||
|
2013
|
$ | 0 | $ | 51,500 | $ | 0 | $ | 51,500 | ||||||||
Audit Committee Pre-Approval Policies and Procedures. Generally, each Fund’s Audit Committee must pre approve (i) all services to be performed for a Fund by a Fund’s Independent Registered Public Accounting Firm and (ii) all non-audit services to be performed by a Fund’s Independent Registered Public Accounting Firm for the DIMA Entities with respect to operations and financial reporting of the Fund, except that the Chairperson or Vice Chairperson of each Fund’s Audit Committee may grant the pre-approval for non-audit services described in items (i) and (ii) above for non-prohibited services for engagements of less than $100,000. All such delegated pre approvals shall be presented to each Fund’s Audit Committee no later than the next Audit Committee meeting.
There were no amounts that were approved by the Audit Committee pursuant to the de minimis exception under Rule 2-01 of Regulation S-X.
According to the registrant’s principal Independent Registered Public Accounting Firm, substantially all of the principal Independent Registered Public Accounting Firm's hours spent on auditing the registrant's financial statements were attributed to work performed by full-time permanent employees of the principal Independent Registered Public Accounting Firm.
***
|
ITEM 5.
|
AUDIT COMMITTEE OF LISTED REGISTRANTS
|
|
|
Not applicable
|
||
|
ITEM 6.
|
SCHEDULE OF INVESTMENTS
|
|
|
Not applicable
|
||
|
ITEM 7.
|
DISCLOSURE OF PROXY VOTING POLICIES AND PROCEDURES FOR CLOSED-END MANAGEMENT INVESTMENT COMPANIES
|
|
|
Not applicable
|
||
|
ITEM 8.
|
PORTFOLIO MANAGERS OF CLOSED-END MANAGEMENT INVESTMENT COMPANIES
|
|
|
Not applicable
|
||
|
ITEM 9.
|
PURCHASES OF EQUITY SECURITIES BY CLOSED-END MANAGEMENT INVESTMENT COMPANY AND AFFILIATED PURCHASERS
|
|
|
Not applicable
|
||
|
ITEM 10.
|
SUBMISSION OF MATTERS TO A VOTE OF SECURITY HOLDERS
|
|
|
There were no material changes to the procedures by which shareholders may recommend nominees to the Fund’s Board. The primary function of the Nominating and Governance Committee is to identify and recommend individuals for membership on the Board and oversee the administration of the Board Governance Guidelines. Shareholders may recommend candidates for Board positions by forwarding their correspondence by U.S. mail or courier service to Kenneth C. Froewiss, Independent Chairman, Deutsche Mutual Funds, P.O. Box 390601, Cambridge, MA 02139.
|
||
|
ITEM 11.
|
CONTROLS AND PROCEDURES
|
|
|
(a)
|
The Chief Executive and Financial Officers concluded that the Registrant’s Disclosure Controls and Procedures are effective based on the evaluation of the Disclosure Controls and Procedures as of a date within 90 days of the filing date of this report.
|
|
|
(b)
|
There have been no changes in the registrant’s internal control over financial reporting that occurred during the second fiscal quarter of the period covered by this report that has materially affected, or is reasonably likely to materially affect, the registrant’s internal controls over financial reporting.
|
|
|
ITEM 12.
|
EXHIBITS
|
|
|
(a)(1)
|
Code of Ethics pursuant to Item 2 of Form N-CSR is filed and attached hereto as EX-99.CODE ETH.
|
|
|
(a)(2)
|
Certification pursuant to Rule 30a-2(a) under the Investment Company Act of 1940 (17 CFR 270.30a-2(a)) is filed and attached hereto as Exhibit 99.CERT.
|
|
|
(b)
|
Certification pursuant to Rule 30a-2(b) under the Investment Company Act of 1940 (17 CFR 270.30a-2(b)) is furnished and attached hereto as Exhibit 99.906CERT.
|
|
SIGNATURES
Pursuant to the requirements of the Securities Exchange Act of 1934 and the Investment Company Act of 1940, the registrant has duly caused this report to be signed on its behalf by the undersigned, thereunto duly authorized.
|
Registrant:
|
Deutsche Enhanced Commodity Strategy Fund, a series of Deutsche Securities Trust
|
|
By:
|
/s/Brian E. Binder
Brian E. Binder
President
|
|
Date:
|
August 29, 2014
|
Pursuant to the requirements of the Securities Exchange Act of 1934 and the Investment Company Act of 1940, this report has been signed below by the following persons on behalf of the registrant and in the capacities and on the dates indicated.
|
By:
|
/s/Brian E. Binder
Brian E. Binder
President
|
|
Date:
|
August 29, 2014
|
|
By:
|
/s/Paul Schubert
Paul Schubert
Chief Financial Officer and Treasurer
|
|
Date:
|
August 29, 2014
|