Exhibit 13


Pictured on front cover: Brian Miller, ProVia; Robbie Keim, Keim Lumber; Judy Delaney, Goodwill Industries of Wayne and Holmes Counties
2013 Report to Shareholders | CSB Bancorp, Inc. 3
LETTER TO SHAREHOLDERS
FELLOW SHAREHOLDERS:
CSB continues to focus on providing excellent service to our customers, developing our employees, supporting our communities and increasing value for our shareholders.
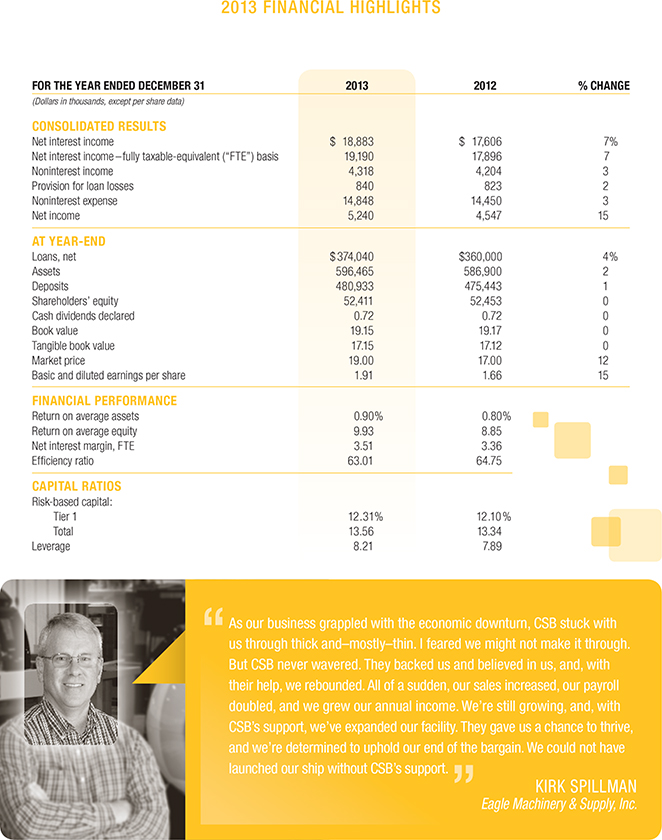
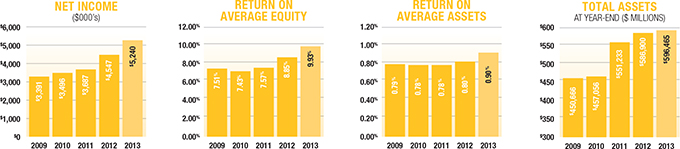
2013 results were encouraging and continued the Company’s growth and forward performance momentum. Net income increased to $5.2 million, eclipsing last year’s record high, while average total assets climbed to $581 million, the seventh consecutive year of record size for the Company.
Return on average shareholders’ equity amounted to 9.93% and return on average assets equaled 0.90%. Both of these numbers, while respectable, leave considerable room for improvement. We are intent on continuing the upward trend.
Credit quality within the Company’s loan and investment portfolios remained solid during 2013. Net charge-offs totaled 0.09% of average loans for the second year in a row. Loans more than 30 days past due or on nonaccrual amounted to 1.26% of year-end balances. The Company has no significant concentrations within its commercial loan portfolio. At year-end, commercial real estate loans, both owner and non-owner occupied, comprised 34% of total loans, followed by commercial and industrial loans at 31% and residential loans at 29%. Construction and land development, and consumer installment loans, comprised the remainder of loan balances.
Average deposit balances increased for the seventh year in a row and reached a fifth consecutive record high. Our capital levels exceed all regulatory requirements.
CSB also continued to pay a strong dividend, with an average yield of 3.75% over the course of the year. Our annual dividend yield has amounted to at least 3.75% for each of the past seven years based on average published daily closing stock prices. Total return on CSB stock during 2013 amounted to 15.9% when including dividends with stock price appreciation.
GROWTH PLANS
We remain committed to steadily growing the Company. Growth provides scale to increase cash flow for needed investments in infrastructure and personnel, generates capital to move forward when opportunities arise and creates a venue for the continued professional development of staff.
We evaluate growth opportunities within the context of prudent risk management and their fit with our strategic plan. We believe our current market area offers considerable growth potential. Growing our existing customer relationships, attracting new customers and serving each customer very well is the daily focus of every CSB employee.
We are also open to select expansion opportunities. Over the past seven years, the Company has acquired one bank, opened two new branches and purchased two additional branches. We continue to evaluate similar opportunities through the lens of what makes good business sense.
THE BANKING ENVIRONMENT
In our view, the new normal for banking includes interest margins that are lower than historic average, pervasive regulatory guidance, disruptive innovation by less-regulated entities, and a general preference among many customers for digital services. The contributing factors to this outlook are myriad and some are complex, but a few are unmistakably noteworthy.
The plodding economic recovery and sustained low interest rate environment continues to tamp down fundamental momentum for banking, as well as many other industries. However, there are clear signs of slow and steady improvement in the housing market, employment, household financial conditions and consumer spending, both nationally and in our local markets. The banking industry also has been regaining its health from a safety and soundness perspective and making progress toward more normalized earnings.
Congress’ inability to meaningfully address our nation’s most vexing fiscal problems portends more significant difficulties down the road. The gridlock is currently having a negative impact on the nation’s gross domestic product and may ultimately have adverse implications for individuals, corporations and communities alike. We do not anticipate that any significant economic legislation will be signed into law during the coming mid-term election year.
Resource intensive regulatory initiatives, technology initiatives, emerging payment system alternatives and threats to data integrity are increasing rapidly and adding to the challenging banking environment. These developments will be present for some time to come and the pace of change is not likely to slow in the foreseeable future.
4 2013 Report to Shareholders | CSB Bancorp, Inc.
LETTER TO SHAREHOLDERS

Many of the above factors are creating, individually or in concert with other factors, uncertainties for banks. These uncertainties are piling on top of existing incursions by nonbanks into traditional banking services such as lending and deposit-like services. Fundamentally, the overall challenge for banks will be to remain relevant in some of the aspects of the monetary system that have historically been the domain of the banking industry.
We are not waiting for more stable conditions to emerge. We are developing the capabilities and talent required for thriving in an environment of continuous change and innovation. We will continue keeping a sharp eye on costs and designing efficiencies. This will allow us to maximize the use of funds and talent for needed priorities. We are aligning our efforts in further development of delivery channels and organizing our teams in a manner that promotes agile response to opportunities at hand. We are investing for the future, positioning the Company for tomorrow’s requirements and opportunities as we grow and prepare for further growth.
INFRASTRUCTURE
In last year’s report, we outlined an ambitious list of technology upgrades and projects we were undertaking to further enhance our ability to serve customers effectively and efficiently. We are happy to report that we successfully completed deployment of a company-wide mortgage loan origination system, company-wide automated phone system, core computer processing system and an excellent mobile banking application. In addition, we’ve made considerable progress with our multi-year electronic document management initiative and are presently completing projects to upgrade all ATMs, install a company-wide commercial loan origination process and enhance debit card transaction capabilities. All of these initiatives are aimed squarely at supporting our commitment to provide excellent products and services safely, effectively and efficiently to our customers.

2013 Report to Shareholders | CSB Bancorp, Inc. 5

6 2013 Report to Shareholders | CSB Bancorp, Inc.

2013 Report to Shareholders | CSB Bancorp, Inc. 7
2013 FINANCIAL REVIEW
INTRODUCTION
CSB Bancorp, Inc. (the “Company” or “CSB”) was incorporated under the laws of the State of Ohio in 1991 and is a registered bank holding company. The Company’s wholly-owned subsidiaries are The Commercial and Savings Bank (the “Bank”) and CSB Investment Services, LLC, inactive. The Bank is chartered under the laws of the State of Ohio and was organized in 1879. The Bank is a member of the Federal Reserve System, with deposits insured by the Federal Deposit Insurance Corporation, and its primary regulators are the Ohio Division of Financial Institutions and the Federal Reserve Board.
The Company, through the Bank, provides retail and commercial banking services to its customers including checking and savings accounts, time deposits, cash management, safe deposit facilities, personal loans, commercial loans, real estate mortgage loans, installment loans, IRAs, night depository facilities and trust and brokerage services. Its customers are located primarily in Holmes, Tuscarawas, Wayne, Stark and portions of surrounding counties in Ohio.
The Company’s market area has historically exhibited relatively stable economic conditions; however, economic activity declined in the latter half of 2008 and the subsequent recovery continues at a slow pace. Unemployment levels in Holmes County have generally been among the lowest in the State of Ohio, while the balance of the Company’s market area reported unemployment levels below the state average for 2013 and 2012. Residential real estate property values have also returned to close to more normalized valuations. Household debt peaked in 2007 and has fallen as consumers were leery of taking on new loans; however, spending on durable goods, such as autos has begun to return to within the normal range. The Federal Reserve Bank of Cleveland has reported that a lot of Ohio’s growth activity in industrial production is coming from oil and shale. The Company’s market is adjacent to areas of primary shale activity.
FORWARD-LOOKING STATEMENTS
Certain statements contained in Management’s Discussion and Analysis of Financial Condition and Results of Operations are not related to historical results, but are forward-looking statements within the meaning of the Private Securities Litigation Reform Act of 1995. These statements involve a number of risks and uncertainties. Any forward-looking statements made by the Company herein and in future reports and statements are not guarantees of future performance, and actual results may differ materially from those in forward-looking statements because of various risk factors as discussed in this annual report and the Company’s Annual Report on Form 10-K. The Company does not undertake, and specifically disclaims, any obligation to publicly release the result of any revisions to any forward-looking statements to reflect the occurrence of unanticipated events or circumstances after the date of such statements.
8 2013 Report to Shareholders | CSB Bancorp, Inc.
2013 FINANCIAL REVIEW
SELECTED FINANCIAL DATA
The following table sets forth certain selected consolidated financial information:
| (Dollars in thousands) |
2013 | 2012 | 2011 | 2010 | 2009 | |||||||||||||||
| Statements of income: |
||||||||||||||||||||
| Total interest income |
$ | 21,138 | $ | 20,584 | $ | 20,018 | $ | 20,390 | $ | 22,105 | ||||||||||
| Total interest expense |
2,255 | 2,978 | 3,678 | 4,820 | 6,340 | |||||||||||||||
|
|
|
|
|
|
|
|
|
|
|
|||||||||||
| Net interest income |
18,883 | 17,606 | 16,340 | 15,570 | 15,765 | |||||||||||||||
| Provision for loan losses |
840 | 823 | 950 | 1,235 | 1,337 | |||||||||||||||
|
|
|
|
|
|
|
|
|
|
|
|||||||||||
| Net interest income after provision for loan losses |
18,043 | 16,783 | 15,390 | 14,335 | 14,428 | |||||||||||||||
| Noninterest income |
4,318 | 4,204 | 3,508 | 3,275 | 3,243 | |||||||||||||||
| Noninterest expense |
14,848 | 14,450 | 13,609 | 12,546 | 12,746 | |||||||||||||||
|
|
|
|
|
|
|
|
|
|
|
|||||||||||
| Income before income taxes |
7,513 | 6,537 | 5,289 | 5,064 | 4,925 | |||||||||||||||
| Income tax provision |
2,273 | 1,990 | 1,602 | 1,568 | 1,534 | |||||||||||||||
|
|
|
|
|
|
|
|
|
|
|
|||||||||||
| Net income |
$ | 5,240 | $ | 4,547 | $ | 3,687 | $ | 3,496 | $ | 3,391 | ||||||||||
|
|
|
|
|
|
|
|
|
|
|
|||||||||||
| Per share of common stock: |
||||||||||||||||||||
| Basic income per share |
$ | 1.91 | $ | 1.66 | $ | 1.35 | $ | 1.28 | $ | 1.24 | ||||||||||
| Diluted income per share |
1.91 | 1.66 | 1.35 | 1.28 | 1.24 | |||||||||||||||
| Dividends |
0.72 | 0.72 | 0.72 | 0.72 | 0.72 | |||||||||||||||
| Book value |
19.15 | 19.17 | 18.07 | 17.24 | 16.76 | |||||||||||||||
| Average basic common shares outstanding |
2,736,473 | 2,734,889 | 2,734,799 | 2,734,799 | 2,734,799 | |||||||||||||||
| Average diluted common shares outstanding |
2,738,477 | 2,735,141 | 2,734,838 | 2,734,799 | 2,734,799 | |||||||||||||||
| Year-end balances: |
||||||||||||||||||||
| Loans, net |
$ | 374,040 | $ | 360,000 | $ | 320,100 | $ | 311,616 | $ | 309,423 | ||||||||||
| Securities |
151,535 | 134,754 | 128,489 | 80,667 | 80,621 | |||||||||||||||
| Total assets |
596,465 | 586,900 | 551,233 | 457,056 | 450,666 | |||||||||||||||
| Deposits |
480,933 | 475,443 | 443,553 | 353,491 | 329,486 | |||||||||||||||
| Borrowings |
61,130 | 56,664 | 56,234 | 54,927 | 73,774 | |||||||||||||||
| Shareholders’ equity |
52,411 | 52,453 | 49,429 | 47,154 | 45,822 | |||||||||||||||
| Average balances: |
||||||||||||||||||||
| Loans, net |
$ | 369,889 | $ | 338,441 | $ | 314,670 | $ | 309,121 | $ | 313,726 | ||||||||||
| Securities |
138,976 | 132,567 | 93,851 | 77,967 | 75,597 | |||||||||||||||
| Total assets |
581,150 | 564,875 | 471,329 | 445,649 | 427,613 | |||||||||||||||
| Deposits |
468,395 | 453,526 | 367,865 | 334,073 | 304,902 | |||||||||||||||
| Borrowings |
57,882 | 57,735 | 52,717 | 62,951 | 75,734 | |||||||||||||||
| Shareholders’ equity |
52,787 | 51,384 | 48,674 | 47,081 | 45,184 | |||||||||||||||
| Select ratios: |
||||||||||||||||||||
| Net interest margin, tax equivalent basis |
3.51 | % | 3.36 | % | 3.71 | % | 3.73 | % | 3.93 | % | ||||||||||
| Return on average total assets |
0.90 | 0.80 | 0.78 | 0.78 | 0.79 | |||||||||||||||
| Return on average shareholders’ equity |
9.93 | 8.85 | 7.57 | 7.43 | 7.51 | |||||||||||||||
| Average shareholders’ equity as a percent of average total assets |
9.08 | 9.10 | 10.33 | 10.56 | 10.57 | |||||||||||||||
| Net loan charge-offs as a percent of average loans |
0.09 | 0.09 | 0.28 | 0.40 | 0.21 | |||||||||||||||
| Allowance for loan losses as a percent of loans at year-end |
1.34 | 1.26 | 1.26 | 1.28 | 1.29 | |||||||||||||||
| Shareholders’ equity as a percent of total year-end assets |
8.79 | 8.94 | 8.97 | 10.32 | 10.17 | |||||||||||||||
| Dividend payout ratio |
37.60 | 43.30 | 53.40 | 56.32 | 58.06 | |||||||||||||||
2013 Report to Shareholders | CSB Bancorp, Inc. 9
2013 FINANCIAL REVIEW
RESULTS OF OPERATIONS
Net Income
CSB’s 2013 net income was $5.2 million compared to $4.5 million for 2012, representing an increase of 15%. Basic and diluted earnings per share were $1.91, also up 15% from the prior year. The increased net income improved the return on average assets to 0.90% in 2013 from 0.80% in 2012 and return on average equity rose to 9.93% in 2013 from 8.85% in 2012.
Net income for 2012 was $4.5 million while basic and diluted earnings per share were $1.66, as compared to $3.7 million or $1.35 per share, for the year ended December 31, 2011. Net income increased 23% during 2012 as compared to 2011, due primarily to a $1.3 million increase in total net interest income and a $696 thousand increase in noninterest income. Partially offsetting the higher revenue were increases in noninterest expenses and federal income taxes. Return on average assets was 0.80% in 2012 compared to 0.78% in 2011, and return on average shareholders’ equity was 8.85% in 2012 as compared to 7.57% in 2011.
Net Interest Income
| (Dollars in thousands) |
2013 | 2012 | 2011 | |||||||||
| Net interest income |
$ | 18,883 | $ | 17,606 | $ | 16,340 | ||||||
| Taxable equivalent1 |
307 | 290 | 256 | |||||||||
|
|
|
|
|
|
|
|||||||
| Net interest income, fully taxable equivalent |
$ | 19,190 | $ | 17,896 | $ | 16,596 | ||||||
|
|
|
|
|
|
|
|||||||
| Net interest yield |
3.46 | % | 3.31 | % | 3.65 | % | ||||||
| Taxable equivalent adjustment1 |
0.05 | 0.05 | 0.06 | |||||||||
|
|
|
|
|
|
|
|||||||
| Net interest yield-taxable equivalent |
3.51 | % | 3.36 | % | 3.71 | % | ||||||
|
|
|
|
|
|
|
|||||||
| 1 | Taxable equivalent adjustments have been computed assuming a 34% tax rate. |
Net interest income is the largest source of the Company’s revenue and consists of the difference between interest income generated on earning assets and interest expense incurred on liabilities (deposits and short-term and long-term borrowings). Volumes, interest rates and composition of interest-earning assets and interest-bearing liabilities affect net interest income.
Net interest income increased $1.3 million or 7% in 2013 compared to 2012, partially due to a 3% increase in average earning assets, and a favorable mix trend of increased average loan balances and decreased cash balances. Additionally, the net interest margin increased to 3.51%, from 3.36% last year. The margin improvement was primarily due to lower funding costs resulting from a 3% increase in total average deposits, with average balance increases in lower cost demand, savings and maturing time deposits repricing at lower rates. Accretion of purchase accounting adjustments for loans, time deposits and borrowings acquired also improved the net interest margin by 5 basis points during 2013 and 2 basis points in 2012.
Interest income increased $554 thousand or 3% in 2013 compared to 2012 due to the $32 million increase in average loan balances, partially offset by lower yields. Rates decreased on all significant earning asset categories from reduced rates on new and repriced assets due to lending competition and the lower interest rate environment. Repricing of loans and lower rates to quality borrowers caused a decline in loan yields of 26 basis points in 2013 as compared to 2012. The increase in average loan volume helped mitigate the low interest rate environment. In 2013, average loan balances to average gross earning assets rose to 69%, compared to 64% in 2012. Securities yields continued to decline in 2013 with new and reinvestment cash flows being deployed at lower rates.
Interest income increased $566 thousand in 2012 as compared to 2011. The increase was primarily due to an increase of $85 million in average earning assets. The interest rate yield on average assets declined 61 basis points during 2012 as compared to 2011.
Interest expense decreased $723 thousand or 24% in 2013 as compared to 2012 due to decreases in the cost of all categories of interest bearing liabilities and a continued shift in the liability mix towards less expensive non-interest bearing demand deposits and savings accounts. Total average time deposits continue to decline with an emphasis on growing customers with multiple banking relationships, as opposed to single service time deposit customers.
Interest expense decreased $700 thousand, or 19%, for 2012 as compared to 2011, due to continued declines in average rates paid for interest bearing liabilities, from 1.05% in 2011 to 0.71% in 2012. Interest expense on deposits declined $541 thousand, even though average interest-bearing deposit balances increased by $65 million, or 22% in 2012 as compared to 2011. Interest expense on borrowed funds decreased by $159 thousand due to principal reductions and maturities of Federal Home Loan Bank (“FHLB”) advances, and lower interest rates remaining on outstanding borrowings.
10 2013 Report to Shareholders | CSB Bancorp, Inc.
2013 FINANCIAL REVIEW
The following table provides detailed analysis of changes in average balances, yield and net interest income:
| AVERAGE BALANCE SHEETS AND NET INTEREST | ||||||||||||||||||||||||||||||||||||
| MARGIN ANALYSIS | ||||||||||||||||||||||||||||||||||||
| 2013 | 2012 | 2011 | ||||||||||||||||||||||||||||||||||
| Average | Average | Average | Average | Average | Average | |||||||||||||||||||||||||||||||
| (Dollars in thousands) |
Balance1 | Interest | Rate2 | Balance1 | Interest | Rate2 | Balance1 | Interest | Rate2 | |||||||||||||||||||||||||||
| Interest-earning assets |
||||||||||||||||||||||||||||||||||||
| Federal funds sold |
$ | 188 | $ | 0 | 0.16 | % | $ | 148 | $ | 0 | 0.12 | % | $ | 92 | $ | 0 | 0.04 | % | ||||||||||||||||||
| Interest-earning deposits |
32,127 | 90 | 0.28 | 56,422 | 147 | 0.26 | 34,205 | 82 | 0.24 | |||||||||||||||||||||||||||
| Securities: |
||||||||||||||||||||||||||||||||||||
| Taxable |
122,314 | 2,572 | 2.10 | 118,867 | 2,672 | 2.25 | 81,341 | 2,538 | 3.12 | |||||||||||||||||||||||||||
| Tax exempt |
16,662 | 513 | 3.08 | 13,700 | 486 | 3.55 | 12,510 | 421 | 3.37 | |||||||||||||||||||||||||||
|
Loans3 |
374,821 | 17,963 | 4.79 | 342,868 | 17,279 | 5.05 | 318,781 | 16,977 | 5.33 | |||||||||||||||||||||||||||
|
|
|
|
|
|
|
|
|
|
|
|
|
|||||||||||||||||||||||||
| Total interest-earning assets |
546,112 | 21,138 | 3.87 | % | 532,005 | 20,584 | 3.87 | % | 446,929 | 20,018 | 4.48 | % | ||||||||||||||||||||||||
| Noninterest-earning assets |
||||||||||||||||||||||||||||||||||||
| Cash and due from banks |
12,911 | 12,399 | 11,094 | |||||||||||||||||||||||||||||||||
| Bank premises and equipment, net |
9,222 | 8,630 | 8,040 | |||||||||||||||||||||||||||||||||
| Other assets |
17,837 | 16,268 | 9,377 | |||||||||||||||||||||||||||||||||
| Allowance for loan losses |
(4,932 | ) | (4,427 | ) | (4,111 | ) | ||||||||||||||||||||||||||||||
|
|
|
|
|
|
|
|||||||||||||||||||||||||||||||
| Total assets |
$ | 581,150 | $ | 564,875 | $ | 471,329 | ||||||||||||||||||||||||||||||
|
|
|
|
|
|
|
|||||||||||||||||||||||||||||||
| Interest-bearing liabilities |
||||||||||||||||||||||||||||||||||||
| Demand deposits |
$ | 70,648 | 42 | 0.06 | % | $ | 63,346 | 50 | 0.08 | % | $ | 53,896 | 44 | 0.08 | % | |||||||||||||||||||||
| Savings deposits |
141,638 | 144 | 0.10 | 135,035 | 230 | 0.17 | 91,232 | 228 | 0.25 | |||||||||||||||||||||||||||
| Time deposits |
149,340 | 1,534 | 1.03 | 163,997 | 2,043 | 1.25 | 152,194 | 2,592 | 1.70 | |||||||||||||||||||||||||||
| Borrowed funds |
57,882 | 535 | 0.92 | 57,735 | 655 | 1.13 | 52,717 | 814 | 1.54 | |||||||||||||||||||||||||||
|
|
|
|
|
|
|
|
|
|
|
|
|
|||||||||||||||||||||||||
| Total interest-bearing liabilities |
419,508 | 2,255 | 0.54 | % | 420,113 | 2,978 | 0.71 | % | 350,039 | 3,678 | 1.05 | % | ||||||||||||||||||||||||
|
|
|
|
|
|
|
|
|
|
|
|
|
|||||||||||||||||||||||||
| Noninterest-bearing liabilities and shareholders’ equity |
||||||||||||||||||||||||||||||||||||
| Demand deposits |
106,769 | 91,148 | 70,543 | |||||||||||||||||||||||||||||||||
| Other liabilities |
2,086 | 2,230 | 2,073 | |||||||||||||||||||||||||||||||||
| Shareholders’ equity |
52,787 | 51,384 | 48,674 | |||||||||||||||||||||||||||||||||
|
|
|
|
|
|
|
|||||||||||||||||||||||||||||||
| Total liabilities and equity |
$ | 581,150 | $ | 564,875 | $ | 471,329 | ||||||||||||||||||||||||||||||
|
|
|
|
|
|
|
|||||||||||||||||||||||||||||||
| Net interest income |
$ | 18,883 | $ | 17,606 | $ | 16,340 | ||||||||||||||||||||||||||||||
|
|
|
|
|
|
|
|||||||||||||||||||||||||||||||
| Net interest margin |
3.46 | % | 3.31 | % | 3.65 | % | ||||||||||||||||||||||||||||||
| Net interest spread |
3.33 | % | 3.16 | % | 3.43 | % | ||||||||||||||||||||||||||||||
| 1 | Average balances have been computed on an average daily basis. |
| 2 | Average rates have been computed based on the amortized cost of the corresponding asset or liability. |
| 3 | Average loan balances include nonaccrual loans. |
2013 Report to Shareholders | CSB Bancorp, Inc. 11
2013 FINANCIAL REVIEW
The following table compares the impact of changes in average rates and changes in average volumes on net interest income:
| RATE/VOLUME ANALYSIS OF CHANGES | ||||||||||||||||||||||||
| IN INCOME AND EXPENSE1 | ||||||||||||||||||||||||
| 2013 v. 2012 | 2012 v. 2011 | |||||||||||||||||||||||
| Net Increase | Net Increase | |||||||||||||||||||||||
| (Dollars in thousands) |
(Decrease) | Volume | Rate | (Decrease) | Volume | Rate | ||||||||||||||||||
| Increase (decrease) in interest income: |
||||||||||||||||||||||||
| Interest-earning deposits |
$ | (57 | ) | $ | (68 | ) | $ | 11 | $ | 65 | $ | 58 | $ | 7 | ||||||||||
| Securities: |
||||||||||||||||||||||||
| Taxable |
(100 | ) | 72 | (172 | ) | 134 | 845 | (711 | ) | |||||||||||||||
| Tax exempt |
27 | 91 | (64 | ) | 65 | 42 | 23 | |||||||||||||||||
| Loans |
684 | 1,531 | (847 | ) | 302 | 1,216 | (914 | ) | ||||||||||||||||
|
|
|
|
|
|
|
|
|
|
|
|
|
|||||||||||||
| Total interest income change |
554 | 1,626 | (1,072 | ) | 566 | 2,161 | (1,595 | ) | ||||||||||||||||
|
|
|
|
|
|
|
|
|
|
|
|
|
|||||||||||||
| Increase (decrease) in interest expense: |
||||||||||||||||||||||||
| Demand deposits |
(8 | ) | 4 | (12 | ) | 6 | 8 | (2 | ) | |||||||||||||||
| Savings deposits |
(86 | ) | 7 | (93 | ) | 2 | 75 | (73 | ) | |||||||||||||||
| Time deposits |
(509 | ) | (151 | ) | (358 | ) | (549 | ) | 147 | (696 | ) | |||||||||||||
| Other borrowed funds |
(120 | ) | 1 | (121 | ) | (159 | ) | 57 | (216 | ) | ||||||||||||||
|
|
|
|
|
|
|
|
|
|
|
|
|
|||||||||||||
| Total interest expense change |
(723 | ) | (139 | ) | (584 | ) | (700 | ) | 287 | (987 | ) | |||||||||||||
|
|
|
|
|
|
|
|
|
|
|
|
|
|||||||||||||
| Net interest income |
$ | 1,277 | $ | 1,765 | $ | (488 | ) | $ | 1,266 | $ | 1,874 | $ | (608 | ) | ||||||||||
|
|
|
|
|
|
|
|
|
|
|
|
|
|||||||||||||
| 1 | Changes attributable to both volume and rate, which cannot be segregated, have been allocated based on the absolute value of the change due to volume and the change due to rate. |
Provision For Loan Losses
The provision for loan losses is determined by management as the amount required to bring the allowance for loan losses to a level considered appropriate to absorb probable future net charge-offs inherent in the loan portfolio as of period end. The provision for loan losses was $840 thousand in 2013, $823 thousand for 2012 and $950 thousand for 2011. Lower provision expense in 2013 and 2012 reflects improving economic conditions which have led to a decrease in charge-offs and nonperforming loans. See “Financial Condition – Allowance for Loan Losses” below for additional discussion and information relative to the provision for loan losses.
Noninterest Income
| YEAR ENDED DECEMBER 31 | ||||||||||||||||||||||||||||
| Change from 2012 | Change from 2011 | |||||||||||||||||||||||||||
| (Dollars in thousands) |
2013 | Amount | % | 2012 | Amount | % | 2011 | |||||||||||||||||||||
| Service charges on deposit accounts |
$ | 1,349 | $ | 44 | 3.4 | % | $ | 1,305 | $ | 171 | 15.1 | % | $ | 1,134 | ||||||||||||||
| Trust services |
826 | 155 | 23.1 | 671 | (6 | ) | (0.9 | ) | 677 | |||||||||||||||||||
| Debit card interchange fees |
779 | (18 | ) | (2.3 | ) | 797 | 166 | 26.3 | 631 | |||||||||||||||||||
| Securities gains |
159 | 159 | 100.0 | — | (237 | ) | (100.0 | ) | 237 | |||||||||||||||||||
| Gain on sale of loans, including MSR’s |
347 | (244 | ) | (41.3 | ) | 591 | 372 | 169.9 | 219 | |||||||||||||||||||
| Other |
858 | 18 | 2.1 | 840 | 230 | 37.7 | 610 | |||||||||||||||||||||
|
|
|
|
|
|
|
|
|
|
|
|||||||||||||||||||
| Total noninterest income |
$ | 4,318 | $ | 114 | 2.7 | % | $ | 4,204 | $ | 696 | 19.8 | % | $ | 3,508 | ||||||||||||||
|
|
|
|
|
|
|
|
|
|
|
|||||||||||||||||||
12 2013 Report to Shareholders | CSB Bancorp, Inc.
2013 FINANCIAL REVIEW
Noninterest income increased $114 thousand, or 3% in 2013 compared to the same period in 2012. Trust and brokerage fees increased 23% as assets under management increased from overall market improvements and customer development initiatives. The average market value of trust assets under management in 2013 was $86 million as compared to $76 million in 2012. Brokerage fees increased $86 thousand in 2013 as customers returned to stock and annuity investments to increase their returns. Service charges on deposits which are primarily customer overdraft fees, increased 3% in 2013 due to growth in deposits. Net gains on sales of mortgage loans including mortgage servicing rights (“MSR’s”) decreased 41% due to a significant slowdown in mortgage refinance activity during 2013. The Bank originated and sold $12 million in mortgage loans in 2013 as compared to the sale of $20 million of loans in 2012. With historical low interest rates during the first half of 2013, available-for-sale securities with gains of $159 thousand were sold as net loan demand increased.
Noninterest income increased $696 thousand, or 20% for 2012 as compared to 2011. Service charges on deposits increased $171 thousand and debit card interchange fees increased $166 thousand in 2012 as compared to 2011, reflecting the increase in accounts following the fourth quarter 2011 Wooster branch acquisition. Trust services income decreased in 2012 as brokerage fees declined $36 thousand, or 20%, and trust revenue increased $30 thousand, or 6%. The average market value of trust assets under management during 2012 and 2011 was $76 million and $68 million, respectively. Gain on sale of loans increased in 2012 from 2011 due to volume increases in 1-4 family residential mortgages sold into the secondary market, reflecting a consumer refinancing wave due to historically low mortgage rates. There were no securities sold in 2012. Other income increased $230 thousand in 2012 over 2011 primarily from increases in cash surrender value of bank-owned life insurance of $124 thousand following an additional $5 million purchase of bank-owned life insurance during first quarter 2012, an increase of $28 thousand in all other credit card fee income and an increase of $10 thousand in noncustomer ATM usage fees in 2012 over 2011.
Noninterest Expenses
| YEAR ENDED DECEMBER 31 |
||||||||||||||||||||||||||||
| Change from 2012 | Change from 2011 | |||||||||||||||||||||||||||
| (Dollars in thousands) |
2013 | Amount | % | 2012 | Amount | % | 2011 | |||||||||||||||||||||
| Salaries and employee benefits |
$ | 8,261 | $ | 301 | 3.8 | % | $ | 7,960 | $ | 501 | 6.7 | % | $ | 7,459 | ||||||||||||||
| Occupancy expense |
1,026 | 1 | 0.1 | 1,025 | 135 | 15.2 | 890 | |||||||||||||||||||||
| Equipment expense |
719 | 101 | 16.3 | 618 | 94 | 17.9 | 524 | |||||||||||||||||||||
| Professional and director fees |
628 | (186 | ) | (22.9 | ) | 814 | 101 | 14.2 | 713 | |||||||||||||||||||
| Franchise tax expense |
581 | 39 | 7.2 | 542 | (8 | ) | (1.5 | ) | 550 | |||||||||||||||||||
| Marketing and public relations |
395 | 3 | 0.8 | 392 | 72 | 22.5 | 320 | |||||||||||||||||||||
| Software expense |
530 | 139 | 35.5 | 391 | 18 | 4.8 | 373 | |||||||||||||||||||||
| Debit card expense |
268 | (36 | ) | (11.8 | ) | 304 | 51 | 20.2 | 253 | |||||||||||||||||||
| Amortization of intangible assets |
135 | (5 | ) | (3.6 | ) | 140 | 62 | 79.5 | 78 | |||||||||||||||||||
| FDIC insurance |
359 | 31 | 9.5 | 328 | (24 | ) | (6.8 | ) | 352 | |||||||||||||||||||
| Branch acquisition expense |
— | (8 | ) | (100.0 | ) | 8 | (329 | ) | (97.6 | ) | 337 | |||||||||||||||||
| Other real estate expenses |
9 | (24 | ) | N.M. | 33 | 58 | N.M. | (25 | ) | |||||||||||||||||||
| Other |
1,937 | 42 | 2.2 | 1,895 | 110 | 6.2 | 1,785 | |||||||||||||||||||||
|
|
|
|
|
|
|
|
|
|
|
|||||||||||||||||||
| Total noninterest expenses |
$ | 14,848 | $ | 398 | 2.8 | % | $ | 14,450 | $ | 841 | 6.2 | % | $ | 13,609 | ||||||||||||||
|
|
|
|
|
|
|
|
|
|
|
|||||||||||||||||||
N.M., not a meaningful value
Noninterest expense increased $398 thousand, or 3% in 2013 as compared to 2012. Salaries and employee benefits increased $301 thousand due to annual adjustments to compensation of $211 thousand and benefit increases of $90 thousand due to higher payroll taxes and retirement benefits. Software expense rose $139 thousand in 2013 due to the acquisition of new core processing and loan documentation software. Equipment expense increased $101 thousand in 2013 as compared to 2012 with the acquisition of a new core processor, new telephone system and new ATMs in the branch network. Franchise tax expense increased $39 thousand in 2013 to $581 thousand but is expected to decrease to under $450 thousand in 2014 with the new Ohio Financial Institutions Tax.
Noninterest expense increased $841 thousand, or 6% in 2012 as compared to 2011. Salaries and employee benefits increased $449 thousand due to a full year increase in personnel costs of the acquired branches and annual adjustments to compensation with employee benefits expense increasing $52 thousand from increased health insurance and retirement benefit costs. Occupancy expense increased $135 thousand and equipment expense increased $94 thousand as both expenses reflected the increase in the number of branches for a full year in
2013 Report to Shareholders | CSB Bancorp, Inc. 13
2013 FINANCIAL REVIEW
2012 as compared to 2011. Professional and director fees increased $101 thousand reflecting employment search fees for the Chief Operating Officer and commercial lending positions as well as fees spent to review the Company’s computer operating system. FDIC deposit insurance expense decreased $24 thousand in 2012 as compared to 2011 due to a prior year change in the calculation which resulted in a decreased rate for a full year in 2012 as compared to a partial year in 2011. Other expenses increased $110 thousand primarily due to the cost of running a larger institution.
Income Taxes
The provision for income taxes amounted to $2.3 million in 2013, $2.0 million in 2012 and $1.6 million in 2011, an effective rate of 30.3% in 2013, 30.4% in 2012 and 30.3% in 2011. The decrease in the effective tax rate during 2013 as compared to 2012 is due primarily to increased tax exempt income on securities and loans.
FINANCIAL CONDITION
Total assets of the Company were $597 million at December 31, 2013, compared to $587 million at December 31, 2012, representing an increase of $10 million, or 2%. Net loans increased $14 million, or 4%, while investment securities increased $17 million, or 13% and interest-earning deposits with other banks decreased $19 million. Deposits increased $6 million, or 1%, while other borrowings from the FHLB decreased by $213 thousand, or 2%.
Securities
Total investment securities increased $17 million, or 13% to $152 million at year-end 2013. CSB’s portfolio is primarily comprised of agency mortgage-backed securities, other government agencies’ debt, and obligations of state and political subdivisions. Restricted securities consist primarily of FHLB stock. During 2013, increases occurred in government agency debt, mortgage-backed securities, and corporate bonds.
The Company has no exposure to government-sponsored enterprise preferred stocks, collateralized debt obligations or trust preferred securities. The Company’s municipal bond portfolio consists of both taxable and tax-exempt general obligation and revenue bonds. As of December 31, 2013, $13.7 million, or 83%, held an S&P or Moody’s investment grade rating and $2.8 million or 17% were non-rated. The municipal portfolio includes a broad spectrum of counties, towns, universities and school districts in Ohio. Total gross unrealized security losses within the portfolio were 1.5% of total available-for-sale securities at December 31, 2013, reflecting interest rate fluctuations, not credit downgrades.
During the third quarter 2013, the Company reclassified $39 million of U.S. Agency and U.S. Agency collateralized mortgage-backed obligations from available-for-sale to held-to-maturity. The Company considers the held-to-maturity classification to be more appropriate in a rising interest rate environment as other comprehensive income is no longer negatively impacted by the decline in value on specific bonds. The Company has the ability and the intent to hold the longer-term Agency debt securities and the mortgage-backed securities to maturity. On the date of transfer, the $1.9 million gross unrealized loss became a discount to the carrying value of the bonds while the net of tax unrealized loss remained in shareholders’ equity in other comprehensive income. The effect on interest income of the accretion of the discount on the bonds is basically offset by the amortization of the other comprehensive loss over the life of the bonds.
One of the primary functions of the securities portfolio is to provide a source of liquidity and it is structured such that maturities and cash flows satisfy the Company’s liquidity needs and asset/liability management requirements.
Loans
Total loans increased $15 million, or 4% during 2013. Volume increases were recognized in commercial and commercial real estate loans of $23 million, or 10%, and residential real estate loans of $1 million, or 1%. Construction loans saw a decline of $10 million, or 42% as projects were completed and converted to permanent financing. During 2012 the Company added two seasoned commercial lenders in its newly expanded markets and combined with low interest rates and business expansion, increases in commercial and commercial real estate loans continued in 2013.
As investment spreads tightened in the mortgage-backed securities market, the Company developed marketing campaigns for fifteen year, lower fee, fixed-rate, owner occupied loans which drove the $1 million increase in residential real estate loans. Attractive interest rates in the secondary market continued to drive consumer demand for longer-term 1-4 family fixed rate residential mortgages during 2013 and the Company sold $12 million of originated mortgages into the secondary market as compared to $20 million in 2012. This demand for low fixed-rate mortgages included some refinancing of the Company’s in-house mortgage portfolio. Demand for home equity loans flattened in 2013, with balances decreasing $107 thousand. Installment lending improved slightly with consumer loans increasing 3% on a year over year basis to $6.7 million at December 31, 2013.
14 2013 Report to Shareholders | CSB Bancorp, Inc.
2013 FINANCIAL REVIEW
Management anticipates the Company’s local service areas will continue to exhibit modest economic growth in line with the past three years. Commercial and commercial real estate loans comprise approximately 65% and 61% of the total loan portfolio at year-end 2013 and 2012. Residential real estate loans decreased from 30% to approximately 29% between December 31, 2012 and December 31, 2013. Construction and land development loans decreased from 6% to 4% of the total portfolio between 2012 and 2013. The Company is well within the respective regulatory guidelines for investment in construction development and investment property loans that are not owner occupied.
Most of the Company’s lending activity is with customers primarily located within Holmes, Tuscarawas, Wayne and Stark Counties in Ohio. Credit concentrations, including commitments, as determined using North American Industry Classification Codes (NAICS), to the four largest industries compared to total loans at December 31, 2013 included $27 million, or 7% of total loans to lessors of non-residential buildings or dwellings; $19 million, or 5% of total loans to lessors of residential real estate; $17 million, or 4.5% of total loans to logging, sawmills and timber tract operations and $14 million, or 4% of total loans to borrowers in the hotel, motel and lodging business. These loans are generally secured by real property and equipment, and repayment is expected from operational cash flow. Credit evaluation is based on an evaluation of cash flow coverage of principal and interest payments and the adequacy of the collateral received.
Nonperforming Assets, Impaired Loans and Loans Past Due 90 Days or More
Nonperforming assets consist of nonaccrual loans, loans past due 90 days and still accruing and other real estate acquired through or in lieu of foreclosure. Other impaired loans include certain loans that are internally classified as substandard or doubtful. Loans are placed on nonaccrual status when they become past due 90 days or more, or when mortgage loans are past due as to principal and interest 120 days or more, unless they are both well secured and in the process of collection.
NONPERFORMING ASSETS
| DECEMBER 31 | ||||||||
| (Dollars in thousands) |
2013 | 2012 | ||||||
| Nonaccrual loans: |
||||||||
| Commercial |
$ | 84 | $ | 483 | ||||
| Commercial real estate |
1,108 | 1,745 | ||||||
| Residential real estate |
1,042 | 805 | ||||||
| Construction & land development |
— | 173 | ||||||
| Loans past due 90 days and still accruing: |
||||||||
| Commercial |
— | — | ||||||
| Commercial real estate |
40 | — | ||||||
| Residential real estate |
46 | 131 | ||||||
| Construction & land development |
950 | — | ||||||
| Total nonperforming loans |
3,270 | 3,337 | ||||||
| Other real estate owned |
— | 25 | ||||||
| Total nonperforming assets |
$ | 3,270 | $ | 3,362 | ||||
| Nonperforming assets as a percentage of loans plus other real estate |
0.86 | % | 0.92 | % | ||||
Allowance for Loan Losses
The allowance for loan losses is maintained at a level considered adequate to cover loan losses that are currently anticipated based on past loss experience, general economic conditions, changes in mix and size of the loan portfolio, information about specific borrower situations and other factors and estimates which are subject to change over time. Management periodically reviews selected large loans, delinquent and other problem loans and selected other loans. Collectability of these loans is evaluated by considering the current financial position and performance of the borrower, estimated market value of the collateral, the Company’s collateral position in relationship to other creditors, guarantees and other potential sources of repayment. Management forms judgments, which are in part subjective, as to the probability of loss and the amount of loss on these loans as well as other loans taken together. The Company’s Allowance for Loan Losses Policy includes, among other items, provisions for classified loans and a provision for the remainder of the portfolio based on historical data, including past charge-offs.
2013 Report to Shareholders | CSB Bancorp, Inc. 15
2013 FINANCIAL REVIEW
ALLOWANCE FOR LOAN LOSSES
| FOR THE YEAR ENDED | ||||||||
| (Dollars in thousands) |
2013 | 2012 | ||||||
| Beginning balance of allowance for loan losses |
$ | 4,580 | $ | 4,082 | ||||
| Provision for loan losses |
840 | 823 | ||||||
| Charge-offs: |
||||||||
| Commercial |
149 | 29 | ||||||
| Commercial real estate |
108 | 283 | ||||||
| Residential real estate & home equity |
82 | 106 | ||||||
| Construction & land development |
— | — | ||||||
| Consumer |
48 | 39 | ||||||
| Deposit accounts |
35 | 50 | ||||||
| Credit cards |
6 | — | ||||||
| Total charge-offs |
428 | 507 | ||||||
| Recoveries: |
||||||||
| Commercial |
15 | 16 | ||||||
| Commercial real estate |
— | — | ||||||
| Residential real estate & home equity |
18 | 102 | ||||||
| Construction & land development |
— | — | ||||||
| Consumer |
50 | 44 | ||||||
| Deposit accounts |
10 | 20 | ||||||
| Credit cards |
— | — | ||||||
| Total recoveries |
93 | 182 | ||||||
| Net charge-offs |
335 | 325 | ||||||
| Ending balance of allowance for loan losses |
$ | 5,085 | $ | 4,580 | ||||
| Net charge-offs as a percentage of average total loans |
0.09 | % | 0.09 | % | ||||
| Allowance for loan losses as a percentage of total loans |
1.34 | 1.26 | ||||||
| Allowance for loan losses to total nonperforming loans |
1.56 | x | 1.37 | x | ||||
| Components of the allowance for loan losses: |
||||||||
| General reserves |
$ | 4,301 | $ | 3,801 | ||||
| Specific reserve allocations |
784 | 779 | ||||||
| Total allowance for loan losses |
$ | 5,085 | $ | 4,580 | ||||
The allowance for loan losses totaled $5.1 million, or 1.34%, of total loans at year-end 2013 as compared to $4.6 million, or 1.26% of total loans at year-end 2012. Net charge-offs for 2013 totaled $335 thousand as compared to net charge-offs of $325 thousand in 2012.
The Company maintains an internal watch list on which it places loans where management’s analysis of the borrower’s operating results and financial condition indicates that the borrower’s cash flows are inadequate to meet its debt service requirements and loans where there exists an increased risk that such a shortfall may occur. Nonperforming loans, which consist of loans past due 90 days or more and nonaccrual loans aggregated $3.3 million, or 0.9% of loans at year-end 2013 as compared to $3.3 million, or 0.9% of loans at year-end 2012. Impaired loans were $10.7 million at year-end 2013 as compared to $10.2 million at year-end 2012. Impaired loans as a percentage of total loans remained stable from 2012 to 2013 and reflect economic stabilization in the Company’s market area with decreasing unemployment levels. Management has assigned loss allocations to absorb the estimated losses on these impaired loans, and these allocations are included in the total allowance for loan losses balance.
16 2013 Report to Shareholders | CSB Bancorp, Inc.
2013 FINANCIAL REVIEW
Other Assets
Net premises and equipment increased $215 thousand to $8.7 million at year-end 2013 primarily as the purchase of equipment and furniture in 2013 exceeded depreciation expense. There was no other real estate owned at December 31, 2013 compared to $25 thousand owned at December 31, 2012. Bank-owned life insurance of $1 million was purchased on the life of a senior management member during 2013. At December 31, 2013 the Company recognized a net deferred tax asset of $1.2 million as compared to a net deferred tax liability of $476 thousand at December 31, 2012. The change in the Company’s net deferred tax position resulted primarily from the increase in the net deferred asset related to the unrealized loss on securities available-for-sale.
Deposits
The Company’s deposits are obtained primarily from individuals and businesses located in its market area. For deposits, the Company must compete with products offered by other financial institutions as well as alternative investment options. Demand and savings deposits increased for the year ended 2013, due to focused retail and business banking strategies to obtain more account relationships as well as customers reflecting their preference for shorter maturities.
| December 31 | Change from 2012 | |||||||||||||||
| (Dollars in thousands) |
2013 | 2012 | Amount | % | ||||||||||||
| Noninterest-bearing demand |
$ | 120,325 | $ | 104,147 | $ | 16,178 | 15.5 | % | ||||||||
| Interest-bearing demand |
76,327 | 74,429 | 1,898 | 2.6 | ||||||||||||
| Traditional savings |
76,630 | 67,957 | 8,673 | 12.8 | ||||||||||||
| Money market savings |
73,307 | 70,837 | 2,470 | 3.5 | ||||||||||||
| Time deposits in excess of $100,000 |
42,562 | 54,163 | (11,601 | ) | (21.4 | ) | ||||||||||
| Other time deposits |
91,782 | 103,910 | (12,128) | (11.7) | ||||||||||||
| Total deposits |
$ | 480,933 | $ | 475,443 | $ | 5,490 | 1.2 | % | ||||||||
Other Funding Sources
The Company obtains additional funds through securities sold under repurchase agreements, overnight borrowings from the FHLB or other financial institutions and advances from the FHLB. Short-term borrowings, which consist of securities sold under repurchase agreements, increased $5 million; while other borrowings, which consist of FHLB advances, decreased $213 thousand due to required principal repayments during 2013.
CAPITAL RESOURCES
Total shareholders’ equity decreased to $52.4 million at December 31, 2013 as compared to $52.5 million at December 31, 2012. This decrease was primarily due to $3.3 million other comprehensive loss and the payment of $2.0 million cash dividends which were offset by $5.2 million of net income in 2013. The Board of Directors approved a Stock Repurchase Program on July 7, 2005 that would allow the repurchase of up to 10% of the Company’s then-outstanding common shares. Repurchased shares are to be held as treasury stock and would be available for general corporate purposes. At December 31, 2013, approximately forty-one thousand shares could still be repurchased under the current authorized program. No shares were repurchased in 2013 or 2012.
`Banking regulations have established minimum capital ratios for banks and bank holding companies. Therefore, the Company and the Bank must meet a risk-based capital requirement, which defines two tiers of capital and compares each to the Company’s “risk-weighted assets.” The Company’s assets and certain off-balance-sheet items, such as loan commitments, are each assigned a risk factor such that assets with potentially higher credit risk will require more capital support than assets with lower risk. These regulations require the Company to have a minimum total risk-based capital ratio of 8%, at least half of which must be Tier 1 capital. The Company’s Tier 1 capital is its shareholders’ equity before any unrealized gain or loss on securities available-for-sale, while total risk-based capital includes Tier 1 capital and a limited amount of the allowance for loan losses. In addition, a bank or bank holding company’s leverage ratio (which for the Company equals its shareholders’ equity before any unrealized gain or loss on securities available-for-sale, divided by average assets) must be maintained at a minimum of 4%. The Company and Bank’s actual and required capital amounts are disclosed in Note 12 to the consolidated financial statements.
2013 Report to Shareholders | CSB Bancorp, Inc. 17
2013 FINANCIAL REVIEW
Dividends paid by the Bank to CSB are the primary source of funds available to the Company for payment of dividends to shareholders and for other working capital needs. The payment of dividends by the Bank to the Company is subject to restrictions by regulatory authorities, which generally limit dividends to current year net income and the prior two years net retained earnings, as defined by regulation. In addition, dividend payments generally cannot reduce regulatory capital levels below the minimum regulatory guidelines discussed above.
In July 2013, the Federal Reserve adopted final rules effective generally on January 1, 2015 to implement the Basel III and regulatory capital changes required by the Dodd-Frank Act. These changes will apply to the Company and the Bank. Among other things, the rules include new minimum risk-based and leverage capital requirements for all banking organizations and removal of references to credit ratings. A new capital conservation buffer of 2.5% of risk-weighted assets is being phased-in over a transition period ending December 31, 2018. Failure to maintain the required ratios will restrict or prohibit dividends, share repurchases and discretionary bonuses. Management is evaluating the new rules and their effects on the Company and the Bank, but Management believes the Company and the Bank will remain “well-capitalized” under the new rules.
LIQUIDITY
| December 31 | Change | |||||||||||
| (Dollars in millions) |
2013 | 2012 | from 2012 | |||||||||
| Cash and cash equivalents |
$ | 43 | $ | 67 | $ | (24 | ) | |||||
| Unused lines of credit |
42 | 41 | 1 | |||||||||
| Unpledged securities at fair market value |
42 | 59 | $ | (17 | ) | |||||||
|
|
|
|
|
|
|
|||||||
| $ | 127 | $ | 167 | (40 | ) | |||||||
|
|
|
|
|
|
|
|||||||
| Net deposits and short-term liabilities |
$ | 473 | $ | 444 | $ | 29 | ||||||
|
|
|
|
|
|
|
|||||||
| Liquidity ratio |
26.9 | % | 37.6 | % | ||||||||
| Minimum board approved liquidity ratio |
20.0 | % | 20.0 | % | ||||||||
Liquidity refers to the Company’s ability to generate sufficient cash to fund current loan demand, meet deposit withdrawals, pay operating expenses and meet other obligations. The Company’s liquidity ratio declined in 2013 as a result of continuing to deploy cash received in the Wooster branch acquisition in fourth quarter 2011 into loans and investments. Liquidity is monitored by CSB’s Asset Liability Committee. The Company was within all Board-approved limits at December 31, 2013 and 2012. Additional sources of liquidity include net income, loan repayments, and adjustments of interest rates to attract deposit accounts.
As summarized in the consolidated statements of cash flows, the most significant investing activities for the Company in 2013 included net loan originations of $15 million and the maturities and repayments of securities totaling $37 million, offset by $64 million in securities purchases and the $1 million purchase of bank-owned life insurance. The Company’s financing activities included a $6 million increase in deposits, a $5 million increase in securities sold under agreements to repurchase and a $213 thousand net repayment of FHLB advances.
QUANTITATIVE AND QUALITATIVE DISCLOSURES ABOUT MARKET RISK
The most significant market risk to which the Company is exposed is interest rate risk. The business of the Company and the composition of its balance sheet consist of investments in interest-earning assets (primarily loans and securities), which are funded by interest-bearing liabilities (deposits and borrowings). These financial instruments have varying levels of sensitivity to changes in the market rates of interest, resulting in market risk. None of the Company’s financial instruments are held for trading purposes.
The Board of Directors establishes policies and operating limits with respect to interest rate risk. The Company manages interest rate risk regularly through its Asset Liability Committee. The Committee meets on a monthly basis and reviews various asset and liability management information including, but not limited to, the Company’s liquidity position, projected sources and uses of funds, interest rate risk position and economic conditions.
Interest rate risk is monitored primarily through the use of an earnings simulation model. The model is highly dependent on various assumptions, which change regularly as the balance sheet and market interest rates change. The earnings simulation model projects changes in net interest income resulting from the effect of changes in interest rates. The analysis is performed quarterly over a twenty-four month horizon. The analysis includes two balance sheet models, one based on a static balance sheet and one on a dynamic balance sheet with projected growth in assets and liabilities. This analysis is performed by estimating the expected cash flows of the Company’s financial instruments using interest rates in effect at year-end 2013 and 2012. Interest rate risk policy limits are tested by measuring the anticipated change in net interest income
18 2013 Report to Shareholders | CSB Bancorp, Inc.
2013 FINANCIAL REVIEW
over a two year period. The tests assume a quarterly ramped 100, 200, 300 and 400 basis point increase and a 100 basis point decrease in 2013 in market interest rates as compared to a stable rate environment or base model. The following table reflects the change to interest income for the first twelve month period of the twenty-four month horizon.
Net Interest Income at Risk
| December 31, 2013 | ||||||||||||||||||||
| Net | ||||||||||||||||||||
| Change In | Interest | Dollar | Board | |||||||||||||||||
| Interest Rates | Income | Change | Percentage | Policy | ||||||||||||||||
| (Basis Points) |
(Dollars in thousands) | Change | Limits | |||||||||||||||||
| + 400 | $ | 20,812 | $ | 962 | 4.8 | % | ±25 | % | ||||||||||||
| + 300 | 20,507 | 657 | 3.3 | ±15 | ||||||||||||||||
| + 200 | 20,217 | 367 | 1.8 | ±10 | ||||||||||||||||
| + 100 | 19,966 | 116 | 0.6 | ±5 | ||||||||||||||||
| 0 | 19,850 | — | — | |||||||||||||||||
| – 100 | 19,644 | (206 | ) | (1.0 | ) | ±5 | ||||||||||||||
| December 31, 2012 | ||||||||||||||||||||
| + 400 | $ | 19,420 | $ | 1,762 | 10.0 | % | ±25 | % | ||||||||||||
| + 300 | 18,982 | 1,324 | 7.5 | ±15 | ||||||||||||||||
| + 200 | 18,507 | 849 | 4.8 | ±10 | ||||||||||||||||
| + 100 | 18,053 | 395 | 2.2 | ±5 | ||||||||||||||||
| 0 | 17,658 | — | — | |||||||||||||||||
| – 100 | 17,483 | (175 | ) | (1.0 | ) | ±5 | ||||||||||||||
Management reviews Net Interest Income at Risk with the Board on a periodic basis. The Company was within all Board-approved limits at December 31, 2013 and 2012.
Economic Value of Equity at Risk
| December 31, 2013 | ||||||||||||
| Change In Interest Rates (Basis Points) |
Percentage Change |
Board Policy Limits |
||||||||||
| + 400 | 9.8 | % | ±35 | % | ||||||||
| + 300 | 8.8 | ±30 | ||||||||||
| + 200 | 7.4 | ±20 | ||||||||||
| + 100 | 4.7 | ±15 | ||||||||||
| – 100 | (7.6 | ) | ±15 | |||||||||
| December 31, 2012 | ||||||||||||
| + 400 | 19.0 | % | ±35 | % | ||||||||
| + 300 | 17.4 | ±30 | ||||||||||
| + 200 | 14.8 | ±20 | ||||||||||
| + 100 | 9.5 | ±15 | ||||||||||
2013 Report to Shareholders | CSB Bancorp, Inc. 19
2013 FINANCIAL REVIEW
The economic value of equity is calculated by subjecting the period-end balance sheet to changes in interest rates and measuring the impact of the changes on the values of the assets and liabilities. Hypothetical changes in interest rates are then applied to the financial instruments, and the cash flows and fair values are again estimated using these hypothetical rates. For the net interest income estimates, the hypothetical rates are applied to the financial instruments based on the assumed cash flows.
Management periodically measures and reviews the Economic Value of Equity at Risk with the Board. At December 31, 2013, the market value of equity as a percent of base in a 400 basis point rising rate environment indicates an increase of 9.8%, as compared to an increase of 19.0% as of December 31, 2012. The Company added the review of a -100 basis change in interest rates during 2013 as rates had risen at December 31, 2013 in comparison with 2012. The Company was within all Board-approved limits at December 31, 2013 and 2012.
SIGNIFICANT ASSUMPTIONS AND OTHER CONSIDERATIONS
The above analysis is based on numerous assumptions, including relative levels of market interest rates, loan prepayments and reactions of depositors to changes in interest rates, and should not be relied upon as being indicative of actual results. Further, the analysis does not necessarily contemplate all actions the Company may undertake in response to changes in interest rates.
U.S. Treasury securities, obligations of U.S. Government corporations and agencies and obligations of states and political subdivisions will generally repay at their stated maturity, or if callable prior to their final maturity date. Mortgage-backed security payments increase when interest rates are low and decrease when interest rates rise. Many of the Company’s loans permit the borrower to prepay the principal balance prior to maturity without penalty. The likelihood of prepayment depends on a number of factors, including current interest rate and interest rate index (if any) on the loan, the financial ability of the borrower to refinance, the economic benefit to be obtained from refinancing, availability of refinancing at attractive terms, as well as economic and other factors in specific geographic areas which affect the sales and price levels of residential and commercial property. In a changing interest rate environment, prepayments may increase or decrease on fixed and adjustable rate loans depending on the current relative levels and expectations of future short-term and long-term interest rates. Prepayments on adjustable rate loans generally increase when long-term interest rates fall or are at historically low levels relative to short-term interest rates, thus making fixed rate loans more desirable. While savings and checking deposits generally may be withdrawn upon the customer’s request without prior notice, a continuing relationship with customers resulting in future deposits and withdrawals is generally predictable, resulting in a dependable and uninterrupted source of funds. Time deposits generally have early withdrawal penalties, which discourage customer withdrawal prior to maturity. Short-term borrowings have fixed maturities. Certain advances from the FHLB carry prepayment penalties and are expected to be repaid in accordance with their contractual terms.
FAIR VALUE MEASUREMENTS
The Company discloses the estimated fair value of its financial instruments at December 31, 2013 and 2012 in Note 15 to the consolidated financial statements.
OFF-BALANCE SHEET ARRANGEMENTS, CONTRACTUAL OBLIGATIONS, AND CONTINGENT LIABILITIES AND COMMITMENTS
The following table summarizes the Company’s loan commitments, including letters of credit, as of December 31, 2013:
| Amount of Commitment to Expire Per Period | ||||||||||||||||||||
| (Dollars in thousands) Type of Commitment |
Total Amount |
Less than 1 year |
1 to 3 Years |
3 to 5 Years |
Over 5 Years |
|||||||||||||||
| Commercial lines-of-credit |
$ | 68,029 | $ | 62,438 | $ | 209 | $ | 2,081 | $ | 3,301 | ||||||||||
| Real estate lines-of-credit |
35,880 | 2,936 | 5,510 | 4,947 | 22,487 | |||||||||||||||
| Consumer lines-of-credit |
842 | 842 | — | — | — | |||||||||||||||
| Credit cards lines-of-credit |
3,493 | 3,493 | — | — | — | |||||||||||||||
| Overdraft privilege |
6,523 | 6,523 | — | — | — | |||||||||||||||
| Commercial real estate loan commitments |
4,804 | 4,804 | — | — | — | |||||||||||||||
| Letters of credit |
679 | 679 | — | — | — | |||||||||||||||
|
|
|
|
|
|
|
|
|
|
|
|||||||||||
| Total commitments |
$ | 120,250 | $ | 81,715 | $ | 5,719 | $ | 7,028 | $ | 25,788 | ||||||||||
|
|
|
|
|
|
|
|
|
|
|
|||||||||||
20 2013 Report to Shareholders | CSB Bancorp, Inc.
2013 FINANCIAL REVIEW
As indicated in Note 10 to the consolidated financial statements, the Company had $120 million in total loan commitments at the end of 2013, with $77 million of that amount expiring within one year. All lines-of-credit represent either fee-paid or legally binding loan commitments for the loan categories noted. Letters of credit are also included in the amounts noted in the table since the Company requires that each letter of credit be supported by a loan agreement. The commercial and consumer lines represent both unsecured and secured obligations. The real estate lines are secured by mortgages on residential and nonresidential property. It is anticipated that a significant portion of these lines will expire without being drawn upon.
The following table summarizes the Company’s other contractual obligations, exclusive of interest, as of December 31, 2013:
| Payment Due by period | ||||||||||||||||||||
| (Dollars in thousands) Contractual Obligations |
Total Amount |
Less than 1 year |
1 to 3 Years |
3 to 5 Years |
Over 5 Years |
|||||||||||||||
| Total time deposits |
$ | 134,344 | $ | 75,051 | $ | 44,073 | $ | 15,173 | $ | 47 | ||||||||||
| Short-term borrowings |
48,671 | 48,671 | — | — | — | |||||||||||||||
| Other borrowings |
12,459 | 2,190 | 266 | 10,003 | — | |||||||||||||||
| Operating leases |
797 | 299 | 466 | 32 | — | |||||||||||||||
|
|
|
|
|
|
|
|
|
|
|
|||||||||||
| Total obligations |
$ | 196,271 | $ | 126,211 | $ | 44,805 | $ | 25,208 | $ | 47 | ||||||||||
|
|
|
|
|
|
|
|
|
|
|
|||||||||||
The other borrowings noted in the preceding table represent borrowings from the FHLB of Cincinnati. The notes require payment of interest on a monthly basis with principal due in monthly installments or at maturity, depending upon the issue. The obligations bear stated fixed interest rates and stipulate a prepayment penalty if the note’s interest rate exceeds the current market rate for similar borrowings at the time of repayment. As the notes mature, the Company evaluates the liquidity and interest rate circumstances, at that time, to determine whether to pay off or renew the note. The evaluation process typically includes the strength of current and projected customer loan demand, the Company’s federal funds sold or purchased position, projected cash flows from maturing investment securities, the current and projected market interest rate environment, local and national economic conditions and customer demand for the Company’s deposit product offerings.
CRITICAL ACCOUNTING POLICIES
The Company’s consolidated financial statements are prepared in accordance with U.S. generally accepted accounting principles and follow general practices within the commercial banking industry. Application of these principles requires management to make estimates, assumptions and judgments that affect the amounts reported in the financial statements. These estimates, assumptions, and judgments are based upon the information available as of the date of the financial statements.
The most significant accounting policies followed by the Company are presented in the Summary of Significant Accounting Policies. These policies, along with the other disclosures presented in the Notes to Consolidated Financial Statements and the 2013 Financial Review, provide information about how significant assets and liabilities are valued in the financial statements and how those values are determined. Management has identified the allowance for loan losses and the fair value of financial instruments as the accounting areas that require the most subjective and complex estimates, assumptions and judgments and, as such, could be the most subject to revision as new information becomes available.
Securities are evaluated periodically to determine whether a decline in their value is other-than-temporary. Management utilizes criteria such as the magnitude and duration of the decline, in addition to the reasons underlying the decline, to determine whether the loss in value is other-than-temporary. The term “other-than-temporary” is not intended to indicate that the decline is permanent, but indicates that the prospect for a near-term recovery of value is not necessarily favorable, or that there is a lack of evidence to support a realizable value equal to or greater than the carrying value of the investment. Once a decline in value is determined to be other-than-temporary, the value of the security is reduced and a corresponding charge to earnings is recognized.
As previously noted in the section entitled Allowance for Loan Losses, management performs analysis to assess the adequacy of its allowance for loan losses. This analysis encompasses a variety of factors including the potential loss exposure for individually reviewed loans, the historical loss experience, the volume of nonperforming loans (i.e., loans in nonaccrual status or past due 90 days or more), the volume of loans past due, any significant changes in lending or loan review staff, an evaluation of current and future local and national economic conditions, any significant changes in the volume or mix of loans within each category, a review of the significant concentrations of credit and any legal, competitive or regulatory concerns.
2013 Report to Shareholders | CSB Bancorp, Inc. 21
2013 FINANCIAL REVIEW
CSB accounts for business combinations using the acquisition method of accounting. Goodwill and intangible assets with indefinite useful lives are not amortized. Intangible assets with finite useful lives, consisting of core deposit intangibles, are amortized using accelerated methods over their estimated weighted-average useful lives, approximating ten years. Additional information is presented in Note 5, Core Deposit Intangible Asset.
IMPACT OF INFLATION AND CHANGING PRICES
The consolidated financial statements and related data presented herein have been prepared in accordance with U.S. generally accepted accounting principles, requiring measurement of financial position and results of operations primarily in terms of historical dollars without considering changes in the relative purchasing power of money over time due to inflation. Unlike most industrial companies, most assets and liabilities of the Company are monetary in nature. Therefore, interest rates have a more significant impact on the Company’s performance than the effects of general levels of inflation. Interest rates do not necessarily move in the same direction or in the same magnitude as prices of goods and services. The liquidity, maturity structure and quality of the Company’s assets and liabilities are critical to maintenance of acceptable performance levels.
COMMON STOCK AND SHAREHOLDER INFORMATION
Common shares of the Company are not traded on an established market. Shares are traded on the over-the-counter-bulletin-board through broker/dealers under the symbol “CSBB” and through private transactions. The table below represents the range of high and low prices paid for transactions known to the Company. Management does not have knowledge of prices paid on all transactions. Because of the lack of an established market, these prices may not reflect the prices at which stock would trade in an active market. These quotations reflect interdealer prices, without mark-up, markdown or commission and may not represent actual transactions. The table specifies cash dividends declared by the Company to its shareholders during 2013 and 2012. No assurances can be given that future dividends will be declared, or if declared, what the amount of any such dividends will be. Additional information concerning restrictions over the payment of dividends is included in Note 12 of the consolidated financial statements.
| Dividends | ||||||||||||||||
| Declared | Dividends | |||||||||||||||
| Quarter Ended |
High | Low | Per Share | Declared | ||||||||||||
| March 31, 2013 |
$ | 19.20 | $ | 17.00 | $ | 0.18 | $ | 492,594 | ||||||||
| June 30, 2013 |
20.85 | 19.00 | 0.18 | 492,594 | ||||||||||||
| September 30, 2013 |
20.80 | 18.60 | 0.18 | 492,594 | ||||||||||||
| December 31, 2013 |
19.60 | 18.62 | 0.18 | 492,594 | ||||||||||||
| March 31, 2012 |
$ | 20.00 | $ | 16.00 | $ | 0.18 | $ | 492,264 | ||||||||
| June 30, 2012 |
20.50 | 17.50 | 0.18 | 492,264 | ||||||||||||
| September 30, 2012 |
20.49 | 17.75 | 0.18 | 492,264 | ||||||||||||
| December 31, 2012 |
18.65 | 16.84 | 0.18 | 492,374 | ||||||||||||
As of December 31, 2013, the Company had 1,300 known shareholders of record and 2,736,634 outstanding shares of common stock.
22 2013 Report to Shareholders | CSB Bancorp, Inc.
REPORT ON MANAGEMENT’S ASSESSMENT OF
INTERNAL CONTROL OVER FINANCIAL REPORTING
The management of CSB Bancorp, Inc. is responsible for establishing and maintaining adequate internal control over financial reporting. Management has designed our internal control over financial reporting to provide reasonable assurance that our published financial statements are fairly presented, in all material respects, in conformity with U.S. generally accepted accounting principles.
Management is required by paragraph (c) of Rule 13a-15 of the Securities Exchange Act of 1934, as amended, to assess the effectiveness of our internal control over financial reporting as of each year-end. In making this assessment, management used the Internal Control-Integrated Framework issued in July 1994 by the Committee of Sponsoring Organizations of the Treadway Commission (COSO).
Management conducted the required assessment of the effectiveness of our internal control over financial reporting as of December 31, 2013. Based upon this assessment, management believes that our internal control over financial reporting is effective as of December 31, 2013.
This annual report does not include an attestation report of the Company’s registered public accounting firm regarding internal control over financial reporting. Management’s report was not subject to attestation by the Company’s registered public accounting firm pursuant to the rules of the Securities and Exchange Commission that permit the Company to provide only management’s report in this annual report.
|

| |
| Eddie L. Steiner | Paula J. Meiler | |
| President, | Senior Vice President, | |
| Chief Executive Officer | Chief Financial Officer | |
2013 Report to Shareholders | CSB Bancorp, Inc. 23
INDEPENDENT REGISTERED PUBLIC ACCOUNTING FIRM REPORT

Board of Directors and Shareholders
CSB Bancorp, Inc.
We have audited the accompanying consolidated balance sheets of CSB Bancorp, Inc. and subsidiaries as of December 31, 2013 and 2012, and the related consolidated statements of income, comprehensive income, changes in shareholders’ equity, and cash flows for each of the three years in the period ended December 31, 2013. These consolidated financial statements are the responsibility of CSB Bancorp, Inc.’s management. Our responsibility is to express an opinion on these consolidated financial statements based on our audits.
We conducted our audits in accordance with the standards of the Public Company Accounting Oversight Board (United States). Those standards require that we plan and perform the audits to obtain reasonable assurance about whether the financial statements are free of material misstatement. CSB Bancorp, Inc. is not required to have, nor were we engaged to perform, an audit of its internal control over financial reporting. Our audits included consideration of internal control over financial reporting as a basis for designing audit procedures that are appropriate in the circumstances, but not for the purpose of expressing an opinion on the effectiveness of CSB Bancorp, Inc.’s internal control over financial reporting. Accordingly, we express no such opinion. An audit also includes examining, on a test basis, evidence supporting the amounts and disclosures in the financial statements, assessing the accounting principles used and significant estimates made by management, as well as evaluating the overall financial statement presentation. We believe that our audits provide a reasonable basis for our opinion.
In our opinion, the consolidated financial statements referred to above present fairly, in all material respects, the financial position of CSB Bancorp, Inc. and subsidiaries as of December 31, 2013 and 2012, and the consolidated results of their operations and their cash flows for each of the years then ended, in conformity with U.S. generally accepted accounting principles.
Wexford, Pennsylvania
March 6, 2014
24 2013 Report to Shareholders | CSB Bancorp, Inc.
CONSOLIDATED BALANCE SHEETS
December 31, 2013 and 2012
| (Dollars in thousands) |
2013 | 2012 | ||||||
| ASSETS |
||||||||
| Cash and cash equivalents |
||||||||
| Cash and due from banks |
$ | 15,777 | $ | 21,485 | ||||
| Interest-earning deposits in other banks |
26,822 | 45,393 | ||||||
|
|
|
|
|
|||||
| Total cash and cash equivalents |
42,599 | 66,878 | ||||||
|
|
|
|
|
|||||
| Securities |
||||||||
| Available-for-sale, at fair value |
101,722 | 129,291 | ||||||
| Held-to-maturity (fair value of $42,643) |
44,350 | — | ||||||
| Restricted stock, at cost |
5,463 | 5,463 | ||||||
|
|
|
|
|
|||||
| Total securities |
151,535 | 134,754 | ||||||
|
|
|
|
|
|||||
| Loans |
379,125 | 364,580 | ||||||
| Less allowance for loan losses |
5,085 | 4,580 | ||||||
|
|
|
|
|
|||||
| Net loans |
374,040 | 360,000 | ||||||
|
|
|
|
|
|||||
| Premises and equipment, net |
8,690 | 8,475 | ||||||
| Core deposit intangible |
759 | 894 | ||||||
| Goodwill |
4,728 | 4,728 | ||||||
| Bank-owned life insurance |
9,551 | 8,298 | ||||||
| Accrued interest receivable and other assets |
4,563 | 2,873 | ||||||
|
|
|
|
|
|||||
| TOTAL ASSETS |
$ | 596,465 | $ | 586,900 | ||||
|
|
|
|
|
|||||
| LIABILITIES AND SHAREHOLDERS’ EQUITY |
||||||||
| LIABILITIES |
||||||||
| Deposits |
||||||||
| Noninterest-bearing |
$ | 120,325 | $ | 104,147 | ||||
| Interest-bearing |
360,608 | 371,296 | ||||||
|
|
|
|
|
|||||
| Total deposits |
480,933 | 475,443 | ||||||
|
|
|
|
|
|||||
| Short-term borrowings |
48,671 | 43,992 | ||||||
| Other borrowings |
12,459 | 12,672 | ||||||
| Accrued interest payable and other liabilities |
1,991 | 2,340 | ||||||
|
|
|
|
|
|||||
| Total liabilities |
544,054 | 534,447 | ||||||
|
|
|
|
|
|||||
| SHAREHOLDERS’ EQUITY |
||||||||
| Common stock, $ 6.25 par value. Authorized 9,000,000 shares; issued 2,980,602 shares; outstanding 2,736,634 shares in 2013 and 2,736,060 in 2012 |
18,629 | 18,629 | ||||||
| Additional paid-in capital |
9,964 | 9,974 | ||||||
| Retained earnings |
30,232 | 26,962 | ||||||
| Treasury stock at cost - 243,968 shares in 2013 and 244,542 in 2012 |
(4,958 | ) | (4,976 | ) | ||||
| Accumulated other comprehensive (loss) income |
(1,456 | ) | 1,864 | |||||
|
|
|
|
|
|||||
| Total shareholders’ equity |
52,411 | 52,453 | ||||||
|
|
|
|
|
|||||
| TOTAL LIABILITIES AND SHAREHOLDERS’ EQUITY |
$ | 596,465 | $ | 586,900 | ||||
|
|
|
|
|
|||||
These consolidated financial statements should be read in connection with the accompanying summary of significant accounting policies and notes to the consolidated financial statements.
2013 Report to Shareholders | CSB Bancorp, Inc. 25
CONSOLIDATED STATEMENTS OF INCOME
Years Ended December 31, 2013, 2012 and 2011
| (Dollars in thousands, except per share data) |
2013 | 2012 | 2011 | |||||||||
| INTEREST AND DIVIDEND INCOME |
||||||||||||
| Loans, including fees |
$ | 17,963 | $ | 17,279 | $ | 16,977 | ||||||
| Taxable securities |
2,572 | 2,672 | 2,538 | |||||||||
| Nontaxable securities |
513 | 486 | 421 | |||||||||
| Other |
90 | 147 | 82 | |||||||||
|
|
|
|
|
|
|
|||||||
| Total interest and dividend income |
21,138 | 20,584 | 20,018 | |||||||||
|
|
|
|
|
|
|
|||||||
| INTEREST EXPENSE |
||||||||||||
| Deposits |
1,720 | 2,323 | 2,864 | |||||||||
| Short-term borrowings |
67 | 91 | 139 | |||||||||
| Other borrowings |
468 | 564 | 675 | |||||||||
|
|
|
|
|
|
|
|||||||
| Total interest expense |
2,255 | 2,978 | 3,678 | |||||||||
|
|
|
|
|
|
|
|||||||
| NET INTEREST INCOME |
18,883 | 17,606 | 16,340 | |||||||||
| PROVISION FOR LOAN LOSSES |
840 | 823 | 950 | |||||||||
|
|
|
|
|
|
|
|||||||
| Net interest income, after provision for loan losses |
18,043 | 16,783 | 15,390 | |||||||||
|
|
|
|
|
|
|
|||||||
| NONINTEREST INCOME |
||||||||||||
| Service charges on deposit accounts |
1,349 | 1,305 | 1,134 | |||||||||
| Trust services |
826 | 671 | 677 | |||||||||
| Debit card interchange fees |
779 | 797 | 631 | |||||||||
| Securities gain, net |
159 | — | 237 | |||||||||
| Gain on sale of loans, net |
347 | 591 | 219 | |||||||||
| Other income |
858 | 840 | 610 | |||||||||
|
|
|
|
|
|
|
|||||||
| Total noninterest income |
4,318 | 4,204 | 3,508 | |||||||||
|
|
|
|
|
|
|
|||||||
| NONINTEREST EXPENSES |
||||||||||||
| Salaries and employee benefits |
8,261 | 7,960 | 7,459 | |||||||||
| Occupancy expense |
1,026 | 1,025 | 890 | |||||||||
| Equipment expense |
719 | 618 | 524 | |||||||||
| Professional and director fees |
628 | 814 | 713 | |||||||||
| Franchise tax expense |
581 | 542 | 550 | |||||||||
| Marketing and public relations |
395 | 392 | 320 | |||||||||
| Software expense |
530 | 391 | 373 | |||||||||
| Debit card expense |
268 | 304 | 253 | |||||||||
| Amortization of intangible assets |
135 | 140 | 78 | |||||||||
| FDIC insurance expense |
359 | 328 | 352 | |||||||||
| Branch acquisition expense |
— | 8 | 337 | |||||||||
| Net cost of operation of other real estate |
9 | 33 | (25 | ) | ||||||||
| Other expenses |
1,937 | 1,895 | 1,785 | |||||||||
|
|
|
|
|
|
|
|||||||
| Total noninterest expenses |
14,848 | 14,450 | 13,609 | |||||||||
|
|
|
|
|
|
|
|||||||
| Income before income taxes |
7,513 | 6,537 | 5,289 | |||||||||
| FEDERAL INCOME TAX PROVISION |
2,273 | 1,990 | 1,602 | |||||||||
|
|
|
|
|
|
|
|||||||
| NET INCOME |
$ | 5,240 | $ | 4,547 | $ | 3,687 | ||||||
|
|
|
|
|
|
|
|||||||
| NET INCOME PER SHARE |
||||||||||||
| Basic |
$ | 1.91 | $ | 1.66 | $ | 1.35 | ||||||
|
|
|
|
|
|
|
|||||||
| Diluted |
$ | 1.91 | $ | 1.66 | $ | 1.35 | ||||||
|
|
|
|
|
|
|
|||||||
These consolidated financial statements should be read in connection with the accompanying summary of significant accounting policies and notes to the consolidated financial statements.
26 2013 Report to Shareholders | CSB Bancorp, Inc.
CONSOLIDATED STATEMENTS OF COMPREHENSIVE INCOME
Years Ended December 31, 2013, 2012 and 2011
| (Dollars in thousands) |
2013 | 2012 | 2011 | |||||||||
| Net income |
$ | 5,240 | $ | 4,547 | $ | 3,687 | ||||||
|
|
|
|
|
|
|
|||||||
| Other comprehensive income (loss) |
||||||||||||
| Unrealized gains (losses) arising during the period |
(3,195 | ) | 657 | 1,081 | ||||||||
| Unrealized losses on held-to-maturity transfer |
(1,931 | ) | — | — | ||||||||
| Amounts reclassified from accumulated other comprehensive income, held-to-maturity |
255 | — | — | |||||||||
| Income tax effect |
1,656 | (223 | ) | (368 | ) | |||||||
| Reclassification adjustment for gains on available for sale securities included in net income |
(159 | ) | — | (237 | ) | |||||||
| Income tax effect |
54 | — | 81 | |||||||||
|
|
|
|
|
|
|
|||||||
| Other comprehensive income (loss) |
(3,320 | ) | 434 | 557 | ||||||||
|
|
|
|
|
|
|
|||||||
| Total comprehensive income |
$ | 1,920 | $ | 4,981 | $ | 4,244 | ||||||
|
|
|
|
|
|
|
|||||||
CONSOLIDATED STATEMENTS OF CHANGES IN SHAREHOLDERS’ EQUITY
Years Ended December 31, 2013, 2012 and 2011
| (Dollars in thousands) |
Common Stock |
Additional Paid-In Capital |
Retained Earnings |
Treasury Stock |
Accumulated Other Comprehensive Income (Loss) |
Total | ||||||||||||||||||
| BALANCE AT DECEMBER 31, 2010 |
$ | 18,629 | $ | 9,994 | $ | 22,673 | $ | (5,015 | ) | $ | 873 | $ | 47,154 | |||||||||||
| Net income |
— | — | 3,687 | — | — | 3,687 | ||||||||||||||||||
| Other comprehensive income |
— | — | — | — | 557 | 557 | ||||||||||||||||||
| Cash dividends declared, $ 0.72 per share |
— | — | (1,969 | ) | — | — | (1,969 | ) | ||||||||||||||||
|
|
|
|
|
|
|
|
|
|
|
|
|
|||||||||||||
| BALANCE AT DECEMBER 31, 2011 |
$ | 18,629 | $ | 9,994 | $ | 24,391 | $ | (5,015 | ) | $ | 1,430 | $ | 49,429 | |||||||||||
| Net income |
— | — | 4,547 | — | — | 4,547 | ||||||||||||||||||
| Other comprehensive income |
— | — | — | — | 434 | 434 | ||||||||||||||||||
| Stock options exercised, 1,261 shares |
— | (20 | ) | (7 | ) | 39 | — | 12 | ||||||||||||||||
| Cash dividends declared, $ 0.72 per share |
— | — | (1,969 | ) | — | — | (1,969 | ) | ||||||||||||||||
|
|
|
|
|
|
|
|
|
|
|
|
|
|||||||||||||
| BALANCE AT DECEMBER 31, 2012 |
$ | 18,629 | $ | 9,974 | $ | 26,962 | $ | (4,976 | ) | $ | 1,864 | $ | 52,453 | |||||||||||
| Net income |
— | — | 5,240 | — | — | 5,240 | ||||||||||||||||||
| Other comprehensive loss |
— | — | — | — | (3,320 | ) | (3,320 | ) | ||||||||||||||||
| Stock options exercised, 574 shares |
— | (10 | ) | — | 18 | — | 8 | |||||||||||||||||
| Cash dividends declared, $ 0.72 per share |
— | — | (1,970 | ) | — | — | (1,970 | ) | ||||||||||||||||
|
|
|
|
|
|
|
|
|
|
|
|
|
|||||||||||||
| BALANCE AT DECEMBER 31, 2013 |
$ | 18,629 | $ | 9,964 | $ | 30,232 | $ | (4,958 | ) | $ | (1,456 | ) | $ | 52,411 | ||||||||||
|
|
|
|
|
|
|
|
|
|
|
|
|
|||||||||||||
These consolidated financial statements should be read in connection with the accompanying summary of significant accounting policies and notes to the consolidated financial statements.
2013 Report to Shareholders | CSB Bancorp, Inc. 27
CONSOLIDATED STATEMENTS OF CASH FLOWS
Years Ended December 31, 2013, 2012 and 2011
| (Dollars in thousands) |
2013 | 2012 | 2011 | |||||||||
| CASH FLOWS FROM OPERATING ACTIVITIES |
||||||||||||
| Net income |
$ | 5,240 | $ | 4,547 | $ | 3,687 | ||||||
| Adjustments to reconcile net income to net cash provided by operating activities: |
||||||||||||
| Depreciation and amortization of premises, equipment and software |
779 | 644 | 662 | |||||||||
| Deferred income taxes |
77 | (50 | ) | 345 | ||||||||
| Provision for loan losses |
840 | 823 | 950 | |||||||||
| Gain on sale of loans, net |
(347 | ) | (591 | ) | (219 | ) | ||||||
| Securities gain, net |
(159 | ) | — | (237 | ) | |||||||
| Security amortization, net of accretion |
456 | 553 | 226 | |||||||||
| Secondary market loan sale proceeds |
12,393 | 20,873 | 7,201 | |||||||||
| Originations of secondary market loans held-for-sale |
(12,106 | ) | (20,384 | ) | (7,019 | ) | ||||||
| Bank-owned life insurance |
(253 | ) | (230 | ) | (107 | ) | ||||||
| Effects of changes in operating assets and liabilities: |
||||||||||||
| Net deferred loan (fees) costs |
(214 | ) | 63 | 35 | ||||||||
| Accrued interest receivable |
(57 | ) | 32 | (134 | ) | |||||||
| Accrued interest payable |
(39 | ) | (47 | ) | (31 | ) | ||||||
| Other assets and liabilities |
339 | 831 | 415 | |||||||||
|
|
|
|
|
|
|
|||||||
| Net cash provided by operating activities |
$ | 6,949 | $ | 7,064 | $ | 5,774 | ||||||
|
|
|
|
|
|
|
|||||||
| CASH FLOWS FROM INVESTING ACTIVITIES |
||||||||||||
| Securities available-for-sale: |
||||||||||||
| Proceeds from maturities and repayments, available-for-sale |
$ | 36,200 | $ | 76,220 | $ | 45,332 | ||||||
| Proceeds from repayments, held-to-maturity |
1,211 | — | — | |||||||||
| Purchases, available-for-sale |
(55,693 | ) | (82,382 | ) | (95,542 | ) | ||||||
| Purchases, held-to-maturity |
(8,135 | ) | — | — | ||||||||
| Proceeds from sale of securities, available-for-sale |
4,309 | — | 3,244 | |||||||||
| Loan originations, net of repayments |
(14,666 | ) | (40,842 | ) | (1,065 | ) | ||||||
| Net cash from acquisition |
— | — | 60,872 | |||||||||
| Proceeds from sale of other real estate |
18 | 26 | 883 | |||||||||
| Property, equipment and software acquisitions |
(1,526 | ) | (953 | ) | (586 | ) | ||||||
| Purchase of bank-owned life insurance |
(1,000 | ) | (5,000 | ) | — | |||||||
|
|
|
|
|
|
|
|||||||
| Net cash provided by (used in) investing activities |
$ | (39,282 | ) | $ | (52,931 | ) | $ | 13,138 | ||||
|
|
|
|
|
|
|
|||||||
These consolidated financial statements should be read in connection with the accompanying summary of significant accounting policies and notes to the consolidated financial statements.
28 2013 Report to Shareholders | CSB Bancorp, Inc.
CONSOLIDATED STATEMENTS OF CASH FLOWS
Years Ended December 31, 2013, 2012 and 2011
| (Dollars in thousands) |
2013 | 2012 | 2011 | |||||||||
| CASH FLOWS FROM FINANCING ACTIVITIES |
||||||||||||
| Net change in deposits |
$ | 5,550 | $ | 32,021 | $ | 15,648 | ||||||
| Net change in short-term borrowings |
4,679 | 6,919 | 5,055 | |||||||||
| Repayment of other borrowings |
(213 | ) | (6,489 | ) | (3,748 | ) | ||||||
| Cash dividends paid |
(1,970 | ) | (1,969 | ) | (1,969 | ) | ||||||
| Proceeds from stock options exercised |
8 | 5 | — | |||||||||
|
|
|
|
|
|
|
|||||||
| Net cash provided by financing activities |
$ | 8,054 | $ | 30,487 | $ | 14,986 | ||||||
|
|
|
|
|
|
|
|||||||
| NET INCREASE (DECREASE) IN CASH AND CASH EQUIVALENTS |
(24,279 | ) | (15,380 | ) | 33,898 | |||||||
| CASH AND CASH EQUIVALENTS AT BEGINNING OF YEAR |
66,878 | 82,258 | 48,360 | |||||||||
|
|
|
|
|
|
|
|||||||
| CASH AND CASH EQUIVALENTS AT END OF YEAR |
$ | 42,599 | $ | 66,878 | $ | 82,258 | ||||||
|
|
|
|
|
|
|
|||||||
| SUPPLEMENTAL DISCLOSURES |
||||||||||||
| Cash paid during the year for: |
||||||||||||
| Interest |
$ | 2,356 | $ | 3,155 | $ | 3,769 | ||||||
| Income taxes |
2,335 | 1,690 | 1,525 | |||||||||
| Acquisition of noncash assets and liabilities: |
||||||||||||
| Assets acquired |
— | — | 13,631 | |||||||||
| Liabilities assumed |
— | — | 74,503 | |||||||||
| Noncash investing activities: |
||||||||||||
| Transfer of loans to other real estate owned |
— | 56 | 814 | |||||||||
| Transfer of securities from available-for-sale to held-to-maturity |
38,930 | — | — | |||||||||
These consolidated financial statements should be read in connection with the accompanying summary of significant accounting policies and notes to the consolidated financial statements.
2013 Report to Shareholders | CSB Bancorp, Inc. 29
NOTES TO CONSOLIDATED FINANCIAL STATEMENTS
NOTE 1 – SUMMARY OF SIGNIFICANT ACCOUNTING POLICIES
CSB Bancorp, Inc. (the “Company” or “CSB”) was incorporated in 1991 in the State of Ohio, and is a registered bank holding company. The Company’s wholly-owned subsidiaries are The Commercial and Savings Bank of Millersburg, Ohio (the “Bank”) and CSB Investment Services, LLC., inactive. The Company, through its subsidiaries, operates in one industry segment; the commercial banking industry.
The Bank, an Ohio-chartered bank organized in 1879, provides financial services through its sixteen Banking Centers located in Holmes, Tuscarawas, Wayne and Stark Counties in Ohio and nearby communities. These communities are the source of substantially all deposit, loan and trust activities. The majority of the Bank’s income is derived from commercial and retail lending activities and investments in securities. Its primary deposit products are checking, savings, and term certificate accounts, and its primary lending products are residential real estate, commercial real estate, commercial and installment loans. Substantially, all loans are secured by specific items of collateral including business assets, consumer assets and real estate. Commercial loans are expected to be repaid from cash flow from business operations. Real estate loans are secured by both residential and commercial real estate.
Significant accounting policies followed by the Company are presented below:
USE OF ESTIMATES IN PREPARING FINANCIAL STATEMENTS
In preparing Consolidated Financial Statements in conformity with U.S. generally accepted accounting principles, management is required to make estimates and assumptions that affect the reported amounts of assets and liabilities as of the date of the Consolidated Balance Sheets and reported amounts of revenues and expenses during each reporting period. Actual results could differ from those estimates. The most significant estimates susceptible to change in the near term relate to management’s determination of the allowance for loan losses and the fair value of financial instruments.
PRINCIPLES OF CONSOLIDATION
The Consolidated Financial Statements include the accounts of the Company and its wholly-owned subsidiaries. All significant inter-company balances and transactions have been eliminated in consolidation.
The Bank has established a trust department and the assets held by the Bank in fiduciary or agency capacities for its customers are not included in the Consolidated Balance Sheets as such items are not assets of the Bank.
CASH AND CASH EQUIVALENTS
For purposes of the Consolidated Statements of Cash Flows, cash and cash equivalents include cash on hand and amounts due from banks which mature overnight or within ninety days.
CASH RESERVE REQUIREMENTS
The Bank is required by the Federal Reserve to maintain reserves consisting of cash on hand and noninterest-earning balances on deposit with the Federal Reserve Bank. There was no required reserve balance at December 31, 2013 and 2012.
SECURITIES
Securities designated as available-for-sale are carried at fair value with unrealized gains and losses on such securities, net of applicable income taxes, recognized as other comprehensive income (loss). During 2013, approximately $39 million par value U.S. Government agencies and mortgage-backed securities of government agencies were transferred from available-for-sale to held-to-maturity. At year end, 28% of the total investment portfolio was classified as held-to-maturity. The volatility in interest rates that has occurred recently does not have as much impact on other comprehensive income as if the entire portfolio was included in the available-for-sale category. The held-to-maturity securities are carried at their fair value on the date of transfer or at purchase value if security purchases are designated as held-to-maturity.
The amortized cost of debt securities is adjusted for amortization of premiums and accretion of discounts to maturity based on the interest method. Such amortization and accretion is included in interest and dividends on securities.
Gains and losses on sales of securities are accounted for on a trade date basis, using the specific identification method, and are included in noninterest income. Securities are periodically reviewed for other-than-temporary impairment based upon a number of factors, including, but not limited to, the length of time and extent to which the market value has been less than cost, the financial condition of the underlying issuer, the receipt of principal and interest according to the contractual terms, the ability of the issuer to meet contractual obligations, the likelihood of the security’s ability to recover any decline in its market value and management’s intent and ability to hold the security for a period of time sufficient to allow for a recovery in market value. Among the factors that are considered in determining management’s intent and ability to hold the security is a review of the Company’s capital adequacy, interest rate risk position and liquidity.
30 2013 Report to Shareholders | CSB Bancorp, Inc.
NOTES TO CONSOLIDATED FINANCIAL STATEMENTS
NOTE 1 – SUMMARY OF SIGNIFICANT ACCOUNTING POLICIES (CONTINUED)
The assessment of a security’s ability to recover any decline in market value, the ability of the issuer to meet contractual obligations and management’s intent and ability to hold the security requires considerable judgment. A decline in value that is considered to be other-than-temporary is recorded as a loss within non-interest income in the Consolidated Statements of Income.
Investments in Federal Home Loan Bank of Cincinnati (“FHLB”) and Federal Reserve Bank stock are classified as restricted stock, carried at cost, and evaluated for impairment. The Bank is required to maintain an investment in common stock of the FHLB and Federal Reserve Bank because the Bank is a member of the FHLB and the Federal Reserve System. We consider these stocks to be nonmarketable equity securities.
Federal Home Loan Bank of Cincinnati reported profits for 2013 and 2012, remains in compliance with regulatory capital and liquidity requirements, continues to pay dividends on the stock and redeems its stock at par value. With consideration given to these factors, management concluded that the stock was not impaired at December 31, 2013 or 2012.
LOANS
Loans that management has the intent and ability to hold for the foreseeable future, or until maturity or pay-off, generally are stated at their outstanding principal amount, adjusted for charge-offs, the allowance for loan losses and any deferred loan fees or costs on originated loans. Interest is accrued based upon the daily outstanding principal balance. Loan origination fees and certain direct origination costs are capitalized and recognized as an adjustment of the yield over the life of the related loan.
Interest income is not reported when full repayment is in doubt, typically when the loan is impaired or payments are past due over 90 days. All interest accrued but not collected for loans that are placed on nonaccrual or charged-off is reversed against interest income. The interest on these loans is accounted for on the cash-basis or cost-recovery method, until qualifying for return to accrual. Loans are returned to accrual status when all the principal and interest amounts contractually due are brought current and future payments are reasonably assured.
At origination, a determination is made whether a loan will be held in the Bank’s portfolio or is intended for sale in the secondary market. Mortgage loans held for sale are recorded at the lower of the aggregate cost or fair value. Generally these loans are held for sale for less than three days. The Bank includes gains and losses on sales of the loans held for sale when the sale is completed.
ALLOWANCE FOR LOAN LOSSES
The allowance for loan losses is established as losses are estimated to have occurred through a provision for loan losses charged to income. Loan losses are charged against the allowance when management believes the uncollectability of a loan balance is confirmed. Subsequent recoveries, if any, are credited to the allowance.
The allowance for loan losses is evaluated on a regular basis by management and is based upon management’s periodic review of the collectability of the loans in light of historical experience, the nature and volume of the loan portfolio, adverse situations that may affect borrowers’ ability to repay, estimated value of any underlying collateral and prevailing economic conditions. This evaluation is inherently subjective as it requires estimates that are susceptible to significant revision as more information becomes available.
A loan is considered impaired when, based on current information and events, it is probable that the Company will be unable to collect the scheduled payments of principal or interest when due according to the contractual terms of the loan agreement. Factors considered by management in determining impairment include payment status, collateral value and the probability of collecting scheduled principal and interest payments when due. Loans that experience insignificant payment delays and payment shortfalls generally are not classified as impaired. Management determines the significance of payment delays and payment shortfalls on a case-by-case basis, taking into consideration all of the circumstances surrounding the loan and the borrower, including the length of the delay, the reasons for the delay, the borrower’s prior payment record and the amount of the shortfall in relation to the principal and interest owed. Impairment is measured on a loan-by-loan basis for commercial, commercial real estate, and construction loans by either the present value of expected future cash flows discounted at the loan’s effective interest rate, the loan’s obtainable market price, or the fair value of the collateral if the loan is collateral dependent.
Large groups of smaller balance homogeneous loans are collectively evaluated for impairment. Accordingly, the Company does not separately identify individual consumer loans for impairment disclosures.
OTHER REAL ESTATE OWNED
Other real estate acquired through or in lieu of foreclosure is initially recorded at fair value, less estimated costs to sell, and any loan balance in excess of fair value is charged to the allowance for loan losses. Subsequent valuations are periodically performed and write-downs are included in other operating expense, as are gains or losses upon sale and expenses related to maintenance of the properties. Other real estate owned amounted to $0 and $25 thousand at December 31, 2013 and 2012, respectively.
2013 Report to Shareholders | CSB Bancorp, Inc. 31
NOTES TO CONSOLIDATED FINANCIAL STATEMENTS
NOTE 1 – SUMMARY OF SIGNIFICANT ACCOUNTING POLICIES (CONTINUED)
PREMISES AND EQUIPMENT
Premises and equipment is stated at cost less accumulated depreciation and amortization. Upon the sale or disposition of the assets, the difference between the depreciated cost and proceeds is charged or credited to income. Depreciation and amortization is determined based on the estimated useful lives of the individual assets (typically 20 to 40 years for buildings and 3 to 10 years for equipment) and is computed using the straight-line method.
GOODWILL AND CORE DEPOSIT INTANGIBLE ASSETS
Goodwill is not amortized, but is tested at least annually for impairment in the fourth quarter or more frequently if indicators of impairment are present. The evaluation for impairment involves comparing the estimated current fair value of the reporting unit to its carrying value, including goodwill. If the estimated current fair value of a reporting unit exceeds its carrying value, no additional testing is required and an impairment loss is not recorded. CSB uses market capitalization and multiples of tangible book value methods to determine the estimated current fair value of its reporting unit. Based on this analysis no impairment was recorded in 2013 or 2012.
The core deposit intangible assets are assigned useful lives, which are amortized on an accelerated basis over their weighted average lives. The Company periodically reviews the intangible asset for impairment as events or changes in circumstances indicate that the carrying amount of such assets may not be recoverable.
MORTGAGE SERVICING RIGHTS
Mortgage servicing rights (“MSRs”) represent the right to service loans for third party investors. MSRs are recognized as a separate asset upon the sale of mortgage loans to a third party investor with the servicing rights retained by CSB. Originated MSRs are recorded at allocated fair value at the time of the sale of the loans to the third party investor. MSRs are amortized in proportion to and over the estimated period of net servicing income. MSRs are carried at amortized cost, less a valuation allowance for impairment, if any. MSRs are evaluated on a discounted earnings basis to determine the present value of future earnings of the underlying serviced mortgages. All assumptions are reviewed annually or more frequently, if necessary, and adjusted to reflect current and anticipated market conditions.
BANK-OWNED LIFE INSURANCE
The cash surrender value of these policies is included as an asset on the Consolidated Balance Sheets and any increases in the cash surrender value are recorded as noninterest income on the Consolidated Statements of Income. In the event of the death of an insured individual under these policies, the Company would receive a death benefit, which would be recorded as noninterest income.
REPURCHASE AGREEMENTS
Substantially all securities sold under repurchase agreements represent amounts advanced by various customers. Securities owned by the Bank are pledged to cover those obligations. These repurchase agreements are not deposits and are not covered by federal deposit insurance.
ADVERTISING COSTS
All advertising costs are expensed as incurred. Advertising expenses amounted to $175 thousand, $190 thousand and $175 thousand for the years ended 2013, 2012 and 2011 respectively.
FEDERAL INCOME TAXES
The Company and its subsidiaries file a consolidated tax return. Deferred income taxes are provided on temporary differences between financial statement and income tax reporting. Temporary differences are differences between the amounts of assets and liabilities reported for financial statement purposes and their tax bases. Deferred tax assets are recognized for temporary differences that will be deductible in future years’ tax returns and for operating loss and tax credit carryforwards. Deferred tax assets are reduced by a valuation allowance if it is deemed more likely than not that some or all of the deferred tax assets will not be realized. Deferred tax liabilities are recognized for temporary differences that will be taxable in future years’ tax returns.
The Bank, domiciled in Ohio, is not currently subject to state and local income taxes.
32 2013 Report to Shareholders | CSB Bancorp, Inc.
NOTES TO CONSOLIDATED FINANCIAL STATEMENTS
NOTE 1 – SUMMARY OF SIGNIFICANT ACCOUNTING POLICIES (CONTINUED)
STOCK-BASED COMPENSATION
The Company sponsored a stock-based compensation plan, administered by a committee. The incentive stock option plan expired in 2012. The Company recorded no stock-based compensation expense for 2013, 2012 or 2011. There was no income tax benefit recognized in the accompanying Consolidated Statements of Income related to stock-based compensation in 2013, 2012 or 2011. Shares issued in connection with stock option exercises were issued from available treasury shares in 2013.
As of December 31, 2013, there was no unrecognized compensation cost related to unvested share-based compensation awards outstanding. All shares are vested.
The fair value of each option is amortized into compensation expense on a straight-line basis between the grant date for the option and each vesting date. CSB estimates the fair value of stock options on the date of the grant using the Black-Scholes option pricing model. The model requires the use of numerous assumptions, many of which are highly subjective in nature. There were no option grants for the years ended December 31, 2013 and 2012.
COMPREHENSIVE INCOME
The Company includes recognized revenue, expenses, gains and losses in net income. Although certain changes in assets and liabilities such as unrealized gains and losses on available-for-sale securities are reported as a separate component of the equity section of the Consolidated Balance Sheets, these items along with net income are components of comprehensive income.
TRANSFERS OF FINANCIAL ASSETS
Transfers of financial assets are accounted for as sales when control over the assets has been surrendered. Control over transferred assets is deemed to be surrendered when (1) the assets have been isolated from the Company, (2) the transferee obtains the right (free of conditions that constrain it from taking advantage of that right) to pledge or exchange the transferred assets, and (3) the Company does not maintain effective control over the transferred assets through an agreement to repurchase them before their maturity.
PER SHARE DATA
Basic net income per share is computed based on the weighted average number of shares of common stock outstanding during each year. Diluted income per common share includes the dilutive effect of additional potential common shares issuable under stock options.
The weighted average number of common shares outstanding for basic and diluted earnings per share computations was as follows:
| 2013 | 2012 | 2011 | ||||||||||
| Weighted average common shares |
2,980,602 | 2,980,602 | 2,980,602 | |||||||||
| Average treasury shares |
(244,129 | ) | (245,713 | ) | (245,803 | ) | ||||||
|
|
|
|
|
|
|
|||||||
| Total weighted average common shares outstanding (basic) |
2,736,473 | 2,734,889 | 2,734,799 | |||||||||
| Dilutive effect of assumed exercise of stock options |
2,004 | 252 | 39 | |||||||||
|
|
|
|
|
|
|
|||||||
| Weighted average common shares outstanding (diluted) |
2,738,477 | 2,735,141 | 2,734,838 | |||||||||
|
|
|
|
|
|
|
|||||||
Dividends per share are based on the number of shares outstanding at the declaration date.
There were no stock options that were antidilutive at December 31, 2013. Options to purchase an aggregate of 29,760 common shares at $18.00 per share were outstanding at December 31, 2012 and 2011 and were antidilutive.
ACCOUNTING DEVELOPMENTS
In February 2013, the Financial Accounting Standards Board (“FASB”) issued Accounting Standards Update (“ASU”) 2013-02, Reporting of Amounts Reclassified Out of Accumulated Other Comprehensive Income. The standard requires that companies present either in a single note or parenthetically on the face of the financial statements, the effect of significant amounts reclassified from each component of accumulated other comprehensive income based on its source and the income statement line items affected by the reclassification. The new requirements took effect for public companies in fiscal years, and interim periods within those years, beginning after December 15, 2012. The Company adopted this standard on January 1, 2013. The effect of adopting this standard increased our disclosure surrounding reclassification items out of accumulated other comprehensive income.
2013 Report to Shareholders | CSB Bancorp, Inc. 33
NOTES TO CONSOLIDATED FINANCIAL STATEMENTS
NOTE 1 – SUMMARY OF SIGNIFICANT ACCOUNTING POLICIES (CONTINUED)
In July 2013, the FASB issued ASU 2013-11, Income Taxes (Topic 740): Presentation of an Unrecognized Tax Benefit When a Net Operating Loss Carryforward, a Similar Tax Loss, or a Tax Credit Carryforward Exists. This Update applies to all entities that have unrecognized tax benefits when a net operating loss carryforward, a similar tax loss, or a tax credit carryforward exists at the reporting date. An unrecognized tax benefit, or a portion of an unrecognized tax benefit, should be presented in the financial statements as a reduction to a deferred tax asset for a net operating loss carryforward, a similar tax loss, or a tax credit carryforward, except as follows. To the extent a net operating loss carryforward, a similar tax loss, or a tax credit carryforward is not available at the reporting date under the tax law of the applicable jurisdiction to settle any additional income taxes that would result from the disallowance of a tax position or the tax law of the applicable jurisdiction does not require the entity to use, and the entity does not intend to use, the deferred tax asset for such purpose, the unrecognized tax benefit should be presented in the financial statements as a liability and should not be combined with deferred tax assets. The assessment of whether a deferred tax asset is available is based on the unrecognized tax benefit and deferred tax asset that exist at the reporting date and should be made presuming disallowance of the tax position at the reporting date. The amendments in this Update are effective for fiscal years, and interim periods within those years, beginning after December 15, 2013. The amendments should be applied prospectively to all unrecognized tax benefits that exist at the effective date. Retrospective application is permitted. The Company is currently evaluating the impact the adoption of the standard will have on the Company’s financial position or results of operations.
In January 2014, the FASB issued ASU 2014-04, Receivables – Troubled Debt Restructurings by Creditors (Subtopic 310-40): Reclassification of Residential Real Estate Collateralized Consumer Mortgage Loans upon Foreclosure. The amendments in this Update clarify that an in substance repossession or foreclosure occurs, and a creditor is considered to have received physical possession of residential real estate property collateralizing a consumer mortgage loan, upon either (1) the creditor obtaining legal title to the residential real estate property upon completion of a foreclosure or (2) the borrower conveying all interest in the residential real estate property to the creditor to satisfy that loan through completion of a deed in lieu of foreclosure or through a similar legal agreement. Additionally, the amendments require interim and annual disclosure of both (1) the amount of foreclosed residential real estate property held by the creditor and (2) the recorded investment in consumer mortgage loans collateralized by residential real estate property that are in the process of foreclosure according to local requirements of the applicable jurisdiction. The amendments in this Update are effective for public business entities for annual periods, and interim periods within those annual periods, beginning after December 15, 2014. An entity can elect to adopt the amendments in this Update using either a modified retrospective transition method or a prospective transition method. The Company is currently evaluating the impact the adoption of the standard will have on the Company’s financial position or results of operations.
RECLASSIFICATION OF COMPARATIVE AMOUNTS
Certain comparative amounts from the prior years have been reclassified to conform to current year classifications. Such classifications had no effect on net income or shareholders’ equity.
34 2013 Report to Shareholders | CSB Bancorp, Inc.
NOTES TO CONSOLIDATED FINANCIAL STATEMENTS
NOTE 2 – SECURITIES
Securities consist of the following at December 31:
| (Dollars in thousands) |
Amortized Cost |
Gross Unrealized Gains |
Gross Unrealized Losses |
Fair Value |
||||||||||||
| 2013 |
||||||||||||||||
| Available-for-sale: |
||||||||||||||||
| U.S. Treasury security |
$ | 1,005 | $ | — | $ | 8 | $ | 997 | ||||||||
| U.S. Government agencies |
22,999 | 8 | 706 | 22,301 | ||||||||||||
| Mortgage-backed securities of government agencies |
54,455 | 536 | 691 | 54,300 | ||||||||||||
| Other mortgage-backed securities |
230 | 5 | — | 235 | ||||||||||||
| Asset-backed securities of government agencies |
2,739 | 36 | — | 2,775 | ||||||||||||
| State and political subdivisions |
16,219 | 371 | 143 | 16,447 | ||||||||||||
| Corporate bonds |
4,500 | 44 | 5 | 4,539 | ||||||||||||
| Equity securities |
106 | 23 | 1 | 128 | ||||||||||||
|
|
|
|
|
|
|
|
|
|||||||||
| Total available-for-sale |
102,253 | 1,023 | 1,554 | 101,722 | ||||||||||||
| Held-to-maturity securities |
||||||||||||||||
| U.S. Government agencies |
19,186 | — | 828 | 18,358 | ||||||||||||
| Mortgage-backed securities of government agencies |
25,164 | — | 879 | 24,285 | ||||||||||||
|
|
|
|
|
|
|
|
|
|||||||||
| Total held-to-maturity |
44,350 | — | 1,707 | 42,643 | ||||||||||||
| Restricted stock |
5,463 | — | — | 5,463 | ||||||||||||
|
|
|
|
|
|
|
|
|
|||||||||
| Total securities |
$ | 152,066 | $ | 1,023 | $ | 3,261 | $ | 149,828 | ||||||||
|
|
|
|
|
|
|
|
|
|||||||||
| 2012 |
||||||||||||||||
| Available-for-sale: |
||||||||||||||||
| U.S. Treasury security |
$ | 100 | $ | — | $ | — | $ | 100 | ||||||||
| U.S. Government agencies |
35,996 | 27 | 43 | 35,980 | ||||||||||||
| Mortgage-backed securities of government agencies |
66,588 | 2,107 | — | 68,695 | ||||||||||||
| Other mortgage-backed securities |
345 | — | 1 | 344 | ||||||||||||
| Asset-backed securities of government agencies |
2,862 | — | 39 | 2,823 | ||||||||||||
| State and political subdivisions |
16,194 | 701 | 12 | 16,883 | ||||||||||||
| Corporate bonds |
4,313 | 112 | 28 | 4,397 | ||||||||||||
| Equity securities |
69 | 9 | 9 | 69 | ||||||||||||
|
|
|
|
|
|
|
|
|
|||||||||
| Total available-for-sale |
126,467 | 2,956 | 132 | 129,291 | ||||||||||||
| Restricted stock |
5,463 | — | — | 5,463 | ||||||||||||
|
|
|
|
|
|
|
|
|
|||||||||
| Total securities |
$ | 131,930 | $ | 2,956 | $ | 132 | $ | 134,754 | ||||||||
|
|
|
|
|
|
|
|
|
|||||||||
2013 Report to Shareholders | CSB Bancorp, Inc. 35
NOTES TO CONSOLIDATED FINANCIAL STATEMENTS
NOTE 2 – SECURITIES (CONTINUED)
The amortized cost and fair value of securities at December 31, 2013, by contractual maturity, are shown below. Actual maturities may differ from contractual maturities because borrowers may have the right to call or prepay obligations with or without call or prepayment penalties.
| (Dollars in thousands) |
Amortized Cost |
Fair Value |
||||||
| Available-for-sale: |
||||||||
| Due in one year or less |
$ | 855 | $ | 875 | ||||
| Due after one through five years |
17,354 | 17,500 | ||||||
| Due after five through ten years |
22,455 | 22,033 | ||||||
| Due after ten years |
61,483 | 61,186 | ||||||
|
|
|
|
|
|||||
| Total debt securities available-for-sale |
$ | 102,147 | $ | 101,594 | ||||
|
|
|
|
|
|||||
| Held-to-maturity: |
||||||||
| Due in one year or less |
$ | — | $ | — | ||||
| Due after one through five years |
— | — | ||||||
| Due after five through ten years |
7,717 | 7,568 | ||||||
| Due after ten years |
36,633 | 35,075 | ||||||
|
|
|
|
|
|||||
| Total debt securities held-to-maturity |
$ | 44,350 | $ | 42,643 | ||||
|
|
|
|
|
|||||
Securities with a market value of approximately $87.9 million and $79.2 million were pledged at December 31, 2013 and 2012, respectively, to secure public deposits, as well as other deposits and borrowings as required or permitted by law.
Restricted stock primarily consists of investments in FHLB and Federal Reserve Bank stock. The Bank’s investment in FHLB stock amounted to $5.0 million at December 31, 2013 and 2012. Federal Reserve Bank stock was $471 thousand at December 31, 2013 and 2012.
The following table shows the proceeds from sales of available-for-sale securities and the gross realized gains and losses on the sales of those securities that have been included in earnings as a result of the sales in 2013 and 2011. There were no securities sold during 2012.
| (Dollars in thousands) |
2013 | 2011 | ||||||
| Proceeds |
$ | 4,309 | $ | 3,244 | ||||
| Realized gains |
$ | 159 | $ | 237 | ||||
| Realized losses |
— | — | ||||||
| Impairment losses |
— | — | ||||||
|
|
|
|
|
|||||
| Net securities gains |
$ | 159 | $ | 237 | ||||
|
|
|
|
|
|||||
The income tax provision applicable to realized gains amounted to $54 thousand in 2013 and $81 thousand in 2011. There were no tax benefits recognized from gross realized losses in 2013, 2012 or 2011.
36 2013 Report to Shareholders | CSB Bancorp, Inc.
NOTES TO CONSOLIDATED FINANCIAL STATEMENTS
NOTE 2 – SECURITIES (CONTINUED)
The following table presents gross unrealized losses and fair value of securities, aggregated by investment category and length of time that individual securities have been in a continuous unrealized loss position, at December 31:
| Securities in a Continuous Unrealized Loss Position | ||||||||||||||||||||||||
| Less Than 12 Months | 12 Months Or More | Total | ||||||||||||||||||||||
| (Dollars in thousands) |
Gross Unrealized Losses |
Fair Value |
Gross Unrealized Losses |
Fair Value |
Gross Unrealized Losses |
Fair Value |
||||||||||||||||||
| 2013 |
||||||||||||||||||||||||
| Available-for-sale |
||||||||||||||||||||||||
| U.S. Treasury security |
$ | 8 | $ | 997 | $ | — | $ | — | $ | 8 | $ | 997 | ||||||||||||
| U.S. Government agencies |
590 | 15,409 | 116 | 1,884 | 706 | 17,293 | ||||||||||||||||||
| Mortgage-backed securities of government agencies |
691 | 29,938 | — | — | 691 | 29,938 | ||||||||||||||||||
| State and political subdivisions |
122 | 3,522 | 21 | 233 | 143 | 3,755 | ||||||||||||||||||
| Corporate bonds |
4 | 1,163 | 1 | 499 | 5 | 1,662 | ||||||||||||||||||
| Equity securities |
— | — | 1 | 1 | 1 | 1 | ||||||||||||||||||
| Held-to-maturity |
||||||||||||||||||||||||
| U.S. Government agencies |
771 | 14,559 | 57 | 1,799 | 828 | 16,358 | ||||||||||||||||||
| Mortgage-backed securities of government agencies |
879 | 20,149 | — | — | 879 | 20,149 | ||||||||||||||||||
|
|
|
|
|
|
|
|
|
|
|
|
|
|||||||||||||
| Total temporarily impaired securities |
$ | 3,065 | $ | 85,737 | $ | 196 | $ | 4,416 | $ | 3,261 | $ | 90,153 | ||||||||||||
|
|
|
|
|
|
|
|
|
|
|
|
|
|||||||||||||
| 2012 |
||||||||||||||||||||||||
| Available-for-sale |
||||||||||||||||||||||||
| U.S. Government agencies |
$ | 43 | $ | 15,957 | $ | — | $ | — | $ | 43 | $ | 15,957 | ||||||||||||
| Other mortgage-backed securities |
1 | 344 | — | — | 1 | 344 | ||||||||||||||||||
| Asset-backed securities of government agencies |
39 | 1,833 | — | — | 39 | 1,833 | ||||||||||||||||||
| State and political subdivisions |
12 | 1,737 | — | — | 12 | 1,737 | ||||||||||||||||||
| Corporate bonds |
4 | 366 | 24 | 975 | 28 | 1,341 | ||||||||||||||||||
|
|
|
|
|
|
|
|
|
|
|
|
|
|||||||||||||
| Total debt securities |
99 | 20,237 | 24 | 975 | 123 | 21,212 | ||||||||||||||||||
| Equity securities |
— | — | 9 | 45 | 9 | 45 | ||||||||||||||||||
|
|
|
|
|
|
|
|
|
|
|
|
|
|||||||||||||
| Total temporarily impaired securities |
$ | 99 | $ | 20,237 | $ | 33 | $ | 1,020 | $ | 132 | $ | 21,257 | ||||||||||||
|
|
|
|
|
|
|
|
|
|
|
|
|
|||||||||||||
There were seventy-three (73) securities in an unrealized loss position at December 31, 2013, seven (7) of which were in a continuous loss position for twelve or more months. At least quarterly, the Company conducts a comprehensive security-level impairment assessment. The assessments are based on the nature of the securities, the extent and duration of the securities, the extent and duration of the loss, management’s intent to sell or if it is more likely than not that management will be required to sell a security before recovery of its amortized cost basis, which may be maturity. Management believes the Company will fully recover the cost of these securities and it does not intend to sell these securities and likely will not be required to sell them before the anticipated recovery of the remaining amortized cost basis, which may be maturity. As a result, management concluded that these securities were not other-than-temporarily impaired at December 31, 2013.
2013 Report to Shareholders | CSB Bancorp, Inc. 37
NOTES TO CONSOLIDATED FINANCIAL STATEMENTS
NOTE 3 – LOANS
Loans consist of the following at December 31:
| (Dollars in thousands) |
2013 | 2012 | ||||||
| Commercial |
$ | 117,478 | $ | 104,899 | ||||
| Commercial real estate |
129,828 | 119,192 | ||||||
| Residential real estate |
111,445 | 110,412 | ||||||
| Construction & land development |
13,444 | 23,358 | ||||||
| Consumer |
6,687 | 6,480 | ||||||
| Total loans before deferred costs |
378,882 | 364,341 | ||||||
| Deferred loan costs |
243 | 239 | ||||||
| Total loans |
$ | 379,125 | $ | 364,580 | ||||
Loan Origination/Risk Management
The Company has certain lending policies and procedures in place that are designed to maximize loan income within an acceptable level of risk. Management reviews and approves these policies and procedures on a regular basis. A reporting system supplements the review process by providing management with frequent reports related to loan production, loan quality, concentrations of credit, loan delinquencies and nonperforming and potential problem loans. Diversification in the loan portfolio is a means of managing risk associated with fluctuations in economic conditions.
Commercial loans are underwritten after evaluating and understanding the borrower’s ability to operate profitably and prudently expand its business. Underwriting standards are designed to promote relationship banking rather than transactional banking. The Company’s management examines current and occasionally projected cash flows to determine the ability of the borrower to repay their obligations as agreed. Commercial loans are primarily made based on the identified cash flows of the borrower and secondarily on the underlying collateral provided by the borrower. However, the cash flows of borrowers may not be as expected and the collateral securing these loans may fluctuate in value. Most commercial loans are secured by the assets being financed or other business assets such as accounts receivable or inventory and may incorporate a personal guarantee; however, some short-term loans may be made on an unsecured basis. In the case of loans secured by accounts receivable, the availability of funds for the repayment of these loans may be substantially dependent on the ability of the borrower to collect amounts due from its customers.
Commercial real estate loans are subject to underwriting standards and processes similar to commercial loans, in addition to those of real estate loans. These loans are viewed primarily as cash flow loans and secondarily as loans secured by real estate. Commercial real estate lending typically involves higher loan principal amounts and the repayment of these loans is largely dependent on the successful operation of the property securing the loan or the business conducted on the property securing the loan. Commercial real estate loans may be adversely affected by conditions in the real estate markets or in the general economy. The properties securing the Company’s commercial real estate portfolio are diverse in terms of type. This diversity helps reduce the Company’s exposure to adverse economic events that affect any single industry. Management monitors and evaluates commercial real estate loans based on collateral, geography and risk grade criteria. In addition, management tracks the level of owner-occupied commercial real estate loans versus non-owner occupied loans. At December 31, 2013 and 2012, approximately 77% and 81%, respectively of the outstanding principal balance of the Company’s commercial real estate loans were secured by owner-occupied properties.
With respect to loans to developers and builders that are secured by non-owner occupied properties, the Company generally requires the borrower to have had an existing relationship with the Company and have a proven record of success. Construction and land development loans are underwritten utilizing independent appraisal reviews, sensitivity analysis of absorption and lease rates, and financial analysis of the developers and property owners. Construction and land development loans are generally based upon estimates of costs and value associated with the completed project. These estimates may be inaccurate. Construction and land development loans often involve the disbursement of substantial funds with repayment substantially dependent on the success of the ultimate project. Sources of repayment for these types of loans may be pre-committed permanent loans from approved long-term lenders, sales of developed property or an interim loan commitment from the Company until permanent financing is obtained. These loans are closely monitored by on-site inspections and are considered to have higher risk than other real estate loans due to their ultimate repayment being sensitive to interest rate changes, governmental regulation of real property, general economic conditions and the availability of long-term financing.
38 2013 Report to Shareholders | CSB Bancorp, Inc.
NOTES TO CONSOLIDATED FINANCIAL STATEMENTS
NOTE 3 – LOANS (CONTINUED)
The Company originates consumer loans utilizing a judgmental underwriting process. To monitor and manage consumer loan risk, policies and procedures are developed and modified, as needed, jointly by line and staff personnel. This activity, coupled with relatively small loan amounts that are spread across many individual borrowers, minimizes risk.
The Company maintains an independent loan review department that reviews and validates the credit risk program on a periodic basis. Results of these reviews are presented to management. The loan review process complements and reinforces the risk identification and assessment decisions made by lenders and credit personnel, as well as the Company’s policies and procedures.
Concentrations of Credit
Nearly all of the Company’s lending activity occurs within the State of Ohio, including the four counties of Holmes, Stark, Tuscarawas and Wayne, as well as other markets. The majority of the Company’s loan portfolio consists of commercial and industrial and commercial real estate loans. As of December 31, 2013 and 2012, there were no concentrations of loans greater than 7% related to any single industry.
Allowance for Loan Losses
The following table details activity in the allowance for loan losses by portfolio segment for the years ended December 31, 2013, 2012 and 2011. Allocation of a portion of the allowance to one category of loans does not preclude its availability to absorb losses in other categories.
| (Dollars in thousands) |
Commercial | Commercial Real Estate |
Residential Real Estate |
Construction & Land Development |
Consumer | Unallocated | Total | |||||||||||||||||||||
| December 31, 2013 |
||||||||||||||||||||||||||||
| Beginning balance |
$ | 933 | $ | 1,902 | $ | 1,096 | $ | 253 | $ | 76 | $ | 320 | $ | 4,580 | ||||||||||||||
| Provision for loan losses |
451 | 78 | 173 | (75 | ) | 13 | 200 | 840 | ||||||||||||||||||||
| Charge-offs |
(190 | ) | (108 | ) | (82 | ) | — | (48 | ) | (428 | ) | |||||||||||||||||
| Recoveries |
25 | — | 18 | — | 50 | 93 | ||||||||||||||||||||||
| Net charge-offs |
(165) | (108) | (64) | — | 2 |
|
|
(335) | ||||||||||||||||||||
| Ending balance |
$ | 1,219 | $ | 1,872 | $ | 1,205 | $ | 178 | $ | 91 | $ | 520 | $ | 5,085 | ||||||||||||||
| December 31, 2012 |
||||||||||||||||||||||||||||
| Beginning balance |
$ | 1,024 | $ | 1,673 | $ | 894 | $ | 180 | $ | 78 | $ | 233 | $ | 4,082 | ||||||||||||||
| Provision for loan losses |
(78 | ) | 512 | 206 | 73 | 23 | 87 | 823 | ||||||||||||||||||||
| Charge-offs |
(29 | ) | (283 | ) | (106 | ) | — | (89 | ) | (507 | ) | |||||||||||||||||
| Recoveries |
16 | — | 102 | — | 64 | 182 | ||||||||||||||||||||||
| Net charge-offs |
(13) | (283) | (4) | — | (25) |
|
|
(325) | ||||||||||||||||||||
| Ending balance |
$ | 933 | $ | 1,902 | $ | 1,096 | $ | 253 | $ | 76 | $ | 320 | $ | 4,580 | ||||||||||||||
| December 31, 2011 |
||||||||||||||||||||||||||||
| Beginning balance |
$ | 1,179 | $ | 1,183 | $ | 1,057 | $ | 213 | $ | 80 | $ | 319 | $ | 4,031 | ||||||||||||||
| Provision for loan losses |
294 | 558 | 115 | 8 | 61 | (86 | ) | 950 | ||||||||||||||||||||
| Charge-offs |
(487 | ) | (68 | ) | (297 | ) | (41 | ) | (121 | ) | (1,014 | ) | ||||||||||||||||
| Recoveries |
38 | — | 19 | — | 58 | 115 | ||||||||||||||||||||||
| Net charge-offs |
(449) | (68) | (278) | (41) | (63) |
|
|
(899) | ||||||||||||||||||||
| Ending balance |
$ | 1,024 | $ | 1,673 | $ | 894 | $ | 180 | $ | 78 | $ | 233 | $ | 4,082 | ||||||||||||||
2013 Report to Shareholders | CSB Bancorp, Inc. 39
NOTES TO CONSOLIDATED FINANCIAL STATEMENTS
NOTE 3 – LOANS (CONTINUED)
The following table presents the balance in the allowance for loan losses and the ending loan balances by portfolio segment and impairment method as of December 31:
| (Dollars in thousands) |
Commercial | Commercial Real Estate |
Residential Real Estate |
Construction & Land Development |
Consumer | Unallocated | Total | |||||||||||||||||||||
| 2013 |
||||||||||||||||||||||||||||
| Allowance for loan losses: |
||||||||||||||||||||||||||||
| Ending allowance balances attributable to loans: |
||||||||||||||||||||||||||||
| Individually evaluated for impairment |
$ | 241 | $ | 331 | $ | 212 | $ | — | $ | — | $ | — | $ | 784 | ||||||||||||||
| Collectively evaluated for impairment |
978 | 1,541 | 993 | 178 | 91 | 520 | 4,301 | |||||||||||||||||||||
| Total ending allowance balance |
$ | 1,219 | $ | 1,872 | $ | 1,205 | $ | 178 | $ | 91 | $ | 520 | $ | 5,085 | ||||||||||||||
| Loans: |
||||||||||||||||||||||||||||
| Loans individually evaluated for impairment |
$ | 5,576 | $ | 3,220 | $ | 1,844 | $ | — | $ | — | $ | 10,640 | ||||||||||||||||
| Loans collectively evaluated for impairment |
111,902 | 126,608 | 109,601 | 13,444 | 6,687 | 368,242 | ||||||||||||||||||||||
| Total ending loans balance |
$ | 117,478 | $ | 129,828 | $ | 111,445 | $ | 13,444 | $ | 6,687 | $ | 378,882 | ||||||||||||||||
| 2012 |
||||||||||||||||||||||||||||
| Allowance for loan losses: |
||||||||||||||||||||||||||||
| Ending allowance balances attributable to loans: |
||||||||||||||||||||||||||||
| Individually evaluated for impairment |
$ | 85 | $ | 522 | $ | 172 | $ | — | $ | — | $ | — | $ | 779 | ||||||||||||||
| Collectively evaluated for impairment |
848 | 1,380 | 924 | 253 | 76 | 320 | 3,801 | |||||||||||||||||||||
| Total ending allowance balance |
$ | 933 | $ | 1,902 | $ | 1,096 | $ | 253 | $ | 76 | $ | 320 | $ | 4,580 | ||||||||||||||
| Loans: |
||||||||||||||||||||||||||||
| Loans individually evaluated for impairment |
$ | 4,315 | $ | 4,573 | $ | 1,137 | $ | 166 | $ | — | $ | 10,191 | ||||||||||||||||
| Loans collectively evaluated for impairment |
100,584 | 114,619 | 109,275 | 23,192 | 6,480 | 354,150 | ||||||||||||||||||||||
| Total ending loans balance |
$ | 104,899 | $ | 119,192 | $ | 110,412 | $ | 23,358 | $ | 6,480 | $ | 364,341 | ||||||||||||||||
40 2013 Report to Shareholders | CSB Bancorp, Inc.
NOTES TO CONSOLIDATED FINANCIAL STATEMENTS
NOTE 3 – LOANS (CONTINUED)
The following table presents loans individually evaluated for impairment by class of loans as of December 31:
| (Dollars in thousands) |
Unpaid Principal Balance |
Recorded Investment With No Allowance |
Recorded Investment With Allowance |
Total Recorded Investment |
Related Allowance |
Average Recorded Investment |
Interest Income Recognized |
|||||||||||||||||||||
| 2013 |
||||||||||||||||||||||||||||
| Commercial |
$ | 5,595 | $ | 7 | $ | 5,580 | $ | 5,587 | $ | 241 | $ | 4,185 | $ | 182 | ||||||||||||||
| Commercial real estate |
3,540 | 563 | 2,658 | 3,221 | 331 | 3,650 | 163 | |||||||||||||||||||||
| Residential real estate |
2,001 | 337 | 1,510 | 1,847 | 212 | 1,315 | 41 | |||||||||||||||||||||
| Construction & land development |
— | — | — | — | — | 21 | 2 | |||||||||||||||||||||
| Total impaired loans |
$ | 11,136 | $ | 907 | $ | 9,748 | $ | 10,655 | $ | 784 | $ | 9,171 | $ | 388 | ||||||||||||||
| 2012 |
||||||||||||||||||||||||||||
| Commercial |
$ | 4,315 | $ | — | $ | 4,329 | $ | 4,329 | $ | 85 | $ | 4,123 | $ | 167 | ||||||||||||||
| Commercial real estate |
4,906 | 1,723 | 2,849 | 4,572 | 522 | 4,396 | 152 | |||||||||||||||||||||
| Residential real estate |
1,223 | 86 | 1,057 | 1,143 | 172 | 770 | 18 | |||||||||||||||||||||
| Construction & land development |
173 | 166 | — | 166 | — | 167 | — | |||||||||||||||||||||
| Total impaired loans |
$ | 10,617 | $ | 1,975 | $ | 8,235 | $ | 10,210 | $ | 779 | $ | 9,456 | $ | 337 | ||||||||||||||
| 2011 |
||||||||||||||||||||||||||||
| Commercial |
$ | 4,605 | $ | — | $ | 4,605 | $ | 4,605 | $ | 165 | $ | 2,890 | $ | 91 | ||||||||||||||
| Commercial real estate |
2,621 | — | 2,476 | 2,476 | 304 | 2,924 | 78 | |||||||||||||||||||||
| Residential real estate |
182 | — | 182 | 182 | 53 | 103 | — | |||||||||||||||||||||
| Construction & land development |
— | — | — | — | — | — | — | |||||||||||||||||||||
| Total impaired loans |
$ | 7,408 | $ | — | $ | 7,263 | $ | 7,263 | $ | 522 | $ | 5,917 | $ | 169 | ||||||||||||||
2013 Report to Shareholders | CSB Bancorp, Inc. 41
NOTES TO CONSOLIDATED FINANCIAL STATEMENTS
NOTE 3 – LOANS (CONTINUED)
The following table presents the aging of past due and nonaccrual loans by class of loans as of December 31:
| (Dollars in thousands) |
Current | 30-59 Days Past Due |
60-89 Days Past Due |
90 Days + Past Due |
Nonaccrual | Total Past Due and Nonaccrual |
Total Loans |
|||||||||||||||||||||
| 2013 |
||||||||||||||||||||||||||||
| Commercial |
$ | 117,342 | $ | 15 | $ | 37 | $ | — | $ | 84 | $ | 136 | $ | 117,478 | ||||||||||||||
| Commercial real estate |
128,462 | 111 | 107 | 40 | 1,108 | 1,366 | 129,828 | |||||||||||||||||||||
| Residential real estate |
109,274 | 616 | 467 | 46 | 1,042 | 2,171 | 111,445 | |||||||||||||||||||||
| Construction & land development |
12,494 | — | — | 950 | — | 950 | 13,444 | |||||||||||||||||||||
| Consumer |
6,524 | 123 | 40 | — | — | 163 | 6,687 | |||||||||||||||||||||
| Total loans |
$ | 374,096 | $ | 865 | $ | 651 | $ | 1,036 | $ | 2,234 | $ | 4,786 | $ | 378,882 | ||||||||||||||
| 2012 |
||||||||||||||||||||||||||||
| Commercial |
$ | 104,348 | $ | 60 | $ | 8 | $ | — | $ | 483 | $ | 551 | $ | 104,899 | ||||||||||||||
| Commercial real estate |
117,372 | 41 | 34 | — | 1,745 | 1,820 | 119,192 | |||||||||||||||||||||
| Residential real estate |
108,574 | 472 | 430 | 131 | 805 | 1,838 | 110,412 | |||||||||||||||||||||
| Construction & land development |
23,180 | — | 5 | — | 173 | 178 | 23,358 | |||||||||||||||||||||
| Consumer |
6,325 | 132 | 23 | — | — | 155 | 6,480 | |||||||||||||||||||||
| Total loans |
$ | 359,799 | $ | 705 | $ | 500 | $ | 131 | $ | 3,206 | $ | 4,542 | $ | 364,341 | ||||||||||||||
Troubled Debt Restructurings
The Company had troubled debt restructurings (“TDRs”) of $8.6 million as of December 31, 2013, with $583 thousand of specific reserves allocated to customers whose loan terms have been modified in troubled debt restructurings. As of December 31, 2012, the Company had TDRs of $8.7 million, with $718 thousand of specific reserves allocated. At December 31, 2013, $7.8 million of the loans classified as TDRs were performing in accordance with their modified terms. Of the remaining $719 thousand, all were in nonaccrual of interest status.
None of the loans that were restructured in 2012 have defaulted in 2013. Of the loans that were restructured in 2011, one loan in the amount of $54 thousand subsequently defaulted in 2012. All of the loan modifications include extensions of the loan maturity dates.
Loan modifications that are considered TDRs completed during the year ended December 31:
| (Dollars in thousands) |
Number Of Loans Restructured |
Pre-Modification Recorded Investment |
Post-Modification Recorded Investment |
|||||||||
| 2013 |
||||||||||||
| Commercial |
3 | $ | 83 | $ | 83 | |||||||
| Residential real estate |
3 | 264 | 264 | |||||||||
| Total restructured loans |
6 | $ | 347 | $ | 347 | |||||||
| 2012 |
||||||||||||
| Commercial real estate |
2 | $ | 177 | $ | 177 | |||||||
| Residential real estate |
9 | 798 | 798 | |||||||||
| Total restructured loans |
11 | $ | 975 | $ | 975 | |||||||
42 2013 Report to Shareholders | CSB Bancorp, Inc.
NOTES TO CONSOLIDATED FINANCIAL STATEMENTS
NOTE 3 – LOANS (CONTINUED)
Credit Quality Indicators
The Company categorizes loans into risk categories based on relevant information about the ability of borrowers to service their debt such as: current financial information, historical payment experience, credit documentation, public information and current economic trends, among other factors. The Company analyzes commercial loans individually by classifying the loans as to credit risk. This analysis includes commercial loans with an outstanding balance greater than $275 thousand. This analysis is performed on an annual basis. The Company uses the following definitions for risk ratings:
Pass. Loans classified as pass (Acceptable, Low Acceptable or Pass Watch) may exhibit a wide array of characteristics but at a minimum represent an acceptable risk to the Bank. Borrowers in this rating may have leveraged but acceptable balance sheet positions, satisfactory asset quality, stable to favorable sales and earnings trends, acceptable liquidity and adequate cash flow. Loans are considered fully collectible and require an average amount of administration. While generally adhering to credit policy, these loans may exhibit occasional exceptions that do not result in undue risk to the Bank. Borrowers are generally capable of absorbing setbacks, financial and otherwise, without the threat of failure.
Special Mention. Loans classified as special mention have a material weakness that deserves management’s close attention. If left uncorrected, these weaknesses may result in deterioration of the repayment prospects for the loan or of the Bank’s credit position at some future date.
Substandard. Loans classified as substandard are inadequately protected by the current net worth and paying capacity of the obligor or of the collateral pledged, if any. Loans so classified have a well-defined weakness or weaknesses that jeopardize the liquidation of the debt. They are characterized by the distinct possibility that the Bank will sustain some loss if the deficiencies are not corrected.
Doubtful. Loans classified as doubtful have all the weaknesses inherent in those classified as substandard, with the added characteristic that the weaknesses make collection or liquidation in full, on the basis of currently existing facts, conditions and values, highly questionable and improbable.
Loans not meeting the criteria above that are analyzed individually as part of the above described process are considered to be pass rated loans. Loans listed as not rated are either less than $275 thousand or are included in groups of homogeneous loans. Based on the most recent analysis performed, the risk category of loans by class is as follows at December 31:
| (Dollars in thousands) |
Pass | Special Mention |
Substandard | Doubtful | Not Rated | Total | ||||||||||||||||||
| 2013 |
||||||||||||||||||||||||
| Commercial |
$ | 101,195 | $ | 10,352 | $ | 5,066 | $ | — | $ | 865 | $ | 117,478 | ||||||||||||
| Commercial real estate |
115,265 | 9,076 | 4,041 | — | 1,446 | 129,828 | ||||||||||||||||||
| Residential real estate |
237 | — | 47 | — | 111,161 | 111,445 | ||||||||||||||||||
| Construction & land development |
9,470 | 587 | 1,884 | — | 1,503 | 13,444 | ||||||||||||||||||
| Consumer |
— | — | — | — | 6,687 | 6,687 | ||||||||||||||||||
|
|
|
|
|
|
|
|
|
|
|
|
|
|||||||||||||
| Total |
$ | 226,167 | $ | 20,015 | $ | 11,038 | $ | — | $ | 121,662 | $ | 378,882 | ||||||||||||
|
|
|
|
|
|
|
|
|
|
|
|
|
|||||||||||||
| 2012 |
||||||||||||||||||||||||
| Commercial |
$ | 92,123 | $ | 5,854 | $ | 6,637 | $ | — | $ | 285 | $ | 104,899 | ||||||||||||
| Commercial real estate |
102,602 | 5,671 | 8,459 | — | 2,460 | 119,192 | ||||||||||||||||||
| Residential real estate |
200 | — | 53 | — | 110,159 | 110,412 | ||||||||||||||||||
| Construction & land development |
18,063 | 2,750 | 1,244 | — | 1,301 | 23,358 | ||||||||||||||||||
| Consumer |
— | — | — | — | 6,480 | 6,480 | ||||||||||||||||||
|
|
|
|
|
|
|
|
|
|
|
|
|
|||||||||||||
| Total |
$ | 212,988 | $ | 14,275 | $ | 16,393 | $ | — | $ | 120,685 | $ | 364,341 | ||||||||||||
|
|
|
|
|
|
|
|
|
|
|
|
|
|||||||||||||
2013 Report to Shareholders | CSB Bancorp, Inc. 43
NOTES TO CONSOLIDATED FINANCIAL STATEMENTS
NOTE 3 – LOANS (CONTINUED)
Nonperforming loans include loans past due 90 days and greater and loans on nonaccrual of interest status. The following table presents loans that are not rated, by class of loans as of December 31:
| (Dollars in thousands) |
Performing | Nonperforming | Total | |||||||||
| 2013 |
||||||||||||
| Commercial |
$ | 865 | $ | — | $ | 865 | ||||||
| Commercial real estate |
1,446 | — | 1,446 | |||||||||
| Residential real estate |
110,119 | 1,042 | 111,161 | |||||||||
| Construction & land development |
1,503 | — | 1,503 | |||||||||
| Consumer |
6,687 | — | 6,687 | |||||||||
|
|
|
|
|
|
|
|||||||
| Total |
$ | 120,620 | $ | 1,042 | $ | 121,662 | ||||||
|
|
|
|
|
|
|
|||||||
| 2012 |
||||||||||||
| Commercial |
$ | 285 | $ | — | $ | 285 | ||||||
| Commercial real estate |
2,460 | — | 2,460 | |||||||||
| Residential real estate |
109,276 | 883 | 110,159 | |||||||||
| Construction & land development |
1,294 | 7 | 1,301 | |||||||||
| Consumer |
6,480 | — | 6,480 | |||||||||
|
|
|
|
|
|
|
|||||||
| Total |
$ | 119,795 | $ | 890 | $ | 120,685 | ||||||
|
|
|
|
|
|
|
|||||||
Mortgage Servicing Rights
For the years ended December 31, 2013 and 2012, the Company had outstanding mortgage servicing rights (“MSRs”) of $225 thousand and $214 thousand, respectively. No valuation allowance was recorded at December 31, 2013 or 2012 as the fair value of the MSRs exceeded their carrying value. On December 31, 2013, the Company had $56.9 million residential mortgage loans with servicing retained as compared to $52.7 million with servicing retained at December 31, 2012.
Total loans serviced for others approximated $70.2 million and $60.2 million at December 31, 2013 and 2012, respectively.
44 2013 Report to Shareholders | CSB Bancorp, Inc.
NOTES TO CONSOLIDATED FINANCIAL STATEMENTS
NOTE 4 – PREMISES AND EQUIPMENT
Premises and equipment consist of the following at December 31:
| (Dollars in thousands) |
2013 | 2012 | ||||||
| Land and improvements |
$ | 1,489 | $ | 1,489 | ||||
| Buildings and improvements |
9,656 | 9,422 | ||||||
| Furniture and equipment |
7,327 | 6,763 | ||||||
| Leasehold improvements |
260 | 260 | ||||||
|
|
|
|
|
|||||
| 18,732 | 17,934 | |||||||
| Accumulated depreciation |
10,042 | 9,459 | ||||||
|
|
|
|
|
|||||
| Premises and equipment, net |
$ | 8,690 | $ | 8,475 | ||||
|
|
|
|
|
|||||
The Bank leases certain office locations. Total rental expense under these leases approximated $299 thousand, $298 thousand, and $187 thousand in 2013, 2012 and 2011, respectively. Depreciation expense amounted to $625 thousand, $567 thousand and $530 thousand for the years ended December 31, 2013, 2012 and 2011, respectively.
Future minimum lease payments at December 31, 2013 were as follows:
| (Dollars in thousands) |
||||
| 2014 |
$ | 299 | ||
| 2015 |
294 | |||
| 2016 |
172 | |||
| 2017 |
32 | |||
|
|
|
|||
| Total |
$ | 797 | ||
|
|
|
|||
NOTE 5 – CORE DEPOSIT INTANGIBLE ASSETS
Core Deposit Intangible
No additional core deposit intangible was recorded in 2013 or 2012, with $706 thousand recorded as a result of the acquisition of two branches in Wooster, Ohio in 2011. The core deposit intangible asset will be amortized over an estimated life of ten years. Amortization expense related to the core deposit intangible asset totaled $135 thousand, $140 thousand and $78 thousand in 2013, 2012 and 2011, respectively. The following table shows the core deposit intangible and the related accumulated amortization as of December 31:
| (Dollars in thousands) |
2013 | 2012 | 2011 | |||||||||
| Gross carrying amount |
$ | 1,251 | $ | 1,251 | $ | 1,251 | ||||||
| Accumulated amortization |
(492 | ) | (357 | ) | (217 | ) | ||||||
|
|
|
|
|
|
|
|||||||
| Net carrying amount |
$ | 759 | $ | 894 | $ | 1,034 | ||||||
|
|
|
|
|
|
|
|||||||
2013 Report to Shareholders | CSB Bancorp, Inc. 45
NOTES TO CONSOLIDATED FINANCIAL STATEMENTS
NOTE 5 – CORE DEPOSIT INTANGIBLE ASSETS (CONTINUED)
The estimated aggregate future amortization expense for the core deposit assets remaining as of December 31, 2013 is as follows:
| (Dollars in thousands) |
Core Deposit Amortization |
|||
| 2014 |
$ | 129 | ||
| 2015 |
125 | |||
| 2016 |
121 | |||
| 2017 |
116 | |||
| 2018 |
101 | |||
| Thereafter |
167 | |||
|
|
|
|||
| $ | 759 | |||
|
|
|
|||
NOTE 6 – INTEREST-BEARING DEPOSITS
Interest-bearing deposits at December 31 are as follows:
| (Dollars in thousands) |
2013 | 2012 | ||||||
| Demand |
$ | 76,327 | $ | 74,429 | ||||
| Savings |
149,937 | 138,794 | ||||||
| Time deposits: |
||||||||
| In excess of $100,000 |
42,562 | 54,163 | ||||||
| Other |
91,782 | 103,910 | ||||||
|
|
|
|
|
|||||
| Total interest-bearing deposits |
$ | 360,608 | $ | 371,296 | ||||
|
|
|
|
|
|||||
At December 31, 2013, stated maturities of time deposits were as follows:
| (Dollars in thousands) |
||||
| 2014 |
$ | 75,051 | ||
| 2015 |
25,282 | |||
| 2016 |
18,791 | |||
| 2017 |
8,271 | |||
| 2018 |
6,902 | |||
| 2019 and beyond |
47 | |||
|
|
|
|||
| Total |
$ | 134,344 | ||
|
|
|
|||
46 2013 Report to Shareholders | CSB Bancorp, Inc.
NOTES TO CONSOLIDATED FINANCIAL STATEMENTS
NOTE 7 – BORROWINGS
Short-term borrowings
Short-term borrowings include overnight repurchase agreements, federal funds purchased and short-term advances through the FHLB. The outstanding balances and related information for short-term borrowings are summarized as follows:
| (Dollars in thousands) |
2013 | 2012 | ||||||
| Balance at year-end |
$ | 48,671 | $ | 43,992 | ||||
| Average balance outstanding |
45,330 | 40,893 | ||||||
| Maximum month-end balance |
48,671 | 43,992 | ||||||
| Weighted-average rate at year-end |
0.15 | % | 0.20 | % | ||||
| Weighted-average rate during the year |
0.15 | 0.22 | ||||||
Average balances outstanding during the year represent daily average balances, and average interest rates represent interest expenses divided by the related average balances.
Other borrowings
The following table sets forth information concerning other borrowings:
| Maturity Range | Weighted Average Interest |
Stated Interest Rate Range |
At December 31, | |||||||||||||||||||||||||
| (Dollars in thousands) |
From | To | Rate | From | To | 2013 | 2012 | |||||||||||||||||||||
| Fixed rate |
10/2/14 | 12/21/17 | 3.62 | % | 3.48 | % | 3.73 | % | $ | 12,000 | $ | 12,000 | ||||||||||||||||
| Fixed rate amortizing |
1/1/14 | 3/1/17 | 5.99 | 4.80 | 7.15 | 459 | 672 | |||||||||||||||||||||
|
|
|
|||||||||||||||||||||||||||
| $ | 12,459 | $ | 12,672 | |||||||||||||||||||||||||
|
|
|
|||||||||||||||||||||||||||
Maturities of other borrowings at December 31, 2013, are summarized as follows for the years ended December 31:
| (Dollars in thousands) |
Amount | Weighted Average Rate |
||||||
| 2014 |
$ | 2,190 | 3.91 | % | ||||
| 2015 |
169 | 6.01 | ||||||
| 2016 |
97 | 5.84 | ||||||
| 2017 |
10,003 | 3.61 | ||||||
|
|
|
|||||||
| $ | 12,459 | 3.71 | % | |||||
|
|
|
|||||||
Monthly principal and interest payments are due on the fixed rate amortizing borrowings; additionally a 10% principal curtailment is due on the borrowing’s anniversary date. FHLB borrowings are secured by a blanket collateral agreement. At December 31, 2013 the Company has the capacity to borrow an additional $42.1 million from the FHLB.
2013 Report to Shareholders | CSB Bancorp, Inc. 47
NOTES TO CONSOLIDATED FINANCIAL STATEMENTS
NOTE 8 – INCOME TAXES
The provision for income taxes consists of the following for the years ended December 31:
| (Dollars in thousands) |
2013 | 2012 | 2011 | |||||||||
| Current |
$ | 2,196 | $ | 2,040 | $ | 1,257 | ||||||
| Deferred |
77 | (50 | ) | 345 | ||||||||
|
|
|
|
|
|
|
|||||||
| Total income tax provision |
$ | 2,273 | $ | 1,990 | $ | 1,602 | ||||||
|
|
|
|
|
|
|
|||||||
The income tax provision attributable to income from operations differs from the amounts computed by applying the statutory federal income tax rate of 34% to income before income taxes as follows:
| (Dollars in thousands) |
2013 | 2012 | 2011 | |||||||||
| Expected provision using statutory federal income tax rate |
$ | 2,554 | $ | 2,223 | $ | 1,798 | ||||||
| Tax-exempt income on state and municipal securities and political subdivision loans |
(203 | ) | (269 | ) | (169 | ) | ||||||
| Interest expense associated with carrying certain state and municipal securities and political subdivision loans |
6 | 6 | 8 | |||||||||
| Tax-exempt income on bank owned life insurance |
(86 | ) | (78 | ) | (36 | ) | ||||||
| Other |
2 | 108 | 1 | |||||||||
|
|
|
|
|
|
|
|||||||
| Total income tax provision |
$ | 2,273 | $ | 1,990 | $ | 1,602 | ||||||
|
|
|
|
|
|
|
|||||||
The tax effects of temporary differences that give rise to deferred tax assets and deferred tax liabilities at December 31 are as follows:
| (Dollars in thousands) |
2013 | 2012 | ||||||
| Allowance for loan losses |
$ | 1,887 | $ | 1,470 | ||||
| Net operating loss carryforward |
470 | 598 | ||||||
| Capital loss carryforward |
35 | 35 | ||||||
| Unrealized loss on securities available-for-sale |
750 | — | ||||||
| Other |
37 | 109 | ||||||
|
|
|
|
|
|||||
| 3,179 | 2,212 | |||||||
| Valuation allowance on deferred tax assets |
(35) | (35) | ||||||
| Deferred tax assets |
3,144 | 2,177 | ||||||
| Premises and equipment |
(443 | ) | (399 | ) | ||||
| Federal Home Loan Bank stock dividends |
(736 | ) | (736 | ) | ||||
| Deferred loan fees |
(226 | ) | (173 | ) | ||||
| Unrealized gain on securities available-for-sale |
— | (960 | ) | |||||
| Prepaid expenses |
(120 | ) | (120 | ) | ||||
| Other |
(462 | ) | (265 | ) | ||||
|
|
|
|
|
|||||
| Deferred tax liabilities |
(1,987 | ) | (2,653 | ) | ||||
|
|
|
|
|
|||||
| Net deferred tax asset (liability) |
$ | 1,157 | $ | (476 | ) | |||
|
|
|
|
|
|||||
48 2013 Report to Shareholders | CSB Bancorp, Inc.
NOTES TO CONSOLIDATED FINANCIAL STATEMENTS
NOTE 8 – INCOME TAXES (CONTINUED)
The Company has a net operating loss tax carryforward of approximately $1.4 million, as of December 31, 2013. The net operating loss carryforward can be used to offset future taxable income and will begin to expire in tax year 2026.
The Company believes it is more likely than not that the benefit of deferred tax assets will be realized with the possible exception of the capital loss carryforward due to expire in 2014. A valuation allowance for the capital loss carryforward is reflected at December 31, 2013 and 2012. No additional valuation allowance is deemed necessary in view of certain tax strategies, coupled with the anticipated future taxable income as evidenced by the Company’s earnings.
There is currently no liability for uncertain tax positions and no known unrecognized tax benefits. CSB recognizes, when applicable, interest and penalties related to unrecognized tax benefits in the provision for income taxes in the Consolidated Statement of Income. With few exceptions, CSB is no longer subject to U.S. federal, state, or local income tax examinations by tax authorities for years prior to 2010.
NOTE 9 – EMPLOYEE BENEFITS
The Company sponsors a contributory 401(k) profit-sharing plan (the “Plan”) covering substantially all employees who meet certain age and service requirements. The Plan permits investment in the Company’s common stock subject to various limitations and provides for discretionary profit sharing and matching contributions. The discretionary profit sharing contribution is determined annually by the Board of Directors and amounted to 2.75% of each eligible participant’s compensation in 2013 and 2.5% of each eligible participant’s compensation for 2012 and 2011, respectively. The Plan also provides for a 50% Company match of participant contributions up to a maximum of 2% of each participant’s annual compensation. Expense under the Plan amounted to approximately $284 thousand, $270 thousand and $242 thousand for 2013, 2012 and 2011, respectively.
The Company maintains a stock option plan. No stock options were granted during the three years presented.
The following summarizes stock options activity for the years ended December 31:
| 2013 | 2012 | 2011 | ||||||||||||||||||||||
| Shares | Weighted Average Exercise Price |
Shares | Weighted Average Exercise Price |
Shares | Weighted Average Exercise Price |
|||||||||||||||||||
| Outstanding at beginning of year |
31,760 | $ | 17.85 | 39,620 | $ | 17.49 | 39,945 | $ | 17.48 | |||||||||||||||
| Granted |
— | — | — | — | — | — | ||||||||||||||||||
| Exercised |
(1,000 | ) | (16.10 | ) | (4,650 | ) | (16.05 | ) | — | — | ||||||||||||||
| Forfeited |
— | (3,210 | ) | (16.06 | ) | (325 | ) | (16.05 | ) | |||||||||||||||
|
|
|
|
|
|
|
|||||||||||||||||||
| Outstanding at end of year |
30,760 | 17.90 | 31,760 | 17.85 | 39,620 | 17.49 | ||||||||||||||||||
|
|
|
|
|
|
|
|||||||||||||||||||
| Options exercisable at year-end |
30,760 | $ | 17.90 | 31,760 | $ | 17.85 | 39,620 | $ | 17.49 | |||||||||||||||
| Weighted-average fair value of options granted during year |
N/A | N/A | N/A | |||||||||||||||||||||
Options outstanding at December 31, 2013 were as follows:
| Outstanding | ||||||||||||||||
| Range Of Exercise Prices |
Number | Weighted Average Remaining Contractual Life (Years) |
Number | Weighted Average Exercise Price |
||||||||||||
| $ 15.00 |
1,000 | 0.60 | 1,000 | $ | 15.00 | |||||||||||
| 18.00 |
29,760 | 2.22 | 29,760 | 18.00 | ||||||||||||
|
|
|
|
|
|||||||||||||
| Outstanding at year-end |
30,760 | 2.17 | 30,760 | $ | 17.90 | |||||||||||
|
|
|
|
|
|||||||||||||
2013 Report to Shareholders | CSB Bancorp, Inc. 49
NOTES TO CONSOLIDATED FINANCIAL STATEMENTS
NOTE 9 – EMPLOYEE BENEFITS (CONTINUED)
The total intrinsic value of outstanding in-the-money stock options and outstanding in-the-money exercisable stock options was $34 thousand and $4 thousand at December 31, 2013 and 2012, respectively. There were 1,000 and 4,650 stock options exercised in 2013 and 2012, respectively and no stock options exercised in 2011. There were no share awards vested in 2013 or 2012.
NOTE 10 – FINANCIAL INSTRUMENTS WITH OFF-BALANCE SHEET RISK
The Bank is party to financial instruments with off-balance sheet risk in the normal course of business to meet the financing needs of its customers. These financial instruments are primarily loan commitments to extend credit and letters of credit. These instruments involve, to varying degrees, elements of credit risk in excess of the amounts recognized in the Consolidated Balance Sheets. The contract amount of these instruments reflects the extent of involvement the Bank has in these financial instruments. The Bank’s exposure to credit loss in the event of the nonperformance by the other party to the financial instruments for loan commitments to extend credit and letters of credit is represented by the contractual amounts of these instruments. The Bank uses the same credit policies in making loan commitments as it does for on-balance sheet loans.
The following financial instruments whose contract amount represents credit risk were outstanding at December 31:
| (Dollars in thousands) |
2013 | 2012 | ||||||
| Commitments to extend credit |
$ | 119,571 | $ | 105,829 | ||||
|
|
|
|
|
|||||
| Letters of credit |
$ | 679 | $ | 1,539 | ||||
|
|
|
|
|
|||||
Commitments to extend credit are agreements to lend to a customer as long as there is no violation of any condition established in the contract. Commitments generally have fixed expiration dates or other termination clauses and may require payment of a fee. Since many of the commitments are expected to expire without being drawn upon, the total commitment amount does not necessarily represent future cash requirements. The Company evaluates each customer’s credit worthiness on a case-by-case basis. The amount of collateral, obtained if deemed necessary by the Company upon extension of credit, is based on management’s credit evaluation of the customer. Collateral held varies but may include accounts receivable, recognized inventory, property, plant and equipment, and income-producing commercial properties.
Letters of credit are written conditional commitments issued by the Company to guarantee the performance of a customer to a third party and are reviewed for renewal at expiration. All letters of credit outstanding at December 31, 2013 are due on demand or expire in 2014. The credit risk involved in issuing letters of credit is essentially the same as that involved in extending loans to customers. The Company requires collateral supporting these commitments when deemed appropriate.
NOTE 11 – RELATED-PARTY TRANSACTIONS
In the ordinary course of business, loans are granted by the Company to executive officers, directors and their related business interests consistent with Federal Reserve Regulation O. The following is an analysis of activity of related-party loans for the year end December 31, 2013:
| (Dollars in thousands) |
||||
| Balance at beginning of year |
$ | 6,218 | ||
| New loans and advances |
315 | |||
| Repayments, including loans sold |
1,441 | |||
|
|
|
|||
| Balance at end of year |
$ | 5,092 | ||
|
|
|
|||
Deposits from executive officers, directors and their related business interests at both December 31, 2013 and 2012 were approximately $10.4 million and $10.5 million.
50 2013 Report to Shareholders | CSB Bancorp, Inc.
NOTES TO CONSOLIDATED FINANCIAL STATEMENTS
NOTE 12 – REGULATORY MATTERS
The Company (on a consolidated basis) and Bank are subject to various regulatory capital requirements administered by the federal and state banking agencies. Failure to meet minimum capital requirements can initiate certain mandatory and possibly additional discretionary actions by regulators that, if undertaken, could have a direct material effect on the Company’s and Bank’s financial statements. Under capital adequacy guidelines and the regulatory framework for prompt corrective action, the Company and Bank must meet specific capital guidelines that involve quantitative measures of the assets, liabilities and certain off-balance-sheet items as calculated under regulatory accounting practices. The capital amounts and classification are also subject to qualitative judgments by the regulators about components, risk weightings and other factors.
Quantitative measures established by regulation to ensure capital adequacy require the Company and Bank to maintain minimum amounts and ratios (set forth in the following table) of Total and Tier 1 capital (as defined in the regulations) to risk-weighted assets (as defined), and of Tier 1 capital to average assets (as defined). Management believes, as of December 31, 2013 and 2012, that the Company and Bank met or exceeded all capital adequacy requirements to which they are subject.
As of December 31, 2013, the most recent notification from federal and state banking agencies categorized the Bank as “well capitalized” under the regulatory framework for prompt corrective action. To be categorized as “well capitalized” an institution must maintain minimum Total risk-based, Tier 1 risk-based and Tier 1 leverage ratios as set forth in the following tables. There are no known conditions or events since that notification that Management believes have changed the Bank’s category.
The actual capital amounts and ratios of the Company and Bank as of December 31, are presented in the following tables:
| Minimum | Minimum Required | |||||||||||||||||||||||
| Required For | To Be Well Capitalized | |||||||||||||||||||||||
| Capital Adequacy | Under Prompt | |||||||||||||||||||||||
| Actual | Purposes | Corrective Action | ||||||||||||||||||||||
| (Dollars in thousands) |
Amount | Ratio | Amount | Ratio | Amount | Ratio | ||||||||||||||||||
| 2013 |
||||||||||||||||||||||||
| Total capital (to risk-weighted assets) |
||||||||||||||||||||||||
| Consolidated |
$ | 53,268 | 13.6 | % | $ | 31,416 | 8.0 | % | $ | 39,270 | 10.0 | % | ||||||||||||
| Bank |
52,458 | 13.4 | 31,392 | 8.0 | 39,240 | 10.0 | ||||||||||||||||||
| Tier I capital (to risk-weighted assets) |
||||||||||||||||||||||||
| Consolidated |
48,357 | 12.3 | 15,708 | 4.0 | 23,562 | 6.0 | ||||||||||||||||||
| Bank |
47,558 | 12.1 | 15,696 | 4.0 | 23,544 | 6.0 | ||||||||||||||||||
| Tier I capital (to average assets) |
||||||||||||||||||||||||
| Consolidated |
48,357 | 8.2 | 23,550 | 4.0 | 29,438 | 5.0 | ||||||||||||||||||
| Bank |
47,558 | 8.1 | 23,544 | 4.0 | 29,430 | 5.0 | ||||||||||||||||||
| 2012 |
||||||||||||||||||||||||
| Total capital (to risk-weighted assets) |
||||||||||||||||||||||||
| Consolidated |
$ | 49,534 | 13.3 | % | $ | 29,707 | 8.0 | % | $ | 37,134 | 10.0 | % | ||||||||||||
| Bank |
48,940 | 13.2 | 29,695 | 8.0 | 37,118 | 10.0 | ||||||||||||||||||
| Tier I capital (to risk-weighted assets) |
||||||||||||||||||||||||
| Consolidated |
44,946 | 12.1 | 14,854 | 4.0 | 22,280 | 6.0 | ||||||||||||||||||
| Bank |
44,352 | 12.0 | 14,847 | 4.0 | 22,271 | 6.0 | ||||||||||||||||||
| Tier I capital (to average assets) |
||||||||||||||||||||||||
| Consolidated |
44,946 | 7.9 | 22,794 | 4.0 | 28,493 | 5.0 | ||||||||||||||||||
| Bank |
44,352 | 7.8 | 22,788 | 4.0 | 28,485 | 5.0 | ||||||||||||||||||
2013 Report to Shareholders | CSB Bancorp, Inc. 51
NOTES TO CONSOLIDATED FINANCIAL STATEMENTS
NOTE 12 – REGULATORY MATTERS (CONTINUED)
The Company’s primary source of funds with which to pay dividends are dividends received from the Bank. The payment of dividends by the Bank to the Company is subject to restrictions by its regulatory agencies. These restrictions generally limit dividends to current year net income and prior two-years’ net retained earnings. Also, dividends may not reduce capital levels below the minimum regulatory requirements disclosed in the prior table. Under these provisions, at January 1, 2014, the Bank could dividend $7.5 million to the Company. The Company does not anticipate the financial need to obtain regulatory approval due to its current cash balances and ability to access the credit markets. Federal law prevents the Company from borrowing from the Bank unless loans are secured by specific obligations. Further, such secured loans are limited to an amount not exceeding ten percent of the Bank’s common stock and capital surplus.
NOTE 13 – CONDENSED PARENT COMPANY FINANCIAL INFORMATION
A summary of condensed financial information of the parent company as of December 31, 2013 and 2012 and for each of the three years in the period ended December 31, 2013 follows:
| (Dollars in thousands) |
2013 | 2012 | ||||||
| CONDENSED BALANCE SHEETS |
||||||||
| ASSETS |
||||||||
| Cash deposited with subsidiary bank |
$ | 598 | $ | 388 | ||||
| Investment in subsidiary bank |
51,596 | 51,858 | ||||||
| Securities available-for-sale |
128 | 69 | ||||||
| Other assets |
192 | 207 | ||||||
|
|
|
|
|
|||||
| TOTAL ASSETS |
$ | 52,514 | $ | 52,522 | ||||
|
|
|
|
|
|||||
| LIABILITIES AND SHAREHOLDERS’ EQUITY |
||||||||
| Total liabilities |
$ | 103 | $ | 69 | ||||
| Total shareholders’ equity |
52,411 | 52,453 | ||||||
|
|
|
|
|
|||||
| TOTAL LIABILITIES AND SHAREHOLDERS’ EQUITY |
$ | 52,514 | $ | 52,522 | ||||
|
|
|
|
|
|||||
| (Dollars in thousands) |
2013 | 2012 | 2011 | |||||||||
| CONDENSED STATEMENTS OF INCOME |
||||||||||||
| Interest on securities |
$ | 2 | $ | 2 | $ | 1 | ||||||
| Dividends from subsidiary |
2,400 | 2,000 | 2,300 | |||||||||
|
|
|
|
|
|
|
|||||||
| Total income |
2,402 | 2,002 | 2,301 | |||||||||
| Operating expenses |
356 | 354 | 336 | |||||||||
|
|
|
|
|
|
|
|||||||
| Income before taxes and undistributed equity income of subsidiary |
2,046 | 1,648 | 1,965 | |||||||||
| Income tax benefit |
(121 | ) | (120 | ) | (115 | ) | ||||||
| Equity earnings in subsidiary, net of dividends |
3,073 | 2,779 | 1,607 | |||||||||
|
|
|
|
|
|
|
|||||||
| NET INCOME |
$ | 5,240 | $ | 4,547 | $ | 3,687 | ||||||
|
|
|
|
|
|
|
|||||||
| COMPREHENSIVE INCOME |
$ | 1,920 | $ | 4,981 | $ | 4,244 | ||||||
|
|
|
|
|
|
|
|||||||
52 2013 Report to Shareholders | CSB Bancorp, Inc.
NOTES TO CONSOLIDATED FINANCIAL STATEMENTS
NOTE 13 – CONDENSED PARENT COMPANY FINANCIAL INFORMATION (CONTINUED)
| (Dollars in thousands) |
2013 | 2012 | 2011 | |||||||||
| CONDENSED STATEMENTS OF CASH FLOWS |
||||||||||||
| Cash flows from operating activities: |
||||||||||||
| Net income |
$ | 5,240 | $ | 4,547 | $ | 3,687 | ||||||
| Adjustments to reconcile net income to cash provided by operations: |
||||||||||||
| Equity earnings in subsidiary, net of dividends |
(3,073 | ) | (2,779 | ) | (1,607 | ) | ||||||
| Change in other assets, liabilities |
42 | 49 | 48 | |||||||||
|
|
|
|
|
|
|
|||||||
| Net cash provided by operating activities |
2,209 | 1,817 | 2,128 | |||||||||
|
|
|
|
|
|
|
|||||||
| Cash flows from investing activities: |
||||||||||||
| Purchase of investment securities |
(37 | ) | — | — | ||||||||
|
|
|
|
|
|
|
|||||||
| Net cash used in investing activities |
(37 | ) | — | — | ||||||||
|
|
|
|
|
|
|
|||||||
| Cash flows from financing activities: |
||||||||||||
| Cash dividends paid |
(1,970 | ) | (1,969 | ) | (1,969 | ) | ||||||
| Cash received from exercise of stock options |
8 | 5 | — | |||||||||
|
|
|
|
|
|
|
|||||||
| Net cash used in financing activities |
(1,962 | ) | (1,964 | ) | (1,969 | ) | ||||||
|
|
|
|
|
|
|
|||||||
| Increase (decrease) in cash |
210 | (147 | ) | 159 | ||||||||
| Cash at beginning of year |
388 | 535 | 376 | |||||||||
|
|
|
|
|
|
|
|||||||
| Cash at end of year |
$ | 598 | $ | 388 | $ | 535 | ||||||
|
|
|
|
|
|
|
|||||||
NOTE 14 – FAIR VALUE MEASUREMENTS
The Company provides disclosures about assets and liabilities carried at fair value. The framework provides a fair value hierarchy that prioritizes the inputs to valuation techniques used to measure fair value. The hierarchy gives the highest priority to unadjusted quoted prices in active markets for identical assets or liabilities and lowest priority to unobservable inputs. The three broad levels of the fair value hierarchy are described below:
| Level I: | Inputs to the valuation methodology are unadjusted quoted prices for identical assets or liabilities in active markets that the Company has the ability to access. |
| Level II: | Inputs to the valuation methodology include quoted prices for similar assets or liabilities in active markets; quoted prices for identical or similar assets or liabilities in inactive markets; inputs other than quoted prices that are observable for the asset or liability; inputs that are derived principally from or corroborated by observable market data by or other means including certified appraisals. If the asset or liability has a specified (contractual) term, the Level II input must be observable for substantially the full term of the asset or liability. |
| Level III: | Inputs to the valuation methodology are unobservable and significant to the fair value measurement. |
2013 Report to Shareholders | CSB Bancorp, Inc. 53
NOTES TO CONSOLIDATED FINANCIAL STATEMENTS
NOTE 14 – FAIR VALUE MEASUREMENTS (CONTINUED)
The following table presents the assets reported on the consolidated statements of financial condition at their fair value as of December 31, 2013 and December 31, 2012, by level within the fair value hierarchy. No liabilities are carried at fair value. As required by the accounting standards, financial assets and liabilities are classified in their entirety based on the lowest level of input that is significant to the fair value measurement. Equity securities and U.S. Treasury Notes are valued at the closing price reported on the active market on which the individual securities are traded. Obligations of U.S. Government corporations and agencies, mortgage-backed securities, asset-backed securities and obligations of states and political subdivisions are valued at observable market data for similar assets.
| (Dollars in thousands) |
Level I | Level II | Level III | Total | ||||||||||||
| December 31, 2013 | ||||||||||||||||
| Assets: |
||||||||||||||||
| Securities available-for-sale |
||||||||||||||||
| U.S. Treasury security |
$ | 997 | $ | — | $ | — | $ | 997 | ||||||||
| U.S. Government agencies |
— | 22,301 | — | 22,301 | ||||||||||||
| Mortgage-backed securities of government agencies |
— | 54,535 | — | 54,535 | ||||||||||||
| Asset-backed securities of government agencies |
— | 2,775 | — | 2,775 | ||||||||||||
| State and political subdivisions |
— | 16,447 | — | 16,447 | ||||||||||||
| Corporate bonds |
— | 4,539 | — | 4,539 | ||||||||||||
|
|
|
|
|
|
|
|
|
|||||||||
| Total debt securities |
997 | 100,597 | — | 101,594 | ||||||||||||
| Equity securities |
128 | — | — | 128 | ||||||||||||
|
|
|
|
|
|
|
|
|
|||||||||
| Total available-for-sale securities |
$ | 1,125 | $ | 100,597 | $ | — | $ | 101,722 | ||||||||
|
|
|
|
|
|
|
|
|
|||||||||
| December 31, 2012 | ||||||||||||||||
| Assets: |
||||||||||||||||
| Securities available-for-sale |
||||||||||||||||
| U.S. Treasury security |
$ | 100 | $ | — | $ | — | $ | 100 | ||||||||
| U.S. Government agencies |
— | 35,980 | — | 35,980 | ||||||||||||
| Mortgage-backed securities of government agencies |
— | 69,039 | — | 69,039 | ||||||||||||
| Asset-backed securities of government agencies |
— | 2,823 | — | 2,823 | ||||||||||||
| State and political subdivisions |
— | 16,883 | — | 16,883 | ||||||||||||
| Corporate bonds |
— | 4,397 | — | 4,397 | ||||||||||||
|
|
|
|
|
|
|
|
|
|||||||||
| Total debt securities |
100 | 129,122 | — | 129,222 | ||||||||||||
| Equity securities |
69 | — | — | 69 | ||||||||||||
|
|
|
|
|
|
|
|
|
|||||||||
| Total available-for-sale securities |
$ | 169 | $ | 129,122 | $ | — | $ | 129,291 | ||||||||
|
|
|
|
|
|
|
|
|
|||||||||
54 2013 Report to Shareholders | CSB Bancorp, Inc.
NOTES TO CONSOLIDATED FINANCIAL STATEMENTS
NOTE 14 – FAIR VALUE MEASUREMENTS (CONTINUED)
The following table presents the assets measured on a nonrecurring basis on the consolidated balance sheets at their fair value as of December 31, 2013 and December 31, 2012, by level within the fair value hierarchy. Impaired loans and other real estate that are collateral dependent are written down to fair value through the establishment of specific reserves. Techniques used to value the collateral securing the impaired loans include: quoted market prices for identical assets classified as Level I inputs; observable inputs, employed by certified appraisers, for similar assets classified as Level II inputs. In cases where valuation techniques included inputs that are unobservable and are based on estimates and assumptions developed by management based on the best information available under each circumstance, the asset valuation is classified as Level III inputs.
The fair value of MSRs is based on a valuation model that calculates the present value of estimated net servicing income. The valuation model incorporates discounted cash flow and repayment assumptions based on management’s best judgment. As a result, these rights are measured at fair value on a nonrecurring basis and are classified within Level III of the fair value hierarchy.
| (Dollars in thousands) |
Level I | Level II | Level III | Total | ||||||||||||
| December 31, 2013 | ||||||||||||||||
| Assets measured on a nonrecurring basis: |
||||||||||||||||
| Impaired loans |
$ | — | $ | — | $ | 9,856 | $ | 9,856 | ||||||||
| Mortgage servicing rights |
— | — | 225 | 225 | ||||||||||||
| December 31, 2012 | ||||||||||||||||
| Assets measured on a nonrecurring basis: |
||||||||||||||||
| Impaired loans |
$ | — | $ | — | $ | 9,412 | $ | 9,412 | ||||||||
| Other real estate owned |
— | — | 25 | 25 | ||||||||||||
| Mortgage servicing rights |
— | — | 214 | 214 | ||||||||||||
The following table presents additional quantitative information about assets measured at fair value on a nonrecurring basis and for which the Company has utilized Level III inputs to determine fair value:
| Quantitative Information about Level III Fair Value Measurements | ||||||||||
| (Dollars in thousands) |
Fair Value Estimate |
Valuation Techniques |
Unobservable Input |
Range (Weighted Average) | ||||||
| December 31, 2013 | ||||||||||
| Impaired loans |
$ | 8,663 | Discounted cash flow | Remaining term Discount rate | 3 mos to 29 yrs / (62 mos) 7.1% to 12% / (7.5%) | |||||
| 1,193 | Appraisal of collateral1,3 | Appraisal adjustments2 Liquidation expense2 | –20% to –25% –10% | |||||||
| Mortgage servicing rights |
225 | Discounted cash flow | Remaining term Discount rate | 12 mos to 30 yrs / (244 mos) 1.5% / (1.5%) | ||||||
2013 Report to Shareholders | CSB Bancorp, Inc. 55
NOTES TO CONSOLIDATED FINANCIAL STATEMENTS
NOTE 14 – FAIR VALUE MEASUREMENTS (CONTINUED)
| Quantitative Information about Level III Fair Value Measurements | ||||||||||
| (Dollars in thousands) |
Fair Value Estimate |
Valuation Techniques |
Unobservable Input |
Range (Weighted Average) | ||||||
| December 31, 2012 | ||||||||||
| Impaired loans |
$ | 7,260 | Discounted cash flow | Remaining term Discount rate | 4 mos to 29 yrs / (74 mos) 7.5% to 12% / (7.8%) | |||||
| 2,152 | Appraisal of collateral1,3 | Appraisal adjustments2 Liquidation expense2 | –20% to –35% –10% | |||||||
| Other real estate owned |
25 | Appraisal of collateral1,3 | Management discount for property type3 | 0% to –67% | ||||||
| Mortgage servicing rights |
214 | Discounted cash flow | Remaining term Discount rate | 24 mos to 30 yrs / (244 mos) 1.5% / (1.5%) | ||||||
| 1 | Fair value is generally determined through independent appraisals of the underlying collateral, which generally include various inputs which are not identifiable. |
| 2 | Appraisals may be adjusted by management for qualitative factors such as estimated liquidation expenses. The range of liquidation expenses and other appraisal adjustments are presented as a percent of the appraisal. |
| 3 | Includes qualitative adjustments by management and estimated liquidation expenses. |
NOTE 15 – FAIR VALUES OF FINANCIAL INSTRUMENTS
The estimated fair values of recognized financial instruments as of December 31 are as follows:
| 2013 | ||||||||||||||||||||
| Carrying | Total Fair | |||||||||||||||||||
| (Dollars in thousands) |
Value | Level I | Level II | Level III | Value | |||||||||||||||
| Financial assets: |
||||||||||||||||||||
| Cash and cash equivalents |
$ | 42,599 | $ | 42,599 | $ | — | $ | — | $ | 42,599 | ||||||||||
| Securities available-for-sale |
101,722 | 1,125 | 100,597 | — | 101,722 | |||||||||||||||
| Securities held-to-maturity |
44,350 | — | 42,643 | — | 42,643 | |||||||||||||||
| Restricted stock |
5,463 | — | 5,463 | — | 5,463 | |||||||||||||||
| Net loans |
374,040 | — | — | 375,055 | 375,055 | |||||||||||||||
| Bank-owned life insurance |
9,551 | 9,551 | — | — | 9,551 | |||||||||||||||
| Accrued interest receivable |
1,374 | 1,374 | — | — | 1,374 | |||||||||||||||
| Financial liabilities: |
||||||||||||||||||||
| Deposits |
$ | 480,933 | $ | 346,589 | $ | — | $ | 135,106 | $ | 481,695 | ||||||||||
| Short-term borrowings |
48,671 | 48,671 | — | — | 48,671 | |||||||||||||||
| Other borrowings |
12,459 | — | — | 12,559 | 12,559 | |||||||||||||||
| Accrued interest payable |
96 | 96 | — | — | 96 | |||||||||||||||
56 2013 Report to Shareholders | CSB Bancorp, Inc.
NOTES TO CONSOLIDATED FINANCIAL STATEMENTS
NOTE 15 – FAIR VALUES OF FINANCIAL INSTRUMENTS (CONTINUED)
| 2012 | ||||||||||||||||||||
| Carrying | Total Fair | |||||||||||||||||||
| (Dollars in thousands) |
Value | Level I | Level II | Level III | Value | |||||||||||||||
| Financial assets: |
||||||||||||||||||||
| Cash and cash equivalents |
$ | 66,878 | $ | 66,878 | $ | — | $ | — | $ | 66,878 | ||||||||||
| Securities available-for-sale |
129,291 | 169 | 129,122 | — | 129,291 | |||||||||||||||
| Restricted stock |
5,463 | — | 5,463 | — | 5,463 | |||||||||||||||
| Net loans |
360,000 | — | — | 367,028 | 367,028 | |||||||||||||||
| Bank-owned life insurance |
8,298 | 8,298 | — | — | 8,298 | |||||||||||||||
| Accrued interest receivable |
1,317 | 1,317 | — | — | 1,317 | |||||||||||||||
| Financial liabilities: |
||||||||||||||||||||
| Deposits |
$ | 475,443 | $ | 317,369 | $ | — | $ | 159,573 | $ | 476,942 | ||||||||||
| Short-term borrowings |
43,992 | 43,992 | — | — | 43,992 | |||||||||||||||
| Other borrowings |
12,672 | — | — | 13,772 | 13,772 | |||||||||||||||
| Accrued interest payable |
135 | 135 | — | — | 135 | |||||||||||||||
For purposes of the above disclosures of estimated fair value, the following assumptions are used:
Cash and cash equivalents; Accrued interest receivable; Short-term borrowings, and Accrued interest payable
The fair value of the above instruments is considered to be carrying value.
Securities
The fair value of securities available-for-sale and securities held-to-maturity which are measured on a recurring basis are determined primarily by obtaining quoted prices on nationally recognized securities exchanges or matrix pricing, which is a mathematical technique used widely in the industry to value debt securities without relying exclusively on quoted prices for the specific securities but rather by relying on securities’ relationship to other similar securities. Classified as Level I or Level II in the fair value hierarchy.
Net loans
The fair value for loans is estimated by discounting future cash flows using current market inputs at which loans with similar terms and qualities would be made to borrowers of similar credit quality. Where quoted market prices were available, primarily for certain residential mortgage loans, such market rates were utilized as estimates for fair value. Fair value of nonaccrual loans is based on carrying value, classified as Level III.
Bank-owned life insurance
The carrying amount of bank-owned life insurance is based on the cash surrender value of the policies and is a reasonable estimate of fair value, classified as Level I.
Restricted stock
Restricted stock includes FHLB Stock and Federal Reserve Bank Stock. It is not practicable to determine the fair value of regulatory equity securities due to restrictions placed on their transferability. Fair value is based on carrying value, classified as Level II.
Deposits
The fair value of certificates of deposit is based on the discounted value of contractual cash flows. The discount rates are estimated using market rates currently offered for similar instruments with similar remaining maturities, resulting in a Level III classification. Demand, savings, and money market deposit accounts are valued at the amount payable on demand as of quarter end, resulting in a Level I classification.
2013 Report to Shareholders | CSB Bancorp, Inc. 57
NOTES TO CONSOLIDATED FINANCIAL STATEMENTS
NOTE 15 – FAIR VALUES OF FINANCIAL INSTRUMENTS (CONTINUED)
Other borrowings
The fair value of FHLB advances are estimated using a discounted cash flow analysis based on the current borrowing rates for similar types of borrowings, resulting in a Level III classification.
The Company also has unrecognized financial instruments at December 31, 2013 and 2012. These financial instruments relate to commitments to extend credit and letters of credit. The aggregated contract amount of such financial instruments was approximately $120.3 million at December 31, 2013 and $107.4 million at December 31, 2012. Such amounts are also considered to be the estimated fair values.
The fair value estimates of financial instruments are made at a specific point in time based on relevant market information. These estimates do not reflect any premium or discount that could result from offering for sale at one time the entire holdings of a particular financial instrument over the value of anticipated future business and the value of assets and liabilities that are not considered financial instruments. Since no ready market exists for a significant portion of the financial instruments, fair value estimates are largely based on judgments after considering such factors as future expected credit losses, current economic conditions, risk characteristics of various financial instruments, and other factors. These estimates are subjective in nature and involve uncertainties and matters of significant judgment and therefore, cannot be determined with precision. Changes in assumptions could significantly affect these estimates.
NOTE 16 – ACCUMULATED OTHER COMPREHENSIVE INCOME
The following table presents the changes in accumulated other comprehensive (loss) income by component net of tax for the years ended December 31, 2013 and 2012.
| (Dollars in thousands) |
Pretax | Tax Effect | After-tax | Affected Line Item in the Consolidated Statements of Income | ||||||||||
| Balance as of December 31, 2012 |
$ | 2,823 | $ | (959 | ) | $ | 1,864 | |||||||
| Unrealized holding loss on available-for-sale securities arising during the period |
(3,195 | ) | 1,086 | (2,109 | ) | |||||||||
| Amount reclassified for net gains included in net income |
(159 | ) | 54 | (105 | ) | (a) (b) | ||||||||
| Unrealized loss on securities transferred from available-for-sale to held-to-maturity |
(1,931 | ) | 657 | (1,274 | ) | |||||||||
| Amortization of held-to-maturity discount resulting from transfer |
255 | (87 | ) | 168 | ||||||||||
|
|
|
|
|
|
|
|||||||||
| Total other comprehensive loss |
(5,030 | ) | 1,710 | (3,320 | ) | |||||||||
|
|
|
|
|
|
|
|||||||||
| BALANCE AS OF DECEMBER 31, 2013 |
$ | (2,207 | ) | $ | 751 | $ | (1,456 | ) | ||||||
|
|
|
|
|
|
|
|||||||||
| Balance as of December 31, 2011 |
$ | 2,166 | $ | (736 | ) | $ | 1,430 | |||||||
| Unrealized holding gain on available-for-sale securities arising during the period |
657 | (223 | ) | 434 | ||||||||||
|
|
|
|
|
|
|
|||||||||
| Total other comprehensive income |
657 | (223 | ) | 434 | ||||||||||
|
|
|
|
|
|
|
|||||||||
| BALANCE AS OF DECEMBER 31, 2012 |
$ | 2,823 | $ | (959 | ) | $ | 1,864 | |||||||
|
|
|
|
|
|
|
|||||||||
| (a) | Securities gain, net. |
| (b) | Federal income tax provision. |
58 2013 Report to Shareholders | CSB Bancorp, Inc.
NOTES TO CONSOLIDATED FINANCIAL STATEMENTS
NOTE 17 – CONTINGENT LIABILITIES
In the normal course of business, the Company is subject to pending and threatened legal actions. Although, the Company is not able to predict the outcome of such actions, after reviewing pending and threatened actions, management believes that the outcome of any or all such actions will not have a material adverse effect on the results of operations or shareholders’ equity of the Company.
The Company has an employment agreement with an officer. Upon the occurrence of certain types of termination of employment, the Company may be required to make specified severance payments if termination occurs within a specified period of time, generally two years from the date of the agreement, or pursuant to certain change in control transactions.
NOTE 18 – QUARTERLY FINANCIAL DATA (UNAUDITED)
The following is a summary of selected quarterly financial data (unaudited) for the years ended December 31:
| (Dollars in thousands, except per share data) |
Interest Income |
Net Interest Income |
Net Income |
Basic Earnings Per Share |
Diluted Earnings Per Share |
|||||||||||||||
| 2013 |
||||||||||||||||||||
| First quarter |
$ | 5,300 | $ | 4,692 | $ | 1,362 | $ | 0.50 | $ | 0.50 | ||||||||||
| Second quarter |
5,173 | 4,592 | 1,247 | 0.45 | 0.45 | |||||||||||||||
| Third quarter |
5,235 | 4,677 | 1,407 | 0.51 | 0.51 | |||||||||||||||
| Fourth quarter |
5,430 | 4,922 | 1,224 | 0.45 | 0.45 | |||||||||||||||
| 2012 |
||||||||||||||||||||
| First quarter |
$ | 5,132 | $ | 4,313 | $ | 1,055 | $ | 0.39 | $ | 0.39 | ||||||||||
| Second quarter |
5,151 | 4,397 | 1,141 | 0.41 | 0.41 | |||||||||||||||
| Third quarter |
5,148 | 4,426 | 1,231 | 0.45 | 0.45 | |||||||||||||||
| Fourth quarter |
5,153 | 4,470 | 1,120 | 0.41 | 0.41 | |||||||||||||||
2013 Report to Shareholders | CSB Bancorp, Inc. 59
OFFICERS OF THE COMMERCIAL AND SAVINGS BANK
60 2013 Report to Shareholders | CSB Bancorp, Inc.
SHAREHOLDERS AND GENERAL INQUIRIES
Stock Listing Common Symbol: CSBB
| CORPORATE OFFICE | ||
| 91 North Clay Street, Millersburg, Ohio | 330-674-9015 or 800-654-9015 |
2013 Report to Shareholders | CSB Bancorp, Inc. 61

62 2013 Report to Shareholders | CSB Bancorp, Inc.