EXHIBIT 99.1

Press Release
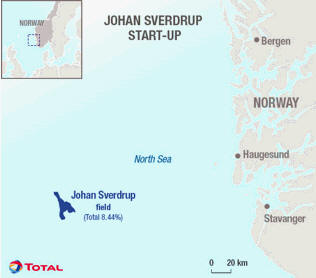
Norway: Johan Sverdrup Giant Field Starts Up in the North Sea
Paris, October, 7 2019 - The production from Phase 1 of the giant Johan Sverdrup field has started — more than two months ahead of schedule and with a cost reduced by more than 30%. The total investment is $10.5 billion and plateau production is 440,000 barrels per day. Johan Sverdrup is operated by Equinor (42.6267%), alongside Lundin Norway (20%), Petoro (17.36%), Aker BP (11.5733%) and Total (8.44%).
“Johan Sverdrup is one of the major developments that were added to Total’s portfolio through the value adding acquisition of Maersk Oil in 2018. It is one of the largest oil fields of the Norwegian Continental Shelf and illustrates our ongoing commitment to Norway – a country that represents about 8% of Total’s global annual production – and to the North Sea where we are the second largest operator,” said Arnaud Breuillac, President Exploration & Production of Total. ”
Located 150 kilometers off the Norwegian coast, Johan Sverdrup’s total recoverable reserves amount to 2.7 billion barrels of oil equivalent. Phase II of the project is already under development and is expected to increase production capacity to 660,000 barrels per day by the end of 2022.
Johan Sverdrup ranks among the world top three offshore projects in terms of carbon emission efficiency. With well below 1 kg of CO2 emitted per barrel, emissions savings are largely due to the electric supply from shore compared with traditional offshore gas turbines.
About Total’s Exploration & Production in Norway
Total has been present in Norway since 1965 and has played a major role in the development
of many important fields on the Norwegian continental shelf. Total holds interests in 65 production licenses and our production was 211,000 barrels of oil equivalent per day in 2018.
In 2017, Total has signed an agreement with Shell and Equinor to mature the development of a full-scale carbon storage on the Norwegian continental shelf. This is in line with Total’s roadmap to develop carbon capture utilization and storage (CCUS) as a key axis of its low carbon strategy.
In terms of competence and technical know-how, Total benefits from its new Copenhagen-based exploration hub that provides synergies and increased focus on future opportunities on the Norwegian Continental Shelf (NCS) and in the North Sea region at large, where Total is present in Norway, UK, Denmark and the Netherlands.
* * * * *
About Total
Total is a major energy player that produces and markets fuels, natural gas and low-carbon electricity. Our 100,000 employees are committed to better energy that is safer, more affordable, cleaner and accessible to as many people as possible. Active in more than 130 countries, our ambition is to become the responsible energy major.
Total Contacts
Media Relations: +33 1 47 44 46 99 l presse@total.com l @TotalPress
Investor Relations: +44 (0)207 719 7962 l ir@total.com
Cautionary note
This press release, from which no legal consequences may be drawn, is for information purposes only. The entities in which TOTAL S.A. directly or indirectly owns investments are separate legal entities. TOTAL S.A. has no liability for their acts or omissions. In this document, the terms “Total”, “Total Group” and Group are sometimes used for convenience. Likewise, the words “we”, “us” and “our” may also be used to refer to subsidiaries in general or to those who work for them.
This document may contain forward-looking information and statements that are based on a number of economic data and assumptions made in a given economic, competitive and regulatory environment. They may prove to be inaccurate in the future and are subject to a number of risk factors. Neither TOTAL S.A. nor any of its subsidiaries assumes any obligation to update publicly any forward-looking information or statement, objectives or trends contained in this document whether as a result of new information, future events or otherwise.
Cautionary note to U.S. Investors
The United States Securities and Exchange Commission permits oil and gas companies, in their filings with the SEC, to separately disclose proved, probable and possible reserves that a company has determined in accordance with the SEC rules. We may use certain terms in this press release, such as resources, that the SEC’s guidelines strictly prohibit us from including in filings with the SEC. U.S. Investors are urged to consider closely the disclosure in our Form 20-F, File No. 1-10888 available from us at TOTAL S.A. — Tour Coupole — 2, place Jean Millier — Arche Nord Coupole/Regnault — 92078 Paris La Défense Cedex — France, or at our website: www.total.com. You can also obtain this form from the SEC by calling 1-800-SEC-0330 or on the SEC’s website: www.sec.gov.