UNITED STATES
SECURITIES AND EXCHANGE COMMISSION
Washington, D.C. 20549
FORM 6-K
REPORT OF FOREIGN PRIVATE ISSUER
PURSUANT TO RULE 13a-16 OR 15d-16
OF THE SECURITIES EXCHANGE ACT OF 1934
October 30, 2019
Commission File Number 001-10888
TOTAL S.A.
(Translation of registrants name into English)
2, place Jean Millier
La Défense 6
92400 Courbevoie
France
(Address of principal executive offices)
Indicate by check mark whether the registrant files or will file annual reports under cover of Form 20-F or Form 40-F.
Form 20-F ☒ Form 40-F ☐
Indicate by check mark if the registrant is submitting the Form 6-K in paper as permitted by Regulation S-T Rule 101(b)(1): ☐
Note: Regulation S-T Rule 101(b)(1) only permits the submission in paper of a Form 6-K if submitted solely to provide an attached annual report to security holders.
Indicate by check mark if the registrant is submitting the Form 6-K in paper as permitted by Regulation S-T Rule 101(b)(7): ☐
Note: Regulation S-T Rule 101(b)(7) only permits the submission in paper of a Form 6-K if submitted to furnish a report or other document that the registrant foreign private issuer must furnish and make public under the laws of the jurisdiction in which the registrant is incorporated, domiciled or legally organized (the registrants home country), or under the rules of the home country exchange on which the registrants securities are traded, as long as the report or other document is not a press release, is not required to be and has not been distributed to the registrants security holders, and, if discussing a material event, has already been the subject of a Form 6-K submission or other Commission filing on EDGAR.
Indicate by check mark whether by furnishing the information contained in this Form, the registrant is also thereby furnishing the information to the Commission pursuant to Rule 12g3-2(b) under the Securities Exchange Act of 1934.
Yes ☐ No ☒
(If Yes is marked, indicate below the file number assigned to the registrant in connection with Rule 12g3-2(b): 82- .)
THIS REPORT ON FORM 6-K SHALL BE DEEMED TO BE INCORPORATED BY REFERENCE IN THE REGISTRATION STATEMENT ON FORM F-3 (NOS. 333-224307, 333-224307-01, 333-224307-02 AND 333-224307-03) OF TOTAL S.A., TOTAL CAPITAL INTERNATIONAL, TOTAL CAPITAL CANADA LTD. AND TOTAL CAPITAL AND THE REGISTRATION STATEMENTS ON FORM S-8 (333-183144 AND 333-222833) OF TOTAL S.A., AND TO BE PART THEREOF FROM THE DATE ON WHICH THIS REPORT IS FURNISHED, TO THE EXTENT NOT SUPERSEDED BY DOCUMENTS OR REPORTS SUBSEQUENTLY FILED OR FURNISHED.
TOTAL S.A. is providing on this Form 6-K its results for the third quarter of 2019 and nine months ended September 30, 2019, and a description of certain recent developments relating to its business, as well as a capitalization table as of September 30, 2019.
EX-99.1: Results for the Third Quarter of 2019 and Nine Months Ended September 30, 2019
EX-99.2: Recent Developments
EX-99.3: Capitalization and Indebtedness
Pursuant to the requirements of the Securities Exchange Act of 1934, the registrant has duly caused this report to be signed on its behalf by the undersigned, thereunto duly authorized.
TOTAL S.A. | ||||||
Date: October 30, 2019 | By: | /s/ ANTOINE LARENAUDIE | ||||
Name: | Antoine LARENAUDIE | |||||
Title: | Group Treasurer |
Exhibit 99.1
OPERATING AND FINANCIAL REVIEW AND PROSPECTS
The financial information on pages 1-15 of this exhibit concerning TOTAL S.A. and all of its direct and indirect consolidated companies located in or outside of France (collectively, TOTAL or the Group) with respect to the third quarter 2019 and nine months ended September 30, 2019, has been derived from TOTALs unaudited consolidated balance sheets as of September 30, 2019, unaudited statements of income, comprehensive income, cash flow, business segment information for the third quarter 2019 and nine months ended September 30, 2019 and unaudited consolidated statements of changes in shareholders equity for the nine months ended September 30, 2019 presented on pages 16-30 and 41-44 of this exhibit.
The following discussion should be read in conjunction with the aforementioned financial statements and with the information, including TOTALs audited consolidated financial statements and related notes, provided in TOTALs Annual Report on Form 20-F for the year ended December 31, 2018, filed with the Securities and Exchange Commission (SEC) on March 20, 2019, as amended on April 26,2019.
A. KEY FIGURES
3Q19 | 2Q19 | 3Q18 | 3Q19 vs 3Q18 |
in millions of dollars (except earnings per share and number of shares) |
9M19 | 9M18 | 9M19 vs 9M18 |
|||||||||||||||||||||
48,589 | 51,242 | 54,717 | -11 | % | Non-Group sales | 151,036 | 156,868 | -4 | % | |||||||||||||||||||
Adjusted net operating income(a) from business segments | ||||||||||||||||||||||||||||
1,734 | 2,022 | 2,439 | -29 | % | Exploration & Production* |
5,478 | 6,571 | -17 | % | |||||||||||||||||||
574 | 429 | 697 | -18 | % | Integrated Gas, Renewables & Power* |
1,595 | 1,743 | -8 | % | |||||||||||||||||||
952 | 715 | 938 | +1 | % | Refining & Chemicals |
2,423 | 2,479 | -2 | % | |||||||||||||||||||
413 | 423 | 474 | -13 | % | Marketing & Services |
1,179 | 1,319 | -11 | % | |||||||||||||||||||
1,381 | 812 | 918 | +50 | % | Net income (loss) from equity affiliates | 2,904 | 2,505 | +16 | % | |||||||||||||||||||
1.04 | 1.00 | 1.47 | -29 | % | Fully-diluted earnings per share ($) | 3.20 | 3.85 | -17 | % | |||||||||||||||||||
2,614 | 2,625 | 2,637 | -1 | % | Fully-diluted weighted-average shares (millions) | 2,621 | 2,618 | n/a | ||||||||||||||||||||
2,800 | 2,756 | 3,957 | -29 | % | Net income (Group share) | 8,667 | 10,314 | -16 | % | |||||||||||||||||||
3,296 | 3,028 | 2,568 | +28 | % | Organic investments(b) | 9,107 | 7,967 | +14 | % | |||||||||||||||||||
3,422 | 402 | 3,640 | -6 | % | Net acquisitions(c) | 4,131 | 4,893 | -16 | % | |||||||||||||||||||
6,718 | 3,430 | 6,208 | +8 | % | Net investments(d) | 13,238 | 12,860 | +3 | % | |||||||||||||||||||
8,206 | 6,251 | 5,736 | +43 | % | Cash flow from operations |
18,086 | 14,063 | +29 | % | |||||||||||||||||||
of which: |
||||||||||||||||||||||||||||
1,523 | (317 | ) | (1,578 | ) | n/a | (increase)/decrease in working capital(e) |
(1,764 | ) | (5,656 | ) | n/a | |||||||||||||||||
(532 | ) | (501 | ) | (419 | ) | n/a | financial charges |
(1,536 | ) | (1,115 | ) | n/a |
2019 data take into account the impact of the new rule IFRS16 Leases, effective January 1, 2019.
* | 3Q18 and 9M18 restated; historical data for 2017 and 2018 available on www.total.com. |
Environment* liquids and gas price realizations**, refining margins
3Q19 |
2Q19 | 3Q18 | 3Q19 vs 3Q18 |
9M19 | 9M18 | 9M19 vs 9M18 |
||||||||||||||||||||||
62.0 | 68.9 | 75.2 | -18 | % | Brent ($/b) | 64.6 | 72.1 | -10 | % | |||||||||||||||||||
2.3 | 2.5 | 2.9 | -19 | % | Henry Hub ($/Mbtu) | 2.6 | 2.8 | -10 | % | |||||||||||||||||||
3.9 | 4.1 | 8.4 | -54 | % | NBP ($/Mbtu) | 4.8 | 7.6 | -37 | % | |||||||||||||||||||
4.7 | 4.9 | 10.7 | -56 | % | JKM ($/Mbtu) | 5.4 | 9.7 | -44 | % | |||||||||||||||||||
|
|
|
|
|
|
|
|
|
|
|
|
|
|
|
||||||||||||||
58.0 | 63.7 | 68.8 | -16 | % | Average liquids price ($/b)** | 60.0 | 66.1 | -9 | % | |||||||||||||||||||
3.48 | 3.82 | 5.06 | -31 | % | Average gas price ($/Mbtu)** | 3.93 | 4.83 | -19 | % | |||||||||||||||||||
|
|
|
|
|
|
|
|
|
|
|
|
|
|
|
||||||||||||||
47.4 | 27.6 | 47.2 | n/a | Variable cost margin European refining, VCM ($/t) | 36.2 | 37.3 | -3 | % |
* | The indicators are shown on page 15. |
** | Consolidated subsidiaries. |
(a) | Adjusted results are defined as income using replacement cost, adjusted for special items, excluding the impact of changes for fair value. See page 3 et seq. Analysis of business segment results below for further details. |
(b) | Organic investments = net investments excluding acquisitions, asset sales and other operations with non-controlling interests. |
(c) | Net acquisitions = acquisitions - assets sales - other transactions with non-controlling interests (see page 13). |
(d) | Net investments = organic investments + net acquisitions (see page 13). |
(e) | The change in working capital as determined using the replacement cost method and, effective second quarter 2019, including organic loan repayments from equity affiliates was $1,353 million in 3Q19, $(456) million in 2Q19, $(1,352) million in 3Q18, $(1,507) million in 9M19 and $(4,794) in 9M18. Effective second quarter 2019, organic loan repayments from equity affiliates are defined as loan repayments from equity affiliates coming from their cash flow from operations. |
1
Production*
3Q19 | 2Q19 |
3Q18 |
3Q19 vs 3Q18 |
9M19 | 9M18 | 9M19 vs 9M18 |
||||||||||||||||||
3,040 | 2,957 | 2,804 | +8 | % | Hydrocarbon production (kboe/d) |
2,981 | 2,742 | +9 | % | |||||||||||||||
1,441 | 1,407 | 1,431 | +1 | % | Oil (including bitumen) (kb/d) |
1,424 | 1,377 | +3 | % | |||||||||||||||
1,599 | 1,549 | 1,373 | +16 | % | Gas (including condensates and associated NGL) (kboe/d) |
1,557 | 1,365 | +14 | % | |||||||||||||||
3Q19 | 2Q19 |
3Q18 |
3Q19 vs 3Q18 |
9M19 | 9M18 | 9M19 vs 9M18 |
||||||||||||||||||
3,040 | 2,957 | 2,804 | +8 | % | Hydrocarbon production (kboe/d) |
2,981 | 2,742 | +9 | % | |||||||||||||||
1,720 | 1,624 | 1,611 | +7 | % | Liquids (kb/d) |
1,658 | 1,558 | +6 | % | |||||||||||||||
7,399 | 7,477 | 6,557 | +13 | % | Gas (Mcf/d) |
7,399 | 6,465 | +14 | % |
* | Group production = production of Exploration & Production segment (EP) + production of Integrated Gas, Renewables & Power segment (iGRP) |
Hydrocarbon production was 3,040 thousand barrels of oil equivalent per day (kboe/d) in third quarter 2019, an increase of 8% compared to last year, due to:
| +12% related to the start-up and ramp-up of new projects, including Yamal LNG in Russia, Ichthys in Australia, Kaombo in Angola and Egina in Nigeria, and Culzean in the United Kingdom; |
| -3% due to the natural decline of the fields; and |
| -1% due to maintenance, notably in Norway. |
Hydrocarbon production was 2,981 thousand barrels of oil equivalent per day (kboe/d) in the first nine months of 2019, an increase of 9% compared to last year, due to:
| +12% related to the start-up and ramp-up of new projects, including Yamal LNG in Russia, Ichthys in Australia, Kaombo in Angola and Egina in Nigeria; |
| +1% due to portfolio effect, notably the integration of the Maersk Oil assets; |
| -3% due to the natural decline of the fields; and |
| -1% due to maintenance, notably in Nigeria and Norway. |
2
B. ANALYSIS OF BUSINESS SEGMENT RESULTS
The financial information for each business segment is reported on the same basis as that used internally by the chief operating decision-maker in assessing segment performance and the allocation of segment resources. Due to their particular nature or significance, certain transactions qualifying as special items are excluded from the business segment figures. In general, special items relate to transactions that are significant, infrequent or unusual. In certain instances, certain transactions such as restructuring costs or asset disposals, which are not considered to be representative of the normal course of business, may qualify as special items although they may have occurred in prior years or are likely to recur in following years.
In accordance with IAS 2, the Group values inventories of petroleum products in its financial statements according to the First-In, First-Out (FIFO) method and other inventories using the weighted-average cost method. Under the FIFO method, the cost of inventory is based on the historic cost of acquisition or manufacture rather than the current replacement cost. In volatile energy markets, this can have a significant distorting effect on the reported income. Accordingly, the adjusted results of the Refining & Chemicals and Marketing & Services segments are presented according to the replacement cost method in order to facilitate the comparability of the Groups results with those of its competitors and to help illustrate the operating performance of these segments excluding the impact of oil price changes on the replacement of inventories. In the replacement cost method, which approximates the Last-In, First-Out (LIFO) method, the variation of inventory values in the statement of income is, depending on the nature of the inventory, determined using either the month-end price differential between one period and another or the average prices of the period. The inventory valuation effect is the difference between the results under the FIFO and replacement cost methods.
The effect of changes in fair value presented as an adjustment item reflects, for trading inventories and storage contracts, differences between internal measures of performance used by TOTALs management and the accounting for these transactions under IFRS, which requires that trading inventories be recorded at their fair value using period-end spot prices. In order to best reflect the management of economic exposure through derivative transactions, internal indicators used to measure performance include valuations of trading inventories recorded at their fair value based on forward prices. Furthermore, TOTAL, in its trading activities, enters into storage contracts, the future effects of which are recorded at fair value in the Groups internal economic performance. IFRS, by requiring accounting for storage contracts on an accrual basis, precludes recognition of this fair value effect.
The adjusted business segment results (adjusted operating income and adjusted net operating income) are defined as replacement cost results, adjusted for special items, excluding the effect of changes in fair value. For further information on the adjustments affecting operating income on a segment-by-segment basis, and for a reconciliation of segment figures to figures reported in TOTALs interim consolidated financial statements, see pages 24-30 and 40-46 of this exhibit.
The Group measures performance at the segment level on the basis of adjusted net operating income. Net operating income comprises operating income of the relevant segment after deducting the amortization and the depreciation of intangible assets other than leasehold rights, translation adjustments and gains or losses on the sale of assets, as well as all other income and expenses related to capital employed (dividends from non-consolidated companies, income from equity affiliates and capitalized interest expenses) and after income taxes applicable to the above. The income and expenses not included in net operating income that are included in net income are interest expenses related to long-term liabilities net of interest earned on cash and cash equivalents, after applicable income taxes (net cost of net debt and non-controlling interests). Adjusted net operating income excludes the effect of the adjustments (special items and the inventory valuation effect) described above.
The profitable growth in the gas and low carbon electricity integrated value chains is one of the key axes of TOTALs strategy. In order to give more visibility to these businesses, a new reporting structure for the business segments financial information has been put in place, effective January 1, 2019. The organization of the Groups activities is structured around the four following segments: Exploration & Production segment, Integrated Gas, Renewables & Power (comprising integrated gas (including LNG) and low carbon electricity businesses. It includes the upstream and midstream LNG activity that was previously reported in the E&P segment); Refining & Chemicals and Marketing & Services. Certain figures for the years 2017 and 2018 have been restated in order to reflect the new organization.
3
B.1. Exploration & Production segment (EP redefined scope)
| Production |
3Q19 | 2Q19 | 3Q18 | 3Q19 vs 3Q18 |
Hydrocarbon production |
9M19 | 9M18 | 9M19 vs 9M18 |
|||||||||||||||||||||
2,501 | 2,398 | 2,433 | +3 | % | EP (kboe/d) | 2,442 | 2,389 | +2 | % | |||||||||||||||||||
1,647 | 1,551 | 1,575 | +5 | % | Liquids (kb/d) |
1,587 | 1,522 | +4 | % | |||||||||||||||||||
4,654 | 4,629 | 4,678 | -1 | % | Gas (Mcf/d) |
4,663 | 4,729 | -1 | % | |||||||||||||||||||
Results | ||||||||||||||||||||||||||||
3Q19 | 2Q19 | 3Q18 | 3Q19 vs 3Q18 |
in millions of dollars (except effective tax rate) |
9M19 | 9M18 | 9M19 vs 9M18 |
|||||||||||||||||||||
1,631 | 2,273 | 2,433 | -33 | % | Non-Group sales | 5,698 | 7,770 | -27 | % | |||||||||||||||||||
2,257 | 2,967 | 3,832 | -41 | % | Operating income | 8,176 | 10,310 | -21 | % | |||||||||||||||||||
77 | 173 | 449 | -83 | % | Net income (loss) from equity affiliates and other items | 444 | 1,026 | -57 | % | |||||||||||||||||||
39.7 | % | 39.5 | % | 47.5 | % | Effective tax rate* | 42.8 | % | 47.5 | % | ||||||||||||||||||
(1,094 | ) | (1,161 | ) | (1,853 | ) | -41 | % | Tax on net operating income | (3,679 | ) | (4,972 | ) | -26 | % | ||||||||||||||
1,240 | 1,979 | 2,428 | -49 | % | Net operating income | 4,941 | 6,364 | -22 | % | |||||||||||||||||||
494 | 43 | 11 | x44 | Adjustments affecting net operating income | 537 | 207 | x2.6 | |||||||||||||||||||||
1,734 | 2,022 | 2,439 | -29 | % | Adjusted net operating income** | 5,478 | 6,571 | -17 | % | |||||||||||||||||||
297 | 239 | 316 | -6 | % | including income from equity affiliates |
749 | 871 | -14 | % | |||||||||||||||||||
2,065 | 1,995 | 1,605 | +29 | % | Organic investments | 6,018 | 5,188 | +16 | % | |||||||||||||||||||
(3 | ) | 204 | 373 | n/a | Net acquisitions | 239 | 2,305 | -90 | % | |||||||||||||||||||
2,061 | 2,199 | 1,978 | +4 | % | Net investments | 6,256 | 7,493 | -17 | % |
* | Effective tax rate = tax on adjusted net operating income / (adjusted net operating income - income from equity affiliates - dividends received from investments - impairment of goodwill + tax on adjusted net operating income). |
** | Detail of adjustment items shown in the business segment information starting on page 24 of this exhibit. |
Exploration & Production adjusted net operating income was:
| $1,734 million in the third quarter 2019, a decrease of 29% year-on-year, impacted notably by lower Brent and natural gas prices as well as higher depreciation, depletion and amortization expenses on new projects; and |
| $5,478 million in the first nine months of 2019, a decrease of 17% compared to the first nine months of 2018, for the same reasons. |
Adjusted net operating income for the Exploration & Production segment excludes special items. In the third quarter 2019, the exclusion of special items had a positive impact of $494 million compared to a positive impact of $11 million in the third quarter 2018. In the first nine months of 2019, the exclusion of special items had a positive impact of $537 million on the segments adjusted net operating income, compared to a positive impact of $207 million in the first nine months of 2018.
In the third quarter 2019, the segments cash flow from operating activities excluding financial charges, except those related to leases was $5,007 million, an increase of 13% compared to $4,431 million in the third quarter 2018. In the first nine months of 2019, the segments cash flow from operating activities excluding financial charges, except those related to leases was $12,711 million, an increase of 4% compared to $12,227 million in the first nine months of 2018. In the third quarter 2019, the segments operating cash flow excluding the change in working capital at replacement cost1 and excluding financial charges, except those related to leases was $4,451 million, a decrease of 14% compared to $5,200 million in the third quarter 2018. In the first nine months of 2019, the segments operating cash flow excluding the change in working capital at replacement cost1 and excluding financial charges, except those related to leases was $13,579 million, a decrease of 2% compared to $13,921 million in the first nine months of 2018. The start-up of highly accretive cash flow projects offset the effect of lower Brent and gas prices.
1 | Operating cash flow excluding the change in working capital at replacement cost and effective second quarter 2019 including organic loan repayments from equity affiliates provides information on underlying cash flow without the short-term impacts of changes in inventory and other working capital elements at replacement cost. For information on the replacement cost method, refer to B. Analysis of business segment results, above. The reconciliation table for different cash flow figures is set forth under Cash Flow on page 13 of this exhibit. |
4
B.2. Integrated Gas, Renewables & Power segment (iGRP)
| Production and liquefied natural gas (LNG) sales |
3Q19 | 2Q19 | 3Q18 | 3Q19 vs 3Q18 |
Hydrocarbon production |
9M19 | 9M18 | 9M19 vs 9M18 |
|||||||||||||||||||||
539 | 559 | 371 | +45 | % | iGRP (kboe/d) |
539 | 353 | +53 | % | |||||||||||||||||||
73 | 73 | 36 | x2 | Liquids (kb/d) |
71 | 36 | +94 | % | ||||||||||||||||||||
2,745 | 2,848 | 1,879 | +46 | % | Gas (Mcf/d) |
2,736 | 1,736 | +58 | % | |||||||||||||||||||
3Q19 | 2Q19 | 3Q18 | 3Q19 vs 3Q18 |
LNG in Mt |
9M19 | 9M18 | 9M19 vs 9M18 |
|||||||||||||||||||||
7.4 | 8.5 | 6.2 | +20 | % | Overall LNG sales |
23.7 | 13.9 | +71 | % | |||||||||||||||||||
4.2 | 4.1 | 2.8 | +50 | % | including sales from equity production* |
12.0 | 7.7 | +55 | % | |||||||||||||||||||
5.5 | 6.7 | 5.1 | +8 | % | including sales by TOTAL from equity production and third party purchases |
18.3 | 10.5 | +75 | % |
* | The Groups equity production may be sold by TOTAL or by joint ventures. |
Production growth compared to a year ago is essentially linked to the start-up of production from the Ichthys project in Australia in the third quarter 2018 and the successive start-ups of trains at Yamal LNG in Russia.
Total LNG sales for the third quarter 2019 increased by 20% compared to last year due to the ramp-up of Yamal LNG and Ichthys as well as the start-up of the first train at Cameron LNG in the United States.
Total LNG sales increased by 71% in the first nine months of 2019 for the same reasons as well as the acquisition of the portfolio of LNG contracts from Engie in the third quarter 2018.
| Results |
3Q19 | 2Q19 | 3Q18 | 3Q19 vs 3Q18 |
in millions of dollars |
9M19 | 9M18 | 9M19 vs 9M18 |
|||||||||||||||||||||
3,667 | 3,789 | 5,568 | -34 | % | Non-Group sales | 13,875 | 13,455 | +3 | % | |||||||||||||||||||
321 | 215 | 270 | +19 | % | Operating income | 858 | 188 | x4.6 | ||||||||||||||||||||
898 | 661 | 445 | x2 | Net income (loss) from equity affiliates and other items | 1,939 | 1,240 | +56 | % | ||||||||||||||||||||
(222 | ) | (450 | ) | (155 | ) | +43 | % | Tax on net operating income | (845 | ) | (392 | ) | +116 | % | ||||||||||||||
997 | 426 | 560 | +78 | % | Net operating income | 1,952 | 1,036 | +88 | % | |||||||||||||||||||
(423 | ) | 3 | 137 | n/a | Adjustments affecting net operating income | (357 | ) | 707 | -150 | % | ||||||||||||||||||
574 | 429 | 697 | -18 | % | Adjusted net operating income* | 1,595 | 1,743 | -8 | % | |||||||||||||||||||
206 | 195 | 324 | -36 | % | including income from equity affiliates |
656 | 802 | -18 | % | |||||||||||||||||||
641 | 442 | 407 | +57 | % | Organic investments | 1,576 | 1,131 | +39 | % | |||||||||||||||||||
3,375 | 159 | 3,341 | +1 | % | Net acquisitions | 3,934 | 3,047 | +29 | % | |||||||||||||||||||
4,015 | 601 | 3,748 | +7 | % | Net investments | 5,509 | 4,178 | +32 | % |
* | Detail of adjustment items shown in the business segment information starting on page 24 of this exhibit. |
Adjusted net operating income for the Integrated Gas, Renewables & Power segment was $574 million in the third quarter 2019, a decrease of 18% compared to $697 million in the third quarter 2018, and $1,595 million in the first nine months of 2019, a decrease of 8% compared to $1,743 million in the first nine months of 2018, impacted by lower gas prices in Europe and Asia in particular as well as higher depreciation, depletion and amortization expenses on new projects.
Adjusted net operating income for the Integrated Gas, Renewables & Power segment excludes special items. In the third quarter 2019, the exclusion of special items had a negative impact of $423 million on the segments adjusted net operating income, compared to a positive impact of $137 million in the third quarter 2018. In the first nine months of 2019, the exclusion of special items had a negative impact of $357 million on the segments adjusted net operating income, compared to a positive impact of $707 million in the first nine months of 2018.
In the third quarter 2019, the segments operating cash flow excluding the change in working capital at replacement cost and excluding financial charges, except those related to leases was $848 million, an increase of 53% compared to $553 million in the third quarter 2018, driven by strong LNG sales growth. In the first nine months of 2019, the segments operating cash flow excluding the change in working capital at replacement cost and excluding financial charges, except those related to leases was $2,327 million, an increase of 62% compared to $1,438 million in the first nine months of 2018 for the same reasons.
5
B.3. Refining & Chemicals segment
| Refinery throughput and utilization rates* |
3Q19 | 2Q19 | 3Q18 | 3Q19 vs 3Q18 |
9M19 | 9M18 | 9M19 vs 9M18 |
||||||||||||||||||||||
1,719 | 1,595 | 1,953 | -12 | % | Total refinery throughput (kb/d) |
1,725 | 1,840 | -6 | % | |||||||||||||||||||
503 | 447 | 654 | -23 | % | France |
514 | 616 | -17 | % | |||||||||||||||||||
757 | 679 | 795 | -5 | % | Rest of Europe |
753 | 737 | +2 | % | |||||||||||||||||||
459 | 469 | 504 | -9 | % | Rest of world |
458 | 487 | -6 | % | |||||||||||||||||||
82 | % | 77 | % | 92 | % | Utilization rates based on crude only** |
83 | % | 87 | % |
* | Includes refineries in Africa reported in the Marketing & Services segment. |
** | Based on distillation capacity at the beginning of the year. |
Refinery throughput volumes:
| decreased by 12% in the third quarter 2019 year-on-year, notably as a result of the start of planned maintenance at Normandy and the partial contribution of Grandpuits in France during the third quarter 2019; and |
| decreased by 6% in the first nine months of 2019 year-on-year for the same reasons. |
| Results |
3Q19 | 2Q19 | 3Q18 | 3Q19 vs 3Q18 |
in millions of dollars |
9M19 | 9M18 | 9M19 vs 9M18 |
|||||||||||||||||||||
21,338 | 22,509 | 23,572 | -9 | % | Non-Group sales |
65,558 | 68,660 | -5 | % | |||||||||||||||||||
1,035 | 484 | 1,142 | -9 | % | Operating income |
2,763 | 3,047 | -9 | % | |||||||||||||||||||
5 | 111 | 221 | n/a | Net income (loss) from equity affiliates and other items |
265 | 638 | -58 | % | ||||||||||||||||||||
(221 | ) | 46 | (292 | ) | +24 | % | Tax on net operating income |
(467 | ) | (675 | ) | -30 | % | |||||||||||||||
819 | 641 | 1,071 | -24 | % | Net operating income |
2,561 | 3,010 | -15 | % | |||||||||||||||||||
133 | 74 | (133 | ) | -200 | % | Adjustments affecting net operating income |
(138 | ) | (531 | ) | -74 | % | ||||||||||||||||
952 | 715 | 938 | +1 | % | Adjusted net operating income* |
2,423 | 2,479 | -2 | % | |||||||||||||||||||
354 | 353 | 295 | +20 | % | Organic investments |
947 | 989 | -4 | % | |||||||||||||||||||
19 | (58 | ) | (6 | ) | n/a | Net acquisitions |
(163 | ) | (313 | ) | n/a | |||||||||||||||||
374 | 295 | 289 | +29 | % | Net investments |
785 | 676 | +16 | % |
* | Detail of adjustment items shown in the business segment information starting on page 24 of this exhibit. |
Adjusted net operating income for the Refining & Chemicals segment was $952 million in the third quarter 2019, an increase of 1% compared to $938 million in the third quarter 2018, benefiting notably from more favorable petrochemical margins in Europe, and amounted to $2,423 million in the first nine months of 2019, a decrease of 2% compared to $2,479 million in the first nine months of 2018.
Adjusted net operating income for the Refining & Chemicals segment excludes any after-tax inventory valuation effect and special items. In the third quarter 2019, the exclusion of the inventory valuation effect had a positive impact of $90 million on the segments adjusted net operating income, compared to a negative impact of $135 million in the third quarter 2018. In the third quarter 2019, the exclusion of special items had a positive impact of $43 million on the segments adjusted net operating income, compared to a negative impact of $2 million in the third quarter 2018. In the first nine months of 2019, the exclusion of the inventory valuation effect had a negative impact of $254 million on the segments adjusted net operating income, compared to a negative impact of $550 million in the first nine months of 2018. In the first nine months of 2019, the exclusion of special items had a positive impact of $116 million on the segments adjusted net operating income, compared to a positive impact of $19 million in the first nine months of 2018.
In the third quarter 2019, the segments cash flow from operating activities excluding financial charges, except those related to leases was $1,575 million, an increase of 18% compared to $1,338 million in the third quarter 2018. In the first nine months of 2019, the segments cash flow from operating activities excluding financial charges, except those related to leases was $2,695 million compared to $1,228 million in the third quarter 2018. In the third quarter 2019, the segments operating cash flow excluding the change in working capital at replacement cost and excluding financial charges, except those related to leases was $1,373 million, an increase of 17% compared to $1,174 million in the third quarter 2018. In the first nine months of 2019, the segments operating cash flow excluding the change in working capital at replacement cost and excluding financial charges, except those related to leases increased by 5% compared to the first nine months of 2018, from $3,112 million to $3,283.
6
B.4. Marketing & Services segment
| Petroleum product sales |
3Q19 | 2Q19 |
3Q18 |
3Q19 vs 3Q18 |
sales in kb/d* |
9M19 |
9M18 |
9M19 vs 9M18 |
|||||||||||||
1,848 | 1,860 | 1,818 | +2 | % | Total Marketing & Services sales |
1,848 | 1,806 | +2 | % | |||||||||||
1,034 | 1,004 | 1,024 | +1 | % | Europe |
1,017 | 1,006 | +1 | % | |||||||||||
814 | 856 | 794 | +3 | % | Rest of world |
831 | 800 | +4 | % |
* | Excludes trading and bulk refining sales. |
Sales of petroleum products increased by 2% in the third quarter 2019 and the first nine months of 2019, due to the development of activities in the African and American regions, notably Mexico and Brazil.
| Results |
3Q19 | 2Q19 | 3Q18 | 3Q19 vs 3Q18 |
in millions of dollars |
9M19 | 9M18 | 9M19 vs 9M18 |
|||||||||||||||||||||
21,951 | 22,671 | 23,144 | -5 | % | Non-Group sales |
65,901 | 66,980 | -2 | % | |||||||||||||||||||
558 | 450 | 569 | -2 | % | Operating income |
1,577 | 1,588 | -1 | % | |||||||||||||||||||
(15 | ) | 111 | 109 | n/a | Net income (loss) from equity affiliates and other items |
86 | 302 | -72 | % | |||||||||||||||||||
(164 | ) | (170 | ) | (166 | ) | +1 | % | Tax on net operating income |
(498 | ) | (463 | ) | +8 | % | ||||||||||||||
379 | 391 | 512 | -26 | % | Net operating income |
1,165 | 1,427 | -18 | % | |||||||||||||||||||
34 | 32 | (38 | ) | n/a | Adjustments affecting net operating income |
14 | (108 | ) | n/a | |||||||||||||||||||
413 | 423 | 474 | -13 | % | Adjusted net operating income* |
1,179 | 1,319 | -11 | % | |||||||||||||||||||
215 | 204 | 245 | -12 | % | Organic investments |
498 | 586 | -15 | % | |||||||||||||||||||
33 | 96 | (69 | ) | n/a | Net acquisitions |
121 | (145 | ) | n/a | |||||||||||||||||||
248 | 300 | 176 | +41 | % | Net investments |
620 | 441 | +41 | % |
* | Detail of adjustment items shown in the business segment information starting on page 24 of this exhibit. |
Adjusted net operating income for the Marketing & Services segment was $413 million in the third quarter 2019, a decrease of 13% compared to $474 million in the third quarter 2018, and $1,179 million in the first nine months of 2019, a decrease of 11% compared to $1,319 million in the first nine months of 2018.
Adjusted net operating income for the Marketing & Services segment excludes any after-tax inventory valuation effect and special items. In the third quarter 2019, the exclusion of the inventory valuation effect had a negative impact of $19 million on the segments adjusted net operating income, compared to a negative impact of $38 million in the third quarter 2018. In the third quarter 2019, the exclusion of special items had a positive impact of $53 million on the segments adjusted net operating income, and no impact on the segments adjusted net operating income in the third quarter 2018. In the first nine months of 2019, the exclusion of the inventory valuation effect had a negative impact of $46 million on the segments adjusted net operating income, compared to a negative impact of $108 million in the first nine months of 2018. In the first nine months of 2019, the exclusion of special items had a positive impact of $60 million on the segments adjusted net operating income and no impact on the segments adjusted net operating income in the first nine months of 2018.
In the third quarter 2019, the segments cash flow from operating activities excluding financial charges, except those related to leases was $1,483 million, an increase of 97% compared to $752 million in the third quarter 2018. In the first nine months of 2019, the segments cash flow from operating activities excluding financial charges, except those related to leases increased by 52% compared to the first nine months of 2018, from $1,533 million to $2,326 million. In the third quarter 2019, the segments operating cash flow excluding the change in working capital at replacement cost and excluding financial charges, except those related to leases was $622 million, an increase of 7% compared to $580 million in the third quarter 2018. In the first nine months of 2019, the segments operating cash flow excluding the change in working capital at replacement cost and excluding financial charges, except those related to leases was $1,830 million, an increase of 10% compared to $1,656 million in the first nine months of 2018.
7
C. GROUP RESULTS
| Net income (Group share) |
In the third quarter 2019, net income (Group share) was $2,800 million, a decrease of 29% compared to $3,957 million in the third quarter 2018. In the first nine months of 2019, net income (Group share) was $8,667 million, a decrease of 16% compared to $10,314 million in the first nine months of 2018.
Adjusted net income excludes the after-tax inventory effect, special items and the impact of changes in fair value1.
Adjusted net income (Group share) was:
| $3,017 million in the third quarter 2019, a decrease of 24% compared to the third quarter 2018. This decrease reflects the decrease in the adjusted net operating income of the segments; and |
| $8,663 million in the first nine months of 2019, a decrease of 17% compared to the first nine months of 2018 for the same reasons and the increase in the net cost of net debt compared to the first nine months of 2018 mainly due to the rise in U.S. dollar interest rates. |
Total adjustments affecting net income (Group share)2 were:
| $(217) million in the third quarter 2019; and |
| $4 million in the first nine months of 2019. |
| Fully-diluted shares and share buyback |
The number of fully-diluted shares was 2,614 million on September 30, 2019.
In the context of the shareholder return policy announced in February 2018, the Group has continued to buy back shares, including:
| the buyback of 16.1 million shares, representing all shares issued in 2019 under the scrip dividend option, until it was terminated; and |
| the buyback of additional shares, representing 8 million shares repurchased in the third quarter 2019 for $0.40 million and 21.7 million shares in the first nine months of 2019 for $1,15 billion as part of the $5 billion share buyback program for 2018-20. |
| Acquisitions - Asset sales |
Acquisitions consisted of:
| $4,429 million in the third quarter 2019, relating notably to the acquisition of Anadarkos interest in Mozambique LNG; and |
| $5,713 million in the first nine months of 2019, relating notably to the elements mentioned above as well as to the signing of the acquisition of a 10% stake in the Arctic LNG 2 project in Russia and the acquisition of Chevrons interest in the Danish Underground Consortium in Denmark. |
Asset sales consisted of:
| $1,007 million in the third quarter 2019, including notably the payment received with the take-over of the Toshiba LNG portfolio in the United States; and |
| $1,582 million in the first nine months of 2019, linked notably to the elements mentioned above and the sale of the interest in the Wepec refinery in China, the sale of the Groups interest in the Hazira terminal in India and polystyrene activities in China. |
1 | Details shown on page 13 of this exhibit. |
2 | Details shown on pages 13 and 33-35 of this exhibit. |
8
| Cash flow |
The Groups cash flow from operating activities increased by 43% in the third quarter 2019 compared to the third quarter 2018 from $5,736 million to $8,206 million. The Groups cash flow from operating activities was $18,086 million in the first nine months of 2019, an increase of 29% compared to $14,063 million in the first nine months of 2018.
The change in working capital at replacement cost in the third quarter 2019, which is the (increase)/decrease in working capital of $1,523 million as determined in accordance with IFRS adjusted for the pre-tax inventory valuation effect of $(69) million, was $1,454 million, compared to $(1,352) million in the third quarter 2018. The change in working capital at replacement cost in the first nine months of 2019, which is the (increase)/decrease in working capital of $(1,764) million as determined in accordance with IFRS adjusted for the pre-tax inventory valuation effect of $457 million, was $(1,307) million, compared to $(4,794) million in the first nine months of 2018.
In the third quarter 2019, operating cash flow excluding the change in working capital at replacement cost was $6,853 million, a decrease of 3% compared to $7,088 million in the third quarter 2018. In the first nine months of 2019, operating cash flow excluding the change in working capital at replacement cost was $19,593 million, an increase of 4% compared to $18,857 million in the first nine months of 2018. In the third quarter 2019, operating cash flow excluding the change in working capital at replacement cost, without financial charges was $7,385 million, a decrease of 2% compared to $7,507 million in the third quarter 2018. In the first nine months of 2019, operating cash flow excluding the change in working capital at replacement cost, without financial charges was $21,129 million, an increase of 6% compared to $19,972 million in the first nine months of 2018.
The Groups net cash flow1 was:
| $135 million in the third quarter 2019, a decrease of $745 million compared to the third quarter 2018 due to increased net acquisitions, and |
| $6,355 million in the first nine months of 2019, an increase of $358 million compared to the first nine months of 2018 due to higher operating cash flow before working capital changes partially offset by higher net acquisitions. |
1 | Net cash flow = operating cash flow before working capital changes - net investments (including other transactions with non-controlling interests). |
9
D. PROFITABILITY
Return on equity for the twelve months ended September 30, 2019, was 10.3%, a decrease compared to the same period a year ago.
in millions of dollars |
10/01/2018 - 09/30/2019 |
07/01/2018 - 06/30/2019 |
10/01/2017- 09/30/2018 |
|||||||||
Adjusted net income |
12,104 | 13,125 | 13,679 | |||||||||
Adjusted shareholders equity |
117,037 | 117,787 | 114,729 | |||||||||
Return on equity (ROE) |
10.3 | % | 11.1 | % | 11.9 | % |
Return on average capital employed was 9.6% for the twelve months ended September 30, 2019, a decrease compared to the same period a year ago.
in millions of dollars |
10/01/2018 - 09/30/2019 |
07/01/2018 - 06/30/2019 |
10/01/2017- 09/30/2018 |
|||||||||
Adjusted net operating income |
14,094 | 15,087 | 15,295 | |||||||||
Adjusted capital employed |
146,222 | 145,247 | 138,242 | |||||||||
ROACE |
9.6 | % | 10.4 | % | 11.1 | % |
E. 2019 SENSITIVITIES*
Change |
Estimated impact on adjusted net operating income |
Estimated impact on cash flow from operations | ||||
Dollar |
+/- $0.1 per | -/+ $0.1 B | ~ $0 B | |||
Average Liquids Price** |
+/- $10/b | +/- $2.7 B | +/- $3.2 B | |||
Variable cost margin, European refining (VCM) |
+/- $10/t | +/- $0.5 B | +/- $0.6 B |
* | Sensitivities are revised once per year upon publication of the previous years fourth quarter results. Sensitivities are estimates based on assumptions about the Groups portfolio in 2019. Actual results could vary significantly from estimates based on the application of these sensitivities. The impact of the $- sensitivity on adjusted net operating income is essentially attributable to Refining & Chemicals. |
** | In a $60/b Brent environment. |
F. SUMMARY AND OUTLOOK
Since the beginning of the fourth quarter 2019, Brent has traded around $60/b on average. The environment remains volatile, with uncertainty about hydrocarbon demand growth related to the outlook for global economic growth and in a context of geopolitical instability.
The Group maintains its cost discipline and the organic pre-dividend cash flow breakeven will remain below $30/b. The Group continues its cost reduction program with more than $0.5 billion of additional savings this year to reach cumulative savings of more than $4.7 billion by the end of 2019. The Group will continue its $5 billion asset sale program over the 2019-20 period ($1.6 billion was completed as at the end of September 2019) and net investments for 2019 should be less than $18 billion.
Production growth should reach 9% in 2019, due to ramp-ups on projects started in 2018 and the start-ups of projects since the beginning of 2019, including Kaombo Sul in Angola, Culzean in the UK North Sea and Johan Sverdrup in Norway, and the upcoming start-up of Iara 1 in Brazil.
The Group will continue to implement its strategy for profitable growth on the integrated gas and low carbon electricity chains, and the iGRP segment will benefit in 2020 from the start-ups of Yamal LNG train 4 as well as Cameron LNG trains 2 and 3.
Despite volatile European refining margins, the Downstream is well positioned to generate cash flow close to $7 billion in 2019.
Taking into account the stronger visibility on the Groups future, the board of directors of TOTAL S.A. decided on September 23, 2019 to accelerate dividend growth for the coming years with a guidance of increasing the dividend by 5%-6% per year. In addition, the Group will continue to buy back shares according to its $5 billion share buyback program over the 2018-2020 period at $60/b with the cumulative projected amount of $3.25 billion by the end of 2019.
10
FORWARD-LOOKING STATEMENTS
This document may contain forward-looking statements within the meaning of the Private Securities Litigation Reform Act of 1995. These statements are based on the beliefs and assumptions of the management of TOTAL and on the information currently available to such management. Forward-looking statements include information concerning forecasts, projections, anticipated synergies, and other information concerning possible or assumed future results of TOTAL, and may be preceded by, followed by, or otherwise include the words believes, expects, anticipates, intends, plans, targets, estimates or similar expressions.
Forward-looking statements are not assurances of results or values. They involve risks, uncertainties and assumptions. TOTALs future results and share value may differ materially from those expressed in these forward-looking statements. Many of the factors that will determine these results and values are beyond TOTALs ability to control or predict. Except for its ongoing obligations to disclose material information as required by applicable securities laws, TOTAL does not have any intention or obligation to update forward-looking statements after the distribution of this document, even if new information, future events or other circumstances have made them incorrect or misleading.
You should understand that various factors, certain of which are discussed elsewhere in this document and in the documents referred to in, or incorporated by reference into, this document, could affect the future results of TOTAL and could cause results to differ materially from those expressed in such forward-looking statements, including:
| material adverse changes in general economic conditions or in the markets served by TOTAL, including changes in the prices of oil, natural gas, refined products, petrochemical products and other chemicals; |
| changes in currency exchange rates and currency devaluations; |
| the success and the economic efficiency of oil and natural gas exploration, development and production programs, including without limitation, those that are not controlled and/or operated by TOTAL; |
| uncertainties about estimates of changes in proven and potential reserves and the capabilities of production facilities; |
| uncertainties about the ability to control unit costs in exploration, production, refining and marketing (including refining margins) and chemicals; |
| changes in the current capital expenditure plans of TOTAL; |
| the ability of TOTAL to realize anticipated cost savings, synergies and operating efficiencies; |
| the financial resources of competitors; |
| changes in laws and regulations, including tax and environmental laws and industrial safety regulations; |
| the quality of future opportunities that may be presented to or pursued by TOTAL; |
| the ability to generate cash flow or obtain financing to fund growth and the cost of such financing and liquidity conditions in the capital markets generally; |
| the ability to obtain governmental or regulatory approvals; |
| the ability to respond to challenges in international markets, including political or economic conditions, including international armed conflict, and trade and regulatory matters; |
| the ability to complete and integrate appropriate acquisitions, strategic alliances and joint ventures; |
| changes in the political environment that adversely affect exploration, production licenses and contractual rights or impose minimum drilling obligations, price controls, nationalization or expropriation, and regulation of refining and marketing, chemicals and power generating activities; |
| the possibility that other unpredictable events such as labor disputes or industrial accidents will adversely affect the business of TOTAL; and |
| the risk that TOTAL will inadequately hedge the price of crude oil or finished products. |
For additional factors, you should read the information set forth under Item 3. -3.2 Risk Factors, Item 4. Information on the Company, Item 5. Operating and Financial Review and Prospects and Item 11. Quantitative and Qualitative Disclosures about Market Risk in TOTALs Form 20-F for the year ended December 31, 2018.
11
OPERATING INFORMATION BY SEGMENT
| Group production (EP + iGRP) |
3Q19 | 2Q19 | 3Q18 | 3Q19 vs 3Q18 |
Combined liquids and gas production by region (kboe/d) |
9M19 | 9M18 | 9M19 vs 9M18 |
|||||||||||||||||||||
1,004 | 997 | 910 | +10 | % | Europe and Central Asia |
997 | 879 | +13 | % | |||||||||||||||||||
733 | 686 | 676 | +8 | % | Africa |
705 | 674 | +5 | % | |||||||||||||||||||
720 | 703 | 687 | +5 | % | Middle East and North Africa |
703 | 669 | +5 | % | |||||||||||||||||||
363 | 358 | 399 | -9 | % | Americas |
364 | 390 | -7 | % | |||||||||||||||||||
221 | 214 | 132 | +68 | % | Asia-Pacific |
212 | 129 | +64 | % | |||||||||||||||||||
|
|
|
|
|
|
|
|
|
|
|
|
|
|
|
||||||||||||||
3,040 | 2,957 | 2,804 | +8 | % | Total production |
2,981 | 2,742 | +9 | % | |||||||||||||||||||
|
|
|
|
|
|
|
|
|
|
|
|
|
|
|
||||||||||||||
698 | 750 | 645 | +8 | % | includes equity affiliates |
719 | 661 | +9 | % | |||||||||||||||||||
3Q19 | 2Q19 | 3Q18 | 3Q19 vs 3Q18 |
Liquids production by region (kb/d) |
9M19 | 9M18 | 9M19 vs 9M18 |
|||||||||||||||||||||
367 | 328 | 341 | +8 | % | Europe and Central Asia |
349 | 324 | +8 | % | |||||||||||||||||||
583 | 549 | 528 | +10 | % | Africa |
558 | 514 | +8 | % | |||||||||||||||||||
562 | 546 | 538 | +4 | % | Middle East and North Africa |
543 | 526 | +3 | % | |||||||||||||||||||
163 | 160 | 186 | -12 | % | Americas |
167 | 180 | -8 | % | |||||||||||||||||||
44 | 41 | 18 | x2.4 | Asia-Pacific |
41 | 14 | x3 | |||||||||||||||||||||
|
|
|
|
|
|
|
|
|
|
|
|
|
|
|
||||||||||||||
1,720 | 1,624 | 1,611 | +7 | % | Total production |
1,658 | 1,558 | +6 | % | |||||||||||||||||||
|
|
|
|
|
|
|
|
|
|
|
|
|
|
|
||||||||||||||
210 | 225 | 221 | -5 | % | includes equity affiliates |
217 | 252 | -14 | % | |||||||||||||||||||
3Q19 | 2Q19 | 3Q18 | 3Q19 vs 3Q18 |
Gas production by region (Mcf/d) |
9M19 | 9M18 | 9M19 vs 9M18 |
|||||||||||||||||||||
3,431 | 3,639 | 3,069 | +12 | % | Europe and Central Asia |
3,498 | 2,993 | +17 | % | |||||||||||||||||||
768 | 703 | 776 | -1 | % | Africa |
754 | 801 | -6 | % | |||||||||||||||||||
866 | 866 | 830 | +4 | % | Middle East and North Africa |
879 | 793 | +11 | % | |||||||||||||||||||
1,124 | 1,107 | 1,198 | -6 | % | Americas |
1,111 | 1,183 | -6 | % | |||||||||||||||||||
1,210 | 1,162 | 684 | +77 | % | Asia-Pacific |
1,157 | 695 | +66 | % | |||||||||||||||||||
|
|
|
|
|
|
|
|
|
|
|
|
|
|
|
||||||||||||||
7,399 | 7,477 | 6,557 | +13 | % | Total production |
7,399 | 6,465 | +14 | % | |||||||||||||||||||
|
|
|
|
|
|
|
|
|
|
|
|
|
|
|
||||||||||||||
2,635 | 2,868 | 2,313 | +14 | % | includes equity affiliates |
2,718 | 2,199 | +24 | % |
| Downstream (Refining & Chemicals and Marketing & Services) |
3Q19 | 2Q19 | 3Q18 | 3Q19 vs 3Q18 |
Petroleum product sales by region (kb/d) |
9M19 | 9M18 | 9M19 vs 9M18 |
|||||||||||||||||||||
1,999 | 2,018 | 2,030 | -2 | % | Europe |
2,013 | 1,958 | +3 | % | |||||||||||||||||||
677 | 751 | 760 | -11 | % | Africa |
695 | 722 | -4 | % | |||||||||||||||||||
920 | 846 | 979 | -6 | % | Americas |
868 | 847 | +2 | % | |||||||||||||||||||
541 | 536 | 569 | -5 | % | Rest of world |
564 | 631 | -11 | % | |||||||||||||||||||
|
|
|
|
|
|
|
|
|
|
|
|
|
|
|
||||||||||||||
4,136 | 4,152 | 4,338 | -5 | % | Total consolidated sales |
4,141 | 4,158 | | ||||||||||||||||||||
544 | 535 | 581 | -6 | % | includes bulk sales |
545 | 569 | -4 | % | |||||||||||||||||||
1,745 | 1,757 | 1,939 | -10 | % | includes trading |
1,748 | 1,783 | -2 | % |
12
ADJUSTMENT ITEMS
| Adjustment items to net income (Group share) |
3Q19 | 2Q19 | 3Q18 | in millions of dollars |
9M19 | 9M18 | |||||||||||||||
(156 | ) | (56 | ) | (152 | ) | Special items affecting net income (Group share) |
(226 | ) | (705 | ) | ||||||||||
|
|
|
|
|
|
|
|
|
|
|
||||||||||
| | 89 | Gain (loss) on asset sales |
| (14 | ) | ||||||||||||||
(20 | ) | (31 | ) | (39 | ) | Restructuring charges |
(53 | ) | (106 | ) | ||||||||||
(160 | ) | (57 | ) | (88 | ) | Impairments |
(217 | ) | (336 | ) | ||||||||||
24 | 32 | (114 | ) | Other |
44 | (249 | ) | |||||||||||||
|
|
|
|
|
|
|
|
|
|
|
||||||||||
(71 | ) | (28 | ) | 160 | After-tax inventory effect: FIFO vs. replacement cost |
289 | 632 | |||||||||||||
|
|
|
|
|
|
|
|
|
|
|
||||||||||
10 | (47 | ) | (9 | ) | Effect of changes in fair value |
(59 | ) | (8 | ) | |||||||||||
|
|
|
|
|
|
|
|
|
|
|
||||||||||
(217 | ) | (131 | ) | (1 | ) | Total adjustments affecting net income |
4 | (81 | ) |
INVESTMENTS DIVESTMENTS
3Q19 | 2Q19 | 3Q18 | 3Q19 vs 3Q18 |
in millions of dollars |
9M19 | 9M18 | 9M19 vs 9M18 |
|||||||||||||||||||||
3,296 | 3,028 | 2,568 | +28 | % | Organic investments (a) | 9,107 | 7,967 | +14 | % | |||||||||||||||||||
|
|
|
|
|
|
|
|
|
|
|
|
|
|
|
||||||||||||||
152 | 185 | 156 | -3 | % | capitalized exploration |
569 | 405 | +41 | % | |||||||||||||||||||
242 | 370 | 147 | +65 | increase in non-current loans |
742 | 458 | +62 | % | ||||||||||||||||||||
(61 | ) | (254 | ) | (688 | ) | n/a | repayment of non-current loans, excluding organic loan repayment from equity affiliates* |
(449 | ) | (1,685 | ) | n/a | ||||||||||||||||
(109 | ) | | | n/a | change in debt from renewable projects (Group share) |
(109 | ) | | n/a | |||||||||||||||||||
|
|
|
|
|
|
|
|
|
|
|
|
|
|
|
||||||||||||||
4,429 | 614 | 3,228 | +37 | % | Acquisitions (b) |
5,713 | 7,343 | -22 | % | |||||||||||||||||||
|
|
|
|
|
|
|
|
|
|
|
|
|
|
|
||||||||||||||
1,007 | 212 | 209 | x4.8 | Asset sales (c) |
1,582 | 3,071 | -48 | % | ||||||||||||||||||||
105 | | | n/a | change in debt from renewable projects (partner share) |
105 | | n/a | |||||||||||||||||||||
|
|
|
|
|
|
|
|
|
|
|
|
|
|
|
||||||||||||||
| | (621 | ) | n/a | Other transactions with non-controlling interests (d) |
| (621 | ) | n/a | |||||||||||||||||||
|
|
|
|
|
|
|
|
|
|
|
|
|
|
|
||||||||||||||
6,718 | 3,430 | 6,208 | +8 | % | Net investments (a+b-c-d) |
13,238 | 12,860 | +3 | % | |||||||||||||||||||
(101 | ) | (99 | ) | | n/a | Organic loan repayment from equity affiliates* (e) |
(200 | ) | | n/a | ||||||||||||||||||
214 | | | n/a | Change in debt from renewable projects** (f) |
214 | | n/a | |||||||||||||||||||||
6,831 | 3,331 | 5,587 | +22 | % | Cash flow used in investing activities (a+b-c+e) |
13,252 | 12,239 | +8 | % |
* | Effective second quarter 2019, organic loan repayments from equity affiliates are defined as loan repayments from equity affiliates coming from their cash flow from operations. |
** | Change in debt from renewable projects (Group share and partner share). |
CASH FLOW
3Q19 | 2Q19 | 3Q18 | 3Q19 vs 3Q18 |
in millions of dollars |
9M19 | 9M18 | 9M19 vs 9M18 |
|||||||||||||||||||||
7,385 | 7,208 | 7,507 | -2 | % | Operating cash flow before working capital changes w/o financial charges (DACF) |
21,129 | 19,972 | +6 | % | |||||||||||||||||||
(532 | ) | (501 | ) | (419 | ) | n/a | Financial charges |
(1,536 | ) | (1,115 | ) | n/a | ||||||||||||||||
6,853 | 6,707 | 7,088 | -3 | % | Operating cash flow before working capital changes (a) |
19,593 | 18,857 | +4 | % | |||||||||||||||||||
1,523 | (317 | ) | (1,578 | ) | n/a | (Increase) decrease in working capital |
(1,764 | ) | (5,656 | ) | n/a | |||||||||||||||||
(69 | ) | (40 | ) | 226 | n/a | Inventory effect |
457 | 862 | -47 | % | ||||||||||||||||||
(101 | ) | (99 | ) | | n/a | Organic repayment of loans from equity affiliates |
(200 | ) | | n/a | ||||||||||||||||||
|
|
|
|
|
|
|
|
|
|
|
|
|
|
|
||||||||||||||
8,206 | 6,251 | 5,736 | +43 | % | Cash flow from operations |
18,086 | 14,063 | +29 | % | |||||||||||||||||||
|
|
|
|
|
|
|
|
|
|
|
|
|
|
|
||||||||||||||
3,296 | 3,028 | 2,568 | +28 | % | Organic investments (b) |
9,107 | 7,967 | +14 | % | |||||||||||||||||||
|
|
|
|
|
|
|
|
|
|
|
|
|
|
|
||||||||||||||
3,557 | 3,679 | 4,520 | -21 | % | Free cash flow after organic investments, w/o net asset sales (a-b) |
10,486 | 10,890 | -4 | % | |||||||||||||||||||
|
|
|
|
|
|
|
|
|
|
|
|
|
|
|
||||||||||||||
6,718 | 3,430 | 6,208 | +8 | % | Net investments (c) |
13,238 | 12,860 | +3 | % | |||||||||||||||||||
|
|
|
|
|
|
|
|
|
|
|
|
|
|
|
||||||||||||||
135 | 3,277 | 880 | -85 | % | Net cash flow (a-c) |
6,355 | 5,997 | +6 | % |
13
GEARING RATIOS*
in millions of dollars |
09/30/2019 | 06/30/2019 | 09/30/2018 | |||||||||
Current borrowings |
14,631 | 16,221 | 15,180 | |||||||||
Net current financial assets |
(3,012 | ) | (3,110 | ) | (2,884 | ) | ||||||
Net financial assets classified as held for sale |
| | (14 | ) | ||||||||
Non-current financial debt |
47,923 | 45,394 | 41,088 | |||||||||
Hedging instruments of non-current debt |
(767 | ) | (771 | ) | (1,129 | ) | ||||||
Cash and cash equivalents |
(27,454 | ) | (26,723 | ) | (25,252 | ) | ||||||
|
|
|
|
|
|
|
||||||
Net debt (a) |
31,321 | 31,011 | 26,989 | |||||||||
|
|
|
|
|
|
|
||||||
Shareholders equity Group share |
114,994 | 116,862 | 118,193 | |||||||||
Non-controlling interests |
2,319 | 2,362 | 2,430 | |||||||||
|
|
|
|
|
|
|
||||||
Shareholders equity (b) |
117,313 | 119,224 | 120,623 | |||||||||
|
|
|
|
|
|
|
||||||
Net-debt-to-capital ratio = a/(a+b) |
21.1 | % | 20.6 | % | 18.3 | % | ||||||
|
|
|
|
|
|
|
||||||
Net-debt-to-capital ratio excluding leases |
17.2 | % | 16.7 | % | 17.3 | % |
* | The net-debt-to-capital ratio on September 30, 2019 and June 30, 2019 include the impact of the new IFRS 16 rule, effective January 1, 2019. |
RETURN ON AVERAGE CAPITAL EMPLOYED
| Twelve months ended September 30, 2019 |
in millions of dollars |
Exploration & Production |
Integrated Gas, Renewables & Power |
Refining & Chemicals |
Marketing & Services |
||||||||||||
Adjusted net operating income |
7,454 | 2,271 | 3,323 | 1,512 | ||||||||||||
Capital employed at 09/30/2018* |
92,104 | 36,587 | 12,884 | 6,841 | ||||||||||||
Capital employed at 09/30/2019* |
88,560 | 41,516 | 11,658 | 7,570 | ||||||||||||
|
|
|
|
|
|
|
|
|
||||||||
ROACE |
8.3 | % | 5.8 | % | 27.1 | % | 21.0 | % |
| Twelve months ended June 30, 2019 |
in millions of dollars |
Exploration & Production |
Integrated Gas, Renewables & Power |
Refining & Chemicals |
Marketing & Services |
||||||||||||
Adjusted net operating income |
8,159 | 2,394 | 3,309 | 1,573 | ||||||||||||
Capital employed at 06/30/2018* |
92,296 | 30,861 | 12,939 | 7,040 | ||||||||||||
Capital employed at 06/30/2019* |
90,633 | 37,290 | 12,300 | 8,535 | ||||||||||||
|
|
|
|
|
|
|
|
|
||||||||
ROACE |
8.9 | % | 7.0 | % | 26.2 | % | 20.2 | % |
* | At replacement cost (excluding after-tax inventory effect). |
14
MAIN INDICATORS
$/ | Brent ($/b) | Average liquids price* ($/b) |
Average gas price* ($/Mbtu) |
Variable cost margin, European refining** ($/t) |
||||||||||||||||
Third quarter 2019 |
1.11 | 62.0 | 58.0 | 3.48 | 47.4 | |||||||||||||||
Second quarter 2019 |
1.12 | 68.9 | 63.7 | 3.82 | 27.6 | |||||||||||||||
First quarter 2019 |
1.14 | 63.1 | 58.7 | 4.51 | 33.0 | |||||||||||||||
Fourth quarter 2018 |
1.14 | 68.8 | 59.2 | 5.01 | 40.8 | |||||||||||||||
Third quarter 2018 |
1.16 | 75.2 | 68.8 | 5.06 | 47.2 |
* | Sales in $ / sales in volume for consolidated subsidiaries (excluding stock value variation). |
** | This indicator represents the average margin on variable costs realized by TOTALs European refining business (equal to the difference between the sales of refined products realized by TOTALs European refining and the crude purchases as well as associated variable costs, divided by refinery throughput in tons). |
Disclaimer: data is based on TOTALs reporting and is not audited. To the extent permitted by law, TOTAL S.A. disclaims all liability from the use of the restated main indicators.
15
CONSOLIDATED STATEMENT OF INCOME
TOTAL
(unaudited)
3rd quarter | 2nd quarter | 3rd quarter | ||||||||||
(M$)(a) |
2019 | 2019 | 2018 | |||||||||
Sales |
48,589 | 51,242 | 54,717 | |||||||||
Excise taxes |
(6,051 | ) | (6,040 | ) | (6,317 | ) | ||||||
Revenues from sales |
42,538 | 45,202 | 48,400 | |||||||||
Purchases, net of inventory variation |
(27,898 | ) | (30,390 | ) | (32,351 | ) | ||||||
Other operating expenses |
(6,362 | ) | (7,078 | ) | (6,873 | ) | ||||||
Exploration costs |
(96 | ) | (170 | ) | (234 | ) | ||||||
Depreciation, depletion and impairment of tangible assets and mineral interests |
(4,173 | ) | (3,661 | ) | (3,279 | ) | ||||||
Other income |
167 | 321 | 581 | |||||||||
Other expense |
(559 | ) | (189 | ) | (355 | ) | ||||||
Financial interest on debt |
(598 | ) | (568 | ) | (536 | ) | ||||||
Financial income and expense from cash & cash equivalents |
| (42 | ) | (63 | ) | |||||||
Cost of net debt |
(598 | ) | (610 | ) | (599 | ) | ||||||
Other financial income |
163 | 326 | 290 | |||||||||
Other financial expense |
(178 | ) | (188 | ) | (171 | ) | ||||||
Net income (loss) from equity affiliates |
1,381 | 812 | 918 | |||||||||
Income taxes |
(1,540 | ) | (1,571 | ) | (2,240 | ) | ||||||
|
|
|
|
|
|
|
||||||
Consolidated net income |
2,845 | 2,804 | 4,087 | |||||||||
|
|
|
|
|
|
|
||||||
Group share |
2,800 | 2,756 | 3,957 | |||||||||
Non-controlling interests |
45 | 48 | 130 | |||||||||
|
|
|
|
|
|
|
||||||
Earnings per share ($) |
1.05 | 1.01 | 1.48 | |||||||||
|
|
|
|
|
|
|
||||||
Fully-diluted earnings per share ($) |
1.04 | 1.00 | 1.47 | |||||||||
|
|
|
|
|
|
|
(a) Except for per share amounts.
16
CONSOLIDATED STATEMENT OF COMPREHENSIVE INCOME
TOTAL
(unaudited)
3rd quarter | 2nd quarter | 3rd quarter | ||||||||||
(M$) |
2019 | 2019 | 2018 | |||||||||
Consolidated net income |
2,845 | 2,804 | 4,087 | |||||||||
|
|
|
|
|
|
|
||||||
Other comprehensive income |
||||||||||||
Actuarial gains and losses |
5 | (223 | ) | 33 | ||||||||
Change in fair value of investments in equity instruments |
19 | 74 | (2 | ) | ||||||||
Tax effect |
(1 | ) | 59 | (13 | ) | |||||||
Currency translation adjustment generated by the parent company |
(3,520 | ) | 1,057 | (511 | ) | |||||||
|
|
|
|
|
|
|
||||||
Items not potentially reclassifiable to profit and loss |
(3,497 | ) | 967 | (493 | ) | |||||||
|
|
|
|
|
|
|
||||||
Currency translation adjustment |
1,207 | (619 | ) | 93 | ||||||||
Cash flow hedge |
(202 | ) | (246 | ) | 55 | |||||||
Variation of foreign currency basis spread |
(4 | ) | 43 | (39 | ) | |||||||
Share of other comprehensive income of equity affiliates, net amount |
73 | (135 | ) | (142 | ) | |||||||
Other |
(6 | ) | 1 | (2 | ) | |||||||
Tax effect |
69 | 69 | (9 | ) | ||||||||
|
|
|
|
|
|
|
||||||
Items potentially reclassifiable to profit and loss |
1,137 | (887 | ) | (44 | ) | |||||||
|
|
|
|
|
|
|
||||||
Total other comprehensive income (net amount) |
(2,360 | ) | 80 | (537 | ) | |||||||
|
|
|
|
|
|
|
||||||
Comprehensive income |
485 | 2,884 | 3,550 | |||||||||
|
|
|
|
|
|
|
||||||
Group share |
462 | 2,797 | 3,436 | |||||||||
Non-controlling interests |
23 | 87 | 114 |
17
CONSOLIDATED STATEMENT OF INCOME
TOTAL
(unaudited)
9 months | 9 months | |||||||
(M$)(a) |
2019 | 2018 | ||||||
Sales |
151,036 | 156,868 | ||||||
Excise taxes |
(18,172 | ) | (19,074 | ) | ||||
Revenues from sales |
132,864 | 137,794 | ||||||
Purchases, net of inventory variation |
(88,009 | ) | (92,396 | ) | ||||
Other operating expenses |
(20,165 | ) | (20,571 | ) | ||||
Exploration costs |
(554 | ) | (596 | ) | ||||
Depreciation, depletion and impairment of tangible assets and mineral interests |
(11,300 | ) | (9,630 | ) | ||||
Other income |
735 | 1,356 | ||||||
Other expense |
(957 | ) | (958 | ) | ||||
Financial interest on debt |
(1,727 | ) | (1,404 | ) | ||||
Financial income and expense from cash & cash equivalents |
(70 | ) | (158 | ) | ||||
Cost of net debt |
(1,797 | ) | (1,562 | ) | ||||
Other financial income |
649 | 851 | ||||||
Other financial expense |
(561 | ) | (500 | ) | ||||
Net income (loss) from equity affiliates |
2,904 | 2,505 | ||||||
Income taxes |
(5,020 | ) | (5,923 | ) | ||||
|
|
|
|
|
||||
Consolidated net income |
8,789 | 10,370 | ||||||
|
|
|
|
|
||||
Group share |
8,667 | 10,314 | ||||||
Non-controlling interests |
122 | 56 | ||||||
|
|
|
|
|
||||
Earnings per share ($) |
3.22 | 3.87 | ||||||
|
|
|
|
|
||||
Fully-diluted earnings per share ($) |
3.20 | 3.85 | ||||||
|
|
|
|
|
(a) Except for per share amounts.
18
CONSOLIDATED STATEMENT OF COMPREHENSIVE INCOME
TOTAL
(unaudited)
9 months | 9 months | |||||||
(M$) |
2019 | 2018 | ||||||
Consolidated net income |
8,789 | 10,370 | ||||||
|
|
|
|
|
||||
Other comprehensive income |
||||||||
Actuarial gains and losses |
(54 | ) | 100 | |||||
Change in fair value of investments in equity instruments |
126 | 3 | ||||||
Tax effect |
13 | (31 | ) | |||||
Currency translation adjustment generated by the parent company |
(3,994 | ) | (3,141 | ) | ||||
|
|
|
|
|
||||
Items not potentially reclassifiable to profit and loss |
(3,909 | ) | (3,069 | ) | ||||
|
|
|
|
|
||||
Currency translation adjustment |
1,394 | 1,061 | ||||||
Cash flow hedge |
(575 | ) | 310 | |||||
Variation of foreign currency basis spread |
50 | (66 | ) | |||||
Share of other comprehensive income of equity affiliates, net amount |
326 | (274 | ) | |||||
Other |
(4 | ) | (4 | ) | ||||
Tax effect |
176 | (84 | ) | |||||
|
|
|
|
|
||||
Items potentially reclassifiable to profit and loss |
1,367 | 943 | ||||||
|
|
|
|
|
||||
Total other comprehensive income (net amount) |
(2,542 | ) | (2,126 | ) | ||||
|
|
|
|
|
||||
Comprehensive income |
6,247 | 8,244 | ||||||
|
|
|
|
|
||||
Group share |
6,099 | 8,242 | ||||||
Non-controlling interests |
148 | 2 |
19
CONSOLIDATED BALANCE SHEET
TOTAL
September 30, 2019 |
June 30, 2019 |
December 31, 2018 |
September 30, 2018 |
|||||||||||||
(M$) |
(unaudited) | (unaudited) |
|
(unaudited) | ||||||||||||
ASSETS |
||||||||||||||||
Non-current assets |
||||||||||||||||
Intangible assets, net |
31,539 | 29,229 | 28,922 | 27,356 | ||||||||||||
Property, plant and equipment, net |
116,900 | 118,063 | 113,324 | 115,136 | ||||||||||||
Equity affiliates: investments and loans |
27,172 | 26,473 | 23,444 | 23,402 | ||||||||||||
Other investments |
1,738 | 1,660 | 1,421 | 1,602 | ||||||||||||
Non-current financial assets |
767 | 771 | 680 | 1,129 | ||||||||||||
Deferred income taxes |
5,689 | 6,022 | 6,663 | 5,186 | ||||||||||||
Other non-current assets |
2,264 | 2,306 | 2,509 | 3,167 | ||||||||||||
|
|
|
|
|
|
|
|
|
||||||||
Total non-current assets |
186,069 | 184,524 | 176,963 | 176,978 | ||||||||||||
|
|
|
|
|
|
|
|
|
||||||||
Current assets |
||||||||||||||||
Inventories, net |
16,226 | 16,410 | 14,880 | 19,689 | ||||||||||||
Accounts receivable, net |
18,568 | 20,349 | 17,270 | 20,010 | ||||||||||||
Other current assets |
14,925 | 15,958 | 14,724 | 18,613 | ||||||||||||
Current financial assets |
3,781 | 3,536 | 3,654 | 3,553 | ||||||||||||
Cash and cash equivalents |
27,454 | 26,723 | 27,907 | 25,252 | ||||||||||||
Assets classified as held for sale |
418 | | 1,364 | 207 | ||||||||||||
|
|
|
|
|
|
|
|
|
||||||||
Total current assets |
81,372 | 82,976 | 79,799 | 87,324 | ||||||||||||
|
|
|
|
|
|
|
|
|
||||||||
Total assets |
267,441 | 267,500 | 256,762 | 264,302 | ||||||||||||
|
|
|
|
|
|
|
|
|
||||||||
LIABILITIES & SHAREHOLDERS EQUITY |
||||||||||||||||
Shareholders equity |
||||||||||||||||
Common shares |
8,300 | 8,301 | 8,227 | 8,304 | ||||||||||||
Paid-in surplus and retained earnings |
123,805 | 123,351 | 120,569 | 123,167 | ||||||||||||
Currency translation adjustment |
(13,297 | ) | (11,177 | ) | (11,313 | ) | (10,321 | ) | ||||||||
Treasury shares |
(3,814 | ) | (3,613 | ) | (1,843 | ) | (2,957 | ) | ||||||||
|
|
|
|
|
|
|
|
|
||||||||
Total shareholders equity - Group share |
114,994 | 116,862 | 115,640 | 118,193 | ||||||||||||
|
|
|
|
|
|
|
|
|
||||||||
Non-controlling interests |
2,319 | 2,362 | 2,474 | 2,430 | ||||||||||||
|
|
|
|
|
|
|
|
|
||||||||
Total shareholders equity |
117,313 | 119,224 | 118,114 | 120,623 | ||||||||||||
|
|
|
|
|
|
|
|
|
||||||||
Non-current liabilities |
||||||||||||||||
Deferred income taxes |
11,333 | 11,486 | 11,490 | 12,138 | ||||||||||||
Employee benefits |
3,273 | 3,375 | 3,363 | 3,308 | ||||||||||||
Provisions and other non-current liabilities |
20,903 | 21,629 | 21,432 | 18,740 | ||||||||||||
Non-current financial debt |
47,923 | 45,394 | 40,129 | 41,088 | ||||||||||||
|
|
|
|
|
|
|
|
|
||||||||
Total non-current liabilities |
83,432 | 81,884 | 76,414 | 75,274 | ||||||||||||
|
|
|
|
|
|
|
|
|
||||||||
Current liabilities |
||||||||||||||||
Accounts payable |
26,237 | 27,059 | 26,134 | 28,100 | ||||||||||||
Other creditors and accrued liabilities |
24,728 | 22,686 | 22,246 | 24,429 | ||||||||||||
Current borrowings |
14,631 | 16,221 | 13,306 | 15,180 | ||||||||||||
Other current financial liabilities |
769 | 426 | 478 | 669 | ||||||||||||
Liabilities directly associated with the assets classified as held for sale |
331 | | 70 | 27 | ||||||||||||
|
|
|
|
|
|
|
|
|
||||||||
Total current liabilities |
66,696 | 66,392 | 62,234 | 68,405 | ||||||||||||
|
|
|
|
|
|
|
|
|
||||||||
Total liabilities & shareholders equity |
267,441 | 267,500 | 256,762 | 264,302 | ||||||||||||
|
|
|
|
|
|
|
|
|
20
CONSOLIDATED STATEMENT OF CASH FLOW
TOTAL
(unaudited)
(M$) |
3rd quarter 2019 |
2nd quarter 2019 |
3rd quarter 2018 |
|||||||||
CASH FLOW FROM OPERATING ACTIVITIES |
||||||||||||
Consolidated net income |
2,845 | 2,804 | 4,087 | |||||||||
Depreciation, depletion, amortization and impairment |
4,242 | 3,819 | 3,477 | |||||||||
Non-current liabilities, valuation allowances and deferred taxes |
235 | 239 | 320 | |||||||||
(Gains) losses on disposals of assets |
(74 | ) | (191 | ) | (267 | ) | ||||||
Undistributed affiliates equity earnings |
(876 | ) | (168 | ) | (416 | ) | ||||||
(Increase) decrease in working capital |
1,523 | (317 | ) | (1,578 | ) | |||||||
Other changes, net |
311 | 65 | 113 | |||||||||
|
|
|
|
|
|
|
||||||
Cash flow from operating activities |
8,206 | 6,251 | 5,736 | |||||||||
CASH FLOW USED IN INVESTING ACTIVITIES |
||||||||||||
Intangible assets and property, plant and equipment additions |
(2,210 | ) | (2,881 | ) | (3,352 | ) | ||||||
Acquisitions of subsidiaries, net of cash acquired |
(4,385 | ) | (208 | ) | (2,714 | ) | ||||||
Investments in equity affiliates and other securities |
(258 | ) | (437 | ) | (271 | ) | ||||||
Increase in non-current loans |
(242 | ) | (370 | ) | (147 | ) | ||||||
|
|
|
|
|
|
|
||||||
Total expenditures |
(7,095 | ) | (3,896 | ) | (6,484 | ) | ||||||
Proceeds from disposals of intangible assets and property, plant and equipment |
63 | 155 | 113 | |||||||||
Proceeds from disposals of subsidiaries, net of cash sold |
(1 | ) | (1 | ) | (11 | ) | ||||||
Proceeds from disposals of non-current investments |
40 | 58 | 107 | |||||||||
Repayment of non-current loans |
162 | 353 | 688 | |||||||||
|
|
|
|
|
|
|
||||||
Total divestments |
264 | 565 | 897 | |||||||||
|
|
|
|
|
|
|
||||||
Cash flow used in investing activities |
(6,831 | ) | (3,331 | ) | (5,587 | ) | ||||||
CASH FLOW USED IN FINANCING ACTIVITIES |
||||||||||||
Issuance (repayment) of shares: |
||||||||||||
Parent company shareholders |
1 | 449 | 16 | |||||||||
Treasury shares |
(420 | ) | (1,279 | ) | (844 | ) | ||||||
Dividends paid: |
||||||||||||
Parent company shareholders |
| (2,935 | ) | | ||||||||
Non-controlling interests |
(21 | ) | (93 | ) | (9 | ) | ||||||
Net issuance (repayment) of perpetual subordinated notes |
| | | |||||||||
Payments on perpetual subordinated notes |
| (175 | ) | | ||||||||
Other transactions with non-controlling interests |
| | (621 | ) | ||||||||
Net issuance (repayment) of non-current debt |
4,466 | 2,331 | 2,146 | |||||||||
Increase (decrease) in current borrowings |
(3,209 | ) | 37 | (1,965 | ) | |||||||
Increase (decrease) in current financial assets and liabilities |
(310 | ) | (164 | ) | 69 | |||||||
Cash flow from (used in) financing activities |
507 | (1,829 | ) | (1,208 | ) | |||||||
|
|
|
|
|
|
|
||||||
Net increase (decrease) in cash and cash equivalents |
1,882 | 1,091 | (1,059 | ) | ||||||||
|
|
|
|
|
|
|
||||||
Effect of exchange rates |
(1,151 | ) | 200 | (164 | ) | |||||||
Cash and cash equivalents at the beginning of the period |
26,723 | 25,432 | 26,475 | |||||||||
|
|
|
|
|
|
|
||||||
Cash and cash equivalents at the end of the period |
27,454 | 26,723 | 25,252 | |||||||||
|
|
|
|
|
|
|
21
CONSOLIDATED STATEMENT OF CASH FLOW
TOTAL
(unaudited)
(M$) |
9 months 2019 |
9 months 2018 |
||||||
CASH FLOW FROM OPERATING ACTIVITIES |
||||||||
Consolidated net income |
8,789 | 10,370 | ||||||
Depreciation, depletion, amortization and impairment |
11,777 | 10,031 | ||||||
Non-current liabilities, valuation allowances and deferred taxes |
614 | 469 | ||||||
(Gains) losses on disposals of assets |
(438 | ) | (540 | ) | ||||
Undistributed affiliates equity earnings |
(1,350 | ) | (973 | ) | ||||
(Increase) decrease in working capital |
(1,764 | ) | (5,656 | ) | ||||
Other changes, net |
458 | 362 | ||||||
|
|
|
|
|
||||
Cash flow from operating activities |
18,086 | 14,063 | ||||||
CASH FLOW USED IN INVESTING ACTIVITIES |
||||||||
Intangible assets and property, plant and equipment additions |
(7,795 | ) | (12,530 | ) | ||||
Acquisitions of subsidiaries, net of cash acquired |
(4,593 | ) | (3,428 | ) | ||||
Investments in equity affiliates and other securities |
(1,448 | ) | (579 | ) | ||||
Increase in non-current loans |
(742 | ) | (458 | ) | ||||
|
|
|
|
|
||||
Total expenditures |
(14,578 | ) | (16,995 | ) | ||||
Proceeds from disposals of intangible assets and property, plant and equipment |
226 | 2,395 | ||||||
Proceeds from disposals of subsidiaries, net of cash sold |
145 | (15 | ) | |||||
Proceeds from disposals of non-current investments |
306 | 691 | ||||||
Repayment of non-current loans |
649 | 1,685 | ||||||
|
|
|
|
|
||||
Total divestments |
1,326 | 4,756 | ||||||
|
|
|
|
|
||||
Cash flow used in investing activities |
(13,252 | ) | (12,239 | ) | ||||
CASH FLOW USED IN FINANCING ACTIVITIES |
||||||||
Issuance (repayment) of shares: |
||||||||
Parent company shareholders |
451 | 498 | ||||||
Treasury shares |
(2,190 | ) | (2,584 | ) | ||||
Dividends paid: |
||||||||
Parent company shareholders |
(4,765 | ) | (4,208 | ) | ||||
Non-controlling interests |
(114 | ) | (93 | ) | ||||
Net issuance (repayment) of perpetual subordinated notes |
| | ||||||
Payments on perpetual subordinated notes |
(315 | ) | (266 | ) | ||||
Other transactions with non-controlling interests |
(150 | ) | (621 | ) | ||||
Net issuance (repayment) of non-current debt |
8,047 | (282 | ) | |||||
Increase (decrease) in current borrowings |
(4,698 | ) | (996 | ) | ||||
Increase (decrease) in current financial assets and liabilities |
(368 | ) | (555 | ) | ||||
Cash flow from (used in) financing activities |
(4,102 | ) | (9,107 | ) | ||||
|
|
|
|
|
||||
Net increase (decrease) in cash and cash equivalents |
732 | (7,283 | ) | |||||
|
|
|
|
|
||||
Effect of exchange rates |
(1,185 | ) | (650 | ) | ||||
Cash and cash equivalents at the beginning of the period |
27,907 | 33,185 | ||||||
|
|
|
|
|
||||
Cash and cash equivalents at the end of the period |
27,454 | 25,252 | ||||||
|
|
|
|
|
22
CONSOLIDATED STATEMENT OF CHANGES IN SHAREHOLDERS EQUITY
TOTAL
(unaudited)
Common shares issued | Paid-in surplus and retained earnings |
Currency translation adjustment |
Treasury shares | Shareholders equity - Group Share |
Non-controlling interests |
Total shareholders equity |
||||||||||||||||||||||||||||||
(M$) |
Number | Amount | Number | Amount | ||||||||||||||||||||||||||||||||
As of January 1, 2018 |
2,528,989,616 | 7,882 | 112,040 | (7,908 | ) | (8,376,756 | ) | (458 | ) | 111,556 | 2,481 | 114,037 | ||||||||||||||||||||||||
|
|
|
|
|
|
|
|
|
|
|
|
|
|
|
|
|
|
|
||||||||||||||||||
Net income of the first nine months 2018 |
| | 10,314 | | | | 10,314 | 56 | 10,370 | |||||||||||||||||||||||||||
Other comprehensive income |
| | 341 | (2,413 | ) | | | (2,072 | ) | (54 | ) | (2,126 | ) | |||||||||||||||||||||||
Comprehensive Income |
| | 10,655 | (2,413 | ) | | | 8,242 | 2 | 8,244 | ||||||||||||||||||||||||||
Dividend |
| | (6,078 | ) | | | | (6,078 | ) | (93 | ) | (6,171 | ) | |||||||||||||||||||||||
Issuance of common shares |
137,393,893 | 422 | 7,265 | | | | 7,687 | | 7,687 | |||||||||||||||||||||||||||
Purchase of treasury shares |
| | | | (45,047,172 | ) | (2,740 | ) | (2,740 | ) | | (2,740 | ) | |||||||||||||||||||||||
Sale of treasury shares(a) |
| | (241 | ) | | 4,079,257 | 241 | | | | ||||||||||||||||||||||||||
Share-based payments |
| | 246 | | | | 246 | | 246 | |||||||||||||||||||||||||||
Share cancellation |
| | | | | | | | | |||||||||||||||||||||||||||
Net issuance (repayment) of perpetual subordinated notes |
| | | | | | | | | |||||||||||||||||||||||||||
Payments on perpetual subordinated notes |
| | (239 | ) | | | | (239 | ) | | (239 | ) | ||||||||||||||||||||||||
Other operations with non-controlling interests |
| | (455 | ) | | | | (455 | ) | (57 | ) | (512 | ) | |||||||||||||||||||||||
Other items |
| | (26 | ) | | | | (26 | ) | 97 | 71 | |||||||||||||||||||||||||
|
|
|
|
|
|
|
|
|
|
|
|
|
|
|
|
|
|
|
||||||||||||||||||
As of September 30, 2018 |
2,666,383,509 | 8,304 | 123,167 | (10,321 | ) | (49,344,671 | ) | (2,957 | ) | 118,193 | 2,430 | 120,623 | ||||||||||||||||||||||||
|
|
|
|
|
|
|
|
|
|
|
|
|
|
|
|
|
|
|
||||||||||||||||||
Net income of the fourth quarter 2018 |
| | 1,132 | | | | 1,132 | 48 | 1,180 | |||||||||||||||||||||||||||
Other comprehensive income |
| | (361 | ) | (992 | ) | | | (1,353 | ) | (15 | ) | (1,368 | ) | ||||||||||||||||||||||
Comprehensive Income |
| | 771 | (992 | ) | | | (221 | ) | 33 | (188 | ) | ||||||||||||||||||||||||
Dividend |
| | (1,803 | ) | | | | (1,803 | ) | (4 | ) | (1,807 | ) | |||||||||||||||||||||||
Issuance of common shares |
18,809,197 | 54 | 1,101 | | | | 1,155 | | 1,155 | |||||||||||||||||||||||||||
Purchase of treasury shares |
| | | | (27,719,309 | ) | (1,588 | ) | (1,588 | ) | | (1,588 | ) | |||||||||||||||||||||||
Sale of treasury shares(a) |
| | 1 | | | (1 | ) | | | | ||||||||||||||||||||||||||
Share-based payments |
| | 48 | | | | 48 | | 48 | |||||||||||||||||||||||||||
Share cancellation |
(44,590,699 | ) | (131 | ) | (2,572 | ) | | 44,590,699 | 2,703 | | | | ||||||||||||||||||||||||
Net issuance (repayment) of perpetual subordinated notes |
| | | | | | | | | |||||||||||||||||||||||||||
Payments on perpetual subordinated notes |
| | (76 | ) | | | | (76 | ) | | (76 | ) | ||||||||||||||||||||||||
Other operations with non-controlling interests |
| | (62 | ) | | | | (62 | ) | (42 | ) | (104 | ) | |||||||||||||||||||||||
Other items |
| | (6 | ) | | | | (6 | ) | 57 | 51 | |||||||||||||||||||||||||
|
|
|
|
|
|
|
|
|
|
|
|
|
|
|
|
|
|
|
||||||||||||||||||
As of December 31, 2018 |
2,640,602,007 | 8,227 | 120,569 | (11,313 | ) | (32,473,281 | ) | (1,843 | ) | 115,640 | 2,474 | 118,114 | ||||||||||||||||||||||||
|
|
|
|
|
|
|
|
|
|
|
|
|
|
|
|
|
|
|
||||||||||||||||||
Net income of the first nine months 2019 |
| | 8,667 | | | | 8,667 | 122 | 8,789 | |||||||||||||||||||||||||||
Other comprehensive income |
| | (584 | ) | (1,984 | ) | | | (2,568 | ) | 26 | (2,542 | ) | |||||||||||||||||||||||
Comprehensive income |
| | 8,083 | (1,984 | ) | | | 6,099 | 148 | 6,247 | ||||||||||||||||||||||||||
Dividend |
| | (5,781 | ) | | | | (5,781 | ) | (114 | ) | (5,895 | ) | |||||||||||||||||||||||
Issuance of common shares |
26,388,503 | 73 | 1,269 | | | | 1,342 | | 1,342 | |||||||||||||||||||||||||||
Purchase of treasury shares |
| | | | (40,871,207 | ) | (2,189 | ) | (2,189 | ) | | (2,189 | ) | |||||||||||||||||||||||
Sale of treasury shares(a) |
| | (218 | ) | | 4,278,158 | 218 | | | | ||||||||||||||||||||||||||
Share-based payments |
| | 157 | | | | 157 | | 157 | |||||||||||||||||||||||||||
Share cancellation |
| | | | | | | | | |||||||||||||||||||||||||||
Net issuance (repayment) of perpetual subordinated notes |
| | (4 | ) | | | | (4 | ) | | (4 | ) | ||||||||||||||||||||||||
Payments on perpetual subordinated notes |
| | (280 | ) | | | | (280 | ) | | (280 | ) | ||||||||||||||||||||||||
Other operations with non-controlling interests |
| | | | | | | (150 | ) | (150 | ) | |||||||||||||||||||||||||
Other items |
| | 10 | | | | 10 | (39 | ) | (29 | ) | |||||||||||||||||||||||||
|
|
|
|
|
|
|
|
|
|
|
|
|
|
|
|
|
|
|
||||||||||||||||||
As of September 30, 2019 |
2,666,990,510 | 8,300 | 123,805 | (13,297 | ) | (69,066,330 | ) | (3,814 | ) | 114,994 | 2,319 | 117,313 | ||||||||||||||||||||||||
|
|
|
|
|
|
|
|
|
|
|
|
|
|
|
|
|
|
|
(a)Treasury shares related to the restricted stock grants.
23
INFORMATIONS BY BUSINESS SEGMENT
TOTAL
(unaudited)
3rd quarter 2019 (M$) |
Exploration & Production |
Integrated Gas, Renewables & Power |
Refining & Chemicals |
Marketing & Services |
Corporate | Intercompany | Total | |||||||||||||||||||||
Non-Group sales |
1,631 | 3,667 | 21,338 | 21,951 | 2 | | 48,589 | |||||||||||||||||||||
Intersegment sales |
7,761 | 573 | 8,341 | 155 | 15 | (16,845 | ) | | ||||||||||||||||||||
Excise taxes |
| | (713 | ) | (5,338 | ) | | | (6,051 | ) | ||||||||||||||||||
|
|
|
|
|
|
|
|
|
|
|
|
|
|
|
||||||||||||||
Revenues from sales |
9,392 | 4,240 | 28,966 | 16,768 | 17 | (16,845 | ) | 42,538 | ||||||||||||||||||||
Operating expenses |
(3,999 | ) | (3,558 | ) | (27,518 | ) | (15,963 | ) | (163 | ) | 16,845 | (34,356 | ) | |||||||||||||||
Depreciation, depletion and impairment of tangible assets and mineral interests |
(3,136 | ) | (361 | ) | (413 | ) | (247 | ) | (16 | ) | | (4,173 | ) | |||||||||||||||
|
|
|
|
|
|
|
|
|
|
|
|
|
|
|
||||||||||||||
Operating income |
2,257 | 321 | 1,035 | 558 | (162 | ) | | 4,009 | ||||||||||||||||||||
Net income (loss) from equity affiliates and other items |
77 | 898 | 5 | (15 | ) | 9 | | 974 | ||||||||||||||||||||
Tax on net operating income |
(1,094 | ) | (222 | ) | (221 | ) | (164 | ) | 70 | | (1,631 | ) | ||||||||||||||||
|
|
|
|
|
|
|
|
|
|
|
|
|
|
|
||||||||||||||
Net operating income |
1,240 | 997 | 819 | 379 | (83 | ) | | 3,352 | ||||||||||||||||||||
Net cost of net debt |
(507 | ) | ||||||||||||||||||||||||||
Non-controlling interests |
(45 | ) | ||||||||||||||||||||||||||
|
|
|
||||||||||||||||||||||||||
Net income - group share |
2,800 | |||||||||||||||||||||||||||
|
|
|
||||||||||||||||||||||||||
3rd quarter 2019 (adjustments)(a) (M$) |
Exploration & Production |
Integrated Gas, Renewables & Power |
Refining & Chemicals |
Marketing & Services |
Corporate | Intercompany | Total | |||||||||||||||||||||
Non-Group sales |
| 12 | | | | | 12 | |||||||||||||||||||||
Intersegment sales |
| | | | | | | |||||||||||||||||||||
Excise taxes |
| | | | | | | |||||||||||||||||||||
|
|
|
|
|
|
|
|
|
|
|
|
|
|
|
||||||||||||||
Revenues from sales |
| 12 | | | | | 12 | |||||||||||||||||||||
Operating expenses |
(100 | ) | (41 | ) | (96 | ) | 22 | | | (215 | ) | |||||||||||||||||
Depreciation, depletion and impairment of tangible assets and mineral interests |
(153 | ) | (9 | ) | (22 | ) | (2 | ) | | | (186 | ) | ||||||||||||||||
|
|
|
|
|
|
|
|
|
|
|
|
|
|
|
||||||||||||||
Operating income (b) |
(253 | ) | (38 | ) | (118 | ) | 20 | | | (389 | ) | |||||||||||||||||
Net income (loss) from equity affiliates and other items |
(90 | ) | 599 | (23 | ) | (53 | ) | | | 433 | ||||||||||||||||||
Tax on net operating income |
(151 | ) | (138 | ) | 8 | (1 | ) | | | (282 | ) | |||||||||||||||||
|
|
|
|
|
|
|
|
|
|
|
|
|
|
|
||||||||||||||
Net operating income (b) |
(494 | ) | 423 | (133 | ) | (34 | ) | | | (238 | ) | |||||||||||||||||
Net cost of net debt |
(4 | ) | ||||||||||||||||||||||||||
Non-controlling interests |
25 | |||||||||||||||||||||||||||
|
|
|
||||||||||||||||||||||||||
Net income - group share |
(217 | ) | ||||||||||||||||||||||||||
|
||||||||||||||||||||||||||||
(a) Adjustments include special items, inventory valuation effect and the effect of changes in fair value. (b) Of which inventory valuation effect |
| |||||||||||||||||||||||||||
On operating income |
| | (94 | ) | 25 | | ||||||||||||||||||||||
On net operating income |
| | (90 | ) | 19 | | ||||||||||||||||||||||
3rd quarter 2019 (adjusted) (M$) |
Exploration & Production |
Integrated Gas, Renewables & Power |
Refining & Chemicals |
Marketing & Services |
Corporate | Intercompany | Total | |||||||||||||||||||||
Non-Group sales |
1,631 | 3,655 | 21,338 | 21,951 | 2 | | 48,577 | |||||||||||||||||||||
Intersegment sales |
7,761 | 573 | 8,341 | 155 | 15 | (16,845 | ) | | ||||||||||||||||||||
Excise taxes |
| | (713 | ) | (5,338 | ) | | | (6,051 | ) | ||||||||||||||||||
|
|
|
|
|
|
|
|
|
|
|
|
|
|
|
||||||||||||||
Revenues from sales |
9,392 | 4,228 | 28,966 | 16,768 | 17 | (16,845 | ) | 42,526 | ||||||||||||||||||||
Operating expenses |
(3,899 | ) | (3,517 | ) | (27,422 | ) | (15,985 | ) | (163 | ) | 16,845 | (34,141 | ) | |||||||||||||||
Depreciation, depletion and impairment of tangible assets and mineral interests |
(2,983 | ) | (352 | ) | (391 | ) | (245 | ) | (16 | ) | | (3,987 | ) | |||||||||||||||
|
|
|
|
|
|
|
|
|
|
|
|
|
|
|
||||||||||||||
Adjusted operating income |
2,510 | 359 | 1,153 | 538 | (162 | ) | | 4,398 | ||||||||||||||||||||
Net income (loss) from equity affiliates and other items |
167 | 299 | 28 | 38 | 9 | | 541 | |||||||||||||||||||||
Tax on net operating income |
(943 | ) | (84 | ) | (229 | ) | (163 | ) | 70 | | (1,349 | ) | ||||||||||||||||
|
|
|
|
|
|
|
|
|
|
|
|
|
|
|
||||||||||||||
Adjusted net operating income |
1,734 | 574 | 952 | 413 | (83 | ) | | 3,590 | ||||||||||||||||||||
Net cost of net debt |
(503 | ) | ||||||||||||||||||||||||||
Non-controlling interests |
(70 | ) | ||||||||||||||||||||||||||
|
|
|
||||||||||||||||||||||||||
Adjusted net income - group share |
3,017 | |||||||||||||||||||||||||||
|
||||||||||||||||||||||||||||
3rd quarter 2019 (M$) |
Exploration & Production |
Integrated Gas, Renewables & Power |
Refining & Chemicals |
Marketing & Services |
Corporate | Intercompany | Total | |||||||||||||||||||||
Total expenditures |
2,077 | 4,331 | 386 | 276 | 25 | 7,095 | ||||||||||||||||||||||
Total divestments |
23 | 192 | 14 | 30 | 5 | 264 | ||||||||||||||||||||||
Cash flow from operating activities |
5,007 | 401 | 1,575 | 1,483 | (260 | ) | 8,206 |
24
INFORMATIONS BY BUSINESS SEGMENT
TOTAL
(unaudited)
2nd quarter 2019 (M$) |
Exploration & Production |
Integrated Gas, Renewables & Power |
Refining & Chemicals |
Marketing & Services |
Corporate | Intercompany | Total | |||||||||||||||||||||
Non-Group sales |
2,273 | 3,789 | 22,509 | 22,671 | | | 51,242 | |||||||||||||||||||||
Intersegment sales |
7,586 | 632 | 8,293 | 139 | 36 | (16,686 | ) | | ||||||||||||||||||||
Excise taxes |
| | (761 | ) | (5,279 | ) | | | (6,040 | ) | ||||||||||||||||||
|
|
|
|
|
|
|
|
|
|
|
|
|
|
|
||||||||||||||
Revenues from sales |
9,859 | 4,421 | 30,041 | 17,531 | 36 | (16,686 | ) | 45,202 | ||||||||||||||||||||
Operating expenses |
(4,205 | ) | (3,878 | ) | (29,168 | ) | (16,844 | ) | (229 | ) | 16,686 | (37,638 | ) | |||||||||||||||
Depreciation, depletion and impairment of tangible assets and mineral interests |
(2,687 | ) | (328 | ) | (389 | ) | (237 | ) | (20 | ) | | (3,661 | ) | |||||||||||||||
|
|
|
|
|
|
|
|
|
|
|
|
|
|
|
||||||||||||||
Operating income |
2,967 | 215 | 484 | 450 | (213 | ) | | 3,903 | ||||||||||||||||||||
Net income (loss) from equity affiliates and other items |
173 | 661 | 111 | 111 | 26 | | 1,082 | |||||||||||||||||||||
Tax on net operating income |
(1,161 | ) | (450 | ) | 46 | (170 | ) | 64 | | (1,671 | ) | |||||||||||||||||
|
|
|
|
|
|
|
|
|
|
|
|
|
|
|
||||||||||||||
Net operating income |
1,979 | 426 | 641 | 391 | (123 | ) | | 3,314 | ||||||||||||||||||||
Net cost of net debt |
(510 | ) | ||||||||||||||||||||||||||
Non-controlling interests |
(48 | ) | ||||||||||||||||||||||||||
|
|
|
||||||||||||||||||||||||||
Net income - group share |
2,756 | |||||||||||||||||||||||||||
|
||||||||||||||||||||||||||||
2nd quarter 2019 (adjustments)(a) (M$) |
Exploration & Production |
Integrated Gas, Renewables & Power |
Refining & Chemicals |
Marketing & Services |
Corporate | Intercompany | Total | |||||||||||||||||||||
Non-Group sales |
| (59 | ) | | | | | (59 | ) | |||||||||||||||||||
Intersegment sales |
| | | | | | | |||||||||||||||||||||
Excise taxes |
| | | | | | | |||||||||||||||||||||
|
|
|
|
|
|
|
|
|
|
|
|
|
|
|
||||||||||||||
Revenues from sales |
| (59 | ) | | | | | (59 | ) | |||||||||||||||||||
Operating expenses |
| (54 | ) | (43 | ) | (34 | ) | | | (131 | ) | |||||||||||||||||
Depreciation, depletion and impairment of tangible assets and mineral interests |
(43 | ) | (11 | ) | (10 | ) | | | | (64 | ) | |||||||||||||||||
|
|
|
|
|
|
|
|
|
|
|
|
|
|
|
||||||||||||||
Operating income (b) |
(43 | ) | (124 | ) | (53 | ) | (34 | ) | | | (254 | ) | ||||||||||||||||
Net income (loss) from equity affiliates and other items |
| 407 | (49 | ) | (7 | ) | | | 351 | |||||||||||||||||||
Tax on net operating income |
| (286 | ) | 28 | 9 | | | (249 | ) | |||||||||||||||||||
|
|
|
|
|
|
|
|
|
|
|
|
|
|
|
||||||||||||||
Net operating income (b) |
(43 | ) | (3 | ) | (74 | ) | (32 | ) | | | (152 | ) | ||||||||||||||||
Net cost of net debt |
(4 | ) | ||||||||||||||||||||||||||
Non-controlling interests |
25 | |||||||||||||||||||||||||||
|
|
|
||||||||||||||||||||||||||
Net income - group share |
(131 | ) | ||||||||||||||||||||||||||
|
||||||||||||||||||||||||||||
(a) Adjustments include special items, inventory valuation effect and the effect of changes in fair value. (b) Of which inventory valuation effect |
| |||||||||||||||||||||||||||
On operating income |
| | (6 | ) | (34 | ) | | |||||||||||||||||||||
On net operating income |
| | (1 | ) | (25 | ) | | |||||||||||||||||||||
2nd quarter 2019 (adjusted) (M$) |
Exploration & Production |
Integrated Gas, Renewables & Power |
Refining & Chemicals |
Marketing & Services |
Corporate | Intercompany | Total | |||||||||||||||||||||
Non-Group sales |
2,273 | 3,848 | 22,509 | 22,671 | | | 51,301 | |||||||||||||||||||||
Intersegment sales |
7,586 | 632 | 8,293 | 139 | 36 | (16,686 | ) | | ||||||||||||||||||||
Excise taxes |
| | (761 | ) | (5,279 | ) | | | (6,040 | ) | ||||||||||||||||||
|
|
|
|
|
|
|
|
|
|
|
|
|
|
|
||||||||||||||
Revenues from sales |
9,859 | 4,480 | 30,041 | 17,531 | 36 | (16,686 | ) | 45,261 | ||||||||||||||||||||
Operating expenses |
(4,205 | ) | (3,824 | ) | (29,125 | ) | (16,810 | ) | (229 | ) | 16,686 | (37,507 | ) | |||||||||||||||
Depreciation, depletion and impairment of tangible assets and mineral interests |
(2,644 | ) | (317 | ) | (379 | ) | (237 | ) | (20 | ) | | (3,597 | ) | |||||||||||||||
|
|
|
|
|
|
|
|
|
|
|
|
|
|
|
||||||||||||||
Adjusted operating income |
3,010 | 339 | 537 | 484 | (213 | ) | | 4,157 | ||||||||||||||||||||
Net income (loss) from equity affiliates and other items |
173 | 254 | 160 | 118 | 26 | | 731 | |||||||||||||||||||||
Tax on net operating income |
(1,161 | ) | (164 | ) | 18 | (179 | ) | 64 | | (1,422 | ) | |||||||||||||||||
|
|
|
|
|
|
|
|
|
|
|
|
|
|
|
||||||||||||||
Adjusted net operating income |
2,022 | 429 | 715 | 423 | (123 | ) | | 3,466 | ||||||||||||||||||||
Net cost of net debt |
(506 | ) | ||||||||||||||||||||||||||
Non-controlling interests |
(73 | ) | ||||||||||||||||||||||||||
|
|
|
||||||||||||||||||||||||||
Adjusted net income - group share |
2,887 | |||||||||||||||||||||||||||
|
||||||||||||||||||||||||||||
2nd quarter 2019 (M$) |
Exploration & Production |
Integrated Gas, Renewables & Power |
Refining & Chemicals |
Marketing & Services |
Corporate | Intercompany | Total | |||||||||||||||||||||
Total expenditures |
2,257 | 857 | 363 | 383 | 36 | 3,896 | ||||||||||||||||||||||
Total divestments |
60 | 349 | 70 | 85 | 1 | 565 | ||||||||||||||||||||||
Cash flow from operating activities |
3,768 | 641 | 1,658 | 611 | (427 | ) | 6,251 |
25
INFORMATIONS BY BUSINESS SEGMENT
TOTAL
(unaudited)
3rd quarter 2018 (M$) |
Exploration & Production |
Integrated Gas, Renewables & Power |
Refining & Chemicals |
Marketing & Services |
Corporate | Intercompany | Total | |||||||||||||||||||||
Non-Group sales |
2,433 | 5,568 | 23,572 | 23,144 | | | 54,717 | |||||||||||||||||||||
Intersegment sales |
8,255 | 575 | 9,280 | 242 | 12 | (18,364 | ) | | ||||||||||||||||||||
Excise taxes |
| | (823 | ) | (5,494 | ) | | | (6,317 | ) | ||||||||||||||||||
|
|
|
|
|
|
|
|
|
|
|
|
|
|
|
||||||||||||||
Revenues from sales |
10,688 | 6,143 | 32,029 | 17,892 | 12 | (18,364 | ) | 48,400 | ||||||||||||||||||||
Operating expenses |
(4,271 | ) | (5,660 | ) | (30,593 | ) | (17,147 | ) | (151 | ) | 18,364 | (39,458 | ) | |||||||||||||||
Depreciation, depletion and impairment of tangible assets and mineral interests |
(2,585 | ) | (213 | ) | (294 | ) | (176 | ) | (11 | ) | | (3,279 | ) | |||||||||||||||
|
|
|
|
|
|
|
|
|
|
|
|
|
|
|
||||||||||||||
Operating income |
3,832 | 270 | 1,142 | 569 | (150 | ) | | 5,663 | ||||||||||||||||||||
Net income (loss) from equity affiliates and other items |
449 | 445 | 221 | 109 | 39 | | 1,263 | |||||||||||||||||||||
Tax on net operating income |
(1,853 | ) | (155 | ) | (292 | ) | (166 | ) | 146 | | (2,320 | ) | ||||||||||||||||
|
|
|
|
|
|
|
|
|
|
|
|
|
|
|
||||||||||||||
Net operating income |
2,428 | 560 | 1,071 | 512 | 35 | | 4,606 | |||||||||||||||||||||
Net cost of net debt |
(519 | ) | ||||||||||||||||||||||||||
Non-controlling interests |
(130 | ) | ||||||||||||||||||||||||||
|
|
|
||||||||||||||||||||||||||
Net income - group share |
3,957 | |||||||||||||||||||||||||||
|
||||||||||||||||||||||||||||
3rd quarter 2018 (adjustments)(a) (M$) |
Exploration & Production |
Integrated Gas, Renewables & Power |
Refining & Chemicals |
Marketing & Services |
Corporate | Intercompany | Total | |||||||||||||||||||||
Non-Group sales |
| | | | | | | |||||||||||||||||||||
Intersegment sales |
| | | | | | | |||||||||||||||||||||
Excise taxes |
| | | | | | | |||||||||||||||||||||
|
|
|
|
|
|
|
|
|
|
|
|
|
|
|
||||||||||||||
Revenues from sales |
| | | | | | | |||||||||||||||||||||
Operating expenses |
(50 | ) | (64 | ) | 176 | 47 | | | 109 | |||||||||||||||||||
Depreciation, depletion and impairment of tangible assets and mineral interests |
(65 | ) | (39 | ) | | | | | (104 | ) | ||||||||||||||||||
|
|
|
|
|
|
|
|
|
|
|
|
|
|
|
||||||||||||||
Operating income (b) |
(115 | ) | (103 | ) | 176 | 47 | | | 5 | |||||||||||||||||||
Net income (loss) from equity affiliates and other items |
39 | (25 | ) | 9 | | | | 23 | ||||||||||||||||||||
Tax on net operating income |
65 | (9 | ) | (52 | ) | (9 | ) | | | (5 | ) | |||||||||||||||||
|
|
|
|
|
|
|
|
|
|
|
|
|
|
|
||||||||||||||
Net operating income (b) |
(11 | ) | (137 | ) | 133 | 38 | | | 23 | |||||||||||||||||||
Net cost of net debt |
(44 | ) | ||||||||||||||||||||||||||
Non-controlling interests |
20 | |||||||||||||||||||||||||||
|
|
|
||||||||||||||||||||||||||
Net income - group share |
(1 | ) | ||||||||||||||||||||||||||
|
||||||||||||||||||||||||||||
(a) Adjustments include special items, inventory valuation effect and the effect of changes in fair value. (b) Of which inventory valuation effect |
| |||||||||||||||||||||||||||
On operating income |
| | 179 | 47 | | |||||||||||||||||||||||
On net operating income |
| | 135 | 38 | | |||||||||||||||||||||||
3rd quarter 2018 (adjusted) (M$) |
Exploration & Production |
Integrated Gas, Renewables & Power |
Refining & Chemicals |
Marketing & Services |
Corporate | Intercompany | Total | |||||||||||||||||||||
Non-Group sales |
2,433 | 5,568 | 23,572 | 23,144 | | | 54,717 | |||||||||||||||||||||
Intersegment sales |
8,255 | 575 | 9,280 | 242 | 12 | (18,364 | ) | | ||||||||||||||||||||
Excise taxes |
| | (823 | ) | (5,494 | ) | | | (6,317 | ) | ||||||||||||||||||
|
|
|
|
|
|
|
|
|
|
|
|
|
|
|
||||||||||||||
Revenues from sales |
10,688 | 6,143 | 32,029 | 17,892 | 12 | (18,364 | ) | 48,400 | ||||||||||||||||||||
Operating expenses |
(4,221 | ) | (5,596 | ) | (30,769 | ) | (17,194 | ) | (151 | ) | 18,364 | (39,567 | ) | |||||||||||||||
Depreciation, depletion and impairment of tangible assets and mineral interests |
(2,520 | ) | (174 | ) | (294 | ) | (176 | ) | (11 | ) | | (3,175 | ) | |||||||||||||||
|
|
|
|
|
|
|
|
|
|
|
|
|
|
|
||||||||||||||
Adjusted operating income |
3,947 | 373 | 966 | 522 | (150 | ) | | 5,658 | ||||||||||||||||||||
Net income (loss) from equity affiliates and other items |
410 | 470 | 212 | 109 | 39 | | 1,240 | |||||||||||||||||||||
Tax on net operating income |
(1,918 | ) | (146 | ) | (240 | ) | (157 | ) | 146 | | (2,315 | ) | ||||||||||||||||
|
|
|
|
|
|
|
|
|
|
|
|
|
|
|
||||||||||||||
Adjusted net operating income |
2,439 | 697 | 938 | 474 | 35 | | 4,583 | |||||||||||||||||||||
Net cost of net debt |
(475 | ) | ||||||||||||||||||||||||||
Non-controlling interests |
(150 | ) | ||||||||||||||||||||||||||
|
|
|
||||||||||||||||||||||||||
Adjusted net income - group share |
3,958 | |||||||||||||||||||||||||||
|
||||||||||||||||||||||||||||
3rd quarter 2018 (M$) |
Exploration & Production |
Integrated Gas, Renewables & Power |
Refining & Chemicals |
Marketing & Services |
Corporate | Intercompany | Total | |||||||||||||||||||||
Total expenditures |
2,472 | 3,325 | 377 | 293 | 17 | 6,484 | ||||||||||||||||||||||
Total divestments |
494 | 198 | 88 | 117 | | 897 | ||||||||||||||||||||||
Cash flow from operating activities |
4,431 | (164 | ) | 1,338 | 752 | (621 | ) | 5,736 |
26
INFORMATIONS BY BUSINESS SEGMENT
TOTAL
(unaudited)
9 months 2019 (M$) |
Exploration & Production |
Integrated Gas, Renewables & Power |
Refining & Chemicals |
Marketing & Services |
Corporate | Intercompany | Total | |||||||||||||||||||||
Non-Group sales |
5,698 | 13,875 | 65,558 | 65,901 | 4 | | 151,036 | |||||||||||||||||||||
Intersegment sales |
23,063 | 1,832 | 24,651 | 456 | 78 | (50,080 | ) | | ||||||||||||||||||||
Excise taxes |
| | (2,250 | ) | (15,922 | ) | | | (18,172 | ) | ||||||||||||||||||
|
|
|
|
|
|
|
|
|
|
|
|
|
|
|
||||||||||||||
Revenues from sales |
28,761 | 15,707 | 87,959 | 50,435 | 82 | (50,080 | ) | 132,864 | ||||||||||||||||||||
Operating expenses |
(12,233 | ) | (13,845 | ) | (84,020 | ) | (48,141 | ) | (569 | ) | 50,080 | (108,728 | ) | |||||||||||||||
Depreciation, depletion and impairment of tangible assets and mineral interests |
(8,352 | ) | (1,004 | ) | (1,176 | ) | (717 | ) | (51 | ) | | (11,300 | ) | |||||||||||||||
|
|
|
|
|
|
|
|
|
|
|
|
|
|
|
||||||||||||||
Operating income |
8,176 | 858 | 2,763 | 1,577 | (538 | ) | | 12,836 | ||||||||||||||||||||
Net income (loss) from equity affiliates and other items |
444 | 1,939 | 265 | 86 | 36 | | 2,770 | |||||||||||||||||||||
Tax on net operating income |
(3,679 | ) | (845 | ) | (467 | ) | (498 | ) | 194 | | (5,295 | ) | ||||||||||||||||
|
|
|
|
|
|
|
|
|
|
|
|
|
|
|
||||||||||||||
Net operating income |
4,941 | 1,952 | 2,561 | 1,165 | (308 | ) | | 10,311 | ||||||||||||||||||||
Net cost of net debt |
(1,522 | ) | ||||||||||||||||||||||||||
Non-controlling interests |
(122 | ) | ||||||||||||||||||||||||||
|
|
|
||||||||||||||||||||||||||
Net income - group share |
8,667 | |||||||||||||||||||||||||||
|
||||||||||||||||||||||||||||
9 months 2019 (adjustments)(a) (M$) |
Exploration & Production |
Integrated Gas, Renewables & Power |
Refining & Chemicals |
Marketing & Services |
Corporate | Intercompany | Total | |||||||||||||||||||||
Non-Group sales |
| (74 | ) | | | | | (74 | ) | |||||||||||||||||||
Intersegment sales |
| | | | | | | |||||||||||||||||||||
Excise taxes |
| | | | | | | |||||||||||||||||||||
|
|
|
|
|
|
|
|
|
|
|
|
|
|
|
||||||||||||||
Revenues from sales |
| (74 | ) | | | | | (74 | ) | |||||||||||||||||||
Operating expenses |
(100 | ) | (153 | ) | 353 | 62 | | | 162 | |||||||||||||||||||
Depreciation, depletion and impairment of tangible assets and mineral interests |
(196 | ) | (20 | ) | (32 | ) | (2 | ) | | | (250 | ) | ||||||||||||||||
|
|
|
|
|
|
|
|
|
|
|
|
|
|
|
||||||||||||||
Operating income (b) |
(296 | ) | (247 | ) | 321 | 60 | | | (162 | ) | ||||||||||||||||||
Net income (loss) from equity affiliates and other items |
(90 | ) | 1,012 | (70 | ) | (60 | ) | | | 792 | ||||||||||||||||||
Tax on net operating income |
(151 | ) | (408 | ) | (113 | ) | (14 | ) | | | (686 | ) | ||||||||||||||||
|
|
|
|
|
|
|
|
|
|
|
|
|
|
|
||||||||||||||
Net operating income (b) |
(537 | ) | 357 | 138 | (14 | ) | | | (56 | ) | ||||||||||||||||||
Net cost of net debt |
(12 | ) | ||||||||||||||||||||||||||
Non-controlling interests |
72 | |||||||||||||||||||||||||||
|
|
|
||||||||||||||||||||||||||
Net income - group share |
4 | |||||||||||||||||||||||||||
|
||||||||||||||||||||||||||||
(a) Adjustments include special items, inventory valuation effect and the effect of changes in fair value. (b) Of which inventory valuation effect |
| |||||||||||||||||||||||||||
On operating income |
| | 392 | 65 | | |||||||||||||||||||||||
On net operating income |
| | 254 | 46 | | |||||||||||||||||||||||
9 months 2019 (adjusted) (M$) |
Exploration & Production |
Integrated Gas, Renewables & Power |
Refining & Chemicals |
Marketing & Services |
Corporate | Intercompany | Total | |||||||||||||||||||||
Non-Group sales |
5,698 | 13,949 | 65,558 | 65,901 | 4 | | 151,110 | |||||||||||||||||||||
Intersegment sales |
23,063 | 1,832 | 24,651 | 456 | 78 | (50,080 | ) | | ||||||||||||||||||||
Excise taxes |
| | (2,250 | ) | (15,922 | ) | | | (18,172 | ) | ||||||||||||||||||
|
|
|
|
|
|
|
|
|
|
|
|
|
|
|
||||||||||||||
Revenues from sales |
28,761 | 15,781 | 87,959 | 50,435 | 82 | (50,080 | ) | 132,938 | ||||||||||||||||||||
Operating expenses |
(12,133 | ) | (13,692 | ) | (84,373 | ) | (48,203 | ) | (569 | ) | 50,080 | (108,890 | ) | |||||||||||||||
Depreciation, depletion and impairment of tangible assets and mineral interests |
(8,156 | ) | (984 | ) | (1,144 | ) | (715 | ) | (51 | ) | | (11,050 | ) | |||||||||||||||
|
|
|
|
|
|
|
|
|
|
|
|
|
|
|
||||||||||||||
Adjusted operating income |
8,472 | 1,105 | 2,442 | 1,517 | (538 | ) | | 12,998 | ||||||||||||||||||||
Net income (loss) from equity affiliates and other items |
534 | 927 | 335 | 146 | 36 | | 1,978 | |||||||||||||||||||||
Tax on net operating income |
(3,528 | ) | (437 | ) | (354 | ) | (484 | ) | 194 | | (4,609 | ) | ||||||||||||||||
|
|
|
|
|
|
|
|
|
|
|
|
|
|
|
||||||||||||||
Adjusted net operating income |
5,478 | 1,595 | 2,423 | 1,179 | (308 | ) | | 10,367 | ||||||||||||||||||||
Net cost of net debt |
(1,510 | ) | ||||||||||||||||||||||||||
Non-controlling interests |
(194 | ) | ||||||||||||||||||||||||||
|
|
|
||||||||||||||||||||||||||
Adjusted net income - group share |
8,663 | |||||||||||||||||||||||||||
|
||||||||||||||||||||||||||||
9 months 2019 (M$) |
Exploration & Production |
Integrated Gas, Renewables & Power |
Refining & Chemicals |
Marketing & Services |
Corporate | Intercompany | Total | |||||||||||||||||||||
Total expenditures |
6,359 | 6,306 | 1,034 | 803 | 76 | 14,578 | ||||||||||||||||||||||
Total divestments |
112 | 766 | 253 | 187 | 8 | 1,326 | ||||||||||||||||||||||
Cash flow from operating activities |
12,711 | 1,934 | 2,695 | 2,326 | (1,580 | ) | 18,086 |
27
INFORMATIONS BY BUSINESS SEGMENT
TOTAL
(unaudited)
9 months 2018 (M$) |
Exploration & Production |
Integrated Gas, Renewables & Power |
Refining & Chemicals |
Marketing & Services |
Corporate | Intercompany | Total | |||||||||||||||||||||
Non-Group sales |
7,770 | 13,455 | 68,660 | 66,980 | 3 | | 156,868 | |||||||||||||||||||||
Intersegment sales |
22,678 | 1,536 | 26,676 | 733 | 46 | (51,669 | ) | | ||||||||||||||||||||
Excise taxes |
| | (2,537 | ) | (16,537 | ) | | | (19,074 | ) | ||||||||||||||||||
|
|
|
|
|
|
|
|
|
|
|
|
|
|
|
||||||||||||||
Revenues from sales |
30,448 | 14,991 | 92,799 | 51,176 | 49 | (51,669 | ) | 137,794 | ||||||||||||||||||||
Operating expenses |
(12,992 | ) | (13,783 | ) | (88,841 | ) | (49,066 | ) | (550 | ) | 51,669 | (113,563 | ) | |||||||||||||||
Depreciation, depletion and impairment of tangible assets and mineral interests |
(7,146 | ) | (1,020 | ) | (911 | ) | (522 | ) | (31 | ) | | (9,630 | ) | |||||||||||||||
|
|
|
|
|
|
|
|
|
|
|
|
|
|
|
||||||||||||||
Operating income |
10,310 | 188 | 3,047 | 1,588 | (532 | ) | | 14,601 | ||||||||||||||||||||
Net income (loss) from equity affiliates and other items |
1,026 | 1,240 | 638 | 302 | 48 | | 3,254 | |||||||||||||||||||||
Tax on net operating income |
(4,972 | ) | (392 | ) | (675 | ) | (463 | ) | 327 | | (6,175 | ) | ||||||||||||||||
|
|
|
|
|
|
|
|
|
|
|
|
|
|
|
||||||||||||||
Net operating income |
6,364 | 1,036 | 3,010 | 1,427 | (157 | ) | | 11,680 | ||||||||||||||||||||
Net cost of net debt |
(1,310 | ) | ||||||||||||||||||||||||||
Non-controlling interests |
(56 | ) | ||||||||||||||||||||||||||
|
|
|
||||||||||||||||||||||||||
Net income - group share |
10,314 | |||||||||||||||||||||||||||
|
||||||||||||||||||||||||||||
9 months 2018 (adjustments)(a) (M$) |
Exploration & Production |
Integrated Gas, Renewables & Power |
Refining & Chemicals |
Marketing & Services |
Corporate | Intercompany | Total | |||||||||||||||||||||
Non-Group sales |
| 13 | | | | | 13 | |||||||||||||||||||||
Intersegment sales |
| | | | | | | |||||||||||||||||||||
Excise taxes |
| | | | | | | |||||||||||||||||||||
|
|
|
|
|
|
|
|
|
|
|
|
|
|
|
||||||||||||||
Revenues from sales |
| 13 | | | | | 13 | |||||||||||||||||||||
Operating expenses |
(200 | ) | (165 | ) | 707 | 152 | (9 | ) | | 485 | ||||||||||||||||||
Depreciation, depletion and impairment of tangible assets and mineral interests |
(65 | ) | (485 | ) | | | | | (550 | ) | ||||||||||||||||||
|
|
|
|
|
|
|
|
|
|
|
|
|
|
|
||||||||||||||
Operating income (b) |
(265 | ) | (637 | ) | 707 | 152 | (9 | ) | | (52 | ) | |||||||||||||||||
Net income (loss) from equity affiliates and other items |
(128 | ) | (40 | ) | 34 | | | | (134 | ) | ||||||||||||||||||
Tax on net operating income |
186 | (30 | ) | (210 | ) | (44 | ) | | | (98 | ) | |||||||||||||||||
|
|
|
|
|
|
|
|
|
|
|
|
|
|
|
||||||||||||||
Net operating income (b) |
(207 | ) | (707 | ) | 531 | 108 | (9 | ) | | (284 | ) | |||||||||||||||||
Net cost of net debt |
(63 | ) | ||||||||||||||||||||||||||
Non-controlling interests |
266 | |||||||||||||||||||||||||||
|
|
|
||||||||||||||||||||||||||
Net income - group share |
(81 | ) | ||||||||||||||||||||||||||
|
||||||||||||||||||||||||||||
(a) Adjustments include special items, inventory valuation effect and the effect of changes in fair value. (b) Of which inventory valuation effect |
|
|||||||||||||||||||||||||||
On operating income |
| | 710 | 152 | | |||||||||||||||||||||||
On net operating income |
| | 550 | 108 | | |||||||||||||||||||||||
9 months 2018 (adjusted) (M$) |
Exploration & Production |
Integrated Gas, Renewables & Power |
Refining & Chemicals |
Marketing & Services |
Corporate | Intercompany | Total | |||||||||||||||||||||
Non-Group sales |
7,770 | 13,442 | 68,660 | 66,980 | 3 | | 156,855 | |||||||||||||||||||||
Intersegment sales |
22,678 | 1,536 | 26,676 | 733 | 46 | (51,669 | ) | | ||||||||||||||||||||
Excise taxes |
| | (2,537 | ) | (16,537 | ) | | | (19,074 | ) | ||||||||||||||||||
|
|
|
|
|
|
|
|
|
|
|
|
|
|
|
||||||||||||||
Revenues from sales |
30,448 | 14,978 | 92,799 | 51,176 | 49 | (51,669 | ) | 137,781 | ||||||||||||||||||||
Operating expenses |
(12,792 | ) | (13,618 | ) | (89,548 | ) | (49,218 | ) | (541 | ) | 51,669 | (114,048 | ) | |||||||||||||||
Depreciation, depletion and impairment of tangible assets and mineral interests |
(7,081 | ) | (535 | ) | (911 | ) | (522 | ) | (31 | ) | | (9,080 | ) | |||||||||||||||
|
|
|
|
|
|
|
|
|
|
|
|
|
|
|
||||||||||||||
Adjusted operating income |
10,575 | 825 | 2,340 | 1,436 | (523 | ) | | 14,653 | ||||||||||||||||||||
Net income (loss) from equity affiliates and other items |
1,154 | 1,280 | 604 | 302 | 48 | | 3,388 | |||||||||||||||||||||
Tax on net operating income |
(5,158 | ) | (362 | ) | (465 | ) | (419 | ) | 327 | | (6,077 | ) | ||||||||||||||||
|
|
|
|
|
|
|
|
|
|
|
|
|
|
|
||||||||||||||
Adjusted net operating income |
6,571 | 1,743 | 2,479 | 1,319 | (148 | ) | | 11,964 | ||||||||||||||||||||
Net cost of net debt |
(1,247 | ) | ||||||||||||||||||||||||||
Non-controlling interests |
(322 | ) | ||||||||||||||||||||||||||
|
|
|
||||||||||||||||||||||||||
Adjusted net income - group share |
10,395 | |||||||||||||||||||||||||||
|
||||||||||||||||||||||||||||
9 months 2018 (M$) |
Exploration & Production |
Integrated Gas, Renewables & Power |
Refining & Chemicals |
Marketing & Services |
Corporate | Intercompany | Total | |||||||||||||||||||||
Total expenditures |
10,629 | 4,347 | 1,113 | 831 | 75 | 16,995 | ||||||||||||||||||||||
Total divestments |
3,136 | 790 | 437 | 390 | 3 | 4,756 | ||||||||||||||||||||||
Cash flow from operating activities |
12,227 | 162 | 1,228 | 1,533 | (1,087 | ) | 14,063 |
28
Reconciliation of the information by business segment with Consolidated Financial Statements
TOTAL
(unaudited)
Consolidated | ||||||||||||
3rd quarter 2019 | statement | |||||||||||
(M$) |
Adjusted | Adjustments(a) | of income | |||||||||
Sales |
48,577 | 12 | 48,589 | |||||||||
Excise taxes |
(6,051 | ) | | (6,051 | ) | |||||||
Revenues from sales |
42,526 | 12 | 42,538 | |||||||||
Purchases net of inventory variation |
(27,805 | ) | (93 | ) | (27,898 | ) | ||||||
Other operating expenses |
(6,240 | ) | (122 | ) | (6,362 | ) | ||||||
Exploration costs |
(96 | ) | | (96 | ) | |||||||
Depreciation, depletion and impairment of tangible assets and mineral interests |
(3,987 | ) | (186 | ) | (4,173 | ) | ||||||
Other income |
167 | | 167 | |||||||||
Other expense |
(132 | ) | (427 | ) | (559 | ) | ||||||
Financial interest on debt |
(594 | ) | (4 | ) | (598 | ) | ||||||
Financial income and expense from cash & cash equivalents |
| | | |||||||||
Cost of net debt |
(594 | ) | (4 | ) | (598 | ) | ||||||
Other financial income |
163 | | 163 | |||||||||
Other financial expense |
(178 | ) | | (178 | ) | |||||||
Net income (loss) from equity affiliates |
521 | 860 | 1,381 | |||||||||
Income taxes |
(1,258 | ) | (282 | ) | (1,540 | ) | ||||||
|
|
|
|
|
|
|
||||||
Consolidated net income |
3,087 | (242 | ) | 2,845 | ||||||||
Group share |
3,017 | (217 | ) | 2,800 | ||||||||
Non-controlling interests |
70 | (25 | ) | 45 |
(a) Adjustments include special items, inventory valuation effect and the effect of changes in fair value.
Consolidated | ||||||||||||
3rd quarter 2018 | statement | |||||||||||
(M$) |
Adjusted | Adjustments(a) | of income | |||||||||
Sales |
54,717 | | 54,717 | |||||||||
Excise taxes |
(6,317 | ) | | (6,317 | ) | |||||||
Revenues from sales |
48,400 | | 48,400 | |||||||||
Purchases net of inventory variation |
(32,567 | ) | 216 | (32,351 | ) | |||||||
Other operating expenses |
(6,766 | ) | (107 | ) | (6,873 | ) | ||||||
Exploration costs |
(234 | ) | | (234 | ) | |||||||
Depreciation, depletion and impairment of tangible assets and mineral interests |
(3,175 | ) | (104 | ) | (3,279 | ) | ||||||
Other income |
465 | 116 | 581 | |||||||||
Other expense |
(209 | ) | (146 | ) | (355 | ) | ||||||
Financial interest on debt |
(492 | ) | (44 | ) | (536 | ) | ||||||
Financial income and expense from cash & cash equivalents |
(63 | ) | | (63 | ) | |||||||
Cost of net debt |
(555 | ) | (44 | ) | (599 | ) | ||||||
Other financial income |
290 | | 290 | |||||||||
Other financial expense |
(171 | ) | | (171 | ) | |||||||
Net income (loss) from equity affiliates |
865 | 53 | 918 | |||||||||
Income taxes |
(2,235 | ) | (5 | ) | (2,240 | ) | ||||||
|
|
|
|
|
|
|
||||||
Consolidated net income |
4,108 | (21 | ) | 4,087 | ||||||||
Group share |
3,958 | (1 | ) | 3,957 | ||||||||
Non-controlling interests |
150 | (20 | ) | 130 |
(a) Adjustments include special items, inventory valuation effect and the effect of changes in fair value.
29
Reconciliation of the information by business segment with Consolidated Financial Statements
TOTAL
(unaudited)
9 months 2019 (M$) |
Adjusted | Adjustments(a) | Consolidated statement of income |
|||||||||
Sales |
151,110 | (74 | ) | 151,036 | ||||||||
Excise taxes |
(18,172 | ) | | (18,172 | ) | |||||||
Revenues from sales |
132,938 | (74 | ) | 132,864 | ||||||||
Purchases net of inventory variation |
(88,338 | ) | 329 | (88,009 | ) | |||||||
Other operating expenses |
(19,998 | ) | (167 | ) | (20,165 | ) | ||||||
Exploration costs |
(554 | ) | | (554 | ) | |||||||
Depreciation, depletion and impairment of tangible assets and mineral interests |
(11,050 | ) | (250 | ) | (11,300 | ) | ||||||
Other income |
620 | 115 | 735 | |||||||||
Other expense |
(322 | ) | (635 | ) | (957 | ) | ||||||
Financial interest on debt |
(1,715 | ) | (12 | ) | (1,727 | ) | ||||||
Financial income and expense from cash & cash equivalents |
(70 | ) | | (70 | ) | |||||||
Cost of net debt |
(1,785 | ) | (12 | ) | (1,797 | ) | ||||||
Other financial income |
649 | | 649 | |||||||||
Other financial expense |
(561 | ) | | (561 | ) | |||||||
Net income (loss) from equity affiliates |
1,592 | 1,312 | 2,904 | |||||||||
Income taxes |
(4,334 | ) | (686 | ) | (5,020 | ) | ||||||
|
|
|
|
|
|
|
||||||
Consolidated net income |
8,857 | (68 | ) | 8,789 | ||||||||
Group share |
8,663 | 4 | 8,667 | |||||||||
Non-controlling interests |
194 | (72 | ) | 122 |
(a) Adjustments include special items, inventory valuation effect and the effect of changes in fair value.
9 months 2018 (M$) |
Adjusted | Adjustments(a) | Consolidated statement of income |
|||||||||
Sales |
156,855 | 13 | 156,868 | |||||||||
Excise taxes |
(19,074 | ) | | (19,074 | ) | |||||||
Revenues from sales |
137,781 | 13 | 137,794 | |||||||||
Purchases net of inventory variation |
(93,190 | ) | 794 | (92,396 | ) | |||||||
Other operating expenses |
(20,262 | ) | (309 | ) | (20,571 | ) | ||||||
Exploration costs |
(596 | ) | | (596 | ) | |||||||
Depreciation, depletion and impairment of tangible assets and mineral interests |
(9,080 | ) | (550 | ) | (9,630 | ) | ||||||
Other income |
1,093 | 263 | 1,356 | |||||||||
Other expense |
(324 | ) | (634 | ) | (958 | ) | ||||||
Financial interest on debt |
(1,341 | ) | (63 | ) | (1,404 | ) | ||||||
Financial income and expense from cash & cash equivalents |
(158 | ) | | (158 | ) | |||||||
Cost of net debt |
(1,499 | ) | (63 | ) | (1,562 | ) | ||||||
Other financial income |
851 | | 851 | |||||||||
Other financial expense |
(500 | ) | | (500 | ) | |||||||
Net income (loss) from equity affiliates |
2,268 | 237 | 2,505 | |||||||||
Income taxes |
(5,825 | ) | (98 | ) | (5,923 | ) | ||||||
|
|
|
|
|
|
|
||||||
Consolidated net income |
10,717 | (347 | ) | 10,370 | ||||||||
Group share |
10,395 | (81 | ) | 10,314 | ||||||||
Non-controlling interests |
322 | (266 | ) | 56 |
(a) Adjustments include special items, inventory valuation effect and the effect of changes in fair value.
30
TOTAL
NOTES TO THE CONSOLIDATED FINANCIAL STATEMENTS
FOR THE FIRST NINE MONTHS 2019
(unaudited)
1) Accounting policies
The consolidated financial statements are prepared in accordance with International Financial Reporting Standards (IFRS) as adopted by the European Union and IFRS as published by the International Accounting Standards Board (IASB).
The interim consolidated financial statements of TOTAL S.A. and its subsidiaries (the Group) as of September 30 2019, are presented in U.S. dollars and have been prepared in accordance with International Accounting Standard (IAS) 34 Interim Financial Reporting.
The accounting principles applied for the consolidated financial statements at September 30, 2019, are consistent with those used for the financial statements at December 31, 2018, with the exception of standards or amendments that must be applied for periods beginning January 1, 2019.
| First-time application of IFRS 16 Leases |
As part of the first application of IFRS 16 Leases as of January 1, 2019, the Group:
| applied the simplified retrospective transition method, accounting for the cumulative effect of the initial application of the standard at the date of first application, without restating the comparative periods; |
| used the following simplification measures provided by the standard in the transitional provisions: |
| exclusion of contracts that the Group had not previously identified as containing a lease under IAS 17 and IFRIC 4, |
| exclusion of leases whose term ends within 12 months of the date of first application; |
| recognized each lease component as a separate lease, separately from non-lease components of the lease (services); |
| applied the two exemptions of the standard on short-term leases and leases of low-value assets. |
Further to the review of leases entered into as part of joint operations, in accordance with the IFRS Interpretations Committee (IFRIC) decision, all liabilities related to such leases have been recognized as at September 30, 2019 when the group has primary responsibility of the lease payments. When the right of use of the asset is jointly controlled by the group and the other partners, a financial receivable has been recognized for the portion of the asset transferred to the partners.
The impact of the application of this standard as at January 1, 2019 is $5,698 million on fixed assets, $(5,505) million on net debt and $(193) million on other assets and liabilities. The weighted average incremental borrowing rate at the transition date is 4.5%.
The impact on fixed assets is broken down as follows:
(in M$)
Right of use of buildings |
2,278 | |||
Right of use of machinery, plant and equipment (including transportation equipment) |
2,632 | |||
Other right of use |
788 | |||
Total |
5,698 |
31
2) Changes in the Group structure
2.1) Main acquisitions and divestments
| Integrated Gas, Renewables & Power |
| On March 4, 2019, Total and Novatek signed a definitive agreement for the acquisition of a 10% direct interest by Total in Arctic LNG 2, a major liquefied natural gas development led by Novatek on the Gydan Peninsula, Russia. |
| On March 15, 2019, TOTAL finalized the sale of 4% of its interest in the Ichthys liquefied natural gas (LNG) project in Australia to operating partner INPEX, reducing its interest in the project from 30% to 26%. |
| On August 30, 2019, TOTAL finalized an agreement with Toshiba to take over its portfolio of liquefied natural gas (LNG) in the United States. This portfolio includes a 20-year tolling agreement and the corresponding gas transportation agreements. Under the transaction, TOTAL acquired all the shares of Toshiba America LNG corporation and was assigned all contracts related to their LNG business by Toshiba Energy Systems and Solutions Corp. |
| On September 27, 2019, TOTAL finalized the acquisition of Anadarkos 26.5% interest in the Mozambique LNG project. This closing comes after TOTAL reached a binding agreement with Occidental on May 3, 2019, to acquire Anadarkos assets in Africa (Mozambique, Algeria, Ghana and South Africa) and signed the subsequent Purchase and Sale Agreement on August 3, 2019. This first transaction follows receipt of all requisite approvals by the relevant authorities and partners. |
| Exploration & Production |
| On April 1, 2019, Total acquired all the share capital of Chevron Denmark Inc. which holds a 12% interest in the Danish Underground Consortium (DUC), a 12% interest in Licence 8/06, and a 7.5% interest in the Tyra West pipeline. The acquisition increased Totals operated share of DUC from 31.2% to 43.2%. |
2.2) Major business combinations
In accordance with IFRS 3, TOTAL is assessing the fair value of identifiable acquired assets, liabilities and contingent liabilities on the basis of available information. This assessment will be finalised within 12 months following the acquisition date.
| Integrated Gas, Renewables & Power |
Anadarko Mozambique
| The Group acquired on September 27, 2019, 100% of the shares of Anadarko Mozambique affiliate which holds a 26.5% interest in the Mozambique LNG project for a purchase price of $4,426 million and recorded a preliminary goodwill for an amount of $134 million. The purchase price may be adjusted within 90 days of the acquisition date in accordance with the share purchase agreement. |
32
The preliminary purchase price allocation is shown below:
(M$) |
At the acquisition date | |||
Goodwill |
134 | |||
Intangible assets |
2,812 | |||
Tangible assets |
1,534 | |||
Other assets and liabilities |
(134 | ) | ||
Net debt |
80 | |||
|
|
|
||
Fair value of consideration |
4,426 | |||
|
|
|
2.3) Divestment projects
| Exploration & Production |
| On July 10, 2019, Total announced the signature of an agreement to divest several UK non-core assets to Petrogas NEO UK Ltd. The overall consideration for this deal that is subject to approval from the relevant authorities amounts to $635 million. At September 30, 2019, the assets and liabilities have been respectively classified in the consolidated balance sheet in assets classified as held for sale for an amount of $418 million and in liabilities directly associated with the assets classified as held for sale for an amount of $331 million. The assets concerned mainly include mineral interests and tangible assets. |
3) Adjustment items
Description of the business segments
Financial information by business segment is reported in accordance with the internal reporting system and shows internal segment information that is used to manage and measure the performance of TOTAL and which is reviewed by the main operational decision-making body of the Group, namely the Executive Committee.
The operational profit and assets are broken down by business segment prior to the consolidation and inter-segment adjustments.
Sales prices between business segments approximate market prices.
The profitable growth in the gas and low carbon electricity integrated value chains is one of the key axes of Totals strategy. In order to give more visibility to these businesses, a new reporting structure for the business segments financial information has been put in place, effective January 1, 2019.
The organization of the Groups activities is structured around the four followings segments:
| An Exploration & Production segment; |
| An Integrated Gas, Renewables & Power segment comprising integrated gas (including LNG) and low carbon electricity businesses. It includes the upstream and midstream LNG activity that was previously reported in the EP segment; |
| A Refining & Chemicals segment constituting a major industrial hub comprising the activities of refining, petrochemicals and specialty chemicals. This segment also includes the activities of oil Supply, Trading and marine Shipping; |
| A Marketing & Services segment including the global activities of supply and marketing in the field of petroleum products; |
In addition the Corporate segment includes holdings operating and financial activities.
Certain figures for the years 2017 and 2018 have been restated in order to reflect the new organization.
33
Adjustment items
Performance indicators excluding the adjustment items, such as adjusted operating income, adjusted net operating income, and adjusted net income are meant to facilitate the analysis of the financial performance and the comparison of income between periods.
Adjustment items include:
(i) Special items
Due to their unusual nature or particular significance, certain transactions qualified as special items are excluded from the business segment figures. In general, special items relate to transactions that are significant, infrequent or unusual. However, in certain instances, transactions such as restructuring costs or assets disposals, which are not considered to be representative of the normal course of business, may be qualified as special items although they may have occurred within prior years or are likely to occur again within the coming years.
(ii) The inventory valuation effect
The adjusted results of the Refining & Chemicals and Marketing & Services segments are presented according to the replacement cost method. This method is used to assess the segments performance and facilitate the comparability of the segments performance with those of its competitors.
In the replacement cost method, which approximates the LIFO (Last-In, First-Out) method, the variation of inventory values in the statement of income is, depending on the nature of the inventory, determined using either the month-end prices differential between one period and another or the average prices of the period rather than the historical value. The inventory valuation effect is the difference between the results according to the FIFO (First-In, First-Out) and the replacement cost methods.
(iii) Effect of changes in fair value
The effect of changes in fair value presented as adjustment items reflects for some transactions differences between internal measure of performance used by TOTALs management and the accounting for these transactions under IFRS.
IFRS requires that trading inventories be recorded at their fair value using period end spot prices. In order to best reflect the management of economic exposure through derivative transactions, internal indicators used to measure performance include valuations of trading inventories based on forward prices.
Furthermore, TOTAL, in its trading activities, enters into storage contracts, which future effects are recorded at fair value in the Groups internal economic performance. IFRS precludes recognition of this fair value effect.
The adjusted results (adjusted operating income, adjusted net operating income, adjusted net income) are defined as replacement cost results, adjusted for special items and the effect of changes in fair value.
The detail of the adjustment items is presented in the table below.
34
ADJUSTMENTS TO OPERATING INCOME
(M$) |
Exploration & Production |
Integrated Gas, Renewables & Power |
Refining & Chemicals |
Marketing & Services |
Corporate | Total | ||||||||||||||||||||
3rd quarter 2019 |
Inventory valuation effect | | | (94 | ) | 25 | | (69 | ) | |||||||||||||||||
Effect of changes in fair value | | 12 | | | | 12 | ||||||||||||||||||||
Restructuring charges | | (2 | ) | | | | (2 | ) | ||||||||||||||||||
Asset impairment charges | (153 | ) | (9 | ) | (22 | ) | (2 | ) | | (186 | ) | |||||||||||||||
Other items | (100 | ) | (39 | ) | (2 | ) | (3 | ) | | (144 | ) | |||||||||||||||
|
|
|
|
|
|
|
|
|
|
|
|
|
||||||||||||||
Total |
(253 | ) | (38 | ) | (118 | ) | 20 | | (389 | ) | ||||||||||||||||
|
|
|
|
|
|
|
|
|
|
|
|
|
||||||||||||||
3rd quarter 2018 |
Inventory valuation effect | | | 179 | 47 | | 226 | |||||||||||||||||||
Effect of changes in fair value | | | | | | | ||||||||||||||||||||
Restructuring charges | (14 | ) | | (3 | ) | | | (17 | ) | |||||||||||||||||
Asset impairment charges | (65 | ) | (39 | ) | | | | (104 | ) | |||||||||||||||||
Other items | (36 | ) | (64 | ) | | | | (100 | ) | |||||||||||||||||
|
|
|
|
|
|
|
|
|
|
|
|
|
||||||||||||||
Total |
(115 | ) | (103 | ) | 176 | 47 | | 5 | ||||||||||||||||||
|
|
|
|
|
|
|
|
|
|
|
|
|
||||||||||||||
9 months 2019 |
Inventory valuation effect | | | 392 | 65 | | 457 | |||||||||||||||||||
Effect of changes in fair value | | (74 | ) | | | | (74 | ) | ||||||||||||||||||
Restructuring charges | | (2 | ) | | | | (2 | ) | ||||||||||||||||||
Asset impairment charges | (196 | ) | (20 | ) | (32 | ) | (2 | ) | | (250 | ) | |||||||||||||||
Other items | (100 | ) | (151 | ) | (39 | ) | (3 | ) | | (293 | ) | |||||||||||||||
|
|
|
|
|
|
|
|
|
|
|
|
|
||||||||||||||
Total |
(296 | ) | (247 | ) | 321 | 60 | | (162 | ) | |||||||||||||||||
|
|
|
|
|
|
|
|
|
|
|
|
|
||||||||||||||
9 months 2018 |
Inventory valuation effect | | | 710 | 152 | | 862 | |||||||||||||||||||
Effect of changes in fair value | | 5 | | | | 5 | ||||||||||||||||||||
Restructuring charges | (67 | ) | | (3 | ) | | | (70 | ) | |||||||||||||||||
Asset impairment charges | (65 | ) | (485 | ) | | | | (550 | ) | |||||||||||||||||
Other items | (133 | ) | (157 | ) | | | (9 | ) | (299 | ) | ||||||||||||||||
|
|
|
|
|
|
|
|
|
|
|
|
|
||||||||||||||
Total |
(265 | ) | (637 | ) | 707 | 152 | (9 | ) | (52 | ) | ||||||||||||||||
|
|
|
|
|
|
|
|
|
|
|
|
|
35
ADJUSTMENTS TO NET INCOME, GROUP SHARE
(M$) |
Exploration & Production |
Integrated Gas, Renewables & Power |
Refining & Chemicals |
Marketing & Services |
Corporate | Total | ||||||||||||||||||||
3rd quarter 2019 |
Inventory valuation effect | | | (89 | ) | 18 | | (71 | ) | |||||||||||||||||
Effect of changes in fair value | | 10 | | | | 10 | ||||||||||||||||||||
Restructuring charges | (5 | ) | (13 | ) | (2 | ) | | | (20 | ) | ||||||||||||||||
Asset impairment charges | (132 | ) | (5 | ) | (22 | ) | (1 | ) | | (160 | ) | |||||||||||||||
Gains (losses) on disposals of assets |
| | | | | | ||||||||||||||||||||
Other items | (357 | ) | 452 | (19 | ) | (52 | ) | | 24 | |||||||||||||||||
|
|
|
|
|
|
|
|
|
|
|
|
|
||||||||||||||
Total |
(494 | ) | 444 | (132 | ) | (35 | ) | | (217 | ) | ||||||||||||||||
|
|
|
|
|
|
|
|
|
|
|
|
|
||||||||||||||
3rd quarter 2018 |
Inventory valuation effect | | | 131 | 29 | | 160 | |||||||||||||||||||
Effect of changes in fair value | | (9 | ) | | | | (9 | ) | ||||||||||||||||||
Restructuring charges | (35 | ) | (2 | ) | (2 | ) | | | (39 | ) | ||||||||||||||||
Asset impairment charges | (65 | ) | (23 | ) | | | | (88 | ) | |||||||||||||||||
Gains (losses) on disposals of assets |
89 | | | | | 89 | ||||||||||||||||||||
Other items | (22 | ) | (43 | ) | | (17 | ) | (32 | ) | (114 | ) | |||||||||||||||
|
|
|
|
|
|
|
|
|
|
|
|
|
||||||||||||||
Total |
(33 | ) | (77 | ) | 129 | 12 | (32 | ) | (1 | ) | ||||||||||||||||
|
|
|
|
|
|
|
|
|
|
|
|
|
||||||||||||||
9 months 2019 |
Inventory valuation effect | | | 252 | 37 | | 289 | |||||||||||||||||||
Effect of changes in fair value | | (59 | ) | | | | (59 | ) | ||||||||||||||||||
Restructuring charges | (5 | ) | (29 | ) | (19 | ) | | | (53 | ) | ||||||||||||||||
Asset impairment charges | (175 | ) | (11 | ) | (30 | ) | (1 | ) | | (217 | ) | |||||||||||||||
Gains (losses) on disposals of assets |
| | | | | | ||||||||||||||||||||
Other items | (357 | ) | 526 | (67 | ) | (58 | ) | | 44 | |||||||||||||||||
|
|
|
|
|
|
|
|
|
|
|
|
|
||||||||||||||
Total |
(537 | ) | 427 | 136 | (22 | ) | | 4 | ||||||||||||||||||
|
|
|
|
|
|
|
|
|
|
|
|
|
||||||||||||||
9 months 2018 |
Inventory valuation effect | | | 543 | 89 | | 632 | |||||||||||||||||||
Effect of changes in fair value | | (8 | ) | | | | (8 | ) | ||||||||||||||||||
Restructuring charges | (94 | ) | (10 | ) | (2 | ) | | | (106 | ) | ||||||||||||||||
Asset impairment charges | (65 | ) | (271 | ) | | | | (336 | ) | |||||||||||||||||
Gains (losses) on disposals of assets |
(14 | ) | | | | | (14 | ) | ||||||||||||||||||
Other items | (56 | ) | (118 | ) | (17 | ) | (17 | ) | (41 | ) | (249 | ) | ||||||||||||||
|
|
|
|
|
|
|
|
|
|
|
|
|
||||||||||||||
Total |
(229 | ) | (407 | ) | 524 | 72 | (41 | ) | (81 | ) | ||||||||||||||||
|
|
|
|
|
|
|
|
|
|
|
|
|
36
4) Shareholders equity
Treasury shares (TOTAL shares held directly by TOTAL S.A.)
In accordance with the February 2018 announcements regarding the shareholder return policy over 2018-2020, confirmed in 2019, TOTAL S.A. has been repurchasing its own shares.
TOTAL S.A. has also repurchased shares to be allocated to free share grant plans.
As a result, as of September 30, 2019, TOTAL S.A. directly holds 69,066,330 TOTAL shares, representing 2.59% of its share capital, which are deducted from the consolidated shareholders equity and allocated as follows:
Shares to be cancelled (1) |
65,109,435 | |||
|
|
|||
Repurchased during Q4 2018 |
27,360,278 | |||
Repurchased during Q1 2019 |
7,374,542 | |||
|
|
|||
Repurchased during Q2 2019 |
22,395,690 | |||
Repurchased during Q3 2019 |
7,978,925 | |||
|
|
|
||
Shares to be allocated as part of free share grant plans (2) |
3,956,895 | |||
|
|
|||
2017 Plan |
3,890,769 | |||
|
|
|||
2018 Plan |
0 | |||
|
|
|||
Other Plans |
66,126 | |||
|
|
|
||
Treasury shares Total (1)+(2) |
69,066,330 | |||
|
|
|
Dividend
Further to its decision of September 23, 2019 to accelerate the dividend growth, the Board of Directors held on October 29, 2019, set the third interim dividend for the fiscal year 2019 at 0.68 per share, a 3% increase compared to the first two interim dividends for this fiscal year. This interim dividend will be detached on March 30, 2020 and paid in cash on April 1, 2020.
Dividend 2019 |
First interim | Second interim | Third interim | |||
Amount |
0.66 | 0.66 | 0.68 | |||
Set date |
April 25, 2019 | July 24, 2019 | October 29, 2019 | |||
Ex-dividend date |
September 27, 2019 | January 6, 2020 | March 30, 2020 | |||
Payment date |
October 1, 2019 | January 8, 2020 | April 1, 2020 |
Earnings per share in Euro
Earnings per share in Euro, calculated from the earnings per share in U.S. dollars converted at the average Euro/USD exchange rate for the period, amounted to 0.95 per share for the 3rd quarter 2019 (0.89 per share for the 2nd quarter 2019 and 1.27 per share for the 3rd quarter 2018). Diluted earnings per share calculated using the same method amounted to 0.94 per share for the 3rd quarter 2019 (0.89 per share for the 2nd quarter 2019 and 1.26 per share for the 3rd quarter 2018).
Earnings per share are calculated after remuneration of perpetual subordinated notes.
Perpetual subordinated notes
The Group has issued perpetual subordinated notes in April 2019:
| Perpetual subordinated notes 1.750% callable in 2024 (EUR 1,500 million). |
The Group has tendered perpetual subordinated in April 2019:
| Perpetual subordinated notes 2.250% callable in 2021 (EUR 1,500 million). |
37
Other comprehensive income
Detail of other comprehensive income is presented in the table below:
(M$) |
9 months 2019 | 9 months 2018 | ||||||||||||||
Actuarial gains and losses |
(54 | ) | 100 | |||||||||||||
Change in fair value of investments in equity instruments |
126 | 3 | ||||||||||||||
Tax effect |
13 | (31 | ) | |||||||||||||
Currency translation adjustment generated by the parent company |
(3,994 | ) | (3,141 | ) | ||||||||||||
|
|
|
|
|
||||||||||||
Sub-total items not potentially reclassifiable to profit and loss |
(3,909 | ) | (3,069 | ) | ||||||||||||
|
|
|
|
|
||||||||||||
Currency translation adjustment |
1,394 | 1,061 | ||||||||||||||
unrealized gain/(loss) of the period |
1,449 | 1,186 | ||||||||||||||
less gain/(loss) included in net income |
55 | 125 | ||||||||||||||
Cash flow hedge |
(575 | ) | 310 | |||||||||||||
unrealized gain/(loss) of the period |
(533 | ) | 241 | |||||||||||||
less gain/(loss) included in net income |
42 | (69 | ) | |||||||||||||
Variation of foreign currency basis spread |
50 | (66 | ) | |||||||||||||
unrealized gain/(loss) of the period |
6 | (66 | ) | |||||||||||||
less gain/(loss) included in net income |
(44 | ) | | |||||||||||||
Share of other comprehensive income of equity affiliates, net amount |
326 | (274 | ) | |||||||||||||
unrealized gain/(loss) of the period |
335 | (234 | ) | |||||||||||||
less gain/(loss) included in net income |
9 | 40 | ||||||||||||||
Other |
(4 | ) | (4 | ) | ||||||||||||
Tax effect |
176 | (84 | ) | |||||||||||||
|
|
|
|
|
||||||||||||
Sub-total items potentially reclassifiable to profit and loss |
1,367 | 943 | ||||||||||||||
|
|
|
|
|
||||||||||||
Total other comprehensive income, net amount |
(2,542 | ) | (2,126 | ) | ||||||||||||
|
|
|
|
|
38
Tax effects relating to each component of other comprehensive income are as follows:
9 months 2019 | 9 months 2018 | |||||||||||||||||||||||
(M$) |
Pre-tax amount |
Tax effect | Net amount | Pre-tax amount |
Tax effect | Net amount | ||||||||||||||||||
Actuarial gains and losses |
(54 | ) | 16 | (38 | ) | 100 | (31 | ) | 69 | |||||||||||||||
Change in fair value of investments in equity instruments |
126 | (3 | ) | 123 | 3 | | 5 | |||||||||||||||||
Currency translation adjustment generated by the parent company |
(3,994 | ) | | (3,994 | ) | (3,141 | ) | | (3,141 | ) | ||||||||||||||
|
|
|
|
|
|
|
|
|
|
|
|
|
||||||||||||
Sub-total items not potentially reclassifiable to profit and loss |
(3,922 | ) | 13 | (3,909 | ) | (3,038 | ) | (31 | ) | (3,069 | ) | |||||||||||||
|
|
|
|
|
|
|
|
|
|
|
|
|
||||||||||||
Currency translation adjustment |
1,394 | | 1,394 | 1,061 | | 1,061 | ||||||||||||||||||
Cash flow hedge |
(575 | ) | 193 | (382 | ) | 310 | (101 | ) | 209 | |||||||||||||||
Variation of foreign currency basis spread |
50 | (17 | ) | 33 | (66 | ) | 17 | (49 | ) | |||||||||||||||
Share of other comprehensive income of equity affiliates, net amount |
326 | | 326 | (274 | ) | | (274 | ) | ||||||||||||||||
Other |
(4 | ) | | (4 | ) | (4 | ) | | (4 | ) | ||||||||||||||
|
|
|
|
|
|
|
|
|
|
|
|
|
||||||||||||
Sub-total items potentially reclassifiable to profit and loss |
1,191 | 176 | 1,367 | 1,027 | (84 | ) | 943 | |||||||||||||||||
|
|
|
|
|
|
|
|
|
|
|
|
|
||||||||||||
Total other comprehensive income |
(2,731 | ) | 189 | (2,542 | ) | (2,011 | ) | (115 | ) | (2,126 | ) | |||||||||||||
|
|
|
|
|
|
|
|
|
|
|
|
|
5) Financial debt
The Group has issued bonds during the first nine months of 2019:
| Bond 3.455% 2019-2029 (USD 1,250 million); |
| Bond 1.660% 2019-2026 (GBP 500 million); |
| Bond 0.696% 2019-2028 (EUR 650 million); |
| Bond 1.535% 2019-2039 (EUR 650 million); |
| Bond 0.166% 2019-2029 (CHF 200 million); |
| Bond 2.218% 2019-2021 (USD 750 million); |
| Bond 2.434% 2019-2025 (USD 1,000 million); |
| Bond 2.829% 2019-2030 (USD 1,250 million); |
| Bond 3.461% 2019-2049 (USD 1,000 million); |
| Bond 1.405% 2019-2031 (GBP 400 million). |
The Group reimbursed bonds during the first nine months of 2019:
| Bond 4.875% issued in 2009 and maturing in January 2019 (EUR 1,200 million); |
| Bond 2.125% issued in 2014 and maturing in January 2019 (USD 750 million); |
| Bond 4.125% issued in 2014 and maturing in March 2019 (AUD 150 million); |
| Bond 4.180% issued in 2009 and maturing in June 2019 (HKD 750 million); |
| Bond 2.100% issued in 2014 and maturing in June 2019 (USD 1,000 million); |
| Bond USD 3-month Libor + 35 basis points issued in 2014 and maturing in June 2019 (USD 250 million); |
| Bond 3.750% issued in 2014 and maturing in June 2019 (AUD 100 million); |
| Bond 5.000% issued in 2014 and maturing in July 2019 (NZD 100 million); |
| Bond GBP 3 month Libor + 30 basis points issued in 2014 and maturing in July 2019 (GBP 275 million); |
39
| Bond USD 3-month Libor + 38 basis points issued in 2014 and maturing in September 2019 (USD 200 million); |
| Bond 3.750% issued in 2014 and maturing in September 2019 (AUD 100 million). |
The Groups financial debt increased by $5,555 million following the first application of IFRS 16 as at January 1, 2019. Impact on net debt included a sub lease financial asset of $50 million and resulted in an increase of $5,505 million.
6) Related parties
The related parties are principally equity affiliates and non-consolidated investments.
In March 2019, the Group signed final agreements for the acquisition of a 10% direct interest in Arctic LNG2 with Novatek, in which TOTAL holds an interest of 19.40%. In July 2019, Novatek sold an additional 30% of Arctic LNG 2 to CNPC, CNOOC and Japan Arctic LNG. For the period ending September 30, 2019, the Group recognized its share of net income generated by these transactions in Novateks financial statements, except for the impact of the 10% purchased by TOTAL, that has been eliminated.
7) Other risks and contingent liabilities
TOTAL is not currently aware of any exceptional event, dispute, risks or contingent liabilities that could have a material impact on the assets and liabilities, results, financial position or operations of the Group.
FERC
The Office of Enforcement of the U.S. Federal Energy Regulatory Commission (FERC) began in 2015 an investigation in connection with the natural gas trading activities in the United States of Total Gas & Power North America, Inc. (TGPNA), a U.S. subsidiary of the Group. The investigation covered transactions made by TGPNA between June 2009 and June 2012 on the natural gas market. TGPNA received a Notice of Alleged Violations from FERC on September 21, 2015. On April 28, 2016, FERC issued an order to show cause to TGPNA and two of its former employees, and to TOTAL S.A. and Total Gas & Power Ltd., regarding the same facts. TGPNA contests the claims brought against it.
A class action launched to seek damages from these three companies, was dismissed by a judgment of the U.S. District Court of New York issued on March 15, 2017. The Court of Appeal upheld this judgment on May 4, 2018. In September 2019, a Californian city publicly announced the launching of a collective action against these three companies on the same legal basis.
Yemen
Due to the security conditions in the vicinity of Balhaf, Yemen LNG, in which the Group holds a stake of 39.62%, stopped its commercial production and export of LNG in April 2015, when it declared Force Majeure to its various stakeholders. The plant is in a preservation mode.
40
8) Information by business segment
9 months 2019 (M$) |
Exploration & Production |
Integrated Gas, Renewables & Power |
Refining & Chemicals |
Marketing & Services |
Corporate | Intercompany | Total | |||||||||||||||||||||
Non-Group sales |
5,698 | 13,875 | 65,558 | 65,901 | 4 | | 151,036 | |||||||||||||||||||||
Intersegment sales |
23,063 | 1,832 | 24,651 | 456 | 78 | (50,080 | ) | | ||||||||||||||||||||
Excise taxes |
| | (2,250 | ) | (15,922 | ) | | | (18,172 | ) | ||||||||||||||||||
|
|
|
|
|
|
|
|
|
|
|
|
|
|
|
||||||||||||||
Revenues from sales |
28,761 | 15,707 | 87,959 | 50,435 | 82 | (50,080 | ) | 132,864 | ||||||||||||||||||||
Operating expenses |
(12,233 | ) | (13,845 | ) | (84,020 | ) | (48,141 | ) | (569 | ) | 50,080 | (108,728 | ) | |||||||||||||||
Depreciation, depletion and impairment of tangible assets and mineral interests |
(8,352 | ) | (1,004 | ) | (1,176 | ) | (717 | ) | (51 | ) | | (11,300 | ) | |||||||||||||||
|
|
|
|
|
|
|
|
|
|
|
|
|
|
|
||||||||||||||
Operating income |
8,176 | 858 | 2,763 | 1,577 | (538 | ) | | 12,836 | ||||||||||||||||||||
Net income (loss) from equity affiliates and other items |
444 | 1,939 | 265 | 86 | 36 | | 2,770 | |||||||||||||||||||||
Tax on net operating income |
(3,679 | ) | (845 | ) | (467 | ) | (498 | ) | 194 | | (5,295 | ) | ||||||||||||||||
|
|
|
|
|
|
|
|
|
|
|
|
|
|
|
||||||||||||||
Net operating income |
4,941 | 1,952 | 2,561 | 1,165 | (308 | ) | | 10,311 | ||||||||||||||||||||
Net cost of net debt |
(1,522 | ) | ||||||||||||||||||||||||||
Non-controlling interests |
(122 | ) | ||||||||||||||||||||||||||
|
|
|
||||||||||||||||||||||||||
Net income - group share |
8,667 | |||||||||||||||||||||||||||
|
|
|
||||||||||||||||||||||||||
9 months 2019 (adjustments)(a) (M$) |
Exploration & Production |
Integrated Gas, Renewables & Power |
Refining & Chemicals |
Marketing & Services |
Corporate | Intercompany | Total | |||||||||||||||||||||
Non-Group sales |
| (74 | ) | | | | | (74 | ) | |||||||||||||||||||
Intersegment sales |
| | | | | | | |||||||||||||||||||||
Excise taxes |
| | | | | | | |||||||||||||||||||||
|
|
|
|
|
|
|
|
|
|
|
|
|
|
|
||||||||||||||
Revenues from sales |
| (74 | ) | | | | | (74 | ) | |||||||||||||||||||
Operating expenses |
(100 | ) | (153 | ) | 353 | 62 | | | 162 | |||||||||||||||||||
Depreciation, depletion and impairment of tangible assets and mineral interests |
(196 | ) | (20 | ) | (32 | ) | (2 | ) | | | (250 | ) | ||||||||||||||||
|
|
|
|
|
|
|
|
|
|
|
|
|
|
|
||||||||||||||
Operating income (b) |
(296 | ) | (247 | ) | 321 | 60 | | | (162 | ) | ||||||||||||||||||
Net income (loss) from equity affiliates and other items |
(90 | ) | 1,012 | (70 | ) | (60 | ) | | | 792 | ||||||||||||||||||
Tax on net operating income |
(151 | ) | (408 | ) | (113 | ) | (14 | ) | | | (686 | ) | ||||||||||||||||
|
|
|
|
|
|
|
|
|
|
|
|
|
|
|
||||||||||||||
Net operating income (b) |
(537 | ) | 357 | 138 | (14 | ) | | | (56 | ) | ||||||||||||||||||
Net cost of net debt |
(12 | ) | ||||||||||||||||||||||||||
Non-controlling interests |
72 | |||||||||||||||||||||||||||
|
|
|
||||||||||||||||||||||||||
Net income - group share |
4 | |||||||||||||||||||||||||||
|
||||||||||||||||||||||||||||
(a) Adjustments include special items, inventory valuation effect and the effect of changes in fair value. (b) Of which inventory valuation effect
|
| |||||||||||||||||||||||||||
On operating income |
| | 392 | 65 | | |||||||||||||||||||||||
On net operating income |
| | 254 | 46 | | |||||||||||||||||||||||
9 months 2019 (adjusted) (M$) |
Exploration & Production |
Integrated Gas, Renewables & Power |
Refining & Chemicals |
Marketing & Services |
Corporate | Intercompany | Total | |||||||||||||||||||||
Non-Group sales |
5,698 | 13,949 | 65,558 | 65,901 | 4 | | 151,110 | |||||||||||||||||||||
Intersegment sales |
23,063 | 1,832 | 24,651 | 456 | 78 | (50,080 | ) | | ||||||||||||||||||||
Excise taxes |
| | (2,250 | ) | (15,922 | ) | | | (18,172 | ) | ||||||||||||||||||
|
|
|
|
|
|
|
|
|
|
|
|
|
|
|
||||||||||||||
Revenues from sales |
28,761 | 15,781 | 87,959 | 50,435 | 82 | (50,080 | ) | 132,938 | ||||||||||||||||||||
Operating expenses |
(12,133 | ) | (13,692 | ) | (84,373 | ) | (48,203 | ) | (569 | ) | 50,080 | (108,890 | ) | |||||||||||||||
Depreciation, depletion and impairment of tangible assets and mineral interests |
(8,156 | ) | (984 | ) | (1,144 | ) | (715 | ) | (51 | ) | | (11,050 | ) | |||||||||||||||
|
|
|
|
|
|
|
|
|
|
|
|
|
|
|
||||||||||||||
Adjusted operating income |
8,472 | 1,105 | 2,442 | 1,517 | (538 | ) | | 12,998 | ||||||||||||||||||||
Net income (loss) from equity affiliates and other items |
534 | 927 | 335 | 146 | 36 | | 1,978 | |||||||||||||||||||||
Tax on net operating income |
(3,528 | ) | (437 | ) | (354 | ) | (484 | ) | 194 | | (4,609 | ) | ||||||||||||||||
|
|
|
|
|
|
|
|
|
|
|
|
|
|
|
||||||||||||||
Adjusted net operating income |
5,478 | 1,595 | 2,423 | 1,179 | (308 | ) | | 10,367 | ||||||||||||||||||||
Net cost of net debt |
(1,510 | ) | ||||||||||||||||||||||||||
Non-controlling interests |
(194 | ) | ||||||||||||||||||||||||||
|
|
|
||||||||||||||||||||||||||
Adjusted net income - group share |
8,663 | |||||||||||||||||||||||||||
|
|
|
||||||||||||||||||||||||||
9 months 2019 (M$) |
Exploration & Production |
Integrated Gas, Renewables & Power |
Refining & Chemicals |
Marketing & Services |
Corporate | Intercompany | Total | |||||||||||||||||||||
Total expenditures |
6,359 | 6,306 | 1,034 | 803 | 76 | 14,578 | ||||||||||||||||||||||
Total divestments |
112 | 766 | 253 | 187 | 8 | 1,326 | ||||||||||||||||||||||
Cash flow from operating activities |
12,711 | 1,934 | 2,695 | 2,326 | (1,580 | ) | 18,086 |
41
9 months 2018 (M$) |
Exploration & Production |
Integrated Gas, Renewables & Power |
Refining & Chemicals |
Marketing & Services |
Corporate | Intercompany | Total | |||||||||||||||||||||
Non-Group sales |
7,770 | 13,455 | 68,660 | 66,980 | 3 | | 156,868 | |||||||||||||||||||||
Intersegment sales |
22,678 | 1,536 | 26,676 | 733 | 46 | (51,669 | ) | | ||||||||||||||||||||
Excise taxes |
| | (2,537 | ) | (16,537 | ) | | | (19,074 | ) | ||||||||||||||||||
|
|
|
|
|
|
|
|
|
|
|
|
|
|
|
||||||||||||||
Revenues from sales |
30,448 | 14,991 | 92,799 | 51,176 | 49 | (51,669 | ) | 137,794 | ||||||||||||||||||||
Operating expenses |
(12,992 | ) | (13,783 | ) | (88,841 | ) | (49,066 | ) | (550 | ) | 51,669 | (113,563 | ) | |||||||||||||||
Depreciation, depletion and impairment of tangible assets and mineral interests |
(7,146 | ) | (1,020 | ) | (911 | ) | (522 | ) | (31 | ) | | (9,630 | ) | |||||||||||||||
|
|
|
|
|
|
|
|
|
|
|
|
|
|
|
||||||||||||||
Operating income |
10,310 | 188 | 3,047 | 1,588 | (532 | ) | | 14,601 | ||||||||||||||||||||
Net income (loss) from equity affiliates and other items |
1,026 | 1,240 | 638 | 302 | 48 | | 3,254 | |||||||||||||||||||||
Tax on net operating income |
(4,972 | ) | (392 | ) | (675 | ) | (463 | ) | 327 | | (6,175 | ) | ||||||||||||||||
|
|
|
|
|
|
|
|
|
|
|
|
|
|
|
||||||||||||||
Net operating income |
6,364 | 1,036 | 3,010 | 1,427 | (157 | ) | | 11,680 | ||||||||||||||||||||
Net cost of net debt |
(1,310 | ) | ||||||||||||||||||||||||||
Non-controlling interests |
(56 | ) | ||||||||||||||||||||||||||
|
|
|
||||||||||||||||||||||||||
Net income - group share |
10,314 | |||||||||||||||||||||||||||
|
|
|
||||||||||||||||||||||||||
9 months 2018 (adjustments)(a) (M$) |
Exploration & Production |
Integrated Gas, Renewables & Power |
Refining & Chemicals |
Marketing & Services |
Corporate | Intercompany | Total | |||||||||||||||||||||
Non-Group sales |
| 13 | | | | | 13 | |||||||||||||||||||||
Intersegment sales |
| | | | | | | |||||||||||||||||||||
Excise taxes |
| | | | | | | |||||||||||||||||||||
|
|
|
|
|
|
|
|
|
|
|
|
|
|
|
||||||||||||||
Revenues from sales |
| 13 | | | | | 13 | |||||||||||||||||||||
Operating expenses |
(200 | ) | (165 | ) | 707 | 152 | (9 | ) | | 485 | ||||||||||||||||||
Depreciation, depletion and impairment of tangible assets and mineral interests |
(65 | ) | (485 | ) | | | | | (550 | ) | ||||||||||||||||||
|
|
|
|
|
|
|
|
|
|
|
|
|
|
|
||||||||||||||
Operating income (b) |
(265 | ) | (637 | ) | 707 | 152 | (9 | ) | | (52 | ) | |||||||||||||||||
Net income (loss) from equity affiliates and other items |
(128 | ) | (40 | ) | 34 | | | | (134 | ) | ||||||||||||||||||
Tax on net operating income |
186 | (30 | ) | (210 | ) | (44 | ) | | | (98 | ) | |||||||||||||||||
|
|
|
|
|
|
|
|
|
|
|
|
|
|
|
||||||||||||||
Net operating income (b) |
(207 | ) | (707 | ) | 531 | 108 | (9 | ) | | (284 | ) | |||||||||||||||||
Net cost of net debt |
(63 | ) | ||||||||||||||||||||||||||
Non-controlling interests |
266 | |||||||||||||||||||||||||||
|
|
|
||||||||||||||||||||||||||
Net income - group share |
(81 | ) | ||||||||||||||||||||||||||
|
||||||||||||||||||||||||||||
(a) Adjustments include special items, inventory valuation effect and the effect of changes in fair value. (b) Of which inventory valuation effect
|
| |||||||||||||||||||||||||||
On operating income |
| | 710 | 152 | | |||||||||||||||||||||||
On net operating income |
| | 550 | 108 | | |||||||||||||||||||||||
9 months 2018 (adjusted) (M$) |
Exploration & Production |
Integrated Gas, Renewables & Power |
Refining & Chemicals |
Marketing & Services |
Corporate | Intercompany | Total | |||||||||||||||||||||
Non-Group sales |
7,770 | 13,442 | 68,660 | 66,980 | 3 | | 156,855 | |||||||||||||||||||||
Intersegment sales |
22,678 | 1,536 | 26,676 | 733 | 46 | (51,669 | ) | | ||||||||||||||||||||
Excise taxes |
| | (2,537 | ) | (16,537 | ) | | | (19,074 | ) | ||||||||||||||||||
|
|
|
|
|
|
|
|
|
|
|
|
|
|
|
||||||||||||||
Revenues from sales |
30,448 | 14,978 | 92,799 | 51,176 | 49 | (51,669 | ) | 137,781 | ||||||||||||||||||||
Operating expenses |
(12,792 | ) | (13,618 | ) | (89,548 | ) | (49,218 | ) | (541 | ) | 51,669 | (114,048 | ) | |||||||||||||||
Depreciation, depletion and impairment of tangible assets and mineral interests |
(7,081 | ) | (535 | ) | (911 | ) | (522 | ) | (31 | ) | | (9,080 | ) | |||||||||||||||
|
|
|
|
|
|
|
|
|
|
|
|
|
|
|
||||||||||||||
Adjusted operating income |
10,575 | 825 | 2,340 | 1,436 | (523 | ) | | 14,653 | ||||||||||||||||||||
Net income (loss) from equity affiliates and other items |
1,154 | 1,280 | 604 | 302 | 48 | | 3,388 | |||||||||||||||||||||
Tax on net operating income |
(5,158 | ) | (362 | ) | (465 | ) | (419 | ) | 327 | | (6,077 | ) | ||||||||||||||||
|
|
|
|
|
|
|
|
|
|
|
|
|
|
|
||||||||||||||
Adjusted net operating income |
6,571 | 1,743 | 2,479 | 1,319 | (148 | ) | | 11,964 | ||||||||||||||||||||
Net cost of net debt |
(1,247 | ) | ||||||||||||||||||||||||||
Non-controlling interests |
(322 | ) | ||||||||||||||||||||||||||
|
|
|
||||||||||||||||||||||||||
Adjusted net income - group share |
10,395 | |||||||||||||||||||||||||||
|
||||||||||||||||||||||||||||
9 months 2018 (M$) |
Exploration & Production |
Integrated Gas, Renewables & Power |
Refining & Chemicals |
Marketing & Services |
Corporate | Intercompany | Total | |||||||||||||||||||||
Total expenditures |
10,629 | 4,347 | 1,113 | 831 | 75 | 16,995 | ||||||||||||||||||||||
Total divestments |
3,136 | 790 | 437 | 390 | 3 | 4,756 | ||||||||||||||||||||||
Cash flow from operating activities |
12,227 | 162 | 1,228 | 1,533 | (1,087 | ) | 14,063 |
42
3rd quarter 2019 (M$) |
Exploration & Production |
Integrated Gas, Renewables & Power |
Refining & Chemicals |
Marketing & Services |
Corporate | Intercompany | Total | |||||||||||||||||||||
Non-Group sales |
1,631 | 3,667 | 21,338 | 21,951 | 2 | | 48,589 | |||||||||||||||||||||
Intersegment sales |
7,761 | 573 | 8,341 | 155 | 15 | (16,845 | ) | | ||||||||||||||||||||
Excise taxes |
| | (713 | ) | (5,338 | ) | | | (6,051 | ) | ||||||||||||||||||
|
|
|
|
|
|
|
|
|
|
|
|
|
|
|
||||||||||||||
Revenues from sales |
9,392 | 4,240 | 28,966 | 16,768 | 17 | (16,845 | ) | 42,538 | ||||||||||||||||||||
Operating expenses |
(3,999 | ) | (3,558 | ) | (27,518 | ) | (15,963 | ) | (163 | ) | 16,845 | (34,356 | ) | |||||||||||||||
Depreciation, depletion and impairment of tangible assets and mineral interests |
(3,136 | ) | (361 | ) | (413 | ) | (247 | ) | (16 | ) | | (4,173 | ) | |||||||||||||||
|
|
|
|
|
|
|
|
|
|
|
|
|
|
|
||||||||||||||
Operating income |
2,257 | 321 | 1,035 | 558 | (162 | ) | | 4,009 | ||||||||||||||||||||
Net income (loss) from equity affiliates and other items |
77 | 898 | 5 | (15 | ) | 9 | | 974 | ||||||||||||||||||||
Tax on net operating income |
(1,094 | ) | (222 | ) | (221 | ) | (164 | ) | 70 | | (1,631 | ) | ||||||||||||||||
|
|
|
|
|
|
|
|
|
|
|
|
|
|
|
||||||||||||||
Net operating income |
1,240 | 997 | 819 | 379 | (83 | ) | | 3,352 | ||||||||||||||||||||
Net cost of net debt |
(507 | ) | ||||||||||||||||||||||||||
Non-controlling interests |
(45 | ) | ||||||||||||||||||||||||||
|
|
|
||||||||||||||||||||||||||
Net income - group share |
2,800 | |||||||||||||||||||||||||||
|
||||||||||||||||||||||||||||
3rd quarter 2019 (adjustments)(a) (M$) |
Exploration & Production |
Integrated Gas, Renewables & Power |
Refining & Chemicals |
Marketing & Services |
Corporate | Intercompany | Total | |||||||||||||||||||||
Non-Group sales |
| 12 | | | | | 12 | |||||||||||||||||||||
Intersegment sales |
| | | | | | | |||||||||||||||||||||
Excise taxes |
| | | | | | | |||||||||||||||||||||
|
|
|
|
|
|
|
|
|
|
|
|
|
|
|
||||||||||||||
Revenues from sales |
| 12 | | | | | 12 | |||||||||||||||||||||
Operating expenses |
(100 | ) | (41 | ) | (96 | ) | 22 | | | (215 | ) | |||||||||||||||||
Depreciation, depletion and impairment of tangible assets and mineral interests |
(153 | ) | (9 | ) | (22 | ) | (2 | ) | | | (186 | ) | ||||||||||||||||
|
|
|
|
|
|
|
|
|
|
|
|
|
|
|
||||||||||||||
Operating income (b) |
(253 | ) | (38 | ) | (118 | ) | 20 | | | (389 | ) | |||||||||||||||||
Net income (loss) from equity affiliates and other items |
(90 | ) | 599 | (23 | ) | (53 | ) | | | 433 | ||||||||||||||||||
Tax on net operating income |
(151 | ) | (138 | ) | 8 | (1 | ) | | | (282 | ) | |||||||||||||||||
|
|
|
|
|
|
|
|
|
|
|
|
|
|
|
||||||||||||||
Net operating income (b) |
(494 | ) | 423 | (133 | ) | (34 | ) | | | (238 | ) | |||||||||||||||||
Net cost of net debt |
(4 | ) | ||||||||||||||||||||||||||
Non-controlling interests |
25 | |||||||||||||||||||||||||||
|
|
|
||||||||||||||||||||||||||
Net income - group share |
(217 | ) | ||||||||||||||||||||||||||
|
||||||||||||||||||||||||||||
(a) Adjustments include special items, inventory valuation effect and the effect of changes in fair value. (b) Of which inventory valuation effect
|
| |||||||||||||||||||||||||||
On operating income |
| | (94 | ) | 25 | | ||||||||||||||||||||||
On net operating income |
| | (90 | ) | 19 | | ||||||||||||||||||||||
3rd quarter 2019 (adjusted) (M$) |
Exploration & Production |
Integrated Gas, Renewables & Power |
Refining & Chemicals |
Marketing & Services |
Corporate | Intercompany | Total | |||||||||||||||||||||
Non-Group sales |
1,631 | 3,655 | 21,338 | 21,951 | 2 | | 48,577 | |||||||||||||||||||||
Intersegment sales |
7,761 | 573 | 8,341 | 155 | 15 | (16,845 | ) | | ||||||||||||||||||||
Excise taxes |
| | (713 | ) | (5,338 | ) | | | (6,051 | ) | ||||||||||||||||||
|
|
|
|
|
|
|
|
|
|
|
|
|
|
|
||||||||||||||
Revenues from sales |
9,392 | 4,228 | 28,966 | 16,768 | 17 | (16,845 | ) | 42,526 | ||||||||||||||||||||
Operating expenses |
(3,899 | ) | (3,517 | ) | (27,422 | ) | (15,985 | ) | (163 | ) | 16,845 | (34,141 | ) | |||||||||||||||
Depreciation, depletion and impairment of tangible assets and mineral interests |
(2,983 | ) | (352 | ) | (391 | ) | (245 | ) | (16 | ) | | (3,987 | ) | |||||||||||||||
|
|
|
|
|
|
|
|
|
|
|
|
|
|
|
||||||||||||||
Adjusted operating income |
2,510 | 359 | 1,153 | 538 | (162 | ) | | 4,398 | ||||||||||||||||||||
Net income (loss) from equity affiliates and other items |
167 | 299 | 28 | 38 | 9 | | 541 | |||||||||||||||||||||
Tax on net operating income |
(943 | ) | (84 | ) | (229 | ) | (163 | ) | 70 | | (1,349 | ) | ||||||||||||||||
|
|
|
|
|
|
|
|
|
|
|
|
|
|
|
||||||||||||||
Adjusted net operating income |
1,734 | 574 | 952 | 413 | (83 | ) | | 3,590 | ||||||||||||||||||||
Net cost of net debt |
(503 | ) | ||||||||||||||||||||||||||
Non-controlling interests |
(70 | ) | ||||||||||||||||||||||||||
|
|
|
||||||||||||||||||||||||||
Adjusted net income - group share |
3,017 | |||||||||||||||||||||||||||
|
||||||||||||||||||||||||||||
3rd quarter 2019 (M$) |
Exploration & Production |
Integrated Gas, Renewables & Power |
Refining & Chemicals |
Marketing & Services |
Corporate | Intercompany | Total | |||||||||||||||||||||
Total expenditures |
2,077 | 4,331 | 386 | 276 | 25 | 7,095 | ||||||||||||||||||||||
Total divestments |
23 | 192 | 14 | 30 | 5 | 264 | ||||||||||||||||||||||
Cash flow from operating activities |
5,007 | 401 | 1,575 | 1,483 | (260 | ) | 8,206 |
43
3rd quarter 2018 (M$) |
Exploration & Production |
Integrated Gas, Renewables & Power |
Refining & Chemicals |
Marketing & Services |
Corporate | Intercompany | Total | |||||||||||||||||||||
Non-Group sales |
2,433 | 5,568 | 23,572 | 23,144 | | | 54,717 | |||||||||||||||||||||
Intersegment sales |
8,255 | 575 | 9,280 | 242 | 12 | (18,364 | ) | | ||||||||||||||||||||
Excise taxes |
| | (823 | ) | (5,494 | ) | | | (6,317 | ) | ||||||||||||||||||
|
|
|
|
|
|
|
|
|
|
|
|
|
|
|
||||||||||||||
Revenues from sales |
10,688 | 6,143 | 32,029 | 17,892 | 12 | (18,364 | ) | 48,400 | ||||||||||||||||||||
Operating expenses |
(4,271 | ) | (5,660 | ) | (30,593 | ) | (17,147 | ) | (151 | ) | 18,364 | (39,458 | ) | |||||||||||||||
Depreciation, depletion and impairment of tangible assets and mineral interests |
(2,585 | ) | (213 | ) | (294 | ) | (176 | ) | (11 | ) | | (3,279 | ) | |||||||||||||||
|
|
|
|
|
|
|
|
|
|
|
|
|
|
|
||||||||||||||
Operating income |
3,832 | 270 | 1,142 | 569 | (150 | ) | | 5,663 | ||||||||||||||||||||
Net income (loss) from equity affiliates and other items |
449 | 445 | 221 | 109 | 39 | | 1,263 | |||||||||||||||||||||
Tax on net operating income |
(1,853 | ) | (155 | ) | (292 | ) | (166 | ) | 146 | | (2,320 | ) | ||||||||||||||||
|
|
|
|
|
|
|
|
|
|
|
|
|
|
|
||||||||||||||
Net operating income |
2,428 | 560 | 1,071 | 512 | 35 | | 4,606 | |||||||||||||||||||||
Net cost of net debt |
(519 | ) | ||||||||||||||||||||||||||
Non-controlling interests |
(130 | ) | ||||||||||||||||||||||||||
|
|
|
||||||||||||||||||||||||||
Net income - group share |
3,957 | |||||||||||||||||||||||||||
|
||||||||||||||||||||||||||||
3rd quarter 2018 (adjustments)(a) (M$) |
Exploration & Production |
Integrated Gas, Renewables & Power |
Refining & Chemicals |
Marketing & Services |
Corporate | Intercompany | Total | |||||||||||||||||||||
Non-Group sales |
| | | | | | | |||||||||||||||||||||
Intersegment sales |
| | | | | | | |||||||||||||||||||||
Excise taxes |
| | | | | | | |||||||||||||||||||||
|
|
|
|
|
|
|
|
|
|
|
|
|
|
|
||||||||||||||
Revenues from sales |
| | | | | | | |||||||||||||||||||||
Operating expenses |
(50 | ) | (64 | ) | 176 | 47 | | | 109 | |||||||||||||||||||
Depreciation, depletion and impairment of tangible assets and mineral interests |
(65 | ) | (39 | ) | | | | | (104 | ) | ||||||||||||||||||
|
|
|
|
|
|
|
|
|
|
|
|
|
|
|
||||||||||||||
Operating income (b) |
(115 | ) | (103 | ) | 176 | 47 | | | 5 | |||||||||||||||||||
Net income (loss) from equity affiliates and other items |
39 | (25 | ) | 9 | | | | 23 | ||||||||||||||||||||
Tax on net operating income |
65 | (9 | ) | (52 | ) | (9 | ) | | | (5 | ) | |||||||||||||||||
|
|
|
|
|
|
|
|
|
|
|
|
|
|
|
||||||||||||||
Net operating income (b) |
(11 | ) | (137 | ) | 133 | 38 | | | 23 | |||||||||||||||||||
Net cost of net debt |
(44 | ) | ||||||||||||||||||||||||||
Non-controlling interests |
20 | |||||||||||||||||||||||||||
|
|
|
||||||||||||||||||||||||||
Net income - group share |
(1 | ) | ||||||||||||||||||||||||||
|
||||||||||||||||||||||||||||
(a) Adjustments include special items, inventory valuation effect and the effect of changes in fair value. (b) Of which inventory valuation effect
|
| |||||||||||||||||||||||||||
On operating income |
| | 179 | 47 | | |||||||||||||||||||||||
On net operating income |
| | 135 | 38 | | |||||||||||||||||||||||
3rd quarter 2018 (adjusted) (M$) |
Exploration & Production |
Integrated Gas, Renewables & Power |
Refining & Chemicals |
Marketing & Services |
Corporate | Intercompany | Total | |||||||||||||||||||||
Non-Group sales |
2,433 | 5,568 | 23,572 | 23,144 | | | 54,717 | |||||||||||||||||||||
Intersegment sales |
8,255 | 575 | 9,280 | 242 | 12 | (18,364 | ) | | ||||||||||||||||||||
Excise taxes |
| | (823 | ) | (5,494 | ) | | | (6,317 | ) | ||||||||||||||||||
|
|
|
|
|
|
|
|
|
|
|
|
|
|
|
||||||||||||||
Revenues from sales |
10,688 | 6,143 | 32,029 | 17,892 | 12 | (18,364 | ) | 48,400 | ||||||||||||||||||||
Operating expenses |
(4,221 | ) | (5,596 | ) | (30,769 | ) | (17,194 | ) | (151 | ) | 18,364 | (39,567 | ) | |||||||||||||||
Depreciation, depletion and impairment of tangible assets and mineral interests |
(2,520 | ) | (174 | ) | (294 | ) | (176 | ) | (11 | ) | | (3,175 | ) | |||||||||||||||
|
|
|
|
|
|
|
|
|
|
|
|
|
|
|
||||||||||||||
Adjusted operating income |
3,947 | 373 | 966 | 522 | (150 | ) | | 5,658 | ||||||||||||||||||||
Net income (loss) from equity affiliates and other items |
410 | 470 | 212 | 109 | 39 | | 1,240 | |||||||||||||||||||||
Tax on net operating income |
(1,918 | ) | (146 | ) | (240 | ) | (157 | ) | 146 | | (2,315 | ) | ||||||||||||||||
|
|
|
|
|
|
|
|
|
|
|
|
|
|
|
||||||||||||||
Adjusted net operating income |
2,439 | 697 | 938 | 474 | 35 | | 4,583 | |||||||||||||||||||||
Net cost of net debt |
(475 | ) | ||||||||||||||||||||||||||
Non-controlling interests |
(150 | ) | ||||||||||||||||||||||||||
|
|
|
||||||||||||||||||||||||||
Adjusted net income - group share |
3,958 | |||||||||||||||||||||||||||
|
||||||||||||||||||||||||||||
3rd quarter 2018 (M$) |
Exploration & Production |
Integrated Gas, Renewables & Power |
Refining & Chemicals |
Marketing & Services |
Corporate | Intercompany | Total | |||||||||||||||||||||
Total expenditures |
2,472 | 3,325 | 377 | 293 | 17 | 6,484 | ||||||||||||||||||||||
Total divestments |
494 | 198 | 88 | 117 | | 897 | ||||||||||||||||||||||
Cash flow from operating activities |
4,431 | (164 | ) | 1,338 | 752 | (621 | ) | 5,736 |
44
9) Reconciliation of the information by business segment with consolidated financial statements
9 months 2019 (M$) |
Adjusted | Adjustments(a) | Consolidated statement of income |
|||||||||
Sales |
151,110 | (74 | ) | 151,036 | ||||||||
Excise taxes |
(18,172 | ) | | (18,172 | ) | |||||||
Revenues from sales |
132,938 | (74 | ) | 132,864 | ||||||||
Purchases net of inventory variation |
(88,338 | ) | 329 | (88,009 | ) | |||||||
Other operating expenses |
(19,998 | ) | (167 | ) | (20,165 | ) | ||||||
Exploration costs |
(554 | ) | | (554 | ) | |||||||
Depreciation, depletion and impairment of tangible assets and mineral interests |
(11,050 | ) | (250 | ) | (11,300 | ) | ||||||
Other income |
620 | 115 | 735 | |||||||||
Other expense |
(322 | ) | (635 | ) | (957 | ) | ||||||
Financial interest on debt |
(1,715 | ) | (12 | ) | (1,727 | ) | ||||||
Financial income and expense from cash & cash equivalents |
(70 | ) | | (70 | ) | |||||||
Cost of net debt |
(1,785 | ) | (12 | ) | (1,797 | ) | ||||||
Other financial income |
649 | | 649 | |||||||||
Other financial expense |
(561 | ) | | (561 | ) | |||||||
Net income (loss) from equity affiliates |
1,592 | 1,312 | 2,904 | |||||||||
Income taxes |
(4,334 | ) | (686 | ) | (5,020 | ) | ||||||
|
|
|
|
|
|
|
||||||
Consolidated net income |
8,857 | (68 | ) | 8,789 | ||||||||
Group share |
8,663 | 4 | 8,667 | |||||||||
Non-controlling interests |
194 | (72 | ) | 122 |
(a) Adjustments include special items, inventory valuation effect and the effect of changes in fair value. |
9 months 2018 (M$) |
Adjusted | Adjustments(a) | Consolidated statement of income |
|||||||||
Sales |
156,855 | 13 | 156,868 | |||||||||
Excise taxes |
(19,074 | ) | | (19,074 | ) | |||||||
Revenues from sales |
137,781 | 13 | 137,794 | |||||||||
Purchases net of inventory variation |
(93,190 | ) | 794 | (92,396 | ) | |||||||
Other operating expenses |
(20,262 | ) | (309 | ) | (20,571 | ) | ||||||
Exploration costs |
(596 | ) | | (596 | ) | |||||||
Depreciation, depletion and impairment of tangible assets and mineral interests |
(9,080 | ) | (550 | ) | (9,630 | ) | ||||||
Other income |
1,093 | 263 | 1,356 | |||||||||
Other expense |
(324 | ) | (634 | ) | (958 | ) | ||||||
Financial interest on debt |
(1,341 | ) | (63 | ) | (1,404 | ) | ||||||
Financial income and expense from cash & cash equivalents |
(158 | ) | | (158 | ) | |||||||
Cost of net debt |
(1,499 | ) | (63 | ) | (1,562 | ) | ||||||
Other financial income |
851 | | 851 | |||||||||
Other financial expense |
(500 | ) | | (500 | ) | |||||||
Net income (loss) from equity affiliates |
2,268 | 237 | 2,505 | |||||||||
Income taxes |
(5,825 | ) | (98 | ) | (5,923 | ) | ||||||
|
|
|
|
|
|
|
||||||
Consolidated net income |
10,717 | (347 | ) | 10,370 | ||||||||
Group share |
10,395 | (81 | ) | 10,314 | ||||||||
Non-controlling interests |
322 | (266 | ) | 56 |
(a) Adjustments include special items, inventory valuation effect and the effect of changes in fair value.
45
3rd quarter 2019 (M$) |
Adjusted | Adjustments(a) | Consolidated statement of income |
|||||||||
Sales |
48,577 | 12 | 48,589 | |||||||||
Excise taxes |
(6,051 | ) | | (6,051 | ) | |||||||
Revenues from sales |
42,526 | 12 | 42,538 | |||||||||
Purchases net of inventory variation |
(27,805 | ) | (93 | ) | (27,898 | ) | ||||||
Other operating expenses |
(6,240 | ) | (122 | ) | (6,362 | ) | ||||||
Exploration costs |
(96 | ) | | (96 | ) | |||||||
Depreciation, depletion and impairment of tangible assets and mineral interests |
(3,987 | ) | (186 | ) | (4,173 | ) | ||||||
Other income |
167 | | 167 | |||||||||
Other expense |
(132 | ) | (427 | ) | (559 | ) | ||||||
Financial interest on debt |
(594 | ) | (4 | ) | (598 | ) | ||||||
Financial income and expense from cash & cash equivalents |
| | | |||||||||
Cost of net debt |
(594 | ) | (4 | ) | (598 | ) | ||||||
Other financial income |
163 | | 163 | |||||||||
Other financial expense |
(178 | ) | | (178 | ) | |||||||
Net income (loss) from equity affiliates |
521 | 860 | 1,381 | |||||||||
Income taxes |
(1,258 | ) | (282 | ) | (1,540 | ) | ||||||
|
|
|
|
|
|
|
||||||
Consolidated net income |
3,087 | (242 | ) | 2,845 | ||||||||
Group share |
3,017 | (217 | ) | 2,800 | ||||||||
Non-controlling interests |
70 | (25 | ) | 45 |
(a) Adjustments include special items, inventory valuation effect and the effect of changes in fair value. |
3rd quarter 2018 (M$) |
Adjusted | Adjustments(a) | Consolidated statement of income |
|||||||||
Sales |
54,717 | | 54,717 | |||||||||
Excise taxes |
(6,317 | ) | | (6,317 | ) | |||||||
Revenues from sales |
48,400 | | 48,400 | |||||||||
Purchases net of inventory variation |
(32,567 | ) | 216 | (32,351 | ) | |||||||
Other operating expenses |
(6,766 | ) | (107 | ) | (6,873 | ) | ||||||
Exploration costs |
(234 | ) | | (234 | ) | |||||||
Depreciation, depletion and impairment of tangible assets and mineral interests |
(3,175 | ) | (104 | ) | (3,279 | ) | ||||||
Other income |
465 | 116 | 581 | |||||||||
Other expense |
(209 | ) | (146 | ) | (355 | ) | ||||||
Financial interest on debt |
(492 | ) | (44 | ) | (536 | ) | ||||||
Financial income and expense from cash & cash equivalents |
(63 | ) | | (63 | ) | |||||||
Cost of net debt |
(555 | ) | (44 | ) | (599 | ) | ||||||
Other financial income |
290 | | 290 | |||||||||
Other financial expense |
(171 | ) | | (171 | ) | |||||||
Net income (loss) from equity affiliates |
865 | 53 | 918 | |||||||||
Income taxes |
(2,235 | ) | (5 | ) | (2,240 | ) | ||||||
|
|
|
|
|
|
|
||||||
Consolidated net income |
4,108 | (21 | ) | 4,087 | ||||||||
Group share |
3,958 | (1 | ) | 3,957 | ||||||||
Non-controlling interests |
150 | (20 | ) | 130 |
(a) Adjustments include special items, inventory valuation effect and the effect of changes in fair value.
46
10) Post-closing
There was no post closing event.
47
Exhibit 99.2
RECENT DEVELOPMENTS
TOTAL announces the third 2019 interim dividend of 0.68/share, an increase of 6% compared to 2018
The Board of Directors of TOTAL S.A. (the Board of Directors), during its meeting held on September 23, 2019, decided to accelerate dividend growth in the coming years, with a guidance of increasing the dividend by 5% to 6% per year.
On October 29, 2019, the Board of Directors confirmed the immediate implementation of this policy and declared the distribution of the third 2019 interim dividend at an amount of 0.68/share, an increase of 6% compared to the 2018 interim and final dividends.
This interim dividend will be detached and paid according to the following timetable:
Shareholders |
ADS holders | |||
Ex-dividend date | March 30, 2020 | March 26, 2020 | ||
Payment date | April 1st, 2020 | April 21, 2020 |
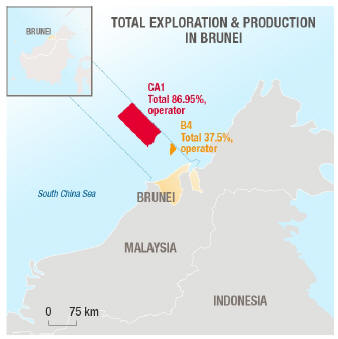
Brunei: TOTAL sells its interest in offshore Block CA1
On October 30, 2019, TOTAL S.A. (together with its direct and indirect consolidated companies located in or outside of France, TOTAL or the Group) announced the signing of an agreement to sell wholly owned subsidiary Total E&P Deep Offshore Borneo BV which holds an 86.95% interest in Block CA1, located 100 kilometers off the coast of Brunei to Shell (Dordtsche Petroleum Maatschappij BV) for $300 million. The transaction is subject to approval by the competent authorities and is expected to close by December 2019.
Block CA1 covers 5,850 square kilometers, with water depths ranging from 1,000 to 2,500 meters. TOTAL currently operates the block alongside partners Murphy Oil (8.05%) and Petronas (5%).
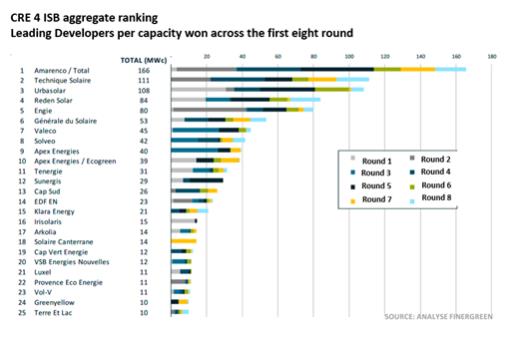
France: TOTAL tops rankings in call for tenders for rooftop solar installations
On October 24, 2019, TOTAL announced that it continues to actively contribute to the growth of solar and wind power in France, with its affiliate Total Quadran winning 32 MW of new solar and wind power projects during the recent call for tenders issued by the French Energy Regulatory Commission (CRE).
Through Energie Développement, its 50-50 joint venture with solar project developer Amarenco France, Total Quadran is among the leaders of the eighth round of the CRE 41 call for tenders, winning 17 MWp, or 14% of the capacity awarded.
In total, with more than 166 MWp won across all rounds of the CRE 4 call for tenders issued in 2017, Energie Développement comes out on top in the rooftop solar installation industry in France (see Finergreen ranking2.)
1 | Group 2 (500 KWp to 8 MWp) |
2 | Source : http://www.finergreen.com/wp-content/uploads/2017/04/19-10-08-Analyse-AO-Solaire-CRE4.8-ISB-vFR.pdf |
TOTAL dedicates its $400 million global venture fund to carbon neutrality
On October 24, 2019, TOTAL announced that it will focus its global venture fund on fostering carbon neutrality. The fund will increase its capital to a cumulative $400 million within five years time. Its investments will support start-ups that develop innovative technologies and solutions which help companies to reduce their energy consumption or the carbon intensity of their activities. The fund will be known as Total Carbon Neutrality Ventures (TCNV).
TCNV will invest globally, with teams based in Europe and the U.S., focusing on the areas such as smart energy, energy storage, smart mobility, bioplastics and recycling.
The fund builds on Total Ventures existing portfolio of 35 global start-ups that directly and indirectly contribute to carbon neutrality. That portfolio includes Solidia, Sunfire, Scoop, Shyft Power Solutions, Ionic Materials, MTPV, AutoGrid, Stem and OnTruck.
Plastics Recycling: TOTAL announces plans to double its capacity of recycled polypropylene for the automotive industry
On October 22, 2019, TOTAL announced its decision to double the production capacity of its affiliate Synova to meet growing market demand for high-performance recycled materials. By early 2021, Normandy-based Synova, a French leader in its sector, is expecting to produce 40,000 tons per year of recycled polypropylene that meets the demanding quality standards of automotive original equipment manufacturers (OEMs) and carmakers.
TOTALs initiatives about end-of-life of plastics:
| TOTAL is a founding member of the Alliance to End Plastic Waste, an organization that brings together around 40 member companies from across the plastics and consumer goods value chain. These members committed over $1 billion, with the ultimate goal of investing $1.5 billion over the next five years to provide solutions to eliminate plastic pollution in the environment, particularly the oceans. |
| TOTAL is working on all forms of recycling to develop high-performance recycled polymers. |
| TOTAL also joined forces with Citeo, Saint-Gobain and Syndifrais to create a polystyrene recycling channel in France by 2020. The feasibility of large-scale production will be validated at the Groups industrial sites in Carling (France) and Feluy (Belgium). |
Additionally, TOTAL is a global leader in bioplastics. The Total Corbion PLA joint venture owns a plant in Thailand with a capacity of approximately 75,000 tons per year of polylactic acid (PLA), a 100% renewable-based bioplastic that is recyclable and biodegradable.
TOTAL set a target of producing 30% recycled plastics by 2030.
China: TOTAL and Zhejiang Energy Group join forces to develop the growing low sulfur marine fuel market
On October 21, 2019, TOTAL announced the signing of a shareholders agreement with Chinese state-owned Zhejiang Energy Group (ZEG), to create a joint venture company dedicated to the supply and delivery of marine fuels in the region of Zhoushan, China.
The agreement, signed on the sidelines of the IPEC conference in Zhoushan, follows a memorandum of understanding entered into between TOTAL and ZEG in April 2019 to explore opportunities in the supply and distribution of energy in China. Total China Investment (TCI) will hold a 49% share in the new company while Zhejiang Zheneng Petroleum New Energy (ZZPNE) will hold the remaining.
Zhoushan region covers both Ningbo and Shanghai ports, the busiest shipping hub in the world in terms of cargo tonnage.
By combining ZEGs historical anchoring in the energy business in the region and TOTALs longstanding expertise in the trading and marketing of international bunkers, the new company aims to actively contribute to the development of this fast-growing market.
The creation of the new company ensures the continuity of TOTALs business development strategy initiated almost 40 years ago in China.
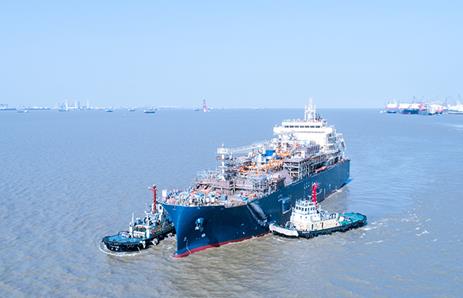
New Marine Fuels: TOTALs first LNG bunker vessel launched
On October 18, 2019, TOTAL announced that its first large liquefied natural gas (LNG) bunker vessel was launched, following the signature of a long-term charter contract between TOTAL and Mitsui O.S.K Lines (MOL) in February 2018.
After delivery expected in 2020, the bunker vessel will operate in Northern Europe, where it will supply LNG to commercial vessels, including approximately 300,000 tons per year for CMA CGMs nine ultra-large newbuild containerships in Europe-Asia trade, for a period of at least 10 years.
The LNG bunker vessels construction is in line with the International Maritime Organization (IMO) decision to drastically limit the sulfur content of marine fuels as of 2020. In this context, the transition from heavy fuel oil to LNG is a competitive, efficient and immediately available solution for maritime transportation. Used as a marine fuel, LNG sharply reduces emissions from ships, resulting in a significant improvement in air quality, particularly for communities in coastal areas and port cities.
Built by Hudong-Zhonghua Shipbuilding at their shipyard near Shanghai, the bunker vessel is fitted with innovative tank technologies, with a capacity of 18,600 cubic meters, provided by the French company GTT. Designed to be highly maneuverable, the 135-meter-long vessel will be able to operate safely in the ports and terminals considered. Lastly, it meets the highest environmental standards thanks to the use of LNG as fuel and complete reliquefaction of boil-off gas.
TOTAL opens a digital factory to further its ambition of becoming the responsible energy major
On October 18, 2019, TOTAL announced the opening of a digital factory in Paris in early 2020 that will bring together up to 300 developers, data scientists and other experts to accelerate the Groups digital transformation. TOTALs goal is to leverage the capabilities of digital tools to create value in all of its businesses.
The digital factory will be tasked with developing the digital solutions TOTAL needs to improve its operations, in terms of both availability and cost; offer new services to customers, notably in the area of managing and controlling energy consumption, extend its reach to new distributed energies; and reduce its environmental impact. TOTALs ambition is to generate as much as $1.5 billion in value per year for the company by 2025 through additional revenue and reductions in operating or investment expenses.
Under the supervision of Frédéric Gimenez, chief digital officer of TOTAL and project manager of the digital factory, teams comprising top developers, data scientists, architects and specialists in agile methodologies will work with operating personnel from TOTALs different businesses in the 5,500-square-meter facility located in the center of Paris. From deep in the citys innovation ecosystem, they will shape the energy professions of tomorrow, focusing on solutions that can be deployed agilely within the Group.
The Digital Factory is a new step in Totals transformation process. It follows on the signature of major partnership agreements with Google on artificial intelligence and geosciences and with Tata Consultancy Services on Refinery 4.0.
Deutsche Post DHL Group and TOTAL reinforce their worldwide collaboration on energy solutions and innovative logistics
On October 14, 2019, TOTAL announced the signing of a strategic cooperation agreement with Deutsche Post DHL Group (DPDHL Group) to strengthen their partnership and their commitment to work together for sustainable mobility and low-carbon energies, logistics and transport services, and contribute to the implementation of their global business ambitions.
Thanks to their complementary geographic presence, the two groups will be able to benefit from new commercial cross-business opportunities, as a customer and a supplier respectively. This B2B partnership displays a common desire of the two companies to work even more closely together on technological and digital challenges and climate issues. Both companies will explore and develop concrete projects alongside their daily business operations and core expertise, including multi-energy offers, sustainable mobility, new solutions for fleet management as well as contract logistics, global freight forwarding, added value supply chain solutions, road freight and express services.
Built on a long history of commercial relationships in more than 100 countries around the world, this B2B agreement between the two groups is also expected to leverage their respective global organizations to implement operational excellence, support sustainable business growth, and shape the future through innovation.
TOTAL expands its strategic partnership with Adani to supply and market natural gas in India
On October 14, 2019, TOTAL, the worlds second-largest LNG player, as part of its strategy to develop new gas markets, announced the expansion of its partnership with the Adani Group, the largest energy and infrastructure conglomerate in India, to contribute to the development of the Indian natural gas market.
The Indian natural gas market represents a substantial growth perspective. Natural gas currently represents only 7% of the energy consumption in India but has grown over the last 3 years by more than 5% per annum, supported by an active policy of the Indian government that aims to diversify its energy mix and develop domestic use of gas in cities and as fuel for vehicles. India has set the ambitious target of increasing the share of natural gas in its energy mix to 15% by 2030.
The partnership between Adani (50%) and TOTAL (50%) includes several assets across the gas value chain notably two imports and regasification LNG terminals: Dhamra in East India and potentially Mundra in the West, as well as Adani Gas Limited, one of the 4 main distributors of city gas in India of which Adani currently holds 74.8% and of which TOTAL will acquire 37.4%.
Adani Gas Limited aims to expand its distribution of gas in the next 10 years through its 38 concessions covering 7.5% of the Indian population and market natural gas to industrial, commercial and domestic customers, targeting 6 million homes as well as through 1,500 retail outlets of natural gas for vehicles.
As part of this partnership, TOTAL will bring its LNG and retail expertise and will supply LNG to Adani Gas Limited. TOTAL and Adani will also establish a joint venture to market LNG in India and Bangladesh.
To reach a 37.4% shareholding in Adani Gas Limited in accordance with Indian stock market regulations and subject to regulatory approvals, TOTAL will initially launch a tender offer to public shareholders to acquire up to 25.2% of equity shares before buying the remaining shares from Adani.
Taking into account the divestiture of the Groups interest in Hazira terminal early 2019, the establishment of this partnership on gas in India represents a net acquisition cost for TOTAL of approximately $600 million over 2019-2020.
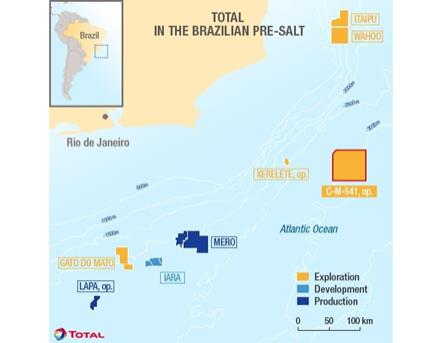
Brazil: TOTAL expands pre-salt footprint with new deep offshore exploration license
On October 10, 2019, TOTAL, operator, and its co-venturers Qatar Petroleum and Petronas announced that they won the C-M-541 deep offshore block in the 16th bidding round held by Brazils National Petroleum Agency (ANP). The acreage is located in the pre-salt Campos Basin in a water depth of about 3,000 meters.
TOTAL will operate the block with a 40% interest, alongside Qatar Petroleum (40%) and Petronas (20%). The consortium plans to drill a first exploration well in 2021.
This entry into a new block follows the FID made by TOTAL and its partners in June 2019 for the second FPSO of the Mero project (Libra Block), which is expected to start up in 2022. Currently under construction, the first FPSO of the Mero project is progressing according to schedule, with start-up planned in 2021. The first FPSO of the Iara project is expected to start up later this year and the second one in 2020.
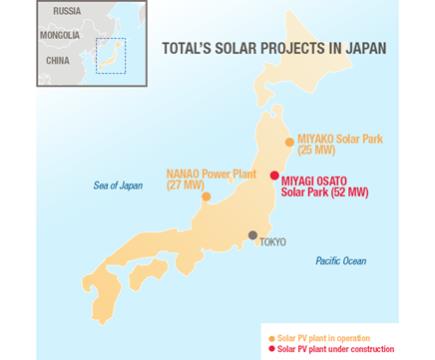
TOTAL launches construction of its third solar power plant in Japan
On October 8, 2019, Total Solar International, a wholly owned TOTAL subsidiary dedicated to utility-scale solar plants, announced the start of the construction of Miyagi Osato Solar Park, a large-scale solar plant of 52 megawatt-peak (MWp) located in Osato, Miyagi prefecture, Japan. The project, which has achieved financial close, is expected to start up in 2021 and will provide clean and reliable electricity to Japanese households.
The plant is designed to fully meet Japans stringent earthquake-resistant building standards. The facility will be equipped with around 116,000 SunPower® Maxeon® high efficiency solar panels that deliver reliable performance throughout the entire life of every installation.
The plant will be operated by Miyagi Osato Solar Park G.K., a special purpose company, majority-owned by Total Solar International (90%), alongside SB Energy Corp. (SB Energy) (10%), a Japanese subsidiary of SoftBank Group.
The launch of the construction of Miyagi Osato Solar Park follows the beginning of the operation of two other large-scale solar plants of Total Solar International in Japan: Miyako Solar Park (25 MWp, 2019) and Nanao Power Plant (27 MWp, 2017). This rapid growth (over 100 MWp of cumulative capacity achieved in 2 years) sets TOTAL as one of the most dynamic players in the Japanese solar market.
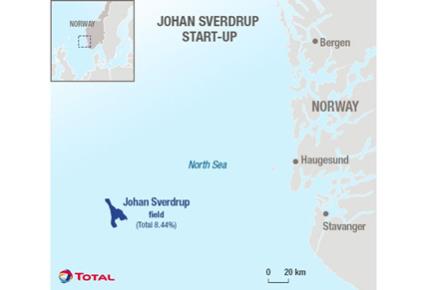
Norway: Johan Sverdrup giant field starts up in the North Sea
On October 7, 2019, TOTAL announced the start-up of the production from phase 1 of the giant Johan Sverdrup field, more than two months ahead of schedule and with a cost reduced by more than 30%. The total investment amounts to approximately $10.5 billion. Johan Sverdrup is operated by Equinor (42.6267%), alongside Lundin Norway (20%), Petoro (17.36%), Aker BP (11.5733%) and TOTAL (8.44%).
Johan Sverdrup ranks among the world top three offshore projects in terms of carbon emission efficiency. With well below 1 kg of CO2 emitted per barrel, emissions savings are largely due to the electric supply from shore compared with traditional offshore gas turbines.
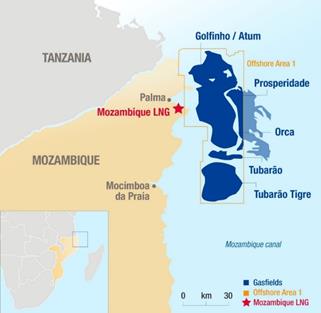
TOTAL closes the acquisition of Anadarkos shareholding in Mozambique LNG
On September 30, 2019, TOTAL announced the closing of the acquisition of Anadarkos 26.5% operated interest in the Mozambique LNG project for a purchase price of $ 3.9 billion.
This closing comes after TOTAL reached a binding agreement with Occidental on May 3, 2019, to acquire Anadarkos assets in Africa (Mozambique, Algeria, Ghana and South Africa) and signed the subsequent purchase and sale agreement on August 3, 2019. This first transaction follows receipt of all requisite approvals by the relevant authorities and partners.
TOTAL operates Mozambique LNG with a 26.5% participating interest alongside ENH Rovuma Área Um, S.A. (15%), Mitsui E&P Mozambique Area1 Ltd. (20%), ONGC Videsh Ltd. (10%), Beas Rovuma Energy Mozambique Limited (10%), BPRL Ventures Mozambique B.V. (10%) and PTTEP Mozambique Area 1 Limited (8.5%).
Closing operations are still ongoing in relation to Anadarkos assets in the other countries (Algeria, Ghana, South Africa).
2019 Strategy & Outlook Presentation
On September 24, 2019, Patrick Pouyanné, Chairman and CEO of TOTAL S.A., Jean-Pierre Sbraire, CFO of TOTAL S.A., and Helle Kristoffersen, President, Strategy Innovation of TOTAL S.A., presented TOTALs Strategy & Outlook in New York.
The presentation confirms TOTALs implementation of its strategy for profitable and sustainable growth for the benefit of all of its stakeholders, taking into account the evolution of energy markets. It also provides strong visibility on the Groups roadmap to 2025.
Key messages of the presentation include:
| Coping with volatile and changing energy markets |
TOTAL is adapting to changing energy markets to ensure a sustainable future. Energy demand growth will benefit mainly gas and electricity, and, within these markets, LNG and renewables will grow the fastest.
| Maintaining the Groups breakeven below 30 $/b and strong financial position to ensure a sustainable future |
In face of volatile energy markets, TOTAL focuses on operational excellence and financial discipline to maintain a low breakeven and strong balance sheet. In recent years, TOTAL has successfully reduced its organic pre-dividend breakeven to less than 30 $/b and confirms its key objective to maintain it below this level to be resilient in any price environment. Discipline on costs will be maintained, illustrated by the additional $1 billion cost reduction target until 2023 notably supported by a strong digital ambition. A strong balance sheet with a gearing expected to be maintained below 20% further strengthens the resilience of the Group.
| Oil & Gas: building on the Groups strengths for sustainable and profitable growth |
TOTAL benefits from a large portfolio of profitable projects to fuel its future growth post 2023, leveraging a favorable oil service cost environment. Renewing reserves is based on two engines: exploration with recent discoveries in North Sea, South Africa and Guyana and access to discovered resources. TOTAL has also demonstrated its agility by making counter-cyclical acquisitions that have significantly high-graded the portfolio. The acquisition of Anadarkos African assets fits perfectly into the strategy and improves visibility on the Groups future. Downstream should make significant additional contributions to cash flow. Refining-Chemicals is focusing on growing petrochemicals using low cost feedstock on integrated platforms and Marketing & Services is expanding in large fast growing markets. Both segments also invest in new businesses linked to the development of low carbon economy (biofuels, bioplastics, plastic recycling, EV charging points, natural gas for trucks and shipping, etc.).
| Investing in growing energy markets for sustainable long term |
The energy transition leads to a growing role for both natural gas (mainly LNG) and electricity in the energy mix. TOTAL expects to increase its LNG sales to 50 Mt per year by 2025, supporting expected cash flow from operations growth in integrated LNG of 2.5 times between 2018 and 2025. In low carbon electricity, TOTAL expects to invest $1.5-$2 billion per year, notably in Europe, as a power producer from renewables and natural gas and distributor, targeting 8 million customers by 2025. Beyond Europe, TOTAL is leveraging strong electricity demand by investing in renewables generation using a capital light model to ensure more than 15% expected equity IRR. This strategy for LNG and electricity contributes to the Groups ambition to reduce the carbon intensity of the energy products used by its customers by 15% between 2015 and 2030.
| Outlook 2025 & Shareholder return |
TOTAL expects to generate production growth of more than 5% per year between 2018 and 2021, followed by a stable period between 2022-23, and growth should then resume at more than 3% per year driven mainly by LNG project start-ups. TOTAL targets to deliver such growth while capital discipline is expected to be maintained with $16-18 billion per year capital investment over 2019 to 2023.
As a result of this strong outlook, the Board of Directors decided to accelerate dividend growth for the coming years with a guidance of increasing the dividend by 5% to 6% per year. As a result, the proposed amount for the third interim dividend for 2019 will be 0.68 per share, an increase of 6% compared to the third interim dividend for 2018.
These decisions reflect the Board of Directors confidence in the ability of the Group to deliver sustainable and profitable growth for the coming years.
South Korea: Hanwha Total Petrochemical increases ethylene production capacity by 30%
On September 17, 2019, TOTAL announced that the Daesan integrated refining and petrochemicals complex in South Korea, a company owned by Hanwha Total Petrochemical (a 50/50 joint venture between TOTAL and Hanwha), started its new ethylene production capacities. With a $450 million investment, the site can produce up to 1.4 million tons per year of ethylene, an increase of 30%.
This project was launched in April 2017 and is the first in a series of three at the complex. More than $300 million are being invested to expand polyethylene production capacity by 50% to 1.1 million tons per year by the end of 2019, and nearly $500 million are being invested to increase polypropylene production capacity by close to 60% to an expected 1.1 million tons per year by 2021.
TOTAL and Envision join forces to capture the fast-growing distributed solar energy market in China
On September 16, 2019, TOTAL announced that TEESS, a 50/50 joint venture company established by TOTAL and Envision Group, a global leading smart energy technology company, had launched its commercial activity to develop on-site distributed generation solar projects for B2B customers in China.
TEESS will offer its clients a unique combination of distributed solar energy systems and digital solar energy solutions running on Envisions AIoT Operating System EnOS. This offer will allow the clients to decarbonize their energy while reducing energy costs, optimizing & digitalizing energy management, and enhancing the safety and reliability of energy utilization.
Russia: launch of the giant Arctic LNG 2 development
On September 5, 2019, TOTAL announced that TOTAL, Novatek and the other project shareholders approved the final investment decision (FID) for Arctic LNG 2, a major liquefied natural gas (LNG) development located on the Gydan peninsula, Russia. The projects production capacity is expected to amount to 19.8 million tons per year (Mt/y) and is expected to export its first LNG cargo by 2023, the second and third trains are expected to start up by 2024 and 2026.
TOTAL has a direct 10% interest in Arctic LNG 2 alongside Novatek (60%), CNOOC (10%), CNPC (10%) and a Mitsui-Jogmec consortium, Japan Arctic LNG (10%). TOTAL also owns an 11.6% indirect participation in the project through its 19.4% stake in Novatek, thus an aggregate economic interest of 21.6% in the project.
TOTAL S.A.s Executive Committee appointments
On September 2, 2019, TOTAL S.A. announced that two new members have joined its Executive Committee.
As of August 1, 2019, Jean-Pierre Sbraire was appointed Chief Financial Officer and member of TOTAL S.A.s Executive Committee, following Patrick de La Chevardières retirement.
As of August 19, 2019, Helle Kristoffersen was appointed President, Strategy & Innovation and member of TOTAL S.A.s Executive Committee. The position was previously held by Philippe Sauquet, now focusing on his responsibilities as President, Gas Renewables & Power.
TOTAL S.A.s Executive Committee now consists of:
| Patrick Pouyanné, Chairman and Chief Executive Officer. |
| Arnaud Breuillac, President, Exploration & Production. |
| Helle Kristoffersen, President, Strategy & Innovation. |
| Momar Nguer, President, Marketing & Services. |
| Bernard Pinatel, President, Refining & Chemicals. |
| Philippe Sauquet, President, Gas Renewables & Power. |
| Jean-Pierre Sbraire, Chief Financial Officer. |
| Namita Shah, President, People & Social Responsibility. |
Uganda: termination of the agreement with Tullow
On August 29, 2019, TOTAL announced the termination of the acquisition agreement entered into with Tullow on January 9, 2017. On January 9, 2017, TOTAL and Tullow entered into a sale and purchase agreement whereby TOTAL would acquire 21.57% out of Tullows 33.33% interest in the Lake Albert licenses. CNOOC exercised its right to pre-empt 50% of the transaction. As a result, TOTAL and CNOOC would have each increased their interest to 44.1% while Tullow would have kept 11.8%.
Since 2017, all parties have been actively progressing the sale and purchase agreement. However, despite diligent discussions with the authorities, no agreement on the fiscal treatment of the transaction has been reached. The deadline for closing the transaction has been extended several times, clearly demonstrating the endeavors of the parties to find an agreement. The final deadline was reached at the end of August 29, 2019, and as such, the acquisition agreement was automatically terminated.
TOTALs interest therefore remains at 33.3% on blocks EA1, EA2 and EA3 prior to the 15% national company back-in, TOTAL being operator of the block EA1. TOTAL keeps the right to pre-empt any future transactions, in case any party divests part or all of its interest.
TOTAL strengthens its international partnership with Qatar Petroleum
On August 27 2019, TOTAL announced that TOTAL and Qatar Petroleum have strengthened their international partnership by signing agreements under which Qatar Petroleum will farm into TOTAL-held exploration acreage in Namibia, Guyana and Kenya. Following completion of the transactions, which are subject to approval by relevant authorities, Qatar Petroleum will partner with TOTAL in each country as outlined below:
| Namibia: TOTAL will transfer to Qatar Petroleum a 30% interest in Block 2913B and retain a 40% interest. TOTAL will also transfer to Qatar Petroleum 28.33% in Block 2912 and retain 37.78%. The deepwater blocks are located in the Orange Basin, offshore Namibia. A first exploration well is scheduled to be drilled next year on Block 2913B. |
| Guyana: Qatar Petroleum will have 40% of the company holding TOTALs existing 25% interests in the Orinduik and Kanuku blocks, adjacent to the Stabroek Block in the prolific offshore Guyana Basin. TOTAL will retain the remaining 60% of this company. Following the Jethro discovery on the Orinduik license earlier this month, a second exploration well (Joe-1) is being drilled on the same block. A third (Carapa-1) is planned for later this year on the Kanuku license. |
| Kenya: with ENI, TOTAL will transfer a combined 25% interest in Blocks L11A, L11B and L12 to Qatar Petroleum. TOTALs interest will be reduced from 45% to 33.75%. All three blocks are located in Kenyas deep offshore. An exploration well is planned for Block L11B in 2020. |
Qatar Petroleum became a shareholder of Total E&P Congo in 2013, acquiring 15% of its share capital. In 2018, TOTAL transferred a 25% working interest to Qatar Petroleum in the 11B/12B license it operates in South Africa, site of the recent Brulpadda discovery.
TOTAL inaugurates its thousandth solar-powered service station
On August 26, 2019, TOTAL announced the inauguration of its thousandth solarized service station, powered by solar panels. The rooftop solar systems at the TOTAL Palmeraie retail outlet in Marrakech, Morocco, are a milestone in the companys program to solarize certain of its service stations worldwide, begun in late 2016.
TOTAL is also solarizing production sites, such as plants and refineries, and office buildings. A number of projects to equip various plants or office buildings with solar panels have been identified, adding up to a nominal power of more than 200 MW-peak, equivalent to the electricity demand of a city of 200,000 people.
France: TOTAL sells interest in pipeline network
On August 5, 2019, TOTAL announced the signing of an agreement to sell a 30% interest in Société des Transports Pétroliers par Pipelines (Trapil) to Pisto SAS for 260 million (approximately $290 million).
Following the transaction, which is subject to French regulatory approvals, TOTAL will remain a minority shareholder with an interest of 5.55% and will continue to use Trapil infrastructure under the current terms and conditions to carry products from the Normandy and Grandpuits refineries.
Exhibit 99.3
CAPITALIZATION AND INDEBTEDNESS OF TOTAL
(unaudited)
The following table sets out the unaudited consolidated capitalization and long-term indebtedness, as well as short-term indebtedness, of the Group as of September 30, 2019, prepared on the basis of IFRS. Currency amounts are expressed in U.S. dollars (dollars or $) or in euros (euros or ).
At September 30, 2019 |
||||
(in millions of dollars) | ||||
Current financial debt, including current portion of non-current financial debt |
||||
Current portion of non-current financial debt |
5,687 | |||
Current financial debt |
8,944 | |||
Current portion of financial instruments for interest rate swaps liabilities |
430 | |||
Other current financial instruments liabilities |
339 | |||
Financial liabilities directly associated with assets held for sale |
| |||
|
|
|||
Total current financial debt |
15,400 | |||
|
|
|||
Non-current financial debt |
47,923 | |||
Non-controlling interests |
2,319 | |||
Shareholders equity |
||||
Common shares |
8,300 | |||
Paid-in surplus and retained earnings |
123,805 | |||
Currency translation adjustment |
13,297 | |||
Treasury shares |
(3,814 | ) | ||
|
|
|||
Total shareholders equity Group share |
114,994 | |||
|
|
|||
Total capitalization and non-current indebtedness |
165,236 | |||
|
|
As of September 30, 2019, TOTAL S.A. had an authorized share capital of 3,659,166,009 ordinary shares with a par value of 2.50 per share, and an issued share capital of 2,666,990,510 ordinary shares (including 69,066,330 treasury shares from shareholders equity).
As of September 30, 2019, approximately $6,308 million of the Groups non-current financial debt was secured and approximately $41,616 million was unsecured, and all of the Groups current financial debt of $8,944 million was unsecured. As of September 30, 2019, TOTAL had no outstanding guarantees from third parties relating to its consolidated indebtedness. For more information about TOTALs off balance sheet commitments and contingencies, see Note 13.1 of the Notes to TOTALs audited Consolidated Financial Statements in its Annual Report on Form 20-F for the year ended December 31, 2018, filed with the Securities and Exchange Commission on March 20, 2019, as amended on April 26, 2019.
Except as disclosed herein, there have been no material changes in the consolidated capitalization, indebtedness and contingent liabilities of TOTAL since September 30, 2019.
,B1?O;>O?T^M "1SQ2DB.5'QUVL#B@ \^$*S>:FU3@G<,"@ :>% 2TJ #&
ME 7&C1].$,D(LXA')C
! MSCM5>/FW&>>>]6/X5':LM'J:ZH2:+S!A6( Y"]JJ-N1@%4%CU(J^G0U57[V? M>A28-#2<80@_6K"&*./*GD]!4T*!S MG-1QD^7C/:EC_B^@J&[/0M(@\MTR9"=N> !4K"13\J'\*ER M).3MH]IY M![,@\W"DD;=W IT #*@(!Z4W44590%4#*]A5)\Q+5B5-F 5 M))7@U!*GF.<]NA%16K'>HR<8J5NC?2CEU#FT!6*A1D\\<"GLXQAN/PJNW &* MF3D#//%'*@NR1'W=6IMQ;F2(O&P$@/!'>HG $#$#G'6F0L?+;D]/6I<1IDJL MWD !\OT^Z:8PB\S;(I+8Y8?UJTG\'TH7YHV)YQGK6
I@MPJYB MN"<=59<$56^[%E>#[4])'\V/YVYZ\U21+98VS2XWR?4^E*;%47(+Y]5Q^M.D M)^7GKUJ:$D$@' ]*NUA;E!83O+!B1ZXP1^%*D3 3M/)J2,G"\GK3:TN(FP_!*$$] M .U*20Q5CTZ@4J,=XY/YU"2>>3]ZES,=B4/D8R<4A)W#)_&G'H?I1V'UJDV2 M1_QC/YTXC@\\^E1O]YOK3NU4Q(=D#@@_C3A'&Y&21GTJ$_UH4G(Y-#36J8EK MHQQ1L9QG'6DSCCG-.).!S4C@8'%4IW=F)QML19;!VF@LQ'.:0=!2L2#Q0W9[ M"6PAQZ49ZBD?[PIQZ5:=UJ2] #'\!ZTF[FD;C-+_ ,L\T^5"YF!;GUHW-[XI M.])0XI I-CAO S1AL9/ZTB]*E'1OI6;E;H78B. A^E-/W :J+Y %B6K'_]D! end
_;_&GI*'+85AC&<^]7&K"3LF3*
M$ENB2K\?^K7Z"L\UH1_ZI?H**A='=CJ***R-PHHHH **** "BBB@ HHHH **
M** .3T#_ %^M?]A.;^E/O)$DN"4.<#!/J:KZ0Q4:\0"3_:,W3\*;M#8;ICIZ
MU4G[I$%[[8-@'@'KS@?SJ982\1DS]T\ #K4ELCJS%A@'&*MBO*K8R2ERQ.Z-
M%6NRO!C[JY'4FHW=(P"[A03@$GO0VDKO8$FW9;CJ4#-*%[GI2$Y]A
MZ57H(&[ =!2444""J][>V^G6
OX?B16=-P;@];?Y:?U
MV'?8H-K#:<,,'GM1]B@^;Y/O \^E6**[?84OY4/PS7H.YD\Y(_MLA4D[F9AP?;
M&:VKC5-(2V(L;9&9S' ZR(0&B)(R/4=:M-JOA]!<%XBI5%AD#1G+(> ![4