Exhibit 99.1
OPERATING AND FINANCIAL REVIEW AND PROSPECTS
The terms “TotalEnergies”, “TotalEnergies
company” and “Company” in this document are used to designate TotalEnergies SE and the consolidated entities directly
or indirectly controlled by TotalEnergies SE.
The financial information on pages 1-18 of
this exhibit concerning TotalEnergies SE and the consolidated entities directly or indirectly controlled by TotalEnergies SE with respect
to the first quarter 2022 has been derived from TotalEnergies’ unaudited consolidated balance sheets as of March 31, 2022,
unaudited statements of income, comprehensive income, cash flow and business segment information for the first quarter 2022 and unaudited
consolidated statements of changes in shareholders’ equity for the first quarter 2022 on pages 20 et seq. of this exhibit.
The following discussion should be read in conjunction
with the aforementioned financial statements and with the information, including TotalEnergies’ audited consolidated financial
statements and related notes, provided in TotalEnergies’ Annual Report on Form 20-F for the year ended December 31,
2021, filed with the Securities and Exchange Commission (“SEC”) on March 25, 2022.
| in
millions of dollars |
1Q22 |
4Q21 |
1Q22
vs
4Q21 |
1Q21 |
1Q22
vs
1Q21 |
| Sales |
68,606 |
60,348 |
+14% |
43,737 |
+57% |
| Adjusted
EBITDA1 |
17,424 |
14,285 |
+22% |
8,170 |
x2.1 |
| Adjusted
net operating income2 from business segments |
9,458 |
7,316 |
+29% |
3,487 |
x2.7 |
| Exploration &
Production |
5,015 |
3,525 |
+42% |
1,975 |
x2.5 |
| Integrated
Gas, Renewables & Power |
3,051 |
2,759 |
+11% |
985 |
x3.1 |
| Refining &
Chemicals |
1,120 |
553 |
x2 |
243 |
x4.6 |
| Marketing &
Services |
272 |
479 |
-43% |
284 |
-4% |
| Net
income (loss) from equity affiliates |
43 |
1,860 |
-98% |
881 |
-95% |
| Fully-diluted
earnings per share ($) |
1.85 |
2.17 |
-15% |
1.23 |
+50% |
| Fully-diluted
weighted-average shares (millions) |
2,614 |
2,644 |
-1% |
2,645 |
-1% |
| Net
income (TotalEnergies share) |
4,944 |
5,837 |
-15% |
3,344 |
+48% |
| Organic
investments3 |
1,981 |
4,681 |
-58% |
2,379 |
-17% |
| Net
acquisitions4 |
922 |
(396) |
ns |
1,590 |
-42% |
| Net
investments5 |
2,903 |
4,285 |
-32% |
3,969 |
-27% |
| Cash
flow from operating activities6 |
7,617 |
11,621 |
-34% |
5,598 |
+36% |
| Of
which: |
|
|
|
|
|
| (increase)
decrease in working capital |
(4,923) |
2,232 |
ns |
(819) |
ns |
| financial
charges |
(369) |
(398) |
ns |
(384) |
ns |
| 1 |
Adjusted EBITDA (Earnings
Before Interest, Tax, Depreciation and Amortization) corresponds to the adjusted earnings before depreciation, depletion and
impairment of tangible and intangible assets and mineral interests, income tax expense and cost of net debt, i.e., all operating
income and contribution of equity affiliates to net income. For further detail, refer to the table “Reconciliation of Net
Income (Totalenergies Share) to Adjusted EBITDA” on page 16 of this exhibit. |
| 2 |
Adjusted results are defined
as income using replacement cost, adjusted for special items, excluding the impact of changes for fair value. See pages 4 et
seq. “Analysis of Business Segment Results” below for further details. |
| 3 |
“Organic investments”
= net investments excluding acquisitions, asset sales and other operations with non-controlling interests. |
| 4 |
“Net acquisitions”
= acquisitions - assets sales - other transactions with non-controlling interests (see page 17). |
| 5 |
“Net investments”
= organic investments + net acquisitions (see “Investments – Divestments’” on page 17). |
| 6 |
See also “C. TotalEnergies
results – Cash Flow”. The reconciliation table for different cash flow figures is set forth under “Cash Flow”
on page 17 of this exhibit. |
Environment* — liquids and gas price realizations, refining
margins
|
|
1Q22 |
|
4Q21 |
|
1Q22
vs
4Q21 |
|
1Q21 |
|
1Q22
vs
1Q21 |
|
| Brent
($/b) |
|
102.2 |
|
79.8 |
|
+28% |
|
61.1 |
|
+67% |
|
| Henry
Hub ($/Mbtu) |
|
4.6 |
|
4.8 |
|
-5% |
|
2.7 |
|
+69% |
|
| NBP**
($/Mbtu) |
|
32.3 |
|
32.8 |
|
-2% |
|
6.8 |
|
x4.8 |
|
JKM*** ($/Mbtu) |
|
31.1 |
|
35.0 |
|
-11% |
|
10.0 |
|
x3.1 |
|
Average
price of liquids ($/b)
Consolidated subsidiaries |
|
90.1 |
|
72.6 |
|
+24% |
|
56.4 |
|
+60% |
|
Average
price of gas ($/Mbtu)
Consolidated subsidiaries |
|
12.27 |
|
11.38 |
|
+8% |
|
4.06 |
|
x3 |
|
Average price of LNG ($/Mbtu)
Consolidated subsidiaries and equity affiliates |
|
13.60 |
|
13.12 |
|
+4% |
|
6.08 |
|
x2.2 |
|
Variable
cost margin – Refining Europe, VCM
($/t)**** |
|
46.3 |
|
16.7 |
|
x2.8 |
|
5.3 |
|
x8.7 |
|
*
The indicators are shown on page 19.
** NBP (National Balancing Point) is
a virtual natural gas trading point in the United Kingdom for transferring rights in respect of physical gas and which is widely used
as a price benchmark for the natural gas markets in Europe. NBP is operated by National Grid Gas plc, the operator of the UK transmission
network.
*** JKM (Japan-Korea Marker) measures
the prices of spot LNG trades in Asia. It is based on prices reported in spot market trades and/or bids and offers collected after the
close of the Asian trading day at 16:30 Singapore time.
**** This indicator represents TotalEnergies’
average margin on variable cost for refining in Europe (equal to the difference between TotalEnergies European refined product sales
and crude oil purchases with associated variable costs divided by volumes refined in tons).
The average LNG selling price at $13.60/Mbtu is up 4% this quarter
compared to the previous quarter, benefiting on a lagged basis from the increase in oil and gas indexes on long-term contracts as well
as high spot gas prices in the quarter.
Greenhouse gas emissions (GHG)1
| GHG
emissions (MtCO2e) |
1Q22 |
4Q21 |
1Q22
vs 4Q21 |
1Q21 |
1Q22
vs 1Q21 |
| Scope 1+2
from operated facilities2 |
9.6 |
9.9 |
-3% |
9.2* |
+5% |
| Scope 1+2
– equity share |
14.0 |
- |
- |
- |
- |
| Scope 3 Oil &
Gas Worldwide3 |
98* |
108* |
-9% |
98* |
- |
| of
which Scope 3 Oil Worldwide4 |
66* |
75* |
-12% |
69* |
-4% |
| Scope 1+2+3
in Europe5 |
66* |
69* |
-4% |
64* |
+3% |
| of
which Scope 3 in Europe |
60* |
63* |
-4% |
58* |
+3% |
Estimated 1Q22
emissions.
* Excluding Covid
effect.
1 The
six greenhouse gases in the Kyoto protocol, namely CO2, CH4, N2O, HFCs, PFCs and SF6, with
their respective GWP (Global Warming Potential) as described in the 2007 IPCC report. HFCs, PFCs and SF6 are virtually absent from the
Company’s emissions or are considered as non-material and are therefore not counted.
2 Scope
1+2 GHG emissions of operated facilities are defined as the sum of direct emissions of greenhouse gases from sites or activities that
are included in the scope of reporting (as defined in TotalEnergies’ 2021 Form 20-F filed on March 25, 2022) and indirect
emissions attributable to brought-in energy (electricity, heat, steam), excluding purchased industrial gases (H2).
3 TotalEnergies
reports Scope 3 GHG emissions, category 11, which correspond to indirect GHG emissions related to the use by customers of energy
products, i.e., combustion of the products to obtain energy. The Company follows the oil & gas industry reporting
guidelines published by IPIECA, which comply with the GHG Protocol methodologies. In order to avoid double counting, this
methodology accounts for the largest volume in the oil and gas value chain, i.e., the higher of the two production volumes or sales
to end customers. For TotalEnergies, in 2021 and 2022, the calculation of Scope 3 GHG emissions for the oil value chain considers oil
products and biofuels sales (higher than production) and for the gas value chain, gas sales either as LNG or as part of direct sales
to B2B/B2C customers (higher than or equivalent to marketable gas production).
4 Scope
3 GHG emissions, category 11, which correspond to indirect GHG emissions related to the sale of petroleum products (including biofuels).
5 Scope
1+2+3 GHG emissions in Europe are defined as the sum of Scope 1+2 GHG emissions of facilities operated by the Company and indirect GHG
emissions related to the use by customers of energy products (Scope 3) in the EU, Norway, United Kingdom and Switzerland.
| Methane
emissions (ktCH4) |
1Q22 |
4Q21 |
1Q22 |
1Q21 |
1Q22 |
|
| vs |
vs |
|
| |
|
|
4Q21 |
|
1Q21 |
|
| Methane emissions
from operated facilities |
10 |
12 |
-17% |
13 |
-23% |
|
| |
|
|
|
|
|
|
| Methane
emissions - equity share |
12 |
- |
- |
- |
- |
|
Estimated 1Q22
emissions. Equity share quarterly 2021 data is not available.
Production*
Hydrocarbon
production |
1Q22 |
4Q21 |
1Q22
vs
4Q21 |
1Q21 |
1Q22
vs
1Q21 |
| Hydrocarbon
production (kboe/d) |
2,843 |
2,852 |
- |
2,863 |
-1% |
| Oil
(including bitumen) (kb/d) |
1,305 |
1,278 |
+2% |
1,272 |
+3% |
| Gas
(including condensates and associated NGL) (kboe/d) |
1,538 |
1,574 |
-2% |
1,591 |
-3% |
Hydrocarbon
production |
1Q22 |
4Q21 |
1Q22
vs
4Q21 |
1Q21 |
1Q22
vs
1Q21 |
| Hydrocarbon
production (kboe/d) |
2,843 |
2,852 |
- |
2,863 |
-1% |
| Liquids
(kb/d) |
1,527 |
1,509 |
+1% |
1,508 |
+1% |
| Gas
(Mcf/d) |
7,162 |
7,328 |
-2% |
7,400 |
-3% |
*
TotalEnergies production = production of Exploration & Production segment (EP) + production of Integrated Gas, Renewables &
Power segment (iGRP).
Hydrocarbon production was 2,843 thousand barrels
of oil equivalent per day (kboe/d) in the first quarter 2022, down 1% year-on-year, comprised of:
| |
● |
+2% due to the start-up
and ramp-up of projects, including the CLOV Phase 2 and Zinia Phase 2 projects in Angola, as well as Iara in Brazil, |
| |
● |
+2% due to the increase
in production quotas of OPEC+ countries, |
| |
● |
-2% due to portfolio effect,
in particular related to the end of the Qatargas 1 operating license and the Utica asset sale in the United States, |
| |
● |
-1% due to the price effect, |
| |
● |
-2% due to natural decline
of fields. |
| B. |
ANALYSIS OF BUSINESS
SEGMENT RESULTS |
Financial information by business segment is reported
in accordance with the internal reporting system and shows internal segment information that is used to manage and measure the performance
of TotalEnergies and which is reviewed by the main operational decision-making body of TotalEnergies, namely the Executive Committee.
Due to their unusual nature or particular significance,
certain transactions qualifying as “special items” are excluded from the business segment figures. In general, special items
relate to transactions that are significant, infrequent or unusual. In certain instances, certain transactions such as restructuring
costs or asset disposals, which are not considered to be representative of the normal course of business, may qualify as special items
although they may have occurred in prior years or are likely to occur again in following years.
In accordance with IAS 2, TotalEnergies values
inventories of petroleum products in its financial statements according to the First-In, First-Out (FIFO) method and other inventories
using the weighted-average cost method. Under the FIFO method, the cost of inventory is based on the historic cost of acquisition or
manufacture rather than the current replacement cost. In volatile energy markets, this can have a significant distorting effect on the
reported income. Accordingly, the adjusted results of the Refining & Chemicals and Marketing & Services segments are
presented according to the replacement cost method. This method is used to assess the segments’ performance and facilitate the
comparability of the segments’ performance with those of its main competitors. In the replacement cost method, which approximates
the Last-In, First-Out (LIFO) method, the variation of inventory values in the statement of income is, depending on the nature of the
inventory, determined using either the month-end price differential between one period and another or the average prices of the period
rather than the historical value. The inventory valuation effect is the difference between the results under the FIFO and replacement
cost methods.
The effect of changes in fair value presented
as an adjustment item reflects, for trading inventories and storage contracts, differences between internal measures of performance used
by TotalEnergies’ Executive Committee and the accounting for these transactions under IFRS. IFRS requires that trading inventories
be recorded at their fair value using period-end spot prices. In order to best reflect the management of economic exposure through derivative
transactions, internal indicators used to measure performance include valuations of trading inventories based on forward prices. TotalEnergies,
in its trading activities, enters into storage contracts, the future effects of which are recorded at fair value in TotalEnergies’
internal economic performance. IFRS precludes recognition of this fair value effect. Furthermore, TotalEnergies enters into derivative
instruments to risk manage certain operational contracts or assets. Under IFRS, these derivatives are recorded at fair value while the
underlying operational transactions are recorded as they occur. Internal indicators defer the fair value on derivatives to match with
the transaction occurrence.
The adjusted business segment results (adjusted
operating income, adjusted net operating income, adjusted net income) are defined as replacement cost results, adjusted for special items,
excluding the effect of changes in fair value. For further information on the adjustments affecting operating income on a segment-by-segment basis,
and for a reconciliation of segment figures to figures reported in TotalEnergies’ interim consolidated financial statements, see
pages 25 et seq. of this exhibit.
TotalEnergies measures performance at the segment
level on the basis of adjusted net operating income. Net operating income comprises operating income of the relevant segment after deducting
the amortization and the depreciation of intangible assets other than leasehold rights, translation adjustments and gains or losses on
the sale of assets, as well as all other income and expenses related to capital employed (dividends from non-consolidated companies,
income from equity affiliates and capitalized interest expenses) and after income taxes applicable to the above. The income and expenses
not included in net operating income that are included in net income are interest expenses related to long-term liabilities net of interest
earned on cash and cash equivalents, after applicable income taxes (net cost of net debt and non-controlling interests). Adjusted
net operating income excludes the effect of the adjustments (special items and the inventory valuation effect) described above. Performance
indicators excluding the adjustment items, such as adjusted incomes and ROACE are meant to facilitate the analysis of the financial performance
and the comparison of income between periods.
B.1. Integrated Gas, Renewables &
Power segment (iGRP)
Production and sales of Liquefied Natural Gas (LNG) and electricity
Hydrocarbon production for LNG |
|
1Q22 |
|
4Q21 |
|
1Q22
vs
4Q21 |
|
1Q21 |
|
1Q22
vs
1Q21 |
|
| iGRP
(kboe/d) |
|
492 |
|
562 |
|
-13% |
|
518 |
|
-5% |
|
| Liquids
(kb/d) |
|
60 |
|
68 |
|
-11% |
|
64 |
|
-5% |
|
| Gas
(Mcf/d) |
|
2,349 |
|
2,697 |
|
-13% |
|
2,476 |
|
-5% |
|
Liquefied
Natural Gas in Mt |
|
1Q22 |
|
4Q21 |
|
1Q22
vs
4Q21 |
|
1Q21 |
|
1Q22
vs
1Q21 |
|
| Overall
LNG sales |
|
13.3 |
|
11.6 |
|
+15% |
|
9.9 |
|
+34% |
|
| including
sales from equity production* |
|
4.4 |
|
4.6 |
|
-4% |
|
4.4 |
|
+2% |
|
| including
sales by TotalEnergies from equity production and third party purchases |
|
11.9 |
|
10.1 |
|
+18% |
|
7.9 |
|
+51% |
|
* TotalEnergies’ equity production may be sold by TotalEnergies
or by the joint ventures.
Hydrocarbon production for LNG in the
first quarter 2022 is down 5% year-on-year, mainly due to the end of the Qatargas 1 operating license.
Total LNG sales in the first quarter 2022
are up 34% year-on-year, supported by strong European LNG demand.
Renewables &
Electricity |
|
1Q22 |
|
4Q21 |
|
1Q22
vs
4Q21 |
|
1Q21 |
|
1Q22
vs
1Q21 |
|
| Portfolio
of renewable power generation gross capacity (GW) (1),(2) |
|
46.8 |
|
43.0 |
|
+9% |
|
40.2 |
|
+16% |
|
| o/w
installed capacity |
|
10.7 |
|
10.3 |
|
+4% |
|
7.8 |
|
+37% |
|
| o/w
capacity in construction |
|
6.1 |
|
6.5 |
|
-7% |
|
5.1 |
|
+19% |
|
| o/w
capacity in development |
|
30.1 |
|
26.2 |
|
+15% |
|
27.3 |
|
+10% |
|
| Gross
renewables capacity with PPA (GW) (1),(2) |
|
26.8 |
|
28.0 |
|
-4% |
|
21.2 |
|
+26% |
|
| Portfolio
of renewable power generation net capacity (GW) (1),(2) |
|
34.4 |
|
31.7 |
|
+8% |
|
30.1 |
|
+14% |
|
| o/w
installed capacity |
|
5.4 |
|
5.1 |
|
+6% |
|
3.8 |
|
+45% |
|
| o/w
capacity in construction |
|
4.2 |
|
4.6 |
|
-9% |
|
3.1 |
|
+33% |
|
| o/w
capacity in development |
|
24.8 |
|
22.0 |
|
+13% |
|
23.2 |
|
+7% |
|
| Net
power production (TWh) (3) |
|
7.6 |
|
6.7 |
|
+14% |
|
4.7 |
|
+61% |
|
| incl.
power production from renewables |
|
2.2 |
|
1.9 |
|
+18% |
|
1.6 |
|
+43% |
|
| Clients
power - BtB and BtC (Million) (2) |
|
6.1 |
|
6.1 |
|
- |
|
5.7 |
|
+6% |
|
| Clients
gas - BtB and BtC (Million) (2) |
|
2.7 |
|
2.7 |
|
- |
|
2.7 |
|
+2% |
|
| Sales
power - BtB and BtC (TWh) |
|
16.3 |
|
16.1 |
|
+1% |
|
16.1 |
|
+2% |
|
| Sales
gas - BtB and BtC (TWh) |
|
35.0 |
|
31.2 |
|
+12% |
|
36.2 |
|
-3% |
|
1 Includes
20% of Adani Green Energy Limited gross capacity effective first quarter 2021.
2 End
of period data.
3 Solar,
wind, biogas, hydroelectric and combined-cycle gas turbine (CCGT) plants.
Gross installed renewable power generation capacity grew to 10.7 GW
at the end of the first quarter 2022, up 400 MW from the previous quarter, thanks in part to the continued increase of start-ups in India.
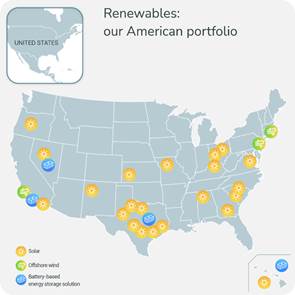
Gross power generation capacity under development increased mainly due
to the award of concessions to develop offshore wind farms, including 3 GW on the east coast of the United States, off New York and New
Jersey, and 2 GW in Scotland.
Net electricity generation stood at 7.6 TWh in the first quarter 2022,
up 61% year-on-year, due to higher utilization rates of flexible power plants (CCGT) to capture higher margins as well as growth in electricity
generation from renewable sources.
Results
|
in millions of dollars |
|
1Q22 |
|
4Q21 |
|
1Q22
vs
4Q21 |
|
1Q21 |
|
1Q22
vs
1Q21 |
|
| External sales |
|
12,294 |
|
11,634 |
|
+5.7% |
|
5,502 |
|
x2.2 |
|
| Operating income |
|
1,812 |
|
1,414 |
|
+28% |
|
624 |
|
x2.9 |
|
| Net income (loss) from equity affiliates and other items |
|
(2,500) |
|
1,281 |
|
ns |
|
263 |
|
ns |
|
| Tax on net operating income |
|
(294) |
|
(237) |
|
ns |
|
(101) |
|
ns |
|
| Net operating income |
|
(982) |
|
2,458 |
|
ns |
|
786 |
|
ns |
|
| Adjustments affecting net operating income |
|
4,033 |
|
301 |
|
x13.4 |
|
199 |
|
x20.3 |
|
| Adjusted net operating income* |
|
3,051 |
|
2,759 |
|
+11% |
|
985 |
|
x3.1 |
|
| including adjusted income from equity affiliates |
|
1,430 |
|
1,321 |
|
+8% |
|
264 |
|
x5.4 |
|
| Organic investments |
|
258 |
|
1,190 |
|
-78% |
|
753 |
|
-66% |
|
| Net acquisitions |
|
641 |
|
47 |
|
x13.7 |
|
1,893 |
|
-66% |
|
| Net investments |
|
899 |
|
1,237 |
|
-27% |
|
2,646 |
|
-66% |
|
*Detail of
adjustment items shown in the business segment information starting on page 25 of this
exhibit.
Adjusted net operating income for the iGRP segment was $3,051 million
in the first quarter 2022, a 3.1-fold increase year-on-year, thanks to higher LNG prices and the very good performance of the gas, LNG
and electricity trading activities.
Adjusted net operating income for the iGRP segment excludes special
items and the impact of changes in fair value. In the first quarter 2022, the exclusion of special items had a positive impact of $4,033
million on the segment’s adjusted net operating income, compared to a positive impact of $199 million in the first quarter 2021.
The segment’s operating cash flow before
working capital changes without financial charges (DACF)1 was $2,585 million in the first quarter 2022, 2.4 times higher
compared to $1,059 million in the first quarter 2021 for the same reasons as adjusted net operating income.
The segment’s cash flow from operating activities excluding financial
charges, except those related to leases was $315 million for the first quarter 2022, mainly due to the working capital impact linked to
the seasonality of the gas and power marketing activities and to price effect on receivables, a decrease of 60% compared to $780 million
in the first quarter 2021.
1
DACF= debt adjusted cash flow. Operating cash flow before working capital changes without financial charges of the segment is
defined as cash flow from operating activities before changes in working capital at replacement cost, without financial charges except
those related to leases, excluding the impact of contracts recognized at fair value for the segment and including capital gains on the
sale of renewable projects. For information on the replacement cost method, refer to “B. Analysis of Business Segment Results”,
above.
B.2. Exploration & Production
segment
Production
Hydrocarbon production |
|
1Q22 |
|
4Q21 |
|
1Q22
vs
4Q21 |
|
1Q21 |
|
1Q22
vs
1Q21 |
|
| EP
(kboe/d) |
|
2,351 |
|
2,290 |
|
+3% |
|
2,345 |
|
- |
|
| Liquids
(kb/d) |
|
1,467 |
|
1,441 |
|
+2% |
|
1,444 |
|
+2% |
|
| Gas
(Mcf/d) |
|
4,813 |
|
4,631 |
|
+4% |
|
4,924 |
|
-2% |
|
Results
in
millions of dollars, except effective tax rate |
|
1Q22 |
|
4Q21 |
|
1Q22
vs
4Q21 |
|
1Q21 |
|
1Q22
vs
1Q21 |
|
| External
Sales |
|
2,151 |
|
2,068 |
|
+4% |
|
1,514 |
|
+42% |
|
| Operating
income |
|
7,600 |
|
5,894 |
|
+29% |
|
2,841 |
|
x2.7 |
|
| Net
income (loss) from equity affiliates and other items |
|
242 |
|
74 |
|
x3.3 |
|
270 |
|
-10% |
|
| Effective
tax rate* |
|
47.0% |
|
49.7% |
|
-5% |
|
41.0% |
|
|
|
| Tax
on net operating income |
|
(3,863) |
|
(3,124) |
|
ns |
|
(1,180) |
|
ns |
|
| Net
operating income |
|
3,979 |
|
2,844 |
|
+40% |
|
1,931 |
|
x2.1 |
|
| Adjustments
affecting net operating income |
|
1,036 |
|
681 |
|
x1.5 |
|
44 |
|
x24 |
|
| Adjusted
net operating income** |
|
5,015 |
|
3,525 |
|
+42% |
|
1,975 |
|
x2.5 |
|
| including
adjusted income from equity affiliates |
|
355 |
|
366 |
|
-3% |
|
270 |
|
+31% |
|
| Organic
investments |
|
1,426 |
|
2,196 |
|
-35% |
|
1,279 |
|
+11% |
|
| Net
acquisitions |
|
316 |
|
(162) |
|
ns |
|
(202) |
|
ns |
|
| Net
investments |
|
1,742 |
|
2,034 |
|
-14% |
|
1,077 |
|
+62% |
|
| |
* |
“Effective tax
rate” = tax on adjusted net operating income / (adjusted net operating income - income from equity affiliates - dividends
received from investments - impairment of goodwill + tax on adjusted net operating income). |
| |
** |
Detail of adjustment items
shown in the business segment information starting on page 25 of this exhibit. |
The Exploration &
Production segment’s adjusted net operating income was $5,015 million in the first quarter 2022, 2.5 times higher than in the first
quarter 2021, due to higher oil and gas prices.
Adjusted net operating income for the
Exploration & Production segment excludes special items. In the first quarter 2022, the exclusion of special items had a positive
impact of $1,036 million on the segment’s adjusted net operating income, compared to a positive impact of $44 million in the first
quarter 2021.
The segment’s
operating cash flow before working capital changes without financial charges (DACF)2 was $7,303 million in the first quarter
2022, up 91% year-on-year compared to $3,824 million for the same reason as adjusted net operating income.
The segment’s
cash flow from operating activites excluding financial charges, except those related to leases was $5,768 million, an increase of 54%
compared to $3,736 million in the first quarter 2021.
2 DACF = debt adjusted cash
flow. Operating cash flow before working capital changes without financial charge of the segment is defined as the cash flow from operating
activities before changes in working capital at replacement cost, without financial charges except those related to leases. For information
on the replacement cost method, refer to “B. Analysis of Business Segment Results”, above.
B.3. Downstream (Refining &
Chemicals and Marketing & Services segments)
Results
in millions of dollars |
|
1Q22 |
|
4Q21 |
|
1Q22
vs
4Q21 |
|
1Q21 |
|
1Q22
vs
1Q21 |
|
| External
sales |
|
54,157 |
|
46,635 |
|
+16% |
|
36,714 |
|
+48% |
|
| Operating
income |
|
2,997 |
|
1,153 |
|
x2.6 |
|
1,554 |
|
x1.9 |
|
| Net
income (loss) from equity affiliates and other items |
|
114 |
|
311 |
|
-63% |
|
54 |
|
x2.1 |
|
| Tax
on net operating income |
|
(750) |
|
(398) |
|
ns |
|
(456) |
|
ns |
|
| Net
operating income |
|
2,361 |
|
1,066 |
|
x2.2 |
|
1,152 |
|
x2.0 |
|
| Adjustments
affecting net operating income |
|
(969) |
|
(34) |
|
ns |
|
(625) |
|
ns |
|
| Adjusted
net operating income* |
|
1,392 |
|
1,032 |
|
+35% |
|
527 |
|
x2.6 |
|
| Organic
investments |
|
292 |
|
1,267 |
|
-77% |
|
335 |
|
-13% |
|
| Net
acquisitions |
|
(34) |
|
(281) |
|
ns |
|
(103) |
|
ns |
|
| Net
investments |
|
258 |
|
986 |
|
-74% |
|
232 |
|
+11% |
|
* Detail
of adjustment items shown in the business segment information starting on page 25 of
this exhibit.
The Downstream segment’s operating
cash flow before working capital changes without financial charges (DACF)3 was $1,896 million in the first quarter 2022,
2.2 times greater than $872 million in the first quarter 2021.
The Downstream segment’s cash flow
from operating activities excluding financial charges, except those related to leases was $2,005 million in the first quarter 2022, an
increase of 21% compared to $1,661 million in the first quarter 2021.
B.4 Refining & Chemicals segment
Refinery and petrochemicals throughput
and utilization rates
Refinery throughput and utilization rate* |
|
1Q22 |
|
4Q21 |
|
1Q22
vs
4Q21 |
|
1Q21 |
|
1Q22
vs
1Q21 |
|
| Total
refinery throughput (kb/d) |
|
1,317 |
|
1,279 |
|
+3% |
|
1,147 |
|
+15% |
|
| France |
|
252 |
|
223 |
|
+13% |
|
114 |
|
x2.2 |
|
| Rest
of Europe |
|
605 |
|
612 |
|
-1% |
|
660 |
|
-8% |
|
| Rest
of world |
|
460 |
|
444 |
|
+4% |
|
373 |
|
+23% |
|
| Utilization
rate based on crude only** |
|
74% |
|
73% |
|
|
|
58% |
|
|
|
* Includes refineries in
Africa reported in the Marketing & Services segment.
**Based on distillation capacity at
the beginning of the year, excluding Grandpuits (shut down first quarter 2021) from 2021 and Lindsey refinery (divested) from second
quarter 2021.
Petrochemicals production and utilization rate | |
| 1Q22 | | |
| 4Q21 | | |
| 1Q22
vs
4Q21 | | |
| 1Q21 | | |
| 1Q22
vs
1Q21 | |
| Monomers* (kt) | |
| 1,404 | | |
| 1,460 | | |
| -4% | | |
| 1,405 | | |
| - | |
| Polymers (kt) | |
| 1,274 | | |
| 1,231 | | |
| +4% | | |
| 1,165 | | |
| +9% | |
| Vapocracker utilization rate** | |
| 86% | | |
| 90% | | |
| | | |
| 87% | | |
| | |
| ** | Based
on olefins production from steamcrackers and their treatment capacity at the start of the year. |
Refinery throughput
increased 15% year-on-year in the first quarter 2022, due to demand recovery, particularly in Europe and the United States, and the 2021
restart of the distillation unit at the Normandy refinery in France.
Monomer production
was stable year-on-year in the first quarter 2022.
Polymer production
increased 9% year-on-year in the first quarter 2022, in particular due to the commissioning of a new polypropylene line in the second
quarter 2021 on the integrated refining and petrochemical platform in Daesan, South Korea. Production in the first quarter 2021 was negatively
impacted by the temporary shutdown of facilities in the United States due to Storm Uri in Texas.
3
DACF = debt adjusted cash flow. Operating cash flow before working
capital changes without financial charge of the segment is defined as the cash flow from operating activities before changes in working
capital at replacement cost, without financial charges except those related to leases. For information on the replacement cost method,
refer to “B. Analysis of business segment results”, above.
Results
| |
in millions of dollars |
|
1Q22 |
|
4Q21 |
|
1Q22
vs
4Q21 |
|
1Q21 |
|
1Q22
vs
1Q21 |
|
| |
External
sales |
|
31,008 |
|
24,781 |
|
+25% |
|
19,201 |
|
+61% |
|
| |
Operating
income |
|
2,302 |
|
610 |
|
x3.8 |
|
993 |
|
x2.3 |
|
| |
Net
income (loss) from equity affiliates and other items |
|
156 |
|
228 |
|
-32% |
|
88 |
|
x1.8 |
|
| |
Tax
on net operating income |
|
(525) |
|
(234) |
|
ns |
|
(280) |
|
ns |
|
| |
Net
operating income |
|
1,933 |
|
604 |
|
x3.2 |
|
801 |
|
x2.4 |
|
| |
Adjustments
affecting net operating income |
|
(813) |
|
(51) |
|
ns |
|
(558) |
|
ns |
|
| |
Adjusted
net operating income* |
|
1,120 |
|
553 |
|
x2 |
|
243 |
|
x4.6 |
|
| |
Organic
investments |
|
197 |
|
680 |
|
-71% |
|
222 |
|
-11% |
|
| |
Net
acquisitions |
|
- |
|
(156) |
|
-100% |
|
(57) |
|
-100% |
|
| |
Net
investments |
|
197 |
|
524 |
|
-62% |
|
165 |
|
+19% |
|
* Detail of adjustment items shown in the business segment information
starting on page 25 of this exhibit.
Adjusted net operating income for the Refining &
Chemicals segment in the first quarter 2022 increased sharply to $1,120 million from $243 million in the first quarter 2021, due to higher
distillate margins in Europe in the context of reduced imports of Russian petroleum products as well as the overperformance of crude oil
and petroleum products trading activities.
Adjusted net operating income for the Refining & Chemicals
segment excludes any after-tax inventory valuation effect and special items. In the first quarter 2022, the exclusion of the inventory
valuation effect had a negative impact of $845 million on the segment’s adjusted net operating income, compared to a negative impact
of $606 million in the first quarter 2021. In the first quarter 2022 the exclusion of special items had a positive impact of $32 million
on the segment’s adjusted net operating income, compared to a positive impact of $48 million in the first quarter 2021.
The segment’s operating cash flow before working capital changes
without financial charges (DACF)4 was $1,433 million in the first quarter 2022, 3.6 times higher than $394 million in the
first quarter 2021 for the same reasons as for adjusted net operating income.
The segment’s cash flow from operating activities
excluding financial charges, except those related to leases was $1,107 million in the first quarter 2022, an increase of 11% compared
to $996 million in the first quarter 2021.
B.5. Marketing & Services segment
Petroleum product sales
| |
Sales in kb/d* |
|
1Q22 |
|
4Q21 |
|
1Q22
vs
4Q21 |
|
1Q21 |
|
1Q22
vs
1Q21 |
|
| |
Total
Marketing & Services sales |
|
1,452 |
|
1,553 |
|
-7% |
|
1,442 |
|
+1% |
|
| |
Europe |
|
790 |
|
868 |
|
-9% |
|
776 |
|
+2% |
|
| |
Rest
of world |
|
662 |
|
684 |
|
-3% |
|
666 |
|
-1% |
|
* Excludes trading and bulk refining sales.
Sales of petroleum products in the first quarter of 2022 were up by
1% year-on-year, as the recovery in aviation activity worldwide was notably offset by lower sales in Asia, due to the pandemic lockdowns.
4 DACF = debt adjusted cash flow. Operating cash flow
before working capital changes without financial charge of the segment is defined as the cash flow from operating activities before changes
in working capital at replacement cost, without financial charges except those related to leases. For information on the replacement
cost method, refer to “B. Analysis of Business Segment Results”, above.
Results
| |
in millions of dollars |
|
1Q22 |
|
4Q21 |
|
1Q22
vs
4Q21 |
|
1Q21 |
|
1Q22
vs
1Q21 |
|
| |
External sales |
|
23,149 |
|
21,854 |
|
+6% |
|
17,513 |
|
+32% |
|
| |
Operating income |
|
695 |
|
543 |
|
+28% |
|
561 |
|
+24% |
|
| |
Net income (loss) from equity affiliates and other items |
|
(42) |
|
83 |
|
ns |
|
(34) |
|
ns |
|
| |
Tax on net operating income |
|
(225) |
|
(164) |
|
ns |
|
(176) |
|
ns |
|
| |
Net operating income |
|
428 |
|
462 |
|
-7% |
|
351 |
|
+22% |
|
| |
Adjustments affecting net operating income |
|
(156) |
|
17 |
|
ns |
|
(67) |
|
ns |
|
| |
Adjusted net operating income* |
|
272 |
|
479 |
|
-43% |
|
284 |
|
-4% |
|
| |
Organic investments |
|
95 |
|
587 |
|
-84% |
|
113 |
|
-16% |
|
| |
Net acquisitions |
|
(34) |
|
(125) |
|
ns |
|
(46) |
|
ns |
|
| |
Net investments |
|
61 |
|
462 |
|
-87% |
|
67 |
|
-9% |
|
*Detail of adjustment items shown in the business
segment information starting on page 25 of this exhibit.
Adjusted net operating income for the Marketing &
Services segment amounted to $272 million and operating cash flow before working capital changes was $463 million in the first quarter
2022, down 4% and 3% respectively year-on-year due to the margin squeeze related to high petroleum products prices.
Adjusted net operating income for the Marketing &
Services segment excludes any after-tax inventory valuation effect and special items. In the first quarter 2022, the exclusion of the
inventory valuation effect had a negative impact of $228 million on the segment’s adjusted net operating income, compared to a negative
impact of $98 million in the first quarter 2021. In the first quarter 2022, the exclusion of special items had a positive impact of $72
million on the segment’s adjusted net operating income, compared to a positive impact of $31 million in the first quarter 2021.
The segment’s operating cash flow before working capital changes
without financial charges (DACF)3 was $463 million in the first quarter 2022, a decrease of 3% compared to $478 million in
the first quarter 2021.
The segment’s cash flow from operating activities
excluding financial charges, except those related to leases was $898 million in the first quarter 2022, an increase of 35% compared to
$665 million in the first quarter 2021.
Net income (TotalEnergies share)
In the first quarter 2022, net income (TotalEnergies
share) was $4,944 million, an increase of 48% compared to $3,344 million in the first quarter 2021.
Adjusted net income (TotalEnergies share) was $8,977
million in the first quarter 2022 compared to $3,003 million in the first quarter 2021, due to higher oil and gas prices and the strong
performance of trading activities.
Adjusted net income excludes the after-tax inventory
effect, special items and the impact of changes in fair value5.
Total adjustments affecting net income6
were $4,033 million in the first quarter 2022, mainly consisting of $4,095 million for impairments notably concerning Arctic LNG 2, the $957 million impairment related to
the withdrawal from the North Platte project in the United States, partially offset by a positive inventory effect of $1,040 million.
Fully-diluted shares
As of March 31, 2022, the number of fully-diluted
shares was 2,607 million.
Share repurchase
As part of its shareholder return policy, TotalEnergies repurchased
19.2 million shares for cancellation in the first quarter 2022 for $1 billion.
5 Details shown on page 16 of this exhibit.
6 Details shown on pages 16 and 25 et seq. of this exhibit.
Acquisitions - Asset sales
Acquisitions were $1,400 million in the first quarter
2022, including the bonus related to the award of the Production Sharing Contracts of Atapu and Sépia in Brazil as well as the
bonus related to the New York Bight offshore wind concession in the United States.
Asset sales were $478 million in the first quarter
2022, including an additional payment related to the sale of interests in the CA1 offshore block in Brunei and the sale by SunPower Corp.
(NASDAQ: SPWR) of its Enphase Energy shares (NASDAQ: ENPH).
Cash flow
Cash flow from operating activities was $7,617
million in the first quarter 2022, compared to operating cash flow before working capital changes7 of $11,626 million, and
was negatively impacted by an increase in working capital requirements of $3,520 million mainly related to the price effect on inventories,
an increase in inventories to ensure the security of supply for refineries and the seasonality of the gas and electricity business.
The change in working capital as determined using the replacement cost
method excluding the mark-to-market effect of iGRP’s contracts, including capital gain from renewable project sales (effective first
quarter 2020) and including organic loan repayment from equity affiliates was an increase of $4,009 million in the first quarter 2022,
compared to a decrease of $232 million in the first quarter 2021.
In the first quarter 2022, the change in working capital was an increase
of $4,923 million in accordance with IFRS. The difference of $914 million between IFRS and replacement cost method corresponds to the
following adjustments: (i) the pre-tax inventory valuation effect of $1,255 million, (ii) plus the mark-to-market effect of
iGRP’s contracts of $148 million, (iii) less the capital gains from renewables project sale of $2 million and (iv) less
the organic loan repayments from equity affiliates of $487 million.
Operating cash flow before working capital changes7
totaled $11,626 million in the first quarter 2022, 2.2 times greater than $5,366 million in the first quarter 2021.
Operating cash flow before working capital changes
without financial charges (DACF)8 totaled $11,995 million in the first quarter 2022, 2.1 times greater than $5,750 million
in the first quarter 2021.
TotalEnergies’ net cash flow9
totaled $8,723 million in the first quarter 2022, 6.2 times greater than $1,397 million in first quarter 2021.
D. PROFITABILITY
Return on equity was 21.8% for the twelve months
ended March 31, 2022.
| |
|
04/01/2021- |
|
01/01/2021- |
|
04/01/2020- |
| in millions
of dollars |
|
3/31/2022 |
|
12/31/2021 |
|
3/31/2021 |
| Adjusted net income |
|
24,382 |
|
18,391 |
|
5,330 |
| Average adjusted shareholders' equity |
|
111,794 |
|
108,504 |
|
109,135 |
| Return on equity (ROE) |
|
21.8% |
|
16.9% |
|
4.9% |
Return on average capital employed was 18.0% for
the twelve months ended March 31, 2022.
| |
|
04/01/2021- |
|
01/01/2021- |
|
04/01/2020- |
| in millions
of dollars |
|
3/31/2022 |
|
12/31/2021 |
|
3/31/2021 |
| Adjusted net operating income |
|
25,803 |
|
19,766 |
|
6,915 |
| Average capital employed |
|
143,517 |
|
142,215 |
|
148,777 |
| ROACE |
|
18.0% |
|
13.9% |
|
4.6% |
7
Operating cash flow before working capital changes is defined as cash flow from operating activities before changes in working
capital at replacement cost, excluding the mark-to-market effect of iGRP’s contracts and including capital gain from renewable
projects sales (effective first quarter 2020). For information on the replacement cost method, refer to “B. Analysis of Business
Segment Results”, above. The reconciliation table for different cash flow figures is set forth under “Cash Flow” on
page 17 of this exhibit.
8
DACF = debt adjusted cash flow, is defined as operating cash flow before working capital changes and without financial charges.
9
Net cash flow = cash flow from operating activities before changes in working capital at replacement cost - net investments (including
other transactions with non-controlling interests).
E. 2022 SENSITIVITIES*
| |
|
|
|
|
|
Estimated |
| |
|
|
|
Estimated impact |
|
impact on cash |
| |
|
|
|
on adjusted net |
|
flow from |
| |
|
Change |
|
operating income |
|
operations |
| Dollar |
|
+/- 0.1 $ per € |
|
-/+ 0.1 B$ |
|
~0 B$ |
| Average liquids price** |
|
+/- 10$/b |
|
+/- 2.7 B$ |
|
+/- 3.2 B$ |
| European gas price – NBP |
|
+/- 10 $/Mbtu |
|
+/- 3.0 B$ |
|
+/- 3.0 B$ |
| Variable cost margin, European refining (VCM) |
|
+/- 10 $/t |
|
+/- 0.4 B$ |
|
+/- 0.5 B$ |
* Sensitivities are revised once per year upon publication
of the previous year’s fourth quarter results. Sensitivities are estimates based on assumptions about TotalEnergies’ portfolio
in 2022. Actual results could vary significantly from estimates based on the application of these sensitivities. The impact of the $-€
sensitivity on adjusted net operating income is essentially attributable to Refining & Chemicals. Please find the indicators
detailed on page 19.
** In
a 60 $/b Brent environment.
F. SUMMARY AND OUTLOOK
Russia's military aggression against Ukraine on February 24,
2022 and its consequences have pushed oil prices to more than $100/b, exacerbating the upward trend seen since the second half of
2021 that stems from a lack of investment in hydrocarbons. These prices could remain at high levels if the mobilization of
additional production capacity from OPEC countries and the growth of unconventional oil production in the United States fail to compensate for the anticipated loss of Russian crude oil production on the order of 2-3 Mb/d as well as the lower production from Russian refining. The effect could be mitigated by a drop in demand caused by the higher prices, the impact of the
crisis and the pandemic lockdowns in China on global growth.
Gas prices have remained very high and volatile
in Europe and Asia since the start of 2022, driven by global demand and the need for Europe to rebuild inventories. Futures markets indicate
average gas prices in Europe and Asia in 2022 around $30/Mbtu. In this context and in line with its investment criteria, TotalEnergies
is mobilizing additional investments to support short-term gas production in the North Sea.
Given the evolution of oil and gas prices in recent
months and the lag effect on price formulas, TotalEnergies anticipates that its average LNG selling price should remain at a high level
above $14/Mbtu in the second quarter of 2022.
In the second quarter, TotalEnergies will benefit
from the increase in its production in Brazil from May 2022 with the start-up of Mero 1 and the entry into Atapu and Sépia
(30 kb/d in the second quarter growing to 60 kb/d in the fourth quarter).
The Company maintains its capital discipline with
net investments10 trending toward $15 billion in 2022, of which 25% will be in renewables and electricity.
The Company's priorities in terms of cash flow
allocation are reaffirmed in this context of higher oil and gas prices: investing in profitable projects to implement the strategy to
transform TotalEnergies into a sustainable multi-energy company, linking dividend growth to structural cash flow growth, maintaining a
strong balance sheet and a long-term debt rating with a minimum "A" level by permanently anchoring gearing11 below
20%, and allocating a share of the surplus cash flow from high hydrocarbon prices to share buybacks.
10
Net investments = organic investments + net acquisitions.
11
Gearing = net debt / (net debt +shareholders equity TotalEnergies share + non-controlling interests); excludes leases receivables
and leases debts. See “Gearing Ratio” on page 18.
FORWARD-LOOKING STATEMENTS
This document may contain forward-looking statements
within the meaning of the Private Securities Litigation Reform Act of 1995, notably with respect to the financial condition, results of
operations, business activities and industrial strategy of TotalEnergies. This document may also contain statements regarding the perspectives,
objectives, areas of improvement and goals of TotalEnergies, including with respect to climate change and carbon neutrality (net zero
emissions). An ambition expresses an outcome desired by TotalEnergies, it being specified that the means to be deployed do not depend
solely on TotalEnergies. These forward-looking statements may generally be identified by the use of the future or conditional tense or
forward-looking words such as “envisions”, “intends”, “anticipates”, “believes”, “considers”,
“plans”, “expects”, “thinks”, “targets”, “aims” or similar terminology. Such
forward-looking statements included in this document are based on economic data, estimates and assumptions prepared in a given economic,
competitive and regulatory environment and considered to be reasonable by TotalEnergies as of the date of this document.
These forward-looking statements are not historical
data and should not be interpreted as assurances that the perspectives, objectives or goals announced will be achieved. They may prove
to be inaccurate in the future, and may evolve or be modified with a significant difference between the actual results and those initially
estimated, due to the uncertainties notably related to the economic, financial, competitive and regulatory environment, or due to the
occurrence of risk factors, such as, notably, the price fluctuations in crude oil and natural gas, the evolution of the demand and price
of petroleum products, the changes in production results and reserves estimates, the ability to achieve cost reductions and operating
efficiencies without unduly disrupting business operations, changes in laws and regulations including those related to the environment
and climate, currency fluctuations, as well as economic and political developments, changes in market conditions, loss of market share
and changes in consumer preferences, or pandemics such as the COVID-19 pandemic. Additionally, certain financial information is based
on estimates particularly in the assessment of the recoverable value of assets and potential impairments of assets relating thereto.
Except for its ongoing obligations to disclose
material information as required by applicable securities laws, TotalEnergies does not have any intention or obligation to update forward-looking
statements after the distribution of this document, even if new information, future events or other circumstances have made them incorrect
or misleading.
For additional factors, you should read the
information set forth under “Item 3. -3.1 Risk Factors”, “Item 4. Information on the Company”, “Item 5.
Operating and Financial Review and Prospects” and “Item 11. Quantitative and Qualitative Disclosures about Market Risk”
in TotalEnergies’ Form 20-F for the year ended December 31, 2021.
RESULTS FROM RUSSIAN ASSETS
| In
millions of dollars |
1Q22 |
2021 |
|
| |
Adjusted
net
operating income |
|
Operating
cash flow
before working
capital changes |
Adjusted
net
operating income |
|
Operating
cash flow
before working
capital changes |
|
| |
|
|
|
|
|
|
|
| Russian
Upstream Assets |
1,021 |
|
288 |
2,092 |
|
1,613 |
|
| |
|
|
|
|
|
|
|
Capital Employed by TotalEnergies in Russia as at March 31, 2022
was $9,976 million.
OPERATING INFORMATION BY SEGMENT
TotalEnergies’ production (Exploration & Production
+ iGRP)
| |
Combined liquids and gas
production by region (kboe/d) | |
| 1Q22 | | |
| 4Q21 | |
| 1Q22
vs
4Q21 | | |
| 1Q21 | |
| 1Q22
vs
1Q21 | |
|
| |
Europe and Central Asia | |
| 1,050 | | |
| 1,063 | |
| -1 | % | |
| 1,050 | |
| - | |
|
| |
Africa | |
| 498 | | |
| 508 | |
| -2 | % | |
| 551 | |
| -10 | % |
|
| |
Middle East and North Africa | |
| 670 | | |
| 682 | |
| -2 | % | |
| 651 | |
| +3 | % |
|
| |
Americas | |
| 386 | | |
| 363 | |
| +6 | % | |
| 376 | |
| +3 | % |
|
| |
Asia-Pacific | |
| 240 | | |
| 235 | |
| +2 | % | |
| 235 | |
| +2 | % |
|
| |
Total production | |
| 2,843 | | |
| 2,852 | |
| - | | |
| 2,863 | |
| -1 | % |
|
| |
includes equity affiliates | |
| 715 | | |
| 739 | |
| -3 | % | |
| 729 | |
| -2 | % |
|
| |
Liquids production by region (kb/d) | |
| 1Q22 | | |
| 4Q21 | |
| 1Q22
vs
4Q21 | | |
| 1Q21 | |
| 1Q22
vs
1Q21 | |
|
| |
Europe and Central Asia | |
| 373 | | |
| 378 | |
| -1 | % | |
| 374 | |
| - | |
|
| |
Africa | |
| 371 | | |
| 379 | |
| -2 | % | |
| 415 | |
| -11 | % |
|
| |
Middle East and North Africa | |
| 538 | | |
| 534 | |
| +1 | % | |
| 499 | |
| +8 | % |
|
| |
Americas | |
| 201 | | |
| 174 | |
| +15 | % | |
| 179 | |
| +12 | % |
|
| |
Asia-Pacific | |
| 45 | | |
| 45 | |
| - | | |
| 41 | |
| +10 | % |
|
| |
Total production | |
| 1,527 | | |
| 1,509 | |
| +1 | % | |
| 1,508 | |
| +1 | % |
|
| |
includes equity affiliates | |
| 210 | | |
| 205 | |
| +3 | % | |
| 201 | |
| +5 | % |
|
| |
Gas production by region (Mcf/d) | |
| 1Q22 | | |
| 4Q21 | |
| 1Q22
vs
4Q21 | | |
| 1Q21 | |
| 1Q22
vs
1Q21 | |
|
| |
Europe and Central Asia | |
| 3,635 | | |
| 3,683 | |
| -1 | % | |
| 3,636 | |
| - | |
|
| |
Africa | |
| 643 | | |
| 664 | |
| -3 | % | |
| 693 | |
| -7 | % |
|
| |
Middle East and North Africa | |
| 727 | | |
| 825 | |
| -12 | % | |
| 843 | |
| -14 | % |
|
| |
Americas | |
| 1,041 | | |
| 1,064 | |
| -2 | % | |
| 1,100 | |
| -5 | % |
|
| |
Asia-Pacific | |
| 1,116 | | |
| 1,092 | |
| +2 | % | |
| 1,128 | |
| -1 | % |
|
| |
Total production | |
| 7,162 | | |
| 7,328 | |
| -2 | % | |
| 7,400 | |
| -3 | % |
|
| |
includes equity affiliates | |
| 2,714 | | |
| 2,889 | |
| -6 | % | |
| 2,855 | |
| -5 | % |
|
Downstream (Refining & Chemicals and Marketing &
Services)
| |
Petroleum product sales by region (kb/d) | |
| 1Q22 | |
| 4Q21 | |
| 1Q22
vs
4Q21 | | |
| 1Q21 | |
| 1Q22
vs
1Q21 | |
|
| |
Europe | |
| 1,635 | |
| 1,668 | |
| -2 | % | |
| 1,558 | |
| +5 | % |
|
| |
Africa | |
| 761 | |
| 780 | |
| -3 | % | |
| 667 | |
| +14 | % |
|
| |
Americas | |
| 775 | |
| 817 | |
| -5 | % | |
| 772 | |
| - | |
|
| |
Rest of world | |
| 531 | |
| 526 | |
| +1 | % | |
| 495 | |
| +7 | % |
|
| |
Total consolidated sales | |
| 3,701 | |
| 3,791 | |
| -2 | % | |
| 3,492 | |
| +6 | % |
|
| |
Includes bulk sales | |
| 409 | |
| 437 | |
| -6 | % | |
| 402 | |
| +2 | % |
|
| |
Includes trading | |
| 1,840 | |
| 1,801 | |
| +2 | % | |
| 1,648 | |
| +12 | % |
|
| |
Petrochemicals production* (kt) | |
| 1Q22 | | |
| 4Q21 | |
| 1Q22
vs
4Q21 | | |
| 1Q21 | |
| 1Q22
vs
1Q21 | |
|
| |
Europe | |
| 1,260 | | |
| 1,250 | |
| +1 | % | |
| 1,346 | |
| -6 | % |
|
| |
Americas | |
| 638 | | |
| 689 | |
| -7 | % | |
| 510 | |
| +25 | % |
|
| |
Middle-East and Asia | |
| 781 | | |
| 753 | |
| +4 | % | |
| 714 | |
| +9 | % |
|
* Olefins, polymers
Renewables
| | |
| 1Q22 | | |
| 4Q21 |
| | |
| | | |
| | | |
| | | |
| | | |
| | | |
| | | |
| | | |
| | | |
| | | |
| |
| Installed power generation gross | |
| | | |
| Onshore | | |
| Offshore | | |
| | | |
| | | |
| | | |
| Onshore | | |
| Offshore | | |
| | | |
| |
| capacity (GW)1,2 | |
| Solar | | |
| Wind | | |
Wind | | |
| Other | | |
| Total | | |
| Solar | | |
| Wind | | |
| Wind | | |
| Other | | |
| Total |
| France | |
| 0.7 | | |
| 0.5 | | |
| 0.0 | | |
| 0.1 | | |
| 1.3 | | |
| 0.6 | | |
| 0.5 | | |
| 0.0 | | |
| 0.1 | | |
| 1.2 |
| Rest of Europe | |
| 0.2 | | |
| 1.0 | | |
| 0.0 | | |
| 0.1 | | |
| 1.3 | | |
| 0.2 | | |
| 1.0 | | |
| 0.0 | | |
| 0.1 | | |
| 1.3 |
| Africa | |
| 0.1 | | |
| 0.0 | | |
| 0.0 | | |
| 0.0 | | |
| 0.1 | | |
| 0.1 | | |
| 0.0 | | |
| 0.0 | | |
| 0.0 | | |
| 0.1 |
| Middle East | |
| 0.3 | | |
| 0.0 | | |
| 0.0 | | |
| 0.0 | | |
| 0.3 | | |
| 0.3 | | |
| 0.0 | | |
| 0.0 | | |
| 0.0 | | |
| 0.3 |
| North America | |
| 0.9 | | |
| 0.0 | | |
| 0.0 | | |
| 0.0 | | |
| 0.9 | | |
| 0.9 | | |
| 0.0 | | |
| 0.0 | | |
| 0.0 | | |
| 0.9 |
| South America | |
| 0.4 | | |
| 0.3 | | |
| 0.0 | | |
| 0.0 | | |
| 0.7 | | |
| 0.4 | | |
| 0.3 | | |
| 0.0 | | |
| 0.0 | | |
| 0.7 |
| India | |
| 4.8 | | |
| 0.2 | | |
| 0.0 | | |
| 0.0 | | |
| 5.0 | | |
| 4.5 | | |
| 0.2 | | |
| 0.0 | | |
| 0.0 | | |
| 4.7 |
| Asia-Pacific | |
| 1.0 | | |
| 0.0 | | |
| 0.1 | | |
| 0.0 | | |
| 1.1 | | |
| 1.0 | | |
| 0.0 | | |
| 0.0 | | |
| 0.0 | | |
| 1.0 |
| Total | |
| 8.4 | | |
| 2.1 | | |
| 0.1 | | |
| 0.1 | | |
| 10.7 | | |
| 8.0 | | |
| 2.0 | | |
| 0.0 | | |
| 0.2 | | |
| 10.3 |
| | |
| 1Q22 | | |
| 4Q21 |
| | |
| | | |
| | | |
| | | |
| | | |
| | | |
| | | |
| | | |
| | | |
| | | |
| |
| Power generation gross capacity from | |
| | | |
| Onshore | | |
| Offshore | | |
| | | |
| | | |
| | | |
| Onshore | | |
| Offshore | | |
| | | |
| |
| renewables in construction (GW)1,2 | |
| Solar | | |
| Wind | | |
| Wind | | |
| Other | | |
| Total | | |
| Solar | | |
| Wind | | |
| Wind | | |
| Other | | |
| Total |
| France | |
| 0.1 | | |
| 0.2 | | |
| 0.0 | | |
| 0.1 | | |
| 0.4 | | |
| 0.2 | | |
| 0.2 | | |
| 0.0 | | |
| 0.1 | | |
| 0.4 |
| Rest of Europe | |
| 0.0 | | |
| 0.0 | | |
| 1.1 | | |
| 0.0 | | |
| 1.2 | | |
| 0.0 | | |
| 0.1 | | |
| 1.1 | | |
| 0.0 | | |
| 1.2 |
| Africa | |
| 0.0 | | |
| 0.0 | | |
| 0.0 | | |
| 0.0 | | |
| 0.0 | | |
| 0.0 | | |
| 0.0 | | |
| 0.0 | | |
| 0.0 | | |
| 0.0 |
| Middle East | |
| 0.8 | | |
| 0.0 | | |
| 0.0 | | |
| 0.0 | | |
| 0.8 | | |
| 0.8 | | |
| 0.0 | | |
| 0.0 | | |
| 0.0 | | |
| 0.8 |
| North America | |
| 1.5 | | |
| 0.0 | | |
| 0.0 | | |
| 0.0 | | |
| 1.5 | | |
| 1.5 | | |
| 0.0 | | |
| 0.0 | | |
| 0.0 | | |
| 1.5 |
| South America | |
| 0.0 | | |
| 0.0 | | |
| 0.0 | | |
| 0.0 | | |
| 0.0 | | |
| 0.0 | | |
| 0.0 | | |
| 0.0 | | |
| 0.0 | | |
| 0.0 |
| India | |
| 1.0 | | |
| 0.3 | | |
| 0.0 | | |
| 0.0 | | |
| 1.3 | | |
| 1.2 | | |
| 0.4 | | |
| 0.0 | | |
| 0.0 | | |
| 1.6 |
| Asia-Pacific | |
| 0.3 | | |
| 0.0 | | |
| 0.6 | | |
| 0.0 | | |
| 0.9 | | |
| 0.3 | | |
| 0.0 | | |
| 0.6 | | |
| 0.0 | | |
| 1.0 |
| Total | |
| 3.7 | | |
| 0.6 | | |
| 1.7 | | |
| 0.1 | | |
| 6.1 | | |
| 4.0 | | |
| 0.6 | | |
| 1.7 | | |
| 0.1 | | |
| 6.5 |
| | |
| 1Q22 | | |
| 4Q21 |
| | |
| | | |
| |
| Power generation gross capacity from | |
| | | |
| Onshore | | |
| Offshore | | |
| | | |
| | | |
| | | |
| Onshore | | |
| Offshore | | |
| | | |
| |
| renewables in development (GW)1,2 | |
| Solar | | |
| Wind | | |
| Wind | | |
| Other | | |
| Total | | |
| Solar | | |
| Wind | | |
| Wind | | |
| Other | | |
| Total |
| France | |
| 2.8 | | |
| 0.5 | | |
| 0.0 | | |
| 0.0 | | |
| 3.3 | | |
| 3.1 | | |
| 0.8 | | |
| 0.0 | | |
| 0.0 | | |
| 3.9 |
| Rest of Europe | |
| 4.7 | | |
| 0.3 | | |
| 4.4 | | |
| 0.0 | | |
| 9.3 | | |
| 5.2 | | |
| 0.3 | | |
| 2.3 | | |
| 0.0 | | |
| 7.8 |
| Africa | |
| 0.7 | | |
| 0.1 | | |
| 0.0 | | |
| 0.1 | | |
| 0.9 | | |
| 0.4 | | |
| 0.0 | | |
| 0.0 | | |
| 0.1 | | |
| 0.5 |
| Middle East | |
| 1.6 | | |
| 0.0 | | |
| 0.0 | | |
| 0.0 | | |
| 1.6 | | |
| 1.6 | | |
| 0.0 | | |
| 0.0 | | |
| 0.0 | | |
| 1.6 |
| North America | |
| 2.0 | | |
| 0.1 | | |
| 3.0 | | |
| 0.7 | | |
| 5.9 | | |
| 2.3 | | |
| 0.1 | | |
| 0.0 | | |
| 0.7 | | |
| 3.1 |
| South America | |
| 0.7 | | |
| 0.3 | | |
| 0.0 | | |
| 0.2 | | |
| 1.2 | | |
| 0.6 | | |
| 0.4 | | |
| 0.0 | | |
| 0.1 | | |
| 1.2 |
| India | |
| 4.0 | | |
| 0.1 | | |
| 0.0 | | |
| 0.0 | | |
| 4.1 | | |
| 4.4 | | |
| 0.1 | | |
| 0.0 | | |
| 0.0 | | |
| 4.5 |
| Asia-Pacific | |
| 1.4 | | |
| 0.0 | | |
| 2.1 | | |
| 0.1 | | |
| 3.6 | | |
| 1.2 | | |
| 0.0 | | |
| 2.1 | | |
| 0.1 | | |
| 3.5 |
| Total | |
| 17.9 | | |
| 1.5 | | |
| 9.5 | | |
| 1.2 | | |
| 30.1 | | |
| 18.9 | | |
| 1.7 | | |
| 4.4 | | |
| 1.1 | | |
| 26.2 |
1 Includes 20% of gross capacity
of Adani Green Energy Ltd effective first quarter 2021.
2 End-of-period data.
| | |
In
operation | | |
In construction | | |
In development |
| Gross
renewables | |
| | |
| | |
| | |
| | |
| | |
| | |
| | |
| | |
| | |
| | |
| | |
| | |
| | |
| | |
|
| capacity
covered by | |
| | |
Onshore | | |
Offshore | | |
| | |
| | |
| | |
Onshore | | |
Offshore | | |
| | |
| | |
| | |
Onshore | | |
Offshore | | |
| | |
|
PPA
at 31
March 2022
(GW) | |
Solar | | |
Wind | | |
Wind | | |
Other | | |
Total | | |
Solar | | |
Wind | | |
Wind | | |
Other | | |
Total | | |
Solar | | |
Wind | | |
Wind | | |
Other | | |
Total |
| Europe | |
| 0.9 | | |
| 1.5 | | |
| - | | |
| X | | |
| 2.5 | | |
| X | | |
| 0.2 | | |
| 0.8 | | |
| X | | |
| 1.2 | | |
| 3.6 | | |
| 0.2 | | |
| X | | |
| X | | |
| 3.8 |
| Asia | |
| 5.8 | | |
| 0.2 | | |
| X | | |
| X | | |
| 6.1 | | |
| 1.2 | | |
| 0.4 | | |
| 0.6 | | |
| - | | |
| 2.2 | | |
| 4.4 | | |
| X | | |
| - | | |
| X | | |
| 4.6 |
| North
America | |
| 0.8 | | |
| - | | |
| - | | |
| - | | |
| 0.8 | | |
| - | | |
| - | | |
| - | | |
| - | | |
| - | | |
| - | | |
| - | | |
| - | | |
| - | | |
| - |
| Rest
of World | |
| 0.8 | | |
| 0.3 | | |
| - | | |
| X | | |
| 1.1 | | |
| 2.3 | | |
| X | | |
| - | | |
| X | | |
| 2.3 | | |
| 2.0 | | |
| X | | |
| - | | |
| X | | |
| 2.1 |
| Total | |
| 8.3 | | |
| 2.1 | | |
| X | | |
| X | | |
| 10.6 | | |
| 3.7 | | |
| 0.6 | | |
| 1.4 | | |
| X | | |
| 5.7 | | |
| 9.9 | | |
| 0.3 | | |
| X | | |
| 0.3 | | |
| 10.5 |
“X” means not specified, capacity < 0.2 GW.
| | |
In operation | | |
In construction | | |
In development | |
| PPA average price | |
| | |
| | |
| | |
| | |
| | |
| | |
| | |
| | |
| | |
| | |
| | |
| | |
| | |
| | |
| |
at
31 March 2022 | |
| | |
Onshore | | |
Offshore | | |
| | |
| | |
| | |
Onshore | | |
Offshore | | |
| | |
| | |
| | |
Onshore | | |
Offshore | | |
| | |
| |
| ($/MWh) | |
| Solar | | |
| Wind | | |
| Wind | | |
| Other | | |
| Total | | |
| Solar | | |
| Wind | | |
| Wind | | |
| Other | | |
| Total | | |
| Solar | | |
| Wind | | |
| Wind | | |
| Other | | |
| Total | |
| Europe | |
| 202 | | |
| 117 | | |
| - | | |
| X | | |
| 146 | | |
| X | | |
| 83 | | |
| 64 | | |
| X | | |
| 70 | | |
| 44 | | |
| 85 | | |
| X | | |
| X | | |
| 48 | |
| Asia | |
| 79 | | |
| 43 | | |
| X | | |
| X | | |
| 79 | | |
| 38 | | |
| 50 | | |
| 254 | | |
| - | | |
| 81 | | |
| 39 | | |
| X | | |
| - | | |
| X | | |
| 39 | |
| North America | |
| 147 | | |
| - | | |
| - | | |
| - | | |
| 150 | | |
| - | | |
| - | | |
| - | | |
| - | | |
| - | | |
| - | | |
| - | | |
| - | | |
| - | | |
| - | |
| Rest of World | |
| 68 | | |
| 54 | | |
| - | | |
| X | | |
| 63 | | |
| 118 | | |
| X | | |
| - | | |
| X | | |
| 118 | | |
| 77 | | |
| X | | |
| - | | |
| X | | |
| 77 | |
| Total | |
| 97 | | |
| 101 | | |
| X | | |
| X | | |
| 99 | | |
| 36 | | |
| 65 | | |
| 143 | | |
| X | | |
| 65 | | |
| 43 | | |
| 81 | | |
| X | | |
| 144 | | |
| 46 | |
“X” means not specified, PPA relating to a capacity <
0.2 GW
ADJUSTMENT ITEMS TO NET INCOME (TOTALENERGIES SHARE)
| |
in millions of dollars | |
| 1Q22 | | |
| 4Q21 | | |
| 1Q21 | |
| |
Special items affecting net income (TotalEnergies share) | |
| (4,993) | | |
| (1,074) | | |
| (342) | |
| |
Gain (loss) on asset sales | |
| - | | |
| (170) | | |
| - | |
| |
Restructuring charges | |
| (3) | | |
| 6 | | |
| (161) | |
| |
Impairments | |
| (5,061) | | |
| (670) | | |
| (144) | |
| |
Other | |
| 71 | | |
| (240) | | |
| (37) | |
| |
After-tax inventory effect: FIFO vs. replacement cost | |
| 1,040 | | |
| 111 | | |
| 689 | |
| |
Effect of changes in fair value | |
| (80) | | |
| (25) | | |
| (6) | |
| |
Total adjustments affecting net income | |
| (4,033) | | |
| (988) | | |
| 341 | |
RECONCILIATION OF NET INCOME (TOTALENERGIES SHARE) TO ADJUSTED
EBITDA
| |
in millions of dollars | |
| 1Q22 | | |
| 4Q21 | |
| 1Q22
vs
4Q21 | | |
| 1Q21 | |
| 1Q22
vs
1Q21 | |
| |
Net
income - TotalEnergies share | |
| 4,944 | | |
| 5,837 | |
| -15 | % | |
| 3,344 | |
| +48% | |
| |
Less:
adjustment items to net income (TotalEnergies share) | |
| 4,033 | | |
| 988 | |
| x4.1 | | |
| (341) | |
| ns | |
| |
Adjusted
net income - TotalEnergies share | |
| 8,977 | | |
| 6,825 | |
| +32 | % | |
| 3,003 | |
| x3 | |
| |
Adjusted items | |
| | | |
| | |
| | | |
| | |
| | |
| |
Add: non-controlling
interests | |
| 76 | | |
| 79 | |
| -4 | % | |
| 59 | |
| +29% | |
| |
Add: income
taxes | |
| 4,724 | | |
| 3,606 | |
| +31 | % | |
| 1,446 | |
| x3.3 | |
| |
Add: depreciation,
depletion and impairment of tangible assets and mineral interests | |
| 3,148 | | |
| 3,278 | |
| -4 | % | |
| 3,180 | |
| -1% | |
| |
Add: amortization
and impairment of intangible assets | |
| 96 | | |
| 119 | |
| -19 | % | |
| 103 | |
| -7% | |
| |
Add: financial
interest on debt | |
| 462 | | |
| 483 | |
| -4 | % | |
| 466 | |
| -1% | |
| |
Less:
financial income and expense from cash & cash equivalents | |
| (59) | | |
| (105) | |
| ns | | |
| (87) | |
| ns | |
| |
Adjusted
EBITDA | |
| 17,424 | | |
| 14,285 | |
| +22 | % | |
| 8,170 | |
| x2.1 | |
INVESTMENTS – DIVESTMENTS
in millions of dollars |
1Q22 |
4Q21 |
1Q22
vs
4Q21 |
1Q21 |
1Q22
vs
1Q21 |
| Organic
investments ( a ) |
1,981 |
4,681 |
-58% |
2,379 |
-17% |
| Capitalized
exploration |
114 |
182 |
-37% |
243 |
-53% |
| Increase
in non-current loans |
234 |
348 |
-33% |
292 |
-20% |
| Repayment
of non-current loans, excluding organic loan repayment from equity affiliates |
(435) |
(234) |
ns |
(96) |
ns |
| Change
in debt from renewable projects (TotalEnergies share) |
- |
(52) |
-100% |
(167) |
-100% |
| Acquisitions
( b ) |
1,400 |
288 |
x4.9 |
2,208 |
-37% |
| Asset
sales ( c ) |
478 |
684 |
-30% |
618 |
-23% |
Change
in debt from renewable projects
(partner
share) |
(2) |
34 |
ns |
100 |
ns |
| Net
acquisitions |
922 |
(396) |
ns |
1,590 |
-42% |
| Net
investments ( a + b - c ) |
2,903 |
4,285 |
-32% |
3,969 |
-27% |
| Other
transactions with non-controlling interests ( d ) |
- |
- |
ns |
- |
ns |
| Organic
loan repayment from equity affiliates ( e ) |
(487) |
(398) |
ns |
(30) |
ns |
| Change
in debt from renewable projects financing * ( f ) |
(2) |
86 |
ns |
267 |
ns |
| Capex
linked to capitalized leasing contracts ( g ) |
36 |
34 |
+6% |
22 |
+64% |
| Expenditures
related to carbon credit ( h ) |
- |
27 |
-100% |
- |
ns |
Cash
flow used in investing activities
(
a + b - c + d + e + f – g - h ) |
2,378 |
3,912 |
-39% |
4,184 |
-43% |
* Change in debt
from renewable projects (TotalEnergies share and partner share).
CASH FLOW
in millions of dollars |
1Q22 |
4Q21 |
1Q22
vs
4Q21 |
1Q21 |
1Q22
vs
1Q21 |
| Operating
cash flow before working capital changes w/o financial charges (DACF) |
11,995 |
9,759 |
+23% |
5,750 |
x2.1 |
| Financial
charges |
(369) |
(398) |
ns |
(384) |
ns |
| Operating
cash flow before working capital changes ( a ) * |
11,626 |
9,361 |
+24% |
5,366 |
x2.2 |
| (Increase)
decrease in working capital ** |
(4,775) |
2,591 |
ns |
(555) |
ns |
| Inventory
effect |
1,255 |
85 |
x14.8 |
883 |
+42% |
| Capital
gain from renewable projects sales |
(2) |
(19) |
ns |
(66) |
ns |
| Organic
loan repayment from equity affiliates |
(487) |
(398) |
ns |
(30) |
ns |
| Cash
flow from operations |
7,617 |
11,621 |
-34% |
5,598 |
+36% |
| |
|
|
|
|
|
| Organic
investments ( b ) |
1,981 |
4,681 |
-58% |
2,379 |
-17% |
| Free
cash flow after organic investments, w/o net asset sales ( a - b ) |
9,645 |
4,680 |
x2.1 |
2,987 |
x3.2 |
| |
|
|
|
|
|
| Net
investments ( c ) |
2,903 |
4,285 |
-32% |
3,969 |
-27% |
| Net
cash flow ( a - c ) |
8,723 |
5,076 |
+72% |
1,397 |
x6.2 |
* Operating cash flow before working
capital changes, is defined as cash flow from operating activities before changes in working capital at replacement cost, excluding the
mark-to-market effect of iGRP’s contracts and including capital gain from renewable projects sales (effective first quarter 2020).
Historical data have been restated to cancel the impact of fair valuation of iGRP sector’s contracts.
** Changes in working capital are presented
excluding the mark-to-market effect of iGRP’s contracts.
GEARING RATIO
| In
millions of dollars |
|
03/31/2022 |
12/31/2021 |
03/31/2021 |
03/31/2020 |
|
| Current
borrowings(1) |
|
16,759 |
13,645 |
19,279 |
17,361 |
|
| Other
current financial liabilities |
|
502 |
372 |
351 |
604 |
|
| Current
financial assets(1),(2) |
|
(7,231) |
(12,183) |
(4,492) |
(6,870) |
|
| Net
financial assets classified as held for sale |
|
(38) |
(4) |
- |
- |
|
| Non-current
financial debt(1) |
|
38,924 |
41,868 |
44,842 |
42,461 |
|
| Non-current
financial assets(1) |
|
(587) |
(1,557) |
(2,669) |
(993) |
|
| Cash
and cash equivalents |
|
(31,276) |
(21,342) |
(30,285) |
(21,634) |
|
| Net
debt (a) |
|
17,053 |
20,799 |
27,026 |
30,929 |
|
| Shareholders’
equity – TotalEnergies share |
|
116,480 |
111,736 |
109,295 |
112,006 |
|
| Non-controlling
interests |
|
3,375 |
3,263 |
2,390 |
2,428 |
|
| Shareholders’
equity (b) |
|
119,855 |
114,999 |
111,685 |
114,434 |
|
| Net-debt-to-capital
ratio = a / (a+b) |
|
12.5% |
15.3% |
19.5% |
21.3% |
|
| Leases
(c) |
|
8,028 |
8,055 |
7,747 |
7,309 |
|
| Net-debt-to-capital
ratio including leases (a+c) / (a+b+c) |
|
17.3% |
20.1% |
23.7% |
25.0% |
|
(1) Excludes
leases receivables and leases debts.
(2) Including
initial margins held as part of the Company’s activities on organized markets.
RETURN ON AVERAGE CAPITAL EMPLOYED
Twelve months ended March 31, 2022
| |
|
Integrated
Gas, |
|
|
|
|
|
|
| |
|
Renewables & |
|
Exploration & |
|
Refining & |
|
Marketing |
| in
millions of dollars |
|
Power |
|
Production |
|
Chemicals |
|
& Services |
| Adjusted
net operating income |
|
8,309 |
|
13,479 |
|
2,786 |
|
1,606 |
| Capital
employed at 03/31/2021* |
|
48,423 |
|
78,170 |
|
10,403 |
|
8,198 |
| Capital
employed at 03/31/2022* |
|
54,740 |
|
71,518 |
|
8,847 |
|
7,751 |
| ROACE |
|
16.1% |
|
18.0% |
|
28.9% |
|
20.1% |
Twelve months ended December 31, 2021
| |
|
Integrated |
|
|
|
|
|
|
| |
|
Gas, |
|
|
|
|
|
|
| |
|
Renewables & |
|
Exploration & |
|
Refining & |
|
Marketing |
| in
millions of dollars |
|
Power |
|
Production |
|
Chemicals |
|
& Services |
| Adjusted
net operating income |
|
6,243 |
|
10,439 |
|
1,909 |
|
1,618 |
| Capital
employed at 12/31/2020* |
|
45,611 |
|
78,928 |
|
11,375 |
|
8,793 |
| Capital
employed at 12/31/2021* |
|
55,978 |
|
71,675 |
|
8,069 |
|
8,783 |
| ROACE |
|
12.3% |
|
13.9% |
|
19.6% |
|
18.4% |
Twelve months ended March 31, 2021
| |
|
Integrated Gas, |
|
|
|
|
|
|
| |
|
Renewables & |
|
Exploration & |
|
Refining & |
|
Marketing & |
| in
millions of dollars |
|
Power |
|
Production |
|
Chemicals |
|
Services |
| Adjusted
net operating income |
|
1,850 |
|
3,635 |
|
900 |
|
1,206 |
| Capital
employed at 03/31/2020* |
|
44,236
|
|
85,622 |
|
12,878 |
|
8,764 |
| Capital
employed at 03/31/2021* |
|
48,423 |
|
78,170 |
|
10,403 |
|
8,198 |
| ROACE |
|
4.0% |
|
4.4% |
|
7.7% |
|
14.2% |
* At
replacement cost (excluding after-tax inventory effect).
MAIN INDICATORS
| |
|
1Q22 |
4Q21 |
3Q21 |
2Q21 |
1Q21 |
| €/$ |
|
1.12 |
1.14 |
1.18 |
1.21 |
1.20 |
| Brent |
($/b) |
102.2 |
79.8 |
73.5 |
69.0 |
61.1 |
| Average
liquids price* |
($/b) |
90.1 |
72.6 |
67.1 |
62.9 |
56.4 |
| Average
gas price* (1) |
($/Mbtu) |
12.27 |
11.38 |
6.33 |
4.43 |
4.06 |
| Average
LNG price** (1) |
($/Mbtu) |
13.60 |
13.12 |
9.10 |
6.59 |
6.08 |
| Variable
Cost Margin, European refining*** |
($/t) |
46.3 |
16.7 |
8.8 |
10.2 |
5.3 |
* Sales
in $ / sales in volume for consolidated affiliates.
** Sales
in $ / sales in volume for consolidated and equity affiliates.
(1) Does
not take into account gas and LNG trading activities, which results are expected to be significantly higher compared to the third quarter
2021, capturing optimization opportunities generated by large LNG trading portfolio in the prevailing high gas spot price environment.
*** This
indicator represents the average margin on variable costs realized by TotalEnergies’ European refining business (equal to the difference
between the sales of refined products realized by TotalEnergies’ European refining and the crude purchases as well as associated
variable costs, divided by refinery throughput in tons).
Disclaimer:
Data is based on TotalEnergies’ reporting and is not audited.
| CONSOLIDATED
STATEMENT OF INCOME |
|
|
| |
|
|
| TotalEnergies |
|
|
|
|
|
| |
|
|
|
|
|
| (unaudited) |
| |
|
1st quarter |
|
4th quarter |
|
1st quarter |
| (M$)(a) |
2022 |
|
2021 |
|
2021 |
| |
|
|
|
|
|
|
| Sales |
68,606 |
|
60,348 |
|
43,737 |
| Excise taxes |
(4,656) |
|
(5,050) |
|
(5,104) |
| |
Revenues from sales |
63,950 |
|
55,298 |
|
38,633 |
| |
|
|
|
|
|
|
| Purchases, net of inventory variation |
(39,648) |
|
(36,161) |
|
(23,398) |
| Other operating expenses |
(7,623) |
|
(6,680) |
|
(6,880) |
| Exploration costs |
(861) |
|
(323) |
|
(167) |
| Depreciation, depletion and impairment of tangible assets and mineral interests |
(3,679) |
|
(3,919) |
|
(3,325) |
| Other income |
143 |
|
536 |
|
358 |
| Other expense |
(2,290) |
|
(755) |
|
(659) |
| |
|
|
|
|
|
|
| Financial interest on debt |
(462) |
|
(483) |
|
(466) |
| Financial income and expense from cash & cash equivalents |
214 |
|
120 |
|
95 |
| |
Cost of net debt |
(248) |
|
(363) |
|
(371) |
| |
|
|
|
|
|
|
| Other financial income |
203 |
|
195 |
|
109 |
| Other financial expense |
(135) |
|
(138) |
|
(130) |
| |
|
|
|
|
|
|
| Net income (loss) from equity affiliates |
43 |
|
1,860 |
|
881 |
| |
|
|
|
|
|
|
| Income taxes |
(4,804) |
|
(3,647) |
|
(1,639) |
| Consolidated net income |
5,051 |
|
5,903 |
|
3,412 |
| TotalEnergies share |
4,944 |
|
5,837 |
|
3,344 |
| Non-controlling interests |
107 |
|
66 |
|
68 |
| Earnings per share ($) |
1.87 |
|
2.19 |
|
1.24 |
| Fully-diluted earnings per share ($) |
1.85 |
|
2.17 |
|
1.23 |
| (a) Except for per share amounts. |
|
|
|
|
|
| CONSOLIDATED
STATEMENT OF COMPREHENSIVE INCOME |
|
|
| |
|
|
| TotalEnergies |
|
|
|
|
|
| |
|
|
|
|
|
| (unaudited) |
| |
| |
1st quarter |
|
4th quarter |
|
1st quarter |
| (M$) |
2022 |
|
2021 |
|
2021 |
| Consolidated net income |
5,051 |
|
5,903 |
|
3,412 |
| |
|
|
|
|
|
| Other comprehensive income |
|
|
|
|
|
| |
|
|
|
|
|
| Actuarial gains and losses |
- |
|
589 |
|
- |
| Change in fair value of investments in equity instruments |
3 |
|
93 |
|
12 |
| Tax effect |
11 |
|
(262) |
|
(12) |
| Currency translation adjustment generated by the parent company |
(1,750) |
|
(1,900) |
|
(4,173) |
| Items not potentially reclassifiable to profit and loss |
(1,736) |
|
(1,480) |
|
(4,173) |
| Currency translation adjustment |
1,012 |
|
1,179 |
|
2,523 |
| Cash flow hedge |
(263) |
|
(226) |
|
504 |
| Variation of foreign currency basis spread |
49 |
|
4 |
|
- |
| share of other comprehensive income of equity affiliates, net amount |
(84) |
|
71 |
|
469 |
| Other |
- |
|
(2) |
|
1 |
| Tax effect |
53 |
|
22 |
|
(157) |
| Items potentially reclassifiable to profit and loss |
767 |
|
1,048 |
|
3,340 |
| Total other comprehensive income (net amount) |
(969) |
|
(432) |
|
(833) |
| |
|
|
|
|
|
| Comprehensive income |
4,082 |
|
5,471 |
|
2,579 |
| TotalEnergies share |
3,953 |
|
5,390 |
|
2,542 |
| Non-controlling interests |
129 |
|
81 |
|
37 |
| CONSOLIDATED
BALANCE SHEET |
|
|
|
|
|
| |
|
|
|
|
|
| TotalEnergies |
|
|
|
|
|
| |
March 31,
2022 |
|
December 31,
2021 |
|
March 31,
2021 |
| (M$) |
(unaudited) |
|
|
|
(unaudited) |
| |
|
|
|
|
|
| ASSETS |
|
|
|
|
|
| |
|
|
|
|
|
| Non-current assets |
|
|
|
|
|
| Intangible assets, net |
32,504 |
|
32,484 |
|
33,239 |
| Property, plant and equipment, net |
104,450 |
|
106,559 |
|
106,859 |
| Equity affiliates : investments and loans |
29,334 |
|
31,053 |
|
30,727 |
| Other investments |
1,490 |
|
1,625 |
|
2,062 |
| Non-current financial assets |
1,490 |
|
2,404 |
|
3,700 |
| Deferred income taxes |
5,299 |
|
5,400 |
|
6,619 |
| Other non-current assets |
3,033 |
|
2,797 |
|
2,638 |
| Total non-current assets |
177,600 |
|
182,322 |
|
185,844 |
| |
|
|
|
|
|
| Current assets |
|
|
|
|
|
| Inventories, net |
24,456 |
|
19,952 |
|
16,192 |
| Accounts receivable, net |
32,000 |
|
21,983 |
|
17,532 |
| Other current assets |
50,976 |
|
35,144 |
|
14,304 |
| Current financial assets |
7,415 |
|
12,315 |
|
4,605 |
| Cash and cash equivalents |
31,276 |
|
21,342 |
|
30,285 |
| Assets classified as held for sale |
856 |
|
400 |
|
396 |
| Total current assets |
146,979 |
|
111,136 |
|
83,314 |
| Total assets |
324,579 |
|
293,458 |
|
269,158 |
| |
|
|
|
|
|
| LIABILITIES & SHAREHOLDERS' EQUITY |
|
|
|
|
|
| |
|
|
|
|
|
| Shareholders' equity |
|
|
|
|
|
| Common shares |
8,137 |
|
8,224 |
|
8,193 |
| Paid-in surplus and retained earnings |
123,008 |
|
117,849 |
|
112,676 |
| Currency translation adjustment |
(13,643) |
|
(12,671) |
|
(11,566) |
| Treasury shares |
(1,022) |
|
(1,666) |
|
(8) |
| Total shareholders' equity - TotalEnergies Share |
116,480 |
|
111,736 |
|
109,295 |
| Non-controlling interests |
3,375 |
|
3,263 |
|
2,390 |
| Total shareholders' equity |
119,855 |
|
114,999 |
|
111,685 |
| |
|
|
|
|
|
| Non-current liabilities |
|
|
|
|
|
| Deferred income taxes |
11,281 |
|
10,904 |
|
10,387 |
| Employee benefits |
2,610 |
|
2,672 |
|
3,644 |
| Provisions and other non-current liabilities |
21,649 |
|
20,269 |
|
20,893 |
| Non-current financial debt |
46,546 |
|
49,512 |
|
52,541 |
| Total non-current liabilities |
82,086 |
|
83,357 |
|
87,465 |
| |
|
|
|
|
|
| Current liabilities |
|
|
|
|
|
| Accounts payable |
46,869 |
|
36,837 |
|
26,959 |
| Other creditors and accrued liabilities |
56,972 |
|
42,800 |
|
22,066 |
| Current borrowings |
18,252 |
|
15,035 |
|
20,471 |
| Other current financial liabilities |
502 |
|
372 |
|
351 |
| Liabilities directly associated with the assets classified as held for sale |
43 |
|
58 |
|
161 |
| Total current liabilities |
122,638 |
|
95,102 |
|
70,008 |
| Total liabilities & shareholders' equity |
324,579 |
|
293,458 |
|
269,158 |
| CONSOLIDATED
STATEMENT OF CASH FLOW |
|
|
|
|
|
| |
|
|
|
|
|
| TotalEnergies |
|
|
|
|
|
| |
|
|
|
|
|
| (unaudited) |
| |
1st quarter |
|
4th quarter |
|
1st quarter |
| (M$) |
2022 |
|
2021 |
|
2021 |
| |
|
|
|
|
|
| CASH FLOW FROM OPERATING ACTIVITIES |
|
|
|
|
|
| |
|
|
|
|
|
| Consolidated net income |
5,051 |
|
5,903 |
|
3,412 |
| Depreciation, depletion, amortization and impairment |
4,578 |
|
4,222 |
|
3,473 |
| Non-current liabilities, valuation allowances and deferred taxes |
2,538 |
|
152 |
|
121 |
| (Gains) losses on disposals of assets |
(13) |
|
(184) |
|
(285) |
| Undistributed affiliates' equity earnings |
262 |
|
(843) |
|
(573) |
| (Increase) decrease in working capital |
(4,923) |
|
2,232 |
|
(819) |
| Other changes, net |
124 |
|
139 |
|
269 |
| Cash flow from operating activities |
7,617 |
|
11,621 |
|
5,598 |
| |
|
|
|
|
|
| CASH FLOW USED IN INVESTING ACTIVITIES |
|
|
|
|
|
| |
|
|
|
|
|
| Intangible assets and property, plant and equipment additions |
(3,457) |
|
(4,540) |
|
(2,410) |
| Acquisitions of subsidiaries, net of cash acquired |
- |
|
(128) |
|
- |
| Investments in equity affiliates and other securities |
(89) |
|
(178) |
|
(2,126) |
| Increase in non-current loans |
(241) |
|
(348) |
|
(300) |
| Total expenditures |
(3,787) |
|
(5,194) |
|
(4,836) |
| Proceeds from disposals of intangible assets and property, plant and equipment |
177 |
|
349 |
|
226 |
| Proceeds from disposals of subsidiaries, net of cash sold |
88 |
|
36 |
|
229 |
| Proceeds from disposals of non-current investments |
215 |
|
266 |
|
63 |
| Repayment of non-current loans |
929 |
|
631 |
|
134 |
| Total divestments |
1,409 |
|
1,282 |
|
652 |
| Cash flow used in investing activities |
(2,378) |
|
(3,912) |
|
(4,184) |
| |
|
|
|
|
|
| CASH FLOW USED IN FINANCING ACTIVITIES |
|
|
|
|
|
| |
|
|
|
|
|
| Issuance (repayment) of shares: |
|
|
|
|
|
| - Parent company shareholders |
- |
|
- |
|
- |
| - Treasury shares |
(1,176) |
|
(1,658) |
|
(165) |
| Dividends paid: |
|
|
|
|
|
| - Parent company shareholders |
(1,928) |
|
(1,991) |
|
(2,090) |
| - Non-controlling interests |
(22) |
|
(20) |
|
(10) |
| Net issuance (repayment) of perpetual subordinated notes |
1,958 |
|
- |
|
3,248 |
| Payments on perpetual subordinated notes |
(136) |
|
(57) |
|
(87) |
| Other transactions with non-controlling interests |
5 |
|
(14) |
|
(55) |
| Net issuance (repayment) of non-current debt |
34 |
|
347 |
|
(890) |
| Increase (decrease) in current borrowings |
657 |
|
(3,368) |
|
(1,662) |
| Increase (decrease) in current financial assets and liabilities |
5,594 |
|
(8,373) |
|
(148) |
| Cash flow from (used in) financing activities |
4,986 |
|
(15,134) |
|
(1,859) |
| Net increase (decrease) in cash and cash equivalents |
10,225 |
|
(7,425) |
|
(445) |
| Effect of exchange rates |
(291) |
|
(204) |
|
(538) |
| Cash and cash equivalents at the beginning of the period |
21,342 |
|
28,971 |
|
31,268 |
| Cash and cash equivalents at the end of the period |
31,276 |
|
21,342 |
|
30,285 |
| CONSOLIDATED
STATEMENT OF CHANGES IN SHAREHOLDERS' EQUITY |
| TotalEnergies |
|
|
|
|
|
|
|
|
|
|
|
|
| (unaudited) |
| |
Common
shares issued |
Paid-in
surplus and |
Currency
translation |
|
Treasury
shares |
|
Shareholders’
equity - |
Non-
controlling |
|
Total
shareholders’ |
| |
|
retained |
adjustment |
|
|
|
TotalEnergies |
interests |
|
equity |
| (M$) |
Number |
Amount |
earnings |
|
|
Number |
Amount |
|
Share |
|
|
|
| As
of January 1, 2021 |
2,653,124,025 |
8,267 |
107,078 |
(10,256) |
|
(24,392,703) |
(1,387) |
|
103,702 |
2,383 |
|
106,085 |
| Net
income of the first quarter 2021 |
- |
- |
3,344 |
- |
|
- |
- |
|
3,344 |
68 |
|
3,412 |
| Other
comprehensive income |
- |
- |
502 |
(1,304) |
|
- |
- |
|
(802) |
(31) |
|
(833) |
| Comprehensive
Income |
- |
- |
3,846 |
(1,304) |
|
- |
- |
|
2,542 |
37 |
|
2,579 |
| Dividend |
- |
- |
- |
- |
|
- |
- |
|
- |
(10) |
|
(10) |
| Issuance
of common shares |
- |
- |
- |
- |
|
- |
- |
|
- |
- |
|
- |
| Purchase
of treasury shares |
- |
- |
- |
- |
|
(3,636,351) |
(165) |
|
(165) |
- |
|
(165) |
| Sale
of treasury shares(a) |
- |
- |
(216) |
- |
|
4,569,755 |
216 |
|
- |
- |
|
- |
| Share-based
payments |
- |
- |
14 |
- |
|
- |
- |
|
14 |
- |
|
14 |
| Share
cancellation |
(23,284,409) |
(74) |
(1,254) |
- |
|
23,284,409 |
1,328 |
|
- |
- |
|
- |
| Net
issuance (repayment) of perpetual subordinated notes |
- |
- |
3,254 |
- |
|
- |
- |
|
3,254 |
- |
|
3,254 |
| Payments
on perpetual subordinated notes |
- |
- |
(90) |
- |
|
- |
- |
|
(90) |
- |
|
(90) |
| Other
operations with
non-controlling
interests |
- |
- |
27 |
(6) |
|
- |
- |
|
21 |
(21) |
|
- |
| Other
items |
- |
- |
17 |
- |
|
- |
- |
|
17 |
1 |
|
18 |
| As
of March 31, 2021 |
2,629,839,616 |
8,193 |
112,676 |
(11,566) |
|
(174,890) |
(8) |
|
109,295 |
2,390 |
|
111,685 |
| Net
income from April 1 to December 31, 2021 |
- |
- |
12,688 |
- |
|
- |
- |
|
12,688 |
266 |
|
12,954 |
| Other
comprehensive income |
- |
- |
489 |
(1,103) |
|
- |
- |
|
(614) |
1 |
|
(613) |
| Comprehensive
Income |
- |
- |
13,177 |
(1,103) |
|
- |
- |
|
12,074 |
267 |
|
12,341 |
| Dividend |
- |
- |
(8,200) |
- |
|
- |
- |
|
(8,200) |
(114) |
|
(8,314) |
| Issuance
of common shares |
10,589,713 |
31 |
350 |
- |
|
- |
- |
|
381 |
- |
|
381 |
| Purchase
of treasury shares |
- |
- |
- |
- |
|
(33,669,654) |
(1,658) |
|
(1,658) |
- |
|
(1,658) |
| Sale
of treasury shares(a) |
- |
- |
- |
- |
|
3,440 |
- |
|
- |
- |
|
- |
| Share-based
payments |
- |
- |
129 |
- |
|
- |
- |
|
129 |
- |
|
129 |
| Share
cancellation |
- |
- |
- |
- |
|
- |
- |
|
- |
- |
|
- |
| Net
issuance (repayment) of perpetual subordinated notes |
- |
- |
- |
- |
|
- |
- |
|
- |
- |
|
- |
| Payments
on perpetual subordinated notes |
- |
- |
(278) |
- |
|
- |
- |
|
(278) |
- |
|
(278) |
| Other
operations with
non-controlling interests |
- |
- |
3 |
- |
|
- |
- |
|
3 |
710 |
|
713 |
| Other
items |
- |
- |
(8) |
(2) |
|
- |
- |
|
(10) |
10 |
|
- |
| As
of December 31, 2021 |
2,640,429,329 |
8,224 |
117,849 |
(12,671) |
|
(33,841,104) |
(1,666) |
|
111,736 |
3,263 |
|
114,999 |
| Net
income of the first quarter 2022 |
- |
- |
4,944 |
- |
|
- |
- |
|
4,944 |
107 |
|
5,051 |
| Other
comprehensive income |
- |
- |
(19) |
(972) |
|
- |
- |
|
(991) |
22 |
|
(969) |
| Comprehensive
Income |
- |
- |
4,925 |
(972) |
|
- |
- |
|
3,953 |
129 |
|
4,082 |
| Dividend |
- |
- |
- |
- |
|
- |
- |
|
- |
(22) |
|
(22) |
| Issuance
of common shares |
- |
- |
- |
- |
|
- |
- |
|
- |
- |
|
- |
| Purchase
of treasury shares |
- |
- |
- |
- |
|
(22,378,128) |
(1,176) |
|
(1,176) |
- |
|
(1,176) |
| Sale
of treasury shares(a) |
- |
- |
(315) |
- |
|
6,168,047 |
315 |
|
- |
- |
|
- |
| Share-based
payments |
- |
- |
92 |
- |
|
- |
- |
|
92 |
- |
|
92 |
| Share
cancellation |
(30,665,526) |
(87) |
(1,418) |
- |
|
30,665,526 |
1,505 |
|
- |
- |
|
- |
| Net
issuance (repayment) of perpetual subordinated notes |
- |
- |
1,958 |
- |
|
- |
- |
|
1,958 |
- |
|
1,958 |
| Payments
on perpetual subordinated notes |
- |
- |
(96) |
- |
|
- |
- |
|
(96) |
- |
|
(96) |
| Other
operations with
non-controlling
interests |
- |
- |
(1) |
- |
|
- |
- |
|
(1) |
6 |
|
5 |
| Other
items |
- |
- |
14 |
- |
|
- |
- |
|
14 |
(1) |
|
13 |
| As
of March 31, 2022 |
2,609,763,803 |
8,137 |
123,008 |
(13,643) |
|
(19,385,659) |
(1,022) |
|
116,480 |
3,375 |
|
119,855 |
| (a)Treasury
shares related to the performance share grants. |
|
|
|
|
|
| INFORMATION
BY BUSINESS SEGMENT |
| TotalEnergies |
|
|
|
|
|
|
|
| (unaudited) |
|
|
|
|
|
|
|
| |
|
|
|
|
|
|
|
1st
quarter 2022
(M$) |
Integrated
Gas,
Renewables
&
Power |
Exploration
&
Production |
Refining
&
Chemicals |
Marketing
&
Services |
Corporate |
Intercompany |
Total |
| External sales |
12,294 |
2,151 |
31,008 |
23,149 |
4 |
- |
68,606 |
| Intersegment sales |
1,471 |
13,818 |
9,277 |
267 |
63 |
(24,896) |
- |
| Excise
taxes |
- |
- |
(192) |
(4,464) |
- |
- |
(4,656) |
| Revenues from sales |
13,765 |
15,969 |
40,093 |
18,952 |
67 |
(24,896) |
63,950 |
| Operating expenses |
(11,632) |
(5,708) |
(37,411) |
(17,984) |
(293) |
24,896 |
(48,132) |
| Depreciation,
depletion and impairment of tangible assets and mineral interests |
(321) |
(2,661) |
(380) |
(273) |
(44) |
- |
(3,679) |
| Operating
income |
1,812 |
7,600 |
2,302 |
695 |
(270) |
- |
12,139 |
| Net income (loss) from equity affiliates and other
items |
(2,500) |
242 |
156 |
(42) |
108 |
- |
(2,036) |
| Tax
on net operating income |
(294) |
(3,863) |
(525) |
(225) |
105 |
- |
(4,802) |
| Net
operating income |
(982) |
3,979 |
1,933 |
428 |
(57) |
- |
5,301 |
| Net cost of net debt |
|
|
|
|
|
|
(250) |
| Non-controlling
interests |
|
|
|
|
|
|
(107) |
| Net income - TotalEnergies
share |
|
|
|
|
|
|
4,944 |
| |
|
|
|
|
|
|
|
1st
quarter 2022 (adjustments)(a)
(M$) |
Integrated
Gas,
Renewables
&
Power |
Exploration
&
Production |
Refining
&
Chemicals |
Marketing
&
Services |
Corporate |
Intercompany |
Total |
| External sales |
12 |
- |
- |
- |
- |
- |
12 |
| Intersegment sales |
- |
- |
- |
- |
- |
- |
- |
| Excise
taxes |
- |
- |
- |
- |
- |
- |
- |
| Revenues from sales |
12 |
- |
- |
- |
- |
- |
12 |
| Operating expenses |
(117) |
(791) |
947 |
268 |
(132) |
- |
175 |
| Depreciation,
depletion and impairment of tangible assets and mineral interests |
- |
(493) |
- |
(29) |
(9) |
- |
(531) |
| Operating
income (b) |
(105) |
(1,284) |
947 |
239 |
(141) |
- |
(344) |
| Net income (loss) from equity affiliates and other
items |
(3,939) |
(14) |
117 |
(3) |
106 |
- |
(3,733) |
| Tax
on net operating income |
11 |
262 |
(251) |
(80) |
20 |
- |
(38) |
| Net
operating income (b) |
(4,033) |
(1,036) |
813 |
156 |
(15) |
- |
(4,115) |
| Net cost of net debt |
|
|
|
|
|
|
113 |
| Non-controlling
interests |
|
|
|
|
|
|
(31) |
| Net income - TotalEnergies
share |
|
|
|
|
|
|
(4,033) |
| |
|
|
|
|
|
|
|
| (a)
Adjustments include special items, inventory valuation effect and the effect of changes in fair value. |
| (b) Of which
inventory valuation effect |
|
|
|
|
|
|
|
| -
On operating income |
- |
- |
947 |
308 |
- |
|
|
| -
On net operating income |
- |
- |
845 |
228 |
- |
|
|
| |
|
|
|
|
|
|
|
1st
quarter 2022 (adjusted)
(M$) |
Integrated
Gas,
Renewables
&
Power |
Exploration
&
Production |
Refining
&
Chemicals |
Marketing
&
Services |
Corporate |
Intercompany |
Total |
| External sales |
12,282 |
2,151 |
31,008 |
23,149 |
4 |
- |
68,594 |
| Intersegment sales |
1,471 |
13,818 |
9,277 |
267 |
63 |
(24,896) |
- |
| Excise
taxes |
- |
- |
(192) |
(4,464) |
- |
- |
(4,656) |
| Revenues from sales |
13,753 |
15,969 |
40,093 |
18,952 |
67 |
(24,896) |
63,938 |
| Operating expenses |
(11,515) |
(4,917) |
(38,358) |
(18,252) |
(161) |
24,896 |
(48,307) |
| Depreciation,
depletion and impairment of tangible assets and mineral interests |
(321) |
(2,168) |
(380) |
(244) |
(35) |
- |
(3,148) |
| Adjusted
operating income |
1,917 |
8,884 |
1,355 |
456 |
(129) |
- |
12,483 |
| Net income (loss) from equity affiliates and other
items |
1,439 |
256 |
39 |
(39) |
2 |
- |
1,697 |
| Tax
on net operating income |
(305) |
(4,125) |
(274) |
(145) |
85 |
- |
(4,764) |
| Adjusted
net operating income |
3,051 |
5,015 |
1,120 |
272 |
(42) |
- |
9,416 |
| Net cost of net debt |
|
|
|
|
|
|
(363) |
| Non-controlling
interests |
|
|
|
|
|
|
(76) |
| Adjusted net income
- TotalEnergies share |
|
|
|
|
|
|
8,977 |
| |
|
|
|
|
|
|
|
1st
quarter 2022
(M$) |
Integrated
Gas,
Renewables
&
Power |
Exploration
&
Production |
Refining
&
Chemicals |
Marketing
&
Services |
Corporate |
Intercompany |
Total |
| Total expenditures |
1,439 |
1,971 |
228 |
140 |
9 |
|
3,787 |
| Total divestments |
1,015 |
283 |
27 |
79 |
5 |
|
1,409 |
| Cash
flow from operating activities |
315 |
5,768 |
1,107 |
898 |
(471) |
|
7,617 |
INFORMATION
BY BUSINESS SEGMENT
TotalEnergies
(unaudited)
4th
quarter 2021
(M$)
|
Integrated
Gas,
Renewables
&
Power |
Exploration
&
Production |
Refining
&
Chemicals |
Marketing
&
Services |
Corporate |
Intercompany |
Total |
| External
sales |
11,634 |
2,068 |
24,781 |
21,854 |
11 |
- |
60,348 |
| Intersegment
sales |
1,466 |
11,875 |
8,716 |
155 |
148 |
(22,360) |
- |
| Excise
taxes |
- |
- |
(238) |
(4,812) |
- |
- |
(5,050) |
| Revenues
from sales |
13,100 |
13,943 |
33,259 |
17,197 |
159 |
(22,360) |
55,298 |
| Operating
expenses |
(11,141) |
(5,412) |
(32,250) |
(16,347) |
(374) |
22,360 |
(43,164) |
| Depreciation,
depletion and impairment of tangible assets and mineral interests |
(545) |
(2,637) |
(399) |
(307) |
(31) |
- |
(3,919) |
| Operating
income |
1,414 |
5,894 |
610 |
543 |
(246) |
- |
8,215 |
| Net income
(loss) from equity affiliates and other items |
1,281 |
74 |
228 |
83 |
32 |
- |
1,698 |
| Tax
on net operating income |
(237) |
(3,124) |
(234) |
(164) |
75 |
- |
(3,684) |
| Net
operating income |
2,458 |
2,844 |
604 |
462 |
(139) |
- |
6,229 |
| Net
cost of net debt |
|
|
|
|
|
|
(326) |
| Non-controlling
interests |
|
|
|
|
|
|
(66) |
| Net
income - TotalEnergies share |
|
|
|
|
|
|
5,837 |
4th
quarter 2021 (adjustments)(a)
(M$)
|
Integrated
Gas,
Renewables
&
Power |
Exploration
&
Production |
Refining
&
Chemicals |
Marketing
&
Services |
Corporate |
Intercompany |
Total |
| External
sales |
- |
- |
- |
- |
- |
- |
- |
| Intersegment
sales |
- |
- |
- |
- |
- |
- |
- |
| Excise
taxes |
- |
- |
- |
- |
- |
- |
- |
| Revenues
from sales |
- |
- |
- |
- |
- |
- |
- |
| Operating
expenses |
(57) |
(132) |
38 |
21 |
- |
- |
(130) |
| Depreciation,
depletion and impairment of tangible assets and mineral interests |
(187) |
(418) |
- |
(36) |
- |
- |
(641) |
| Operating
income (b) |
(244) |
(550) |
38 |
(15) |
- |
- |
(771) |
| Net income
(loss) from equity affiliates and other items |
(116) |
(111) |
23 |
(6) |
6 |
- |
(204) |
| Tax
on net operating income |
59 |
(20) |
(10) |
4 |
(69) |
- |
(36) |
| Net
operating income (b) |
(301) |
(681) |
51 |
(17) |
(63) |
- |
(1,011) |
| Net
cost of net debt |
|
|
|
|
|
|
10 |
| Non-controlling
interests |
|
|
|
|
|
|
13 |
| Net
income - TotalEnergies share |
|
|
|
|
|
|
(988) |
| |
|
|
|
|
|
|
|
| (a)
Adjustments include special items, inventory valuation effect and the effect of changes in fair value. |
| (b)
Of which inventory valuation effect |
|
|
|
|
|
|
|
| -
On operating income |
- |
- |
32 |
53 |
- |
|
|
| -
On net operating income |
- |
- |
74 |
47 |
- |
|
|
4th
quarter 2021 (adjusted)
(M$)
|
Integrated
Gas,
Renewables
&
Power |
Exploration
&
Production |
Refining
&
Chemicals |
Marketing
&
Services |
Corporate |
Intercompany |
Total |
| External
sales |
11,634 |
2,068 |
24,781 |
21,854 |
11 |
- |
60,348 |
| Intersegment
sales |
1,466 |
11,875 |
8,716 |
155 |
148 |
(22,360) |
- |
| Excise
taxes |
- |
- |
(238) |
(4,812) |
- |
- |
(5,050) |
| Revenues
from sales |
13,100 |
13,943 |
33,259 |
17,197 |
159 |
(22,360) |
55,298 |
| Operating
expenses |
(11,084) |
(5,280) |
(32,288) |
(16,368) |
(374) |
22,360 |
(43,034) |
| Depreciation,
depletion and impairment of tangible assets and mineral interests |
(358) |
(2,219) |
(399) |
(271) |
(31) |
- |
(3,278) |
| Adjusted
operating income |
1,658 |
6,444 |
572 |
558 |
(246) |
- |
8,986 |
| Net income
(loss) from equity affiliates and other items |
1,397 |
185 |
205 |
89 |
26 |
- |
1,902 |
| Tax
on net operating income |
(296) |
(3,104) |
(224) |
(168) |
144 |
- |
(3,648) |
| Adjusted
net operating income |
2,759 |
3,525 |
553 |
479 |
(76) |
- |
7,240 |
| Net
cost of net debt |
|
|
|
|
|
|
(336) |
| Non-controlling
interests |
|
|
|
|
|
|
(79) |
| Adjusted
net income - TotalEnergies share |
|
|
|
|
|
|
6,825 |
4th
quarter 2021
(M$)
|
Integrated
Gas,
Renewables
&
Power |
Exploration
&
Production |
Refining
&
Chemicals |
Marketing
&
Services |
Corporate |
Intercompany |
Total |
| Total
expenditures |
1,471 |
2,327 |
723 |
643 |
30 |
|
5,194 |
| Total
divestments |
540 |
357 |
202 |
181 |
2 |
|
1,282 |
| Cash
flow from operating activities |
(57) |
8,624 |
2,446 |
386 |
222 |
|
11,621 |
INFORMATION
BY BUSINESS SEGMENT
TotalEnergies
(unaudited)
1st
quarter 2021
(M$)
|
Integrated
Gas,
Renewables
&
Power |
Exploration
&
Production |
Refining
&
Chemicals |
Marketing
&
Services |
Corporate |
Intercompany |
Total |
| External
sales |
5,502 |
1,514 |
19,201 |
17,513 |
7 |
- |
43,737 |
| Intersegment
sales |
811 |
6,578 |
5,521 |
78 |
29 |
(13,017) |
- |
| Excise
taxes |
- |
- |
(405) |
(4,699) |
- |
- |
(5,104) |
| Revenues
from sales |
6,313 |
8,092 |
24,317 |
12,892 |
36 |
(13,017) |
38,633 |
| Operating
expenses |
(5,218) |
(3,068) |
(22,933) |
(12,076) |
(167) |
13,017 |
(30,445) |
| Depreciation,
depletion and impairment of tangible assets and mineral interests |
(471) |
(2,183) |
(391) |
(255) |
(25) |
- |
(3,325) |
| Operating
income |
624 |
2,841 |
993 |
561 |
(156) |
- |
4,863 |
| Net income
(loss) from equity affiliates and other items |
263 |
270 |
88 |
(34) |
(28) |
- |
559 |
| Tax
on net operating income |
(101) |
(1,180) |
(280) |
(176) |
38 |
- |
(1,699) |
| Net
operating income |
786 |
1,931 |
801 |
351 |
(146) |
- |
3,723 |
| Net
cost of net debt |
|
|
|
|
|
|
(311) |
| Non-controlling
interests |
|
|
|
|
|
|
(68) |
| Net
income - TotalEnergies share |
|
|
|
|
|
|
3,344 |
1st
quarter 2021 (adjustments)(a)
(M$)
|
Integrated
Gas,
Renewables
&
Power |
Exploration
&
Production |
Refining
&
Chemicals |
Marketing
&
Services |
Corporate |
Intercompany |
Total |
| External
sales |
(35) |
- |
- |
- |
- |
- |
(35) |
| Intersegment
sales |
- |
- |
- |
- |
- |
- |
- |
| Excise
taxes |
- |
- |
- |
- |
- |
- |
- |
| Revenues
from sales |
(35) |
- |
- |
- |
- |
- |
(35) |
| Operating
expenses |
(8) |
- |
745 |
142 |
- |
- |
879 |
| Depreciation,
depletion and impairment of tangible assets and mineral interests |
(145) |
- |
- |
- |
- |
- |
(145) |
| Operating
income (b) |
(188) |
- |
745 |
142 |
- |
- |
699 |
| Net income
(loss) from equity affiliates and other items |
(49) |
(46) |
6 |
(35) |
(40) |
- |
(164) |
| Tax
on net operating income |
38 |
2 |
(193) |
(40) |
2 |
- |
(191) |
| Net
operating income (b) |
(199) |
(44) |
558 |
67 |
(38) |
- |
344 |
| Net
cost of net debt |
|
|
|
|
|
|
6 |
| Non-controlling
interests |
|
|
|
|
|
|
(9) |
| Net
income - TotalEnergies share |
|
|
|
|
|
|
341 |
| |
|
|
|
|
|
|
|
| (a)
Adjustments include special items, inventory valuation effect and the effect of changes in fair value. |
| (b)
Of which inventory valuation effect |
|
|
|
|
|
|
|
| -
On operating income |
- |
- |
746 |
137 |
- |
|
|
| -
On net operating income |
- |
- |
606 |
98 |
- |
|
|
1st
quarter 2021 (adjusted)
(M$)
|
Integrated
Gas,
Renewables
&
Power |
Exploration
&
Production |
Refining
&
Chemicals |
Marketing
&
Services |
Corporate |
Intercompany |
Total |
| External
sales |
5,537 |
1,514 |
19,201 |
17,513 |
7 |
- |
43,772 |
| Intersegment
sales |
811 |
6,578 |
5,521 |
78 |
29 |
(13,017) |
- |
| Excise
taxes |
- |
- |
(405) |
(4,699) |
- |
- |
(5,104) |
| Revenues
from sales |
6,348 |
8,092 |
24,317 |
12,892 |
36 |
(13,017) |
38,668 |
| Operating
expenses |
(5,210) |
(3,068) |
(23,678) |
(12,218) |
(167) |
13,017 |
(31,324) |
| Depreciation,
depletion and impairment of tangible assets and mineral interests |
(326) |
(2,183) |
(391) |
(255) |
(25) |
- |
(3,180) |
| Adjusted
operating income |
812 |
2,841 |
248 |
419 |
(156) |
- |
4,164 |
| Net income
(loss) from equity affiliates and other items |
312 |
316 |
82 |
1 |
12 |
- |
723 |
| Tax
on net operating income |
(139) |
(1,182) |
(87) |
(136) |
36 |
- |
(1,508) |
| Adjusted
net operating income |
985 |
1,975 |
243 |
284 |
(108) |
- |
3,379 |
| Net
cost of net debt |
|
|
|
|
|
|
(317) |
| Non-controlling
interests |
|
|
|
|
|
|
(59) |
| Adjusted
net income - TotalEnergies share |
|
|
|
|
|
|
3,003 |
1st
quarter 2021
(M$)
|
Integrated
Gas,
Renewables
&
Power |
Exploration
&
Production |
Refining
&
Chemicals |
Marketing
&
Services |
Corporate |
Intercompany |
Total |
| Total
expenditures |
3,020 |
1,365 |
287 |
138 |
26 |
|
4,836 |
| Total
divestments |
142 |
311 |
116 |
71 |
12 |
|
652 |
| Cash
flow from operating activities |
780 |
3,736 |
996 |
665 |
(579) |
|
5,598 |
Reconciliation
of the information by business segment with Consolidated Financial Statements
TotalEnergies
(unaudited)
| 1st quarter 2022 |
|
|
|
|
Consolidated
statement |
| (M$) |
Adjusted |
|
Adjustments(a) |
|
of
income |
| Sales |
68,594 |
|
12 |
|
68,606 |
| Excise taxes |
(4,656) |
|
- |
|
(4,656) |
| Revenues from sales |
63,938 |
|
12 |
|
63,950 |
| |
|
|
|
|
|
| Purchases net of inventory
variation |
(40,762) |
|
1,114 |
|
(39,648) |
| Other operating expenses |
(7,409) |
|
(214) |
|
(7,623) |
| Exploration costs |
(136) |
|
(725) |
|
(861) |
| Depreciation, depletion and
impairment of tangible assets and mineral interests |
(3,148) |
|
(531) |
|
(3,679) |
| Other
income |
121 |
|
22 |
|
143 |
| Other expense |
(269) |
|
(2,021) |
|
(2,290) |
| |
|
|
|
|
|
| Financial interest on debt |
(462) |
|
- |
|
(462) |
| Financial income and expense
from cash & cash equivalents |
59 |
|
155 |
|
214 |
| Cost of net debt |
(403) |
|
155 |
|
(248) |
| |
|
|
|
|
|
| Other financial income |
119 |
|
84 |
|
203 |
| Other financial expense |
(135) |
|
- |
|
(135) |
| |
|
|
|
|
|
| Net income (loss) from equity
affiliates |
1,861 |
|
(1,818) |
|
43 |
| |
|
|
|
|
|
| Income
taxes |
(4,724) |
|
(80) |
|
(4,804) |
| Consolidated net income |
9,053 |
|
(4,002) |
|
5,051 |
| TotalEnergies share |
8,977 |
|
(4,033) |
|
4,944 |
| Non-controlling interests |
76 |
|
31 |
|
107 |
| |
|
|
|
|
|
| (a) Adjustments
include special items, inventory valuation effect and the effect of changes in fair value. |
| |
|
|
|
|
Consolidated
|
| 1st quarter 2021 |
|
|
|
|
statement |
| (M$) |
Adjusted |
|
Adjustments(a) |
|
of
income |
| Sales |
43,772 |
|
(35) |
|
43,737 |
| Excise taxes |
(5,104) |
|
- |
|
(5,104) |
| Revenues from sales |
38,668 |
|
(35) |
|
38,633 |
| |
|
|
|
|
|
| Purchases net of inventory
variation |
(24,289) |
|
891 |
|
(23,398) |
| Other operating expenses |
(6,868) |
|
(12) |
|
(6,880) |
| Exploration costs |
(167) |
|
- |
|
(167) |
| Depreciation, depletion and
impairment of tangible assets and mineral interests |
(3,180) |
|
(145) |
|
(3,325) |
| Other
income |
416 |
|
(58) |
|
358 |
| Other expense |
(192) |
|
(467) |
|
(659) |
| |
|
|
|
|
|
| Financial interest on debt |
(466) |
|
- |
|
(466) |
| Financial income and expense
from cash & cash equivalents |
87 |
|
8 |
|
95 |
| Cost of net debt |
(379) |
|
8 |
|
(371) |
| |
|
|
|
|
|
| Other financial income |
109 |
|
- |
|
109 |
| Other financial expense |
(130) |
|
- |
|
(130) |
| |
|
|
|
|
|
| Net income (loss) from equity
affiliates |
520 |
|
361 |
|
881 |
| |
|
|
|
|
|
| Income
taxes |
(1,446) |
|
(193) |
|
(1,639) |
| Consolidated net income |
3,062 |
|
350 |
|
3,412 |
| TotalEnergies share |
3,003 |
|
341 |
|
3,344 |
| Non-controlling interests |
59 |
|
9 |
|
68 |
| |
|
|
|
|
|
| (a) Adjustments
include special items, inventory valuation effect and the effect of changes in fair value. |
TotalEnergies
NOTES TO THE CONSOLIDATED FINANCIAL STATEMENTS
FOR THE FIRST QUARTER 2022
(unaudited)
1)
Basis of preparation of the consolidated financial statements
The consolidated
financial statements are prepared in accordance with International Financial Reporting Standards (IFRS) as adopted by the European Union
and IFRS as published by the International Accounting Standards Board (IASB).
The interim consolidated financial statements of
TotalEnergies SE and its subsidiaries (the Company) as of March 31, 2022, are presented in U.S. dollars and have been prepared in accordance
with International Accounting Standard (IAS) 34 “Interim Financial Reporting”.
The accounting principles
applied for the consolidated financial statements at March 31, 2022, are consistent with those used
for the financial statements at December 31, 2021. Since January 1, 2020, the Company has early adopted the amendments to IFRS
7 and IFRS 9 relating to the interest rate benchmark reform phase II. In particular, these amendments allow to maintain the hedge accounting
qualification of interest rate derivatives.
The preparation of financial statements
in accordance with IFRS for the closing as of March 31, 2022 requires the General Management to make estimates, assumptions and judgments
that affect the information reported in the Consolidated Financial Statements and the Notes thereto.
These estimates, assumptions and
judgments are based on historical experience and other factors believed to be reasonable at the date of preparation of the financial statements.
They are reviewed on an on-going basis by General Management and therefore could be revised as circumstances change or as a result of
new information.
The main estimates, judgments
and assumptions relate to the estimation of hydrocarbon reserves in application of the successful efforts method for the oil and gas
activities, asset impairments, employee benefits, asset retirement obligations and income taxes. These estimates and assumptions are
described in the Notes to the Consolidated Financial Statements as of December 31, 2021.
The
interim consolidated financial statements are impacted by the Russian-Ukrainian conflict described in paragraph 7 Other risks and commitments.
The Company has taken this environment into account in its estimates and has decided to record as of 31 March 2022 an impairment of $4,095
million concerning notably Arctic LNG 2.
Different estimates, assumptions
and judgments could significantly affect the information reported, and actual results may differ from the amounts included in the Consolidated
Financial Statements and the Notes thereto.
Furthermore, when the accounting
treatment of a specific transaction is not addressed by any accounting standard or interpretation, the General Management of the Company
applies its judgment to define and apply accounting policies that provide information consistent with the general IFRS concepts: faithful
representation, relevance and materiality.
2)
Changes in the Company structure
2.1) Main acquisitions and divestments
| · | Integrated Gas, Renewables & Power |
| · | On February 28, 2022, TotalEnergies has successfully been named a winner of maritime lease area OCS-A
0538 by the BOEM (Bureau of Ocean Energy Management) in the New York Bight auction in United States. |
This bid for the development of an
offshore wind farm off the U.S. East Coast was won for a consideration of $795 million (100%) by both TotalEnergies and EnBW.
Located up to 47 nautical miles (87
kilometers) from the coast, the lease covers a 132 square miles (341 square kilometer) area that could accommodate a generation capacity
of at least 3 GW, enough to provide power to about one million homes. The project is expected to come online by 2028.
| · | Exploration & Production |
| · | In January 2022, TotalEnergies has decided to initiate the contractual process of withdrawing from the
Yadana field and from MGTC in Myanmar, both as operator and as shareholder, without any financial compensation for TotalEnergies. This
withdrawal has been notified to TotalEnergies' partners in Yadana and MGTC and will be effective at the latest at the expiry of the 6-month
contractual period. |
As a result, TotalEnergies registered an impairment
of assets of $(201) million in operational result and of $(305) million in TotalEnergies’ share net result in the financial statements
as of December 31, 2021.
| · | In February 2022, TotalEnergies announced its decision not to sanction and so to withdraw from the North
Platte deepwater project in the US Gulf of Mexico. |
The decision not to continue with the
project was taken as TotalEnergies has better opportunities of allocation of its capital within its global portfolio.
An impairment of the project’s
assets has been recorded in the consolidated financial statements of the first quarter of 2022, for an amount of $957 million in net income,
TotalEnergies’ share.
2.2) Divestment projects
As of March 31, 2022, there
is no material divestment project recorded in “assets held for sale”.
3)
Business segment information
Description of the business segments
Financial information by business segment is reported
in accordance with the internal reporting system and shows internal segment information that is used to manage and measure the performance
of TotalEnergies and which is reviewed by the main operational decision-making body of the Company, namely the Executive Committee.
The operational profit and assets are broken down
by business segment prior to the consolidation and inter-segment adjustments.
Sales prices between business segments approximate
market prices.
The organization of the Company's activities is
structured around the four followings segments:
| - | An
Integrated Gas, Renewables & Power segment comprising integrated
gas (including LNG) and low carbon electricity businesses. It includes the upstream and midstream
LNG activity; |
| - | An Exploration & Production segment; Starting September 2021, it notably includes the carbon neutrality
activity that was previously reported in the Integrated Gas, Renewables & Power segment; |
| - | A Refining & Chemicals segment constituting a major industrial hub comprising the activities of refining,
petrochemicals and specialty chemicals. This segment also includes the activities of oil Supply, Trading and marine Shipping; |
| - | A Marketing & Services segment including the global activities of supply and marketing in the field
of petroleum products; |
In addition the Corporate segment includes holdings
operating and financial activities.
Adjustment items
Performance indicators excluding the adjustment
items, such as adjusted operating income, adjusted net operating income, and adjusted net income are meant to facilitate the analysis
of the financial performance and the comparison of income between periods.
Adjustment items include:
Due to their unusual nature or particular
significance, certain transactions qualified as "special items" are excluded from the business segment figures. In general,
special items relate to transactions that are significant, infrequent or unusual. However, in certain instances, transactions such as
restructuring costs or assets disposals, which are not considered to be representative of the normal course of business, may be qualified
as special items although they may have occurred within prior years or are likely to occur again within the coming years.
(ii)
The inventory valuation effect
The adjusted results of the Refining
& Chemicals and Marketing & Services segments are presented according to the replacement cost method. This method is used to assess
the segments’ performance and facilitate the comparability of the segments’ performance with those of its competitors.
In the replacement cost method, which
approximates the LIFO (Last-In, First-Out) method, the variation of inventory values in the statement of income is, depending on the nature
of the inventory, determined using either the month-end prices differential between one period and another or the average prices of the
period rather than the historical value. The inventory valuation effect is the difference between the results according to the FIFO (First-In,
First-Out) and the replacement cost methods.
(iii) Effect of
changes in fair value
The effect of changes in fair value
presented as adjustment items reflects for certain transactions differences between the internal measure of performance used by TotalEnergies’s
management and the accounting for these transactions under IFRS.
IFRS requires that trading inventories
be recorded at their fair value using period end spot prices. In order to best reflect the management of economic exposure through derivative
transactions, internal indicators used to measure performance include valuations of trading inventories based on forward prices.
TotalEnergies, in its trading activities,
enters into storage contracts, whose future effects are recorded at fair value in the Company’s internal economic performance. IFRS
precludes recognition of this fair value effect.
Furthermore, TotalEnergies enters into
derivative instruments to risk manage certain operational contracts or assets. Under IFRS, these derivatives are recorded at fair value
while the underlying operational transactions are recorded as they occur. Internal indicators defer the fair value on derivatives to match
with the transaction occurrence.
The adjusted results (adjusted operating income,
adjusted net operating income, adjusted net income) are defined as replacement cost results, adjusted for special items and the effect
of changes in fair value.
3.1)
Information by business segment
| |
|
|
|
|
|
|
|
| 1st quarter 2022 |
Integrated Gas,
Renewables
& Power |
Exploration
&
Production |
Refining
&
Chemicals |
Marketing
&
Services |
Corporate |
Intercompany |
Total |
| (M$) |
| External sales |
12,294 |
2,151 |
31,008 |
23,149 |
4 |
- |
68,606 |
| Intersegment sales |
1,471 |
13,818 |
9,277 |
267 |
63 |
(24,896) |
- |
| Excise taxes |
- |
- |
(192) |
(4,464) |
- |
- |
(4,656) |
| Revenues from sales |
13,765 |
15,969 |
40,093 |
18,952 |
67 |
(24,896) |
63,950 |
| Operating expenses |
(11,632) |
(5,708) |
(37,411) |
(17,984) |
(293) |
24,896 |
(48,132) |
| Depreciation, depletion and impairment of tangible assets and mineral interests |
(321) |
(2,661) |
(380) |
(273) |
(44) |
- |
(3,679) |
| Operating income |
1,812 |
7,600 |
2,302 |
695 |
(270) |
- |
12,139 |
| Net income (loss) from equity affiliates and other items |
(2,500) |
242 |
156 |
(42) |
108 |
- |
(2,036) |
| Tax on net operating income |
(294) |
(3,863) |
(525) |
(225) |
105 |
- |
(4,802) |
| Net operating income |
(982) |
3,979 |
1,933 |
428 |
(57) |
- |
5,301 |
| Net cost of net debt |
|
|
|
|
|
|
(250) |
| Non-controlling interests |
|
|
|
|
|
|
(107) |
| Net income - TotalEnergies share |
|
|
|
|
|
|
4,944 |
| |
|
|
|
|
|
|
|
| 1st quarter 2022 (adjustments)(a) |
Integrated Gas,
Renewables
& Power |
Exploration
&
Production |
Refining
&
Chemicals |
Marketing
&
Services |
Corporate |
Intercompany |
Total |
| (M$) |
| External sales |
12 |
- |
- |
- |
- |
- |
12 |
| Intersegment sales |
- |
- |
- |
- |
- |
- |
- |
| Excise taxes |
- |
- |
- |
- |
- |
- |
- |
| Revenues from sales |
12 |
- |
- |
- |
- |
- |
12 |
| Operating expenses |
(117) |
(791) |
947 |
268 |
(132) |
- |
175 |
| Depreciation, depletion and impairment of tangible assets and mineral interests |
- |
(493) |
- |
(29) |
(9) |
- |
(531) |
| Operating income (b) |
(105) |
(1,284) |
947 |
239 |
(141) |
- |
(344) |
| Net income (loss) from equity affiliates and other items |
(3,939) |
(14) |
117 |
(3) |
106 |
- |
(3,733) |
| Tax on net operating income |
11 |
262 |
(251) |
(80) |
20 |
- |
(38) |
| Net operating income (b) |
(4,033) |
(1,036) |
813 |
156 |
(15) |
- |
(4,115) |
| Net cost of net debt |
|
|
|
|
|
|
113 |
| Non-controlling interests |
|
|
|
|
|
|
(31) |
| Net income - TotalEnergies share |
|
|
|
|
|
|
(4,033) |
| |
|
|
|
|
|
|
|
| (a) Adjustments include special items, inventory valuation effect and the effect of changes in fair value. |
| (b) Of which inventory valuation effect |
|
|
|
|
|
|
|
| - On operating income |
- |
- |
947 |
308 |
- |
|
|
| - On net operating income |
- |
- |
845 |
228 |
- |
|
|
| |
|
|
|
|
|
|
|
| 1st quarter 2022 (adjusted) |
Integrated Gas,
Renewables
& Power |
Exploration
&
Production |
Refining
&
Chemicals |
Marketing
&
Services |
Corporate |
Intercompany |
Total |
| (M$) |
| External sales |
12,282 |
2,151 |
31,008 |
23,149 |
4 |
- |
68,594 |
| Intersegment sales |
1,471 |
13,818 |
9,277 |
267 |
63 |
(24,896) |
- |
| Excise taxes |
- |
- |
(192) |
(4,464) |
- |
- |
(4,656) |
| Revenues from sales |
13,753 |
15,969 |
40,093 |
18,952 |
67 |
(24,896) |
63,938 |
| Operating expenses |
(11,515) |
(4,917) |
(38,358) |
(18,252) |
(161) |
24,896 |
(48,307) |
| Depreciation, depletion and impairment of tangible assets and mineral interests |
(321) |
(2,168) |
(380) |
(244) |
(35) |
- |
(3,148) |
| Adjusted operating income |
1,917 |
8,884 |
1,355 |
456 |
(129) |
- |
12,483 |
| Net income (loss) from equity affiliates and other items |
1,439 |
256 |
39 |
(39) |
2 |
- |
1,697 |
| Tax on net operating income |
(305) |
(4,125) |
(274) |
(145) |
85 |
- |
(4,764) |
| Adjusted net operating income |
3,051 |
5,015 |
1,120 |
272 |
(42) |
- |
9,416 |
| Net cost of net debt |
|
|
|
|
|
|
(363) |
| Non-controlling interests |
|
|
|
|
|
|
(76) |
| Adjusted net income - TotalEnergies share |
|
|
|
|
|
|
8,977 |
| |
|
|
|
|
|
|
|
| 1st quarter 2022 |
Integrated Gas,
Renewables
& Power |
Exploration
&
Production |
Refining
&
Chemicals |
Marketing
&
Services |
Corporate |
Intercompany |
Total |
| (M$) |
| Total expenditures |
1,439 |
1,971 |
228 |
140 |
9 |
|
3,787 |
| Total divestments |
1,015 |
283 |
27 |
79 |
5 |
|
1,409 |
| Cash flow from operating activities |
315 |
5,768 |
1,107 |
898 |
(471) |
|
7,617 |
| |
|
|
|
|
|
|
|
| 1st quarter 2021 |
Integrated Gas,
Renewables
& Power |
Exploration
&
Production |
Refining
&
Chemicals |
Marketing
&
Services |
Corporate |
Intercompany |
Total |
| (M$) |
| External sales |
5,502 |
1,514 |
19,201 |
17,513 |
7 |
- |
43,737 |
| Intersegment sales |
811 |
6,578 |
5,521 |
78 |
29 |
(13,017) |
- |
| Excise taxes |
- |
- |
(405) |
(4,699) |
- |
- |
(5,104) |
| Revenues from sales |
6,313 |
8,092 |
24,317 |
12,892 |
36 |
(13,017) |
38,633 |
| Operating expenses |
(5,218) |
(3,068) |
(22,933) |
(12,076) |
(167) |
13,017 |
(30,445) |
| Depreciation, depletion and impairment of tangible assets and mineral interests |
(471) |
(2,183) |
(391) |
(255) |
(25) |
- |
(3,325) |
| Operating income |
624 |
2,841 |
993 |
561 |
(156) |
- |
4,863 |
| Net income (loss) from equity affiliates and other items |
263 |
270 |
88 |
(34) |
(28) |
- |
559 |
| Tax on net operating income |
(101) |
(1,180) |
(280) |
(176) |
38 |
- |
(1,699) |
| Net operating income |
786 |
1,931 |
801 |
351 |
(146) |
- |
3,723 |
| Net cost of net debt |
|
|
|
|
|
|
(311) |
| Non-controlling interests |
|
|
|
|
|
|
(68) |
| Net income - TotalEnergies share |
|
|
|
|
|
|
3,344 |
| |
|
|
|
|
|
|
|
| 1st quarter 2021 (adjustments)(a) |
Integrated Gas,
Renewables
& Power |
Exploration
&
Production |
Refining
&
Chemicals |
Marketing
&
Services |
Corporate |
Intercompany |
Total |
| (M$) |
| External sales |
(35) |
- |
- |
- |
- |
- |
(35) |
| Intersegment sales |
- |
- |
- |
- |
- |
- |
- |
| Excise taxes |
- |
- |
- |
- |
- |
- |
- |
| Revenues from sales |
(35) |
- |
- |
- |
- |
- |
(35) |
| Operating expenses |
(8) |
- |
745 |
142 |
- |
- |
879 |
| Depreciation, depletion and impairment of tangible assets and mineral interests |
(145) |
- |
- |
- |
- |
- |
(145) |
| Operating income (b) |
(188) |
- |
745 |
142 |
- |
- |
699 |
| Net income (loss) from equity affiliates and other items |
(49) |
(46) |
6 |
(35) |
(40) |
- |
(164) |
| Tax on net operating income |
38 |
2 |
(193) |
(40) |
2 |
- |
(191) |
| Net operating income (b) |
(199) |
(44) |
558 |
67 |
(38) |
- |
344 |
| Net cost of net debt |
|
|
|
|
|
|
6 |
| Non-controlling interests |
|
|
|
|
|
|
(9) |
| Net income - TotalEnergies share |
|
|
|
|
|
|
341 |
| |
|
|
|
|
|
|
|
| (a) Adjustments include special items, inventory valuation effect and the effect of changes in fair value. |
| (b) Of which inventory valuation effect |
|
|
|
|
|
|
|
| - On operating income |
- |
- |
746 |
137 |
- |
|
|
| - On net operating income |
- |
- |
606 |
98 |
- |
|
|
| |
|
|
|
|
|
|
|
| 1st quarter 2021 (adjusted) |
Integrated Gas,
Renewables
& Power |
Exploration
&
Production |
Refining
&
Chemicals |
Marketing
&
Services |
Corporate |
Intercompany |
Total |
| (M$) |
| External sales |
5,537 |
1,514 |
19,201 |
17,513 |
7 |
- |
43,772 |
| Intersegment sales |
811 |
6,578 |
5,521 |
78 |
29 |
(13,017) |
- |
| Excise taxes |
- |
- |
(405) |
(4,699) |
- |
- |
(5,104) |
| Revenues from sales |
6,348 |
8,092 |
24,317 |
12,892 |
36 |
(13,017) |
38,668 |
| Operating expenses |
(5,210) |
(3,068) |
(23,678) |
(12,218) |
(167) |
13,017 |
(31,324) |
| Depreciation, depletion and impairment of tangible assets and mineral interests |
(326) |
(2,183) |
(391) |
(255) |
(25) |
- |
(3,180) |
| Adjusted operating income |
812 |
2,841 |
248 |
419 |
(156) |
- |
4,164 |
| Net income (loss) from equity affiliates and other items |
312 |
316 |
82 |
1 |
12 |
- |
723 |
| Tax on net operating income |
(139) |
(1,182) |
(87) |
(136) |
36 |
- |
(1,508) |
| Adjusted net operating income |
985 |
1,975 |
243 |
284 |
(108) |
- |
3,379 |
| Net cost of net debt |
|
|
|
|
|
|
(317) |
| Non-controlling interests |
|
|
|
|
|
|
(59) |
| Adjusted net income - TotalEnergies share |
|
|
|
|
|
|
3,003 |
| |
|
|
|
|
|
|
|
| 1st quarter 2021 |
Integrated Gas,
Renewables
& Power |
Exploration
&
Production |
Refining
&
Chemicals |
Marketing
&
Services |
Corporate |
Intercompany |
Total |
| (M$) |
| Total expenditures |
3,020 |
1,365 |
287 |
138 |
26 |
|
4,836 |
| Total divestments |
142 |
311 |
116 |
71 |
12 |
|
652 |
| Cash flow from operating activities |
780 |
3,736 |
996 |
665 |
(579) |
|
5,598 |
3.2)
Reconciliation of the information by business segment with consolidated financial statements
| | |
| | |
| | |
Consolidated | |
| 1st
quarter 2022 | |
| | |
| | |
statement | |
| (M$) | |
Adjusted | | |
Adjustments(a) | | |
of
income | |
| Sales | |
| 68,594 | | |
| 12 | | |
| 68,606 | |
| Excise
taxes | |
| (4,656 | ) | |
| - | | |
| (4,656 | ) |
| Revenues
from sales | |
| 63,938 | | |
| 12 | | |
| 63,950 | |
| | |
| | | |
| | | |
| | |
| Purchases
net of inventory variation | |
| (40,762 | ) | |
| 1,114 | | |
| (39,648 | ) |
| Other
operating expenses | |
| (7,409 | ) | |
| (214 | ) | |
| (7,623 | ) |
| Exploration
costs | |
| (136 | ) | |
| (725 | ) | |
| (861 | ) |
| Depreciation,
depletion and impairment of tangible assets and mineral interests | |
| (3,148 | ) | |
| (531 | ) | |
| (3,679 | ) |
| Other
income | |
| 121 | | |
| 22 | | |
| 143 | |
| Other
expense | |
| (269 | ) | |
| (2,021 | ) | |
| (2,290 | ) |
| | |
| | | |
| | | |
| | |
| Financial
interest on debt | |
| (462 | ) | |
| - | | |
| (462 | ) |
| Financial
income and expense from cash & cash equivalents | |
| 59 | | |
| 155 | | |
| 214 | |
| Cost
of net debt | |
| (403 | ) | |
| 155 | | |
| (248 | ) |
| | |
| | | |
| | | |
| | |
| Other
financial income | |
| 119 | | |
| 84 | | |
| 203 | |
| Other
financial expense | |
| (135 | ) | |
| - | | |
| (135 | ) |
| | |
| | | |
| | | |
| | |
| Net
income (loss) from equity affiliates | |
| 1,861 | | |
| (1,818 | ) | |
| 43 | |
| | |
| | | |
| | | |
| | |
| Income
taxes | |
| (4,724 | ) | |
| (80 | ) | |
| (4,804 | ) |
| Consolidated
net income | |
| 9,053 | | |
| (4,002 | ) | |
| 5,051 | |
| TotalEnergies
share | |
| 8,977 | | |
| (4,033 | ) | |
| 4,944 | |
| Non-controlling
interests | |
| 76 | | |
| 31 | | |
| 107 | |
| | |
| | | |
| | | |
| | |
(a)
Adjustments include special items, inventory valuation effect and the effect of changes in fair value.
| | |
| | |
| | |
Consolidated | |
| 1st quarter 2021 | |
| | |
| | |
statement | |
| (M$) | |
Adjusted | | |
Adjustments(a) | | |
of income | |
| Sales | |
| 43,772 | | |
| (35 | ) | |
| 43,737 | |
| Excise taxes | |
| (5,104 | ) | |
| - | | |
| (5,104 | ) |
| Revenues
from sales | |
| 38,668 | | |
| (35 | ) | |
| 38,633 | |
| | |
| | | |
| | | |
| | |
| Purchases net of inventory variation | |
| (24,289 | ) | |
| 891 | | |
| (23,398 | ) |
| Other operating expenses | |
| (6,868 | ) | |
| (12 | ) | |
| (6,880 | ) |
| Exploration costs | |
| (167 | ) | |
| - | | |
| (167 | ) |
| Depreciation, depletion and impairment of tangible assets and mineral interests | |
| (3,180 | ) | |
| (145 | ) | |
| (3,325 | ) |
| Other income | |
| 416 | | |
| (58 | ) | |
| 358 | |
| Other expense | |
| (192 | ) | |
| (467 | ) | |
| (659 | ) |
| | |
| | | |
| | | |
| | |
| Financial interest on debt | |
| (466 | ) | |
| - | | |
| (466 | ) |
| Financial income and expense from cash & cash equivalents | |
| 87 | | |
| 8 | | |
| 95 | |
| Cost
of net debt | |
| (379 | ) | |
| 8 | | |
| (371 | ) |
| | |
| | | |
| | | |
| | |
| Other financial income | |
| 109 | | |
| - | | |
| 109 | |
| Other financial expense | |
| (130 | ) | |
| - | | |
| (130 | ) |
| | |
| | | |
| | | |
| | |
| Net income (loss) from equity affiliates | |
| 520 | | |
| 361 | | |
| 881 | |
| | |
| | | |
| | | |
| | |
| Income taxes | |
| (1,446 | ) | |
| (193 | ) | |
| (1,639 | ) |
| Consolidated net income | |
| 3,062 | | |
| 350 | | |
| 3,412 | |
| TotalEnergies share | |
| 3,003 | | |
| 341 | | |
| 3,344 | |
| Non-controlling interests | |
| 59 | | |
| 9 | | |
| 68 | |
| | |
| | | |
| | | |
| | |
| (a) Adjustments include special items, inventory valuation effect and the effect of changes in fair value. |
3.3)
Adjustment items
The detail of the adjustment items is presented
in the table below.
| ADJUSTMENTS TO OPERATING INCOME |
|
|
|
|
|
|
|
|
|
|
|
|
|
| (M$) |
|
Integrated Gas,
Renewables
& Power |
|
Exploration
&
Production |
|
Refining
&
Chemicals |
|
Marketing
&
Services |
|
Corporate |
|
Total |
|
| 1st quarter 2022 |
Inventory valuation effect |
|
- |
|
- |
|
947 |
|
308 |
|
- |
|
1,255 |
|
| |
Effect of changes in fair value |
|
(88) |
|
- |
|
- |
|
- |
|
- |
|
(88) |
|
| |
Restructuring charges |
|
(5) |
|
- |
|
- |
|
- |
|
- |
|
(5) |
|
| |
Asset impairment and provisions charges |
|
- |
|
(1,284) |
|
- |
|
(69) |
|
(9) |
|
(1,362) |
|
| |
- |
|
- |
|
- |
|
- |
|
- |
|
- |
|
- |
|
| |
Other items |
|
(12) |
|
- |
|
- |
|
- |
|
(132) |
|
(144) |
|
| Total |
|
|
(105) |
|
(1,284) |
|
947 |
|
239 |
|
(141) |
|
(344) |
|
| 1st quarter 2021 |
Inventory valuation effect |
|
- |
|
- |
|
746 |
|
137 |
|
- |
|
883 |
|
| |
Effect of changes in fair value |
|
(9) |
|
- |
|
- |
|
- |
|
- |
|
(9) |
|
| |
Restructuring charges |
|
(9) |
|
- |
|
- |
|
- |
|
- |
|
(9) |
|
| |
Asset impairment and provisions charges |
|
(145) |
|
- |
|
- |
|
- |
|
- |
|
(145) |
|
| |
Other items |
|
(25) |
|
- |
|
(1) |
|
5 |
|
- |
|
(21) |
|
| Total |
|
|
(188) |
|
- |
|
745 |
|
142 |
|
- |
|
699 |
|
| ADJUSTMENTS TO
NET INCOME, TotalEnergies SHARE |
|
|
|
|
|
|
|
|
|
|
|
|
|
| |
|
|
|
|
|
|
|
|
|
|
|
|
|
|
| (M$) |
|
Integrated Gas,
Renewables
& Power |
|
Exploration
&
Production |
|
Refining
&
Chemicals |
|
Marketing
&
Services |
|
Corporate |
|
Total |
|
| 1st quarter 2022 |
Inventory valuation effect |
|
- |
|
- |
|
835 |
|
205 |
|
- |
|
1,040 |
|
| |
Effect of changes in fair value |
|
(80 |
) |
- |
|
- |
|
- |
|
- |
|
(80 |
) |
| |
Restructuring charges |
|
(3 |
) |
- |
|
- |
|
- |
|
- |
|
(3 |
) |
| |
Asset impairment and provisions charges |
|
(3,948 |
) |
(1,032 |
) |
- |
|
(72 |
) |
(9 |
) |
(5,061 |
) |
| |
Gains (losses) on disposals of assets |
|
- |
|
- |
|
- |
|
- |
|
- |
|
- |
|
| |
Other items |
|
- |
|
14 |
|
(32 |
) |
- |
|
89 |
|
71 |
|
| Total |
|
|
(4,031 |
) |
(1,018 |
) |
803 |
|
133 |
|
80 |
|
(4,033 |
) |
| - |
|
| |
|
|
|
|
|
|
|
|
|
|
|
|
|
|
| 1st quarter 2021 |
Inventory valuation effect |
|
- |
|
- |
|
599 |
|
90 |
|
- |
|
689 |
|
| |
Effect of changes in fair value |
|
(6 |
) |
- |
|
- |
|
- |
|
- |
|
(6 |
) |
| |
Restructuring charges |
|
(8 |
) |
(41 |
) |
(39 |
) |
(35 |
) |
(38 |
) |
(161 |
) |
| |
Asset impairment and provisions charges |
|
(144 |
) |
- |
|
- |
|
- |
|
- |
|
(144 |
) |
| Gains (losses) on disposals of assets |
|
- |
|
- |
|
- |
|
- |
|
- |
|
- |
|
| |
Other items |
|
(35 |
) |
3 |
|
(9 |
) |
4 |
|
- |
|
(37 |
) |
| Total |
|
|
(193 |
) |
(38 |
) |
551 |
|
59 |
|
(38 |
) |
341 |
|
| - |
|
4)
Shareholders’ equity
Treasury shares (TotalEnergies shares held directly
by TotalEnergies SE)
| (1) Shares to be cancelled |
19,179,676 |
| (2) Shares to be allocated as part of performance share grant plans |
205,983 |
| |
including other plans |
105,983 |
| |
including the 2020 plan |
100,000 |
| Total Treasury shares (1) + (2) |
19,385,659 |
At its meeting on February 9, 2022, the Board of Directors
decided, following the authorization of the Extraordinary Shareholder's Meeting on May 26, 2017, to cancel 30,665,526 treasury shares
bought back during 2021.
Dividend
TotalEnergies SE has paid three interim dividends
for the fiscal year 2021, each for an amount of €0.66 per share.
The Board of Directors has proposed to the Shareholders’
meeting of May 25, 2022 to pay a dividend of €2.64 per share for the 2021 fiscal year, i.e. a balance of €0.66 per share to
be distributed after deduction of those first three interim dividends. The dividend calendar for fiscal year 2021 is as follows:
| Dividend 2021 |
First interim |
Second interim |
Third interim |
Final |
| Amount |
€0.66 |
€0.66 |
€0.66 |
€0.66 |
| Set date |
April 28, 2021 |
July 28, 2021 |
October 27, 2021 |
May 25, 2022 |
| Ex-dividend date |
September 21, 2021 |
January 3, 2022 |
March 22, 2022 |
June 21, 2022 |
| Payment date |
October 1, 2021 |
January 13, 2022 |
April 1, 2022 |
July 1, 2022 |
The Board of Directors, during its April 27, 2022
meeting, set the first interim dividend for the fiscal year 2022 at €0.69 per share. The ex-dividend date of this interim dividend
will be September 21, 2022 and it will be paid in cash on October 3, 2022.
Earnings per share in Euro
Earnings per share in Euro, calculated from the
earnings per share in U.S. dollars converted at the average Euro/USD exchange rate for the period, amounted to €1.67 per share for
the 1st quarter 2022 (€1.88 per share for the 4th quarter 2021 and €1.03 per share for the 1st
quarter 2021). Diluted earnings per share calculated using the same method amounted to €1.65 per share for the 1st quarter
2022 (€1.88 per share for the 4th quarter 2021 and €1.02 per share for the 1st quarter 2021).
Earnings per share are calculated after remuneration
of perpetual subordinated notes.
Perpetual
subordinated notes
On January 17, 2022, TotalEnergies SE issued perpetual
subordinated notes:
| - | Perpetual subordinated notes 2.000% callable in April 2027, or in anticipation in January 2027 (€1,000
million); and |
| - | Perpetual subordinated notes 3.250% callable in January 2037, or in anticipation in July 2036 (€750
million). |
Other comprehensive income
Detail of other comprehensive income is presented
in the table below:
| (M$) |
1st
quarter 2022 |
|
1st
quarter 2021 |
| Actuarial
gains and losses |
|
- |
|
|
- |
| Change
in fair value of investments in equity instruments |
|
3 |
|
|
12 |
| Tax
effect |
|
11 |
|
|
(12) |
| Currency
translation adjustment generated by the parent company |
|
(1,750) |
|
|
(4,173) |
| Sub-total
items not potentially reclassifiable to profit and loss |
|
(1,736) |
|
|
(4,173) |
| |
|
|
|
|
|
| Currency
translation adjustment |
|
1,012 |
|
|
2,523 |
| -
unrealized gain/(loss) of the period |
|
1,012 |
|
|
2,623 |
| -
less gain/(loss) included in net income |
|
- |
|
|
100 |
| |
|
|
|
|
|
| |
|
|
|
|
|
| Cash
flow hedge |
|
(263) |
|
|
504 |
| -
unrealized gain/(loss) of the period |
|
(151) |
|
|
441 |
| -
less gain/(loss) included in net income |
|
112 |
|
|
(63) |
| |
|
|
|
|
|
| Variation
of foreign currency basis spread |
|
49 |
|
|
- |
| -
unrealized gain/(loss) of the period |
|
60 |
|
|
(14) |
| -
less gain/(loss) included in net income |
|
11 |
|
|
(14) |
| |
|
|
|
|
|
Share
of other comprehensive income of
equity
affiliates, net amount |
|
(84) |
|
|
469 |
| -
unrealized gain/(loss) of the period |
|
(97) |
|
|
467 |
| -
less gain/(loss) included in net income |
|
(13) |
|
|
(2) |
| |
|
|
|
|
|
| Other |
|
- |
|
|
1 |
| |
|
|
|
|
|
| Tax
effect |
|
53 |
|
|
(157) |
| Sub-total
items potentially reclassifiable to profit and loss |
|
767 |
|
|
3,340 |
| Total
other comprehensive income (net amount) |
|
(969) |
|
|
(833) |
Tax effects relating to each component of other
comprehensive income are as follows:
| |
|
1st
quarter 2022 |
1st
quarter 2021 |
| |
(M$) |
Pre-tax
amount |
Tax
effect |
Net
amount |
Pre-tax
amount |
Tax
effect |
Net
amount |
| |
Actuarial
gains and losses |
- |
- |
- |
- |
- |
- |
| |
Change
in fair value of investments in equity instruments |
3 |
11 |
14 |
12 |
(12) |
- |
| |
Currency
translation adjustment generated by the parent company |
(1,750) |
- |
(1,750) |
(4,173) |
- |
(4,173) |
| |
Sub-total
items not potentially reclassifiable to profit and loss |
(1,747) |
11 |
(1,736) |
(4,161) |
(12) |
(4,173) |
| |
Currency
translation adjustment |
1,012 |
- |
1,012 |
2,523 |
- |
2,523 |
| |
Cash
flow hedge |
(263) |
66 |
(197) |
504 |
(157) |
347 |
| |
Variation
of foreign currency basis spread |
49 |
(13) |
36 |
- |
- |
- |
| |
Share
of other comprehensive income of equity affiliates, net amount |
(84) |
- |
(84) |
469 |
- |
469 |
| |
Other |
- |
- |
- |
1 |
- |
1 |
| |
Sub-total
items potentially reclassifiable to profit and loss |
714 |
53 |
767 |
3,497 |
(157) |
3,340 |
| |
Total
other comprehensive income |
(1,033) |
64 |
(969) |
(664) |
(169) |
(833) |
5)
Financial debt
The Company has not issued any new senior bond
during the first three months of 2022.
The Company reimbursed two senior bonds during
the first three months of 2022:
| - | Bond 2.875% issued by TotalEnergies Capital International in 2012 and maturing in February 2022 ($1,000
million) |
| - | Bond 1.125% issued by TotalEnergies Capital Canada in 2014 and maturing in March 2022 (€1,000 million). |
On March 4, 2022, the Company put in place a committed
syndicated credit line with banks for an amount of $8,000 million and with a 12-month tenor (with the option to extend its maturity twice
by a further 6 months at TotalEnergies SE’ hand).
6)
Related parties
The related parties are mainly equity affiliates
and non-consolidated investments.
There were no major changes concerning transactions
with related parties during the first three months of 2022.
The impact of the Russian-Ukrainian conflict on
transactions with related parties in Russia is described in paragraph 7 Other risks and commitments.
7) Other
risks and contingent liabilities
TotalEnergies is not currently aware of any exceptional
event, dispute, risks or contingent liabilities that could have a material impact on the assets and liabilities, results, financial position
or operations of the TotalEnergies, other than those mentioned below.
Yemen
In Yemen, the deterioration of security conditions
in the vicinity of the Balhaf site caused the company Yemen LNG, in which TotalEnergies holds a stake of 39.62%, to stop its commercial
production and export of LNG and to declare force majeure to its various stakeholders in 2015. The plant has been put in preservation
mode.
Mozambique
Considering the evolution of the security situation
in the north of the Cabo Delgado province in Mozambique, TotalEnergies has confirmed on April 26, 2021, the withdrawal of all Mozambique
LNG project personnel from the Afungi site. This situation led TotalEnergies, as operator of Mozambique LNG project, to declare force
majeure.
Russian-Ukrainian conflict
Since the month of February 2022, Russia's invasion
of Ukraine led European and American authorities to adopt several sets of sanctions measures targeting Russian and Belarusian persons
and entities, as well as the financial sector.
TotalEnergies holds investments in this country
in major LNG projects (Yamal LNG and Arctic LNG 2) both directly and through its holding in the company PAO Novatek, whose production
and sale of LNG are not materially impacted by the sanctions adopted as of the date hereof.
Depending on the developments of the Russian-Ukrainian
conflict and the measures that the European and American authorities could be required to take, the activities of TotalEnergies in Russia
could be affected in the future.
TotalEnergies announced on March 1, 2022, that
it condemned Russia's military aggression against Ukraine, supported the scope and strength of the sanctions that will be implemented
by the Company regardless of the consequences on its asset management.
On March 22, 2022, TotalEnergies announced that,
given the uncertainty created by the technological and financial sanctions on the ability to carry out the Arctic LNG 2 project currently
under construction and their probable tightening with the worsening conflict, TotalEnergies SE had decided to no longer book proved reserves
for the Arctic LNG 2 project.
Since then, on April 8, new sanctions have
effectively been adopted by the European authorities, notably prohibiting export from European Union countries of goods and
technology for use in the liquefaction of natural gas benefitting a Russian company. It appears that these new prohibitions
constitute additional risks on the execution of the Arctic LNG 2 project.
As a result, TotalEnergies has decided to
record, in its accounts as of March 31, 2022, an impairment of $4,095 million, concerning notably Arctic LNG 2.
8) Subsequent events
There are no other post-balance sheet events that
could have a material impact on the Company’s financial statements.