0001193125-16-750778.txt : 20161028 0001193125-16-750778.hdr.sgml : 20161028 20161028090956 ACCESSION NUMBER: 0001193125-16-750778 CONFORMED SUBMISSION TYPE: 6-K PUBLIC DOCUMENT COUNT: 12 CONFORMED PERIOD OF REPORT: 20161028 FILED AS OF DATE: 20161028 DATE AS OF CHANGE: 20161028 FILER: COMPANY DATA: COMPANY CONFORMED NAME: Norbord Inc. CENTRAL INDEX KEY: 0000877365 STANDARD INDUSTRIAL CLASSIFICATION: LUMBER & WOOD PRODUCTS (NO FURNITURE) [2400] IRS NUMBER: 999999999 STATE OF INCORPORATION: A6 FISCAL YEAR END: 1231 FILING VALUES: FORM TYPE: 6-K SEC ACT: 1934 Act SEC FILE NUMBER: 001-37694 FILM NUMBER: 161957086 BUSINESS ADDRESS: STREET 1: 1 TORONTO STREET STREET 2: SUITE 600 CITY: TORONTO STATE: A6 ZIP: M5C2W4 BUSINESS PHONE: 416-643-8820 MAIL ADDRESS: STREET 1: 1 TORONTO STREET STREET 2: SUITE 600 CITY: TORONTO STATE: A6 ZIP: M5C2W4 FORMER COMPANY: FORMER CONFORMED NAME: NORBORD INC DATE OF NAME CHANGE: 20040707 FORMER COMPANY: FORMER CONFORMED NAME: NEXFOR INC DATE OF NAME CHANGE: 20000418 FORMER COMPANY: FORMER CONFORMED NAME: NORANDA FOREST INC DATE OF NAME CHANGE: 19940224 6-K 1 d233971d6k.htm 6-K 6-K


UNITED STATES

SECURITIES AND EXCHANGE COMMISSION

Washington, D.C. 20549


FORM 6-K


REPORT OF FOREIGN PRIVATE ISSUER

PURSUANT TO RULE 13a-16 OR 15d-16 UNDER

THE SECURITIES EXCHANGE ACT OF 1934

For the month of October 2016

Commission File Number: 001-37694


NORBORD INC.

(Translation of the registrant’s name into English)


1 Toronto Street, Suite 600, Toronto, Ontario, Canada, M5C 2W4

(Address of principal executive office)


Indicate by check mark whether the registrant files or will file annual reports under cover of Form 20-F or Form 40-F.

Form 20-F  ☐                 Form 40-F  ☒

Indicate by check mark if the registrant is submitting the Form 6-K in paper as permitted by Regulation S-T Rule 101(b)(1):  ☐

Indicate by check mark if the registrant is submitting the Form 6-K in paper as permitted by Regulation S-T Rule 101(b)(7):  ☐


The following documents, which are attached as exhibits hereto, are incorporated by reference herein:


Exhibit


Title

99.1    Press Release, dated October 28, 2016.
99.2    Press Release, dated October 28, 2016.
99.3    Unaudited Condensed Interim Consolidated Financial Statements.
99.4    Management’s Discussion and Analysis.
99.5    Form 52-109F2 - Certification of Interim Filings – CEO.
99.6    Form 52-109F2 - Certification of Interim Filings – CFO.
99.7    Code of Business Conduct, dated October 27, 2016.


SIGNATURES

Pursuant to the requirements of the Securities Exchange Act of 1934, the registrant has duly caused this report to be signed on its behalf by the undersigned, thereunto duly authorized.


    NORBORD INC.
Date: October 28, 2016     By:  

/s/ Elaine Toomey

      Name: Elaine Toomey
      Title: Assistant Corporate Secretary
EX-99.1 2 d233971dex991.htm EX-99.1 EX-99.1

Exhibit 99.1


LOGO

News Release

NORBORD REPORTS THIRD QUARTER 2016 RESULTS; DECLARES QUARTERLY DIVIDEND

Note: Financial references in US dollars unless otherwise indicated.

Q3 2016 HIGHLIGHTS


    Adjusted earnings of $0.67 per diluted share, a $0.72 improvement over Q3 2015


    Adjusted EBITDA of $114 million, a more than threefold increase over Q3 2015


    Merger synergies target of $45 million (cumulative, annualized) now fully captured


    North Central average benchmark OSB price up 48% year-over-year


    North American manufacturing costs decreased 3% year-to-date


    Declared quarterly dividend of CAD $0.10 per share to shareholders of record on December 1, 2016

TORONTO, ON (October 28, 2016) – Norbord Inc. (TSX and NYSE: OSB) today reported Adjusted EBITDA of $114 million for the third quarter of 2016 versus $30 million in the third quarter of 2015 and $94 million in the second quarter of 2016. The improvement versus both comparative periods is primarily due to higher North American oriented strand board (OSB) prices. North American operations generated Adjusted EBITDA of $106 million in the quarter compared to $22 million in the same quarter last year and $85 million in the prior quarter. European operations delivered Adjusted EBITDA of $10 million compared to $11 million in both comparative quarters.

“Our financial performance continued to improve in the third quarter as North American benchmark OSB prices strengthened further,” said Peter Wijnbergen, Norbord’s President and CEO. “Norbord generated Adjusted EBITDA of $114 million, marking the seventh consecutive quarter of improvement. As we enter the seasonally slower winter building period, North American benchmark OSB prices remain well above where they were this time last year as US housing starts, particularly single-family, continue to recover and drive increasing OSB demand.”

“In Europe, our panel business delivered another $10 million of Adjusted EBITDA despite the political uncertainty following the Brexit referendum in the UK. While the devaluation of the Pound Sterling following the referendum will remain a currency translation headwind in the near term, the underlying fundamentals of our European business remain favourable. In fact, our year-to-date European EBITDA is 11% ahead of last year, and 22% ahead in Pound Sterling terms.”

“Finally, I’m pleased that we have delivered the full $45 million of annualized synergies from our merger with Ainsworth ahead of schedule. These synergies have resulted from reduced corporate overhead costs, optimization of sales and logistics, procurement savings and the sharing of operational best practices. In addition to these synergies, the merger is enabling us to avoid an estimated $35 million in capital cash outlays.”

Norbord recorded Adjusted earnings of $58 million or $0.67 per diluted share ($0.68 per basic share) in the current quarter compared to an Adjusted loss of $4 million or $0.05 per share in the same quarter last


LOGO


year and Adjusted earnings of $42 million or $0.49 per share in the prior quarter. Adjusted earnings/loss exclude non-recurring items and use a normalized income tax rate:


$ millions

   Q3-
2016
    Q2-
2016
    Q3-
2015
    YTD
2016
    YTD
2015
 

Earnings (loss)

     55        44        (9     122        (69

Adjusted for:


Merger transaction costs

     —          —          —          —          8   

Costs to achieve merger synergies

     4        2        —          7        4   

Costs related to High Level fire

     —          1        —          1        —     

Cost on early debt extinguishment

     —          —          —          —          49   

Reported income tax expense (recovery)

     19        10        3        32        (33


Adjusted pre-tax earnings (loss)

     78        57        (6     162        (41

Income tax (expense) recovery at statutory rate

     (20     (15     2        (42     11   


Adjusted earnings (loss)

     58        42        (4     120        (30


Market Conditions

In North America, year-to-date US housing starts were up 4% versus the same period last year. Single-family starts, which use approximately three times more OSB than multi-family, increased by 9% and single-family permits were 8% higher. The seasonally-adjusted annualized rate was 1.05 million in September with permits at 1.23 million. The consensus forecast from US housing economists is for approximately 1.20 million starts in 2016, an 8% year-over-year improvement.

North American benchmark OSB prices increased significantly in the third quarter versus both the same quarter last year and the previous quarter as new home construction activity and OSB demand continued to improve. OSB prices continued to rise through July before leveling out in August and September. The North Central benchmark price averaged $301 per thousand square feet (Msf) (7/16-inch basis) for the quarter. The spread between the North Central and the South East and Western Canada regions (where 65% of Norbord’s operating capacity is located) increased to approximately $40 from approximately $20 in the previous quarter on the seasonal demand variations between regions. The table below summarizes benchmark OSB prices ($ per Msf, 7/16-inch basis) by region for the relevant quarters:


North American region

   % of Norbord’s
operating capacity
    Q3-2016      Q2-2016      Q3-2015  

North Central

     16     301         264         204   

South East

     33     256         245         176   

Western Canada

     32     265         242         158   

In Europe, panel demand remains strong in the Company’s core UK and German markets but prices in US dollar terms were impacted by the significant devaluation of the Pound Sterling following the “Brexit” referendum. In local currency terms, quarter-over-quarter, average prices for OSB, particleboard and medium density fibreboard (MDF) were modestly higher in the UK while continental OSB prices were modestly lower. Year-over-year was the opposite, with average panel prices lower in the UK and OSB prices higher on the continent.

Performance

Norbord’s North American OSB shipments increased 4% year-over-year but were 2% lower quarter-over-quarter due to lower productivity. Norbord’s operating North American OSB mills produced at 95% of stated capacity (excluding the two curtailed mills in Huguley, Alabama and Val-d’Or, Quebec) compared


LOGO


to 92% in the same quarter last year and 96% in the prior quarter. Both shipments and capacity utilization increased year-over-year primarily due to fewer maintenance shuts and production curtailments. One of Norbord’s North American mills achieved a quarterly production record.

Norbord’s North American OSB cash production costs per unit (before mill profit share) decreased 3% year-to-date due to higher volume, lower resin and energy prices, improved raw material usages and the weaker Canadian dollar. Cash production costs increased 2% versus the prior quarter and 1% versus the same quarter last year primarily due to higher supplies and maintenance costs, with lower volume and higher resin and energy prices also having some impact quarter-over-quarter.

In Europe, Norbord’s shipments were 3% lower than the same quarter last year and 5% lower than the prior quarter. The European mills produced at 99% of stated capacity in the quarter, unchanged from the same quarter last year and compared to 104% in the prior quarter. Both shipments and capacity utilization decreased quarter-over-quarter due to lost production days following a fatality at the Cowie, Scotland mill. Two of Norbord’s European mills achieved a quarterly production record.

Norbord’s mills delivered Margin Improvement Program (MIP) gains of $10 million year-to-date from improved productivity and lower raw material use as well as merger synergies and returns on recent capital investments. MIP gains are measured relative to the prior year at constant prices and exchange rates.

As of the third quarter of 2016, Norbord has captured $45 million in cumulative (annual run rate) synergies from the merger, within 18 months of closing. Of this amount, $36 million has been realized and the remaining $9 million is expected to be realized in future quarters from synergy initiatives already executed. In addition to these synergies, the merger is enabling the Company to avoid significant capital cash outlays it would otherwise have to incur. Norbord estimates this capital cost avoidance at $35 million, which includes utilizing formerly idle assets throughout the Company. As the merger synergies target has now been fully realized, Norbord will continue to report progress on continuous improvement initiatives through MIP.

In January 2016, the Board of Directors approved a $135 million investment over the next two years to modernize and expand the Company’s Inverness, Scotland OSB mill. During the quarter, the unused second press from the Grande Prairie, Alberta mill was moved to Inverness. Norbord expects the new line to start up in the second half of 2017, with no disruption to existing production capacity in the interim.

Capital investments year-to-date were $63 million (including $19 million related to the Inverness project) compared to $43 million in the first nine months of last year. Norbord’s 2016 regular capital expenditure budget is $75 million. In addition, the Company expects to spend $45 million on the Inverness project in 2016.

Operating working capital was $156 million at quarter-end compared to $145 million at the end of the same quarter last year and $163 million at the end of the prior quarter. Working capital increased year-over-year primarily due to the impact of higher North American OSB prices on accounts receivable and the insurance receivable related to the High Level, Alberta fire. Working capital decreased quarter-over-quarter primarily due to the timing of payments and accruals as well as partial collections on the insurance receivable related to the High Level fire.

Due to improved Adjusted EBITDA this year, cash generated from operations for the first nine months of 2016 was $183 million compared with $32 million of cash consumed in the same period of 2015.


LOGO


At quarter-end, Norbord had unutilized liquidity of $420 million, consisting of $74 million in cash and $346 million in unused credit lines. The Company’s tangible net worth was $848 million and net debt to total capitalization on a book basis was 45%. Both ratios remain well within bank covenants.

Norbord has $200 million senior secured notes that are due in February 2017, which the Company intends to permanently repay at maturity using cash on hand, cash generated from operations and if necessary, by drawing upon the accounts receivable securitization program.

Quebec Mill Exchange

Norbord also announced today that is has reached an agreement with Louisiana-Pacific Corporation (LP) (NYSE: LPX) to exchange OSB mills in Quebec. Norbord will swap ownership of its mill in Val-d’Or, Quebec for LP’s OSB mill in Chambord, Quebec. Both mills have been curtailed for a number of years.

Please see the separate press release dated October 28, 2016 for further details.

Dividend

The Board of Directors declared a quarterly dividend of CAD $0.10 per common share, payable on December 21, 2016 to shareholders of record on December 1, 2016.

Norbord’s dividends are declared in Canadian dollars. Registered and beneficial shareholders may opt to receive their dividends in either Canadian dollars or the US dollar equivalent. Unless they request the US dollar equivalent, shareholders will continue to receive dividends in Canadian dollars. The US dollar equivalent of the dividend will be based on the Bank of Canada noon exchange rate on the record date or, if the record date falls on a weekend or holiday, on the Bank of Canada noon exchange rate of the preceding business day.

Registered shareholders wishing to receive the US dollar dividend equivalent should contact Norbord’s transfer agent, CST Trust Company, by phone at 1-800-387-0825 or by email at inquiries@canstockta.com. Beneficial shareholders (i.e., those holding their Norbord shares with their brokerage) should contact the broker with whom their shares are held.

Norbord’s variable dividend policy targets the payment to shareholders of a portion of free cash flow based upon the Company’s financial position, results of operations, cash flow, capital requirements and restrictions under the Company’s revolving bank lines, as well as the market outlook for the Company’s principal products and broader market and economic conditions, among other factors. The Board retains the discretion to amend the Company’s dividend policy in any manner and at any time as it may deem necessary or appropriate in the future. For these reasons, as well as others, the Board in its sole discretion can decide to increase, maintain, decrease, suspend or discontinue the payment of cash dividends in the future.

Normal Course Issuer Bid

Norbord also announced today that the Toronto Stock Exchange (TSX) has accepted its notice of intention to renew its normal course issuer bid in accordance with TSX rules. Under the bid, Norbord may purchase up to 4,280,997 of its common shares, representing 5% of the Company’s issued and outstanding common shares of 85,619,946 as of October 20, 2016, pursuant to TSX rules.

Purchases under the bid may commence on November 3, 2016, and will terminate on the earlier of November 2, 2017, the date Norbord completes its purchases pursuant to the notice of intention to make a


LOGO


normal course issuer bid filed with the TSX or the date of notice by Norbord of termination of the bid. Purchases will be made on the open market by Norbord through the facilities of the TSX, the New York Stock Exchange or Canadian or US alternative trading systems, if eligible, in accordance with the requirements of the TSX and applicable securities laws. The price that Norbord will pay for any such common shares will be the market price of such shares at the time of acquisition. Common shares purchased under the bid will be cancelled. Norbord’s average daily trading volume on the TSX during the last six calendar months was 156,497 common shares. Daily purchases of common shares will not exceed 39,124 subject to the Company’s ability to make “block” purchases under the rules of the TSX. Norbord did not acquire any common shares in the past 12 months.

Norbord believes that the market price of its common shares at certain times may be attractive and that the purchase of these common shares from time to time would be an appropriate use of Norbord’s funds in light of potential benefits to remaining shareholders.

From time to time, when Norbord does not possess material non-public information about itself or its securities, it may enter into an automatic purchase plan with its broker to allow for the purchase of common shares at times when Norbord ordinarily would not be active in the market due to its own internal trading blackout periods, insider trading rules or otherwise. Any such plans entered into with Norbord’s broker will be adopted in accordance with applicable Canadian securities laws.

Additional Information

Norbord’s Q3 2016 letter to shareholders, news release, management’s discussion and analysis, consolidated unaudited interim financial statements and notes to the financial statements have been filed on SEDAR (www.sedar.com), EDGAR (www.sec.gov) and are available in the investor section of the Company’s website at www.norbord.com. Shareholders may receive a hard copy of Norbord’s audited annual financial statements free of charge upon request. The Company has also made available on its website presentation materials containing certain historical and forward-looking information relating to Norbord, including materials that contain additional information about the Company’s financial results. Shareholders are encouraged to read this material.

Conference Call

Norbord will hold a conference call for analysts and institutional investors on Friday, October 28, 2016 at 11:00 a.m. ET. The call will be broadcast live over the Internet via www.norbord.com and www.newswire.ca. An accompanying presentation will be available in the “Investors/Conference Call” section of the Norbord website prior to the start of the call. A replay number will be available approximately one hour after completion of the call and will be accessible until November 26, 2016 by dialing 1-888-203-1112 or 647-436-0148. The passcode is 2666510. Audio playback and a written transcript will be available on the Norbord website.


LOGO


Norbord Profile

Norbord Inc. is a leading global manufacturer of wood-based panels and the world’s largest producer of oriented strand board (OSB). In addition to OSB, Norbord manufactures particleboard, medium density fibreboard and related value-added products. Norbord has assets of approximately $1.7 billion and employs approximately 2,600 people at 17 plant locations in the United States, Canada and Europe. Norbord is a publicly traded company listed on the Toronto Stock Exchange and New York Stock Exchange under the symbol “OSB”.

-end-

Contact:

Heather Colpitts

Senior Manager, Corporate Affairs

Tel. (416) 365-0705

info@norbord.com

This news release contains forward-looking statements, as defined by applicable securities legislation, including statements related to our strategy, projects, plans, future financial or operating performance and other statements that express management’s expectations or estimates of future performance. Often, but not always, forward-looking statements can be identified by the use of words such as “expect,” “believe,” “forecast,” “likely,” “support,” “target,” “consider,” “continue,” “suggest,” “intend,” “should,” “appear,” “would,” “will,” “will not,” “plan,” “can,” “may,” and other expressions which are predictions of or indicate future events, trends or prospects and which do not relate to historical matters identify forward-looking statements. Forward-looking statements involve known and unknown risks, uncertainties and other factors which may cause the actual results, performance or achievements of Norbord to be materially different from any future results, performance or achievements expressed or implied by the forward-looking statements.

Although Norbord believes it has a reasonable basis for making these forward-looking statements, readers are cautioned not to place undue reliance on such forward-looking information. By its nature, forward-looking information involves numerous assumptions, inherent risks and uncertainties, both general and specific, which contribute to the possibility that the predictions, forecasts and other forward-looking statements will not occur. Factors that could cause actual results to differ materially from those contemplated or implied by forward-looking statements include: assumptions in connection with the economic and financial conditions in the US, Europe, Canada and globally; risks inherent to product concentration and cyclicality; effects of competition and product pricing pressures; risks inherent to customer dependence; effects of variations in the price and availability of manufacturing inputs; risks inherent to a capital intensive industry; ability to realize synergies; and other risks and factors described from time to time in filings with Canadian securities regulatory authorities.

Except as required by applicable law, Norbord does not undertake to update any forward-looking statements, whether written or oral, that may be made from time to time by, or on behalf of, the Company, whether as a result of new information, future events or otherwise, or to publicly update or revise the above list of factors affecting this information. See the “Caution Regarding Forward-Looking Information” statement in the January 27, 2016 Annual Information Form and the cautionary statement contained in the “Forward-Looking Statements” section of the 2015 Management’s Discussion and Analysis dated January 27, 2016 and Q3 2016 Management’s Discussion and Analysis dated October 27, 2016.

Norbord defines Adjusted EBITDA as earnings (loss) determined in accordance with International Financial Reporting Standards (IFRS) before finance costs, income taxes, depreciation and amortization, and other unusual or non-recurring items, and Adjusted earnings (loss) as earnings (loss) determined in accordance with IFRS before unusual or non-recurring items and using a normalized income tax rate. Adjusted EBITDA and Adjusted earnings (loss) are non-IFRS financial measures, do not have any standardized meaning prescribed by IFRS and are therefore unlikely to be comparable to similar measures presented by other companies. See the Non-IFRS Financial Measures section in Norbord’s 2015 Management’s Discussion and Analysis dated January 27, 2016 and Q3 2016 Management’s Discussion and Analysis dated October 27, 2016 for a quantitative reconciliation of Adjusted EBITDA and Adjusted earnings (loss) to earnings (the most directly comparable IFRS measure).


LOGO


Peter Wijnbergen

President & CEO

October 28, 2016

To Our Shareholders,

I am pleased to report our best quarter in over three years, reflecting market conditions that continue to be very favourable for Norbord. Supported by consistent operating performance at our mills and strong North American OSB prices, we generated Adjusted EBITDA of $114 million and Adjusted earnings of $0.67 per diluted share during the quarter. US single family housing starts are trending toward a 10% year-over-year increase for 2016 and housing economists expect similar improvement again in 2017. We reported another solid result from our European business despite the volatility related to currency fluctuations and our Asian exports are up over last year.

Contributing to these strong results were realized benefits from last year’s merger with Ainsworth as we hit our target of $45 million in annualized synergies within just 18 months of closing the transaction. In addition to these synergies, the merger is enabling us to avoid an estimated $35 million in capital cash outlays we would otherwise incur for current and future debottlenecking and manufacturing cost reduction initiatives. I thank all our employees for their hard work as we’ve seamlessly integrated the two companies and quickly delivered on our synergies commitment.

My disappointment this quarter is our safety performance. We experienced two serious incidents that impacted everyone in our company, particularly our mill operating teams. We know that safety and operating performance go hand in hand and remain focused on achieving world-class safety performance.

Looking ahead, the fundamental dynamics in all the markets which affect our business remain positive. North American OSB demand continues to grow and OSB prices remain at levels that are 16% above this time last year, even as we move into the seasonally slower winter building period. Our European business is resilient in the face of post-“Brexit” referendum uncertainty.

With rapidly improving free cash flow, Norbord is in a solid financial position. In the near term, our capital priorities include investing in our mills and optimizing our debt profile. At our mills, our biggest priority is the Inverness, Scotland expansion which is on track for completion in record time. Regarding our balance sheet, we intend to permanently reduce debt by repaying our $200 million 2017 bonds when they come due next February. This will bring us into targeted more comfortable leverage range and take $15 million off our annual interest payments.

Finally, we also announced today an agreement with Louisiana-Pacific under which we will exchange our OSB mill in Val-d’Or, Quebec for their OSB mill in Chambord,


LOGO


Quebec. Both mills have been curtailed for a number of years, and this swap will better align our portfolio of northern mills with our business strategy. The Chambord mill is 38% larger and located in the biggest timber-producing region in Quebec. While market conditions do not support an immediate restart of Chambord, the asset is in good condition and is located closer to key markets, representing a better competitive opportunity for Norbord.

As always, we thank our shareholders for their investment in and support for Norbord.


LOGO

This letter includes forward-looking statements, as defined by applicable securities legislation including statements related to our strategy, projects, plans, future financial or operating performance and other statements that express management’s expectations or estimates of future performance. Often, but not always, forward-looking statements can be identified by the use of words such as “expect,” “suggest,” “support,” “believe,” “should,” “potential,” “likely,” “continue,” “forecast,” “plan,” “indicate,” “consider,” “future,” or variations of such words and phrases or statements that certain actions “may,” “could,” “must,” “would,” “might,” or “will” be undertaken, occur or be achieved. Forward-looking statements involve known and unknown risks, uncertainties and other factors that may cause the actual results, performance or achievements of Norbord to be materially different from any future results, performance or achievement expressed or implied by the forward-looking statements. See the cautionary language in the Forward-Looking Statements section of the 2015 Management’s Discussion and Analysis dated January 27, 2016 and Q3 2016 Management’s Discussion and Analysis dated October 27, 2016.

Norbord defines Adjusted EBITDA as earnings (loss) determined in accordance with International Financial Reporting Standards (IFRS) before finance costs, income taxes, depreciation and amortization, and other unusual or non-recurring items, and Adjusted earnings (loss) as earnings (loss) determined in accordance with IFRS before unusual or non-recurring items and using a normalized income tax rate. Adjusted EBITDA and Adjusted earnings (loss) are non-IFRS financial measures, do not have any standardized meaning prescribed by IFRS and are therefore unlikely to be comparable to similar measures presented by other companies. See the Non-IFRS Financial Measures section in Norbord’s 2015 Management’s Discussion and Analysis dated January 27, 2016 and Q3 2016 Management’s Discussion and Analysis dated October 27, 2016 for a quantitative reconciliation of Adjusted EBITDA and Adjusted earnings (loss) to earnings (the most directly comparable IFRS measure).


Interim Consolidated Balance Sheets


(Unaudited)

(US $ millions)

   Sep 24, 2016      Dec 31, 2015  

Assets


Current assets


Cash

   $ 74       $ 9   

Accounts receivable

     160         135   

Tax receivable

     —           2   

Inventory

     189         181   

Prepaids

     13         10   


     436         337   

Non-current assets


Property, plant and equipment

     1,240         1,260   

Intangible assets

     21         18   

Deferred income tax assets

     5         5   

Other assets

     16         15   


     1,282         1,298   


   $ 1,718       $ 1,635   


Liabilities and shareholders’ equity


Current liabilities


Accounts payable and accrued liabilities

   $ 206       $ 201   

Tax payable

     1         2   

Current portion of long-term debt

     200         —     


     407         203   

Non-current liabilities


Long-term debt

     546         745   

Other long-term debt

     —           30   

Other liabilities

     43         31   

Deferred income tax liabilities

     129         107   


     718         913   


Shareholders’ equity

     593         519   


   $ 1,718       $ 1,635   


Interim Consolidated Statements of Earnings


(Unaudited)

Periods ended Sep 24 and Sep 26 (US $ millions, except per share information)

   Q3 2016     Q3 2015     9 mos 2016     9 mos 2015  

Sales

   $ 453      $ 378      $ 1,284      $ 1,094   

Cost of sales

     (340     (345     (1,015     (1,022

General and administrative expenses

     (3     (3     (8     (9

Depreciation and amortization

     (23     (22     (68     (65


Operating income (loss)

     87        8        193        (2

Non-operating (expense) income:


Finance costs

     (13     (14     (39     (41

Costs on early debt extinguishment

     —          —          —          (25

Foreign exchange loss on Ainsworth Notes

     —          —          —          (28

Gain on derivative financial instrument on Ainsworth Notes

     —          —          —          4   

Merger transaction costs

     —          —          —          (8

Severance costs related to Merger

     —          —          —          (2


Earnings (loss) before income tax

     74        (6     154        (102

Income tax (expense) recovery

     (19     (3     (32     33   


Earnings (loss)

   $ 55      $ (9   $ 122      $ (69


Earnings (loss) per common share


Basic

   $ 0.64      $ (0.11   $ 1.43      $ (0.81

Diluted

     0.64        (0.11     1.42        (0.81

Interim Consolidated Statements of Comprehensive Income


(Unaudited)

Periods ended Sep 24 and Sep 26 (US $ millions)

   Q3 2016     Q3 2015     9 mos 2016     9 mos 2015  

Earnings (loss)

   $ 55      $ (9   $ 122      $ (69

Other comprehensive (loss) income, net of tax


Items that will not be reclassified to earnings:


Actuarial gain (loss) on post-employment obligation

     1        —          (11     4   

Items that may be reclassified subsequently to earnings:


Foreign currency translation loss on foreign operations

     (10     (11     (21     (44

Net loss on Euro cash flow hedge

     —          (1     —          —     


Other comprehensive loss, net of tax

     (9     (12     (32     (40


Comprehensive income (loss)

   $ 46      $ (21   $ 90      $ (109


Interim Consolidated Statements of Changes in Shareholders’ Equity


(Unaudited)

Periods ended Sep 24 and Sep 26 (US $ millions)

   Q3 2016     Q3 2015     9 mos 2016     9 mos 2015  

Share capital


Balance, beginning of period

   $ 1,337      $ 1,334      $ 1,334      $ 1,331   

Issue of common shares upon exercise of options and Dividend Reinvestment Plan

     1        —          4        3   


Balance, end of period

   $ 1,338      $ 1,334      $ 1,338      $ 1,334   


Merger reserve


Balance, beginning and end of period

   $ (96   $ (96   $ (96   $ (96


Contributed surplus


Balance, beginning of period

   $ 10      $ 10      $ 10      $ 9   

Stock-based compensation

     —          —          —          1   


Balance, end of period

   $ 10      $ 10      $ 10      $ 10   


Retained deficit


Balance, beginning of period

   $ (505   $ (551   $ (559   $ (463

Earnings (loss)

     55        (9     122        (69

Common share dividends

     (7     (6     (20     (34


Balance, end of period(i)

   $ (457   $ (566   $ (457   $ (566


Accumulated other comprehensive loss


Balance, beginning of period

   $ (193   $ (150   $ (170   $ (122

Other comprehensive loss

     (9     (12     (32     (40


Balance, end of period

   $ (202   $ (162   $ (202   $ (162


Shareholders’ equity

   $ 593      $ 520      $ 593      $ 520   


(i)  Retained deficit comprised of:


Deficit arising on cashless exercise of warrants in 2013

   $ (263   $ (263

All other retained deficit

     (194     (303


   $ (457   $ (566


Interim Consolidated Statements of Cash Flows


(Unaudited)

Periods ended Sep 24 and Sep 26 (US $ millions)

   Q3 2016     Q3 2015     9 mos 2016     9 mos 2015  

CASH PROVIDED BY (USED FOR):


Operating activities


Earnings (loss)

   $ 55      $ (9   $ 122      $ (69

Items not affecting cash:


Depreciation and amortization

     23        22        68        65   

Deferred income tax

     19        2        29        (32

Gain on derivative financial instrument on Ainsworth Notes

     —          —          —          (4

Foreign exchange loss on Ainsworth Notes

     —          —          —          28   

Other items

     5        (1     14        13   


     102        14        233        1   

Net change in non-cash operating working capital balances

     (5     7        (51     (34

Net change in tax payable (receivable)

     —          2        1        1   


     97        23        183        (32


Investing activities


Investment in property, plant and equipment

     (24     (13     (58     (41

Investment in intangible assets

     (2     (1     (5     (3


     (26     (14     (63     (44


Financing activities


Common share dividends paid

     (7     (6     (20     (34

Accounts receivable securitization (repayments) drawings, net

     —          (6     (30     44   

Issue of common shares

     —          —          2        1   

Issuance of debt

     —          —          —          315   

Debt issue costs

     —          —          —          (6

Repayment of debt

     —          —          —          (315

Premium on early debt extinguishment

     —          —          —          (13


     (7     (12     (48     (8


Foreign exchange revaluation on cash

     (2     (5     (7     (6


Cash


Increase (decrease) during period

     62        (8     65        (90

Balance, beginning of period

     12        10        9        92   


Balance, end of period

   $ 74      $ 2      $ 74      $ 2   


EX-99.2 3 d233971dex992.htm EX-99.2 EX-99.2

Exhibit 99.2


LOGO

News Release

NORBORD ANNOUNCES MILL EXCHANGE IN QUEBEC

TORONTO, ON (October 28, 2016) – Norbord Inc. (TSX and NYSE: OSB) today announced that it has reached an agreement with Louisiana-Pacific Corporation (LP) (NYSE: LPX) to exchange OSB mills in Quebec. Norbord will swap ownership of its mill in Val-d’Or, Quebec for LP’s OSB mill in Chambord, Quebec. Both mills have been curtailed for a number of years.

“This asset exchange will better align our portfolio of northern mills with our business strategy,” said Peter Wijnbergen, Norbord’s President and Chief Executive Officer. “The Chambord mill is larger and located in the Saguenay-Lac St. Jean area which is the biggest timber-producing region in Quebec. While market conditions do not support an immediate restart of Chambord, the asset is in good condition and is located closer to key markets, representing a better competitive opportunity for Norbord.”

The Chambord OSB mill was built in the 1980s and has a stated capacity of 470 million square feet (3/8-inch basis). It was curtailed by LP in 2008.

In addition to the Chambord mill, Norbord’s assets in Quebec include an operating OSB mill in La Sarre and a technology research and development centre in St-Laurent. The La Sarre mill is a key part of Norbord’s ability to serve markets in eastern Canada and New England. Over the last five years, the Company has invested more than US$35 million to improve and ensure the mill’s long-term competitiveness, including significant investments in new technology, equipment and processes.

The asset exchange transaction is expected to close in early November 2016.

Norbord Profile

Norbord Inc. is a leading global manufacturer of wood-based panels and the world’s largest producer of oriented strand board (OSB). In addition to OSB, Norbord manufactures particleboard, medium density fibreboard and related value-added products. Norbord has assets of approximately $1.7 billion and employs approximately 2,600 people at 17 plant locations in the United States, Canada and Europe. Norbord is a publicly traded company listed on the Toronto Stock Exchange and New York Stock Exchange under the symbol “OSB”.

-end-


1


LOGO


Contact:

For Investors:

Heather Colpitts

Senior Manager, Corporate Affairs

(416) 365-0705

info@norbord.com

For Media:

Trevor Zeck

Longview Communications Inc.

(604) 694-6037

tzeck@longviewcomms.ca

This news release contains forward-looking statements, as defined by applicable securities legislation, including statements related to our strategy, projects, plans, future financial or operating performance and other statements that express management’s expectations or estimates of future performance. Often, but not always, forward-looking statements can be identified by the use of words such as “expect,” “believe,” “forecast,” “likely,” “support,” “target,” “consider,” “continue,” “suggest,” “intend,” “should,” “appear,” “would,” “will,” “will not,” “plan,” “can,” “may,” and other expressions which are predictions of or indicate future events, trends or prospects and which do not relate to historical matters identify forward-looking statements. Forward-looking statements involve known and unknown risks, uncertainties and other factors which may cause the actual results, performance or achievements of Norbord to be materially different from any future results, performance or achievements expressed or implied by the forward-looking statements.

Although Norbord believes it has a reasonable basis for making these forward-looking statements, readers are cautioned not to place undue reliance on such forward-looking information. By its nature, forward-looking information involves numerous assumptions, inherent risks and uncertainties, both general and specific, which contribute to the possibility that the predictions, forecasts and other forward-looking statements will not occur. Factors that could cause actual results to differ materially from those contemplated or implied by forward-looking statements include: the satisfaction (or waiver) of closing conditions; assumptions in connection with the economic and financial conditions in the US, Europe, Canada and globally; risks inherent to product concentration and cyclicality; effects of competition and product pricing pressures; risks inherent to customer dependence; effects of variations in the price and availability of manufacturing inputs; risks inherent to a capital intensive industry; ability to realize synergies; and other risks and factors described from time to time in filings with Canadian securities regulatory authorities.

Except as required by applicable law, Norbord does not undertake to update any forward-looking statements, whether written or oral, that may be made from time to time by, or on behalf of, the Company, whether as a result of new information, future events or otherwise, or to publicly update or revise the above list of factors affecting this information. See the “Caution Regarding Forward-Looking Information” statement in the January 27, 2016 Annual Information Form and the cautionary statement contained in the “Forward-Looking Statements” section of the 2015 Management’s Discussion and Analysis dated January 27, 2016 and Q3 2016 Management’s Discussion and Analysis dated October 27, 2016.


2

EX-99.3 4 d233971dex993.htm EX-99.3 EX-99.3

Exhibit 99.3

Interim Consolidated Balance Sheets


(Unaudited)

(US $ millions)

   Note      Sep 24, 2016      Dec 31, 2015  

Assets


Current assets


Cash

      $ 74       $ 9   

Accounts receivable

     3         160         135   

Tax receivable

        —           2   

Inventory

     4         189         181   

Prepaids

        13         10   


        436         337   

Non-current assets


Property, plant and equipment

        1,240         1,260   

Intangible assets

        21         18   

Deferred income tax assets

        5         5   

Other assets

     5         16         15   


        1,282         1,298   


      $ 1,718       $ 1,635   


Liabilities and shareholders’ equity


Current liabilities


Accounts payable and accrued liabilities

      $ 206       $ 201   

Tax payable

        1         2   

Current portion of long-term debt

     6         200         —     


        407         203   

Non-current liabilities


Long-term debt

     6         546         745   

Other long-term debt

     3         —           30   

Other liabilities

     7         43         31   

Deferred income tax liabilities

        129         107   


        718         913   


Shareholders’ equity

     8         593         519   


      $ 1,718       $ 1,635   


(See accompanying notes)

Commitments and Contingencies (note 13)

Subsequent Event (note 17)


1


Interim Consolidated Statements of Earnings


(Unaudited)

Periods ended Sep 24 and Sep 26 (US $ millions, except per share information)

   Note      Q3 2016     Q3 2015     9 mos 2016     9 mos 2015  

Sales

     15       $ 453      $ 378      $ 1,284      $ 1,094   

Cost of sales

     9         (340     (345     (1,015     (1,022

General and administrative expenses

        (3     (3     (8     (9

Depreciation and amortization

     15         (23     (22     (68     (65


Operating income (loss)

        87        8        193        (2

Non-operating (expense) income:


Finance costs

        (13     (14     (39     (41

Costs on early debt extinguishment

        —          —          —          (25

Foreign exchange loss on Ainsworth Notes

        —          —          —          (28

Gain on derivative financial instrument on Ainsworth Notes

        —          —          —          4   

Merger transaction costs

     1         —          —          —          (8

Severance costs related to Merger

     1         —          —          —          (2


Earnings (loss) before income tax

        74        (6     154        (102

Income tax (expense) recovery

        (19     (3     (32     33   


Earnings (loss)

      $ 55      $ (9   $ 122      $ (69


Earnings (loss) per common share

     10            

Basic

      $ 0.64      $ (0.11   $ 1.43      $ (0.81

Diluted

        0.64        (0.11     1.42        (0.81

(See accompanying notes)

Interim Consolidated Statements of Comprehensive Income


(Unaudited)

Periods ended Sep 24 and Sep 26 (US $ millions)

   Q3 2016     Q3 2015     9 mos 2016     9 mos 2015  

Earnings (loss)

   $ 55      $ (9   $ 122      $ (69

Other comprehensive (loss) income, net of tax


Items that will not be reclassified to earnings:


Actuarial gain (loss) on post-employment obligation

     1        —          (11     4   

Items that may be reclassified subsequently to earnings:


Foreign currency translation loss on foreign operations

     (10     (11     (21     (44

Net loss on Euro cash flow hedge

     —          (1     —          —     


Other comprehensive loss, net of tax

     (9     (12     (32     (40


Comprehensive income (loss)

   $ 46      $ (21   $ 90      $ (109


(See accompanying notes)


2


Interim Consolidated Statements of Changes in Shareholders’ Equity


(Unaudited)

Periods ended Sep 24 and Sep 26 (US $ millions)

   Note      Q3 2016     Q3 2015     9 mos 2016     9 mos 2015  

Share capital


Balance, beginning of period

      $ 1,337      $ 1,334      $ 1,334      $ 1,331   

Issue of common shares upon exercise of options and Dividend Reinvestment Plan

     8         1        —          4        3   


Balance, end of period

      $ 1,338      $ 1,334      $ 1,338      $ 1,334   


Merger reserve


Balance, beginning and end of period

     8       $ (96   $ (96   $ (96   $ (96


Contributed surplus


Balance, beginning of period

      $ 10      $ 10      $ 10      $ 9   

Stock-based compensation

     8         —          —          —          1   


Balance, end of period

      $ 10      $ 10      $ 10      $ 10   


Retained deficit


Balance, beginning of period

      $ (505   $ (551   $ (559   $ (463

Earnings (loss)

        55        (9     122        (69

Common share dividends

        (7     (6     (20     (34


Balance, end of period(i)

      $ (457   $ (566   $ (457   $ (566


Accumulated other comprehensive loss


Balance, beginning of period

      $ (193   $ (150   $ (170   $ (122

Other comprehensive loss

        (9     (12     (32     (40


Balance, end of period

     8       $ (202   $ (162   $ (202   $ (162


Shareholders’ equity

      $ 593      $ 520      $ 593      $ 520   


(See accompanying notes)


(i) Retained deficit comprised of:


Deficit arising on cashless exercise of warrants in 2013

   $ (263   $ (263

All other retained deficit

     (194     (303


   $ (457   $ (566


3


Interim Consolidated Statements of Cash Flows


(Unaudited)

Periods ended Sep 24 and Sep 26 (US $ millions)

   Note      Q3 2016     Q3 2015     9 mos 2016     9 mos 2015  

CASH PROVIDED BY (USED FOR):


Operating activities


Earnings (loss)

      $ 55      $ (9   $ 122      $ (69

Items not affecting cash:


Depreciation and amortization

        23        22        68        65   

Deferred income tax

        19        2        29        (32

Gain on derivative financial instrument on Ainsworth Notes

        —          —          —          (4

Foreign exchange loss on Ainsworth Notes

        —          —          —          28   

Other items

     11         5        (1     14        13   


        102        14        233        1   

Net change in non-cash operating working capital balances

     11         (5     7        (51     (34

Net change in tax payable (receivable)

        —          2        1        1   


        97        23        183        (32


Investing activities


Investment in property, plant and equipment

        (24     (13     (58     (41

Investment in intangible assets

        (2     (1     (5     (3


        (26     (14     (63     (44


Financing activities


Common share dividends paid

        (7     (6     (20     (34

Accounts receivable securitization (repayments) drawings, net

     3         —          (6     (30     44   

Issue of common shares

        —          —          2        1   

Issuance of debt

        —          —          —          315   

Debt issue costs

        —          —          —          (6

Repayment of debt

        —          —          —          (315

Premium on early debt extinguishment

        —          —          —          (13


        (7     (12     (48     (8


Foreign exchange revaluation on cash

        (2     (5     (7     (6


Cash


Increase (decrease) during period

        62        (8     65        (90

Balance, beginning of period

        12        10        9        92   


Balance, end of period

      $ 74      $ 2      $ 74      $ 2   


(See accompanying notes, including note 11 for supplemental cash flow information)


4


Notes to the Interim Consolidated Financial Statements

(in US $, unless otherwise noted)

In these notes, “Norbord” and the “Company” means Norbord Inc. and all of its consolidated subsidiaries and affiliates, unless the context implies otherwise. “Brookfield” means Brookfield Asset Management Inc., or any of its consolidated subsidiaries and affiliates, which are related parties by virtue of a controlling equity interest in the Company.

NOTE 1. NATURE AND DESCRIPTION OF THE COMPANY

Norbord is an international producer of wood-based panels with 17 plant locations in the United States, Europe and Canada. Norbord is a publicly traded company listed on the Toronto Stock Exchange (TSX) and also began trading on the New York Stock Exchange (NYSE) on February 19, 2016. The ticker symbol on both exchanges is “OSB”. The Company is incorporated under the Canada Business Corporations Act and is headquartered in Toronto, Ontario, Canada.

On March 31, 2015, Norbord completed a merger (the Merger) with Ainsworth Lumber Co. Ltd. (Ainsworth).

Prior to the completion of the Merger, Brookfield controlled approximately 52% and 55% of the outstanding common shares of the Company and Ainsworth, respectively. Subsequent to the Merger, Brookfield controls approximately 53% of the outstanding common shares of the Company.

NOTE 2. SIGNIFICANT ACCOUNTING POLICIES


(a) Statement of Compliance

These condensed consolidated interim financial statements (interim financial statements) have been prepared in accordance with International Accounting Standard (IAS) 34, Interim Financial Reporting on a basis consistent with the accounting policies the Company disclosed in its audited consolidated financial statements as at, and for the year ended, December 31, 2015. These interim financial statements do not contain all of the disclosures that are required in annual financial statements prepared under International Financial Reporting Standards (IFRS) and should be read in conjunction with the Company’s 2015 audited annual financial statements which include information necessary or useful to understanding the Company’s business and financial statement presentation. The Company’s interim results are not necessarily indicative of its results for a full year.

These interim financial statements were authorized for issuance by the Board of Directors of the Company on October 27, 2016.


(b) Basis of Presentation

These interim financial statements include the accounts of the Company and all of its wholly-owned subsidiaries.


5


(c) Future Changes in Accounting Policies

In addition to the future changes in accounting policies disclosed in the Company’s 2015 audited annual financial statements, below are new accounting policies issued in 2016:


  (i) Income Taxes

In January 2016, the International Accounting Standards Board (IASB) issued amendments to clarify the requirements for recognizing deferred tax assets on unrealized losses. The amendments clarify the accounting for deferred tax where an asset is measured at fair value and that fair value is below the asset’s tax base. They also clarify certain other aspects of accounting for deferred tax assets. The amendments are effective for the year beginning on or after January 1, 2017. The Company does not expect these amendments to have a significant impact on its financial statements.


  (ii) Cash Flow Statement Disclosure

In January 2016, the IASB issued an amendment to IAS 7, Statement of Cash Flows, introducing additional disclosure requirements for liabilities arising from financing activities. The amendments are effective for the year beginning on or after January 1, 2017. The Company does not expect this amendment to have a significant impact on its financial statements.


  (iii) Share-Based Payment

In June 2016, the IASB issued an amendment to IFRS 2, Share-based Payment, clarifying the accounting for certain types of share-based payment transactions. The amendments provide requirements on accounting for the effects of vesting and non-vesting conditions of cash-settled share-based payments, withholding tax obligations for share-based payments with a net settlement feature, and when a modification to the terms of a share-based payment changes the classification of the transaction from cash-settled to equity-settled. The amendments are effective for the year beginning on or after January 1, 2018. The Company is currently assessing the impact of these amendments on its financial statements.

NOTE 3. ACCOUNTS RECEIVABLE

The Company has a $125 million multi-currency accounts receivable securitization program with a third-party trust sponsored by a highly rated Canadian financial institution. The program is revolving and has an evergreen commitment subject to termination on 12 months’ notice. Under the program, Norbord has transferred substantially all of its present and future trade accounts receivable to the trust, on a fully serviced basis, for proceeds consisting of cash and deferred purchase price. However, the asset de-recognition criteria under IFRS have not been met and the transferred accounts receivable remain recorded as an asset.

At period-end, Norbord had transferred but continued to recognize $142 million (December 31, 2015 – $122 million) in trade accounts receivable, and Norbord recorded no drawings as other long-term debt (December 31, 2015 – $30 million) relating to this financing program. The level of trade accounts receivable transferred under the program fluctuates with the level of shipment volumes, product prices and foreign exchange rates. The amount Norbord chooses to draw under the program at any point in time depends on the level of accounts receivable transferred, timing of cash settlements and fluctuates with the Company’s cash requirements. Any drawings are presented as other long-term debt on the balance sheet and are excluded from the net debt to capitalization calculation for financial covenant purposes (note 6). The utilization charge, which is based on money market rates plus a margin, and other program fees are recorded as finance costs. Year-to-date, the utilization charge on drawings ranged from 1.5% to 2.1%.

The securitization program contains no financial covenants; however, the program is subject to minimum credit-rating requirements. The Company must maintain a long-term issuer credit rating of at least single B (mid) or the equivalent. As at October 27, 2016, Norbord’s ratings were BB (DBRS), BB- (Standard & Poor’s Ratings Services) and Ba2 (Moody’s Investors Service).


6


NOTE 4. INVENTORY


(US $ millions)

   Sep 24, 2016      Dec 31, 2015  

Raw materials

   $ 52       $ 52   

Finished goods

     66         65   

Operating and maintenance supplies

     71         64   


   $ 189       $ 181   


At period-end, the provision to reflect inventories at the lower of cost and net realizable value was less than $1 million (December 31, 2015 – less than $1 million).

NOTE 5. OTHER ASSETS


(US $ millions)

   Sep 24, 2016      Dec 31, 2015  

Investment tax credit receivable

   $ 15       $ 13   

Other

     1         2   


   $ 16       $ 15   


NOTE 6. LONG-TERM DEBT


(US $ millions)

   Sep 24, 2016      Dec 31, 2015  

Principal value


7.7% senior secured notes due February 2017

   $ 200       $ 200   

5.375% senior secured notes due December 2020

     240         240   

6.25% senior secured notes due April 2023

     315         315   


     755         755   

Less: Debt issue costs

     (9      (10

Less: Current portion

     (200      —     


   $ 546       $ 745   


Revolving Bank Lines

The Company has an aggregate commitment of $245 million under committed revolving bank lines which bears interest at money market rates plus a margin that varies with the Company’s credit rating. The maturity date of the total aggregate commitment is May 2019. The bank lines are secured by a first lien on the Company’s North American OSB inventory and property, plant and equipment. This lien is shared pari passu with holders of the 2017, 2020 and 2023 senior secured notes.

At period-end, none of the revolving bank lines were drawn as cash, $24 million (December 31, 2015 – $5 million) was utilized for letters of credit and $221 million (December 31, 2015 – $240 million) was available to support short-term liquidity requirements.

The revolving bank lines contain two quarterly financial covenants: minimum tangible net worth of $500 million and maximum net debt to capitalization, book basis, of 65%. The Company was in compliance with the financial covenants at period-end.


7


NOTE 7. OTHER LIABILITIES


(US $ millions)

   Sep 24, 2016      Dec 31, 2015  

Defined benefit pension obligation

   $ 34       $ 23   

Accrued employee benefits

     6         5   

Reforestation obligation

     2         3   

Other

     1         —     


   $ 43       $ 31   


NOTE 8. SHAREHOLDERS’ EQUITY

Share Capital


     9 mos 2016  
     Shares
(millions)
     Amount
(US $ millions)
 

Common shares outstanding, beginning of period

     85.4       $ 1,334   

Issuance of common shares upon exercise of options and Dividend Reinvestment Plan

     0.2         4   


Common shares outstanding, end of period

     85.6       $ 1,338   


Stock Options

Year-to-date, no stock options were granted (2015 – 0.2 million stock options) under the Company’s stock option plan. Year-to-date, stock option expense of $1 million (2015 – $1 million) was recorded with a corresponding increase in contributed surplus. Year-to-date, 0.2 million common shares (2015 – 0.1 million common shares) were issued as a result of options exercised under the stock option plan for total proceeds of $2 million (2015 – $1 million).

Dividend Reinvestment Plan

Year-to-date, less than $1 million of dividends were reinvested in common shares (2015 – less than $1 million).

Merger Reserve

On March 31, 2015, the Company and Ainsworth completed an arrangement under which the Company acquired all of the outstanding common shares of Ainsworth in an all-share transaction. The merger reserve represents the difference between the fair value of the Norbord common shares on the date of issuance, and the book value of Ainsworth’s net assets exchanged upon closing of the Merger.

Accumulated Other Comprehensive Loss


(US $ millions)

   Sep 24, 2016      Dec 31, 2015  

Foreign currency translation loss on investment in foreign operations, net of tax of $(4) (Dec 31, 2015 – $(10))

   $ (151    $ (130

Net loss on hedge of net investment in foreign operations, net of tax of $3 (Dec 31, 2015 – $3)

     (8      (8

Actuarial loss on post-employment obligation, net of tax of $12 (Dec 31, 2015 – $11)

     (43      (32


Accumulated other comprehensive loss, net of tax

   $ (202    $ (170


8


NOTE 9. HIGH LEVEL FIRE

On May 4, 2016, a fire started in the wood yard of the High Level, Alberta mill. Production was halted immediately while the fire was brought under control. The fire destroyed a portion of the mill’s log inventory. The Company incurred costs to control the fire and restore the mill. The mill returned to production approximately three weeks later. The Company has insurance coverage for property damage and business interruption. Year-to-date, the following amounts were recognized in cost of sales related to the fire:


(US $ millions)


Write-off of log inventory destroyed by the fire

   $ (7

Costs of fire fighting and site restoration

     (6

Insurance recovery for the reimbursement of the lost log inventory, fire fighting costs and site restoration

     12   


Insurance claim deductible, net

     (1

Insurance recovery for business interruption

     2   


Net insurance claim recoverable

   $ 1   


At period-end, $8 million of insurance proceeds for property damage had been received and $6 million is included in accounts receivable. Subsequent to period-end, a further installment of insurance proceeds of $3 million was received. The insurance claim is ongoing.

NOTE 10. EARNINGS PER COMMON SHARE


(US $ millions, except share and per share information, unless otherwise noted)

   Q3 2016      Q3 2015      9 mos 2016      9 mos 2015  

Earnings (loss) available to common shareholders

   $ 55       $ (9    $ 122       $ (69


Common shares (millions):


Weighted average number of common shares outstanding(1)

     85.6         85.4         85.5         85.3   

Stock options(2)

     0.6         —           0.6         —     


Diluted number of common shares

     86.2         85.4         86.1         85.3   


Earnings (loss) per common share:


Basic

   $ 0.64       $ (0.11    $ 1.43       $ (0.81

Diluted

     0.64         (0.11      1.42         (0.81


(1)  For 2015, includes 31.8 million Norbord common shares issued upon closing of the Merger to give effect to the Merger as if Norbord and Ainsworth had always been combined.
(2)  Applicable if dilutive and when the weighted average daily closing share price for the period was greater than the exercise price for stock options. At period-end, there were 1.5 million stock options (Sep 26, 2015 – 2.0 million) that were not taken into account in the calculation of diluted earnings per share because their effect was anti-dilutive.

NOTE 11. SUPPLEMENTAL CASH FLOW INFORMATION

Other items comprises:


(US $ millions)

   Q3 2016      Q3 2015      9 mos 2016      9 mos 2015  

Stock-based compensation

   $ 1       $ —         $ 1       $ 1   

Pension funding (greater) less than expense

     (2      —           (3      2   

Interest paid less than interest expense

     5         4         4         7   

Amortization of debt issue costs

     1         1         2         1   

High Level insurance claim deductible

     —           —           1         —     

Early debt extinguishment payments

     —           —           —           25   

Unrealized foreign exchange (gain) loss

     —           (4      2         (8

Other

     —           (2      7         (15


   $ 5       $ (1    $ 14       $ 13   


9


The net change in non-cash operating working capital balance comprises:


(US $ millions)

   Q3 2016      Q3 2015      9 mos 2016      9 mos 2015  

Cash (used for) provided by:


Accounts receivable

   $ 3       $ 2       $ (33    $ (34

Prepaids

     (5      (5      (2      3   

Inventory

     (1      (1      (4      5   

Accounts payable and accrued liabilities

     (2      11         (12      (8


   $ (5    $ 7       $ (51    $ (34


Cash interest and income taxes comprise:


(US $ millions)

   Q3 2016      Q3 2015      9 mos 2016      9 mos 2015  

Cash interest paid

   $ 8       $ 8       $ 33       $ 31   

Cash income taxes (recovered) paid, net

     —           (2      1         (4

NOTE 12. FINANCIAL INSTRUMENTS

Non-Derivative Financial Instruments

The net book values and fair values of non-derivative financial instruments were as follows:


(US $ millions)

          Sep 24, 2016      Dec 31, 2015  
     Financial Instrument Category      Net Book
Value
     Fair
Value
     Net Book
Value
     Fair
Value
 

Financial assets:


Cash

     Fair value through profit or loss       $ 74       $ 74       $ 9       $ 9   

Accounts receivable

     Loans and receivables         160         160         135         135   


      $ 234       $ 234       $ 144       $ 144   


Financial liabilities:


Accounts payable and accrued liabilities

     Other financial liabilities       $ 206       $ 206       $ 201       $ 201   

Long-term debt(1)

     Other financial liabilities         755         793         755         760   

Other long-term debt

     Other financial liabilities         —           —           30         30   

Other liabilities

     Other financial liabilities         43         43         31         31   


      $ 1,004       $ 1,042       $ 1,017       $ 1,022   


(1)  Principal value of Long-term debt

Derivative Financial Instruments

Canadian dollar monetary hedge

At period-end, the Company had foreign currency contracts representing a notional amount of CAD $23 million (December 31, 2015 – CAD $1 million) in place to buy Canadian dollars and sell US dollars with a maturity of October 2016. The fair value of these contracts at period-end is an unrealized loss of less than $1 million (December 31, 2015 – an unrealized gain of less than $1 million); the carrying value of the derivative instrument is equivalent to the unrealized loss at period-end. During the quarter, realized losses on the Company’s matured hedges were less than $1 million (2015 – less than $1 million realized gains). Year-to-date, realized gains on the Company’s matured hedges were $1 million (2015 – $1 million).


10


Derivative instruments are measured at fair value as determined using valuation techniques under Level 2 of the fair value hierarchy. The fair values of over-the-counter derivative financial instruments are based on broker quotes or observable market rates. Those quotes are tested for reasonableness by discounting expected future cash flows using market interest and exchange rates for a similar instrument at the measurement date. Fair values reflect the credit risk of the instrument for the Company and counterparty when appropriate. Realized and unrealized gains and losses on derivative financial instruments are offset by realized and unrealized losses and gains on the underlying exposures being hedged.

NOTE 13. COMMITMENTS AND CONTINGENCIES

The Company has provided certain guarantees, commitments and indemnifications, including those related to former businesses. The maximum amounts from many of these items cannot be reasonably estimated at this time. However, in certain circumstances, the Company has recourse against other parties to mitigate the risk of loss. In the normal course of its business activities, the Company is subject to claims and legal actions that may be made against its customers, suppliers and others. While the final outcome with respect to actions outstanding or pending as at period-end cannot be predicted with certainty, the Company believes the resolution will not have a material effect on the Company’s financial position, financial performance, or cash flows.

The Company has entered into various contractual commitments as follows:


     Payments Due by Period  

(US $ millions)

   Less than 1 year      1-5 years      Thereafter      Total  

Purchase obligations

   $ 72       $ 49       $ —         $ 121   

Operating leases

     4         6         3         13   

Reforestation obligations

     —           1         1         2   


   $ 76       $ 56       $ 4       $ 136   


Purchase obligations relate to the purchase of property, plant and equipment and long-term purchase contracts with minimum fixed payment amounts, of which $35 million relates to the Inverness expansion project. All contracts are at market prices and on normal business terms.

NOTE 14. RELATED PARTY TRANSACTIONS

In the normal course of operations, Norbord enters into various transactions with related parties which have been measured at exchange value and recognized in the consolidated financial statements. The following transactions have occurred between Norbord and its related parties during the normal course of business.

Norbord periodically engages the services of Brookfield for various financial, real estate and other business advisory services. During the quarter, the fees for services rendered were less than $1 million (2015 – less than $1 million). Year-to-date, the fees for services rendered were less than $1 million (2015 – less than $1 million).

Sales to Asian markets are handled by Interex Forest Products Ltd. (Interex), a cooperative sales company over which Norbord, as a 25% shareholder, has significant influence. During the quarter, net sales of $16 million (2015 – $15 million) were made to Interex. Year-to-date, net sales of $40 million (2015 – $36 million) were made to Interex. At period-end, $4 million (December 31, 2015 – $3 million) due from Interex was included in accounts receivable.


11


NOTE 15. GEOGRAPHIC SEGMENTS

Norbord operates principally in North America and Europe. Sales by geographic segment are determined based on the origin of shipment.


     Q3 2016  

(US $ millions)

   North America      Europe      Unallocated      Total  

Sales

   $ 356       $ 97       $ —         $ 453   

EBITDA(1)

     103         10         (3      110   

Depreciation and amortization

     19         4         —           23   

Investment in property, plant and equipment

     11         16         —           27   
     Q3 2015  

(US $ millions)

   North America      Europe      Unallocated      Total  

Sales

   $ 258       $ 120       $ —         $ 378   

EBITDA(1)

     22         11         (3      30   

Depreciation and amortization

     19         3         —           22   

Investment in property, plant and equipment

     9         4         —           13   
     9 mos 2016  

(US $ millions)

   North America      Europe      Unallocated      Total  

Sales

   $ 975       $ 309       $ —         $ 1,284   

EBITDA(1)

     238         31         (8      261   

Depreciation and amortization

     57         11         —           68   

Investment in property, plant and equipment

     33         26         —           59   

Property, plant and equipment

     1,109         131         —           1,240   
     9 mos 2015  

(US $ millions)

   North America      Europe      Unallocated      Total  

Sales

   $ 749       $ 345       $ —         $ 1,094   

EBITDA(1)

     44         28         (68      4   

Depreciation and amortization

     54         11         —           65   

Investment in property, plant and equipment

     31         8         —           39   

Property, plant and equipment(2)

     1,139         121         —           1,260   


(1)  EBITDA is a non-IFRS financial measure, which the Company defines as earnings (loss) before finance costs, income tax, and depreciation and amortization. Non-IFRS financial measures do not have any standardized meaning prescribed by IFRS and are therefore unlikely to be comparable to similar measures presented by other companies.
(2)  Balance as at December 31, 2015.

NOTE 16. PRIOR PERIOD COMPARATIVES

Certain 2015 figures have been reclassified to conform with the current period’s presentation.

NOTE 17. SUBSEQUENT EVENT

Subsequent to quarter-end, the Company reached an agreement with Louisiana-Pacific Corporation (LP) to exchange OSB mills in the province of Quebec. Norbord will swap ownership of its mill in Val-d’Or for LP’s mill in Chambord. Production at both mills has been curtailed for a number of years. The non-monetary asset exchange transaction is expected to close in November 2016.


12

EX-99.4 5 d233971dex994.htm EX-99.4 EX-99.4

Exhibit 99.4

OCTOBER 27, 2016

Management’s Discussion and Analysis

INTRODUCTION

The Management’s Discussion and Analysis (MD&A) provides a review of the significant developments that impacted Norbord’s performance during the period. The information in this section should be read in conjunction with the unaudited condensed consolidated interim financial statements for the period ended September 24, 2016 and the audited annual financial statements and annual MD&A in the 2015 Annual Report.

In this MD&A, “Norbord” or the “Company” means Norbord Inc. and all of its consolidated subsidiaries and affiliates, unless the context implies otherwise. “Brookfield” means Brookfield Asset Management Inc., or any of its consolidated subsidiaries and affiliates, which are related parties by virtue of a controlling equity interest in the Company.

Annual financial data provided has been prepared in accordance with International Financial Reporting Standards (IFRS) as issued by the International Accounting Standards Board (the IASB) and interim financial data has been prepared in accordance with International Accounting Standard (IAS) 34, Interim Financial Reporting. Additional information on Norbord, including the Company’s annual information form and other documents publicly filed by the Company, is available on the Company’s website at www.norbord.com, the System for Electronic Document Analysis and Retrieval (SEDAR) administered by the Canadian Securities Administrators (the CSA) at www.sedar.com and on the Electronic Data Gathering, Analysis and Retrieval System (EDGAR) section of the US Securities and Exchange Commission (the SEC) website at www.sec.gov/edgar/searchedgar/companysearch.html. All financial references in the MD&A are stated in US dollars, unless otherwise noted.

Some of the statements included or incorporated by reference in this MD&A constitute forward-looking statements within the meaning of applicable securities legislation. Forward-looking statements are based on various assumptions and are subject to various risks. See the cautionary statement contained in the Forward-Looking Statements section.

The Company has prepared this MD&A with reference to National Instrument 51-102 – Continuous Disclosure Obligations of the CSA. The Company is an eligible issuer under the Multijurisdictional Disclosure System (MJDS) and complies with the US reporting requirements by filing its Canadian disclosure documents with the SEC. As a MJDS issuer, the Company is permitted to prepare this MD&A in accordance with the disclosure requirements of Canada, whose requirements are different from those of the United States.

This MD&A provides financial and operating results for the three month and nine month periods ended September 24, 2016 and additional disclosure of material information up to and including the date of issue, being October 27, 2016.

Adjusted EBITDA, Adjusted earnings (loss), Adjusted earnings (loss) per share, cash provided by operating activities per share, operating working capital, total working capital, capital employed, return on capital employed (ROCE), return on equity (ROE), net debt for financial covenant purposes, tangible net worth, net


Some of the statements included in this MD&A constitute forward-looking statements that are based on various assumptions and are subject to various risks. See the cautionary statement contained in the Forward-Looking Statements section.


1


debt to capitalization, book basis, and net debt to capitalization, market basis, are non-IFRS financial measures described in the Non-IFRS Financial Measures section. Non-IFRS financial measures do not have any standardized meaning prescribed by IFRS and are therefore unlikely to be comparable to similar measures presented by other companies. Where appropriate, a quantitative reconciliation of the non-IFRS financial measure to the most directly comparable IFRS measure is also provided.


BUSINESS OVERVIEW & STRATEGY

Norbord is a leading global manufacturer of wood-based panels with 17 plant locations in the United States (US), Canada and Europe. After the completion of the merger with Ainsworth Lumber Co. Ltd. (Ainsworth) on March 31, 2015, Norbord became the largest global producer of oriented strand board (OSB) with annual capacity of 8 billion square feet (Bsf) (3/8-inch basis). In North America, Norbord owns 13 OSB production facilities located in the Southern region of the US, Western Canada, Quebec, Ontario and Minnesota. In Europe, the Company operates an OSB production facility, two particleboard mills and one medium density fibreboard (MDF) mill in the United Kingdom (UK) and one OSB production facility in Belgium and is the UK’s largest panel producer. The Company reports its operations in two geographic segments, North America and Europe with approximately 80% of its panel production capacity in North America and 20% in Europe. Norbord’s business strategy is focused entirely on the wood-based panels sector – in particular OSB – in North America, Europe and Asia.

OSB Accounts for 90% of Norbord’s Business


LOGO

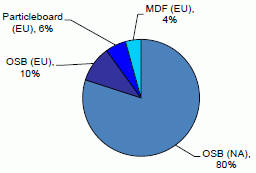
Production Capacity by Product

NA = North America

EU = Europe


Norbord’s financial goal is to achieve top-quartile ROCE among North American forest products companies over the business cycle.

Protecting the balance sheet is an important element of Norbord’s financing strategy. Management believes that its record of superior operational performance, disciplined capital allocation and prudent balance sheet management will enable it to access public and private capital markets (subject to financial market conditions). At period-end, Norbord had unutilized liquidity of $420 million, comprising $74 million in cash, $221 million in unutilized revolving bank lines and $125 million undrawn under its accounts receivable securitization program. The Company has $200 million senior secured notes that are due in February 2017, which the Company intends to permanently repay at maturity using cash on hand, cash generated from operations and if necessary, by drawing upon the accounts receivable securitization program.

MERGER WITH AINSWORTH

On March 31, 2015, Norbord completed its merger with Ainsworth (the Merger). The Merger created the largest global OSB producer and brought together Norbord’s manufacturing cost leadership with Ainsworth’s track record of innovation in product development. It also allows Norbord to better serve the Company’s North American customers as well as gain access to small but growing Asian markets.


Some of the statements included in this MD&A constitute forward-looking statements that are based on various assumptions and are subject to various risks. See the cautionary statement contained in the Forward-Looking Statements section.


2


As of the third quarter of 2016, Norbord has captured $45 million in cumulative (annual run rate) synergies from the Merger, within 18 months of closing. Of this amount, $36 million has been realized within the past 18 months and the remaining $9 million is expected to be realized in future quarters from synergy initiatives already executed. These synergies have resulted from reduced corporate overhead costs, optimization of sales and logistics, procurement savings, the sharing of operational best practices and implementing best practices related to operating working capital management such as optimizing inventory levels and customer/supplier payment terms. Since the Merger, the Company has incurred one-time costs of $14 million to achieve these synergies, of which $7 million was incurred in 2015 and $7 million to-date in 2016. In addition to these synergies, the Merger is enabling the Company to avoid significant capital cash outlays it would otherwise have had to incur. Norbord estimates this capital cost avoidance at $35 million, which includes utilizing formerly idle assets throughout the Company. As the Merger synergies target has now been fully realized, the Company will continue to report progress on continuous improvement initiatives through the Margin Improvement Program (MIP).

QUEBEC MILL EXCHANGE

Subsequent to quarter-end, the Company reached an agreement with Louisiana-Pacific Corporation (LP) to exchange OSB mills in the province of Quebec. Norbord will swap ownership of its mill in Val-d’Or for LP’s mill in Chambord. Production at both mills has been curtailed for a number of years. The non-monetary asset exchange transaction is expected to close in November 2016. The Chambord mill has a stated capacity of 470 million square feet (3/8-inch basis) and the Val-d’Or mill has a stated capacity of 340 million square feet (3/8-inch basis).

HIGH LEVEL FIRE

On May 4, 2016, a fire started in the wood yard of the High Level, Alberta mill. Production was halted immediately while the fire was brought under control. The mill has an annual stated production capacity of 860 million square feet (3/8-inch basis) and has been ramping up toward full production since resuming operations in late 2013. The fire destroyed a portion of the mill’s log inventory. The mill returned to production approximately three weeks later.

To date, the Company has recognized the following amounts:


(US $ millions)


Write-off of log inventory destroyed by the fire

   $ (7

Costs of fighting and site restoration

     (6

Insurance recovery for the reimbursement of the lost log inventory, fire fighting costs and site restoration

     12   


Costs related to High Level fire, net

     (1

Insurance recovery for business interruption

     2   


Net insurance claim recovery to-date

   $ 1   


At quarter-end, $8 million of insurance proceeds for property damage had been received and $6 million is included in accounts receivable. Subsequent to quarter-end, a further installment of insurance proceeds of $3 million was received. The insurance claim is ongoing.

SUMMARY

North American OSB demand continues to improve, driven by a gradual rebound in new home construction and continued growth in repair and remodel and industrial markets. Year-to-date US housing starts were up 4% compared to 2015, with single-family starts 9% higher. The North Central benchmark price averaged $301 per Msf (7/16-inch basis) for the quarter, up 14% against the previous quarter and up 48% against the same quarter last year. Norbord’s North American third quarter capacity utilization was in line with the prior


Some of the statements included in this MD&A constitute forward-looking statements that are based on various assumptions and are subject to various risks. See the cautionary statement contained in the Forward-Looking Statements section.


3


quarter and improved versus the same quarter last year, primarily due to fewer maintenance shutdown days and production curtailments.

Norbord’s European panel business continues to generate steady financial results despite the unexpected outcome of the “Brexit” referendum (UK withdrawal from the European Union), as demand in the Company’s core markets in the UK and Germany remains strong. The European mills third quarter capacity utilization was lower than the prior quarter primarily due to lost production days following a fatality at the Cowie, Scotland mill, but in line with the same quarter last year as improved productivity was offset by the lost production days.

Norbord generated operating income of $87 million in the third quarter of 2016, up from $67 million in the second quarter of 2016 and $8 million in the third quarter of 2015. Year-to-date, Norbord generated operating income of $193 million, up from an operating loss of $2 million in the same period of 2015. Norbord recorded earnings of $55 million ($0.64 per basic and diluted share) in the third quarter of 2016 versus earnings of $44 million ($0.51 per basic and diluted share) in the second quarter of 2016 and a loss of $9 million ($0.11 loss per basic and diluted share) in the third quarter of 2015. Year-to-date, Norbord recorded earnings of $122 million ($1.43 per basic share and $1.42 per diluted share), up from a loss of $69 million ($0.81 loss per basic and diluted share) in the same period of 2015.

Excluding the impact of non-recurring items (which includes costs related to the $315 million senior secured notes due 2017 of Ainsworth (Ainsworth Notes), which were redeemed prior to maturity in the second quarter of 2015) and using a normalized Canadian statutory tax rate, Norbord recorded Adjusted earnings of $58 million ($0.68 per basic share and $0.67 per diluted share) in the third quarter of 2016 compared to Adjusted earnings of $42 million ($0.49 per basic and diluted share) in the second quarter of 2016 and an Adjusted loss of $4 million ($0.05 loss per basic and diluted share) in the third quarter of 2015. Year-to-date, Norbord recorded Adjusted earnings of $120 million ($1.40 per basic share and $1.39 per diluted share) versus an Adjusted loss of $30 million ($0.35 loss per basic and diluted share) in the same period of 2015.

The following table reconciles Adjusted earnings (loss) to the most directly comparable IFRS measure:


(US $ millions)

   Q3
2016
    Q2
2016
    Q3
2015
    9 mos
2016
    9 mos
2015
 

Earnings (loss)

   $ 55      $ 44      $ (9   $ 122      $ (69

Add: Merger transaction costs

     —          —          —          —          8   

Add: Severance costs related to Merger

     —          —          —          —          2   

Add: Other costs incurred to achieve Merger synergies

     4        2        —          7        2   

Add: Costs related to High Level fire

     —          1        —          1        —     

Add: Costs on early debt extinguishment

     —          —          —          —          25   

Add: Foreign exchange loss on Ainsworth Notes

     —          —          —          —          28   

Less: Gain on derivative financial instrument on Ainsworth Notes

     —          —          —          —          (4

Add: Reported income tax expense (recovery)

     19        10        3        32        (33


Adjusted pre-tax earnings (loss)

     78        57        (6     162        (41

Less: Income tax (expense) recovery at statutory rate(1)

     (20     (15     2        (42     11   


Adjusted earnings (loss)

   $ 58      $ 42      $ (4   $ 120      $ (30


(1)  Represents Canadian combined federal and provincial statutory rate.

Against the market and operating backdrop described above, Norbord generated Adjusted EBITDA of $114 million in the third quarter of 2016 versus $94 million in the second quarter of 2016 and $30 million in the third quarter of 2015. Year-to-date, Norbord generated Adjusted EBITDA of $269 million versus $65 million in the same period of 2015. On the controllable side of the business, Norbord generated $10 million of MIP gains in the first nine months of 2016, measured relative to 2015 at constant prices and exchange rates, primarily from lower raw material usages and higher productivity.


Some of the statements included in this MD&A constitute forward-looking statements that are based on various assumptions and are subject to various risks. See the cautionary statement contained in the Forward-Looking Statements section.


4


The following table reconciles Adjusted EBITDA to the most directly comparable IFRS measure:


(US $ millions)

   Q3
2016
     Q2
2016
     Q3
2015
    9 mos
2016
     9 mos
2015
 

Earnings (loss)

   $ 55       $ 44       $ (9   $ 122       $ (69

Add: Finance costs

     13         13         14        39         41   

Add: Depreciation and amortization

     23         24         22        68         65   

Add: Income tax expense (recovery)

     19         10         3        32         (33

Add: Merger transaction costs

     —           —           —          —           8   

Add: Costs related to High Level fire

     —           1         —          1         —     

Add: Severance costs related to Merger

     —           —           —          —           2   

Add: Other costs incurred to achieve Merger synergies

     4         2         —          7         2   

Add: Costs on early debt extinguishment

     —           —           —          —           25   

Add: Foreign exchange loss on Ainsworth Notes

     —           —           —          —           28   

Less: Gain on derivative financial instrument on Ainsworth Notes

     —           —           —          —           (4


Adjusted EBITDA

   $ 114       $ 94       $ 30      $ 269       $ 65   


Home construction activity, particularly in the US, influences OSB demand and pricing. With 80% of the Company’s panel capacity located in North America, fluctuations in North American OSB demand and prices significantly affect Norbord’s results. Year-to-date, approximately 55% of Norbord’s North American OSB sales volume went into the new home construction sector. The remainder went into repair and remodelling, light commercial construction, industrial applications and export markets. Management believes this diversification provides opportunities to maximize profitability while limiting the Company’s relative exposure to the new home construction segment during periods of soft housing activity. As the US housing market recovery progresses, management expects Norbord’s shipment volume to the new home construction sector will continue to grow.

North America OSB demand is primarily driven by home construction activity. The long-term fundamentals that support North American housing activity such as new household formations and replacement of housing stock are forecasted by US housing economists to be strong. Norbord’s European operations and Asian exports are exposed to different market dynamics relative to North America and this has provided meaningful market and geographic diversification for the Company. Combined with Norbord’s strong financial liquidity and solid customer partnerships, the Company believes it is well positioned to benefit from the continuing recovery in the US housing markets and growing demand in the its core European and Asian markets.

On the input cost side, fluctuations in raw material input prices significantly impact operating costs. Wood fibre, resin, wax and energy account for approximately 65% of Norbord’s OSB cash production costs. The prices for these commodities are determined by economic and market conditions. In the third quarter of 2016, resin prices were up slightly relative to the prior quarter but still lower than the same quarter last year. Resin used in the OSB manufacturing process is a petrochemical product, therefore its price is expected to remain around these lower levels as long as global oil prices remain under pressure. Norbord will continue to pursue aggressive MIP initiatives to reduce raw material usages and improve productivity to offset potentially higher uncontrollable costs.


Some of the statements included in this MD&A constitute forward-looking statements that are based on various assumptions and are subject to various risks. See the cautionary statement contained in the Forward-Looking Statements section.


5


SUMMARY OF FINANCIAL AND OPERATING HIGHLIGHTS


(US $ millions, except per share information, unless otherwise noted)

   Q3
2016
    Q2
2016
    Q3
2015
    9 mos
2016
    9 mos
2015
 

KEY PERFORMANCE METRICS


Return on capital employed (ROCE)(1)

     32     26     8     26     6

Return on equity (ROE)(1)

     41     31     (3 )%      29     (7 )% 

Cash provided by (used for) operating activities

     97        83        23        183        (32

Per Common Share


Earnings (loss), basic(2)

     0.64        0.51        (0.11     1.43        (0.81

Adjusted earnings (loss), basic (1,3)

     0.68        0.49        (0.05     1.40        (0.36

Cash provided by (used for) operating activities(1)

     1.13        0.97        0.27        2.14        (0.38

Dividends declared(4)

     0.10        0.10        0.10        0.30        0.60   


SALES AND EARNINGS


Sales

     453        447        378        1,284        1,094   

Operating income (loss)

     87        67        8        193        (2

Adjusted EBITDA(1)

     114        94        30        269        65   

Earnings (loss)

     55        44        (9     122        (69

Adjusted earnings (loss)(1)

     58        42        (4     120        (30


Total assets

     1,718        1,654        1,653       

Long-term debt(5)

     746        745        744       

Net debt for financial covenant purposes(1)

     705        751        758       

Net debt to capitalization, market basis(1)

     29     31     32    

Net debt to capitalization, book basis(1)

     45     48     51    


KEY STATISTICS


Shipments (MMsf–3/8”)


North America

     1,463        1,487        1,409        4,287        4,038   

Europe

     438        459        453        1,332        1,315   

Indicative Average OSB Price


North Central ($/Msf–7/16”)

     301        264        204        264        197   

South East ($/Msf–7/16”)

     256        245        176        239        175   

Western Canada ($/Msf–7/16”)

     265        242        158        233        156   

Europe (€/m3)(6)

     235        237        220        234        223   


(1)  Non-IFRS measure; see Non-IFRS Financial Measures section.
(2)  Basic and diluted earnings (loss) per share are the same except diluted earnings per share for 9 months 2016 is $1.42.
(3)  Basic and diluted Adjusted earnings (loss) per share are the same except diluted Adjusted earnings per share for Q3 2016 is $0.67 and for the 9 months 2016 is $1.39.
(4)  Dividends declared per share stated in Canadian dollars.
(5)  Includes current and non-current long-term debt.
(6)  European indicative average OSB price represents the gross delivered price to the largest continental market.

Sales

Total sales in the quarter were $453 million, compared to $447 million in the previous quarter and $378 million in the same quarter last year. Year-to-date, sales were $1,284 million versus $1,094 million in the same period of 2015. Quarter-over-quarter, total sales increased by $6 million or 1%. In North America, sales increased by 5% due to higher OSB prices that were partially offset by 2% lower shipment volumes. In Europe, sales decreased by 10% primarily due to the translation impact of the weaker Pound Sterling versus the US dollar, as 5% lower shipment volumes were offset by higher average prices. Year-over-year, sales increased by $75 million or 20%. In North America, sales increased by 38% due to significantly higher OSB prices and 4% higher shipment volumes. In Europe, sales decreased by 18% primarily due to the translation impact of the weaker Pound Sterling versus the US dollar, as 3% lower shipment volumes were offset by higher average prices. Year-to-date, sales increased by $190 million or 17%. In North America, sales increased by 30% due to higher OSB prices and 6% higher shipment volumes. In Europe, sales decreased by


Some of the statements included in this MD&A constitute forward-looking statements that are based on various assumptions and are subject to various risks. See the cautionary statement contained in the Forward-Looking Statements section.


6


10% due to the translation impact of the weaker Pound Sterling versus the US dollar partially offset by 1% higher shipment volumes.

Markets

In North America, demand from US housing continues to improve. Year-to-date, US housing starts were up 4% versus the same period in 2015. Single-family starts (which use approximately three times more OSB than multi-family) increased by 9% and single-family permits were 8% higher. The seasonally-adjusted annualized rate was 1.05 million in September with permits at 1.23 million. The consensus forecast from US housing economists stands at approximately 1.20 million starts in 2016, which suggests an 8% improvement over last year. Despite the significant rebound in new home construction since the low of 0.55 million in 2009, US housing starts remain below the long-term annual average of 1.5 million.

North American benchmark OSB prices increased significantly in the third quarter of 2016 versus both the previous quarter and the same quarter last year as new home construction activity and OSB demand continued to improve. OSB prices continued to rise through July before leveling out in August and September. The North Central benchmark price averaged $301 per Msf (7/16-inch basis) for the quarter, and the spread between North Central and the South East and Western Canadian regions (where 65% of Norbord’s North American capacity is located) increased to approximately $40 (from approximately $20 in the previous quarter) on seasonal demand variations between regions. The table below summarizes benchmark OSB prices by region for the relevant quarters:


North American Region

   % of Norbord’s estimated
annual operating capacity(1)
    Q3 2016
($/Msf-7/16”)
     Q2 2016
($/Msf-7/16”)
     Q3 2015
($/Msf-7/16”)
 

North Central

     16   $ 301       $ 264       $ 204   

South East

     33     256         245         176   

Western Canada

     32     265         242         158   


(1)  Excludes Val-d’Or, Quebec and Huguley, Alabama mills currently curtailed which represents 12% of estimated annual capacity.

In Europe, panel demand remains strong in the Company’s core UK and German markets but reported prices in US dollar terms were impacted by the significant devaluation of the Pound Sterling following the “Brexit” referendum. In local currency terms, quarter-over-quarter, average prices for OSB, particleboard and MDF were modestly higher in the UK while continental OSB prices were modestly lower. Year-over-year was the opposite, with average panel prices modestly lower in the UK and OSB prices modestly higher on the continent.

Historically, the UK has been a net importer of panel products and Norbord is the largest domestic producer. A weaker Pound Sterling relative to the Euro is advantageous to Norbord’s primarily UK-based operations as it improves sales opportunities within the UK and supports Norbord’s export program into the continent. The Pound Sterling averaged 1.18 during the third quarter of 2016, compared to an average of 1.13 in the previous quarter and 1.40 in the same quarter last year.

Operating Results


Adjusted EBITDA (US $ millions)

   Q3
2016
    Q2
2016
    Q3
2015
    9 mos
2016
    9 mos
2015
 

North America

   $ 106      $ 85      $ 22      $ 244      $ 44   

Europe

     10        11        11        31        28   

Unallocated

     (2     (2     (3     (6     (7


Total

   $ 114      $ 94      $ 30      $ 269      $ 65   

Norbord generated Adjusted EBITDA of $114 million in the third quarter of 2016, compared to $94 million in the second quarter of 2016 and $30 million in the third quarter of 2015. Adjusted EBITDA was $269 million


Some of the statements included in this MD&A constitute forward-looking statements that are based on various assumptions and are subject to various risks. See the cautionary statement contained in the Forward-Looking Statements section.


7


year-to-date compared to $65 million in the same period of 2015. The higher Adjusted EBITDA versus all comparative periods was primarily due to significantly higher North American OSB prices.

Adjusted EBITDA Variance

The components of the Adjusted EBITDA change are summarized in the variance table below:


(US $ millions)

   Q3 2016
vs.
Q2 2016
     Q3 2016
vs.
Q3 2015
     9 mos 2016
vs.
9 mos 2015
 

Adjusted EBITDA – current period

   $ 114       $ 114       $ 269   

Adjusted EBITDA – comparative period

     94         30         65   


Variance

     20         84         204   


Mill nets(1)

     23         87         169   

Volume(2)

     (5      (1      17   

Key input prices(3)

     (3      5         19   

Key input usage(3)

     —           1         10   

Mill profit share and bonus

     —           (3      (7

Other operating costs and foreign exchange(4)

     5         (5      (4


Total

   $ 20       $ 84       $ 204   


(1)  The mill nets variance represents the estimated impact of change in realized pricing across all products. Mill nets are calculated as sales (net of outbound freight costs) divided by shipment volume.
(2)  The volume variance represents the impact of shipment volume changes across all products.
(3)  The key inputs include fibre, resin, wax and energy.
(4)  The other operating costs and foreign exchange category covers all remaining variances including labour and benefits, and maintenance.

North America

Norbord’s North American operations generated $106 million in Adjusted EBITDA in the third quarter of 2016 versus $85 million in the second quarter of 2016 and $22 million in the third quarter of 2015. Year-to-date, North American operations generated $244 million versus $44 million in the same period last year. Quarter-over-quarter, the increase in Adjusted EBITDA of $21 million is primarily due to higher OSB prices partially offset by lower shipment volumes, higher supplies and maintenance costs and higher resin and energy prices. Year-over-year, the increase in Adjusted EBITDA of $84 million is primarily due to higher OSB prices, lower resin prices and improved raw material usages which more than offset higher supplies and maintenance costs and higher profit share costs attributed to higher earnings. Year-to-date, the increase in Adjusted EBITDA of $200 million is primarily due to higher OSB prices as well as higher shipment volumes, lower resin and energy prices, improved raw material usages and the foreign exchange benefit of a weaker Canadian dollar with a partial offset from higher supplies and maintenance costs and higher profit share costs attributed to higher earnings.

Norbord’s North American OSB cash production costs per unit (excluding mill profit share) increased by 2% versus the second quarter of 2016 and 1% versus the third quarter of 2015 but decreased 3% year-to-date. Quarter-over-quarter, unit costs increased as a result of higher supplies and maintenance costs, lower volume and higher resin and energy prices. Year-over-year, the higher unit cost was primarily driven by higher supplies and maintenance costs partially offset by lower resin prices and improved raw material usages. Year-to-date, unit costs were lower as a result of higher production volume, lower resin and energy prices, improved raw material usages and the foreign exchange benefit of a weaker Canadian dollar, partially offset by higher supplies and maintenance costs.

Production has remained indefinitely suspended at the Huguley, Alabama mill since the first quarter of 2009, and at the Val-d’Or, Quebec mill since the third quarter of 2012. Norbord does not currently expect to restart its curtailed mill in Val-d’Or, Quebec in 2016, but will continue to monitor market conditions. As previously announced, Norbord continues to rebuild the press line at the curtailed Huguley, Alabama mill to prepare it for future restart. The Company has not set a restart date and will only do so when it is sufficiently clear that


Some of the statements included in this MD&A constitute forward-looking statements that are based on various assumptions and are subject to various risks. See the cautionary statement contained in the Forward-Looking Statements section.


8


customers require more product. These two mills represent 12% of Norbord’s annual estimated capacity in North America.

Excluding the indefinitely curtailed mills (Huguley, Alabama and Val-d’Or, Quebec), Norbord’s operating mills produced at 95% of their stated capacity in the third quarter of 2016 compared to 96% in the second quarter of 2016 and 92% in the third quarter of 2015. During the quarter, one of Norbord’s North American mills achieved a quarterly production record. Quarter-over-quarter, capacity utilization was in line due to the loss of approximately three weeks of production in the second quarter due to the High Level fire and lower productivity in the third quarter. Year-over-year, capacity utilization increased due primarily to fewer maintenance shutdown days and production curtailments.

Europe

Norbord’s European operations generated $10 million in Adjusted EBITDA in the third quarter of 2016, down from $11 million in both the second quarter of 2016 and the third quarter of 2015. Year-to-date, European operations generated $31 million in Adjusted EBITDA versus $28 million in 2015. Quarter-over-quarter, Adjusted EBITDA decreased by $1 million as a result of the translation impact of a weaker Pound Sterling, with lower shipment volumes and higher resin and energy prices offset by higher average panel prices. Year-over-year, Adjusted EBITDA decreased by $1 million due to the translation impact of a weaker Pound Sterling with lower shipment volumes offset by the lower resin and energy prices. Year-to-date, Adjusted EBITDA increased by $3 million despite the negative translation impact of a weaker Pound Sterling as lower resin and energy prices and improved raw material usages were only partially offset by lower panel prices.

The European mills produced at 99% of stated capacity in the quarter compared to 104% in the second quarter of 2016 and 99% in the third quarter of 2015. During the quarter, two of Norbord’s European mills achieved a quarterly production record. Quarter-over-quarter, capacity utilization decreased due to lost production days following a fatality at the Cowie, Scotland mill. Year-over-year, capacity utilization was in line as improved productivity was offset by the lost production days.

Margin Improvement Program (MIP)

Margin improvement is a key operating focus for the Company. The Company realized MIP gains, measured relative to 2015 at constant prices and exchange rates, of $10 million in the first nine months of 2016. Contributions to MIP included improved productivity and raw material usage reduction initiatives. Merger synergies and returns on the Company’s recent capital investments (such as fines screening technology) also contributed to the MIP gains.

FINANCE COSTS, COSTS ON AINSWORTH NOTES, DEPRECIATION AND AMORTIZATION, AND INCOME TAX


(US $ millions)

   Q3
2016
    Q2
2016
    Q3
2015
    9 mos
2016
    9 mos
2015
 

Finance costs

   $ (13   $ (13   $ (14   $ (39   $ (41

Foreign exchange loss on Ainsworth Notes

     —          —          —          —          (28

Gain on derivative financial instrument on Ainsworth Notes

     —          —          —          —          4   

Costs on early extinguishment of Ainsworth Notes

     —          —          —          —          (25

Depreciation and amortization

     (23     (24     (22     (68     (65

Income tax (expense) recovery

     (19     (10     (3     (32     33   


Some of the statements included in this MD&A constitute forward-looking statements that are based on various assumptions and are subject to various risks. See the cautionary statement contained in the Forward-Looking Statements section.


9


Finance Costs

Finance costs include interest expense on long-term debt and program fees on the accounts receivable securitization, and are consistent across all comparative periods.

Foreign Exchange Loss on Ainsworth Notes

The Ainsworth Notes were denominated in US dollars and Ainsworth’s functional currency was Canadian dollars prior to the Merger. As a result, upon revaluation to Canadian dollars, Ainsworth recorded foreign exchange losses due to the strengthening of the US dollar. In the second quarter of 2015, these notes were redeemed prior to maturity.

Gain on Derivative Financial Instrument and Costs on Early Extinguishment of Ainsworth Notes

The Ainsworth Notes contained an embedded call option and this derivative was recorded initially at fair value with subsequent revaluation gains and losses recorded in earnings. This derivative was extinguished when the Ainsworth Notes were redeemed prior to maturity.

Depreciation and Amortization

The Company uses the units-of-production method to depreciate its production equipment and fluctuations in depreciation expense reflect relative changes in production levels by mill. Amortization expense is in line with the prior year.

Income Tax

A tax expense of $19 million was recorded on pre-tax income of $74 million in the third quarter of 2016. Year-to-date, a tax expense of $32 million was recorded on pre-tax income of $154 million. The effective tax rate differs from the statutory rate principally due to rate differences on foreign activities, fluctuations in relative currency values and the recognition of certain income tax recoveries.

LIQUIDITY AND CAPITAL RESOURCES


(US $ millions, except per share information, unless otherwise noted)

   Q3
2016
    Q2
2016
    Q3
2015
    9 mos
2016
     9 mos
2015
 

Cash provided by (used for) operating activities

   $ 97      $ 83      $ 23      $ 183       $ (32

Cash provided by (used for) operating activities per share

     1.13        0.97        0.27        2.14         (0.38


Operating working capital

     156        163        145        

Total working capital

     229        174        147        

Investment in property, plant and equipment & intangible assets

     29        23        15        63         43   

Net debt to capitalization, market basis

     29     31     32     

Net debt to capitalization, book basis

     45     48     51     

At period-end, the Company had unutilized liquidity of $420 million, comprising $74 million in cash, $221 million in revolving bank lines and $125 million undrawn under its accounts receivable securitization program, which the Company believes is sufficient to fund expected short-term cash requirements.

Senior Secured Notes Due 2017

The Company’s $200 million senior secured notes due February 2017 bear an interest rate that varies with the Company’s credit ratings. The interest rate has been 7.70% since August 15, 2013. The Company intends to permanently repay these notes at maturity using cash on hand, cash generated from operations and if necessary, by drawing upon the accounts receivable securitization program.

Senior Secured Notes Due 2020

The Company’s $240 million senior secured notes due December 2020 bear an interest rate of 5.375%.


Some of the statements included in this MD&A constitute forward-looking statements that are based on various assumptions and are subject to various risks. See the cautionary statement contained in the Forward-Looking Statements section.


10


Senior Secured Notes Due 2023

The Company’s $315 million senior secured notes due April 2023 bear an interest rate of 6.25%.

Revolving Bank Lines

The Company has an aggregate commitment of $245 million under committed revolving bank lines which bears interest at money market rates plus a margin that varies with the Company’s credit rating. During the year, the Company amended these bank lines to reset the tangible net worth covenant to $500 million and extend the maturity date to May 2019. The bank lines are secured by a first lien on the Company’s North American OSB inventory and property, plant and equipment. This lien is shared pari passu with the holders of the 2017, 2020 and 2023 senior secured notes.

The bank lines contain two quarterly financial covenants: minimum tangible net worth of $500 million and maximum net debt to capitalization, book basis, of 65%. For the purposes of the tangible net worth calculation, the following adjustments have been made as at period-end:


    the IFRS transitional adjustments to shareholders’ equity of $21 million at January 1, 2011 are added back;


    changes to other comprehensive income subsequent to January 1, 2011 is excluded;


    intangible assets (other than timber rights and software acquisition and development costs) are excluded; and


    the impact of the change in functional currency of Ainsworth on shareholders’ equity of $155 million is excluded.

Net debt for financial covenant purposes includes total debt, principal amount excluding any drawings on the accounts receivable securitization program, less cash, plus letters of credit issued and any bank advances. At period-end, the Company’s tangible net worth was $848 million and net debt for financial covenant purposes was $705 million. Net debt to capitalization, book basis, was 45%. The Company was in compliance with the financial covenants at period-end.

Norbord’s capital structure at period-end consisted of the following:


(US $ millions)

   Sep 24, 2016     Dec 31, 2015  

Long-term debt, principal value

   $ 755      $ 755   

Add: Other long-term debt

     —          30   

Less: Cash

     (74     (9


Net debt

     681        776   

Less: Other long-term debt

     —          (30

Add: Letters of credit

     24        5   


Net debt for financial covenant purposes

     705        751   


Shareholders’ equity

     593        519   

Less: Intangible assets(1)

     —          (18

Add: Other comprehensive income movement(2)

     79        47   

Add: Impact of Ainsworth changing functional currencies

     155        155   

Add: IFRS transitional adjustments

     21        21   


Tangible net worth for financial covenant purposes

     848        724   


Total capitalization

   $ 1,553      $ 1,475   


Net debt to capitalization, market basis

     29     32

Net debt to capitalization, book basis

     45     51


(1)  Timber rights and software development costs were excluded from the definition of intangible assets when the bank lines were renewed in June 2016.
(2)  Cumulative subsequent to January 1, 2011.


Some of the statements included in this MD&A constitute forward-looking statements that are based on various assumptions and are subject to various risks. See the cautionary statement contained in the Forward-Looking Statements section.


11


Accounts Receivable Securitization

The Company has a $125 million multi-currency accounts receivable securitization program with a third-party trust sponsored by a highly rated Canadian financial institution. The program is revolving and has an evergreen commitment subject to termination on 12 months’ notice. Under the program, Norbord has transferred substantially all of its present and future trade accounts receivable to the trust on a fully serviced basis for proceeds consisting of cash and deferred purchase price. However, the asset de-recognition criteria under IFRS have not been met and the transferred accounts receivable remain recorded as an asset.

At period-end, Norbord had transferred but continued to recognize $142 million in trade accounts receivable and the Company did not have any drawings relating to this program. The level of trade accounts receivable transferred under the program fluctuates with the level of shipment volumes, product prices and foreign exchange rates. The amount Norbord chooses to draw under the program at any point in time depends on the level of accounts receivable transferred, timing of cash settlements and fluctuates with the Company’s cash requirements. Any drawings are presented as other long-term debt on the balance sheet and are excluded from the net debt to capitalization calculation for financial covenant purposes. The utilization charge, which is based on money market rates plus a margin, and other program fees are recorded as finance costs. Year-to-date, the utilization charge on drawings ranged from 1.5% to 2.1%.

The securitization program contains no financial covenants. However, the program is subject to minimum credit rating requirements. The Company must maintain a long-term issuer credit rating of at least single B(mid) or the equivalent. As at October 27, 2016, Norbord’s ratings were BB (DBRS), BB- (Standard & Poor’s Ratings Services) and Ba2 (Moody’s Investors Service).

Other Liquidity and Capital Resources

Operating working capital, consisting of accounts receivable, inventory and prepaids less accounts payable and accrued liabilities, was $156 million at period-end compared to $163 million at the end of the prior quarter and $145 million at September 26, 2015. The Company aims to continuously minimize the amount of capital held as operating working capital and takes actions to manage it at minimal levels.

Quarter-over-quarter, operating working capital decreased by $7 million primarily due to higher accounts payable and accrued liabilities and lower accounts receivable partially offset by higher prepaids. Higher accounts payable and accrued liabilities is due to the timing of payments, higher interest accrual due to the timing of coupon payments on the senior secured notes and higher mill profit share accruals. Lower accounts receivable is attributable to partial collections on the insurance receivable related to the High Level fire and the timing of commodity tax refunds. Higher prepaids is primarily due to payment of annual insurance premiums during the quarter.

Year-over-year, operating working capital increased by $11 million primarily due to higher accounts receivable and higher inventory. Higher accounts receivable is mainly attributable to higher North American OSB prices and the remaining insurance receivable on the High Level fire. Higher inventory is a result of higher operating and maintenance supplies due to the timing of maintenance shuts.

Total working capital, which includes operating working capital plus cash and income tax receivable less bank advances and tax payable, was $229 million as at the end of the third quarter of 2016, compared to $174 million at June 25, 2016 and $147 million at September 26, 2015. Quarter-over-quarter, the increase is primarily attributed to higher cash partially offset by the lower operating working capital. Year-over-year, the increase is primarily attributed to higher cash and higher operating working capital.

Operating activities generated $97 million of cash or $1.13 per share in the third quarter of 2016, compared to $83 million or $0.97 per share generated in the prior quarter and $23 million or $0.27 per share generated in the third quarter of 2015. Year-to-date, operating activities provided $183 million of cash or $2.14 per share


Some of the statements included in this MD&A constitute forward-looking statements that are based on various assumptions and are subject to various risks. See the cautionary statement contained in the Forward-Looking Statements section.


12


compared to $32 million or $0.38 per share consumed in the prior period. The higher generation of cash versus the comparative periods is mainly attributed to the higher Adjusted EBITDA in the current period.

INVESTMENTS AND DIVESTITURES

Investments

Investment in property, plant and equipment and intangible assets was $29 million in the third quarter of 2016 compared to $23 million in the second quarter and $15 million in the third quarter of 2015. The increase versus the prior quarters is primarily attributable to the Inverness project (described below).

Norbord’s 2016 investment in property, plant and equipment and intangible assets is expected to be $75 million (excluding the Inverness project, described below). The investment plan for the current year includes further process debottlenecking and manufacturing cost reduction projects under the Company’s multi-year capital reinvestment strategy. These investments will be funded with cash on hand, cash generated from operations and, if necessary, drawings under the Company’s accounts receivable securitization program or committed revolving bank lines.

Inverness Project

In January 2016, the Board of Directors approved the investment of $135 million over the next two years to modernize and expand the Company’s Inverness, Scotland OSB mill. On-site construction work commenced in the second quarter of 2016 and work was completed to move the unused second press from the Grande Prairie, Alberta mill during the current quarter. Norbord expects the new line to start up in the second half of 2017, with no disruption to existing production capacity in the interim. Capital spending is expected to be $45 million in 2016, of which $19 million has been incurred year-to-date. The investment will be funded with cash on hand, cash generated from operations and, if necessary, drawings under the Company’s accounts receivable securitization program or committed revolving bank lines.

CAPITALIZATION

At October 27, 2016, there were 85.6 million common shares outstanding. In addition, 2.1 million stock options were outstanding, of which 65% were fully vested.

Dividends

Norbord’s variable dividend policy targets the payment to shareholders of a portion of free cash flow based upon the Company’s financial position, results of operations, cash flow, capital requirements and restrictions under the Company’s revolving bank lines, as well as the market outlook for the Company’s principal products and broader market and economic conditions, among other factors. Under this policy, the Board of Directors (the Board) has declared the following dividends and has adjusted the level twice to maintain flexibility in the Company’s capital structure as well as to fund growth and other attractive capital investment opportunities:


(in CAD $)

   Quarterly dividend declared
per common share
 

Q2-2013 to Q4-2014

   $ 0.60   

Q1-2015 & Q2-2015

     0.25   

Q3-2015 to Q3-2016

     0.10   

The Board retains the discretion to amend the Company’s dividend policy in any manner and at any time as it may deem necessary or appropriate in the future. For these reasons, as well as others, the Board in its sole discretion can decide to increase, maintain, decrease, suspend or discontinue the payment of cash dividends in the future.


Some of the statements included in this MD&A constitute forward-looking statements that are based on various assumptions and are subject to various risks. See the cautionary statement contained in the Forward-Looking Statements section.


13


FINANCIAL INSTRUMENTS

The Company utilizes various derivative financial instruments to manage risk and make better use of capital. The fair values of these instruments are reflected on the Company’s balance sheet and are disclosed in note 12 to the condensed consolidated interim financial statements.

TRANSACTIONS WITH RELATED PARTIES

In the normal course of operations, the Company enters into various transactions with related parties which have been measured at the exchange amounts and are recognized in the consolidated financial statements. The following transactions have occurred between the Company and its related parties during the quarter.

The Company periodically engages the services of Brookfield for various financial, real estate and other business advisory services. Year-to-date, the fees for services rendered were less than $1 million (2015 – less than $1 million).

Sales to Asian markets are handled by Interex Forest Products Ltd. (Interex), a cooperative sales company over which Norbord, as a 25% shareholder, has significant influence. Year-to-date, net sales of $40 million (2015 – $36 million) were made to Interex. At period-end, $4 million (December 31, 2015 – $3 million) due from Interex was included in Accounts receivable.

SELECTED QUARTERLY INFORMATION


     2016     2015     2014  

(US $ millions, except per share information, unless otherwise noted)

   Q3     Q2     Q1     Q4     Q3     Q2     Q1     Q4  

KEY PERFORMANCE METRICS


Return on capital employed (ROCE)(1)

     32     26     18     15     8     5     4     4

Return on equity (ROE)(1)

     41     31     16     11     (3 )%      (9 )%      (10 )%      (8 )% 

Cash provided by (used for) operating activities

     97        83        3        56        23        (3     (52     9   

Cash provided by (used for) operating activities per share(1)

     1.13        0.97        0.04        0.66        0.27        (0.04     (0.61     0.11   


SALES AND EARNINGS


Sales

     453        447        384        415        378        365        351        372   

Operating income (loss)

     87        67        39        33        8        (4     (6     (9

Adjusted EBITDA(1)

     114        94        61        57        30        19        16        14   

Earnings (loss)

     55        44        23        13        (9     (23     (37     (26

Adjusted earnings (loss)(1)

     58        42        20        16        (4     (12     (14     (16

PER COMMON SHARE EARNINGS


Earnings (loss), basic and diluted

     0.64        0.51        0.27        0.15        (0.11     (0.27     (0.43     (0.30

Adjusted earnings (loss), basic(1,2)

     0.68        0.49        0.23        0.19        (0.05     (0.14     (0.16     (0.18

Dividends declared(3)

     0.10        0.10        0.10        0.10        0.10        0.25        0.25        0.60   


KEY STATISTICS


Shipments (MMsf–3/8”)


North America

     1,463        1,487        1,337        1,459        1,409        1,375        1,254        1,312   

Europe

     438        459        435        425        453        438        424        401   

Indicative Average OSB Price


North Central ($/Msf–7/16”)

     301        264        226        242        204        193        193        216   

South East ($/Msf–7/16”)

     256        245        215        221        176        174        175        181   

Western Canada ($/Msf–7/16”)

     265        242        191        204        158        152        159        172   

Europe (€/m3)(4)

     235        237        230        226        220        218        232        248   


(1)  Non-IFRS measure; see Non-IFRS Financial Measures section.
(2)  Basic and diluted Adjusted earnings (loss) per share are the same except diluted Adjusted earnings per share for Q3 2016 is $0.67.
(3)  Dividends declared per share stated in Canadian dollars.
(4)  European indicative average OSB price represents the gross delivered price to the largest continental market.


Some of the statements included in this MD&A constitute forward-looking statements that are based on various assumptions and are subject to various risks. See the cautionary statement contained in the Forward-Looking Statements section.


14


Quarterly results are impacted by seasonal factors such as weather and building activity. Market demand varies seasonally, as homebuilding activity and repair and remodelling work – the principal end uses of Norbord’s products – are generally stronger in the spring and summer months. Adverse weather can also limit access to logging areas, which can affect the supply of fibre to Norbord’s operations. OSB shipment volumes and prices are affected by these factors as well as by global supply and demand conditions.

Operating working capital is typically built up in the first quarter of the year due primarily to log inventory purchases in the northern regions of North America and Europe. This inventory is generally consumed in the spring and summer months.

The demand for and the price of OSB in North America are significant variables affecting the comparability of Norbord’s results over the past eight quarters. Fluctuations in earnings during that time mirror fluctuations in the demand for and the price of OSB in North America. The Company estimates that the annualized impact on Adjusted EBITDA of a $10 per Msf (7/16-inch basis) change in the North American OSB price, when all operations (including the indefinitely curtailed Huguley, Alabama and Val-d’Or, Quebec mills) are running at full capacity, is approximately $58 million. Regional pricing variations, particularly in the Southern US and Western Canada, make the North Central benchmark price a useful, albeit imperfect, proxy for overall North American OSB pricing. Similarly in Europe, regional pricing variations, relative foreign exchange rates and product mix also make the European OSB indicative price a useful, albeit imperfect, proxy for overall European OSB pricing. Further, premiums obtained on value-added products, the pricing lag effect of maintaining an order file, and volume and trade discounts cause realized prices to differ from the benchmarks for both North America and Europe.

Global commodity prices affect the prices of key raw material inputs, primarily wood fibre, resin, wax and energy which had been increasing as the broader US economic recovery gained traction. However, prices for resin, a petroleum-based product, started trending down along with oil prices in the fourth quarter of 2014, reversing a decade-long upward trend. In the current quarter, the downward trend halted and there was a slight increase in resin prices. The Company expects to continue to benefit from lower resin prices as long as global oil prices remain under pressure.

Norbord has exposure to the Canadian dollar related to certain Canadian dollar denominated manufacturing costs as approximately 37% of its panel production capacity is located in Canada. The Company estimates that the favourable impact of a one-cent (US) decrease in the value of the Canadian dollar would positively impact annual Adjusted EBITDA by approximately $3 million when all six of Norbord’s Canadian OSB mills operate at capacity.

Items not related to ongoing business operations that had a significant impact on quarterly results include:

Merger Transaction CostsIncluded in the second quarter of 2015 is $1 million ($0.01 per basic and diluted share) of transaction costs related to the Merger. Included in the first quarter of 2015 is $7 million ($0.08 per basic and diluted share) of transaction costs related to the Merger. Included in the fourth quarter of 2014 is $9 million ($0.11 per basic and diluted share) of transaction costs related to the Merger.

Severance Costs Related to MergerIncluded in the second quarter of 2015 is $2 million ($0.02 per basic and diluted share) of severance costs incurred to achieve synergies from the Merger.

Other Costs Incurred to Achieve Merger Synergies – Included in the third quarter of 2016 is $4 million ($0.05 per basic and diluted share) of other costs incurred to achieve synergies from the Merger, including consulting and professional fees, and costs expensed to dismantle certain idle equipment at the Grande Prairie, Alberta mill which will be put to use in Inverness, Scotland. Included in the second quarter of 2016 is $2 million ($0.02 per basic and diluted share) of similar costs. Included in the first quarter of 2016 is $1 million ($0.01 per basic and diluted share) of other costs incurred to achieve synergies from the Merger including consulting and professional fees. Included in the fourth quarter of 2015 is $3 million ($0.03 per


Some of the statements included in this MD&A constitute forward-looking statements that are based on various assumptions and are subject to various risks. See the cautionary statement contained in the Forward-Looking Statements section.


15


basic and diluted share) and in the second quarter of 2015 is $1 million ($0.01 per basic and diluted share) of similar costs. Included in the first quarter of 2015 is $1 million ($0.01 per basic and diluted share) of costs associated with the immediate vesting of certain Ainsworth stock options upon closing of the Merger.

Costs on Early Debt ExtinguishmentIncluded in the second quarter of 2015 is a $13 million ($0.15 per basic and diluted share) premium paid on the early redemption of the Ainsworth Notes, an $11 million ($0.13 per basic and diluted share) write-off of the related financial instrument on the call options embedded in the Ainsworth Notes and a related $1 million ($0.01 per basic and diluted share) write-off of net unamortized debt issue costs.

Income Taxes – Included in the fourth quarter of 2014 is a $7 million ($0.08 per basic and diluted share) income tax recovery comprised of: (i) the recognition and utilization of certain tax assets that offset taxes previously expensed; and (ii) the recognition of previously unrecognized deferred tax assets as a result of reassessments of probability of future recovery of these assets.

Foreign Exchange Loss on Ainsworth Notes – Included in the first quarter of 2015 is a $28 million ($0.33 per basic and diluted share) foreign exchange loss due to the revaluation of the Ainsworth Notes to Canadian dollars since the Ainsworth Notes were denominated in US dollars and Ainsworth’s functional currency was Canadian dollars prior to the Merger. Included in the fourth quarter of 2014 is an $11 million ($0.13 per basic and diluted share) foreign exchange revaluation loss.

Gain (Loss) on Derivative Financial Instrument on Ainsworth NotesIncluded in the first quarter of 2015 is a $4 million ($0.05 per basic and diluted share) revaluation gain on the embedded call option contained in the Ainsworth Notes. This derivative was extinguished when the Ainsworth Notes were redeemed early. Included in the fourth quarter of 2014 is a $2 million ($0.02 per basic and diluted share) revaluation loss.

FUTURE CHANGES IN ACCOUNTING POLICIES

In addition to the future changes in accounting policies discussed in the Company’s 2015 annual MD&A, below are new accounting policies issued in 2016.


(i) Income Taxes

In January 2016, the IASB issued amendments to clarify the requirements for recognizing deferred tax assets on unrealized losses. The amendments clarify the accounting for deferred tax where an asset is measured at fair value and that fair value is below the asset’s tax base. They also clarify certain other aspects of accounting for deferred tax assets. The amendments are effective for the year ending January 1, 2017 and the Company does not expect these amendments to have a significant impact on its financial statements.


(ii) Cash Flow Statement Disclosure

In January 2016, the IASB issued an amendment to IAS 7, Statement of Cash Flows, introducing additional disclosure requirements for liabilities arising from financing activities. The amendments are effective for the year ending January 1, 2017 and the Company does not expect this amendment to have a significant impact on its financial statements.


(iii) Share-Based Payment

In June 2016, the IASB issued an amendment to IFRS 2, Share-based Payment, clarifying the accounting for certain types of share-based payment transactions. The amendments provide requirements on accounting for the effects of vesting and non-vesting conditions of cash-settled share-based payments, withholding tax obligations for share-based payments with a net settlement feature, and when a modification to the terms of a share-based payment changes the classification of the transaction from cash-settled to equity-settled. The


Some of the statements included in this MD&A constitute forward-looking statements that are based on various assumptions and are subject to various risks. See the cautionary statement contained in the Forward-Looking Statements section.


16


amendments are effective for the year beginning on or after January 1, 2018 and the Company is currently assessing the impact of this amendment on its financial statements.

SIGNIFICANT ACCOUNTING POLICIES, JUDGEMENTS AND ESTIMATES

Management has selected appropriate accounting policies and made certain estimates and judgements that affect the reported amounts and other disclosures in the financial statements. These accounting policies, estimates and judgements are described in the 2015 audited annual financial statements of the Company.

INTERNAL CONTROLS OVER FINANCIAL REPORTING AND DISCLOSURE CONTROLS AND PROCEDURES

There were no changes in the Company’s internal controls over financial reporting and disclosure controls and procedures during the three months ended September 24, 2016 that have materially affected, or are reasonably likely to materially affect, its internal controls over financial reporting.

NON-IFRS FINANCIAL MEASURES

The following non-IFRS financial measures have been used in this MD&A. Non-IFRS financial measures do not have any standardized meaning prescribed by IFRS and are therefore unlikely to be comparable to similar measures presented by other companies. Each non-IFRS financial measure is defined below. Where appropriate, a quantitative reconciliation of the non-IFRS financial measure to the most directly comparable IFRS measure is provided.

Adjusted earnings (loss) is defined as earnings (loss) determined in accordance with IFRS before unusual or non-recurring items and using a normalized income tax rate. Non-recurring items include costs related to the Merger, foreign exchange on the Ainsworth Notes and fair value movements on the financial instrument associated with the Ainsworth Notes and costs on early debt extinguishment. The actual income tax (expense) recovery is (added back) deducted and a tax (expense) recovery calculated at the Canadian combined federal and provincial statutory rate is (deducted) added. Adjusted earnings (loss) per share is Adjusted earnings (loss) divided by the weighted average number of common shares outstanding.

The following table reconciles Adjusted earnings (loss) to the most directly comparable IFRS measure:


(US $ millions)

   Q3
2016
    Q2
2016
    Q3
2015
    9 mos
2016
    9 mos
2015
 

Earnings (loss)

   $ 55      $ 44      $ (9   $ 122      $ (69

Add: Merger transaction costs

     —          —          —          —          8   

Add: Severance costs related to Merger

     —          —          —          —          2   

Add: Other costs incurred to achieve Merger synergies

     4        2        —          7        2   

Add: Costs related to High Level fire

     —          1        —          1        —     

Add: Costs on early debt extinguishment

     —          —          —          —          25   

Add: Foreign exchange loss on Ainsworth Notes

     —          —          —          —          28   

Less: Gain on derivative financial instrument on Ainsworth Notes

     —          —          —          —          (4

Add: Reported income tax expense (recovery)

     19        10        3        32        (33


Adjusted pre-tax earnings (loss)

     78        57        (6     162        (41

Less: Income tax (expense) recovery at statutory rate(1)

     (20     (15     2        (42     11   


Adjusted earnings (loss)

   $ 58      $ 42      $ (4   $ 120      $ (30


(1)  Represents Canadian combined federal and provincial statutory rate.

Adjusted EBITDA is defined as earnings (loss) determined in accordance with IFRS before finance costs, income taxes, depreciation and amortization, and other unusual or non-recurring items. Non-recurring items include costs related to the Merger, foreign exchange on the Ainsworth Notes and fair value movements on the financial instrument associated with the Ainsworth Notes and costs on early debt extinguishment. As Norbord operates in a cyclical commodity business, Norbord interprets Adjusted EBITDA over the business


Some of the statements included in this MD&A constitute forward-looking statements that are based on various assumptions and are subject to various risks. See the cautionary statement contained in the Forward-Looking Statements section.


17


cycle as a useful indicator of the Company’s ability to incur and service debt and meet capital expenditure requirements. In addition, Norbord views Adjusted EBITDA as a measure of gross profit and interprets Adjusted EBITDA trends as indicators of relative operating performance.

The following table reconciles Adjusted EBITDA to the most directly comparable IFRS measure:


(US $ millions)

   Q3
2016
     Q2
2016
     Q3
2015
    9 mos
2016
     9 mos
2015
 

Earnings (loss)

   $ 55       $ 44       $ (9   $ 122       $ (69

Add: Finance costs

     13         13         14        39         41   

Add: Depreciation and amortization

     23         24         22        68         65   

Add: Income tax expense (recovery)

     19         10         3        32         (33

Add: Merger transaction costs

     —           —           —          —           8   

Add: Costs related to High Level fire

     —           1         —          1         —     

Add: Severance costs related to Merger

     —           —           —          —           2   

Add: Other costs incurred to achieve Merger synergies

     4         2         —          7         2   

Add: Costs on early debt extinguishment

     —           —           —          —           25   

Add: Foreign exchange loss on Ainsworth Notes

     —           —           —          —           28   

Less: Gain on derivative financial instrument on Ainsworth Notes

     —           —           —          —           (4


Adjusted EBITDA

   $ 114       $ 94       $ 30      $ 269       $ 65   


Operating working capital is defined as accounts receivable plus inventory, prepaids less accounts payable and accrued liabilities. Operating working capital is a measure of the investment in accounts receivable, inventory, prepaids, accounts payable and accrued liabilities required to support operations. The Company aims to minimize its investment in operating working capital; however, the amount will vary with seasonality and sales expansions and contractions.


(US $ millions)

   Sep 24, 2016      Jun 25, 2016      Dec 31, 2015      Sep 26, 2015  

Accounts receivable

   $ 160       $ 166       $ 135       $ 153   

Inventory

     189         188         181         185   

Prepaids

     13         7         10         14   

Accounts payable and accrued liabilities

     (206      (198      (201      (207


Operating working capital

   $ 156       $ 163       $ 125       $ 145   


Total working capital is operating working capital plus cash and tax receivable less bank advances, if any and tax payable.


(US $ millions)

   Sep 24, 2016      Jun 25, 2016      Dec 31, 2015      Sep 26, 2015  

Operating working capital

   $ 156       $ 163       $ 125       $ 145   

Cash

     74         12         9         2   

Tax receivable

     —           1         2         1   

Tax payable

     (1      (2      (2      (1


Total working capital

   $ 229       $ 174       $ 134       $ 147   


Some of the statements included in this MD&A constitute forward-looking statements that are based on various assumptions and are subject to various risks. See the cautionary statement contained in the Forward-Looking Statements section.


18


Capital employed is defined as the sum of property, plant and equipment, intangible assets and operating working capital. Capital employed is a measure of the total investment in a business in terms of property, plant and equipment, intangible assets and operating working capital.


(US $ millions)

   Sep 24, 2016      Jun 25, 2016      Dec 31, 2015      Sep 26, 2015  

Property, plant and equipment

   $ 1,240       $ 1,239       $ 1,260       $ 1,264   

Intangible assets

     21         20         18         13   

Accounts receivable

     160         166         135         153   

Prepaids

     13         7         10         14   

Inventory

     189         188         181         185   

Accounts payable and accrued liabilities

     (206      (198      (201      (207


Capital employed

   $ 1,417       $ 1,422       $ 1,403       $ 1,422   


ROCE (return on capital employed) is Adjusted EBITDA divided by average capital employed. ROCE is a measurement of financial performance, focusing on cash generation and the effective use of capital. As Norbord operates in a cyclical commodity business, it monitors ROCE over the cycle as a useful means of comparing businesses in terms of efficiency of management. Norbord targets top-quartile ROCE among North American forest products companies over the business cycle.

ROE (return on equity) is Adjusted earnings (loss) divided by common shareholders’ equity. ROE is a measure that allows common shareholders to determine how effectively their invested capital is being employed. As Norbord operates in a cyclical commodity business, it looks at ROE over the business cycle and targets top-quartile performance among North American forest products companies.

Cash provided by (used for) operating activities per share is calculated as cash provided by (used for) operating activities as determined under IFRS, divided by the weighted average number of common shares outstanding.

Net debt is the principal value of long-term debt, including the current portion, other long-term debt and bank advances, if any, less cash. Net debt for financial covenant purposes is Net debt excluding other long-term debt and including letters of credit outstanding. Net debt is a useful indicator of a company’s debt position. Net debt comprises:


(US $ millions)

   Sep 24, 2016      Jun 25, 2016      Dec 31, 2015      Sep 26, 2015  

Long-term debt, principal value

   $ 755       $ 755       $ 755       $ 755   

Add: Other long-term debt

     —           —           30         44   

Less: Cash

     (74      (12      (9      (2


Net debt

     681         743         776         797   

Less: Other long-term debt

     —           —           (30      (44

Add: Letters of credit

     24         8         5         5   


Net debt for financial covenant purposes

   $ 705       $ 751       $ 751       $ 758   


Some of the statements included in this MD&A constitute forward-looking statements that are based on various assumptions and are subject to various risks. See the cautionary statement contained in the Forward-Looking Statements section.


19


Tangible net worth consists of shareholders’ equity including certain adjustments. A minimum tangible net worth is one of two financial covenants contained in the Company’s committed bank lines. For financial covenant purposes, effective January 1, 2011, tangible net worth excludes all IFRS transitional adjustments and all movement in cumulative other comprehensive income subsequent to January 1, 2011 (includes those movements related to the translation of Ainsworth in prior periods).


(US $ millions)

   Sep 24, 2016      Jun 25, 2016      Dec 31, 2015      Sep 26, 2015  

Shareholders’ equity

   $ 593       $ 553       $ 519       $ 520   

Less: Intangible assets(1)

     —           —           (18      (13

Add: Other comprehensive income movement(2)

     79         70         47         39   

Add: Impact of Ainsworth changing functional currencies

     155         155         155         155   

Add: IFRS transitional adjustments

     21         21         21         21   


Tangible net worth

   $ 848       $ 799       $ 724       $ 722   


(1)  Timber rights and software development costs were excluded from the definition of intangible assets when the bank lines were renewed in June 2016.
(2)  Cumulative subsequent to January 1, 2011.

Net debt to capitalization, book basis, is net debt for financial covenant purposes divided by the sum of net debt for financial covenant purposes and tangible net worth. Net debt to capitalization on a book basis is a measure of a company’s relative debt position. Norbord interprets this measure as an indicator of the relative strength and flexibility of its balance sheet. In addition, a maximum net debt to capitalization, book basis, is one of two financial covenants contained in the Company’s committed bank lines.

Net debt to capitalization, market basis, is net debt for financial covenant purposes divided by the sum of net debt for financial covenant purposes and market capitalization. Market capitalization is the number of common shares outstanding at period-end multiplied by the trailing 12-month average per share market price. Net debt to capitalization, market basis, is a key measure of a company’s relative debt position and Norbord interprets this measure as an indicator of the relative strength and flexibility of its balance sheet. While the Company considers both book and market basis metrics, it believes the market basis to be superior to the book basis in measuring the true strength and flexibility of its balance sheet.


Some of the statements included in this MD&A constitute forward-looking statements that are based on various assumptions and are subject to various risks. See the cautionary statement contained in the Forward-Looking Statements section.


20


FORWARD-LOOKING STATEMENTS

This document includes forward-looking statements, as defined by applicable securities legislation. Often, but not always, forward-looking statements can be identified by the use of words such as “believes,” “expects,” “targets,” “outlook,” “scheduled,” “estimates,” “forecasts,” “aims,” “predicts,” “plans,” “projects,” “anticipates,” “intends” or variations of such words and phrases or negative versions thereof or statements that certain actions, events or results “may,” “could,” “would,” “should,” “might” or “will” be taken, occur or be achieved. Forward-looking statements involve known and unknown risks, uncertainties and other factors which may cause the actual results, performance or achievements of Norbord to be materially different from any future results, performance or achievements expressed or implied by the forward-looking statements.

Examples of such statements include, but are not limited to, comments with respect to: (1) outlook for the markets for products; (2) expectations regarding future product pricing; (3) outlook for operations; (4) expectations regarding mill capacity; (5) objectives; (6) strategies to achieve those objectives; (7) expected financial results including the expected results of the MIP; (8) sensitivity to changes in product prices, such as the price of OSB; (9) sensitivity to changes in foreign exchange rates; (10) sensitivity to key input prices, such as the price of fibre, resin, wax and energy; (11) expectations regarding compliance with environmental regulations; (12) expectations regarding income tax rates; (13) expectations regarding contingent liabilities and guarantees, including the outcome of pending litigation; (14) expectations regarding the amount, timing and benefits of capital investments; (15) expectations regarding the amount and timing of dividend payments; and (16) historical, forecasted and other forward-looking information published by third parties such as the US Census Bureau and Forest Economic Advisors, LLC (FEA) which we may refer to but have not independently verified; (17) the integration of the Ainsworth operations; and (18) the ability of the combined Company to realize synergies.

Although Norbord believes it has a reasonable basis for making these forward-looking statements, readers are cautioned not to place undue reliance on such forward-looking information. By its nature, forward-looking information involves numerous assumptions, inherent risks and uncertainties, both general and specific, which contribute to the possibility that the predictions, forecasts and other forward-looking statements will not occur. These factors include, but are not limited to: (1) assumptions in connection with the economic and financial conditions in the US, Europe, Canada and globally; (2) risks inherent to product concentration and cyclicality; (3) effects of competition and product pricing pressures; (4) risks inherent to customer dependence; (5) effects of variations in the price and availability of manufacturing inputs, including continued access to fibre resources at competitive prices; (6) availability of rail services and port facilities; (7) various events that could disrupt operations, including natural or catastrophic events and ongoing relations with employees; (8) impact of changes to, or non-compliance with, environmental regulations; (9) impact of any product liability claims in excess of insurance coverage; (10) risks inherent to a capital intensive industry; (11) impact of future outcomes of tax exposures; and (12) effects of currency exposures and exchange rate fluctuations.

The above list of important factors affecting forward-looking information is not exhaustive. Additional factors are noted elsewhere, and reference should be made to the other risks discussed in filings with Canadian and US securities regulatory authorities. Except as required by applicable law, Norbord does not undertake to update any forward-looking statements, whether written or oral, that may be made from time to time by, or on behalf of, the Company, whether as a result of new information, future events or otherwise, or to publicly update or revise the above list of factors affecting this information.


Some of the statements included in this MD&A constitute forward-looking statements that are based on various assumptions and are subject to various risks. See the cautionary statement contained in the Forward-Looking Statements section.


21

EX-99.5 6 d233971dex995.htm EX-99.5 EX-99.5

Exhibit 99.5

FORM 52-109F2

CERTIFICATION OF INTERIM FILINGS

FULL CERTIFICATE

I, Peter C. Wijnbergen, President and Chief Executive Officer of Norbord Inc., certify the following:


1. Review: I have reviewed the interim financial report and interim MD&A (together, the “interim filings”) of Norbord Inc. (the “issuer”) for the interim period ended September 24, 2016.


2. No misrepresentations: Based on my knowledge, having exercised reasonable diligence, the interim filings do not contain any untrue statement of a material fact or omit to state a material fact required to be stated or that is necessary to make a statement not misleading in light of the circumstances under which it was made, with respect to the period covered by the interim filings.


3. Fair presentation: Based on my knowledge, having exercised reasonable diligence, the interim financial report together with the other financial information included in the interim filings fairly present in all material respects the financial condition, financial performance and cash flows of the issuer, as of the date of and for the periods presented in the interim filings.


4. Responsibility: The issuer’s other certifying officer(s) and I are responsible for establishing and maintaining disclosure controls and procedures (DC&P) and internal control over financial reporting (ICFR), as those terms are defined in National Instrument 52-109 Certification of Disclosure in Issuers’ Annual and Interim Filings, for the issuer.


5. Design: Subject to the limitations, if any, described in paragraphs 5.2 and 5.3, the issuer’s other certifying officer(s) and I have, as at the end of the period covered by the interim filings


  (a) designed DC&P, or caused it to be designed under our supervision, to provide reasonable assurance that


  (i) material information relating to the issuer is made known to us by others, particularly during the period in which the interim filings are being prepared; and


  (ii) information required to be disclosed by the issuer in its annual filings, interim filings or other reports filed or submitted by it under securities legislation is recorded, processed, summarized and reported within the time periods specified in securities legislation; and


  (b) designed ICFR, or caused it to be designed under our supervision, to provide reasonable assurance regarding the reliability of financial reporting and the preparation of financial statements for external purposes in accordance with the issuer’s GAAP.


5.1 Control framework: The control framework the issuer’s other certifying officer(s) and I used to design the issuer’s ICFR is the Committee of Sponsoring Organizations of the Treadway Commission (“COSO”) 2013 framework.


5.2 N/A


5.3 N/A


6. Reporting changes in ICFR: The issuer has disclosed in its interim MD&A any change in the issuer’s ICFR that occurred during the period beginning on June 26, 2016 and ended on September 24, 2016, that has materially affected, or is reasonably likely to materially affect, the issuer’s ICFR.


Date:   October 28, 2016
 

(signed) Peter Wijnbergen


Peter C. Wijnbergen

President and Chief Executive Officer


- 2 -

EX-99.6 7 d233971dex996.htm EX-99.6 EX-99.6

Exhibit 99.6

FORM 52-109F2

CERTIFICATION OF INTERIM FILINGS

FULL CERTIFICATE

I, Robin Lampard, Senior Vice President and Chief Financial Officer of Norbord Inc., certify the following:


1. Review: I have reviewed the interim financial report and interim MD&A (together, the “interim filings”) of Norbord Inc. (the “issuer”) for the interim period ended September 24, 2016.


2. No misrepresentations: Based on my knowledge, having exercised reasonable diligence, the interim filings do not contain any untrue statement of a material fact or omit to state a material fact required to be stated or that is necessary to make a statement not misleading in light of the circumstances under which it was made, with respect to the period covered by the interim filings.


3. Fair presentation: Based on my knowledge, having exercised reasonable diligence, the interim financial report together with the other financial information included in the interim filings fairly present in all material respects the financial condition, financial performance and cash flows of the issuer, as of the date of and for the periods presented in the interim filings.


4. Responsibility: The issuer’s other certifying officer(s) and I are responsible for establishing and maintaining disclosure controls and procedures (DC&P) and internal control over financial reporting (ICFR), as those terms are defined in National Instrument 52-109 Certification of Disclosure in Issuers’ Annual and Interim Filings, for the issuer.


5. Design: Subject to the limitations, if any, described in paragraphs 5.2 and 5.3, the issuer’s other certifying officer(s) and I have, as at the end of the period covered by the interim filings


  (a) designed DC&P, or caused it to be designed under our supervision, to provide reasonable assurance that


  (i) material information relating to the issuer is made known to us by others, particularly during the period in which the interim filings are being prepared; and


  (ii) information required to be disclosed by the issuer in its annual filings, interim filings or other reports filed or submitted by it under securities legislation is recorded, processed, summarized and reported within the time periods specified in securities legislation; and


  (b) designed ICFR, or caused it to be designed under our supervision, to provide reasonable assurance regarding the reliability of financial reporting and the preparation of financial statements for external purposes in accordance with the issuer’s GAAP.


5.1 Control framework: The control framework the issuer’s other certifying officer(s) and I used to design the issuer’s ICFR is the Committee of Sponsoring Organizations of the Treadway Commission (“COSO”) 2013 framework.


5.2 N/A


5.3 N/A


6. Reporting changes in ICFR: The issuer has disclosed in its interim MD&A any change in the issuer’s ICFR that occurred during the period beginning on June 26, 2016 and ended on September 24, 2016, that has materially affected, or is reasonably likely to materially affect, the issuer’s ICFR.


Date:   October 28, 2016
 

(signed) Robin Lampard


Robin Lampard

Senior Vice President and Chief Financial Officer


- 2 -

EX-99.7 8 d233971dex997.htm EX-99.7 EX-99.7

Exhibit 99.7


LOGO


Norbord Statement of Policy and Procedure

Department:    Human Resources    Policy #   
Section:    Board of Directors    Date Issued:    05/15/2015
      Date Revised:    10/27/2016
Subject:    CODE OF BUSINESS CONDUCT    Country:    Can/US/EU
Issue to:    All Designated Employees    Legislated:    Yes

SUMMARY OF THE CODE OF BUSINESS CONDUCT (the “Code”)

As an employee, when acting on behalf of the Company, you are expected to:


Page

Compliance with the Law

•       Comply with all laws, rules and regulations applicable to the Company’s businesses.

   3

Personal Integrity

•       Protect the Company’s assets, and use them properly and with care for the benefit of the Company, and not for personal use.

•       Deal fairly with Company’s stakeholders and others.

•       Comply with the policies of the Company to provide an environment that promotes the health and safety of all employees and is free of discrimination, harassment and violence.

   3

Conflicts of Interests

•       Obtain permission before joining the board of directors of another organization.

•       Avoid all situations in which your personal interests conflict or might conflict with the interests of the Company.

   4

Disclosure of Company Information

•       Help ensure that the Company provides accurate and fair public disclosure.

•       Ensure that the books and records of the Company are complete, accurate and detailed, and report any accounting, auditing or disclosure concerns.

   5

Confidential Information

•       Not use for your own financial gain, or disclose for the use of others, information obtained as a result of your role in the Company that has not been disclosed to the public.

•       Not buy or sell shares in the Company if you have knowledge of undisclosed material information.

•       Follow the blackout periods if you are an insider or deemed insider.

•       Refer all inquiries from the media, analysts, and investment community to an Authorized Spokesperson.

   6


October 26, 2016    Page 1 of 12


Norbord Inc.

Code of Business Conduct


Page

Communications and Media    7

•       Use the Company’s various forms of communication properly and appropriately.

•       Be cautious in your use of social media.


Anti-Bribery and Corruption

•       Not give or receive bribes, including “facilitation payments”.

•       Be sensitive when interacting with public officials.

•       Not permit any joint venture partners, agents, contractors or suppliers to pay a bribe on the Company’s behalf.

•       Only give or receive gifts and entertainment that are proportionate and reasonable for the circumstances.

•       Not offer contributions to political parties or candidates that might influence, or be perceived as influencing, a business decision.

•       Not engage in any lobbying activities on behalf of the Company without specific authorization.

•       Not solicit or offer donations to suppliers, vendors or public officials in a manner which communicates that compliance is a prerequisite for future business.

   7

Compliance with Code

•       Report any violation of this Code.

•       Understand that you will be disciplined for any Code violations.

•       Sign an acknowledgement to confirm your agreement to comply with the Code.

   10


October 27, 2016    Page 2 of 12


Norbord Inc.

Code of Business Conduct


EXPLANATION OF CODE

COMPLIANCE WITH THE LAW

Many of the Company’s activities are subject to complex and changing laws, rules and regulations. Ignorance of the law is not, in general, a defense to an action for contravention of a law. We expect employees to make every reasonable effort to become familiar with laws, rules and regulations affecting their activities and to exert due diligence in complying with them. Our objective is to restrict willful or negligent violations of these laws, rules and regulations.

For example, there are laws for the protection of the environment. The Company’s policy is to meet or exceed all applicable governmental requirements regarding the environment. Employees whose activities may affect the environment must be aware of the applicable governmental requirements and report any violations thereof to their superiors, or to a senior officer of the Company. Similarly, no employee may make any agreement or enter into any arrangement contrary to antitrust or competition laws. The Company’s Antitrust Policy sets out its beliefs and practices to ensure compliance with those laws and is available on the Company’s website at www.norbord.com.

The Company will make information concerning applicable laws available to its employees. If you have any doubts as to the applicability of any law, you should refer the matter to your supervisor or proceed as set out under the “Reports and Complaints” section of this Code.

PERSONAL INTEGRITY

Protecting the Company’s Assets

Company assets are to be used only for the purpose of fulfilling your employee responsibilities, not for personal use. All employees of Norbord have a responsibility to protect and safeguard the Company’s assets from loss, theft, misuse and waste.

The Company’s assets should never be used for personal gain, and you should not allow the Company’s assets to be used for illegal activities. If you become aware of theft, misuse or waste of our assets or have any questions about your proper use of them, you should speak with your supervisor. However, if you feel uncomfortable approaching your supervisor with your concern, you may proceed as set out under the “Reports and Complaints” section of this Code.

Misappropriation of the Company’s assets is a breach of your duty to the Company and may be an act of fraud against the Company. Taking the Company’s property from our facilities without permission is regarded as theft and could result in dismissal. In addition, carelessness or waste of the Company’s assets may also be a breach of your duty to the Company and could result in dismissal.

The Company’s assets include all memos, notes, lists, records and other documents (and copies of each of these) that you make or compile relating to the Company’s businesses. All of these are to be delivered to the Company promptly after your employment ceases, or at any time that the Company requests.

The Company’s assets also include electronic data, computer equipment, computer software, company information systems, access to e-mail, the Internet, telephones and other communications equipment. These assets must be safeguarded at all times and should not be used to conduct personal business. Internet use must be conducted in a professional manner, e.g., accessing internet sites containing obscene or offensive material, or sending e-mails that are derogatory or harassing to another person or group of people or chain e-mails, is prohibited. In addition, employees must be vigilant to ensure that electronic


October 27, 2016    Page 3 of 12


Norbord Inc.

Code of Business Conduct


information is protected and that network security is maintained.

The Company reserves the right to retrieve and review any business systems information and data stored including any electronic messages composed, sent or received. All information and messaging data may be reviewed at any time.

Opportunities discovered through the use of Company assets or confidential information also belong to the Company.

Employees owe a duty to the Company to advance its legitimate interests whenever possible.

Fair Dealing

Employees must behave ethically at all times and with all people. Each employee is to deal fairly with the Company’s security holders, customers, suppliers, competitors and other employees as well as governments and the general public and should not take advantage of anyone through manipulation, concealment, abuse of privileged information, misrepresentation of material facts, or any other unfair-dealing practice.

Work Environment

Each employee must comply with the Company’s policy of providing an environment free of discrimination and harassment based on race, sex, sexual orientation, colour, national or ethnic origin, religion, marital status, family status, age or disability. Norbord prohibits behaviour that is disrespectful of coworkers, such as harassment, discrimination and other unacceptable but initially nonviolent behaviour that may escalate into violence if not corrected.

Employees have a responsibility to report workplace discrimination, harassment and violence.

Norbord has zero tolerance toward workplace violence. Employees must think of their safety first by taking appropriate action by remaining calm, disengaging from the situation or removing themselves from the area, immediately report the information to Security, and then their manager and Human Resources or if in a crisis situation, call 911 or local emergency services.

The Company is committed to ensuring the health and safety of its employees. All employees must comply with applicable occupational health and safety laws and not engage in illegal or dangerous behaviour.

In addition to this Code, there may be other local policies that you need to comply with. Please consult your local HR Manager for further information.

CONFLICTS OF INTEREST

Board Members for Other Organizations

An employee of the Company must obtain permission before joining the board of another organization whose interests may conflict with the Company’s interests.

Serving as a director of another organization, even one in which the Company has an interest, may create a conflict of interest. Being a director or serving on a standing committee of some organizations, including government agencies, may also create a conflict.


October 27, 2016    Page 4 of 12


Norbord Inc.

Code of Business Conduct


Before accepting an appointment to the board or a committee of any organization whose interests may conflict with the Company’s interests, employees must receive written approval from the Chair of the Board of the Company.

Employees are permitted, however, to serve on boards of charities or non-profit organizations or in private family businesses that have no relation to the Company and its businesses. Prior approval is not required for these types of situations, however employees should be mindful that their participation must not prevent them from adequately discharging their duties to the Company. Employees should obtain permission from their supervisor before speaking publicly for a charitable entity on behalf of the Company.

Conflicts Of Interest

A conflict of interest arises where an employee’s judgment in acting on behalf of the Company is or may be influenced by an actual or potential personal benefit to the employee or a relative or friend. These benefits may be financial or non-financial, direct or indirect, through family connections or personal associations, or otherwise. Employees have a conflict of interest if they are involved in any activity that prevents them from performing their Company duties properly, or that may create a situation that could affect their judgment or ability to act in the best interests of the Company. For example, no employee should have a significant interest in a business that supplies goods to, or buys goods from, the Company. Employees should also obtain permission from their supervisor before engaging in business activities not related to the Company and make full disclosure of these activities, if any, each year.

DISCLOSURE OF COMPANY INFORMATION

Providing Accurate and Fair Public Disclosure

The Company is required to provide full, fair, accurate, timely and understandable disclosure in reports and documents that we file with, or submit to the Ontario Securities Commission, the U.S. Securities and Exchange Commission and other securities regulators, the Toronto Stock Exchange, the New York Stock Exchange, as well as in other public communications made by the Company. All employees who are responsible for the preparation of the Company public disclosures, or who provide information as part of the process, have a responsibility to ensure that disclosures and information made by the Company are made honestly, accurately and in compliance with the Company’s disclosure controls and procedures. The Company’s Disclosure Policy provides guidelines for the disclosure of information and is available on the Company’s website at www.norbord.com.

Accuracy of Books and Records

The books and records of the Company must reflect all its transactions in a timely and accurate manner, and with sufficient detail so that the purpose and amount of any such transaction is clear. All assets and liabilities of the Company must be recorded. False, misleading, or artificial entries should never be made in the books and records of the Company for any reason. The books and records of the Company must be preserved in accordance with the Company’s Record Management Policy.

This permits, among other things, the preparation of accurate financial statements. In addition, some anti-bribery legislation, such as the Foreign Corrupt Practices Act, requires proper record-keeping and the establishment and maintenance of internal controls. The purpose of these provisions is to prevent companies from concealing bribes and to discourage fraudulent accounting practices.

All employees of Norbord have a responsibility to submit good faith questions and disclosure concerns regarding accounting, auditing or disclosure matters. Complaints and concerns related to such matters


October 27, 2016    Page 5 of 12


Norbord Inc.

Code of Business Conduct


include, among others, actions involving:


  (a) fraud or deliberate errors in the preparation, maintenance, evaluation, review or audit of any financial statement or financial record;


  (b) deficiencies in, or non-compliance with, internal accounting controls;


  (c) misrepresentations or false statements to or by a senior officer or accountant regarding a matter contained in the financial records, financial reports or audit reports; or


  (d) deviations from full and fair reporting of the Company’s financial condition.

See “Reports and Complaints” for information on communicating complaints and concerns.

CONFIDENTIALITY OF INFORMATION

Confidential Information

All employees must keep confidential, and not use for themselves or others, all information concerning the Company or its businesses that has not been disclosed by the Company to the public, unless such disclosure is authorized by a senior officer of the Company. Information is considered to be disclosed to the public if it is in Norbord’s annual report, annual information form, management proxy circular, press releases or other communications made by management to the public.

The obligation not to disclose confidential information also applies to confidential information of employees, customers, suppliers and others. The Norbord Privacy Policy describes the principles the Company follows to ensure protection of personal information and all employees must adhere to this Policy.

This non-disclosure obligation applies both during employment with the Company, and after termination of employment or retirement.

Insider Trading

No employee who has material confidential information concerning the Company may buy or sell securities of the Company until such information has been disclosed to the public. Doing so would be considered insider trading and you would be subject to the sanctions imposed by Canadian Securities legislation, the penalties for which could include fines and/or imprisonment. You should refer to the Company’s Disclosure Policy for additional rules on the disclosure of confidential information.

Blackout Periods

Regular quarterly trading blackout periods apply to those employees and insiders with access to undisclosed material information from 10 calendar days prior to quarter-end to two trading days following the news release of the Company’s financial results for that quarter. Additional blackout periods may be imposed from time to time.

Authorized Spokespersons

Only the CEO, CFO and Senior Manager, Corporate Affairs are authorized to speak with the media, analysts, investors, brokers and other members of the investment community. Unless designated by one of these spokespersons, no other person is permitted to respond to inquiries from the investment community, the media or others. All such inquiries should be forwarded to an Authorized Spokesperson.


October 27, 2016    Page 6 of 12


Norbord Inc.

Code of Business Conduct


The Company’s Disclosure Policy is available on the Company’s website at www.norbord.com. Should you have any questions or concerns regarding the applicability of the Disclosure Policy, contact the Chief Financial Officer or the Assistant Corporate Secretary.

COMMUNICATIONS AND MEDIA

All business matters that involve electronic, written communication must be conducted by employees on the company’s e-mail system or through other systems provided by the Company. You must at all times use our e-mail, Internet, telephones and other forms of communication appropriately and professionally. While we appreciate the need for limited use of these tools for personal purposes, your use should not be excessive or detract from your work. Employees should not email business information to their personal email accounts or maintain a copy of business information on their personal computers or other non-work electronic devices. When using company-provided technologies such as computers, cell phones and voicemail, you should not expect that the information you send or receive is private. Your activity may be monitored to ensure these resources are used appropriately.

The Company’s social media policy is that, unless you are expressly authorized, you are strictly prohibited from commenting, posting or discussing the company, its customers and clients, and its securities, investments and other business matters on social networks, chat rooms, wikis, virtual worlds and blogs (collectively, “social media”).

ANTI-BRIBERY AND CORRUPTION

Zero Tolerance Approach to Bribery

We value our reputation for conducting business with honesty and integrity. It is vital for us to maintain this reputation as it generates confidence in our business by our customers, clients, investees and other persons – which ultimately means it is good for business.

We do not pay bribes in furtherance of our business and do not expect you to do so on our behalf. We have a zero tolerance approach towards bribery. This commitment comes from the highest levels of management and you must meet this standard.

A bribe is anything of value that is offered, promised, given or received to influence a decision or to gain an improper or unfair advantage. Bribery may not always be in the form of cash payments and may take many other forms, including:


    Non-arm’s length loans or other transactions;


    Phony jobs or “consulting” relationships;


    Political contributions;


    Charitable contributions; or


    Gifts, travel, and hospitality.

Facilitation payments are also a form of bribe and are, therefore, not permitted. Facilitation payments are small payments made to secure or speed up routine actions or otherwise induce public officials or other third parties to perform routine functions they are otherwise obligated to perform, such as issuing permits, approving immigration documents or releasing goods held in customs. This does not include legally required administrative fees or fees to fast-track services.


October 27, 2016    Page 7 of 12


Norbord Inc.

Code of Business Conduct


Dealing with Public Officials

A “public official” is any person who is employed by or is acting in an official capacity for a government, a department, agency or instrumentality of a government, or a public international organization. This includes elected or appointed persons who hold legislative, administrative or judicial positions such as politicians, bureaucrats and judges. It also includes persons who perform public functions such as professionals working for public health agencies, water authorities, planning officials and agents of public international organizations such as the UN or World Bank. A “public official” may also include employees of government-owned or controlled businesses, including sovereign wealth funds. For example, if a government has an interest in a bank and exercises control over the activities of that bank, then the banking officials are likely to be considered “public officials”.

There is increased sensitivity and scrutiny of dealings with public officials because this has traditionally been an area where bribery activity is more likely to occur. Be cognizant of these risks in your dealings and interactions with public officials and consider how your actions may be viewed. For example, payments to close relatives of public officials may be treated by enforcement authorities as direct payments to the public officials and, therefore, may constitute violations of law.

Third-Parties

The Company may be prosecuted for failing to prevent bribery by a person associated with it. This includes any person or entity that performs services for or on behalf of the Company. Employees should avoid doing business with partners, agents and contractors who do not have a zero tolerance approach to bribery.

This means due diligence should be undertaken on contractors, partners and agents to establish their anti-bribery credentials, where warranted by the assessed level of risk. This could include informing these persons (and associated companies) of the Company’s anti-bribery policy, meeting with them to better assess their business practices, and making commercially reasonable inquiries into their reputation and past conduct. Anti-bribery language should be included in contractor, partner or agency agreements, where appropriate, in consultation with internal legal counsel.

Gifts and Entertainment

Gifts (e.g. merchandise) given to or received from persons who have a business relationship with the Company are generally acceptable, if the gift is modest in value, appropriate to the business relationship, and does not create an appearance of impropriety. No cash payments should be given or received. In addition, gifts should not be given to or received from public officials.

Entertainment (e.g. meals, tickets to sporting events or theatre, rounds of golf) given to or received from persons who have a business relationship with the Company are generally acceptable, if the entertainment is reasonable in value, appropriate to the business relationship, does not create an appearance of impropriety and if a representative from the sponsoring organization (the party paying for the entertainment) is present at the event. Note that many jurisdictions have laws restricting entertainment given to public officials.

Gifts and entertainment (including meals) that are repetitive, no matter how small, may be perceived to be an attempt to create an obligation to the giver and should be avoided. Employees should not pay for gifts and entertainment (including meals) personally to avoid having to report or seek approval for it.


October 27, 2016    Page 8 of 12


Norbord Inc.

Code of Business Conduct


Employees should not give or receive “big-ticket” items, such as travel, conference fees, costs for road shows, or event sponsorships, without prior written authorization from the CFO to provide such authorization.

Political Donations and Lobbying

To ensure that we do not breach the law regarding political donations in any country, all political donations, no matter how small or insignificant, made on behalf of the Company (directly or indirectly) must be approved in advance by the CFO. Political donations should not be made on behalf of the Company in countries in which we do not have a presence.

Political donations made by individuals on their own behalf should comply with local laws and regulations.

In the U.S., various federal, state, and municipal laws and regulations impose specific restrictions and rules with respect to political contributions, both those made on behalf of the Company or made by individuals on their own behalf, which can carry significant penalties for the Company for violations. The CFO should be consulted before making any political contributions in the U.S. on behalf of the Company or by individuals on their own behalf.

The Company encourages its employees, officers and directors to take an active role in public service. However, any participation in this regard is to be undertaken as an individual and not as a representative of the Company and individuals should be mindful that their participation in any outside interest must not prevent them from adequately discharging their duties to the Company.

Lobbying activities generally include attempts to influence the passage or defeat of legislation and it may trigger registration and reporting requirements. In many jurisdictions, the definition of lobbying activity is extended to cover efforts to induce rule-making by executive branch agencies or other official actions of agencies, including the decision to enter into a contract or other arrangement.

You should not engage in lobbying activities on behalf of the Company without the prior written approval of the CFO.

Charitable Donations

We encourage our directors, officers and employees to contribute personal time and resources to charities and non-profit organizations. However, unless the solicitation is supported by the Company, you are prohibited from using the Company name or Company stationery for solicitation of donations.

All requests for corporate gifts to charities and other not-for-profit organizations should be approved in advance by the CFO. Charitable donations made by individuals on their own behalf should comply with local laws and regulations.

If you are requested by a public official to make a personal donation to a particular charity, please consult with the CFO before agreeing to or making the donation.


October 27, 2016    Page 9 of 12


Norbord Inc.

Code of Business Conduct


COMPLIANCE WITH CODE

Reports and Complaints

Each employee must act in compliance with, and report any violation of, this Code. In most cases, you should report your concern to your immediate supervisor.

In the event you do not want to report violations to your supervisor, you can always

report a complaint through the Company’s reporting hotline.

Our reporting hotline (the “Reporting Hotline”) is managed by an independent third party called Clearview Connects. The Reporting Hotline allows anyone to call anonymously (if they so choose) to report suspected unethical, illegal or unsafe behaviour. The Reporting Hotline is available toll-free, 24 hours a day, 7 days a week. Reports will be investigated in a fair, unbiased and timely manner, and there is a ‘Sensitive Report’ option that submits your comments directly to the Chair of the Audit Committee. Employees’ identity will be protected. The contact information is as follows: :

Website: www.clearviewconnects.com

Mail: Clearview Connects – PO Box 11017, Toronto, Ontario, M1E 1N0

North American Hotline: 1 (866) 608-7287 / European Hotline: 00 800 9643 9643

Directors should promptly report violations to the Chair of the Board, or to the relevant committee Chair.

You will not experience retribution or retaliation for a complaint made in “good faith”.

No retribution or retaliation will be taken against any person who has filed a report based on the reasonable good faith belief that a violation of the Code has occurred or may in the future occur; however, making a report does not necessarily absolve you (if you are involved) or anyone else of the breach or suspected breach of the Code. The Company reserves the right to discipline you if you provide false information or make an accusation you know to be untrue. This does not mean that the information that you provide has to be correct, but it does mean that you must reasonably believe that the information is truthful and demonstrates a possible violation of the Code. If you believe that you have been unfairly or unlawfully retaliated against, you may file a complaint with your supervisor or by calling the Reporting Hotline. The person named in the report will be given an opportunity to respond to the complaint or concern in writing and that response will be included in the final record relating to the complaint or concern.

Disciplinary Action for Code Violations

We will impose discipline for each Code violation that fits the nature and particular facts of the violation. Depending on the nature of the violation you may be disciplined up to and including immediate termination for cause and, if warranted, legal proceedings may be brought against you.

Compliance with Code

All Designated Employees of the Company will be provided with a copy of this Code. At the commencement of employment and each year thereafter, each Designated Employee will be required to acknowledge their receipt and their obligation to comply with the Code. Employee acknowledgements will be retained by the Human Resources department.


October 27, 2016    Page 10 of 12


Norbord Inc.

Code of Business Conduct


Designated Employees include:


  i) the President and all Vice-Presidents, Directors, General Managers, Managers and Supervisors;


  ii) all other employees working in finance, accounting, sales, logistics, information systems, environmental, communications, safety, procurement, human resources, payroll, stores and shipping; and


  iii) any other employee specified by an officer of the Company.

In addition, all employees must disclose in writing to the head of their departments all activities, investments or businesses that might create, or reasonably be regarded as creating, an actual or potential conflict of interest with their duties for the Company. Each head of a department must ensure that actions are taken so that there will be no conflicts of interest within his or her department.


October 27, 2016    Page 11 of 12


Norbord Inc.

Code of Business Conduct


SCHEDULE ACKNOWLEDGEMENT

I acknowledge that I have received a copy of Norbord’s Code of Business Conduct and that I have read it and understand its contents. I acknowledge and accept that my continued employment by Norbord may be dependent upon my compliance with its rules as set forth in the Code of Business Conduct. I also understand that I have an obligation to report any violation of these rules in the manner set forth in the Code of Business Conduct.


Signature of employee


Name of employee


Title


Location


Date


October 27, 2016    Page 12 of 12
GRAPHIC 9 g23397101.jpg GRAPHIC begin 644 g23397101.jpg M_]C_X 02D9)1@ ! $ 8 !@ #__@ ?3$5!1"!496-H;F]L;V=I97,@26YC M+B!6,2XP,0#_VP"$ @&!@<&!0@'!P<*"0@*#18.#0P,#1L3%! 6(!PB(1\< M'QXC*#,K(R8P)AX?+#TM,#4V.3HY(BL_0SXX0S,X.3H.$A8:' MB(F*DI.4E9:7F)F:HJ.DI::GJ*FJLK.TM;:WN+FZPL/$Q<;'R,G*TM/4U=;7 MV-G:X>+CY.7FY^CIZO'R\_3U]O?X^?H1 (! @0$ P0'!00$ $"=P ! @,1 M! 4A,08205$'87$3(C*!"!1"D:&QP0DC,U+P%6)RT0H6)#3A)?$7&!D:)BH*#A(6& MAXB)BI*3E)66EYB9FJ*CI*6FIZBIJK*SM+6VM[BYNL+#Q,7&Q\C)RM+3U-76 MU]C9VN+CY.7FY^CIZO+S]/7V]_CY^O_ !$( "8 G ,!$0 "$0$#$0'_V@ , M P$ A$#$0 _ /?:0C(\1>)]'\*::;_6;U+:'.%!Y9SZ*HY)H \>U3]I*!+A MDTKP\\L(Z27,X0G_ ("H./SICL1V'[28-PJZCX;*PGJ]O*+K4)Y'^S*Y2UA/ CC!X& M/4]3[FF,S-'33[GS;&_86_G8\F[Z^2XZ!AW0YP>XX(Z$$&4KRSN-/NY+6ZB, M4T9PRGGW!!'!!&""."#D4P-#PSXCO_"FOVNKZ=(5F@;YES@2+W4^Q'^/:D!] ML:7J$&K:39ZE;$F"[A2:/(P=K $?SI$F#XW\?:3X!M+2YU6"[F6Z;+$))(T$9,88GD.3C"G'%,9WM(04 % !0 4 M!S']F1&QMQG.YA_>%,9TFDZC#K&C6.J6ZNL%Y D\:R !@KJ& ."1G!]:0B>Y MA^T6DT.<>8A7/ID8H ^$K^RGTW4;FQNHS'<6\C12(>S X(JBBYH\VG'S;+5$ M"07&-MTJY>W8=&QW7GD=<PN;=X[I&V&/&3D],8ZYR,$=(+KP!XPL[J\ M5H[&_MPLPZAH9!D./H<'\"* +7PC\1P^$M6U_7)H_-%KI#E8\XWN9H55<]LD MCF@#9TKQ!\5_'R:GJFDZI*D%F-S1PLL*COL0=SCU/U/- &EX=^,6OZEX*\0V M5[=?\3:TM/M%K>HBAB Z@@C&,C<,<>N: ,'0O%?Q7\9K+::+J-Y=-;'S)6C: M.(KG@ L<>AP,^M '.Z>_B"+XGS?\(\6_MMKR>.$@*3N;XZ%N3TZT =GX M?^(OC;P?\08M%\4WLUS%YR0W4$[!R@;&'5A[$'T(_0 LZU\2O&/CGQR=!\'7 MGV2U,K);^40ID5IH 7P[\2O&7@WQZOASQ;=&\A\](9UE*LT M>[&'5QR1A@<'MZ&@#&N_B'\0[SQCJ&AZ1JUS-++=2V\$*(F0 YQ@XXP!U/09 M^M "Z]\1/B!H%K#X6O+Z>WU:)S)&O^P9;?^BEH$;](#RGX MH?!Z'QA,VKZ/)%:ZQ@"17&([@#@9(Z-COWP/K3&>)Q^"?$&B7,^F:_X:U#[) M.!^_M[O*YY'H0" "2+PSK$'F>'-H/.,[@0#I_ -G>:-XVT_3O&7AB[N3I\OE6=X('<6[9^7) P\8)RIY MVDY% 'TO2$>,?M#:;?ZCH^B+8V5Q=%)Y"PAB9]ORCK@<4QHYKQ1X!N]3^"_A MK5;>PF_M738?+EA$1\QHF<\;<9R"F+W1X\Z%OW;XV[E(X88]\ M<#GU )?#'PYUVU\$^)=@?L\:9>Z M;I.N"^L9[5WGCV^=$4+ *>F1S0!Y:EGXMT/XDWVN:1H5Y+/:WL\T>ZU=D92S M ],9!![&@"YI&C^)OB?\3H]5O=-EMT>=);F41,D44:8 )[X '4GGU- $]W MX>\2_"+XAC5M/TF6\L(I'\APC/')$P(VL1T8 ]^XSR* #2?#GB;XH_$K^W;[ M29+.SEGCDN)6C9(UC0 !5+?>;"@<=^>* +_@'1-5@^/J7DVF7<=J+R\;SG@8 M)@I+@[B,#Q@/%&FVDT]M%2YBE0!1D#H,*N#TSG\0# MD_&FK^-_B ;"^U'0;@00(T"HI(/ ?AV&6-HY8 M]-MU9&&"I$:Y!'8T"-RD 4 % !0 4 % !0 4 % !0 4 % !0 4 % !0 4 % &!0 4 ?_9 end GRAPHIC 10 g23397102.jpg GRAPHIC begin 644 g23397102.jpg M_]C_X 02D9)1@ ! @ 9 !D #_[ 11'5C:WD 0 $ 9 _^X #D%D M;V)E &3 ?_; (0 0$! 0$! 0$! 0$! 0$! 0$! 0$! 0$! 0$! 0$! M 0$! 0$! 0$! 0$! 0(" @(" @(" @(" P,# P,# P,# P$! 0$! 0$" 0$" M @(! @(# P,# P,# P,# P,# P,# P,# P,# P,# P,# P,# P,# P,# P,# M P,# P,# P,#_\ $0@ 1P# P$1 (1 0,1 ?_$ &\ 0 # (" P M '" D%!@0* 0(# 0$ $ !! ,! (" @$# M @< $ P4&!P$"" 1"1(3(10B,14605%Q,B,S%Q@9$0$ M _]H # ,! (1 Q$ /P#W^/ \#P>.66* *0:<2.$$(BH0466LF,*, M.CKG=5<@A;;1)%%+37.=MMLXUUQCYSGP4%?/LO MR[7.TQKUN=A5Q$%&YQO66N\&H,8K7).V^R>LG44TT'5_+7&^NNFX=3KS[&3D MWB'Q_K/C_I3AXNPIFTP*%2JXM*JG=2.TJDBW]")1UWM>C;'LF-01^ECU^+>V MH2'_ &E(YP7'%&66((32R&EW@>!X'@>!X'@>!X'@>!X'@>!X'@>!X'@>"GM\ M]>,]:RG2EJ@A3ET?U(Y-XSFVT-!7MJ:EXJQN"!2@$^O";N."&2E:O47'U2PZ M.*:YQZJNB36 XKY_3@(OVX9-OUP;)?WS.4N@5A=DW!KYMCR;C'>/X4=_<"=! M-2JY75PY7T_1\D;*"3Y.-S$%M/R6%9VK*NR. T#:VML8VT!F96X!G9VH,9N: MVIK#';VUM;PTM!Q 0 1$T10PQ4$]=$TD]-=---<8UQC&/CP4V^R;6)?_ )\= MLK3A<02-!XV:N.59)]05H;81(:9Z(A$X*AC*O+%Q4771-T2'5?E"-M M-2=<$:ZYQA3&-_GP2_X'@>!X'@>!X'@>!X'@>!X'@>!X'@>"D/1UPVI(9JW< MJ\FR")-5_O #!+K4L:3M>9.P\Q4:]FO+?K9)T8SE-NEMHS1P82FV#QPU9$4X MM IS-_-M:R420G&B^>ZOYWCCPPUPR*(N$OD)4ULF[#LJ M5KZ:GRB6O&HB>NZV_P" XR":8HB(PB* Z0 M7!X(_A M-KUI93I83+7T[BLU=:FFJU;V8%&'H%Z6@T_&8V22&0R3?T%E]&J3 LVNHG=;I&UB]M=_P!PKU9;>W&Q.$)95*-V3::HK49EBP2>JNR>4&?] MO_N+*;;!/V%Z![A.I(+C.?R3/C(B^F/RTTWU"_DWF<;KF&2RP9DZ#,<1@\;>Y=)WDQ3 M1(5JC\=;27=W<"%-]M=-4A !%-\_.U9MK M>TJ8GP4<9\K6LU6@-AYXH\U)!4C4->K*>!;M'0;551/65.#ROKMM_8SMD- ? M \#P4$Z+Z2G+S:(?&W)R+;(.B7QJ:WZW;"-S_;@O'M/OZBJ*=F3_ /3JIH[6 MM+A$"$Z_AWSJ0]');.!OZ&4,I=0+(<]\]U;S!5K%4-0L2K-&&==R=7 ]R.)> MY9-)?(3EGB86'8,J<-E7B:6%.'\I=Q>7%QRH&%5A6$9LE"TTT0]:2XP1.]@.6V^ZNVJZ9:.^-$OYTP&E1H03D*N XB"G@E)[(E!FCI%"DI;?\ MF27'7T4163V_ZZ[8SC/@\KP/ \%).INDIY#93#.;.:XJWV!U;;S48]L*#_J7 MI6M&U>"?HSR+H2[7$+&JZ,.8'!;^HRL@V^KK+WW\0 _U().+@WA+?-W-U="H=^=/R6K+79G>K-9!VV/C[:ENRA*N?W#IH;J>"S2DP6>/1F.-I+P_/CJ:MG5(-M:6L-4A=7;.-4TD]ML_QCP0/S MUU77'4Z;K)Z-$DM3(K^:!;V&! MEAR:BJ*@:N0@0FB$YS69Q2N8?*; G<@:XG"81'GB62Z4/A:8+-'HW'V\AU>W MIT,5SA,8!M;A5%E=\_QKIIG/@R08G=HZ>$8/L0[>>&.CN(ZD&%N/E.DK8= X MJT#!"#;ND6[%ZEU?%PVU.Q#F570Z#0XO&Z<'&(T-+U4DBNFC.&A%)=7T9?W/ M<;ZG@\N5:J+E@;RZLLXLID>JG&58V62.D7VD)@-C@1ER:V!U/:MUF\LI)%$\ M)5 E';=%9/?8+&:[8VQC;7.-M=L8VUVUSC.-L9Q\XSC./XSC./!P;3*(T_EN MP#%(F)Z.82!X/C\L?.=?G'Y8QC;.OSCYQC;.V-W%SF91LL ML/@:8JKZETJ@O8/-;N8NELE.^19C)#]88TM7[70]Q5<^;WTC:!.J2FFFR3<( MQ&[?PZIXP$Y=IWUKR]R7T3T!H@L8Y5543HG_ +U7-20ICEY2>-OR M>+ V9AG"Q)$1G8MPVW-DTZ-<7$C;*ZWY+E;Y_/;Y_+(2!>]XUCS53UAWQZRNFF M0H#$><[7[J_K7#W-I*Z_IYW#3R+N/ M;%$]M8X(6G$X;E3H"FMZFJ;T][*Z,["^RM^<18E0O(G.XKQM%X MN?(#6]MP"+NJ*D>\.!6"@D?DRZNRK([ENVO[9LVG9;650U.&-:U>TC!C=*YH MN^)K(V!\J^IVZZY.1O-[:M5MI\5P>9OA4)C;6X=^C^1VP?8G?;<-3V>61:1& MOK9'Y+'WURBY^K5)F]G>6YS-CKGNG^[1N?1 B5UV@_='_/")&J:F=?Y^/CP4 MN['YMN.R9?0O1'+DS@\*Z8YP>Y:A'1+32D6]26S4UHMK:U6K35FK0]%>5-;4 M^*Q]H>&ET#1-W9WYD$(R&4G^Q'8(EF]2?:3T0J_P>=WGS;QM3;R JVN+GRNW M32]>C'EN-$!%"]'/=#5GR M]2-7<]4VQ[1RL:@AK-!X:U+%+.!J;2S#81P8ZN1&P&(:6:DA<5!SFPZ ;Y^T%@:/_O[(<+?BVK"FMZ4M9=3A2]M5-_\ '_() M(A[I]MC*&0W3N!_7;8YHVX20,MC%P=)4[H[()MH>AY;A!'&B;LU9BB';"^Z: M2+^8FFAG37.V=L;9\'238Y]T4\,,!7LSZY>;V @Z2#CO$-KWH3IZ9ALQ8"FL M6/%UF3E1/9-1_!3GL.F9C-HY$+FI(,=7IGFQW2VQ;\S6154 AE8P,#;+Q)GP[=/\=E,82;P=,_O.)%%T47T#AZ3;K\ META+N2[EUJV%>8V@T0;FEF=6M[!KYL.(%=3GZU96V)K!S.XCMD$1EDFPA2.L M Z2@P*KANLNY$!)MU4O6/1%53FDKGB+=.ZOLAB7CDQBCIN6B*ZMBRB1&GX%M MY ;BW'A&#I$BEBK(E"%(IK(J:*IZ;X" 6/DN.\V\]7)!.&XY"ZRN::0R4+1F MR++.ET^(,BE@(LX@^G7KFA6*Z&"5=?5[S'&KOO2:6Q8L> M^O:H&>$S":@G+;-4'8L7-<+9+BJRBD2AX080#+%XT"6!KA=3=Y-,*)-6"4_I M+=X/93WW==U)7);ED,MS*:H&+DS738-Y/ \#P/ \#P/ \#P/ \#P/ \'KU6#5\RI MG[Q>+X@"@RN/,]ZI=B=60AI/!R2[5=TXV4JWU]=H,1756W':HG931,PI0LGH MGA;_ )&XNZVN^FA:FB@>PKX*A=$<6UET1.(!;),NMRF[IK5GD,3C5S4'/5ZZ ML-2 2Q8(Z25K(CLM[RRRR .SVT@N>6YR!*3' MYS#V*0RRWI8V L\TOBWYI*+>O"7MK?\ Y#M;K9,^='M^ CR:^^^?;IM>;U#"WPV.D2?H& R"H':)7]5D-BCO)& M1V=E<1IQ:W,UQ;QG/=E0"U540U_;HLF&C'@>!X'@>!X'@>!X'@>!X'@>!X'@ )>!X'@>!X/__9 end GRAPHIC 11 g23397103.jpg GRAPHIC begin 644 g23397103.jpg M_]C_X 02D9)1@ ! $ 8 !@ #__@ ?3$5!1"!496-H;F]L;V=I97,@26YC M+B!6,2XP,0#_VP"$ @&!@<&!0@'!P<*"0@*#18.#0P,#1L3%! 6(!PB(1\< M'QXC*#,K(R8P)AX?+#TM,#4V.3HY(BL_0SXX0S,X.3H.$A8:' MB(F*DI.4E9:7F)F:HJ.DI::GJ*FJLK.TM;:WN+FZPL/$Q<;'R,G*TM/4U=;7 MV-G:X>+CY.7FY^CIZO'R\_3U]O?X^?H1 (! @0$ P0'!00$ $"=P ! @,1 M! 4A,08205$'87$3(C*!"!1"D:&QP0DC,U+P%6)RT0H6)#3A)?$7&!D:)BH*#A(6& MAXB)BI*3E)66EYB9FJ*CI*6FIZBIJK*SM+6VM[BYNL+#Q,7&Q\C)RM+3U-76 MU]C9VN+CY.7FY^CIZO+S]/7V]_CY^O_ !$( *T! ,!$0 "$0$#$0'_V@ , M P$ A$#$0 _ /?:0@H * "@ H * "@ H * "@ H * "@ H * "@ H * ,,^ M+--37-3TF02QSZ=;"ZE9E&QD(R=ISDD<9X'44K^XYKH[%J7*RVB7;[%A!A1BP&X-("3\IX4'I5R7*W?9=?Q$E=)KJVON_P"' M+$7BE;N[6+3=(OM0@*1R&YA:%8U5QD$[Y%;ISPIHY6FT]+.WY?YDWTT[7_-? MH6]5UZWTD2AX9KB2*'SFCA"YQN"J/F(&23QSV-3OHNZ7W[%/17?G^"NR.'79 M"L9O=&OM/,LRPH)VA8L6SS^[D;@8[T[:I=[_ (*_Z$MVN^UOQ=OU)3KMJM[+ M:LDJF*Y6U9R!M#L@=>_0[@/J:$KV\[_A_5_D5)*W&I6RW,L(G2!I5$A0C.[:3G&.]7)7$?EET@N(S@.^P M(=+-RMO!>0W,WV@6[I!(KF)R"<. ?EX4U*UMV=_PU!Z7OTM^+M^I%/XKT."W M%R-3M9;83_9Y)HYT*0O@D[VSA<8H[>86>OE_G8M2:[I$)M!+JMFGVS_CVW7" M#SO]SGYNO:G9\W+U)NN7FZ =;TD7-S;'5+,3VJ[IX_/7=$/5AG*CZTNE^A33 M6C*Q\4Z(UW9VMOJ5M=3W; 1I!,CMM()#X!SM^4\TTKNW];7$]%=_UK;\'N;% M( H * "@ H * "@ H * ,E/$-E++(D,=W,(Y6B+Q6LC)N5BK#9&=!%G?$% :,G/1BJG/M4P7+^/Z6^YJXY^\K>5O_ $J_ MX2:_$;#X7U2PEB;3=9MX5^R):R^;9&1B%9SN4B0!3\YZAN@IVO'E>VGY6*WO4+: MWFG^5U^"_$MO1>C7WK^OP(++PA/9Z=+;0R:/92B9+B!M.TK[.BR+W=/,.\$< M=5X[^E7VMTOZ:JQ%D[WZ_H[HED\.WC0;+BY6YN+N_ANKJ:*/RD01[2 JEB0# MY:CJ>I-.,N5QMLK_ (I_Y_>F/QJ>B_K7J+O_6G3\":D 4 % !0 4 % !0!B7GA72]2U\ZKJ-E:7K+ D M427%NLAB*LS;E)SC.X=/2G'W;M;E2=XJ/:_XV_R,_4?"%UJ.O+?R:P5MXI/, MBMQ$PVYC*$'#A6'.02N1ZXXJ;>ZT^J:^_P#KI;3[PYK-6\OP:?\ 6XZ3PUA=/(Y;R) ZD'=\N>01@]1SQSK*?-*4GU;?WIK]28>Y3C3[)K[T MO\B&'P1(([:WGU&-[:U C@$=J$E\O:PPTFXEF^;J,#VSS64ES7ON]/P:_7_* MQ?-:3DN]_P#R92?Y?YW*UAX N--C5H-5C:[ADC:&::.>8!8PP5662=O[Y/R[ M/8#M;DW9]=?Q5O7\60DDN7I_P4_3IV)9/ LQMY(8M4C5+N V][OM=Q=3([DQ M?,/+YD;KN &..,TXRY6K;*S_ / ;6U^7;TL.[MYZ^FN^G]>=QMQX#N;V^N;B MZUHRI)%-"B&%L*DC \KYFTD8QD*N1USUI0?)9^GX-/\ &VO3K8F:YHN*\_Q3 M7Z^OF:3^&)CKRWJ7T0M!=B\,)MLR>8(_+XDW?=QVVY]\<4HOEM?I?\;_ *L; MUO;K:_RM_D7Y3KR[S"FGOC.U69USZ G!Q]<&@!+/78)[H65W%)8WYSB"? WX M[HPX7NG/96L-QI]O=VT@1;F1)-XF7+,JQL M"H'OQR2#@8NCI53EY_\ I+_'_AM+L<_X^?Y77]) M=DUU1Z992SS6%O+Y/4%!0 4 % !0 M 4 % !0 4 % &1K%Q*FHZ/:I(T<=Q<-YA4D$A8V<+D>I ^H!'>EW\DW^2_4' MHO5I?F_TM\SSSPWJ)O=$NA!JD$VKOILI18O$L]S<&39WMV^5#GT)VGI5NRC= M;:>>FE]=_P#,V]U8FTMN9^75]/3_ #.F;6H-:N6.EZL9((-,E,TEO-E89LH5 MW8. XPW!YQG/%*H^6,YKI9KL[Y5(['D<45URN2B]$[%89\_(Y];'"H-3N= U%K+Q*)H;9E MN)+I;R98T)1PR!]SMN1MK%,A3PNU035NT;.UTFTO/:UN_5*[>KO?1)13NY6E MV5_QNGV[MI*RZ=7T'@OQ!?:AJFHV.I6[)=AC,P,Y7Z+7YW^^ZZ':U!04 07EC:ZA;-;7EO'/"V"4D7( MR.A^H]: ,D6FJZ*H^P2OJ5DH_P"/:XDS,H_V)6^]]'.?]JF!>T[6;+4V>.%V M2XB_UEO*I26/G'*GG''!Z'L30!?I % !0 4 9/B=I%\,Z@D,ABFFA,$;CJKO M\BG\V%,#4C18HUC0850 !Z 4@'4 % !0 4 % !0 4 % !0 4 % !0 4 % !0 M!%<6L-T(Q,F[RW$B')!5AT.1_GM1L[ATL2T 17-M#>6TEM<)OAD&UUR1D>G% M'F/8@"GK0!JV.H6 MFI6XGL[A)H\D$J>A'4$=01Z'FD!9H * .?\ $][90MI5K>3Q11S7T;$R. %\ ML&4$Y_VHU'U(IAL._P"$W\)@D?\ "3Z1E>H%[&O \LUCX[ M/8I/9Z=:6VH7,9VQWPWI"XP/F\L_,.K2BT>4*T$#>3&%/'\."0/]HFO:Q608;"8?VD;M MIJ]^VS_._P C@QE2K*A+V;L[=#N(=/LKG+H:QKU(]3K-*^)6JV1": MK;)J$(',L $AZ-K^F:_;F;3KI9=G#H05 M>,^C*>17#*+B[,ZTTU=&E4C"@ H * "@ H * "@ H * "@ H * "@ H * "@ M H * "@ H * ,#Q7XNTWPCIOVF^??-)D06R$>9*?8>@[GH/RK2G3E4ERQ0;' MS5XX\7ZYXIOUFU*?%ENS#:Q\1PG_ -F./XC[]!Q7V61T,/AJR557D]GV?;_) M_P"9A4;:T.5K[HY@K&M25:E*E+9IK[P/:M'O/[0T>TNB06DC!;!XW=#^N:^& MA?E][?KZ]3\[Q5+V->5/L_PZ%76O^/JP_P!Y_P#T&L,1]D]3)OXDO0@K ^E" M@ H 6)I;:[CO+29[:\B!"3Q'#*#U'N.!D'(-9U*4:BM(TA4E!W1ZAX0\=)K, MJZ9JBI;ZGC*,O$=P .=N>C=RI[OI>M62V.]XVVMZZNUNUWT MTZ"TLI?\-LW?O9=?4R[_ %C6K*,::FH:M)?MHHW:2[O\ *ZO^>G3S#:+D_*W;=)VZ];:]?(V=+UZ]MO"&K7VH+/)=::TP M*7*QK)A1N4.8_D)P1RO'-.2;C'EW>GSO;_A_P"FN:HX/R_)/_ABE)<>()?$$ MEHEUK4D,$< 9[!+$1AF7+%_.&_\ [Y[>].-N9]KVU]%VUZZD-MQ7=J^GFWWT MZ:?B7[G6KN+3+YUN0)X=5CMERJY"-+&-N,=U8^_-*"OR7ZW_ :[+ M_P!M3_,UM'OI;F?4[69B[V5T8@Y7&Y2BNO3T#@?A22]R+]?P;7Z!)6E;Y_U\ M[_*QJ4A!0 C,J#+,%'J3B@"M+J>GP F:^MXPO7?*HQ^M &'KGC_PWH=A<3MJ MUIO?H.IZ5<(.LWWB'6)M4U&0/-"-EN9-W,Z2-98VC<95A@UT-7$8DD;02M$_4=#_> M'K7UF6XWZS3Y)_''?S\_\_,PG&ST&UZI!Z3\/;WSM'FLV<%[>3( &,*W(_4- M7Q>,I^RQ4X]]5\_^#<^1SRCRUE46TE^*_P"!8U]:_P"/JP_WG_\ 0:\W$?9) MR;^)+T(*P/I0H * "@!KH) !EE*D,K*<,K#D$$<@@]#4RBI*S'&3B[H]6\"^ M+7UNW;3=1O0,!T.#T(KQ:U)TI6Z'JTJBJ1N=C6!J% ! M0 4 % !0 4 % 0""",CTH#8HV>B:3IR3I9:79VRW!)F$,"H)#_M8'/XT;QY M>@^O-U,R_P!)\(:/HS6][I6E6VFR3+F%K5!&\A.%^3&"W/IFG\3C'KT%\*=N9MJ;ADLF<;<$-T.00>16GO*7-L]^V MVGR9-DE;HOZT[]>^S\SI&T;2WU--3;3;1K]%VK82.?FW.,'I[8'T H6BLNUOQO^>H-7=WWO^%OR(?\ A'-. M_P"GK_P,F_\ BJ #_A&]'/#V*2#TD)?^9- $47@_PS#.9XO#NEI,N3C- %^+2]/@"B&QMHPO3;$HQ^E(#YZ^(WBC_A(_$LD-LP&F6#&*W"]';H\ MGXD8'L,]S7N9?0Y8^T>[(D^AR->H0% %:]M?M,0V\2)RI_I5TZDJ-158;K\? M(&KJQC@^HP>X/:OML/7AB*:J0V?]6.9JSL=5X#OOLVO_ &9F.RY0J!CC<.1^ M@/YUX>?#A!6!]*% !0 4 % #X+JZT^\@O[%@MW;-OCST;U4^Q&0?K6-:FJD+&E*I[ M.5SW72-4M]:TBUU*U)\FX0. >JGNI]P<@^XKPVK.S/73N7:0!0 4 % !0 4 M% !0 4 9VN:>^IZ5+:Q;!*Q4JS]!A@3^@H6DD^S3^YI@]8M=TU]Z:,=]"U-] M>D)6S.ER7JWID,K><"(@FS9MVXR,YW=#C%-6LE+I?YWO_F_P"75QZV_!K_)& M-=?#^\@U07FBW*V2I)LB072Q!4#RS\FU5&0!50DU).6O?[_ ,;Z MW;UN[ZV03]Z+2_K?[K:6MV?\S/0NU2 4@"@ H * .3^)&OMX=\%7D\,OEW=S MBVMVS@AW[CW"AF_X#6M&G[2HH]P;L?-BJ%4*HP , 5]4DDK(Q%I@% !0!F:C M;;2;E!Q_RT']:[E M?09I3]IA)-;K7[M?RNCAKTE5I2IOJCU;5V#W&GLIRI9B#_P&OC*_V3Y;)DU4 MFGV(:P/I H * "@ H * .[^%^IF*ZO\ 1'/R,/M< S[[9!CL,E#]7->3C*?+ M/F74]+#3YH6['I5<1TA0 4 % !0 4 % !0 4 % !0 4 % !0 4 % !0!Y7\5 MIHK[5M.TF41RPPPO<2Q.H.2QVH@;^AGLXC<1RJT4G99%*D_GUK6-:$M+FR:>P^M1B$9&#TH Q;JW^RS;0 M/W3?A:;>?;=$T1_XH]\1&#I-4W]EM?.>D% !0 4 % !0 4 % M!0 4 % !0 4 % !0 4 % 'C?CN7SO'%[Q_J88HOPP6_]GKU<$O<;//Q;]Y(Y MZNXY H ;+%'-&8Y8UD0]589!_"DTGHP3:V,F?PW9/DVYDMF](VRO_?)R!^&* M23C\+L;QKS6^IFSZ%J,&3&(KI?\ 8.QOR/'ZUHJTUNK^G]?J;QKP>^ADW<:E M3;W2/ Q^[YB[3GU!/!_"M8UXW5G9K;U-DU):%SPK=M'>#3) ZNTPP.ORX)_ M]!Q_]:EB\0JU=2ZM7?JE9_)I)_\ #'G5Z'+5]JNUOU7ZG:5B0% !0 4 % !0 M!#=7 LK9[P_\NV)O^^#N_I6597IR]#2D[31]%UX)ZX4 % !0 4 % !0 4 % M!0 4 % !0 4 % !0 4 >+^-5*^.-4R,9\HCZ>6H_I7K8+^&_4\_%?$C"KM.0 M* "@ H * $=$D0HZAE/!##(-%K@G;8I0:-86UX+JWMQ%*!CY#@8^G05"A%.Z M+=24E9LO59 4 % !0 4 % %/5XVET6^B09=X'51ZDJ0*SJ_PY>A=+XUZGTC7 M@'L!0 4 % !0 4 % !0 4 % !0 4 % !0 4 % !0!Y'\1K=X/&*3$ 17-FFW MW9&8-^C)7I8&6\3BQ:V9RU>B<(4 % !0 4 % !0 4 % !0 4 % !0!-9VYO- M5TZT5-_GW<2%?]G>"WY*&/X5SXB7+29M05ZB/?Z\0]4* "@ H * "@ H * " M@ H * "@ H * "@ H * .#^*.G>;I%EJJH"]C-L=NXCDPI_\>$9^@KIPL^2H MO,QKQYH,\VKVCR@H * "@ H * "@ H * "@ H * "@#I?A]8&_\ &27!4&'3 MH3*QSTD?*(/^^?,_(5YV-GHH';A([R/8*\T[@H * "@ H * "@ H * "@ H M* "@ H * "@ H KZA8P:GIUS8W2;X+B-HG'J",&GL!X)-:7&G7EQIUYS=6C^ M7(<8W=U8>S @_C7N4:GM()GDU8] M>%5G[2;D>Q3AR143IZR+"@ H * "@ H * "@ H * "@ H * "@ H * "@ H MX3XA^&7OH%UNPB9[RU3;-&@R9HNO [LIR1Z@D=Q73AZWLI:[&-:G[2/F>9QN MDD:R1L&1AD$="*]E--71Y35M&.I@% !0 4 % !0 4 % !0 4 =+X'\.-KVK+ M?7$9_LRQ?//2>8'A1ZJIY/O@=B*\[%U_^7:=H4 % !0 4 M% !0 4 % !0 4 % !0 4 % !0 4 % !0 4 >8>-/!,MG--J^BP-+!(QDN;5! MEE)Y+H._J5'U'I7;A\1[/W9;'-6H<^L=SAXY$FC62-PZ,,A@<@UZJ::NCS6F MG9CJ8!0 4 % !0 4 % !0!K>&_#-WXKN/W3-!I:,5FNAP6QP4C]3Q@GHOUXK MAQ&)4?=AN==&A?WI;'M%E96VG64-G:0K#;PJ%1%& !7EGH$]( H * "@ H * M "@ H * "@ H * "@ H * "@ H * "@ H * .+\2_#VUU262^TJ1;&_;EUVY MAF/JP'0_[0_$&NBE7E2VV,JE*-3<\UU*PO\ 1)A#JUH]HQ.U9#S$Y_V7Z'IT MX/M7IT\1"?6S//G0G @KH,0H * "@ H 2,M/=+:6T4EQ=-]V&%2[GWP.@]SQ M6D=$=]/ M#QAK+5G7P6FH^'(4@LT_M#28E");@!9X%'93P'4#'!P1CJW2N,Z35T[4[/5; M?SK.;>H.&4J5>,_W64X*GV(!I 6Z ,W4M>T_294AN7F:5QN$<%O).X7^\5C4 MD+[GBA.[L.UE<@N?%>C6@A+732+-&)@T$$DRK&>CL44A%X/S-@<'T-.SO8+. MU_Z^X0>+-'.IMIXFG\Y91 7^R2^2)" 0OF[=F3D<;NXH2;V\_P -_P G]Q+: M7X?CM^9C9Z4W[M[]-_Q_R9*:=FNNWX?YH@M-=TR^L;:]M;I9 M+:YD\J*0*<%LD8Z<<@CG^HI\K32^?X7_ "'M?R_X8T:D H * "@ H * "@ H M * "@ H * "@ H * &2Q1S1-%+&LD;C#*PR"/0B@#D[_ .&GAVZ):TBFTUS@ M?Z&^U!CTC(*#\%%;0K5(;,SE2A+=&'/\++Q9";77(FCQPLUJ=WXLK8_\=KH6 M-FMT8O"PZ,IGX::\"0+O3R/7K+2>-ET12PD>K->R^%VDQ-OO[V\OC@?(7$29]@@#?FQK"6)JRZFL:%./0Z M[3]+L-)M_(T^SAM8LY*Q(%!/J<=3[USMW-MBW2 * ,W4-$MKZ=;M'DM+Y!A+ MJ [7QZ-V=>?NL"._7!I@4C-XM@)C73M(O%7@3M?2VY?W,8A?;_WT?Z4 %W8Z MO;:S)JFF164\ES!'#-#0W9V?5?U\ MOZ[&5-X7U:VM+>WLA:2R",AKH74UK+&Y=G)&P-YB9;(1L#C!)SP>2TLDK[[* MRNMF"LM^[=O5WWZ=BI'X-U@:]+I<]8I+^\OO2M^7Y%.Y\(Z@MQJ$-A>QPZ?=VP MMXUR1);!GS+LX((P25!Z$XZ8PDKJTO+[E>R_&WIY[N[34ENK_>[:_A=^?KHU MO#5_IEGD 4 % M !0 4 % !0 4 % !0 4 % !0 4 % !0 4 % !0 4 % !0 4 % !0 4 % 'D[ M:Q=BXU4-JKA#N-T8[]W>!/M"#R:*VH:1K+SZ58WK""0WTC-.OR;=KC<9COW MH%8X.[KP*%S+D;6K_P#DG;3S5M>BU(T:G%>6O;W=?N>MO*QN>!->N]52^M=0 MA*WEO(6F83F0*Q9@4((&PC;PO/RE3WIV7(FOZZ_\.NCTZ [J3O\ \-_71]=6 M=A4#"@ H * "@ H * "@ H * "@ H * "@ H * "@ H * "@ H * "@ H * 2"@ H * "@ H * "@ H * /_9 end GRAPHIC 12 g23397104.jpg GRAPHIC begin 644 g23397104.jpg M_]C_X 02D9)1@ ! $ 8 !@ #__@ ?3$5!1"!496-H;F]L;V=I97,@26YC M+B!6,2XP,0#_VP"$ @&!@<&!0@'!P<*"0@*#18.#0P,#1L3%! 6(!PB(1\< M'QXC*#,K(R8P)AX?+#TM,#4V.3HY(BL_0SXX0S,X.3H.$A8:' MB(F*DI.4E9:7F)F:HJ.DI::GJ*FJLK.TM;:WN+FZPL/$Q<;'R,G*TM/4U=;7 MV-G:X>+CY.7FY^CIZO'R\_3U]O?X^?H1 (! @0$ P0'!00$ $"=P ! @,1 M! 4A,08205$'87$3(C*!"!1"D:&QP0DC,U+P%6)RT0H6)#3A)?$7&!D:)BH*#A(6& MAXB)BI*3E)66EYB9FJ*CI*6FIZBIJK*SM+6VM[BYNL+#Q,7&Q\C)RM+3U-76 MU]C9VN+CY.7FY^CIZO+S]/7V]_CY^O_ !$( "H MP,!$0 "$0$#$0'_V@ , M P$ A$#$0 _ /?:0CF/%GQ!\.>#(_\ B;7P%P1N6VB&^5A_N]A[G I@>6WW M[2<*3.MAX:>2(?=>:Z"D_P# 0IQ^= [#K#]I.V>9%U#PW)%$?O/!\8P%]'OUDE09>!QMD3ZJ?YC(H$='2 * "@ H * "@ H * " M@ H * "@ H * "@ H * "@#B_B?XV_X0CPC)>0;3J%PWDVJGLQ'+8] .?KBF M,^0+V^NM2O);N]N)+BXE.YY)&RS'W-,9TFGZ#:^)O#^=(&W7K%"9K//-W$.? M,C_VU'!7N ".WNH&W1R(<$'_ #VI ?8? MPZ\8IXW\(V^IE52[0^35;W22-@=3@$G%,#5I % !0 4 % !0!5O]2L M-*M3=:C>V]G;@A3+<2K&H)Z#)(% #--UC3-9A>72]1M;Z)&VL]M,L@4^A*DX M- 'AG[2OF>?X;SCRML^/7.8\_P!*8T>"TQG36>F.^C1:_P"'KB5-0TSYKV%6 MQ)%@_+.GJG0'NI&3P1A :US90?$*RGU32[=8?$MNADO;*)<+=J.LT0[-_>7O MU'<4"V.#(P<'BF,^@_V:O/\ L7B/=G[/YD&STW8?=^FVD)GN](1\A_&O_DKF MN?\ ;#_T1'3&=W\ ?&'^C7_A.[E_@:XL]Q]OG0?^A8_WJ .1^ __ "5*T_Z] MYO\ T&@&>K>+?CWH?A_4);#3+*35IX6*2.LHBB!'4!L$G\!CWH K^&OV@]#U M:^2UU?3Y-(\QMJS&82QC_>.%*CWQ0%C9\??%RV\!ZU!ITNDR7GFP"82),% R M2,8P?2@#E;[X\V>N7,^AZ?H4K07<+PBYDN-I!*')V;3D#ZC/M0!Y3\,_%EGX M*\5MK%[%++&EM(BQQ8RS'&!ST^M SV#0/VB-*U+5H[35-'?3+>0[1<"X\T*? M]H;1@>_- K'?>-?B!HO@;3X[C47>6:;_ %-O#@O)[\G 'O\ SH \QB_:5MS< MJLWA:1+?=RZ7H9@/7;L S[9H"QZ%<_$[1O\ A7=SXQTY'O;:W**]OD)(K,ZK MM;K@C<#WH X5_P!I'318-)'X>N&N]X"PM< *5[DMM./I@_A0%C6U#X[Z9IOA M;2]2ETN1M2OXVE6P68$1J'*@M)M[[B5&49SSA2#SZ4 =E^S=_R+.M?]?:_^@"@&=M\4?!/_ F_A)[2# U"V;SK M4G RP'*DGL1^N* /D"\L[G3[N6TO('@N(F*O'(N&4CL13&='IMIJ.CZ;:>+] M N][6K[+M5&6MG.0 X[QNO?IR5/;*$:=Q;1ZA%_PF/@[=97EF1+?6$)(:U;_ M )ZQ]S$3V_AZ'B@"632XOB3;'4-(BAA\4*?]+L$(1;L?\]HQT#=V7\10&Q]& M?#CP8O@?PC!IC.)+N1C-] CK:0'R=\6#CXY:@?2:U_P#1 M4=,8GQ"T2[^&OQ-^WZ6/)MI'^UV; ?* 3\T?T!R,>A'K0!F?#%[F+Q+J$E@6 M^U)I5X8".&WB%MOXYQ0!=^"UII-[\2+6+6(X94\IVA290RM+QC@\9QDCW H MN_'BSTFR^(*QZ7'!$QM$:YCA 63] (S/B3)<2VGA"2Z.93H MD.3ZCG!_+% 'M7ACP-X=TWX30:@FEV\M_-I9NS=21AI-[1%N#VQG H \,^% M-GHM]\1--M]>$36;;ML"S5%BAE&4#-G+$=SQQ]?I0!R'Q M3M$L/B9J]I%;Q6\,3HL44:A55-BX&!TX/ZT >C?&?2/!=CX$TB;0K>PANGE7 MR&M@H:6+8UTA'*^+?AWX; M\:)NU6RQ=!=JW<)V2J/KW^A!%,9P6E_ N[\-ZU]OT7Q(KQ,#');7=KN2:(C# M1OAL,#]!^E #&^!-WI7BDZQX7\0C3HU?=%%)"9-@/5"<_,O48/;@YZT +JOP M'E;7XM8T#6X])F&V1HXX6VQR]S'\V0N>@/3UH ]>TN*_ATNWBU.XBN+U$Q+- M$FQ7/KMR<4A%N@#Q[QG\%;SQ1XZNO$<&N0VHG:)EB>W+E2B*O7<,_=S3&=?\ M1_ -OX^T*.S,ZVUY;R;X)RF[;G[P(]"/U H$"O%<6LS:U#=)'&Z M>4L!4G<,=2:!E#Q7^SW:ZAJ,M[X>U);!926-K+'F-2>NTCD#VP: *_AS]G6* MVU"*Y\0ZNMU#&03;6Z%0^.Q<\X]@/Q% 7-_XC_""?QQK=K?6NJ06,-O;K L1 MA+=">F",#D4 =W9Z"]KX'M_#QN SQ:S=C]<4A'C=M^S;((YUNO M$2%BO[IH[<_*V>X)Y&,_I3'A8]!],_A MUH"YZ'X_^&&D^.[2#S'-C?6R[(;B) <+_<9>Z^G(Q^>0#RR/]F[5C/MD\0VB MP9^\L+%O^^<@?K0%ST:7X2:=:_#._P#".DW!AEO6C>:\F7.[B/4K6[%C MJD:"-G9-R2J.@89X(SU_#TP <-:_LVW!L)_M?B"-;PX\H10DQCD9+9P3QG@8 M[4!<])^&/@";X?Z5?6&YF$H9(RFW"XQR30!W5(04 % !0 4 % !0 4 =% !0 4 % !0 4 % !0 4 % !0 4 % !0 4 ?_]D! end