Exhibit 99.1

PRESS RELEASE FOR IMMEDIATE ISSUE
| FOR: | MDC Partners Inc. | CONTACT: | Matt Chesler, CFA |
| 745 Fifth Avenue, 19th Floor | VP, Investor Relations and Finance | ||
| New York, NY 10151 | 646-412-6877 | ||
| mchesler@mdc-partners.com |
MDC
PARTNERS INC. REPORTS RESULTS FOR THE
THREE MONTHS ENDED MARCH 31, 2017
FIRST QUARTER HIGHLIGHTS:
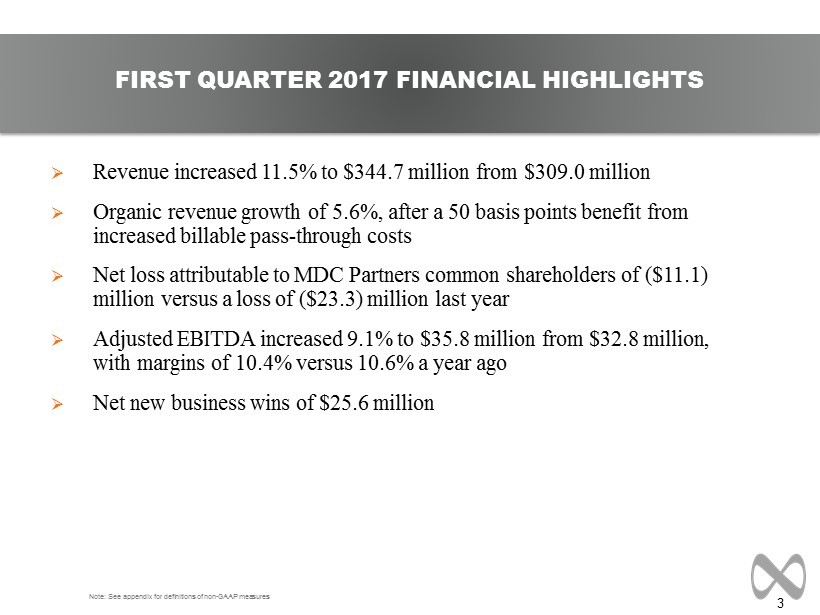
| · | Reported revenue increased 11.5% to $344.7 million |
| · | Organic revenue growth of 5.6% |
| · | Net loss attributable to MDC Partners common shareholders of ($11.1) million vs a loss of ($23.3) million last year |
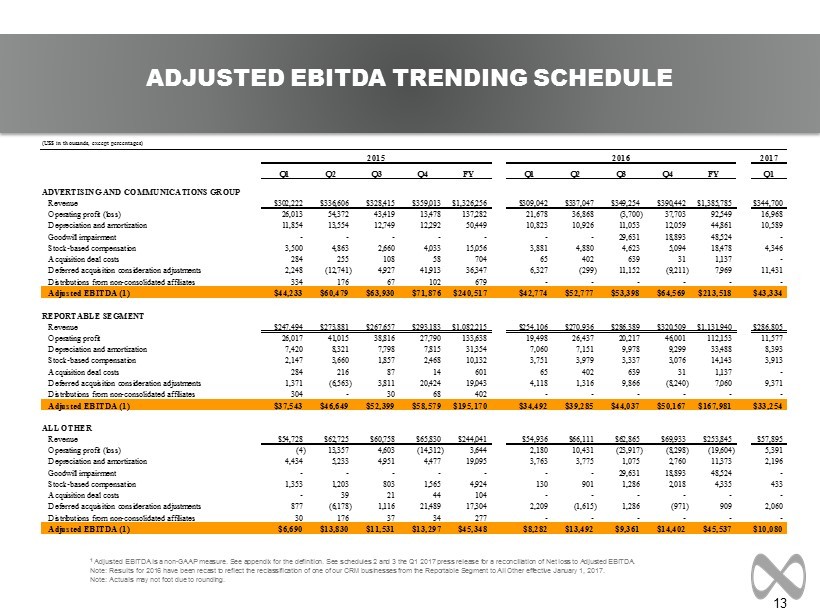
| · | Adjusted EBITDA increased 9.1% to $35.8 million, with margins of 10.4% (See Schedule 2 and 3) |
| · | Net New Business wins totaled $25.6 million in the first quarter |
New York, NY, April 27, 2017 (NASDAQ: MDCA) – MDC Partners Inc. (“MDC Partners” or the “Company”) today announced financial results for the three months ended March 31, 2017.
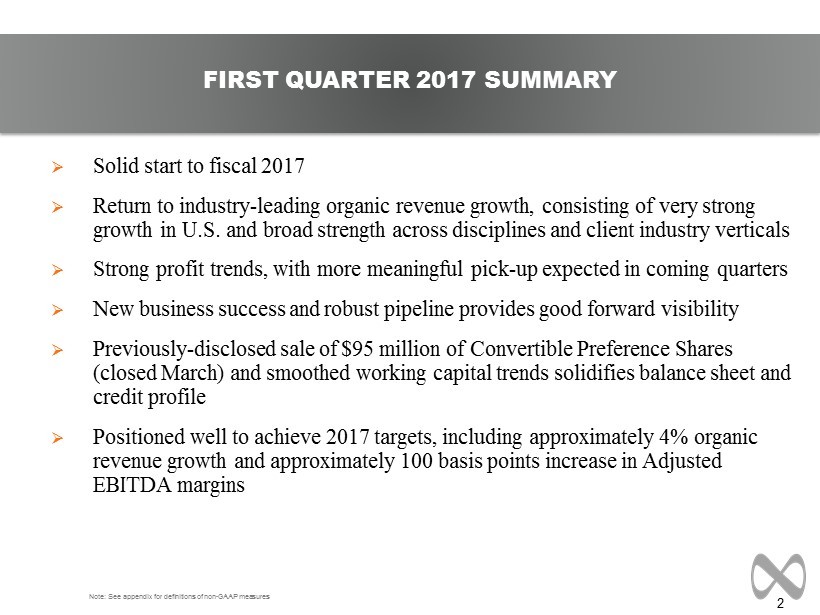
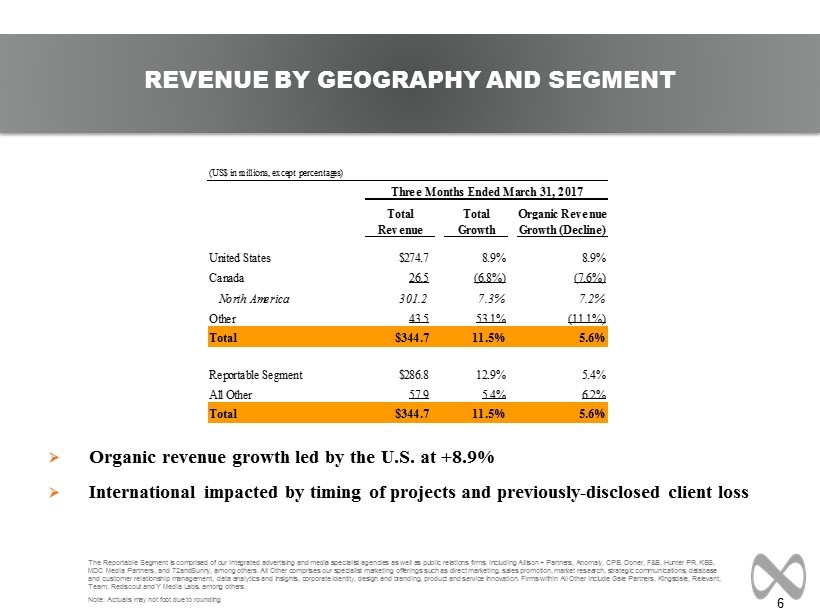
Scott Kauffman, Chairman and Chief Executive Officer of MDC Partners, said, “We are pleased to enter 2017 with renewed revenue and earnings momentum and a significantly strengthened balance sheet. Our organic revenue growth accelerated to 5.6% in the quarter with very strong 8.9% growth in the U.S. as our portfolio of world-class agencies are winning market share. In the quarter we won $26 million of net annualized revenue and the new business pipeline continues to be robust. We are excited about what the remainder of the year holds.”
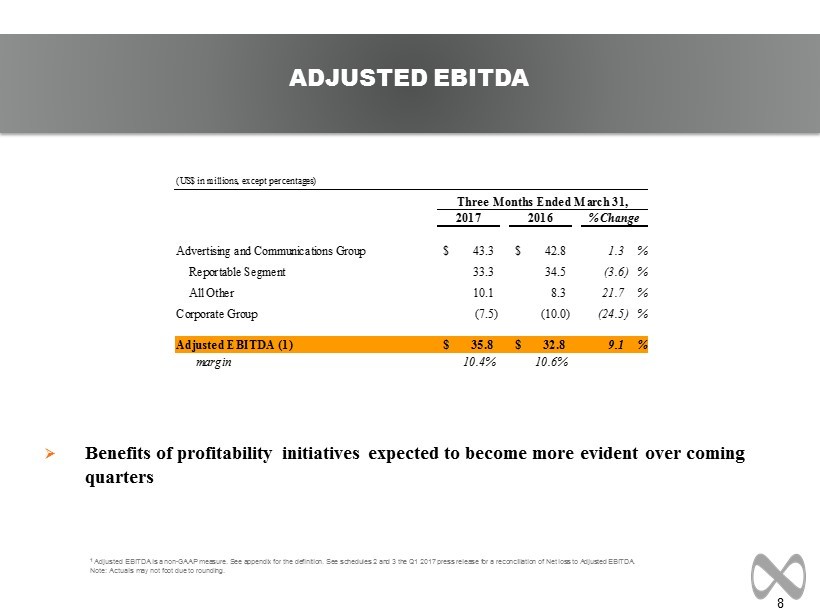
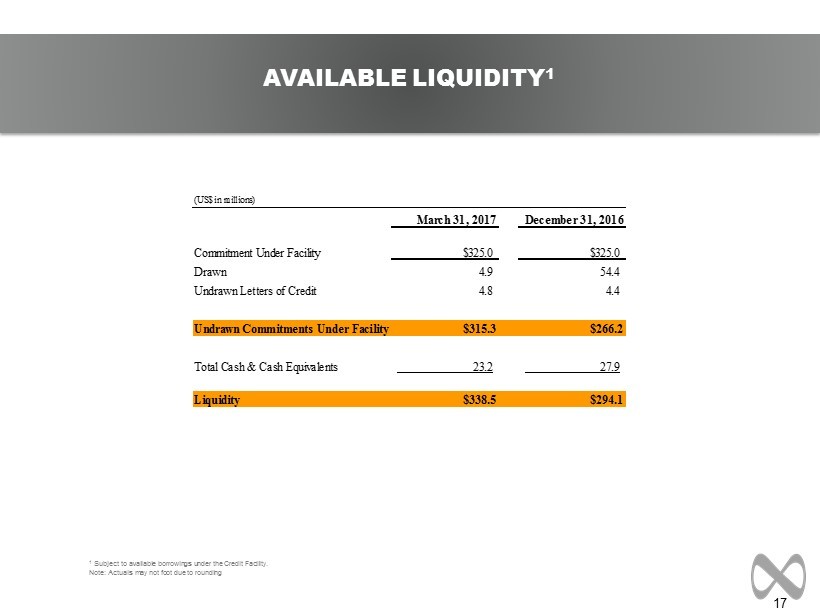
David Doft, Chief Financial Officer of MDC Partners, said, “The solid first quarter and our favorable business outlook positions us well to achieve our 2017 financial targets, including approximately 4% organic revenue growth and an improvement in Adjusted EBITDA margins of approximately 100 basis points on a full year basis. We expect the benefits of the profitability improvement initiatives we have been undertaking to become increasingly evident as we move through the year. Importantly, the completion of the previously-announced Convertible Preference Shares offering this past quarter, as well as the smoothed working capital trends we are seeing, strengthens our balance sheet and credit profile.”
First Quarter 2017 Financial Results
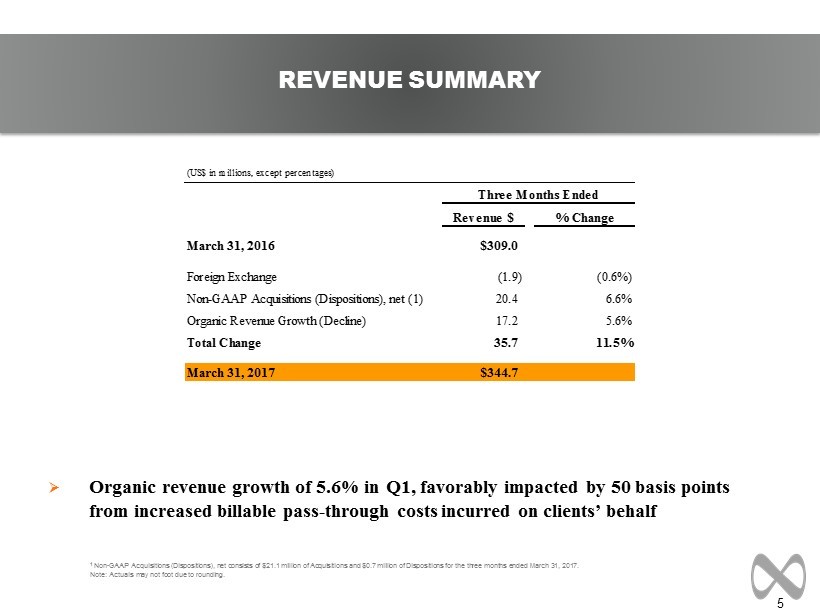
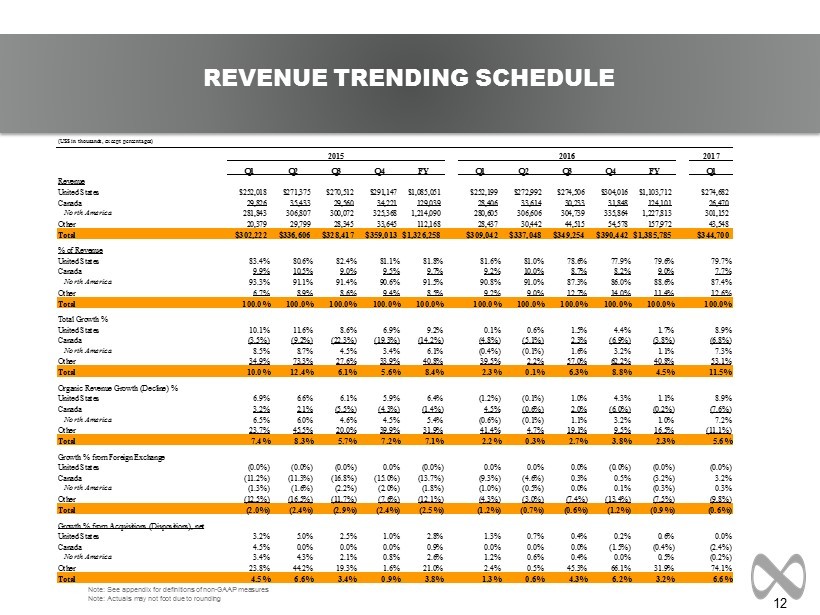
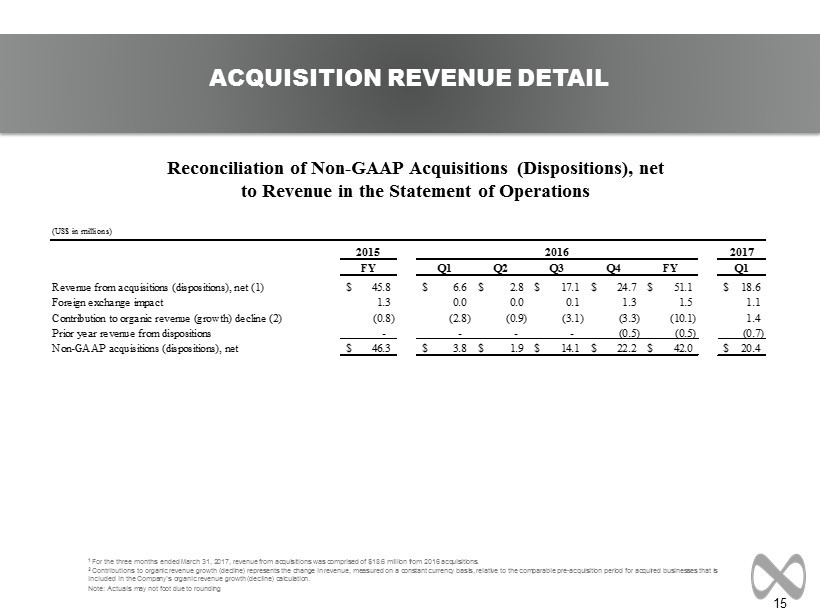
Revenue for the first quarter of 2017 was $344.7 million, an increase of 11.5%, compared to $309.0 million in the first quarter of 2016. The effect of foreign exchange was negative 0.6%, the impact of Non-GAAP acquisitions (dispositions), net was positive 6.6%, and the resulting organic revenue growth was 5.6%. Organic revenue growth for the period was favorably impacted by 50 basis points from increased billable pass-through costs incurred on clients’ behalf from certain of our partner firms acting as principal.
Page 1
Net loss attributable to MDC Partners common shareholders in the first quarter of 2017 was ($11.1) million compared to a loss of ($23.3) million in the first quarter of 2016. Diluted loss per share attributable to MDC Partners common shareholders for the first quarter of 2017 was ($0.21) compared to a loss of ($0.47) per share in the first quarter of 2016. Adjusted EBITDA for the first quarter of 2017 was $35.8 million, an increase of 9.1% compared to $32.8 million in the first quarter of 2016.
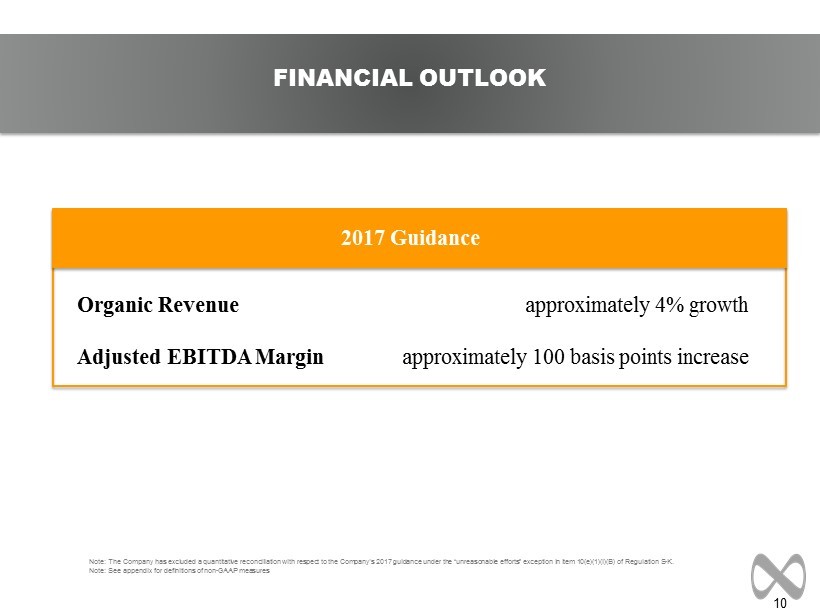
Financial Outlook
Guidance for 2017 is maintained as follows:
| 2017 Guidance | ||
| Organic Revenue | approximately 4% growth | |
| Adjusted EBITDA Margin | approximately 100 basis points increase |
* The Company has excluded a quantitative reconciliation with respect to the Company’s 2017 guidance under the “unreasonable efforts” exception in item 10(e)(1)(i)(B) of Regulation S-K.
Convertible Preference Shares
During the first quarter the Company completed the previously-announced sale of $95 million of non-voting Convertible Preference Shares to affiliates of The Goldman Sachs Group, Inc. In conjunction with the closing of the transaction, Bradley J. Gross, a managing director in the Merchant Banking Division of Goldman Sachs, joined the MDC Partners Board of Directors, which expanded to seven members.
Conference Call
Management will host a conference call on Thursday, April 27, 2017, at 4:30 p.m. (ET) to discuss results. The conference call will be accessible by dialing 1-412-902-4266 or toll free 1-888-346-6216. An investor presentation has been posted on our website www.mdc-partners.com and may be referred to during the conference call.
A recording of the conference call will be available one hour after the call until 12:00 a.m. (ET), May 4, 2017, by dialing 1-412-317-0088 or toll free 1-877-344-7529 (passcode 10105975), or by visiting our website at www.mdc-partners.com.
About MDC Partners Inc.
MDC Partners is one of the fastest-growing and most influential marketing and communications networks in the world. Its 50+ advertising, public relations, branding, digital, social and event marketing agencies are responsible for some of the most memorable and engaging campaigns for the world’s most respected brands. As "The Place Where Great Talent Lives," MDC Partners is known for its unique partnership model, empowering the most entrepreneurial and innovative talent to drive competitive advantage and business growth for clients. By leveraging technology, data analytics, insights, and strategic consulting solutions, MDC Partners drives measurable results and optimizes return on marketing investment for over 1,700 clients worldwide. For more information about MDC Partners and its partner firms, visit our website at www.mdc-partners.com and follow us on Twitter at http://www.twitter.com/mdcpartners.
Non-GAAP Financial Measures
In addition to its reported results, MDC Partners has included in this earnings release certain financial results that the Securities and Exchange Commission defines as "non-GAAP financial measures." Management believes that such non-GAAP financial measures, when read in conjunction with the Company's reported results, can provide useful supplemental information for investors analyzing period to period comparisons of the Company's results. Such non-GAAP financial measures for the three months ended March 31, 2017, include the following:
Page 2
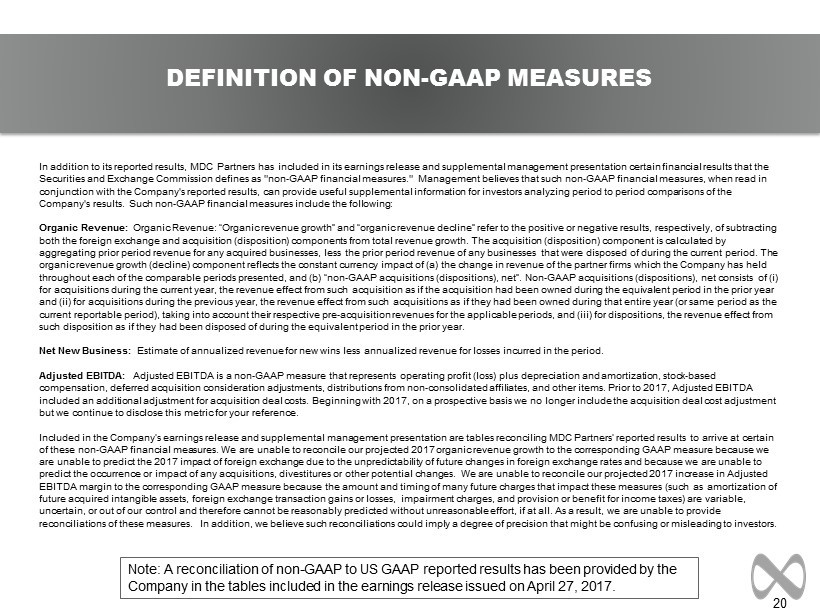
(1) Organic Revenue: “Organic revenue growth” and “organic revenue decline” refer to the positive or negative results, respectively, of subtracting both the foreign exchange and acquisition (disposition) components from total revenue growth. The acquisition (disposition) component is calculated by aggregating prior period revenue for any acquired businesses, less the prior period revenue of any businesses that were disposed of during the current period. The organic revenue growth (decline) component reflects the constant currency impact of (a) the change in revenue of the partner firms which the Company has held throughout each of the comparable periods presented, and (b) “non-GAAP acquisitions (dispositions), net”. Non-GAAP acquisitions (dispositions), net consists of (i) for acquisitions during the current year, the revenue effect from such acquisition as if the acquisition had been owned during the equivalent period in the prior year and (ii) for acquisitions during the previous year, the revenue effect from such acquisitions as if they had been owned during that entire year (or same period as the current reportable period), taking into account their respective pre-acquisition revenues for the applicable periods, and (iii) for dispositions, the revenue effect from such disposition as if they had been disposed of during the equivalent period in the prior year.
(2) Net New Business: Estimate of annualized revenue for new wins less annualized revenue for losses incurred in the period.
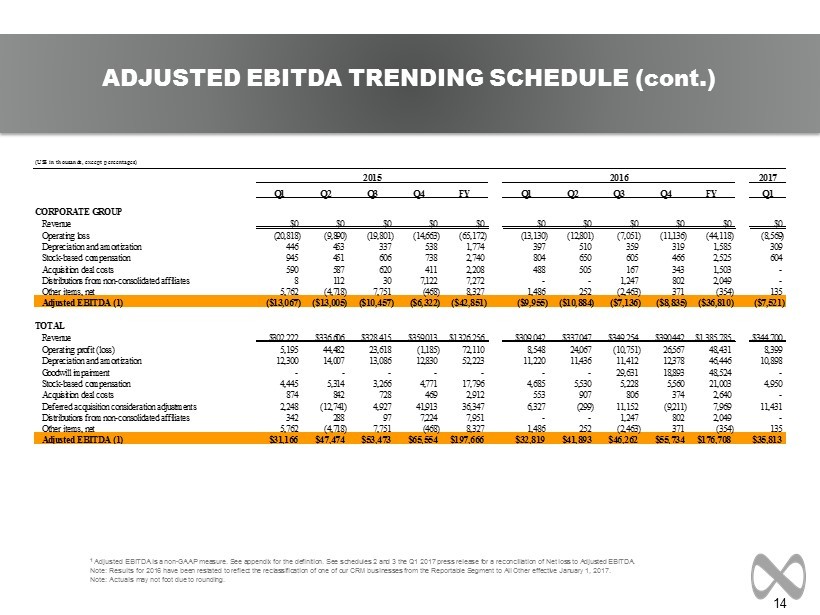
(3) Adjusted EBITDA: Adjusted EBITDA is a non-GAAP measure that represents operating profit plus depreciation and amortization, stock-based compensation, deferred acquisition consideration adjustments, distributions from non-consolidated affiliates, and other items. Prior to 2017, Adjusted EBITDA included an additional adjustment for acquisition deal costs. Beginning with 2017, on a prospective basis we no longer include the acquisition deal cost adjustment but we continue to disclose this metric on Schedule 6 for your reference.
Included in this earnings release are tables reconciling MDC Partners’ reported results to arrive at certain of these non-GAAP financial measures. We are unable to reconcile our projected 2017 organic revenue growth to the corresponding GAAP measure because we are unable to predict the 2017 impact of foreign exchange due to the unpredictability of future changes in foreign exchange rates and because we are unable to predict the occurrence or impact of any acquisitions, dispositions, or other potential changes. We are unable to reconcile our projected 2017 increase in Adjusted EBITDA margin to the corresponding GAAP measure because the amount and timing of many future charges that impact these measures (such as amortization of future acquired intangible assets, foreign exchange transaction gains or losses, impairment charges, provision or benefit for income taxes, and certain assumptions used in the calculation of deferred acquisition consideration) are variable, uncertain, or out of our control and therefore cannot be reasonably predicted without unreasonable effort, if at all. As a result, we are unable to provide reconciliations of these measures. In addition, we believe such reconciliations could imply a degree of precision that might be confusing or misleading to investors.
Page 3
This press release contains forward-looking statements. The Company’s representatives may also make forward-looking statements orally from time to time. Statements in this press release that are not historical facts, including statements about the Company’s beliefs and expectations, earnings guidance, recent business and economic trends, potential acquisitions, and estimates of amounts for redeemable noncontrolling interests and deferred acquisition consideration, constitute forward-looking statements. These statements are based on current plans, estimates and projections, and are subject to change based on a number of factors, including those outlined in this section. Forward-looking statements speak only as of the date they are made, and the Company undertakes no obligation to update publicly any of them in light of new information or future events, if any.
Forward-looking statements involve inherent risks and uncertainties. A number of important factors could cause actual results to differ materially from those contained in any forward-looking statements. Such risk factors include, but are not limited to, the following:
| · | risks associated with severe effects of international, national and regional economic conditions; |
| · | the Company’s ability to attract new clients and retain existing clients; |
| · | the spending patterns and financial success of the Company’s clients; |
| · | the Company’s ability to retain and attract key employees; |
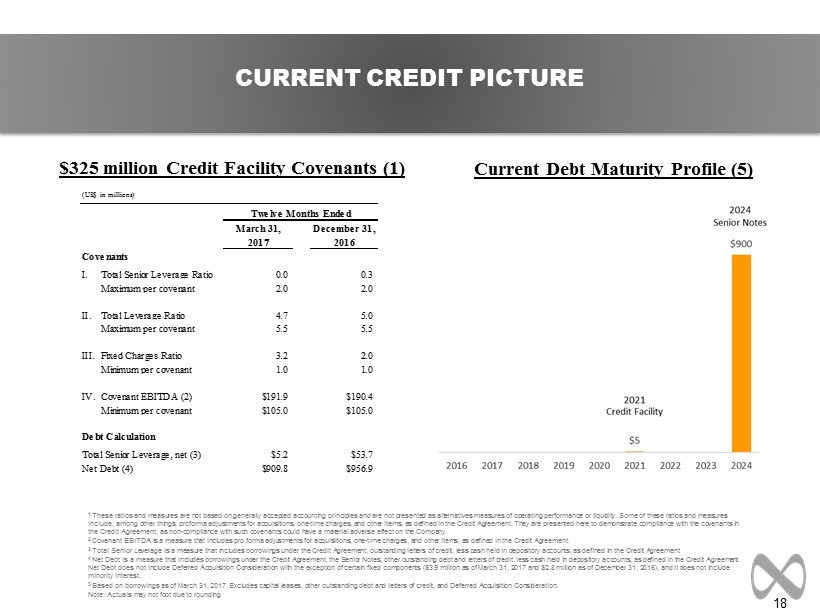
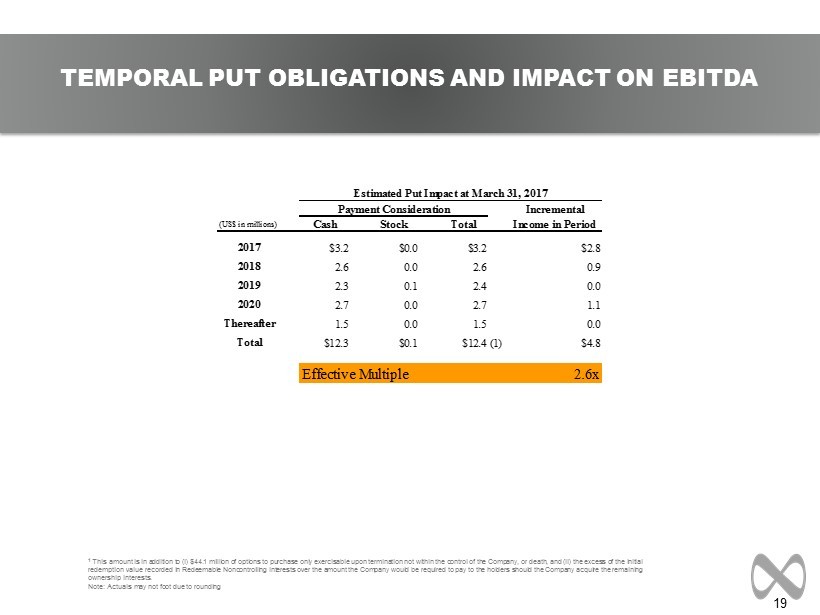
| · | the Company’s ability to remain in compliance with its debt agreements and the Company’s ability to finance its contingent payment obligations when due and payable, including but not limited to those relating to redeemable noncontrolling interests and deferred acquisition consideration; |
| · | the successful completion and integration of acquisitions which complement and expand the Company’s business capabilities; |
| · | foreign currency fluctuations; and |
| · | risks associated with the one Canadian securities class action litigation claim. |
The Company’s business strategy includes ongoing efforts to engage in acquisitions of ownership interests in entities in the marketing communications services industry. The Company intends to finance these acquisitions by using available cash from operations, from borrowings under its credit facility and through incurrence of bridge or other debt financing, any of which may increase the Company’s leverage ratios, or by issuing equity, which may have a dilutive impact on existing shareholders proportionate ownership. At any given time, the Company may be engaged in a number of discussions that may result in one or more acquisitions. These opportunities require confidentiality and may involve negotiations that require quick responses by the Company. Although there is uncertainty that any of these discussions will result in definitive agreements or the completion of any transactions, the announcement of any such transaction may lead to increased volatility in the trading price of the Company’s securities.
Investors should carefully consider these risk factors and the additional risk factors outlined in more detail in the Annual Report on Form 10-K under the caption “Risk Factors” and in the Company’s other SEC filings.
Page 4
SCHEDULE 1
MDC PARTNERS INC.
UNAUDITED CONSOLIDATED STATEMENTS OF OPERATIONS
(US$ in 000s, except share and per share amounts)
| Three Months Ended March 31, | ||||||||
| 2017 | 2016 | |||||||
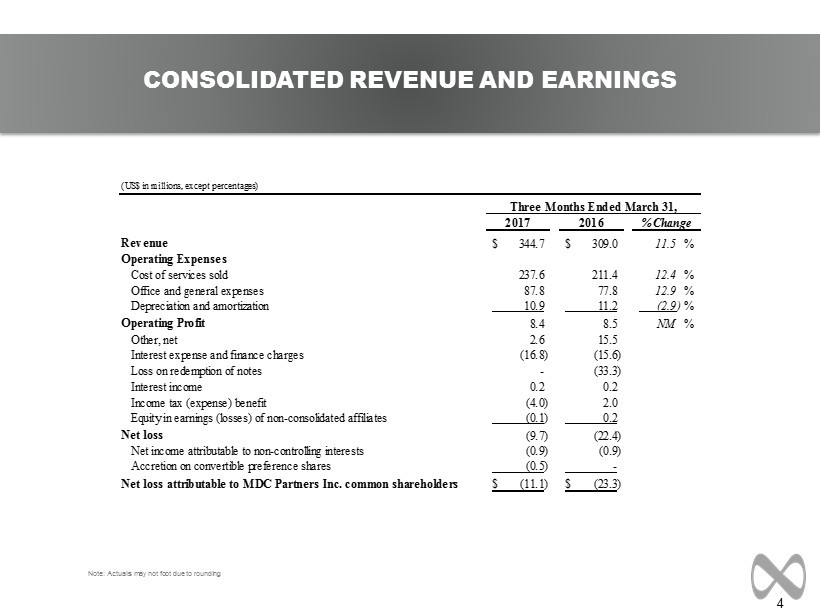
| Revenue | $ | 344,700 | $ | 309,042 | ||||
| Operating expenses: | ||||||||
| Cost of services sold | 237,563 | 211,446 | ||||||
| Office and general expenses | 87,840 | 77,828 | ||||||
| Depreciation and amortization | 10,898 | 11,220 | ||||||
| 336,301 | 300,494 | |||||||
| Operating profit | 8,399 | 8,548 | ||||||
| Other income (expense): | ||||||||
| Other, net | 2,567 | 15,512 | ||||||
| Interest expense and finance charges | (16,768 | ) | (15,575 | ) | ||||
| Loss on redemption of notes | - | (33,298 | ) | |||||
| Interest income | 227 | 178 | ||||||
| (13,974 | ) | (33,183 | ) | |||||
| Loss before income taxes and equity in earnings of non-consolidated affiliates | (5,575 | ) | (24,635 | ) | ||||
| Income tax expense (benefit) | 3,969 | (1,972 | ) | |||||
| Loss before equity in earnings of non-consolidated affiliates | (9,544 | ) | (22,663 | ) | ||||
| Equity in earnings (losses) of non-consolidated affiliates | (139 | ) | 229 | |||||
| Net loss | (9,683 | ) | (22,434 | ) | ||||
| Net income attributable to the noncontrolling interests | (883 | ) | (859 | ) | ||||
| Net loss attributable to MDC Partners Inc. | (10,566 | ) | (23,293 | ) | ||||
| Accretion on convertible preference shares | (507 | ) | - | |||||
| Net loss attributable to MDC Partners Inc. common | ||||||||
| shareholders | $ | (11,073 | ) | $ | (23,293 | ) | ||
| Loss per common share: | ||||||||
| Basic and diluted: | ||||||||
| Net loss attributable to MDC Partners Inc. common | ||||||||
| shareholders | $ | (0.21 | ) | $ | (0.47 | ) | ||
| Weighted average number of common shares outstanding: | ||||||||
| Basic and diluted | 52,998,244 | 50,002,552 | ||||||
Page 5
SCHEDULE 2
MDC PARTNERS INC.
UNAUDITED RECONCILIATION OF NET INCOME (LOSS) TO ADJUSTED EBITDA
(US$ in 000s, except percentages)
For the Three Months Ended March 31, 2017
| Advertising and | Reportable | |||||||||||||||||||
| Communications | Segment | All Other | Corporate | Total | ||||||||||||||||
| Revenue | $ | 344,700 | $ | 286,805 | $ | 57,895 | $ | - | $ | 344,700 | ||||||||||
| Net loss attributable to MDC Partners Inc. | $ | (10,566 | ) | |||||||||||||||||
| Adjustments to reconcile to operating profit (loss): | ||||||||||||||||||||
| Net income attributable to the noncontrolling interests | 883 | |||||||||||||||||||
| Equity in losses of non-consolidated affiliates | 139 | |||||||||||||||||||
| Income tax expense | 3,969 | |||||||||||||||||||
| Interest expense and finance charges, net | 16,541 | |||||||||||||||||||
| Other, net | (2,567 | ) | ||||||||||||||||||
| Operating profit (loss) | $ | 16,968 | $ | 11,577 | $ | 5,391 | $ | (8,569 | ) | $ | 8,399 | |||||||||
| margin | 4.9 | % | 4.0 | % | 9.3 | % | 2.4 | % | ||||||||||||
| Additional adjustments to reconcile to Adjusted EBITDA: | ||||||||||||||||||||
| Depreciation and amortization | 10,589 | 8,393 | 2,196 | 309 | 10,898 | |||||||||||||||
| Stock-based compensation | 4,346 | 3,913 | 433 | 604 | 4,950 | |||||||||||||||
| Deferred acquisition consideration adjustments | 11,431 | 9,371 | 2,060 | - | 11,431 | |||||||||||||||
| Other items, net ** | - | - | - | 135 | 135 | |||||||||||||||
| Adjusted EBITDA * | $ | 43,334 | $ | 33,254 | $ | 10,080 | $ | (7,521 | ) | $ | 35,813 | |||||||||
| margin | 12.6 | % | 11.6 | % | 17.4 | % | 10.4 | % | ||||||||||||
| * | Adjusted EBITDA is a non-GAAP measure, but as shown above it represents operating profit (loss) plus depreciation and amortization, stock-based compensation, deferred acquisition consideration adjustments, distributions from non-consolidated affiliates, and other items. Prior to 2017, Adjusted EBITDA included an additional adjustment for acquisition deal costs. Beginning with 2017, on a prospective basis, we no longer include the acquisition deal cost adjustment but we continue to disclose this metric on Schedule 6 for your reference. |
| ** | Other items, net includes (i) one-time gains related to the former CEO's repayment to the Company for certain perquisites and expenses, (ii) legal fees and related expenses, net of insurance proceeds, relating to the SEC investigation and related class action litigation claims, (iii) one-time charge for the balance of prior cash bonus award amounts paid to the former CEO and CAO that will not be recovered, (iv) write-off of certain assets related to the former CEO and CAO termination, and (v) a one-time penalty relating to the final settlement of the SEC investigation. See Schedule 6 for reconciliation of amounts. |
Page 6
SCHEDULE 3
MDC PARTNERS INC.
UNAUDITED RECONCILIATION OF NET INCOME (LOSS) TO ADJUSTED EBITDA
(US$ in 000s, except percentages)
For the Three Months Ended March 31, 2016
| Advertising and | Reportable | |||||||||||||||||||
| Communications | Segment | All Other | Corporate | Total | ||||||||||||||||
| Revenue | $ | 309,042 | $ | 254,106 | $ | 54,936 | $ | - | $ | 309,042 | ||||||||||
| Net loss attributable to MDC Partners Inc. | $ | (23,293 | ) | |||||||||||||||||
| Adjustments to reconcile to operating profit (loss): | ||||||||||||||||||||
| Net income attributable to the noncontrolling interests | 859 | |||||||||||||||||||
| Equity in earnings of non-consolidated affiliates | (229 | ) | ||||||||||||||||||
| Income tax benefit | (1,972 | ) | ||||||||||||||||||
| Interest expense and finance charges, net | 15,397 | |||||||||||||||||||
| Loss on redemption of notes | 33,298 | |||||||||||||||||||
| Other, net | (15,512 | ) | ||||||||||||||||||
| Operating profit (loss) | $ | 21,678 | $ | 19,498 | $ | 2,180 | $ | (13,130 | ) | $ | 8,548 | |||||||||
| margin | 7.0 | % | 7.7 | % | 4.0 | % | 2.8 | % | ||||||||||||
| Additional adjustments to reconcile to Adjusted EBITDA: | ||||||||||||||||||||
| Depreciation and amortization | 10,823 | 7,060 | 3,763 | 397 | 11,220 | |||||||||||||||
| Stock-based compensation | 3,881 | 3,751 | 130 | 804 | 4,685 | |||||||||||||||
| Acquisition deal costs | 65 | 65 | - | 488 | 553 | |||||||||||||||
| Deferred acquisition consideration adjustments | 6,327 | 4,118 | 2,209 | - | 6,327 | |||||||||||||||
| Other items, net ** | - | - | - | 1,486 | 1,486 | |||||||||||||||
| Adjusted EBITDA * | $ | 42,774 | $ | 34,492 | $ | 8,282 | $ | (9,955 | ) | $ | 32,819 | |||||||||
| margin | 13.8 | % | 13.6 | % | 15.1 | % | 10.6 | % | ||||||||||||
| * | Adjusted EBITDA is a non-GAAP measure, but as shown above it represents operating profit (loss) plus depreciation and amortization, stock-based compensation, acquisition deal costs, deferred acquisition consideration adjustments, distributions from non-consolidated affiliates, and other items. Beginning with 2017, on a prospective basis, we no longer include an adjustment for acquisition deal costs in our Adjusted EBITDA measure. For your reference, we continue to disclose this metric on Schedule 6. |
| ** | Other items, net includes (i) one-time gains related to the former CEO's repayment to the Company for certain perquisites and expenses, (ii) legal fees and related expenses, net of insurance proceeds, relating to the SEC investigation and related class action litigation claims, (iii) one-time charge for the balance of prior cash bonus award amounts paid to the former CEO and CAO that will not be recovered, (iv) write-off of certain assets related to the former CEO and CAO termination, and (v) a one-time penalty relating to the final settlement of the SEC investigation. See Schedule 6 for reconciliation of amounts. |
Note: Results for 2016 have been recasted to reflect the reclassification of one of our CRM businesses from the Reportable Segment to All Other effective January 1, 2017.
Page 7
SCHEDULE 4
MDC PARTNERS INC.
UNAUDITED CONSOLIDATED BALANCE SHEETS
(US$ in 000s)
| March 31, | December 31, | |||||||
| 2017 | 2016 | |||||||
| (Unaudited) | ||||||||
| Assets | ||||||||
| Current assets: | ||||||||
| Cash and cash equivalents | $ | 23,186 | $ | 27,921 | ||||
| Cash held in trusts | 5,377 | 5,341 | ||||||
| Accounts receivable, net | 428,195 | 388,340 | ||||||
| Expenditures billable to clients | 37,071 | 33,118 | ||||||
| Other current assets | 38,606 | 34,862 | ||||||
| Total current assets | 532,435 | 489,582 | ||||||
| Fixed assets, net | 82,228 | 78,377 | ||||||
| Investments in non-consolidated affiliates | 4,606 | 4,745 | ||||||
| Goodwill | 846,124 | 844,759 | ||||||
| Other intangible assets, net | 80,968 | 85,071 | ||||||
| Deferred tax assets | 41,539 | 41,793 | ||||||
| Other assets | 38,753 | 33,051 | ||||||
| Total assets | $ | 1,626,653 | $ | 1,577,378 | ||||
| Liabilities, redeemable noncontrolling interests, and shareholders' deficit | ||||||||
| Current liabilities: | ||||||||
| Accounts payable | $ | 252,146 | $ | 251,456 | ||||
| Trust liability | 5,377 | 5,341 | ||||||
| Accruals and other liabilities | 294,341 | 303,581 | ||||||
| Advance billings | 148,679 | 133,925 | ||||||
| Current portion of long-term debt | 260 | 228 | ||||||
| Current portion of deferred acquisition consideration | 111,612 | 108,290 | ||||||
| Total current liabilities | 812,415 | 802,821 | ||||||
| Long-term debt, less current portion | 887,270 | 936,208 | ||||||
| Long-term portion of deferred acquisition consideration | 123,758 | 121,274 | ||||||
| Other liabilities | 54,611 | 56,012 | ||||||
| Deferred tax liabilities | 105,402 | 103,443 | ||||||
| Total liabilities | 1,983,456 | 2,019,758 | ||||||
| Redeemable noncontrolling interests | 60,383 | 60,180 | ||||||
| Shareholders' deficit | ||||||||
| Convertible preference shares (liquidation preference $95,507) | 90,220 | - | ||||||
| Common shares | 323,023 | 317,784 | ||||||
| Shares to be issued | - | 2,360 | ||||||
| Charges in excess of capital | (308,808 | ) | (311,581 | ) | ||||
| Accumulated deficit | (585,498 | ) | (574,932 | ) | ||||
| Accumulated other comprehensive loss | (2,021 | ) | (1,824 | ) | ||||
| MDC Partners Inc. shareholders' deficit | (483,084 | ) | (568,193 | ) | ||||
| Noncontrolling interests | 65,898 | 65,633 | ||||||
| Total shareholders' deficit | (417,186 | ) | (502,560 | ) | ||||
| Total liabilities, redeemable noncontrolling interests, and shareholders' deficit | $ | 1,626,653 | $ | 1,577,378 | ||||
Page 8
SCHEDULE 5
MDC PARTNERS INC.
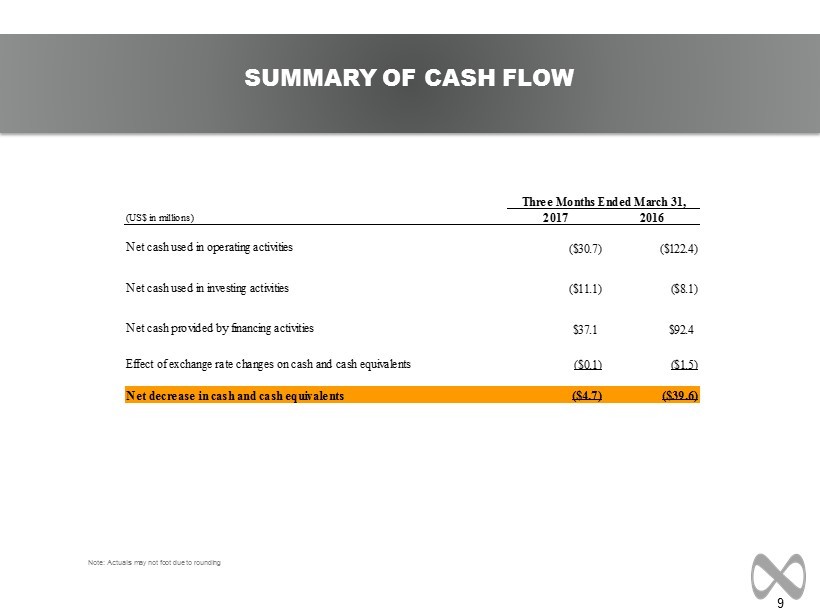
UNAUDITED SUMMARY CASH FLOW DATA
(US$ in 000s)
| Three Months Ended March 31, | ||||||||
| 2017 | 2016 | |||||||
| Net cash used in operating activities | $ | (30,676 | ) | $ | (122,416 | ) | ||
| Net cash used in investing activities | (11,090 | ) | (8,128 | ) | ||||
| Net cash provided by financing activities | 37,089 | 92,443 | ||||||
| Effect of exchange rate changes on cash and cash equivalents | (58 | ) | (1,517 | ) | ||||
| Net decrease in cash and cash equivalents | $ | (4,735 | ) | $ | (39,618 | ) | ||
Page 9
SCHEDULE 6
MDC PARTNERS INC.
UNAUDITED RECONCILIATION OF COMPONENTS OF NON-GAAP MEASURES
(US$ in 000s)
| 2016 | 2017 | |||||||||||||||||||||||
| Q1 | Q2 | Q3 | Q4 | FY | Q1 | |||||||||||||||||||
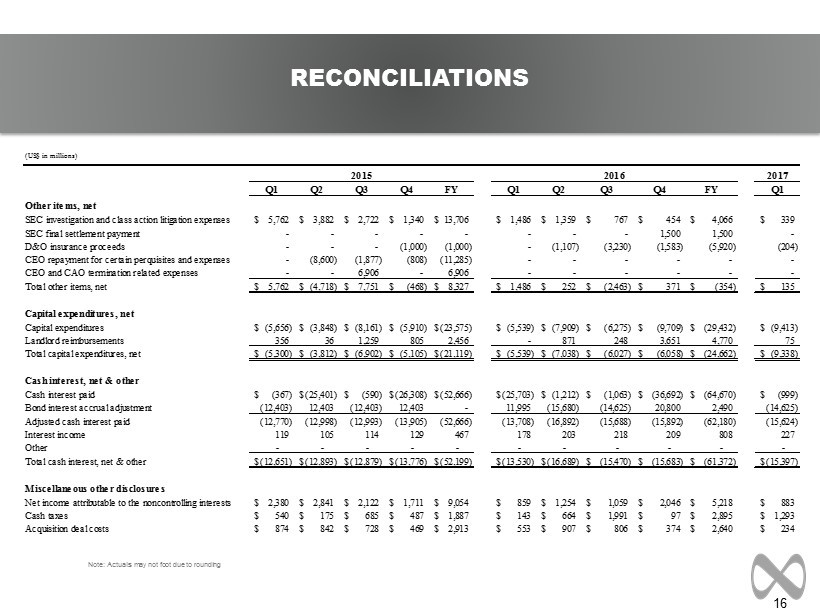
| OTHER ITEMS, NET | ||||||||||||||||||||||||
| SEC investigation and class action litigation expenses | $ | 1,486 | $ | 1,359 | $ | 767 | $ | 454 | $ | 4,066 | $ | 339 | ||||||||||||
| SEC final settlement payment | - | - | - | 1,500 | 1,500 | - | ||||||||||||||||||
| D&O insurance proceeds | - | (1,107 | ) | (3,230 | ) | (1,583 | ) | (5,920 | ) | (204 | ) | |||||||||||||
| CEO repayment for certain perquisites and expenses | - | - | - | - | - | - | ||||||||||||||||||
| CEO and CAO termination related expenses | - | - | - | - | - | - | ||||||||||||||||||
| Total other items, net | $ | 1,486 | $ | 252 | $ | (2,463 | ) | $ | 371 | $ | (354 | ) | $ | 135 | ||||||||||
| 2016 | 2017 | |||||||||||||||||||||||
| Q1 | Q2 | Q3 | Q4 | FY | Q1 | |||||||||||||||||||
| CAPITAL EXPENDITURES, NET | ||||||||||||||||||||||||
| Capital expenditures | $ | (5,539 | ) | $ | (7,909 | ) | $ | (6,275 | ) | $ | (9,709 | ) | $ | (29,432 | ) | $ | (9,413 | ) | ||||||
| Landlord reimbursements | - | 871 | 248 | 3,651 | 4,770 | 75 | ||||||||||||||||||
| Total capital expenditures, net | $ | (5,539 | ) | $ | (7,038 | ) | $ | (6,027 | ) | $ | (6,058 | ) | $ | (24,662 | ) | $ | (9,338 | ) | ||||||
| 2016 | 2017 | |||||||||||||||||||||||
| Q1 | Q2 | Q3 | Q4 | FY | Q1 | |||||||||||||||||||
| CASH INTEREST, NET & OTHER | ||||||||||||||||||||||||
| Cash interest paid | $ | (25,703 | ) | $ | (1,212 | ) | $ | (1,063 | ) | $ | (36,692 | ) | $ | (64,670 | ) | $ | (999 | ) | ||||||
| Bond interest accrual adjustment | 11,995 | (15,680 | ) | (14,625 | ) | 20,800 | 2,490 | (14,625 | ) | |||||||||||||||
| Adjusted cash interest paid | (13,708 | ) | (16,892 | ) | (15,688 | ) | (15,892 | ) | (62,180 | ) | (15,624 | ) | ||||||||||||
| Interest income | 178 | 203 | 218 | 209 | 808 | 227 | ||||||||||||||||||
| Total cash interest, net & other | $ | (13,530 | ) | $ | (16,689 | ) | $ | (15,470 | ) | $ | (15,683 | ) | $ | (61,372 | ) | $ | (15,397 | ) | ||||||
| 2016 | 2017 | |||||||||||||||||||||||
| Q1 | Q2 | Q3 | Q4 | FY | Q1 | |||||||||||||||||||
| MISCELLANEOUS OTHER DISCLOSURES | ||||||||||||||||||||||||
| Net income attributable to the noncontrolling interests | $ | 859 | $ | 1,254 | $ | 1,059 | $ | 2,046 | $ | 5,218 | $ | 883 | ||||||||||||
| Cash taxes | $ | 143 | $ | 664 | $ | 1,991 | $ | 97 | $ | 2,895 | $ | 1,293 | ||||||||||||
| Acquisition deal costs | $ | 553 | $ | 907 | $ | 806 | $ | 374 | $ | 2,640 | $ | 234 | ||||||||||||
Note: Actuals may not foot due to rounding
Page 10