PRESS RELEASE FOR IMMEDIATE ISSUE
| FOR: | MDC Partners Inc. | CONTACT: | Matt Chesler, CFA | |
| 745 Fifth Avenue, 19th Floor | VP, Investor Relations | |||
| New York, NY 10151 | 646-412-6877 | |||
| mchesler@mdc-partners.com |
MDC
PARTNERS INC. REPORTS STRONG RESULTS FOR THE
THREE AND SIX MONTHS ENDED JUNE 30, 2014
INCREASED 2014 GUIDANCE FOR ADJUSTED EBITDA OF $184 TO $188 MILLION IMPLIES YEAR-OVER-YEAR GROWTH OF +15.4% TO +17.9% AND MARGIN IMPROVEMENT OF 90 BASIS POINTS
INCREASED 2014 GUIDANCE FOR ADJUSTED EBITDA AVAILABLE FOR GENERAL CAPITAL PURPOSES OF $108 TO $112 MILLION IMPLIES YEAR-OVER-YEAR GROWTH OF +18.0% TO +22.3%
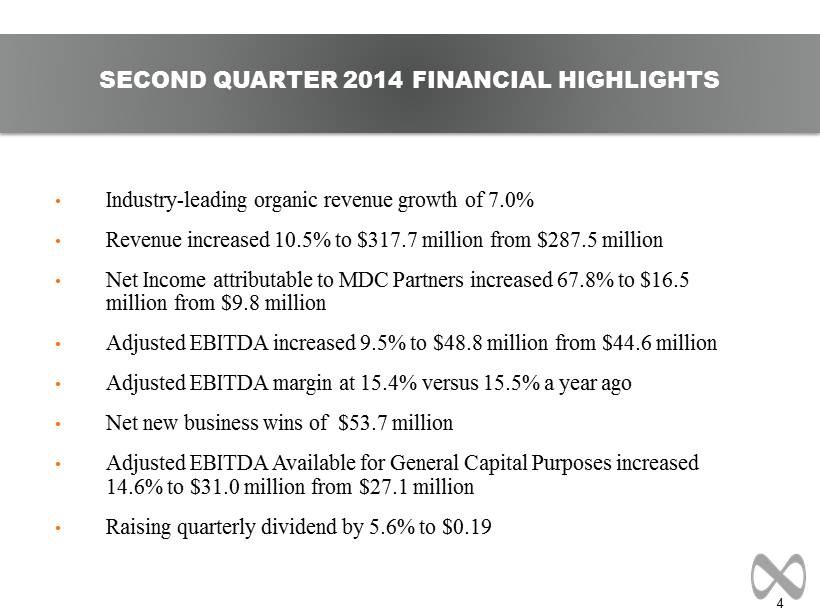
QUARTERLY DIVIDEND INCREASED 5.6% TO $0.19
SECOND QUARTER HIGHLIGHTS:
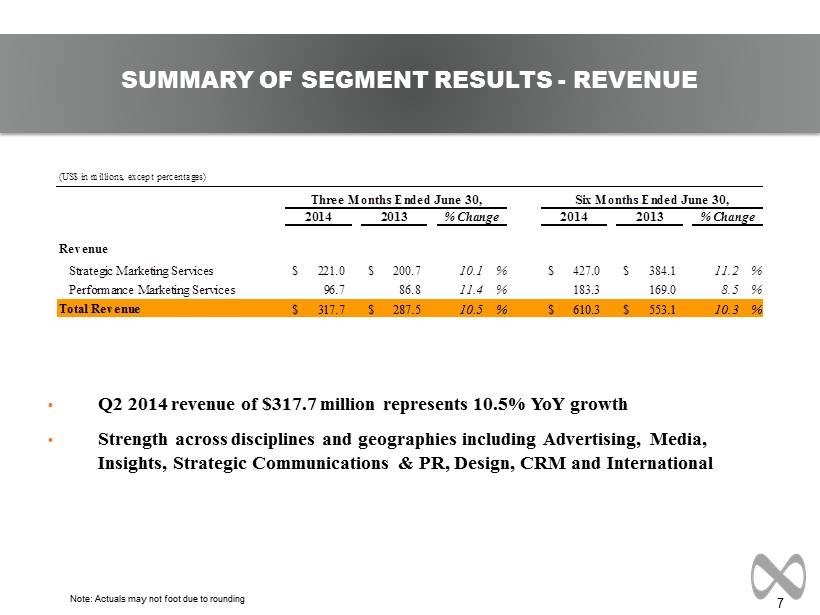
| · | Revenue increased to $317.7 million from $287.5 million, an increase of 10.5% |
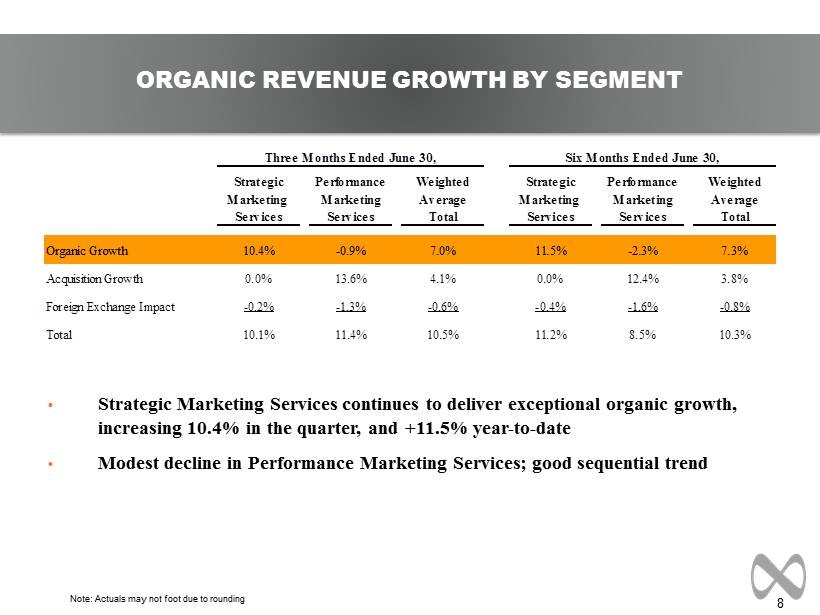
| · | Organic revenue increased 7.0% |
| · | Net Income attributable to MDC Partners increased to $16.5 million from $9.8 million, an increase of 67.8% |
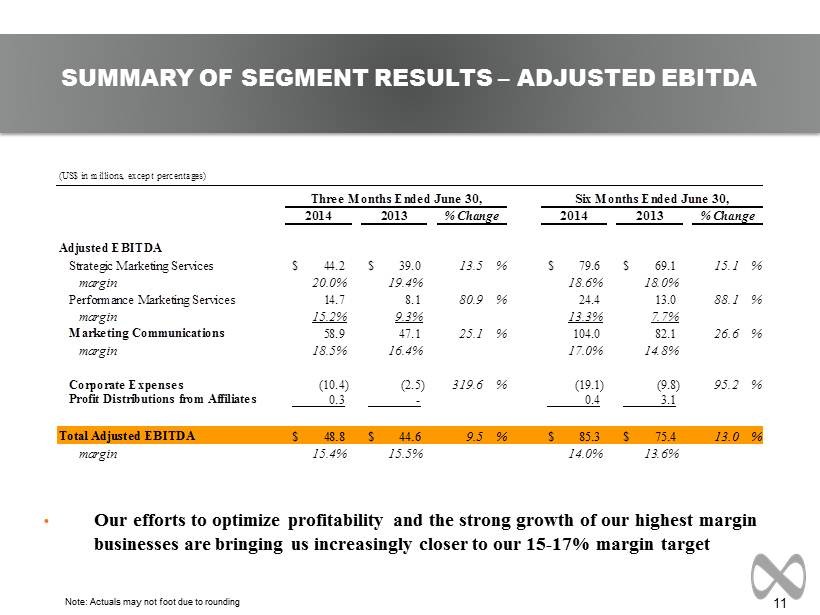
| · | Adjusted EBITDA increased to $48.8 million from $44.6 million, an increase of 9.5% (see Schedules 2 and 3) |
| · | Adjusted EBITDA margin of 15.4% versus 15.5% |
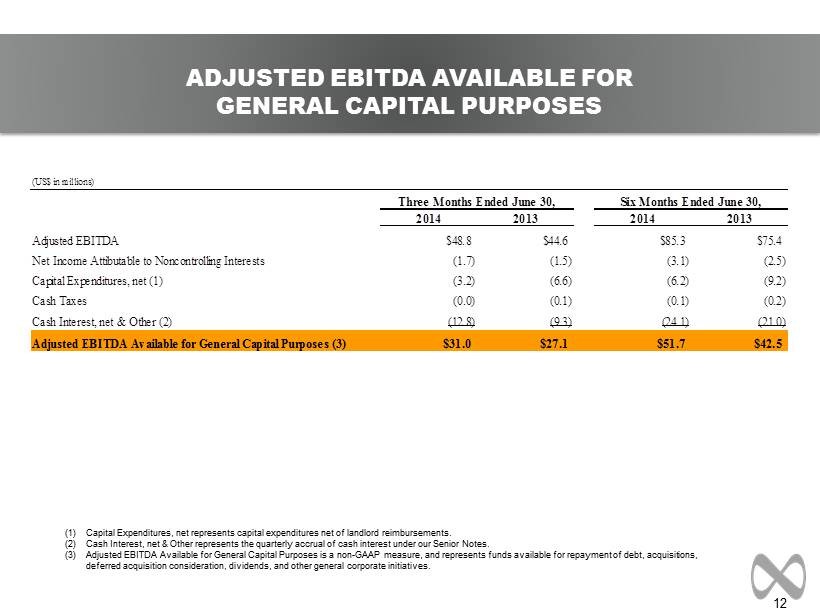
| · | Adjusted EBITDA Available for General Capital Purposes increased to $31.0 million from $27.1 million, an increase of 14.6% (see Schedule 6) |
| · | Net New Business wins totaled a record $53.7 million |
YEAR-TO-DATE HIGHLIGHTS:
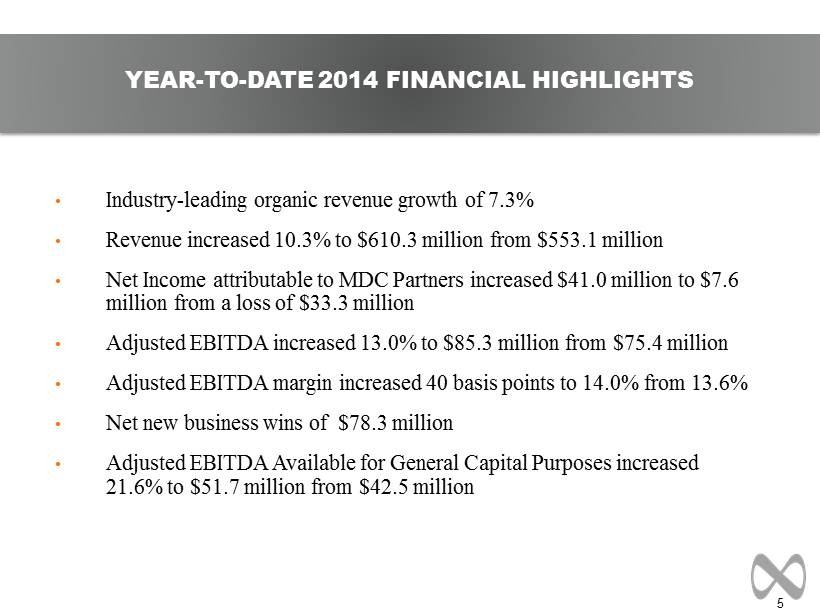
| · | Revenue increased to $610.3 million from $553.1 million, an increase of 10.3% |
| · | Organic revenue increased 7.3% |
| · | Net Income attributable to MDC Partners increased $41.0 million to $7.6 million from a loss of $33.3 million |
| · | Adjusted EBITDA increased to $85.3 million from $75.4 million, an increase of 13.0% (see Schedules 4 and 5) |
| · | Adjusted EBITDA margin increased 40 basis points to 14.0% from 13.6% |
| · | Adjusted EBITDA Available for General Capital Purposes increased to $51.7 million from $42.5 million, an increase of 21.6% (see Schedule 6) |
| · | Net New Business wins totaled $78.3 million |
NEW YORK, NY (July 24, 2014) – MDC Partners Inc. (NASDAQ: MDCA; TSX: MDZ.A) today announced financial results for the three and six months ended June 30, 2014.
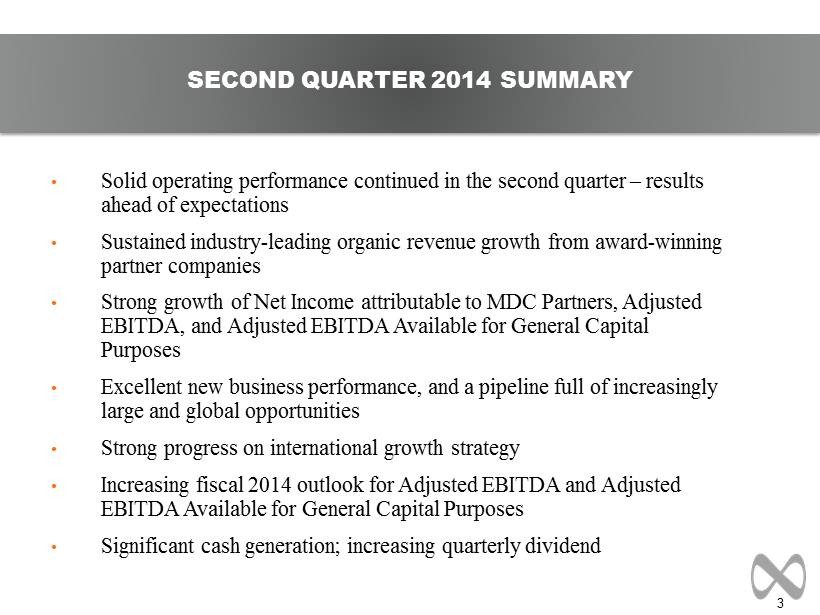
Miles S. Nadal, Chairman and Chief Executive Officer of MDC Partners, said, “We delivered very strong results in the second quarter. It’s clear that our business model is unique and increasing the return on marketing investment for clients, and increasing the sustainable profitable growth rate of our business. Organic revenue grew 7.0% and Adjusted EBITDA increased 9.5%, representing a 15.4% margin. Adjusted EBITDA Available for General Capital Purposes increased 14.6% to $31.0 million and net new business wins were $53.7 million during the quarter. The business pipeline is full of increasingly large and global opportunities as our agencies scale their capabilities. Our partner agencies are performing ahead of our expectations and we are executing well against a number of our growth initiatives. Our prospects for 2014 are even more encouraging than what we detailed in the first quarter and as a result, we are once again raising our 2014 guidance for Adjusted EBITDA and Adjusted EBITDA Available for General Capital Purposes.”
Guidance for 2014 is revised as follows:
| 2014 | 2014 | 2014 | Implied | |||||||
| 2013 | Initial Guidance | Revised Guidance 1Q | Revised Guidance 2Q | Year over Year | ||||||
| Actuals | February 20, 2014 | April 24, 2014 | July 24, 2014 | Change | ||||||
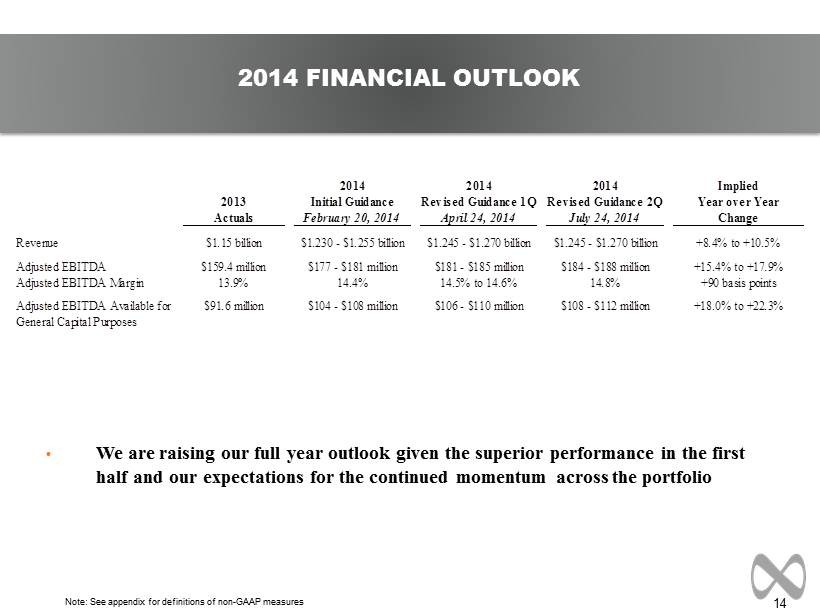
| Revenue | $1.15 billion | $1.230 - $1.255 billion | $1.245 - $1.270 billion | $1.245 - $1.270 billion | +8.4% to +10.5% | |||||
| Adjusted EBITDA | $159.4 million | $177 - $181 million | $181 - $185 million | $184 - $188 million | +15.4% to +17.9% | |||||
| Adjusted EBITDA Margin | 13.9% | 14.4% | 14.5% to 14.6% | 14.8% | +90 basis points | |||||
| Adjusted EBITDA Available for General Capital Purposes | $91.6 million | $104 - $108 million | $106 - $110 million | $108 - $112 million | +18.0% to +22.3% |
Consolidated revenue for the second quarter of 2014 was $317.7 million, an increase of 10.5% compared to $287.5 million in the second quarter of 2013. Adjusted EBITDA for the second quarter of 2014 was $48.8 million, an increase of 9.5% compared to $44.6 million in the second quarter of 2013. Net income attributable to MDC Partners in the second quarter was $16.5 million compared to $9.8 million in the second quarter of 2013. Diluted income per share from continuing operations attributable to MDC Partners common shareholders for the second quarter of 2014 was $0.33 compared to $0.22 per share in the same period of 2013. Adjusted EBITDA Available for General Capital Purposes was $31.0 million in the second quarter of 2014, an increase of 14.6% compared to $27.1 million in the second quarter of 2013.
For the six month period ended June 30, 2014, consolidated revenue was $610.3 million, an increase of 10.3% compared to $553.1 million in the six months ended June 30, 2013. Adjusted EBITDA for the six months ended June 30, 2014 increased 13.0% to $85.3 million compared to $75.4 million in the same period of 2013. Net income attributable to MDC Partners in the six months ended June 30, 2014 was $7.6 million compared to a loss of $33.3 million in 2013. Diluted income per share from continuing operations attributable to MDC Partners common shareholders for the six months ended June 30, 2014 was $0.16 compared to a loss of ($0.64) per share in the same period of 2013. Adjusted EBITDA Available for General Capital Purposes was $51.7 million in the six months ended June 30, 2014, an increase of 21.6% compared to $42.5 million in the same period of 2013.
David Doft, CFO of MDC Partners, said, “Given the superior performance we delivered in the first half of the year, and our growing expectations for the third and fourth quarters, we believe that it is prudent to provide updated financial targets for the year. While our revenue guidance is maintained at $1.245 to $1.270 billion, implying 8.4% to 10.5% year over year growth, we are increasing our Adjusted EBITDA guidance for the year to $184 million to $188 million, or year over year growth of 15.4% to 17.9% and Adjusted EBITDA margins of 14.8%, up 90 basis points year over year. We are also increasing guidance for Adjusted EBITDA Available for General Capital Purposes to $108 to $112 million, representing an increase of 18.0% to 22.3%, despite the incremental interest expense from our debt financings. Our increased margin forecast indicates that we are on pace to achieving our long-term target margins of 15% to 17% well ahead of schedule.”
MDC Partners Announces $0.19 per Share Quarterly Cash Dividend
MDC Partners today also announced that its Board of Directors has declared a cash dividend of $0.19 per share on all of its outstanding Class A shares and Class B shares. The quarterly dividend represents an increase of 5.6% from our prior quarterly dividend of $0.18, and will be payable on or about August 19, 2014, to shareholders of record at the close of business on August 5, 2014.
Conference Call
Management will host a conference call on Thursday, July 24, 2014 at 4:30 p.m. (ET) to discuss results. The conference call will be accessible by dialing 1-412-317-0790 or toll free 1-877-870-4263. An investor presentation has been posted on our website www.mdc-partners.com and may be referred to during the conference call.
A recording of the conference call will be available one hour after the call until 9:00 a.m. (ET) August 8, 2014, by dialing 1-412-317-0088 or toll free 1-877-344-7529 (passcode 10049255) or by visiting our website at www.mdc-partners.com.
About MDC Partners Inc.
MDC is one of the world’s largest Business Transformation Organizations that utilizes technology, marketing communications, data analytics, insights and strategic consulting solutions to drive meaningful returns on Marketing and Communications Investments for multinational clients in the United States, Canada, and worldwide.
MDC Partners’ durable competitive advantage is to Empower the Most Talented Entrepreneurial Thought Leaders to Drive Business Success to new levels of Achievement, for both our Clients and our Shareholders, reinforcing MDC's reputation as "The Place Where Great Talent Lives."
MDC Partners' Class A shares are publicly traded on NASDAQ under the symbol "MDCA" and on the Toronto Stock Exchange under the symbol "MDZ.A".
Please visit us: www.mdc-partners.com
Follow us on Twitter: http://www.twitter.com/mdcpartners
Join us on LinkedIn: http://www.linkedin.com/company/mdc-partners
Find us on Instagram: http://www.instagram.com/mdcpartners
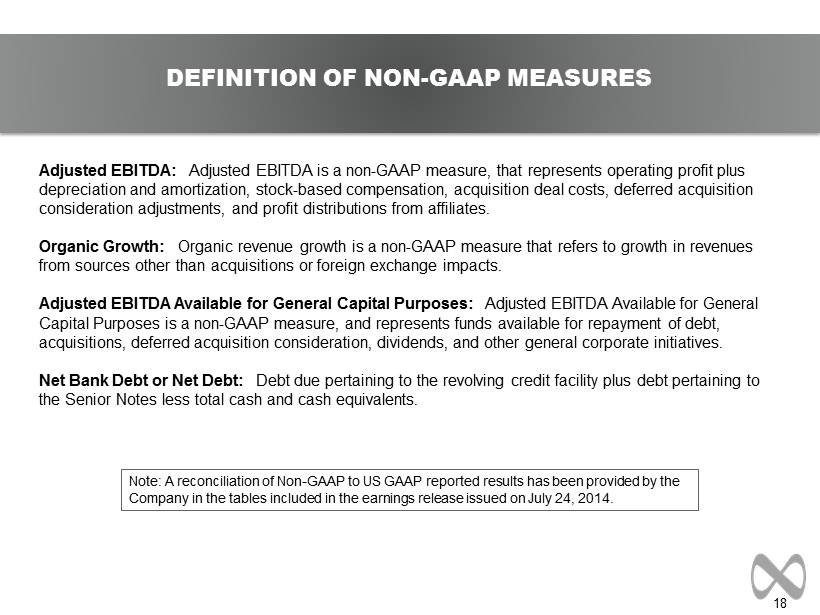
Non-GAAP Financial Measures
In addition to its reported results, MDC Partners has included in this earnings release certain financial results that the Securities and Exchange Commission defines as "non-GAAP financial measures." Management believes that such non-GAAP financial measures, when read in conjunction with the Company's reported results, can provide useful supplemental information for investors analyzing period to period comparisons of the Company's results. These non-GAAP financial measures relate to: (1) presenting Adjusted EBITDA and EBITDA margin (as defined) for the three and six months ended June 30, 2014, and 2013; and (2) presenting Adjusted EBITDA Available for General Capital Purposes for the three and six months ended June 30, 2014, and 2013. Included in this earnings release are tables reconciling MDC’s reported results to arrive at these non-GAAP financial measures.
This press release contains forward-looking statements. The Company’s representatives may also make forward-looking statements orally from time to time. Statements in this press release that are not historical facts, including statements about the Company’s beliefs and expectations, earnings guidance, recent business and economic trends, potential acquisitions, estimates of amounts for deferred acquisition consideration and “put” option rights, constitute forward-looking statements. These statements are based on current plans, estimates and projections, and are subject to change based on a number of factors, including those outlined in this section. Forward-looking statements speak only as of the date they are made, and the Company undertakes no obligation to update publicly any of them in light of new information or future events, if any.
Forward-looking statements involve inherent risks and uncertainties. A number of important factors could cause actual results to differ materially from those contained in any forward-looking statements. Such risk factors include, but are not limited to, the following:
| · | risks associated with severe effects of international, national and regional economic downturn; |
| · | the Company’s ability to attract new clients and retain existing clients; |
| · | the spending patterns and financial success of the Company’s clients; |
| · | the Company’s ability to retain and attract key employees; |
| · | the Company’s ability to remain in compliance with its debt agreements and the Company’s ability to finance its contingent payment obligations when due and payable, including but not limited to those relating to “put” option right and deferred acquisition consideration; |
| · | the successful completion and integration of acquisitions which complement and expand the Company’s business capabilities; and |
| · | foreign currency fluctuations. |
The Company’s business strategy includes ongoing efforts to engage in material acquisitions of ownership interests in entities in the marketing communications services industry. The Company intends to finance these acquisitions by using available cash from operations, from borrowings under its credit facility and through incurrence of bridge or other debt financing, any of which may increase the Company’s leverage ratios, or by issuing equity, which may have a dilutive impact on existing shareholders proportionate ownership. At any given time the Company may be engaged in a number of discussions that may result in one or more material acquisitions. These opportunities require confidentiality and may involve negotiations that require quick responses by the Company. Although there is uncertainty that any of these discussions will result in definitive agreements or the completion of any transactions, the announcement of any such transaction may lead to increased volatility in the trading price of the Company’s securities.
Investors should carefully consider these risk factors and the additional risk factors outlined in more detail in the Annual Report on Form 10-K under the caption “Risk Factors” and in the Company’s other SEC filings.
SCHEDULE 1
MDC PARTNERS INC.
UNAUDITED CONSOLIDATED STATEMENTS OF OPERATIONS
(US$ in 000s, except share and per share amounts)
| Three Months Ended June 30, | Six Months Ended June 30, | |||||||||||||||
| 2014 | 2013 | 2014 | 2013 | |||||||||||||
| Revenue | $ | 317,719 | $ | 287,499 | $ | 610,288 | $ | 553,135 | ||||||||
| Operating Expenses: | ||||||||||||||||
| Cost of services sold | 200,182 | 189,677 | 391,875 | 367,535 | ||||||||||||
| Office and general expenses | 78,558 | 60,845 | 156,732 | 128,205 | ||||||||||||
| Depreciation and amortization | 10,730 | 9,488 | 22,025 | 18,967 | ||||||||||||
| 289,470 | 260,010 | 570,632 | 514,707 | |||||||||||||
| Operating profit | 28,249 | 27,489 | 39,656 | 38,428 | ||||||||||||
| Other Income (Expenses): | ||||||||||||||||
| Other, net | 7,302 | (2,880 | ) | 765 | (191 | ) | ||||||||||
| Interest expense and finance charges | (13,882 | ) | (10,375 | ) | (26,636 | ) | (22,803 | ) | ||||||||
| Loss on Redemption of Notes | - | - | - | (55,588 | ) | |||||||||||
| Interest income | 1 | 62 | 110 | 165 | ||||||||||||
| Income (Loss) from continuing operations before income taxes and equity in non-consolidated affiliates | 21,670 | 14,296 | 13,895 | (39,989 | ) | |||||||||||
| Income tax expense (benefit) | 3,378 | 1,727 | 3,044 | (12,523 | ) | |||||||||||
| Income (Loss) from continuing operations before equity in non-consolidated affiliates | 18,292 | 12,569 | 10,851 | (27,466 | ) | |||||||||||
| Equity in earnings of non-consolidated affiliates | 79 | 82 | 142 | 123 | ||||||||||||
| Income (Loss) from continuing operations | 18,371 | 12,651 | 10,993 | (27,343 | ) | |||||||||||
| Loss from discontinued operations attributable to MDC Partners Inc., net of taxes | (152 | ) | (1,321 | ) | (258 | ) | (3,503 | ) | ||||||||
| Net Income (loss) | 18,219 | 11,330 | 10,735 | (30,846 | ) | |||||||||||
| Net income attributable to the noncontrolling interests | (1,749 | ) | (1,514 | ) | (3,111 | ) | (2,496 | ) | ||||||||
| Net income (loss) attributable to MDC Partners Inc. | $ | 16,470 | $ | 9,816 | $ | 7,624 | $ | (33,342 | ) | |||||||
| Income (Loss) Per Common Share: | ||||||||||||||||
| Basic | ||||||||||||||||
| Income (Loss) from continuing operations attributable to MDC Partners Inc. common shareholders | $ | 0.34 | $ | 0.24 | $ | 0.16 | $ | (0.64 | ) | |||||||
| Discontinued operations attributable to MDC Partners Inc. common shareholders | $ | (0.00 | ) | $ | (0.03 | ) | $ | (0.01 | ) | $ | (0.07 | ) | ||||
| Net Income (Loss) attributable to MDC Partners Inc. common shareholders | $ | 0.34 | $ | 0.21 | $ | 0.15 | $ | (0.71 | ) | |||||||
| Income (loss) Per Common Share: | ||||||||||||||||
| Diluted: | ||||||||||||||||
| Income (loss) from continuing operations attributable to MDC Partners Inc. common shareholders | $ | 0.33 | $ | 0.22 | $ | 0.16 | $ | (0.64 | ) | |||||||
| Discontinued operations attributable to MDC Partners Inc. common shareholders | $ | (0.00 | ) | $ | (0.03 | ) | $ | (0.01 | ) | $ | (0.07 | ) | ||||
| Net Income (loss) attributable to MDC Partners Inc. common shareholders | $ | 0.33 | $ | 0.19 | $ | 0.15 | $ | (0.71 | ) | |||||||
| Weighted Average Number of Common Shares: | ||||||||||||||||
| Basic | 49,546,062 | 47,098,392 | 49,442,770 | 46,975,299 | ||||||||||||
| Diluted | 50,195,321 | 51,174,437 | 50,106,545 | 46,975,299 | ||||||||||||
SCHEDULE 2
MDC PARTNERS INC.
RECONCILIATION OF OPERATING PROFIT (LOSS) TO ADJUSTED EBITDA
(US$ in 000s, except percentages)
For the Three Months Ended June 30, 2014
| Strategic | Performance | |||||||||||||||
| Marketing | Marketing | |||||||||||||||
| Services | Services | Corporate | Total | |||||||||||||
| Revenue | $ | 221,017 | $ | 96,702 | - | $ | 317,719 | |||||||||
| Net income attributable to MDC Partners Inc. | $ | 16,470 | ||||||||||||||
| Adjustments to reconcile to Operating Profit: | ||||||||||||||||
| Net income attributable to the noncontrolling interests | 1,749 | |||||||||||||||
| Loss from discontinued operations attributable to MDC Partners Inc., net of taxes | 152 | |||||||||||||||
| Equity in earnings of non-consolidated affiliates | (79 | ) | ||||||||||||||
| Income tax Expense | 3,378 | |||||||||||||||
| Interest expense and finance charges, net | 13,881 | |||||||||||||||
| Other, net | (7,302 | ) | ||||||||||||||
| Operating profit (loss) | $ | 35,497 | $ | 5,298 | $ | (12,546 | ) | $ | 28,249 | |||||||
| margin | 16.1 | % | 5.5 | % | 8.9 | % | ||||||||||
| Additional adjustments to reconcile to Adjusted EBITDA: | ||||||||||||||||
| Depreciation and amortization | 5,038 | 5,259 | 433 | 10,730 | ||||||||||||
| Stock-based compensation | 2,112 | 930 | 1,386 | 4,428 | ||||||||||||
| Acquisition deal costs | 441 | 202 | 341 | 984 | ||||||||||||
| Deferred acquisition consideration adjustments to P&L | 1,123 | 2,948 | - | 4,071 | ||||||||||||
| Profit distributions from affiliates | - | 45 | 311 | 356 | ||||||||||||
| Adjusted EBITDA * | $ | 44,211 | $ | 14,682 | $ | (10,075 | ) | $ | 48,818 | |||||||
| margin | 20.0 | % | 15.2 | % | 15.4 | % | ||||||||||
| * | Adjusted EBITDA is a non-GAAP measure, but as shown above it represents operating profit (loss) plus depreciation and amortization, stock-based compensation, acquisition deal costs, deferred acquisition consideration adjustments,and profit distributions from affiliates. |
SCHEDULE 3
MDC PARTNERS INC.
RECONCILIATION OF OPERATING PROFIT (LOSS) TO ADJUSTED EBITDA
(US$ in 000s, except percentages)
For the Three Months Ended June 30, 2013
| Strategic | Performance | |||||||||||||||
| Marketing | Marketing | |||||||||||||||
| Services | Services | Corporate | Total | |||||||||||||
| Revenue | $ | 200,670 | $ | 86,829 | - | $ | 287,499 | |||||||||
| Net income attributable to MDC Partners Inc. | $ | 9,816 | ||||||||||||||
| Adjustments to reconcile to Operating Profit: | ||||||||||||||||
| Net income attributable to the noncontrolling interests | 1,514 | |||||||||||||||
| Loss from discontinued operations attributable to MDC Partners Inc., net of taxes | 1,321 | |||||||||||||||
| Equity in earnings of non-consolidated affiliates | (82 | ) | ||||||||||||||
| Income tax Expense | 1,727 | |||||||||||||||
| Interest expense and finance charges, net | 10,313 | |||||||||||||||
| Other, net | 2,880 | |||||||||||||||
| Operating profit (loss) | $ | 27,771 | $ | 4,742 | $ | (5,024 | ) | $ | 27,489 | |||||||
| margin | 13.8 | % | 5.5 | % | 9.6 | % | ||||||||||
| Additional adjustments to reconcile to Adjusted EBITDA: | ||||||||||||||||
| Depreciation and amortization | 5,753 | 3,408 | 327 | 9,488 | ||||||||||||
| Stock-based compensation | 1,839 | 1,030 | 1,885 | 4,754 | ||||||||||||
| Acquisition deal costs | 39 | 99 | 337 | 475 | ||||||||||||
| Deferred acquisition consideration adjustments to P&L | 3,549 | (1,162 | ) | - | 2,387 | |||||||||||
| Profit distributions from affiliates | - | - | - | - | ||||||||||||
| Adjusted EBITDA * | $ | 38,951 | $ | 8,117 | $ | (2,475 | ) | $ | 44,593 | |||||||
| margin | 19.4 | % | 9.3 | % | 15.5 | % | ||||||||||
| * | Adjusted EBITDA is a non-GAAP measure, but as shown above it represents operating profit (loss) plus depreciation and amortization, stock-based compensation, acquisition deal costs, deferred acquisition consideration adjustments, and profit distributions from affiliates. |
SCHEDULE 4
MDC PARTNERS INC.
RECONCILIATION OF OPERATING PROFIT (LOSS) TO ADJUSTED EBITDA
(US$ in 000s, except percentages)
For the Six Months Ended June 30, 2014
| Strategic | Performance | |||||||||||||||
| Marketing | Marketing | |||||||||||||||
| Services | Services | Corporate | Total | |||||||||||||
| Revenue | $ | 426,965 | $ | 183,323 | - | $ | 610,288 | |||||||||
| Net income attributable to MDC Partners Inc. | $ | 7,624 | ||||||||||||||
| Adjustments to reconcile to Operating Profit: | ||||||||||||||||
| Net income attributable to the noncontrolling interests | 3,111 | |||||||||||||||
| Loss from discontinued operations attributable to MDC Partners Inc., net of taxes | 258 | |||||||||||||||
| Equity in earnings of non-consolidated affiliates | (142 | ) | ||||||||||||||
| Income tax Expense | 3,044 | |||||||||||||||
| Interest expense and finance charges, net | 26,526 | |||||||||||||||
| Other, net | (765 | ) | ||||||||||||||
| Operating profit (loss) | $ | 59,100 | $ | 3,579 | $ | (23,023 | ) | 39,656 | ||||||||
| margin | 13.8 | % | 2.0 | % | 6.5 | % | ||||||||||
| Additional adjustments to reconcile to Adjusted EBITDA: | ||||||||||||||||
| Depreciation and amortization | 10,084 | 11,006 | 935 | 22,025 | ||||||||||||
| Stock-based compensation | 4,251 | 2,207 | 2,338 | 8,796 | ||||||||||||
| Acquisition deal costs | 596 | 786 | 673 | 2,055 | ||||||||||||
| Deferred acquisition consideration adjustments to P&L | 5,554 | 6,539 | - | 12,093 | ||||||||||||
| Profit distributions from affiliates | - | 283 | 354 | 637 | ||||||||||||
| Adjusted EBITDA * | 79,585 | 24,400 | (18,723 | ) | 85,262 | |||||||||||
| margin | 18.6 | % | 13.3 | % | 14.0 | % | ||||||||||
| * | Adjusted EBITDA is a non-GAAP measure, but as shown above it represents operating profit (loss) plus depreciation and amortization, stock-based compensation, acquisition deal costs, deferred acquisition consideration adjustments, and profit distributions from affiliates. |
SCHEDULE 5
MDC PARTNERS INC.
RECONCILIATION OF OPERATING PROFIT (LOSS) TO ADJUSTED EBITDA
(US$ in 000s, except percentages)
For the Six Months Ended June 30, 2013
| Strategic | Performance | |||||||||||||||
| Marketing | Marketing | |||||||||||||||
| Services | Services | Corporate | Total | |||||||||||||
| Revenue | $ | 384,100 | $ | 169,035 | - | $ | 553,135 | |||||||||
| Net income attributable to MDC Partners Inc. | $ | (33,342 | ) | |||||||||||||
| Adjustments to reconcile to Operating Profit: | ||||||||||||||||
| Net income attributable to the noncontrolling interests | 2,496 | |||||||||||||||
| Loss from discontinued operations attributable to MDC Partners Inc., net of taxes | 3,503 | |||||||||||||||
| Equity in earnings of non-consolidated affiliates | (123 | ) | ||||||||||||||
| Income tax Benefit | (12,523 | ) | ||||||||||||||
| Interest expense, finance charges, and loss on redemption of notes, net | 78,226 | |||||||||||||||
| Other, net | 191 | |||||||||||||||
| Operating profit (loss) | $ | 50,428 | $ | 3,534 | $ | (15,534 | ) | $ | 38,428 | |||||||
| margin | 13.1 | % | 2.1 | % | 6.9 | % | ||||||||||
| Additional adjustments to reconcile to Adjusted EBITDA: | ||||||||||||||||
| Depreciation and amortization | 11,527 | 6,748 | 692 | 18,967 | ||||||||||||
| Stock-based compensation | 2,980 | 1,859 | 4,416 | 9,255 | ||||||||||||
| Acquisition deal costs | 165 | 194 | 652 | 1,011 | ||||||||||||
| Deferred acquisition consideration adjustments to P&L | 4,048 | 635 | - | 4,683 | ||||||||||||
| Profit distributions from affiliates | - | - | 3,096 | 3,096 | ||||||||||||
| Adjusted EBITDA * | $ | 69,148 | $ | 12,970 | $ | (6,678 | ) | $ | 75,440 | |||||||
| margin | 18.0 | % | 7.7 | % | 13.6 | % | ||||||||||
| * | Adjusted EBITDA is a non-GAAP measure, but as shown above it represents operating profit (loss) plus depreciation and amortization, stock-based compensation, acquisition deal costs, deferred acquisition consideration adjustments, and profit distributions from affiliates. |
SCHEDULE 6
MDC PARTNERS INC.
ADJUSTED EBITDA AVAILABLE FOR GENERAL CAPITAL PURPOSES
(US$ in 000s)
| Three Months Ended June 30, | Six Months Ended June 30, | |||||||||||||||
| 2014 | 2013 | 2014 | 2013 | |||||||||||||
| Adjusted EBITDA (1) | $ | 48,818 | $ | 44,593 | $ | 85,262 | $ | 75,440 | ||||||||
| Net Income Attributable to Noncontrolling Interests | (1,749 | ) | (1,514 | ) | (3,111 | ) | (2,496 | ) | ||||||||
| Capital Expenditures, net (2) | (3,229 | ) | (6,589 | ) | (6,245 | ) | (9,237 | ) | ||||||||
| Cash Taxes | (35 | ) | (132 | ) | (118 | ) | (199 | ) | ||||||||
| Cash Interest, net & Other (3) | (12,763 | ) | (9,262 | ) | (24,126 | ) | (21,025 | ) | ||||||||
| Adjusted EBITDA Available for General Capital Purposes (4) | $ | 31,042 | $ | 27,096 | $ | 51,662 | $ | 42,483 | ||||||||
(1) Adjusted EBITDA is a non GAAP measure. See schedules 2 through 5 for a reconciliation of Net Income (loss) to Adjusted EBITDA.
(2) Capital Expenditures, net represents capital expenditures net of landlord reimbursements.
(3) Cash Interest, net & Other represents the quarterly accrual of cash interest under our Senior Notes.
(4) Adjusted EBITDA Available for General Capital Purposes is a non-GAAP measure, and represents funds available for repayment of debt, acquisitions, deferred acquisition consideration, dividends, and other general corporate initiatives
SCHEDULE 7
MDC PARTNERS INC.
CONSOLIDATED BALANCE SHEETS
(US$ in 000s)
| June 30, | December 31, | |||||||
| 2014 | 2013 | |||||||
| Assets | ||||||||
| Current Assets: | ||||||||
| Cash and cash equivalents | $ | 72,339 | $ | 102,007 | ||||
| Accounts receivable, net | 394,342 | 309,796 | ||||||
| Expenditures billable to clients | 91,880 | 63,246 | ||||||
| Other current assets | 31,733 | 25,458 | ||||||
| Total Current Assets | 590,294 | 500,507 | ||||||
| Fixed assets, net | 50,709 | 52,071 | ||||||
| Investment in non-consolidated affiliates | 412 | 275 | ||||||
| Goodwill | 882,667 | 744,333 | ||||||
| Other intangible assets, net | 68,817 | 56,262 | ||||||
| Deferred tax assets | 21,363 | 21,131 | ||||||
| Other assets | 70,756 | 50,648 | ||||||
| Total Assets | $ | 1,685,018 | $ | 1,425,227 | ||||
| Liabilities, Redeemable Noncontrolling Interests and Shareholders' Deficit | ||||||||
| Current Liabilities: | ||||||||
| Accounts payable | $ | 289,505 | $ | 246,694 | ||||
| Accruals and other liabilities | 267,048 | 240,580 | ||||||
| Advance billings | 192,906 | 149,540 | ||||||
| Current portion of long term debt | 617 | 467 | ||||||
| Current portion of deferred acquisition consideration | 69,138 | 53,041 | ||||||
| Total Current Liabilities | 819,214 | 690,322 | ||||||
| Long-term debt | 743,599 | 664,661 | ||||||
| Long-term portion of deferred acquisition consideration | 111,668 | 100,872 | ||||||
| Other liabilities | 32,635 | 34,430 | ||||||
| Deferred tax liabilities | 65,413 | 63,020 | ||||||
| Total Liabilities | 1,772,529 | 1,553,305 | ||||||
| Redeemable Noncontrolling Interests | 164,508 | 148,534 | ||||||
| Shareholders' Deficit | ||||||||
| Common shares | 265,615 | 262,656 | ||||||
| Shares to be issued | - | 424 | ||||||
| Charges in excess of capital | (170,068 | ) | (126,352 | ) | ||||
| Accumulated deficit | (457,952 | ) | (465,576 | ) | ||||
| Stock subscription receivable | (55 | ) | (55 | ) | ||||
| Accumulated other comprehensive loss | (1,143 | ) | (797 | ) | ||||
| MDC Partners Inc. Shareholders' Deficit | (363,603 | ) | (329,700 | ) | ||||
| Noncontrolling Interests | 111,584 | 53,088 | ||||||
| Total Shareholders' Deficit | (252,019 | ) | (276,612 | ) | ||||
| Total Liabilities, Redeemable Noncontrolling | ||||||||
| Interests and Shareholders' Deficit | $ | 1,685,018 | $ | 1,425,227 | ||||
SCHEDULE 8
MDC PARTNERS INC.
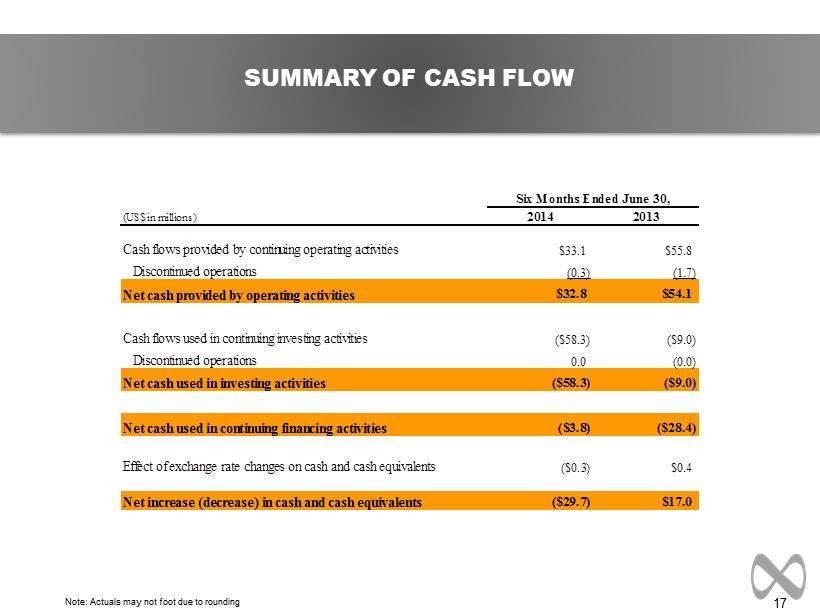
SUMMARY CASH FLOW DATA
(US$ in 000s)
| Six Months Ended June 30, | ||||||||
| 2014 | 2013 | |||||||
| Cash flows provided by continuing operating activities | $ | 33,099 | $ | 55,773 | ||||
| Discontinued operations | (258 | ) | (1,702 | ) | ||||
| Net cash provided by operating activities | 32,841 | 54,071 | ||||||
| Cash flows used in continuing investing activities | (58,331 | ) | (9,028 | ) | ||||
| Discontinued operations | - | (11 | ) | |||||
| Net cash used in investing activities | (58,331 | ) | (9,039 | ) | ||||
| Net cash used in continuing financing activities | (3,848 | ) | (28,408 | ) | ||||
| Effect of exchange rate changes on cash and cash equivalents | (330 | ) | 382 | |||||
| Net increase (decrease) in cash and cash equivalents | $ | (29,668 | ) | $ | 17,006 | |||