Table of Contents
UNITED STATES
SECURITIES AND EXCHANGE COMMISSION
Washington, D.C. 20549
FORM 10-K
| x | ANNUAL REPORT PURSUANT TO SECTION 13 OR 15(d) OF THE SECURITIES EXCHANGE ACT OF 1934 |
For the Fiscal Year Ended December 31, 2010
-OR-
| ¨ | TRANSITION REPORT FILED PURSUANT TO SECTION 13 OR 15(d) OF THE SECURITIES EXCHANGE ACT OF 1934 |
COMMISSION FILE NUMBER 1-12291

The AES Corporation
(Exact name of registrant as specified in its charter)
| Delaware |
54 1163725 | |
| (State or other jurisdiction of incorporation or organization) |
(I.R.S. Employer Identification No.) | |
| 4300 Wilson Boulevard Arlington, Virginia |
22203 | |
| (Address of principal executive offices) | (Zip Code) | |
Registrant’s telephone number, including area code: (703) 522-1315
Securities registered pursuant to Section 12(b) of the Act:
| Title of Each Class |
Name of Each Exchange on Which Registered | |
| Common Stock, par value $0.01 per share | New York Stock Exchange | |
| AES Trust III, $3.375 Trust Convertible Preferred Securities | New York Stock Exchange |
Securities registered pursuant to Section 12(g) of the Act:
None
Indicate by check mark if the Registrant is a well-known seasoned issuer, as defined in Rule 405 of the Securities Act. Yes x No ¨
Indicate by check mark if the Registrant is not required to file reports pursuant to Section 13 or Section 15 (d) of the Act. Yes ¨ No x
Indicate by check mark whether the registrant (1) has filed all reports required to be filed by Section 13 or 15(d) of the Securities Exchange Act of 1934 during the preceding 12 months (or for such shorter period that the registrant was required to file such reports), and (2) has been subject to such filing requirements for the past 90 days. Yes x No ¨
Indicate by check mark whether the registrant has submitted electronically and posted on its corporate Web site, if any, every Interactive Data File required to be submitted and posted pursuant to Rule 405 of Regulation S-T during the preceding 12 months (or for such shorter period that the registrant was required to submit and post such files). Yes x No ¨
Indicate by check mark if disclosure of delinquent filers pursuant to Item 405 of Regulation S-K is not contained herein, and will not be contained, to the best of registrant’s knowledge, in definitive proxy or information statements incorporated by reference in Part III of this Form 10-K or any amendment to this Form 10-K. x
Indicate by check mark whether the registrant is a large accelerated filer, an accelerated filer, a non-accelerated filer or a smaller reporting company. See the definitions of “large accelerated filer,” “accelerated filer” and “smaller reporting company” in Rule 12b-2 of the Exchange Act. (Check one):
| Large accelerated filer x |
Accelerated filer ¨ | Non-accelerated filer ¨ | Smaller reporting company ¨ | |||
| (Do not check if a smaller reporting company) |
Indicate by check mark whether the Registrant is a shell company (as defined in Rule 12b-2 of the Exchange Act). Yes ¨ No x
The aggregate market value of the voting and non-voting common equity held by non-affiliates on June 30, 2010, the last business day of the Registrant’s most recently completed second fiscal quarter (based on the closing sale price of $9.24 of the Registrant’s Common Stock, as reported by the New York Stock Exchange on such date) was approximately $7.350 billion.
The number of shares outstanding of the Registrant’s Common Stock, par value $0.01 per share, on February 23, 2011, was 788,253,071.
DOCUMENTS INCORPORATED BY REFERENCE
Portions of Registrant’s Proxy Statement for its 2011 annual meeting of stockholders are incorporated by reference in Parts II and III
Table of Contents
THE AES CORPORATION
FISCAL YEAR 2010 FORM 10-K
| 1 | ||||
| 3 | ||||
| 3 | ||||
| 6 | ||||
| 19 | ||||
| 19 | ||||
| 19 | ||||
| 20 | ||||
| 21 | ||||
| 73 | ||||
| 97 | ||||
| 97 | ||||
| 107 | ||||
| 108 | ||||
| 108 | ||||
| 108 | ||||
| Purchases of Equity Securities by the Issuer and Affiliated Purchasers |
108 | |||
| 109 | ||||
| 110 | ||||
| 110 | ||||
| 111 | ||||
| ITEM 7. MANAGEMENT’S DISCUSSION AND ANALYSIS OF FINANCIAL CONDITION AND RESULTS OF OPERATIONS |
113 | |||
| 113 | ||||
| 117 | ||||
| 120 | ||||
| 129 | ||||
| 149 | ||||
| 153 | ||||
| 154 | ||||
| 164 | ||||
| ITEM 7A. QUANTITATIVE AND QUALITATIVE DISCLOSURES ABOUT MARKET RISK |
165 | |||
| 168 | ||||
| ITEM 9. CHANGES IN AND DISAGREEMENTS WITH ACCOUNTANTS ON ACCOUNTING AND FINANCIAL DISCLOSURE |
277 | |||
| 277 | ||||
| 280 | ||||
| 280 | ||||
| ITEM 10. DIRECTORS, EXECUTIVE OFFICERS AND CORPORATE GOVERNANCE |
280 | |||
| 280 | ||||
| 280 | ||||
| ITEM 13. CERTAIN RELATIONSHIPS AND RELATED PARTY TRANSACTIONS AND DIRECTOR INDEPENDENCE |
282 | |||
| 282 | ||||
| 283 | ||||
| 283 | ||||
| 288 |
Table of Contents
In this Annual Report the terms “AES,” “the Company,” “us,” or “we” refer to The AES Corporation and all of its subsidiaries and affiliates, collectively. The term “The AES Corporation” and “Parent Company” refers only to the parent, publicly-held holding company, The AES Corporation, excluding its subsidiaries and affiliates.
FORWARD-LOOKING INFORMATION
In this filing we make statements concerning our expectations, beliefs, plans, objectives, goals, strategies, and future events or performance. Such statements are “forward-looking statements” within the meaning of the Private Securities Litigation Reform Act of 1995. Although we believe that these forward-looking statements and the underlying assumptions are reasonable, we cannot assure you that they will prove to be correct.
Forward-looking statements involve a number of risks and uncertainties, and there are factors that could cause actual results to differ materially from those expressed or implied in our forward-looking statements. Some of those factors (in addition to others described elsewhere in this report and in subsequent securities filings) include:
| • | the economic climate, particularly the state of the economy in the areas in which we operate, including the fact that the global economy faces considerable uncertainty for the foreseeable future, which further increases many of the risks discussed in this Form 10-K; |
| • | changes in inflation, demand for power, interest rates and foreign currency exchange rates, including our ability to hedge our interest rate and foreign currency risk; |
| • | changes in the price of electricity at which our Generation businesses sell into the wholesale market and our Utility businesses purchase to distribute to their customers, and the success of our risk management practices, such as our ability to hedge our exposure to such market price risk; |
| • | changes in the prices and availability of coal, gas and other fuels (including our ability to have fuel transported to our facilities) and the success of our risk management practices, such as our ability to hedge our exposure to such market price risk, and our ability to meet credit support requirements for fuel and power supply contracts; |
| • | changes in and access to the financial markets, particularly changes affecting the availability and cost of capital in order to refinance existing debt and finance capital expenditures, acquisitions, investments and other corporate purposes; |
| • | our ability to manage liquidity and comply with covenants under our recourse and non-recourse debt, including our ability to manage our significant liquidity needs and to comply with covenants under our senior secured credit facility and other existing financing obligations; |
| • | changes in our or any of our subsidiaries’ corporate credit ratings or the ratings of our or any of our subsidiaries’ debt securities or preferred stock, and changes in the rating agencies’ ratings criteria; |
| • | our ability to purchase and sell assets at attractive prices and on other attractive terms; |
| • | our ability to compete in markets where we do business; |
| • | our ability to manage our operation and maintenance costs; |
| • | the performance and reliability of our generating plants, including our ability to reduce unscheduled down-times; |
| • | our ability to locate and acquire attractive “greenfield” projects and our ability to finance, construct and begin operating our “greenfield” projects on schedule and within budget; |
1
Table of Contents
| • | our ability to enter into long-term contracts, which limit volatility in our results of operations and cash flow, such as power purchase agreements, fuel supply, and other agreements and to manage counterparty credit risks in these agreements; |
| • | variations in weather, especially mild winters and cooler summers in the areas in which we operate, low levels of wind or sunlight for our wind and solar businesses, and the occurrence of difficult hydrological conditions for our hydro-power plants, as well as hurricanes and other storms and disasters; |
| • | our ability to meet our expectations in the development, construction, operation and performance of our wind businesses, which rely, in part, on actual wind conditions and wind turbine performance being in line with our expectations; |
| • | the success of our initiatives in other renewable energy projects, as well as greenhouse gas emissions reduction projects and energy storage projects; |
| • | our ability to keep up with advances in technology; |
| • | the potential effects of threatened or actual acts of terrorism and war; |
| • | the expropriation or nationalization of our businesses or assets by foreign governments, whether with or without adequate compensation; |
| • | our ability to achieve expected rate increases in our Utility businesses; |
| • | changes in laws, rules and regulations affecting our international businesses; |
| • | changes in laws, rules and regulations affecting our North America business, including, but not limited to, deregulation of wholesale power markets and its effects on competition, the ability to recover net utility assets and other potential stranded costs by our utilities, the establishment of a regional transmission organization that includes our utility service territory, the application of market power criteria by the Federal Energy Regulatory Commission, changes in law resulting from new federal energy legislation, including the effects of the repeal of Public Utility Holding Company Act of 1935, and changes in political or regulatory oversight or incentives affecting our wind business, our solar joint venture, our other renewables projects and our initiatives in greenhouse gas reductions and energy storage including tax incentives; |
| • | changes in environmental laws, including requirements for reduced emissions of sulfur, nitrogen, carbon, mercury, coal ash, hazardous air pollutants and other substances, including potential greenhouse gas legislation, regulation and/or treaties; |
| • | changes in tax laws and the effects of our strategies to reduce tax payments; |
| • | the effects of litigation and government and regulatory investigations; |
| • | our ability to maintain adequate insurance; |
| • | decreases in the value of pension plan assets, increases in pension plan expenses and our ability to fund defined benefit pension and other post-retirement plans at our subsidiaries; |
| • | losses on the sale or write-down of assets due to impairment events or changes in management intent with regard to either holding or selling certain assets; |
| • | changes in accounting standards, corporate governance and securities law requirements; |
| • | our ability to maintain effective internal controls over financial reporting; and |
| • | our ability to attract and retain talented directors, management and other personnel, including, but not limited to, financial personnel in our foreign businesses that have extensive knowledge of accounting principles generally accepted in the United States. |
2
Table of Contents
These factors in addition to others described elsewhere in this Form 10-K, including those described under Item 1A.—Risk Factors, and in subsequent securities filings, should not be construed as a comprehensive listing of factors that could cause results to vary from our forward looking information.
We undertake no obligation to publicly update or revise any forward-looking statements, whether as a result of new information, future events, or otherwise. If one or more forward-looking statements are updated, no inference should be drawn that additional updates will be made with respect to those or other forward-looking statements.
| ITEM 1. | BUSINESS |
We are a global power company. We own a portfolio of electricity generation and distribution businesses on five continents in 28 countries, with total capacity of approximately 40,500 Megawatts (“MW”) and distribution networks serving over 12 million people as of December 31, 2010. In addition, we have more than 2,000 MW under construction in six countries. Our global workforce of approximately 29,000 people helps provide electricity to people in diverse markets ranging from urban centers in the United States to remote villages in India. We were incorporated in Delaware in 1981 and for three decades we have been committed to providing safe and reliable energy.
We own and operate two primary types of businesses. The first is our Generation business, where we own and/or operate power plants to generate and sell power to wholesale customers such as utilities and other intermediaries. The second is our Utilities business, where we own and/or operate utilities to distribute, transmit and sell electricity to end-user customers in the residential, commercial, industrial and governmental sectors within a defined service area.
Our assets are diverse with respect to fuel source and type of market, which helps reduce certain types of operating risk. Our portfolio employs a broad range of fuels, including coal, gas, fuel oil, biomass and renewable sources such as hydroelectric power, wind and solar, which reduces the risks associated with dependence on any one fuel source. Our presence in mature markets helps reduce the volatility associated with our businesses in faster-growing emerging markets. In addition, our Generation portfolio is largely contracted, which reduces the risk related to market prices of electricity and fuel. We also attempt to limit risk by hedging some of our interest rate and commodity risk, and by matching the currency of most of our subsidiary debt to the revenue of the underlying business. However, our business is still subject to these and other risks, which are further described in Item 1A.—Risk Factors of this Form 10-K.
Our goal is to maximize value for our shareholders through continued focus on increasing the profitability of our existing portfolio and increasing cash flow while managing our risk and employing rigorous capital allocation. We will continue to seek prudent expansion of our traditional Generation and Utilities lines of business, along with expansion of wind, solar and energy storage, through acquisitions or greenfield developments. Portfolio management remains an area of focus through which we have sold and expect to continue to sell or monetize a portion of certain businesses or assets when market values appear attractive. Furthermore, we will continue to focus on improving our business operations and management processes, including our internal controls over financial reporting.
Key Lines of Business
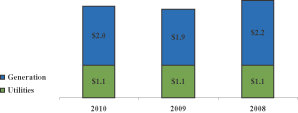
AES’ primary sources of revenue and gross margin today are from Generation and Utilities. These businesses are distinguished by the nature of the customers, operational differences, cost structure, regulatory environment and risk exposure. The breakout of revenue and gross margin between Generation and Utilities for the years ended December 31, 2010, 2009 and 2008, respectively, is shown below. Operating results for integrated utilities, which have both Generation and Utilities, are reflected in the Utilities amounts below.
3
Table of Contents
Revenue
($ in billions)

Gross Margin
($ in billions)
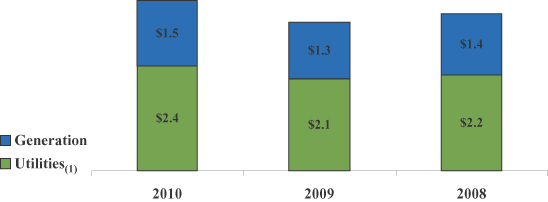
| (1) | Utilities gross margin includes the margin from generation businesses owned by the Company and from whom the utility purchases energy. |
Generation
We currently own or operate a generation portfolio of approximately 34,100 MW, excluding the generation capabilities of our integrated utilities, consisting of 100 Generation facilities in 25 countries on five continents at our generation businesses. We also have approximately 1,700 MW of capacity currently under construction in four countries. We are a major power source in many countries, such as Panama where we are the largest generator of electricity, and Chile, where AES Gener (“Gener”) is the second largest electricity generation company in terms of capacity. Our Generation business uses a wide range of technologies and fuel types including coal, combined-cycle gas turbines, hydroelectric power and biomass. Generation revenue was $7.5 billion, $6.1 billion and $7.4 billion for the years ended December 31, 2010, 2009 and 2008, respectively.
Performance drivers for our Generation businesses include, among other factors, plant reliability, fuel costs, power prices, volume and fixed-cost management. Growth in the Generation business is largely tied to securing new power purchase agreements (“PPAs”), expanding capacity in our existing facilities and building or acquiring new power plants.
4
Table of Contents
The majority of the electricity produced by our Generation businesses is sold under long-term PPAs, to wholesale customers. In 2010, approximately 64% of the revenue from our Generation business was from plants that operate under PPAs of three years or longer for 75% or more of their output capacity. These businesses often reduce their exposure to fuel supply risks by entering into long-term fuel supply contracts or fuel tolling arrangements where the customer assumes full responsibility for purchasing and supplying the fuel to the power plant. These long-term contractual agreements help reduce the volatility of our cash flows and earnings and also reduce exposure to volatility in the market price for electricity and fuel; however, the amount of earnings and cash flow predictability varies from business to business based on the degree to which its exposure is limited by the contracts it has negotiated.
Our Generation businesses with long-term contracts face most of their competition from other utilities and independent power producers (“IPPs”) prior to the execution of a power sales agreement during the development phase of a project or upon expiration of an existing agreement. Once a project is operational, we traditionally have faced limited competition due to the long-term nature of the generation contracts. However, as our existing contracts expire, the introduction of new power markets has increased competition to attract new customers and maintain our current customer base.
The balance of our Generation business sells power through competitive markets under short-term contracts, directly in the spot market or, in some cases, at regulated prices. As a result, the cash flows and earnings associated with these businesses are more sensitive to fluctuations in the market price for electricity, natural gas, coal and other fuels. Competitive factors for these facilities include price, reliability, operational cost and third-party credit requirements.
Utilities
AES utility businesses distribute power to over 12 million people in seven countries on five continents and consist primarily of 14 companies owned or operated under management agreements, each of which operate in defined service areas. These businesses also include 15 generation plants in two countries with generation capacity totaling approximately 4,600 MW. These businesses have a variety of structures ranging from pure distribution businesses to fully integrated utilities, which generate, transmit and distribute power. For instance, our wholly owned subsidiary in the U.S., Indianapolis Power & Light (“IPL”), has the exclusive right to provide retail services to approximately 470,000 customers in Indianapolis, Indiana. Eletropaulo Metropolitana Electricidad de São Paulo S.A (“AES Eletropaulo” or “Eletropaulo”), serving the São Paulo metropolitan region for over 100 years, has approximately six million customers and is the largest electricity distribution company in Brazil in terms of revenue and electricity distributed. In Cameroon, we are the primary generator and distributor of electricity and in El Salvador we provide distribution services to serve more than 77% of the country’s electricity customers. Utilities revenue was $9.1 billion, $7.8 billion and $7.8 billion for the years ended December 31, 2010, 2009 and 2008, respectively.
Performance drivers for Utilities include, but are not limited to, reliability of service, management of working capital, negotiation of tariff adjustments, compliance with extensive regulatory requirements, and in developing countries, reduction of commercial and technical losses. The results of operations of our Utilities businesses are sensitive to changes in economic growth, regulations and variations in weather conditions in the areas in which they operate.
Utilities face relatively little direct competition due to significant barriers to entry which are present in these markets. In certain locations, our distribution businesses face increased competition as a result of changes in laws and regulations which allow wholesale and retail services to be provided on a competitive basis. Competition is a factor in efforts to acquire existing businesses. In this arena, we compete against a number of other market participants, some of which have greater financial resources, have been engaged in distribution related businesses for longer periods of time and/or have accumulated more significant portfolios. Relevant competitive factors for our power distribution businesses include financial resources, governmental assistance, regulatory restrictions and access to non-recourse financing.
5
Table of Contents
Renewables and Other Initiatives
In recent years, as demand for renewable sources of energy has grown, we have placed increasing emphasis on developing projects in wind, solar and other renewable initiatives including energy storage. In 2005, we started a wind generation business (“AES Wind Generation”), which currently has 20 plants in operation in five countries totaling approximately 1,800 MW in generation capacity and is one of the largest producers of wind power in the U.S. In addition, 264 MW are under construction in four countries. In March 2008, we formed AES Solar Energy LLC (“AES Solar”), a joint venture with Riverstone Holdings, LLC (“Riverstone”), a private equity firm, which has since commenced commercial operations of nine plants totaling 37 MW of solar projects in France, Greece and Spain. We have a few projects producing GHG credits in Asia, Europe and Latin America. We also have a line of business to develop and implement utility scale energy storage systems (such as batteries), which store and release power when needed. While none of these initiatives are currently material to our operations, we believe that as these businesses grow, they may become a material contributor to our operations. However, there are risks associated with these initiatives, which are further described in Item 1A.—Risk Factors of this Form 10-K. As further described in “Our Organization and Segments” below, some of these projects are managed within the region in which they are located, while others are managed as separate business units and reported as set forth below.
Risks
We routinely encounter and address risks, some of which may cause our future results to be different, sometimes materially different, than we presently anticipate. The categories of risk we have identified in Item 1A.—Risk Factors of this Form 10-K include the following:
| • | risks associated with our disclosure controls and internal controls over financial reporting; |
| • | risks related to our high level of indebtedness; |
| • | risks associated with our ability to raise needed capital; |
| • | external risks associated with revenue and earnings volatility; |
| • | risks associated with our operations; and |
| • | risks associated with governmental regulation and laws. |
The categories of risk identified above are discussed in greater detail in Item 1A.—Risk Factors of this Form 10-K. These risk factors should be read in conjunction with Item 7.—Management’s Discussion and Analysis of Financial Condition and Results of Operations, and the Consolidated Financial Statements and related notes included elsewhere in this report.
We believe our broad geographic footprint allows us to focus development in targeted markets with opportunities for new investment, and provides stability through our presence in more developed regions. In addition, our presence in each region affords us important relationships and helps us identify local markets with attractive opportunities for new investment. As a result, we have structured our organization into geographic regions, and each region is led by a regional president or other senior executive responsible for managing those businesses. The regional presidents report to our Chief Operating Officer (“COO”), who in turn reports to our Chief Executive Officer (“CEO”). Both our CEO and COO are based in Arlington, Virginia.
The Company’s segment reporting structure is organized along our two lines of business (Generation and Utilities) and three regions: (1) Latin America & Africa; (2) North America; and (3) Europe, Middle East & Asia (collectively, “EMEA”), which reflects how we manage the business internally. Additionally, AES Wind Generation is managed within our North America region. For financial reporting purposes, the Company has six reportable segments which include:
| • | Latin America—Generation; |
| • | Latin America—Utilities; |
6
Table of Contents
| • | North America—Generation; |
| • | North America—Utilities; |
| • | Europe—Generation; |
| • | Asia—Generation. |
Corporate and Other—The Company’s Europe Utilities, Africa Utilities, Africa Generation and AES Wind Generation businesses as well as the Company’s renewables initiatives are reported within “Corporate and Other” because they do not require separate disclosure under segment reporting accounting guidance. See Item 7.—Management’s Discussion and Analysis of Financial Condition and Results of Operations for further discussion of the Company’s segment structure used for financial reporting purposes.
The following describes our businesses as they are aligned in our segment reporting structure for financial reporting purposes.
Latin America
Our Latin America operations accounted for 69%, 70% and 68% of consolidated AES revenue in 2010, 2009 and 2008, respectively. The following table provides highlights of our Latin America operations:
| Countries |
Argentina, Brazil, Chile, Colombia, Dominican Republic, El Salvador and Panama | |
| Generation Capacity |
11,907 Gross MW | |
| Utilities Penetration |
8.6 million customers (49,280 Gigawatt Hours (“GWh”)) | |
| Generation Facilities |
55 (including 3 under construction) | |
| Utilities Businesses |
8 | |
| Key Generation Businesses |
Gener, Tietê and Alicura | |
| Key Utilities Businesses |
Eletropaulo and Sul |
The graph below shows the breakdown between our Latin America Generation and Utilities segments as a percentage of total Latin America revenue and gross margin for the years ended December 31, 2010, 2009, and 2008. See Note 15—Segment and Geographic Information in the Consolidated Financial Statements in Item 8 of this Form 10-K for information on revenue from external customers, Adjusted Gross Margin (a non-GAAP measure) and total assets by segment.
| Revenue ($ in billions)
|
Gross Margin ($ in billions)
|


Latin America Generation. Our largest generation business in Latin America, AES Tietê (“Tietê”), located in Brazil, represents approximately 18% of the total generation capacity in the state of São Paulo and is the tenth largest generator in Brazil. AES holds a 24% economic interest in Tietê. In Argentina, we are the third largest
7
Table of Contents
private power generator contributing 11% of the country’s total power generation capacity. In Chile, we are the second largest generator of power. We currently have three new generation plants under construction—two coal plants in Chile and one hydro plant in Panama with a combined generation capacity of 1,011 MW.
Set forth below is a list of our Latin America Generation facilities:
Generation
| Business |
Location | Fuel | Gross MW |
AES Equity Interest (Percent, Rounded) |
Year Acquired or Began Operation |
|||||||||||
| Alicura |
Argentina | Hydro | 1,050 | 99 | % | 2000 | ||||||||||
| Central Dique |
Argentina | Gas/Diesel | 68 | 51 | % | 1998 | ||||||||||
| Gener—TermoAndes |
Argentina | Gas/Diesel | 643 | 71 | % | 2000 | ||||||||||
| Los Caracoles(1) |
Argentina | Hydro | 125 | 0 | % | 2009 | ||||||||||
| Paraná-GT |
Argentina | Gas/Diesel | 845 | 99 | % | 2001 | ||||||||||
| Quebrada de Ullum(1) |
Argentina | Hydro | 45 | 0 | % | 2004 | ||||||||||
| Rio Juramento—Cabra Corral |
Argentina | Hydro | 102 | 99 | % | 1995 | ||||||||||
| Rio Juramento—El Tunal |
Argentina | Hydro | 10 | 99 | % | 1995 | ||||||||||
| San Juan—Sarmiento |
Argentina | Gas/Diesel | 33 | 99 | % | 1996 | ||||||||||
| San Juan—Ullum |
Argentina | Hydro | 45 | 99 | % | 1996 | ||||||||||
| San Nicolás |
Argentina | Coal/Gas/Oil | 675 | 99 | % | 1993 | ||||||||||
| Tietê(2) |
Brazil | Hydro | 2,657 | 24 | % | 1999 | ||||||||||
| Uruguaiana |
Brazil | Gas | 639 | 46 | % | 2000 | ||||||||||
| Gener—Electrica Santiago(3) |
Chile | Gas/Diesel | 479 | 64 | % | 2000 | ||||||||||
| Gener—Electrica Ventanas(4) |
Chile | Coal | 272 | 71 | % | 2010 | ||||||||||
| Gener—Energía Verde(5) |
Chile | Biomass/Diesel | 49 | 71 | % | 2000 | ||||||||||
| Gener—Gener(6) |
Chile | Hydro/Coal/Diesel | 953 | 71 | % | 2000 | ||||||||||
| Gener—Guacolda(7),(8) |
Chile | Coal/Pet Coke | 608 | 35 | % | 2000 | ||||||||||
| Gener—Norgener |
Chile | Coal/Pet Coke | 277 | 71 | % | 2000 | ||||||||||
| Chivor |
Colombia | Hydro | 1,000 | 71 | % | 2000 | ||||||||||
| Andres |
Dominican Republic | Gas | 319 | 100 | % | 2003 | ||||||||||
|
Itabo(9) |
Dominican Republic | Coal | 295 | 50 | % | 2000 | ||||||||||
| Los Mina |
Dominican Republic | Gas | 236 | 100 | % | 1996 | ||||||||||
| Bayano |
Panama | Hydro | 260 | 49 | % | 1999 | ||||||||||
| Chiriqui—Esti |
Panama | Hydro | 120 | 49 | % | 2003 | ||||||||||
| Chiriqui—La Estrella |
Panama | Hydro | 48 | 49 | % | 1999 | ||||||||||
| Chiriqui—Los Valles |
Panama | Hydro | 54 | 49 | % | 1999 | ||||||||||
| 11,907 | ||||||||||||||||
| (1) | AES operates these facilities through management or operations and maintenance (“O&M”) agreements and owns no equity interest in these businesses. |
| (2) | Tietê plants: Água Vermelha, Bariri, Barra Bonita, Caconde, Euclides da Cunha, Ibitinga, Limoeiro, Mog-Guaçu, Nova Avanhandava, Promissão and seven other small hydroelectric plants below Tietê’s wholly-owned subsidiary “PCH Minas Ltda”. |
| (3) | Gener—Electrica Santiago plants: Nueva Renca and Renca. |
| (4) | Gener—Electrica Ventanas plant: Nueva Ventanas. |
| (5) | Gener—Energia Verde Plants: Constitución, Laja and San Francisco de Mostazal. |
| (6) | Gener—Gener plants: Alfalfal, Laguna Verde, Laguna Verde Turbogas, Los Vientos, Maitenas, Queltehues, Santa Lidia, Ventanas and Volcán. |
| (7) | Gener—Guacolda plants: Guacolda 1, Guacolda 2, Guacolda 3 and Guacolda 4. |
| (8) | Unconsolidated entities, the results of operations of which are reflected in Equity in Earnings of Affiliates. |
| (9) | Itabo plants: Itabo complex (two coal-fired steam turbines and one gas-fired steam turbine). |
8
Table of Contents
Generation under construction
| Business |
Location |
Fuel |
Gross MW |
AES Equity Interest (Percent, Rounded) |
Expected Year of Commercial Operations |
|||||||||||
| Angamos |
Chile | Coal | 518 | 71 | % | 2011 | ||||||||||
| Campiche |
Chile | Coal | 270 | 71 | % | 2013 | ||||||||||
| Changuinola I |
Panama | Hydro | 223 | 100 | % | 2011 | ||||||||||
| 1,011 | ||||||||||||||||
Latin America Utilities. Each of our Utilities businesses in Latin America sells electricity under regulated tariff agreements and has transmission and distribution capabilities but none of them has generation capability. AES Eletropaulo, a consolidated subsidiary of which AES owns a 16% economic interest and which has served the São Paulo, Brazil area for over 100 years, has approximately six million customers and is the largest electricity distribution company in Brazil in terms of revenue and electricity distributed. Pursuant to its concession agreement, AES Eletropaulo is entitled to distribute electricity in its service area until 2028. AES Eletropaulo’s service territory consists of 24 municipalities in the greater São Paulo metropolitan area and adjacent regions that account for approximately 17% of Brazil’s GDP and 40% of the population in the State of São Paulo. AES Sul (“Sul”), a wholly-owned subsidiary, serves over one million customers. In El Salvador, our Utilities businesses provide electricity to over 81% of the country, serving more than one million customers.
Set forth below is a list of our Latin America Utilities facilities:
Distribution
| Business |
Location | Approximate Number of Customers Served as of 12/31/2010 |
GWh Sold in 2010 |
AES Equity Interest (Percent, Rounded) |
Year Acquired |
|||||||||||||||
| Edelap |
Argentina | 329,000 | 2,776 | 90 | % | 1998 | ||||||||||||||
| Edes |
Argentina | 172,000 | 894 | 90 | % | 1997 | ||||||||||||||
| Eletropaulo |
Brazil | 5,832,000 | 33,860 | 16 | % | 1998 | ||||||||||||||
| Sul |
Brazil | 1,181,474 | 8,320 | 100 | % | 1997 | ||||||||||||||
| CAESS |
El Salvador | 516,000 | 2,060 | 75 | % | 2000 | ||||||||||||||
| CLESA |
El Salvador | 304,000 | 786 | 64 | % | 1998 | ||||||||||||||
| DEUSEM |
El Salvador | 62,000 | 108 | 74 | % | 2000 | ||||||||||||||
| EEO |
El Salvador | 229,000 | 476 | 89 | % | 2000 | ||||||||||||||
| 8,625,474 | 49,280 | |||||||||||||||||||
North America
Our North America operations accounted for 19%, 22% and 22% of consolidated revenue in 2010, 2009 and 2008, respectively. The following table provides highlights of our North America operations:
| Countries |
U.S., Puerto Rico and Mexico | |
| Generation Capacity |
13,396 Gross MW | |
| Utilities Penetration |
470,000 customers (16,537 GWh) | |
| Generation Facilities |
19 | |
| Utilities Businesses |
1 integrated utility (includes 4 generation plants) | |
| Key Generation Businesses |
Eastern Energy, Southland and TEG/TEP | |
| Key Utilities Business |
IPL |
9
Table of Contents
The graph below shows the breakdown between our North America Generation and Utilities segments as a percentage of total North America revenue and gross margin for the years ended December 31, 2010, 2009 and 2008. See Note 15—Segment and Geographic Information in the Consolidated Financial Statements in Item 8 of this Form 10-K for information on revenue from external customers, Adjusted Gross Margin (a non-GAAP measure) and total assets by segment.
| Revenue ($ in billions) |
Gross Margin ($ in millions) | |
|

|
North America Generation. Approximately 86% of the generation capacity is supported by long-term power purchase or tolling agreements. Our North America Generation business consists of six gas-fired, ten coal-fired and three petroleum coke-fired plants in the United States, Puerto Rico and Mexico.
Our largest generation business is AES Southland. This business operates three gas-fired plants, representing generation capacity of 4,327 MW, in the Los Angeles basin under a long-term tolling agreement. In addition, in the Western New York power market, AES Eastern Energy operates four of our coal-fired plants, Cayuga, Greenidge, Somerset and Westover, representing generation capacity of 1,169 MW, providing power to this market under short-term contracts, as well as in the spot electricity market.
10
Table of Contents
Set forth below is a list of our North America Generation facilities:
Generation
| Business |
Location | Fuel | Gross MW |
AES Equity Ownership (Percent, Rounded) |
Year Acquired or Began Operation |
|||||||||||
| Mérida III |
Mexico | Gas | 484 | 55 | % | 2000 | ||||||||||
| Termoelectrica del Golfo (TEG) |
Mexico | Pet Coke | 230 | 99 | % | 2007 | ||||||||||
| Termoelectrica del Peñoles (TEP) |
Mexico | Pet Coke | 230 | 99 | % | 2007 | ||||||||||
| Southland—Alamitos |
USA—CA | Gas | 2,047 | 100 | % | 1998 | ||||||||||
| Southland—Huntington Beach |
USA—CA | Gas | 904 | 100 | % | 1998 | ||||||||||
| Southland—Redondo Beach |
USA—CA | Gas | 1,376 | 100 | % | 1998 | ||||||||||
| Thames |
USA—CT | Coal | 208 | 100 | % | 1990 | ||||||||||
| Hawaii |
USA—HI | Coal | 203 | 100 | % | 1992 | ||||||||||
| Warrior Run |
USA—MD | Coal | 205 | 100 | % | 2000 | ||||||||||
| Red Oak |
USA—NJ | Gas | 832 | 100 | % | 2002 | ||||||||||
| Cayuga |
USA—NY | Coal | 306 | 100 | % | 1999 | ||||||||||
| Greenidge |
USA—NY | Coal | 106 | 100 | % | 1999 | ||||||||||
| Somerset |
USA—NY | Coal | 675 | 100 | % | 1999 | ||||||||||
| Westover |
USA—NY | Coal | 82 | 100 | % | 1999 | ||||||||||
| Shady Point |
USA—OK | Coal | 360 | 100 | % | 1991 | ||||||||||
| Beaver Valley |
USA—PA | Coal | 125 | 100 | % | 1985 | ||||||||||
| Ironwood |
USA—PA | Gas | 710 | 100 | % | 2001 | ||||||||||
| Puerto Rico |
USA—PR | Coal | 454 | 100 | % | 2002 | ||||||||||
| Deepwater |
USA—TX | Pet Coke | 160 | 100 | % | 1986 | ||||||||||
| 9,697 | ||||||||||||||||
North America Utilities. AES has one integrated utility in North America, IPL, which it owns through IPALCO Enterprises Inc. (“IPALCO”), the parent holding company of IPL. IPL generates, transmits, distributes and sells electricity to approximately 470,000 customers in the city of Indianapolis and neighboring areas within the state of Indiana. IPL owns and operates four generation facilities that provide more than 96% of the electricity it distributes. Two of the generation facilities are coal-fired plants. The third facility has a combination of units that use coal (base load capacity) and natural gas and/or oil (peaking capacity). The fourth facility is a small peaking station that uses gas-fired combustion turbine technology. IPL’s gross generation capacity is 3,699 MW. Approximately 45% of IPL’s coal is provided by one supplier with which IPL has long-term contracts. A key driver for the business is tariff recovery for environmental projects through the rate adjustment process. IPL’s customers include residential, industrial, commercial and all other which made up 37%, 40%, 15% and 8%, respectively, of North America Utilities revenue for 2010.
IPL’s generation facilities
| Business |
Location | Fuel | Gross MW |
AES Equity Interest (Percent, Rounded) |
Year Acquired or Began Operation |
|||||||||
|
IPL(1) |
USA—IN | Coal/Gas/Oil | 3,699 | 100 | % | 2001 | ||||||||
| (1) | IPL plants: Eagle Valley, Georgetown, Harding Street and Petersburg. |
11
Table of Contents
Distribution
| Business |
Location | Approximate Number of Customers Served as of 12/31/2010 |
GWh Sold in 2010 |
AES Equity Interest (Percent, Rounded) |
Year Acquired |
|||||||||||||
| IPL |
USA—IN | 470,000 | 16,537 | 100 | % | 2001 | ||||||||||||
Europe
The following table provides highlights of our Europe operations:
| Countries |
Czech Republic, Hungary, Jordan, Kazakhstan, Netherlands, Spain, Turkey, Ukraine and the United Kingdom | |
| Generation Capacity |
7,986 Gross MW | |
| Utilities Penetration |
1.8 million customers (9,904 GWh) | |
| Generation Facilities |
21 (including 3 under construction) | |
| Utilities Businesses |
4 | |
| Key Generation Businesses |
Ballylumford, Cartagena, Kilroot, Tisza II | |
| Key Utilities Businesses |
Kievoblenergo and Rivneenergo |
Our Utilities operations in Europe are discussed further under Corporate and Other below.
Europe Generation. Our Generation operations in Europe accounted for 8%, 6% and 8% of our consolidated revenue in 2010, 2009 and 2008, respectively. In 2007, we began commercial operation of AES Cartagena (“Cartagena”), our first power plant in Spain, with capacity of 1,199 MW. As a result of the new accounting guidance for variable interest entities, the Company consolidated Cartagena effective January 1, 2010. In prior periods, the results of operations for Cartagena were included in the Equity in Earnings of Affiliates line item on the Consolidated Statements of Operations. Today, AES operates four power plants in Kazakhstan which account for 8% of the country’s total installed generation capacity. In September 2009, AES completed construction and launched commercial operation of the 380 MW combined-cycle Amman East power plant in Jordan. See Note 15—Segment and Geographic Information in the Consolidated Financial Statements in Item 8 of this Form 10-K for revenue, Adjusted Gross Margin (a non-GAAP measure) and total assets by segment. Key business drivers of this segment are: foreign currency exchange rates, new legislation and regulations including those related to the environment.
12
Table of Contents
Set forth below is a list of our Europe Generation facilities:
Generation
| Business |
Location | Fuel | Gross MW |
AES Equity Interest (Percent, Rounded) |
Year Acquired or Began Operation |
|||||||||||||||
| Bohemia |
Czech Republic | Coal/Biomass | 50 | 100 | % | 2001 | ||||||||||||||
| Borsod |
Hungary | Biomass/Coal | 71 | 100 | % | 1996 | ||||||||||||||
| Tisza II |
Hungary | Gas/Oil | 900 | 100 | % | 1996 | ||||||||||||||
| Tiszapalkonya |
Hungary | Coal/Biomass | 90 | 100 | % | 1996 | ||||||||||||||
| Amman East |
Jordan | Gas | 380 | 37 | % | 2008 | ||||||||||||||
| Shulbinsk HPP(1) |
Kazakhstan | Hydro | 702 | 0 | % | 1997 | ||||||||||||||
| Sogrinsk CHP |
Kazakhstan | Coal | 301 | 100 | % | 1997 | ||||||||||||||
| Ust—Kamenogorsk HPP(1) |
Kazakhstan | Hydro | 331 | 0 | % | 1997 | ||||||||||||||
| Ust—Kamenogorsk CHP |
Kazakhstan | Coal | 1,354 | 100 | % | 1997 | ||||||||||||||
|
Elsta(2) |
Netherlands | Gas | 630 | 50 | % | 1998 | ||||||||||||||
| Cartagena |
Spain | Gas | 1,199 | 71 | % | 2006 | ||||||||||||||
| Damlapinar(2)(3) |
Turkey | Hydro | 16 | 51 | % | 2010 | ||||||||||||||
| Girlevik II-Mercan(2) |
Turkey | Hydro | 12 | 51 | % | 2007 | ||||||||||||||
| Kepezkaya(2)(3) |
Turkey | Hydro | 28 | 51 | % | 2010 | ||||||||||||||
| Yukari-Mercan(2) |
Turkey | Hydro | 14 | 51 | % | 2007 | ||||||||||||||
| Ballylumford |
United Kingdom | Natural Gas | 1,246 | 100 | % | 2010 | ||||||||||||||
| Kilroot(4) |
United Kingdom | Coal/Gas/Oil | 662 | 99 | % | 1992 | ||||||||||||||
| 7,986 | ||||||||||||||||||||
| (1) | AES operates these facilities under concession agreements until 2017. |
| (2) | Unconsolidated entities, the results of operations of which are reflected in Equity in Earnings of Affiliates. |
| (3) | Joint Venture with I.C. Energy. |
| (4) | Includes Kilroot Open Cycle Gas Turbine (“OCGT”). |
Generation under construction
| Business |
Location | Fuel | Gross MW |
AES Equity Interest (Percent, Rounded) |
Expected Year of Commercial Operation |
|||||||||||||||
| Maritza East(1) |
Bulgaria | Coal | 670 | 100 | % | 2011 | ||||||||||||||
| Kumkoy(2) |
Turkey | Hydro | 18 | 51 | % | 2011 | ||||||||||||||
| Niksar(2) |
Turkey | Hydro | 40 | 51 | % | 2011 | ||||||||||||||
| 728 | ||||||||||||||||||||
| (1) | Construction of the Maritza East facility is currently on hold. For further discussion please see Item 7.—Management’s Discussion and Analysis—Key Trends and Uncertainties and Item 1A.—Risk Factors, “Our business is subject to substantial development uncertainties.” |
| (2) | Joint Venture with I.C. Energy. The joint venture is an unconsolidated entity, the results of operations of which are reflected in Equity in Earnings of Affiliates. |
13
Table of Contents
Asia
Our Asia operations accounted for 4%, 3% and 2% of consolidated revenue in 2010, 2009 and 2008, respectively. Asia’s Generation business operates 9 power plants with a total capacity of 4,103 MW in four countries. In Asia, AES operates generation facilities only. See Note 15—Segment and Geographic Information in the Consolidated Financial Statements in Item 8 of this Form 10-K for revenue, Adjusted Gross Margin (a non-GAAP measure) and total assets by segment. The following table provides highlights of our Asia operations:
| Countries |
China, India, the Philippines and Sri Lanka | |
| Generation Capacity |
4,103 Gross MW | |
| Utilities Penetration |
None | |
| Generation Facilities |
9 | |
| Utilities Businesses |
None | |
| Key Businesses |
Yangcheng and Masinloc |
Asia Generation. In 2010, the Company closed the sales of our businesses in Oman, Pakistan and Qatar. See Note 21—Discontinued Operations and Held for Sale Businesses in Item 8 of this Form 10-K for further information on these sales. More than half of our remaining generation capacity in Asia is located in China. In 1996, AES joined with Chinese partners to build Yangcheng, the first “coal-by-wire” power plant with the generation capacity of 2,100 MW. In April 2008, the Company completed the purchase of a 92% interest in a 660 MW coal-fired thermal power generation facility in Masinloc, Philippines (“Masinloc”).
Set forth below is a list of our generation facilities in Asia:
Generation
| Business |
Location | Fuel | Gross MW |
AES Equity Interest (Percent, Rounded) |
Year Acquired or Began Operation |
|||||||||||||||
| Aixi |
China | Coal | 51 | 71 | % | 1998 | ||||||||||||||
| Chengdu(1) |
China | Gas | 50 | 35 | % | 1997 | ||||||||||||||
| Cili |
China | Hydro | 25 | 51 | % | 1994 | ||||||||||||||
|
JHRH(1) |
China | Hydro | 379 | 35 | % | 2010 | ||||||||||||||
|
Wuhu(1),(2) |
China | Coal | 250 | 25 | % | 1996 | ||||||||||||||
| Yangcheng(1) |
China | Coal | 2,100 | 25 | % | 2001 | ||||||||||||||
|
OPGC(1) |
India | Coal | 420 | 49 | % | 1998 | ||||||||||||||
| Masinloc |
Philippines | Coal | 660 | 92 | % | 2008 | ||||||||||||||
| Kelanitissa |
Sri Lanka | Diesel | 168 | 90 | % | 2003 | ||||||||||||||
| 4,103 | ||||||||||||||||||||
| (1) | Unconsolidated entities, the results of operations of which are reflected in Equity in Earnings of Affiliates. |
| (2) | AES agreed to sell its 25% equity interest in this business on August 11, 2010. The disposal was approved by the government authority on December 6, 2010. |
Corporate and Other
“Corporate and Other” includes the net operating results from our Utilities businesses in Africa and Europe, Africa Generation and AES Wind Generation and other renewables projects. These operations do not require separate segment disclosure. The following provides additional details about our Utilities businesses in Africa and Europe, Africa generation and AES Wind Generation, which are reported within “Corporate and Other” for financial reporting purposes.
14
Table of Contents
Europe Utilities. Our distribution businesses in the Ukraine and Kazakhstan together serve approximately 1.8 million customers.
Distribution
| Business |
Location | Approximate Number of Customers Served as of 12/31/2010 |
GWh Sold in 2010 |
AES Equity Interest (Percent, Rounded) |
Year Acquired |
|||||||||||||||
| Eastern Kazakhstan REC(1)(2) |
Kazakhstan | 459,000 | 3,444 | 0 | % | |||||||||||||||
| Ust-Kamenogorsk Heat Nets(1)(3) |
Kazakhstan | 96,000 | — | 0 | % | |||||||||||||||
| Kievoblenergo |
Ukraine | 861,828 | 4,557 | 89 | % | 2001 | ||||||||||||||
| Rivneenergo |
Ukraine | 405,934 | 1,903 | 84 | % | 2001 | ||||||||||||||
| 1,822,762 | 9,904 | |||||||||||||||||||
| (1) | AES operates these businesses through management agreements and owns no equity interest in these businesses. |
| (2) | Shygys Energo Trade, a retail electricity company, is 100% owned by Eastern Kazakhstan REC (“EK REC”) and purchases distribution service from EK REC and electricity in the wholesale electricity market and resells to the distribution customers of EK REC. |
| (3) | Ust-Kamenogorsk Heat Nets provide transmission and distribution of heat with a total heat generating capacity of 224 Gcal. |
Africa Utilities. AES owns a 56% interest in an integrated utility, Société Nationale d’Electricité (“Sonel”). Sonel generates, transmits and distributes electricity to over half a million people and is the sole distributor of electricity in Cameroon.
Set forth below is a list of the generation and distribution facilities of Sonel:
Sonel’s generation facilities
| Business |
Location | Fuel | Gross MW |
AES Equity Interest (Percent, Rounded) |
Year Acquired or Began Operation |
|||||||||||||||
|
Sonel(1) |
Cameroon | Hydro/ Diesel/Heavy Fuel Oil | 936 | 56 | % | 2001 | ||||||||||||||
| (1) | Sonel plants: Bafoussam, Bassa, Djamboutou, Edéa, Lagdo, Limbé, Logbaba I, Logbaba II, Oyomabang I, Oyomabang II, Song Loulou, and other small remote network units. |
Sonel’s distribution facility
| Business |
Location | Approximate Number of Customers Served as of 12/31/2010 |
GWh Sold in 2010 |
AES Equity Interest (Percent, Rounded) |
Year Acquired |
|||||||||||||
| Sonel |
Cameroon | 660,484 | 3,345 | 56 | % | 2001 | ||||||||||||
15
Table of Contents
Africa Generation. Set forth below is a list of our generation facilities in Africa.
Generation
| Business |
Location | Fuel | Gross MW |
AES Equity Interest (Percent, Rounded) |
Year Acquired or Began Operation |
|||||||||||||||
| Dibamba |
Cameroon | Heavy Fuel Oil | 86 | 56 | % | 2009 | ||||||||||||||
| Ebute |
Nigeria | Gas | 294 | 95 | % | 2001 | ||||||||||||||
| 380 | ||||||||||||||||||||
Wind Generation. We own and operate 1,538 MW of wind generation capacity and operate an additional 215 MW of capacity through operating and management agreements. Our wind business is located primarily in North America where we operate wind generation facilities that have generation capacity of 1,269 MW.
Set forth below is a list of AES Wind Generation facilities:
Generation
| Business |
Location | Power Source |
Gross MW |
AES Equity Interest (Percent, Rounded) |
Year Acquired or Began Operation |
|||||||||||||||
| St. Nikola |
Bulgaria | Wind | 156 | 89 | % | 2010 | ||||||||||||||
| Dong Qi(1),(3) |
China | Wind | 49 | 49 | % | 2010 | ||||||||||||||
| Huanghua I(1),(3) |
China | Wind | 49 | 49 | % | 2009 | ||||||||||||||
| Huanghua II(1),(3) |
China | Wind | 49 | 49 | % | 2010 | ||||||||||||||
| Hulunbeier(1),(3) |
China | Wind | 49 | 49 | % | 2008 | ||||||||||||||
| InnoVent(2),(3) |
France | Wind | 75 | 40 | % | 2003-2009 | ||||||||||||||
| St. Patrick |
France | Wind | 35 | 100 | % | 2010 | ||||||||||||||
| North Rhins |
Scotland | Wind | 22 | 100 | % | 2010 | ||||||||||||||
| Altamont |
USA—CA | Wind | 40 | 100 | % | 2005 | ||||||||||||||
| Mountain View I & II(4) |
USA—CA | Wind | 67 | 100 | % | 2008 | ||||||||||||||
| Palm Springs |
USA—CA | Wind | 30 | 100 | % | 2005 | ||||||||||||||
| Tehachapi |
USA—CA | Wind | 58 | 100 | % | 2007 | ||||||||||||||
| Storm Lake II(4) |
USA—IA | Wind | 78 | 100 | % | 2007 | ||||||||||||||
| Lake Benton I(4) |
USA—MN | Wind | 106 | 100 | % | 2007 | ||||||||||||||
| Condon(4) |
USA—OR | Wind | 50 | 100 | % | 2005 | ||||||||||||||
| Armenia Mountain(4) |
USA—PA | Wind | 101 | 100 | % | 2009 | ||||||||||||||
| Buffalo Gap I(4) |
USA—TX | Wind | 121 | 100 | % | 2006 | ||||||||||||||
| Buffalo Gap II(4) |
USA—TX | Wind | 233 | 100 | % | 2007 | ||||||||||||||
| Buffalo Gap III(4) |
USA—TX | Wind | 170 | 100 | % | 2008 | ||||||||||||||
| Wind generation facilities(5) |
USA | Wind | 215 | 0 | % | 2005 | ||||||||||||||
| 1,753 | ||||||||||||||||||||
| (1) | Joint Venture with Guohua Energy Investment Co. Ltd. |
| (2) | InnoVent plants: Bignan, Chepy, Croixrault-Moyencourt, Frenouville, Gapree, Grand Fougeray, Guehenno, Hargicourt, Hescamps, LePortal, Les Diagots, Nibas, Plechatel, Saint-Hilaire la Croix and Valhoun. InnoVent owns various percentages of underlying projects. |
| (3) | Unconsolidated entities, the results of operations of which are reflected in Equity in Earnings of Affiliates. |
16
Table of Contents
| (4) | AES owns these assets together with third party tax equity investors with variable ownership interests. The tax equity investors receive a portion of the economic attributes of the facilities, including tax attributes that vary over the life of the projects. The proceeds from the issuance of tax equity are recorded as Noncontrolling Interest in the Company’s Consolidated Balance Sheets. |
| (5) | AES operates these facilities through management or O&M agreements and owns no equity interest in these businesses. |
AES Wind Generation projects under construction
| Business |
Location | Power Source |
Gross MW |
AES Equity Interest (Percent, Rounded) |
Expected Year of Commercial Operation |
|||||||||||||||
| Chen Qi(1) |
China | Wind | 49 | 49 | % | 2011 | ||||||||||||||
| InnoVent(2) |
France | Wind | 29 | 40 | % | 2011 | ||||||||||||||
| Saurashtra |
India | Wind | 39 | 100 | % | 2011 | ||||||||||||||
| Mountain View IV |
US-CA | Wind | 49 | 100 | % | 2011 | ||||||||||||||
| Laurel Mountain |
US-WV | Wind | 98 | 100 | % | 2011 | ||||||||||||||
| 264 | ||||||||||||||||||||
| (1) | Joint Venture with Guohua Energy Investment Co. Ltd. |
| (2) | InnoVent plants: Allery, Audrieu, Lamballe, Lefaux and Vron. InnoVent owns various percentages of underlying projects. |
Other. AES Solar and certain other unconsolidated businesses are accounted for using the equity method of accounting. Therefore, their operating results are included in “Net Equity in Earnings of Affiliates” on the face of the Consolidated Statements of Operations, not in revenue and gross margin. AES Solar was formed in March 2008 to develop, own and operate solar installations. Since its launch, AES Solar has commenced commercial operations of 37 MW of solar projects in France, Greece and Spain, has 75 MW under construction in Italy, and has development potential in Bulgaria, India and the U.S.
“Corporate and Other” also includes general and administrative expenses related to corporate staff functions and initiatives, executive management, business development, finance, legal, human resources and information systems which are not allocable to our business segments and the effects of eliminating transactions, such as self insurance charges, between the operating segments and corporate. See Note 15—Segment and Geographic Information in the Consolidated Financial Statements in Item 8 of this Form 10-K for information on revenue from external customers, Adjusted Gross Margin (a non-GAAP measure) and total assets by segment.
17
Table of Contents
Financial Data by Country
The table below presents information, by country, about our consolidated operations for each of the three years ended December 31, 2010, 2009 and 2008, respectively, and property, plant and equipment as of December 31, 2010 and 2009, respectively. Revenue is recognized in the country in which it is earned and assets are reflected in the country in which they are located.
| Revenue | Property, Plant & Equipment, net | |||||||||||||||||||
| 2010 | 2009 | 2008 | 2010 | 2009 | ||||||||||||||||
| (in millions) | ||||||||||||||||||||
| United States |
$ | 2,615 | $ | 2,545 | $ | 2,745 | $ | 6,167 | $ | 7,016 | ||||||||||
| Non-U.S.: |
||||||||||||||||||||
| Brazil |
6,473 | 5,394 | 5,501 | 6,413 | 5,799 | |||||||||||||||
| Chile |
1,355 | 1,239 | 1,349 | 2,560 | 2,321 | |||||||||||||||
| Argentina |
887 | 684 | 949 | 459 | 448 | |||||||||||||||
| El Salvador |
648 | 619 | 484 | 261 | 254 | |||||||||||||||
| Dominican Republic |
535 | 429 | 601 | 625 | 634 | |||||||||||||||
| Philippines(1) |
501 | 250 | 148 | 784 | 765 | |||||||||||||||
| Cameroon |
422 | 370 | 379 | 823 | 742 | |||||||||||||||
|
Spain(2) |
411 | — | — | 667 | — | |||||||||||||||
| Mexico |
409 | 329 | 463 | 786 | 802 | |||||||||||||||
| Colombia |
393 | 347 | 291 | 387 | 390 | |||||||||||||||
| United Kingdom |
385 | 241 | 342 | 527 | 433 | |||||||||||||||
| Ukraine |
356 | 286 | 403 | 86 | 80 | |||||||||||||||
| Hungary |
296 | 317 | 466 | 80 | 196 | |||||||||||||||
| Puerto Rico |
253 | 267 | 251 | 596 | 609 | |||||||||||||||
| Panama |
194 | 168 | 210 | 921 | 834 | |||||||||||||||
| Kazakhstan |
138 | 123 | 234 | 63 | 48 | |||||||||||||||
| Jordan |
120 | 104 | 47 | 224 | 231 | |||||||||||||||
| Sri Lanka |
100 | 109 | 184 | 69 | 74 | |||||||||||||||
| Bulgaria(3) |
44 | — | — | 1,825 | 1,835 | |||||||||||||||
|
Qatar(4) |
— | — | — | — | — | |||||||||||||||
| Pakistan(5) |
— | — | — | — | — | |||||||||||||||
|
Oman(6) |
— | — | — | — | — | |||||||||||||||
| Other Non-U.S. |
112 | 133 | 150 | 298 | 285 | |||||||||||||||
| Total Non-U.S. |
14,032 | 11,409 | 12,452 | 18,454 | 16,780 | |||||||||||||||
| Total |
$ | 16,647 | $ | 13,954 | $ | 15,197 | $ | 24,621 | $ | 23,796 | ||||||||||
| (1) | Masinloc was acquired in April 2008; 2008 revenue represents results for a partial year. |
| (2) | Cartagena was consolidated effective January 1, 2010 upon implementation of the variable interest entity accounting guidance. |
| (3) | Maritza East and our wind project in Bulgaria were under development and therefore not operational as of December 31, 2009. Our wind project in Bulgaria started operations in 2010. |
| (4) | Excludes revenue of $129 million, $163 million and $161 million for the years ended December 31, 2010, 2009 and 2008, respectively, and property, plant and equipment of $501 million as of December 31, 2009 related to Ras Laffan, which was reflected as discontinued operations and businesses held for sale in the accompanying Consolidated Statements of Operations and Consolidated Balance Sheets. |
| (5) | Excludes revenue of $299 million, $470 million and $607 million for the years ended December 31, 2010, 2009 and 2008, respectively, and property, plant and equipment of $36 million as of December 31, 2009 related to Lal Pir and Pak Gen, which were reflected as discontinued operations and businesses held for sale in the accompanying Consolidated Statements of Operations and Consolidated Balance Sheets. |
18
Table of Contents
| (6) | Excludes revenue of $62 million, $101 million and $105 million for the years ended December 31, 2010, 2009 and 2008, respectively, and property, plant and equipment of $311 million as of December 31, 2009, related to Barka, which was reflected as discontinued operations and businesses held for sale in the accompanying Consolidated Statements of Operations and Consolidated Balance Sheets. |
We sell to a wide variety of customers. No individual customer accounted for 10% or more of our 2010 total revenue. In our generation business, we own and/or operate power plants to generate and sell power to wholesale customers such as utilities and other intermediaries. Our utilities sell to end-user customers in the residential, commercial, industrial and governmental sectors in a defined service area.
As of December 31, 2010, we employed approximately 29,000 people.
The following individuals are our executive officers:
Paul Hanrahan, 53 years old, has been the President, CEO and a member of our Board of Directors since 2002. Prior to assuming his current position, Mr. Hanrahan was the Executive Vice President and COO. In this role, he was responsible for managing all aspects of business development activities and the operation of multiple electric utilities and generation facilities in Europe, Asia and Latin America. Mr. Hanrahan was previously the President and CEO of the AES China Generating Company, Ltd., a public company formerly listed on NASDAQ. Mr. Hanrahan also has managed other AES businesses in the United States, Europe and Asia. In March 2006, he was elected to the board of directors of Corn Products International, Inc. Prior to joining AES, Mr. Hanrahan served as a line officer on the U.S. fast attack nuclear submarine, USS Parche (SSN-683). Mr. Hanrahan is a graduate of Harvard Business School and the U.S. Naval Academy.
Andres R. Gluski, 53 years old, has been an Executive Vice President and COO of the Company since March 2007. Prior to becoming the COO of AES, Mr. Gluski was Executive Vice President and the Regional President of Latin America from 2006 to 2007. Mr. Gluski was Senior Vice President for the Caribbean and Central America from 2003 to 2006, CEO of La Electricidad de Caracas (“EDC”) from 2002 to 2003 and CEO of AES Gener (Chile) in 2001. Prior to joining AES in 2000, Mr. Gluski was Executive Vice President and CFO of EDC, Executive Vice President of Banco de Venezuela (Grupo Santander), Vice President for Santander Investment, and Executive Vice President and CFO of CANTV (subsidiary of GTE). Mr. Gluski has also worked with the International Monetary Fund in the Treasury and Latin American Departments and served as Director General of the Ministry of Finance of Venezuela. Mr. Gluski currently serves on the Board of Directors of Cliffs Natural Resources, The Council of Americas, US Spain Business Council and The Edison Electric Institute and is Chairman of AES Gener and AES Brasiliana. Mr. Gluski is a graduate of Wake Forest University and holds an M.A and a Ph.D in Economics from the University of Virginia.
Ned Hall, 51 years old, has been an Executive Vice President, Regional President for North America and Chairman, Global Wind Generation and Energy Storage since June 2008. In August of 2009, Mr. Hall joined the Board of AES Solar Energy, Ltd., a joint venture between AES and Riverstone Holdings LLC. Prior to his current position, Mr. Hall was Vice President of the Company and President, Global Wind Generation from April 2005 to June 2008, Managing Director of AES Global Development from September 2003 to April 2005, and was an AES Group Manager from April 2001 to September 2003. Mr. Hall joined AES in 1988 as a Project Manager working in the Development Group and has held a variety of development and operating roles for AES, including assignments in the U.S., Europe, Asia and Latin America. He is a registered professional engineer in the Commonwealth of Massachusetts. Mr. Hall holds a BSME degree from Tufts University and an MBA degree in finance/operations management from the MIT Sloan School of Management.
19
Table of Contents
Victoria D. Harker, 46 years old, has been an Executive Vice President and CFO since January 2006. Prior to joining the Company, Ms. Harker held the positions of Acting CFO, Senior Vice President and Treasurer of MCI from November 2002 to January 2006. Prior to that, Ms. Harker served as CFO of MCI Group, a unit of WorldCom Inc., from 1998 to 2002. Prior to 1998, Ms. Harker held several positions at MCI in the areas of finance, information technology and operations. In November of 2009, she was elected to the board of directors of Darden Restaurants, Inc. She has also been a member of the University of Virginia Board of Managers since 2007 and the board of the Wolf Trap Foundation for the Performing Arts since 2009. Ms. Harker received a Bachelor of Arts degree in English and Economics from the University of Virginia and a Masters in Business Administration, Finance from American University.
Brian A. Miller, 45 years old, is an Executive Vice President of the Company, General Counsel, and Corporate Secretary. Since November of 2010, Mr. Miller has also served as the co-head of the Company’s Development Steering Committee. Mr. Miller joined the Company in 2001 and has served in various positions including Vice President, Deputy General Counsel, Corporate Secretary, General Counsel for North America and Assistant General Counsel. In March of 2008, Mr. Miller joined the Board of AES Solar Energy, Ltd., a joint venture between AES and Riverstone Holdings LLC. In 2009, he joined the board of AgCert International Limited and AgCert Canada Holding Limited. Prior to joining AES, he was an attorney with the law firm Chadbourne & Parke, LLP. Mr. Miller received a bachelor’s degree in History and Economics from Boston College and holds a Juris Doctorate from the University of Connecticut School of Law.
Richard Santoroski, 46 years old, became an Executive Vice President in February 2010 and has led the Company’s Global Risk & Commodity Organization since February 2008. Since November of 2010, he has also served as co-head of the Company’s Development Steering Committee. Prior to his current position, Mr. Santoroski was Vice President, Energy & Natural Resources, a business development group, and Vice President, Risk Management. Mr. Santoroski joined AES in January 1999 to lead AES Eastern Energy’s commodity management. Prior to AES, Mr. Santoroski held various engineering, trading and risk management positions at New York State Electric & Gas, including leading the energy trading group. He graduated from Pennsylvania State University with a Bachelor of Science in Electrical Engineering, and earned an MBA and a Master of Science in Electrical Engineering from Syracuse University. Mr. Santoroski is a Licensed Professional Engineer in the State of New York.
Andrew Vesey, 55 years old, is Executive Vice President and Regional President of Latin America and Africa. He has held that position since April 2009. Prior to this, Mr. Vesey was Executive Vice President and Regional President for Latin America from March 2008 through March 2009 and Chief Operating Officer for Latin America from July 2007 through February 2008. Mr. Vesey also served as Vice President and Group Manager for AES Latin America, DR-CAFTA Region from 2006 to 2007, Vice President of the Global Business Transformation Group from 2005 to 2006, and Vice President of the Integrated Utilities Development Group from 2004 to 2005. Prior to joining the Company in 2004, Mr. Vesey was a Managing Director of the Utility Finance and Regulatory Advisory Practice at FTI Consulting Inc., a partner in the Energy, Chemicals and Utilities Practice of Ernst & Young LLP, and CEO and Managing Director of Citipower Pty of Melbourne, Australia. He received his BA in Economics and BS in Mechanical Engineering from Union College in Schenectady, New York and his MS from New York University.
How to Contact AES and Sources of Other Information
Our principal offices are located at 4300 Wilson Boulevard, Arlington, Virginia 22203. Our telephone number is (703) 522-1315. Our website address is http://www.aes.com. Our annual reports on Form 10-K, quarterly reports on Form 10-Q and current reports on Form 8-K and any amendments to such reports filed pursuant to Section 13(a) or Section 15(d) of the Securities Exchange Act of 1934 (the “Exchange Act”) are posted on our website. After the reports are filed with, or furnished to, the Securities and Exchange Commission (“SEC”), they are available from us free of charge. Material contained on our website is not part of and is not incorporated by reference in this Form 10-K. You may also read and copy any materials we file with the SEC at
20
Table of Contents
the SEC’s Public Reference Room at 100 F Street, N.E., Washington, D.C. 20549. You may obtain information about the operation of the Public Reference Room by calling the SEC at 1-800-SEC-0330. The SEC maintains an internet website that contains the reports, proxy and information statements and other information that we file electronically with the SEC at www.sec.gov.
Our CEO and our CFO have provided certifications to the SEC as required by Section 302 of the Sarbanes-Oxley Act of 2002. These certifications are included as exhibits to this Annual Report on Form 10-K.
Our CEO provided a certification pursuant to Section 303A of the New York Stock Exchange Listed Company Manual on May 21, 2010.
Our Code of Business Conduct (“Code of Conduct”) and Corporate Governance Guidelines have been adopted by our Board of Directors. The Code of Conduct is intended to govern, as a requirement of employment, the actions of everyone who works at AES, including employees of our subsidiaries and affiliates. Our Ethics and Compliance Department provides training, information, and certification programs for AES employees related to the Code of Conduct. The Ethics and Compliance Department also has programs in place to prevent and detect criminal conduct, promote an organizational culture that encourages ethical behavior and a commitment to compliance with the law, and to monitor and enforce AES policies on corruption, bribery, money laundering and associations with terrorists groups. The Code of Conduct and the Corporate Governance Guidelines are located in their entirety on our website at http://www.aes.com. Any person may obtain a copy of the Code of Conduct or the Corporate Governance Guidelines without charge by making a written request to: Corporate Secretary, The AES Corporation, 4300 Wilson Boulevard, Arlington, VA 22203. If any amendments to, or waivers from, the Code of Conduct or the Corporate Governance Guidelines are made, we will disclose such amendments or waivers on our website.
Overview
In each country where we conduct business, we are subject to extensive and complex governmental regulations which affect most aspects of our business, such as regulations governing the generation and distribution of electricity and environmental regulations. These regulations affect the operation, development, growth and ownership of our businesses. Regulations differ on a country-by-country basis and are based upon the type of business we operate in a particular country.
Regulation of our Generation Businesses
Our Generation businesses operate in two different types of regulatory environments: Market Environments and Other Environments.
Market Environments. In market environments, sales of electricity may be made directly on the spot market, under negotiated bilateral contracts, or pursuant to PPAs. The spot markets are typically administered by a central dispatch or system operator who seeks to optimize the use of the generation resources throughout an interconnected system (the cost of the least expensive next-generation plant required to meet system demand). The spot price is usually set at the marginal cost of energy or based on bid prices. In addition, many of these wholesale markets include markets for ancillary services to support the reliable operation of the transmission system, such as regulation (a service that corrects for short-term changes in electricity use that could impact the stability of the power system). Most of our businesses in Europe, Latin America and the United States operate in these types of liberalized markets.
Other Environments. We operate Generation assets in certain countries that do not have a spot market. In these environments, electricity is sold only through PPAs with state-owned entities and/or industrial clients as the offtaker. Examples of countries where we operate in this type of environment include Jordan, Nigeria, Puerto Rico and Sri Lanka.
21
Table of Contents
Regulation of our Distribution Businesses
In general, our distribution companies sell electricity directly to end-users such as homes and businesses and bill customers directly. The amount our distribution companies can charge customers for electricity is governed by a regulated tariff. The tariff, in turn, is generally based upon a certain usage level that includes a pass-through to the customer of costs that are not controlled by the distribution company, including the costs of fuel (in the case of integrated utilities) and/or the costs of purchased energy, plus a margin for the value added by the distributor, which is usually calculated as a fair return on the fair value of the company’s assets. This regulated tariff is periodically reviewed and reset by the applicable regulatory agency. Components of the tariff that are directly passed through to the customer are usually adjusted through an automated process. In many instances, the tariffs can be adjusted between scheduled regulatory resets pursuant to an inflation adjustment or another index. Customers with demand above a certain level are often unregulated and can choose to contract with generation companies directly and pay a wheeling fee, which is a fee to the distribution company for use of the distribution system. Most of our utilities operate as monopolies within exclusive geographic areas set by the regulatory agency and face limited competition from other distributors.
Set forth below is a discussion of certain regulations we operate under in the countries where we do business. In each country, the regulatory environment can pose material risks to our business, operations or financial condition. For further discussion of those risks, see the Item 1A.—Risk Factors of this Form 10-K.
Latin America and Africa
Argentina
Structure of Electricity Market. The Argentine electricity market is divided into three separate lines of business: generation, transmission and distribution. AES Argentina operates 12% of the installed capacity of the Wholesale Electricity Market (“WEM”) and two distribution companies: one under federal jurisdiction–EDELAP; and the other under the jurisdiction of the Province of Buenos Aires–EDES. The law recognizes a category of large users made up of industrial companies and other consumers with substantial electricity supply needs.
The WEM is comprised of:
| • | A Term Contracts Market, with contracts freely agreed amongst producers and consumers; |
| • | A Spot Market, with prices sanctioned on an hourly basis considering the economic cost of production represented by the short-term marginal cost (spot prices); and |
| • | A Stabilization System on a quarterly basis of the prices forecasted for the spot market, created for the purchase of the distributors (seasonal prices). |
Principal Regulators. The National Electricity Regulating Agency (“ENRE”) is responsible for ensuring transmission and distribution companies comply with the concessions granted by the Argentine government and approving distribution tariffs. The WEM is managed by Compañía Administradora del Mercado Mayorista Eléctrico, Sociedad Anónima (“CAMMESA”), the independent system operator. CAMMESA also acts as the dispatch entity, or OED (Organismo Encargado de Desapacho), and manages the organization, dispatch and operations of the WEM at large according to the policies established by the Energy Secretariat, under the Ministry of Federal Planning, Public Investment and Services. In such capacity, CAMMESA is empowered to interpret the rules relating to the organization, dispatch and energy agreements in the WEM. In addition to these duties, CAMMESA manages the information on supply and demand in the WEM, which is used by the Energy Secretariat to fix the seasonal prices and the market’s operational rules. CAMMESA’s operating costs are borne by the WEM’s participants and agents.
In the Provincial Jurisdiction, the regulator is the Organismo de Control de la Electricidad de Buenos Aires and the Dirección Provincial de Energía under the Ministry of Infrastructure.
22
Table of Contents
Principal Regulations. The electricity sector activities are regulated by the Electricity Act. Law 24.065 and Law 11.796 regulate the activities of generation, transmission and distribution of electric energy in the territory of the Province of Buenos Aires, determining what activities of transmission and distribution of energy are public services, whereas the generation is an activity of general interest.
Presently, the price of electric energy is determined assuming all generating units in Argentina are operating with natural gas, even though the generators may be using more expensive, alternative fuels. In the case of generators using alternative fuels, CAMMESA pays the total variable cost of production, which may exceed the established spot price. Additionally, in the spot market, generators are also remunerated for their capacity to generate electricity in excess of supply agreements or private contracts executed by them.
The Argentine government has adopted many new economic measures since 2002, by means of the “Emergency Law” 25561, as amended and extended by various supplemental laws and regulations. These laws and regulations effectively terminated the use of the United States Dollar as the functional currency of the Argentine electricity sector. Distribution companies are ruled by their Concession Contracts on November 12, 2004.
Material Regulatory Actions. On July 31, 2008, the ENRE issued Resolution 324 that granted EDELAP a tariff DVA increase of approximately 18%. In addition, the government recognized that a process to establish the RTI (integral tariff reset) should take place during February 2009. On September 12, 2009, EDELAP submitted the tariff reset proposal to the ENRE. ENRE is considering the tariff proposals submitted by the federal distribution companies. If the regulatory agency continues to delay the granting of the tariff increase needed by EDELAP, EDELAP could experience significant operational challenges in the future. Total DVA increase granted to EDELAP pursuant to this process is 66%.
In March 2008, the Ministry of Infrastructure of the Province of Buenos Aires issued Resolution 741 which settled a tariff increase of 15% average) to be applied for EDES during 2008 and an increase of 15% average to be applied from 2009. On March 22, 2010, the Ministry of Infrastructure of the Province of Buenos Aires issued Resolution 141 which settled the new tariff to be applied by EDES during 2010. It represents an average increase of approximately 24%. Total DVA increase granted to EDES pursuant to this process is 190%.
During 2004, the Energy Secretariat reached agreements with natural gas and electricity producers to reform the energy markets. In the electricity sector, the Energy Secretariat passed Resolution 826/2004, inviting generators to contribute a percentage of their sales margins to fund the development and construction of two new combined cycle power plants to be installed by 2008/2009 (“FONINVEMEM I & II”). The time period for the funding was set from January 2004 through December 2006 and was subsequently extended through December 2007. During 2008, both power plants started operation of the gas turbines, and since March 2010, the plants started operations in combined cycle mode. In exchange, the Argentine government committed to reform market regulation to match more favorable regulations that existed prior to 2001. Additionally, participating generators will receive a pro rata ownership share in the new generation plants after ten years.
Potential or Proposed Regulations. A non-binding general agreement with the rest of the Generators operating in Argentina and the government was signed on November 25, 2010 to address a nation-wide problem of overdue accounts receivables to the generation market. The non-binding agreement established the guidelines for the detailed documentation that will allow the execution FONINVEMEM III project agreement and some additional cash revenues. Under the agreement, accounts receivable accrued from July 2009 to December 2011, for an amount of approximately $204 million will be converted into a generation asset (estimated at 800 MW) to be built under the FONINVEMEM III project. The government will provide funds necessary to finance the projects. The plant will have a PPA with CAMMESA for ten (10) years, calculated to recover 100% of the receivables invested plus a margin of LIBOR + 5%. Payments will be made once the project begins operations. We expect the existing FONINVEMEM I and II documents will be taken as a base for the future contracts; assuming this, the collection of the 120 installment will not be tied to the availability of the plant. Availability
23
Table of Contents
risk will be assumed by the operator through a Long-Term Service Agreement (“LTSA”). Some penalties may apply to the generating companies, but only in those cases where the unavailability is caused by their operating decisions not considered in the LTSA. According to this, the yearly penalty would be capped at 10% of the yearly amount required under the PPA. Initially, AES Argentina Generación S.A. will participate in this proposal under the terms and conditions referred to above. Its equity ownership in the new project will equal its contribution of receivables among the generating companies, estimated to be 24% of the resulting plants. Both power plants that were built under similar regulations started full operation in combined cycle mode in March 2010, and the installments agreed are being paid on a timely basis.
Brazil
Structure of Electricity Market. In Brazil, there are two regulatory regimes which regulate PPAs the Regulated Contracting Ambience (“ACR”), for the Generation and Distribution of Electric Power Agents, and the Ambience for Free Contracting (“ACL”), for the Generation, Commercialization, Importers and Exporters of Energy Power Agents as well as consumers.
This model establishes a number of requirements to be followed by the participants in the industry, such as the obligation for distributors to contract for their market growth years in advance through regulated auctions; hydro and thermal energy contracting conditions to ensure better balance between supply cost and system stability; and a permanent supply monitoring structure to detect possible imbalances between supply and demand.
Principal Regulators. In Brazil, there are a number of regulatory bodies which govern the electricity sector including the Brazilian Electricity Regulatory Agency (“ANEEL”) and the Chamber of Electrical Energy Commercialization (“CCEE”).
ANEEL’s responsibilities are to regulate and inspect production, transmission, distribution and commercialization of electricity in order to assure quality of provided services and universal access. ANEEL is also responsible for the establishment of tariffs for end consumers, in a way that the economic and financial feasibility of power sector participants as Generation, Transmission and Distribution companies and such as the industry as a whole is preserved. The changes brought about in 2004 by the new model made ANEEL responsible for promoting, directly or indirectly, auctions for the Distribution companies to purchase energy through long-term contracts within the National Interconnected System (Sistema Interligado Nacional) (“SIN”).
The CCEE (former Mercado Atacadista de Energia) paramount obligations include: the determination of the Differences’ Price Settlement (Preço de Liquidação de Diferenças) (“PLD”), or Spot Price, used to value short-term market transactions; the execution of the energy accounting process, identifying who and how much electricity is involved in multilateral short-term market transactions; the financial settlement of the amounts calculated in the energy accounting process; and preparation and execution of energy auctions within the ACR by ANEEL’s delegation.
Principal Regulations.
Distribution Companies. AES has two distribution businesses in Brazil: AES Eletropaulo and AES Sul. Under the power sector model, distribution companies have to purchase electricity at the regulated market through auctions. Every distribution utility is obligated to contract to meet 100% of its energy needs in the ACR. Bilateral contracts are being honored but cannot be renewed. The tariff charged by distribution companies to captive customers is composed of a non-manageable cost component (“Parcel A”), which includes energy purchase costs and charges related to the use of transmission and distribution systems and is directly passed through to customers, and a manageable cost component (“Parcel B”), which includes operation and maintenance costs based on a model distribution company defined by ANEEL, recovery of depreciated assets and a component for the value added by the distributor (calculated as net asset base multiplied by pre-tax weighted
24
Table of Contents
average cost of capital). Parcel B is reset every four years for AES Eletropaulo and every five years for AES Sul. There is an annual tariff adjustment to pass through Parcel A costs to customers and to adjust the Parcel B costs by inflation, less an efficiency factor. Distribution companies could also be entitled to extraordinary tariff revisions in the event of significant changes to their cost structure.
In the first half of 2010, all distribution companies signed amendments to the Concession Contracts, capturing market variance effects over sector charges. AES Eletropaulo signed its amendment on May 3, while AES Sul signed it on April 12. The 2010 tariff readjustment already reflected such amendment. Additionally, ANEEL conducted a public hearing regarding the partition of the extraordinary tariff reset (“RTE”) between Generation and Distribution companies. The RTE was designed to recover revenue losses of Distribution companies and energy purchase costs of Generation companies, both during the rationing period that occurred in 2001 and as a result of regulatory, market and weather-related conditions. The RTE’s period of application for AES Eletropaulo was limited to 70 months, which was not sufficient to recover its revenue losses. The Public Hearing process was concluded on January 12, 2010, generating an initial negative impact before taxes to AES Eletropaulo of R$6.8 million ($4.1 million) recorded in 2009, offset by a positive impact before taxes of R$7.3 million ($4.4 million) recorded in 2010 for additional RTE adjustments. AES Tietê recorded revenue of R$6.2 million ($3.7 million) in 2010.
Generation Companies. AES has two generation businesses in Brazil: AES Tietê and AES Uruguaiana. Under the power sector model, the Ministry of Mines and Energy MME determines the amount of energy to be sold by each plant known as “assured energy” or the amount of energy representing the long-term average energy production of the plant defined by ANEEL. Together with the system operator, ANEEL establishes the assured energy which is the amount of energy to be sold by each plant through long term contracts. The system operator determines generation dispatch which takes into account nationwide electricity demand, hydrological conditions and system constraints. In order to mitigate the risks involved in hydroelectric generation for each generator and to optimize the system generation capacity, a mechanism is in place to transfer energy from those who generated more than the average of the system to those who generated less than the average. The energy that is reallocated through this mechanism is priced pursuant to an energy optimization tariff, designed to optimize the use of generation available in the system.
AES Tietê is allowed to sell electric power within the ACR and ACL, maintaining the competitive nature of the generation. Generation companies must provide physical coverage from their own power generation or purchase contracts for 100% of their sale contracts. The failure to provide the required physical coverage and/or present purchase contracts, which is subject to monthly verification, exposes the generation company to the payment of penalties.
Beginning in 2003, 25% of AES Tiete’s assured energy has been added annually to the volume marketed through a PPA and consequently since 2006, all of AES Tiete’s assured energy has been sold to AES Eletropaulo. The PPA entered into with AES Eletropaulo which expires on December 31, 2015, and requires that the price of energy sold be adjusted annually based on the Brazilian inflation variation. Before the end of the PPA in 2015, AES Tietê must seek alternatives to the immediate re-contracting of its assured energy from 2016 onwards. Existing legislation allows AES Tietê to allocate its energy to the regulated auctions of existing energy, or in the free market through bilateral contracts for non-distribution companies.
The state of São Paulo stablished some conditions to privatize the generation sector in Sao Paulo state including an obligation to increase generation capacity by 15%, originally to be accomplished by the end of 2007. AES Tietê, as well as other concessionaire generators, were not able to meet this requirement due to regulatory, environmental and hydrological constraints. Currently, the matter is under consideration by the government of the State of São Paulo (related to the increased capacity) after a decision by ANEEL’s Board of Officers that ANEEL is not the appropriate authority to consider the extension, since the expansion obligation derives from the purchase and sale agreement between AES Tietê and the Government of São Paulo, and not from the concession agreement itself. AES Tietê is reviewing any may pursue the development of certain gas-fired facilities in order to meet this obligation.
25
Table of Contents
Environmental Regulations. Electric sector companies are subject to strict environmental legislation in federal, state and municipal spheres in matters such as atmospheric emissions and special protected areas. Such companies need permits and authorizations from government bodies in order to conduct their activities. In case of violation of or non-compliance with such laws, regulations, permits and authorizations, companies may suffer administrative sanctions such as fines, shutdown of activities, invalidation of permits and the annulment of authorizations. The government Attorney’s Office may institute a civil investigation and/or promote a public civil action seeking indemnity for environmental or third-party damages. Government agencies or other authorities may enact new stricter rules or search for more restrictive interpretations of existing laws and regulations that may oblige power companies to spend additional resources for environmental compliance, including attainment of environmental permits for facilities and equipment that did not require those types of permits previously. Government agencies or other authorities may delay the issuance of permits and necessary authorizations for the development of power companies causing project implementation schedule delays and, consequently, unfavorable effects in the companies’ businesses and results. Any action in this direction from the government agencies may negatively affect businesses in the power sector and have adverse effects on the business and results of the companies.
Material Regulatory Actions. According to the Concession Contract, distribution companies go through a tariff adjustment process every year. AES Eletropaulo was granted an 8.00% average tariff adjustment to be applied to the Company’s tariff as from July 4, 2010. AES Sul’s average tariff adjustment was 5.56% as of April 19, 2010.
On May 16, 2002, ANEEL issued the Order #288, a regulation that established the retroactive denial to the choice of not participating in the “exposition relief mechanism,” a tool that allowed the sale of energy from Itaipu Generating Co. in the Spot Market. Due to its negative impact, AES Sul filed a lawsuit seeking the annulment of Order #288. For a further discussion of this dispute see Item 3.—Legal Proceedings in this Form 10-K.
Potential or Proposed Regulations. In 2011, the Third Reset Cycle begins; AES Eletropaulo’s will take place in 2011 and AES Sul’s will occur in 2013. A public hearing proposed a new methodology for tariff reset and our comments were submitted on January 10, 2011, There is a another on going regarding a new methodology for tariff reset promote a new methodology for defining quality of service indicators. The outcome of these hearings is unknown. However, if the revised tariff is inexplicitly low or our quality of service indicators are found inadequate, there could be a material impact on our business.
Cameroon
Structure of Electricity Market. Our subsidiaries in Cameroon are involved in the generation, transmission, distribution and sale of electricity through AES SONEL, Dibamba Power Development Company (“DPDC”) and Kribi Power Development Company (“KPDC”). AES SONEL is an integrated utility which operates approximately 930 MW of generation capacity, two interconnected transmission networks and distributes electricity to approximately 700,000 customers under a 20-year concession agreement that was signed in July of 2001. AES SONEL has the exclusive distribution rights to all medium voltage and low voltage customers, except for customers with an installed capacity of more than 1 MW (“Major Customers”) who are free to negotiate bilateral agreements. Generation in Cameroon is open for competition and our subsidiary, DPDC, developed, built and is currently operating an 86 MW heavy fuel oil power plant near Douala as an IPP which provides power to AES SONEL under a tolling agreement. In order to meet increasing demand for power, the government is developing the Lom Pangar Dam project on the Sanaga River which will increase the flows of the Sanaga River and increase the generation capacity of the two major hydro power plants currently operated by AES SONEL. The Lom Pangar Dam will also generate 50 MW. Another AES subsidiary, KPDC, is developing a 216 MW gas-fired power plant in Kribi as another IPP which will provide power to AES SONEL.
Under its Concession Agreement, AES SONEL operates the two interconnected transmission networks in the country: the Southern Grid with a length of 1550 km and the Northern Grid with a length of 665 km. Major
26
Table of Contents
Customers, distributors, or vendors can access the grid subject to paying a fee. Sales to low voltage and medium voltage customers are subject to tariff levels agreed to between AES SONEL and the regulator based on the framework established in the AES SONEL Concession Agreement. Management of energy flows on the transmission network is currently undertaken by AES SONEL. Under the Concession requirements, AES SONEL will be required to create a separate legal entity under which the transmission system will operate. Under the regulation in force, such entity is contemplated to be a 100% subsidiary of AES SONEL whose share capital will be opened up to other operators in the sector in accordance with procedures to be approved by the regulator.
Principal Regulators. Cameroon’s electricity regulatory agency, ARSEL, has functional and decision-making autonomy, and is run by a Board of Directors and a General Manager assisted by a Deputy General Manager. Its financing is provided by the state budget and fees collected from revenues generated from activities carried out by operators of the sectors concerned. ARSEL’s decisions are highly influenced by the government via the Ministry of Power, the Prime Minister’s Office and the General Secretariat of the Presidency of the Republic. The Ministry of Energy and Water is the Ministry mandated to issue specific regulations relating to the electricity sector and to issue the concessions, licenses and authorizations to be granted to the operators in the sector.
Principal Regulations. The principal legislative instrument governing the power sector is Law No. 98/022 of December 24, 1998 which sets out a new institutional framework for the Power Sector and lays the foundations for competition in the power market in Cameroon. It is supplemented by the following instruments:
| • | Decree No. 2000/464/PM of June 30, 2000 governing the activities of the power sector; |
| • | Decree No. 2001/021/PM of January 29, 2001 setting out the rates and methods of calculation, collection and distribution of the fees payable by operators involved in the power sector; |
| • | Ministerial Order No. 061/CAB/MINMEE of January 30, 2001 setting out the documents and fees required in applying for concessions, licenses, authorizations and declarations for the generation, transmission, distribution, export and sale of power; |
| • | Ministerial Order No. 000013/MINMEE of January 26, 2009 approving the regulation of the public distribution of electricity in Cameroon; and |
| • | The Concession Agreements and license between the Republic of Cameroon and AES SONEL signed on July 18, 2001 and amended in 2006. |
Material Regulatory Issues. Cameroon is currently preparing for presidential elections in 2011 and local elections in 2012. Tariff adjustments expected for 2010 were challenged by the government, resulting in shortfalls of compensation due under the Concession Agreement to AES SONEL for 2010 and 2011. Following lengthy negotiations, a compensation agreement was signed by both parties on November 24, 2010, which provides, among other things, for compensation to be paid to AES SONEL by the government of Cameroon for any revenue shortfall in 2010 and 2011 arising from the difference between tariffs applied to end-users and tariffs due under the Concession Agreement. The estimated shortfall for 2010 was approximately $22 million, which has been paid in full. The normal tariff mechanisms to end-users are expected to be restored in 2012.
Environmental Regulations. The environmental regulation is derived from Law No. 96/12 of August 5, 1996 and various implementing decrees and ministerial orders. This regulation applies to all sectors but there are some specific requirements relating to the electricity sector. The main requirement of this regulation is the obligation to conduct an environmental impact analysis for planned construction of new generation installations or new transmission lines or substations.
Potential or Proposed Regulations. In addition, there are plans to review the legal and regulatory framework of the power sector to consider the formation of new public entities. Presently, to make up for the power shortage anticipated in 2012 (due to delays in commissioning the Kribi power plant developed by KPDC and the Lom
27
Table of Contents
Pangar Dam developed by the government) and the additional demand generated by a number of infrastructural projects, the government is planning to construct thermal plants with an overall capacity of 40 MW and a hydroelectric plant with a capacity of 200 MW. Additionally, there are other generation projects whose specifications have yet to be clearly determined. The regulatory framework relating to the development of this new capacity and to the future contractual relationship between these new projects and AES SONEL is still unclear. However, the tariff compensation agreement referred to above provides that additional costs imposed on AES SONEL with regard to these projects shall be fully passed through in tariffs charged to end-users.
Despite the provisions of the regulation described above relating to the operation of the transmission network, the Minister of Energy has formally expressed his preference for a different solution that would take responsibilities for transmission activity and management of the transmission grid away from AES SONEL and assign them to a new public entity to be created and majority-owned by the state. The impact on AES is not known at this time; however, it could be material to our results of operations.
Chile
Structure of Electricity Market. In Chile, except for the small isolated systems of Aysén and Punta Arenas, generation activities are principally in two electric systems: the Central Interconnected Grid (“SIC”), which supplies approximately 92% of the country’s population; and the Northern Interconnected Grid (“SING”), where the principal users are mining and industrial companies. Power generation is based primarily on long-term contracts between generation companies and customers specifying the volume, price and conditions for the sale of energy and capacity. The law recognizes two types of customers for generation companies: unregulated customers and regulated customers. Unregulated customers are principally consumers whose connected capacity is higher than 2 MW and consumers whose connected capacity is between 500 kW and 2 MW who have selected the unregulated pricing mechanism for a period of four years. These customers are not subject to price regulation and are able to freely negotiate prices and conditions for electricity supply with generation and distribution companies. Regulated customers are those whose connected capacity is less than or equal to 500 kW and those with connected capacity between 500 kW and 2 MW who have selected, also for four years, the regulated pricing system.
Electricity generation in each of the SIC and the SING is coordinated by the respective independent Economic Load Dispatch Center (“CDEC”) in order to minimize operational costs and ensure the highest economic efficiency of the system, while fulfilling all quality of service and reliability requirements established by current regulations. In order to satisfy demand at the lowest possible cost at all times, each CDEC orders the dispatch of generation plants based strictly on variable generation costs, starting with the lowest variable cost, and does so independent of the contracts held by each generation company. Thus, while the generation companies are free to enter into supply contracts with their customers and are obligated to comply with such contracts, the energy needed to satisfy demand is always produced by the CDEC members whose variable production costs are lower than the system’s marginal cost at the time of dispatch. For this reason, in each hour a given generator is either a net supplier to the system or a net buyer. Net buyers pay net suppliers the system’s marginal cost. In addition, the Chilean market is designed to include payments for capacity (or firm capacity), which are explicitly paid to generation companies for contributing to the system’s sufficiency. The cost of investment and operation of transmission systems is borne by generation companies and consumers (regulated tolls) in proportion to their use.
Principal Regulators. The Chilean Ministry of Energy, created in 2010, grants concessions for the provision of the public service of electric distribution and the National Commission for the Environment administers the system for evaluating the environmental impact of projects. Thermoelectric plants do not require electrical concession agreements from the government in order to be built or operate. The new Ministry of Energy works with several agencies related to energy issues, such as the National Energy Commission (“NEC”), the Electricity and Fuel Superintendent and the Chilean Nuclear Commission, among others, in order to provide a better coordination of energy affairs. The Ministry of Energy will also oversee a new Energy Efficiency agency. The
28
Table of Contents
NEC establishes, regulates and coordinates energy policy. The Superintendent of Electricity and Fuels oversees compliance with service quality and safety regulations. The General Water Authority issues the rights to use water for hydroelectric generation plants. The Chilean electric system includes a Panel of Experts—an independent technical agency whose purpose is to analyze and resolve in a timely fashion conflicts arising between companies within the electric sector and among one or more of these companies and the energy regulators. In addition, the Ministry of Environment is responsible for the development and implementation of environmental regulations, protection of the environment, environmental education and pollution control, among others.
Principal Regulations. The distinct electricity sector activities are regulated by the General Electricity Services Law. Sector activities are also governed by the corresponding technical regulations and standards. The keystones of the electricity regulation are: (i) a regulated compulsory marginal cost dispatch based on audited variable costs; (ii) a contract-based wholesale generation market; (iii) an open-access regime for transmission with benchmark regulation for existent transmission lines and open bids for new lines; (iv) benchmark regulation for the distribution grid; and (v) electricity retailing by distribution companies in their exclusive concession areas.
In accordance with these laws, new contracts assigned by distribution companies for consumption from 2010 onward must be awarded to generation companies based on the lowest supply price offered in public bid processes. These prices, called “long-term node prices,” include indexation formulas and are valid for the entire term of the contract, up to a maximum of fifteen years. More precisely, the long-term energy node price for a particular contract is the lowest energy price offered by the generation companies participating in each respective bid process, while the long-term capacity node price is that set in the node price decree in effect at the time of the bid.
On February 17, 2011, President Sebastian Pinera’s administration enacted an energy decree that enables the government to take preventive measures to reduce the risk of future energy shortages. Chile is experiencing a significant drought that has diminished the country’s reservoir levels and hydroelectric power capacity affecting the (SIC). The decree will be in forced until August 2011 and focuses on three main actions: cutting available voltage by 10-12.5%; saving reservoir capacity up to 500 GWh; and offering incentives for consumers to save electricity. The decree is not expected to have a material impact on AES Gener’s results in 2011
Environmental Regulations. Law 20,257 was enacted in April 2008 and promotes non-conventional renewable energy sources, such as solar, wind, small hydroelectric and biomass energy. The Law requires that a percentage of the new power purchase contracts held by generation companies after August 31, 2007 be supplied from renewable sources. The required energy percentage begins at 5% for 2010-2014, and gradually increases to a maximum of 10% in 2024. Generation companies are charged for each kWh not supplied in accordance with the Law. Our businesses in Chile have developed a plan for complying with this law, which includes the sale of certain water rights, the purchasers of which have agreed to build a small hydroelectric plant and sell the energy to our businesses in Chile at a fixed price.
Potential or Proposed Regulations. In December 2009, the environmental agency published a draft of a potential new ruling which will regulate the emissions from thermal power plants of NOX, SO2, particulate matter (“PM”) and metals. The President of Chile approved the regulation on January 18, 2011 and the regulation will become effective upon approval of the General Comptroller of Chile. The regulation will require AES Gener, our Chilean subsidiary, to install emissions reduction equipment at its existing thermal plants from late 2011 through 2015. The exact costs of compliance with such regulation have not yet been determined and the Company believes some of the compliance costs are contractually passed through to counterparties. However, the compliance costs could be material.
A proposed law which would give new incentives to Non-Conventional Renewable Energy (“NCRE”) such as solar, wind, small hydroelectric and biomass energy is under discussion in the Congress. The proposed law
29
Table of Contents
increases the requirements of NCRE beginning 2015, such requirements reaching 20% as a percentage of the customer load in 2020. The current law imposes a requirement to reach 10% in 2024. The new requirements would need to be fulfilled with NCRE coming from the same system (separates SIC and SING). The NCRE would need to be accredited by the NEC, which may impose fines for non-compliance. The impact to AES Gener is under analysis; however, it will depend on the new size limit of small run of river units and if the new requirement affects the current supply contracts, which only include the 10% required by the current law. The proposed law, if passed, could result in increased costs or otherwise have a material impact on our results of operations.
In September 2010, the NEC proposed a new normative in Ancillary Services (“AASS”) based on a cost-efficient regulation informed by generators and customers. The normative regulates the AASS transactions among generators in: regulation, spinning reserve, non-operating reserve and the Automatic Load Shedding Scheme (“ALSS”). AES Gener has presented observations principally against compulsory investments requested by the CDEC; AASS costs allocated incorrectly among generators according to their power generation (it believes it should be according to their electricity withdrawals) and the ALSS’s are a demand-side obligation and adjustment mechanisms are only considered for imbalances in contributions between consumers. AES Gener is assessing the potential impact of this regulation, and an estimate of the impact can only be established when the final regulation is issued. However, if passed, the regulations could result in required investments or other increased costs which could have a material and adverse impact on our results of operations.
Colombia
Structure of Electricity Market. Colombia has one main national interconnected system (the “SIN”). The wholesale market is organized around both bilateral contracts and a mandatory pool and spot market for all generation units larger than 20 MW.
In the spot market, each unit bids its availability and a set price for a 24-hour period. The dispatch is arranged from lowest to highest bid price and the spot price is set by the marginal price. There are two types of customers: unregulated customers and regulated customers. Unregulated customers are consumers whose maximum capacity consumption is higher than 0.1 MW, or whose energy demand is greater than 55 MWh/month. These customers are not subject to price regulation; therefore, generators or trader companies are able to freely negotiate prices and conditions for electricity supply with them. Regulated customers have their prices determined by means of public tenders.
Electricity generation in the Colombian system is coordinated by the market administrator whose goal is to minimize operational costs while fulfilling all quality-of-service and reliability requirements established by current regulations. In order to satisfy demand at the lowest possible cost at all times, market administrator orders the dispatch of generation plants based on offer price (variable cost plus reliability charge) by merit, starting with the lowest offer price, and does so independent of the contracts held by each generation company. For this reason, in each hour a given generator is either a net supplier to the system or a net buyer. Net buyers pay net suppliers the system’s spot price. In addition, the Colombian market is designed to include reliability payments, which are paid to generation companies for contributing to the system’s sufficiency. The cost of investment and operation of transmission systems are borne by the consumers in proportion to their use.
Principal Regulators. The Ministry of Mines and Energy (“MME”) establishes the energy policies and the Regulatory Commission of Electricity and Gas (“CREG”) was created to foster the efficient supply of energy through regulation of the wholesale market, the natural monopolies of transmission, and distribution, and by setting limits for horizontal and vertical integration. The Ministry of the Environment (“MMA”) establishes the environmental policies.
The Public Services Superintendence supervises the correct provision of utilities and the Industry and Commerce Superintendence is in charge of sanctioning any anticompetitive practice. Other entities that have an
30
Table of Contents
impact on the electric system include the Energy Planning Unit (“UPME”), in charge of planning the electricity and gas system, and the National Development Planning Office (“DNP”), whose main role is to develop a general development plan for the government.
Principal Regulations. The laws of Domiciliary Public Services and the Electricity Law set the institutional arrangement and the general regulatory framework for the electricity sector. The keystones of the electricity regulation are: (i) the dispatch is based on an offer price that represents the variable cost of the plants; (ii) a contract-based wholesale generation market; (iii) an open access regime for transmission with revenue regulated for existent transmission lines and open bids for new lines; (iv) revenue regulated for the distribution grid; and (v) electricity retail can be performed by distribution and/or traders.
The spot market started in July 1995, and in 1996 a capacity payment was introduced for a term of ten years. In December 2006, a regulation was enacted that replaced the capacity charge with the reliability charge and established two implementation periods. The first period consists of a transition period from December 2006 to November 2012 during which the price is equal to $13.045 per MWh and volume is determined based on each plant’s firm energy which is prorated so that the total firm energy level does not exceed system demand. During the second period, which begins on December 2012, the reliability charge will be determined based on the energy price and the volume of offers submitted by market participants bidding for new capacity for the system. The first reliability charge auction was held in May 2008 with the following results: (i) the reliability charge for existing plants for the period between December 2012 and November 2013 will be $13.998 per MWh; (ii) for new plants that won the auction, the charge will be paid for twenty years starting December 2012; and (iii) three new projects won the auction for a total capacity of 430 MW starting in 2012. The new methodology established in 2006 recognized the reliability provide by Chivor’s system and favored the company by increasing the reliability charge by approximately 120%, moving from $18 million in 2006 to almost $40 million in 2007 and is expected to have a similar amount per year until 2015.
Environmental Regulations. In Colombia, Law 99 created the MMA in 1993. This law requires that projects that affect the land or impact the environment must obtain a license from the MMA. While regional environmental authorities can issue licenses for generation projects with capacity of less than 100 MW, only the MMA has the authority to issue licenses for the construction of large-scale generation or transmission projects. Chivor initiated operations in 1977 through a water concession, the only environmental requirement at that time. Furthermore, in August 1995 the MMA requested hydroelectrical plants, including Chivor to fulfill the requirements of an “Environmental Management Plan,” which serves as an environmental permit to operate. Each year, Chivor has to demonstrate to the environmental authorities that the obligations included in such plan are accordingly fulfilled. Additionally, hydro plants must contribute 6% of their gross generation and thermal plants 4% of their gross generation to the area of influence valued at a special tariff defined by CREG. In 2008, MMA issued Resolution 909 that regulates the emission of thermal power plants. This Resolution is not expected to affect Chivor because it is a hydro but could affect AES if we decide to acquire or build a thermal plant in Colombia.
Potential or Proposed Regulations. CREG issued a proposal to create the Organized Regulated Market (“MOR”). The MOR will replace the current bilateral contracts markets (between traders/utilities and generators) by putting in place a centralized auction in which the Market Administrator buys energy for all regulated customers served by the traders/utilities. The main provisions contained in the proposal are: (i) it is mandatory for all traders/utilities to buy energy at the auction price and it is voluntary for sellers (generators and trade companies) to offer energy in each auction; (ii) one single price for the energy sales in the auction; (iii) the auctions are held one year before the actual dispatch and the commitment period of the auction is one year; and (iv) to establish four auctions per year. Bilateral contracts executed before the beginning of the MOR’s operation will not suffer any change and will remain valid. In general, we consider that if MOR is correctly designed, it should benefit our businesses in Colombia. We expect that a definitive resolution will be issued in the first half of 2011.
31
Table of Contents
During 2010, MME issued Decree 2730 which intends to solve the potential long-term and/or cyclical unavailability of gas by (i) importing LNG and (ii) establishing strategic storage alternatives. Also, the government presented the basis for the “National Development Plan 2011–2014.” For the electricity sector, the plan mainly focuses on: (i) maintaining stability of the current regulatory framework, supporting the current reliability charge structure, promoting fair competition among technologies and guaranteeing no new taxes to transactions made in the wholesale market; (ii) assuring energy supply for the medium and long term; (iii) enhancing and strengthening the electricity market’s competitiveness in order to maintain investment confidence and convert the electricity system in Colombia into a world class sector; (iv) making the right decisions in the natural gas sector to make it reliable; and (v) promoting institutional improvement guided by transparency, independence and efficiency. Among these initiatives, they are considering reviewing the separation of National Dispatch Center from the Commercial Transactions Administrator and self-regulation initiatives to avoid or minimize interventions in the market by the government. These initiatives also seek to resolve the gas supply problem for thermal plants. As a result, we believe they may be favorable to our business in Colombia because they may improve the overall reliability of the electricity system and reduce the current uncertainties. Additionally, we believe these initiatives may help Chivor better manage its water resources and its associated risk and may also provide more certainty about long term energy prices. Furthermore, the National Development Plan proposal aims to maintain the stability and certainty of the market rules in order to consolidate the investor trust.
As a part of CREG regulatory agenda for 2011, the regulator is planning to review the lessons learned from the dry conditions brought by the 2009-10 “El Niño” phenomenon and issue regulations for these extreme events, permitting players to know in advance the additional reliability measures that the regulator may take under those circumstances. Also, CREG is planning to issue regulations that will strengthen the energy market by improving the spot market guarantees scheme, and establish measures to control market power from pivotal agents (agents needed at any cost to fulfill the demand requirements). This last initiative may affect spot prices but should not materially impact AES as Chivor has a high level of coverage through bilateral contracts.
Dominican Republic
Structure of Electricity Market. The Dominican Republic has one main interconnected system composed primarily of thermal generation and supplemented by hydroelectric power plants that harness power from available rivers. The regulatory framework in the Dominican Republic consists of: decentralized industry; unbundled generation, transmission and distribution; regulated prices in monopolistic segments (transmission and distribution); and a competitive wholesale generation market. In accordance with this regulatory structure, all agents and electric generation, transmission and distribution companies must conduct their operations to provide the best service at minimum cost; and comply with standards of quality, safety, continuity of services and conservation of the environment.
The spot or wholesale market is based on a centralized economic dispatch. The Organismo Coordinador (“OC”) is in charge of planning and supervision of operations through the “Centro del Control del SENI,” which is in charge of real-time dispatch. The dispatch of the thermal units is based on auditable declared variable costs and, for the hydro units, the variable cost is equal to zero, meaning that these units are the first for dispatch and reflect optimal system costs. The spot market relies on competitive bidding based on each generator’s variable costs as a means of providing a merit order for dispatch. Variable cost information is submitted weekly by the generators to the OC, which then determines the merit order for dispatch based on this information.
For the sale of electricity under long-term contracts, the regulatory framework establishes that the sale of electricity of a generating company to a distribution company will be done at prices resulting from the competitive procedures of public bidding. These bids are governed by the conditions established by the Superintendency of Electricity (“SIE”) which supervises the bidding and awarding process. With the objective of ensuring that generation prices represent reasonable values in the market, the SIE ensures that the sale of electricity through contracts is not greater than 80% of interconnected electric energy demand, and that the spot market represents a minimum of 20% of the total national consumption of the interconnected system annually.
32
Table of Contents
The electricity tariff applicable to regulated customers is subject to regulation within the concessions of the distribution companies. Electricity end-users are considered customers of public services according to regulations; hence the tariff is set by resolution of the SIE. For clients with demand above 1.2 MW who are classified as unregulated customers, tariffs are unregulated.
Principal Regulators. In order to regulate the electric sector and implement the provisions contained in the General Electricity Law No. 125 and its By-Law, two regulators are responsible for monitoring and ensuring compliance with the law: the National Energy Commission (“CNE”) and the SIE. All electric companies (generators, transmission and distributors), are subject to and regulated by the General Electricity Law, whether they are of national and/or foreign capital, private and/or public.
In general, CNE’s main responsibilities are to draft and coordinate the legal framework and regulatory legislation; propose and adopt policies and procedures to assure best practices; draft plans to ensure the proper functioning and development of the energy sector and propose them to the executive branch; ensure compliance with the law; promote investment decisions in accordance with these plans; and advise the executive branch on all matters related to the energy sector. The SIE’s main responsibilities are to develop, ensure compliance with and analyze the structure and level of prices of electricity and to set the rates and tolls subject to regulation. SIE also reviews electricity rate levels requested by companies, monitors and supervises compliance with legal provisions and rules and monitors compliance with the technical procedures governing generation, transmission, distribution and commercialization of electricity. In addition, SIE supervises electric market behavior in order to avoid monopolistic practices and applies penalties and fines in the cases of non-compliance with the laws and regulations.
Principal Regulations. The energy sector regulatory framework in the Dominican Republic is governed primarily by:
| • | General Electricity Law 125-01, its by-law and its amendment by Law 186-07, constitute the legal framework which regulates all phases related to the production, transmission, distribution and commercialization of electricity, as well as the functions of State agencies created by this Law and related to these matters. The regulatory framework in the Dominican electricity market establishes a methodology for calculating the firm capacity for each power generation unit. |
| • | Renewable Energy Incentives Law 57-07 establishes incentives for renewable energy, mainly income tax exemption, import taxes reduction, as well as special operational, technical and commercial treatment. The law applies to hydro generation with a capacity equal to or below 5 MW, wind generation with a capacity less than 50 MW, biomass generation with a capacity less than 80 MW, photovoltaic generation, and thermo-solar generation with a capacity less than 120 MW. |
| • | Hydrocarbons Law 112-00 is a regime that established a tax on consumption of fossil fuels and oil. All fossil fuels used to produce electricity has a tax exemption under the law, as well as natural gas, and any change in this regulation does not affect AES Dominicana as a natural gas provider. All agents that use any fossil fuel to produce electricity need a resolution from CNE and the Industry and Commerce Ministry to apply for this exemption. |
| • | Industry and Commerce Ministry periodic resolutions for technical and price regulations for vehicular natural gas use (transportation). |
In addition, the Dominican government has directly exercised varying degrees of regulation over the electricity market and AES Dominicana’s businesses in the past, such as involvement in the re-negotiation of the existing PPAs, oversight responsibilities of the SENI and environmental controls. No assurance can be given that the Dominican government will not alter regulations in the future in a way that will negatively affect AES Dominicana’s businesses, financial conditions or results of operations.
Environmental Regulations. The main environmental regulations are the General Law on Environment and Natural Resources 64-00 and the Regulation and Licensing Systems Environmental Permits by-law. These
33
Table of Contents
regulations provide for centralized environmental planning by the state through the integration of environmental protection and economic development plans in a common approach and policy throughout the sector. Environmental management is achieved through permits or environmental licenses, environmental quality standards and environmental reporting. The main regulatory institutions are:
| • | The Ministry for the Environment and Natural Resources, which is responsible for implementing and designing the policy for the conservation and protection of the environment and natural resources in the Dominican Republic; |
| • | National Council of Environment and Natural Resources which is the link between the various Ministries of State in charge of evaluating the impact of environmental policies; and |
| • | Procurator for the Defense of the Environment and Natural Resources, which is responsible for performing the actions by the State Environmental conflicts environment. |
Despite extensive compliance plans in place by each of the entities, it is possible AES Dominicana generating units could fall out of compliance with such environmental standards. Such non-compliance, and resulting penalties or bad publicity might negatively affect the financial results of AES Dominicana. One such penalty could be a requirement that AES Dominicana operates its offending unit below its rated capacity, and such unavailability might affect compliance with obligations under its PPAs. In such a scenario AES Dominicana might need to make significant investments in environmental-related infrastructure. In addition, the environmental laws and regulations may become more stringent and AES Dominicana might be forced to make certain investments to be compliant with the new standards.
Potential or Proposed Regulations. Last year, the CNE proposed a Natural Gas Act, which seeks to establish new regulations for the services and the commercialization of natural gas, which may result in access barriers to develop the natural gas market. The proposed law does not establish a mechanism for promoting investments in the construction of new gas pipelines or kits for fuel conversion for the automotive sector in accordance with modern regulation in this market. However, AES does not currently expect any material impact to AES Dominicana with the promulgation of such law, mainly because AES Dominicana’s role is as a supplier of natural gas to the Dominican Republic, which is not regulated under the Natural Gas Act.
El Salvador
Structure of Electricity Market. The Salvadorean electricity market is composed of a single interconnected system. Under the General Electriticity Law (“GEL”), competition was introduced in generation and trading and additional regulations were implemented related to price and quality of service in non-competitive segments such as distribution, transmission, system operation and administration.
The wholesale electricity market is based on a contract market and a spot market. The contract market is further classified into bilateral contracts, which are freely negotiated by electricity generators, distributors, and trading companies; and regulated contracts, which are the product of regulated public bids carried out by the distribution companies under the supervision of the Regulator, Superintendencia General de Electricidad y Telecomunicaciones (“SIGET”). Starting in June 2011, the distribution companies are required to acquire 70% of their forecasted demand through regulated bids. The spot market is structured as a day-ahead market, and transactions are settled on a monthly basis. Currently, the price-setting mechanism for the spot market is based on a bidding system. Regulations are in place to implement a cost-based system to replace the current bidding system.
Distribution companies are regulated under an incentive system, specifically a Revenue Cap system, whereby the maximum tariff to be charged to the end-users is subject to the approval of SIGET. The components of the electricity tariff are (i) charges for the use of the distribution network (the “Distribution Charge”), (ii) customer service costs (the “Service Charge”) and (iii) average energy price (the “Energy Charge”). Both the
34
Table of Contents
Distribution Charge and Service Charge are based on average capital costs as well as operation and maintenance costs of an efficient distribution company. The Distribution Charge and Service Charge are approved by SIGET every five years and have two adjustments: (i) an annual adjustment considering the inflation variation and (ii) an automatic adjustment in April, July and October, provided that the change in inflation is greater than 10%.
Competition is encouraged by the GEL and it provides the end user with the option to acquire its electricity from a Distribution Company or an electricity trader. The Distribution and Transmission Companies are mandated by the GEL to allow the use of the distribution grid to traders in order to deliver electricity to their customers. The grid access terms, including tariffs, are detailed in a “distribution contract” registered and regulated by SIGET.
Principal Regulators. SIGET is the Independent Regulatory Authority established through the GEL. SIGET’s principal responsibilities and attributions are approval of Distribution Charges, enforcement of sector regulation, dispute resolution among market participants, granting concessions for hydroelectric and geothermal projects, among others.
In addition, the National Energy Council, formed in 2007, is the policy-making entity, whose board of directors is composed by the Secretaries of the Treasury, the Economy, Public Works, Environmental and Natural Resources and the Consumer Protection Agency.
Principal Regulations. The electricity sector is governed by the General Electricity Act, the General Electricity Act Regulations, the Transmission System and Wholesale Market Operating Regulations and the general and specific orders issued by SIGET, under its statutory attributions.
Environmental Regulations. The environment is protected through the Environment and Natural Resources Act (“ENRA”), enacted in 1998, and it’s Regulation, enacted in 2000. These statutes empower the Environment and Natural Resources Secretary as the policy-making entity and ENRA establishes a duty of care to the environment and orders the sustainable use of natural resources. Additionally, ENRA introduces the concept of the Environmental Permit for the handling of certain potentially hazardous or risky materials or performing certain activities in the environment, such as the construction and operation of power plants (except fuel oil) and transmission lines.
Material Regulatory Actions. The Energy Charge has been, under current methodology, adjusted every six months to reflect the spot market price for electricity during the previous six months. However, starting on January 12, 2011, the energy charge will be adjusted quarterly. Presidential decree 160 was published on December 23, 2010 and went into effect on January 1, 2011. This decree shortens the Energy Charge reset period from six months to three months; the new Energy Charge reset dates will be January 12th, April 12th, July 12th and October 12th instead of April 12th and Oct 12th each year. The reduction of the “energy charge” reset period reduces the distribution companies’ cash flow exposure before any significant spike in energy prices since the lag between energy revenues and costs has been reduced by half.
Potential or Proposed Regulations. The Transmission System and Wholesale Market Operating Rules have been amended to convert the wholesale market price-setting mechanism to be based on audited variable production costs instead of a competitive bidding process and will become effective in June 2011. However, this effective date may be delayed due to technical delays necessary for implementation. Again, since electricity costs are a pass-through for distribution companies, such new regulation will have an indirect benefit to the companies by providing a stable, marginal cost of electricity.
Nigeria
Structure of Electricity Market. In Nigeria, the state-owned entity, Power Holding Company of Nigeria (“PHCN”), holds approximately 80% of the electricity market share and private power generating companies account for the remaining 20%. The power generating companies, of which AES Nigeria Barge Ltd. (“AESNB”) is one, maintain long-term contracts with PHCN as the sole offtaker.
35
Table of Contents
All power transmission operations are currently carried out by PHCN. Under new political initiatives and reforms, as provided under the Roadmap for Power Sector Reforms (“the Power Roadmap”), there are indications that 11 distribution companies and six generation companies would be fully privatized while the ownership of the Transmission Company of Nigeria (“TCN”) would be retained by the government, but with private sector management. Current electricity generation is from either gas-fired or hydro power plants. Most assets are owned by state-owned companies, though some private investors have been able to establish IPPs following recent reforms. In addition, the government is developing approximately 4,800 MW of installed capacity intended to be completed by 2013, known as the National Integrated Power Plants (“NIPPs”). The Presidential Task Force on Power has announced its intention to privatize the NIPPs in future rounds of privatization, following completion of construction.
Principal Regulators. The Nigerian Electricity Regulatory Commission (“Nigerian ERC”) is an independent regulatory agency, that was established under the 2005 Reform Act to undertake both the technical and economic regulation of the Nigerian electricity sector. It is responsible for general oversight functions, including the licensing of operators, setting of tariffs and industry standards for future electricity sector development.
Two of the Nigerian ERC’s key regulatory functions are licensing and tariff regulation. Since AESNB operates under a long-term bilateral agreement with PHCN, it is not subject to the tariff setting process. On the basis of the current reforms embodied in the Power Roadmap, a number of new regulatory and/or other governing bodies will be established to regulate the industry.
Principal Regulations. In March 2005, the Nigerian President signed the Electric Power Sector Reform Bill into law, enabling private companies to participate in transmission and distribution in addition to electricity generation that had previously been legalized. The government has separated PHCN into eleven distribution firms, six generating companies, and a transmission company, in preparation for privatization.
Several problems, including union opposition, have delayed the privatization indefinitely, however, in recent months the current Government has put significant emphasis on completing the privatization of the eighteen successor companies of the PHCN in 2011. There are clauses in the AESNB PPA that, upon the effective date of a privatization, require the business to use all reasonable endeavors to obtain and require all fuel necessary for the operation of the plant. Additionally, the off-taker is envisaged to be transferred from PHCN to Lagos State. However, no material impact to our operations is expected at this time.
Potential or Proposed Regulations. The Nigerian Government is currently preparing for an election in 2011 and privatization of the electricity sector has been a principal issue emphasized by political parties. The 2005 Reform Act and NERC regulations provide for a generation license to have a duration of 10 years, renewable for a further five years. This is in line with a current proposal for a uniform tariff for the power sector, MYTO, which is derived from a building blocks approach that intends a cost-reflective outcome, including a capacity and an energy component; financing costs and other key costs (operating costs, depreciation) are intended to be accommodated; and key fluctuating costs (fuel costs, foreign exchange, inflation) are also intended to be reflected. A total license and uniform tariff duration of 15 years may present challenges to potential investors given that 15 years may be shorter than the useful life of assets and shorter than the tenor of potential long-term debt financing. These regulations, if adopted, could make it difficult to acquire or develop new facilities.
Panama
Structure of Electricity Market. In Panama, distribution companies are required to contract 100% of their annual power requirements (although they can self-generate up to 15% of their demand). Generators can enter into long-term PPAs with distributors or unregulated consumers. In addition, generators can enter into alternative supply contracts with each other. The terms and contents of PPAs are determined through a competitive bidding process and are governed by the Commercial Rules. Besides the PPA market, generators may buy and sell energy in the spot market. Energy sold in the spot market corresponds to the hourly differences between the actual dispatch of energy by each generator and its contractual commitments to supply energy. The energy spot price is
36
Table of Contents
set by the order in which generators are dispatched. The National Dispatch Center (“CND”) ranks generators according to their variable cost (thermal) and water value (hydroelectric), starting with the lowest value, thereby establishing on an hourly basis the merit order in which generators will be dispatched the following day in order to meet expected demand.
Principal Regulators. The National Secretary of Energy (“SNE”) was created by Law 52 on July 30, 2008; and has the responsibilities of planning, investigating, directing, supervising and controlling policies of the energy sector within Panama. With these responsibilities, the Secretariat has defined strategies and policies for the Republic of Panama, which include promoting energy security for the benefit of the population and the country’s development, and proposing laws and regulations to the executive agency that promote the procurement of electrical energy, hydrocarbons and alternative energies in the best conditions for the country. The regulator of public services, known as the National Authority of Public Services (“ASEP”), was created by Law 26 on January 29, 1996. ASEP is an autonomous agency of the state, with legal responsibility and self-patrimony. ASEP is responsible for the control and oversight of public services, such as potable water, sewerage, electricity, telecommunications and radio and television systems, as well as the transmission and distribution of natural gas utilities and the companies that provide such services. ASEP’s mission is to ensure the efficient provision of the public services, as well as national technical, commercial, and environmental quality standards.
Principal Regulations. In the Republic of Panama, the electricity sector is regulated by Law No. 6 issued on February 1997 which was amended by Law Decree 10 on February 26, 1998, and more recently by Law 57 on October 2009. The most notable amendments by Law 57 were: (i) generators are now obligated to participate in public bids for PPAs, to the extent they have available firm capacity and energy, and failure to do so precludes them from participating in the spot market; (ii) ETESA, as opposed to the distribution companies, will now be the purchaser in charge of adjudicating PPA bids to the winning generators, subsequently assigning such PPAs to the corresponding distribution companies; and (iii) the maximum fines which ASEP may impose for violations to the provisions of the Electricity Law increased from $1 million to $20 million. Resolution AN No. 3885-Elec, which was approved on October 8, 2010, sets forth the methodology for calculating the capacity and/or energy that generators must make available for short term bids and long term contracting.
These amendments state that ETESA has to prepare the list of charges, make the call for bids and evaluate and award contracts for supply in accordance with the parameters, criteria and procedures established by ASEP. Consequently, ASEP must approve the list of charges produced by ETESA in addition to overseeing the process to confirm it complies with legal requirements and current regulations.
Environmental Regulations. ASEP issued Resolution AN No. 3932-Elec on October 22, 2010 related to the Security of Dams in the Electricity Sector. This legislation has sensitive and important Security and Environmental elements related to: reports, controls by ASEP, protocols for modifications to the structure of the dams and the operation of dams and reservoirs during floods. This regulation will be effective on November 9, 2011, but it will require a thorough process to review our current action plans during emergencies and protocols against the requirements of the new law to properly determine the impact to AES Panama. However, the new requirements may require AES Panama to expend additional amounts which could have a material adverse impact on our business and results of operations.
Material Regulatory Actions. By virtue of Resolutions AN No. 34-01-Elec on April 1, 2010 and Resolution AN No. 3852-Elec on September 21, 2010, ASEP declared the Changuinola I project to be of public interest and urgent necessity (granting AES access to private properties near the project). The owner of one of the Fincas (land) filed a constitutional action alleging violations of due process and private property rights. The impact to the business is that if the Supreme Court admits the request, this will automatically suspend the effects of the ASEP resolution and the project will no longer be of public interest. This could impact AES Panama’s authorization with regard to the premises and impede progress on the project. AES Panama has requested that the Supreme Court reject the action filed. For further discussion see Item 3.—Legal Proceedings in this Form 10-K.
37
Table of Contents
Potential or Proposed Regulations. In July 2010, ASEP hired Consorcio Fundación Bariloche-PSI Consultores to evaluate alternative allocation of the Charge per Usage of the Principal Transmission System in order to encourage the development of alternative sources of generation, especially hydropower. The consultants expect to deliver their final report by mid-January 2011 to ASEP but as of mid-February 2011 the consultants have not delivered the report. Once ASEP receives the report it is expected to present the amendments to the current transmission rates for public comment and the amendments are expected to take effect on July 1, 2011. This could result in a possible reduction of the amounts currently being paid by AES Panama in transmission rates.
On October 13, 2010, ASEP requested the CND to make an amendment to the weekly programming methodology so that the hydroelectric dams with a reservoir regulation equal to or less than ninety (90) days should be modeled as run-of-the-river units with zero variable cost. Under the current regulations, the Changuinola I Plant is defined as a hydro plant with a reservoir regulation of 7.26 days. The proposed modification will cause the Changuinola I Plant to be considered as a run-of-the-river plant. It is estimated that this change could result in a reduction in energy generated by approximately 18 GWh/year for AES Panama, which is a substantial impact on AES Panama and could have an adverse impact on our businesses and results of operations. Furthermore, this proposal could change the firm capacity of Changuinola II. Currently, the proposal is under analysis by ASEP.
North America
Mexico
Structure of Electricity Market. Mexico has a single national electricity grid (referred to as the “National Interconnected System”), covering nearly all of Mexico’s territory. The only exception is the Baja California peninsula which has its own separate electricity system. Article 27 of the Mexican Constitution reserves the generation, transmission, transformation, distribution and supply of electric power exclusively to the Mexican State for the purpose of providing a “public service.”
In Mexico, since 1995 the power sector legal framework partially opened to private entities under the following schemes: cogeneration; self supply; IPP exports; and imports for self consumption. Private investments are allowed today in this sector in the following areas: transport, storage, and distribution. The Energy Regulatory Commission (“CRE”) is in charge of issuing the permits related to the activities from the power and natural gas sectors that were open to private investment since 1995.
Principal Regulators. The Federal Electricity Commission (“CFE”), by virtue of Article 1 of the Energy Law, is granted sole and exclusive responsibility for providing this public service as it relates to the supply, transmission and distribution of electric power.
Principal Regulations. In 1992, the Energy Law was amended to allow private parties to invest in certain activities in the Mexico electrical power market, under the assumption that “self-supply” generation of electric power is not considered a public service. These reforms allowed private parties to obtain permits from the Ministry of Energy for (i) generating power for self-supply; (ii) generating power through co-generation processes; (iii) generating power through independent production; (iv) small-scale production; and (v) importing and exporting electrical power. Beneficiaries holding any of the permits contemplated under the Energy Law are required to enter into PPAs with the CFE with regard to all surplus power produced. It is under this basis that AES’ Mérida and TEG/TEP facilities operate. Mérida provides power exclusively to CFE under a long-term contract. TEG/TEP provides the majority of its output to two offtakers under long-term contracts, and can sell any excess or surplus energy produced to CFE at a predetermined day-ahead price.
Environmental Impact. When works or activities that may disrupt the ecological balance or exceed the limits and conditions established in the applicable laws or the regulations are proposed, these activities shall be subject
38
Table of Contents
to the conditions established by regulatory authorities, for the purposes of reducing to a minimum the negative effects on the environment. In these cases, it is necessary to first obtain the authorization on environmental impact matters from the regulatory authorities.
In addition, high risk activities are also regulated even though they do not define specifically what is meant by “high risk.” The Mexican Department of the Interior issued two lists defining high risk substances. The criteria used to determine whether an activity is of high risk, is based in the characteristics or volume of the substance used, where relevant. If in the event of being spilt or released it is liable to cause an explosion or significantly affect the environment, people or property, it will be considered as of ‘high risk’. Further, if a project contemplates the use of a compound included in the lists issued by the regulator, in the necessary volumes, the interested Party must present a Risk Evaluation before the regulator.
Environmental Sanctions. The Attorney General’s Office for the Protection of the Environment is in charge of enforcing environmental legal provisions in Mexico. The sanctions that may be imposed depend on the environmental obligations that are not observed by individuals or corporations, and vary from fines ranging from the equivalent of 50 and up to 50,000 days of minimum wage. Additional sanctions may also be imposed, including the annulment of environmental permits and authorizations, partial or total closures of a facility, and administrative arrest.
Mexican Legislation provides that the energy sector is integrated by the Electrical and Petroleum sectors. Federation is the only one entitled to extract and process fossil fuels, as well as to generate electricity; however, certain exceptions apply.
Renewable Energy. On October 23, 2008, a proposal for the approval of the Renewable Energies and Financing of the Energy Transition Law was sent for the approval of the Mexican House of Representatives, and on October 25, 2008, this same proposal was approved by the Energy Committee of the same House. The law encourages generation and transportation of energy generated by renewable sources, giving certainty and lower costs to provide incentives to participate in the private sector of this field.
In addition, the Federal government’s all-encompassing Special Program on Climate Change (“SPECC”) was formally approved. The SPECC provides a program to reduce the alleged effects of climate change. The principal actions proposed to achieve competitive levels, include the gradual substitution of oil for natural gas in the national energy mix, stimulating the implementation of cogeneration and other efficiency saving technologies and strongly stimulating the development of renewable energies.
Priority will be given to electricity generation from wind (up to 507 MW installed by 2012), geothermal energy (153 MW installed by 2012), hydroelectric and solar power. The SPECC proposes a joint program between public bodies and private investors in order to increase the amount of electricity generation capacity from renewable sources up to 1,957 MW by 2012.
The SPECC makes it clear that many of its objectives will be achieved through the following normative, economic and market instruments: accessible financing mechanisms; simplification procedures for permitting; facilitation of electrical grid interconnection and transmission contracts; and stimulus for private investment in energy infrastructure. Our businesses in Mexico are still reviewing the impact of these developments on their operations; however, they could be material to the business and results of operations.
United States
Structure of Electricity Market. The United States wholesale electricity market consists of multiple distinct regional markets that are subject to both federal regulation, as implemented by the FERC, and regional regulation as defined by rules designed and implemented by the Independent System Operators (“ISO”). These rules for the most part govern such items as the determination of the market mechanism for setting the system marginal price
39
Table of Contents
for energy and the establishment of guidelines and incentives for the addition of new capacity. The current regulatory framework in the United States is the result of a series of regulatory actions that have taken place over the past two decades, as well as numerous policies adopted by both the federal government and the individual states that encourage competition in wholesale and retail electricity markets.
Principal Regulators. The federal government, through regulations promulgated by FERC, has primary jurisdiction over wholesale electricity markets and transmission services. While there have been numerous federal statutes enacted during the past 32 years, including the Public Utility Regulatory Policy Act of 1978 (“PURPA”), the Energy Policy Act of 1992 (“EPAct 1992”) and the Energy Policy Act of 2005 (“EPAct 2005”), there are two fundamental regulatory initiatives implemented by FERC during that time frame that directly impact our United States businesses:
| • | FERC approval of market-based rate authority beginning in 1986 for many providers of wholesale generation; and |
| • | FERC issuance of Order #888 in 1996 mandating the functional separation of generation and transmission operations and requiring utilities to provide open access to their transmission systems. |
FERC has civil penalty authority over violations of any provision of Part II of the Federal Power Act (“FPA”) which concerns wholesale generation or transmission, as well as any rule or order issued thereunder. FERC is authorized to assess a maximum civil penalty of $1 million per violation for each day that the violation continues. The FPA also provides for the assessment of criminal fines and imprisonment for violations under Part II of the FPA. This penalty authority was enhanced in EPAct 2005. With this expanded enforcement authority, violations of the FPA and FERC’s regulations could potentially have more serious consequences than in the past.
Pursuant to EPAct 2005, the North America Reliability Corporation (“NERC”) has been certified by FERC as the Electric Reliability Organization (“ERO”) to develop mandatory and enforceable electric system reliability standards applicable throughout the United States to improve the overall reliability of the electric grid. These standards are subject to FERC review and approval. Once approved, the reliability standards may be enforced by FERC independently, or, alternatively, by the ERO and regional reliability organizations with responsibility for auditing, investigating and otherwise ensuring compliance with reliability standards, subject to FERC oversight. Monetary penalties of up to $1 million per day per violation may be assessed for violations of the reliability standards.
Principal Regulations for Generation Businesses. Several of our generation businesses in the United States currently operate as Qualifying Facilities (“QFs”) as defined under PURPA. These businesses entered into long-term contracts with electric utilities that had a mandatory obligation at that time, as specified under PURPA, to purchase power from QFs at the utility’s avoided cost (i.e., the likely costs for both energy and capital investment that would have been incurred by the purchasing utility if that utility had to provide its own generating capacity or purchase it from another source). EPAct 2005 later amended PURPA to provide for the elimination of the mandatory purchase obligation in certain markets, but did so only on a prospective basis. Cogeneration facilities and small power production facilities that meet certain criteria can be QFs. To be a QF, a cogeneration facility must produce electricity and useful thermal energy for an industrial or commercial process or heating or cooling applications in certain proportions to the facility’s total energy output, and must meet certain efficiency standards. To be a QF, a small power production facility must generally use a renewable resource as its energy input and meet certain size criteria.
Our non-QF generation businesses in the United States currently operate as Exempt Wholesale Generators (“EWGs”) as defined under EPAct 1992. These businesses were historically exempt from the Public Utility Holding Company Act of 1935 and are also exempt from the Public Utility Holding Company Act of 2005 (“PUHCA 2005”), and, subject to FERC approval, have the right as public utilities under the FPA to sell power at market-based rates, either directly to the wholesale market or to a third-party offtaker such as a power marketer or utility/industrial customer. Under the FPA and FERC’s regulations, approval from FERC to sell
40
Table of Contents
wholesale power at market-based rates is generally dependent upon a showing to FERC that the seller lacks market power in generation and transmission, that the seller and its affiliates cannot erect other barriers to market entry and there is no opportunity for abusive transactions involving regulated affiliates of the seller. To prevent market manipulation, FERC requires sellers with market-based rate authority to file certain reports, including a triennial updated market power analysis for markets in which they control certain threshold amounts of generation.
Principal Regulations for Traditional Utility Business. In addition to our generation businesses, we also own IPL, a vertically integrated utility located in Indiana. A description of the regulatory environment under which IPL operates is provided below:
IPL. As a regulated electric utility, IPL is subject to regulation by the FERC and the Indiana Utility Regulatory Commission (“IURC”). As indicated below, the financial performance of IPL is directly impacted by the outcome of various regulatory proceedings before the IURC and FERC.
IPL is subject to regulation by the IURC with respect to the following: its services and facilities; the valuation of property; the construction, purchase or lease of electric generating facilities; the classification of accounts; rates of depreciation; retail rates and charges; the issuance of securities (other than evidences of indebtedness payable less than twelve months after the date of issue); the acquisition and sale of some public utility properties or securities; and certain other matters.
IPL’s tariff rates for electric service to retail customers (basic rates and charges) are set and approved by the IURC after public hearings (“general rate cases”). General rate cases, which have occurred at irregular intervals, include the participation of consumer advocacy groups and certain customers. The last general rate case for IPL was completed in 1995. In addition, pursuant to statute, the IURC is to conduct a periodic review of the basic rates and charges of all Indiana utilities at least once every four years, but the IURC has the authority to review the rates of any Indiana utility at any time it chooses. Such reviews have not been subject to public hearings.
The majority of IPL customers are served pursuant to retail tariffs that provide for the monthly billing or crediting to customers of increases or decreases, respectively, in the actual costs of fuel (including purchased power costs) consumed from estimated fuel costs embedded in basic rates, subject to certain restrictions on the level of operating income. These billing or crediting mechanisms are referred to as “trackers.” This is significant because fuel and purchased power costs represent a large and volatile portion of IPL’s total costs. In addition, IPL’s rate authority provides for a return on IPL’s investment and recovery of the depreciation and operation and maintenance expenses associated with certain IURC-approved environmental investments. The trackers allow IPL to recover the cost of qualifying investments, including a return on investment, without the need for a general rate case.
IPL may apply to the IURC for a change in its fuel charge every three months to recover its estimated fuel costs, including the energy portion of purchased power costs, which may be above or below the levels included in its basic rates and charges. IPL must present evidence in each fuel adjustment charge (“FAC”) proceeding that it has made every reasonable effort to acquire fuel and generate or purchase power, or both, so as to provide electricity to its retail customers at the lowest cost reasonably possible.
Independent of the IURC’s ability to review basic rates and charges, Indiana law requires electric utilities under the jurisdiction of the IURC to meet operating expense and income test requirements as a condition for approval of requested changes in the FAC. Additionally, customer refunds may result if IPL’s rolling twelve-month operating income, determined at quarterly measurement dates, exceeds IPL’s authorized annual jurisdictional net operating income and there are not sufficient applicable cumulative net operating income deficiencies against which the excess rolling twelve-month jurisdictional net operating income can be offset.
In IPL’s ten most recently approved FAC filings (FAC 81 through 90), the IURC found that IPL’s rolling annual jurisdictional retail electric net operating income was lower than the authorized annual jurisdictional net
41
Table of Contents
operating income. FAC 90 includes the twelve months ended October 31, 2010. In IPL’s FAC 76 through 80 filings, the IURC found that IPL’s rolling annual jurisdictional retail electric net operating income was greater than the authorized annual jurisdictional net operating income. Because IPL has a cumulative net operating income deficiency, IPL was not required to make customer refunds in its FAC proceedings.
In December 2007, IPL received a letter from the staff of the IURC requesting information relevant to the IURC’s periodic review of IPL’s basic rates and charges and IPL subsequently provided information to the staff. Since IPL’s cumulative net operating income deficiency (described above) requires no customer refunds in the FAC process, the IURC staff was concerned that the higher-than-usual 2007 earnings may continue in the future. In response to the inquiry, IPL provided voluntary credits to its retail customers totaling $32 million. IPL recorded a $30 million deferred fuel regulatory liability in March 2008 and a $2 million deferred fuel regulatory liability in June 2008, with corresponding and respective reductions against revenues for these voluntary credits. All of these credits have been applied in the form of offsets against fuel charges that customers would have otherwise been billed during June 1, 2008 through February 28, 2009.
Over the past few years, IPL has received correspondence from the IURC on a few occasions expressing concern for IPL’s level of earnings and inquiring about IPL’s depreciation rates. In response, IPL provided additional information to the IURC relevant to IPL’s earnings as well as the results of a depreciation analysis that IPL conducted. In the fourth quarter of 2010, IPL received a letter from the IURC stating that they did not have any additional questions.
IPL is a member of the Midwest Independent System Operator, Inc. (“Midwest ISO”). Midwest ISO serves as the third-party operator of IPL’s transmission system and runs the day-ahead and real-time Energy Market and, beginning in January 2009, the Ancillary Services Market for its members.
IPL transferred functional control of its transmission facilities to the Midwest ISO and its transmission operations were integrated with those of the Midwest ISO. IPL’s participation and authority to sell wholesale power at market-based rates are subject to the FERC jurisdiction. Transmission service over IPL’s facilities is now provided through the Midwest ISO’s tariff.
As a member of the Midwest ISO, IPL offers its generation and bids its demand into the markets operated by the Midwest ISO on an hourly basis. The Midwest ISO settles energy hourly offers and bids based on locational marginal prices, which is pricing for energy at a given location based on a market clearing price that takes into account physical limitations, generation and demand throughout the Midwest ISO region. The Midwest ISO evaluates the market participants’ energy offers and demand bids optimizing for energy products to economically and reliably dispatch the entire Midwest ISO system. The Company has certain regulatory assets on its balance sheet relating to IPL’s participation in the Midwest ISO. The IURC has authorized IPL to recover the fuel portion of its costs from the Midwest ISO, to defer certain operational, administrative and other costs from the Midwest ISO and seek recovery in IPL’s next basic rate case proceeding. Total Midwest ISO costs deferred by IPL as long-term regulatory assets were $71.0 million and $62.8 million as of December 31, 2010 and December 31, 2009, respectively. IPL will seek to recover the deferred costs in its next basic rate case proceeding; however, there can be no assurance that IPL would be successful in that regard.
Beginning in 2007, Midwest ISO transmission owners, including IPL, began to share the costs of transmission expansion projects with other transmission owners after such projects were approved by the Midwest ISO Board of Directors. Upon approval by the Midwest ISO Board of Directors, the transmission owners must make a good-faith effort to build the projects. Costs allocated to IPL for the projects of other transmission owners are collected by the Midwest ISO per their tariff. We believe it is probable, but not certain, that IPL will ultimately be able to recover from its customers the money it pays to the Midwest ISO for its share of transmission expansion projects of other utilities, but such recovery is subject to IURC approval in IPL’s next basic rate case. Therefore, such costs to date have been deferred as long-term regulatory assets. To date, such costs have not been material to IPL. However, given the magnitude of the costs anticipated to enable conformance with renewables mandates in the Midwest ISO footprint, it is probable that such costs will become
42
Table of Contents
material in the next few years. Our current estimates are that IPL’s share of such costs could be more than $50 million annually by 2020 and continue increasing after that.
In 2004, the IURC initiated an investigation to examine the overall effectiveness of Demand-Side Management (“DSM”) programs throughout the State of Indiana and to consider any alternatives to improve DSM performance statewide. On December 9, 2009, the IURC issued a Generic DSM Order that found that electric utilities subject to its jurisdiction must meet an overall goal of annual cost-effective DSM programs that reduce retail kWh sales (as compared to what sales would have been excluding the DSM programs) of 2% per year by 2019 (beginning in 2010 at 0.3% and growing to 2.0% in 2019 subject to certain adjustments). The IURC also found that all jurisdictional electric utilities have to participate in five initial, statewide core DSM programs, which will be administered by a Third-Party Administrator. Consequently, IPL’s DSM spending, both capital and operating, will increase significantly going forward, which will likely reduce IPL’s retail energy sales and the associated revenues.
Prior to the issuance of the Generic DSM Order, IPL filed a petition seeking relief for substantive DSM programs. IPL proposed a DSM plan to be considered in two phases. The first phase (“Phase I”) sought recovery for traditional-type DSM programs, such as residential home weatherization and energy efficiency education programs, with additional offerings. The IURC issued an Order in February 2010 that approved the programs included in IPL’s Phase I request. In addition to IPL’s traditional recovery of the direct costs of the DSM program, the Order also included performance-based incentives. The second phase (“Phase II”) sought recovery for “Advanced” DSM programs and was coincident with IPL’s application for a smart grid funding grant from the Department of Energy. The “Advanced” DSM programs included an Advanced Metering Infrastructure communication backbone as well as two-way meters and home area network devices for certain of IPL’s customers. In February 2010, the IURC issued an Order that approved IPL’s Phase II program, but denied IPL’s request to timely recover its expenditures. Instead, IPL would need to seek recovery of the costs incurred under its Phase II program during its next basic rate case proceeding.
In June 2010, IPL filed a petition with the IURC seeking authority for an additional DSM program and to recover the lost revenue resulting from decreased kWh consumption and kW demand beginning on June 11, 2010 as a result of the implementation of all approved DSM programs. The IURC granted IPL’s request related to the additional DSM program, but denied the request to recover lost revenue. Additionally, in October 2010, IPL filed a petition with the IURC for approval of its plan to comply with the IURC’s Generic DSM Order, which petition includes estimated DSM spending of approximately $65 million from 2011 to 2013. It is not possible to predict at this time what the IURC’s response will be to this petition.
The American Recovery and Reinvestment Act of 2009 includes various provisions that fund the development of the electric power industry at the federal and state level. These provisions include, but are not limited to, improving energy efficiency and reliability; electricity delivery (including smart grid technology); energy research and development; renewable energy; and demand response management. IPL submitted a Smart Grid Investment Grant for $20 million to provide its customers with tools to help them more efficiently use electricity and also to upgrade its delivery system infrastructure. IPL’s application was approved and the agreement with the United States Department of Energy was executed in April 2010.
Environmental Regulations. See “Environmental and Land Use Regulations” below for a description of the United States Environmental Regulations.
43
Table of Contents
Europe, Middle East & Asia
Europe
European Union
Structure of Electricity Market. All European Union (“EU”) member states are required to implement EU legislation, although there is a degree of disparity as to how such legislation is implemented and the pace of implementation in the respective member states. EU legislation covers a range of topics which impact the energy sector, including market liberalization and environmental legislation.
The Company has subsidiaries which operate existing generation businesses in a number of countries which are member states of the EU, including the Czech Republic, Hungary, the Netherlands, Spain and the United Kingdom. The Company also has subsidiaries which are in the process of commissioning a generation plant in Bulgaria. Bulgaria became a member state of the EU as of January 1, 2007.
Principal Regulations. The principles of market liberalization in the EU electricity and gas markets were introduced under the 2003 Electricity and Gas Directives. In 2005, the European Commission (the “Commission”) launched a sector-wide inquiry into the European gas and electricity markets. To tackle the issues identified in the inquiry and to further improve the regulatory framework for energy liberalization, the Commission launched the Third Energy Package in 2007. In the context of the electricity market, the inquiry has to date focused on identifying issues related to price formation in the electricity wholesale markets and the role of long-term agreements as a possible barrier to entry with a view to improving the competitive situation. In January 2007, the Commission published a proposal for a new common energy policy for Europe. In November 2008, the Commission published a non-binding second Strategic Energy Review aimed at developing the concept of a common European energy policy. It focused mainly on security of supply and infrastructure development. The Strategic Energy Review proposed reviews of the Gas Storage Directive in 2010 and an update of the Oil Stocks Directives.
In October 2008, the Energy Ministers reached political agreement on the “Third Liberalization Package,” which includes five pieces of legislation, Electricity and Gas Directives, Electricity and Gas Regulations and a Regulation creating a new Agency for the Coordination of Energy Regulators, which will have limited powers to deal with cross-border interconnectors and related issues. This legislation was formally adopted in August 2009 and must be implemented on a national level by March 2011.
Environmental Regulations. See “Environmental and Land Use Regulations—International” below for a description of these directives.
Bulgaria
Structure of Electricity Market. The Bulgarian energy sector model allows for trading at regulated prices, at freely negotiated prices between parties or on the organized market. Since an organized market has not evolved yet despite the availability of adequate legislative framework for it, the primary means for wholesale trading is the regulated market, the bilateral transactions market and the Electricity Balancing Mechanism. These arrangements are also supplemented by an imbalance settlement regime.
The Bulgarian power market has evolved from a system where the National Electricity Company (“NEK”), established in November 1991 as a fully state-owned vertically integrated utility, was responsible for the entire cycle of generation, transmission and distribution. After a decade of functioning in this role, NEK was vertically unbundled with a resulting legal separation of generation, transmission and distribution assets into different operating entities. While these structural reforms greatly helped create a competitive electricity sector, there are no actual trading rules to enable the market to operate freely. To ensure accessible customer prices and support to renewable energy supply (“RES”) producers and the highly efficient cogeneration assets, NEK is still acting as single buyer, purchasing the majority of power generated in Bulgaria and then selling the power to distribution companies or to transmission network-connected consumers or to export across interconnectors (as the sole
44
Table of Contents
licensed Bulgarian power exporter). NEK also owns the biggest hydro-electric and pump storage generation facilities in Bulgaria.
While the transmission system in Bulgaria remains under NEK’s formal ownership, to comply fully with EU legislation, NEK has spun-off transmission operations (i.e., system operation, balancing market administration and systems’ operation and maintenance) to the Electricity System Operator. The system also allows for a regulated third-party access.
Principal Regulators. The State Energy and Water Regulatory Commission (“SEWRC”) established in 1999 is the independent regulator for both the energy and water markets. SEWRC’s key responsibilities are:
| • | Licensing activities in the electricity, heat and natural gas sectors; |
| • | Regulating electricity, heat and natural gas prices (including those from RES and CHP power sources); |
| • | Regulating interconnection to distribution and transmission networks; and |
| • | Issuing of certificates of origin and green certificates for the electricity produced from RES and co-generation. |
Principal Regulations. Bulgaria is at a juncture of adopting legislative packages that cover three key European policy goals—energy independence (Directive 2009/28/EC), environmental sustainability through GHG emissions control (Directive 2009/29/EC) and market liberalization (Directive 2009/72/EC). In line with these EU-mandated goals, the government of Bulgaria has set the following key priorities: a 20% reduction of the energy intensity of GDP by 2013 and a 50% reduction by 2020; increased renewables share of the total energy consumption to 12% by 2013 and to a minimum of 16% by 2020; and competitive energy market through promoting new generation entry, security of supply, and sustainable development. A key milestone would be a 30% increase of bilateral contracts in the electricity market by 2013.
A key law that sets the stage for the above priorities is the Bulgarian Energy Act developed in 2004 (the “BEA”) with a view to a transparent and predictable regulatory environment to promote further liberalization through an independent regulatory authority. The BEA creates a framework for viable commercial companies in the sector through more investment, greater autonomy of SERWC and more effective commercial restructuring. The BEA is structured so that the market can shift away from the single-buyer model into a more market-oriented third-party network access model that allows for trading at regulated or freely negotiated prices, as well as at a free market exchange. To be in full compliance with the EU Third Energy Package, the BEA is being amended in order for the electricity market to be fully liberalized under clear regulatory rules and sustainable market mechanisms. Recent amendments to the BEA are making clear the commitment of the government to honoring long-term contracts for power purchasing with generators whose investments have helped upgrade the national asset base.
To help further develop the energy market, the SERWC developed new Trading Rules, adopted in the summer of 2010, where generators, consumers and grid operators are organized in balancing groups for the most cost-effective balance between energy supply and consumption. An underlying principle of the Trading Rules will be the presence of a “Day-ahead” market (a departure from the existing practice of weekly notification schedules). Importantly, the Trading Rules will also establish the principles for the Bulgarian power exchange, all in line with the EU’s Third Energy Liberalization legislation.
Environmental Regulations. The main environmental regulations reflect the implementation of EU environmental directives. As of January 2007, Bulgaria is introducing EU Emissions Trading Scheme (“ETS”) as the main mechanism for meeting Kyoto Protocol GHG reduction commitments. The Bulgarian Environmental Protection Act amended on September 27, 2005, and all secondary legislation following from it, have incorporated all EU and Kyoto emission reduction commitments. The Bulgarian National Allocation Plan (“NAP”) allows a total of 42.3 million tonnes of CO2 for the whole volume of fossil fuel-based generation in the country. The AES Galabovo coal-based power plant will be covered by the NAP at 80% of its projected
45
Table of Contents
generation for 2011 and 2012. The portion of CO2 allowances which are not covered by NAP will be billed directly to NEK.
Bulgaria is also subject to the Large Combustion Plant Directive (2001/80/EC) (“LCPD”), which aims to reduce particulate emissions by controlling SO2, NOX and dust from large combustion plants. The LCPD allows for existing plants to opt for exemption from the emission level values, as long as the operator undertakes not to operate for more than 20,000 hours starting from January 1, 2008 and ending no later than December 31, 2015. Major rehabilitation work has been taking place across units of various Bulgarian thermal power plants in the last decade. The rehabilitated Maritza East 2 complex is now fitted with electrical filters for capturing dust and Flue Gas Desulphurisation (“FGD”) units (more than 94% efficiency). The AES Galabovo power plant, which is currently in the process of commissioning, is equipped with a state-of-the-art wet FGD system that ensures 98% of SO2 removal.
Bulgaria is dependent on foreign imports for 70% of its primary fuel sources, which makes exploration of renewable energy sources paramount for the country’s achievement of energy independence and environmental objectives. Bulgaria’s EU-mandated renewable targets have been met mostly by hydro power plants with limited contribution to the fuel mix by wind energy and even less from biomass. The main goal of the Renewable and Alternative Energy Sources and Biofuels Act of 2007 is to encourage generation from and grid interconnection of installations utilizing renewable energy sources.
Material Regulatory Actions. In connection with Bulgaria’s accession into the EU, the European Commission (the “Commission”) has opened an investigation into alleged anti-competitive behavior and possible restrictions of competition in the Bulgarian electricity markets. The current focus of the Commission’s investigation is NEK. As part of its investigation, the Commission is attempting to determine whether NEK’s long-term contracts are anti-competitive, including its long-term PPAs with AES’ Bulgarian entities, AES Maritza East and AES Geo Energy. Accordingly, the Commission has issued separate information requests to AES Maritza and AES Geo Energy about their respective PPAs with NEK. While these particular requests were voluntary, both AES Maritza and AES Geo Energy have cooperated in good faith with the Commission, have provided the requested information and have met with the Commission in order to provide background and any further required information about the projects. The Commission has clearly specified that neither AES Maritza nor AES Geo Energy were the target of the investigation. We believe the Commission is partly concerned that long-term PPAs could pose a problem with respect to the liberalization of Bulgaria’s electricity markets but we believe that the projects and their respective PPAs did not tie up capacity but created capacity that would not otherwise exist. However, if the Commission determined that PPAs are anti-competitive, they could take actions up to and including termination of our PPA, which could have a material adverse impact on AES Maritza and our results of operations and financial condition.
Potential or Proposed Regulations. The AESB Act referred to above is currently being amended in order to better incorporate the EU principles set forth in Directive 2009/29/EC. Recent draft amendments to the AESB Act ensure predictability for off-take tariffs for wind project investments that have been undertaken in the last several years (including the AES-owned Saint Nikola Wind Farm) as well as create new development opportunities for solar power, including the new solar power projects in the Bulgaria pipeline of AES Solar.
Czech Republic
Structure of Electricity Market. In accordance with EU directives regarding market liberalization, all electricity customers in the Czech Republic are able to select their energy supplier. Since August 2007, the Prague Energy Exchange has been trading energy in the form of base load and peak load on a monthly, quarterly and annual basis. The majority of electricity is, however, still traded on a bilateral contract basis between generators and distributors, independent traders and also between generators and final customers. In February 2008, a day-ahead spot market was incorporated into the Prague Energy Exchange. Another important entity active in the energy sector is OTE, which is responsible for: processing and reporting business balance of electricity according to data supplied by electricity market participants; organization of short-term markets and
46
Table of Contents
the balancing market by regulating energy in cooperation with transmission system operator; and evaluation and settlement of imbalances between the agreed and actual electricity supplies and consumption.
Principal Regulators. The Energy Regulatory Office regulates the energy sector by granting permits for businesses in the energy sector. The main tasks of the Energy Regulatory Office are: supporting competition, supporting the use of renewable and secondary energy resources, and protection of consumer interests in monopolistic markets.
Principal Regulations. The principal regulations are those which implement EU regulations. The energy activities are regulated mainly by Act No. 458, as amended, which provides the conditions for business activity, the exercise of public administration and nondiscriminatory regulation in the energy sectors, including the electricity, gas and heat sectors, as well as the rights and obligations of individuals and legal entities related thereto, in compliance with the law of the European Communities. The other principal law is Act No. 180/2005 Coll., as amended, on the promotion of electricity production from renewable energy sources which regulates, in accordance with the legislation of the European Communities, the method of promoting the production of electricity from renewable energy sources and from mining gas from closed mines, the performance of state administration and the rights and obligations of natural and legal persons connected therewith. The methodology of price control in each line of business is governed by Regulation No. 438/2001 (as amended) which regulates the procedures for price control in the energy sector. The revenue cap regulatory method has been selected for electricity transmission and distribution activities. Actual regulated fees associated with transmission and distribution as fees for capacity payments, network usage, renewable subsidies in the form of feed-in tariffs or green bonuses and system services charges, are actualized annually in the relevant price decision issued by the Energy Regulatory Office. The gradual liberalization of the electricity market made all customers eligible customers and trading is not subject to regulation. Energy activities are also governed by the corresponding technical regulations and standards.
Environmental Regulations. The principal environmental regulations are the Pollution Prevention and Control Regulations 76/2002 Coll. These regulations introduce a pollution control system known as Pollution Prevention and Control (“PPC”). AES Bohemia is subject to air pollution control and is regulated by the Regional Environmental Authority. The key concept of the regulations concerns the application of Best Available Techniques (“BAT”) in order to prevent pollution. The PPC regime requires installations operating certain activities to apply for a permit to operate. The PPC permit contains conditions on: waste management; material storage and handling; releases to air, water and land; environmental management techniques; accident prevention and control; monitoring, reporting and record-keeping; and site decommissioning.
Material Regulatory Actions. During 2010, as a result of a feed-in tariff for solar plants, the Czech Republic experienced a boom in solar installation tripling installed capacity from January 1, 2010. This forced the government to introduce new measures for solar plants to limit the future support to only smaller installations, reduce feed-in tariffs and implement a new tax regime. However, solar installation has already significantly affected the grid by making any development of new projects more difficult due to limited free capacity in the grid. In addition, the government decided to introduce a gift tax on free allocated CO2 credits to electricity generators to generate additional resources for financing renewable electricity in the future and to protect electricity customers, at least partly, from a major increase in the regulated fee for the support of renewable electricity. Although the law stipulates that the CO2 gift tax should not be paid from cogeneration electricity, it is assumed now that the AES Bohemia tax duty may exceed $1.5 million payable in the first quarter of 2011. The final regulation, which will provide calculations of the gift tax for cogeneration producers has not been issued yet.
Hungary
Structure of Electricity Market. The Hungarian market has one main interconnected system. The state-owned electricity wholesaler, MVM, is the dominant exporter, importer and wholesaler of electricity. MVM’s affiliated company, MAVIR, is the Hungarian transmission system operator. Currently, Hungary is dependent on
47
Table of Contents
energy imports (mainly from Russia) since domestic production only partially covers consumption. The wholesale market is legally liberalized, although it remains dominated by MVM due to MVM’s access to and control over a significant portion of the Hungarian generating facilities. The spot market is relatively illiquid with trading dominated by over-the-counter or bilateral contracts. Relative to more western parts of Europe, the volumes traded are smaller and typically for shorter durations, although contracts with a duration that is greater than one year are available.
Principal regulators. Magyar Energia Hivatal (“MEH”) is the government entity responsible for regulation of the electricity industry in Hungary. The Ministry of National Development oversees the activities of the MEH.
Principal Regulations. The main regulations in Hungary are those being implemented under EU directives, the adoption of the Hungarian Electricity Act in 2007, which became effective January 1, 2008, was the final legislative step to implement a fully liberalized electricity market. By virtue of the Hungarian Electricity Act, all customers are eligible to choose their electricity supplier. In the competitive market, generators sell capacity to wholesale traders, distribution companies, other generators, electricity traders and eligible customers at an unregulated price. In the light of the third energy liberalization package issued by the EU in 2009, Hungary is planning to implement a major amendment of the Electricity Act and the Gas Act which will conform to the EU package.
Environmental Regulations. The main environmental permit is the Integrated Pollution Prevention Control (“IPPC”). The IPPC Directive is based on several principles, namely (i) an integrated approach, (ii) BAT, (iii) flexibility and (iv) public participation. The integrated approach means that the permits must take into account the whole environmental performance of the plant, covering, e.g., emissions to air, water and land, generation of waste, use of raw materials, energy efficiency, noise, prevention of accidents and restoration of the site upon closure. The purpose of the Directive is to ensure a high level of protection of the environment taken as a whole. The permit conditions including emission limit values must be based on Best Available Techniques (“BAT”) as defined in the IPPC Directive. To assist the licensing authorities and companies to determine BAT, the Commission organizes an exchange of information between experts from the EU Member States, industry and environmental organizations. This work is coordinated by the European IPPC Bureau of the Institute for Prospective Technology Studies at the EU Joint Research Centre in Seville, Spain. This results in the adoption and publication by the Commission of the BAT Reference Documents (the “BREFs”). The IPPC Directive contains elements of flexibility by allowing the licensing authorities, in determining permit conditions, to take into account the technical characteristics of the installation, its geographical location and the local environmental conditions. Finally, the Directive ensures that the public has a right to participate in the decision-making process, and to be informed of its consequences, by giving the public access to permit applications in order to provide their opinions, permits, results of the monitoring of releases and the European Pollutant Release and Transfer Register (“E-PRTR”). E-PRTR provides emission data reported by Member States accessible in a public register, which is intended to provide environmental information on major industrial activities. E-PRTR has replaced the previous EU-wide pollutant inventory, the so-called European Pollutant Emission Register.
Material Regulatory Actions. Shortly before its accession to the EU, the Hungarian government notified the Commission of arrangements concerning compensation to the state-owned electricity wholesaler MVM. The Commission decided to open a formal investigation in 2005 to determine whether any government subsidies were provided by MVM to its suppliers which were incompatible with the common market. In June 2008, the Commission reached its decision that these PPAs, including AES Tisza’s PPA, contain elements of illegal state aid. The decision required MVM to terminate the PPAs within six months of the June 2008 decision, and to recover the alleged illegal state aid from the generators by April 2009. AES Tisza is challenging the Commission’s decision in the Court of First Instance of the European Communities. Referring to the Commission’s decision, Hungary adopted act number LXX of 2008 which terminates all long-term PPAs in Hungary, including AES Tisza’s PPA, as of December 31, 2008, and requires generators to repay the alleged illegal state aid that was allegedly received by the generators through the PPAs, and provides for the possibility to offset the generators stranded costs from the repayable state aid. The MEH issued its Resolution No. 342/2010 pursuant to which it stated AES Tisza did not receive illegal state aid.
48
Table of Contents
At the end of 2006 and for all of 2007, the Hungarian government reintroduced administrative pricing for all electricity generators, overriding PPA pricing, including the pricing in AES Tisza’s PPA. In January 2007, AES Summit Generation Limited (“AES Summit”), a holding company associated with AES Tisza’s operations in Hungary, and AES Tisza notified the Hungarian government of a dispute concerning its acts and omissions related to AES’ substantial investments in Hungary in connection with the reintroduction of the administrative pricing for Hungarian electricity generators. In conjunction with this, AES Summit and AES Tisza have commenced International Centre for Settlement of Investment Disputes (“ICSID”) arbitration proceedings against Hungary under the Energy Charter Treaty in connection with Hungary’s reintroduction of the administrative pricing for Hungarian electricity generators. In the meantime, pursuant to the new Electricity Act in force from January 1, 2008, administrative pricing for electricity generators was subsequently abolished. The ICSID arbitration panel issued the final determination on September 23, 2010 pursuant to which AES’ claim was dismissed. AES is in the process of analyzing the determination and the potential legal remedies.
In 2008, Hungary introduced a special tax to be levied on energy companies including companies such as AES Tisza. The rate of the special tax was 8% and, in 2010, was extended until 2013. Hungary also introduced a further tax on certain industries, including energy companies (the “Crisis Tax”). The rate of the Crisis Tax for energy companies is 1.05% of the net sales revenues.
Spain
Structure of Electricity Market. Spain is a member of the EU and, as such, the Spanish Government has been taking steps to liberalize the country’s electricity sector in accordance with EU directives. Since January 1, 2003, all customers have been eligible to choose their electricity supplier.
AES currently operates and holds a 71% ownership interest in a 1,199 MW natural gas-fired plant located in Cartagena on the southeast coast of Spain. The plant sells energy into the Pan-Iberian electricity market (“MIBEL”). The MIBEL market was created in January 2004 when Spain and Portugal signed a formal agreement. This new market allows generators in the two countries to sell their electricity on both sides of the Spanish-Portuguese border as one single market. OMEL, Spain’s energy market operator and Portugal’s equivalent, OMIP, exchanged stakes in April 2006, and were reorganized such that an electricity forwards market was created in Lisbon and a spot market was created in Madrid.
The main transmission company, Red Eléctrica de España (“REE”), owns 99% of the 400 kV grid and 98% of the 220 kV network. The law has been changed to ensure that REE will become the sole transmission company in Spain. REE is also the system operator and is responsible for technical management of the system and for monitoring transmission. Under the country’s energy infrastructure plan, REE plans to invest in strengthening the mainland grid, connecting new plants and improving interconnection throughout the country. In due course, AES Cartagena entered into an agreement with REE for the construction of the interconnection facilities. The use of such facilities is the subject of another standard regulated contract stating the specific terms and conditions of access.
Principal Regulations. On December 23, 2010, the Spanish Government implemented the RDL 14/2010 which, among other things, limits the numbers of hours and amount of feed-in-tariff available for photovoltaic power plants.
| • | The law that was passed on December 23, 2010 forms part of the government’s policy aimed at rationalizing and delimiting the legally regulated costs in the electricity network, while searching for new sources of income and protecting the most vulnerable consumers. It is the latest law of those passed in the legislative year of 2010. |
| • | Companies will finance the “Bono Social” (income-based subsidy) until 2013 and they will assume the costs involved in the energy savings and efficiency policies for the period of 2011-2013. |
49
Table of Contents
| • | All the companies generating electrical power, both those that operate under the ordinary regime as well as those related to renewable energy and cogeneration, will be paying an access tariff that amounts to €0.50/MWh. |
| • | The hours that are entitled to premiums in the power plants using photovoltaic technology will be limited for a period of three years and in addition, a further cap on hours is introduced for the duration of the FIT scheme as is the case in the other sectors using wind-powered and thermo-solar technology. |
| • | The maximum limits for the tariff deficit in 2010, 2011 and 2012 have been amended to better adapt to the deviations that arose, and the year 2013 has been kept as the point in time when self-sufficiency will be reached with regard to tariffs. |
This Decree could have a material impact on AES Cartagena and AES Solar’s business in Spain.
In September 2002, the Spanish Cabinet approved a ten-year energy plan which focuses on meeting the country’s future energy requirements. The plan also reflects reliance on renewable energy sources and cogeneration. The Spanish electricity system has seen a steady increase in the new generation capacity from renewable energy sources for many years, particularly as a result of attractive feed-in tariffs (approved by Royal Decree 661/207). Solar photovoltaic installed capacity in the region is estimated at 3.8 GW. The increase in renewable energy generation capacity supported by generous feed-in tariffs has led to major changes in the regulations with the aim of reducing the total cost of the feed-in tariffs for the Spanish electricity system. Partly as a result of that and also as a result of the tariff deficit already accumulated, Royal Decree-Law 6/2009 has introduced new measures that affect AES Cartagena. Primarily, the creation of a new obligation on AES Cartagena (and certain other generation companies) requires them to pay for a portion of the cost of providing a social subsidy to groups of economically vulnerable electricity consumers. The liability for this cost, under the AES Cartagena Energy Agreement, is currently the subject of a dispute with the Energy Manager, which has been referred to arbitration.
In February 2006, Spain introduced a law (Article 2 of Royal Decree Law 3/2006), which became effective March 2, 2006, that an amount equivalent to the value of the CO2 emission allowances allocated free of charge to electricity generators will be netted from electricity sales proceeds obtained by Ordinary Regime electricity generation such as the AES Cartagena plant. The parties obliged to pay these sums are the owners of generation facilities. For the years 2008, 2009, and 2010 the number of “CO2 credits” required to be surrendered by AES Cartagena under the ETS has been greater than the number of free credits allocated to it. Liability, under the AES Cartagena Energy Agreement, for the cost of the shortfall in CO2 emissions credits is currently in dispute, and is also the subject of the above-mentioned arbitration proceedings. For a further discussion see Item 3.—Legal Proceedings.
The Spanish Government implemented Orders (Order ITC/3315/2007, introduced on December 15, 2007, and Orders ITC/1721/2009 and ITC/1722/2009, introduced on June 26, 2009) which developed the principles set out in Article 2 and set the rules applicable for 2006, 2007 and January 1, 2008 – June 30, 2009, respectively. The effect of these legislative provisions is that all owners of Ordinary Regime generation facilities in Spain are required to pay sums equivalent to the value of the CO2 emissions allowances allocated free of charge for 2006, 2007, 2008 and the first six months of 2009. Liability, under the AES Cartagena Energy Agreement, for these costs is currently in dispute and is the subject of the above-mentioned arbitration proceedings. For a further discussion see Item 3. —Legal Proceedings. As for the periods after 2012, Directive 2003/87/EC establishes that power generation facilities will not be issued with allowances free of charge.
On December 23, 2002, Cadastral Law 48/2002 was enacted, which created a new category of property identified as Special Real Estate. This, together with further legislative changes (i.e., Law 51/2002 and Law 16/2007), led to the Municipality of Cartagena increasing the relevant tax rate and the issuance by the Cadastral authorities of a new property value assessment on November 21, 2007, which resulted in an increase in the
50
Table of Contents
amount of Spanish property tax that is payable by AES Cartagena in respect of the plant. Liability under the Energy Agreement for this increase in tax is currently in dispute and is the subject of the above-mentioned arbitration proceedings.
Turkey
Structure of Electricity Market. The wholesale generation and distribution market in Turkey is primarily a bilateral market dominated by state-owned entities. The state-owned Electricity Generation Company (“EUAS”) and its subsidiaries comprise approximately 24 GW of generation capacity and represent approximately 48% of the market. Private producers (with public offtake) account for another 35%, and auto producers and merchant power plants the remaining 17%.
Principal Regulators. The transmission network is owned and controlled by TEIAS, the State Transmission Company. TETAS, the Wholesale Trading Company, sets wholesale prices based on average procurement costs from EUAS, auto-producers and Build Operate/Build Own Transfer/Transfer of Operating Rights producers. This wholesale price represents the buying price for 21 distribution companies. Under TEDAS, there were 20 regional distribution companies. In 2006, four of them were privatized and transferred to the new owners in 2008. Another five of them have been privatized in 2009 and transferred to the new owners in 2010. In 2010, the remaining ones were privatized and are awaiting approval for handover. In 2010, the Turkish Privatization Administration finished privatizing all regional distribution companies. There is also an hourly balancing spot market, with prices typically differing from hour to hour, which is growing and has a capacity of 50 Gigawatt hours (“GWh”) of daily trade. The automatic price mechanism, which is meant to halt the government subsidization, has been approved and implementation commenced in July 2008. With this mechanism, all major cost items (foreign exchange, gas price increases, inflation, among others) are expected to be reflected in the tariff. As a result, mid-term market wholesale prices are expected to converge to the current spot market prices. Distribution companies can procure 80-90% of their needs from TETAS and EUAS, but can also source up to 10-20% from other sources. Additionally, eligible customers, using greater than 100 MWh annually, can contract with the private wholesale companies and private power plants. Retail electricity prices are calculated and proposed by the distribution companies and then approved by the electricity market regulatory authority, EMRA.
Environmental Regulations. Turkey has introduced a “renewable” feed-in tariff that sets a floor for renewable generation (geothermal, wind and small-scale hydro) for the first ten years of operation. The floor is between €0.050 and €0.055 per kWh and decreed by EMRA each year. AES’ Turkey hydro assets fall under the renewable feed-in tariffs.
The Turkish Government has also announced plans to privatize all the state-owned generation assets, other than certain large hydro-electric plants, in 2011.
Ukraine
Structure of Electricity Market. The electricity sector in Ukraine is regulated by the National Energy Regulatory Commission (“NERC”). Electricity costs to end-users in Ukraine consist of three main components: (1) the wholesale market tariff is the price at which the distributor purchases energy on the wholesale market, (2) the distribution tariff covers the cost of transporting electricity over the distribution network, and (3) the supply tariff covers the cost of supplying electricity to an end-user. The total cost permitted by the regulator under the distribution and supply tariff each year is referred to as the DVA. The distribution and supply tariffs for all distribution companies in Ukraine are established by the NERC on an annual basis, at which time DVA and electricity distribution volumes in the tariff are adjusted. A change in the DVA methodology was effected at the end of 2007 with respect to the treatment of wages and salaries such that the adjustment for inflation was replaced by an allowance based on the average industrial wage in the country and normative quantity of personnel.
51
Table of Contents
Principal Regulations. In 2006, NERC authorized two 25% increases in end-user tariffs for residential customers. Since 2006, there have been no further changes in residential end-user tariffs. In 2010, the level of end-user residential tariff covered approximately 30% of real energy costs. A moratorium on end-user tariff increases was introduced by Presidential decree for non-residential customers, effective from December 1, 2008, which resulted in the freezing of retail tariffs for the greater part of 2009. In 2010, the retail tariffs have slightly increased but legally the moratorium is still in force. The wholesale electricity market price increased by 49% in 2008, by 8.5% in 2009, and by 18% in 2010. In the course of 2010, a simultaneous increase in wholesale market price and pressure on the end-user tariff growth resulted in an increase of the debt to distribution companies by NERC on compensation of losses for supplying energy to residential customers at privileged tariffs.
A comprehensive review of the distribution tariff methodology addressing issues of revaluation of the rate base, operational expenses coverage on tariffs, the rate of return and introduction of regulatory incentives to increase the quality of service was initially expected to take place at the end of 2008. However, since late 2008 and then on an annual basis, NERC has been introducing minimal changes into the tariff methodology to be valid for just one year, including for 2010, setting the rate of return on initial investment at the level of 15% after tax, wages and salaries treatment remaining as per the mechanism introduced in 2007, and material operational expenses subject to indexation by inflation. A similar extension of provisions for 2011 has been effected in late 2010. Development and approval of a comprehensive methodology is expected to take place during 2011 to be introduced in 2012.
In 2010, the President of Ukraine announced the list of reforms for implementation up through 2014 in all sectors of the economy, including the electric industry. According to such reforms, there are plans to (i) develop new tariff methodology in 2011; (ii) increase tariffs for residential customers; (iii) commence elimination of cross subsidies; (iv) make changes to legislation to improve customers’ payment discipline; (v) privatize state-owned distribution companies and generation companies; and (vi) introduce a new market structure based on bilateral agreements and balancing market, etc.
In 2009, the Supreme Court of Ukraine took a preliminary position affecting distribution companies in the Ukraine, including AES Kievoblenergo and AES Rivneoblenergo, whereunder it required that certain network commercial losses of power that were previously treated as tax deductible could no longer be treated as such. This position, if maintained, may have a material effect on AES Kievoblenergo and AES Rivneoblenergo. The Company expects that the Supreme Court of Ukraine may clarify its position in 2011, and the proceedings in respect to AES Kievoblenergo and AES Rivneoblenergo are not likely to be finally resolved for another several years.
United Kingdom
Structure of Electricity Market. On March 21, 2007, the Electricity (Single Wholesale Market) (Northern Ireland) Order 2007 was enacted, which provided for the introduction and regulation of a single wholesale electricity market (the “SEM”) for Northern Ireland and the Republic of Ireland that began operation in November of 2007. Revenue from the SEM includes a regulated capacity and an energy payment based on the system marginal price. Bidding principles insist bids are cost-reflective and are based on short run marginal cost. Total annual capacity payments are calculated as the product of the annualized fixed cost of a best new entrant peaking plant multiplied by the capacity required to meet the security standard. This accumulated capacity is then distributed on the basis of plant availability throughout the year on a per trading period basis.
Certain generating units (Kilroot GTs 1 and 2 and Ballylumford units 4, CCGT units 10 & 20 and GTs 1 and 2) are contracted under long-term PPAs to NIE Energy Limited terminating on various dates. The CCGT units are subject to extension by NIEE between March 2012 and 2024. All of the PPAs can be cancelled under direction from NIAUR from November 1, 2010 with six months’ notice other than the Ballylumford 10 and 20 units which can be cancelled from April 1, 2012. All other units (Kilroot units K1 and K2 whose PPAs terminated in November 2010, GTs 3 and 4 and Ballylumford units 5 and 6) participate as merchant units in the SEM as described above.
52
Table of Contents
The effect of this on the Northern Ireland units operated as merchant plants in the SEM depends largely on the relative costs of coal and gas. The relevant units receive capacity payments under the SEM.
For the units with PPAs in place, Kilroot and Ballylumford are neutral with respect to the cost of fuel as this is passed through to its PPA counterparty as an element of the payments made to the respective units based on their availability.
Principal Regulators. Kilroot and Ballylumford are located in Northern Ireland, which is part of the United Kingdom, and are subject to regulation by the Northern Ireland Authority for Utility Regulation (“NIAUR”).
Principal Regulations. The principal legislation is The Electricity (Northern Ireland) Order 1992 under which the Generation Licenses of Kilroot and Ballylumford are granted.
Environmental Regulations. The Kilroot and Ballylumford plants operate under permits granted under the Pollution Prevention Control Regulations (NI) 2003.
The Industrial Emissions Directive was approved by the European Parliament on July 7, 2010 and is expected to become law by 2014. The Directive sets stricter limits on the emissions of pollutants such as NOX, SO2 and particulate and requires further reductions in such emissions by January 2016. The combined package of the Industrial Emission Directive, National Emissions Ceiling Directive and Best Available Technique requirements forms a Regulatory Framework for all electricity generation Large Combustion Plants for the period from 2016 onwards, principally comprising coal-fired, gas-fired, oil-fired and biomass-fired plants. The following steps may be required in respect of Kilroot: (i) fit selective catalytic reduction and comply with the new limits by 2023, at which time there may be another review; (ii) opt out and run under a limited life derogation for a maximum of 17,500 hours; and (iii) opt into a Transitional National Plan which shall apply from January 1, 2016 until June 30, 2020 then option to comply with Emission Limit Values or Closure.
Currently, the Ballylumford units 4, 5 and 6 (the B Station) are scheduled to close by the end of 2015 under the Large Combustion Plant Directive; however, there is the possibility that these units may be adapted to be compliant under the Industrial Emissions Directive. The exact detail will not be known until the Industrial Emissions Directive is implemented.
With regard to the C Station at Ballylumford, gas turbines using light oils and middle distillates as liquid fuels shall be subject to an emission limit value for NOX of 90mg/Nm3. GT10 (part of the CCGT plant) is currently permitted to 120mg/m3 on distillate. This could mean that possible modifications are required to be able to continue to run distillate as a dual fuel.
It is expected that there will be transitionary arrangements within the Directive to allow plants to manage the introduction of the new limits and it has been suggested that large combustion plants may have until July 2020 to meet the requirements. The option appears attractive to AES and would allow the units to operate without substantial capital investment on a restricted load factor until the end of 2020. After 2020, AES would be required to comply with the new emissions limits in order to continue operations.
The Environmental Liability Directive came into force in Northern Ireland on June 24, 2009 and is aimed at the prevention and remedying of environmental damage. An operator will be held financially liable if is carries out certain activities which cause environmental damage, or where there is an imminent threat of such damage, regardless of whether it intended to cause the damage or was negligent. This includes IPPC permitted installations. In practice there should be no real change to AES’ operations as a result of the coming into force of this Directive.
Material Regulatory Actions. On November 25, 2009, the NIAUR published a “Consultation Paper on Relevant Considerations in Relation to the Possible Cancellation of Generating Unit Agreements in Northern
53
Table of Contents
Ireland” which is relevant to various long-term PPAs in Northern Ireland including those at Kilroot and Ballylumford. On April 30, 2010, NIAUR made notification to Kilroot that it intended to exercise the early cancellation provisions of the GUAs for the main coal units (K1 and K2) effective November 1, 2010. The formal cancellation notices were received on October 28, 2010 instructing NIEE to cancel the GUAs for units K1 and K2 effective November 1, 2010. All remaining units remain contracted but are kept under review. Units K1 and K2 fully operate within the SEM (as mentioned above).
Potential or Proposed Regulations. In November 2010, the Council of the EU approved a revised directive on industrial emissions so as to reduce emissions of pollutants that are harmful to the environment and associated with cancer, asthma and acid rain. The industrial emissions directive seeks to prevent and control air, water and soil pollution by industrial installations. It regulates emissions of a wide range of pollutants, including sulphur and nitrogen compounds, dust particles, asbestos and heavy metals. The directive is aimed at improving local air, water and soil quality, not at mitigating the global warming effects of some of these substances. The review integrates seven directives into a single legal Framework and provides for a more harmonized and rigorous implementation of emissions limits associated with the cleanest available technology, so-called BAT. Deviations from this standard are only permitted where local and technical characteristics would make it disproportionately costly. The recast also tightens emission limits for NOX, SO2 and dust from power plants and large combustion installations in oil refineries and the metal industry. New plants must apply the cleanest available technology from 2012, four years earlier than initially proposed. Existing plants have to comply with this standard from 2016, though a transition period is foreseen. Until June 30, 2020, member states may define transitional plans with declining annual caps for NOX, SO2 or dust emissions. Where installations are already scheduled to close by the end of 2023 or operate less than 17,500 hours after 2016, they may not need to upgrade. Member States have two years to transpose the Directive.
Middle East & Asia
China
In 2005, the National Development and Reform Commission (“NDRC”) released interim regulations governing on-grid tariffs, along with two other regulations governing transmission and retail tariffs. The On-Grid Tariff Measures specify different rules for the determination of on-grid tariffs before and after the implementation of competitive pricing. Before the implementation of competitive pricing, the on-grid tariffs shall be appraised and ratified by the pricing authorities by reference to the economic life of power generation projects and determined in accordance with the principle of allowing IPPs to cover reasonable costs and to obtain reasonable returns. Such costs were defined to be the average costs in the industry and reasonable returns will be calculated on the basis of the interest rate of China’s long-term Treasury bond plus certain percentage points. After the establishment of competitive regional power markets, the on-grid tariffs of electricity generation companies which participate in the competitive market shall principally consist of two components: the capacity charge, which is to be determined by the tariff regulatory authority, and the energy charge, which is to be determined by market competition. However, no implementation rules have been issued to introduce the competitive pricing. The Retail Tariff Measures aim to reform the various classes of tariff for end-users into three categories: residential electricity, electricity used in agricultural production and electricity used in industry, commerce or for other purposes. The tariff for each category is fixed per voltage class. The tariffs shall be determined with consideration to the fair sharing of the burden, the efficient adjustment of the demand for electricity and the public policy objectives.
In addition to the foregoing tariff-setting mechanism, China’s central government also issued a tariff adjustment policy allowing the on-grid tariffs to be pegged to the fuel price in the case of significant fluctuations in fuel price. Seventy percent of the increase in fuel costs may be passed through in the tariff. The tariffs of coal-fired facilities in China were increased in 2005, 2006, 2008 and 2009 pursuant to this policy to alleviate the escalation of fuel price; however, such adjustments were obtained from the regulatory authorities only after a time lag and fell short of compensating all businesses for coal price increases in recent years. There was no catch-up tariff adjustment in 2010 pursuant to the foregoing policy.
54
Table of Contents
Pursuant to the “Renewable Energy Law of China,” which came into effect on January 1, 2006 and was amended on December 26, 2009, renewable resources such as wind, solar, biomass, geo-thermal and hydro enjoy complete and unrestricted generation and dispatch, and local grid interconnection is mandated to such plants. To implement the Renewable Energy Law, on August 2, 2007, various central government agencies jointly issued the “Temporary Measures for Dispatching Electricity Generated by Energy Conservation Projects”. Under this regulation, power plants are categorized into various groups and each group will, under certain circumstances, enjoy priority dispatch over the subsequent groups. The first group is renewable energy power plants, namely wind, hydro, solar, biomass, tidal-wave, geo-thermal and landfill gas power plants that satisfy certain environmental standards. The second group is nuclear power plants. The third group is power plants using “modern coal” which includes cogeneration power plants, and power plants utilizing residual heat, residual gas, coal-gangue (or waste coal) and coal mine methane. The last three groups are natural gas, conventional coal and oil-fired power plants. As a result, power plants using renewable resources will enjoy priority dispatch over power plants using fossil fuels. The amendment to the Renewable Energy Law requires that the local grid companies abide by the periodic targets developed by the government on the proportion of power to be generated by renewable energy sources as compared to the total electricity generation and to purchase the entire amount of electricity generated by renewable resources. This is in line with the requirement that renewable energy power plants will enjoy unrestricted generation and dispatch under the Renewable Energy Law, as well as the Chinese government’s policy objective to encourage comprehensive utilization of resources in an energy efficient and environmentally friendly manner.
In 2007, the Chinese government issued a number of rules and procedures that govern the shutdown of small coal or oil-fired power plants. The types of plants to be shut down include: (i) power plants with a capacity under 50 MW; (ii) power plants with a capacity of up to 100 MW which are over 20 years old; (iii) power plants with a capacity of up to 200 MW whose equipment has reached the end of its useful life; and (iv) power plants that have coal consumption rates that are higher than either 10% above the applicable provincial average or 15% above the national average. The shutdown procedures have been set in place to ensure that certain smaller power plants are appropriately shut down and replaced by larger and more efficient power plants. The purpose of such rules and regulations is again in accordance with China’s policy to achieve energy conservation and emissions reductions. China Power International Holdings Ltd., our joint venture partner in Wuhu IV, intended to construct and develop a 2x600 MW coal-fired power plant. According to this policy and the ratification for the unit of Wuhu V needs to obtain the corresponding closing and shut-down capacity. After consultation among all shareholders of Wuhu IV, the shareholders, including AES, agreed to transfer their respective shares to the owner of Wuhu V and to shut down Wuhu IV. The consideration for the sale of our 25% share in Wuhu IV is Renminbi 50 million ($7.6 million). The deal is expected to be closed by the end of March 2011.
On July 20, 2009, NDRC issued the “Circular on Refining the Policy for On-Grid Pricing of Wind Power” (NDRC Price 2009 No. 1906), which introduces a benchmark system for on-grid tariffs for wind power replacing the existing public bidding and concession model for wind projects. The circular provides that on-grid tariffs for onshore wind power projects approved from August 1, 2009 onwards are fixed using a centrally controlled price determination mechanism, while on-grid tariffs for offshore wind projects will be determined separately. Under the circular, China’s onshore area is divided into four different types of wind-power resource regions, and different prices are set for each of these regions ranging from 0.51 yuan/kWh (US cent 7.5/kWh) for wind power in regions with the best wind resources, such as Inner Mongolia, to 0.61 yuan/kWh (US cent 8.9/kWh) for regions with the worst wind resources. According to NDRC, the legislation’s intent is to standardize the wind power price regulation and promote healthy and sustainable development of the wind-power industry. Currently, we do not expect that this newly issued circular will have a material adverse impact on our wind power businesses in China.
India
Structure of Electricity Market. Pursuant to reforms by the Government of India, including enactment of the Electricity Act of India (“EAI”), the electricity market in India is moving towards a multi-buyer, multi-seller system as opposed to the past structure which permitted a single buyer to purchase power from power generators.
55
Table of Contents
This legal and regulatory framework provides flexibility in granting electricity regulatory commissions freedom in determining tariffs as well as encouraging competition with regulatory intervention. Transmission, distribution and trade of electricity remain regulated activities which require licenses from an electricity regulatory commission, unless exempted. The Central Government, through the Ministry of Power, is involved in the power sector planning, policy formulation and appointment of central regulators. State governments also have powers to appoint or remove members of the State Regulatory Commissions. The state governments set up and notify the state load dispatch center. Under the EAI, the state governments are required to unbundle the State Electricity Boards into separate generation, distribution and transmission companies.
Principal Regulators. India’s power sector is regulated by a two-level regulatory system: at the national level, the Central Electricity Regulatory Commission (“CERC”); and at the state level, the State Electricity Regulatory Commissions (“SERC”) (together the “Regulatory Commissions”). CERC regulates tariffs of generating stations owned by the Central Government, or those involved in generating in more than one State, and regulating interstate transmission of electricity. SERC regulates intra-state transmission and supply of electricity within each state. While discharging functions under the EAI, regulatory commissions are guided by the National Electricity Policy, the Tariff Policy and the National Electricity Plan and directions on any policy involving public interest issued by the Central Government or state government. Regulatory Commissions are quasi-judicial authorities entrusted with various functions including determining tariffs, granting licensees and settling disputes between the generating companies and the licensees, and between licensees. An Appellate Tribunal has been set up for appeal against orders of Regulatory Commissions. The Appellate Tribunal has quasi-judicial powers to summon, enforce attendance, require discovery, receive evidence and review decisions. The orders of the Appellate Tribunal are executable as decrees of a civil court and can be challenged in the Supreme Court.
Principal Regulations. In 2003, the Government of India enacted the EAI to establish a framework for a multi-seller/multi-buyer model for the electricity industry, introducing significant changes to India’s electricity sector. The EAI is a central unified legislation relating to generation, transmission, distribution trading and use of electricity that replaced multiple legislations. Pursuant to the EAI, the Government of India ratified the National Electricity Policy in 2005 and the National Tariff Policy in 2006. The policies established deadlines to implement different provisions of the EAI. However, the pace of actual implementation of the reform process is contingent on the respective state governments and SERCs, as electricity is a “concurrent” subject in India’s constitution. There is no license required to set up generation plants under the EAI and generators are allowed to sell to state utilities, traders and open-access consumers. The access to consumers is subject to regulatory provisions on transmission corridor availability and payment of cross-subsidy surcharge.
The Central Government ratified the National Electricity Policy in 2005, which includes the following objectives: access to electricity for all households; availability of power demand to be met by 2012; energy and peaking shortages to be overcome and adequate spinning reserve to be available; supply of reliable and quality power of specified standards in an efficient manner and at reasonable rates; per capita availability of electricity to be increased to over 1,000 units by 2012; financial turnaround and the commercial viability of electricity sector; and the protection of consumers’ interests. The “Policy for setting up of Mega Power Projects” was ratified by the Ministry of Power in 1995, and has been revised from time to time. Conditions required to be fulfilled by a developer for the grant of Mega Power Project status include a thermal power plant with a capacity of 700 MW or more located in the States of Jammu & Kashmir, the north eastern states of India; a thermal power plant of a capacity of 1,000 MW or more located in States other than those specified above; a hydro electricity power plant of a capacity of 350 MW or more located in the States of Jammu & Kashmir, the northeastern states of India; or a hydro electricity power plant of a capacity of 500 MW or more located in states other than those specified above. Mega Power Projects would be required to secure long-term PPAs with distribution companies in accordance with the National Electricity Policy 2005 and the National Tariff Policy 2006, as amended from time to time. Fiscal concessions available to the Mega Power Projects include the import of capital equipment free of customs duty and export benefits are available to domestic bidders for projects under both public and private sectors after meeting certain requirements. Capital goods required for setting up any mega power project qualify for the above
56
Table of Contents
fiscal benefits after it is certified that: (i) the power purchasing states have granted to the Regulatory Commissions full powers to fix tariffs; (ii) the power purchasing states undertake, in principle, to privatize distribution in all cities, in that state, which has a population of more than one million, within a period to be fixed by the Ministry of Power; and (iii) the income tax holiday regime as per Section 80-IA of the Income Tax Act, 1961 is also available.
The EAI specifies trading in electricity as a licensed activity. The license for electricity trading is required to be obtained from the relevant regulatory commission. In 2009, CERC issued regulations for the grant of trading licenses to regulate the interstate trading of electricity. Trading license regulations set out qualifications for the grant of the license including technical and professional qualifications and net worth requirements. Licensees are subject to conditions specifying, among other things the extent of trading margin, maintenance of records and a requirement to pay a license fee, as specified by CERC. The Regulatory Commissions have the right to fix a ceiling on trading margins in intra-state trading. Two power exchanges have received licenses from CERC and have started operations. The volume of power trading on the power exchanges is short-term as the bulk of power is still traded through long-term bilateral contracts.
Environmental Regulations. Compliance with relevant environmental laws is the responsibility of the occupier or operator of the facilities. Principal regulations include the “Environment (Protection) Act, 1986” (“EPAct”), an umbrella legislation of environmental protection laws. The EPAct vests the Government of India with the power to take measures it deems necessary for protecting and improving the quality of the environment and preventing and controlling environmental pollution. This includes rules for the quality of the environment, standards for emission of discharge of environmental pollutants from various sources and inspection of any premises, plant, equipment, machinery, and materials likely to cause pollution. Penalties for violation of the EPAct include fines or imprisonment. “Environment Impact Assessment Notification S.O. 1533(E), 2006” issued under the EPAct and the Environment (Protection) Rules, 1986, mandate prior approval by the Ministry of Environment & Forests or State Environment Impact Assessment Authority for establishing a new project or expansion or modernization of existing projects. Projects that require preparation of an environment impact assessment report involve public consultation and hearings. Pursuant thereto, the appropriate authority makes an appraisal of the project after a final environment impact assessment report is submitted addressing the questions raised in the public consultation process. “The Water (Prevention and Control of Pollution) Cess Act, 1977” (the “Water Cess Act”) mandates levy and collection of a tax on water consumed by industries calculated on the basis of the amount of water consumed for any of the purposes specified under the Water Cess Act. “The Air (Prevention and Control of Pollution) Act, 1981” (the “Air Act”) requires an industrial plant to obtain consent of the State Pollution Control Board (“Board”). Similarly, “The Water (Prevention and Control of Pollution) Act, 1974” (the “Water Act”) provides provisions for making an application to the Board for establishing an industry which may cause effluent discharge into water bodies. The Board may impose conditions relating to pollution control equipment to be installed at the facilities. Industrial plants in any air pollution control area are not permitted to discharge emissions/air pollutants in excess of the standards laid by the Board. Under the Air Act and the Water Act, the Central Pollution Control Board has powers to specify standards for quality of air, while State Boards have powers to inspect any control equipment, industrial plant or manufacturing process.
Material Regulatory Actions. The Electricity Regulatory Commission (“ERC”) is empowered to determine tariffs for supply of electricity by a generating company to a distribution licensee, transmission of electricity, wheeling of electricity and retail sale of electricity. In case of a shortage of supply of electricity, the ERC may fix the minimum and maximum tariff ceiling for sale or purchase of electricity for a period not exceeding one year to ensure reasonable prices of electricity. While determining tariffs, the ERC follows principles and methodologies specified by the CERC for determination of tariffs, including the principle that generation, transmission, distribution and supply of electricity should be conducted on commercial principles and takes into account factors which encourage competition, efficiency and economical use of resources.
The EAI provides that the ERC will adopt such tariffs determined through a transparent process of bidding in accordance with guidelines issued by the Central Government. The Central Government, through the Ministry
57
Table of Contents
of Power, has issued guidelines for competitive bidding and draft documentation (PPAs) for competitively bid projects. The determination of tariffs for a power project depends on the mode of participation in the project. Tariffs may be determined in two ways: (i) based on tariff principles prescribed by CERC, i.e., cost-plus basis consisting of a capacity charge, an energy charge, an unscheduled interchange charge and incentive payments; or (ii) a competitive bidding process where the tariff is purely market based.
The ERC is required to adopt a bid-based tariff, although the “Guidelines for Determination of Tariff by Bidding Process for Procurement of Power by Distribution Licensees, 2005” (“Bidding Guidelines”) permit the bidding authority to reject all price bids received. The Bidding Guidelines recommend bid evaluation on the basis of levelized tariff and include two types of bids: Case I bids, where the location, technology and fuel is not specified by the procurers, i.e., the generating company has the freedom to choose the site and the technology for the power plant; and Case II bids, where the projects are location-specific and fuel-specific. Tariff rates for procurement of electricity by distribution licensees can be for long-term procurement of electricity for a period of seven years and above; or medium-term procurement for a period of up to seven years but exceeding one year. For long-term procurement under tariff bidding guidelines, a two-stage process is adopted for the bid process and includes a request for qualification and request for proposal. The procurer may adopt a single-stage tender process for medium-term procurement, combining the request for qualification and request for proposal processes. Under this route, IPPs can bid at two parameters, i.e., the fixed or capacity charge or the variable or energy charge, which comprises the fuel cost for the electricity generated. The bidders are usually permitted to quote a base price and an acceptable escalation formula. Bidding Guidelines include a two-step process—pre-qualification and final bid. Bidders are required to submit a technical and financial bid at the RFP stage. Power purchase and distribution licenses are increasing through the competitive bid route. The Tariff Policy requires all procurement of power after January 6, 2006 (except for PPAs approved or submitted for approval before January 6, 2006 or projects which have obtained financing prior to January 6, 2006) by distribution licensees to be through competitive bidding. Some state regulators have ratified the purchase of power under memorandums of understanding, on the ground that the tariff policy discussed above is merely indicative and not binding.
Kazakhstan
Structure of Electricity Market. In Kazakhstan, the electricity sector is divided into wholesale and retail markets. The wholesale electricity market of Kazakhstan is based on bilateral contracts conducted through an over-the-counter market and KOREM’s centralized trading system. In the retail market, the power distribution and supply functions are unbundled and retail customers with consumption of one MW or more have a right to buy the electricity directly from power plants or retail supply companies.
Principal Regulators. The Government of Kazakhstan approves subordinate acts in the power sector (licensing requirement, technical regulations, market rules, tariff methodologies for natural monopolies, etc.) and determines the level of price caps for groups of power plants.
The Ministry of Industry and New Technologies (the “Ministry”) is the central executive body responsible for developing state policy in the power sector and conducting technical regulation. As a part of price cap regulation, the Ministry is responsible for determining groups of power companies for each price cap, annual adjustments of price caps and signing agreements on investment obligations with power plants.
The Agency for Regulation of Natural Monopolies (the “Regulator”) acts as a regulator of industries considered to be “natural monopolies” (transmission and distribution of oil, gas, electricity and heat, railroads, airports, etc.). In the power industry, the Regulator is responsible for the approval of tariffs for heat generation, distribution and supply, electricity transmission and distribution as well as end-user tariffs for dominant companies in the retail power market. The Regulator grants different licenses in the power sector such as licenses for generation, distribution and retail activities.
The Agency for Protection of Competition (the “AZK”) monitors power market participants to determine entities with a dominant position and detect violations of antimonopoly legislation.
58
Table of Contents
The Ministry of Environmental Protection (the “Environmental Ministry”) is responsible for environmental policy, grants emissions permits and evaluates the environmental impact of new projects.
JSC KEGOC is a state-owned electricity transmission company, which also acts as the system operator with a central dispatch management function and as the operator of the balancing market.
Principal Regulations. The following major laws and regulations govern the electricity industry:
| • | Law “On the Power Industry” (the “Kazakhstan Electricity law”); |
| • | Law “On Natural Monopolies and Regulated Markets”; |
| • | Law “On Competition”; |
| • | Law “On Supporting the Use of Renewable Energy Sources”; |
| • | Environmental Code; |
| • | Law “On Licensing”; |
| • | Resolution of the Government of the Republic of Kazakhstan “On Approval of the Price Caps”; and |
| • | The state program of power industry development in 2010-2014. |
Continuous changes in the law and regulations result in contradictions between different laws and regulations. This in turn results in an uncertain regulatory environment in the power sector.
The key elements of price cap regulation of power plants are as follows: (i) the Ministry has determined the power plant grouping based on the plant type, equipment, fuel and distance from coal mines (thirteen groups of power plants were defined); (ii) the Ministry has proposed to the government the price cap for each group based on actual prices in 2008 and the level of investment required and the government has approved price caps for each groups of power plants for the seven-year period from 2009-2015; (iii) the Ministry may propose to the government additional annual adjustments to price caps to reflect inflation and investment requirements within any group or a power plant may apply for an individual investment tariff to the Ministry and the Regulator; (iv) a power plant determines its investment obligations at its own discretion and signs an agreement with the Ministry on investment obligations; and (v) the price cap and individual investment tariff regime does not constitute a price guarantee and power plants should sell to consumers at the competitive market price but not higher than their group price cap or an individual investment tariff. Only exports of power and sale of ten percent of generation through a centralized trading system are exempt from this restriction. Power trading activities are restricted and power plants are allowed to conduct trading activities to provide electricity supply to their consumers during emergency shutdowns.
The Regulator approves and regulates all tariffs for heat generation, transmission and supply, as well as electricity transmission and distribution tariffs on a cost-based methodology. Power trading companies, which the AZK considers dominant entities, must notify the Regulator of any proposed increase in their tariffs and the Regulator has the right to veto such proposed tariff increases. Furthermore, the Regulator has the right to request a decrease in the applicable tariffs.
The AZK determines the borders of electricity markets at its own discretion, which does not correspond with the provisions of the Kazakhstan Electricity Law, and designates entities with dominant market power. The AZK may consider the tariff of a power plant which is in compliance with price cap regulation to be an excessive monopolistic price of a dominant entity and impose sanctions, as happens from time to time to AES’ generating companies.
Environmental regulations. The Environmental Ministry is responsible for environmental policy and environmental regulations. The Environmental Ministry issues environmental permits, sets emissions limits and
59
Table of Contents
organizes ecological control in the forms of state environmental impact assessment and independent ecological audit. The Environmental Ministry reviews applications of power plants and, after conducting the environmental impact assessment, grants environmental permits for industrial waste, air and water pollutions for a period of not more than three years.
Material Regulatory Actions. In December 2010, the Ministry refused to sign agreements on investment obligations with AES UK HPP and AES UK CHP for 2011 and has requested to amend the existing agreement on investment obligation from AES Shulbinsk HPP in 2011. The Ministry has demanded that AES power plants in Kazakhstan undertake an additional obligation to spend all profits in new investment projects. The absence of signed agreements on investment obligations may lead to further sanctions by the AZK and other state authorities against our businesses.
The AREM has refused to grant a necessary tariff increase to the AES retail company Shygysenergotrade LLP for 2011. Contrary to applicable law, AREM is requesting that Shygysenergotrade LLP confirm the existence of agreements on investment obligations between the AES power plants and the Ministry as a condition for the right to purchase power at new price caps. Increased investment costs and/or sanctions could have a material impact on these businesses, require additional capital investment, and may impact our results of operations.
The AZK has designated all AES power plants in Kazakhstan as dominant entities in the Eastern Kazakhstan and Pavlodar regions. Shygysenergotrade LLP has also been designated by the AZK as a dominant entity in the Eastern Kazakhstan retail market. AES has challenged these designations but so far has been unsuccessful in having the designations overturned. The AZK is conducting other investigations into alleged violations by AES businesses in Kazakhstan of antimonopoly legislation such as excessive monopolistic prices and ungrounded refusal to supply power to certain customers. AES believes that the investigations per se and allegations made by the AZK in the course of investigations are without merits, and AES is vigorously challenging the unfounded actions of the AZK. However, if AES Kazakhstan does not prevail in these proceedings, there could be a material impact on these businesses and our results of operations.
Potential or Proposed Regulations. The Ministry plans to introduce a capacity market starting in 2015 to support new investments in generating assets. The capacity market should replace price cap regulation. Details of the new regulations are not yet publicly available and the regulations are still under review by the government. The capacity market regulations could be unfavorable to our businesses in Kazakhstan and may have a material impact on our financial results.
The Ministry and the Regulator have drafted amendments to the Kazakhstan Electricity Law to increase sanctions for any failure to implement the investment program or comply with the price cap regulation. The absence of a signed agreement on investment obligations will limit a power plant’s right to apply tariffs up to the price cap, such that the electricity tariff of a power plant cannot not exceed its 2008 level. It is expected that this regulation will come into force in 2011. As a result, we may be required to make significant capital investments and to incur other expenses in order to obtain the benefits of the price caps.
The Regulator plans to introduce benchmarking tariff regulations for power distribution to be effective in 2013. The Environmental Ministry plans to amend the Ecological Code to introduce carbon regulation to comply with the Kyoto Protocol, which was ratified by Kazakhstan. According to the draft regulation, a power plant will receive carbon emissions allocations and a carbon trading system will be established. In addition, a violation of environmental legislation may lead to criminal liability and fines.
Philippines
Structure of Electricity Market. From a vertically integrated industry, the Philippines has unbundled its power sector into generation, transmission, distribution and supply. The enabling law for this restructuring is Republic Act No. 9136, otherwise known as the Electric Power Industry Reform Act of 2001 (“EPIRA”). The
60
Table of Contents
EPIRA primarily aims to increase private sector participation in the power sector and to privatize the Government’s generation and transmission assets. Generation and supply are open and competitive sectors, while transmission and distribution are regulated sectors. Sale of power is done primarily thorough medium-term contracts between generation companies and customers specifying the volume, price and conditions for the sale of energy and capacity. The Energy Regulatory Commission (“ERC”) approves the said contracts for supply of energy. Power is also traded in the Wholesale Electricity Spot Market (“WESM”) from which at least 10% of the distribution companies or electricity cooperatives power requirement must be sourced.
A market optimization model determines the price and dispatch by processing the bids from trading participants and the system condition from the system operator. The market operator then comes out with a schedule of both price and energy which maximizes economic gains for participants subject to certain constraints. The dispatch schedule is then coordinated with the system operator for implementation. The market is operating under a gross pool, net settlement system, whereby each generator submits energy offers regardless of their contracted energy. However, the generator should declare their contracted quantities, since the market will not include contracted energy in its settlement.
New contracts assigned by distribution companies for consumption after expiration are awarded to generation companies either through the lowest supply price offered in public bid processes or through a negotiated contract. The ERC then approves the said contract benchmarked against, among others, the prices of the best new entrant generation company. Except for its supply to MERALCO (the largest distribution company in the Philippines), to which it is allocated about 14.89% of the contract energy under the NPC Transition Supply Contract, all supply contracts of AES Masinloc are bilateral contracts already provisionally approved by the ERC.
Principal Regulators. The ERC, created under the EPIRA, is mandated to protect long-term consumer interest in terms of quality, reliability and reasonable pricing of sustainable supply of electricity. It is a quasi-judicial body that promulgates and enforces rules, regulations, guidelines and policies. The Department of Energy is mandated to prepare, integrate, coordinate, supervise and control all plans, programs, projects and activities of the government relative to energy exploration, development, utilization, distribution and conservation. The DOE endorses new or existing generators. The Department of Environment and Natural Resources administers the system for evaluating the environmental impact of new or existing generating plants.
Principal Regulations. The distinct electricity sector activities are regulated by the EPIRA. Sector activities are also governed by the corresponding technical regulations and standards, namely, the Philippine Grid Code, Philippine Distribution Code, Open Access Transmission Service Rules, WESM Rules, and Distribution System Open Access Rules (“DSOAR”).The keystones of the electricity regulation are: (i) performance based on revenue cap and non-discriminatory access to transmission lines; (ii) a contract-based supply and spot electricity trading for generation; (iii) performance based on maximum average price and non-discriminatory access for DUs and ECs under the performance base rate regime; and (iv) electricity supply by distribution companies in their respective franchise areas.
Section 31 of EPIRA establishes the Retail Competition and Open Access (“RC&OA”) under which Retail Electricity Suppliers, who are duly licensed by the ERC, may supply directly to Contestable Customers (end-users with an average demand of at least 1,000 kW) with DUs and ECs providing non-discriminatory wires services. Four of the five pre-conditions for RC&OA have already been satisfied and the remaining condition for open access to commence is expected to be achieved next year. Actual RC&OA may commence six months after ERC’s determination that all conditions have been satisfied.
Environmental Regulations. The Renewable Energy Act of 2008 was enacted in December 2008 (“R.A. 9513”) R.A. 9513 promotes non-conventional renewable energy sources, such as solar, wind, small hydroelectric and biomass energies. The law requires that electric power participants to initially source 10% of their supply from eligible renewable energy resources. The initial requirement of 10% is preliminary, as the National Renewable Energy Board (“NREB”) has not decided on the final figure. It is also unknown at this time if the
61
Table of Contents
definition of electric power participant applies to entities that are power producers or if it applies to power consumers. If and once the regulations are implemented, our businesses in the Philippines could be adversely impacted by having to source a portion of its generation from renewable energy resources to supply its customers’ contracts, which could in turn affect our results of operations.
Under Section 6 of the said law, consumers are also given a green energy option which provides end-users the option to choose renewable energy resources as their source of energy. Water rights are given by the National Water Resources Board under the Department of Environment and Natural Resource for extraction and discharge of water used in the operation of the Masinloc Plant.
Material Regulatory Actions. Pending with the ERC is the decision for the approval of additional fees for AES Masinloc through a rate adjustment and currency exchange adjustment. The ERC previously ruled that NPC shall be responsible for any recovery/refund for both these recoveries for the transition period prior to the closing date for each company such as AES Masinloc which obtained facilities in the privatization. With the acquisition of the Masinloc, our business also acquired the right to supply the electricity requirement of various NPC customers pursuant to the Transition Supply Contracts entered into between NPC and those customers. In an Order on November 15, 2010, the ERC approved the refund for currency exchange recovery adjustment, covering the test period up to June 2009.
Potential or Proposed Regulations. Section 72 of the EPIRA requires a mandated rate reduction from NPC rates. With the assignment of the Transition Supply Contracts to successor generating companies, such as AES Masinloc, NPC’s position is that the mandated rate reduction shall be for the account of the successor generating companies. AES Masinloc filed a petition with ERC to initiate rule making and clarify the MRR implementation in light of the ongoing privatization of NPC plants. In its decision, the ERC ruled in favor of AES Masinloc, saying that the EPIRA mandated rate reduction shall be implemented by the successor generating company subject to the execution of a written instrument between NPC and the new generator specifically containing the assumption by the latter of such obligation. The ERC ruled in favor of AES Masinloc since there was no such written instrument. NPC filed a petition for review with the Court asking for a reversal of the said ERC decision. The case is pending with the Court of Appeals. If AES Masinloc loses this matter on appeal, it may be subject to the rate reduction described above, which could have a material impact on its business and our results of operations.
A similar mandated rate reduction case is pending with the ERC. MERALCO alleges that AES Masinloc failed to account for the rate reduction in MERALCO’s favor amounting to Php179,611,458.98 ($4.1 million). It is assumed that the ERC will wait for the decision of the first matter described in the preceding paragraph before ruling on the MERALCO case since the latter is particularly dependent on the outcome of the pending petition with the Court of Appeals.
Environmental and Land Use Regulations
Overview. The Company faces certain risks and uncertainties related to numerous environmental laws and regulations, including existing and potential greenhouse gas (“GHG”) legislation or regulations, and actual or potential laws and regulations pertaining to water discharges, waste management (including disposal of coal combustion byproducts), and certain air emissions, such as SO2, NOX, particulate matter, mercury and other hazardous air pollutants. Such risks and uncertainties could result in increased capital expenditures or other compliance costs which could have a material adverse effect on certain of our United States or international subsidiaries, and our consolidated results of operations. For further information about these risks, see Item 1A.—Risk Factors, “Our businesses are subject to stringent environmental laws and regulations,” “Our businesses are subject to enforcement initiatives from environmental regulatory agencies,” and “Regulators, politicians, non-governmental organizations and other private parties have expressed concern about greenhouse gas, or GHG, emissions and the potential risks associated with climate change and are taking actions which could have a material adverse impact on our consolidated results of operations, financial condition and cash flows” in this Form 10-K.
62
Table of Contents
Many of the countries in which the Company does business also have laws and regulations relating to the siting, construction, permitting, ownership, operation, modification, repair and decommissioning of, and power sales from electric power generation or distribution assets. In addition, international projects funded by the International Finance Corporation, the private sector lending arm of the World Bank, or many other international lenders are subject to World Bank environmental standards or similar standards, which tend to be more stringent than local country standards. The Company often has used advanced environmental technologies in order to minimize environmental impacts, including circulating fluidized bed (“CFB”) coal technologies, flue gas desulphurization technologies, selective catalytic reduction technologies and advanced gas turbines.
Environmental laws and regulations affecting electric power generation and distribution facilities are complex, change frequently and have become more stringent over time. The Company has incurred and will continue to incur capital costs and other expenditures to comply with environmental laws and regulations. See Item 7.—Management’s Discussion and Analysis of Financial Condition and Results of Operations—Capital Expenditures in this Form 10-K for more detail. If these regulations change or the enforcement of these regulations becomes more rigorous, the Company and its subsidiaries may be required to make significant capital or other expenditures to comply. There can be no assurance that the businesses operated by the subsidiaries of the Company would be able to recover any of these compliance costs from their counterparties or customers such that the Company’s consolidated results of operations, financial condition and cash flows would not be materially adversely affected.
Various licenses, permits and approvals are required for our operations. Failure to comply with permits or approvals, or with environmental laws, can result in fines, penalties, capital expenditures, interruptions or changes to our operations. Certain subsidiaries of the Company are subject to litigation or regulatory action relating to environmental permits or approvals. See Item 3.—Legal Proceedings in this Form 10-K for more detail with respect to environmental litigation and regulatory action, including a Notice of Violation (“NOV”) issued by the United States Environmental Protection Agency against IPL concerning new source review and prevention of significant deterioration issues under the United States Clean Air Act.
Greenhouse Gas Laws, Protocols and Regulations. In 2010, the Company’s subsidiaries operated electric power generation businesses which had total approximate direct CO2 emissions of 77.2 million metric tonnes, approximately 40 million metric tonnes of which were emitted in the United States (both figures ownership adjusted). The Company uses CO2 emission estimation methodologies supported by the “The Greenhouse Gas Protocol” reporting standard on GHG emissions. For existing power generation plants, CO2 emissions are either obtained directly from plant continuous emission monitoring systems or calculated from actual fuel heat inputs and fuel type CO2 emission factors. The following is an overview of both the regulations and laws that currently apply to our businesses and those that may be imposed over the next few years. Such regulations and laws could have a material adverse effect on the electric power generation and distribution businesses of the Company’s subsidiaries and on the Company’s consolidated results of operations, financial condition and cash flows.
International
In July 2003, the European Community “Directive 2003/87/EC on Greenhouse Gas Emission Allowance Trading” was created, which requires member states to limit emissions of CO2 from large industrial sources within their countries. To do so, member states are required to implement EC-approved national allocation plans (“NAPs”). Under the NAPs, member states are responsible for allocating limited CO2 allowances within their borders. Directive 2003/87/EC does not dictate how these allocations are to be made, and NAPs that have been submitted thus far have varied in their allocation methodologies. For these and other reasons, uncertainty remains with respect to the implementation of the European Union Emissions Trading System (“EU ETS”) that commenced in January 2005. The European Union has announced that it intends to keep the EU ETS in place after 2012, even if the Kyoto Protocol is not extended or replaced by another agreement. The Company’s subsidiaries operate eight electric power generation facilities, and another subsidiary has one under construction, within six member states which have adopted NAPs to implement Directive 2003/87/EC. At this time, the
63
Table of Contents
Company cannot determine fully whether achieving and maintaining compliance with the NAPs to which its subsidiaries are subject will have a material impact on its consolidated operations or results. The risk and benefit associated with achieving compliance with applicable NAPs at several facilities of the Company’s subsidiaries are not the responsibility of the Company’s subsidiaries, as they are subject to contractual provisions that transfer the costs associated with compliance to contract counterparties. However, one such contract counterparty, GDF-Suez, is currently disputing these provisions with AES Energia Cartagena S.R.L. The matter has been submitted to arbitration and the parties are currently awaiting a decision. See Item 3.—Legal Proceedings in this Form 10-K for more detail regarding this dispute. In connection with this dispute or any similar dispute that might arise with other contract counterparties, there can be no assurance that the Company and/or the relevant subsidiary would prevail, or that the failure to prevail in any such dispute will not have a material adverse effect on the Company and its financial condition or consolidated results of operations. Certain of the Company’s subsidiaries will bear some or all of the risk and benefit associated with compliance with applicable NAPs at certain facilities. Based upon anticipated operations, CO2 emission allowance allocations, and the costs to acquire offsets and emission allowances for compliance purposes, the Company has not to-date incurred material costs to comply with Directive 2003/87/EC and applicable NAPs; however, there can be no guarantees that compliance will not have a material adverse effect on our business in future periods.
Legislative efforts at the EU have produced a “Climate Change Package.” This package consists of three directives—Carbon Capture & Storage, an amended EU ETS and a revised Renewables Directive. The amended EU ETS and Renewable Directives have now been approved by the EU Parliament and they will enter into force with respect to individual EU member states upon adoption by each such country of implementing legislation or regulations. The main objectives of the Climate Change Package are usually referred to as the “20-20-20” goals:
| • | A 20% reduction in EU GHG emissions by 2020, as compared with 1990 levels, or 30% if other developed nations agree to take similar action by 2020; |
| • | The EU ETS caps on emissions allowances is designed to deliver 21% GHG reduction by 2020 compared to 2005 levels, with distribution of allowances skewed in favor of member states with lower GDP, and with the potential for auctioning to be phased in for affected facilities; |
| • | 20% increase in energy efficiency; and |
| • | Minimum compulsory 10% target for renewable energy by 2020. |
Progress in implementation of the directives referred to above varies from member state to member state, and many states have not yet adopted any implementing legislation or regulations. AES generation businesses in each member state will be required to comply with the relevant measures taken to implement the directives.
On February 16, 2005, the Kyoto Protocol became effective. The Kyoto Protocol requires the industrialized countries that have ratified it to significantly reduce their GHG emissions, including CO2. The vast majority of developing countries which have ratified the Kyoto Protocol have no GHG reduction requirements, including many of the countries in which the Company’s subsidiaries operate. Of the 28 countries in which the Company’s subsidiaries currently operate, all but one—the United States (including Puerto Rico)—have ratified the Kyoto Protocol. To date, compliance with the Kyoto Protocol and EU ETS has not had a material adverse effect on the Company’s consolidated results of operations, financial condition and cash flows. In December 2010, the annual United Nations conference of the parties to the Kyoto Protocol (called COP 16) was held in Cancún, Mexico to focus on establishing an international agreement or framework to succeed the Kyoto Protocol when it expires at the end of 2012. COP 16 did not result in any legally binding successor agreement to the Kyoto Protocol, but countries did agree to continue to work toward a successor international agreement on GHG emissions reductions by the next annual conference. Countries also agreed to report their annual GHG emissions and many countries have submitted non-binding emission targets. The United States reaffirmed its non-binding target of reducing GHG emissions by 17% from 2005 levels by 2020. At present, the Company cannot predict whether compliance with the Kyoto Protocol or any successor agreements will have a material adverse effect on the Company’s consolidated results of operations, financial condition and cash flows in future periods.
64
Table of Contents
Even though it has been announced that the EU ETS will remain in place even if the Kyoto Protocol expires at the end of 2012 without any successor agreement or commitment on GHG emissions reductions, there remains significant uncertainty with respect to the implementation of NAPs post-2012. The EU has indicated that a portion of the emission allowances given to member states will need to be auctioned under the NAPs and the Company cannot predict with any certainty if compliance with such programs will have a material adverse effect on its consolidated financial condition or results of operations.
Countries in Latin America, Asia and Africa in which subsidiaries of the Company operate may also choose to adopt regulations that directly or indirectly regulate GHG emissions from power plants. For a discussion of regulations in individual countries where our subsidiaries operate, see Item 1. Business—Regulatory Matters in this Form 10-K. Although the Company does not currently believe that the laws and regulations pertaining to GHG emissions that have been adopted to date in countries in Latin America, Asia and Africa in which subsidiaries of the Company operate will have a material impact on the Company, the Company cannot predict with any certainty if future laws and regulations in these countries regarding CO2 emissions will have a material adverse effect on the Company’s consolidated financial condition or results of operations.
United States—Federal Legislation and Regulation
Currently, in the United States there is no Federal legislation establishing mandatory GHG emissions reduction programs (including CO2) affecting the electric power generation facilities of the Company’s subsidiaries. There are numerous state programs regulating GHG emissions from electric power generation facilities and there is a possibility that federal GHG legislation will be enacted within the next several years. Further, the United States Environmental Protection Agency (“EPA”) has adopted regulations pertaining to GHG emissions and has announced its intention to propose new regulations for electric generating units under Section 111 of the United States Clean Air Act (“CAA”).
Potential United States Federal GHG Legislation. Federal legislation passed the United States House of Representatives in 2009 that, if adopted, would impose a nationwide cap-and-trade program to reduce GHG emissions. In the United States Senate, several different draft bills pertaining to GHG legislation have been considered at various times since then, including comprehensive GHG legislation similar to the legislation that passed the United States House of Representatives and more limited legislation focusing only on the utility and electric generation industry. It is uncertain whether any such legislation or new legislation pertaining to GHG emissions will be voted on or passed by the Senate. If any legislation is passed by the Senate, it is uncertain whether such legislation will be reconciled with the House of Representatives’ legislation and ultimately enacted into law. However, if any such legislation is enacted, the impact could be material to the Company.
EPA GHG Regulation. The EPA promulgated regulations governing GHG emissions from automobiles under the CAA. The effect of the EPA’s regulation of GHG emissions from mobile sources is that certain provisions of the CAA will also apply to GHG emissions from existing stationary sources, including many United States power plants. Beginning on January 2, 2011, construction of new stationary sources and modifications to existing stationary sources that result in increased GHG emissions became subject to permitting requirements under the prevention of significant deterioration (“PSD”) program of the CAA. The PSD program, as currently applicable to GHG emissions, requires sources that emit above a certain threshold of GHGs to obtain PSD permits prior to commencement of new construction or modifications to existing facilities. In addition, major sources of GHG emissions may be required to amend, or obtain new, Title V air permits under the CAA to reflect any new applicable GHG emissions requirements for new construction or for modifications to existing facilities.
The EPA promulgated a final rule on June 3, 2010, (the “Tailoring Rule”) that sets thresholds for GHG emissions that would trigger PSD permitting requirements. The Tailoring Rule, which became effective in January of 2011, provides that sources already subject to PSD permitting requirements need to install Best Available Control Technology (“BACT”) for greenhouse gases if a proposed modification would result in the
65
Table of Contents
increase of more than 75,000 tons per year of GHG emissions. Also, under the Tailoring Rule, commencing in July of 2011, any new sources of GHG emissions that would emit over 100,000 tons per year of GHG emissions, in addition to any modification that would result in GHG emissions exceeding 75,000 tons per year, would require PSD review and be subject to related permitting requirements. The EPA anticipates that it will adjust downward the permitting thresholds of 100,000 tons and 75,000 tons for new sources and modifications, respectively, in future rulemaking actions. The Tailoring Rule substantially reduces the number of sources subject to PSD requirements for GHG emissions and the number of sources required to obtain Title V air permits, although new thermal power plants may still be subject to PSD and Title V requirements because annual GHG emissions from such plants typically far exceed the 100,000 ton threshold noted above. The 75,000 ton threshold for increased GHG emissions from modifications to existing sources may reduce the likelihood that future modifications to plants owned by some of our United States subsidiaries would trigger PSD requirements, although some projects that would expand capacity or electric output are likely to exceed this threshold, and in any such cases the capital expenditures necessary to comply with the PSD requirements could be significant.
In December 2010, the EPA entered into a settlement agreement with several states and environmental groups to resolve a petition for review challenging EPA’s new source performance standards (“NSPS”) rulemaking for electric utility steam generating units (“EUSGUs”) based on the NSPS’s failure to address GHG emissions. Under the settlement agreement, the EPA has committed to propose GHG emissions standards for EUSGUs by July 26, 2011 and to finalize GHG emissions standards for EUSGUs by May 26, 2012. The NSPS will establish GHG emission standards for newly constructed and reconstructed EUSGUs. The NSPS also will establish guidelines regarding the best system for achieving further GHG emissions reductions from EUSGUs and, based on such guidelines, individual states will be required to submit a plan to the EPA to establish GHG emission standards for existing EUSGUs within their state. It is impossible to estimate the impact and compliance cost associated with any future NSPS applicable to EUSGUs until such regulations are finalized. However, the compliance costs could have a material and adverse impact on our consolidated financial condition or results of operations.
United States—State Legislation and Regulation
Regional Greenhouse Gas Initiative. The primary regulation of GHG emissions affecting the United States plants of the Company’s subsidiaries has been through the Regional Greenhouse Gas Initiative (“RGGI”). Under RGGI, ten Northeastern States have coordinated to establish rules that require reductions in CO2 emissions from power plant operations within those states through a cap-and-trade program. States participating in RGGI in which our subsidiaries have generating facilities include Connecticut, Maryland, New York and New Jersey. Under RGGI, power plants must acquire one carbon allowance through auction or in the emission trading markets for each ton of CO2 emitted. We have estimated the costs to the Company of compliance with RGGI could be approximately $15 million for 2011. The initial three-year compliance period for RGGI expires at the end of 2011 and revisions to RGGI for 2012 and thereafter are currently under discussion. While these estimated compliance costs are not material to the Company, changes in the regulations or price of allowances under RGGI could have a material and adverse impact on our operations and financial performance.
The Company’s Eastern Energy business is located in New York. Under the New York RGGI rule, each budgeted source of CO2 emissions is required to surrender one CO2 allowance for each metric tonne of CO2 emitted during a three-year compliance period. All fossil fuel powered generating facilities in New York that have a generating capacity of 25 or more MW are subject to the rule. Eastern Energy secures its allowance requirements from the RGGI allowance auction or through the secondary market.
The Company’s Thames business is located in Connecticut. The state of Connecticut passed legislation, effective July 1, 2007, which requires that the Connecticut Department of Environmental Protection develop necessary regulations to implement RGGI. The regulations adopted to implement RGGI include an auction of CO2 emission allowances except for several set-aside accounts. AES Thames is eligible for a set-aside for the first compliance period, 2009-2011, which allows CO2 allowances to be purchased at $2 per allowance in 2009,
66
Table of Contents
and $2 per allowance plus a consumer price indexing in years 2010 and 2011. During 2010, a similar $2 per allowance provision for the second compliance period, 2012-2014, was enacted by the Connecticut legislature for contracted facilities.
The Company’s Warrior Run business is located in Maryland. In April 2006, the Maryland General Assembly passed the Maryland Healthy Air Act which, among other things, required the State of Maryland to join RGGI. The Maryland Department of Environment (“MDE”) adopted regulations that require 100% of the allowances the State receives to be auctioned except for several small allowance set-aside accounts. The MDE regulations include a safety valve to control the economic impact of the CO2 cap-and-trade program. If the auction closing price reaches $7, up to 50% of a year’s allowances will be reserved for purchase by electric power generation facilities located within Maryland at $7 per allowance, regardless of auction prices. Warrior Run continues to secure its allowance requirements through the RGGI allowance auction.
The Company’s Red Oak business is located in New Jersey. The State of New Jersey adopted the Global Warming Response Act in July 2007, which established goals for the reduction of GHG emissions in the State. In furtherance of these goals, in January 2008, additional state legislation authorized the New Jersey Department of Environmental Protection (“NJDEP”) to develop and adopt RGGI regulations and the NJDEP RGGI regulations became effective in 2008. Under the terms of Red Oak’s tolling agreement, RGGI CO2 compliance costs are passed through to its power offtaker.
In 2010, of the approximately 40 million metric tonnes of CO2 emitted in the United States by the businesses operated by our subsidiaries (ownership adjusted), approximately 11.3 million metric tonnes were emitted in states participating in RGGI. Over the past three years, such emissions have averaged approximately 10.9 million metric tonnes. While CO2 emissions from businesses operated by subsidiaries of the Company are calculated globally in metric tonnes, RGGI allowances are denominated in short tons. (1 metric tonne equals 2,200 pounds and 1 short ton equals 2,000 pounds.) For forecasting purposes, the Company has modeled the impact of CO2 compliance based on a three-year average of CO2 emissions for its businesses that are subject to RGGI and that may not be able to pass through compliance costs. The model includes a conversion from metric tonnes to short tons, as well as the impact of some market recovery by merchant plants and contractual and regulatory provisions. The model also utilizes a price of $1.86 per allowance under RGGI. The source of this allowance price estimate was the clearing price in the most recent RGGI allowance auction held in December 2010. Based on these assumptions, the Company estimates that the RGGI compliance costs could be approximately $15 million for 2011, which is the last year of the first RGGI compliance period. Given the fact that the assumptions utilized in the model may prove to be incorrect, there is a significant risk that our actual compliance costs under RGGI will differ from our estimates by a material amount and that our model could underestimate our costs of compliance.
California. The Company’s Southland and Placerita businesses are located in California. On September 27, 2006, the Governor of California signed the Global Warming Solutions Act of 2006, also called Assembly Bill 32 (“A.B. 32”). A.B. 32 directs the California Air Resources Board (“CARB”) to promulgate regulations that will require the reduction of CO2 and other GHG emissions to 1990 levels by 2020. On October 29, 2010, CARB released the design of its GHG cap-and-trade program and on December 16, 2010 voted 9-1 to approve the plan. The plan begins with Phase I in 2012, and initially covers emissions from electricity generating facilities, large industrial sources with annual emissions greater than 25,000 tons, and imported electricity. Emitters will be required to hold enough allowances to match their emissions and can comply by reducing their emissions or by purchasing tradable allowances from other emitters or at state-run auctions. Companies that reduce their emissions below the allowances they hold have the opportunity to sell unused allowances. Initially, retail utilities will be issued free allowances and merchant facilities will be required to bid for allowances at auctions. There is a floor price of $10 for all allowances purchased at auctions. The number of free allowances will decline in Phase II and will further decline when Phase III begins in 2018. CARB will continue to refine certain elements of the cap-and-trade program and further define important provisions, such as allocations in early 2011, through CARB’s “15 day notice” procedure, whereby changes to adopted regulations are recommended by CARB staff
67
Table of Contents
and subject to a 15-day public comment period. The Company believes that any compliance costs arising from A.B. 32 for the thermal power plants of its subsidiaries operating in California will be borne by the power offtaker under the terms of existing tolling agreements with the offtaker and under the terms of A.B. 32. However, after the expiration of such tolling agreements, if the Company’s subsidiaries were to sell power on a merchant basis then such compliance costs could be borne by the subsidiaries.
Western Climate Initiative (WCI). In February 2007, the governors of the Western United States states (Arizona, New Mexico, California, Washington and Oregon) established the WCI. The WCI has since been joined by two other states (Montana and Utah) and four Canadian provinces (British Columbia, Manitoba, Ontario, and Quebec). Participating states and provinces have agreed to cut GHG emissions to 15% below 2005 levels by 2020, and they are considering the implementation of a cap-and-trade program for the electricity industry to achieve this reduction. On September 23, 2008, the WCI issued its design recommendations for a cap-and-trade program that would apply to in-state electricity generators and the first jurisdictional deliverer of electricity into a WCI partner state. The WCI issued draft guidance on the creation of cap-and-trade allowance budgets on November 29, 2009. The draft guidance contemplates an eventual cap-and-trade program with flexible mechanisms, such as allowance banking and offsets. The final regulatory design of this program is not yet known.
Midwestern Greenhouse Gas Reduction Accord (MGGRA). The Company owns the utility IPL, which is located in Indiana. On November 15, 2007, six Midwestern state governors (including the Governor of Indiana) and the premier of Manitoba signed the Midwestern Greenhouse Gas Reduction Accord (“MGGRA”), committing the participating states and province to reduce GHG emissions through the implementation of a cap-and-trade program. Three states (including Indiana) and the province of Ontario have signed as observers. In May of 2010, the MGGRA Advisory Group finalized a set of recommendations for the establishment of targets for emissions reductions in the region and for the design of a regional cap-and-trade program. These include a recommended reduction in GHG emissions of 20% below 2005 emission levels by 2025. The recommendations are from the advisory group only, and have not been endorsed or approved by individual governors, including the Governor of Indiana. If Indiana were to implement the recommended reduction targets, the impact on the Company’s consolidated results of operations, financial condition, and cash flows could be material.
Hawaii. The Company owns a power generation facility in Hawaii. On June 30, 2007, the Governor of Hawaii signed Act 234 which sets a goal of reducing GHG emissions to at or below 1990 levels by January 1, 2020. Act 234 also established the Greenhouse Gas Emissions Reduction Task Force, which is tasked with developing measures to meet Hawaii’s GHG emissions reduction goal. The Task Force filed a report to the Hawaii Legislature on December 30, 2009, strongly supporting the Hawaii Clean Energy Initiative, which calls for additional renewable energy development, increased energy efficiency, and incorporates already-enacted renewable portfolio standards. The Task Force also evaluated other mechanisms and concluded that a state-level cap-and-trade program is inappropriate due to the small size of Hawaii’s economy.
At this time, other than the estimated impact of CO2 compliance noted above for certain of its businesses that are subject to RGGI, the Company has not estimated the costs of compliance with other potential United States federal, state or regional CO2 emissions reduction legislation or initiatives, such as A.B. 32, WCI, MGGRA and potential Hawaii regulations, due to the fact that most of these proposals are in the early stages of development and any final regulations or laws, if adopted, could vary drastically from current proposals. Although complete specific implementation measures for any federal regulations, A.B. 32, WCI, MGGRA and the Hawaiian regulations have yet to be finalized, if these GHG-related initiatives are finalized they may affect a number of the Company’s United States subsidiaries unless they are preempted by federal GHG legislation. Any federal, state or regional legislation or regulations adopted in the United States that would require the reduction of GHG emissions could have a material adverse effect on the Company’s consolidated results of operations, financial condition and cash flows.
68
Table of Contents
The possible impact of any future federal GHG legislation or regulations or any regional or state proposal will depend on various factors, including but not limited to:
| • | the geographic scope of legislation and/or regulation (e.g., federal, regional, state), which entities are subject to the legislation and/or regulation (e.g., electricity generators, load-serving entities, electricity deliverers, etc.), the enactment date of the legislation and/or regulation and the compliance deadlines set forth therein; |
| • | the level of reductions of CO2 being sought by the regulation and/or legislation (e.g., 10%, 20%, 50%, etc.) and the year selected as a baseline for determining the amount or percentage of mandated CO2 reduction (e.g., 10% reduction from 1990 CO2 emission levels, 20% reduction from 2000 CO2 emission levels, etc.); |
| • | the legislative and/or regulatory structure (e.g., a CO2 cap-and-trade program, a carbon tax, CO2 emission limits, etc.); |
| • | in any cap-and-trade program, the mechanism used to determine the price of emission allowances or offsets to be auctioned by designated governmental authorities or representatives; |
| • | the price of offsets and emission allowances in the secondary market, including any price floors or price caps on the costs of offsets and emission allowances; |
| • | the operation of and emissions from regulated units; |
| • | the permissibility of using offsets to meet reduction requirements and the requirements of such offsets (e.g., type of offset projects allowed, the amount of offsets that can be used for compliance purposes, any geographic limitations regarding the origin or location of creditable offset projects), as well as the methods required to determine whether the offsets have resulted in reductions in GHG emissions and that those reductions are permanent (i.e., the verification method); |
| • | whether the use of proceeds of any auction conducted by responsible governmental authorities is reinvested in developing new energy technologies, is used to offset any cost impact on certain energy consumers or is used to address issues unrelated to power; |
| • | how the price of electricity is determined at the affected businesses, including whether the price includes any costs resulting from any new CO2 legislation and the potential to transfer compliance costs pursuant to legislation, market or contract, to other parties; |
| • | any impact on fuel demand and volatility that may affect the market clearing price for power; |
| • | the effects of any legislation or regulation on the operation of power generation facilities that may in turn affect reliability; |
| • | the availability and cost of carbon control technology; |
| • | the extent to which existing contractual arrangements transfer compliance costs to power offtakers or other contractual counterparties of our subsidiaries; |
| • | whether legislation regulating GHG emissions will preclude EPA from regulating GHG emissions under the Clean Air Act or preempt private nuisance suits or other litigation by third parties; and |
| • | any opportunities to change the use of fuel at the generation facilities of our subsidiaries or opportunities to increase efficiency. |
Other United States Air Emissions Regulations and Legislation. In the United States the CAA and various state laws and regulations regulate emissions of air pollutants, including SO2, NOX, particulate matter (“PM”), mercury and other hazardous air pollutants (“HAPs”). The applicable rules and the steps taken by the Company to comply with the rules are discussed in further detail below.
69
Table of Contents
The EPA promulgated the “Clean Air Interstate Rule” (“CAIR”) on March 10, 2005, which required allowance surrender for SO2 and NOX emissions from existing power plants located in 28 eastern states and the District of Columbia. CAIR was subsequently challenged in federal court, and on July 11, 2008, the United States Court of Appeals for the D.C. Circuit issued an opinion striking down much of CAIR and remanding it to the EPA.
In response to the D.C. Circuit’s opinion, on July 6, 2010, the EPA issued a new proposed rule (the “Clean Air Transport Rule”) to replace CAIR. The final Clean Air Transport Rule (“Transport Rule”) is scheduled to be issued by July 2011. The Transport Rule would require significant additional reductions in SO2 and NOX emissions in 31 states and the District of Columbia starting in 2012, including several states where subsidiaries of the Company conduct business.
The Transport Rule contemplates three possible options for reducing SO2 and NOX emissions in the designated states. The EPA’s preferred option contemplates a set limit or budget on SO2 and NOX emissions for each of the states, with limited interstate trading of emissions allowances and unlimited intrastate trading of SO2 and NOX emissions allowances. Affected power plants would receive emissions allowances based on the applicable state emissions budgets. The EPA’s second option under the Transport Rule would establish emission budgets for each state, but only allow intrastate trading of emissions allowances. The final option would set emission rate limitations for each power plant, but would allow for some intrastate averaging of emission rates. Under any of the proposed options, additional pollution control technology may be required by some of our subsidiaries, and the cost of implementing any such technology could affect the financial condition or results of operations of these subsidiaries or the parent company. The EPA has received public comments on the Transport Rule, and such public comments will be considered by the EPA prior to promulgating a final rule.
On December 23, 2009, the New York State Department of Environmental Conservation (“NYSDEC”) published and enacted a rulemaking requiring the application of Reasonably Available Control Technology (“RACT”) for reductions in NOX emissions from electric utility and industrial boilers, combustion turbines and internal combustion engines. The regulations establish that sources subject to the new emission limits must provide a compliance plan by January 1, 2012 and demonstrate compliance by July 1, 2014.
As a result of prior EPA determinations and a D.C. Circuit Court ruling, the EPA is obligated under Section 112 of the CAA to develop a rule requiring pollution controls for hazardous air pollutants, including mercury, hydrogen chloride, hydrogen fluoride, and nickel species from coal and oil-fired power plants. The EPA has entered into a consent decree under which it is obligated to propose the rule by March 2011 and to finalize the rule by November 2011. In connection with such rule, the CAA requires the EPA to establish maximum achievable control technology (“MACT”) standards for each pollutant regulated under the rule. MACT is defined as the emission limitation achieved by the “best performing 12%” of sources in the source category. While it is impossible to project what emission rate levels the EPA may propose as MACT, the rule may require all coal-fired power plants to install acid gas scrubbers (wet or dry flue gas desulfurization technology) and/or some other type of mercury control technology, such as sorbent injection. Most of the Company’s United States coal-fired plants have acid gas scrubbers or comparable control technologies, but it is possible that EPA regulations will require improvements to such control technologies at some of our plants. Under the CAA, compliance is required within three years of the effective date of the rule; however, the compliance period for a unit, or group of units, may be extended by state permitting authorities (for one additional year) or through a determination by the President (for up to two additional years). At this time, the Company cannot predict whether new regulations for hazardous air pollutants will be promulgated or, if promulgated, the extent of such regulations, but the cost of compliance with any such regulations could be material.
In July 1999, the EPA published the “Regional Haze Rule” to reduce haze and protect visibility in designated federal areas. On June 15, 2005, the EPA proposed amendments to the Regional Haze Rule that, among other things, set guidelines for determining when to require the installation of “best available retrofit technology” (“BART”) at older plants. The amendment to the Regional Haze Rule required states to consider the
70
Table of Contents
visibility impacts of the haze produced by an individual facility, in addition to other factors, when determining whether that facility must install potentially costly emissions controls. States were required to submit their regional haze state implementation plans (“SIPs”) to the EPA by December 2007, but only 13 states met this deadline. The EPA has yet to approve any state’s Regional Haze state implementation plan. The statute requires compliance within five years after the EPA approves the relevant SIP, although individual states may impose more stringent compliance schedules.
Other International Air Emissions Regulations and Legislation. In Europe, the Company is, and will continue to be, required to reduce air emissions from our facilities to comply with applicable EC Directives, including Directive 2001/80/EC on the limitation of emissions of certain pollutants into the air from large combustion plants (the “LCPD”), which sets emission limit values for NOX, SO2, and particulate matter for large-scale industrial combustion plants for all member states. Until June 2004, existing coal plants could “opt-in” or “opt-out” of the LCPD emissions standards. Those plants that opted out will be required to cease all operations by 2015 and may not operate for more than 20,000 hours after 2008. Those that opted-in, like the Company’s Kilroot facility in the United Kingdom, must invest in abatement technology to achieve specific SO2 reductions. Kilroot installed a new flue gas desulphurization system in the second quarter of 2009 in order to satisfy SO2 reduction requirements. The Company’s other coal plants in Europe are either exempt from the Directive due to their size or have opted-in but will not require any additional abatement technology to comply with the LCPD.
In November 2010, the Council of the EU approved a revised directive on industrial emissions so as to reduce emissions of pollutants that are alleged to be harmful to the environment and associated with cancer, asthma and acid rain. The industrial emissions directive seeks to prevent and control air, water and soil pollution by industrial installations. It regulates emissions of a wide range of pollutants, including sulphur and nitrogen compounds, dust particles, asbestos and heavy metals. The directive is aimed at improving local air, water and soil quality. The review integrates seven directives into a single legal framework and provides for a more harmonized and rigorous implementation of emissions limits associated with the cleanest available technology, so-called BAT. Deviations from this standard are only permitted where local and technical characteristics would make it disproportionately costly to comply. The recast also tightens emission limits for NOX, SO2 and dust from power plants and large combustion installations in oil refineries and the metal industry. New plants must apply the cleanest available technology from 2012, four years earlier than initially proposed. Existing plants have to comply with this standard beginning in 2016, though a transition period is foreseen. Until June 30, 2020, member states may define transitional plans with declining annual caps for NOX, SO2 or dust emissions. Where installations are already scheduled to close by the end of 2023 or operate less than 17,500 hours after 2016, they may not need to upgrade. Member states have two years to implement the Directive. Progress in implementation of the directives referred to above varies from member state to member state. AES generation businesses in each member state will be required to comply with the relevant measures taken to implement the directives.
On January 18 2011, the President of Chile approved a new air emissions regulation submitted to him by the national environmental regulatory agency (“CONAMA”). The new regulation establishes limits on emissions of NOX, SO2, metals and particulate matter for both existing and new thermal power plants, with more stringent limitations on new facilities. The regulation will become effective upon approval of the General Comptroller of Chile. The regulation will require AES Gener, our Chilean subsidiary, to install emissions reduction equipment at its existing thermal plants from late 2011 through 2015. The exact costs of compliance with such regulation have not yet been determined and the Company believes some of the compliance costs are contractually passed through to counterparties. However, the compliance costs could be material.
Water Discharges. The Company’s facilities are subject to a variety of rules governing water discharges. In particular, the Company is subject to the United States Clean Water Act Section 316(b) rule regarding existing power plant cooling water intake structures issued by the EPA in 2005 (69 Fed. Reg. 41579, July 9, 2004), and the subsequent Circuit Court of Appeals decision and Supreme Court decision regarding this rule. The rule as originally issued could affect 12 of the Company’s United States power plants and the rule’s requirements would
71
Table of Contents
be implemented via each plant’s National Pollutant Discharge Elimination System (“NPDES”) water quality permit renewal process. These permits are usually processed by state water quality agencies. To protect fish and other aquatic organisms, the 2004 rule requires existing steam electric generating facilities to utilize the best technology available for cooling water intake structures. To comply, a steam electric generating facility must first prepare a Comprehensive Demonstration Study to assess the facility’s effect on the local aquatic environment. Since each facility’s design, location, existing control equipment and results of impact assessments must be taken into consideration, costs will likely vary. The timing of capital expenditures to achieve compliance with this rule will vary from site to site. On January 25, 2007, the United States Court of Appeals for the Second Circuit decision (Docket Nos. 04-6692 to 04-6699) vacated and remanded major parts of the 2004 rule back to the EPA. In November 2007, three industry petitioners sought review of the Second Circuit’s decision by the United States Supreme Court, and this review was granted by the United States Supreme Court in April 2008. In its April 2009 decision, the United States Supreme Court granted the EPA authority to use a cost-benefit analysis when setting technology-based requirements under Section 316(b) of the Clean Water Act, and expressed no view on the remaining bases for the Second Circuit’s remand. New draft rule 316(b) regulations are expected to be proposed by the EPA by March 14, 2011, and finalized by July 27, 2012. Until such regulations are final, the EPA has instructed state regulatory agencies to use their best professional judgment in determining how to evaluate what constitutes best technology available for minimizing adverse environmental impacts from cooling water intake structures. Certain states in which the Company operates power generation facilities, such as New York, have been delegated authority and are moving forward with best technology available determinations in the absence of any final rule from the EPA. On September 27, 2010, the California Office of Administrative Law approved a policy adopted by the California Water Resources Control Board with respect to power plant cooling water intake structures. This policy became effective on October 1, 2010, and establishes technology-based standards to implement Section 316(b) of the United States Clean Water Act. At this time, it is contemplated that the Company’s Redondo Beach, Huntington Beach and Alamitos power plants in California will need to have in place best technology available by December 31, 2020, or repower the facilities. At present, the Company cannot predict the final requirements under Section 316(b) or whether compliance with the anticipated new 316(b) rule will have a material impact on our operations or results, but the Company expects that capital investments and/or modifications resulting from such requirements could be significant. In the third quarter of 2010, we impaired approximately $200 million at our business at Southland as a result of this regulation.
Waste Management. In the course of operations, the Company’s facilities generate solid and liquid waste materials requiring eventual disposal or processing. With the exception of coal combustion byproducts (“CCB”), the wastes are not usually physically disposed of on our property, but are shipped off site for final disposal, treatment or recycling. CCB, which consists of bottom ash, fly ash and air pollution control wastes, is disposed of at some of our coal-fired power generation plant sites using engineered, permitted landfills. Waste materials generated at our electric power and distribution facilities include CCB, oil, scrap metal, rubbish, small quantities of industrial hazardous wastes such as spent solvents, tree and land clearing wastes and polychlorinated biphenyl (“PCB”) contaminated liquids and solids. The Company endeavors to ensure that all of its solid and liquid wastes are disposed of in accordance with applicable national, regional, state and local regulations. On December 22, 2009, a dike at a coal ash containment area at the Tennessee Valley Authority’s plant in Kingston, Tennessee failed, and over 1 billion gallons of ash was released into adjacent waterways and properties. Following such incident, there has been heightened focus on the regulation of CCBs. On June 21, 2010, the EPA published in the Federal Register a proposed rule to regulate CCB under the Resource Conservation and Recovery Act (“RCRA”). The proposed rule provides two possible options for CCB regulation, and both options contemplate heightened structural integrity requirements for surface impoundments of CCB. The first option contemplates regulation of CCB as a hazardous waste subject to regulation under Subtitle C of the RCRA. Under this option, existing surface impoundments containing CCB would be required to be retrofitted with composite liners and these impoundments would likely be phased out over several years. State and/or federal permit programs would be developed for storage, transport and disposal of CCB. States could bring enforcement actions for non-compliance with permitting requirements, and the EPA would have oversight responsibilities as well as the authority to bring lawsuits for non-compliance. The second option contemplates regulation of CCB under Subtitle D of the RCRA. Under this option, the EPA would create national criteria applicable to CCB landfills and surface impoundments.
72
Table of Contents
Existing impoundments would also be required to be retrofitted with composite liners and would likely be phased out over several years. This option would not contain federal or state permitting requirements. The primary enforcement mechanism under regulation pursuant to Subtitle D would be private lawsuits.
The public comment period for this proposed regulation has expired, and EPA is required to consider the public comments prior to promulgating a final rule. Requirements under a final rule are expected to become effective by January 2012, with a compliance schedule of five years. While the exact impact and compliance cost associated with future regulations of CCB cannot be established until such regulations are finalized, there can be no assurance that the Company’s businesses, financial condition or results of operations would not be materially and adversely affected by such regulations.
Subsequent Events
Subsequent to December 31, 2010, the Company continued to repurchase stock under the stock repurchase program announced on July 7, 2010. The Company has repurchased 1,026,610 shares at a cost of $13 million in 2011, bringing the cumulative total through February 22, 2010 to 9,409,435 shares at a total cost of $112 million (average price of $11.92 per share including commissions). As of February 25, 2011, $388 million of the $500 million authorized remained available under the stock repurchase program. For additional information, see Note 14—Equity.
On February 1, 2011, AES Thames, LLC (“Thames”), our 208 MW coal-fired plant in Connecticut, filed petitions for bankruptcy protection under Chapter 11 in the U. S. Bankruptcy Court. The bankruptcy is due, in part, to the increased cost of energy production. The bankruptcy protection is not expected to have a material impact on the Company’s financial position or the results of operations.
| ITEM 1A. | RISK FACTORS |
You should consider carefully the following risks, along with the other information contained in or incorporated by reference in this Form 10-K. Additional risks and uncertainties also may adversely affect our business and operations including those discussed in Item 7.—Management’s Discussion and Analysis of Financial Condition and Results of Operations in this Form 10-K. If any of the following events actually occur, our business, financial results and financial condition could be materially adversely affected.
Risks Associated with our Disclosure Controls and Internal Control over Financial Reporting
We completed the remediation of our material weaknesses in internal control over financial reporting in 2008. However, our disclosure controls and procedures may not be effective in future periods if our judgments prove incorrect or new material weaknesses are identified.
For each of the fiscal quarters since December 31, 2004 through September 30, 2008, our management reported material weaknesses in our internal control over financial reporting. A material weakness is a deficiency (within the meaning of the Public Company Accounting Oversight Board (“PCAOB”) Auditing Standard No. 5), or a combination of deficiencies, that adversely affects a company’s ability to initiate, authorize, record, process, or report external financial data reliably in accordance with generally accepted accounting principles such that there is a reasonable possibility that a material misstatement of the annual or interim financial statements will not be prevented or detected. As a result of these material weaknesses, our management concluded that for each of the fiscal quarters from December 31, 2004 through September 30, 2008, we did not maintain effective internal control over financial reporting and concluded that our disclosure controls and procedures were not effective to provide reasonable assurance that financial information that we are required to disclose in our reports under the Exchange Act was recorded, processed, summarized and reported accurately.
To address these material weaknesses in our internal control over financial reporting, each time we prepared our annual and quarterly reports, we performed additional analyses and other post-closing procedures. These
73
Table of Contents
additional procedures were costly, time consuming and required us to dedicate a significant amount of our resources, including the time and attention of our senior management, toward the correction of these problems. Nevertheless, even with these additional procedures, the material weaknesses in our internal control over financial reporting caused us to have errors in our financial statements and since 2003 we had to restate our annual financial statements six times to correct these errors.
The material weaknesses in our internal control over financial reporting also caused us to delay the filing of certain quarterly and annual reports with the SEC to dates that went beyond the deadlines prescribed by the SEC’s rules to file such reports. We did not timely file with the SEC our quarterly and annual reports for the year ended December 31, 2005, our quarterly reports for the second and third quarters of 2005, our annual report for the year ended December 31, 2006, and our quarterly report for the quarter ended March 31, 2007. Under SEC rules, failure to timely file these reports prohibited us for a period of twelve months from offering and selling our securities pursuant to our shelf registration statement on Form S-3, which impaired our ability to access the capital markets through the public sale of registered securities in a timely manner. The failure to file our annual and quarterly reports with the SEC in a timely fashion also resulted in covenant defaults under our senior secured credit facility and the indenture governing certain of our outstanding debt securities. Such defaults required us to obtain a waiver from the lenders under the senior secured credit facility; however the default under the indentures was cured upon the filing of the reports within the permitted grace period. In addition to these problems, the material weaknesses in internal controls, the restatements of our financial statements and the delay in the filing of our annual and quarterly reports exposed us to other risks including, but not limited to:
| • | litigation or an expansion of the SEC’s informal inquiry into our restatements or the commencement of formal proceedings by the SEC or other regulatory authorities, which could require us to incur significant legal expenses and other costs or to pay damages, fines or other penalties; |
| • | negative publicity; |
| • | ratings downgrades; |
| • | inability to raise capital in the public markets and/or private markets when desired or necessary; or |
| • | the loss or impairment of investor confidence in the Company. |
Since December 31, 2008, our management has reported that all of our previously identified material weaknesses have been remediated and that our internal control over financial reporting and our disclosure controls have been effective. For a discussion of our internal control over financial reporting and our disclosure controls, see Item 9A.—Controls and Procedures in this Form 10-K. In making its assessment about the effectiveness of our internal control over financial reporting and our disclosure controls and procedures, management had to make certain judgments and it is possible that any number of their judgments could prove to be incorrect and that our remediation efforts did not fully and completely cure the previously identified material weaknesses. There is also the possibility that there are other material weaknesses in our internal control that are unknown to us or that new material weaknesses may develop in the future. The existence of any material weakness in our internal control over financial reporting would subject us to all of the risks described above.
Furthermore, any evaluation of the effectiveness of controls is subject to risks that those internal controls may become inadequate in future periods because of changes in business conditions, changes in accounting practice or policy, or that the degree of compliance with the revised policies or procedures deteriorates over time. Management, including our CEO and CFO, does not expect that our internal controls will prevent or detect all errors and all fraud. A control system, no matter how well designed and operated, can provide only reasonable, not absolute, assurance that the objectives of the control system are met. Further, the design of a control system must reflect the fact that there are resource constraints, and the benefits of controls must be considered relative to their costs.
74
Table of Contents
In the future, we may be adversely impacted by the efforts required to adopt new accounting standards issued by the FASB as a result of the convergence of accounting standards project between the FASB and IASB
The U.S Financial Accounting Standards Board (the “FASB”), which establishes accounting principles generally accepted in the United States (“GAAP”) guidelines that companies follow in the United States, and the International Accounting Standards Board (“IASB”), which is an international accounting standards setter outside of the United States, are presently engaged in a project to converge several accounting standards. The convergence project may result in the issuance of several new accounting standards in the future that revise existing GAAP accounting standards and which the Company may be required to adopt under GAAP.
Based on the present timeline released by the FASB, several pronouncements could be issued in final form in 2011. Although the release of final pronouncements is not assured and the proposed adoption dates of these standards have not been set, each new standard that the Company must comply with may require significant effort to adopt. For each new standard, the Company will be required to evaluate the impact of any accounting changes necessitated by a new standard which will include, but not be limited to, an evaluation of a new standard’s impact on its financial statements and contractual arrangements; planning for and implementation of any changes to accounting systems; processes and procedures to ensure the Company properly complies with a new standard; and training personnel. To the extent that multiple standards are effective as of one date or in close proximity to one another, the Company may require considerable resources to achieve compliance with these new standards. An inability to complete these efforts prior to their effective date could have an adverse effect on our ability to timely file our financial statements with the SEC and/or the effectiveness of our internal controls over financial reporting.
Risks Related to our High Level of Indebtedness
We have a significant amount of debt, a large percentage of which is secured, which could adversely affect our business and the ability to fulfill our obligations.
As of December 31, 2010, we had approximately $19.7 billion of outstanding indebtedness on a consolidated basis. All outstanding borrowings under The AES Corporation’s senior secured credit facility and certain other indebtedness are secured by certain of our assets, including the pledge of capital stock of many of The AES Corporation’s directly held subsidiaries. Most of the debt of The AES Corporation’s subsidiaries is secured by substantially all of the assets of those subsidiaries. Since we have such a high level of debt, a substantial portion of cash flow from operations must be used to make payments on this debt. Furthermore, since a significant percentage of our assets are used to secure this debt, this reduces the amount of collateral that is available for future secured debt or credit support and reduces our flexibility in dealing with these secured assets. This high level of indebtedness and related security could have other important consequences to us and our investors, including:
| • | making it more difficult to satisfy debt service and other obligations at the holding company and/or individual subsidiaries; |
| • | increasing the likelihood of a downgrade of our debt, which could cause future debt costs and/or payments to increase under our debt and related hedging instruments and consume an even greater portion of cash flow; |
| • | increasing our vulnerability to general adverse industry conditions and economic conditions, including but not limited to adverse changes in foreign exchange rates and commodity prices; |
| • | reducing the availability of cash flow to fund other corporate purposes and grow our business; |
| • | limiting our flexibility in planning for, or reacting to, changes in our business and the industry; |
| • | placing us at a competitive disadvantage to our competitors that are not as highly leveraged; and |
75
Table of Contents
| • | limiting, along with the financial and other restrictive covenants relating to such indebtedness, among other things, our ability to borrow additional funds as needed or take advantage of business opportunities as they arise, pay cash dividends or repurchase common stock. |
The agreements governing our indebtedness, including the indebtedness of our subsidiaries, limit, but do not prohibit the incurrence of additional indebtedness. To the extent we become more leveraged, the risks described above would increase. Further, our actual cash requirements in the future may be greater than expected. Accordingly, our cash flows may not be sufficient to repay at maturity all of the outstanding debt as it becomes due and, in that event, we may not be able to borrow money, sell assets, raise equity or otherwise raise funds on acceptable terms or at all to refinance our debt as it becomes due. See Note 10—Debt included in Item 8. of this Form 10-K for a schedule of our debt maturities.
The AES Corporation is a holding company and its ability to make payments on its outstanding indebtedness, including its public debt securities, is dependent upon the receipt of funds from its subsidiaries by way of dividends, fees, interest, loans or otherwise.
The AES Corporation is a holding company with no material assets other than the stock of its subsidiaries. All of The AES Corporation’s revenue is generated through its subsidiaries. Accordingly, almost all of The AES Corporation’s cash flow is generated by the operating activities of its subsidiaries. Therefore, The AES Corporation’s ability to make payments on its indebtedness and to fund its other obligations is dependent not only on the ability of its subsidiaries to generate cash, but also on the ability of the subsidiaries to distribute cash to it in the form of dividends, fees, interest, loans or otherwise.
However, our subsidiaries face various restrictions in their ability to distribute cash to The AES Corporation. Most of the subsidiaries are obligated, pursuant to loan agreements, indentures or project financing arrangements, to satisfy certain restricted payment covenants or other conditions before they may make distributions to The AES Corporation. In addition, the payment of dividends or the making of loans, advances or other payments to The AES Corporation may be subject to other contractual, legal or regulatory restrictions. Business performance and local accounting and tax rules may limit the amount of retained earnings that may be distributed to us as a dividend. Subsidiaries in foreign countries may also be prevented from distributing funds to The AES Corporation as a result of foreign governments restricting the repatriation of funds or the conversion of currencies. Any right that The AES Corporation has to receive any assets of any of its subsidiaries upon any liquidation, dissolution, winding up, receivership, reorganization, bankruptcy, insolvency or similar proceedings (and the consequent right of the holders of The AES Corporation’s indebtedness to participate in the distribution of, or to realize proceeds from, those assets) will be effectively subordinated to the claims of any such subsidiary’s creditors (including trade creditors and holders of debt issued by such subsidiary).
The AES Corporation could receive less funds than it expects as a result of the current challenges facing the global and local economies, which could impact the performance of our businesses and their ability to distribute cash to The AES Corporation. For further discussion of the macroeconomic environment and its impact on our business, see Item 7.—Management’s Discussion and Analysis of Financial Condition and Results of Operations—Global Economic Conditions.
The AES Corporation’s subsidiaries are separate and distinct legal entities and, unless they have expressly guaranteed any of The AES Corporation’s indebtedness, have no obligation, contingent or otherwise, to pay any amounts due pursuant to such debt or to make any funds available whether by dividends, fees, loans or other payments. While some of The AES Corporation’s subsidiaries guarantee the Parent’s indebtedness under the Parent’s senior secured credit facility, none of its subsidiaries guarantee, or are otherwise obligated with respect to, its outstanding public debt securities.
76
Table of Contents
Even though The AES Corporation is a holding company, existing and potential future defaults by subsidiaries or affiliates could adversely affect The AES Corporation.
We attempt to finance our domestic and foreign projects primarily under loan agreements and related documents which, except as noted below, require the loans to be repaid solely from the project’s revenues and provide that the repayment of the loans (and interest thereon) is secured solely by the capital stock, physical assets, contracts and cash flow of that project subsidiary or affiliate. This type of financing is usually referred to as non-recourse debt or “project financing.” In some project financings, The AES Corporation has explicitly agreed to undertake certain limited obligations and contingent liabilities, most of which by their terms will only be effective or will be terminated upon the occurrence of future events. These obligations and liabilities take the form of guarantees, indemnities, letter of credit reimbursement agreements and agreements to pay, in certain circumstances, the project lenders or other parties.
As of December 31, 2010, we had approximately $19.7 billion of outstanding indebtedness on a consolidated basis, of which approximately $4.6 billion was recourse debt of The AES Corporation and approximately $15.1 billion was non-recourse debt. In addition, we have outstanding guarantees, letters of credit, and other credit support commitments which are further described in this Form 10-K in Item 7.—Management’s Discussion and Analysis of Financial Condition and Results of Operations—Capital Resources and Liquidity—Parent Company Liquidity.
Some of our subsidiaries are currently in default with respect to all or a portion of their outstanding indebtedness. The total debt classified as current in our consolidated balance sheets related to such defaults was $1.4 billion at December 31, 2010. While the lenders under our non-recourse project financings generally do not have direct recourse to The AES Corporation (other than to the extent of any credit support given by The AES Corporation), defaults thereunder can still have important consequences for The AES Corporation, including, without limitation:
| • | reducing The AES Corporation’s receipt of subsidiary dividends, fees, interest payments, loans and other sources of cash since the project subsidiary will typically be prohibited from distributing cash to The AES Corporation during the pendency of any default; |
| • | triggering The AES Corporation’s obligation to make payments under any financial guarantee, letter of credit or other credit support which The AES Corporation has provided to or on behalf of such subsidiary; |
| • | causing The AES Corporation to record a loss in the event the lender forecloses on the assets; |
| • | triggering defaults in The AES Corporation’s outstanding debt and trust preferred securities. For example, The AES Corporation’s senior secured credit facility and outstanding senior notes include events of default for certain bankruptcy related events involving material subsidiaries. In addition, The AES Corporation’s senior secured credit facility includes certain events of default relating to accelerations of outstanding debt of material subsidiaries; |
| • | the loss or impairment of investor confidence in the Company; or |
| • | foreclosure on the assets that are pledged under the nonrecourse loans, therefore eliminating any and all potential future benefits derived from those assets. |
None of the projects that are currently in default are owned by subsidiaries that meet the applicable definition of materiality in The AES Corporation’s senior secured credit facility or other debt agreements in order for such defaults to trigger an event of default or permit acceleration under such indebtedness. However, as a result of future mix of distributions, write-down of assets, dispositions and other matters that affect our financial position and results of operations, it is possible that one or more of these subsidiaries could fall within the applicable definition of materiality and thereby upon an acceleration of such subsidiary’s debt, trigger an event of default and possible acceleration of the indebtedness under The AES Corporation’s senior secured credit facility. The risk of such defaults may have increased as a result of the deteriorating global economy. For further
77
Table of Contents
discussion of these conditions, see Item 7.—Management’s Discussion and Analysis of Financial Condition and Results of Operations—Global Economic Conditions of this Form 10-K.
Risks Associated with our Ability to Raise Needed Capital
The AES Corporation has significant cash requirements and limited sources of liquidity.
The AES Corporation requires cash primarily to fund:
| • | principal repayments of debt; |
| • | interest and preferred dividends; |
| • | acquisitions; |
| • | construction and other project commitments; |
| • | other equity commitments, including business development investments; |
| • | equity repurchases; |
| • | taxes; and |
| • | Parent Company overhead costs. |
The AES Corporation’s principal sources of liquidity are:
| • | dividends and other distributions from its subsidiaries; |
| • | proceeds from debt and equity financings at the Parent Company level; and |
| • | proceeds from asset sales. |
For a more detailed discussion of The AES Corporation’s cash requirements and sources of liquidity, please see Item 7.—Management’s Discussion and Analysis of Financial Condition and Results of Operations—Capital Resources and Liquidity of this Form 10-K.
While we believe that these sources will be adequate to meet our obligations at the Parent Company level for the foreseeable future, this belief is based on a number of material assumptions, including, without limitation, assumptions about our ability to access the capital or commercial lending markets, the operating and financial performance of our subsidiaries, exchange rates, our ability to sell assets, and the ability of our subsidiaries to pay dividends. Any number of assumptions could prove to be incorrect and therefore there can be no assurance that these sources will be available when needed or that our actual cash requirements will not be greater than expected. For example, in recent years, certain financial institutions have gone bankrupt. In the event that a bank who is party to our senior secured credit facility or other facilities goes bankrupt or is otherwise unable to fund its commitments, we would need to replace that bank in our syndicate or risk a reduction in the size of the facility, which would reduce our liquidity. In addition, our cash flow may not be sufficient to repay at maturity the entire principal outstanding under our credit facilities and our debt securities and we may have to refinance such obligations. There can be no assurance that we will be successful in obtaining such refinancing on terms acceptable to us or at all and any of these events could have a material effect on us.
Our ability to grow our business could be materially adversely affected if we were unable to raise capital on favorable terms.
From time to time, we rely on access to capital markets as a source of liquidity for capital requirements not satisfied by operating cash flows. Our ability to arrange for financing on either a recourse or non-recourse basis and the costs of such capital are dependent on numerous factors, some of which are beyond our control, including:
| • | general economic and capital market conditions; |
| • | the availability of bank credit; |
78
Table of Contents
| • | investor confidence; |
| • | the financial condition, performance and prospects of The AES Corporation in general and/or that of any subsidiary requiring the financing as well as companies in our industry or similar financial circumstances; and |
| • | changes in tax and securities laws which are conducive to raising capital. |
Should future access to capital not be available to us, we may have to sell assets or decide not to build new plants or expand or improve existing facilities, either of which would affect our future growth, results of operations or financial condition.
A downgrade in the credit ratings of The AES Corporation or its subsidiaries could adversely affect our ability to access the capital markets which could increase our interest costs or adversely affect our liquidity and cash flow.
If any of the credit ratings of The AES Corporation or its subsidiaries were to be downgraded, our ability to raise capital on favorable terms could be impaired and our borrowing costs would increase. Furthermore, depending on The AES Corporation’s credit ratings and the trading prices of its equity and debt securities, counterparties may no longer be as willing to accept general unsecured commitments by The AES Corporation to provide credit support. Accordingly, with respect to both new and existing commitments, The AES Corporation may be required to provide some other form of assurance, such as a letter of credit and/or collateral, to backstop or replace any credit support by The AES Corporation. There can be no assurance that such counterparties will accept such guarantees or that AES could arrange such further assurances in the future. In addition, to the extent The AES Corporation is required and able to provide letters of credit or other collateral to such counterparties, it will limit the amount of credit available to The AES Corporation to meet its other liquidity needs.
We may not be able to raise sufficient capital to fund “greenfield” projects in certain less developed economies which could change or in some cases adversely affect our growth strategy.
Part of our strategy is to grow our business by developing Generation and Utility businesses in less developed economies where the return on our investment may be greater than projects in more developed economies. Commercial lending institutions sometimes refuse to provide non-recourse project financing in certain less developed economies, and in these situations we have sought and will continue to seek direct or indirect (through credit support or guarantees) project financing from a limited number of multilateral or bilateral international financial institutions or agencies. As a precondition to making such project financing available, the lending institutions may also require governmental guarantees of certain project and sovereign related risks. There can be no assurance, however, that project financing from the international financial agencies or that governmental guarantees will be available when needed, and if they are not, we may have to abandon the project or invest more of our own funds which may not be in line with our investment objectives and would leave less funds for other projects. These risks have increased as a result of the recent credit crisis and the deteriorating global economy. For further discussion of these global economic conditions and their potential impact on the Company, see Item 7.—Management’s Discussion and Analysis of Financial Condition and Results of Operations—Global Economic Conditions.
External Risks Associated with Revenue and Earnings Volatility
Our businesses may incur substantial costs and liabilities and be exposed to price volatility as a result of risks associated with the wholesale electricity markets, which could have a material adverse effect on our financial performance.
Some of our businesses sell electricity in the wholesale spot markets in cases where they operate wholly or partially without long-term power sales agreements. Our Generation and Utility businesses may also buy electricity in the wholesale spot markets. As a result, we are exposed to the risks of rising and falling prices in
79
Table of Contents
those markets. The open market wholesale prices for electricity are very volatile and often reflect the fluctuating cost of coal, natural gas or oil. Consequently, any changes in the supply and cost of coal, natural gas, or oil may impact the open market wholesale price of electricity.
Volatility in market prices for fuel and electricity may result from among other things:
| • | plant availability in the markets generally; |
| • | availability and effectiveness of transmission facilities owned and operated by third parties; |
| • | competition; |
| • | demand for energy commodities; |
| • | electricity usage; |
| • | seasonality; |
| • | interest rate and foreign exchange rate fluctuation; |
| • | availability and price of emission credits; |
| • | input prices; |
| • | hydrology and other weather conditions; |
| • | illiquid markets; |
| • | transmission or transportation constraints or inefficiencies; |
| • | availability of competitively priced renewables sources; |
| • | available supplies of natural gas, crude oil and refined products, and coal; |
| • | generating unit performance; |
| • | natural disasters, terrorism, wars, embargoes and other catastrophic events; |
| • | energy, market and environmental regulation, legislation and policies; |
| • | geopolitical concerns affecting global supply of oil and natural gas; and |
| • | general economic conditions in areas where we operate which impact energy consumption. |
Our financial position and results of operations may fluctuate significantly due to fluctuations in currency exchange rates experienced at our foreign operations.
Our exposure to currency exchange rate fluctuations results primarily from the translation exposure associated with the preparation of the Consolidated Financial Statements, as well as from transaction exposure associated with transactions in currencies other than an entity’s functional currency. While the Consolidated Financial Statements are reported in U.S. Dollars, the financial statements of many of our subsidiaries outside the United States are prepared using the local currency as the functional currency and translated into U.S. Dollars by applying appropriate exchange rates. As a result, fluctuations in the exchange rate of the U.S. Dollar relative to the local currencies where our subsidiaries outside the United States report could cause significant fluctuations in our results. In addition, while our expenses with respect to foreign operations are generally denominated in the same currency as corresponding sales, we have transaction exposure to the extent receipts and expenditures are not denominated in the subsidiary’s functional currency.
We also experience foreign transaction exposure to the extent monetary assets and liabilities, including debt, are in a different currency than the subsidiary’s functional currency. Moreover, the costs of doing business abroad may increase as a result of adverse exchange rate fluctuations. Our financial position and results of operations have been affected by fluctuations in the value of a number of currencies, primarily the Euro, Brazilian real, Argentine peso, Chilean peso, Colombian peso and Philippine peso.
80
Table of Contents
We may not be adequately hedged against our exposure to changes in commodity prices or interest rates.
We routinely enter into contracts to hedge a portion of our purchase and sale commitments for electricity, fuel requirements and other commodities to lower our financial exposure related to commodity price fluctuations. As part of this strategy, we routinely utilize fixed-price forward physical purchase and sales contracts, futures, financial swaps, and option contracts traded in the over-the-counter markets or on exchanges. We also enter into contracts which help us hedge our interest rate exposure on variable rate debt. However, we may not cover the entire exposure of our assets or positions to market price or interest rate volatility, and the coverage will vary over time. Furthermore, the risk management procedures we have in place may not always be followed or may not work as planned. In particular, if prices of commodities or interest rates significantly deviate from historical prices or interest rates or if the price or interest rate volatility or distribution of these changes deviates from historical norms, our risk management system may not protect us from significant losses. As a result, fluctuating commodity prices or interest rates may negatively impact our financial results to the extent we have unhedged or inadequately hedged positions. In addition, certain types of economic hedging activities may not qualify for hedge accounting under GAAP, resulting in increased volatility in our net income. The Company may also suffer losses associated with “basis risk” which is the assumed relative correlation of performance between the intended hedge instrument and the targeted underlying exposure. Furthermore, there is a risk that the current counterparties to these arrangements may fail or are unable to perform their obligations under these arrangements.
In 2010, we faced substantial challenges in North America as a result of high coal prices relative to natural gas, which has affected the results of certain of our coal plants in the region, particularly those which are merchant plants that are exposed to market risk and those that have hybrid merchant risk, meaning those businesses that have a PPA in place but purchase fuel at market prices or under short term contracts. In particular, our coal-fired plants in New York and our petroleum coke-fired plant in Texas have been affected by these conditions. In North America, current dark spreads and the corresponding forward curves do not currently present a long-term opportunity to engage in hedging activity for 2011 and we have very limited hedges in place. As short-term opportunities occur or should dark spreads improve, the Company may engage in additional hedging in 2011. As a result of these and other challenges that arose from new regulatory concerns, we impaired $1.1 billion of assets and goodwill in North America as described in Item 7.—Management’s Discussion and Analysis of Financial Condition and Results of Operations—Impairments. In addition, AES Thames, our 208 MW coal-fired generation business in Connecticut, filed for bankruptcy protection in January 2011.
Supplier and/or customer concentration may expose the Company to significant financial credit or performance risks.
We often rely on a single contracted supplier or a small number of suppliers for the provision of fuel, transportation of fuel and other services required for the operation of certain of our facilities. If these suppliers cannot perform, we would seek to meet our fuel requirements by purchasing fuel at market prices, exposing us to market price volatility and the risk that fuel and transportation may not be available during certain periods at any price, which could be lower than contracted prices and would expose these businesses to considerable price volatility.
At times, we rely on a single customer or a few customers to purchase all or a significant portion of a facility’s output, in some cases under long-term agreements that account for a substantial percentage of the anticipated revenue from a given facility. We have also hedged a portion of our exposure to power price fluctuations through forward fixed price power sales. Counterparties to these agreements may breach or may be unable to perform their obligations. We may not be able to enter into replacement agreements on terms as favorable as our existing agreements, or at all. If we were unable to enter into replacement PPAs, these businesses may have to sell power at market prices.
81
Table of Contents
The failure of any supplier or customer to fulfill its contractual obligations to The AES Corporation or our subsidiaries could have a material adverse effect on our financial results. Consequently, the financial performance of our facilities is dependent on the credit quality of, and continued performance by, suppliers and customers.
The market pricing of our common stock has been volatile and may continue to be volatile in future periods.
The market price for our common stock has been volatile in the past, and the price of our common stock could fluctuate substantially in the future. Stock price movements on a quarter by quarter basis for the past two years are set forth in Item 5.—Market—Market Information of this Form 10-K. Factors that could affect the price of our common stock in the future include general conditions in our industry, in the power markets in which we participate and in the world, including environmental and economic developments, over which we have no control, as well as developments specific to us, including, risks that could result in revenue and earnings volatility as well as other risk factors described in this Item 1A.—Risk Factors and those matters described in Item 7.—Management’s Discussion and Analysis of Financial Conditions and Results of Operations.
Risks Associated with our Operations
We do a significant amount of business outside the United States, including in developing countries, which presents significant risks.
A significant amount of our revenue is generated outside the United States and a significant portion of our international operations is conducted in developing countries. Part of our growth strategy is to expand our business in developing countries because the growth rates and the opportunity to implement operating improvements and achieve higher operating margins may be greater than those typically achievable in more developed countries. International operations, particularly the operation, financing and development of projects in developing countries, entail significant risks and uncertainties, including, without limitation:
| • | economic, social and political instability in any particular country or region; |
| • | adverse changes in currency exchange rates; |
| • | government restrictions on converting currencies or repatriating funds; |
| • | unexpected changes in foreign laws and regulations or in trade, monetary or fiscal policies; |
| • | high inflation and monetary fluctuations; |
| • | restrictions on imports of coal, oil, gas or other raw materials required by our generation businesses to operate; |
| • | threatened or consummated expropriation or nationalization of our assets by foreign governments; |
| • | difficulties in hiring, training and retaining qualified personnel, particularly finance and accounting personnel with GAAP expertise; |
| • | unwillingness of governments, government agencies, similar organizations or other counterparties to honor their contracts; |
| • | unwillingness of governments, government agencies, courts or similar bodies to enforce contracts that are economically advantageous to subsidiaries of the Company and economically unfavorable to counterparties, against such counterparties, whether such counterparties are governments or private parties; |
| • | inability to obtain access to fair and equitable political, regulatory, administrative and legal systems; |
| • | adverse changes in government tax policy; |
82
Table of Contents
| • | difficulties in enforcing our contractual rights or enforcing judgments or obtaining a favorable result in local jurisdictions; and |
| • | potentially adverse tax consequences of operating in multiple jurisdictions. |
Any of these factors, by itself or in combination with others, could materially and adversely affect our business, results of operations and financial condition. For example, partly in response to challenging business and political conditions in Kazakhstan, in 2008, we sold certain businesses in that country. As another example, in the second quarter of 2007, we sold our stake in EDC to Petróleos de Venezuela, S.A., the state-owned energy company in Venezuela after Venezuelan President Hugo Chavez threatened to expropriate the electricity business in Venezuela. In connection with the sale, we recognized an impairment charge of approximately $680 million. In addition, our Latin American operations experience volatility in revenues and gross margin which have caused and are expected to cause significant volatility in our results of operations and cash flows. The volatility is caused by regulatory and economic difficulties, political instability and currency devaluations being experienced in many of these countries. This volatility reduces the predictability and enhances the uncertainty associated with cash flows from these businesses.
The operation of power generation and distribution facilities involves significant risks that could adversely affect our financial results. We and/or our subsidiaries may not have adequate insurance coverage for liabilities.
We are in the business of generating and distributing electricity, which involves certain risks that can adversely affect financial and operating performance, including:
| • | changes in the availability of our generation facilities or distribution systems due to increases in scheduled and unscheduled plant outages, equipment failure, failure of transmission systems, labor disputes, disruptions in fuel supply, inability to comply with regulatory or permit requirements or catastrophic events such as fires, floods, storms, hurricanes, earthquakes, explosions, terrorist acts or other similar occurrences; and |
| • | changes in our operating cost structure including, but not limited to, increases in costs relating to: gas, coal, oil and other fuel; fuel transportation; purchased electricity; operations, maintenance and repair; environmental compliance, including the cost of purchasing emissions offsets and capital expenditures to install environmental emission equipment; transmission access; and insurance. |
Our businesses require reliable transportation sources (including related infrastructure such as roads, ports and rail), power sources and water sources to access and conduct operations. The availability and cost of this infrastructure affects capital and operating costs and levels of production and sales. Limitations, or interruptions in transportation including as a result of third parties intentionally or unintentionally disrupting the facilities of our subsidiaries, could impede their ability to produce electricity. This could have a material adverse effect on our businesses’ results of operations, financial condition and prospects.
In addition, a portion of our generation facilities were constructed many years ago. Older generating equipment may require significant capital expenditures for maintenance. This equipment is also likely to require periodic upgrading and improvement. Breakdown or failure of one of our operating facilities may prevent the facility from performing under applicable power sales agreements which, in certain situations, could result in termination of a power purchase or other agreement or incurring a liability for liquidated damages and/or other penalties.
As a result of the above risks and other potential hazards associated with the power generation and distribution industries, we may from time to time become exposed to significant liabilities for which we may not have adequate insurance coverage. Power generation involves hazardous activities, including acquiring, transporting and unloading fuel, operating large pieces of rotating equipment and delivering electricity to
83
Table of Contents
transmission and distribution systems. In addition to natural risks, such as earthquakes, floods, lightning, hurricanes and wind, hazards, such as fire, explosion, collapse and machinery failure, are inherent risks in our operations which may occur as a result of inadequate internal processes, technological flaws, human error or certain external events. The control and management of these risks depend upon adequate development and training of personnel and on the existence of operational procedures, preventative maintenance plans and specific programs supported by quality control systems which reduce, but do not eliminate the possibility of the occurrence and impact of these risks.
The hazards described above can cause significant personal injury or loss of life, severe damage to and destruction of property, plant and equipment, contamination of, or damage to, the environment and suspension of operations. The occurrence of any one of these events may result in our being named as a defendant in lawsuits asserting claims for substantial damages, environmental cleanup costs, personal injury and fines and/or penalties. We maintain an amount of insurance protection that we believe is customary, but there can be no assurance that our insurance will be sufficient or effective under all circumstances and against all hazards or liabilities to which we may be subject. A claim for which we are not fully insured or insured at all could hurt our financial results and materially harm our financial condition. Further, due to rising insurance costs and changes in the insurance markets, we cannot provide assurance that insurance coverage will continue to be available on terms similar to those presently available to us or at all. Any losses not covered by insurance could have a material adverse effect on our financial condition, results of operations or cash flows.
Our businesses’ insurance does not cover every potential risk associated with its operations. Adequate coverage at reasonable rates is not always obtainable. In addition, insurance may not fully cover the liability or the consequences of any business interruptions such as equipment failure or labor dispute. The occurrence of a significant adverse event not fully or partially covered by insurance could have a material adverse effect on the Company’s business, results or operations, financial condition and prospects.
Any of the above risks could have a material adverse effect on our business and results of operations.
Our inability to attract and retain skilled people could have a material adverse effect on our operations.
Our operating success and ability to carry out growth initiatives depends in part on our ability to retain executives and to attract and retain additional qualified personnel who have experience in our industry and in operating a company of our size and complexity, including people in our foreign businesses. The inability to attract and retain qualified personnel could have a material adverse effect on our business, because of the difficulty of promptly finding qualified replacements. In particular, we routinely are required to assess the financial and tax impacts of complicated business transactions which occur on a worldwide basis. These assessments are dependent on hiring personnel on a worldwide basis with sufficient expertise in GAAP to timely and accurately comply with United States reporting obligations. An inability to maintain adequate internal accounting and managerial controls and hire and retain qualified personnel could have an adverse affect on our financial and tax reporting.
We have contractual obligations to certain customers to provide full requirements service, which makes it difficult to predict and plan for load requirements and may result in increased operating costs to certain of our businesses.
We have contractual obligations to certain customers to supply power to satisfy all or a portion of their energy requirements. The uncertainty regarding the amount of power that our power generation and distribution facilities must be prepared to supply to customers may increase our operating costs. A significant under- or over-estimation of load requirements could result in our facilities not having enough or having too much power to cover their obligations, in which case we would be required to buy or sell power from or to third parties at prevailing market prices. Those prices may not be favorable and thus could increase our operating costs.
84
Table of Contents
We may not be able to enter into long-term contracts, which reduce volatility in our results of operations. Even when we successfully enter into long-term contracts, our generation businesses are often dependent on one or a limited number of customers and a limited number of fuel suppliers.
Many of our generation plants conduct business under long-term contracts. In these instances, we rely on power sales contracts with one or a limited number of customers for the majority of, and in some cases all of, the relevant plant’s output and revenues over the term of the power sales contract. The remaining terms of the power sales contracts range from 1 to 25 years. In many cases, we also limit our exposure to fluctuations in fuel prices by entering into long-term contracts for fuel with a limited number of suppliers. In these instances, the cash flows and results of operations are dependent on the continued ability of customers and suppliers to meet their obligations under the relevant power sales contract or fuel supply contract, respectively. Some of our long-term power sales agreements are at prices above current spot market prices and some of our long-term fuel supply contracts are at prices below current market prices. The loss of significant power sales contracts or fuel supply contracts, or the failure by any of the parties to such contracts that prevents us from fulfilling our obligations thereunder, could have a material adverse impact on our business, results of operations and financial condition. In addition, depending on market conditions and regulatory regimes, it may be difficult for us to secure long-term contracts, either where our current contracts are expiring or for new development projects. The inability to enter into long-term contracts could require many of our businesses to purchase inputs at market prices and sell electricity into spot markets, which may not be favorable. For example, during the past several years, various governmental authorities in Europe have terminated or declined to fulfill their obligations under long-term contracts with our subsidiaries. In 2008, as part of the accession to the European Union, the Hungarian government terminated all long-term PPAs, including AES Tisza’s PPA, as of December 31, 2008. Partly as a result of the termination AES Tisza’s results of operations declined and we were required to record an $85 million asset impairment charge for AES Tisza in the third quarter of 2010. Kilroot in Northern Ireland received notice from the Utility Regulator directing Kilroot and NIE Energy to terminate the Generating Unit Agreements for the two coal fired units effective November 1, 2010 and, as a result, the performance (and contributions to income and cash flow) from Kilroot will decline in 2011 when compared to prior years. Furthermore, these businesses (and any other businesses whose long-term contracts may be challenged) may have to sell electricity into the spot markets. Because of the volatile nature of inputs and power prices, the inability to secure long-term contracts could generate increased volatility in our earnings and cash flows and could generate substantial losses (or result in a write-down of assets), which could have a material impact on our business and results of operations.
We have sought to reduce counterparty credit risk under our long-term contracts in part by entering into power sales contracts with utilities or other customers of strong credit quality and by obtaining guarantees from certain sovereign governments of the customer’s obligations. However, many of our customers do not have, or have failed to maintain, an investment-grade credit rating, and our Generation business cannot always obtain government guarantees and if they do, the government does not always have an investment grade credit rating. We have also sought to reduce our credit risk by locating our plants in different geographic areas in order to mitigate the effects of regional economic downturns. However, there can be no assurance that our efforts to mitigate this risk will be successful. These risks have increased as a result of the deteriorating and volatile global economy. For further discussion of these global economic conditions and their potential impact on the Company, see Item 7.—Management’s Discussion and Analysis of Financial Condition and Results of Operations—Global Economic Conditions in this Form 10-K.
Competition is increasing and could adversely affect us.
The power production markets in which we operate are characterized by numerous strong and capable competitors, many of whom may have extensive and diversified developmental or operating experience (including both domestic and international) and financial resources similar to or greater than ours. Further, in recent years, the power production industry has been characterized by strong and increasing competition with respect to both obtaining power sales agreements and acquiring existing power generation assets. In certain
85
Table of Contents
markets, these factors have caused reductions in prices contained in new power sales agreements and, in many cases, have caused higher acquisition prices for existing assets through competitive bidding practices. The evolution of competitive electricity markets and the development of highly efficient gas-fired power plants have also caused, or are anticipated to cause, price pressure in certain power markets where we sell or intend to sell power. These competitive factors could have a material adverse effect on us.
Some of our subsidiaries participate in defined benefit pension plans and their net pension plan obligations may require additional significant contributions.
Certain of our subsidiaries have defined benefit pension plans covering substantially all of their respective employees. Of the twenty nine defined benefit plans, three are at United States subsidiaries and the remaining plans are at foreign subsidiaries. Pension costs are based upon a number of actuarial assumptions, including an expected long-term rate of return on pension plan assets, the expected life span of pension plan beneficiaries and the discount rate used to determine the present value of future pension obligations. Any of these assumptions could prove to be wrong, resulting in a shortfall of pension plan assets compared to pension obligations under the pension plan. The Company periodically evaluates the value of the pension plan assets to ensure that they will be sufficient to fund the respective pension obligations. The Company’s exposure to market volatility is mitigated to some extent due to the fact that the asset allocations in our largest plans are more heavily weighted to investments in fixed income securities that have not been as severely impacted by the global recession. Future downturns in the debt and/or equity markets, or the inaccuracy of any of our significant assumptions underlying the estimates of our subsidiaries’ pension plan obligations, could result in an increase in pension expense and future funding requirements, which may be material. Our subsidiaries who participate in these plans are responsible for satisfying the funding requirements required by law in their respective jurisdiction for any shortfall of pension plan assets compared to pension obligations under the pension plan. This may necessitate additional cash contributions to the pension plans that could adversely affect the Parent Company and our subsidiaries’ liquidity.
For additional information regarding the funding position of the Company’s pension plans, see Item 7.—Management’s Discussion and Analysis of Financial Condition and Results of Operations—Critical Accounting—Estimates—Pension and Postretirement Obligations and Note 13 to our Consolidated Financial Statements included in this Form 10-K.
Our business is subject to substantial development uncertainties.
Certain of our subsidiaries and affiliates are in various stages of developing and constructing “greenfield” power plants, some but not all of which have signed long-term contracts or made similar arrangements for the sale of electricity. Successful completion depends upon overcoming substantial risks, including, but not limited to, risks relating to failures of siting, financing, construction, permitting, governmental approvals, commissioning delays, or the potential for termination of the power sales contract as a result of a failure to meet certain milestones. Timing of equipment purchases can also pose financial risks to the Company. As part of our development process, we attempt to make purchases of equipment and/or materials as needed. However, from time to time, there may be excess demand for certain types of equipment with substantial delays between the time we place orders and receive delivery. In those instances, to avoid construction delays and costs associated with the inability to own and place such equipment and/or materials into service when needed in the construction process, we may place orders well in advance of deployment. In some cases, we may order such equipment and/or materials without yet having a specific project where the equipment and/or materials will be deployed, in anticipation that equipment and materials will be needed at the time of delivery. However, there is a risk that at the time of delivery, we are required to accept delivery and pay for such equipment and/or materials, even though no project has materialized where these items will be used. This can result in our having to incur material equipment and/or material costs, with no deployment plan at delivery. Financing risk has also increased as a result of the deterioration of the global economy and the crisis in the financial markets and, as a result, we may forgo certain development opportunities. We believe that capitalized costs for projects under development are
86
Table of Contents
recoverable; however, there can be no assurance that any individual project will be completed and reach commercial operation. If these development efforts are not successful, we may abandon a project under development and write off the costs incurred in connection with such project. At the time of abandonment, we would expense all capitalized development costs incurred in connection therewith and could incur additional losses associated with any related contingent liabilities.
Certain delays have occurred at the 670 MW Maritza coal-fired project in Bulgaria, and the project has not begun commercial operations. As noted in Note 10—Debt included in Item 8 of this Form 10-K, as a result of these delays the project debt is in default and the Company is working with its lenders to resolve the default. In addition, as noted in Item 3. —Legal Proceedings, the Company is in litigation with the contractor regarding the cause of delays. At this time, management believes that Maritza will commence commercial operations for at least some of the project’s capacity by the second half of 2011. However, commencement of commercial operations could be delayed beyond this timeframe. There can be no assurance that Maritza will achieve commercial operations, in whole or in part, by the second half of 2011, resolve the default with the lenders or prevail in the litigation referenced above, which could result in the loss of some or all of our investment or require additional funding for the project. Any of these events could have a material adverse effect on the Company’s operating.
In June 2009, the Supreme Court of Chile affirmed a January 2009 decision of the Valparaiso Court of Appeals (“VCA”) that the environmental permit for Empresa Electrica Campiche’s (“EEC”) thermal power plant (“Plant”) was not properly granted and illegal. Construction of the Plant stopped as a consequence of the Supreme Court’s decision. In December 2009, Chilean authorities approved new land use regulations that entitled EEC to apply for a new environmental permit. EEC applied for a new environmental permit in January 2010 and permit approval was granted by the Environmental Authority in February 2010. In March 2010, the Mayor of Puchuncaví and another third party challenged the new environmental permit before the VCA. The parties later entered into a settlement agreement pursuant to which the challenge to the new environmental permit was withdrawn in July 2010. In addition, the construction permit that is required to resume construction of the Plant was issued by the Municipality in August 2010. In September 2010, neighbors of Puchuncaví challenged the construction permit filing claims in the VCA. In November 2010, the VCA rejected the claims. The challenging parties subsequently filed appeals with the Supreme Court. In January 2011, the Supreme Court confirmed the decision of the VCA, finally rejecting the constitutional action. EEC has resumed construction of the Plant.
Our acquisitions may not perform as expected.
Historically, acquisitions have been a significant part of our growth strategy. We may continue to grow our business through acquisitions. Although acquired businesses may have significant operating histories, we will have a limited or no history of owning and operating many of these businesses and possibly limited or no experience operating in the country or region where these businesses are located. Some of these businesses may be government owned and some may be operated as part of a larger integrated utility prior to their acquisition. If we were to acquire any of these types of businesses, there can be no assurance that:
| • | we will be successful in transitioning them to private ownership; |
| • | such businesses will perform as expected; |
| • | integration or other one-time costs will not be greater than expected; |
| • | we will not incur unforeseen obligations or liabilities; |
| • | such business will generate sufficient cash flow to support the indebtedness incurred to acquire them or the capital expenditures needed to develop them; or |
| • | the rate of return from such businesses will justify our decision to invest our capital to acquire them. |
87
Table of Contents
In some of our joint venture projects and businesses, we have granted protective rights to minority holders or we own less than a majority of the equity in the project or business and do not manage or otherwise control the project or business, which entails certain risks.
We have invested in some joint ventures where we own less than a majority of the voting equity in the venture. Very often, one of our subsidiaries seeks to exert a degree of influence with respect to the management and operation of projects or businesses in which we have less than a majority of the ownership interests by operating the project or business pursuant to a management contract, negotiating to obtain positions on management committees or to receive certain limited governance rights, such as rights to veto significant actions. However, we do not always have this type of control over the project or business in every instance; and we may be dependent on our co-venturers to operate such projects or businesses. Our co-venturers may not have the level of experience, technical expertise, human resources, management and other attributes necessary to operate these projects or businesses optimally. The approval of co-venturers also may be required for us to receive distributions of funds from projects or to transfer our interest in projects or businesses.
In some joint venture agreements where we do have majority control of the voting securities, we have entered into shareholder agreements granting protective minority rights to the other shareholders. For example, Companhia Brasiliana de Energia (“Brasiliana”) is a holding company in which we have a controlling equity interest and through which we own three of our four Brazilian businesses: Eletropaulo, Tietê and Uruguaiana. We entered into a shareholders’ agreement with an affiliate of the Brazilian National Development Bank (“BNDES”) which owns more than 49% of the voting equity of Brasiliana. Among other things, the shareholders’ agreement requires the consent of both parties before taking certain corporate actions, grants both parties rights of first refusal in connection with the sale of interests in Brasiliana and grants certain drag-along rights to BNDES. In May 2007, BNDES notified us that it intends to sell all of its interest in Brasiliana pursuant to a public auction (the “Brasiliana Sale”). BNDES also informed us that if we fail to exercise our right of first refusal to purchase all of its interest in Brasiliana, then BNDES intends to exercise its drag-along rights under the shareholders’ agreement and cause us to sell all of our interests in Brasiliana in the Brasiliana Sale as well. BNDES has since suspended the auction; however, BNDES may determine to recommence a sale process in the future. In that event, after the auction, if a third party offer has been received in the Brasiliana Sale, we will have 30 days to exercise our right of first refusal to purchase all of BNDES’s interest in Brasiliana on the same terms as the third-party offer. If we do not exercise this right and BNDES proceeds to exercise its drag-along rights, then we may be forced to sell all of our interest in Brasiliana. Due to the uncertainty in the sale price at this point in time, we are uncertain whether we will exercise our right of first refusal should BNDES receive a valid third-party offer in the Brasiliana Sale and, if we do, whether we would do it alone or with joint venture partners. Even if we desire to exercise our right of first refusal, we cannot assure that we will have the cash on hand or that debt or equity financing will be available at acceptable terms in order to purchase BNDES’s interest in Brasiliana. If we do not exercise our right of first refusal, we cannot be assured that we will not have to record a loss if the sale price is below the book value of our investment in Brasiliana.
Our renewable energy projects and other initiatives face considerable uncertainties including, development, operational and regulatory challenges.
AES Wind Generation, AES Solar, our greenhouse gas emissions reductions projects (“GHG Emissions Reduction Projects”), and our investments in projects such as energy storage are subject to substantial risks. Projects of this nature have been developed through advancement in technologies which may not be proven or whose commercial application is limited, and which are unrelated to our core business. Some of these business lines are dependent upon favorable regulatory incentives to support continued investment, and there is significant uncertainty about the extent to which such favorable regulatory incentives will be available in the future. For example, several European countries have recently faced a debt crisis, which has or may result in government austerity measures. If these incentives are repealed, or sovereign governments are unable or unwilling to fulfill their commitments or maintain favorable regulatory incentives for renewables, this could materially impact our renewable businesses, results of operations and financial condition, and impact the ability of the affected
88
Table of Contents
businesses to continue or grow their operations. In addition, any of the foregoing could also impact contractual counterparties of our subsidiaries in core power or renewables. If such counterparties are adversely impacted, then they may be unable to meet their commitments to our subsidiaries, which could also have a material impact on our results of operations.
Furthermore, production levels for our wind, solar, and GHG Emissions Reduction Projects may be dependent upon adequate wind, sunlight, or biogas production which can vary significantly from period to period, resulting in volatility in production levels and profitability. For example, for our wind projects, wind resource estimates are based on historical experience when available and on wind resource studies conducted by an independent engineer, and are not expected to reflect actual wind energy production in any given year. With regard to GHG Emissions Reduction Projects, there is particular uncertainty about whether agreements providing incentives for reductions in greenhouse gas emissions, such as the Kyoto Protocol, will continue and whether countries around the world will enact or maintain legislation that provides incentives for reductions in greenhouse gas emissions, without which such projects may not be economical or financing for such projects may become unavailable.
As a result, renewable energy projects face considerable risk relative to our core business, including the risk that favorable regulatory regimes expire or are adversely modified. In addition, because certain of these projects depend on technology outside of our expertise in Generation and Utility businesses, there are risks associated with our ability to develop and manage such projects profitably. Furthermore, at the development or acquisition stage, because of the nascent nature of these industries or the limited experience with the relevant technologies, our ability to predict actual performance results may be hindered and the projects may not perform as predicted. There are also risks associated with the fact that many of these projects exist in new or emerging markets, where long-term fixed price contracts for the major cost and revenue components may be unavailable, which in turn may result in these projects having relatively high levels of volatility.
These projects can be capital-intensive and generally require that we obtain third party financing, which may be difficult to obtain. As a result, these capital constraints may reduce our ability to develop these projects. These risks may be exacerbated by the current global economic crisis, including our management’s increased focus on liquidity, which may also result in slower growth in the number of projects we can pursue. The economic downturn could also impact the value of our assets in these countries and our ability to develop these projects. If the value of these assets decline, this could result in a material impairment or a series of impairments which are material in the aggregate, which would adversely affect our financial statements.
An impairment in the carrying value of goodwill or long-lived assets would negatively impact our consolidated results of operations and net worth.
Goodwill is initially recorded at fair value and is not amortized, but is evaluated for impairment at least annually, or more frequently if impairment indicators are present. In assessing the recoverability of goodwill, we make estimates and assumptions about sales, operating margin growth rates and discount rates based on our budgets, business plans, economic projections, anticipated future cash flows and marketplace data. There are inherent uncertainties related to these factors and management’s judgment in applying these factors. The fair value of a reporting unit has been determined using an income approach based on the present value of future cash flows of each reporting unit. We could be required to evaluate the recoverability of goodwill outside of the required annual assessment process if we experience situations, including but not limited to, disruptions to the business, unexpected significant declines in operating results, divestiture of a significant component of our business or adverse actions or assessments by a regulator. There could also be impairments if our acquisitions do not perform as expected. See further discussion in Risk Factor, “Our Acquisitions May Not Perform as Expected.” These types of events and the resulting analyses could result in goodwill impairment charges in the future. Impairment charges could substantially affect our financial results in the periods of such charges. As of December 31, 2010, we had $1.3 billion of goodwill, which represented approximately 3% of total assets. If current conditions in the global economy continue or worsen, this could increase the risk that we will have to
89
Table of Contents
impair goodwill, as further described in Item 7.—Management’s Discussion and Analysis of Financial Condition and Results of Operations—Global Economic Conditions.
Long-lived assets are initially recorded at fair value and are amortized or depreciated over their useful lives. Long-lived assets are evaluated for impairment when impairment indicators are present. In assessing the recoverability of long-lived assets, we make estimates and assumptions about sales, operating margin growth rates, commodity prices and discount rates based on our budgets, business plans, economic projections, anticipated future cash flows and marketplace data. There are inherent uncertainties related to these factors and management’s judgment in applying these factors. Generally, the fair value of a long-lived asset or asset group is determined using an income approach based on the present value of future cash flows of each asset group. We could be required to evaluate the recoverability of long-lived assets if we experience situations, including but not limited to, disruptions to the business, unexpected significant declines in operating results, divestiture of a significant component of our business or adverse action or assessment by a regulator. These types of events and the resulting analyses could result in additional long-lived asset impairment charges in the future. Impairment charges could substantially affect our financial results in the periods of such charges. If current conditions in the global economy continue or worsen, this could increase the risk that we will have to impair long-lived assets, as further described in Item 7.—Management’s Discussion and Analysis of Financial Condition and Results of Operations—Global Economic Conditions.
Certain of our businesses are sensitive to variations in weather.
Our businesses are affected by variations in general weather conditions and unusually severe weather. Our businesses forecast electric sales on the basis of normal weather, which represents a long-term historical average. While we also consider possible variations in normal weather patterns and potential impacts on our facilities and our businesses, there can be no assurance that such planning can prevent these impacts, which can adversely affect our business. Generally, demand for electricity peaks in winter and summer. Typically, when winters are warmer than expected and summers are cooler than expected, demand for energy is lower, resulting in less demand for electricity than forecasted. Significant variations from normal weather where our businesses are located could have a material impact on our results of operations.
In addition, we are dependent upon hydrological conditions prevailing from time to time in the broad geographic regions in which our hydroelectric generation facilities are located. If hydrological conditions result in droughts or other conditions that negatively affect our hydroelectric generation business, our results of operations could be materially adversely affected. In the past, our businesses in Latin America have been negatively impacted by lower than normal rainfall. Similarly, our wind businesses are dependent on adequate wind conditions while the solar projects at AES Solar are dependent on sufficient sunlight. In each case, inadequate wind or sunlight could have a material adverse impact on these businesses.
Risks associated with Governmental Regulation and Laws
Our operations are subject to significant government regulation and our business and results of operations could be adversely affected by changes in the law or regulatory schemes.
Our inability to predict, influence or respond appropriately to changes in law or regulatory schemes, including any inability to obtain expected or contracted increases in electricity tariff rates or tariff adjustments for increased expenses, could adversely impact our results of operations or our ability to meet publicly announced projections or analysts’ expectations. Furthermore, changes in laws or regulations or changes in the application or interpretation of regulatory provisions in jurisdictions where we operate, particularly our Utilities where electricity tariffs are subject to regulatory review or approval, could adversely affect our business, including, but not limited to:
| • | changes in the determination, definition or classification of costs to be included as reimbursable or pass-through costs to be included in the rates we charge our customers, including but not limited to costs incurred to upgrade our power plants to comply with more stringent environmental regulations; |
90
Table of Contents
| • | changes in the determination of what is an appropriate rate of return on invested capital or a determination that a utility’s operating income or the rates it charges customers is too high, resulting in a reduction of rates or consumer rebates; |
| • | changes in the definition or determination of controllable or non-controllable costs; |
| • | adverse changes in tax law; |
| • | changes in the definition of events which may or may not qualify as changes in economic equilibrium; |
| • | changes in the timing of tariff increases; |
| • | other changes in the regulatory determinations under the relevant concessions; or |
| • | other changes related to licensing or permitting which affect our ability to conduct business. |
Any of the above events may result in lower margins for the affected businesses, which can adversely affect our business.
In many countries where we conduct business, the regulatory environment is constantly changing or the regulations can be difficult to interpret. As a result, there is risk that we may not properly interpret certain regulations and may not understand the impact of certain regulations on our business. For example, in October 2006, ANEEL, which regulates our utility operations at Sul and Eletropaulo in Brazil, issued Normative Resolution 234 requiring that utilities begin amortizing a liability called “Special Obligations” beginning with their second tariff reset cycle in 2007 or a later year as an offset to depreciation expense. As of May 23, 2007, the date of the filing of our 2006 Form 10-K, no industry positions or any other consensus had been reached regarding how ANEEL guidance should be applied at that date and accordingly, no adjustments to the financial statements were made relating to Special Obligations in Brazil. Subsequent to May 23, 2007, industry discussions occurred and other Brazilian companies filed Forms 20-F with the SEC reflecting the impact of Resolution 234 in their December 31, 2006 financial statements differently from how the Company accounted for Resolution 234. In the absence of any significant regulatory developments between May 23, 2007 and the date of these other filings, the Company determined that Resolution 234 required us to record an adjustment to our Special Obligations liability as of December 31, 2006. In part, the decision to record the adjustment led to the restatement of our financial statements in the third quarter of 2007. If we face additional challenges interpreting regulations or changes in regulations, it could have a material adverse impact on our business.
On July 21, 2010, President Obama signed the Dodd-Frank Wall Street Reform and Consumer Protection Act (the “Dodd-Frank Act”). While the bulk of regulations contained in the Dodd-Frank Act regulate financial institutions and their products, there are several provisions related to corporate governance, executive compensation, disclosure and other matters which relate to public companies generally. The types of provisions described above are currently not expected to have a material impact on the Company or its results of operations. Furthermore, while the Dodd-Frank Act substantially expands the regulation regarding the trading, clearing and reporting of derivative transactions, the Dodd-Frank Act provides for commercial end-user exemptions which may apply to our derivative transactions, though this is not certain since the Act directs the SEC, CFTC and listed companies to enact rules that will clarify the Dodd-Frank Act, and such rulemaking could impact the availability of the commercial end-user exemption. Even if the exemption is available, the Dodd-Frank Act could still have a material adverse impact on the Company, as the regulation of derivatives (which includes capital and margin requirements for non-exempt companies), could limit the availability of derivative transactions that we use to reduce interest rate, commodity and currency risks, which would increase our exposure to these risks. Even if derivative transactions remain available, the costs to enter into these transactions may increase, which could adversely affect the operating results of certain projects; cause us to default on certain types of contracts where we are contractually obligated to hedge certain risks, such as project financing agreements; prevent us from developing new projects where interest rate hedging is required; cause the Company to abandon certain of its hedging strategies and transactions, thereby increasing our exposure to interest rate, commodity and currency risk; and/or consume substantial liquidity by forcing the Company to post cash and/or other permitted collateral in support of these derivatives. Any of these outcomes could have a material adverse effect on the Company.
91
Table of Contents
On June 12, 2009 AES Kelanitissa received a letter and an invoice from the Director General, Public Utilities Commission of Sri Lanka (“PUC”) seeking payment of an Annual Regulatory Fee and pursuant to PUC assurances on an application for renewal of the AES Kelanitissa generation license. The application is pursuant to an April 2009 revision of the Sri Lanka Electricity Act (“Electricity Act”), which came into force in April 2009, notwithstanding that in March 29, 2001, AES Kelanitissa had been granted, and pre-paid fees for, a 21 year generation license with effect from September 25, 2000 under the Electricity Act, 1950. AES Kelanitissa submitted an application to be licensed under the revised legislation and, on August 26, 2009, PUC published its intention to issue a generation license under the revised legislation to AES Kelanitissa and other Independent Power Producers (“IPPs”) in Sri Lanka. This was consistent with assurances received from relevant authorities that the revised legislation was to be amended to grandfather IPPs with existing generation licenses. In a letter dated June 21, 2010 from the PUC, AES Kelanitissa was informed that under the new regulations, as amended in 2009, AES Kelanitissa (Pvt) Ltd no longer fulfilled the eligibility criteria to apply for a generation license. The “eligibility criteria” to which the letter refers is a provision requiring an element of state ownership. Representatives of AES Kelanitissa have been informed that an amendment to the Electricity Act to grandfather existing IPPs remains in the legislative pipeline, although it is not possible to predict with certainty when or whether such an amendment will be passed. In addition, AES Kelanitissa believes that under Sri Lankan law, it may continue operations under the 21 year license issued in 2001. No step has been taken to date to prohibit AES Kelanitissa from generating power and conducting its operations. However, in the event that it is determined that AES Kelanitissa may not operate under its current license or the revised legislation is not amended (and PUC maintains that AES Kelanitissa is ineligible for a generation license or extension of the Generating License), AES Kelanitissa may not be able to continue operations on grounds that it has no license under the revised legislation. In that event, AES Kelanitissa and/or the Company could face a number of adverse consequences, including potential litigation with counterparties mitigating a write down in the value of the assets of the business, continued default status under its debt documents and/or other consequences which could have a material impact on the Company or its results of operations.
Our Generation business in the United States is subject to the provisions of various laws and regulations administered in whole or in part by the FERC, including the Public Utility Regulatory Policies Act of 1978 (“PURPA”), the Federal Power Act, and the EPAct 2005. Actions by the FERC and by state utility commissions can have a material effect on our operations.
EPAct 2005 authorizes the FERC to remove the obligation of electric utilities under Section 210 of PURPA to enter into new contracts for the purchase or sale of electricity from or to QFs if certain market conditions are met. Pursuant to this authority, the FERC has instituted a rebuttable presumption that utilities located within the control areas of the Midwest Transmission System Operator, Inc., PJM (“Pennsylvania, New Jersey and Maryland”) Interconnection, L.L.C., ISO New England, Inc., the New York Independent System Operator (“NYISO”) and the Electric Reliability Council of Texas, Inc. are not required to purchase or sell power from or to QFs above a certain size. In addition, the FERC is authorized under the new law to remove the purchase/sale obligations of individual utilities on a case-by-case basis. While the new law does not affect existing contracts, as a result of the changes to PURPA, our QFs may face a more difficult market environment when their current long-term contracts expire.
EPAct 2005 repealed PUHCA 1935 and enacted PUHCA 2005 in its place. PUHCA 1935 had the effect of requiring utility holding companies to operate in geographically proximate regions and therefore limited the range of potential combinations and mergers among utilities. By comparison, PUHCA 2005 has no such restrictions and simply provides the FERC and state utility commissions with enhanced access to the books and records of certain utility holding companies. The repeal of PUHCA 1935 removed barriers to mergers and other potential combinations which could result in the creation of large, geographically dispersed utility holding companies. These entities may have enhanced financial strength and therefore an increased ability to compete with us in the United States generation market.
92
Table of Contents
In accordance with Congressional mandates in the EPAct 1992 and now in EPAct 2005, the FERC has strongly encouraged competition in wholesale electric markets. Increased competition may have the effect of lowering our operating margins. Among other steps, the FERC has encouraged RTOs and ISOs to develop demand response bidding programs as a mechanism for responding to peak electric demand. These programs may reduce the value of our peaking assets which rely on very high prices during a relatively small number of hours to recover their costs. Similarly, the FERC is encouraging the construction of new transmission infrastructure in accordance with provisions of EPAct 2005. Although new transmission lines may increase market opportunities, they may also increase the competition in our existing markets.
While the FERC continues to promote competition, some state utility commissions have reversed course and begun to encourage the construction of generation facilities by traditional utilities to be paid for on a cost-of-service basis by retail ratepayers. Such actions have the effect of reducing sale opportunities in the competitive wholesale generating markets in which we operate.
Our businesses are subject to stringent environmental laws and regulations.
Our activities are subject to stringent environmental laws and regulations by many federal, regional, state and local authorities, international treaties and foreign governmental authorities. These laws and regulations generally concern emissions into the air, effluents into the water, use of water, wetlands preservation, remediation of contamination, waste disposal, endangered species and noise regulation, among others. Failure to comply with such laws and regulations or to obtain any necessary environmental permits pursuant to such laws and regulations could result in fines or other sanctions. Environmental laws and regulations affecting power generation and distribution are complex and have tended to become more stringent over time. Congress and other domestic and foreign governmental authorities have either considered or implemented various laws and regulations to restrict or tax certain emissions, particularly those involving air and water emissions. See the various descriptions of these laws and regulations contained in Item 1.—Business—Regulatory Matters of this Form 10-K. These laws and regulations have imposed, and proposed laws and regulations could impose in the future, additional costs on the operation of our power plants. We have incurred and will continue to incur significant capital and other expenditures to comply with these and other environmental laws and regulations. Changes in, or new, environmental restrictions may force us to incur significant expenses or expenses that may exceed our estimates. There can be no assurance that we would be able to recover all or any increased environmental costs from our customers or that our business, financial condition, including recorded asset values or results of operations would not be materially and adversely affected by such expenditures or any changes in domestic or foreign environmental laws and regulations.
Our businesses are subject to enforcement initiatives from environmental regulatory agencies.
The EPA has pursued an enforcement initiative against coal-fired generating plants alleging wide-spread violations of the new source review and prevention of significant deterioration provisions of the CAA. The EPA has brought suit against a number of companies and has obtained settlements with approximately 17 companies over such allegations. The allegations typically involve claims that a company made major modifications to a coal-fired generating unit without proper permit approval and without installing best available control technology. The principal focus of this EPA enforcement initiative is emissions of SO2 and NOX. In connection with this enforcement initiative, the EPA has imposed fines and required companies to install improved pollution control technologies to reduce emissions of SO2 and NOX. One of our businesses, IPL, is currently the subject of such an EPA enforcement action, and another business, Eastern Energy, has received an information request from the EPA in connection with a possible enforcement action. See Item 3.—Legal Proceedings of this Form 10-K for more detail with respect to these EPA enforcement actions and information requests. There can be no assurance that foreign environmental regulatory agencies in countries in which our subsidiaries operate will not pursue similar enforcement initiatives under relevant laws and regulations.
93
Table of Contents
Regulators, politicians, non-governmental organizations and other private parties have expressed concern about greenhouse gas, or GHG, emissions and the potential risks associated with climate change and are taking actions which could have a material adverse impact on our consolidated results of operations, financial condition and cash flows.
As discussed in Item 1.—Business—Regulatory Matters—Environmental and Land Use Regulations, at the international, federal and various regional and state levels, rules are in effect or policies are under development to regulate GHG emissions, thereby effectively putting a cost on such emissions in order to create financial incentives to reduce them. In 2010, the Company’s subsidiaries operated businesses which had total approximate CO2 emissions of 77.2 million metric tonnes approximately 40 million of which were emitted by businesses located in the United States (both figures ownership adjusted). The Company uses CO2 emission estimation methodologies supported by “The Greenhouse Gas Protocol” reporting standard on GHG emissions. For existing power generation plants, CO2 emissions are either obtained directly from plant continuous emission monitoring systems or calculated from actual fuel heat inputs and fuel type CO2 emission factors. The estimated annual CO2 emissions from fossil fuel electric power generation facilities of the Company’s subsidiaries that are in construction or development and have received the necessary air permits for commercial operations are approximately 18 million metric tonnes (ownership adjusted). This overall estimate is based upon a number of projections and assumptions which may prove to be incorrect such as the forecast dispatch, anticipated plant efficiency, fuel type, CO2 emissions and our subsidiaries’ achieving completion of such construction and development projects. However, it is certain that the projects under construction or development when completed will increase emissions of our portfolio and therefore could increase the risks associated with emissions described below. Because there is significant uncertainty regarding these estimates, actual emissions from these projects under construction or development may vary substantially from these estimates.
The subsidiaries of the Company often seek to pass on any costs arising from CO2 emissions to contract counterparties, but there can be no assurance that the subsidiaries of the Company will effectively pass such costs onto the contract counterparties or that the cost and burden associated with any dispute over which party bears such costs would not be burdensome and costly to the relevant subsidiaries of the Company.
Foreign, federal, state or regional regulation of GHG emissions could have a material adverse impact on the Company’s financial performance. The actual impact on the Company’s financial performance and the financial performance of the Company’s subsidiaries will depend on a number of factors, including among others, the degree and timing of GHG emissions reductions required under any such legislation or regulations, the cost of emissions reduction equipment the price and availability of offsets, the extent to which market based compliance options are available, the extent to which our subsidiaries would be entitled to receive GHG emissions allowances without having to purchase them in an auction or on the open market and the impact of such legislation or regulation on the ability of our subsidiaries to recover costs incurred through rate increases or otherwise. As a result of these factors, our cost of compliance could be substantial and could have a material impact on our results of operations.
In January 2005, based on European Community “Directive 2003/87/EC on Greenhouse Gas Emission Allowance Trading,” the European Union Greenhouse Gas Emission Trading Scheme (“EU ETS”) commenced operation as the largest multi-country GHG emission trading scheme in the world. On February 16, 2005, the Kyoto Protocol became effective. The Kyoto Protocol requires the 40 developed countries that have ratified it to substantially reduce their GHG emissions, including CO2. To date, compliance with the Kyoto Protocol and the EU ETS has not had a material adverse effect on the Company’s consolidated results of operations, financial condition and cash flows.
The United States has not ratified the Kyoto Protocol. In the United States, there currently is no legislation establishing federal mandatory GHG emission reduction programs (including CO2) affecting the electric power generation facilities of the Company’s subsidiaries. However, federal GHG legislation has been proposed in the United States Congress that would, if enacted, constrain GHG emissions, including CO2, and/or impose costs on
94
Table of Contents
us that could be material to our business or results of operations. The EPA has also initiated regulations pertaining to GHG emissions that require new sources of GHG emissions of over 100,000 tons per year, and existing sources planning physical changes that would increase their GHG emissions by more than 75,000 tons per year, to obtain new source review permits from the EPA prior to construction or modification.
Such regulations could increase our costs directly and indirectly and have a material adverse effect on our business and/or results of operations. See Item 1. Business—Regulatory Matters—Environmental and Land Use Regulations of this Form 10-K for further discussion about these environmental agreements, laws and regulations.
At the state level, RGGI, a cap-and-trade program covering CO2 emissions from electric power generation facilities in the Northeast, became effective in January 2009, and the WCI is also developing market-based programs to address GHG emissions in seven western states. In addition, several states, including California, have adopted comprehensive legislation that, when effective, will require mandatory GHG reductions from several industrial sectors, including the electric power generation industry. See Item 1.—Business—Regulatory Matters—Environmental and Land Use Regulations of this Form 10-K for further discussion about the United States state environmental regulations we face. At this time, other than with regard to RGGI (further described below), the Company cannot estimate the costs of compliance with United States federal, regional or state CO2 emissions reduction legislation or initiatives, due to the fact that these proposals are in earlier stages of development and any final regulations or legislation, if adopted, could vary drastically from current proposals.
The RGGI program became effective in January 2009. The first regional auction of RGGI allowances needed to be acquired by power generators to comply with state programs implementing RGGI was held in September 2008, with subsequent auctions occurring approximately every quarter. Our subsidiaries in New York, New Jersey, Connecticut and Maryland are subject to RGGI. Of the approximately 40 million metric tonnes of CO2 emitted in the United States by our subsidiaries in 2010 (ownership adjusted), approximately 11.3 million metric tonnes were emitted in United States states participating in RGGI. Over the past three years, such emissions have averaged approximately 10.9 million metric tonnes. While CO2 emissions from businesses operated by subsidiaries of the Company are calculated globally in metric tonnes, RGGI allowances are denominated in short tons. (1 metric tonne equals 2,200 pounds and 1 short ton equals 2,000 pounds.) For forecasting purposes, the Company has modeled the impact of CO2 compliance based on a 3-year average of CO2 emissions for its businesses that are subject to RGGI and that may not be able to pass through compliance costs. The model includes a conversion from metric tonnes to short tons as well as the impact of some market recovery by merchant plants and contractual and regulatory provisions. The model also utilizes a price of $1.86 per allowance under RGGI. The source of this allowance price estimate was the clearing price in the recent RGGI allowance auction held in December 2010. Based on these assumptions, the Company estimates that the RGGI compliance costs could be approximately $15 million for 2011, which is the last year of the first RGGI compliance period. Given the fact that the assumptions utilized in the model may prove to be incorrect, there is a significant risk that our actual compliance costs under RGGI will differ from our estimates by a material amount and that our model could underestimate our costs of compliance.
In addition to government regulators, other groups such as politicians, environmentalists and other private parties have expressed increasing concern about GHG emissions. For example, certain financial institutions have expressed concern about providing financing for facilities which would emit GHGs, which can affect our ability to obtain capital, or if we can obtain capital, to receive it on commercially viable terms. In addition, rating agencies may decide to downgrade our credit ratings based on the emissions of the businesses operated by our subsidiaries or increased compliance costs which could make financing unattractive. In addition, environmental groups and other private plaintiffs have brought and may decide to bring additional private lawsuits against the Company because of its subsidiaries’ GHG emissions. The Company is facing and may face in the future private lawsuits relating to GHG emissions that may have a material impact on the Company’s results of operations. In one recent case in the United States, which does not involve the Company, a federal appellate court reversed the dismissal by a federal district court of nuisance and other claims against emitters of GHG based on property damage allegedly caused by their contributions to global warming. While the scope of relief sought in that case is
95
Table of Contents
unclear, the plaintiffs in this case evidently seek injunctive relief to prevent or reduce further GHG emissions. The defendants appealed the appellate court decision to the Supreme Court of the United States, and the Supreme Court is expected to render a decision in 2011. If the defendants do not prevail, other parties may be encouraged to bring similar suits against electric power generators, including the Company or any of its United States subsidiaries. Also, unless the United States Congress acts to preempt such suits as part of comprehensive federal legislation, additional lawsuits may be brought against the Company or its subsidiaries. At this stage of the litigation, it is impossible to predict whether such lawsuits are likely to prevail or result in damages awards. Consequently, it is impossible to determine whether such lawsuits are likely to have a material adverse effect on the Company’s consolidated results of operations and financial condition.
Furthermore, according to the Intergovernmental Panel on Climate Change, physical risks from climate change could include, but are not limited to, increased runoff and earlier spring peak discharge in many glacier and snow fed rivers, warming of lakes and rivers, an increase in sea level, changes and variability in precipitation and in the intensity and frequency of extreme weather events. Physical impacts may have the potential to significantly affect the Company’s business and operations, and any such potential impact may render it more difficult for our businesses to obtain financing. For example, extreme weather events could result in increased downtime and operation and maintenance costs at the electric power generation facilities and support facilities of the Company’s subsidiaries. Variations in weather conditions, primarily temperature and humidity also would be expected to affect the energy needs of customers. A decrease in energy consumption could decrease the revenues of the Company’s subsidiaries. In addition, while revenues would be expected to increase if the energy consumption of customers increased, such increase could prompt the need for additional investment in generation capacity. Changes in the temperature of lakes and rivers and changes in precipitation that result in drought could adversely affect the operations of the fossil-fuel fired electric power generation facilities of the Company’s subsidiaries. Changes in temperature, precipitation and snow pack conditions also could affect the amount and timing of hydroelectric generation.
In addition to potential physical risks noted by the Intergovernmental Panel on Climate Change, there could be damage to the reputation of the Company and its subsidiaries due to public perception of GHG emissions by the Company or any of its subsidiaries, and any such negative public perception or concerns could ultimately result in a decreased demand for electric power generation or distribution from our subsidiaries. The level of GHG emissions made by subsidiaries of the Company is not a factor in the compensation of executives of the Company.
If any of the foregoing risks materialize, costs may increase or revenues may decrease and there could be a material adverse effect on the electric power generation businesses of the Company’s subsidiaries and on the Company’s consolidated results of operations, financial condition and cash flows.
Tax legislation initiatives or challenges to our tax positions could adversely affect our results of operations and financial condition.
Our subsidiaries have operations in the United States and various non-United States jurisdictions. As such, we are subject to the tax laws and regulations of the United States federal, state and local governments and of many non-United States jurisdictions. From time to time, legislative measures may be enacted that could adversely affect our overall tax positions. There can be no assurance that our effective tax rate or tax payments will not be adversely affected by these initiatives. In addition, United States federal, state and local, as well as non-United States, tax laws and regulations are extremely complex and subject to varying interpretations. There can be no assurance that our tax positions will be sustained if challenged by relevant tax authorities.
We and our affiliates are subject to material litigation and regulatory proceedings.
We and our affiliates are parties to material litigation and regulatory proceedings. See Item 3.—Legal Proceedings below. There can be no assurances that the outcome of such matters will not have a material adverse effect on our consolidated financial position.
96
Table of Contents
The SEC is conducting an informal inquiry relating to our restatements.
We have been cooperating with an informal inquiry by the SEC Staff concerning our past restatements and related matters, and have been providing information and documents to the SEC Staff on a voluntary basis. Although we have not received correspondence regarding this inquiry for some time, we have not been advised that the matter is closed. Because we are unable to predict the outcome of this inquiry, the SEC Staff may disagree with the manner in which we have accounted for and reported the financial impact of the adjustments to previously filed financial statements and there may be a risk that the inquiry by the SEC could lead to circumstances in which we may have to further restate previously filed financial statements, amend prior filings or take other actions not currently contemplated.
| ITEM 1B. | UNRESOLVED STAFF COMMENTS |
None.
| ITEM 2. | PROPERTIES |
We maintain offices in many places around the world, generally pursuant to the provisions of long- and short-term leases, none of which we believe are material. With a few exceptions, our facilities, which are described in Item 1 of this Form 10-K, are subject to mortgages or other liens or encumbrances as part of the project’s related finance facility. In addition, the majority of our facilities are located on land that is leased. However, in a few instances, no accompanying project financing exists for the facility, and in a few of these cases, the land interest may not be subject to any encumbrance and is owned outright by the subsidiary or affiliate.
| ITEM 3. | LEGAL PROCEEDINGS |
The Company is involved in certain claims, suits and legal proceedings in the normal course of business, some of which are described below. The Company has accrued for litigation and claims where it is probable that a liability has been incurred and the amount of loss can be reasonably estimated. The Company has evaluated claims in accordance with the accounting guidance for contingencies that it deems both probable and reasonably estimable and accordingly, has recorded aggregate reserves for all claims for approximately $450 million and $482 million as of December 31, 2010 and 2009. These are reported on the Consolidated Balance Sheet within “accrued and other liabilities” and “other long-term liabilities.” A significant portion of these reserves relate to employment, non-income tax and customer disputes in international jurisdictions, principally Brazil. Certain of the Company’s subsidiaries, principally in Brazil, are defendants in a number of labor and employment lawsuits. The complaints generally seek unspecified monetary damages, injunctive relief, or other relief. The subsidiaries have denied any liability and intend to vigorously defend themselves in all of these proceedings. There can be no assurance that this reserve will be adequate to cover all existing and future claims or that we will have the liquidity to pay such claims as they arise.
The Company believes, based upon information it currently possesses and taking into account established reserves for liabilities and its insurance coverage, that the ultimate outcome of these proceedings and actions is unlikely to have a material effect on the Company’s financial statements. However, even where no reserve has been recognized, it is reasonably possible that some matters could be decided unfavorably to the Company, and could require the Company to pay damages or make expenditures in amounts that could be material.
In 1989, Centrais Elétricas Brasileiras S.A. (“Eletrobrás”) filed suit in the Fifth District Court in the State of Rio de Janeiro against Eletropaulo Eletricidade de São Paulo S.A. (“EEDSP”) relating to the methodology for calculating monetary adjustments under the parties’ financing agreement. In April 1999, the Fifth District Court
97
Table of Contents
found for Eletrobrás and in September 2001, Eletrobrás initiated an execution suit in the Fifth District Court to collect approximately R$1.10 billion ($659 million) from Eletropaulo (as estimated by Eletropaulo) and a lesser amount from an unrelated company, Companhia de Transmissão de Energia Elétrica Paulista (“CTEEP”) (Eletropaulo and CTEEP were spun off from EEDSP pursuant to its privatization in 1998). In November 2002, the Fifth District Court rejected Eletropaulo’s defenses in the execution suit. Eletropaulo appealed and in September 2003, the Appellate Court of the State of Rio de Janeiro (“AC”) ruled that Eletropaulo was not a proper party to the litigation because any alleged liability had been transferred to CTEEP pursuant to the privatization. In June 2006, the Superior Court of Justice (“SCJ”) reversed the Appellate Court’s decision and remanded the case to the Fifth District Court for further proceedings, holding that Eletropaulo’s liability, if any, should be determined by the Fifth District Court. Eletropaulo’s subsequent appeals to the Special Court (the highest court within the SCJ) and the Supreme Court of Brazil were dismissed. Eletrobrás later requested that the amount of Eletropaulo’s alleged debt be determined by an accounting expert appointed by the Fifth District Court. Eletropaulo consented to the appointment of such an expert, subject to a reservation of rights. In February 2010, the Fifth District Court appointed an accounting expert to determine the amount of the alleged debt and the responsibility for its payment in light of the privatization, in accordance with the methodology proposed by Eletrobrás. Pursuant to its reservation of rights, Eletropaulo filed an interlocutory appeal with the AC asserting that the expert was required to determine the issues in accordance with the methodology proposed by Eletropaulo, and that Eletropaulo should be entitled to take discovery and present arguments on the issues to be determined by the expert. In April 2010, the AC issued a decision agreeing with Eletropaulo’s arguments and directing the Fifth District Court to proceed accordingly. Eletrobrás may restart the accounting proceedings at the Fifth District Court at any time, which would proceed according to the AC’s April 2010 decision. In the Fifth District Court proceedings, the expert’s conclusions will be subject to the Fifth District Court’s review and approval. If Eletropaulo is determined to be responsible for the debt, after the amount of the alleged debt is determined, Eletrobrás will be entitled to resume the execution suit in the Fifth District Court at any time. If Eletrobrás does so, Eletropaulo will be required to provide security in the amount of its alleged liability. In that case, if Eletrobrás requests the seizure of such security and the Fifth District Court grants such request, Eletropaulo’s results of operations may be materially adversely affected, and in turn the Company’s results of operations could be materially adversely affected. In addition, in February 2008, CTEEP filed a lawsuit in the Fifth District Court against Eletrobrás and Eletropaulo seeking a declaration that CTEEP is not liable for any debt under the financing agreement. The parties are disputing the proper venue for the CTEEP lawsuit. Eletropaulo believes it has meritorious defenses to the claims asserted against it and will defend itself vigorously in these proceedings; however, there can be no assurances that it will be successful in its efforts.
In August 2000, the FERC announced an investigation into the organized California wholesale power markets to determine whether rates were just and reasonable. Further investigations involved alleged market manipulation. FERC requested documents from each of the AES Southland, LLC plants and AES Placerita, Inc. AES Southland and AES Placerita have cooperated fully with the FERC investigations. AES Southland was not subject to refund liability because it did not sell into the organized spot markets due to the nature of its tolling agreement. After hearings at FERC, AES Placerita was found subject to refund liability of $588,000 plus interest for spot sales to the California Power Exchange from October 2, 2000 to June 20, 2001. As FERC investigations and hearings progressed, numerous appeals on related issues were filed with the U.S. Court of Appeals for the Ninth Circuit. Over the years, the Ninth Circuit issued several opinions that had the potential to expand the scope of the FERC proceedings and increase refund exposure for AES Placerita and other sellers of electricity. Following remand of one of the Ninth Circuit appeals in March 2009, FERC started a new hearing process involving AES Placerita and other sellers. In May 2009, AES Placerita entered into a settlement, approved by FERC in July 2009, concerning the claims before FERC against AES Placerita relating to the California energy crisis of 2000-2001, including the California refund proceeding. Pursuant to the settlement, AES Placerita paid $6 million and assigned a receivable of $168,119 due to it from the California Power Exchange in return for a release of all claims against it at FERC by the settling parties and other consideration. More than 98% of the buyers in the market elected to join the settlement. A small amount of AES Placerita’s settlement payment was placed in escrow for buyers that did not join the settlement (“non-settling parties”). It is unclear whether the escrowed funds will be enough to satisfy any additional sums that might be determined to be owed to
98
Table of Contents
non-settling parties at the conclusion of the FERC proceedings concerning the California energy crisis. However, any such additional sums are expected to be immaterial to the Company’s consolidated financial statements. In November 2009, one non-settling party, the Sacramento Municipal Utility District (“SMUD”), filed an appeal of the FERC’s approval of the settlement which is pending in the Ninth Circuit. SMUD’s appeal has been stayed pending further order of the court. The settlement agreement is still effective and will continue to remain effective unless it is vacated by the Ninth Circuit. SMUD has reached a settlement in principal with buyers of electricity that, if approved by FERC, will leave only immaterial claims of non-settling parties against AES Placerita.
In August 2001, the Grid Corporation of Orissa, India, now Gridco Ltd. (“Gridco”), filed a petition against the Central Electricity Supply Company of Orissa Ltd. (“CESCO”), an affiliate of the Company, with the Orissa Electricity Regulatory Commission (“OERC”), alleging that CESCO had defaulted on its obligations as an OERC-licensed distribution company, that CESCO management abandoned the management of CESCO, and asking for interim measures of protection, including the appointment of an administrator to manage CESCO. Gridco, a state-owned entity, is the sole wholesale energy provider to CESCO. Pursuant to the OERC’s August 2001 order, the management of CESCO was replaced with a government administrator who was appointed by the OERC. The OERC later held that the Company and other CESCO shareholders were not necessary or proper parties to the OERC proceeding. In August 2004, the OERC issued a notice to CESCO, the Company and others giving the recipients of the notice until November 2004 to show cause why CESCO’s distribution license should not be revoked. In response, CESCO submitted a business plan to the OERC. In February 2005, the OERC issued an order rejecting the proposed business plan. The order also stated that the CESCO distribution license would be revoked if an acceptable business plan for CESCO was not submitted to and approved by the OERC prior to March 31, 2005. In its April 2, 2005 order, the OERC revoked the CESCO distribution license. CESCO has filed an appeal against the April 2, 2005 OERC order and that appeal remains pending in the Indian courts. In addition, Gridco asserted that a comfort letter issued by the Company in connection with the Company’s indirect investment in CESCO obligates the Company to provide additional financial support to cover all of CESCO’s financial obligations to Gridco. In December 2001, Gridco served a notice to arbitrate pursuant to the Indian Arbitration and Conciliation Act of 1996 on the Company, AES Orissa Distribution Private Limited (“AES ODPL”), and Jyoti Structures (“Jyoti”) pursuant to the terms of the CESCO Shareholders Agreement between Gridco, the Company, AES ODPL, Jyoti and CESCO (the “CESCO arbitration”). In the arbitration, Gridco appeared to be seeking approximately $189 million in damages, plus undisclosed penalties and interest, but a detailed alleged damage analysis was not filed by Gridco. The Company counterclaimed against Gridco for damages. In June 2007, a 2-to-1 majority of the arbitral tribunal rendered its award rejecting Gridco’s claims and holding that none of the respondents, the Company, AES ODPL, or Jyoti, had any liability to Gridco. The respondents’ counterclaims were also rejected. In September 2007, Gridco filed a challenge of the arbitration award with the local Indian court. In June 2008, Gridco filed a separate application with the local Indian court for an order enjoining the Company from selling or otherwise transferring its shares in Orissa Power Generation Corporation Ltd.’s (“OPGC”), an equity method investment, and requiring the Company to provide security in the amount of the contested damages in the CESCO arbitration until Gridco’s challenge to the arbitration award is resolved. In June 2010, a 2-to-1 majority of the arbitral tribunal awarded the Company some of its costs relating to the arbitration. In August 2010, Gridco filed a challenge of the cost award with the local Indian court. The Company believes that it has meritorious defenses to the claims asserted against it and will defend itself vigorously in these proceedings; however, there can be no assurances that it will be successful in its efforts.
In early 2002, Gridco made an application to the OERC requesting that the OERC initiate proceedings regarding the terms of OPGC’s existing PPA with Gridco. In response, OPGC filed a petition in the Indian courts to block any such OERC proceedings. In early 2005, the Orissa High Court upheld the OERC’s jurisdiction to initiate such proceedings as requested by Gridco. OPGC appealed that High Court’s decision to the Supreme Court and sought stays of both the High Court’s decision and the underlying OERC proceedings regarding the PPAs terms. In April 2005, the Supreme Court granted OPGC’s requests and ordered stays of the High Court’s decision and the OERC proceedings with respect to the PPA’s terms. The matter is awaiting further hearing.
99
Table of Contents
Unless the Supreme Court finds in favor of OPGC’s appeal or otherwise prevents the OERC’s proceedings regarding the PPA’s terms, the OERC will likely lower the tariff payable to OPGC under the PPA, which would have an adverse impact on OPGC’s financials. OPGC believes that it has meritorious claims and defenses and will assert them vigorously in these proceedings; however, there can be no assurances that it will be successful in its efforts.
In March 2003, the office of the Federal Public Prosecutor for the State of São Paulo, Brazil (“MPF”) notified AES Eletropaulo that it had commenced an inquiry related to the BNDES financings provided to AES Elpa and AES Transgás and the rationing loan provided to Eletropaulo, changes in the control of Eletropaulo, sales of assets by Eletropaulo and the quality of service provided by Eletropaulo to its customers, and requested various documents from Eletropaulo relating to these matters. In July 2004, the MPF filed a public civil lawsuit in the Federal Court of São Paulo (“FSCP”) alleging that BNDES violated Law 8429/92 (the Administrative Misconduct Act) and BNDES’s internal rules by: (1) approving the AES Elpa and AES Transgás loans; (2) extending the payment terms on the AES Elpa and AES Transgás loans; (3) authorizing the sale of Eletropaulo’s preferred shares at a stock-market auction; (4) accepting Eletropaulo’s preferred shares to secure the loan provided to Eletropaulo; and (5) allowing the restructurings of Light Serviços de Eletricidade S.A. and Eletropaulo. The MPF also named AES Elpa and AES Transgás as defendants in the lawsuit because they allegedly benefited from BNDES’s alleged violations. In May 2006, the FCSP ruled that the MPF could pursue its claims based on the first, second, and fourth alleged violations noted above. The MPF subsequently filed an interlocutory appeal with the Federal Court of Appeals (“FCA”) seeking to require the FCSP to consider all five alleged violations. Also, in July 2006, AES Elpa and AES Transgás filed an interlocutory appeal with the FCA, which was subsequently consolidated with the MPF’s interlocutory appeal, seeking a transfer of venue and to enjoin the FCSP from considering any of the alleged violations. In June 2009, the FCA granted the injunction sought by AES Elpa and AES Transgás and transferred the case to the Federal Court of Rio de Janeiro. In May 2010, the MPF filed an appeal with the Superior Court of Justice challenging the transfer. The MPF’s lawsuit before the FCSP has been stayed pending a final decision on the interlocutory appeals. AES Elpa and AES Brasiliana (the successor of AES Transgás) believe they have meritorious defenses to the allegations asserted against them and will defend themselves vigorously in these proceedings; however, there can be no assurances that they will be successful in their efforts.
AES Florestal, Ltd. (“Florestal”), had been operating a pole factory and had other assets, including a wooded area known as “Horto Renner,” in the State of Rio Grande do Sul, Brazil (collectively, “Property”). Florestal had been under the control of AES Sul (“Sul”) since October 1997, when Sul was created pursuant to a privatization by the Government of the State of Rio Grande do Sul. After it came under the control of Sul, Florestal performed an environmental audit of the entire operational cycle at the pole factory. The audit discovered 200 barrels of solid creosote waste and other contaminants at the pole factory. The audit concluded that the prior operator of the pole factory, Companhia Estadual de Energia Elétrica (“CEEE”), had been using those contaminants to treat the poles that were manufactured at the factory. Sul and Florestal subsequently took the initiative of communicating with Brazilian authorities, as well as CEEE, about the adoption of containment and remediation measures. The Public Attorney’s Office has initiated a civil inquiry (Civil Inquiry n. 24/05) to investigate potential civil liability and has requested that the police station of Triunfo institute a police investigation (IP number 1041/05) to investigate potential criminal liability regarding the contamination at the pole factory. The parties filed defenses in response to the civil inquiry. The Public Attorney’s Office then requested an injunction which the judge rejected on September 26, 2008. The Public Attorney’s office has a right to appeal the decision. The environmental agency (“FEPAM”) has also started a procedure (Procedure n. 088200567/059) to analyze the measures that shall be taken to contain and remediate the contamination. Also, in March 2000, Sul filed suit against CEEE in the 2nd Court of Public Treasure of Porto Alegre seeking to register in Sul’s name the Property that it acquired through the privatization but that remained registered in CEEE’s name. During those proceedings, AES subsequently waived its claim to re-register the Property and asserted a claim to recover the amounts paid for the Property. That claim is pending. In November 2005, the 7th Court of Public Treasure of Porto Alegre ruled that the Property must be returned to CEEE. CEEE has had sole possession of Horto Renner since September 2006 and of the rest of the Property since April 2006. In February 2008, Sul
100
Table of Contents
and CEEE signed a “Technical Cooperation Protocol” pursuant to which they requested a new deadline from FEPAM in order to present a proposal. In March 2008, the State Prosecution office filed a Public Class Action against AES Florestal, AES Sul and CEEE, requiring an injunction for the removal of the alleged sources of contamination and the payment of an indemnity in the amount of R$6 million ($4 million). The injunction was rejected and the case is in the evidentiary stage awaiting the judge’s determination concerning the production of expert evidence. The above-referenced proposal was delivered on April 8, 2008. FEPAM responded by indicating that the parties should undertake the first step of the proposal which would be to retain a contractor. In its response, Sul indicated that such step should be undertaken by CEEE as the relevant environmental events resulted from CEEE’s operations. It is estimated that remediation could cost approximately R$14.7 million ($9 million). Discussions between Sul and CEEE are ongoing.
In January 2004, the Company received notice of a “Formulation of Charges” filed against the Company by the Superintendence of Electricity of the Dominican Republic. In the “Formulation of Charges,” the Superintendence asserts that the existence of three generation companies (Empresa Generadora de Electricidad Itabo, S.A. (“Itabo”), Dominican Power Partners, and AES Andres BV) and one distribution company (Empresa Distribuidora de Electricidad del Este, S.A. (“Este”)) in the Dominican Republic, violates certain cross-ownership restrictions contained in the General Electricity Law of the Dominican Republic. In February 2004, the Company filed in the First Instance Court of the National District of the Dominican Republic an action seeking injunctive relief based on several constitutional due process violations contained in the “Formulation of Charges” (“Constitutional Injunction”). In February 2004, the Court granted the Constitutional Injunction and ordered the immediate cessation of any effects of the “Formulation of Charges,” and the enactment by the Superintendence of Electricity of a special procedure to prosecute alleged antitrust complaints under the General Electricity Law. In March 2004, the Superintendence of Electricity appealed the Court’s decision. In July 2004, the Company divested any interest in Este. The Superintendence of Electricity’s appeal is pending. The Company believes it has meritorious defenses to the claims asserted against it and will defend itself vigorously in these proceedings; however, there can be no assurances that it will be successful in its efforts.
In July 2004, the Corporación Dominicana de Empresas Eléctricas Estatales (“CDEEE”) filed lawsuits against Itabo, an affiliate of the Company, in the First and Fifth Chambers of the Civil and Commercial Court of First Instance for the National District. CDEEE alleges in both lawsuits that Itabo spent more than was necessary to rehabilitate two generation units of an Itabo power plant and, in the Fifth Chamber lawsuit, that those funds were paid to affiliates and subsidiaries of AES Gener and Coastal Itabo, Ltd. (“Coastal”), a former shareholder of Itabo, without the required approval of Itabo’s board of administration. In the First Chamber lawsuit, CDEEE seeks an accounting of Itabo’s transactions relating to the rehabilitation. In November 2004, the First Chamber dismissed the case for lack of legal basis. On appeal, in October 2005 the Court of Appeals of Santo Domingo ruled in Itabo’s favor, reasoning that it lacked jurisdiction over the dispute because the parties’ contracts mandated arbitration. The Supreme Court of Justice is considering CDEEE’s appeal of the Court of Appeals’ decision. In the Fifth Chamber lawsuit, which also names Itabo’s former president as a defendant, CDEEE seeks $15 million in damages and the seizure of Itabo’s assets. In October 2005, the Fifth Chamber held that it lacked jurisdiction to adjudicate the dispute given the arbitration provisions in the parties’ contracts. The First Chamber of the Court of Appeal ratified that decision in September 2006. In a related proceeding, in May 2005, Itabo filed a lawsuit in the U.S. District Court for the Southern District of New York seeking to compel CDEEE to arbitrate its claims. The petition was denied in July 2005. Itabo’s appeal of that decision to the U.S. Court of Appeals for the Second Circuit has been stayed since September 2006. Further, in September 2006, in an International Chamber of Commerce arbitration, an arbitral tribunal determined that it lacked jurisdiction to decide arbitration claims concerning these disputes. Itabo believes it has meritorious claims and defenses and will assert them vigorously in these proceedings; however, there can be no assurances that it will be successful in its efforts.
In April 2006, a putative class action was filed in the U.S. District Court for the Southern District of Mississippi (“District Court”) on behalf of certain individual plaintiffs and all residents and/or property owners in the State of Mississippi who allegedly suffered harm as a result of Hurricane Katrina, and against the Company and numerous unrelated companies, whose alleged greenhouse gas emissions contributed to alleged global
101
Table of Contents
warming which, in turn, allegedly increased the destructive capacity of Hurricane Katrina. The plaintiffs assert unjust enrichment, civil conspiracy/aiding and abetting, public and private nuisance, trespass, negligence, and fraudulent misrepresentation and concealment claims against the defendants. The plaintiffs seek damages relating to loss of property, loss of business, clean-up costs, personal injuries and death, but do not quantify their alleged damages. In August 2007, the District Court dismissed the case. The plaintiffs subsequently appealed to the U.S. Court of Appeals for the Fifth Circuit, which, in October 2009, affirmed the District Court’s dismissal of the plaintiffs’ unjust enrichment, fraudulent misrepresentation, and civil conspiracy claims. However, the Fifth Circuit reversed the District Court’s dismissal of the plaintiffs’ public and private nuisance, trespass, and negligence claims, and remanded those claims to the District Court for further proceedings. In February 2010, the Fifth Circuit granted the petitions for en banc rehearing filed by the Company and other defendants, and thereby vacated its October 2009 decision. In May 2010, the Fifth Circuit dismissed the appeal on the ground that it had lost its quorum for en banc review. In August 2010, the plaintiffs filed a petition for a writ of mandamus in the U.S. Supreme Court, requesting the Supreme Court to direct the Fifth Circuit to reinstate the appeal and return it to the panel that issued the October 2009 decision. In January 2011, the Supreme Court denied the petition, ending the case.
In July 2007, the Competition Committee of the Ministry of Industry and Trade of the Republic of Kazakhstan (the “Competition Committee”) ordered Nurenergoservice, an AES subsidiary, to pay approximately KZT 18 billion ($120 million) for alleged antimonopoly violations in 2005 through the first quarter of 2007. The Competition Committee’s order was affirmed by the economic court in April 2008 (“April 2008 Decision”). The economic court also issued an injunction to secure Nurenergoservice’s alleged liability, freezing Nurenergoservice’s bank accounts and prohibiting Nurenergoservice from transferring or disposing of its property. Nurenergoservice’s subsequent appeals to the court of appeals were rejected. In February 2009, the Antimonopoly Agency (the Competition Committee’s successor) seized approximately KZT 783 million ($5 million) from a frozen Nurenergoservice bank account in partial satisfaction of Nurenergoservice’s alleged damages liability. However, on appeal to the Kazakhstan Supreme Court, in October 2009, the Supreme Court annulled the decisions of the lower courts because of procedural irregularities and remanded the case to the economic court for reconsideration. On remand, in January 2010, the economic court reaffirmed its April 2008 Decision. Nurenergoservice’s appeals in the court of appeals (first panel) and the court of appeals (second panel) were unsuccessful. Nurenergoservice intends to file a further appeal to the Kazakhstan Supreme Court. In separate but related proceedings, in August 2007, the Competition Committee ordered Nurenergoservice to pay approximately KZT 1.8 billion ($12 million) in administrative fines for its alleged antimonopoly violations. Nurenergoservice’s appeal to the administrative court was rejected in February 2009. Given the adverse court decisions against Nurenergoservice, the Antimonopoly Agency may attempt to seize Nurenergoservice’s remaining assets, which are immaterial to the Company’s consolidated financial statements. The Antimonopoly Agency has not indicated whether it intends to assert claims against Nurenergoservice for alleged antimonopoly violations post first quarter 2007. Nurenergoservice believes it has meritorious defenses to the claims asserted against it; however, there can be no assurances that it will prevail in these proceedings.
In April 2009, the Antimonopoly Agency initiated an investigation of the power sales of Ust-Kamenogorsk HPP (“UK HPP”) and Shulbinsk HPP, hydroelectric plants under AES concession (collectively, the “Hydros”), in January through February 2009. The investigation of Shulbinsk HPP is ongoing, but the investigation of UK HPP has been completed. The Antimonopoly Agency determined that UK HPP abused its market position and charged monopolistically high prices for power in January through February 2009. The Agency sought an order from the administrative court requiring UK HPP to pay an administrative fine of approximately KZT 120 million ($1 million) and to disgorge profits for the period at issue, estimated by the Antimonopoly Agency to be approximately KZT 440 million ($3 million). No fines or damages have been paid to date, however, as the proceedings in the administrative court have been suspended due to the initiation of related criminal proceedings against officials of UK HPP. The Hydros believe they have meritorious defenses and will assert them vigorously in these proceedings; however, there can be no assurances that they will be successful in their efforts.
102
Table of Contents
In April 2009, the Antimonopoly Agency initiated an investigation of Ust-Kamenogorsk TETS LLP’s (“UKT”) power sales in 2008 through February 2009. The Antimonopoly Agency subsequently concluded that UKT abused its market position and charged monopolistically high prices for power and should pay an administrative fine of approximately KZT 136 million ($1 million). The Antimonopoly Agency later sought an order from the administrative court requiring UKT to pay the fine. The administrative court proceedings have been suspended due to a related criminal investigation of UKT employees. If the investigation is terminated and the Antimonopoly Agency prevails in the administrative proceedings, UKT may be ordered to pay the administrative fine and disgorge the profits from the sales at issue, estimated by the Antimonopoly Agency to be approximately 514 million KZT ($3 million). UKT believes it has meritorious defenses and will assert them vigorously in these proceedings; however, there can be no assurances that it will be successful in its efforts.
In December 2007, an arbitral tribunal terminated ESSA’s gas supply contracts with members of the Sierra Chata Consortium in light of the restrictions that had been placed on the export of gas by the Argentine Republic. ESSA thereafter terminated its gas transportation contract with Transportadora de Gas del Norte S.A. (“TGN”), and initiated arbitration seeking relief from the obligation to pay the firm tariff under ESSA’s gas transportation contracts with Gasoducto GasAndes (Argentina) S.A. (“GasAndes Argentina”) and Gasoducto GasAndes S.A. (“GasAndes Chile”) or in the alternative, termination of such contracts. TGN (which later filed a lawsuit against ESSA in Argentina), GasAndes Argentina, and GasAndes Chile disputed that the restrictions on the export of gas justified the adjustment or termination of the respective gas transportation contracts and sought due tariff payments. On December 29, 2010, ESSA reached settlement agreements with GasAndes Argentina, GasAndes Chile, and TGN terminating the respective gas transportation contracts and resolving all pending legal disputes and potential future claims. ESSA recognized approximately $72 million as other expense for the three months ended December 31, 2010 related to the settlement agreements. Upon termination of the TGN gas transportation contract, ESSA is no longer required to pay certain charges imposed by the Argentine Republic relating to gas supply infrastructure.
In February 2008, the Native Village of Kivalina and the City of Kivalina, Alaska, filed a complaint in the U.S. District Court for the Northern District of California against the Company and numerous unrelated companies, claiming that the defendants’ alleged GHG emissions have contributed to alleged global warming which, in turn, allegedly has led to the erosion of the plaintiffs’ alleged land. The plaintiffs assert nuisance and concert of action claims against the Company and the other defendants, and a conspiracy claim against a subset of the other defendants. The plaintiffs seek to recover relocation costs, indicated in the complaint to be from $95 million to $400 million, and other unspecified damages from the defendants. The Company filed a motion to dismiss the case, which the District Court granted in October 2009. The plaintiffs have appealed to the U.S. Court of Appeals for the Ninth Circuit. The parties have briefed the appeal and are awaiting a date for oral argument. The Company believes it has meritorious defenses to the claims asserted against it and will defend itself vigorously in these proceedings; however, there can be no assurances that it will be successful in its efforts.
In July, 1993 the Public Attorney’s office filed a claim against Eletropaulo, the Sao Paulo State Government, SABESP (a state-owned company), CETESB (a state-owned company) and DAEE (the municipal Water and Electric Energy Department) alleging that they were liable for pollution of the Billings Reservoir as a result of pumping water from the Pinheiros River into the Billings Reservoir. The events in question occurred while Eletropaulo was a state-owned company. An initial lower court decision in 2007 found the parties liable for the payment of approximately R$670 million ($401 million) for remediation. Eletropaulo subsequently appealed the decision to the Appellate Court of the State of Sao Paulo which reversed the lower court decision. In 2009, the Public Attorney’s Office has filed appeals to both Superior Court of Justice (“SCJ”) and the Supreme Court (“SC”) and such appeals were answered by Eletropaulo in the fourth quarter of 2009. Eletropaulo believes it has meritorious defenses to the claims asserted against it and will defend itself vigorously in these proceedings; however, there can be no assurances that it will be successful in its efforts.
In September 1996, a public civil action was asserted against Eletropaulo and Associação Desportiva Cultural Eletropaulo (the “Associação”) relating to alleged environmental damage caused by construction of the
103
Table of Contents
Associação near Guarapiranga Reservoir. The initial decision that was upheld by the Appellate Court of the State of Sao Paulo in 2006 found that Eletropaulo should repair the alleged environmental damage by demolishing certain construction and reforesting the area, and either sponsor an environmental project which would cost approximately R$1 million ($599 thousand) as of December 31, 2010, or pay an indemnification amount of approximately R$10.2 million ($6 million). Eletropaulo has appealed this decision to the Supreme Court and is awaiting a decision.
In February 2009, a CAA Section 114 information request from the EPA regarding Cayuga and Somerset was received. The request seeks various operating and testing data and other information regarding certain types of projects at the Cayuga and Somerset facilities, generally for the time period from January 1, 2000 through the date of the information request. This type of information request has been used in the past to assist the EPA in determining whether a plant is in compliance with applicable standards under the CAA. Cayuga and Somerset responded to the EPA’s information request in June 2009, and they are awaiting a response from the EPA regarding their submittal. At this time, it is not possible to predict what impact, if any, this request may have on the Company, its results of operations or its financial position.
On February 2, 2009, the Cayuga facility received a Notice of Violation from the New York State Department of Environmental Conservation (“NYSDEC”) that the facility had exceeded the permitted volume limit of coal ash that can be disposed of in the on-site landfill. Cayuga has met with NYSDEC and submitted a Landfill Liner Demonstration Report to them. Such report found that the landfill has adequate engineering integrity to support the additional coal ash and there is no inherent environmental threat. NYSDEC has indicated they accept the finding of the report. A permit modification was approved by the NYSDEC on May 14, 2010 and such permit modification allows for closure of this approximately 10-acre portion of the landfill. The construction in accordance with the approved permit modification was completed in November 2010 and the certification report for this construction project is currently being drafted to submit to the NYSDEC in the second quarter of 2011. While at this time it is not possible to predict what impact, if any, this matter may have on the Company, its results of operations or its financial position, based upon the discussions to date, the Company does not believe the impact will be material.
In March 2009, AES Uruguaiana Empreendimentos S.A. (“AESU”) initiated arbitration in the International Chamber of Commerce (“ICC”) against YPF S.A. (“YPF”) seeking damages and other relief relating to YPF’s breach of the parties’ gas supply agreement (“GSA”). Thereafter, in April 2009, YPF initiated arbitration in the ICC against AESU and two unrelated parties, Companhia de Gas do Esado do Rio Grande do Sul and Transportador de Gas del Mercosur S.A. (“TGM”), claiming that AESU wrongfully terminated the GSA and caused the termination of a transportation agreement (“TA”) between YPF and TGM (“YPF Arbitration”). YPF seeks an unspecified amount of damages from AESU, a declaration that YPF’s performance was excused under the GSA due to certain alleged force majeure events, or, in the alternative, a declaration that the GSA and the TA should be terminated without a finding of liability against YPF because of the allegedly onerous obligations imposed on YPF by those agreements. In addition, in the YPF Arbitration, TGM asserts that if it is determined that AESU is responsible for the termination of the GSA, AESU is liable for TGM’s alleged losses, including losses under the TA. The procedural schedules for the arbitrations have been established but the hearing dates have not been scheduled to date. AESU believes it has meritorious defenses to the claims asserted against it and will defend itself vigorously; however, there can be no assurances that it will be successful in its efforts.
In June 2009, the Supreme Court of Chile affirmed a January 2009 decision of the Valparaiso Court of Appeals (“VCA”) that the environmental permit for Empresa Electrica Campiche’s (“EEC”) thermal power plant (“Plant”) was not properly granted and illegal. Construction of the Plant stopped as a consequence of the Supreme Court’s decision. In December 2009, Chilean authorities approved new land use regulations that entitled EEC to apply for a new environmental permit. EEC applied for a new environmental permit in January 2010 and permit approval was granted by the Environmental Authority in February 2010. In March 2010, the Mayor of Puchuncaví and another third party challenged the new environmental permit before the VCA. The parties later entered into a settlement agreement pursuant to which the challenge to the new environmental permit
104
Table of Contents
was withdrawn in July 2010. In addition, the construction permit that is required to resume construction of the Plant was issued by the Municipality in August 2010. In September 2010, neighbors of Puchuncaví challenged the construction permit filing claims in the VCA. In November 2010, the VCA rejected the claims. The challenging parties subsequently filed appeals with the Supreme Court. In January 2011, the Supreme Court confirmed the decision of the VCA, finally rejecting the constitutional action. EEC has resumed construction of the Plant.
In June 2009, the Inter-American Commission on Human Rights of the Organization of American States (“IACHR”) requested that the Republic of Panama suspend the construction of AES Changuinola S.A.’s hydroelectric project (“Project”) until the bodies of the Inter-American human rights system can issue a final decision on a petition (286/08) claiming that the construction violates the human rights of alleged indigenous communities. In July 2009, Panama responded by informing the IACHR that it would not suspend construction of the Project and requesting that the IACHR revoke its request. In June 2010, the Inter-American Court of Human Rights vacated the IACHR’s request. With respect to the merits of the underlying petition, the IACHR heard arguments by the communities and Panama in November 2009, but has not issued a decision to date. The Company cannot predict Panama’s response to any determination on the merits of the petition by the bodies of the Inter-American human rights system.
In July 2009, AES Energía Cartagena S.R.L. (“AES Cartagena”) received notices from the Spanish national energy regulator, Comisión Nacional de Energía (“CNE”), stating that the proceeds of the sale of electricity from AES Cartagena’s plant should be reduced by roughly the value of the CO2 allowances that were granted to AES Cartagena for free for the years 2007, 2008, and the first half of 2009. In particular, the notices stated that CNE intended to invoice AES Cartagena to recover that value, which CNE calculated as approximately €20 million ($27 million) for 2007-2008 and an amount to be determined for the first half of 2009. In September 2009, AES Cartagena received invoices for €523,548 (approximately $694,000) for the allowances granted for free for 2007 and €19,907,248 (approximately $26 million) for 2008. In July 2010, AES Cartagena received an invoice for approximately €5.4 million ($7 million) for the allowances granted for free for the first half of 2009. AES Cartagena does not expect to be charged for CO2 allowances issued free of charge for subsequent periods. AES Cartagena has paid the amounts invoiced and has filed challenges to the CNE’s demands in the Spanish judicial system. There can be no assurances that the challenges will be successful. AES Cartagena has demanded indemnification from its fuel supply and electricity toller, GDF-Suez, in relation to the CNE invoices under the long-term energy agreement (the “Energy Agreement”) with GDF-Suez. However, GDF-Suez has disputed that it is responsible for the CNE invoices under the Energy Agreement. Therefore, in September 2009, AES Cartagena initiated arbitration against GDF-Suez, seeking to recover the payments made to CNE. In the arbitration, AES Cartagena also seeks a determination that GDF-Suez is responsible for procuring and bearing the cost of CO2 allowances that are required to offset the CO2 emissions of AES Cartagena’s power plant, which is also in dispute between the parties. To date, AES Cartagena has paid approximately €20 million ($27 million) for the CO2 allowances that have been required to offset 2008 and 2009 CO2 emissions. AES Cartagena expects that allowances will need to be purchased to offset emissions for subsequent years. The evidentiary hearing in the arbitration took place from May 31-June 4, 2010, and closing arguments were heard on September 1, 2010. In February 2011, the arbitral tribunal requested further briefing from the parties on certain issues in the arbitration. If AES Cartagena does not prevail in the arbitration and is required to bear the cost of carbon compliance, its results of operations could be materially adversely affected and, in turn, there could be a material adverse effect on the Company and its results of operations. AES Cartagena believes it has meritorious claims and will assert them vigorously in these proceedings; however, there can be no assurances that it will be successful in its efforts.
In September 2009, the Public Defender’s Office of the State of Rio Grande do Sul (“PDO”) filed a class action against AES Sul in the 16th District Court of Porto Alegre, Rio Grande do Sul (“District Court”), claiming that AES Sul has been illegally passing PIS and COFINS taxes (taxes based on AES Sul’s income) to consumers. According to ANEEL’s Order No. 93/05, the federal laws of Brazil, and the Brazilian Constitution, energy companies such as AES Sul are entitled to highlight PIS and COFINS taxes in power bills to final consumers, as the cost of those taxes is included in the energy tariffs that are applicable to final consumers. Before AES Sul had
105
Table of Contents
been served with the action, the District Court dismissed the lawsuit in October 2009 on the ground that AES Sul had been properly highlighting PIS and COFINS taxes in consumer bills in accordance with Brazilian law. In April 2010, the PDO appealed to the Appellate Court of the State of Rio Grande do Sul (“AC”). In November 2010, the AC affirmed the dismissal. The PDO is expected to appeal. If the dismissal is ever reversed and AES Sul does not prevail in the lawsuit and is ordered to cease recovering PIS and COFINS taxes pursuant to its energy tariff, its potential prospective losses could be approximately R$9.6 million ($6 million) per month, as estimated by AES Sul. In addition, if AES Sul is ordered to reimburse consumers, its potential retrospective liability could be approximately R$1.2 billion ($718 million), as estimated by AES Sul. AES Sul believes it has meritorious defenses to the claims asserted against it and will defend itself vigorously in these proceedings if it is served with the action; however, there can be no assurances that it would be successful in its efforts. Furthermore, if AES Sul does not prevail in the litigation it will seek to adjust its energy tariff to compensate it for its losses, but there can be no assurances that it would be successful in obtaining an adjusted energy tariff.
In October 2009, IPL received a Notice of Violation (“NOV”) and Finding of Violation from EPA pursuant to CAA Section 113(a). The NOV alleges violations of the CAA at IPL’s three coal-fired electric generating facilities dating back to 1986. The alleged violations primarily pertain to EPA’s Prevention of Significant Deterioration and nonattainment New Source Review (“NSR”) requirements under the CAA. Since receiving the letter, IPL management has met with EPA staff and is currently in discussions with the EPA regarding possible resolutions to this NOV. At this time, we cannot predict the ultimate resolution of this matter. However, settlements and litigated outcomes of similar cases have required companies to pay civil penalties and to install additional pollution control technology on coal-fired electric generating units. A similar outcome in this case could have a material impact to IPL and could, in turn, have a material impact on the Company. IPL would seek recovery through customer rates of any operating or capital expenditures related to pollution control technology systems to reduce regulated air emissions; however, there can be no assurances that it would be successful in that regard.
In November 2009, April 2010 and December 2010, substantially similar personal injury lawsuits were filed by a total of 26 residents and estates in the Dominican Republic against the Company, AES Atlantis, Inc., AES Puerto Rico, LP, AES Puerto Rico, Inc., and AES Puerto Rico Services, Inc., in the Superior Court for the State of Delaware. In each lawsuit the plaintiffs allege that the coal combustion byproducts of AES Puerto Rico’s power plant were illegally placed in the Dominican Republic in October 2003 through March 2004 and subsequently caused the plaintiffs’ birth defects, other personal injuries, and/or deaths. The plaintiffs do not quantify their alleged damages, but generally allege that they are entitled to compensatory and punitive damages. The AES defendants have moved for partial dismissal of both the November 2009 and April 2010 lawsuits on various grounds. (The AES Defendants have until mid-February to respond to the December 2010 lawsuit.) In September 2010, the Superior Court heard arguments on the motions. The Superior Court dismissed the plaintiffs’ fraud allegations without prejudice to replead, and the plaintiffs filed amended complaints in November 2010. The AES defendants have filed a renewed motion to dismiss the amended issues. The remaining claims (other than fraud) addressed in the AES defendants’ original motion to dismiss are still pending. The AES defendants believe they have meritorious defenses to the claims asserted against them and will defend themselves vigorously; however, there can be no assurances that they will be successful in their efforts.
On December 21, 2010, AES-3C Maritza East 1 EOOD, which owns an unfinished 670MW lignite-fired power plant in Bulgaria, made the first in a series of demands on the performance bond securing the construction Contractor’s obligations under the parties’ EPC Contract. The Contractor failed to complete the plant on schedule. The total amount demanded by Maritza under the performance bond is approximately €155 million ($205 million). However, the Contractor obtained a temporary injunction from a French court preventing the issuing bank from honoring the bond demands. As the performance bond is governed by English law, Maritza obtained a judgment from an English court that the bond should be paid, and then presented this judgment to the French court which issued the temporary injunction. However, on February 10, 2011, the French court issued a decision enjoining the issuing bank from honoring the demands on the performance bond pending the determination of the arbitration between Maritza and the Contractor, described below. Maritza is attempting to
106
Table of Contents
lift that injunction or otherwise obtain payment on its demands. In addition, in December 2010, the Contractor issued a notice of dispute alleging that the lignite that has been supplied by Maritza for commissioning of the power plant is out of specification, allegedly entitling the Contractor to an extension of time to complete the power plant, an increase to the contract price of approximately €62 million ($82 million), and other relief. The Contractor thereafter advised Maritza that it had stopped commissioning of the power plant’s two units because of the characteristics of the lignite supplied, and, in January 2011, initiated arbitration on its lignite claim. Maritza disputes that the lignite is out of specification and intends to defend the arbitration and assert counterclaims for delay liquidated damages and other relief relating to the Contractor’s failure to complete the power plant and other breaches of the EPC contract. Maritza believes it has meritorious claims and defenses and will assert them vigorously in these proceedings; however, there can be no assurances that it will be successful in its efforts.
| ITEM 4. | REMOVED AND RESERVED |
107
Table of Contents
| ITEM 5. | MARKET FOR REGISTRANT’S COMMON EQUITY, RELATED STOCKHOLDER MATTERS AND ISSUER PURCHASES OF EQUITY SECURITIES |
Recent Sales of Unregistered Securities
On March 12, 2010, the Company and Terrific Investment Corporation (“Investor”), a wholly owned subsidiary of China Investment Corporation, entered into a stockholder agreement (the “Stockholder Agreement”) in connection with the agreement discussed in the following paragraph. Under the Stockholder Agreement, as long as Investor holds more than 5% of the outstanding shares of common stock of the Company, Investor will have the right to designate one nominee, who must be reasonably acceptable to the Board, for election to the Board of Directors of the Company. Investor has not designated its nominee for election to the Board of Directors of the Company. In addition, until such time as Investor holds 5% or less of the outstanding shares of common stock, Investor has agreed to vote its shares in accordance with the recommendation of the Company on any matters submitted to a vote of the stockholders of the Company relating to the election of directors and compensation matters. Otherwise, Investor may vote its shares at its discretion. Further, under the Stockholder Agreement, Investor will be subject to a standstill restriction which generally prohibits Investor from purchasing additional securities of the Company beyond the level acquired by it under the stock purchase agreement entered into between Investor and the Company on November 6, 2009. In addition, Investor has agreed to a lock-up restriction such that Investor would not sell its shares for a period of 12 months following the closing, subject to certain exceptions. The standstill and lock-up restrictions also terminate at such time as Investor holds 5% or less of the outstanding shares of common stock. Investor will have certain registration rights and preemptive rights under the Stockholder Agreement with respect to its shares of common stock of the Company.
On March 15, 2010, the Company completed the sale of 125,468,788 shares of common stock to Investor. The shares were sold for $12.60 per share, for an aggregate purchase price of $1.58 billion. Investor’s ownership in the Company’s common stock is now approximately 15% of the Company’s total outstanding shares of common stock on a fully diluted basis.
Purchases of Equity Securities by the Issuer and Affiliated Purchasers
In July 2010, the Company’s Board of Directors approved a stock repurchase program under which the Company may repurchase up to $500 million of AES common stock. The Board authorization permits the Company to repurchase stock through a variety of methods, including open market repurchases and/or privately negotiated transactions. The original authorization was set to expire on December 31, 2010, however; in December 2010, the Board authorized an extension of the stock repurchase program. There can be no assurance as to the amount, timing or prices of repurchases, which may vary based on market conditions and other factors. The stock repurchase program may be modified, extended or terminated by the Board of Directors at any time. During the year ended December 31, 2010, shares of common stock repurchased under this plan totaled 8,382,825 at a total cost of $99 million plus a nominal amount of commissions (average of $11.86 per share including commissions). There was $401 million remaining under the stock repurchase program available for future repurchases at December 31, 2010.
108
Table of Contents
The following table presents information regarding purchases made by The AES Corporation of its common stock in the fourth quarter of 2010:
| Repurchase Period | Total Number of Shares Purchased |
Average Price Paid per Share |
Total Number of Shares Repurchased as Part of a Publicly Announced Repurchase Plan |
Dollar Value of Maximum Number of Shares To Be Purchased Under the Plan |
||||||||||||
| 10/1/10—10/31/10 |
6,086,345 | $ | 12.30 | 6,086,345 | $ | 409,713,649 | ||||||||||
| 11/1/10—11/30/10 |
— | $ | — | — | $ | 409,713,649 | ||||||||||
| 12/1/10—12/31/10 |
755,000 | $ | 11.89 | 755,000 | $ | 400,732,931 | ||||||||||
| Total |
6,841,345 | $ | 12.26 | 6,841,345 | ||||||||||||
Our common stock is currently traded on the New York Stock Exchange (“NYSE”) under the symbol “AES.” The closing price of our common stock as reported by the NYSE on February 23, 2011, was $12.25, per share. The Company repurchased 8,382,825 and 10,691,267 shares of its common stock in 2010 and 2008, respectively, and did not repurchase any of its common stock in 2009. The following tables set forth the high and low sale prices, and performance trends for our common stock as reported by the NYSE for the periods indicated:
| 2010 | 2009 | |||||||||||||||
| Price Range of Common Stock | High | Low | High | Low | ||||||||||||
| First Quarter |
$ | 14.24 | $ | 10.73 | $ | 9.48 | $ | 4.80 | ||||||||
| Second Quarter |
12.46 | 8.94 | 11.64 | 5.62 | ||||||||||||
| Third Quarter |
11.57 | 8.82 | 15.37 | 10.67 | ||||||||||||
| Fourth Quarter |
12.54 | 10.70 | 15.44 | 12.50 | ||||||||||||
109
Table of Contents
Performance Graph
THE AES CORPORATION
PEER GROUP INDEX/STOCK PRICE PERFORMANCE
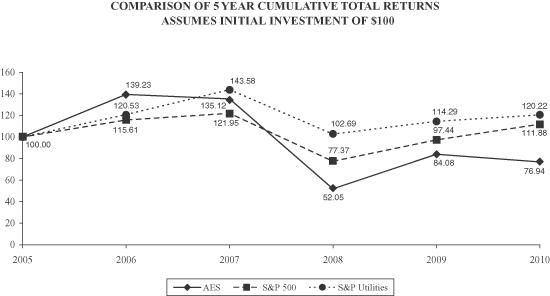
Source: Bloomberg
We have selected the Standard and Poor’s (“S&P”) 500 Utilities Index as our peer group index. The S&P 500 Utilities Index is a published sector index comprising the 32 electric and gas utilities included in the S&P 500.
The five year total return chart assumes $100 invested on December 31, 2005 in AES Common Stock, the S&P 500 Index and the S&P 500 Utilities Index. The information included under the heading “Performance Graph” shall not be considered “filed” for purposes of Section 18 of the Securities Exchange Act of 1934 or incorporated by reference in any filing under the Securities Act of 1933 or the Securities Exchange Act of 1934.
As of February 23, 2011, there were approximately 7,379 record holders of our common stock.
We do not currently pay dividends on our common stock. We intend to retain our future earnings, if any, to finance the future development and operation of our business. Accordingly, we do not anticipate paying any dividends on our common stock in the foreseeable future.
Under the terms of our senior secured credit facility, which we entered into with a commercial bank syndicate, we have limitations on our ability to pay cash dividends and/or repurchase stock. In addition, under the terms of a guaranty we provided to the utility customer in connection with the AES Thames project, we are precluded from paying cash dividends on our common stock if we do not meet certain net worth and liquidity tests.
110
Table of Contents
Our project subsidiaries’ ability to declare and pay cash dividends to us is subject to certain limitations contained in the project loans, governmental provisions and other agreements to which our project subsidiaries are subject.
See the information contained under the caption “Securities Authorized for Issuance under Equity Compensation Plans” of the Proxy Statement for the 2010 Annual Meeting of Shareholders of the Registrant, which information is incorporated herein by reference.
| ITEM 6. | SELECTED FINANCIAL DATA |
The following table sets forth our selected financial data as of the dates and for the periods indicated. You should read this data together with Item 7.—Management’s Discussion and Analysis of Financial Condition and Results of Operations and the Consolidated Financial Statements and the notes thereto included in Item 8 of this Form 10-K. The selected financial data for each of the years in the five year period ended December 31, 2010 have been derived from our audited Consolidated Financial Statements. Our historical results are not necessarily indicative of our future results.
Acquisitions, disposals, reclassifications and changes in accounting principles affect the comparability of information included in the tables below. Please refer to the Notes to the Consolidated Financial Statements included in Item 8.—Financial Statements and Supplementary Data of this Form 10-K for further explanation of the effect of such activities. Please also refer to Item 1A.—Risk Factors of this Form 10-K and Note 24—Risks and Uncertainties to the Consolidated Financial Statements included in Item 8 of this Form 10-K for certain risks and uncertainties that may cause the data reflected herein not to be indicative of our future financial condition or results of operations.
111
Table of Contents
SELECTED FINANCIAL DATA
| Year Ended December 31, | ||||||||||||||||||||
| Statement of Operations Data | 2010 | 2009 | 2008 | 2007 | 2006 | |||||||||||||||
| (in millions, except per share amounts) | ||||||||||||||||||||
| Revenue |
$ | 16,647 | $ | 13,954 | $ | 15,197 | $ | 12,835 | $ | 10,909 | ||||||||||
| Income from continuing operations(1) |
920 | 1,809 | 1,929 | 814 | 545 | |||||||||||||||
| Income (loss) from continuing operations attributable to The AES Corporation, net of tax |
(86 | ) | 710 | 1,170 | 428 | 123 | ||||||||||||||
| Discontinued operations, net of tax |
95 | (52 | ) | 64 | (523 | ) | 102 | |||||||||||||
| Extraordinary items, net of tax |
— | — | — | — | 22 | |||||||||||||||
| Net income (loss) attributable to The |
$ | 9 | $ | 658 | $ | 1,234 | $ | (95 | ) | $ | 247 | |||||||||
| Basic (loss) earnings per share: |
||||||||||||||||||||
| Income (loss) from continuing operations attributable to The AES Corporation, net of tax |
$ | (0.11 | ) | $ | 1.06 | $ | 1.75 | $ | 0.64 | $ | 0.19 | |||||||||
| Discontinued operations, net of tax |
0.12 | (0.07 | ) | 0.09 | (0.78 | ) | 0.15 | |||||||||||||
| Extraordinary items, net of tax |
— | — | — | — | 0.03 | |||||||||||||||
| Basic earnings (loss) per share |
$ | 0.01 | $ | 0.99 | $ | 1.84 | $ | (0.14 | ) | $ | 0.37 | |||||||||
| Diluted (loss) earnings per share: |
||||||||||||||||||||
| Income (loss) from continuing operations attributable to The AES Corporation, net of tax |
$ | (0.11 | ) | $ | 1.06 | $ | 1.73 | $ | 0.63 | $ | 0.19 | |||||||||
| Discontinued operations, net of tax |
0.12 | (0.08 | ) | $ | 0.09 | (0.77 | ) | 0.15 | ||||||||||||
| Extraordinary items, net of tax |
— | — | — | — | 0.03 | |||||||||||||||
| Diluted earnings (loss) per share |
$ | 0.01 | $ | 0.98 | $ | 1.82 | $ | (0.14 | ) | $ | 0.37 | |||||||||
| December 31, | ||||||||||||||||||||
| Balance Sheet Data: | 2010 | 2009 | 2008 | 2007 | 2006 | |||||||||||||||
| (in millions) | ||||||||||||||||||||
| Total assets |
$ | 40,511 | $ | 39,535 | $ | 34,806 | $ | 34,453 | $ | 31,274 | ||||||||||
| Non-recourse debt (long-term) |
$ | 12,544 | $ | 12,304 | $ | 11,254 | $ | 10,621 | $ | 9,136 | ||||||||||
| Non-recourse debt (long-term)—Discontinued operations |
$ | — | $ | 560 | $ | 615 | $ | 709 | $ | 1,046 | ||||||||||
| Recourse debt (long-term) |
$ | 4,149 | $ | 5,301 | $ | 4,994 | $ | 5,332 | $ | 4,790 | ||||||||||
| Cumulative preferred stock of a subsidiary |
$ | 60 | $ | 60 | $ | 60 | $ | 60 | $ | 60 | ||||||||||
| Retained earnings (accumulated deficit) |
$ | 620 | $ | 650 | $ | (8 | ) | $ | (1,241 | ) | $ | (1,093 | ) | |||||||
| The AES Corporation stockholders’ equity |
$ | 6,473 | $ | 4,675 | $ | 3,669 | $ | 3,164 | $ | 2,979 | ||||||||||
| (1) | Includes pretax impairment expense of $1.2 billion, $147 million, $175 million and $408 million for the years ended December 31, 2010, 2009, 2008 and 2007, respectively. |
112
Table of Contents
| ITEM 7. | MANAGEMENT’S DISCUSSION AND ANALYSIS OF FINANCIAL CONDITION AND RESULTS OF OPERATIONS |
We are a global power company. We operate two primary lines of business. The first is our Generation business, where we own and/or operate power plants to generate and sell power to wholesale customers such as utilities, other intermediaries and certain end-users. The second is our Utilities business, where we own and/or operate utilities to distribute, transmit and sell electricity to end-user customers in the residential, commercial, industrial and governmental sectors within a defined service area. For the year ended December 31, 2010, our Generation and Utilities businesses comprised approximately 45% and 55% of our consolidated revenue, respectively.
We are also continuing to expand our wind and solar generation businesses. These initiatives are not material contributors to our operating results at this time, but we believe that certain of these initiatives may become material in the future. For additional information regarding our business, see Item 1.—Business of this Form 10-K.
Our Organization and Segments. Our management reporting structure is organized along our two lines of business (Generation and Utilities) and three regions: (1) Latin America & Africa; (2) North America; and (3) Europe, Middle East & Asia (collectively “EMEA”), each managed by a regional president. The financial reporting segment structure uses our management reporting structure as its foundation and reflects how we manage the business internally. Based on our application of the segment reporting accounting guidance, which provides certain quantitative thresholds and aggregation criteria, we have concluded that the Company has the following six reportable segments:
| • | Latin America—Generation; |
| • | Latin America—Utilities; |
| • | North America—Generation; |
| • | North America—Utilities; |
| • | Europe—Generation; |
| • | Asia—Generation. |
We report the Company’s Europe Utilities, Africa Utilities, Africa Generation, Wind Generation and Climate Solutions operating segments within “Corporate and Other” because they do not meet the criteria to allow for aggregation with another operating segment or the quantitative thresholds that would require separate disclosure under segment reporting accounting guidance. None of these operating segments are currently material to our financial statement presentation of reportable segments, individually or in the aggregate. “Corporate and Other” also includes corporate overhead costs which are not directly associated with the operations of our six reportable segments and other intercompany charges such as self-insurance premiums which are fully eliminated in consolidation.
During the second quarter of 2010, the Company modified its internal reporting structure to move the management of the Company’s generation business in Jordan, Amman East, from Asia to Europe. Accordingly, Amman East is now reported within the Europe—Generation segment. All prior periods have been retrospectively restated to reflect this change and conform to current period presentation.
Key Drivers of Our Results of Operations. Our Generation and Utilities businesses are distinguished by the nature of their customers, operational differences, cost structure, regulatory environment and risk exposure. As a result, each line of business has slightly different drivers which affect operating results. Performance drivers for our Generation businesses include, among other things, plant reliability and efficiency, power prices, volume,
113
Table of Contents
management of fixed and variable operating costs, management of working capital including collection of receivables, and the extent to which our plants have hedged their exposure to currency and commodities such as fuel. For our Generation businesses which sell power under short-term contracts or in the spot market, the most crucial factors are the current market price of electricity and the marginal costs of production. Growth in our Generation business is largely tied to securing new PPAs, expanding capacity in our existing facilities and building or acquiring new power plants. Performance drivers for our Utilities businesses include, but are not limited to, reliability of service; management of working capital, including collection of receivables; negotiation of tariff adjustments; compliance with extensive regulatory requirements; and in developing countries, reduction of commercial and technical losses. The operating results of our Utilities businesses are sensitive to changes in economic growth and weather conditions in areas in which they operate. In addition to these drivers, as further explained below, the Company also has exposure to currency exchange rate fluctuations.
One of the key factors which affect our Generation business is our ability to enter into contracts for the sale of electricity and the purchase of fuel used to produce that electricity. Long-term contracts are intended to reduce exposure to volatility associated with fuel prices in the market and the price of electricity by fixing the revenue and costs for these businesses. The majority of the electricity produced by our Generation businesses is sold under long-term contracts, or PPAs, to wholesale customers. In turn, most of these businesses enter into long-term fuel supply contracts or fuel tolling arrangements where the customer assumes full responsibility for purchasing and supplying the fuel to the power plant. While these long-term contractual agreements reduce exposure to volatility in the market price for electricity and fuel, the predictability of operating results and cash flows vary by business based on the extent to which a facility’s generation capacity and fuel requirements are contracted and the negotiated terms of these agreements. Entering into these contracts exposes us to counterparty credit risk. For further discussion of these risks, see “Supplier and/or customer concentration may expose the Company to significant financial credit or performance risks” in Item 1A.—Risk Factors of this Form 10-K.
When fuel costs increase, many of our businesses are able to pass these costs on to their customers. Generation businesses with long-term contracts in place do this by including fuel pass-through or fuel indexing arrangements in their contracts. Utilities businesses can pass costs on to their customers through increases in current or future tariff rates. Therefore, in a rising fuel cost environment, the increased fuel costs for these businesses often result in an increase in revenue to the extent these costs can be passed through (though not necessarily on a one-for-one basis). Conversely, in a declining fuel cost environment, the decreased fuel costs can result in a decrease in revenue. Increases or decreases in revenue at these businesses that have the ability to pass through costs to the customer have a corresponding impact on cost of sales, to the extent the costs can be passed through, resulting in a limited impact on gross margin, if any. Although these circumstances may not have a large impact on gross margin, they can significantly affect gross margin as a percentage of revenue. As a result, gross margin as a percentage of revenue is a less relevant measure when evaluating our operating performance. To the extent our businesses are unable to pass through fuel cost increases to their customers, gross margin may be adversely affected.
Global diversification also helps us mitigate risk. Our presence in mature markets helps mitigate the exposure associated with our businesses in emerging markets. Additionally, our portfolio employs a broad range of fuels, including coal, gas, fuel oil, water (hydroelectric power), wind and solar, which reduces the risks associated with dependence on any one fuel source. However, to the extent the mix of fuel sources enabling our generation capabilities in any one market is not diversified, the spread in costs of different fuels or the availability of natural resources such as water for hydroelectric power production or wind may also influence the operating performance and the ability of our subsidiaries to compete within that market. For example, in a market where gas prices fall to a low level compared to coal prices, power prices may be set by low gas prices which can affect the profitability of our coal plants in that market. In certain cases, we may attempt to hedge fuel prices to manage this risk, but there can be no assurance that these strategies will be effective.
We also attempt to limit risk by hedging much of our interest rate and commodity risk, and by matching the currency of most of our subsidiary debt to the revenue of the underlying business. However, we only hedge a
114
Table of Contents
portion of our currency and commodity risks, and our businesses are still subject to these risks, as further described in Item 1A.—Risk Factors of this Form 10-K, “We may not be adequately hedged against our exposure to changes in commodity prices or interest rates.” Commodity and power price volatility could continue to impact our financial metrics to the extent this volatility is not hedged. For a discussion of our sensitivities to commodity, currency and interest rate risk, see Item 7A.—Quantitative and Qualitative Disclosures About Market Risk in this Form 10-K.
Due to our global presence, the Company has significant exposure to foreign currency fluctuations. The exposure is primarily associated with the impact of the translation of our foreign subsidiaries’ operating results from their local currency to U.S. Dollars that is required for the preparation of our consolidated financial statements. Additionally, there is foreign currency transaction exposure when an entity enters into transactions, including debt agreements, in currencies other than their functional currency. These risks are further described in Item 1A.—Risk Factors of this Form 10-K, “Our financial position and results of operations may fluctuate significantly due to fluctuations in currency exchange rates experienced at our foreign operations.” During 2010, changes in foreign currency exchange rates had a significant impact on our operating results. If the current foreign currency exchange rate volatility continues, our gross margin and other financial metrics could continue to be affected.
Another key driver of our results is our ability to bring new businesses into commercial operation successfully. We currently have approximately 1,300 MW of projects under construction in eight countries. Our prospects for improved operating results and cash flows are dependent upon successful completion of these projects on time and within budget. However, as disclosed in Item 1A.—Risk Factors of this Form 10-K, “Our business is subject to substantial development uncertainties,” construction is subject to a number of risks, including risks associated with site identification, financing, permitting and our ability to meet construction deadlines. Delays or the inability to complete projects and commence commercial operations can result in increased costs, impairment of assets and other challenges involving partners and counterparties to our construction agreements, PPAs and other agreements.
Our gross margin is also impacted by the fact that in each country in which we conduct business, we are subject to extensive and complex governmental regulations, such as regulations governing the generation and distribution of electricity, and environmental regulations which affect most aspects of our business. Regulations differ on a country by country basis (and even at the state and local municipality levels) and are based upon the type of business we operate in a particular country, and affect many aspects of our operations and development projects. Our ability to negotiate tariffs, enter into long-term contracts, pass through costs related to capital expenditures and otherwise navigate these regulations can have an impact on our revenue, costs and gross margin. Environmental and land use regulations, including existing and proposed regulation of GHG emissions, could substantially increase our capital expenditures or other compliance costs, which could in turn have a material adverse affect on our business and results of operations. For a further discussion of the Regulatory Environment, see Note 12—Contingencies and Commitments—Environmental, included in Item 8.—Financial Statements, Item 1.—Business—Regulatory Matters—Environmental and Land Use Regulations and Item 1A.—Risk Factors—Risks Associated with Government Regulation and Laws of this Form 10-K.
Key Drivers of Results in 2010
In 2010, the Company’s gross margin and cash flow from operations increased $531 million and $1.3 billion, respectively, while net income attributable to The AES Corporation decreased $649 million compared to the prior year.
During 2010, our North American generation businesses continued to face challenges associated with relatively lower gas prices and a decline in power prices relative to coal and other fuel. In particular, lower gas and power prices have affected the generation volume and financial results of our coal-fired plants in New York and our petroleum coke-fired plant in Texas which are merchant businesses and not subject to PPAs. We expect
115
Table of Contents
this trend to continue. In 2010, these challenges were partially mitigated by hedging arrangements. In North America, current dark spreads and the corresponding forward curves do not present a long-term opportunity to engage in hedging activity for 2011 and we have very limited hedges in place. As short-term opportunities occur or should dark spreads improve, the Company may engage in additional hedging in 2011. As a result of these and other challenges that arose from new regulatory concerns, we impaired $1.1 billion of assets and goodwill in North America as described in Impairments below. In addition, AES Thames, our 208 MW coal-fired generation business in Connecticut, filed for bankruptcy protection in January 2011.
Despite these challenges, many of our financial measures have improved when compared to 2009. Gross margin increased due to the favorable impact of foreign currency translation caused by a weaker U.S. dollar compared to most foreign currencies in 2010 and better operating performance at certain businesses. For instance, certain of the Company’s Latin American businesses experienced continued increases in market demand due to the local economic recovery in Latin America. The Company also benefited from higher demand and favorable market conditions at Masinloc, our generation business in the Philippines. Masinloc’s higher availability enabled the Company to benefit from increased contract and spot market sales and favorable market prices in the Philippines. In addition, cash provided by operating activities increased due to the improved operating results at Latin America generation businesses and Masinloc; contributions from the consolidation of Cartagena and the Ballylumford acquisition in 2010; and changes in working capital in Latin America.
Despite the increase in gross margin in 2010, net income attributable to The AES Corporation decreased primarily from the impact of long-lived asset impairments recognized related to four businesses: Eastern Energy in New York, Southland in California, Tisza II in Hungary and Deepwater in Texas. These were partially offset by gains from the sale of our discontinued businesses in Oman and Qatar and a decrease in goodwill impairment charges.
In 2011, we expect to face continued challenges in our business, including the trends in North America described above. In addition, the impact of fluctuating foreign exchange rates and commodity prices on our operations may continue into 2011. In 2011, the components of the tariff reset in Brazil and its potential impact on our Brazilian utilities are uncertain at this time and we expect continued challenges in our merchant businesses such as those in the U.S., Hungary and Northern Ireland. However, management expects that improved operating performance at certain businesses and growth from new businesses acquired, that commenced operations in 2010 or are expected to commence operations in 2011, may lessen or offset the impact of these challenges described above, as they did in 2010. However, if these favorable effects do not occur, or if the challenges described above or elsewhere in this section impact us more than we currently anticipate, or if volatile foreign currencies and commodities move unfavorably, then these adverse factors (or other adverse factors unknown to us) may impact our gross margin and net income attributable to The AES Corporation. In addition, we do not expect the trend of an increase in net cash provided by operating activities realized in 2010 to continue in 2011. Such cash flows may be influenced by the operating challenges presented above and will also not include the cash flows from operations which were sold in 2010 or the increases experienced from the cash flows provided by the initial consolidation of Cartagena, the acquisition of Ballylumford and several working capital transactions at our Latin American utilities in 2010 as discussed in Capital Resources and Liquidity.
The following briefly describes the key changes in our reported revenue, gross margin, net income attributable to The AES Corporation, diluted earnings per share from continuing operations, Adjusted Earnings per Share (a non-GAAP measure) and net cash provided by operating activities for the year ended December 31, 2010 compared to 2009 and 2008 and should be read in conjunction with our Consolidated Results of Operations and Segment Analysis discussion within Management’s Discussion and Analysis of Financial Condition.
116
Table of Contents
| Year Ended December 31, | ||||||||||||
| 2010 | 2009 | 2008 | ||||||||||
| (in millions, except per share amounts) | ||||||||||||
| Revenue |
$ | 16,647 | $ | 13,954 | $ | 15,197 | ||||||
| Gross Margin |
$ | 3,964 | $ | 3,433 | $ | 3,568 | ||||||
| Net Income Attributable to The AES Corporation |
$ | 9 | $ | 658 | $ | 1,234 | ||||||
| Diluted Earnings (Loss) per Share from Continuing Operations |
$ | (0.11 | ) | $ | 1.06 | $ | 1.73 | |||||
| Adjusted Earnings Per Share (a non-GAAP measure)(1) |
$ | 0.94 | $ | 1.06 | $ | 1.06 | ||||||
| Net Cash Provided by Operating Activities |
$ | 3,510 | $ | 2,202 | $ | 2,160 | ||||||
| (1) | See reconciliation and definition below under Non-GAAP Measure. |
Year Ended December 31, 2010
Revenue increased $2.7 billion, or 19%, to $16.6 billion in 2010 compared with $14.0 billion in 2009. Key drivers of the increase included:
| • | the favorable impact of foreign currency of $805 million; |
| • | increased volume and rates at our Brazilian utilities attributable to increased demand due to the recovery of the local economy and the favorable impact of the June 2009 tariff reset; |
| • | the impact of the consolidation of Cartagena, in Spain, in accordance with the new consolidation accounting guidance which became effective January 1, 2010; |
| • | the favorable impact of rates at our generation businesses in Argentina; |
| • | higher generation rates and volume at Masinloc in the Philippines; |
| • | higher demand at Gener in Chile; |
| • | the impact of the Company’s new business in Northern Ireland, acquired in August 2010; and |
| • | higher demand and rates at Indianapolis Power and Light. |
Gross margin increased $531 million, or 15%, to $4.0 billion in 2010 compared with $3.4 billion in 2009. Key drivers of the increase included:
| • | the favorable impact of foreign currency of $219 million; |
| • | an increase in demand at our generation and utilities businesses in Latin America; |
| • | higher generation rates and volume at Masinloc in the Philippines; and |
| • | the impact of the consolidation of Cartagena, in Spain, in accordance with the new consolidation accounting guidance which became effective January 1, 2010. |
These increases were partially offset by:
| • | an increase in fixed costs in Latin America, largely driven by bad debt recoveries and a reduction in bad debt expense in Brazil in 2009 that did not recur; and |
| • | lower rates at our generation businesses in New York. |
Net income attributable to The AES Corporation decreased $649 million to $9 million in 2010, compared to $658 million in 2009. Key drivers of the decrease included:
| • | Impairment losses in New York related to our Eastern Energy facilities, in California related to our Southland (Huntington Beach) generation facility, in Hungary related to our Tisza II generation facility and in Texas related to our Deepwater facility; |
117
Table of Contents
| • | A decrease in gain on sale of investments due to the sale of our businesses in Northern Kazakhstan which occurred in 2009; and |
| • | A decrease in other income due to the reduction in interest and penalties in 2009 associated with federal tax debts at Eletropaulo and Sul as a result of the Programa de Recuperacao Fiscal (“REFIS”) program and a favorable court decision in 2009 enabling Eletropaulo to receive reimbursement of excess non-income taxes paid from 1989 to 1992 in the form of tax credits to be applied against future tax liabilities. |
These decreases were partially offset by:
| • | The gain on sale of discontinued operations related to the sale of Barka which occurred in August 2010; |
| • | An increase in net equity in earnings of affiliates partially offset by income tax expense related to the sale of the Company’s indirect investment in Companhia Energética de Minas Gerais (“CEMIG”); |
| • | Lower impairment expenses related to a goodwill impairment of our business in Kilroot that occurred in 2009; |
| • | Lower income tax expense due to 2010 asset impairments primarily recorded at certain U.S. subsidiaries; and |
| • | An increase in gross margin as described above. |
Net cash provided by operating activities increased $1.3 billion, or 59%, to $3.5 billion in 2010 compared with $2.2 billion in 2009. This net increase was primarily due to the following:
| • | an increase of $837 million at our Latin American Utilities businesses due to increased tax payments in 2009 associated with a tax amnesty program of $326 million, higher working capital requirements during 2009 related to payments on the settlement of swap agreements of $65 million and in 2010, a $50 million decrease in employer contributions to pension plans and lower payments for contingencies; |
| • | an increase of $215 million at our Latin American Generation businesses due to the higher gross margin in 2010 combined with improved working capital mainly as a result of higher collections of value added taxes and accounts receivable; |
| • | an increase of $99 million at Masinloc in the Philippines due to higher gross margin; and |
| • | an increase of $58 million as a result of our consolidation of Cartagena in 2010 and the acquisition of Ballylumford in Northern Ireland. |
These increases were partially offset by:
| • | a decrease of $136 million in operating cash flows from discontinued operations of businesses sold in 2010 compared to 2009. In 2010, net cash provided by operating activities of businesses sold was $33 million and will not recur in 2011. |
In 2010 the increase in net cash provided by operating activities at our Latin American Utilities businesses included several items such as the tax amnesty program and settlement of swap agreements, as described above, that are not expected to recur. In addition, 2010 net cash provided by operating activities benefited from the one time cash savings related to the utilization of tax credits received as a result of the REFIS program. As such, the Company does not expect the trend of an increase in net cash provided by operating activities realized in 2010 to continue in 2011.
118
Table of Contents
Year Ended December 31, 2009
Revenue decreased $1.2 billion, or 8%, to $14.0 billion in 2009 compared with $15.2 billion in 2008. Key drivers of the decrease included:
| • | the unfavorable impact of foreign currency of $997 million, largely driven by the Brazilian Real; |
| • | decreases in volume at Uruguaiana due to the renegotiation of its power sales agreements in 2009 to reduce the energy volume sold, as well as in New York and Hungary and lower dispatch in Northern Ireland due to unfavorable gas prices compared to coal; |
| • | the impact of lower spot and contract energy prices at our generation business in Chile; and |
| • | lower energy prices and volume at our generation businesses in the Dominican Republic. |
These decreases were partially offset by:
| • | an increase in tariff rates at our utilities businesses in Latin America primarily reflecting the recovery of energy purchases that were passed through to our customers. |
Gross margin decreased $135 million, or 4%, to $3.4 billion in 2009 compared with $3.6 billion in 2008. Key drivers of the decrease included:
| • | the unfavorable impact of foreign currency of $218 million, largely driven by the Brazilian Real; |
| • | lower energy prices and higher purchased energy costs at our generation businesses in the Dominican Republic and Argentina; |
| • | increased pension costs in Brazil and the U.S.; and |
| • | lower volume in New York due to lower spot market rates. |
These decreases were partially offset by:
| • | improved operating performance at our generation businesses in Chile and the Philippines; |
| • | higher tariffs in Brazil and El Salvador; and |
| • | bad debt recoveries and a reduction in bad debt expense in Brazil. |
Net income attributable to The AES Corporation decreased $576 million to $658 million in 2009, compared to $1.2 billion in 2008. Key drivers of the decrease included:
| • | a gain recognized in 2008 from the sale of two wholly-owned subsidiaries in Northern Kazakhstan partially offset by a performance incentive bonus recognized in 2009 for management services provided to these subsidiaries and a settlement upon termination of the management agreement in 2009; |
| • | the reduction in gross margin in 2009 as described above; and |
| • | higher impairment expenses in 2009 as a result of an impairment of goodwill at Kilroot in Northern Ireland, and an impairment recognized on our assets in Pakistan which is reflected in discontinued operations, offset by a decline in long-lived asset impairment compared to 2008. |
These decreases were partially offset by:
| • | a reduction in foreign currency transaction losses on net monetary position as a result of reduced losses at our businesses in Chile and the Philippines; |
| • | a reduction in interest expense due primarily to lower interest rates and debt balances in Brazil and favorable foreign currency translation; and |
| • | lower income tax expenses driven in part by lower pre-tax income and a decrease in the effective tax rate from 29% in 2008 to 26% in 2009 due, in part, to tax benefits recorded in 2009 upon the release of |
119
Table of Contents
| valuation allowances at U.S. and Brazilian subsidiaries, $165 million of non-taxable income recognized in Brazil as a result of the REFIS program in 2009 and an increase in U.S. taxes on distributions from the Company’s primary holding company in the second quarter of 2008. |
In 2008, the $905 million gain recognized on the sale of our two Northern Kazakhstan businesses had a significant impact on net income attributable to The AES Corporation. In 2009, the Company recognized a performance incentive bonus of $80 million in the first quarter for management services provided to these sold businesses, reflected as other income. Additionally, in the second quarter of 2009, the Company recognized an additional gain on the sale of the businesses of $98.5 million upon the termination of the management agreement. While the Company engages in the sale of assets and businesses from time to time, the gain or loss recognized in any such sale will depend on a number of factors related to the asset or business that may be sold. Therefore, the Company does not believe that the decline in net income between 2008 and 2009 represents a trend. All of the amounts related to our two Northern Kazakhstan businesses were reported in continuing operations and will not recur in 2010 or future years.
Net cash from operating activities increased $42 million, or 2%, to $2.2 billion in 2009 compared with $2.2 billion in 2008. This net increase was primarily due to the following:
| • | an increase of $238 million at our Latin American Generation businesses due to improved working capital management; |
| • | an increase of $148 million at our Asia Generation businesses due to improved working capital management and improved gross margin; and |
| • | an increase of $115 million at our Europe Generation businesses primarily due to the collection of the $80 million Kazakhstan management performance incentive bonus in the first quarter 2009. |
These increases were partially offset by:
| • | a decrease of $391 million at our Latin American Utilities businesses due to increased working capital requirements, including the payment of the settlement of a swap agreement, increased tax payments associated with a tax amnesty program and increased payments related to the settlement of contingencies and energy purchases, partially offset by increased operating results; and |
| • | a decrease of $77 million at our North America Generation businesses, primarily due to reduced operating results. |
We define adjusted earnings per share (“Adjusted EPS”) as diluted earnings per share from continuing operations excluding gains or losses of the consolidated entity due to (a) mark-to-market amounts related to derivative transactions, (b) unrealized foreign currency gains or losses, (c) significant gains or losses due to dispositions and acquisitions of business interests, (d) significant losses due to impairments, and (e) costs due to the early retirement of debt. The GAAP measure most comparable to Adjusted EPS is diluted earnings per share from continuing operations. AES believes that Adjusted EPS better reflects the underlying business performance of the Company and is considered in the Company’s internal evaluation of financial performance. Factors in this determination include the variability due to mark-to-market gains or losses related to derivative transactions, currency gains or losses, losses due to impairments and strategic decisions to dispose or acquire business interests or retire debt, which affect results in a given period or periods. Adjusted EPS should not be construed as an alternative to diluted earnings per share from continuing operations, which is determined in accordance with GAAP.
For the year ended December 31, 2010, the Company reported a loss from continuing operations of $0.11 per share. For purposes of measuring loss per share under GAAP, common stock equivalents were excluded from weighted average shares as their inclusion would be antidilutive. However, for purposes of computing Adjusted
120
Table of Contents
EPS (a non-GAAP measure), the Company has included the impact of dilutive common stock equivalents as the inclusion of the defined adjustments result in income for Adjusted EPS. The table below reconciles the weighted average shares used in GAAP diluted earnings per share to the weighted average shares used in calculating the non-GAAP measure of Adjusted EPS:
| Year Ended December 31, 2010 | ||||||||||||
| Reconciliation of Denominator used for Adjusted Earnings Per Share | Loss | Shares | $ per Share | |||||||||
| GAAP DILUTED EARNINGS PER SHARE |
||||||||||||
| Loss from continuing operations attributable to The AES Corporation common stockholders |
$ | (86 | ) | 769 | $ | (0.11 | ) | |||||
| EFFECT OF DILUTIVE SECURITIES |
||||||||||||
| Stock options |
— | 2 | — | |||||||||
| Restricted stock units |
— | 3 | — | |||||||||
| NON-GAAP DILUTED EARNINGS (LOSS) PER SHARE |
$ | (86 | ) | 774 | $ | (0.11 | ) | |||||
| Year Ended December 31, | ||||||||||||
| Reconciliation of Adjusted Earnings Per Share | 2010 | 2009 | 2008 | |||||||||
| Diluted earnings (loss) per share from continuing operations |
$ | (0.11 | ) | $ | 1.06 | $ | 1.73 | |||||
| Derivative mark-to-market (gains) losses(1) |
(0.01 | ) | 0.02 | 0.05 | ||||||||
| Currency transaction (gains) losses(2) |
(0.04 | ) | (0.04 | ) | 0.17 | |||||||
| Disposition/acquisition (gains) losses |
— | (3) | (0.19 | )(4) | (1.27 | )(5) | ||||||
| Impairment losses |
1.07 | (6) | 0.21 | (7) | 0.13 | (8) | ||||||
| Debt retirement (gains) losses |
0.03 | (9) | — | 0.25 | (10) | |||||||
| Adjusted earnings per share |
$ | 0.94 | $ | 1.06 | $ | 1.06 | ||||||
| (1) | Derivative mark-to-market (gains) losses were net of income tax per share of $0.00, $0.01 and $0.00 in 2010, 2009 and 2008, respectively. |
| (2) | Unrealized foreign currency transaction (gains) losses were net of income tax per share of $0.00, $0.01 and $0.00 in 2010, 2009 and 2008, respectively. |
| (3) | The Company has not adjusted for the gain or the related tax effect from the sale of its indirect investment in CEMIG, disclosed in Note 7—Investments in and Advances to Affiliates, in its determination of Adjusted EPS because the gain was recognized by an equity method investee. The Company does not adjust for transactions of its equity method investees in its determination of adjusted EPS. |
| (4) | Amount includes: Kazakhstan gain of $98 million, or $0.15 per share, related to the termination of a management agreement as well as a gain of $13 million, or $0.02 per share, related to the reversal of a withholding tax contingency. In addition, there was a gain on sale associated with the shutdown of the Hefei plant in China of $14 million, or $0.02 per share. There were no taxes associated with any of these transactions. |
| (5) | Amount includes: Net gain on Kazakhstan sale of $905 million, or $1.31 per share, and net loss on sale of subsidiary interests in Gener of $31 million, or $0.04 per share. There was no income tax impact associated with these transactions. |
| (6) | Amount primarily includes asset impairments at Eastern Energy of $827 million, Southland (Huntington Beach) of $200 million, Tisza of $85 million, and Deepwater of $79 million ($537 million, or $0.69 per share, $130 million, or $0.17 per share, $69 million, or $0.09 per share, and $51 million, or $0.07 per share, net of income tax, respectively) and goodwill impairment at Deepwater of $18 million (or $0.02 per share, with no income tax impact). |
| (7) | Amount includes: Goodwill impairments at Kilroot of $118 million, or $0.18 per share, and in the Ukraine of $4 million, or $0.01 per share; write-off of development project costs in Latin America and Asia of $19 million ($11 million net of noncontrolling interests, or $0.01 per share) and an impairment of $10 million, or $0.01 per share, of the Company’s investment in a company developing “blue gas” (coal to gas) technology. There was no income tax impact associated with any of these transactions. |
121
Table of Contents
| (8) | Amount includes: Impairment charges primarily associated with development projects in North America of $75 million ($34 million net of noncontrolling interests and income tax, or $0.06 per share); Uruguaiana asset write-down of $36 million ($17 million net of noncontrolling interest, or $0.02 per share); South Africa peaker development cost write-off of $31 million ($28 million net of income tax, or $0.04 per share) and a nontaxable impairment of the Company’s investment in “blue gas” (coal to gas) technology of $10 million, or $0.01 per share. Impairment losses are net of an income tax benefit of $0.02 per share in 2008. |
| (9) | Amount includes loss on retirement of debt at the Parent Company of $15 million, at Andres of $10 million, and at Itabo of $8 million ($10 million, or $0.01 per share, net of income tax at the Parent Company, $0.01 per share at Andres, and $4 million, or $0.01 per share, net of noncontrolling interest at Itabo). |
| (10) | Amount includes: $55 million ($34 million net of income tax, or $0.05 per share) loss on the retirement of Parent Company debt; $131 million, or $0.19 per share, which represented the tax impact on the repatriation of a portion of the Kazakhstan sale proceeds that were used to fund the early retirement of Parent Company debt; and $14 million ($9 million net of income tax, or $0.01 per share) of debt refinancing at IPALCO. Debt retirement (gains) losses are net of an income tax benefit of $0.04 per share in 2008. |
Management’s Priorities
Management continues to focus on the following priorities:
| • | Execution of our balanced capital allocation strategy including funds received in 2010 from asset and equity sales: |
| • | investing in value-accretive projects; |
| • | delevering to increase financial flexibility, reduce risk and to create future borrowing capacity; and |
| • | executing its stock repurchase program; from July through December 2010 we have repurchased a total of $99 million, or approximately 8.4 million shares of AES common stock, at an average price per share of $11.86, including commissions. |
| • | Improvement of operations in the existing portfolio; |
| • | Achieve cost savings through the alignment of overhead costs with business requirements, systems automation and optimal allocation of business development spending; |
| • | Strategic portfolio management of existing projects including restructuring and potential sales of certain North American generation subsidiaries; |
| • | Completion of an approximately 1,300 MW active construction program on time and within budget; |
| • | Achieving commercial operation at Maritza in Bulgaria. At the end of 2010, the Company experienced certain commissioning delays, as further described in Key Trends and Uncertainties—Development below; and |
122
Table of Contents
| • | Integration of new projects. During 2010, the following projects were acquired or commenced commercial operations: |
| Project |
Location | Fuel | Gross MW |
AES Equity Interest (Percent, Rounded) |
||||||||
| Ballylumford |
United Kingdom | Gas | 1,246 | 100 | % | |||||||
|
JHRH(1) |
China | Hydro | 379 | 35 | % | |||||||
| Nueva Ventanas |
Chile | Coal | 272 | 71 | % | |||||||
| St. Nikola |
Bulgaria | Wind | 156 | 89 | % | |||||||
| Guacolda 4(2) |
Chile | Coal | 152 | 35 | % | |||||||
| Dong Qi(3) |
China | Wind | 49 | 49 | % | |||||||
| Huanghua II(3) |
China | Wind | 49 | 49 | % | |||||||
| St. Patrick |
France | Wind | 35 | 100 | % | |||||||
| North Rhins |
Scotland | Wind | 22 | 100 | % | |||||||
| Kepezkaya |
Turkey | Hydro | 28 | 51 | % | |||||||
| Damlapinar(4) |
Turkey | Hydro | 16 | 51 | % | |||||||
| (1) | Jianghe Rural Electrification Development Co. Ltd. (“JHRH”) and AES China Hydropower Investment Co. Ltd. entered into an agreement to acquire a 49% interest in this joint venture in June 2010. Acquisition of 35% ownership was completed in June 2010 and the transfer of the remaining 14% ownership, which is subject to approval by the Chinese government, is expected to be completed in May 2011. |
| (2) | Guacolda is an equity method investment indirectly held by AES through Gener. The AES equity interest reflects the 29% noncontrolling interests in Gener. |
| (3) | Joint venture with Guohua Energy Investment Co. Ltd. |
| (4) | Joint Venture with I.C. Energy. |
Key Trends and Uncertainties
Our operations continue to face many risks as discussed in Item 1A.—Risk Factors of this Form 10-K. Some of these challenges are also described above in Key Drivers of Results in 2010. We continue to monitor our operations and address challenges as they arise.
Development. During the past year, the Company has successfully acquired and completed construction of a number of projects, totaling approximately 2,404 MW, including the acquisition of Ballylumford in the United Kingdom and completion of construction of a number of projects in Europe, Chile and China. However, as discussed in Item 1A.—Risk Factors—Our business is subject to substantial development uncertainties of this Form 10-K, our development projects are subject to uncertainties. Certain delays have occurred at the 670 MW Maritza coal-fired project in Bulgaria, and the project has not yet begun commercial operations. As noted in Note 10—Debt included in Item 8 of this Form 10-K, as a result of these delays the project debt is in default and the Company is working with its lenders to resolve the default. In addition, as noted in Item 3.—Legal Proceedings, the Company is in litigation with the contractor regarding the cause of delays. At this time, we believe that Maritza will commence commercial operations for at least some of the project’s capacity by the second half of 2011. However, commencement of commercial operations could be delayed beyond this time frame. There can be no assurance that Maritza will achieve commercial operations, in whole or in part, by the second half of 2011, resolve the default with the lenders or prevail in the litigation referenced above, which could result in the loss of some or all of our investment or require additional funding for the project. Any of these events could have a material adverse effect on the Company’s operating results or financial position.
Global Economic Conditions. During the past few years, economic conditions in some countries where our subsidiaries conduct business have deteriorated. Although the economic conditions in several of these countries have improved in recent months, our businesses could be impacted in the event these recent trends do not continue.
123
Table of Contents
Our business or results of operations could be impacted if our subsidiaries are unable to access the capital markets on favorable terms or at all, are unable to raise funds through the sale of assets or are otherwise unable to finance or refinance their activities. The Company could also be adversely affected if capital market disruptions result in increased borrowing costs (including with respect to interest payments on the Company’s or our subsidiaries’ variable rate debt) or if commodity prices affect the profitability of our plants or their ability to continue operations. Additionally, the Company could be adversely affected if general economic or political conditions in the markets where our subsidiaries operate deteriorate, resulting in a reduction in cash flow from operations, a reduction in the availability and/or an increase in the cost of capital, or if the value of our assets remain depressed or decline further. Any of the foregoing events or a combination thereof could have a material impact on the Company, its results of operations, liquidity, financial covenants, and/or its credit rating.
Our subsidiaries are subject to credit risk, which includes risk related to the ability of counterparties (such as parties to our PPAs, fuel supply agreements, hedging agreements and other contractual arrangements) to deliver contracted commodities or services at the contracted price or to satisfy their financial or other contractual obligations. The Company has not suffered any material effects related to its counterparties during 2010. However, if macroeconomic conditions impact our counterparties, they may be unable to meet their commitments which could result in the loss of favorable contractual positions, which could have a material impact on our business.
In addition, during the past year, certain European countries have faced a sovereign debt crisis and it is possible that other nations could be affected. This crisis has resulted in an increased risk of default by governments and the implementation of austerity measures in countries. If the crisis continues, worsens, or spreads, there could be a material adverse impact on the Company. Our businesses may be impacted if they are unable to access the capital markets, face increased taxes or labor costs, or if governments fail to fulfill their obligations to us or adopt austerity measures which adversely impact our projects. In addition, as noted in the Risk Factor entitled, “Our renewable energy projects and other initiatives face considerable uncertainties including development, operational and regulatory challenges,” our renewables businesses are dependent on favorable regulatory incentives, including subsidies, which are provided by sovereign governments. If these subsidies or other incentives are reduced or repealed, or sovereign governments are unable or unwilling to fulfill their commitments or maintain favorable regulatory incentives for renewables, in whole or in part, this could impact the ability of the affected businesses to continue to grow their operations. For example, the Spanish government recently issued a decree which limits the feed-in-tariff and number of photovoltaic hours eligible for the tariff, which could adversely impact AES Solar in Spain. For further information on the decree see Item 1.— Regulatory—Spain of this Form 10-K. In addition, any of the foregoing could also impact contractual counterparties of our subsidiaries in core power or renewables. If such counterparties are adversely impacted, then they may be unable to meet their commitments to our subsidiaries. For further information on the importance of long-term contracts and our counterparty credit risk, see the Risk Factor from this Form 10-K titled, “We may not be able to enter into long-term contracts, which reduce volatility in our results of operations…”. As a result of any of the foregoing events, we may have to provide loans or equity to support affected businesses or projects, restructure them, write down their value and/or face the possibility that these projects cannot continue operations or provide returns consistent with our expectations, any of which could have a material impact on the Company. The Company’s investment in AES Solar, whose primary operations are in Europe, at December 31, 2010 was $312 million.
For a discussion of the risks associated with commodity prices, see “We may not be adequately hedged against our exposure to changes in commodity prices or interest rates” in Item 1A.—Risk Factors of this Form 10-K. It is also possible that commodity or power price volatility could continue to impact our financial results. As noted in Key Drivers of Results in 2010, and Item 7A.—Quantitative and Qualitative Disclosures About Market Risk—Commodity Price Risk of this Form 10-K, the Company’s North American businesses continue to face pressure as a result of high coal prices relative to natural gas, which has affected the results of certain of our coal plants in the region, particularly those which are merchant plants that are exposed to market risk and those that have hybrid merchant risk, meaning those businesses that have a PPA in place, but purchase
124
Table of Contents
fuel at market prices or under short term contracts. If these conditions continue or worsen, these businesses may need to restructure their obligations or seek additional funding (including from the Parent) or face the possibility that they may be unable to meet their obligations and continue operations. Presently, Eastern Energy, Deepwater and Thames are seeking to restructure their financial obligations and/or place certain of their plants in protective layup status to mitigate operating risks caused by high fuel costs and other competitive pressures. There can be no assurance the Company will be successful in these efforts.
The Company presently manages its commodity risk with hedging activities to mitigate earnings volatility. However, at present in North America, dark spreads and the corresponding forward curves do not currently present an opportunity to engage in additional hedging activity for 2011. As a result, there are hedging arrangements in place for only a relatively small portion of 2011. As short-term opportunities occur or should dark spreads improve, the Company may engage in additional hedging in 2011. Specifically, the operating results of the Company’s Eastern Energy generation business in New York could be adversely impacted by continued higher coal prices relative to electricity prices if hedging continues to be uneconomic.
If global economic conditions worsen, it could also affect the rates we receive for the electricity we generate or transmit. Utility regulators or parties to our generation contracts may seek to lower our rates based on prevailing market conditions as PPAs, concession agreements or other contracts come up for renewal or reset. In addition, rising fuel and other costs coupled with contractual rate or tariff decreases could restrict our ability to operate profitably in a given market. Each of these factors, as well as those discussed above, could result in a decline in the value of our assets including those at the businesses we operate, our equity investments and projects under development and could result in asset impairments that could be material to our operations. We continue to monitor our projects and businesses.
Impairments.
Long-lived assets. The global economic conditions and other adverse factors discussed above heighten the risk of a significant asset impairment. Examples of conditions that could be indicative of impairment which would require us to evaluate the recovery of a long-lived asset or asset group include:
| • | current period operating or cash flow losses combined with a history of operating or cash flow losses or a projection that demonstrates continuing losses associated with the use of a long-lived asset group; |
| • | a significant adverse change in legal factors, including changes in environmental or other regulations or in the business climate that could affect the value of a long-lived asset group, including an adverse action or assessment by a regulator; and |
| • | a significant adverse change in the extent or manner in which a long-lived asset group is being used or in its physical condition. |
As further described in Item 1.—Regulatory Matters—United Kingdom, the Northern Ireland Authority for Utility Regulation (“NIAUR”) had the right to require the termination of the long-term PPAs under which Kilroot, our generation business in the United Kingdom, supplies electricity to NIE Energy as early as 2010. One of the conditions to the early termination was 180 days’ notice, which was provided to Kilroot on April 30, 2010. At March 31, 2010, management evaluated Kilroot’s long-lived assets for potential impairment assuming the early termination of the PPA and concluded that no impairment existed at that time. On October 28, 2010, Kilroot received final notice from NIAUR directing Kilroot and NIE Energy to terminate the PPA effective November 1, 2010. Kilroot may not be able to replace the contract on competitive terms and, upon cancellation of the PPA effective November 1, 2010, became a merchant plant. It will operate under the gross mandatory pool of the SEM in Northern Ireland. There have been no additional impairment indicators since March 31, 2010.
AES Eastern Energy (“AEE”) operates four coal-fired power plants: Cayuga, Greenidge, Somerset and Westover, representing generation capacity of 1,169 MW in the western New York power market. During 2010, the power prices in the New York power market trended downward, similar to North America natural gas prices.
125
Table of Contents
The New York Independent System Operator (“NYISO”) continues to move forward with the potential addition of a new capacity zone, which is expected to put further downward pressure on the capacity prices paid to the AEE facilities. In November 2010, legislation was proposed in the state of New Jersey for the addition of state subsidized capacity additions serving to lower PJM capacity price expectations. Similar changes to capacity pricing may be made in the future in New York. Continued pressure on energy prices, driven by falling natural gas prices and state actions, indicate that capacity prices are unlikely to reach levels significantly in excess of those achieved historically. Accordingly, management’s view of long-term capacity markets in western New York was revised downward. In December 2010, management revised its cash flow forecasts based on these developments and forecasted continuing negative operating cash flow and losses through 2034. The forecasted energy prices are such that a hedge strategy significantly beyond those in place at December 31, 2010 would not be economical. Additionally, on November 15, 2010, Standard & Poor’s downgraded the bond rating of AEE from BB to B+. Collectively, in the fourth quarter of 2010, these events were considered an impairment indicator for the AES New York asset group, of which AEE is the most significant component and necessitated an impairment evaluation of the asset group.
The long-lived asset group subject to the impairment evaluation was determined to include all of the generating plants of AEE. This determination was based on the assessment of the plants’ inability to generate independent cash flow. When the recoverability test of the asset group was performed, management concluded that, on an undiscounted cash flow basis, the carrying amount of the asset group was not recoverable. To measure the amount of impairment loss, management was required to determine the fair value of the asset group. To this end, an independent valuation firm was engaged to assist management in its estimation of fair value. Cash flow forecasts and the underlying assumptions for the valuation were developed by management. While there were numerous assumptions that impact the fair value, potential state actions that impact capacity pricing and forward energy prices were the most significant.
In determining the fair value of the asset group, the three valuation approaches prescribed by the fair value measurement accounting guidance were considered. The fair value under the income approach was considered the most appropriate and resulted in a zero fair value. Any salvage value of the asset group is expected to be offset by environmental and other remediation costs. Accordingly, the long-lived asset group was considered fully impaired and $827 million of impairment expense was recognized in the fourth quarter of 2010.
In March 2010, Deepwater, our 160 MW petroleum coke (“pet coke”)-fired merchant power plant located in Texas, experienced deteriorating market conditions due to increasing pet coke prices and diminishing power prices. As a result, Deepwater incurred an operating loss for the period and forecasted short term losses. These conditions gradually worsened in the second quarter of 2010 and management determined it could not operate the plant at certain times during the year without generating negative operating margin.
As the contraction of energy margin continued in the second quarter of 2010, management determined the collective events to be an indicator of impairment and performed an impairment evaluation of Deepwater’s goodwill and recoverability test for the long-lived asset group. Based on the results of these tests, in the second quarter of 2010, management concluded no impairment was necessary. In the third quarter of 2010, these downward trends continued and management, after determining that there was an indicator of impairment, performed another impairment evaluation of Deepwater’s goodwill and a recoverability test of the long-lived asset group. The results in the third quarter indicated no impairment was necessary for the asset group, but the goodwill associated with the reporting unit was deemed to be impaired and the $18 million goodwill balance was written-off during the quarter ended September 30, 2010.
In the fourth quarter of 2010, further adverse trends in energy and pet coke pricing curves were observed in management’s review of external market analyses. The most significant impact on the forecasted energy prices reviewed by management in November 2010 related to the general external market consensus that Federal CO2 cap and trade legislation was less likely, resulting in a drop in long-term energy price projections. At that time, Deepwater’s revised forecasts indicated that Deepwater would have operating losses which would extend beyond
126
Table of Contents
2020 and negative cash flows through 2019. Management concluded that, on an undiscounted cash flow basis, the carrying amount of the asset group was no longer recoverable. To measure the amount of impairment loss, management was required to determine the fair value of the asset group. To this end, an independent valuation firm was engaged to assist management in its estimation of fair value. Cash flow forecasts and the underlying assumptions for the valuation were developed by management. In determining the fair value of the asset group, all three valuation approaches described by the fair value measurement accounting guidance were considered. The fair value under the income approach was considered most appropriate. On that basis, the carrying value of the asset group was determined to be impaired and $79 million of impairment expense was recognized in the fourth quarter of 2010.
In May 2010, the California State Water Board approved a policy to reduce the number of marine animals killed by seawater cooling systems in coastal power plants in California. At that time, since the policy required the approval of California’s Office of Administrative Law, it was unclear whether the policy would be approved and what form the regulations would take. In September 2010, the Office of Administrative Law in California approved the policy that will require the Company to change the process through which it uses ocean water to cool the generation turbines at its Alamitos, Huntington Beach and Redondo Beach (collectively “Southland”) gas-fired generation facilities in California. The policy requires compliance with the new regulations by December 31, 2020. The change in the water cooling process will result in significant future capital expenditures to ensure compliance with the new regulations. This was considered as an impairment indicator for the long-lived asset groups. The recoverability test of the long-lived asset groups indicated that the carrying amount of the Huntington Beach asset group was not recoverable on an undiscounted cash flows basis. To assist management in determining the fair value of the asset group, an independent valuation firm was engaged. Cash flow forecasts and the underlying assumptions for the valuation were developed by management. The carrying amount of the Huntington Beach asset group exceeded its fair value by $200 million which was recognized as an impairment expense. The carrying amounts of the Alamitos and Redondo Beach long-lived asset groups were determined to be recoverable on an undiscounted cash flows basis at September 30, 2010 and no impairment was necessary.
During the third quarter of 2010, we also recognized impairment on the long-lived assets at our Tisza II generation plant in Hungary. Tisza II operates under an annual contract with an off-taker. In the third quarter of 2010, when Tisza II began the negotiation of its 2011 contract, future undiscounted cash flows of the plant were no longer expected to recover the long-lived assets group’s carrying amount due to prevailing market rates, higher generation costs and lower demand expectations. Accordingly, the Company measured the fair value of the long-lived asset group and recorded an impairment expense of $85 million, representing the excess of carrying amount over the fair value at September 30, 2010.
Goodwill. The Company seeks business acquisitions as one of its growth strategies. We have achieved significant growth in the past as a result of several business acquisitions, which also resulted in the recognition of goodwill. As noted in Item 1A.—Risk Factors of this Form 10-K, there is always a risk that “Our acquisitions may not perform as expected.” The benefits of goodwill are typically realized through the future operating results of an acquired business. Management believes that the recoverability of goodwill is positively correlated with the economic environments in which our acquired businesses operate and a severe economic downturn could negatively impact the recoverability of goodwill. Also, the evolving environmental regulations, including GHG regulations, around the globe continue to increase the operating costs of our generation businesses. In extreme situations, the environmental regulations could even make a once profitable business uneconomical. In addition, most of our generation businesses have a finite life and as the acquired businesses reach the end of their finite lives, the carrying amount of goodwill is gradually recovered through their periodic operating results. The accounting guidance, however, prohibits the systematic amortization of goodwill and rather requires an annual impairment evaluation. Thus, as some of our acquired businesses approach the end of their finite lives, they may incur goodwill impairment charges even if there are no discrete adverse changes in the economic environment.
As noted in Long-lived assets above, adverse market conditions at Deepwater were also considered an interim impairment indicator for its goodwill. Accordingly, in the second and third quarters of 2010, interim
127
Table of Contents
goodwill impairment evaluations were performed at the Deepwater reporting unit level. The reporting unit passed Step 1 of goodwill impairment evaluation in the second quarter and no impairment was recognized. In the third quarter, however, the reporting unit failed Step 1 of goodwill impairment evaluation. Upon measurement of impairment loss in Step 2, the entire $18 million goodwill balance was considered impaired and recognized as goodwill impairment.
In the fourth quarter of 2010, the Company completed its annual goodwill impairment evaluation and did not have any reporting units that were considered “at risk.” A reporting unit is considered “at risk” when its fair value is not higher than its carrying amount by more than 10%. While there were no potential impairment indicators that could result in the recognition of goodwill impairment for any of these reporting units, it is possible we may incur goodwill impairment on these reporting units in future years if any of the following events occur: a significant adverse change in business climate or legal factors, an adverse action or assessment by a regulator, a sale of assets at less than carrying amount, unanticipated competition, a loss of key personnel, an acquisition not performing as expected, changing environmental regulations that significantly increase the cost of doing business, or a business reaches the end of its finite life. The likelihood of the occurrence of these events may increase because of the challenging global macroeconomic conditions.
Regulatory— Environment. The Company faces certain risks and uncertainties related to numerous environmental laws and regulations, including existing and potential GHG legislation or regulations, and actual or potential laws and regulations pertaining to water discharges, waste management (including disposal of coal combustion byproducts), and certain air emissions, such as SO2, NOx, particulate matter and mercury. For a description of material regulations faced by the Company, see Item 1. —Business —Regulatory Matters. Such risks and uncertainties could result in increased capital expenditures or other compliance costs which could have a material adverse effect on certain of our United States or international subsidiaries and our consolidated results of operations. For further information about these risks, see Item 1A.—Risk Factors, “Our businesses are subject to stringent environmental laws and regulations”, “Our businesses are subject to enforcement initiatives from environmental regulatory agencies” and “Regulators, politicians, non-governmental organizations and other private parties have expressed concern about greenhouse gas, or GHG, emissions and the potential risks associated with climate change and are taking actions which could have a material adverse impact on our consolidated results of operations, financial condition and cash flows” set forth in this Form 10-K.
Recent Events
Subsequent to December 31, 2010, the Company continued to repurchase stock under the stock repurchase program announced on July 7, 2010. The Company has repurchased 1,026,610 shares at a cost of $13 million in 2011, bringing the cumulative total through February 22, 2010 to 9,409,435 shares at a total cost of $112 million (average price of $11.92 per share including commissions). As of February 25, 2011, $388 million of the $500 million authorized remained available under the stock repurchase program. For additional information, see Note 14—Equity.
On February 1, 2011, AES Thames, LLC (“Thames”), our 208 MW coal-fired plant in Connecticut, filed petitions for bankruptcy protection under Chapter 11 in the U. S. Bankruptcy Court. The bankruptcy is due, in part, to the increased cost of energy production. The bankruptcy protection is not expected to have a material impact on the Company’s financial position or the results of operations.
128
Table of Contents
Consolidated Results of Operations
| Year Ended December 31, | ||||||||||||||||||||
| Results of operations | 2010 | 2009 | 2008 | $ change 2010 vs. 2009 |
$ change 2009 vs. 2008 |
|||||||||||||||
| (in millions, except per share amounts) | ||||||||||||||||||||
| Revenue: |
||||||||||||||||||||
| Latin America Generation |
$ | 4,281 | $ | 3,651 | $ | 4,468 | $ | 630 | $ | (817 | ) | |||||||||
| Latin America Utilities |
7,222 | 6,092 | 5,907 | 1,130 | 185 | |||||||||||||||
| North America Generation |
1,972 | 1,940 | 2,234 | 32 | (294 | ) | ||||||||||||||
| North America Utilities |
1,145 | 1,068 | 1,079 | 77 | (11 | ) | ||||||||||||||
| Europe Generation |
1,362 | 820 | 1,143 | 542 | (323 | ) | ||||||||||||||
| Asia Generation |
618 | 375 | 345 | 243 | 30 | |||||||||||||||
| Corporate and Other(1) |
1,066 | 870 | 1,012 | 196 | (142 | ) | ||||||||||||||
| Eliminations(2) |
(1,019 | ) | (862 | ) | (991 | ) | (157 | ) | 129 | |||||||||||
| Total Revenue |
$ | 16,647 | $ | 13,954 | $ | 15,197 | $ | 2,693 | $ | (1,243 | ) | |||||||||
| Gross Margin: |
||||||||||||||||||||
| Latin America Generation |
$ | 1,497 | $ | 1,357 | $ | 1,398 | $ | 140 | $ | (41 | ) | |||||||||
| Latin America Utilities |
1,072 | 918 | 886 | 154 | 32 | |||||||||||||||
| North America Generation |
435 | 477 | 660 | (42 | ) | (183 | ) | |||||||||||||
| North America Utilities |
249 | 239 | 261 | 10 | (22 | ) | ||||||||||||||
| Europe Generation |
268 | 212 | 273 | 56 | (61 | ) | ||||||||||||||
| Asia Generation |
240 | 93 | (10 | ) | 147 | 103 | ||||||||||||||
| Corporate and Other(3) |
186 | 117 | 62 | 69 | 55 | |||||||||||||||
| Eliminations(4) |
17 | 20 | 38 | (3 | ) | (18 | ) | |||||||||||||
| General and administrative expenses |
(392 | ) | (339 | ) | (368 | ) | (53 | ) | 29 | |||||||||||
| Interest expense |
(1,526 | ) | (1,485 | ) | (1,770 | ) | (41 | ) | 285 | |||||||||||
| Interest income |
411 | 348 | 519 | 63 | (171 | ) | ||||||||||||||
| Other expense |
(239 | ) | (111 | ) | (161 | ) | (128 | ) | 50 | |||||||||||
| Other income |
108 | 465 | 375 | (357 | ) | 90 | ||||||||||||||
| Gain on sale of investments |
— | 131 | 909 | (131 | ) | (778 | ) | |||||||||||||
| Loss on sale of subsidiary stock |
— | — | (31 | ) | — | 31 | ||||||||||||||
| Goodwill impairment |
(21 | ) | (122 | ) | — | 101 | (122 | ) | ||||||||||||
| Asset impairment expense |
(1,221 | ) | (25 | ) | (175 | ) | (1,196 | ) | 150 | |||||||||||
| Foreign currency transaction gains (losses) on net monetary position |
(33 | ) | 33 | (184 | ) | (66 | ) | 217 | ||||||||||||
| Other non-operating expense |
(7 | ) | (12 | ) | (15 | ) | 5 | 3 | ||||||||||||
| Income tax expense |
(307 | ) | (599 | ) | (771 | ) | 292 | 172 | ||||||||||||
| Net equity in earnings of affiliates |
183 | 92 | 33 | 91 | 59 | |||||||||||||||
| Income from continuing operations |
920 | 1,809 | 1,929 | (889 | ) | (120 | ) | |||||||||||||
| Income from operations of discontinued businesses |
75 | 96 | 97 | (21 | ) | (1 | ) | |||||||||||||
| Gain (loss) from disposal of discontinued businesses |
64 | (150 | ) | 6 | 214 | (156 | ) | |||||||||||||
| Net income |
1,059 | 1,755 | 2,032 | (696 | ) | (277 | ) | |||||||||||||
| Noncontrolling interests: |
||||||||||||||||||||
| Income from continuing operations attributable to noncontrolling interests |
(1,006 | ) | (1,099 | ) | (759 | ) | 93 | (340 | ) | |||||||||||
| (Income) loss from discontinuing operations attributable to noncontrolling interests |
(44 | ) | 2 | (39 | ) | (46 | ) | 41 | ||||||||||||
| Net income attributable to The AES Corporation |
$ | 9 | $ | 658 | $ | 1,234 | $ | (649 | ) | $ | (576 | ) | ||||||||
| Per Share Data: |
||||||||||||||||||||
| Basic income per share from continuing operations |
$ | (0.11 | ) | $ | 1.06 | $ | 1.75 | $ | (1.17 | ) | $ | (0.69 | ) | |||||||
| Diluted income per share from continuing operations |
$ | (0.11 | ) | $ | 1.06 | $ | 1.73 | $ | (1.17 | ) | $ | (0.67 | ) | |||||||
| (1) | Corporate and Other includes revenue from our generation and utilities businesses in Africa, utilities businesses in Europe, Wind Generation and other renewables initiatives. |
| (2) | Represents inter-segment eliminations of revenue related to transfers of electricity from Tietê (generation) to Eletropaulo (utility). |
| (3) | Corporate and Other gross margin includes gross margin from our generation and utilities businesses in Africa, utilities businesses in Europe, Wind Generation and other renewables initiatives. |
| (4) | Represents inter-segment eliminations of gross margin related to corporate charges for self insurance premiums. |
129
Table of Contents
Segment Analysis
Latin America—Generation
The following table summarizes revenue and gross margin for our Generation segment in Latin America for the periods indicated:
| For the Years Ended December 31, | ||||||||||||||||||||
| 2010 | 2009 | 2008 | % Change 2010 vs. 2009 |
% Change 2009 vs. 2008 |
||||||||||||||||
| ($’s in millions) | ||||||||||||||||||||
| Latin America Generation |
||||||||||||||||||||
| Revenue |
$ | 4,281 | $ | 3,651 | $ | 4,468 | 17 | % | -18 | % | ||||||||||
| Gross Margin |
$ | 1,497 | $ | 1,357 | $ | 1,398 | 10 | % | -3 | % | ||||||||||
Fiscal Year 2010 versus 2009
Excluding the favorable impact of foreign currency translation and remeasurement of $133 million, generation revenue for 2010 increased $497 million, or 14%, from 2009 primarily due to:
| • | higher spot prices of $221 million associated with increased fuel prices in Argentina; |
| • | higher volume of $139 million at Gener in Chile due to higher demand; |
| • | higher volume and ancillary services of $115 million, and higher contract prices from PPAs indexed to gas and higher spot prices of $27 million in the Dominican Republic; |
| • | higher contract prices of $58 million in Colombia and Tietê in Brazil; |
| • | the positive impact of $28 million resulting from the final settlement of the power sales agreement between Sul and Uruguaiana, our businesses in Brazil; and |
| • | higher volume of $21 million in Panama due to higher water inflows into the system. |
These increases were partially offset by:
| • | lower volume sold at Uruguaiana of $53 million as a result of renegotiation of its power sales agreements; |
| • | lower volume due to unfavorable hydrology in Colombia and Argentina of $41 million; |
| • | lower contract prices at Gener of $32 million; and |
| • | lower contract prices on PPAs indexed to international coal prices in the Dominican Republic of $22 million. |
Excluding the favorable impact of foreign currency translation and remeasurement of $106 million, generation gross margin for 2010 increased $34 million, or 3%, from 2009 primarily due to:
| • | higher spot prices in Argentina of $69 million; |
| • | higher volume and ancillary services in the Dominican Republic of $55 million; |
| • | higher contract prices of $33 million in Colombia; |
| • | the positive impact of $28 million resulting from the final settlement of the power sales agreement between Sul and Uruguaiana, as mentioned above; and |
| • | higher volume of $23 million in Panama. |
These increases were partially offset by:
| • | higher fuel and purchased energy prices at Gener of $48 million; |
| • | the net effect of lower PPA prices and higher fuel costs in the Dominican Republic of $38 million; |
130
Table of Contents
| • | the impact of a reversal of bad debt expense during the first quarter of 2009 of $36 million at Uruguaiana as a result of the renegotiation of one of its power sales agreements; and |
| • | higher fixed costs of $30 million at Gener primarily due to higher employee costs, increased maintenance expenses and costs incurred due to construction delays at Campiche. |
For the year ended December 31, 2010, revenue increased 17% while gross margin increased 10%, primarily due to higher spot purchases and fuel prices at Gener and the reversal of bad debt expense as a result of the renegotiation of one of the power sales agreements at Uruguaiana in the first quarter of 2009.
Fiscal Year 2009 versus 2008
Excluding the unfavorable impact of foreign currency translation and remeasurement of $181 million, driven by Brazil and Argentina, generation revenue for 2009 decreased $636 million, or 14%, from 2008 primarily due to:
| • | lower spot and contract prices of $295 million at Gener; |
| • | lower volume of $227 million at Uruguaiana as a result of the renegotiation of its power sales agreements in 2009 to reduce the energy volume sold; and |
| • | lower energy prices and volume of $174 million in the Dominican Republic. |
These decreases were partially offset by:
| • | and increase of $100 million due to fewer outages at Gener and in Argentina in 2009; and |
| • | higher prices of energy sold of $66 million at Tietê. |
Excluding the unfavorable impact of foreign currency translation and remeasurement of $94 million, driven by Brazil and Argentina, generation gross margin for 2009 increased $53 million, or 4%, from 2008 primarily due to:
| • | higher prices of energy sold of $66 million at Tietê; |
| • | fewer outages of $60 million at Gener and in Argentina; |
| • | lower diesel consumption, partially offset by higher energy purchases and higher gas consumption, at Gener of $47 million; |
| • | lower volume of energy purchased at Uruguaiana of $44 million as a result of the renegotiated power sales agreements; and |
| • | the favorable impact of $28 million of a decrease in bad debt expense at Uruguaiana as a result of the renegotiated power sales agreements. |
These increases were partially offset by:
| • | the unfavorable impact of lower energy prices of $75 million in the Dominican Republic; |
| • | lower volume and energy prices of $66 million in Argentina; |
| • | higher purchased energy prices of $48 million at Uruguaiana; and |
| • | lower spot sales of $48 million at Panama. |
For the year ended December 31, 2009, revenue decreased by 18% while gross margin decreased 3%, primarily due to reduced energy purchases, fewer outages and lower bad debt expense.
131
Table of Contents
Latin America—Utilities
The following table summarizes revenue and gross margin for our Utilities segment in Latin America for the periods indicated:
| For the Years Ended December 31, | ||||||||||||||||||||
| 2010 | 2009 | 2008 | % Change 2010 vs. 2009 |
% Change 2009 vs. 2008 |
||||||||||||||||
| ($’s in millions) | ||||||||||||||||||||
| Latin America Utilities |
||||||||||||||||||||
| Revenue |
$ | 7,222 | $ | 6,092 | $ | 5,907 | 19 | % | 3 | % | ||||||||||
| Gross Margin |
$ | 1,072 | $ | 918 | $ | 886 | 17 | % | 4 | % | ||||||||||
Fiscal Year 2010 versus 2009
Excluding the favorable impact of foreign currency translation of $697 million, primarily in Brazil, utilities revenue for 2010 increased $433 million, or 7%, from 2009 primarily due to:
| • | increased volume of $316 million, primarily in Brazil, due to increased market demand; and |
| • | higher tariffs of $114 million primarily related to the July 2009 tariff reset in Brazil partially offset by the unfavorable impact on rates at Eletropaulo in Brazil of a cumulative adjustment to regulatory liabilities and higher energy prices across our Latin America utility businesses associated with energy purchases passed through to customers of $97 million. |
Excluding the favorable impact of foreign currency translation of $107 million, primarily in Brazil, utilities gross margin for 2010 increased $47 million, or 5%, from 2009 primarily due to:
| • | increased volume of $163 million, primarily in Brazil, due to the increased market demand; and |
| • | lower contingencies of $142 million in Eletropaulo primarily related to labor contingencies which included a one-time reversal, reflecting an agreement with Fundação CESP, the pension plan administrator, of $51 million associated with claims for past benefit obligations which will now be accounted for as a component of the pension plan. |
These increases were partially offset by:
| • | higher fixed costs of $238 million primarily due to the recovery in 2009 of a municipality receivable previously written off in Brazil and higher salaries and other employee related costs, provisions for commercial losses, regulatory penalties and maintenance costs; and |
| • | $28 million related to the final settlement of the power sales agreement between Sul and Uruguaiana. |
Fiscal Year 2009 versus 2008
Excluding the unfavorable impact of foreign currency translation of $442 million, primarily in Brazil, utilities revenue for 2009 increased $627 million, or 11%, from 2008 primarily due to:
| • | higher tariffs of $560 million reflecting the recovery of energy purchases of $453 million that were passed through to customers at our utilities in Brazil and El Salvador; and |
| • | higher volume in Brazil of $62 million. |
Excluding the unfavorable impact of foreign currency translation of $62 million, primarily in Brazil, utilities gross margin for 2009 increased $94 million, or 11%, from 2008 primarily due to:
| • | higher tariffs of $107 million in El Salvador and Brazil; |
| • | a $64 million recovery of a municipality receivable previously written off; |
132
Table of Contents
| • | a non-recurring PIS/COFINS fine in 2008 of $33 million; and |
| • | higher volume of $32 million across the region. |
These increases were partially offset by:
| • | the unfavorable impact of higher fixed costs of $120 million mainly related to pension expense, labor contingencies and maintenance costs in Brazil. |
North America—Generation
The following table summarizes revenue and gross margin for our Generation segment in North America for the periods indicated:
| For the Years Ended December 31, | ||||||||||||||||||||
| 2010 | 2009 | 2008 | % Change 2010 vs. 2009 |
% Change 2009 vs. 2008 |
||||||||||||||||
| ($’s in millions) | ||||||||||||||||||||
| North America Generation |
||||||||||||||||||||
| Revenue |
$ | 1,972 | $ | 1,940 | $ | 2,234 | 2 | % | -13 | % | ||||||||||
| Gross Margin |
$ | 435 | $ | 477 | $ | 660 | -9 | % | -28 | % | ||||||||||
Fiscal Year 2010 versus 2009
Excluding the favorable impact of foreign currency translation of $19 million, generation revenue for 2010 increased $13 million, or 1%, from 2009 primarily due to:
| • | increased rates, volume and an availability bonus at TEG/TEP in Mexico of $41 million; |
| • | higher volume, primarily due to fewer outages and higher rates, of $22 million at Merida in Mexico; |
| • | higher volume of $19 million at Warrior Run in Maryland due to fewer outages; and |
| • | an increase of $13 million in New York due to the favorable impact of mark-to-market derivative adjustments. |
These increases were partially offset by:
| • | a net decrease of $50 million in New York due to lower rates partially offset by higher volume of electricity sold due to fewer outages; |
| • | a net decrease of $18 million at Deepwater in Texas primarily due to lower volume; and |
| • | a net decrease of $14 million in Puerto Rico primarily due to a penalty from a forced outage. |
Excluding the favorable impact of foreign currency translation of $3 million, generation gross margin for 2010 decreased $45 million, or 9%, from 2009 primarily due to:
| • | a net decrease of $94 million in New York due to lower rates and higher coal prices partially offset by higher volume of electricity sold due to fewer outages; |
| • | a decrease of $16 million at Deepwater due to lower volume and rates; |
| • | a net decrease of $11 million in Puerto Rico primarily due to a penalty from a forced outage; |
| • | a decrease of $9 million in Hawaii due to an unfavorable impact of mark-to-market derivatives; and |
| • | a decrease of $7 million in Puerto Rico due to higher fixed costs. |
These decreases were partially offset by:
| • | an increase of $39 million in New York primarily due to lower fixed costs as a result of lower contract and maintenance costs, and other employee related costs; |
133
Table of Contents
| • | a net increase of $26 million at TEG/TEP due to a current year availability bonus and fewer outages partially offset by higher fuel prices; |
| • | higher volume of $14 million at Warrior Run due to fewer outages; and |
| • | an increase of $13 million in New York due to the favorable impact of mark-to-market derivative adjustments. |
For the year ended December 31, 2010, revenue increased by 2% while gross margin decreased 9%, primarily due to the change in rates in New York having a greater impact on gross margin than revenue.
Fiscal Year 2009 versus 2008
Excluding the unfavorable impact of foreign currency translation of $44 million, primarily in Mexico, generation revenue for 2009 decreased $250 million, or 11%, from 2008 primarily due to:
| • | a net decrease of $107 million in New York due to a reduction in the volume of electricity sold in the spot market as a result of lower spot rates, partially offset by a rate increase on electricity sold under favorable contracts; |
| • | a decrease of $80 million due to a reduction in natural gas prices at Merida; |
| • | increased outages of $22 million, $21 million and $17 million at Warrior Run, TEG/TEP and New York, respectively; |
| • | lower rates of $20 million at Deepwater; |
| • | the unfavorable impact of commodity derivatives in New York of $11 million; and |
| • | the unfavorable impact in 2009 of derivative amortization at Warrior Run of $9 million. |
These decreases were partially offset by:
| • | a $15 million revenue adjustment at Merida in 2008. |
Excluding the unfavorable impact of foreign currency translation of $9 million, generation gross margin for 2009 decreased $174 million, or 26%, from 2008 primarily due to:
| • | a net decrease of $72 million in New York driven by a reduction in the volume of electricity sold in the spot market as a result of lower spot rates, partially offset by a rate increase on electricity sold under favorable contracts; |
| • | a $29 million unfavorable impact of mark-to-market derivative adjustments on coal supply contracts in Hawaii as a result of a gain of $22 million in 2008 compared to a loss of $7 million in 2009; |
| • | an increase in outages of $22 million and $6 million at Warrior Run and in New York, respectively; |
| • | the unfavorable impact of commodity derivatives of $11 million and higher emission allowance purchases of $13 million in New York; and |
| • | the unfavorable impact of $9 million in 2009 of derivative amortization at Warrior Run. |
These decreases were partially offset by:
| • | a $15 million revenue adjustment at Merida in 2008. |
For the year ended December 31, 2009, revenue decreased by 13% while gross margin decreased 28%, primarily due to the increase in coal prices in New York and the unfavorable impact of derivatives in 2009 in Hawaii that had no corresponding impact on revenue.
134
Table of Contents
North America—Utilities
The following table summarizes revenue and gross margin for our Utilities segment in North America for the periods indicated:
| For the Years Ended December 31, | ||||||||||||||||||||
| 2010 | 2009 | 2008 | % Change 2010 vs. 2009 |
% Change 2009 vs. 2008 |
||||||||||||||||
| ($’s in millions) | ||||||||||||||||||||
| North America Utilities |
||||||||||||||||||||
| Revenue |
$ | 1,145 | $ | 1,068 | $ | 1,079 | 7 | % | -1 | % | ||||||||||
| Gross Margin |
$ | 249 | $ | 239 | $ | 261 | 4 | % | -8 | % | ||||||||||
Fiscal Year 2010 versus 2009
Utilities revenue for 2010 increased $77 million, or 7%, from 2009 primarily due to:
| • | higher retail demand of $64 million as a result of warmer weather and higher fuel adjustment charges; and |
| • | increased wholesale revenue of $11 million primarily due to higher prices. |
Utilities gross margin for 2010 increased $10 million, or 4%, from 2009 primarily due to:
| • | higher retail margin of $20 million due to increased demand; |
| • | lower pension expense of $12 million; and |
| • | lower emission allowance expense of $5 million. |
These increases were partially offset by:
| • | increased maintenance expenses of $16 million due to the timing of major generating unit overhauls; and |
| • | increased fixed costs of $14 million. |
For the year ended December 31, 2010, revenue increased by 7% while gross margin increased 4%, primarily due to increased fuel and maintenance costs.
Fiscal Year 2009 versus 2008
Utilities revenue for 2009 decreased $11 million, or 1%, from 2008 primarily due to:
| • | lower retail volume of $31 million due primarily to milder weather and the economic recession; and |
| • | decreased wholesale revenue of $7 million driven by lower market prices. |
These decreases were partially offset by:
| • | $32 million of voluntary credits IPL provided to retail customers in 2008. See Item 1.—Business—Regulatory Matters—North America of this Form 10-K for further information regarding these credits. |
Utilities gross margin for 2009 decreased $22 million, or 8%, from 2008 primarily due to:
| • | decreased wholesale margin of $16 million due to unfavorable prices; and |
| • | increased pension expense of $25 million largely due to the decline in market value of IPL’s pension assets during 2008. |
135
Table of Contents
These decreases were partially offset by:
| • | increased retail margin of $15 million, primarily due to the $32 million of voluntary customer credits IPL issued to its retail customers in 2008, partially offset by lower retail sales volumes in 2009; and |
| • | decreased property tax expense of $5 million. |
For the year ended December 31, 2009, revenue decreased by 1% while gross margin decreased 8%, primarily due to the $25 million increase in pension expense and the $32 million of voluntary customer credits IPL issued to its retail customers in 2008, both of which had an unfavorable impact on gross margin.
Europe—Generation
The following table summarizes revenue and gross margin for our Generation segment in Europe for the periods indicated:
| For the Years Ended December 31, | ||||||||||||||||||||
| 2010 | 2009 | 2008 | % Change 2010 vs. 2009 |
% Change 2009 vs. 2008 |
||||||||||||||||
| ($’s in millions) | ||||||||||||||||||||
| Europe Generation |
||||||||||||||||||||
| Revenue |
$ | 1,362 | $ | 820 | $ | 1,143 | 66 | % | -28 | % | ||||||||||
| Gross Margin |
$ | 268 | $ | 212 | $ | 273 | 26 | % | -22 | % | ||||||||||
Fiscal Year 2010 versus 2009
Excluding the unfavorable impact of foreign currency translation of $41 million, generation revenue for 2010 increased $583 million, or 71%, from 2009 primarily due to:
| • | $409 million from the adoption of new accounting guidance on the consolidation of variable interest entities (“VIEs”) which resulted in the consolidation of Cartagena in Spain, a generation business previously accounted for under the equity method of accounting; |
| • | $117 million from the operations of Ballylumford in the United Kingdom, which was acquired in August 2010; |
| • | $16 million from a full year of combined cycle operations at our Amman East plant in Jordan, which was single cycle until August 2009; |
| • | higher tariffs of $16 million at Altai in Kazakhstan; |
| • | higher volume of $15 million at Kilroot in the United Kingdom largely driven by coal pass-through and increased demand, partially offset by lower capacity revenue due to the termination of the long term PPA and related supplementary agreements. |
These increases were partially offset by:
| • | lower volume and sales of emissions allowances in Hungary of $16 million. |
Excluding the unfavorable impact of foreign currency translation of $1 million, generation gross margin for 2010 increased $57 million, or 27%, from 2009 primarily due to:
| • | $62 million from the consolidation of Cartagena as discussed above; |
| • | higher tariffs and lower fixed costs at Altai of $29 million; and |
| • | $13 million from the operations of Ballylumford since its acquisition. |
136
Table of Contents
These increases were partially offset by:
| • | lower gross margin of $28 million primarily from the termination of the long-term PPA at Kilroot; and |
| • | lower gross margin of $20 million in Hungary primarily attributable to higher fuel costs that could not be passed through and lower sales of emission allowances. |
For the year ended December 31, 2010, revenue increased 66% while gross margin increased 26%, primarily due to the consolidation of Cartagena and acquisition of Ballylumford that have a larger positive impact on revenue than gross margin, and the positive impact of higher energy revenue at Kilroot, which as a pass-through had no corresponding impact on gross margin.
Fiscal Year 2009 versus 2008
Excluding the unfavorable impact of foreign currency translation of $146 million, driven mainly by Kilroot, Hungary and Kazakhstan, generation revenue for 2009 decreased $177 million, or 15%, from 2008 primarily due to:
| • | lower revenue of $101 million as a result of the sale of Ekibastuz and Maikuben in May 2008; |
| • | lower volume of $81 million in Hungary due to the combined impact of the cancellation of one of our PPAs and reduced demand; and |
| • | lower volume of $67 million at Kilroot, a coal-fired plant, mainly driven by lower dispatch due to favorable gas prices compared to coal. |
These decreases were partially offset by:
| • | the benefit of new business of $50 million at Amman East, which commenced single cycle operations in July 2008; and |
| • | higher rates of $15 million in Kazakhstan. |
Excluding the unfavorable impact of foreign currency translation of $35 million, driven mainly by Kilroot and Kazakhstan, generation gross margin for 2009 decreased $26 million, or 10%, from 2008 primarily due to:
| • | lower gross margin of $41 million as a result of the sale of Ekibastuz and Maikuben in May 2008; |
| • | lower demand of $12 million in Hungary; and |
| • | an overall increase of $22 million in fixed costs across the region. |
These decreases were partially offset by:
| • | higher capacity revenue at Kilroot; |
| • | higher energy prices in Kazakhstan; and |
| • | the benefit of new business at Amman East. |
Asia—Generation
The following table summarizes revenue and gross margin for our Generation segment in Asia for the periods indicated:
| For the Years Ended December 31, | ||||||||||||||||||||
| 2010 | 2009 | 2008 | % Change 2010 vs. 2009 |
% Change 2009 vs. 2008 |
||||||||||||||||
| ($’s in millions) | ||||||||||||||||||||
| Asia Generation |
||||||||||||||||||||
| Revenue |
$ | 618 | $ | 375 | $ | 345 | 65 | % | 9 | % | ||||||||||
| Gross Margin |
$ | 240 | $ | 93 | $ | (10 | ) | 158 | % | 1030 | % | |||||||||
137
Table of Contents
Fiscal Year 2010 versus 2009
Excluding the favorable impact of foreign currency translation of $28 million, generation revenue for 2010 increased $215 million, or 57%, from 2009 primarily due to:
| • | favorable generation rates and volume of $210 million at Masinloc in the Philippines as a result of increased market demand and improved plant availability subsequent to the completion of its overhaul at the beginning of 2010; and |
| • | higher demand from both new and existing contract and spot customers as a result of lower supply shortages in the Philippines power market due to a strong energy growth rate. |
Excluding the favorable impact of foreign currency translation of $13 million, generation gross margin for 2010 increased $134 million, or 144%, from 2009 primarily due to a combination of higher availability attributable to improved plant operations, higher market demand and favorable spot prices at Masinloc.
For the year ended December 31, 2010, revenue increased 65% while gross margin increased 158%, primarily due to the positive influence on gross margin due to favorable spot rates and operational efficiencies resulting from the Masinloc plant overhauls in late 2009 and early 2010, which led to higher availability and allowed for more efficient operations that have materially improved the operating results for 2010 as compared to 2009.
Fiscal Year 2009 versus 2008
Excluding the unfavorable impact of foreign currency translation of $23 million, primarily in the Philippines and Sri Lanka, generation revenue for 2009 increased $53 million, or 15%, from 2008 primarily due to:
| • | the benefit of $46 million of our new business Masinloc, which was acquired in April 2008; |
| • | increased revenue of $70 million in 2009 at Masinloc due to improved rates and volume as a result of improved availability and new customer contracts; and |
| • | $18 million from a one-time favorable energy sales settlement at Masinloc. |
These increases were partially offset by:
| • | the decrease in revenue of $71 million at Kelanitissa in Sri Lanka primarily due to a decline in fuel costs which are largely passed through to the customer and higher outages in 2009 as compared to 2008 partially offset by higher capacity revenue. |
Excluding the unfavorable impact of foreign currency translation of $6 million, primarily in the Philippines, generation gross margin for 2009 increased $109 million, or 1,090%, from 2008 primarily due to:
| • | the impact of our new business at Masinloc of $23 million; |
| • | a $91 million increase at Masinloc due to higher contract sales, where margins are more favorable than spot sales, lower fuel prices, improved availability and the favorable energy sales settlement described above; and |
| • | higher capacity revenue at Kelanitissa of $10 million. |
These increases were partially offset by:
| • | higher fixed costs of $20 million at Masinloc. |
For the year ended December 31, 2009, revenue increased 9% while gross margin increased 1,030%, primarily due to higher contract margins at Masinloc as a result of improved operations, availability and lower fuel prices, as well as the larger relative impact on gross margin from the one-time favorable energy sales settlement described above.
138
Table of Contents
Corporate and Other
Corporate and other includes the net operating results from our generation and utilities businesses in Africa, utilities businesses in Europe, AES Wind Generation and renewables projects which are immaterial for the purposes of separate segment disclosure. The following table excludes inter-segment activity and summarizes revenue and gross margin for Corporate and Other entities for the periods indicated:
| For the Years Ended December 31, | ||||||||||||||||||||
| 2010 | 2009 | 2008 | % Change 2010 vs. 2009 |
% Change 2009 vs. 2008 |
||||||||||||||||
| ($’s in millions) | ||||||||||||||||||||
| Revenue |
||||||||||||||||||||
| Europe Utilities |
$ | 356 | $ | 286 | $ | 403 | 24 | % | -29 | % | ||||||||||
| Africa Utilities |
422 | 370 | 379 | 14 | % | -2 | % | |||||||||||||
| Africa Generation |
61 | 65 | 65 | -6 | % | 0 | % | |||||||||||||
| Wind Generation |
202 | 133 | 128 | 52 | % | 4 | % | |||||||||||||
| Corp/Other |
25 | 16 | 37 | 56 | % | -57 | % | |||||||||||||
| Total Corporate and Other |
$ | 1,066 | $ | 870 | $ | 1,012 | 23 | % | -14 | % | ||||||||||
| Gross Margin |
||||||||||||||||||||
| Europe Utilities |
$ | 21 | $ | 16 | $ | 34 | 31 | % | -53 | % | ||||||||||
| Africa Utilities |
65 | 71 | 30 | -8 | % | 137 | % | |||||||||||||
| Africa Generation |
54 | 41 | 28 | 32 | % | 46 | % | |||||||||||||
| Wind Generation |
44 | 11 | 19 | 300 | % | -42 | % | |||||||||||||
| Corp/Other |
2 | (22 | ) | (49 | ) | -109 | % | -55 | % | |||||||||||
| Total Corporate and Other |
$ | 186 | $ | 117 | $ | 62 | 59 | % | 89 | % | ||||||||||
Fiscal Year 2010 versus 2009
Excluding the unfavorable impact of foreign currency translation of $30 million, primarily in Cameroon, Corporate and Other revenue increased $226 million for 2010, or 26% from 2009. The increase was primarily due to:
| • | higher volume at our utility businesses in Ukraine driven by an overall increase in market demand; |
| • | higher volume and utility tariffs at Sonel in Cameroon driven by an increase in market demand; and |
| • | incremental revenue from new wind generation projects that commenced operations during the year and an overall volume increase across our wind businesses. |
Excluding the unfavorable impact of foreign currency translation of $8 million, primarily in Cameroon, Corporate and Other gross margin increased $77 million for 2010, or 66% from 2009. The increase was primarily due to:
| • | an increase in gross margin from our new wind generation projects and higher volume, as discussed above; and |
| • | an increase in volume at Dibamba, our generation business, in Cameroon. |
These increases were partially offset by:
| • | an increase in fixed costs at Sonel. |
139
Table of Contents
Fiscal Year 2009 versus 2008
Excluding the unfavorable impact of foreign currency translation of $162 million, primarily in Ukraine, Corporate and Other revenue increased $20 million for 2009, or 2%, from 2008. The increase was primarily due to:
| • | higher tariffs in Ukraine of $27 million. |
Excluding the unfavorable impact of foreign currency translation of $12 million, primarily in Ukraine, Corporate and Other gross margin increased $67 million for 2009, or 108%, from 2008. The increase was primarily due to:
| • | a decrease in fixed costs across the Africa region. |
The increase was partially offset by:
| • | higher fuel consumption attributable to lower hydrology at Sonel. |
General and Administrative Expense
General and administrative expense includes those expenses related to corporate and region staff functions and/or initiatives, executive management, finance, legal, human resources, information systems, and development costs.
General and administrative expenses increased $53 million, or 16%, to $392 million in 2010 from 2009. The increase is primarily related to business development costs associated with increased development efforts, primarily in Europe, Turkey and India.
General and administrative expenses decreased $29 million, or 8%, to $339 million in 2009 from 2008. The decrease is primarily related to 2008 professional fees associated with remediation efforts and a reduction in business development costs. The favorable variance is partially offset by an increase in costs associated with the worldwide implementation of SAP.
Interest expense
Interest expense increased $41 million, or 3%, to $1.5 billion in 2010 from 2009. This increase was primarily due to interest expense at Cartagena which is now a consolidated entity, higher interest rates at Tietê, increased debt principal at Eletropaulo and interest being expensed related to St. Nikola, our wind project in Bulgaria, due to commencement of operations in 2010. These increases were partially offset by reduced debt principal at the Parent Company.
Interest expense decreased $285 million, or 16%, to $1.5 billion in 2009 from 2008. This decrease was primarily due to lower interest rates globally due to economic conditions and inflationary adjustments to the market price index in Brazil. In addition, interest expense decreased as a result of favorable foreign currency translation, mainly in Brazil and lower interest expenses associated with decreased debt balances at Eletropaulo. These decreases were partially offset by higher interest expense at Masinloc in the Philippines which was acquired in April 2008, and interest expense at Infovias in Brazil where a fee on a non-exercised credit line was written off.
Interest income
Interest income increased $63 million, or 18%, to $411 million in 2010 from 2009. This increase was primarily due to a higher average balance in short term investments at Eletropaulo and the favorable impact of
140
Table of Contents
foreign currency translation in Brazil as well as the settlement of a dispute related to inflation adjustments for energy sales at Tietê. These increases were partially offset by reduced interest income from a loan to a wind development project in Brazil which was repaid in June 2010.
Interest income decreased $171 million, or 33%, to $348 million in 2009 from 2008. This decrease was primarily due to lower interest rates and lower investment balances in Brazil, unfavorable foreign currency translation in Brazil, the impact of decreased interest rates and inflationary adjustments on accounts receivable in 2008 at Gener in Chile and a decreased cash balance at the Parent Company.
Other income
|
Years Ended December 31, |
||||||||||||
| 2010 | 2009 | 2008 | ||||||||||
| (in millions) | ||||||||||||
| Gain on extinguishment of tax and other liabilities |
$ | 65 | $ | 168 | $ | 199 | ||||||
| Tax credit settlement |
— | 129 | — | |||||||||
| Performance incentive fee |
— | 80 | — | |||||||||
| Insurance proceeds |
— | — | 40 | |||||||||
| Gain on sale of assets |
12 | 14 | 34 | |||||||||
| Other |
31 | 74 | 102 | |||||||||
| Total other income |
$ | 108 | $ | 465 | $ | 375 | ||||||
Other income of $108 million for the year ended December 31, 2010 was primarily related to the extinguishment of a swap liability owed by two of our Brazilian subsidiaries, resulting in the recognition of a $62 million gain. The net impact to the Company after taxes and noncontrolling interest was $9 million. Other income also included a gain on sale of assets at Eletropaulo.
Other income of $465 million for the year ended December 31, 2009 included $165 million from the reduction in interest and penalties associated with federal tax debts at Eletropaulo and Sul as a result of the REFIS program and a $129 million gain related to a favorable court decision enabling Eletropaulo to receive reimbursement of excess non-income taxes paid from 1989 to 1992 in the form of tax credits to be applied against future tax liabilities. The net impact to the Company after income taxes and noncontrolling interests for these items was $44 million. In addition, the Company recognized income in 2009 of $80 million from a performance incentive bonus for management services provided to Ekibastuz and Maikuben in 2008. The management agreement was related to the sale of these businesses in Kazakhstan in May 2008; see further discussion of this transaction in Note 22—Acquisitions and Dispositions, to the Consolidated Financial Statements included in Item 8 of this Form 10-K.
Other income of $375 million for the year ended December 31, 2008 included gains on the extinguishment of a gross receipts tax liability and a legal contingency at Eletropaulo of $117 million and $75 million, respectively, $32 million of cash proceeds related to a favorable legal settlement at Southland in California, $29 million of insurance recoveries for damaged turbines at Uruguaiana, $23 million of gains associated with a sale of land at Eletropaulo and sales of turbines at Itabo, and compensation of $18 million for the impairment associated with the settlement agreement to shut down Hefei.
141
Table of Contents
Other expense
| Years Ended December 31, | ||||||||||||
| 2010 | 2009 | 2008 | ||||||||||
| (in millions) | ||||||||||||
| Loss on sale and disposal of assets |
$ | 84 | $ | 42 | $ | 34 | ||||||
| Gener gas settlement |
72 | — | — | |||||||||
| Loss on extinguishment of debt |
37 | — | 70 | |||||||||
| AES Wind transaction costs |
22 | — | — | |||||||||
| Other |
24 | 69 | 57 | |||||||||
| Total other expense |
$ | 239 | $ | 111 | $ | 161 | ||||||
Other expense of $239 million for the year ended December 31, 2010 included $72 million for a settlement agreement of gas transportation contracts at Gener. There were also previously capitalized transaction costs of $22 million that were incurred in connection with the preparation for the sale of a noncontrolling interest in our Wind Generation business which were written off upon the expiration of the letter of intent in June 2010. In addition, there were losses on the disposal of assets at Eletropaulo, Panama, and Gener, an $18 million loss on debt extinguishment at Andres and Itabo and a $15 million loss at the Parent Company from the retirement of senior notes.
Other expense of $111 million for the year ended December 31, 2009 included a $13 million loss recognized when three of our businesses in the Dominican Republic received $110 million par value bonds issued by the Dominican Republic government to settle existing accounts receivable for the same amount from the government-owned distribution companies. The loss represented an adjustment to reflect the fair value of the bonds on the date received. Other expense also included losses on the disposal of assets at Eletropaulo and Andres and contingencies at our businesses in Kazakhstan and Alicura in Argentina.
Other expense of $161 million for the year ended December 31, 2008 included $69 million of losses on the retirement of debt at the Parent Company in connection with the refinancing in June 2008 and IPALCO associated with a $375 million refinancing in April 2008 and losses on disposal of assets primarily at Eletropaulo.
Goodwill Impairment
In 2010, the Company recognized goodwill impairment expense of $21 million. During the third quarter of 2010, Deepwater, our pet coke-fired merchant generation facility in Texas, determined that there was an interim impairment indicator for its goodwill. This determination was primarily based on management’s decision not to operate the plant for more than 30 days in the third quarter of 2010, current operating and cash flow losses, and forecasted operating and cash flow losses for the remainder of 2010 through 2014 as a result of declining trends in energy pricing curves and increasing pet coke prices. As a result, Deepwater recognized a goodwill impairment of $18 million. Deepwater is reported in the North America Generation segment.
In 2009, the Company recognized goodwill impairment expense of $122 million. This was a result of impairment at certain of our businesses in the United Kingdom and Ukraine as a result of the Company’s annual goodwill impairment evaluation as of October 1. The most significant goodwill impairment was at Kilroot, our generation business in the United Kingdom. Factors contributing to the recognition of impairment included: reduced profit expectations based on latest estimates of future commodity prices and reduced expectations on the recovery of cash flows on the existing plant following the Company’s decision to forgo capital expenditures to meet emission allowance requirements taking effect in 2024. The fair value of the Company’s reporting units are inherently sensitive to the assumptions underlying the estimates of fair value. Note 1—General and Summary of Significant Accounting Policies, Fair Value, Goodwill and Intangibles in Item 8 of this Form 10-K provides a
142
Table of Contents
more detailed discussion of those assumptions. As discussed in Key Trends and Uncertainties, in the future, the fair values of the Company’s reporting units might decline as a result of adverse changes in their operating environments or the businesses reaching the end of their finite lives, which could require the Company to record additional goodwill impairment charges.
The Company did not incur any goodwill impairment charges in 2008.
Asset Impairment Expense
As discussed in Note 19—Impairment Expense to the Consolidated Financial Statements included in Item 8 of this Form 10-K, asset impairment expense for the year 2010 was $1,221 million and consisted primarily of the following:
Eastern Energy—AEE operates four coal-fired power plants: Cayuga, Greenidge, Somerset and Westover, representing generation capacity of 1,169 MW in the western New York power market. During 2010, the power prices in the New York power market trended downward, similar to North America natural gas prices. The New York Independent System Operator (“NYISO”) continues to move forward with the potential addition of a new capacity zone, which is expected to put further downward pressure on the capacity prices paid to the AEE facilities. In November 2010, legislation was proposed in the state of New Jersey for the addition of state subsidized capacity additions serving to lower PJM capacity price expectations. Similar changes to capacity pricing may be made in the future in New York. Continued pressure on energy prices, driven by falling natural gas prices and state actions, indicate that capacity prices are unlikely to reach levels significantly in excess of those achieved historically. Accordingly, management’s view of long-term capacity markets in western New York was revised downward. In December 2010, management revised its cash flow forecasts based on these developments and forecasted continuing negative operating cash flow and losses through 2034. The forecasted energy prices are such that a hedge strategy significantly beyond those in place at December 31, 2010 would not be economical. Additionally, on November 15, 2010, Standard & Poor’s downgraded the bond rating of AEE from BB to B+. Collectively, in the fourth quarter of 2010, these events were considered an impairment indicator for the AES New York asset group, of which AEE is the most significant component and necessitated a recoverability test of the asset group.
The long-lived asset group subject to the impairment evaluation was determined to include all of the generating plants of AEE. This determination was based on the assessment of the plants’ inability to generate independent cash flow. When the recoverability test of the asset group was performed, management concluded that, on an undiscounted cash flow basis, the carrying amount of the asset group was not recoverable. To measure the amount of impairment loss, management was required to determine the fair value of the asset group. To this end, an independent valuation firm was engaged to assist management in its estimation of fair value. Cash flow forecasts and the underlying assumptions for the valuation were developed by management. While there were numerous assumptions that impact the fair value, potential state actions that impact capacity pricing and forward energy prices were the most significant.
In determining the fair value of the asset group, the three valuation approaches prescribed by the fair value measurement accounting guidance were considered. The fair value under the income approach was considered the most appropriate and resulted in a zero fair value. Any salvage value of the asset group is expected to be offset by environmental and other remediation costs. Accordingly, the long-lived asset group was considered fully impaired and $827 million of impairment expense was recognized in the fourth quarter of 2010.
Southland—In May 2010, the California State Water Board approved a policy to reduce the number of marine animals killed by seawater cooling systems in coastal power plants in California. At that time since the policy required the approval of California’s Office of Administrative Law, it was unclear whether the policy would be approved and the exact form the regulations would take. In September 2010, the Office of Administrative Law in California approved the policy that will require the Company to change the process
143
Table of Contents
through which it uses ocean water to cool the generation turbines at its Alamitos, Huntington Beach and Redondo Beach (collectively “Southland”) gas-fired generation facilities in California. The policy requires compliance with the new regulations by December 31, 2020. The change in the water cooling process will result in significant future capital expenditures to ensure compliance with the new regulations and the Company determined that an indicator of impairment existed at September 30, 2010. The Company performed an asset impairment test in accordance with the accounting guidance on property, plant and equipment. The asset group was determined to be at the individual plant level and based on the undiscounted cash flow analysis, the Company determined that the Huntington Beach asset group was not recoverable. The fair value of the Huntington Beach asset group was then determined using a discounted cash flow analysis. To assist management in determining the fair value of the asset group, an independent valuation firm was engaged. Cash flow forecasts and the underlying assumptions for the valuation were developed by management. The carrying value of the Huntington Beach plant of $288 million exceeded the fair value of $88 million resulting in the recognition of asset impairment expense of $200 million. The undiscounted cash flows of the Alamitos and Redondo Beach generation facilities exceeded their respective carrying values and resulted in no impairment. Huntington Beach is reported in the North America Generation reportable segment.
Tisza II—During the third quarter of 2010, the Company entered into annual negotiations with the offtaker of its Tisza II generation plant in Hungary. As a result of these preliminary negotiations, as well as the further deterioration of the economic environment in Hungary, the Company determined that an indicator of impairment existed at September 30, 2010. Thus, the Company performed an asset impairment test in accordance with the accounting guidance on property, plant and equipment and determined that based on the undiscounted cash flow analysis, the carrying amount of the Tisza II asset group was not recoverable. The fair value of the asset group was then determined using a discounted cash flow analysis. The carrying value of the Tisza II asset group of $160 million exceeded the fair value of $75 million resulting in the recognition of asset impairment expense of $85 million. Tisza II is reported in the Europe Generation reportable segment.
Deepwater—In March 2010, Deepwater, our 160 MW pet coke-fired merchant power plant located in Texas, experienced deteriorating market conditions due to increasing pet coke prices and diminishing power prices. As a result, Deepwater incurred an operating loss for the period and forecasted short term losses. These conditions gradually worsened in the second quarter of 2010 and management determined it could not operate the plant at certain times during the year without generating negative operating margin.
As the contraction of energy margin continued in the second quarter of 2010, management determined the collective events to be an indicator of impairment and performed an impairment evaluation of Deepwater’s goodwill and recoverability test for the long-lived asset group. Based on the results of these tests, in the second quarter of 2010, management concluded no impairment was necessary. In the third quarter of 2010, these downward trends continued and management, after determining that there was an indicator of impairment, performed another impairment evaluation of Deepwater’s goodwill and recoverability test of the long-lived asset group. The results in the third quarter indicated no impairment was necessary for the asset group, but the goodwill associated with the reporting unit was deemed to be impaired and the $18 million goodwill balance was written off during the quarter ended September 30, 2010.
In the fourth quarter of 2010, further adverse trends in energy and pet coke pricing curves were observed in management’s review of external market analyses. The most significant impact on the forecasted energy prices reviewed by management in November 2010 related to the general external market consensus that Federal CO2 cap and trade legislation was less likely, resulting in a drop in long-term energy price projections. At that time, Deepwater’s revised forecasts indicated that Deepwater would have operating losses which would extend beyond 2020 and negative cash flows through 2019. Management concluded that, on an undiscounted cash flow basis, the carrying amount of the asset group was no longer recoverable. To measure the amount of impairment loss, management was required to determine the fair value of the asset group. To this end, an independent valuation firm was engaged to assist management in its estimation of fair value. Cash flow forecasts and the underlying assumptions for the valuation were developed by management. In determining the fair value of the asset group,
144
Table of Contents
all three valuation approaches described by the fair value measurement accounting guidance were considered. The fair value under the income approach was considered most appropriate. On that basis, the carrying value of the asset group was determined to be impaired and $79 million of impairment expense was recognized in the fourth quarter of 2010.
Asset impairment expense for the year 2009 was $25 million. In 2009, the Company recognized a pre-tax long-lived asset impairment charge of $11 million related to the Company’s Piabanha hydro project in Brazil. The Company determined that the carrying value exceeded the future discounted cash flows and abandoned the project.
Asset impairment expense for the year 2008 was $175 million. In the fourth quarter of 2008, and in response to the financial market crisis, the Company reviewed and prioritized projects in the development pipeline. From this review, the Company determined that the carrying value exceeded the future discounted cash flows for certain projects. As a result, the Company recorded an impairment charge of $75 million ($34 million, net of noncontrolling interests and income taxes) related to two liquefied natural gas projects in North America and a non-power development project at one of our facilities in North America. During 2008, the Company recognized additional impairment charges of $36 million related to long-lived assets at Uruguaiana. The impairment was triggered by a combination of gas curtailments and increases in the spot market price of energy in 2007 that continued in 2008. Following an initial impairment charge in the fourth quarter of 2007, further charges were incurred in 2008 due to fixed asset purchase agreements in place. During the first half of 2008, the Company withdrew from projects in South Africa and Israel which resulted in impairment charges of $36 million. The Company also recognized an impairment of $18 million related to the shutdown of the Hefei plant in China.
Gain on sale of investments
There was no gain on sale of investments in 2010.
Gain on sale of investments of $131 million in 2009 consisted primarily of $98 million recognized in May 2009 related to the termination of the management agreement between the Company and Kazakhmys PLC for Ekibastuz and Maikuben, a gain of $14 million from the sale of the remaining assets associated with the shutdown of the Hefei plant in China and $13 million from the reversal of a contingent liability related to the Kazakhstan sale in 2008.
Gain on sale of investments of $909 million in 2008 consisted primarily of the sale in May 2008 of two wholly owned subsidiaries in Kazakhstan, Ekibastuz and Maikuben for a net gain of $905 million.
Loss on sale of subsidiary stock
There was no loss on sale of subsidiary stock in 2010 or 2009.
Loss on sale of subsidiary stock of $31 million in 2008 was the result of sales of AES Gener shares made by our wholly owned subsidiary Cachagua. In November 2008, Cachagua sold 9.6% of its ownership in Gener to a third party reducing its ownership in Gener to 70.6%.
145
Table of Contents
Foreign currency transaction gains (losses) on net monetary position
The following table summarizes the gains (losses) on the Company’s net monetary position from foreign currency transaction activities:
| Years Ended December 31, | ||||||||||||
| 2010 | 2009 | 2008 | ||||||||||
| (in millions) | ||||||||||||
| AES Corporation |
$ | (50 | ) | $ | 13 | $ | 38 | |||||
| Chile |
8 | 65 | (96 | ) | ||||||||
| Philippines |
8 | 15 | (57 | ) | ||||||||
| Brazil |
(6 | ) | (9 | ) | (44 | ) | ||||||
| Argentina |
12 | (10 | ) | (28 | ) | |||||||
| Kazakhstan |
1 | (24 | ) | 14 | ||||||||
| Colombia |
(4 | ) | (11 | ) | 5 | |||||||
| Other |
(2 | ) | (6 | ) | (16 | ) | ||||||
|
Total(1) |
$ | (33 | ) | $ | 33 | $ | (184 | ) | ||||
| (1) | Includes (losses) gains of $(10) million, $(39) million and $10 million on foreign currency derivative contracts for the years ended December 31, 2010, 2009 and 2008, respectively. |
The Company recognized foreign currency transaction losses of $33 million for the year ended December 31, 2010. These losses consisted primarily of losses at The AES Corporation partially offset by gains in Argentina.
| • | Losses of $50 million at The AES Corporation were primarily due to the devaluation of notes receivable resulting from the weakening of the Euro and British Pound, and losses on foreign exchange swaps and options, partially offset by gains on cash balances and debt denominated in British Pounds. |
| • | Gains of $12 million in Argentina were primarily due to a gain on a foreign currency embedded derivative related to government receivables, partially offset by losses due to the devaluation of the Argentine Peso by 5%, resulting in losses at Alicura (an Argentine Peso functional currency subsidiary) associated with its U.S. Dollar denominated debt. |
The Company recognized foreign currency transaction gains of $33 million for the year ended December 31, 2009. These gains consisted primarily of gains in Chile, the Philippines and at The AES Corporation partially offset by losses in Kazakhstan, Colombia, Argentina and Brazil.
| • | Gains of $65 million in Chile were primarily due to the appreciation of the Chilean Peso of 20% resulting in gains at Gener (a U.S. Dollar functional currency subsidiary) associated with its net working capital denominated in Chilean Peso, mainly cash and accounts receivables. This gain was partially offset by $14 million in losses on foreign currency derivatives. |
| • | Gains of $15 million in the Philippines were primarily due to the appreciation of the Philippine Peso of 3%, resulting in gains at Masinloc (a Philippine Peso functional currency subsidiary) on the remeasurement of U.S. Dollar denominated debt. |
| • | Gains of $13 million at The AES Corporation were primarily due to the settlement of the senior unsecured credit facility and the revaluation of notes receivable denominated in the Euro, partially offset by losses on debt denominated in British Pounds. |
| • | Losses of $24 million in Kazakhstan were primarily due to net foreign currency transaction losses of $12 million related to energy sales denominated and fixed in the U.S. Dollar and $12 million of foreign currency transaction losses on debt and other liabilities denominated in currencies other than the Kazakh Tenge. |
146
Table of Contents
| • | Losses of $11 million in Colombia were primarily due to the appreciation of the Colombian Peso of 9%, resulting in losses at Chivor (a U.S. Dollar functional currency subsidiary) associated with its Colombian Peso denominated debt and losses on foreign currency derivatives. |
| • | Losses of $10 million in Argentina were primarily due to the devaluation of the Argentine Peso of 10% in 2009, resulting in losses at Alicura (an Argentine Peso functional currency subsidiary) associated with its U.S. Dollar denominated debt, partially offset by derivative gains. |
| • | Losses of $9 million in Brazil were primarily due to energy purchases made by Eletropaulo denominated in U.S. Dollar, resulting in foreign currency transaction losses of $18 million, partially offset by gains of $9 million due to the appreciation in 2009 of the Brazilian Real of 25%, resulting in gains at Sul and Uruguaiana associated with U.S. Dollar denominated liabilities. |
The Company recognized foreign currency transaction losses of $184 million for the year ended December 31, 2008. These losses consisted primarily of losses in Chile, the Philippines, Brazil and Argentina partially offset by gains at The AES Corporation and in Kazakhstan.
| • | Losses of $96 million in Chile were primarily due to the devaluation of the Chilean Peso of 28% in 2008, resulting in losses at Gener (a U.S. Dollar functional currency subsidiary) associated with its net working capital denominated in Chilean Pesos, mainly cash, accounts receivable and value added tax (“VAT”) receivables. |
| • | Losses of $57 million in the Philippines were primarily due to remeasurement losses at Masinloc (a Philippine Peso functional currency subsidiary) on U.S. Dollar denominated debt resulting from depreciation of the Philippine Peso of 14% in 2008. |
| • | Losses of $44 million in Brazil were primarily due to the realization of deferred exchange variance on past energy purchases made by Eletropaulo denominated in U.S. Dollar. |
| • | Losses of $28 million in Argentina were primarily due to the devaluation of the Argentine Peso of 10% in 2008, resulting in losses at Alicura (an Argentine Peso functional currency subsidiary) associated with its U.S. Dollar denominated debt. |
| • | Gains of $38 million at The AES Corporation were primarily due to debt denominated in British Pounds and gains on foreign exchange derivatives, partially offset by losses on notes receivable denominated in the Euro. |
| • | Gains of $14 million in Kazakhstan were primarily due to net foreign currency transaction gains of $16 million related to energy sales denominated and fixed in the U.S. Dollar, offset by $5 million of foreign currency transaction losses on external and intercompany debt denominated in other than the Kazakh Tenge functional currency. |
Income taxes
Income tax expense on continuing operations decreased $292 million, or 49%, to $307 million in 2010. The Company’s effective tax rates were 29% for 2010 and 26% for 2009.
The net increase in the 2010 effective tax rate was primarily due to tax expense recorded in the second quarter of 2010 relating to the CEMIG sale transaction, tax benefit recorded in 2009 upon the release of valuation allowances at certain U.S. and Brazilian subsidiaries, and $165 million of non-taxable income recorded in 2009 at Brazil as a result of the REFIS program. These items were offset by income tax benefits related to a reversal of withholding tax liabilities at certain Chilean subsidiaries and 2010 asset impairments primarily recorded at certain U.S. subsidiaries. Included in the net tax expense related to the CEMIG sale transaction is tax expense on the equity earnings associated with the reversal of the net long-term liability and tax benefit related to release of a valuation allowance against certain deferred tax assets.
147
Table of Contents
Income tax expense on continuing operations decreased $172 million, or 22%, to $599 million in 2009. The Company’s effective tax rates were 26% for 2009 and 29% for 2008.
The net decrease in the 2009 effective tax rate was primarily due to tax benefit recorded in 2009 upon the release of valuation allowance at certain U.S. and Brazilian subsidiaries, $165 million of non-taxable income recorded at Brazil as a result of the REFIS program in 2009 and an increase in U.S. taxes on distributions from the Company’s primary holding company in the second quarter of 2008.
Net equity in earnings of affiliates
Net equity in earnings of affiliates increased $91 million, or 99%, to $183 million in 2010 from $92 million in 2009. This increase was primarily due to a gain recognized upon the sale of our interest in CEMIG during the second quarter of 2010, partially offset by 2009 equity in earnings of Cartagena which was accounted for as a consolidated entity in 2010 and thus reported directly within revenues and expenses.
Net equity in earnings of affiliates increased $59 million, or 179%, to $92 million in 2009 from $33 million in 2008. This increase was primarily due to a cash settlement received by Cartagena, in Spain, in June 2009 for liquidated damages received related to a construction delay from December 2005 to November 2006; increased earnings at Guacolda in Chile mainly due to lower cost of coal; increased earnings of Chigen affiliates from higher tariffs partially offset by lower volume and a valuation write-off in 2008 at an affiliate in Turkey. These increases were partially offset by decreased earnings at OPGC, in India, mainly due to lower tariff and a dividend distribution tax in March 2009 and increased expenses for an equipment overhaul at Elsta in the Netherlands.
Income from continuing operations attributable to noncontrolling interests
Income from continuing operations attributable to noncontrolling interests decreased $93 million, or 8%, to $1.0 billion in 2010 from $1.1 billion in 2009. This decrease was primarily due to decreased earnings at Eletropaulo as a result of the absence of legal settlement income present in 2009, a loss on legal settlement at Gener and reduced revenues due to decreased coal prices along with higher electricity purchases at Itabo. These decreases were partially offset by the appreciation of the Brazilian Real.
Income from continuing operations attributable to noncontrolling interests increased $340 million, or 45%, to $1.1 billion in 2009 from $0.8 billion in 2008. This increase was primarily due to increases in gross margin and other income, lower interest expense and a decrease in impairments in 2009 at our Brazilian businesses, and increases in gross margin and foreign currency transaction gains at our businesses in Chile. In addition, in the fourth quarter of 2009, income from continuing operations attributable to noncontrolling interests increased $44 million at certain of our wind generation businesses as a result of a charge related to the potential future taxes that could be deemed due in the calculation of the hypothetical liquidation value of certain of our wind tax equity partnerships.
Discontinued operations
As further discussed in Note 21—Discontinued Operations and Held for Sale Businesses to the Consolidated Financial Statements included in Item 8 of this Form 10-K, Discontinued Operations includes the results of five businesses: Ras Laffan, a generation business in Qatar (sold in October 2010); Barka, a generation business in Oman, (sold in August 2010); Lal Pir and Pak Gen, generation businesses in Pakistan, (sold in June 2010); and Jiaozuo, a generation business in China, (sold in December 2008). Prior periods have been restated to reflect these businesses within Discontinued Operations for all periods presented.
In 2010, income from operations of discontinued businesses, net of tax and income attributable to noncontrolling interests, was $39 million and reflected the operations of our 55% stake in Ras Laffan, a combined cycle gas facility and water desalination plant in Qatar, our 35% stake in Barka, a combined cycle gas
148
Table of Contents
facility and water desalination plant in Oman and our 55% stake in Lal Pir and Pak Gen, two oil-fired facilities in Pakistan. The sale of Lal Pir and Pak Gen closed in June 2010, resulting in additional impairment expense and a loss on the sale in 2010 of $14 million, net of tax and noncontrolling interests. The Barka plant was sold in August 2010, resulting in a gain on sale of $63 million, net of tax and noncontrolling interests. The sale of Ras Laffan closed in October 2010, resulting in a gain on sale of $6 million, net of tax.
In 2009, income from operations of discontinued businesses, net of tax and income attributable to noncontrolling interests, was $54 million and reflected the operations of Ras Laffan, Barka, Lal Pir and Pak Gen. Loss on disposal of discontinued businesses, net of tax and loss attributable to noncontrolling interests was $105 million and represented the difference between the net book value of the Company’s interests in its Pakistan businesses and their estimated fair value.
In 2008, income from operations of discontinued businesses, net of tax and income attributable to noncontrolling interests, was $60 million and reflected the operations of Ras Laffan, Barka, Lal Pir, Pak Gen and Jiaozuo, a coal-fired generation facility in China sold in December 2008. The Company received $73 million for its 70% interest in the business. The net gain on the disposition was $7 million.
The Consolidated Financial Statements of AES are prepared in conformity with GAAP, which requires the use of estimates, judgments and assumptions that affect the reported amounts of assets and liabilities at the date of the financial statements and the reported amounts of revenue and expenses during the periods presented. AES’ significant accounting policies are described in Note 1—General and Summary of Significant Accounting Policies to the Consolidated Financial Statements included in Item 8 of this Form 10-K.
An accounting estimate is considered critical if:
| • | the estimate requires management to make assumptions about matters that were highly uncertain at the time the estimate was made; |
| • | different estimates reasonably could have been used; or |
| • | the impact of the estimates and assumptions on financial condition or operating performance is material. |
Management believes that the accounting estimates employed are appropriate and the resulting balances are reasonable; however, actual results could materially differ from the original estimates, requiring adjustments to these balances in future periods. Management has discussed these critical accounting policies with the Audit Committee, as appropriate. Listed below are the Company’s most significant critical accounting estimates and assumptions used in the preparation of the Consolidated Financial Statements.
Income Tax Reserves
We are subject to income taxes in both the United States and numerous foreign jurisdictions. Our worldwide income tax provision requires significant judgment and is based on calculations and assumptions that are subject to examination by the Internal Revenue Service and other taxing authorities. The Company and certain of its subsidiaries are under examination by relevant taxing authorities for various tax years. The Company regularly assesses the potential outcome of these examinations in each of the tax jurisdictions when determining the adequacy of the provision for income taxes. Accounting guidance for uncertainty in income taxes prescribes a more-likely-than-not recognition threshold. Tax reserves have been established, which the Company believes to be adequate in relation to the potential for additional assessments. Once established, reserves are adjusted only when there is more information available or when an event occurs necessitating a change to the reserves. While the Company believes that the amounts of the tax estimates are reasonable, it is possible that the ultimate outcome of current or future examinations may exceed current reserves in amounts that could be material.
149
Table of Contents
On December 17, 2010, President Obama signed into law the Tax Relief Unemployment Insurance Reauthorization and Job Creation Act of 2010 (“the Act”). The Act includes several provisions which provide for tax relief for businesses by extending certain tax benefits and credits, including the Subpart F exception for active financing income and the Controlled Foreign Corporation look-through provisions of Subpart F. This legislation resulted in a benefit for the Company’s 2010 provision for income taxes; however, there can be no assurances that the benefits of this legislation will extend beyond 2011, when it is currently scheduled to expire.
Impairments
Our accounting policies on goodwill and long-lived assets are described in detail in Note 1—General and Summary of Significant Accounting Policies, Goodwill and Other Intangibles and Long-lived Assets, respectively, included in Item 8 of this Form 10-K. Goodwill is tested annually for impairment at the reporting unit level on October 1. In addition, goodwill is tested for impairment whenever events or circumstances indicate that it is more likely than not that the fair value of a reporting unit has been reduced below its carrying amount. A long-lived asset (asset group) will be tested for recoverability whenever events or changes in circumstances indicate that its carrying amount may not be recoverable, i.e., the future undiscounted cash flows associated with the asset are less than its carrying amount. In the event that the carrying amount of the long-lived asset (asset group) is not recoverable, an impairment evaluation is performed, in which the fair value of the asset is estimated and compared to the carrying amount. Examples of indicators that would result in an impairment test for goodwill and a recoverability test for long-lived assets include, but are not limited to, a significant adverse change in the business climate, legislation changes or a change in the extent or manner in which a long-lived asset is being used or in its physical condition. Throughout the impairment evaluation process, management makes considerable judgments; however, the fair value determination is typically the most judgmental part of an impairment evaluation.
The Company determines the fair value of a reporting unit or a long-lived asset (asset group) by applying the approaches prescribed under the fair value measurement accounting framework. Generally, the market approach and income approach are most relevant in the fair value measurement of our reporting units and long-lived assets; however, due to the lack of available relevant observable market information in many circumstances, the Company often relies on the income approach. The Company may engage an independent valuation firm to assist management with the valuation. The decision to engage an independent valuation firm considers all relevant facts and circumstances, including a cost/benefit analysis and the Company’s internal valuation knowledge of the long-lived asset (asset group) or business. The Company develops the underlying assumptions consistent with its internal budgets and forecasts for such valuations. Additionally, the Company uses an internal discounted cash flow valuation model (the “DCF model”), based on the principles of present value techniques, to estimate the fair value of its reporting units or long-lived assets under the income approach. The DCF model estimates fair value by discounting our internal budgets and cash flow forecasts, adjusted to reflect market participant assumptions, to the extent necessary, at an appropriate discount rate.
Management applies considerable judgment in selecting several input assumptions during the development of our internal budgets and cash flow forecasts. Examples of the input assumptions that our budgets and forecasts are sensitive to include macroeconomic factors such as growth rates, industry demand, inflation, exchange rates, power prices and commodity prices. Whenever appropriate, management obtains these input assumptions from observable market data sources and extrapolates the market information if an input assumption is not observable for the entire forecast period. Many of these input assumptions are dependent on other economic assumptions, which are often derived from statistical economic models with inherent limitations such as estimation differences. Further, several input assumptions are based on historical trends which often do not recur. The input assumptions most significant to our budgets and cash flows are based on expectations of macroeconomic factors which have been volatile recently. It is not uncommon that different market data sources have different views of the macroeconomic factors expectations and related assumptions. As a result, macroeconomic factors and related assumptions are often available in a narrow range; however, in some situations these ranges become wide and the use of a different set of input assumptions could produce significantly different budgets and cash flow forecasts.
150
Table of Contents
A considerable amount of judgment is also applied in the estimation of the discount rate used in the DCF model. To the extent practical, inputs to the discount rate are obtained from market data sources (e.g., Bloomberg, Capital IQ, etc.). The Company selects and uses a set of publicly traded companies from the relevant industry to estimate the discount rate inputs. Management applies judgment in the selection of such companies based on its view of the most likely market participants. It is reasonably possible that the selection of a different set of likely market participants could produce different input assumptions and result in the use of a different discount rate.
Fair value of a reporting unit or a long-lived asset (asset group) is sensitive to both input assumptions to our budgets and cash flow forecasts and the discount rate. Further, estimates of long-term growth and terminal value are often critical to the fair value determination. As part of the impairment evaluation process, management analyzes the sensitivity of fair value to various underlying assumptions. The level of scrutiny increases as the gap between fair value and carrying amount decreases. Changes in any of these assumptions could result in management reaching a different conclusion regarding the potential impairment, which could be material. Our impairment evaluations inherently involve uncertainties from uncontrollable events that could positively or negatively impact the anticipated future economic and operating conditions.
Further discussion of the impairment charges recognized by the Company can be found within Management’s Discussion and Analysis, Consolidated Results of Operations—Goodwill Impairment and Asset Impairment Expense and Note 19—Impairment Expense and Note 8—Goodwill and Other Intangible Assets to the Consolidated Financial Statements included in Item 8 of this Form 10-K.
Fair Value
Fair Value of Financial Instruments
A significant number of the Company’s financial instruments are carried at fair value with changes in fair value recognized in earnings or other comprehensive income each period. The Company makes estimates regarding the valuation of assets and liabilities measured at fair value in preparing the Consolidated Financial Statements. These assets and liabilities include short and long-term investments in debt and equity securities, included in the balance sheet line items “Short-term investments” and “Other assets (Noncurrent)”, derivative assets, included in “Other current assets” and “Other assets (Noncurrent)” and derivative liabilities, included in “Accrued and other liabilities (current)” and “Other long-term liabilities”. The Company uses valuation techniques and methodologies that maximize the use of observable inputs and minimize the use of unobservable inputs. Where available, fair value is based on observable market prices or parameters or derived from such prices or parameters. Where observable prices are not available, valuation models are applied to estimate the fair value using the available observable inputs. The valuation techniques involve some level of management estimation and judgment, the degree of which is dependent on the price transparency for the instruments or market and the instruments’ complexity. Investments are generally fair valued based on quoted market prices or other observable market data such as interest rate indices. The Company’s investments are primarily certificates of deposit, government debt securities and money market funds. Derivatives are valued using observable data as inputs into internal valuation models. The Company’s derivatives primarily consist of interest rate swaps, foreign currency instruments, and commodity and embedded derivatives. Additional discussion regarding the nature of these financial instruments and valuation techniques can be found in Note 4—Fair Value in Item 8 of this Form 10-K.
Accounting for Derivative Instruments and Hedging Activities
We enter into various derivative transactions in order to hedge our exposure to certain market risks. We primarily use derivative instruments to manage our interest rate, commodity and foreign currency exposures. We do not enter into derivative transactions for trading purposes.
In accordance with the accounting standards for derivatives and hedging, we recognize all derivatives as either assets or liabilities in the balance sheet and measure those instruments at fair value except where
151
Table of Contents
derivatives qualify and are designated as “normal purchase/normal sale” transactions. Changes in fair value of derivatives are recognized in earnings unless specific hedge criteria are met. Income and expense related to derivative instruments are recognized in the same category as generated by the underlying asset or liability.
The accounting standards for derivatives and hedging enable companies to designate qualifying derivatives as hedging instruments based on the exposure being hedged. These hedge designations include fair value hedges and cash flow hedges. Changes in the fair value of a derivative that is highly effective and is designated and qualifies as a fair value hedge, are recognized in earnings as offsets to the changes in fair value of the exposure being hedged. The Company has no fair value hedges at this time. Changes in the fair value of a derivative that is highly effective and is designated as and qualifies as a cash flow hedge, are deferred in accumulated other comprehensive income and are recognized into earnings as the hedged transactions occur. Any ineffectiveness is recognized in earnings immediately. For all hedge contracts, the Company provides formal documentation of the hedge and effectiveness testing in accordance with the accounting standards for derivatives and hedging.
The fair value measurement accounting standard provides additional guidance on the definition of fair value and defines fair value as the price that would be received to sell an asset or paid to transfer a liability in an orderly transaction between market participants at the measurement date, or exit price. The fair value measurement standard requires the Company to consider and reflect the assumptions of market participants in the fair value calculation. These factors include nonperformance risk (the risk that the obligation will not be fulfilled) and credit risk, both of the reporting entity (for liabilities) and of the counterparty (for assets). Due to the nature of the Company’s interest rate swaps, which are typically associated with non-recourse debt, credit risk for AES is evaluated at the subsidiary level rather than at the Parent Company level. Nonperformance risk on the Company’s derivative instruments is an adjustment to the initial asset/liability fair value position that is derived from internally developed valuation models that utilize observable market inputs.
As a result of uncertainty, complexity and judgment, accounting estimates related to derivative accounting could result in material changes to our financial statements under different conditions or utilizing different assumptions. As a part of accounting for these derivatives, we make estimates concerning nonperformance, volatilities, market liquidity, future commodity prices, interest rates, credit ratings (both ours and our counterparty’s) and exchange rates.
The fair value of our derivative portfolio is generally determined using internal valuation models, most of which are based on observable market inputs including interest rate curves and forward and spot prices for currencies and commodities. The Company derives most of its financial instrument market assumptions from market efficient data sources (e.g., Bloomberg and Platt’s). In some cases, where market data is not readily available, management uses comparable market sources and empirical evidence to derive market assumptions to determine a financial instrument’s fair value. In certain instances, the published curve may not extend through the remaining term of the contract and management must make assumptions to extrapolate the curve. Additionally, in the absence of quoted prices, we may rely on “indicative pricing” quotes from financial institutions to input into our valuation model for certain of our foreign currency swaps. These indicative pricing quotes do not constitute either a bid or ask price and therefore are not considered observable market data. For individual contracts, the use of different valuation models or assumptions could have a material effect on the calculated fair value.
Fair Value of Nonfinancial Assets and Liabilities
The Company adopted the fair value measurement accounting guidance for nonfinancial assets and liabilities effective January 1, 2009. The most significant of these estimates surround the fair value measurement of long-lived tangible and intangible assets when tested for impairment upon a triggering event or during the annual impairment evaluation for indefinite-lived intangible assets, including goodwill. These estimates include making assumptions regarding useful life, the impact of economic obsolescence and expected future cash flows. Additional factors are discussed above in the Impairments section.
152
Table of Contents
Fair Value Hierarchy
The Company uses valuation techniques and methodologies that maximize the use of observable inputs and minimize the use of unobservable inputs. Where available, fair value is based on observable market prices or parameters or derived from such prices or parameters. Where observable prices are not available, valuation models are applied to estimate the fair value using the available observable inputs. The valuation techniques involve some level of management estimation and judgment, the degree of which is dependent on the price transparency for the instruments or market and the instruments’ complexity.
To increase consistency and enhance disclosure of the fair value of financial instruments, the fair value measurement standard creates a fair value hierarchy to prioritize the inputs used to measure fair value into three categories. A financial instrument’s level within the fair value hierarchy is based on the lowest level of input significant to the fair value measurement, where Level 1 is the highest and Level 3 is the lowest. For more information regarding the fair value hierarchy, see Note 1—General and Summary of Significant Accounting Policies in Item 8. Financial Statements and Supplementary Data of this Form 10-K.
Regulatory Assets and Liabilities
The Company accounts for certain of its regulated operations in accordance with the regulatory accounting standards. As a result, AES recognizes assets and liabilities that result from the regulated ratemaking process that would not be recognized under GAAP for non-regulated entities. Regulatory assets generally represent incurred costs that have been deferred because such costs are probable of future recovery through customer rates. Regulatory liabilities generally represent obligations to make refunds to customers for previous collections for costs that are not likely to be incurred or included in future rate initiatives. Management continually assesses whether the regulatory assets are probable of future recovery by considering factors such as applicable regulatory changes, recent rate orders applicable to other regulated entities and the status of any pending or potential deregulation legislation. If future recovery of costs ceases to be probable, any asset write-offs would be required to be recognized in operating income.
New Accounting Pronouncements Adopted
Effective January 1, 2010, we adopted new accounting provisions related to the following topics as a result of new accounting guidance issued by the Financial Accounting Standards Board (“FASB”). The financial statement impact of these new accounting pronouncements is included in Note 1—General and Summary of Significant Accounting Policies included in Item 8 of this Form 10-K.
| • | Consolidations, Improvements to Financial Reporting by Enterprises Involved with Variable Interest Entities (“VIEs”). The new accounting guidance on the consolidation of VIEs requires an entity to qualitatively, rather than quantitatively, assess the determination of the primary beneficiary of a VIE. This determination is based on whether the entity has the power to direct the activities that most significantly impact the economic performance of the VIE and the obligation to absorb losses or the right to receive benefits of the VIE that could potentially be significant to the VIE. Other key changes include: a requirement for the ongoing reconsideration of the primary beneficiary, the criteria for determining whether service provider or decision maker contracts are variable interests, the consideration of kick-out and removal rights in determining whether an entity is a VIE, the types of events that trigger the reassessment of whether an entity is a VIE and the expansion of the disclosures previously required. The adoption of the new accounting guidance on the consolidation of VIEs resulted in the deconsolidation of certain immaterial VIEs previously consolidated. Additionally, assets, liabilities and operating results of two of the Company’s VIEs, previously accounted for under the equity method of accounting, were required to be consolidated. Cartagena, a 71% owned generation business in Spain, and Cili, a 51% owned generation business in China, were consolidated under the new guidance. |
| • | Accounting for Transfers of Financial Assets. The new accounting guidance on transfers of financial assets, among other things: removes the concept of a qualifying special purpose entity; introduces the |
153
Table of Contents
| concept of participating interests and specifies that in order to qualify for sale accounting a partial transfer of a financial asset or a group of financial assets should meet the definition of a participating interest; clarifies that an entity should consider all arrangements made contemporaneously with or in contemplation of a transfer and requires enhanced disclosures to provide financial statement users with greater transparency about transfers of financial assets and a transferor’s continuing involvement with transfers of financial assets accounted for as sales. Upon adoption on January 1, 2010, the Company recognized $40 million as accounts receivable and as an associated secured borrowing on its Consolidated Balance Sheet; both of which have since increased to $50 million as of December 31, 2010, as additional interests in receivables have been sold. While securitizing these accounts receivable through IPL Funding, a special purpose entity, IPL, the Company’s integrated utility in Indianapolis, had previously recognized the transaction as a sale, but had not recognized the accounts receivable and secured borrowing on its balance sheet. |
Accounting Pronouncements Issued But Not Yet Effective
The following accounting standards have been issued, but as of December 31, 2010 are not yet effective for and have not been adopted by AES.
Accounting Standards Update (“ASU”) No. 2010-28, Intangibles—Goodwill and Other (Topic 350), When to Perform Step 2 of the Goodwill Impairment Test for Reporting Units with Zero or Negative Carrying Amounts
In December 2010, the FASB issued ASU No. 2010-28, which amends the accounting guidance related to goodwill. The amendments in ASU No. 2010-28 modify Step 1 of the goodwill impairment test for reporting units with zero or negative carrying amounts. For those reporting units, an entity is required to perform Step 2 of the goodwill impairment test if it is more likely than not that a goodwill impairment exists, eliminating an entity’s ability to assert that a reporting unit is not required to perform Step 2 because the carrying amount of the reporting unit is zero or negative despite the existence of qualitative factors that indicate the goodwill is more likely than not impaired. In determining whether it is more likely than not that a goodwill impairment exists, an entity should consider whether there are any adverse qualitative factors indicating that an impairment may exist. ASU No. 2010-28 is effective for fiscal years, and interim periods within those years, beginning after December 15, 2010, or January 1, 2011 for AES. Early adoption is prohibited. The adoption is not expected to have a material impact on the Company’s financial position, results of operations or cash flows.
Capital Resources and Liquidity
Overview. In November 2009, the Company announced a binding stock purchase agreement with CIC, to sell 125.5 million shares of AES stock to CIC, representing a 15% ownership stake in the Company. The transaction closed in March 2010 and generated $1.58 billion of new equity to fund future growth opportunities. During 2010, the Company redeemed $690 million aggregate principal of its outstanding 8.75% Second Priority Senior Secured Notes due 2013. The Notes were redeemed in May and October 2010 at a redemption price equal to 101.458% of the principal amount redeemed.
As of December 31, 2010, the Company had unrestricted cash and cash equivalents of $2.6 billion, of which approximately $1.1 billion is held at the Parent Company and qualified holding companies, and short term investments of $1.7 billion. In addition, we had restricted cash and debt service reserves of $1.3 billion. The Company also had non-recourse and recourse aggregate principal amounts of debt outstanding of $15.1 billion and $4.6 billion, respectively. Of the approximately $2.6 billion of our short-term non-recourse debt, $1.2 billion is presented as current because it is due in the next twelve months and $1.4 billion relates to defaulted debt. We expect such current maturities will be repaid from net cash provided by operating activities of the subsidiary to which the debt relates or through opportunistic refinancing activity or some combination thereof. Approximately $463 million of our recourse debt matures within the next twelve months, which we expect to repay using cash on hand at the Parent Company or through net cash provided by operating activities. See further discussion of Parent Company Liquidity below.
154
Table of Contents
The Company has two types of debt reported on its consolidated balance sheet: non-recourse and recourse debt. Non-recourse debt is used to fund investments and capital expenditures for construction and acquisition of our electric power plants, wind projects and distribution facilities at our subsidiaries. Non-recourse debt is generally secured by the capital stock, physical assets, contracts and cash flows of the related subsidiary. The default risk is limited to the respective business and is without recourse to the Parent Company and other subsidiaries. Recourse debt is direct borrowings by the Parent Company and is used to fund development, construction or acquisitions, including funding for equity investments or to provide loans to the Parent Company’s subsidiaries or affiliates. This Parent Company debt is with recourse to the Parent Company and is structurally subordinated to the debt of the Parent Company’s subsidiaries or affiliates, except to the extent such subsidiaries or affiliates guarantee the Parent Company’s debt.
We rely mainly on long-term debt obligations to fund our construction activities. We have, to the extent available at acceptable terms, utilized non-recourse debt to fund a significant portion of the capital expenditures and investments required to construct and acquire our electric power plants, distribution companies and related assets. Our non-recourse financing is designed to limit cross default risk to the Parent Company or other subsidiaries and affiliates. Our non-recourse long-term debt is a combination of fixed and variable interest rate instruments. Generally, a portion or all of the variable rate debt is fixed through the use of interest rate swaps. In addition, the debt is typically denominated in the currency that matches the currency of the revenue expected to be generated from the benefiting project, thereby reducing currency risk. In certain cases, the currency is matched through the use of derivative instruments. The majority of our non-recourse debt is funded by international commercial banks, with debt capacity supplemented by multilaterals and local regional banks. For more information on our long-term debt, see Note 10—Debt of the Consolidated Financial Statements included in Item 8. of this Form 10-K.
Given our long-term debt obligations, the Company is subject to interest rate risk on debt balances that accrue interest at variable rates. When possible, the Company will borrow funds at fixed interest rates or hedge its variable rate debt to fix its interest costs on such obligations. In addition, the Company has historically tried to maintain at least 70% of its consolidated long-term obligations at fixed interest rates, including fixing the interest rate through the use of interest rate swaps. These efforts apply to the notional amount of the swaps compared to the amount of related underlying debt. While the Company believes that this represents an economic hedge, the Company is required to mark-to-market all of these interest rate swaps and other derivatives. Presently, the Parent Company’s only direct exposure to variable interest rate debt relates to indebtedness under its senior secured credit facility. On a consolidated basis, of the Company’s $19.7 billion of total debt outstanding as of December 31, 2010, approximately $5.0 billion bore interest at variable rates that were not subject to a derivative instrument which fixed the interest rate.
In addition to utilizing non-recourse debt at a subsidiary level when available, the Parent Company provides a portion, or in certain instances all, of the remaining long-term financing or credit required to fund development, construction or acquisition of a particular project. These investments have generally taken the form of equity investments or intercompany loans, which are subordinated to the project’s non-recourse loans. We generally obtain the funds for these investments from our cash flows from operations, proceeds from the sales of assets and/or the proceeds from our issuances of debt, common stock and other securities. Similarly, in certain of our businesses, the Parent Company may provide financial guarantees or other credit support for the benefit of counterparties who have entered into contracts for the purchase or sale of electricity, equipment or other services with our subsidiaries or lenders. In such circumstances, if a business defaults on its payment or supply obligation, the Parent Company will be responsible for the business’ obligations up to the amount provided for in the relevant guarantee or other credit support. At December 31, 2010, the Parent Company had provided outstanding financial and performance-related guarantees or other credit support commitments to or for the benefit of our businesses, which were limited by the terms of the agreements, of approximately $415 million in aggregate (excluding investment commitments and those collateralized by letters of credit and other obligations discussed below).
155
Table of Contents
As a result of the Parent Company’s below investment grade rating, counterparties may be unwilling to accept our general unsecured commitments to provide credit support. Accordingly, with respect to both new and existing commitments, the Parent Company may be required to provide some other form of assurance, such as a letter of credit, to backstop or replace our credit support. The Parent Company may not be able to provide adequate assurances to such counterparties. To the extent we are required and able to provide letters of credit or other collateral to such counterparties, this will reduce the amount of credit available to us to meet our other liquidity needs. At December 31, 2010, we had $85 million in letters of credit outstanding, which operate to guarantee performance relating to certain project development activities and business operations. These letters of credit were provided under the senior secured credit facility. During the year ended December 31, 2010, the Company paid letter of credit fees ranging from 3.19% to 3.75% per annum on the outstanding amounts.
We expect to continue to seek, where possible, non-recourse debt financing in connection with the assets or businesses that we or our affiliates may develop, construct or acquire. However, depending on local and global market conditions and the unique characteristics of individual businesses, non-recourse debt may not be available on economically attractive terms or at all. See Global Economic Conditions discussion above. If we decide not to provide any additional funding or credit support to a subsidiary project that is under construction or has near-term debt payment obligations and that subsidiary is unable to obtain additional non-recourse debt, such subsidiary may become insolvent, and we may lose our investment in that subsidiary. Additionally, if any of our subsidiaries lose a significant customer, the subsidiary may need to withdraw from a project or restructure the non-recourse debt financing. If we or the subsidiary choose not to proceed with a project or are unable to successfully complete a restructuring of the non-recourse debt, we may lose our investment in that subsidiary.
Many of our subsidiaries depend on timely and continued access to capital markets to manage their liquidity needs. The inability to raise capital on favorable terms, to refinance existing indebtedness or to fund operations and other commitments during times of political or economic uncertainty may have material adverse effects on the financial condition and results of operations of those subsidiaries. In addition, changes in the timing of tariff increases or delays in the regulatory determinations under the relevant concessions could affect the cash flows and results of operations of our businesses.
As of December 31, 2010, the Company had approximately $347 million of trade accounts receivable related to certain of its generation and utility businesses in Latin America classified as other long-term assets. These consist primarily of trade accounts receivable that, pursuant to amended agreements or government resolutions, have collection periods that extend beyond December 31, 2011, or one year past the balance sheet date. The Company is actively collecting these receivables and does not expect any significant collection issues. Additionally, the current portion of these trade accounts receivable was $101 million at December 31, 2010.
Capital Expenditures
The Company spent $2.3 billion, $2.5 billion and $2.9 billion on capital expenditures in 2010, 2009 and 2008, respectively. A significant majority of these costs were funded with non-recourse debt consistent with our financial strategy. At December 31, 2010, the Company had a total of $432 million of availability under long-term non-recourse construction credit facilities. As more fully described in Key Trends and Uncertainties above, we have taken steps to decrease the amount of new discretionary capital spending. We expect to continue funding projects that are currently in the construction phase using existing capital provided by these non-recourse credit facilities as supplemented by internally generated cash flows, Parent Company liquidity, contribution from existing or new partners and other funding sources. As a result, property, plant and equipment and long-term non-recourse debt are expected to increase over the next few years even though the rate of discretionary spending has decreased. While we believe we have the resources to continue funding the projects in construction, there can be no assurances that we will continue to fund all these existing construction efforts.
As of December 31, 2010, the Company had $66 million of commitments to invest in subsidiaries under construction and to purchase related equipment, excluding $26 million of such obligations already included in the
156
Table of Contents
letters of credit discussed above. The Company expects to fund these net investment commitments in 2011. The exact payment schedules will be dictated by the construction milestones. We expect to fund these commitments from a combination of current liquidity and internally generated Parent Company cash flow.
Environmental Capital Expenditures
The Company continues to assess the possible need for capital expenditures associated with international, federal, regional and state regulation of GHG emissions from electric power generation facilities. Currently in the United States there is no Federal legislation establishing mandatory GHG emissions reduction programs (including CO2) affecting the electric power generating facilities of the Company’s subsidiaries. There are numerous state programs regulating GHG emissions from electric power generation facilities and there is a possibility that federal GHG legislation will be enacted within the next several years. Further, the EPA has adopted regulations pertaining to GHG emissions and has announced its intention to propose new regulations for electric generating units under Section 111 of the CAA. The EPA regulations and any subsequent Federal legislation, if enacted, may place significant costs on GHG emissions from fossil fuel-fired electric power generation facilities, particularly coal-fired facilities, and in order to comply, CO2 emitting facilities may be required to purchase additional GHG emissions allowances or offsets under cap-and-trade programs, pay a carbon tax or install new emission reduction equipment to capture or reduce the amount of GHG emitted from the facilities, in the event that reliable technology to do so is developed. The capital expenditures required to comply with any future GHG legislation or any GHG regulations could be significant and unless such costs can be passed on to customers or counterparties, such regulations could impair the profitability of some of the electric power generation facilities operated by our subsidiaries or render certain of them uneconomical to operate, either of which could have a material adverse effect on our consolidated results of operations and financial condition.
With respect to our operations outside the United States, certain of the businesses operated by the Company’s subsidiaries are subject to compliance with EU ETS and the Kyoto Protocol in certain countries and other country-specific programs to regulate GHG emissions. To date, compliance with the Kyoto Protocol and EU ETS has not had a material adverse effect on the Company’s consolidated results of operations, financial condition and cash flows because of, among other factors, the cost of GHG emission allowances and/or the ability of our businesses to pass the cost of purchasing such allowances on to customers or counterparties. However, in the event that such counterparties or regulatory authorities challenge our ability to pass these costs on, there can be no assurance that the Company and/or the relevant subsidiary would prevail in any such dispute. Furthermore, even if the Company and/or the relevant subsidiary does prevail, it would be subject to the cost and administrative burden associated with such dispute.
As discussed in Item 1.—Business—Regulatory Matters—Environmental and Land Use Regulations, in the United States there presently is no federal legislation establishing mandatory GHG emission reduction programs. In 2010, the Company’s subsidiaries operated businesses which had total approximate CO2 emissions of 77.2 million metric tonnes (ownership adjusted). Approximately 40 million metric tonnes of the 77.2 million metric tonnes were emitted in the United States (both figures ownership adjusted). Approximately 11.3 million metric tonnes were emitted in United States states participating in the RGGI. We believe that legislative or regulatory actions, if enacted, may require a material increase in capital expenditures at our subsidiaries.
In the future the actual impact on our subsidiaries’ capital expenditures from any potential federal program to regulate and reduce GHG emissions, if enacted, and the state and regional programs developed or in the process of development, or any EPA regulation of GHG emissions, will depend on a number of factors, including among others, the GHG reductions required under any such legislation or regulations, the cost of emissions reduction equipment, the price and availability of offsets, the extent to which our subsidiaries would be entitled to receive GHG emission allowances without having to purchase them, the quantity of allowances which our subsidiaries would have to purchase, the price of allowances, and our subsidiaries’ ability to recover or pass-through costs incurred to comply with any legislative or regulatory requirements that are ultimately imposed and the use of market-based compliance options such as cap-and-trade programs.
157
Table of Contents
Income Taxes
We recognized tax expense of $307 million for the year ended December 31, 2010, while our cash payments for income taxes, net of refunds, totaled $698 million. The difference resulted primarily from impairment charges recognized at certain subsidiaries in the United States, for which we recognized a benefit in our domestic tax provision. As a result, global cash tax payments exceeded the consolidated tax provision.
Consolidated Cash Flows
At December 31, 2010, cash and cash equivalents increased $772 million from December 31, 2009 to $2.6 billion. The increase in cash and cash equivalents was due to $3.5 billion of cash provided by operating activities, $2.0 billion of cash used for investing activities, $706 million of cash used for financing activities and the favorable effect of foreign currency exchange rates on cash of $8 million.
At December 31, 2009, cash and cash equivalents increased $917 million from December 31, 2008 to $1.8 billion. The increase in cash and cash equivalents was due to $2.2 billion of cash provided by operating activities, $1.9 billion of cash used for investing activities, $610 million of cash provided by financing activities and the favorable effect of foreign currency exchange rates on cash of $22 million.
| $ Change | ||||||||||||||||||||
| 2010 | 2009 | 2008 | 2010 vs. 2009 | 2009 vs. 2008 | ||||||||||||||||
| (in millions) | ||||||||||||||||||||
| Net cash provided by operating activities |
$ | 3,510 | $ | 2,202 | $ | 2,160 | $ | 1,308 | $ | 42 | ||||||||||
| Net cash used in investing activities |
$ | 2,040 | $ | 1,917 | $ | 3,581 | $ | 123 | $ | (1,664 | ) | |||||||||
| Net cash (used in) provided by financing activities |
$ | (706 | ) | $ | 610 | $ | 362 | $ | (1,316 | ) | $ | 248 | ||||||||
Operating Activities
Net cash provided by operating activities increased $1.3 billion, or 59%, to $3.5 billion during 2010 compared to 2009. This net increase was primarily due to the following:
| • | an increase of $837 million at our Latin American Utilities businesses due to increased tax payments in 2009 associated with a tax amnesty program of $326 million, higher working capital requirements during 2009 related to payments on the settlement of swap agreements of $65 million and in 2010, a $50 million decrease in employer contributions to pension plans and lower payments for contingencies; |
| • | an increase of $215 million at our Latin American Generation businesses due to the higher gross margin in 2010 combined with improved working capital mainly as a result of higher collections of value added taxes and accounts receivable; |
| • | an increase of $99 million at Masinloc in the Philippines due to higher gross margin; and |
| • | an increase of $58 million as a result of our consolidation of Cartagena in 2010 and the acquisition of Ballylumford in Northern Ireland. |
These increases were partially offset by:
| • | a decrease of $136 million in operating cash flows from discontinued operations of businesses sold in 2010 compared to 2009. In 2010, net cash provided by operating activities of businesses sold was $33 million and will not recur in 2011. |
In 2010 the increase in net cash provided by operating activities at our Latin American Utilities businesses included several items such as the tax amnesty program and settlement of swap agreements, as described above, that are not expected to recur. In addition, 2010 net cash provided by operating activities benefited from the one time cash savings related to the utilization of tax credits received as a result of the REFIS program. As such, the Company does not expect the trend of an increase in net cash provided by operating activities realized in 2010 to continue in 2011.
158
Table of Contents
Investing Activities
Net cash used for investing activities increased $123 million, or 6%, to $2.0 billion during 2010 compared to 2009. This increase was largely attributable to the following:
| • | an increase in the purchase of short-term investments of $1.6 billion during 2010 compared to 2009 primarily due to the investment of cash proceeds from debt issuances at our Brazilian subsidiaries and the purchase of time deposits at Gener in 2010. Purchases were offset by an increase in sales of short-term investments of $1.3 billion mainly due to the use of proceeds from investments for the repayment of debt instruments and dividend distributions at our Brazilian subsidiaries and the sales of time deposits at Gener; |
| • | an increase of $406 million in funding requirements for restricted cash balances during 2010 compared to 2009. During 2010, $104 million of funds were transferred to restricted cash balances while during 2009, $302 million was transferred out of restricted cash; |
| • | an increase of $254 million for acquisitions, net of cash acquired, primarily due to $138 million related to the acquisition of Ballylumford in Northern Ireland, $65 million related to the purchase of three wind development pipelines in the U.K. and Poland, $35 million related to the acquisition of JHRH, and $11 million related to the buyout of noncontrolling interests at Changuinola; |
| • | an increase of $241 million in debt service reserves during 2010 compared to 2009. During 2010, $56 million of funds were transferred to debt service reserves while during 2009, $185 million was utilized for debt maturities; partially offset by |
| • | an increase of $593 million in proceeds from the sale of businesses primarily due to proceeds of $226 million related to the sale in October 2010 of Ras Laffan in Qatar, $170 million related to the sale in August 2010 of Barka in Oman, the final settlement proceeds of $99 million received in January 2010 from the termination of a management agreement with Kazakhmys in Kazakhstan related to Ekibastuz and Maikuben which were sold in May 2008, and the net proceeds from the sale of Lal Pir and Pak Gen in Pakistan in June 2010 of $100 million; |
| • | a decrease of $210 million in capital expenditures to $2.3 billion primarily due to a decrease in expenditures of $298 million at Gener and $250 million at our Europe Wind generation projects. These decreases were partially offset by a net increase in capital expenditures of $261 million at our Brazilian subsidiaries, $66 million at Maritza in Bulgaria, and $16 million at our U.S. Wind generation projects; and |
| • | an increase of $132 million in proceeds related to the repayment of the loan receivable from a wind development project in Brazil. There were no proceeds from loan repayments during 2009. |
Financing Activities
Net cash used for financing activities increased $1,316 million, or 216%, to $706 million during 2010 compared to net cash provided by financing activities of $610 million during 2009. This increase was primarily attributable to the following:
| • | a $1.7 billion increase in repayments of recourse and non-recourse debt, predominately due to increases of $760 million of recourse debt repayments at the Parent Company, $706 million at our Brazilian businesses, $279 million at our businesses in the Dominican Republic, $55 million at Masinloc in the Philippines, $44 million at New York, $40 million at our European wind businesses, $31 million at Chigen and $30 million at Cartagena, partially offset by decreases of $132 million at IPALCO and $115 at Armenia Mountain; |
| • | a $560 million decrease in proceeds from issuances of recourse and non-recourse debt primarily due to decreases of $503 million of recourse debt at the Parent Company, $286 million at Gener, $209 million at Armenia Mountain, $208 million at our European wind businesses, $123 million at Sonel and $122 million at IPALCO, partially offset by increases of $604 million at our Brazilian businesses and $294 million at our businesses in the Dominican Republic; |
159
Table of Contents
| • | a $399 million increase in distributions to noncontrolling interests, primarily due to $245 million at our Brazilian businesses, $84 million related to distributions in connection with the sale of discontinued operations and $69 million at Armenia Mountain; |
| • | a $190 million decrease in contributions from noncontrolling interests primarily due to a reduction of $117 million at Armenia Mountain and $71 million at Gener; and |
| • | a $99 million acquisition of treasury stock. |
These decreases were partially offset by:
| • | a $1.6 billion issuance of common stock net of transaction costs to CIC; and |
| • | a $67 million increase in net borrowings under revolving credit facilities primarily due to decreased repayments attributable to discontinued operations sold in 2010. |
Contractual Obligations
A summary of our contractual obligations, commitments and other liabilities as of December 31, 2010 is presented in the table below (in millions):
| Contractual Obligations |
Total | Less than 1 year |
1-3 years | 4-5 years | 5 years and more |
Other | Footnote Reference(10) |
|||||||||||||||||||||
| Debt Obligations(1) |
$ | 19,653 | $ | 3,026 | $ | 1,591 | $ | 3,963 | $ | 11,073 | $ | — | 10 | |||||||||||||||
| Interest Payments on Long-Term Debt(2) |
9,533 | 1,358 | 2,531 | 2,055 | 3,589 | — | n/a | |||||||||||||||||||||
| Capital Lease Obligations(3) |
206 | 17 | 26 | 21 | 142 | — | 11 | |||||||||||||||||||||
| Operating Lease Obligations(4) |
919 | 56 | 111 | 104 | 648 | — | 11 | |||||||||||||||||||||
| Sale/Leaseback Obligations(5) |
664 | 43 | 90 | 94 | 437 | — | 11 | |||||||||||||||||||||
| Electricity Obligations(6) |
52,160 | 3,055 | 6,118 | 5,211 | 37,776 | — | 11 | |||||||||||||||||||||
| Fuel Obligations(7) |
8,871 | 1,587 | 1,887 | 1,006 | 4,391 | — | 11 | |||||||||||||||||||||
| Other Purchase Obligations(8) |
21,040 | 1,628 | 2,603 | 2,752 | 14,057 | — | 11 | |||||||||||||||||||||
| Other Long-term Liabilities Reflected on AES’s Consolidated Balance Sheet under GAAP(9) |
625 | 4 | 93 | 94 | 298 | 136 | n/a | |||||||||||||||||||||
| Total |
$ | 113,671 | $ | 10,774 | $ | 15,050 | $ | 15,300 | $ | 72,411 | $ | 136 | ||||||||||||||||
| (1) | Includes recourse and non-recourse debt presented on the Consolidated Balance Sheet. Non-recourse debt borrowings are not a direct obligation of AES, the Parent Company. Recourse debt represents the direct borrowings of AES, the Parent Company. See Note 10—Debt to the Consolidated Financial Statements included in Item 8 of this Form 10-K which provides additional disclosure regarding these obligations. These amounts exclude capital lease obligations which are included in the capital lease category, see (3) below. |
| (2) | Interest payments are estimated based on final maturity dates of debt securities outstanding at December 31, 2010 and do not reflect anticipated future refinancing, early redemptions or new debt issuances. Variable rate interest obligations are estimated based on rates as of December 31, 2010. |
| (3) | Several AES subsidiaries have leases for operating and office equipment and vehicles that are classified as capital leases within Property, Plant and Equipment. Minimum contractual obligations include $127 million of imputed interest. |
| (4) | The Company was obligated under long-term noncancelable operating leases, primarily for office rental and site leases. These amounts exclude amounts related to the sale/leaseback discussed below in item (5). |
| (5) | Sale/Leaseback Obligations—represent a sales/leaseback with operating lease treatment at one of our New York subsidiaries. |
| (6) | Operating subsidiaries of the Company have entered into contracts for the purchase of electricity from third parties. |
160
Table of Contents
| (7) | Operating subsidiaries of the Company have entered into fuel purchase contracts subject to termination only in certain limited circumstances. |
| (8) | Amounts relate to other contractual obligations where the Company has an enforceable and legally binding agreement to purchase goods or services that specifies all significant terms, including: quantity, pricing, and approximate timing. These amounts include planned capital expenditures that are contractually obligated. |
| (9) | These amounts do not include current liabilities on the Consolidated Balance Sheet except for the current portion of uncertain tax obligations. Noncurrent uncertain tax obligations are reflected in the “Other” column of the table above as the Company is not able to reasonably estimate the timing of the future payments. In addition, the amounts do not include: (1) regulatory liabilities (See Note 9—Regulatory Assets and Liabilities), (2) contingencies (See Note 12—Contingencies), (3) pension and other post retirement employee benefit liabilities (see Note 13—Benefit Plans) or (4) any taxes (See Note 20—Income Taxes) except for uncertain tax obligations, as the Company is not able to reasonably estimate the timing of future payments. See the indicated notes to the Consolidated Financial Statements included in Item 8 of this Form 10-K for additional information on the items excluded. Derivatives (See Note 6—Derivative Instruments and Hedging Activities) and incentive compensation are excluded as the Company is not able to reasonably estimate the timing or amount of the future payments. |
| (10) | For further information see the note referenced below in Item 8.—Financial Statements and Supplementary Data. |
Parent Company Liquidity
The following discussion of “Parent Company Liquidity” has been included because we believe it is a useful measure of the liquidity available to The AES Corporation, or the Parent Company, given the non-recourse nature of most of our indebtedness. Parent Company liquidity as outlined below is a non-GAAP measure and should not be construed as an alternative to cash and cash equivalents which are determined in accordance with GAAP, as a measure of liquidity. Cash and cash equivalents are disclosed in the Consolidated Statements of Cash Flows and the Parent Only Unconsolidated Statements of Cash Flows in Schedule I of this Form 10-K. Parent Company liquidity may differ from similarly titled measures used by other companies. The principal sources of liquidity at the Parent Company level are:
| • | dividends and other distributions from our subsidiaries, including refinancing proceeds; |
| • | proceeds from debt and equity financings at the Parent Company level, including availability under our credit facilities; and |
| • | proceeds from asset sales. |
Cash requirements at the Parent Company level are primarily to fund:
| • | interest; |
| • | principal repayments of debt; |
| • | acquisitions; |
| • | construction commitments; |
| • | other equity commitments; |
| • | equity repurchases; |
| • | taxes; and |
| • | Parent Company overhead and development costs. |
The Company defines Parent Company Liquidity as cash available to the Parent Company plus available borrowings under existing credit facilities. The cash held at qualified holding companies represents cash sent to subsidiaries of the Company domiciled outside of the U.S. Such subsidiaries have no contractual restrictions on their ability to send cash to the Parent Company. Parent Company Liquidity is reconciled to its most directly
161
Table of Contents
comparable U.S. GAAP financial measure, “cash and cash equivalents” at December 31, 2010 and 2009 as follows:
| Parent Company Liquidity |
2010 | 2009 | ||||||
| (in millions) | ||||||||
| Cash and cash equivalents |
$ | 2,554 | $ | 1,782 | ||||
| Less: Cash and cash equivalents at subsidiaries |
(1,432 | ) | (1,105 | ) | ||||
| Parent and qualified holding companies cash and cash equivalents |
1,122 | 677 | ||||||
| Commitments under Parent credit facilities |
800 | 785 | ||||||
| Less: Borrowings and letters of credit under the credit facilities |
(85 | ) | (204 | ) | ||||
| Borrowings available under Parent credit facilities |
715 | 581 | ||||||
| Total Parent Company Liquidity |
$ | 1,837 | $ | 1,258 | ||||
Recourse Debt Transactions:
During 2010, the Company redeemed $690 million aggregate principal of its 8.75% Second Priority Senior Secured Notes due 2013 (“the 2013 Notes”). The 2013 Notes were redeemed at a redemption price equal to 101.458% of the principal amount redeemed. The Company recognized a pre-tax loss on the redemption of the 2013 Notes of $15 million for the year ended December 31, 2010, which is included in “Other expense” in the accompanying Consolidated Statement of Operations.
On July 29, 2010, the Company entered into an Amendment No. 2 (the “Amendment No. 2”) to the Fourth Amended and Restated Credit and Reimbursement Agreement, dated as of July 29, 2008, among the Company, various subsidiary guarantors and various lending institutions (the “Existing Credit Agreement”) that amends and restates the Existing Credit Agreement (as so amended and restated by the Amendment No. 2, the “Fifth Amended and Restated Credit Agreement”). The Fifth Amended and Restated Credit Agreement adjusted the terms and conditions of the Existing Credit Agreement, including the following changes:
| • | the aggregate commitment for the revolving credit loan facility was increased to $800 million; |
| • | the final maturity date of the revolving credit loan facility was extended to January 29, 2015; |
| • | there were changes to the facility fee applicable to the revolving credit loan facility; |
| • | the interest rate margin applicable to the revolving credit loan facility is now based on the credit rating assigned to the loans under the credit agreement, with pricing currently at LIBOR + 3.00%; |
| • | there is an undrawn fee of 0.625% per annum; |
| • | the Company may incur a combination of additional term loan and revolver commitments so long as total term loan and revolver commitments (including those currently outstanding) do not exceed $1.4 billion; and |
| • | the negative pledge (i.e., a cap on first lien debt) of $3.0 billion. |
Recourse Debt:
Our recourse debt at year-end was approximately $4.6 billion and $5.5 billion in 2010 and 2009, respectively. The following table sets forth our Parent Company contingent contractual obligations as of December 31, 2010:
| Contingent contractual obligations |
Amount | Number of Agreements |
Maximum Exposure Range for Each Agreement |
|||||||||
| (in millions) | (in millions) | |||||||||||
| Guarantees |
$ | 415 | 24 | <$ | 1 - $62 | |||||||
| Letters of credit under the senior secured credit facility |
85 | 30 | <$ | 1 - $26 | ||||||||
| Total |
$ | 500 | 54 | |||||||||
162
Table of Contents
As of December 31, 2010, the Company had $66 million of commitments to invest in subsidiaries under construction and to purchase related equipment, excluding $26 million of such obligations already included in the letters of credit discussed above. The Company expects to fund these net investment commitments in 2011. The exact payment schedules will be dictated by the construction milestones. We expect to fund these commitments from a combination of current liquidity and internally generated Parent Company cash flow.
We have a diverse portfolio of performance related contingent contractual obligations. These obligations are designed to cover potential risks and only require payment if certain targets are not met or certain contingencies occur. The risks associated with these obligations include change of control, construction cost overruns, subsidiary default, political risk, tax indemnities, spot market power prices, sponsor support and liquidated damages under power sales agreements for projects in development, in operation and under construction. While we do not expect that we will be required to fund any material amounts under these contingent contractual obligations during 2011 or beyond, many of the events which would give rise to such obligations are beyond our control. We can provide no assurance that we will be able to fund our obligations under these contingent contractual obligations if we are required to make substantial payments thereunder.
While we believe that our sources of liquidity will be adequate to meet our needs for the foreseeable future, this belief is based on a number of material assumptions, including, without limitation, assumptions about our ability to access the capital markets (see Key Trends and Uncertainties and Global Economic Conditions), the operating and financial performance of our subsidiaries, currency exchange rates, power market pool prices, and the ability of our subsidiaries to pay dividends. In addition, our subsidiaries’ ability to declare and pay cash dividends to us (at the Parent Company level) is subject to certain limitations contained in loans, governmental provisions and other agreements. We can provide no assurance that these sources will be available when needed or that the actual cash requirements will not be greater than anticipated. We have met our interim needs for shorter-term and working capital financing at the Parent Company level with our senior secured credit facility. See Item 1A.—Risk Factors, “The AES Corporation is a holding company and its ability to make payments on its outstanding indebtedness, including its public debt securities, is dependent upon the receipt of funds from its subsidiaries by way of dividends, fees, interest, loans or otherwise.” of this Form 10-K.
Various debt instruments at the Parent Company level, including our senior secured credit facility, contain certain restrictive covenants. The covenants provide for, among other items:
| • | limitations on other indebtedness, liens, investments and guarantees; |
| • | limitations on dividends, stock repurchases and other equity transactions; |
| • | restrictions and limitations on mergers and acquisitions, sales of assets, leases, transactions with affiliates and off-balance sheet and derivative arrangements; |
| • | maintenance of certain financial ratios; and |
| • | financial and other reporting requirements. |
As of December 31, 2010, we were in compliance with these covenants at the Parent Company level.
Non-Recourse Debt:
While the lenders under our non-recourse debt financings generally do not have direct recourse to the Parent Company, defaults thereunder can still have important consequences for our results of operations and liquidity, including, without limitation:
| • | reducing our cash flows as the subsidiary will typically be prohibited from distributing cash to the Parent Company during the time period of any default; |
| • | triggering our obligation to make payments under any financial guarantee, letter of credit or other credit support we have provided to or on behalf of such subsidiary; |
163
Table of Contents
| • | causing us to record a loss in the event the lender forecloses on the assets; and |
| • | triggering defaults in our outstanding debt at the Parent Company. |
For example, our senior secured credit facilities and outstanding debt securities at the Parent Company include events of default for certain bankruptcy related events involving material subsidiaries. In addition, our revolving credit agreement at the Parent Company includes events of default related to payment defaults and accelerations of outstanding debt of material subsidiaries.
Some of our subsidiaries are currently in default with respect to all or a portion of their outstanding indebtedness. The total non-recourse debt classified as current in the accompanying Consolidated Balance Sheets amounts to $2.6 billion. The portion of current debt related to such defaults was $1.4 billion at December 31, 2010, all of which was non-recourse debt related to four subsidiaries—Maritza, Sonel, Kelanitissa and Aixi.
None of the subsidiaries that are currently in default are subsidiaries that met the applicable definition of materiality under AES’ corporate debt agreements as of December 31, 2010 in order for such defaults to trigger an event of default or permit acceleration under such indebtedness. However, as a result of additional dispositions of assets, other significant reductions in asset carrying values or other matters in the future that may impact our financial position and results of operations or the financial position of the individual subsidiary, it is possible that one or more of these subsidiaries could fall within the definition of a “material subsidiary” and thereby upon an acceleration trigger an event of default and possible acceleration of the indebtedness under the AES Parent Company’s outstanding debt securities.
Off-Balance Sheet Arrangements
In May 1999, our subsidiary in New York acquired six electric generating plants from New York State Electric and Gas. Concurrently, the subsidiary sold two of the plants to unrelated third parties for $666 million and simultaneously entered into a leasing arrangement with the unrelated parties. In May 2007, the subsidiary purchased 37.5% interest in a trust estate that holds the leased plants. Future minimum lease commitments under the lease agreement have been reduced by the subsidiary’s interest in the plants. We have accounted for this sale/leaseback transaction as an operating lease. We amortize the off-balance sheet lease obligation reduced by the subsidiary interest over the life of the lease, which resulted in the recognition of expense of $34 million for each of the years ended December 31, 2010, 2009 and 2008, respectively. AES is not subject to any additional liabilities or contingencies if the arrangement terminates and we believe that the dissolution of the off-balance sheet arrangement would have minimal effects on our operating cash flows. The terms of Eastern Energy’s credit facility include restrictive covenants such as the maintenance of certain coverage ratios. Historically, the plants have satisfied the restrictive covenants of the credit facility; however as a result of the continued pressure on energy prices and negative forecasted operating cash flow and losses previously discussed under Key Trends and Uncertainties, management does not believe that cash flow from operations, together with amounts available under existing credit facilities, will be sufficient to cover expected capital requirements over the terms of the leases. Management is exploring revenue enhancements as well as reviewing cost and debt structure for meaningful reductions that could be implemented in the future; however, in the event of a default Eastern Energy could be subject to full payment of the outstanding principal, accrued interest and termination costs under its lease arrangements and existing $200 million credit facility. In addition, the subsidiary lessor could be subject to full payment of the outstanding principal, accrued interest and make-whole premiums under its bond indenture. Also, a default by Eastern Energy or its related subsidiaries could result in the loss of AES’s ownership interest in Eastern Energy and related subsidiaries. See Note 11—Commitments to the Consolidated Financial Statements included in Item 8 of this Form 10-K for further discussion of this transaction.
164
Table of Contents
| ITEM 7A. | QUANTITATIVE AND QUALITATIVE DISCLOSURES ABOUT MARKET RISK |
Overview Regarding Market Risks
We are a global company in the power generation and distribution businesses. We own and/or operate power plants to generate and sell power to wholesale customers. We also own and/or operate utilities to distribute, transmit and sell electricity to end-user customers. Our primary market risk exposure is to the price of commodities particularly electricity, oil, natural gas, coal and environmental credits. We operate in multiple countries and as such are subject to volatility in exchange rates at the subsidiary level and between our functional currency, the U.S. Dollar, and currencies of the countries in which we operate. We are also exposed to interest rate fluctuations due to our issuance of debt and related financial instruments.
These disclosures set forth in this Item 7A are based upon a number of assumptions, and actual impacts to the Company may not follow the assumptions made by the Company. The safe harbor provided in Section 27A of the Securities Act of 1933 and Section 21E of the Securities Exchange Act of 1934 shall apply to the disclosures contained in this Item 7A. For further information regarding market risk, see Item 1A.—Risk Factors, “Our financial position and results of operations may fluctuate significantly due to fluctuations in currency exchange rates experienced at our foreign operations”, “Our businesses may incur substantial costs and liabilities and be exposed to price volatility as a result of risks associated with the wholesale electricity markets, which could have a material adverse effect on our financial performance” and “We may not be adequately hedged against our exposure to changes in commodity prices or interest rates” in this Form 10-K.
Commodity Price Risk
We are exposed to the impact of market fluctuations in the price of electricity, fuels and environmental credits. Although we primarily consist of businesses with long-term contracts or retail sales concessions, a portion of our current and expected future revenues are derived from businesses without significant long-term revenue or supply contracts. These businesses subject our operational results to the volatility of prices for electricity, fuels and environmental credits in competitive markets. We employ risk management strategies to hedge our financial performance against the effects of fluctuations in energy commodity prices. The implementation of these strategies can involve the use of physical and financial commodity contracts, futures, swaps and options.
When hedging the output of our generation assets, we have PPAs or other hedging instruments that lock in the spread per MWh between variable costs, such as fuel, to generate a unit of electricity and the price at which the electricity can be sold. The portion of our sales and purchases that are not subject to such agreements will be exposed to commodity price risk.
AES businesses will see variance in variable margin performance as global commodity prices shift. For 2011, including operations from the Company’s merchant generation assets in New York, we project pre-tax earnings exposure would be approximately $10 million for a $10/barrel move in oil, $110 million for a $1/MMBTU move in natural gas, and $50 million for a $10/ton shift in coal prices. Excluding New York, we project approximately $35 million for a $1/MMBTU move in natural gas and $35 million for a $10/ton shift in coal prices. The decrease in oil exposure from $15 million on December 31, 2009 is primarily due to higher hedge levels at some businesses and lower hedging of fuel costs at our Hungarian facility where fuel cost is indexed to oil partially offset by higher exposure at Gener due to the commissioning of new power facilities. The increase in natural gas exposure from $50 million on December 31, 2009 is primarily due to lower hedging levels at Eastern Energy, due to dark spread compression, and our Kilroot facility, which is no longer operating under a long-term PPA. The increase in coal exposure from $20 million on December 31, 2009 arises primarily from the lower hedge levels at Eastern Energy, Kilroot long-term PPA termination, Argentina pricing rules that limit the ability to reflect coal price movement under some conditions, and inclusion of China due to a delay in energy tariff resets intended to reflect changes in coal prices. These numbers have been produced by forecasting the impact of a change in commodity price to spot power prices and power and fuel contracts held by each business. Our estimates exclude correlation. For example, a decline in oil or natural gas prices can be accompanied by a decline
165
Table of Contents
in coal price if commodity prices are correlated. In aggregate, the Company’s downside exposure occurs with lower oil, lower natural gas, and higher coal prices. Exposures at individual businesses will change as new contracts or financial hedges are executed.
Commodity prices affect our businesses differently depending on the local market characteristics and risk management strategies. Generation costs can be directly affected by movements in the price of natural gas, oil and coal. Spot power prices and contract indexation provisions are affected by these same commodity price movements. We have some natural offsets across our businesses such that low commodity prices may benefit certain businesses and be a cost to others. Variance is not perfectly linear or symmetric. The sensitivities are affected by a number of non-market, or indirect market, factors. Examples of these factors include hydrology, energy market supply/demand balances, regional fuel supply issues, and regulatory interventions such as price caps. Operational flexibility changes the shape of our sensitivities. For instance, power plants may reduce dispatch in low market environments limiting downside exposure. Volume variation also affects our commodity exposure. The volume sold under contracts or retail concessions can vary based on weather and economic conditions resulting in a higher or lower volume of sales in spot markets. Thermal unit availability and hydrology can affect the generation output available for sale and can affect the marginal unit setting power prices.
Our larger contributors to commodity risk include Eastern Energy and wholesale power sales from IPL in North America; Gener, Argentina, the Dominican Republic and Panama in Latin America; Kilroot in Europe; and Masinloc in Asia.
In North America, commodity risk is due to “dark spread” to the extent a portion of sales are un-hedged. Given that natural gas-fired generators set power prices for many periods, higher natural gas prices expand margins and higher coal prices cause a decline in margins. The positive impact on margins will be moderated if natural gas-fired generators set the market price only during certain peak periods. IPL sells power at wholesale once retail demand is served, so retail sales demand may affect commodity exposure.
In Chile, we own assets and have associated contracts in both the central and northern regions of the country. Contracts tend to be long-term and indexed to fuel limiting commodity risk. Oil-fired generators set power prices for some periods impacting spot power margins. Gener has been adding coal-fired generation to its portfolio, increasing its exposure to dark spreads on un-hedged volumes. Gener also owns natural gas/diesel, hydropower and biomass generation facilities.
In other Latin American markets, the businesses have commodity exposure on un-hedged volumes. In Panama and Colombia, we own hydropower assets, so contracts are not indexed to fuel. In the Dominican Republic, we own natural gas-fired and coal-fired assets, and both contract and spot prices may move with commodity prices. In Argentina, prices are set according to government rules that result in commodity exposure based on the spread between cost of coal-fired generation and oil-fired generation and other factors.
In Europe, our Kilroot facility’s long term PPA was terminated during the fourth quarter of 2010. The commodity risk at our Kilroot business is due to “dark spread” to the extent sales are un-hedged. Natural gas-fired generators set power prices for many periods, so higher natural gas prices expand margins and higher coal prices cause a decline. The positive impact on margins will be moderated if natural gas-fired generators set the market price only during certain peak periods.
Our Masinloc business in Asia is a coal-fired generation facility, which hedges its output through medium term contracts that are indexed to fuel prices. Low oil prices may be a driver of margin compression since oil affects spot power sale prices.
166
Table of Contents
Foreign Exchange Rate Risk
In the normal course of business, we are exposed to foreign currency risk and other foreign operations risks that arise from investments in foreign subsidiaries and affiliates. A key component of these risks stems from the fact that some of our foreign subsidiaries and affiliates utilize currencies other than our consolidated reporting currency, the U.S. Dollar. Additionally, certain of our foreign subsidiaries and affiliates have entered into monetary obligations in the U.S. Dollar or currencies other than their own functional currencies. Primarily, we are exposed to changes in the exchange rate between the U.S. Dollar and the following currencies: Argentine Peso, Brazilian Real, British Pound, Cameroonian Franc, Chilean Peso, Colombian Peso, Euro, Kazakhstani Tenge, Mexican Peso, and Philippine Peso. These subsidiaries and affiliates have attempted to limit potential foreign exchange exposure by entering into revenue contracts that adjust to changes in foreign exchange rates. We also use foreign currency forwards, swaps and options, where possible, to manage our risk related to certain foreign currency fluctuations.
During 2010, we entered into hedges to partially mitigate the exposure of earnings translated into the U.S. Dollar to foreign exchange volatility. As of December 31, 2010, assuming a 10% U.S. Dollar appreciation, 2011 pre-tax earnings attributable to foreign subsidiaries exposed to movements in the exchange rates of the Brazilian Real, Chilean Peso, Philippine Peso and Euro (the earnings attributable to subsidiaries exposed to Cameroonian Franc movements are included under Euro due to the fixed exchange rate of the Cameroonian Franc to the Euro) relative to the U.S. Dollar are projected to be approximately $40 million, $15 million, $10 million, and $20 million, respectively, and represent the majority of the Company’s pre-tax earnings exposure to currency moves. The increases relative to December 31, 2009 figures, which were $35 million, $10 million, $5 million and $10 million for the Brazilian Real, Chilean Peso, Philippine Peso and Euro, respectively, are primarily driven by forecasted increases in the foreign currency denominated pre-tax earnings notably attributable to businesses in Brazil, Chile, the Philippines and Europe. These numbers have been produced by applying a one-time 10% U.S. Dollar appreciation to forecasted exposed pre-tax earnings for 2011 coming from subsidiaries where the local currency is either not the U.S. Dollar or is not exhibiting the characteristics of a peg or managed float relative to the U.S. Dollar, net of the impact of outstanding hedges and holding all other variables constant. The numbers presented above are net of any transactional gains/losses. These sensitivities may change in the future as new hedges are executed or existing hedges unwound. Additionally, updates to the forecasted pre-tax earnings exposed to foreign exchange risk may result in further modification.
Interest Rate Risks
We are exposed to risk resulting from changes in interest rates as a result of our issuance of variable and fixed-rate debt, as well as interest rate swap, cap and floor and option agreements.
Decisions on the fixed-floating debt ratio are made to be consistent with the risk factors faced by individual businesses or plants. Depending on whether a plant’s capacity payments or revenue stream is fixed or varies with inflation, we partially hedge against interest rate fluctuations by arranging fixed-rate or variable-rate financing. In certain cases, particularly for non-recourse financing, we execute interest rate swap, cap and floor agreements to effectively fix or limit the interest rate exposure on the underlying financing.
As of December 31, 2010, the portfolio’s 2011 pre-tax earnings exposure (adjusted to reflect noncontrolling interests) to a 100 basis point increase in Brazilian Real, British Pound, Colombian Peso, Euro, Philippine Peso, Ukraine Hryvnia and U.S. Dollar interest rates would be approximately $25 million. This number is based on the impact of a one-time, 100 basis point increase in interest rates on interest expense for Brazilian Real, British Pound, Colombian Peso, Euro, Philippine Peso, Ukraine Hryvnia and U.S. Dollar-denominated debt, which is primarily non-recourse financing. The numbers do not take into account the historical correlation between these interest rates. This compares to $20 million as of December 31, 2009. The increase is driven by an increase in the notional amount of floating rate debt in the portfolio.
167
Table of Contents
| ITEM 8. | FINANCIAL STATEMENTS AND SUPPLEMENTARY DATA |
REPORT OF INDEPENDENT REGISTERED PUBLIC ACCOUNTING FIRM
The Board of Directors and Stockholders of The AES Corporation:
We have audited the accompanying consolidated balance sheets of The AES Corporation and subsidiaries as of December 31, 2010 and December 31, 2009, and the related consolidated statements of operations, stockholders’ equity and cash flows for each of the three years in the period ended December 31, 2010. Our audits also included the financial statement schedules listed in the index at Item 15(a). These financial statements and schedules are the responsibility of the Company’s management. Our responsibility is to express an opinion on these financial statements and schedules based on our audits.
We conducted our audits in accordance with the standards of the Public Company Accounting Oversight Board (United States). Those standards require that we plan and perform the audit to obtain reasonable assurance about whether the financial statements are free of material misstatement. An audit includes examining, on a test basis, evidence supporting the amounts and disclosures in the financial statements. An audit also includes assessing the accounting principles used and significant estimates made by management, as well as evaluating the overall financial statement presentation. We believe that our audits provide a reasonable basis for our opinion.
In our opinion, the financial statements referred to above present fairly, in all material respects, the consolidated financial position of The AES Corporation and subsidiaries at December 31, 2010 and 2009, and the consolidated results of their operations and their cash flows for each of the three years in the period ended December 31, 2010, in conformity with U.S. generally accepted accounting principles. Also, in our opinion, the related financial statement schedules, when considered in relation to the basic financial statements taken as a whole, present fairly, in all material respects, the information set forth therein.
As discussed in Note 1 to the consolidated financial statements, in 2010 The AES Corporation and subsidiaries changed their method of accounting for the consolidation of variable interest entities with the adoption of amendments to Financial Accounting Standards Board (“FASB”) Accounting Standards Codification (“ASC”) 810, Consolidation, and their method of accounting for transfers and servicing of financial assets with the adoption of the amendments to FASB ASC 860, Transfers and Servicing, both effective January 1, 2010.
We also have audited, in accordance with the standards of the Public Company Accounting Oversight Board (United States), The AES Corporation’s internal control over financial reporting as of December 31, 2010, based on criteria established in Internal Control-Integrated Framework issued by the Committee of Sponsoring Organizations of the Treadway Commission and our report dated February 25, 2011 expressed an unqualified opinion thereon.
/s/: Ernst & Young LLP
McLean, Virginia
February 25, 2011
168
Table of Contents
CONSOLIDATED BALANCE SHEETS
DECEMBER 31, 2010 AND 2009
| 2010 | 2009 | |||||||
| (in millions, except share and per share data) |
||||||||
| ASSETS |
||||||||
| CURRENT ASSETS |
||||||||
| Cash and cash equivalents |
$ | 2,554 | $ | 1,782 | ||||
| Restricted cash |
574 | 407 | ||||||
| Short-term investments |
1,730 | 1,648 | ||||||
| Accounts receivable, net of allowance for doubtful accounts of $308 and $290, respectively |
2,362 | 2,118 | ||||||
| Inventory |
600 | 560 | ||||||
| Receivable from affiliates |
27 | 24 | ||||||
| Deferred income taxes—current |
306 | 210 | ||||||
| Prepaid expenses |
234 | 161 | ||||||
| Other current assets |
1,059 | 1,557 | ||||||
| Current assets of discontinued and held for sale businesses |
— | 320 | ||||||
| Total current assets |
9,446 | 8,787 | ||||||
| NONCURRENT ASSETS |
||||||||
| Property, Plant and Equipment: |
||||||||
| Land |
1,128 | 1,111 | ||||||
| Electric generation, distribution assets and other |
28,207 | 26,815 | ||||||
| Accumulated depreciation |
(9,173 | ) | (8,774 | ) | ||||
| Construction in progress |
4,459 | 4,644 | ||||||
| Property, plant and equipment, net |
24,621 | 23,796 | ||||||
| Other Assets: |
||||||||
| Deferred financing costs, net of accumulated amortization of $295 and $293, respectively |
376 | 377 | ||||||
| Investments in and advances to affiliates |
1,320 | 1,157 | ||||||
| Debt service reserves and other deposits |
691 | 595 | ||||||
| Goodwill |
1,271 | 1,299 | ||||||
| Other intangible assets, net of accumulated amortization of $160 and $223, respectively |
516 | 510 | ||||||
| Deferred income taxes—noncurrent |
646 | 587 | ||||||
| Other |
1,624 | 1,551 | ||||||
| Noncurrent assets of discontinued and held for sale businesses |
— | 876 | ||||||
| Total other assets |
6,444 | 6,952 | ||||||
| TOTAL ASSETS |
$ | 40,511 | $ | 39,535 | ||||
| LIABILITIES AND EQUITY |
||||||||
| CURRENT LIABILITIES |
||||||||
| Accounts payable |
$ | 2,060 | $ | 1,862 | ||||
| Accrued interest |
265 | 269 | ||||||
| Accrued and other liabilities |
2,700 | 2,331 | ||||||
| Non-recourse debt—current, including $1,152 related to variable interest entities at December 31, 2010 |
2,577 | 1,718 | ||||||
| Recourse debt—current |
463 | 214 | ||||||
| Current liabilities of discontinued and held for sale businesses |
— | 227 | ||||||
| Total current liabilities |
8,065 | 6,621 | ||||||
| LONG-TERM LIABILITIES |
||||||||
| Non-recourse debt—noncurrent, including $2,201 related to variable interest entities at December 31, 2010 |
12,544 | 12,304 | ||||||
| Recourse debt—noncurrent |
4,149 | 5,301 | ||||||
| Deferred income taxes—noncurrent |
895 | 1,090 | ||||||
| Pension and other post-retirement liabilities |
1,522 | 1,322 | ||||||
| Other long-term liabilities |
2,863 | 3,146 | ||||||
| Long-term liabilities of discontinued and held for sale businesses |
— | 811 | ||||||
| Total long-term liabilities |
21,973 | 23,974 | ||||||
| Contingencies and Commitments (see Notes 12 and 11) |
||||||||
| Cumulative preferred stock of subsidiary |
60 | 60 | ||||||
| EQUITY |
||||||||
| THE AES CORPORATION STOCKHOLDERS’ EQUITY |
||||||||
| Common stock ($0.01 par value, 1,200,000,000 shares authorized; 804,894,313 issued and 787,607,240 outstanding at December 31, 2010 and 677,214,493 issued and 667,679,913 outstanding at December 31, 2009) |
8 | 7 | ||||||
| Additional paid-in capital |
8,444 | 6,868 | ||||||
| Retained earnings |
620 | 650 | ||||||
| Accumulated other comprehensive loss |
(2,383 | ) | (2,724 | ) | ||||
| Treasury stock, at cost (17,287,073 and 9,534,580 shares at December 31, 2010 and 2009, respectively) |
(216 | ) | (126 | ) | ||||
| Total The AES Corporation stockholders’ equity |
6,473 | 4,675 | ||||||
| NONCONTROLLING INTERESTS |
3,940 | 4,205 | ||||||
| Total equity |
10,413 | 8,880 | ||||||
| TOTAL LIABILITIES AND EQUITY |
$ | 40,511 | $ | 39,535 | ||||
See Accompanying Notes to these Consolidated Financial Statements
169
Table of Contents
CONSOLIDATED STATEMENTS OF OPERATIONS
YEARS ENDED DECEMBER 31, 2010, 2009, AND 2008
| 2010 | 2009 | 2008 | ||||||||||
| (in millions, except per share amounts) | ||||||||||||
| Revenue: |
||||||||||||
| Regulated |
$ | 9,145 | $ | 7,816 | $ | 7,768 | ||||||
| Non-Regulated |
7,502 | 6,138 | 7,429 | |||||||||
| Total revenue |
16,647 | 13,954 | 15,197 | |||||||||
| Cost of Sales: |
||||||||||||
| Regulated |
(6,718 | ) | (5,705 | ) | (5,564 | ) | ||||||
| Non-Regulated |
(5,965 | ) | (4,816 | ) | (6,065 | ) | ||||||
| Total cost of sales |
(12,683 | ) | (10,521 | ) | (11,629 | ) | ||||||
| Gross margin |
3,964 | 3,433 | 3,568 | |||||||||
| General and administrative expenses |
(392 | ) | (339 | ) | (368 | ) | ||||||
| Interest expense |
(1,526 | ) | (1,485 | ) | (1,770 | ) | ||||||
| Interest income |
411 | 348 | 519 | |||||||||
| Other expense |
(239 | ) | (111 | ) | (161 | ) | ||||||
| Other income |
108 | 465 | 375 | |||||||||
| Gain on sale of investments |
— | 131 | 909 | |||||||||
| Loss on sale of subsidiary stock |
— | — | (31 | ) | ||||||||
| Goodwill impairment |
(21 | ) | (122 | ) | — | |||||||
| Asset impairment expense |
(1,221 | ) | (25 | ) | (175 | ) | ||||||
| Foreign currency transaction gains (losses) on net monetary position |
(33 | ) | 33 | (184 | ) | |||||||
| Other non-operating expense |
(7 | ) | (12 | ) | (15 | ) | ||||||
| INCOME FROM CONTINUING OPERATIONS BEFORE TAXES AND EQUITY IN EARNINGS OF AFFILIATES |
1,044 | 2,316 | 2,667 | |||||||||
| Income tax expense |
(307 | ) | (599 | ) | (771 | ) | ||||||
| Net equity in earnings of affiliates |
183 | 92 | 33 | |||||||||
| INCOME FROM CONTINUING OPERATIONS |
920 | 1,809 | 1,929 | |||||||||
| Income from operations of discontinued businesses, net of income tax expense of $2, $3 and $7, respectively |
75 | 96 | 97 | |||||||||
| Gain (loss) from disposal of discontinued businesses, net of income tax expense of $132, $— and $—, respectively |
64 | (150 | ) | 6 | ||||||||
| NET INCOME |
1,059 | 1,755 | 2,032 | |||||||||
| Noncontrolling interests: |
||||||||||||
| Less: Income from continuing operations attributable to noncontrolling interests |
(1,006 | ) | (1,099 | ) | (759 | ) | ||||||
| Less: (Income) loss from discontinued operations attributable to noncontrolling interests |
(44 | ) | 2 | (39 | ) | |||||||
| Total net income attributable to noncontrolling interests |
(1,050 | ) | (1,097 | ) | (798 | ) | ||||||
| NET INCOME ATTRIBUTABLE TO THE AES CORPORATION |
$ | 9 | $ | 658 | $ | 1,234 | ||||||
| BASIC EARNINGS (LOSS) PER SHARE: |
||||||||||||
| Income (loss) from continuing operations attributable to The AES Corporation common stockholders, net of tax |
$ | (0.11 | ) | $ | 1.06 | $ | 1.75 | |||||
| Discontinued operations attributable to The AES Corporation common stockholders, net of tax |
0.12 | (0.07 | ) | 0.09 | ||||||||
| NET INCOME ATTRIBUTABLE TO THE AES CORPORATION COMMON STOCKHOLDERS |
$ | 0.01 | $ | 0.99 | $ | 1.84 | ||||||
| DILUTED EARNINGS (LOSS) PER SHARE: |
||||||||||||
| Income (loss) from continuing operations attributable to The AES Corporation common stockholders, net of tax |
$ | (0.11 | ) | $ | 1.06 | $ | 1.73 | |||||
| Discontinued operations attributable to The AES Corporation common stockholders, net of tax |
0.12 | (0.08 | ) | 0.09 | ||||||||
| NET INCOME ATTRIBUTABLE TO THE AES CORPORATION COMMON STOCKHOLDERS |
$ | 0.01 | $ | 0.98 | $ | 1.82 | ||||||
| AMOUNTS ATTRIBUTABLE TO THE AES CORPORATION COMMON STOCKHOLDERS: |
||||||||||||
| Income (loss) from continuing operations, net of tax |
$ | (86 | ) | $ | 710 | $ | 1,170 | |||||
| Discontinued operations, net of tax |
95 | (52 | ) | 64 | ||||||||
| Net income |
$ | 9 | $ | 658 | $ | 1,234 | ||||||
See Accompanying Notes to these Consolidated Financial Statements
170
Table of Contents
CONSOLIDATED STATEMENTS OF CASH FLOWS
YEARS ENDED DECEMBER 31, 2010, 2009, AND 2008
| 2010 | 2009 | 2008 | ||||||||||
| (in millions) | ||||||||||||
| OPERATING ACTIVITIES: |
||||||||||||
| Net income |
$ | 1,059 | $ | 1,755 | $ | 2,032 | ||||||
| Adjustments to net income: |
||||||||||||
| Depreciation and amortization |
1,178 | 1,049 | 1,001 | |||||||||
| (Gain) loss from sale of investments and impairment expense |
1,313 | 57 | (712 | ) | ||||||||
| (Gain) loss on disposal and impairment write-down—discontinued operations |
(209 | ) | 150 | (7 | ) | |||||||
| Provision for deferred taxes |
(418 | ) | 15 | 160 | ||||||||
| Contingencies |
37 | (122 | ) | 52 | ||||||||
| (Gain) loss on the extinguishment of debt |
34 | (6 | ) | 56 | ||||||||
| Undistributed gain from sale of equity method investment |
(106 | ) | — | — | ||||||||
| Noncontrolling interest of discontinued operations |
— | — | (4 | ) | ||||||||
| Other |
(31 | ) | (99 | ) | 127 | |||||||
| Changes in operating assets and liabilities: |
||||||||||||
| (Increase) decrease in accounts receivable |
(98 | ) | 62 | (451 | ) | |||||||
| (Increase) decrease in inventory |
10 | (34 | ) | (83 | ) | |||||||
| (Increase) decrease in prepaid expenses and other current assets |
430 | 138 | (62 | ) | ||||||||
| (Increase) decrease in other assets |
(248 | ) | (177 | ) | (467 | ) | ||||||
| Increase (decrease) in accounts payable and accrued liabilities |
136 | (308 | ) | 260 | ||||||||
| Increase (decrease) in income taxes and other income tax payables, net |
166 | 88 | 226 | |||||||||
| Increase (decrease) in other liabilities |
257 | (366 | ) | 32 | ||||||||
| Net cash provided by operating activities |
3,510 | 2,202 | 2,160 | |||||||||
| INVESTING ACTIVITIES: |
||||||||||||
| Capital expenditures |
(2,310 | ) | (2,520 | ) | (2,850 | ) | ||||||
| Acquisitions—net of cash acquired |
(254 | ) | — | (1,135 | ) | |||||||
| Proceeds from the sale of businesses |
595 | 2 | 1,328 | |||||||||
| Proceeds from the sale of assets |
23 | 17 | 105 | |||||||||
| Sale of short-term investments |
5,786 | 4,526 | 5,150 | |||||||||
| Purchase of short-term investments |
(5,795 | ) | (4,248 | ) | (5,469 | ) | ||||||
| (Increase) decrease in restricted cash |
(104 | ) | 302 | (295 | ) | |||||||
| (Increase) decrease in debt service reserves and other assets |
(56 | ) | 185 | (100 | ) | |||||||
| Affiliate advances and equity investments |
(97 | ) | (155 | ) | (240 | ) | ||||||
| Proceeds from loan repayments |
132 | — | — | |||||||||
| Loan advances |
— | — | (173 | ) | ||||||||
| Other investing |
40 | (26 | ) | 98 | ||||||||
| Net cash used in investing activities |
(2,040 | ) | (1,917 | ) | (3,581 | ) | ||||||
| FINANCING ACTIVITIES: |
||||||||||||
| Issuance of common stock |
1,567 | — | — | |||||||||
| Borrowings (repayments) under the revolving credit facilities, net |
78 | 11 | 298 | |||||||||
| Issuance of recourse debt |
— | 503 | 625 | |||||||||
| Issuance of non-recourse debt |
1,940 | 1,997 | 2,158 | |||||||||
| Repayments of recourse debt |
(914 | ) | (154 | ) | (1,037 | ) | ||||||
| Repayments of non-recourse debt |
(1,945 | ) | (1,008 | ) | (1,260 | ) | ||||||
| Payments for deferred financing costs |
(61 | ) | (91 | ) | (82 | ) | ||||||
| Distributions to noncontrolling interests |
(1,245 | ) | (846 | ) | (597 | ) | ||||||
| Contributions from noncontrolling interests |
— | 190 | 410 | |||||||||
| Financed capital expenditures |
(23 | ) | (18 | ) | (47 | ) | ||||||
| Purchase of treasury stock |
(99 | ) | — | (143 | ) | |||||||
| Other financing |
(4 | ) | 26 | 37 | ||||||||
| Net cash (used in) provided by financing activities |
(706 | ) | 610 | 362 | ||||||||
| Effect of exchange rate changes on cash |
8 | 22 | (96 | ) | ||||||||
| Total increase (decrease) in cash and cash equivalents |
772 | 917 | (1,155 | ) | ||||||||
| Cash and cash equivalents, beginning |
1,782 | 865 | 2,020 | |||||||||
| Cash and cash equivalents, ending |
$ | 2,554 | $ | 1,782 | $ | 865 | ||||||
| SUPPLEMENTAL DISCLOSURES: |
||||||||||||
| Cash payments for interest, net of amounts capitalized |
$ | 1,462 | $ | 1,395 | $ | 1,615 | ||||||
| Cash payments for income taxes, net of refunds |
$ | 698 | $ | 484 | $ | 465 | ||||||
| SCHEDULE OF NONCASH INVESTING AND FINANCING ACTIVITIES: |
||||||||||||
| Assets acquired in acquisition of subsidiary |
$ | — | $ | — | $ | 1,097 | ||||||
| Liabilities assumed in acquisition of subsidiary |
$ | — | $ | — | $ | 49 | ||||||
| Assets acquired in noncash asset exchange |
$ | 42 | $ | 111 | $ | 18 | ||||||
| Assets disposed of in noncash asset exchange |
$ | — | $ | — | $ | 4 | ||||||
See Accompanying Notes to these Consolidated Financial Statements
171
Table of Contents
CONSOLIDATED STATEMENTS OF CHANGES IN STOCKHOLDERS’ EQUITY
YEARS ENDED DECEMBER 31, 2010, 2009, AND 2008
| THE AES CORPORATION STOCKHOLDERS | ||||||||||||||||||||||||||||||||||||
| Common Stock | Treasury Stock | Additional Paid-In Capital |
Retained Earnings (Accumulated Deficit) |
Accumulated Other Comprehensive Loss |
Noncontrolling Interests |
Consolidated Comprehensive Income |
||||||||||||||||||||||||||||||
| Shares | Amount | Shares | Amount | |||||||||||||||||||||||||||||||||
| (in millions) | ||||||||||||||||||||||||||||||||||||
| Balance at January 1, 2008 |
670.3 | $ | 7 | — | $ | — | $ | 6,776 | $ | (1,241 | ) | $ | (2,378 | ) | $ | 3,181 | ||||||||||||||||||||
| Net income |
— | — | — | — | — | 1,234 | — | 798 | $ | 2,032 | ||||||||||||||||||||||||||
| Foreign currency translation adjustment, net of income tax |
— | — | — | — | — | — | (560 | ) | (492 | ) | (1,052 | ) | ||||||||||||||||||||||||
| Change in unfunded pensions obligation, net of income tax |
— | — | — | — | — | — | (49 | ) | (100 | ) | (149 | ) | ||||||||||||||||||||||||
| Change in derivative fair value, including a reclassification to earnings, net of income tax |
— | — | — | — | — | — | (31 | ) | (37 | ) | (68 | ) | ||||||||||||||||||||||||
| Other comprehensive income |
(1,269 | ) | ||||||||||||||||||||||||||||||||||
| Total comprehensive income |
$ | 763 | ||||||||||||||||||||||||||||||||||
| Capital contributions from noncontrolling interests |
— | — | — | — | — | — | — | 619 | ||||||||||||||||||||||||||||
| Dividends declared to noncontrolling interests |
— | — | — | — | — | — | — | (574 | ) | |||||||||||||||||||||||||||
| Disposition of businesses |
— | — | — | — | — | — | — | (37 | ) | |||||||||||||||||||||||||||
| Effect of pension measurement date change |
— | — | — | — | — | (1 | ) | — | — | |||||||||||||||||||||||||||
| Acquisition of treasury stock |
— | — | 10.7 | (144 | ) | — | — | — | — | |||||||||||||||||||||||||||
| Issuance of common stock under benefit plans and exercise of stock options and warrants, net of income tax |
3.2 | — | — | — | 30 | — | — | — | ||||||||||||||||||||||||||||
| Stock compensation |
— | — | — | — | 26 | — | — | — | ||||||||||||||||||||||||||||
| Balance at December 31, 2008 |
673.5 | $ | 7 | 10.7 | $ | (144 | ) | $ | 6,832 | $ | (8 | ) | $ | (3,018 | ) | $ | 3,358 | |||||||||||||||||||
| Net income |
— | — | — | — | — | 658 | — | 1,097 | $ | 1,755 | ||||||||||||||||||||||||||
| Change in fair value of available-for-sale securities, net of income tax |
— | — | — | — | — | — | 6 | — | 6 | |||||||||||||||||||||||||||
| Foreign currency translation adjustment, net of income tax |
— | — | — | — | — | — | 271 | 471 | 742 | |||||||||||||||||||||||||||
| Change in unfunded pensions obligation, net of income tax |
— | — | — | — | — | — | (23 | ) | (116 | ) | (139 | ) | ||||||||||||||||||||||||
| Change in derivative fair value, including a reclassification to earnings, net of income tax |
— | — | — | — | — | — | 40 | 33 | 73 | |||||||||||||||||||||||||||
| Other comprehensive income |
682 | |||||||||||||||||||||||||||||||||||
| Total comprehensive income |
$ | 2,437 | ||||||||||||||||||||||||||||||||||
| Capital contributions from noncontrolling interests |
— | — | — | — | — | — | — | 195 | ||||||||||||||||||||||||||||
| Dividends declared to noncontrolling interests |
— | — | — | — | — | — | — | (825 | ) | |||||||||||||||||||||||||||
| Disposition of businesses |
— | — | — | — | — | — | — | (8 | ) | |||||||||||||||||||||||||||
| Issuance of treasury stock |
— | — | (1.2 | ) | 18 | (20 | ) | — | — | — | ||||||||||||||||||||||||||
| Issuance of common stock under benefit plans and exercise of stock options and warrants, net of income tax |
3.7 | — | — | — | 18 | — | — | — | ||||||||||||||||||||||||||||
| Stock compensation |
— | — | — | — | 38 | — | — | — | ||||||||||||||||||||||||||||
| Balance at December 31, 2009 |
677.2 | $ | 7 | 9.5 | $ | (126 | ) | $ | 6,868 | $ | 650 | $ | (2,724 | ) | $ | 4,205 | ||||||||||||||||||||
| Net income |
— | — | — | — | — | 9 | — | 1,050 | $ | 1,059 | ||||||||||||||||||||||||||
| Change in fair value of available-for-sale securities, net of income tax |
— | — | — | — | — | — | (5 | ) | — | (5 | ) | |||||||||||||||||||||||||
| Foreign currency translation adjustment, net of income tax |
— | — | — | — | — | — | 383 | 85 | 468 | |||||||||||||||||||||||||||
| Change in unfunded pensions obligation, net of income tax |
— | — | — | — | — | — | (22 | ) | (66 | ) | (88 | ) | ||||||||||||||||||||||||
| Change in derivative fair value, including a reclassification to earnings, net of income tax |
— | — | — | — | — | — | (120 | ) | (31 | ) | (151 | ) | ||||||||||||||||||||||||
| Other comprehensive income |
224 | |||||||||||||||||||||||||||||||||||
| Total comprehensive income |
$ | 1,283 | ||||||||||||||||||||||||||||||||||
| Cumulative effect of consolidation of entities under variable interest entity accounting guidance |
— | — | — | — | — | (47 | ) | (38 | ) | 15 | ||||||||||||||||||||||||||
| Cumulative effect of deconsolidation of entities under variable interest entity accounting guidance |
— | — | — | — | — | 1 | — | — | ||||||||||||||||||||||||||||
| Capital contributions from noncontrolling interests |
— | — | — | — | — | — | — | 35 | ||||||||||||||||||||||||||||
| Dividends declared to noncontrolling interests |
— | — | — | — | — | — | — | (1,220 | ) | |||||||||||||||||||||||||||
| Disposition of businesses |
— | — | — | — | — | — | 143 | (138 | ) | |||||||||||||||||||||||||||
| Acquisition of treasury stock |
— | — | 8.4 | (99 | ) | — | — | — | — | |||||||||||||||||||||||||||
| Issuance of common stock |
125.5 | 1 | — | — | 1,566 | — | — | — | ||||||||||||||||||||||||||||
| Issuance of common stock under benefit plans and exercise of stock options and warrants, net of income tax |
2.2 | — | (0.6 | ) | 9 | 9 | — | — | — | |||||||||||||||||||||||||||
| Stock compensation |
— | — | — | — | 26 | — | — | — | ||||||||||||||||||||||||||||
| Changes in the carrying amount of redeemable stock of subsidiaries |
— | — | — | — | — | 7 | — | — | ||||||||||||||||||||||||||||
| Acquisition of subsidiary shares from noncontrolling interests |
— | — | — | — | (25 | ) | — | — | 5 | |||||||||||||||||||||||||||
| Balance at December 31, 2010 |
804.9 | $ | 8 | 17.3 | $ | (216 | ) | $ | 8,444 | $ | 620 | $ | (2,383 | ) | $ | 3,940 | ||||||||||||||||||||
See Accompanying Notes to these Consolidated Financial Statements
172
Table of Contents
NOTES TO CONSOLIDATED FINANCIAL STATEMENTS
DECEMBER 31, 2010, 2009, AND 2008
1. GENERAL AND SUMMARY OF SIGNIFICANT ACCOUNTING POLICIES
The AES Corporation is a holding company (the “Parent Company”) that through its subsidiaries and affiliates, (collectively, “AES” or “the Company”) operates a geographically diversified portfolio of electricity generation and distribution businesses. Generally, given this holding company structure, the liabilities of the individual operating entities are not recourse to the parent and are isolated to the operating entities. Most of our operating entities are structured as corporations, therefore limiting the liability of the shareholders. The structure is generally the same regardless of whether a subsidiary is consolidated under a voting or variable interest model.
PRINCIPLES OF CONSOLIDATION—The Consolidated Financial Statements of the Company include the accounts of The AES Corporation, its subsidiaries and controlled affiliates, and variable interest entities (“VIEs”) of which the Company is the primary beneficiary. All intercompany transactions and balances have been eliminated in consolidation.
A VIE is an entity (a) that has a total equity investment at risk that is not sufficient to finance its activities without additional subordinated financial support or (b) where the group of equity holders does not have (i) the ability to make significant decisions about the entity’s activities, (ii) the obligation to absorb the entity’s expected losses or (iii) the right to receive the entity’s expected residual returns or (c) where the voting rights of some equity holders are not proportional to their obligations to absorb expected losses, receive expected residual returns, or both, and substantially all of the entity’s activities either involve or are conducted on behalf of an investor that has disproportionately few voting rights.
Effective January 1, 2010, the Company prospectively adopted the new accounting guidance on the consolidation of VIEs. The new guidance requires an entity to determine qualitatively, rather than quantitatively, the primary beneficiary of a VIE. This determination is based on whether the entity has the power to direct the activities that most significantly impact the economic performance of the VIE and the obligation to absorb losses or the right to receive benefits of the VIE that could potentially be significant to the VIE. Other key changes include: a requirement for the ongoing reconsideration of the primary beneficiary, the criteria used for determining whether service provider or decision maker contracts are variable interests, the consideration of kick-out and removal rights in determining whether an entity is a VIE, the types of events that trigger the reassessment of whether an entity is a VIE and expansion of the disclosures previously required.
The determination of which party has the power to direct the activities that most significantly impact the economic performance of the VIE could require significant judgment and assumptions. That determination considers the purpose and design of the business, the risks that the business was designed to create and pass along to other entities, the activities of the business that can be directed and which party can direct them, and the expected relative impact of those activities on the economic performance of the business through its life. The businesses for which significant judgment and assumptions were required were primarily certain generation businesses who have power purchase agreements (“PPAs”) to sell energy exclusively or primarily to a single counterparty for the term of those agreements. For these generation businesses, the counterparty has the power to dispatch energy and, in some instances, to make decisions regarding the sale of excess energy. As such, the counterparty has the power to direct certain activities that significantly impact the economic performance of the business primarily through the cash flows and gross margin, if any, earned by the business from the sale of energy to the counterparty and sometimes through the counterparty’s absorption of fuel price risk. However, the counterparty usually does not have the power to direct any of the other activities that could significantly impact the economic performance. These other activities include: daily operation and management, maintenance, repairs and capital expenditures, plant expansion, decisions regarding the overall financing of ongoing operations and budgets and, in some instances, decisions regarding the sale of excess energy. As such, AES has the power to
173
Table of Contents
THE AES CORPORATION
NOTES TO CONSOLIDATED FINANCIAL STATEMENTS—(Continued)
DECEMBER 31, 2010, 2009, AND 2008
direct some activities of the business that significantly impact its economic performance, primarily through the cash flows and gross margin earned from capacity payments received from being available to produce energy and from the sale of energy to other entities (particularly during any period beyond the end of the power purchase agreement). For these businesses, the determination as to which set of activities most significantly impact the economic performance of the business requires significant judgment and the use of assumptions. The Company concluded that the activities directed by the counterparty were less significant than those directed by AES.
The adoption of the new accounting guidance on the consolidation of VIEs resulted in the deconsolidation of certain immaterial VIEs previously consolidated. Additionally, assets, liabilities and operating results of two of the Company’s VIEs, previously accounted for under the equity method of accounting, were required to be consolidated. Cartagena, a 71% owned generation business in Spain, and Cili, a 51% owned generation business in China, were consolidated under the new guidance. This resulted in a cumulative effect adjustment of $47 million to retained earnings as of January 1, 2010. The cumulative effect adjustment is primarily comprised of losses that were not recognized while the equity method of accounting was suspended for Cartagena. The equity method of accounting was suspended in December 2008 when the Company’s basis in its investment in Cartagena was reduced to zero. As of December 31, 2010, total assets and total liabilities related to these VIEs were $850 million and $919 million, respectively. In addition, revenue for the year ended December 31, 2010 included $416 million of revenue from these VIEs. Prior period operating results of these VIEs are reflected in “Net equity in earnings of affiliates” except for those prior periods during which the equity method of accounting was suspended.
USE OF ESTIMATES—The preparation of these consolidated financial statements in conformity with accounting principles generally accepted in the United States of America (“U.S. GAAP”) requires the Company to make estimates and assumptions that affect reported amounts of assets and liabilities and disclosures of contingent assets and liabilities at the date of the consolidated financial statements, as well as the reported amounts of revenue and expenses during the reporting period. Actual results could differ from those estimates. Items subject to such estimates and assumptions include: the carrying value and estimated useful lives of long-lived assets; impairment of goodwill, long-lived assets and equity method investments; valuation allowances for receivables and deferred tax assets; the recoverability of deferred regulatory assets; the valuation of certain financial instruments; the determination of noncontrolling interest using the hypothetical liquidation at book value (“HLBV”) method for certain wind generation partnerships; pension liabilities; environmental liabilities; and potential litigation claims and settlements.
DISCONTINUED OPERATIONS AND RECLASSIFICATIONS—A discontinued operation is a component of the Company that either has been disposed of or is classified as held for sale. A component of the Company comprises operations and cash flows that can be clearly distinguished, operationally and for financial reporting purposes, from the rest of the Company. In accordance with the accounting standards on the impairment or disposal of long-lived assets, the prior period Consolidated Financial Statements in this Form 10-K have been restated to reflect the businesses determined to be discontinued operations, as further discussed in Note 21—Discontinued Operations and Held for Sale Businesses. The Company has reclassified certain of its trade related payables from accrued and other liabilities to accounts payable within the Consolidated Financial Statements to conform to current year presentation.
FAIR VALUE—Fair value, as defined in the fair value measurement accounting guidance, is the price that would be received to sell an asset or paid to transfer a liability in an orderly transaction between market participants at the measurement date, or exit price. The Company applies the fair value measurement accounting guidance for financial assets and liabilities to determine the fair value of short and long term investments in marketable debt and equity securities, included in the consolidated balance sheet line items “Short-term investments” and “Other assets (noncurrent),” derivative assets, included in “Other current assets” and “Other
174
Table of Contents
THE AES CORPORATION
NOTES TO CONSOLIDATED FINANCIAL STATEMENTS—(Continued)
DECEMBER 31, 2010, 2009, AND 2008
assets (noncurrent)” and derivative liabilities, included in “Accrued and other liabilities (current)” and “Other long-term liabilities.” The Company applies the fair value measurement guidance for nonfinancial assets upon the acquisition of a business in accordance with the accounting guidance for business combinations or in conjunction with the measurement of an impairment loss on an asset group or reporting unit under the accounting guidance for the impairment of long-lived assets or goodwill.
The fair value measurement accounting guidance requires that the Company make assumptions that market participants would use in pricing an asset or liability based on the best information available. These factors include nonperformance risk (the risk that the obligation will not be fulfilled) and credit risk of the reporting entity (for liabilities) and of the counterparty (for assets). The fair value measurement guidance prohibits the inclusion of transaction costs and any adjustments for blockage factors in determining the instruments’ fair value. The principal or most advantageous market should be considered from the perspective of the reporting entity.
Fair value, where available, is based on observable quoted market prices. Where observable prices or inputs are not available, several valuation models and techniques are applied. These models and techniques attempt to maximize the use of observable inputs and minimize the use of unobservable inputs. The process involves varying levels of management judgment, the degree of which is dependent on the price transparency of the instruments or market and the instruments’ complexity.
To increase consistency and enhance disclosure of the fair value of financial instruments, the fair value measurement accounting guidance creates a fair value hierarchy to prioritize the inputs used to measure fair value into three categories. An asset or liability’s level within the fair value hierarchy is based on the lowest level of input significant to the fair value measurement, where Level 1 is the highest and Level 3 is the lowest. The three levels are defined as follows:
Level 1—unadjusted quoted prices in active markets accessible by the reporting entity for identical assets or liabilities. Active markets are those in which transactions for the asset or liability occur with sufficient frequency and volume to provide pricing information on an ongoing basis.
Level 2—pricing inputs other than quoted market prices included in Level 1 which are based on observable market data, that are directly or indirectly observable for substantially the full term of the asset or liability. These include quoted market prices for similar assets or liabilities, quoted market prices for identical or similar assets in markets that are not active, adjusted quoted market prices, inputs from observable data such as interest rate and yield curves, volatilities or default rates observable at commonly quoted intervals or inputs derived from observable market data by correlation or other means. The fair value of most over-the-counter derivatives derived from internal valuation models using market inputs and most investments in marketable debt securities qualify as Level 2.
Level 3—pricing inputs that are unobservable, or less observable, from objective sources. Unobservable inputs are only used to the extent observable inputs are not available. These inputs maintain the concept of an exit price from the perspective of a market participant and should reflect assumptions of other market participants. An entity should consider all market participant assumptions that are available without unreasonable cost and effort. These are given the lowest priority and are generally used in internally developed methodologies to generate management’s best estimate of the fair value when no observable market data is available. The fair value of the Company’s reporting units determined using a discounted cash flows valuation model for goodwill impairment assessment and the fair value of the Company’s long-lived asset groups determined using a discounted cash flows valuation model for the long-lived asset impairment assessments qualify as Level 3.
175
Table of Contents
THE AES CORPORATION
NOTES TO CONSOLIDATED FINANCIAL STATEMENTS—(Continued)
DECEMBER 31, 2010, 2009, AND 2008
Any transfers between the fair value hierarchy levels are recognized at the end of the reporting period.
CASH AND CASH EQUIVALENTS—The Company considers unrestricted cash on hand, deposits in banks, certificates of deposit and short-term marketable securities, with an original or remaining maturity at the date of acquisition of three months or less, to be cash and cash equivalents. The carrying amount of such balances approximate fair value.
RESTRICTED CASH—Restricted cash includes cash and cash equivalents which are restricted as to withdrawal or usage. The nature of restrictions includes restrictions imposed by financing agreements such as security deposits kept as collateral, debt service reserves, maintenance reserves and others, as well as restrictions imposed by long-term PPAs.
INVESTMENTS IN MARKETABLE SECURITIES—Short-term investments in marketable debt and equity securities consist of securities with original or remaining maturities in excess of three months but less than one year. The Company’s marketable investments are primarily certificates of deposit, government debt securities and money market funds.
Marketable debt securities that the Company has both the positive intent and ability to hold to maturity are classified as held-to-maturity and are carried at amortized cost. Other marketable securities that the Company does not intend to hold to maturity are classified as available-for-sale or trading and are carried at fair value. Available-for-sale investments are marked-to-market at the end of each reporting period, with unrealized holding gains or losses, which represent changes in the market value of the investment, reflected in accumulated other comprehensive income (“AOCI”), a separate component of stockholders’ equity. In measuring the other-than-temporary impairment of debt securities, the Company identifies two components: 1) the amount representing the credit loss, which is recognized as “other non-operating expense” in the Consolidated Statements of Operations; and 2) the amount related to other factors, which is recognized in AOCI unless there is a plan to sell the security, in which case it would be recognized in earnings. The amount recognized in AOCI for held-to-maturity debt securities is then amortized over the remaining life of the security.
Investments classified as trading are marked-to-market on a periodic basis through the Consolidated Statements of Operations. Interest and dividends on investments are reported in interest income and other income, respectively. Gains and losses on sales of investments are determined using the specific identification method.
See Note 4—Fair Value and the Company’s fair value policy for additional discussion regarding the determination of the fair value of the Company’s investments in marketable debt and equity securities.
ACCOUNTS AND NOTES RECEIVABLE AND ALLOWANCE FOR DOUBTFUL ACCOUNTS—Accounts and Notes receivable are carried at amortized cost. The Company periodically assesses the collectability of accounts receivable considering factors such as specific evaluation of collectability, historical collection experience, the age of accounts receivable and other currently available evidence of the collectability, and records an allowance for doubtful accounts for the estimated uncollectable amount as appropriate. Certain of our businesses charge interest on accounts receivable either under contractual terms or where charging interest is a customary business practice. In such cases, interest income is recognized on an accrual basis. In situations where the collection of interest is uncertain, interest income is recognized as cash is received. Individual accounts and notes receivable are written off when they are no longer deemed collectible. Included in “Noncurrent Other Assets” are long-term financing receivables of $151 million, primarily with certain Latin American governmental
176
Table of Contents
THE AES CORPORATION
NOTES TO CONSOLIDATED FINANCIAL STATEMENTS—(Continued)
DECEMBER 31, 2010, 2009, AND 2008
bodies. These receivables have contractual maturities of greater than one year and are being collected in installments. Of the total $151 million, amounts of $81 million and $55 million, respectively, relate to our businesses in Argentina and the Dominican Republic. The remaining amount relates to our distribution businesses in Brazil.
INVENTORY—Inventory primarily consists of coal, fuel oil and other raw materials used to generate power, and spare parts and supplies used to maintain power generation and distribution facilities. Inventory is carried at lower of cost or market. Cost is the sum of the purchase price and incidental expenditures and charges incurred to bring the inventory to its existing condition or location. Cost is determined under the first-in, first-out (“FIFO”), average cost or specific identification method. Generally, cost is reduced to market value if the market value of inventory has declined and it is probable that the utility of inventory, in its disposal in the ordinary course of business, will not be recovered through revenue earned from the generation of power.
LONG-LIVED ASSETS—Long-lived assets include property, plant and equipment, assets under capital leases and intangible assets subject to amortization (i.e., finite-lived intangible assets).
Property, plant and equipment
Property, plant and equipment are stated at cost, net of accumulated depreciation. The cost of renewals and improvements that extend the useful life of property, plant and equipment are capitalized.
Construction progress payments, engineering costs, insurance costs, salaries, interest and other costs directly relating to construction in progress are capitalized during the construction period, provided the completion of the project is deemed probable, or expensed at the time the Company determines that development of a particular project is no longer probable. The continued capitalization of such costs is subject to ongoing risks related to successful completion, including those related to government approvals, site identification, financing, construction permitting and contract compliance. Construction in progress balances are transferred to electric generation and distribution assets when an asset group is ready for its intended use. Government subsidies are recorded as a reduction to property, plant and equipment and reflected in cash flows from investing activities.
Depreciation, after consideration of salvage value and asset retirement obligations, is computed primarily using the straight-line method over the estimated useful lives of the assets, which are determined on a composite or component basis. Maintenance and repairs are charged to expense as incurred. Capital spare parts, including rotable spare parts, are included in electric generation and distribution assets. If the spare part is considered a component, it is depreciated over its useful life after the part is placed in service. If the spare part is deemed part of a composite asset, the part is depreciated over the composite useful life even when being held as a spare part.
Intangible Assets Subject to Amortization
Finite-lived intangible assets are amortized over their useful lives which range from 1- 89 years. The Company accounts for purchased emission allowances as intangible assets and records an expense when utilized or sold. Granted allowances are valued at zero.
Impairment of Long-lived Assets
The Company evaluates the impairment of long-lived assets (asset group) using internal projections of undiscounted cash flows when circumstances indicate that the carrying amount of such assets may not be recoverable or the assets meet the held for sale criteria under the relevant accounting standards. Events or
177
Table of Contents
THE AES CORPORATION
NOTES TO CONSOLIDATED FINANCIAL STATEMENTS—(Continued)
DECEMBER 31, 2010, 2009, AND 2008
changes in circumstances that may necessitate a recoverability evaluation may include but are not limited to: changes to or the passage of new legislation, changes in the relative pricing of wholesale electricity, anticipated demand and/or cost of fuel. The carrying amount of a long-lived asset (asset group) may not be recoverable if it exceeds the sum of undiscounted cash flows expected to result from the use and eventual disposal of the asset (asset group). In such cases, fair value of the long-lived asset (asset group) is determined in accordance with the fair value measurement accounting guidance. The excess of carrying amount over fair value, if any, is recognized as an impairment expense. For regulated assets, an impairment expense could be reduced by the establishment of a regulatory asset, if recovery through approved rates was probable. For non-regulated assets, impairment is recognized as an expense against earnings.
DEFERRED FINANCING COSTS—Financing costs are deferred and amortized over the related financing period using the effective interest method or the straight-line method when it does not differ materially from the effective interest method. Make-whole payments in connection with early debt retirements are classified as cash flows used in investing activities.
EQUITY METHOD INVESTMENTS—Investments in entities over which the Company has the ability to exercise significant influence, but not control, are accounted for using the equity method of accounting and reported in “Investments in and advances to affiliates” on the Consolidated Balance Sheets. In accordance with the accounting guidance for equity method investments, the Company periodically assesses the recoverability of its equity method investments. If an identified event or change in circumstances requires an impairment evaluation, management assesses the fair value based on valuation methodologies, including discounted cash flows, estimates of sale proceeds and external appraisals, as appropriate. The difference between the carrying amount of the equity method investment and its estimated fair value is recognized as impairment when the loss in value is deemed other-than-temporary and included in “Other non-operating expense” on the Consolidated Statements of Operations.
In accordance with the accounting standards for equity method investments, the Company discontinues the application of the equity method when an investment is reduced to zero and the Company is not otherwise committed to provide further financial support to the investee. The Company resumes the application of the equity method if the investee subsequently reports net income to the extent that the Company’s share of such net income equals the share of net losses not recognized during the period in which the equity method of accounting was suspended.
GOODWILL AND INDEFINITE-LIVED INTANGIBLE ASSETS—In accordance with the accounting guidance on goodwill and other intangible assets, the Company recognizes goodwill as an asset representing the future economic benefits arising from other assets acquired in a business combination that are not individually identified and separately recognized. The Company evaluates goodwill and indefinite-lived intangible assets for impairment on an annual basis and whenever events or changes in circumstances necessitate an evaluation for impairment. The Company’s annual impairment testing date is October 1st.
Goodwill:
The Company evaluates goodwill impairment at the reporting unit level, which is an operating segment, as defined in the segment reporting accounting guidance, or one level below an operating segment, a component. In determining its reporting units, the Company starts with its segment reporting structure. Operating segments are identified and then analyzed to identify components (usually businesses) which make up these operating segments. Two or more components are combined into a single reporting unit if they share the economic similarity criteria prescribed by the accounting guidance. Assets and liabilities are allocated to a reporting unit if
178
Table of Contents
THE AES CORPORATION
NOTES TO CONSOLIDATED FINANCIAL STATEMENTS—(Continued)
DECEMBER 31, 2010, 2009, AND 2008
the assets will be employed by or a liability relates to the operations of a reporting unit or would be considered by a market participant in determining its fair value. Goodwill resulting from an acquisition is assigned to the reporting units that are expected to benefit from the synergies of the acquisition. Generally, each AES business constitutes a reporting unit.
Goodwill impairment evaluation is performed in two steps. In Step 1, the carrying amount of a reporting unit is compared to its fair value and if the fair value exceeds the carrying amount, Step 2 is unnecessary. If the carrying amount exceeds the reporting unit’s fair value, this could indicate potential impairment and Step 2 of the goodwill evaluation process is required to determine if goodwill is impaired and to measure the amount of impairment loss to recognize, if any. In determining the implied fair value of goodwill for impairment measurement, the accounting guidance requires measuring all assets and liabilities, including unrecognized assets and liabilities, at fair value, as would be done in a business combination. When a Step 2 analysis is required to be completed, the fair value of individual assets and liabilities is determined using valuations (which in some cases may be based in part on third party valuation reports), or other observable sources of fair value, as appropriate. An impairment loss is recognized to the extent the carrying amount of goodwill exceeds its implied fair value, not to exceed the carrying value of goodwill.
Most of the Company’s reporting units are not publicly traded. Therefore, the Company estimates the fair value of its reporting units under the fair value measurement accounting guidance which requires making assumptions that a market participant would make in a hypothetical sale transaction at the testing date. The fair value of a reporting unit is estimated using internal budgets and forecasts, adjusted for any market participants’ assumptions and discounted at the rate of return required by a market participant. The Company considers both market and income-based approaches to determine a range of fair value, but typically concludes that the value derived using an income-based approach is more representative of fair value due to the lack of direct market comparables. The Company does use market data to corroborate and determine the reasonableness of the fair value derived from the income-based discounted cash flow analysis.
Indefinite-lived Intangible Assets:
The Company’s indefinite-lived intangible assets include items such as land use rights, easements, and concessions. These are tested for impairment on an annual basis or whenever events or changes in circumstances necessitate an evaluation for impairment in accordance with applicable accounting guidance for indefinite-lived intangible assets.
INCOME TAXES—Deferred tax assets and liabilities are recognized for the future tax consequences attributable to differences between the financial statement carrying amounts of the existing assets and liabilities, and their respective income tax bases. The Company establishes a valuation allowance when it is more likely than not that all or a portion of a deferred tax asset will not be realized. The Company’s tax positions are evaluated under a more-likely-than-not recognition threshold and measurement analysis before they are recognized for financial statement reporting.
Uncertain tax positions have been classified as noncurrent income tax liabilities unless expected to be paid within one year. The Company’s policy for interest and penalties related to income tax exposures is to recognize interest and penalties as a component of the provision for income taxes in the Consolidated Statements of Operations.
PENSION AND OTHER POSTRETIREMENT PLANS—In accordance with the accounting guidance on defined benefit pension and other postretirement plans, the Company recognizes in its Consolidated Balance Sheets an asset or liability reflecting the funded status of pension and other postretirement plans with current year
179
Table of Contents
THE AES CORPORATION
NOTES TO CONSOLIDATED FINANCIAL STATEMENTS—(Continued)
DECEMBER 31, 2010, 2009, AND 2008
changes in the funded status recognized in AOCI. All plan assets are recorded at fair value. AES follows the measurement date provisions of the accounting guidance, which require a year-end measurement date of plan assets and obligations for all defined benefit plans.
NONCONTROLLING INTERESTS—In accordance with the accounting guidance on noncontrolling interests, such interests are classified as a separate component of equity in the Consolidated Balance Sheets and Statements of Changes in Equity. Additionally, net income and comprehensive income attributable to noncontrolling interests are reflected separately from consolidated net income and comprehensive income in the Consolidated Statements of Operations and Statements of Changes in Equity. Any change in ownership of a subsidiary while the controlling financial interest is retained is accounted for as an equity transaction between the controlling and noncontrolling interests. Losses continue to be attributed to the noncontrolling interests, even when the noncontrolling interests’ basis has been reduced to zero.
Although in general, the noncontrolling ownership interest in earnings is calculated based on ownership percentage, certain of the Company’s wind businesses use the HLBV method in consolidation. HLBV uses a balance sheet approach, which measures the Company’s equity in income or loss by calculating the change in the amount of net worth the partners are legally able to claim based on a hypothetical liquidation of the entity at the beginning of a reporting period compared to the end of that period. This method is used in AES Wind Generation partnerships which contain agreements designating different allocations of value among investors, where the allocations change in form or percentage over the life of the partnership.
ACCOUNTS PAYABLE AND OTHER ACCRUED LIABILITIES—Accounts payable consists of amounts due to trade creditors related to the Company’s core business operations. The nature of these payables include amounts owed to vendors and suppliers for items such as energy purchased for resale, fuel, maintenance, inventory and other raw materials. Other accrued liabilities include items such as income taxes, regulatory liabilities, legal contingencies and employee related costs including payroll, benefits and related taxes.
ASSET RETIREMENT OBLIGATIONS—In accordance with the accounting standards for asset retirement obligations, the Company records the fair value of the liability for a legal obligation to retire an asset in the period in which the obligation is incurred. When a new liability is recognized, the Company capitalizes the costs of the liability by increasing the carrying amount of the related long-lived asset. The liability is accreted to its present value each period and the capitalized cost is depreciated over the useful life of the related asset. Upon settlement of the obligation, the Company eliminates the liability and, based on the actual cost to retire, may incur a gain or loss.
GUARANTOR ACCOUNTING—In accordance with the accounting standards on guarantees, at the inception of a guarantee, the Company records the fair value of a guarantee as a liability, with the offset dependent on the circumstances under which the guarantee was issued.
TRANSFER OF FINANCIAL ASSETS—Effective January 1, 2010, the Company prospectively adopted the new accounting guidance on transfers of financial assets, which among other things: removes the concept of a qualifying special purpose entity; introduces the concept of participating interests and specifies that in order to qualify for sale accounting a partial transfer of a financial asset or a group of financial assets should meet the definition of a participating interest; clarifies that an entity should consider all arrangements made contemporaneously with or in contemplation of a transfer and requires enhanced disclosures to provide financial statement users with greater transparency about transfers of financial assets and a transferor’s continuing involvement with transfers of financial assets accounted for as sales. Upon adoption on January 1, 2010, the Company recognized $40 million as accounts receivable and as an associated secured borrowing on its
180
Table of Contents
THE AES CORPORATION
NOTES TO CONSOLIDATED FINANCIAL STATEMENTS—(Continued)
DECEMBER 31, 2010, 2009, AND 2008
Consolidated Balance Sheet; both of which have since increased to $50 million as of December 31, 2010, as additional interests in receivables have been sold. While securitizing these accounts receivable through IPL Funding, a special purpose entity, IPL, the Company’s integrated utility in Indianapolis, had previously recognized the transaction as a sale, but had not recognized the accounts receivable and secured borrowing on its balance sheet. Under the facility, interests in these accounts receivable are sold, on a revolving basis, to unrelated parties (the Purchasers) up to the lesser of $50 million or an amount determinable under the facility agreement. The Purchasers assume the risk of collection on the interest sold without recourse to IPL, which retains the servicing responsibilities for the interest sold. While no direct recourse to IPL exists, IPL risks loss in the event collections are not sufficient to allow for full recovery of the retained interests. No servicing asset or liability is recorded since the servicing fee paid to IPL approximates a market rate. Under the new accounting guidance, the retained interest in these securitized accounts receivable does not meet the definition of a participating interest, thereby requiring the Company to recognize on its Consolidated Balance Sheet the portion transferred and the proceeds received as accounts receivable and a secured borrowing, respectively.
FOREIGN CURRENCY TRANSLATION—A business’ functional currency is the currency of the primary economic environment in which the business operates and is generally the currency in which the business generates and expends cash. Subsidiaries and affiliates whose functional currency is a currency other than the U.S. Dollar translate their assets and liabilities into U.S. Dollars at the current exchange rates in effect at the end of the fiscal period. The revenue and expense accounts of such subsidiaries and affiliates are translated into U.S. Dollars at the average exchange rates that prevailed during the period. Translation adjustments are included in AOCI. Gains and losses on intercompany foreign currency transactions that are long-term in nature and which the Company does not intend to settle in the foreseeable future, are also recognized in AOCI. Gains and losses that arise from exchange rate fluctuations on transactions denominated in a currency other than the functional currency are included in determining net income.
REVENUE RECOGNITION—Revenue from Utilities is classified as regulated on the Consolidated Statements of Operations. Revenue from the sale of energy is recognized in the period during which the sale occurs. The calculation of revenue earned but not yet billed is based on the number of days not billed in the month, the estimated amount of energy delivered during those days and the estimated average price per customer class for that month. Differences between actual and estimated unbilled revenue are usually immaterial. Revenue from the Generation business is classified as non-regulated and is recognized based upon output delivered and capacity provided, at rates as specified under contract terms or prevailing market rates. The Company has businesses where it makes sales and purchases of power to and from Independent System Operators (“ISOs”) and Regional Transmission Organizations (“RTOs”). In those instances, the Company accounts for these transactions on a net hourly basis because the transactions are settled on a net hourly basis. Revenue is recorded net of any taxes assessed on and collected from customers, which are remitted to the governmental authorities.
SHARE-BASED COMPENSATION—The Company grants share-based compensation in the form of stock options and restricted stock units. The Company accounts for stock-based compensation plans under the accounting guidance on stock-based compensation, which requires entities to recognize compensation costs relating to share-based payments in their financial statements. That cost is measured on the grant date based on the fair value of the equity or liability instrument issued and is expensed on a straight-line basis over the requisite service period, net of estimated forfeitures. Currently, the Company uses a Black-Scholes option pricing model to estimate the fair value of stock options granted to its employees.
GENERAL AND ADMINISTRATIVE EXPENSES—General and administrative expenses include corporate and other expenses related to corporate staff functions and initiatives, primarily executive management,
181
Table of Contents
THE AES CORPORATION
NOTES TO CONSOLIDATED FINANCIAL STATEMENTS—(Continued)
DECEMBER 31, 2010, 2009, AND 2008
finance, legal, human resources and information systems, which are not directly allocable to our business segments. Additionally, all costs associated with business development efforts are classified as general and administrative expenses.
REGULATORY ASSETS AND LIABILITIES—The Company accounts for certain of its regulated operations in accordance with the accounting standards on regulated operations. As a result, AES records assets and liabilities that result from the regulated ratemaking process that are not recognized under GAAP for non-regulated entities. Regulatory assets generally represent incurred costs that have been deferred due to the probability of future recovery in customer rates. Regulatory liabilities generally represent obligations to make refunds to customers. Management continually assesses whether the regulatory assets are probable of future recovery by considering factors such as applicable regulatory changes, recent rate orders applicable to other regulated entities and the status of any pending or potential deregulation legislation. If future recovery of costs previously deferred ceases to be probable, the asset write-offs are recognized in continuing operations.
DERIVATIVES AND HEDGING ACTIVITIES—Derivatives primarily consist of interest rate swaps, cross currency swaps, foreign currency instruments, and commodity and embedded derivatives. The Company enters into various derivative transactions in order to hedge its exposure to certain market risks. AES primarily uses derivative instruments to manage its interest rate, foreign currency and commodity exposures. The Company does not enter into derivative transactions for trading purposes.
Under the accounting standards for derivatives and hedging, the Company recognizes all contracts that meet the definition of a derivative, except those designated as normal purchase or normal sale at inception, as either assets or liabilities in the Consolidated Balance Sheets and measures those instruments at fair value. Changes in the fair value of derivatives are recognized in earnings unless specific hedge criteria are met. Gains and losses related to derivative instruments that qualify as hedges are recognized in the same category as generated by the underlying asset or liability. Gains or losses on derivatives that do not qualify for hedge accounting are recognized as interest expense for interest rate and cross currency derivatives, foreign currency transaction gains or losses for foreign currency derivatives, and non-regulated revenue or non-regulated cost of sales for commodity derivatives.
The accounting standards for derivatives and hedging enable companies to designate qualifying derivatives as hedging instruments based on the exposure being hedged. These hedge designations include fair value hedges and cash flow hedges. Changes in the fair value of a derivative that is highly effective, designated and qualifies as a fair value hedge are recognized in earnings as offsets to the changes in fair value of the exposure being hedged. The Company has no fair value hedges at this time. Changes in the fair value of a derivative that is highly effective, designated and qualifies as a cash flow hedge are deferred in AOCI and are recognized into earnings as the hedged transactions affect earnings. Any ineffectiveness is recognized in earnings immediately. The ineffective portion is recognized as interest expense for interest rate and cross currency hedges, foreign currency transaction gains or losses for foreign currency hedges, and non-regulated revenue or non-regulated cost of sales for commodity hedges. For all hedge contracts, the Company maintains formal documentation of the hedge and effectiveness testing in accordance with the accounting standards for derivatives and hedging. If AES determines that the derivative is not highly effective as a hedge, hedge accounting will be discontinued prospectively.
For cash flow hedges of forecasted transactions, AES estimates the future cash flows of the forecasted transactions and evaluates the probability of the occurrence and timing of such transactions. Changes in conditions or the occurrence of unforeseen events could require discontinuance of hedge accounting or could affect the timing of the reclassification of gains or losses on cash flow hedges from AOCI into earnings.
182
Table of Contents
THE AES CORPORATION
NOTES TO CONSOLIDATED FINANCIAL STATEMENTS—(Continued)
DECEMBER 31, 2010, 2009, AND 2008
The Company has elected not to offset net derivative positions in the financial statements. Accordingly, the Company does not offset such derivative positions against the fair value of amounts (or amounts that approximate fair value) recognized for the right to reclaim cash collateral (a receivable) or the obligation to return cash collateral (a payable) under master netting arrangements.
See Note 4—Fair Value and the Company’s fair value policy for additional discussion regarding the determination of the fair value of the Company’s derivative assets and liabilities.
Accounting Pronouncements Issued But Not Yet Effective
The following accounting standards have been issued, but as of December 31, 2010 are not yet effective for and have not been adopted by AES.
Accounting Standards Update (“ASU”) No. 2010-28, Intangibles—Goodwill and Other (Topic 350), “When to Perform Step 2 of the Goodwill Impairment Test for Reporting Units with Zero or Negative Carrying Amounts”
In December 2010, the FASB issued ASU No. 2010-28, which amends the accounting guidance related to goodwill. The amendments in ASU No. 2010-28 modify Step 1 of the goodwill impairment test for reporting units with zero or negative carrying amounts. For those reporting units, an entity is required to perform Step 2 of the goodwill impairment test if it is more likely than not that a goodwill impairment exists, eliminating an entity’s ability to assert that a reporting unit is not required to perform Step 2 because the carrying amount of the reporting unit is zero or negative despite the existence of qualitative factors that indicate the goodwill is more likely than not impaired. In determining whether it is more likely than not that a goodwill impairment exists, an entity should consider whether there are any adverse qualitative factors indicating that an impairment may exist. ASU No. 2010-28 is effective for fiscal years, and interim periods within those years, beginning after December 15, 2010, or January 1, 2011 for AES. Early adoption is prohibited. The adoption is not expected to have a material impact on the Company’s financial position, results of operations or cash flows.
2. INVENTORY
As of December 31, 2010, 77% of the Company’s inventory was valued using average cost, 21% was determined using the FIFO method and the remaining inventory was valued using the specific identification method. The following table summarizes our inventory balances as of December 31, 2010 and 2009:
| December 31, | ||||||||
| 2010 | 2009 | |||||||
| (in millions) | ||||||||
| Coal, fuel oil and other raw materials |
$ | 296 | $ | 293 | ||||
| Spare parts and supplies |
304 | 267 | ||||||
| Total |
$ | 600 | $ | 560 | ||||
183
Table of Contents
THE AES CORPORATION
NOTES TO CONSOLIDATED FINANCIAL STATEMENTS—(Continued)
DECEMBER 31, 2010, 2009, AND 2008
3. PROPERTY, PLANT & EQUIPMENT
The following table summarizes the components of the electric generation and distribution assets and other property, plant and equipment with their estimated useful lives:
| Estimated | December 31, | |||||||||||
| Useful Life | 2010 | 2009 | ||||||||||
| (in millions) | ||||||||||||
| Electric generation and distribution facilities |
3 - 62 yrs. | $ | 24,400 | $ | 23,484 | |||||||
| Other buildings |
3 - 50 yrs. | 2,215 | 1,926 | |||||||||
| Furniture, fixtures and equipment |
3 - 31 yrs. | 729 | 685 | |||||||||
| Other |
1 - 50 yrs. | 863 | 720 | |||||||||
| Total electric generation and distribution assets and other |
28,207 | 26,815 | ||||||||||
| Accumulated depreciation |
(9,173 | ) | (8,774 | ) | ||||||||
| Net electric generation and distribution assets and other(1) |
$ | 19,034 | $ | 18,041 | ||||||||
| (1) | Net electric generation and distribution assets and other related to Lal Pir, Pak Gen, Barka and Ras Laffan of $848 million as of December 31, 2009 were excluded from the table above and were included in the noncurrent assets of discontinued and held for sale businesses. |
The amounts as of December 31, 2010 in the table above are stated net of impairment losses recognized in 2010 as further discussed in Note 19—Impairment Expense.
The following table summarizes interest capitalized during development and construction on qualifying assets for the years ended December 31, 2010, 2009 and 2008:
| December 31, | ||||||||||||
| 2010 | 2009 | 2008 | ||||||||||
| (in millions) | ||||||||||||
| Interest capitalized during development and construction |
$ | 193 | $ | 187 | $ | 176 | ||||||
Recoveries of liquidated damages from construction delays and government subsidies are reflected as a reduction in the related projects’ construction costs. Approximately $12.2 billion of property, plant and equipment, net of accumulated depreciation, was mortgaged, pledged or subject to liens as of December 31, 2010.
Depreciation expense, including the amortization of assets recorded under capital leases, was $1.1 billion, $980 million and $928 million for the years ended December 31, 2010, 2009 and 2008, respectively.
Net electric generation and distribution assets and other include unamortized internal use software costs of $170 million and $182 million as of December 31, 2010 and 2009, respectively. Amortization expense associated with software costs was $52 million, $48 million and $41 million for the years ended December 31, 2010, 2009 and 2008.
184
Table of Contents
THE AES CORPORATION
NOTES TO CONSOLIDATED FINANCIAL STATEMENTS—(Continued)
DECEMBER 31, 2010, 2009, AND 2008
The following table summarizes regulated and non-regulated generation and distribution property, plant and equipment and accumulated depreciation as of December 31, 2010 and 2009:
| December 31, | ||||||||
| 2010 | 2009 | |||||||
| (in millions) | ||||||||
| Regulated assets |
$ | 12,488 | $ | 11,744 | ||||
| Regulated accumulated depreciation |
(5,123 | ) | (4,830 | ) | ||||
| Regulated generation, distribution assets, and other, net |
7,365 | 6,914 | ||||||
| Non-regulated assets |
15,719 | 15,071 | ||||||
| Non-regulated accumulated depreciation |
(4,050 | ) | (3,944 | ) | ||||
| Non-regulated generation, distribution assets, and other, net |
11,669 | 11,127 | ||||||
| Net electric generation and distribution assets, and other |
$ | 19,034 | $ | 18,041 | ||||
The following table summarizes the amounts recognized, which were related to asset retirement obligations, for the years ended December 31, 2010 and 2009:
| 2010 | 2009 | |||||||
| (in millions) | ||||||||
| Balance at January 1 |
$ | 101 | $ | 70 | ||||
| Additional liabilities incurred |
20 | 17 | ||||||
| Liabilities settled |
— | (1 | ) | |||||
| Accretion expense |
7 | 5 | ||||||
| Change in estimated cash flows |
2 | 10 | ||||||
| Translation adjustments |
(1 | ) | — | |||||
| Balance at December 31 |
$ | 129 | $ | 101 | ||||
The Company’s asset retirement obligations covered by the relevant guidance primarily include active ash landfills, water treatment basins and the removal or dismantlement of certain plant and equipment. The fair value of legally restricted assets for purposes of settling asset retirement obligations was $12 million and $0 at December 31, 2010 and 2009, respectively.
4. FAIR VALUE
The fair value of current financial assets and liabilities, debt service reserves and other deposits approximate their reported carrying amounts. The fair value of non-recourse debt is estimated differently based upon the type of loan. For variable rate loans, carrying value approximates fair value. For fixed rate loans, the fair value is estimated using quoted market prices or discounted cash flow analyses. See Note 10—Debt for additional information on the fair value and carrying value of debt. The fair value of interest rate swap, cap and floor agreements, foreign currency forwards, swaps and options, and energy derivatives is the estimated net amount that the Company would receive or pay to sell or transfer the agreements as of the balance sheet date.
The estimated fair values of the Company’s assets and liabilities have been determined using available market information. By virtue of these amounts being estimates and based on hypothetical transactions to sell assets or transfer liabilities, the use of different market assumptions and/or estimation methodologies may have a material effect on the estimated fair value amounts.
185
Table of Contents
THE AES CORPORATION
NOTES TO CONSOLIDATED FINANCIAL STATEMENTS—(Continued)
DECEMBER 31, 2010, 2009, AND 2008
The following table summarizes the carrying and fair value of certain of the Company’s financial assets and liabilities as of December 31, 2010 and 2009:
| December 31, | ||||||||||||||||
| 2010 | 2009 | |||||||||||||||
| Carrying Amount |
Fair Value |
Carrying Amount |
Fair Value |
|||||||||||||
| (in millions) | ||||||||||||||||
| Assets |
||||||||||||||||
| Marketable securities |
$ | 1,772 | $ | 1,772 | $ | 1,691 | $ | 1,691 | ||||||||
| Derivatives |
125 | 125 | 141 | 141 | ||||||||||||
| Total assets |
$ | 1,897 | $ | 1,897 | $ | 1,832 | $ | 1,832 | ||||||||
| Liabilities |
||||||||||||||||
| Debt |
$ | 19,733 | $ | 20,339 | $ | 19,537 | $ | 20,008 | ||||||||
| Derivatives |
424 | 424 | 310 | 310 | ||||||||||||
| Total liabilities |
$ | 20,157 | $ | 20,763 | $ | 19,847 | $ | 20,318 | ||||||||
Valuation Techniques:
The fair value measurement accounting guidance describes three main approaches to measuring the fair value: (1) market approach; (2) income approach and (3) cost approach. The market approach uses prices and other relevant information generated from market transactions involving identical or comparable assets or liabilities. The income approach often uses valuation techniques to convert future amounts to a single present value amount. The measurement is based on current market expectations of return on those future amounts. The cost approach is based on the amount that would currently be required to replace an asset. The Company measures its investments and derivatives at fair value on a recurring basis. Additionally, in connection with annual or event-driven impairment evaluations, certain nonfinancial assets and liabilities are measured at fair value on a nonrecurring basis. These include long-lived tangible assets (i.e., property, plant and equipment), goodwill and intangible assets (e.g., sales concessions, land use rights and emissions allowances etc). In general, the Company determines the fair value of investments using the market approach and of derivatives using the income approach. In the nonrecurring measurements of nonfinancial assets and liabilities, all three approaches are considered; however, fair value generated by the income approach is often selected.
Investments
The Company’s investments measured at fair value primarily consist of marketable debt and equity securities. Equity securities are measured at fair value using quoted market prices. Debt securities primarily consist of unsecured debentures, certificates of deposit and government debt securities held by our Brazilian subsidiaries. Returns and pricing on these instruments are generally indexed to the CDI (Brazilian equivalent to London Inter Bank Offered Rate (“LIBOR”), a benchmark interest rate widely used by banks in the money market), or Selic (overnight borrowing rate) rates in Brazil. Fair value is determined from comparisons of market data obtained for similar assets and is considered Level 2 in the fair value hierarchy. For more detail regarding the fair value of investments see Note 5—Investments in Marketable Securities.
186
Table of Contents
THE AES CORPORATION
NOTES TO CONSOLIDATED FINANCIAL STATEMENTS—(Continued)
DECEMBER 31, 2010, 2009, AND 2008
Derivatives
When deemed appropriate, the Company manages its risk from interest and foreign currency exchange rate and commodity price fluctuations through the use of financial and physical derivative instruments. The Company’s derivatives are primarily interest rate swaps to hedge non-recourse debt to establish a fixed rate on variable rate debt, foreign exchange instruments to hedge against currency fluctuations, commodity derivatives to hedge against commodity price fluctuations and embedded derivatives associated with commodity contracts. The Company’s subsidiaries are counterparties to various over-the-counter derivatives, which include interest rate swaps and options, foreign currency options and forwards and commodity swaps. In addition, the Company’s subsidiaries are counterparties to certain PPAs and fuel supply agreements that are derivatives or include embedded derivatives.
For the derivatives where there is a standard industry valuation model, the Company uses that model to estimate the fair value. For the derivatives (such the PPAs and fuel supply agreements that are derivatives or include embedded derivatives) where there is not a standard industry valuation model, the Company has created internal valuation models to estimate the fair value, using observable data to the extent available. For all derivatives, the income approach is used, which consists of forecasting future cash flows based on contractual notional amounts and applicable and available market data as of the valuation date. The following are among the most common market data inputs used in the income approach: volatilities, spot and forward benchmark interest rates (such as LIBOR and Euro Inter Bank Offered Rate (“EURIBOR”)), foreign exchange rates and commodity prices. Forward rates and prices are generally obtained from published information provided by pricing services for an instrument with the same duration as the derivative instrument being valued. In situations where significant inputs are not observable, the Company uses relevant techniques to best estimate the inputs, such as regression analysis, Monte Carlo simulation or prices for similarly traded instruments available in the market.
For each derivative, the income approach is used to estimate the cash flows over the remaining term of the contract. Those cash flows are then discounted using the relevant spot benchmark interest rate (such as LIBOR or EURIBOR) plus a spread that reflects the credit or nonperformance risk. This risk is estimated by the Company using credit spreads and risk premiums that are observable in the market, whenever possible, or estimated borrowing costs based on bank quotes, industry publications and/or information on financing closed on similar projects. To the extent that management can estimate the fair value of these assets or liabilities without the use of significant unobservable inputs, these derivatives are classified as Level 2.
In certain instances, the published forward rates or prices may not extend through the remaining term of the contract and management must make assumptions to extrapolate the curve, which necessitates the use of unobservable inputs, such as proxy commodity prices or historical settlements to forecast forward prices. In addition, in certain instances, there may not be third party data readily available which requires the use of unobservable inputs. Similarly, in certain instances, the spread that reflects the credit or nonperformance risk is unobservable. The fair value hierarchy of an asset or a liability is based on the Level of significance of input assumptions. An input assumption is considered significant if it affects the fair value by at least 10%. Assets and liabilities are transferred to Level 3 when the use of unobservable inputs becomes significant. Similarly, when the use of unobservable input becomes insignificant for Level 3 assets and liabilities, they are transferred to Level 2.
Transfers in and out of Level 3 are determined as of the end of the reporting period and are from and to Level 2. The Company has not had any Level 1 derivatives so there have not been any transfers between Levels 1 and 2.
187
Table of Contents
THE AES CORPORATION
NOTES TO CONSOLIDATED FINANCIAL STATEMENTS—(Continued)
DECEMBER 31, 2010, 2009, AND 2008
Nonfinancial assets and liabilities
For nonrecurring measurements derived using the income approach, fair value is determined using valuation models based on the principles of discounted cash flows (“DCF”). The income approach is most often used in the impairment evaluation of long-lived tangible assets, goodwill and intangible assets. The Company has developed internal valuation models for such valuations; however, an independent valuation firm may be engaged in certain situations. In such situations, the independent valuation firm largely uses DCF valuation models as the primary measure of fair value though other valuation approaches are also considered. A few examples of input assumptions to such valuations include macroeconomic factors such as growth rates, industry demand, inflation, exchange rates, power prices and commodity prices. Whenever possible, the Company attempts to obtain market observable data to develop input assumptions. Where the use of market observable data is limited or not possible for certain input assumptions, the Company develops its own estimates of such assumptions using a variety of techniques such as regression analysis and extrapolations.
For nonrecurring measurements derived using the market approach, recent market transactions involving the sale of identical or similar assets are considered. The use of this approach is limited because it is often difficult to find sale transactions of identical or similar assets. This approach is used in the impairment evaluations of certain intangible assets. Otherwise, it is used to corroborate the fair value determined under the income approach.
For nonrecurring measurements derived using the cost approach, fair value is typically determined using the replacement cost approach. Under this approach, the depreciated replacement cost of assets is determined by first determining the current replacement cost of assets and then applying the remaining useful lives percentages to such cost. Further adjustments for economic and functional obsolescence are made to the depreciated replacement cost. This approach involves a considerable amount of judgment which is why its use is limited to the measurement of a few long-lived tangible assets. Like the market approach, this approach is also used to corroborate the fair value determined under the income approach. For the year ended December 31, 2010, the Company did not measure any nonfinancial assets under the cost approach.
Fair Value Considerations:
In determining fair value, the Company considers the source of observable market data inputs, liquidity of the instrument, the credit risk of the counterparty and the risk of the Company’s nonperformance. The conditions and criteria used to assess these factors are:
Sources of market assumptions:
The Company derives most of its market assumptions from market efficient data sources (e.g., Bloomberg and Platt’s). In some cases, where market data is not readily available, management uses comparable market sources and empirical evidence to derive market assumptions to determine the fair value.
Market liquidity:
The Company evaluates market liquidity based on whether the financial or physical instrument, or the underlying asset, is traded in an active or inactive market. An active market exists if the prices are fully transparent to market participants, can be measured by market bid and ask quotes, the market has a relatively large proportion of trading volume as compared to the Company’s current trading volume and the market has a significant number of market participants that will allow the market to rapidly absorb the quantity of the assets traded without significantly affecting the market price. Other factors the Company considers when determining
188
Table of Contents
THE AES CORPORATION
NOTES TO CONSOLIDATED FINANCIAL STATEMENTS—(Continued)
DECEMBER 31, 2010, 2009, AND 2008
whether a market is active or inactive include the presence of government or regulatory control over pricing that could make it difficult to establish a market based price when entering into a transaction.
Nonperformance risk:
Nonperformance risk refers to the risk that the obligation will not be fulfilled and affects the value at which a liability is transferred or an asset is sold. Nonperformance risk includes, but may not be limited to, the Company or counterparty’s credit and settlement risk. Nonperformance risk adjustments are dependent on credit spreads, letters of credit, collateral, other arrangements available and the nature of master netting arrangements. The Company and its subsidiaries are parties to various interest rate swaps and options; foreign currency options and forwards; and derivatives and embedded derivatives which subject the Company to nonperformance risk. The financial and physical instruments held at the subsidiary Level are generally non-recourse to the Parent Company.
Nonperformance risk on the investments held by the Company is incorporated in the investment’s exit price that is derived from quoted market data that is used to mark the investment to fair value.
The Company adjusts for nonperformance risk or credit risk on its derivative instruments by deducting a credit valuation adjustment (“CVA”). The CVA is based on the margin or debt spread of the Company or counterparty and the tenor of the respective derivative instrument. The counterparty for a derivative asset position is considered to be the bank or government sponsored banking entity or counterparty to the PPA or commodity contract. The CVA for asset positions is based on the counterparty’s credit ratings and debt spreads or, in the absence of readily obtainable credit information, the respective country debt spreads are used as a proxy. The CVA for liability positions is based on the Parent Company’s or the subsidiary’s current debt spread, the margin on indicative financing arrangements, or in the absence of readily obtainable credit information, the respective country debt spreads are used as a proxy. If the instrument is recourse to the Parent Company, the Parent Company’s current debt spread is used to adjust for nonperformance risk. All derivative instruments are analyzed individually and are subject to unique risk exposures.
189
Table of Contents
THE AES CORPORATION
NOTES TO CONSOLIDATED FINANCIAL STATEMENTS—(Continued)
DECEMBER 31, 2010, 2009, AND 2008
Recurring Measurements:
The following table sets forth, by Level within the fair value hierarchy, the Company’s financial assets and liabilities that were measured at fair value on a recurring basis as of December 31, 2010 and 2009. Financial assets and liabilities have been classified in their entirety based on the lowest Level of input that is significant to the fair value measurement. The Company’s assessment of the significance of a particular input to the fair value measurement requires judgment, and may affect the determination of the fair value of the assets and liabilities and their placement within the fair value hierarchy levels.
| Quoted Market Prices in Active Market for Identical Assets (Level 1) |
Significant Other Observable Inputs (Level 2) |
Significant Unobservable Inputs (Level 3) |
Total December 31, 2010 |
|||||||||||||
| (in millions) | ||||||||||||||||
| Assets |
||||||||||||||||
| Available-for-sale securities |
$ | 8 | $ | 1,712 | $ | 42 | $ | 1,762 | ||||||||
| Trading securities |
10 | — | — | 10 | ||||||||||||
| Derivatives |
— | 64 | 61 | 125 | ||||||||||||
| Total assets |
$ | 18 | $ | 1,776 | $ | 103 | $ | 1,897 | ||||||||
| Liabilities |
||||||||||||||||
| Derivatives |
$ | — | $ | 412 | $ | 12 | $ | 424 | ||||||||
| Total liabilities |
$ | — | $ | 412 | $ | 12 | $ | 424 | ||||||||
| Quoted Market Prices in Active Market for Identical Assets (Level 1) |
Significant Other Observable Inputs (Level 2) |
Significant Unobservable Inputs (Level 3) |
Total December 31, 2009 |
|||||||||||||
| (in millions) | ||||||||||||||||
| Assets |
||||||||||||||||
| Available-for-sale securities |
$ | 133 | $ | 1,501 | $ | 42 | $ | 1,676 | ||||||||
| Trading securities |
7 | — | — | 7 | ||||||||||||
| Derivatives |
— | 111 | 30 | 141 | ||||||||||||
| Total assets |
$ | 140 | $ | 1,612 | $ | 72 | $ | 1,824 | ||||||||
| Liabilities |
||||||||||||||||
| Derivatives |
$ | — | $ | 280 | $ | 30 | $ | 310 | ||||||||
| Total liabilities |
$ | — | $ | 280 | $ | 30 | $ | 310 | ||||||||
190
Table of Contents
THE AES CORPORATION
NOTES TO CONSOLIDATED FINANCIAL STATEMENTS—(Continued)
DECEMBER 31, 2010, 2009, AND 2008
The following table presents a reconciliation of derivative assets and liabilities measured at fair value on a recurring basis using significant unobservable inputs (Level 3) for the years ended December 31, 2010 and 2009:
| Year Ended December 31, | ||||||||||||||||||||||||
| 2010 | 2009 | |||||||||||||||||||||||
| Interest Rate |
Cross Currency |
Foreign Currency |
Commodity & Other |
Total | Total | |||||||||||||||||||
| (in millions) | ||||||||||||||||||||||||
| Balance at beginning of period(1) |
$ | (12 | ) | $ | (12 | ) | $ | — | $ | 24 | $ | — | $ | (69 | ) | |||||||||
| Total gains (losses) (realized and unrealized):(1) |
||||||||||||||||||||||||
| Included in earnings(2) |
1 | 4 | 25 | 21 | 51 | (20 | ) | |||||||||||||||||
| Included in other comprehensive income |
(12 | ) | 13 | — | — | 1 | 134 | |||||||||||||||||
| Included in regulatory assets |
(3 | ) | — | — | 1 | (2 | ) | — | ||||||||||||||||
| Purchases, issuances and settlements(1) |
7 | 5 | (1 | ) | (28 | ) | (17 | ) | 31 | |||||||||||||||
| Transfers of assets (liabilities) into Level 3(3) |
— | — | (2 | ) | — | (2 | ) | 1 | ||||||||||||||||
| Transfers of (assets) liabilities out of Level 3(3) |
18 | — | — | — | 18 | (77 | ) | |||||||||||||||||
| Balance at end of period(1) |
$ | (1 | ) | $ | 10 | $ | 22 | $ | 18 | $ | 49 | $ | — | |||||||||||
| Total gains (losses) for the period included in earnings attributable to the change in unrealized gains (losses) relating to assets and liabilities held at the end of the period(1) |
$ | — | $ | 7 | $ | 24 | $ | 9 | $ | 40 | $ | (2 | ) | |||||||||||
| (1) | Derivative assets and (liabilities) are presented on a net basis. |
| (2) | The gains (losses) included in earnings for these Level 3 derivatives are classified as follows: interest rate and cross currency derivatives as interest expense, foreign currency derivatives as foreign currency transaction gains (losses) and commodity and other derivatives as either non-regulated revenue, non-regulated cost of sales or other expense. See Note 6—Derivative Instruments and Hedging Activities for further information regarding the classification of gains and losses included in earnings in the Consolidated Statements of Operations. |
| (3) | Transfers in and out of Level 3 are determined as of the end of the reporting period and are from and to Level 2. The (assets) liabilities transferred out of Level 3 are primarily the result of a decrease in the significance of unobservable inputs used to calculate the credit valuation adjustments of these derivative instruments. Similarly, the assets (liabilities) transferred into Level 3 are primarily the result of an increase in the significance of unobservable inputs used to calculate the credit valuation adjustments of these derivative instruments. |
The following table presents a reconciliation of available-for-sale securities measured at fair value on a recurring basis using significant unobservable inputs (Level 3) for the years ended December 31, 2010 and 2009:
| Year Ended December 31, | ||||||||
| 2010 | 2009 | |||||||
| (in millions) | ||||||||
| Balance at beginning of period(1) |
$ | 42 | $ | 42 | ||||
| Purchases, issuances and settlements |
— | — | ||||||
| Balance at end of period |
$ | 42 | $ | 42 | ||||
| Total gains (losses) for the period included in earnings attributable to the change in unrealized gains/losses relating to assets held at the end of the period |
$ | — | $ | — | ||||
191
Table of Contents
THE AES CORPORATION
NOTES TO CONSOLIDATED FINANCIAL STATEMENTS—(Continued)
DECEMBER 31, 2010, 2009, AND 2008
| (1) | Available-for-sale securities in Level 3 are auction rate securities and variable rate demand notes which have failed remarketing or are not actively trading and for which there are no longer adequate observable inputs to measure the fair value. |
Nonrecurring Measurements:
For the purpose of impairment evaluation, the Company measured fair values of long-lived assets, goodwill and intangibles assets, and assets and liabilities of discontinued operations under the fair value measurement accounting guidance. The following table summarizes major categories of assets and liabilities measured at fair value on a nonrecurring basis during the year and their level within the fair value hierarchy:
| Year Ended December 31, 2010 | ||||||||||||||||||||
| Carrying Amount (1) |
Fair Value | Gross (Gain) Loss |
||||||||||||||||||
| Level 1 | Level 2 | Level 3 | ||||||||||||||||||
| (in millions) | ||||||||||||||||||||
| Long-lived assets held and used: |
||||||||||||||||||||
| Eastern Energy |
$ | 827 | $ | — | $ | — | $ | — | $ | 827 | ||||||||||
| Southland (Huntington Beach) |
288 | — | — | 88 | 200 | |||||||||||||||
| Tisza II |
160 | — | — | 75 | 85 | |||||||||||||||
| Deepwater |
83 | — | — | 4 | 79 | |||||||||||||||
| Discontinued operations and businesses held for sale: |
||||||||||||||||||||
| Barka |
20 | — | 124 | — | (104 | ) | ||||||||||||||
| Ras Laffan |
120 | — | 226 | — | (106 | ) | ||||||||||||||
| Goodwill: |
||||||||||||||||||||
| Deepwater |
18 | — | — | — | 18 | |||||||||||||||
| Other |
3 | — | — | — | 3 | |||||||||||||||
| (1) | Carrying amount as of the month end prior to impairment. |
Long-lived Assets Held and Used
In the fourth quarter of 2010, the Company determined there were impairment indicators for the long-lived assets at Eastern Energy, our coal-fired generation plants in New York. These long-lived assets had a carrying amount of $827 million and were considered fully impaired. This resulted in the recognition of asset impairment expense of $827 million.
In the fourth quarter of 2010, the Company determined there were impairment indicators for the long-lived assets at Deepwater, our pet-coke-fired generation facility in Texas. These long-lived assets had a carrying amount of $83 million and were written down to their fair value of $4 million. This resulted in the recognition of asset impairment expense of $79 million.
In the third quarter of 2010, the Company determined there were impairment indicators for the long-lived assets at Tisza II, our gas-fired generation plant in Hungary, and Huntington Beach, one of our gas-fired generation plants in California. These long-lived assets had carrying amounts of $160 million and $288 million, respectively, and were written down to their fair value of $75 million and $88 million, respectively. These resulted in the recognition of asset impairment expense of $85 million and $200 million, respectively.
Since the majority of significant assumptions used in the valuations were not observable, management believes that the measurements are Level 3 in the fair value hierarchy. For further discussion of these impairments, see Note 19—Impairment Expense.
192
Table of Contents
THE AES CORPORATION
NOTES TO CONSOLIDATED FINANCIAL STATEMENTS—(Continued)
DECEMBER 31, 2010, 2009, AND 2008
Discontinued Operations and Held for Sale Businesses
The Company determined the fair value of nonfinancial assets and liabilities of our held for sale businesses during the year ended December 31, 2010. These included the Company’s operations in Oman and Qatar.
Since the fair value estimates were based on sale price, management believes that the measurement is Level 2 in the fair value hierarchy. For further discussion, see Note 21—Discontinued Operations and Held for Sale Businesses.
Goodwill
As noted in Note 8—Goodwill and Other Intangible Assets, goodwill of $18 million related to our Deepwater business was written down to its implied fair value of zero during an interim impairment evaluation, resulting in the recognition of goodwill impairment of $18 million for the year ended December 31, 2010.
Since the majority of significant assumptions used in the valuation were not observable, management believes that the measurement is Level 3 in the fair value hierarchy. For further discussion, see Note 8—Goodwill and Other Intangible Assets.
5. INVESTMENTS IN MARKETABLE SECURITIES
The following table sets forth the Company’s investments in marketable debt and equity securities classified as trading and available-for-sale as of December 31, 2010 and 2009 by type of investment and by level within the fair value hierarchy. The security types are determined based on the nature and risk of the security and are consistent with how the Company manages, monitors and measures its securities.
| December 31, | ||||||||||||||||||||||||||||||||
| 2010 | 2009 | |||||||||||||||||||||||||||||||
| Level 1 | Level 2 | Level 3 | Total | Level 1 | Level 2 | Level 3 | Total | |||||||||||||||||||||||||
| (in millions) | ||||||||||||||||||||||||||||||||
| AVAILABLE-FOR-SALE:(1) |
||||||||||||||||||||||||||||||||
| Debt securities: |
||||||||||||||||||||||||||||||||
| Unsecured debentures(2) |
$ | — | $ | 727 | $ | — | $ | 727 | $ | — | $ | 667 | $ | — | $ | 667 | ||||||||||||||||
| Certificates of deposit(2) |
— | 877 | — | 877 | — | 652 | — | 652 | ||||||||||||||||||||||||
| Government debt securities |
— | 47 | — | 47 | — | 152 | — | 152 | ||||||||||||||||||||||||
| Other |
— | — | 42 | 42 | — | — | 42 | 42 | ||||||||||||||||||||||||
| Subtotal |
— | 1,651 | 42 | 1,693 | — | 1,471 | 42 | 1,513 | ||||||||||||||||||||||||
| Equity securities: |
||||||||||||||||||||||||||||||||
| Mutual funds |
1 | 61 | — | 62 | 117 | — | — | 117 | ||||||||||||||||||||||||
| Common stock |
7 | — | — | 7 | 16 | — | — | 16 | ||||||||||||||||||||||||
| Money market funds |
— | — | — | — | — | 30 | — | 30 | ||||||||||||||||||||||||
| Subtotal |
8 | 61 | — | 69 | 133 | 30 | — | 163 | ||||||||||||||||||||||||
| Total available-for-sale |
8 | 1,712 | 42 | 1,762 | 133 | 1,501 | 42 | $ | 1,676 | |||||||||||||||||||||||
| TRADING: |
||||||||||||||||||||||||||||||||
| Equity securities: |
||||||||||||||||||||||||||||||||
| Mutual funds |
10 | — | — | 10 | 7 | — | — | 7 | ||||||||||||||||||||||||
| Total trading |
10 | — | — | 10 | 7 | — | — | 7 | ||||||||||||||||||||||||
| TOTAL |
$ | 18 | $ | 1,712 | $ | 42 | $ | 1,772 | $ | 140 | $ | 1,501 | $ | 42 | $ | 1,683 | ||||||||||||||||
| Held-to-maturity securities(3) |
— | 8 | ||||||||||||||||||||||||||||||
| Total marketable securities |
$ | 1,772 | $ | 1,691 | ||||||||||||||||||||||||||||
193
Table of Contents
THE AES CORPORATION
NOTES TO CONSOLIDATED FINANCIAL STATEMENTS—(Continued)
DECEMBER 31, 2010, 2009, AND 2008
| (1) | Amortized cost approximated fair value at December 31, 2010 and 2009, with the exception of certain common stock investments with a cost basis of $6 million carried at their fair value of $7 million and $16 million at December 31, 2010 and 2009, respectively. |
| (2) | Unsecured debentures are instruments similar to certificates of deposit that are held primarily by our subsidiaries in Brazil. The unsecured debentures and certificates of deposit included here do not qualify as cash equivalents and meet the definition of a security under the relevant guidance and are therefore classified as available-for-sale securities. |
| (3) | Held-to-maturity securities are carried at amortized cost and not measured at fair value on a recurring basis. These investments consist primarily of certificates of deposit and government debt securities. The amortized cost approximated fair value of the held-to-maturity securities at December 31, 2009. |
As of December 31, 2010, all available-for-sale debt securities had stated maturities less than one year, with the exception of $42 million of auction rate securities and variable rate demand notes held by IPL, a subsidiary of the Company in Indiana. These securities, classified as other debt securities in the table above, had stated maturities of greater than ten years.
During the second quarter of 2009, three of the Company’s generation businesses in the Dominican Republic exchanged $110 million of accounts receivable due from the government-owned distribution companies in the Dominican Republic for sovereign bonds of the same amount. The bonds, which were classified as available-for-sale securities, were adjusted to fair value when acquired. During the second and third quarters of 2009, the Company used a portion of the bonds with a carrying value of $31 million to settle third-party liabilities and sold the remaining bonds. As of December 31, 2009, all of the sovereign bonds had been sold or transferred.
The following table summarizes the pre-tax gains and losses related to available-for-sale securities for the years ended December 31, 2010, 2009 and 2008. There were no realized gains or losses on trading securities and there were no realized losses on the sale of available-for-sale securities. There was no other-than-temporary impairment of marketable securities recognized in earnings or other comprehensive income for the years ended December 31, 2010, 2009 or 2008.
| December 31, | ||||||||||||
| 2010 | 2009 | 2008 | ||||||||||
| (in millions) | ||||||||||||
| Gains (losses) included in other comprehensive income |
$ | 2 | $ | 10 | $ | (2 | ) | |||||
| Gains reclassified out of other comprehensive income into earnings |
— | 2 | — | |||||||||
| Proceeds from sales |
5,888 | 4,466 | 5,006 | |||||||||
| Gross realized gains on sales |
2 | 3 | — | |||||||||
6. DERIVATIVE INSTRUMENTS AND HEDGING ACTIVITIES
Risk Management Objectives
The Company is exposed to market risks associated with its enterprise-wide business activities, namely the purchase and sale of fuel and electricity as well as foreign currency risk and interest rate risk. In order to manage the market risks associated with these business activities, we enter into contracts that incorporate derivatives and financial instruments, including forwards, futures, options, swaps or combinations thereof, as appropriate. The Company applies hedge accounting for all contracts as long as they are eligible under the accounting standards for derivatives and hedging. While derivative transactions are not entered into for trading purposes, some contracts are not eligible for hedge accounting.
194
Table of Contents
THE AES CORPORATION
NOTES TO CONSOLIDATED FINANCIAL STATEMENTS—(Continued)
DECEMBER 31, 2010, 2009, AND 2008
Interest Rate Risk
AES and its subsidiaries utilize variable rate debt financing for construction projects and operations, resulting in an exposure to interest rate risk. Interest rate swap, cap and floor agreements are entered into to manage interest rate risk by effectively fixing or limiting the interest rate exposure on the underlying financing. These interest rate contracts range in maturity through 2027, and are typically designated as cash flow hedges. The following table sets forth, by underlying type of interest rate index, the Company’s current and maximum outstanding notional under its interest rate derivative instruments, the weighted average remaining term and the percentage of variable-rate debt hedged that is based on the related index as of December 31, 2010 regardless of whether the derivative instruments are in qualifying cash flow hedging relationships:
| December 31, 2010 | ||||||||||||||||||||||||
| Current | Maximum(1) | |||||||||||||||||||||||
| Interest Rate Derivatives |
Derivative Notional |
Derivative Notional Translated to USD |
Derivative Notional |
Derivative Notional Translated to USD |
Weighted Average Remaining Term(1) |
% of Debt Currently Hedged by Index(2) |
||||||||||||||||||
| (in millions) | (in years) | |||||||||||||||||||||||
| LIBOR (U.S. Dollar) |
2,543 | $ | 2,543 | 2,671 | $ | 2,671 | 10 | 69 | % | |||||||||||||||
| EURIBOR (Euro) |
1,233 | 1,651 | 1,233 | 1,651 | 13 | 72 | % | |||||||||||||||||
| LIBOR (British Pound Sterling) |
44 | 68 | 44 | 68 | 10 | 69 | % | |||||||||||||||||
| Securities Industry and Financial Markets |
||||||||||||||||||||||||
| Association Municipal Swap Index (U.S. Dollar) |
40 | 40 | 40 | 40 | 12 | N/A | (3) | |||||||||||||||||
| (1) | The Company’s interest rate derivative instruments primarily include accreting and amortizing notionals. The maximum derivative notional represents the largest notional at any point between December 31, 2010 and the maturity of the derivative instrument, which includes forward starting derivative instruments. The weighted average remaining term represents the remaining tenor of our interest rate derivatives weighted by the corresponding maximum notional. |
| (2) | Excludes variable-rate debt tied to other indices where the Company has no interest rate derivatives. |
| (3) | The debt that was being hedged is no longer exposed to variable interest payments because it is now held on IPL’s behalf and no longer bears interest. |
Cross currency swaps are utilized in certain instances to manage the risk related to fluctuations in both interest rates and certain foreign currencies. These cross currency contracts range in maturity through 2028. The following table sets forth, by type of foreign currency denomination, the Company’s outstanding notional of its cross currency derivative instruments as of December 31, 2010 which are all in qualifying cash flow hedge relationships. These swaps are amortizing and therefore the notional amount represents the maximum outstanding notional as of December 31, 2010:
| December 31, 2010 | ||||||||||||||||
| Cross Currency Swaps |
Notional | Notional Translated to USD |
Weighted Average Remaining Term(1) |
% of Debt Currently Hedged by Index(2) |
||||||||||||
| (in millions) | (in years) | |||||||||||||||
| Chilean Unidad de Fomento (CLF) |
6 | $ | 257 | 15 | 83 | % | ||||||||||
| (1) | Represents the remaining tenor of our cross currency swaps weighted by the corresponding notional. |
| (2) | Represents the proportion of foreign currency denominated debt hedged by the same foreign currency denominated notional of the cross currency swap. |
195
Table of Contents
THE AES CORPORATION
NOTES TO CONSOLIDATED FINANCIAL STATEMENTS—(Continued)
DECEMBER 31, 2010, 2009, AND 2008
Foreign Currency Risk
We are exposed to foreign currency risk as a result of our investments in foreign subsidiaries and affiliates. AES operates businesses in many foreign environments and such operations in foreign countries may be impacted by significant fluctuations in foreign currency exchange rates. Foreign currency options and forwards are utilized, where possible, to manage the risk related to fluctuations in certain foreign currencies. These foreign currency contracts range in maturity through 2011. The following tables set forth, by type of foreign currency denomination, the Company’s outstanding notional over the remaining terms of its foreign currency derivative instruments as of December 31, 2010 regardless of whether the derivative instruments are in qualifying hedging relationships:
| December 31, 2010 | ||||||||||||||||
| Foreign Currency Options |
Notional(1) | Notional Translated to USD(1) |
Probability Adjusted Notional(2) |
Weighted Average Remaining Term(3) |
||||||||||||
| (in millions) | (in years) | |||||||||||||||
| Brazilian Real (BRL) |
208 | $ | 120 | $ | 30 | <1 | ||||||||||
| Euro (EUR) |
15 | 21 | 18 | <1 | ||||||||||||
| Philippine Peso (PHP) |
266 | 6 | 1 | <1 | ||||||||||||
| British Pound (GBP) |
3 | 4 | 2 | <1 | ||||||||||||
| (1) | Represents contractual notionals at inception of trade. |
| (2) | Represents the gross notional amounts times the probability of exercising the option, which is based on the relationship of changes in the option value with respect to changes in the price of the underlying currency. |
| (3) | Represents the remaining tenor of our foreign currency options weighted by the corresponding notional. |
| December 31, 2010 | ||||||||||||
| Foreign Currency Forwards |
Notional | Notional Translated to USD |
Weighted Average Remaining Term(1) |
|||||||||
| (in millions) | (in years) | |||||||||||
| Chilean Peso (CLP) |
89,106 | $ | 179 | <1 | ||||||||
| Colombian Peso (COP) |
13,151 | 7 | <1 | |||||||||
| Argentine Peso (ARS) |
57 | 13 | <1 | |||||||||
| (1) | Represents the remaining tenor of our foreign currency forwards weighted by the corresponding notional. |
196
Table of Contents
THE AES CORPORATION
NOTES TO CONSOLIDATED FINANCIAL STATEMENTS—(Continued)
DECEMBER 31, 2010, 2009, AND 2008
In addition, certain of our subsidiaries have entered into contracts which contain embedded derivatives that require separate valuation and accounting due to the fact that the item being purchased or sold is denominated in a currency other than the functional currency of that subsidiary or the currency of the item. These contracts range in maturity through 2025. The following table sets forth, by type of foreign currency denomination, the Company’s outstanding notional over the remaining terms of its foreign currency embedded derivative instruments as of December 31, 2010:
| December 31, 2010 | ||||||||||||
| Embedded Foreign Currency Derivatives |
Notional | Notional Translated to USD |
Weighted Average Remaining Term(1) |
|||||||||
| (in millions) | (in years) | |||||||||||
| Philippine Peso (PHP) |
21,176 | $ | 484 | 3 | ||||||||
| Kazakhstani Tenge (KZT) |
31,084 | 210 | 10 | |||||||||
| Argentine Peso (ARS) |
331 | 83 | 9 | |||||||||
| Euro (EUR) |
28 | 38 | 4 | |||||||||
| Brazilian Real (BRL) |
19 | 11 | 1 | |||||||||
| Cameroon Franc (XAF) |
1,755 | 4 | 2 | |||||||||
| (1) | Represents the remaining tenor of our foreign currency embedded derivatives weighted by the corresponding notional. |
Commodity Price Risk
We are exposed to the impact of market fluctuations in the price of electricity, fuel and environmental credits. Although we primarily consist of businesses with long-term contracts or retail sales concessions (which provide our distribution businesses with a franchise to serve a specific geographic region), a portion of our current and expected future revenues are derived from businesses without significant long-term purchase or sales contracts. These businesses subject our results of operations to the volatility of prices for electricity, fuel and environmental credits in competitive markets. We have used a hedging strategy, where appropriate, to hedge our financial performance against the effects of fluctuations in energy commodity prices. The implementation of this strategy can involve the use of commodity forward contracts, futures, swaps and options. Some of our businesses hedge certain aspects of their commodity risks using financial hedging instruments, as described below.
We also enter into short-term contracts for electricity and fuel in other competitive markets in which we operate. When hedging the output of our generation assets, we have power purchase agreements or other hedging instruments that lock in the spread in dollars per MWh between the cost of fuel to generate a unit of electricity and the price at which the electricity can be sold (“Dark Spread” where the fuel is coal). The portion of our sales and fuel purchases that are not subject to such agreements will be exposed to commodity price risk. Eastern Energy sells electricity into the power pools managed by the New York Independent System Operator (“NYISO”). In addition, Eastern Energy hedges a portion of its power exposure by entering into hedges of natural gas prices, as movements in natural gas prices affect power prices. As of December 31, 2010, Eastern Energy has no net exposure under its hedges of natural gas prices. While there is a strong relationship between natural gas and power prices, the natural gas hedges do not currently qualify for hedge accounting treatment. The following table sets forth the Company’s current notionals under its commodity hedges at Eastern Energy and the percentage of forecasted electricity sales for 2011 hedged as of December 31, 2010 regardless of whether the derivative instruments are in qualifying cash flow hedging relationships:
| 2011 | ||||||||
| Commodity Hedges |
Notional | % of Forecasted Sales Hedged |
||||||
| (in millions) | ||||||||
| NYISO electricity swaps (MWh) |
1 | 10 | % | |||||
197
Table of Contents
THE AES CORPORATION
NOTES TO CONSOLIDATED FINANCIAL STATEMENTS—(Continued)
DECEMBER 31, 2010, 2009, AND 2008
The PPAs and fuel supply agreements entered into by the Company are evaluated to determine if they meet the definition of a derivative or contain embedded derivatives, either of which require separate valuation and accounting. To be a derivative under the accounting standards for derivatives and hedging, an agreement would need to have a notional and an underlying, require little or no initial net investment and could be net settled. Generally, these agreements do not meet the definition of a derivative, often due to the inability to be net settled. On a quarterly basis, we evaluate the markets for the commodities to be delivered under these agreements to determine if facts and circumstances have changed such that the agreements could then be net settled and meet the definition of a derivative.
Nonetheless, certain of the PPAs and fuel supply agreements entered into by certain of the Company’s subsidiaries are derivatives or contain embedded derivatives requiring separate valuation and accounting. These agreements range in maturity through 2024. The following table sets forth by type of commodity the Company’s outstanding notionals for the remaining term of its commodity derivative (excluding Eastern Energy which is presented in the above table) and embedded derivative instruments as of December 31, 2010:
| December 31, 2010 | ||||||||
| Commodity Derivatives |
Notional | Weighted Average Remaining Term(1) |
||||||
| (in millions) | (in years) | |||||||
| Natural gas (MMBtu) |
34 | 12 | ||||||
| Petcoke (Metric tons) |
14 | 14 | ||||||
| Aluminum (MWh) |
17 | (3) | 9 | |||||
| Certified Emission Reductions (CER) |
1 | 2 | ||||||
| Log wood (Tons) |
— | (2) | 2 | |||||
| Financial transmission rights (MW) |
— | (2) | <1 | |||||
| (1) | Represents the remaining tenor of our commodity and embedded derivatives weighted by the corresponding volume. |
| (2) | De minimis amount. |
| (3) | Our exposure is to fluctuations in the price of aluminum while the notional is based on the amount of power we sell under the PPA. |
In addition, as part of the settlement agreements terminating the gas transportation contracts with Gasoducto GasAndes (Argentina) S.A. and Gasoducto GasAndes (Chile) S.A. discussed in Note 12—Contingencies, we have an embedded derivative related to the dividends that could result from our 13% ownership in these two gas transportation companies.
198
Table of Contents
THE AES CORPORATION
NOTES TO CONSOLIDATED FINANCIAL STATEMENTS—(Continued)
DECEMBER 31, 2010, 2009, AND 2008
Accounting and Reporting
The following table sets forth the Company’s derivative instruments as of December 31, 2010 and 2009 by type of derivative and by level within the fair value hierarchy. Derivative assets and liabilities are recognized at their fair value. Derivative assets and liabilities are combined with other balances and included in the following captions in our Consolidated Balance Sheets: current derivative assets in other current assets, noncurrent derivative assets in other noncurrent assets, current derivative liabilities in accrued and other liabilities and long-term derivative liabilities in other long-term liabilities.
| December 31, 2010 | December 31, 2009 | |||||||||||||||||||||||||||||||
| Level 1 | Level 2 | Level 3 | Total | Level 1 | Level 2 | Level 3 | Total | |||||||||||||||||||||||||
| (in millions) | (in millions) | |||||||||||||||||||||||||||||||
| Assets |
||||||||||||||||||||||||||||||||
| Current assets: |
||||||||||||||||||||||||||||||||
| Foreign currency derivatives |
$ | — | $ | 4 | (1) | $ | 3 | $ | 7 | $ | — | $ | 6 | $ | — | $ | 6 | |||||||||||||||
| Commodity and other derivatives: |
||||||||||||||||||||||||||||||||
| Electricity |
— | — | — | — | — | 22 | — | 22 | ||||||||||||||||||||||||
| Natural gas |
— | 1 | — | 1 | — | — | 11 | 11 | ||||||||||||||||||||||||
| Other |
— | 2 | 3 | 5 | — | — | 17 | 17 | ||||||||||||||||||||||||
| Total current assets |
— | 7 | 6 | 13 | — | 28 | 28 | 56 | ||||||||||||||||||||||||
| Noncurrent assets: |
||||||||||||||||||||||||||||||||
| Interest rate derivatives |
— | 49 | — | 49 | — | 83 | 2 | 85 | ||||||||||||||||||||||||
| Foreign currency derivatives |
— | 4 | (1) | 27 | 31 | — | — | — | — | |||||||||||||||||||||||
| Cross currency derivatives |
— | — | 12 | 12 | — | — | — | — | ||||||||||||||||||||||||
| Commodity and other derivatives |
— | 4 | 16 | 20 | — | — | — | — | ||||||||||||||||||||||||
| Total noncurrent assets |
— | 57 | 55 | 112 | — | 83 | 2 | 85 | ||||||||||||||||||||||||
| Total assets |
$ | — | $ | 64 | $ | 61 | $ | 125 | $ | — | $ | 111 | $ | 30 | $ | 141 | ||||||||||||||||
| Liabilities |
||||||||||||||||||||||||||||||||
| Current liabilities: |
||||||||||||||||||||||||||||||||
| Interest rate derivatives |
$ | — | $ | 137 | (1) | $ | — | $ | 137 | $ | — | $ | 118 | $ | 7 | $ | 125 | |||||||||||||||
| Cross currency derivatives |
— | — | 2 | 2 | — | — | — | — | ||||||||||||||||||||||||
| Foreign currency derivatives |
— | 13 | — | 13 | — | 3 | — | 3 | ||||||||||||||||||||||||
| Commodity and other derivatives: |
||||||||||||||||||||||||||||||||
| Electricity |
— | 1 | — | 1 | — | 2 | — | 2 | ||||||||||||||||||||||||
| Natural gas |
— | — | — | — | — | 5 | — | 5 | ||||||||||||||||||||||||
| Other |
— | — | — | — | — | — | 2 | 2 | ||||||||||||||||||||||||
| Total current liabilities |
— | 151 | 2 | 153 | — | 128 | 9 | 137 | ||||||||||||||||||||||||
| Long-term liabilities: |
||||||||||||||||||||||||||||||||
| Interest rate derivatives |
— | 246 | (1) | 1 | 247 | — | 150 | 7 | 157 | |||||||||||||||||||||||
| Cross currency derivatives |
— | — | — | — | — | — | 12 | 12 | ||||||||||||||||||||||||
| Foreign currency derivatives |
— | 15 | 8 | 23 | — | 2 | — | 2 | ||||||||||||||||||||||||
| Commodity and other derivatives: |
||||||||||||||||||||||||||||||||
| Natural gas |
— | — | — | — | — | — | 2 | 2 | ||||||||||||||||||||||||
| Other |
— | — | 1 | 1 | — | — | — | — | ||||||||||||||||||||||||
| Total long-term liabilities |
— | 261 | 10 | 271 | — | 152 | 21 | 173 | ||||||||||||||||||||||||
| Total liabilities |
$ | — | $ | 412 | $ | 12 | $ | 424 | $ | — | $ | 280 | $ | 30 | $ | 310 | ||||||||||||||||
199
Table of Contents
THE AES CORPORATION
NOTES TO CONSOLIDATED FINANCIAL STATEMENTS—(Continued)
DECEMBER 31, 2010, 2009, AND 2008
| (1) | Includes the impact of consolidating Cartagena beginning January 1, 2010 under VIE accounting guidance as follows: $1 million of current assets and $4 million of noncurrent assets on foreign currency derivatives and $19 million of current liabilities and $46 million of long-term liabilities for interest rate derivatives as of December 31, 2010. |
The following table sets forth the fair value and balance sheet classification of derivative instruments as of December 31, 2010 and 2009:
| December 31, 2010 | December 31, 2009 | |||||||||||||||||||||||
| Designated as Hedging Instruments |
Not Designated as Hedging Instruments |
Total | Designated as Hedging Instruments |
Not Designated as Hedging Instruments |
Total | |||||||||||||||||||
| (in millions) | (in millions) | |||||||||||||||||||||||
| Assets |
||||||||||||||||||||||||
| Other current assets: |
||||||||||||||||||||||||
| Foreign currency derivatives |
$ | — | $ | 7 | (1) | $ | 7 | $ | — | $ | 6 | $ | 6 | |||||||||||
| Commodity & other derivatives: |
||||||||||||||||||||||||
| Electricity |
— | — | — | 22 | — | 22 | ||||||||||||||||||
| Natural gas |
— | 1 | 1 | — | 11 | 11 | ||||||||||||||||||
| Other |
— | 5 | 5 | — | 17 | 17 | ||||||||||||||||||
| Total other current assets |
— | 13 | 13 | 22 | 34 | 56 | ||||||||||||||||||
| Other assets: |
||||||||||||||||||||||||
| Interest rate derivatives |
49 | — | 49 | 85 | — | 85 | ||||||||||||||||||
| Foreign currency derivatives |
— | 31 | (1) | 31 | — | — | — | |||||||||||||||||
| Cross currency derivatives |
12 | — | 12 | — | — | — | ||||||||||||||||||
| Commodity & other derivatives: |
— | 20 | 20 | — | — | — | ||||||||||||||||||
| Total other assets—noncurrent |
61 | 51 | 112 | 85 | — | 85 | ||||||||||||||||||
| Total assets |
$ | 61 | $ | 64 | $ | 125 | $ | 107 | $ | 34 | $ | 141 | ||||||||||||
| Liabilities |
||||||||||||||||||||||||
| Accrued and other liabilities: |
||||||||||||||||||||||||
| Interest rate derivatives |
$ | 126 | (1) | $ | 11 | $ | 137 | $ | 115 | $ | 10 | $ | 125 | |||||||||||
| Cross currency derivatives |
2 | — | 2 | — | — | — | ||||||||||||||||||
| Foreign currency derivatives |
8 | 5 | 13 | 2 | 1 | 3 | ||||||||||||||||||
| Commodity & other derivatives: |
||||||||||||||||||||||||
| Electricity |
1 | — | 1 | 2 | — | 2 | ||||||||||||||||||
| Natural gas |
— | — | — | — | 5 | 5 | ||||||||||||||||||
| Other |
— | — | — | — | 2 | 2 | ||||||||||||||||||
| Total accrued and other liabilities |
137 | 16 | 153 | 119 | 18 | 137 | ||||||||||||||||||
| Other long-term liabilities: |
||||||||||||||||||||||||
| Interest rate derivatives |
232 | (1) | 15 | 247 | 141 | 16 | 157 | |||||||||||||||||
| Cross currency derivatives |
— | — | — | 12 | — | 12 | ||||||||||||||||||
| Foreign currency derivatives |
— | 23 | 23 | — | 2 | 2 | ||||||||||||||||||
| Commodity & other derivatives: |
||||||||||||||||||||||||
| Natural gas |
— | — | — | — | 2 | 2 | ||||||||||||||||||
| Other |
— | 1 | 1 | — | — | — | ||||||||||||||||||
| Total other long-term liabilities |
232 | 39 | 271 | 153 | 20 | 173 | ||||||||||||||||||
| Total liabilities |
$ | 369 | $ | 55 | $ | 424 | $ | 272 | $ | 38 | $ | 310 | ||||||||||||
200
Table of Contents
THE AES CORPORATION
NOTES TO CONSOLIDATED FINANCIAL STATEMENTS—(Continued)
DECEMBER 31, 2010, 2009, AND 2008
| (1) | Includes the impact of consolidating Cartagena beginning January 1, 2010 under VIE accounting guidance as follows: $1 million of current assets and $4 million of noncurrent assets on foreign currency derivatives and $19 million of current liabilities and $46 million of long-term liabilities for interest rate derivatives as of December 31, 2010. |
The Company has elected not to offset net derivative positions in the financial statements. Accordingly, the Company does not offset such derivative positions against the fair value of amounts (or amounts that approximate fair value) recognized for the right to reclaim cash collateral (a receivable) or the obligation to return cash collateral (a payable) under master netting arrangements. At December 31, 2010 and 2009, we held $0 and $8 million, respectively, of cash collateral that we received from counterparties to our derivative positions, which is recorded in restricted cash and in accrued and other liabilities in the Consolidated Balance Sheets. Beyond the cash collateral we received, our derivative assets are exposed to the credit risk of the respective counterparty and, due to this credit risk, the fair value of our derivative assets (as shown in the above two tables) have been reduced by a credit valuation adjustment. Also, at December 31, 2010 and 2009, we had no cash collateral posted with (held by) counterparties to our derivative positions.
The table below sets forth the pre-tax accumulated other comprehensive income (loss) expected to be recognized as an increase (decrease) to income from continuing operations before income taxes over the next twelve months as of December 31, 2010 for the following types of derivative instruments:
| Accumulated Other Comprehensive Income (Loss) |
||||
| (in millions) | ||||
| Interest rate derivatives |
$ | (88 | ) | |
| Cross currency derivatives |
$ | (4 | ) | |
| Foreign currency derivatives |
$ | (9 | ) | |
| Commodity derivatives |
$ | (1 | ) | |
The balance in accumulated other comprehensive loss related to derivative transactions will be reclassified into earnings as interest expense is recognized for interest rate hedges and cross currency swaps, as depreciation is recognized for interest rate hedges during construction, as foreign currency transaction gains and losses are recognized for hedges of foreign currency exposure, and as electricity sales and fuel purchases are recognized for hedges of forecasted electricity and fuel transactions. These balances are included in the consolidated statements of cash flows as operating and/or investing activities based on the nature of the underlying transaction.
For the years ended December 31, 2010, 2009 and 2008, pre-tax gains (losses) of $(1) million, $7 million, and $(1) million net of noncontrolling interests, respectively, were reclassified into earnings as a result of the discontinuance of a cash flow hedge because it was probable that the forecasted transaction would not occur by the end of the originally specified time period (as documented at the inception of the hedging relationship) or within an additional two-month time period thereafter.
201
Table of Contents
THE AES CORPORATION
NOTES TO CONSOLIDATED FINANCIAL STATEMENTS—(Continued)
DECEMBER 31, 2010, 2009, AND 2008
The following table sets forth the pre-tax gains (losses) recognized in accumulated other comprehensive loss (“AOCL”) and earnings related to the effective portion of derivative instruments in qualifying cash flow hedging relationships, as defined in the accounting standards for derivatives and hedging, for the years ended December 31, 2010 and 2009:
| Gains
(Losses) Recognized in AOCL |
Gains
(Losses) Reclassified from AOCL into Earnings |
|||||||||||||||||
| 2010 | 2009 | Statement of Operations |
2010 | 2009 | ||||||||||||||
| (in millions) | (in millions) | |||||||||||||||||
| Interest rate derivatives |
$ | (243 | )(3) | $ | 49 | Interest expense |
$ | (108 | )(1) | $ | (72 | )(1) | ||||||
| Non-regulated cost of sales |
(2 | ) | — | |||||||||||||||
| Net equity in earnings of affiliates |
(1 | ) | — | (2) | ||||||||||||||
| Cross currency derivatives |
11 | 48 | Interest expense |
(1 | ) | 2 | ||||||||||||
| Foreign currency transaction gains (losses) |
— | 43 | ||||||||||||||||
| Foreign currency derivatives |
(9 | ) | 2 | Foreign currency transaction gains (losses) |
(3 | ) | — | (2) | ||||||||||
| Commodity derivatives—electricity |
(8 | ) | 120 | Non-regulated revenue |
11 | 193 | ||||||||||||
| Total |
$ | (249 | ) | $ | 219 | $ | (104 | ) | $ | 166 | ||||||||
| (1) | Includes amounts that were reclassified from AOCL related to derivative instruments that previously, but no longer, qualify for cash flow hedge accounting. Excludes $(113) million and $(35) million related to discontinued operations for the years ended December 31, 2010 and 2009, respectively. |
| (2) | De minimis amount. |
| (3) | Includes $(29) million related to Cartagena for the year ended December 31, 2010, which was consolidated prospectively beginning January 1, 2010 under VIE accounting guidance. |
Amounts recognized in AOCL due to derivative instruments that currently are, or previously were (but no longer are) qualifying cash flow hedging relationships, as defined in the accounting standards for derivatives and hedging, after income taxes, during the year ended December 31, 2008 are as follows:
| Balance, January 1 |
Reclassification to earnings |
Change in fair value |
Balance, December 31 |
|||||||||||||
| (in millions) | ||||||||||||||||
| 2008 |
$ | (232 | ) | $ | 76 | $ | (107 | ) | $ | (263 | ) | |||||
202
Table of Contents
THE AES CORPORATION
NOTES TO CONSOLIDATED FINANCIAL STATEMENTS—(Continued)
DECEMBER 31, 2010, 2009, AND 2008
The following table sets forth the pre-tax gains (losses) recognized in earnings related to the ineffective portion of derivative instruments in qualifying cash flow hedging relationships, as defined in the accounting standards for derivatives and hedging, for the years ended December 31, 2010 and 2009:
| Classification in Consolidated Statement of Operations |
Gains (Losses) Recognized in Earnings |
|||||||||
| 2010 | 2009 | |||||||||
| (in millions) | ||||||||||
| Interest rate derivatives |
Interest expense |
$ | (15 | ) | $ | (8 | ) | |||
| Net equity in earnings of affiliates |
— | (1) | (1 | ) | ||||||
| Cross currency derivatives |
Interest expense |
5 | (11 | ) | ||||||
| Foreign currency derivatives |
Foreign currency transaction gains (losses) |
— | (1) | — | (1) | |||||
| Commodity derivatives—electricity |
Non-regulated revenue |
— | (2 | ) | ||||||
| Total |
$ | (10 | ) | $ | (22 | ) | ||||
| (1) | De minimis amount. |
The Company recognized after-tax losses of $45 million, net of noncontrolling interests, related to the ineffective portion of derivative instruments in qualifying cash flow hedging relationships, as defined in the accounting standards for derivatives and hedging, for the year ended December 31, 2008.
The following table sets forth the pre-tax gains (losses) recognized in earnings related to derivative instruments not designated as hedging instruments under the accounting standards for derivatives and hedging, for the years ended December 31, 2010 and 2009:
| Classification in Consolidated Statement of Operations |
Gains (Losses) Recognized in Earnings |
|||||||||
| 2010 | 2009 | |||||||||
| (in millions) | ||||||||||
| Interest rate derivatives |
Interest expense |
$ | (7 | ) | $ | (25 | ) | |||
| Foreign exchange derivatives |
Foreign currency transaction gains (losses) |
(36 | ) | (38 | ) | |||||
| Net equity in earnings of affiliates |
(2 | ) | — | (1) | ||||||
| Commodity derivatives—natural gas |
Non-regulated revenue |
47 | (6 | ) | ||||||
| Non-regulated cost of sales |
3 | (8 | ) | |||||||
| Commodity & other derivatives |
Non-regulated revenue |
21 | 1 | |||||||
| Non-regulated cost of sales |
2 | (24 | ) | |||||||
| Other income |
— | 8 | ||||||||
| Net equity in earnings of affiliates |
— | (1) | — | (1) | ||||||
| Total |
$ | 28 | $ | (92 | ) | |||||
| (1) | De minimis amount. |
The Company recognized after-tax gains of $10 million net of noncontrolling interests related to the changes in fair value of derivative instruments not in qualifying cash flow hedging relationships, as defined in the accounting standards for derivatives and hedging, for the year ended December 31, 2008.
203
Table of Contents
THE AES CORPORATION
NOTES TO CONSOLIDATED FINANCIAL STATEMENTS—(Continued)
DECEMBER 31, 2010, 2009, AND 2008
In addition, IPL has two derivative instruments for which the gains and losses are accounted for in accordance with accounting standards for regulated operations, as regulatory assets or liabilities. Gains and losses on these derivatives due to changes in the fair value of these derivatives are probable of recovery through future rates and are initially recognized as an adjustment to the regulatory asset or liability and recognized through earnings when the related costs are recovered through IPL’s rates. Therefore, these gains and losses are excluded from the above table. The following table sets forth the change in regulatory assets and liabilities resulting from the change in the fair value of these derivatives for the years ended December 31, 2010 and 2009:
| 2010 | 2009 | |||||||
| (in millions) | ||||||||
| (Increase) decrease in regulatory assets |
$ | (3 | ) | $ | — | |||
| Increase (decrease) in regulatory liabilities |
$ | 1 | $ | (4 | ) | |||
Credit Risk-Related Contingent Features
The following businesses have derivative agreements that contain credit contingent provisions which would permit the counterparties with which we are in a net liability position to require collateral credit support when the fair value of the derivatives exceeds the unsecured thresholds established in the agreements. These thresholds vary based on our subsidiaries’ credit ratings and as their credit ratings are lowered, the thresholds decrease, requiring more collateral support.
Eastern Energy, our generation business in New York, enters into commodity derivative transactions with several counterparties who have market exposure limits defined in their transaction agreements. Pursuant to the aforementioned credit contingent provisions, if Eastern Energy’s credit rating were to fall below the minimum thresholds established in each of the respective transaction agreements, the counterparties could demand immediate collateralization of the entire mark-to-market value of the derivatives (excluding credit valuation adjustments) if the derivatives were in a net liability position. As of December 31, 2010, Eastern Energy has $1 million in net liability positions but had posted no collateral. As of December 31, 2009, Eastern Energy had net liability positions of $2 million and had posted a nominal amount of collateral to support these positions based on its current credit rating and the related thresholds in the agreements.
Gener, our generation business in Chile, has a cross currency swap agreement with a counterparty to swap Chilean inflation indexed bonds issued in December 2007 into U.S. Dollars. Pursuant to the aforementioned credit contingent provisions, if Gener’s credit rating were to fall below the minimum threshold established in the swap agreements, the counterparty can demand immediate collateralization of the entire mark-to-market value of the swaps (excluding credit valuation adjustments) if Gener is in a net liability position, which was zero and $12 million, respectively, at December 31, 2010 and 2009. As of December 31, 2010 and 2009, Gener had posted zero and $25 million, respectively, in the form of a letter of credit to support these swaps.
204
Table of Contents
THE AES CORPORATION
NOTES TO CONSOLIDATED FINANCIAL STATEMENTS—(Continued)
DECEMBER 31, 2010, 2009, AND 2008
7. INVESTMENTS IN AND ADVANCES TO AFFILIATES
The following table summarizes the relevant effective equity ownership interest and carrying values for the Company’s investments accounted for under the equity method as of December 31, 2010 and 2009.
| December 31, | ||||||||||||||||||
| Affiliate |
Country |
2010 | 2009 | 2010 | 2009 | |||||||||||||
| Carrying Value | Ownership Interest % | |||||||||||||||||
| (in millions) | ||||||||||||||||||
| AES Solar Energy Ltd. |
United States |
$ | 256 | $ | 224 | 50 | % | 50 | % | |||||||||
| AES Solar Power Ltd. |
United States |
8 | — | 50 | % | — | % | |||||||||||
|
Barry(1) |
United Kingdom |
— | — | 100 | % | 100 | % | |||||||||||
| Cartagena |
Spain |
N/A | — | N/A | 71 | % | ||||||||||||
|
CEMIG(2) |
Brazil |
22 | — | 72 | % | 10 | % | |||||||||||
| Chigen affiliates |
China |
146 | 182 | 25 | % | 27 | % | |||||||||||
| China Wind |
China |
69 | 52 | 49 | % | 49 | % | |||||||||||
| Elsta |
Netherlands |
202 | 204 | 50 | % | 50 | % | |||||||||||
| Guacolda |
Chile |
149 | 131 | 35 | % | 35 | % | |||||||||||
| IC Ictas Energy Group |
Turkey |
151 | 104 | 51 | % | 51 | % | |||||||||||
| InnoVent(1) |
France |
31 | 30 | 40 | % | 40 | % | |||||||||||
| JHRH |
China |
39 | — | 35 | % | — | % | |||||||||||
| OPGC |
India |
224 | 208 | 49 | % | 49 | % | |||||||||||
| Trinidad Generation Unlimited(1) |
Trinidad |
20 | 16 | 10 | % | 10 | % | |||||||||||
| Other affiliates |
3 | 6 | — | % | — | % | ||||||||||||
| Total investments in and advances to affiliates |
$ | 1,320 | $ | 1,157 | ||||||||||||||
| (1) | Represent VIEs in which we hold a variable interest, but are not the primary beneficiary. |
| (2) | The Company sold its interest in CEMIG during the year ended December 31, 2010; and retains its equity ownership in Cayman Energy Traders (“CET”). See additional discussion of the sale below. |
AES Solar Energy Ltd.—In March 2008, the Company formed AES Solar Energy Ltd (“AES Solar”), a joint venture with Riverstone Holdings LLC (“Riverstone”). AES Solar develops land-based solar photovoltaic panels that capture sunlight to convert into electricity that feed directly into power grids. AES Solar is accounted for under the equity method of accounting based on the Company’s 50% ownership and significant influence, but not control over the joint venture. Under the terms of the agreement, the Company and Riverstone may each provide up to $500 million of capital over the next five years. As of December 31, 2010, AES had invested approximately $312 million in the joint venture.
AES Solar Power Ltd.—In March 2010, the Company formed AES Solar Power Ltd. (“AES Solar Power”), a joint venture with Riverstone. AES Solar Power develops solar photovoltaic projects in the United States. AES Solar Power is accounted for under the equity method of accounting based on the Company’s 50% ownership and significant influence, but not control over the joint venture. Under the terms of the agreement, the Company and Riverstone may each provide up to $100 million of capital over the next five years. As of December 31, 2010, AES had invested approximately $11 million in the joint venture.
AES Barry Ltd.—The Company holds a 100% ownership interest in AES Barry Ltd. (“Barry”), a dormant entity in the United Kingdom that disposed of its generation and other operating assets. As a result of a debt agreement, no material financial or operating decisions can be made without the banks’ consent, and the Company does not control Barry. As of December 31, 2010 and 2009, other long-term liabilities included $53 million and $54 million, respectively, related to this debt agreement.
205
Table of Contents
THE AES CORPORATION
NOTES TO CONSOLIDATED FINANCIAL STATEMENTS—(Continued)
DECEMBER 31, 2010, 2009, AND 2008
Cartagena Energia—The Company owns 71% of Cartagena Energia (“Cartagena”), a 1,199 MW power plant in Cartagena, Spain completed in November 2007. The Company’s initial investment in Cartagena was approximately $29 million. As a result of the accounting guidance issued in 2009 regarding VIEs, the Company consolidated Cartagena effective January 1, 2010. Cartagena is no longer accounted for under the equity method of accounting. For further discussion, see Note 1—General and Summary of Significant Accounting Policies.
CEMIG—During the second quarter of 2010, the Company, through its Brazilian subsidiary, Southern Electric Brasil Participações Ltda. (“SEB”), transferred its shares of Companhia Energética de Minas Gerais (“CEMIG”), an integrated utility in Minas Gerais, Brazil, to Andrade Gutierrez Concessões S.A. and an affiliated company (jointly referred to as, “AG”). AG also assumed SEB’s debt with Banco Nacional de Desenvolvimento Econômico e Social (“BNDES”) in the amount of approximately $1.4 billion (the “BNDES Loan”) including all unpaid interest and penalties. In exchange, SEB received $25 million and obtained a full release from any claims of BNDES and originating from the BNDES Loan. See Note 12—Contingencies, for additional information regarding these claims and proceedings.
Prior to the transfer of shares, the Company, through SEB, a VIE, had a 14.8% voting interest in CEMIG. The Company holds its interest in SEB through its equity ownership in Cayman Energy Traders (“CET”), a holding company whose sole activity is its investment in SEB. Although our interest in CEMIG was below 20%, AES had significant influence over the operational and financial policies of CEMIG through representation on the board of directors of CEMIG. In 2002, the Company determined there was an other-than-temporary impairment of its investment in CEMIG and wrote it down to fair market value, $155 million. Additionally, AES established a valuation allowance against a deferred tax asset related to its investment in CEMIG. The total amount of these charges, net of tax, was $587 million. As a result, the Company’s investment in CEMIG was a $484 million net liability at December 31, 2009 and was included in “Other long-term liabilities” on the Consolidated Balance Sheet. The Company discontinued the application of the equity method in accordance with its accounting policy regarding equity method investments.
The consummation of the share purchase and sale agreement along with AG’s assumption of the BNDES Loan in June 2010 resulted in the reversal of the Company’s net long-term liability along with the associated cumulative translation adjustment, resulting in the recognition of a $115 million pre-tax gain reflected in “Net equity in earnings of affiliates” on the Consolidated Statement of Operations for the year ended December 31, 2010. Additionally, $70 million of net tax expense resulting from the CEMIG sale transaction was recorded as “income tax expense,” rather than equity earnings, since the expense is attributable to a consolidated corporate level partner in the CEMIG investment.
The Company retains its ownership in CET.
China Wind—In May 2007, the Company entered into a joint venture with Guohua Energy Investment Co. Ltd. (“Guohua”) for a 49% interest in Guohua AES (Huanghua) Wind Power Co., Ltd. (“AES Huanghua”) that is primarily engaged to develop, construct, own and operate wind projects in Huanghua. Huanghua I went live in the third quarter of 2009 and Huanghua II went live in April 2010. In the second and third quarters of 2008, the Company acquired a 49% interest in Guohua AES (“Hulunbeier”) Wind Power Co., Ltd. and entered into joint venture agreements with Guohua for 49% interest in Guohua AES (“Xinba’erhu”) Wind Power Co., Ltd. (“Dong Qi”) which went live in June 2010 and Guohua AES (“Chenba’erhu”) Wind Power Co., Ltd. (“Chen Qi”) which is expected to go live in 2011. The Company invested approximately $12 million in the aforementioned projects in 2010, bringing the cumulative investment to $62 million.
206
Table of Contents
THE AES CORPORATION
NOTES TO CONSOLIDATED FINANCIAL STATEMENTS—(Continued)
DECEMBER 31, 2010, 2009, AND 2008
Jianghe Rural Electrification Development Co., LTD (“JHRH”)— On June 3, 2010, the Company entered into an agreement to acquire a 35% ownership in this joint venture which operates seven hydro plants in China. The agreement entitled the Company to acquire up to a 49% interest. The purchase of an additional 14% ownership is expected to be completed by May 2011.
Trinidad Generation Unlimited—In 2007, the Company began pursuing a development project to construct and operate a 720 MW combined cycle power plant in Trinidad through its wholly owned subsidiary, Trinidad Generation Unlimited (“TGU”). In July 2008, a shareholder agreement was executed establishing the Company’s ownership interest in TGU at 60% with the remaining 40% interest held by the Government of Trinidad and Tobago. Although the Company’s ownership in TGU was reduced to 10% in 2009, the Company continues to account for its investment in Trinidad as an equity method investment because AES continues to exercise significant influence through the supermajority vote requirement for any significant future project development activities.
Summarized Financial Information
The following tables summarize financial information of the Company’s 50%-or-less owned affiliates and majority-owned unconsolidated subsidiaries that are accounted for using the equity method.
| 50%-or-less Owned Affiliates | Majority-Owned Unconsolidated Subsidiaries |
|||||||||||||||||||||||
| Years ended December 31, |
2010 | 2009 | 2008 | 2010 | 2009 | 2008 | ||||||||||||||||||
| (in millions) | (in millions) | |||||||||||||||||||||||
| Revenue |
$ | 1,341 | $ | 1,229 | $ | 1,180 | $ | 20 | $ | 158 | $ | 170 | ||||||||||||
| Gross margin |
207 | 240 | 274 | 18 | 71 | 61 | ||||||||||||||||||
| Net income (loss) |
100 | 110 | 83 | 7 | (5 | ) | (4 | ) | ||||||||||||||||
| December 31, |
2010 | 2009 | 2010 | 2009 | ||||||||||||||||||||
| (in millions) | (in millions) | |||||||||||||||||||||||
| Current assets |
$ | 948 | $ | 882 | $ | 114 | $ | 142 | ||||||||||||||||
| Noncurrent assets |
4,131 | 3,543 | 646 | 1,140 | ||||||||||||||||||||
| Current liabilities |
687 | 528 | 144 | 153 | ||||||||||||||||||||
| Noncurrent liabilities |
1,597 | 1,406 | 242 | 1,055 | ||||||||||||||||||||
| Noncontrolling interests |
(206 | ) | (191 | ) | 125 | (24 | ) | |||||||||||||||||
| Stockholders’ equity |
3,001 | 2,682 | 249 | 98 | ||||||||||||||||||||
At December 31, 2010, retained earnings included $168 million related to the undistributed earnings of the Company’s 50%-or-less owned affiliates. Distributions received from these affiliates were $49 million, $35 million and $50 million for the years ended December 31, 2010, 2009 and 2008, respectively.
Refer to Item 1 of this Form 10-K for additional information on these affiliates.
207
Table of Contents
THE AES CORPORATION
NOTES TO CONSOLIDATED FINANCIAL STATEMENTS—(Continued)
DECEMBER 31, 2010, 2009, AND 2008
8. GOODWILL AND OTHER INTANGIBLE ASSETS
The following table summarizes the changes in the carrying amount of goodwill, by segment for the years ended December 31, 2010, 2009 and 2008. There was no goodwill associated with our North America—Utilities segment during the years ended December 31, 2010, 2009 and 2008.
| Latin America - Generation |
Latin America - Utilities |
North America - Generation |
Europe - Generation |
Asia - Generation |
Corporate and Other |
Total | ||||||||||||||||||||||
| Balance as of December 31, 2008 |
||||||||||||||||||||||||||||
| Goodwill |
$ | 926 | $ | 140 | $ | 121 | $ | 127 | $ | 78 | $ | 101 | $ | 1,493 | ||||||||||||||
| Accumulated impairment losses |
(24 | ) | (7 | ) | (20 | ) | (19 | ) | — | (2 | ) | (72 | ) | |||||||||||||||
| Net balance |
902 | 133 | 101 | 108 | 78 | 99 | 1,421 | |||||||||||||||||||||
| Impairment losses |
— | — | — | (118 | ) | — | (4 | ) | (122 | ) | ||||||||||||||||||
| Goodwill associated with the sale of a business |
— | — | — | — | (2 | ) | — | (2 | ) | |||||||||||||||||||
| Foreign currency translation and other |
— | — | (10 | ) | 10 | 2 | — | 2 | ||||||||||||||||||||
| Balance as of December 31, 2009 |
||||||||||||||||||||||||||||
| Goodwill |
926 | 140 | 111 | 137 | 78 | 101 | 1,493 | |||||||||||||||||||||
| Accumulated impairment losses |
(24 | ) | (7 | ) | (20 | ) | (137 | ) | — | (6 | ) | (194 | ) | |||||||||||||||
| Net balance |
902 | 133 | 91 | — | 78 | 95 | 1,299 | |||||||||||||||||||||
| Impairment losses |
— | — | (18 | ) | — | — | (3 | ) | (21 | ) | ||||||||||||||||||
| Foreign currency translation and other |
— | — | (10 | ) | — | 3 | — | (7 | ) | |||||||||||||||||||
| Balance as of December 31, 2010 |
||||||||||||||||||||||||||||
| Goodwill |
926 | 140 | 101 | 137 | 81 | 101 | 1,486 | |||||||||||||||||||||
| Accumulated impairment losses |
(24 | ) | (7 | ) | (38 | ) | (137 | ) | — | (9 | ) | (215 | ) | |||||||||||||||
| Net balance |
$ | 902 | $ | 133 | $ | 63 | $ | — | $ | 81 | $ | 92 | $ | 1,271 | ||||||||||||||
During the third quarter of 2010, Deepwater, our petcoke-fired merchant generation facility in Texas, reported in the North America Generation segment, incurred a goodwill impairment of $18 million. The Company determined that there was an impairment indicator for Deepwater’s goodwill. This determination was based primarily on the fact that Deepwater did not operate for more than 30 days in the third quarter of 2010, incurred current operating and cash flow losses and, at that time, was forecasting operating and cash flow losses for the remainder of 2010 through 2014. This resulted from a decrease in future power price expectations and an increase in pet coke prices affecting the market. The Company performed the two-step goodwill impairment test of Deepwater’s goodwill as of August 31, 2010 and recognized the entire $18 million carrying amount of goodwill as goodwill impairment.
208
Table of Contents
THE AES CORPORATION
NOTES TO CONSOLIDATED FINANCIAL STATEMENTS—(Continued)
DECEMBER 31, 2010, 2009, AND 2008
In 2009, Kilroot, our subsidiary in the United Kingdom, reported in the Europe Generation segment, incurred a goodwill impairment loss of $118 million. Kilroot is a generation plant fired primarily by coal. Factors contributing to the impairment included: reduced profit expectations based on latest estimates of future commodity prices and reduced expectations on the recovery of cash flows on the existing plant following the Company’s decision to forgo capital expenditures to meet emission allowance requirements taking effect in 2024. Additionally, one of our subsidiaries located in the Ukraine and reported within “Corporate and Other” incurred a goodwill impairment loss of $4 million. For the year ended December 31, 2008, the Company had no goodwill impairment.
The following tables summarize the balances comprising other intangible assets in the accompanying Consolidated Balance Sheets as of December 31, 2010 and 2009:
| December 31, 2010 | December 31, 2009 | |||||||||||||||||||||||
| Gross Balance |
Accumulated Amortization |
Net Balance |
Gross Balance |
Accumulated Amortization |
Net Balance |
|||||||||||||||||||
| (in millions) | (in millions) | |||||||||||||||||||||||
| Subject to Amortization |
||||||||||||||||||||||||
| Project development rights(1) |
$ | 141 | $ | — | $ | 141 | $ | — | $ | — | $ | — | ||||||||||||
| Sales concessions |
162 | (88 | ) | 74 | 167 | (84 | ) | 83 | ||||||||||||||||
| Contractual payment rights(2) |
65 | (4 | ) | 61 | — | — | — | |||||||||||||||||
| Land use rights |
50 | (2 | ) | 48 | 48 | (1 | ) | 47 | ||||||||||||||||
| Management rights |
66 | (30 | ) | 36 | 64 | (27 | ) | 37 | ||||||||||||||||
| Emission allowances(3) |
26 | — | 26 | 18 | — | 18 | ||||||||||||||||||
| Inseparable intangible assets(4) |
8 | (4 | ) | 4 | 253 | (83 | ) | 170 | ||||||||||||||||
|
Other(5) |
94 | (32 | ) | 62 | 118 | (28 | ) | 90 | ||||||||||||||||
| Subtotal |
612 | (160 | ) | 452 | 668 | (223 | ) | 445 | ||||||||||||||||
| Indefinite-Lived Intangible Assets |
||||||||||||||||||||||||
| Land use rights |
51 | — | 51 | 50 | — | 50 | ||||||||||||||||||
| Emission allowances(6) |
8 | — | 8 | 15 | — | 15 | ||||||||||||||||||
| Other |
5 | — | 5 | — | — | — | ||||||||||||||||||
| Subtotal |
64 | — | 64 | 65 | — | 65 | ||||||||||||||||||
| Total |
$ | 676 | $ | (160 | ) | $ | 516 | $ | 733 | $ | (223 | ) | $ | 510 | ||||||||||
| (1) | Represent development rights, including but not limited to, land control, various permits and right to acquire equity interests in development projects resulting from asset acquisitions by our Wind group. |
| (2) | Represent legal rights to receive system reliability payments from the regulator. |
| (3) | Acquired or purchased emission allowances are expensed when utilized and included in net income for the year. |
| (4) | Represent various intangible assets relating to an asset acquisition in the state of New York in 1999. During the fourth quarter of 2010, the unamortized amount of $158 million was recognized as impairment expense as part of Eastern Energy long-lived asset impairment evaluation. |
| (5) | Consists of various intangible assets including PPAs and transmission rights, none of which is individually significant. |
| (6) | Represent perpetual emission allowances without an expiration date. |
209
Table of Contents
THE AES CORPORATION
NOTES TO CONSOLIDATED FINANCIAL STATEMENTS—(Continued)
DECEMBER 31, 2010, 2009, AND 2008
The following table summarizes, by category, intangible assets acquired during the years ended December 31, 2010 and 2009:
| December 31, 2010 | ||||||||||||||
| Amount | Subject to Amortization/ Indefinite-Lived |
Weighted Average Amortization Period |
Amortization Method |
|||||||||||
| (in millions) | (in years) | |||||||||||||
| Project development rights |
$ | 141 | Subject to amortization |
Various | Straight line | |||||||||
| Contractual payment rights |
65 | Subject to amortization |
10 | Straight line | ||||||||||
| Emission allowances |
14 | Subject to amortization |
Various | As utilized | ||||||||||
| Land use rights |
7 | Indefinite-lived |
N/A | N/A | ||||||||||
| Total |
$ | 227 | ||||||||||||
| December 31, 2009 | ||||||||||||||
| Amount | Subject to Amortization/ Indefinite-Lived |
Weighted Average Amortization Period |
Amortization Method |
|||||||||||
| (in millions) | (in years) | |||||||||||||
| Emission allowances |
$ | 17 | Subject to amortization |
Various | As utilized | |||||||||
| Land use rights |
4 | Indefinite-lived |
N/A | N/A | ||||||||||
| Other |
1 | Subject to amortization |
35 | — | ||||||||||
| Total |
$ | 22 | ||||||||||||
In 2009, the Company reclassified $42 million from other assets into intangible assets at a subsidiary in Latin America.
The following table summarizes the estimated amortization expense, broken down by intangible asset category, for 2011 through 2015:
| Estimated amortization expense | ||||||||||||||||||||
| 2011 | 2012 | 2013 | 2014 | 2015 | ||||||||||||||||
| (in millions) | ||||||||||||||||||||
| Contractual payment rights |
$ | 9 | $ | 9 | $ | 9 | $ | 9 | $ | 9 | ||||||||||
| Sales concessions |
6 | 6 | 6 | 6 | 6 | |||||||||||||||
| All other |
7 | 6 | 5 | 4 | 4 | |||||||||||||||
| Total |
$ | 22 | $ | 21 | $ | 20 | $ | 19 | $ | 19 | ||||||||||
Intangible asset amortization expense was $21 million, $24 million and $19 million for the years ended December 31, 2010, 2009 and 2008, respectively.
210
Table of Contents
THE AES CORPORATION
NOTES TO CONSOLIDATED FINANCIAL STATEMENTS—(Continued)
DECEMBER 31, 2010, 2009, AND 2008
9. REGULATORY ASSETS & LIABILITIES
The Company has recorded regulatory assets and liabilities that it expects to pass through to its customers in accordance with, and subject to, regulatory provisions as follows:
| December 31, | ||||||||||||
| 2010 | 2009 | Recovery Period | ||||||||||
| (in millions) | ||||||||||||
| REGULATORY ASSETS |
||||||||||||
| Current regulatory assets: |
||||||||||||
| Brazil tariff recoveries:(1) |
||||||||||||
| Energy purchases |
$ | 62 | $ | 144 | Over tariff reset period | |||||||
| Transmission costs, regulatory fees and other |
82 | 120 | Over tariff reset period | |||||||||
| El Salvador tariff recoveries(2) |
67 | 125 | Over tariff reset period | |||||||||
|
Other(3) |
1 | 6 | Various | |||||||||
| Total current regulatory assets |
212 | 395 | ||||||||||
| Noncurrent regulatory assets: |
||||||||||||
| Defined benefit pension obligations at IPL(4)(5) |
235 | 217 | Various | |||||||||
| Income taxes recoverable from customers(4)(6) |
66 | 70 | Various | |||||||||
| Brazil tariff recoveries:(1) |
||||||||||||
| Energy purchases |
18 | 22 | Over tariff reset period | |||||||||
| Transmission costs, regulatory fees and other |
32 | 30 | Over tariff reset period | |||||||||
|
Other(3) |
119 | 111 | Various | |||||||||
| Total noncurrent regulatory assets |
470 | 450 | ||||||||||
| TOTAL REGULATORY ASSETS |
$ | 682 | $ | 845 | ||||||||
| REGULATORY LIABILITIES |
||||||||||||
| Current regulatory liabilities: |
||||||||||||
| Efficiency program costs(7) |
$ | 58 | $ | 133 | Over tariff reset period | |||||||
| Brazil tariff recoveries:(1) |
||||||||||||
| Energy purchases |
118 | 61 | Over tariff reset period | |||||||||
| Transmission costs, regulatory fees and other |
71 | 67 | Over tariff reset period | |||||||||
|
Other(8) |
39 | 35 | Various | |||||||||
| Total current regulatory liabilities |
286 | 296 | ||||||||||
| Noncurrent regulatory liabilities: |
||||||||||||
| Asset retirement obligations(9) |
509 | 482 | Over life of assets | |||||||||
| Brazil special obligations(10) |
435 | 402 | To be determined | |||||||||
| Brazil tariff recoveries:(1) |
||||||||||||
| Energy purchases |
69 | 42 | Over tariff reset period | |||||||||
| Transmission costs, regulatory fees and other |
57 | 35 | Over tariff reset period | |||||||||
| Efficiency program costs(7) |
54 | 4 | Over tariff reset period | |||||||||
|
Other(8) |
13 | 17 | Various | |||||||||
| Total noncurrent regulatory liabilities |
1,137 | 982 | ||||||||||
| TOTAL REGULATORY LIABILITIES |
$ | 1,423 | $ | 1,278 | ||||||||
211
Table of Contents
THE AES CORPORATION
NOTES TO CONSOLIDATED FINANCIAL STATEMENTS—(Continued)
DECEMBER 31, 2010, 2009, AND 2008
| (1) | Recoverable per National Electric Energy Agency (“ANEEL”) regulations through the Annual Tariff Adjustment (“IRT”). These costs are generally non-controllable costs and primarily consist of purchased electricity, energy transmission costs and sector costs that are considered volatile. These costs are recovered in 24 installments through the annual IRT process and are amortized over the tariff reset period. |
| (2) | Deferred fuel costs incurred by our El Salvador subsidiaries associated with purchase of energy from the El Salvador spot market and the power generation plants. In El Salvador, the deferred fuel adjustment represents the variance between the actual fuel costs and the fuel costs recovered in the tariffs. The variance is recovered semi-annually at the tariff reset period. |
| (3) | Includes assets with and without a rate of return. All current regulatory assets earned a rate of return as of December 31, 2010 and 2009. Other noncurrent regulatory assets that did not earn a rate of return were $95 million and $90 million, as of December 31, 2010 and 2009, respectively. Those without a rate of return that are recoverable primarily consist of transmission service costs and other administrative costs from IPL’s participation in the Midwest ISO market. Recovery of costs is probable, but the timing is not yet determined. |
| (4) | Past expenditures on which the Company does not earn a rate of return. |
| (5) | The regulatory accounting standards allow the defined pension and postretirement benefit obligation to be recorded as a regulatory asset equal to the previously unrecognized actuarial gains and losses and prior service costs that are expected to be recovered through future rates. Pension expense is recognized based on the plan’s actuarially determined pension liability. Recovery of costs is probable, but not yet determined. Pension contributions made by our Brazilian subsidiaries are not included in regulatory assets as those contributions are not covered by the established tariff in Brazil. |
| (6) | Probable of recovery through future rates, based upon established regulatory practices, which permit the recovery of current taxes. This amount is expected to be recovered, without interest, over the period as book-tax temporary differences reverse and become current taxes. |
| (7) | Payments received for costs expected to be incurred to improve the efficiency of our plants in Brazil that are refunded as part of the IRT. |
| (8) | Other Current and Noncurrent Regulatory Liabilities consist of: |
| • | Deferred fuel costs, which are expected to be refunded to customers as a credit against future fuel adjustment charges. In the United States, deferred fuel costs at IPL represent variances between estimated and actual fuel and purchased power costs. IPL is required to refund overestimated fuel and purchased power costs in future rates. |
| • | Penalties and fees from regulators at our Brazilian subsidiaries. |
| • | Financial transmission rights used to hedge exposure in the Midwest ISO market that are credited per specific rate orders. |
| • | The cost incurred by electricity generators due to variance in energy prices during rationing periods (Free Energy). Our Brazilian subsidiaries are authorized to recover or refund this cost associated with monthly energy price variances between the wholesale energy market prices owed to the power generation plants producing Free Energy and the capped price reimbursed by the local distribution companies which are passed through to the final customers through energy tariffs. |
| (9) | Obligations for removal costs which do not have an associated legal retirement obligation as defined by the accounting standards on asset retirement obligations. |
| (10) | Obligations established by ANEEL in Brazil associated with electric utility concessions and represent amounts received from customers or donations not subject to return. These donations are allocated to support energy network expansion and to improve utility operations to meet customers’ needs. The term of the obligation is established by ANEEL. Settlement shall occur when the concession ends. |
212
Table of Contents
THE AES CORPORATION
NOTES TO CONSOLIDATED FINANCIAL STATEMENTS—(Continued)
DECEMBER 31, 2010, 2009, AND 2008
The current regulatory assets and liabilities are recorded in “Other current assets” and “Accrued and other liabilities,” respectively, on the accompanying Consolidated Balance Sheets. The noncurrent regulatory assets and liabilities are recorded in “Other assets” and “Other long-term liabilities,” respectively, in the accompanying Consolidated Balance Sheets.
The following table summarizes regulatory assets by region as of December 31, 2010 and 2009:
| December 31, | ||||||||
| 2010 | 2009 | |||||||
| (in millions) | ||||||||
| Latin America |
$ | 265 | $ | 445 | ||||
| North America |
417 | 400 | ||||||
| Total regulatory assets |
$ | 682 | $ | 845 | ||||
The following table summarizes regulatory liabilities by region as of December 31, 2010 and 2009:
| December 31, | ||||||||
| 2010 | 2009 | |||||||
| (in millions) | ||||||||
| Latin America |
$ | 897 | $ | 772 | ||||
| North America |
526 | 506 | ||||||
| Total regulatory liabilities |
$ | 1,423 | $ | 1,278 | ||||
10. DEBT
The Company has two types of debt reported on its Consolidated Balance Sheets: non-recourse and recourse debt. Non-recourse debt is used to fund investments and capital expenditures for the construction and acquisition of electric power plants, wind projects, distribution companies and other project-related investments at our subsidiaries. Non-recourse debt is generally secured by the capital stock, physical assets, contracts and cash flows of the related subsidiary. Absent guarantees, intercompany loans or other credit support, the default risk is limited to the respective business and is without recourse to the Parent Company and other subsidiaries, though the Company’s equity investments and/or subordinated loans to projects (if any) are at risk. Recourse debt is direct borrowings by the Parent Company and is used to fund development, construction or acquisitions, including serving as funding for equity investments or loans to the affiliates. The Parent Company’s debt is, among other things, recourse to the Parent Company and is structurally subordinated to the affiliates’ debt.
The following table summarizes the carrying amount and estimated fair values of the Company’s recourse and non-recourse debt as of December 31, 2010 and 2009:
| December 31, | ||||||||||||||||
| 2010 | 2009 | |||||||||||||||
| Carrying | Fair | Carrying | Fair | |||||||||||||
| Amount | Value | Amount | Value | |||||||||||||
| (in millions) | ||||||||||||||||
| Non-recourse debt |
$ | 15,121 | $ | 15,471 | $ | 14,022 | $ | 14,405 | ||||||||
| Recourse debt |
4,612 | 4,868 | 5,515 | 5,603 | ||||||||||||
| Total debt |
$ | 19,733 | $ | 20,339 | $ | 19,537 | $ | 20,008 | ||||||||
213
Table of Contents
THE AES CORPORATION
NOTES TO CONSOLIDATED FINANCIAL STATEMENTS—(Continued)
DECEMBER 31, 2010, 2009, AND 2008
Recourse and non-recourse debt are carried at amortized cost. The fair value of recourse debt is estimated based on quoted market prices. The fair value of non-recourse debt is estimated differently based upon the type of loan. The fair value of fixed rate loans is estimated using quoted market prices, if available or a discounted cash flow analysis. In the discounted cash flow analysis, the discount rate is based on the credit rating of the individual debt instruments if available, or the credit rating of the subsidiary. If the subsidiary’s credit rating is not available, a synthetic credit rating is determined using certain key metrics, including cash flow ratios and interest coverage, as well as other industry specific factors. For subsidiaries located outside of the U.S., in the event that the country rating is lower than the credit rating previously determined, the country rating is used for the purposes of the discounted cash flow analysis. The fair value of recourse and non-recourse debt excludes accrued interest at the valuation date.
The estimated fair value was determined using available market information as of December 31, 2010 and 2009. The Company is not aware of any factors that would significantly affect the estimated fair value amounts since December 31, 2010.
NON-RECOURSE DEBT
The following table summarizes the carrying amount and terms of non-recourse debt as of December 31, 2010 and 2009:
| December 31, | ||||||||||||||||
| NON-RECOURSE DEBT |
Interest Rate(1) |
Maturity | 2010 | 2009 | ||||||||||||
| (in millions) | ||||||||||||||||
| VARIABLE RATE:(2) |
||||||||||||||||
| Bank loans |
2.39 | % | 2011 – 2027 | $ | 3,840 | $ | 3,118 | |||||||||
| Notes and bonds |
12.14 | % | 2011 – 2020 | 2,982 | 1,922 | |||||||||||
| Debt to (or guaranteed by) multilateral, export credit agencies or development banks(3) |
2.95 | % | 2011 – 2027 | 1,848 | 1,679 | |||||||||||
| Other |
4.13 | % | 2011 – 2038 | 365 | 922 | |||||||||||
| FIXED RATE: |
||||||||||||||||
| Bank loans |
8.44 | % | 2011 – 2023 | 424 | 446 | |||||||||||
| Notes and bonds |
7.35 | % | 2011 – 2037 | 5,007 | 5,450 | |||||||||||
| Debt to (or guaranteed by) multilateral, export credit agencies or development banks(3) |
6.41 | % | 2011 – 2027 | 467 | 406 | |||||||||||
| Other |
6.32 | % | 2011 – 2039 | 188 | 79 | |||||||||||
| SUBTOTAL |
$ | 15,121 | (4) | $ | 14,022 | (4) | ||||||||||
| Less: Current maturities |
(2,577 | ) | (1,718 | ) | ||||||||||||
| TOTAL |
$ | 12,544 | $ | 12,304 | ||||||||||||
| (1) | Weighted average interest rate at December 31, 2010. |
| (2) | The Company has interest rate swaps and interest rate option agreements in an aggregate notional principal amount of approximately $4.3 billion on non-recourse debt outstanding at December 31, 2010. The swap agreements economically change the variable interest rates on the portion of the debt covered by the notional amounts to fixed rates ranging from approximately 0.71% to 6.98%. The option agreements fix interest rates within a range from 4.03% to 7.00%. The agreements expire at various dates from 2016 through 2027. |
214
Table of Contents
THE AES CORPORATION
NOTES TO CONSOLIDATED FINANCIAL STATEMENTS—(Continued)
DECEMBER 31, 2010, 2009, AND 2008
| (3) | Multilateral loans include loans funded and guaranteed by bilaterals, multilaterals, development banks and other similar institutions. |
| (4) | Non-recourse debt of $708 million as of December 31, 2009 was excluded from non-recourse debt and included in current and long-term liabilities of held for sale and discontinued businesses in the accompanying Consolidated Balance Sheets. |
Non-recourse debt as of December 31, 2010 is scheduled to reach maturity as set forth in the table below:
| December 31, |
Annual Maturities |
|||
| (in millions) | ||||
| 2011 |
$ | 2,577 | ||
| 2012 |
657 | |||
| 2013 |
953 | |||
| 2014 |
1,839 | |||
| 2015 |
1,138 | |||
| Thereafter |
7,957 | |||
| Total non-recourse debt |
$ | 15,121 | ||
As of December 31, 2010, AES subsidiaries with facilities under construction had a total of approximately $432 million of committed but unused credit facilities available to fund construction and other related costs. Excluding these facilities under construction, AES subsidiaries had approximately $893 million in a number of available but unused committed revolving credit lines to support their working capital, debt service reserves and other business needs. These credit lines can be used in one or more of the following ways: solely for borrowings; solely for letters of credit; or a combination of these uses. The weighted average interest rate on borrowings from these facilities was 3.24% at December 31, 2010.
Non-Recourse Debt Covenants, Restrictions and Defaults
The terms of the Company’s non-recourse debt include certain financial and non-financial covenants. These covenants are limited to subsidiary activity and vary among the subsidiaries. These covenants may include but are not limited to maintenance of certain reserves, minimum levels of working capital and limitations on incurring additional indebtedness. Compliance with certain covenants may not be objectively determinable.
As of December 31, 2010 and 2009, approximately $803 million and $653 million, respectively, of restricted cash was maintained in accordance with certain covenants of the non-recourse debt agreements, and these amounts were included within “Restricted cash” and “Debt service reserves and other deposits” in the accompanying Consolidated Balance Sheets.
Various lender and governmental provisions restrict the ability of certain of the Company’s subsidiaries to transfer their net assets to the Parent Company. Such restricted net assets of subsidiaries amounted to approximately $5.4 billion at December 31, 2010.
215
Table of Contents
THE AES CORPORATION
NOTES TO CONSOLIDATED FINANCIAL STATEMENTS—(Continued)
DECEMBER 31, 2010, 2009, AND 2008
The following table summarizes the Company’s subsidiary non-recourse debt in default or accelerated as of December 31, 2010 and is included in the current portion of non-recourse debt unless otherwise indicated:
| Primary Nature of Default |
December 31, 2010 | |||||||||||
| Subsidiary |
Default | Net Assets | ||||||||||
| (in millions) | ||||||||||||
| Maritza |
Covenant | $ | 986 | $ | 262 | |||||||
| Sonel |
Covenant | 390 | 357 | |||||||||
| Kelanitissa |
Covenant | 28 | 31 | |||||||||
| Aixi |
Payment | 4 | (8 | ) | ||||||||
| Total |
$ | 1,408 | ||||||||||
None of the subsidiaries that are currently in default are subsidiaries that met the applicable definition of materiality under AES’ corporate debt agreements as of December 31, 2010 in order for such defaults to trigger an event of default or permit acceleration under such indebtedness. The bankruptcy or acceleration of material amounts of debt at such entities would cause a cross default under the recourse senior secured credit facility. However, as a result of additional dispositions of assets, other significant reductions in asset carrying values or other matters in the future that may impact our financial position and results of operations or the financial position or results of the individual subsidiary, it is possible that one or more of these subsidiaries could fall within the definition of a “material subsidiary” and thereby upon a bankruptcy or acceleration of its non-recourse debt trigger an event of default and possible acceleration of the indebtedness under the AES Parent Company’s outstanding debt securities.
RECOURSE DEBT
The following table summarizes the carrying amount and terms of recourse debt of the Company as of December 31, 2010 and 2009:
| December 31, | ||||||||||||||||
| RECOURSE DEBT |
Interest Rate | Maturity | 2010 | 2009 | ||||||||||||
| (in millions) | ||||||||||||||||
| Senior Unsecured Note |
9.375% | 2010 | $ | — | $ | 214 | ||||||||||
| Senior Secured Term Loan |
LIBOR + 1.75% | 2011 | 200 | 200 | ||||||||||||
| Senior Unsecured Note |
8.875% | 2011 | 129 | 129 | ||||||||||||
| Senior Unsecured Note |
8.375% | 2011 | 134 | 139 | ||||||||||||
| Second Priority Senior Secured Note |
8.75% | 2013 | — | 690 | ||||||||||||
| Senior Unsecured Note |
7.75% | 2014 | 500 | 500 | ||||||||||||
| Senior Unsecured Note |
7.75% | 2015 | 500 | 500 | ||||||||||||
| Senior Unsecured Note |
9.75% | 2016 | 535 | 535 | ||||||||||||
| Senior Unsecured Note |
8.00% | 2017 | 1,500 | 1,500 | ||||||||||||
| Senior Unsecured Note |
8.00% | 2020 | 625 | 625 | ||||||||||||
| Term Convertible Trust Securities |
6.75% | 2029 | 517 | 517 | ||||||||||||
| Unamortized discounts |
(28 | ) | (34 | ) | ||||||||||||
| SUBTOTAL |
$ | 4,612 | $ | 5,515 | ||||||||||||
| Less: Current maturities |
(463 | ) | (214 | ) | ||||||||||||
| Total |
$ | 4,149 | $ | 5,301 | ||||||||||||
216
Table of Contents
THE AES CORPORATION
NOTES TO CONSOLIDATED FINANCIAL STATEMENTS—(Continued)
DECEMBER 31, 2010, 2009, AND 2008
Recourse debt as of December 31, 2010 is scheduled to reach maturity as set forth in the table below:
| December 31, |
Annual Maturities | |||
| (in millions) | ||||
| 2011 |
$ | 463 | ||
| 2012 |
— | |||
| 2013 |
— | |||
| 2014 |
497 | |||
| 2015 |
500 | |||
| Thereafter |
3,152 | |||
| Total recourse debt |
$ | 4,612 | ||
Recourse Debt Transactions
During 2010, the Company redeemed $690 million aggregate principal of its 8.75% Second Priority Senior Secured Notes due 2013 (“the 2013 Notes”). The 2013 Notes were redeemed at a redemption price equal to 101.458% of the principal amount redeemed. The Company recognized a pre-tax loss on the redemption of the 2013 Notes of $15 million for the year ended December 31, 2010, which is included in “Other expense” in the accompanying Consolidated Statement of Operations.
On July 29, 2010, the Company entered into a second amendment (“Amendment No. 2”) to the Fourth Amended and Restated Credit and Reimbursement Agreement, dated as of July 29, 2008, among the Company, various subsidiary guarantors and various lending institutions (the “Existing Credit Agreement”) that amends and restates the Existing Credit Agreement (as so amended and restated by Amendment No. 2, the “Fifth Amended and Restated Credit Agreement”). The Fifth Amended and Restated Credit Agreement adjusted the terms and conditions of the Existing Credit Agreement, including the following changes:
| • | the aggregate commitment for the revolving credit loan facility was increased to $800 million; |
| • | the final maturity date of the revolving credit loan facility was extended to January 29, 2015; |
| • | changes to the facility fee applicable to the revolving credit loan facility; |
| • | the interest rate margin applicable to the revolving credit loan facility is now based on the credit rating assigned to the loans under the credit agreement, with pricing currently at LIBOR + 3.00%; |
| • | there is an undrawn fee of 0.625% per annum; |
| • | the Company may incur a combination of additional term loan and revolver commitments so long as total term loan and revolver commitments (including those currently outstanding) do not exceed $1.4 billion; and |
| • | the negative pledge (i.e., a cap on first lien debt) of $3.0 billion. |
Recourse Debt Covenants and Guarantees
Certain of the Company’s obligations under the senior secured credit facility are guaranteed by its direct subsidiaries through which the Company owns its interests in the AES Shady Point, AES Hawaii, AES Warrior Run and AES Eastern Energy businesses. The Company’s obligations under the senior secured credit facility are, subject to certain exceptions, secured by:
| (i) | all of the capital stock of domestic subsidiaries owned directly by the Company and 65% of the capital stock of certain foreign subsidiaries owned directly or indirectly by the Company; and |
217
Table of Contents
THE AES CORPORATION
NOTES TO CONSOLIDATED FINANCIAL STATEMENTS—(Continued)
DECEMBER 31, 2010, 2009, AND 2008
| (ii) | certain intercompany receivables, certain intercompany notes and certain intercompany tax sharing agreements. |
The senior secured credit facility is subject to mandatory prepayment under certain circumstances, including the sale of a guarantor subsidiary. In such a situation, the net cash proceeds from the sale of a Guarantor or any of its subsidiaries must be applied pro rata to repay the term loan using 60% of net cash proceeds, reduced to 50% when and if the parent’s recourse debt to cash flow ratio is less than 5:1. The lenders have the option to waive their pro rata redemption.
The senior secured credit facility contains customary covenants and restrictions on the Company’s ability to engage in certain activities, including, but not limited to, limitations on other indebtedness, liens, investments and guarantees; limitations on restricted payments such as shareholder dividends and equity repurchases; restrictions on mergers and acquisitions, sales of assets, leases, transactions with affiliates and off-balance sheet or derivative arrangements; and other financial reporting requirements.
The senior secured credit facility also contains financial covenants requiring the Company to maintain certain financial ratios including a cash flow to interest coverage ratio, calculated quarterly, which provides that a minimum ratio of the Company’s adjusted operating cash flow to the Company’s interest charges related to recourse debt of 1.3× must be maintained at all times and a recourse debt to cash flow ratio, calculated quarterly, which provides that the ratio of the Company’s total recourse debt to the Company’s adjusted operating cash flow must not exceed a maximum at any time of calculation, or 7.5× at December 31, 2010.
The terms of the Company’s senior unsecured notes and senior secured credit facility contain certain covenants including, without limitation, limitation on the Company’s ability to incur liens or enter into sale and leaseback transactions.
TERM CONVERTIBLE TRUST SECURITIES
Between 1999 and 2000, AES Trust III, a wholly owned special purpose business trust, issued approximately 10.35 million of $3.375 Term Convertible Preferred Securities (“TECONS”) (liquidation value $50) for total proceeds of $517 million and concurrently purchased $517 million of 6.75% Junior Subordinated Convertible Debentures due 2029 (the “6.75% Debentures” of the Company). The TECONS are consolidated and classified as long-term recourse debt on the Company’s Consolidated Balance Sheet.
AES, at its option, can redeem the 6.75% Debentures which would result in the required redemption of the TECONS issued by AES Trust III, currently for $50 per TECON. The TECONS must be redeemed upon maturity of the 6.75% Debentures. The TECONS are convertible into the common stock of AES at each holder’s option prior to October 15, 2029 at the rate of 1.4216, representing a conversion price of $35.17 per share. The maximum number of shares of common stock AES would be required to issue should all holders decide to convert their securities would be 14.7 million shares.
Dividends on the TECONS are payable quarterly at an annual rate of 6.75%. The Trust is permitted to defer payment of dividends for up to 20 consecutive quarters, provided that the Company has exercised its right to defer interest payments under the corresponding debentures or notes. During such deferral periods, dividends on the TECONS would accumulate quarterly and accrue interest, and the Company may not declare or pay dividends on its common stock. AES has not exercised the option to defer any dividends at this time and all dividends due under the Trust have been paid.
218
Table of Contents
THE AES CORPORATION
NOTES TO CONSOLIDATED FINANCIAL STATEMENTS—(Continued)
DECEMBER 31, 2010, 2009, AND 2008
AES Trust III is a VIE under the relevant consolidation accounting guidance. AES’ obligations under the 6.75% Debentures and other relevant trust agreements, in aggregate, constitute a full and unconditional guarantee by AES of the TECON Trusts’ obligations. Accordingly, AES consolidates AES Trust III. As of December 31, 2010 and 2009, the sole assets of AES Trust III are the 6.75% Debentures.
11. COMMITMENTS
OPERATING LEASES—As of December 31, 2010, the Company was obligated under long-term non-cancelable operating leases, primarily for certain transmission lines, office rental and site leases. Rental expense for lease commitments under these operating leases for the years ended December 31, 2010, 2009 and 2008 was $58 million, $63 million and $74 million, respectively.
The table below sets forth the future minimum lease commitments under these operating leases as of December 31, 2010 for 2011 through 2015 and thereafter:
| December 31, |
Future Commitments for Operating Leases |
|||
| (in millions) | ||||
| 2011 |
$ | 56 | ||
| 2012 |
55 | |||
| 2013 |
56 | |||
| 2014 |
54 | |||
| 2015 |
50 | |||
| Thereafter |
648 | |||
| Total |
$ | 919 | ||
CAPITAL LEASES—Several AES subsidiaries lease operating and office equipment and vehicles that are considered capital lease transactions. These capital leases are recognized in Property, Plant and Equipment within “Electric generation and distribution assets” and primarily relate to transmission lines at our subsidiaries in Brazil. The gross value of the leased assets as of December 31, 2010 and 2009 was $99 million and $106 million, respectively.
The following table summarizes the future minimum lease payments under capital leases together with the present value of the net minimum lease payments as of December 31, 2010 for 2011 through 2015 and thereafter:
| December 31, |
Future Minimum Lease Payments |
|||
| (in millions) | ||||
| 2011 |
$ | 17 | ||
| 2012 |
14 | |||
| 2013 |
12 | |||
| 2014 |
11 | |||
| 2015 |
10 | |||
| Thereafter |
142 | |||
| Total |
$ | 206 | ||
| Less: Imputed interest |
127 | |||
| Present value of total minimum lease payments |
$ | 79 | ||
219
Table of Contents
THE AES CORPORATION
NOTES TO CONSOLIDATED FINANCIAL STATEMENTS—(Continued)
DECEMBER 31, 2010, 2009, AND 2008
SALE/LEASEBACK—In May 1999, a subsidiary of the Company acquired six electric generating stations from New York State Electric and Gas (“NYSEG”). Concurrently, the subsidiary sold two of the plants to an unrelated third party for $666 million and simultaneously entered into a leasing arrangement with the unrelated party. This transaction has been accounted for as a sale/leaseback with operating lease treatment. In May 2007, the subsidiary purchased a portion of the lessor’s interest in a trust estate that holds the leased plants. Future minimum lease commitments under the lease agreement are reduced by the subsidiary’s interest in the plants. Rental expense was $34 million for each of the years ended December 31, 2010, 2009 and 2008.
The following table summarizes the future minimum lease commitments under the sale/leaseback arrangement as of December 31, 2010 for 2011 through 2015 and thereafter:
| December 31, |
Future Minimum Lease Commitments |
|||
| (in millions) | ||||
| 2011 |
$ | 43 | ||
| 2012 |
44 | |||
| 2013 |
46 | |||
| 2014 |
47 | |||
| 2015 |
47 | |||
| Thereafter |
437 | |||
| Total |
$ | 664 | ||
CONTRACTS—Operating subsidiaries of the Company have entered into contracts for the purchase of electricity from third parties that primarily include energy auction agreements at our Brazil subsidiaries with extended terms from 2011 through 2042 and in some cases are subject to variable quantities or prices. Purchases in the years ended December 31, 2010, 2009 and 2008 were approximately $2.4 billion, $2.1 billion and $1.5 billion, respectively.
The table below sets forth the future minimum commitments under these electricity purchase contracts at December 31, 2010 for 2011 through 2015 and thereafter:
| December 31, |
Future Commitments for Electricity Purchase Contracts |
|||
| (in millions) | ||||
| 2011 |
$ | 3,055 | ||
| 2012 |
3,273 | |||
| 2013 |
2,845 | |||
| 2014 |
2,569 | |||
| 2015 |
2,642 | |||
| Thereafter |
37,776 | |||
| Total |
$ | 52,160 | ||
Operating subsidiaries of the Company have entered into various long-term contracts for the purchase of fuel subject to termination only in certain limited circumstances and in some cases are subject to variable quantities or prices. Purchases in the years ended December 31, 2010, 2009 and 2008 were $1.9 billion, $1.3 billion and $1.3 billion, respectively.
220
Table of Contents
THE AES CORPORATION
NOTES TO CONSOLIDATED FINANCIAL STATEMENTS—(Continued)
DECEMBER 31, 2010, 2009, AND 2008
The table below sets forth the future minimum commitments under these fuel contracts as of December 31, 2010 for 2011 through 2015 and thereafter:
| December 31, |
Future Commitments for Fuel Contracts |
|||
| (in millions) | ||||
| 2011 |
$ | 1,587 | ||
| 2012 |
1,154 | |||
| 2013 |
733 | |||
| 2014 |
552 | |||
| 2015 |
454 | |||
| Thereafter |
4,391 | |||
| Total |
$ | 8,871 | ||
The Company’s subsidiaries have entered into other various long-term contracts. These contracts are mainly for construction projects, service and maintenance, transmission of electricity and other operation services. Payments under these contracts for the years ended December 31, 2010, 2009 and 2008 were $1.7 billion, $2.8 billion and $1.9 billion, respectively.
The table below sets forth the future minimum commitments under these other purchase contracts as of December 31, 2010 for 2011 through 2015 and thereafter:
| December 31, |
Future Commitments for Other Purchase Contracts |
|||
| (in millions) | ||||
| 2011 |
$ | 1,628 | ||
| 2012 |
1,357 | |||
| 2013 |
1,246 | |||
| 2014 |
1,540 | |||
| 2015 |
1,212 | |||
| Thereafter |
14,057 | |||
| Total |
$ | 21,040 | ||
12. CONTINGENCIES
ENVIRONMENTAL LIABILITIES
The Company will record liabilities when an environmental assessment indicates that remedial actions are probable and that costs can be reasonably estimated. As of December 31, 2010, the Company has recognized liabilities of $28 million for estimated environmental remediation costs and potential fines and penalties. These are reported on the Consolidated Balance Sheet within “accrued and other liabilities” and “other long-term liabilities.” Due to the uncertainties associated with environmental assessment and remediation activities, actual future costs of compliance or remediation could be higher or lower than the amount currently accrued. Certain expenditures many also be capitalized in accordance with the Company’s property, plant and equipment policies and are excluded from environmental liabilities in accordance with accounting guidelines. Any capital expenditures incurred of this nature would be incremental to amounts reserved.
221
Table of Contents
THE AES CORPORATION
NOTES TO CONSOLIDATED FINANCIAL STATEMENTS—(Continued)
DECEMBER 31, 2010, 2009, AND 2008
ENVIRONMENTAL REGULATION
The Company is subject to numerous environmental laws and regulations in the jurisdictions in which it operates. The Company expenses environmental regulation compliance costs as incurred unless the underlying expenditure qualifies for capitalization under its property, plant and equipment policies. The Company faces certain risks and uncertainties related to these environmental laws and regulations, including existing and potential greenhouse gas (“GHG”) legislation or regulations, and actual or potential laws and regulations pertaining to water discharges, waste management (including disposal of coal combustion byproducts), and certain air emissions, such as SO2, NOX, particulate matter and mercury. Such risks and uncertainties could result in increased capital expenditures or other compliance costs which could have a material adverse effect on certain of our United States or international subsidiaries, and our consolidated results of operations. For further information about environmental risks, see Item 1A.—Risk Factors, “Our businesses are subject to stringent environmental laws and regulations,” “Our businesses are subject to enforcement initiatives from environmental regulatory agencies,” and “Regulators, politicians, non-governmental organizations and other private parties have expressed concern about greenhouse gas, or GHG, emissions and the potential risks associated with climate change and are taking actions which could have a material adverse impact on our consolidated results of operations, financial condition and cash flows.”
Legislation and Regulation of GHG Emissions
Currently in the United States there is no Federal legislation establishing mandatory GHG emissions reduction programs (including CO2) affecting the electric power generation facilities of the Company’s subsidiaries. There are numerous state programs regulating GHG emissions from electric power generation facilities and there is a possibility that federal GHG legislation will be enacted within the next several years. Further, the EPA has adopted regulations pertaining to GHG emissions and has announced its intention to propose new regulations for electric generating units under Section 111 of the United States Clean Air Act (“CAA”).
Potential United States Federal GHG Legislation. Federal legislation passed the United States House of Representatives in 2009 that, if adopted, would impose a nationwide cap-and-trade program to reduce GHG emissions. In the United States Senate, several different draft bills pertaining to GHG legislation have been considered at various times since then, including comprehensive GHG legislation similar to the legislation that passed the United States House of Representatives and more limited legislation focusing only on the utility and electric generation industry. It is uncertain whether any such legislation or any new legislation pertaining to GHG emissions will be voted on or passed by the Senate. If any legislation is passed by the Senate, it is uncertain whether such legislation will be reconciled with the House of Representatives’ legislation and ultimately enacted into law. However, if any such legislation is enacted, the impact could be material to the Company.
EPA GHG Regulation. The EPA promulgated regulations governing GHG emissions from automobiles under the CAA. The effect of the EPA’s regulation of GHG emissions from mobile sources is that certain provisions of the CAA will also apply to GHG emissions from existing stationary sources, including many United States power plants. Beginning on January 2, 2011, construction of new stationary sources and modifications to existing stationary sources that result in increased GHG emissions, became subject to permitting requirements under the prevention of significant deterioration (“PSD”) program of the CAA. The PSD program, as currently applicable to GHG emissions, requires sources that emit above a certain threshold of GHGs to obtain PSD permits prior to commencement of new construction or modifications to existing facilities. In addition, major sources of GHG emissions may be required to amend, or obtain new, Title V-air permits under the CAA to reflect any new applicable GHG emissions requirements for new construction or for modifications to existing facilities.
222
Table of Contents
THE AES CORPORATION
NOTES TO CONSOLIDATED FINANCIAL STATEMENTS—(Continued)
DECEMBER 31, 2010, 2009, AND 2008
The EPA promulgated a final rule on June 3, 2010, (the “Tailoring Rule”) that sets thresholds for GHG emissions that would trigger PSD permitting requirements. The Tailoring Rule, which became effective in January of 2011, provides that sources already subject to PSD permitting requirements need to install Best Available Control Technology (“BACT”) for greenhouse gases if a proposed modification would result in the increase of more than 75,000 tons per year of GHG emissions. Also, under the Tailoring Rule, commencing in July of 2011, any new sources of GHG emissions that would emit over 100,000 tons per year of GHG emissions, in addition to any modification that would result in GHG emissions exceeding 75,000 tons per year would require PSD review and be subject to related permitting requirements. The EPA anticipates that it will adjust downward the permitting thresholds of 100,000 tons and 75,000 tons for new sources and modifications, respectively, in future rulemaking actions. The Tailoring Rule substantially reduces the number of sources subject to PSD requirements for GHG emissions and the number of sources required to obtain Title V air permits, although new thermal power plants may still be subject to PSD and Title V requirements because annual GHG emissions from such plants typically far exceed the 100,000 ton threshold noted above. The 75,000 ton threshold for increased GHG emissions from modifications to existing sources may reduce the likelihood that future modifications to plants owned by some of our United States subsidiaries would trigger PSD requirements, although some projects that would expand capacity or electric output are likely to exceed this threshold, and in any such cases the capital expenditures necessary to comply with the PSD requirements could be significant.
In December 2010, the EPA entered into a settlement agreement with several states and environmental groups to resolve a petition for review challenging EPA’s new source performance standards (“NSPS”) rulemaking for electric utility steam generating units (“EUSGUs”) based on the NSPS’ failure to address GHG emissions. Under the settlement agreement, the EPA has committed to propose GHG emissions standards for EUSGUs by July 26, 2011 and to finalize GHG emissions standards for EUSGUs by May 26, 2012. The NSPS will establish GHG emission standards for newly constructed and reconstructed EUSGUs. The NSPS also will establish guidelines regarding the best system for achieving further GHG emissions reductions from EUSGUs and, based on such guidelines, individual states will be required to submit a plan to the EPA to establish GHG emission standards for existing EUSGUs within their state. It is impossible to estimate the impact and compliance cost associated with any future NSPS applicable to EUSGUs until such regulations are finalized. However, the compliance costs could have a material and adverse impact on our consolidated financial condition or results of operations.
Regional Greenhouse Gas Initiative. The primary regulation of GHG emissions affecting the United States plants of the Company’s subsidiaries has been through the Regional Greenhouse Gas Initiative (“RGGI”). Under RGGI, ten Northeastern States have coordinated to establish rules that require reductions in CO2 emissions from power plant operations within those states through a cap-and-trade program. States participating in RGGI in which our subsidiaries have generating facilities include Connecticut, Maryland, New York and New Jersey. Under RGGI, power plants must acquire one carbon allowance through auction or in the emission trading markets for each ton of CO2 emitted.
In July 2003, the European Community “Directive 2003/87/EC on Greenhouse Gas Emission Allowance Trading” was created, which requires member states to limit emissions of CO2 from large industrial sources within their countries. To do so, member states are required to implement EC-approved national allocation plans (“NAPs”). Under the NAPs, member states are responsible for allocating limited CO2 allowances within their borders. Directive 2003/87/EC does not dictate how these allocations are to be made, and NAPs that have been submitted thus far have varied in their allocation methodologies. For these and other reasons, uncertainty remains with respect to the implementation of the European Union Emissions Trading System (“EU ETS”) that commenced in January 2005. The European Union has announced that it intends to keep the EU ETS in place after 2012, even if the Kyoto Protocol is not extended or replaced by another agreement. The Company’s subsidiaries operate eight
223
Table of Contents
THE AES CORPORATION
NOTES TO CONSOLIDATED FINANCIAL STATEMENTS—(Continued)
DECEMBER 31, 2010, 2009, AND 2008
electric power generation facilities, and another subsidiary has one under construction, within six member states which have adopted NAPs to implement Directive 2003/87/EC. At this time, the Company cannot determine fully whether achieving and maintaining compliance with the NAPs, to which its subsidiaries are subject, will have a material impact on its consolidated operations or results. The risk and benefit associated with achieving compliance with applicable NAPs at several facilities of the Company’s subsidiaries are not the responsibility of the Company’s subsidiaries, as they are subject to contractual provisions that transfer the costs associated with compliance to contract counterparties. However, one such contract counterparty, GDF-Suez, is currently disputing these provisions with AES Energia Cartagena S.R.L. The matter has been submitted to arbitration and the parties are currently awaiting a decision. See Item 3.—Legal Proceedings—in this Form 10-K for more detail regarding this dispute. In connection with this dispute or any similar dispute that might arise with other contract counterparties, there can be no assurance that the Company and/or the relevant subsidiary would prevail, or that the failure to prevail in any such dispute will not have a material adverse effect on the Company and its financial condition or consolidated results of operations.
On February 16, 2005, the Kyoto Protocol became effective. The Kyoto Protocol requires the industrialized countries that have ratified it to significantly reduce their GHG emissions, including CO2. The vast majority of developing countries which have ratified the Kyoto Protocol have no GHG reduction requirements, including many of the countries in which the Company’s subsidiaries operate. Of the 28 countries in which the Company’s subsidiaries currently operate all but one—the United States (including Puerto Rico)—have ratified the Kyoto Protocol.
In addition to the risks and uncertainties related to GHG regulations or potential legislation, the Company faces certain risks and uncertainties related to regulations or legislation concerning other types of air emissions. In the United States the CAA and various state laws and regulations regulate emissions of air pollutants, including SO2, NOX, particulate matter (“PM”), mercury and other hazardous air pollutants (“HAPs”). The applicable rules and steps taken by the Company to comply with the rules are discussed in further detail below.
The EPA promulgated the “Clean Air Interstate Rule” (“CAIR”) on March 10, 2005, which required allowance surrender for SO2 and NOX, emissions from existing power plants located in 28 eastern states and the District of Columbia. CAIR was subsequently challenged in federal court on July 11, 2008 and the United States Court of Appeals for the D.C. Circuit issued an opinion striking down much of CAIR and remanding it to the EPA.
In response to the D.C. Circuit’s opinion, on July 6, 2010, the EPA issued a new proposed rule (the “Transport Rule”) to replace CAIR. The final Transport Rule is scheduled to be issued by July 2011. The Clean Air Transport Rule would require significant reductions in SO2 and NOX emissions in 31 states and the District of Columbia starting in 2012, including several states where subsidiaries of the Company conduct business.
The Transport Rule contemplates three possible options for reducing SO2 and NOX emissions in the designated states. The EPA’s preferred option contemplates a set limit or budget on SO2 and NOX emissions for each of the states, with limited interstate trading of emissions allowances and unlimited intrastate trading of SO2 and NOX emissions allowances. Affected power plants would receive emissions allowances based on the applicable state emissions budgets. The EPA’s second option under the Transport Rule would establish emission budgets for each state but only allow intrastate trading of emissions allowances. The final option would set emission rate limitations for each power plant but would allow for some intrastate averaging of emission rates. Under any of the proposed options, additional air emission control technology may be required by some of our subsidiaries, and the cost of implementing any such technology could affect the financial condition or results of operations of these subsidiaries or the Parent Company. The EPA has received public comments on the Transport Rule, and such public comments will be considered by the EPA prior to promulgating a final rule.
224
Table of Contents
THE AES CORPORATION
NOTES TO CONSOLIDATED FINANCIAL STATEMENTS—(Continued)
DECEMBER 31, 2010, 2009, AND 2008
As a result of prior EPA determinations and a D.C. Circuit Court ruling, the EPA is obligated under Section 112 of the CAA to develop a rule requiring pollution controls for hazardous air pollutants, including mercury, hydrogen chloride, hydrogen fluoride, and nickel species from coal and oil-fired power plants. The EPA has entered into a consent decree under which it is obligated to propose the rule by March 2011 and to finalize the rule by November 2011. In connection with such rule, the CAA requires the EPA to establish maximum achievable control technology (“MACT”) standards for each pollutant regulated under the rule. MACT is defined as the emission limitation achieved by the “best performing 12%” of sources in the source category. While it is impossible to project what emission rate levels the EPA may propose as MACT, the rule may require all coal-fired power plants to install acid gas scrubbers (wet or dry flue gas desulfurization technology) and/or some other type of mercury control technology, such as sorbent injection. Most of the Company’s United States coal-fired plants have acid gas scrubbers or comparable control technologies, but it is possible that EPA regulations will require improvements to such control technologies at some of our plants. Under the CAA, compliance is required within three years of the effective date of the rule; however, the compliance period for a unit, or group of units, may be extended by state permitting authorities (for one additional year) or through a determination by the President (for up to two additional years). At this time, the Company cannot predict whether new regulations for hazardous air pollutants will be promulgated or, if promulgated, the extent of such regulations, but the cost of compliance with any such regulations could be material.
In July 1999, the EPA published the “Regional Haze Rule” to reduce haze and protect visibility in designated federal areas. On June 15, 2005, the EPA proposed amendments to the Regional Haze Rule that, among other things, set guidelines for determining when to require the installation of “best available retrofit technology” (“BART”) at older plants. The amendment to the Regional Haze Rule required states to consider the visibility impacts of the haze produced by an individual facility, in addition to other factors, when determining whether that facility must install potentially costly emissions controls. States were required to submit their regional haze state implementation plans (“SIPs”) to the EPA by December 2007, but only 13 states met this deadline. The EPA has yet to approve any state’s Regional Haze state implementation plan. The statute requires compliance within five years after the EPA approves the relevant SIP, although individual states may impose more stringent compliance schedules.
In Europe, the Company is, and will continue to be, required to reduce air emissions from our facilities to comply with applicable EC Directives, including Directive 2001/80/EC on the limitation of emissions of certain pollutants into the air from large combustion plants (the “LCPD”), which sets emission limit values for NOX, SO2, and particulate matter for large-scale industrial combustion plants for all member states. Until June 2004, existing coal plants could “opt-in” or “opt-out” of the LCPD emissions standards. Those plants that opted out will be required to cease all operations by 2015 and may not operate for more than 20,000 hours after 2008. Those that opted-in, like the Company’s AES Kilroot facility in the United Kingdom, must invest in abatement technology to achieve specific SO2 reductions. Kilroot installed a new flue gas desulphurization system in the second quarter of 2009 in order to satisfy SO2 reduction requirements. The Company’s other coal plants in Europe are either exempt from the Directive due to their size or have opted-in but will not require any additional abatement technology to comply with the LCPD.
On January 18 2011, the President of Chile approved a new air emissions regulation submitted to him by the national environmental regulatory agency (“CONAMA”). The new regulation establishes limits on emissions of NOX, SO2, metals and particulate matter for both existing and new thermal power plants, with more stringent limitations on new facilities. The regulation will become effective upon approval of the General Comptroller of Chile. The regulation will require AES Gener, our Chilean subsidiary, to install emissions reduction equipment at its existing thermal plants from late 2011 through 2015. The exact costs of compliance with such regulation have
225
Table of Contents
THE AES CORPORATION
NOTES TO CONSOLIDATED FINANCIAL STATEMENTS—(Continued)
DECEMBER 31, 2010, 2009, AND 2008
not yet been determined and the Company believes some of the compliance costs are contractually passed through to counterparties. However, the compliance costs could be material.
Water Discharges
The Company also faces certain risks and uncertainties related to environmental laws and regulations pertaining to water discharge. The Company’s facilities are subject to a variety of rules governing water discharges. In particular, the Company is subject to the United States Clean Water Act Section 316(b) rule regarding existing power plant cooling water intake structures issued by the EPA in 2005 (69 Fed. Reg. 41579, July 9, 2004), and the subsequent Circuit Court of Appeals decision and Supreme Court decision regarding this rule. The rule as originally issued could affect 12 of the Company’s United States power plants and the rule’s requirements would be implemented via each plant’s National Pollutant Discharge Elimination System (“NPDES”) water quality permit renewal process. These permits are usually processed by state water quality agencies. To protect fish and other aquatic organisms, the 2004 rule requires existing steam electric generating facilities to utilize the best technology available for cooling water intake structures. To comply, a steam electric generating facility must first prepare a Comprehensive Demonstration Study to assess the facility’s effect on the local aquatic environment. Since each facility’s design, location, existing control equipment and results of impact assessments must be taken into consideration, costs will likely vary. The timing of capital expenditures to achieve compliance with this rule will vary from site to site. On January 25, 2007, the United States Court of Appeals for the Second Circuit decision (Docket Nos. 04-6692 to 04-6699) vacated and remanded major parts of the 2004 rule back to the EPA. In November 2007, three industry petitioners sought review of the Second Circuit’s decision by the United States Supreme Court, and this review was granted by the United States Supreme Court in April 2008. In its April 2009 decision, the United States Supreme Court granted the EPA authority to use a cost-benefit analysis when setting technology-based requirements under Section 316(b) of the Clean Water Act, and expressed no view on the remaining bases for the Second Circuit’s remand. New draft rule 316(b) regulations are expected to be proposed by the EPA by March 14, 2011, and finalized by July 27, 2010. Until such regulations are final, the EPA has instructed state regulatory agencies to use their best professional judgment in determining how to evaluate what constitutes best technology available for minimizing adverse environmental impacts from cooling water intake structures. Certain states in which the Company operates power generation facilities, such as New York, have been delegated authority and are moving forward with best technology available determinations in the absence of any final rule from the EPA. On September 27, 2010, the California Office of Administrative Law approved a policy adopted by the California Water Resources Control Board with respect to power plant cooling water intake structures. This policy became effective on October 1, 2010 and establishes technology-based standards to implement Section 316(b) of the United States Clean Water Act. At this time, it is contemplated that the Company’s Redondo Beach, Huntington Beach and Alamitos power plants in California will need to have in place “best technology available” by December 31, 2020, or repower the facilities. At present, the Company cannot predict the final requirements under Section 316(b) or whether compliance with the anticipated new 316(b) rule will have a material impact on our operations or results, but the Company expects that capital investments and/or modifications resulting from such requirements could be significant.
Waste Management
The Company also faces certain risks and uncertainties related to environmental laws and regulations pertaining to waste management. In the course of operations, the Company’s facilities generate solid and liquid waste materials requiring eventual disposal or processing. With the exception of coal combustion byproducts (“CCB”), the wastes are not usually physically disposed of on our property, but are shipped off site for final disposal, treatment or recycling. CCB, which consists of bottom ash, fly ash and air pollution control wastes, is
226
Table of Contents
THE AES CORPORATION
NOTES TO CONSOLIDATED FINANCIAL STATEMENTS—(Continued)
DECEMBER 31, 2010, 2009, AND 2008
disposed of at some of our coal-fired power generation plant sites using engineered, permitted landfills. Waste materials generated at our electric power and distribution facilities include CCB, oil, scrap metal, rubbish, small quantities of industrial hazardous wastes such as spent solvents, tree and land clearing wastes and polychlorinated biphenyl contaminated liquids and solids. The Company endeavors to ensure that all of its solid and liquid wastes are disposed of in accordance with applicable national, regional, state and local regulations. On December 22, 2009, a dike at a coal ash containment area at the Tennessee Valley Authority’s plant in Kingston, Tennessee failed, and over 1 billion gallons of ash was released into adjacent waterways and properties. Following such incident, there has been heightened focus on the regulation of CCBs. On June 21, 2010, the EPA published in the Federal Register a proposed rule to regulate CCB under the Resource Conservation and Recovery Act (“RCRA”). The proposed rule provides two possible options for CCB regulation, both options contemplate heightened structural integrity requirements for surface impoundments of CCB.
The first option contemplates regulation of CCB as a hazardous waste subject to regulation under Subtitle C of the RCRA. Under this option, existing surface impoundments containing CCB would be required to be retrofitted with composite liners and these impoundments would likely be phased out over several years. State and/or federal permit programs would be developed for storage, transport and disposal of CCB. States could bring enforcement actions for non-compliance with permitting requirements, and the EPA would have oversight responsibilities as well as the authority to bring lawsuits for non-compliance.
The second option contemplates regulation of CCB under Subtitle D of the RCRA. Under this option, the EPA would create national criteria applicable to CCB landfills and surface impoundments. Existing impoundments would also be required to be retrofitted with composite liners and would likely be phased out over several years. This option would not contain federal or state permitting requirements. The primary enforcement mechanism under regulation pursuant to Subtitle D would be private lawsuits.
The public comment period for this proposed regulation has expired, and the EPA is required to consider the public comments prior to promulgating a final rule. Requirements under a final rule are expected to become effective by January 2012, with a compliance schedule of five years. While the exact impact and compliance cost associated with future regulations of CCB cannot be established until such regulations are finalized, there can be no assurance that the Company’s businesses, financial condition or results of operations would not be materially and adversely affected by such regulations.
GUARANTEES, LETTERS OF CREDIT
In connection with certain project financing, acquisition, power purchase and other agreements, AES has expressly undertaken limited obligations and commitments, most of which will only be effective or will be terminated upon the occurrence of future events. In the normal course of business, AES has entered into various agreements, mainly guarantees and letters of credit, to provide financial or performance assurance to third parties on behalf of AES businesses. These agreements are entered into primarily to support or enhance the creditworthiness otherwise achieved by a business on a stand-alone basis, thereby facilitating the availability of sufficient credit to accomplish their intended business purposes. Most of the contingent obligations primarily relate to future performance commitments which the Company or its businesses expect to fulfill within the normal course of business. The expiration dates of these guarantees vary from less than one year to more than 16 years. In addition to the contingent obligations of the Parent Company identified in the table below, the Company’s subsidiaries had letters of credit outstanding to support various contingent obligations.
The following table summarizes the Parent Company’s contingent contractual obligations as of December 31, 2010. Amounts presented in the table below represent the Parent Company’s current undiscounted
227
Table of Contents
THE AES CORPORATION
NOTES TO CONSOLIDATED FINANCIAL STATEMENTS—(Continued)
DECEMBER 31, 2010, 2009, AND 2008
exposure to guarantees and the range of maximum undiscounted potential exposure. The maximum exposure is not reduced by the amounts, if any, that could be recovered under the recourse or collateralization provisions in the guarantees. The amounts include obligations made by the Parent Company for the direct benefit of the lenders associated with the non-recourse debt of businesses of $101 million.
| Contingent contractual obligations |
Amount | Number of Agreements |
Maximum Exposure Range for Each Agreement |
|||||||||
| (in millions) | (in millions) | |||||||||||
| Guarantees |
$ | 415 | 24 | <$ | 1 - $62 | |||||||
| Letters of credit under the senior secured credit facility |
85 | 30 | <$ | 1 - $26 | ||||||||
| Total |
$ | 500 | 54 | |||||||||
The risks associated with these obligations include change of control, construction cost overruns, political risk, tax indemnities, spot market power prices, sponsor support and liquidated damages under power purchase agreements and other agreements for projects in development, under construction and operating. While the Company does not expect to be required to fund any material amounts under these contingent contractual obligations during 2011 or beyond that are not recognized on the Consolidated Balance Sheet, many of the events which would give rise to such an obligation are beyond the Parent Company’s control. There can be no assurance that the Parent Company would have adequate sources of liquidity to fund its obligations under these contingent contractual obligations if it were required to make substantial payments thereunder.
During 2010, the Company paid letter of credit fees ranging from 3.19% to 3.75% per annum on the outstanding amounts of letters of credit.
LITIGATION
The Company is involved in certain claims, suits and legal proceedings in the normal course of business, some of which are described below. The Company has accrued for litigation and claims where it is probable that a liability has been incurred and the amount of loss can be reasonably estimated. The Company has evaluated claims in accordance with the accounting guidance for contingencies that it deems both probable and reasonably estimable and accordingly, has recorded aggregate reserves for all claims for approximately $450 million and $482 million as of December 31, 2010 and 2009. These are reported on the Consolidated Balance Sheet within “accrued and other liabilities” and “other long-term liabilities.” A significant portion of these reserves relate to employment, non-income tax and customer disputes in international jurisdictions, principally Brazil. Certain of the Company’s subsidiaries, principally in Brazil, are defendants in a number of labor and employment lawsuits. The complaints generally seek unspecified monetary damages, injunctive relief or other relief. The subsidiaries have denied any liability and intend to vigorously defend themselves in all of these proceedings. There can be no assurance that this reserve will be adequate to cover all existing and future claims or that we will have the liquidity to pay such claims as they arise.
The Company believes, based upon information it currently possesses and taking into account established reserves for liabilities and its insurance coverage, that the ultimate outcome of these proceedings and actions is unlikely to have a material effect on the Company’s financial statements. However, even where no reserve has
228
Table of Contents
THE AES CORPORATION
NOTES TO CONSOLIDATED FINANCIAL STATEMENTS—(Continued)
DECEMBER 31, 2010, 2009, AND 2008
been recognized, it is reasonably possible that some matters could be decided unfavorably to the Company, and could require the Company to pay damages or make expenditures in amounts that could be material.
In 1989, Centrais Elétricas Brasileiras S.A. (“Eletrobrás”) filed suit in the Fifth District Court in the State of Rio de Janeiro against Eletropaulo Eletricidade de São Paulo S.A. (“EEDSP”) relating to the methodology for calculating monetary adjustments under the parties’ financing agreement. In April 1999, the Fifth District Court found for Eletrobrás and in September 2001, Eletrobrás initiated an execution suit in the Fifth District Court to collect approximately R$1.10 billion ($659 million) from Eletropaulo (as estimated by Eletropaulo) and a lesser amount from an unrelated company, Companhia de Transmissão de Energia Elétrica Paulista (“CTEEP”) (Eletropaulo and CTEEP were spun off from EEDSP pursuant to its privatization in 1998). In November 2002, the Fifth District Court rejected Eletropaulo’s defenses in the execution suit. Eletropaulo appealed and in September 2003, the Appellate Court of the State of Rio de Janeiro (“AC”) ruled that Eletropaulo was not a proper party to the litigation because any alleged liability had been transferred to CTEEP pursuant to the privatization. In June 2006, the Superior Court of Justice (“SCJ”) reversed the Appellate Court’s decision and remanded the case to the Fifth District Court for further proceedings, holding that Eletropaulo’s liability, if any, should be determined by the Fifth District Court. Eletropaulo’s subsequent appeals to the Special Court (the highest court within the SCJ) and the Supreme Court of Brazil were dismissed. Eletrobrás later requested that the amount of Eletropaulo’s alleged debt be determined by an accounting expert appointed by the Fifth District Court. Eletropaulo consented to the appointment of such an expert, subject to a reservation of rights. In February 2010, the Fifth District Court appointed an accounting expert to determine the amount of the alleged debt and the responsibility for its payment in light of the privatization, in accordance with the methodology proposed by Eletrobrás. Pursuant to its reservation of rights, Eletropaulo filed an interlocutory appeal with the AC asserting that the expert was required to determine the issues in accordance with the methodology proposed by Eletropaulo, and that Eletropaulo should be entitled to take discovery and present arguments on the issues to be determined by the expert. In April 2010, the AC issued a decision agreeing with Eletropaulo’s arguments and directing the Fifth District Court to proceed accordingly. Eletrobrás may restart the accounting proceedings at the Fifth District Court at any time, which would proceed according to the AC’s April 2010 decision. In the Fifth District Court proceedings, the expert’s conclusions will be subject to the Fifth District Court’s review and approval. If Eletropaulo is determined to be responsible for the debt, after the amount of the alleged debt is determined, Eletrobrás will be entitled to resume the execution suit in the Fifth District Court at any time. If Eletrobrás does so, Eletropaulo will be required to provide security in the amount of its alleged liability. In that case, if Eletrobrás requests the seizure of such security and the Fifth District Court grants such request, Eletropaulo’s results of operations may be materially adversely affected, and in turn the Company’s results of operations could be materially adversely affected. In addition, in February 2008, CTEEP filed a lawsuit in the Fifth District Court against Eletrobrás and Eletropaulo seeking a declaration that CTEEP is not liable for any debt under the financing agreement. The parties are disputing the proper venue for the CTEEP lawsuit. Eletropaulo believes it has meritorious defenses to the claims asserted against it and will defend itself vigorously in these proceedings; however, there can be no assurances that it will be successful in its efforts.
In August 2000, the FERC announced an investigation into the organized California wholesale power markets to determine whether rates were just and reasonable. Further investigations involved alleged market manipulation. FERC requested documents from each of the AES Southland, LLC plants and AES Placerita, Inc. AES Southland and AES Placerita have cooperated fully with the FERC investigations. AES Southland was not subject to refund liability because it did not sell into the organized spot markets due to the nature of its tolling agreement. After hearings at FERC, AES Placerita was found subject to refund liability of $588,000 plus interest for spot sales to the California Power Exchange from October 2, 2000 to June 20, 2001. As FERC investigations and hearings progressed, numerous appeals on related issues were filed with the U.S. Court of Appeals for the Ninth Circuit.
229
Table of Contents
THE AES CORPORATION
NOTES TO CONSOLIDATED FINANCIAL STATEMENTS—(Continued)
DECEMBER 31, 2010, 2009, AND 2008
Over the years, the Ninth Circuit issued several opinions that had the potential to expand the scope of the FERC proceedings and increase refund exposure for AES Placerita and other sellers of electricity. Following remand of one of the Ninth Circuit appeals in March 2009, FERC started a new hearing process involving AES Placerita and other sellers. In May 2009, AES Placerita entered into a settlement, approved by FERC in July 2009, concerning the claims before FERC against AES Placerita relating to the California energy crisis of 2000-2001, including the California refund proceeding. Pursuant to the settlement, AES Placerita paid $6 million and assigned a receivable of $168,119 due to it from the California Power Exchange in return for a release of all claims against it at FERC by the settling parties and other consideration. More than 98% of the buyers in the market elected to join the settlement. A small amount of AES Placerita’s settlement payment was placed in escrow for buyers that did not join the settlement (“non-settling parties”). It is unclear whether the escrowed funds will be enough to satisfy any additional sums that might be determined to be owed to non-settling parties at the conclusion of the FERC proceedings concerning the California energy crisis. However, any such additional sums are expected to be immaterial to the Company’s consolidated financial statements. In November 2009, one non-settling party, the Sacramento Municipal Utility District (“SMUD”), filed an appeal of the FERC’s approval of the settlement which is pending in the Ninth Circuit. SMUD’s appeal has been stayed pending further order of the court. The settlement agreement is still effective and will continue to remain effective unless it is vacated by the Ninth Circuit. SMUD has reached a settlement in principal with buyers of electricity that, if approved by FERC, will leave only immaterial claims of non-settling parties against AES Placerita.
In August 2001, the Grid Corporation of Orissa, India, now Gridco Ltd. (“Gridco”), filed a petition against the Central Electricity Supply Company of Orissa Ltd. (“CESCO”), an affiliate of the Company, with the Orissa Electricity Regulatory Commission (“OERC”), alleging that CESCO had defaulted on its obligations as an OERC-licensed distribution company, that CESCO management abandoned the management of CESCO, and asking for interim measures of protection, including the appointment of an administrator to manage CESCO. Gridco, a state-owned entity, is the sole wholesale energy provider to CESCO. Pursuant to the OERC’s August 2001 order, the management of CESCO was replaced with a government administrator who was appointed by the OERC. The OERC later held that the Company and other CESCO shareholders were not necessary or proper parties to the OERC proceeding. In August 2004, the OERC issued a notice to CESCO, the Company and others giving the recipients of the notice until November 2004 to show cause why CESCO’s distribution license should not be revoked. In response, CESCO submitted a business plan to the OERC. In February 2005, the OERC issued an order rejecting the proposed business plan. The order also stated that the CESCO distribution license would be revoked if an acceptable business plan for CESCO was not submitted to and approved by the OERC prior to March 31, 2005. In its April 2, 2005 order, the OERC revoked the CESCO distribution license. CESCO has filed an appeal against the April 2, 2005 OERC order and that appeal remains pending in the Indian courts. In addition, Gridco asserted that a comfort letter issued by the Company in connection with the Company’s indirect investment in CESCO obligates the Company to provide additional financial support to cover all of CESCO’s financial obligations to Gridco. In December 2001, Gridco served a notice to arbitrate pursuant to the Indian Arbitration and Conciliation Act of 1996 on the Company, AES Orissa Distribution Private Limited (“AES ODPL”), and Jyoti Structures (“Jyoti”) pursuant to the terms of the CESCO Shareholders Agreement between Gridco, the Company, AES ODPL, Jyoti and CESCO (the “CESCO arbitration”). In the arbitration, Gridco appeared to be seeking approximately $189 million in damages, plus undisclosed penalties and interest, but a detailed alleged damage analysis was not filed by Gridco. The Company counterclaimed against Gridco for damages. In June 2007, a 2-to-1 majority of the arbitral tribunal rendered its award rejecting Gridco’s claims and holding that none of the respondents, the Company, AES ODPL, or Jyoti, had any liability to Gridco. The respondents’ counterclaims were also rejected. In September 2007, Gridco filed a challenge of the arbitration award with the local Indian court. In June 2008, Gridco filed a separate application with the local Indian court for an order enjoining the Company from selling or otherwise transferring its shares in
230
Table of Contents
THE AES CORPORATION
NOTES TO CONSOLIDATED FINANCIAL STATEMENTS—(Continued)
DECEMBER 31, 2010, 2009, AND 2008
Orissa Power Generation Corporation Ltd.’s (“OPGC”), an equity method investment, and requiring the Company to provide security in the amount of the contested damages in the CESCO arbitration until Gridco’s challenge to the arbitration award is resolved. In June 2010, a 2-to-1 majority of the arbitral tribunal awarded the Company some of its costs relating to the arbitration. In August 2010, Gridco filed a challenge of the cost award with the local Indian court. The Company believes that it has meritorious defenses to the claims asserted against it and will defend itself vigorously in these proceedings; however, there can be no assurances that it will be successful in its efforts.
In early 2002, Gridco made an application to the OERC requesting that the OERC initiate proceedings regarding the terms of OPGC’s existing PPA with Gridco. In response, OPGC filed a petition in the Indian courts to block any such OERC proceedings. In early 2005, the Orissa High Court upheld the OERC’s jurisdiction to initiate such proceedings as requested by Gridco. OPGC appealed that High Court’s decision to the Supreme Court and sought stays of both the High Court’s decision and the underlying OERC proceedings regarding the PPAs terms. In April 2005, the Supreme Court granted OPGC’s requests and ordered stays of the High Court’s decision and the OERC proceedings with respect to the PPA’s terms. The matter is awaiting further hearing. Unless the Supreme Court finds in favor of OPGC’s appeal or otherwise prevents the OERC’s proceedings regarding the PPA’s terms, the OERC will likely lower the tariff payable to OPGC under the PPA, which would have an adverse impact on OPGC’s financials. OPGC believes that it has meritorious claims and defenses and will assert them vigorously in these proceedings; however, there can be no assurances that it will be successful in its efforts.
In March 2003, the office of the Federal Public Prosecutor for the State of São Paulo, Brazil (“MPF”) notified AES Eletropaulo that it had commenced an inquiry related to the BNDES financings provided to AES Elpa and AES Transgás and the rationing loan provided to Eletropaulo, changes in the control of Eletropaulo, sales of assets by Eletropaulo and the quality of service provided by Eletropaulo to its customers, and requested various documents from Eletropaulo relating to these matters. In July 2004, the MPF filed a public civil lawsuit in the Federal Court of São Paulo (“FSCP”) alleging that BNDES violated Law 8429/92 (the Administrative Misconduct Act) and BNDES’s internal rules by: (1) approving the AES Elpa and AES Transgás loans; (2) extending the payment terms on the AES Elpa and AES Transgás loans; (3) authorizing the sale of Eletropaulo’s preferred shares at a stock-market auction; (4) accepting Eletropaulo’s preferred shares to secure the loan provided to Eletropaulo; and (5) allowing the restructurings of Light Serviços de Eletricidade S.A. and Eletropaulo. The MPF also named AES Elpa and AES Transgás as defendants in the lawsuit because they allegedly benefited from BNDES’s alleged violations. In May 2006, the FCSP ruled that the MPF could pursue its claims based on the first, second, and fourth alleged violations noted above. The MPF subsequently filed an interlocutory appeal with the Federal Court of Appeals (“FCA”) seeking to require the FCSP to consider all five alleged violations. Also, in July 2006, AES Elpa and AES Transgás filed an interlocutory appeal with the FCA, which was subsequently consolidated with the MPF’s interlocutory appeal, seeking a transfer of venue and to enjoin the FCSP from considering any of the alleged violations. In June 2009, the FCA granted the injunction sought by AES Elpa and AES Transgás and transferred the case to the Federal Court of Rio de Janeiro. In May 2010, the MPF filed an appeal with the Superior Court of Justice challenging the transfer. The MPF’s lawsuit before the FCSP has been stayed pending a final decision on the interlocutory appeals. AES Elpa and AES Brasiliana (the successor of AES Transgás) believe they have meritorious defenses to the allegations asserted against them and will defend themselves vigorously in these proceedings; however, there can be no assurances that they will be successful in their efforts.
AES Florestal, Ltd. (“Florestal”), had been operating a pole factory and had other assets, including a wooded area known as “Horto Renner,” in the State of Rio Grande do Sul, Brazil (collectively, “Property”). Florestal had been under the control of AES Sul (“Sul”) since October 1997, when Sul was created pursuant to a privatization by the Government of the State of Rio Grande do Sul. After it came under the control of Sul, Florestal performed an
231
Table of Contents
THE AES CORPORATION
NOTES TO CONSOLIDATED FINANCIAL STATEMENTS—(Continued)
DECEMBER 31, 2010, 2009, AND 2008
environmental audit of the entire operational cycle at the pole factory. The audit discovered 200 barrels of solid creosote waste and other contaminants at the pole factory. The audit concluded that the prior operator of the pole factory, Companhia Estadual de Energia Elétrica (“CEEE”), had been using those contaminants to treat the poles that were manufactured at the factory. Sul and Florestal subsequently took the initiative of communicating with Brazilian authorities, as well as CEEE, about the adoption of containment and remediation measures. The Public Attorney’s Office has initiated a civil inquiry (Civil Inquiry n. 24/05) to investigate potential civil liability and has requested that the police station of Triunfo institute a police investigation (IP number 1041/05) to investigate potential criminal liability regarding the contamination at the pole factory. The parties filed defenses in response to the civil inquiry. The Public Attorney’s Office then requested an injunction which the judge rejected on September 26, 2008. The Public Attorney’s office has a right to appeal the decision. The environmental agency (“FEPAM”) has also started a procedure (Procedure n. 088200567/059) to analyze the measures that shall be taken to contain and remediate the contamination. Also, in March 2000, Sul filed suit against CEEE in the 2nd Court of Public Treasure of Porto Alegre seeking to register in Sul’s name the Property that it acquired through the privatization but that remained registered in CEEE’s name. During those proceedings, AES subsequently waived its claim to re-register the Property and asserted a claim to recover the amounts paid for the Property. That claim is pending. In November 2005, the 7th Court of Public Treasure of Porto Alegre ruled that the Property must be returned to CEEE. CEEE has had sole possession of Horto Renner since September 2006 and of the rest of the Property since April 2006. In February 2008, Sul and CEEE signed a “Technical Cooperation Protocol” pursuant to which they requested a new deadline from FEPAM in order to present a proposal. In March 2008, the State Prosecution office filed a Public Class Action against AES Florestal, AES Sul and CEEE, requiring an injunction for the removal of the alleged sources of contamination and the payment of an indemnity in the amount of R$6 million ($4 million). The injunction was rejected and the case is in the evidentiary stage awaiting the judge’s determination concerning the production of expert evidence. The above-referenced proposal was delivered on April 8, 2008. FEPAM responded by indicating that the parties should undertake the first step of the proposal which would be to retain a contractor. In its response, Sul indicated that such step should be undertaken by CEEE as the relevant environmental events resulted from CEEE’s operations. It is estimated that remediation could cost approximately R$14.7 million ($9 million). Discussions between Sul and CEEE are ongoing.
In January 2004, the Company received notice of a “Formulation of Charges” filed against the Company by the Superintendence of Electricity of the Dominican Republic. In the “Formulation of Charges,” the Superintendence asserts that the existence of three generation companies (Empresa Generadora de Electricidad Itabo, S.A. (“Itabo”), Dominican Power Partners, and AES Andres BV) and one distribution company (Empresa Distribuidora de Electricidad del Este, S.A. (“Este”)) in the Dominican Republic, violates certain cross-ownership restrictions contained in the General Electricity Law of the Dominican Republic. In February 2004, the Company filed in the First Instance Court of the National District of the Dominican Republic an action seeking injunctive relief based on several constitutional due process violations contained in the “Formulation of Charges” (“Constitutional Injunction”). In February 2004, the Court granted the Constitutional Injunction and ordered the immediate cessation of any effects of the “Formulation of Charges,” and the enactment by the Superintendence of Electricity of a special procedure to prosecute alleged antitrust complaints under the General Electricity Law. In March 2004, the Superintendence of Electricity appealed the Court’s decision. In July 2004, the Company divested any interest in Este. The Superintendence of Electricity’s appeal is pending. The Company believes it has meritorious defenses to the claims asserted against it and will defend itself vigorously in these proceedings; however, there can be no assurances that it will be successful in its efforts.
In July 2004, the Corporación Dominicana de Empresas Eléctricas Estatales (“CDEEE”) filed lawsuits against Itabo, an affiliate of the Company, in the First and Fifth Chambers of the Civil and Commercial Court of First Instance for the National District. CDEEE alleges in both lawsuits that Itabo spent more than was necessary to rehabilitate two generation units of an Itabo power plant and, in the Fifth Chamber lawsuit, that those funds
232
Table of Contents
THE AES CORPORATION
NOTES TO CONSOLIDATED FINANCIAL STATEMENTS—(Continued)
DECEMBER 31, 2010, 2009, AND 2008
were paid to affiliates and subsidiaries of AES Gener and Coastal Itabo, Ltd. (“Coastal”), a former shareholder of Itabo, without the required approval of Itabo’s board of administration. In the First Chamber lawsuit, CDEEE seeks an accounting of Itabo’s transactions relating to the rehabilitation. In November 2004, the First Chamber dismissed the case for lack of legal basis. On appeal, in October 2005 the Court of Appeals of Santo Domingo ruled in Itabo’s favor, reasoning that it lacked jurisdiction over the dispute because the parties’ contracts mandated arbitration. The Supreme Court of Justice is considering CDEEE’s appeal of the Court of Appeals’ decision. In the Fifth Chamber lawsuit, which also names Itabo’s former president as a defendant, CDEEE seeks $15 million in damages and the seizure of Itabo’s assets. In October 2005, the Fifth Chamber held that it lacked jurisdiction to adjudicate the dispute given the arbitration provisions in the parties’ contracts. The First Chamber of the Court of Appeal ratified that decision in September 2006. In a related proceeding, in May 2005, Itabo filed a lawsuit in the U.S. District Court for the Southern District of New York seeking to compel CDEEE to arbitrate its claims. The petition was denied in July 2005. Itabo’s appeal of that decision to the U.S. Court of Appeals for the Second Circuit has been stayed since September 2006. Further, in September 2006, in an International Chamber of Commerce arbitration, an arbitral tribunal determined that it lacked jurisdiction to decide arbitration claims concerning these disputes. Itabo believes it has meritorious claims and defenses and will assert them vigorously in these proceedings; however, there can be no assurances that it will be successful in its efforts.
In April 2006, a putative class action was filed in the U.S. District Court for the Southern District of Mississippi (“District Court”) on behalf of certain individual plaintiffs and all residents and/or property owners in the State of Mississippi who allegedly suffered harm as a result of Hurricane Katrina, and against the Company and numerous unrelated companies, whose alleged greenhouse gas emissions contributed to alleged global warming which, in turn, allegedly increased the destructive capacity of Hurricane Katrina. The plaintiffs assert unjust enrichment, civil conspiracy/aiding and abetting, public and private nuisance, trespass, negligence, and fraudulent misrepresentation and concealment claims against the defendants. The plaintiffs seek damages relating to loss of property, loss of business, clean-up costs, personal injuries and death, but do not quantify their alleged damages. In August 2007, the District Court dismissed the case. The plaintiffs subsequently appealed to the U.S. Court of Appeals for the Fifth Circuit, which, in October 2009, affirmed the District Court’s dismissal of the plaintiffs’ unjust enrichment, fraudulent misrepresentation, and civil conspiracy claims. However, the Fifth Circuit reversed the District Court’s dismissal of the plaintiffs’ public and private nuisance, trespass, and negligence claims, and remanded those claims to the District Court for further proceedings. In February 2010, the Fifth Circuit granted the petitions for en banc rehearing filed by the Company and other defendants, and thereby vacated its October 2009 decision. In May 2010, the Fifth Circuit dismissed the appeal on the ground that it had lost its quorum for en banc review. In August 2010, the plaintiffs filed a petition for a writ of mandamus in the U.S. Supreme Court, requesting the Supreme Court to direct the Fifth Circuit to reinstate the appeal and return it to the panel that issued the October 2009 decision. In January 2011, the Supreme Court denied the petition, ending the case.
In July 2007, the Competition Committee of the Ministry of Industry and Trade of the Republic of Kazakhstan (the “Competition Committee”) ordered Nurenergoservice, an AES subsidiary, to pay approximately KZT 18 billion ($120 million) for alleged antimonopoly violations in 2005 through the first quarter of 2007. The Competition Committee’s order was affirmed by the economic court in April 2008 (“April 2008 Decision”). The economic court also issued an injunction to secure Nurenergoservice’s alleged liability, freezing Nurenergoservice’s bank accounts and prohibiting Nurenergoservice from transferring or disposing of its property. Nurenergoservice’s subsequent appeals to the court of appeals were rejected. In February 2009, the Antimonopoly Agency (the Competition Committee’s successor) seized approximately KZT 783 million ($5 million) from a frozen Nurenergoservice bank account in partial satisfaction of Nurenergoservice’s alleged damages liability. However, on appeal to the Kazakhstan Supreme Court, in October 2009, the Supreme Court annulled the decisions of the lower courts because of procedural irregularities and remanded the case to the economic court for reconsideration. On remand, in January 2010, the economic court reaffirmed its April 2008
233
Table of Contents
THE AES CORPORATION
NOTES TO CONSOLIDATED FINANCIAL STATEMENTS—(Continued)
DECEMBER 31, 2010, 2009, AND 2008
Decision. Nurenergoservice’s appeals in the court of appeals (first panel) and the court of appeals (second panel) were unsuccessful. Nurenergoservice intends to file a further appeal to the Kazakhstan Supreme Court. In separate but related proceedings, in August 2007, the Competition Committee ordered Nurenergoservice to pay approximately KZT 1.8 billion ($12 million) in administrative fines for its alleged antimonopoly violations. Nurenergoservice’s appeal to the administrative court was rejected in February 2009. Given the adverse court decisions against Nurenergoservice, the Antimonopoly Agency may attempt to seize Nurenergoservice’s remaining assets, which are immaterial to the Company’s consolidated financial statements. The Antimonopoly Agency has not indicated whether it intends to assert claims against Nurenergoservice for alleged antimonopoly violations post first quarter 2007. Nurenergoservice believes it has meritorious defenses to the claims asserted against it; however, there can be no assurances that it will prevail in these proceedings.
In April 2009, the Antimonopoly Agency initiated an investigation of the power sales of Ust-Kamenogorsk HPP (“UK HPP”) and Shulbinsk HPP, hydroelectric plants under AES concession (collectively, the “Hydros”), in January through February 2009. The investigation of Shulbinsk HPP is ongoing, but the investigation of UK HPP has been completed. The Antimonopoly Agency determined that UK HPP abused its market position and charged monopolistically high prices for power in January through February 2009. The Agency sought an order from the administrative court requiring UK HPP to pay an administrative fine of approximately KZT 120 million ($1 million) and to disgorge profits for the period at issue, estimated by the Antimonopoly Agency to be approximately KZT 440 million ($3 million). No fines or damages have been paid to date, however, as the proceedings in the administrative court have been suspended due to the initiation of related criminal proceedings against officials of UK HPP. The Hydros believe they have meritorious defenses and will assert them vigorously in these proceedings; however, there can be no assurances that they will be successful in their efforts.
In April 2009, the Antimonopoly Agency initiated an investigation of Ust-Kamenogorsk TETS LLP’s (“UKT”) power sales in 2008 through February 2009. The Antimonopoly Agency subsequently concluded that UKT abused its market position and charged monopolistically high prices for power and should pay an administrative fine of approximately KZT 136 million ($1 million). The Antimonopoly Agency later sought an order from the administrative court requiring UKT to pay the fine. The administrative court proceedings have been suspended due to a related criminal investigation of UKT employees. If the investigation is terminated and the Antimonopoly Agency prevails in the administrative proceedings, UKT may be ordered to pay the administrative fine and disgorge the profits from the sales at issue, estimated by the Antimonopoly Agency to be approximately 514 million KZT ($3 million). UKT believes it has meritorious defenses and will assert them vigorously in these proceedings; however, there can be no assurances that it will be successful in its efforts.
In December 2007, an arbitral tribunal terminated ESSA’s gas supply contracts with members of the Sierra Chata Consortium in light of the restrictions that had been placed on the export of gas by the Argentine Republic. ESSA thereafter terminated its gas transportation contract with Transportadora de Gas del Norte S.A. (“TGN”), and initiated arbitration seeking relief from the obligation to pay the firm tariff under ESSA’s gas transportation contracts with Gasoducto GasAndes (Argentina) S.A. (“GasAndes Argentina”) and Gasoducto GasAndes S.A. (“GasAndes Chile”) or in the alternative, termination of such contracts. TGN (which later filed a lawsuit against ESSA in Argentina), GasAndes Argentina, and GasAndes Chile disputed that the restrictions on the export of gas justified the adjustment or termination of the respective gas transportation contracts and sought due tariff payments. On December 29, 2010, ESSA reached settlement agreements with GasAndes Argentina, GasAndes Chile, and TGN terminating the respective gas transportation contracts and resolving all pending legal disputes and potential future claims. ESSA recognized approximately $72 million as other expense for the three months ended December 31, 2010 related to the settlement agreements. Upon termination of the TGN gas transportation contract, ESSA is no longer required to pay certain charges imposed by the Argentine Republic relating to gas supply infrastructure.
234
Table of Contents
THE AES CORPORATION
NOTES TO CONSOLIDATED FINANCIAL STATEMENTS—(Continued)
DECEMBER 31, 2010, 2009, AND 2008
In February 2008, the Native Village of Kivalina and the City of Kivalina, Alaska, filed a complaint in the U.S. District Court for the Northern District of California against the Company and numerous unrelated companies, claiming that the defendants’ alleged GHG emissions have contributed to alleged global warming which, in turn, allegedly has led to the erosion of the plaintiffs’ alleged land. The plaintiffs assert nuisance and concert of action claims against the Company and the other defendants, and a conspiracy claim against a subset of the other defendants. The plaintiffs seek to recover relocation costs, indicated in the complaint to be from $95 million to $400 million, and other unspecified damages from the defendants. The Company filed a motion to dismiss the case, which the District Court granted in October 2009. The plaintiffs have appealed to the U.S. Court of Appeals for the Ninth Circuit. The parties have briefed the appeal and are awaiting a date for oral argument. The Company believes it has meritorious defenses to the claims asserted against it and will defend itself vigorously in these proceedings; however, there can be no assurances that it will be successful in its efforts.
In July, 1993 the Public Attorney’s office filed a claim against Eletropaulo, the Sao Paulo State Government, SABESP (a state-owned company), CETESB (a state-owned company) and DAEE (the municipal Water and Electric Energy Department) alleging that they were liable for pollution of the Billings Reservoir as a result of pumping water from the Pinheiros River into the Billings Reservoir. The events in question occurred while Eletropaulo was a state-owned company. An initial lower court decision in 2007 found the parties liable for the payment of approximately R$670 million ($401 million) for remediation. Eletropaulo subsequently appealed the decision to the Appellate Court of the State of Sao Paulo which reversed the lower court decision. In 2009, the Public Attorney’s Office has filed appeals to both Superior Court of Justice (“SCJ”) and the Supreme Court (“SC”) and such appeals were answered by Eletropaulo in the fourth quarter of 2009. Eletropaulo believes it has meritorious defenses to the claims asserted against it and will defend itself vigorously in these proceedings; however, there can be no assurances that it will be successful in its efforts.
In September 1996, a public civil action was asserted against Eletropaulo and Associação Desportiva Cultural Eletropaulo (the “Associação”) relating to alleged environmental damage caused by construction of the Associação near Guarapiranga Reservoir. The initial decision that was upheld by the Appellate Court of the State of Sao Paulo in 2006 found that Eletropaulo should repair the alleged environmental damage by demolishing certain construction and reforesting the area, and either sponsor an environmental project which would cost approximately R$1 million ($599 thousand) as of December 31, 2010, or pay an indemnification amount of approximately R$10.2 million ($6 million). Eletropaulo has appealed this decision to the Supreme Court and is awaiting a decision.
In February 2009, a CAA Section 114 information request from the EPA regarding Cayuga and Somerset was received. The request seeks various operating and testing data and other information regarding certain types of projects at the Cayuga and Somerset facilities, generally for the time period from January 1, 2000 through the date of the information request. This type of information request has been used in the past to assist the EPA in determining whether a plant is in compliance with applicable standards under the CAA. Cayuga and Somerset responded to the EPA’s information request in June 2009, and they are awaiting a response from the EPA regarding their submittal. At this time, it is not possible to predict what impact, if any, this request may have on the Company, its results of operations or its financial position.
On February 2, 2009, the Cayuga facility received a Notice of Violation from the New York State Department of Environmental Conservation (“NYSDEC”) that the facility had exceeded the permitted volume limit of coal ash that can be disposed of in the on-site landfill. Cayuga has met with NYSDEC and submitted a Landfill Liner Demonstration Report to them. Such report found that the landfill has adequate engineering integrity to support the additional coal ash and there is no inherent environmental threat. NYSDEC has indicated they accept the finding of the report. A permit modification was approved by the NYSDEC on May 14, 2010 and
235
Table of Contents
THE AES CORPORATION
NOTES TO CONSOLIDATED FINANCIAL STATEMENTS—(Continued)
DECEMBER 31, 2010, 2009, AND 2008
such permit modification allows for closure of this approximately 10-acre portion of the landfill. The construction in accordance with the approved permit modification was completed in November 2010 and the certification report for this construction project is currently being drafted to submit to the NYSDEC in the second quarter of 2011. While at this time it is not possible to predict what impact, if any, this matter may have on the Company, its results of operations or its financial position, based upon the discussions to date, the Company does not believe the impact will be material.
In March 2009, AES Uruguaiana Empreendimentos S.A. (“AESU”) initiated arbitration in the International Chamber of Commerce (“ICC”) against YPF S.A. (“YPF”) seeking damages and other relief relating to YPF’s breach of the parties’ gas supply agreement (“GSA”). Thereafter, in April 2009, YPF initiated arbitration in the ICC against AESU and two unrelated parties, Companhia de Gas do Esado do Rio Grande do Sul and Transportador de Gas del Mercosur S.A. (“TGM”), claiming that AESU wrongfully terminated the GSA and caused the termination of a transportation agreement (“TA”) between YPF and TGM (“YPF Arbitration”). YPF seeks an unspecified amount of damages from AESU, a declaration that YPF’s performance was excused under the GSA due to certain alleged force majeure events, or, in the alternative, a declaration that the GSA and the TA should be terminated without a finding of liability against YPF because of the allegedly onerous obligations imposed on YPF by those agreements. In addition, in the YPF Arbitration, TGM asserts that if it is determined that AESU is responsible for the termination of the GSA, AESU is liable for TGM’s alleged losses, including losses under the TA. The procedural schedules for the arbitrations have been established but the hearing dates have not been scheduled to date. AESU believes it has meritorious defenses to the claims asserted against it and will defend itself vigorously; however, there can be no assurances that it will be successful in its efforts.
In June 2009, the Supreme Court of Chile affirmed a January 2009 decision of the Valparaiso Court of Appeals (“VCA”) that the environmental permit for Empresa Electrica Campiche’s (“EEC”) thermal power plant (“Plant”) was not properly granted and illegal. Construction of the Plant stopped as a consequence of the Supreme Court’s decision. In December 2009, Chilean authorities approved new land use regulations that entitled EEC to apply for a new environmental permit. EEC applied for a new environmental permit in January 2010 and permit approval was granted by the Environmental Authority in February 2010. In March 2010, the Mayor of Puchuncaví and another third party challenged the new environmental permit before the VCA. The parties later entered into a settlement agreement pursuant to which the challenge to the new environmental permit was withdrawn in July 2010. In addition, the construction permit that is required to resume construction of the Plant was issued by the Municipality in August 2010. In September 2010, neighbors of Puchuncaví challenged the construction permit filing claims in the VCA. In November 2010, the VCA rejected the claims. The challenging parties subsequently filed appeals with the Supreme Court. In January 2011, the Supreme Court confirmed the decision of the VCA, finally rejecting the constitutional action. EEC has resumed construction of the Plant.
In June 2009, the Inter-American Commission on Human Rights of the Organization of American States (“IACHR”) requested that the Republic of Panama suspend the construction of AES Changuinola S.A.’s hydroelectric project (“Project”) until the bodies of the Inter-American human rights system can issue a final decision on a petition (286/08) claiming that the construction violates the human rights of alleged indigenous communities. In July 2009, Panama responded by informing the IACHR that it would not suspend construction of the Project and requesting that the IACHR revoke its request. In June 2010, the Inter-American Court of Human Rights vacated the IACHR’s request. With respect to the merits of the underlying petition, the IACHR heard arguments by the communities and Panama in November 2009, but has not issued a decision to date. The Company cannot predict Panama’s response to any determination on the merits of the petition by the bodies of the Inter-American human rights system.
236
Table of Contents
THE AES CORPORATION
NOTES TO CONSOLIDATED FINANCIAL STATEMENTS—(Continued)
DECEMBER 31, 2010, 2009, AND 2008
In July 2009, AES Energía Cartagena S.R.L. (“AES Cartagena”) received notices from the Spanish national energy regulator, Comisión Nacional de Energía (“CNE”), stating that the proceeds of the sale of electricity from AES Cartagena’s plant should be reduced by roughly the value of the CO2 allowances that were granted to AES Cartagena for free for the years 2007, 2008, and the first half of 2009. In particular, the notices stated that CNE intended to invoice AES Cartagena to recover that value, which CNE calculated as approximately €20 million ($27 million) for 2007 - 2008 and an amount to be determined for the first half of 2009. In September 2009, AES Cartagena received invoices for €523,548 (approximately $694,000) for the allowances granted for free for 2007 and €19,907,248 (approximately $26 million) for 2008. In July 2010, AES Cartagena received an invoice for approximately €5.4 million ($7 million) for the allowances granted for free for the first half of 2009. AES Cartagena does not expect to be charged for CO2 allowances issued free of charge for subsequent periods. AES Cartagena has paid the amounts invoiced and has filed challenges to the CNE’s demands in the Spanish judicial system. There can be no assurances that the challenges will be successful. AES Cartagena has demanded indemnification from its fuel supply and electricity toller, GDF-Suez, in relation to the CNE invoices under the long-term energy agreement (the “Energy Agreement”) with GDF-Suez. However, GDF-Suez has disputed that it is responsible for the CNE invoices under the Energy Agreement. Therefore, in September 2009, AES Cartagena initiated arbitration against GDF-Suez, seeking to recover the payments made to CNE. In the arbitration, AES Cartagena also seeks a determination that GDF-Suez is responsible for procuring and bearing the cost of CO2 allowances that are required to offset the CO2 emissions of AES Cartagena’s power plant, which is also in dispute between the parties. To date, AES Cartagena has paid approximately €20 million ($27 million) for the CO2 allowances that have been required to offset 2008 and 2009 CO2 emissions. AES Cartagena expects that allowances will need to be purchased to offset emissions for subsequent years. The evidentiary hearing in the arbitration took place from May 31-June 4, 2010, and closing arguments were heard on September 1, 2010. In February 2011, the arbitral tribunal requested further briefing from the parties on certain issues in the arbitration. If AES Cartagena does not prevail in the arbitration and is required to bear the cost of carbon compliance, its results of operations could be materially adversely affected and, in turn, there could be a material adverse effect on the Company and its results of operations. AES Cartagena believes it has meritorious claims and will assert them vigorously in these proceedings; however, there can be no assurances that it will be successful in its efforts.
In September 2009, the Public Defender’s Office of the State of Rio Grande do Sul (“PDO”) filed a class action against AES Sul in the 16th District Court of Porto Alegre, Rio Grande do Sul (“District Court”), claiming that AES Sul has been illegally passing PIS and COFINS taxes (taxes based on AES Sul’s income) to consumers. According to ANEEL’s Order No. 93/05, the federal laws of Brazil, and the Brazilian Constitution, energy companies such as AES Sul are entitled to highlight PIS and COFINS taxes in power bills to final consumers, as the cost of those taxes is included in the energy tariffs that are applicable to final consumers. Before AES Sul had been served with the action, the District Court dismissed the lawsuit in October 2009 on the ground that AES Sul had been properly highlighting PIS and COFINS taxes in consumer bills in accordance with Brazilian law. In April 2010, the PDO appealed to the Appellate Court of the State of Rio Grande do Sul (“AC”). In November 2010, the AC affirmed the dismissal. The PDO is expected to appeal. If the dismissal is ever reversed and AES Sul does not prevail in the lawsuit and is ordered to cease recovering PIS and COFINS taxes pursuant to its energy tariff, its potential prospective losses could be approximately R$9.6 million ($6 million) per month, as estimated by AES Sul. In addition, if AES Sul is ordered to reimburse consumers, its potential retrospective liability could be approximately R$1.2 billion ($718 million), as estimated by AES Sul. AES Sul believes it has meritorious defenses to the claims asserted against it and will defend itself vigorously in these proceedings if it is served with the action; however, there can be no assurances that it would be successful in its efforts. Furthermore, if AES Sul does not prevail in the litigation it will seek to adjust its energy tariff to compensate it for its losses, but there can be no assurances that it would be successful in obtaining an adjusted energy tariff.
237
Table of Contents
THE AES CORPORATION
NOTES TO CONSOLIDATED FINANCIAL STATEMENTS—(Continued)
DECEMBER 31, 2010, 2009, AND 2008
In October 2009, IPL received a Notice of Violation (“NOV”) and Finding of Violation from EPA pursuant to CAA Section 113(a). The NOV alleges violations of the CAA at IPL’s three coal-fired electric generating facilities dating back to 1986. The alleged violations primarily pertain to EPA’s Prevention of Significant Deterioration and nonattainment New Source Review (“NSR”) requirements under the CAA. Since receiving the letter, IPL management has met with EPA staff and is currently in discussions with the EPA regarding possible resolutions to this NOV. At this time, we cannot predict the ultimate resolution of this matter. However, settlements and litigated outcomes of similar cases have required companies to pay civil penalties and to install additional pollution control technology on coal-fired electric generating units. A similar outcome in this case could have a material impact to IPL and could, in turn, have a material impact on the Company. IPL would seek recovery through customer rates of any operating or capital expenditures related to pollution control technology systems to reduce regulated air emissions; however, there can be no assurances that it would be successful in that regard.
In November 2009, April 2010 and December 2010, substantially similar personal injury lawsuits were filed by a total of 26 residents and estates in the Dominican Republic against the Company, AES Atlantis, Inc., AES Puerto Rico, LP, AES Puerto Rico, Inc., and AES Puerto Rico Services, Inc., in the Superior Court for the State of Delaware. In each lawsuit the plaintiffs allege that the coal combustion byproducts of AES Puerto Rico’s power plant were illegally placed in the Dominican Republic in October 2003 through March 2004 and subsequently caused the plaintiffs’ birth defects, other personal injuries, and/or deaths. The plaintiffs do not quantify their alleged damages, but generally allege that they are entitled to compensatory and punitive damages. The AES defendants have moved for partial dismissal of both the November 2009 and April 2010 lawsuits on various grounds. (The AES Defendants have until mid-February to respond to the December 2010 lawsuit.) In September 2010, the Superior Court heard arguments on the motions. The Superior Court dismissed the plaintiffs’ fraud allegations without prejudice to replead, and the plaintiffs filed amended complaints in November 2010. The AES defendants have filed a renewed motion to dismiss the amended issues. The remaining claims (other than fraud) addressed in the AES defendants’ original motion to dismiss are still pending. The AES defendants believe they have meritorious defenses to the claims asserted against them and will defend themselves vigorously; however, there can be no assurances that they will be successful in their efforts.
On December 21, 2010, AES-3C Maritza East 1 EOOD, which owns an unfinished 670MW lignite-fired power plant in Bulgaria, made the first in a series of demands on the performance bond securing the construction Contractor’s obligations under the parties’ EPC Contract. The Contractor failed to complete the plant on schedule. The total amount demanded by Maritza under the performance bond is approximately €155 million ($205 million). However, the Contractor obtained a temporary injunction from a French court preventing the issuing bank from honoring the bond demands. As the performance bond is governed by English law, Maritza obtained a judgment from an English court that the bond should be paid, and then presented this judgment to the French court which issued the temporary injunction. However, on February 10, 2011, the French court issued a decision enjoining the issuing bank from honoring the demands on the performance bond pending the determination of the arbitration between Maritza and the Contractor, described below. Maritza is attempting to lift that injunction or otherwise obtain payment on its demands. In addition, in December 2010, the Contractor issued a notice of dispute alleging that the lignite that has been supplied by Maritza for commissioning of the power plant is out of specification, allegedly entitling the Contractor to an extension of time to complete the power plant, an increase to the contract price of approximately €62 million ($82 million), and other relief. The Contractor thereafter advised Maritza that it had stopped commissioning of the power plant’s two units because of the characteristics of the lignite supplied, and, in January 2011, initiated arbitration on its lignite claim. Maritza disputes that the lignite is out of specification and intends to defend the arbitration and assert counterclaims for delay liquidated damages and other relief relating to the Contractor’s failure to complete the
238
Table of Contents
THE AES CORPORATION
NOTES TO CONSOLIDATED FINANCIAL STATEMENTS—(Continued)
DECEMBER 31, 2010, 2009, AND 2008
power plant and other breaches of the EPC contract. Maritza believes it has meritorious claims and defenses and will assert them vigorously in these proceedings; however, there can be no assurances that it will be successful in its efforts.
13. BENEFIT PLANS
DEFINED CONTRIBUTION PLAN—The Company sponsors one defined contribution plan, qualified under section 401 of the Internal Revenue Code. All U.S. employees of the Company are eligible to participate in the plan except for those employees who are not covered by their collective bargaining agreement. The plan provides matching contributions in AES common stock, other contributions at the discretion of the Compensation Committee of the Board of Directors in AES common stock and discretionary tax deferred contributions from the participants. Participants are fully vested in their own contributions and the Company’s matching contributions. Participants vest in other company contributions ratably over a five-year period ending on the fifth anniversary of their hire date. Company contributions to the plans were approximately $22 million, $22 million, and $21 million for the years ended December 31, 2010, 2009, and 2008, respectively.
DEFINED BENEFIT PLANS—Certain of the Company’s subsidiaries have defined benefit pension plans covering substantially all of their respective employees. Pension benefits are based on years of credited service, age of the participant and average earnings. Of the 29 defined benefit plans, three are at U.S. subsidiaries and the remaining plans are at foreign subsidiaries.
AES adopted the measurement date provisions of the pension accounting guidance, which require a year-end measurement date of plan assets and obligations for all defined benefit plans, for the fiscal year ended December 31, 2008 and, accordingly, recognized a cumulative adjustment of $1 million to retained earnings as of December 31, 2008.
239
Table of Contents
THE AES CORPORATION
NOTES TO CONSOLIDATED FINANCIAL STATEMENTS—(Continued)
DECEMBER 31, 2010, 2009, AND 2008
The following table reconciles the Company’s funded status, both domestic and foreign, as of December 31, 2010 and 2009:
| December 31, | ||||||||||||||||
| 2010 | 2009 | |||||||||||||||
| U.S. | Foreign | U.S. | Foreign | |||||||||||||
| (in millions) | ||||||||||||||||
| CHANGE IN PROJECTED BENEFIT OBLIGATION: |
||||||||||||||||
| Benefit obligation at beginning of year |
$ | 579 | $ | 5,138 | $ | 557 | $ | 3,498 | ||||||||
| Service cost |
7 | 17 | 7 | 13 | ||||||||||||
| Interest cost |
33 | 511 | 34 | 459 | ||||||||||||
| Employee contributions |
— | 5 | — | 19 | ||||||||||||
| Plan amendments |
11 | — | — | — | ||||||||||||
| Plan settlements |
— | (2 | ) | — | — | |||||||||||
| Benefits paid |
(31 | ) | (411 | ) | (30 | ) | (366 | ) | ||||||||
| Business combinations |
— | 14 | — | — | ||||||||||||
| Actuarial loss |
43 | 474 | 11 | 304 | ||||||||||||
| Effect of foreign currency exchange rate change |
— | 249 | — | 1,211 | ||||||||||||
| Benefit obligation as of December 31 |
$ | 642 | $ | 5,995 | $ | 579 | $ | 5,138 | ||||||||
| CHANGE IN PLAN ASSETS: |
||||||||||||||||
| Fair value of plan assets at beginning of year |
$ | 392 | $ | 4,045 | $ | 327 | $ | 2,752 | ||||||||
| Actual return on plan assets |
48 | 742 | 74 | 489 | ||||||||||||
| Employer contributions |
29 | 157 | 21 | 188 | ||||||||||||
| Employee contributions |
— | 5 | — | 19 | ||||||||||||
| Plan settlements |
— | (2 | ) | — | — | |||||||||||
| Benefits paid |
(31 | ) | (411 | ) | (30 | ) | (366 | ) | ||||||||
| Effect of foreign currency exchange rate change |
— | 198 | — | 963 | ||||||||||||
| Fair value of plan assets as of December 31 |
$ | 438 | $ | 4,734 | $ | 392 | $ | 4,045 | ||||||||
| RECONCILIATION OF FUNDED STATUS |
||||||||||||||||
| Funded status as of December 31 |
$ | (204 | ) | $ | (1,261 | ) | $ | (187 | ) | $ | (1,093 | ) | ||||
The following table summarizes the amounts recognized on the Consolidated Balance Sheets related to the funded status of the plans, both domestic and foreign, as of December 31, 2010 and 2009:
| December 31, | ||||||||||||||||
| 2010 | 2009 | |||||||||||||||
| U.S. | Foreign | U.S. | Foreign | |||||||||||||
| (in millions) | ||||||||||||||||
| AMOUNTS RECOGNIZED ON THE |
||||||||||||||||
| CONSOLIDATED BALANCE SHEETS |
||||||||||||||||
| Noncurrent assets |
$ | — | $ | 34 | $ | — | $ | 32 | ||||||||
| Accrued benefit liability—current |
— | (5 | ) | — | (4 | ) | ||||||||||
| Accrued benefit liability—long-term |
(204 | ) | (1,290 | ) | (187 | ) | (1,121 | ) | ||||||||
| Net amount recognized at end of year |
$ | (204 | ) | $ | (1,261 | ) | $ | (187 | ) | $ | (1,093 | ) | ||||
240
Table of Contents
THE AES CORPORATION
NOTES TO CONSOLIDATED FINANCIAL STATEMENTS—(Continued)
DECEMBER 31, 2010, 2009, AND 2008
The following table summarizes the Company’s accumulated benefit obligation, both domestic and foreign, as of December 31, 2010 and 2009:
| December 31, | ||||||||||||||||
| 2010 | 2009 | |||||||||||||||
| U.S. | Foreign | U.S. | Foreign | |||||||||||||
| (in millions) | ||||||||||||||||
| Accumulated Benefit Obligation |
$ | 623 | $ | 5,936 | $ | 562 | $ | 5,098 | ||||||||
| Information for pension plans with an accumulated benefit obligation in excess of plan assets: |
||||||||||||||||
| Projected benefit obligation |
$ | 642 | $ | 5,703 | $ | 579 | $ | 4,887 | ||||||||
| Accumulated benefit obligation |
623 | 5,657 | 562 | 4,855 | ||||||||||||
| Fair value of plan assets |
438 | 4,410 | 392 | 3,765 | ||||||||||||
| Information for pension plans with a projected benefit obligation in excess of plan assets: |
||||||||||||||||
| Projected benefit obligation |
$ | 642 | $ | 5,710 | $ | 579 | $ | 4,892 | ||||||||
| Fair value of plan assets |
438 | 4,415 | 392 | 3,766 | ||||||||||||
The table below summarizes the significant weighted average assumptions used in the calculation of benefit obligation and net periodic benefit cost, both domestic and foreign, as of December 31, 2010 and 2009:
| December 31, | ||||||||||||||||
| 2010 | 2009 | |||||||||||||||
| U.S. | Foreign | U.S. | Foreign | |||||||||||||
| Benefit Obligation: |
||||||||||||||||
| Discount rates |
5.38 | % | 9.84 | % | 5.93 | % | 10.56 | % | ||||||||
| Rates of compensation increase |
4.00 | % | 6.00 | % | 4.00 | % | 6.00 | % | ||||||||
| Periodic Benefit Cost: |
||||||||||||||||
| Discount rate |
5.93 | % | 10.56 | % | 6.26 | % | 11.78 | % | ||||||||
| Expected long-term rate of return on plan assets |
8.00 | % | 11.12 | % | 8.00 | % | 11.99 | % | ||||||||
| Rate of compensation increase |
4.00 | % | 6.00 | % | 4.75 | % | 5.97 | % | ||||||||
A subsidiary of the Company has a defined benefit obligation of $607 million and $549 million as of December 31, 2010 and 2009, respectively, and uses salary bands to determine future benefit costs rather than rates of compensation increases. Rates of compensation increases in the table above do not include amounts related to this specific defined benefit plan.
The Company establishes its estimated long-term return on plan assets considering various factors, which include the targeted asset allocation percentages, historic returns and expected future returns.
The measurement of pension obligations, costs and liabilities is dependent on a variety of assumptions. These assumptions include estimates of the present value of projected future pension payments to all plan participants, taking into consideration the likelihood of potential future events such as salary increases and demographic experience. These assumptions may have an effect on the amount and timing of future contributions.
241
Table of Contents
THE AES CORPORATION
NOTES TO CONSOLIDATED FINANCIAL STATEMENTS—(Continued)
DECEMBER 31, 2010, 2009, AND 2008
The assumptions used in developing the required estimates include the following key factors:
| • | discount rates; |
| • | salary growth; |
| • | retirement rates; |
| • | inflation; |
| • | expected return on plan assets; and |
| • | mortality rates. |
The effects of actual results differing from the Company’s assumptions are accumulated and amortized over future periods and, therefore, generally affect the Company’s recognized expense in such future periods.
Sensitivity of the Company’s pension funded status to the indicated increase or decrease in the discount rate and long-term rate of return on plan assets assumptions is shown below. Note that these sensitivities may be asymmetric and are specific to the base conditions at year-end 2010. They also may not be additive, so the impact of changing multiple factors simultaneously cannot be calculated by combining the individual sensitivities shown. The December 31, 2010 funded status is affected by the December 31, 2010 assumptions. Pension expense for 2010 is affected by the December 31, 2009 assumptions. The impact on pension expense from a one percentage point change in these assumptions is shown in the table below (in millions):
| Increase of 1% in the discount rate |
$ | (34 | ) | |
| Decrease of 1% in the discount rate |
$ | 43 | ||
| Increase of 1% in the long-term rate of return on plan assets |
$ | (42 | ) | |
| Decrease of 1% in the long-term rate of return on plan assets |
$ | 42 |
The following table summarizes the components of the net periodic benefit cost, both domestic and foreign, for the years ended December 31, 2010 through 2008:
| December 31, | ||||||||||||||||||||||||
| 2010 | 2009 | 2008 | ||||||||||||||||||||||
| Components of Net Periodic Benefit Cost: |
U.S. | Foreign | U.S. | Foreign | U.S. | Foreign | ||||||||||||||||||
| (in millions) | ||||||||||||||||||||||||
| Service cost |
$ | 7 | $ | 17 | $ | 7 | $ | 13 | $ | 6 | $ | 11 | ||||||||||||
| Interest cost |
33 | 511 | 34 | 459 | 32 | 453 | ||||||||||||||||||
| Expected return on plan assets |
(30 | ) | (427 | ) | (26 | ) | (374 | ) | (34 | ) | (412 | ) | ||||||||||||
| Amortization of initial net asset |
— | (1 | ) | — | (2 | ) | — | (3 | ) | |||||||||||||||
| Amortization of prior service cost |
3 | — | 4 | — | 3 | — | ||||||||||||||||||
| Amortization of net loss |
12 | 38 | 16 | 7 | 1 | 2 | ||||||||||||||||||
| Settlement gain recognized |
— | 1 | — | — | 1 | — | ||||||||||||||||||
| Total pension cost |
$ | 25 | $ | 139 | $ | 35 | $ | 103 | $ | 9 | $ | 51 | ||||||||||||
242
Table of Contents
THE AES CORPORATION
NOTES TO CONSOLIDATED FINANCIAL STATEMENTS—(Continued)
DECEMBER 31, 2010, 2009, AND 2008
The following table summarizes the amounts reflected in Accumulated Other Comprehensive Loss on the Consolidated Balance Sheet as of December 31, 2010 that have not yet been recognized as components of net periodic benefit cost:
| December 31, 2010 | ||||||||||||||||
| Accumulated Other Comprehensive Loss |
Amounts expected to be reclassified to earnings in next fiscal year |
|||||||||||||||
| U.S. | Foreign | U.S. | Foreign | |||||||||||||
| (in millions) | ||||||||||||||||
| Prior service cost |
$ | — | $ | (2 | ) | $ | — | $ | — | |||||||
| Unrecognized net actuarial gain (loss) |
(3 | ) | (876 | ) | — | (23 | ) | |||||||||
| Total |
$ | (3 | ) | $ | (878 | ) | $ | — | $ | (23 | ) | |||||
The following table summarizes the Company’s target allocation for 2010 and pension plan asset allocation, both domestic and foreign, as of December 31, 2010 and 2009:
| Percentage of Plan Assets as of December 31, |
||||||||||||||||||||||||
| Target Allocations | 2010 | 2009 | ||||||||||||||||||||||
| Asset Category |
U.S. | Foreign | U.S. | Foreign | U.S. | Foreign | ||||||||||||||||||
| Equity securities |
47% | 15% - 30% | 53.66 | % | 22.71 | % | 57.23 | % | 22.22 | % | ||||||||||||||
| Debt securities |
39% | 59% - 85% | 26.71 | % | 73.36 | % | 34.50 | % | 73.34 | % | ||||||||||||||
| Real estate |
0% | 0% - 4% | — | % | 2.09 | % | — | % | 2.07 | % | ||||||||||||||
| Other |
14% | 0% - 6% | 19.63 | % | 1.84 | % | 8.27 | % | 2.37 | % | ||||||||||||||
| Total pension assets |
100.00 | % | 100.00 | % | 100.00 | % | 100.00 | % | ||||||||||||||||
The U.S. plans seek to achieve the following long-term investment objectives:
| • | Maintenance of sufficient income and liquidity to pay retirement benefits and other lump sum payments; |
| • | Long-term rate of return in excess of the annualized inflation rate; |
| • | Long-term rate of return, net of relevant fees, that meet or exceed the assumed actuarial rate; and |
| • | Long-term competitive rate of return on investments, net of expenses, that is equal to or exceeds various benchmark rates. |
243
Table of Contents
THE AES CORPORATION
NOTES TO CONSOLIDATED FINANCIAL STATEMENTS—(Continued)
DECEMBER 31, 2010, 2009, AND 2008
The asset allocation is reviewed periodically to determine a suitable asset allocation which seeks to manage risk through portfolio diversification and takes into account, among other possible factors, the above-stated objectives, in conjunction with current funding levels, cash flow conditions and economic and industry trends. The following table summarizes the Company’s U.S. plan assets by category of investment and level within the fair value hierarchy as of December 31, 2010 and 2009:
| December 31, 2010 | December 31, 2009 | |||||||||||||||||||||||||||||||
| U.S. Plans |
Level 1 | Level 2 | Level 3 | Total | Level 1 | Level 2 | Level 3 | Total | ||||||||||||||||||||||||
| (in millions) | ||||||||||||||||||||||||||||||||
| Equity securities: |
||||||||||||||||||||||||||||||||
| Common stock |
$ | 160 | $ | 36 | $ | — | $ | 196 | $ | 189 | $ | 31 | $ | — | $ | 220 | ||||||||||||||||
| Mutual funds |
39 | — | — | 39 | 3 | — | — | 3 | ||||||||||||||||||||||||
| Debt securities: |
||||||||||||||||||||||||||||||||
| Government debt securities |
38 | — | — | 38 | 48 | — | — | 48 | ||||||||||||||||||||||||
| Corporate debt securities |
66 | — | — | 66 | 71 | — | — | 71 | ||||||||||||||||||||||||
| Mutual funds(1) |
2 | — | — | 2 | 2 | — | — | 2 | ||||||||||||||||||||||||
| Other debt securities |
11 | — | — | 11 | 15 | — | — | 15 | ||||||||||||||||||||||||
| Other: |
||||||||||||||||||||||||||||||||
| Cash and cash equivalents |
70 | — | — | 70 | 17 | — | — | 17 | ||||||||||||||||||||||||
| Other investments |
— | 16 | — | 16 | — | 16 | — | 16 | ||||||||||||||||||||||||
| Total plan assets |
$ | 386 | $ | 52 | $ | — | $ | 438 | $ | 345 | $ | 47 | $ | — | $ | 392 | ||||||||||||||||
| (1) | Mutual funds categorized as debt securities consist of mutual funds for which debt securities are the primary underlying investment. |
The investment strategy of the foreign plans seeks to maximize return on investment while minimizing risk. The assumed asset allocation has less exposure to equities in order to closely match market conditions and near term forecasts. The following table summarizes the Company’s foreign plan assets by category of investment and level within the fair value hierarchy as of December 31, 2010 and 2009:
| December 31, 2010 | December 31, 2009 | |||||||||||||||||||||||||||||||
| Foreign Plans |
Level 1 | Level 2 | Level 3 | Total | Level 1 | Level 2 | Level 3 | Total | ||||||||||||||||||||||||
| (in millions) | ||||||||||||||||||||||||||||||||
| Equity securities: |
||||||||||||||||||||||||||||||||
| Common stock |
$ | 30 | $ | — | $ | — | $ | 30 | $ | 21 | $ | — | $ | — | $ | 21 | ||||||||||||||||
| Mutual funds |
524 | — | — | 524 | 472 | — | — | 472 | ||||||||||||||||||||||||
| Private equity(1) |
— | — | 521 | 521 | — | — | 406 | 406 | ||||||||||||||||||||||||
| Debt securities: |
||||||||||||||||||||||||||||||||
| Certificates of deposit |
— | 4 | — | 4 | — | 7 | — | 7 | ||||||||||||||||||||||||
| Unsecured debentures |
— | 19 | — | 19 | — | 14 | — | 14 | ||||||||||||||||||||||||
| Government debt securities |
— | 234 | — | 234 | — | 206 | — | 206 | ||||||||||||||||||||||||
| Mutual funds(2) |
95 | 3,110 | — | 3,205 | 88 | 2,646 | — | 2,734 | ||||||||||||||||||||||||
| Other debt securities |
— | 11 | — | 11 | — | 5 | — | 5 | ||||||||||||||||||||||||
| Real estate: |
||||||||||||||||||||||||||||||||
| Real estate(1) |
— | — | 99 | 99 | — | — | 84 | 84 | ||||||||||||||||||||||||
| Other: |
||||||||||||||||||||||||||||||||
| Cash and cash equivalents |
— | 4 | — | 4 | 20 | 2 | — | 22 | ||||||||||||||||||||||||
| Participant loans(3) |
— | — | 83 | 83 | — | — | 74 | 74 | ||||||||||||||||||||||||
| Total plan assets |
$ | 649 | $ | 3,382 | $ | 703 | $ | 4,734 | $ | 601 | $ | 2,880 | $ | 564 | $ | 4,045 | ||||||||||||||||
244
Table of Contents
THE AES CORPORATION
NOTES TO CONSOLIDATED FINANCIAL STATEMENTS—(Continued)
DECEMBER 31, 2010, 2009, AND 2008
| (1) | Plan assets of our Brazilian subsidiaries are invested in private equities and commercial real estate through the plan administrator in Brazil. The fair value of these assets is determined using the income approach through annual appraisals based on a discounted cash flow analysis. |
| (2) | Mutual funds categorized as debt securities consist of mutual funds for which debt securities are the primary underlying investment. |
| (3) | Loans to participants are stated at cost, which approximates fair value. |
The following table presents a reconciliation of all plan assets measured at fair value using significant unobservable inputs (Level 3) for the years ended December 31, 2010 and 2009:
| Year Ended December 31, |
||||||||
| 2010 | 2009 | |||||||
| (in millions) | ||||||||
| Balance at January 1 |
$ | 564 | $ | 380 | ||||
| Actual return on plan assets: |
||||||||
| Returns relating to assets still held at reporting date |
104 | 46 | ||||||
| Purchases, sales, issuances and settlements |
3 | 1 | ||||||
| Change due to exchange rate changes |
32 | 137 | ||||||
| Balance at December 31 |
$ | 703 | $ | 564 | ||||
The following table summarizes the scheduled cash flows for U.S. and foreign expected employer contributions and expected future benefit payments, both domestic and foreign:
| U.S. | Foreign | |||||||
| (in millions) | ||||||||
| Expected employer contribution in 2011 |
$ | 36 | $ | 165 | ||||
| Expected benefit payments for fiscal year ending: |
||||||||
| 2011 |
32 | 432 | ||||||
| 2012 |
33 | 447 | ||||||
| 2013 |
35 | 464 | ||||||
| 2014 |
36 | 481 | ||||||
| 2015 |
38 | 498 | ||||||
| 2016 - 2020 |
212 | 2,751 | ||||||
14. EQUITY
STOCK PURCHASE AGREEMENT
On March 12, 2010, the Company and Terrific Investment Corporation (“Investor”), a wholly owned subsidiary of China Investment Corporation, entered into a stockholder agreement (the “Stockholder Agreement”) in connection with the agreement discussed in the following paragraph. Under the Stockholder Agreement, as long as Investor holds more than 5% of the outstanding shares of common stock of the Company, Investor will have the right to designate one nominee, who must be reasonably acceptable to the Board, for election to the Board of Directors of the Company. Investor has not designated its nominee for election to the Board of Directors of the Company. In addition, until such time as Investor holds 5% or less of the outstanding shares of common stock, Investor has agreed to vote its shares in accordance with the recommendation of the
245
Table of Contents
THE AES CORPORATION
NOTES TO CONSOLIDATED FINANCIAL STATEMENTS—(Continued)
DECEMBER 31, 2010, 2009, AND 2008
Company on any matters submitted to a vote of the stockholders of the Company relating to the election of directors and compensation matters. Otherwise, Investor may vote its shares at its discretion. Further, under the Stockholder Agreement, Investor will be subject to a standstill restriction which generally prohibits Investor from purchasing additional securities of the Company beyond the level acquired by it under the stock purchase agreement entered into between Investor and the Company on November 6, 2009. In addition, Investor has agreed to a lock-up restriction such that Investor would not sell its shares for a period of 12 months following the closing, subject to certain exceptions. The standstill and lock-up restrictions also terminate at such time as Investor holds 5% or less of the outstanding shares of common stock. Investor will have certain registration rights and preemptive rights under the Stockholder Agreement with respect to its shares of common stock of the Company.
On March 15, 2010, the Company completed the sale of 125,468,788 shares of common stock to Investor. The shares were sold for $12.60 per share, for an aggregate purchase price of $1.58 billion. Investor’s ownership in the Company’s common stock is now approximately 15% of the Company’s total outstanding shares of common stock on a fully diluted basis.
STOCK REPURCHASE PROGRAM
In July 2010, the Company’s Board of Directors approved a stock repurchase program under which the Company may repurchase up to $500 million of AES common stock. The Board authorization permits the Company to repurchase stock through a variety of methods, including open market repurchases and/or privately negotiated transactions. The original authorization was set to expire on December 31, 2010, however; in December 2010, the Board authorized an extension of the stock repurchase program. There can be no assurance as to the amount, timing or prices of repurchases, which may vary based on market conditions and other factors. The stock repurchase program may be modified, extended or terminated by the Board of Directors at any time. During the year ended December 31, 2010, shares of common stock repurchased under this plan totaled 8,382,825 at a total cost of $99 million plus a nominal amount of commissions (average of $11.86 per share including commissions). There was $401 million remaining under the stock repurchase program available for future repurchases at December 31, 2010.
On August 7, 2008, the Company’s Board of Directors approved a share repurchase plan for up to $400 million of AES common stock. The Board authorization permitted the Company to repurchase shares over a six month period ended February 7, 2009. Shares of common stock repurchased under this plan through December 31, 2008 totaled 10,691,267 at a total cost of $143 million plus commissions of $0.3 million (average of $13.41 per share including commissions). The Board authorization of the stock repurchase program expired on February 7, 2009.
The shares of stock repurchased have been classified as treasury stock and accounted for using the cost method. A total of 17,287,073 and 9,534,580 shares were held in treasury stock at December 31, 2010 and 2009, respectively. The Company has not retired any shares held in treasury during the years ended December 31, 2010, 2009 or 2008.
246
Table of Contents
THE AES CORPORATION
NOTES TO CONSOLIDATED FINANCIAL STATEMENTS—(Continued)
DECEMBER 31, 2010, 2009, AND 2008
COMPREHENSIVE INCOME
The components of comprehensive income for the years ended December 31, 2010, 2009 and 2008 were as follows:
| December 31, | ||||||||||||
| 2010 | 2009 | 2008 | ||||||||||
| (in millions) | ||||||||||||
| Net income |
$ | 1,059 | $ | 1,755 | $ | 2,032 | ||||||
| Change in fair value of available-for-sale securities, net of income tax (expense) benefit of $3, $(4) and $0, respectively |
(5 | ) | 6 | — | ||||||||
| Foreign currency translation adjustments, net of income tax (expense) benefit of $(11), $(78) and $53, respectively |
468 | 742 | (1,052 | ) | ||||||||
| Derivative activity: |
||||||||||||
| Reclassification to earnings, net of income tax (expense) of $(30), $(41) and $(19), respectively |
91 | (141 | ) | 90 | ||||||||
| Change in derivative fair value, net of income tax (expense) benefit of $56, $34 and $(29), respectively |
(242 | ) | 214 | (158 | ) | |||||||
| Total change in fair value of derivatives |
(151 | ) | 73 | (68 | ) | |||||||
| Change in unfunded pension obligation, net of income tax benefit of $45, $69 and $77, respectively |
(88 | ) | (139 | ) | (149 | ) | ||||||
| Other comprehensive income (loss) |
224 | 682 | (1,269 | ) | ||||||||
| Comprehensive income |
1,283 | 2,437 | 763 | |||||||||
| Less: Comprehensive income attributable to noncontrolling interests(1) |
(1,038 | ) | (1,485 | ) | (169 | ) | ||||||
| Comprehensive income attributable to The AES Corporation |
$ | 245 | $ | 952 | $ | 594 | ||||||
| (1) | Reflects the (income) loss attributed to noncontrolling interests in the form of common securities and dividends on preferred stock. |
The following table summarizes the balances comprising accumulated other comprehensive loss, net of tax, as of December 31, 2010 and 2009:
| December 31, | ||||||||
| 2010 | 2009 | |||||||
| (in millions) | ||||||||
| Foreign currency translation adjustment |
$ | 1,824 | $ | 2,312 | ||||
| Unrealized derivative losses |
344 | 224 | ||||||
| Unfunded pension obligation |
216 | 194 | ||||||
| Unrealized loss on securities available for sale |
(1 | ) | (6 | ) | ||||
| Total |
$ | 2,383 | $ | 2,724 | ||||
247
Table of Contents
THE AES CORPORATION
NOTES TO CONSOLIDATED FINANCIAL STATEMENTS—(Continued)
DECEMBER 31, 2010, 2009, AND 2008
The following table summarizes the net income attributable to The AES Corporation and transfers (to) from noncontrolling interests for the years ended December 31, 2010 and 2009:
| December 31, | ||||||||
| 2010 | 2009 | |||||||
| (in millions) | ||||||||
| Net income attributable to The AES Corporation |
$ | 9 | $ | 658 | ||||
| Transfers (to) from the noncontrolling interests: |
||||||||
| Decrease in The AES Corporation’s paid-in capital for purchase of subsidiary shares |
(25 | ) | — | |||||
| Net transfers (to) from noncontrolling interest |
(25 | ) | — | |||||
| Change from net income attributable to The AES Corporation and transfers (to) from noncontrolling interests |
$ | (16 | ) | $ | 658 | |||
15. SEGMENT AND GEOGRAPHIC INFORMATION
The management reporting structure is organized along our two lines of business (Generation and Utilities) and three regions: (1) Latin America & Africa; (2) North America; and (3) Europe, Middle East & Asia (collectively “EMEA”), each managed by a regional president. The segment reporting structure uses the Company’s management reporting structure as its foundation to reflect how the Company manages the business internally. During 2010, the Company modified its internal reporting structure to move the management of the Company’s generation business in Jordan, Amman East, from Asia to Europe. Accordingly, Amman East is now reported within the Europe—Generation segment. All prior periods have been retrospectively restated to reflect this change and conform to current period presentation. The Company applied the segment reporting accounting guidance, which provides certain quantitative thresholds and aggregation criteria, and the Company concluded it has six reportable segments which include:
| • | Latin America—Generation; |
| • | Latin America—Utilities; |
| • | North America—Generation; |
| • | North America—Utilities; |
| • | Europe—Generation; |
| • | Asia—Generation. |
Corporate and Other—The Company’s Europe Utilities, Africa Utilities, Africa Generation, Wind Generation and Climate Solutions operating segments are reported within “Corporate and Other” because they do not meet the criteria to allow for aggregation with another operating segment or the quantitative thresholds that would require separate disclosure under segment reporting accounting guidance. None of these operating segments are currently material to our presentation of reportable segments, individually or in the aggregate. AES Solar and certain other unconsolidated businesses are accounted for using the equity method of accounting; therefore, their operating results are included in “Net Equity in Earnings of Affiliates” on the face of the Consolidated Statements of Operations, not in revenue or gross margin. “Corporate and Other” also includes costs related to corporate overhead costs which are not directly associated with the operations of our six reportable segments and other intercompany charges such as self-insurance premiums which are fully eliminated in consolidation.
248
Table of Contents
THE AES CORPORATION
NOTES TO CONSOLIDATED FINANCIAL STATEMENTS—(Continued)
DECEMBER 31, 2010, 2009, AND 2008
The Company uses Adjusted Gross Margin, a non-GAAP measure, to evaluate the performance of its segments. Adjusted Gross Margin is defined by the Company as: Gross Margin plus depreciation and amortization less general and administrative expenses.
Segment revenue includes inter-segment sales related to the transfer of electricity from generation plants to utilities within Latin America. No material inter-segment revenue relationships exist between other segments. Corporate allocations include certain management fees and self insurance activities which are reflected within segment Adjusted Gross Margin. All intra-segment activity has been eliminated with respect to revenue and Adjusted Gross Margin within the segment. Inter-segment activity has been eliminated within the total consolidated results. All balance sheet information for businesses that were discontinued or classified as held for sale as of December 31, 2010 is segregated and is shown in the line “Discontinued Businesses” in the accompanying segment tables.
The tables below present the breakdown of business segment balance sheet and income statement data as of and for the years ended December 31, 2010 through 2008:
| Total Revenue | Intersegment | External Revenue | ||||||||||||||||||||||||||||||||||
| 2010 | 2009 | 2008 | 2010 | 2009 | 2008 | 2010 | 2009 | 2008 | ||||||||||||||||||||||||||||
| (in millions) | ||||||||||||||||||||||||||||||||||||
| Revenue |
||||||||||||||||||||||||||||||||||||
| Latin America—Generation |
$ | 4,281 | $ | 3,651 | $ | 4,468 | $ | (1,017 | ) | $ | (864 | ) | $ | (991 | ) | $ | 3,264 | $ | 2,787 | $ | 3,477 | |||||||||||||||
| Latin America—Utilities |
7,222 | 6,092 | 5,907 | — | — | — | 7,222 | 6,092 | 5,907 | |||||||||||||||||||||||||||
| North America—Generation |
1,972 | 1,940 | 2,234 | — | — | — | 1,972 | 1,940 | 2,234 | |||||||||||||||||||||||||||
| North America—Utilities |
1,145 | 1,068 | 1,079 | — | — | — | 1,145 | 1,068 | 1,079 | |||||||||||||||||||||||||||
| Europe—Generation |
1,362 | 820 | 1,143 | (2 | ) | 2 | — | 1,360 | 822 | 1,143 | ||||||||||||||||||||||||||
| Asia—Generation |
618 | 375 | 345 | — | — | — | 618 | 375 | 345 | |||||||||||||||||||||||||||
| Corp/Other and eliminations |
47 | 8 | 21 | 1,019 | 862 | 991 | 1,066 | 870 | 1,012 | |||||||||||||||||||||||||||
| Total Revenue |
$ | 16,647 | $ | 13,954 | $ | 15,197 | $ | — | $ | — | $ | — | $ | 16,647 | $ | 13,954 | $ | 15,197 | ||||||||||||||||||
249
Table of Contents
THE AES CORPORATION
NOTES TO CONSOLIDATED FINANCIAL STATEMENTS—(Continued)
DECEMBER 31, 2010, 2009, AND 2008
| Total Adjusted Gross Margin |
Intersegment | External Adjusted Gross Margin |
||||||||||||||||||||||||||||||||||
| 2010 | 2009 | 2008 | 2010 | 2009 | 2008 | 2010 | 2009 | 2008 | ||||||||||||||||||||||||||||
| (in millions) | ||||||||||||||||||||||||||||||||||||
| Adjusted Gross Margin |
||||||||||||||||||||||||||||||||||||
| Latin America—Generation |
$ | 1,698 | $ | 1,528 | $ | 1,557 | $ | (1,010 | ) | $ | (852 | ) | $ | (978 | ) | $ | 688 | $ | 676 | $ | 579 | |||||||||||||||
| Latin America—Utilities |
1,320 | 1,130 | 1,102 | 1,018 | 865 | 991 | 2,338 | 1,995 | 2,093 | |||||||||||||||||||||||||||
| North America—Generation |
611 | 658 | 836 | 2 | (3 | ) | 17 | 613 | 655 | 853 | ||||||||||||||||||||||||||
| North America—Utilities |
407 | 401 | 419 | 2 | 2 | 2 | 409 | 403 | 421 | |||||||||||||||||||||||||||
| Europe—Generation |
355 | 244 | 299 | 3 | 4 | 2 | 358 | 248 | 301 | |||||||||||||||||||||||||||
| Asia—Generation |
255 | 111 | (11 | ) | 2 | 4 | 4 | 257 | 115 | (7 | ) | |||||||||||||||||||||||||
| Corp/Other and eliminations |
63 | 2 | (64 | ) | (17 | ) | (20 | ) | (38 | ) | 46 | (18 | ) | (102 | ) | |||||||||||||||||||||
| Reconciliation to Income from Continuing Operations before Taxes |
| |||||||||||||||||||||||||||||||||||
| Depreciation and amortization |
|
(1,137 | ) | (980 | ) | (938 | ) | |||||||||||||||||||||||||||||
| Interest expense |
|
(1,526 | ) | (1,485 | ) | (1,770 | ) | |||||||||||||||||||||||||||||
| Interest income |
|
411 | 348 | 519 | ||||||||||||||||||||||||||||||||
| Other expense |
|
(239 | ) | (111 | ) | (161 | ) | |||||||||||||||||||||||||||||
| Other income |
|
108 | 465 | 375 | ||||||||||||||||||||||||||||||||
| Gain on sale of investments |
|
— | 131 | 909 | ||||||||||||||||||||||||||||||||
| Loss on sale of subsidiary stock |
|
— | — | (31 | ) | |||||||||||||||||||||||||||||||
| Goodwill impairment |
|
(21 | ) | (122 | ) | — | ||||||||||||||||||||||||||||||
| Asset impairment expense |
|
(1,221 | ) | (25 | ) | (175 | ) | |||||||||||||||||||||||||||||
| Foreign currency transaction gains (losses) on net monetary position |
|
(33 | ) | 33 | (184 | ) | ||||||||||||||||||||||||||||||
| Other non-operating expense |
|
(7 | ) | (12 | ) | (15 | ) | |||||||||||||||||||||||||||||
| Income from continuing operations before taxes and equity in earnings of affiliates |
|
$ | 1,044 | $ | 2,316 | $ | 2,667 | |||||||||||||||||||||||||||||
| Total Assets | Depreciation and Amortization |
Capital Expenditures | ||||||||||||||||||||||||||||||||||
| 2010 | 2009 | 2008 | 2010 | 2009 | 2008 | 2010 | 2009 | 2008 | ||||||||||||||||||||||||||||
| (in millions) | ||||||||||||||||||||||||||||||||||||
| Latin America—Generation |
$ | 10,373 | $ | 9,802 | $ | 8,217 | $ | 215 | $ | 183 | $ | 168 | $ | 641 | $ | 951 | $ | 886 | ||||||||||||||||||
| Latin America—Utilities |
10,081 | 9,233 | 7,124 | 254 | 220 | 221 | 649 | 413 | 437 | |||||||||||||||||||||||||||
| North America—Generation |
4,926 | 6,226 | 6,444 | 206 | 208 | 197 | 81 | 98 | 134 | |||||||||||||||||||||||||||
| North America—Utilities |
3,139 | 3,035 | 3,092 | 161 | 157 | 152 | 177 | 116 | 117 | |||||||||||||||||||||||||||
| Europe—Generation |
4,191 | 3,184 | 2,885 | 117 | 56 | 49 | 235 | 212 | 534 | |||||||||||||||||||||||||||
| Asia—Generation |
1,762 | 1,594 | 1,588 | 33 | 32 | 23 | 10 | 22 | 32 | |||||||||||||||||||||||||||
| Discontinued businesses |
— | 1,196 | 1,387 | 8 | 44 | 53 | 4 | 4 | 13 | |||||||||||||||||||||||||||
| Corp/Other and eliminations |
6,039 | 5,265 | 4,069 | 184 | 149 | 138 | 536 | 722 | 744 | |||||||||||||||||||||||||||
| Total |
$ | 40,511 | $ | 39,535 | $ | 34,806 | $ | 1,178 | $ | 1,049 | $ | 1,001 | $ | 2,333 | $ | 2,538 | $ | 2,897 | ||||||||||||||||||
250
Table of Contents
THE AES CORPORATION
NOTES TO CONSOLIDATED FINANCIAL STATEMENTS—(Continued)
DECEMBER 31, 2010, 2009, AND 2008
| Investment in and Advances to Affiliates |
Equity in Earnings (Loss) | |||||||||||||||||||||||
| 2010 | 2009 | 2008 | 2010 | 2009 | 2008 | |||||||||||||||||||
| (in millions) | ||||||||||||||||||||||||
| Latin America—Generation |
$ | 150 | $ | 129 | $ | 81 | $ | 48 | $ | 30 | $ | 9 | ||||||||||||
| Latin America—Utilities |
— | — | — | — | — | — | ||||||||||||||||||
| North America—Generation |
— | 3 | 2 | (2 | ) | (2 | ) | (2 | ) | |||||||||||||||
| North America—Utilities |
— | — | 1 | — | — | — | ||||||||||||||||||
| Europe—Generation |
353 | 308 | 232 | 19 | 50 | 28 | ||||||||||||||||||
| Asia—Generation |
409 | 390 | 371 | 3 | 28 | 12 | ||||||||||||||||||
| Discontinued businesses |
— | — | — | — | — | — | ||||||||||||||||||
| Corp/Other and eliminations |
408 | 327 | 214 | 115 | (14 | ) | (14 | ) | ||||||||||||||||
| Total |
$ | 1,320 | $ | 1,157 | $ | 901 | $ | 183 | $ | 92 | $ | 33 | ||||||||||||
The table below presents information, by country, about the Company’s consolidated operations for each of the years ended December 31, 2010 through 2008 and as of December 31, 2010 and 2009, respectively. Revenue is recorded in the country in which it is earned and assets are recorded in the country in which they are located.
| Revenue | Property, Plant & Equipment, net |
|||||||||||||||||||
| 2010 | 2009 | 2008 | 2010 | 2009 | ||||||||||||||||
| (in millions) | ||||||||||||||||||||
| United States |
$ | 2,615 | $ | 2,545 | $ | 2,745 | $ | 6,167 | $ | 7,016 | ||||||||||
| Non-U.S.: |
||||||||||||||||||||
| Brazil |
6,473 | 5,394 | 5,501 | 6,413 | 5,799 | |||||||||||||||
| Chile |
1,355 | 1,239 | 1,349 | 2,560 | 2,321 | |||||||||||||||
| Argentina |
887 | 684 | 949 | 459 | 448 | |||||||||||||||
| El Salvador |
648 | 619 | 484 | 261 | 254 | |||||||||||||||
| Dominican Republic |
535 | 429 | 601 | 625 | 634 | |||||||||||||||
| Philippines(1) |
501 | 250 | 148 | 784 | 765 | |||||||||||||||
| Cameroon |
422 | 370 | 379 | 823 | 742 | |||||||||||||||
|
Spain(2) |
411 | — | — | 667 | — | |||||||||||||||
| Mexico |
409 | 329 | 463 | 786 | 802 | |||||||||||||||
| Colombia |
393 | 347 | 291 | 387 | 390 | |||||||||||||||
| United Kingdom |
385 | 241 | 342 | 527 | 433 | |||||||||||||||
| Ukraine |
356 | 286 | 403 | 86 | 80 | |||||||||||||||
| Hungary |
296 | 317 | 466 | 80 | 196 | |||||||||||||||
| Puerto Rico |
253 | 267 | 251 | 596 | 609 | |||||||||||||||
| Panama |
194 | 168 | 210 | 921 | 834 | |||||||||||||||
| Kazakhstan |
138 | 123 | 234 | 63 | 48 | |||||||||||||||
| Jordan |
120 | 104 | 47 | 224 | 231 | |||||||||||||||
| Sri Lanka |
100 | 109 | 184 | 69 | 74 | |||||||||||||||
| Bulgaria(3) |
44 | — | — | 1,825 | 1,835 | |||||||||||||||
|
Qatar(4) |
— | — | — | — | — | |||||||||||||||
| Pakistan(5) |
— | — | — | — | — | |||||||||||||||
|
Oman(6) |
— | — | — | — | — | |||||||||||||||
| Other Non-U.S. |
112 | 133 | 150 | 298 | 285 | |||||||||||||||
| Total Non-U.S. |
14,032 | 11,409 | 12,452 | 18,454 | 16,780 | |||||||||||||||
| Total |
$ | 16,647 | $ | 13,954 | $ | 15,197 | $ | 24,621 | $ | 23,796 | ||||||||||
251
Table of Contents
THE AES CORPORATION
NOTES TO CONSOLIDATED FINANCIAL STATEMENTS—(Continued)
DECEMBER 31, 2010, 2009, AND 2008
| (1) | Masinloc was acquired in April 2008; 2008 revenue represents results for a partial year. |
| (2) | Cartagena was consolidated effective January 1, 2010 upon implementation of the variable interest entity accounting guidance. |
| (3) | Maritza East and our wind project in Bulgaria were under development and therefore not operational as of December 31, 2009. Our wind project in Bulgaria started operations in 2010. |
| (4) | Excludes revenue of $129 million, $163 million and $161 million for the years ended December 31, 2010, 2009 and 2008, respectively, and property, plant and equipment of $501 million as of December 31, 2009 related to Ras Laffan, which was reflected as discontinued operations and businesses held for sale in the accompanying Consolidated Statements of Operations and Consolidated Balance Sheets. |
| (5) | Excludes revenue of $299 million, $470 million and $607 million for the years ended December 31, 2010, 2009 and 2008, respectively, and property, plant and equipment of $36 million as of December 31, 2009 related to Lal Pir and Pak Gen, which were reflected as discontinued operations and businesses held for sale in the accompanying Consolidated Statements of Operations and Consolidated Balance Sheets. |
| (6) | Excludes revenue of $62 million, $101 million and $105 million for the years ended December 31, 2010, 2009 and 2008, respectively, and property, plant and equipment of $311 million as of December 31, 2009, related to Barka, which was reflected as discontinued operations and businesses held for sale in the accompanying Consolidated Statements of Operations and Consolidated Balance Sheets. |
16. SHARE-BASED COMPENSATION
STOCK OPTIONS—AES grants options to purchase shares of common stock under stock option plans. Under the terms of the plans, the Company may issue options to purchase shares of the Company’s common stock at a price equal to 100% of the market price at the date the option is granted. Stock options are generally granted based upon a percentage of an employee’s base salary. Stock options issued under these plans in 2010, 2009 and 2008 have a three-year vesting schedule and vest in one-third increments over the three-year period. The stock options have a contractual term of ten years. At December 31, 2010, approximately 20 million shares were remaining for award under the plans. In all circumstances, stock options granted by AES do not entitle the holder the right, or obligate AES, to settle the stock option in cash or other assets of AES.
The weighted average fair value of each option grant has been estimated, as of the grant date, using the Black-Scholes option-pricing model with the following weighted average assumptions:
| December 31, | ||||||||||||
| 2010 | 2009 | 2008 | ||||||||||
| Expected volatility |
38 | % | 66 | % | 37 | % | ||||||
| Expected annual dividend yield |
— | % | — | % | — | % | ||||||
| Expected option term (years) |
6 | 6 | 6 | |||||||||
| Risk-free interest rate |
2.86 | % | 2.01 | % | 3.04 | % | ||||||
The Company exclusively relies on implied volatility as the expected volatility to determine the fair value using the Black-Scholes option-pricing model. The implied volatility may be exclusively relied upon due to the following factors:
| • | The Company utilizes a valuation model that is based on a constant volatility assumption to value its employee share options; |
| • | The implied volatility is derived from options to purchase AES common stock that are actively traded; |
252
Table of Contents
THE AES CORPORATION
NOTES TO CONSOLIDATED FINANCIAL STATEMENTS—(Continued)
DECEMBER 31, 2010, 2009, AND 2008
| • | The market prices of both the traded options and the underlying shares are measured at a similar point in time and on a date reasonably close to the grant date of the employee share options; |
| • | The traded options have exercise prices that are both near-the-money and close to the exercise price of the employee share options; and |
| • | The remaining maturities of the traded options on which the estimate is based are at least one year. |
Pursuant to share-based compensation accounting guidance, the Company used a simplified method to determine the expected term based on the average of the original contractual term and the pro rata vesting period. This simplified method was used for stock options granted during 2010, 2009 and 2008. This is appropriate given a lack of relevant stock option exercise data. This simplified method may be used as the Company’s stock options have the following characteristics:
| • | The stock options are granted at-the-money; |
| • | Exercisability is conditional only on performing service through the vesting date; |
| • | If an employee terminates service prior to vesting, the employee forfeits the stock options; |
| • | If an employee terminates service after vesting, the employee has a limited time to exercise the stock option; and |
| • | The stock option is nonhedgeable and not transferable. |
The Company does not discount the grant date fair values to estimate post-vesting restrictions. Post-vesting restrictions include black-out periods when the employee is not able to exercise stock options based on their potential knowledge of information prior to the release of that information to the public.
Using the above assumptions, the weighted average fair value of each stock option granted was $5.08, $4.08 and $7.65, for the years ended December 31, 2010, 2009, and 2008, respectively.
The following table summarizes the components of stock-based compensation related to employee stock options recognized in the Company’s financial statements:
| December 31, | ||||||||||||
| 2010 | 2009 | 2008 | ||||||||||
| (in millions) | ||||||||||||
| Pre-tax compensation expense |
$ | 9 | $ | 10 | $ | 12 | ||||||
| Tax benefit |
(2 | ) | (3 | ) | (3 | ) | ||||||
| Stock options expense, net of tax |
$ | 7 | $ | 7 | $ | 9 | ||||||
| Total intrinsic value of options exercised |
$ | 2 | $ | 3 | $ | 9 | ||||||
| Total fair value of options vested |
11 | 13 | 13 | |||||||||
| Cash received from the exercise of stock options |
2 | 6 | 17 | |||||||||
| Windfall tax benefits realized from the exercised stock options |
— | — | 1 | |||||||||
There was no cash used to settle stock options or compensation cost capitalized as part of the cost of an asset for the years ended December 31, 2010, 2009 and 2008. As of December 31, 2010, $5 million of total unrecognized compensation cost related to stock options is expected to be recognized over a weighted average period of 1.5 years. There were no modifications to stock option awards during the year ended December 31, 2010.
253
Table of Contents
THE AES CORPORATION
NOTES TO CONSOLIDATED FINANCIAL STATEMENTS—(Continued)
DECEMBER 31, 2010, 2009, AND 2008
A summary of the option activity for the year ended December 31, 2010 follows (number of options in thousands, dollars in millions except per option amounts):
| Options | Weighted Average Exercise Price |
Weighted Average Remaining Contractual Term (in years) |
Aggregate Intrinsic Value |
|||||||||||||
| Outstanding at December 31, 2009 |
22,372 | $ | 17.59 | |||||||||||||
| Exercised |
(338 | ) | 6.09 | |||||||||||||
| Forfeited and expired |
(2,380 | ) | 30.89 | |||||||||||||
| Granted |
828 | 12.17 | ||||||||||||||
| Outstanding at December 31, 2010 |
20,482 | $ | 16.04 | 3.1 | $ | 25 | ||||||||||
| Vested and expected to vest at December 31, 2010 |
20,150 | $ | 16.10 | 2.6 | $ | 24 | ||||||||||
| Eligible for exercise at December 31, 2010 |
18,079 | $ | 16.68 | 2.4 | $ | 20 | ||||||||||
The aggregate intrinsic value in the table above represents the total pre-tax intrinsic value (the difference between the Company’s closing stock price on the last trading day of the fourth quarter of 2010 and the exercise price, multiplied by the number of in-the-money options) that would have been received by the option holders had all option holders exercised their options on December 31, 2010. The amount of the aggregate intrinsic value will change based on the fair market value of the Company’s stock.
The Company initially recognizes compensation cost on the estimated number of instruments for which the requisite service is expected to be rendered. In 2010, AES has estimated a forfeiture rate of 18.6% and 12.09% for stock options granted in 2010 to non-officer employees and officer employees of AES, respectively. Those estimates will be revised if subsequent information indicates that the actual number of instruments forfeited is likely to differ from previous estimates. Based on the estimated forfeiture rates, the Company expects to expense $3.7 million on a straight-line basis over a three year period (approximately $1.2 million per year) related to stock options granted during the year ended December 31, 2010.
RESTRICTED STOCK
Restricted Stock Units Without Market Conditions—The Company issues restricted stock units (“RSUs”) without market conditions under its long-term compensation plan. The RSUs are generally granted based upon a percentage of the participant’s base salary. The units have a three-year vesting schedule and vest in one-third increments over the three-year period. The units are then required to be held for an additional two years before they can be converted into shares, and thus become transferable. In all circumstances, restricted stock units granted by AES do not entitle the holder the right, or obligate AES, to settle the restricted stock unit in cash or other assets of AES.
For the years ended December 31, 2010, 2009, and 2008, RSUs issued without a market condition had a grant date fair value equal to the closing price of the Company’s stock on the grant date. The Company does not discount the grant date fair values to reflect any post-vesting restrictions. RSUs without a market condition granted to non-executive employees during the years ended December 31, 2010, 2009, and 2008 had grant date fair values per RSU of $12.18, $6.71 and $18.87, respectively. The total grant date fair value of RSUs granted in 2010 without a market condition was $13 million.
254
Table of Contents
THE AES CORPORATION
NOTES TO CONSOLIDATED FINANCIAL STATEMENTS—(Continued)
DECEMBER 31, 2010, 2009, AND 2008
The following table summarizes the components of the Company’s stock-based compensation related to its employee RSUs issued without market conditions recognized in the Company’s consolidated financial statements:
| December 31, | ||||||||||||
| 2010 | 2009 | 2008 | ||||||||||
| (in millions) | ||||||||||||
| RSU expense before income tax |
$ | 11 | $ | 11 | $ | 10 | ||||||
| Tax benefit |
(2 | ) | (3 | ) | (2 | ) | ||||||
| RSU expense, net of tax |
$ | 9 | $ | 8 | $ | 8 | ||||||
| Total value of RSUs converted(1) |
$ | 5 | $ | 7 | $ | — | ||||||
| Total fair value of RSUs vested |
$ | 12 | $ | 12 | $ | 10 | ||||||
| (1) | Amount represents fair market value on the date of conversion. |
There was no cash used to settle RSUs or compensation cost capitalized as part of the cost of an asset for the years ended December 31, 2010, 2009 and 2008. As of December 31, 2010, $11 million of total unrecognized compensation cost related to RSUs without a market condition is expected to be recognized over a weighted average period of approximately 1.8 years. There were no modifications to RSU awards during the year ended December 31, 2010.
A summary of the activity of RSUs without a market condition for the year ended December 31, 2010 follows (number of RSUs in thousands):
| RSUs | Weighted Average Grant Date Fair Values |
Weighted Average Remaining Vesting Term |
||||||||||
| Nonvested at December 31, 2009 |
2,471 | $ | 10.73 | |||||||||
| Vested |
(929 | ) | 12.56 | |||||||||
| Forfeited and expired |
(455 | ) | 12.20 | |||||||||
| Granted |
1,080 | 12.18 | ||||||||||
| Nonvested at December 31, 2010 |
2,167 | $ | 10.20 | 1.5 | ||||||||
| Vested at December 31, 2010 |
2,226 | $ | 16.48 | |||||||||
| Vested and expected to vest at December 31, 2010 |
3,999 | $ | 13.67 | |||||||||
The table below summarizes the RSUs without a market condition that vested and were converted during the years ended December 31, 2010, 2009 and 2008 (number of RSUs in thousands):
| December 31, | ||||||||||||
| 2010 | 2009 | 2008 | ||||||||||
| RSUs vested during the year |
929 | 619 | 597 | |||||||||
| RSUs converted during the year(1) |
386 | 772 | 59 | |||||||||
| (1) | Net of shares withheld for taxes of 127,000 and 238,000 in the years ended December 31, 2010 and 2009, respectively. No shares were withheld for taxes during the year ended December 31, 2008. |
255
Table of Contents
THE AES CORPORATION
NOTES TO CONSOLIDATED FINANCIAL STATEMENTS—(Continued)
DECEMBER 31, 2010, 2009, AND 2008
Restricted Stock Units With Market Conditions—Restricted stock units issued to officers of the Company have a three-year vesting schedule and include a market condition to vest. Vesting will occur if the applicable continued employment conditions are satisfied and the Total Stockholder Return (“TSR”) on AES common stock exceeds the TSR of the Standard and Poor’s 500 (“S&P 500”) over the three-year measurement period beginning on January 1st in the year of grant and ending after three years on December 31st. In certain situations where the TSR of both AES common stock and the S&P 500 exhibit a gain over the measurement period, the grant may vest without the TSR of AES common stock exceeding the TSR of the S&P 500, if the Compensation Committee exercises its discretion to permit such vesting. The units are then required to be held for an additional two years subsequent to vesting before they can be converted into shares, and thus become transferable. In all circumstances, restricted stock units granted by AES do not entitle the holder the right, or obligate AES, to settle the restricted stock unit in cash or other assets of AES.
The effect of the market condition on restricted stock units issued to officers of the Company is reflected in the award’s fair value on the grant date for the year ended December 31, 2010. A discount of 5.0% was applied to the closing price of the Company’s stock on the date of grant to estimate the fair value to reflect the market condition for RSUs with market conditions granted during the year ended December 31, 2010. RSUs that included a market condition granted during the year ended December 31, 2010, 2009 and 2008 had a grant date fair value per RSU of $11.57, $6.68 and $16.23, respectively. The total grant date fair value of RSUs with a market condition granted in 2010 was $4 million. If no discount was applied to reflect the market condition for RSUs issued to officers, the total grant date fair value of RSUs with a market condition granted during the year ended December 31, 2010 would have increased by an immaterial amount.
The following table summarizes the components of the Company’s stock-based compensation related to its RSUs granted with market conditions recognized in the Company’s consolidated financial statements:
| December 31, | ||||||||||||
| 2010 | 2009 | 2008 | ||||||||||
| (in millions) | ||||||||||||
| RSU expense before income tax |
$ | 4 | $ | 4 | $ | 4 | ||||||
| Tax benefit |
(1 | ) | (1 | ) | (1 | ) | ||||||
| RSU expense, net of tax |
$ | 3 | $ | 3 | $ | 3 | ||||||
| Total value of RSUs converted(1) |
$ | 3 | $ | 4 | $ | — | ||||||
| Total fair value of RSUs vested(2) |
$ | — | $ | — | $ | 5 | ||||||
| (1) | Amount represents fair market value on the date of conversion. |
| (2) | RSUs granted in 2007 with a market condition did not vest in 2010 because the TSR on AES common stock did not exceed the TSR of the S&P 500 over the three year vesting period. |
There was no cash used to settle RSUs or compensation cost capitalized as part of the cost of an asset for the years ended December 31, 2010, 2009 and 2008. As of December 31, 2010, $5 million of total unrecognized compensation cost related to RSUs with a market condition is expected to be recognized over a weighted average period of approximately 1.7 years. There were no modifications to RSU awards during the year ended December 31, 2010.
256
Table of Contents
THE AES CORPORATION
NOTES TO CONSOLIDATED FINANCIAL STATEMENTS—(Continued)
DECEMBER 31, 2010, 2009, AND 2008
A summary of the activity of RSUs with a market condition for the year ended December 31, 2010 follows (number of RSUs in thousands):
| RSUs | Weighted Average Grant Date Fair Values |
Weighted Average Remaining Vesting Term |
||||||||||
| Nonvested at December 31, 2009 |
1,136 | $ | 10.80 | |||||||||
| Vested |
— | — | ||||||||||
| Forfeited and expired |
(223 | ) | 17.78 | |||||||||
| Granted |
370 | 11.57 | ||||||||||
| Nonvested at December 31, 2010 |
1,283 | $ | 9.80 | 1.3 | ||||||||
| Vested at December 31, 2010 |
— | $ | — | |||||||||
| Vested and expected to vest at December 31, 2010 |
1,125 | $ | 9.76 | |||||||||
The table below summarizes the RSUs with a market condition that vested and were converted during the years ended 2010, 2009 and 2008 (number of RSUs in thousands):
| December 31, | ||||||||||||
| 2010 | 2009 | 2008 | ||||||||||
| RSUs vested during the year |
— | — | 352 | |||||||||
| RSUs converted during the year(1) |
245 | 410 | — | |||||||||
| (1) | Net of shares withheld for taxes of 102,000 and 153,000 during the years ended December 31, 2010 and 2009, respectively. There were no shares withheld for taxes during the year ended December 31, 2008. |
17. SUBSIDIARY STOCK
The Company’s subsidiary had $60 million of cumulative preferred stock outstanding at December 31, 2010 and 2009. This represented five series of preferred stock of IPL, the Company’s integrated utility in Indiana. The total annual dividend requirements were approximately $3 million at December 31, 2010 and 2009. Certain series of the preferred stock were redeemable solely at the option of the issuer at prices between $100 and $118 per share. Holders of the preferred stock are entitled to elect a majority of IPL’s board of directors if IPL has not paid dividends to its preferred stockholders for four consecutive quarters. Based on the preferred stockholders’ ability to elect a majority of IPL’s board of directors in this circumstance, the redemption of the preferred shares is considered to be not solely within the control of the issuer and the preferred stock is considered temporary equity and presented in the mezzanine level of the Consolidated Balance Sheets in accordance with the relevant accounting guidance for noncontrolling interests and redeemable securities.
In February 2009, in connection with a preemptive rights period associated with a share issuance (capital increase) at AES Gener, Inversiones Cachagua Limitada (“Cachagua”), a wholly owned subsidiary of the Company, paid $175 million to AES Gener to maintain its current ownership percentage of approximately 70.6%.
On November 6, 2008, Cachagua sold a 9.6% ownership interest in AES Gener in a private transaction for $174.9 million. The sale reduced the Company’s ownership percentage of AES Gener from 80.2% to 70.6%. The Company recognized a pre-tax loss of $30.8 million, net of $3.6 million of related fees, from this transaction in the fourth quarter of 2008.
257
Table of Contents
THE AES CORPORATION
NOTES TO CONSOLIDATED FINANCIAL STATEMENTS—(Continued)
DECEMBER 31, 2010, 2009, AND 2008
18. OTHER INCOME AND EXPENSE
The components of other income are summarized as follows:
| Years Ended December 31, | ||||||||||||
| 2010 | 2009 | 2008 | ||||||||||
| (in millions) | ||||||||||||
| Gain on extinguishment of tax and other liabilities |
$ | 65 | $ | 168 | $ | 199 | ||||||
| Tax credit settlement |
— | 129 | — | |||||||||
| Performance incentive fee |
— | 80 | — | |||||||||
| Insurance proceeds |
— | — | 40 | |||||||||
| Gain on sale of assets |
12 | 14 | 34 | |||||||||
| Other |
31 | 74 | 102 | |||||||||
| Total other income |
$ | 108 | $ | 465 | $ | 375 | ||||||
Other income generally includes gains on asset sales and extinguishments of liabilities, favorable judgments on contingencies, and other income from miscellaneous transactions.
Other income of $108 million for the year ended December 31, 2010 included the extinguishment of a swap liability owed by two of our Brazilian subsidiaries, resulting in the recognition of a $62 million gain. The net impact to the Company after taxes and noncontrolling interest was $9 million. Other income also included a gain on sale of assets at Eletropaulo.
Other income of $465 million for the year ended December 31, 2009 included $165 million from the reduction in interest and penalties associated with federal tax debts at Eletropaulo and Sul as a result of the Programa de Recuperacao Fiscal (“REFIS”) program and a $129 million gain related to a favorable court decision enabling Eletropaulo to receive reimbursement of excess non-income taxes paid from 1989 to 1992 in the form of tax credits to be applied against future tax liabilities. The net impact to the Company after income taxes and noncontrolling interests for these items was $44 million. In addition, the Company recognized income of $80 million from a performance incentive bonus for management services provided to Ekibastuz and Maikuben in 2008. The management agreement was related to the sale of these businesses in Kazakhstan in May 2008; see further discussion of this transaction in Note 22—Acquisitions and Dispositions.
Other income of $375 million for the year ended December 31, 2008 included gains on the extinguishment of a gross receipts tax liability and a legal contingency at Eletropaulo of $117 million and $75 million, respectively, $32 million of cash proceeds related to a favorable legal settlement at Southland in California, $29 million of insurance recoveries for damaged turbines at Uruguaiana, $23 million of gains associated with a sale of land at Eletropaulo and sales of turbines at Itabo, and compensation of $18 million for the impairment associated with the settlement agreement to shut down Hefei.
258
Table of Contents
THE AES CORPORATION
NOTES TO CONSOLIDATED FINANCIAL STATEMENTS—(Continued)
DECEMBER 31, 2010, 2009, AND 2008
The components of other expense are summarized as follows:
| Years Ended December 31, | ||||||||||||
| 2010 | 2009 | 2008 | ||||||||||
| (in millions) | ||||||||||||
| Loss on sale and disposal of assets |
$ | 84 | $ | 42 | $ | 34 | ||||||
| Gener gas settlement |
72 | — | — | |||||||||
| Loss on extinguishment of debt |
37 | — | 70 | |||||||||
| AES Wind transaction costs |
22 | — | — | |||||||||
| Other |
24 | 69 | 57 | |||||||||
| Total other expense |
$ | 239 | $ | 111 | $ | 161 | ||||||
Other expense generally includes losses on asset sales, losses on extinguishment of debt, legal contingencies and losses from other miscellaneous transactions.
Other expense of $239 million for the year ended December 31, 2010 included $72 million for a settlement agreement of gas transportation contracts at Gener. There were also previously capitalized transaction costs of $22 million that were incurred in connection with the preparation for the sale of a noncontrolling interest in our Wind Generation business. These costs were written off upon the expiration of the letter of intent on June 30, 2010. In addition, there were losses on disposal of assets at Eletropaulo, Panama, and Gener, an $18 million loss on debt extinguishment at Andres and Itabo, and a $15 million loss at the Parent Company from the retirement of senior notes.
Other expense of $111 million for the year ended December 31, 2009 included a $13 million loss recognized when three of our businesses in the Dominican Republic received $110 million par value bonds issued by the Dominican Republic government to settle existing accounts receivable for the same amount from the government-owned distribution companies. The loss represented an adjustment to reflect the fair value of the bonds on the date received. Other expenses also included losses on the disposal of assets at Eletropaulo and Andres and contingencies at Alicura in Argentina and our businesses in Kazakhstan.
Other expense of $161 million for the year ended December 31, 2008 included $69 million of losses on the retirement of debt at the Parent Company in June 2008 and at IPALCO associated with a $375 million refinancing in April 2008, and losses on the disposal of assets primarily at Eletropaulo in Brazil.
19. IMPAIRMENT EXPENSE
Asset Impairment
Asset impairment expense for the year ended December 31, 2010 consisted of:
| 2010 | ||||
| (in millions) | ||||
| Eastern Energy |
$ | 827 | ||
| Southland (Huntington Beach) |
200 | |||
| Tisza II |
85 | |||
| Deepwater |
79 | |||
| Other |
30 | |||
| Total |
$ | 1,221 | ||
259
Table of Contents
THE AES CORPORATION
NOTES TO CONSOLIDATED FINANCIAL STATEMENTS—(Continued)
DECEMBER 31, 2010, 2009, AND 2008
Eastern Energy—AES Eastern Energy (“AEE”) operates four coal-fired power plants: Cayuga, Greenidge, Somerset and Westover, representing generation capacity of 1,169 MW in the western New York power market. During 2010, the power prices in the New York power market trended downward, similar to North America natural gas prices. The New York Independent System Operator (“NYISO”) continues to move forward with the potential addition of a new capacity zone, which is expected to put further downward pressure on the capacity prices paid to the AEE facilities. In November 2010, legislation was proposed in the state of New Jersey for the addition of state subsidized capacity additions serving to lower PJM (“Pennsylvania, New Jersey and Maryland”) Interconnection, L.L.C. capacity price expectations. Similar changes to capacity pricing may be made in the future in New York. Continued pressure on energy prices, driven by falling natural gas prices and state actions, indicate that capacity prices are unlikely to reach levels significantly in excess of those achieved historically. Accordingly, management’s view of long-term capacity markets in western New York was revised downward. In December 2010, management revised its cash flow forecasts based on these developments and forecasted continuing negative operating cash flow and losses through 2034. The forecasted energy prices are such that a hedge strategy significantly beyond those in place at December 31, 2010 would not be economical. Additionally, on November 15, 2010, Standard & Poor’s downgraded the bond rating of AEE from BB to B+. Collectively, in the fourth quarter of 2010, these events were considered an impairment indicator for the AES New York asset group, of which AEE is the most significant component and necessitated a recoverability test of the asset group.
The long-lived asset group subject to the impairment evaluation was determined to include all of the generating plants of AEE. This determination was based on the assessment of the plants’ inability to generate independent cash flow. When the recoverability test of the asset group was performed, management concluded that, on an undiscounted cash flow basis, the carrying amount of the asset group was not recoverable. To measure the amount of impairment loss, management was required to determine the fair value of the asset group. To this end, an independent valuation firm was engaged to assist management in its estimation of fair value. Cash flow forecasts and the underlying assumptions for the valuation were developed by management. While there were numerous assumptions that impact the fair value, potential state actions that impact capacity pricing and forward energy prices were the most significant.
In determining the fair value of the asset group, the three valuation approaches prescribed by the fair value measurement accounting guidance were considered. The fair value under the income approach was considered the most appropriate and resulted in a zero fair value. Any salvage value of the asset group is expected to be offset by environmental and other remediation costs. The carrying value of the AEE plants of $827 million exceeded the fair value of $0 million resulting in the recognition of asset impairment expense of $827 million for the year ended December 31, 2010. AEE is reported in the North America Generation segment.
Southland—In May 2010, the California State Water Board approved a policy to reduce the number of marine animals killed by seawater cooling systems in coastal power plants in California. At that time since the policy required the approval of California’s Office of Administrative Law, it was unclear whether the policy would be approved and the exact form the regulations would take. In October 2010, the Office of Administrative Law in California approved the policy that will require the Company to change the process through which it uses ocean water to cool the generation turbines at its Alamitos, Huntington Beach and Redondo Beach (collectively “Southland”) gas-fired generation facilities in California. The policy requires compliance with the new regulations by December 31, 2020. The change in the water cooling process will result in significant future capital expenditures to ensure compliance with the new regulations and the Company determined that an indicator of impairment existed at September 30, 2010. The Company performed an asset impairment test in accordance with the accounting guidance on property, plant and equipment. The asset group was determined to be at the individual plant level and based on the undiscounted cash flow analysis, the Company determined that
260
Table of Contents
THE AES CORPORATION
NOTES TO CONSOLIDATED FINANCIAL STATEMENTS—(Continued)
DECEMBER 31, 2010, 2009, AND 2008
the Huntington Beach asset group was not recoverable. The fair value of the Huntington Beach asset group was then determined using a discounted cash flow analysis. To assist management in determining the fair value of the asset group, an independent valuation firm was engaged. Cash flow forecasts and the underlying assumptions for the valuation were developed by management. The carrying value of the Huntington Beach plant of $288 million exceeded the fair value of $88 million resulting in the recognition of asset impairment expense of $200 million for the year ended December 31, 2010. The undiscounted cash flows of the Alamitos and Redondo Beach generation facilities exceeded their respective carrying values and resulted in no impairment. Huntington Beach is reported in the North America Generation reportable segment.
Tisza II—During the third quarter of 2010, the Company entered into annual negotiations with the offtaker of its Tisza II generation plant in Hungary. As a result of these preliminary negotiations, as well as the further deterioration of the economic environment in Hungary, the Company determined that an indicator of impairment existed at September 30, 2010. Thus, the Company performed an asset impairment test in accordance with the accounting guidance on property, plant and equipment and determined that based on the undiscounted cash flow analysis, the carrying amount of the Tisza II asset group was not recoverable. The fair value of the asset group was then determined using a discounted cash flow analysis. The carrying value of the Tisza II asset group of $160 million exceeded the fair value of $75 million resulting in the recognition of asset impairment expense of $85 million during the year ended December 31, 2010. Tisza II is reported in the Europe Generation reportable segment.
Deepwater—In March 2010, Deepwater, our 160 MW pet coke-fired merchant power plant located in Texas, experienced deteriorating market conditions due to increasing pet coke prices and diminishing power prices. As a result, Deepwater incurred an operating loss for the period and forecasted short term losses. These conditions gradually worsened in the second quarter of 2010 and management determined it could not operate the plant at certain times during the year without generating negative operating margin.
As the contraction of energy margin continued in the second quarter of 2010, management determined the collective events to be an indicator of impairment and performed an impairment evaluation of Deepwater’s goodwill and recoverability test for the long-lived asset group. Based on the results of these tests in the second quarter of 2010, management concluded no impairment was necessary. In the third quarter of 2010, these downward trends continued and management, after determining that there was an indicator of impairment, performed another impairment evaluation of Deepwater’s goodwill and recoverability test of the long-lived asset group. The results in the third quarter indicated no impairment was necessary for the asset group, but the goodwill associated with the reporting unit was deemed to be impaired and the $18 million goodwill balance was written off during the quarter ended September 30, 2010.
In the fourth quarter of 2010, further adverse trends in energy and pet coke pricing curves were observed in management’s review of external market analyses. The most significant impact on the forecasted energy prices reviewed by management in November 2010 related to the general external market consensus that Federal CO2 cap and trade legislation was less likely, resulting in a drop in long-term energy price projections. At that time, Deepwater’s revised forecasts indicated that Deepwater would have operating losses which would extend beyond 2020 and negative cash flows through 2019. Management concluded that, on an undiscounted cash flow basis, the carrying amount of the asset group was no longer recoverable. To measure the amount of impairment loss, management was required to determine the fair value of the asset group. To this end, an independent valuation firm was engaged to assist management in its estimation of fair value. Cash flow forecasts and the underlying assumptions for the valuation were developed by management. In determining the fair value of the asset group, all three valuation approaches described by the fair value measurement accounting guidance were considered.
261
Table of Contents
THE AES CORPORATION
NOTES TO CONSOLIDATED FINANCIAL STATEMENTS—(Continued)
DECEMBER 31, 2010, 2009, AND 2008
The fair value under the income approach was considered most appropriate. On that basis, the carrying value of the asset group was determined to be impaired and $79 million of impairment expense was recognized in the fourth quarter of 2010. Deepwater is reported in the North America Generation reportable segment.
Asset impairment expense for the year ended December 31, 2009 consisted of:
| 2009 | ||||
| (in millions) | ||||
| Piabanha |
$ | 11 | ||
| Other |
14 | |||
| Total |
$ | 25 | ||
During the fourth quarter of 2009, the Company recognized a pre-tax long-lived asset impairment charge of $11 million related to the Company’s Piabanha hydro project in Brazil. The Company determined that the carrying value exceeded the future discounted cash flows and abandoned the project. Piabanha is reported in the Company’s Latin America Generation segment.
Asset impairment expense for the year ended December 31, 2008 consisted of:
| 2008 | ||||
| (in millions) | ||||
| LNG projects in North America |
$ | 67 | ||
| Uruguaiana |
36 | |||
| South African peakers |
31 | |||
| Hefei |
18 | |||
| Other |
23 | |||
| Total |
$ | 175 | ||
In the fourth quarter of 2008 and in response to the financial market crisis, the Company reviewed and prioritized projects in the development pipeline. From this review, the Company determined that the carrying value exceeded the future discounted cash flows for certain projects. In accordance with the accounting standards for the impairment or disposal of long-lived assets, the Company recorded a total pre-tax impairment charge of $75 million ($34 million, net of noncontrolling interests and income taxes) related to two liquefied natural gas projects in North America and a non-power development project at one of our facilities in North America. These projects were reported in the North America Generation segment.
Following an initial impairment charge in the fourth quarter of 2007 at Uruguaiana, there were impairment charges of $36 million recognized during the first three quarters of 2008. The impairment was triggered by a combination of gas curtailments and increases in the spot market price of energy in 2007 that continued in 2008. The additional impairment charges in 2008 were primarily due to fixed asset purchase agreements in place. Uruguaiana is a thermoelectric generation plant located in Brazil and reported in the Latin America Generation segment.
The Company recognized impairment charges totaling $31 million related to a project in South Africa the Company withdrew from during the first quarter of 2008. These represented project development costs and an impairment of turbine deposits related to the project. All costs capitalized and incurred on the project have been written off as no future benefit is expected from these assets. This project was reported in “Corporate and Other.”
262
Table of Contents
THE AES CORPORATION
NOTES TO CONSOLIDATED FINANCIAL STATEMENTS—(Continued)
DECEMBER 31, 2010, 2009, AND 2008
The Anhui Development and Reform commission issued notice to our Hefei plant in China, in March 2007 as a result of the 2007 State Council’s decision to shut down smaller, inefficient and potentially polluting generation units nationwide. A settlement agreement was signed March 30, 2008 to end the contractual PPA arrangement. In accordance with the accounting standards for goodwill and other intangible assets, management concluded that the assets were impaired in March 2008, since the long-lived asset group would be sold or otherwise disposed of significantly before the end of its previously estimated life. As a result, impairment charges of $18 million were recognized associated with the settlement agreement to shut down the Hefei plant, which is reported in the Asia Generation segment.
Other Impairments
In addition to the asset impairment expense discussed above, other-than-temporary impairments of cost method investments of $1 million, $12 million and $15 million were recorded in the years ended December 31, 2010, 2009 and 2008, respectively. The impairment charges in 2009 and 2008 primarily related to the Company’s investment in a company developing a commercial facility for a “blue gas” (coal to gas) technology project. The Company accounted for the investment in convertible preferred shares under the cost method of accounting. During the fourth quarter of 2008, the market value of the shares materially declined due to downward trends in the capital markets and management concluded that the decline was other-than-temporary and recorded an impairment charge of $10 million. In 2009, this investment was determined to be further impaired and an additional $10 million other-than-temporary impairment charge, representing the remaining value of the shares, was recognized.
20. INCOME TAXES
INCOME TAX PROVISION
The following table summarizes the expense for income taxes on continuing operations, for the years ended December 31, 2010, 2009 and 2008:
| December 31, | ||||||||||||
| 2010 | 2009 | 2008 | ||||||||||
| (in millions) | ||||||||||||
| Federal: |
||||||||||||
| Current |
$ | (8 | ) | $ | 3 | $ | 12 | |||||
| Deferred |
(407 | ) | (146 | ) | 122 | |||||||
| State: |
||||||||||||
| Current |
1 | — | (1 | ) | ||||||||
| Deferred |
(19 | ) | (9 | ) | (7 | ) | ||||||
| Foreign: |
||||||||||||
| Current |
699 | 552 | 611 | |||||||||
| Deferred |
41 | 199 | 34 | |||||||||
| Total |
$ | 307 | $ | 599 | $ | 771 | ||||||
263
Table of Contents
THE AES CORPORATION
NOTES TO CONSOLIDATED FINANCIAL STATEMENTS—(Continued)
DECEMBER 31, 2010, 2009, AND 2008
EFFECTIVE AND STATUTORY RATE RECONCILIATION
The following table summarizes a reconciliation of the U.S. statutory federal income tax rate to the Company’s effective tax rate, as a percentage of income from continuing operations before taxes for the years ended December 31, 2010, 2009 and 2008:
| December 31, | ||||||||||||
| 2010 | 2009 | 2008 | ||||||||||
| Statutory Federal tax rate |
35 | % | 35 | % | 35 | % | ||||||
| State taxes, net of Federal tax benefit |
(9 | ) | (1 | ) | — | |||||||
| Taxes on foreign earnings |
(9 | ) | (5 | ) | (3 | ) | ||||||
| Valuation allowance |
11 | — | 2 | |||||||||
| Gain on sale of businesses |
6 | (3 | ) | (12 | ) | |||||||
| Chilean withholding tax reversals |
(5 | ) | — | — | ||||||||
| Taxes on cash repatriation |
— | — | 5 | |||||||||
| Other—net |
— | — | 2 | |||||||||
| Effective tax rate |
29 | % | 26 | % | 29 | % | ||||||
The current income taxes receivable and payable are included in Other Current Assets and Accrued and Other Liabilities, respectively, on the accompanying Consolidated Balance Sheets. The noncurrent income taxes receivable and payable are included in Other Assets and Other Long-Term Liabilities, respectively, on the accompanying Consolidated Balance Sheets. The following table summarizes the income taxes receivable and payable as of December 31, 2010 and 2009:
| December 31, | ||||||||
| 2010 | 2009 | |||||||
| (in millions) | ||||||||
| Income taxes receivable—current |
$ | 520 | $ | 434 | ||||
| Income taxes receivable—noncurrent |
21 | 22 | ||||||
| Total income taxes receivable |
$ | 541 | $ | 456 | ||||
| Income taxes payable—current |
$ | 701 | $ | 508 | ||||
| Income taxes payable—noncurrent |
8 | 11 | ||||||
| Total income taxes payable |
$ | 709 | $ | 519 | ||||
DEFERRED INCOME TAXES—Deferred income taxes reflect the net tax effects of (a) temporary differences between the carrying amounts of assets and liabilities for financial reporting purposes and the amounts used for income tax purposes and (b) operating loss and tax credit carryforwards. These items are stated at the enacted tax rates that are expected to be in effect when taxes are actually paid or recovered.
As of December 31, 2010, the Company had federal net operating loss carryforwards for tax purposes of approximately $1.7 billion expiring in years 2023 to 2029. Approximately $68 million of the net operating loss carryforward related to stock option deductions will be recognized in additional paid-in capital when realized. The Company also had federal general business tax credit carryforwards of approximately $18 million expiring primarily from 2020 to 2030, and federal alternative minimum tax credits of approximately $5 million that carryforward without expiration. The Company had state net operating loss carryforwards as of December 31, 2010 of approximately $3.5 billion expiring in years 2016 to 2031. As of December 31, 2010, the Company had
264
Table of Contents
THE AES CORPORATION
NOTES TO CONSOLIDATED FINANCIAL STATEMENTS—(Continued)
DECEMBER 31, 2010, 2009, AND 2008
foreign net operating loss carryforwards of approximately $4.6 billion that expire at various times beginning in 2011 and some of which carryforward without expiration, and tax credits available in foreign jurisdictions of approximately $37 million, $3 million of which expire in 2011 to 2013, $15 million of which expire in 2014 to 2021 and $19 million of which carryforward without expiration.
Valuation allowances decreased $338 million during 2010 to $1.3 billion at December 31, 2010. This net decrease was primarily the result of the removal of valuation allowances against deferred tax assets at foreign subsidiaries.
Valuation allowances increased $268 million during 2009 to $1.7 billion at December 31, 2009. This net increase was primarily the result of an increase in foreign net operating loss carryforwards that required full offsetting valuation allowances.
The Company believes that it is more likely than not that the net deferred tax assets as shown below will be realized when future taxable income is generated through the reversal of existing taxable temporary differences and income that is expected to be generated by businesses that have long-term contracts or a history of generating taxable income. The Company continues to monitor the utilization of its deferred tax asset for its U.S. consolidated net operating loss carryforward. Although management believes it is more likely than not that this deferred tax asset will be realized through generation of sufficient taxable income prior to expiration of the loss carryforwards, such realization is not assured.
The following table summarizes the deferred tax assets and liabilities, as of December 31, 2010 and 2009:
| December 31, | ||||||||
| 2010 | 2009 | |||||||
| (in millions) | ||||||||
| Differences between book and tax basis of property |
$ | 1,245 | $ | 1,693 | ||||
| Cumulative translation adjustment |
94 | (200 | ) | |||||
| Other taxable temporary differences |
392 | 310 | ||||||
| Total deferred tax liability |
1,731 | 1,803 | ||||||
| Operating loss carryforwards |
(1,657 | ) | (1,701 | ) | ||||
| Capital loss carryforwards |
(93 | ) | (107 | ) | ||||
| Bad debt and other book provisions |
(544 | ) | (562 | ) | ||||
| Retirement costs |
(315 | ) | (283 | ) | ||||
| Tax credit carryforwards |
(60 | ) | (68 | ) | ||||
| Other deductible temporary differences |
(414 | ) | (427 | ) | ||||
| Total gross deferred tax asset |
(3,083 | ) | (3,148 | ) | ||||
| Less: valuation allowance |
1,339 | 1,677 | ||||||
| Total net deferred tax asset |
(1,744 | ) | (1,471 | ) | ||||
| Net deferred tax (asset)/liability |
$ | (13 | ) | $ | 332 | |||
The Company considers undistributed earnings of certain foreign subsidiaries to be indefinitely reinvested outside of the United States and, accordingly, no U.S. deferred taxes have been recorded with respect to such earnings in accordance with the relevant accounting guidance for income taxes. Should the earnings be remitted as dividends, the Company may be subject to additional U.S. taxes, net of allowable foreign tax credits. It is not practicable to estimate the amount of any additional taxes which may be payable on the undistributed earnings.
265
Table of Contents
THE AES CORPORATION
NOTES TO CONSOLIDATED FINANCIAL STATEMENTS—(Continued)
DECEMBER 31, 2010, 2009, AND 2008
Income from operations in certain countries is subject to reduced tax rates as a result of satisfying specific commitments regarding employment and capital investment. The Company’s income tax benefits related to the tax status of these operations are estimated to be $60 million, $35 million and $23 million for the years ended December 31, 2010, 2009 and 2008, respectively. The per share effect of these benefits after noncontrolling interests was $0.07, $0.04 and $0.03 for the year ended December 31, 2010, 2009 and 2008, respectively.
The following table summarizes the income (loss) from continuing operations, before income taxes, net equity in earnings of affiliates and noncontrolling interests, for the years ended December 31, 2010, 2009 and 2008:
| December 31, | ||||||||||||
| 2010 | 2009 | 2008 | ||||||||||
| (in millions) | ||||||||||||
| U.S. |
$ | (1,342 | ) | $ | (976 | ) | $ | (314 | ) | |||
| Non-U.S. |
2,386 | 3,292 | 2,981 | |||||||||
| Total |
$ | 1,044 | $ | 2,316 | $ | 2,667 | ||||||
UNCERTAIN TAX POSITIONS
Uncertain tax positions have been classified as noncurrent income tax liabilities unless expected to be paid in one year. The Company’s policy for interest and penalties related to income tax exposures is to recognize interest and penalties as a component of the provision for income taxes in the Consolidated Statements of Operations.
As of December 31, 2010 and 2009, the total amount of gross accrued income tax related interest included in the Consolidated Balance Sheets was $12 million and $21 million, respectively. The total amount of gross accrued income tax related penalties included in the Consolidated Balance Sheets as of December 31, 2010 and 2009 was $4 million and $5 million, respectively.
The total expense (benefit) for interest related to unrecognized tax benefits for the years ended December 31, 2010, 2009 and 2008 amounted to $(10) million, $4 million and $2 million, respectively. For the years ended December 31, 2010, 2009 and 2008, the total expense (benefit) for penalties related to unrecognized tax benefits amounted to $(1) million, $0 million and $(2) million, respectively.
266
Table of Contents
THE AES CORPORATION
NOTES TO CONSOLIDATED FINANCIAL STATEMENTS—(Continued)
DECEMBER 31, 2010, 2009, AND 2008
We are potentially subject to income tax audits in numerous jurisdictions in the U.S. and internationally until the applicable statute of limitations expires. Tax audits by their nature are often complex and can require several years to complete. The following is a summary of tax years potentially subject to examination in the significant tax and business jurisdictions in which we operate:
| Jurisdiction |
Tax Years Subject to Examination |
|||
| Argentina |
2004-2010 | |||
| Brazil |
2005-2010 | |||
| Cameroon |
2007-2010 | |||
| Chile |
1998-2010 | |||
| Colombia |
2008-2010 | |||
| El Salvador |
2007-2010 | |||
| United Kingdom |
1999-2010 | |||
| United States (Federal) |
1994-2010 | |||
As of December 31, 2010, 2009 and 2008, the total amount of unrecognized tax benefits was $437 million, $511 million and $555 million, respectively. The total amount of unrecognized tax benefits that would benefit the effective tax rate as of December 31, 2010, 2009 and 2008 is $412 million, $484 million and $527 million, respectively, of which $51 million, $55 million and $131 million, respectively, would be in the form of tax attributes that would warrant a full valuation allowance.
The total amount of unrecognized tax benefits anticipated to result in a net decrease to unrecognized tax benefits within 12 months of December 31, 2010 is estimated to be between $4 million and $8 million.
The following is a reconciliation of the beginning and ending amounts of unrecognized tax benefits for the years ended December 31, 2010, 2009 and 2008:
| 2010 | 2009 | 2008 | ||||||||||
| (in millions) | ||||||||||||
| Balance at January 1 |
$ | 511 | $ | 555 | $ | 590 | ||||||
| Additions for current year tax positions |
14 | 72 | 6 | |||||||||
| Additions for tax positions of prior years |
51 | 7 | 80 | |||||||||
| Reductions for tax positions of prior years |
(46 | ) | (9 | ) | (26 | ) | ||||||
| Effects of foreign currency translation |
(3 | ) | 6 | (74 | ) | |||||||
| Settlements |
(67 | ) | (104 | ) | (18 | ) | ||||||
| Lapse of statute of limitations |
(23 | ) | (16 | ) | (3 | ) | ||||||
| Balance at December 31 |
$ | 437 | $ | 511 | $ | 555 | ||||||
The amount of settlements of uncertain tax positions in 2009 was primarily the result of a non-cash audit settlement for $105 million at a Brazilian subsidiary which resulted in no tax expense or benefit.
The Company and certain of its subsidiaries are currently under examination by the relevant taxing authorities for various tax years. The Company regularly assesses the potential outcome of these examinations in each of the taxing jurisdictions when determining the adequacy of the amount of unrecognized tax benefit recorded. While it is often difficult to predict the final outcome or the timing of resolution of any particular uncertain tax position, we believe we have appropriately accrued for our uncertain tax benefits. However, audit
267
Table of Contents
THE AES CORPORATION
NOTES TO CONSOLIDATED FINANCIAL STATEMENTS—(Continued)
DECEMBER 31, 2010, 2009, AND 2008
outcomes and the timing of audit settlements and future events that would impact our previously recorded unrecognized tax benefits and the range of anticipated increases or decreases in unrecognized tax benefits are subject to significant uncertainty. It is possible that the ultimate outcome of current or future examinations may exceed our provision for current unrecognized tax benefits in amounts that could be material, but cannot be estimated as of December 31, 2010. Our effective tax rate and net income in any given future period could therefore be materially impacted.
21. DISCONTINUED OPERATIONS AND HELD FOR SALE BUSINESSES
The following table summarizes the income (loss) on disposal and impairment for the following discontinued operations for the years ended December 31, 2010, 2009 and 2008:
| December 31, | ||||||||||||
| Subsidiary |
2010 | 2009 | 2008 | |||||||||
| (in millions) | ||||||||||||
| Barka |
$ | 80 | $ | — | $ | — | ||||||
| Lal Pir |
(6 | ) | (74 | ) | — | |||||||
| Pak Gen |
(16 | ) | (76 | ) | — | |||||||
| Ras Laffan |
6 | — | — | |||||||||
| Jiaozuo |
— | — | 7 | |||||||||
| Central Valley |
— | — | (1 | ) | ||||||||
| Gain (loss) on disposal and impairment, after taxes |
$ | 64 | $ | (150 | ) | $ | 6 | |||||
On October 20, 2010, the Company completed the sale of its 55% equity interest in Ras Laffan and the associated operations company in Qatar for aggregate proceeds of approximately $234 million. The Ras Laffan facility, which was previously reported in the Asia Generation segment, is comprised of a 756 MW combined cycle gas plant and a water desalination facility. The Company recognized a gain on disposal of $6 million, net of tax, during the year ended December 31, 2010.
On August 19, 2010, the Company completed the sale of its 35% ownership interest in Barka, a 456 MW combined cycle gas facility and water desalination plant and its wholly owned interest in two Barka related service companies. Barka is located in Oman and was previously reported in the Asia Generation segment. Total consideration received in the transaction was approximately $170 million, of which $124 million was AES’ portion. The Company recognized a gain on disposal of $63 million during the year ended December 31, 2010, net of noncontrolling interest and $38 million of tax expense associated with the sale.
On June 11, 2010, the Company completed the sale of its 55% ownership in Lal Pir and Pak Gen, two oil-fired facilities in Pakistan with respective generation capacities of 362 MW and 365 MW. These businesses were previously reported in the Asia Generation segment. Total consideration received in the transaction was approximately $117 million, of which $65 million was AES’ portion. The Company recognized a loss on disposal of $150 million during the year ended December 31, 2009 and impairment losses totaling $22 million ($14 million, net of tax and noncontrolling interests) during the year ended December 31, 2010 to reflect the change in the carrying value of net assets of Lal Pir and Pak Gen subsequent to meeting the held for sale criteria as of December 31, 2009.
In December 2008, the Company completed the sale of its 70% ownership interest in Jiaozuo AES Wanfang Power Co., Ltd. (“Jiaozuo”), which was reported in the Asia Generation segment, for approximately $73 million
268
Table of Contents
THE AES CORPORATION
NOTES TO CONSOLIDATED FINANCIAL STATEMENTS—(Continued)
DECEMBER 31, 2010, 2009, AND 2008
net of any withholding taxes. The Company recognized a gain on the sale of approximately $7 million. Goodwill of $4 million was written off in connection with the gain on sale.
Information for business components included in discontinued operations is as follows:
| December 31, | ||||||||||||
| 2010 | 2009 | 2008 | ||||||||||
| (in millions) | ||||||||||||
| Revenue |
$ | 491 | $ | 736 | $ | 972 | ||||||
| Income from operations of discontinued businesses, before taxes |
$ | 77 | $ | 99 | $ | 104 | ||||||
| Income tax expense |
(2 | ) | (3 | ) | (7 | ) | ||||||
| Income from operations of discontinued businesses |
$ | 75 | $ | 96 | $ | 97 | ||||||
| Gain (loss) on disposal of discontinued businesses, after taxes |
$ | 64 | $ | (150 | ) | $ | 6 | |||||
As further discussed in Note 22—Acquisitions and Dispositions, in February 2008, the Company entered into an agreement to sell two of its wholly owned subsidiaries in Kazakhstan, AES Ekibastuz LLP (“Ekibastuz”) and Maikuben West LLP (“Maikuben”). These businesses are included in the Europe Generation segment. The sale was completed on May 30, 2008. As a result of AES’ continuing involvement in the management and operations of the businesses after the sale was completed, their results of operations continued to be reflected as part of income from continuing operations for all periods presented. Revenue recognized subsequent to the sale represented the management fees earned for the Company’s continued management of the operations of the businesses.
22. ACQUISITIONS AND DISPOSITIONS
Acquisitions
The Company completed its acquisition of the Ballylumford Power Station in the third quarter of 2010 and in accordance with the accounting guidance for business combinations, has recorded the preliminary amounts for the purchase price allocation. The purchase price allocation is preliminary and adjustments will continue to be made during the measurement period. Subsequent adjustments, if any, will be retrospectively adjusted in future filings with the SEC.
In April 2008, the Company completed the purchase of a 92% interest in a 660 gross MW coal-fired thermal power generation facility in Masinloc, Philippines (“Masinloc”) from the Power Sector Assets & Liabilities Management Corporation, a state enterprise, for $930 million in cash. Project financing of $665 million was obtained from International Finance Corporation (“IFC”), the Asian Development Bank and a consortium of commercial banks. IFC is also an 8% minority shareholder in Masinloc. AES immediately embarked upon a comprehensive rehabilitation program to improve the output, reliability and general condition of the plant. Including transaction costs and completion of the planned upgrade program to improve environmental and operational performance, the total project cost was approximately $1.1 billion. Beginning on the acquisition date in April 2008, the results of operations of Masinloc are reflected in the Consolidated Financial Statements. The Company finalized the purchase price allocation of this acquisition in the fourth quarter of 2008.
269
Table of Contents
THE AES CORPORATION
NOTES TO CONSOLIDATED FINANCIAL STATEMENTS—(Continued)
DECEMBER 31, 2010, 2009, AND 2008
Dispositions
On May 30, 2008, the Company completed the sale of two of its wholly owned subsidiaries in Kazakhstan, Ekibastuz, a coal-fired generation plant, and Maikuben, a coal mine. Total consideration received in the transaction was approximately $1.1 billion plus additional potential earn-out provisions, a three-year management and operation agreement and a capital expenditures program bonus. Due to the fact that AES was to have significant continuing involvement in the management and operations of the businesses through its three-year management and operation agreement, the results of operations from Ekibastuz and Maikuben were included in income from continuing operations through the date of the disposition. Income earned as a result of the three-year management and operation agreement has been recognized as management fee income for all periods subsequent to the disposition.
On March 23, 2009, the Company and Kazakhmys PLC (“Kazakhmys”), which purchased the subsidiaries, mutually agreed to terminate the original sale agreement and the three-year management and operation agreement. In connection with the termination of these agreements, the Company and Kazakhmys entered into a new agreement (the “2009 Agreement”). Under the 2009 Agreement, Kazakhmys agreed to pay the Company an $80 million performance incentive bonus in April 2009 for management services provided in 2008. This was recognized as “Other Income” during the first quarter of 2009. A $13 million gain was recognized related to a reversal of a tax contingency for a contractual obligation, under which the Company provided indemnification to Kazakhmys, which expired in January 2009. This was recorded as an adjustment to the gain on the sale of Ekibastuz and Maikuben during the first quarter of 2009.
The 2009 agreement also provided for an additional $102 million payment, primarily related to the termination of the management agreement, payable to AES in January 2010. In May 2009, Kazakhmys provided an irrevocable standby letter of credit from a creditworthy institution to AES of $102 million to secure the final payment. The payment of the final component of the management termination agreement was not contingent upon any future events. As a result, the Company recognized an additional gain on the sale of Ekibastuz and Maikuben of approximately $98.5 million in the second quarter of 2009. AES received the final payment of $102 million from Kazakhmys in January 2010.
The parties agreed to terminate both the Stock Purchase Agreement and the Management Agreement, and have further agreed to a mutual release of prior claims. As part of the management termination agreement, AES agreed to transition the management of the businesses to Kazakhmys over a period of 100 days from March 13, 2009. The transition period ended June 21, 2009 and at that time the management of Ekibastuz and Maikuben became the responsibility of Kazakhmys. The Company’s involvement with the businesses remained in place for more than one year from the date of the sale; therefore, the Company has continued to include the businesses as part of continuing operations in the Consolidated Financial Statements for all periods presented, despite the termination of the management agreement.
Excluding income earned under the three-year management and operation agreement (terminated in March 2009), Ekibastuz and Maikuben generated no revenue or net income in 2010 and 2009 and generated revenue and net income of $114 million and $61 million, respectively, for the year ended December 31, 2008.
23. EARNINGS PER SHARE
Basic and diluted earnings per share are based on the weighted average number of shares of common stock and potential common stock outstanding during the period. Potential common stock, for purposes of determining diluted earnings per share, includes the effects of dilutive restricted stock units, stock options and convertible
270
Table of Contents
THE AES CORPORATION
NOTES TO CONSOLIDATED FINANCIAL STATEMENTS—(Continued)
DECEMBER 31, 2010, 2009, AND 2008
securities. The effect of such potential common stock is computed using the treasury stock method or the if-converted method, as applicable.
The following table presents a reconciliation of the numerators and denominators of the basic and diluted earnings per share computations for income from continuing operations. In the table below, income represents the numerator (in millions) and shares represent the denominator (in millions):
| December 31, 2010 | December 31, 2009 | December 31, 2008 | ||||||||||||||||||||||||||||||||||
| Loss | Shares | $ per Share |
Income | Shares | $ per Share |
Income | Shares | $ per Share |
||||||||||||||||||||||||||||
| BASIC EARNINGS PER SHARE |
||||||||||||||||||||||||||||||||||||
| Income (loss) from continuing operations attributable to The AES Corporation common stockholders |
$ | (86 | ) | 769 | $ | (0.11 | ) | $ | 710 | 667 | $ | 1.06 | $ | 1,170 | 669 | $ | 1.75 | |||||||||||||||||||
| EFFECT OF DILUTIVE SECURITIES |
||||||||||||||||||||||||||||||||||||
| Convertible securities |
— | — | — | — | — | — | 22 | 15 | (0.02 | ) | ||||||||||||||||||||||||||
| Stock options |
— | — | — | — | 1 | — | — | 4 | — | |||||||||||||||||||||||||||
| Restricted stock units |
— | — | — | — | 2 | — | — | 1 | — | |||||||||||||||||||||||||||
| DILUTED EARNINGS PER SHARE |
$ | (86 | ) | 769 | $ | (0.11 | ) | $ | 710 | 670 | $ | 1.06 | $ | 1,192 | 689 | $ | 1.73 | |||||||||||||||||||
The calculation of diluted earnings per share at December 31, 2010 excluded all convertible securities, stock options and restricted stock units because they are antidilutive.
The calculation of diluted earnings per share excluded 18,035,813 and 11,150,853 options outstanding at December 31, 2009 and 2008, respectively, that could potentially dilute basic earnings per share in the future. Those options were not included in the computation of diluted earnings per share because the exercise price of those options exceeded the average market price during the related period. In 2009, all convertible debentures were omitted from the earnings per share calculation because they were antidilutive. In 2008, all convertible debentures were included in the earnings per share calculation. In arriving at income attributable to AES Corporation common stockholders in computing basic earnings per share, dividends on preferred stock of our subsidiary were deducted.
In addition, on March 15, 2010, the Company issued 125,468,788 shares of common stock to an investor as described in Note 14—Equity.
24. RISKS AND UNCERTAINTIES
AES is a global power producer in 28 countries on five continents. See additional discussion of the Company’s principal markets in Note 15—Segment and Geographic Information. Our principal lines of business are Generation and Utilities. The Generation line of business uses a wide range of technologies, including coal, gas, hydroelectric, and biomass as fuel to generate electricity. Our Utilities business is comprised of businesses that transmit, distribute, and in certain circumstances, generate power. In addition, the Company continues to expand its reach into the renewables area. These efforts include projects primarily in wind and solar.
POLITICAL AND ECONOMIC RISKS—The Company’s market capitalization was negatively impacted largely in the second half of 2008 and in 2009. During this period, credit markets and global markets deteriorated and experienced increased market volatility, which can pose risks to the overall liquidity and/or asset values of
271
Table of Contents
THE AES CORPORATION
NOTES TO CONSOLIDATED FINANCIAL STATEMENTS—(Continued)
DECEMBER 31, 2010, 2009, AND 2008
our businesses with heightened unpredictability in currencies, counterparty credit risk and the widening of credit spreads in certain markets. If market conditions are protracted or continue to deteriorate, the Company may be at risk of decreased earnings and cash flows due to, among other factors, adverse fluctuations in the commodities and foreign currency spot markets or deterioration in global macroeconomic conditions. With the tightening of the credit markets, there is a risk that future investments may not be able to be financed through accessing capital and debt markets and may be subject to restrictions in the near future.
Currently, the Company has a below-investment grade rating from Standard & Poor’s of BB-. This may limit the ability of the Company to finance new and existing development projects to cash currently available on hand and through reinvestment of earnings. As of December 31, 2010, the Company had $2.6 billion of unrestricted cash and cash equivalents.
During 2010, approximately 84% of our revenue, and all of our revenue from discontinued businesses, was generated outside the United States and a significant portion of our international operations is conducted in developing countries. We continue to invest in projects in developing countries because the growth rates and the opportunity to implement operating improvements and achieve higher operating margins may be greater than those typically achievable in more developed countries. International operations, particularly the operation, financing and development of projects in developing countries, entail significant risks and uncertainties, including, without limitation:
| • | economic, social and political instability in any particular country or region; |
| • | ability to economically hedge energy prices; |
| • | volatility in commodity prices; |
| • | adverse changes in currency exchange rates; |
| • | government restrictions on converting currencies or repatriating funds; |
| • | unexpected changes in foreign laws and regulations or in trade, monetary or fiscal policies; |
| • | high inflation and monetary fluctuations; |
| • | restrictions on imports of coal, oil, gas or other raw materials required by our generation businesses to operate; |
| • | threatened or consummated expropriation or nationalization of our assets by foreign governments; |
| • | unwillingness of governments, government agencies, similar organizations or other counterparties to honor their contracts; |
| • | unwillingness of governments, government agencies, courts or similar bodies to enforce contracts that are economically advantageous to subsidiaries of the Company and economically unfavorable to counterparties, against such counterparties, whether such counterparties are governments or private parties; |
| • | inability to obtain access to fair and equitable political, regulatory, administrative and legal systems; |
| • | adverse changes in government tax policy; |
| • | difficulties in enforcing our contractual rights or enforcing judgments or obtaining a just result in local jurisdictions; and |
| • | potentially adverse tax consequences of operating in multiple jurisdictions. |
272
Table of Contents
THE AES CORPORATION
NOTES TO CONSOLIDATED FINANCIAL STATEMENTS—(Continued)
DECEMBER 31, 2010, 2009, AND 2008
Any of these factors, individually or in combination with others, could materially and adversely affect our business, results of operations and financial condition. In addition, our Latin American operations experience volatility in revenue and earnings which have caused and are expected to cause significant volatility in our results of operations and cash flows. The volatility is caused by regulatory and economic difficulties, political instability and currency fluctuations being experienced in many of these countries. This volatility reduces the predictability and enhances the uncertainty associated with cash flows from these businesses.
Our inability to predict, influence or respond appropriately to changes in law or regulatory schemes, including any inability to obtain expected or contracted increases in electricity tariff rates or tariff adjustments for increased expenses, could adversely impact our results of operations or our ability to meet publicly announced projections or analysts’ expectations. Furthermore, changes in laws or regulations or changes in the application or interpretation of regulatory provisions in jurisdictions where we operate, particularly our Utilities businesses where electricity tariffs are subject to regulatory review or approval, could adversely affect our business, including, but not limited to:
| • | changes in the determination, definition or classification of costs to be included as reimbursable or pass-through costs; |
| • | changes in the definition or determination of controllable or noncontrollable costs; |
| • | adverse changes in tax law; |
| • | changes in the definition of events which may or may not qualify as changes in economic equilibrium; |
| • | changes in the timing of tariff increases; |
| • | other changes in the regulatory determinations under the relevant concessions; or |
| • | changes in environmental regulations, including regulations relating to GHG emissions in any of our businesses. |
Any of the above events may result in lower margins for the affected businesses, which can adversely affect our business.
RISKS RELATED TO FOREIGN CURRENCIES—AES operates businesses in many foreign countries and such operations may be impacted by significant fluctuations in foreign currency exchange rates. The Company’s financial position and results of operations have been significantly affected by fluctuations in the value of the Brazilian real, the Argentine peso, the Dominican Republic peso, the Euro, the Chilean peso, the Colombian peso and the Philippine peso relative to the U.S. Dollar.
RISKS RELATED TO POWER SALES CONTRACTS—Several of the Company’s power plants rely on power sales contracts with one or a limited number of entities for the majority of, and in some case all of, the relevant plant’s output over the term of the power sales contract. The remaining term of the power sales contracts related to the Company’s power plants range from less than one to 38 years. No single customer accounted for 10% or more of total revenue in 2010, 2009, or 2008.
The cash flows and results of operations of such plants are dependent on the credit quality of the purchasers and the continued ability of their customers and suppliers to meet their obligations under the relevant power sales contract. If a substantial portion of the Company’s long-term power sales contracts were modified or terminated, the Company would be adversely affected to the extent that it was unable to find other customers at the same level of contract profitability. The loss of one or more significant power sales contracts or the failure by any of the parties to a power sales contract to fulfill its obligations thereunder could have a material adverse impact on the Company’s cash flow, results of operations and financial condition.
273
Table of Contents
THE AES CORPORATION
NOTES TO CONSOLIDATED FINANCIAL STATEMENTS—(Continued)
DECEMBER 31, 2010, 2009, AND 2008
25. RELATED PARTY TRANSACTIONS
Our generation businesses in Panama are partially owned by the Government of Panama (the “Panamanian Government”). The Panamanian Government, in turn, partially owns the distribution companies within Panama. For the years ended December 31, 2010, 2009 and 2008, our Panamanian businesses recognized electricity sales to the Panamanian Government totaling $146 million, $143 million and $203 million, respectively. For the same period, our Panamanian businesses purchased electricity, which excludes transmission charges from the Panamanian Government, totaling $21 million, $25 million and $27 million, respectively. As of December 31, 2010 and 2009, our Panamanian businesses owed the Panamanian Government $4 million and $7 million, respectively, payable on normal trade terms. For the same period, the Panamanian Government owed our Panamanian businesses $12 million and $25 million, respectively, payable on normal trade terms.
Our generation businesses in the Dominican Republic are partially owned by the Government of the Dominican Republic (the “Dominican Government”). The Dominican Government, in turn, owns the distribution companies within the Dominican Republic. For the years ended December 31, 2010, 2009 and 2008, our Dominican Republic businesses recognized electricity sales to the Dominican Government totaling $179 million, $204 million and $244 million, respectively. For the same period, the Dominican Government owed our Dominican Republic businesses $88 million and $121 million, respectively, payable on normal trade terms.
In December 2010, ESSA , one of our subsidiaries in Latin America, signed termination agreements related to its long term gas transportation contracts that were under dispute in arbitration tribunals. As a result of these settlements, ESSA paid $52 million to two of the gas transportation companies which are related parties and recorded a loss of $43 million. In addition, an aggregate amount of $16 million was payable to these related parties at December 31, 2010. See Note 12—Contingencies, Litigations for details.
274
Table of Contents
THE AES CORPORATION
NOTES TO CONSOLIDATED FINANCIAL STATEMENTS—(Continued)
DECEMBER 31, 2010, 2009, AND 2008
26. SELECTED QUARTERLY FINANCIAL DATA (UNAUDITED)
Quarterly Financial Data
The following tables summarize the unaudited quarterly statements of operations for the Company for 2010 and 2009. Amounts reflect all adjustments necessary in the opinion of management for a fair statement of the results for interim periods. Amounts have been restated to reflect discontinued operations in all periods presented.
| Quarter ended 2010 | ||||||||||||||||
| Mar 31 | June 30 | Sept 30 | Dec 31 | |||||||||||||
| (in millions, except per share data) | ||||||||||||||||
| Revenue |
$ | 4,071 | $ | 4,021 | $ | 4,151 | $ | 4,404 | ||||||||
| Gross margin |
986 | 982 | 985 | 1,011 | ||||||||||||
| Income (loss) from continuing operations, net of tax(1) |
392 | 411 | 296 | (179 | ) | |||||||||||
| Discontinued operations, net of tax |
10 | 18 | 101 | 10 | ||||||||||||
| Net income |
402 | 429 | 397 | (169 | ) | |||||||||||
| Net income (loss) attributable to The AES Corporation |
$ | 187 | $ | 144 | $ | 114 | $ | (436 | ) | |||||||
| Basic income per share: |
||||||||||||||||
| Income (loss) from continuing operations attributable to |
$ | 0.26 | $ | 0.17 | $ | 0.05 | $ | (0.56 | ) | |||||||
| Discontinued operations attributable to |
0.01 | 0.01 | 0.09 | 0.01 | ||||||||||||
| Basic income (loss) per share attributable to |
$ | 0.27 | $ | 0.18 | $ | 0.14 | $ | (0.55 | ) | |||||||
| Diluted income per share: |
||||||||||||||||
| Income (loss) from continuing operations attributable to |
$ | 0.26 | $ | 0.17 | $ | 0.05 | $ | (0.56 | ) | |||||||
| Discontinued operations attributable to |
0.01 | 0.01 | 0.09 | 0.01 | ||||||||||||
| Diluted income (loss) per share attributable to |
$ | 0.27 | $ | 0.18 | $ | 0.14 | $ | (0.55 | ) | |||||||
275
Table of Contents
THE AES CORPORATION
NOTES TO CONSOLIDATED FINANCIAL STATEMENTS—(Continued)
DECEMBER 31, 2010, 2009, AND 2008
| Quarter ended 2009 | ||||||||||||||||
| Mar 31 | June 30 | Sept 30 | Dec 31 | |||||||||||||
| (in millions, except per share data) | ||||||||||||||||
| Revenue |
$ | 3,235 | $ | 3,291 | $ | 3,652 | $ | 3,776 | ||||||||
| Gross margin |
849 | 803 | 967 | 814 | ||||||||||||
| Income from continuing operations, net of tax(2) |
483 | 503 | 414 | 409 | ||||||||||||
| Discontinued operations, net of tax |
19 | 27 | 26 | (126 | ) | |||||||||||
| Net income |
502 | 530 | 440 | 283 | ||||||||||||
| Net income (loss) attributable to The AES Corporation |
$ | 218 | $ | 303 | $ | 185 | $ | (48 | ) | |||||||
| Basic income (loss) per share: |
||||||||||||||||
| Income from continuing operations attributable to |
$ | 0.31 | $ | 0.43 | $ | 0.26 | $ | 0.07 | ||||||||
| Discontinued operations attributable to |
0.02 | 0.02 | 0.02 | (0.14 | ) | |||||||||||
| Basic income (loss) per share attributable to |
$ | 0.33 | $ | 0.45 | $ | 0.28 | $ | (0.07 | ) | |||||||
| Diluted income (loss) per share: |
||||||||||||||||
| Income from continuing operations attributable to |
$ | 0.31 | $ | 0.43 | $ | 0.26 | $ | 0.07 | ||||||||
| Discontinued operations attributable to |
0.02 | 0.02 | 0.02 | (0.14 | ) | |||||||||||
| Diluted income (loss) per share attributable to |
$ | 0.33 | $ | 0.45 | $ | 0.28 | $ | (0.07 | ) | |||||||
| (1) | Includes pretax impairment expense of $314 million and $927 million, for the third and fourth quarters of 2010, respectively. See Note 19—Impairment Expense and Note 8—Goodwill and Other Intangible Assets for additional discussion on these impairment expenses. |
| (2) | Includes pretax impairment expense $140 million for the fourth quarter of 2009. See Note 19—Impairment Expense and Note 8—Goodwill and Other Intangible Assets for additional discussion on the impairment expense. |
27. SUBSEQUENT EVENTS
Subsequent to December 31, 2010, the Company continued to repurchase stock under the stock repurchase program announced on July 7, 2010. The Company has repurchased 1,026,610 shares at a cost of $13 million in 2011, bringing the cumulative total through February 22, 2010 to 9,409,435 shares at a total cost of $112 million (average price of $11.92 per share including commissions). As of February 22, 2011, $388 million of the $500 million authorized remained available under the stock repurchase program. For additional information, see Note 14—Equity.
On February 1, 2011, AES Thames, LLC (“Thames”), our 208 MW coal-fired plant in Connecticut, filed petitions for bankruptcy protection under Chapter 11 in the U. S. Bankruptcy Court. The bankruptcy is due, in part, to the increased cost of energy production. The bankruptcy protection is not expected to have a material impact on the Company’s financial position or the results of operations.
276
Table of Contents
| ITEM 9. | CHANGES IN AND DISAGREEMENTS WITH ACCOUNTANTS ON ACCOUNTING AND FINANCIAL DISCLOSURE |
None.
| ITEM 9A. | CONTROLS AND PROCEDURES |
Conclusion Regarding the Effectiveness of Disclosure Controls and Procedures
The Company maintains disclosure controls and procedures that are designed to ensure that information required to be disclosed in the reports that the Company files or submits under the Securities Exchange Act of 1934, as amended (the “Exchange Act”), is recorded, processed, summarized and reported within the time periods specified in the SEC’s rules and forms, and that such information is accumulated and communicated to the chief executive officer (“CEO”) and chief financial officer (“CFO”), as appropriate, to allow timely decisions regarding required disclosures.
The Company carried out the evaluation required by Rules 13a-15(b) and 15d-15(b), under the supervision and with the participation of our management, including the CEO and CFO, of the effectiveness of our “disclosure controls and procedures” (as defined in the Exchange Act Rules 13a-15(e) and 15d-15(e)). Based upon this evaluation, the CEO and CFO concluded that as of December 31, 2010, our disclosure controls and procedures were effective.
Management’s Report on Internal Control Over Financial Reporting
Management of the Company is responsible for establishing and maintaining adequate internal control over financial reporting, as defined in Rule 13a-15(f) under the Exchange Act. The Company’s internal control over financial reporting is a process designed to provide reasonable assurance regarding the reliability of financial reporting and the preparation of financial statements for external purposes in accordance with GAAP and includes those policies and procedures that:
| • | pertain to the maintenance of records that in reasonable detail, accurately and fairly reflect the transactions and dispositions of the assets of the Company; |
| • | provide reasonable assurance that transactions are recorded as necessary to permit preparation of financial statements in accordance with GAAP, and that receipts and expenditures of the Company are being made only in accordance with authorizations of management and directors of the Company; and |
| • | provide reasonable assurance that unauthorized acquisition, use or disposition of the Company’s assets that could have a material effect on the financial statements are prevented or detected timely. |
Management, including our CEO and CFO, does not expect that our internal controls will prevent or detect all errors and all fraud. A control system, no matter how well designed and operated, can provide only reasonable, not absolute, assurance that the objectives of the control system are met. Further, the design of a control system must reflect the fact that there are resource constraints, and the benefits of controls must be considered relative to their costs. In addition, any evaluation of the effectiveness of controls is subject to risks that those internal controls may become inadequate in future periods because of changes in business conditions, or that the degree of compliance with the policies or procedures deteriorates.
Management assessed the effectiveness of our internal control over financial reporting as of December 31, 2010. In making this assessment, management used the criteria established in Internal Control—Integrated Framework issued by the Committee of Sponsoring Organizations (“COSO”). Based on this assessment management, believes that the Company maintained effective internal control over financial reporting as of December 31, 2010.
277
Table of Contents
The effectiveness of the Company’s internal control over financial reporting as of December 31, 2010, has been audited by Ernst & Young LLP, an independent registered public accounting firm, as stated in their report, which appears herein.
Changes in Internal Control Over Financial Reporting:
There were no changes that occurred during the quarter ended December 31, 2010 that have materially affected, or are reasonably likely to materially affect, our internal control over financial reporting.
278
Table of Contents
REPORT OF INDEPENDENT REGISTERED PUBLIC ACCOUNTING FIRM
The Board of Directors and Stockholders of The AES Corporation:
We have audited The AES Corporation’s internal control over financial reporting as of December 31, 2010 based on criteria established in Internal Control—Integrated Framework issued by the Committee of Sponsoring Organizations of the Treadway Commission (the COSO criteria). The AES Corporation’s management is responsible for maintaining effective internal control over financial reporting, and for its assessment of the effectiveness of internal control over financial reporting included in the accompanying Management’s Report on Internal Control over Financial Reporting. Our responsibility is to express an opinion on the company’s internal control over financial reporting based on our audit.
We conducted our audit in accordance with the standards of the Public Company Accounting Oversight Board (United States). Those standards require that we plan and perform the audit to obtain reasonable assurance about whether effective internal control over financial reporting was maintained in all material respects. Our audit included obtaining an understanding of internal control over financial reporting, assessing the risk that a material weakness exists, testing and evaluating the design and operating effectiveness of internal control based on the assessed risk, and performing such other procedures as we considered necessary in the circumstances. We believe that our audit provides a reasonable basis for our opinion.
A company’s internal control over financial reporting is a process designed to provide reasonable assurance regarding the reliability of financial reporting and the preparation of financial statements for external purposes in accordance with generally accepted accounting principles. A company’s internal control over financial reporting includes those policies and procedures that (1) pertain to the maintenance of records that, in reasonable detail, accurately and fairly reflect the transactions and dispositions of the assets of the company; (2) provide reasonable assurance that transactions are recorded as necessary to permit preparation of financial statements in accordance with generally accepted accounting principles, and that receipts and expenditures of the company are being made only in accordance with authorizations of management and directors of the company; and (3) provide reasonable assurance regarding prevention or timely detection of unauthorized acquisition, use or disposition of the company’s assets that could have a material effect on the financial statements.
Because of its inherent limitations, internal control over financial reporting may not prevent or detect misstatements. Also, projections of any evaluation of effectiveness to future periods are subject to the risk that controls may become inadequate because of changes in conditions, or that the degree of compliance with the policies or procedures may deteriorate.
In our opinion, The AES Corporation maintained, in all material respects, effective internal control over financial reporting as of December 31, 2010, based on the COSO criteria.
We also have audited, in accordance with the standards of the Public Company Accounting Oversight Board (United States), the consolidated balance sheets of The AES Corporation and subsidiaries as of December 31, 2010 and 2009, and the related consolidated statements of operations, stockholders’ equity and cash flows for each of the three years in the period ended December 31, 2010 and our report dated February 25, 2011 expressed an unqualified opinion thereon.
/s/ Ernst & Young LLP
McLean, Virginia
February 25, 2011
279
Table of Contents
| ITEM 9B. | OTHER INFORMATION. |
None.
| ITEM 10. | DIRECTORS, EXECUTIVE OFFICERS AND CORPORATE GOVERNANCE |
The following information is incorporated by reference from the Registrant’s Proxy Statement for the Registrant’s 2011 Annual Meeting of Stock Holders which the Registrant expects will be filed on or around March 1, 2011 (the “2011 Proxy Statement”):
| • | Information regarding the directors required by this item found under the heading Board of Directors |
| • | Information regarding AES’ Code of Ethics found under the heading AES Code of Business Conduct and Corporate Governance Guidelines |
| • | Information regarding compliance with Section 16 of the Exchange Act required by this item found under the heading Governance Matters—Section 16(a) Beneficial Ownership Reporting Compliance |
| • | Information regarding AES’ Financial Audit Committee found under the heading The Committees of the Board—Financial Audit Committee (the “Audit Committee”) |
Certain information regarding executive officers required by this Item is set forth as a supplementary item in Part I hereof (pursuant to Instruction 3 to Item 401(b) of Regulation S-K). The other information required by this Item, to the extent not included above, will be contained in our 2011 Proxy Statement and is herein incorporated by reference.
| ITEM 11. | EXECUTIVE COMPENSATION |
The following information is contained in the 2011 Proxy Statement and is incorporated by reference: the information regarding executive compensation contained under the heading Compensation Discussion and Analysis and the Compensation Committee Report on Executive Compensation under the heading Report of the Compensation Committee.
| ITEM 12. | SECURITY OWNERSHIP OF CERTAIN BENEFICIAL OWNERS AND MANAGEMENT AND RELATED STOCKHOLDER MATTERS |
| (a) | Security Ownership of Certain Beneficial Owners. |
See the information contained under the caption “Security Ownership of Certain Beneficial Owners, Directors, and Executive Officers” of the Proxy Statement for the 2011 Annual Meeting of Shareholders of the Registrant, which information is incorporated herein by reference.
| (b) | Security Ownership of Directors and Executive Officers. |
See the information contained under the caption “Security Ownership of Certain Beneficial Owners, Directors, and Executive Officers” of the Proxy Statement for the 2011 Annual Meeting of Shareholders of the Registrant, which information is incorporated herein by reference.
| (c) | Changes in Control. |
None.
280
Table of Contents
| (d) | Securities Authorized for Issuance under Equity Compensation Plans. |
The following table provides information about shares of AES common stock that may be issued under AES’ equity compensation plans, as of December 31, 2010:
Securities Authorized for Issuance under Equity Compensation Plans (As of December 31, 2010)
| (a) | (b) | (c) | ||||||||||
| Plan category |
Number of securities to be issued upon exercise of outstanding options, warrants and rights |
Weighted average exercise price of outstanding options, warrants and rights |
Number of securities remaining available for future issuance under equity compensation plans (excluding securities reflected in column (a)) |
|||||||||
| Equity compensation plans |
21,128,007 | (2) | $ | 17.21 | 19,723,531 | |||||||
| Equity compensation plans not |
5,618,255 | $ | 13.15 | — | ||||||||
| Total |
26,746,262 | $ | 16.10 | 19,723,531 | ||||||||
| (1) | The following equity compensation plans have been approved by the Company’s Stockholders: |
| (A) | The LTC Plan was adopted in 2003 and provided for 17,000,000 shares authorized for issuance thereunder. In 2008, an amendment to the Plan to provide an additional 12,000,000 shares was approved by AES’ stockholders, bringing the total authorized shares to 29,000,000. In 2010, an additional amendment to the Plan to provide an additional 9,000,000 shares was approved by AES’ stockholders, bringing the total authorized shares to 38,000,000. The weighted average exercise price of Options outstanding under this plan included in Column (b) is $14.87 (excluding RSU awards), with 19,723,351 shares available for future issuance. |
| (B) | The AES Corporation 2001 Stock Option Plan adopted in 2001 provided for 15,000,000 shares authorized for issuance. The weighted average exercise price of Options outstanding under this plan included in Column (b) is $14.95. In conjunction with the 2010 amendment to the 2003 Long Term Compensation plan, ongoing award issuance from this plan was discontinued in 2010. Any remaining shares under this plan, which are not reserved for issuance under outstanding awards, are not available for future issuance and thus the amount of 2,067,856 shares is not included in Column (c) above. |
| (C) | The AES Corporation 2001 Plan for Outside Directors adopted in 2001 provided for 2,750,000 shares authorized for issuance. The weighted average exercise price of Options outstanding under this plan included in Column (b) is $11.70. In conjunction with the 2010 amendment to the 2003 Long Term Compensation plan, ongoing award issuance from this plan was discontinued in 2010. Any remaining shares under this plan, which are not reserved for issuance under outstanding awards, are not available for future issuance and thus the amount of 2,194,404 shares is not included in Column (c) above. |
| (D) | The AES Corporation Second Amended and Restated Deferred Compensation Plan for Directors provided for 2,000,000 shares authorized for issuance. Column (b) excludes the Director stock units granted thereunder. In conjunction with the 2010 amendment to the 2003 Long Term Compensation Plan, ongoing award issuance from this plan was discontinued in 2010 as Director stock units will be issued from the 2003 Long Term Compensation Plan. Any remaining shares under this plan, which are not reserved for issuance under outstanding awards, are not available for future issuance and thus the amount of 105,341 shares is not included in Column (c) above. |
| (E) | The AES Corporation Incentive Stock Option Plan adopted in 1991 provided for 57,500,000 shares authorized for issuance. The weighted average exercise price of Options outstanding under this plan included in Column (b) is $55.29. This plan terminated on June 1, 2001, such that no additional grants may be granted under the plan after that date. Any remaining shares under this plan, which are not reserved for issuance under outstanding awards, are not available for future issuance in light of this plan’s termination and thus the amount 23,502,620 shares is not included in Column (c) above. |
281
Table of Contents
| (2) | Includes 5,448,036 (2,217,074 of which are vested and 3,230,962 are unvested) shares underlying RSU awards (assuming performance at a maximum level), 778,328 shares underlying Director stock unit awards, and 14,901,643 shares issuable upon the exercise of Stock Option grants, for an aggregate number of 21,128,007 shares. |
| (3) | The AES Corporation 2001 Non-Officer Stock Option Plan provided for 12,000,000 shares authorized for issuance. The weighted average exercise price of Options outstanding under this plan shown in Column (b) is $13.15. In conjunction with the 2010 amendment to the 2003 Long Term Compensation plan, ongoing award issuance from this plan was discontinued in 2010. Any remaining shares under this plan, which are not reserved for issuance under outstanding awards, are not available for future issuance and thus the amount of 1,549,919 shares is not included in Column (c) above. This plan is described in the narrative below. |
The AES Corporation 2001 Non-Officer Stock Option Plan (the “2001 Plan”) was adopted by the Board on October 18, 2001, and became effective October 25, 2001. The 2001 Plan did not require approval of AES’ stockholders under SEC or NYSE rules and/or regulations at that time. All employees that are not Officers, Directors or beneficial owners of more than 10% of AES’ common stock are eligible to participate in the 2001 Plan. The total aggregate number of shares for which Options can be granted pursuant to the 2001 Plan is 12 million. As of December 31, 2010, approximately 3,423 employees held Options under the 2001 Plan. The exercise price of each Option awarded under the 2001 Plan is equal to the fair market value of AES’ common stock on the grant date of the Option. Options under the 2001 Plan generally vest as to 50% of their underlying shares on each anniversary of the Option grant date; however, grants dated October 25, 2001 vested in one year. Unless otherwise provided by the Compensation Committee of the Board, upon the death or disability of an employee, or a change of control (as defined therein), all Options granted under the 2001 Plan will become fully vested and exercisable. Unless otherwise provided by the Compensation Committee of the Board, in the event that the employee’s employment with the Company terminates for any reason other than death or disability, all Options held by such employee will automatically expire on the earlier of (a) the date the Option would have expired had the employee continued in such employment, and (b) 180 days after the date that such employee’s employment ceases. The 2001 Plan will expire on October 25, 2011. The Board may amend, modify or terminate the 2001 Plan at any time.
| ITEM 13. | CERTAIN RELATIONSHIPS AND RELATED TRANSACTIONS, AND DIRECTOR INDEPENDENCE |
The information regarding related party transactions required by this item is included in the 2011 Proxy Statement found under the headings Transactions with Related Persons, Proposal I: Election of Directors and The Committees of the Board and are incorporated herein by reference.
| ITEM 14. | PRINCIPAL ACCOUNTANT FEES AND SERVICES |
The information concerning principal accountant fees and services included in the 2011 Proxy Statement contained under the heading Information Regarding The Independent Registered Public Accounting Firm’s Fees, Services and Independence and is incorporated herein by reference.
282
Table of Contents
| ITEM 15. | EXHIBITS AND FINANCIAL STATEMENT SCHEDULES |
| (a) | Financial Statements. |
| Financial Statements and Schedules: |
Page | |
| Consolidated Balance Sheets as of December 31, 2010 and 2009 |
169 | |
| Consolidated Statements of Operations for the years ended December 31, 2010, 2009 and 2008 |
170 | |
| Consolidated Statements of Cash Flows for the years ended December 31, 2010, 2009 and 2008 |
171 | |
| 172 | ||
| 173 | ||
| S-2-S-8 |
| (b) | Exhibits. |
| 3.1 | Sixth Restated Certificate of Incorporation of The AES Corporation is incorporated herein by reference to Exhibit 3.1 of the Company’s Form 10-K for the year ended December 31, 2008. | |
| 3.2 | By-Laws of The AES Corporation, as amended and incorporated herein by reference to Exhibit 3.1 of the Company’s Form 8-K filed on August 11, 2009. | |
| 4 | There are numerous instruments defining the rights of holders of long-term indebtedness of the Registrant and its consolidated subsidiaries, none of which exceeds ten percent of the total assets of the Registrant and its subsidiaries on a consolidated basis. The Registrant hereby agrees to furnish a copy of any of such agreements to the Commission upon request. Since these documents are not required filings under Item 601 of Regulation S-K, the Company has elected to file certain of these documents as Exhibits 4(a)—4(o). | |
| 4.(a) | Junior Subordinated Indenture, dated as of March 1, 1997, between The AES Corporation and Wells Fargo Bank, National Association, as successor to Bank One, National Association (formerly known as The First National Bank of Chicago) is incorporated herein by reference to Exhibit 4.(a) of the Company’s Form 10-K for the year ended December 31, 2008. | |
| 4.(b) | Third Supplemental Indenture, dated as of October 14, 1999, between The AES Corporation and Wells Fargo Bank, National Association, as successor to Bank One, National Association is incorporated herein by reference to Exhibit 4.(b) of the Company’s Form 10-K for the year ended December 31, 2008. | |
| 4.(c) | Senior Indenture, dated as of December 8, 1998, between The AES Corporation and Wells Fargo Bank, National Association, as successor to Bank One, National Association (formerly known as The First National Bank of Chicago) is incorporated herein by reference to Exhibit 4.01 of the Company’s Form 8-K filed on December 11, 1998. | |
| 4.(d) | Form of Second Supplemental Indenture, dated as of June 11, 1999, between The AES Corporation and Wells Fargo Bank, National Association, as successor to Bank One, National Association (formerly known as The First National Bank of Chicago) is incorporated herein by reference to Exhibit 4.01 of the Company’s Form 8-K filed on June 11, 1999. | |
| 4.(e) | Third Supplemental Indenture, dated as of September 12, 2000, between The AES Corporation and Wells Fargo Bank, National Association, as successor to Bank One, National Association is incorporated herein by reference to Exhibit 4.(e) of the Company’s Form 10-K for the year ended December 31, 2008. | |
| 4.(f) | Form of Fifth Supplemental Indenture, dated as of February 9, 2001, between The AES Corporation and Wells Fargo Bank, National Association, as successor to Bank One, National Association is incorporated herein by reference to Exhibit 4.1 of the Company’s Form 8-K filed on February 8, 2001. | |
283
Table of Contents
| 4.(g) | Form of Sixth Supplemental Indenture, dated as of February 22, 2001, between The AES Corporation and Wells Fargo Bank, National Association, as successor to Bank One, National Association is incorporated herein by reference to Exhibit 4.1 of the Company’s Form 8-K filed on February 21, 2001. | |
| 4.(h) | Ninth Supplemental Indenture, dated as of April 3, 2003, between The AES Corporation and Wells Fargo Bank, National Association (as successor by consolidation to Wells Fargo Bank Minnesota, National Association) is incorporated herein by reference to Exhibit 4.6 of the Company’s Form S-4 filed on December 7, 2007. | |
| 4.(i) | Form of Tenth Supplemental Indenture, dated as of February 13, 2004, between The AES Corporation and Wells Fargo Bank, National Association (as successor by consolidation to Wells Fargo Bank Minnesota, National Association) is incorporated herein by reference to Exhibit 4.1 of the Company’s Form 8-K filed on February 13, 2004. | |
| 4.(j) | Eleventh Supplemental Indenture, dated as of October 15, 2007, between The AES Corporation and Wells Fargo Bank, National Association is incorporated herein by reference to Exhibit 4.7 of the Company’s Form S-4 filed on December 7, 2007. | |
| 4.(k) | Twelfth Supplemental Indenture, dated as of October 15, 2007, between The AES Corporation and Wells Fargo Bank, National Association is incorporated herein by reference to Exhibit 4.8 of the Company’s Form S-4 filed on December 7, 2007. | |
| 4.(l) | Thirteenth Supplemental Indenture, dated as of May 19, 2008, between The AES Corporation and Wells Fargo Bank, National Association is incorporated herein by reference to Exhibit 4.(l) of the Company’s Form 10-K for the year ended December 31, 2008. | |
| 4.(m) | Fourteenth Supplemental indenture, dated as of April 2, 2009, between The AES Corporation and Wells Fargo Bank, National Association is incorporated herein by reference to Exhibit 99.1 of the Company’s Form 8-K filed on April 2, 2009. | |
| 4.(n) | Senior Indenture, dated as of May 8, 2003, between The AES Corporation and Wells Fargo Bank, National Association (as successor by consolidation to Wells Fargo Bank Minnesota, National Association) is incorporated herein by reference to Exhibit 4.(m) of the Company’s Form 10-K for the year ended December 31, 2008. | |
| 4.(o) | First Supplemental Indenture, dated as of May 28, 2008, between The AES Corporation and Wells Fargo Bank, National Association is incorporated herein by reference to Exhibit 4.(n) of the Company’s Form 10-K for the year ended December 31, 2008. | |
| 10.1 | The AES Corporation Profit Sharing and Stock Ownership Plan are incorporated herein by reference to Exhibit 4(c)(1) of the Registration Statement on Form S-8 (Registration No. 33-49262) filed on July 2, 1992. | |
| 10.2 | The AES Corporation Incentive Stock Option Plan of 1991, as amended, is incorporated herein by reference to Exhibit 10.30 of the Company’s Form 10-K for the year ended December 31, 1995. | |
| 10.3 | Applied Energy Services, Inc. Incentive Stock Option Plan of 1982 is incorporated herein by reference to Exhibit 10.31 of the Registration Statement on Form S-1 (Registration No. 33-40483). | |
| 10.4 | Deferred Compensation Plan for Executive Officers, as amended, is incorporated herein by reference to Exhibit 10.32 of Amendment No. 1 to the Registration Statement on Form S-1(Registration No. 33-40483). | |
| 10.5 | Deferred Compensation Plan for Directors is incorporated herein by reference to Exhibit 10.9 of the Company’s Form 10-Q for the quarter ended March 31, 1998. | |
| 10.6 | The AES Corporation Stock Option Plan for Outside Directors as amended is incorporated herein by reference to Appendix C of the Registrant’s 2003 Proxy Statement filed on March 25, 2003. | |
284
Table of Contents
| 10.7 | The AES Corporation Supplemental Retirement Plan is incorporated herein by reference to Exhibit 10.63 of the Company’s Form 10-K for the year ended December 31, 1994. | |
| 10.7A | Amendment to The AES Corporation Supplemental Retirement Plan, dated March 13, 2008 is incorporated herein by reference to Exhibit 10.9.A of the Company’s Form 10-K for the year ended December 31, 2007. | |
| 10.8 | The AES Corporation 2001 Stock Option Plan is incorporated herein by reference to Exhibit 10.12 of the Company’s Form 10-K for the year ended December 31, 2000. | |
| 10.9 | Second Amended and Restated Deferred Compensation Plan for Directors is incorporated herein by reference to Exhibit 10.13 of the Company’s Form 10-K for the year ended December 31, 2000. | |
| 10.10 | The AES Corporation 2001 Non-Officer Stock Option Plan is incorporated herein by reference to Exhibit 10.12 of the Company’s Form 10-K for the year ended December 31, 2002. | |
| 10.10A | Amendment to the 2001 Stock Option Plan and 2001 Non-Officer Stock Option Plan, dated March 13, 2008 is incorporated herein by reference to Exhibit 10.12.A of the Company’s Form 10-K for the year ended December 31, 2007. | |
| 10.11 | The AES Corporation 2003 Long Term Compensation Plan, as amended and restated on April 22, 2010, is incorporated herein by reference to Exhibit 10.1 of the Company’s Form 8-K filed on April 27, 2010. | |
| 10.12 | Form of AES 2010 Nonqualified Stock Option Award Agreement under The AES Corporation 2003 Long Term Compensation Plan (Outside Directors) is incorporated herein by reference to Exhibit 10.2 of the Company’s Form 8-K filed on April 27, 2010. | |
| 10.13 | Form of AES Performance Stock Unit Award Agreement under The AES Corporation 2003 Long Term Compensation Plan (filed herewith). | |
| 10.14 | Form of AES Restricted Stock Unit Award Agreement under The AES Corporation 2003 Long Term Compensation Plan (filed herewith). | |
| 10.15 | Form of AES Executive Stock Option Unit Award Agreement under The AES Corporation 2003 Long Term Compensation Plan (filed herewith). | |
| 10.16 | The AES Corporation Restoration Supplemental Retirement Plan, as amended and restated, dated December 29, 2008 is incorporated herein by reference to Exhibit 10.15 of the Company’s Form 10-K for the year ended December 31, 2008. | |
| 10.17 | The AES Corporation International Retirement Plan, as amended and restated on December 29, 2008 is incorporated herein by reference to Exhibit 10.16 of the Company’s Form 10-K for the year ended December 31, 2008. | |
| 10.18 | The AES Corporation Severance Plan, as amended and restated on December 10, 2010 (filed herewith). | |
| 10.19 | The AES Corporation Performance Incentive Plan, as amended and restated on April 22, 2010 is incorporated herein by reference to Exhibit 10.4 of the Company’s Form 8-K filed on April 27, 2010. | |
| 10.20 | The AES Corporation Deferred Compensation Program For Directors dated April 22, 2010, is incorporated herein by reference to Exhibit 10.4 of the Company’s Form 8-K filed on April 27, 2010. | |
| 10.21 | Amendment No. 2 to the Fourth Amended and Restated Credit and Reimbursement Agreement dated as of July 29, 2010 among the Company, the Subsidiary Guarantors, Citicorp USA, Inc., as Administrative Agent, Citibank N.A. as Collateral Agent and various lenders named therein is incorporated herein by reference to Exhibit 10.1 of the Company’s Form 8-K filed on July 30, 2010. | |
285
Table of Contents
| 10.21.A | Fifth Amended and Restated Credit and Reimbursement Agreement dated as of July 29, 2010 among The AES Corporation, a Delaware corporation, the Subsidiary Guarantors listed herein, the Banks listed on the signature pages thereof, Citicorp USA, Inc., as Administrative Agent, Citibank, N.A. as Collateral Agent, Citigroup Global Markets Inc., as Lead Arranger and Book Runner, Banc of America Securities LLC, as Lead Arranger and Book Runner and Co-Syndication Agent, Barclays Capital, as Lead Arranger and Book Runner and Co-Syndication Agent, RBS Securities Inc., as Lead Arranger and Book Runner and Co-Syndication Agent, RBS Securities Inc., as lead Arranger and Book Runner and Co-Syndication Agent, and Union Bank, N.A., as Lead Arranger and Book Runner and Co-Syndication Agent is incorporated herein by reference to Exhibit 10.1.A of the Company’s Form 8-K filed on July 30, 2010. | |
| 10.21.B | Appendices and Exhibits to the Fifth Amended and Restated Credit and Reimbursement Agreement, dated as of July 29, 2010 is incorporated herein by reference to Exhibit 10.1.B of the Company’s Form 8-K filed on July 30, 2010. | |
| 10.22 | Collateral Trust Agreement dated as of December 12, 2002 among The AES Corporation, AES International Holdings II, Ltd., Wilmington Trust Company, as corporate trustee and Bruce L. Bisson, an individual trustee is incorporated herein by reference to Exhibit 4.2 of the Company’s Form 8-K filed on December 17, 2002. | |
| 10.23 | Security Agreement dated as of December 12, 2002 made by The AES Corporation to Wilmington Trust Company, as corporate trustee and Bruce L. Bisson, as individual trustee is incorporated herein by reference to Exhibit 4.3 of the Company’s Form 8-K filed on December 17, 2002. | |
| 10.24 | Charge Over Shares dated as of December 12, 2002 between AES International Holdings II, Ltd. and Wilmington Trust Company, as corporate trustee and Bruce L. Bisson, as individual trustee is incorporated herein by reference to Exhibit 4.4 of the Company’s Form 8-K filed on December 17, 2002. | |
| 10.25 | Stock Purchase Agreement between The AES Corporation and Terrific Investment Corporation dated November 6, 2009 is incorporated herein by reference to Exhibit 10.1 of the Company’s form 8-K filed on November 11, 2009. | |
| 10.26 | Stockholder Agreement between The AES Corporation and Terrific Investment Corporation dated March 12, 2010 is incorporated herein by reference to Exhibit 10.1 of the Company’s Form 8-K filed on March 15, 2010. | |
| 12 | Statement of computation of ratio of earnings to fixed charges (filed herewith). | |
| 21 | Subsidiaries of The AES Corporation (filed herewith). | |
| 23.1 | Consent of Independent Registered Public Accounting Firm, Ernst & Young LLP (filed herewith). | |
| 24 | Powers of Attorney (filed herewith). | |
| 31.1 | Rule 13a-14(a)/15d-14(a) Certification of Paul Hanrahan (filed herewith). | |
| 31.2 | Rule 13a-14(a)/15d-14(a) Certification of Victoria D. Harker (filed herewith). | |
| 32.1 | Section 1350 Certification of Paul Hanrahan (filed herewith). | |
| 32.2 | Section 1350 Certification of Victoria D. Harker (filed herewith). | |
| 101.INS | XBRL Instance Document (furnished herewith as provided in Rule 406T of Regulation S-T). | |
| 101.SCH | XBRL Taxonomy Extension Schema Document (furnished herewith as provided in Rule 406T of Regulation S-T). | |
| 101.CAL | XBRL Taxonomy Extension Calculation Linkbase Document (furnished herewith as provided in Rule 406T of Regulation S-T). | |
286
Table of Contents
| 101.DEF | XBRL Taxonomy Extension Definition Linkbase Document (furnished herewith as provided in Rule 406T of Regulation S-T). | |
| 101.LAB | XBRL Taxonomy Extension Label Linkbase Document (furnished herewith as provided in Rule 406T of Regulation S-T). | |
| 101.PRE | XBRL Taxonomy Extension Presentation Linkbase Document (furnished herewith as provided in Rule 406T of Regulation S-T). | |
| (c) | Schedules |
Schedule I—Condensed Financial Information of Registrant
Schedule II—Valuation and Qualifying Accounts
287
Table of Contents
Pursuant to the requirements of Section 13 or 15(d) of the Securities Exchange Act of 1934, as amended, the Company has duly caused this report to be signed on its behalf by the undersigned, thereunto duly authorized.
| THE AES CORPORATION (Company) | ||||
| Date: February 25, 2011 |
By: | /s/ PAUL HANRAHAN | ||
| Name: | Paul Hanrahan | |||
| President, Chief Executive Officer | ||||
Pursuant to the requirements of the Securities Exchange Act of 1934, as amended, this report has been signed below by the following persons on behalf of the Company and in the capacities and on the dates indicated.
| Name |
Title |
Date | ||||
| * Paul Hanrahan |
President, Chief Executive Officer (Principal Executive Officer) and Director | February 25, 2011 | ||||
| * Samuel W. Bodman, III |
Director |
February 25, 2011 | ||||
| * Kristina Johnson |
Director |
February 25, 2011 | ||||
| * Tarun Khanna |
Director |
February 25, 2011 | ||||
| * John A. Koskinen |
Director |
February 25, 2011 | ||||
| * Philip Lader |
Director |
February 25, 2011 | ||||
| * John B. Morse |
Director |
February 25, 2011 | ||||
| * Sandra O. Moose |
Director |
February 25, 2011 | ||||
| * Philip A. Odeen |
Chairman of the Board and Lead Independent Director | February 25, 2011 | ||||
| * Charles O. Rossotti |
Director |
February 25, 2011 | ||||
| * Sven Sandstrom |
Director |
February 25, 2011 | ||||
| /s/ VICTORIA D. HARKER Victoria D. Harker |
Executive Vice President and Chief Financial Officer (Principal Financial Officer) | February 25, 2011 | ||||
| /s/ MARY WOOD Mary Wood |
Vice President and Controller (Principal Accounting Officer) | February 25, 2011 | ||||
| *BY: | /s/ BRIAN A. MILLER Attorney-in-fact |
February 25, 2011 | ||||
288
Table of Contents
THE AES CORPORATION AND SUBSIDIARIES
INDEX TO FINANCIAL STATEMENT SCHEDULES
| S-2 | ||||
| S-8 |
Schedules other than those listed above are omitted as the information is either not applicable, not required, or has been furnished in the financial statements or notes thereto included in Item 8 hereof.
S-1
Table of Contents
SCHEDULE I CONDENSED FINANCIAL INFORMATION OF REGISTRANT
UNCONSOLIDATED BALANCE SHEETS
| December 31, | ||||||||
| 2010 | 2009 | |||||||
| (in millions) | ||||||||
| ASSETS | ||||||||
| Current Assets: |
||||||||
| Cash and cash equivalents |
$ | 594 | $ | 628 | ||||
| Restricted cash |
10 | 9 | ||||||
| Accounts and notes receivable from subsidiaries |
1,031 | 514 | ||||||
| Deferred income taxes |
23 | 27 | ||||||
| Prepaid expenses and other current assets |
31 | 34 | ||||||
| Total current assets |
1,689 | 1,212 | ||||||
| Investment in and advances to subsidiaries and affiliates |
9,240 | 8,639 | ||||||
| Office Equipment: |
||||||||
| Cost |
93 | 86 | ||||||
| Accumulated depreciation |
(59 | ) | (47 | ) | ||||
| Office equipment, net |
34 | 39 | ||||||
| Other Assets: |
||||||||
| Deferred financing costs (net of accumulated amortization of $39 and $76, respectively) |
64 | 72 | ||||||
| Deferred income taxes |
352 | 516 | ||||||
| Other assets |
1 | 25 | ||||||
| Total other assets |
417 | 613 | ||||||
| Total |
$ | 11,380 | $ | 10,503 | ||||
| LIABILITIES AND STOCKHOLDERS’ EQUITY | ||||||||
| Current Liabilities: |
||||||||
| Accounts payable |
$ | 2 | $ | 5 | ||||
| Accrued and other liabilities |
187 | 208 | ||||||
| Term loan |
200 | — | ||||||
| Senior notes payable—current portion |
263 | 214 | ||||||
| Total current liabilities |
652 | 427 | ||||||
| Long-term Liabilities: |
||||||||
| Term loan |
— | 200 | ||||||
| Senior notes payable |
3,631 | 4,584 | ||||||
| Junior subordinated notes and debentures payable |
517 | 517 | ||||||
| Other long-term liabilities |
107 | 100 | ||||||
| Total long-term liabilities |
4,255 | 5,401 | ||||||
| Stockholders’ equity: |
||||||||
| Common stock |
8 | 7 | ||||||
| Additional paid-in capital |
8,444 | 6,868 | ||||||
| Retained earnings |
620 | 650 | ||||||
| Accumulated other comprehensive loss |
(2,383 | ) | (2,724 | ) | ||||
| Treasury stock |
(216 | ) | (126 | ) | ||||
| Total stockholders’ equity |
6,473 | 4,675 | ||||||
| Total |
$ | 11,380 | $ | 10,503 | ||||
See Notes to Schedule I
S-2
Table of Contents
THE AES CORPORATION
SCHEDULE I CONDENSED FINANCIAL INFORMATION OF REGISTRANT
STATEMENTS OF UNCONSOLIDATED OPERATIONS
| For the Years Ended December 31 |
||||||||||||
| 2010 | 2009 | 2008 | ||||||||||
| (in millions) | ||||||||||||
| Revenues from subsidiaries and affiliates |
$ | 34 | $ | 39 | $ | 36 | ||||||
| Equity in earnings of subsidiaries and affiliates |
590 | 983 | 2,019 | |||||||||
| Interest income |
279 | 131 | 173 | |||||||||
| General and administrative expenses |
(261 | ) | (218 | ) | (264 | ) | ||||||
| Interest expense |
(461 | ) | (485 | ) | (516 | ) | ||||||
| Income (loss) before income taxes |
181 | 450 | 1,448 | |||||||||
| Income tax benefit (expense) |
(172 | ) | 208 | (214 | ) | |||||||
| Net income |
$ | 9 | $ | 658 | $ | 1,234 | ||||||
See Notes to Schedule I
S-3
Table of Contents
THE AES CORPORATION
SCHEDULE I CONDENSED FINANCIAL INFORMATION OF REGISTRANT
STATEMENTS OF UNCONSOLIDATED CASH FLOWS
| For the Years Ended December 31, |
||||||||||||
| 2010 | 2009 | 2008 | ||||||||||
| (in millions) | ||||||||||||
| Net cash provided by operating activities |
$ | 488 | $ | 178 | $ | 863 | ||||||
| Investing Activities: |
||||||||||||
| Investment in and advances to subsidiaries |
(1,185 | ) | (452 | ) | (1,098 | ) | ||||||
| Acquisitions—net of cash acquired |
(3 | ) | (5 | ) | (95 | ) | ||||||
| Return of capital |
300 | 166 | 89 | |||||||||
| (Increase) decrease in restricted cash |
(2 | ) | 4 | 2 | ||||||||
| Additions to property, plant and equipment |
(22 | ) | (8 | ) | (23 | ) | ||||||
| Net cash used in investing activities |
(912 | ) | (295 | ) | (1,125 | ) | ||||||
| Financing Activities: |
||||||||||||
| Borrowings of notes payable and other coupon bearing securities |
— | 503 | 625 | |||||||||
| Repayments of notes payable and other coupon bearing securities |
(914 | ) | (154 | ) | (1,037 | ) | ||||||
| Loans (to) from subsidiaries |
(154 | ) | 205 | 90 | ||||||||
| Proceeds from issuance of common stock |
1,569 | 14 | 28 | |||||||||
| Purchase of treasury stock |
(99 | ) | — | (143 | ) | |||||||
| Payments for deferred financing costs |
(12 | ) | (23 | ) | (14 | ) | ||||||
| Net cash provided by (used in) financing activities |
390 | 545 | (451 | ) | ||||||||
| Increase (decrease) in cash and cash equivalents |
(34 | ) | 428 | (713 | ) | |||||||
| Cash and cash equivalents, beginning |
628 | 200 | 913 | |||||||||
| Cash and cash equivalents, ending |
$ | 594 | $ | 628 | $ | 200 | ||||||
| Supplemental Disclosures: |
||||||||||||
| Cash payments for interest, net of amounts capitalized |
$ | 412 | $ | 410 | $ | 469 | ||||||
| Cash payments for income taxes, net of refunds |
$ | — | $ | — | $ | — | ||||||
See Notes to Schedule I
S-4
Table of Contents
THE AES CORPORATION
SCHEDULE I
NOTES TO SCHEDULE I
1. Application of Significant Accounting Principles
Accounting for Subsidiaries and Affiliates—The AES Corporation (the “Company”) has accounted for the earnings of its subsidiaries on the equity method in the unconsolidated financial information.
Revenue—Construction management fees earned by the parent from its consolidated subsidiaries are eliminated.
Income Taxes—Positions taken on the Company’s income tax return which satisfy a more-likely-than-not threshold will be recognized in the financial statements. The unconsolidated income tax expense or benefit computed for the Company reflects the tax assets and liabilities of the Company on a stand-alone basis and the effect of filing a consolidated U.S. income tax return with certain other affiliated companies.
Accounts and Notes Receivable from Subsidiaries—such amounts have been shown in current or long-term assets based on terms in agreements with subsidiaries, but payment is dependent upon meeting conditions precedent in the subsidiary loan agreements.
Selected Unconsolidated Balance Sheet Data:
| December
31, 2010 |
December
31, 2009 |
|||||||
| (in millions) | ||||||||
| Assets |
||||||||
| Investment in and advances to subsidiaries and affiliates |
$ | 9,240 | $ | 8,639 | ||||
| Deferred income taxes |
$ | 352 | $ | 516 | ||||
| Total other assets |
$ | 417 | $ | 613 | ||||
| Total assets |
$ | 11,380 | $ | 10,503 | ||||
| Liabilities and Stockholders’ Equity |
||||||||
| Other long-term liabilities |
$ | 107 | $ | 100 | ||||
| Total long-term liabilities |
$ | 4,255 | $ | 5,401 | ||||
| Additional paid-in capital |
$ | 8,444 | $ | 6,868 | ||||
| Retained earnings |
$ | 620 | $ | 650 | ||||
| Accumulated other comprehensive loss |
$ | (2,383 | ) | $ | (2,724 | ) | ||
| Total stockholders’ equity |
$ | 6,473 | $ | 4,675 | ||||
| Total liabilities and stockholders’ equity |
$ | 11,380 | $ | 10,503 | ||||
Selected Unconsolidated Operations Data:
| For the Year Ended December 31, |
||||||||||||
| 2010 | 2009 | 2008 | ||||||||||
| (in millions) | ||||||||||||
| Equity in earnings of subsidiaries and affiliates |
$ | 590 | $ | 983 | $ | 2,019 | ||||||
| Income before income taxes |
$ | 181 | $ | 450 | $ | 1,448 | ||||||
| Income tax benefit (expense) |
$ | (172 | ) | $ | 208 | $ | (214 | ) | ||||
| Net income attributable to The AES Corporation |
$ | 9 | $ | 658 | $ | 1,234 | ||||||
S-5
Table of Contents
2. Notes Payable
| December 31, | ||||||||||||||||
| Interest Rate | Maturity | 2010 | 2009 | |||||||||||||
| (in millions) | ||||||||||||||||
| Senior Unsecured Note |
9.375% | 2010 | $ | — | $ | 214 | ||||||||||
| Senior Secured Term Loan |
LIBOR + 1.75% | 2011 | 200 | 200 | ||||||||||||
| Senior Unsecured Note |
8.875% | 2011 | 129 | 129 | ||||||||||||
| Senior Unsecured Note |
8.375% | 2011 | 134 | 139 | ||||||||||||
| Second Priority Senior Secured Note |
8.75% | 2013 | — | 690 | ||||||||||||
| Senior Unsecured Note |
7.75% | 2014 | 500 | 500 | ||||||||||||
| Senior Unsecured Note |
7.75% | 2015 | 500 | 500 | ||||||||||||
| Senior Unsecured Note |
9.75% | 2016 | 535 | 535 | ||||||||||||
| Senior Unsecured Note |
8.00% | 2017 | 1,500 | 1,500 | ||||||||||||
| Senior Unsecured Note |
8.00% | 2020 | 625 | 625 | ||||||||||||
| Term Convertible Trust Securities |
6.75% | 2029 | 517 | 517 | ||||||||||||
| Unamortized discounts |
(28 | ) | (34 | ) | ||||||||||||
| SUBTOTAL |
$ | 4,612 | $ | 5,515 | ||||||||||||
| Less: Current maturities |
(463 | ) | (214 | ) | ||||||||||||
| Total |
$ | 4,149 | $ | 5,301 | ||||||||||||
FUTURE MATURITIES OF DEBT—Recourse debt as of December 31, 2010 is scheduled to reach maturity as set forth in the table below:
| December 31, |
Annual Maturities |
|||
| (in millions) | ||||
| 2011 |
$ | 463 | ||
| 2012 |
— | |||
| 2013 |
— | |||
| 2014 |
497 | |||
| 2015 |
500 | |||
| Thereafter |
3,152 | |||
| Total debt |
$ | 4,612 | ||
3. Dividends from Subsidiaries and Affiliates
Cash dividends received from consolidated subsidiaries and from affiliates accounted for by the equity method were as follows:
| 2010 | 2009 | 2008 | ||||||||||
| (in millions) | ||||||||||||
| Subsidiaries |
$ | 944 | $ | 948 | $ | 738 | ||||||
| Affiliates |
$ | 10 | $ | 60 | $ | 61 | ||||||
S-6
Table of Contents
4. Guarantees and Letters of Credit
GUARANTEES—In connection with certain of its project financing, acquisition, and power purchase agreements, the Company has expressly undertaken limited obligations and commitments, most of which will only be effective or will be terminated upon the occurrence of future events. These obligations and commitments, excluding those collateralized by letter of credit and other obligations discussed below, were limited as of December 31, 2010, by the terms of the agreements, to an aggregate of approximately $415 million representing 24 agreements with individual exposures ranging from less than $1 million up to $62 million.
LETTERS OF CREDIT—At December 31, 2010, the Company had $85 million in letters of credit outstanding representing 30 agreements with individual exposures ranging from less than $1 million up to $26 million, which operate to guarantee performance relating to certain project development and construction activities and subsidiary operations. During 2010, the Company paid letter of credit fees ranging from 3.19% to 3.75% per annum on the outstanding amounts.
S-7
Table of Contents
SCHEDULE II
VALUATION AND QUALIFYING ACCOUNTS
(IN MILLIONS)
| Balance at Beginning of the Period |
Charged to Cost and Expense |
Amounts Written off |
Translation Adjustment |
Balance at the End of the Period |
||||||||||||||||
| Allowance for accounts receivables |
||||||||||||||||||||
| (current and noncurrent) |
||||||||||||||||||||
| Year ended December 31, 2008 . |
$ | 257 | $ | 128 | $ | (56 | ) | $ | (74 | ) | $ | 255 | ||||||||
| Year ended December 31, 2009 . |
255 | 106 | (109 | ) | 41 | 293 | ||||||||||||||
| Year ended December 31, 2010 . |
293 | 53 | (41 | ) | 3 | 308 | ||||||||||||||
S-8