Table of Contents
UNITED STATES
SECURITIES AND EXCHANGE COMMISSION
Washington, D.C. 20549
FORM N-CSR/A
CERTIFIED SHAREHOLDER REPORT OF REGISTERED
MANAGEMENT INVESTMENT COMPANIES
Investment Company Act file number: 811-06241
Loomis Sayles Funds II
(Exact name of Registrant as specified in charter)
399 Boylston Street, Boston, Massachusetts 02116
(Address of principal executive offices) (Zip code)
Coleen Downs Dinneen, Esq.
NGAM Distribution, L.P.
399 Boylston Street
Boston, Massachusetts 02116
(Name and address of agent for service)
Registrant’s telephone number, including area code: (617) 449-2810
Date of fiscal year end: September 30
Date of reporting period: September 30, 2012
Note: This Form N-CSR/A for Loomis Sayles Funds II (the “Registrant”) is being filed solely to reflect changes to the annual report of the Loomis Sayles Strategic Income Fund. The annual reports for the other series of the Registrant contained in the Form N-CSR filed on December 4, 2012 (Accession Number 0001193125-12-490086) are not amended or modified in any way by this Form N-CSR/A. This Form N-CSR/A also updates Item 11 “Controls and Procedures” with respect to the Loomis Sayles Strategic Income Fund as required. Other than the aforementioned amendment, no other information or disclosures contained in the Registrant’s Form N-CSR filed on December 4, 2012 is being amended by this Form N-CSR/A.
Table of Contents
| Item 1. | Reports to Stockholders. |
The Registrant’s annual report transmitted to shareholders pursuant to Rule 30e-1 under the Investment Company Act of 1940 is as follows:
Table of Contents
LOOMIS SAYLES STRATEGIC INCOME FUND
(the “Fund”)
Supplement dated March 4, 2013 to the Fund’s Annual Report for the period ended September 30, 2012.
The average annual total returns (with 4.50% maximum sales charge) for Class A shares of the Fund were incorrectly reported in the Fund’s annual report for the period ended September 30, 2012. The average annual total returns for Class A shares reported in the Fund’s annual report were as follows:
Average Annual Total Returns – September 30, 20126
| 1 Year | 5 Years | 10 Years | ||||||||||
| Class A (Inception 5/1/95) With 4.50% Maximum Sales Charge |
10.00 | % | 6.13 | % | 10.74 | % | ||||||
6Fund performance has been increased by fee waivers and/or expense reimbursements, if any, without which performance would have been lower.
Inadvertently, a maximum sales charge of 3.50% was applied to the originally reported average annual returns resulting in overstated performance amounts for Class A shares. The corrected average annual total returns in the table below reflect the correct maximum sales charge of 4.50% for Class A shares of the Fund.
Effective immediately, the average annual total returns information with respect to Class A within the table “Average Annual Total Returns – September 30, 2012” in the annual report is amended and restated as follows for Class A shares of the Fund:
Average Annual Total Returns – September 30, 20126
| 1 Year | 5 Years | 10 Years | ||||||||||
| Class A (Inception 5/1/95) With 4.50% Maximum Sales Charge |
8.89 | % | 5.90 | % | 10.62 | % | ||||||
6Fund performance has been increased by fee waivers and/or expense reimbursements, if any, without which performance would have been lower.
Table of Contents
ANNUAL REPORT
September 30, 2012

Loomis Sayles Strategic Income Fund
Portfolio Review page 1
Portfolio of Investments page 13
Financial Statements page 35
Notes to Financial Statements page 41
Table of Contents
LOOMIS SAYLES STRATEGIC INCOME FUND
Management Discussion
1 |
Table of Contents
among the fund’s foreign-currency-denominated issues. The New Zealand dollar, Australian dollar and Canadian dollar also posted positive results. In addition, the fund’s exposure to high-yield securities benefitted from a robust new issuance market, supported by the Fed’s assurance that interest rates would remain low into 2015. Within high yield, the industrial sector contributed the most to returns, buoyed by strong showings from individual names, while the financial and utility sectors also proved additive. Exposure to convertible securities also boosted performance. Convertibles trended higher alongside equities, which climbed during the period.
An underweight position in commercial mortgage-backed securities, which were strong performers during the period, detracted from relative returns. In addition, the fund’s allocation to sovereign issues weighed on performance, largely due to certain issues denominated in the Swiss franc and Norwegian krone. Exposure to investment-grade utilities detracted from performance, as the traditionally defensive sector was out of favor for much of the period.
Outlook
Unprecedented monetary support in both the United States and Europe continues to largely dictate market sentiment and flows, while preserving low interest rates. Investor desire for yield in this environment will most likely support sustained demand in the corporate arena. Fundamental credit quality in the corporate sector remains a source of confidence for investors. However, if economic conditions continue to deteriorate globally, the challenge of investing in stable to improving companies will become more challenging.
The U.S. elections, pending “fiscal cliff” and increasingly weakening economic conditions in Europe, China and the United States are all situations that could potentially provide market volatility and opportunities. We consider recent positive developments in the U.S. housing market along with the Fed’s latest purchase program in the mortgage market to be sources of good news on the economic front and view the sectors as continuing opportunities. Our strategy of populating the fund with individual specific-risks ideas remains an important theme, as do the concepts of yield advantage and investing with a long-term horizon in mind. Macroeconomic developments continue to dominate the headlines and market flows, but our belief that owning quality companies based on fundamentals continues to serve us well and will drive our investment process through the rest of this calendar year.
| 2
Table of Contents
LOOMIS SAYLES STRATEGIC INCOME FUND
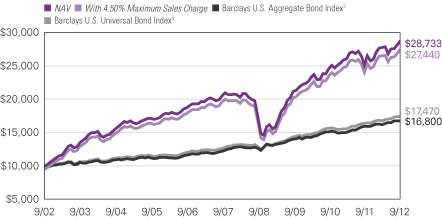
Investment Results through September 30, 2012
Growth of a $10,000 Investment in Class A Shares6
September 30, 2002 through September 30, 2012
3 |
Table of Contents
Average Annual Total Returns — September 30, 20126
| 1 Year | 5 Years | 10 Years | ||||||||||
| Class A (Inception 5/1/95) | ||||||||||||
| NAV | 14.02 | % | 6.89 | % | 11.13 | % | ||||||
| With 4.50% Maximum Sales Charge | 10.00 | 6.13 | 10.74 | |||||||||
| Class B (Inception 5/1/95) | ||||||||||||
| NAV | 13.15 | 6.10 | 10.31 | |||||||||
| With CDSC2 | 8.15 | 5.78 | 10.31 | |||||||||
| Class C (Inception 5/1/95) | ||||||||||||
| NAV | 13.18 | 6.10 | 10.31 | |||||||||
| With CDSC2 | 12.18 | 6.10 | 10.31 | |||||||||
| Class Y (Inception 12/1/99) | ||||||||||||
| NAV | 14.31 | 7.16 | 11.43 | |||||||||
| Admin Class (Inception 2/1/10)1 | ||||||||||||
| NAV | 13.79 | 6.59 | 10.80 | |||||||||
| Comparative Performance | ||||||||||||
| Barclays U.S. Aggregate Bond Index3 | 5.16 | 6.53 | 5.32 | |||||||||
| Barclays U.S. Universal Bond Index4 | 6.45 | 6.63 | 5.74 | |||||||||
| Morningstar Multisector Bond Fund Average5 | 12.54 | 6.69 | 7.90 | |||||||||
Past performance does not guarantee future results. The chart and table do not reflect taxes shareholders might owe on any fund distributions or when they redeem their shares. Returns reflect changes in share price and reinvestment of dividends and capital gains, if any. Unlike a fund, an index is not managed and does not reflect fees and expenses.
| 1 | Prior to the inception of Admin Class shares (2/1/10), performance is that of Class A shares, restated to reflect the higher net expenses of Admin Class shares. |
| 2 | Performance for Class B shares assumes a maximum 5% contingent deferred sales charge (“CDSC”) applied when you sell shares, which declines annually between years 1-6 according to the following schedule: 5, 4, 3, 3, 2, 1, 0%. Class C share performance assumes a 1% CDSC applied when you sell shares within one year of purchase. |
| 3 | Barclays U.S. Aggregate Bond Index is an unmanaged index that covers the U.S.-dollar denominated, investment-grade, fixed-rate, taxable bond market of SEC-registered securities. The index includes bonds from the Treasury, government-related, corporate, mortgage-backed securities, asset-backed securities, and collateralized mortgage-backed securities sectors. |
| 4 | Barclays U.S. Universal Bond Index is an unmanaged index that covers U.S. dollar-denominated taxable bonds, including U.S. government and investment grade debt, non-investment grade debt, asset-backed and mortgage-backed securities, Eurobonds, 144A securities and emerging market debt. |
| 5 | Morningstar Multisector Bond Fund Average is the average performance without sales charges of funds with similar investment objectives, as calculated by Morningstar, Inc. |
| 6 | Fund performance has been increased by fee waivers and/or expense reimbursements, if any, without which performance would have been lower. |
| 4
Table of Contents
ADDITIONAL INFORMATION
The views expressed in this report reflect those of the portfolio managers as of the dates indicated. The managers’ views are subject to change at any time without notice based on changes in market or other conditions. References to specific securities or industries should not be regarded as investment advice. Because the fund is actively managed, there is no assurance that it will continue to invest in the securities, countries or industries mentioned.
PROXY VOTING INFORMATION
A description of the fund’s proxy voting policies and procedures is available without charge, upon request, by calling Natixis Funds at 800-225-5478; on the fund’s website at ngam.natixis.com; and on the Securities and Exchange Commission’s (SEC’s) website at www.sec.gov. Information regarding how the fund voted proxies relating to portfolio securities during the 12-month period ended June 30, 2012 is available from the fund’s website and the SEC’s website.
QUARTERLY PORTFOLIO SCHEDULES
The fund files a complete schedule of portfolio holdings with the SEC for the first and third quarters of each fiscal year on Form N-Q. The fund’s Forms N-Q are available on the SEC’s website at www.sec.gov and may be reviewed and copied at the SEC’s Public Reference Room in Washington, DC. Information on the operation of the Public Reference Room may be obtained by calling 800-SEC-0330.
5 |
Table of Contents
UNDERSTANDING YOUR FUND’S EXPENSES
As a mutual fund shareholder, you incur different types of costs: transaction costs, including sales charges (loads) on purchases and contingent deferred sales charges on redemptions; and ongoing costs, including management fees, distribution fees (12b-1 fees) and/or service fees, and other fund expenses. These costs are described in more detail in the fund’s prospectus. The examples below are intended to help you understand the ongoing costs of investing in the fund and help you compare these with the ongoing costs of investing in other mutual funds.
The first line in the table for each class shows the actual amount of fund expenses you would have paid on a $1,000 investment in the fund from April 1, 2012 through September 30, 2012. It also shows how much a $1,000 investment would be worth at the close of the period, assuming actual fund returns and expenses. To estimate the expenses you paid over the period, simply divide your account value by $1,000 (for example $8,600 account value divided by $1,000 =8.60) and multiply the result by the number in Expenses Paid During Period column as shown below for your class.
The second line in the table for each class provides information about hypothetical account values and hypothetical expenses based on the fund’s actual expense ratios and an assumed rate of return of 5% per year before expenses, which is not the fund’s actual return. The hypothetical account values and expenses may not be used to estimate the actual ending account balance or expenses you paid on your investment for the period. You may use this information to compare the ongoing costs of investing in the fund and other funds. To do so, compare this 5% hypothetical example with the 5% hypothetical examples that appear in the shareholder reports of the other funds.
Please note that the expenses shown reflect ongoing costs only, and do not include any transaction costs. Therefore, the second line in the table of the fund is useful in comparing ongoing costs only, and will not help you determine the relative costs of owning different funds. If transaction costs were included, total costs would be higher.
| 6
Table of Contents
| LOOMIS SAYLES STRATEGIC INCOME FUND | BEGINNING ACCOUNT VALUE 4/1/2012 |
ENDING ACCOUNT VALUE 9/30/2012 |
EXPENSES PAID DURING PERIOD* 4/1/2012 – 9/30/2012 |
|||||||||
| Class A |
||||||||||||
| Actual |
$1,000.00 | $1,033.10 | $4.88 | |||||||||
| Hypothetical (5% return before expenses) |
$1,000.00 | $1,020.20 | $4.85 | |||||||||
| Class B |
||||||||||||
| Actual |
$1,000.00 | $1,029.60 | $8.68 | |||||||||
| Hypothetical (5% return before expenses) |
$1,000.00 | $1,016.45 | $8.62 | |||||||||
| Class C |
||||||||||||
| Actual |
$1,000.00 | $1,029.70 | $8.68 | |||||||||
| Hypothetical (5% return before expenses) |
$1,000.00 | $1,016.45 | $8.62 | |||||||||
| Class Y |
||||||||||||
| Actual |
$1,000.00 | $1,034.40 | $3.61 | |||||||||
| Hypothetical (5% return before expenses) |
$1,000.00 | $1,021.45 | $3.59 | |||||||||
| Admin Class |
||||||||||||
| Actual |
$1,000.00 | $1,032.60 | $6.15 | |||||||||
| Hypothetical (5% return before expenses) |
$1,000.00 | $1,018.95 | $6.11 | |||||||||
| * | Expenses are equal to the Fund’s annualized expense ratio: 0.96%, 1.71%, 1.71%, 0.71% and 1.21% for Class A, B, C, Y and Admin Class, respectively, multiplied by the average account value over the period, multiplied by the number of days in the most recent fiscal half-year, divided by 366 (to reflect the half-year period). |
7 |
Table of Contents
BOARD APPROVAL OF THE EXISTING ADVISORY AGREEMENT
The Board of Trustees of the Trust, including the Independent Trustees, considers matters bearing on the Fund’s advisory agreement (the “Agreement”) at most of its meetings throughout the year. Each year, usually in the spring, the Contract Review and Governance Committee of the Board meets to review the Agreement to determine whether to recommend that the full Board approve the continuation of the Agreement, typically for an additional one-year period. After the Committee has made its recommendation, the full Board, including the Independent Trustees, determines whether to approve the continuation of the Agreement.
In connection with these meetings, the Trustees receive materials that the Fund’s investment adviser (the “Adviser”) believes to be reasonably necessary for the Trustees to evaluate the Agreement. These materials generally include, among other items, (i) information on the investment performance of the Fund and the performance of a peer group of funds and the Fund’s performance benchmarks, (ii) information on the Fund’s advisory fees and other expenses, including information comparing the Fund’s expenses to the fees charged to institutional accounts with similar strategies managed by the Adviser and to those of a peer group of funds and information about any applicable expense caps and fee “breakpoints,” (iii) sales and redemption data in respect of the Fund, (iv) information about the profitability of the Agreement to the Adviser and (v) information obtained through the completion by the Adviser of a questionnaire distributed on behalf of the Trustees. The Board of Trustees, including the Independent Trustees, also consider other matters such as (i) the Adviser’s financial results and financial condition, (ii) the Fund’s investment objective and strategies and the size, education and experience of the Adviser’s investment staff and its use of technology, external research and trading cost measurement tools, (iii) arrangements in respect of the distribution of the Fund’s shares and the related costs, (iv) the procedures employed to determine the value of the Fund’s assets, (v) the allocation of the Fund’s brokerage, if any, including, if applicable, allocations to brokers affiliated with the Adviser and the use of “soft” commission dollars to pay Fund expenses and to pay for research and other similar services, (vi) the resources devoted to, and the record of compliance with, the Fund’s investment policies and restrictions, policies on personal securities transactions and other compliance policies, (vii) information about amounts invested by the Fund’s portfolio managers in the Fund or in similar accounts that they manage and (viii) the general economic outlook with particular emphasis on the mutual fund industry. Throughout the process, the Trustees are afforded the opportunity to ask questions of and request additional materials from the Adviser.
In addition to the materials requested by the Trustees in connection with their annual consideration of the continuation of the Agreement, the Trustees receive materials in advance of each regular quarterly meeting of the Board of Trustees of the Trust that provide detailed information about the Fund’s investment performance and the fees charged to the Fund for advisory and other services. This information generally includes, among other things, an internal performance rating for the Fund based on agreed-upon criteria, graphs showing the Fund’s performance and fee differentials against the Fund’s
| 8
Table of Contents
peer group/category, performance ratings provided by a third-party, total return information for various periods, and third-party performance rankings for various periods comparing the Fund against similarly categorized funds. The portfolio management team for the Fund or other representatives of the Adviser make periodic presentations to the Contract Review and Governance Committee and/or the full Board of Trustees of the Trust, and if the Fund is identified as presenting possible performance concerns it may be subject to more frequent board presentations and reviews. In addition, each quarter the Trustees are provided with detailed statistical information about the Fund’s portfolio. The Trustees also receive periodic updates between meetings.
The Board of Trustees of the Trust most recently approved the continuation of the Agreement at their meeting held in June 2012. The Agreement was continued for a one-year period for the Fund. In considering whether to approve the continuation of the Agreement, the Board of Trustees of the Trust, including the Independent Trustees, did not identify any single factor as determinative. Individual Trustees may have evaluated the information presented differently from one another, giving different weights to various factors. Matters considered by the Trustees, including the Independent Trustees, in connection with their approval of the Agreement included, but were not limited to, the factors listed below.
The nature, extent and quality of the services provided to the Fund under the Agreement. The Trustees considered the nature, extent and quality of the services provided by the Adviser and its affiliates to the Fund and the resources dedicated to the Fund by the Adviser and its affiliates.
The Trustees considered not only the advisory services provided by the Adviser to the Fund, but also the administrative services provided by NGAM Advisors, L.P. (“NGAM Advisors”) and its affiliates to the Fund.
The Trustees also considered the benefits to shareholders of investing in a mutual fund that is part of a family of funds that offers shareholders the right to exchange shares of one type of fund for shares of another type of fund, and provides a variety of fund and shareholder services.
After reviewing these and related factors, the Trustees concluded, within the context of their overall conclusions regarding the Agreement, that the nature, extent and quality of services provided supported the renewal of the Agreement.
Investment performance of the Fund and the Adviser. As noted above, the Trustees received information about the performance of the Fund over various time periods, including information which compared the performance of the Fund to the performance of similarly categorized funds and the Fund’s performance benchmarks. In addition, the Trustees also reviewed data prepared by an independent third party which analyzed the performance of the Fund using a variety of performance metrics, including metrics which also measured the performance of the Fund on a risk adjusted basis.
The Board concluded that the Fund’s performance or other relevant factors supported the renewal of the Agreement. Although the Trustees noted that the Fund had performance that lagged that of a relevant peer group median and/or category median for certain (although not necessarily all) periods, the Board concluded that other factors relevant to
9 |
Table of Contents
performance supported renewal of the Agreement. These factors included the following: (1) that underperformance was attributable, to a significant extent, to investment decisions (such as security selection or sector allocation) by the Adviser that were reasonable and consistent with the Fund’s investment objective and policies and (2) that the Fund’s performance was stronger over the long term.
The Trustees also considered the Adviser’s performance and reputation generally, the performance of the fund family generally (as noted by certain financial publications), and the historical responsiveness of the Adviser to Trustee concerns about performance and the willingness of the Adviser to take steps intended to improve performance.
After reviewing these and related factors, the Trustees concluded, within the context of their overall conclusions regarding each of the Agreement, that the performance of the Fund and the Adviser and/or other relevant factors supported the renewal of the Agreement.
The costs of the services to be provided and profits to be realized by the Adviser and its affiliates from their respective relationships with the Fund. The Trustees considered the fees charged to the Fund for advisory services as well as the total expense levels of the Fund. This information included comparisons (provided both by management and also by an independent third party) of the Fund’s advisory fees and total expense levels to those of its peer group and information about the advisory fees charged by the Adviser to comparable accounts (such as institutional separate accounts), as well as information about differences in such fees and the reasons for any such differences. In considering the fees charged to comparable accounts, the Trustees considered, among other things, management’s representations about the differences between managing mutual funds as compared to other types of accounts, including the additional resources required to effectively manage and the greater regulatory costs associated with the management of mutual fund assets. In evaluating the Fund’s advisory fee, the Trustees also took into account the demands, complexity and quality of the investment management of the Fund, as well as the need for the Adviser to offer competitive compensation and to expend additional resources as the Fund grows in size. The Trustees considered that over the past several years, management had made recommendations regarding reductions in advisory fee rates, implementation of advisory fee breakpoints and the institution of advisory fee waivers and expense caps for various funds in the fund family. They noted that, as of December 31, 2011, the Fund has an expense cap in place, and the Trustees considered that the current expenses are below the cap. The Trustees noted that the Fund had an advisory fee rate that was above the median of a peer group of funds. The Trustees considered the factors which management believed justified such relatively higher fees, including that: (1) the Fund’s advisory fee rate was only slightly above its peer group median and (2) the Fund had not yet reached asset levels at which the advisory fee breakpoints would have an impact on fees.
The Trustees also considered the compensation directly or indirectly received by the Adviser and its affiliates from their relationships with the Fund. The Trustees reviewed information provided by management as to the profitability of the Adviser’s and its affiliates’ relationships with the Fund, and information about the allocation of expenses used to calculate profitability. They also reviewed information provided by management about the effect of distribution costs and changes in asset levels on Adviser profitability,
| 10
Table of Contents
including information regarding resources spent on distribution activities. When reviewing profitability, the Trustees also considered information about court cases in which adviser compensation or profitability were issues, the performance of the Fund, the expense levels of the Fund, whether the Adviser had implemented breakpoints and/or expense caps with respect to the Fund and the overall profit margin of the Adviser compared to other investment managers.
After reviewing these and related factors, the Trustees concluded, within the context of their overall conclusions regarding the Agreement, that the advisory fee charged to the Fund was fair and reasonable, and that the costs of these services generally and the related profitability of the Adviser and its affiliates in respect of their relationships with the Fund supported the renewal of the Agreement.
Economies of Scale. The Trustees considered the existence of any economies of scale in the provision of services by the Adviser and whether those economies are shared with the Fund through breakpoints in its investment advisory fees or other means, such as expense waivers or caps. The Trustees also discussed with management the factors considered with respect to the implementation of breakpoints in investment advisory fees or expense waivers or caps for certain funds. Management explained that a number of factors are taken into account in considering the possible implementation of breakpoints or an expense cap for a fund, including, among other things, factors such as a fund’s assets, the projected growth of a fund, projected profitability and a fund’s fees and performance. With respect to economies of scale, the Trustees noted the Fund is subject to breakpoints in its advisory fees. The Trustees further noted that the Fund was subject to an expense cap or waiver. In considering these issues, the Trustees also took note of the costs of the services provided (both on an absolute and a relative basis) and the profitability to the Adviser and its affiliates of their relationships with the Fund, as discussed above.
After reviewing these and related factors, the Trustees concluded, within the context of their overall conclusions regarding the Agreement, that the extent to which economies of scale were shared with the Fund supported the renewal of the Agreement.
The Trustees also considered other factors, which included but were not limited to the following:
| · | The effect of recent market and economic events on the performance, asset levels and expense ratios of the Fund. |
| · | Whether the Fund has operated in accordance with its investment objective and the Fund’s record of compliance with its investment restrictions, and the compliance programs of the Fund and the Adviser. They also considered the compliance-related resources the Adviser and its affiliates were providing to the Fund. |
| · | The nature, quality, cost and extent of administrative and shareholder services performed by the Adviser and its affiliates, both under the Agreement and under a separate agreement covering administrative services. |
11 |
Table of Contents
| · | So-called “fallout benefits” to the Adviser, such as the engagement of affiliates of the Adviser to provide distribution, administrative and brokerage services to the Fund, and the benefits of research made available to the Adviser by reason of brokerage commissions (if any) generated by the Fund’s securities transactions. The Trustees also considered the fact that NGAM Advisors’ parent company benefits from the retention of an affiliated Adviser. The Trustees considered the possible conflicts of interest associated with these fallout and other benefits, and the reporting, disclosure and other processes in place to disclose and monitor such possible conflicts of interest. |
| · | The Trustees’ review and discussion of the Fund’s advisory arrangements in prior years, and management’s record of responding to Trustee concerns raised during the year and in prior years. |
Based on their evaluation of all factors that they deemed to be material, including those factors described above, and assisted by the advice of independent counsel, the Trustees, including the Independent Trustees, concluded that the existing Agreement should be continued through June 30, 2013.
| 12
Table of Contents
Portfolio of Investments – as of September 30, 2012
Loomis Sayles Strategic Income Fund
| Principal Amount (‡) |
Description | Value (†) | ||||||
| Bonds and Notes — 71.5% of Net Assets | ||||||||
| Non-Convertible Bonds — 63.3% | ||||||||
| ABS Car Loan — 0.0% | ||||||||
| $ | 4,093,750 | Avis Budget Rental Car Funding AESOP LLC, Series 2010-5A, Class B, 5.110%, 3/20/2017, 144A |
$ | 4,480,278 | ||||
|
|
|
|||||||
| Aerospace & Defense — 0.3% | ||||||||
| 620,000 | Bombardier, Inc., 7.350%, 12/22/2026, 144A, (CAD) | 664,985 | ||||||
| 11,800,000 | Bombardier, Inc., 7.450%, 5/01/2034, 144A | 12,036,000 | ||||||
| 2,425,000 | Ducommun, Inc., 9.750%, 7/15/2018 | 2,558,375 | ||||||
| 8,236,000 | Meccanica Holdings USA, Inc., 6.250%, 7/15/2019, 144A | 7,762,570 | ||||||
| 5,436,000 | Meccanica Holdings USA, Inc., 6.250%, 1/15/2040, 144A | 4,454,498 | ||||||
| 20,755,000 | Meccanica Holdings USA, Inc., 7.375%, 7/15/2039, 144A | 18,366,701 | ||||||
| 5,310,000 | Textron Financial Corp., (fixed rate to 2/15/2017, variable rate thereafter), 6.000%, 2/15/2067, 144A |
4,433,850 | ||||||
|
|
|
|||||||
| 50,276,979 | ||||||||
|
|
|
|||||||
| Airlines — 2.6% | ||||||||
| 35,455,000 | Air Canada, 10.125%, 8/01/2015, 144A, (CAD) | 37,326,747 | ||||||
| 38,693 | Continental Airlines Pass Through Trust, Series 1996-1, Class A, 6.940%, 4/15/2015 |
38,984 | ||||||
| 1,116,353 | Continental Airlines Pass Through Trust, Series 1997-1, Class A, 7.461%, 10/01/2016 |
1,172,171 | ||||||
| 1,777,301 | Continental Airlines Pass Through Trust, Series 1997-4, Class B, 6.900%, 7/02/2018 |
1,848,393 | ||||||
| 1,992,872 | Continental Airlines Pass Through Trust, Series 1998-1, Class B, 6.748%, 9/15/2018 |
2,092,516 | ||||||
| 3,297,567 | Continental Airlines Pass Through Trust, Series 1999-1, Class B, 6.795%, 2/02/2020 |
3,495,421 | ||||||
| 2,231,607 | Continental Airlines Pass Through Trust, Series 1999-2, Class B, 7.566%, 9/15/2021 |
2,387,819 | ||||||
| 1,273,967 | Continental Airlines Pass Through Trust, Series 2000-1, Class A-1, 8.048%, 5/01/2022 |
1,455,507 | ||||||
| 1,473,632 | Continental Airlines Pass Through Trust, Series 2000-2, Class A-1, 7.707%, 10/02/2022 |
1,646,784 | ||||||
| 2,962,404 | Continental Airlines Pass Through Trust, Series 2000-2, Class B, 8.307%, 10/02/2019 |
3,169,772 | ||||||
| 1,860,333 | Continental Airlines Pass Through Trust, Series 2001-1, Class A-1, 6.703%, 12/15/2022 |
2,020,303 | ||||||
| 1,063,631 | Continental Airlines Pass Through Trust, Series 2001-1, Class B, 7.373%, 6/15/2017 |
1,139,468 | ||||||
| 10,866,506 | Continental Airlines Pass Through Trust, Series 2007-1, Class A, 5.983%, 10/19/2023 |
12,116,154 | ||||||
| 18,741,526 | Continental Airlines Pass Through Trust, Series 2007-1, Class B, 6.903%, 10/19/2023 |
19,677,478 | ||||||
| 17,148,751 | Continental Airlines Pass Through Trust, Series 2009-1, 9.000%, 1/08/2018 | 19,806,808 | ||||||
| 15,712,916 | Continental Airlines Pass Through Trust, Series 2009-2, Class A, 7.250%, 5/10/2021 |
17,952,007 | ||||||
See accompanying notes to financial statements.
13 |
Table of Contents
Portfolio of Investments – as of September 30, 2012
Loomis Sayles Strategic Income Fund – (continued)
| Principal Amount (‡) |
Description | Value (†) | ||||||
| Airlines — continued | ||||||||
| $ | 3,980,000 | Continental Airlines Pass Through Trust, Series 2012-1, Class B, 6.250%, 10/22/2021 |
$ | 4,119,300 | ||||
| 1,285,967 | Delta Air Lines Pass Through Trust, Series 2007-1, Class A, 6.821%, 2/10/2024 |
1,420,994 | ||||||
| 6,417,317 | Delta Air Lines Pass Through Trust, Series 2007-1, Class B, 8.021%, 2/10/2024 |
6,930,702 | ||||||
| 20,642,922 | Delta Air Lines Pass Through Trust, Series 2007-1, Class C, 8.954%, 8/10/2014 |
21,185,831 | ||||||
| 1,900,639 | Northwest Airlines, Inc., Series 2002-1, Class G2, (MBIA insured), 6.264%, 5/20/2023 |
2,005,175 | ||||||
| 1,500,000 | Qantas Airways Ltd., 5.125%, 6/20/2013, 144A | 1,519,614 | ||||||
| 29,995,000 | Qantas Airways Ltd., 6.050%, 4/15/2016, 144A | 30,942,782 | ||||||
| 17,663,390 | UAL Pass Through Trust, Series 2007-1, Class A, 6.636%, 1/02/2024 | 18,458,243 | ||||||
| 8,245,091 | UAL Pass Through Trust, Series 2009-1, 10.400%, 5/01/2018 | 9,502,467 | ||||||
| 16,831,237 | US Airways Pass Through Trust, Series 2010-1B, Class B, 8.500%, 10/22/2018 |
17,252,018 | ||||||
| 40,155,931 | US Airways Pass Through Trust, Series 2010-1C, Class C, 11.000%, 10/22/2014, 144A |
41,159,829 | ||||||
| 51,235,705 | US Airways Pass Through Trust, Series 2011-1B, Class B, 9.750%, 4/22/2020 |
53,797,490 | ||||||
| 21,811,204 | US Airways Pass Through Trust, Series 2011-1C, Class C, 10.875%, 10/22/2014 |
22,356,484 | ||||||
| 14,095,000 | US Airways Pass Through Trust, Series 2012-1A, Class A, 5.900%, 4/01/2026 |
14,905,463 | ||||||
| 7,280,000 | US Airways Pass Through Trust, Series 2012-1B, Class B, 8.000%, 4/01/2021 |
7,498,400 | ||||||
| 5,680,000 | US Airways Pass Through Trust, Series 2012-1C, Class C, 9.125%, 10/01/2015 |
5,765,200 | ||||||
|
|
|
|||||||
| 386,166,324 | ||||||||
|
|
|
|||||||
| Automotive — 0.9% | ||||||||
| 265,000 | ArvinMeritor, Inc., 8.125%, 9/15/2015 | 278,250 | ||||||
| 3,800,000 | Chrysler Group LLC/CG Co-Issuer, Inc., 8.250%, 6/15/2021 | 4,047,000 | ||||||
| 19,011,000 | Ford Motor Co., 6.375%, 2/01/2029 | 20,702,789 | ||||||
| 1,220,000 | Ford Motor Co., 6.625%, 2/15/2028 | 1,319,268 | ||||||
| 74,829,000 | Ford Motor Co., 6.625%, 10/01/2028 | 83,572,170 | ||||||
| 2,365,000 | Ford Motor Co., 7.125%, 11/15/2025 | 2,672,450 | ||||||
| 1,345,000 | Ford Motor Co., 7.500%, 8/01/2026 | 1,550,113 | ||||||
| 6,000,000 | Goodyear Tire & Rubber Co. (The), 7.000%, 5/15/2022 | 6,360,000 | ||||||
| 4,977,000 | Goodyear Tire & Rubber Co. (The), 7.000%, 3/15/2028 | 4,989,442 | ||||||
|
|
|
|||||||
| 125,491,482 | ||||||||
|
|
|
|||||||
| Banking — 6.0% | ||||||||
| 1,175,000 | AgriBank FCB, 9.125%, 7/15/2019, 144A | 1,559,360 | ||||||
| 20,565,000 | Associates Corp. of North America, 6.950%, 11/01/2018 | 24,727,706 | ||||||
| 1,675,000 | Bank of America Corp., 5.420%, 3/15/2017 | 1,810,588 | ||||||
| 900,000 | Bank of America Corp., 5.490%, 3/15/2019 | 980,518 | ||||||
| 265,000 | Bank of America Corp., MTN, 5.000%, 5/13/2021 | 291,283 | ||||||
See accompanying notes to financial statements.
| 14
Table of Contents
Portfolio of Investments – as of September 30, 2012
Loomis Sayles Strategic Income Fund – (continued)
| Principal Amount (‡) |
Description | Value (†) | ||||||
| Banking — continued | ||||||||
| 1,000,000 | Bank of America Corp., MTN, 6.750%, 9/09/2013, (AUD) | $ | 1,061,917 | |||||
| 1,500,000 | Bank of America Corp., Series K, (fixed rate to 1/30/2018, variable rate thereafter), 8.000%, 12/29/2049 | 1,633,410 | ||||||
| 8,020,000 | Bank of America NA, 5.300%, 3/15/2017 | 8,905,761 | ||||||
| 1,130,000 | Barclays Bank PLC, (fixed rate to 12/15/2017, variable rate thereafter), 6.000%, 6/29/2049, (GBP) |
1,304,677 | ||||||
| 39,890,000,000 | Barclays Bank PLC, EMTN, 3.680%, 8/20/2015, (KRW) | 36,742,910 | ||||||
| 7,320,000 | Barclays Bank PLC, EMTN, (fixed rate to 3/15/2020, variable rate thereafter), 4.750%, 3/29/2049, (EUR) | 5,686,268 | ||||||
| 57,792,000,000 | Barclays Financial LLC, EMTN, 3.500%, 11/29/2016, (KRW) | 53,157,668 | ||||||
| 1,600,000 | BNP Paribas S.A., (fixed rate to 4/13/2017, variable rate thereafter), 5.019%, 4/29/2049, (EUR) |
1,727,964 | ||||||
| 5,331,000 | BNP Paribas S.A., (fixed rate to 6/29/2015, variable rate thereafter), 5.186%, 6/29/2049, 144A |
4,904,520 | ||||||
| 4,000,000 | Citigroup, Inc., 5.365%, 3/06/2036, (CAD)(b) | 3,496,857 | ||||||
| 350,000 | Citigroup, Inc., 5.850%, 12/11/2034 | 413,340 | ||||||
| 24,610,000 | Citigroup, Inc., 5.875%, 2/22/2033 | 25,992,344 | ||||||
| 8,999,000 | Citigroup, Inc., 6.000%, 10/31/2033 | 9,701,588 | ||||||
| 6,060,000 | Citigroup, Inc., 6.125%, 8/25/2036 | 6,580,263 | ||||||
| 22,091,000 | Citigroup, Inc., 6.250%, 6/29/2017, (NZD) | 18,800,082 | ||||||
| 3,350,000 | Citigroup, Inc., EMTN, (fixed rate to 11/30/2012, variable rate thereafter), 3.625%, 11/30/2017, (EUR) |
3,874,425 | ||||||
| 3,035,000 | Cooperatieve Centrale Raiffeisen-Boerenleenbank BA/Utrect, 3.375%, 1/19/2017 |
3,221,379 | ||||||
| 17,730,000 | Cooperatieve Centrale Raiffeisen-Boerenleenbank BA/Utrect, 3.875%, 2/08/2022 |
18,816,672 | ||||||
| 400,000 | Goldman Sachs Group, Inc. (The), 6.450%, 5/01/2036 | 419,108 | ||||||
| 34,060,000 | Goldman Sachs Group, Inc. (The), 6.750%, 10/01/2037 | 36,487,865 | ||||||
| 6,120,000 | HBOS PLC, 6.000%, 11/01/2033, 144A | 5,193,738 | ||||||
| 50,604,000 | HBOS PLC, GMTN, 6.750%, 5/21/2018, 144A | 51,363,060 | ||||||
| 9,090,000 | ICICI Bank Ltd., (fixed rate to 4/30/2017, variable rate thereafter), 6.375%, 4/30/2022, 144A |
9,090,000 | ||||||
| 260,000,000,000 | JPMorgan Chase & Co., EMTN, 7.070%, 3/22/2014, (IDR) | 26,994,357 | ||||||
| 227,000,000,000 | JPMorgan Chase Bank NA, 7.700%, 6/01/2016, 144A, (IDR) | 24,924,932 | ||||||
| 7,300,000 | Lloyds Banking Group PLC, (fixed rate to 10/01/2015, variable rate thereafter), 5.920%, 9/29/2049, 144A | 4,818,000 | ||||||
| 27,555,000 | Lloyds TSB Bank PLC, MTN, 6.500%, 9/14/2020, 144A | 29,026,437 | ||||||
| 3,010,000 | Merrill Lynch & Co., Inc., 5.700%, 5/02/2017 | 3,292,988 | ||||||
| 1,900,000 | Merrill Lynch & Co., Inc., 6.050%, 5/16/2016 | 2,075,987 | ||||||
| 6,700,000 | Merrill Lynch & Co., Inc., 6.110%, 1/29/2037 | 7,107,822 | ||||||
| 51,500,000 | Merrill Lynch & Co., Inc., 10.710%, 3/08/2017, (BRL) | 27,880,750 | ||||||
| 3,450,000 | Merrill Lynch & Co., Inc., EMTN, 4.625%, 9/14/2018, (EUR) | 4,411,254 | ||||||
| 5,410,000 | Merrill Lynch & Co., Inc., MTN, 6.875%, 4/25/2018 | 6,481,797 | ||||||
| 800,000 | Merrill Lynch & Co., Inc., Series C, MTN, 6.050%, 6/01/2034 | 824,814 | ||||||
| 1,235,000 | Merrill Lynch & Co., Inc., Series C, MTN, 6.400%, 8/28/2017 | 1,436,753 | ||||||
| 2,000,000 | Morgan Stanley, 0.935%, 10/15/2015(c) | 1,905,648 | ||||||
| 13,400,000 | Morgan Stanley, 5.500%, 7/24/2020 | 14,468,060 | ||||||
| 3,300,000 | Morgan Stanley, 5.750%, 1/25/2021 | 3,622,248 | ||||||
See accompanying notes to financial statements.
15 |
Table of Contents
Portfolio of Investments – as of September 30, 2012
Loomis Sayles Strategic Income Fund – (continued)
| Principal Amount (‡) |
Description | Value (†) | ||||||
| Banking — continued | ||||||||
| 74,310,000 | Morgan Stanley, 7.600%, 8/08/2017, (NZD) | $ | 64,073,193 | |||||
| 100,265,000 | Morgan Stanley, 8.000%, 5/09/2017, (AUD) | 112,462,176 | ||||||
| 950,000 | Morgan Stanley, EMTN, 5.750%, 2/14/2017, (GBP) | 1,637,671 | ||||||
| 1,000,000 | Morgan Stanley, GMTN, 4.500%, 2/23/2016, (EUR) | 1,346,383 | ||||||
| 79,700,000 | Morgan Stanley, GMTN, 7.625%, 3/03/2016, (AUD) | 87,578,969 | ||||||
| 10,000,000 | Morgan Stanley, MTN, 6.250%, 8/09/2026 | 11,251,580 | ||||||
| 6,600,000 | Morgan Stanley, Series F, GMTN, 5.625%, 9/23/2019 | 7,210,361 | ||||||
| 7,900,000 | Morgan Stanley, Series F, GMTN, 6.625%, 4/01/2018 | 9,076,626 | ||||||
| 12,100,000 | Morgan Stanley, Series F, MTN, 0.905%, 10/18/2016(c) | 11,245,365 | ||||||
| 5,210,000 | Morgan Stanley, Series F, MTN, 5.950%, 12/28/2017 | 5,852,112 | ||||||
| 4,100,000 | Morgan Stanley, Series G & H, GMTN, 5.125%, 11/30/2015, (GBP) | 6,966,111 | ||||||
| 2,850,000 | RBS Capital Trust A, 2.321%, 12/29/2049, (EUR)(c) | 2,169,967 | ||||||
| 1,905,000 | RBS Capital Trust C, (fixed rate to 1/12/2016, variable rate thereafter), 4.243%, 12/29/2049, (EUR) |
1,444,332 | ||||||
| 3,185,000 | RBS Capital Trust I, (fixed rate to 7/01/2013, variable rate thereafter), 4.709%, 12/29/2049 |
1,974,700 | ||||||
| 4,050,000 | RBS Capital Trust II, (fixed rate to 1/03/2034, variable rate thereafter), 6.425%, 12/29/2049 |
3,321,000 | ||||||
| 2,085,000 | RBS Capital Trust III, (fixed rate to 9/30/2014, variable rate thereafter), 5.512%, 9/29/2049 |
1,303,125 | ||||||
| 930,000 | Royal Bank of Scotland Group PLC, 5.250%, 6/29/2049, (EUR) | 746,935 | ||||||
| 15,100,000 | Royal Bank of Scotland Group PLC, 5.500%, 11/29/2049, (EUR) | 12,519,623 | ||||||
| 1,990,000 | Royal Bank of Scotland Group PLC, (fixed rate to 9/29/2017, variable rate thereafter), 7.634%, 3/29/2049 | 1,626,825 | ||||||
| 850,000 | Royal Bank of Scotland PLC (The), EMTN, 4.350%, 1/23/2017, (EUR) | 1,038,154 | ||||||
| 7,750,000 | Royal Bank of Scotland PLC (The), EMTN, 6.934%, 4/09/2018, (EUR) | 10,134,307 | ||||||
| 2,150,000 | Royal Bank of Scotland PLC (The), EMTN, (fixed rate to 9/22/2016, variable rate thereafter), 4.625%, 9/22/2021, (EUR) | 2,393,325 | ||||||
| 700,000 | Santander Financial Issuances Ltd., 7.250%, 11/01/2015 | 717,850 | ||||||
| 1,300,000 | Santander International Debt SAU, EMTN, 4.000%, 3/27/2017, (EUR) | 1,605,095 | ||||||
| 1,800,000 | Santander Issuances SAU, 5.911%, 6/20/2016, 144A | 1,773,000 | ||||||
| 1,500,000 | Santander Issuances SAU, (fixed rate to 8/11/2014, variable rate thereafter), 6.500%, 8/11/2019, 144A | 1,466,984 | ||||||
| 4,140,000 | SG Capital Trust III, (fixed rate to 11/10/2013, variable rate thereafter), 5.419%, 11/29/2049, (EUR) |
4,628,492 | ||||||
| 8,750,000 | Societe Generale S.A., (fixed rate to 5/22/2013, variable rate thereafter), 7.756%, 5/29/2049, (EUR) |
9,810,552 | ||||||
|
|
|
|||||||
| 874,591,931 | ||||||||
|
|
|
|||||||
| Brokerage — 0.7% | ||||||||
| 2,655,000 | Cantor Fitzgerald LP, 6.375%, 6/26/2015, 144A | 2,695,552 | ||||||
| 13,425,000 | Jefferies Group, Inc., 5.125%, 4/13/2018 | 13,626,375 | ||||||
| 19,810,000 | Jefferies Group, Inc., 6.250%, 1/15/2036 | 19,611,900 | ||||||
| 15,215,000 | Jefferies Group, Inc., 6.450%, 6/08/2027 | 15,595,375 | ||||||
| 39,040,000 | Jefferies Group, Inc., 6.875%, 4/15/2021 | 42,016,800 | ||||||
| 2,440,000 | Jefferies Group, Inc., 8.500%, 7/15/2019 | 2,799,900 | ||||||
|
|
|
|||||||
| 96,345,902 | ||||||||
|
|
|
|||||||
See accompanying notes to financial statements.
| 16
Table of Contents
Portfolio of Investments – as of September 30, 2012
Loomis Sayles Strategic Income Fund – (continued)
| Principal Amount (‡) |
Description | Value (†) | ||||||
| Building Materials — 0.8% | ||||||||
| $ | 6,995,000 | Masco Corp., 6.500%, 8/15/2032 | $ | 7,243,546 | ||||
| 5,510,000 | Masco Corp., 7.125%, 3/15/2020 | 6,272,121 | ||||||
| 2,630,000 | Masco Corp., 7.750%, 8/01/2029 | 2,778,385 | ||||||
| 35,980,000 | Owens Corning, Inc., 7.000%, 12/01/2036 | 39,479,739 | ||||||
| 46,412,000 | USG Corp., 6.300%, 11/15/2016 | 46,876,120 | ||||||
| 14,155,000 | USG Corp., 9.750%, 1/15/2018 | 15,287,400 | ||||||
|
|
|
|||||||
| 117,937,311 | ||||||||
|
|
|
|||||||
| Chemicals — 0.4% | ||||||||
| 20,070,000 | Hercules, Inc., 6.500%, 6/30/2029 | 18,364,050 | ||||||
| 5,200,000 | Hexion US Finance Corp./Hexion Nova Scotia Finance ULC, 8.875%, 2/01/2018 |
5,343,000 | ||||||
| 23,584,000 | Momentive Specialty Chemicals, Inc., 7.875%, 2/15/2023(b) | 18,395,520 | ||||||
| 8,020,000 | Momentive Specialty Chemicals, Inc., 8.375%, 4/15/2016(b) | 7,218,000 | ||||||
| 8,757,000 | Momentive Specialty Chemicals, Inc., 9.200%, 3/15/2021(b) | 7,706,160 | ||||||
|
|
|
|||||||
| 57,026,730 | ||||||||
|
|
|
|||||||
| Collateralized Mortgage Obligations — 0.0% | ||||||||
| 4,774,605 | Wells Fargo Mortgage Backed Securities Trust, Series 2005-AR4, Class 2A2, 2.690%, 4/25/2035(c) | 4,822,275 | ||||||
|
|
|
|||||||
| Commercial Mortgage-Backed Securities — 0.1% | ||||||||
| 7,940,000 | Credit Suisse Mortgage Capital Certificates, Series 2007-C5, Class AM, 5.869%, 9/15/2040 |
7,523,031 | ||||||
|
|
|
|||||||
| Construction Machinery — 0.2% | ||||||||
| 1,425,000 | Joy Global, Inc., 6.625%, 11/15/2036 | 1,603,386 | ||||||
| 10,790,000 | Terex Corp., 8.000%, 11/15/2017 | 11,167,650 | ||||||
| 525,000 | United Rentals North America, Inc., 8.375%, 9/15/2020 | 561,750 | ||||||
| 13,630,000 | UR Financing Escrow Corp., 7.625%, 4/15/2022, 144A | 14,924,850 | ||||||
|
|
|
|||||||
| 28,257,636 | ||||||||
|
|
|
|||||||
| Consumer Cyclical Services — 0.0% | ||||||||
| 670,000 | ServiceMaster Co. (The), 7.100%, 3/01/2018 | 649,900 | ||||||
| 5,500,000 | ServiceMaster Co. (The), 7.450%, 8/15/2027 | 4,578,750 | ||||||
| 1,048,000 | Western Union Co. (The), 6.200%, 6/21/2040 | 1,241,453 | ||||||
|
|
|
|||||||
| 6,470,103 | ||||||||
|
|
|
|||||||
| Electric — 2.7% | ||||||||
| 7,640,279 | AES Ironwood LLC, 8.857%, 11/30/2025 | 8,786,322 | ||||||
| 854,827 | AES Red Oak LLC, Series A, 8.540%, 11/30/2019 | 912,528 | ||||||
| 47,363,314 | Alta Wind Holdings LLC, 7.000%, 6/30/2035, 144A | 52,479,025 | ||||||
| 66,044,844 | Bruce Mansfield Unit, 6.850%, 6/01/2034 | 70,236,710 | ||||||
| 2,754,970 | CE Generation LLC, 7.416%, 12/15/2018 | 2,754,970 | ||||||
| 11,275,000 | Dynegy Holdings, Inc., 7.125%, 5/15/2018(d) | 6,398,563 | ||||||
| 10,185,000 | Dynegy Holdings, Inc., 7.625%, 10/15/2026(d) | 5,703,600 | ||||||
| 8,955,000 | Dynegy Holdings, Inc., 7.750%, 6/01/2019(d) | 5,059,575 | ||||||
| 51,405,000 | Edison Mission Energy, 7.625%, 5/15/2027 | 26,345,063 | ||||||
| 41,900,000 | EDP Finance BV, 4.900%, 10/01/2019, 144A | 38,967,000 | ||||||
| 15,100,000 | EDP Finance BV, 6.000%, 2/02/2018, 144A | 15,073,122 | ||||||
| 2,800,000 | EDP Finance BV, EMTN, 4.625%, 6/13/2016, (EUR) | 3,463,209 | ||||||
See accompanying notes to financial statements.
17 |
Table of Contents
Portfolio of Investments – as of September 30, 2012
Loomis Sayles Strategic Income Fund – (continued)
| Principal Amount (‡) |
Description | Value (†) | ||||||
| Electric — continued | ||||||||
| 500,000 | EDP Finance BV, EMTN, 4.750%, 9/26/2016, (EUR) | $ | 616,837 | |||||
| 100,000 | EDP Finance BV, EMTN, 5.875%, 2/01/2016, (EUR) | 128,120 | ||||||
| 250,000 | Empresa Nacional de Electricidad S.A. (Endesa-Chile), 8.350%, 8/01/2013 | 263,941 | ||||||
| 4,070,000 | Endesa S.A./Cayman Islands, 7.875%, 2/01/2027 | 5,025,237 | ||||||
| 15,552,000 | Enel Finance International NV, 6.000%, 10/07/2039, 144A | 13,984,483 | ||||||
| 1,435,000 | Enel Finance International NV, 6.800%, 9/15/2037, 144A | 1,390,456 | ||||||
| 5,940,000 | Energy Future Holdings Corp., 10.000%, 1/15/2020 | 6,548,850 | ||||||
| 555,000 | Enersis S.A., Cayman Islands, 7.400%, 12/01/2016 | 656,700 | ||||||
| 31,035,000 | NGC Corp. Capital Trust I, Series B, 8.316%, 6/01/2027(b)(d) | 4,034,550 | ||||||
| 16,670,000 | Texas Competitive Electric Holdings Co. LLC/TCEH Finance, Inc., 11.500%, 10/01/2020, 144A |
13,044,275 | ||||||
| 50,270,000 | TXU Corp., Series P, 5.550%, 11/15/2014 | 40,467,350 | ||||||
| 101,735,000 | TXU Corp., Series Q, 6.500%, 11/15/2024 | 60,532,325 | ||||||
| 6,675,000 | TXU Corp., Series R, 6.550%, 11/15/2034 | 3,637,875 | ||||||
| 7,300,000 | White Pine Hydro LLC, 6.310%, 7/10/2017(b)(e) | 5,767,000 | ||||||
| 10,935,000 | White Pine Hydro LLC, 6.960%, 7/10/2037(b)(e) | 7,107,750 | ||||||
|
|
|
|||||||
| 399,385,436 | ||||||||
|
|
|
|||||||
| Financial Other — 0.3% | ||||||||
| 19,005,000 | Aviation Capital Group Corp., 6.750%, 4/06/2021, 144A | 19,373,697 | ||||||
| 20,000,000 | National Life Insurance Co., 10.500%, 9/15/2039, 144A | 26,705,860 | ||||||
|
|
|
|||||||
| 46,079,557 | ||||||||
|
|
|
|||||||
| Food & Beverage — 0.0% | ||||||||
| 4,370,000 | Viterra, Inc., 6.406%, 2/16/2021, 144A, (CAD) | 4,864,787 | ||||||
|
|
|
|||||||
| Gaming — 0.3% | ||||||||
| 810,000 | MGM Resorts International, 6.625%, 7/15/2015 | 866,700 | ||||||
| 865,000 | MGM Resorts International, 6.875%, 4/01/2016 | 903,925 | ||||||
| 710,000 | MGM Resorts International, 7.500%, 6/01/2016 | 759,700 | ||||||
| 1,770,000 | MGM Resorts International, 7.625%, 1/15/2017 | 1,876,200 | ||||||
| 37,005,000 | MGM Resorts International, 8.625%, 2/01/2019, 144A | 40,335,450 | ||||||
|
|
|
|||||||
| 44,741,975 | ||||||||
|
|
|
|||||||
| Government Guaranteed — 0.5% | ||||||||
| 11,038,000 | Instituto de Credito Oficial, MTN, 5.500%, 10/11/2012, (AUD) | 11,443,618 | ||||||
| 72,695,000 | Queensland Treasury Corp., 7.125%, 9/18/2017, 144A, (NZD) | 69,089,302 | ||||||
|
|
|
|||||||
| 80,532,920 | ||||||||
|
|
|
|||||||
| Government Owned — No Guarantee — 0.6% | ||||||||
| 19,500,000 | DP World Ltd., 6.850%, 7/02/2037, 144A | 21,011,250 | ||||||
| 70,300,000,000 | Export-Import Bank of Korea, 6.600%, 11/04/2013, 144A, (IDR) | 7,342,934 | ||||||
| 499,300,000,000 | Export-Import Bank of Korea, 8.300%, 3/15/2014, 144A, (IDR) | 53,216,928 | ||||||
| 8,935,000 | Petroleos de Venezuela S.A., 5.375%, 4/12/2027 | 5,517,363 | ||||||
|
|
|
|||||||
| 87,088,475 | ||||||||
|
|
|
|||||||
| Government Sponsored — 0.1% | ||||||||
| 10,807,000 | Eksportfinans ASA, 2.000%, 9/15/2015 | 10,104,545 | ||||||
| 9,005,000 | Eksportfinans ASA, 2.375%, 5/25/2016 | 8,329,625 | ||||||
| 1,000,000 | Eksportfinans ASA, EMTN, 2.250%, 2/11/2021, (CHF) | 914,407 | ||||||
|
|
|
|||||||
| 19,348,577 | ||||||||
|
|
|
|||||||
See accompanying notes to financial statements.
| 18
Table of Contents
Portfolio of Investments – as of September 30, 2012
Loomis Sayles Strategic Income Fund – (continued)
| Principal Amount (‡) |
Description | Value (†) | ||||||
| Healthcare — 1.5% | ||||||||
| $ | 9,960,000 | HCA, Inc., 5.875%, 3/15/2022 | $ | 10,794,150 | ||||
| 14,620,000 | HCA, Inc., 7.050%, 12/01/2027 | 13,815,900 | ||||||
| 11,104,000 | HCA, Inc., 7.190%, 11/15/2015 | 12,158,880 | ||||||
| 20,447,000 | HCA, Inc., 7.500%, 12/15/2023 | 20,651,470 | ||||||
| 24,215,000 | HCA, Inc., 7.500%, 11/06/2033 | 23,730,700 | ||||||
| 46,148,000 | HCA, Inc., 7.690%, 6/15/2025 | 46,840,220 | ||||||
| 32,745,000 | HCA, Inc., 8.360%, 4/15/2024 | 34,300,387 | ||||||
| 15,815,000 | HCA, Inc., MTN, 7.580%, 9/15/2025 | 15,894,075 | ||||||
| 9,492,000 | HCA, Inc., MTN, 7.750%, 7/15/2036 | 9,420,810 | ||||||
| 32,559,000 | Tenet Healthcare Corp., 6.875%, 11/15/2031 | 29,140,305 | ||||||
|
|
|
|||||||
| 216,746,897 | ||||||||
|
|
|
|||||||
| Home Construction — 0.8% | ||||||||
| 11,265,000 | Desarrolladora Homex SAB de CV, 7.500%, 9/28/2015 | 11,265,000 | ||||||
| 13,360,000 | K. Hovnanian Enterprises, Inc., 5.000%, 11/01/2021, 144A | 11,088,800 | ||||||
| 16,075,000 | K. Hovnanian Enterprises, Inc., 6.250%, 1/15/2016 | 14,869,375 | ||||||
| 6,290,000 | K. Hovnanian Enterprises, Inc., 7.500%, 5/15/2016 | 5,881,150 | ||||||
| 11,315,000 | KB Home, 7.250%, 6/15/2018 | 12,191,912 | ||||||
| 47,260,000 | Pulte Group, Inc., 6.000%, 2/15/2035 | 42,770,300 | ||||||
| 13,190,000 | Pulte Group, Inc., 6.375%, 5/15/2033 | 12,266,700 | ||||||
|
|
|
|||||||
| 110,333,237 | ||||||||
|
|
|
|||||||
| Independent Energy — 0.3% | ||||||||
| 1,150,000 | Chesapeake Energy Corp., 6.250%, 1/15/2017, (EUR) | 1,522,141 | ||||||
| 1,375,000 | Chesapeake Energy Corp., 6.625%, 8/15/2020 | 1,417,969 | ||||||
| 1,040,000 | Chesapeake Energy Corp., 6.875%, 11/15/2020 | 1,097,200 | ||||||
| 19,645,000 | Connacher Oil and Gas Ltd., 8.500%, 8/01/2019, 144A | 16,894,700 | ||||||
| 12,635,000 | QEP Resources, Inc., 6.875%, 3/01/2021 | 14,277,550 | ||||||
| 2,780,000 | SandRidge Energy, Inc., 7.500%, 2/15/2023, 144A | 2,863,400 | ||||||
|
|
|
|||||||
| 38,072,960 | ||||||||
|
|
|
|||||||
| Industrial Other — 0.1% | ||||||||
| 10,000,000 | Worthington Industries, Inc., 6.500%, 4/15/2020 | 11,133,030 | ||||||
|
|
|
|||||||
| Life Insurance — 1.2% | ||||||||
| 34,562,000 | American International Group, Inc., 6.250%, 3/15/2087 | 34,907,620 | ||||||
| 27,655,000 | American International Group, Inc., (fixed rate to 5/15/2038, variable rate thereafter), 8.175%, 5/15/2068 | 33,842,806 | ||||||
| 19,625,000 | American International Group, Inc., Series G, MTN, 5.850%, 1/16/2018 | 22,763,685 | ||||||
| 2,855,000 | American International Group, Inc., Series MPLE, 4.900%, 6/02/2014, (CAD) |
2,974,184 | ||||||
| 23,200,000 | AXA S.A., (fixed rate to 12/14/2036, variable rate thereafter), 6.379%, 12/29/2049, 144A |
20,880,000 | ||||||
| 1,000,000 | AXA S.A., EMTN, (fixed rate to 10/16/2019, variable rate thereafter), 6.772%, 10/29/2049, (GBP) |
1,315,932 | ||||||
| 1,350,000 | AXA S.A., EMTN, (fixed rate to 4/16/2020, variable rate thereafter), 5.250%, 4/16/2040, (EUR) |
1,588,260 | ||||||
| 15,000,000 | Forethought Financial Group, Inc., 8.625%, 4/15/2021, 144A | 16,050,000 | ||||||
| 1,475,000 | MetLife Capital Trust X, 9.250%, 4/08/2068, 144A | 1,947,000 | ||||||
| 15,930,000 | MetLife, Inc., 6.400%, 12/15/2066 | 16,711,860 | ||||||
See accompanying notes to financial statements.
19 |
Table of Contents
Portfolio of Investments – as of September 30, 2012
Loomis Sayles Strategic Income Fund – (continued)
| Principal Amount (‡) |
Description | Value (†) | ||||||
| Life Insurance — continued | ||||||||
| $ | 8,145,000 | MetLife, Inc., 10.750%, 8/01/2069 | $ | 12,095,325 | ||||
| 8,920,000 | NLV Financial Corp., 7.500%, 8/15/2033, 144A | 9,189,928 | ||||||
| 3,910,000 | Penn Mutual Life Insurance Co. (The), 6.650%, 6/15/2034, 144A | 4,429,553 | ||||||
|
|
|
|||||||
| 178,696,153 | ||||||||
|
|
|
|||||||
| Local Authorities — 1.4% | ||||||||
| 3,905,000 | Manitoba (Province of), GMTN, 6.375%, 9/01/2015, (NZD) | 3,486,240 | ||||||
| 82,840,000 | New South Wales Treasury Corp., 6.000%, 2/01/2018, (AUD) | 97,142,182 | ||||||
| 66,305,000 | New South Wales Treasury Corp., Series 17RG, 5.500%, 3/01/2017, (AUD) | 75,671,077 | ||||||
| 26,730,000 | Queensland Treasury Corp., Series 14, 5.750%, 11/21/2014, (AUD) | 29,308,448 | ||||||
|
|
|
|||||||
| 205,607,947 | ||||||||
|
|
|
|||||||
| Media Cable — 0.6% | ||||||||
| 25,270,000 | Shaw Communications, Inc., 5.650%, 10/01/2019, (CAD) | 28,952,413 | ||||||
| 44,800,000 | UPC Holding BV, 6.375%, 9/15/2022, 144A, (EUR) | 57,006,040 | ||||||
|
|
|
|||||||
| 85,958,453 | ||||||||
|
|
|
|||||||
| Media Non-Cable — 0.6% | ||||||||
| 4,295,000 | Clear Channel Communications, Inc., 5.500%, 9/15/2014 | 3,865,500 | ||||||
| 64,250,000 | Clear Channel Communications, Inc., 9.000%, 3/01/2021 | 57,182,500 | ||||||
| 28,455,000 | R.R. Donnelley & Sons Co., 8.250%, 3/15/2019 | 28,881,825 | ||||||
|
|
|
|||||||
| 89,929,825 | ||||||||
|
|
|
|||||||
| Metals & Mining — 0.6% | ||||||||
| 3,949,000 | Alcoa, Inc., 5.870%, 2/23/2022 | 4,247,517 | ||||||
| 1,405,000 | Alcoa, Inc., 5.950%, 2/01/2037 | 1,405,580 | ||||||
| 4,330,000 | Alcoa, Inc., 6.750%, 1/15/2028 | 4,805,213 | ||||||
| 25,271,000 | ArcelorMittal, 7.000%, 3/01/2041 | 22,718,553 | ||||||
| 18,750,000 | Essar Steel Algoma, Inc., 9.875%, 6/15/2015, 144A | 14,859,375 | ||||||
| 16,135,000 | Russel Metals, Inc., 6.000%, 4/19/2022, 144A, (CAD) | 16,791,823 | ||||||
| 7,000,000 | United States Steel Corp., 6.050%, 6/01/2017 | 6,947,500 | ||||||
| 6,779,000 | United States Steel Corp., 6.650%, 6/01/2037 | 5,694,360 | ||||||
| 16,435,000 | United States Steel Corp., 7.000%, 2/01/2018 | 16,476,088 | ||||||
|
|
|
|||||||
| 93,946,009 | ||||||||
|
|
|
|||||||
| Non-Captive Consumer — 4.2% | ||||||||
| 63,088,000 | Residential Capital LLC, 9.625%, 5/15/2015(d) | 63,166,860 | ||||||
| 109,950(††) | SLM Corp., 6.000%, 12/15/2043 | 2,610,305 | ||||||
| 20,970,000 | SLM Corp., MTN, 5.050%, 11/14/2014 | 22,134,066 | ||||||
| 17,600,000 | SLM Corp., MTN, 7.250%, 1/25/2022 | 19,712,000 | ||||||
| 2,160,000 | SLM Corp., MTN, 8.000%, 3/25/2020 | 2,494,800 | ||||||
| 3,750,000 | SLM Corp., Series A, MTN, 0.751%, 1/27/2014(c) | 3,641,711 | ||||||
| 41,770,000 | SLM Corp., Series A, MTN, 5.000%, 4/15/2015 | 44,121,275 | ||||||
| 14,465,000 | SLM Corp., Series A, MTN, 5.000%, 6/15/2018 | 14,487,623 | ||||||
| 48,100,000 | SLM Corp., Series A, MTN, 5.625%, 8/01/2033 | 45,406,400 | ||||||
| 95,060,000 | SLM Corp., Series A, MTN, 8.450%, 6/15/2018 | 111,335,888 | ||||||
| 26,150,000 | Springleaf Finance Corp., 3.250%, 1/16/2013, (EUR) | 33,099,990 | ||||||
| 10,120,000 | Springleaf Finance Corp., MTN, 5.750%, 9/15/2016 | 8,734,774 | ||||||
| 6,900,000 | Springleaf Finance Corp., Series H, MTN, 5.375%, 10/01/2012 | 6,900,000 | ||||||
| 14,232,000 | Springleaf Finance Corp., Series I, MTN, 5.400%, 12/01/2015 | 12,782,044 | ||||||
See accompanying notes to financial statements.
| 20
Table of Contents
Portfolio of Investments – as of September 30, 2012
Loomis Sayles Strategic Income Fund – (continued)
| Principal Amount (‡) |
Description | Value (†) | ||||||
| Non-Captive Consumer —continued | ||||||||
| $ | 14,430,000 | Springleaf Finance Corp., Series I, MTN, 5.850%, 6/01/2013 | $ | 14,357,850 | ||||
| 800,000 | Springleaf Finance Corp., Series J, MTN, 6.500%, 9/15/2017 | 676,000 | ||||||
| 248,290,000 | Springleaf Finance Corp., Series J, MTN, 6.900%, 12/15/2017 | 211,046,500 | ||||||
|
|
|
|||||||
| 616,708,086 | ||||||||
|
|
|
|||||||
| Non-Captive Diversified — 4.6% | ||||||||
| 7,855,000 | Aircastle Ltd., 7.625%, 4/15/2020 | 8,699,412 | ||||||
| 32,711,000 | Ally Financial, Inc., 8.000%, 12/31/2018 | 36,799,875 | ||||||
| 29,332,000 | Ally Financial, Inc., 8.000%, 11/01/2031 | 34,201,112 | ||||||
| 25,320,000 | General Electric Capital Corp., Series A, EMTN, 5.500%, 2/01/2017, (NZD) | 21,970,404 | ||||||
| 79,035,000 | General Electric Capital Corp., Series A, EMTN, 6.750%, 9/26/2016, (NZD) | 71,145,085 | ||||||
| 58,490,000 | General Electric Capital Corp., Series A, GMTN, 7.625%, 12/10/2014, (NZD) |
52,075,396 | ||||||
| 15,305,000 | General Electric Capital Corp., Series A, MTN, 0.755%, 5/13/2024(c) | 13,127,114 | ||||||
| 245,797,000 | General Electric Capital Corp., Series A, MTN, 6.500%, 9/28/2015, (NZD) | 216,090,856 | ||||||
| 1,710,000 | International Lease Finance Corp., 5.875%, 4/01/2019 | 1,813,089 | ||||||
| 24,750,000 | International Lease Finance Corp., 5.875%, 8/15/2022 | 25,567,987 | ||||||
| 2,950,000 | International Lease Finance Corp., 6.250%, 5/15/2019 | 3,171,250 | ||||||
| 20,610,000 | International Lease Finance Corp., 7.125%, 9/01/2018, 144A | 24,010,650 | ||||||
| 10,245,000 | International Lease Finance Corp., 8.250%, 12/15/2020 | 12,191,550 | ||||||
| 2,620,000 | International Lease Finance Corp., Series R, MTN, 5.625%, 9/20/2013 | 2,701,875 | ||||||
| 2,547,000 | International Lease Finance Corp., Series R, MTN, 5.650%, 6/01/2014 | 2,668,237 | ||||||
| 23,175,000 | iStar Financial, Inc., 5.850%, 3/15/2017 | 22,016,250 | ||||||
| 20,478,000 | iStar Financial, Inc., 5.875%, 3/15/2016 | 19,761,270 | ||||||
| 8,300,000 | iStar Financial, Inc., 6.050%, 4/15/2015 | 8,134,000 | ||||||
| 35,130,000 | iStar Financial, Inc., 8.625%, 6/01/2013 | 36,183,900 | ||||||
| 2,920,000 | iStar Financial, Inc., Series B, 5.700%, 3/01/2014 | 2,923,650 | ||||||
| 44,610,000 | iStar Financial, Inc., Series B, 5.950%, 10/15/2013 | 44,610,000 | ||||||
| 19,915,000 | Ladder Capital Finance Holdings LLLP/Ladder Capital Finance Corp., 7.375%, 10/01/2017, 144A |
20,313,300 | ||||||
|
|
|
|||||||
| 680,176,262 | ||||||||
|
|
|
|||||||
| Oil Field Services — 0.1% | ||||||||
| 7,275,000 | Rowan Cos., Inc., 7.875%, 8/01/2019 | 9,019,349 | ||||||
|
|
|
|||||||
| Paper — 1.1% | ||||||||
| 14,715,000 | Georgia-Pacific LLC, 7.250%, 6/01/2028 | 18,621,053 | ||||||
| 12,410,000 | Georgia-Pacific LLC, 7.375%, 12/01/2025 | 16,425,801 | ||||||
| 47,875,000 | Georgia-Pacific LLC, 7.750%, 11/15/2029 | 63,251,588 | ||||||
| 775,000 | Georgia-Pacific LLC, 8.875%, 5/15/2031 | 1,146,348 | ||||||
| 14,520,000 | Westvaco Corp., 7.950%, 2/15/2031 | 19,070,379 | ||||||
| 25,210,000 | Westvaco Corp., 8.200%, 1/15/2030 | 33,601,880 | ||||||
| 2,840,000 | Weyerhaeuser Co., 6.950%, 10/01/2027 | 3,078,779 | ||||||
|
|
|
|||||||
| 155,195,828 | ||||||||
|
|
|
|||||||
| Pharmaceuticals — 0.4% | ||||||||
| 11,225,000 | Valeant Pharmaceuticals International, 6.375%, 10/15/2020, 144A | 11,449,500 | ||||||
| 43,165,000 | VPI Escrow Corp., 6.375%, 10/15/2020, 144A | 44,028,300 | ||||||
|
|
|
|||||||
| 55,477,800 | ||||||||
|
|
|
|||||||
See accompanying notes to financial statements.
21 |
Table of Contents
Portfolio of Investments – as of September 30, 2012
Loomis Sayles Strategic Income Fund – (continued)
| Principal Amount (‡) |
Description | Value (†) | ||||||
| Pipelines — 1.2% | ||||||||
| $ | 750,000 | El Paso Corp., GMTN, 7.800%, 8/01/2031 | $ | 871,466 | ||||
| 9,115,000 | Energy Transfer Partners LP, 6.625%, 10/15/2036 | 10,319,748 | ||||||
| 13,175,000 | Enterprise Products Operating LLC, 4.050%, 2/15/2022 | 14,401,685 | ||||||
| 8,935,000 | IFM US Colonial Pipeline 2 LLC, 6.450%, 5/01/2021, 144A | 9,969,879 | ||||||
| 41,557,104 | Maritimes & Northeast Pipeline LLC, 7.500%, 5/31/2014, 144A(b) | 44,194,733 | ||||||
| 81,710,000 | NGPL PipeCo LLC, 7.119%, 12/15/2017, 144A | 86,816,875 | ||||||
| 3,870,000 | NGPL PipeCo LLC, 7.768%, 12/15/2037, 144A | 3,870,000 | ||||||
| 3,065,000 | Rockies Express Pipeline LLC, 6.875%, 4/15/2040, 144A | 2,681,875 | ||||||
| 4,168,000 | Transportadora de Gas del Sur S.A., 7.875%, 5/14/2017, 144A | 3,553,220 | ||||||
|
|
|
|||||||
| 176,679,481 | ||||||||
|
|
|
|||||||
| Property & Casualty Insurance — 0.4% | ||||||||
| 14,855,000 | Hanover Insurance Group, Inc. (The), 6.375%, 6/15/2021 | 17,002,795 | ||||||
| 3,405,000 | Hanover Insurance Group, Inc. (The), 7.500%, 3/01/2020 | 3,977,779 | ||||||
| 6,075,000 | Marsh & McLennan Cos., Inc., 5.875%, 8/01/2033 | 7,163,257 | ||||||
| 11,865,000 | MBIA Insurance Corp., (fixed rate to 1/15/2013, variable rate thereafter), 14.000%, 1/15/2033, 144A |
6,051,150 | ||||||
| 2,275,000 | Nationwide Mutual Insurance Co., 6.600%, 4/15/2034, 144A | 2,282,587 | ||||||
| 11,200,000 | White Mountains Re Group Ltd., 6.375%, 3/20/2017, 144A | 11,849,399 | ||||||
| 3,000,000 | White Mountains Re Group Ltd., (fixed rate to 6/30/2017, variable rate thereafter), 7.506%, 5/29/2049, 144A | 3,057,480 | ||||||
| 1,425,000 | XL Group PLC, 6.375%, 11/15/2024 | 1,693,416 | ||||||
|
|
|
|||||||
| 53,077,863 | ||||||||
|
|
|
|||||||
| Railroads — 0.0% | ||||||||
| 1,153,000 | Missouri Pacific Railroad Co., 5.000%, 1/01/2045(b) | 951,225 | ||||||
|
|
|
|||||||
| Retailers — 0.8% | ||||||||
| 2,500,000 | Dillard’s, Inc., 6.625%, 1/15/2018 | 2,637,500 | ||||||
| 3,325,000 | Dillard’s, Inc., 7.000%, 12/01/2028 | 3,308,375 | ||||||
| 4,187,000 | Dillard’s, Inc., 7.130%, 8/01/2018 | 4,532,427 | ||||||
| 1,500,000 | Dillard’s, Inc., 7.750%, 7/15/2026 | 1,550,625 | ||||||
| 425,000 | Dillard’s, Inc., 7.875%, 1/01/2023 | 454,750 | ||||||
| 10,270,000 | Foot Locker, Inc., 8.500%, 1/15/2022 | 11,348,350 | ||||||
| 3,685,000 | J.C. Penney Corp., Inc., 5.750%, 2/15/2018 | 3,500,750 | ||||||
| 37,064,000 | J.C. Penney Corp., Inc., 6.375%, 10/15/2036 | 30,253,490 | ||||||
| 635,000 | J.C. Penney Corp., Inc., 7.125%, 11/15/2023 | 604,838 | ||||||
| 160,000 | J.C. Penney Corp., Inc., 7.400%, 4/01/2037 | 143,400 | ||||||
| 3,985,000 | J.C. Penney Corp., Inc., 7.625%, 3/01/2097 | 3,397,212 | ||||||
| 12,275,000 | Macy’s Retail Holdings, Inc., 6.790%, 7/15/2027 | 13,615,148 | ||||||
| 2,365,000 | Macy’s Retail Holdings, Inc., 6.900%, 4/01/2029 | 2,790,364 | ||||||
| 6,365,000 | Marks & Spencer PLC, 7.125%, 12/01/2037, 144A | 6,948,480 | ||||||
| 37,646,000 | Toys R Us, Inc., 7.375%, 10/15/2018 | 33,787,285 | ||||||
|
|
|
|||||||
| 118,872,994 | ||||||||
|
|
|
|||||||
| Sovereigns — 2.0% | ||||||||
| 47,935,000 | Hellenic Republic Government International Bond, 2.125%, 7/05/2013, (CHF) |
21,173,458 | ||||||
| 64,132,000,000 | Indonesia Treasury Bond, Series FR43, 10.250%, 7/15/2022, (IDR) | 8,725,738 | ||||||
| 10,000,000,000 | Indonesia Treasury Bond, Series FR47, 10.000%, 2/15/2028, (IDR) | 1,400,690 | ||||||
See accompanying notes to financial statements.
| 22
Table of Contents
Portfolio of Investments – as of September 30, 2012
Loomis Sayles Strategic Income Fund – (continued)
| Principal Amount (‡) |
Description | Value (†) | ||||||
| Sovereigns — continued | ||||||||
| 272,460,000,000 | Indonesia Treasury Bond, Series ZC3, Zero Coupon, 11/20/2012, (IDR) | $ | 28,240,351 | |||||
| 166,250,000 | Republic of Brazil, 8.500%, 1/05/2024, (BRL) | 95,948,946 | ||||||
| 56,700,000 | Republic of Brazil, 10.250%, 1/10/2028, (BRL) | 36,569,367 | ||||||
| 49,120,000 | Republic of Brazil, 12.500%, 1/05/2016, (BRL) | 30,420,599 | ||||||
| 18,400,000 | Republic of Croatia, 6.750%, 11/05/2019, 144A | 20,746,000 | ||||||
| 5,226,139,000 | Republic of Iceland, 6.000%, 10/13/2016, (ISK) | 28,512,127 | ||||||
| 3,178,700,000 | Republic of Iceland, 7.250%, 5/17/2013, (ISK) | 16,971,278 | ||||||
| 1,715,823,000 | Republic of Iceland, 8.750%, 2/26/2019, (ISK) | 10,082,247 | ||||||
|
|
|
|||||||
| 298,790,801 | ||||||||
|
|
|
|||||||
| Supermarkets — 0.5% | ||||||||
| 8,336,000 | American Stores Co., 7.900%, 5/01/2017 | 7,752,480 | ||||||
| 73,686,000 | New Albertson’s, Inc., 7.450%, 8/01/2029 | 41,079,945 | ||||||
| 20,250,000 | New Albertson’s, Inc., 7.750%, 6/15/2026 | 12,403,125 | ||||||
| 10,950,000 | New Albertson’s, Inc., 8.000%, 5/01/2031 | 6,460,500 | ||||||
| 3,425,000 | New Albertson’s, Inc., 8.700%, 5/01/2030 | 2,033,594 | ||||||
| 13,707,000 | New Albertson’s, Inc., Series C, MTN, 6.625%, 6/01/2028 | 7,401,780 | ||||||
|
|
|
|||||||
| 77,131,424 | ||||||||
|
|
|
|||||||
| Supranational — 1.6% | ||||||||
| 128,560,000 | European Bank for Reconstruction & Development, GMTN, 9.000%, 4/28/2014, (BRL) |
66,636,220 | ||||||
| 16,375,000 | European Investment Bank, 11.250%, 2/14/2013, (BRL) | 8,240,609 | ||||||
| 460,500,000,000 | European Investment Bank, EMTN, Zero Coupon, 4/24/2013, 144A, (IDR) | 46,622,617 | ||||||
| 60,665,000 | European Investment Bank, MTN, 6.250%, 4/15/2015, (AUD) | 66,877,927 | ||||||
| 244,840,000,000 | Inter-American Development Bank, EMTN, Zero Coupon, 5/20/2013, (IDR) | 24,729,607 | ||||||
| 24,450,000 | Inter-American Development Bank, EMTN, 6.000%, 12/15/2017, (NZD) | 22,578,727 | ||||||
| 8,300,000 | International Bank for Reconstruction & Development, 1.430%, 3/05/2014, (SGD) |
6,780,056 | ||||||
|
|
|
|||||||
| 242,465,763 | ||||||||
|
|
|
|||||||
| Technology — 0.9% | ||||||||
| 7,475,000 | Agilent Technologies, Inc., 6.500%, 11/01/2017 | 9,147,195 | ||||||
| 832,000 | Alcatel-Lucent, EMTN, 6.375%, 4/07/2014, (EUR) | 1,082,526 | ||||||
| 31,237,000 | Alcatel-Lucent France, Inc., 8.500%, 1/15/2016, (EUR) | 37,632,280 | ||||||
| 79,074,000 | Alcatel-Lucent USA, Inc., 6.450%, 3/15/2029 | 51,793,470 | ||||||
| 5,845,000 | Alcatel-Lucent USA, Inc., 6.500%, 1/15/2028 | 3,799,250 | ||||||
| 21,850,000 | Amkor Technology, Inc., 6.375%, 10/01/2022, 144A | 21,522,250 | ||||||
| 63,000 | Freescale Semiconductor, Inc., 8.875%, 12/15/2014 | 63,945 | ||||||
| 475,000 | Motorola Solutions, Inc., 6.000%, 11/15/2017 | 566,941 | ||||||
| 2,562,000 | Motorola Solutions, Inc., 6.625%, 11/15/2037 | 2,745,237 | ||||||
| 4,170,000 | Nortel Networks Capital Corp., 7.875%, 6/15/2026(d) | 4,430,625 | ||||||
| 240,000 | Samsung Electronics Co. Ltd., 7.700%, 10/01/2027, 144A | 310,113 | ||||||
|
|
|
|||||||
| 133,093,832 | ||||||||
|
|
|
|||||||
| Textile — 0.0% | ||||||||
| 2,595,000 | Jones Group, Inc. (The), 6.125%, 11/15/2034 | 2,127,900 | ||||||
| 3,450,000 | Jones Group, Inc./Apparel Group Holdings/Apparel Group USA/Footwear Accessories Retail, 6.875%, 3/15/2019 | 3,562,125 | ||||||
|
|
|
|||||||
| 5,690,025 | ||||||||
|
|
|
|||||||
See accompanying notes to financial statements.
23 |
Table of Contents
Portfolio of Investments – as of September 30, 2012
Loomis Sayles Strategic Income Fund – (continued)
| Principal Amount (‡) |
Description | Value (†) | ||||||
| Tobacco — 0.1% | ||||||||
| $ | 6,175,000 | Reynolds American, Inc., 7.250%, 6/15/2037 | $ | 7,806,046 | ||||
|
|
|
|||||||
| Transportation Services — 0.3% | ||||||||
| 10,503,000 | APL Ltd., 8.000%, 1/15/2024(b) | 8,953,808 | ||||||
| 7,403,003 | Atlas Air Pass Through Trust, Series 1998-1, Class B, 7.680%, 7/02/2015 | 7,069,868 | ||||||
| 6,862,758 | Atlas Air Pass Through Trust, Series 1998-1, Class C, 8.010%, 7/02/2011(f)(g) |
6,039,227 | ||||||
| 6,325,041 | Atlas Air Pass Through Trust, Series 1999-1, Class A-1, 7.200%, 7/02/2020 | 6,388,292 | ||||||
| 6,267,285 | Atlas Air Pass Through Trust, Series 1999-1, Class B, 7.630%, 7/02/2016 | 5,421,202 | ||||||
| 4,744,556 | Atlas Air Pass Through Trust, Series 1999-1, Class C, 8.770%, 7/02/2012(f)(g) |
3,629,585 | ||||||
| 2,815,458 | Atlas Air Pass Through Trust, Series 2000-1, Class B, 9.057%, 7/02/2017 | 2,787,303 | ||||||
| 3,280,000 | Continental Airlines Pass Through Certificates, Series 2012-2, Class B, 5.500%, 4/29/2022 |
3,362,000 | ||||||
| 3,970,000 | Erac USA Finance Co., 7.000%, 10/15/2037, 144A | 4,947,100 | ||||||
|
|
|
|||||||
| 48,598,385 | ||||||||
|
|
|
|||||||
| Treasuries — 17.1% | ||||||||
| 272,755,000 | Canadian Government, 2.250%, 8/01/2014, (CAD) | 283,336,707 | ||||||
| 201,485,000 | Canadian Government, 2.500%, 6/01/2015, (CAD) | 212,453,851 | ||||||
| 89,045,000 | Canadian Government, 3.000%, 12/01/2015, (CAD) | 95,682,390 | ||||||
| 80,216,000 | Canadian Government, 3.500%, 6/01/2013, (CAD) | 82,924,137 | ||||||
| 171,980,000 | Canadian Government, 3.750%, 6/01/2019, (CAD) | 200,300,458 | ||||||
| 25,445,000 | Canadian Government, 4.250%, 6/01/2018, (CAD) | 29,956,822 | ||||||
| 118,375,000 | Ireland Government Bond, 4.500%, 10/18/2018, (EUR) | 151,308,495 | ||||||
| 80,820,000 | Ireland Government Bond, 4.500%, 4/18/2020, (EUR) | 99,911,126 | ||||||
| 24,400,000 | Ireland Government Bond, 5.000%, 10/18/2020, (EUR) | 31,098,101 | ||||||
| 121,560,000 | Ireland Government Bond, 5.400%, 3/13/2025, (EUR) | 155,157,629 | ||||||
| 1,440,000 | Italy Buoni Poliennali Del Tesoro, 5.000%, 8/01/2034, (EUR) | 1,680,598 | ||||||
| 1,440,000 | Italy Buoni Poliennali Del Tesoro, 5.250%, 11/01/2029, (EUR) | 1,787,260 | ||||||
| 1,435,000 | Italy Buoni Poliennali Del Tesoro, 5.750%, 2/01/2033, (EUR) | 1,840,764 | ||||||
| 18,686,981(†††) | Mexican Fixed Rate Bonds, Series M-20, 8.000%, 12/07/2023, (MXN) | 176,392,731 | ||||||
| 22,670,000 | New Zealand Government Bond, 6.000%, 12/15/2017, (NZD) | 21,618,686 | ||||||
| 53,301,000 | New Zealand Government Bond, 6.500%, 4/15/2013, (NZD) | 45,110,619 | ||||||
| 457,420,000 | Norwegian Government Bond, 4.250%, 5/19/2017, (NOK) | 89,622,031 | ||||||
| 221,050,000 | Norwegian Government Bond, 5.000%, 5/15/2015, (NOK) | 42,115,602 | ||||||
| 1,520,540,000 | Norwegian Government Bond, 6.500%, 5/15/2013, (NOK) | 273,118,063 | ||||||
| 21,120,000 | Portugal Obrigacoes do Tesouro OT, 3.850%, 4/15/2021, (EUR) | 19,087,738 | ||||||
| 1,995,000 | Portugal Obrigacoes do Tesouro OT, 4.100%, 4/15/2037, (EUR) | 1,400,535 | ||||||
| 6,225,000 | Portugal Obrigacoes do Tesouro OT, 4.800%, 6/15/2020, (EUR) | 6,232,359 | ||||||
| 14,475,000 | Portugal Obrigacoes do Tesouro OT, 4.950%, 10/25/2023, (EUR) | 13,294,203 | ||||||
| 65,300,000 | Singapore Government Bond, 1.375%, 10/01/2014, (SGD) | 54,370,338 | ||||||
| 419,985,000 | U.S. Treasury Note, 0.250%, 6/30/2014 | 420,066,897 | ||||||
|
|
|
|||||||
| 2,509,868,140 | ||||||||
|
|
|
|||||||
| Wireless — 0.7% | ||||||||
| 19,004,000 | Nextel Communications, Inc., Series D, 7.375%, 8/01/2015 | 19,075,265 | ||||||
| 31,041,000 | Sprint Capital Corp., 6.875%, 11/15/2028 | 28,557,720 | ||||||
| 29,252,000 | Sprint Capital Corp., 6.900%, 5/01/2019 | 30,348,950 | ||||||
See accompanying notes to financial statements.
| 24
Table of Contents
Portfolio of Investments – as of September 30, 2012
Loomis Sayles Strategic Income Fund – (continued)
| Principal Amount (‡) |
Description | Value (†) | ||||||
| Wireless — continued | ||||||||
| $ | 6,260,000 | Sprint Capital Corp., 8.750%, 3/15/2032 | $ | 6,479,100 | ||||
| 11,309,000 | Sprint Nextel Corp., 6.000%, 12/01/2016 | 11,648,270 | ||||||
|
|
|
|||||||
| 96,109,305 | ||||||||
|
|
|
|||||||
| Wirelines — 3.7% | ||||||||
| 5,650,000 | Axtel SAB de CV, 9.000%, 9/22/2019, 144A | 3,503,000 | ||||||
| 4,370,000 | Bell Canada, MTN, 6.550%, 5/01/2029, 144A, (CAD) | 5,518,886 | ||||||
| 21,480,000 | Bell Canada, Series M-17, 6.100%, 3/16/2035, (CAD) | 26,655,214 | ||||||
| 2,715,000 | BellSouth Telecommunications, Inc., 7.000%, 12/01/2095 | 3,406,918 | ||||||
| 72,320,000 | CenturyLink, Inc., 6.450%, 6/15/2021 | 81,613,120 | ||||||
| 765,000 | CenturyLink, Inc., 7.650%, 3/15/2042 | 815,039 | ||||||
| 7,410,000 | CenturyLink, Inc., Series G, 6.875%, 1/15/2028 | 7,962,438 | ||||||
| 2,965,000 | CenturyLink, Inc., Series P, 7.600%, 9/15/2039 | 3,135,855 | ||||||
| 350,000 | Cincinnati Bell Telephone Co. LLC, 6.300%, 12/01/2028 | 318,500 | ||||||
| 155,000 | Cincinnati Bell, Inc., 7.000%, 2/15/2015 | 156,550 | ||||||
| 5,330,000 | Embarq Corp., 7.995%, 6/01/2036 | 5,994,342 | ||||||
| 38,336,000 | Frontier Communications Corp., 7.875%, 1/15/2027 | 37,665,120 | ||||||
| 1,120,000 | Koninklijke (Royal) KPN NV, EMTN, 5.750%, 3/18/2016, (GBP) | 2,020,707 | ||||||
| 1,800,000 | Koninklijke (Royal) KPN NV, GMTN, 4.000%, 6/22/2015, (EUR) | 2,482,981 | ||||||
| 28,505,000 | Level 3 Financing, Inc., 7.000%, 6/01/2020, 144A | 28,790,050 | ||||||
| 5,965,000 | Level 3 Financing, Inc., 8.625%, 7/15/2020 | 6,442,200 | ||||||
| 2,555,000 | Level 3 Financing, Inc., 9.375%, 4/01/2019 | 2,836,050 | ||||||
| 500,000 | OTE PLC, GMTN, 4.625%, 5/20/2016, (EUR) | 446,568 | ||||||
| 16,550,000 | Portugal Telecom International Finance BV, EMTN, 4.500%, 6/16/2025, (EUR) |
17,014,058 | ||||||
| 29,750,000 | Portugal Telecom International Finance BV, EMTN, 5.000%, 11/04/2019, (EUR) |
35,271,210 | ||||||
| 750,000 | Portugal Telecom International Finance BV, EMTN, 5.625%, 2/08/2016, (EUR) |
958,968 | ||||||
| 800,000 | Portugal Telecom International Finance BV, GMTN, 4.375%, 3/24/2017, (EUR) |
969,956 | ||||||
| 16,335,000 | Qwest Capital Funding, Inc., 6.500%, 11/15/2018 | 18,661,823 | ||||||
| 42,460,000 | Qwest Capital Funding, Inc., 6.875%, 7/15/2028 | 44,804,047 | ||||||
| 12,463,000 | Qwest Capital Funding, Inc., 7.625%, 8/03/2021 | 13,756,285 | ||||||
| 32,395,000 | Qwest Capital Funding, Inc., 7.750%, 2/15/2031 | 35,176,726 | ||||||
| 31,060,000 | Qwest Corp., 6.875%, 9/15/2033 | 31,448,250 | ||||||
| 3,075,000 | Qwest Corp., 7.200%, 11/10/2026 | 3,109,594 | ||||||
| 3,999,000 | Qwest Corp., 7.250%, 9/15/2025 | 4,897,743 | ||||||
| 26,800,000 | Telecom Italia Capital S.A., 6.000%, 9/30/2034 | 23,718,000 | ||||||
| 22,415,000 | Telecom Italia Capital S.A., 6.375%, 11/15/2033 | 20,453,687 | ||||||
| 4,350,000 | Telefonica Emisiones SAU, 7.045%, 6/20/2036 | 4,241,250 | ||||||
| 31,690,000 | Telus Corp., 4.950%, 3/15/2017, (CAD) | 35,792,197 | ||||||
| 18,600,000 | Telus Corp., Series CG, 5.050%, 12/04/2019, (CAD) | 21,631,132 | ||||||
| 3,060,000 | Verizon Maryland, Inc., Series B, 5.125%, 6/15/2033 | 3,244,937 | ||||||
| 3,346,000 | Verizon New England, Inc., 7.875%, 11/15/2029 | 4,300,236 | ||||||
| 5,215,000 | Verizon Pennsylvania, Inc., 6.000%, 12/01/2028 | 5,669,289 | ||||||
|
|
|
|||||||
| 544,882,926 | ||||||||
|
|
|
|||||||
| Total Non-Convertible Bonds (Identified Cost $8,608,650,732) |
9,302,451,755 | |||||||
|
|
|
|||||||
See accompanying notes to financial statements.
25 |
Table of Contents
Portfolio of Investments – as of September 30, 2012
Loomis Sayles Strategic Income Fund – (continued)
| Principal Amount (‡) |
Description | Value (†) | ||||||
| Convertible Bonds — 7.2% | ||||||||
| Airlines — 0.0% | ||||||||
| $ | 1,255,000 | United Continental Holdings, Inc., 4.500%, 6/30/2021 | $ | 1,189,351 | ||||
|
|
|
|||||||
| Automotive — 1.3% | ||||||||
| 4,240,000 | ArvinMeritor, Inc., (Step to Zero Coupon on 2/15/2019), 4.000%, 2/15/2027(h) |
3,156,150 | ||||||
| 125,580,000 | Ford Motor Co., 4.250%, 11/15/2016 | 173,221,912 | ||||||
| 8,460,000 | Navistar International Corp., 3.000%, 10/15/2014 | 7,502,963 | ||||||
|
|
|
|||||||
| 183,881,025 | ||||||||
|
|
|
|||||||
| Brokerage — 0.0% | ||||||||
| 5,025,000 | Jefferies Group, Inc., 3.875%, 11/01/2029 | 4,842,844 | ||||||
|
|
|
|||||||
| Diversified Manufacturing — 0.3% | ||||||||
| 30,570,000 | Owens-Brockway Glass Container, Inc., 3.000%, 6/01/2015, 144A | 29,958,600 | ||||||
| 16,727,000 | Trinity Industries, Inc., 3.875%, 6/01/2036 | 17,281,082 | ||||||
|
|
|
|||||||
| 47,239,682 | ||||||||
|
|
|
|||||||
| Electric — 0.0% | ||||||||
| 1,800,000 | CMS Energy Corp., 5.500%, 6/15/2029 | 3,071,250 | ||||||
|
|
|
|||||||
| Healthcare — 0.4% | ||||||||
| 19,215,000 | Hologic, Inc., (accretes to principal after 12/15/2013), 2.000%, 12/15/2037(h) |
19,058,878 | ||||||
| 1,300,000 | Hologic, Inc., (accretes to principal after 3/1/2018), 2.000%, 3/01/2042(h) | 1,265,063 | ||||||
| 1,810,000 | Illumina, Inc., 0.250%, 3/15/2016, 144A | 1,686,694 | ||||||
| 190,000 | LifePoint Hospitals, Inc., 3.250%, 8/15/2025 | 190,950 | ||||||
| 2,380,000 | LifePoint Hospitals, Inc., 3.500%, 5/15/2014 | 2,586,762 | ||||||
| 3,780,000 | Omnicare, Inc., 3.250%, 12/15/2035 | 3,732,750 | ||||||
| 20,495,000 | Omnicare, Inc., 3.750%, 12/15/2025 | 28,949,187 | ||||||
|
|
|
|||||||
| 57,470,284 | ||||||||
|
|
|
|||||||
| Home Construction — 0.6% | ||||||||
| 52,005,000 | Lennar Corp., 3.250%, 11/15/2021, 144A | 85,743,244 | ||||||
|
|
|
|||||||
| Independent Energy — 0.3% | ||||||||
| 20,440,000 | Chesapeake Energy Corp., 2.250%, 12/15/2038 | 16,466,975 | ||||||
| 24,655,000 | Chesapeake Energy Corp., 2.500%, 5/15/2037 | 22,143,272 | ||||||
| 11,536,000 | Chesapeake Energy Corp., 2.750%, 11/15/2035 | 10,980,830 | ||||||
|
|
|
|||||||
| 49,591,077 | ||||||||
|
|
|
|||||||
| Life Insurance — 0.5% | ||||||||
| 72,915,000 | Old Republic International Corp., 3.750%, 3/15/2018 | 72,550,425 | ||||||
|
|
|
|||||||
| Media Non-Cable — 0.0% | ||||||||
| 5,841,174 | Liberty Media LLC, 3.500%, 1/15/2031 | 2,759,955 | ||||||
|
|
|
|||||||
| Metals & Mining — 0.1% | ||||||||
| 1,000,000 | Steel Dynamics, Inc., 5.125%, 6/15/2014 | 1,045,625 | ||||||
| 11,270,000 | United States Steel Corp., 4.000%, 5/15/2014 | 11,389,744 | ||||||
|
|
|
|||||||
| 12,435,369 | ||||||||
|
|
|
|||||||
| Pharmaceuticals — 0.0% | ||||||||
| 3,065,000 | Vertex Pharmaceuticals, Inc., 3.350%, 10/01/2015 | 3,936,609 | ||||||
|
|
|
|||||||
See accompanying notes to financial statements.
| 26
Table of Contents
Portfolio of Investments – as of September 30, 2012
Loomis Sayles Strategic Income Fund – (continued)
| Principal Amount (‡) |
Description | Value (†) | ||||||
| REITs - Warehouse/Industrials — 0.2% | ||||||||
| $ | 19,445,000 | ProLogis LP, 3.250%, 3/15/2015 | $ | 21,814,859 | ||||
|
|
|
|||||||
| Technology — 2.7% | ||||||||
| 4,320,000 | Alcatel-Lucent USA, Inc., Series B, 2.875%, 6/15/2025 | 4,233,600 | ||||||
| 49,215,000 | Ciena Corp., 0.875%, 6/15/2017 | 42,355,659 | ||||||
| 7,185,000 | Ciena Corp., 3.750%, 10/15/2018, 144A | 7,544,250 | ||||||
| 6,075,000 | Ciena Corp., 4.000%, 3/15/2015, 144A | 6,538,219 | ||||||
| 11,463,000 | Intel Corp., 2.950%, 12/15/2035 | 12,466,013 | ||||||
| 220,000,000 | Intel Corp., 3.250%, 8/01/2039 | 271,150,000 | ||||||
| 1,055,000 | Lam Research Corp., Series B, 1.250%, 5/15/2018 | 1,019,394 | ||||||
| 52,965,000 | Micron Technology, Inc., Series B, 1.875%, 8/01/2031 | 46,642,303 | ||||||
| 8,550,000 | Micron Technology, Inc., Series C, 2.375%, 5/01/2032, 144A | 7,994,250 | ||||||
|
|
|
|||||||
| 399,943,688 | ||||||||
|
|
|
|||||||
| Wirelines — 0.8% | ||||||||
| 6,000,000 | Level 3 Communications, Inc., 6.500%, 10/01/2016 | 8,625,000 | ||||||
| 54,075,000 | Level 3 Communications, Inc., 7.000%, 3/15/2015, 144A(b) | 65,396,953 | ||||||
| 32,895,000 | Level 3 Communications, Inc., Series B, 7.000%, 3/15/2015(b) | 39,782,390 | ||||||
| 900,000 | Portugal Telecom International Finance BV, Series PTC, 4.125%, 8/28/2014, (EUR) |
1,147,871 | ||||||
|
|
|
|||||||
| 114,952,214 | ||||||||
|
|
|
|||||||
| Total Convertible Bonds (Identified Cost $893,931,444) |
1,061,421,876 | |||||||
|
|
|
|||||||
| Municipals — 1.0% | ||||||||
| District of Columbia — 0.0% | ||||||||
| 3,850,000 | Metropolitan Washington DC Airports Authority, Series D, 8.000%, 10/01/2047 |
4,770,612 | ||||||
|
|
|
|||||||
| Illinois — 0.3% | ||||||||
| 1,725,000 | Chicago O’Hare International Airport, Series A, (AGMC insured), 4.500%, 1/01/2038 |
1,797,674 | ||||||
| 47,285,000 | State of Illinois, 5.100%, 6/01/2033 | 45,826,731 | ||||||
|
|
|
|||||||
| 47,624,405 | ||||||||
|
|
|
|||||||
| Michigan — 0.1% | ||||||||
| 12,375,000 | Michigan Tobacco Settlement Finance Authority Taxable Turbo, Series A, 7.309%, 6/01/2034(b) | 9,986,749 | ||||||
|
|
|
|||||||
| Virginia — 0.6% | ||||||||
| 128,820,000 | Virginia Tobacco Settlement Financing Corp., Series A-1, 6.706%, 6/01/2046(b) |
87,426,269 | ||||||
|
|
|
|||||||
| Total Municipals (Identified Cost $182,422,709) |
149,808,035 | |||||||
|
|
|
|||||||
| Total Bonds and Notes (Identified Cost $9,685,004,885) |
10,513,681,666 | |||||||
|
|
|
|||||||
See accompanying notes to financial statements.
27 |
Table of Contents
Portfolio of Investments – as of September 30, 2012
Loomis Sayles Strategic Income Fund – (continued)
| Principal Amount (‡) |
Description | Value (†) | ||||||
| Senior Loans — 1.7% | ||||||||
| Automotive — 0.1% | ||||||||
| $ | 19,082,055 | TI Group Automotive Systems, LLC, New Term Loan, 6.750%, 3/14/2018(c) | $ | 19,177,466 | ||||
|
|
|
|||||||
| Consumer Products — 0.2% | ||||||||
| 2,665,820 | Supervalu, Inc., New Term Loan B, 8/30/2018(i) | 2,678,189 | ||||||
| 26,543,729 | Supervalu, Inc., New Term Loan B, 8.000%, 8/30/2018(c) | 26,666,892 | ||||||
|
|
|
|||||||
| 29,345,081 | ||||||||
|
|
|
|||||||
| Electric — 0.0% | ||||||||
| 4,788,467 | Texas Competitive Electric Holdings Company, LLC, Non-Extended Term Loan, 3.757%, 10/10/2014(j) | 3,553,952 | ||||||
|
|
|
|||||||
| Food & Beverage — 0.1% | ||||||||
| 13,701,976 | DS Waters Enterprises, LP, 1st Lien Term Loan, 10.500%, 8/29/2017(c) | 14,113,035 | ||||||
|
|
|
|||||||
| Independent Energy — 0.2% | ||||||||
| 22,900,000 | Chesapeake Energy Corporation, Unsecured Term Loan, 8.500%, 12/01/2017(c) |
22,958,395 | ||||||
|
|
|
|||||||
| Media Non-Cable — 0.1% | ||||||||
| 21,200,705 | SuperMedia, Inc., Exit Term Loan, 11.000%, 12/31/2015(c) | 13,851,057 | ||||||
|
|
|
|||||||
| Metals & Mining — 0.1% | ||||||||
| 11,620,000 | Essar Steel Algoma, Inc., ABL Term Loan, 8.750%, 9/19/2014(c) | 11,649,050 | ||||||
|
|
|
|||||||
| Non-Captive Diversified — 0.6% | ||||||||
| 84,000,000 | iStar Financial, Inc., Add on Term Loan A2, 7.000%, 3/17/2017(c) | 85,260,000 | ||||||
|
|
|
|||||||
| Wireless — 0.1% | ||||||||
| 19,725,000 | Hawaiian Telcom Communications, Inc., Term Loan B, 7.000%, 2/28/2017(c) |
19,959,333 | ||||||
|
|
|
|||||||
| Wirelines — 0.2% | ||||||||
| 24,458,644 | FairPoint Communications, Inc., New Term Loan B, 6.501%, 1/22/2016(j) | 22,925,576 | ||||||
|
|
|
|||||||
| Total Senior Loans (Identified Cost $248,122,199) |
242,792,945 | |||||||
|
|
|
|||||||
| Shares | ||||||||
| Common Stocks — 17.3% | ||||||||
| Biotechnology — 0.3% | ||||||||
| 867,059 | Vertex Pharmaceuticals, Inc.(g) | 48,511,951 | ||||||
|
|
|
|||||||
| Chemicals — 1.8% | ||||||||
| 1,364,851 | Dow Chemical Co. (The) | 39,526,085 | ||||||
| 2,000,000 | PPG Industries, Inc. | 229,680,000 | ||||||
|
|
|
|||||||
| 269,206,085 | ||||||||
|
|
|
|||||||
| Containers & Packaging — 0.1% | ||||||||
| 460,656 | Owens-Illinois, Inc.(g) | 8,641,907 | ||||||
| 1,675 | Rock-Tenn Co., Class A | 120,901 | ||||||
|
|
|
|||||||
| 8,762,808 | ||||||||
|
|
|
|||||||
| Diversified Financial Services — 0.2% | ||||||||
| 3,979,932 | Bank of America Corp. | 35,142,800 | ||||||
|
|
|
|||||||
See accompanying notes to financial statements.
| 28
Table of Contents
Portfolio of Investments – as of September 30, 2012
Loomis Sayles Strategic Income Fund – (continued)
| Shares |
Description | Value (†) | ||||||
| Diversified Telecommunication Services — 2.1% | ||||||||
| 183,181 | FairPoint Communications, Inc.(g) | $ | 1,384,849 | |||||
| 283,397 | Hawaiian Telcom Holdco, Inc.(g) | 5,024,629 | ||||||
| 200,000 | Telecom Italia SpA, Sponsored ADR | 2,008,000 | ||||||
| 3,871,339 | Telecom Italia SpA, Sponsored ADR | 33,487,082 | ||||||
| 19,550,590 | Telefonica S.A., Sponsored ADR | 259,631,835 | ||||||
|
|
|
|||||||
| 301,536,395 | ||||||||
|
|
|
|||||||
| Electric Utilities — 0.0% | ||||||||
| 94,166 | Duke Energy Corp. | 6,101,957 | ||||||
|
|
|
|||||||
| Electronic Equipment, Instruments & Components — 2.9% | ||||||||
| 32,000,000 | Corning, Inc. | 420,800,000 | ||||||
|
|
|
|||||||
| Food Products — 0.4% | ||||||||
| 2,309,175 | ConAgra Foods, Inc. | 63,710,138 | ||||||
|
|
|
|||||||
| Household Durables — 0.2% | ||||||||
| 477,725 | KB Home | 6,855,354 | ||||||
| 549,450 | Lennar Corp., Class A | 19,104,376 | ||||||
|
|
|
|||||||
| 25,959,730 | ||||||||
|
|
|
|||||||
| Insurance — 0.6% | ||||||||
| 1,510,275 | Prudential Financial, Inc. | 82,325,090 | ||||||
|
|
|
|||||||
| Oil, Gas & Consumable Fuels — 1.9% | ||||||||
| 846,398 | Chesapeake Energy Corp. | 15,971,530 | ||||||
| 5,351,804 | Repsol YPF S.A., Sponsored ADR | 103,289,817 | ||||||
| 2,134,173 | Royal Dutch Shell PLC, ADR | 148,132,948 | ||||||
| 141,249 | Spectra Energy Corp. | 4,147,071 | ||||||
|
|
|
|||||||
| 271,541,366 | ||||||||
|
|
|
|||||||
| Pharmaceuticals — 3.0% | ||||||||
| 8,514,190 | Bristol-Myers Squibb Co. | 287,353,912 | ||||||
| 2,288 | Teva Pharmaceutical Industries, Ltd., Sponsored ADR | 94,746 | ||||||
| 2,691,177 | Valeant Pharmaceuticals International, Inc.(g) | 148,741,353 | ||||||
|
|
|
|||||||
| 436,190,011 | ||||||||
|
|
|
|||||||
| REITs — Apartments — 0.3% | ||||||||
| 290,904 | Apartment Investment & Management Co., Class A | 7,560,595 | ||||||
| 889,730 | Associated Estates Realty Corp. | 13,488,307 | ||||||
| 460,000 | Equity Residential | 26,463,800 | ||||||
|
|
|
|||||||
| 47,512,702 | ||||||||
|
|
|
|||||||
| REITs — Regional Malls — 0.1% | ||||||||
| 123,159 | Simon Property Group, Inc. | 18,696,768 | ||||||
|
|
|
|||||||
| REITs — Shopping Centers — 0.0% | ||||||||
| 201,557 | DDR Corp. | 3,095,915 | ||||||
|
|
|
|||||||
| Semiconductors & Semiconductor Equipment — 2.1% | ||||||||
| 13,359,360 | Intel Corp. | 302,990,285 | ||||||
|
|
|
|||||||
| Software — 1.3% | ||||||||
| 6,568,091 | Microsoft Corp. | 195,597,750 | ||||||
|
|
|
|||||||
| Total Common Stocks (Identified Cost $2,301,163,783) |
2,537,681,751 | |||||||
|
|
|
|||||||
See accompanying notes to financial statements.
29 |
Table of Contents
Portfolio of Investments – as of September 30, 2012
Loomis Sayles Strategic Income Fund – (continued)
| Shares |
Description | Value (†) | ||||||
| Preferred Stocks — 2.7% | ||||||||
| Convertible Preferred Stocks — 1.9% | ||||||||
| Automotive — 0.9% | ||||||||
| 2,826,055 | General Motors Co., Series B, 4.750% | $ | 105,355,330 | |||||
| 657,940 | Goodyear Tire & Rubber Co. (The), 5.875% | 29,061,210 | ||||||
|
|
|
|||||||
| 134,416,540 | ||||||||
|
|
|
|||||||
| Banking — 0.3% | ||||||||
| 19,062 | Bank of America Corp., Series L, 7.250% | 20,777,580 | ||||||
| 203,658 | Sovereign Capital Trust IV, 4.375% | 13,339,599 | ||||||
| 8,533 | Wells Fargo & Co., Series L, Class A, 7.500% | 10,563,854 | ||||||
|
|
|
|||||||
| 44,681,033 | ||||||||
|
|
|
|||||||
| Construction Machinery — 0.1% | ||||||||
| 145,110 | United Rentals Trust I, 6.500% | 7,024,224 | ||||||
|
|
|
|||||||
| Electric — 0.1% | ||||||||
| 380,577 | AES Trust III, 6.750% | 18,967,958 | ||||||
|
|
|
|||||||
| Home Construction — 0.1% | ||||||||
| 355,000 | Hovnanian Enterprises, Inc., 7.250% | 6,737,900 | ||||||
|
|
|
|||||||
| Independent Energy — 0.1% | ||||||||
| 52,020 | Chesapeake Energy Corp., 4.500% | 4,214,140 | ||||||
| 99,800 | SandRidge Energy, Inc., 8.500% | 10,859,238 | ||||||
|
|
|
|||||||
| 15,073,378 | ||||||||
|
|
|
|||||||
| Pipelines — 0.1% | ||||||||
| 242,297 | El Paso Energy Capital Trust I, 4.750% | 13,166,419 | ||||||
|
|
|
|||||||
| REITs - Healthcare — 0.0% | ||||||||
| 116,700 | Health Care REIT, Inc., Series I, 6.500% | 6,432,504 | ||||||
|
|
|
|||||||
| Technology — 0.2% | ||||||||
| 55,430 | Lucent Technologies Capital Trust I, 7.750% | 32,149,400 | ||||||
|
|
|
|||||||
| Total Convertible Preferred Stocks (Identified Cost $306,794,784) |
278,649,356 | |||||||
|
|
|
|||||||
| Non-Convertible Preferred Stocks — 0.8% | ||||||||
| Banking — 0.2% | ||||||||
| 35,000 | Bank of America Corp., 6.375% | 872,900 | ||||||
| 847,800 | Citigroup Capital XIII, (fixed rate to 10/30/2015, variable rate thereafter), 7.875% | 23,611,230 | ||||||
| 389,800 | Countrywide Capital IV, 6.750% | 9,745,000 | ||||||
|
|
|
|||||||
| 34,229,130 | ||||||||
|
|
|
|||||||
| Electric — 0.0% | ||||||||
| 393 | Entergy New Orleans, Inc., 4.750% | 40,896 | ||||||
|
|
|
|||||||
| Government Sponsored — 0.2% | ||||||||
| 26,000 | Falcons Funding Trust I, (Step to 10.875% on 3/15/2015, variable rate after 3/15/2020), 8.875%, 144A(h) | 27,308,125 | ||||||
|
|
|
|||||||
| Home Construction — 0.0% | ||||||||
| 208,246 | Hovnanian Enterprises, Inc., 7.625%(g) | 1,707,617 | ||||||
|
|
|
|||||||
See accompanying notes to financial statements.
| 30
Table of Contents
Portfolio of Investments – as of September 30, 2012
Loomis Sayles Strategic Income Fund – (continued)
| Shares |
Description | Value (†) | ||||||
| Independent Energy — 0.0% | ||||||||
| 20,800 | Chesapeake Energy Corp., 5.000% | $ | 1,664,000 | |||||
|
|
|
|||||||
| Non-Captive Consumer — 0.0% | ||||||||
| 101,175 | SLM Corp., Series A, 6.970% | 4,843,247 | ||||||
|
|
|
|||||||
| Non-Captive Diversified — 0.3% | ||||||||
| 45,861 | Ally Financial, Inc., Series G, 7.000%, 144A | 42,901,535 | ||||||
|
|
|
|||||||
| REITs — Office Property — 0.0% | ||||||||
| 1,596 | Highwoods Properties, Inc., Series A, 8.625% | 1,925,175 | ||||||
|
|
|
|||||||
| REITs — Warehouse/Industrials — 0.1% | ||||||||
| 116,192 | ProLogis, Inc., Series Q, 8.540% | 7,087,712 | ||||||
|
|
|
|||||||
| Total Non-Convertible Preferred Stocks (Identified Cost $84,479,145) |
121,707,437 | |||||||
|
|
|
|||||||
| Total Preferred Stocks (Identified Cost $391,273,929) |
400,356,793 | |||||||
|
|
|
|||||||
| Closed End Investment Companies — 0.0% | ||||||||
| 37,350 | Morgan Stanley Emerging Markets Debt Fund, Inc. | 450,068 | ||||||
| 681,131 | NexPoint Credit Strategies Fund | 4,706,615 | ||||||
|
|
|
|||||||
| Total Closed End Investment Companies (Identified Cost $10,586,370) |
5,156,683 | |||||||
|
|
|
|||||||
| Principal Amount (‡) |
||||||||
| Short-Term Investments — 5.9% | ||||||||
| $ | 2,655,073 | Repurchase Agreement with State Street Bank and Trust Company, dated 9/28/2012 at 0.010% to be repurchased at $2,655,075 on 10/01/2012 collateralized by $1,920,000 U.S. Treasury Bond, 5.250% due 2/15/2029 valued at $2,704,852 including accrued interest (Note 2 of Notes to Financial Statements) | 2,655,073 | |||||
| 866,468,158 | Tri-Party Repurchase Agreement with Fixed Income Clearing Corporation, dated 9/28/2012 at 0.010% to be repurchased at $866,468,880 on 10/01/2012 collateralized by $112,120,000 Federal Home Loan Mortgage Corp., 3.000% due 8/01/2019 valued at $115,012,696; $109,860,000 Federal Home Loan Mortgage Corp., 3.000% due 7/10/2019 valued at $112,881,150; $142,000,000 Federal Home Loan Mortgage Corp., 3.000% due 7/31/2019 valued at $145,905,000; $150,000,000 Federal National Mortgage Association, 0.750%, due 9/21/2016 valued at $150,021,875; $143,055,000 U.S. Treasury Note, 2.750% due 11/30/2016 valued at $157,718,138; $40,520,000 U.S. Treasury Note, 1.500% due 7/31/2016 valued at $42,257,254; $156,000,000 U.S. Treasury Note, 1.000% due 10/31/2016 valued at $160,003,896 including accrued interest (Note 2 of Notes to Financial Statements) | 866,468,158 | ||||||
|
|
|
|||||||
| Total Short-Term Investments (Identified Cost $869,123,231) |
869,123,231 | |||||||
|
|
|
|||||||
See accompanying notes to financial statements.
31 |
Table of Contents
Portfolio of Investments – as of September 30, 2012
Loomis Sayles Strategic Income Fund – (continued)
| Value (†) | ||||||||
| Total Investments — 99.1% (Identified Cost $13,505,274,397)(a) |
$ | 14,568,793,069 | ||||||
| Other assets less liabilities — 0.9% | 128,957,713 | |||||||
|
|
|
|||||||
| Net Assets — 100.0% | $ | 14,697,750,782 | ||||||
|
|
|
|||||||
| (‡) | Principal Amount stated in U.S. dollars unless otherwise noted. | |||||||
| (†) | See Note 2 of Notes to Financial Statements. | |||||||
| (††) | Amount shown represents units. One unit represents a principal amount of 25. | |||||||
| (†††) | Amount shown represents units. One unit represents a principal amount of 100. | |||||||
| (a) | Federal Tax Information: | |||||||
| At September 30, 2012, the net unrealized appreciation on investments based on a cost of $13,606,771,954 for federal income tax purposes was as follows: | ||||||||
| Aggregate gross unrealized appreciation for all investments in which there is an excess of value over tax cost | $ | 1,631,360,131 | ||||||
| Aggregate gross unrealized depreciation for all investments in which there is an excess of tax cost over value | (669,339,016 | ) | ||||||
|
|
|
|||||||
| Net unrealized appreciation | $ | 962,021,115 | ||||||
|
|
|
|||||||
| (b) | Illiquid security. At September 30, 2012, the value of these securities amounted to $310,417,964 or 2.1% of net assets. | |||||||
| (c) | Variable rate security. Rate as of September 30, 2012 is disclosed. | |||||||
| (d) | The issuer is in default with respect to interest and/or principal payments. Income is not being accrued. | |||||||
| (e) | Fair valued security by the Fund’s investment adviser. At September 30, 2012, the value of this security amounted to $12,874,750 or 0.1% of net assets. | |||||||
| (f) | Maturity has been extended under the terms of a plan of reorganization. | |||||||
| (g) | Non-income producing security. | |||||||
| (h) | Coupon rate is a fixed rate for an initial period then resets at a specified date and rate. | |||||||
| (i) | Position is unsettled. Contract rate was not determined at September 30, 2012 and does not take effect until settlement date. | |||||||
| (j) | Variable rate security. Rate shown represents the weighted average rate of underlying contracts at September 30, 2012. | |||||||
| 144A | All or a portion of these securities are exempt from registration under Rule 144A of the Securities Act of 1933. These securities may be resold in transactions exempt from registration, normally to qualified institutional buyers. At September 30, 2012, the value of Rule 144A holdings amounted to $1,551,876,789 or 10.6% of net assets. | |||||||
| ADR | An American Depositary Receipt is a certificate issued by a custodian bank representing the right to receive securities of the foreign issuer described. The values of ADRs may be significantly influenced by trading on exchanges not located in the United States. | |||||||
| ABS | Asset-Backed Securities | |||||||
| AGMC | Assured Guaranty Municipal Corp. | |||||||
| EMTN | Euro Medium Term Note | |||||||
| GMTN | Global Medium Term Note | |||||||
| MBIA | Municipal Bond Investors Assurance Corp. | |||||||
| MTN | Medium Term Note | |||||||
| REITs | Real Estate Investment Trusts | |||||||
See accompanying notes to financial statements.
| 32
Table of Contents
Portfolio of Investments – as of September 30, 2012
Loomis Sayles Strategic Income Fund – (continued)
| AUD | Australian Dollar | |||||
| BRL | Brazilian Real | |||||
| CAD | Canadian Dollar | |||||
| CHF | Swiss Franc | |||||
| EUR | Euro | |||||
| GBP | British Pound | |||||
| IDR | Indonesian Rupiah | |||||
| ISK | Icelandic Krona | |||||
| KRW | South Korean Won | |||||
| MXN | Mexican Peso | |||||
| NOK | Norwegian Krone | |||||
| NZD | New Zealand Dollar | |||||
| SGD | Singapore Dollar | |||||
Industry Summary at September 30, 2012 (Unaudited)
| Treasuries |
17.1 | % | ||
| Banking |
6.5 | |||
| Non-Captive Diversified |
5.5 | |||
| Wirelines |
4.7 | |||
| Non-Captive Consumer |
4.2 | |||
| Technology |
3.8 | |||
| Pharmaceuticals |
3.4 | |||
| Automotive |
3.2 | |||
| Electronic Equipment, Instruments & Components |
2.9 | |||
| Electric |
2.8 | |||
| Airlines |
2.6 | |||
| Chemicals |
2.2 | |||
| Semiconductors & Semiconductor Equipment |
2.1 | |||
| Diversified Telecommunication Services |
2.1 | |||
| Sovereigns |
2.0 | |||
| Other Investments, less than 2% each |
28.1 | |||
| Short-Term Investments |
5.9 | |||
|
|
|
|||
| Total Investments |
99.1 | |||
| Other assets less liabilities |
0.9 | |||
|
|
|
|||
| Net Assets |
100.0 | % | ||
|
|
|
See accompanying notes to financial statements.
33 |
Table of Contents
Portfolio of Investments – as of September 30, 2012
Loomis Sayles Strategic Income Fund – (continued)
Currency Exposure Summary at September 30, 2012 (Unaudited)
| United States Dollar |
70.3 | % | ||
| Canadian Dollar |
7.5 | |||
| Euro |
4.8 | |||
| New Zealand Dollar |
3.9 | |||
| Australian Dollar |
3.4 | |||
| Norwegian Krone |
2.8 | |||
| Other, less than 2% each |
6.4 | |||
|
|
|
|||
| Total Investments |
99.1 | |||
| Other assets less liabilities |
0.9 | |||
|
|
|
|||
| Net Assets |
100.0 | % | ||
|
|
|
See accompanying notes to financial statements.
| 34
Table of Contents
Statement of Assets and Liabilities
September 30, 2012
| ASSETS |
| |||
| Investments at cost |
$ | 13,505,274,397 | ||
| Net unrealized appreciation |
1,063,518,672 | |||
|
|
|
|||
| Investments at value |
14,568,793,069 | |||
| Cash |
76,018 | |||
| Due from custodian (Note 2) |
2,847,444 | |||
| Foreign currency at value (identified cost $6,644,076) |
6,620,909 | |||
| Receivable for Fund shares sold |
35,957,697 | |||
| Receivable for securities sold |
13,517,809 | |||
| Dividends and interest receivable |
176,716,225 | |||
| Tax reclaims receivable |
266,865 | |||
|
|
|
|||
| TOTAL ASSETS |
14,804,796,036 | |||
|
|
|
|||
| LIABILITIES |
||||
| Payable for securities purchased |
66,884,925 | |||
| Payable for Fund shares redeemed |
27,757,140 | |||
| Foreign taxes payable (Note 2) |
167,609 | |||
| Due to brokers (Note 2) |
2,847,444 | |||
| Management fees payable (Note 5) |
6,709,397 | |||
| Deferred Trustees’ fees (Note 5) |
834,963 | |||
| Administrative fees payable (Note 5) |
540,045 | |||
| Payable to distributor (Note 5d) |
124,277 | |||
| Other accounts payable and accrued expenses |
1,179,454 | |||
|
|
|
|||
| TOTAL LIABILITIES |
107,045,254 | |||
|
|
|
|||
| NET ASSETS |
$ | 14,697,750,782 | ||
|
|
|
|||
| NET ASSETS CONSIST OF: |
||||
| Paid-in capital |
$ | 13,885,428,398 | ||
| Undistributed net investment income |
38,251,969 | |||
| Accumulated net realized loss on investments and foreign currency transactions |
(289,873,847 | ) | ||
| Net unrealized appreciation on investments and foreign currency translations |
1,063,944,262 | |||
|
|
|
|||
| NET ASSETS |
$ | 14,697,750,782 | ||
|
|
|
|||
See accompanying notes to financial statements.
35 |
Table of Contents
| COMPUTATION OF NET ASSET VALUE AND OFFERING PRICE: |
||||
| Class A shares: |
||||
| Net assets |
$ | 5,155,286,543 | ||
|
|
|
|||
| Shares of beneficial interest |
336,874,690 | |||
|
|
|
|||
| Net asset value and redemption price per share |
$ | 15.30 | ||
|
|
|
|||
| Offering price per share (100/95.50 of net asset value) (Note 1) |
$ | 16.02 | ||
|
|
|
|||
| Class B shares: (redemption price per share is equal to net asset value less any applicable contingent deferred sales charge) (Note 1) |
||||
| Net assets |
$ | 89,552,103 | ||
|
|
|
|||
| Shares of beneficial interest |
5,812,402 | |||
|
|
|
|||
| Net asset value and offering price per share |
$ | 15.41 | ||
|
|
|
|||
| Class C shares: (redemption price per share is equal to net asset value less any applicable contingent deferred sales charge) (Note 1) |
||||
| Net assets |
$ | 5,064,185,562 | ||
|
|
|
|||
| Shares of beneficial interest |
329,044,586 | |||
|
|
|
|||
| Net asset value and offering price per share |
$ | 15.39 | ||
|
|
|
|||
| Class Y shares: |
||||
| Net assets |
$ | 4,339,240,236 | ||
|
|
|
|||
| Shares of beneficial interest |
283,754,124 | |||
|
|
|
|||
| Net asset value, offering and redemption price per share |
$ | 15.29 | ||
|
|
|
|||
| Admin Class shares: |
||||
| Net assets |
$ | 49,486,338 | ||
|
|
|
|||
| Shares of beneficial interest |
3,241,722 | |||
|
|
|
|||
| Net asset value, offering and redemption price per share |
$ | 15.27 | ||
|
|
|
See accompanying notes to financial statements.
| 36
Table of Contents
Statement of Operations
For the Year Ended September 30, 2012
| INVESTMENT INCOME |
| |||
| Interest |
$ | 681,795,151 | ||
| Dividends |
131,109,522 | |||
| Less net foreign taxes withheld |
(9,311,011 | ) | ||
|
|
|
|||
| 803,593,662 | ||||
|
|
|
|||
| Expenses |
||||
| Management fees (Note 5) |
77,503,021 | |||
| Service and distribution fees (Note 5) |
63,469,687 | |||
| Administrative fees (Note 5) |
6,330,496 | |||
| Trustees’ fees and expenses (Note 5) |
313,364 | |||
| Transfer agent fees and expenses (Note 5) |
11,634,164 | |||
| Audit and tax services fees |
54,256 | |||
| Custodian fees and expenses |
648,642 | |||
| Legal fees |
196,521 | |||
| Registration fees |
376,056 | |||
| Shareholder reporting expenses |
645,226 | |||
| Miscellaneous expenses |
345,364 | |||
|
|
|
|||
| Total expenses |
161,516,797 | |||
|
|
|
|||
| Net investment income |
642,076,865 | |||
|
|
|
|||
| NET REALIZED AND UNREALIZED GAIN (LOSS) ON INVESTMENTS AND FOREIGN CURRENCY TRANSACTIONS |
||||
| Net realized gain (loss) on: |
||||
| Investments |
294,161,002 | |||
| Foreign currency transactions |
(5,976,561 | ) | ||
| Net change in unrealized appreciation (depreciation) on: |
||||
| Investments |
827,816,685 | |||
| Foreign currency translations |
7,452,752 | |||
|
|
|
|||
| Net realized and unrealized gain on investments and foreign currency transactions |
1,123,453,878 | |||
|
|
|
|||
| NET INCREASE IN NET ASSETS RESULTING FROM OPERATIONS |
$ | 1,765,530,743 | ||
|
|
|
|||
See accompanying notes to financial statements.
37 |
Table of Contents
Statement of Changes in Net Assets
| Year Ended September 30, 2012 |
Year Ended September 30, 2011 |
|||||||
| FROM OPERATIONS: |
| |||||||
| Net investment income |
$ | 642,076,865 | $ | 662,753,316 | ||||
| Net realized gain on investments and foreign currency transactions |
288,184,441 | 365,118,083 | ||||||
| Net change in unrealized appreciation (depreciation) on investments and foreign currency translations |
835,269,437 | (756,514,895 | ) | |||||
|
|
|
|
|
|||||
| Net increase in net assets resulting from operations |
1,765,530,743 | 271,356,504 | ||||||
|
|
|
|
|
|||||
| FROM DISTRIBUTIONS TO SHAREHOLDERS: |
||||||||
| Net investment income |
||||||||
| Class A |
(300,094,602 | ) | (312,937,228 | ) | ||||
| Class B |
(4,942,822 | ) | (5,960,721 | ) | ||||
| Class C |
(241,863,153 | ) | (237,583,471 | ) | ||||
| Class Y |
(208,703,036 | ) | (155,221,506 | ) | ||||
| Admin Class |
(1,997,277 | ) | (816,337 | ) | ||||
|
|
|
|
|
|||||
| Total distributions |
(757,600,890 | ) | (712,519,263 | ) | ||||
|
|
|
|
|
|||||
| NET INCREASE (DECREASE) IN NET ASSETS FROM CAPITAL SHARE TRANSACTIONS (NOTE 8) |
820,378,728 | (256,613,434 | ) | |||||
|
|
|
|
|
|||||
| Net increase (decrease) in net assets |
1,828,308,581 | (697,776,193 | ) | |||||
| NET ASSETS |
||||||||
| Beginning of the year |
12,869,442,201 | 13,567,218,394 | ||||||
|
|
|
|
|
|||||
| End of the year |
$ | 14,697,750,782 | $ | 12,869,442,201 | ||||
|
|
|
|
|
|||||
| UNDISTRIBUTED NET INVESTMENT INCOME |
$ | 38,251,969 | $ | 62,197,900 | ||||
|
|
|
|
|
|||||
See accompanying notes to financial statements.
| 38
Table of Contents
Financial Highlights
For a share outstanding throughout each period.
| Income (Loss) from Investment Operations: |
Less Distributions: | |||||||||||||||||||||||||||
| Net asset value, beginning of the period |
Net investment income (a) |
Net realized and unrealized gain (loss) |
Total from investment operations |
Dividends from net investment income |
Distributions from net realized capital gains |
Total distributions |
||||||||||||||||||||||
| Class A |
|
|||||||||||||||||||||||||||
| 9/30/2012 |
$ | 14.21 | $ | 0.72 | $ | 1.21 | $ | 1.93 | $ | (0.84 | ) | $ | — | $ | (0.84 | ) | ||||||||||||
| 9/30/2011 |
14.69 | 0.77 | (0.42 | ) | 0.35 | (0.83 | ) | — | (0.83 | ) | ||||||||||||||||||
| 9/30/2010 |
13.39 | 0.80 | 1.31 | 2.11 | (0.81 | ) | — | (0.81 | ) | |||||||||||||||||||
| 9/30/2009 |
12.10 | 0.87 | 1.36 | 2.23 | (0.86 | ) | (0.08 | ) | (0.94 | ) | ||||||||||||||||||
| 9/30/2008 |
15.18 | 0.96 | (3.02 | ) | (2.06 | ) | (1.01 | ) | (0.01 | ) | (1.02 | ) | ||||||||||||||||
| Class B |
|
|||||||||||||||||||||||||||
| 9/30/2012 |
14.30 | 0.61 | 1.23 | 1.84 | (0.73 | ) | — | (0.73 | ) | |||||||||||||||||||
| 9/30/2011 |
14.78 | 0.66 | (0.43 | ) | 0.23 | (0.71 | ) | — | (0.71 | ) | ||||||||||||||||||
| 9/30/2010 |
13.46 | 0.69 | 1.33 | 2.02 | (0.70 | ) | — | (0.70 | ) | |||||||||||||||||||
| 9/30/2009 |
12.16 | 0.79 | 1.36 | 2.15 | (0.77 | ) | (0.08 | ) | (0.85 | ) | ||||||||||||||||||
| 9/30/2008 |
15.25 | 0.85 | (3.04 | ) | (2.19 | ) | (0.89 | ) | (0.01 | ) | (0.90 | ) | ||||||||||||||||
| Class C |
|
|||||||||||||||||||||||||||
| 9/30/2012 |
14.29 | 0.61 | 1.23 | 1.84 | (0.74 | ) | — | (0.74 | ) | |||||||||||||||||||
| 9/30/2011 |
14.77 | 0.66 | (0.43 | ) | 0.23 | (0.71 | ) | — | (0.71 | ) | ||||||||||||||||||
| 9/30/2010 |
13.45 | 0.69 | 1.33 | 2.02 | (0.70 | ) | — | (0.70 | ) | |||||||||||||||||||
| 9/30/2009 |
12.15 | 0.79 | 1.37 | 2.16 | (0.78 | ) | (0.08 | ) | (0.86 | ) | ||||||||||||||||||
| 9/30/2008 |
15.24 | 0.85 | (3.03 | ) | (2.18 | ) | (0.90 | ) | (0.01 | ) | (0.91 | ) | ||||||||||||||||
| Class Y |
|
|||||||||||||||||||||||||||
| 9/30/2012 |
14.20 | 0.75 | 1.22 | 1.97 | (0.88 | ) | — | (0.88 | ) | |||||||||||||||||||
| 9/30/2011 |
14.68 | 0.81 | (0.43 | ) | 0.38 | (0.86 | ) | — | (0.86 | ) | ||||||||||||||||||
| 9/30/2010 |
13.38 | 0.83 | 1.31 | 2.14 | (0.84 | ) | — | (0.84 | ) | |||||||||||||||||||
| 9/30/2009 |
12.09 | 0.90 | 1.36 | 2.26 | (0.89 | ) | (0.08 | ) | (0.97 | ) | ||||||||||||||||||
| 9/30/2008 |
15.17 | 1.00 | (3.03 | ) | (2.03 | ) | (1.04 | ) | (0.01 | ) | (1.05 | ) | ||||||||||||||||
| Admin Class |
|
|||||||||||||||||||||||||||
| 9/30/2012 |
14.18 | 0.67 | 1.23 | 1.90 | (0.81 | ) | — | (0.81 | ) | |||||||||||||||||||
| 9/30/2011 |
14.66 | 0.73 | (0.42 | ) | 0.31 | (0.79 | ) | — | (0.79 | ) | ||||||||||||||||||
| 9/30/2010* |
13.87 | 0.52 | 0.79 | 1.31 | (0.52 | ) | — | (0.52 | ) | |||||||||||||||||||
| * | From commencement of Class operations on February 1, 2010 through September 30, 2010. |
| (a) | Per share net investment income has been calculated using the average shares outstanding during the period. |
| (b) | Amount rounds to less than $0.01 per share, if applicable. |
| (c) | Effective June 2, 2008, redemption fees were eliminated. |
| (d) | Had certain expenses not been waived/reimbursed during the period, if applicable, total returns would have been lower. |
| (e) | A sales charge for Class A shares and a contingent deferred sales charge for Class B and Class C shares are not reflected in total return calculations. Periods less than one year, if applicable, are not annualized. |
| (f) | The investment adviser and/or administrator agreed to waive its fees and/or reimburse a portion of the Fund’s expenses during the period. Without this waiver/reimbursement, if applicable, expenses would have been higher. |
| (g) | Computed on an annualized basis for periods less than one year, if applicable. |
See accompanying notes to financial statements.
39 |
Table of Contents
| Ratios to Average Net Assets: | ||||||||||||||||||||||||||||||
| Redemption fees (b)(c) |
Net asset value, end of the period |
Total return (%) (d)(e) |
Net assets, end of the period (000’s) |
Net expenses (%) (f)(g) |
Gross expenses (%) (g) |
Net investment income (%) (g) |
Portfolio turnover rate (%) |
|||||||||||||||||||||||
| $ | — | $ | 15.30 | 14.02 | $ | 5,155,287 | 0.96 | 0.96 | 4.84 | 30 | ||||||||||||||||||||
| — | 14.21 | 2.20 | 5,262,765 | 0.95 | 0.95 | 5.10 | 25 | |||||||||||||||||||||||
| — | 14.69 | 16.20 | 5,758,070 | 0.96 | 0.96 | 5.67 | 27 | |||||||||||||||||||||||
| — | 13.39 | 20.56 | 5,544,029 | 0.99 | 0.99 | 7.74 | 39 | |||||||||||||||||||||||
| 0.00 | 12.10 | (14.54 | ) | 5,551,066 | 0.97 | 0.98 | 6.59 | 24 | ||||||||||||||||||||||
| — | 15.41 | 13.15 | 89,552 | 1.70 | 1.70 | 4.11 | 30 | |||||||||||||||||||||||
| — | 14.30 | 1.48 | 107,400 | 1.70 | 1.70 | 4.35 | 25 | |||||||||||||||||||||||
| — | 14.78 | 15.39 | 137,268 | 1.71 | 1.71 | 4.92 | 27 | |||||||||||||||||||||||
| — | 13.46 | 19.62 | 148,887 | 1.74 | 1.74 | 7.02 | 39 | |||||||||||||||||||||||
| 0.00 | 12.16 | (15.19 | ) | 161,751 | 1.72 | 1.73 | 5.78 | 24 | ||||||||||||||||||||||
| — | 15.39 | 13.18 | 5,064,186 | 1.71 | 1.71 | 4.08 | 30 | |||||||||||||||||||||||
| — | 14.29 | 1.42 | 4,666,077 | 1.70 | 1.70 | 4.35 | 25 | |||||||||||||||||||||||
| — | 14.77 | 15.40 | 5,146,164 | 1.71 | 1.71 | 4.92 | 27 | |||||||||||||||||||||||
| — | 13.45 | 19.66 | 4,894,546 | 1.74 | 1.74 | 6.95 | 39 | |||||||||||||||||||||||
| 0.00 | 12.15 | (15.19 | ) | 3,984,204 | 1.72 | 1.73 | 5.85 | 24 | ||||||||||||||||||||||
| — | 15.29 | 14.31 | 4,339,240 | 0.71 | 0.71 | 5.05 | 30 | |||||||||||||||||||||||
| — | 14.20 | 2.46 | 2,807,777 | 0.70 | 0.70 | 5.35 | 25 | |||||||||||||||||||||||
| — | 14.68 | 16.50 | 2,521,337 | 0.71 | 0.71 | 5.92 | 27 | |||||||||||||||||||||||
| — | 13.38 | 20.91 | 2,057,888 | 0.72 | 0.72 | 7.76 | 39 | |||||||||||||||||||||||
| 0.00 | 12.09 | (14.34 | ) | 783,058 | 0.72 | 0.72 | 6.88 | 24 | ||||||||||||||||||||||
| — | 15.27 | 13.79 | 49,486 | 1.21 | 1.21 | 4.52 | 30 | |||||||||||||||||||||||
| — | 14.18 | 1.98 | 25,424 | 1.21 | 1.21 | 4.87 | 25 | |||||||||||||||||||||||
| — | 14.66 | 9.61 | 4,379 | 1.24 | 1.24 | 5.52 | 27 | |||||||||||||||||||||||
See accompanying notes to financial statements.
| 40
Table of Contents
Notes to Financial Statements
September 30, 2012
1. Organization. Loomis Sayles Funds II (the “Trust”) is organized as a Massachusetts business trust. The Trust is registered under the Investment Company Act of 1940, as amended (the “1940 Act”), as an open-end management investment company. The Declaration of Trust permits the Board of Trustees to authorize the issuance of an unlimited number of shares of the Trust in multiple series. The financial statements for certain funds of the Trust are presented in separate reports. Information presented in these financial statements pertains to Loomis Sayles Strategic Income Fund (the “Fund”).
The Fund is a diversified investment company.
The Fund offers Class A, Class C, Class Y and Admin Class shares. Effective October 12, 2007, Class B shares are no longer offered. Existing Class B shareholders may continue to reinvest dividends into Class B shares and exchange their Class B shares for Class B shares of other Natixis Funds subject to existing exchange privileges as described in the prospectus.
Class A shares are sold with a maximum front-end sales charge of 4.50%. Class B shares do not pay a front-end sales charge; however, they are charged higher Rule 12b-1 fees, and are subject to a contingent deferred sales charge (“CDSC”) if such shares are redeemed within six years of purchase. After eight years of ownership, Class B shares convert to Class A shares. Class C shares do not pay a front-end sales charge, do not convert to any other class of shares, pay higher Rule 12b-1 fees than Class A shares and may be subject to a CDSC of 1.00% if those shares are redeemed within one year of acquisition, except for reinvested distributions. Class Y shares do not pay a front-end sales charge, a CDSC or Rule 12b-1 fees. Class Y shares are generally intended for institutional investors with a minimum initial investment of $100,000, though some categories of investors are exempted from the minimum investment amount as outlined in the Fund’s prospectus. Admin Class shares do not pay a front-end sales charge or a CDSC, but do pay a Rule 12b-1 fee. Admin Class shares are offered exclusively through intermediaries.
Most expenses of the Trust can be directly attributed to a fund. Expenses which cannot be directly attributed to a fund are generally apportioned based on the relative net assets of each of the funds in the Trust. Expenses of the Fund are borne pro rata by the holders of each class of shares, except that each class bears expenses unique to that class (including the Rule 12b-1 service and distribution fees). In addition, each class votes as a class only with respect to its own Rule 12b-1 Plan. Shares of each class would receive their pro rata share of the net assets of the Fund if the Fund were liquidated. The Trustees approve separate distributions from net investment income on each class of shares.
2. Significant Accounting Policies. The following is a summary of significant accounting policies consistently followed by the Fund in the preparation of its financial
41 |
Table of Contents
Notes to Financial Statements (continued)
September 30, 2012
statements. The Fund’s financial statements are prepared in accordance with accounting principles generally accepted in the United States of America which require the use of management estimates that affect the reported amounts and disclosures in the financial statements. Actual results could differ from those estimates. Management has evaluated the events and transactions subsequent to year-end through the date the financial statements were issued and has determined that there were no material events that would require disclosure in the Fund’s financial statements.
a. Valuation. Debt securities (other than short-term obligations purchased with an original or remaining maturity of sixty days or less) and unlisted equity securities are generally valued on the basis of evaluated bids furnished to the Fund by an independent pricing service recommended by the investment adviser and approved by the Board of Trustees, which service determines valuations for normal, institutional-size trading units of such securities using market information, transactions for comparable securities and various relationships between securities which are generally recognized by institutional traders. Senior loans are priced at bid prices supplied by an independent pricing service, if available. Equity securities, including shares of closed-end investment companies and exchange-traded funds, for which market quotations are readily available are valued at market value, as reported by independent pricing services recommended by the investment adviser and approved by the Board of Trustees. Such independent pricing services generally use the security’s last sale price on the exchange or market where the security is primarily traded or, if there is no reported sale during the day, the closing bid price. Securities traded on the NASDAQ Global Select Market, NASDAQ Global Market and NASDAQ Capital Market are valued at the NASDAQ Official Closing Price (“NOCP”), or if lacking a NOCP, at the most recent bid quotation on the applicable NASDAQ Market. Broker-dealer bid quotations may also be used to value debt and equity securities and senior loans where an independent pricing service is unable to price a security or where an independent pricing service does not provide a reliable price for the security. Investments in other open-end investment companies are valued at their net asset value each day. Short-term obligations purchased with an original or remaining maturity of sixty days or less are valued at amortized cost, which approximates market value. Securities for which market quotations are not readily available are valued at fair value as determined in good faith by the Fund’s investment adviser using consistently applied procedures under the general supervision of the Board of Trustees.
The Fund may hold securities traded in foreign markets. Foreign securities are valued at the closing market price in the foreign market. However, if events occurring after the close of the foreign market (but before the close of regular trading on the New York Stock Exchange) are believed to materially affect the value of those securities, such securities are fair valued pursuant to procedures approved by the Board of Trustees. When fair valuing securities, the Fund may, among other things, use modeling tools or other processes that may take into account factors such as securities market activity
| 42
Table of Contents
Notes to Financial Statements (continued)
September 30, 2012
and/or significant events that occur after the close of the foreign market and before the Fund calculates its net asset value.
b. Investment Transactions and Related Investment Income. Investment transactions are accounted for on a trade date plus one basis for daily net asset value calculation. However, for financial reporting purposes, investment transactions are reported on trade date. Dividend income is recorded on ex-dividend date, or in the case of certain foreign securities, as soon as the Fund is notified, and interest income is recorded on an accrual basis. Interest income is increased by the accretion of discount and decreased by the amortization of premium. Distributions received from investments in securities that represent a return of capital or capital gain are recorded as a reduction of the cost of investments or as a realized gain, respectively. In determining net gain or loss on securities sold, the cost of securities has been determined on an identified cost basis. Investment income, non-class specific expenses and realized and unrealized gains and losses are allocated on a pro rata basis to each class based on the relative net assets of each class to the total net assets of the Fund.
c. Foreign Currency Translation. The books and records of the Fund are maintained in U.S. dollars. The values of securities, currencies and other assets and liabilities denominated in currencies other than U.S. dollars are translated into U.S. dollars based upon foreign exchange rates prevailing at the end of the period. Purchases and sales of investment securities, income and expenses are translated on the respective dates of such transactions.
Since the values of investment securities are presented at the foreign exchange rates prevailing at the end of the period, it is not practical to isolate that portion of the results of operations arising from changes in exchange rates from fluctuations which arise due to changes in market prices of investment securities. Such changes are included with the net realized and unrealized gain or loss on investments.
Net realized foreign exchange gains or losses arise from sales of foreign currency, currency gains or losses realized between the trade and settlement dates on securities transactions, and the difference between the amounts of dividends, interest and foreign withholding taxes recorded on the Fund’s books and the U.S. dollar equivalent of the amounts actually received or paid. Net unrealized foreign exchange gains and losses arise from changes in the value of assets and liabilities, other than investment securities, at the end of the fiscal period, resulting from changes in exchange rates.
The Fund may use foreign currency exchange contracts to facilitate transactions in foreign-denominated investments. Losses may arise from changes in the value of the foreign currency or if the counterparties do not perform under the contracts’ terms.
d. Federal and Foreign Income Taxes. The Trust treats each fund as a separate entity for federal income tax purposes. The Fund intends to meet the requirements of the
43 |
Table of Contents
Notes to Financial Statements (continued)
September 30, 2012
Internal Revenue Code of 1986, as amended, applicable to regulated investment companies, and to distribute to its shareholders substantially all of its net investment income and any net realized capital gains at least annually. Management has performed an analysis of the Fund’s tax positions for the open tax years as of September 30, 2012 and has concluded that no provisions for income tax are required. The Fund’s federal tax returns for the prior three fiscal years remain subject to examination by the Internal Revenue Service. Management is not aware of any events that are reasonably possible to occur in the next twelve months that would result in the amounts of any unrecognized tax benefits significantly increasing or decreasing for the Fund. However, management’s conclusions regarding tax positions taken may be subject to review and adjustment at a later date based on factors including, but not limited to, new tax laws and accounting regulations and interpretations thereof.
The Fund may be subject to foreign withholding taxes on investment income and taxes on capital gains on investments that are accrued and paid based upon the Fund’s understanding of the tax rules and regulations that exist in the countries in which the Fund invests. Foreign withholding taxes on dividend and interest income are reflected on the Statements of Operations as a reduction of investment income, net of amounts eligible to be reclaimed. Dividends and interest receivable on the Statements of Assets and Liabilities are net of foreign withholding taxes. Foreign withholding taxes eligible to be reclaimed are reflected on the Statements of Assets and Liabilities as tax reclaims receivable. Capital gains taxes paid are included in net realized gain (loss) on investments in the Statements of Operations. Accrued but unpaid capital gains taxes are reflected as foreign taxes payable on the Statements of Assets and Liabilities, if applicable, and reduce unrealized gains on investments. In the event that realized gains on investments are subsequently offset by realized losses, taxes paid on realized gains may be returned to the Fund. Such amounts, if applicable, are reflected as foreign tax rebates receivable on the Statements of Assets and Liabilities and are recorded as a realized gain when received.
e. Dividends and Distributions to Shareholders. Dividends and distributions are recorded on ex-dividend date. The timing and characterization of certain income and capital gain distributions are determined annually in accordance with federal tax regulations, which may differ from accounting principles generally accepted in the United States of America. Permanent differences are primarily due to differing treatments for book and tax purposes of items such as foreign currency transactions, contingent payment debt instruments, premium amortization, defaulted bond adjustments, paydown gains and losses, trust preferred securities and return of capital and capital gains distributions from real estate investment trusts (“REITs”). Permanent book and tax basis differences relating to shareholder distributions will result in reclassifications to capital accounts. Temporary differences between book and tax distributable earnings are primarily due to wash sales, premium amortization, non-REIT return of capital outstanding, REIT basis adjustments, trust preferred securities,
| 44
Table of Contents
Notes to Financial Statements (continued)
September 30, 2012
contingent payment debt instruments and defaulted bond interest. Distributions from net investment income and short-term capital gains are considered to be distributed from ordinary income for tax purposes.
The tax characterization of distributions is determined on an annual basis. The tax character of distributions paid to shareholders during the years ended September 30, 2012 and 2011 was as follows:
| 2012 Distributions Paid From: |
2011 Distributions Paid From: | |||||||||||||||||||
| Ordinary |
Long-Term Capital Gains |
Total |
Ordinary Income |
Long-Term Capital Gains |
Total |
|||||||||||||||
| $757,600,890 |
$ | — | $ | 757,600,890 | $ | 712,519,263 | $ | — | $ | 712,519,263 | ||||||||||
As of September 30, 2012, the components of distributable earnings on a tax basis were as follows:
| Undistributed ordinary income |
$ | 103,098,571 | ||
| Undistributed long-term capital gains |
— | |||
|
|
|
|||
| Total undistributed earnings |
103,098,571 | |||
|
|
|
|||
| Capital loss carryforward: |
||||
| Short-term: |
||||
| Expires September 30, 2018 |
(242,738,243 | ) | ||
|
|
|
|||
| Unrealized appreciation |
962,451,446 | |||
|
|
|
|||
| Total accumulated gains |
$ | 822,811,774 | ||
|
|
|
|||
| Capital loss carryforward utilized in the current year |
$ | 197,790,946 | ||
|
|
|
On December 22, 2010, the Regulated Investment Company Modernization Act of 2010 (the “Act”) was enacted. Under the Act, for taxable years beginning after December 22, 2010, capital losses may be carried forward indefinitely. Rules in effect previously limited the carryforward period to eight years. Additionally, capital losses realized in taxable years beginning after the effective date of the Act are carried over in the character (short-term or long-term) realized. Rules in effect previously treated all capital loss carryforwards as short-term.
f. Repurchase Agreements. It is the Fund’s policy that the market value of the collateral for repurchase agreements be at least equal to 102% of the repurchase price, including interest. Certain repurchase agreements are tri-party arrangements whereby the collateral is held in a segregated account for the benefit of the Fund and on behalf of the counterparty. Repurchase agreements could involve certain risks in the event of default or insolvency of the counterparty including possible delays or restrictions upon the Fund’s ability to dispose of the underlying securities.
45 |
Table of Contents
Notes to Financial Statements (continued)
September 30, 2012
g. Securities Lending. The Fund has entered into an agreement with State Street Bank and Trust Company (“State Street Bank”), as agent of the Fund, to lend securities to certain designated borrowers. The loans are collateralized with cash or securities in an amount equal to at least 105% or 102% of the market value (including accrued interest) of the loaned international or domestic securities, respectively, when the loan is initiated. Thereafter, the value of the collateral must remain at least 102% of the market value (including accrued interest) of loaned securities for U.S. equities and U.S. corporate debt; at least 105% of the market value (including accrued interest) of loaned securities for non-U.S. equities; and at least 100% of the market value (including accrued interest) of loaned securities for U.S. Government securities, sovereign debt issued by non-U.S. Governments and non-U.S. corporate debt. In the event that the market value of the collateral falls below the required percentages described above, the borrower will deliver additional collateral on the next business day. As with other extensions of credit, the Fund may bear the risk of loss with respect to the investment of the collateral. The Fund invests cash collateral in short-term investments, a portion of the income from which is remitted to the borrowers and the remainder allocated between the Fund and State Street Bank as lending agent. Excess collateral in the amount of $2,847,444 related to terminated loans with a bankrupt borrower is held by State Street Bank on behalf of the Fund.
For the year ended September 30, 2012, the Fund did not loan securities under this agreement.
h. Indemnifications. Under the Trust’s organizational documents, its officers and Trustees are indemnified against certain liabilities arising out of the performance of their duties to the Fund. Additionally, in the normal course of business, the Fund enters into contracts with service providers that contain general indemnification clauses. The Fund’s maximum exposure under these arrangements is unknown as this would involve future claims that may be made against the Fund that have not yet occurred. However, based on experience, the Fund expects the risk of loss to be remote.
3. Fair Value Measurements. In accordance with accounting standards related to fair value measurements and disclosures, the Fund has categorized the inputs utilized in determining the value of the Fund’s assets or liabilities. These inputs are summarized in the three broad levels listed below:
| • | Level 1 – quoted prices in active markets for identical assets or liabilities; |
| • | Level 2 – prices determined using other significant inputs that are observable either directly, or indirectly through corroboration with observable market data (which could include quoted prices for similar assets or liabilities, interest rates, credit risk, etc.); and |
| 46
Table of Contents
Notes to Financial Statements (continued)
September 30, 2012
| • | Level 3 – prices determined using significant unobservable inputs when quoted prices or observable inputs are unavailable such as when there is little or no market activity for an asset or liability (unobservable inputs reflect the Fund’s own assumptions in determining the fair value of assets or liabilities and would be based on the best information available). |
The inputs or methodology used for valuing securities are not necessarily an indication of the risk associated with investing in those securities.
The following is a summary of the inputs used to value the Fund’s investments as of September 30, 2012, at value:
Asset Valuation Inputs
| Description |
Level 1 |
Level 2 |
Level 3 |
Total |
||||||||||||
| Bonds and Notes |
||||||||||||||||
| Non-Convertible Bonds |
||||||||||||||||
| Banking |
$ | — | $ | 855,791,849 | $ | 18,800,082 | $ | 874,591,931 | ||||||||
| Electric |
— | 386,510,686 | 12,874,750 | 399,385,436 | ||||||||||||
| Non-Captive Consumer |
2,610,305 | 614,097,781 | — | 616,708,086 | ||||||||||||
| Sovereigns |
— | 277,617,343 | 21,173,458 | 298,790,801 | ||||||||||||
| Transportation Services |
— | 39,644,577 | 8,953,808 | 48,598,385 | ||||||||||||
| All Other Non-Convertible Bonds(a) |
— | 7,064,377,116 | — | 7,064,377,116 | ||||||||||||
|
|
|
|
|
|
|
|
|
|||||||||
| Total Non-Convertible Bonds |
2,610,305 | 9,238,039,352 | 61,802,098 | 9,302,451,755 | ||||||||||||
|
|
|
|
|
|
|
|
|
|||||||||
| Convertible Bonds(a) |
— | 1,061,421,876 | — | 1,061,421,876 | ||||||||||||
| Municipals(a) |
— | 149,808,035 | — | 149,808,035 | ||||||||||||
|
|
|
|
|
|
|
|
|
|||||||||
| Total Bonds and Notes |
2,610,305 | 10,449,269,263 | 61,802,098 | 10,513,681,666 | ||||||||||||
|
|
|
|
|
|
|
|
|
|||||||||
| Senior Loans(a) |
— | 242,792,945 | — | 242,792,945 | ||||||||||||
| Common Stocks(a) |
2,537,681,751 | — | — | 2,537,681,751 | ||||||||||||
47 |
Table of Contents
Notes to Financial Statements (continued)
September 30, 2012
Asset Valuation Inputs (continued)
| Description |
Level 1 |
Level 2 |
Level 3 |
Total |
||||||||||||
| Preferred Stocks |
||||||||||||||||
| Convertible Preferred Stocks |
||||||||||||||||
| Banking |
$ | 31,341,434 | $ | 13,339,599 | $ | — | $ | 44,681,033 | ||||||||
| Construction Machinery |
— | 7,024,224 | — | 7,024,224 | ||||||||||||
| Independent Energy |
4,214,140 | 10,859,238 | — | 15,073,378 | ||||||||||||
| All Other Convertible Preferred Stocks(a) |
211,870,721 | — | — | 211,870,721 | ||||||||||||
|
|
|
|
|
|
|
|
|
|||||||||
| Total Convertible Preferred Stocks |
247,426,295 | 31,223,061 | — | 278,649,356 | ||||||||||||
|
|
|
|
|
|
|
|
|
|||||||||
| Non-Convertible Preferred Stocks |
||||||||||||||||
| Electric |
— | 40,896 | — | 40,896 | ||||||||||||
| Government Sponsored |
— | 27,308,125 | — | 27,308,125 | ||||||||||||
| Non-Captive Diversified |
— | 42,901,535 | — | 42,901,535 | ||||||||||||
| REITs - Office Property |
— | 1,925,175 | — | 1,925,175 | ||||||||||||
| All Other Non-Convertible Preferred Stocks(a) |
49,531,706 | — | — | 49,531,706 | ||||||||||||
|
|
|
|
|
|
|
|
|
|||||||||
| Total Non-Convertible Preferred Stocks |
49,531,706 | 72,175,731 | — | 121,707,437 | ||||||||||||
|
|
|
|
|
|
|
|
|
|||||||||
| Total Preferred Stocks |
296,958,001 | 103,398,792 | — | 400,356,793 | ||||||||||||
|
|
|
|
|
|
|
|
|
|||||||||
| Closed End Investment Companies |
5,156,683 | — | — | 5,156,683 | ||||||||||||
| Short-Term Investments |
— | 869,123,231 | — | 869,123,231 | ||||||||||||
|
|
|
|
|
|
|
|
|
|||||||||
| Total |
$ | 2,842,406,740 | $ | 11,664,584,231 | $ | 61,802,098 | $ | 14,568,793,069 | ||||||||
|
|
|
|
|
|
|
|
|
|||||||||
| (a) | Details of the major categories of the Fund’s investments are reflected within the Portfolio of Investments. |
A preferred stock valued at $9,179,640 was transferred from Level 1 to Level 2 during the period ended September 30, 2012. At September 30, 2011, this security was valued at market price in accordance with the Fund’s valuation policies; at September 30, 2012, this security was valued on the basis of evaluated bids furnished to the Fund by an independent pricing service as a market price was not available.
| 48
Table of Contents
Notes to Financial Statements (continued)
September 30, 2012
All transfers are recognized as of the beginning of the reporting period.
The following is a reconciliation of Level 3 investments for which significant unobservable inputs were used to determine fair value as of September 30, 2012:
Asset Valuation Inputs
| Investments in Securities |
Balance as of |
Accrued |
Realized |
Change in |
Purchases |
|||||||||||||||
| Bonds and Notes |
||||||||||||||||||||
| Non-Convertible Bonds |
||||||||||||||||||||
| Banking |
$ | — | $ | — | $ — | $ | 1,415,570 | $ | 17,384,512 | |||||||||||
| Consumer Cyclical Services |
4,482,500 | — | — | — | — | |||||||||||||||
| Electric |
— | — | — | (6,785,170 | ) | — | ||||||||||||||
| Sovereigns |
— | 6,988,544 | — | (19,781,429 | ) | 16,686 | ||||||||||||||
| Technology |
1,740,000 | 106,837 | (3,925,024 | ) | 4,358,575 | — | ||||||||||||||
| Transportation Services |
— | 65,117 | — | 2,166,771 | — | |||||||||||||||
| Treasuries |
742,727 | 20,092 | (926,055 | ) | 581,249 | — | ||||||||||||||
| Preferred Stocks |
||||||||||||||||||||
| Convertible Preferred Stocks |
||||||||||||||||||||
| Electric |
4,847,625 | — | 105,583 | 433,042 | — | |||||||||||||||
| Independent Energy |
9,980,000 | — | — | — | — | |||||||||||||||
| Non-Convertible Preferred Stocks |
||||||||||||||||||||
| Non-Captive Diversified |
22,149,600 | — | — | — | — | |||||||||||||||
|
|
|
|
|
|
|
|
|
|
|
|||||||||||
| Total |
$ | 43,942,452 | $ | 7,180,590 | $ | (4,745,496 | ) | $ | (17,611,392 | ) | $ | 17,401,198 | ||||||||
|
|
|
|
|
|
|
|
|
|
|
|||||||||||
49 |
Table of Contents
Notes to Financial Statements (continued)
September 30, 2012
Asset Valuation Inputs (continued)
| Investments in Securities |
Sales |
Transfers into Level 3 |
Transfers Level 3 |
Balance as of |
Change
in |
|||||||||||||||
| Bonds and Notes |
||||||||||||||||||||
| Non-Convertible Bonds |
||||||||||||||||||||
| Banking |
$ | — | $ | — | $ | — | $ | 18,800,082 | $ | 1,415,570 | ||||||||||
| Consumer Cyclical Services |
— | — | (4,482,500 | ) | — | — | ||||||||||||||
| Electric |
— | 19,659,920 | — | 12,874,750 | (6,785,170 | ) | ||||||||||||||
| Sovereigns |
— | 33,949,657 | — | 21,173,458 | (19,781,429 | ) | ||||||||||||||
| Technology |
(2,280,388 | ) | — | — | — | — | ||||||||||||||
| Transportation Services |
— | 6,721,920 | — | 8,953,808 | 2,166,771 | |||||||||||||||
| Treasuries |
(418,013 | ) | — | — | — | — | ||||||||||||||
| Preferred Stocks |
||||||||||||||||||||
| Convertible Preferred Stocks |
||||||||||||||||||||
| Electric |
(5,386,250 | ) | — | — | — | — | ||||||||||||||
| Independent Energy |
— | — | (9,980,000 | ) | — | — | ||||||||||||||
| Non-Convertible Preferred Stocks |
||||||||||||||||||||
| Non-Captive Diversified |
— | — | (22,149,600 | ) | — | — | ||||||||||||||
|
|
|
|
|
|
|
|
|
|
|
|||||||||||
| Total |
$ | (8,084,651 | ) | $ | 60,331,497 | $ | (36,612,100 | ) | $ | 61,802,098 | $ | (22,984,258 | ) | |||||||
|
|
|
|
|
|
|
|
|
|
|
|||||||||||
A debt security ($4,482,500) and preferred stocks ($32,129,600) valued at $36,612,100 were transferred from Level 3 to Level 2 during the period ended September 30, 2012. At September 30, 2011, these securities were valued using broker-dealer bid quotations based on inputs unobservable to the Fund as an independent pricing service did not provide a reliable price for the security; at September 30, 2012, these securities were valued on the basis of evaluated bids furnished to the Fund by an independent pricing service in accordance with the Fund’s valuation policies.
| 50
Table of Contents
Notes to Financial Statements (continued)
September 30, 2012
Debt securities valued at $40,671,577 were transferred from Level 2 to Level 3 during the period ended September 30, 2012. At September 30, 2011, these securities were valued on the basis of evaluated bids furnished to the Fund by an independent pricing service in accordance with the Fund’s valuation policies; at September 30, 2012, these securities were valued using broker-dealer bid quotations based on inputs unobservable to the Fund as an independent pricing service did not provide a reliable price for the security.
Debt securities valued at $19,659,920 were transferred from Level 2 to Level 3 during the period ended September 30, 2012. At September 30, 2011, these securities were valued on the basis of evaluated bids furnished to the Fund by an independent pricing service in accordance with the Fund’s valuation policies; at September 30, 2012, these securities were valued at fair value as determined in good faith by the Fund’s investment adviser as an independent pricing service did not provide a reliable price for the security.
All transfers are recognized as of the beginning of the reporting period.
4. Purchases and Sales of Securities. For the year ended September 30, 2012, purchases and sales of securities (excluding short-term investments and U.S. Government/Agency securities and including paydowns) were $3,266,712,923 and $3,507,917,510, respectively. Purchases and sales of U.S. Government/Agency securities (excluding short-term investments and including paydowns) were $827,101,946 and $418,916,792, respectively.
5. Management Fees and Other Transactions with Affiliates.
a. Management Fees. Loomis, Sayles & Company, L.P. (“Loomis Sayles”) serves as investment adviser to the Fund. Under the terms of the management agreement, the Fund pays a management fee at the following annual rates, calculated daily and payable monthly, based on the Fund’s average daily net assets:
| Percentage of Average Daily Net Assets |
||||||||||||
| First |
Next $1.8 billion |
Next $13 billion |
Over $15 billion |
|||||||||
| 0.65% |
0.60 | % | 0.55 | % | 0.54 | % | ||||||
Loomis Sayles has given a binding undertaking to the Fund to waive management fees and/or reimburse certain expenses to limit the Fund’s operating expenses, exclusive of acquired fund fees and expenses, brokerage expenses, interest expense, taxes and extraordinary expenses. This undertaking is in effect until January 31, 2013 and is reevaluated on an annual basis. Management fees payable, as reflected on the Statement of Assets and Liabilities, is net of waivers and/or expense reimbursements, if any, pursuant to this undertaking.
51 |
Table of Contents
Notes to Financial Statements (continued)
September 30, 2012
For the year ended September 30, 2012, the expense limits as a percentage of average daily net assets under the expense limitation agreement were as follows:
| Expense Limit as a Percentage of Average Daily Net Assets |
||||||||||||||||
| Class A |
Class B | Class C | Class Y | Admin Class | ||||||||||||
| 1.25% |
2.00 | % | 2.00 | % | 1.00 | % | 1.50 | % | ||||||||
Loomis Sayles shall be permitted to recover expenses it has borne under the expense limitation agreement (whether through waiver of its management fees or otherwise) on a class by class basis in later periods to the extent the expenses of a class fall below a class’ expense limits, provided, however, that a class is not obligated to pay such waived/reimbursed fees or expenses more than one year after the end of the fiscal year in which the fees or expenses were waived/reimbursed.
For the year ended September 30, 2012, the management fees for the Fund were $77,503,021 (effective rate of 0.56% of average daily net assets).
No expenses were recovered during the year ended September 30, 2012 under the terms of the expense limitation agreement.
Certain officers and employees of Loomis Sayles are also officers or Trustees of the Trust. Loomis Sayles’ general partner is indirectly owned by Natixis Global Asset Management, L.P. (“Natixis US”), which is part of Natixis Global Asset Management, an international asset management group based in Paris, France.
b. Service and Distribution Fees. NGAM Distribution, L.P. (“NGAM Distribution”), which is a wholly-owned subsidiary of Natixis US, has entered into a distribution agreement with the Trust. Pursuant to this agreement, NGAM Distribution serves as principal underwriter of the Funds of the Trust.
Pursuant to Rule 12b-1 under the 1940 Act, the Trust has adopted a Service Plan relating to the Fund’s Class A shares (the “Class A Plan”), a Distribution and Service Plan relating to the Fund’s Class B and Class C shares (the “Class B and Class C Plans”), and a Distribution Plan relating to its Admin Class shares (the “Admin Class Plan”).
Under the Class A Plan, the Fund pays NGAM Distribution a monthly service fee at an annual rate not to exceed 0.25% of the average daily net assets attributable to the Fund’s Class A shares, as reimbursement for expenses incurred by NGAM Distribution in providing personal services to investors in Class A shares and/or the maintenance of shareholder accounts.
Under the Class B and Class C Plans, the Fund pays NGAM Distribution a monthly service fee at an annual rate not to exceed 0.25% of the average daily net assets attributable to the Fund’s Class B and Class C shares, as compensation for services provided by NGAM Distribution in providing personal services to investors in Class B and Class C shares and/or the maintenance of shareholder accounts.
| 52
Table of Contents
Notes to Financial Statements (continued)
September 30, 2012
Also under the Class B and Class C Plans, the Fund pays NGAM Distribution a monthly distribution fee at an annual rate of 0.75% of the average daily net assets attributable to the Fund’s Class B and Class C shares, as compensation for services provided by NGAM Distribution in connection with the marketing or sale of Class B and Class C shares.
Under the Admin Class Plan, the Fund pays NGAM Distribution a monthly distribution fee at an annual rate not to exceed 0.25% of the average daily net assets attributable to the Fund’s Admin Class shares, as compensation for services provided by NGAM Distribution in connection with the marketing or sale of Admin Class shares or for payments made by NGAM Distribution to securities dealers or other financial intermediaries as commissions, asset-based sales charges or other compensation with respect to the sale of Admin Class shares, or for providing personal services to investors and/or the maintenance of shareholder accounts.
In addition, the Admin Class shares of the Fund may pay NGAM Distribution an administrative service fee, at an annual rate not to exceed 0.25% of the average daily net assets attributable to Admin Class shares. These fees are subsequently paid to securities dealers or financial intermediaries for providing personal services and/or account maintenance for their customers who hold such shares.
For the year ended September 30, 2012, the service and distribution fees for the Fund were as follows:
| Service Fees | Distribution Fees | |||||||||||
| Class A |
Class B |
Class C |
Admin Class |
Class B |
Class C |
Admin Class | ||||||
| $13,114,937 | $249,385 | $12,292,508 | $93,589 | $748,156 | $36,877,523 | $93,589 | ||||||
c. Administrative Fees. NGAM Advisors, L.P. (“NGAM Advisors”) provides certain administrative services for the Fund and contracts with State Street Bank to serve as sub-administrator. NGAM Advisors is a wholly-owned subsidiary of Natixis US. Pursuant to an agreement among Natixis Funds Trust I, Natixis Funds Trust II, Natixis Funds Trust IV, Gateway Trust (“Natixis Funds Trusts”), Loomis Sayles Funds I, Loomis Sayles Funds II (“Loomis Sayles Funds Trusts”), Hansberger International Series and NGAM Advisors, the Fund pays NGAM Advisors monthly its pro rata portion of fees equal to an annual rate of 0.0575% of the first $15 billion of the average daily net assets of the Natixis Funds Trusts, Loomis Sayles Funds Trusts and Hansberger International Series, 0.0500% of the next $15 billion, 0.0400% of the next $30 billion and 0.0350% of such assets in excess of $60 billion, subject to an annual aggregate minimum fee for the Natixis Funds Trusts, Loomis Sayles Funds Trusts and Hansberger International Series of $10 million, which is reevaluated on an annual basis.
For the year ended September 30, 2012, the administrative fees for the Fund were $6,330,496.
53 |
Table of Contents
Notes to Financial Statements (continued)
September 30, 2012
d. Sub-Transfer Agent Fees. NGAM distribution has entered into agreements, which include servicing agreements, with financial intermediaries that provide recordkeeping, processing, shareholder communications and other services to customers of the intermediaries that hold positions in the Fund and has agreed to compensate the intermediaries for providing those services. Intermediaries transact with the Fund primarily through the use of omnibus accounts on behalf of their customers who hold positions in the Fund. These services would have been provided by the Fund’s transfer agent and other service providers if the shareholders’ accounts were maintained directly at the Fund’s transfer agent. Accordingly, the Fund has agreed to reimburse NGAM Distribution for all or a portion of the servicing fees paid to these intermediaries. The reimbursement amounts (sub-transfer agent fees) paid to NGAM Distribution are subject to a current per-account equivalent fee limit approved by the Fund’s Board, which is based on fees for similar services paid to the Fund’s transfer agent and other service providers.
For the year ended September 30, 2012, the sub-transfer agent fees (which are reflected in transfer agent fees and expenses in the Statement of Operations) for the Fund were $9,803,740. As of September 30, 2012, the Fund owes NGAM Distribution $124,277 in reimbursement for sub-transfer agent fees.
e. Commissions. Commissions (including CDSCs) on Fund shares retained by NGAM Distribution during the year ended September 30, 2012 amounted to $4,914,453.
f. Trustees Fees and Expenses. The Trust does not pay any compensation directly to its officers or Trustees who are directors, officers or employees of NGAM Advisors, NGAM Distribution, Natixis US or their affiliates. Effective January 1, 2012, the Chairperson of the Board receives a retainer fee at the annual rate of $265,000. The Chairperson does not receive any meeting attendance fees for Board of Trustees meetings or committee meetings that she attends. Each Independent Trustee (other than the Chairperson) receives, in the aggregate, a retainer fee at the annual rate of $95,000. Each Independent Trustee also receives a meeting attendance fee of $10,000 for each meeting of the Board of Trustees that he or she attends in person and $5,000 for each meeting of the Board of Trustees that he or she attends telephonically. In addition, each committee chairman receives an additional retainer fee at an annual rate of $15,000. Each Contract Review and Governance Committee member is compensated $6,000 for each Committee meeting that he or she attends in person and $3,000 for each meeting that he or she attends telephonically. Each Audit Committee member is compensated $7,500 for each Committee meeting that he or she attends in person and $3,750 for each meeting that he or she attends telephonically. These fees are allocated among the funds in the Natixis Funds Trusts, Loomis Sayles Funds Trusts and Hansberger International Series based on a formula that takes into account, among other factors, the relative net assets of each fund. Trustees are reimbursed for travel expenses in connection with attendance at meetings.
| 54
Table of Contents
Notes to Financial Statements (continued)
September 30, 2012
Prior to January 1, 2012, the Chairperson of the Board received a retainer fee at the annual rate of $250,000 and each Independent Trustee (other than the Chairperson) received, in aggregate, a retainer fee at the annual rate of $80,000. All other Trustee fees remain unchanged.
A deferred compensation plan (the “Plan”) is available to the Trustees on a voluntary basis. Deferred amounts remain in the Fund until distributed in accordance with the provisions of the Plan. The value of a participating Trustee’s deferral account is based on theoretical investments of deferred amounts, on the normal payment dates, in certain funds of the Natixis Funds Trusts, Loomis Sayles Funds Trusts and Hansberger International Series as designated by the participating Trustees. Changes in the value of participants’ deferral accounts are allocated pro rata among the funds in the Natixis Funds Trusts, Loomis Sayles Funds Trusts, and Hansberger International Series, and are normally reflected as Trustees’ fees and expenses in the Statement of Operations. The portions of the accrued obligations allocated to the Fund under the Plan are reflected as Deferred Trustees’ fees in the Statement of Assets and Liabilities.
6. Line of Credit. The Fund, together with certain other funds of Natixis Funds Trusts, Loomis Sayles Funds Trusts and Hansberger International Series, participates in a $200,000,000 committed unsecured line of credit provided by State Street Bank, with an individual limit of $125,000,000 for each fund that participates in the line of credit. Interest is charged to each participating fund based on its borrowings at a rate per annum equal to the greater of the Federal Funds rate or overnight LIBOR, plus 1.25%. In addition, a commitment fee of 0.10% per annum, payable at the end of each calendar quarter, is accrued and apportioned among the participating funds based on their average daily unused portion of the line of credit. Prior to April 19, 2012, the commitment fee was 0.125% per annum.
For the year ended September 30, 2012, the Fund had no borrowings under these agreements.
7. Concentration of Risk. The Fund’s investments in foreign securities are subject to foreign currency fluctuations, higher volatility than U.S. securities, varying degrees of regulation and limited liquidity. Greater political, economic, credit and information risks are also associated with foreign securities.
55 |
Table of Contents
Notes to Financial Statements (continued)
September 30, 2012
8. Capital Shares. The Fund may issue an unlimited number of shares of beneficial interest, without par value. Transactions in capital shares were as follows:
| |
Year Ended September 30, 2012 |
|
|
Year Ended September 30, 2011 |
| |||||||||||
| Shares | Amount | Shares | Amount | |||||||||||||
| Class A | ||||||||||||||||
| Issued from the sale of shares |
89,649,016 | $ | 1,329,714,799 | 100,728,799 | $ | 1,519,559,694 | ||||||||||
| Issued in connection with the reinvestment of distributions |
17,112,282 | 251,237,402 | 16,985,705 | 254,980,186 | ||||||||||||
| Redeemed |
(140,160,164 | ) | (2,089,858,590 | ) | (139,402,301 | ) | (2,096,241,991 | ) | ||||||||
|
|
|
|
|
|
|
|
|
|||||||||
| Net change |
(33,398,866 | ) | $ | (508,906,389 | ) | (21,687,797 | ) | $ | (321,702,111 | ) | ||||||
|
|
|
|
|
|
|
|
|
|||||||||
| Class B | ||||||||||||||||
| Issued from the sale of shares |
142,281 | $ | 2,116,364 | 192,090 | $ | 2,919,791 | ||||||||||
| Issued in connection with the reinvestment of distributions |
185,322 | 2,735,333 | 201,211 | 3,037,937 | ||||||||||||
| Redeemed |
(2,023,077 | ) | (30,224,174 | ) | (2,173,334 | ) | (32,992,197 | ) | ||||||||
|
|
|
|
|
|
|
|
|
|||||||||
| Net change |
(1,695,474 | ) | $ | (25,372,477 | ) | (1,780,033 | ) | $ | (27,034,469 | ) | ||||||
|
|
|
|
|
|
|
|
|
|||||||||
| Class C | ||||||||||||||||
| Issued from the sale of shares |
46,818,995 | $ | 698,131,858 | 43,771,397 | $ | 662,887,999 | ||||||||||
| Issued in connection with the reinvestment of distributions |
8,706,591 | 128,555,991 | 7,721,378 | 116,516,115 | ||||||||||||
| Redeemed |
(52,957,737 | ) | (789,494,609 | ) | (73,499,317 | ) | (1,110,786,820 | ) | ||||||||
|
|
|
|
|
|
|
|
|
|||||||||
| Net change |
2,567,849 | $ | 37,193,240 | (22,006,542 | ) | $ | (331,382,706 | ) | ||||||||
|
|
|
|
|
|
|
|
|
|||||||||
| Class Y | ||||||||||||||||
| Issued from the sale of shares |
152,377,472 | $ | 2,276,301,803 | 98,118,850 | $ | 1,481,121,222 | ||||||||||
| Issued in connection with the reinvestment of distributions |
7,426,725 | 109,413,688 | 4,346,254 | 65,258,226 | ||||||||||||
| Redeemed |
(73,738,087 | ) | (1,089,758,132 | ) | (76,525,358 | ) | (1,145,382,580 | ) | ||||||||
|
|
|
|
|
|
|
|
|
|||||||||
| Net change |
86,066,110 | $ | 1,295,957,359 | 25,939,746 | $ | 400,996,868 | ||||||||||
|
|
|
|
|
|
|
|
|
|||||||||
| Admin Class | ||||||||||||||||
| Issued from the sale of shares |
1,594,030 | $ | 23,654,032 | 1,568,042 | $ | 23,628,559 | ||||||||||
| Issued in connection with the reinvestment of distributions |
108,806 | 1,599,070 | 41,605 | 625,462 | ||||||||||||
| Redeemed |
(253,748 | ) | (3,746,107 | ) | (115,648 | ) | (1,745,037 | ) | ||||||||
|
|
|
|
|
|
|
|
|
|||||||||
| Net change |
1,449,088 | $ | 21,506,995 | 1,493,999 | $ | 22,508,984 | ||||||||||
|
|
|
|
|
|
|
|
|
|||||||||
| Increase (decrease) from capital share transactions |
54,988,707 | $ | 820,378,728 | (18,040,627 | ) | $ | (256,613,434 | ) | ||||||||
|
|
|
|
|
|
|
|
|
|||||||||
| 56
Table of Contents
Report of Independent Registered Public Accounting Firm
To the Trustees of Loomis Sayles Funds II and Shareholders of Loomis Sayles Strategic Income Fund:
In our opinion, the accompanying statement of assets and liabilities, including the portfolio of investments, and the related statements of operations and of changes in net assets and the financial highlights present fairly, in all material respects, the financial position of the Loomis Sayles Strategic Income Fund, a series of Loomis Sayles Funds II (the “Fund”), at September 30, 2012, and the results of its operations, the changes in its net assets and the financial highlights for each of the periods indicated, in conformity with accounting principles generally accepted in the United States of America. These financial statements and financial highlights (hereafter referred to as “financial statements”) are the responsibility of the Fund’s management; our responsibility is to express an opinion on these financial statements based on our audits. We conducted our audits of these financial statements in accordance with the standards of the Public Company Accounting Oversight Board (United States). Those standards require that we plan and perform the audits to obtain reasonable assurance about whether the financial statements are free of material misstatement. An audit includes examining, on a test basis, evidence supporting the amounts and disclosures in the financial statements, assessing the accounting principles used and significant estimates made by management, and evaluating the overall financial statement presentation. We believe that our audits, which included confirmation of securities at September 30, 2012 by correspondence with the custodian and brokers, provide a reasonable basis for our opinion.
PricewaterhouseCoopers LLP
Boston, Massachusetts
November 20, 2012
57 |
Table of Contents
2012 U.S. Tax Distribution Information to Shareholders (Unaudited)
Corporate Dividends Received Deduction. For the fiscal year ended September 30, 2012, 7.37% of dividends distributed by Strategic Income Fund qualify for the dividends received deduction for corporate shareholders.
Qualified Dividend Income. For the fiscal year ended September 30, 2012, the Strategic Income Fund will designate up to the maximum amount allowable pursuant to the Internal Revenue Code as qualified dividend income eligible for reduced tax rates. These lower rates range from 0% to 15% depending on an individual’s tax bracket. If the Fund pays a distribution during calendar year 2012, complete information will be reported in conjunction with Form 1099-DIV.
| 58
Table of Contents
Trustee and Officer Information
The tables below provide certain information regarding the trustees and officers of Loomis Sayles Funds II (the “Trust”). Unless otherwise indicated, the address of all persons below is 399 Boylston Street, Boston, MA 02116. The Fund’s Statement of Additional Information includes additional information about the trustees of the Trust and is available by calling Natixis Funds at 800-225-5478.
| Name and Year of |
Position(s) Held with the Trust, Length of Time Served and Term of Office1 |
Principal Occupation(s) During Past 5 Years |
Number of Portfolios in Fund Complex Overseen2 and Other Directorships Held During Past 5 Years |
Experience, Qualifications, Attributes, Skills for Board Membership | ||||
| INDEPENDENT TRUSTEES | ||||||||
| Graham T. Allison, Jr. (1940) | Trustee Since 2003 Contract Review and Governance Committee Member |
Douglas Dillon Professor and Director of the Belfer Center for Science and International Affairs, John F. Kennedy School of Government, Harvard University | 44 Director, Taubman Centers, Inc. (real estate investment trust) |
Significant experience on the Board of Trustees of the Trust and on the board of other business organizations (including a real estate investment trust); government experience (including as Assistant Secretary of Defense under President Clinton); academic experience | ||||
| Charles D. Baker (1956) | Trustee From 2005 to 2009 and Since 2011 Contract Review and Governance Committee Member |
Executive in Residence at General Catalyst Partners (venture capital and growth equity firm); formerly, President and Chief Executive Officer, Harvard Pilgrim Health Care (health care organization) | 44 None |
Significant experience on the Board of Trustees of the Trust; executive experience (including president and chief executive officer of a health care organization and executive officer of a venture capital and growth equity firm) | ||||
59 |
Table of Contents
Trustee and Officer Information
| Name and Year of |
Position(s) Held with the Trust, Length of Time Served and Term of Office1 |
Principal Occupation(s) During Past 5 Years |
Number of Portfolios in Fund Complex Overseen2 and Other Directorships Held During Past 5 Years |
Experience, Qualifications, Attributes, Skills for Board Membership | ||||
| INDEPENDENT TRUSTEES continued |
||||||||
| Daniel M. Cain (1945) |
Trustee Since 2003 Chairman of the Contract Review and Governance Committee |
Chairman (formerly, President and Chief Executive Officer) of Cain Brothers & Company, Incorporated (investment banking) | 44 Director, Sheridan Healthcare Inc. (physician practice management) |
Significant experience on the Board of Trustees of the Trust and on the board of other business organizations (including at a health care organization); experience in the financial industry (including roles as chairman and former chief executive officer of an investment banking firm) | ||||
| Kenneth A. Drucker (1945) |
Trustee Since 2008 Chairman of the Audit Committee |
Retired | 44 Formerly, Director, M Fund, Inc. (investment company); Director, Gateway Trust (investment company) |
Significant experience on the Board of Trustees of the Trust and on the board of other business organizations (including at investment companies); executive experience (including as treasurer of an aerospace, automotive, and metal manufacturing corporation) | ||||
| 60
Table of Contents
Trustee and Officer Information
| Name and Year of |
Position(s) Held with the Trust, Length of Time Served and Term of Office1 |
Principal Occupation(s) During Past 5 Years |
Number of Portfolios in Fund Complex Overseen2 and Other Directorships Held During Past 5 Years |
Experience, Qualifications, Attributes, Skills for Board Membership | ||||
| INDEPENDENT TRUSTEES continued |
||||||||
| Wendell J. Knox (1948) |
Trustee Since 2009 Audit Committee Member |
Director (formerly, President and Chief Executive Officer) of Abt Associates Inc. (research and consulting) | 44 Director, Eastern Bank (commercial bank); Director, The Hanover Insurance Group (property and casualty insurance) |
Significant experience on the Board of Trustees of the Trust and on the board of other business organizations (including at a commercial bank and at a property and casualty insurance firm); executive experience (including roles as president and chief executive officer of a consulting company) | ||||
| Martin T. Meehan3 (1956) | Trustee Since 2012 Contract Review and Governance Committee Member |
Chancellor and faculty member, University of Massachusetts Lowell | 44 Director, Lowell Cooperative Bank (commercial bank); Director, Lowell General Hospital (healthcare); formerly, Director, Qteros, Inc. (biofuels); formerly, Trustee, Suffolk University (education); formerly, Director, D’Youville Foundation (senior care) |
Experience as Chancellor of the University of Massachusetts Lowell; experience on the board of other business organizations; government experience (including as a member of the U.S. House of Representatives); academic experience | ||||
61 |
Table of Contents
Trustee and Officer Information
| Name and Year of |
Position(s) Held with the Trust, Length of Time Served and Term of Office1 |
Principal Occupation(s) During Past 5 Years |
Number of Portfolios in Fund Complex Overseen2 and Other Directorships Held During Past 5 Years |
Experience, Qualifications, Attributes, Skills for Board Membership | ||||
| INDEPENDENT TRUSTEES continued |
||||||||
| Sandra O. Moose (1942) |
Chairperson of the Board of Trustees Since November 2005 Trustee Since 2003 Ex officio member of the Audit Committee and Contract Review and Governance Committee |
President, Strategic Advisory Services (management consulting) | 44 Director, Verizon Communications; Director, AES Corporation (international power company); formerly, Director, Rohm and Haas Company (specialty chemicals) |
Significant experience on the Board of Trustees of the Trust and on the board of other business organizations (including at an international power company and a specialty chemicals corporation); executive experience (including at a management consulting company) | ||||
| Erik R. Sirri (1958) |
Trustee Since 2009 Contract Review and Governance Committee Member |
Professor of Finance at Babson College; formerly, Director of the Division of Trading and Markets at the Securities and Exchange Commission | 44 None |
Experience on the Board of Trustees of the Trust; experience as Director of the Division of Trading and Markets at the Securities and Exchange Commission; academic experience; training as an economist | ||||
| 62
Table of Contents
Trustee and Officer Information
| Name and Year of |
Position(s) Held with the Trust, Length of Time Served and Term of Office1 |
Principal Occupation(s) During Past 5 Years |
Number of Portfolios in Fund Complex Overseen2 and Other Directorships Held During Past 5 Years |
Experience, Qualifications, Attributes, Skills for Board Membership | ||||
| INDEPENDENT TRUSTEES continued |
||||||||
| Peter J. Smail (1952) |
Trustee Since 2009 Contract Review and Governance Committee Member |
Retired; formerly, President and Chief Executive Officer of Pyramis Global Advisors (investment management) | 44 None |
Experience on the Board of Trustees of the Trust; mutual fund industry and executive experience (including roles as president and chief executive officer for an investment adviser) | ||||
| Cynthia L. Walker (1956) |
Trustee Since 2005 Audit Committee Member |
Deputy Dean for Finance and Administration, Yale University School of Medicine; formerly, Executive Dean for Administration, Harvard Medical School | 44 None |
Significant experience on the Board of Trustees of the Trust; executive experience in a variety of academic organizations (including roles as dean for finance and administration) | ||||
| INTERESTED TRUSTEES | ||||||||
| Robert J. Blanding4 (1947) 555 California Street San Francisco, CA 94104 |
Trustee and Chief Executive Officer since 2002 |
President, Chairman, Director and Chief Executive Officer, Loomis, Sayles & Company, L.P. | 44 None |
Significant experience on the Board of Trustees of the Trust; continuing service as President, Chairman, and Chief Executive Officer of Loomis, Sayles & Company, L.P. | ||||
63 |
Table of Contents
Trustee and Officer Information
| Name and Year of |
Position(s) Held with the Trust, Length of Time Served and Term of Office1 |
Principal Occupation(s) During Past 5 Years |
Number of Portfolios in Fund Complex Overseen2 and Other Directorships Held During Past 5 Years |
Experience, Qualifications, Attributes, Skills for Board Membership | ||||
| INTERESTED TRUSTEES continued |
||||||||
| David L. Giunta5 (1965) | Trustee Since 2011 President Since 2008 |
President and Chief Executive Officer, NGAM Distribution Corporation, NGAM Advisors, L.P. and NGAM Distribution, L.P.; formerly President, Fidelity Charitable Gift Fund; and formerly, Senior Vice President, Fidelity Brokerage Company | 44 None |
Experience on the Board of Trustees of the Trust; continuing experience as President and Chief Executive Officer of NGAM Advisors, L.P. | ||||
| John T. Hailer6 (1960) |
Trustee Since 2003 |
President and Chief Executive Officer-U.S. and Asia, Natixis Global Asset Management, L.P.; formerly, President and Chief Executive Officer, NGAM Distribution Corporation, NGAM Advisors L.P. and NGAM Distribution, L.P. | 44 None |
Significant experience on the Board of Trustees of the Trust; continuing experience as Chief Executive Officer-U.S. and Asia, Natixis Global Asset Management, L.P. | ||||
| 1 | Each trustee serves until retirement, resignation or removal from the Board of Trustees of the Trust. The current retirement age is 72. The position of Chairperson of the Board is appointed for a two-year term. Ms. Moose was appointed to serve an additional two year term as the Chairperson of the Board on November 18, 2011. |
| 2 | The trustees of the Trust serve as trustees of a fund complex that includes all series of the Natixis Funds Trust I, Natixis Funds Trust II, Natixis Funds Trust IV and Gateway Trust (collectively, the “Natixis Funds Trusts”), Loomis Sayles Funds I and Loomis Sayles Funds II (collectively, the “Loomis Sayles Funds Trusts”), and Hansberger International Series (collectively, the “Fund Complex”). |
| 3 | Mr. Meehan was appointed as a trustee effective July 1, 2012. |
| 4 | Mr. Blanding is deemed an “interested person” of the Trust because he holds the following positions with an affiliated person of the Trust: President, Chairman, Director and Chief Executive Officer of Loomis, Sayles & Company, L.P. |
| 64
Table of Contents
Trustee and Officer Information
| 5 | Mr. Giunta is deemed an “interested person” of the Trust because he holds the following positions with an affiliated person of the Trust: President and Chief Executive Officer of NGAM Distribution Corporation, NGAM Advisors, L.P. and NGAM Distribution, L.P. |
| 6 | Mr. Hailer is deemed an “interested person” of the Trust because he holds the following positions with an affiliated person of the Trust: President and Chief Executive Officer – U.S. and Asia, Natixis Global Asset Management, L.P. |
65 |
Table of Contents
Trustee and Officer Information
| Name and Year of Birth |
Position(s) Held with the |
Term of
Office1 and |
Principal Occupation(s) | |||
| OFFICERS OF THE TRUST | ||||||
| Coleen Downs Dinneen (1960) |
Secretary, Clerk and Chief Legal Officer | Since September 2004 | Executive Vice President, General Counsel, Secretary and Clerk (formerly, Senior Vice President, Deputy General Counsel, Assistant Secretary and Assistant Clerk), NGAM Distribution Corporation, NGAM Advisors, L.P. and NGAM Distribution, L.P. | |||
| Daniel J. Fuss (1933) One Financial Center Boston, MA 02111 |
Executive Vice President | Since June 2003 | Vice Chairman and Director, Loomis, Sayles & Company, L.P. | |||
| Russell L. Kane (1969) |
Chief Compliance Officer, Assistant Secretary and Anti-Money Laundering Officer |
Chief Compliance Officer, since May 2006; Assistant Secretary since June 2004; and Anti-Money Laundering Officer since April 2007 | Chief Compliance Officer for Mutual Funds, Senior Vice President, Deputy General Counsel, Assistant Secretary and Assistant Clerk, NGAM Distribution Corporation, NGAM Advisors, L.P. and NGAM Distribution, L.P. | |||
| Michael C. Kardok (1959) |
Treasurer, Principal Financial and Accounting Officer | Since October 2004 | Senior Vice President, NGAM Advisors, L.P. and NGAM Distribution, L.P. | |||
| 1 | Each officer of the Trust serves for an indefinite term in accordance with the Trust’s current by-laws until the date his or her successor is elected and qualified, or until he or she sooner dies, retires, is removed or becomes disqualified. |
| 2 | Each person listed above, except as noted, holds the same position(s) with the Fund Complex. Mr. Fuss is not an officer of the Natixis Funds Trusts or the Hansberger International Series. Previous positions during the past five years with NGAM Distribution, L.P., NGAM Advisors, L.P. or Loomis, Sayles & Company, L.P. are omitted, if not materially different from a trustee’s or officer’s current position with such entity. |
| 66
Table of Contents
| Item 2. | Code of Ethics. |
The Registrant has adopted a code of ethics that applies to the Registrant’s principal executive officer, principal financial officer and persons performing similar functions. There have been no amendments or waivers of the Registrant’s code of ethics during the period.
| Item 3. | Audit Committee Financial Expert. |
The Board of Trustees of the Registrant has established an audit committee. Ms. Cynthia L. Walker, Mr. Wendell J. Knox and Mr. Kenneth A. Drucker are members of the audit committee and have been designated as “audit committee financial experts” by the Board of Trustees. Each of these individuals is also an Independent Trustee of the Registrant.
| Item 4. | Principal Accountant Fees and Services. |
Fees billed by the Principal Accountant for services rendered to the Registrant.
The table below sets forth fees billed by the principal accountant, PricewaterhouseCoopers LLP, for the past two fiscal years for professional services rendered in connection with a) the audit of the Registrant’s annual financial statements and services provided in connection with regulatory filings; b) audit-related services (including services that are reasonably related to the performance of the audit of the Registrant’s financial statements and but not reported under “Audit Fees”); c) tax compliance, tax advice and tax planning and d) all other fees billed for professional services rendered by the principal accountant to the Registrant, other than the services reported as a part of (a) through (c) of this Item.
| Audit fees | Audit-related fees1 | Tax fees2 | All other fees3 | |||||||||||||||||||||||||||||
| 10/1/10- 9/30/11 |
10/1/11- 9/30/12 |
10/1/10- 9/30/11 |
10/1/11- 9/30/12 |
10/1/10- 9/30/11 |
10/1/11- 9/30/12 |
10/1/10- 9/30/11 |
10/1/11- 9/30/12 |
|||||||||||||||||||||||||
| Loomis Sayles Funds II |
$ | 378,470 | $ | 384,464 | $ | 13,432 | $ | 4,846 | $ | 97,230 | $ | 83,360 | $ | 30,422 | $ | 18,578 | ||||||||||||||||
| 1. | Audit-related fees consist of: |
2011 & 2012 – performance of agreed-upon procedures related to the Registrant’s deferred compensation plan and consulting services with respect to regulatory matters.
| 2. | Tax fees consist of: |
2011 & 2012 – review of Registrant’s tax returns, consulting services with respect to complex security types, consulting services related to Form 1099 penalties and review of liquidating fund distributions.
| 3. | All other fees consist of: |
2011 & 2012 – filing and translation services with respect to Japanese shareholders in Loomis Sayles Investment Grade Bond Fund.
Aggregate fees billed to the Registrant for non-audit services during 2011 and 2012 were $141,084 and $106,784, respectively.
Fees billed by the Principal Accountant for services rendered to the Adviser and Control Affiliates.
The following table sets forth the fees billed by the Registrant’s principal accountant for non-audit services rendered to Loomis, Sayles & Company, L.P. and entities controlling, controlled by or under common control with Loomis, Sayles & Company, L.P. Registrant (“Control Affiliates”) that provide ongoing services to the Registrant, for engagements that related directly to the operations and financial reporting of the Registrant for the last two fiscal years.
| Audit-related fees | Tax fees | All other fees | ||||||||||||||||||||||
| 10/1/10- 9/30/11 |
10/1/11- 9/30/12 |
10/1/10- 9/30/11 |
10/1/11- 9/30/12 |
10/1/10- 9/30/11 |
10/1/11- 9/30/12 |
|||||||||||||||||||
| Control Affiliates |
$ | — | $ | — | $ | — | $ | 6,838 | $ | — | $ | — | ||||||||||||
Table of Contents
The following table sets forth the aggregate fees billed by the Registrant’s principal accountant for non-audit services rendered to Loomis, Sayles & Company, L.P. and Control Affiliates that provide ongoing services to the Registrant, for the last two fiscal years, including the fees disclosed in the table above.
| Aggregate Non-Audit Fees | ||||||||
| 10/1/10-9/30/11 | 10/1/11-9/30/12 | |||||||
| Control Affiliates |
$ | 56,589 | $ | 87,658 | ||||
None of the services described above were approved pursuant to (c)(7)(i)(C) of Regulation S-X.
Audit Committee Pre Approval Policies.
Annually, the Registrant’s Audit Committee reviews the audit, audit-related, tax and other non-audit services together with the projected fees, for services proposed to be rendered to the Trust and/or other entities for which pre-approval is required during the upcoming year. Any subsequent revisions to already pre-approved services or fees (including fee increases) and requests for pre-approval of new services would be presented for consideration quarterly as needed.
If, in the opinion of management, a proposed engagement by the Registrant’s independent accountants needs to commence before the next regularly scheduled Audit Committee meeting, any member of the Audit Committee who is an independent Board member is authorized to pre-approve the engagement, but only for engagements to provide audit, audit related and tax services. This approval is subject to review of the full Audit Committee at its next quarterly meeting. All other engagements require the approval of all the members of the Audit Committee.
| Item 5. | Audit Committee of Listed Registrants. |
Not applicable.
| Item 6. | Schedule of Investments. |
Included as part of the Report to Shareholders filed as Item 1 herewith.
| Item 7. | Disclosure of Proxy Voting Policies and Procedures for Closed-End Management Investment Companies. |
Not applicable.
| Item 8. | Portfolio Managers of Closed-End Management Investment Companies |
Not applicable.
| Item 9. | Purchases of Equity Securities by Closed-End Management Investment Companies and Affiliated Purchasers. |
Not applicable.
| Item 10. | Submission of Matters to a Vote of Securities Holders. |
There were no material changes to the procedures by which shareholders may recommend nominees to the Registrant’s Board of Trustees.
| Item 11. | Controls and Procedures. |
The Registrant’s principal executive officer and principal financial officer have concluded that the Registrant’s disclosure controls and procedures are sufficient to ensure that information required to be disclosed by the Registrant in this Form N-CSR/A was recorded, processed, summarized and reported within the time periods specified in the Securities and Exchange Commission’s rules and forms, based upon such officers’ evaluation of these controls and procedures as of a date within 90 days of the filing date of the report.
There were no changes in the Registrant’s internal control over financial reporting that occurred during the Registrant’s last fiscal quarter of the period covered by the report that has materially affected, or is reasonably likely to materially affect, the Registrant’s internal control over financial reporting.
Table of Contents
| Item 12. | Exhibits. |
| (a) |
(1 | ) | Code of Ethics required by Item 2 hereof, filed herewith as Exhibit (a)(1). | |||
| (a) |
(2 | ) | Certifications of Principal Executive Officer and Principal Financial Officer pursuant to Rule 30a-2(a) under the Investment Company Act of 1940 (17 CFR 270.30a-2(a)), filed herewith as Exhibits (a)(2)(1) and (a)(2)(2), respectively. | |||
| (a) |
(3 | ) | Not applicable. | |||
| (b) |
Certification of Principal Executive Officer and Principal Financial Officer pursuant to Section 906 of Sarbanes-Oxley Act of 2002 are filed herewith as Exhibit (b). | |||||
Table of Contents
SIGNATURES
Pursuant to the requirements of the Securities Exchange Act of 1934 and the Investment Company Act of 1940, the Registrant has duly caused this report to be signed on its behalf by the undersigned, thereunto duly authorized.
| Loomis Sayles Funds II | ||
| By: | /s/ Robert J. Blanding | |
| Name: | Robert J. Blanding | |
| Title: | Chief Executive Officer | |
| Date: | March 4, 2013 | |
Pursuant to the requirements of the Securities Exchange Act of 1934 and the Investment Company Act of 1940, this report has been signed by the following persons on behalf of the Registrant and in the capacities and on the dates indicated.
| By: | /s/ Robert J. Blanding | |
| Name: | Robert J. Blanding | |
| Title: | Chief Executive Officer | |
| Date: | March 4, 2013 |
| By: | /s/ Michael C. Kardok | |
| Name: | Michael C. Kardok | |
| Title: | Treasurer | |
| Date: | March 4, 2013 |