
|
|
Class A
|
Class C
|
Class N
|
Class T*
|
Class Y
|
|
Loomis Sayles Core Plus Bond Fund
|
NEFRX
|
NECRX
|
NERNX
|
LCPTX
|
NERYX
|
|
Loomis Sayles Global Allocation Fund
|
LGMAX
|
LGMCX
|
LGMNX
|
LGMTX
|
LSWWX
|
|
Loomis Sayles Growth Fund
|
LGRRX
|
LGRCX
|
LGRNX
|
LGRTX
|
LSGRX
|
|
Loomis Sayles Intermediate Duration Bond Fund
|
LSDRX
|
LSCDX
|
LSDNX
|
LSDTX
|
LSDIX
|
|
Loomis Sayles Limited Term Government and Agency Fund
|
NEFLX
|
NECLX
|
LGANX
|
LGATX
|
NELYX
|
| * | Class T shares of the Funds are not currently available for purchase. |
|
(fees paid directly from your investment)
|
Class A
|
Class C
|
Class N
|
Class T
|
Class Y
|
|
Maximum sales charge (load) imposed on purchases (as a percentage of offering price)
|
4.25%
|
None
|
None
|
2.50%
|
None
|
|
Maximum deferred sales charge (load) (as a percentage of original purchase price or redemption proceeds, as applicable)
|
None*
|
1.00%
|
None
|
None
|
None
|
|
Redemption fees
|
None
|
None
|
None
|
None
|
None
|
| * | A 1.00% contingent deferred sales charge (“CDSC”) may apply to certain purchases of Class A shares of $1,000,000 or more that are redeemed within eighteen months of the date of purchase. |
|
(expenses that you pay each year as a percentage of the value of your investment)
|
Class A
|
Class C
|
Class N
|
Class T
|
Class Y
|
|
Management fees
|
0.32%
|
0.32%
|
0.32%
|
0.32%
|
0.32%
|
|
Distribution and/or service (12b-1) fees
|
0.25%
|
1.00%
|
0.00%
|
0.25%
|
0.00%
|
|
Other expenses
|
0.18%
|
0.18%
|
0.08%
|
0.18%1
|
0.18%
|
|
Total annual fund operating expenses
|
0.75%
|
1.50%
|
0.40%
|
0.75%
|
0.50%
|
|
Fee waiver and/or expense reimbursement2
|
0.01%
|
0.01%
|
0.00%
|
0.01%
|
0.01%
|
|
Total annual fund operating expenses after fee waiver and/or expense reimbursement
|
0.74%
|
1.49%
|
0.40%
|
0.74%
|
0.49%
|
| 1 | Other expenses for Class T shares are estimated for the current fiscal year. |
| 2 | Loomis, Sayles & Company, L.P. (“Loomis Sayles” or the “Adviser”) and Natixis Advisors, LLC (“Natixis Advisors”), the Fund’s advisory administrator, have given a binding contractual undertaking to the Fund to limit the amount of the Fund’s total annual fund operating expenses to 0.74%, 1.49%, 0.44%, 0.74% and 0.49% of the Fund’s average daily net assets for Class A, C, N, T and Y shares, respectively, exclusive of acquired fund fees and expenses, brokerage expenses, interest expense, taxes, and organizational and extraordinary expenses, such as litigation and indemnification expenses. This undertaking is in effect through January 31, 2025 and may be terminated before then only with the consent of the Fund’s Board of Trustees. The Adviser will be permitted to recover, on a class-by-class basis, management fees waived and/or expenses reimbursed to the extent that expenses in later periods fall below both (1) the class’ applicable expense limitation at the time such amounts were waived/reimbursed and (2) the class’ current applicable expense limitation. The Fund will not be obligated to repay any such waived/reimbursed fees and expenses more than one year after the end of the fiscal year in which the fees or expenses were waived/reimbursed. |
|
If shares are redeemed:
|
1 year
|
3 years
|
5 years
|
10 years
|
||||
|
Class A
|
$
|
497
|
$
|
654
|
$
|
823
|
$
|
1,315
|
|
Class C
|
$
|
252
|
$
|
473
|
$
|
818
|
$
|
1,587
|
|
If shares are redeemed:
|
1 year
|
3 years
|
5 years
|
10 years
|
||||
|
Class N
|
$
|
41
|
$
|
128
|
$
|
224
|
$
|
505
|
|
Class T
|
$
|
324
|
$
|
483
|
$
|
656
|
$
|
1,156
|
|
Class Y
|
$
|
50
|
$
|
159
|
$
|
279
|
$
|
627
|
|
If shares are not redeemed:
|
1 year
|
3 years
|
5 years
|
10 years
|
||||
|
Class C
|
$
|
152
|
$
|
473
|
$
|
818
|
$
|
1,587
|
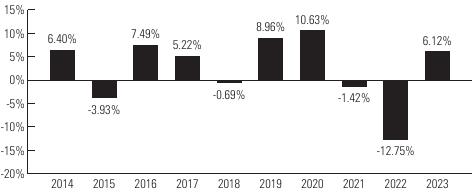 |
Highest Quarterly Return:
Fourth Quarter 2023, 7.28% Lowest Quarterly Return: Second Quarter 2022, -5.97% |
|
Average Annual Total Returns
|
|
|
|
|
(for the periods ended December 31, 2023)
|
Past 1 Year
|
Past 5 Years
|
Past 10 Years
|
|
Class Y - Return Before Taxes
|
6.12%
|
1.93%
|
2.36%
|
|
Return After Taxes on Distributions
|
4.46%
|
0.57%
|
0.99%
|
|
Return After Taxes on Distributions and Sale of Fund Shares
|
3.58%
|
0.93%
|
1.22%
|
|
Class A - Return Before Taxes
|
1.44%
|
0.81%
|
1.67%
|
|
Class C - Return Before Taxes
|
4.09%
|
0.92%
|
1.50%
|
|
Class N - Return Before Taxes
|
6.21%
|
2.02%
|
2.45%
|
|
Class T - Return Before Taxes
|
3.27%
|
1.17%
|
1.86%
|
|
Bloomberg U.S. Aggregate Bond Index
|
5.53%
|
1.10%
|
1.81%
|
|
Type of Account
|
Minimum Initial Purchase
|
|
|
Any account other than those listed below
|
$
|
2,500
|
|
For shareholders participating in Natixis Funds’ Automatic Investment Plan
|
$
|
1,000
|
|
For Traditional IRA, Roth IRA, Rollover IRA, SEP-IRA and Keogh plans
|
$
|
1,000
|
|
•
|
Fee Based Programs (such as wrap accounts) where an advisory fee is paid to the broker-dealer or other financial intermediary. Please consult your financial representative to determine if your fee based program is subject to additional or different conditions or fees.
|
|
•
|
Certain Retirement Plans. Please consult your retirement plan administrator to determine if your retirement plan is subject to additional or different conditions or fees imposed by the plan administrator.
|
|
•
|
Clients of a Registered Investment Adviser where the Registered Investment Adviser receives an advisory, management or consulting fee.
|
|
•
|
Certain Retirement Plans. Please consult your retirement plan administrator to determine if your retirement plan is subject to additional or different conditions or fees imposed by the plan administrator.
|
|
•
|
Sub-accounts held within an omnibus account, where the omnibus account has at least $1,000,000.
|
|
•
|
Funds of funds that are distributed by the Distributor.
|
|
•
|
Fee Based Programs (such as wrap accounts) where an advisory fee is paid to the broker-dealer or other financial intermediary. Please consult your financial representative to determine if your fee based program is subject to additional or different conditions or fees.
|
|
•
|
Certain Retirement Plans. Please consult your retirement plan administrator to determine if your retirement plan is subject to additional or different conditions or fees imposed by the plan administrator.
|
|
•
|
Certain Individual Retirement Accounts if the amounts invested represent rollover distributions from investments by any of the retirement plans invested in the Fund.
|
|
•
|
Clients of a Registered Investment Adviser where the Registered Investment Adviser receives an advisory, management or consulting fee.
|
|
•
|
Fund Trustees, former Fund trustees, employees of affiliates of the Natixis Funds and other individuals who are affiliated with any Natixis Fund (this also
|
|
applies to any spouse, parents, children, siblings, grandparents, grandchildren and in-laws of those mentioned) and Natixis affiliate employee benefit plans.
|
|
|
Class A
|
Class C
|
Class N
|
Class T
|
Class Y
|
|
Maximum sales charge (load) imposed on purchases (as a percentage of offering price)
|
|
|
|
|
|
|
Maximum deferred sales charge (load) (as a percentage of original purchase price or redemption proceeds, as applicable)
|
|
|
|
|
|
|
Redemption fees
|
|
|
|
|
|
| * | |
|
|
Class A
|
Class C
|
Class N
|
Class T
|
Class Y
|
|
Management fees
|
|
|
|
|
|
|
Distribution and/or service (12b-1) fees
|
|
|
|
|
|
|
Other expenses
|
|
|
|
|
|
|
Total annual fund operating expenses
|
|
|
|
|
|
|
Fee waiver and/or expense reimbursement2
|
|
|
|
|
|
|
Total annual fund operating expenses after fee waiver and/or expense reimbursement
|
|
|
|
|
|
| 1 |
| 2 | Loomis, Sayles & Company, L.P. (“Loomis Sayles” or the “Adviser”) has given a binding contractual undertaking to the Fund to limit the amount of the Fund’s total annual fund operating expenses to 1.20%, 1.95%, 0.90%, 1.20% and 0.95% of the Fund’s average daily net assets for Class A, C, N, T and Y shares, respectively, exclusive of brokerage expenses, interest expense, taxes, acquired fund fees and expenses, organizational and extraordinary expenses, such as litigation and indemnification expenses. This undertaking is in effect through |
|
|
1 year
|
3 years
|
5 years
|
10 years
|
||||
|
Class A
|
$
|
|
$
|
|
$
|
|
$
|
|
|
Class C
|
$
|
|
$
|
|
$
|
|
$
|
|
|
Class N
|
$
|
|
$
|
|
$
|
|
$
|
|
|
Class T
|
$
|
|
$
|
|
$
|
|
$
|
|
|
If shares are redeemed:
|
1 year
|
3 years
|
5 years
|
10 years
|
||||
|
Class Y
|
$
|
|
$
|
|
$
|
|
$
|
|
|
|
1 year
|
3 years
|
5 years
|
10 years
|
||||
|
Class C
|
$
|
|
$
|
|
$
|
|
$
|
|
 |
|
|
|
|
|
|
|
|
|
Past 1 Year
|
Past 5 Years
|
Past 10 Years
|
Life of Class N
(2/1/17) |
|
Class Y - Return Before Taxes
|
|
|
|
-
|
|
Return After Taxes on Distributions
|
|
|
|
-
|
|
Return After Taxes on Distributions and Sale of Fund Shares
|
|
|
|
-
|
|
Class A - Return Before Taxes
|
|
|
|
-
|
|
Class C - Return Before Taxes
|
|
|
|
-
|
|
Class N - Return Before Taxes
|
|
|
-
|
|
|
Class T - Return Before Taxes
|
|
|
|
-
|
|
MSCI All Country World Index (Net)
|
|
|
|
|
|
Blended Index (60% MSCI All Country World Index (Net) / 40% Bloomberg Global Aggregate Bond Index)
|
|
|
|
|
|
Type of Account
|
Minimum Initial Purchase
|
|
|
Any account other than those listed below
|
$
|
2,500
|
|
For shareholders participating in Natixis Funds’ Automatic Investment Plan
|
$
|
1,000
|
|
For Traditional IRA, Roth IRA, Rollover IRA, SEP-IRA and Keogh plans
|
$
|
1,000
|
|
•
|
Fee Based Programs (such as wrap accounts) where an advisory fee is paid to the broker-dealer or other financial intermediary. Please consult your financial representative to determine if your fee based program is subject to additional or different conditions or fees.
|
|
•
|
Certain Retirement Plans. Please consult your retirement plan administrator to determine if your retirement plan is subject to additional or different conditions or fees imposed by the plan administrator.
|
|
•
|
Clients of a Registered Investment Adviser where the Registered Investment Adviser receives an advisory, management or consulting fee.
|
|
•
|
Certain Retirement Plans. Please consult your retirement plan administrator to determine if your retirement plan is subject to additional or different conditions or fees imposed by the plan administrator.
|
|
•
|
Sub-accounts held within an omnibus account, where the omnibus account has at least $1,000,000.
|
|
•
|
Funds of funds that are distributed by the Distributor.
|
|
•
|
Fee Based Programs (such as wrap accounts) where an advisory fee is paid to the broker-dealer or other financial intermediary. Please consult your financial representative to determine if your fee based program is subject to additional or different conditions or fees.
|
|
•
|
Certain Retirement Plans. Please consult your retirement plan administrator to determine if your retirement plan is subject to additional or different conditions or fees imposed by the plan administrator.
|
|
•
|
Certain Individual Retirement Accounts if the amounts invested represent rollover distributions from investments by any of the retirement plans invested in the Fund.
|
|
•
|
Clients of a Registered Investment Adviser where the Registered Investment Adviser receives an advisory, management or consulting fee.
|
|
•
|
Fund Trustees, former Fund trustees, employees of affiliates of the Natixis Funds and other individuals who are affiliated with any Natixis Fund (this also applies to any spouse, parents, children, siblings, grandparents, grandchildren and in-laws of those mentioned) and Natixis affiliate employee benefit plans.
|
|
|
Class A
|
Class C
|
Class N
|
Class T
|
Class Y
|
|
Maximum sales charge (load) imposed on purchases (as a percentage of offering price)
|
|
|
|
|
|
|
Maximum deferred sales charge (load) (as a percentage of original purchase price or redemption proceeds, as applicable)
|
|
|
|
|
|
|
Redemption fees
|
|
|
|
|
|
| * |
|
|
Class A
|
Class C
|
Class N
|
Class T
|
Class Y
|
|
Management fees
|
|
|
|
|
|
|
Distribution and/or service (12b-1) fees
|
|
|
|
|
|
|
Other expenses
|
|
|
|
|
|
|
Total annual fund operating expenses
|
|
|
|
|
|
|
Fee waiver and/or expense reimbursement2
|
|
|
|
|
|
|
Total annual fund operating expenses after fee waiver and/or expense reimbursement
|
|
|
|
|
|
| 1 |
| 2 | Loomis, Sayles & Company, L.P. (“Loomis Sayles” or the “Adviser”) has given a binding contractual undertaking to the Fund to limit the amount of the Fund’s total annual fund operating expenses to 1.00%, 1.75%, 0.70%, 1.00% and 0.75% of the Fund’s average daily net assets for Class A, C, N, T and Y shares, respectively, exclusive of acquired fund fees and expenses, brokerage expenses, interest expense, taxes, and organizational and extraordinary expenses, such as litigation and indemnification expenses. In addition, Loomis Sayles will waive its management fee on any portion of the Fund’s assets that are invested in the Natixis Loomis Sayles Focused Growth ETF. This undertaking is in effect through |
|
|
1 year
|
3 years
|
5 years
|
10 years
|
||||
|
Class A
|
$
|
|
$
|
|
$
|
|
$
|
|
|
Class C
|
$
|
|
$
|
|
$
|
|
$
|
|
|
Class N
|
$
|
|
$
|
|
$
|
|
$
|
|
|
Class T
|
$
|
|
$
|
|
$
|
|
$
|
|
|
Class Y
|
$
|
|
$
|
|
$
|
|
$
|
|
|
|
1 year
|
3 years
|
5 years
|
10 years
|
||||
|
Class C
|
$
|
|
$
|
|
$
|
|
$
|
|
 |
|
|
|
|
|
|
|
|
Past 1 Year
|
Past 5 Years
|
Past 10 Years
|
|
Class Y - Return Before Taxes
|
|
|
|
|
Return After Taxes on Distributions
|
|
|
|
|
Return After Taxes on Distributions and Sale of Fund Shares
|
|
|
|
|
Class A - Return Before Taxes
|
|
|
|
|
Class C - Return Before Taxes
|
|
|
|
|
Class N - Return Before Taxes
|
|
|
|
|
Class T - Return Before Taxes
|
|
|
|
|
S&P 500® Index1
|
|
|
|
|
Russell 1000® Growth Index
|
|
|
|
| 1 | Effective February 1, 2024, the Fund’s primary broad-based performance index changed to the S&P 500® Index. The S&P 500® Index is a broad-based securities market index that represents the overall market applicable to the Fund. The Fund will retain the Russell 1000 Growth® Index as its additional benchmark for performance comparison. |
|
Type of Account
|
Minimum Initial Purchase
|
|
|
Any account other than those listed below
|
$
|
2,500
|
|
For shareholders participating in Natixis Funds’ Automatic Investment Plan
|
$
|
1,000
|
|
For Traditional IRA, Roth IRA, Rollover IRA, SEP-IRA and Keogh plans
|
$
|
1,000
|
|
•
|
Fee Based Programs (such as wrap accounts) where an advisory fee is paid to the broker-dealer or other financial intermediary. Please consult your financial representative to determine if your fee based program is subject to additional or different conditions or fees.
|
|
•
|
Certain Retirement Plans. Please consult your retirement plan administrator to determine if your retirement plan is subject to additional or different conditions or fees imposed by the plan administrator.
|
|
•
|
Clients of a Registered Investment Adviser where the Registered Investment Adviser receives an advisory, management or consulting fee.
|
|
•
|
Certain Retirement Plans. Please consult your retirement plan administrator to determine if your retirement plan is subject to additional or different conditions or fees imposed by the plan administrator.
|
|
•
|
Sub-accounts held within an omnibus account, where the omnibus account has at least $1,000,000.
|
|
•
|
Funds of funds that are distributed by the Distributor.
|
|
•
|
Fee Based Programs (such as wrap accounts) where an advisory fee is paid to the broker-dealer or other financial intermediary. Please consult your financial representative to determine if your fee based program is subject to additional or different conditions or fees.
|
|
•
|
Certain Retirement Plans. Please consult your retirement plan administrator to determine if your retirement plan is subject to additional or different conditions or fees imposed by the plan administrator.
|
|
•
|
Certain Individual Retirement Accounts if the amounts invested represent rollover distributions from investments by any of the retirement plans invested in the Fund.
|
|
•
|
Clients of a Registered Investment Adviser where the Registered Investment Adviser receives an advisory, management or consulting fee.
|
|
•
|
Fund Trustees, former Fund trustees, employees of affiliates of the Natixis Funds and other individuals who are affiliated with any Natixis Fund (this also applies to any spouse, parents, children, siblings, grandparents, grandchildren and in-laws of those mentioned) and Natixis affiliate employee benefit plans.
|
|
(fees paid directly from your investment)
|
Class A
|
Class C
|
Class N
|
Class T
|
Class Y
|
|
Maximum sales charge (load) imposed on purchases (as a percentage of offering price)
|
4.25%
|
None
|
None
|
2.50%
|
None
|
|
Maximum deferred sales charge (load) (as a percentage of original purchase price or redemption proceeds, as applicable)
|
None*
|
1.00%
|
None
|
None
|
None
|
|
Redemption fees
|
None
|
None
|
None
|
None
|
None
|
| * | A 1.00% contingent deferred sales charge (“CDSC”) may apply to certain purchases of Class A shares of $1,000,000 or more that are redeemed within eighteen months of the date of purchase. |
|
(expenses that you pay each year as a percentage of the value of your investment)
|
Class A
|
Class C
|
Class N
|
Class T
|
Class Y
|
|
Management fees
|
0.25%
|
0.25%
|
0.25%
|
0.25%
|
0.25%
|
|
Distribution and/or service (12b-1) fees
|
0.25%
|
1.00%
|
0.00%
|
0.25%
|
0.00%
|
|
Other expenses
|
0.21%
|
0.21%
|
0.14%
|
0.21%1
|
0.21%
|
|
Total annual fund operating expenses
|
0.71%
|
1.46%
|
0.39%
|
0.71%
|
0.46%
|
|
Fee waiver and/or expense reimbursement2,3
|
0.06%
|
0.06%
|
0.04%
|
0.06%
|
0.06%
|
|
Total annual fund operating expenses after fee waiver and/or expense reimbursement
|
0.65%
|
1.40%
|
0.35%
|
0.65%
|
0.40%
|
| 1 | Other expenses for Class T shares are estimated for the current fiscal year. |
| 2 | Loomis, Sayles & Company, L.P. (“Loomis Sayles” or the “Adviser”) has given a binding contractual undertaking to the Fund to limit the amount of the Fund’s total annual fund operating expenses to 0.65%, 1.40%, 0.35%, 0.65% and 0.40% of the Fund’s average daily net assets for Class A, C, N, T and Y shares, respectively, exclusive of brokerage expenses, interest expense, taxes, acquired fund fees and expenses, organizational and extraordinary expenses, such as litigation and indemnification expenses. This undertaking is in effect through January 31, 2025 and may be terminated before then only with the consent of the Fund’s Board of Trustees. The Adviser will be permitted to recover, on a class-by-class basis, management fees waived and/or expenses reimbursed to the extent that expenses in later periods fall below both (1) the class’ applicable expense limitation at the time such amounts were waived/reimbursed and (2) the class’ current applicable expense limitation. The Fund will not be obligated to repay any such waived/reimbursed fees and expenses more than one year after the end of the fiscal year in which the fees or expenses were waived/reimbursed. |
| 3 | Natixis Advisors, LLC (“Natixis Advisors”) has given a binding contractual undertaking to the Fund to reimburse any and all transfer agency expenses for Class N shares. This undertaking is in effect through January 31, 2025 and may be terminated before then only with the consent of the Fund’s Board of Trustees. |
|
If shares are redeemed:
|
1 year
|
3 years
|
5 years
|
10 years
|
||||
|
Class A
|
$
|
489
|
$
|
637
|
$
|
798
|
$
|
1,265
|
|
Class C
|
$
|
243
|
$
|
456
|
$
|
792
|
$
|
1,537
|
|
Class N
|
$
|
36
|
$
|
121
|
$
|
215
|
$
|
489
|
|
Class T
|
$
|
315
|
$
|
465
|
$
|
629
|
$
|
1,105
|
|
Class Y
|
$
|
41
|
$
|
142
|
$
|
252
|
$
|
573
|
|
If shares are not redeemed:
|
1 year
|
3 years
|
5 years
|
10 years
|
||||
|
Class C
|
$
|
143
|
$
|
456
|
$
|
792
|
$
|
1,537
|
 |
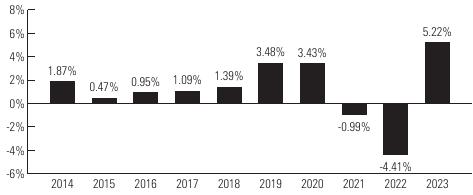
Highest Quarterly Return:
Second Quarter 2020, 5.03% Lowest Quarterly Return: First Quarter 2022, -4.85% |
|
Average Annual Total Returns
|
|
|
|
|
|
(for the periods ended December 31, 2023)
|
Past 1 Year
|
Past 5 Years
|
Past 10 Years
|
Life of Class N
(2/1/19) |
|
Class Y - Return Before Taxes
|
5.75%
|
2.04%
|
2.07%
|
-
|
|
Return After Taxes on Distributions
|
4.13%
|
0.78%
|
0.87%
|
-
|
|
Return After Taxes on Distributions and Sale of Fund Shares
|
3.37%
|
1.05%
|
1.07%
|
-
|
|
Class A - Return Before Taxes
|
0.90%
|
0.90%
|
1.35%
|
-
|
|
Class C - Return Before Taxes
|
3.66%
|
1.03%
|
1.18%
|
-
|
|
Class N - Return Before Taxes
|
5.81%
|
-
|
-
|
1.95%
|
|
Class T - Return Before Taxes
|
2.70%
|
1.25%
|
1.54%
|
-
|
|
Bloomberg U.S. Aggregate Bond Index1
|
5.53%
|
1.10%
|
1.81%
|
0.90%
|
|
Bloomberg U.S. Intermediate Government/Credit Bond Index
|
5.24%
|
1.59%
|
1.72%
|
1.48%
|
| 1 | Effective February 1, 2024, the Fund’s primary broad-based performance index changed to the Bloomberg U.S. Aggregate Bond Index. The Bloomberg U.S. Aggregate Bond Index is a broad-based securities market index that represents the overall market applicable to the Fund. The Fund will retain the Bloomberg U.S. Intermediate Government/Credit Bond Index as its additional benchmark for performance comparison. |
|
Type of Account
|
Minimum Initial Purchase
|
|
|
Any account other than those listed below
|
$
|
2,500
|
|
For shareholders participating in Natixis Funds’ Automatic Investment Plan
|
$
|
1,000
|
|
For Traditional IRA, Roth IRA, Rollover IRA, SEP-IRA and Keogh plans
|
$
|
1,000
|
|
•
|
Fee Based Programs (such as wrap accounts) where an advisory fee is paid to the broker-dealer or other financial intermediary. Please consult your financial representative to determine if your fee based program is subject to additional or different conditions or fees.
|
|
•
|
Certain Retirement Plans. Please consult your retirement plan administrator to determine if your retirement plan is subject to additional or different conditions or fees imposed by the plan administrator.
|
|
•
|
Clients of a Registered Investment Adviser where the Registered Investment Adviser receives an advisory, management or consulting fee.
|
|
•
|
Certain Retirement Plans. Please consult your retirement plan administrator to determine if your retirement plan is subject to additional or different conditions or fees imposed by the plan administrator.
|
|
•
|
Sub-accounts held within an omnibus account, where the omnibus account has at least $1,000,000.
|
|
•
|
Funds of funds that are distributed by the Distributor.
|
|
•
|
Fee Based Programs (such as wrap accounts) where an advisory fee is paid to the broker-dealer or other financial intermediary. Please consult your financial representative to determine if your fee based program is subject to additional or different conditions or fees.
|
|
•
|
Certain Retirement Plans. Please consult your retirement plan administrator to determine if your retirement plan is subject to additional or different conditions or fees imposed by the plan administrator.
|
|
•
|
Certain Individual Retirement Accounts if the amounts invested represent rollover distributions from investments by any of the retirement plans invested in the Fund.
|
|
•
|
Clients of a Registered Investment Adviser where the Registered Investment Adviser receives an advisory, management or consulting fee.
|
|
•
|
Fund Trustees, former Fund trustees, employees of affiliates of the Natixis Funds and other individuals who are affiliated with any Natixis Fund (this also applies to any spouse, parents, children, siblings, grandparents, grandchildren and in-laws of those mentioned) and Natixis affiliate employee benefit plans.
|
|
|
Class A
|
Class C
|
Class N
|
Class T
|
Class Y
|
|
Maximum sales charge (load) imposed on purchases (as a percentage of offering price)
|
|
|
|
|
|
|
Maximum deferred sales charge (load) (as a percentage of original purchase price or redemption proceeds, as applicable)
|
|
|
|
|
|
|
Redemption fees
|
|
|
|
|
|
| * |
|
|
Class A
|
Class C
|
Class N
|
Class T
|
Class Y
|
|
Management fees
|
|
|
|
|
|
|
Distribution and/or service (12b-1) fees
|
|
|
|
|
|
|
Other expenses
|
|
|
|
|
|
|
Total annual fund operating expenses
|
|
|
|
|
|
|
Fee waiver and/or expense reimbursement3,4
|
|
|
|
|
|
|
Total annual fund operating expenses after fee waiver and/or expense reimbursement
|
|
|
|
|
|
| 1 | Other expenses include the refund of prior year service fees of 0.01%. |
| 2 |
| 3 | Loomis, Sayles & Company, L.P. (“Loomis Sayles” or the “Adviser”) has given a binding contractual undertaking to the Fund to limit the amount of the Fund’s total annual fund operating expenses to 0.70%, 1.45%, 0.40%, 0.70% and 0.45% of the Fund’s average daily net assets for Class A, C, N, T and Y shares, respectively, exclusive of brokerage expenses, interest expense, taxes, acquired fund fees and expenses, organizational and extraordinary expenses, such as litigation and indemnification expenses. This undertaking is in effect through January 31, 2025 and may be terminated before then only with the consent of the Fund’s Board of Trustees. The Adviser will be permitted to recover, on a class-by-class basis, management fees waived and/or expenses reimbursed to the extent that expenses in later periods fall below both (1) the class’ applicable expense limitation at the time such amounts were waived/reimbursed and (2) the class’ current applicable expense limitation. The Fund will not be obligated to repay any such waived/reimbursed fees and expenses more than one year after the end of the fiscal year in which the fees or expenses were waived/reimbursed. |
| 4 | Natixis Advisors, LLC (“Natixis Advisors”) has given a binding contractual undertaking to the Fund to reimburse any and all transfer agency expenses for Class N shares. This undertaking is in effect through |
| 5 | In order to ensure that the total annual fund operating expenses after fee waiver and/or expense reimbursement do not exceed the amounts disclosed in the table, the Adviser may voluntarily waive additional advisory fees and/or other expenses. This may result in Class A shareholders realizing a total annual fund operating expense after fee waiver and/or expense reimbursement lower than 0.70% of the Fund’s average daily net assets. This additional waiver may be terminated at any time. |
|
|
1 year
|
3 years
|
5 years
|
10 years
|
||||
|
Class A
|
$
|
|
$
|
|
$
|
|
$
|
|
|
Class C
|
$
|
|
$
|
|
$
|
|
$
|
|
|
Class N
|
$
|
|
$
|
|
$
|
|
$
|
|
|
Class T
|
$
|
|
$
|
|
$
|
|
$
|
|
|
Class Y
|
$
|
|
$
|
|
$
|
|
$
|
|
|
|
1 year
|
3 years
|
5 years
|
10 years
|
||||
|
Class C
|
$
|
|
$
|
|
$
|
|
$
|
|
 |
|
|
|
|
|
|
|
|
|
Past 1 Year
|
Past 5 Years
|
Past 10 Years
|
Life of Class N
(2/1/17) |
|
Class Y - Return Before Taxes
|
|
|
|
-
|
|
Return After Taxes on Distributions
|
|
|
|
-
|
|
Return After Taxes on Distributions and Sale of Fund Shares
|
|
|
|
-
|
|
Average Annual Total Returns
|
|
|
|
|
|
(for the periods ended December 31, 2023)
|
Past 1 Year
|
Past 5 Years
|
Past 10 Years
|
Life of Class N
(2/1/17) |
|
Class A - Return Before Taxes
|
|
|
|
-
|
|
Class C - Return Before Taxes
|
|
|
|
-
|
|
Class N - Return Before Taxes
|
|
|
-
|
|
|
Class T - Return Before Taxes
|
|
|
|
-
|
|
Bloomberg U.S. Aggregate Bond Index1
|
|
|
|
|
|
Bloomberg U.S. 1-5 Year Government Bond Index
|
|
|
|
|
| 1 | Effective February 1, 2024, the Fund’s primary broad-based performance index changed to the Bloomberg U.S. Aggregate Bond Index. The Bloomberg U.S. Aggregate Bond Index is a broad-based securities market index that represents the overall market applicable to the Fund. The Fund will retain the Bloomberg U.S. 1-5 Year Government Bond Index as its additional benchmark for performance comparison. |
|
Type of Account
|
Minimum Initial Purchase
|
|
|
Any account other than those listed below
|
$
|
2,500
|
|
For shareholders participating in Natixis Funds’ Automatic Investment Plan
|
$
|
1,000
|
|
For Traditional IRA, Roth IRA, Rollover IRA, SEP-IRA and Keogh plans
|
$
|
1,000
|
|
•
|
Fee Based Programs (such as wrap accounts) where an advisory fee is paid to the broker-dealer or other financial intermediary. Please consult your financial representative to determine if your fee based program is subject to additional or different conditions or fees.
|
|
•
|
Certain Retirement Plans. Please consult your retirement plan administrator to determine if your retirement plan is subject to additional or different conditions or fees imposed by the plan administrator.
|
|
•
|
Clients of a Registered Investment Adviser where the Registered Investment Adviser receives an advisory, management or consulting fee.
|
|
•
|
Certain Retirement Plans. Please consult your retirement plan administrator to determine if your retirement plan is subject to additional or different conditions or fees imposed by the plan administrator.
|
|
•
|
Sub-accounts held within an omnibus account, where the omnibus account has at least $1,000,000.
|
|
•
|
Funds of funds that are distributed by the Distributor.
|
|
•
|
Fee Based Programs (such as wrap accounts) where an advisory fee is paid to the broker-dealer or other financial intermediary. Please consult your financial representative to determine if your fee based program is subject to additional or different conditions or fees.
|
|
•
|
Certain Retirement Plans. Please consult your retirement plan administrator to determine if your retirement plan is subject to additional or different conditions or fees imposed by the plan administrator.
|
|
•
|
Certain Individual Retirement Accounts if the amounts invested represent rollover distributions from investments by any of the retirement plans invested in the Fund.
|
|
•
|
Clients of a Registered Investment Adviser where the Registered Investment Adviser receives an advisory, management or consulting fee.
|
|
•
|
Fund Trustees, former Fund trustees, employees of affiliates of the Natixis Funds and other individuals who are affiliated with any Natixis Fund (this also applies to any spouse, parents, children, siblings, grandparents, grandchildren and in-laws of those mentioned) and Natixis affiliate employee benefit plans.
|
| 1 | The advisory fee for the Loomis Sayles Core Plus Bond Fund consisted of a fee of 0.16% payable to Loomis Sayles as investment adviser to the Fund and an advisory administration fee of 0.16% payable to Natixis Advisors, LLC as advisory administrator to the Fund. |
|
•
|
You pay a sales charge when you buy Class A shares. There are several ways to reduce this charge. See the section “How Sales Charges Are Calculated.”
|
|
•
|
You pay lower annual expenses than Class C shares, giving you the potential for higher returns per share. However, where front-end sales charges are applicable, returns are earned on a smaller amount of your investment.
|
|
•
|
You pay higher expenses than Class N and Class Y shares.
|
|
•
|
You do not pay a sales charge if your total investment reaches $1 million or more (or $500,000 or more for the Loomis Sayles Limited Term Government and Agency Fund), but you may pay a charge on redemptions if you redeem these shares within 18 months of purchase.
|
|
•
|
You do not pay a sales charge when you buy Class C shares. All of your money goes to work for you right away.
|
|
•
|
You pay higher annual expenses than Class A, Class N, Class T and Class Y shares.
|
|
•
|
You may pay a sales charge on redemptions if you sell your Class C shares within one year of purchase.
|
|
•
|
Investors will not be permitted to purchase $1 million or more of Class C shares as a single investment per account. There may be certain exceptions to this restriction for omnibus and other nominee accounts. Investors may want to consider the lower operating expense of Class A shares in such instances. You may pay a charge on redemptions if you redeem Class A shares within 18 months of purchase.
|
|
•
|
Except as noted below, Class C shares will automatically convert to Class A shares after eight years. Please see the section “Exchanging or Converting Shares” for details regarding a conversion of shares. Generally, to be eligible to have your Class C shares automatically converted to Class A shares, a Fund or the financial intermediary through which you purchased your shares will need to have records verifying that your Class C shares have been held for eight years. Due to operational limitations at your financial intermediary, your ability to have your Class C shares automatically converted to Class A shares may be limited. Group retirement plans of certain financial intermediaries who hold Class C shares with a Fund in an omnibus account do not track participant level aging of shares and therefore these shares will not be eligible for an automatic conversion. Certain intermediaries may convert your Class C shares to Class A shares in accordance with a conversion schedule that may differ from the one described above. Please consult your financial representative for more information.
|
|
•
|
You have a minimum initial investment of $1,000,000. There are several ways to waive this minimum. See the section “Purchase and Sale of Fund Shares.”
|
|
•
|
You do not pay a sales charge when you buy Class N shares. All of your money goes to work for you right away.
|
|
•
|
You do not pay a sales charge on redemptions.
|
|
•
|
You may pay lower annual expenses than Class A, Class C, Class T and Class Y shares, giving you the potential for higher returns per share.
|
|
•
|
Class T shares of the Funds are not currently available for purchase.
|
|
•
|
The shares are available to a limited type of investor. See the section “Purchase and Sale of Fund Shares.”
|
|
•
|
You pay a sales charge when you buy Class T shares. This charge is reduced for purchases of $250,000 or more. See the section “How Sales Charges Are Calculated.”
|
|
•
|
You pay lower annual expenses than Class C shares, giving you the potential for higher returns per share. However, where front-end sales charges are applicable, returns are earned on a smaller amount of your investment.
|
|
•
|
You pay higher expenses than Class N and Class Y shares.
|
|
•
|
You have a minimum initial investment of $100,000. There are several ways to waive this minimum. See the section “Purchase and Sale of Fund Shares.”
|
|
•
|
You do not pay a sales charge when you buy Class Y shares. All of your money goes to work for you right away.
|
|
•
|
You do not pay a sales charge on redemptions.
|
|
•
|
You pay lower annual expenses than Class A, Class T and Class C shares, giving you the potential for higher returns per share.
|
|
•
|
You may pay higher annual expenses than Class N shares.
|
|
Class A Sales Charges*
|
|
|
||||
|
|
Loomis Sayles Core Plus Bond Fund, Loomis Sayles Intermediate Duration Bond Fund
|
|
|
Loomis Sayles Limited Term Government and Agency Fund
|
||
|
Your Investment
|
As a % of offering price
|
As a % of your investment
|
|
Your Investment
|
As a % of offering price
|
As a % of your investment
|
|
Less than $100,000
|
4.25%
|
4.44%
|
|
Less than $100,000
|
2.25%
|
2.30%
|
|
$100,000-$249,999
|
3.50%
|
3.63%
|
|
$100,000-$249,999
|
1.75%
|
1.78%
|
|
$250,000-$499,999
|
2.50%
|
2.56%
|
|
$250,000-$499,999
|
1.25%
|
1.27%
|
|
$500,000-$999,999
|
2.00%
|
2.04%
|
|
$500,000 or more**
|
0.00%
|
0.00%
|
|
$1,000,000 or more***
|
0.00%
|
0.00%
|
||||
|
|
Loomis Sayles Global Allocation Fund, Loomis Sayles Growth Fund
|
|||||
|
Your Investment
|
As a % of offering price
|
As a % of your investment
|
||||
|
Less than $50,000
|
5.75%
|
6.10%
|
||||
|
$50,000-$99,999
|
4.50%
|
4.71%
|
||||
|
$100,000-$249,999
|
3.50%
|
3.63%
|
||||
|
$250,000-$499,999
|
2.50%
|
2.56%
|
||||
|
$500,000-$999,999
|
2.00%
|
2.04%
|
||||
|
$1,000,000 or more***
|
0.00%
|
0.00%
|
||||
| Due to rounding, the actual sales charge for a particular transaction may be higher or lower than the rates listed above. |
| * | Not imposed on shares that are purchased with reinvested dividends or other distributions. |
| ** | For purchases of Class A shares of a Fund of $500,000 or more, there is no front-end sales charge, but a CDSC of 0.75% may apply to redemptions of your shares within 18 months of the date of purchase. See the section “How the CDSC is Applied to Your Shares.” |
| *** | For purchases of Class A shares of a Fund of $1 million or more, there is no front-end sales charge, but a contingent deferred sales charge (“CDSC”) of 1.00% may apply to redemptions of your shares within 18 months of the date of purchase. See the section “How the CDSC is Applied to Your Shares.” |
|
•
|
Letter of Intent — By signing a Letter of Intent, you may purchase Class A shares of any Natixis Fund over a 13-month period but pay sales charges as if you had purchased all shares at once. This program can save you money if you plan to invest $100,000 or more (or $50,000 or more for Loomis Sayles Global Allocation Fund and Loomis Sayles Growth Fund) within 13 months.
|
|
•
|
Cumulative Purchase Discount — You may be entitled to a reduced sales charge if your “total investment” reaches a breakpoint for a reduced sales charge. The total investment is determined by adding the amount of your current purchase in a Fund, including the applicable sales charge, to the current public offering price of all series and classes of shares (excluding Class T shares) of the Natixis Funds held by you in one or more accounts. If your total investment exceeds a sales charge breakpoint in the table above, the lower sales charge applies to the entire amount of your current purchase in a Fund.
|
|
•
|
Combining Accounts — This allows you to combine shares of multiple Natixis Funds and classes for purposes of calculating your sales charge.
|
|
Individual Accounts: You may elect to combine your purchase(s) and your total investment, as defined above, with the purchases and total investment of your spouse, parents, children, siblings, grandparents, grandchildren, in-laws (of those previously mentioned), individual retirement accounts, sole proprietorships, single trust estates and any other individuals acceptable to the Distributor.
Certain Retirement Plan Accounts: The Distributor may, at its discretion, combine the purchase(s) and total investment of all qualified participants in the same retirement plan for purposes of determining the availability of a reduced sales charge. In most instances, individual accounts may not be linked with certain retirement plan accounts for the purposes of calculating sales charges. Savings Incentive Match Plan for Employees (“SIMPLE IRA”) contributions will automatically be linked with those of other participants in the same SIMPLE IRA |
|
Plan (Class A shares only) using the Natixis Funds prototype document. SIMPLE IRA accounts may not be linked with any other Natixis Fund account for rights of accumulation. Please refer to the SAI for more detailed information on combining accounts.
|
|
•
|
Clients of a financial intermediary that has entered into an agreement with the Distributor and has been approved by the Distributor to offer Fund shares to self-directed investment brokerage accounts that may or may not charge a transaction fee;
|
|
•
|
Any government entity that is prohibited from paying a sales charge or commission to purchase mutual fund shares;
|
|
•
|
All employees of financial intermediaries under arrangements with the Distributor (this also applies to spouses and children under the age of 21 of those mentioned);
|
|
•
|
Fund trustees, former trustees, employees of affiliates of the Natixis Funds and other individuals who are affiliated with any Natixis Fund (this also applies to any spouse, parents, children, siblings, grandparents, grandchildren and in-laws of those mentioned);
|
|
•
|
Certain Retirement Plans. The availability of this pricing may depend upon the policies and procedures of your specific financial intermediary; consult your financial adviser;
|
|
•
|
Non-discretionary and non-retirement accounts of bank trust departments or trust companies, but only if they principally engage in banking or trust activities;
|
|
•
|
Fee Based Programs of certain broker-dealers, the Adviser or the Distributor. Please consult your financial representative to determine if your fee based program is subject to additional or different conditions or fees; and
|
|
•
|
Registered Investment Advisers investing on behalf of clients in exchange for an advisory, management or consulting fee.
|
|
Year Since Purchase
|
CDSC on Shares Being Sold
|
|
1st
|
1.00%
|
|
Year Since Purchase
|
CDSC on Shares Being Sold
|
|
Thereafter
|
0.00%
|
|
•
|
Is calculated based on the number of shares you are selling;
|
|
•
|
Calculation is based on either your original purchase price or the current NAV of the shares being sold, whichever is lower in order to minimize your CDSC;
|
|
•
|
Is deducted from the proceeds of the redemption unless you request, at the time of the redemption, that it be deducted from the amount remaining in your account; and
|
|
•
|
Applies to redemptions made within the time frame shown above for each class.
|
|
•
|
Increases in NAV above the purchase price;
|
|
•
|
Shares you acquired by reinvesting your dividends or capital gains distributions; or
|
|
•
|
Exchanges. However, the original purchase date of the shares from which the exchange is made determines if the newly acquired shares are subject to the CDSC when they are sold.
|
|
Class T Sales Charges*,**
|
|
|
|
|
|
|
|
Your Investment
|
As a % of offering price
|
As a % of your investment
|
|
Less than $250,000
|
2.50%
|
2.56%
|
|
$250,000 – $499,999
|
2.00%
|
2.04%
|
|
$500,000 – $999,999
|
1.50%
|
1.52%
|
|
$1,000,000 or more
|
1.00%
|
1.01%
|
| * | Due to rounding, the actual sales charge for a particular transaction may be higher or lower than the rates listed above. |
| ** | Not imposed on shares that are purchased with reinvested dividends or other distributions. |
|
•
|
If you are selling more than $100,000 per day from a single fund/account and you are requesting the proceeds by check (this does not apply to IRA transfer of assets to new custodian).
|
|
•
|
If you are requesting that the proceeds check (of any amount) be made out to someone other than the registered owner(s) or sent to an address other than the address of record.
|
|
•
|
If the account registration or bank account information has changed within the past 30 days.
|
|
•
|
If you are instructing us to send the proceeds by check, wire or ACH to a bank not already active on the fund account.
|
|
Restriction
|
Situation
|
|
Each Fund may suspend the right of redemption:
|
|
|
Each Fund reserves the right to suspend account services or refuse transaction requests:
|
|
|
Each Fund may pay the redemption price in whole or in part by a distribution in-kind of readily marketable securities in lieu of cash or may take up to 7 days to pay a redemption request in order to raise capital:
|
|
|
Each Fund may withhold redemption proceeds for 10 days from the purchase date:
|
|

|
•
|
A share’s NAV is determined at the close of regular trading on the NYSE on the days the NYSE is open for trading. This is normally 4:00 p.m., Eastern time. A Fund’s shares will not be priced on the days on which the NYSE is closed for trading. In addition, a Fund’s shares will not be priced on the holidays listed in the SAI. See the section “Net Asset Value” in the SAI for more details.
|
|
•
|
The price you pay for purchasing, redeeming or exchanging a share will be based upon the NAV next calculated (plus or minus applicable sales charges as described earlier in the Fund Summary) after your order is received by the transfer agent, SS&C Global Investor & Distribution Solutions, Inc. (formerly, DST Asset Manager Solutions, Inc.), (rather than when the order arrives at the P.O. box) “in good order” (meaning that the order is complete and contains all necessary information).1
|
|
•
|
Requests received by the Funds after the NYSE closes will be processed based upon the NAV determined at the close of regular trading on the next day that the NYSE is open. If the transfer agent receives the order in good order prior to the NYSE market close (normally 4:00 p.m., Eastern time), the shareholder will receive that day’s NAV. Under limited circumstances, the Distributor may enter into contractual agreements pursuant to which orders received by your investment dealer before a Fund determines its NAV and transmitted to the transfer agent prior to market open on the next business day are processed at the NAV determined on the day the order was received by your investment dealer. Please contact your investment dealer to determine whether it has entered into such a contractual agreement. If your investment dealer has not entered into such a contractual agreement, your order will be processed at the NAV next determined after your investment dealer submits the order to a Fund.
|
|
•
|
If a Fund invests in foreign securities, it may have NAV changes on days when you cannot buy or sell its shares.
|
| 1 | Please see the section “How to Purchase Shares,” which provides additional information regarding who can receive a purchase order. |
|
•
|
Equity securities (including shares of closed-end investment companies and exchange-traded funds (“ETFs”)), exchange traded notes, rights, and warrants — listed equity securities are valued at the last sale price quoted on the exchange where they are traded most extensively or, if there is no reported sale during the day, the closing bid quotation as reported by a third-party pricing service. Securities traded on the NASDAQ Global Select Market, NASDAQ Global Market and NASDAQ Capital Market are valued at the NASDAQ Official Closing Price (“NOCP”), or if lacking an NOCP, at the most recent bid quotations on the applicable NASDAQ Market. Unlisted equity securities (except unlisted preferred equity securities discussed below) are valued at the last sale price quoted in the market where they are traded most extensively or, if there is no reported sale during the day, the closing bid quotation as reported by a third-party pricing service. If there is no sale price or closing bid quotation available, unlisted equity securities will be valued using evaluated bids furnished by a third-party pricing service, if available. In some foreign markets, an official close price and a last sale price may be available from the foreign exchange or market. In those cases, the official close price is used. Valuations based on information from foreign markets may be subject to the Funds’ fair value policies described below. If a right is not traded on any exchange, its value is based on the market value of the underlying security, less the cost to subscribe to the underlying security (e.g., to exercise the right), adjusted for the subscription ratio. If a warrant is not traded on any exchange, a price is obtained from a broker-dealer.
|
|
•
|
Debt securities and unlisted preferred equity securities — evaluated bids furnished to a Fund by a third-party pricing service using market information, transactions for comparable securities and various relationships between securities, if available, or bid prices obtained from broker-dealers.
|
|
•
|
Senior Loans — bid prices supplied by a third-party pricing service, if available, or bid prices obtained from broker-dealers.
|
|
•
|
Bilateral Swaps — bilateral credit default swaps are valued based on mid prices (between the bid price and the ask price) supplied by a third-party pricing service. Bilateral interest rate swaps and bilateral standardized commodity and equity index total return swaps are valued based on prices supplied by a third-party pricing service. If prices from a third-party pricing service are not available, prices from a broker-dealer may be used.
|
|
•
|
Centrally Cleared Swaps — settlement prices of the clearing house on which the contracts were traded or prices obtained from broker-dealers.
|
|
•
|
Options — domestic exchange-traded index and single name equity options contracts (including options on ETFs) are valued at the mean of the National
|
|
Best Bid and Offer quotations as determined by the Options Price Reporting Authority. Foreign exchange-traded single name equity options contracts are valued at the most recent settlement price. Options contracts on foreign indices are priced at the most recent settlement price. Options on futures contracts are valued using the current settlement price on the exchange on which, over time, they are traded most extensively. Other exchange-traded options are valued at the average of the closing bid and ask quotations on the exchange on which, over time, they are traded most extensively. OTC currency options and swaptions are valued at mid prices (between the bid price and the ask price) supplied by a third-party pricing service, if available. Other OTC options contracts (including currency options and swaptions not priced through a third-party pricing service) are valued based on prices obtained from broker-dealers. Valuations based on information from foreign markets may be subject to the Funds’ fair value policies as described below.
|
|
•
|
Futures — most recent settlement price on the exchange on which the Adviser believes that, over time, they are traded most extensively. Valuations based on information from foreign markets may be subject to the Funds’ fair value policies as described below.
|
|
•
|
Forward Foreign Currency Contracts — interpolated rates determined based on information provided by a third-party pricing service.
|
|
Annually
|
Monthly
|
Daily
|
|
Loomis Sayles Global Allocation Fund
|
Loomis Sayles Core Plus Bond Fund
|
Loomis Sayles Limited Term Government and Agency Fund†
|
|
Loomis Sayles Growth Fund
|
Loomis Sayles Intermediate Duration Bond Fund
|
| † | Declares dividends for each class daily and pays them monthly. |
|
•
|
Participate in the Dividend Diversification Program, which allows you to have all dividends and distributions automatically invested at NAV in shares of the same class of another Natixis Fund registered in your name. Certain investment minimums and restrictions may apply. For more information about the program, see the section “Additional Investor Services;”
|
|
•
|
Receive distributions from dividends and interest in cash while reinvesting distributions from capital gains in additional shares of the same class of the Fund, or in the same class of another Natixis Fund;
|
|
•
|
Receive distributions from capital gains in cash while reinvesting distributions from dividends and interest in additional shares of the same class of the Fund, or in the same class of another Natixis Fund; or
|
|
•
|
Receive all distributions in cash.
|
|
|
Class A
|
|||||||||
|
|
Year Ended
September 30, 2023 |
Year Ended
September 30, 2022 |
Year Ended
September 30, 2021 |
Year Ended
September 30, 2020 |
Year Ended
September 30, 2019 |
|||||
|
Net asset value, beginning of the period
|
$
|
11.20
|
$
|
13.59
|
$
|
14.08
|
$
|
13.25
|
$
|
12.53
|
|
Income (loss) from Investment Operations:
|
|
|
|
|
|
|
|
|
|
|
|
Net investment income(a)
|
|
0.38
|
|
0.26
|
|
0.21
|
|
0.26
|
|
0.34
|
|
Net realized and unrealized gain (loss)
|
|
(0.25
)
|
|
(2.30
)
|
|
(0.13
)
|
|
0.86
|
|
0.70
|
|
Total from Investment Operations
|
|
0.13
|
|
(2.04
)
|
|
0.08
|
|
1.12
|
|
1.04
|
|
Less Distributions From:
|
|
|
|
|
|
|
|
|
|
|
|
Net investment income
|
|
(0.40
)
|
|
(0.32
)
|
|
(0.29
)
|
|
(0.29
)
|
|
(0.32
)
|
|
Net realized capital gains
|
|
—
|
|
(0.03
)
|
|
(0.28
)
|
|
—
|
|
—
|
|
Total Distributions
|
|
(0.40
)
|
|
(0.35
)
|
|
(0.57
)
|
|
(0.29
)
|
|
(0.32
)
|
|
Net asset value, end of the period
|
$
|
10.93
|
$
|
11.20
|
$
|
13.59
|
$
|
14.08
|
$
|
13.25
|
|
Total return(b)
|
|
1.04
%
(c)
|
|
(15.24
)%
(c)
|
|
0.53
%
|
|
8.60
%
|
|
8.39
%
|
|
Ratios to Average Net Assets:
|
|
|
|
|
|
|
|
|
|
|
|
Net assets, end of the period (000’s)
|
$
|
376,624
|
$
|
428,825
|
$
|
747,497
|
$
|
617,609
|
$
|
558,291
|
|
Net expenses
|
|
0.74
%
(d)
|
|
0.73
%
(d)(e)
|
|
0.71
%
|
|
0.72
%
(f)
|
|
0.73
%
|
|
Gross expenses
|
|
0.75
%
|
|
0.74
%
|
|
0.71
%
|
|
0.72
%
|
|
0.73
%
|
|
Net investment income
|
|
3.33
%
|
|
2.08
%
|
|
1.51
%
|
|
1.88
%
|
|
2.63
%
|
|
Portfolio turnover rate
|
|
168
%
|
|
280
%
|
|
266
%
|
|
359
%
(g)
|
|
297
%
|
|
(a)
|
Per share net investment income has been calculated using the average shares outstanding during the period.
|
|
(b)
|
A sales charge for Class A shares is not reflected in total return calculations.
|
|
(c)
|
Had certain expenses not been waived/reimbursed during the period, total returns would have been lower.
|
|
(d)
|
The investment adviser agreed to waive its fees and/or reimburse a portion of the Fund’s expenses during the period. Without this waiver/reimbursement, expenses would have been higher.
|
|
(e)
|
Effective July 1, 2022, the expense limit decreased from 0.75% to 0.74%.
|
|
(f)
|
Effective July 1, 2020, the expense limit decreased from 0.80% to 0.75%.
|
|
(g)
|
The variation in the Fund’s turnover rate from 2019 to 2020 was primarily due to a significant repositioning of the portfolio.
|
|
|
Class C
|
|||||||||
|
|
Year Ended
September 30, 2023 |
Year Ended
September 30, 2022 |
Year Ended
September 30, 2021 |
Year Ended
September 30, 2020 |
Year Ended
September 30, 2019 |
|||||
|
Net asset value, beginning of the period
|
$
|
11.21
|
$
|
13.60
|
$
|
14.09
|
$
|
13.25
|
$
|
12.53
|
|
Income (loss) from Investment Operations:
|
|
|
|
|
|
|
|
|
|
|
|
Net investment income(a)
|
|
0.30
|
|
0.17
|
|
0.10
|
|
0.15
|
|
0.24
|
|
Net realized and unrealized gain (loss)
|
|
(0.26
)
|
|
(2.30
)
|
|
(0.13
)
|
|
0.88
|
|
0.70
|
|
Total from Investment Operations
|
|
0.04
|
|
(2.13
)
|
|
(0.03
)
|
|
1.03
|
|
0.94
|
|
Less Distributions From:
|
|
|
|
|
|
|
|
|
|
|
|
Net investment income
|
|
(0.31
)
|
|
(0.23
)
|
|
(0.18
)
|
|
(0.19
)
|
|
(0.22
)
|
|
Net realized capital gains
|
|
—
|
|
(0.03
)
|
|
(0.28
)
|
|
—
|
|
—
|
|
Total Distributions
|
|
(0.31
)
|
|
(0.26
)
|
|
(0.46
)
|
|
(0.19
)
|
|
(0.22
)
|
|
Net asset value, end of the period
|
$
|
10.94
|
$
|
11.21
|
$
|
13.60
|
$
|
14.09
|
$
|
13.25
|
|
Total return(b)
|
|
0.26
%
(c)
|
|
(15.88
)%
(c)
|
|
(0.24
)%
|
|
7.83
%
|
|
7.57
%
|
|
Ratios to Average Net Assets:
|
|
|
|
|
|
|
|
|
|
|
|
Net assets, end of the period (000’s)
|
$
|
30,402
|
$
|
48,679
|
$
|
95,755
|
$
|
132,590
|
$
|
160,201
|
|
Net expenses
|
|
1.49
%
(d)
|
|
1.48
%
(d)(e)
|
|
1.46
%
|
|
1.47
%
(f)
|
|
1.48
%
|
|
Gross expenses
|
|
1.50
%
|
|
1.49
%
|
|
1.46
%
|
|
1.47
%
|
|
1.48
%
|
|
Net investment income
|
|
2.57
%
|
|
1.33
%
|
|
0.75
%
|
|
1.13
%
|
|
1.88
%
|
|
Portfolio turnover rate
|
|
168
%
|
|
280
%
|
|
266
%
|
|
359
%
(g)
|
|
297
%
|
|
(a)
|
Per share net investment income has been calculated using the average shares outstanding during the period.
|
|
(b)
|
A contingent deferred sales charge for Class C shares is not reflected in total return calculations.
|
|
(c)
|
Had certain expenses not been waived/reimbursed during the period, total returns would have been lower.
|
|
(d)
|
The investment adviser agreed to waive its fees and/or reimburse a portion of the Fund’s expenses during the period. Without this waiver/reimbursement, expenses would have been higher.
|
|
(e)
|
Effective July 1, 2022, the expense limit decreased from 1.50% to 1.49%.
|
|
(f)
|
Effective July 1, 2020, the expense limit decreased from 1.55% to 1.50%.
|
|
(g)
|
The variation in the Fund’s turnover rate from 2019 to 2020 was primarily due to a significant repositioning of the portfolio.
|
|
|
Class N
|
|||||||||
|
|
Year Ended
September 30, 2023 |
Year Ended
September 30, 2022 |
Year Ended
September 30, 2021 |
Year Ended
September 30, 2020 |
Year Ended
September 30, 2019 |
|||||
|
Net asset value, beginning of the period
|
$
|
11.31
|
$
|
13.72
|
$
|
14.21
|
$
|
13.37
|
$
|
12.63
|
|
Income (loss) from Investment Operations:
|
|
|
|
|
|
|
|
|
|
|
|
Net investment income(a)
|
|
0.43
|
|
0.31
|
|
0.26
|
|
0.30
|
|
0.38
|
|
Net realized and unrealized gain (loss)
|
|
(0.26
)
|
|
(2.32
)
|
|
(0.14
)
|
|
0.88
|
|
0.72
|
|
Total from Investment Operations
|
|
0.17
|
|
(2.01
)
|
|
0.12
|
|
1.18
|
|
1.10
|
|
Less Distributions From:
|
|
|
|
|
|
|
|
|
|
|
|
Net investment income
|
|
(0.44
)
|
|
(0.37
)
|
|
(0.33
)
|
|
(0.34
)
|
|
(0.36
)
|
|
Net realized capital gains
|
|
—
|
|
(0.03
)
|
|
(0.28
)
|
|
—
|
|
—
|
|
Total Distributions
|
|
(0.44
)
|
|
(0.40
)
|
|
(0.61
)
|
|
(0.34
)
|
|
(0.36
)
|
|
Net asset value, end of the period
|
$
|
11.04
|
$
|
11.31
|
$
|
13.72
|
$
|
14.21
|
$
|
13.37
|
|
Total return
|
|
1.37
%
|
|
(14.94
)%
|
|
0.86
%
|
|
8.95
%
|
|
8.85
%
|
|
Ratios to Average Net Assets:
|
|
|
|
|
|
|
|
|
|
|
|
Net assets, end of the period (000’s)
|
$
|
2,015,457
|
$
|
1,890,793
|
$
|
2,563,736
|
$
|
2,682,487
|
$
|
2,610,699
|
|
Net expenses
|
|
0.40
%
|
|
0.38
%
(b)
|
|
0.38
%
|
|
0.38
%
(c)
|
|
0.39
%
|
|
Gross expenses
|
|
0.40
%
|
|
0.38
%
|
|
0.38
%
|
|
0.38
%
|
|
0.39
%
|
|
Net investment income
|
|
3.69
%
|
|
2.47
%
|
|
1.84
%
|
|
2.21
%
|
|
2.96
%
|
|
Portfolio turnover rate
|
|
168
%
|
|
280
%
|
|
266
%
|
|
359
%
(d)
|
|
297
%
|
|
(a)
|
Per share net investment income has been calculated using the average shares outstanding during the period.
|
|
(b)
|
Effective July 1, 2022, the expense limit decreased from 0.45% to 0.44%.
|
|
(c)
|
Effective July 1, 2020, the expense limit decreased from 0.50% to 0.45%.
|
|
(d)
|
The variation in the Fund’s turnover rate from 2019 to 2020 was primarily due to a significant repositioning of the portfolio.
|
|
|
Class Y
|
|||||||||
|
|
Year Ended
September 30, 2023 |
Year Ended
September 30, 2022 |
Year Ended
September 30, 2021 |
Year Ended
September 30, 2020 |
Year Ended
September 30, 2019 |
|||||
|
Net asset value, beginning of the period
|
$
|
11.30
|
$
|
13.71
|
$
|
14.20
|
$
|
13.36
|
$
|
12.63
|
|
Income (loss) from Investment Operations:
|
|
|
|
|
|
|
|
|
|
|
|
Net investment income(a)
|
|
0.42
|
|
0.30
|
|
0.24
|
|
0.29
|
|
0.37
|
|
Net realized and unrealized gain (loss)
|
|
(0.26
)
|
|
(2.32
)
|
|
(0.13
)
|
|
0.88
|
|
0.71
|
|
Total from Investment Operations
|
|
0.16
|
|
(2.02
)
|
|
0.11
|
|
1.17
|
|
1.08
|
|
Less Distributions From:
|
|
|
|
|
|
|
|
|
|
|
|
Net investment income
|
|
(0.43
)
|
|
(0.36
)
|
|
(0.32
)
|
|
(0.33
)
|
|
(0.35
)
|
|
Net realized capital gains
|
|
—
|
|
(0.03
)
|
|
(0.28
)
|
|
—
|
|
—
|
|
Total Distributions
|
|
(0.43
)
|
|
(0.39
)
|
|
(0.60
)
|
|
(0.33
)
|
|
(0.35
)
|
|
Net asset value, end of the period
|
$
|
11.03
|
$
|
11.30
|
$
|
13.71
|
$
|
14.20
|
$
|
13.36
|
|
Total return
|
|
1.28
%
(b)
|
|
(15.03
)%
(b)
|
|
0.78
%
|
|
8.87
%
|
|
8.67
%
|
|
Ratios to Average Net Assets:
|
|
|
|
|
|
|
|
|
|
|
|
Net assets, end of the period (000’s)
|
$
|
4,290,526
|
$
|
3,543,096
|
$
|
5,442,563
|
$
|
5,846,057
|
$
|
4,163,785
|
|
Net expenses
|
|
0.49
%
(c)
|
|
0.48
%
(c)(d)
|
|
0.46
%
|
|
0.47
%
(e)
|
|
0.48
%
|
|
Gross expenses
|
|
0.50
%
|
|
0.49
%
|
|
0.46
%
|
|
0.47
%
|
|
0.48
%
|
|
Net investment income
|
|
3.60
%
|
|
2.35
%
|
|
1.76
%
|
|
2.11
%
|
|
2.87
%
|
|
Portfolio turnover rate
|
|
168
%
|
|
280
%
|
|
266
%
|
|
359
%
(f)
|
|
297
%
|
|
(a)
|
Per share net investment income has been calculated using the average shares outstanding during the period.
|
|
(b)
|
Had certain expenses not been waived/reimbursed during the period, total returns would have been lower.
|
|
(c)
|
The investment adviser agreed to waive its fees and/or reimburse a portion of the Fund’s expenses during the period. Without this waiver/reimbursement, expenses would have been higher.
|
|
(d)
|
Effective July 1, 2022, the expense limit decreased from 0.50% to 0.49%.
|
|
(e)
|
Effective July 1, 2020, the expense limit decreased from 0.55% to 0.50%.
|
|
(f)
|
The variation in the Fund’s turnover rate from 2019 to 2020 was primarily due to a significant repositioning of the portfolio.
|
|
|
Class A
|
|||||||||
|
|
Year Ended
September 30, 2023 |
Year Ended
September 30, 2022 |
Year Ended
September 30, 2021 |
Year Ended
September 30, 2020 |
Year Ended
September 30, 2019 |
|||||
|
Net asset value, beginning of the period
|
$
|
19.94
|
$
|
28.86
|
$
|
26.23
|
$
|
23.76
|
$
|
23.10
|
|
Income (loss) from Investment Operations:
|
|
|
|
|
|
|
|
|
|
|
|
Net investment income(a)
|
|
0.23
|
|
0.13
|
|
0.06
|
|
0.10
|
|
0.19
|
|
Net realized and unrealized gain (loss)
|
|
3.31
|
|
(6.89
)
|
|
4.18
|
|
3.05
|
|
1.38
|
|
Total from Investment Operations
|
|
3.54
|
|
(6.76
)
|
|
4.24
|
|
3.15
|
|
1.57
|
|
Less Distributions From:
|
|
|
|
|
|
|
|
|
|
|
|
Net investment income
|
|
—
|
|
—
|
|
(0.13
)
|
|
(0.12
)
|
|
(0.16
)
|
|
Net realized capital gains
|
|
(2.03
)
|
|
(2.16
)
|
|
(1.48
)
|
|
(0.56
)
|
|
(0.75
)
|
|
Total Distributions
|
|
(2.03
)
|
|
(2.16
)
|
|
(1.61
)
|
|
(0.68
)
|
|
(0.91
)
|
|
Net asset value, end of the period
|
$
|
21.45
|
$
|
19.94
|
$
|
28.86
|
$
|
26.23
|
$
|
23.76
|
|
Total return(b)
|
|
18.67
%
|
|
(25.59
)%
|
|
16.73
%
|
|
13.41
%
|
|
7.66
%
|
|
Ratios to Average Net Assets:
|
|
|
|
|
|
|
|
|
|
|
|
Net assets, end of the period (000’s)
|
$
|
474,968
|
$
|
482,031
|
$
|
737,469
|
$
|
632,479
|
$
|
453,009
|
|
Net expenses
|
|
1.17
%
|
|
1.14
%
|
|
1.13
%
|
|
1.15
%
|
|
1.16
%
|
|
Gross expenses
|
|
1.17
%
|
|
1.14
%
|
|
1.13
%
|
|
1.15
%
|
|
1.16
%
|
|
Net investment income
|
|
1.09
%
|
|
0.52
%
|
|
0.23
%
|
|
0.42
%
|
|
0.83
%
|
|
Portfolio turnover rate
|
|
19
%
|
|
35
%
|
|
45
%
|
|
37
%
|
|
27
%
|
|
(a)
|
Per share net investment income has been calculated using the average shares outstanding during the period.
|
|
(b)
|
A sales charge for Class A shares is not reflected in total return calculations.
|
|
|
Class C
|
|||||||||
|
|
Year Ended
September 30, 2023 |
Year Ended
September 30, 2022 |
Year Ended
September 30, 2021 |
Year Ended
September 30, 2020 |
Year Ended
September 30, 2019 |
|||||
|
Net asset value, beginning of the period
|
$
|
19.34
|
$
|
28.26
|
$
|
25.78
|
$
|
23.43
|
$
|
22.78
|
|
Income (loss) from Investment Operations:
|
|
|
|
|
|
|
|
|
|
|
|
Net investment income (loss)(a)
|
|
0.07
|
|
(0.06
)
|
|
(0.14
)
|
|
(0.08
)
|
|
0.02
|
|
Net realized and unrealized gain (loss)
|
|
3.21
|
|
(6.70
)
|
|
4.10
|
|
2.99
|
|
1.38
|
|
Total from Investment Operations
|
|
3.28
|
|
(6.76
)
|
|
3.96
|
|
2.91
|
|
1.40
|
|
Less Distributions From:
|
|
|
|
|
|
|
|
|
|
|
|
Net investment income
|
|
—
|
|
—
|
|
—
|
|
—
|
|
(0.00
)
(b)
|
|
Net realized capital gains
|
|
(2.03
)
|
|
(2.16
)
|
|
(1.48
)
|
|
(0.56
)
|
|
(0.75
)
|
|
Total Distributions
|
|
(2.03
)
|
|
(2.16
)
|
|
(1.48
)
|
|
(0.56
)
|
|
(0.75
)
|
|
Net asset value, end of the period
|
$
|
20.59
|
$
|
19.34
|
$
|
28.26
|
$
|
25.78
|
$
|
23.43
|
|
Total return(c)
|
|
17.84
%
|
|
(26.16
)%
|
|
15.85
%
|
|
12.55
%
|
|
6.85
%
|
|
Ratios to Average Net Assets:
|
|
|
|
|
|
|
|
|
|
|
|
Net assets, end of the period (000’s)
|
$
|
256,487
|
$
|
302,501
|
$
|
503,073
|
$
|
483,814
|
$
|
480,479
|
|
Net expenses
|
|
1.92
%
|
|
1.89
%
|
|
1.88
%
|
|
1.90
%
|
|
1.91
%
|
|
Gross expenses
|
|
1.92
%
|
|
1.89
%
|
|
1.88
%
|
|
1.90
%
|
|
1.91
%
|
|
Net investment income (loss)
|
|
0.33
%
|
|
(0.23
)%
|
|
(0.52
)%
|
|
(0.33
)%
|
|
0.08
%
|
|
Portfolio turnover rate
|
|
19
%
|
|
35
%
|
|
45
%
|
|
37
%
|
|
27
%
|
|
(a)
|
Per share net investment income (loss) has been calculated using the average shares outstanding during the period.
|
|
(b)
|
Amount rounds to less than $0.01 per share.
|
|
(c)
|
A contingent deferred sales charge for Class C shares is not reflected in total return calculations.
|
|
|
Class N
|
|||||||||
|
|
Year Ended
September 30, 2023 |
Year Ended
September 30, 2022 |
Year Ended
September 30, 2021 |
Year Ended
September 30, 2020 |
Year Ended
September 30, 2019 |
|||||
|
Net asset value, beginning of the period
|
$
|
20.14
|
$
|
29.09
|
$
|
26.42
|
$
|
23.92
|
$
|
23.25
|
|
Income (loss) from Investment Operations:
|
|
|
|
|
|
|
|
|
|
|
|
Net investment income(a)
|
|
0.31
|
|
0.22
|
|
0.15
|
|
0.18
|
|
0.27
|
|
Net realized and unrealized gain (loss)
|
|
3.36
|
|
(6.96
)
|
|
4.21
|
|
3.07
|
|
1.38
|
|
Total from Investment Operations
|
|
3.67
|
|
(6.74
)
|
|
4.36
|
|
3.25
|
|
1.65
|
|
Less Distributions From:
|
|
|
|
|
|
|
|
|
|
|
|
Net investment income
|
|
—
|
|
(0.05
)
|
|
(0.21
)
|
|
(0.19
)
|
|
(0.23
)
|
|
Net realized capital gains
|
|
(2.03
)
|
|
(2.16
)
|
|
(1.48
)
|
|
(0.56
)
|
|
(0.75
)
|
|
Total Distributions
|
|
(2.03
)
|
|
(2.21
)
|
|
(1.69
)
|
|
(0.75
)
|
|
(0.98
)
|
|
Net asset value, end of the period
|
$
|
21.78
|
$
|
20.14
|
$
|
29.09
|
$
|
26.42
|
$
|
23.92
|
|
Total return
|
|
19.16
%
|
|
(25.36
)%
|
|
17.10
%
|
|
13.78
%
|
|
8.04
%
|
|
Ratios to Average Net Assets:
|
|
|
|
|
|
|
|
|
|
|
|
Net assets, end of the period (000’s)
|
$
|
266,298
|
$
|
243,862
|
$
|
350,222
|
$
|
264,338
|
$
|
202,692
|
|
Net expenses
|
|
0.82
%
|
|
0.81
%
|
|
0.81
%
|
|
0.82
%
|
|
0.82
%
|
|
Gross expenses
|
|
0.82
%
|
|
0.81
%
|
|
0.81
%
|
|
0.82
%
|
|
0.82
%
|
|
Net investment income
|
|
1.43
%
|
|
0.87
%
|
|
0.55
%
|
|
0.76
%
|
|
1.20
%
|
|
Portfolio turnover rate
|
|
19
%
|
|
35
%
|
|
45
%
|
|
37
%
|
|
27
%
|
|
(a)
|
Per share net investment income has been calculated using the average shares outstanding during the period.
|
|
|
Class Y
|
|||||||||
|
|
Year Ended
September 30, 2023 |
Year Ended
September 30, 2022 |
Year Ended
September 30, 2021 |
Year Ended
September 30, 2020 |
Year Ended
September 30, 2019 |
|||||
|
Net asset value, beginning of the period
|
$
|
20.14
|
$
|
29.09
|
$
|
26.42
|
$
|
23.92
|
$
|
23.25
|
|
Income (loss) from Investment Operations:
|
|
|
|
|
|
|
|
|
|
|
|
Net investment income(a)
|
|
0.29
|
|
0.20
|
|
0.13
|
|
0.16
|
|
0.24
|
|
Net realized and unrealized gain (loss)
|
|
3.35
|
|
(6.96
)
|
|
4.21
|
|
3.07
|
|
1.40
|
|
Total from Investment Operations
|
|
3.64
|
|
(6.76
)
|
|
4.34
|
|
3.23
|
|
1.64
|
|
Less Distributions From:
|
|
|
|
|
|
|
|
|
|
|
|
Net investment income
|
|
—
|
|
(0.03
)
|
|
(0.19
)
|
|
(0.17
)
|
|
(0.22
)
|
|
Net realized capital gains
|
|
(2.03
)
|
|
(2.16
)
|
|
(1.48
)
|
|
(0.56
)
|
|
(0.75
)
|
|
Total Distributions
|
|
(2.03
)
|
|
(2.19
)
|
|
(1.67
)
|
|
(0.73
)
|
|
(0.97
)
|
|
Net asset value, end of the period
|
$
|
21.75
|
$
|
20.14
|
$
|
29.09
|
$
|
26.42
|
$
|
23.92
|
|
Total return
|
|
19.00
%
|
|
(25.41
)%
|
|
17.02
%
|
|
13.70
%
|
|
7.95
%
|
|
Ratios to Average Net Assets:
|
|
|
|
|
|
|
|
|
|
|
|
Net assets, end of the period (000’s)
|
$
|
1,698,560
|
$
|
1,932,913
|
$
|
3,286,680
|
$
|
2,660,927
|
$
|
1,938,124
|
|
Net expenses
|
|
0.92
%
|
|
0.89
%
|
|
0.88
%
|
|
0.90
%
|
|
0.91
%
|
|
Gross expenses
|
|
0.92
%
|
|
0.89
%
|
|
0.88
%
|
|
0.90
%
|
|
0.91
%
|
|
Net investment income
|
|
1.33
%
|
|
0.77
%
|
|
0.48
%
|
|
0.67
%
|
|
1.08
%
|
|
Portfolio turnover rate
|
|
19
%
|
|
35
%
|
|
45
%
|
|
37
%
|
|
27
%
|
|
(a)
|
Per share net investment income has been calculated using the average shares outstanding during the period.
|
|
|
Class A
|
|||||||||
|
|
Year Ended
September 30, 2023 |
Year Ended
September 30, 2022 |
Year Ended
September 30, 2021 |
Year Ended
September 30, 2020 |
Year Ended
September 30, 2019 |
|||||
|
Net asset value, beginning of the period
|
$
|
16.45
|
$
|
23.85
|
$
|
20.72
|
$
|
16.02
|
$
|
16.05
|
|
Income (loss) from Investment Operations:
|
|
|
|
|
|
|
|
|
|
|
|
Net investment income (loss)(a)
|
|
(0.08
)
|
|
(0.06
)
|
|
(0.05
)
|
|
0.01
|
|
0.05
|
|
Net realized and unrealized gain (loss)
|
|
5.89
|
|
(6.10
)
|
|
4.17
|
|
5.14
|
|
0.71
|
|
Total from Investment Operations
|
|
5.81
|
|
(6.16
)
|
|
4.12
|
|
5.15
|
|
0.76
|
|
Less Distributions From:
|
|
|
|
|
|
|
|
|
|
|
|
Net investment income
|
|
—
|
|
—
|
|
—
|
|
(0.05
)
|
|
(0.05
)
|
|
Net realized capital gains
|
|
(2.68
)
|
|
(1.24
)
|
|
(0.99
)
|
|
(0.40
)
|
|
(0.74
)
|
|
Total Distributions
|
|
(2.68
)
|
|
(1.24
)
|
|
(0.99
)
|
|
(0.45
)
|
|
(0.79
)
|
|
Net asset value, end of the period
|
$
|
19.58
|
$
|
16.45
|
$
|
23.85
|
$
|
20.72
|
$
|
16.02
|
|
Total return(b)
|
|
40.67
%
|
|
(27.48
)%
|
|
20.43
%
|
|
32.80
%
|
|
5.81
%
|
|
Ratios to Average Net Assets:
|
|
|
|
|
|
|
|
|
|
|
|
Net assets, end of the period (000’s)
|
$
|
798,843
|
$
|
1,164,116
|
$
|
1,740,523
|
$
|
1,477,915
|
$
|
1,250,030
|
|
Net expenses
|
|
0.92
%
|
|
0.90
%
|
|
0.89
%
|
|
0.90
%
|
|
0.91
%
|
|
Gross expenses
|
|
0.92
%
|
|
0.90
%
|
|
0.89
%
|
|
0.90
%
|
|
0.91
%
|
|
Net investment income (loss)
|
|
(0.43
)%
|
|
(0.30
)%
|
|
(0.22
)%
|
|
0.04
%
|
|
0.35
%
|
|
Portfolio turnover rate
|
|
13
%
|
|
20
%
|
|
9
%
|
|
19
%
|
|
7
%
|
|
(a)
|
Per share net investment income (loss) has been calculated using the average shares outstanding during the period.
|
|
(b)
|
A sales charge for Class A shares is not reflected in total return calculations.
|
|
|
Class C
|
|||||||||
|
|
Year Ended
September 30, 2023 |
Year Ended
September 30, 2022 |
Year Ended
September 30, 2021 |
Year Ended
September 30, 2020 |
Year Ended
September 30, 2019 |
|||||
|
Net asset value, beginning of the period
|
$
|
14.42
|
$
|
21.21
|
$
|
18.66
|
$
|
14.53
|
$
|
14.68
|
|
Income (loss) from Investment Operations:
|
|
|
|
|
|
|
|
|
|
|
|
Net investment loss(a)
|
|
(0.18
)
|
|
(0.20
)
|
|
(0.20
)
|
|
(0.11
)
|
|
(0.06
)
|
|
Net realized and unrealized gain (loss)
|
|
5.04
|
|
(5.35
)
|
|
3.74
|
|
4.64
|
|
0.65
|
|
Total from Investment Operations
|
|
4.86
|
|
(5.55
)
|
|
3.54
|
|
4.53
|
|
0.59
|
|
Less Distributions From:
|
|
|
|
|
|
|
|
|
|
|
|
Net realized capital gains
|
|
(2.68
)
|
|
(1.24
)
|
|
(0.99
)
|
|
(0.40
)
|
|
(0.74
)
|
|
Net asset value, end of the period
|
$
|
16.60
|
$
|
14.42
|
$
|
21.21
|
$
|
18.66
|
$
|
14.53
|
|
Total return(b)
|
|
39.68
%
|
|
(28.05
)%
|
|
19.55
%
|
|
31.76
%
|
|
5.05
%
|
|
Ratios to Average Net Assets:
|
|
|
|
|
|
|
|
|
|
|
|
Net assets, end of the period (000’s)
|
$
|
78,116
|
$
|
65,977
|
$
|
127,003
|
$
|
128,764
|
$
|
120,493
|
|
Net expenses
|
|
1.67
%
|
|
1.65
%
|
|
1.63
%
|
|
1.65
%
|
|
1.66
%
|
|
Gross expenses
|
|
1.67
%
|
|
1.65
%
|
|
1.63
%
|
|
1.65
%
|
|
1.66
%
|
|
Net investment loss
|
|
(1.18
)%
|
|
(1.05
)%
|
|
(0.97
)%
|
|
(0.71
)%
|
|
(0.39
)%
|
|
Portfolio turnover rate
|
|
13
%
|
|
20
%
|
|
9
%
|
|
19
%
|
|
7
%
|
|
(a)
|
Per share net investment loss has been calculated using the average shares outstanding during the period.
|
|
(b)
|
A contingent deferred sales charge for Class C shares is not reflected in total return calculations.
|
|
|
Class N
|
|||||||||
|
|
Year Ended
September 30, 2023 |
Year Ended
September 30, 2022 |
Year Ended
September 30, 2021 |
Year Ended
September 30, 2020 |
Year Ended
September 30, 2019 |
|||||
|
Net asset value, beginning of the period
|
$
|
17.87
|
$
|
25.73
|
$
|
22.26
|
$
|
17.17
|
$
|
17.15
|
|
Income (loss) from Investment Operations:
|
|
|
|
|
|
|
|
|
|
|
|
Net investment income (loss)(a)
|
|
(0.02
)
|
|
0.01
|
|
0.02
|
|
0.07
|
|
0.11
|
|
Net realized and unrealized gain (loss)
|
|
6.49
|
|
(6.63
)
|
|
4.49
|
|
5.53
|
|
0.76
|
|
Total from Investment Operations
|
|
6.47
|
|
(6.62
)
|
|
4.51
|
|
5.60
|
|
0.87
|
|
Less Distributions From:
|
|
|
|
|
|
|
|
|
|
|
|
Net investment income
|
|
—
|
|
—
|
|
(0.05
)
|
|
(0.11
)
|
|
(0.11
)
|
|
Net realized capital gains
|
|
(2.68
)
|
|
(1.24
)
|
|
(0.99
)
|
|
(0.40
)
|
|
(0.74
)
|
|
Total Distributions
|
|
(2.68
)
|
|
(1.24
)
|
|
(1.04
)
|
|
(0.51
)
|
|
(0.85
)
|
|
Net asset value, end of the period
|
$
|
21.66
|
$
|
17.87
|
$
|
25.73
|
$
|
22.26
|
$
|
17.17
|
|
Total return
|
|
41.19
%
|
|
(27.25
)%
|
|
20.80
%
|
|
33.26
%
|
|
6.14
%
|
|
Ratios to Average Net Assets:
|
|
|
|
|
|
|
|
|
|
|
|
Net assets, end of the period (000’s)
|
$
|
718,311
|
$
|
663,001
|
$
|
806,186
|
$
|
579,571
|
$
|
442,787
|
|
Net expenses
|
|
0.58
%
|
|
0.57
%
|
|
0.56
%
|
|
0.57
%
|
|
0.56
%
|
|
Gross expenses
|
|
0.58
%
|
|
0.57
%
|
|
0.56
%
|
|
0.57
%
|
|
0.56
%
|
|
Net investment income
|
|
(0.08
)%
|
|
0.04
%
|
|
0.09
%
|
|
0.38
%
|
|
0.69
%
|
|
Portfolio turnover rate
|
|
13
%
|
|
20
%
|
|
9
%
|
|
19
%
|
|
7
%
|
|
(a)
|
Per share net investment income (loss) has been calculated using the average shares outstanding during the period.
|
|
|
Class Y
|
|||||||||
|
|
Year Ended
September 30, 2023 |
Year Ended
September 30, 2022 |
Year Ended
September 30, 2021 |
Year Ended
September 30, 2020 |
Year Ended
September 30, 2019 |
|||||
|
Net asset value, beginning of the period
|
$
|
17.86
|
$
|
25.73
|
$
|
22.26
|
$
|
17.17
|
$
|
17.14
|
|
Income (loss) from Investment Operations:
|
|
|
|
|
|
|
|
|
|
|
|
Net investment income (loss)(a)
|
|
(0.03
)
|
|
(0.01
)
|
|
0.01
|
|
0.05
|
|
0.10
|
|
Net realized and unrealized gain (loss)
|
|
6.46
|
|
(6.62
)
|
|
4.48
|
|
5.53
|
|
0.77
|
|
Total from Investment Operations
|
|
6.43
|
|
(6.63
)
|
|
4.49
|
|
5.58
|
|
0.87
|
|
Less Distributions From:
|
|
|
|
|
|
|
|
|
|
|
|
Net investment income
|
|
—
|
|
—
|
|
(0.03
)
|
|
(0.09
)
|
|
(0.10
)
|
|
Net realized capital gains
|
|
(2.68
)
|
|
(1.24
)
|
|
(0.99
)
|
|
(0.40
)
|
|
(0.74
)
|
|
Total Distributions
|
|
(2.68
)
|
|
(1.24
)
|
|
(1.02
)
|
|
(0.49
)
|
|
(0.84
)
|
|
Net asset value, end of the period
|
$
|
21.61
|
$
|
17.86
|
$
|
25.73
|
$
|
22.26
|
$
|
17.17
|
|
Total return
|
|
40.97
%
|
|
(27.29
)%
|
|
20.72
%
|
|
33.15
%
|
|
6.09
%
|
|
Ratios to Average Net Assets:
|
|
|
|
|
|
|
|
|
|
|
|
Net assets, end of the period (000’s)
|
$
|
9,204,871
|
$
|
7,594,603
|
$
|
11,094,922
|
$
|
9,313,775
|
$
|
7,017,707
|
|
Net expenses
|
|
0.67
%
|
|
0.65
%
|
|
0.64
%
|
|
0.65
%
|
|
0.66
%
|
|
Gross expenses
|
|
0.67
%
|
|
0.65
%
|
|
0.64
%
|
|
0.65
%
|
|
0.66
%
|
|
Net investment income (loss)
|
|
(0.17
)%
|
|
(0.05
)%
|
|
0.02
%
|
|
0.27
%
|
|
0.60
%
|
|
Portfolio turnover rate
|
|
13
%
|
|
20
%
|
|
9
%
|
|
19
%
|
|
7
%
|
|
(a)
|
Per share net investment income (loss) has been calculated using the average shares outstanding during the period.
|
|
|
Class A
|
|||||||||
|
|
Year Ended
September 30, 2023 |
Year Ended
September 30, 2022 |
Year Ended
September 30, 2021 |
Year Ended
September 30, 2020 |
Year Ended
September 30, 2019 |
|||||
|
Net asset value, beginning of the period
|
$
|
9.23
|
$
|
10.58
|
$
|
10.99
|
$
|
10.51
|
$
|
9.97
|
|
Income (loss) from Investment Operations:
|
|
|
|
|
|
|
|
|
|
|
|
Net investment income(a)
|
|
0.29
|
|
0.15
|
|
0.11
|
|
0.19
|
|
0.25
|
|
Net realized and unrealized gain (loss)
|
|
(0.06
)
|
|
(1.30
)
|
|
(0.11
)
|
|
0.54
|
|
0.55
|
|
Total from Investment Operations
|
|
0.23
|
|
(1.15
)
|
|
(0.00
)
(b)
|
|
0.73
|
|
0.80
|
|
Less Distributions From:
|
|
|
|
|
|
|
|
|
|
|
|
Net investment income
|
|
(0.30
)
|
|
(0.15
)
|
|
(0.12
)
|
|
(0.20
)
|
|
(0.26
)
|
|
Net realized capital gains
|
|
—
|
|
(0.05
)
|
|
(0.29
)
|
|
(0.05
)
|
|
—
|
|
Total Distributions
|
|
(0.30
)
|
|
(0.20
)
|
|
(0.41
)
|
|
(0.25
)
|
|
(0.26
)
|
|
Net asset value, end of the period
|
$
|
9.16
|
$
|
9.23
|
$
|
10.58
|
$
|
10.99
|
$
|
10.51
|
|
Total return(c)(d)
|
|
2.53
%
|
|
(10.98
)%
|
|
(0.06
)%
|
|
7.06
%
|
|
8.11
%
|
|
Ratios to Average Net Assets:
|
|
|
|
|
|
|
|
|
|
|
|
Net assets, end of the period (000’s)
|
$
|
7,150
|
$
|
18,077
|
$
|
20,942
|
$
|
19,962
|
$
|
21,415
|
|
Net expenses(e)
|
|
0.65
%
|
|
0.65
%
|
|
0.65
%
|
|
0.65
%
|
|
0.65
%
|
|
Gross expenses
|
|
0.71
%
|
|
0.68
%
|
|
0.70
%
|
|
0.72
%
|
|
0.72
%
|
|
Net investment income
|
|
3.12
%
|
|
1.49
%
|
|
1.03
%
|
|
1.78
%
|
|
2.42
%
|
|
Portfolio turnover rate
|
|
138
%
|
|
144
%
|
|
100
%
|
|
123
%
|
|
135
%
|
|
(a)
|
Per share net investment income has been calculated using the average shares outstanding during the period.
|
|
(b)
|
Amount rounds to less than $0.01 per share.
|
|
(c)
|
A sales charge for Class A shares is not reflected in total return calculations.
|
|
(d)
|
Had certain expenses not been waived/reimbursed during the period, total returns would have been lower.
|
|
(e)
|
The investment adviser agreed to waive its fees and/or reimburse a portion of the Fund’s expenses during the period. Without this waiver/reimbursement, expenses would have been higher.
|
|
|
Class C
|
|||||||||
|
|
Year Ended
September 30, 2023 |
Year Ended
September 30, 2022 |
Year Ended
September 30, 2021 |
Year Ended
September 30, 2020 |
Year Ended
September 30, 2019 |
|||||
|
Net asset value, beginning of the period
|
$
|
9.27
|
$
|
10.62
|
$
|
11.02
|
$
|
10.54
|
$
|
10.00
|
|
Income (loss) from Investment Operations:
|
|
|
|
|
|
|
|
|
|
|
|
Net investment income(a)
|
|
0.24
|
|
0.06
|
|
0.03
|
|
0.11
|
|
0.17
|
|
Net realized and unrealized gain (loss)
|
|
(0.08
)
|
|
(1.29
)
|
|
(0.11
)
|
|
0.54
|
|
0.55
|
|
Total from Investment Operations
|
|
0.16
|
|
(1.23
)
|
|
(0.08
)
|
|
0.65
|
|
0.72
|
|
Less Distributions From:
|
|
|
|
|
|
|
|
|
|
|
|
Net investment income
|
|
(0.24
)
|
|
(0.07
)
|
|
(0.03
)
|
|
(0.12
)
|
|
(0.18
)
|
|
Net realized capital gains
|
|
—
|
|
(0.05
)
|
|
(0.29
)
|
|
(0.05
)
|
|
—
|
|
Total Distributions
|
|
(0.24
)
|
|
(0.12
)
|
|
(0.32
)
|
|
(0.17
)
|
|
(0.18
)
|
|
Net asset value, end of the period
|
$
|
9.19
|
$
|
9.27
|
$
|
10.62
|
$
|
11.02
|
$
|
10.54
|
|
Total return(b)(c)
|
|
1.69
%
|
|
(11.65
)%
|
|
(0.76
)%
|
|
6.27
%
|
|
7.28
%
|
|
Ratios to Average Net Assets:
|
|
|
|
|
|
|
|
|
|
|
|
Net assets, end of the period (000’s)
|
$
|
698
|
$
|
174
|
$
|
315
|
$
|
668
|
$
|
467
|
|
Net expenses(d)
|
|
1.40
%
|
|
1.40
%
|
|
1.40
%
|
|
1.40
%
|
|
1.40
%
|
|
Gross expenses
|
|
1.46
%
|
|
1.43
%
|
|
1.45
%
|
|
1.46
%
|
|
1.48
%
|
|
Net investment income
|
|
2.53
%
|
|
0.60
%
|
|
0.30
%
|
|
1.00
%
|
|
1.64
%
|
|
Portfolio turnover rate
|
|
138
%
|
|
144
%
|
|
100
%
|
|
123
%
|
|
135
%
|
|
(a)
|
Per share net investment income has been calculated using the average shares outstanding during the period.
|
|
(b)
|
A contingent deferred sales charge for Class C shares is not reflected in total return calculations.
|
|
(c)
|
Had certain expenses not been waived/reimbursed during the period, total returns would have been lower.
|
|
(d)
|
The investment adviser agreed to waive its fees and/or reimburse a portion of the Fund’s expenses during the period. Without this waiver/reimbursement, expenses would have been higher.
|
|
|
Class N
|
|||||||||
|
|
Year Ended
September 30, 2023 |
Year Ended
September 30, 2022 |
Year Ended
September 30, 2021 |
Year Ended
September 30, 2020 |
Period Ended
September 30, 2019* |
|||||
|
Net asset value, beginning of the period
|
$
|
9.22
|
$
|
10.57
|
$
|
10.98
|
$
|
10.50
|
$
|
10.07
|
|
Income (loss) from Investment Operations:
|
|
|
|
|
|
|
|
|
|
|
|
Net investment income(a)
|
|
0.33
|
|
0.18
|
|
0.14
|
|
0.22
|
|
0.17
|
|
Net realized and unrealized gain (loss)
|
|
(0.06
)
|
|
(1.30
)
|
|
(0.11
)
|
|
0.54
|
|
0.45
|
|
Total from Investment Operations
|
|
0.27
|
|
(1.12
)
|
|
0.03
|
|
0.76
|
|
0.62
|
|
Less Distributions From:
|
|
|
|
|
|
|
|
|
|
|
|
Net investment income
|
|
(0.33
)
|
|
(0.18
)
|
|
(0.15
)
|
|
(0.23
)
|
|
(0.19
)
|
|
Net realized capital gains
|
|
—
|
|
(0.05
)
|
|
(0.29
)
|
|
(0.05
)
|
|
—
|
|
Total Distributions
|
|
(0.33
)
|
|
(0.23
)
|
|
(0.44
)
|
|
(0.28
)
|
|
(0.19
)
|
|
Net asset value, end of the period
|
$
|
9.16
|
$
|
9.22
|
$
|
10.57
|
$
|
10.98
|
$
|
10.50
|
|
Total return(b)
|
|
2.97
%
|
|
(10.73
)%
|
|
0.25
%
|
|
7.39
%
|
|
6.19
%
(c)
|
|
Ratios to Average Net Assets:
|
|
|
|
|
|
|
|
|
|
|
|
Net assets, end of the period (000’s)
|
$
|
55,983
|
$
|
19,294
|
$
|
20,094
|
$
|
3,307
|
$
|
3,546
|
|
Net expenses(d)
|
|
0.35
%
|
|
0.35
%
|
|
0.35
%
|
|
0.35
%
|
|
0.35
%
(e)
|
|
Gross expenses
|
|
0.39
%
|
|
0.37
%
|
|
0.38
%
|
|
0.43
%
|
|
0.42
%
(e)
|
|
Net investment income
|
|
3.60
%
|
|
1.80
%
|
|
1.32
%
|
|
2.09
%
|
|
2.54
%
(e)
|
|
Portfolio turnover rate
|
|
138
%
|
|
144
%
|
|
100
%
|
|
123
%
|
|
135
%
(f)
|
|
*
|
From commencement of Class operations on February 1, 2019 through September 30, 2019.
|
|
(a)
|
Per share net investment income has been calculated using the average shares outstanding during the period.
|
|
(b)
|
Had certain expenses not been waived/reimbursed during the period, total returns would have been lower.
|
|
(c)
|
Periods less than one year are not annualized.
|
|
(d)
|
The investment adviser agreed to waive its fees and/or reimburse a portion of the Fund’s expenses during the period. Without this waiver/reimbursement, expenses would have been higher.
|
|
(e)
|
Computed on an annualized basis for periods less than one year.
|
|
(f)
|
Represents the Fund’s portfolio turnover rate for year ended September 30, 2019.
|
|
|
Class Y
|
|||||||||
|
|
Year Ended
September 30, 2023 |
Year Ended
September 30, 2022 |
Year Ended
September 30, 2021 |
Year Ended
September 30, 2020 |
Year Ended
September 30, 2019 |
|||||
|
Net asset value, beginning of the period
|
$
|
9.23
|
$
|
10.58
|
$
|
10.99
|
$
|
10.51
|
$
|
9.97
|
|
Income (loss) from Investment Operations:
|
|
|
|
|
|
|
|
|
|
|
|
Net investment income(a)
|
|
0.32
|
|
0.17
|
|
0.14
|
|
0.21
|
|
0.27
|
|
Net realized and unrealized gain (loss)
|
|
(0.06
)
|
|
(1.29
)
|
|
(0.11
)
|
|
0.54
|
|
0.55
|
|
Total from Investment Operations
|
|
0.26
|
|
(1.12
)
|
|
0.03
|
|
0.75
|
|
0.82
|
|
Less Distributions From:
|
|
|
|
|
|
|
|
|
|
|
|
Net investment income
|
|
(0.33
)
|
|
(0.18
)
|
|
(0.15
)
|
|
(0.22
)
|
|
(0.28
)
|
|
Net realized capital gains
|
|
—
|
|
(0.05
)
|
|
(0.29
)
|
|
(0.05
)
|
|
—
|
|
Total Distributions
|
|
(0.33
)
|
|
(0.23
)
|
|
(0.44
)
|
|
(0.27
)
|
|
(0.28
)
|
|
Net asset value, end of the period
|
$
|
9.16
|
$
|
9.23
|
$
|
10.58
|
$
|
10.99
|
$
|
10.51
|
|
Total return(b)
|
|
2.81
%
|
|
(10.76
)%
|
|
0.20
%
|
|
7.33
%
|
|
8.38
%
|
|
Ratios to Average Net Assets:
|
|
|
|
|
|
|
|
|
|
|
|
Net assets, end of the period (000’s)
|
$
|
281,284
|
$
|
255,418
|
$
|
340,326
|
$
|
293,577
|
$
|
215,752
|
|
Net expenses(c)
|
|
0.40
%
|
|
0.40
%
|
|
0.40
%
|
|
0.40
%
|
|
0.40
%
|
|
Gross expenses
|
|
0.46
%
|
|
0.44
%
|
|
0.45
%
|
|
0.47
%
|
|
0.48
%
|
|
Net investment income
|
|
3.47
%
|
|
1.70
%
|
|
1.28
%
|
|
2.01
%
|
|
2.67
%
|
|
Portfolio turnover rate
|
|
138
%
|
|
144
%
|
|
100
%
|
|
123
%
|
|
135
%
|
|
(a)
|
Per share net investment income has been calculated using the average shares outstanding during the period.
|
|
(b)
|
Had certain expenses not been waived/reimbursed during the period, total returns would have been lower.
|
|
(c)
|
The investment adviser agreed to waive its fees and/or reimburse a portion of the Fund’s expenses during the period. Without this waiver/reimbursement, expenses would have been higher.
|
|
|
Class A
|
|||||||||
|
|
Year Ended
September 30, 2023 |
Year Ended
September 30, 2022 |
Year Ended
September 30, 2021 |
Year Ended
September 30, 2020 |
Year Ended
September 30, 2019 |
|||||
|
Net asset value, beginning of the period
|
$
|
10.65
|
$
|
11.40
|
$
|
11.54
|
$
|
11.34
|
$
|
11.09
|
|
Income (loss) from Investment Operations:
|
|
|
|
|
|
|
|
|
|
|
|
Net investment income(a)
|
|
0.32
|
|
0.07
|
|
0.04
|
|
0.11
|
|
0.15
|
|
Net realized and unrealized gain (loss)
|
|
(0.04
)
|
|
(0.72
)
|
|
(0.11
)
|
|
0.25
|
|
0.34
|
|
Total from Investment Operations
|
|
0.28
|
|
(0.65
)
|
|
(0.07
)
|
|
0.36
|
|
0.49
|
|
Less Distributions From:
|
|
|
|
|
|
|
|
|
|
|
|
Net investment income
|
|
(0.36
)
|
|
(0.10
)
|
|
(0.07
)
|
|
(0.16
)
|
|
(0.24
)
|
|
Net asset value, end of the period
|
$
|
10.57
|
$
|
10.65
|
$
|
11.40
|
$
|
11.54
|
$
|
11.34
|
|
Total return(b)
|
|
2.64
%
(c)
|
|
(5.75
)%
(c)
|
|
(0.58
)%
(c)
|
|
3.19
%
|
|
4.42
%
|
|
Ratios to Average Net Assets:
|
|
|
|
|
|
|
|
|
|
|
|
Net assets, end of the period (000’s)
|
$
|
209,032
|
$
|
246,532
|
$
|
287,244
|
$
|
296,217
|
$
|
308,186
|
|
Net expenses
|
|
0.69
%
(d)(e)
|
|
0.69
%
(d)(f)
|
|
0.73
%
(d)(f)(g)
|
|
0.78
%
(h)
|
|
0.80
%
|
|
Gross expenses
|
|
0.77
%
(e)
|
|
0.72
%
(f)
|
|
0.73
%
(f)
|
|
0.78
%
|
|
0.80
%
|
|
Net investment income
|
|
3.04
%
|
|
0.65
%
|
|
0.36
%
|
|
0.93
%
|
|
1.31
%
|
|
Portfolio turnover rate
|
|
267
%
|
|
203
%
|
|
247
%
|
|
319
%
(i)
|
|
527
%
(i)
|
|
(a)
|
Per share net investment income has been calculated using the average shares outstanding during the period.
|
|
(b)
|
A sales charge for Class A shares is not reflected in total return calculations.
|
|
(c)
|
Had certain expenses not been waived/reimbursed during the period, total returns would have been lower.
|
|
(d)
|
The investment adviser agreed to waive its fees and/or reimburse a portion of the Fund’s expenses during the period. Without this waiver/reimbursement, expenses would have been higher.
|
|
(e)
|
Includes refund of prior year service fee of 0.01%.
|
|
(f)
|
Includes refund of prior year service fee of 0.01%.
|
|
(g)
|
Effective July 1, 2021, the expense limit decreased from 0.75% to 0.70%.
|
|
(h)
|
Effective July 1, 2020, the expense limit decreased from 0.80% to 0.75%.
|
|
(i)
|
The variation in the Fund’s turnover rate from 2019 to 2020 is due to changes in volume of U.S. Treasury securities related to certain trading strategies.
|
|
|
Class C
|
|||||||||
|
|
Year Ended
September 30, 2023 |
Year Ended
September 30, 2022 |
Year Ended
September 30, 2021 |
Year Ended
September 30, 2020 |
Year Ended
September 30, 2019 |
|||||
|
Net asset value, beginning of the period
|
$
|
10.62
|
$
|
11.38
|
$
|
11.54
|
$
|
11.35
|
$
|
11.10
|
|
Income (loss) from Investment Operations:
|
|
|
|
|
|
|
|
|
|
|
|
Net investment income (loss)(a)
|
|
0.24
|
|
(0.02
)
|
|
(0.05
)
|
|
0.02
|
|
0.06
|
|
Net realized and unrealized gain (loss)
|
|
(0.04
)
|
|
(0.71
)
|
|
(0.11
)
|
|
0.24
|
|
0.34
|
|
Total from Investment Operations
|
|
0.20
|
|
(0.73
)
|
|
(0.16
)
|
|
0.26
|
|
0.40
|
|
Less Distributions From:
|
|
|
|
|
|
|
|
|
|
|
|
Net investment income
|
|
(0.28
)
|
|
(0.03
)
|
|
(0.00
)
(b)
|
|
(0.07
)
|
|
(0.15
)
|
|
Net asset value, end of the period
|
$
|
10.54
|
$
|
10.62
|
$
|
11.38
|
$
|
11.54
|
$
|
11.35
|
|
Total return(c)
|
|
1.86
%
(d)
|
|
(6.43
)%
(d)
|
|
(1.35
)%
(d)
|
|
2.34
%
|
|
3.64
%
|
|
Ratios to Average Net Assets:
|
|
|
|
|
|
|
|
|
|
|
|
Net assets, end of the period (000’s)
|
$
|
8,510
|
$
|
14,145
|
$
|
24,922
|
$
|
19,628
|
$
|
22,142
|
|
Net expenses
|
|
1.45
%
(e)
|
|
1.45
%
(e)
|
|
1.48
%
(e)(f)
|
|
1.53
%
(g)
|
|
1.55
%
|
|
Gross expenses
|
|
1.53
%
|
|
1.48
%
|
|
1.49
%
|
|
1.53
%
|
|
1.55
%
|
|
Net investment income (loss)
|
|
2.24
%
|
|
(0.16
)%
|
|
(0.40
)%
|
|
0.18
%
|
|
0.57
%
|
|
Portfolio turnover rate
|
|
267
%
|
|
203
%
|
|
247
%
|
|
319
%
(h)
|
|
527
%
(h)
|
|
(a)
|
Per share net investment income (loss) has been calculated using the average shares outstanding during the period.
|
|
(b)
|
Amount rounds to less than $0.01 per share.
|
|
(c)
|
A contingent deferred sales charge for Class C shares is not reflected in total return calculations.
|
|
(d)
|
Had certain expenses not been waived/reimbursed during the period, total returns would have been lower.
|
|
(e)
|
The investment adviser agreed to waive its fees and/or reimburse a portion of the Fund’s expenses during the period. Without this waiver/reimbursement, expenses would have been higher.
|
|
(f)
|
Effective July 1, 2021, the expense limit decreased from 1.50% to 1.45%.
|
|
(g)
|
Effective July 1, 2020, the expense limit decreased from 1.55% to 1.50%.
|
|
(h)
|
The variation in the Fund’s turnover rate from 2019 to 2020 is due to changes in volume of U.S. Treasury securities related to certain trading strategies.
|
|
|
Class N
|
|||||||||
|
|
Year Ended
September 30, 2023 |
Year Ended
September 30, 2022 |
Year Ended
September 30, 2021 |
Year Ended
September 30, 2020 |
Year Ended
September 30, 2019 |
|||||
|
Net asset value, beginning of the period
|
$
|
10.68
|
$
|
11.43
|
$
|
11.57
|
$
|
11.37
|
$
|
11.12
|
|
Income (loss) from Investment Operations:
|
|
|
|
|
|
|
|
|
|
|
|
Net investment income(a)
|
|
0.37
|
|
0.11
|
|
0.08
|
|
0.14
|
|
0.19
|
|
Net realized and unrealized gain (loss)
|
|
(0.06
)
|
|
(0.73
)
|
|
(0.11
)
|
|
0.26
|
|
0.33
|
|
Total from Investment Operations
|
|
0.31
|
|
(0.62
)
|
|
(0.03
)
|
|
0.40
|
|
0.52
|
|
Less Distributions From:
|
|
|
|
|
|
|
|
|
|
|
|
Net investment income
|
|
(0.39
)
|
|
(0.13
)
|
|
(0.11
)
|
|
(0.20
)
|
|
(0.27
)
|
|
Net asset value, end of the period
|
$
|
10.60
|
$
|
10.68
|
$
|
11.43
|
$
|
11.57
|
$
|
11.37
|
|
Total return(b)
|
|
2.94
%
|
|
(5.45
)%
|
|
(0.25
)%
|
|
3.53
%
|
|
4.77
%
|
|
Ratios to Average Net Assets:
|
|
|
|
|
|
|
|
|
|
|
|
Net assets, end of the period (000’s)
|
$
|
45,716
|
$
|
19,656
|
$
|
12,972
|
$
|
11,035
|
$
|
5,272
|
|
Net expenses(c)
|
|
0.40
%
|
|
0.39
%
|
|
0.40
%
(d)
|
|
0.45
%
(e)
|
|
0.46
%
|
|
Gross expenses
|
|
0.43
%
|
|
0.40
%
|
|
0.41
%
|
|
0.46
%
|
|
0.48
%
|
|
Net investment income
|
|
3.44
%
|
|
1.03
%
|
|
0.68
%
|
|
1.20
%
|
|
1.65
%
|
|
Portfolio turnover rate
|
|
267
%
|
|
203
%
|
|
247
%
|
|
319
%
(f)
|
|
527
%
(f)
|
|
(a)
|
Per share net investment income has been calculated using the average shares outstanding during the period.
|
|
(b)
|
Had certain expenses not been waived/reimbursed during the period, total returns would have been lower.
|
|
(c)
|
The investment adviser agreed to waive its fees and/or reimburse a portion of the Fund’s expenses during the period. Without this waiver/reimbursement, expenses would have been higher.
|
|
(d)
|
Effective July 1, 2021, the expense limit decreased from 0.45% to 0.40%.
|
|
(e)
|
Effective July 1, 2020, the expense limit decreased from 0.50% to 0.45%.
|
|
(f)
|
The variation in the Fund’s turnover rate from 2019 to 2020 is due to changes in volume of U.S. Treasury securities related to certain trading strategies.
|
|
|
Class Y
|
|||||||||
|
|
Year Ended
September 30, 2023 |
Year Ended
September 30, 2022 |
Year Ended
September 30, 2021 |
Year Ended
September 30, 2020 |
Year Ended
September 30, 2019 |
|||||
|
Net asset value, beginning of the period
|
$
|
10.69
|
$
|
11.43
|
$
|
11.57
|
$
|
11.38
|
$
|
11.13
|
|
Income (loss) from Investment Operations:
|
|
|
|
|
|
|
|
|
|
|
|
Net investment income(a)
|
|
0.35
|
|
0.10
|
|
0.07
|
|
0.13
|
|
0.17
|
|
Net realized and unrealized gain (loss)
|
|
(0.05
)
|
|
(0.72
)
|
|
(0.11
)
|
|
0.25
|
|
0.34
|
|
Total from Investment Operations
|
|
0.30
|
|
(0.62
)
|
|
(0.04
)
|
|
0.38
|
|
0.51
|
|
Less Distributions From:
|
|
|
|
|
|
|
|
|
|
|
|
Net investment income
|
|
(0.39
)
|
|
(0.12
)
|
|
(0.10
)
|
|
(0.19
)
|
|
(0.26
)
|
|
Net asset value, end of the period
|
$
|
10.60
|
$
|
10.69
|
$
|
11.43
|
$
|
11.57
|
$
|
11.38
|
|
Total return
|
|
2.79
%
(b)
|
|
(5.42
)%
(b)
|
|
(0.33
)%
(b)
|
|
3.35
%
|
|
4.67
%
|
|
Ratios to Average Net Assets:
|
|
|
|
|
|
|
|
|
|
|
|
Net assets, end of the period (000’s)
|
$
|
486,496
|
$
|
491,162
|
$
|
707,904
|
$
|
691,616
|
$
|
457,248
|
|
Net expenses
|
|
0.45
%
(c)
|
|
0.45
%
(c)
|
|
0.48
%
(c)(d)
|
|
0.53
%
(e)
|
|
0.55
%
|
|
Gross expenses
|
|
0.53
%
|
|
0.48
%
|
|
0.49
%
|
|
0.53
%
|
|
0.55
%
|
|
Net investment income
|
|
3.30
%
|
|
0.87
%
|
|
0.61
%
|
|
1.11
%
|
|
1.55
%
|
|
Portfolio turnover rate
|
|
267
%
|
|
203
%
|
|
247
%
|
|
319
%
(f)
|
|
527
%
(f)
|
|
(a)
|
Per share net investment income has been calculated using the average shares outstanding during the period.
|
|
(b)
|
Had certain expenses not been waived/reimbursed during the period, total returns would have been lower.
|
|
(c)
|
The investment adviser agreed to waive its fees and/or reimburse a portion of the Fund’s expenses during the period. Without this waiver/reimbursement, expenses would have been higher.
|
|
(d)
|
Effective July 1, 2021, the expense limit decreased from 0.50% to 0.45%.
|
|
(e)
|
Effective July 1, 2020, the expense limit decreased from 0.55% to 0.50%.
|
|
(f)
|
The variation in the Fund’s turnover rate from 2019 to 2020 is due to changes in volume of U.S. Treasury securities related to certain trading strategies.
|
|
•
|
The redemption and repurchase occur in the same account.
|
|
•
|
The redemption proceeds are used to process an: IRA contribution, excess contributions, conversion, recharacterizing of contributions, or distribution, and the repurchase is done in an account within the same Edward Jones grouping for ROA.
|
|
•
|
Employer-sponsored retirement, deferred compensation and employee benefit plans (including health savings accounts) and trusts used to fund those plans, provided that the shares are not held in a commission-based brokerage account and shares are held for the benefit of the plan;
|
|
•
|
Shares purchased by a 529 Plan (does not include 529 Plan units or 529-specific share classes or equivalents);
|
|
•
|
Shares purchased through a Merrill Lynch affiliated investment advisory program;
|
|
•
|
Shares exchanged due to the holdings moving from a Merrill Lynch affiliated investment advisory program to a Merrill Lynch brokerage (non-advisory) account pursuant to Merrill Lynch’s policies relating to sales load discounts and waivers
|
|
•
|
Shares purchased by third party investment advisors on behalf of their advisory clients through Merrill Lynch’s platform;
|
|
•
|
Shares of funds purchased through the Merrill Edge Self-Directed platform (if applicable);
|
|
•
|
Shares purchased through reinvestment of capital gains distributions and dividend reinvestment when purchasing shares of the same fund (but not any other fund within the fund family);
|
|
•
|
Shares exchanged from Class C (i.e., level-load) shares of the same fund pursuant to Merrill Lynch’s policies and procedures relating to sales load discounts and waivers;
|
|
•
|
Employees and registered representatives of Merrill Lynch or its affiliates and their family members;
|
|
•
|
Directors or Trustees of the Fund, and employees of the Fund’s investment adviser or any of its affiliates, as described in the Prospectus; and
|
|
•
|
Eligible shares purchased from the proceeds of redemptions within the same fund family, provided (1) the repurchase occurs within 90 days following the redemption, (2) the redemption and purchase occur in the same account, and (3) redeemed shares were subject to a front-end or deferred sales load (known as Rights of Reinstatement). Automated transactions (i.e. systematic purchases and withdrawals) and purchases made after shares are automatically sold to pay Merrill Lynch’s account maintenance fees are not eligible for reinstatement.
|
|
•
|
Death or disability of the shareholder;
|
|
•
|
Shares sold as part of a systematic withdrawal plan as described in the Fund’s Prospectus;
|
|
•
|
Return of excess contributions from an IRA account;
|
|
•
|
Shares sold as part of a required minimum distribution for IRA and retirement accounts pursuant to the Internal Revenue Code;
|
|
•
|
Shares sold to pay Merrill Lynch fees but only if the transaction is initiated by Merrill Lynch;
|
|
•
|
Shares acquired through a right of reinstatement; and
|
|
•
|
Shares held in retirement brokerage accounts, that are exchanged for a lower cost share class due to transfer to a fee based account or platform (applicable to Class A and C shares only).
|
|
•
|
Shares received through an exchange due to the holdings moving from a Merrill Lynch affiliated investment advisory program to a Merrill Lynch brokerage (non-advisory) account pursuant to Merrill Lynch’s policies relating to sales load discounts and waivers.
|
|
•
|
Breakpoints as described in this Prospectus;
|
|
•
|
Rights of Accumulation (ROA) which entitle shareholders to breakpoint discounts as described in this prospectus will be automatically calculated based on the aggregated holding of fund family assets held by accounts (including 529 program holdings where applicable) within the purchaser’s household at
|
|
Merrill Lynch. Eligible fund family assets not held at Merrill Lynch may be included in the ROA calculation only if the shareholder notifies his or her financial advisor about such assets; and
|
|
•
|
Letters of Intent (LOI) which allow for breakpoint discounts based on anticipated purchases within a fund family, through Merrill Lynch, over a 13-month period of time (if applicable).
|
|
Blended Index
|
A combination of benchmarks against which a portfolio can be compared. Weights are assigned to each individual benchmark in the blend, and a rebalancing frequency is set for how often the blend is reset to its original weights. These rebalancings will not necessarily correspond to the rebalancing of the Loomis Sayles Global Allocation Fund’s investment portfolio, and the relative weightings of the asset classes in the Fund will generally differ to some extent from the weightings in the Blended Index. The blended index for the Loomis Sayles Global Allocation Fund is composed of the following weights: 60% MSCI All Country World Index (Net)/40% Bloomberg Global Aggregate Bond Index.
|
|
Bloomberg U.S. 1-5 Year Government Bond Index
|
A subindex of the Bloomberg U.S. Government Index, which is comprised of the Bloomberg U.S Treasury and U.S. Agency Indices. The Bloomberg U.S. Government Index includes Treasuries (public obligations of the U.S. Treasury that have remaining maturities of more than one year) and U.S. agency debentures (publicly issued debt of U.S. Government agencies, quasi-federal corporations, and corporate or foreign debt guaranteed by the US Government). The Bloomberg U.S. Government Index is a component of the Bloomberg U.S. Government/Credit Bond Index and the Bloomberg U.S. Aggregate Bond Index.
|
|
Bloomberg U.S. Aggregate Bond Index
|
A broad-based index that covers the U.S. dollar-denominated, investment-grade, fixed-rate, taxable bond market of SEC-registered securities. The index includes bonds from the U.S. Treasury, government-related, corporate, mortgage-backed securities, asset-backed securities, and collateralized mortgage-backed securities sectors.
|
|
Bloomberg U.S. Intermediate Government/Credit Bond Index
|
Includes securities in the intermediate maturity range within the Government and Credit Indices. The Government Index includes treasuries (i.e., public obligations of the U.S. Treasury that have remaining maturities of more than one year) and agencies (i.e., publicly issued debt of U.S. Government agencies, quasi-federal corporations, and corporate or foreign debt guaranteed by the U.S. Government). The Credit Index includes publicly issued US corporate and foreign debentures and secured notes that meet specified maturity, liquidity, and quality requirements.
|
|
MSCI All Country World Index (Net)
|
A free float-adjusted market capitalization weighted index that is designed to measure the equity market performance of developed and emerging markets.
|
|
Russell 1000® Growth Index
|
An unmanaged index that measures the performance of the large-cap growth segment of the US equity universe. It includes those Russell 1000® companies with higher price-to-book ratios and higher forecasted growth values.
|
|
S&P 500® Index
|
The index measures the performance of 500 widely held stocks in US equity market. Standard and Poor’s chooses member companies for the index based on market size, liquidity and industry group representation.
|
|
Investment Company Act File No. 811-06241
|
XB51-0224
|
|
Investment Company Act File No. 811-08282
|
|
|
Investment Company Act File No. 811-04323
|

|
|
Admin
Class |
Retail
Class |
Institutional
Class |
Class
N |
|
Loomis Sayles Fixed Income Fund
|
|
|
LSFIX
|
|
|
Loomis Sayles Global Bond Fund
|
|
LSGLX
|
LSGBX
|
LSGNX
|
|
Loomis Sayles Inflation Protected Securities Fund
|
|
LIPRX
|
LSGSX
|
LIPNX
|
|
Loomis Sayles Institutional High Income Fund
|
|
|
LSHIX
|
|
|
Loomis Sayles Small Cap Growth Fund
|
|
LCGRX
|
LSSIX
|
LSSNX
|
|
Loomis Sayles Small Cap Value Fund
|
LSVAX
|
LSCRX
|
LSSCX
|
LSCNX
|
|
Loomis Sayles Small/Mid Cap Growth Fund
|
|
|
LSMIX
|
LSMNX
|
|
(expenses that you pay each year as a percentage of the value of your investment)
|
Institutional Class
|
|
Management fees
|
0.50%
|
|
Distribution and/or service (12b-1) fees
|
0.00%
|
|
Other expenses
|
0.11%
|
|
Total annual fund operating expenses
|
0.61%
|
|
Fee waiver and/or expense reimbursement1
|
0.00%
|
|
Total annual fund operating expenses after fee waiver and/or expense reimbursement
|
0.61%
|
| 1 | Loomis, Sayles & Company, L.P. (“Loomis Sayles” or the “Adviser”) has given a binding contractual undertaking to the Fund to limit the amount of the Fund’s total annual fund operating expenses to 0.65% of the Fund’s average daily net assets, exclusive of brokerage expenses, interest expense, taxes, acquired fund fees and expenses, organizational and extraordinary expenses, such as litigation and indemnification expenses. This undertaking is in effect through January 31, 2025 and may be terminated before then only with the consent of the Fund’s Board of Trustees. The Adviser will be permitted to recover management fees waived and/or expenses reimbursed to the extent that expenses in later periods fall below both (1) the class’ applicable expense limitation at the time such amounts were waived/reimbursed and (2) the class’ current applicable expense limitation. The Fund will not be obligated to repay any such waived/reimbursed fees and expenses more than one year after the end of the fiscal year in which the fees or expenses were waived/reimbursed. |
|
|
1 year
|
3 years
|
5 years
|
10 years
|
||||
|
Institutional Class
|
$
|
62
|
$
|
195
|
$
|
340
|
$
|
762
|
 |
Highest Quarterly Return:
Second Quarter 2020, 9.15% Lowest Quarterly Return: First Quarter 2020, -12.99% |
|
Average Annual Total Returns
|
|
|
|
|
(for the periods ended December 31, 2023)
|
Past 1 Year
|
Past 5 Years
|
Past 10 Years
|
|
Institutional Class - Return Before Taxes
|
8.20%
|
3.29%
|
2.93%
|
|
Return After Taxes on Distributions
|
6.34%
|
1.69%
|
1.04%
|
|
Return After Taxes on Distributions and Sale of Fund Shares
|
4.86%
|
2.01%
|
1.55%
|
|
Bloomberg U.S. Aggregate Bond Index1
|
5.53%
|
1.10%
|
1.81%
|
|
Bloomberg U.S. Government/Credit Bond Index
|
5.72%
|
1.41%
|
1.97%
|
| 1 | Effective February 1, 2024, the Fund’s primary broad-based performance index changed to the Bloomberg U.S. Aggregate Bond Index. The Bloomberg U.S. Aggregate Bond Index is a broad-based securities market index that represents the overall market applicable to the Fund. The Bloomberg U.S. Aggregate Bond Index replaced the Bloomberg U.S. Government/Credit Bond Index as the Fund’s primary benchmark because the Fund believes it provides a more appropriate comparison to the Fund’s investable universe. |
|
•
|
Fund Trustees, former Fund trustees, employees of affiliates of the Loomis Sayles Funds and other individuals who are affiliated with any Loomis Sayles Fund (this also applies to any spouse, parents, children, siblings, grandparents, grandchildren and in-laws of those mentioned) and Natixis affiliate employee benefit plans.
|
|
(expenses that you pay each year as a percentage of the value of your investment)
|
Institutional Class
|
Retail Class
|
Class N
|
|
Management fees
|
0.55%
|
0.55%
|
0.55%
|
|
Distribution and/or service (12b-1) fees
|
0.00%
|
0.25%
|
0.00%
|
|
Other expenses
|
0.23%
|
0.23%
|
0.13%
|
|
Total annual fund operating expenses
|
0.78%
|
1.03%
|
0.68%
|
|
Fee waiver and/or expense reimbursement1
|
0.09%
|
0.09%
|
0.04%
|
|
Total annual fund operating expenses after fee waiver and/or expense reimbursement
|
0.69%
|
0.94%
|
0.64%
|
| 1 | Loomis, Sayles & Company, L.P. (“Loomis Sayles” or the “Adviser”) has given a binding contractual undertaking to the Fund to limit the amount of the Fund’s total annual fund operating expenses to 0.69%, 0.94% and 0.64% of the Fund’s average daily net assets for Institutional Class shares, Retail Class shares and Class N shares, respectively, exclusive of brokerage expenses, interest expense, taxes, acquired fund fees and expenses, organizational and extraordinary expenses, such as litigation and indemnification expenses. This undertaking is in effect through January 31, 2025 and may be terminated before then only with the consent of the Fund’s Board of Trustees. The Adviser will be permitted to recover, on a class by class basis, management fees waived and/or expenses reimbursed to the extent that expenses in later periods fall below both (1) the class’ applicable expense limitation at the time such amounts were waived/reimbursed and (2) the class’ current applicable expense limitation. The Fund will not be obligated to repay any such waived/reimbursed fees and expenses more than one year after the end of the fiscal year in which the fees or expenses were waived/reimbursed. |
|
|
1 year
|
3 years
|
5 years
|
10 years
|
||||
|
Institutional Class
|
$
|
70
|
$
|
240
|
$
|
424
|
$
|
958
|
|
Retail Class
|
$
|
96
|
$
|
319
|
$
|
560
|
$
|
1,251
|
|
Class N
|
$
|
65
|
$
|
214
|
$
|
375
|
$
|
843
|
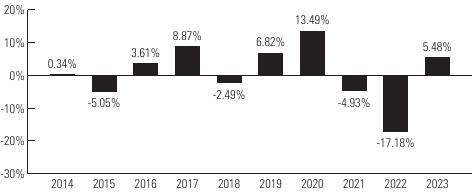 |
Highest Quarterly Return:
Fourth Quarter 2023, 8.69% Lowest Quarterly Return: Second Quarter 2022, -9.58% |
|
Average Annual Total Returns
|
|
|
|
|
(for the periods ended December 31, 2023)
|
Past 1 Year
|
Past 5 Years
|
Past 10 Years
|
|
Institutional Class - Return Before Taxes
|
5.48%
|
0.13%
|
0.54%
|
|
Return After Taxes on Distributions
|
5.48%
|
-0.58%
|
-0.01%
|
|
Return After Taxes on Distributions and Sale of Fund Shares
|
3.24%
|
-0.09%
|
0.24%
|
|
Retail Class - Return Before Taxes
|
5.15%
|
-0.13%
|
0.28%
|
|
Class N - Return Before Taxes
|
5.46%
|
0.16%
|
0.60%
|
|
Bloomberg Global Aggregate Bond Index
|
5.72%
|
-0.32%
|
0.38%
|
|
Type of Account
|
Minimum Initial Purchase
|
|
Any account other than those listed below
|
$2,500
|
|
For shareholders participating in Loomis Sayles Funds’ Automatic Investment Plan
|
$1,000
|
|
For Traditional IRA, Roth IRA, Rollover IRA and SEP-IRA
|
$1,000
|
|
•
|
Fee-based programs (such as wrap accounts) where an advisory fee is paid to the broker-dealer or other financial intermediary. Please consult your financial representative to determine if your fee based program is subject to additional or different conditions or fees.
|
|
•
|
Certain Retirement Plans. Please consult your retirement plan administrator to determine if your retirement plan is subject to additional or different conditions or fees imposed by the plan administrator.
|
|
•
|
Clients of a Registered Investment Adviser where the Registered Investment Adviser receives an advisory, management or consulting fee.
|
|
•
|
Fee-based programs (such as wrap accounts) where an advisory fee is paid to the broker-dealer or other financial intermediary. Please consult your financial representative to determine if your fee based program is subject to additional or different conditions or fees.
|
|
•
|
Certain Retirement Plans. Please consult your retirement plan administrator to determine if your retirement plan is subject to additional or different conditions or fees imposed by the plan administrator.
|
|
•
|
Certain Individual Retirement Accounts if the amounts invested represent rollover distributions from investments by any of the retirement plans invested in the Fund.
|
|
•
|
Clients of a Registered Investment Adviser where the Registered Investment Adviser receives an advisory, management or consulting fee.
|
|
•
|
Fund Trustees, former Fund trustees, employees of affiliates of the Loomis Sayles Funds and other individuals who are affiliated with any Loomis Sayles Fund (this also applies to any spouse, parents, children, siblings, grandparents, grandchildren and in-laws of those mentioned) and Natixis affiliate employee benefit plans.
|
|
•
|
Certain Retirement Plans. Please consult your retirement plan administrator to determine if your retirement plan is subject to additional or different conditions or fees imposed by the plan administrator.
|
|
•
|
Sub-accounts held within an omnibus account, where the omnibus account has at least $1,000,000.
|
|
•
|
Funds of funds that are distributed by the Distributor.
|
|
(expenses that you pay each year as a percentage of the value of your investment)
|
Institutional Class
|
Retail Class
|
Class N
|
|
Management fees
|
0.25%
|
0.25%
|
0.25%
|
|
Distribution and/or service (12b-1) fees
|
0.00%
|
0.25%
|
0.00%
|
|
Other expenses
|
0.31%
|
0.31%
|
0.22%
|
|
Total annual fund operating expenses
|
0.56%
|
0.81%
|
0.47%
|
|
Fee waiver and/or expense reimbursement1,2
|
0.16%
|
0.16%
|
0.12%
|
|
Total annual fund operating expenses after fee waiver and/or expense reimbursement
|
0.40%
|
0.65%
|
0.35%
|
| 1 | Loomis, Sayles & Company, L.P. (“Loomis Sayles” or the “Adviser”) has given a binding contractual undertaking to the Fund to limit the amount of the Fund’s total annual fund operating expenses to 0.40%, 0.65% and 0.35% of the Fund’s average daily net assets for Institutional Class shares, Retail Class shares and Class N shares, respectively, exclusive of brokerage expenses, interest expense, taxes, acquired fund fees and expenses, organizational and extraordinary expenses, such as litigation and indemnification expenses. This undertaking is in effect through January 31, 2025 and may be terminated before then only with the consent of the Fund’s Board of Trustees. The Adviser will be permitted to recover, on a class by class basis, management fees waived and/or expenses reimbursed to the extent that expenses in later periods fall below both (1) the class’ applicable expense limitation at the time such amounts were waived/reimbursed and (2) the class’ current applicable expense limitation. The Fund will not be obligated to repay any such waived/reimbursed fees and expenses more than one year after the end of the fiscal year in which the fees or expenses were waived/reimbursed. |
| 2 | Natixis Advisors, LLC (“Natixis Advisors”) has given a binding contractual undertaking to the Fund to reimburse any and all transfer agency expenses for Class N shares. This undertaking is in effect through January 31, 2025 and may be terminated before then only with the consent of the Fund’s Board of Trustees. |
|
|
1 year
|
3 years
|
5 years
|
10 years
|
||||
|
Institutional Class
|
$
|
41
|
$
|
163
|
$
|
297
|
$
|
686
|
|
Retail Class
|
$
|
66
|
$
|
243
|
$
|
434
|
$
|
987
|
|
Class N
|
$
|
36
|
$
|
139
|
$
|
251
|
$
|
580
|
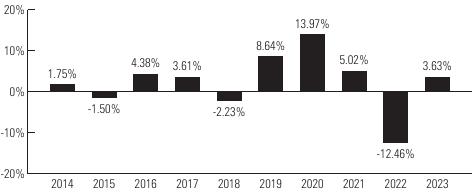 |
Highest Quarterly Return:
Second Quarter 2020, 5.24% Lowest Quarterly Return: Second Quarter 2022, -6.73% |
|
Average Annual Total Returns
|
|
|
|
|
|
(for the periods ended December 31, 2023)
|
Past 1 Year
|
Past 5 Years
|
Past 10 Years
|
Life of Class N
(2/1/17) |
|
Institutional Class - Return Before Taxes
|
3.63%
|
3.36%
|
2.26%
|
-
|
|
Return After Taxes on Distributions
|
2.01%
|
1.71%
|
1.04%
|
-
|
|
Return After Taxes on Distributions and Sale of Fund Shares
|
2.13%
|
1.92%
|
1.22%
|
-
|
|
Retail Class - Return Before Taxes
|
3.48%
|
3.13%
|
2.00%
|
-
|
|
Class N - Return Before Taxes
|
3.69%
|
3.43%
|
-
|
2.57%
|
|
Bloomberg U.S. Aggregate Bond Index1
|
5.53%
|
1.10%
|
1.81%
|
1.27%
|
|
Average Annual Total Returns
|
|
|
|
|
|
(for the periods ended December 31, 2023)
|
Past 1 Year
|
Past 5 Years
|
Past 10 Years
|
Life of Class N
(2/1/17) |
|
Bloomberg U.S. TIPS Index
|
3.90%
|
3.15%
|
2.42%
|
2.40%
|
| 1 | Effective February 1, 2024, the Fund’s primary broad-based performance index changed to the Bloomberg U.S. Aggregate Bond Index. The Bloomberg U.S. Aggregate Bond Index is a broad-based securities market index that represents the overall market applicable to the Fund. The Fund will retain the Bloomberg U.S. TlPS Index as its additional benchmark for performance comparison. |
|
Type of Account
|
Minimum Initial Purchase
|
|
Any account other than those listed below
|
$2,500
|
|
For shareholders participating in Loomis Sayles Funds’ Automatic Investment Plan
|
$1,000
|
|
For Traditional IRA, Roth IRA, Rollover IRA and SEP-IRA
|
$1,000
|
|
•
|
Fee-based programs (such as wrap accounts) where an advisory fee is paid to the broker-dealer or other financial intermediary. Please consult your financial representative to determine if your fee based program is subject to additional or different conditions or fees.
|
|
•
|
Certain Retirement Plans. Please consult your retirement plan administrator to determine if your retirement plan is subject to additional or different conditions or fees imposed by the plan administrator.
|
|
•
|
Clients of a Registered Investment Adviser where the Registered Investment Adviser receives an advisory, management or consulting fee.
|
|
•
|
Fee-based programs (such as wrap accounts) where an advisory fee is paid to the broker-dealer or other financial intermediary. Please consult your financial representative to determine if your fee based program is subject to additional or different conditions or fees.
|
|
•
|
Certain Retirement Plans. Please consult your retirement plan administrator to determine if your retirement plan is subject to additional or different conditions or fees imposed by the plan administrator.
|
|
•
|
Certain Individual Retirement Accounts if the amounts invested represent rollover distributions from investments by any of the retirement plans invested in the Fund.
|
|
•
|
Clients of a Registered Investment Adviser where the Registered Investment Adviser receives an advisory, management or consulting fee.
|
|
•
|
Fund Trustees, former Fund trustees, employees of affiliates of the Loomis Sayles Funds and other individuals who are affiliated with any Loomis Sayles Fund (this also applies to any spouse, parents, children, siblings, grandparents, grandchildren and in-laws of those mentioned) and Natixis affiliate employee benefit plans.
|
|
•
|
Certain Retirement Plans. Please consult your retirement plan administrator to determine if your retirement plan is subject to additional or different conditions or fees imposed by the plan administrator.
|
|
•
|
Sub-accounts held within an omnibus account, where the omnibus account has at least $1,000,000.
|
|
•
|
Funds of funds that are distributed by the Distributor.
|
|
(expenses that you pay each year as a percentage of the value of your investment)
|
Institutional Class
|
|
Management fees1
|
0.58%
|
|
Distribution and/or service (12b-1) fees
|
0.00%
|
|
Other expenses2
|
0.12%
|
|
Total annual fund operating expenses
|
0.70%
|
|
Fee waiver and/or expense reimbursement3
|
0.00%
|
|
Total annual fund operating expenses after fee waiver and/or expense reimbursement
|
0.70%
|
| 1 | The Fund’s operating expenses have been restated to reflect a reduction in management fees, effective as of July 1, 2023, as if such reduction had been in effect during the fiscal year ended September 30, 2023. The information has been restated to better reflect anticipated expenses of the Fund. |
| 2 | Other expenses include acquired fund fees and expenses of less than 0.01%. |
| 3 | Loomis, Sayles & Company, L.P. (“Loomis Sayles” or the “Adviser”) has given a binding contractual undertaking to the Fund to limit the amount of the Fund’s total annual fund operating expenses to 0.73% of the Fund’s average daily net assets, exclusive of brokerage expenses, interest expense, taxes, acquired fund fees and expenses, organizational and extraordinary expenses, such as litigation and indemnification expenses. This undertaking is in effect through January 31, 2025 and may be terminated before then only with the consent of the Fund’s Board of Trustees. The Adviser will be permitted to recover management fees waived and/or expenses reimbursed to the extent that expenses in later periods fall below both (1) the class’ applicable expense limitation at the time such amounts were waived/reimbursed and (2) the class’ current applicable expense limitation. The Fund will not be obligated to repay any such waived/reimbursed fees and expenses more than one year after the end of the fiscal year in which the fees or expenses were waived/reimbursed. |
|
|
1 year
|
3 years
|
5 years
|
10 years
|
||||
|
Institutional Class
|
$
|
72
|
$
|
224
|
$
|
390
|
$
|
871
|
 |
Highest Quarterly Return:
Second Quarter 2020, 11.00% Lowest Quarterly Return: First Quarter 2020, -18.43% |
|
Average Annual Total Returns
|
|
|
|
|
(for the periods ended December 31, 2023)
|
Past 1 Year
|
Past 5 Years
|
Past 10 Years
|
|
Institutional Class - Return Before Taxes
|
9.98%
|
3.76%
|
3.51%
|
|
Return After Taxes on Distributions
|
7.33%
|
1.50%
|
0.90%
|
|
Return After Taxes on Distributions and Sale of Fund Shares
|
5.92%
|
1.98%
|
1.61%
|
|
Bloomberg U.S. Aggregate Bond Index1
|
5.53%
|
1.10%
|
1.81%
|
|
Bloomberg U.S. Corporate High-Yield Bond Index
|
13.44%
|
5.37%
|
4.60%
|
| 1 | Effective February 1, 2024, the Fund’s primary broad-based performance index changed to the Bloomberg U.S. Aggregate Bond Index. The Bloomberg U.S. Aggregate Bond Index is a broad-based securities market index that represents the overall market applicable to the Fund. The Fund will retain the Bloomberg U.S. Corporate High-Yield Bond Index as its additional benchmark for performance comparison. |
|
•
|
Fund Trustees, former Fund trustees, employees of affiliates of the Loomis Sayles Funds and other individuals who are affiliated with any Loomis Sayles Fund (this also applies to any spouse, parents, children, siblings, grandparents, grandchildren and in-laws of those mentioned) and Natixis affiliate employee benefit plans.
|
|
|
Institutional Class
|
Retail Class
|
Class N
|
|
Management fees
|
|
|
|
|
Distribution and/or service (12b-1) fees
|
|
|
|
|
Other expenses
|
|
|
|
|
Total annual fund operating expenses
|
|
|
|
|
Fee waiver and/or expense reimbursement1
|
|
|
|
|
Total annual fund operating expenses after fee waiver and/or expense reimbursement
|
|
|
|
| 1 | Loomis, Sayles & Company, L.P. (“Loomis Sayles” or the “Adviser”) has given a binding contractual undertaking to the Fund to limit the amount of the Fund’s total annual fund operating expenses to 0.95%, 1.20% and 0.90% of the Fund’s average daily net assets for Institutional Class shares, Retail Class shares and Class N shares, respectively, exclusive of brokerage expenses, interest expense, taxes, acquired fund fees and expenses, organizational and extraordinary expenses, such as litigation and indemnification expenses. This undertaking is in effect through |
|
|
1 year
|
3 years
|
5 years
|
10 years
|
||||
|
Institutional Class
|
$
|
|
$
|
|
$
|
|
$
|
|
|
Retail Class
|
$
|
|
$
|
|
$
|
|
$
|
|
|
Class N
|
$
|
|
$
|
|
$
|
|
$
|
|
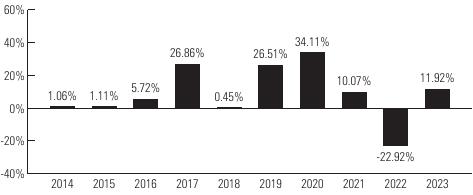 |
|
|
|
|
|
|
|
|
Past 1 Year
|
Past 5 Years
|
Past 10 Years
|
|
Institutional Class - Return Before Taxes
|
|
|
|
|
Return After Taxes on Distributions
|
|
|
|
|
Return After Taxes on Distributions and Sale of Fund Shares
|
|
|
|
|
Retail Class - Return Before Taxes
|
|
|
|
|
Class N - Return Before Taxes
|
|
|
|
|
Russell 3000® Index1
|
|
|
|
|
Russell 2000® Growth Index
|
|
|
|
| 1 | Effective February 1, 2024, the Fund’s primary broad-based performance index changed to the Russell 3000® Index. The Russell 3000® Index is a broad-based securities market index that represents the overall market applicable to the Fund. The Fund will retain the Russell 2000® Growth Index as its additional benchmark for performance comparison. |
|
Type of Account
|
Minimum Initial Purchase
|
|
Any account other than those listed below
|
$2,500
|
|
For shareholders participating in Loomis Sayles Funds’ Automatic Investment Plan
|
$1,000
|
|
For Traditional IRA, Roth IRA, Rollover IRA and SEP-IRA
|
$1,000
|
|
•
|
Fee-based programs (such as wrap accounts) where an advisory fee is paid to the broker-dealer or other financial intermediary. Please consult your financial representative to determine if your fee based program is subject to additional or different conditions or fees.
|
|
•
|
Certain Retirement Plans. Please consult your retirement plan administrator to determine if your retirement plan is subject to additional or different conditions or fees imposed by the plan administrator.
|
|
•
|
Clients of a Registered Investment Adviser where the Registered Investment Adviser receives an advisory, management or consulting fee.
|
|
•
|
Fee-based programs (such as wrap accounts) where an advisory fee is paid to the broker-dealer or other financial intermediary. Please consult your financial representative to determine if your fee based program is subject to additional or different conditions or fees.
|
|
•
|
Certain Retirement Plans. Please consult your retirement plan administrator to determine if your retirement plan is subject to additional or different conditions or fees imposed by the plan administrator.
|
|
•
|
Certain Individual Retirement Accounts if the amounts invested represent rollover distributions from investments by any of the retirement plans invested in the Fund.
|
|
•
|
Clients of a Registered Investment Adviser where the Registered Investment Adviser receives an advisory, management or consulting fee.
|
|
•
|
Fund Trustees, former Fund trustees, employees of affiliates of the Loomis Sayles Funds and other individuals who are affiliated with any Loomis Sayles Fund (this also applies to any spouse, parents, children, siblings, grandparents, grandchildren and in-laws of those mentioned) and Natixis affiliate employee benefit plans.
|
|
•
|
Certain Retirement Plans. Please consult your retirement plan administrator to determine if your retirement plan is subject to additional or different conditions or fees imposed by the plan administrator.
|
|
•
|
Sub-accounts held within an omnibus account, where the omnibus account has at least $1,000,000.
|
|
•
|
Funds of funds that are distributed by the Distributor.
|
|
(expenses that you pay each year as a percentage of the value of your investment)
|
Institutional Class
|
Retail Class
|
Admin Class
|
Class N
|
|
Management fees
|
0.75%
|
0.75%
|
0.75%
|
0.75%
|
|
Distribution and/or service (12b-1) fees
|
0.00%
|
0.25%
|
0.25%
|
0.00%
|
|
Other expenses
|
0.21%
|
0.21%
|
0.46%1
|
0.12%
|
|
Total annual fund operating expenses
|
0.96%
|
1.21%
|
1.46%
|
0.87%
|
|
Fee waiver and/or expense reimbursement2
|
0.06%
|
0.06%
|
0.06%
|
0.02%
|
|
Total annual fund operating expenses after fee waiver and/or expense reimbursement
|
0.90%
|
1.15%
|
1.40%
|
0.85%
|
| 1 | Other expenses include an administrative services fee of 0.25% for Admin Class shares. |
| 2 | Loomis, Sayles & Company, L.P. (“Loomis Sayles” or the “Adviser”) has given a binding contractual undertaking to the Fund to limit the amount of the Fund’s total annual fund operating expenses to 0.90%, 1.15%, 1.40% and 0.85% of the Fund’s average daily net assets for Institutional Class shares, Retail Class shares, Admin Class shares and Class N shares, respectively, exclusive of brokerage expenses, interest expense, taxes, acquired fund fees and expenses, organizational and extraordinary expenses, such as litigation and indemnification expenses. This undertaking is in effect through January 31, 2025 and may be terminated before then only with the consent of the Fund’s Board of Trustees. The Adviser will be permitted to recover, on a class-by-class basis, management fees waived and/or expenses reimbursed to the extent that expenses in later periods fall below both (1) the class’ applicable expense limitation at the time such amounts were waived/reimbursed and (2) the class’ current applicable expense limitation. The Fund will not be obligated to repay any such waived/reimbursed fees and expenses more than one year after the end of the fiscal year in which the fees or expenses were waived/reimbursed. |
|
|
1 year
|
3 years
|
5 years
|
10 years
|
||||
|
Institutional Class
|
$
|
92
|
$
|
300
|
$
|
525
|
$
|
1,173
|
|
Retail Class
|
$
|
117
|
$
|
378
|
$
|
659
|
$
|
1,461
|
|
Admin Class
|
$
|
143
|
$
|
456
|
$
|
792
|
$
|
1,741
|
|
Class N
|
$
|
87
|
$
|
276
|
$
|
480
|
$
|
1,071
|
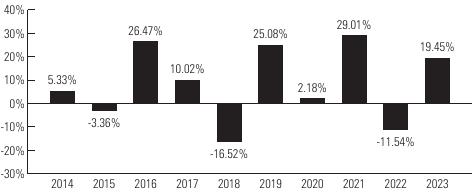 |
Highest Quarterly Return:
Fourth Quarter 2020, 27.47% Lowest Quarterly Return: First Quarter 2020, -33.76% |
|
Average Annual Total Returns
|
|
|
|
|
(for the periods ended December 31, 2023)
|
Past 1 Year
|
Past 5 Years
|
Past 10 Years
|
|
Institutional Class - Return Before Taxes
|
19.45%
|
11.75%
|
7.50%
|
|
Return After Taxes on Distributions
|
14.68%
|
8.56%
|
4.51%
|
|
Return After Taxes on Distributions and Sale of Fund Shares
|
14.96%
|
9.08%
|
5.45%
|
|
Retail Class - Return Before Taxes
|
19.10%
|
11.47%
|
7.23%
|
|
Admin Class - Return Before Taxes
|
18.81%
|
11.18%
|
6.96%
|
|
Class N - Return Before Taxes
|
19.46%
|
11.80%
|
7.56%
|
|
Russell 3000® Index1
|
25.96%
|
15.16%
|
11.48%
|
|
Russell 2000® Value Index
|
14.65%
|
10.00%
|
6.76%
|
|
Russell 2000® Index
|
16.93%
|
9.97%
|
7.16%
|
| 1 | Effective February 1, 2024, the Fund’s primary broad-based performance index changed to the Russell 3000® Index. The Russell 3000® Index is a broad-based securities market index that represents the overall market applicable to the Fund. The Fund will retain the Russell 2000® VaIue Index and the Russell 2000® Index as its additional benchmarks for performance comparison. |
|
Type of Account
|
Minimum Initial Purchase
|
|
Any account other than those listed below
|
$2,500
|
|
For shareholders participating in Loomis Sayles Funds’ Automatic Investment Plan
|
$1,000
|
|
For Traditional IRA, Roth IRA, Rollover IRA and SEP-IRA
|
$1,000
|
|
•
|
Fee-based programs (such as wrap accounts) where an advisory fee is paid to the broker-dealer or other financial intermediary. Please consult your financial representative to determine if your fee based program is subject to additional or different conditions or fees.
|
|
•
|
Certain Retirement Plans. Please consult your retirement plan administrator to determine if your retirement plan is subject to additional or different conditions or fees imposed by the plan administrator.
|
|
•
|
Clients of a Registered Investment Adviser where the Registered Investment Adviser receives an advisory, management or consulting fee.
|
|
•
|
Fee-based programs (such as wrap accounts) where an advisory fee is paid to the broker-dealer or other financial intermediary. Please consult your financial representative to determine if your fee based program is subject to additional or different conditions or fees.
|
|
•
|
Certain Retirement Plans. Please consult your retirement plan administrator to determine if your retirement plan is subject to additional or different conditions or fees imposed by the plan administrator.
|
|
•
|
Certain Individual Retirement Accounts if the amounts invested represent rollover distributions from investments by any of the retirement plans invested in the Fund.
|
|
•
|
Clients of a Registered Investment Adviser where the Registered Investment Adviser receives an advisory, management or consulting fee.
|
|
•
|
Fund Trustees, former Fund trustees, employees of affiliates of the Loomis Sayles Funds and other individuals who are affiliated with any Loomis Sayles Fund (this also applies to any spouse, parents, children, siblings, grandparents, grandchildren and in-laws of those mentioned) and Natixis affiliate employee benefit plans.
|
|
•
|
Certain Retirement Plans. Please consult your retirement plan administrator to determine if your retirement plan is subject to additional or different conditions or fees imposed by the plan administrator.
|
|
•
|
Sub-accounts held within an omnibus account, where the omnibus account has at least $1,000,000.
|
|
•
|
Funds of funds that are distributed by the Distributor.
|
|
|
Institutional Class
|
Class N
|
|
Management fees
|
|
|
|
Distribution and/or service (12b-1) fees
|
|
|
|
Other expenses
|
|
|
|
Total annual fund operating expenses
|
|
|
|
Fee waiver and/or expense reimbursement1
|
|
|
|
Total annual fund operating expenses after fee waiver and/or expense reimbursement
|
|
|
| 1 | Loomis, Sayles & Company, L.P. (“Loomis Sayles” or the “Adviser”) has given a binding contractual undertaking to the Fund to limit the amount of the Fund’s total annual fund operating expenses to 0.85% and 0.83% of the Fund’s average daily net assets for Institutional Class shares and Class N shares, respectively, exclusive of brokerage expenses, interest expense, taxes, acquired fund fees and expenses, organizational and extraordinary expenses, such as litigation and indemnification expenses. This undertaking is in effect through |
| 2 | Natixis Advisors, LLC (“Natixis Advisors”) has given a binding contractual undertaking to the Fund to reimburse any and all transfer agency expenses for Class N shares. This undertaking is in effect through January 31, 2025 and may be terminated before then only with the consent of the Fund’s Board of Trustees. |
|
|
1 year
|
3 years
|
5 years
|
10 years
|
||||
|
Institutional Class
|
$
|
|
$
|
|
$
|
|
$
|
|
|
Class N
|
$
|
|
$
|
|
$
|
|
$
|
|
 |
|
|
|
|
|
|
|
|
|
Past 1 Year
|
Past 5 Years
|
Life of Institutional Class
(6/30/15) |
Life of Class N
(10/1/19) |
|
Institutional Class - Return Before Taxes
|
|
|
|
-
|
|
Return After Taxes on Distributions
|
|
|
|
-
|
|
Return After Taxes on Distributions and Sale of Fund Shares
|
|
|
|
-
|
|
Class N - Return Before Taxes
|
|
-
|
-
|
|
|
Russell 3000® Index1
|
|
|
|
|
|
Russell 2500™ Growth Index
|
|
|
|
|
| 1 | Effective February 1, 2024, the Fund’s primary broad-based performance index changed to the Russell 3000® Index. The Russell 3000® Index is a broad-based securities market index that represents the overall market applicable to the Fund. The Fund will retain the Russell 2500™ Growth Index as its additional benchmark for performance comparison. |
|
•
|
Certain Retirement Plans. Please consult your retirement plan administrator to determine if your retirement plan is subject to additional or different conditions or fees imposed by the plan administrator.
|
|
•
|
Fund Trustees, former Fund trustees, employees of affiliates of the Loomis Sayles Funds and other individuals who are affiliated with any Loomis Sayles Fund (this also applies to any spouse, parents, children, siblings, grandparents, grandchildren and in-laws of those mentioned) and Natixis affiliate employee benefit plans.
|
|
•
|
Certain Retirement Plans. Please consult your retirement plan administrator to determine if your retirement plan is subject to additional or different conditions or fees imposed by the plan administrator.
|
|
•
|
Sub-accounts held within an omnibus account, where the omnibus account has at least $1,000,000.
|
|
•
|
Funds of funds that are distributed by the Distributor.
|
|
Fund
|
Aggregate Advisory Fee
|
|
Loomis Sayles Fixed Income Fund
|
0.50%
|
|
Loomis Sayles Global Bond Fund (after waiver)
|
0.48%
|
|
Loomis Sayles Inflation Protected Securities Fund (after waiver)
|
0.10%
|
|
Loomis Sayles Institutional High Income Fund
|
0.58%
|
|
Loomis Sayles Small Cap Growth Fund
|
0.75%
|
|
Loomis Sayles Small Cap Value Fund (after waiver)
|
0.70%
|
|
Loomis Sayles Small/Mid Cap Growth Fund (after waiver)
|
0.66%
|

|
•
|
A share’s NAV is determined at the close of regular trading on the New York Stock Exchange (“NYSE”) on the days the NYSE is open for trading. This is normally 4:00 p.m., Eastern time. A Fund’s shares will not be priced on the days on which the NYSE is closed for trading. In addition, a Fund’s shares will not be priced on the holidays listed in the SAI. See the section “Net Asset Value” in the SAI for more details.
|
|
•
|
The price you pay for purchasing, redeeming or exchanging a share will be based upon the NAV next calculated after your order is received by the transfer agent, SS&C Global Investor & Distribution Solutions, Inc. (formerly, DST Asset Manager Solutions, Inc.), (rather than when the order arrives at the P.O. box) “in good order” (meaning that the order is complete and contains all necessary information). See the Section “How to Purchase Shares,” which provides additional information regarding who can receive a purchase order.
|
|
•
|
Requests received by the Funds after the NYSE closes will be processed based upon the NAV determined at the close of regular trading on the next day that the NYSE is open. If the transfer agent receives the order in good order prior to the NYSE market close (normally 4:00 p.m., Eastern time), the shareholder will receive that day’s NAV. Under limited circumstances, the Distributor may enter into contractual agreements pursuant to which orders received by your investment dealer before a Fund determines its NAV and transmitted to the transfer agent prior to market open on the next business day are processed at the NAV determined on the day the order was received by your investment dealer. Please contact your investment dealer to determine whether it has entered into such a contractual agreement. If your investment dealer has not entered into such a contractual agreement, your order will be processed at the NAV next determined after your investment dealer submits the order to a Fund.
|
|
•
|
If a Fund invests in foreign securities, it may have NAV changes on days when you cannot buy or sell its shares.
|
|
•
|
Equity securities (including shares of closed-end investment companies and exchange-traded funds (“ETFs”)), exchange traded notes, rights, and warrants — listed equity securities are valued at the last sale price quoted on the exchange where they are traded most extensively or, if there is no reported sale during the day, the closing bid quotation as reported by a third-party pricing service. Securities traded on the NASDAQ Global Select Market, NASDAQ Global Market and NASDAQ Capital Market are valued at the NASDAQ Official Closing Price (“NOCP”), or if lacking an NOCP, at the most recent bid quotations on the applicable NASDAQ Market. Unlisted equity securities (except unlisted preferred equity securities discussed below) are valued at the last sale price quoted in the market
|
|
where they are traded most extensively or, if there is no reported sale during the day, the closing bid quotation as reported by a third-party pricing service. If there is no sale price or closing bid quotation available, unlisted equity securities will be valued using evaluated bids furnished by a third-party pricing service, if available. In some foreign markets, an official close price and a last sale price may be available from the foreign exchange or market. In those cases, the official close price is used. Valuations based on information from foreign markets may be subject to the Funds’ fair value policies described below. If a right is not traded on any exchange, its value is based on the market value of the underlying security, less the cost to subscribe to the underlying security (e.g., to exercise the right), adjusted for the subscription ratio. If a warrant is not traded on any exchange, a price is obtained from a broker-dealer.
|
|
•
|
Debt securities and unlisted preferred equity securities — evaluated bids furnished to a Fund by a third-party pricing service using market information, transactions for comparable securities and various relationships between securities, if available, or bid prices obtained from broker-dealers.
|
|
•
|
Senior Loans — bid prices supplied by a third-party pricing service, if available, or bid prices obtained from broker-dealers.
|
|
•
|
Bilateral Swaps — bilateral credit default swaps are valued based on mid prices (between the bid price and the ask price) supplied by a third-party pricing service. Bilateral interest rate swaps and bilateral standardized commodity and equity index total return swaps are valued based on prices supplied by a third-party pricing service. If prices from a third-party pricing service are not available, prices from a broker-dealer may be used.
|
|
•
|
Centrally Cleared Swaps — settlement prices of the clearing house on which the contracts were traded or prices obtained from broker-dealers.
|
|
•
|
Options — domestic exchange-traded index and single name equity options contracts (including options on ETFs) are valued at the mean of the National Best Bid and Offer quotations as determined by the Options Price Reporting Authority. Foreign exchange-traded single name equity options contracts are valued at the most recent settlement price. Options contracts on foreign indices are priced at the most recent settlement price. Options on futures contracts are valued using the current settlement price on the exchange on which, over time, they are traded most extensively. Other exchange-traded options are valued at the average of the closing bid and ask quotations on the exchange on which, over time, they are traded most extensively. OTC currency options and swaptions are valued at mid prices (between the bid price and the ask price) supplied by a third-party pricing service, if available. Other OTC options contracts (including currency options and swaptions not priced through a third-party pricing service) are valued based on prices obtained from broker-dealers. Valuations based on information from foreign markets may be subject to the Funds’ fair value policies as described below.
|
|
•
|
Futures — most recent settlement price on the exchange on which the Adviser believes that, over time, they are traded most extensively. Valuations based on information from foreign markets may be subject to the Funds’ fair value policies as described below.
|
|
•
|
Forward Foreign Currency Contracts — interpolated rates determined based on information provided by a third-party pricing service.
|
|
Regular Mail
|
Overnight Mail
|
|
|
Loomis Sayles Funds
P.O. Box 219594 Kansas City, MO 64121-9594 |
Loomis Sayles Funds
330 West 9th Street Kansas City, MO 64105-1514 |
|
|
Regular Mail
|
Overnight Mail
|
|
|
Loomis Sayles Funds
P.O. Box 219594 Kansas City, MO 64121-9594 |
Loomis Sayles Funds
330 West 9th Street Kansas City, MO 64105-1514 |
|
|
•
|
If you are selling more than $100,000 per day from a single fund/account and you are requesting the proceeds by check (this does not apply to IRA transfer of assets to new custodian).
|
|
•
|
If you are requesting that the proceeds check (of any amount) be made out to someone other than the registered owner(s) or sent to an address other than the address of record.
|
|
•
|
If the account registration or bank account information has changed within the past 30 days.
|
|
•
|
If you are instructing us to send the proceeds by check, wire or ACH to a bank not already active on the fund account.
|
|
Generally declares and pays dividends annually
|
Generally declares and pays dividends quarterly
|
|
Loomis Sayles Fixed Income Fund
|
Loomis Sayles Inflation Protected Securities Fund
|
|
Loomis Sayles Global Bond Fund
|
|
|
Loomis Sayles Institutional High Income Fund
|
|
|
Loomis Sayles Small Cap Growth Fund
|
|
|
Loomis Sayles Small Cap Value Fund
|
|
|
Loomis Sayles Small/Mid Cap Growth Fund
|
|
•
|
Participate in the Dividend Diversification Program, which allows you to have all dividends and distributions automatically invested in shares of the same class of another Loomis Sayles Fund registered in your name. Certain investment minimums and restrictions may apply.
|
|
•
|
Receive distributions from dividends and interest in cash while reinvesting distributions from capital gains in additional shares of the same class of the Fund, or in the same class of another Loomis Sayles Fund.
|
|
•
|
Receive distributions from capital gains in cash while reinvesting distributions from dividends and interest in additional shares of the same class of the Fund, or in the same class of another Loomis Sayles Fund.
|
|
•
|
Receive all distributions in cash.
|
|
Restriction
|
Situation
|
|
Each Fund may suspend the right of redemption:
|
|
|
Each Fund reserves the right to suspend account services or refuse transaction requests:
|
|
|
Each Fund may pay the redemption price in whole or in part by a distribution in-kind of readily marketable securities in lieu of cash or may take up to 7 days to pay a redemption request in order to raise capital:
|
|
|
Each Fund may withhold redemption proceeds for 10 days from the purchase date:
|
|
|
|
Institutional Class
|
|||||||||
|
|
Year Ended September 30, 2023
|
Year Ended
September 30, 2022 |
Year Ended
September 30, 2021 |
Year Ended
September 30, 2020 |
Year Ended
September 30, 2019 |
|||||
|
Net asset value, beginning of the period
|
$
|
10.99
|
$
|
13.52
|
$
|
13.17
|
$
|
13.49
|
$
|
13.40
|
|
Income (loss) from Investment Operations:
|
|
|
|
|
|
|
|
|
|
|
|
Net investment income(a)
|
|
0.46
|
|
0.33
|
|
0.44
|
|
0.55
|
|
0.59
|
|
Net realized and unrealized gain (loss)
|
|
(0.10
)
|
|
(2.06
)
|
|
0.73
|
|
(0.31
)
|
|
0.19
|
|
Total from Investment Operations
|
|
0.36
|
|
(1.73
)
|
|
1.17
|
|
0.24
|
|
0.78
|
|
Less Distributions From:
|
|
|
|
|
|
|
|
|
|
|
|
Net investment income
|
|
(0.11
)
|
|
(0.29
)
|
|
(0.64
)
|
|
(0.56
)
|
|
(0.59
)
|
|
Net realized capital gains
|
|
(0.06
)
|
|
(0.51
)
|
|
(0.18
)
|
|
—
|
|
(0.10
)
|
|
Total Distributions
|
|
(0.17
)
|
|
(0.80
)
|
|
(0.82
)
|
|
(0.56
)
|
|
(0.69
)
|
|
Net asset value, end of the period
|
$
|
11.18
|
$
|
10.99
|
$
|
13.52
|
$
|
13.17
|
$
|
13.49
|
|
Total return
|
|
3.26
%
|
|
(13.63
)%
|
|
9.08
%
|
|
1.78
%
|
|
6.29
%
|
|
Ratios to Average Net Assets:
|
|
|
|
|
|
|
|
|
|
|
|
Net assets, end of the period (000’s)
|
$
|
423,522
|
$
|
399,698
|
$
|
511,058
|
$
|
633,060
|
$
|
776,812
|
|
Net expenses
|
|
0.61
%
|
|
0.58
%
|
|
0.59
%
|
|
0.58
%
|
|
0.57
%
|
|
Gross expenses
|
|
0.61
%
|
|
0.58
%
|
|
0.59
%
|
|
0.58
%
|
|
0.57
%
|
|
Net investment income
|
|
4.06
%
|
|
2.66
%
|
|
3.27
%
|
|
4.23
%
|
|
4.51
%
|
|
Portfolio turnover rate
|
|
35
%
|
|
36
%
|
|
99
%
(b)
|
|
29
%
|
|
14
%
|
|
(a)
|
Per share net investment income has been calculated using the average shares outstanding during the period.
|
|
(b)
|
The variation in the Fund’s turnover rate from 2020 to 2021 was primarily due to a repositioning of the portfolio due to a change in the portfolio management team.
|
|
|
Institutional Class
|
|||||||||
|
|
Year Ended September 30, 2023
|
Year Ended September 30, 2022
|
Year Ended September 30, 2021
|
Year Ended September 30, 2020
|
Year Ended September 30, 2019
|
|||||
|
Net asset value, beginning of the period
|
$
|
13.22
|
$
|
17.62
|
$
|
18.33
|
$
|
17.07
|
$
|
16.16
|
|
Income (loss) from Investment Operations:
|
|
|
|
|
|
|
|
|
|
|
|
Net investment income(a)
|
|
0.33
|
|
0.25
|
|
0.27
|
|
0.33
|
|
0.33
|
|
Net realized and unrealized gain (loss)
|
|
(0.08
)
(b)
|
|
(3.93
)
|
|
(0.07
)
|
|
1.12
|
|
0.69
|
|
Total from Investment Operations
|
|
0.25
|
|
(3.68
)
|
|
0.20
|
|
1.45
|
|
1.02
|
|
Less Distributions From:
|
|
|
|
|
|
|
|
|
|
|
|
Net investment income
|
|
—
|
|
(0.38
)
|
|
(0.35
)
|
|
(0.08
)
|
|
(0.05
)
|
|
Net realized capital gains
|
|
—
|
|
(0.34
)
|
|
(0.56
)
|
|
(0.11
)
|
|
(0.06
)
|
|
Total Distributions
|
|
—
|
|
(0.72
)
|
|
(0.91
)
|
|
(0.19
)
|
|
(0.11
)
|
|
Net asset value, end of the period
|
$
|
13.47
|
$
|
13.22
|
$
|
17.62
|
$
|
18.33
|
$
|
17.07
|
|
Total return(c)
|
|
1.89
%
|
|
(21.73
)%
|
|
0.91
%
|
|
8.57
%
|
|
6.27
%
|
|
Ratios to Average Net Assets:
|
|
|
|
|
|
|
|
|
|
|
|
Net assets, end of the period (000’s)
|
$
|
229,010
|
$
|
258,963
|
$
|
381,340
|
$
|
375,501
|
$
|
353,872
|
|
Net expenses(d)
|
|
0.69
%
|
|
0.70
%
(e)
|
|
0.69
%
|
|
0.69
%
|
|
0.70
%
(e)
|
|
Gross expenses
|
|
0.78
%
|
|
0.75
%
(e)
|
|
0.75
%
|
|
0.76
%
|
|
0.76
%
(e)
|
|
Net investment income
|
|
2.35
%
|
|
1.58
%
|
|
1.47
%
|
|
1.90
%
|
|
2.00
%
|
|
Portfolio turnover rate
|
|
49
%
|
|
103
%
(f)
|
|
267
%
|
|
273
%
|
|
215
%
|
|
(a)
|
Per share net investment income has been calculated using the average shares outstanding during the period.
|
|
(b)
|
The amount shown for a share outstanding does not correspond with the aggregate realized and unrealized gain (loss) on investments for the period due to the timing of sales and redemptions of fund shares in relation to fluctuating market values of investments of the Fund.
|
|
(c)
|
Had certain expenses not been waived/reimbursed during the period, total returns would have been lower.
|
|
(d)
|
The investment adviser agreed to waive its fees and/or reimburse a portion of the Fund’s expenses during the period. Without this waiver/reimbursement, expenses would have been higher.
|
|
(e)
|
Includes interest expense. Without this expense the ratio of net expenses would have been 0.69% and the ratio of gross expenses would have been 0.75%.
|
|
(f)
|
The variation in the Fund’s turnover rate from 2021 to 2022 was primarily due to a change in trading strategy from a previously utilized auction strategy used in prior fiscal years.
|
|
|
Retail Class
|
|||||||||
|
|
Year Ended September 30, 2023
|
Year Ended September 30, 2022
|
Year Ended September 30, 2021
|
Year Ended September 30, 2020
|
Year Ended September 30, 2019
|
|||||
|
Net asset value, beginning of the period
|
$
|
12.96
|
$
|
17.29
|
$
|
18.00
|
$
|
16.76
|
$
|
15.86
|
|
Income (loss) from Investment Operations:
|
|
|
|
|
|
|
|
|
|
|
|
Net investment income(a)
|
|
0.29
|
|
0.21
|
|
0.22
|
|
0.28
|
|
0.28
|
|
Net realized and unrealized gain (loss)
|
|
(0.08
)
(b)
|
|
(3.87
)
|
|
(0.07
)
|
|
1.10
|
|
0.68
|
|
Total from Investment Operations
|
|
0.21
|
|
(3.66
)
|
|
0.15
|
|
1.38
|
|
0.96
|
|
Less Distributions From:
|
|
|
|
|
|
|
|
|
|
|
|
Net investment income
|
|
—
|
|
(0.33
)
|
|
(0.30
)
|
|
(0.03
)
|
|
(0.00
)
(c)
|
|
Net realized capital gains
|
|
—
|
|
(0.34
)
|
|
(0.56
)
|
|
(0.11
)
|
|
(0.06
)
|
|
Total Distributions
|
|
—
|
|
(0.67
)
|
|
(0.86
)
|
|
(0.14
)
|
|
(0.06
)
|
|
Net asset value, end of the period
|
$
|
13.17
|
$
|
12.96
|
$
|
17.29
|
$
|
18.00
|
$
|
16.76
|
|
Total return(d)
|
|
1.62
%
|
|
(21.96
)%
|
|
0.67
%
|
|
8.32
%
|
|
6.08
%
|
|
Ratios to Average Net Assets:
|
|
|
|
|
|
|
|
|
|
|
|
Net assets, end of the period (000’s)
|
$
|
103,003
|
$
|
117,540
|
$
|
171,318
|
$
|
178,887
|
$
|
207,251
|
|
Net expenses(e)
|
|
0.94
%
|
|
0.95
%
(f)
|
|
0.94
%
|
|
0.94
%
|
|
0.95
%
(f)
|
|
Gross expenses
|
|
1.03
%
|
|
1.00
%
(f)
|
|
1.00
%
|
|
1.01
%
|
|
1.01
%
(f)
|
|
Net investment income
|
|
2.10
%
|
|
1.33
%
|
|
1.22
%
|
|
1.65
%
|
|
1.75
%
|
|
Portfolio turnover rate
|
|
49
%
|
|
103
%
(g)
|
|
267
%
|
|
273
%
|
|
215
%
|
|
(a)
|
Per share net investment income has been calculated using the average shares outstanding during the period.
|
|
(b)
|
The amount shown for a share outstanding does not correspond with the aggregate realized and unrealized gain (loss) on investments for the period due to the timing of sales and redemptions of fund shares in relation to fluctuating market values of investments of the Fund.
|
|
(c)
|
Amount rounds to less than $0.01 per share.
|
|
(d)
|
Had certain expenses not been waived/reimbursed during the period, total returns would have been lower.
|
|
(e)
|
The investment adviser agreed to waive its fees and/or reimburse a portion of the Fund’s expenses during the period. Without this waiver/reimbursement, expenses would have been higher.
|
|
(f)
|
Includes interest expense. Without this expense the ratio of net expenses would have been 0.94% and the ratio of gross expenses would have been 1.00%.
|
|
(g)
|
The variation in the Fund’s turnover rate from 2021 to 2022 was primarily due to a change in trading strategy from a previously utilized auction strategy used in prior fiscal years.
|
|
|
Class N
|
|||||||||
|
|
Year Ended September 30, 2023
|
Year Ended September 30, 2022
|
Year Ended September 30, 2021
|
Year Ended September 30, 2020
|
Year Ended September 30, 2019
|
|||||
|
Net asset value, beginning of the period
|
$
|
13.26
|
$
|
17.68
|
$
|
18.39
|
$
|
17.12
|
$
|
16.21
|
|
Income (loss) from Investment Operations:
|
|
|
|
|
|
|
|
|
|
|
|
Net investment income(a)
|
|
0.33
|
|
0.26
|
|
0.27
|
|
0.33
|
|
0.34
|
|
Net realized and unrealized gain (loss)
|
|
(0.07
)
(b)
|
|
(3.95
)
|
|
(0.07
)
|
|
1.14
|
|
0.69
|
|
Total from Investment Operations
|
|
0.26
|
|
(3.69
)
|
|
0.20
|
|
1.47
|
|
1.03
|
|
Less Distributions From:
|
|
|
|
|
|
|
|
|
|
|
|
Net investment income
|
|
—
|
|
(0.39
)
|
|
(0.35
)
|
|
(0.09
)
|
|
(0.06
)
|
|
Net realized capital gains
|
|
—
|
|
(0.34
)
|
|
(0.56
)
|
|
(0.11
)
|
|
(0.06
)
|
|
Total Distributions
|
|
—
|
|
(0.73
)
|
|
(0.91
)
|
|
(0.20
)
|
|
(0.12
)
|
|
Net asset value, end of the period
|
$
|
13.52
|
$
|
13.26
|
$
|
17.68
|
$
|
18.39
|
$
|
17.12
|
|
Total return(c)
|
|
1.96
%
|
|
(21.73
)%
|
|
0.95
%
|
|
8.66
%
|
|
6.31
%
|
|
Ratios to Average Net Assets:
|
|
|
|
|
|
|
|
|
|
|
|
Net assets, end of the period (000’s)
|
$
|
$94,721
|
$
|
137,544
|
$
|
195,829
|
$
|
157,341
|
$
|
246,394
|
|
Net expenses(d)
|
|
0.64
%
|
|
0.65
%
(e)
|
|
0.64
%
|
|
0.64
%
|
|
0.65
%
(e)
|
|
Gross expenses
|
|
0.68
%
|
|
0.66
%
(e)
|
|
0.66
%
|
|
0.66
%
|
|
0.66
%
(e)
|
|
Net investment income
|
|
2.39
%
|
|
1.63
%
|
|
1.51
%
|
|
1.93
%
|
|
2.06
%
|
|
Portfolio turnover rate
|
|
49
%
|
|
103
%
(f)
|
|
267
%
|
|
273
%
|
|
215
%
|
|
(a)
|
Per share net investment income has been calculated using the average shares outstanding during the period.
|
|
(b)
|
The amount shown for a share outstanding does not correspond with the aggregate realized and unrealized gain (loss) on investments for the period due to the timing of sales and redemptions of fund shares in relation to fluctuating market values of investments of the Fund.
|
|
(c)
|
Had certain expenses not been waived/reimbursed during the period, total returns would have been lower.
|
|
(d)
|
The investment adviser agreed to waive its fees and/or reimburse a portion of the Fund’s expenses during the period. Without this waiver/reimbursement, expenses would have been higher.
|
|
(e)
|
Includes interest expense. Without this expense the ratio of net expenses would have been 0.64% and the ratio of gross expenses would have been 0.65%.
|
|
(f)
|
The variation in the Fund’s turnover rate from 2021 to 2022 was primarily due to a change in trading strategy from a previously utilized auction strategy used in prior fiscal years.
|
|
|
Institutional Class
|
|||||||||
|
|
Year Ended September 30, 2023
|
Year Ended September 30, 2022
|
Year Ended September 30, 2021
|
Year Ended September 30, 2020
|
Year Ended September 30, 2019
|
|||||
|
Net asset value, beginning of the period
|
$
|
9.53
|
$
|
11.94
|
$
|
11.78
|
$
|
10.59
|
$
|
10.13
|
|
Income (loss) from Investment Operations:
|
|
|
|
|
|
|
|
|
|
|
|
Net investment income(a)
|
|
0.27
|
|
0.66
|
|
0.44
|
|
0.11
|
|
0.20
|
|
Net realized and unrealized gain (loss)
|
|
(0.17
)
|
|
(2.09
)
|
|
0.18
|
|
1.18
|
|
0.48
|
|
Total from Investment Operations
|
|
0.10
|
|
(1.43
)
|
|
0.62
|
|
1.29
|
|
0.68
|
|
Less Distributions From:
|
|
|
|
|
|
|
|
|
|
|
|
Net investment income
|
|
(0.39
)
|
|
(0.84
)
|
|
(0.46
)
|
|
(0.10
)
|
|
(0.22
)
|
|
Net realized capital gains
|
|
—
|
|
(0.14
)
|
|
—
|
|
—
|
|
—
|
|
Total Distributions
|
|
(0.39
)
|
|
(0.98
)
|
|
(0.46
)
|
|
(0.10
)
|
|
(0.22
)
|
|
Net asset value, end of the period
|
$
|
9.24
|
$
|
9.53
|
$
|
11.94
|
$
|
11.78
|
$
|
10.59
|
|
Total return(b)
|
|
0.99
%
|
|
(12.55
)%
|
|
5.33
%
|
|
12.20
%
|
|
6.73
%
|
|
Ratios to Average Net Assets:
|
|
|
|
|
|
|
|
|
|
|
|
Net assets, end of the period (000’s)
|
$
|
93,240
|
$
|
176,873
|
$
|
217,863
|
$
|
116,549
|
$
|
24,076
|
|
Net expenses(c)
|
|
0.40
%
|
|
0.40
%
|
|
0.40
%
|
|
0.40
%
|
|
0.40
%
|
|
Gross expenses
|
|
0.56
%
|
|
0.49
%
|
|
0.52
%
|
|
0.70
%
|
|
0.96
%
|
|
Net investment income
|
|
2.73
%
|
|
5.90
%
|
|
3.65
%
|
|
1.00
%
|
|
1.92
%
|
|
Portfolio turnover rate
|
|
36
%
|
|
107
%
|
|
57
%
|
|
82
%
|
|
246
%
|
|
(a)
|
Per share net investment income has been calculated using the average shares outstanding during the period.
|
|
(b)
|
Had certain expenses not been waived/reimbursed during the period, total returns would have been lower.
|
|
(c)
|
The investment adviser agreed to waive its fees and/or reimburse a portion of the Fund’s expenses during the period. Without this waiver/reimbursement, expenses would have been higher.
|
|
|
Retail Class
|
|||||||||
|
|
Year Ended September 30, 2023
|
Year Ended September 30, 2022
|
Year Ended September 30, 2021
|
Year Ended September 30, 2020
|
Year Ended September 30, 2019
|
|||||
|
Net asset value, beginning of the period
|
$
|
9.51
|
$
|
11.92
|
$
|
11.77
|
$
|
10.57
|
$
|
10.11
|
|
Income (loss) from Investment Operations:
|
|
|
|
|
|
|
|
|
|
|
|
Net investment income(a)
|
|
0.26
|
|
0.62
|
|
0.45
|
|
0.10
|
|
0.18
|
|
Net realized and unrealized gain (loss)
|
|
(0.18
)
|
|
(2.07
)
|
|
0.14
|
|
1.17
|
|
0.47
|
|
Total from Investment Operations
|
|
0.08
|
|
(1.45
)
|
|
0.59
|
|
1.27
|
|
0.65
|
|
Less Distributions From:
|
|
|
|
|
|
|
|
|
|
|
|
Net investment income
|
|
(0.37
)
|
|
(0.82
)
|
|
(0.44
)
|
|
(0.07
)
|
|
(0.19
)
|
|
Net realized capital gains
|
|
—
|
|
(0.14
)
|
|
—
|
|
—
|
|
—
|
|
Total Distributions
|
|
(0.37
)
|
|
(0.96
)
|
|
(0.44
)
|
|
(0.07
)
|
|
(0.19
)
|
|
Net asset value, end of the period
|
$
|
9.22
|
$
|
9.51
|
$
|
11.92
|
$
|
11.77
|
$
|
10.57
|
|
Total return(b)
|
|
0.74
%
|
|
(12.79
)%
|
|
5.04
%
|
|
12.09
%
|
|
6.47
%
|
|
Ratios to Average Net Assets:
|
|
|
|
|
|
|
|
|
|
|
|
Net assets, end of the period (000’s)
|
$
|
29,500
|
$
|
31,496
|
$
|
33,949
|
$
|
7,805
|
$
|
1,076
|
|
Net expenses(c)
|
|
0.65
%
|
|
0.65
%
|
|
0.65
%
|
|
0.65
%
|
|
0.65
%
|
|
Gross expenses
|
|
0.81
%
|
|
0.74
%
|
|
0.77
%
|
|
0.95
%
|
|
1.21
%
|
|
Net investment income
|
|
2.67
%
|
|
5.50
%
|
|
3.76
%
|
|
0.91
%
|
|
1.77
%
|
|
Portfolio turnover rate
|
|
36
%
|
|
107
%
|
|
57
%
|
|
82
%
|
|
246
%
|
|
(a)
|
Per share net investment income has been calculated using the average shares outstanding during the period.
|
|
(b)
|
Had certain expenses not been waived/reimbursed during the period, total returns would have been lower.
|
|
(c)
|
The investment adviser agreed to waive its fees and/or reimburse a portion of the Fund’s expenses during the period. Without this waiver/reimbursement, expenses would have been higher.
|
|
|
Class N
|
|||||||||
|
|
Year Ended September 30, 2023
|
Year Ended September 30, 2022
|
Year Ended September 30, 2021
|
Year Ended September 30, 2020
|
Year Ended September 30, 2019
|
|||||
|
Net asset value, beginning of the period
|
$
|
9.54
|
$
|
11.95
|
$
|
11.79
|
$
|
10.59
|
$
|
10.13
|
|
Income (loss) from Investment Operations:
|
|
|
|
|
|
|
|
|
|
|
|
Net investment income(a)
|
|
0.31
|
|
0.70
|
|
0.49
|
|
0.10
|
|
0.21
|
|
Net realized and unrealized gain (loss)
|
|
(0.20
)
|
|
(2.12
)
|
|
0.14
|
|
1.20
|
|
0.47
|
|
Total from Investment Operations
|
|
0.11
|
|
(1.42
)
|
|
0.63
|
|
1.30
|
|
0.68
|
|
Less Distributions From:
|
|
|
|
|
|
|
|
|
|
|
|
Net investment income
|
|
(0.40
)
|
|
(0.85
)
|
|
(0.47
)
|
|
(0.10
)
|
|
(0.22
)
|
|
Net realized capital gains
|
|
—
|
|
(0.14
)
|
|
—
|
|
—
|
|
—
|
|
Total Distributions
|
|
(0.40
)
|
|
(0.99
)
|
|
(0.47
)
|
|
(0.10
)
|
|
(0.22
)
|
|
Net asset value, end of the period
|
$
|
9.25
|
$
|
9.54
|
$
|
11.95
|
$
|
11.79
|
$
|
10.59
|
|
Total return(b)
|
|
1.05
%
|
|
(12.49
)%
|
|
5.37
%
|
|
12.33
%
|
|
6.78
%
|
|
Ratios to Average Net Assets:
|
|
|
|
|
|
|
|
|
|
|
|
Net assets, end of the period (000’s)
|
$
|
14,070
|
$
|
12,523
|
$
|
8,401
|
$
|
3,291
|
$
|
1,779
|
|
Net expenses(c)
|
|
0.35
%
|
|
0.35
%
|
|
0.35
%
|
|
0.35
%
|
|
0.35
%
|
|
Gross expenses
|
|
0.47
%
|
|
0.41
%
|
|
0.46
%
|
|
0.68
%
|
|
0.91
%
|
|
Net investment income
|
|
3.14
%
|
|
6.26
%
|
|
4.06
%
|
|
0.90
%
|
|
2.09
%
|
|
Portfolio turnover rate
|
|
36
%
|
|
107
%
|
|
57
%
|
|
82
%
|
|
246
%
|
|
(a)
|
Per share net investment income has been calculated using the average shares outstanding during the period.
|
|
(b)
|
Had certain expenses not been waived/reimbursed during the period, total returns would have been lower.
|
|
(c)
|
The investment adviser agreed to waive its fees and/or reimburse a portion of the Fund’s expenses during the period. Without this waiver/reimbursement, expenses would have been higher.
|
|
|
Institutional Class
|
|||||||||
|
|
Year Ended
September 30, 2023 |
Year Ended
September 30, 2022 |
Year Ended
September 30, 2021 |
Year Ended
September 30, 2020 |
Year Ended
September 30, 2019 |
|||||
|
Net asset value, beginning of the period
|
$
|
5.31
|
$
|
6.56
|
$
|
5.99
|
$
|
6.44
|
$
|
6.90
|
|
Income (loss) from Investment Operations:
|
|
|
|
|
|
|
|
|
|
|
|
Net investment income(a)
|
|
0.33
|
|
0.28
|
|
0.26
|
|
0.29
|
|
0.34
|
|
Net realized and unrealized gain (loss)
|
|
0.08
|
|
(1.15
)
|
|
0.63
|
|
(0.32
)
|
|
(0.35
)
|
|
Total from Investment Operations
|
|
0.41
|
|
(0.87
)
|
|
0.89
|
|
(0.03
)
|
|
(0.01
)
|
|
Less Distributions From:
|
|
|
|
|
|
|
|
|
|
|
|
Net investment income
|
|
(0.26
)
|
|
(0.23
)
|
|
(0.32
)
|
|
(0.37
)
|
|
(0.37
)
|
|
Net realized capital gains
|
|
—
|
|
(0.15
)
|
|
—
|
|
(0.05
)
|
|
(0.08
)
|
|
Total Distributions
|
|
(0.26
)
|
|
(0.38
)
|
|
(0.32
)
|
|
(0.42
)
|
|
(0.45
)
|
|
Net asset value, end of the period
|
$
|
5.46
|
$
|
5.31
|
$
|
6.56
|
$
|
5.99
|
$
|
6.44
|
|
Total return
|
|
7.88
%
|
|
(14.06
)%
|
|
15.16
%
|
|
(0.67
)%
|
|
0.20
%
|
|
Ratios to Average Net Assets:
|
|
|
|
|
|
|
|
|
|
|
|
Net assets, end of the period (000’s)
|
$
|
312,743
|
$
|
312,065
|
$
|
364,445
|
$
|
516,815
|
$
|
572,393
|
|
Net expenses
|
|
0.72
%
|
|
0.69
%
|
|
0.70
%
|
|
0.69
%
|
|
0.68
%
|
|
Gross expenses
|
|
0.72
%
|
|
0.69
%
|
|
0.70
%
|
|
0.69
%
|
|
0.68
%
|
|
Net investment income
|
|
6.12
%
|
|
4.70
%
|
|
4.07
%
|
|
4.84
%
|
|
5.33
%
|
|
Portfolio turnover rate
|
|
64
%
|
|
65
%
|
|
105
%
(b)
|
|
25
%
|
|
23
%
|
|
(a)
|
Per share net investment income has been calculated using the average shares outstanding during the period.
|
|
(b)
|
The variation in the Fund’s turnover rate from 2020 to 2021 was primarily due to a repositioning of the portfolio due to a change in the portfolio management team.
|
|
|
Institutional Class
|
|||||||||
|
|
Year Ended September 30, 2023
|
Year Ended
September 30, 2022 |
Year Ended
September 30, 2021 |
Year Ended
September 30, 2020 |
Year Ended
September 30, 2019 |
|||||
|
Net asset value, beginning of the period
|
$
|
22.88
|
$
|
36.57
|
$
|
28.51
|
$
|
26.30
|
$
|
31.55
|
|
Income (loss) from Investment Operations:
|
|
|
|
|
|
|
|
|
|
|
|
Net investment loss(a)
|
|
(0.12
)
|
|
(0.15
)
(b)
|
|
(0.26
)
|
|
(0.17
)
|
|
(0.16
)
|
|
Net realized and unrealized gain (loss)
|
|
2.75
|
|
(7.06
)
|
|
8.94
|
|
4.73
|
|
(2.51
)
|
|
Total from Investment Operations
|
|
2.63
|
|
(7.21
)
|
|
8.68
|
|
4.56
|
|
(2.67
)
|
|
Less Distributions From:
|
|
|
|
|
|
|
|
|
|
|
|
Net realized capital gains
|
|
(0.72
)
|
|
(6.48
)
|
|
(0.62
)
|
|
(2.35
)
|
|
(2.58
)
|
|
Net asset value, end of the period
|
$
|
24.79
|
$
|
22.88
|
$
|
36.57
|
$
|
28.51
|
$
|
26.30
|
|
Total return
|
|
11.64
%
|
|
(24.77
)%
(b)
|
|
30.53
%
|
|
17.98
%
|
|
(6.88
)%
|
|
Ratios to Average Net Assets:
|
|
|
|
|
|
|
|
|
|
|
|
Net assets, end of the period (000’s)
|
$
|
974,539
|
$
|
883,458
|
$
|
1,299,777
|
$
|
1,037,625
|
$
|
908,616
|
|
Net expenses
|
|
0.94
%
|
|
0.93
%
|
|
0.92
%
|
|
0.94
%
|
|
0.95
%
|
|
Gross expenses
|
|
0.94
%
|
|
0.93
%
|
|
0.92
%
|
|
0.94
%
|
|
0.95
%
|
|
Net investment loss
|
|
(0.50
)%
|
|
(0.51
)%
(b)
|
|
(0.72
)%
|
|
(0.66
)%
|
|
(0.62
)%
|
|
Portfolio turnover rate
|
|
37
%
|
|
34
%
|
|
52
%
|
|
52
%
|
|
67
%
|
|
(a)
|
Per share net investment loss has been calculated using the average shares outstanding during the period.
|
|
(b)
|
Includes a non-recurring dividend. Without this dividend, net investment loss per share would have been $(0.16), total return would have been (24.83%) and the ratio of net investment loss to average net assets would have been (0.56%).
|
|
|
Retail Class
|
|||||||||
|
|
Year Ended September 30, 2023
|
Year Ende
September 30, 2022 |
Year Ended
September 30, 2021 |
Year Ended
September 30, 2020 |
Year Ended
September 30, 2019 |
|||||
|
Net asset value, beginning of the period
|
$
|
19.98
|
$
|
32.79
|
$
|
25.67
|
$
|
23.95
|
$
|
29.09
|
|
Income (loss) from Investment Operations:
|
|
|
|
|
|
|
|
|
|
|
|
Net investment loss(a)
|
|
(0.16
)
|
|
(0.19
)
(b)
|
|
(0.30
)
|
|
(0.21
)
|
|
(0.21
)
|
|
Net realized and unrealized gain (loss)
|
|
2.39
|
|
(6.14
)
|
|
8.04
|
|
4.28
|
|
(2.35
)
|
|
Total from Investment Operations
|
|
2.23
|
|
(6.33
)
|
|
7.74
|
|
4.07
|
|
(2.56
)
|
|
Less Distributions From:
|
|
|
|
|
|
|
|
|
|
|
|
Net realized capital gains
|
|
(0.72
)
|
|
(6.48
)
|
|
(0.62
)
|
|
(2.35
)
|
|
(2.58
)
|
|
Net asset value, end of the period
|
$
|
21.49
|
$
|
19.98
|
$
|
32.79
|
$
|
25.67
|
$
|
23.95
|
|
Total return
|
|
11.32
%
|
|
(24.94
)%
(b)
|
|
30.20
%
|
|
17.67
%
|
|
(7.11
)%
(c)
|
|
Ratios to Average Net Assets:
|
|
|
|
|
|
|
|
|
|
|
|
Net assets, end of the period (000’s)
|
$
|
62,965
|
$
|
62,909
|
$
|
105,027
|
$
|
98,205
|
$
|
95,635
|
|
Net expenses
|
|
1.19
%
|
|
1.18
%
|
|
1.17
%
|
|
1.19
%
|
|
1.19
%
(d)
|
|
Gross expenses
|
|
1.19
%
|
|
1.18
%
|
|
1.17
%
|
|
1.19
%
|
|
1.20
%
|
|
Net investment loss
|
|
(0.75
)%
|
|
(0.76
)%
(b)
|
|
(0.92
)%
|
|
(0.91
)%
|
|
(0.86
)%
|
|
Portfolio turnover rate
|
|
37
%
|
|
34
%
|
|
52
%
|
|
52
%
|
|
67
%
|
|
(a)
|
Per share net investment loss has been calculated using the average shares outstanding during the period.
|
|
(b)
|
Includes a non-recurring dividend. Without this dividend, net investment loss per share would have been $(0.21), total return would have been (25.01%) and the ratio of net investment loss to average net assets would have been (0.81%).
|
|
(c)
|
Had certain expenses not been waived/reimbursed during the period, total returns would have been lower.
|
|
(d)
|
The administrator agreed to waive its fees and/or reimburse a portion of the Fund’s expenses during the period. Without this waiver/reimbursement, expenses would have been higher.
|
|
|
Class N
|
|||||||||
|
|
Year Ended September 30, 2023
|
Year Ended
September 30, 2022 |
Year Ended
September 30, 2021 |
Year Ended
September 30, 2020 |
Year Ended
September 30, 2019 |
|||||
|
Net asset value, beginning of the period
|
$
|
23.23
|
$
|
37.01
|
$
|
28.81
|
$
|
26.53
|
$
|
31.76
|
|
Income (loss) from Investment Operations:
|
|
|
|
|
|
|
|
|
|
|
|
Net investment loss(a)
|
|
(0.10
)
|
|
(0.11
)
(b)
|
|
(0.22
)
|
|
(0.14
)
|
|
(0.13
)
|
|
Net realized and unrealized gain (loss)
|
|
2.80
|
|
(7.19
)
|
|
9.04
|
|
4.77
|
|
(2.52
)
|
|
Total from Investment Operations
|
|
2.70
|
|
(7.30
)
|
|
8.82
|
|
4.63
|
|
(2.65
)
|
|
Less Distributions From:
|
|
|
|
|
|
|
|
|
|
|
|
Net realized capital gains
|
|
(0.72
)
|
|
(6.48
)
|
|
(0.62
)
|
|
(2.35
)
|
|
(2.58
)
|
|
Net asset value, end of the period
|
$
|
25.21
|
$
|
23.23
|
$
|
37.01
|
$
|
28.81
|
$
|
26.53
|
|
Total return
|
|
11.77
%
|
|
(24.69
)%
(b)
|
|
30.66
%
|
|
18.09
%
|
|
(6.76
)%
|
|
Ratios to Average Net Assets:
|
|
|
|
|
|
|
|
|
|
|
|
Net assets, end of the period (000’s)
|
$
|
1,154,817
|
$
|
1,030,728
|
$
|
1,475,139
|
$
|
1,066,067
|
$
|
629,914
|
|
Net expenses
|
|
0.83
%
|
|
0.82
%
|
|
0.82
%
|
|
0.82
%
|
|
0.82
%
|
|
Gross expenses
|
|
0.83
%
|
|
0.82
%
|
|
0.82
%
|
|
0.82
%
|
|
0.82
%
|
|
Net investment loss
|
|
(0.38
)%
|
|
(0.39
)%
(b)
|
|
(0.62
)%
|
|
(0.54
)%
|
|
(0.49
)%
|
|
Portfolio turnover rate
|
|
37
%
|
|
34
%
|
|
52
%
|
|
52
%
|
|
67
%
|
|
(a)
|
Per share net investment loss has been calculated using the average shares outstanding during the period.
|
|
(b)
|
Includes a non-recurring dividend. Without this dividend, net investment loss per share would have been $(0.13), total return would have been (24.71%) and the ratio of net investment loss to average net assets would have been (0.44%).
|
|
|
Institutional Class
|
|||||||||
|
|
Year Ended September 30, 2023
|
Year Ended September 30, 2022
|
Year Ended September 30, 2021
|
Year Ended September 30, 2020
|
Year Ended September 30, 2019
|
|||||
|
Net asset value, beginning of the period
|
$
|
22.57
|
$
|
32.05
|
$
|
22.34
|
$
|
28.66
|
$
|
35.27
|
|
Income (loss) from Investment Operations:
|
|
|
|
|
|
|
|
|
|
|
|
Net investment income(a)
|
|
0.08
|
|
0.13
|
|
0.04
|
|
0.12
|
|
0.10
|
|
Net realized and unrealized gain (loss)
|
|
4.37
|
|
(4.18
)
|
|
11.79
|
|
(4.03
)
|
|
(2.49
)
|
|
Total from Investment Operations
|
|
4.45
|
|
(4.05
)
|
|
11.83
|
|
(3.91
)
|
|
(2.39
)
|
|
Less Distributions From:
|
|
|
|
|
|
|
|
|
|
|
|
Net investment income
|
|
(0.13
)
|
|
(0.05
)
|
|
(0.13
)
|
|
(0.12
)
|
|
(0.08
)
|
|
Net realized capital gains
|
|
(2.72
)
|
|
(5.38
)
|
|
(1.99
)
|
|
(2.29
)
|
|
(4.14
)
|
|
Total Distributions
|
|
(2.85
)
|
|
(5.43
)
|
|
(2.12
)
|
|
(2.41
)
|
|
(4.22
)
|
|
Net asset value, end of the period
|
$
|
24.17
|
$
|
22.57
|
$
|
32.05
|
$
|
22.34
|
$
|
28.66
|
|
Total return(b)
|
|
20.73
%
|
|
(16.18
)%
|
|
55.05
%
|
|
(15.31
)%
|
|
(4.11
)%
|
|
Ratios to Average Net Assets:
|
|
|
|
|
|
|
|
|
|
|
|
Net assets, end of the period (000’s)
|
$
|
201,632
|
$
|
276,020
|
$
|
378,856
|
$
|
295,006
|
$
|
433,360
|
|
Net expenses(c)
|
|
0.90
%
|
|
0.90
%
|
|
0.90
%
|
|
0.90
%
|
|
0.90
%
|
|
Gross expenses
|
|
0.96
%
|
|
0.93
%
|
|
0.94
%
|
|
0.95
%
|
|
0.93
%
|
|
Net investment income
|
|
0.34
%
|
|
0.48
%
|
|
0.12
%
|
|
0.48
%
|
|
0.36
%
|
|
Portfolio turnover rate
|
|
26
%
|
|
28
%
|
|
23
%
|
|
23
%
|
|
24
%
|
|
(a)
|
Per share net investment income has been calculated using the average shares outstanding during the period.
|
|
(b)
|
Had certain expenses not been waived/reimbursed during the period, total returns would have been lower.
|
|
(c)
|
The investment adviser agreed to waive its fees and/or reimburse a portion of the Fund’s expenses during the period. Without this waiver/reimbursement, expenses would have been higher.
|
|
|
Retail Class
|
|||||||||
|
|
Year Ended September 30, 2023
|
Year Ended September 30, 2022
|
Year Ended September 30, 2021
|
Year Ended September 30, 2020
|
Year Ended September 30, 2019
|
|||||
|
Net asset value, beginning of the period
|
$
|
21.95
|
$
|
31.33
|
$
|
21.87
|
$
|
28.11
|
$
|
34.66
|
|
Income (loss) from Investment Operations:
|
|
|
|
|
|
|
|
|
|
|
|
Net investment income (loss)(a)
|
|
0.02
|
|
0.06
|
|
(0.04
)
|
|
0.05
|
|
0.03
|
|
Net realized and unrealized gain (loss)
|
|
4.26
|
|
(4.06
)
|
|
11.55
|
|
(3.96
)
|
|
(2.44
)
|
|
Total from Investment Operations
|
|
4.28
|
|
(4.00
)
|
|
11.51
|
|
(3.91
)
|
|
(2.41
)
|
|
Less Distributions From:
|
|
|
|
|
|
|
|
|
|
|
|
Net investment income
|
|
(0.07
)
|
|
—
|
|
(0.06
)
|
|
(0.04
)
|
|
—
|
|
Net realized capital gains
|
|
(2.72
)
|
|
(5.38
)
|
|
(1.99
)
|
|
(2.29
)
|
|
(4.14
)
|
|
Total Distributions
|
|
(2.79
)
|
|
(5.38
)
|
|
(2.05
)
|
|
(2.33
)
|
|
(4.14
)
|
|
Net asset value, end of the period
|
$
|
23.44
|
$
|
21.95
|
$
|
31.33
|
$
|
21.87
|
$
|
28.11
|
|
Total return(b)
|
|
20.47
%
|
|
(16.40
)%
|
|
54.69
%
|
|
(15.56
)%
|
|
(4.33
)%
|
|
Ratios to Average Net Assets:
|
|
|
|
|
|
|
|
|
|
|
|
Net assets, end of the period (000’s)
|
$
|
68,979
|
$
|
63,738
|
$
|
92,036
|
$
|
83,163
|
$
|
134,434
|
|
Net expenses(c)
|
|
1.15
%
|
|
1.15
%
|
|
1.15
%
|
|
1.15
%
|
|
1.15
%
|
|
Gross expenses
|
|
1.21
%
|
|
1.18
%
|
|
1.19
%
|
|
1.20
%
|
|
1.18
%
|
|
Net investment income (loss)
|
|
0.09
%
|
|
0.23
%
|
|
(0.12
)%
|
|
0.23
%
|
|
0.10
%
|
|
Portfolio turnover rate
|
|
26
%
|
|
28
%
|
|
23
%
|
|
23
%
|
|
24
%
|
|
(a)
|
Per share net investment income (loss) has been calculated using the average shares outstanding during the period.
|
|
(b)
|
Had certain expenses not been waived/reimbursed during the period, total returns would have been lower.
|
|
(c)
|
The investment adviser agreed to waive its fees and/or reimburse a portion of the Fund’s expenses during the period. Without this waiver/reimbursement, expenses would have been higher.
|
|
|
Admin Class
|
|||||||||
|
|
Year Ended September 30, 2023
|
Year Ended September 30, 2022
|
Year Ended September 30, 2021
|
Year Ended September 30, 2020
|
Year Ended September 30, 2019
|
|||||
|
Net asset value, beginning of the period
|
$
|
20.31
|
$
|
29.44
|
$
|
20.65
|
$
|
26.68
|
$
|
33.25
|
|
Income (loss) from Investment Operations:
|
|
|
|
|
|
|
|
|
|
|
|
Net investment loss(a)
|
|
(0.03
)
|
|
(0.01
)
|
|
(0.10
)
|
|
(0.01
)
|
|
(0.04
)
|
|
Net realized and unrealized gain (loss)
|
|
3.92
|
|
(3.74
)
|
|
10.88
|
|
(3.73
)
|
|
(2.39
)
|
|
Total from Investment Operations
|
|
3.89
|
|
(3.75
)
|
|
10.78
|
|
(3.74
)
|
|
(2.43
)
|
|
Less Distributions From:
|
|
|
|
|
|
|
|
|
|
|
|
Net investment income
|
|
(0.01
)
|
|
—
|
|
—
|
|
—
|
|
—
|
|
Net realized capital gains
|
|
(2.72
)
|
|
(5.38
)
|
|
(1.99
)
|
|
(2.29
)
|
|
(4.14
)
|
|
Total Distributions
|
|
(2.73
)
|
|
(5.38
)
|
|
(1.99
)
|
|
(2.29
)
|
|
(4.14
)
|
|
Net asset value, end of the period
|
$
|
21.47
|
$
|
20.31
|
$
|
29.44
|
$
|
20.65
|
$
|
26.68
|
|
Total return(b)
|
|
20.18
%
|
|
(16.63
)%
|
|
54.29
%
|
|
(15.74
)%
|
|
(4.60
)%
|
|
Ratios to Average Net Assets:
|
|
|
|
|
|
|
|
|
|
|
|
Net assets, end of the period (000’s)
|
$
|
5,812
|
$
|
6,776
|
$
|
9,440
|
$
|
7,662
|
$
|
13,357
|
|
Net expenses(c)
|
|
1.40
%
|
|
1.40
%
|
|
1.40
%
|
|
1.40
%
|
|
1.40
%
|
|
Gross expenses
|
|
1.46
%
|
|
1.43
%
|
|
1.43
%
|
|
1.45
%
|
|
1.43
%
|
|
Net investment loss
|
|
(0.16
)%
|
|
(0.02
)%
|
|
(0.38
)%
|
|
(0.03
)%
|
|
(0.15
)%
|
|
Portfolio turnover rate
|
|
26
%
|
|
28
%
|
|
23
%
|
|
23
%
|
|
24
%
|
|
(a)
|
Per share net investment loss has been calculated using the average shares outstanding during the period.
|
|
(b)
|
Had certain expenses not been waived/reimbursed during the period, total returns would have been lower.
|
|
(c)
|
The investment adviser agreed to waive its fees and/or reimburse a portion of the Fund’s expenses during the period. Without this waiver/reimbursement, expenses would have been higher.
|
|
|
Class N
|
|||||||||
|
|
Year Ended September 30, 2023
|
Year Ended September 30, 2022
|
Year Ended September 30, 2021
|
Year Ended September 30, 2020
|
Year Ended September 30, 2019
|
|||||
|
Net asset value, beginning of the period
|
$
|
22.58
|
$
|
32.07
|
$
|
22.35
|
$
|
28.68
|
$
|
35.31
|
|
Income (loss) from Investment Operations:
|
|
|
|
|
|
|
|
|
|
|
|
Net investment income(a)
|
|
0.10
|
|
0.15
|
|
0.05
|
|
0.13
|
|
0.12
|
|
Net realized and unrealized gain (loss)
|
|
4.37
|
|
(4.19
)
|
|
11.80
|
|
(4.03
)
|
|
(2.50
)
|
|
Total from Investment Operations
|
|
4.47
|
|
(4.04
)
|
|
11.85
|
|
(3.90
)
|
|
(2.38
)
|
|
Less Distributions From:
|
|
|
|
|
|
|
|
|
|
|
|
Net investment income
|
|
(0.15
)
|
|
(0.07
)
|
|
(0.14
)
|
|
(0.14
)
|
|
(0.11
)
|
|
Net realized capital gains
|
|
(2.72
)
|
|
(5.38
)
|
|
(1.99
)
|
|
(2.29
)
|
|
(4.14
)
|
|
Total Distributions
|
|
(2.87
)
|
|
(5.45
)
|
|
(2.13
)
|
|
(2.43
)
|
|
(4.25
)
|
|
Net asset value, end of the period
|
$
|
24.18
|
$
|
22.58
|
$
|
32.07
|
$
|
22.35
|
$
|
28.68
|
|
Total return
|
|
20.80
%
(b)
|
|
(16.16
)%
|
|
55.15
%
|
|
(15.28
)%
|
|
(4.07
)%
|
|
Ratios to Average Net Assets:
|
|
|
|
|
|
|
|
|
|
|
|
Net assets, end of the period (000’s)
|
$
|
65,720
|
$
|
75,168
|
$
|
112,310
|
$
|
92,818
|
$
|
141,821
|
|
Net expenses
|
|
0.85
%
(c)
|
|
0.84
%
|
|
0.85
%
|
|
0.85
%
|
|
0.83
%
|
|
Gross expenses
|
|
0.87
%
|
|
0.84
%
|
|
0.85
%
|
|
0.85
%
|
|
0.83
%
|
|
Net investment income
|
|
0.40
%
|
|
0.53
%
|
|
0.17
%
|
|
0.53
%
|
|
0.43
%
|
|
Portfolio turnover rate
|
|
26
%
|
|
28
%
|
|
23
%
|
|
23
%
|
|
24
%
|
|
(a)
|
Per share net investment income has been calculated using the average shares outstanding during the period.
|
|
(b)
|
Had certain expenses not been waived/reimbursed during the period, total returns would have been lower.
|
|
(c)
|
The investment adviser agreed to waive its fees and/or reimburse a portion of the Fund’s expenses during the period. Without this waiver/reimbursement, expenses would have been higher.
|
|
|
Institutional Class
|
|||||||||
|
|
Year Ended September 30, 2023
|
Year Ended
September 30, 2022 |
Year Ended
September 30, 2021 |
Year Ended
September 30, 2020 |
Year Ended
September 30, 2019 |
|||||
|
Net asset value, beginning of the period
|
$
|
10.34
|
$
|
15.25
|
$
|
11.81
|
$
|
10.03
|
$
|
15.49
|
|
Income (loss) from Investment Operations:
|
|
|
|
|
|
|
|
|
|
|
|
Net investment loss(a)
|
|
(0.04
)
|
|
(0.06
)
|
|
(0.02
)
(b)
|
|
(0.04
)
|
|
(0.04
)
|
|
Net realized and unrealized gain (loss)
|
|
0.46
|
|
(3.37
)
|
|
3.56
|
|
2.06
|
|
(1.55
)
(c)
|
|
Total from Investment Operations
|
|
0.42
|
|
(3.43
)
|
|
3.54
|
|
2.02
|
|
(1.59
)
|
|
Less Distributions From:
|
|
|
|
|
|
|
|
|
|
|
|
Net realized capital gains
|
|
—
|
|
(1.48
)
|
|
(0.10
)
|
|
(0.24
)
|
|
(3.87
)
|
|
Net asset value, end of the period
|
$
|
10.76
|
$
|
10.34
|
$
|
15.25
|
$
|
11.81
|
$
|
10.03
|
|
Total return(d)
|
|
4.06
%
|
|
(25.43
)%
|
|
30.00
%
(b)
|
|
20.38
%
|
|
(3.27
)%
|
|
Ratios to Average Net Assets:
|
|
|
|
|
|
|
|
|
|
|
|
Net assets, end of the period (000’s)
|
$
|
118,499
|
$
|
106,566
|
$
|
70,526
|
$
|
52,170
|
$
|
34,312
|
|
Net expenses(e)
|
|
0.85
%
|
|
0.84
%
(f)
|
|
0.84
%
(f)
|
|
0.84
%
|
|
0.85
%
|
|
Gross expenses
|
|
0.93
%
|
|
0.91
%
|
|
0.99
%
|
|
1.21
%
|
|
1.30
%
|
|
Net investment loss
|
|
(0.37
)%
|
|
(0.45
)%
|
|
(0.14
)%
(b)
|
|
(0.34
)%
|
|
(0.35
)%
|
|
Portfolio turnover rate
|
|
63
%
|
|
50
%
|
|
50
%
|
|
60
%
|
|
67
%
|
|
(a)
|
Per share net investment loss has been calculated using the average shares outstanding during the period.
|
|
(b)
|
Includes a non-recurring dividend. Without this dividend, net investment loss per share would have been $(0.08), total return would have been 29.49% and the ratio of net investment loss to average net assets would have been (0.52%).
|
|
(c)
|
The amount shown for a share outstanding does not correspond with the aggregate realized and unrealized gain (loss) on investments for the period due to the timing of sales and redemptions of fund shares in relation to fluctuating market values of investments of the Fund.
|
|
(d)
|
Had certain expenses not been waived/reimbursed during the period, total returns would have been lower.
|
|
(e)
|
The investment adviser agreed to waive its fees and/or reimburse a portion of the Fund’s expenses during the period. Without this waiver/reimbursement, expenses would have been higher.
|
|
(f)
|
Includes additional voluntary waiver of advisory fee of 0.01%.
|
|
|
Class N
|
|||||||
|
|
Year Ended September 30, 2023
|
Year Ended
September 30, 2022 |
Year Ended
September 30, 2021 |
Period Ended
September 30, 2020* |
||||
|
Net asset value, beginning of the period
|
$
|
10.35
|
$
|
15.26
|
$
|
11.81
|
$
|
9.89
|
|
Income (loss) from Investment Operations:
|
|
|
|
|
|
|
|
|
|
Net investment loss(a)
|
|
(0.04
)
|
|
(0.05
)
|
|
(0.01
)
(b)
|
|
(0.04
)
|
|
Net realized and unrealized gain (loss)
|
|
0.46
|
|
(3.38
)
|
|
3.56
|
|
2.20
|
|
Total from Investment Operations
|
|
0.42
|
|
(3.43
)
|
|
3.55
|
|
2.16
|
|
Less Distributions From:
|
|
|
|
|
|
|
|
|
|
Net realized capital gains
|
|
—
|
|
(1.48
)
|
|
(0.10
)
|
|
(0.24
)
|
|
Net asset value, end of the period
|
$
|
10.77
|
$
|
10.35
|
$
|
15.26
|
$
|
11.81
|
|
Total return(c)
|
|
4.06
%
|
|
(25.41
)%
|
|
30.08
%
(b)
|
|
22.08
%
(d)
|
|
Ratios to Average Net Assets:
|
|
|
|
|
|
|
|
|
|
Net assets, end of the period (000’s)
|
$
|
25,035
|
$
|
46,814
|
$
|
9,260
|
$
|
1
|
|
Net expenses(e)
|
|
0.83
%
|
|
0.83
%
|
|
0.83
%
|
|
0.83
%
(f)
|
|
Gross expenses
|
|
0.92
%
|
|
0.91
%
|
|
1.00
%
|
|
107.49
%
(f)
|
|
Net investment loss
|
|
(0.37
)%
|
|
(0.44
)%
|
|
(0.08
)%
(b)
|
|
(0.34
)%
(f)
|
|
Portfolio turnover rate
|
|
63
%
|
|
50
%
|
|
50
%
|
|
60
%
(g)
|
|
*
|
Class operations commenced on October 1, 2019.
|
|
(a)
|
Per share net investment loss has been calculated using the average shares outstanding during the period.
|
|
(b)
|
Includes a non-recurring dividend. Without this dividend, net investment loss per share would have been $(0.07), total return would have been 29.66% and the ratio of net investment loss to average net assets would have been (0.50%).
|
|
(c)
|
Had certain expenses not been waived/reimbursed during the period, total returns would have been lower.
|
|
(d)
|
Periods less than one year are not annualized.
|
|
(e)
|
The investment adviser agreed to waive its fees and/or reimburse a portion of the Fund’s expenses during the period. Without this waiver/reimbursement, expenses would have been higher.
|
|
(f)
|
Computed on an annualized basis for periods less than one year.
|
|
(g)
|
Represents the Fund’s portfolio turnover rate for the year ended September 30, 2020.
|
|
Bloomberg Global Aggregate Bond Index
|
Provides a broad-based measure of the global investment-grade fixed income markets. The four major components of this index are the U.S. Aggregate, the Pan-European Aggregate, the Asian-Pacific Aggregate, and the Canadian Aggregate Indices. The index also includes Eurodollar and Euro-Yen corporate bonds, Canadian government, agency and corporate securities, and USD investment grade 144A securities.
|
|
Bloomberg U.S. Aggregate Bond Index
|
A broad-based index that covers the U.S. dollar-denominated, investment-grade, fixed-rate, taxable bond market of SEC-registered securities. The index includes bonds from the U.S. Treasury, government-related, corporate, mortgage-backed securities, asset-backed securities, and collateralized mortgage-backed securities sectors.
|
|
Bloomberg U.S. Corporate High-Yield Bond Index
|
Measures the market of U.S. dollar-denominated, non-investment grade, fixed-rate, taxable corporate bonds. Securities are classified as high yield if the middle rating of Moody’s, Fitch, and S&P is Ba1/BB+/BB+ or below, excluding emerging market debt.
|
|
Bloomberg U.S. Government/Credit Bond Index
|
The index is a broad-based flagship benchmark that measures the non-securitized component of the U.S. Aggregate Index. The U.S. Government/Credit Bond Index includes investment grade, U.S. dollar-denominated, fixed-rate Treasuries (i.e., public obligations of the U.S. Treasury that have remaining maturities of more than one year), government-related issues (i.e., agency, sovereign, supranational, and local authority debt), and corporate securities.
|
|
Bloomberg U.S. Treasury Inflation Protected Securities Index
|
An unmanaged index that tracks inflation-protected securities issued by the U.S. Treasury.
|
|
Russell 2000® Growth Index
|
An unmanaged index that measures the performance of the small-cap growth segment of the U.S. equity universe. It includes those Russell 2000® companies with higher price-to-book ratios and higher forecasted growth values.
|
|
Russell 2500™ Growth Index
|
An unmanaged index that measures the performance of the small to mid-cap growth segment of the U.S. equity universe. It includes those Russell 2500™ Index companies with higher price-to-book ratios and higher forecasted growth values.
|
|
Russell 2000® Index
|
An unmanaged index that measures the performance of the small-cap segment of the U.S. equity universe.
|
|
Russell 3000® Index
|
An unmanaged index that measures the performance of the largest 3000 US companies representing approximately 98% of the investable US equity market.
|
|
Russell 2000® Value Index
|
An unmanaged index that measures the performance of the small-cap value segment of the U.S. equity universe. It includes those Russell 2000® companies with lower price-to-book ratios and lower forecasted growth values.
|

|
Loomis Sayles Funds I
File No. 811-08282
Loomis Sayles Funds II
File No. 811-06241
|
M-LS51-0224
|