
FRANKLIN STRATEGIC SERIES


Annual Report
Economic and Market Overview
The U.S. economy expanded despite geopolitical and inflationary pressures from around the globe during the 12-month period ended April 30, 2011. Business activity increased and consumer spending recovered to pre-recession levels. The U.S. has been a key engine in an ongoing global manufacturing rebound, which accelerated in the first quarter of 2011 and helped spur U.S. economic output. Worldwide demand for capital goods aided U.S. manufacturing profits and increased employment in the industry.
Unemployment and underemployment eased as job creation began to gain some traction and the U.S. jobless rate declined from 9.7% to 9.0% during the year.1 Consumer spending rose for the tenth consecutive month in April, but rising gasoline and food prices eventually led to a sharp drop in consumer confidence. The banking sector appeared closer to a full recovery although the U.S. still faced challenges dealing with massive debt at period-end.
Inflation at the consumer, producer and trade levels rose across much of the world, but in the U.S. it remained relatively contained. The Federal Open Market Committee kept monetary policy unchanged while continuing its second round of quantitative easing, scheduled to terminate in June.
Investor confidence shifted with each release of encouraging or discouraging economic, regulatory and geopolitical news, causing equity market volatility to increase globally. U.S. investors weathered international events that included a massive oil spill in the Gulf of Mexico, revolutions and ongoing civil unrest across the Middle East and North Africa, sovereign debt worries and credit downgrades in Europe, and the multiple crises triggered by Japan’s earthquake and tsunami. Ultimately, U.S. and global stock indexes delivered strong gains during the year under review as equity markets rose amid generally improving economic signs and rising consumer spending.
The foregoing information reflects our analysis and opinions as of April 30, 2011. The information is not a complete analysis of every aspect of any market, country, industry, security or fund. Statements of fact are from sources considered reliable.
1. Source: Bureau of Labor Statistics.
Annual Report | 3
Franklin Flex Cap Growth Fund
Your Fund’s Goal and Main Investments: Franklin Flex Cap Growth Fund seeks capital appreciation. The Fund normally invests predominantly in equity securities of companies that the manager believes have the potential for capital appreciation. The Fund has flexibility to invest in companies located, headquartered or operating inside and outside the U.S., across the entire market capitalization spectrum from small, emerging growth companies to well-established, large cap companies.
Performance data represent past performance, which does not guarantee future results. Investment return and principal value will fluctuate, and you may have a gain or loss when you sell your shares. Current performance may differ from figures shown. Please visit franklintempleton.com or call (800) 342-5236 for most recent month-end performance.
This annual report for Franklin Flex Cap Growth Fund covers the fiscal year ended April 30, 2011.
Performance Overview
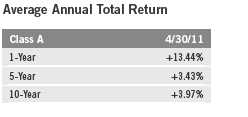
For the 12 months under review, Franklin Flex Cap Growth Fund – Class A delivered a +20.37% cumulative total return. Compared with its narrow benchmarks, the Fund underperformed the +21.62% total return of the Russell 3000® Growth Index, which measures performance of Russell 3000 Index companies with higher price-to-book ratios and higher forecasted growth values, and performed comparably to the +20.87% total return of Russell 1000® Growth Index, which tracks the performance of Russell 1000 Index companies with higher price-to-book ratios and higher forecasted growth values.1 The Fund outperformed the +17.22% total return of its broad benchmark, the Standard & Poor’s 500 Index (S&P 500), which tracks the broad U.S. stock market.1 In addition, the Fund underperformed the +21.94% total return of its peers in the Lipper Multi-Cap Growth Funds Classification Average, which consists of funds chosen by Lipper that invest in companies of any size with earnings expected to grow significantly faster than the earnings of stocks in major unmanaged stock indexes.2 You can find the Fund’s long-term performance data in the Performance Summary beginning on page 7.
1. Source: © 2011 Morningstar. All Rights Reserved. The information contained herein: (1) is proprietary to Morningstar and/or its content providers; (2) may not be copied or distributed; and (3) is not warranted to be accurate, complete or timely. Neither Morningstar nor its content providers are responsible for any damages or losses arising from any use of this information. STANDARD & POOR’S®, S&P® and S&P 500® are registered trademarks of Standard & Poor’s Financial Services LLC. Standard & Poor’s does not sponsor, endorse, sell or promote any S&P index-based product.
2. Source: Lipper Inc. For the 12-month period ended 4/30/11, this category consisted of 463 funds. Lipper calculations do not include sales charges or subsidization by a Fund’s manager. The Fund’s performance relative to the average may have differed if these or other factors had been considered.
The indexes are unmanaged and include reinvested dividends. One cannot invest directly in an index, and an index is not representative of the Fund’s portfolio.
The dollar value, number of shares or principal amount, and names of all portfolio holdings are listed in the Fund’s Statement of Investments (SOI). The SOI begins on page 59.
4 | Annual Report
Investment Strategy
We use fundamental, bottom-up research to seek companies meeting our criteria of growth potential, quality and valuation. In seeking sustainable growth characteristics, we look for companies we believe can produce sustainable earnings and cash flow growth, evaluating the long-term market opportunity and competitive structure of an industry to target leaders and emerging leaders. We define quality companies as those with strong and improving competitive positions in attractive markets. We also believe important attributes of quality are experienced and talented management teams as well as financial strength reflected in the capital structure, gross and operating margins, free cash flow generation and returns on capital employed. Our valuation analysis includes a range of potential outcomes based on an assessment of multiple scenarios. In assessing value, we consider whether security prices fully reflect the balance of the sustainable growth opportunities relative to business and financial risks.
Manager’s Discussion
During the 12 months under review, all sectors represented in the Fund’s portfolio delivered positive returns as the broad market rallied. Stock selection in the information technology sector, which benefited from increased business and consumer spending, supported Fund performance relative to the Russell 3000 Growth Index.3 Major contributors from the sector included Sybase,4 an enterprise and mobile phone software company acquired by software maker SAP; Citrix Systems,4 a leading provider of desktop virtualization solutions; NetApp, a storage and data management company; and EMC, a data storage devices and software manufacturer. Stock selection in the industrials sector also enhanced relative performance as waste management company Stericycle and diesel and natural gas engine manufacturer Cummins delivered stellar returns.5 Additionally, stock selection in the energy sector, which benefited from crude oil and natural gas price increases, also helped relative performance, particularly our holdings in Concho Resources, an acquirer, explorer and developer of oil and natural gas properties in southeastern New Mexico and west Texas; and Cameron International, a manufacturer of oil and gas pressure control equipment. Industrial chemical producer Celanese, in the materials sector, also contributed meaningfully to relative performance. Although holdings in the consumer discretionary sector generally hurt relative performance, overweighting
3. The information technology sector comprises semiconductors and semiconductor equipment, software and services, and technology hardware and equipment in the SOI.
4. No longer held by period-end.
5. The industrials sector comprises capital goods, commercial and professional services, and transportation in the SOI.

Annual Report | 5
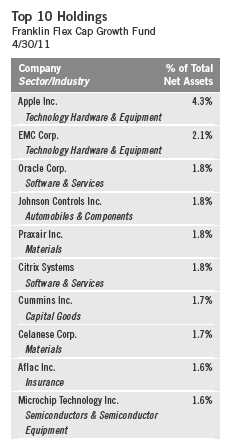
of online travel company Priceline.com, which delivered triple-digit returns during the reporting period, boosted the Fund’s performance.6
In contrast, the Fund had some detractors from relative performance. Stock selection in the consumer discretionary sector hindered returns, as for-profit education company Apollo Group4 and hotel operator and franchisor Marriott International fell in value. Overweighting and stock selection in the health care sector7 hurt relative performance, and key detractors included biotechnology company Celgene, medical equipment manufacturer Intuitive Surgical, pet health care provider VCA Antech4 and pharmaceutical company Merck & Co. Among our consumer staples sector8 holdings, major detractors from relative performance included household products manufacturer Procter & Gamble and integrated pharmacy health care provider CVS Caremark.4 Although our holdings in the information technology sector generally helped the Fund’s absolute and relative performance, there were some notable detractors, including light-emitting diodes (LED) products manufacturer Cree,4 integrated circuit maker Silicon Laboratories and global payments technology company Visa.
Thank you for your continued participation in Franklin Flex Cap Growth Fund. We look forward to serving your future investment needs.
The foregoing information reflects our analysis, opinions and portfolio holdings as of April 30, 2011, the end of the reporting period. The way we implement our main investment strategies and the resulting portfolio holdings may change depending on factors such as market and economic conditions. These opinions may not be relied upon as investment advice or an offer for a particular security. The information is not a complete analysis of every aspect of any market, country, industry, security or the Fund. Statements of fact are from sources considered reliable, but the investment manager makes no representation or warranty as to their completeness or accuracy. Although historical performance is no guarantee of future results, these insights may help you understand our investment management philosophy.
6. The consumer discretionary sector comprises automobiles and components, consumer durables and apparel, consumer services, media, and retailing in the SOI.
7. The health care sector comprises health care equipment and services; and pharmaceuticals, biotechnology and life sciences in the SOI.
8. The consumer staples sector comprises food and staples retailing; food, beverage and tobacco; and household and personal products in the SOI.
6 | Annual Report
Performance Summary as of 4/30/11
Franklin Flex Cap Growth Fund
Your dividend income will vary depending on dividends or interest paid by securities in the Fund’s portfolio, adjusted for operating expenses of each class. Capital gain distributions are net profits realized from the sale of portfolio securities. The performance table and graphs do not reflect any taxes that a shareholder would pay on Fund dividends, capital gain distributions, if any, or any realized gains on the sale of Fund shares. Total return reflects reinvestment of the Fund’s dividends and capital gain distributions, if any, and any unrealized gains or losses.

Annual Report | 7
Performance Summary (continued)
Performance
Cumulative total return excludes sales charges. Average annual total returns and value of $10,000 investment include maximum sales charges. Class A: 5.75% maximum initial sales charge; Class B: contingent deferred sales charge (CDSC) declining from 4% to 1% over six years, and eliminated thereafter; Class C: 1% CDSC in first year only;
Class R/Advisor Class: no sales charges.

Performance data represent past performance, which does not guarantee future results. Investment return and principal value will fluctuate, and you may have a gain or loss when you sell your shares. Current performance may differ from figures shown. For most recent month-end performance, go to franklintempleton.com or call (800) 342-5236.
8 | Annual Report
Performance Summary (continued)
Total Return Index Comparison for a Hypothetical $10,000 Investment
Total return represents the change in value of an investment over the periods shown. It includes any current, applicable, maximum sales charge, Fund expenses, account fees and reinvested distributions. The unmanaged indexes include reinvestment of any income or distributions. They differ from the Fund in composition and do not pay management fees or expenses. One cannot invest directly in an index.

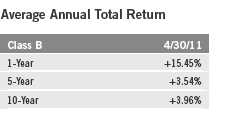
Annual Report | 9
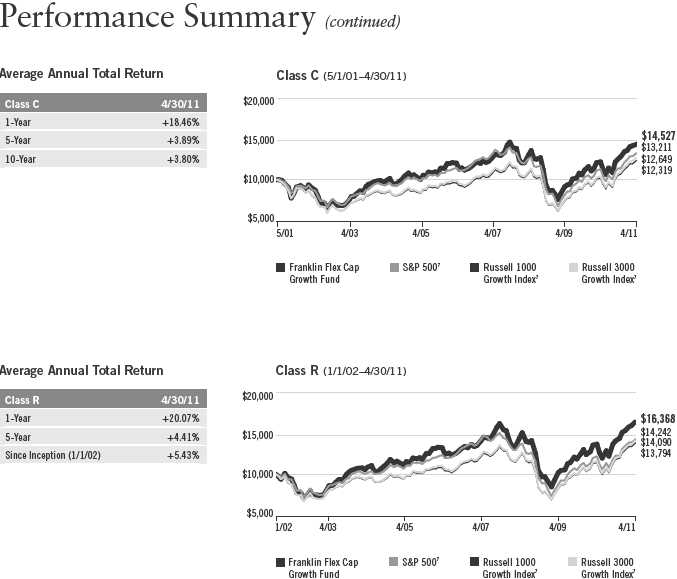
10 | Annual Report

Your Fund’s Expenses
Franklin Flex Cap Growth Fund
As a Fund shareholder, you can incur two types of costs:
- Transaction costs, including sales charges (loads) on Fund purchases; and
- Ongoing Fund costs, including management fees, distribution and service (12b-1) fees, and other Fund expenses. All mutual funds have ongoing costs, sometimes referred to as operating expenses.
The following table shows ongoing costs of investing in the Fund and can help you understand these costs and compare them with those of other mutual funds. The table assumes a $1,000 investment held for the six months indicated.
Actual Fund Expenses
The first line (Actual) for each share class listed in the table provides actual account values and expenses. The “Ending Account Value” is derived from the Fund’s actual return, which includes the effect of Fund expenses.
You can estimate the expenses you paid during the period by following these steps. Of course, your account value and expenses will differ from those in this illustration:
| 1. | Divide your account value by $1,000. |
| If an account had an $8,600 value, then $8,600 ÷ $1,000 = 8.6. | |
| 2. | Multiply the result by the number under the heading “Expenses Paid During Period.” |
| If Expenses Paid During Period were $7.50, then 8.6 x $7.50 = $64.50. |
In this illustration, the estimated expenses paid this period are $64.50.
Hypothetical Example for Comparison with Other Funds
Information in the second line (Hypothetical) for each class in the table can help you compare ongoing costs of investing in the Fund with those of other mutual funds. This information may not be used to estimate the actual ending account balance or expenses you paid during the period. The hypothetical “Ending Account Value” is based on the actual expense ratio for each class and an assumed 5% annual rate of return before expenses, which does not represent the Fund’s actual return. The figure under the heading “Expenses Paid During Period” shows the hypothetical expenses your account would have incurred under this scenario. You can compare this figure with the 5% hypothetical examples that appear in shareholder reports of other funds.
12 | Annual Report
Your Fund’s Expenses (continued)
Please note that expenses shown in the table are meant to highlight ongoing costs and do not reflect any transaction costs, such as sales charges. Therefore, the second line for each class is useful in comparing ongoing costs only, and will not help you compare total costs of owning different funds. In addition, if transaction costs were included, your total costs would have been higher. Please refer to the Fund prospectus for additional information on operating expenses.
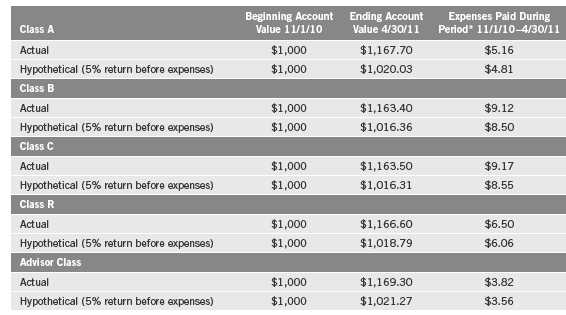
*Expenses are calculated using the most recent six-month expense ratio, annualized for each class (A: 0.96%; B: 1.70%; C: 1.71%; R: 1.21%; and Advisor: 0.71%), multiplied by the average account value over the period, multiplied by 181/365 to reflect the one-half year period.
Annual Report | 13
Franklin Focused Core Equity Fund
Your Fund’s Goal and Main Investments: Franklin Focused Core Equity Fund seeks capital appreciation by normally investing at least 80% of its net assets in equity securities. The Fund normally invests primarily to predominantly in equity securities of large capitalization companies, which are similar in size to those in the Standard & Poor’s 500 Index (S&P 500).1
Performance data represent past performance, which does not guarantee future results. Investment return and principal value will fluctuate, and you may have a gain or loss when you sell your shares. Current performance may differ from figures shown. Please visit franklintempleton.com or call (800) 342-5236 for most recent month-end performance.
This annual report for Franklin Focused Core Equity Fund covers the fiscal year ended April 30, 2011.
Performance Overview
For the 12 months under review, Franklin Focused Core Equity Fund – Class A posted a +14.92% cumulative total return. The Fund underperformed the +17.22% total return of its benchmark, the S&P 500, which tracks the broad U.S. stock market.2 You can find more of the Fund’s performance data in the Performance Summary beginning on page 17.
Investment Strategy
We are research-driven, bottom-up, fundamental investors. Our investment approach is opportunistic and contrarian, and we seek to identify mispriced companies using fundamental analysis. We seek to take advantage of price dislocations that result from the market’s short-term focus. Our analysis includes the investigation of the valuation for each investment based upon the view that the price paid for the security is a critical factor determining long-term success. We rely on a team of analysts to help provide in-depth industry expertise and use both qualitative and quantitative analysis to evaluate companies. Our
1. The S&P 500 is a market capitalization-weighted index of 500 stocks designed to measure total U.S. equity market performance.
2. Source: © 2011 Morningstar. All Rights Reserved. The information contained herein: (1) is proprietary to Morningstar and/or its content providers; (2) may not be copied or distributed; and (3) is not warranted to be accurate, complete or timely. Neither Morningstar nor its content providers are responsible for any damages or losses arising from any use of this information. The index is unmanaged and includes reinvested dividends. One cannot invest directly in an index, and an index is not representative of the Fund’s portfolio.
The dollar value, number of shares or principal amount, and names of all portfolio holdings are listed in the Fund’s Statement of Investments (SOI). The SOI begins on page 67.
14 | Annual Report
analysts identify each company’s market opportunity, competitive position, management and financial strength, business and financial risks, and valuation. We choose to invest in those companies that, in our opinion, offer the best trade-off between growth opportunity, business and financial risk, and valuation.
Manager’s Discussion
During the fiscal year under review, the Fund’s investments in the materials, information technology, health care, financials, energy and industrials sectors contributed significantly to absolute returns. Within the materials sector, chemical companies Celanese, Monsanto2 and Westlake Chemical2 provided strong gains. Most of the Fund’s information technology holdings supported absolute returns, led by integrated circuits manufacturer Maxim Integrated Products, personal computer and mobile devices leader Apple, and global payment solutions company MasterCard. Within the health care sector, diversified health care benefits company Aetna and pharmaceutical companies Roche Holding and Merck & Co. aided the Fund’s performance. Key contributors from the financials sector included Legg Mason, JPMorgan Chase and a new position in BlackRock. Marathon Oil in the energy sector and European discount airline Ryanair Holdings in the industrials sector also boosted the Fund’s absolute performance.
In contrast, the consumer discretionary sector detracted from absolute returns, as shares of for-profit education company Apollo Group and multiline retail company Target lost value; however, household durables company Harman International Industries2 performed well and supported Fund performance. Although most sectors were positive for the Fund, certain individual holdings detracted from results. Among these were independent oil refiner Petroplus Holdings, international financial services company Northern Trust and mobile communications company Research in Motion, a new holding this fiscal year.
2. Sold by period-end.
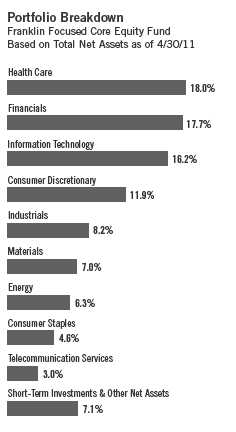
Annual Report | 15
Top 10 Equity Holdings
Franklin Focused Core Equity Fund 4/30/11
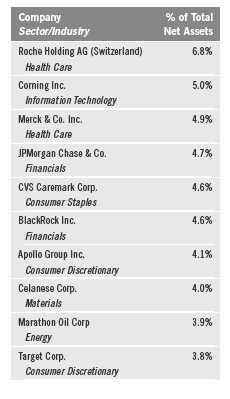
Thank you for your continued participation in Franklin Focused Core Equity Fund. We look forward to serving your future investment needs.


Steven Kornfeld, CFA
Portfolio Manager
Franklin Focused Core Equity Fund
The foregoing information reflects our analysis, opinions and portfolio holdings as of April 30, 2011, the end of the reporting period. The way we implement our main investment strategies and the resulting portfolio holdings may change depending on factors such as market and economic conditions. These opinions may not be relied upon as investment advice or an offer for a particular security. The information is not a complete analysis of every aspect of any market, country, industry, security or the Fund. Statements of fact are from sources considered reliable, but the investment manager makes no representation or warranty as to their completeness or accuracy. Although historical performance is no guarantee of future results, these insights may help you understand our investment management philosophy.
16 | Annual Report
Performance Summary as of 4/30/11
Franklin Focused Core Equity Fund
Your dividend income will vary depending on dividends or interest paid by securities in the Fund’s portfolio, adjusted for operating expenses of each class. Capital gain distributions are net profits realized from the sale of portfolio securities. The performance table and graphs do not reflect any taxes that a shareholder would pay on Fund dividends, capital gain distributions, if any, or any realized gains on the sale of Fund shares. Total return reflects reinvestment of the Fund’s dividends and capital gain distributions, if any, and any unrealized gains or losses.
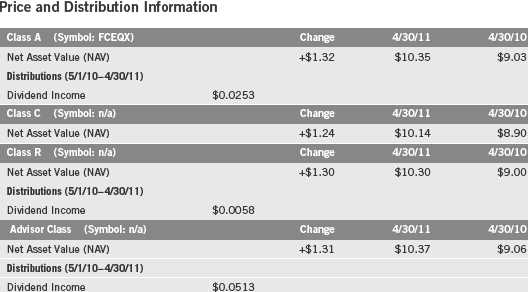
Annual Report | 17
Performance Summary (continued)
Performance1
Cumulative total return excludes sales charges. Average annual total returns and value of $10,000 investment include maximum sales charges. Class A: 5.75% maximum initial sales charge; Class C: 1% contingent deferred sales charge in first year only; Class R/Advisor Class: no sales charges.

Performance data represent past performance, which does not guarantee future results. Investment return and principal value will fluctuate, and you may have a gain or loss when you sell your shares. Current performance may differ from figures shown. For most recent month-end performance, go to franklintempleton.com or call (800) 342-5236.
The investment manager and administrator have contractually agreed to waive or assume certain expenses so that common expenses (excluding the Rule 12b-1 fees and acquired fund fees and expenses) for each class of the Fund do not exceed 0.89% (other than certain nonroutine expenses) until 8/31/11.
18 | Annual Report
Performance Summary (continued)
Total Return Index Comparison for a Hypothetical $10,000 Investment1
Total return represents the change in value of an investment over the periods shown. It includes any applicable maximum sales charge, Fund expenses, account fees and reinvested distributions. The unmanaged index includes reinvestment of any income or distributions. It differs from the Fund in composition and does not pay management fees or expenses. One cannot invest directly in an index.
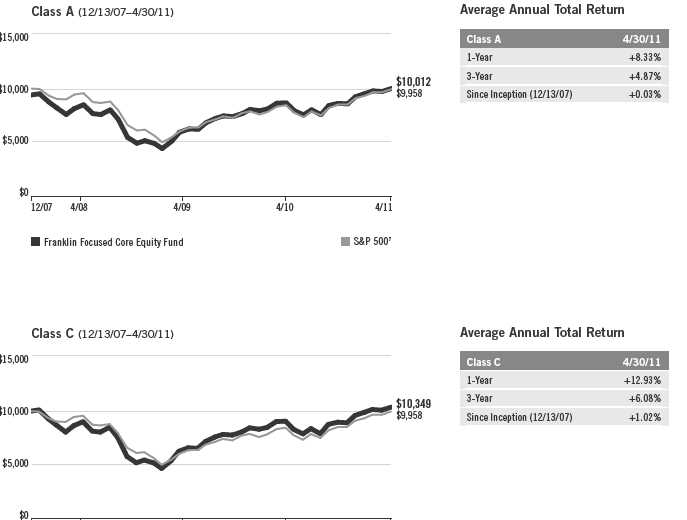

Annual Report | 19
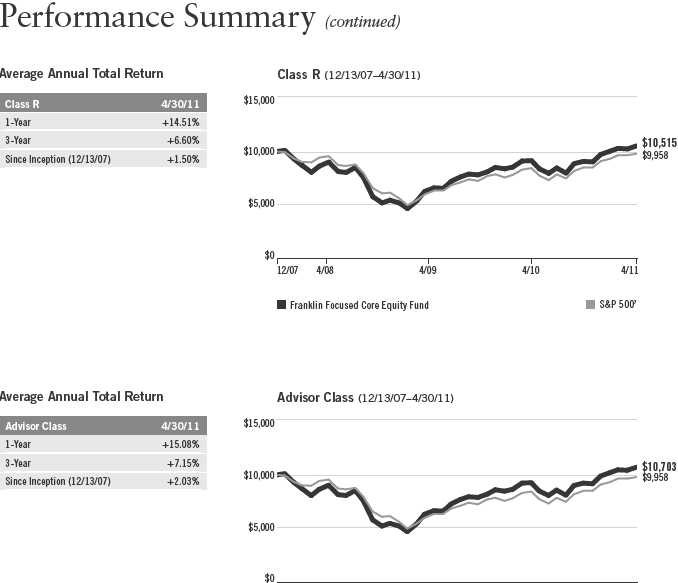

20 | Annual Report
Performance Summary (continued)
Endnotes
While stocks have historically outperformed other asset classes over the long term, they tend to fluctuate more dramatically over the short term. Special risks are involved with significant exposure to a particular sector, including increased susceptibility related to economic, business or other developments affecting that sector, which may result in increased volatility. The Fund also has the potential to invest in foreign company stocks, which involve exposure to currency volatility and political uncertainty. The manager applies various techniques and analyses in making investment decisions for the Fund, but there can be no guarantee that these decisions will produce the desired results. The Fund’s prospectus also includes a description of the main investment risks.
Class C: Class R: |
These shares have higher annual fees and expenses than Class A shares. Shares are available to certain eligible investors as described in the prospectus. These shares have higher annual fees and expenses than Class A shares. |
Advisor Class: |
Shares are available to certain eligible investors as described in the prospectus. |
1. If the manager and administrator had not waived fees, the Fund’s total returns would have been lower.
2. Cumulative total return represents the change in value of an investment over the periods indicated.
3. Average annual total return represents the average annual change in value of an investment over the periods indicated.
4. These figures represent the value of a hypothetical $10,000 investment in the Fund over the periods indicated.
5. In accordance with SEC rules, we provide standardized average annual total return information through the latest calendar quarter.
6. Figures are as stated in the Fund’s prospectus current as of the date of this report. In periods of market volatility, assets may decline significantly,
causing total annual Fund operating expenses to become higher than the figures shown.
7. Source: © 2011 Morningstar. The S&P 500 is a market capitalization-weighted index of 500 stocks designed to measure total U.S. equity market
performance.
Annual Report | 21
Your Fund’s Expenses
Franklin Focused Core Equity Fund
As a Fund shareholder, you can incur two types of costs:
- Transaction costs, including sales charges (loads) on Fund purchases; and
- Ongoing Fund costs, including management fees, distribution and service (12b-1) fees, and other Fund expenses. All mutual funds have ongoing costs, sometimes referred to as operating expenses.
The following table shows ongoing costs of investing in the Fund and can help you understand these costs and compare them with those of other mutual funds. The table assumes a $1,000 investment held for the six months indicated.
Actual Fund Expenses
The first line (Actual) for each share class listed in the table provides actual account values and expenses. The “Ending Account Value” is derived from the Fund’s actual return, which includes the effect of Fund expenses.
You can estimate the expenses you paid during the period by following these steps. Of course, your account value and expenses will differ from those in this illustration:
| 1. | Divide your account value by $1,000. |
| If an account had an $8,600 value, then $8,600 ÷ $1,000 = 8.6. | |
| 2. | Multiply the result by the number under the heading “Expenses Paid During Period.” |
| If Expenses Paid During Period were $7.50, then 8.6 x $7.50 = $64.50. |
In this illustration, the estimated expenses paid this period are $64.50.
Hypothetical Example for Comparison with Other Funds
Information in the second line (Hypothetical) for each class in the table can help you compare ongoing costs of investing in the Fund with those of other mutual funds. This information may not be used to estimate the actual ending account balance or expenses you paid during the period. The hypothetical “Ending Account Value” is based on the actual expense ratio for each class and an assumed 5% annual rate of return before expenses, which does not represent the Fund’s actual return. The figure under the heading “Expenses Paid During Period” shows the hypothetical expenses your account would have incurred under this scenario. You can compare this figure with the 5% hypothetical examples that appear in shareholder reports of other funds.
22 | Annual Report
Your Fund’s Expenses (continued)
Please note that expenses shown in the table are meant to highlight ongoing costs and do not reflect any transaction costs, such as sales charges. Therefore, the second line for each class is useful in comparing ongoing costs only, and will not help you compare total costs of owning different funds. In addition, if transaction costs were included, your total costs would have been higher. Please refer to the Fund prospectus for additional information on operating expenses.

Franklin Growth Opportunities Fund
Your Fund’s Goal and Main Investments: Franklin Growth Opportunities Fund seeks capital appreciation by normally investing substantially in equity securities of companies demonstrating accelerating growth, increasing profitability, or above-average growth or growth potential, when compared with the overall economy.
Performance data represent past performance, which does not guarantee future results. Investment return and principal value will fluctuate, and you may have a gain or loss when you sell your shares. Current performance may differ from figures shown. Please visit franklintempleton.com or call (800) 342-5236 for most recent month-end performance.
We are pleased to bring you Franklin Growth Opportunities Fund’s annual report for the fiscal year ended April 30, 2011.
Performance Overview
For the 12 months under review, Franklin Growth Opportunities Fund –Class A delivered a +23.94% cumulative total return. The Fund outperformed the +21.62% total return of its narrow benchmark, the Russell 3000 Growth Index, which measures performance of Russell 3000 Index companies with higher price-to-book ratios and higher forecasted growth values.1 The Fund also outperformed the +17.22% total return of its broad benchmark, the Standard & Poor’s 500 Index (S&P 500), which tracks the broad U.S. stock market.1 You can find the Fund’s long-term performance data in the Performance Summary beginning on page 27.
Investment Strategy
We use fundamental, bottom-up research to seek companies meeting our criteria of growth potential, quality and valuation. In seeking sustainable growth characteristics, we look for companies we believe can produce sustainable earnings and cash flow growth, evaluating the long-term market opportunity and competitive structure of an industry to target leaders and emerging leaders. We define quality companies as those with strong and improving competitive positions in attractive markets. We also believe important attributes of quality are
1. Source: © 2011 Morningstar. All Rights Reserved. The information contained herein: (1) is proprietary to Morningstar and/or its content providers; (2) may not be copied or distributed; and (3) is not warranted to be accurate, complete or timely. Neither Morningstar nor its content providers are responsible for any damages or losses arising from any use of this information. The indexes are unmanaged and include reinvested dividends. One cannot invest directly in an index, and an index is not representative of the Fund’s portfolio.
The dollar value, number of shares or principal amount, and names of all portfolio holdings are listed in the Fund’s Statement of Investments (SOI). The SOI begins on page 74.
24 | Annual Report
experienced and talented management teams as well as financial strength reflected in the capital structure, gross and operating margins, free cash flow generation and returns on capital employed. Our valuation analysis includes a range of potential outcomes based on an assessment of multiple scenarios. In assessing value, we consider whether security prices fully reflect the balance of the sustainable growth opportunities relative to business and financial risks.
Manager’s Discussion
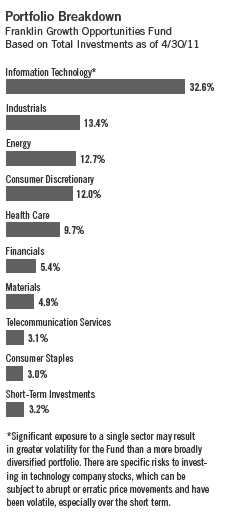
Most sectors the Fund invested in rose in value and contributed to absolute performance during the 12 months under review as the broad market rallied. Information technology (IT), energy and industrials sector holdings notably benefited the Fund. The Fund’s IT sector holdings produced stellar gains for the period, driven largely by an improving global economic recovery and its coinciding wave of pent-up, post-recession demand for technology, at both the consumer and business levels. Virtualization technology developer Citrix Systems and sales and customer service software maker Salesforce.com were among the leading software industry contributors. Shares of computer hardware and software giant Apple in the computers and peripherals industry advanced due to the roll-out of its second generation iPad tablet computer and brisk sales of its iPhone smartphone. In the semiconductors and semiconductor equipment industry, the stock price of processor designer ARM Holdings benefited from increased adoption of smartphones and tablet personal computers using the company’s fast, low-cost and power-efficient chips. The Fund’s energy sector holdings, including oil and natural gas companies Concho Resources and Anadarko Petroleum and oil and gas equipment and services provider FMC Technologies, benefited from a surge in oil prices sparked by worries about global supply. Among the Fund’s industrials sector holdings, diesel and natural gas engine manufacturer Cummins, shipping space reseller Expeditors International of Washington, and power and automation technology developer ABB were notable contributors to Fund results.
In contrast, the Fund’s sole detractor from a sector perspective was financials The Fund’s investment in Bank of America was particularly detrimental. The diversified financial services company faced a number of investigations and lawsuits related to its mortgage business during the reporting period. Some other individual securities also detracted from performance. In the health care sector, robotically aided surgical systems developer Intuitive Surgical and bio-technology firm Celgene weighed on results. We sold Intuitive Surgical during
Annual Report | 25

the period. Among consumer discretionary holdings, nontraditional university system Strayer Education and gaming machine manufacturer WMS Industries declined in value as they felt the effects of cautious consumer spending. Although the IT sector overall aided Fund performance, several holdings lost value and negatively affected results, including Internet communications provider Cisco Systems, global payments technology company Visa, IT service company Alliance Data Systems and light-emitting diodes (LED) products manufacturer Cree. We eliminated these IT and consumer discretionary holdings by period-end.
Thank you for your continued participation in Franklin Growth Opportunities Fund. We look forward to serving your future investment needs.
The foregoing information reflects our analysis, opinions and portfolio holdings as of April 30, 2011, the end of the reporting period. The way we implement our main investment strategies and the resulting portfolio holdings may change depending on factors such as market and economic conditions. These opinions may not be relied upon as investment advice or an offer for a particular security. The information is not a complete analysis of every aspect of any market, country, industry, security or the Fund. Statements of fact are from sources considered reliable, but the investment manager makes no representation or warranty as to their completeness or accuracy. Although historical performance is no guarantee of future results, these insights may help you understand our investment management philosophy.
26 | Annual Report
Performance Summary as of 4/30/11
Franklin Growth Opportunities Fund
Your dividend income will vary depending on dividends or interest paid by securities in the Fund’s portfolio, adjusted for operating expenses of each class. Capital gain distributions are net profits realized from the sale of portfolio securities. The performance table and graphs do not reflect any taxes that a shareholder would pay on Fund dividends, capital gain distributions, if any, or any realized gains on the sale of Fund shares. Total return reflects reinvestment of the Fund’s dividends and capital gain distributions, if any, and any unrealized gains or losses.

Annual Report | 27
Performance Summary (continued)
Performance
Cumulative total return excludes sales charges. Average annual total returns and value of $10,000 investment include maximum sales charges. Class A: 5.75% maximum initial sales charge; Class B: contingent deferred sales charge (CDSC) declining from 4% to 1% over six years, and eliminated thereafter; Class C: 1% CDSC in first year only;
Class R/Advisor Class: no sales charges.
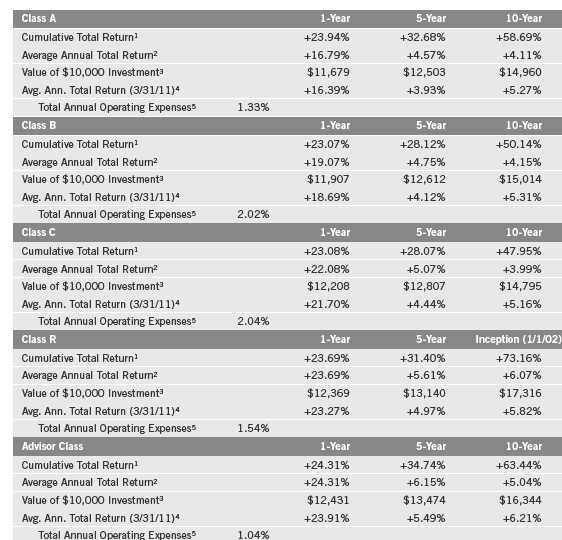
Performance data represent past performance, which does not guarantee future results. Investment return and principal value will fluctuate, and you may have a gain or loss when you sell your shares. Current performance may differ from figures shown. For most recent month-end performance, go to franklintempleton.com or call (800) 342-5236.
28 | Annual Report
Performance Summary (continued)
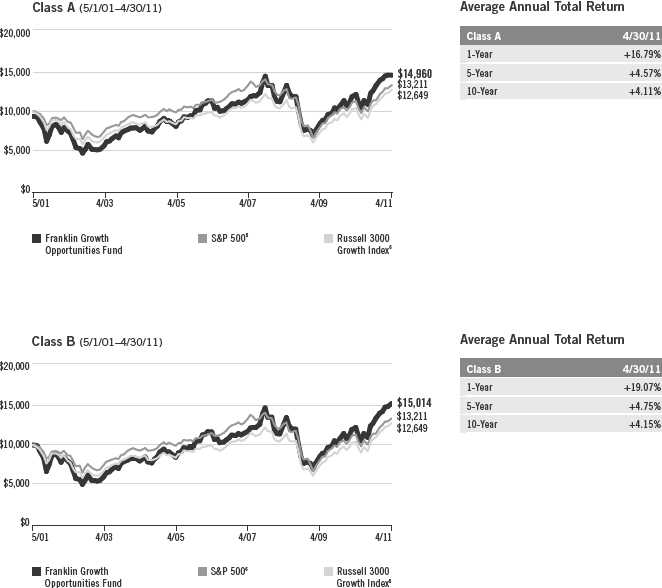
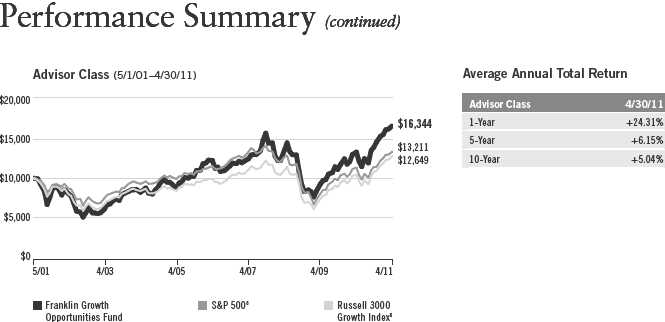
Total Return Index Comparison for a Hypothetical $10,000 Investment
Total return represents the change in value of an investment over the periods shown. It includes any current, applicable, maximum sales charge, Fund expenses, account fees and reinvested distributions. The unmanaged indexes include reinvestment of any income or distributions. They differ from the Fund in composition and do not pay management fees or expenses. One cannot invest directly in an index.
Annual Report | 29

30 | Annual Report
Endnotes
The Fund may be more volatile than a more conservative equity fund and may be best suited for long-term investors. The Fund’s investments in smaller and midsized company stocks involve special risks such as relatively smaller revenues, limited product lines and smaller market share. Smaller and midsized company stocks historically have exhibited greater price volatility than larger company stocks, particularly over the short term. The Fund’s portfolio includes technology stocks, a sector which has been one of the most volatile and involves special risks. The manager applies various techniques and analyses in making investment decisions for the Fund, but there can be no guarantee that these decisions will produce the desired results. The Fund’s prospectus also includes a description of the main investment risks.
Class B: Class C: |
These shares have higher annual fees and expenses than Class A shares. Prior to 1/1/04, these shares were offered with an initial sales charge; thus actual total returns would have differed. These shares have higher annual fees and expenses than Class A shares. |
Class R: |
Shares are available to certain eligible investors as described in the prospectus. These shares have higher annual fees and expenses than Class A shares. |
Advisor Class: |
Shares are available to certain eligible investors as described in the prospectus. |
1. Cumulative total return represents the change in value of an investment over the periods indicated.
2. Average annual total return represents the average annual change in value of an investment over the periods indicated.
3. These figures represent the value of a hypothetical $10,000 investment in the Fund over the periods indicated.
4. In accordance with SEC rules, we provide standardized average annual total return information through the latest calendar quarter.
5. Figures are as stated in the Fund’s prospectus current as of the date of this report. In periods of market volatility, assets may decline significantly, causing total annual Fund operating expenses to become higher than the figures shown.
6. Source: © 2011 Morningstar. The S&P 500 is a market capitalization-weighted index of 500 stocks designed to measure total U.S. equity market performance. The Russell 3000 Growth Index is market capitalization weighted and measures performance of those Russell 3000 Index companies with higher price-to-book ratios and higher forecasted growth values.
Annual Report | 31
Your Fund’s Expenses
Franklin Growth Opportunities Fund
As a Fund shareholder, you can incur two types of costs:
- Transaction costs, including sales charges (loads) on Fund purchases; and
- Ongoing Fund costs, including management fees, distribution and service (12b-1) fees, and other Fund expenses. All mutual funds have ongoing costs, sometimes referred to as operating expenses.
The following table shows ongoing costs of investing in the Fund and can help you understand these costs and compare them with those of other mutual funds. The table assumes a $1,000 investment held for the six months indicated.
Actual Fund Expenses
The first line (Actual) for each share class listed in the table provides actual account values and expenses. The “Ending Account Value” is derived from the Fund’s actual return, which includes the effect of Fund expenses.
You can estimate the expenses you paid during the period by following these steps. Of course, your account value and expenses will differ from those in this illustration:
| 1. | Divide your account value by $1,000. |
| If an account had an $8,600 value, then $8,600 ÷ $1,000 = 8.6. | |
| 2. | Multiply the result by the number under the heading “Expenses Paid During Period.” |
| If Expenses Paid During Period were $7.50, then 8.6 x $7.50 = $64.50. |
In this illustration, the estimated expenses paid this period are $64.50.
Hypothetical Example for Comparison with Other Funds
Information in the second line (Hypothetical) for each class in the table can help you compare ongoing costs of investing in the Fund with those of other mutual funds. This information may not be used to estimate the actual ending account balance or expenses you paid during the period. The hypothetical “Ending Account Value” is based on the actual expense ratio for each class and an assumed 5% annual rate of return before expenses, which does not represent the Fund’s actual return. The figure under the heading “Expenses Paid During Period” shows the hypothetical expenses your account would have incurred under this scenario. You can compare this figure with the 5% hypothetical examples that appear in shareholder reports of other funds.
32 | Annual Report
Your Fund’s Expenses (continued)
Please note that expenses shown in the table are meant to highlight ongoing costs and do not reflect any transaction costs, such as sales charges. Therefore, the second line for each class is useful in comparing ongoing costs only, and will not help you compare total costs of owning different funds. In addition, if transaction costs were included, your total costs would have been higher. Please refer to the Fund prospectus for additional information on operating expenses.
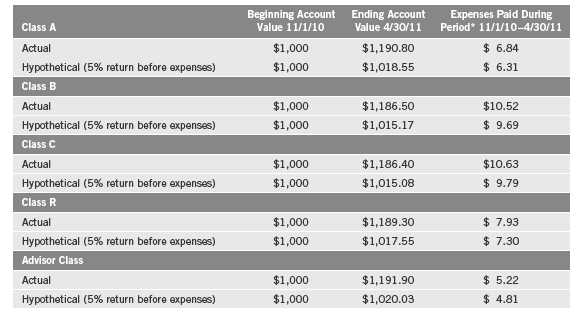
*Expenses are calculated using the most recent six-month expense ratio, annualized for each class (A: 1.26%; B: 1.94%; C: 1.96%; R: 1.46%; and Advisor: 0.96%), multiplied by the average account value over the period, multiplied by 181/365 to reflect the one-half year period.
Annual Report | 33
Franklin Small Cap Growth Fund
Your Fund’s Goal and Main Investments: Franklin Small Cap Growth Fund seeks
long-term capital growth by normally investing at least 80% of its net assets in equity securities of small-capitalization companies, which for this Fund are those with market capitalizations not exceeding that of the highest market capitalization in the Russell 2000® Index or $1.5 billion, whichever is greater, at the time of purchase.1
Performance data represent past performance, which does not guarantee future results. Investment return and principal value will fluctuate, and you may have a gain or loss when you sell your shares. Current performance may differ from figures shown. Please visit franklintempleton.com or call (800) 342-5236 for most recent month-end performance.
We are pleased to bring you Franklin Small Cap Growth Fund’s annual report for the fiscal year ended April 30, 2011.
Performance Overview
For the 12 months under review, Franklin Small Cap Growth Fund – Class A delivered a +29.94% cumulative total return. The Fund performed comparably to the +30.29% total return of its narrow benchmark, the Russell 2000 Growth Index, which measures performance of small companies with higher price-to-book ratios and higher forecasted growth values.2 The Fund outperformed the +17.22% total return of its broad benchmark, the Standard & Poor’s 500 Index (S&P 500), which tracks the broad U.S. stock market.2 You can find the Fund’s long-term performance data in the Performance Summary beginning on page 37.
Investment Strategy
We use fundamental, bottom-up research to seek companies meeting our criteria of growth potential, quality and valuation. In seeking sustainable growth characteristics, we look for companies we believe can produce sustainable earnings and cash flow growth, evaluating the long-term market opportunity and competitive structure of an industry to target leaders and emerging leaders. We define quality companies as those with strong and improving competitive positions in
1. The Russell 2000 Index is market capitalization weighted and measures performance of the 2,000 smallest companies in the Russell 3000 Index, which represent a small amount of the total market capitalization of the Russell 3000 Index.
2. Source: © 2011 Morningstar. All Rights Reserved. The information contained herein: (1) is proprietary to Morningstar and/or its content providers; (2) may not be copied or distributed; and (3) is not warranted to be accurate, complete or timely. Neither Morningstar nor its content providers are responsible for any damages or losses arising from any use of this information. The indexes are unmanaged and include reinvested dividends. One cannot invest directly in an index, and an index is not representative of the Fund’s portfolio.
The dollar value, number of shares or principal amount, and names of all portfolio holdings are listed in the Fund’s Statement of Investments (SOI). The SOI begins on page 82.
34 | Annual Report
attractive markets. We also believe important attributes of quality are experienced and talented management teams as well as financial strength reflected in the capital structure, gross and operating margins, free cash flow generation and returns on capital employed. Our valuation analysis includes a range of potential outcomes based on an assessment of multiple scenarios. In assessing value, we consider whether security prices fully reflect the balance of the sustainable growth opportunities relative to business and financial risks.
Manager’s Discussion
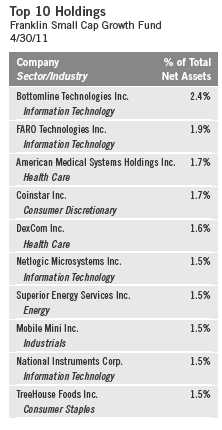
During the year under review, stock selection in the consumer discretionary, health care and consumer staples sectors contributed to Fund performance relative to the Russell 2000 Growth Index. Consumer discretionary holding Under Armour, an athletic undergarment and apparel company, was especially beneficial. In health care, American Medical Systems Holdings, a company that treats numerous pelvic disorders, performed particularly well, and our relatively large position enhanced relative results. In the consumer staples sector, Hain Celestial Group, an organic food and personal care products company, supported the Fund’s performance. In the information technology (IT) sector, several stocks produced stellar returns, including data warehouse appliances provider Netezza, network performance analysis systems maker Ixia, e-commerce software and related IT services company Art Technology Group, and financial resources management software company Bottomline Technologies. We sold Netezza and Art Technology Group by period-end.
In contrast, stock selection in the financials, industrials and materials sectors weighed on relative Fund performance. NetSpend Holdings, a leading provider of prepaid debit cards in the financials sector, and airline company Allegiant Travel in the industrials sector were major detractors from Fund performance. In the materials sector, STR Holdings, a manufacturer of films for solar panels, also hurt relative results. Our underweighting in the materials sector hampered performance during a period of rapidly rising commodity prices. In other sectors, several individual holdings that are not part of the index also hurt relative results. These included integrated circuit maker Silicon Laboratories, Internet catalog firm Gaiam, health care provider Community Health Systems and leading pet health care services provider VCA Antech.

Annual Report | 35
Thank you for your continued participation in Franklin Small Cap Growth Fund. We look forward to serving your future investment needs.

The foregoing information reflects our analysis, opinions and portfolio holdings as of April 30, 2011, the end of the reporting period. The way we implement our main investment strategies and the resulting portfolio holdings may change depending on factors such as market and economic conditions. These opinions may not be relied upon as investment advice or an offer for a particular security. The information is not a complete analysis of every aspect of any market, country, industry, security or the Fund. Statements of fact are from sources considered reliable, but the investment manager makes no representation or warranty as to their completeness or accuracy. Although historical performance is no guarantee of future results, these insights may help you understand our investment management philosophy.
36 | Annual Report
Performance Summary as of 4/30/11
Franklin Small Cap Growth Fund
Your dividend income will vary depending on dividends or interest paid by securities in the Fund’s portfolio, adjusted for operating expenses of each class. Capital gain distributions are net profits realized from the sale of portfolio securities. The performance table and graphs do not reflect any taxes that a shareholder would pay on Fund dividends, capital gain distributions, if any, or any realized gains on the sale of Fund shares. Total return reflects reinvestment of the Fund’s dividends and capital gain distributions, if any, and any unrealized gains or losses.
Annual Report | 37
Performance Summary (continued)
Performance
Cumulative total return excludes sales charges. Average annual total returns and value of $10,000 investment include maximum sales charges. Class A: 5.75% maximum initial sales charge; Class B: contingent deferred sales charge (CDSC) declining from 4% to 1% over six years, and eliminated thereafter; Class C: 1% CDSC in first year only;
Class R/Advisor Class: no sales charges.

Performance data represent past performance, which does not guarantee future results. Investment return and principal value will fluctuate, and you may have a gain or loss when you sell your shares. Current performance may differ from figures shown. For most recent month-end performance, go to franklintempleton.com or call (800) 342-5236.
38 | Annual Report
Performance Summary (continued)
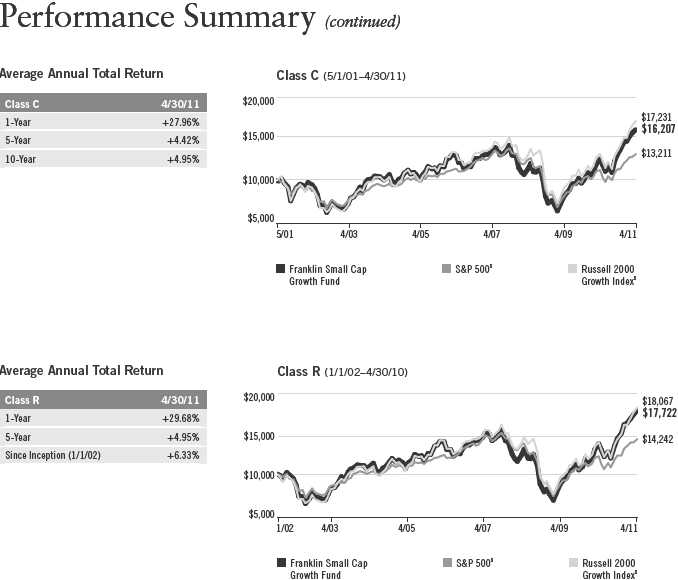
Total Return Index Comparison for a Hypothetical $10,000 Investment
Total return represents the change in value of an investment over the periods shown. It includes any current, applicable, maximum sales charge, Fund expenses, account fees and reinvested distributions. The unmanaged indexes include reinvestment of any income or distributions. They differ from the Fund in composition and do not pay management fees or expenses. One cannot invest directly in an index.

Average Annual Total Return

Average Annual Total Return

Annual Report | 39
40 | Annual Report
Performance Summary (continued)
Advisor Class (5/1/01–4/30/11)
Average Annual Total Return

Your Fund’s Expenses
Franklin Small Cap Growth Fund
As a Fund shareholder, you can incur two types of costs:
- Transaction costs, including sales charges (loads) on Fund purchases; and
- Ongoing Fund costs, including management fees, distribution and service (12b-1) fees, and other Fund expenses. All mutual funds have ongoing costs, sometimes referred to as operating expenses.
The following table shows ongoing costs of investing in the Fund and can help you understand these costs and compare them with those of other mutual funds. The table assumes a $1,000 investment held for the six months indicated.
Actual Fund Expenses
The first line (Actual) for each share class listed in the table provides actual account values and expenses. The “Ending Account Value” is derived from the Fund’s actual return, which includes the effect of Fund expenses.
You can estimate the expenses you paid during the period by following these steps. Of course, your account value and expenses will differ from those in this illustration:
| 1. | Divide your account value by $1,000. |
| If an account had an $8,600 value, then $8,600 ÷ $1,000 = 8.6. | |
| 2. | Multiply the result by the number under the heading “Expenses Paid During Period.” |
| If Expenses Paid During Period were $7.50, then 8.6 x $7.50 = $64.50. |
In this illustration, the estimated expenses paid this period are $64.50.
Hypothetical Example for Comparison with Other Funds
Information in the second line (Hypothetical) for each class in the table can help you compare ongoing costs of investing in the Fund with those of other mutual funds. This information may not be used to estimate the actual ending account balance or expenses you paid during the period. The hypothetical “Ending Account Value” is based on the actual expense ratio for each class and an assumed 5% annual rate of return before expenses, which does not represent the Fund’s actual return. The figure under the heading “Expenses Paid During Period” shows the hypothetical expenses your account would have incurred under this scenario. You can compare this figure with the 5% hypothetical examples that appear in shareholder reports of other funds.
42 | Annual Report
Your Fund’s Expenses (continued)
Please note that expenses shown in the table are meant to highlight ongoing costs and do not reflect any transaction costs, such as sales charges. Therefore, the second line for each class is useful in comparing ongoing costs only, and will not help you compare total costs of owning different funds. In addition, if transaction costs were included, your total costs would have been higher. Please refer to the Fund prospectus for additional information on operating expenses.
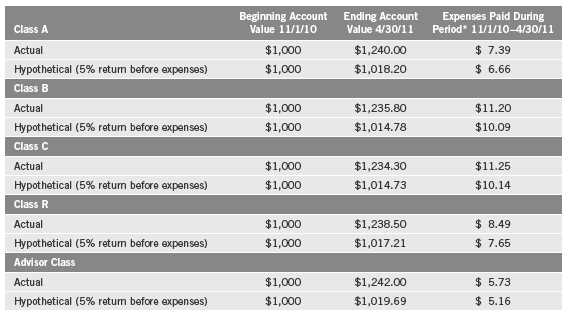
*Expenses are calculated using the most recent six-month expense ratio, annualized for each class (A: 1.33%; B: 2.02%; C: 2.03%; R: 1.53%; and Advisor: 1.03%), multiplied by the average account value over the period, multiplied by 181/365 to reflect the one-half year period.
Annual Report | 43
Franklin Small-Mid Cap Growth Fund
Your Fund’s Goal and Main Investments: Franklin Small-Mid Cap Growth Fund seeks long-term capital growth by normally investing at least 80% of its net assets in equity securities of small-cap and mid-cap companies. The Fund defines small-cap companies as those within the market capitalization range of companies in the Russell 2500™ Index at the time of purchase, and mid-cap companies as those within the market capitalization range of the Russell Midcap® Index at the time of purchase.1
Performance data represent past performance, which does not guarantee future results. Investment return and principal value will fluctuate, and you may have a gain or loss when you sell your shares. Current performance may differ from figures shown. Please visit franklintempleton.com or call (800) 342-5236 for most recent month-end performance.
We are pleased to bring you Franklin Small-Mid Cap Growth Fund’s annual report for the fiscal year ended April 30, 2011.
Performance Overview
For the 12 months under review, Franklin Small-Mid Cap Growth Fund –Class A delivered a +28.43% cumulative total return. The Fund performed comparably to the +27.40% total return of its narrow benchmark, the Russell Midcap Growth Index, which measures performance of companies in the Russell Midcap Index with higher price-to-book ratios and higher forecasted growth values.2 The Fund outperformed the +17.22% total return of its broad benchmark, the Standard & Poor’s 500 Index (S&P 500), which tracks the broad U.S. stock market.2 You can find the Fund’s long-term performance data in the Performance Summary beginning on page 47.
Investment Strategy
We use fundamental, bottom-up research to seek companies meeting our criteria of growth potential, quality and valuation. In seeking sustainable growth characteristics, we look for companies we believe can produce sustainable earnings
1. The Russell 2500 Index is market capitalization weighted and measures performance of the 2,500 smallest companies
in the Russell 3000 Index, which represent a modest amount of the Russell 3000 Index’s total market capitalization. The
Russell Midcap Index is market capitalization weighted and measures performance of the smallest companies in the
Russell 1000 Index, which represent a modest amount of the Russell 1000 Index’s total market capitalization.
2. Source: © 2011 Morningstar. All Rights Reserved. The information contained herein: (1) is proprietary to Morningstar
and/or its content providers; (2) may not be copied or distributed; and (3) is not warranted to be accurate, complete or
timely. Neither Morningstar nor its content providers are responsible for any damages or losses arising from any use of
this information. The indexes are unmanaged and include reinvested dividends. One cannot invest directly in an index,
and an index is not representative of the Fund’s portfolio.
The dollar value, number of shares or principal amount, and names of all portfolio holdings are listed in the Fund’s
Statement of Investments (SOI). The SOI begins on page 91.
44 | Annual Report
and cash flow growth, evaluating the long-term market opportunity and competitive structure of an industry to target leaders and emerging leaders. We define quality companies as those with strong and improving competitive positions in attractive markets. We also believe important attributes of quality are experienced and talented management teams as well as financial strength reflected in the capital structure, gross and operating margins, free cash flow generation and returns on capital employed. Our valuation analysis includes a range of potential outcomes based on an assessment of multiple scenarios. In assessing value, we consider whether security prices fully reflect the balance of the sustainable growth opportunities relative to business and financial risks.
Manager’s Discussion
During the fiscal year under review, as the broad market rallied, all sectors represented in the Fund’s portfolio contributed to absolute returns. The energy, information technology (IT) and consumer discretionary sectors contributed significantly to the Fund’s performance relative to the Russell Midcap Growth Index primarily due to stock selection. Stellar performers within the energy sector included Concho Resources3 and SM Energy, which acquire, explore and develop oil and natural gas. These companies benefited from rising oil prices during the year. Top IT contributors included NXP Semiconductors, networking technology developer Atheros Communications3 and software companies Sybase3 (acquired by SAP) and Citrix Systems. Key contributors in the consumer discretionary sector included sports apparel company Under Armour,4 specialty retail store Gymboree3, 4 (acquired by Bain Capital), restaurant chain Chipotle Mexican Grill, and auto component manufacturer BorgWarner. Industrial chemicals producer Celanese, a materials sector holding, also aided the Fund’s relative performance. Although the industrials sector overall hurt relative returns, our positions in mining equipment manufacturer Joy Global, diesel and natural gas engine manufacturer Cummins, and industrial conglomerate AMETEK performed well and boosted the Fund’s relative performance.
In contrast, stock selection in the financials, industrials and health care sectors hindered relative results. Within the financials sector, real estate investment trust iStar Financial,3, 4 and capital markets companies Charles Schwab3, 4 and Northern Trust4 weighed on relative returns. Among industrials sector holdings, overweighted positions in aerospace and defense company Rockwell Collins and airline company Allegiant Travel hurt relative performance. Community Health
3. No longer held by period-end.
4. This holding is not an index component.

Annual Report | 45

Systems, a hospital operator, was a major detractor in the health care sector. Finally, despite outperformance for IT stocks as a group, our investments in integrated circuit maker Silicon Laboratories, solar panel manufacturer First Solar and global payment solutions company MasterCard3, 4 declined in value and detracted from relative results.
Thank you for your continued participation in Franklin Small-Mid Cap Growth Fund. We look forward to serving your future investment needs.

The foregoing information reflects our analysis, opinions and portfolio holdings as of April 30, 2011, the end of the reporting period. The way we implement our main investment strategies and the resulting portfolio holdings may change depending on factors such as market and economic conditions. These opinions may not be relied upon as investment advice or an offer for a particular security. The information is not a complete analysis of every aspect of any market, country, industry, security or the Fund. Statements of fact are from sources considered reliable, but the investment manager makes no representation or warranty as to their completeness or accuracy. Although historical performance is no guarantee of future results, these insights may help you understand our investment management philosophy.
46 | Annual Report
Performance Summary as of 4/30/11
Franklin Small-Mid Cap Growth Fund
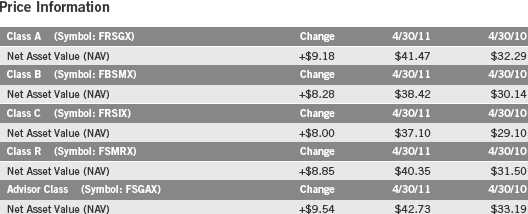
Your dividend income will vary depending on dividends or interest paid by securities in the Fund’s portfolio, adjusted for operating expenses of each class. Capital gain distributions are net profits realized from the sale of portfolio securities. The performance table and graphs do not reflect any taxes that a shareholder would pay on Fund dividends, capital gain distributions, if any, or any realized gains on the sale of Fund shares. Total return reflects reinvestment of the Fund’s dividends and capital gain distributions, if any, and any unrealized gains or losses.
Annual Report | 47
Performance Summary (continued)
Performance
Cumulative total return excludes sales charges. Average annual total returns and value of $10,000 investment include maximum sales charges. Class A: 5.75% maximum initial sales charge; Class B: contingent deferred sales charge (CDSC) declining from 4% to 1% over six years, and eliminated thereafter; Class C: 1% CDSC in first year only;
Class R/Advisor Class: no sales charges.
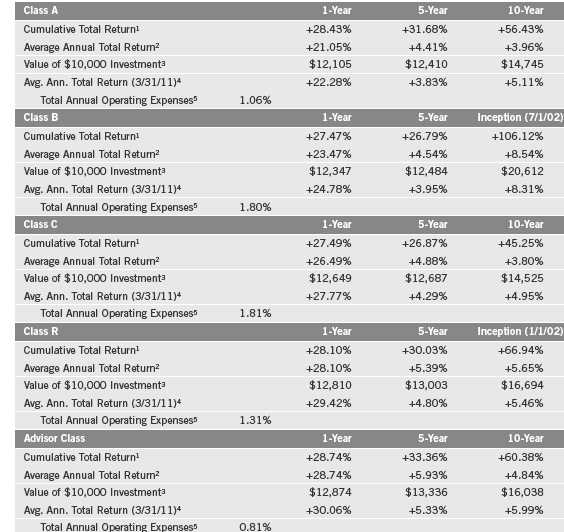
Performance data represent past performance, which does not guarantee future results. Investment return and principal value will fluctuate, and you may have a gain or loss when you sell your shares. Current performance may differ from figures shown. For most recent month-end performance, go to franklintempleton.com or call (800) 342-5236.
48 | Annual Report
Performance Summary (continued)
Total Return Index Comparison for a Hypothetical $10,000 Investment
Total return represents the change in value of an investment over the periods shown. It includes any current, applicable, maximum sales charge, Fund expenses, account fees and reinvested distributions. The unmanaged indexes include reinvestment of any income or distributions. They differ from the Fund in composition and do not pay management fees or expenses. One cannot invest directly in an index.
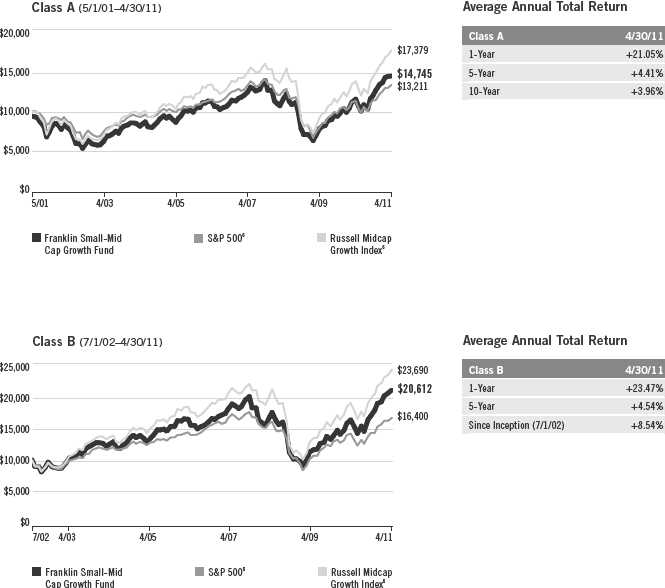
Annual Report | 49

50 | Annual Report

Endnotes
Investors should be comfortable with fluctuations in the value of their investment, as small and midsized company stocks can be volatile, especially over the short term. Smaller or relatively new or unseasoned companies can be particularly sensitive to changing economic conditions, and their prospects for growth are less certain than those of larger, more established companies. The Fund includes investments in the technology sector, which has been highly volatile and involves special risks. The manager applies various techniques and analyses in making investment decisions for the Fund, but there can be no guarantee that these decisions will produce the desired results. The Fund’s prospectus also includes a description of the main investment risks.
Class B: Class C: |
These shares have higher annual fees and expenses than Class A shares. Prior to 1/1/04, these shares were offered with an initial sales charge; thus actual total returns would have differed. These shares have higher annual fees and expenses than Class A shares. |
Class R: |
Shares are available to certain eligible investors as described in the prospectus. These shares have higher annual fees and expenses than Class A shares. |
Advisor Class: |
Shares are available to certain eligible investors as described in the prospectus. |
1. Cumulative total return represents the change in value of an investment over the periods indicated.
2. Average annual total return represents the average annual change in value of an investment over the periods indicated.
3. These figures represent the value of a hypothetical $10,000 investment in the Fund over the periods indicated.
4. In accordance with SEC rules, we provide standardized average annual total return information through the latest calendar quarter.
5. Figures are as stated in the Fund’s prospectus current as of the date of this report. In periods of market volatility, assets may decline significantly, causing total annual Fund operating expenses to become higher than the figures shown.
6. Source: © 2011 Morningstar. The S&P 500 is a market capitalization-weighted index of 500 stocks designed to measure total U.S. equity market performance. The Russell Midcap Growth Index is market capitalization weighted and measures performance of those Russell Midcap Index companies with higher price-to-book ratios and higher forecasted growth values.
Annual Report | 51
Your Fund’s Expenses
Franklin Small-Mid Cap Growth Fund
As a Fund shareholder, you can incur two types of costs:
- Transaction costs, including sales charges (loads) on Fund purchases; and
- Ongoing Fund costs, including management fees, distribution and service (12b-1) fees, and other Fund expenses. All mutual funds have ongoing costs, sometimes referred to as operating expenses.
The following table shows ongoing costs of investing in the Fund and can help you understand these costs and compare them with those of other mutual funds. The table assumes a $1,000 investment held for the six months indicated.
Actual Fund Expenses
The first line (Actual) for each share class listed in the table provides actual account values and expenses. The “Ending Account Value” is derived from the Fund’s actual return, which includes the effect of Fund expenses.
You can estimate the expenses you paid during the period by following these steps. Of course, your account value and expenses will differ from those in this illustration:
| 1. | Divide your account value by $1,000. |
| If an account had an $8,600 value, then $8,600 ÷ $1,000 = 8.6. | |
| 2. | Multiply the result by the number under the heading “Expenses Paid During Period.” |
| If Expenses Paid During Period were $7.50, then 8.6 x $7.50 = $64.50. |
In this illustration, the estimated expenses paid this period are $64.50.
Hypothetical Example for Comparison with Other Funds
Information in the second line (Hypothetical) for each class in the table can help you compare ongoing costs of investing in the Fund with those of other mutual funds. This information may not be used to estimate the actual ending account balance or expenses you paid during the period. The hypothetical “Ending Account Value” is based on the actual expense ratio for each class and an assumed 5% annual rate of return before expenses, which does not represent the Fund’s actual return. The figure under the heading “Expenses Paid During Period” shows the hypothetical expenses your account would have incurred under this scenario. You can compare this figure with the 5% hypothetical examples that appear in shareholder reports of other funds.
52 | Annual Report
Your Fund’s Expenses (continued)
Please note that expenses shown in the table are meant to highlight ongoing costs and do not reflect any transaction costs, such as sales charges. Therefore, the second line for each class is useful in comparing ongoing costs only, and will not help you compare total costs of owning different funds. In addition, if transaction costs were included, your total costs would have been higher. Please refer to the Fund prospectus for additional information on operating expenses.
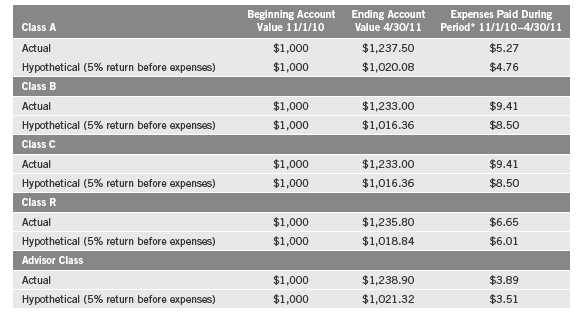
*Expenses are calculated using the most recent six-month expense ratio, annualized for each class (A: 0.95%; B: 1.70%; C: 1.70%; R: 1.20%; and Advisor: 0.70%), multiplied by the average account value over the period, multiplied by 181/365 to reflect the one-half year period.
Annual Report | 53

aThe amount shown for a share outstanding throughout the period may not correlate with the Statement of Operations for the period due to the timing of sales and repurchases of
the Fund shares in relation to income earned and/or fluctuating market value of the investments of the Fund.
bBased on average daily shares outstanding.
cEffective September 1, 2008, the redemption fee was eliminated.
dAmount rounds to less than $0.01 per share.
eTotal return does not reflect sales commissions or contingent deferred sales charges, if applicable.
fBenefit of expense reduction rounds to less than 0.01%.
54 | The accompanying notes are an integral part of these financial statements. | Annual Report

aThe amount shown for a share outstanding throughout the period may not correlate with the Statement of Operations for the period due to the timing of sales and repurchases of
the Fund shares in relation to income earned and/or fluctuating market value of the investments of the Fund.
bBased on average daily shares outstanding.
cEffective September 1, 2008, the redemption fee was eliminated.
dAmount rounds to less than $0.01 per share.
eTotal return does not reflect sales commissions or contingent deferred sales charges, if applicable.
fBenefit of expense reduction rounds to less than 0.01%.
Annual Report | The accompanying notes are an integral part of these financial statements. | 55

aThe amount shown for a share outstanding throughout the period may not correlate with the Statement of Operations for the period due to the timing of sales and repurchases of
the Fund shares in relation to income earned and/or fluctuating market value of the investments of the Fund.
bBased on average daily shares outstanding.
cEffective September 1, 2008, the redemption fee was eliminated.
dAmount rounds to less than $0.01 per share.
eTotal return does not reflect sales commissions or contingent deferred sales charges, if applicable.
fBenefit of expense reduction rounds to less than 0.01%.
56 | The accompanying notes are an integral part of these financial statements. | Annual Report
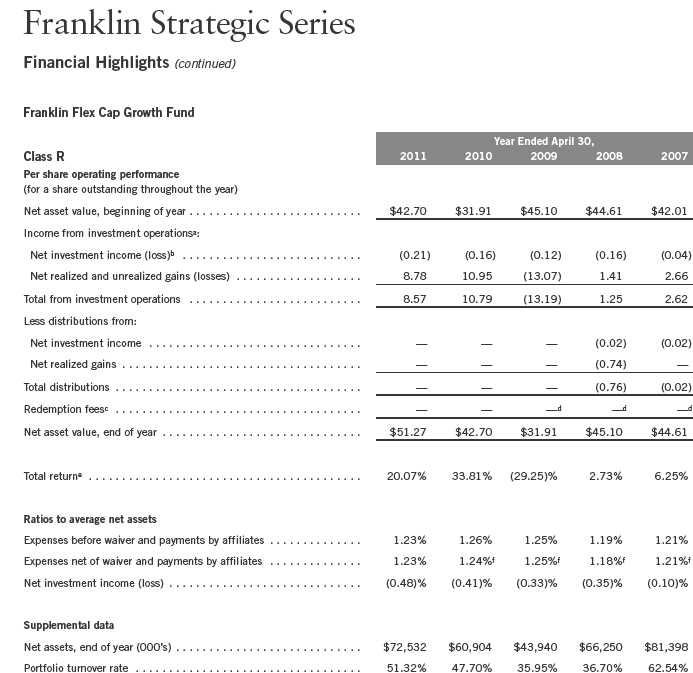
aThe amount shown for a share outstanding throughout the period may not correlate with the Statement of Operations for the period due to the timing of sales and repurchases of
the Fund shares in relation to income earned and/or fluctuating market value of the investments of the Fund.
bBased on average daily shares outstanding.
cEffective September 1, 2008, the redemption fee was eliminated.
dAmount rounds to less than $0.01 per share.
eTotal return does not reflect sales commissions or contingent deferred sales charges, if applicable.
fBenefit of expense reduction rounds to less than 0.01%.
Annual Report | The accompanying notes are an integral part of these financial statements. | 57

aThe amount shown for a share outstanding throughout the period may not correlate with the Statement of Operations for the period due to the timing of sales and repurchases of
the Fund shares in relation to income earned and/or fluctuating market value of the investments of the Fund.
bBased on average daily shares outstanding.
cEffective September 1, 2008, the redemption fee was eliminated.
dAmount rounds to less than $0.01 per share.
eBenefit of expense reduction rounds to less than 0.01%.
58 | The accompanying notes are an integral part of these financial statements. | Annual Report
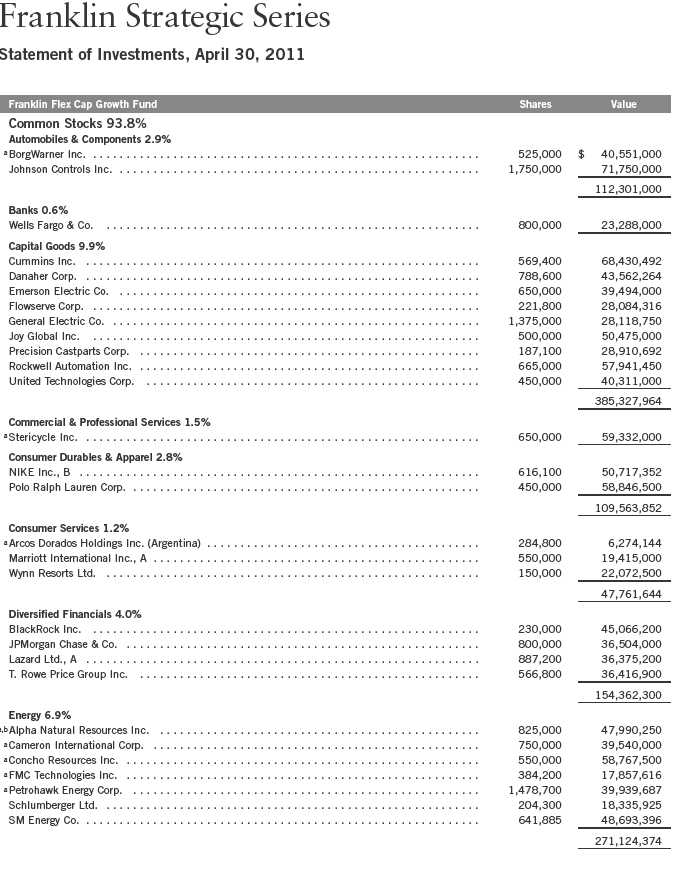
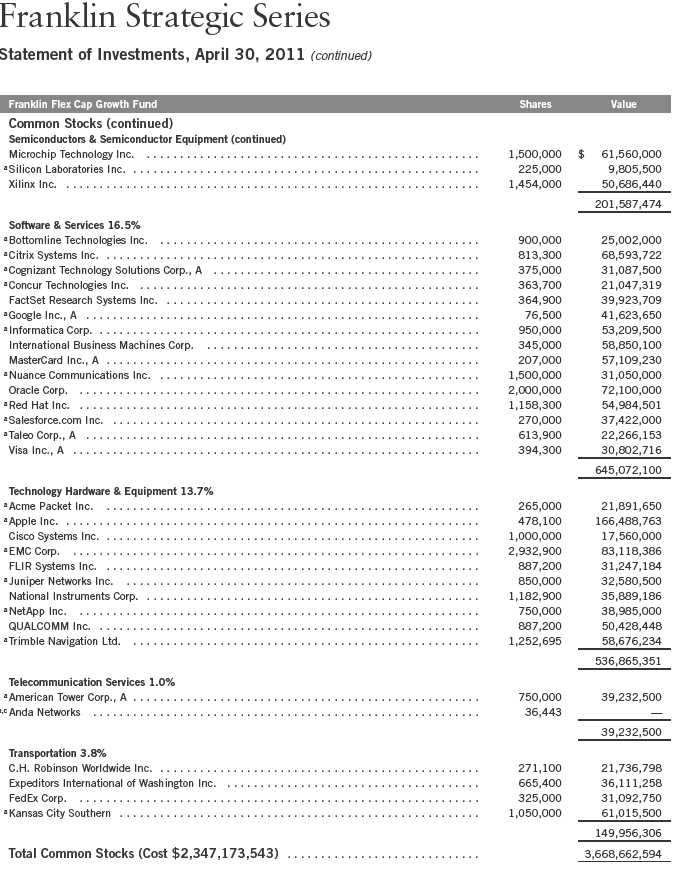
Annual Report | 59

60 | Annual Report
Annual Report | 61

62 | The accompanying notes are an integral part of these financial statements. | Annual Report
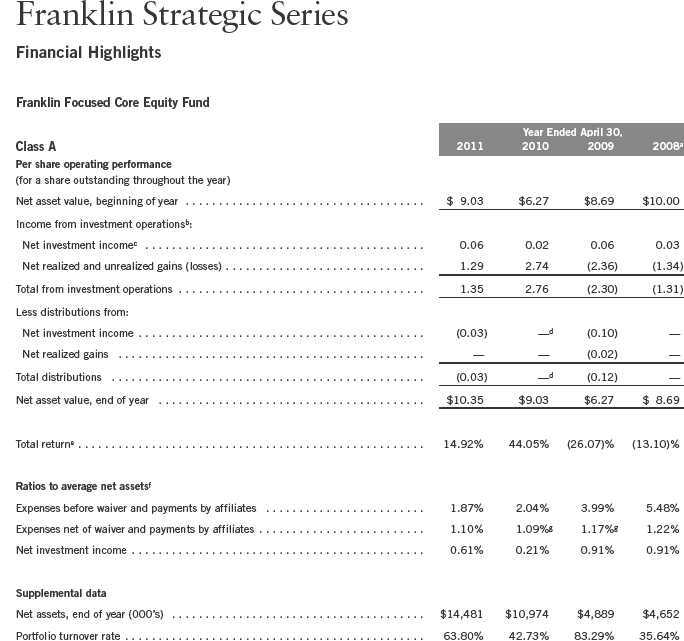
aFor the period December 13, 2007 (commencement of operations) to April 30, 2008.
bThe amount shown for a share outstanding throughout the period may not correlate with the Statement of Operations for the period due to the timing of sales and repurchases of
the Fund shares in relation to income earned and/or fluctuating market value of the investments of the Fund.
cBased on average daily shares outstanding.
dAmount rounds to less than $0.01 per share.
eTotal return does not reflect sales commissions or contingent deferred sales charges, if applicable, and is not annualized for periods less than one year.
fRatios are annualized for periods less than one year.
gBenefit of expense reduction rounds to less than 0.01%.
Annual Report | The accompanying notes are an integral part of these financial statements. | 63

aFor the period December 13, 2007 (commencement of operations) to April 30, 2008.
bThe amount shown for a share outstanding throughout the period may not correlate with the Statement of Operations for the period due to the timing of sales and repurchases of
the Fund shares in relation to income earned and/or fluctuating market value of the investments of the Fund.
cBased on average daily shares outstanding.
dAmount rounds to less than $0.01 per share.
eTotal return does not reflect sales commissions or contingent deferred sales charges, if applicable, and is not annualized for periods less than one year.
fRatios are annualized for periods less than one year.
gBenefit of expense reduction rounds to less than 0.01%.
64 | The accompanying notes are an integral part of these financial statements. | Annual Report
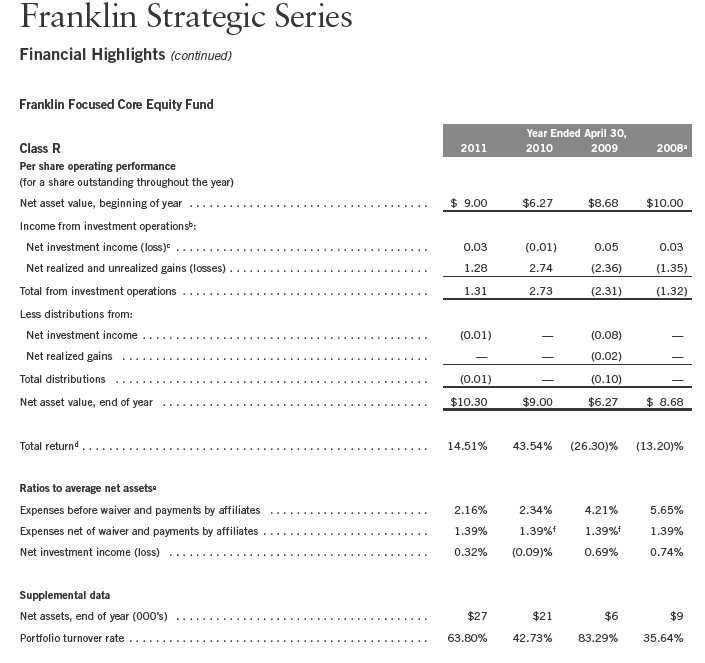
aFor the period December 13, 2007 (commencement of operations) to April 30, 2008.
bThe amount shown for a share outstanding throughout the period may not correlate with the Statement of Operations for the period due to the timing of sales and repurchases of
the Fund shares in relation to income earned and/or fluctuating market value of the investments of the Fund.
cBased on average daily shares outstanding.
dTotal return does not reflect sales commissions or contingent deferred sales charges, if applicable, and is not annualized for periods less than one year.
eRatios are annualized for periods less than one year.
fBenefit of expense reduction rounds to less than 0.01%.
Annual Report | The accompanying notes are an integral part of these financial statements. | 65
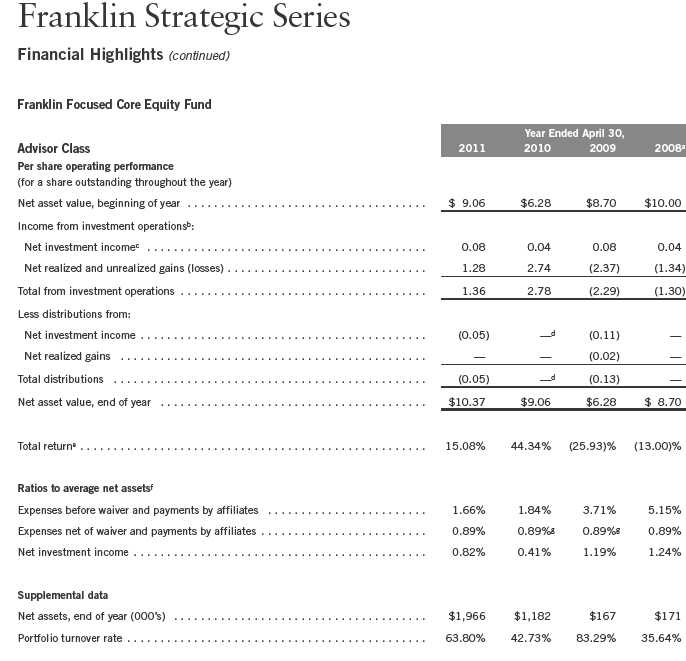
aFor the period December 13, 2007 (commencement of operations) to April 30, 2008.
bThe amount shown for a share outstanding throughout the period may not correlate with the Statement of Operations for the period due to the timing of sales and repurchases of
the Fund shares in relation to income earned and/or fluctuating market value of the investments of the Fund.
cBased on average daily shares outstanding.
dAmount rounds to less than $0.01 per share.
eTotal return is not annualized for periods less than one year.
fRatios are annualized for periods less than one year.
gBenefit of expense reduction rounds to less than 0.01%.
66 | The accompanying notes are an integral part of these financial statements. | Annual Report
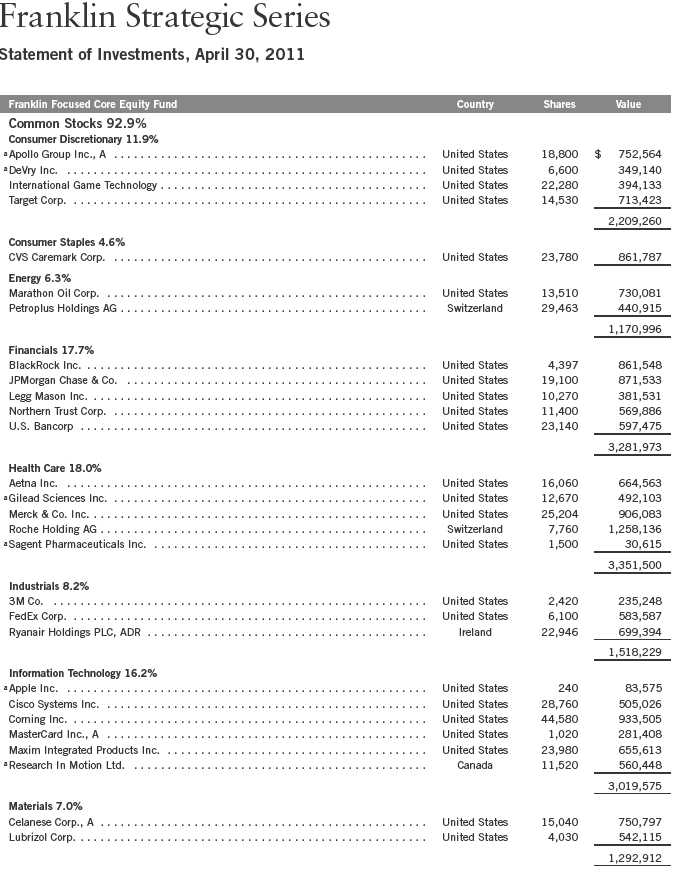
Annual Report | 67

See Abbreviations on page 121.
aNon-income producing.
bSee Note 7 regarding investments in the Institutional Fiduciary Trust Money Market Portfolio.
68 | The accompanying notes are an integral part of these financial statements. | Annual Report

aThe amount shown for a share outstanding throughout the period may not correlate with the Statement of Operations for the period due to the timing of sales and repurchases of
the Fund shares in relation to income earned and/or fluctuating market value of the investments of the Fund.
bBased on average daily shares outstanding.
cEffective September 1, 2008, the redemption fee was eliminated.
dAmount rounds to less than $0.01 per share.
eTotal return does not reflect sales commissions or contingent deferred sales charges, if applicable.
fBenefit of expense reduction rounds to less than 0.01%.
Annual Report | The accompanying notes are an integral part of these financial statements. | 69
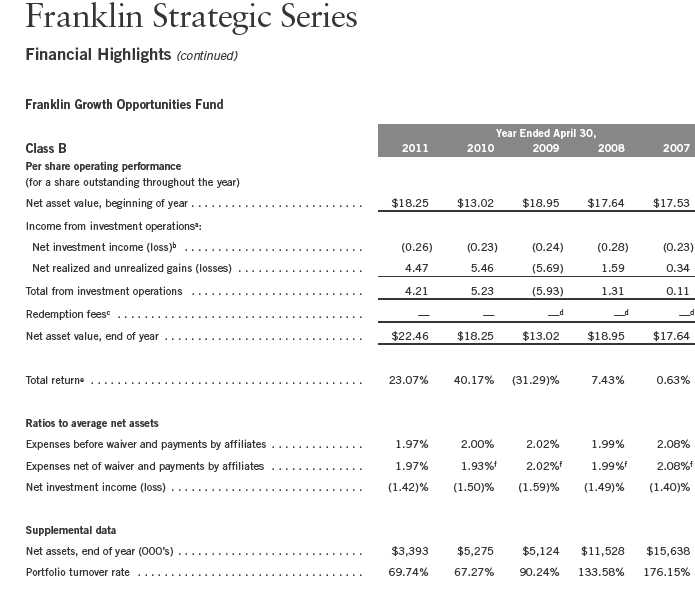
aThe amount shown for a share outstanding throughout the period may not correlate with the Statement of Operations for the period due to the timing of sales and repurchases of
the Fund shares in relation to income earned and/or fluctuating market value of the investments of the Fund.
bBased on average daily shares outstanding.
cEffective September 1, 2008, the redemption fee was eliminated.
dAmount rounds to less than $0.01 per share.
eTotal return does not reflect sales commissions or contingent deferred sales charges, if applicable.
fBenefit of expense reduction rounds to less than 0.01%.
70 | The accompanying notes are an integral part of these financial statements. | Annual Report

aThe amount shown for a share outstanding throughout the period may not correlate with the Statement of Operations for the period due to the timing of sales and repurchases of
the Fund shares in relation to income earned and/or fluctuating market value of the investments of the Fund.
bBased on average daily shares outstanding.
cEffective September 1, 2008, the redemption fee was eliminated.
dAmount rounds to less than $0.01 per share.
eTotal return does not reflect sales commissions or contingent deferred sales charges, if applicable.
fBenefit of expense reduction rounds to less than 0.01%.
Annual Report | The accompanying notes are an integral part of these financial statements. | 71
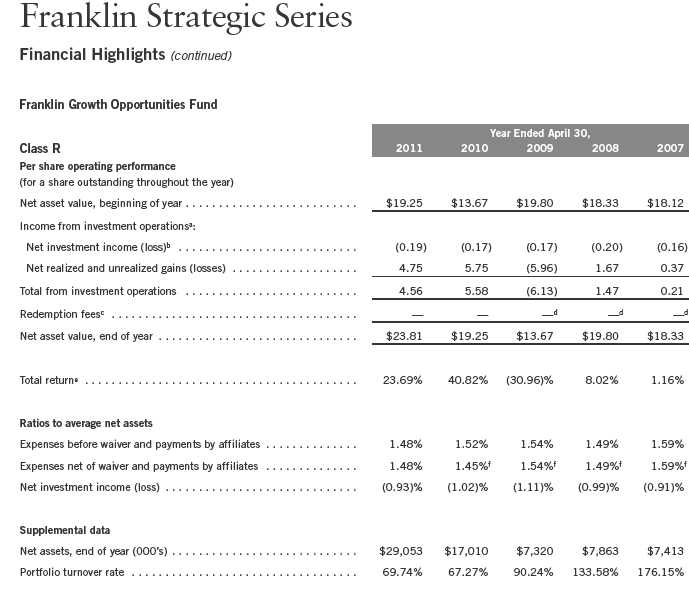
aThe amount shown for a share outstanding throughout the period may not correlate with the Statement of Operations for the period due to the timing of sales and repurchases of
the Fund shares in relation to income earned and/or fluctuating market value of the investments of the Fund.
bBased on average daily shares outstanding.
cEffective September 1, 2008, the redemption fee was eliminated.
dAmount rounds to less than $0.01 per share.
eTotal return does not reflect sales commissions or contingent deferred sales charges, if applicable.
fBenefit of expense reduction rounds to less than 0.01%.
72 | The accompanying notes are an integral part of these financial statements. | Annual Report
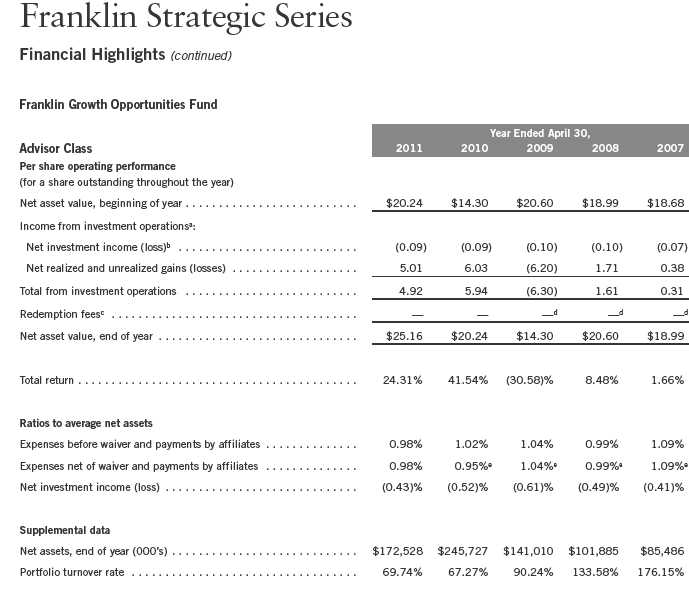
aThe amount shown for a share outstanding throughout the period may not correlate with the Statement of Operations for the period due to the timing of sales and repurchases of
the Fund shares in relation to income earned and/or fluctuating market value of the investments of the Fund.
bBased on average daily shares outstanding.
cEffective September 1, 2008, the redemption fee was eliminated.
dAmount rounds to less than $0.01 per share.
eBenefit of expense reduction rounds to less than 0.01%.
Annual Report | The accompanying notes are an integral part of these financial statements. | 73
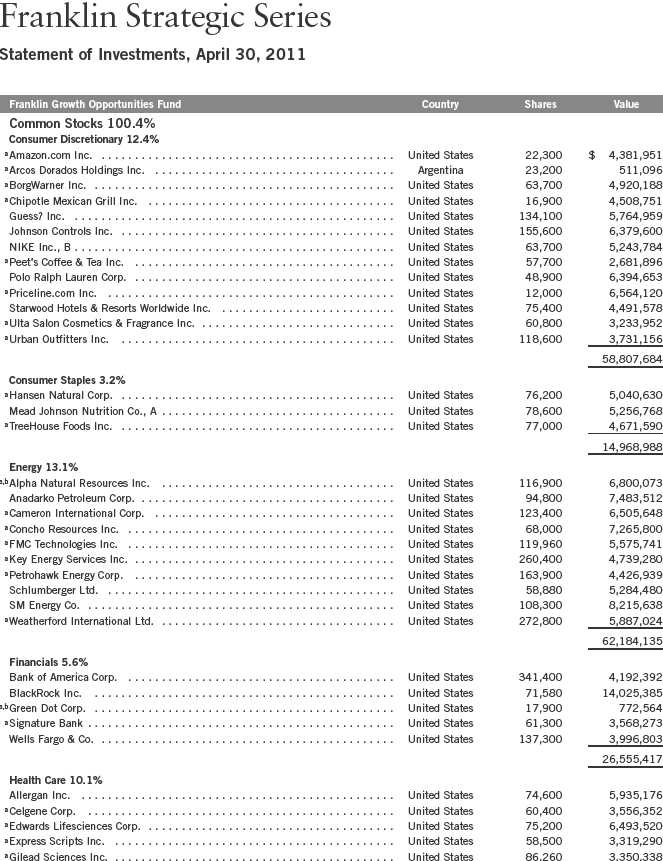
74 | Annual Report
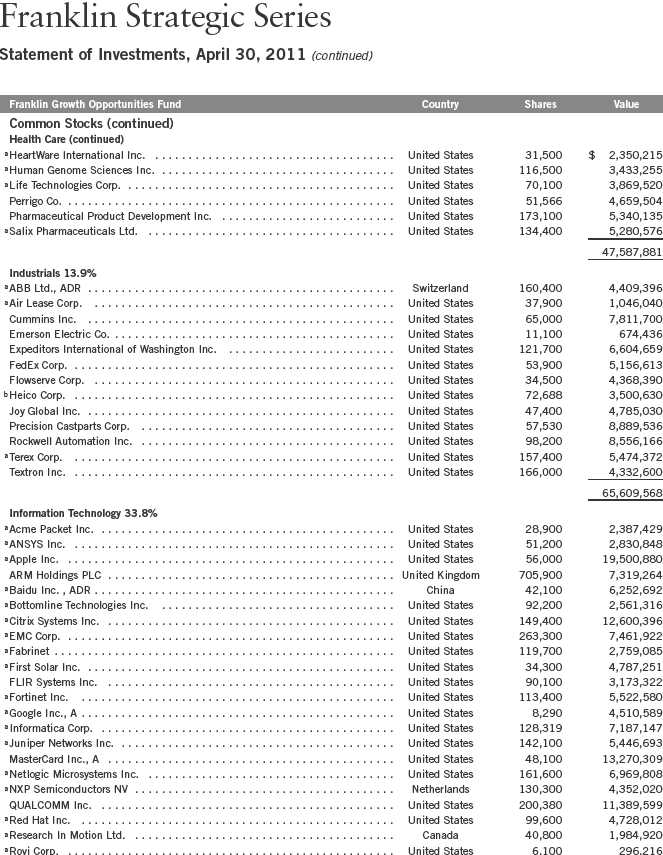
Annual Report | 75
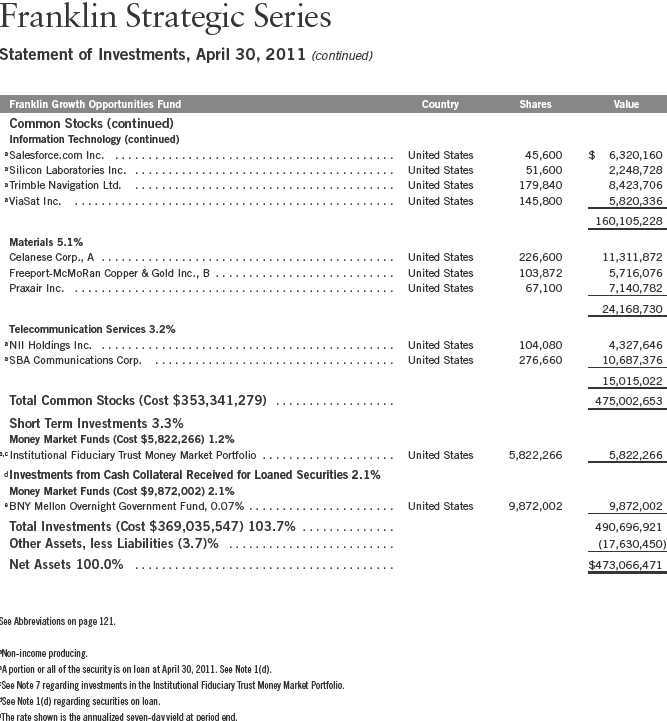
76 | The accompanying notes are an integral part of these financial statements. | Annual Report
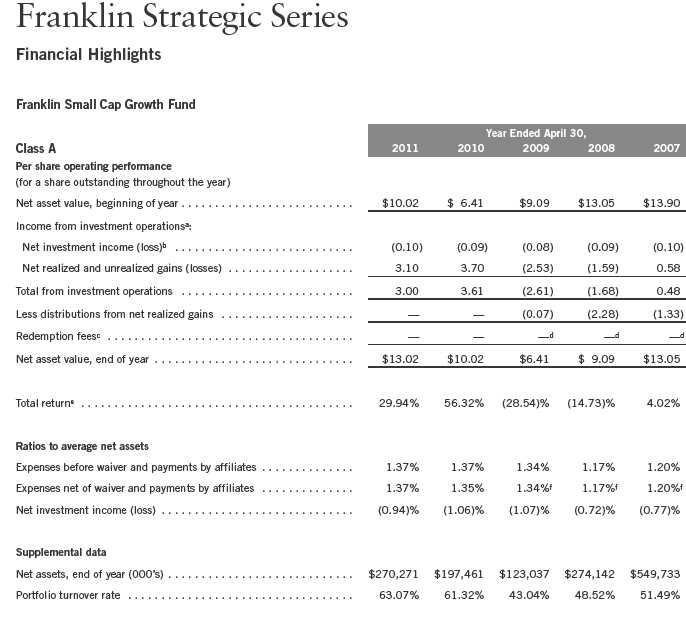
aThe amount shown for a share outstanding throughout the period may not correlate with the Statement of Operations for the period due to the timing of sales and repurchases of
the Fund shares in relation to income earned and/or fluctuating market value of the investments of the Fund.
bBased on average daily shares outstanding.
cEffective September 1, 2008, the redemption fee was eliminated.
dAmount rounds to less than $0.01 per share.
eTotal return does not reflect sales commissions or contingent deferred sales charges, if applicable.
fBenefit of expense reduction rounds to less than 0.01%.
Annual Report | The accompanying notes are an integral part of these financial statements. | 77
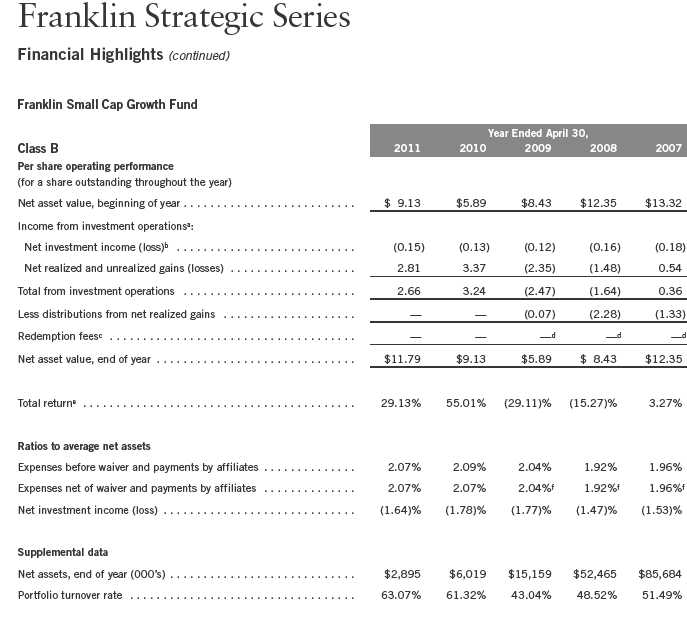
aThe amount shown for a share outstanding throughout the period may not correlate with the Statement of Operations for the period due to the timing of sales and repurchases of
the Fund shares in relation to income earned and/or fluctuating market value of the investments of the Fund.
bBased on average daily shares outstanding.
cEffective September 1, 2008, the redemption fee was eliminated.
dAmount rounds to less than $0.01 per share.
eTotal return does not reflect sales commissions or contingent deferred sales charges, if applicable.
fBenefit of expense reduction rounds to less than 0.01%.
78 | The accompanying notes are an integral part of these financial statements. | Annual Report

aThe amount shown for a share outstanding throughout the period may not correlate with the Statement of Operations for the period due to the timing of sales and repurchases of
the Fund shares in relation to income earned and/or fluctuating market value of the investments of the Fund.
bBased on average daily shares outstanding.
cEffective September 1, 2008, the redemption fee was eliminated.
dAmount rounds to less than $0.01 per share.
eTotal return does not reflect sales commissions or contingent deferred sales charges, if applicable.
fBenefit of expense reduction rounds to less than 0.01%.
Annual Report | The accompanying notes are an integral part of these financial statements. | 79

aThe amount shown for a share outstanding throughout the period may not correlate with the Statement of Operations for the period due to the timing of sales and repurchases of
the Fund shares in relation to income earned and/or fluctuating market value of the investments of the Fund.
bBased on average daily shares outstanding.
cEffective September 1, 2008, the redemption fee was eliminated.
dAmount rounds to less than $0.01 per share.
eTotal return does not reflect sales commissions or contingent deferred sales charges, if applicable.
fBenefit of expense reduction rounds to less than 0.01%.
80 | The accompanying notes are an integral part of these financial statements. | Annual Report
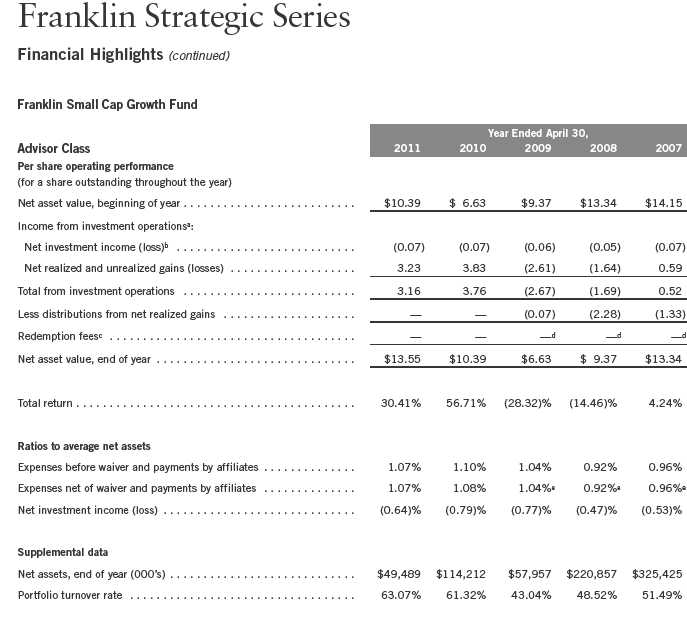
aThe amount shown for a share outstanding throughout the period may not correlate with the Statement of Operations for the period due to the timing of sales and repurchases of
the Fund shares in relation to income earned and/or fluctuating market value of the investments of the Fund.
bBased on average daily shares outstanding.
cEffective September 1, 2008, the redemption fee was eliminated.
dAmount rounds to less than $0.01 per share.
eBenefit of expense reduction rounds to less than 0.01%.
Annual Report | The accompanying notes are an integral part of these financial statements. | 81

82 | Annual Report

Annual Report | 83

84 | Annual Report
Franklin Strategic Series
Statement of Investments, April 30, 2011 (continued)
Franklin Small Cap Growth Fund
See Abbreviations on page 121.
aNon-income producing.
bA portion or all of the security is on loan at April 30, 2011. See Note 1(d).
cSee Note 7 regarding investments in the Institutional Fiduciary Trust Money Market Portfolio.
dSee Note 1(d) regarding securities on loan.
eThe rate shown is the annualized seven-day yield at period end.
Annual Report | The accompanying notes are an integral part of these financial statements. | 85

aThe amount shown for a share outstanding throughout the period may not correlate with the Statement of Operations for the period due to the timing of sales and repurchases of
the Fund shares in relation to income earned and/or fluctuating market value of the investments of the Fund.
bBased on average daily shares outstanding.
cEffective September 1, 2008, the redemption fee was eliminated.
dAmount rounds to less than $0.01 per share.
eTotal return does not reflect sales commissions or contingent deferred sales charges, if applicable.
fBenefit of expense reduction rounds to less than 0.01%.
86 | The accompanying notes are an integral part of these financial statements. | Annual Report
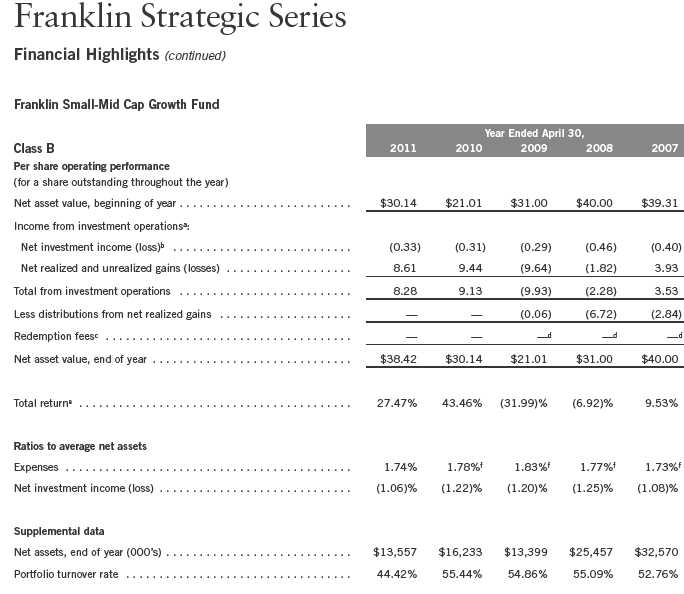
aThe amount shown for a share outstanding throughout the period may not correlate with the Statement of Operations for the period due to the timing of sales and repurchases of
the Fund shares in relation to income earned and/or fluctuating market value of the investments of the Fund.
bBased on average daily shares outstanding.
cEffective September 1, 2008, the redemption fee was eliminated.
dAmount rounds to less than $0.01 per share.
eTotal return does not reflect sales commissions or contingent deferred sales charges, if applicable.
fBenefit of expense reduction rounds to less than 0.01%.
Annual Report | The accompanying notes are an integral part of these financial statements. | 87
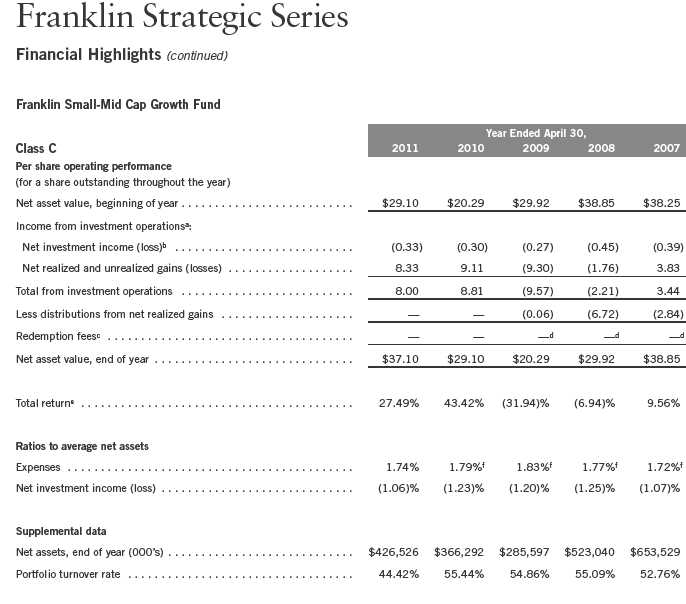
aThe amount shown for a share outstanding throughout the period may not correlate with the Statement of Operations for the period due to the timing of sales and repurchases of
the Fund shares in relation to income earned and/or fluctuating market value of the investments of the Fund.
bBased on average daily shares outstanding.
cEffective September 1, 2008, the redemption fee was eliminated.
dAmount rounds to less than $0.01 per share.
eTotal return does not reflect sales commissions or contingent deferred sales charges, if applicable.
fBenefit of expense reduction rounds to less than 0.01%.
88 | The accompanying notes are an integral part of these financial statements. | Annual Report

aThe amount shown for a share outstanding throughout the period may not correlate with the Statement of Operations for the period due to the timing of sales and repurchases of
the Fund shares in relation to income earned and/or fluctuating market value of the investments of the Fund.
bBased on average daily shares outstanding.
cEffective September 1, 2008, the redemption fee was eliminated.
dAmount rounds to less than $0.01 per share.
eTotal return does not reflect sales commissions or contingent deferred sales charges, if applicable.
fBenefit of expense reduction rounds to less than 0.01%.
Annual Report | The accompanying notes are an integral part of these financial statements. | 89

aThe amount shown for a share outstanding throughout the period may not correlate with the Statement of Operations for the period due to the timing of sales and repurchases of
the Fund shares in relation to income earned and/or fluctuating market value of the investments of the Fund.
bBased on average daily shares outstanding.
cEffective September 1, 2008, the redemption fee was eliminated.
dAmount rounds to less than $0.01 per share.
eBenefit of expense reduction rounds to less than 0.01%.
90 | The accompanying notes are an integral part of these financial statements. | Annual Report
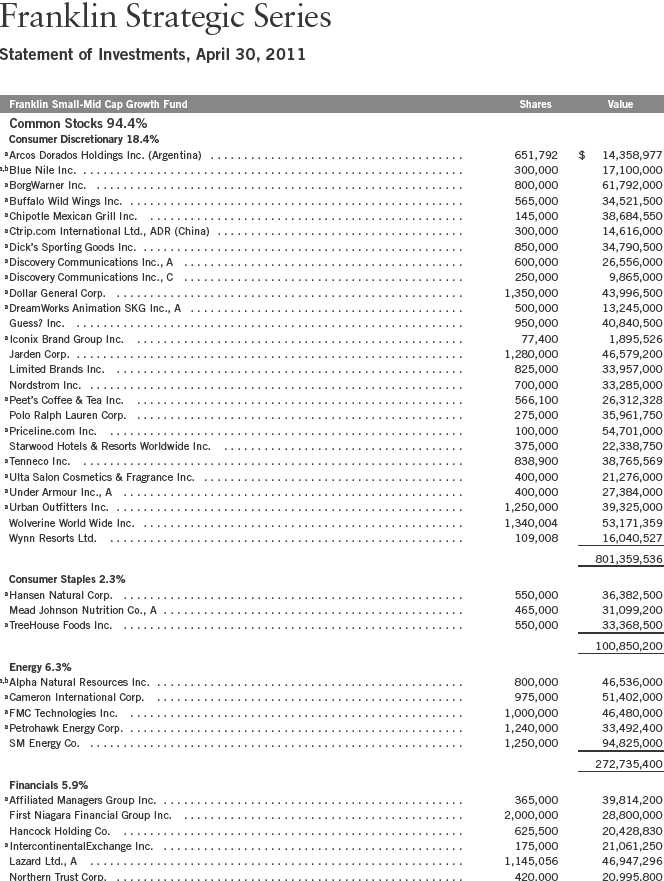
Annual Report | 91
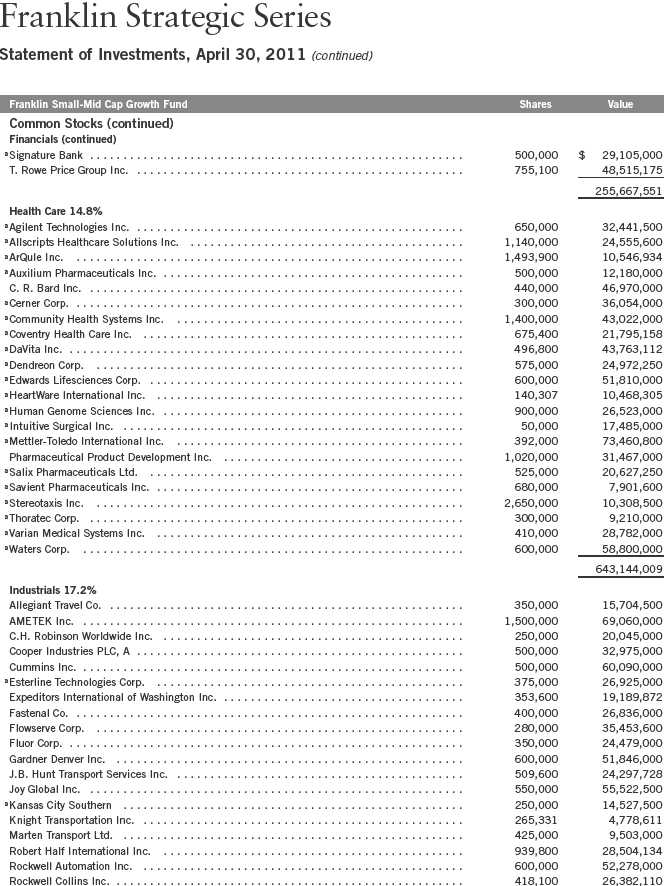
92 | Annual Report

Annual Report | 93

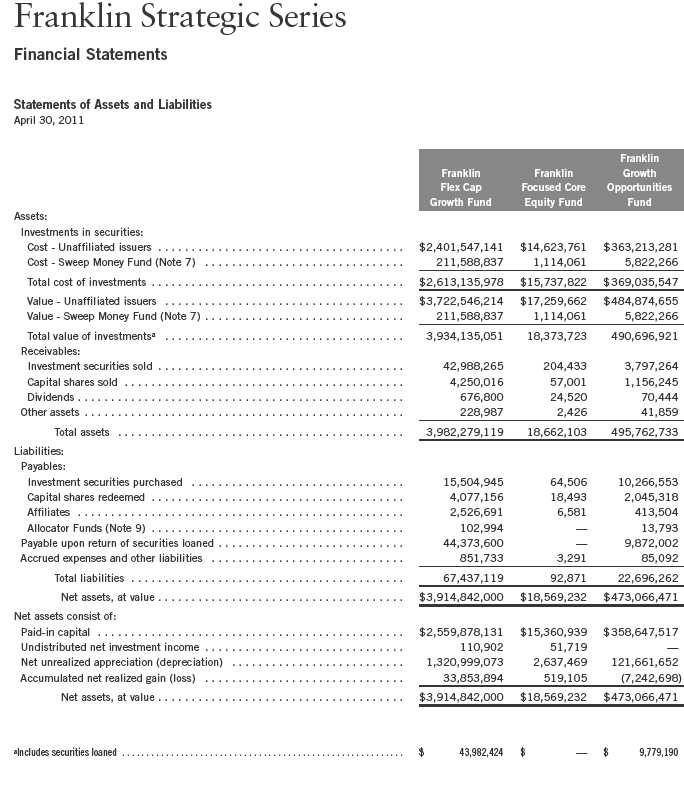
Annual Report | The accompanying notes are an integral part of these financial statements. | 95
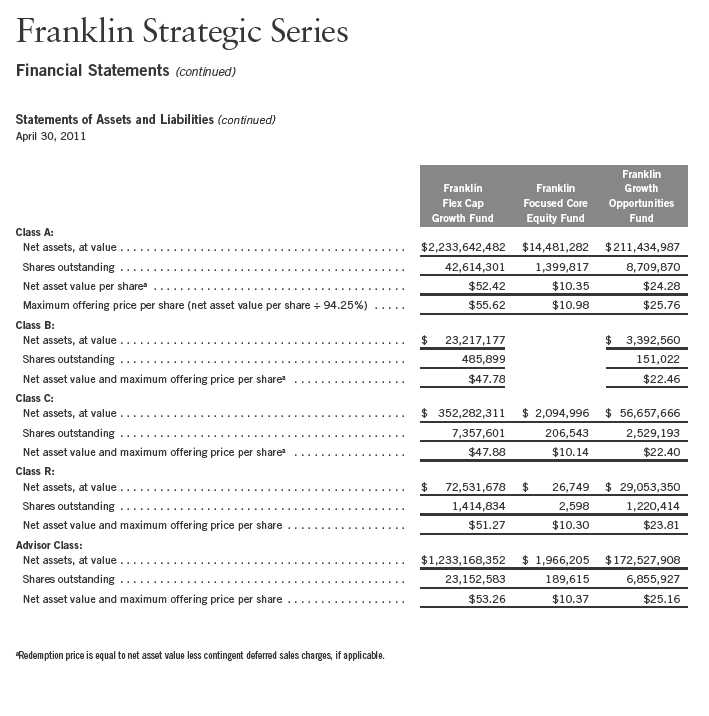
96 | The accompanying notes are an integral part of these financial statements. | Annual Report

Annual Report | The accompanying notes are an integral part of these financial statements. | 97
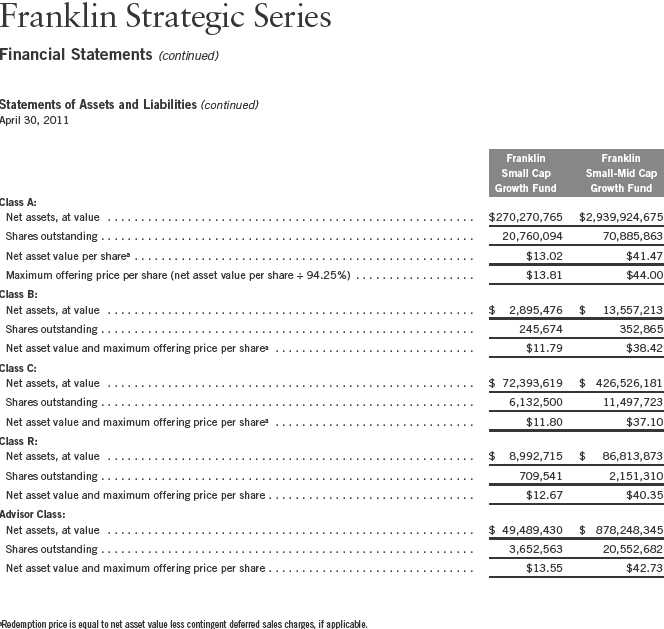
98 | The accompanying notes are an integral part of these financial statements. | Annual Report

Annual Report | The accompanying notes are an integral part of these financial statements. | 99

100 | The accompanying notes are an integral part of these financial statements. | Annual Report
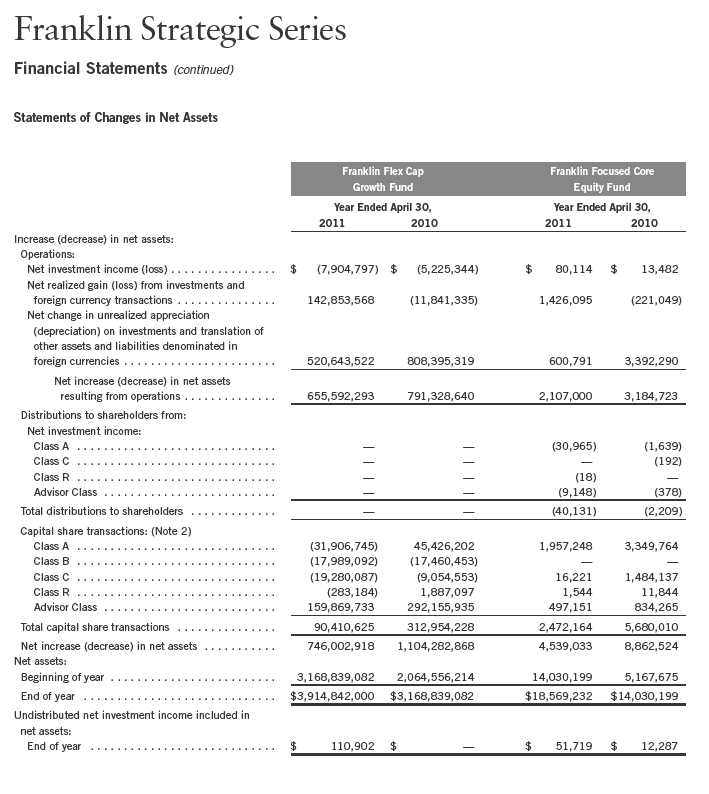
Annual Report | The accompanying notes are an integral part of these financial statements. | 101

102 | The accompanying notes are an integral part of these financial statements. | Annual Report
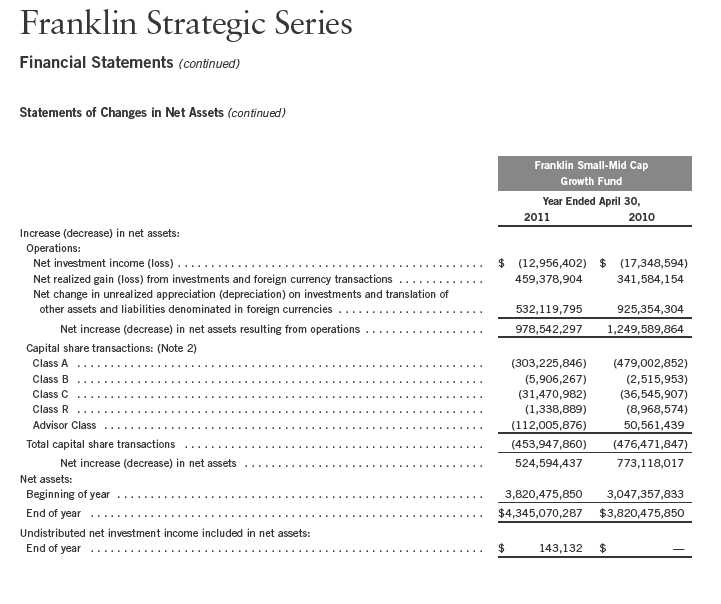
Annual Report | The accompanying notes are an integral part of these financial statements. | 103
Franklin Strategic Series
Notes to Financial Statements
1. ORGANIZATION AND SIGNIFICANT ACCOUNTING POLICIES
Franklin Strategic Series (Trust) is registered under the Investment Company Act of 1940, as amended, (1940 Act) as an open-end investment company, consisting of eight separate funds, five of which are included in this report (Funds). The financial statements of the remaining funds in the Trust are presented separately. The classes of shares offered within each of the Funds are indicated below. Each class of shares differs by its initial sales load, contingent deferred sales charges, distribution fees, voting rights on matters affecting a single class and its exchange privilege.

The following summarizes the Funds’ significant accounting policies.
a. Financial Instrument Valuation
The Funds’ investments in securities and other financial instruments are carried at fair value daily. Fair value is the price that would be received to sell an asset or paid to transfer a liability in an orderly transaction between market participants on the measurement date. Under procedures approved by the Trust’s Board of Trustees, the Funds may utilize independent pricing services, quotations from securities and financial instrument dealers, and other market sources to determine fair value.
Equity securities listed on an exchange or on the NASDAQ National Market System are valued at the last quoted sale price or the official closing price of the day, respectively. Foreign equity securities are valued as of the close of trading on the foreign stock exchange on which the security is primarily traded, or the NYSE, whichever is earlier. The value is then converted into its U.S. dollar equivalent at the foreign exchange rate in effect at the close of the NYSE on the day that the value of the security is determined. Over-the-counter securities are valued within the range of the most recent quoted bid and ask prices. Securities that trade in multiple markets or on multiple exchanges are valued according to the broadest and most representative market. Certain equity securities are valued based upon fundamental characteristics or relationships to similar securities. Investments in open-end mutual funds and non-registered money market funds are valued at the closing net asset value. Repurchase agreements are valued at cost, which approximates market value.
The Funds have procedures to determine the fair value of securities and other financial instruments for which market prices are not readily available or which may not be reliably priced. Under these procedures, the Funds primarily employ a market-based approach which may use related or comparable assets or liabilities, recent transactions, market multiples, book values, and other
104 | Annual Report
Franklin Strategic Series
Notes to Financial Statements (continued)
| 1. | ORGANIZATION AND SIGNIFICANT ACCOUNTING POLICIES (continued) |
| a. | Financial Instrument Valuation (continued) |
relevant information for the investment to determine the fair value of the investment. The Funds may also use an income-based valuation approach in which the anticipated future cash flows of the investment are discounted to calculate fair value. Discounts may also be applied due to the nature or duration of any restrictions on the disposition of the investments. Due to the inherent uncertainty of valuations of such investments, the fair values may differ significantly from the values that would have been used had an active market existed.
Trading in securities on foreign securities stock exchanges and over-the-counter markets may be completed before the daily close of business on the NYSE. Occasionally, events occur between the time at which trading in a foreign security is completed and the close of the NYSE that might call into question the reliability of the value of a portfolio security held by the fund. As a result, differences may arise between the value of the Funds’ portfolio securities as determined at the foreign market close and the latest indications of value at the close of the NYSE. In order to minimize the potential for these differences, the investment manager monitors price movements following the close of trading in foreign stock markets through a series of country specific market proxies (such as baskets of American Depository Receipts, futures contracts and exchange traded funds). These price movements are measured against established trigger thresholds for each specific market proxy to assist in determining if an event has occurred that may call into question the reliability of the values of the foreign securities held by the Funds. If such an event occurs, the securities may be valued using fair value procedures, which may include the use of independent pricing services.
b. Foreign Currency Translation
Portfolio securities and other assets and liabilities denominated in foreign currencies are translated into U.S. dollars based on the exchange rate of such currencies against U.S. dollars on the date of valuation. The Funds may enter into foreign currency exchange contracts to facilitate transactions denominated in a foreign currency. Purchases and sales of securities, income and expense items denominated in foreign currencies are translated into U.S. dollars at the exchange rate in effect on the transaction date. Portfolio securities and assets and liabilities denominated in foreign currencies contain risks that those currencies will decline in value relative to the U.S. dollar. Occasionally, events may impact the availability or reliability of foreign exchange rates used to convert the U.S. dollar equivalent value. If such an event occurs, the foreign exchange rate will be valued at fair value using procedures established and approved by the Funds’ Board of Trustees.
The Funds do not separately report the effect of changes in foreign exchange rates from changes in market prices on securities held. Such changes are included in net realized and unrealized gain or loss from investments on the Statement of Operations.
Annual Report | 105
Franklin Strategic Series
Notes to Financial Statements (continued)
| 1. | ORGANIZATION AND SIGNIFICANT ACCOUNTING POLICIES (continued) |
| b. | Foreign Currency Translation (continued) |
Realized foreign exchange gains or losses arise from sales of foreign currencies, currency gains or losses realized between the trade and settlement dates on securities transactions and the difference between the recorded amounts of dividends, interest, and foreign withholding taxes and the U.S. dollar equivalent of the amounts actually received or paid. Net unrealized foreign exchange gains and losses arise from changes in foreign exchange rates on foreign denominated assets and liabilities other than investments in securities held at the end of the reporting period.
c. Joint Repurchase Agreement
The Franklin Small-Mid Cap Growth Fund enters into a joint repurchase agreement whereby its uninvested cash balance is deposited into a joint cash account with other funds managed by the investment manager or an affiliate of the investment manager and is used to invest in one or more repurchase agreements. The value and face amount of the joint repurchase agreement are allocated to the funds based on their pro-rata interest. A repurchase agreement is accounted for as a loan by the fund to the seller, collateralized by securities which are delivered to the fund’s custodian. The market value, including accrued interest, of the initial collateralization is required to be at least 102% of the dollar amount invested by the funds, with the value of the underlying securities marked to market daily to maintain coverage of at least 100%. The joint repurchase agreement held by the fund at year end had been entered into on April 29, 2011.
d. Securities Lending
Certain funds participate in an agency based security lending program. The fund receives cash collateral against the loaned securities in an amount equal to at least 102% of the market value of the loaned securities. Collateral is maintained over the life of the loan in an amount not less than 100% of the market value of loaned securities, as determined at the close of fund business each day; any additional collateral required due to changes in security values is delivered to the fund on the next business day. The collateral is invested in money funds managed by the fund’s custodian on the fund’s behalf. The fund receives income from the investment of cash collateral, in addition to lending fees and rebates paid by the borrower. The fund bears the market risk with respect to the collateral investment, securities loaned, and the risk that the agent may default on its obligations to the fund. The securities lending agent has agreed to indemnify the fund in the event of default by a third party borrower.
e. Income Taxes
It is each fund’s policy to qualify as a regulated investment company under the Internal Revenue Code. Each fund intends to distribute to shareholders substantially all of its taxable income and net realized gains to relieve it from federal income and excise taxes. As a result, no provision for U.S. federal income taxes is required. Each fund files U.S. income tax returns as well as tax returns
106 | Annual Report
Franklin Strategic Series
Notes to Financial Statements (continued)
| 1. | ORGANIZATION AND SIGNIFICANT ACCOUNTING POLICIES (continued) |
| e. | Income Taxes (continued) |
in certain other jurisdictions. Each fund records a provision for taxes in its financial statements including penalties and interest, if any, for a tax position taken on a tax return (or expected to be taken) when it fails to meet the more likely than not (a greater than 50% probability) threshold and based on the technical merits, the tax position may not be sustained upon examination by the tax authorities. As of April 30, 2011, and for all open tax years, each fund has determined that no provision for income tax is required in the each fund’s financial statements. Open tax years are those that remain subject to examination and are based on each tax jurisdiction statute of limitation.
f. Security Transactions, Investment Income, Expenses and Distributions
Security transactions are accounted for on trade date. Realized gains and losses on security transactions are determined on a specific identification basis. Interest income and estimated expenses are accrued daily. Dividend income is recorded on the ex-dividend date except that certain dividends from foreign securities are recognized as soon as the Funds are notified of the ex-dividend date. Distributions to shareholders are recorded on the ex-dividend date and are determined according to income tax regulations (tax basis). Distributable earnings determined on a tax basis may differ from earnings recorded in accordance with accounting principles generally accepted in the United States of America. These differences may be permanent or temporary. Permanent differences are reclassified among capital accounts to reflect their tax character. These reclassifications have no impact on net assets or the results of operations. Temporary differences are not reclassified, as they may reverse in subsequent periods.
Common expenses incurred by the Trust are allocated among the Funds based on the ratio of net assets of each fund to the combined net assets of the Trust. Fund specific expenses are charged directly to the fund that incurred the expense.
Realized and unrealized gains and losses and net investment income, not including class specific expenses, are allocated daily to each class of shares based upon the relative proportion of net assets of each class. Differences in per share distributions, by class, are generally due to differences in class specific expenses.
g. Accounting Estimates
The preparation of financial statements in accordance with accounting principles generally accepted in the United States of America requires management to make estimates and assumptions that affect the reported amounts of assets and liabilities at the date of the financial statements and the amounts of income and expenses during the reporting period. Actual results could differ from those estimates.
Annual Report | 107
Franklin Strategic Series
Notes to Financial Statements (continued)
| 1. | ORGANIZATION AND SIGNIFICANT ACCOUNTING POLICIES (continued) |
| h. | Guarantees and Indemnifications |
Under the Trust’s organizational documents, its officers and trustees are indemnified by the Trust against certain liabilities arising out of the performance of their duties to the Trust. Additionally, in the normal course of business, the Trust, on behalf of the Funds, enters into contracts with service providers that contain general indemnification clauses. The Trust’s maximum exposure under these arrangements is unknown as this would involve future claims that may be made against the Trust that have not yet occurred. Currently, the Trust expects the risk of loss to be remote.
2. SHARES OF BENEFICIAL INTEREST
At April 30, 2011, there were an unlimited number of shares authorized (without par value).
Transactions in the Funds’ shares were as follows:
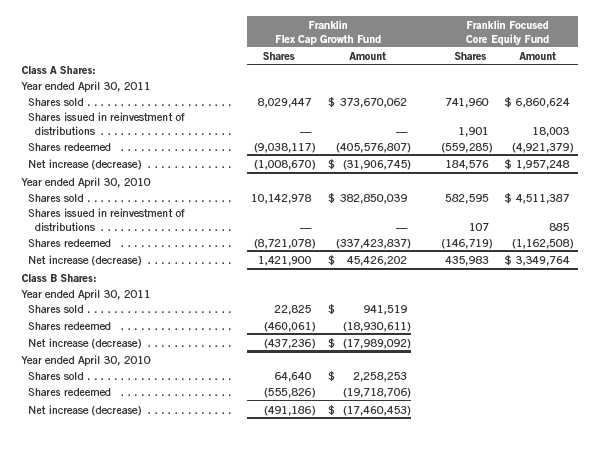
108 | Annual Report
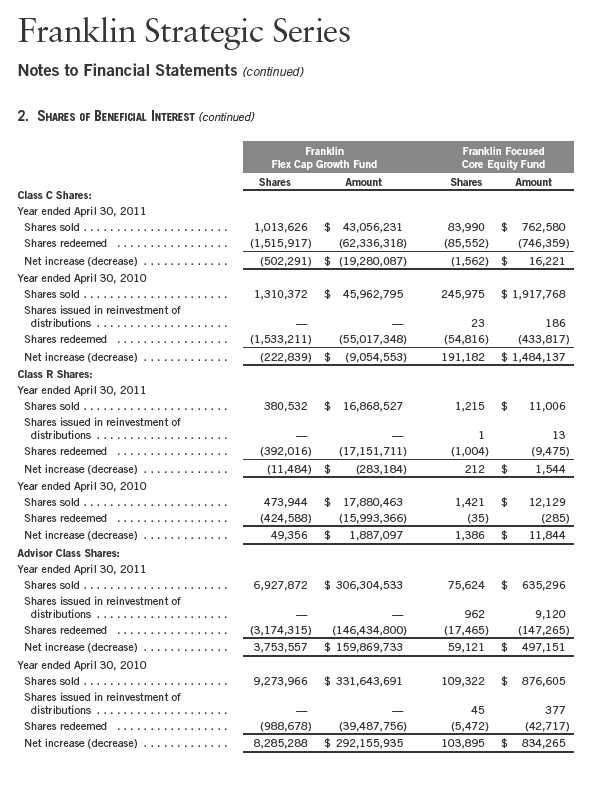
Annual Report | 109

110 | Annual Report
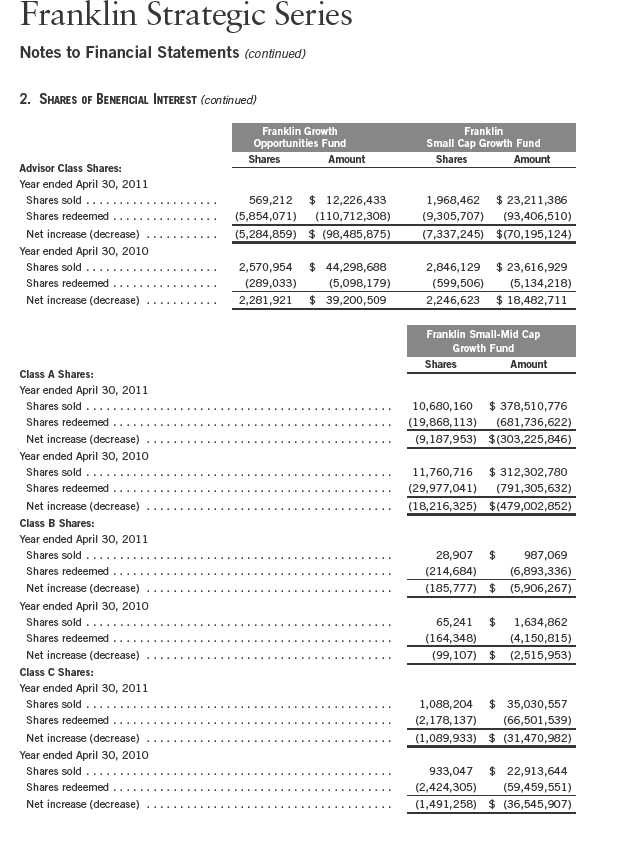
Annual Report | 111
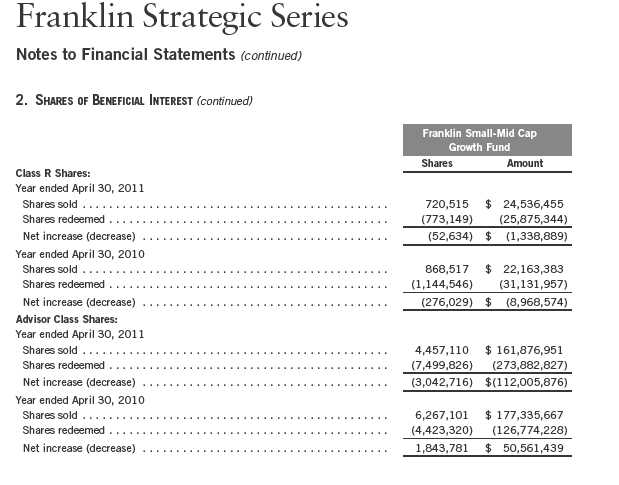
3. TRANSACTIONS WITH AFFILIATES
Franklin Resources, Inc. is the holding company for various subsidiaries that together are referred to as Franklin Templeton Investments. Certain officers and trustees of the Trust are also officers and/or directors of the following subsidiaries:

a. Management Fees
The Franklin Flex Cap Growth Fund and the Franklin Small-Mid Cap Growth Fund pay an investment management fee to Advisers based on the average daily net assets of each of the funds as follows:

Franklin Strategic Series
Notes to Financial Statements (continued)
| 3. | TRANSACTIONS WITH AFFILIATES (continued) |
| a. | Management Fees (continued) |
The Franklin Focused Core Equity Fund pays an investment management fee to Advisers based on the average daily net assets of the fund as follows:

The Franklin Growth Opportunities Fund pays an investment management fee to Advisers based on the average daily net assets of the fund as follows:
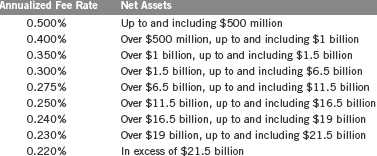
The Franklin Small Cap Growth Fund pays an investment management fee to Advisers based on the average daily net assets of the fund as follows:

Annual Report | 113
Franklin Strategic Series
Notes to Financial Statements (continued)
| 3. | TRANSACTIONS WITH AFFILIATES (continued) |
| b. | Administrative Fees |
The Franklin Focused Core Equity Fund, the Franklin Growth Opportunities Fund, and the Franklin Small Cap Growth Fund pay an administrative fee to FT Services of 0.20% per year of the average daily net assets of each of the fund.
Under an agreement with Advisers, FT Services provides administrative services to the Franklin Flex Cap Growth Fund and the Franklin Small-Mid Cap Growth Fund. The fee is paid by Advisers based on average daily net assets, and is not an additional expense of the funds.
c. Distribution Fees
The Trust’s Board of Trustees has adopted distribution plans for each share class, with the exception of Advisor Class shares, pursuant to Rule 12b-1 under the 1940 Act. Under the Funds’ Class A reimbursement distribution plans, the Funds reimburse Distributors for costs incurred in connection with the servicing, sale and distribution of each fund’s shares up to the maximum annual plan rate. Under the Class A reimbursement distribution plans, costs exceeding the maximum for the current plan year cannot be reimbursed in subsequent periods.
In addition, under the Funds’ Class B, C and R compensation distribution plans, the Funds pay Distributors for costs incurred in connection with the servicing, sale and distribution of each fund’s shares up to the maximum annual plan rate for each class.
The maximum annual plan rates, based on the average daily net assets, for each class, are as follows:

The Board of Trustees has set the current rate at 0.30% per year for Class A shares for the Franklin Focused Core Equity Fund, the Franklin Growth Opportunities Fund, and the Franklin Small Cap Growth Fund until further notice and approval by the Board.
114 | Annual Report
Franklin Strategic Series
Notes to Financial Statements (continued)
| 3. | TRANSACTIONS WITH AFFILIATES (continued) |
| d. | Sales Charges/Underwriting Agreements |
Distributors has advised the Funds of the following commission transactions related to the sales and redemptions of the Funds’ shares for the year:


e. Transfer Agent Fees
For the year ended April 30, 2011, the Funds paid transfer agent fees as noted in the Statements of Operations of which the following amounts were retained by Investor Services:

For the Franklin Focused Core Equity Fund, Advisers and FT Services have contractually agreed in advance to waive or limit their respective fees and to assume as their own expense certain expenses otherwise payable by the fund so that the common expenses (i.e. a combination of management fees, administrative fees, and other expenses, but excluding distribution fees, and acquired fund fees and expenses) for each class of the fund do not exceed 0.89% (other than certain non-routine expenses or costs, including those relating to litigation, indemnification, reorganizations, and liquidations) until August 31, 2011.
g. Other Affiliated Transactions
At April 30, 2011, Advisers owned 27.63% of the Franklin Focused Core Equity Fund’s outstanding shares.
Annual Report | 115
Franklin Strategic Series
Notes to Financial Statements (continued)
4. EXPENSE OFFSET ARRANGEMENT
The Funds have entered into an arrangement with their custodian whereby credits realized as a result of uninvested cash balances are used to reduce a portion of the Funds’ custodian expenses. During the year ended April 30, 2011, there were no credits earned.
5. INCOME TAXES
For tax purposes, capital losses may be carried over to offset future capital gains, if any. At April 30, 2011, the capital loss carryforwards were as follows:
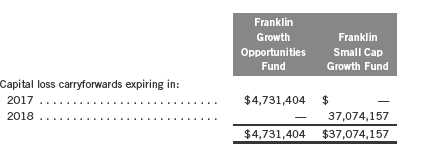
During the year end April 30, 2011, the Funds utilized capital loss carryforwards as follows:

The tax character of distributions paid during the years ended April 30, 2011 and 2010, was as follows:

116 | Annual Report
Franklin Strategic Series
Notes to Financial Statements (continued)
5. INCOME TAXES (continued)
At April 30, 2011, the cost of investments, net unrealized appreciation (depreciation), undistributed ordinary income and undistributed long term capital gains for income tax purposes were as follows:

Net investment income (loss) differs for financial statement and tax purposes primarily due to differing treatments of foreign currency transactions, passive foreign investment company shares, pass-through entity income, and regulatory settlements.
Net realized gains (losses) differ for financial statement and tax purposes primarily due to differing treatments of wash sales, foreign currency transactions, and pass-through entity income.
6. INVESTMENT TRANSACTIONS
Purchases and sales (excluding short term securities) for the year ended April 30, 2011, were as follows:

Annual Report | 117
Franklin Strategic Series
Notes to Financial Statements (continued)
7. INVESTMENTS IN INSTITUTIONAL FIDUCIARY TRUST MONEY MARKET PORTFOLIO
The Funds invest in the Institutional Fiduciary Trust Money Market Portfolio (Sweep Money Fund), an open-end investment company managed by Advisers. Management fees paid by the Funds are reduced on assets invested in the Sweep Money Fund, in an amount not to exceed the management and administrative fees paid by the Sweep Money Fund.
8. RESTRICTED SECURITIES
Certain funds invest in securities that are restricted under the Securities Act of 1933 (1933 Act) or which are subject to legal, contractual, or other agreed upon restrictions on resale. Restricted securities are often purchased in private placement transactions, and cannot be sold without prior registration unless the sale is pursuant to an exemption under the 1933 Act. Disposal of these securities may require greater effort and expense, and prompt sale at an acceptable price may be difficult. The funds may have registration rights for restricted securities. The issuer generally incurs all registration costs.
At April 30, 2011, the funds held investments in restricted securities, excluding certain securities exempt from registration under the 1933 Act deemed to be liquid, as follows:

9. SPECIAL SERVICING AGREEMENT
The Franklin Flex Cap Growth Fund, the Franklin Growth Opportunities Fund, the Franklin Small Cap Growth Fund, and the Franklin Small-Mid Cap Growth Fund, which are eligible underlying investments of one or more of the Franklin Templeton Fund Allocator Series Funds (Allocator Funds), participates in a Special Servicing Agreement (SSA) with the Allocator Funds and certain service providers of the funds and the Allocator Funds. Under the SSA, the funds may pay a portion of the Allocator Funds’ expenses (other than any asset allocation, administrative and distribution fees), to the extent such payments are less than the amount of the benefits realized or expected to be realized by the funds (e.g., due to reduced costs associated with servicing accounts) from the investment in the funds by the Allocator Funds. The Allocator Funds are either managed by Franklin Advisers, Inc. or administered by FT Services, affiliates of the funds. For the year ended April 30, 2011, the Franklin Flex Cap Growth Fund, the Franklin Growth
118 | Annual Report
Franklin Strategic Series
Notes to Financial Statements (continued)
9. SPECIAL SERVICING AGREEMENT (continued)
Opportunities Fund, and the Franklin Small Cap Growth Fund were held by one or more of the Allocator Funds and the amount of expenses borne by the funds is noted in the Statements of Operations. At April 30, 2011, 19.16% of the Franklin Flex Cap Growth Fund and 22.91% of the Franklin Growth Opportunities Fund outstanding shares were held by one or more of the Allocator Funds. At April 30, 2011, the Franklin Small Cap Growth Fund was no longer held by any of the Allocator Funds.
10. CREDIT FACILITY
The Funds, together with other U.S. registered and foreign investment funds (collectively, Borrowers), managed by Franklin Templeton Investments, are borrowers in a joint syndicated senior unsecured credit facility totaling $750 million (Global Credit Facility) which matures on January 20, 2012. This Global Credit Facility provides a source of funds to the Borrowers for temporary and emergency purposes, including the ability to meet future unanticipated or unusually large redemption requests.
Under the terms of the Global Credit Facility, the Funds shall, in addition to interest charged on any borrowings made by the Funds and other costs incurred by the Funds, pay their share of fees and expenses incurred in connection with the implementation and maintenance of the Global Credit Facility, based upon their relative share of the aggregate net assets of all of the Borrowers, including an annual commitment fee of 0.08% based upon the unused portion of the Global Credit Facility, which is reflected in other expenses on the Statements of Operations. During the year ended April 30, 2011, the Funds did not use the Global Credit Facility.
11. REGULATORY AND LITIGATION MATTERS
During the year ended April 30, 2011, the Franklin Flex Cap Growth Fund and the Franklin Small-Mid Cap Growth Fund received $353,377 and $3,533,869, respectively, resulting from a settlement between the U.S. Securities and Exchange Commission and Advisers relating to market-timing activities, as previously reported in the fund’s financial statements during the years ended April 30, 2004 through April 30, 2007. This payment is included in capital shares transactions on the Statements of Changes in Net Assets.
12. FAIR VALUE MEASUREMENTS
The Trust follows a fair value hierarchy that distinguishes between market data obtained from independent sources (observable inputs) and the Trust’s own market assumptions (unobservable
Annual Report | 119
Franklin Strategic Series
Notes to Financial Statements (continued)
12. FAIR VALUE MEASUREMENTS (continued)
inputs). These inputs are used in determining the value of the Funds’ investments and are summarized in the following fair value hierarchy:
- Level 1 – quoted prices in active markets for identical securities
- Level 2 – other significant observable inputs (including quoted prices for similar securi- ties, interest rates, prepayment speed, credit risk, etc.)
- Level 3 – significant unobservable inputs (including the fund’s own assumptions in deter- mining the fair value of investments)
The inputs or methodology used for valuing securities are not an indication of the risk associated with investing in those securities.
For movements between the levels within the fair value hierarchy, the Funds have adopted a policy of recognizing the transfers as of the date of the underlying event which caused the movement.
The following is a summary of the inputs used as of April 30, 2011, in valuing the Funds’ assets and liabilities carried at fair value:

120 | Annual Report
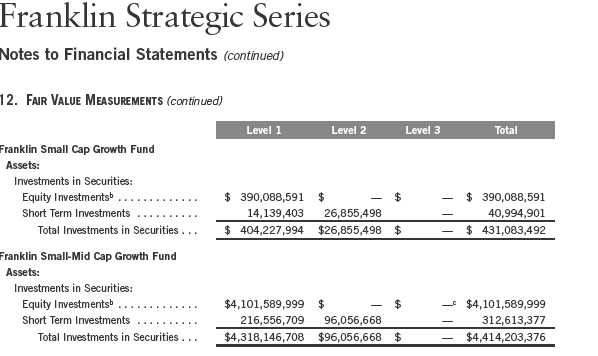
alncludes common and preferred stocks as well as other equity investments.
bFor detailed industry descriptions, see the accompanying Statements of Investments.
cIncludes a security determined to have no value at April 30, 2011.
At April 30, 2011, the reconciliation of assets in which significant unobservable inputs (Level 3) were used in determining the fund’s fair value, was as follows:

13. SUBSEQUENT EVENTS
The Funds have evaluated subsequent events through the issuance of the financial statements and determined that no events have occurred that require disclosure.
ABBREVIATIONS
Selected Portfolio
ADR - American Depository Receipt
Annual Report | 121
Franklin Strategic Series
Report of Independent Registered Public Accounting Firm
To the Board of Trustees and Shareholders of Franklin Strategic Series
In our opinion, the accompanying statements of assets and liabilities, including the statements of investments, and the related statements of operations and of changes in net assets and the financial highlights present fairly, in all material respects, the financial position of the Franklin Flex Cap Growth Fund, Franklin Focused Core Equity Fund, Franklin Growth Opportunities Fund, Franklin Small Cap Growth Fund and Franklin Small-Mid Cap Growth Fund (separate portfolios of Franklin Strategic Series, hereafter referred to as the “Funds”) at April 30, 2011, the results of each of their operations for the year then ended, the changes in each of their net assets for each of the two years in the period then ended and the financial highlights for each of the periods presented, in conformity with accounting principles generally accepted in the United States of America. These financial statements and financial highlights (hereafter referred to as “financial statements”) are the responsibility of the Funds’ management. Our responsibility is to express an opinion on these financial statements based on our audits. We conducted our audits of these financial statements in accordance with the standards of the Public Company Accounting Oversight Board (United States). Those standards require that we plan and perform the audit to obtain reasonable assurance about whether the financial statements are free of material misstatement. An audit includes examining, on a test basis, evidence supporting the amounts and disclosures in the financial statements, assessing the accounting principles used and significant estimates made by management, and evaluating the overall financial statement presentation. We believe that our audits, which included confirmation of securities at April 30, 2011 by correspondence with the custodian and brokers, provide a reasonable basis for our opinion.
PricewaterhouseCoopers LLP
San Francisco, California
June 16, 2011
122 | Annual Report
Franklin Strategic Series
Tax Designation (unaudited)
Under Section 854(b)(2) of the Internal Revenue Code (Code), the Franklin Focused Core Equity Fund designates 100% of the ordinary income dividends as income qualifying for the dividends received deduction for the fiscal year ended April 30, 2011.
Under Section 854(b)(2) of the Code, the Funds designate the maximum amount allowable but no less than the following amounts as qualified dividends for purposes of the maximum rate under Section 1(h)(11) of the Code for the fiscal year ended April 30, 2011:

Distributions, including qualified dividend income, paid during calendar year 2011 will be reported to shareholders on Form 1099-DIV in January 2012. Shareholders are advised to check with their tax advisors for information on the treatment of these amounts on their individual income tax returns.
Annual Report | 123
Franklin Strategic Series
Board Members and Officers
The name, year of birth and address of the officers and board members, as well as their affiliations, positions held with the Trust, principal occupations during the past five years and number of portfolios overseen in the Franklin Templeton Investments fund complex are shown below. Generally, each board member serves until that person’s successor is elected and qualified.

Principal Occupation During Past 5 Years:
Director of various companies; and formerly, Director, RBC Holdings, Inc. (bank holding company) (until 2002); and President, Chief Executive Officer and Chairman of the Board, General Host Corporation (nursery and craft centers) (until 1998).

Principal Occupation During Past 5 Years:
Private investor; and formerly, Chairman of the Board, Vodafone AirTouch, PLC (wireless company); Chairman of the Board and Chief Executive Officer, AirTouch Communications (cellular communications) (1993-1998) and Pacific Telesis Group (telephone holding company) (1988-1994).

Principal Occupation During Past 5 Years:
Director or Trustee of various companies and trusts; and formerly, Assistant to the President of the United States and Secretary of the Cabinet (1990-1993); General Counsel to the United States Treasury Department (1989-1990); and Counselor to the Secretary and Assistant Secretary, Public Affairs and Public Liaison – United States Treasury Department (1988-1989).

Principal Occupation During Past 5 Years:
Executive Vice President, General Counsel and member of Executive Council, The Boeing Company; and formerly, Federal Appeals Court Judge, U.S. Court of Appeals for the Fourth Circuit (1991-2006).
124 | Annual Report

Principal Occupation During Past 5 Years:
Chairman Emeritus, The Hertz Corporation (car rental) (since 2000) (Chairman of the Board (1980-2000) and Chief Executive Officer (1977-1999)); and formerly, Chairman of the Board, President and Chief Executive Officer, UAL Corporation (airlines).

Principal Occupation During Past 5 Years:
Senior Vice President – Government Affairs, General Counsel and Secretary, PepsiCo, Inc. (consumer products); and formerly, Director, Delta Airlines (aviation) (2003-2005) and Providian Financial Corp. (credit card provider) (1997-2001); Senior Fellow of The Brookings Institution (2003-2004); Visiting Professor, University of Georgia School of Law (2004); and Deputy Attorney General, U.S. Department of Justice (2001-2003).

Principal Occupation During Past 5 Years:
President and Founder, Hyannis Port Capital, Inc. (real estate and private equity investing); serves on private and non-profit boards; and formerly, Chief Operating Officer and Executive Vice President, Gap, Inc. (retail) (1996-2000); Chief Financial Officer and Executive Vice President – Finance and Strategy, Staples, Inc. (office supplies) (1992-1996); Senior Vice President – Corporate Planning, Northwest Airlines, Inc. (airlines) (1990-1992); and Vice President and Partner, Bain & Company (consulting firm) (1986-1990).

Principal Occupation During Past 5 Years:
Chairman of the Board, Member – Office of the Chairman and Director, Franklin Resources, Inc.; and officer and/or director or trustee, as the case may be, of some of the other subsidiaries of Franklin Resources, Inc. and of 41 of the investment companies in Franklin Templeton Investments.
Annual Report | 125

Principal Occupation During Past 5 Years:
Vice Chairman, Member – Office of the Chairman and Director, Franklin Resources, Inc.; Director, Franklin Advisers, Inc.; Senior Vice President, Franklin Advisory Services, LLC; and officer and/or director or trustee, as the case may be, of some of the other subsidiaries of Franklin Resources, Inc. and of 25 of the investment companies in Franklin Templeton Investments.

Principal Occupation During Past 5 Years:
Director, Global Compliance, Franklin Resources, Inc.; officer of some of the other subsidiaries of Franklin Resources, Inc. and of 45 of the investment companies in Franklin Templeton Investments; and formerly, Director of Compliance, Franklin Resources, Inc. (1994-2001).

Principal Occupation During Past 5 Years:
Senior Vice President, Franklin Templeton Services, LLC; officer of 45 of the investment companies in Franklin Templeton Investments; and formerly, Director and member of Audit and Valuation Committees, Runkel Funds, Inc. (2003-2004); Assistant Treasurer of most of the investment companies in Franklin Templeton Investments (1997-2003); and Vice President, Franklin Templeton Services, LLC (1997-2003).

Principal Occupation During Past 5 Years:
Director, Fund Accounting, Franklin Templeton Investments; and officer of 27 of the investment companies in Franklin Templeton Investments.

Principal Occupation During Past 5 Years:
Senior Associate General Counsel, Franklin Templeton Investments; officer of 45 of the investment companies in Franklin Templeton Investments; and formerly, Litigation Associate, Steefel, Levitt & Weiss, LLP (2000-2004).

Principal Occupation During Past 5 Years:
Senior Associate General Counsel, Franklin Templeton Investments; and officer and/or director, as the case may be, of some of the other subsidiaries of Franklin Resources, Inc. and of 45 of the investment companies in Franklin Templeton Investments.
126 | Annual Report

Principal Occupation During Past 5 Years:
Senior Associate General Counsel, Franklin Templeton Investments; Vice President, Franklin Templeton Distributors, Inc.; and officer of 45 of the investment companies in Franklin Templeton Investments.

Principal Occupation During Past 5 Years:
President, Chief Investment Officer and Director, Franklin Advisers, Inc.; Executive Vice President, Franklin Templeton Institutional, LLC; and officer and/or trustee, as the case may be, of some of the other subsidiaries of Franklin Resources, Inc. and of 10 of the investment companies in Franklin Templeton Investments.

Principal Occupation During Past 5 Years:
Director and Executive Vice President, Franklin Advisers, Inc.; Executive Vice President, Franklin Templeton Institutional, LLC; and officer of some of the other subsidiaries of Franklin Resources, Inc. and of 22 of the investment companies in Franklin Templeton Investments.

Principal Occupation During Past 5 Years:
Senior Associate General Counsel, Franklin Templeton Investments; Assistant Secretary, Franklin Resources, Inc.; Vice President and Secretary, Templeton Investment Counsel, LLC; Vice President, Secretary and Trust Officer, Fiduciary Trust International of the South; and officer of 45 of the investment companies in Franklin Templeton Investments.

Principal Occupation During Past 5 Years:
Senior Associate General Counsel, Franklin Templeton Investments; and officer of 45 of the investment companies in Franklin Templeton Investments.
Annual Report | 127

Principal Occupation During Past 5 Years:
General Counsel and Executive Vice President, Franklin Resources, Inc.; officer of some of the other subsidiaries of Franklin Resources, Inc. and of 45 of the investment companies in Franklin Templeton Investments; and formerly, Partner, Shearman & Sterling, LLP (2004-2005); and General Counsel, Investment Company Institute (ICI) (1997-2004).
*We base the number of portfolios on each separate series of the U.S. registered investment companies within the Franklin Templeton Investments fund complex. These portfolios have a common investment manager or affiliated investment managers.
**Charles B. Johnson and Rupert H. Johnson, Jr. are considered to be interested persons of the Trust under the federal securities laws due to their positions as officers and directors and major shareholders of Franklin Resources, Inc., which is the parent company of the Fund's investment manager and distributor.
Note 1: Charles B. Johnson and Rupert H. Johnson, Jr. are brothers.
Note 2: Officer information is current as of the date of this report. It is possible that after this date, information about officers may change.
Note 3: Prior to April 30, 2011, Frank W.T. LaHaye ceased to be a trustee of the Fund.
The Sarbanes-Oxley Act of 2002 and Rules adopted by the Securities and Exchange Commission require the Fund to disclose whether the Fund’s Audit Committee includes at least one member who is an audit committee financial expert within the meaning of such Act and Rules. The Fund’s Board has determined that there is at least one such financial expert on the Audit Committee and has designated John B. Wilson as its audit committee financial expert. The Board believes that Mr. Wilson qualifies as such an expert in view of his extensive business background and experience, including service as chief financial officer of Staples, Inc. from 1992 to 1996. Mr. Wilson has been a Member and Chairman of the Fund’s Audit Committee since 2006. As a result of such background and experience, the Board believes that Mr. Wilson has acquired an understanding of generally accepted accounting principles and financial statements, the general application of such principles in connection with the accounting estimates, accruals and reserves, and analyzing and evaluating financial statements that present a breadth and level of complexity of accounting issues generally comparable to those of the Fund, as well as an understanding of internal controls and procedures for financial reporting and an understanding of audit committee functions. Mr. Wilson is an independent Board member as that term is defined under the relevant Securities and Exchange Commission Rules and Releases.
The Statement of Additional Information (SAI) includes additional information about the board members and is available, without charge, upon request. Shareholders may call (800) DIAL BEN/342-5236 to request the SAI.
128 | Annual Report
Franklin Strategic Series
Shareholder Information
Board Review of Investment Management Agreement
At a meeting held April 19, 2011, the Board of Trustees (Board), including a majority of non-interested or independent Trustees, approved renewal of the investment management agreement for each of the separate funds within the Trust (Fund(s)). In reaching this decision, the Board took into account information furnished throughout the year at regular Board meetings, as well as information prepared specifically in connection with the annual renewal review process. Information furnished and discussed throughout the year included investment performance reports and related financial information for each Fund, as well as periodic reports on expenses, shareholder services, legal, compliance, pricing, brokerage commissions and execution and other services provided by the Investment Manager (Manager) and its affiliates. Information furnished specifically in connection with the renewal process included a report for each Fund prepared by Lipper, Inc. (Lipper), an independent organization, as well as additional material, including a Fund profitability analysis prepared by management. The Lipper reports compared each Fund’s investment performance and expenses with those of other mutual funds deemed comparable to the Fund as selected by Lipper. The Fund profitability analysis discussed the profitability to Franklin Templeton Investments from its overall U.S. fund operations, as well as on an individual fund-by-fund basis. Additional material accompanying such profitability analysis included information on a fund-by-fund basis listing portfolio managers and other accounts they manage, as well as information on management fees charged by the Manager and its affiliates to U.S. mutual funds and other accounts, including management’s explanation of differences where relevant. Such material also included a memorandum prepared by management describing project initiatives and capital investments relating to the services provided to the Funds by the Franklin Templeton Investments organization, as well as a memorandum relating to economies of scale and a comparative analysis concerning transfer agent fees charged each Fund.
In considering such materials, the independent Trustees received assistance and advice from and met separately with independent counsel. While the investment management agreements for all Funds were considered at the same Board meeting, the Board dealt with each Fund separately. In approving continuance of the investment management agreement for each Fund, the Board, including a majority of independent Trustees, determined that the existing management fee structure was fair and reasonable and that continuance of the investment management agreement was in the best interests of each Fund and its shareholders. While attention was given to all information furnished, the following discusses some primary factors relevant to the Board’s decision.
NATURE, EXTENT AND QUALITY OF SERVICE. The Board was satisfied with the nature and quality of the overall services provided by the Manager and its affiliates to the Funds and their shareholders. In addition to investment performance and expenses discussed later, the Board’s opinion was based, in part, upon periodic reports furnished it showing that the investment policies and restrictions for each Fund were consistently complied with as well as other reports periodically furnished the Board covering matters such as the compliance of portfolio managers and other
Annual Report | 129
Franklin Strategic Series
Shareholder Information (continued)
Board Review of Investment Management Agreement (continued)
management personnel with the code of ethics adopted throughout the Franklin Templeton fund complex, the adherence to fair value pricing procedures established by the Board, and the accuracy of net asset value calculations. The Board also noted the extent of benefits provided Fund shareholders from being part of the Franklin Templeton family of funds, including the right to exchange investments between the same class of funds without a sales charge, the ability to reinvest Fund dividends into other funds and the right to combine holdings in other funds to obtain a reduced sales charge. Favorable consideration was given to management’s continuous efforts and expenditures in establishing back-up systems and recovery procedures to function in the event of a natural disaster, it being noted that such systems and procedures had functioned smoothly during the Florida hurricanes and blackouts experienced in previous years. Among other factors taken into account by the Board were the Manager’s best execution trading policies, including a favorable report by an independent portfolio trading analytical firm. Consideration was also given to the experience of each Fund’s portfolio management team, the number of accounts managed and general method of compensation. In this latter respect, the Board noted that a primary factor in management’s determination of a portfolio manager’s bonus compensation was the relative investment performance of the funds he or she managed and that a portion of such bonus was required to be invested in a predesignated list of funds within such person’s fund management area so as to be aligned with the interests of shareholders. The Board also took into account the quality of transfer agent and shareholder services provided Fund shareholders by an affiliate of the Manager, and the continuous enhancements to the Franklin Templeton website. Particular attention was given to management’s conservative approach and diligent risk management procedures, including continuous monitoring of counterparty credit risk and attention given to derivatives and other complex instruments. The Board also took into account, among other things, management’s efforts in establishing a global credit facility for the benefit of the Funds and other accounts managed by Franklin Templeton Investments to provide a source of cash for temporary and emergency purposes or to meet unusual redemption requests as well as the strong financial position of the Manager’s parent company and its commitment to the mutual fund business as evidenced by its subsidization of money market funds.
INVESTMENT PERFORMANCE. The Board placed significant emphasis on the investment performance of the Funds in view of its importance to shareholders. While consideration was given to performance reports and discussions with portfolio managers at Board meetings throughout the year, particular attention in assessing performance was given to the Lipper reports furnished for the agreement renewals. The Lipper reports prepared for each individual Fund showed the investment performance of its Class A shares in comparison to a performance universe selected by Lipper. Comparative performance for each Fund was shown for the one-year period ended January 31, 2011, and previous periods ended that date of up to 10 years depending on when a particular Fund commenced operations. The following summarizes the performance results for each of these Funds and the Board’s view of such performance.
130 | Annual Report
Franklin Strategic Series
Shareholder Information (continued)
Board Review of Investment Management Agreement (continued)
Franklin Flex Cap Growth Fund – The performance universe for this Fund consisted of the Fund and all retail and institutional multi-cap growth funds as selected by Lipper. The Lipper report showed the Fund’s total return to be in the second-lowest quintile of such performance universe for the one-year period, but on an annualized basis to be in the second-highest quintile of the performance universe during the previous three-year period and in the upper half of such universe during each of the previous five- and 10-year periods. The Board discussed with management the reasons for the one-year performance, which was primarily attributable to sector positioning and certain stock selections, but believed the Fund’s overall performance was satisfactory, noting that the Fund’s total return for the one-year period as set forth in the Lipper report exceeded 23%.
Franklin Focused Core Equity Fund – The performance universe for this Fund consisted of all retail and institutional multi-cap core funds as selected by Lipper. The Fund has been in operation for only three full years and the Lipper report showed its total return for the one-year period to be in the second-lowest quintile of such performance universe, but on an annualized basis to be in the highest quintile of such performance universe for the three-year period of operation. The Board did not believe such performance to be particularly meaningful in view of the Fund’s brief period of operation.
Franklin Growth Opportunities Fund – The performance universe for this Fund consisted of the Fund and all retail and institutional multi-cap growth funds as selected by Lipper. The Lipper report showed the Fund’s total return for the one-year period to be in the second-highest quintile of its performance universe, and on an annualized basis to be in the highest quintile of such universe during each of the previous three- and five-year periods, and in the middle quintile of such universe for the previous 10-year period. The Board was satisfied with the Fund’s comparative investment performance as set forth in the Lipper report.
Franklin Small Cap Growth Fund – The performance universe for this Fund consisted of the Fund and all retail and institutional small cap growth funds as selected by Lipper. The Lipper report showed the Fund’s total return to be in the highest quintile of such performance universe during the one-year period, and on an annualized basis to also be in the highest quintile of such universe for the previous three-year period, the second-highest quintile of such universe for the previous five-year period, and the upper half of such universe for the previous 10-year period. The Board was satisfied with the Fund’s comparative investment performance as set forth in the Lipper report.
Franklin Small-Mid Cap Growth Fund – The performance universe for this Fund consisted of all retail and institutional mid-cap growth funds as selected by Lipper. The Lipper report comparison for the Fund showed its total return during the one-year period to be in the second-highest quintile of such performance universe, and on an annualized basis to also be in the second-highest quintile of such universe during the previous three-year period, the upper half of such universe for the previous five-year period, and the second-lowest quintile of such universe during the previous 10-year
Annual Report | 131
Franklin Strategic Series
Shareholder Information (continued)
Board Review of Investment Management Agreement (continued)
period. The Board was satisfied with the Fund’s overall comparative investment performance as set forth in the Lipper report.
COMPARATIVE EXPENSES. Consideration was given to a comparative analysis of the management fees and total expense ratios of each Fund compared with those of a group of other funds selected by Lipper as its appropriate Lipper expense group. Lipper expense data is based upon information taken from each fund’s most recent annual report, which reflects historical asset levels that may be quite different from those currently existing, particularly in a period of market volatility. While recognizing such inherent limitation and the fact that expense ratios generally increase as assets decline and decrease as assets grow, the Board believed the independent analysis conducted by Lipper to be an appropriate measure of comparative expenses. In reviewing comparative costs, Lipper provides information on each Fund’s contractual investment management fee in comparison with the investment management fee that would have been charged by other funds within its Lipper expense group assuming they were similar in size to the Fund, as well as the actual total expense ratio of the Fund in comparison with those of its Lipper expense group. The Lipper contractual investment management fee analysis includes administrative charges as being part of the investment management fee, and actual total expenses, for comparative consistency, are shown by Lipper for Fund Class A shares. The results of such expense comparisons showed the contractual investment management fee rates and actual total expense ratios for each of Franklin Flex Cap Growth Fund and Franklin Small-Mid Cap Growth Fund to be in the least expensive quintile of their respective Lipper expense groups. The contractual investment management fee rate for Franklin Small Cap Growth Fund was in the least expensive quintile of its Lipper expense group and its actual total expense ratio was below the median of such expense group. The contractual investment management fee rate for Franklin Growth Opportunities Fund was in the least expensive quintile of its Lipper expense group and its actual total expense ratio was in the second least expensive quintile of such group. The Board was satisfied with the contractual management fees and total expense ratios of this Fund in comparison to its expense group as shown in the Lipper reports. The contractual investment management fee rate for Franklin Focused Core Equity Fund was in the second most expensive quintile of its Lipper expense group, but its actual total expense ratio was in the least expensive quintile of such expense group. The Board was satisfied with the expenses of this Fund as shown in its Lipper report, noting they were subsidized by management.
MANAGEMENT PROFITABILITY. The Board also considered the level of profits realized by the Manager and its affiliates in connection with the operation of each Fund. In this respect, the Board reviewed the Fund profitability analysis that addresses the overall profitability of Franklin Templeton’s U.S. fund business, as well as its profits in providing management and other services to each of the individual funds during the 12-month period ended September 30, 2010, being the most recent fiscal year-end for Franklin Resources, Inc., the Manager’s parent. In reviewing the analysis, attention was given to the methodology followed in allocating costs to each Fund, it being
132 | Annual Report
Franklin Strategic Series
Shareholder Information (continued)
Board Review of Investment Management Agreement (continued)
recognized that allocation methodologies are inherently subjective and various allocation methodologies may each be reasonable while producing different results. In this respect, the Board noted that, while being continuously refined and reflecting changes in the Manager’s own cost accounting, the allocation methodology was consistent with that followed in profitability report presentations for the Funds made in prior years and that the Funds’ independent registered public accounting firm had been engaged by the Manager to review the reasonableness of the allocation methodologies solely for use by the Funds’ Board in reference to the profitability analysis. In reviewing and discussing such analysis, management discussed with the Board its belief that costs incurred in establishing the infrastructure necessary for the type of mutual fund operations conducted by the Manager and its affiliates may not be fully reflected in the expenses allocated to each Fund in determining its profitability, as well as the fact that the level of profits, to a certain extent, reflected operational cost savings and efficiencies initiated by management. The Board also took into account management’s expenditures in improving shareholder services provided the Funds, as well as the need to meet additional regulatory and compliance requirements resulting from the Sarbanes-Oxley Act and recent SEC and other regulatory requirements. In addition, the Board considered a third-party study comparing the profitability of the Manager’s parent on an overall basis to other publicly held managers broken down to show profitability from management operations exclusive of distribution expenses, as well as profitability including distribution expenses. The Board also considered the extent to which the Manager and its affiliates might derive ancillary benefits from fund operations, including revenues generated from transfer agent services and potential benefits resulting from allocation of fund brokerage and the use of commission dollars to pay for research. Based upon its consideration of all these factors, the Board determined that the level of profits realized by the Manager and its affiliates from providing services to each Fund was not excessive in view of the nature, quality and extent of services provided.
ECONOMIES OF SCALE. The Board also considered whether economies of scale are realized by the Manager as the Funds grow larger and the extent to which this is reflected in the level of management fees charged. While recognizing that any precise determination is inherently subjective, the Board noted that based upon the Fund profitability analysis, it appears that as some funds get larger, at some point economies of scale do result in the Manager realizing a larger profit margin on management services provided such a fund. The Board noted that economies of scale were shared with each Fund and its shareholders through management fee breakpoints so that as a Fund grows in size, its effective management fee rate declines. The fee structures under the investment management agreements for all of the Funds contain breakpoints that continued to asset levels that exceeded their asset sizes at December 31, 2010. The assets of Franklin Focused Core Equity Fund amounted to approximately $15 million at December 31, 2010, and the Board did not believe such size afforded any economies of scale, noting expenses were subsidized by management. In view of such fee structure and the favorable expense comparisons of each of the Funds within their respective expense groups, the Board believed that to the extent economies of scale may be realized by the manager of these Funds and its affiliates, that there was a sharing of benefits with each Fund and its shareholders.
Annual Report | 133
Franklin Strategic Series
Shareholder Information (continued)
Proxy Voting Policies and Procedures
The Trust’s investment manager has established Proxy Voting Policies and Procedures (Policies) that the Trust uses to determine how to vote proxies relating to portfolio securities. Shareholders may view the Trust’s complete Policies online at franklintempleton.com. Alternatively, shareholders may request copies of the Policies free of charge by calling the Proxy Group collect at (954) 527-7678 or by sending a written request to: Franklin Templeton Companies, LLC, 300 S.E. 2nd Street, Fort Lauderdale, FL 33301, Attention: Proxy Group. Copies of the Trust’s proxy voting records are also made available online at franklintempleton.com and posted on the U.S. Securities and Exchange Commission’s website at sec.gov and reflect the most recent 12-month period ended June 30.
Quarterly Statement of Investments
The Trust files a complete statement of investments with the U.S. Securities and Exchange Commission for the first and third quarters for each fiscal year on Form N-Q. Shareholders may view the filed Form N-Q by visiting the Commission’s website at sec.gov. The filed form may also be viewed and copied at the Commission’s Public Reference Room in Washington, DC. Information regarding the operations of the Public Reference Room may be obtained by calling (800) SEC-0330.
Householding of Reports and Prospectuses
You will receive each of the Fund’s financial reports every six months as well as an annual updated summary prospectus (prospectus available upon request). To reduce Fund expenses, we try to identify related shareholders in a household and send only one copy of the financial reports and summary prospectus. This process, called “householding,” will continue indefinitely unless you instruct us otherwise. If you prefer not to have these documents householded, please call us at (800) 632-2301. At any time you may view current prospectuses/summary prospectuses and financial reports on our website. If you choose, you may receive these documents through electronic delivery.
134 | Annual Report
This page intentionally left blank.
This page intentionally left blank.

FRANKLIN STRATEGIC SERIES


| 1
Annual Report
Economic and Market Overview
The U.S. economy expanded despite geopolitical and inflationary pressures from around the globe during the 12-month period ended April 30, 2011. Business activity increased and consumer spending recovered to pre-recession levels. The U.S. has been a key engine in an ongoing global manufacturing rebound, which accelerated in the first quarter of 2011 and helped spur U.S. economic output. Worldwide demand for capital goods aided U.S. manufacturing profits and increased employment in the industry.
Unemployment and underemployment eased as job creation began to gain some traction and the U.S. jobless rate declined from 9.7% to 9.0% during the year.1 Consumer spending rose for the tenth consecutive month in April, but rising gasoline and food prices eventually led to a sharp drop in consumer confidence. The banking sector appeared closer to a full recovery, although the U.S. still faced challenges dealing with massive debt at period-end.
Inflation at the consumer, producer and trade levels rose across much of the world, but in the U.S. it remained relatively contained. The Federal Open Market Committee kept monetary policy unchanged while continuing its second round of quantitative easing, scheduled to terminate in June.
Investor confidence shifted with each release of encouraging or discouraging economic, regulatory and geopolitical news, causing equity market volatility to increase globally. U.S. investors weathered international events that included a massive oil spill in the Gulf of Mexico, revolutions and ongoing civil unrest across the Middle East and North Africa, sovereign debt worries and credit downgrades in Europe, and the multiple crises triggered by Japan’s earthquake and tsunami. Ultimately, U.S. and global stock indexes delivered strong gains during the year under review as equity markets rose amid generally improving economic signs and rising consumer spending.
The foregoing information reflects our analysis and opinions as of April 30, 2011. The information is not a complete analysis of every aspect of any market, country, industry, security or fund. Statements of fact are from sources considered reliable.
1. Source: Bureau of Labor Statistics.
Annual Report | 3
Franklin Biotechnology Discovery Fund
Your Fund’s Goal and Main Investments: Franklin Biotechnology Discovery Fund seeks capital appreciation by investing at least 80% of its net assets in securities of biotechnology companies and discovery research firms located in the U.S. and other countries.
Performance data represent past performance, which does not guarantee future results. Investment return and principal value will fluctuate, and you may have a gain or loss when you sell your shares. Current performance may differ from figures shown. Please visit franklintempleton.com or call (800) 342-5236 for most recent month-end performance.
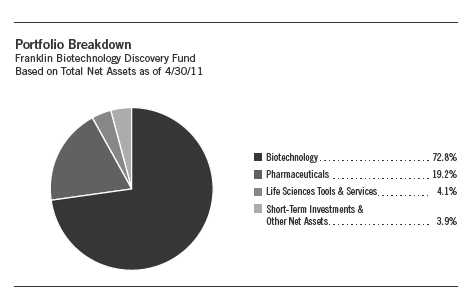
We are pleased to bring you Franklin Biotechnology Discovery Fund’s annual report for the fiscal year ended April 30, 2011.
Performance Overview
Franklin Biotechnology Discovery Fund – Class A delivered a +19.51% cumulative total return for the 12 months under review. The Fund outperformed U.S. and international-based biotechnology stocks as measured by its narrow benchmark, the NASDAQ Biotechnology Index, which produced a total return +18.75%, and the U.S. stock market tracked by its broad benchmark, the Standard & Poor’s 500 Index (S&P 500), which delivered a +17.22% total return for the same period.1 For comparison, domestic and international-based
1. Source: © 2011 Morningstar. All Rights Reserved. The information contained herein: (1) is proprietary to Morningstar and/or its content providers; (2) may not be copied or distributed; and (3) is not warranted to be accurate, complete or timely. Neither Morningstar nor its content providers are responsible for any damages or losses arising from any use of this information. STANDARD & POOR’S®, S&P® and S&P 500® are registered trademarks of Standard & Poor’s Financial Services LLC. Standard & Poor’s does not sponsor, endorse, sell or promote any S&P index-based product. The indexes are unmanaged and include reinvested dividends. One cannot invest directly in an index, and an index is not representative of the Fund’s portfolio.
The dollar value, number of shares or principal amount, and names of all portfolio holdings are listed in the Fund’s Statement of Investments (SOI). The SOI begins on page 27.
4 | Annual Report
stocks as measured by the NASDAQ Composite Index generated a +17.84% total return.1 You can find the Fund’s long-term performance data in the Performance Summary beginning on page 8.
Investment Strategy
The Fund is managed using a bottom-up approach to individual stock selection, with a focus on fundamental analysis and primary research. We look for biotechnology, biopharmaceutical, pharmaceutical and platform technology companies that possess products with favorable competitive profiles, large market opportunities and strong intellectual property, supported by thoughtful clinical and market development strategies. Our assessment of these products is based on extensive primary research and due diligence and includes, but is not limited to, a thorough review of medical literature, consultation of community and academic physicians, and attendance at scientific meetings and symposia. Additionally, we seek companies that have identifiable drivers of future earnings growth and that present, in our opinion, the best trade-off between that potential earnings growth, business and financial risk, and valuation.
Manager’s Discussion
During the fiscal year ended April 30, 2011, the majority of the Fund’s holdings appreciated in value. Biotechnology stocks were particularly strong, led by Genzyme (sold by period-end), which develops treatments for rare genetic disorders, kidney disease and cancer; and Alexion Pharmaceuticals, which produces drugs that inhibit immune system dysfunctions that cause autoimmune and neurological disorders. Two other standout performers were Pharmasset, a clinical-stage pharmaceutical company currently developing a class of oral drug candidates to treat viral infections; and Biogen Idec, a company focused on developing treatments in the areas of oncology, immunology and neurology. Additional key contributors from the biotechnology industry included drug discovery and development firm Vertex Pharmaceuticals and Italy-based Gentium, which manufactures and sells anticoagulants and other products geared toward blood vessel disorders, in particular those caused by harsh cancer treatments such as chemotherapy and radiation therapy.
A number of pharmaceuticals industry holdings also contributed to the Fund’s advance, notably Amarin, an Ireland-based drug developer focused on cardiovascular disease treatments. Its lead (and only) candidate, AMR101, is in late-stage clinical trials for the treatment of high triglycerides, which are a common risk factor for coronary artery disease. Amarin intends to partner with a larger pharmaceutical firm to commercialize AMR101 in the U.S. and
Top 10 Holdings
Franklin Biotechnology Discovery Fund 4/30/11

Annual Report | 5
other territories if and when it receives Federal Drug Administration (FDA) approval. Two other pharmaceutical holdings that posted triple-digit returns and boosted the Fund’s performance were Jazz Pharmaceuticals and Questcor Pharmaceuticals. Jazz develops drugs to treat psychiatric and neurological conditions, while Questcor makes and develops drugs for neurological conditions, multiple sclerosis in particular, and kidney treatments.
Despite the Fund’s strong overall performance this year, there were some detractors from its overall results. These included biotechnology companies Acorda Therapeutics and Celgene, as well as pharmaceuticals companies Teva Pharmaceutical Industries and Nuvo Research. Acorda is a drug developer that aims to restore neurological function for patients with central nervous system disorders, such as spinal cord injuries. Acorda’s stock price declined after the launch of its drug used to improve walking for multiple sclerosis patients, Ampyra, did not meet expectations. Celgene is a drug development company focused primarily on cancer treatments and whose lead product is Revlimid, approved in the U.S. and Europe as a treatment for multiple myeloma (bone marrow cancer). Celgene shares lost value amid concerns about the incidence of secondary cancer in some of the Revlimid trials for myeloma. Despite its recent setbacks, we still believed in Celgene’s growth potential, and it was the Fund’s largest holding at period-end. Israel-based Teva makes generic versions of hundreds of brand-name antibiotics, heart drugs, heartburn medications, and more. Teva’s stock price fell after the announcement of positive data for experimental drugs that would compete with its major product, Copaxone, for multiple sclerosis. Investor concerns about increased competition for Copaxone when its patents expire in 2014 also hurt Teva’s stock. Finally, shares of Nuvo Research, a small, Canadian company that makes site-specific delivery systems to administer therapeutic drugs through the skin, came under pressure during the year after a disappointing launch of Pennsaid, a topical nonsteroidal anti-inflammatory drug for osteoarthritis.
6 | Annual Report
Thank you for your continued participation in Franklin Biotechnology Discovery Fund. We look forward to serving your future investment needs.


Evan McCulloch, CFA Portfolio Manager
Franklin Biotechnology Discovery Fund
CFA® is a trademark owned by CFA Institute.
The foregoing information reflects our analysis, opinions and portfolio holdings as of April 30, 2011, the end of the reporting period. The way we implement our main investment strategies and the resulting portfolio holdings may change depending on factors such as market and economic conditions. These opinions may not be relied upon as investment advice or an offer for a particular security. The information is not a complete analysis of every aspect of any market, country, industry, security or the Fund. Statements of fact are from sources considered reliable, but the investment manager makes no representation or warranty as to their completeness or accuracy. Although historical performance is no guarantee of future results, these insights may help you understand our investment management philosophy.
Annual Report | 7
Performance Summary as of 4/30/11
Franklin Biotechnology Discovery Fund
Your dividend income will vary depending on dividends or interest paid by securities in the Fund’s portfolio, adjusted for operating expenses of each class. Capital gain distributions are net profits realized from the sale of portfolio securities. The performance table and graphs do not reflect any taxes that a shareholder would pay on Fund dividends, capital gain distributions, if any, or any realized gains on the sale of Fund shares. Total return reflects reinvestment of the Fund’s dividends and capital gain distributions, if any, and any unrealized gains or losses.

Performance
Cumulative total return excludes sales charges. Average annual total returns and value of $10,000 investment include maximum sales charges. Class A: 5.75% maximum initial sales charge; Advisor Class: no sales charges.
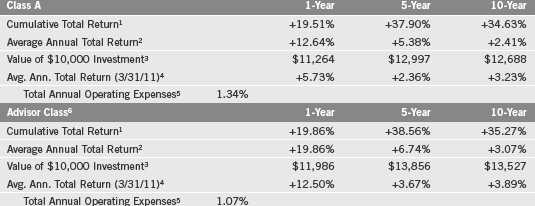
Performance data represent past performance, which does not guarantee future results. Investment return and principal value will fluctuate, and you may have a gain or loss when you sell your shares. Current performance may differ from figures shown. For most recent month-end performance, go to franklintempleton.com or call (800) 342-5236.
8 | Annual Report
Performance Summary (continued)
Total Return Index Comparison for a Hypothetical $10,000 Investment
Total return represents the change in value of an investment over the periods shown. It includes any applicable maximum sales charge, Fund expenses, account fees and reinvested distributions. The unmanaged indexes include reinvestment of any income or distributions. They differ from the Fund in composition and do not pay management fees or expenses. One cannot invest directly in an index.

Performance Summary (continued)
Endnotes
The Fund is a nondiversified fund that concentrates in the biotechnology sector, which involves risks such as patent considerations, product liability, government regulatory requirements, and regulatory approval for new drugs and medical products. Biotechnology companies often are small and/or relatively new. Smaller companies can be particularly sensitive to changes in economic conditions and have less certain growth prospects than larger, more established companies and can be volatile, especially over the short term. The Fund may also invest in foreign companies, which involve special risks, including currency fluctuations and political uncertainty. The manager applies various techniques and analyses in making investment decisions for the Fund, but there can be no guarantee that these decisions will produce the desired results. The Fund’s prospectus also includes a description of the main investment risks.
Advisor Class: Shares are available to certain eligible investors as described in the prospectus.
1. Cumulative total return represents the change in value of an investment over the periods indicated.
2. Average annual total return represents the average annual change in value of an investment over the periods indicated. 3. These figures represent the value of a hypothetical $10,000 investment in the Fund over the periods indicated.
4. In accordance with SEC rules, we provide standardized average annual total return information through the latest calendar quarter.
5. Figures are as stated in the Fund’s prospectus current as of the date of this report. In periods of market volatility, assets may decline significantly, causing total annual Fund operating expenses to become higher than the figures shown.
6. Effective 9/1/09, the Fund began offering Advisor Class shares, which do not have sales charges or a Rule 12b-1 plan. Performance quotations for this class reflect the following methods of calculation: (a) For periods prior to 9/1/09, a restated figure is used based upon the Fund’s Class A performance, excluding the effect of Class A’s maximum initial sales charge, but reflecting the effect of the Class A Rule 12b-1 fees; and (b) for periods after 8/31/09, actual Advisor Class performance is used reflecting all charges and fees applicable to that class. Since 9/1/09 (commencement of sales), the cumulative and average annual total returns of Advisor Class shares were +37.10% and +20.93%.
7. Source: © 2011 Morningstar. The S&P 500 is a market capitalization-weighted index of 500 stocks designed to measure total U.S. equity market performance. The NASDAQ Biotechnology Index is a capitalization-weighted index designed to measure the performance of all NASDAQ stocks in the biotechnology sector.
10 | Annual Report
Your Fund’s Expenses
Franklin Biotechnology Discovery Fund
As a Fund shareholder, you can incur two types of costs:
- Transaction costs, including sales charges (loads) on Fund purchases; and
- Ongoing Fund costs, including management fees, distribution and service (12b-1) fees, and other Fund expenses. All mutual funds have ongoing costs, sometimes referred to as operating expenses.
The following table shows ongoing costs of investing in the Fund and can help you understand these costs and compare them with those of other mutual funds. The table assumes a $1,000 investment held for the six months indicated.
Actual Fund Expenses
The first line (Actual) for each share class listed in the table provides actual account values and expenses. The “Ending Account Value” is derived from the Fund’s actual return, which includes the effect of Fund expenses.
You can estimate the expenses you paid during the period by following these steps. Of course, your account value and expenses will differ from those in this illustration:
| 1. | Divide your account value by $1,000. |
| If an account had an $8,600 value, then $8,600 ÷ $1,000 = 8.6. | |
| 2. | Multiply the result by the number under the heading “Expenses Paid During Period.” |
| If Expenses Paid During Period were $7.50, then 8.6 x $7.50 = $64.50. |
In this illustration, the estimated expenses paid this period are $64.50.
Hypothetical Example for Comparison with Other Funds
Information in the second line (Hypothetical) for each class in the table can help you compare ongoing costs of investing in the Fund with those of other mutual funds. This information may not be used to estimate the actual ending account balance or expenses you paid during the period. The hypothetical “Ending Account Value” is based on the actual expense ratio for each class and an assumed 5% annual rate of return before expenses, which does not represent the Fund’s actual return. The figure under the heading “Expenses Paid During Period” shows the hypothetical expenses your account would have incurred under this scenario. You can compare this figure with the 5% hypothetical examples that appear in shareholder reports of other funds.
Annual Report | 11
Your Fund’s Expenses (continued)
Please note that expenses shown in the table are meant to highlight ongoing costs and do not reflect any transaction costs, such as sales charges. Therefore, the second line for each class is useful in comparing ongoing costs only, and will not help you compare total costs of owning different funds. In addition, if transaction costs were included, your total costs would have been higher. Please refer to the Fund prospectus for additional information on operating expenses.

*Expenses are calculated using the most recent six-month expense ratio, annualized for each class (A: 1.25% and Advisor: 0.97%), multiplied by the average account value over the period, multiplied by 181/365 to reflect the one-half year period.
12 | Annual Report
Franklin Natural Resources Fund
Your Fund’s Goal and Main Investments: Franklin Natural Resources Fund seeks high total return (total return consists of both capital appreciation and current dividend and interest income) by investing at least 80% of its net assets in equity and debt securities of companies that own, produce, refine, process, transport or market natural resources, as well as those that provide related services for natural resources companies.
Performance data represent past performance, which does not guarantee future results. Investment return and principal value will fluctuate, and you may have a gain or loss when you sell your shares. Current performance may differ from figures shown. Please visit franklintempleton.com or call (800) 342-5236 for most recent month-end performance.
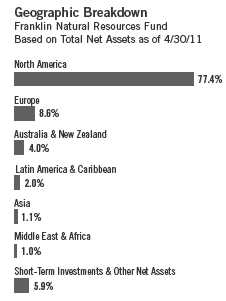
We are pleased to bring you Franklin Natural Resources Fund’s annual report for the fiscal year ended April 30, 2011.
Performance Overview
Franklin Natural Resources Fund – Class A delivered a +37.31% cumulative total return for the 12 months under review. The Fund outperformed the +32.72% total return of its narrow benchmark, the Standard & Poor’s (S&P) North American Natural Resources Index, which tracks companies involved in extractive industries (mining), energy, timber and forestry services, and the production of pulp and paper.1 It also outperformed the U.S. stock market as measured by its broad benchmark, the S&P 500 Index (S&P 500), which generated a +17.22% total return for the same period.1 You can find the Fund’s long-term performance data in the Performance Summary beginning on page 19.
Investment Strategy
We use a fundamental, research-driven approach to identify industries in the natural resources sector that we believe offer the strongest underlying attributes including, but not limited to, favorable supply and demand characteristics, barriers to entry, and pricing power. Within those industries, we seek companies that have identifiable growth drivers and that present, in our opinion, the best trade-off between growth, business and financial risk, and valuation. The Fund’s holdings are typically concentrated in the energy sector but also can include investments in the metals and mining, chemicals, paper and forest products, and other related sectors.
1. Source: © 2011 Morningstar. All Rights Reserved. The information contained herein: (1) is proprietary to Morningstar and/or its content providers; (2) may not be copied or distributed; and (3) is not warranted to be accurate, complete or timely. Neither Morningstar nor its content providers are responsible for any damages or losses arising from any use of this information. The indexes are unmanaged and include reinvested dividends. One cannot invest directly in an index, and an index is not representative of the Fund’s portfolio.
The dollar value, number of shares or principal amount, and names of all portfolio holdings are listed in the Fund’s Statement of Investments (SOI). The SOI begins on page 33.
Annual Report | 13

Sector Overview
During the 12-month reporting period, prices for commodities and commodity-related stocks rose significantly, but often followed the volatile movements of global equities. Overall, global economic growth advanced and favored increased consumption and improving industrial demand for raw materials, creating market conditions suited for generally rising commodity prices. The influence of these fundamental factors were accompanied and aided in part by depreciation of the U.S. dollar to a three-year low against other major currencies, the reinforcement of longer term inflation concerns tied to loose monetary policies and high fiscal deficits in the West. The Reuters/Jefferies CRB Index (CRB), which tracks prices for 19 key global commodities, produced relatively subdued results until early September 2010, before gathering momentum through April 2011, and appreciating 33.43% in price during the Fund’s fiscal year.2 Several metals and agricultural products reached all-time high prices during the year, most notably copper and gold. Of the CRB’s 19 components, silver, coffee, cotton and corn were especially strong, while only natural gas fell in value as robust supply growth outweighed demand for the fuel.
After nearly three years of recessionary demand destruction and pricing pressure, the return of rapidly rising oil prices commanded worldwide attention during the latter half of the Fund’s fiscal year. Prices for crude oil and petroleum products had fallen in value during the first six months of the reporting period, influenced by signs of slowing economic growth, but then surged through period-end with spot oil prices rising from $81 to $114 per barrel between October 31, 2010, and April 30, 2011. Much of this rise reflected robust global demand forecasts and mounting fears of supply disruptions among several politically unstable Middle East and North African oil-producing nations. As one would expect, this environment was beneficial for the equity values of many energy sector companies. This was a big reversal from the first six months of the Fund’s fiscal year, when commodity and equity markets heeded signs that energy demand had not yet returned to prerecession levels while contending with fallout from the Macondo well oil spill in the Gulf of Mexico, which dominated the news media throughout the spring and summer of 2010.
Another positive trend for the Fund’s performance was investors’ distinct preference for energy and materials sector stocks. Business activity in both sectors, considered crucial for ongoing global industrial and economic expansions,
2. Sources: Thomson Reuters; Jefferies Financial Products, LLC.
14 | Annual Report
enjoyed a rebound influenced primarily by pent-up demand for power and raw materials. Returns for these two sectors outpaced those of most of others, as evidenced by the S&P 500 Energy Index’s 12-month return of nearly 36% and the S&P 500 Materials Index’s advance of more than 26%.1 Within these sectors, shares of diversified metals and mining companies, oil refiners, and providers of drilling and other equipment to the oil and gas industries each produced returns in excess of 40%.2 By comparison, the broad S&P 500 rose just 17.22% during the same time.1 Although resilient Asian economies continued to drive demand for natural resources of all kinds, energy and some industrial metals futures were occasionally weighed down by signs of debt problems and uneven recoveries in developed countries. In addition, periods of volatility resulted from renewed worries that China and other developing countries’ rapid rate of growth might decelerate as they took various steps to dampen inflation.
Manager’s Discussion
During the year under review, the Fund continued to benefit broadly from its investment positioning, and more specifically from selective investments made during the stock market’s recessionary lows of 2008-2009 and the summer of 2010. Our shift away from North American natural gas-focused companies toward those geared to oil and petroleum products also proved beneficial to Fund returns. Against the backdrop of a robust and broad-based commodities rally, the majority of the Fund’s holdings increased in value.
Much of the Fund’s positive absolute performance was driven by strong returns from our investments in the oil and gas equipment and services industry. Top contributors included oilfield services companies Halliburton, Schlumberger, National Oilwell Varco and Cameron International. Halliburton and Schlumberger benefited foremost from strong U.S. onshore production activity underpinned by a surge in spending on oil-focused exploration, development and production activity. This marked a significant shift for the oilfield service companies, as most spending in the U.S. had been focused on the highly cyclical domestic natural gas market over the past 15 years. Our investments in oil-focused exploration and production (E&P) companies provided insights into this trend and the confidence to make additional investments in the oilfield services industry. National Oilwell Varco, a leading supplier of drilling rig equipment, benefited from a significant increase in orders for new drilling rigs, spurred in part by rising oil prices and an expected increase in demand for drilling services. Meanwhile, Cameron rebounded as demand for the company’s equipment accelerated. In addition, the company’s shares benefited
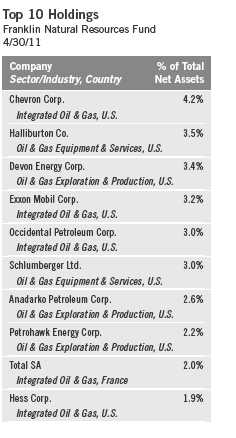
Annual Report | 15
from the lifting of the Gulf of Mexico subsea drilling moratorium and as investors became more comfortable that the company’s potential liability related to the Macondo accident was manageable.
In several cases, we made opportunistic purchases during the summer of 2010 when equity values were negatively impacted by concerns related to the Macondo accident and, more broadly, the potential for slowing growth in developing markets. The share prices of many companies with direct or indirect exposure to the accident rebounded sharply after the leaking well was fully contained in September and the Obama administration nominally reopened the Gulf for deepwater drilling in October.
Investments in the oil and gas E&P industry also drove Fund performance. Among E&P company holdings, key contributors included our positions in Devon Energy, Concho Resources, SM Energy and Brigham Exploration, all of which were boosted by the rise in commodity prices in addition to individual company catalysts. In addition to seeking to gain from company-specific growth opportunities, we made several of these investments in our efforts to focus on oil producers as opposed to natural gas, a shift we began in 2007 given our less sanguine view of the U.S. natural gas market.
Devon benefited from continued progress in its management’s efforts to refocus the company on the North American market, while Concho, SM and Brigham delivered improved well results from their respective resource development projects. Concho and Brigham Exploration are increasingly involved in the production of oil in North Dakota’s Bakken shale formation and the Permian oil basin of Texas and New Mexico, both of which have become more accessible through the development of horizontal drilling technologies and other newly deployed extraction methods. The deployment of new technology and drilling methods presents two potential opportunities for investors, in our opinion; namely, the ability to invest in rapidly growing E&P companies that are developing previously uneconomic resources and in oilfield service companies that provide the equipment and services utilized by producers.
Support for the Fund’s returns also came from solid gains among our gold mining stocks and those of diversified metals and mining companies, many of which rose with prices for most metals. We took some profits in the mining sectors during the latter half of 2010, particularly in strongly performing development-stage companies, leading to a reduction in the Fund’s weighting by period-end.
16 | Annual Report
Leading gold mining contributors included Newcrest Mining, Osisko Mining and Centerra Gold. Newcrest’s performance was tied to gold’s upward trajectory and the stock’s attractive valuation, in our view. In addition, Newcrest acquired Lihir Gold in September 2010, creating one of the world’s largest gold mining companies. Osisko benefited from continued progress on development of the company’s Malartic mine in Quebec, which poured its first gold in April, and the advancement of several other growth initiatives. Meanwhile, Centerra’s advance was partially attributable to local political events, as it gained favor among investors following peaceful elections in the Kyrgyz Republic and the end to a workers’ strike at the country’s Kumtor gold mine.
Among diversified mining companies, the Fund’s top contributors included Sandfire Resources, Ivanhoe Mines and BHP Billiton. Sandfire’s stock price responded to successful drilling results at its Degrussa Copper-Gold project in Western Australia and OZ Minerals’ garnering a 19% stake in the company. Canadian mineral exploration and development company Ivanhoe Mines benefited from progress at the company’s Oyu Tolgoi project in Mongolia. BHP shares appreciated as the company refocused its efforts on internal growth projects following the failed takeover attempt of Potash Corp. earlier in the year. This included the announcement of an $80 billion capital expenditure program over the next five years and a significant share buyback program.
The Fund had some disappointments during the fiscal year, including Aegean Marine Petroleum Network, a Greece-based supplier of refined marine fuels; offshore drilling contractor Transocean; and XTO Energy. Our small position in Aegean shares lost value after the company posted weak quarterly operating results that reflected increased competition in the fuel bunkering market. Transocean, owner of the Deepwater Horizon rig involved in the Macondo accident, detracted from performance following the disaster. We sold the position to buy shares in Pride International, which had also experienced a significant decline in value despite having no direct Macondo exposure. The position in Pride subsequently benefited Fund returns as the sector recovered and the company announced its acquisition by Ensco in early February. Although XTO Energy was acquired by Exxon in late June, we sold the position prior to that date, and used the proceeds to take advantage of what we considered more attractive investment opportunities.
Finally, at period-end the Fund’s cash position, at 5.9% of total net assets, was somewhat higher than usual as we took profits in strongly performing positions and sought opportunities to reinvest the proceeds. As always, we will seek to deploy the Fund’s cash on a selective and opportunistic basis.
Annual Report | 17
Thank you for your continued participation in Franklin Natural Resources Fund. We look forward to serving your future investment needs.


Frederick G. Fromm, CFA
Portfolio Manager
Franklin Natural Resources Fund
The foregoing information reflects our analysis, opinions and portfolio holdings as of April 30, 2011, the end of the reporting period. The way we implement our main investment strategies and the resulting portfolio holdings may change depending on factors such as market and economic conditions. These opinions may not be relied upon as investment advice or an offer for a particular security. The information is not a complete analysis of every aspect of any market, country, industry, security or the Fund. Statements of fact are from sources considered reliable, but the investment manager makes no representation or warranty as to their completeness or accuracy. Although historical performance is no guarantee of future results, these insights may help you understand our investment management philosophy.
18 | Annual Report
Performance Summary as of 4/30/11
Franklin Natural Resources Fund
Your dividend income will vary depending on dividends or interest paid by securities in the Fund’s portfolio, adjusted for operating expenses of each class. Capital gain distributions are net profits realized from the sale of portfolio securities. The performance table and graphs do not reflect any taxes that a shareholder would pay on Fund dividends, capital gain distributions, if any, or any realized gains on the sale of Fund shares. Total return reflects reinvestment of the Fund’s dividends and capital gain distributions, if any, and any unrealized gains or losses.

Annual Report | 19
Performance Summary (continued)
Performance
Cumulative total return excludes sales charges. Average annual total returns and value of $10,000 investment include maximum sales charges. Class A: 5.75% maximum initial sales charge; Class C: 1% contingent deferred sales charge in first year only; Advisor Class: no sales charges.
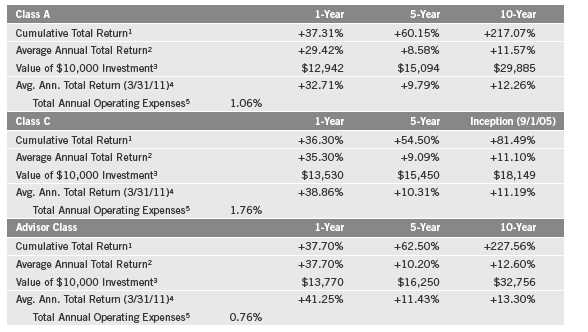
Performance data represent past performance, which does not guarantee future results. Investment return and principal value will fluctuate, and you may have a gain or loss when you sell your shares. Current performance may differ from figures shown. For most recent month-end performance, go to franklintempleton.com or call (800) 342-5236.
20 | Annual Report
Performance Summary (continued)
Total Return Index Comparison for a Hypothetical $10,000 Investment
Total return represents the change in value of an investment over the periods shown. It includes any current, applicable, maximum sales charge, Fund expenses, account fees and reinvested distributions. The unmanaged indexes include reinvestment of any income or distributions. They differ from the Fund in composition and do not pay management fees or expenses. One cannot invest directly in an index.
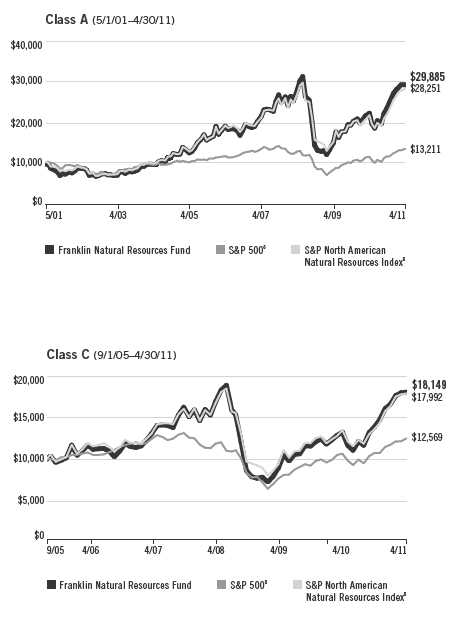
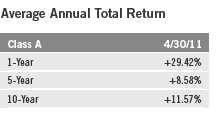
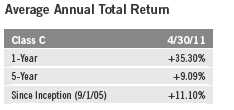
Annual Report | 21

Your Fund’s Expenses
Franklin Natural Resources Fund
As a Fund shareholder, you can incur two types of costs:
- Transaction costs, including sales charges (loads) on Fund purchases; and
- Ongoing Fund costs, including management fees, distribution and service (12b-1) fees, and other Fund expenses. All mutual funds have ongoing costs, sometimes referred to as operating expenses.
The following table shows ongoing costs of investing in the Fund and can help you understand these costs and compare them with those of other mutual funds. The table assumes a $1,000 investment held for the six months indicated.
Actual Fund Expenses
The first line (Actual) for each share class listed in the table provides actual account values and expenses. The “Ending Account Value” is derived from the Fund’s actual return, which includes the effect of Fund expenses.
You can estimate the expenses you paid during the period by following these steps. Of course, your account value and expenses will differ from those in this illustration:
| 1. | Divide your account value by $1,000. |
| If an account had an $8,600 value, then $8,600 ÷ $1,000 = 8.6. | |
| 2. | Multiply the result by the number under the heading “Expenses Paid During Period.” |
| If Expenses Paid During Period were $7.50, then 8.6 x $7.50 = $64.50. |
In this illustration, the estimated expenses paid this period are $64.50.
Hypothetical Example for Comparison with Other Funds
Information in the second line (Hypothetical) for each class in the table can help you compare ongoing costs of investing in the Fund with those of other mutual funds. This information may not be used to estimate the actual ending account balance or expenses you paid during the period. The hypothetical “Ending Account Value” is based on the actual expense ratio for each class and an assumed 5% annual rate of return before expenses, which does not represent the Fund’s actual return. The figure under the heading “Expenses Paid During Period” shows the hypothetical expenses your account would have incurred under this scenario. You can compare this figure with the 5% hypothetical examples that appear in shareholder reports of other funds.
Annual Report | 23
Your Fund’s Expenses (continued)
Please note that expenses shown in the table are meant to highlight ongoing costs and do not reflect any transaction costs, such as sales charges. Therefore, the second line for each class is useful in comparing ongoing costs only, and will not help you compare total costs of owning different funds. In addition, if transaction costs were included, your total costs would have been higher. Please refer to the Fund prospectus for additional information on operating expenses.

*Expenses are calculated using the most recent six-month expense ratio, annualized for each class (A: 0.96%; C: 1.66%; and Advisor: 0.66%), multiplied by the average account value over the period, multiplied by 181/365 to reflect the one-half year period.
24 | Annual Report

aThe amount shown for a share outstanding throughout the period may not correlate with the Statement of Operations for the period due to the timing of sales and repurchases of
the Fund shares in relation to income earned and/or fluctuating market value of the investments of the Fund.
bBased on average daily shares outstanding.
cEffective September 1, 2008, the redemption fee was eliminated.
dAmount rounds to less than $0.01 per share.
eTotal return does not reflect sales commissions or contingent deferred sales charges, if applicable.
fBenefit of expense reduction rounds to less than 0.01%.
Annual Report | The accompanying notes are an integral part of these financial statements. | 25
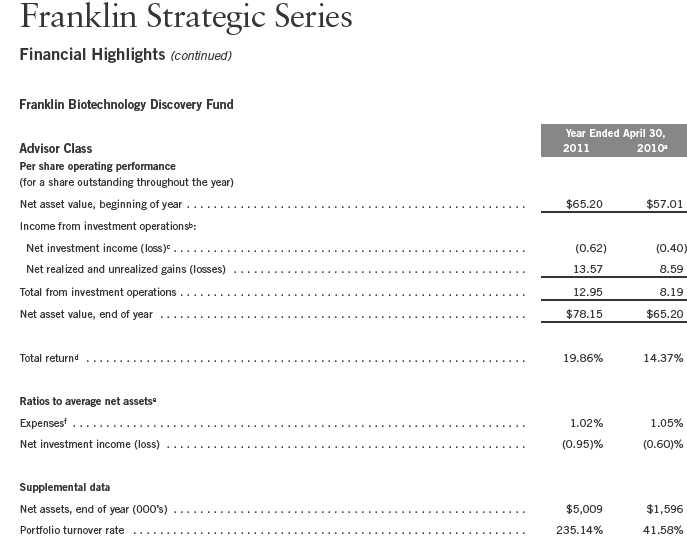
aFor the period September 1, 2009 (effective date) to April 30, 2010.
bThe amount shown for a share outstanding throughout the period may not correlate with the Statement of Operations for the period due to the timing of sales and repurchases of
the Fund shares in relation to income earned and/or fluctuating market value of the investments of the Fund.
cBased on average daily shares outstanding.
dTotal return is not annualized for periods less than one year.
eRatios are annualized for periods less than one year.
fBenefit of expense reduction rounds to less than 0.01%.
26 | The accompanying notes are an integral part of these financial statements. | Annual Report

Annual Report | 27
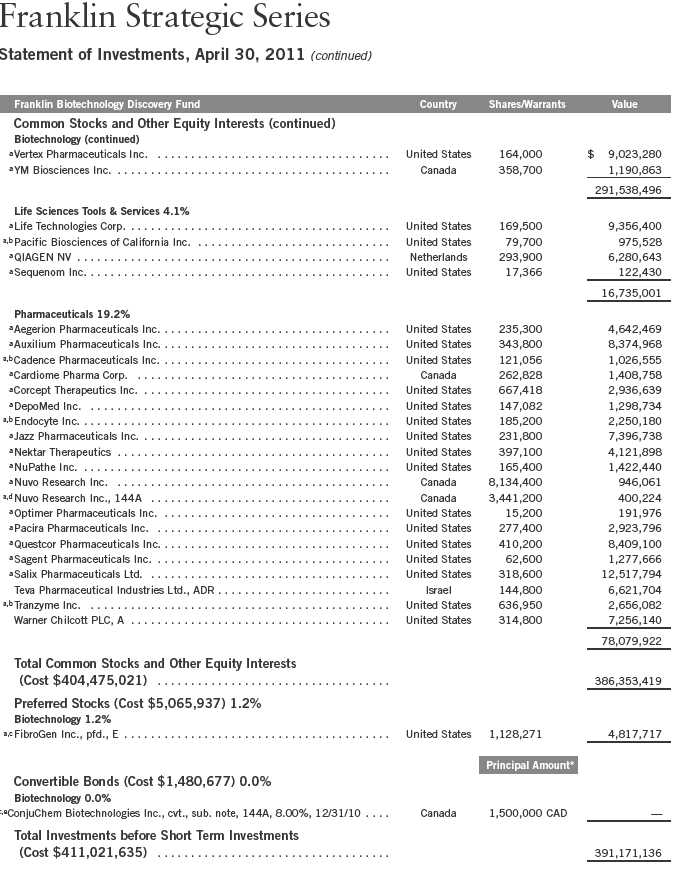
28 | Annual Report
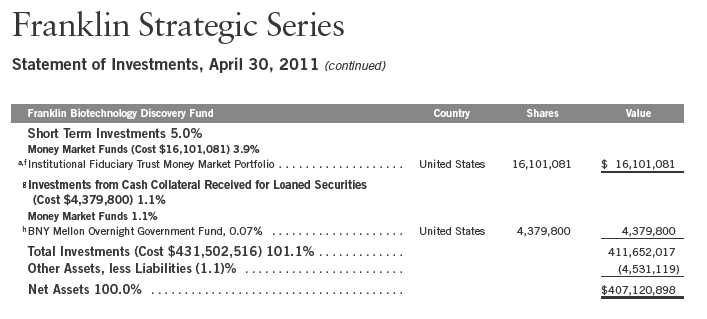
See Abbreviations on page 54.
*The principal amount is stated in U.S. dollars unless otherwise indicated.
aNon-income producing.
bA portion or all of the security is on loan at April 30, 2011. See Note 1(c).
cSee Note 8 regarding restricted securities.
dSecurity was purchased pursuant to Rule 144A under the Securities Act of 1933 and may be sold in transactions exempt from registration only to qualified institutional buyers or in
a public offering registered under the Securities Act of 1933. These securities have been deemed liquid under guidelines approved by the Trust’s Board of Trustees. At April 30, 2011,
the aggregate value of these securities was $1,753,962, representing 0.43% of net assets.
eDefaulted security.
fSee Note 7 regarding investments in the Institutional Fiduciary Trust Money Market Portfolio.
gSee Note 1(c) regarding securities on loan.
hThe rate shown is the annualized seven-day yield at period end.
Annual Report | The accompanying notes are an integral part of these financial statements. | 29

aThe amount shown for a share outstanding throughout the period may not correlate with the Statement of Operations for the period due to the timing of sales and repurchases of
the Fund shares in relation to income earned and/or fluctuating market value of the investments of the Fund.
bBased on average daily shares outstanding.
cEffective September 1, 2008, the redemption fee was eliminated.
dAmount rounds to less than $0.01 per share.
eTotal return does not reflect sales commissions or contingent deferred sales charges, if applicable.
fBenefit of expense reduction rounds to less than 0.01%.
30 | The accompanying notes are an integral part of these financial statements. | Annual Report
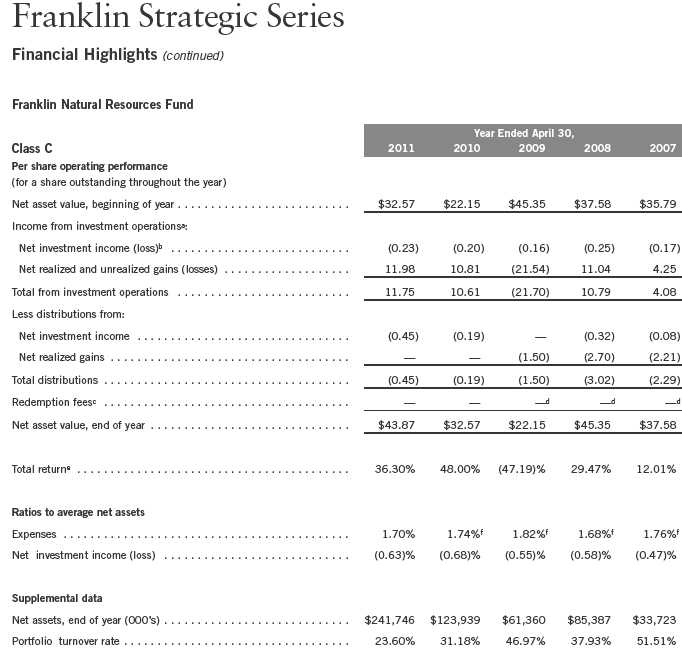
aThe amount shown for a share outstanding throughout the period may not correlate with the Statement of Operations for the period due to the timing of sales and repurchases of
the Fund shares in relation to income earned and/or fluctuating market value of the investments of the Fund.
bBased on average daily shares outstanding.
cEffective September 1, 2008, the redemption fee was eliminated.
dAmount rounds to less than $0.01 per share.
eTotal return does not reflect sales commissions or contingent deferred sales charges, if applicable.
fBenefit of expense reduction rounds to less than 0.01%.
Annual Report | The accompanying notes are an integral part of these financial statements. | 31

aThe amount shown for a share outstanding throughout the period may not correlate with the Statement of Operations for the period due to the timing of sales and repurchases of
the Fund shares in relation to income earned and/or fluctuating market value of the investments of the Fund.
bBased on average daily shares outstanding.
cEffective September 1, 2008, the redemption fee was eliminated.
dAmount rounds to less than $0.01 per share.
eBenefit of expense reduction rounds to less than 0.01%.
32 | The accompanying notes are an integral part of these financial statements. | Annual Report

Annual Report | 33
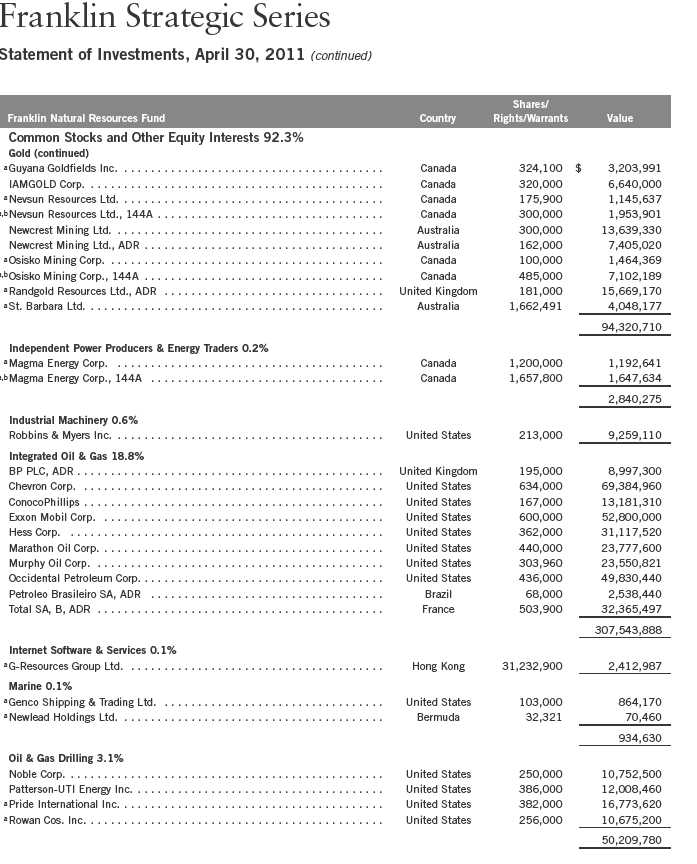
34 | Annual Report

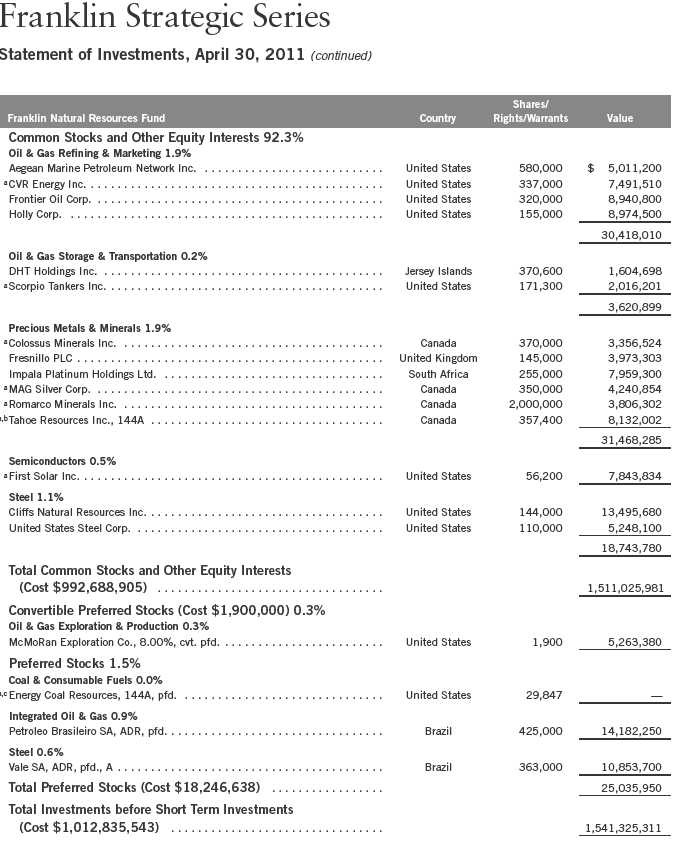
36 | Annual Report
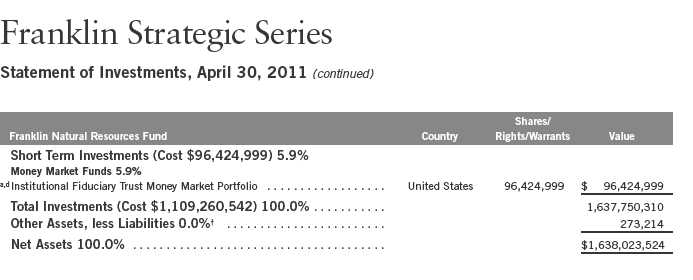
See Abbreviations on page 54.
†Rounds to less than 0.1% of net assets.
aNon-income producing.
bSecurity was purchased pursuant to Rule 144A under the Securities Act of 1933 and may be sold in transactions exempt from registration only to qualified institutional buyers or in
a public offering registered under the Securities Act of 1933. These securities have been deemed liquid under guidelines approved by the Trust’s Board of Trustees. At April 30, 2011,
the aggregate value of these securities was $33,685,829, representing 2.06% of net assets.
cSee Note 8 regarding restricted securities.
dSee Note 7 regarding investments in the Institutional Fiduciary Trust Money Market Portfolio.
Annual Report | The accompanying notes are an integral part of these financial statements. | 37
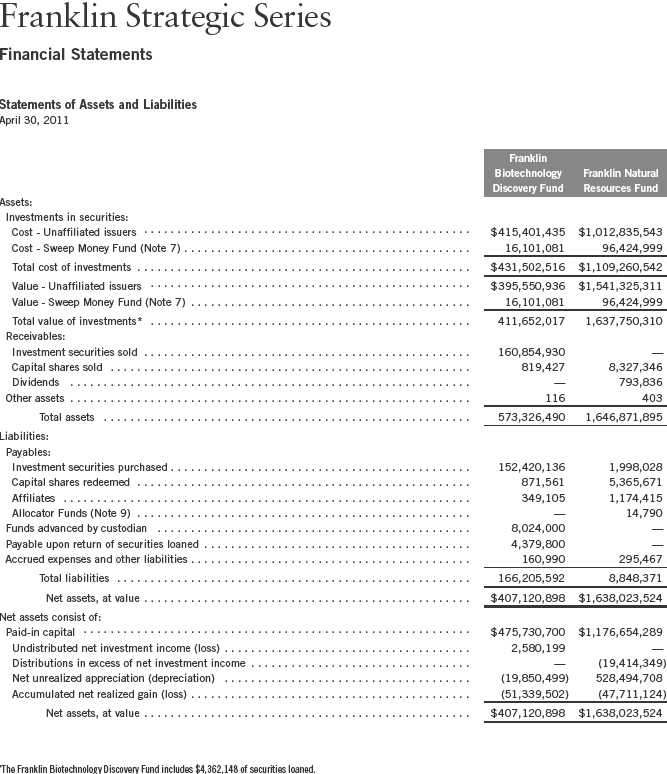
38 | The accompanying notes are an integral part of these financial statements. | Annual Report

Annual Report | The accompanying notes are an integral part of these financial statements. | 39
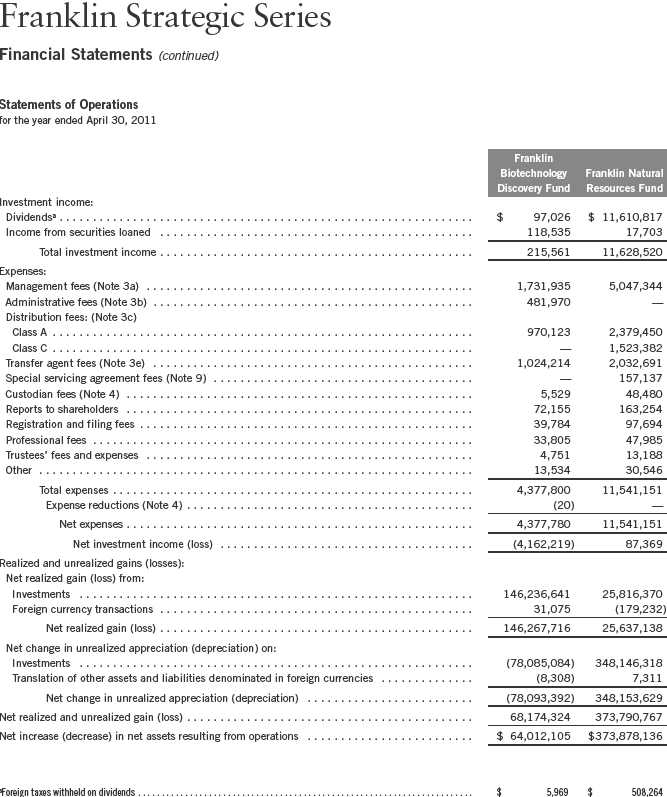
40 | The accompanying notes are an integral part of these financial statements. | Annual Report
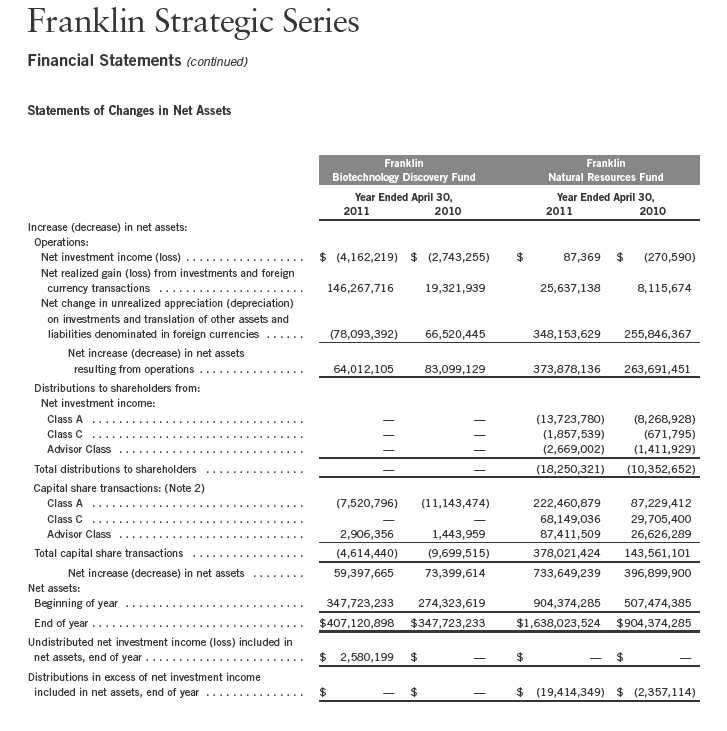
Annual Report | The accompanying notes are an integral part of these financial statements. | 41
Franklin Strategic Series
Notes to Financial Statements
1. ORGANIZATION AND SIGNIFICANT ACCOUNTING POLICIES
Franklin Strategic Series (Trust) is registered under the Investment Company Act of 1940, as amended, (1940 Act) as an open-end investment company, consisting of eight separate funds, two of which are included in this report (Funds). The financial statements of the remaining funds in the Trust are presented separately. The classes of shares offered within each of the Funds are indicated below. Each class of shares differs by its initial sales load, contingent deferred sales charges, distribution fees, voting rights on matters affecting a single class and its exchange privilege.
Class A & Advisor Class Class A, Class C & Advisor Class
Franklin Biotechnology Discovery Fund Franklin Natural Resources Fund
The following summarizes the Funds’ significant accounting policies.
a. Financial Instrument Valuation
The Funds’ investments in securities and other financial instruments are carried at fair value daily. Fair value is the price that would be received to sell an asset or paid to transfer a liability in an orderly transaction between market participants on the measurement date. Under procedures approved by the Trust’s Board of Trustees, the Funds may utilize independent pricing services, quotations from securities and financial instrument dealers, and other market sources to determine fair value.
Equity securities listed on an exchange or on the NASDAQ National Market System are valued at the last quoted sale price or the official closing price of the day, respectively. Foreign equity securities are valued as of the close of trading on the foreign stock exchange on which the security is primarily traded, or the NYSE, whichever is earlier. The value is then converted into its U.S. dollar equivalent at the foreign exchange rate in effect at the close of the NYSE on the day that the value of the security is determined. Over-the-counter securities are valued within the range of the most recent quoted bid and ask prices. Securities that trade in multiple markets or on multiple exchanges are valued according to the broadest and most representative market. Certain equity securities are valued based upon fundamental characteristics or relationships to similar securities. Investments in open-end mutual funds are valued at the closing net asset value.
Debt securities generally trade in the over-the-counter market rather than on a securities exchange. The Funds’ pricing services use multiple valuation techniques to determine fair value. In instances where sufficient market activity exists, the pricing services may utilize a market-based approach through which quotes from market makers are used to determine fair value. In instances where sufficient market activity may not exist or is limited, the pricing services also utilize proprietary valuation models which may consider market characteristics such as benchmark yield curves, option-adjusted spreads, credit spreads, estimated default rates, coupon rates, anticipated timing of principal repayments, underlying collateral, and other unique security features in order to estimate the relevant cash flows, which are then discounted to calculate the fair value. Securities denominated in a foreign currency are converted into their U.S. dollar equivalent at the foreign
42 | Annual Report
Franklin Strategic Series
Notes to Financial Statements (continued)
| 1. | ORGANIZATION AND SIGNIFICANT ACCOUNTING POLICIES (continued) |
| a. | Financial Instrument Valuation (continued) |
exchange rate in effect at the close of the NYSE on the date that the values of the foreign debt securities are determined.
The Funds have procedures to determine the fair value of securities and other financial instruments for which market prices are not readily available or which may not be reliably priced. Under these procedures, the Funds primarily employ a market-based approach which may use related or comparable assets or liabilities, recent transactions, market multiples, book values, and other relevant information for the investment to determine the fair value of the investment. The Funds may also use an income-based valuation approach in which the anticipated future cash flows of the investment are discounted to calculate fair value. Discounts may also be applied due to the nature or duration of any restrictions on the disposition of the investments. Due to the inherent uncertainty of valuations of such investments, the fair values may differ significantly from the values that would have been used had an active market existed.
Trading in securities on foreign securities stock exchanges and over-the-counter markets may be completed before the daily close of business on the NYSE. Occasionally, events occur between the time at which trading in a foreign security is completed and the close of the NYSE that might call into question the reliability of the value of a portfolio security held by the fund. As a result, differences may arise between the value of the Funds’ portfolio securities as determined at the foreign market close and the latest indications of value at the close of the NYSE. In order to minimize the potential for these differences, the investment manager monitors price movements following the close of trading in foreign stock markets through a series of country specific market proxies (such as baskets of American Depository Receipts, futures contracts and exchange traded funds). These price movements are measured against established trigger thresholds for each specific market proxy to assist in determining if an event has occurred that may call into question the reliability of the values of the foreign securities held by the Funds. If such an event occurs, the securities may be valued using fair value procedures, which may include the use of independent pricing services.
b. Foreign Currency Translation
Portfolio securities and other assets and liabilities denominated in foreign currencies are translated into U.S. dollars based on the exchange rate of such currencies against U.S. dollars on the date of valuation. The Funds may enter into foreign currency exchange contracts to facilitate transactions denominated in a foreign currency. Purchases and sales of securities, income and expense items denominated in foreign currencies are translated into U.S. dollars at the exchange rate in effect on the transaction date. Portfolio securities and assets and liabilities denominated in foreign currencies contain risks that those currencies will decline in value relative to the U.S. dollar. Occasionally, events may impact the availability or reliability of foreign exchange rates used to convert the U.S. dollar equivalent value. If such an event occurs, the foreign exchange rate will be valued at fair value using procedures established and approved by the Trust’s Board of Trustees.
Annual Report | 43
Franklin Strategic Series
Notes to Financial Statements (continued)
| 1. | ORGANIZATION AND SIGNIFICANT ACCOUNTING POLICIES (continued) |
| b. | Foreign Currency Translation (continued) |
The Funds do not separately report the effect of changes in foreign exchange rates from changes in market prices on securities held. Such changes are included in net realized and unrealized gain or loss from investments on the Statement of Operations.
Realized foreign exchange gains or losses arise from sales of foreign currencies, currency gains or losses realized between the trade and settlement dates on securities transactions and the difference between the recorded amounts of dividends, interest, and foreign withholding taxes and the U.S. dollar equivalent of the amounts actually received or paid. Net unrealized foreign exchange gains and losses arise from changes in foreign exchange rates on foreign denominated assets and liabilities other than investments in securities held at the end of the reporting period.
c. Securities Lending
The Funds participate in an agency based security lending program. The fund receives cash collateral against the loaned securities in an amount equal to at least 102% of the market value of the loaned securities. Collateral is maintained over the life of the loan in an amount not less than 100% of the market value of loaned securities, as determined at the close of fund business each day, any additional collateral required due to changes in security values is delivered to the fund on the next business day. The collateral is invested in a money market fund managed by the fund’s custodian on the fund’s behalf. The fund receives income from the investment of cash collateral, in addition to lending fees and rebates paid by the borrower. The fund bears the market risk with respect to the collateral investment, securities loaned, and the risk that the agent may default on its obligations to the fund. The securities lending agent has agreed to indemnify the fund in the event of default by a third party borrower. At April 30, 2011, the Franklin Natural Resources Fund had no securities on loan.
d. Income Taxes
It is each fund’s policy to qualify as a regulated investment company under the Internal Revenue Code. Each fund intends to distribute to shareholders substantially all of its taxable income and net realized gains to relieve it from federal income and excise taxes. As a result, no provision for U.S. federal income taxes is required. Each fund files U.S. income tax returns as well as tax returns in certain other jurisdictions. Each fund records a provision for taxes in its financial statements including penalties and interest, if any, for a tax position taken on a tax return (or expected to be taken) when it fails to meet the more likely than not (a greater than 50% probability) threshold and based on the technical merits, the tax position may not be sustained upon examination by the tax authorities. As of April 30, 2011, and for all open tax years, each fund has determined that no provision for income tax is required in each fund’s financial statements. Open tax years are those that remain subject to examination and are based on each tax jurisdiction statute of limitation.
44 | Annual Report
Franklin Strategic Series
Notes to Financial Statements (continued)
| 1. | ORGANIZATION AND SIGNIFICANT ACCOUNTING POLICIES (continued) |
| d. | Income Taxes (continued) |
The Funds may be subject to foreign taxation related to income received, capital gains on the sale of securities and certain foreign currency transactions in the foreign jurisdictions in which it invests. Foreign taxes, if any, are recorded based on the tax regulations and rates that exist in the foreign markets in which the Funds invest. When a capital gain tax is determined to apply the Funds record an estimated deferred tax liability for unrealized gains on these securities in an amount that would be payable if the securities were disposed of on the valuation date.
e. Security Transactions, Investment Income, Expenses and Distributions
Security transactions are accounted for on trade date. Realized gains and losses on security transactions are determined on a specific identification basis. Estimated expenses are accrued daily. Dividend income is recorded on the ex-dividend date except that certain dividends from foreign securities are recognized as soon as the Funds are notified of the ex-dividend date. Distributions to shareholders are recorded on the ex-dividend date and are determined according to income tax regulations (tax basis). Distributable earnings determined on a tax basis may differ from earnings recorded in accordance with accounting principles generally accepted in the United States of America. These differences may be permanent or temporary. Permanent differences are reclassified among capital accounts to reflect their tax character. These reclassifications have no impact on net assets or the results of operations. Temporary differences are not reclassified, as they may reverse in subsequent periods.
Common expenses incurred by the Trust are allocated among the funds based on the ratio of net assets of each fund to the combined net assets of the Trust. Fund specific expenses are charged directly to the fund that incurred the expense.
Realized and unrealized gains and losses and net investment income, not including class specific expenses, are allocated daily to each class of shares based upon the relative proportion of net assets of each class. Differences in per share distributions, by class, are generally due to differences in class specific expenses.
f. Accounting Estimates
The preparation of financial statements in accordance with accounting principles generally accepted in the United States of America requires management to make estimates and assumptions that affect the reported amounts of assets and liabilities at the date of the financial statements and the amounts of income and expenses during the reporting period. Actual results could differ from those estimates.
g. Guarantees and Indemnifications
Under the Trust’s organizational documents, its officers and trustees are indemnified by the Trust against certain liabilities arising out of the performance of their duties to the Trust. Additionally,
Annual Report | 45
Franklin Strategic Series
Notes to Financial Statements (continued)
| 1. | ORGANIZATION AND SIGNIFICANT ACCOUNTING POLICIES (continued) |
| g. | Guarantees and Indemnifications (continued) |
in the normal course of business, the Trust, on behalf of the Funds, enters into contracts with service providers that contain general indemnification clauses. The Trust’s maximum exposure under these arrangements is unknown as this would involve future claims that may be made against the Trust that have not yet occurred. Currently, the Trust expects the risk of loss to be remote.
2. SHARES OF BENEFICIAL INTEREST
At April 30, 2011, there were an unlimited number of shares authorized (without par value).
Transactions in the Funds’ shares were as follows:
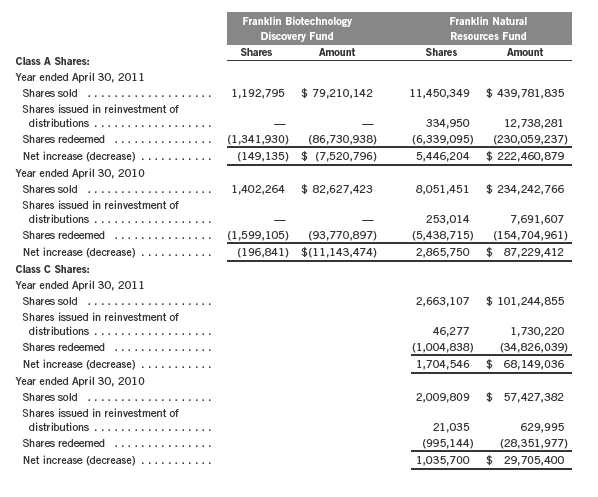
46 | Annual Report

aFor the period September 1, 2009 (effective date) to October 31, 2010 for the Franklin Biotechnology Discovery Fund.
3. TRANSACTIONS WITH AFFILIATES
Franklin Resources, Inc. is the holding company for various subsidiaries that together are referred to as Franklin Templeton Investments. Certain officers and trustees of the Trust are also officers and/or directors of the following subsidiaries:

a. Management Fees
The Funds pay an investment management fee to Advisers based on the daily net assets of each of the Funds as follows:

Annual Report | 47
Franklin Strategic Series
Notes to Financial Statements (continued)
| 3. | TRANSACTIONS WITH AFFILIATES (continued) |
| b. | Administrative Fees |
The Franklin Biotechnology Discovery Fund pays an administrative fee to FT Services based on the fund’s average daily net assets as follows:

Under an agreement with Advisers, FT Services provides administrative services to the Franklin Natural Resources Fund. The fee is paid by Advisers based on average daily net assets, and is not an additional expense of the Fund.
c. Distribution Fees
The Trust’s Board of Trustees has adopted distribution plans for each share class, with the exception of Advisor Class shares, pursuant to Rule 12b-1 under the 1940 Act. Under the Funds’ Class A reimbursement distribution plans, the Funds reimburse Distributors for costs incurred in connection with the servicing, sale and distribution of each fund’s shares up to the maximum annual plan rate for each class. Under the Class A reimbursement distribution plans, costs exceeding the maximum for the current plan year cannot be reimbursed in subsequent periods.
In addition, under the Franklin Natural Resources Fund’s Class C compensation distribution plan, the fund pays Distributors for costs incurred in connection with the servicing, sale and distribution of the fund’s shares up to the maximum annual plan rate.
The maximum annual plan rates, based on the average daily net assets, for each class, are as follows:

The Board of Trustees has set the current rate at 0.30% per year for Class A shares until further notice and approval by the Board.
48 | Annual Report
Franklin Strategic Series
Notes to Financial Statements (continued)
| 3. | TRANSACTIONS WITH AFFILIATES (continued) |
| d. | Sales Charges/Underwriting Agreements |
Distributors has advised the Funds of the following commission transactions related to the sales and redemptions of the Funds’ shares for the year:

e. Transfer Agent Fees
For the year ended April 30, 2011, the Funds paid transfer agent fees as noted in the Statements of Operations of which the following amounts were retained by Investor Services:

4. EXPENSE OFFSET ARRANGEMENT
The Funds have entered into an arrangement with their custodian whereby credits realized as a result of uninvested cash balances are used to reduce a portion of the Funds’ custodian expenses. During the year ended April 30, 2011, the custodian fees were reduced as noted in the Statements of Operations.
5. INCOME TAXES
For tax purposes, capital losses may be carried over to offset future capital gains, if any. At April 30, 2011, the capital loss carryforwards were as follows:

During the year ended April 30, 2011, the Franklin Biotechnology Discovery Fund and the Franklin Natural Resources Fund utilized $138,750,139 and $17,727,580, respectively, of capital loss carryforwards.
Annual Report | 49
Franklin Strategic Series
Notes to Financial Statements (continued)
5. INCOME TAXES (continued)
On April 30, 2011, the The Franklin Biotechnology Discovery Fund had expired capital loss carryforwards of $49,377,567, which were reclassified to paid-in capital.
The tax character of distributions paid during the years ended April 30, 2011 and 2010, was as follows:

At April 30, 2011, the cost of investments, net unrealized appreciation (depreciation), and undistributed ordinary income for income tax purposes were as follows:

Net investment income (loss) differs for financial statement and tax purposes primarily due to differing treatments of foreign currency transactions and passive foreign investment company shares.
Net realized gains (losses) differ for financial statement and tax purposes primarily due to differing treatments of wash sales, foreign currency transactions and passive foreign investment company shares.
6. INVESTMENT TRANSACTIONS
Purchases and sales of investments (excluding short term securities) for the year ended April 30, 2011, were as follows:

50 | Annual Report
Franklin Strategic Series
Notes to Financial Statements (continued)
7. INVESTMENTS IN INSTITUTIONAL FIDUCIARY TRUST MONEY MARKET PORTFOLIO
The Funds invest in the Institutional Fiduciary Trust Money Market Portfolio (Sweep Money Fund), an open-end investment company managed by Advisers. Management fees paid by the Funds are reduced on assets invested in the Sweep Money Fund, in an amount not to exceed the management and administrative fees paid by the Sweep Money Fund.
8. RESTRICTED SECURITIES
The Funds invest in securities that are restricted under the Securities Act of 1933 (1933 Act) or which are subject to legal, contractual, or other agreed upon restrictions on resale. Restricted securities are often purchased in private placement transactions, and cannot be sold without prior registration unless the sale is pursuant to an exemption under the 1933 Act. Disposal of these securities may require greater effort and expense, and prompt sale at an acceptable price may be difficult. The Funds may have registration rights for restricted securities. The issuer generally incurs all registration costs.
At April 30, 2011, the Funds held investments in restricted securities, excluding certain securities exempt from registration under the 1933 Act deemed to be liquid, as follows:
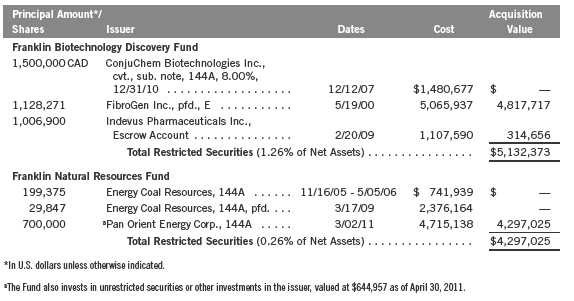
9. SPECIAL SERVICING AGREEMENT
The Franklin Natural Resources Fund, which is an eligible underlying investment of one or more of the Franklin Templeton Fund Allocator Series Funds (Allocator Funds), participates in a Special Servicing Agreement (SSA) with the Allocator Funds and certain service providers of the fund and the Allocator Funds. Under the SSA, the fund may pay a portion of the Allocator Funds’ expenses (other than any asset allocation, administrative and distribution fees), to the extent such
Annual Report | 51
Franklin Strategic Series
Notes to Financial Statements (continued)
9. SPECIAL SERVICING AGREEMENT (continued)
payments are less than the amount of the benefits realized or expected to be realized by the fund (e.g., due to reduced costs associated with servicing accounts) from the investment in the fund by the Allocator Funds. The Allocator Funds are either managed by Advisers or administered by FT Services, affiliates of the funds. For the year ended April 30, 2011, the fund was held by one or more of the Allocator Funds and the amount of expenses borne by the fund is noted in the Statements of Operations. At April 30, 2011, 7.79% of the fund’s outstanding shares were held by one or more of the Allocator Funds.
10. CREDIT FACILITY
The Funds, together with other U.S. registered and foreign investment funds (collectively, Borrowers), managed by Franklin Templeton Investments, are borrowers in a joint syndicated senior unsecured credit facility totaling $750 million (Global Credit Facility) which matures on January 20, 2012. This Global Credit Facility provides a source of funds to the Borrowers for temporary and emergency purposes, including the ability to meet future unanticipated or unusually large redemption requests.
Under the terms of the Global Credit Facility, the Funds shall, in addition to interest charged on any borrowings made by the Funds and other costs incurred by the Funds, pay their share of fees and expenses incurred in connection with the implementation and maintenance of the Global Credit Facility, based upon their relative share of the aggregate net assets of all of the Borrowers, including an annual commitment fee of 0.08% based upon the unused portion of the Global Credit Facility, which is reflected in other expenses on the Statements of Operations. During the year ended April 30, 2011, the Funds did not use the Global Credit Facility.
11. FAIR VALUE MEASUREMENTS
The Funds follow a fair value hierarchy that distinguishes between market data obtained from independent sources (observable inputs) and the Fund’s own market assumptions (unobservable inputs). These inputs are used in determining the value of the Fund’s investments and are summarized in the following fair value hierarchy:
- Level 1 – quoted prices in active markets for identical securities
- Level 2 – other significant observable inputs (including quoted prices for similar securities, interest rates, prepayment speed, credit risk, etc.)
- Level 3 – significant unobservable inputs (including the Funds’ own assumptions in determining the fair value of investments)
52 | Annual Report
Franklin Strategic Series
Notes to Financial Statements (continued)
11. FAIR VALUE MEASUREMENTS (continued)
The inputs or methodology used for valuing securities are not an indication of the risk associated with investing in those securities.
For movements between the levels within the fair value hierarchy, the Funds have adopted a policy of recognizing the transfers as of the date of the underlying event which caused the movement.
The following is a summary of the inputs used as of April 30, 2011, in valuing the Funds’ assets and liabilities carried at fair value:

Annual Report | 53
Franklin Strategic Series
Notes to Financial Statements (continued)
11. FAIR VALUE MEASUREMENTS (continued)
At April 30, 2011, the reconciliation of assets in which significant unobservable inputs (Level 3) were used in determining the Funds’ fair value, is as follows:

12. SUBSEQUENT EVENTS
The Funds have evaluated subsequent events through the issuance of the financial statements and determined that no events have occurred that require disclosure.

54 | Annual Report
Franklin Strategic Series
Report of Independent Registered Public Accounting Firm
To the Board of Trustees and Shareholders of Franklin Strategic Series
In our opinion, the accompanying statements of assets and liabilities, including the statements of investments, and the related statements of operations and of changes in net assets and the financial highlights present fairly, in all material respects, the financial position of Franklin Biotechnology Discovery Fund and Franklin Natural Resources Fund (separate portfolios of Franklin Strategic Series, hereafter referred to as the “Funds”) at April 30, 2011, the results of each of their operations for the year then ended, the changes in each of their net assets for each of the two years in the period then ended and the financial highlights for each of the five years in the period then ended, in conformity with accounting principles generally accepted in the United States of America. These financial statements and financial highlights (hereafter referred to as “financial statements”) are the responsibility of the Funds’ management. Our responsibility is to express an opinion on these financial statements based on our audits. We conducted our audits of these financial statements in accordance with the standards of the Public Company Accounting Oversight Board (United States). Those standards require that we plan and perform the audit to obtain reasonable assurance about whether the financial statements are free of material misstatement. An audit includes examining, on a test basis, evidence supporting the amounts and disclosures in the financial statements, assessing the accounting principles used and significant estimates made by management, and evaluating the overall financial statement presentation. We believe that our audits, which included confirmation of securities at April 30, 2011 by correspondence with the custodian and brokers, provide a reasonable basis for our opinion.
PricewaterhouseCoopers LLP
San Francisco, California
June 16, 2011
Annual Report | 55
Franklin Strategic Series
Tax Designation (unaudited)
Under Section 854(b)(2) of the Internal Revenue Code (Code), the Franklin Natural Resources Fund designates 34.38% of the ordinary income dividends as income qualifying for the dividends received deduction for the fiscal year ended April 30, 2011.
Under Section 854(b)(2) of the Code, the Funds designate the maximum amount allowable but no less than the following amounts as qualified dividends for purposes of the maximum rate under Section 1(h)(11) of the Code for the fiscal year ended April 30, 2011:

Distributions, including qualified dividend income, paid during calendar year 2011 will be reported to shareholders on Form 1099-DIV in January 2012. Shareholders are advised to check with their tax advisors for information on the treatment of these amounts on their individual income tax returns.
56 | Annual Report
Franklin Strategic Series
Board Members and Officers
The name, year of birth and address of the officers and board members, as well as their affiliations, positions held with the Trust, principal occupations during the past five years and number of portfolios overseen in the Franklin Templeton Investments fund complex are shown below. Generally, each board member serves until that person’s successor is elected and qualified.

Principal Occupation During Past 5 Years:
Director of various companies; and formerly, Director, RBC Holdings, Inc. (bank holding company) (until 2002); and President, Chief Executive Officer and Chairman of the Board, General Host Corporation (nursery and craft centers) (until 1998).

Principal Occupation During Past 5 Years:
Private investor; and formerly, Chairman of the Board, Vodafone AirTouch, PLC (wireless company); Chairman of the Board and Chief Executive Officer, AirTouch Communications (cellular communications) (1993-1998) and Pacific Telesis Group (telephone holding company) (1988-1994).

Principal Occupation During Past 5 Years:
Director or Trustee of various companies and trusts; and formerly, Assistant to the President of the United States and Secretary of the Cabinet (1990-1993); General Counsel to the United States Treasury Department (1989-1990); and Counselor to the Secretary and Assistant Secretary, Public Affairs and Public Liaison – United States Treasury Department (1988-1989).

Principal Occupation During Past 5 Years:
Executive Vice President, General Counsel and member of Executive Council, The Boeing Company; and formerly, Federal Appeals Court Judge, U.S. Court of Appeals for the Fourth Circuit (1991-2006).
Annual Report | 57

Principal Occupation During Past 5 Years:
Chairman Emeritus, The Hertz Corporation (car rental) (since 2000) (Chairman of the Board (1980-2000) and Chief Executive Officer (1977-1999)); and formerly, Chairman of the Board, President and Chief Executive Officer, UAL Corporation (airlines).

Principal Occupation During Past 5 Years:
Senior Vice President – Government Affairs, General Counsel and Secretary, PepsiCo, Inc. (consumer products); and formerly, Director, Delta Airlines (aviation) (2003-2005) and Providian Financial Corp. (credit card provider) (1997-2001); Senior Fellow of The Brookings Institution (2003-2004); Visiting Professor, University of Georgia School of Law (2004); and Deputy Attorney General, U.S. Department of Justice (2001-2003).

Principal Occupation During Past 5 Years:
President and Founder, Hyannis Port Capital, Inc. (real estate and private equity investing); serves on private and non-profit boards; and formerly, Chief Operating Officer and Executive Vice President, Gap, Inc. (retail) (1996-2000); Chief Financial Officer and Executive Vice President – Finance and Strategy, Staples, Inc. (office supplies) (1992-1996); Senior Vice President – Corporate Planning, Northwest Airlines, Inc. (airlines) (1990-1992); and Vice President and Partner, Bain & Company (consulting firm) (1986-1990).

Principal Occupation During Past 5 Years:
Chairman of the Board, Member – Office of the Chairman and Director, Franklin Resources, Inc.; and officer and/or director or trustee, as the case may be, of some of the other subsidiaries of Franklin Resources, Inc. and of 41 of the investment companies in Franklin Templeton Investments.
58 | Annual Report

Principal Occupation During Past 5 Years:
Vice Chairman, Member – Office of the Chairman and Director, Franklin Resources, Inc.; Director, Franklin Advisers, Inc.; Senior Vice President, Franklin Advisory Services, LLC; and officer and/or director or trustee, as the case may be, of some of the other subsidiaries of Franklin Resources, Inc. and of 25 of the investment companies in Franklin Templeton Investments.

Principal Occupation During Past 5 Years:
Director, Global Compliance, Franklin Resources, Inc.; officer of some of the other subsidiaries of Franklin Resources, Inc. and of 45 of the investment companies in Franklin Templeton Investments; and formerly, Director of Compliance, Franklin Resources, Inc. (1994-2001).

Principal Occupation During Past 5 Years:
Senior Vice President, Franklin Templeton Services, LLC; officer of 45 of the investment companies in Franklin Templeton Investments; and formerly, Director and member of Audit and Valuation Committees, Runkel Funds, Inc. (2003-2004); Assistant Treasurer of most of the investment companies in Franklin Templeton Investments (1997-2003); and Vice President, Franklin Templeton Services, LLC (1997-2003).

Principal Occupation During Past 5 Years:
Director, Fund Accounting, Franklin Templeton Investments; and officer of 27 of the investment companies in Franklin Templeton Investments.

Principal Occupation During Past 5 Years:
Senior Associate General Counsel, Franklin Templeton Investments; officer of 45 of the investment companies in Franklin Templeton Investments; and formerly, Litigation Associate, Steefel, Levitt & Weiss, LLP (2000-2004).

Principal Occupation During Past 5 Years:
Senior Associate General Counsel, Franklin Templeton Investments; and officer and/or director, as the case may be, of some of the other subsidiaries of Franklin Resources, Inc. and of 45 of the investment companies in Franklin Templeton Investments.
Annual Report | 59

Principal Occupation During Past 5 Years:
Senior Associate General Counsel, Franklin Templeton Investments; Vice President, Franklin Templeton Distributors, Inc.; and officer of 45 of the investment companies in Franklin Templeton Investments.

Principal Occupation During Past 5 Years:
President, Chief Investment Officer and Director, Franklin Advisers, Inc.; Executive Vice President, Franklin Templeton Institutional, LLC; and officer and/or trustee, as the case may be, of some of the other subsidiaries of Franklin Resources, Inc. and of 10 of the investment companies in Franklin Templeton Investments.

Principal Occupation During Past 5 Years:
Director and Executive Vice President, Franklin Advisers, Inc.; Executive Vice President, Franklin Templeton Institutional, LLC; and officer of some of the other subsidiaries of Franklin Resources, Inc. and of 22 of the investment companies in Franklin Templeton Investments.

Principal Occupation During Past 5 Years:
Senior Associate General Counsel, Franklin Templeton Investments; Assistant Secretary, Franklin Resources, Inc.; Vice President and Secretary, Templeton Investment Counsel, LLC; Vice President, Secretary and Trust Officer, Fiduciary Trust International of the South; and officer of 45 of the investment companies in Franklin Templeton Investments.

Principal Occupation During Past 5 Years:
Senior Associate General Counsel, Franklin Templeton Investments; and officer of 45 of the investment companies in Franklin Templeton Investments.
60 | Annual Report

*We base the number of portfolios on each separate series of the U.S. registered investment companies within the Franklin Templeton Investments fund complex. These portfolios
have a common investment manager or affiliated investment managers.
**Charles B. Johnson and Rupert H. Johnson, Jr. are considered to be interested persons of the Trust under the federal securities laws due to their positions as officers and directors
and major shareholders of Franklin Resources, Inc., which is the parent company of the Fund's investment manager and distributor.
Note 1: Charles B. Johnson and Rupert H. Johnson, Jr. are brothers.
Note 2: Officer information is current as of the date of this report. It is possible that after this date, information about officers may change.
Note 3: Prior to April 30, 2011, Frank W.T. LaHaye ceased to be a trustee of the Fund.
The Sarbanes-Oxley Act of 2002 and Rules adopted by the Securities and Exchange Commission require the Fund to disclose whether the Fund’s Audit Committee includes
at least one member who is an audit committee financial expert within the meaning of such Act and Rules. The Fund’s Board has determined that there is at least one such
financial expert on the Audit Committee and has designated John B. Wilson as its audit committee financial expert. The Board believes that Mr. Wilson qualifies as such an
expert in view of his extensive business background and experience, including service as chief financial officer of Staples, Inc. from 1992 to 1996. Mr. Wilson has been a
Member and Chairman of the Fund’s Audit Committee since 2006. As a result of such background and experience, the Board believes that Mr. Wilson has acquired an under-
standing of generally accepted accounting principles and financial statements, the general application of such principles in connection with the accounting estimates,
accruals and reserves, and analyzing and evaluating financial statements that present a breadth and level of complexity of accounting issues generally comparable to those
of the Fund, as well as an understanding of internal controls and procedures for financial reporting and an understanding of audit committee functions. Mr. Wilson is an
independent Board member as that term is defined under the relevant Securities and Exchange Commission Rules and Releases.
The Statement of Additional Information (SAI) includes additional information about the board members and is available, without charge, upon request. Shareholders may
call (800) DIAL BEN/342-5236 to request the SAI.
Annual Report | 61
Franklin Strategic Series
Shareholder Information
Board Review of Investment Management Agreement
At a meeting held April 19, 2011, the Board of Trustees (Board), including a majority of non-interested or independent Trustees, approved renewal of the investment management agreement for each of the separate funds within the Trust (Fund(s)). In reaching this decision, the Board took into account information furnished throughout the year at regular Board meetings, as well as information prepared specifically in connection with the annual renewal review process. Information furnished and discussed throughout the year included investment performance reports and related financial information for each Fund, as well as periodic reports on expenses, shareholder services, legal, compliance, pricing, brokerage commissions and execution and other services provided by the Investment Manager (Manager) and its affiliates. Information furnished specifically in connection with the renewal process included a report for each Fund prepared by Lipper, Inc. (Lipper), an independent organization, as well as additional material, including a Fund profitability analysis prepared by management. The Lipper reports compared each Fund’s investment performance and expenses with those of other mutual funds deemed comparable to the Fund as selected by Lipper. The Fund profitability analysis discussed the profitability to Franklin Templeton Investments from its overall U.S. fund operations, as well as on an individual fund-by-fund basis. Additional material accompanying such profitability analysis included information on a fund-by-fund basis listing portfolio managers and other accounts they manage, as well as information on management fees charged by the Manager and its affiliates to U.S. mutual funds and other accounts, including management’s explanation of differences where relevant. Such material also included a memorandum prepared by management describing project initiatives and capital investments relating to the services provided to the Funds by the Franklin Templeton Investments organization, as well as a memorandum relating to economies of scale and a comparative analysis concerning transfer agent fees charged each Fund.
In considering such materials, the independent Trustees received assistance and advice from and met separately with independent counsel. While the investment management agreements for all Funds were considered at the same Board meeting, the Board dealt with each Fund separately. In approving continuance of the investment management agreement for each Fund, the Board, including a majority of independent Trustees, determined that the existing management fee structure was fair and reasonable and that continuance of the investment management agreement was in the best interests of each Fund and its shareholders. While attention was given to all information furnished, the following discusses some primary factors relevant to the Board’s decision.
NATURE, EXTENT AND QUALITY OF SERVICE. The Board was satisfied with the nature and quality of the overall services provided by the Manager and its affiliates to the Funds and their shareholders. In addition to investment performance and expenses discussed later, the Board’s opinion was based, in part, upon periodic reports furnished it showing that the investment policies and restrictions for each Fund were consistently complied with as well as other reports periodically furnished the Board covering matters such as the compliance of portfolio managers and other management personnel with the code of ethics adopted throughout the Franklin Templeton fund complex, the adherence to fair value pricing procedures established by the Board, and the accuracy
62 | Annual Report
Franklin Strategic Series
Shareholder Information (continued)
Board Review of Investment Management Agreement (continued)
of net asset value calculations. The Board also noted the extent of benefits provided Fund shareholders from being part of the Franklin Templeton family of funds, including the right to exchange investments between the same class of funds without a sales charge, the ability to reinvest Fund dividends into other funds and the right to combine holdings in other funds to obtain a reduced sales charge. Favorable consideration was given to management’s continuous efforts and expenditures in establishing back-up systems and recovery procedures to function in the event of a natural disaster, it being noted that such systems and procedures had functioned smoothly during the Florida hurricanes and blackouts experienced in previous years. Among other factors taken into account by the Board were the Manager’s best execution trading policies, including a favorable report by an independent portfolio trading analytical firm. Consideration was also given to the experience of each Fund’s portfolio management team, the number of accounts managed and general method of compensation. In this latter respect, the Board noted that a primary factor in management’s determination of a portfolio manager’s bonus compensation was the relative investment performance of the funds he or she managed and that a portion of such bonus was required to be invested in a predesignated list of funds within such person’s fund management area so as to be aligned with the interests of shareholders. The Board also took into account the quality of transfer agent and shareholder services provided Fund shareholders by an affiliate of the Manager, and the continuous enhancements to the Franklin Templeton website. Particular attention was given to management’s conservative approach and diligent risk management procedures, including continuous monitoring of counterparty credit risk and attention given to derivatives and other complex instruments. The Board also took into account, among other things, management’s efforts in establishing a global credit facility for the benefit of the Funds and other accounts managed by Franklin Templeton Investments to provide a source of cash for temporary and emergency purposes or to meet unusual redemption requests as well as the strong financial position of the Manager’s parent company and its commitment to the mutual fund business as evidenced by its subsidization of money market funds.
INVESTMENT PERFORMANCE. The Board placed significant emphasis on the investment performance of the Funds in view of its importance to shareholders. While consideration was given to performance reports and discussions with portfolio managers at Board meetings throughout the year, particular attention in assessing performance was given to the Lipper reports furnished for the agreement renewals. The Lipper reports prepared for each individual Fund showed the investment performance of its Class A shares in comparison to a performance universe selected by Lipper. Comparative performance for each Fund was shown for the one-year period ended January 31, 2011, and previous periods ended that date of up to 10 years depending on when a particular Fund commenced operations. The following summarizes the performance results for each of these Funds and the Board’s view of such performance.
Franklin Biotechnology Discovery Fund – The performance universe for this Fund consisted of the Fund and all retail and institutional health/biotechnology funds as selected by Lipper. The Lipper report showed the Fund’s total return for the one-year period to be in the second-highest quintile of its performance universe, and on an annualized basis, to be in the highest quintile of such universe
Annual Report | 63
Franklin Strategic Series
Shareholder Information (continued)
Board Review of Investment Management Agreement (continued)
for the previous three-year period, the middle quintile of such universe for the previous five-year period, and the second-lowest quintile of such universe for the previous 10-year period. The Board was satisfied with the Fund’s recent comparative investment performance as set forth in the Lipper report and believed its overall performance to be acceptable.
Franklin Natural Resources Fund – The performance universe for this Fund consisted of the Fund and all retail and institutional global natural resources funds as selected by Lipper. The Lipper report comparison for the Fund showed its total return for the one-year period to be in the highest quintile of its performance universe, and on an annualized basis to also be in the highest quintile of the performance universe for each of the previous three- and five-year periods, and to be in the second-lowest quintile of such universe for the previous 10-year period. The Board was satisfied with the Fund’s performance as set forth in the Lipper report, and noted that the Lipper report showed the Fund’s annualized return for the 10-year period exceeded 12%.
COMPARATIVE EXPENSES. Consideration was given to a comparative analysis of the management fees and total expense ratios of each Fund compared with those of a group of other funds selected by Lipper as its appropriate Lipper expense group. Lipper expense data is based upon information taken from each fund’s most recent annual report, which reflects historical asset levels that may be quite different from those currently existing, particularly in a period of market volatility. While recognizing such inherent limitation and the fact that expense ratios generally increase as assets decline and decrease as assets grow, the Board believed the independent analysis conducted by Lipper to be an appropriate measure of comparative expenses. In reviewing comparative costs, Lipper provides information on each Fund’s contractual investment management fee in comparison with the investment management fee that would have been charged by other funds within its Lipper expense group assuming they were similar in size to the Fund, as well as the actual total expense ratio of the Fund in comparison with those of its Lipper expense group. The Lipper contractual investment management fee analysis includes administrative charges as being part of the investment management fee, and actual total expenses, for comparative consistency, are shown by Lipper for Fund Class A shares. The results of such expense comparisons showed the contractual investment management fee rates and actual total expense ratio for Franklin Natural Resources Fund to be in the least expensive quintile of its Lipper expense group. The contractual investment management fee rate for Franklin Biotechnology Discovery Fund was in the least expensive quintile of its Lipper expense group and its actual total expense ratio was in the second least expensive quin-tile of such group. The Board was satisfied with the contractual management fees and total expense ratio of each of these Funds in comparison to its expense group as shown in the Lipper reports.
MANAGEMENT PROFITABILITY. The Board also considered the level of profits realized by the Manager and its affiliates in connection with the operation of each Fund. In this respect, the Board reviewed the Fund profitability analysis that addresses the overall profitability of Franklin Templeton’s U.S. fund business, as well as its profits in providing management and other services to each of the individual funds during the 12-month period ended September 30, 2010, being the
64 | Annual Report
Franklin Strategic Series
Shareholder Information (continued)
Board Review of Investment Management Agreement (continued)
most recent fiscal year-end for Franklin Resources, Inc., the Manager’s parent. In reviewing the analysis, attention was given to the methodology followed in allocating costs to each Fund, it being recognized that allocation methodologies are inherently subjective and various allocation methodologies may each be reasonable while producing different results. In this respect, the Board noted that, while being continuously refined and reflecting changes in the Manager’s own cost accounting, the allocation methodology was consistent with that followed in profitability report presentations for the Funds made in prior years and that the Funds’ independent registered public accounting firm had been engaged by the Manager to review the reasonableness of the allocation methodologies solely for use by the Funds’ Board in reference to the profitability analysis. In reviewing and discussing such analysis, management discussed with the Board its belief that costs incurred in establishing the infrastructure necessary for the type of mutual fund operations conducted by the Manager and its affiliates may not be fully reflected in the expenses allocated to each Fund in determining its profitability, as well as the fact that the level of profits, to a certain extent, reflected operational cost savings and efficiencies initiated by management. The Board also took into account management’s expenditures in improving shareholder services provided the Funds, as well as the need to meet additional regulatory and compliance requirements resulting from the Sarbanes-Oxley Act and recent SEC and other regulatory requirements. In addition, the Board considered a third-party study comparing the profitability of the Manager’s parent on an overall basis to other publicly held managers broken down to show profitability from management operations exclusive of distribution expenses, as well as profitability including distribution expenses. The Board also considered the extent to which the Manager and its affiliates might derive ancillary benefits from fund operations, including revenues generated from transfer agent services and potential benefits resulting from allocation of fund brokerage and the use of commission dollars to pay for research. Based upon its consideration of all these factors, the Board determined that the level of profits realized by the Manager and its affiliates from providing services to each Fund was not excessive in view of the nature, quality and extent of services provided.
ECONOMIES OF SCALE. The Board also considered whether economies of scale are realized by the Manager as the Funds grow larger and the extent to which this is reflected in the level of management fees charged. While recognizing that any precise determination is inherently subjective, the Board noted that based upon the Fund profitability analysis, it appears that as some funds get larger, at some point economies of scale do result in the Manager realizing a larger profit margin on management services provided such a fund. The Board noted that economies of scale were shared with each Fund and its shareholders through management fee breakpoints so that as a Fund grows in size, its effective management fee rate declines. The fee structures under the investment management agreements for the Funds contain breakpoints that continued to asset levels that exceeded their asset sizes at December 31, 2010. In view of such fee structure and the favorable expense comparisons of each of the Funds within their respective expense groups, the Board believed that to the extent economies of scale may be realized by the manager of these Funds and its affiliates, that there was a sharing of benefits with each Fund and its shareholders.
Annual Report | 65
Franklin Strategic Series
Shareholder Information (continued)
Proxy Voting Policies and Procedures
The Trust’s investment manager has established Proxy Voting Policies and Procedures (Policies) that the Trust uses to determine how to vote proxies relating to portfolio securities. Shareholders may view the Trust’s complete Policies online at franklintempleton.com. Alternatively, shareholders may request copies of the Policies free of charge by calling the Proxy Group collect at (954) 527-7678 or by sending a written request to: Franklin Templeton Companies, LLC, 300 S.E. 2nd Street, Fort Lauderdale, FL 33301, Attention: Proxy Group. Copies of the Trust’s proxy voting records are also made available online at franklintempleton.com and posted on the U.S. Securities and Exchange Commission’s website at sec.gov and reflect the most recent 12-month period ended June 30.
Quarterly Statement of Investments
The Trust files a complete statement of investments with the U.S. Securities and Exchange Commission for the first and third quarters for each fiscal year on Form N-Q. Shareholders may view the filed Form N-Q by visiting the Commission’s website at sec.gov. The filed form may also be viewed and copied at the Commission’s Public Reference Room in Washington, DC. Information regarding the operations of the Public Reference Room may be obtained by calling (800) SEC-0330.
Householding of Reports and Prospectuses
You will receive each Fund’s financial reports every six months as well as an annual updated summary prospectus (prospectus available upon request). To reduce Fund expenses, we try to identify related shareholders in a household and send only one copy of the financial reports and summary prospectus. This process, called “householding,” will continue indefinitely unless you instruct us otherwise. If you prefer not to have these documents householded, please call us at (800) 632-2301. At any time you may view current prospectuses/summary prospectuses and financial reports on our website. If you choose, you may receive these documents through electronic delivery.
66 | Annual Report
This page intentionally left blank.
This page intentionally left blank.


FRANKLIN
STRATEGIC INCOME FUND


| 1
Annual Report
Franklin Strategic Income Fund
Your Fund’s Goals and Main Investments: Franklin Strategic Income Fund seeks a high level of current income, with capital appreciation over the long term as a secondary objective. The Fund uses an active asset allocation process and under normal market conditions invests at least 65% of its assets in U.S. and foreign debt securities, including those in emerging markets, which include all varieties of fixed and floating rate income securities, including bonds, bank loans (and loan participations), mortgage securities and other asset-backed securities, and convertible securities.
Performance data represent past performance, which does not guarantee future results. Investment return and principal value will fluctuate, and you may have a gain or loss when you sell your shares. Current performance may differ from figures shown. Please visit franklintempleton.com or call (800) 342-5236 for most recent month-end performance.
We are pleased to bring you Franklin Strategic Income Fund’s annual report for the fiscal year ended April 30, 2011.
Performance Overview
Franklin Strategic Income Fund – Class A posted a +9.41% cumulative total return for the 12 months under review. The Fund outperformed the +5.36% total return of its benchmark, the Barclays Capital (BC) U.S. Aggregate Index, which tracks the U.S. investment-grade, fixed-rate, taxable bond market.1 In comparison, the Fund’s peers had a total return of +8.68% as measured by the Lipper Multi-Sector Income Funds Classification Average, which consists of funds chosen by Lipper that seek current income by allocating assets among different fixed income securities sectors, with a significant portion rated below investment grade.2 You can find the Fund’s long-term performance data in the Performance Summary beginning on page 10.
1. Source: © 2011 Morningstar. All Rights Reserved. The information contained herein: (1) is proprietary to Morningstar and/or its content providers; (2) may not be copied or distributed; and (3) is not warranted to be accurate, complete or timely. Neither Morningstar nor its content providers are responsible for any damages or losses arising from any use of this information. The index is unmanaged and includes reinvestment of any income or distributions. One cannot invest directly in an index, and an index is not representative of the Fund’s portfolio.
2. Source: Lipper Inc. For the 12-month period ended 4/30/11, this category consisted of 177 funds. Lipper calculations do not include sales charges or expense subsidization by a fund’s manager. Fund performance relative to the average may have differed if these or other factors had been considered. The Lipper average includes reinvestment of any income or distributions. One cannot invest directly in a Lipper average, and the average is not representative of the Fund’s portfolio.
The dollar value, number of shares or principal amount, and names of all portfolio holdings are listed in the Fund’s Statement of Investments (SOI). The SOI begins on page 23.
Annual Report | 3
Economic and Market Overview
The U.S. economy expanded during the 12-month reporting period as consumer spending improved. Early in the year, economic improvement and benign inflation trends prompted Federal Reserve Board (Fed) policymakers to maintain historically low interest rates and discontinue certain stimulus plans. In June, the Fed offered a more restrained view of the economy largely because of developments in Europe and signs the U.S. economic expansion lacked momentum. In November, to promote a stronger recovery and help maintain inflation levels the Fed believed consistent with its dual mandate to foster maximum employment and price stability, the Fed announced its intention to buy $600 billion of longer term Treasury securities by the end of the second quarter of 2011. The job market recovered slowly, and the unemployment rate fell during the year under review. The growing job market boosted consumer confidence, and led to improved real estate and retail activity beginning in March.
Rising oil and food prices, however, eroded consumers’ spending power. Crude oil prices began the reporting period at $86 per barrel. However, the falling U.S. dollar, positive economic data and geopolitical instability in North Africa and the Middle East drove oil prices to a 12-month high of $114 at period-end. Storms and droughts in several states reduced crop yields, pushing up prices for corn, wheat and soybeans. As oil and food prices rose, the pace of inflation accelerated during the period.
Globally, the period under review was relatively favorable overall for risk assets as equity markets performed well and bond yields generally rose, supported by the strengthening global economic recovery. Emerging markets continued to recover, with many returning to pre-crisis activity levels. Previous market fears of a hard landing in emerging markets, China in particular, proved unfounded during the reporting period. Although some developed economies, such as those of Australia and Scandinavia, also enjoyed relatively strong recoveries, the G-3 (U.S., eurozone and Japan) continued to experience growth that was slow by historical standards. Divergent economic conditions among countries led to increasing differences in economic policies around the world. In countries where recoveries were relatively strong, policy was tightened during the period as output gaps closed and inflationary pressures showed signs of picking up. In contrast, many developed countries had significant slack in their economies and growth that remained below trend, which prompted policymakers to maintain historically loose monetary policy. A consequence of these divergent conditions was a further increase of capital flows to emerging markets.
4 | Annual Report
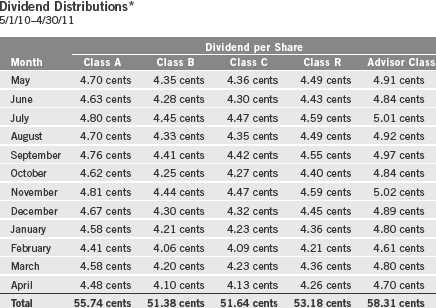
*All Fund distributions will vary depending upon current market conditions, and past distributions are not indicative of future trends.
Despite turmoil in North Africa and the Middle East, the multiple crises triggered by Japan’s earthquake, and the threat of a U.S. government shutdown, a generally favorable economic backdrop and positive corporate earnings reports gave investors confidence. Equity and fixed income markets generally performed well for the 12 months under review.
Investment Strategy
The Fund uses an active asset allocation strategy, investing across the fixed income market in sectors including high yield and investment grade corporate bonds, international developed and emerging market bonds, U.S. government and agency securities, mortgage- and other asset-backed securities, corporate bank loans, convertible securities and preferred stocks, and municipal securities. In addition to our bottom-up, fundamental analysis of market sectors, industries and issuers, we evaluate country risk, business cycles, yield curves, and values between and within markets as part of our portfolio construction process. We may also enter into various transactions involving certain currency-, interest rate- or credit-related derivative instruments for hedging purposes, to enhance returns or to obtain exposure to various market sectors.
Annual Report | 5
What is duration?
Duration is a measure of a bond’s price sensitivity to interest rate changes. In general, a portfolio of securities with a lower duration can be expected to be less sensitive to interest rate changes than a portfolio with a higher duration.
Manager’s Discussion
During the fiscal year under review, financial market headlines focused on the debt crisis of some eurozone countries, the launch of a second round of quantitative easing in the U.S., political uprisings in the Middle East and North Africa, and the earthquake and tsunami in Japan and subsequent nuclear plant containment issues. As a result, intra-period Treasury yields experienced heightened volatility, with 10-year U.S. Treasury note yields dropping from 3.69% at the beginning of the period to a post-recession low of 2.41% in early October 2010, but then rising to 3.32% at period-end. However, even with longer term U.S. Treasury rate volatility, most financial market sectors exhibited far less volatility, with a generally bullish investment bias. For the fiscal year, global and domestic stock markets generally posted healthy, double-digit returns. The credit sectors of the fixed income markets likewise delivered strong returns, with tightening of investment-grade and high yield corporate bond yield spreads over U.S. Treasuries and leveraged bank loan yield spreads over LIBOR, supported by healthy credit fundamentals and strong buying demand for those asset classes. Outside the U.S., the U.S. dollar continued to weaken, given superior growth prospects in certain developing countries and more aggressive short-term rate policies in certain developed countries. Overall, the fixed income environment over the past year favored higher beta, spread sectors and foreign currency investments over higher quality, more interest rate-sensitive investments.
In this environment, Franklin Strategic Income Fund generated positive price and total return performance, outpacing the BC U.S. Aggregate Index while performing in line with its median peers in the Lipper Multi-Sector Income Funds classification. The Fund’s lower weighting in longer duration, U.S. interest rate-sensitive fixed income sectors (i.e., U.S. Treasuries and agency bonds) positively impacted performance relative to the BC U.S. Aggregate Index, and the Fund’s exposure to investment-grade and below investment-grade credit sectors, which delivered strong returns for the year, also benefited the Fund’s performance. While high yield corporate bonds represented the Fund’s largest sector weighting and provided one of the highest total returns for the period, a lower weighting versus certain peer funds constrained performance relative to the Lipper peer average. Certain of the Fund’s non-U.S. dollar holdings also provided positive returns given currency appreciation relative to the U.S. dollar. However, a lower weighting in emerging market, hard currency sovereign bonds relative to certain peer funds limited returns relative to the Lipper peer group.
6 | Annual Report
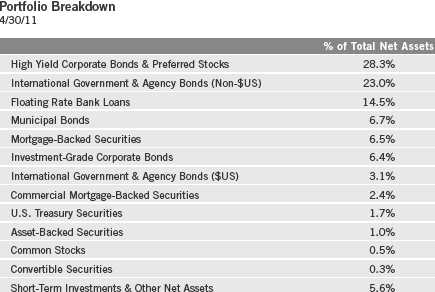
The slight decline in longer term U.S. interest rates allowed U.S. Treasuries to generally post returns somewhat above their coupon income. Relative to similar-duration Treasuries, agency mortgage-backed securities generally outperformed as yield spreads to Treasuries tightened. Although core inflationary pressures in the U.S. are anticipated to remain relatively low over the near term, the continuation of moderate economic growth, along with longer term concerns regarding the impact of the fiscal deficit on interest rates, caused us to maintain low exposure to Treasury and agency debentures. The Fund favored the current yield advantage of agency mortgage-backed securities, although exposure to that sector also remained relatively low compared to the Fund’s historical weightings. The commercial mortgage-backed securities (CMBS) sector posted another strong period of returns, following a very healthy rebound in calendar year 2009. The Fund sought to take advantage of this strong price performance to reduce its exposure to the CMBS sector during the reporting period. Conversely, negative headlines battered the municipal bond market in the latter half of the Fund’s fiscal year. Although these unfavorable stories may persist, we remain comfortable with the longer term credit quality of the state and municipal obligations the Fund has invested in. Consequently, during the period the Fund added to its municipal bond positions, with a focus on certain Build America Bonds (BABs) during calendar year 2010 and tax-exempt issuers in 2011.
Annual Report | 7
What is a forward currency exchange contract?
A foreign currency exchange contract is an agreement between the Fund and a counterparty to buy or sell a foreign currency for a specific exchange rate on a future date.
The corporate credit markets continued their strong relative performance, which began in calendar year 2009. Driven by the global economic rebound, corporate earnings and cash flow growth moved higher, supporting credit metrics for many issuers. In addition, an accommodative new-issue market allowed most companies to refinance their debt obligations at attractive rates. As a result, 12-month trailing default rates for high yield corporate bonds and leveraged bank loans continued to move lower, declining to very low single digits by period-end. Demand for the higher yield of such below investment-grade instruments as high yield corporate bonds and leveraged bank loans provided ongoing price support for these two sectors. Although bank loans experienced a pause in performance in early 2011 as certain bank loan issuers sought to reprice their loan obligations at lower LIBOR-based spread levels, in general the corporate credit sectors were strong contributors to the Fund’s performance during the fiscal year. Over the year, the Fund’s high yield corporate exposure remained relatively steady, while we took some gains from our investment-grade holdings and redeployed those into the less interest rate-sensitive bank loan sector. As part of the increase in effective bank loan exposure, the Fund established a position in a bank loan derivative instrument, the Markit North American Loan Credit Default Swap Index (LCDX), a tradable index of 100 equally weighted, first-lien loan credit default swaps.
The Fund continued to incrementally add to its non-U.S. dollar exposure during the period, given a view toward greater fundamental and technical support for certain foreign currencies, particularly in various developing markets. With U.S. dollar weakness during the period, the Fund’s holdings in currencies and countries in the Asia-Pacific region, particularly Australia, as well as with certain non-eurozone European holdings, such as Sweden, provided positive returns for the Fund. However, the Japanese yen’s strength negatively affected the Fund’s short forward currency position, through the use of forward currency exchange contracts, in that country. Similarly, euro strength offset some of the gains we would have otherwise experienced in the currencies of non-eurozone European countries such as Norway and Poland, given our proxy short euro hedge, through the use of forward currency exchange contracts, against those holdings. Supported by strong fundamental credit trends, particularly relative to certain developed markets, the hard currency U.S.-dollar emerging market bond sector performed well during the period. However, considering historically rich valuations, the Fund held a relatively small position in this sector during the period.
8 | Annual Report
Thank you for your continued participation in Franklin Strategic Income Fund. We look forward to serving your future investment needs.


Christopher J. Molumphy, CFA

Eric G. Takaha, CFA
Portfolio Management Team
Franklin Strategic Income Fund
CFA® is a trademark owned by CFA Institute.
The foregoing information reflects our analysis, opinions and portfolio holdings as of April 30, 2011, the end of the reporting period. The way we implement our main investment strategies and the resulting portfolio holdings may change depending on factors such as market and economic conditions. These opinions may not be relied upon as investment advice or an offer for a particular security. The information is not a complete analysis of every aspect of any market, country, industry, security or the Fund. Statements of fact are from sources considered reliable, but the investment manager makes no representation or warranty as to their completeness or accuracy. Although historical performance is no guarantee of future results, these insights may help you understand our investment management philosophy.
Annual Report | 9
Performance Summary as of 4/30/11
Your dividend income will vary depending on dividends or interest paid by securities in the Fund’s portfolio, adjusted for operating expenses of each class. Capital gain distributions are net profits realized from the sale of portfolio securities. The performance table and graphs do not reflect any taxes that a shareholder would pay on Fund dividends, capital gain distributions, if any, or any realized gains on the sale of Fund shares. Total return reflects reinvestment of the Fund’s dividends and capital gain distributions, if any, and any unrealized gains or losses.

10 | Annual Report
Performance Summary (continued)
Performance
Cumulative total return excludes sales charges. Average annual total returns include maximum sales charges. Class A: 4.25% maximum initial sales charge; Class B: contingent deferred sales charge (CDSC) declining from 4% to 1% over six years, and eliminated thereafter; Class C: 1% CDSC in first year only; Class R/Advisor Class: no sales charges.

Performance data represent past performance, which does not guarantee future results. Investment return and principal value will fluctuate, and you may have a gain or loss when you sell your shares. Current performance may differ from figures shown. For most recent month-end performance, go to franklintempleton.com or call (800) 342-5236.
Annual Report | 11
Performance Summary (continued)
Total Return Index Comparison for a Hypothetical $10,000 Investment
Total return represents the change in value of an investment over the periods shown. It includes any current, applicable, maximum sales charge, Fund expenses, account fees and reinvested distributions. The unmanaged indexes include reinvestment of any income or distributions. They differ from the Fund in composition and do not pay management fees or expenses. One cannot invest directly in an index.
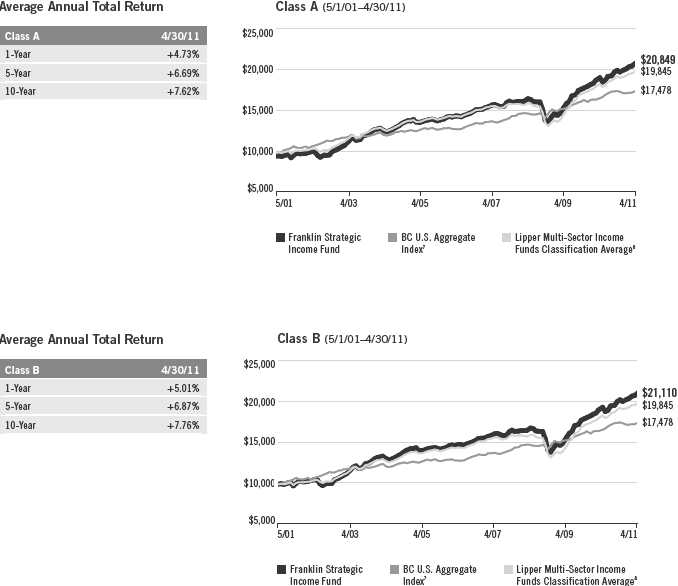
12 | Annual Report

Annual Report | 13

14 | Annual Report
Performance Summary (continued)
Endnotes
Bond prices generally move in the opposite direction of interest rates. Thus, as prices of bonds in the Fund adjust to a rise in interest rates, the Fund’s share price may decline. High yields reflect the higher credit risks associated with certain lower rated securities held in the portfolio. Floating rate loans and high yield corporate bonds are rated below investment grade and are subject to greater risk of default, which could result in loss of principal — a risk that may be heightened in a slowing economy. The risks of foreign securities include currency fluctuations and political uncertainty. Investments in developing markets involve heightened risks related to the same factors, in addition to those associated with their relatively small size and lesser liquidity. Investing in derivative securities and the use of foreign currency techniques involve special risks as such techniques may not achieve the anticipated benefits and/or may result in losses to the Fund. The manager applies various techniques and analyses in making investment decisions for the Fund, but there can be no guarantee that these decisions will produce the desired results. The Fund’s prospectus also includes a description of the main investment risks.
Class B: Class C: |
These shares have higher annual fees and expenses than Class A shares. Prior to 1/1/04, these shares were offered with an initial sales charge; thus actual total returns would have differed. These shares have higher annual fees and expenses than Class A shares. |
Class R: |
Shares are available to certain eligible investors as described in the prospectus. These shares have higher annual fees and expenses than Class A shares. |
Advisor Class: |
Shares are available to certain eligible investors as described in the prospectus. |
1. Cumulative total return represents the change in value of an investment over the periods indicated.
2. Average annual total return represents the average annual change in value of an investment over the periods indicated.
3. In accordance with SEC rules, we provide standardized average annual total return information through the latest calendar quarter.
4. Distribution rate is based on an annualization of the respective class’s April dividend and the maximum offering price (NAV for Classes B, C, R and Advisor) per share on 4/30/11.
5. The 30-day standardized yield for the 30 days ended 4/30/11 reflects an estimated yield to maturity (assuming all portfolio securities are held to maturity). It should be regarded as an estimate of the Fund’s rate of investment income, and it may not equal the Fund’s actual income distribution rate (which reflects the Fund’s past dividends paid to shareholders) or the income reported in the Fund’s financial statements.
6. Figures are as stated in the Fund’s prospectus current as of the date of this report. In periods of market volatility, assets may decline significantly, causing total annual Fund operating expenses to become higher than the figures shown.
7. Source: © 2011 Morningstar. The BC U.S. Aggregate Index is a market capitalization-weighted index representing the U.S. investment grade, fixed-rate, taxable bond market with index components for government and corporate, mortgage pass-through and asset-backed securities. All issues included are SEC-registered, taxable, dollar denominated, nonconvertible, must have at least one year to final maturity, and must be rated investment grade (Baa3/BBB-/BBB- or above) using the middle rating of Moody’s, Standard & Poor’s and Fitch, respectively. Total return includes price appreciation/depreciation and income as a percentage of the original investment. The index is rebalanced monthly by market capitalization.
8. Source: Lipper Inc. The Lipper Multi-Sector Income Funds Classification Average is calculated by averaging the total returns of all funds within the Lipper Multi-Sector Income Funds classification in the Lipper Open-End underlying funds universe. Lipper Multi-Sector Income Funds are defined as funds that seek current income by allocating assets among different fixed income securities sectors (not primarily in one sector except for defensive purposes), including U.S. and foreign governments, with a significant portion rated below investment grade. For the 12-month period ended 4/30/11, this category consisted of 177 funds. Lipper calculations do not include sales charges, but include reinvestment of any income or distributions. Fund performance relative to the average may have differed if these and other factors had been considered.
Annual Report | 15
Your Fund’s Expenses
As a Fund shareholder, you can incur two types of costs:
- Transaction costs, including sales charges (loads) on Fund purchases; and
- Ongoing Fund costs, including management fees, distribution and service (12b-1) fees, and other Fund expenses. All mutual funds have ongoing costs, sometimes referred to as operating expenses.
The following table shows ongoing costs of investing in the Fund and can help you understand these costs and compare them with those of other mutual funds. The table assumes a $1,000 investment held for the six months indicated.
Actual Fund Expenses
The first line (Actual) for each share class listed in the table provides actual account values and expenses. The “Ending Account Value” is derived from the Fund’s actual return, which includes the effect of Fund expenses.
You can estimate the expenses you paid during the period by following these steps. Of course, your account value and expenses will differ from those in this illustration:
| 1. | Divide your account value by $1,000. |
| If an account had an $8,600 value, then $8,600 ÷ $1,000 = 8.6. | |
| 2. | Multiply the result by the number under the heading “Expenses Paid During Period.” |
| If Expenses Paid During Period were $7.50, then 8.6 x $7.50 = $64.50. |
In this illustration, the estimated expenses paid this period are $64.50.
Hypothetical Example for Comparison with Other Funds
Information in the second line (Hypothetical) for each class in the table can help you compare ongoing costs of investing in the Fund with those of other mutual funds. This information may not be used to estimate the actual ending account balance or expenses you paid during the period. The hypothetical “Ending Account Value” is based on the actual expense ratio for each class and an assumed 5% annual rate of return before expenses, which does not represent the Fund’s actual return. The figure under the heading “Expenses Paid During Period” shows the hypothetical expenses your account would have incurred under this scenario. You can compare this figure with the 5% hypothetical examples that appear in shareholder reports of other funds.
16 | Annual Report
Your Fund’s Expenses (continued)
Please note that expenses shown in the table are meant to highlight ongoing costs and do not reflect any transaction costs, such as sales charges. Therefore, the second line for each class is useful in comparing ongoing costs only, and will not help you compare total costs of owning different funds. In addition, if transaction costs were included, your total costs would have been higher. Please refer to the Fund prospectus for additional information on operating expenses.
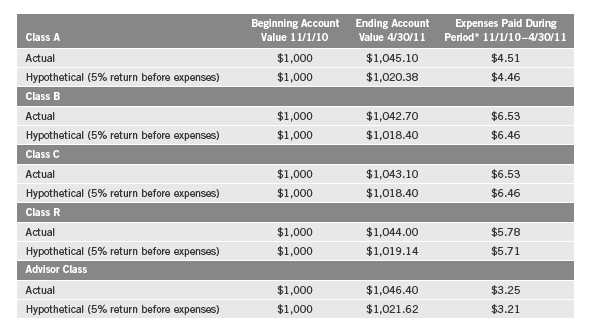
*Expenses are calculated using the most recent six-month expense ratio, annualized for each class (A: 0.89%; B: 1.29%; C: 1.29%; R: 1.14%; and Advisor: 0.64%), multiplied by the average account value over the period, multiplied by 181/365 to reflect the one-half year period.
Annual Report | 17
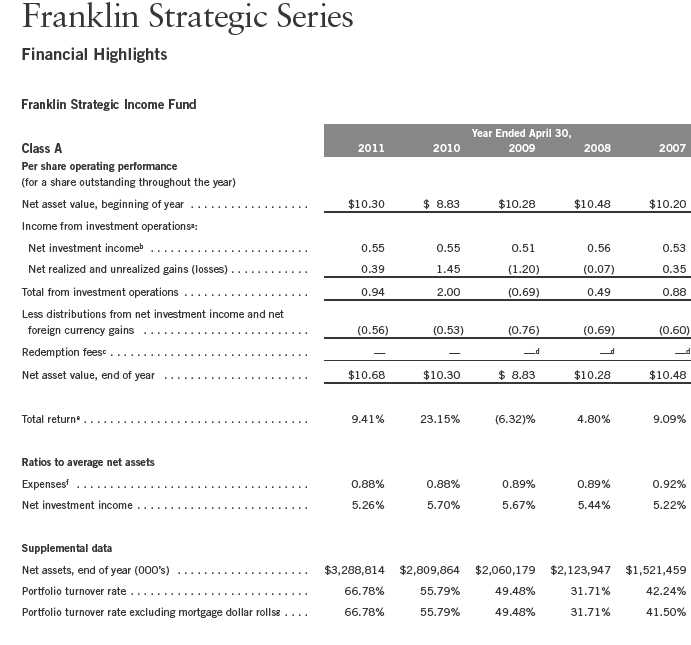
aThe amount shown for a share outstanding throughout the period may not correlate with the Statement of Operations for the period due to the timing of sales and repurchases of
the Fund shares in relation to income earned and/or fluctuating market value of the investments of the Fund.
bBased on average daily shares outstanding.
cEffective September 1, 2008, the redemption fee was eliminated.
dAmount rounds to less than $0.01 per share.
eTotal return does not reflect sales commissions or contingent deferred sales charges, if applicable.
fBenefit of expense reduction rounds to less than 0.01%.
gSee Note 1(f) regarding mortgage dollar rolls.
18 | The accompanying notes are an integral part of these financial statements. | Annual Report

aThe amount shown for a share outstanding throughout the period may not correlate with the Statement of Operations for the period due to the timing of sales and repurchases of
the Fund shares in relation to income earned and/or fluctuating market value of the investments of the Fund.
bBased on average daily shares outstanding.
cEffective September 1, 2008, the redemption fee was eliminated.
dAmount rounds to less than $0.01 per share.
eTotal return does not reflect sales commissions or contingent deferred sales charges, if applicable.
fBenefit of expense reduction rounds to less than 0.01%.
gSee Note 1(f) regarding mortgage dollar rolls.
Annual Report | The accompanying notes are an integral part of these financial statements. | 19
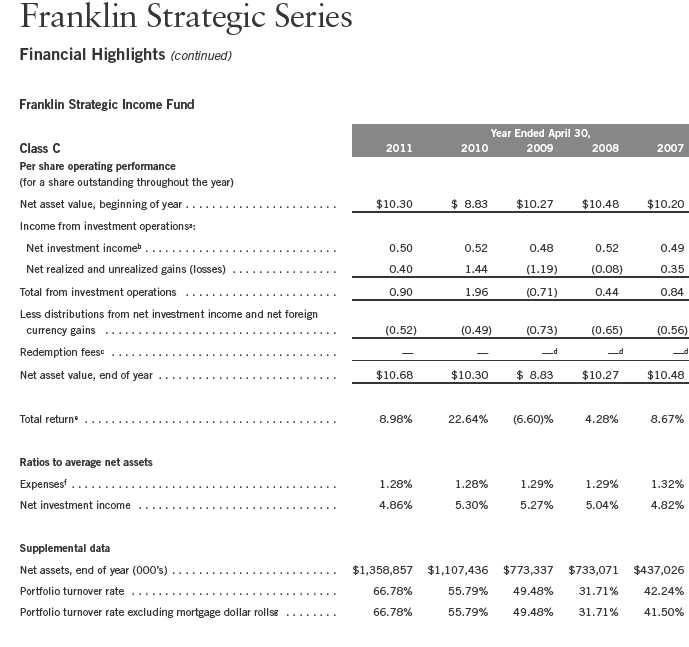
aThe amount shown for a share outstanding throughout the period may not correlate with the Statement of Operations for the period due to the timing of sales and repurchases of
the Fund shares in relation to income earned and/or fluctuating market value of the investments of the Fund.
bBased on average daily shares outstanding.
cEffective September 1, 2008, the redemption fee was eliminated.
dAmount rounds to less than $0.01 per share.
eTotal return does not reflect sales commissions or contingent deferred sales charges, if applicable.
fBenefit of expense reduction rounds to less than 0.01%.
gSee Note 1(f) regarding mortgage dollar rolls.
20 | The accompanying notes are an integral part of these financial statements. | Annual Report

aThe amount shown for a share outstanding throughout the period may not correlate with the Statement of Operations for the period due to the timing of sales and repurchases of
the Fund shares in relation to income earned and/or fluctuating market value of the investments of the Fund.
bBased on average daily shares outstanding.
cEffective September 1, 2008, the redemption fee was eliminated.
dAmount rounds to less than $0.01 per share.
eTotal return does not reflect sales commissions or contingent deferred sales charges, if applicable.
fBenefit of expense reduction rounds to less than 0.01%.
gSee Note 1(f) regarding mortgage dollar rolls.
Annual Report | The accompanying notes are an integral part of these financial statements. | 21
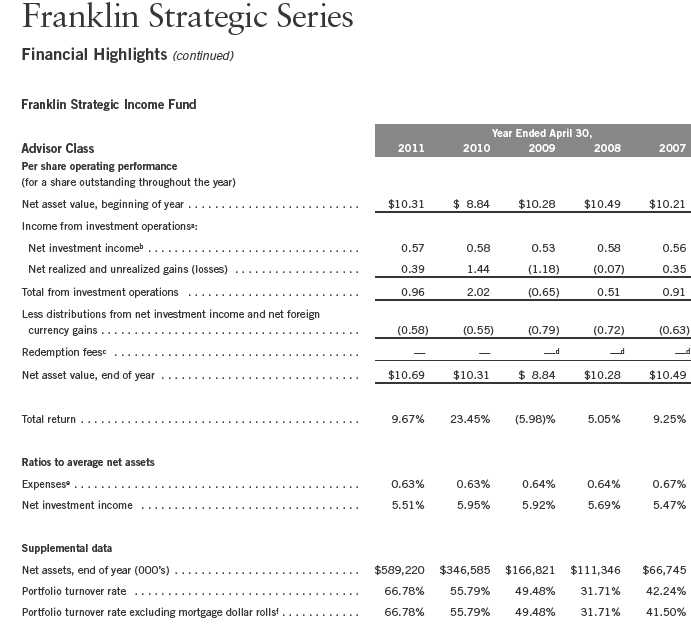
aThe amount shown for a share outstanding throughout the period may not correlate with the Statement of Operations for the period due to the timing of sales and repurchases of
the Fund shares in relation to income earned and/or fluctuating market value of the investments of the Fund.
bBased on average daily shares outstanding.
cEffective September 1, 2008, the redemption fee was eliminated.
dAmount rounds to less than $0.01 per share.
eBenefit of expense reduction rounds to less than 0.01%.
fSee Note 1(f) regarding mortgage dollar rolls.
22 | The accompanying notes are an integral part of these financial statements. | Annual Report
Franklin Strategic Series
Statement of Investments, April 30, 2011

Annual Report | 23
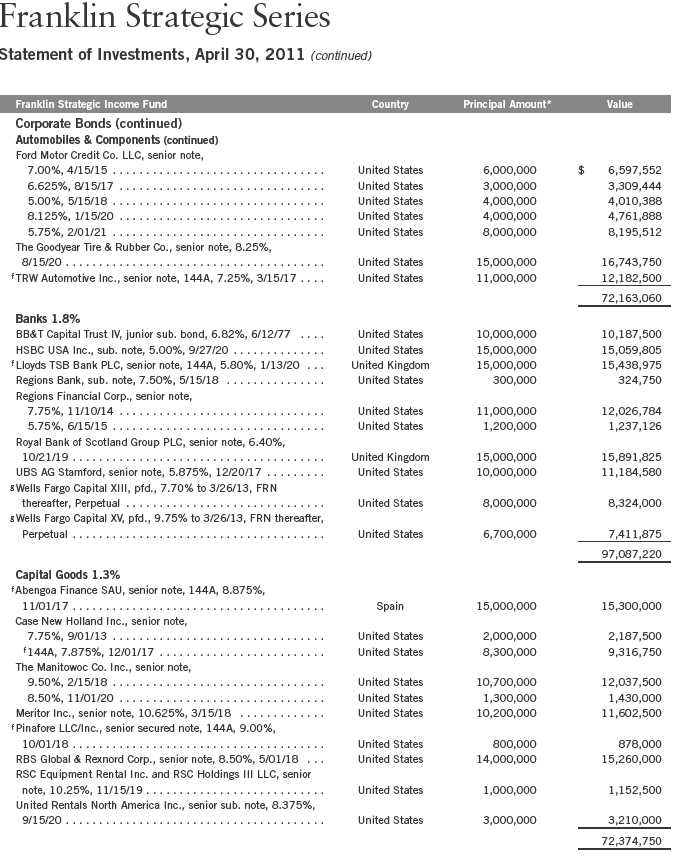
24 | Annual Report
Franklin Strategic Series
Statement of Investments, April 30, 2011 (continued)
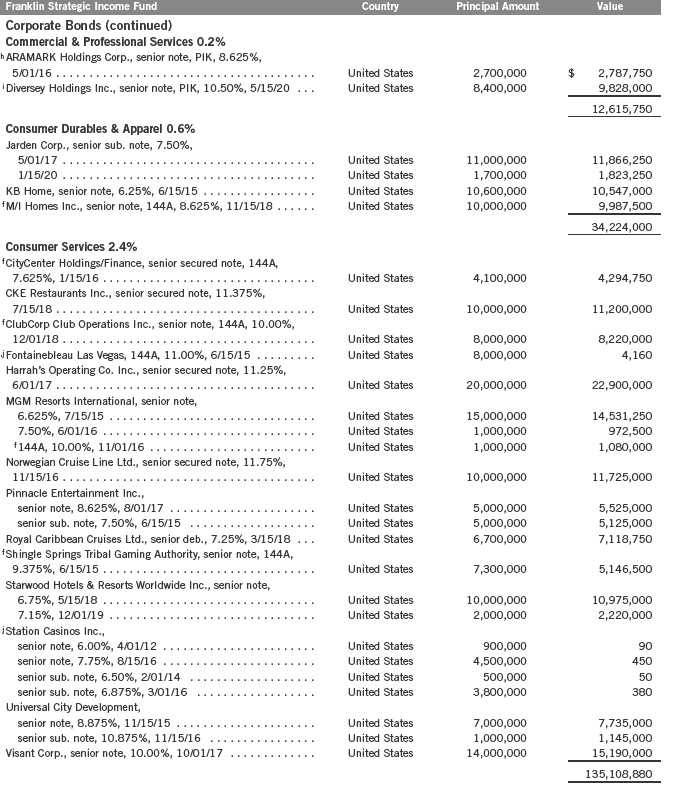
Annual Report | 25
Franklin Strategic Series
Statement of Investments, April 30, 2011 (continued)

26 | Annual Report


28 | Annual Report
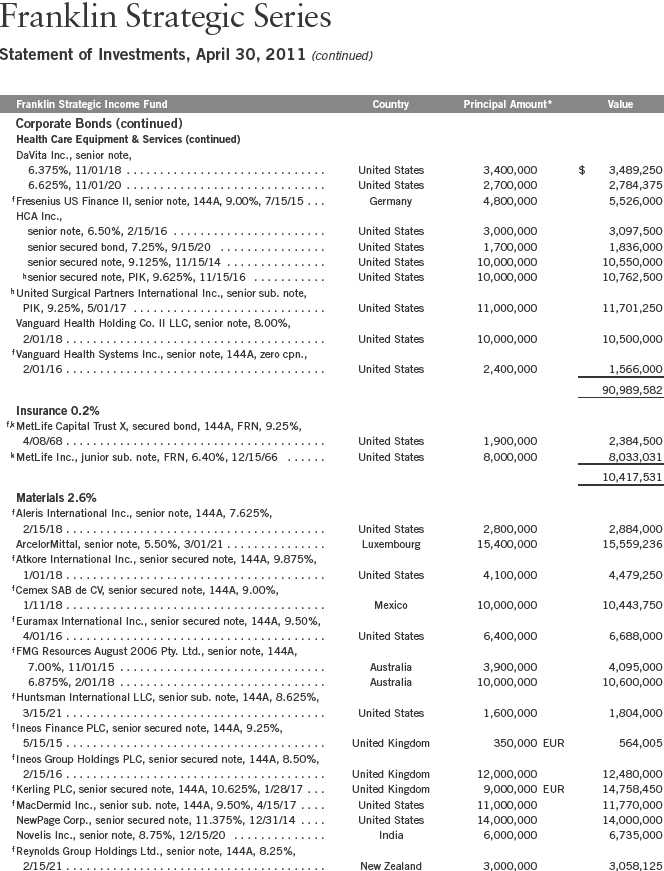
Annual Report | 29
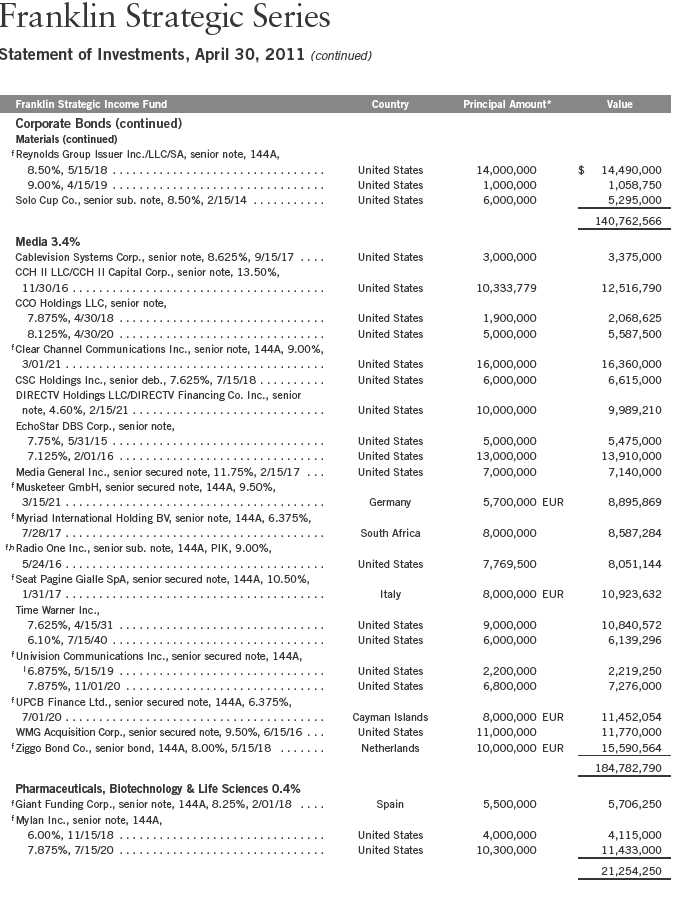
30 | Annual Report
Franklin Strategic Series
Statement of Investments, April 30, 2011 (continued)

Annual Report | 31
Franklin Strategic Series
Statement of Investments, April 30, 2011 (continued)
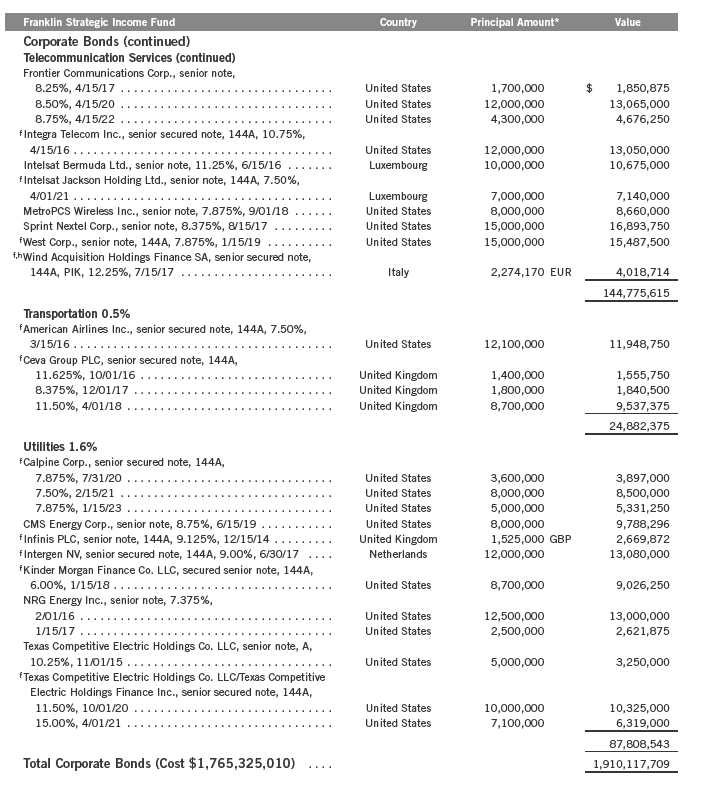
32 | Annual Report
Franklin Strategic Series
Statement of Investments, April 30, 2011 (continued)

Annual Report | 33
Franklin Strategic Series
Statement of Investments, April 30, 2011 (continued)

34 | Annual Report

Annual Report | 35

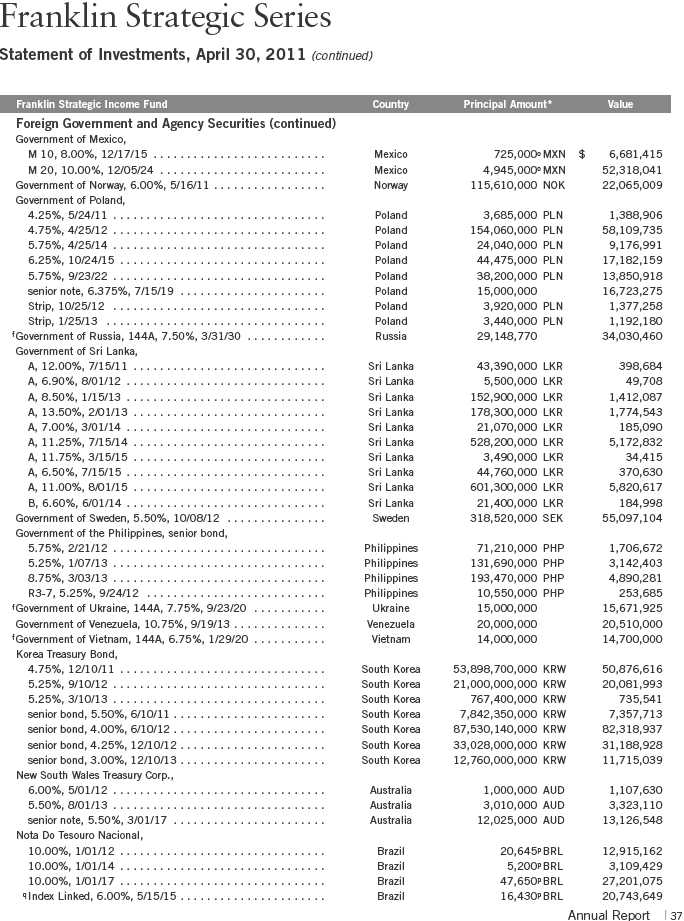

38 | Annual Report
Franklin Strategic Series
Statement of Investments, April 30, 2011 (continued)

Annual Report | 39
Franklin Strategic Series
Statement of Investments, April 30, 2011 (continued)
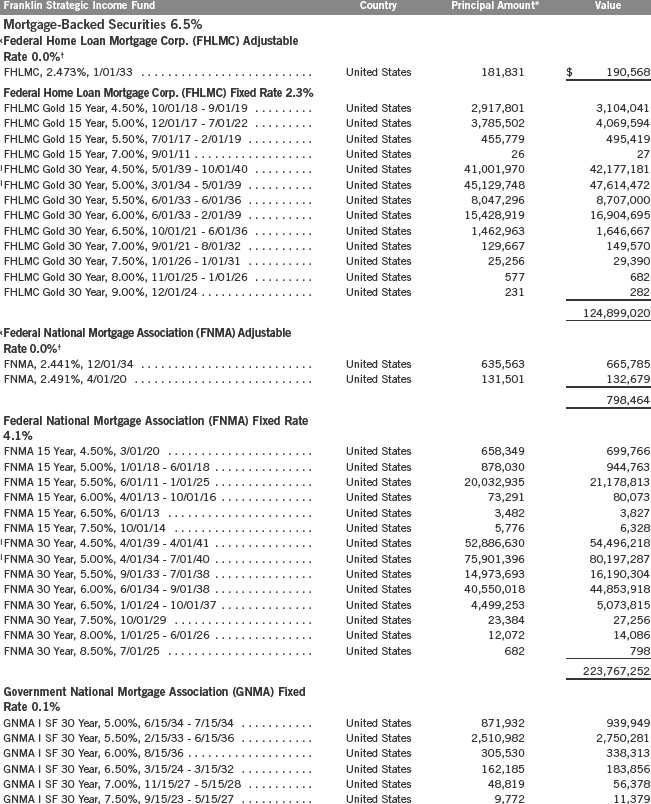
40
Franklin Strategic Series
Statement of Investments, April 30, 2011 (continued)
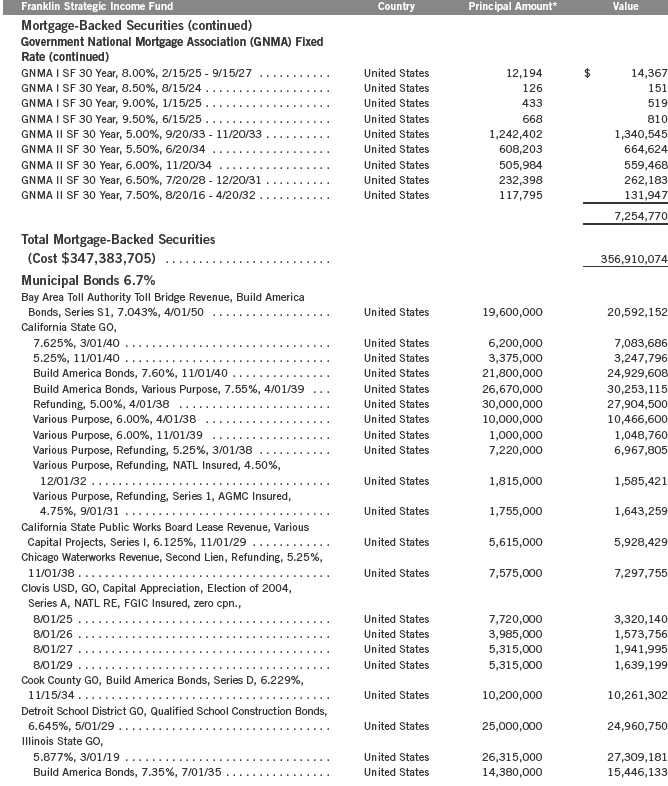
Annual Report | 41

42 | Annual Report
Franklin Strategic Series
Statement of Investments, April 30, 2011 (continued)
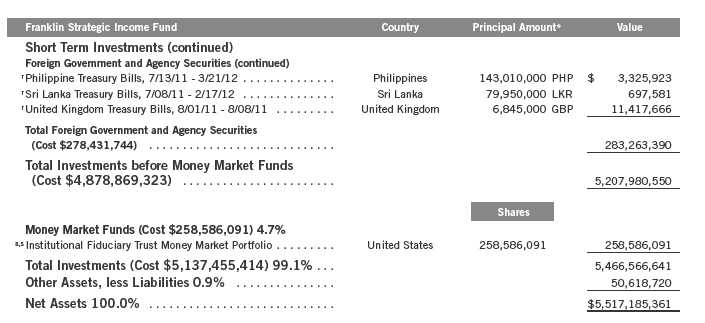
†Rounds to less than 0.1% of net assets.
*The principal amount is stated in U.S. dollars unless otherwise indicated.
aNon-income producing.
bSee Note 9 regarding restricted securities.
cSecurity has been deemed illiquid because it may not be able to be sold within seven days. At April 30, 2011, the aggregate value of these securities was $5,752,729, representing
0.10% of net assets.
dSee Note 1(e) regarding investment in FT Holdings Corporation II.
eAt April 30, 2011, pursuant to the Fund’s policies and the requirements of applicable securities law, the Fund may be restricted from trading this security for a limited or extended
period of time due to ownership limits and/or potential possession of material non-public information.
fSecurity was purchased pursuant to Rule 144A under the Securities Act of 1933 and may be sold in transactions exempt from registration only to qualified institutional buyers or in a
public offering registered under the Securities Act of 1933. These securities have been deemed liquid under guidelines approved by the Trust’s Board of Trustees. At April 30, 2011, the
aggregate value of these securities was $917,820,298, representing 16.64% of net assets.
gPerpetual security with no stated maturity date.
hIncome may be received in additional securities and/or cash.
iIncome may be reflected in the redemption value or received in additional securities and/or cash.
jSee Note 8 regarding defaulted securities.
kThe coupon rate shown represents the rate at period end.
lA portion or all of the security purchased on a when-issued, delayed delivery, or to-be-announced basis. See Note 1(c).
mSee Note 1(g) regarding senior floating rate interests.
nThe principal amount is stated in original face, and scheduled paydowns are reflected in the market price on ex-date.
oPrincipal amount is stated in 100 Mexican Peso Units.
pPrincipal amount is stated in 1,000 Brazilian Real Units.
qRedemption price at maturity is adjusted for inflation. See Note 1(i).
rThe security is traded on a discount basis with no stated coupon rate.
sSee Note 7 regarding investments in the Institutional Fiduciary Trust Money Market Portfolio.
Annual Report | 43
Franklin Strategic Series
Statement of Investments, April 30, 2011 (continued)
Franklin Strategic Income Fund
At April 30, 2011, the Fund had the following forward exchange contracts outstanding. See Note 1(d).
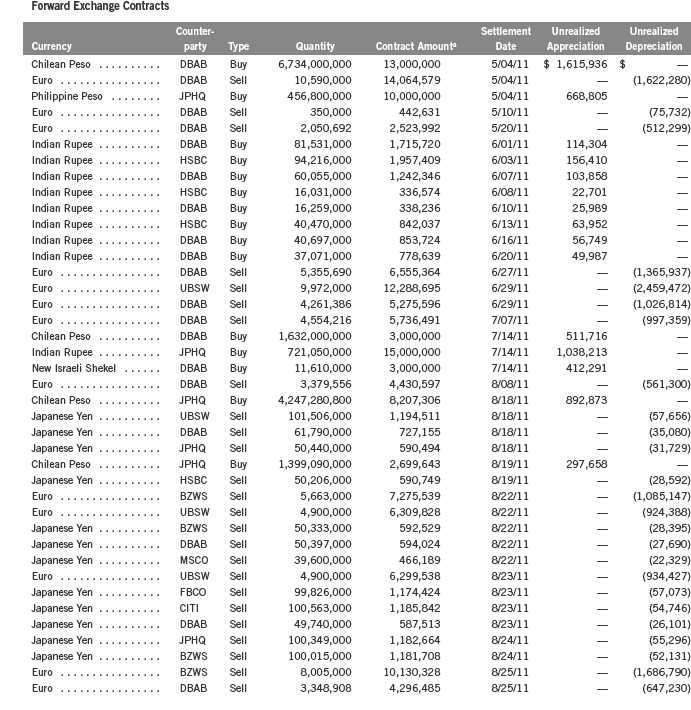
44 | Annual Report

Annual Report | 45

46 | Annual Report

Annual Report | 47
Franklin Strategic Series
Statement of Investments, April 30, 2011 (continued)
Franklin Strategic Income Fund
At April 30, 2011, the Fund had the following credit default swap contracts outstanding. See Note 1(d).
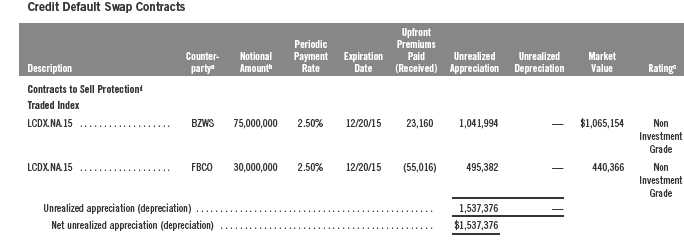
aPositions are generally not collateralized if the market value is under $250,000. Collateral requirements may be net of current positions at the individual counterparty for the Fund.
The table below summarizes the cash and/or securities held as collateral for each applicable counterparty at year end:

bIn U.S. dollars unless otherwise indicated. For contracts to sell protection, the notional amount is equal to the maximum potential amount of the future payments and no recourse provisions have been entered into in association with the contracts. cBased on Standard and Poor’s (S&P) Rating for single name swaps and internal ratings for index swaps. Internal ratings based on mapping into equivalent ratings from external vendors. dThe Fund enters contracts to sell protection to create a long credit position. Performance triggers include failure to pay or bankruptcy for traded index swaps.
See Abbreviations on page 68.
48 | The accompanying notes are an integral part of these financial statements. | Annual Report

Annual Report | The accompanying notes are an integral part of these financial statements. | 49
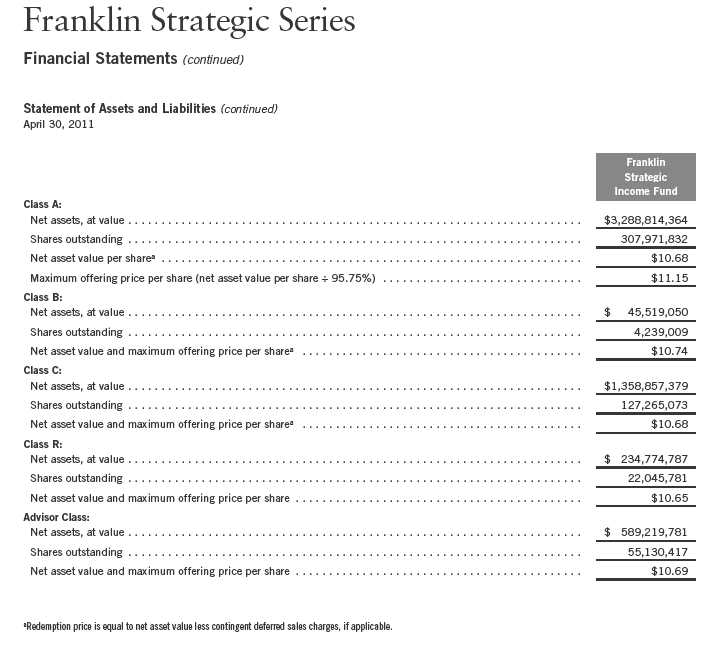
50 | The accompanying notes are an integral part of these financial statements. | Annual Report
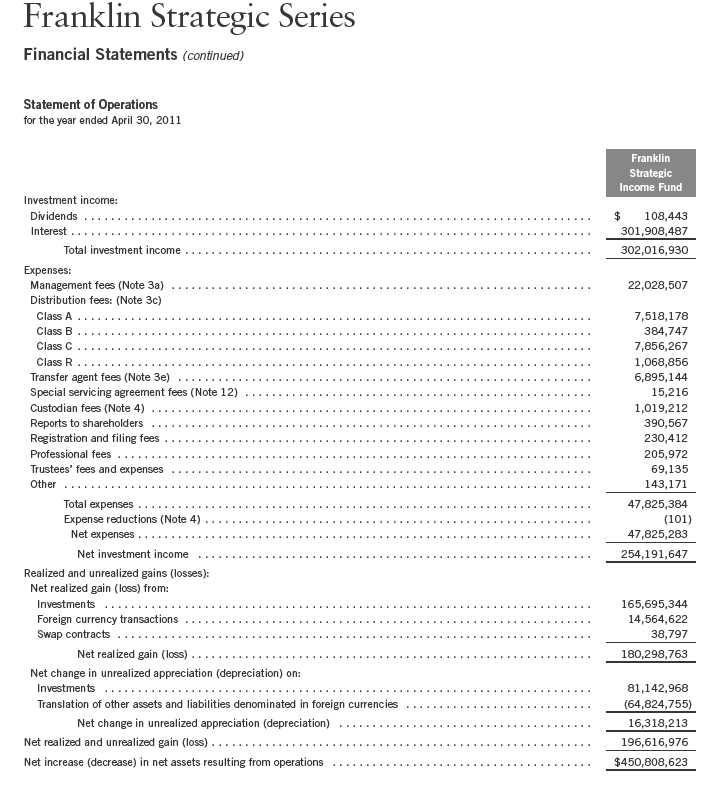
Annual Report | The accompanying notes are an integral part of these financial statements. | 51
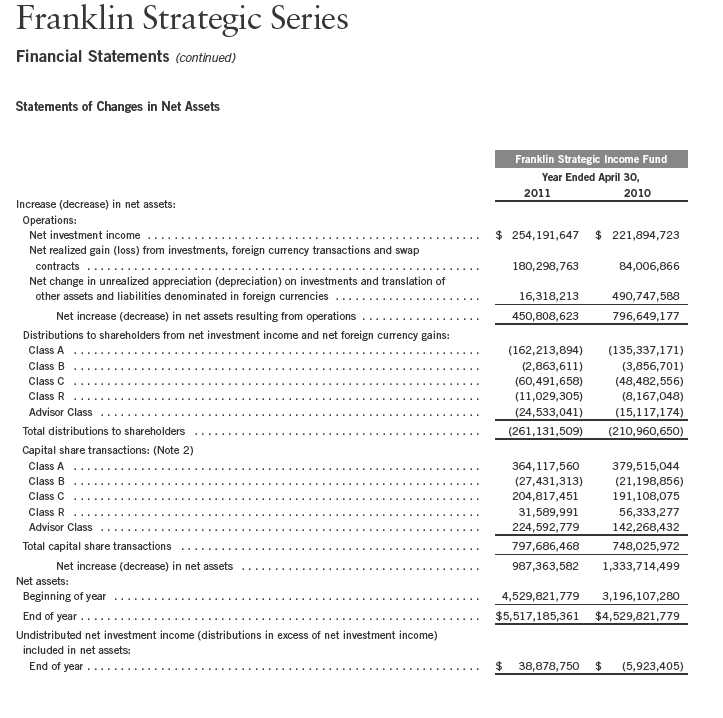
52 | The accompanying notes are an integral part of these financial statements. | Annual Report
Franklin Strategic Series
Notes to Financial Statements
Franklin Strategic Income Fund
1. ORGANIZATION AND SIGNIFICANT ACCOUNTING POLICIES
Franklin Strategic Series (Trust) is registered under the Investment Company Act of 1940, as amended, (1940 Act) as an open-end investment company, consisting of eight separate funds. The Franklin Strategic Income Fund (Fund) is included in this report. The financial statements of the remaining funds in the Trust are presented separately. The Fund offers five classes of shares: Class A, Class B, Class C, Class R, and Advisor Class. Each class of shares differs by its initial sales load, contingent deferred sales charges, distribution fees, voting rights on matters affecting a single class and its exchange privilege.
The following summarizes the Fund’s significant accounting policies.
a. Financial Instrument Valuation
The Fund’s investments in securities and other financial instruments are carried at fair value daily. Fair value is the price that would be received to sell an asset or paid to transfer a liability in an orderly transaction between market participants on the measurement date. Under procedures approved by the Trust’s Board of Trustees, the Fund may utilize independent pricing services, quotations from securities and financial instrument dealers, and other market sources to determine fair value.
Equity securities listed on an exchange or on the NASDAQ National Market System are valued at the last quoted sale price or the official closing price of the day, respectively. Over-the-counter securities are valued within the range of the most recent quoted bid and ask prices. Securities that trade in multiple markets or on multiple exchanges are valued according to the broadest and most representative market. Certain equity securities are valued based upon fundamental characteristics or relationships to similar securities. Investments in open-end mutual funds are valued at the closing net asset value.
Debt securities generally trade in the over-the-counter market rather than on a securities exchange. The Fund’s pricing services use multiple valuation techniques to determine fair value. In instances where sufficient market activity exists, the pricing services may utilize a market-based approach through which quotes from market makers are used to determine fair value. In instances where sufficient market activity may not exist or is limited, the pricing services also utilize proprietary valuation models which may consider market characteristics such as benchmark yield curves, option-adjusted spreads, credit spreads, estimated default rates, coupon rates, anticipated timing of principal repayments, underlying collateral, and other unique security features in order to estimate the relevant cash flows, which are then discounted to calculate the fair value. Securities denominated in a foreign currency are converted into their U.S. dollar equivalent at the foreign exchange rate in effect at the close of the NYSE on the date that the values of the foreign debt securities are determined.
Annual Report | 53
Franklin Strategic Series
Notes to Financial Statements (continued)
Franklin Strategic Income Fund
| 1. | ORGANIZATION AND SIGNIFICANT ACCOUNTING POLICIES (continued) |
| a. | Financial Instrument Valuation (continued) |
Certain derivative financial instruments (derivatives) trade in the over-the-counter market. The Fund’s pricing services use various techniques including industry standard option pricing models and proprietary discounted cash flow models to determine the fair value of those instruments. The Fund’s net benefit or obligation under the derivative contract, as measured by the fair market value of the contract, is included in net assets.
The Fund has procedures to determine the fair value of securities and other financial instruments for which market prices are not readily available or which may not be reliably priced. Under these procedures, the Fund primarily employs a market-based approach which may use related or comparable assets or liabilities, recent transactions, market multiples, book values, and other relevant information for the investment to determine the fair value of the investment. The Fund may also use an income-based valuation approach in which the anticipated future cash flows of the investment are discounted to calculate fair value. Discounts may also be applied due to the nature or duration of any restrictions on the disposition of the investments. Due to the inherent uncertainty of valuations of such investments, the fair values may differ significantly from the values that would have been used had an active market existed.
b. Foreign Currency Translation
Portfolio securities and other assets and liabilities denominated in foreign currencies are translated into U.S. dollars based on the exchange rate of such currencies against U.S. dollars on the date of valuation. The Fund may enter into foreign currency exchange contracts to facilitate transactions denominated in a foreign currency. Purchases and sales of securities, income and expense items denominated in foreign currencies are translated into U.S. dollars at the exchange rate in effect on the transaction date. Portfolio securities and assets and liabilities denominated in foreign currencies contain risks that those currencies will decline in value relative to the U.S. dollar. Occasionally, events may impact the availability or reliability of foreign exchange rates used to convert the U.S. dollar equivalent value. If such an event occurs, the foreign exchange rate will be valued at fair value using procedures established and approved by the Trust’s Board of Trustees.
The Fund does not separately report the effect of changes in foreign exchange rates from changes in market prices on securities held. Such changes are included in net realized and unrealized gain or loss from investments on the Statement of Operations.
Realized foreign exchange gains or losses arise from sales of foreign currencies, currency gains or losses realized between the trade and settlement dates on securities transactions and the difference between the recorded amounts of dividends, interest, and foreign withholding taxes and
54 | Annual Report
Franklin Strategic Series
Notes to Financial Statements (continued)
Franklin Strategic Income Fund
| 1. | ORGANIZATION AND SIGNIFICANT ACCOUNTING POLICIES (continued) |
| b. | Foreign Currency Translation (continued) |
the U.S. dollar equivalent of the amounts actually received or paid. Net unrealized foreign exchange gains and losses arise from changes in foreign exchange rates on foreign denominated assets and liabilities other than investments in securities held at the end of the reporting period.
c. Securities Purchased on a When-Issued, Delayed Delivery, and TBA Basis
The Fund purchases securities on a when-issued, delayed delivery, and to-be-announced (TBA) basis, with payment and delivery scheduled for a future date. These transactions are subject to market fluctuations and are subject to the risk that the value at delivery may be more or less than the trade date purchase price. Although the Fund will generally purchase these securities with the intention of holding the securities, it may sell the securities before the settlement date. Sufficient assets have been segregated for these securities.
d. Derivative Financial Instruments
The Fund invested in derivatives in order to manage risk or gain exposure to various other investments or markets. Derivatives are financial contracts based on an underlying or notional amount, require no initial investment or an initial net investment that is smaller than would normally be required to have a similar response to changes in market factors, and require or permit net settlement. Derivatives contain various risks including the potential inability of the counterparty to fulfill their obligations under the terms of the contract, the potential for an illiquid secondary market, and/or the potential for market movements which expose the Fund to gains or losses in excess of the amounts shown on the Statement of Assets and Liabilities. Realized gain and loss and unrealized appreciation and depreciation on these contracts for the period are included in the Statement of Operations.
The Fund entered into forward exchange contracts primarily to manage and/or gain exposure to certain foreign currencies. A forward exchange contract is an agreement between the Fund and a counterparty to buy or sell a foreign currency for a specific exchange rate on a future date. Pursuant to the terms of the forward exchange contracts, cash or securities may be required to be deposited as collateral. Unrestricted cash may be invested according to the Fund’s investment objectives.
The Fund entered into credit default swap contracts primarily to manage and/or gain exposure to credit risk. A credit default swap is an agreement between the Fund and a counterparty whereby the buyer of the contract receives credit protection and the seller of the contract guarantees the credit worthiness of a referenced debt obligation. In the event of a default of the underlying referenced debt obligation, the buyer is entitled to receive the notional amount of the credit default swap contract (or other agreed upon amount) from the seller. Over the term of the contract, the
Annual Report | 55
Franklin Strategic Series
Notes to Financial Statements (continued)
Franklin Strategic Income Fund
| 1. | ORGANIZATION AND SIGNIFICANT ACCOUNTING POLICIES (continued) |
| d. | Derivative Financial Instruments (continued) |
buyer pays the seller a periodic stream of payments, provided that no event of default has occurred. Such periodic payments are accrued daily as an unrealized appreciation or depreciation until the payments are made, at which time they are realized. Payments received or paid to initiate a credit default swap contract are reflected on the Statement of Assets and Liabilities and represent compensating factors between stated terms of the credit default swap agreement and prevailing market conditions (credit spreads and other relevant factors). These upfront payments are amortized over the term of the contract as a realized gain or loss on the Statement of Operations. Pursuant to the terms of the credit default swap contract, cash or securities may be required to be deposited as collateral. Unrestricted cash may be invested according to the Fund’s investment objectives.
See Note 11 regarding other derivative information.
e. FT Holdings Corporation II
The Fund invests in certain securities through its investment in FT Holdings Corporation II, a Delaware Corporation and a wholly-owned subsidiary (Subsidiary) of the Fund. The Subsidiary has the ability to invest in securities consistent with the investment objective of the Fund. At April 30, 2011, all Subsidiary investments as well as any other assets and liabilities are reflected in the Fund’s Statement of Investments and Statement of Assets and Liabilities. All income and expenses of the Subsidiary during the period ended April 30, 2011, have been included in the Fund’s Statement of Operations.
f. Mortgage Dollar Rolls
The Fund enters into mortgage dollar rolls, typically on a TBA basis. Mortgage dollar rolls are agreements between the Fund and a financial institution to simultaneously sell and repurchase mortgage-backed securities at a future date. Gains or losses are realized on the initial sale, and the difference between the repurchase price and the sale price is recorded as an unrealized gain or loss to the fund upon entering into the mortgage dollar roll. In addition, the Fund may invest the cash proceeds that are received from the initial sale. During the period between the sale and repurchase, the Fund is not entitled to principal and interest paid on the mortgage backed securities. The risks of mortgage dollar roll transactions include the potential inability of the counterparty to fulfill its obligations.
56 | Annual Report
Franklin Strategic Series
Notes to Financial Statements (continued)
Franklin Strategic Income Fund
| 1. | ORGANIZATION AND SIGNIFICANT ACCOUNTING POLICIES (continued) |
| g. | Senior Floating Rate Interests |
The Fund invests in senior secured corporate loans that pay interest at rates which are periodically reset by reference to a base lending rate plus a spread. These base lending rates are generally the prime rate offered by a designated U.S. bank or the London InterBank Offered Rate (LIBOR). Senior secured corporate loans often require prepayment of principal from excess cash flows or at the discretion of the borrower. As a result, actual maturity may be substantially less than the stated maturity.
Senior secured corporate loans in which the Fund invests are generally readily marketable, but may be subject to some restrictions on resale.
h. Income Taxes
It is the Fund’s policy to qualify as a regulated investment company under the Internal Revenue Code. The Fund intends to distribute to shareholders substantially all of its taxable income and net realized gains to relieve it from federal income and excise taxes. As a result, no provision for U.S. federal income taxes is required. The Fund files U.S. income tax returns as well as tax returns in certain other jurisdictions. The Fund records a provision for taxes in its financial statements including penalties and interest, if any, for a tax position taken on a tax return (or expected to be taken) when it fails to meet the more likely than not (a greater than 50% probability) threshold and based on the technical merits, the tax position may not be sustained upon examination by the tax authorities. As of April 30, 2011, and for all open tax years, the Fund has determined that no provision for income tax is required in the Fund’s financial statements. Open tax years are those that remain subject to examination and are based on each tax jurisdiction statute of limitation.
The Fund may be subject to foreign taxation related to income received, capital gains on the sale of securities and certain foreign currency transactions in the foreign jurisdictions in which it invests. Foreign taxes, if any, are recorded based on the tax regulations and rates that exist in the foreign markets in which the Fund invests. When a capital gain tax is determined to apply the Fund records an estimated deferred tax liability for unrealized gains on these securities in an amount that would be payable if the securities were disposed of on the valuation date.
i. Security Transactions, Investment Income, Expenses and Distributions
Security transactions are accounted for on trade date. Realized gains and losses on security transactions are determined on a specific identification basis. Interest income and estimated expenses are accrued daily. Amortization of premium and accretion of discount on debt securities are included in interest income. Facility fees are recognized as income over the expected term of the
Annual Report | 57
Franklin Strategic Series
Notes to Financial Statements (continued)
Franklin Strategic Income Fund
| 1. | ORGANIZATION AND SIGNIFICANT ACCOUNTING POLICIES (continued) |
| i. | Security Transactions, Investment Income, Expenses and Distributions (continued) |
loan. Dividend income is recorded on the ex-dividend date. Distributions to shareholders are recorded on the ex-dividend date and are determined according to income tax regulations (tax basis). Distributable earnings determined on a tax basis may differ from earnings recorded in accordance with accounting principles generally accepted in the United States of America. These differences may be permanent or temporary. Permanent differences are reclassified among capital accounts to reflect their tax character. These reclassifications have no impact on net assets or the results of operations. Temporary differences are not reclassified, as they may reverse in subsequent periods.
Common expenses incurred by the Trust are allocated among the funds based on the ratio of net assets of each fund to the combined net assets of the Trust. Fund specific expenses are charged directly to the fund that incurred the expense.
Realized and unrealized gains and losses and net investment income, not including class specific expenses, are allocated daily to each class of shares based upon the relative proportion of net assets of each class. Differences in per share distributions, by class, are generally due to differences in class specific expenses.
Inflation-indexed bonds are adjusted for inflation through periodic increases or decreases in the security’s interest accruals, face amount, or principal redemption value, by amounts corresponding to the rate of inflation as measured by an index. Any increase or decrease in the face amount or principal redemption value will be included as interest income on the Statement of Operations.
j. Accounting Estimates
The preparation of financial statements in accordance with accounting principles generally accepted in the United States of America requires management to make estimates and assumptions that affect the reported amounts of assets and liabilities at the date of the financial statements and the amounts of income and expenses during the reporting period. Actual results could differ from those estimates.
k. Guarantees and Indemnifications
Under the Trust’s organizational documents, its officers and trustees are indemnified by the Trust against certain liabilities arising out of the performance of their duties to the Trust. Additionally, in the normal course of business, the Trust, on behalf of the Fund, enters into contracts with service providers that contain general indemnification clauses. The Trust’s maximum exposure under these arrangements is unknown as this would involve future claims that may be made against the Trust that have not yet occurred. Currently, the Trust expects the risk of loss to be remote.
58 | Annual Report
Franklin Strategic Series
Notes to Financial Statements (continued)
Franklin Strategic Income Fund
2. SHARES OF BENEFICIAL INTEREST
At April 30, 2011, there were an unlimited number of shares authorized (without par value).
Transactions in the Fund’s shares were as follows:

Annual Report | 59
Franklin Strategic Series
Notes to Financial Statements (continued)
Franklin Strategic Income Fund
3. TRANSACTIONS WITH AFFILIATES
Franklin Resources, Inc. is the holding company for various subsidiaries that together are referred to as Franklin Templeton Investments. Certain officers and trustees of the Trust are also officers and/or directors of the following subsidiaries:

a. Management Fees
The Fund pays an investment management fee to Advisers based on the average daily net assets of the Fund as follows:
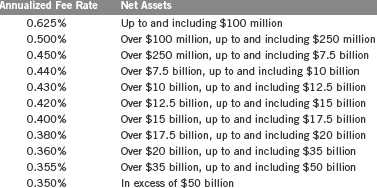
b. Administrative Fees
Under an agreement with Advisers, FT Services provides administrative services to the Fund. The fee is paid by Advisers based on average daily net assets, and is not an additional expense of the Fund.
c. Distribution Fees
The Trust’s Board of Trustees has adopted distribution plans for each share class, with the exception of Advisor Class shares, pursuant to Rule 12b-1 under the 1940 Act. Under the Fund’s Class A reimbursement distribution plan, the Fund reimburses Distributors for costs incurred in connection with the servicing, sale and distribution of the Fund’s shares up to the maximum annual plan rate. Under the Class A reimbursement distribution plan, costs exceeding the maximum for the current plan year cannot be reimbursed in subsequent periods.
60 | Annual Report
Franklin Strategic Series
Notes to Financial Statements (continued)
Franklin Strategic Income Fund
| 3. | TRANSACTIONS WITH AFFILIATES (continued) |
| c. | Distribution Fees (continued) |
In addition, under the Fund’s Class B, C, and R compensation distribution plans, the Fund pays Distributors for costs incurred in connection with the servicing, sale and distribution of the Fund’s shares up to the maximum annual plan rate for each class.
The maximum annual plan rates, based on the average daily net assets, for each class, are as follows:

d. Sales Charges/Underwriting Agreements
Distributors has advised the Fund of the following commission transactions related to the sales and redemptions of the Fund’s shares for the year:

e. Transfer Agent Fees
For the year ended April 30, 2011, the Fund paid transfer agent fees of $6,895,144, of which $3,650,716 was retained by Investor Services.
4. EXPENSE OFFSET ARRANGEMENT
The Fund has entered into an arrangement with its custodian whereby credits realized as a result of uninvested cash balances are used to reduce a portion of the Fund’s custodian expenses. During the year ended April 30, 2011, the custodian fees were reduced as noted in the Statement of Operations.
5. INCOME TAXES
For tax purposes, capital losses may be carried over to offset future capital gains, if any. At April 30, 2011, the Fund had tax basis capital losses of $16,083,983 expiring in 2018. During the year ended April 30, 2011, the Fund utilized $132,201,798 of capital loss carryforwards.
Annual Report | 61
Franklin Strategic Series
Notes to Financial Statements (continued)
Franklin Strategic Income Fund
5. INCOME TAXES (continued)
For tax purposes, realized currency losses occurring subsequent to October 31 may be deferred and treated as occurring on the first day of the following fiscal year. At April 30, 2011, the Fund deferred realized currency losses of $3,854,426.
The tax character of distributions paid during the years ended April 30, 2011 and 2010, was as follows:

At April 30, 2011, the cost of investments, net unrealized appreciation (depreciation), and undistributed ordinary income for income tax purposes were as follows:

Net investment income (loss) differs for financial statement and tax purposes primarily due to differing treatments of defaulted securities, foreign currency transactions, mortgage dollar rolls, paydown losses, payments-in-kind, bond discounts and premiums, swaps, tax straddles, and inflation related adjustments on foreign securities.
Net realized gains (losses) differ for financial statement and tax purposes primarily due to differing treatments of wash sales, foreign currency transactions, mortgage dollar rolls, paydown losses, payments-in-kind, bond discounts and premiums, swaps, tax straddles, and inflation related adjustments on foreign securities.
6. INVESTMENT TRANSACTIONS
Purchases and sales of investments (excluding short term securities) for the year ended April 30, 2011, aggregated $3,436,377,404 and $3,070,265,711, respectively.
62 | Annual Report
Franklin Strategic Series
Notes to Financial Statements (continued)
Franklin Strategic Income Fund
7. INVESTMENTS IN INSTITUTIONAL FIDUCIARY TRUST MONEY MARKET PORTFOLIO
The Fund invests in the Institutional Fiduciary Trust Money Market Portfolio (Sweep Money Fund), an open-end investment company managed by Advisers. Management fees paid by the Fund are reduced on assets invested in the Sweep Money Fund, in an amount not to exceed the management and administrative fees paid by the Sweep Money Fund.
8. CREDIT RISK AND DEFAULTED SECURITIES
At April 30, 2011, the Fund had 47.02% of its portfolio invested in high yield securities, senior secured floating rate notes, or other securities rated below investment grade. These securities may be more sensitive to economic conditions causing greater price volatility and are potentially subject to a greater risk of loss due to default than higher rated securities.
The Fund held defaulted securities and/or other securities for which the income has been deemed uncollectible. At April 30, 2011, the aggregate value of these securities represents less than 0.05% of the Fund’s net assets. The Fund discontinues accruing income on securities for which income has been deemed uncollectible and provides an estimate for losses on interest receivable. The securities have been identified on the accompanying Statement of Investments.
9. RESTRICTED SECURITIES
The Fund invests in securities that are restricted under the Securities Act of 1933 (1933 Act) or which are subject to legal, contractual, or other agreed upon restrictions on resale. Restricted securities are often purchased in private placement transactions, and cannot be sold without prior registration unless the sale is pursuant to an exemption under the 1933 Act. Disposal of these securities may require greater effort and expense, and prompt sale at an acceptable price may be difficult. The Fund may have registration rights for restricted securities. The issuer generally incurs all registration costs.
At April 30, 2011, the Fund held investments in restricted securities, excluding certain securities exempt from registration under the 1933 Act deemed to be liquid, as follows:

Annual Report | 63
Franklin Strategic Series
Notes to Financial Statements (continued)
Franklin Strategic Income Fund
10. UNFUNDED LOAN COMMITMENTS
The Fund enters into certain credit agreements, all or a portion of which may be unfunded. The Fund is obligated to fund these loan commitments at the borrowers’ discretion. Funded portions of credit agreements are presented on the Statement of Investments.
At April 30, 2011, unfunded commitments were as follows:

Unfunded loan commitments and funded portions of credit agreements are marked to market daily and any unrealized appreciation or depreciation is included in the Statement of Assets and Liabilities and Statement of Operations.
11. OTHER DERIVATIVE INFORMATION
At April 30, 2011, the Fund has invested in derivative contracts which are reflected on the Statement of Assets and Liabilities as follows:

For the year ended April 30, 2011, the effect of derivative contracts on the Fund’s Statement of Operations was as follows:
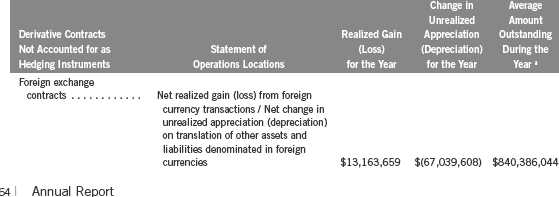
Franklin Strategic Series
Notes to Financial Statements (continued)
Franklin Strategic Income Fund
11. OTHER DERIVATIVE INFORMATION (continued)
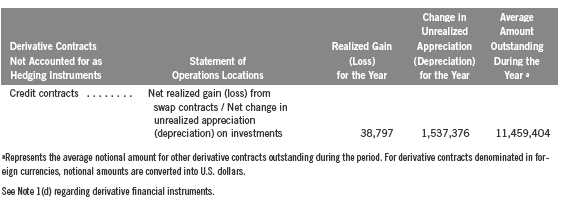
12. SPECIAL SERVICING AGREEMENT
The Fund, which is an eligible underlying investment of one or more of the Franklin Templeton Fund Allocator Series Funds (Allocator Funds), participates in a Special Servicing Agreement (SSA) with the Allocator Funds and certain service providers of the Fund and the Allocator Funds. Under the SSA, the Fund may pay a portion of the Allocator Funds’ expenses (other than any asset allocation, administrative, and distribution fees) to the extent such payments are less than the amount of the benefits realized or expected to be realized by the Fund (e.g., due to reduced costs associated with servicing accounts) from the investment in the Fund by the Allocator Funds. The Allocator Funds are either managed by Advisers or administered by FT Services. For the year ended ended April 30, 2011, the Fund was held by one or more of the Allocator Funds and the amount of expenses borne by the Fund is noted in the Statement of Operations. At April 30, 2011, 1.12% of the Fund’s outstanding shares was held by one or more of the Allocator Funds.
13. CREDIT FACILITY
The Fund, together with other U.S. registered and foreign investment funds (collectively, Borrowers), managed by Franklin Templeton Investments, are borrowers in a joint syndicated senior unsecured credit facility totaling $750 million (Global Credit Facility) which matures on January 20, 2012. This Global Credit Facility provides a source of funds to the Borrowers for temporary and emergency purposes, including the ability to meet future unanticipated or unusually large redemption requests.
Under the terms of the Global Credit Facility, the Fund shall, in addition to interest charged on any borrowings made by the Fund and other costs incurred by the Fund, pay its share of fees and expenses incurred in connection with the implementation and maintenance of the Global
Annual Report | 65
Franklin Strategic Series
Notes to Financial Statements (continued)
Franklin Strategic Income Fund
13. CREDIT FACILITY (continued)
Credit Facility, based upon its relative share of the aggregate net assets of all of the Borrowers, including an annual commitment fee of 0.08% based upon the unused portion of the Global Credit Facility, which is reflected in other expenses on the Statement of Operations. During the year ended April 30, 2011, the Fund did not use the Global Credit Facility.
14. FAIR VALUE MEASUREMENTS
The Fund follows a fair value hierarchy that distinguishes between market data obtained from independent sources (observable inputs) and the Fund’s own market assumptions (unobservable inputs). These inputs are used in determining the value of the Fund’s investments and are summarized in the following fair value hierarchy:
- Level 1 – quoted prices in active markets for identical securities
- Level 2 – other significant observable inputs (including quoted prices for similar securities, interest rates, prepayment speed, credit risk, etc.)
- Level 3 – significant unobservable inputs (including the Fund’s own assumptions in determining the fair value of investments)
The inputs or methodology used for valuing securities are not an indication of the risk associated with investing in those securities.
For movements between the levels within the fair value hierarchy, the Fund has adopted a policy of recognizing the transfers as of the date of the underlying event which caused the movement.
66 | Annual Report
Franklin Strategic Series
Notes to Financial Statements (continued)
Franklin Strategic Income Fund
14. FAIR VALUE MEASUREMENTS (continued)
The following is a summary of the inputs used as of April 30, 2011, in valuing the Fund’s assets and liabilities carried at fair value:
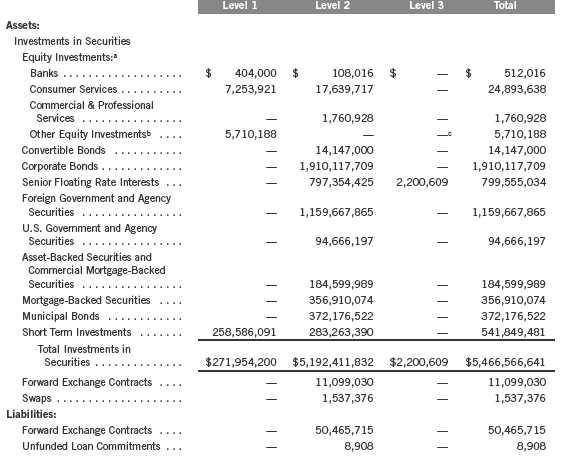
alncludes common, preferred, and convertible preferred stocks as well as other equity investments.
bFor detailed industry descriptions, see the accompanying Statement of Investments.
clncludes securities determined to have no value.
Annual Report | 67
Franklin Strategic Series
Notes to Financial Statements (continued)
Franklin Strategic Income Fund
14. FAIR VALUE MEASUREMENTS (continued)
At April 30, 2011 the reconciliation of assets in which significant unobservable inputs (Level 3) were used in determining fair value, is as follows:

15. SUBSEQUENT EVENTS
The Fund has evaluated subsequent events through the issuance of the financial statements and determined that no events have occurred that require disclosure.
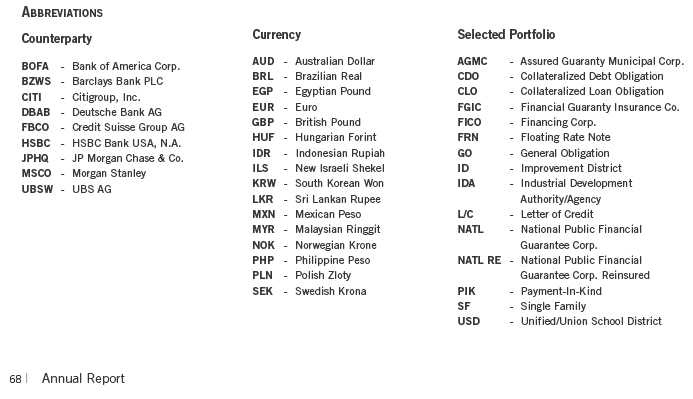
Franklin Strategic Series
Report of Independent Registered Public Accounting Firm
Franklin Strategic Income Fund
To the Board of Trustees of Franklin Strategic Series and Shareholders of The Franklin Strategic Income Fund
In our opinion, the accompanying statement of assets and liabilities, including the statement of investments, and the related statements of operations and of changes in net assets and the financial highlights present fairly, in all material respects, the financial position of the Franklin Strategic Income Fund (one of the funds constituting the Franklin Strategic Series, hereafter referred to as the “Fund”) at April 30, 2011, the results of its operations for the year then ended, the changes in its net assets for each of the two years in the period then ended and the financial highlights for each of the five years in the period then ended, in conformity with accounting principles generally accepted in the United States of America. These financial statements and financial highlights (hereafter referred to as “financial statements”) are the responsibility of the Fund’s management. Our responsibility is to express an opinion on these financial statements based on our audits. We conducted our audits of these financial statements in accordance with the standards of the Public Company Accounting Oversight Board (United States). Those standards require that we plan and perform the audit to obtain reasonable assurance about whether the financial statements are free of material misstatement. An audit includes examining, on a test basis, evidence supporting the amounts and disclosures in the financial statements, assessing the accounting principles used and significant estimates made by management, and evaluating the overall financial statement presentation. We believe that our audits, which included confirmation of securities at April 30, 2011 by correspondence with the custodian and brokers, provide a reasonable basis for our opinion.
PricewaterhouseCoopers LLP
San Francisco, California
June, 16, 2011
Annual Report | 69
Franklin Strategic Series
Board Members and Officers
The name, year of birth and address of the officers and board members, as well as their affiliations, positions held with the Trust, principal occupations during the past five years and number of portfolios overseen in the Franklin Templeton Investments fund complex are shown below. Generally, each board member serves until that person’s successor is elected and qualified.

Principal Occupation During Past 5 Years:
Director of various companies; and formerly, Director, RBC Holdings, Inc. (bank holding company) (until 2002); and President, Chief Executive Officer and Chairman of the Board, General Host Corporation (nursery and craft centers) (until 1998).

Principal Occupation During Past 5 Years:
Private investor; and formerly, Chairman of the Board, Vodafone AirTouch, PLC (wireless company); Chairman of the Board and Chief Executive Officer, AirTouch Communications (cellular communications) (1993-1998) and Pacific Telesis Group (telephone holding company) (1988-1994).

Principal Occupation During Past 5 Years:
Director or Trustee of various companies and trusts; and formerly, Assistant to the President of the United States and Secretary of the Cabinet (1990-1993); General Counsel to the United States Treasury Department (1989-1990); and Counselor to the Secretary and Assistant Secretary, Public Affairs and Public Liaison – United States Treasury Department (1988-1989).

Principal Occupation During Past 5 Years:
Executive Vice President, General Counsel and member of Executive Council, The Boeing Company; and formerly, Federal Appeals Court Judge, U.S. Court of Appeals for the Fourth Circuit (1991-2006).
70 | Annual Report

Principal Occupation During Past 5 Years:
Chairman Emeritus, The Hertz Corporation (car rental) (since 2000) (Chairman of the Board (1980-2000) and Chief Executive Officer (1977-1999)); and formerly, Chairman of the Board, President and Chief Executive Officer, UAL Corporation (airlines).

Principal Occupation During Past 5 Years:
Senior Vice President – Government Affairs, General Counsel and Secretary, PepsiCo, Inc. (consumer products); and formerly, Director, Delta Airlines (aviation) (2003-2005) and Providian Financial Corp. (credit card provider) (1997-2001); Senior Fellow of The Brookings Institution (2003-2004); Visiting Professor, University of Georgia School of Law (2004); and Deputy Attorney General, U.S. Department of Justice (2001-2003).

Principal Occupation During Past 5 Years:
President and Founder, Hyannis Port Capital, Inc. (real estate and private equity investing); serves on private and non-profit boards; and formerly, Chief Operating Officer and Executive Vice President, Gap, Inc. (retail) (1996-2000); Chief Financial Officer and Executive Vice President – Finance and Strategy, Staples, Inc. (office supplies) (1992-1996); Senior Vice President – Corporate Planning, Northwest Airlines, Inc. (airlines) (1990-1992); and Vice President and Partner, Bain & Company (consulting firm) (1986-1990).

Principal Occupation During Past 5 Years:
Chairman of the Board, Member – Office of the Chairman and Director, Franklin Resources, Inc.; and officer and/or director or trustee, as the case may be, of some of the other subsidiaries of Franklin Resources, Inc. and of 41 of the investment companies in Franklin Templeton Investments.
Annual Report | 71

Principal Occupation During Past 5 Years:
Vice Chairman, Member – Office of the Chairman and Director, Franklin Resources, Inc.; Director, Franklin Advisers, Inc.; Senior Vice President, Franklin Advisory Services, LLC; and officer and/or director or trustee, as the case may be, of some of the other subsidiaries of Franklin Resources, Inc. and of 25 of the investment companies in Franklin Templeton Investments.

Principal Occupation During Past 5 Years:
Director, Global Compliance, Franklin Resources, Inc.; officer of some of the other subsidiaries of Franklin Resources, Inc. and of 45 of the investment companies in Franklin Templeton Investments; and formerly, Director of Compliance, Franklin Resources, Inc. (1994-2001).

Principal Occupation During Past 5 Years:
Senior Vice President, Franklin Templeton Services, LLC; officer of 45 of the investment companies in Franklin Templeton Investments; and formerly, Director and member of Audit and Valuation Committees, Runkel Funds, Inc. (2003-2004); Assistant Treasurer of most of the investment companies in Franklin Templeton Investments (1997-2003); and Vice President, Franklin Templeton Services, LLC (1997-2003).

Principal Occupation During Past 5 Years:
Director, Fund Accounting, Franklin Templeton Investments; and officer of 27 of the investment companies in Franklin Templeton Investments.

Principal Occupation During Past 5 Years:
Senior Associate General Counsel, Franklin Templeton Investments; officer of 45 of the investment companies in Franklin Templeton Investments; and formerly, Litigation Associate, Steefel, Levitt & Weiss, LLP (2000-2004).

Principal Occupation During Past 5 Years:
Senior Associate General Counsel, Franklin Templeton Investments; and officer and/or director, as the case may be, of some of the other subsidiaries of Franklin Resources, Inc. and of 45 of the investment companies in Franklin Templeton Investments.
72 | Annual Report

Principal Occupation During Past 5 Years:
Senior Associate General Counsel, Franklin Templeton Investments; Vice President, Franklin Templeton Distributors, Inc.; and officer of 45 of the investment companies in Franklin Templeton Investments.

Principal Occupation During Past 5 Years:
President, Chief Investment Officer and Director, Franklin Advisers, Inc.; Executive Vice President, Franklin Templeton Institutional, LLC; and officer and/or trustee, as the case may be, of some of the other subsidiaries of Franklin Resources, Inc. and of 10 of the investment companies in Franklin Templeton Investments.

Principal Occupation During Past 5 Years:
Director and Executive Vice President, Franklin Advisers, Inc.; Executive Vice President, Franklin Templeton Institutional, LLC; and officer of some of the other subsidiaries of Franklin Resources, Inc. and of 22 of the investment companies in Franklin Templeton Investments.

Principal Occupation During Past 5 Years:
Senior Associate General Counsel, Franklin Templeton Investments; Assistant Secretary, Franklin Resources, Inc.; Vice President and Secretary, Templeton Investment Counsel, LLC; Vice President, Secretary and Trust Officer, Fiduciary Trust International of the South; and officer of 45 of the investment companies in Franklin Templeton Investments.

Principal Occupation During Past 5 Years:
Senior Associate General Counsel, Franklin Templeton Investments; and officer of 45 of the investment companies in Franklin Templeton Investments.
Annual Report | 73

*We base the number of portfolios on each separate series of the U.S. registered investment companies within the Franklin Templeton Investments fund complex. These portfolios
have a common investment manager or affiliated investment managers.
**Charles B. Johnson and Rupert H. Johnson, Jr. are considered to be interested persons of the Trust under the federal securities laws due to their positions as officers and directors
and major shareholders of Franklin Resources, Inc., which is the parent company of the Fund's investment manager and distributor.
Note 1: Charles B. Johnson and Rupert H. Johnson, Jr. are brothers.
Note 2: Officer information is current as of the date of this report. It is possible that after this date, information about officers may change.
Note 3: Prior to April 30, 2011, Frank W.T. LaHaye ceased to be a trustee of the Fund.
The Sarbanes-Oxley Act of 2002 and Rules adopted by the Securities and Exchange Commission require the Fund to disclose whether the Fund’s Audit Committee includes at least one member who is an audit committee financial expert within the meaning of such Act and Rules. The Fund’s Board has determined that there is at least one such financial expert on the Audit Committee and has designated John B. Wilson as its audit committee financial expert. The Board believes that Mr. Wilson qualifies as such an expert in view of his extensive business background and experience, including service as chief financial officer of Staples, Inc. from 1992 to 1996. Mr. Wilson has been a Member and Chairman of the Fund’s Audit Committee since 2006. As a result of such background and experience, the Board believes that Mr. Wilson has acquired an understanding of generally accepted accounting principles and financial statements, the general application of such principles in connection with the accounting estimates, accruals and reserves, and analyzing and evaluating financial statements that present a breadth and level of complexity of accounting issues generally comparable to those of the Fund, as well as an understanding of internal controls and procedures for financial reporting and an understanding of audit committee functions. Mr. Wilson is an independent Board member as that term is defined under the relevant Securities and Exchange Commission Rules and Releases.
The Statement of Additional Information (SAI) includes additional information about the board members and is available, without charge, upon request. Shareholders may call (800) DIAL BEN/342-5236 to request the SAI.
74 | Annual Report
Franklin Strategic Series
Shareholder Information
Franklin Strategic Income Fund
Board Review of Investment Management Agreement
At a meeting held April 19, 2011, the Board of Trustees (Board), including a majority of non-interested or independent Trustees, approved renewal of the investment management agreement for each of the separate funds within the Trust, including Franklin Strategic Income Fund (Fund(s)). In reaching this decision, the Board took into account information furnished throughout the year at regular Board meetings, as well as information prepared specifically in connection with the annual renewal review process. Information furnished and discussed throughout the year included investment performance reports and related financial information for each Fund, as well as periodic reports on expenses, shareholder services, legal, compliance, pricing, brokerage commissions and execution and other services provided by the Investment Manager (Manager) and its affiliates. Information furnished specifically in connection with the renewal process included a report for each Fund prepared by Lipper, Inc. (Lipper), an independent organization, as well as additional material, including a Fund profitability analysis prepared by management. The Lipper reports compared each Fund’s investment performance and expenses with those of other mutual funds deemed comparable to the Fund as selected by Lipper. The Fund profitability analysis discussed the profitability to Franklin Templeton Investments from its overall U.S. fund operations, as well as on an individual fund-by-fund basis. Additional material accompanying such profitability analysis included information on a fund-by-fund basis listing portfolio managers and other accounts they manage, as well as information on management fees charged by the Manager and its affiliates to U.S. mutual funds and other accounts, including management’s explanation of differences where relevant. Such material also included a memorandum prepared by management describing project initiatives and capital investments relating to the services provided to the Funds by the Franklin Templeton Investments organization, as well as a memorandum relating to economies of scale and a comparative analysis concerning transfer agent fees charged each Fund.
In considering such materials, the independent Trustees received assistance and advice from and met separately with independent counsel. While the investment management agreements for all Funds were considered at the same Board meeting, the Board dealt with each Fund separately. In approving continuance of the investment management agreement for each Fund, the Board, including a majority of independent Trustees, determined that the existing management fee structure was fair and reasonable and that continuance of the investment management agreement was in the best interests of each Fund and its shareholders. While attention was given to all information furnished, the following discusses some primary factors relevant to the Board’s decision.
NATURE, EXTENT AND QUALITY OF SERVICE. The Board was satisfied with the nature and quality of the overall services provided by the Manager and its affiliates to the Fund and its shareholders. In addition to investment performance and expenses discussed later, the Board’s opinion was based, in part, upon periodic reports furnished it showing that the investment policies and restrictions for the Fund were consistently complied with as well as other reports periodically furnished the Board covering matters such as the compliance of portfolio managers and other
Annual Report | 75
Franklin Strategic Series
Shareholder Information (continued)
Franklin Strategic Income Fund
Board Review of Investment Management Agreement (continued)
management personnel with the code of ethics adopted throughout the Franklin Templeton fund complex, the adherence to fair value pricing procedures established by the Board, and the accuracy of net asset value calculations. The Board also noted the extent of benefits provided Fund shareholders from being part of the Franklin Templeton family of funds, including the right to exchange investments between the same class of funds without a sales charge, the ability to reinvest Fund dividends into other funds and the right to combine holdings in other funds to obtain a reduced sales charge. Favorable consideration was given to management’s continuous efforts and expenditures in establishing back-up systems and recovery procedures to function in the event of a natural disaster, it being noted that such systems and procedures had functioned smoothly during the Florida hurricanes and blackouts experienced in previous years. Among other factors taken into account by the Board were the Manager’s best execution trading policies, including a favorable report by an independent portfolio trading analytical firm. Consideration was also given to the experience of the Fund’s portfolio management team, the number of accounts managed and general method of compensation. In this latter respect, the Board noted that a primary factor in management’s determination of a portfolio manager’s bonus compensation was the relative investment performance of the funds he or she managed and that a portion of such bonus was required to be invested in a predesignated list of funds within such person’s fund management area so as to be aligned with the interests of shareholders. The Board also took into account the quality of transfer agent and shareholder services provided Fund shareholders by an affiliate of the Manager, and the continuous enhancements to the Franklin Templeton website. Particular attention was given to management’s conservative approach and diligent risk management procedures, including continuous monitoring of counterparty credit risk and attention given to derivatives and other complex instruments. The Board also took into account, among other things, management’s efforts in establishing a global credit facility for the benefit of the Fund and other accounts managed by Franklin Templeton Investments to provide a source of cash for temporary and emergency purposes or to meet unusual redemption requests as well as the strong financial position of the Manager’s parent company and its commitment to the mutual fund business as evidenced by its subsidization of money market funds.
INVESTMENT PERFORMANCE. The Board placed significant emphasis on the investment performance of the Fund in view of its importance to shareholders. While consideration was given to performance reports and discussions with portfolio managers at Board meetings throughout the year, particular attention in assessing performance was given to the Lipper reports furnished for the agreement renewal. The Lipper reports prepared for the Fund showed the investment performance of its Class A shares in comparison to a performance universe selected by Lipper. Comparative performance for the Fund was shown for the one-year period ended January 31, 2011, and previous periods ended that date of up to 10 years. The performance universe for the Fund consisted of the Fund and all retail and institutional multi-sector income funds as selected by Lipper. The Lipper report comparison showed the Fund’s income return for the one-year
76 | Annual Report
Franklin Strategic Series
Shareholder Information (continued)
Franklin Strategic Income Fund
Board Review of Investment Management Agreement (continued)
period to be in the upper half of its performance universe, and on an annualized basis to be in the second-highest quintile of such universe during each of the previous three-, five- and 10-year periods. The Lipper report showed the Fund’s total return for the one-year period to be in the upper half of its performance universe, and on an annualized basis to be in the middle quintile of such universe for the previous three-year period, and the second-highest quintile of such universe for each of the previous five- and 10-year periods. The Board was satisfied with the Fund’s investment performance as set forth in the Lipper report.
COMPARATIVE EXPENSES. Consideration was given to a comparative analysis of the management fees and total expense ratio of the Fund compared with those of a group of other funds selected by Lipper as its appropriate Lipper expense group. Lipper expense data is based upon information taken from each fund’s most recent annual report, which reflects historical asset levels that may be quite different from those currently existing, particularly in a period of market volatility. While recognizing such inherent limitation and the fact that expense ratios generally increase as assets decline and decrease as assets grow, the Board believed the independent analysis conducted by Lipper to be an appropriate measure of comparative expenses. In reviewing comparative costs, Lipper provides information on the Fund’s contractual investment management fee in comparison with the investment management fee that would have been charged by other funds within its Lipper expense group assuming they were similar in size to the Fund, as well as the actual total expense ratio of the Fund in comparison with those of its Lipper expense group. The Lipper contractual investment management fee analysis includes administrative charges as being part of the investment management fee, and actual total expenses, for comparative consistency, are shown by Lipper for Fund Class A shares. The results of such expense comparisons showed the contractual investment management fee rates and actual total expense ratio for the Fund to be in the least expensive quintile of its Lipper expense group. The Board was satisfied with the contractual management fees and total expense ratio of the Fund in comparison to its expense group as shown in the Lipper reports.
MANAGEMENT PROFITABILITY. The Board also considered the level of profits realized by the Manager and its affiliates in connection with the operation of the Fund. In this respect, the Board reviewed the Fund profitability analysis that addresses the overall profitability of Franklin Templeton’s U.S. fund business, as well as its profits in providing management and other services to each of the individual funds during the 12-month period ended September 30, 2010, being the most recent fiscal year-end for Franklin Resources, Inc., the Manager’s parent. In reviewing the analysis, attention was given to the methodology followed in allocating costs to the Fund, it being recognized that allocation methodologies are inherently subjective and various allocation methodologies may each be reasonable while producing different results. In this respect, the Board noted that, while being continuously refined and reflecting changes in the Manager’s own cost accounting,
Annual Report | 77
Franklin Strategic Series
Shareholder Information (continued)
Franklin Strategic Income Fund
Board Review of Investment Management Agreement (continued)
the allocation methodology was consistent with that followed in profitability report presentations for the Fund made in prior years and that the Fund’s independent registered public accounting firm had been engaged by the Manager to review the reasonableness of the allocation methodologies solely for use by the Fund’s Board in reference to the profitability analysis. In reviewing and discussing such analysis, management discussed with the Board its belief that costs incurred in establishing the infrastructure necessary for the type of mutual fund operations conducted by the Manager and its affiliates may not be fully reflected in the expenses allocated to the Fund in determining its profitability, as well as the fact that the level of profits, to a certain extent, reflected operational cost savings and efficiencies initiated by management. The Board also took into account management’s expenditures in improving shareholder services provided the Fund, as well as the need to meet additional regulatory and compliance requirements resulting from the Sarbanes-Oxley Act and recent SEC and other regulatory requirements. In addition, the Board considered a third-party study comparing the profitability of the Manager’s parent on an overall basis to other publicly held managers broken down to show profitability from management operations exclusive of distribution expenses, as well as profitability including distribution expenses. The Board also considered the extent to which the Manager and its affiliates might derive ancillary benefits from fund operations, including revenues generated from transfer agent services and potential benefits resulting from allocation of fund brokerage and the use of commission dollars to pay for research. Based upon its consideration of all these factors, the Board determined that the level of profits realized by the Manager and its affiliates from providing services to the Fund was not excessive in view of the nature, quality and extent of services provided.
ECONOMIES OF SCALE. The Board also considered whether economies of scale are realized by the Manager as the Fund grows larger and the extent to which this is reflected in the level of management fees charged. While recognizing that any precise determination is inherently subjective, the Board noted that based upon the Fund profitability analysis, it appears that as some funds get larger, at some point economies of scale do result in the Manager realizing a larger profit margin on management services provided such a fund. The Board noted that economies of scale were shared with the Fund and its shareholders through management fee breakpoints so that as a Fund grows in size, its effective management fee rate declines. The fee structure under the investment management agreement for the Fund contains breakpoints that continued to asset levels that exceeded its asset size at December 31, 2010. In view of such fee structure and the favorable expense comparisons of the Fund within its expense group, the Board believed that to the extent economies of scale may be realized by the manager of the Fund and its affiliates, that there was a sharing of benefits with the Fund and its shareholders.
78 | Annual Report
Franklin Strategic Series
Shareholder Information (continued)
Franklin Strategic Income Fund
Proxy Voting Policies and Procedures
The Trust’s investment manager has established Proxy Voting Policies and Procedures (Policies) that the Trust uses to determine how to vote proxies relating to portfolio securities. Shareholders may view the Trust’s complete Policies online at franklintempleton.com. Alternatively, shareholders may request copies of the Policies free of charge by calling the Proxy Group collect at (954) 527-7678 or by sending a written request to: Franklin Templeton Companies, LLC, 300 S.E. 2nd Street, Fort Lauderdale, FL 33301, Attention: Proxy Group. Copies of the Trust’s proxy voting records are also made available online at franklintempleton.com and posted on the U.S. Securities and Exchange Commission’s website at sec.gov and reflect the most recent 12-month period ended June 30.
Quarterly Statement of Investments
The Trust files a complete statement of investments with the U.S. Securities and Exchange Commission for the first and third quarters for each fiscal year on Form N-Q. Shareholders may view the filed Form N-Q by visiting the Commission’s website at sec.gov. The filed form may also be viewed and copied at the Commission’s Public Reference Room in Washington, DC. Information regarding the operations of the Public Reference Room may be obtained by calling (800) SEC-0330.
Householding of Reports and Prospectuses
You will receive the Fund’s financial reports every six months as well as an annual updated summary prospectus (prospectus available upon request). To reduce Fund expenses, we try to identify related shareholders in a household and send only one copy of the financial reports and prospectuses. This process, called “householding,” will continue indefinitely unless you instruct us otherwise. If you prefer not to have these documents householded, please call us at (800) 632-2301. At any time you may view current prospectuses/summary prospectuses and financial reports on our website. If you choose, you may receive these documents through electronic delivery.
Annual Report | 79
This page intentionally left blank.
Item 2. Code of Ethics.
(a) The Registrant has adopted a code of ethics that applies to its principal executive officers and principal financial and accounting officer.
(c) N/A
(d) N/A
(f) Pursuant to Item 12(a)(1), the Registrant is attaching as an exhibit a copy of its code of ethics that applies to its principal executive officers and principal financial and accounting officer.
Item 3. Audit Committee Financial Expert.
(a)(1) The Registrant has an audit committee financial expert serving on its audit committee.
(2) The audit committee financial expert is John B. Wilson and he is "independent" as defined under the relevant Securities and Exchange Commission Rules and Releases.
Item 4. Principal Accountant Fees and Services.
(a) Audit Fees
The aggregate fees paid to the principal accountant for professional services rendered by the principal accountant for the audit of the registrant’s annual financial statements or for services that are normally provided by the principal accountant in connection with statutory and regulatory filings or engagements were $294,180 for the fiscal year ended April 30, 2011 and $288,532 for the fiscal year ended April 30, 2010.
(b) Audit-Related Fees
There were no fees paid to the principal accountant for assurance and related services rendered by the principal accountant to the registrant that are reasonably related to the performance of the audit of the registrant's financial statements and are not reported under paragraph (a) of Item 4.
There were no fees paid to the principal accountant for assurance and related services rendered by the principal accountant to the registrant's investment adviser and any entity controlling, controlled by or under common control with the investment adviser that provides ongoing services to the registrant that are reasonably related to the performance of the audit of their financial statements.
(c) Tax Fees
There were no fees paid to the principal accountant for professional services rendered by the principal accountant to the registrant for tax compliance, tax advice and tax planning.
The aggregate fees paid to the principal accountant for professional services rendered by the principal accountant to the registrant’s
investment adviser and any entity controlling, controlled by or under common control with the investment adviser that provides ongoing services to the registrant for tax compliance, tax advice and tax planning were $85,000 for the fiscal year ended April 30, 2011 and $0 for the fiscal year ended April 30, 2010. The services for which these fees were paid included technical tax consultation for capital gain tax reporting to foreign governments and the application of local country tax laws to investments made by various Franklin Templeton funds.
(d) All Other Fees
The aggregate fees paid to the principal accountant for products and services rendered by the principal accountant to the registrant not reported in paragraphs (a)-(c) of Item 4 were $5,057 for the fiscal year ended April 30, 2011 and $0 for the fiscal year ended April 30, 2010. The services for which these fees were paid included review of materials provided to the fund Board in connection with the investment management contract renewal process.
The aggregate fees paid to the principal accountant for products and services rendered by the principal accountant to the registrant’s investment adviser and any entity controlling, controlled by or under common control with the investment adviser that provides ongoing services to the registrant other than services reported in paragraphs (a)-(c) of Item 4 were $139,743 for the fiscal year ended April 30, 2011 and $0 for the fiscal year ended April 30, 2010. The services for which these fees were paid included review of materials provided to the fund Board in connection with the investment management contract renewal process.
(e) (1) The registrant’s audit committee is directly responsible for approving the services to be provided by the auditors, including:
(i) pre-approval of all audit and audit related services;
(ii) pre-approval of all non-audit related services to be provided to the Fund by the auditors;
(iii) pre-approval of all non-audit related services to be provided to the registrant by the auditors to the registrant’s investment adviser or to any entity that controls, is controlled by or is under common control with the registrant’s investment adviser and that provides ongoing services to the registrant where the non-audit services relate directly to the operations or financial reporting of the registrant; and
(iv) establishment by the audit committee, if deemed necessary or appropriate, as an alternative to committee pre-approval of services to be provided by the auditors, as required by paragraphs (ii) and (iii) above, of policies and procedures to permit such services to be pre-approved by other means, such as through establishment of guidelines or by action of a designated member or members of the committee; provided the policies and procedures are detailed as to the particular service and the committee is informed of each service and such policies and procedures do not include delegation of audit committee responsibilities, as contemplated under the Securities Exchange Act of 1934, to management; subject, in the case of (ii)
through (iv), to any waivers, exceptions or exemptions that may be available under applicable law or rules.
(e) (2) None of the services provided to the registrant described in paragraphs (b)-(d) of Item 4 were approved by the audit committee pursuant to paragraph (c)(7)(i)(C) of Rule 2-01 of regulation S-X.
(f) No disclosures are required by this Item 4(f).
(g) The aggregate non-audit fees paid to the principal accountant for services rendered by the principal accountant to the registrant and the registrant’s investment adviser and any entity controlling, controlled by or under common control with the investment adviser that provides ongoing services to the registrant were $229,800 for the fiscal year ended April 30, 2011 and $0 for the fiscal year ended April 30, 2010.
(h) The registrant’s audit committee of the board has considered whether the provision of non-audit services that were rendered to the registrant’s investment adviser (not including any sub-adviser whose role is primarily portfolio management and is subcontracted with or overseen by another investment adviser), and any entity controlling, controlled by, or under common control with the investment adviser that provides ongoing services to the registrant that were not pre-approved pursuant to paragraph (c)(7)(ii) of Rule 2-01 of Regulation S-X is compatible with maintaining the principal accountant’s independence.
Item 5. Audit Committee of Listed Registrants. N/A
Item 6. Schedule of Investments. N/A
Item 7. Disclosure of Proxy Voting Policies and Procedures for Closed-End Management Investment Companies. N/A
Item 8. Portfolio Managers of Closed-End Management Investment Companies. N/A
Item 9. Purchases of Equity Securities by Closed-End Management Investment Company and Affiliated Purchasers. N/A
Item 10. Submission of Matters to a Vote of Security Holders.
There have been no changes to the procedures by which shareholders may recommend nominees to the Registrant's Board of Trustees that would require disclosure herein.
Item 11. Controls and Procedures.
(a) Evaluation of Disclosure Controls and Procedures. The Registrant maintains disclosure controls and procedures that are designed to ensure that information required to be disclosed in the Registrant’s filings under the Securities Exchange Act of 1934 and the Investment
Company Act of 1940 is recorded, processed, summarized and reported within the periods specified in the rules and forms of the Securities and Exchange Commission. Such information is accumulated and communicated to the Registrant’s management, including its principal executive officer and principal financial officer, as appropriate, to allow timely decisions regarding required disclosure. The Registrant’s management, including the principal executive officer and the principal financial officer, recognizes that any set of controls and procedures, no matter how well designed and operated, can provide only reasonable assurance of achieving the desired control objectives.
Within 90 days prior to the filing date of this Shareholder Report on Form N-CSR, the Registrant had carried out an evaluation, under the supervision and with the participation of the Registrant’s management, including the Registrant’s principal executive officer and the Registrant’s principal financial officer, of the effectiveness of the design and operation of the Registrant’s disclosure controls and procedures. Based on such evaluation, the Registrant’s principal executive officer and principal financial officer concluded that the Registrant’s disclosure controls and procedures are effective.
(b) Changes in Internal Controls. There have been no significant changes in the Registrant’s internal controls or in other factors that could significantly affect the internal controls subsequent to the date of their evaluation in connection with the preparation of this Shareholder Report on Form N-CSR.
Item 12. Exhibits.
(a) (1) Code of Ethics
(a) (2) Certifications pursuant to Section 302 of the Sarbanes-Oxley Act of 2002 of Laura F. Fergerson, Chief Executive Officer - Finance and Administration, and Gaston Gardey, Chief Financial Officer and Chief Accounting Officer
(b) Certifications pursuant to Section 906 of the Sarbanes-Oxley Act of 2002 of Laura F. Fergerson, Chief Executive Officer - Finance and Administration, and Gaston Gardey, Chief Financial Officer and Chief Accounting Officer
SIGNATURES
Pursuant to the requirements of the Securities Exchange Act of 1934 and the Investment Company Act of 1940, the registrant has duly caused this report to be signed on its behalf by the undersigned, thereunto duly authorized.
FRANKLIN STRATEGIC SERIES
By /s/LAURA F. FERGERSON
Laura F. Fergerson
Chief Executive Officer –
Finance and Administration
Date June 27, 2011
Pursuant to the requirements of the Securities Exchange Act of 1934 and the Investment Company Act of 1940, this report has been signed below by the following persons on behalf of the registrant and in the capacities and on the dates indicated.
By /s/LAURA F. FERGERSON
Laura F. Fergerson
Chief Executive Officer –
Finance and Administration
Date June 27, 2011
By /s/GASTON GARDEY
Gaston Gardey
Chief Financial Officer and
Chief Accounting Officer
Date June 27, 2011