UNITED STATES
SECURITIES AND EXCHANGE COMMISSION
Washington, D.C. 20549
FORM N-CSR
CERTIFIED SHAREHOLDER REPORT OF REGISTERED
MANAGEMENT INVESTMENT COMPANIES
Investment Company Act file number 811-06279
Harris Associates Investment Trust
(Exact name of Registrant as specified in charter)
111 South Wacker Drive, Suite 4600
Chicago, Illinois 60606-4319
(Address of principal executive offices) (Zip code)
| Rana J. Wright | Ndenisarya M. Bregasi, Esq. | |
| Harris Associates L.P. | K&L Gates LLP | |
| 111 South Wacker Drive, Suite 4600 | 1601 K Street, N.W. | |
| Chicago, Illinois 60606-4319 | Washington, D.C. 20006-1600 | |
| (Name and address of agents for service) | ||
Registrant's telephone number, including area code: (312) 646-3600
Date of fiscal year end: 09/30/21
Date of reporting period: 03/31/22
Item 1. Reports to Shareholders.
| (a) | Following is a copy of the semi-annual report transmitted to shareholders pursuant to Rule 30e-1 under the Act. |
OAKMARK FUNDS
SEMI-ANNUAL REPORT | MARCH 31, 2022
OAKMARK FUND
OAKMARK SELECT FUND
OAKMARK GLOBAL FUND
OAKMARK GLOBAL SELECT FUND
OAKMARK INTERNATIONAL FUND
OAKMARK INTERNATIONAL SMALL CAP FUND
OAKMARK EQUITY AND INCOME FUND
OAKMARK BOND FUND

Oakmark Funds
2022 Semi-Annual Report
TABLE OF CONTENTS
|
Fund Expenses |
1 |
||||||
|
Commentary on Oakmark and Oakmark Select Funds |
2 |
||||||
|
Oakmark Fund |
|||||||
|
Summary Information |
4 |
||||||
|
Portfolio Manager Commentary |
5 |
||||||
|
Schedule of Investments |
7 |
||||||
|
Oakmark Select Fund |
|||||||
|
Summary Information |
10 |
||||||
|
Portfolio Manager Commentary |
11 |
||||||
|
Schedule of Investments |
12 |
||||||
|
Oakmark Global Fund |
|||||||
|
Summary Information |
14 |
||||||
|
Portfolio Manager Commentary |
15 |
||||||
|
Schedule of Investments |
17 |
||||||
|
Oakmark Global Select Fund |
|||||||
|
Summary Information |
20 |
||||||
|
Portfolio Manager Commentary |
21 |
||||||
|
Schedule of Investments |
22 |
||||||
|
Commentary on Oakmark International and Oakmark International Small Cap Funds |
24 |
||||||
|
Oakmark International Fund |
|||||||
|
Summary Information |
26 |
||||||
|
Portfolio Manager Commentary |
27 |
||||||
|
Schedule of Investments |
29 |
||||||
|
Oakmark International Small Cap Fund |
|||||||
|
Summary Information |
32 |
||||||
|
Portfolio Manager Commentary |
33 |
||||||
|
Schedule of Investments |
34 |
||||||
|
Oakmark Equity and Income Fund |
|||||||
|
Summary Information |
38 |
||||||
|
Portfolio Manager Commentary |
39 |
||||||
|
Schedule of Investments |
42 |
||||||
|
Oakmark Bond Fund |
|||||||
|
Summary Information |
48 |
||||||
|
Portfolio Manager Commentary |
49 |
||||||
|
Schedule of Investments |
52 |
||||||
|
Financial Statements |
|||||||
|
Statements of Assets and Liabilities |
55 |
||||||
|
Statements of Operations |
58 |
||||||
|
Statements of Changes in Net Assets |
61 |
||||||
|
Notes to Financial Statements |
77 |
||||||
|
Financial Highlights |
88 |
||||||
|
Disclosure Regarding Investment Advisory Agreements Approval |
96 |
||||||
|
Disclosures and Endnotes |
100 |
||||||
|
Trustees and Officers |
105 |
||||||
|
As permitted by regulations adopted by the U.S. Securities and Exchange Commission, paper copies of the Oakmark Funds' annual and semi-annual shareholder reports will no longer be sent by mail, unless you specifically request paper copies of the reports. Instead, the reports will be made available on Oakmark.com, and you will be notified by mail each time a report is posted and provided with a website link to access the report. If you already elected to receive shareholder reports electronically, you will not be affected by this change and you need not take any action. You may elect to receive shareholder reports and other communications from the Funds electronically anytime by contacting your financial intermediary (such as a broker-dealer or bank) or, if you hold your shares directly with the Funds, by calling 1-800-OAKMARK (625-6275) or visiting Oakmark.com. |
|||
You may elect to receive all future reports in paper free of charge. If you invest through a financial intermediary, you can contact your financial intermediary to request that you continue to receive paper copies of your shareholder reports. If you hold your shares directly with the Funds, you can call 1-800-OAKMARK (625-6275) to let the Funds know you wish to continue receiving paper copies of your shareholder reports. Your election to receive reports in paper will apply to all Funds you hold directly or all Funds you hold through your financial intermediary, as applicable.
FORWARD-LOOKING STATEMENT DISCLOSURE
One of our most important responsibilities as mutual fund managers is to communicate with shareholders in an open and direct manner. Some of our comments in our letters to shareholders are based on current management expectations and are considered "forward-looking statements." Actual future results, however, may prove to be different from our expectations. You can identify forward-looking statements by words such as "estimate," "may," "will," "expect," "believe,"
"plan" and other similar terms. We cannot promise future returns. Our opinions are a reflection of our best judgment at the time this report is compiled, and we disclaim any obligation to update or alter forward-looking statements as a result of new information, future events or otherwise.
Oakmark.com
Expense Example
A shareholder of each Fund incurs ongoing costs, including investment advisory fees, transfer agent fees and other Fund expenses. The examples below are intended to help shareholders understand the ongoing costs (in dollars) of investing in each Fund and to compare these costs with the ongoing costs of investing in other funds.
The following table provides information about actual account values and actual Fund expenses as well as hypothetical account values and hypothetical fund expenses for shares of each Fund.
ACTUAL EXPENSES
The following table shows the expenses a shareholder would have paid on a $1,000 investment in each Fund from October 1, 2021 to March 31, 2022, as well as how much a $1,000 investment would be worth at the close of the period, assuming actual Fund returns and expenses. A shareholder can estimate expenses incurred for the period by dividing the account value at March 31, 2022, by $1,000 and multiplying the result by the number in the "Actual—Expenses Paid During Period" column shown below.
HYPOTHETICAL EXAMPLE FOR COMPARISON PURPOSES
The following table provides information about hypothetical account values and hypothetical expenses for shares of each Fund based on actual expense ratios and an assumed rate of return of 5% per year before expenses, which are not the Funds' actual returns. The hypothetical account values and expenses may not be used to estimate the actual ending account balances or actual expenses shareholders paid for the period. Shareholders may use this information to compare the ongoing costs of investing in a Fund and other funds. To do so, compare this 5% hypothetical example with the 5% hypothetical examples that appear in the shareholder reports of the other funds.
Please note that the expenses shown in the table are meant to highlight your ongoing costs only and do not reflect any transaction costs, such as redemption fees. Therefore, the "Hypothetical—Expenses Paid During Period" column of the table is useful in comparing ongoing costs only and will not help you determine the relative total costs of owning different funds. If these transaction costs were included, the total costs would have been higher.
|
ACTUAL |
HYPOTHETICAL (5% annual return before expenses) |
||||||||||||||||||||||||||
|
Beginning Account Value (10/01/21) |
Ending Account Value (03/31/22) |
Expenses Paid During Period* |
Ending Account Value (03/31/22) |
Expenses Paid During Period* |
Annualized Expense Ratio |
||||||||||||||||||||||
|
Oakmark Fund |
|||||||||||||||||||||||||||
|
Investor Class |
$ |
1,000.00 |
$ |
1,019.80 |
$ |
4.53 |
$ |
1,020.44 |
$ |
4.53 |
0.90 |
% |
|||||||||||||||
|
Advisor Class |
$ |
1,000.00 |
$ |
1,021.00 |
$ |
3.38 |
$ |
1,021.59 |
$ |
3.38 |
0.67 |
% |
|||||||||||||||
|
Institutional Class |
$ |
1,000.00 |
$ |
1,021.00 |
$ |
3.38 |
$ |
1,021.59 |
$ |
3.38 |
0.67 |
% |
|||||||||||||||
|
R6 Class |
$ |
1,000.00 |
$ |
1,021.30 |
$ |
3.12 |
$ |
1,021.84 |
$ |
3.13 |
0.62 |
% |
|||||||||||||||
|
Oakmark Select Fund |
|||||||||||||||||||||||||||
|
Investor Class |
$ |
1,000.00 |
$ |
971.60 |
$ |
4.82 |
$ |
1,020.04 |
$ |
4.94 |
0.98 |
% |
|||||||||||||||
|
Advisor Class |
$ |
1,000.00 |
$ |
972.40 |
$ |
4.18 |
$ |
1,020.69 |
$ |
4.28 |
0.85 |
% |
|||||||||||||||
|
Institutional Class |
$ |
1,000.00 |
$ |
972.80 |
$ |
3.84 |
$ |
1,021.04 |
$ |
3.93 |
0.78 |
% |
|||||||||||||||
|
R6 Class |
$ |
1,000.00 |
$ |
972.80 |
$ |
3.59 |
$ |
1,021.29 |
$ |
3.68 |
0.73 |
% |
|||||||||||||||
|
Oakmark Global Fund |
|||||||||||||||||||||||||||
|
Investor Class |
$ |
1,000.00 |
$ |
981.90 |
$ |
5.48 |
$ |
1,019.40 |
$ |
5.59 |
1.11 |
% |
|||||||||||||||
|
Advisor Class |
$ |
1,000.00 |
$ |
982.70 |
$ |
4.50 |
$ |
1,020.39 |
$ |
4.58 |
0.91 |
% |
|||||||||||||||
|
Institutional Class |
$ |
1,000.00 |
$ |
982.90 |
$ |
4.35 |
$ |
1,020.54 |
$ |
4.43 |
0.88 |
% |
|||||||||||||||
|
R6 Class |
$ |
1,000.00 |
$ |
982.80 |
$ |
4.20 |
$ |
1,020.69 |
$ |
4.28 |
0.85 |
% |
|||||||||||||||
|
Oakmark Global Select Fund |
|||||||||||||||||||||||||||
|
Investor Class |
$ |
1,000.00 |
$ |
950.10 |
$ |
5.25 |
$ |
1,019.55 |
$ |
5.44 |
1.08 |
% |
|||||||||||||||
|
Advisor Class |
$ |
1,000.00 |
$ |
951.10 |
$ |
4.43 |
$ |
1,020.39 |
$ |
4.58 |
0.91 |
% |
|||||||||||||||
|
Institutional Class |
$ |
1,000.00 |
$ |
951.20 |
$ |
4.23 |
$ |
1,020.59 |
$ |
4.38 |
0.87 |
% |
|||||||||||||||
|
R6 Class |
$ |
1,000.00 |
$ |
951.50 |
$ |
3.99 |
$ |
1,020.84 |
$ |
4.13 |
0.82 |
% |
|||||||||||||||
|
Oakmark International Fund |
|||||||||||||||||||||||||||
|
Investor Class |
$ |
1,000.00 |
$ |
922.10 |
$ |
4.98 |
$ |
1,019.75 |
$ |
5.24 |
1.04 |
% |
|||||||||||||||
|
Advisor Class |
$ |
1,000.00 |
$ |
923.10 |
$ |
4.12 |
$ |
1,020.64 |
$ |
4.33 |
0.86 |
% |
|||||||||||||||
|
Institutional Class |
$ |
1,000.00 |
$ |
923.40 |
$ |
3.79 |
$ |
1,020.99 |
$ |
3.98 |
0.79 |
% |
|||||||||||||||
|
R6 Class |
$ |
1,000.00 |
$ |
923.60 |
$ |
3.60 |
$ |
1,021.19 |
$ |
3.78 |
0.75 |
% |
|||||||||||||||
|
Oakmark International Small Cap Fund |
|||||||||||||||||||||||||||
|
Investor Class |
$ |
1,000.00 |
$ |
896.20 |
$ |
6.29 |
$ |
1,018.30 |
$ |
6.69 |
1.33 |
% |
|||||||||||||||
|
Advisor Class |
$ |
1,000.00 |
$ |
896.50 |
$ |
5.44 |
$ |
1,019.20 |
$ |
5.79 |
1.15 |
% |
|||||||||||||||
|
Institutional Class |
$ |
1,000.00 |
$ |
897.10 |
$ |
5.11 |
$ |
1,019.55 |
$ |
5.44 |
1.08 |
% |
|||||||||||||||
|
R6 Class |
$ |
1,000.00 |
$ |
897.30 |
$ |
4.97 |
$ |
1,019.70 |
$ |
5.29 |
1.05 |
% |
|||||||||||||||
|
Oakmark Equity and Income Fund |
|||||||||||||||||||||||||||
|
Investor Class |
$ |
1,000.00 |
$ |
997.30 |
$ |
4.13 |
$ |
1,020.79 |
$ |
4.18 |
0.83 |
% |
|||||||||||||||
|
Advisor Class |
$ |
1,000.00 |
$ |
998.10 |
$ |
2.89 |
$ |
1,022.04 |
$ |
2.92 |
0.58 |
% |
|||||||||||||||
|
Institutional Class |
$ |
1,000.00 |
$ |
998.10 |
$ |
2.89 |
$ |
1,022.04 |
$ |
2.92 |
0.58 |
% |
|||||||||||||||
|
R6 Class |
$ |
1,000.00 |
$ |
998.30 |
$ |
2.69 |
$ |
1,022.24 |
$ |
2.72 |
0.54 |
% |
|||||||||||||||
|
Oakmark Bond Fund |
|||||||||||||||||||||||||||
|
Investor Class |
$ |
1,000.00 |
$ |
966.10 |
$ |
1.24 |
(a) |
$ |
1,021.24 |
$ |
3.73 |
0.74 |
% |
||||||||||||||
|
Advisor Class |
$ |
1,000.00 |
$ |
947.50 |
$ |
2.62 |
$ |
1,022.24 |
$ |
2.72 |
0.54 |
% |
|||||||||||||||
|
Institutional Class |
$ |
1,000.00 |
$ |
947.50 |
$ |
2.52 |
$ |
1,022.34 |
$ |
2.62 |
0.52 |
% |
|||||||||||||||
|
R6 Class |
$ |
1,000.00 |
$ |
947.90 |
$ |
2.14 |
$ |
1,022.74 |
$ |
2.22 |
0.44 |
% |
|||||||||||||||
* Expenses are calculated using the Annualized Expense Ratio, multiplied by the average account value over the period, multiplied by 182 and divided by 365 (to reflect one-half year period)
(a) Expenses are calculated using the Annualized Expense Ratio, multiplied by the average account value over the period, multiplied by 62 and divided by 365 (to reflect number of days the class was open)
Oakmark.com 1
Oakmark and Oakmark Select Funds March 31, 2022
Portfolio Manager Commentary

William C. Nygren, CFA
Portfolio Manager
oakmx@oakmark.com
oaklx@oakmark.com
oakwx@oakmark.com
At Oakmark, we are long-term investors. We attempt to identify growing businesses that are managed to benefit their shareholders. We will purchase stock in those businesses only when priced substantially below our estimate of intrinsic value. After purchase, we patiently wait for the gap between stock price and intrinsic value to close.
"Fear and pessimism bring opportunities."
-Michael Price (1951-2022)
The commentary I wrote in 2016 for Oakmark's 25-year anniversary looked back at the investment performance of the Fund and the stock market in the context of the many events in the world that investors worried about. The conclusion was that investors did just fine despite one crisis after another—and this conclusion still holds true today.
The Oakmark Fund was launched in 1991 shortly after Operation Desert Storm, in which the United States led a multi-nation coalition that prevented Iraq from annexing Kuwait. Today we remember that conflict mostly for how fast victory was achieved—six weeks of bombing followed by only four days of armed combat. But before the fighting began, there was tremendous fear that we could lose to Iraq's highly trained Republican Army, that losing access to Middle Eastern oil could cause a global depression and that Iraqi use of weapons of mass destruction could kill people across the world. I remember one of Harris Associates' founding partners, Myron Szold, saying, "Betting that the world is going to end is the worst bet you can make. You're unlikely to win, and even if you do, you can't collect."
They say history doesn't repeat; it rhymes. Many of today's concerns about the tragedy in Ukraine seem analogous to the concerns investors had about war in Iraq when we were preparing to launch the Oakmark Fund in 1991. One analyst report last month grabbed headlines when it predicted a 10% probability that Russia's attack on Ukraine would spread and end civilization. It may sound cavalier to ignore that risk, but using Myron's logic, there is no payoff to structuring a portfolio for the end of civilization. We believe it is reassuring to put current events into context as we determine how to invest our assets today.
Here is an update to the list I used in 2016 of troubling events we've been through since we started the Oakmark Fund in 1991. We've experienced the following, roughly by year:
• Operation Desert Storm
• Global Recession
• Hillarycare
• Fed Increasing Interest Rates
• Oklahoma City Bombing
• U.S. Government Shutdown
• Mad Cow Disease
• Asian Flu
• Clinton Impeachment
• Y2K
• Tech Bubble
• 9/11
• Afghan War
• Recession
• Iraq War
• SARS
• Hurricane Katrina
• Subprime Mortgage Crisis
• Lehman Bros. Bankruptcy
• Obamacare
• Real Estate Collapse
• Global Financial Crisis
• Greek Bailout
• S&P Downgrading U.S. Debt
• Oil Price Collapse
• Ebola
• Ukraine/Crimea/Russia
• Syrian Migrant Crisis
• Brexit
• Divisive Presidential Election
• Trump Impeachment
• China Trade War
• Covid-19
• Inflation Acceleration
• Ukraine/Russia
That's an intimidating list. In 2016, I wrote that despite all that went wrong in the world, an investor who bought the S&P 500 in 1991 and held their position through 2016 would have accumulated more than nine times their initial capital. And that return is despite experiencing eight corrections and three bear markets. (Corrections are defined as a drop of at least 10% in the S&P 500, a level reached in the past quarter; and bear markets are declines of over 20%.) Though it is tempting to use world events to try to profitably move in and out of the market, it's hard to improve on that buy-and-hold record by picking the right periods to sit out. Likewise, during those 25 years, the Oakmark Fund had periods of both good and bad returns relative to the S&P 500, but an investor who bought at the
See accompanying Disclosures and Endnotes on page 100.
2 OAKMARK FUNDS
Oakmark and Oakmark Select Funds March 31, 2022
Portfolio Manager Commentary (continued)
beginning in 1991 and held through 2016 ended with more than 19 times their starting capital. Those 25 years included many frustrating times when fundamental value investing was out of favor, but the 25-year return of over twice the S&P 500 would have been difficult to improve on by trying to guess when our investment style was going to be in favor.
Updating those numbers through the end of March 2022 shows that over the past six years the S&P 500 investor more than doubled their capital, going from nine times to more than 20 times the original value. That return was despite experiencing four corrections and two bear markets. And even though the Oakmark Fund hasn't quite kept pace with the S&P 500 since 2016, our investors have grown their capital from 19 times to nearly 40 times the original value, roughly double the return of the S&P 500.
When confronted with global uncertainty, it can be difficult to imagine what the next year or even the next month will bring, and that can be scary. But at Oakmark, we are anchored by an investment philosophy that exploits deviations between current prices and long-term values. We only own stocks that are selling at unusually large discounts to what we believe those businesses will be worth roughly seven years from now. The events investors worry about might lead to significant reductions in current earnings, but that is usually transitory. It is rare for such issues to cause meaningful reductions in estimates of long-term business value. That is why in periods of high volatility, as occurred this past quarter, we see opportunity and often make more portfolio changes than usual.
My favorite sporting event is March Madness. The David versus Goliath early-round matchups are the most fun. Every couple of years a huge favorite gets knocked off by a small school we've barely heard of. In this year's first round, oddsmakers gave perennial favorite and number-2 seed Kentucky a 95% chance of beating number-15 seed St. Peter's. And though it ruined my bracket, watching the kids from St. Peter's celebrate their win is what makes March Madness must-see TV.
We don't know which game will produce the huge March Madness upset, but we've come to expect them. There are eight matchups annually between 1- or 2-seeds and 15- or 16-seeds. If each underdog has a 5% chance of winning, there is a 34% chance that a major upset happens in any given year. I wish investors could think about stock market corrections like March Madness upsets. They are to be expected, happening about every two years. And just like the winning bracket is not the one that anticipates the most upsets, the best long-term investment record is not the one that anticipates the most corrections. I'm not going to take the analogy so far as to say that you can actually enjoy the corrections as much as you enjoy the upsets, but you can use them to your advantage.
We encourage shareholders to have a target for the percentage of their assets they want to have invested in the stock market. When stock prices fall, stocks will fall below that percentage target. But individual investors often sell after stock prices fall. This not only hurts their returns, but it moves their portfolios further away from their targets. If you buy after your percentage in stocks has fallen below your target and sell after it has risen above the target, you can avoid the trap of buying high and selling low.
When world events cause the stock market to fall, don't join in the panic. Check your portfolio. And if stocks have fallen
meaningfully under your target weighting, take advantage of the cheaper prices. It won't be as much fun as watching St. Peter's celebrate, but it may ease the pain and boost your returns.
See accompanying Disclosures and Endnotes on page 100.
Oakmark.com 3
Oakmark Fund March 31, 2022
Summary Information
VALUE OF A $10,000 INVESTMENT
Since Inception - 08/05/91 (Unaudited)
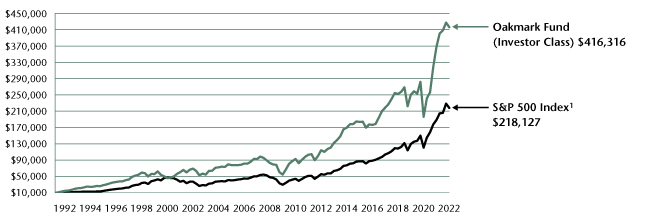
PERFORMANCE
|
Average Annual Total Returns (as of 03/31/22) |
|||||||||||||||||||||||||||||||
| (Unaudited) |
Total Return Last 3 Months |
1-year |
3-year |
5-year |
10-year |
Since Inception |
Inception Date |
||||||||||||||||||||||||
|
Oakmark Fund (Investor Class) |
-2.63 |
% |
13.12 |
% |
18.41 |
% |
13.73 |
% |
13.80 |
% |
12.94 |
% |
08/05/91 |
||||||||||||||||||
|
S&P 500 Index |
-4.60 |
% |
15.65 |
% |
18.92 |
% |
15.99 |
% |
14.64 |
% |
10.58 |
% |
|||||||||||||||||||
|
Dow Jones Industrial Average2 |
-4.10 |
% |
7.11 |
% |
12.57 |
% |
13.40 |
% |
12.77 |
% |
10.91 |
% |
|||||||||||||||||||
|
Lipper Large-Cap Value Funds Index3 |
-0.93 |
% |
11.73 |
% |
14.09 |
% |
11.41 |
% |
11.82 |
% |
9.27 |
% |
|||||||||||||||||||
|
Oakmark Fund (Advisor Class) |
-2.56 |
% |
13.37 |
% |
18.59 |
% |
13.88 |
% |
N/A |
14.18 |
% |
11/30/16 |
|||||||||||||||||||
|
Oakmark Fund (Institutional Class) |
-2.56 |
% |
13.39 |
% |
18.65 |
% |
13.94 |
% |
N/A |
14.23 |
% |
11/30/16 |
|||||||||||||||||||
|
Oakmark Fund (R6 Class) |
-2.56 |
% |
13.43 |
% |
N/A |
N/A |
N/A |
25.19 |
% |
12/15/20 |
|||||||||||||||||||||
The graph and table above do not reflect the deduction of taxes that a shareholder would pay on Fund distributions or the redemption of Fund shares.
Past performance is no guarantee of future results. The performance data quoted represents past performance. Current performance may be lower or higher than the performance data quoted. Total return includes change in share prices and, in each case, includes reinvestment of dividends and capital gain distributions. The investment return and principal value vary so that an investor's shares, when redeemed, may be worth more or less than the original cost. To obtain the most recent month-end performance, please visit Oakmark.com.
|
TOP TEN EQUITY HOLDINGS4 |
% of Net Assets | ||||||
|
EOG Resources, Inc. |
3.5 |
||||||
|
Alphabet, Inc., Class A |
3.2 |
||||||
|
Ally Financial, Inc. |
3.2 |
||||||
|
APA Corp. |
2.9 |
||||||
|
The Charles Schwab Corp. |
2.7 |
||||||
|
Capital One Financial Corp. |
2.6 |
||||||
|
ConocoPhillips |
2.6 |
||||||
|
American International Group, Inc. |
2.2 |
||||||
|
Citigroup, Inc. |
2.2 |
||||||
|
Charter Communications, Inc., Class A |
2.2 |
||||||
|
FUND STATISTICS |
|||||||
|
Ticker* |
OAKMX |
||||||
|
Number of Equity Holdings |
56 |
||||||
|
Net Assets |
$18 billion | ||||||
|
Weighted Average Market Cap |
$149.3 billion | ||||||
|
Median Market Cap |
$57.9 billion | ||||||
|
Gross Expense Ratio - Investor Class*^ |
0.93% | ||||||
|
Net Expense Ratio - Investor Class*†^ |
0.91% | ||||||
* This information is related to the Investor Class. Please visit Oakmark.com for information related to the Advisor, Institutional and R6 Classes.
† The net expense ratio reflects a contractual advisory fee waiver agreement through January 27, 2023.
^ The Gross Expense Ratio and Net Expense Ratio are from the Fund's Prospectus dated January 28, 2022.
|
SECTOR ALLOCATION |
% of Net Assets | ||||||
|
Financials |
29.7 |
||||||
|
Communication Services |
14.8 |
||||||
|
Information Technology |
10.5 |
||||||
|
Energy |
10.4 |
||||||
|
Consumer Discretionary |
9.0 |
||||||
|
Health Care |
7.1 |
||||||
|
Consumer Staples |
5.8 |
||||||
|
Industrials |
4.9 |
||||||
|
Real Estate |
1.2 |
||||||
|
Short-Term Investments and Other |
6.6 |
||||||
See accompanying Disclosures and Endnotes on page 100.
4 OAKMARK FUNDS
Oakmark Fund March 31, 2022
Portfolio Manager Commentary


William C. Nygren, CFA
Portfolio Manager
oakmx@oakmark.com
Michael A. Nicolas, CFA
Portfolio Manager
oakmx@oakmark.com
The Oakmark Fund generated a –3% return during the first quarter, outperforming the S&P 500 Index's1 return of –5%. Our holdings in the energy sector were the biggest contributor to our outperformance during the period, whereas our holdings in the communication services sector detracted the most. Our highest contributing securities during the period were EOG Resources and APA Corp, while our largest detractors were Netflix and Meta Platforms. We continue to own each of these investments given their significant discounts to our estimates of business value, and we added exposure to both Meta Platforms and Netflix.
We took advantage of the market's heightened volatility during the quarter by adding six new positions to the portfolio. (See descriptions below.) We also eliminated our holdings in ADP, Mastercard, and S&P Global. Each of these successful investments approached our estimate of intrinsic value and was sold to pursue more attractive alternatives.
A close look at the portfolio shows an increase in options positions. We use options for two reasons. We frequently use them as part of our tax-loss selling to reduce taxable capital gain distributions. What you see this quarter, however, is different. When other investors believe our companies are substantially riskier than we do, options prices will be higher than our estimate of their intrinsic value. When opportunities like this surface, we'll sell puts or calls as an alternative to purchasing or selling shares, respectively. During the quarter, we took advantage of elevated volatility by selling calls against a small portion of our energy holdings instead of trimming them. We also sold puts on Meta Platforms (rather than adding to it) and Amazon (to initiate a new position).
The following is a brief description of our new holdings:
Amazon is the leading e-commerce and cloud-computing provider in the world. In e-commerce, two-thirds of U.S. households are Amazon Prime subscribers, and over half of all online product searches now start on Amazon. We believe the company's strong customer loyalty and massive infrastructure are significant barriers to entry in a growing e-commerce market. Separately, Amazon Web Services (AWS) controls nearly half of the market in cloud computing. We believe AWS has become utility-like in nature and scale, and we expect healthy growth moving forward as IT workloads continue moving to the cloud. More recently, concerns about rising investment spending have weighed on the stock—as they have in times past—providing us another opportunity to purchase shares at an attractive multiple of normalized earnings and a discount to its peer-weighted enterprise value-to-sales multiple.
Equifax is one of the leading U.S. credit bureaus. The company competes in a triopoly with TransUnion and Experian, all of which are great businesses due to their entrenched competitive position, valuable data sets, deep client integration and pricing
power. In our view, what separates Equifax from its peers is its proprietary Workforce Solutions database, which is now its largest and most differentiated business. Workforce Solutions is an income and employment database used to evaluate the creditworthiness of a consumer in real-time. Furthermore, Equifax's collection of alternative data is becoming increasingly important to lenders so they can assess the creditworthiness of consumers with thin or even nonexistent credit files. We were able to purchase this well-managed company at an attractive valuation due to concerns that rising interest rates would adversely affect credit inquiries. Despite these near-term headwinds, Equifax recently reiterated full-year guidance and continues to expect significant market outgrowth. Longer term, the company anticipates 7-10% organic sales growth, an outlook that we believe is not properly reflected in today's stock price.
Global Payments is a leading provider of merchant acquiring services. The company is also one of the largest providers of payment processing and related technology solutions to credit card issuers. We believe Global Payments' merchant acquiring business is well positioned given its strength in software-driven payments. This is one of the fastest growing parts of the industry as small business customers are increasingly recognizing the efficiency benefits of having payments seamlessly integrated into the software they use to run their businesses. In addition, Global Payments benefits from the broader secular shift away from cash and toward electronic payment methods. Together, these tailwinds have the potential to drive low-double-digit revenue growth and even faster earnings growth. With this strong outlook and with management returning a significant portion of free cash flow to shareholders via repurchase, we think the stock looks attractive at its current valuation of just 12.5x next year's expected EPS.5
We previously had an opportunity to own Pinterest when the stock sold off during the Covid-19-related downturn, and we were pleased to be able to invest in the company once again at an attractive price during the quarter. Pinterest is an online personal discovery tool that people use to find ideas based on their tastes and interests. Unlike most social media companies, the objectives of users and advertisers are fundamentally aligned on Pinterest. Users find a positive and useful product discovery experience, and advertisers find an audience with high commercial intent and the ability to integrate ads naturally. Although Pinterest had more than 430 million global users as of year-end, the company is still in the early days of monetizing its platform. We believe that its shares trade well below fair value on conventional metrics, such as enterprise value to revenue, as well as when we benchmark its ultimate revenue and margin potential against more mature internet companies.
Pulte is one of the nation's largest homebuilders. While demographic tailwinds are expected to support healthy housing
See accompanying Disclosures and Endnotes on page 100.
Oakmark.com 5
Oakmark Fund March 31, 2022
Portfolio Manager Commentary (continued)
demand for years to come, more important to our thesis is the company's operational transformation over the past decade. Having adopted a more rigorous, returns-driven approach to land acquisition and manufacturing, Pulte now consistently earns returns on equity near the high end of its peer group. We expect the company to generate approximately 15% of its market cap in free cash flow this year, and management is putting that cash to good use by strengthening its balance sheet and returning capital to shareholders. While we recognize that the recent surge in home prices is producing a level of profitability that's above what we would consider "normal," we still find the stock attractive relative to our more tempered estimate of mid-cycle earnings.
Over the past 20 years, Salesforce has become a dominant global player in sales, customer service, commerce and marketing software. CRM earns 80% gross margins, grows 20% organically and virtually all of its revenue is recurring. It's a great business that we've admired from afar for a long time. More recently, the organization has made some changes at the top that prompted us to take a closer look at the stock. New CEO Bret Taylor and CFO Amy Weaver are bringing a culture of financial discipline. We believe this renewed focus on profitability, combined with Salesforce's strong underlying business characteristics, will yield strong results. The current valuation of 5x next year's revenues represents a significant discount compared to publicly traded comparables and private market values in the software space. We view this discount as an opportunity to invest in a great business at a good value.
We thank you, our fellow shareholders, for your investment and continued support of the Oakmark Fund.
See accompanying Disclosures and Endnotes on page 100.
6 OAKMARK FUNDS
Oakmark Fund March 31, 2022 (Unaudited)
Schedule of Investments (in thousands)
|
Shares |
Value |
||||||||||
|
COMMON STOCKS - 93.4% |
|||||||||||
|
FINANCIALS - 29.7% |
|||||||||||
|
DIVERSIFIED FINANCIALS - 19.0% |
|||||||||||
|
Ally Financial, Inc. |
13,243 |
$ |
575,810 |
||||||||
|
The Charles Schwab Corp. |
5,709 |
481,326 |
|||||||||
|
Capital One Financial Corp. |
3,597 |
472,250 |
|||||||||
|
The Goldman Sachs Group, Inc. |
1,105 |
364,760 |
|||||||||
|
American Express Co. |
1,804 |
337,404 |
|||||||||
|
Intercontinental Exchange, Inc. |
2,400 |
317,088 |
|||||||||
|
State Street Corp. |
3,568 |
310,827 |
|||||||||
|
KKR & Co., Inc. |
4,030 |
235,634 |
|||||||||
|
The Bank of New York Mellon Corp. |
4,335 |
215,123 |
|||||||||
|
Moody's Corp. |
330 |
111,302 |
|||||||||
|
3,421,524 |
|||||||||||
|
INSURANCE - 5.5% |
|||||||||||
|
American International Group, Inc. |
6,293 |
394,999 |
|||||||||
|
Willis Towers Watson PLC |
1,350 |
318,897 |
|||||||||
|
Reinsurance Group of America, Inc. |
2,519 |
275,733 |
|||||||||
|
989,629 |
|||||||||||
|
BANKS - 5.2% |
|||||||||||
|
Citigroup, Inc. |
7,324 |
391,112 |
|||||||||
|
Wells Fargo & Co. |
7,000 |
339,220 |
|||||||||
|
Bank of America Corp. |
4,946 |
203,854 |
|||||||||
|
934,186 |
|||||||||||
|
5,345,339 |
|||||||||||
|
COMMUNICATION SERVICES - 14.8% |
|||||||||||
|
MEDIA & ENTERTAINMENT - 13.4% |
|||||||||||
|
Alphabet, Inc., Class A (a) |
210 |
583,569 |
|||||||||
|
Charter Communications, Inc., Class A (a) |
711 |
387,592 |
|||||||||
|
Netflix, Inc. (a) |
903 |
338,105 |
|||||||||
|
Meta Platforms, Inc., Class A (a) (b) |
1,330 |
295,828 |
|||||||||
|
Comcast Corp., Class A |
6,261 |
293,144 |
|||||||||
|
Take-Two Interactive Software, Inc. (a) |
1,700 |
261,358 |
|||||||||
|
Pinterest, Inc., Class A (a) |
10,000 |
246,100 |
|||||||||
|
2,405,696 |
|||||||||||
|
TELECOMMUNICATION SERVICES - 1.4% |
|||||||||||
|
T-Mobile US, Inc. (a) |
2,000 |
256,700 |
|||||||||
|
2,662,396 |
|||||||||||
|
ENERGY - 10.5% |
|||||||||||
|
EOG Resources, Inc. (b) |
5,259 |
626,978 |
|||||||||
|
APA Corp. (b) |
12,824 |
530,008 |
|||||||||
|
ConocoPhillips (b) |
4,706 |
470,570 |
|||||||||
|
Diamondback Energy, Inc. (b) |
1,960 |
268,677 |
|||||||||
|
1,896,233 |
|||||||||||
|
Shares |
Value |
||||||||||
|
INFORMATION TECHNOLOGY - 10.4% |
|||||||||||
|
SOFTWARE & SERVICES - 9.6% |
|||||||||||
|
Fiserv, Inc. (a) |
3,800 |
$ |
385,320 |
||||||||
|
Gartner, Inc. (a) |
1,177 |
349,969 |
|||||||||
|
Workday, Inc., Class A (a) |
1,207 |
288,980 |
|||||||||
|
salesforce.com, Inc. (a) |
1,000 |
212,320 |
|||||||||
|
DXC Technology Co. (a) |
6,458 |
210,716 |
|||||||||
|
Global Payments, Inc. |
1,400 |
191,576 |
|||||||||
|
Visa, Inc., Class A |
435 |
96,403 |
|||||||||
|
1,735,284 |
|||||||||||
|
TECHNOLOGY HARDWARE & EQUIPMENT - 0.8% |
|||||||||||
|
TE Connectivity, Ltd. |
1,123 |
147,057 |
|||||||||
|
1,882,341 |
|||||||||||
|
CONSUMER DISCRETIONARY - 9.0% |
|||||||||||
|
CONSUMER SERVICES - 3.5% |
|||||||||||
|
Booking Holdings, Inc. (a) |
157 |
367,767 |
|||||||||
|
Hilton Worldwide Holdings, Inc. (a) |
1,722 |
261,312 |
|||||||||
|
629,079 |
|||||||||||
|
AUTOMOBILES & COMPONENTS - 3.0% |
|||||||||||
|
General Motors Co. (a) |
7,762 |
339,510 |
|||||||||
|
BorgWarner, Inc. |
5,000 |
194,500 |
|||||||||
|
534,010 |
|||||||||||
|
RETAILING - 1.5% |
|||||||||||
|
eBay, Inc. |
4,598 |
263,264 |
|||||||||
|
Qurate Retail, Inc., Class A |
3,792 |
18,050 |
|||||||||
|
281,314 |
|||||||||||
|
CONSUMER DURABLES & APPAREL - 1.0% |
|||||||||||
|
Pulte Homes, Inc. |
4,200 |
175,980 |
|||||||||
|
1,620,383 |
|||||||||||
|
HEALTH CARE - 7.1% |
|||||||||||
|
HEALTH CARE EQUIPMENT & SERVICES - 5.3% |
|||||||||||
|
HCA Healthcare, Inc. |
1,500 |
375,929 |
|||||||||
|
Humana, Inc. |
823 |
358,145 |
|||||||||
|
CVS Health Corp. |
2,103 |
212,862 |
|||||||||
|
946,936 |
|||||||||||
|
PHARMACEUTICALS, BIOTECHNOLOGY & LIFE SCIENCES - 1.8% |
|||||||||||
|
Regeneron Pharmaceuticals, Inc. (a) |
468 |
326,788 |
|||||||||
|
1,273,724 |
|||||||||||
|
CONSUMER STAPLES - 5.8% |
|||||||||||
|
FOOD, BEVERAGE & TOBACCO - 5.8% |
|||||||||||
|
Altria Group, Inc. |
7,000 |
365,750 |
|||||||||
|
Constellation Brands, Inc., Class A |
1,535 |
353,518 |
|||||||||
|
Keurig Dr Pepper, Inc. |
8,578 |
325,103 |
|||||||||
|
1,044,371 |
|||||||||||
See accompanying Notes to Financial Statements.
Oakmark.com 7
Oakmark Fund March 31, 2022 (Unaudited)
Schedule of Investments (in thousands) (continued)
|
Shares |
Value |
||||||||||
|
COMMON STOCKS - 93.4% (continued) |
|||||||||||
|
INDUSTRIALS - 4.9% |
|||||||||||
|
CAPITAL GOODS - 3.8% |
|||||||||||
|
General Electric Co. |
2,127 |
$ |
194,621 |
||||||||
|
PACCAR, Inc. |
2,000 |
176,140 |
|||||||||
|
General Dynamics Corp. |
650 |
156,767 |
|||||||||
|
Cummins, Inc. |
722 |
148,089 |
|||||||||
|
675,617 |
|||||||||||
|
COMMERCIAL & PROFESSIONAL SERVICES - 1.1% |
|||||||||||
|
Equifax, Inc. |
850 |
201,535 |
|||||||||
|
877,152 |
|||||||||||
|
REAL ESTATE - 1.2% |
|||||||||||
|
CBRE Group, Inc., Class A (a) |
2,368 |
216,719 |
|||||||||
|
TOTAL COMMON STOCKS - 93.4% (COST $10,255,082) |
16,818,658 |
||||||||||
|
Par Value |
Value |
||||||||||
|
SHORT-TERM INVESTMENT - 6.4% |
|||||||||||
|
REPURCHASE AGREEMENT - 6.4% |
|||||||||||
|
Fixed Income Clearing Corp. Repurchase Agreement, 0.28% dated 03/31/22 due 04/01/22, repurchase price $1,148,725, collateralized by United States Treasury Notes, 0.125% - 2.500% due 02/28/26 - 03/31/27, aggregate value plus accrued interest of $1,171,691 (Cost: $1,148,716) |
$ |
1,148,716 |
1,148,716 |
||||||||
|
TOTAL SHORT-TERM INVESTMENTS - 6.4% (COST $1,148,716) |
1,148,716 |
||||||||||
|
TOTAL INVESTMENTS - 99.8% (COST $11,403,798) |
17,967,374 |
||||||||||
|
Other Assets In Excess of Liabilities - 0.2% |
27,685 |
||||||||||
|
TOTAL NET ASSETS - 100.0% |
$ |
17,995,059 |
|||||||||
(a) Non-income producing security
(b) All or a portion of this investment is held in connection with one or more options within the Fund.
See accompanying Notes to Financial Statements.
8 OAKMARK FUNDS
Oakmark Fund March 31, 2022 (Unaudited)
Schedule of Investments (in thousands) (continued)
WRITTEN OPTIONS
|
Description |
Exercise Price |
Expiration Date |
Number of Contracts |
Notional Amount |
Market Value |
Premiums (Received) by Fund |
Unrealized Gain/(Loss) |
||||||||||||||||||||||||
|
CALLS |
|||||||||||||||||||||||||||||||
|
ConocoPhillips |
$ |
105.00 |
8/19/22 |
(5,000 |
) |
$ |
(50,000 |
) |
$ |
(3,175 |
) |
$ |
(5,154 |
) |
$ |
1,979 |
|||||||||||||||
|
APA Corp. |
$ |
40.00 |
7/15/22 |
(13,000 |
) |
$ |
(53,729 |
) |
$ |
(6,857 |
) |
$ |
(7,232 |
) |
$ |
375 |
|||||||||||||||
|
Diamondback Energy, Inc. |
$ |
140.00 |
6/17/22 |
(2,000 |
) |
$ |
(27,416 |
) |
$ |
(2,260 |
) |
$ |
(3,091 |
) |
$ |
831 |
|||||||||||||||
|
EOG Resources, Inc. |
$ |
124.00 |
7/15/22 |
(5,500 |
) |
$ |
(65,577 |
) |
$ |
(4,249 |
) |
$ |
(5,763 |
) |
$ |
1,514 |
|||||||||||||||
|
$ |
(196,722 |
) |
$ |
(16,541 |
) |
$ |
(21,240 |
) |
$ |
4,699 |
|||||||||||||||||||||
|
PUTS |
|||||||||||||||||||||||||||||||
|
Amazon.com, Inc. |
$ |
3,070.00 |
6/17/22 |
(680 |
) |
$ |
(221,677 |
) |
$ |
(7,834 |
) |
$ |
(13,705 |
) |
$ |
5,871 |
|||||||||||||||
|
Amazon.com, Inc. |
$ |
3,200.00 |
6/17/22 |
(680 |
) |
$ |
(221,677 |
) |
$ |
(11,109 |
) |
$ |
(10,810 |
) |
$ |
(299 |
) |
||||||||||||||
|
Meta Platforms, Inc. |
$ |
200.00 |
4/14/22 |
(8,000 |
) |
$ |
(177,888 |
) |
$ |
(604 |
) |
$ |
(8,628 |
) |
$ |
8,024 |
|||||||||||||||
|
$ |
(621,242 |
) |
$ |
(19,547 |
) |
$ |
(33,143 |
) |
$ |
13,596 |
|||||||||||||||||||||
See accompanying Notes to Financial Statements.
Oakmark.com 9
Oakmark Select Fund March 31, 2022
Summary Information
VALUE OF A $10,000 INVESTMENT
Since Inception - 11/01/96 (Unaudited)
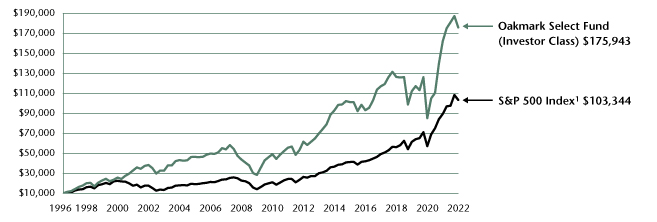
PERFORMANCE
|
Average Annual Total Returns (as of 03/31/22) |
|||||||||||||||||||||||||||||||
| (Unaudited) |
Total Return Last 3 Months |
1-year |
3-year |
5-year |
10-year |
Since Inception |
Inception Date |
||||||||||||||||||||||||
|
Oakmark Select Fund (Investor Class) |
-6.07 |
% |
8.47 |
% |
16.21 |
% |
8.49 |
% |
11.06 |
% |
11.95 |
% |
11/01/96 |
||||||||||||||||||
|
S&P 500 Index |
-4.60 |
% |
15.65 |
% |
18.92 |
% |
15.99 |
% |
14.64 |
% |
9.63 |
% |
|||||||||||||||||||
|
Lipper Multi-Cap Value Fund Index6 |
-1.16 |
% |
11.06 |
% |
13.17 |
% |
9.41 |
% |
10.68 |
% |
8.01 |
% |
|||||||||||||||||||
|
Oakmark Select Fund (Advisor Class) |
-6.04 |
% |
8.62 |
% |
16.36 |
% |
8.63 |
% |
N/A |
9.23 |
% |
11/30/16 |
|||||||||||||||||||
|
Oakmark Select Fund (Institutional Class) |
-6.02 |
% |
8.71 |
% |
16.44 |
% |
8.70 |
% |
N/A |
9.28 |
% |
11/30/16 |
|||||||||||||||||||
|
Oakmark Select Fund (R6 Class) |
-6.02 |
% |
8.71 |
% |
N/A |
N/A |
N/A |
20.58 |
% |
12/15/20 |
|||||||||||||||||||||
The graph and table do not reflect the deduction of taxes that a shareholder would pay on Fund distributions or the redemption of Fund shares.
Past performance is no guarantee of future results. The performance data quoted represents past performance. Current performance may be lower or higher than the performance data quoted. Total return includes change in share prices and, in each case, includes reinvestment of dividends and capital gain distributions. The investment return and principal value vary so that an investor's shares, when redeemed, may be worth more or less than the original cost. To obtain the most recent month-end performance, please visit Oakmark.com.
|
TOP TEN EQUITY HOLDINGS4 |
% of Net Assets | ||||||
|
Alphabet, Inc., Class A |
9.0 |
||||||
|
CBRE Group, Inc., Class A |
6.9 |
||||||
|
Ally Financial, Inc. |
5.7 |
||||||
|
Netflix, Inc. |
4.5 |
||||||
|
Charter Communications, Inc., Class A |
4.4 |
||||||
|
Fiserv, Inc. |
4.4 |
||||||
|
APA Corp. |
4.3 |
||||||
|
American International Group, Inc. |
4.0 |
||||||
|
Citigroup, Inc. |
3.9 |
||||||
|
Lithia Motors, Inc. |
3.9 |
||||||
|
FUND STATISTICS |
|||||||
|
Ticker* |
OAKLX |
||||||
|
Number of Equity Holdings |
25 |
||||||
|
Net Assets |
$5.3 billion | ||||||
|
Weighted Average Market Cap |
$257 billion | ||||||
|
Median Market Cap |
$55.2 billion | ||||||
|
Gross Expense Ratio - Investor Class*^ |
1.00% | ||||||
|
Net Expense Ratio - Investor Class*†^ |
0.98% | ||||||
* This information is related to the Investor Class. Please visit Oakmark.com for information related to the Advisor, Institutional and R6 Classes.
† The net expense ratio reflects a contractual advisory fee waiver agreement through January 27, 2023.
^ The Gross Expense Ratio and Net Expense Ratio are from the Fund's Prospectus dated January 28, 2022.
|
SECTOR ALLOCATION |
% of Net Assets | ||||||
|
Financials |
23.7 |
||||||
|
Communication Services |
21.0 |
||||||
|
Consumer Discretionary |
11.2 |
||||||
|
Energy |
7.9 |
||||||
|
Health Care |
7.0 |
||||||
|
Real Estate |
6.9 |
||||||
|
Industrials |
6.3 |
||||||
|
Information Technology |
4.4 |
||||||
|
Consumer Staples |
3.9 |
||||||
|
Short-Term Investments and Other |
7.7 |
||||||
See accompanying Disclosures and Endnotes on page 100.
10 OAKMARK FUNDS
Oakmark Select Fund March 31, 2022
Portfolio Manager Commentary


William C. Nygren, CFA
Portfolio Manager
oaklx@oakmark.com
Anthony P. Coniaris, CFA
Portfolio Manager
oaklx@oakmark.com
The Oakmark Select Fund declined 6% in the first quarter of 2022 compared to a 5% decline in the S&P 500.1 While the portfolio is well positioned for rising interest rates and higher oil prices—both of which were front and center to start the year—two company-specific earnings reports put a damper on what otherwise would have been a solid relative performance quarter. Concentration is a double-edged sword, and we felt the negative side of the blade this quarter.
Netflix (–38%) and Meta Platforms (–34%) were the most significant detractors in the first quarter—detracting twice as much as the next closest stock. Netflix is experiencing what we would describe as a Covid-19-induced hangover. The pandemic pulled forward subscriber growth while content spend was limited due to health restrictions pushing out production timelines. This led to a perfect storm of accelerated revenue and margin growth, which the Fund benefited from in 2020 and into 2021 when Netflix was one of our top performers. Now the reverse is occurring. Looking at Netflix's business performance with a longer term lens, one hardly sees any disruption in the franchise. We used the price strength in 2021 to reduce our position and have used the current weakness to add to our exposure to Netflix. Meta reported a disappointing outlook for the first quarter of this year as well, but for different reasons. The company's targeted advertising business has been negatively impacted by Apple's new privacy policies, and the franchise also appears to be maturing somewhat. The stock was pummeled on news that the first quarter of 2022 could see revenue growth in the 5-10% plus range. While most companies would kill for an outlook like that, Meta shareholders were accustomed to more. Now shares are valued as if the company won't grow much at all going forward, which we believe is misguided. We sold put options to add to our economic exposure in Meta to take advantage of the price weakness. Please see the Oakmark Fund letter for a more thorough description of why we have elected to use options to increase our exposure to certain names in the Fund.
Our two oil holdings, APA Corporation (+54%) and EOG Resources (+36%), were our top contributors in the quarter as oil prices rallied due to tight supplies, which were then exacerbated by the Russian invasion of Ukraine. Although their share prices have increased considerably, both companies still look quite undervalued even using longer term oil prices in the $65-70 dollar range. Meanwhile, if times are good over the next couple of years, we expect these companies to return significant percentages of their market caps to shareholders.
As is typical during periods of significant volatility, we added a new name to the portfolio. Lithia Motors is the largest franchised auto dealer group in the United States. The company has a long history of creating shareholder value through best-in-class operations and consistent acquisitions of smaller dealers at
attractive returns. There is a long runway for management to continue creating value through such acquisitions. Management believes this will drive earnings per share to more than $50 by 2025, even as car prices return to pre-pandemic levels. Meanwhile, Lithia has a significant opportunity to further accelerate growth through Driveway, its online auto retailing platform. We believe Lithia's existing nationwide infrastructure provides Driveway with significant competitive advantages in e-commerce, which smaller dealers will struggle to replicate. Driveway is not generating any earnings today, but it could become a major contributor over the next five to seven years. With the stock priced at less than 7x management's 2025 EPS5 target and with substantial future growth potential from Driveway, we believe Lithia shares are a bargain today.
Humana and Hilton were reduced to minimal positions in the portfolio as the discount to value narrowed considerably during the quarter. Our CIT shares were converted to First Citizens Bancshares as the merger was completed.
Thank you, our fellow shareholders, for your continued investment in the Fund.
See accompanying Disclosures and Endnotes on page 100.
Oakmark.com 11
Oakmark Select Fund March 31, 2022 (Unaudited)
Schedule of Investments (in thousands)
|
Shares |
Value |
||||||||||
|
COMMON STOCKS - 92.3% |
|||||||||||
|
FINANCIALS - 23.7% |
|||||||||||
|
BANKS - 10.3% |
|||||||||||
|
Citigroup, Inc. |
3,942 |
$ |
210,503 |
||||||||
|
First Citizens BancShares, Inc., Class A |
290 |
193,046 |
|||||||||
|
Bank of America Corp. |
3,362 |
138,578 |
|||||||||
|
First Citizens BancShares, Inc., Class B |
14 |
8,795 |
|||||||||
|
550,922 |
|||||||||||
|
DIVERSIFIED FINANCIALS - 9.4% |
|||||||||||
|
Ally Financial, Inc. |
7,000 |
304,364 |
|||||||||
|
Capital One Financial Corp. |
1,479 |
194,191 |
|||||||||
|
498,555 |
|||||||||||
|
INSURANCE - 4.0% |
|||||||||||
|
American International Group, Inc. |
3,410 |
214,033 |
|||||||||
|
1,263,510 |
|||||||||||
|
COMMUNICATION SERVICES - 21.0% |
|||||||||||
|
MEDIA & ENTERTAINMENT - 21.0% |
|||||||||||
|
Alphabet, Inc., Class A (a) |
172 |
477,866 |
|||||||||
|
Netflix, Inc. (a) |
641 |
240,150 |
|||||||||
|
Charter Communications, Inc., Class A (a) |
429 |
233,973 |
|||||||||
|
Meta Platforms, Inc., Class A (a) (b) |
760 |
168,994 |
|||||||||
|
1,120,983 |
|||||||||||
|
CONSUMER DISCRETIONARY - 11.2% |
|||||||||||
|
CONSUMER SERVICES - 4.2% |
|||||||||||
|
Booking Holdings, Inc. (a) |
82 |
192,573 |
|||||||||
|
Hilton Worldwide Holdings, Inc. (a) |
196 |
29,813 |
|||||||||
|
222,386 |
|||||||||||
|
RETAILING - 3.9% |
|||||||||||
|
Lithia Motors, Inc. |
700 |
210,084 |
|||||||||
|
AUTOMOBILES & COMPONENTS - 3.1% |
|||||||||||
|
Lear Corp. |
1,150 |
163,979 |
|||||||||
|
596,449 |
|||||||||||
|
ENERGY - 7.9% |
|||||||||||
|
APA Corp. (b) |
5,550 |
229,381 |
|||||||||
|
EOG Resources, Inc. (b) |
1,640 |
195,494 |
|||||||||
|
424,875 |
|||||||||||
|
HEALTH CARE - 7.0% |
|||||||||||
|
HEALTH CARE EQUIPMENT & SERVICES - 4.1% |
|||||||||||
|
HCA Healthcare, Inc. |
703 |
176,122 |
|||||||||
|
Humana, Inc. |
97 |
42,212 |
|||||||||
|
218,334 |
|||||||||||
|
PHARMACEUTICALS, BIOTECHNOLOGY & LIFE SCIENCES - 2.9% |
|||||||||||
|
Regeneron Pharmaceuticals, Inc. (a) |
224 |
156,446 |
|||||||||
|
374,780 |
|||||||||||
|
REAL ESTATE - 6.9% |
|||||||||||
|
CBRE Group, Inc., Class A (a) (b) |
4,017 |
367,605 |
|||||||||
|
Shares |
Value |
||||||||||
|
INDUSTRIALS - 6.3% |
|||||||||||
|
CAPITAL GOODS - 6.3% |
|||||||||||
|
Allison Transmission Holdings, Inc. |
4,490 |
$ |
176,278 |
||||||||
|
General Electric Co. |
1,753 |
160,372 |
|||||||||
|
336,650 |
|||||||||||
|
INFORMATION TECHNOLOGY - 4.4% |
|||||||||||
|
SOFTWARE & SERVICES - 4.4% |
|||||||||||
|
Fiserv, Inc. (a) |
2,300 |
233,220 |
|||||||||
|
CONSUMER STAPLES - 3.9% |
|||||||||||
|
FOOD, BEVERAGE & TOBACCO - 3.9% |
|||||||||||
|
Constellation Brands, Inc., Class A |
910 |
209,499 |
|||||||||
|
TOTAL COMMON STOCKS - 92.3% (COST $2,960,329) |
4,927,571 |
||||||||||
|
Par Value |
Value |
||||||||||
|
SHORT-TERM INVESTMENTS - 8.2% |
|||||||||||
|
REPURCHASE AGREEMENT - 8.2% |
|||||||||||
|
Fixed Income Clearing Corp. Repurchase Agreement, 0.28% dated 03/31/22 due 04/01/22, repurchase price $437,124, collateralized by United States Treasury Notes, 0.125% - 0.625% due 10/15/25 - 01/31/26, aggregate value plus accrued interest of $445,863 (Cost: $437,120) |
$ |
437,120 |
437,120 |
||||||||
|
TOTAL SHORT-TERM INVESTMENTS - 8.2% (COST $437,120) |
437,120 |
||||||||||
|
TOTAL INVESTMENTS - 100.5% (COST $3,397,449) |
5,364,691 |
||||||||||
|
Liabilities In Excess of Other Assets - (0.5)% |
(26,113 |
) |
|||||||||
|
TOTAL NET ASSETS - 100.0% |
$ |
5,338,578 |
|||||||||
(a) Non-income producing security
(b) All or a portion of this investment is held in connection with one or more options within the Fund.
See accompanying Notes to Financial Statements.
12 OAKMARK FUNDS
Oakmark Select Fund March 31, 2022 (Unaudited)
Schedule of Investments (in thousands) (continued)
WRITTEN OPTIONS
|
Description |
Exercise Price |
Expiration Date |
Number of Contracts |
Notional Amount |
Market Value |
Premiums (Received) by Fund |
Unrealized Gain/(Loss) |
||||||||||||||||||||||||
|
CALLS |
|||||||||||||||||||||||||||||||
|
APA Corp. |
$ |
40.00 |
7/15/22 |
(6,000 |
) |
$ |
(24,798 |
) |
$ |
(3,165 |
) |
$ |
(3,337 |
) |
$ |
172 |
|||||||||||||||
|
EOG Resources, Inc. |
$ |
124.00 |
7/15/22 |
(2,000 |
) |
$ |
(23,846 |
) |
$ |
(1,545 |
) |
$ |
(2,096 |
) |
$ |
551 |
|||||||||||||||
|
CBRE Group, Inc. |
$ |
95.00 |
6/17/22 |
(18,000 |
) |
$ |
(164,736 |
) |
$ |
(6,750 |
) |
$ |
(17,441 |
) |
$ |
10,691 |
|||||||||||||||
|
$ |
(213,380 |
) |
$ |
(11,460 |
) |
$ |
(22,874 |
) |
$ |
11,414 |
|||||||||||||||||||||
|
PUTS |
|||||||||||||||||||||||||||||||
|
Meta Platforms, Inc. |
$ |
215.00 |
6/17/22 |
(4,000 |
) |
$ |
(88,944 |
) |
$ |
(5,240 |
) |
$ |
(6,386 |
) |
$ |
1,146 |
|||||||||||||||
|
$ |
(88,944 |
) |
$ |
(5,240 |
) |
$ |
(6,386 |
) |
$ |
1,146 |
|||||||||||||||||||||
See accompanying Notes to Financial Statements.
Oakmark.com 13
Oakmark Global Fund March 31, 2022
Summary Information
VALUE OF A $10,000 INVESTMENT
Since Inception - 08/04/99 (Unaudited)
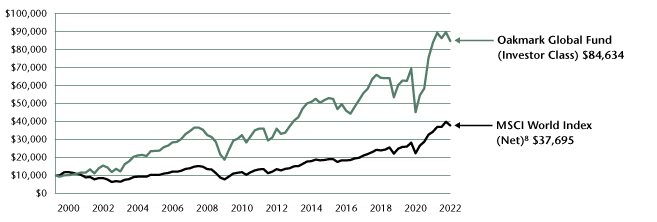
PERFORMANCE
|
Average Annual Total Returns (as of 03/31/22) |
|||||||||||||||||||||||||||||||
| (Unaudited) |
Total Return Last 3 Months |
1-year |
3-year |
5-year |
10-year |
Since Inception |
Inception Date |
||||||||||||||||||||||||
|
Oakmark Global Fund (Investor Class) |
-5.53 |
% |
1.07 |
% |
12.09 |
% |
8.70 |
% |
8.96 |
% |
9.89 |
% |
08/04/99 |
||||||||||||||||||
|
MSCI World Index (Net) |
-5.15 |
% |
10.12 |
% |
14.98 |
% |
12.42 |
% |
10.88 |
% |
6.03 |
% |
|||||||||||||||||||
|
Lipper Global Fund Index9 |
-8.23 |
% |
2.23 |
% |
12.03 |
% |
9.93 |
% |
9.42 |
% |
6.13 |
% |
|||||||||||||||||||
|
Oakmark Global Fund (Advisor Class) |
-5.48 |
% |
1.26 |
% |
12.26 |
% |
8.85 |
% |
N/A |
10.41 |
% |
11/30/16 |
|||||||||||||||||||
|
Oakmark Global Fund (Institutional Class) |
-5.48 |
% |
1.28 |
% |
12.31 |
% |
8.91 |
% |
N/A |
10.47 |
% |
11/30/16 |
|||||||||||||||||||
|
Oakmark Global Fund (R6 Class) |
-5.48 |
% |
1.30 |
% |
N/A |
N/A |
N/A |
11.12 |
% |
12/15/20 |
|||||||||||||||||||||
The graph and table do not reflect the deduction of taxes that a shareholder would pay on Fund distributions or the redemption of Fund shares.
Past performance is no guarantee of future results. The performance data quoted represents past performance. Current performance may be lower or higher than the performance data quoted. Total return includes change in share prices and, in each case, includes reinvestment of dividends and capital gain distributions. The investment return and principal value vary so that an investor's shares, when redeemed, may be worth more or less than the original cost. To obtain the most recent month-end performance, please visit Oakmark.com.
|
TOP TEN EQUITY HOLDINGS4 |
% of Net Assets | ||||||
|
Alphabet, Inc., Class A |
6.7 |
||||||
|
Bayer AG |
4.8 |
||||||
|
TE Connectivity, Ltd. |
4.4 |
||||||
|
Lloyds Banking Group PLC |
4.0 |
||||||
|
General Motors Co |
3.9 |
||||||
|
Allianz SE |
3.6 |
||||||
|
Tenet Healthcare Corp. |
3.6 |
||||||
|
Credit Suisse Group AG |
3.5 |
||||||
|
Alibaba Group Holding, Ltd. |
3.3 |
||||||
|
Bank of America Corp. |
3.3 |
||||||
|
FUND STATISTICS |
|||||||
|
Ticker* |
OAKGX |
||||||
|
Number of Equity Holdings |
47 |
||||||
|
Net Assets |
$1.4 billion | ||||||
|
Weighted Average Market Cap |
$221.5 billion | ||||||
|
Median Market Cap |
$42.6 billion | ||||||
|
Gross Expense Ratio - Investor Class*^ |
1.15% | ||||||
|
Net Expense Ratio - Investor Class*†^ |
1.13% | ||||||
* This information is related to the Investor Class. Please visit Oakmark.com for information related to the Advisor, Institutional and R6 Classes.
† The net expense ratio reflects a contractual advisory fee waiver agreement through January 27, 2023.
^ The Gross Expense Ratio and Net Expense Ratio are from the Fund's Prospectus dated January 28, 2022.
|
SECTOR ALLOCATION |
% of Net Assets | ||||||
|
Equity Investments |
|||||||
|
Financials |
20.5 |
||||||
|
Consumer Discretionary |
17.3 |
||||||
|
Communication Services |
15.1 |
||||||
|
Information Technology |
12.6 |
||||||
|
Health Care |
12.5 |
||||||
|
Industrials |
10.5 |
||||||
|
Consumer Staples |
3.3 |
||||||
|
Materials |
3.2 |
||||||
|
Energy |
2.0 |
||||||
|
Total Equity Investments |
97.0 |
||||||
|
Preferred Stocks |
0.7 |
||||||
|
Short-Term Investments and Other |
2.3 |
||||||
|
GEOGRAPHIC ALLOCATION |
|||||||
|
% of Equity |
|||||||
|
North America |
50.1 |
||||||
|
United States |
50.1 |
||||||
|
Europe |
43.9 |
||||||
|
Germany* |
16.8 |
||||||
|
Switzerland |
10.6 |
||||||
|
United Kingdom |
10.1 |
||||||
|
Netherlands* |
3.1 |
||||||
|
Belgium* |
2.1 |
||||||
|
Ireland* |
1.2 |
||||||
|
% of Equity |
|||||||
|
Asia |
4.8 |
||||||
|
China |
3.4 |
||||||
|
India |
0.7 |
||||||
|
South Korea |
0.7 |
||||||
|
Latin America |
1.2 |
||||||
|
Mexico |
1.2 |
||||||
* Euro currency countries comprise 23.2% of equity investments.
See accompanying Disclosures and Endnotes on page 100.
14 OAKMARK FUNDS
Oakmark Global Fund March 31, 2022
Portfolio Manager Commentary


David G. Herro, CFA
Portfolio Manager
oakgx@oakmark.com
Clyde S. McGregor, CFA
Portfolio Manager
oakgx@oakmark.com
Anthony P. Coniaris, CFA
Portfolio Manager
oakgx@oakmark.com
Jason E. Long, CFA
Portfolio Manager
oakgx@oakmark.com
The Oakmark Global Fund declined by 5.53% for the quarter ended March 31, 2022, compared to a decline of 5.15% for the MSCI World Index (Net)8 and a decline of 8.23% for the Lipper Global Fund Index.9 Since its inception in 1999, the Fund has achieved a compound annual rate of return18 of 9.89%, which compares to 6.03% for the MSCI World Index (Net) and 6.13% for the Lipper Global Fund Index.
For the quarter, the countries that contributed the most to the Fund's return were Mexico, India, Australia and Japan, while the U.S., Netherlands, U.K., Germany and Switzerland were the most significant detractors. From an individual security perspective, Bayer (Germany), Glencore (Switzerland), NOV (U.S.), Flowserve (U.S.) and Grupo Televisa (Mexico) were the strongest contributors. The Fund holdings that detracted most were Prosus (Netherlands), General Motors (U.S.), Continental (Germany), TE Connectivity (U.S.) and Credit Suisse (Switzerland). We discuss a few of the key contributors and detractors in further detail below.
Bayer (Germany), a life science company with pharmaceuticals, consumer health and crop science divisions, was a top contributor to the Fund's performance for the quarter. The company reported strong earnings results for 2021, in our view, with growth exceeding expectations across divisions. Notably, the crop science division delivered 11% growth, staging a robust recovery following two years of an agriculture downcycle and competitive challenges. Management's increased guidance for crop science in 2022 calls for 7% organic growth and a 25-26% margin, which we believe is a key positive for the segment as it signals a long-awaited favorable transition toward profitable growth. In the pharmaceuticals division, revenue growth of more than 7% also bested expectations, supported by a strong recovery of Eylea, the continued growth of Xarelto and the slate of new products. Moreover, Bayer's pipeline enjoyed notable successes in the period, including a favorable read-out for the cancer drug Nubeqa. We spoke with Bayer CFO Wolfgang Nickl during the quarter, who noted that tailwinds are robust in the business today. Notably, he expressed confidence in both the pricing and competitive backdrop in the crop science business as rate increases are layering into sales growth and cost cuts begin to come through. Nickl also reiterated Bayer's expectations for continued growth in pharmaceuticals, driven largely by new launches and technologies.
In our view, Glencore (Switzerland) delivered a solid fiscal-year 2021 earnings report due to significantly improved year-over-year financial metrics, driven by both the mining business, where higher prices supported strong profitability, and the marketing business, which benefited from rising prices, supply constraints
and inventory drawdowns. Glencore's free-cash-flow generation was quite robust and resulted in net debt of just $6 billion, which is a record low 0.3x EBITDA10 and well below the $10-$16 billion range targeted by the company. Back in mid-February, guidance already suggested significantly higher earnings and cash flow, compared to 2022, due to significantly higher commodity prices across the board. This has been further amplified by additional price surges for most of the commodities that Glencore mines, including copper, cobalt, zinc, nickel and thermal coal. As a result, Glencore should report a substantial amount of free cash flow and incremental shareholder returns for the year. We recently met with CEO Gary Nagle and CFO Steve Kalmin and discussed the massive impact the crisis in Ukraine is having on Glencore's markets. In many cases, realized prices significantly exceed index prices due to very tight physical markets. Management reiterated its commitment to pay out all excess cash below $10 billion of net debt to shareholders and noted that the company now has 27 assets that are either in the process of being sold or are under consideration for sale. This is in addition to the nine assets already sold under the portfolio simplification. We appreciate Nagle's focus on efficiency and returns, and we believe the company continues to trade at a large discount to our perception of its intrinsic value.
Prosus (Netherlands), owing to its 29% stake in Tencent and the impact of the Russian invasion of Ukraine, was a notable detractor for the first quarter. Tencent was negatively impacted by fears for increased regulation and a poor macro backdrop that have negatively impacted fundamentals. We have spoken with numerous contacts on the changing regulatory landscape in China. Although we believe structural growth at Tencent will be lower in the future due to the new regulatory environment, it remains an excellent business with a high degree of innovation. Later during the quarter, Russia's invasion of Ukraine weighed on companies with exposure to Russia. In Prosus' case, its two Russian assets, Avito (the largest online classifieds company in Russia) and Mail.ru (the largest social media company in Russia), are now valueless in our estimation and resulted in a small reduction of our estimate of Prosus' intrinsic value. While we monitor any new developments closely, we continue to believe Prosus remains extremely undervalued relative to its sum of the parts.
General Motors (GM) (U.S.) was a detractor during the quarter, due to increased macro uncertainty, higher fuel prices, and concerns over rising input costs, which pressured the company in particular and the auto industry as a whole. While we are closely monitoring the potential impact of these dynamics, industry demand remains robust, driven by strong consumer
See accompanying Disclosures and Endnotes on page 100.
Oakmark.com 15
Oakmark Global Fund March 31, 2022
Portfolio Manager Commentary (continued)
balance sheets and pent-up demand after multiple years of constrained production. We also remain confident in GM's ability to navigate a complex operating environment, which the company has consistently demonstrated over the past few years. Finally, the long-term picture remains bright. We believe GM is significantly undervalued, is well-positioned for the long-term transition to electric vehicles and has numerous needle-moving ancillary business opportunities (most notably Cruise, which is an industry leader in autonomous vehicle technology) that are underappreciated.
In addition, we were disappointed to see the departure of Antonio Horta-Osorio from Credit Suisse (Switzerland) given his talents and the restructuring plan he initiated there. The company then delivered a disappointing fiscal year 2021 earnings report as a CHF 1.6 billion non-cash goodwill impairment exceeded our expectations and pressured results. Also of concern was the company's weakened revenue generation as underlying fourth-quarter revenues declined CH 860 million from the year-ago period due primarily to weakness in the investment banking division. Management provided limited guidance for 2022 but reiterated that it would be a transition year, with expectations for about CHF 17 billion in adjusted operating expenditures for the fiscal year. Although the results were a bit disappointing and we understand that 2022 will be a transition year, we appreciate that the problems surfacing today are legacy issues and that Credit Suisse is taking the proper corrective action to improve its franchise and earnings power over the medium term. It is also important to note that Credit Suisse has made significant changes to both its senior management team and its board of directors. Toward the end of the period, the company provided an update on its exposure to Russia, which it reduced since the end of 2021. We believe the remaining exposure, including credit exposure from derivatives and financing from the investment bank, has an immaterial impact on our estimate of the firm's intrinsic value. Moreover, we remain hopeful that with the various management enhancements mentioned, especially in areas of risk control and compliance, Credit Suisse will live up to its potential and avoid the pitfalls of the past. In the appointment of Axel Lehmann as the new chairman, we hope that with his experience, along with the timely execution of this new strategic plan, that Credit Suisse will not only be strengthened but revitalized.
During the quarter, we consolidated our holding in Ryanair Holdings (Ireland) while maintaining exposure through Ryanair Holdings ADR (Ireland). We also exited our positions in Compass Group (U.K.), Toyota (Japan), Citigroup (U.S.) and Incitec Pivot (Australia). Increased market volatility spurred a bit more portfolio turnover than usual as we used capital from the aforementioned sales to increase our stake in current holdings and to purchase new securities that we believe possess more attractive risk-return profiles.
We initiated positions in two new holdings and received shares of Iveco Group from a spinoff transaction.
• Amazon (U.S.) is the leading e-commerce retailer and cloud-computing company. In e-commerce, two-thirds of U.S. households are Amazon Prime subscribers, and over half of all online product searches now start on Amazon. Amazon has also built a delivery network that will soon surpass UPS and FedEx in packages shipped. We believe the company's customer loyalty and infrastructure are strong barriers to
entry in a growing e-commerce market. Separately, Amazon Web Services (AWS) controls nearly half of the market in cloud computing. AWS has significant technical expertise and operates a large and growing number of data centers that run entire IT departments for businesses. We believe AWS has become utility-like in scale, and we expect healthy growth moving forward as IT workloads continue moving to the cloud. Despite strong share price performance since the pandemic, Amazon lagged behind its peers in retail and technology. As a result, Amazon trades at a discount to its peer-weighted sales multiple, the first time this has happened since 2015. We believe this is due to Amazon's sizeable investment in e-commerce, which is largely expensed through the company's income statement. In our analysis, Amazon's normalized margins are higher than today, and the company is undervalued on normalized earnings.
• We previously had an opportunity to own Pinterest (U.S.) when the stock sold off during the Covid-19-related downturn, and we were pleased to be able to invest in the company once again at an attractive price during the quarter. Pinterest is an online personal discovery tool that people use to find ideas based on their tastes and interests. Unlike most social media companies, the objectives of users and advertisers are fundamentally aligned on Pinterest. Users find a positive and useful product discovery experience, and advertisers find an audience with high commercial intent and the ability to integrate ads naturally. Although Pinterest had more than 430 million global users as of year-end, the company is still in the early days of monetizing its platform. We believe that its shares trade well below fair value on both conventional metrics, such as enterprise value to revenue, as well as when we benchmark its ultimate revenue and margin potential against more mature internet companies.
• Iveco Group's (Italy) arrival in the Fund stemmed from CNH Industrial's demerger of its trucks and commercial vehicles business in early January. We spoke with Iveco's management team ahead of the split and believe that the powertrain business is reasonably competitive, while the buses division is decently profitable and resilient. In our view, the company also possesses an excellent light truck position and has the opportunity to recognize real profit improvement. We also think Iveco remains an attractive takeover candidate.
We continue to believe the Swiss franc is overvalued versus the U.S. dollar. As a result, we defensively hedged 15% of the Fund's Swiss franc exposure at quarter end. Geographically, we ended the quarter with 50.1% of our holdings headquartered in the U.S. with the remaining 49.9% coming from international markets. Our international weightings are comprised of Europe and the U.K. (44.0%), Asia (4.7%), and Latin America (1.2%).
Thank you for being our partners in the Oakmark Global Fund.
See accompanying Disclosures and Endnotes on page 100.
16 OAKMARK FUNDS
Oakmark Global Fund March 31, 2022 (Unaudited)
Schedule of Investments (in thousands)
|
Shares |
Value |
||||||||||
|
COMMON STOCKS - 97.0% |
|||||||||||
|
FINANCIALS - 20.5% |
|||||||||||
|
BANKS - 8.0% |
|||||||||||
|
Lloyds Banking Group PLC (United Kingdom) |
94,272 |
$ |
57,409 |
||||||||
|
Bank of America Corp. (United States) |
1,133 |
46,706 |
|||||||||
|
Axis Bank, Ltd. (India) (a) |
955 |
9,505 |
|||||||||
|
113,620 |
|||||||||||
|
INSURANCE - 6.6% |
|||||||||||
|
Allianz SE (Germany) |
216 |
51,660 |
|||||||||
|
Willis Towers Watson PLC (United States) |
107 |
25,181 |
|||||||||
|
Prudential PLC (United Kingdom) |
1,228 |
18,132 |
|||||||||
|
94,973 |
|||||||||||
|
DIVERSIFIED FINANCIALS - 5.9% |
|||||||||||
|
Credit Suisse Group AG (Switzerland) |
6,285 |
49,479 |
|||||||||
|
Julius Baer Group, Ltd. (Switzerland) |
606 |
35,055 |
|||||||||
|
84,534 |
|||||||||||
|
293,127 |
|||||||||||
|
CONSUMER DISCRETIONARY - 17.3% |
|||||||||||
|
AUTOMOBILES & COMPONENTS - 9.0% |
|||||||||||
|
General Motors Co. (United States) (a) |
1,274 |
55,729 |
|||||||||
|
Mercedes-Benz Group AG (Germany) |
558 |
39,145 |
|||||||||
|
Continental AG (Germany) (a) |
434 |
31,090 |
|||||||||
|
Vitesco Technologies Group AG (Germany) (a) |
57 |
2,250 |
|||||||||
|
128,214 |
|||||||||||
|
RETAILING - 7.3% |
|||||||||||
|
Alibaba Group Holding, Ltd. (China) (a) |
3,457 |
47,175 |
|||||||||
|
Prosus N.V. (Netherlands) |
775 |
41,819 |
|||||||||
|
Amazon.com, Inc. (United States) (a) |
5 |
15,827 |
|||||||||
|
104,821 |
|||||||||||
|
CONSUMER SERVICES - 1.0% |
|||||||||||
|
Booking Holdings, Inc. (United States) (a) |
6 |
14,478 |
|||||||||
|
247,513 |
|||||||||||
|
COMMUNICATION SERVICES - 15.1% |
|||||||||||
|
MEDIA & ENTERTAINMENT - 13.4% |
|||||||||||
|
Alphabet, Inc., Class A (United States) (a) |
35 |
96,193 |
|||||||||
|
The Interpublic Group of Cos., Inc. (United States) |
947 |
33,577 |
|||||||||
|
Liberty Broadband Corp., Class C (United States) (a) |
239 |
32,342 |
|||||||||
|
Grupo Televisa SAB ADR (Mexico) (b) |
1,422 |
16,639 |
|||||||||
|
Pinterest, Inc., Class A (United States) (a) |
276 |
6,787 |
|||||||||
|
Charter Communications, Inc., Class A (United States) (a) |
10 |
5,510 |
|||||||||
|
191,048 |
|||||||||||
|
TELECOMMUNICATION SERVICES - 1.7% |
|||||||||||
|
Liberty Global PLC, Class A (United Kingdom) (a) |
930 |
23,719 |
|||||||||
|
214,767 |
|||||||||||
|
Shares |
Value |
||||||||||
|
INFORMATION TECHNOLOGY - 12.6% |
|||||||||||
|
SOFTWARE & SERVICES - 8.2% |
|||||||||||
|
Fiserv, Inc. (United States) (a) |
329 |
$ |
33,340 |
||||||||
|
Oracle Corp. (United States) |
391 |
32,331 |
|||||||||
|
Mastercard, Inc., Class A (United States) |
81 |
28,948 |
|||||||||
|
SAP SE (Germany) |
207 |
22,942 |
|||||||||
|
117,561 |
|||||||||||
|
TECHNOLOGY HARDWARE & EQUIPMENT - 4.4% |
|||||||||||
|
TE Connectivity, Ltd. (United States) |
480 |
62,844 |
|||||||||
|
180,405 |
|||||||||||
|
HEALTH CARE - 12.5% |
|||||||||||
|
PHARMACEUTICALS, BIOTECHNOLOGY & LIFE SCIENCES - 6.6% |
|||||||||||
|
Bayer AG (Germany) |
999 |
68,336 |
|||||||||
|
Novartis AG (Switzerland) |
296 |
26,004 |
|||||||||
|
94,340 |
|||||||||||
|
HEALTH CARE EQUIPMENT & SERVICES - 5.9% |
|||||||||||
|
Tenet Healthcare Corp. (United States) (a) |
591 |
50,832 |
|||||||||
|
Humana, Inc. (United States) |
68 |
29,722 |
|||||||||
|
Envista Holdings Corp. (United States) (a) |
72 |
3,488 |
|||||||||
|
84,042 |
|||||||||||
|
178,382 |
|||||||||||
|
INDUSTRIALS - 10.5% |
|||||||||||
|
CAPITAL GOODS - 9.3% |
|||||||||||
|
CNH Industrial N.V. (United Kingdom) |
1,724 |
27,161 |
|||||||||
|
Howmet Aerospace, Inc. (United States) |
752 |
27,034 |
|||||||||
|
Flowserve Corp. (United States) |
615 |
22,061 |
|||||||||
|
General Dynamics Corp. (United States) |
87 |
21,055 |
|||||||||
|
Daimler Truck Holding AG (Germany) (a) |
672 |
18,636 |
|||||||||
|
Travis Perkins PLC (United Kingdom) |
887 |
14,308 |
|||||||||
|
Iveco Group N.V. (Netherlands) (a) |
352 |
2,297 |
|||||||||
|
132,552 |
|||||||||||
|
TRANSPORTATION - 1.2% |
|||||||||||
|
Ryanair Holdings PLC ADR (Ireland) (a) (b) |
194 |
16,940 |
|||||||||
|
149,492 |
|||||||||||
|
CONSUMER STAPLES - 3.3% |
|||||||||||
|
FOOD, BEVERAGE & TOBACCO - 3.3% |
|||||||||||
|
Anheuser-Busch InBev SA/NV (Belgium) |
487 |
29,093 |
|||||||||
|
Keurig Dr Pepper, Inc. (United States) |
491 |
18,620 |
|||||||||
|
47,713 |
|||||||||||
|
MATERIALS - 3.2% |
|||||||||||
|
Glencore PLC (Switzerland) |
5,691 |
37,031 |
|||||||||
|
Arconic Corp. (United States) (a) |
306 |
7,840 |
|||||||||
|
44,871 |
|||||||||||
|
ENERGY - 2.0% |
|||||||||||
|
Nov, Inc. (United States) |
1,442 |
28,268 |
|||||||||
|
TOTAL COMMON STOCKS - 97.0% (COST $970,304) |
1,384,538 |
||||||||||
See accompanying Notes to Financial Statements.
Oakmark.com 17
Oakmark Global Fund March 31, 2022 (Unaudited)
Schedule of Investments (in thousands) (continued)
|
Shares |
Value |
||||||||||
|
PREFERRED STOCKS - 0.7% |
|||||||||||
|
TECHNOLOGY HARDWARE, STORAGE & PERIPHERALS - 0.7% |
|||||||||||
|
Samsung Electronics Co., Ltd. (South Korea) |
182 |
$ |
9,451 |
||||||||
|
TOTAL PREFERRED STOCKS - 0.7% (COST $10,305) |
9,451 |
||||||||||
|
Par Value |
Value |
||||||||||
|
SHORT-TERM INVESTMENT - 2.1% |
|||||||||||
|
REPURCHASE AGREEMENT - 2.1% |
|||||||||||
|
Fixed Income Clearing Corp. Repurchase Agreement, 0.28% dated 03/31/22 due 04/01/22, repurchase price $30,011, collateralized by United States Treasury Note, 2.500% due 03/31/27, value plus accrued interest of $30,611 (Cost: $30,011) |
$ |
30,011 |
30,011 |
||||||||
|
TOTAL SHORT-TERM INVESTMENTS - 2.1% (COST $30,011) |
30,011 |
||||||||||
|
TOTAL INVESTMENTS - 99.8% (COST $1,010,620) |
1,424,000 |
||||||||||
|
Foreign Currencies (Cost $0) (d) - 0.0% (c) |
0 |
(d) |
|||||||||
|
Other Assets In Excess of Liabilities - 0.2% |
3,240 |
||||||||||
|
TOTAL NET ASSETS - 100.0% |
$ |
1,427,240 |
|||||||||
(a) Non-income producing security
(b) Sponsored American Depositary Receipt
(c) Amount rounds to less than 0.1%.
(d) Amount rounds to less than $1,000.
See accompanying Notes to Financial Statements.
18 OAKMARK FUNDS
Oakmark Global Fund March 31, 2022 (Unaudited)
Schedule of Investments (in thousands) (continued)
FORWARD FOREIGN CURRENCY CONTRACT (in thousands)
|
Local Contract Amount |
Base Contract Amount |
Settlement Date |
Valuation at 03/31/22 |
Unrealized Appreciation/ (Depreciation) |
|||||||||||||||||||
|
Foreign Currency Bought: |
|||||||||||||||||||||||
|
Swiss Franc |
1,477 |
$ |
1,606 |
06/15/22 |
$ |
1,604 |
$ |
(2 |
) |
||||||||||||||
|
$ |
1,604 |
$ |
(2 |
) |
|||||||||||||||||||
|
Foreign Currency Sold: |
|||||||||||||||||||||||
|
Swiss Franc |
17,148 |
$ |
18,680 |
06/15/22 |
$ |
18,621 |
$ |
59 |
|||||||||||||||
|
$ |
18,621 |
$ |
59 |
||||||||||||||||||||
See accompanying Notes to Financial Statements.
Oakmark.com 19
Oakmark Global Select Fund March 31, 2022
Summary Information
VALUE OF A $10,000 INVESTMENT
Since Inception - 10/02/06 (Unaudited)
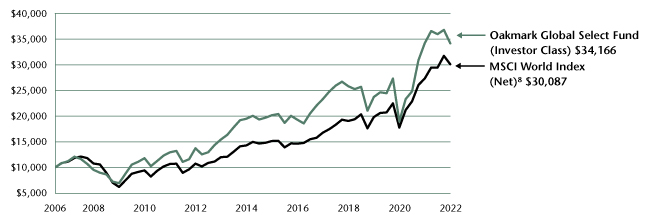
PERFORMANCE
|
Average Annual Total Returns (as of 03/31/22) |
|||||||||||||||||||||||||||||||
| (Unaudited) |
Total Return Last 3 Months |
1-year |
3-year |
5-year |
10-year |
Since Inception |
Inception Date |
||||||||||||||||||||||||
|
Oakmark Global Select Fund (Investor Class) |
-7.12 |
% |
-0.13 |
% |
12.96 |
% |
7.95 |
% |
9.56 |
% |
8.25 |
% |
10/02/06 |
||||||||||||||||||
|
MSCI World Index (Net) |
-5.15 |
% |
10.12 |
% |
14.98 |
% |
12.42 |
% |
10.88 |
% |
7.37 |
% |
|||||||||||||||||||
|
Lipper Global Fund Index9 |
-8.23 |
% |
2.23 |
% |
12.03 |
% |
9.93 |
% |
9.42 |
% |
6.58 |
% |
|||||||||||||||||||
|
Oakmark Global Select Fund (Advisor Class) |
-7.09 |
% |
0.02 |
% |
13.10 |
% |
8.07 |
% |
N/A |
9.25 |
% |
11/30/16 |
|||||||||||||||||||
|
Oakmark Global Select Fund (Institutional Class) |
-7.05 |
% |
0.07 |
% |
13.18 |
% |
8.14 |
% |
N/A |
9.31 |
% |
11/30/16 |
|||||||||||||||||||
|
Oakmark Global Select Fund (R6 Class) |
-7.04 |
% |
0.10 |
% |
N/A |
N/A |
N/A |
9.75 |
% |
12/15/20 |
|||||||||||||||||||||
The graph and table do not reflect the deduction of taxes that a shareholder would pay on Fund distributions or the redemption of Fund shares.
Past performance is no guarantee of future results. The performance data quoted represents past performance. Current performance may be lower or higher than the performance data quoted. Total return includes change in share prices and, in each case, includes reinvestment of dividends and capital gain distributions. The investment return and principal value vary so that an investor's shares, when redeemed, may be worth more or less than the original cost. To obtain the most recent month-end performance, please visit Oakmark.com.
|
TOP TEN EQUITY HOLDINGS4 |
% of Net Assets | ||||||
|
Alphabet, Inc., Class A |
12.1 |
||||||
|
Charter Communications, Inc., Class A |
5.3 |
||||||
|
HCA Healthcare, Inc. |
4.9 |
||||||
|
Lloyds Banking Group PLC |
4.6 |
||||||
|
Fiserv, Inc. |
4.6 |
||||||
|
Bayer AG |
4.5 |
||||||
|
Citigroup, Inc. |
4.3 |
||||||
|
Netflix, Inc. |
4.1 |
||||||
|
Credit Suisse Group AG |
4.0 |
||||||
|
Fresenius Medical Care AG & Co. KGaA |
4.0 |
||||||
|
FUND STATISTICS |
|||||||
|
Ticker* |
OAKWX |
||||||
|
Number of Equity Holdings |
25 |
||||||
|
Net Assets |
$1.5 billion | ||||||
|
Weighted Average Market Cap |
$310.5 billion | ||||||
|
Median Market Cap |
$67.7 billion | ||||||
|
Gross Expense Ratio - Investor Class*^ |
1.12% | ||||||
|
Net Expense Ratio - Investor Class*†^ |
1.10% | ||||||
* This information is related to the Investor Class. Please visit Oakmark.com for information related to the Advisor, Institutional and R6 Classes.
† The net expense ratio reflects a contractual advisory fee waiver agreement through January 27, 2023.
^ The Gross Expense Ratio and Net Expense Ratio are from the Fund's Prospectus dated January 28, 2022.
|
SECTOR ALLOCATION |
% of Net Assets | ||||||
|
Equity Investments |
|||||||
|
Communication Services |
24.0 |
||||||
|
Financials |
20.1 |
||||||
|
Health Care |
19.4 |
||||||
|
Consumer Discretionary |
13.2 |
||||||
|
Information Technology |
7.5 |
||||||
|
Real Estate |
3.9 |
||||||
|
Industrials |
3.4 |
||||||
|
Consumer Staples |
2.3 |
||||||
|
Total Equity Investments |
93.8 |
||||||
|
Preferred Stocks |
2.7 |
||||||
|
Short-Term Investments and Other |
3.5 |
||||||
|
GEOGRAPHIC ALLOCATION |
|||||||
|
% of Equity |
|||||||
|
North America |
55.6 |
||||||
|
United States |
55.6 |
||||||
|
Europe |
36.5 |
||||||
|
Germany* |
16.2 |
||||||
|
United Kingdom |
7.5 |
||||||
|
Switzerland |
6.4 |
||||||
|
% of Equity |
|||||||
|
Europe (cont'd) |
36.5 |
||||||
|
Netherlands* |
4.0 |
||||||
|
France* |
2.4 |
||||||
|
Asia |
7.9 |
||||||
|
South Korea |
5.4 |
||||||
|
China |
2.5 |
||||||
* Euro currency countries comprise 22.6% of equity investments.
See accompanying Disclosures and Endnotes on page 100.
20 OAKMARK FUNDS
Oakmark Global Select Fund March 31, 2022
Portfolio Manager Commentary


William C. Nygren, CFA
Portfolio Manager
oakwx@oakmark.com
David G. Herro, CFA
Portfolio Manager
oakwx@oakmark.com
Anthony P. Coniaris, CFA
Portfolio Manager
oakwx@oakmark.com
Eric Liu, CFA
Portfolio Manager
oakwx@oakmark.com
The Oakmark Global Select Fund declined 7.1% for the quarter ended March 31, 2022, underperforming the MSCI World Index (Net)8, which returned –5.2%. However, the Fund has returned an average of 8.3% per year since its inception in October 2006, outperforming the MSCI World Index's (Net) annualized gain of 7.4% over the same period.
Bayer (Germany), a life science company with pharmaceuticals, consumer health and crop science divisions, was a top contributor to the Fund's performance for the quarter. The company reported strong earnings results for 2021, in our view, with growth exceeding expectations across divisions. Notably, the crop science division delivered 11% growth, staging a robust recovery following two years of an agriculture downcycle and competitive challenges. Management's increased guidance for crop science in 2022 calls for 7% organic growth and a 25-26% margin, which we believe is a key positive for the segment as it signals a long-awaited favorable transition toward profitable growth. In the pharmaceuticals division, revenue growth of more than 7% also bested expectations, supported by a strong recovery of Eylea, the continued growth of Xarelto and the slate of new products. Moreover, Bayer's pipeline enjoyed notable successes in the period, including a favorable read-out for the cancer drug Nubeqa. We spoke with Bayer CFO Wolfgang Nickl during the quarter, who noted that tailwinds are robust in the business today. Notably, he expressed confidence in both the pricing and competitive backdrop in the crop science business as rate increases are layering into sales growth and cost cuts begin to come through. Nickl also reiterated Bayer's expectations for continued growth in pharmaceuticals, driven largely by new launches and technologies.
Prosus (Netherlands), owing to its 29% stake in Tencent and the impact of the Russian invasion of Ukraine, was a notable detractor for the first quarter. Tencent was negatively impacted by fears of increased regulation and a poor macro backdrop that have negatively impacted fundamentals. We have spoken with numerous contacts on the changing regulatory landscape in China. Although we believe structural growth at Tencent will be lower in the future as a result of the new regulatory environment, it remains an excellent business with a high degree of innovation. Later during the quarter, Russia's invasion of Ukraine weighed on companies with exposure to Russia. In Prosus' case, its two Russian assets, Avito (the largest online classifieds company in Russia) and Mail.ru (the largest social media company in Russia), are now valueless, in our estimation, and resulted in a small reduction of our estimate of Prosus' intrinsic value. While we are monitoring any new developments closely,
we continue to believe Prosus remains extremely undervalued relative to its sum of the parts.
In addition, we initiated the following position during the quarter:
• Netflix (U.S.) is the leading streaming entertainment service with 222 million subscribers and $30 billion of revenue. This scale creates a valuable moat, which allows the company to buy more content than its competitors in aggregate but pay less per subscriber. This dynamic has created a more valuable customer proposition as the business has grown, which we expect to manifest in a larger subscriber base over time. Netflix stock declined significantly over the past several months as market participants reacted to slowing subscriber growth and margin pressure. We believe it is likely that both of these issues are temporary. Growth decelerated as the economy reopened, but this occurred on the heels of a rapid acceleration period earlier in the pandemic. Margin pressure is mostly related to foreign currency exchanges. Netflix's cost base is primarily dollar-denominated, meaning that declining foreign currency values pressure profit margins. After the pullback in the stock, Netflix trades for 5.5x consensus 2022 revenue and 34x consensus EPS5, which is compelling in the context of our expectations for future growth and profitability. We greatly admire Netflix's management team and the company's unique corporate culture. We are excited to invest alongside them as they capitalize on the enormous opportunity in streamed entertainment.
We continue to believe the Swiss franc is overvalued versus the U.S. dollar. As a result, we defensively hedged a portion of the Fund's exposure. Approximately 15% of the Swiss franc exposure was hedged at quarter end.
Geographically, we ended the quarter with 55% of the portfolio in the U.S., 37% in the U.K. and Europe, and 8% in Asia.
We thank you for your continued support.
See accompanying Disclosures and Endnotes on page 100.
Oakmark.com 21
Oakmark Global Select Fund March 31, 2022 (Unaudited)
Schedule of Investments (in thousands)
|
Shares |
Value |
||||||||||
|
COMMON STOCKS - 93.8% |
|||||||||||
|
COMMUNICATION SERVICES - 24.0% |
|||||||||||
|
MEDIA & ENTERTAINMENT - 24.0% |
|||||||||||
|
Alphabet, Inc., Class A (United States) (a) |
66 |
$ |
182,771 |
||||||||
|
Charter Communications, Inc., Class A (United States) (a) |
148 |
80,737 |
|||||||||
|
Netflix, Inc. (United States) (a) |
166 |
62,144 |
|||||||||
|
NAVER Corp. (South Korea) |
135 |
37,493 |
|||||||||
|
363,145 |
|||||||||||
|
FINANCIALS - 20.1% |
|||||||||||
|
BANKS - 12.2% |
|||||||||||
|
Lloyds Banking Group PLC (United Kingdom) |
115,196 |
70,151 |
|||||||||
|
Citigroup, Inc. (United States) |
1,205 |
64,352 |
|||||||||
|
Bank of America Corp. (United States) |
1,192 |
49,142 |
|||||||||
|
183,645 |
|||||||||||
|
DIVERSIFIED FINANCIALS - 4.0% |
|||||||||||
|
Credit Suisse Group AG (Switzerland) |
7,694 |
60,571 |
|||||||||
|
INSURANCE - 3.9% |
|||||||||||
|
American International Group, Inc. (United States) |
946 |
59,368 |
|||||||||
|
303,584 |
|||||||||||
|
HEALTH CARE - 19.4% |
|||||||||||
|
HEALTH CARE EQUIPMENT & SERVICES - 12.7% |
|||||||||||
|
HCA Healthcare, Inc. (United States) |
293 |
73,331 |
|||||||||
|
Fresenius Medical Care AG & Co. KGaA (Germany) |
903 |
60,505 |
|||||||||
|
Humana, Inc. (United States) |
134 |
58,313 |
|||||||||
|
192,149 |
|||||||||||
|
PHARMACEUTICALS, BIOTECHNOLOGY & LIFE SCIENCES - 6.7% |
|||||||||||
|
Bayer AG (Germany) |
989 |
67,620 |
|||||||||
|
Novartis AG (Switzerland) |
374 |
32,825 |
|||||||||
|
100,445 |
|||||||||||
|
292,594 |
|||||||||||
|
CONSUMER DISCRETIONARY - 13.2% |
|||||||||||
|
RETAILING - 6.3% |
|||||||||||
|
Prosus N.V. (Netherlands) |
1,088 |
58,695 |
|||||||||
|
Alibaba Group Holding, Ltd. (China) (a) |
2,684 |
36,625 |
|||||||||
|
95,320 |
|||||||||||
|
AUTOMOBILES & COMPONENTS - 3.5% |
|||||||||||
|
Mercedes-Benz Group AG (Germany) |
755 |
52,958 |
|||||||||
|
CONSUMER SERVICES - 3.4% |
|||||||||||
|
Booking Holdings, Inc. (United States) (a) |
22 |
51,314 |
|||||||||
|
199,592 |
|||||||||||
|
INFORMATION TECHNOLOGY - 7.5% |
|||||||||||
|
SOFTWARE & SERVICES - 7.5% |
|||||||||||
|
Fiserv, Inc. (United States) (a) |
690 |
69,966 |
|||||||||
|
SAP SE (Germany) |
386 |
42,758 |
|||||||||
|
112,724 |
|||||||||||
|
Shares |
Value |
||||||||||
|
REAL ESTATE - 3.9% |
|||||||||||
|
CBRE Group, Inc., Class A (United States) (a) |
644 |
$ |
58,966 |
||||||||
|
INDUSTRIALS - 3.4% |
|||||||||||
|
CAPITAL GOODS - 3.4% |
|||||||||||
|
CNH Industrial N.V. (United Kingdom) |
2,531 |
39,867 |
|||||||||
|
Daimler Truck Holding AG (Germany) (a) |
444 |
12,319 |
|||||||||
|
52,186 |
|||||||||||
|
CONSUMER STAPLES - 2.3% |
|||||||||||
|
FOOD, BEVERAGE & TOBACCO - 2.3% |
|||||||||||
|
Danone SA (France) |
633 |
34,952 |
|||||||||
|
TOTAL COMMON STOCKS - 93.8% (COST $1,106,087) |
1,417,743 |
||||||||||
|
PREFERRED STOCKS - 2.7% |
|||||||||||
|
TECHNOLOGY HARDWARE, STORAGE & PERIPHERALS - 2.7% |
|||||||||||
|
Samsung Electronics Co., Ltd. (South Korea) |
780 |
40,431 |
|||||||||
|
TOTAL PREFERRED STOCKS - 2.7% (COST $44,356) |
40,431 |
||||||||||
|
Par Value |
Value |
||||||||||
|
SHORT-TERM INVESTMENTS - 7.5% |
|||||||||||
|
REPURCHASE AGREEMENT - 7.5% |
|||||||||||
|
Fixed Income Clearing Corp. Repurchase Agreement, 0.28% dated 03/31/22 due 04/01/22, repurchase price $113,939, collateralized by United States Treasury Notes, 0.375% - 0.500% due 01/31/26 - 02/28/26, aggregate value plus accrued interest of $116,216 (Cost: $113,938) |
$ |
113,938 |
113,938 |
||||||||
|
TOTAL SHORT-TERM INVESTMENTS - 7.5% (COST $113,938) |
113,938 |
||||||||||
|
TOTAL INVESTMENTS - 104.0% (COST $1,264,381) |
1,572,112 |
||||||||||
|
Foreign Currencies (Cost $0) - 0.0% (b) |
0 |
(c) |
|||||||||
|
Liabilities In Excess of Other Assets - (4.0)% |
(60,493 |
) |
|||||||||
|
TOTAL NET ASSETS - 100.0% |
$ |
1,511,619 |
|||||||||
(a) Non-income producing security
(b) Amount rounds to less than 0.1%.
(c) Amount rounds to less than $1,000.
See accompanying Notes to Financial Statements.
22 OAKMARK FUNDS
Oakmark Global Select Fund March 31, 2022 (Unaudited)
Schedule of Investments (in thousands) (continued)
FORWARD FOREIGN CURRENCY CONTRACT (in thousands)
|
Local Contract Amount |
Base Contract Amount |
Settlement Date |
Valuation at 03/31/22 |
Unrealized Appreciation/ (Depreciation) |
|||||||||||||||||||
|
Foreign Currency Bought: |
|||||||||||||||||||||||
|
Swiss Franc |
3,550 |
$ |
3,858 |
06/15/22 |
$ |
3,855 |
$ |
(3 |
) |
||||||||||||||
|
$ |
3,855 |
$ |
(3 |
) |
|||||||||||||||||||
|
Foreign Currency Sold: |
|||||||||||||||||||||||
|
Swiss Franc |
16,813 |
$ |
18,315 |
06/15/22 |
$ |
18,257 |
$ |
58 |
|||||||||||||||
|
$ |
18,257 |
$ |
58 |
||||||||||||||||||||
See accompanying Notes to Financial Statements.
Oakmark.com 23
Oakmark International and Oakmark
International Small Cap Funds March 31, 2022
Portfolio Manager Commentary

David G. Herro, CFA
Portfolio Manager
oakix@oakmark.com
oakex@oakmark.com
oakgx@oakmark.com
oakwx@oakmark.com
Fellow Shareholders,
After a strong start to the year, the International Funds' performances faded and turned negative in reaction to the war in Ukraine. Please refer to my shareholder letter released in early March where I discuss this specific issue. Despite the adverse impact on share prices, especially in Europe, we believe company valuations remain attractive as the underlying intrinsic values of the companies we own, in most cases, have remained stable or even increased, despite the events in Eastern Europe.
Out with the Old, in with the New
During my 35+ years as a professional investor, there has been no shortage of macro events that have caused large disturbances in global equity markets. And, of course, there were plenty of such events before I started in this business: wars, banking crisis, regional economic crisis, pandemics, etc. It seems when one event passes, another often follows—as we have seen this year. In actuality, however, no two events are ever alike. Macro events cause similar share price reactions as investors tend to act in a synchronized, knee-jerk fashion because of unknown fears that these events precipitate. As more of the "unknowns" become "known," equity prices often recover. Investors also like to replicate past behavior, despite circumstances differing for each macro event.
As an example, we have seen heavy selling of financials and economically sensitive businesses with the unfolding of events in Ukraine. This aggressive selling because of a macro event is basically the same playbook investors used during the great financial crisis (GFC) in 2008 and, to a lesser extent, the Greek situation post the GFC. However, we would argue the situation today is far different than the situation surrounding the GFC as the global financial system has spent the last 10+ years recapitalizing. Whereas banks entered the GFC light on capital, today many of these financials have excess capital. The same is true for many of our economically sensitive industrial businesses, such as the auto companies. Today's auto OEM tends to have excess cash and is experiencing excess demand conditions where they are unable to satisfy demand for their products. Despite these differences in circumstance, we see no investor behavior change. We believe this provides opportunity for the true long-term investor.
Finally, I would highlight the importance of the pandemic winding down on business conditions. With the focus on the war, many have almost forgotten that we are coming out of a 2+-year pandemic that should have positive economic consequences. The consumer is still king when it comes to growth in GDP, and for the last two years the global consumer has been constrained on spending, resulting in a high level of savings.
The labor market is extremely tight with rising employment levels and nominal wages. Though inflation and supply chain issues will continue to plague the global economy, and notwithstanding the war in Eastern Europe, the post pandemic re-opening of the economy combined with the strong consumer make for an advantageous environment for global value investors. In addition, to reiterate what I wrote in my last letter, it is becoming evident that the "lower for longer" interest rate environment, which has dominated the post-GFC era, is coming to an end. All else equal, this should be extremely beneficial to banks and other financial institutions that have suffered slow earnings growth because of soft monetary policy.
Thank you again for your continued support and patience!
See accompanying Disclosures and Endnotes on page 100.
24 OAKMARK FUNDS

This page intentionally left blank.
Oakmark.com 25
Oakmark International Fund March 31, 2022
Summary Information
VALUE OF A $10,000 INVESTMENT
Since Inception - 9/30/92 (Unaudited)
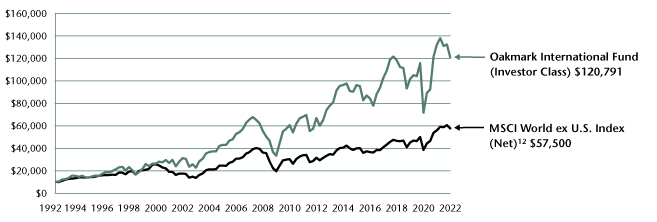
PERFORMANCE
|
Average Annual Total Returns (as of 03/31/22) |
|||||||||||||||||||||||||||||||
| (Unaudited) |
Total Return Last 3 Months |
1-year |
3-year |
5-year |
10-year |
Since Inception |
Inception Date |
||||||||||||||||||||||||
|
Oakmark International Fund (Investor Class) |
-8.69 |
% |
-8.66 |
% |
5.97 |
% |
3.33 |
% |
6.12 |
% |
8.81 |
% |
09/30/92 |
||||||||||||||||||
|
MSCI World ex U.S. Index (Net) |
-4.81 |
% |
3.04 |
% |
8.55 |
% |
7.14 |
% |
6.25 |
% |
6.11 |
% |
|||||||||||||||||||
|
MSCI EAFE Index (Net)11 |
-5.91 |
% |
1.16 |
% |
7.78 |
% |
6.72 |
% |
6.27 |
% |
5.91 |
% |
|||||||||||||||||||
|
Lipper International Fund Index13 |
-8.20 |
% |
-2.47 |
% |
8.71 |
% |
7.22 |
% |
6.61 |
% |
6.84 |
% |
|||||||||||||||||||
|
Oakmark International Fund (Advisor Class) |
-8.59 |
% |
-8.47 |
% |
6.11 |
% |
3.47 |
% |
N/A |
5.68 |
% |
11/30/16 |
|||||||||||||||||||
|
Oakmark International Fund (Institutional Class) |
-8.59 |
% |
-8.44 |
% |
6.20 |
% |
3.54 |
% |
N/A |
5.75 |
% |
11/30/16 |
|||||||||||||||||||
|
Oakmark International Fund (R6 Class) |
-8.59 |
% |
-8.39 |
% |
N/A |
N/A |
N/A |
0.65 |
% |
12/15/20 |
|||||||||||||||||||||
The graph and table above do not reflect the deduction of taxes that a shareholder would pay on Fund distributions or the redemption of Fund shares.
Past performance is no guarantee of future results. The performance data quoted represents past performance. Current performance may be lower or higher than the performance data quoted. Total return includes change in share prices and, in each case, includes reinvestment of dividends and capital gain distributions. The investment return and principal value vary so that an investor's shares, when redeemed, may be worth more or less than the original cost. To obtain the most recent month-end performance, please visit Oakmark.com.
|
TOP TEN EQUITY HOLDINGS4 |
% of Net Assets | ||||||
|
Bayer AG |
3.8 |
||||||
|
Lloyds Banking Group PLC |
3.2 |
||||||
|
Allianz SE |
3.2 |
||||||
|
Intesa Sanpaolo SPA |
3.1 |
||||||
|
BNP Paribas SA |
3.0 |
||||||
|
Credit Suisse Group AG |
2.7 |
||||||
|
Bayerische Motoren Werke AG |
2.7 |
||||||
|
Mercedes-Benz Group AG |
2.7 |
||||||
|
Glencore PLC |
2.7 |
||||||
|
Prosus N.V. |
2.5 |
||||||
|
FUND STATISTICS |
|||||||
|
Ticker* |
OAKIX |
||||||
|
Number of Equity Holdings |
67 |
||||||
|
Net Assets |
$24.9 billion | ||||||
|
Weighted Average Market Cap |
$55.9 billion | ||||||
|
Median Market Cap |
$25.7 billion | ||||||
|
Gross Expense Ratio - Investor Class*^ |
1.07% | ||||||
|
Net Expense Ratio - Investor Class*†^ |
1.05% | ||||||
* This information is related to the Investor Class. Please visit Oakmark.com for information related to the Advisor, Institutional and R6 Classes.
† The net expense ratio reflects a contractual advisory fee waiver agreement through January 27, 2023.
^ The Gross Expense Ratio and Net Expense Ratio are from the Fund's Prospectus dated January 28, 2022.
|
SECTOR ALLOCATION |
% of Net Assets | ||||||
|
Equity Investments |
|||||||
|
Consumer Discretionary |
22.7 |
||||||
|
Financials |
22.4 |
||||||
|
Industrials |
11.0 |
||||||
|
Health Care |
10.6 |
||||||
|
Materials |
8.1 |
||||||
|
Communication Services |
7.9 |
||||||
|
Information Technology |
7.6 |
||||||
|
Consumer Staples |
5.2 |
||||||
|
Total Equity Investments |
95.5 |
||||||
|
Preferred Stocks |
1.3 |
||||||
|
Short-Term Investments and Other |
3.2 |
||||||
|
GEOGRAPHIC ALLOCATION |
|||||||
|
% of Equity |
|||||||
|
Europe |
84.5 |
||||||
|
Germany* |
26.9 |
||||||
|
United Kingdom |
15.4 |
||||||
|
France* |
12.4 |
||||||
|
Switzerland |
11.3 |
||||||
|
Netherlands* |
5.4 |
||||||
|
Sweden |
4.3 |
||||||
|
Italy* |
3.2 |
||||||
|
Belgium* |
2.0 |
||||||
|
Spain* |
1.5 |
||||||
|
Ireland* |
1.4 |
||||||
|
Finland* |
0.7 |
||||||
|
% of Equity |
|||||||
|
Asia |
9.9 |
||||||
|
China |
4.0 |
||||||
|
South Korea |
3.0 |
||||||
|
Japan |
1.6 |
||||||
|
India |
1.2 |
||||||
|
Indonesia |
0.1 |
||||||
|
Australasia |
2.2 |
||||||
|
Australia |
2.2 |
||||||
|
North America |
2.2 |
||||||
|
Canada |
2.2 |
||||||
|
Latin America |
1.2 |
||||||
|
Mexico |
1.2 |
||||||
* Euro currency countries comprise 53.5% of equity investments.
See accompanying Disclosures and Endnotes on page 100.
26 OAKMARK FUNDS
Oakmark International Fund March 31, 2022
Portfolio Manager Commentary


David G. Herro, CFA
Portfolio Manager
oakix@oakmark.com
Michael L. Manelli, CFA
Portfolio Manager
oakix@oakmark.com
The Oakmark International Fund returned –8.7% for the quarter ended March 31, 2022, compared to the benchmark, the MSCI World ex U.S. Index (Net)12, which returned –4.8% for the same period. In addition, the Fund has returned an average of 8.8% per year since its inception in September 1992, outperforming the MSCI World ex U.S. Index (Net), which has averaged 6.1% per year over the same period.
Bayer (Germany), a life science company with pharmaceuticals, consumer health and crop science divisions, was a top contributor to the Fund's performance for the quarter. The company reported strong earnings results for 2021, in our view, with growth exceeding expectations across divisions. Notably, the crop science division delivered 11% growth, staging a robust recovery following two years of an agriculture downcycle and competitive challenges. Management's increased guidance for crop science in 2022 calls for 7% organic growth and a 25-26% margin, which we believe is a key positive for the segment as it signals a long-awaited favorable transition toward profitable growth. In the pharmaceuticals division, revenue growth of more than 7% also bested expectations, supported by a strong recovery of Eylea, the continued growth of Xarelto and the slate of new products. Moreover, Bayer's pipeline enjoyed notable successes in the period, including a favorable read-out for the cancer drug Nubeqa. We spoke with Bayer CFO Wolfgang Nickl during the quarter, who noted that tailwinds are robust in the business today. Notably, he expressed confidence in both the pricing and competitive backdrop in the crop science business as rate increases are layering into sales growth and cost cuts begin to come through. Nickl also reiterated Bayer's expectations for continued growth in pharmaceuticals, driven largely by new launches and technologies.
Prosus (Netherlands), owing to its 29% stake in Tencent and the impact of the Russian invasion of Ukraine, was a notable detractor for the first quarter. Tencent was negatively impacted by fears of increased regulation and a poor macro backdrop that have negatively impacted fundamentals. We have spoken with numerous contacts on the changing regulatory landscape in China. Although we believe structural growth at Tencent will be lower in the future as a result of the new regulatory environment, it remains an excellent business with a high degree of innovation. Later during the quarter, Russia's invasion of Ukraine weighed on companies with exposure to Russia. In Prosus' case, its two Russian assets, Avito (the largest online classifieds company in Russia) and Mail.ru (the largest social media company in Russia), are now valueless, in our estimation, and resulted in a small reduction of our estimate of Prosus' intrinsic value. While we are monitoring any new developments closely, we continue to believe Prosus remains extremely undervalued relative to its sum of the parts.
During the quarter, we were also disappointed to learn of the departure of Chairman Antonio Horta-Osorio from Credit
Suisse (Switzerland) given his talents and the restructuring plan he initiated there. The company then delivered a disappointing fiscal year 2021 earnings report as a CHF 1.6 billion non-cash goodwill impairment exceeded our expectations and pressured results. Also of concern was the company's weakened revenue generation as underlying fourth-quarter revenues declined CH 860 million from the year-ago period due primarily to weakness in the investment banking division. Management provided limited guidance for 2022 but reiterated that it would be a transition year, with expectations for about CHF 17 billion in adjusted operating expenditures for the fiscal year. Although the results were a bit disappointing and we understand that 2022 will be a transition year, we appreciate that the problems surfacing today are legacy issues and that Credit Suisse is taking the proper corrective actions to improve its franchise and earnings power over the medium term. It is also important to note that Credit Suisse has made significant changes to both its senior management team and its board of directors. Toward the end of the period, the company provided an update on its exposure to Russia, which it reduced since the end of 2021. We believe the remaining exposure, including credit exposure from derivatives and financing from the investment bank, has an immaterial impact on our estimate of the firm's intrinsic value. Moreover, we remain hopeful that with the various management enhancements mentioned, especially in areas of risk control and compliance, Credit Suisse will live up to its potential and avoid the pitfalls of the past. In the appointment of Axel Lehmann as the new chairman, we hope that with his experience, along with the timely execution of this new strategic plan, that Credit Suisse will not only be strengthened but revitalized.
During the quarter, we consolidated several holdings, including selling our investments in Henkel Pfd (Germany), Ryanair Holdings (Ireland) and Naspers (South Africa) while maintaining exposure through the respective positions: Henkel (Germany), Ryanair Holdings ADR (Ireland) and Prosus (Netherlands).
We initiated the below positions during the quarter:
• Edenred (France) is a diversified digital services and payments platform that operates via three business segments: employee benefits, fleet & mobility, and complementary. We appreciate that the company is a technology leader that built and operates a two-sided network of corporate customers and merchant partners in specialized verticals. Within these verticals, users pay for goods/services with payment cards and/or digital wallets proprietary to Edenred that run on either the company's closed-loop or filtered loop rails, providing a highly defensive business model. Moreover, we find that Edenred is well positioned to capture market share gains as its technology advantage and digital
See accompanying Disclosures and Endnotes on page 100.
Oakmark.com 27
Oakmark International Fund March 31, 2022
Portfolio Manager Commentary (continued)
capabilities enable down-market penetration of small- and medium-sized enterprises that monetize at higher rates.
• Iveco Group's (Italy) arrival in the Fund stemmed from CNH Industrial's demerger of its trucks and commercial vehicles business in early January. We spoke with Iveco's management team ahead of the split and believe that the powertrain business is reasonably competitive, while the buses division is decently profitable and resilient. In our view, the company also possesses an excellent light truck position and has the opportunity to recognize real profit improvement. We also believe Iveco remains an attractive takeover candidate.
• Philips (Netherlands) is a global provider of health technology products through its personal health, connected care, and diagnosis & treatment segments. After a year of poor share price performance stemming from a product recall within its sleep franchise as well as supply chain issues that proved more severe than its peers, we believe Philips is now priced attractively for long-term investors. Despite potential legal liabilities from the sleep recall, we believe the recent lost market share should mostly be recovered in the coming years due to a favorable market structure. Moreover, we appreciate the company's 100% focus on the medical technology space following the sale of its domestic appliances business. We believe Philips's current portfolio is positioned to support long-term revenue growth of about 5% per year and normalized margins in the mid-teens.
• Siemens (Germany) is an industrials conglomerate that provides technology solutions for automation and digitalization to customers across the globe. We appreciate the company's efforts over the past several years to consolidate its business into three focused areas: digital industries, smart infrastructure and mobility. We think this has improved the company's execution and resulted in greater than market growth, project charge eliminations and solid cash flow generation. In addition, the company's leading automation hardware and software offerings create a scarce asset that aligns digitization tailwinds, in our estimation. We see opportunities for the company to close its profitability gap in key business units, providing potential value for shareholders.
• adidas (Germany) is a global sportswear company. The business is a leader in athletic footwear and apparel with a brand quality that helps to drive superior sales and margins across multiple segments and geographies. In our view, adidas' shift to a vertical-based model in the past several years led to superior innovations and more consistent product development. Moreover, we believe the improved product, brand perception, sales and profitability have positioned the company well. We think sustained investments in brand, product and distribution should support above-market growth rates and improved margins moving forward. We also appreciate that CEO Kasper Rorsted executed structural changes decided before his arrival, which should lead to improved growth, margins and capital management.
We continue to believe the Swiss franc is overvalued versus the U.S. dollar. As a result, we defensively hedged a portion of the Fund's exposure. Approximately 15% of the Swiss franc exposure was hedged at quarter end.
Geographically, we ended the quarter with approximately 84% of our holdings in Europe and the U.K., 10% in Asia, and 2% in Australasia. The remaining positions are 2% in North America (Canada) and 1% in Latin America (Mexico).
We thank you for your continued support.
See accompanying Disclosures and Endnotes on page 100.
28 OAKMARK FUNDS
Oakmark International Fund March 31, 2022 (Unaudited)
Schedule of Investments (in thousands)
|
Shares |
Value |
||||||||||
|
COMMON STOCKS - 95.5% |
|||||||||||
|
CONSUMER DISCRETIONARY - 22.7% |
|||||||||||
|
AUTOMOBILES & COMPONENTS - 9.3% |
|||||||||||
|
Bayerische Motoren Werke AG (Germany) |
7,741 |
$ |
668,991 |
||||||||
|
Mercedes-Benz Group AG (Germany) |
9,518 |
668,081 |
|||||||||
|
Continental AG (Germany) (a) |
7,230 |
518,284 |
|||||||||
|
Valeo (France) (b) |
13,961 |
257,881 |
|||||||||
|
Toyota Motor Corp. (Japan) |
10,796 |
194,743 |
|||||||||
|
Vitesco Technologies Group AG (Germany) (a) |
279 |
11,061 |
|||||||||
|
2,319,041 |
|||||||||||
|
RETAILING - 7.6% |
|||||||||||
|
Prosus N.V. (Netherlands) |
11,621 |
626,686 |
|||||||||
|
Alibaba Group Holding, Ltd. (China) (a) |
44,442 |
606,487 |
|||||||||
|
H & M Hennes & Mauritz AB, Class B (Sweden) |
29,129 |
391,132 |
|||||||||
|
Vipshop Holdings, Ltd. ADR (China) (a) (c) |
28,270 |
254,427 |
|||||||||
|
1,878,732 |
|||||||||||
|
CONSUMER SERVICES - 3.8% |
|||||||||||
|
Accor SA (France) (a) (b) |
15,131 |
487,518 |
|||||||||
|
Restaurant Brands International, Inc. (Canada) |
3,850 |
224,811 |
|||||||||
|
Compass Group PLC (United Kingdom) |
6,996 |
150,552 |
|||||||||
|
Trip.com Group, Ltd. (China) (a) |
3,916 |
91,417 |
|||||||||
|
954,298 |
|||||||||||
|
CONSUMER DURABLES & APPAREL - 2.0% |
|||||||||||
|
adidas AG (Germany) |
957 |
223,076 |
|||||||||
|
The Swatch Group AG, Bearer Shares (Switzerland) |
774 |
219,404 |
|||||||||
|
Cie Financiere Richemont SA, Class A (Switzerland) |
419 |
53,049 |
|||||||||
|
495,529 |
|||||||||||
|
5,647,600 |
|||||||||||
|
FINANCIALS - 22.4% |
|||||||||||
|
BANKS - 11.5% |
|||||||||||
|
Lloyds Banking Group PLC (United Kingdom) |
1,316,695 |
801,822 |
|||||||||
|
Intesa Sanpaolo SPA (Italy) |
340,405 |
779,107 |
|||||||||
|
BNP Paribas SA (France) |
13,207 |
754,732 |
|||||||||
|
Axis Bank, Ltd. (India) (a) |
28,239 |
281,144 |
|||||||||
|
NatWest Group PLC (United Kingdom) |
68,527 |
193,544 |
|||||||||
|
Bank Mandiri Persero Tbk PT (Indonesia) |
66,032 |
36,216 |
|||||||||
|
2,846,565 |
|||||||||||
|
DIVERSIFIED FINANCIALS - 6.4% |
|||||||||||
|
Credit Suisse Group AG (Switzerland) |
84,983 |
668,993 |
|||||||||
|
EXOR N.V. (Netherlands) |
6,729 |
511,542 |
|||||||||
|
Schroders PLC (United Kingdom) |
9,692 |
408,116 |
|||||||||
|
1,588,651 |
|||||||||||
|
INSURANCE - 4.5% |
|||||||||||
|
Allianz SE (Germany) |
3,356 |
801,391 |
|||||||||
|
Prudential PLC (United Kingdom) |
22,276 |
328,859 |
|||||||||
|
1,130,250 |
|||||||||||
|
5,565,466 |
|||||||||||
|
Shares |
Value |
||||||||||
|
INDUSTRIALS - 11.0% |
|||||||||||
|
CAPITAL GOODS - 8.7% |
|||||||||||
|
CNH Industrial N.V. (United Kingdom) |
32,890 |
$ |
518,048 |
||||||||
|
SKF AB, Class B (Sweden) |
21,349 |
348,124 |
|||||||||
|
Daimler Truck Holding AG (Germany) (a) |
12,315 |
341,559 |
|||||||||
|
Volvo AB, Class B (Sweden) |
15,300 |
285,418 |
|||||||||
|
Siemens AG (Germany) |
1,524 |
211,024 |
|||||||||
|
Komatsu, Ltd. (Japan) |
8,065 |
193,768 |
|||||||||
|
Smiths Group PLC (United Kingdom) |
7,165 |
135,750 |
|||||||||
|
Rolls-Royce Holdings PLC (United Kingdom) (a) |
75,071 |
98,718 |
|||||||||
|
Iveco Group N.V. (Netherlands) (a) |
3,320 |
21,690 |
|||||||||
|
2,154,099 |
|||||||||||
|
TRANSPORTATION - 1.4% |
|||||||||||
|
Ryanair Holdings PLC ADR (Ireland) (a) (c) |
4,011 |
349,417 |
|||||||||
|
COMMERCIAL & PROFESSIONAL SERVICES - 0.9% |
|||||||||||
|
Brambles, Ltd. (Australia) |
31,093 |
229,457 |
|||||||||
|
2,732,973 |
|||||||||||
|
HEALTH CARE - 10.6% |
|||||||||||
|
PHARMACEUTICALS, BIOTECHNOLOGY & LIFE SCIENCES - 6.3% |
|||||||||||
|
Bayer AG (Germany) |
13,856 |
947,730 |
|||||||||
|
Novartis AG (Switzerland) |
5,341 |
468,868 |
|||||||||
|
Roche Holding AG (Switzerland) |
355 |
140,460 |
|||||||||
|
1,557,058 |
|||||||||||
|
HEALTH CARE EQUIPMENT & SERVICES - 4.3% |
|||||||||||
|
Fresenius Medical Care AG & Co. KGaA (Germany) |
7,334 |
491,449 |
|||||||||
|
Fresenius SE & Co. KGaA (Germany) |
12,116 |
444,838 |
|||||||||
|
Koninklijke Philips N.V. (Netherlands) |
4,538 |
138,386 |
|||||||||
|
1,074,673 |
|||||||||||
|
2,631,731 |
|||||||||||
|
MATERIALS - 8.1% |
|||||||||||
|
Glencore PLC (Switzerland) |
101,739 |
661,986 |
|||||||||
|
Holcim, Ltd. (Switzerland) |
10,271 |
499,572 |
|||||||||
|
thyssenkrupp AG (Germany) (a) (b) |
43,878 |
375,043 |
|||||||||
|
Orica, Ltd. (Australia) (b) |
25,663 |
305,333 |
|||||||||
|
UPM-Kymmene OYJ (Finland) |
5,342 |
174,427 |
|||||||||
|
2,016,361 |
|||||||||||
|
COMMUNICATION SERVICES - 7.9% |
|||||||||||
|
MEDIA & ENTERTAINMENT - 6.2% |
|||||||||||
|
Publicis Groupe SA (France) |
6,659 |
404,189 |
|||||||||
|
NAVER Corp. (South Korea) |
1,420 |
394,756 |
|||||||||
|
Grupo Televisa SAB ADR (Mexico) (c) |
25,509 |
298,454 |
|||||||||
|
Informa PLC (United Kingdom) (a) |
30,630 |
239,983 |
|||||||||
|
WPP PLC (United Kingdom) |
16,329 |
213,722 |
|||||||||
|
1,551,104 |
|||||||||||
|
TELECOMMUNICATION SERVICES - 1.7% |
|||||||||||
|
Liberty Global PLC, Class A (United Kingdom) (a) |
16,143 |
411,800 |
|||||||||
|
1,962,904 |
|||||||||||
See accompanying Notes to Financial Statements.
Oakmark.com 29
Oakmark International Fund March 31, 2022 (Unaudited)
Schedule of Investments (in thousands) (continued)
|
Shares |
Value |
||||||||||
|
COMMON STOCKS - 95.5% (continued) |
|||||||||||
|
INFORMATION TECHNOLOGY - 7.6% |
|||||||||||
|
SOFTWARE & SERVICES - 7.6% |
|||||||||||
|
Worldline SA (France) (a) |
11,379 |
$ |
493,863 |
||||||||
|
SAP SE (Germany) |
4,109 |
455,415 |
|||||||||
|
Amadeus IT Group SA (Spain) (a) |
5,511 |
358,295 |
|||||||||
|
Open Text Corp. (Canada) |
7,253 |
307,531 |
|||||||||
|
Capgemini SE (France) |
890 |
197,597 |
|||||||||
|
Edenred (France) |
1,414 |
69,910 |
|||||||||
|
1,882,611 |
|||||||||||
|
CONSUMER STAPLES - 5.2% |
|||||||||||
|
FOOD, BEVERAGE & TOBACCO - 3.2% |
|||||||||||
|
Anheuser-Busch InBev SA/NV (Belgium) |
7,907 |
472,762 |
|||||||||
|
Danone SA (France) |
5,814 |
321,183 |
|||||||||
|
793,945 |
|||||||||||
|
HOUSEHOLD & PERSONAL PRODUCTS - 2.0% |
|||||||||||
|
Henkel AG & Co. KGaA (Germany) |
4,774 |
315,115 |
|||||||||
|
Reckitt Benckiser Group PLC (United Kingdom) |
2,612 |
199,259 |
|||||||||
|
514,374 |
|||||||||||
|
1,308,319 |
|||||||||||
|
TOTAL COMMON STOCKS - 95.5% (COST $24,183,475) |
23,747,965 |
||||||||||
|
PREFERRED STOCKS - 1.3% |
|||||||||||
|
INFORMATION TECHNOLOGY - 1.3% |
|||||||||||
|
TECHNOLOGY HARDWARE & EQUIPMENT - 1.3% |
|||||||||||
|
Samsung Electronics Co., Ltd. (South Korea) |
6,285 |
325,649 |
|||||||||
|
TOTAL PREFERRED STOCKS - 1.3% (COST $368,307) |
325,649 |
||||||||||
|
Par Value |
Value |
||||||||||
|
SHORT-TERM INVESTMENTS - 2.9% |
|||||||||||
|
REPURCHASE AGREEMENT - 2.6% |
|||||||||||
|
Fixed Income Clearing Corp. Repurchase Agreement, 0.28% dated 03/31/22 due 04/01/22, repurchase price $630,138, collateralized by United States Treasury Notes, 0.125% - 0.250% due 07/31/25 - 10/15/25, aggregate value plus accrued interest of $642,736 (Cost: $630,133) |
$ |
630,133 |
630,133 |
||||||||
|
Par Value |
Value |
||||||||||
|
COMMERCIAL PAPER - 0.3% |
|||||||||||
|
Walgreens Boots, 144A, 0.80% - 1.06%, due 04/06/22 - 05/06/22 (d) (e) |
$ |
60,000 |
$ |
59,966 |
|||||||
|
American Honda Finance Corp., 0.86%, due 04/05/22 (e) |
15,000 |
14,999 |
|||||||||
|
TOTAL COMMERCIAL PAPER - 0.3% (COST $74,965) |
74,965 |
||||||||||
|
TOTAL SHORT-TERM INVESTMENTS - 2.9% (COST $705,098) |
705,098 |
||||||||||
|
TOTAL INVESTMENTS - 99.7% (COST $25,256,880) |
24,778,712 |
||||||||||
|
Foreign Currencies (Cost $26,144) - 0.1% |
25,944 |
||||||||||
|
Other Assets In Excess of Liabilities - 0.2% |
60,679 |
||||||||||
|
TOTAL NET ASSETS - 100.0% |
$ |
24,865,335 |
|||||||||
(a) Non-income producing security
(b) See Note 6 in the Notes to Financial Statements regarding investments in affiliated issuers.
(c) Sponsored American Depositary Receipt
(d) Security exempt from registration under Rule 144A of the Securities Act of 1933, as amended. These securities may be resold, normally only to qualified institutional buyers.
(e) The rate shown represents the annualized yield at the time of purchase; not a coupon rate.
See accompanying Notes to Financial Statements.
30 OAKMARK FUNDS
Oakmark International Fund March 31, 2022 (Unaudited)
Schedule of Investments (in thousands) (continued)
FORWARD FOREIGN CURRENCY CONTRACT (in thousands)
|
Local Contract Amount |
Base Contract Amount |
Settlement Date |
Valuation at 03/31/22 |
Unrealized Appreciation/ (Depreciation) |
|||||||||||||||||||
|
Foreign Currency Bought: |
|||||||||||||||||||||||
|
Swiss Franc |
50,842 |
$ |
55,270 |
06/15/22 |
$ |
55,209 |
$ |
(61 |
) |
||||||||||||||
|
$ |
55,209 |
$ |
(61 |
) |
|||||||||||||||||||
|
Foreign Currency Sold: |
|||||||||||||||||||||||
|
Swiss Franc |
341,128 |
$ |
371,437 |
06/15/22 |
$ |
370,427 |
$ |
1,010 |
|||||||||||||||
|
$ |
370,427 |
$ |
1,010 |
||||||||||||||||||||
SCHEDULE OF TRANSACTIONS WITH AFFILIATED ISSUERS
Purchase and sale transactions and dividend and interest income earned during the period on these securities are set forth below (in thousands). The industry, country or geographic region for each of the below affiliates can be found in the Schedule of Investments.
| Affiliates |
Shares Held |
Purchases (Cost) |
Sales (Proceeds) |
Realized Gain/(Loss) |
Change in Unrealized |
Dividend Income |
Value September 30, 2021 |
Value March 31, 2022 |
Percent of Net Assets |
||||||||||||||||||||||||||||||
|
Accor SA |
15,131 |
$ |
15,705 |
$ |
71,948 |
$ |
(11,599 |
) |
$ |
(34,625 |
) |
$ |
0 |
$ |
589,985 |
$ |
487,518 |
2.0 |
% |
||||||||||||||||||||
|
Orica, Ltd. |
25,663 |
11,728 |
31,642 |
(17,945 |
) |
76,174 |
3,357 |
267,018 |
305,333 |
1.2 |
% |
||||||||||||||||||||||||||||
|
thyssenkrupp AG |
43,878 |
28,618 |
34,395 |
(12,105 |
) |
(71,853 |
) |
0 |
464,778 |
375,043 |
1.5 |
% |
|||||||||||||||||||||||||||
|
Valeo |
13,961 |
17,904 |
0 |
0 |
(130,221 |
) |
0 |
370,198 |
257,881 |
1.0 |
% |
||||||||||||||||||||||||||||
|
TOTAL |
98,633 |
$ |
73,955 |
$ |
137,985 |
$ |
(41,649 |
) |
$ |
(160,525 |
) |
$ |
3,357 |
$ |
1,691,979 |
$ |
1,425,775 |
5.7 |
% |
||||||||||||||||||||
See accompanying Notes to Financial Statements.
Oakmark.com 31
Oakmark International Small Cap Fund March 31, 2022
Summary Information
VALUE OF A $10,000 INVESTMENT
Since 3/31/12# (Unaudited)
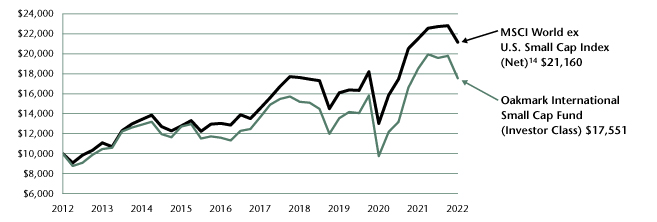
PERFORMANCE
|
Average Annual Total Returns (as of 03/31/22) |
|||||||||||||||||||||||||||||||
| (Unaudited) |
Total Return Last 3 Months |
1-year |
3-year |
5-year |
10-year |
Since Inception |
Inception Date |
||||||||||||||||||||||||
|
Oakmark International Small Cap Fund (Investor Class) |
-11.31 |
% |
-5.29 |
% |
9.00 |
% |
5.13 |
% |
5.79 |
% |
8.70 |
% |
11/01/95 |
||||||||||||||||||
|
MSCI World ex U.S. Small Cap Index (Net) |
-7.23 |
% |
-1.69 |
% |
9.55 |
% |
7.79 |
% |
7.78 |
% |
N/A |
||||||||||||||||||||
|
MSCI World ex U.S. Index (Net)12 |
-4.81 |
% |
3.04 |
% |
8.55 |
% |
7.14 |
% |
6.25 |
% |
5.45 |
% |
|||||||||||||||||||
|
Lipper International Small Cap Fund Index15 |
-12.63 |
% |
-5.66 |
% |
9.20 |
% |
7.50 |
% |
7.87 |
% |
N/A |
||||||||||||||||||||
|
Oakmark International Small Cap Fund (Advisor Class) |
-11.26 |
% |
-5.12 |
% |
9.15 |
% |
5.23 |
% |
N/A |
7.36 |
% |
11/30/16 |
|||||||||||||||||||
|
Oakmark International Small Cap Fund (Institutional Class) |
-11.29 |
% |
-5.04 |
% |
9.22 |
% |
5.33 |
% |
N/A |
7.45 |
% |
11/30/16 |
|||||||||||||||||||
|
Oakmark International Small Cap Fund (R6 Class) |
-11.25 |
% |
-5.02 |
% |
N/A |
N/A |
N/A |
5.57 |
% |
12/15/20 |
|||||||||||||||||||||
# The graph shows only 10 years of performance because the MSCI World ex U.S. Small Cap Index (Net) was launched on 01/01/2001 and does not have data going back to the Fund's inception.
The graph and table do not reflect the deduction of taxes that a shareholder would pay on Fund distributions or the redemption of Fund shares.
Past performance is no guarantee of future results. The performance data quoted represents past performance. Current performance may be lower or higher than the performance data quoted. Total return includes change in share prices and, in each case, includes reinvestment of dividends and capital gain distributions. The investment return and principal value vary so that an investor's shares, when redeemed, may be worth more or less than the original cost. The performance of the Fund does not reflect the 2% redemption fee imposed on shares redeemed within 90 days of purchase. To obtain the most recent month-end performance, please visit Oakmark.com.
|
TOP TEN EQUITY HOLDINGS4 |
% of Net Assets | ||||||
|
Konecranes OYJ |
3.7 |
||||||
|
Julius Baer Group, Ltd. |
3.5 |
||||||
|
Software AG |
3.3 |
||||||
|
BNK Financial Group, Inc. |
3.0 |
||||||
|
Azimut Holding SpA |
2.9 |
||||||
|
Loomis AB |
2.9 |
||||||
|
Kimberly-Clark de Mexico SAB de CV, Class A |
2.7 |
||||||
|
Applus Services SA |
2.7 |
||||||
|
Atea ASA |
2.6 |
||||||
|
Ansell, Ltd. |
2.5 |
||||||
|
FUND STATISTICS |
|||||||
|
Ticker* |
OAKEX |
||||||
|
Number of Equity Holdings |
59 |
||||||
|
Net Assets |
$1.4 billion | ||||||
|
Weighted Average Market Cap |
$4.2 billion | ||||||
|
Median Market Cap |
$2.9 billion | ||||||
|
Gross Expense Ratio - Investor Class*^ |
1.37% | ||||||
|
Net Expense Ratio - Investor Class*†^ |
1.35% | ||||||
* This information is related to the Investor Class. Please visit Oakmark.com for information related to the Advisor, Institutional and R6 Classes.
† The net expense ratio reflects a contractual advisory fee waiver agreement through January 27, 2023.
^ The Gross Expense Ratio and Net Expense Ratio are from the Fund's Prospectus dated January 28, 2022.
|
SECTOR ALLOCATION |
% of Net Assets | ||||||
|
Industrials |
26.9 |
||||||
|
Financials |
21.9 |
||||||
|
Information Technology |
11.3 |
||||||
|
Communication Services |
8.5 |
||||||
|
Consumer Discretionary |
7.9 |
||||||
|
Consumer Staples |
7.0 |
||||||
|
Health Care |
6.6 |
||||||
|
Materials |
4.4 |
||||||
|
Real Estate |
2.4 |
||||||
|
Short-Term Investments and Other |
3.1 |
||||||
|
GEOGRAPHIC ALLOCATION |
|||||||
|
% of Equity |
|||||||
|
Europe |
72.5 |
||||||
|
United Kingdom |
19.9 |
||||||
|
Germany* |
10.9 |
||||||
|
Switzerland |
9.8 |
||||||
|
Sweden |
6.7 |
||||||
|
Finland* |
5.6 |
||||||
|
Italy* |
4.8 |
||||||
|
Netherlands* |
3.8 |
||||||
|
Spain* |
3.3 |
||||||
|
Norway |
2.7 |
||||||
|
Denmark |
2.4 |
||||||
|
Portugal* |
1.8 |
||||||
|
Belgium* |
0.8 |
||||||
|
% of Equity |
|||||||
|
Asia |
12.5 |
||||||
|
South Korea |
5.0 |
||||||
|
Japan |
4.0 |
||||||
|
China |
2.4 |
||||||
|
Indonesia |
1.1 |
||||||
|
Australasia |
6.9 |
||||||
|
Australia |
6.9 |
||||||
|
Latin America |
5.0 |
||||||
|
Mexico |
5.0 |
||||||
|
North America |
2.2 |
||||||
|
Canada |
2.2 |
||||||
|
Africa/Middle East |
0.9 |
||||||
|
Israel |
0.9 |
||||||
* Euro currency countries comprise 31.0% of equity investments.
See accompanying Disclosures and Endnotes on page 100.
32 OAKMARK FUNDS
Oakmark International Small Cap Fund March 31, 2022
Portfolio Manager Commentary


David G. Herro, CFA
Portfolio Manager
oakex@oakmark.com
Michael L. Manelli, CFA
Portfolio Manager
oakex@oakmark.com
Justin D. Hance, CFA
Portfolio Manager
oakex@oakmark.com
The Oakmark International Small Cap Fund returned –11.3% for the quarter ending March 31, underperforming the MSCI World ex U.S. Small Cap Index (Net),14 which returned –7.2% for the same period. Since its November 1995 inception, the Fund has returned an average of 8.7% per year.
As discussed in greater detail in David Herro's lead letter, the Fund started the year strong; however, performance turned negative on both an absolute and relative basis during the last six weeks of the quarter as war broke out in Ukraine. The Fund's overweight to Europe, exposure to more economically sensitive sectors, such as industrials and financials, and lack of exposure to energy all weighed on performance. Although we are disappointed by the near-term underperformance, we remain comfortable with the overall exposure of the portfolio and have generally been adding to those positions that have underperformed during the period. Clearly, the war in Ukraine and the associated increase in inflation (particularly with regards to energy prices in Europe) have increased macro risks, but one also needs to keep in mind the tailwinds associated with economic reopening (particularly in Europe) and the fact that consumers are entering this period with high savings rates. Many of the "economically sensitive" businesses we own began 2022 at relatively low valuation levels, and when accounting for share price declines during the first quarter, we believe the share prices already reflect a significant downturn in the macro environment—or, in some instances, an outright recession. We are mindful of the increased macro risks, but at this point, we do not believe a significant macro slowdown is certain. Thus, we continue to find attractive risk/return propositions in several economically sensitive stocks with share prices that already suggest a significant slowdown.
Incitec Pivot, a large Australian manufacturer of mining explosives and fertilizers, was a top contributor to the Fund's performance for the period. The company benefited in the first quarter from rising fertilizer prices caused by supply concerns, export bans and rising gas costs. While global markets set Incitec's realized prices, the company's input costs are more nuanced and benefit from long-term contracts or low-cost positions as in the case of U.S. natural gas. Ammonia (produced at Incitec's Waggaman plant in Louisiana) and diammonium phosphate (produced at Incitec's Phosphate Hill plant in Australia) have soared to extremely high levels, providing near-term earnings upside for the company. Although prices will not remain this high forever and our view of normalized earnings is largely unchanged, the additional cash flow further reduces the company's debt and can be returned to shareholders. Incitec also announced new CFO Paul Victor, who is currently CFO of Sasol and has significant experience spanning oil and gas, gold and coal mining, and chemicals and energy. We believe this new addition will prove beneficial for Incitec.
Duerr, a German mechanical and plant engineering firm, was a top detractor for the quarter. Although we believed the company's fiscal-year earnings results were decent, they proved disappointing to investors as net income, revenue and earnings fell short of analysts' estimates. However, free cash flow generation was strong, order intake set a record and finished up 31% year-over-year, and management's guidance for 2022 largely aligned with our expectations. We spoke with CFO Dietmar Heinrich in January and new CEO Jochen Weyrauch in March. We believe the company remains well-placed to restore profitability to pre-Covid-19 levels. In our view, Duerr remains a compelling investment with multiple avenues for growth in the core business as well as exciting options in battery coating, medical technology and software.
We initiated one new position during the quarter in Grifols, a Spanish pharmaceuticals company specializing in human plasma-derived products. We appreciate that Grifols participates in the vertically integrated plasma protein oligopoly, which enjoys large competitive moats and global volume growth. As the world moves toward the recovery phase from Covid-19, we believe the company is well positioned to recognize upside potential as plasma collection volumes stabilize and donor compensation normalizes. Moreover, given the opportunistic acquisition of Bio Test and the significant research and development pipeline for drugs, we believe Grifols is positioned to double its earnings over the next five years. We also sold Autogrill, an Italy-based multi-national catering company, during the quarter as its share price reached our estimate of intrinsic value.
Geographically, we ended the quarter with approximately 72% of our holdings in Europe and the U.K., 13% in Asia, and 7% in Australasia. The remaining positions are 5% in Latin America (Mexico), 2% in North America (Canada) and 1% in Africa/Middle East (Israel). We believe the Swiss franc remains overvalued versus the U.S. dollar, and we ended the quarter with defensive hedges on approximately 15% of the Fund's franc exposure.
Thank you for your continued confidence and support.
See accompanying Disclosures and Endnotes on page 100.
Oakmark.com 33
Oakmark International Small Cap Fund March 31, 2022 (Unaudited)
Schedule of Investments (in thousands)
|
Shares |
Value |
||||||||||
|
COMMON STOCKS - 96.9% |
|||||||||||
|
INDUSTRIALS - 26.9% |
|||||||||||
|
COMMERCIAL & PROFESSIONAL SERVICES - 13.7% |
|||||||||||
|
Loomis AB (Sweden) |
1,517 |
$ |
41,379 |
||||||||
|
Applus Services SA (Spain) |
4,672 |
38,689 |
|||||||||
|
ISS A/S (Denmark) (a) |
1,885 |
33,493 |
|||||||||
|
Hays PLC (United Kingdom) |
15,697 |
25,136 |
|||||||||
|
Mitie Group PLC (United Kingdom) |
26,662 |
19,130 |
|||||||||
|
Randstad N.V. (Netherlands) |
318 |
19,117 |
|||||||||
|
SThree PLC (United Kingdom) |
2,113 |
11,421 |
|||||||||
|
Pagegroup PLC (United Kingdom) |
1,411 |
9,087 |
|||||||||
|
197,452 |
|||||||||||
|
CAPITAL GOODS - 13.2% |
|||||||||||
|
Konecranes OYJ (Finland) |
1,720 |
52,809 |
|||||||||
|
Duerr AG (Germany) |
1,090 |
32,150 |
|||||||||
|
Travis Perkins PLC (United Kingdom) |
1,886 |
30,414 |
|||||||||
|
Babcock International Group PLC (United Kingdom) (a) |
6,718 |
28,526 |
|||||||||
|
Metso Outotec Oyj (Finland) |
3,095 |
26,091 |
|||||||||
|
Sulzer AG (Switzerland) |
192 |
15,971 |
|||||||||
|
Howden Joinery Group PLC (United Kingdom) |
452 |
4,526 |
|||||||||
|
dormakaba Holding AG (Switzerland) |
2 |
975 |
|||||||||
|
191,462 |
|||||||||||
|
388,914 |
|||||||||||
|
FINANCIALS - 21.9% |
|||||||||||
|
DIVERSIFIED FINANCIALS - 14.5% |
|||||||||||
|
Julius Baer Group, Ltd. (Switzerland) |
865 |
50,085 |
|||||||||
|
Azimut Holding SpA (Italy) |
1,831 |
42,443 |
|||||||||
|
EFG International AG (Switzerland) |
4,311 |
33,218 |
|||||||||
|
Abrdn PLC (United Kingdom) |
10,800 |
30,240 |
|||||||||
|
St James's Place PLC (United Kingdom) |
1,480 |
27,907 |
|||||||||
|
Element Fleet Management Corp. (Canada) |
2,690 |
26,039 |
|||||||||
|
209,932 |
|||||||||||
|
BANKS - 4.9% |
|||||||||||
|
BNK Financial Group, Inc. (South Korea) |
6,657 |
43,335 |
|||||||||
|
DGB Financial Group, Inc. (South Korea) |
3,547 |
27,107 |
|||||||||
|
70,442 |
|||||||||||
|
INSURANCE - 2.5% |
|||||||||||
|
Talanx AG (Germany) |
810 |
35,676 |
|||||||||
|
316,050 |
|||||||||||
|
INFORMATION TECHNOLOGY - 11.3% |
|||||||||||
|
SOFTWARE & SERVICES - 9.6% |
|||||||||||
|
Software AG (Germany) |
1,369 |
47,326 |
|||||||||
|
Atea ASA (Norway) |
2,514 |
37,567 |
|||||||||
|
Nihon Unisys, Ltd. (Japan) |
963 |
24,432 |
|||||||||
|
TeamViewer AG (Germany) (a) |
1,621 |
23,931 |
|||||||||
|
Link Administration Holdings, Ltd. (Australia) |
1,301 |
5,009 |
|||||||||
|
138,265 |
|||||||||||
|
Shares |
Value |
||||||||||
|
TECHNOLOGY HARDWARE & EQUIPMENT - 1.7% |
|||||||||||
|
Softwareone Holding AG (Switzerland) (a) |
1,750 |
$ |
24,665 |
||||||||
|
162,930 |
|||||||||||
|
COMMUNICATION SERVICES - 8.5% |
|||||||||||
|
MEDIA & ENTERTAINMENT - 5.7% |
|||||||||||
|
Megacable Holdings SAB de CV (Mexico) |
10,209 |
30,761 |
|||||||||
|
oOh!media, Ltd. (Australia) |
21,324 |
25,732 |
|||||||||
|
Hakuhodo DY Holdings, Inc. (Japan) |
1,285 |
16,130 |
|||||||||
|
Nordic Entertainment Group AB, Class B (Sweden) (a) |
244 |
9,865 |
|||||||||
|
82,488 |
|||||||||||
|
TELECOMMUNICATION SERVICES - 2.8% |
|||||||||||
|
NOS SGPS SA (Portugal) |
5,918 |
24,934 |
|||||||||
|
Sarana Menara Nusantara Tbk PT (Indonesia) |
209,040 |
15,556 |
|||||||||
|
40,490 |
|||||||||||
|
122,978 |
|||||||||||
|
CONSUMER DISCRETIONARY - 7.9% |
|||||||||||
|
AUTOMOBILES & COMPONENTS - 4.8% |
|||||||||||
|
Pirelli & C SpA (Italy) |
4,682 |
25,407 |
|||||||||
|
Autoliv, Inc. (Sweden) |
302 |
23,062 |
|||||||||
|
Vitesco Technologies Group AG (Germany) (a) |
337 |
13,361 |
|||||||||
|
Dometic Group AB (Sweden) |
910 |
7,830 |
|||||||||
|
69,660 |
|||||||||||
|
CONSUMER SERVICES - 2.3% |
|||||||||||
|
Wynn Macau, Ltd. (China) (a) |
45,492 |
32,967 |
|||||||||
|
RETAILING - 0.4% |
|||||||||||
|
Wickes Group PLC (United Kingdom) |
2,380 |
5,736 |
|||||||||
|
CONSUMER DURABLES & APPAREL - 0.4% |
|||||||||||
|
Gildan Activewear, Inc. (Canada) |
144 |
5,401 |
|||||||||
|
113,764 |
|||||||||||
|
CONSUMER STAPLES - 7.0% |
|||||||||||
|
FOOD, BEVERAGE & TOBACCO - 3.3% |
|||||||||||
|
JDE Peet's N.V. (Netherlands) |
1,195 |
34,205 |
|||||||||
|
Strauss Group, Ltd. (Israel) |
438 |
13,041 |
|||||||||
|
47,246 |
|||||||||||
|
HOUSEHOLD & PERSONAL PRODUCTS - 2.7% |
|||||||||||
|
Kimberly-Clark de Mexico SAB de CV, Class A (Mexico) |
27,876 |
39,214 |
|||||||||
|
FOOD & STAPLES RETAILING - 1.0% |
|||||||||||
|
Sugi Holdings Co., Ltd. (Japan) |
306 |
15,136 |
|||||||||
|
101,596 |
|||||||||||
|
HEALTH CARE - 6.6% |
|||||||||||
|
HEALTH CARE EQUIPMENT & SERVICES - 6.1% |
|||||||||||
|
Ansell, Ltd. (Australia) |
1,890 |
36,248 |
|||||||||
|
ConvaTec Group PLC (United Kingdom) |
11,975 |
33,821 |
|||||||||
|
Elekta AB, Class B (Sweden) |
1,431 |
11,267 |
|||||||||
|
Healius, Ltd. (Australia) |
1,861 |
6,068 |
|||||||||
|
87,404 |
|||||||||||
See accompanying Notes to Financial Statements.
34 OAKMARK FUNDS
Oakmark International Small Cap Fund March 31, 2022 (Unaudited)
Schedule of Investments (in thousands) (continued)
|
Shares |
Value |
||||||||||
|
COMMON STOCKS - 96.9% (continued) |
|||||||||||
|
HEALTH CARE - 6.6% (continued) |
|||||||||||
|
PHARMACEUTICALS, BIOTECHNOLOGY & LIFE SCIENCES - 0.5% |
|||||||||||
|
Grifols SA (Spain) (b) |
650 |
$ |
7,592 |
||||||||
|
94,996 |
|||||||||||
|
MATERIALS - 4.4% |
|||||||||||
|
DS Smith PLC (United Kingdom) |
6,914 |
29,080 |
|||||||||
|
Incitec Pivot, Ltd. (Australia) |
8,129 |
23,011 |
|||||||||
|
Titan Cement International SA (Belgium) |
778 |
11,351 |
|||||||||
|
Essentra PLC (United Kingdom) |
210 |
863 |
|||||||||
|
64,305 |
|||||||||||
|
REAL ESTATE - 2.4% |
|||||||||||
|
LSL Property Services PLC (United Kingdom) |
4,369 |
22,267 |
|||||||||
|
IWG PLC (Switzerland) (a) |
3,436 |
11,754 |
|||||||||
|
34,021 |
|||||||||||
|
TOTAL COMMON STOCKS - 96.9% (COST $1,406,796) |
1,399,554 |
||||||||||
|
Par Value |
Value |
||||||||||
|
SHORT-TERM INVESTMENT - 2.3% |
|||||||||||
|
REPURCHASE AGREEMENT - 2.3% |
|||||||||||
|
Fixed Income Clearing Corp. Repurchase Agreement, 0.28% dated 03/31/22 due 04/01/22, repurchase price $33,272, collateralized by United States Treasury Note, 0.250% due 07/31/25, value plus accrued interest of $33,938 (Cost: $33,272) |
$ |
33,272 |
33,272 |
||||||||
|
TOTAL SHORT-TERM INVESTMENTS - 2.3% (COST $33,272) |
33,272 |
||||||||||
|
TOTAL INVESTMENTS - 99.2% (COST $1,440,068) |
1,432,826 |
||||||||||
|
Foreign Currencies (Cost $0) (d) - 0.0% (c) |
0 |
(d) |
|||||||||
|
Other Assets In Excess of Liabilities - 0.8% |
11,996 |
||||||||||
|
TOTAL NET ASSETS - 100.0% |
$ |
1,444,822 |
|||||||||
(a) Non-income producing security
(b) Sponsored American Depositary Receipt
(c) Amount rounds to less than 0.1%.
(d) Amount rounds to less than $1,000.
See accompanying Notes to Financial Statements.
Oakmark.com 35
Oakmark International Small Cap Fund March 31, 2022 (Unaudited)
Schedule of Investments (in thousands) (continued)
FORWARD FOREIGN CURRENCY CONTRACT (in thousands)
|
Local Contract Amount |
Base Contract Amount |
Settlement Date |
Valuation at 3/31/22 |
Unrealized Appreciation/ (Depreciation) |
|||||||||||||||||||
|
Foreign Currency Bought: |
|||||||||||||||||||||||
|
Swiss Franc |
322 |
$ |
350 |
06/15/22 |
$ |
350 |
$ |
0 |
|||||||||||||||
|
$ |
350 |
$ |
0 |
||||||||||||||||||||
|
Foreign Currency Sold: |
|||||||||||||||||||||||
|
Swiss Franc |
17,964 |
$ |
19,569 |
06/15/22 |
$ |
19,507 |
$ |
62 |
|||||||||||||||
|
$ |
19,507 |
$ |
62 |
||||||||||||||||||||
See accompanying Notes to Financial Statements.
36 OAKMARK FUNDS

This page intentionally left blank.
Oakmark.com 37
Oakmark Equity and Income Fund March 31, 2022
Summary Information
VALUE OF A $10,000 INVESTMENT
Since Inception - 11/01/95 (Unaudited)
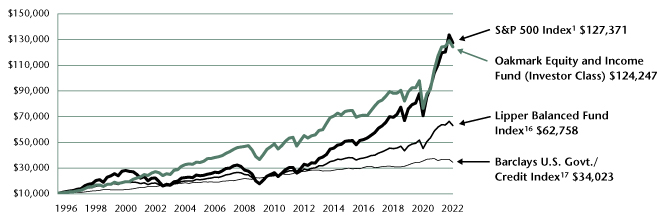
PERFORMANCE
|
Average Annual Total Returns (as of 03/31/22) |
|||||||||||||||||||||||||||||||
| (Unaudited) |
Total Return Last 3 Months |
1-year |
3-year |
5-year |
10-year |
Since Inception |
Inception Date |
||||||||||||||||||||||||
|
Oakmark Equity and Income Fund (Investor Class) |
-3.73 |
% |
6.13 |
% |
11.73 |
% |
8.86 |
% |
8.51 |
% |
10.01 |
% |
11/01/95 |
||||||||||||||||||
|
Lipper Balanced Fund Index |
-4.98 |
% |
2.05 |
% |
10.37 |
% |
8.78 |
% |
8.17 |
% |
7.20 |
% |
|||||||||||||||||||
|
S&P 500 Index |
-4.60 |
% |
15.65 |
% |
18.92 |
% |
15.99 |
% |
14.64 |
% |
10.11 |
% |
|||||||||||||||||||
|
Barclays U.S. Govt./Credit Index |
-6.33 |
% |
-3.85 |
% |
2.12 |
% |
2.44 |
% |
2.45 |
% |
4.75 |
% |
|||||||||||||||||||
|
Oakmark Equity and Income Fund (Advisor Class) |
-3.68 |
% |
6.37 |
% |
11.89 |
% |
9.03 |
% |
N/A |
9.59 |
% |
11/30/16 |
|||||||||||||||||||
|
Oakmark Equity and Income Fund (Institutional Class) |
-3.68 |
% |
6.37 |
% |
11.95 |
% |
9.07 |
% |
N/A |
9.64 |
% |
11/30/16 |
|||||||||||||||||||
|
Oakmark Equity and Income Fund (R6 Class) |
-3.65 |
% |
6.42 |
% |
N/A |
N/A |
N/A |
14.33 |
% |
12/15/20 |
|||||||||||||||||||||
The graph and table above do not reflect the deduction of taxes that a shareholder would pay on Fund distributions or the redemption of Fund shares.
Past performance is no guarantee of future results. The performance data quoted represents past performance. Current performance may be lower or higher than the performance data quoted. Total return includes change in share prices and, in each case, includes reinvestment of dividends and capital gain distributions. The investment return and principal value vary so that an investor's shares, when redeemed, may be worth more or less than the original cost. To obtain the most recent month-end performance, please visit Oakmark.com.
|
TOP TEN EQUITY HOLDINGS4 |
% of Net Assets | ||||||
|
Alphabet, Inc., Class A |
4.9 |
||||||
|
Philip Morris International, Inc. |
2.9 |
||||||
|
Ally Financial, Inc. |
2.7 |
||||||
|
Glencore PLC |
2.5 |
||||||
|
Bank of America Corp. |
2.5 |
||||||
|
TE Connectivity, Ltd. |
2.4 |
||||||
|
General Motors Co. |
2.4 |
||||||
|
HCA Healthcare, Inc. |
2.1 |
||||||
|
PDC Energy, Inc. |
2.1 |
||||||
|
Carlisle Cos., Inc. |
2.0 |
||||||
|
FUND STATISTICS |
|||||||
|
Ticker* |
OAKBX |
||||||
|
Number of Equity Holdings |
48 |
||||||
|
Net Assets |
$7.4 billion | ||||||
|
Weighted Average Market Cap |
$233.8 billion | ||||||
|
Median Market Cap |
$44.9 billion | ||||||
|
Gross Expense Ratio - Investor Class*^ |
0.86% | ||||||
|
Net Expense Ratio - Investor Class*†^ |
0.84% | ||||||
* This information is related to the Investor Class. Please visit Oakmark.com for information related to the Advisor, Institutional and R6 Classes.
† The net expense ratio reflects a contractual advisory fee waiver agreement through January 27, 2023.
^ The Gross Expense Ratio and Net Expense Ratio are from the Fund's Prospectus dated January 28, 2022.
|
SECTOR ALLOCATION |
% of Net Assets | ||||||
|
Equity Investments |
|||||||
|
Financials |
12.5 |
||||||
|
Communication Services |
9.5 |
||||||
|
Consumer Discretionary |
8.3 |
||||||
|
Information Technology |
5.7 |
||||||
|
Industrials |
5.5 |
||||||
|
Consumer Staples |
5.2 |
||||||
|
Health Care |
4.9 |
||||||
|
Energy |
4.4 |
||||||
|
Materials |
3.5 |
||||||
|
Real Estate |
1.3 |
||||||
|
Total Equity Investments |
60.8 |
||||||
|
Preferred Stocks |
0.1 |
||||||
|
Fixed Income Investments |
|||||||
|
Corporate Bonds |
22.0 |
||||||
|
Government and Agency Securities |
7.7 |
||||||
|
Bank Loans |
0.9 |
||||||
|
Convertible Bonds |
0.2 |
||||||
|
Total Fixed Income Investments |
30.8 |
||||||
|
Short-Term Investments and Other |
8.3 |
||||||
See accompanying Disclosures and Endnotes on page 100.
38 OAKMARK FUNDS
Oakmark Equity and Income Fund March 31, 2022
Portfolio Manager Commentary


Clyde S. McGregor, CFA
Portfolio Manager
oakbx@oakmark.com
M. Colin Hudson, CFA
Portfolio Manager
oakbx@oakmark.com
Adam D. Abbas
Portfolio Manager
oakbx@oakmark.com
The Ukraine War Changes the Narrative
It has been two years since the Covid-19 pandemic began to afflict our world, and now yet another plague has struck, a land war in Ukraine that began in February. We have been writing these reports for the Equity and Income Fund for more than 25 years, but in all of that time, this is the first report to require discussion of a major land war's impact. We hope and pray for a quick, peaceful resolution to this conflict and regret the need to reflect on the war's financial effects.
Western governments sanctioned Russia for this invasion, and even though the Russian economy is only the world's 11th largest (and Ukraine's economy is much smaller), these sanctions will have significant ramifications, some of which are not yet well defined. Ukraine and Russia export large quantities of many different commodities and this has caused war news to intensify commodity price volatility. Wars are often associated with an acceleration in price inflation, and this war began at a moment when price inflation was already accelerating. Examples of other effects include western countries pledging to increase their defense budgets, many American and European companies shuttering their Russian operations, and uncertainty growing around the repayment of certain bank loans and aircraft leases. As the pandemic unfolded two years ago, it produced behavioral changes that benefited some companies and businesses while impairing others. The war may develop similarly, although short-term volatility has made predictions untrustworthy so far. Perhaps the most significant immediate impact on the international economy has been to increase fossil fuel prices.
When we began to think about subjects for this quarterly report, we did not contemplate including a section discussing a war and its impacts. Our hearts go out to all whom this war has touched.
Recession/Stagflation?
During the quarter, economists and investors began to shift their economic projections away from continued growth to stagflation (low growth/high inflation) or even recession. The pandemic disrupted globalized supply chains, and the war has intensified that disruption. At the same time, many central banks have begun to increase short-term interest rates in an attempt to decelerate price inflation. Given the war's location, many forecasters now anticipate a recession or material slowdown in Europe unless the war ends quickly. In the U.S., the bond market has experienced yield curve flattening such that yields on intermediate-term issues now exceed those of longer term. This inversion (when short-term yields exceed long-term) is often a precursor of recessions, although in this case, the picture is more muddled because the yield on very short-term issues is still well below that of longer term. The most bearish investors note that the Federal Reserve has never before tightened monetary policy at a time of a shooting war, a pandemic
and a flat yield curve. As well, inflation has never before been measured this high so early in what still seems to be an economic expansion.
We invest the Equity and Income Fund primarily in U.S. securities, so we will leave the discussion of international economies to our colleagues. Despite the factors mentioned above, we do not see a recession developing in the U.S. in the near term. Monetary stimulus has been significant during the pandemic, and history shows that the growth-enhancing effects of such stimulus continue long after it ends. Fiscal stimulus programs strengthened consumer balance sheets over the past two years, and corporations took advantage of low interest rates to refinance. Corporate executives to whom we speak generally see continued economic strength and momentum. The combination of high price inflation and a flattening yield curve does concern us, but every cycle is different. The idiosyncratic circumstances coming together at this time may mean that previous economic history has little predictive value.
Quarter Review
The Equity and Income Fund declined 3.7% in the quarter, which contrasts with a 5% loss for the Lipper Balanced Fund Index,16 the Fund's performance benchmark. Since its inception in 1995, the Fund's compound annual rate of return18 is 10.0%, while the corresponding return to the Lipper Index is 7.2%. Once again the Fund's short duration of its fixed income allocation aided relative performance in the quarter. To repeat ourselves, we have argued that exceptionally low interest rates meant that longer term bonds had become biased toward risk rather than return. The benchmark 10-year U.S. Treasury's 6.6% loss in the quarter demonstrated that riskiness.
The war's impact on stock market action defined the quarter's list of contributors and detractors. Energy, defense and commodities benefitted while automotive sector holdings declined, most likely because of their potential sensitivity to rising gasoline prices. PDC Energy, Glencore, ChampionX, General Dynamics and Diamondback Energy led the contributors while General Motors, TE Connectivity, Charter Communications, Lear and Meta Platforms detracted most from return. For the first six months of the Fund's fiscal year, PDC Energy again headed the contributors' list, followed by CVS Health, Glencore, Carlisle and Diamondback Energy. Charter Communications detracted most followed by Citigroup, Thor Industries, Ally Financial and General Motors.
Transaction Activity
We were unusually active in the quarter as increased price volatility provided us with what we viewed as attractive opportunities. As interest rates rose, we added to the fixed income allocation and increased the portfolio duration by one year. In terms of equities, we initiated six new holdings and completed
See accompanying Disclosures and Endnotes on page 100.
Oakmark.com 39
Oakmark Equity and Income Fund March 31, 2022
Portfolio Manager Commentary (continued)
the sale of three. Befitting the erratic and uneven investing environment of the past few months, the new equity positions represent a mix of traditional value names and growth-oriented issues.
Perhaps the best example of an issue on the growth side of the ledger is Amazon. Amazon's share price had languished for roughly a year, and we had the opportunity in the recent quarter to purchase shares at prices discounted by roughly one-fourth from their previous high. Amazon is the leading e-commerce retailer and cloud computing company. In e-commerce, two-thirds of U.S. households are Amazon Prime subscribers, and over half of all online product searches begin on Amazon. Amazon has also built a delivery network that will soon surpass UPS and FedEx in packages shipped. We believe Amazon's customer loyalty and infrastructure are strong barriers to entry in a growing e-commerce market. Separately, Amazon Web Services (AWS) has nearly half of the market in cloud computing. AWS has the significant technical expertise and operates a large and growing number of data centers that run entire IT departments for businesses. We believe AWS has become utility-like in nature and scale and expect it will continue to grow as IT workloads move to the cloud. Despite strong share price performance since the pandemic, Amazon lagged behind its peers in retail and technology. As a result, the company trades at a discount to its peer-weighted sales multiple, the first time this has happened since 2015. We believe the reason is Amazon's investment in e-commerce, which is largely expensed through the income statement. We believe Amazon's normalized margins are higher than today, and the company is undervalued on normalized earnings.
Next alphabetically is BlackRock, the investment industry's largest asset manager. BlackRock's assets are well diversified across region, client type, product and style (active, index and ETF). The ETF category has consistently gained market share due to its ease of use and tax advantages. BlackRock is the global leader in ETFs through its iShares brand (~40% of revenue). iShares' organic revenue growth has consistently been around 10% and we believe it can sustain around this level of growth for many more years. BlackRock's active business has grown well in excess of most other active managers due to its dominance in fixed income and leadership in multi-asset, sustainable investing and alternative assets. We believe this positioning should lead to mid-single-digit organic revenue growth, and with normal market returns, overall revenue growth should be in the high-single-digits with earnings per share growth of around 10%. Despite this outlook, the stock price has declined much more than global markets due to worries about rising interest rates and the Russian-Ukrainian war. At a mid-teens multiple of next year's earnings, we believe that the stock is undervalued.
KKR is one of the largest alternative asset managers in the world, managing $471 billion in assets across various investment vehicles. Approximately 80% of the company's assets under management are held under capital commitments of eight years or longer, creating a highly stable stream of fee earnings. Moreover, KKR's assets under management have been growing at double-digit rates as the company has drawn on its established brand and relationships to expand into new strategies and geographies. We believe many of these newer strategies have a considerable runway for future growth. Furthermore, we think the market is undervaluing KKR because of its large
balance sheet investments and the volatility of its performance fees. We estimate that the company's investments are worth approximately $19/share today or close to one-third of its current market capitalization. After adjusting for these factors, the company's shares trade at a low-teens multiple of our forward earnings estimate. We find this valuation too cheap for a business with KKR's growth outlook and return profile.
Next up is Lithia Motors, the largest franchised auto dealer group in the U.S. The company has a long history of creating shareholder value through best-in-class operations and consistent acquisitions of smaller dealers at attractive returns. There is a long runway for management to continue creating value through such acquisitions, and management believes this will drive earnings per share to more than $50 by 2025, even as automobile prices return to pre-pandemic levels. Meanwhile, Lithia has a significant opportunity to accelerate growth through Driveway, its online auto retailing platform. We believe Lithia's existing nationwide infrastructure provides Driveway with significant competitive advantages in e-commerce that smaller dealers will struggle to replicate. Driveway is not generating any earnings today but could become a major contributor over the next five to seven years. With the stock priced at less than 7x management's 2025 EPS5 target and with substantial future growth potential from Driveway, we believe Lithia shares are a bargain today.
Netflix is the leading streaming entertainment service with 222 million subscribers and $30 billion of revenue. This scale creates a valuable moat allowing Netflix to buy more content than its competitors in aggregate but pay less per subscriber. This dynamic has created a more valuable customer proposition as the business has grown, which we expect to manifest in a larger subscriber base over time. Netflix stock declined significantly over the past several months as market participants reacted to slowing subscriber growth and margin pressure. We believe it is likely that both of these issues are temporary. Growth decelerated as the economy reopened, but this occurred on the heels of a rapid acceleration period earlier in the pandemic. Weak foreign currencies in the company's international markets were the primary source of margin pressure. Netflix's cost base is primarily dollar-denominated, meaning that declining foreign currency values pressure profit margins. After the pullback in the stock, Netflix trades for 5.5x consensus 2022 revenue and 34x consensus EPS, which is compelling in the context of our expectations for future growth and profitability. We greatly admire Netflix's management team and the company's unique corporate culture. We are excited to invest alongside them as they capitalize on the enormous opportunity in streamed entertainment.
The next purchase is a return appearance to the Fund, Parker Hannifin. In our opinion, investors have a stale perception of the company. It is still viewed as a short-cycle, diversified manufacturer that is heavily tied to industrial production. This ignores the fine job that CEO Thomas Williams has done since his promotion in 2015. He has vastly improved operations and shifted the portfolio to longer cycled, higher growth, higher margin and higher return end markets. The results are impressive. Margins, returns and earnings have increased substantially. With the expected closing of the Meggitt acquisition in the calendar year third quarter, the highly depressed aerospace segment will be the largest end market. We anticipate a rebound in
See accompanying Disclosures and Endnotes on page 100.
40 OAKMARK FUNDS
Oakmark Equity and Income Fund March 31, 2022
Portfolio Manager Commentary (continued)
aerospace revenue, which—combined with the company's strong position in attractive businesses including clean technologies and factory automation—should accelerate revenue growth. Parker Hannifin trades at a discount to other high-quality industrials, which we believe is unwarranted since its growth and returns should be similar or better. At a low-teens multiple of next year's normalized cash earnings, Parker Hannifin is an attractive investment in our view.
We eliminated three equity holdings as well as a very small spinoff distribution received from Zimmer Biomet in the quarter. We sold Nestlé and Regeneron Pharmaceuticals as they approached their sell targets. Zimmer Biomet was also a profitable investment that we sold as we reevaluated its growth in intrinsic value to be less compelling. The net impact on equity asset allocation was quite modest.
We thank you for your interest in the Equity and Income Fund.
See accompanying Disclosures and Endnotes on page 100.
Oakmark.com 41
Oakmark Equity and Income Fund March 31, 2022 (Unaudited)
Schedule of Investments (in thousands)
|
Shares |
Value |
||||||||||
|
COMMON STOCKS - 60.8% |
|||||||||||
|
FINANCIALS - 12.5% |
|||||||||||
|
DIVERSIFIED FINANCIALS - 5.1% |
|||||||||||
|
Ally Financial, Inc. |
4,607 |
$ |
200,295 |
||||||||
|
The Charles Schwab Corp. |
706 |
59,506 |
|||||||||
|
State Street Corp. |
653 |
56,907 |
|||||||||
|
KKR & Co., Inc. |
696 |
40,677 |
|||||||||
|
BlackRock, Inc. |
24 |
18,493 |
|||||||||
|
375,878 |
|||||||||||
|
BANKS - 4.3% |
|||||||||||
|
Bank of America Corp. |
4,473 |
184,361 |
|||||||||
|
Citigroup, Inc. |
2,530 |
135,083 |
|||||||||
|
319,444 |
|||||||||||
|
INSURANCE - 3.1% |
|||||||||||
|
Reinsurance Group of America, Inc. |
1,298 |
142,134 |
|||||||||
|
American International Group, Inc. |
1,460 |
91,619 |
|||||||||
|
233,753 |
|||||||||||
|
929,075 |
|||||||||||
|
COMMUNICATION SERVICES - 9.5% |
|||||||||||
|
MEDIA & ENTERTAINMENT - 9.5% |
|||||||||||
|
Alphabet, Inc., Class A (a) |
130 |
361,297 |
|||||||||
|
Charter Communications, Inc., Class A (a) |
274 |
149,364 |
|||||||||
|
Comcast Corp., Class A |
1,760 |
82,408 |
|||||||||
|
Meta Platforms, Inc., Class A (a) |
245 |
54,478 |
|||||||||
|
Netflix, Inc. (a) |
100 |
37,534 |
|||||||||
|
Warner Music Group Corp., Class A |
618 |
23,385 |
|||||||||
|
708,466 |
|||||||||||
|
CONSUMER DISCRETIONARY - 8.3% |
|||||||||||
|
AUTOMOBILES & COMPONENTS - 6.2% |
|||||||||||
|
General Motors Co. (a) |
4,052 |
177,226 |
|||||||||
|
BorgWarner, Inc. |
3,140 |
122,161 |
|||||||||
|
Lear Corp. |
672 |
95,840 |
|||||||||
|
Thor Industries, Inc. |
808 |
63,568 |
|||||||||
|
458,795 |
|||||||||||
|
RETAILING - 0.8% |
|||||||||||
|
Amazon.com, Inc. (a) |
14 |
44,009 |
|||||||||
|
Lithia Motors, Inc. |
60 |
18,007 |
|||||||||
|
62,016 |
|||||||||||
|
CONSUMER DURABLES & APPAREL - 0.8% |
|||||||||||
|
Carter's, Inc. |
602 |
55,350 |
|||||||||
|
CONSUMER SERVICES - 0.5% |
|||||||||||
|
Booking Holdings, Inc. (a) |
16 |
38,374 |
|||||||||
|
614,535 |
|||||||||||
|
INFORMATION TECHNOLOGY - 5.7% |
|||||||||||
|
SOFTWARE & SERVICES - 3.3% |
|||||||||||
|
Global Payments, Inc. |
671 |
91,833 |
|||||||||
|
Fiserv, Inc. (a) |
776 |
78,707 |
|||||||||
|
salesforce.com, Inc. (a) |
350 |
74,291 |
|||||||||
|
244,831 |
|||||||||||
|
Shares |
Value |
||||||||||
|
TECHNOLOGY HARDWARE & EQUIPMENT - 2.4% |
|||||||||||
|
TE Connectivity, Ltd. |
1,364 |
$ |
178,640 |
||||||||
|
423,471 |
|||||||||||
|
INDUSTRIALS - 5.5% |
|||||||||||
|
CAPITAL GOODS - 5.2% |
|||||||||||
|
Carlisle Cos., Inc. |
614 |
151,087 |
|||||||||
|
Howmet Aerospace, Inc. |
2,483 |
89,250 |
|||||||||
|
General Dynamics Corp. |
312 |
75,296 |
|||||||||
|
Parker-Hannifin Corp. |
130 |
36,946 |
|||||||||
|
Johnson Controls International PLC |
542 |
35,530 |
|||||||||
|
388,109 |
|||||||||||
|
COMMERCIAL & PROFESSIONAL SERVICES - 0.3% |
|||||||||||
|
KAR Auction Services, Inc. (a) |
1,322 |
23,855 |
|||||||||
|
411,964 |
|||||||||||
|
CONSUMER STAPLES - 5.2% |
|||||||||||
|
FOOD, BEVERAGE & TOBACCO - 5.2% |
|||||||||||
|
Philip Morris International, Inc. |
2,257 |
212,004 |
|||||||||
|
Keurig Dr Pepper, Inc. |
3,617 |
137,077 |
|||||||||
|
Constellation Brands, Inc., Class A |
163 |
37,427 |
|||||||||
|
386,508 |
|||||||||||
|
HEALTH CARE - 4.9% |
|||||||||||
|
HEALTH CARE EQUIPMENT & SERVICES - 4.9% |
|||||||||||
|
HCA Healthcare, Inc. |
636 |
159,294 |
|||||||||
|
LivaNova PLC (a) |
1,280 |
104,743 |
|||||||||
|
CVS Health Corp. |
714 |
72,217 |
|||||||||
|
Humana, Inc. |
58 |
25,066 |
|||||||||
|
361,320 |
|||||||||||
|
ENERGY - 4.4% |
|||||||||||
|
PDC Energy, Inc. |
2,111 |
153,412 |
|||||||||
|
ChampionX Corp. (a) |
3,756 |
91,941 |
|||||||||
|
Diamondback Energy, Inc. |
367 |
50,261 |
|||||||||
|
Nov, Inc. |
1,615 |
31,674 |
|||||||||
|
327,288 |
|||||||||||
|
MATERIALS - 3.5% |
|||||||||||
|
Glencore PLC |
28,371 |
184,600 |
|||||||||
|
Arconic Corp. (a) |
1,761 |
45,111 |
|||||||||
|
Sealed Air Corp. |
521 |
34,893 |
|||||||||
|
264,604 |
|||||||||||
|
REAL ESTATE - 1.3% |
|||||||||||
|
The Howard Hughes Corp. (a) |
904 |
93,612 |
|||||||||
|
TOTAL COMMON STOCKS - 60.8% (COST $2,552,291) |
4,520,843 |
||||||||||
|
PREFERRED STOCKS - 0.1% |
|||||||||||
|
COMMUNICATION SERVICES - 0.1% |
|||||||||||
|
Liberty Broadband Corp., 7.00% (b) |
224 |
6,079 |
|||||||||
|
TOTAL PREFERRED STOCKS - 0.1% (COST $6,229) |
6,079 |
||||||||||
See accompanying Notes to Financial Statements.
42 OAKMARK FUNDS
Oakmark Equity and Income Fund March 31, 2022 (Unaudited)
Schedule of Investments (in thousands) (continued)
|
Par Value |
Value |
||||||||||
|
FIXED INCOME - 30.8% |
|||||||||||
|
CORPORATE BONDS - 22.0% |
|||||||||||
|
FINANCIALS - 5.3% |
|||||||||||
|
AerCap Ireland Capital DAC / AerCap Global Aviation Trust 2.45%, due 10/29/26 |
$ |
19,000 |
$ |
17,574 |
|||||||
|
3.40%, due 10/29/33 |
7,500 |
6,722 |
|||||||||
|
Ally Financial, Inc. 4.70%(5 year Treasury Constant Maturity Rate + 3.868%) (b) (c) |
23,750 |
22,356 |
|||||||||
|
3.875%, due 05/21/24 |
7,950 |
8,041 |
|||||||||
|
2.20%, due 11/02/28 |
8,750 |
7,904 |
|||||||||
|
Apollo Commercial Real Estate Finance, Inc. REIT, 144A 4.625%, due 06/15/29 (d) |
20,373 |
18,489 |
|||||||||
|
Bank Of America Corp. 2.551% (SOFR + 1.050%), due 02/04/28 (c) |
13,575 |
12,971 |
|||||||||
|
Bank of America Corp. 4.45%, due 03/03/26 |
5,000 |
5,171 |
|||||||||
|
Blackstone Mortgage Trust, Inc. REIT, 144A 3.75%, due 01/15/27 (d) |
27,500 |
25,575 |
|||||||||
|
Citigroup, Inc. |
|||||||||||
|
3.40%, due 05/01/26 |
15,000 |
15,116 |
|||||||||
|
3.352%(3 mo. USD LIBOR + .897%), due 04/24/25 (c) |
6,360 |
6,375 |
|||||||||
|
CNO Financial Group, Inc. 5.25%, due 05/30/25 |
5,895 |
6,115 |
|||||||||
|
E*TRADE Financial Corp. 2.95%, due 08/24/22 |
11,965 |
12,024 |
|||||||||
|
Equitable Financial Life Global Funding, 144A 1.70%, due 11/12/26 (d) |
15,000 |
13,918 |
|||||||||
|
JPMorgan Chase & Co. 1.47%(SOFR + .765%), due 09/22/27 (c) |
31,000 |
28,569 |
|||||||||
|
1.489%(3 mo. USD LIBOR + 1.230%), due 10/24/23 (c) |
19,910 |
20,003 |
|||||||||
|
LPL Holdings, Inc., 144A 4.00%, due 03/15/29 (d) |
9,350 |
8,873 |
|||||||||
|
Nasdaq, Inc. 1.65%, due 01/15/31 |
8,750 |
7,377 |
|||||||||
|
Pershing Square Holdings, Ltd, 144A 3.25%, due 11/15/30 (d) |
14,000 |
12,846 |
|||||||||
|
Reinsurance Group of America, Inc. 3.15%, due 06/15/30 |
6,900 |
6,646 |
|||||||||
|
3.95%, due 09/15/26 |
4,905 |
5,012 |
|||||||||
|
RGA Global Funding, 144A 2.00%, due 11/30/26 (d) |
8,500 |
8,060 |
|||||||||
|
S&P Global, Inc. 2.95%, due 01/22/27 |
7,810 |
7,776 |
|||||||||
|
Stifel Financial Corp. 4.00%, due 05/15/30 |
12,242 |
12,363 |
|||||||||
|
SVB Financial Group 2.10%, due 05/15/28 |
21,500 |
19,595 |
|||||||||
|
1.80%, due 10/28/26 |
14,250 |
13,241 |
|||||||||
|
4.25%(5 year Treasury Constant Maturity Rate + 3.074%) (b) (c) |
13,900 |
12,858 |
|||||||||
|
Par Value |
Value |
||||||||||
|
The Goldman Sachs Group, Inc. 3.615%(SOFR + 1.846%), due 03/15/28 (c) |
$ |
14,200 |
$ |
14,180 |
|||||||
|
1.948%(SOFR + .913%), due 10/21/27 (c) |
13,500 |
12,546 |
|||||||||
|
3.20%, due 02/23/23 |
7,000 |
7,062 |
|||||||||
|
Wells Fargo & Co. 2.393%(SOFR + 2.100%), due 06/02/28 (c) |
11,000 |
10,402 |
|||||||||
|
1.529%(3 mo. USD LIBOR + 1.230%), due 10/31/23 (c) |
8,603 |
8,642 |
|||||||||
|
394,402 |
|||||||||||
|
CONSUMER DISCRETIONARY - 4.7% |
|||||||||||
|
Aramark Services, Inc., 144A 6.375%, due 05/01/25 (d) |
9,900 |
10,163 |
|||||||||
|
AutoNation, Inc. 1.95%, due 08/01/28 |
4,940 |
4,421 |
|||||||||
|
Booking Holdings, Inc. 3.55%, due 03/15/28 |
9,950 |
10,035 |
|||||||||
|
3.60%, due 06/01/26 |
8,230 |
8,378 |
|||||||||
|
4.625%, due 04/13/30 |
4,950 |
5,369 |
|||||||||
|
Brunswick Corp. 2.40%, due 08/18/31 |
25,757 |
21,814 |
|||||||||
|
CCO Holdings LLC / CCO Holdings Capital Corp., 144A 4.75%, due 03/01/30 (d) |
2,980 |
2,862 |
|||||||||
|
5.125%, due 05/01/27 (d) |
250 |
250 |
|||||||||
|
Charter Communications Operating LLC / Charter Communications Operating Capital 4.20%, due 03/15/28 |
9,950 |
10,055 |
|||||||||
|
Daimler Trucks Finance North America LLC, 144A 2.50%, due 12/14/31 (d) |
3,750 |
3,282 |
|||||||||
|
Dick S Sporting Goods 3.15%, due 01/15/32 |
20,000 |
18,334 |
|||||||||
|
Expedia Group, Inc. 4.625%, due 08/01/27 |
18,526 |
19,244 |
|||||||||
|
3.25%, due 02/15/30 |
5,860 |
5,578 |
|||||||||
|
5.00%, due 02/15/26 |
4,334 |
4,538 |
|||||||||
|
Hyatt Hotels Corp. 1.80%, due 10/01/24 |
18,596 |
17,892 |
|||||||||
|
1.30%, due 10/01/23 |
2,000 |
1,949 |
|||||||||
|
International Game Technology PLC, 144A 6.50%, due 02/15/25 (d) |
19,600 |
20,554 |
|||||||||
|
6.25%, due 01/15/27 (d) |
200 |
211 |
|||||||||
|
Kontoor Brands, Inc. 144A 4.125%, due 11/15/29 (d) |
3,300 |
3,019 |
|||||||||
|
Lear Corp. 2.60%, due 01/15/32 |
14,850 |
13,117 |
|||||||||
|
3.50%, due 05/30/30 |
6,950 |
6,654 |
|||||||||
|
Lithia Motors, Inc., 144A 3.875%, due 06/01/29 (d) |
4,250 |
4,017 |
|||||||||
|
4.625%, due 12/15/27 (d) |
2,980 |
2,958 |
|||||||||
|
M/I Homes, Inc. 3.95%, due 02/15/30 |
7,100 |
6,248 |
|||||||||
|
Marriott International, Inc. 2.75%, due 10/15/33 |
13,750 |
12,135 |
|||||||||
|
4.625%, due 06/15/30 |
9,400 |
9,735 |
|||||||||
|
4.15%, due 12/01/23 |
8,094 |
8,243 |
|||||||||
|
3.60%, due 04/15/24 |
6,960 |
7,031 |
|||||||||
See accompanying Notes to Financial Statements.
Oakmark.com 43
Oakmark Equity and Income Fund March 31, 2022 (Unaudited)
Schedule of Investments (in thousands) (continued)
|
Par Value |
Value |
||||||||||
|
FIXED INCOME - 30.8% (continued) |
|||||||||||
|
CORPORATE BONDS - 22.0% (continued) |
|||||||||||
|
MGM Resorts International 4.75%, due 10/15/28 |
$ |
13,875 |
$ |
13,429 |
|||||||
|
6.75%, due 05/01/25 |
9,850 |
10,162 |
|||||||||
|
Sands China, Ltd. 5.40%, due 08/08/28 |
5,000 |
4,901 |
|||||||||
|
5.125%, due 08/08/25 |
3,000 |
2,974 |
|||||||||
|
Scientific Games International, Inc., 144A 5.00%, due 10/15/25 (d) |
19,910 |
20,408 |
|||||||||
|
Starbucks Corp. 3.80%, due 08/15/25 |
9,950 |
10,161 |
|||||||||
|
3.00%, due 02/14/32 |
5,750 |
5,483 |
|||||||||
|
4.00%, due 11/15/28 |
2,985 |
3,081 |
|||||||||
|
Tapestry, Inc. 3.05%, due 03/15/32 |
6,375 |
5,793 |
|||||||||
|
Thor Industries, Inc., 144A 4.00%, due 10/15/29 (d) |
19,500 |
17,119 |
|||||||||
|
Tractor Supply Co. 1.75%, due 11/01/30 |
1,980 |
1,701 |
|||||||||
|
Under Armour, Inc. 3.25%, due 06/15/26 |
12,565 |
12,157 |
|||||||||
|
Yum! Brands, Inc. 3.875%, due 11/01/23 |
6,329 |
6,376 |
|||||||||
|
351,831 |
|||||||||||
|
INDUSTRIALS - 4.4% |
|||||||||||
|
Albertsons Cos., Inc. / Safeway, Inc. / New Albertsons, LP / Albertsons LLC, 144A 3.50%, due 02/15/23 (d) |
12,470 |
12,470 |
|||||||||
|
AutoNation, Inc. 3.85%, due 03/01/32 |
9,250 |
8,955 |
|||||||||
|
Bacardi, Ltd., 144A 4.45%, due 05/15/25 (d) |
4,900 |
5,015 |
|||||||||
|
BAT Capital Corp. 3.557%, due 08/15/27 |
6,965 |
6,779 |
|||||||||
|
2.259%, due 03/25/28 |
2,975 |
2,669 |
|||||||||
|
BAT International Finance PLC 1.668%, due 03/25/26 |
4,460 |
4,093 |
|||||||||
|
Carlisle Cos., Inc. 2.20%, due 03/01/32 |
25,000 |
21,780 |
|||||||||
|
Carrier Global Corp. 2.242%, due 02/15/25 |
691 |
673 |
|||||||||
|
Delta Air Lines, Inc. 3.80%, due 04/19/23 |
6,440 |
6,480 |
|||||||||
|
Delta Air Lines, Inc. / SkyMiles IP, Ltd, 144A 4.75%, due 10/20/28 (d) |
12,985 |
13,084 |
|||||||||
|
Embecta Corp, 144A 5.00%, due 02/15/30 (d) |
10,000 |
9,432 |
|||||||||
|
Fedex Corp. Pass Through Trust 1.875%, due 08/20/35 |
11,270 |
10,262 |
|||||||||
|
Fortune Brands Home & Security, Inc. 4.00%, due 06/15/25 |
13,430 |
13,664 |
|||||||||
|
4.00%, due 09/21/23 |
9,945 |
10,140 |
|||||||||
|
GXO Logistics, Inc., 144A 1.65%, due 07/15/26 (d) |
6,750 |
6,094 |
|||||||||
|
Par Value |
Value |
||||||||||
|
Hilton Domestic Operating Co., Inc., 144A 4.00%, due 05/01/31 (d) |
$ |
19,250 |
$ |
18,167 |
|||||||
|
3.625%, due 02/15/32 (d) |
13,500 |
12,251 |
|||||||||
|
3.75%, due 05/01/29 (d) |
9,000 |
8,448 |
|||||||||
|
Howmet Aerospace, Inc. 3.00%, due 01/15/29 |
25,500 |
23,285 |
|||||||||
|
Lennox International, Inc. 1.35%, due 08/01/25 |
2,000 |
1,872 |
|||||||||
|
MIWD Hold Co / MIWD Finance Corporation, 144A 5.50%, due 02/01/30 (d) |
8,000 |
7,470 |
|||||||||
|
Southwest Airlines Co. 5.125%, due 06/15/27 |
15,853 |
16,947 |
|||||||||
|
5.25%, due 05/04/25 |
7,875 |
8,270 |
|||||||||
|
2.625%, due 02/10/30 |
8,444 |
7,702 |
|||||||||
|
The Boeing Co. 2.70%, due 02/01/27 |
41,847 |
40,137 |
|||||||||
|
Uber Technologies, Inc., 144A 8.00%, due 11/01/26 (d) |
21,430 |
22,774 |
|||||||||
|
7.50%, due 05/15/25 (d) |
7,940 |
8,285 |
|||||||||
|
7.50%, due 09/15/27 (d) |
4,470 |
4,766 |
|||||||||
|
4.50%, due 08/15/29 (d) |
4,710 |
4,416 |
|||||||||
|
US Foods, Inc., 144A 4.75%, due 02/15/29 (d) |
4,830 |
4,607 |
|||||||||
|
Viterra Finance BV, 144A 2.00%, due 04/21/26 (d) |
6,400 |
5,892 |
|||||||||
|
326,879 |
|||||||||||
|
ENERGY - 2.0% |
|||||||||||
|
Apergy Corp. 6.375%, due 05/01/26 |
7,447 |
7,596 |
|||||||||
|
Baker Hughes Holdings LLC / Baker Hughes Co-Obligor, Inc. 2.061%, due 12/15/26 |
2,500 |
2,381 |
|||||||||
|
Boardwalk Pipelines LP 3.60%, due 09/01/32 |
3,798 |
3,621 |
|||||||||
|
BP Capital Markets America Co. 2.721%, due 01/12/32 |
13,500 |
12,705 |
|||||||||
|
Chesapeake Energy Corp, 144A 5.875%, due 02/01/29 (d) |
14,525 |
14,997 |
|||||||||
|
Diamondback Energy, Inc. 3.125%, due 03/24/31 |
10,200 |
9,742 |
|||||||||
|
3.50%, due 12/01/29 |
2,900 |
2,873 |
|||||||||
|
Florida Gas Transmission Co. LLC, 144A 2.30%, due 10/01/31 (d) |
14,750 |
13,053 |
|||||||||
|
Hess Midstream Operations LP, 144A 4.25%, due 02/15/30 (d) |
20,000 |
18,872 |
|||||||||
|
NOV, Inc. 3.60%, due 12/01/29 |
24,835 |
24,414 |
|||||||||
|
Parsley Energy LLC / Parsley Finance Corp, 144A 4.125%, due 02/15/28 (d) |
20,576 |
20,466 |
|||||||||
|
Schlumberger Holdings Corp., 144A 4.00%, due 12/21/25 (d) |
9,830 |
9,990 |
|||||||||
|
Vine Energy Holdings LLC, 144A 6.75%, due 04/15/29 (d) |
8,000 |
8,473 |
|||||||||
|
149,183 |
|||||||||||
See accompanying Notes to Financial Statements.
44 OAKMARK FUNDS
Oakmark Equity and Income Fund March 31, 2022 (Unaudited)
Schedule of Investments (in thousands) (continued)
|
Par Value |
Value |
||||||||||
|
FIXED INCOME - 30.8% (continued) |
|||||||||||
|
CORPORATE BONDS - 22.0% (continued) |
|||||||||||
|
COMMUNICATION SERVICES - 1.2% |
|||||||||||
|
Charter Communications Operating LLC / Charter Communications Operating Capital 4.908%, due 07/23/25 |
$ |
2,985 |
$ |
3,095 |
|||||||
|
2.30%, due 02/01/32 |
2,665 |
2,278 |
|||||||||
|
Magallanes, Inc.144A 4.054%, due 03/15/29 (d) |
3,750 |
3,769 |
|||||||||
|
Netflix, Inc. 4.875%, due 04/15/28 |
33,740 |
35,385 |
|||||||||
|
5.875%, due 02/15/25 |
11,940 |
12,732 |
|||||||||
|
5.875%, due 11/15/28 |
6,965 |
7,678 |
|||||||||
|
Netflix, Inc., 144A 5.375%, due 11/15/29 (d) |
4,970 |
5,380 |
|||||||||
|
T-Mobile USA, Inc. 3.75%, due 04/15/27 |
19,855 |
19,971 |
|||||||||
|
3.50%, due 04/15/25 |
1,985 |
1,998 |
|||||||||
|
Twitter, Inc., 144A 5.00%, due 03/01/30 (d) |
750 |
746 |
|||||||||
|
93,032 |
|||||||||||
|
REAL ESTATE - 1.2% |
|||||||||||
|
CBRE Services, Inc. 2.50%, due 04/01/31 |
10,750 |
9,713 |
|||||||||
|
GLP Capital, LP / GLP Financing II, Inc. REIT 5.375%, due 11/01/23 |
12,000 |
12,300 |
|||||||||
|
4.00%, due 01/15/31 |
9,425 |
9,141 |
|||||||||
|
5.75%, due 06/01/28 |
4,975 |
5,354 |
|||||||||
|
5.25%, due 06/01/25 |
4,975 |
5,121 |
|||||||||
|
5.375%, due 04/15/26 |
3,925 |
4,101 |
|||||||||
|
MGM Growth Properties Operating Partnership, LP / MGP Finance Co-Issuer, Inc. REIT 5.625%, due 05/01/24 |
2,945 |
3,032 |
|||||||||
|
Omega Healthcare Investors, Inc. REIT 4.375%, due 08/01/23 |
3,098 |
3,146 |
|||||||||
|
5.25%, due 01/15/26 |
1,992 |
2,066 |
|||||||||
|
RHP Hotel Properties, LP / RHP Finance Corp. REIT, 144A 4.50%, due 02/15/29 (d) |
20,000 |
18,800 |
|||||||||
|
Sun Communities Operating, LP REIT 2.70%, due 07/15/31 |
1,750 |
1,579 |
|||||||||
|
The Howard Hughes Corp., 144A 4.375%, due 02/01/31 (d) |
8,750 |
8,225 |
|||||||||
|
5.375%, due 08/01/28 (d) |
3,400 |
3,414 |
|||||||||
|
Ventas Realty, LP REIT 3.50%, due 02/01/25 |
900 |
902 |
|||||||||
|
86,894 |
|||||||||||
|
HEALTH CARE - 1.0% |
|||||||||||
|
Bio-Rad Laboratories, Inc. 3.70%, due 03/15/32 |
8,750 |
8,647 |
|||||||||
|
CVS Health Corp. 5.00%, due 12/01/24 |
6,880 |
7,187 |
|||||||||
|
HCA, Inc. 5.625%, due 09/01/28 |
2,985 |
3,227 |
|||||||||
|
Par Value |
Value |
||||||||||
|
IQVIA, Inc., 144A 5.00%, due 10/15/26 (d) |
$ |
4,000 |
$ |
4,070 |
|||||||
|
Regeneron Pharmaceuticals, Inc. 1.75%, due 09/15/30 |
20,959 |
18,188 |
|||||||||
|
Universal Health Services, Inc., 144A 1.65%, due 09/01/26 (d) |
7,750 |
7,109 |
|||||||||
|
Zimmer Biomet Holdings, Inc. 2.60%, due 11/24/31 |
21,850 |
19,941 |
|||||||||
|
3.05%, due 01/15/26 |
4,965 |
4,911 |
|||||||||
|
73,280 |
|||||||||||
|
INFORMATION TECHNOLOGY - 0.9% |
|||||||||||
|
Apple, Inc. 1.65%, due 02/08/31 |
9,750 |
8,774 |
|||||||||
|
2.65%, due 02/08/51 |
6,000 |
5,175 |
|||||||||
|
Avnet, Inc. 4.875%, due 12/01/22 |
8,275 |
8,433 |
|||||||||
|
Broadcom Corp. / Broadcom Cayman Finance, Ltd. 3.50%, due 01/15/28 |
4,975 |
4,885 |
|||||||||
|
Broadcom, Inc., 144A 3.469%, due 04/15/34 (d) |
9,955 |
9,220 |
|||||||||
|
3.419%, due 04/15/33 (d) |
6,950 |
6,487 |
|||||||||
|
Dell International LLC / EMC Corp. 5.45%, due 06/15/23 |
3,927 |
4,045 |
|||||||||
|
Micron Technology, Inc. 2.703%, due 04/15/32 |
3,500 |
3,169 |
|||||||||
|
Motorola Solutions, Inc. 4.60%, due 02/23/28 |
2,985 |
3,069 |
|||||||||
|
NortonLifeLock, Inc.,144A 5.00%, due 04/15/25 (d) |
1,000 |
998 |
|||||||||
|
NXP BV / NXP Funding LLC / NXP USA, Inc., 144A 2.50%, due 05/11/31 (d) |
3,750 |
3,368 |
|||||||||
|
Tyco Electronics Group SA 3.70%, due 02/15/26 |
9,830 |
10,031 |
|||||||||
|
67,654 |
|||||||||||
|
MATERIALS - 0.7% |
|||||||||||
|
Anglo American Capital PLC, 144A 3.875%, due 03/16/29 (d) |
1,000 |
1,000 |
|||||||||
|
Anglo American Capital PLC, 144A 2.25%, due 03/17/28 (d) |
18,750 |
17,124 |
|||||||||
|
Glencore Funding LLC, 144A 3.00%, due 10/27/22 (d) |
9,950 |
9,983 |
|||||||||
|
2.625%, due 09/23/31 (d) |
10,000 |
8,945 |
|||||||||
|
3.875%, due 10/27/27 (d) |
4,950 |
4,929 |
|||||||||
|
Novelis Corp, 144A 3.875%, due 08/15/31 (d) |
9,681 |
8,855 |
|||||||||
|
3.25%, due 11/15/26 (d) |
4,345 |
4,151 |
|||||||||
|
54,987 |
|||||||||||
|
CONSUMER STAPLES - 0.4% |
|||||||||||
|
Altria Group, Inc. 2.45%, due 02/04/32 |
30,400 |
26,426 |
|||||||||
|
Smithfield Foods, Inc., 144A 4.25%, due 02/01/27 (d) |
995 |
1,005 |
|||||||||
|
27,431 |
|||||||||||
See accompanying Notes to Financial Statements.
Oakmark.com 45
Oakmark Equity and Income Fund March 31, 2022 (Unaudited)
Schedule of Investments (in thousands) (continued)
|
Par Value |
Value |
||||||||||
|
FIXED INCOME - 30.8% (continued) |
|||||||||||
|
CORPORATE BONDS - 22.0% (continued) |
|||||||||||
|
UTILITIES - 0.2% |
|||||||||||
|
The Southern Co. 3.75% (5 year Treasury Constant Maturity Rate + 2.915%), due 09/15/51 (c) |
$ |
13,750 |
$ |
12,678 |
|||||||
|
Total Corporate Bonds (Cost $1,695,976) |
1,638,251 |
||||||||||
|
GOVERNMENT AND AGENCY SECURITIES - 7.7% |
|||||||||||
|
U.S. GOVERNMENT NOTES - 7.7% |
|||||||||||
|
United States Treasury Notes 1.25%, due 12/31/26 |
150,000 |
141,721 |
|||||||||
|
1.375%, due 11/15/31 |
150,000 |
137,625 |
|||||||||
|
2.375%, due 02/15/42 |
100,000 |
96,453 |
|||||||||
|
2.00%, due 11/30/22 |
74,625 |
74,951 |
|||||||||
|
1.125%, due 10/31/26 |
75,000 |
70,547 |
|||||||||
|
2.125%, due 12/31/22 |
49,745 |
49,998 |
|||||||||
|
571,295 |
|||||||||||
|
Total Government and Agency Securities (Cost $587,750) |
571,295 |
||||||||||
|
BANK LOANS - 0.9% |
|||||||||||
|
HEALTH CARE - 0.3% |
|||||||||||
|
Medline Industries, Inc. Usd Term Loan B 3.75% (1 mo. USD LIBOR + 3.250%), due 10/23/28 (c) |
20,000 |
19,790 |
|||||||||
|
INDUSTRIALS - 0.2% |
|||||||||||
|
Skymiles IP, Ltd. 2020 Term Loan B 4.75% (3 mo. USD LIBOR + 3.750%), due 10/20/27 (c) |
14,000 |
14,435 |
|||||||||
|
Naked Juice Llc Term Loan 3.75% (6 mo. SOFR + 3.250%), due 01/24/29 (c) |
945 |
928 |
|||||||||
|
Naked Juice Llc Delayed Draw Term Loan 3.75% (6 mo. SOFR + 3.250%), due 01/24/29 (c) |
55 |
54 |
|||||||||
|
15,417 |
|||||||||||
|
MATERIALS - 0.2% |
|||||||||||
|
Asplundh Tree Expert LLC 2021 Term Loan B 2.21% (1 mo. USD LIBOR + 1.750%), due 09/07/27 (c) |
13,830 |
13,659 |
|||||||||
|
ENERGY - 0.2% |
|||||||||||
|
Apergy Corp. 2020 Term Loan 6.00% (1 mo. USD LIBOR + 5.000%), due 06/03/27 (c) |
12,501 |
12,522 |
|||||||||
|
FINANCIALS - 0.0% (e) |
|||||||||||
|
Allspring Buyer LLC Term Loan B 4.31% (3 mo. USD LIBOR + 3.250%), due 11/01/28 (c) |
2,661 |
2,641 |
|||||||||
|
CONSUMER DISCRETIONARY - 0.0% (e) |
|||||||||||
|
Rent A Center, Inc. 2021 First Lien Term Loan B 3.81% (3 mo. USD LIBOR + 3.250%), due 02/17/28 (c) |
990 |
968 |
|||||||||
|
Total Bank Loans (Cost $65,343) |
64,997 |
||||||||||
|
Par Value |
Value |
||||||||||
|
CONVERTIBLE BOND - 0.2% |
|||||||||||
|
Peloton Interactive, Inc., 0.00%, due 02/15/26 (f) (Cost $13,442) |
$ |
15,765 |
$ |
13,026 |
|||||||
|
Total Convertible Bond (Cost $13,442) |
13,026 |
||||||||||
|
TOTAL FIXED INCOME - 30.8% (COST $2,362,511) |
2,287,569 |
||||||||||
|
SHORT-TERM INVESTMENTS - 7.6% |
|||||||||||
|
REPURCHASE AGREEMENT - 5.5% |
|||||||||||
|
Fixed Income Clearing Corp. Repurchase Agreement, 0.28% dated 03/31/22 due 04/01/22, repurchase price $412,040, collateralized by United States Treasury Notes, 2.375% - 4.250% due 03/31/27 - 11/15/40, aggregate value plus accrued interest of $420,278 (Cost: $412,037) |
412,037 |
412,037 |
|||||||||
|
COMMERCIAL PAPER - 2.1% |
|||||||||||
|
Walgreens Boots, 144A, 0.76% - 1.02%, due 04/04/22 - 05/04/22 (d) (g) |
59,750 |
59,718 |
|||||||||
|
Kellogg Co., 144A, 0.63% - 0.71%, due 04/01/22 - 04/07/22 (d) (g) |
56,700 |
56,695 |
|||||||||
|
American Honda Finance Corp., 0.83%, due 04/05/22 (g) |
39,800 |
39,797 |
|||||||||
|
Total Commercial Paper (Cost $156,212) |
156,210 |
||||||||||
|
TOTAL SHORT-TERM INVESTMENTS - 7.6% (COST $568,249) |
568,247 |
||||||||||
|
TOTAL INVESTMENTS - 99.3% (COST $5,489,280) |
7,382,738 |
||||||||||
|
Foreign Currencies (Cost $0) (h) - 0.0% (e) |
0 |
(h) |
|||||||||
|
Other Assets In Excess of Liabilities - 0.7% |
53,069 |
||||||||||
|
NET ASSETS - 100.0% |
$ |
7,435,807 |
|||||||||
(a) Non-income producing security
(b) Security is perpetual and has no stated maturity date.
(c) Floating Rate Note. Rate shown is as of March 31, 2022.
(d) Security exempt from registration under Rule 144A of the Securities Act of 1933, as amended. These securities may be resold, normally only to qualified institutional buyers.
(e) Amount rounds to less than 0.1%.
(f) Zero Coupon Bond.
(g) The rate shown represents the annualized yield at the time of purchase; not a coupon rate.
(h) Amount rounds to less than $1,000.
Abbreviations:
REIT: Real Estate Investment Trust
See accompanying Notes to Financial Statements.
46 OAKMARK FUNDS

This page intentionally left blank.
Oakmark.com 47
Oakmark Bond Fund March 31, 2022
Summary Information
VALUE OF A $1,000,000 INVESTMENT
Since Inception - 06/10/20 (Unaudited)
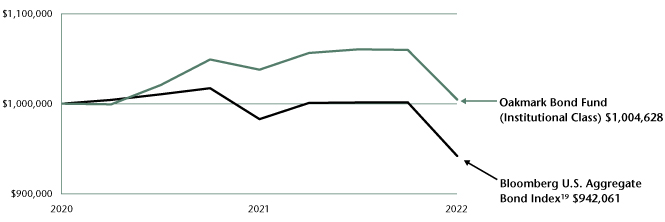
PERFORMANCE
|
Average Annual Total Returns (as of 03/31/22) |
|||||||||||||||||||||||||||||||
| (Unaudited) |
Total Return Last 3 Months |
1-year |
3-year |
5-year |
10-year |
Since Inception |
Inception Date |
||||||||||||||||||||||||
|
Oakmark Bond Fund (Institutional Class) |
-5.19 |
% |
-3.19 |
% |
N/A |
N/A |
N/A |
0.26 |
% |
06/10/20 |
|||||||||||||||||||||
|
Bloomberg U.S. Aggregate Bond Index |
-5.93 |
% |
-4.15 |
% |
N/A |
N/A |
N/A |
-3.25 |
% |
||||||||||||||||||||||
|
Lipper Core Plus Bond Fund Index20 |
-5.75 |
% |
-3.78 |
% |
N/A |
N/A |
N/A |
-1.63 |
% |
||||||||||||||||||||||
|
Oakmark Bond Fund (Advisor Class) |
-5.19 |
% |
-3.12 |
% |
N/A |
N/A |
N/A |
0.20 |
% |
06/10/20 |
|||||||||||||||||||||
|
Oakmark Bond Fund (R6 Class) |
-5.17 |
% |
-3.01 |
% |
N/A |
N/A |
N/A |
-2.77 |
% |
12/15/20 |
|||||||||||||||||||||
|
Oakmark Bond Fund (Investor Class) |
N/A |
N/A |
N/A |
N/A |
N/A |
-3.39 |
% |
01/28/22 |
|||||||||||||||||||||||
The table above does not reflect the deduction of taxes that a shareholder would pay on Fund distributions or the redemption of Fund shares.
Past performance is no guarantee of future results. The performance data quoted represents past performance. Current performance may be lower or higher than the performance data quoted. Total return includes change in share prices and, in each case, includes reinvestment of dividends and capital gain distributions. The investment return and principal value vary so that an investor's shares, when redeemed, may be worth more or less than the original cost. To obtain the most recent month-end performance, please visit Oakmark.com.
|
TOP TEN FIXED INCOME HOLDINGS4 |
% of Net Assets | ||||||
|
U.S. Treasury Note 0.875% due 09/30/26 |
10.0 |
||||||
|
Fed Farm Credit CC 06/21 0.320% due 12/23/24 |
5.4 |
||||||
|
Fed Farm Credit CC 09/21 0.360% due 09/24/24 |
4.3 |
||||||
|
U.S. Treasury Note 1.250% due 06/30/28 |
3.2 |
||||||
|
Fedl Home Ln Bks QC 09/21 0.480% due 09/10/24 |
2.7 |
||||||
|
U.S. Treasury Note 1.375% due 10/31/28 |
2.1 |
||||||
|
Parsley Energy CC 2/23 144A 4.125% due 02/15/28 |
1.7 |
||||||
|
Chesapeake CC 02/24 144A 5.875% due 02/01/29 |
1.3 |
||||||
|
U.S. Treasury Note 1.875% due 11/15/51 |
1.3 |
||||||
|
Altria Group CC 11/31 2.450% due 02/04/32 |
1.2 |
||||||
|
FUND STATISTICS |
|||||||
|
Ticker* |
OANCX |
||||||
|
Number of Fixed Income Holdings |
88 |
||||||
|
Net Assets |
$88.2 million | ||||||
|
Weighted Average Maturity |
9.4 years | ||||||
|
Effective Duration |
5.6 years | ||||||
|
30-Day SEC Yield-Unsubsidized*@ |
2.04% | ||||||
|
30-Day SEC Yield-Subsidized*@ |
2.83% | ||||||
|
Gross Expense Ratio - Institutional Class*^ |
0.89% | ||||||
|
Net Expense Ratio - Institutional Class*†^ |
0.52% | ||||||
* This information is related to the Institutional Class. Please visit Oakmark.com for information related to the Advisor, R6 and Investor Classes.
† The net expense ratio reflects an expense limitation agreement through January 27, 2023.
@ SEC Yield is an annualization of the Fund's net investment income for the trailing 30-day period. Dividends paid by the Fund may be higher or lower than implied by the SEC Yield.
^ The Gross Expense Ratio and Net Expense Ratio are from the Fund's Prospectus dated January 28, 2022.
|
SECTOR ALLOCATION |
% of Net Assets | ||||||
|
Corporate Debt |
52.0 |
||||||
|
U.S. Treasury |
18.6 |
||||||
|
U.S. Agency |
12.4 |
||||||
|
Bank Loans |
4.9 |
||||||
|
Asset Backed Securities |
3.9 |
||||||
|
Collateralized Mortgage Obligations |
2.2 |
||||||
|
Convertible Bonds |
0.6 |
||||||
|
Preferred Stock |
1.1 |
||||||
|
Short-Term Investments and Other |
4.3 |
||||||
See accompanying Disclosures and Endnotes on page 100.
48 OAKMARK FUNDS
Oakmark Bond Fund March 31, 2022
Portfolio Manager Commentary


M. Colin Hudson, CFA
Portfolio Manager
Adam D. Abbas
Portfolio Manager
To understand the Fed's policies today, we need to understand the events that brought us here. In just the first decade of this century, there was a dot-com explosion, followed by a housing boom and bust, and then rounded off by a global financial crisis. Policymakers, confounded by both the severity and frequency of these economic events, searched for answers. That search led them to Japan and its Prime Minister Shinzo Abe who was garnering attention for fighting the ghosts of a deflationary past through a novel monetary policy called "quantitative easing." The concept was fairly simple: A government could create new money and then use that newly minted money to buy financial instruments (typically bonds) in the open market. This in turn would lower interest rates, increase the amount of money in the system and ultimately stimulate economic growth. Facing a full systemic collapse in the wake of the global financial crisis, acting U.S. Federal Reserve Chairman Ben Bernanke took a chance and adopted the policy on November 25, 2008. The program, titled "QE1," called for the Federal Reserve to purchase $600 billion in bank debt, U.S.
Treasury notes and mortgage-backed securities (MBS) from member banks. At the time, no one understood just how historic that day was. Over the next decade, the Federal Reserve launched subsequent quantitative programs, including QE2, QE3, operation twist and QE4, totaling more than $2.5 trillion in stimulus.
Fast forward to March 2020, when the U.S. was hit with the once-in-a-century Covid-19 pandemic that halted the global economy. A full 12 years after "QE1," the Federal Reserve acted with almost no hesitation and embarked on another quantitative easing plan that dwarfed any previous program. Even though the pandemic quantitative easing plan was orders of magnitude larger than anything the world had ever seen, market experts, pundits and passive participants welcomed it—even expected it—with limited scrutiny. Financial markets, awash in an unprecedented amount of liquidity, quickly found their footing, and over the next 18 months, investors enjoyed significant gains.
Chart 1: Stimulus Response to Global Financial Crisis vs. Covid-19 Crisis (1) (2)
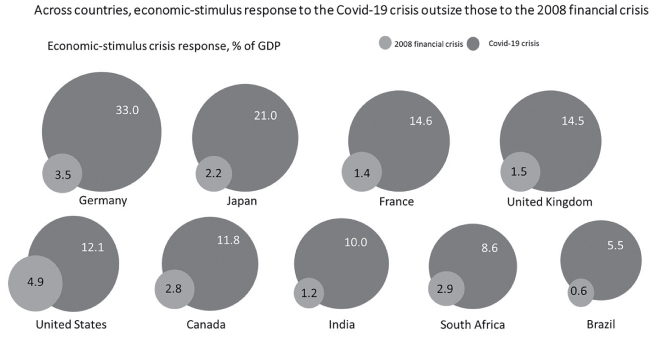
1 2019 GDP used as the base for COVID 19, % of GDP calculation
2 Source: International Monetary Fund, "Global economic policies and prospects," March 2009
See accompanying Disclosures and Endnotes on page 100.
Oakmark.com 49
Oakmark Bond Fund March 31, 2022
Portfolio Manager Commentary (continued)
But as growth forecasts brightened and asset prices improved, liabilities quietly grew as well. Supply-chain shortages and labor imbalances were the first signs of trouble. By the second half of 2021, central bankers, as well as consumers, could see that inflation was the primary obstacle to further prosperity. Not only was it dangerously high, but it was also unrelenting. The limits of
easy money policies that had gone on for more than two decades were finally being realized. Federal Reserve Chairman Jerome Powell and his counterparts around the globe had simply no other choice, and they began the largest and sharpest policy pivot in financial history. Policy normalization was underway for the third time this century.
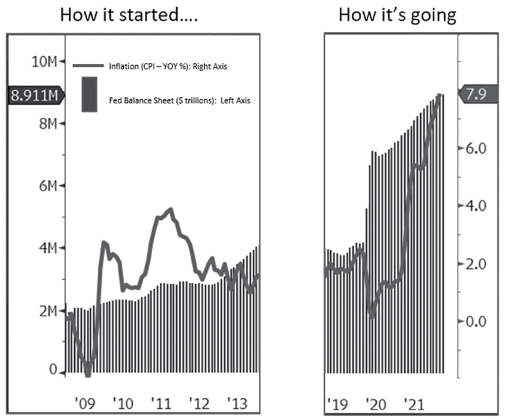
Today, inflation is sticky at 8%, most global growth indicators are slowing and the markets predict a 75% probability for a 50 basis points hike to the Fed Funds rate in May. The infamous 10s-versus-2 spread, a relatively accurate historical signal for economic recessions when it inverts, is currently inverted by three basis points. On top of that, the Ukrainian/Russian war threatens to further exacerbate inflation and supply-chain issues and it poses the threat of a broader, major world war. There is no reason to sugarcoat it. The risks to financial markets have increased quite significantly since our last letter.
We mentioned this on a recent podcast,1 but one emerging risk we don't think is getting enough coverage is just how little flexibility central banks have at the moment. The Federal Reserve has maximum flexibility during periods of moderate growth (1-3% real GDP growth) and benign inflation (inflation less than 3%). Other than the pandemic slowdown in 2020, that's essentially been the prevailing profile of the U.S. since the global financial crisis. Under these "goldilocks" economic conditions, the Federal Reserve could opt to slowly raise rates to mitigate market excess, slowly lower rates to create an inflationary growth impulse or do absolutely nothing. Today, however,
1 Griffin, Graham. "Value Investing Live Recap: Adam Abbas." GuruFocus, https://www.gurufocus.com/news/1638694/value-investing-live-recap-adam-abbas. Accessed February 9, 2022.
inflation is four to five times the last 20-year average, which means the market won't have the luxury of leaning on a flexible Federal Reserve any time soon. Instead, the exact opposite of a "goldilocks" environment has been created by a kind of perfect storm of disrupted supply chains and trade, significantly higher food and energy prices, tighter financial conditions, and lower business and consumer confidence. Now, growth threatens to be too cold, while inflation remains too hot.
Increased risks don't necessarily mean doom and gloom for markets, however. The recovery in the U.S. and other developed economies has been shaken by a few punches, but it is still upright. Although economic growth forecasts are decreasing, the U.S. economy can still grow 1.5%-2.5% in the remaining three quarters of the year. Moreover, our bottom-up research suggests our Fund's holdings remain fundamentally solid; a majority now boast net leverage (net debt versus profitability) that has returned to pre-pandemic levels and equity cushions that have grown. Their interest coverage (profitability versus interest costs) and free-cash-flow-to-debt are also up quite significantly versus 2019.
In summary, investors should expect more volatility as the interplay between aggressive central bank policies, inflationary forces and growth continues for the remainder of the year. The Ukrainian/Russian war, depending on both the length and possible resolution, also poses significant risks that are very
See accompanying Disclosures and Endnotes on page 100.
50 OAKMARK FUNDS
Oakmark Bond Fund March 31, 2022
Portfolio Manager Commentary (continued)
difficult to handicap. Regardless, the Federal Reserve cannot pivot to a more supportive policy stance if growth decelerates more quickly than expected or if the war escalates. Investors who have grown used to the Fed backstop should not count on it this time around. Fortunately, U.S. corporations are arguably more creditworthy than before the pandemic, and cash flow and valuation cushions will make them more resilient as we face cycle headwinds. Consumers are also in relatively good shape due to a savings build-up over the last several years. For all of these reasons, we recommend turning down the volume on doomsayers predicting a near-term default cycle or major recession. However, we do recognize that a larger number of variables are generating a wider set of outcomes and producing a thicker cloud of uncertainty than financial markets have faced since the spring of 2020. As we navigate the fog, we will prioritize portfolio flexibility and look for compelling opportunities if or when market pricing detaches from our values.
MARKET OUTLOOK POSITIONING
Performance and Outlook
The Oakmark Bond Fund returned –5.19% in the first quarter ending March 31, 2022, and generated 74 basis points of excess returns versus its benchmark, the Bloomberg U.S. Aggregate Bond Index.19 Inception-to-date performance was 0.26% through March 31, 2022, generating excess return against the benchmark of 351 basis points on an annualized basis.
The Fund's outperformance in the quarter was driven by the Fund's curve positioning in our government allocation and our overall short duration position versus the index. Specifically, curve flattening and significantly higher rates translated to relative gains given our current barbell approach to curve positioning in U.S. Treasurys and our overall portfolio duration of 5.4 years versus our peers and index averages of 6.2 and 6.7, respectively. Although our relative overweight in corporate credit was a detractor to performance as credit spreads widened, our security selection continues to serve as a tailwind to attribution versus the index. Our strongest contributors included securities issued by T-Mobile, Parsley Energy, Marriott and Kraton. Our largest detractors from selection came from securities issued by Ally Financial, Brunswick Corporation, NXP Semiconductors and Aercap.
Outlook and Positioning
As highlighted above, credit markets may weaken further if the Ukrainian/Russian war escalates or if central banks enact tighter policies to combat heightened inflationary pressures. As a result, our credit positioning remains focused on resiliency, liquidity and principal preservation in anticipation of a wide array of scenarios. However, this is not a time to be idle. In fact, quite the opposite. Amid the largest quarterly sell-off in the core plus funds on record, we picked up activity in the Fund. Toward the end of the quarter, we actively began to reposition out of our shorter duration Treasury and credit and into longer duration corporate credit and structured products. Going forward, we see the potential to increase spread risk opportunistically in our portfolios, but with a preference for quality. We recognize the possibility of a "wider set of outcomes, across a wider set of variables." As a result, we are prepared to rotate into credit risk, but in a cautious, measured manner. With such a highly uncertain environment, we are broadening the ranges of inputs into our
base case model, focusing on our downside cases, and prioritizing hard asset value, good collateral and visible cash flows.
See accompanying Disclosures and Endnotes on page 100.
Oakmark.com 51
Oakmark Bond Fund March 31, 2022 (Unaudited)
Schedule of Investments (in thousands)
|
Shares |
Value |
||||||||||
|
PREFERRED STOCKS - 1.1% |
|||||||||||
|
COMMUNICATION SERVICES - 1.1% |
|||||||||||
|
Liberty Broadband Corp. 7.00% (a) |
35 |
$ |
937 |
||||||||
|
TOTAL PREFERRED STOCKS - 1.1% (COST $929) |
937 |
||||||||||
|
Par Value |
Value |
||||||||||
|
FIXED INCOME - 94.6% |
|||||||||||
|
CORPORATE BONDS - 52.0% |
|||||||||||
|
INDUSTRIALS - 12.2% |
|||||||||||
|
AutoNation, Inc. 3.85%, due 03/01/32 |
$ |
500 |
484 |
||||||||
|
BAT Capital Corp. 2.259%, due 03/25/28 |
1,000 |
897 |
|||||||||
|
Carlisle Cos., Inc. 2.20%, due 03/01/32 |
500 |
436 |
|||||||||
|
Delta Air Lines, Inc. / SkyMiles IP, Ltd, 144A 4.75%, due 10/20/28 (b) |
750 |
756 |
|||||||||
|
Embecta Corp, 144A 5.00%, due 02/15/30 (b) |
500 |
472 |
|||||||||
|
Hilton Domestic Operating Co., Inc., 144A 3.625%, due 02/15/32 (b) |
1,000 |
907 |
|||||||||
|
Howmet Aerospace, Inc. 3.00%, due 01/15/29 |
600 |
548 |
|||||||||
|
MIWD Hold Co / MIWD Finance Corporation, 144A 5.50%, due 02/01/30 (b) |
500 |
467 |
|||||||||
|
Mozart Debt Merger Sub, 144A 5.25%, due 10/01/29 (b) |
750 |
697 |
|||||||||
|
Ritchie Bros Holdings, Inc. 144A 4.75%, due 12/15/31 (b) |
1,000 |
975 |
|||||||||
|
Southwest Airlines Co. 5.125%, due 06/15/27 |
1,000 |
1,069 |
|||||||||
|
The Boeing Co. 2.70%, due 02/01/27 |
750 |
719 |
|||||||||
|
Uber Technologies, Inc., 144A 4.50%, due 08/15/29 (b) |
1,100 |
1,031 |
|||||||||
|
US Foods, Inc., 144A 4.75%, due 02/15/29 (b) |
370 |
353 |
|||||||||
|
Viterra Finance BV, 144A 2.00%, due 04/21/26 (b) |
1,000 |
921 |
|||||||||
|
10,732 |
|||||||||||
|
ENERGY - 8.5% |
|||||||||||
|
Boardwalk Pipelines LP 3.60%, due 09/01/32 |
1,000 |
953 |
|||||||||
|
BP Capital Markets America Co. 2.721%, due 01/12/32 |
1,000 |
941 |
|||||||||
|
Chesapeake Energy Corp, 144A 5.875%, due 02/01/29 (b) |
1,117 |
1,153 |
|||||||||
|
Diamondback Energy, Inc. 3.125%, due 03/24/31 |
500 |
478 |
|||||||||
|
Enable Midstream Partners, LP 4.15%, due 09/15/29 |
500 |
501 |
|||||||||
|
Hess Midstream Operations LP, 144A 4.25%, due 02/15/30 (b) |
750 |
708 |
|||||||||
|
NOV, Inc. 3.60%, due 12/01/29 |
750 |
737 |
|||||||||
|
Par Value |
Value |
||||||||||
|
Parsley Energy LLC / Parsley Finance Corp, 144A 4.125%, due 02/15/28 (b) |
$ |
1,500 |
$ |
1,492 |
|||||||
|
Weatherford International Ltd, 144A 8.625%, due 04/30/30 (b) |
500 |
508 |
|||||||||
|
7,471 |
|||||||||||
|
FINANCIALS - 7.7% |
|||||||||||
|
AerCap Ireland Capital DAC / AerCap Global Aviation Trust 2.45%, due 10/29/26 |
500 |
462 |
|||||||||
|
3.40%, due 10/29/33 |
500 |
448 |
|||||||||
|
Ally Financial, Inc. 4.70%(H15T7Y + 3.481%) (a) (c) |
1,000 |
910 |
|||||||||
|
2.20%, due 11/02/28 |
500 |
452 |
|||||||||
|
Apollo Commercial Real Estate Finance, Inc. REIT, 144A 4.625%, due 06/15/29 (b) |
500 |
454 |
|||||||||
|
Blackstone Mortgage Trust, Inc. REIT, 144A 3.75%, due 01/15/27 (b) |
1,000 |
930 |
|||||||||
|
LPL Holdings, Inc., 144A 4.00%, due 03/15/29 (b) |
500 |
474 |
|||||||||
|
Signature Bank/New York NY 4.00% (AMERIBOR + 3.890%), due 10/15/30 (c) |
1,000 |
987 |
|||||||||
|
SVB Financial Group 4.25%(H15T5Y + 3.074%) (a) (c) |
750 |
694 |
|||||||||
|
1.80%, due 10/28/26 |
500 |
465 |
|||||||||
|
The Goldman Sachs Group, Inc. 3.615% (SOFR + 1.846%), due 03/15/28 (c) |
500 |
499 |
|||||||||
|
6,775 |
|||||||||||
|
CONSUMER DISCRETIONARY - 6.5% |
|||||||||||
|
Brunswick Corp. 2.40%, due 08/18/31 |
1,100 |
932 |
|||||||||
|
Daimler Trucks Finance North America LLC, 144A 2.375%, due 12/14/28 (b) |
1,000 |
910 |
|||||||||
|
Kontoor Brands, Inc. 144A 4.125%, due 11/15/29 (b) |
500 |
457 |
|||||||||
|
Lithia Motors, Inc., 144A 4.375%, due 01/15/31 (b) |
500 |
483 |
|||||||||
|
M/I Homes, Inc. 3.95%, due 02/15/30 |
500 |
440 |
|||||||||
|
Marriott International, Inc. 2.75%, due 10/15/33 |
1,000 |
883 |
|||||||||
|
3.125%, due 06/15/26 |
250 |
247 |
|||||||||
|
Starbucks Corp. 3.00%, due 02/14/32 |
1,000 |
954 |
|||||||||
|
Thor Industries, Inc., 144A 4.00%, due 10/15/29 (b) |
500 |
439 |
|||||||||
|
5,745 |
|||||||||||
|
HEALTH CARE - 3.9% |
|||||||||||
|
Bio-Rad Laboratories, Inc. 3.70%, due 03/15/32 |
1,000 |
988 |
|||||||||
|
Regeneron Pharmaceuticals, Inc. 1.75%, due 09/15/30 |
1,250 |
1,085 |
|||||||||
|
Tenet Healthcare Corp, 144A 4.25%, due 06/01/29 (b) |
500 |
479 |
|||||||||
|
Zimmer Biomet Holdings, Inc. 2.60%, due 11/24/31 |
1,000 |
913 |
|||||||||
|
3,465 |
|||||||||||
See accompanying Notes to Financial Statements.
52 OAKMARK FUNDS
Oakmark Bond Fund March 31, 2022 (Unaudited)
Schedule of Investments (in thousands) (continued)
|
Par Value |
Value |
||||||||||
|
FIXED INCOME - 94.6% (continued) |
|||||||||||
|
CORPORATE BONDS - 52.0% (continued) |
|||||||||||
|
REAL ESTATE - 3.7% |
|||||||||||
|
CBRE Services, Inc. 2.50%, due 04/01/31 |
$ |
1,000 |
$ |
904 |
|||||||
|
GLP Capital, LP / GLP Financing II, Inc. REIT 4.00%, due 01/15/31 |
500 |
485 |
|||||||||
|
RHP Hotel Properties, LP / RHP Finance Corp. REIT, 144A 4.50%, due 02/15/29 (b) |
1,000 |
940 |
|||||||||
|
Sun Communities Operating, LP REIT 2.70%, due 07/15/31 |
1,000 |
902 |
|||||||||
|
3,231 |
|||||||||||
|
MATERIALS - 2.8% |
|||||||||||
|
Anglo American Capital PLC, 144A 3.875%, due 03/16/29 (b) |
1,000 |
1,000 |
|||||||||
|
Glencore Funding LLC, 144A 2.625%, due 09/23/31 (b) |
1,000 |
895 |
|||||||||
|
Novelis Corp, 144A 3.875%, due 08/15/31 (b) |
362 |
331 |
|||||||||
|
3.25%, due 11/15/26 (b) |
210 |
201 |
|||||||||
|
2,427 |
|||||||||||
|
COMMUNICATION SERVICES - 2.5% |
|||||||||||
|
Charter Communications Operating LLC / Charter Communications Operating Capital 2.30%, due 02/01/32 |
270 |
231 |
|||||||||
|
Magallanes, Inc.144A 4.054%, due 03/15/29 (b) |
1,000 |
1,005 |
|||||||||
|
Twitter, Inc., 144A 5.00%, due 03/01/30 (b) |
1,000 |
995 |
|||||||||
|
2,231 |
|||||||||||
|
INFORMATION TECHNOLOGY - 2.0% |
|||||||||||
|
Micron Technology, Inc. 2.703%, due 04/15/32 |
1,000 |
905 |
|||||||||
|
NXP BV / NXP Funding LLC / NXP USA, Inc., 144A 2.50%, due 05/11/31 (b) |
1,000 |
898 |
|||||||||
|
1,803 |
|||||||||||
|
CONSUMER STAPLES - 1.2% |
|||||||||||
|
Altria Group, Inc. 2.45%, due 02/04/32 |
1,250 |
1,086 |
|||||||||
|
UTILITIES - 1.0% |
|||||||||||
|
The Southern Co. 3.75% (H15T5Y + 2.915%), due 09/15/51 (c) |
1,000 |
922 |
|||||||||
|
Total Corporate Bonds (Cost $48,647) |
45,888 |
||||||||||
|
GOVERNMENT AND AGENCY SECURITIES - 31.0% |
|||||||||||
|
U.S. GOVERNMENT NOTES - 18.6% |
|||||||||||
|
United States Treasury Notes 0.875%, due 09/30/26 |
9,500 |
8,843 |
|||||||||
|
1.25%, due 06/30/28 |
3,000 |
2,791 |
|||||||||
|
1.375%, due 10/31/28 |
2,000 |
1,870 |
|||||||||
|
Par Value |
Value |
||||||||||
|
United States Treasury Bonds 1.875%, due 11/15/51 |
$ |
1,250 |
$ |
1,096 |
|||||||
|
2.25%, due 02/15/52 |
500 |
480 |
|||||||||
|
0.75%, due 08/31/26 |
500 |
463 |
|||||||||
|
2.00%, due 11/15/41 |
500 |
452 |
|||||||||
|
2.00%, due 08/15/51 |
500 |
451 |
|||||||||
|
16,446 |
|||||||||||
|
U.S. GOVERNMENT AGENCIES - 12.4% |
|||||||||||
|
Federal Farm Credit Banks Funding Corp. 0.32%, due 12/23/24 |
5,000 |
4,720 |
|||||||||
|
0.36%, due 09/24/24 |
4,000 |
3,821 |
|||||||||
|
Federal Home Loan Banks, 0.48%, due 09/10/24 |
2,500 |
2,396 |
|||||||||
|
10,937 |
|||||||||||
|
Total Government and Agency Securities (Cost $29,090) |
27,383 |
||||||||||
|
BANK LOANS - 4.9% |
|||||||||||
|
INDUSTRIALS - 2.3% |
|||||||||||
|
Naked Juice Llc Term Loan 3.75% (6 mo. Term SOFR+ 3.25%), due 01/24/29 (c) |
945 |
928 |
|||||||||
|
Naked Juice Llc Delayed Draw Term Loan 3.75% (6 mo. Term SOFR+ 3.25%), due 01/24/29 (c) |
55 |
54 |
|||||||||
|
Skymiles IP, Ltd. 2020 Term Loan B 4.75% (3 mo. USD LIBOR + 3.75%), due 10/20/27 (c) |
1,000 |
1,031 |
|||||||||
|
2,013 |
|||||||||||
|
ENERGY - 1.0% |
|||||||||||
|
Apergy Corp. 2020 Term Loan 6.00% (3 mo. USD LIBOR + 5.00%), due 06/03/27 (c) |
913 |
914 |
|||||||||
|
FINANCIALS - 1.0% |
|||||||||||
|
Allspring Buyer LLC Term Loan B 4.31% (3 mo. USD LIBOR + 3.25%), due 11/01/28 (c) |
887 |
880 |
|||||||||
|
HEALTH CARE - 0.6% |
|||||||||||
|
Owens & Minor Distribution, Inc. 0.00%, due 03/29/29 (d) |
500 |
498 |
|||||||||
|
Total Bank Loans (Cost $4,298) |
4,305 |
||||||||||
|
ASSET BACKED SECURITIES - 3.9% |
|||||||||||
|
Santander Drive Auto Receivable, 3.76%, due 07/16/29 |
1,000 |
994 |
|||||||||
|
Carvana Auto Receivables Trust, 4.80%, due 01/10/29 |
1,000 |
989 |
|||||||||
|
Sierra Receivables Funding Co. 144A 3.94%, due 10/20/38 (b) |
1,000 |
988 |
|||||||||
|
Carvana Auto Receivables Trust 144A 4.13%, due 12/11/28 (b) (c) |
500 |
495 |
|||||||||
|
Total Asset Backed Securities (Cost $3,487) |
3,466 |
||||||||||
See accompanying Notes to Financial Statements.
Oakmark.com 53
Oakmark Bond Fund March 31, 2022 (Unaudited)
Schedule of Investments (in thousands) (continued)
|
Par Value |
Value |
||||||||||
|
FIXED INCOME - 94.6% (continued) |
|||||||||||
|
COLLATERALIZED MORTGAGE OBLIGATIONS - 2.2% |
|||||||||||
|
BANK 2022-BNK40, 3.507%, due 03/15/64 (c) |
$ |
1,000 |
$ |
1,007 |
|||||||
|
JP Morgan Mortgage Trust, 144A 3.122%, due 08/25/52 (b) (c) |
1,000 |
892 |
|||||||||
|
Total Collateralized Mortgage Obligations (Cost $1,948) |
1,899 |
||||||||||
|
CONVERTIBLE BOND - 0.6% |
|||||||||||
|
CONSUMER DISCRETIONARY - 0.6% |
|||||||||||
|
Peloton Interactive, Inc., 144A 0.00%, due 02/15/26 (b) (e) (Cost $551) |
645 |
533 |
|||||||||
|
Total Convertible Bond (Cost $551) |
533 |
||||||||||
|
TOTAL FIXED INCOME - 94.6% (COST $88,021) |
83,474 |
||||||||||
|
SHORT-TERM INVESTMENTS - 2.2% |
|||||||||||
|
REPURCHASE AGREEMENT - 2.2% |
|||||||||||
|
Fixed Income Clearing Corp. Repurchase Agreement, 0.28% dated 03/31/22 due 04/01/22, repurchase price $1,974, collateralized by United States Treasury Note, 0.125% due 10/15/25, value plus accrued interest of $2,013 (Cost: $1,974) |
1,974 |
1,974 |
|||||||||
|
TOTAL SHORT-TERM INVESTMENTS - 2.2% (COST $1,974) |
1,974 |
||||||||||
|
TOTAL INVESTMENTS - 97.9% (COST $90,924) |
86,385 |
||||||||||
|
Other Assets In Excess of Liabilities - 2.1% |
1,809 |
||||||||||
|
NET ASSETS - 100.0% |
$ |
88,194 |
|||||||||
(a) Security is perpetual and has no stated maturity date.
(b) Security exempt from registration under Rule 144A of the Securities Act of 1933, as amended. These securities may be resold, normally only to qualified institutional buyers.
(c) Floating Rate Note. Rate shown is as of March 31, 2022.
(d) This position represents an unsettled loan commitment at period end. Certain details associated with this purchase are not known prior to the settlement date, including coupon rate, which will be adjusted on settlement date.
(e) Zero Coupon Bond.
Abbreviations:
REIT: Real Estate Investment Trust
See accompanying Notes to Financial Statements.
54 OAKMARK FUNDS
Oakmark Funds
Statements of Assets and Liabilities—March 31, 2022 (Unaudited)
(in thousands except per share amounts)
|
Oakmark Fund |
Oakmark Select Fund |
Oakmark Global Fund |
|||||||||||||
|
Assets |
|||||||||||||||
|
Investments in unaffiliated securities, at value (a) |
$ |
17,967,374 |
$ |
5,364,691 |
$ |
1,424,000 |
|||||||||
|
Foreign currency, at value (b) |
0 |
0 |
0 |
(c) |
|||||||||||
|
Receivable for: |
|||||||||||||||
|
Securities sold |
4,708 |
0 |
4,388 |
||||||||||||
|
Fund shares sold |
68,665 |
5,775 |
278 |
||||||||||||
|
Dividends and interest from unaffiliated securities (Net of foreign tax withheld) |
14,893 |
322 |
864 |
||||||||||||
|
Forward foreign currency contracts |
0 |
0 |
57 |
||||||||||||
|
Tax reclaim from unaffiliated securities |
0 |
0 |
1,888 |
||||||||||||
|
Total receivables |
88,266 |
6,097 |
7,475 |
||||||||||||
|
Other assets |
106 |
30 |
8 |
||||||||||||
|
Total assets |
$ |
18,055,746 |
$ |
5,370,818 |
$ |
1,431,483 |
|||||||||
|
Liabilities and net assets |
|||||||||||||||
|
Payable for: |
|||||||||||||||
|
Securities purchased |
0 |
11,626 |
2,362 |
||||||||||||
|
Fund shares redeemed |
16,961 |
1,606 |
357 |
||||||||||||
|
Options written, at value |
36,088 |
(d) |
16,700 |
(d) |
0 |
||||||||||
|
Investment advisory fee |
2,123 |
749 |
221 |
||||||||||||
|
Other shareholder servicing fees |
986 |
299 |
52 |
||||||||||||
|
Transfer and dividend disbursing agent fees |
216 |
114 |
58 |
||||||||||||
|
Trustee fees |
2 |
3 |
4 |
||||||||||||
|
Deferred trustee compensation |
1,505 |
640 |
381 |
||||||||||||
|
Other |
2,806 |
503 |
808 |
||||||||||||
|
Total liabilities |
60,687 |
32,240 |
4,243 |
||||||||||||
|
Net assets applicable to Fund shares outstanding |
$ |
17,995,059 |
$ |
5,338,578 |
$ |
1,427,240 |
|||||||||
|
Analysis of net assets |
|||||||||||||||
|
Paid in capital |
$ |
9,721,655 |
$ |
2,916,687 |
$ |
892,531 |
|||||||||
|
Distributable earnings |
8,273,404 |
2,421,891 |
534,709 |
||||||||||||
|
Net assets applicable to Fund shares outstanding |
$ |
17,995,059 |
$ |
5,338,578 |
$ |
1,427,240 |
|||||||||
|
Price of shares |
|||||||||||||||
|
Net asset value, offering and redemption price per share: Investor Class |
$ |
116.04 |
$ |
60.35 |
$ |
32.78 |
|||||||||
|
Investor Class—Net assets |
$ |
8,545,221 |
$ |
1,794,296 |
$ |
734,334 |
|||||||||
|
Investor Class—Shares outstanding (Unlimited shares authorized) |
73,638 |
29,732 |
22,403 |
||||||||||||
|
Net asset value, offering and redemption price per share: Advisor Class |
$ |
116.07 |
$ |
60.24 |
$ |
32.77 |
|||||||||
|
Advisor Class—Net assets |
$ |
3,144,201 |
$ |
2,559,409 |
$ |
205,787 |
|||||||||
|
Advisor Class—Shares outstanding (Unlimited shares authorized) |
27,090 |
42,484 |
6,280 |
||||||||||||
|
Net asset value, offering and redemption price per share: Institutional Class |
$ |
116.07 |
$ |
60.29 |
$ |
32.77 |
|||||||||
|
Institutional Class—Net assets |
$ |
4,890,944 |
$ |
644,836 |
$ |
399,164 |
|||||||||
|
Institutional Class—Shares outstanding (Unlimited shares authorized) |
42,138 |
10,695 |
12,182 |
||||||||||||
|
Net asset value, offering and redemption price per share: R6 Class |
$ |
116.10 |
$ |
60.29 |
$ |
32.76 |
|||||||||
|
R6 Class—Net assets |
1,414,693 |
340,037 |
87,955 |
||||||||||||
|
R6 Class—Shares outstanding (Unlimited shares authorized) |
12,185 |
5,640 |
2,685 |
||||||||||||
| (a) Identified cost of investments in unaffiliated securities. |
$ |
11,403,798 |
$ |
3,397,449 |
$ |
1,010,620 |
|||||||||
| (b) Identified cost of foreign currency. |
$ |
0 |
$ |
0 |
$ |
0 |
(c) |
||||||||
| (c) Amount rounds to less than $1,000. | |||||||||||||||
| (d) Written options premiums received of $54,383 and $29,260 (in thousands) for the Oakmark Fund and the Oakmark Select Fund, respectively. | |||||||||||||||
See accompanying Notes to Financial Statements.
Oakmark.com 55
Oakmark Funds
Statements of Assets and Liabilities—March 31, 2022 (Unaudited) (continued)
(in thousands except per share amounts)
|
Oakmark Global Select Fund |
Oakmark International Fund |
Oakmark International Small Cap Fund |
|||||||||||||
|
Assets |
|||||||||||||||
|
Investments in unaffiliated securities, at value (a) |
$ |
1,572,112 |
$ |
23,352,937 |
$ |
1,432,826 |
|||||||||
|
Investments in affiliated securities, at value (b) |
0 |
1,425,775 |
0 |
||||||||||||
|
Foreign currency, at value (c) |
0 |
(d) |
25,944 |
0 |
(d) |
||||||||||
|
Receivable for: |
|||||||||||||||
|
Securities sold |
10,925 |
48,748 |
3,694 |
||||||||||||
|
Fund shares sold |
395 |
34,727 |
993 |
||||||||||||
|
Dividends and interest from unaffiliated securities (Net of foreign tax withheld) |
434 |
43,278 |
7,180 |
||||||||||||
|
Forward foreign currency contracts |
55 |
949 |
62 |
||||||||||||
|
Tax reclaim from unaffiliated securities |
2,754 |
27,308 |
3,965 |
||||||||||||
|
Total receivables |
14,563 |
155,010 |
15,894 |
||||||||||||
|
Other assets |
8 |
139 |
8 |
||||||||||||
|
Total assets |
$ |
1,586,683 |
$ |
24,959,805 |
$ |
1,448,728 |
|||||||||
|
Liabilities and net assets |
|||||||||||||||
|
Payable for: |
|||||||||||||||
|
Securities purchased |
73,791 |
38,175 |
2,391 |
||||||||||||
|
Fund shares redeemed |
375 |
34,293 |
516 |
||||||||||||
|
Investment advisory fee |
226 |
3,485 |
274 |
||||||||||||
|
Other shareholder servicing fees |
120 |
622 |
44 |
||||||||||||
|
Transfer and dividend disbursing agent fees |
23 |
123 |
23 |
||||||||||||
|
Trustee fees |
3 |
9 |
3 |
||||||||||||
|
Deferred trustee compensation |
298 |
2,256 |
362 |
||||||||||||
|
Other |
228 |
15,507 |
293 |
||||||||||||
|
Total liabilities |
75,064 |
94,470 |
3,906 |
||||||||||||
|
Net assets applicable to Fund shares outstanding |
$ |
1,511,619 |
$ |
24,865,335 |
$ |
1,444,822 |
|||||||||
|
Analysis of net assets |
|||||||||||||||
|
Paid in capital |
$ |
1,126,891 |
$ |
26,774,530 |
$ |
1,451,213 |
|||||||||
|
Distributable Earnings |
384,728 |
(1,909,195 |
) |
(6,391 |
) |
||||||||||
|
Net assets applicable to Fund shares outstanding |
$ |
1,511,619 |
$ |
24,865,335 |
$ |
1,444,822 |
|||||||||
|
Price of shares |
|||||||||||||||
|
Net asset value, offering and redemption price per share: Investor Class |
$ |
21.13 |
$ |
25.65 |
$ |
17.56 |
|||||||||
|
Investor Class—Net assets |
$ |
516,109 |
$ |
7,568,386 |
$ |
443,493 |
|||||||||
|
Investor Class—Shares outstanding (Unlimited shares authorized) |
24,422 |
295,030 |
25,261 |
||||||||||||
|
Net asset value, offering and redemption price per share: Advisor Class |
$ |
21.11 |
$ |
25.63 |
$ |
17.57 |
|||||||||
|
Advisor Class—Net assets |
$ |
221,846 |
$ |
3,105,575 |
$ |
171,181 |
|||||||||
|
Advisor Class—Shares outstanding (Unlimited shares authorized) |
10,507 |
121,186 |
9,743 |
||||||||||||
|
Net asset value, offering and redemption price per share: Institutional Class |
$ |
21.12 |
$ |
25.63 |
$ |
17.52 |
|||||||||
|
Institutional Class—Net assets |
$ |
657,384 |
$ |
10,721,361 |
$ |
461,798 |
|||||||||
|
Institutional Class—Shares outstanding (Unlimited shares authorized) |
31,133 |
418,333 |
26,360 |
||||||||||||
|
Net asset value, offering and redemption price per share: R6 Class |
$ |
21.12 |
$ |
25.64 |
$ |
17.52 |
|||||||||
|
R6 Class—Net assets |
116,280 |
3,470,013 |
368,350 |
||||||||||||
|
R6 Class—Shares outstanding (Unlimited shares authorized) |
5,505 |
135,337 |
21,029 |
||||||||||||
| (a) Identified cost of investments in unaffiliated securities. |
$ |
1,264,381 |
$ |
23,004,590 |
$ |
1,440,068 |
|||||||||
| (b) Identified cost of investments in affiliated securities. |
0 |
2,252,290 |
0 |
||||||||||||
| (c) Identified cost of foreign currency. |
$ |
0 |
(d) |
$ |
26,144 |
$ |
0 |
(d) |
|||||||
| (d) Amount rounds to less than $1,000. | |||||||||||||||
See accompanying Notes to Financial Statements.
56 OAKMARK FUNDS
Oakmark Funds
Statements of Assets and Liabilities—March 31, 2022 (Unaudited) (continued)
(in thousands except per share amounts)
|
Oakmark Equity and Income Fund |
Oakmark Bond Fund |
||||||||||
|
Assets |
|||||||||||
|
Investments in unaffiliated securities, at value (a) |
$ |
7,382,738 |
$ |
86,385 |
|||||||
|
Cash |
4,389 |
0 |
|||||||||
|
Foreign currency, at value (b) |
0 |
(c) |
0 |
||||||||
|
Receivable for: |
|||||||||||
|
Securities sold |
25,049 |
2,801 |
|||||||||
|
Fund shares sold |
5,309 |
0 |
|||||||||
|
Dividends and interest from unaffiliated securities (Net of foreign tax withheld) |
24,394 |
503 |
|||||||||
|
Forward foreign currency contracts |
0 |
0 |
|||||||||
|
Tax reclaim from unaffiliated securities |
1,836 |
0 |
|||||||||
|
Total receivables |
56,588 |
3,304 |
|||||||||
|
Other assets |
40 |
1 |
|||||||||
|
Total assets |
$ |
7,443,755 |
$ |
89,690 |
|||||||
|
Liabilities and net assets |
|||||||||||
|
Payable for: |
|||||||||||
|
Securities purchased |
80 |
1,387 |
|||||||||
|
Fund shares redeemed |
2,759 |
0 |
|||||||||
|
Investment advisory fee |
759 |
(5 |
) |
||||||||
|
Other shareholder servicing fees |
700 |
0 |
|||||||||
|
Transfer and dividend disbursing agent fees |
153 |
1 |
|||||||||
|
Trustee fees |
6 |
2 |
|||||||||
|
Deferred trustee compensation |
1,464 |
45 |
|||||||||
|
Other |
2,027 |
66 |
|||||||||
|
Total liabilities |
7,948 |
1,496 |
|||||||||
|
Net assets applicable to Fund shares outstanding |
$ |
7,435,807 |
$ |
88,194 |
|||||||
|
Analysis of net assets |
|||||||||||
|
Paid in capital |
$ |
4,824,468 |
$ |
93,331 |
|||||||
|
Distributable Earnings |
2,611,339 |
(5,137 |
) |
||||||||
|
Net assets applicable to Fund shares outstanding |
$ |
7,435,807 |
$ |
88,194 |
|||||||
|
Price of shares |
|||||||||||
|
Net asset value, offering and redemption price per share: Investor Class |
$ |
33.00 |
$ |
9.52 |
(d)(e) |
||||||
|
Investor Class—Net assets |
$ |
5,346,475 |
$ |
655 |
|||||||
|
Investor Class—Shares outstanding (Unlimited shares authorized) |
162,035 |
69 |
|||||||||
|
Net asset value, offering and redemption price per share: Advisor Class |
$ |
32.98 |
$ |
9.53 |
(e) |
||||||
|
Advisor Class—Net assets |
$ |
873,410 |
$ |
1,598 |
|||||||
|
Advisor Class—Shares outstanding (Unlimited shares authorized) |
26,481 |
168 |
|||||||||
|
Net asset value, offering and redemption price per share: Institutional Class |
$ |
32.98 |
$ |
9.53 |
(e) |
||||||
|
Institutional Class—Net assets |
$ |
1,124,529 |
$ |
3,064 |
|||||||
|
Institutional Class—Shares outstanding (Unlimited shares authorized) |
34,096 |
322 |
|||||||||
|
Net asset value, offering and redemption price per share: R6 Class |
$ |
32.99 |
$ |
9.53 |
|||||||
|
R6 Class—Net assets |
91,393 |
82,877 |
|||||||||
|
R6 Class—Shares outstanding (Unlimited shares authorized) |
2,770 |
8,699 |
|||||||||
| (a) Identified cost of investments in unaffiliated securities. |
$ |
5,489,280 |
$ |
90,924 |
|||||||
| (b) Identified cost of foreign currency. |
0 |
(c) |
0 |
||||||||
| (c) Amount rounds to less than $1,000. | |||||||||||
| (d) Commenced on 1/28/2022. | |||||||||||
| (e) Net assets have been rounded for presentation purposes. The net asset value per share shown is as reported on March 31, 2022. | |||||||||||
See accompanying Notes to Financial Statements.
Oakmark.com 57
Oakmark Funds
Statements of Operations—March 31, 2022 (Unaudited)
(in thousands)
|
Oakmark Fund |
Oakmark Select Fund |
Oakmark Global Fund |
|||||||||||||
|
Investment Income: |
|||||||||||||||
|
Dividends from unaffiliated securities |
$ |
145,032 |
$ |
31,027 |
$ |
5,509 |
|||||||||
|
Interest income from unaffiliated securities |
260 |
68 |
78 |
||||||||||||
|
Non-cash dividends from unaffiliated securities |
0 |
0 |
8,319 |
||||||||||||
|
Foreign taxes withheld |
0 |
0 |
(168 |
) |
|||||||||||
|
Total investment income |
145,292 |
31,095 |
13,738 |
||||||||||||
|
Expenses: |
|||||||||||||||
|
Investment advisory fee |
56,263 |
20,179 |
6,271 |
||||||||||||
|
Transfer and dividend disbursing agent fees |
439 |
224 |
106 |
||||||||||||
|
Other shareholder servicing fees—Investor Class |
2,714 |
487 |
199 |
||||||||||||
|
Other shareholder servicing fees—Advisor Class |
711 |
1,434 |
49 |
||||||||||||
|
Other shareholder servicing fees—Service Class |
27 |
12 |
5 |
||||||||||||
|
Other shareholder servicing fees—Institutional Class |
1,132 |
140 |
60 |
||||||||||||
|
Service fee—Investor Class |
9,233 |
1,718 |
727 |
||||||||||||
|
Service fee—Service Class |
31 |
13 |
6 |
||||||||||||
|
Reports to shareholders |
290 |
128 |
20 |
||||||||||||
|
Custody and accounting fees |
246 |
128 |
137 |
||||||||||||
|
Registration and blue sky expenses |
169 |
87 |
66 |
||||||||||||
|
Trustees fees |
187 |
102 |
74 |
||||||||||||
|
Legal fees |
146 |
76 |
54 |
||||||||||||
|
Audit and tax services fees |
24 |
21 |
27 |
||||||||||||
|
Other |
240 |
119 |
78 |
||||||||||||
|
Total expenses |
71,852 |
24,868 |
7,879 |
||||||||||||
|
Advisory fee waiver |
(1,797 |
) |
(553 |
) |
(154 |
) |
|||||||||
|
Net expenses |
70,055 |
24,315 |
7,725 |
||||||||||||
|
Net investment income |
75,237 |
6,780 |
6,013 |
||||||||||||
|
Net realized and unrealized gain (loss): |
|||||||||||||||
|
Net realized gain (loss) on: |
|||||||||||||||
|
Unaffiliated investments |
(17,384 |
) |
(14,696 |
) |
129,918 |
(a) |
|||||||||
|
Unaffiliated in-kind transactions |
1,741,937 |
483,404 |
0 |
||||||||||||
|
Forward foreign currency contracts |
0 |
0 |
605 |
||||||||||||
|
Foreign currency transactions |
0 |
0 |
72 |
||||||||||||
|
Purchased options |
275 |
(3,580 |
) |
0 |
|||||||||||
|
Written options |
24,012 |
6,662 |
0 |
||||||||||||
|
Net realized gain |
1,748,840 |
471,790 |
130,595 |
||||||||||||
|
Net change in unrealized appreciation (depreciation) on: |
|||||||||||||||
|
Unaffiliated investments |
(1,532,899 |
) |
(644,187 |
) |
(161,702 |
)(b) |
|||||||||
|
Forward foreign currency contracts |
0 |
0 |
(694 |
) |
|||||||||||
|
Foreign currency translation |
0 |
0 |
(54 |
) |
|||||||||||
|
Written options |
18,295 |
12,149 |
0 |
||||||||||||
|
Net change in unrealized appreciation (depreciation) |
(1,514,604 |
) |
(632,038 |
) |
(162,450 |
) |
|||||||||
|
Net realized and unrealized gain (loss) |
234,236 |
(160,248 |
) |
(31,855 |
) |
||||||||||
|
Net increase (decrease) in net assets resulting from operations |
$ |
309,473 |
$ |
(153,468 |
) |
$ |
(25,842 |
) |
|||||||
(a) Net of capital gain withholding taxes of $410 and $3,047 (in thousands) for the Oakmark Global Fund and the Oakmark International Fund, respectively.
(b) Includes net change in capital gain withholding taxes of $536 and $4,647 (in thousands) for the Oakmark Global Fund and the Oakmark International Fund, respectively.
See accompanying Notes to Financial Statements.
58 OAKMARK FUNDS
Oakmark Funds
Statements of Operations—March 31, 2022 (Unaudited) (continued)
(in thousands)
|
Oakmark Global Select Fund |
Oakmark International Fund |
Oakmark International Small Cap Fund |
|||||||||||||
|
Investment Income: |
|||||||||||||||
|
Dividends from unaffiliated securities |
$ |
4,788 |
$ |
188,921 |
$ |
14,390 |
|||||||||
|
Interest income from unaffiliated securities |
18 |
1,451 |
7 |
||||||||||||
|
Non-cash dividends from affiliated securities |
0 |
3,357 |
0 |
||||||||||||
|
Non-cash dividends from unaffiliated securities |
12,544 |
140,159 |
0 |
||||||||||||
|
Other income |
0 |
(145 |
) |
0 |
|||||||||||
|
Foreign taxes withheld |
(252 |
) |
(23,277 |
) |
(1,463 |
) |
|||||||||
|
Total investment income |
17,098 |
310,466 |
12,934 |
||||||||||||
|
Expenses: |
|||||||||||||||
|
Investment advisory fee |
6,616 |
100,424 |
8,041 |
||||||||||||
|
Transfer and dividend disbursing agent fees |
39 |
245 |
45 |
||||||||||||
|
Other shareholder servicing fees—Investor Class |
174 |
2,938 |
157 |
||||||||||||
|
Other shareholder servicing fees—Advisor Class |
106 |
1,930 |
88 |
||||||||||||
|
Other shareholder servicing fees—Service Class |
0 |
55 |
0 |
||||||||||||
|
Other shareholder servicing fees—Institutional Class |
204 |
2,584 |
88 |
||||||||||||
|
Service fee—Investor Class |
540 |
9,604 |
544 |
||||||||||||
|
Service fee—Service Class |
0 |
67 |
0 |
||||||||||||
|
Reports to shareholders |
23 |
646 |
31 |
||||||||||||
|
Custody and accounting fees |
120 |
1,486 |
198 |
||||||||||||
|
Registration and blue sky expenses |
57 |
193 |
52 |
||||||||||||
|
Trustees fees |
78 |
260 |
75 |
||||||||||||
|
Legal fees |
54 |
199 |
55 |
||||||||||||
|
Audit and tax services fees |
25 |
29 |
24 |
||||||||||||
|
Other |
79 |
337 |
79 |
||||||||||||
|
Total expenses |
8,115 |
120,997 |
9,477 |
||||||||||||
|
Advisory fee waiver |
(169 |
) |
(2,708 |
) |
(160 |
) |
|||||||||
|
Net expenses |
7,946 |
118,289 |
9,317 |
||||||||||||
|
Net investment income |
9,152 |
192,177 |
3,617 |
||||||||||||
|
Net realized and unrealized gain (loss): |
|||||||||||||||
|
Net realized gain (loss) on: |
|||||||||||||||
|
Unaffiliated investments |
82,951 |
729,417 |
(a) |
30,476 |
|||||||||||
|
Affiliated investments |
0 |
(41,649 |
) |
0 |
|||||||||||
|
Forward foreign currency contracts |
526 |
10,755 |
593 |
||||||||||||
|
Foreign currency transactions |
(51 |
) |
(1,420 |
) |
(118 |
) |
|||||||||
|
Purchased options |
230 |
0 |
0 |
||||||||||||
|
Written options |
2,253 |
0 |
0 |
||||||||||||
|
Net realized gain |
85,909 |
697,103 |
30,951 |
||||||||||||
|
Net change in unrealized depreciation on: |
|||||||||||||||
|
Unaffiliated investments |
(181,166 |
) |
(2,869,923 |
)(b) |
(204,962 |
) |
|||||||||
|
Affiliated investments |
0 |
(160,525 |
) |
0 |
|||||||||||
|
Forward foreign currency contracts |
(597 |
) |
(12,225 |
) |
(675 |
) |
|||||||||
|
Foreign currency translation |
(10 |
) |
(43 |
) |
(92 |
) |
|||||||||
|
Net change in unrealized appreciation (depreciation) |
(181,773 |
) |
(3,042,716 |
) |
(205,729 |
) |
|||||||||
|
Net realized and unrealized loss |
(95,864 |
) |
(2,345,613 |
) |
(174,778 |
) |
|||||||||
|
Net increase (decrease) in net assets resulting from operations |
$ |
(86,712 |
) |
$ |
(2,153,436 |
) |
$ |
(171,161 |
) |
||||||
(a) Net of capital gain withholding taxes of $410 and $3,047 (in thousands) for the Oakmark Global Fund and the Oakmark International Fund, respectively.
(b) Includes net change in capital gain withholding taxes of $536 and $4,647 (in thousands) for the Oakmark Global Fund and the Oakmark International Fund, respectively.
See accompanying Notes to Financial Statements.
Oakmark.com 59
Oakmark Funds
Statements of Operations—March 31, 2022 (Unaudited) (continued)
(in thousands)
|
Oakmark Equity and Income Fund |
Oakmark Bond Fund |
||||||||||
|
Investment Income: |
|||||||||||
|
Dividends from unaffiliated securities |
$ |
34,698 |
$ |
53 |
|||||||
|
Interest income from unaffiliated securities |
34,423 |
1,130 |
|||||||||
|
Total investment income |
69,121 |
1,183 |
|||||||||
|
Expenses: |
|||||||||||
|
Investment advisory fee |
21,238 |
185 |
|||||||||
|
Transfer and dividend disbursing agent fees |
286 |
1 |
|||||||||
|
Other shareholder servicing fees—Investor Class |
1,881 |
0 |
(a) |
||||||||
|
Other shareholder servicing fees—Advisor Class |
134 |
0 |
(a) |
||||||||
|
Other shareholder servicing fees—Service Class |
69 |
0 |
|||||||||
|
Other shareholder servicing fees—Institutional Class |
191 |
0 |
|||||||||
|
Service fee—Investor Class |
5,975 |
0 |
(a) |
||||||||
|
Service fee—Service Class |
80 |
0 |
|||||||||
|
Reports to shareholders |
86 |
0 |
(a) |
||||||||
|
Custody and accounting fees |
178 |
47 |
|||||||||
|
Registration and blue sky expenses |
72 |
42 |
|||||||||
|
Trustees fees |
103 |
69 |
|||||||||
|
Legal fees |
89 |
45 |
|||||||||
|
Audit and tax services fees |
22 |
20 |
|||||||||
|
Other |
149 |
36 |
|||||||||
|
Total expenses |
30,553 |
445 |
|||||||||
|
Advisory fee waiver / Expense reimbursement from Advisor |
(777 |
) |
(234 |
) |
|||||||
|
Net expenses |
29,776 |
211 |
|||||||||
|
Net investment income |
39,345 |
972 |
|||||||||
|
Net realized and unrealized gain (loss): |
|||||||||||
|
Net realized gain (loss) on: |
|||||||||||
|
Unaffiliated investments |
93,549 |
(613 |
) |
||||||||
|
Unaffiliated in-kind transactions |
605,754 |
0 |
|||||||||
|
Net realized gain (loss) |
699,303 |
(613 |
) |
||||||||
|
Net change in unrealized depreciation on: |
|||||||||||
|
Unaffiliated investments |
(738,174 |
) |
(5,430 |
) |
|||||||
|
Net change in unrealized appreciation (depreciation) |
(738,174 |
) |
(5,430 |
) |
|||||||
|
Net realized and unrealized loss |
(38,871 |
) |
(6,043 |
) |
|||||||
|
Net increase (decrease) in net assets resulting from operations |
$ |
474 |
$ |
(5,071 |
) |
||||||
(a) Amount rounds to less than $1,000.
See accompanying Notes to Financial Statements.
60 OAKMARK FUNDS
Oakmark Funds
Statements of Changes in Net Assets
(in thousands)
|
Oakmark Fund |
|||||||||||
|
Six Months Ended March 31, 2022 (Unaudited) |
Year Ended September 30, 2021 |
||||||||||
|
From Operations: |
|||||||||||
|
Net investment income |
$ |
75,237 |
$ |
79,732 |
|||||||
|
Net realized gain (loss) |
1,748,840 |
2,028,398 |
|||||||||
|
Net change in unrealized appreciation (depreciation) |
(1,514,604 |
) |
4,345,862 |
||||||||
|
Net increase in net assets from operations |
309,473 |
6,453,992 |
|||||||||
|
Distributions to shareholders from: |
|||||||||||
|
Distributions to shareholders—Investor Class |
(129,975 |
) |
(11,993 |
) |
|||||||
|
Distributions to shareholders—Advisor Class |
(45,944 |
) |
(10,727 |
) |
|||||||
|
Distributions to shareholders—Institutional Class |
(82,975 |
) |
(7,585 |
) |
|||||||
|
Distributions to shareholders—Service Class |
(820 |
) |
0 |
||||||||
|
Distributions to shareholders—R6 Class |
(20,063 |
) |
0 |
||||||||
|
Total distributions to shareholders |
(279,777 |
) |
(30,305 |
) |
|||||||
|
From Fund share transactions: |
|||||||||||
|
Proceeds from shares sold—Investor Class |
982,943 |
1,081,638 |
|||||||||
|
Proceeds from shares sold—Investor Class converted from Service Class (a) |
62,110 |
0 |
|||||||||
|
Proceeds from shares sold—Advisor Class |
785,921 |
1,361,365 |
|||||||||
|
Proceeds from shares sold—Institutional Class |
1,129,598 |
3,880,650 |
|||||||||
|
Proceeds from shares sold—Service Class |
2,408 |
7,162 |
|||||||||
|
Proceeds from shares sold—Class R6 |
3,140,191 |
3,232,987 |
|||||||||
|
Reinvestment of distributions—Investor Class |
122,219 |
11,275 |
|||||||||
|
Reinvestment of distributions—Advisor Class |
43,233 |
9,621 |
|||||||||
|
Reinvestment of distributions—Institutional Class |
70,864 |
7,201 |
|||||||||
|
Reinvestment of distributions—Service Class |
711 |
0 |
|||||||||
|
Reinvestment of distributions—Class R6 |
19,842 |
0 |
|||||||||
|
Payment for shares redeemed—Investor Class |
(1,154,460 |
) |
(2,113,893 |
) |
|||||||
|
Payment for shares redeemed—Advisor Class |
(511,979 |
) |
(3,655,588 |
) |
|||||||
|
Payment for shares redeemed—Institutional Class |
(826,422 |
) |
(2,218,379 |
) |
|||||||
|
Payment for shares redeemed—Service Class |
(4,878 |
) |
(26,149 |
) |
|||||||
|
Payment for shares redeemed—Service Class converted to Investor Class (a) |
(62,110 |
) |
0 |
||||||||
|
Payment for shares redeemed—Class R6 |
(2,806,407 |
) |
(2,346,348 |
) |
|||||||
|
Net increase (decrease) in net assets from Fund share transactions |
993,784 |
(768,458 |
) |
||||||||
|
Total increase in net assets |
1,023,480 |
5,655,229 |
|||||||||
|
Net assets: |
|||||||||||
|
Beginning of period |
16,971,579 |
11,316,350 |
|||||||||
|
End of period |
$ |
17,995,059 |
$ |
16,971,579 |
|||||||
See accompanying Notes to Financial Statements.
Oakmark.com 61
Oakmark Funds
Statements of Changes in Net Assets (continued)
(in thousands)
|
Oakmark Fund (continued) |
|||||||||||
|
Six Months Ended March 31, 2022 (Unaudited) |
Year Ended September 30, 2021 |
||||||||||
|
Fund share transactions—Investor Class: |
|||||||||||
|
Shares sold |
8,280 |
10,358 |
|||||||||
|
Shares sold—shares converted from Service Class (a) |
536 |
0 |
|||||||||
|
Shares issued in reinvestment of dividends |
1,041 |
127 |
|||||||||
|
Less shares redeemed |
(9,711 |
) |
(21,673 |
) |
|||||||
|
Net increase (decrease) in shares outstanding |
146 |
(11,188 |
) |
||||||||
|
Fund share transactions—Advisor Class: |
|||||||||||
|
Shares sold |
6,539 |
13,142 |
|||||||||
|
Shares issued in reinvestment of dividends |
369 |
108 |
|||||||||
|
Less shares redeemed |
(4,241 |
) |
(33,820 |
) |
|||||||
|
Net increase (decrease) in shares outstanding |
2,667 |
(20,570 |
) |
||||||||
|
Fund share transactions—Institutional Class: |
|||||||||||
|
Shares sold |
9,457 |
37,553 |
|||||||||
|
Shares issued in reinvestment of dividends |
604 |
81 |
|||||||||
|
Less shares redeemed |
(6,991 |
) |
(23,866 |
) |
|||||||
|
Net increase in shares outstanding |
3,070 |
13,768 |
|||||||||
|
Fund share transactions—Service Class: |
|||||||||||
|
Shares sold |
20 |
73 |
|||||||||
|
Shares issued in reinvestment of dividends |
6 |
0 |
|||||||||
|
Less shares redeemed |
(40 |
) |
(263 |
) |
|||||||
|
Less shares redeemed—shares converted Investor Class (a) |
(538 |
) |
0 |
||||||||
|
Net decrease in shares outstanding |
(552 |
) |
(190 |
) |
|||||||
|
Fund share transactions—R6 Class: |
|||||||||||
|
Shares sold |
26,387 |
31,170 |
|||||||||
|
Shares issued in reinvestment of dividends |
169 |
0 |
|||||||||
|
Less shares redeemed |
(23,717 |
) |
(21,824 |
) |
|||||||
|
Net increase in shares outstanding |
2,839 |
9,346 |
|||||||||
(a) Service Class shares were converted into Investor Class shares at the close of business on December 17, 2021.
See accompanying Notes to Financial Statements.
62 OAKMARK FUNDS
Oakmark Funds
Statements of Changes in Net Assets (continued)
(in thousands)
|
Oakmark Select Fund |
|||||||||||
|
Six Months Ended March 31, 2022 (Unaudited) |
Year Ended September 30, 2021 |
||||||||||
|
From Operations: |
|||||||||||
|
Net investment income |
$ |
6,780 |
$ |
1,252 |
|||||||
|
Net realized gain (loss) |
471,790 |
634,107 |
|||||||||
|
Net change in unrealized appreciation (depreciation) |
(632,038 |
) |
1,478,101 |
||||||||
|
Net increase (decrease) in net assets from operations |
(153,468 |
) |
2,113,460 |
||||||||
|
Distributions to shareholders from: |
|||||||||||
|
Distributions to shareholders—Investor Class |
(5,682 |
) |
0 |
||||||||
|
Distributions to shareholders—Advisor Class |
(10,556 |
) |
(4,450 |
) |
|||||||
|
Distributions to shareholders—Institutional Class |
(3,374 |
) |
(1,826 |
) |
|||||||
|
Distributions to shareholders—Service Class |
(53 |
) |
(38 |
) |
|||||||
|
Distributions to shareholders—R6 Class |
(1,737 |
) |
0 |
||||||||
|
Total distributions to shareholders |
(21,402 |
) |
(6,314 |
) |
|||||||
|
From Fund share transactions: |
|||||||||||
|
Proceeds from shares sold—Investor Class |
66,540 |
120,191 |
|||||||||
|
Proceeds from shares sold—Investor Class converted from Service Class (a) |
21,426 |
0 |
|||||||||
|
Proceeds from shares sold—Advisor Class |
364,527 |
495,225 |
|||||||||
|
Proceeds from shares sold—Institutional Class |
90,568 |
335,564 |
|||||||||
|
Proceeds from shares sold—Service Class |
664 |
20,598 |
|||||||||
|
Proceeds from shares sold—Class R6 |
800,095 |
960,405 |
|||||||||
|
Reinvestment of distributions—Investor Class |
5,478 |
0 |
|||||||||
|
Reinvestment of distributions—Advisor Class |
10,344 |
4,233 |
|||||||||
|
Reinvestment of distributions—Institutional Class |
2,930 |
1,706 |
|||||||||
|
Reinvestment of distributions—Service Class |
53 |
38 |
|||||||||
|
Reinvestment of distributions—Class R6 |
1,735 |
0 |
|||||||||
|
Payment for shares redeemed—Investor Class |
(220,190 |
) |
(385,428 |
) |
|||||||
|
Payment for shares redeemed—Advisor Class |
(184,708 |
) |
(400,177 |
) |
|||||||
|
Payment for shares redeemed—Institutional Class |
(64,500 |
) |
(531,622 |
) |
|||||||
|
Payment for shares redeemed—Service Class |
(5,019 |
) |
(7,728 |
) |
|||||||
|
Payment for shares redeemed—Service Class converted to Investor Class (a) |
(21,426 |
) |
0 |
||||||||
|
Payment for shares redeemed—Class R6 |
(780,072 |
) |
(694,242 |
) |
|||||||
|
Net increase (decrease) in net assets from Fund share transactions |
88,445 |
(81,237 |
) |
||||||||
|
Total increase (decrease) in net assets |
(86,425 |
) |
2,025,909 |
||||||||
|
Net assets: |
|||||||||||
|
Beginning of period |
5,425,003 |
3,399,094 |
|||||||||
|
End of period |
$ |
5,338,578 |
$ |
5,425,003 |
|||||||
See accompanying Notes to Financial Statements.
Oakmark.com 63
Oakmark Funds
Statements of Changes in Net Assets (continued)
(in thousands)
|
Oakmark Select Fund (continued) |
|||||||||||
|
Six Months Ended March 31, 2022 (Unaudited) |
Year Ended September 30, 2021 |
||||||||||
|
Fund share transactions—Investor Class: |
|||||||||||
|
Shares sold |
1,046 |
2,116 |
|||||||||
|
Shares sold—shares converted from Service Class (a) |
344 |
0 |
|||||||||
|
Shares issued in reinvestment of dividends |
87 |
0 |
|||||||||
|
Less shares redeemed |
(3,465 |
) |
(7,523 |
) |
|||||||
|
Net decrease in shares outstanding |
(1,988 |
) |
(5,407 |
) |
|||||||
|
Fund share transactions—Advisor Class: |
|||||||||||
|
Shares sold |
5,782 |
9,093 |
|||||||||
|
Shares issued in reinvestment of dividends |
164 |
88 |
|||||||||
|
Less shares redeemed |
(2,913 |
) |
(7,532 |
) |
|||||||
|
Net increase in shares outstanding |
3,033 |
1,649 |
|||||||||
|
Fund share transactions—Institutional Class: |
|||||||||||
|
Shares sold |
1,419 |
7,237 |
|||||||||
|
Shares issued in reinvestment of dividends |
47 |
36 |
|||||||||
|
Less shares redeemed |
(1,023 |
) |
(11,496 |
) |
|||||||
|
Net increase (decrease) in shares outstanding |
443 |
(4,223 |
) |
||||||||
|
Fund share transactions—Service Class: |
|||||||||||
|
Shares sold |
10 |
504 |
|||||||||
|
Shares issued in reinvestment of dividends |
1 |
1 |
|||||||||
|
Less shares redeemed |
(81 |
) |
(154 |
) |
|||||||
|
Less shares redeemed—shares converted Investor Class (a) |
(349 |
) |
0 |
||||||||
|
Net increase (decrease) in shares outstanding |
(419 |
) |
351 |
||||||||
|
Fund share transactions—R6 Class: |
|||||||||||
|
Shares sold |
12,763 |
17,641 |
|||||||||
|
Shares issued in reinvestment of dividends |
28 |
0 |
|||||||||
|
Less shares redeemed |
(12,469 |
) |
(12,323 |
) |
|||||||
|
Net increase in shares outstanding |
322 |
5,318 |
|||||||||
(a) Service Class shares were converted into Investor Class shares at the close of business on December 17, 2021.
See accompanying Notes to Financial Statements.
64 OAKMARK FUNDS
Oakmark Funds
Statements of Changes in Net Assets (continued)
(in thousands)
|
Oakmark Global Fund |
|||||||||||
|
Six Months Ended March 31, 2022 (Unaudited) |
Year Ended September 30, 2021 |
||||||||||
|
From Operations: |
|||||||||||
|
Net investment income |
$ |
6,013 |
$ |
6,517 |
|||||||
|
Net realized gain (loss) |
130,595 |
143,096 |
|||||||||
|
Net change in unrealized appreciation (depreciation) |
(162,450 |
) |
397,180 |
||||||||
|
Net increase (decrease) in net assets from operations |
(25,842 |
) |
546,793 |
||||||||
|
Distributions to shareholders from: |
|||||||||||
|
Distributions to shareholders—Investor Class |
(69,039 |
) |
(1,297 |
) |
|||||||
|
Distributions to shareholders—Advisor Class |
(18,838 |
) |
(778 |
) |
|||||||
|
Distributions to shareholders—Institutional Class |
(38,791 |
) |
(1,351 |
) |
|||||||
|
Distributions to shareholders—Service Class |
(999 |
) |
0 |
||||||||
|
Distributions to shareholders—R6 Class |
(8,204 |
) |
0 |
||||||||
|
Total distributions to shareholders |
(135,871 |
) |
(3,426 |
) |
|||||||
|
From Fund share transactions: |
|||||||||||
|
Proceeds from shares sold—Investor Class |
28,823 |
83,443 |
|||||||||
|
Proceeds from shares sold—Investor Class converted from Service Class (a) |
11,221 |
0 |
|||||||||
|
Proceeds from shares sold—Advisor Class |
20,762 |
54,219 |
|||||||||
|
Proceeds from shares sold—Institutional Class |
37,414 |
130,315 |
|||||||||
|
Proceeds from shares sold—Service Class |
491 |
2,325 |
|||||||||
|
Proceeds from shares sold—Class R6 |
574 |
88,736 |
|||||||||
|
Reinvestment of distributions—Investor Class |
67,452 |
1,268 |
|||||||||
|
Reinvestment of distributions—Advisor Class |
17,655 |
704 |
|||||||||
|
Reinvestment of distributions—Institutional Class |
37,386 |
1,336 |
|||||||||
|
Reinvestment of distributions—Service Class |
839 |
0 |
|||||||||
|
Reinvestment of distributions—Class R6 |
8,130 |
0 |
|||||||||
|
Payment for shares redeemed—Investor Class |
(93,400 |
) |
(220,213 |
) |
|||||||
|
Payment for shares redeemed—Advisor Class |
(24,728 |
) |
(151,870 |
) |
|||||||
|
Payment for shares redeemed—Institutional Class |
(61,299 |
) |
(146,167 |
) |
|||||||
|
Payment for shares redeemed—Service Class |
(420 |
) |
(2,984 |
) |
|||||||
|
Payment for shares redeemed—Service Class converted to Investor Class (a) |
(11,221 |
) |
0 |
||||||||
|
Payment for shares redeemed—Class R6 |
(3,010 |
) |
(8,056 |
) |
|||||||
|
Net increase (decrease) in net assets from Fund share transactions |
36,669 |
(166,944 |
) |
||||||||
|
Total increase (decrease) in net assets |
(125,044 |
) |
376,423 |
||||||||
|
Net assets: |
|||||||||||
|
Beginning of period |
1,552,284 |
1,175,861 |
|||||||||
|
End of period |
$ |
1,427,240 |
$ |
1,552,284 |
|||||||
See accompanying Notes to Financial Statements.
Oakmark.com 65
Oakmark Funds
Statements of Changes in Net Assets (continued)
(in thousands)
|
Oakmark Global Fund (continued) |
|||||||||||
|
Six Months Ended March 31, 2022 (Unaudited) |
Year Ended September 30, 2021 |
||||||||||
|
Fund share transactions—Investor Class: |
|||||||||||
|
Shares sold |
834 |
2,384 |
|||||||||
|
Shares sold—shares converted from Service Class (a) |
334 |
0 |
|||||||||
|
Shares issued in reinvestment of dividends |
1,980 |
41 |
|||||||||
|
Less shares redeemed |
(2,705 |
) |
(6,558 |
) |
|||||||
|
Net increase (decrease) in shares outstanding |
443 |
(4,133 |
) |
||||||||
|
Fund share transactions—Advisor Class: |
|||||||||||
|
Shares sold |
597 |
1,597 |
|||||||||
|
Shares issued in reinvestment of dividends |
519 |
23 |
|||||||||
|
Less shares redeemed |
(705 |
) |
(4,198 |
) |
|||||||
|
Net increase (decrease) in shares outstanding |
411 |
(2,578 |
) |
||||||||
|
Fund share transactions—Institutional Class: |
|||||||||||
|
Shares sold |
1,060 |
3,517 |
|||||||||
|
Shares issued in reinvestment of dividends |
1,098 |
43 |
|||||||||
|
Less shares redeemed |
(1,796 |
) |
(4,404 |
) |
|||||||
|
Net increase (decrease) in shares outstanding |
362 |
(844 |
) |
||||||||
|
Fund share transactions—Service Class: |
|||||||||||
|
Shares sold |
14 |
67 |
|||||||||
|
Shares issued in reinvestment of dividends |
26 |
0 |
|||||||||
|
Less shares redeemed |
(12 |
) |
(96 |
) |
|||||||
|
Less shares redeemed—shares converted Investor Class (a) |
(346 |
) |
0 |
||||||||
|
Net decrease in shares outstanding |
(318 |
) |
(29 |
) |
|||||||
|
Fund share transactions—R6 Class: |
|||||||||||
|
Shares sold |
16 |
2,735 |
|||||||||
|
Shares issued in reinvestment of dividends |
239 |
0 |
|||||||||
|
Less shares redeemed |
(83 |
) |
(222 |
) |
|||||||
|
Net increase in shares outstanding |
172 |
2,513 |
|||||||||
(a) Service Class shares were converted into Investor Class shares at the close of business on December 17, 2021.
See accompanying Notes to Financial Statements.
66 OAKMARK FUNDS
Oakmark Funds
Statements of Changes in Net Assets (continued)
(in thousands)
|
Oakmark Global Select Fund |
|||||||||||
|
Six Months Ended March 31, 2022 (Unaudited) |
Year Ended September 30, 2021 |
||||||||||
|
From Operations: |
|||||||||||
|
Net investment income |
$ |
9,152 |
$ |
6,541 |
|||||||
|
Net realized gain (loss) |
85,909 |
177,761 |
|||||||||
|
Net change in unrealized appreciation (depreciation) |
(181,773 |
) |
368,068 |
||||||||
|
Net increase (decrease) in net assets from operations |
(86,712 |
) |
552,370 |
||||||||
|
Distributions to shareholders from: |
|||||||||||
|
Distributions to shareholders—Investor Class |
(51,810 |
) |
0 |
||||||||
|
Distributions to shareholders—Advisor Class |
(21,418 |
) |
(530 |
) |
|||||||
|
Distributions to shareholders—Institutional Class |
(72,901 |
) |
(825 |
) |
|||||||
|
Distributions to shareholders—R6 Class |
(11,585 |
) |
0 |
||||||||
|
Total distributions to shareholders |
(157,714 |
) |
(1,355 |
) |
|||||||
|
From Fund share transactions: |
|||||||||||
|
Proceeds from shares sold—Investor Class |
35,794 |
76,233 |
|||||||||
|
Proceeds from shares sold—Advisor Class |
29,715 |
121,079 |
|||||||||
|
Proceeds from shares sold—Institutional Class |
107,025 |
467,094 |
|||||||||
|
Proceeds from shares sold—Class R6 |
5,617 |
147,923 |
|||||||||
|
Reinvestment of distributions—Investor Class |
50,153 |
0 |
|||||||||
|
Reinvestment of distributions—Advisor Class |
20,925 |
469 |
|||||||||
|
Reinvestment of distributions—Institutional Class |
62,435 |
741 |
|||||||||
|
Reinvestment of distributions—Class R6 |
11,504 |
0 |
|||||||||
|
Payment for shares redeemed—Investor Class |
(65,759 |
) |
(189,439 |
) |
|||||||
|
Payment for shares redeemed—Advisor Class |
(54,067 |
) |
(430,685 |
) |
|||||||
|
Payment for shares redeemed—Institutional Class |
(159,303 |
) |
(274,986 |
) |
|||||||
|
Payment for shares redeemed—Class R6 |
(7,296 |
) |
(40,841 |
) |
|||||||
|
Net increase (decrease) in net assets from Fund share transactions |
36,743 |
(122,412 |
) |
||||||||
|
Total increase (decrease) in net assets |
(207,683 |
) |
428,603 |
||||||||
|
Net assets: |
|||||||||||
|
Beginning of period |
1,719,302 |
1,290,699 |
|||||||||
|
End of period |
$ |
1,511,619 |
$ |
1,719,302 |
|||||||
See accompanying Notes to Financial Statements.
Oakmark.com 67
Oakmark Funds
Statements of Changes in Net Assets (continued)
(in thousands)
|
Oakmark Global Select Fund (continued) |
|||||||||||
|
Six Months Ended March 31, 2022 (Unaudited) |
Year Ended September 30, 2021 |
||||||||||
|
Fund share transactions—Investor Class: |
|||||||||||
|
Shares sold |
1,533 |
3,267 |
|||||||||
|
Shares issued in reinvestment of dividends |
2,247 |
0 |
|||||||||
|
Less shares redeemed |
(2,870 |
) |
(8,445 |
) |
|||||||
|
Net increase (decrease) in shares outstanding |
910 |
(5,178 |
) |
||||||||
|
Fund share transactions—Advisor Class: |
|||||||||||
|
Shares sold |
1,297 |
5,200 |
|||||||||
|
Shares issued in reinvestment of dividends |
939 |
23 |
|||||||||
|
Less shares redeemed |
(2,267 |
) |
(17,996 |
) |
|||||||
|
Net decrease in shares outstanding |
(31 |
) |
(12,773 |
) |
|||||||
|
Fund share transactions—Institutional Class: |
|||||||||||
|
Shares sold |
4,654 |
19,016 |
|||||||||
|
Shares issued in reinvestment of dividends |
2,801 |
36 |
|||||||||
|
Less shares redeemed |
(7,500 |
) |
(12,446 |
) |
|||||||
|
Net increase (decrease) in shares outstanding |
(45 |
) |
6,606 |
||||||||
|
Fund share transactions—R6 Class: |
|||||||||||
|
Shares sold |
247 |
6,732 |
|||||||||
|
Shares issued in reinvestment of dividends |
516 |
0 |
|||||||||
|
Less shares redeemed |
(330 |
) |
(1,660 |
) |
|||||||
|
Net increase in shares outstanding |
433 |
5,072 |
|||||||||
See accompanying Notes to Financial Statements.
68 OAKMARK FUNDS
Oakmark Funds
Statements of Changes in Net Assets (continued)
(in thousands)
|
Oakmark International Fund |
|||||||||||
|
Six Months Ended March 31, 2022 (Unaudited) |
Year Ended September 30, 2021 |
||||||||||
|
From Operations: |
|||||||||||
|
Net investment income |
$ |
192,177 |
$ |
315,380 |
|||||||
|
Net realized gain (loss) |
697,103 |
746,591 |
|||||||||
|
Net change in unrealized appreciation (depreciation) |
(3,042,716 |
) |
7,603,780 |
||||||||
|
Net increase (decrease) in net assets from operations |
(2,153,436 |
) |
8,665,751 |
||||||||
|
Distributions to shareholders from: |
|||||||||||
|
Distributions to shareholders—Investor Class |
(104,445 |
) |
(31,246 |
) |
|||||||
|
Distributions to shareholders—Advisor Class |
(45,714 |
) |
(37,862 |
) |
|||||||
|
Distributions to shareholders—Institutional Class |
(177,875 |
) |
(48,820 |
) |
|||||||
|
Distributions to shareholders—Service Class |
(1,306 |
) |
(110 |
) |
|||||||
|
Distributions to shareholders—R6 Class |
(51,583 |
) |
0 |
||||||||
|
Total distributions to shareholders |
(380,923 |
) |
(118,038 |
) |
|||||||
|
From Fund share transactions: |
|||||||||||
|
Proceeds from shares sold—Investor Class |
691,265 |
1,523,448 |
|||||||||
|
Proceeds from shares sold—Investor Class converted from Service Class (a) |
132,197 |
0 |
|||||||||
|
Proceeds from shares sold—Advisor Class |
493,492 |
1,903,742 |
|||||||||
|
Proceeds from shares sold—Institutional Class |
1,855,983 |
8,102,302 |
|||||||||
|
Proceeds from shares sold—Service Class |
8,998 |
33,300 |
|||||||||
|
Proceeds from shares sold—Class R6 |
1,143,913 |
3,462,881 |
|||||||||
|
Reinvestment of distributions—Investor Class |
100,150 |
29,913 |
|||||||||
|
Reinvestment of distributions—Advisor Class |
44,817 |
21,958 |
|||||||||
|
Reinvestment of distributions—Institutional Class |
104,275 |
42,668 |
|||||||||
|
Reinvestment of distributions—Service Class |
713 |
53 |
|||||||||
|
Reinvestment of distributions—Class R6 |
51,009 |
0 |
|||||||||
|
Payment for shares redeemed—Investor Class |
(1,353,565 |
) |
(3,870,003 |
) |
|||||||
|
Payment for shares redeemed—Advisor Class |
(435,496 |
) |
(7,548,317 |
) |
|||||||
|
Payment for shares redeemed—Institutional Class |
(1,861,292 |
) |
(6,404,347 |
) |
|||||||
|
Payment for shares redeemed—Service Class |
(12,578 |
) |
(143,916 |
) |
|||||||
|
Payment for shares redeemed—Service Class converted to Investor Class (a) |
(132,197 |
) |
0 |
||||||||
|
Payment for shares redeemed—Class R6 |
(391,532 |
) |
(401,906 |
) |
|||||||
|
Net increase (decrease) in net assets from Fund share transactions |
440,152 |
(3,248,224 |
) |
||||||||
|
Total increase (decrease) in net assets |
(2,094,207 |
) |
5,299,489 |
||||||||
|
Net assets: |
|||||||||||
|
Beginning of period |
26,959,542 |
21,660,053 |
|||||||||
|
End of period |
$ |
24,865,335 |
$ |
26,959,542 |
|||||||
See accompanying Notes to Financial Statements.
Oakmark.com 69
Oakmark Funds
Statements of Changes in Net Assets (continued)
(in thousands)
|
Oakmark International Fund (continued) |
|||||||||||
|
Six Months Ended March 31, 2022 (Unaudited) |
Year Ended September 30, 2021 |
||||||||||
|
Fund share transactions—Investor Class: |
|||||||||||
|
Shares sold |
25,047 |
55,752 |
|||||||||
|
Shares sold—shares converted from Service Class (a) |
4,905 |
0 |
|||||||||
|
Shares issued in reinvestment of dividends |
3,677 |
1,174 |
|||||||||
|
Less shares redeemed |
(49,435 |
) |
(145,872 |
) |
|||||||
|
Net decrease in shares outstanding |
(15,806 |
) |
(88,946 |
) |
|||||||
|
Fund share transactions—Advisor Class: |
|||||||||||
|
Shares sold |
17,623 |
69,568 |
|||||||||
|
Shares issued in reinvestment of dividends |
1,648 |
864 |
|||||||||
|
Less shares redeemed |
(15,882 |
) |
(268,475 |
) |
|||||||
|
Net increase (decrease) in shares outstanding |
3,389 |
(198,043 |
) |
||||||||
|
Fund share transactions—Institutional Class: |
|||||||||||
|
Shares sold |
66,830 |
282,388 |
|||||||||
|
Shares issued in reinvestment of dividends |
3,835 |
1,677 |
|||||||||
|
Less shares redeemed |
(69,110 |
) |
(230,444 |
) |
|||||||
|
Net increase in shares outstanding |
1,555 |
53,621 |
|||||||||
|
Fund share transactions—Service Class: |
|||||||||||
|
Shares sold |
313 |
1,237 |
|||||||||
|
Shares issued in reinvestment of dividends |
26 |
2 |
|||||||||
|
Less shares redeemed |
(438 |
) |
(5,457 |
) |
|||||||
|
Less shares redeemed—shares converted Investor Class (a) |
(4,857 |
) |
0 |
||||||||
|
Net decrease in shares outstanding |
(4,956 |
) |
(4,218 |
) |
|||||||
|
Fund share transactions—R6 Class: |
|||||||||||
|
Shares sold |
41,728 |
120,129 |
|||||||||
|
Shares issued in reinvestment of dividends |
1,875 |
0 |
|||||||||
|
Less shares redeemed |
(14,567 |
) |
(13,828 |
) |
|||||||
|
Net increase in shares outstanding |
29,036 |
106,301 |
|||||||||
(a) Service Class shares were converted into Investor Class shares at the close of business on December 17, 2021.
See accompanying Notes to Financial Statements.
70 OAKMARK FUNDS
Oakmark Funds
Statements of Changes in Net Assets (continued)
(in thousands)
|
Oakmark International Small Cap Fund |
|||||||||||
|
Six Months Ended March 31, 2022 (Unaudited) |
Year Ended September 30, 2021 |
||||||||||
|
From Operations: |
|||||||||||
|
Net investment income |
$ |
3,617 |
$ |
20,341 |
|||||||
|
Net realized gain (loss) |
30,951 |
205,165 |
|||||||||
|
Net change in unrealized appreciation (depreciation) |
(205,729 |
) |
323,896 |
||||||||
|
Net increase (decrease) in net assets from operations |
(171,161 |
) |
549,402 |
||||||||
|
Distributions to shareholders from: |
|||||||||||
|
Distributions to shareholders—Investor Class |
(8,861 |
) |
(9,119 |
) |
|||||||
|
Distributions to shareholders—Advisor Class |
(3,257 |
) |
(3,675 |
) |
|||||||
|
Distributions to shareholders—Institutional Class |
(9,896 |
) |
(15,216 |
) |
|||||||
|
Distributions to shareholders—Service Class |
(12 |
) |
(13 |
) |
|||||||
|
Distributions to shareholders—R6 Class |
(6,974 |
) |
0 |
||||||||
|
Total distributions to shareholders |
(29,000 |
) |
(28,023 |
) |
|||||||
|
From Fund share transactions: |
|||||||||||
|
Proceeds from shares sold—Investor Class |
32,511 |
128,773 |
|||||||||
|
Proceeds from shares sold—Investor Class converted from Service Class (a) |
787 |
0 |
|||||||||
|
Proceeds from shares sold—Advisor Class |
24,566 |
63,393 |
|||||||||
|
Proceeds from shares sold—Institutional Class |
47,898 |
151,931 |
|||||||||
|
Proceeds from shares sold—Service Class |
28 |
123 |
|||||||||
|
Proceeds from shares sold—Class R6 |
75,628 |
371,148 |
|||||||||
|
Reinvestment of distributions—Investor Class |
8,647 |
8,902 |
|||||||||
|
Reinvestment of distributions—Advisor Class |
3,198 |
3,299 |
|||||||||
|
Reinvestment of distributions—Institutional Class |
6,902 |
8,177 |
|||||||||
|
Reinvestment of distributions—Service Class |
7 |
7 |
|||||||||
|
Reinvestment of distributions—Class R6 |
2,222 |
0 |
|||||||||
|
Payment for shares redeemed—Investor Class |
(97,045 |
) |
(143,753 |
) |
|||||||
|
Payment for shares redeemed—Advisor Class |
(23,140 |
) |
(102,250 |
) |
|||||||
|
Payment for shares redeemed—Institutional Class |
(54,588 |
) |
(519,412 |
) |
|||||||
|
Payment for shares redeemed—Service Class |
(13 |
) |
(442 |
) |
|||||||
|
Payment for shares redeemed—Service Class converted to Investor Class (a) |
(787 |
) |
0 |
||||||||
|
Payment for shares redeemed—Class R6 |
(26,605 |
) |
(6,074 |
) |
|||||||
|
Net increase (decrease) in net assets from Fund share transactions |
216 |
(36,178 |
) |
||||||||
|
Total increase (decrease) in net assets |
(199,945 |
) |
485,201 |
||||||||
|
Net assets: |
|||||||||||
|
Beginning of period |
1,644,767 |
1,159,566 |
|||||||||
|
End of period |
$ |
1,444,822 |
$ |
1,644,767 |
|||||||
See accompanying Notes to Financial Statements.
Oakmark.com 71
Oakmark Funds
Statements of Changes in Net Assets (continued)
(in thousands)
|
Oakmark International Small Cap Fund (continued) |
|||||||||||
|
Six Months Ended March 31, 2022 (Unaudited) |
Year Ended September 30, 2021 |
||||||||||
|
Fund share transactions—Investor Class: |
|||||||||||
|
Shares sold |
1,677 |
7,055 |
|||||||||
|
Shares sold—shares converted from Service Class (a) |
42 |
0 |
|||||||||
|
Shares issued in reinvestment of dividends |
454 |
539 |
|||||||||
|
Less shares redeemed |
(5,022 |
) |
(7,927 |
) |
|||||||
|
Net decrease in shares outstanding |
(2,849 |
) |
(333 |
) |
|||||||
|
Fund share transactions—Advisor Class: |
|||||||||||
|
Shares sold |
1,265 |
3,308 |
|||||||||
|
Shares issued in reinvestment of dividends |
168 |
200 |
|||||||||
|
Less shares redeemed |
(1,176 |
) |
(5,396 |
) |
|||||||
|
Net increase (decrease) in shares outstanding |
257 |
(1,888 |
) |
||||||||
|
Fund share transactions—Institutional Class: |
|||||||||||
|
Shares sold |
2,473 |
8,098 |
|||||||||
|
Shares issued in reinvestment of dividends |
363 |
497 |
|||||||||
|
Less shares redeemed |
(2,938 |
) |
(27,112 |
) |
|||||||
|
Net decrease in shares outstanding |
(102 |
) |
(18,517 |
) |
|||||||
|
Fund share transactions—Service Class: |
|||||||||||
|
Shares sold |
2 |
7 |
|||||||||
|
Less shares redeemed |
(1 |
) |
(28 |
) |
|||||||
|
Less shares redeemed—shares converted Investor Class (a) |
(42 |
) |
0 |
||||||||
|
Net decrease in shares outstanding |
(41 |
) |
(21 |
) |
|||||||
|
Fund share transactions—R6 Class: |
|||||||||||
|
Shares sold |
3,906 |
18,757 |
|||||||||
|
Shares issued in reinvestment of dividends |
117 |
0 |
|||||||||
|
Less shares redeemed |
(1,459 |
) |
(292 |
) |
|||||||
|
Net increase in shares outstanding |
2,564 |
18,465 |
|||||||||
(a) Service Class shares were converted into Investor Class shares at the close of business on December 17, 2021.
See accompanying Notes to Financial Statements.
72 OAKMARK FUNDS
Oakmark Funds
Statements of Changes in Net Assets (continued)
(in thousands)
|
Oakmark Equity and Income Fund |
|||||||||||
|
Six Months Ended March 31, 2022 (Unaudited) |
Year Ended September 30, 2021 |
||||||||||
|
From Operations: |
|||||||||||
|
Net investment income |
$ |
39,345 |
$ |
80,971 |
|||||||
|
Net realized gain (loss) |
699,303 |
1,730,949 |
|||||||||
|
Net change in unrealized appreciation (depreciation) |
(738,174 |
) |
586,546 |
||||||||
|
Net increase in net assets from operations |
474 |
2,398,466 |
|||||||||
|
Distributions to shareholders from: |
|||||||||||
|
Distributions to shareholders—Investor Class |
(442,431 |
) |
(235,119 |
) |
|||||||
|
Distributions to shareholders—Advisor Class |
(70,199 |
) |
(43,545 |
) |
|||||||
|
Distributions to shareholders—Institutional Class |
(95,112 |
) |
(38,067 |
) |
|||||||
|
Distributions to shareholders—Service Class |
(12,652 |
) |
(6,284 |
) |
|||||||
|
Distributions to shareholders—R6 Class |
(7,171 |
) |
0 |
||||||||
|
Total distributions to shareholders |
(627,565 |
) |
(323,015 |
) |
|||||||
|
From Fund share transactions: |
|||||||||||
|
Proceeds from shares sold—Investor Class |
163,094 |
320,759 |
|||||||||
|
Proceeds from shares sold—Investor Class converted from Service Class (a) |
158,931 |
0 |
|||||||||
|
Proceeds from shares sold—Advisor Class |
93,693 |
162,480 |
|||||||||
|
Proceeds from shares sold—Institutional Class |
129,788 |
1,256,141 |
|||||||||
|
Proceeds from shares sold—Service Class |
7,082 |
23,414 |
|||||||||
|
Proceeds from shares sold—Class R6 |
880,516 |
826,248 |
|||||||||
|
Reinvestment of distributions—Investor Class |
422,736 |
223,724 |
|||||||||
|
Reinvestment of distributions—Advisor Class |
65,810 |
37,649 |
|||||||||
|
Reinvestment of distributions—Institutional Class |
84,504 |
35,843 |
|||||||||
|
Reinvestment of distributions—Service Class |
11,875 |
5,684 |
|||||||||
|
Reinvestment of distributions—Class R6 |
6,936 |
0 |
|||||||||
|
Payment for shares redeemed—Investor Class |
(534,774 |
) |
(1,959,894 |
) |
|||||||
|
Payment for shares redeemed—Advisor Class |
(81,793 |
) |
(560,926 |
) |
|||||||
|
Payment for shares redeemed—Institutional Class |
(131,244 |
) |
(1,224,314 |
) |
|||||||
|
Payment for shares redeemed—Service Class |
(10,055 |
) |
(88,419 |
) |
|||||||
|
Payment for shares redeemed—Service Class converted to Investor Class (a) |
(158,931 |
) |
0 |
||||||||
|
Payment for shares redeemed—Class R6 |
(887,107 |
) |
(754,844 |
) |
|||||||
|
Net increase (decrease) in net assets from Fund share transactions |
221,061 |
(1,696,455 |
) |
||||||||
|
Total increase (decrease) in net assets |
(406,030 |
) |
378,996 |
||||||||
|
Net assets: |
|||||||||||
|
Beginning of period |
7,841,837 |
7,462,841 |
|||||||||
|
End of period |
$ |
7,435,807 |
$ |
7,841,837 |
|||||||
See accompanying Notes to Financial Statements.
Oakmark.com 73
Oakmark Funds
Statements of Changes in Net Assets (continued)
(in thousands)
|
Oakmark Equity and Income Fund (continued) |
|||||||||||
|
Six Months Ended March 31, 2022 (Unaudited) |
Year Ended September 30, 2021 |
||||||||||
|
Fund share transactions—Investor Class: |
|||||||||||
|
Shares sold |
4,704 |
9,494 |
|||||||||
|
Shares sold—shares converted from Service Class (a) |
4,740 |
0 |
|||||||||
|
Shares issued in reinvestment of dividends |
12,514 |
7,381 |
|||||||||
|
Less shares redeemed |
(15,378 |
) |
(61,162 |
) |
|||||||
|
Net increase (decrease) in shares outstanding |
6,580 |
(44,287 |
) |
||||||||
|
Fund share transactions—Advisor Class: |
|||||||||||
|
Shares sold |
2,738 |
4,816 |
|||||||||
|
Shares issued in reinvestment of dividends |
1,950 |
1,243 |
|||||||||
|
Less shares redeemed |
(2,341 |
) |
(16,526 |
) |
|||||||
|
Net increase (decrease) in shares outstanding |
2,347 |
(10,467 |
) |
||||||||
|
Fund share transactions—Institutional Class: |
|||||||||||
|
Shares sold |
3,741 |
39,287 |
|||||||||
|
Shares issued in reinvestment of dividends |
2,504 |
1,184 |
|||||||||
|
Less shares redeemed |
(3,781 |
) |
(39,515 |
) |
|||||||
|
Net increase in shares outstanding |
2,464 |
956 |
|||||||||
|
Fund share transactions—Service Class: |
|||||||||||
|
Shares sold |
194 |
695 |
|||||||||
|
Shares issued in reinvestment of dividends |
353 |
188 |
|||||||||
|
Less shares redeemed |
(277 |
) |
(2,773 |
) |
|||||||
|
Less shares redeemed—shares converted Investor Class (a) |
(4,761 |
) |
0 |
||||||||
|
Net decrease in shares outstanding |
(4,491 |
) |
(1,890 |
) |
|||||||
|
Fund share transactions—R6 Class: |
|||||||||||
|
Shares sold |
25,662 |
23,588 |
|||||||||
|
Shares issued in reinvestment of dividends |
206 |
0 |
|||||||||
|
Less shares redeemed |
(25,522 |
) |
(21,164 |
) |
|||||||
|
Net increase in shares outstanding |
346 |
2,424 |
|||||||||
(a) Service Class shares were converted into Investor Class shares at the close of business on December 17, 2021.
See accompanying Notes to Financial Statements.
74 OAKMARK FUNDS
Oakmark Funds
Statements of Changes in Net Assets (continued)
(in thousands)
|
Oakmark Bond Fund |
|||||||||||
|
Six Months Ended March 31, 2022 (Unaudited) |
Year Ended September 30, 2021 |
||||||||||
|
From Operations: |
|||||||||||
|
Net investment income |
$ |
972 |
$ |
1,543 |
|||||||
|
Net realized gain (loss) |
(613 |
) |
1,964 |
||||||||
|
Net change in unrealized appreciation (depreciation) |
(5,430 |
) |
(127 |
) |
|||||||
|
Net increase (decrease) in net assets from operations |
(5,071 |
) |
3,380 |
||||||||
|
Distributions to shareholders from: |
|||||||||||
|
Distributions to shareholders—Investor Class |
(2 |
) |
0 |
||||||||
|
Distributions to shareholders—Advisor Class |
(51 |
) |
(25 |
) |
|||||||
|
Distributions to shareholders—Institutional Class |
(90 |
) |
(630 |
) |
|||||||
|
Distributions to shareholders—R6 Class |
(2,612 |
) |
(1,242 |
) |
|||||||
|
Total distributions to shareholders |
(2,755 |
) |
(1,897 |
) |
|||||||
|
From Fund share transactions: |
|||||||||||
|
Proceeds from shares sold—Investor Class |
676 |
0 |
|||||||||
|
Proceeds from shares sold—Advisor Class |
26 |
1,941 |
|||||||||
|
Proceeds from shares sold—Institutional Class |
301 |
4,425 |
|||||||||
|
Proceeds from shares sold—Class R6 |
7,154 |
89,884 |
|||||||||
|
Reinvestment of distributions—Investor Class |
2 |
0 |
|||||||||
|
Reinvestment of distributions—Advisor Class |
51 |
25 |
|||||||||
|
Reinvestment of distributions—Institutional Class |
90 |
630 |
|||||||||
|
Reinvestment of distributions—Class R6 |
1,867 |
1,209 |
|||||||||
|
Payment for shares redeemed—Advisor Class |
(713 |
) |
(216 |
) |
|||||||
|
Payment for shares redeemed—Institutional Class |
(318 |
) |
(81,978 |
) |
|||||||
|
Payment for shares redeemed—Class R6 |
(10,010 |
) |
(108 |
) |
|||||||
|
Net increase (decrease) in net assets from Fund share transactions |
(874 |
) |
15,812 |
||||||||
|
Total increase (decrease) in net assets |
(8,700 |
) |
17,295 |
||||||||
|
Net assets: |
|||||||||||
|
Beginning of period |
96,894 |
79,599 |
|||||||||
|
End of period |
$ |
88,194 |
$ |
96,894 |
|||||||
See accompanying Notes to Financial Statements.
Oakmark.com 75
Oakmark Funds
Statements of Changes in Net Assets (continued)
(in thousands)
|
Oakmark Bond Fund (continued) |
|||||||||||
|
Six Months Ended March 31, 2022 (Unaudited) |
Year Ended September 30, 2021 |
||||||||||
|
Fund share transactions—Investor Class: |
|||||||||||
|
Shares sold |
69 |
0 |
|||||||||
|
Shares issued in reinvestment of dividends |
0 |
0 |
|||||||||
|
Less shares redeemed |
0 |
0 |
|||||||||
|
Net increase in shares outstanding |
69 |
0 |
|||||||||
|
Fund share transactions—Advisor Class: |
|||||||||||
|
Shares sold |
3 |
189 |
|||||||||
|
Shares issued in reinvestment of dividends |
5 |
2 |
|||||||||
|
Less shares redeemed |
(70 |
) |
(21 |
) |
|||||||
|
Net increase (decrease) in shares outstanding |
(62 |
) |
170 |
||||||||
|
Fund share transactions—Institutional Class: |
|||||||||||
|
Shares sold |
30 |
429 |
|||||||||
|
Shares issued in reinvestment of dividends |
9 |
61 |
|||||||||
|
Less shares redeemed |
(31 |
) |
(7,942 |
) |
|||||||
|
Net increase (decrease) in shares outstanding |
8 |
(7,452 |
) |
||||||||
|
Fund share transactions—R6 Class: |
|||||||||||
|
Shares sold |
723 |
8,708 |
|||||||||
|
Shares issued in reinvestment of dividends |
186 |
117 |
|||||||||
|
Less shares redeemed |
(1,025 |
) |
(10 |
) |
|||||||
|
Net increase (decrease) in shares outstanding |
(116 |
) |
8,815 |
||||||||
See accompanying Notes to Financial Statements.
76 OAKMARK FUNDS
Oakmark Funds
Notes to Financial Statements
1. ORGANIZATION
The following are the significant accounting policies of Oakmark Fund ("Oakmark"), Oakmark Select Fund ("Select"), Oakmark Global Fund ("Global"), Oakmark Global Select Fund ("Global Select"), Oakmark International Fund ("International"), Oakmark International Small Cap Fund ("Int'l Small Cap"), Oakmark Equity and Income Fund ("Equity and Income"), and Oakmark Bond Fund ("Bond") collectively referred to as the "Funds," each a series of Harris Associates Investment Trust (the "Trust"), a Massachusetts business trust, organized on February 1, 1991, which is registered as an open-end management investment company under the Investment Company Act of 1940, as amended (the "1940 Act") and accordingly follows the investment company accounting and reporting guidance of the Financial Accounting Standards Board ("FASB") Accounting Standards Codification ("ASC") Topic 946 Financial Services—Investment Companies. Each Fund, other than Select and Global Select, is diversified in accordance with the 1940 Act. The following policies are in conformity with accounting principles generally accepted in the United States of America ("GAAP"). The presentation of financial statements in conformity with GAAP requires management to make estimates and assumptions that affect the reported amounts of assets and liabilities at the date of the financial statements and the reported amounts of revenues and expenses during the reporting period. Actual results could differ from those estimates and assumptions.
Each Fund offers four classes of shares: Investor Class Shares, Advisor Class Shares, Institutional Class Shares and R6 Class Shares. Shares of each Class are offered for purchase directly from the Funds and through certain intermediaries who have entered into an agreement with the Funds' distributor and/or Harris Associates L.P., investment adviser to the Funds (the "Adviser"). Investor Class Shares are also offered to certain retirement plans, such as 401(k) and profit sharing plans. Investor Class Shares of a Fund each pay a service fee not to exceed 0.25% per annum of the average daily net assets of the Fund's Investor Shares. This service fee is paid to third-party intermediaries who provide services for and/or maintain shareholder accounts.
On July 28, 2021, the Board of Trustees of Harris Associates Investment Trust approved the combination of the Investor Class and Service Class Shares and the conversion of the Funds' Service Class Shares to Investor Class Shares (the "Combination"). The class attributes of each Fund's Service Class and Investor Class were substantially similar. As a result of the Combination, the existing Service Class Shares were terminated, and those Shares of the Funds held by each shareholder were converted to Investor Class Shares of the same Fund, in each case with lower net total expenses. The Combination became effective on the close of business on December 17, 2021 and was not a taxable transaction for any Fund or its shareholders.
Income, realized and unrealized capital gains and losses, and expenses of the Funds not directly attributable to a specific class of shares are allocated to each class pro rata based on the relative net assets of each class. Transfer and dividend disbursing agent fees, other shareholder servicing fees, and reports to shareholders expenses are specific to each class.
2. SIGNIFICANT ACCOUNTING POLICIES
Security valuation
The share price is also called the net asset value (the "NAV") of a share. The NAV of shares of each class is normally determined by the Funds' custodian as of the close of regular session trading (usually 4:00 p.m. Eastern time) on the New York Stock Exchange (the "NYSE") on any day on which the NYSE is open for regular trading. If the NYSE is unexpectedly closed on a day it would normally be open for business, or if the NYSE has an unscheduled early closure, the Funds reserve the right to accept purchase and redemption orders and calculate their share price as of the normally scheduled close of regular trading on the NYSE for that day.
The NYSE is closed on Saturdays and Sundays and on New Year's Day, the third Mondays in January and February, Good Friday, the last Monday in May, Independence Day, Labor Day, Thanksgiving, and Christmas. If one of these holidays falls on a Saturday or Sunday, the NYSE will be closed on the preceding Friday or the following Monday, respectively. A Fund's NAV will not be calculated on days when the NYSE is closed. The NAV of a class of Fund shares is determined by dividing the value of the assets attributable to that class, less liabilities attributable to that class, by the number of outstanding shares of that class.
Trading in securities of non-U.S. issuers takes place in various markets on some days and at times when the NYSE is not open for trading. In addition, securities of non-U.S. issuers may not trade on some days when the NYSE is open for trading. The value of the Funds' portfolio holdings may change on days when the NYSE is not open for trading and you cannot purchase or redeem Fund shares.
Equity securities principally traded on securities exchanges in the United States are valued at the last sale price or the official closing price as of the time of valuation on that exchange, or lacking a reported sale price on the principal exchange at the time of valuation, at the most recent bid quotation. Each over-the-counter security traded on the NASDAQ National Market System shall be valued at the NASDAQ Official Closing Price ("NOCP"), or lacking a NOCP at the time of valuation, at the most recent bid quotation. Other over-the-counter securities are valued at the last sales prices at the time of valuation or, lacking any reported sales on that day, at the most recent bid quotations. Each equity security principally traded on a securities exchange outside the United States shall be valued, depending on local convention or regulation, at the last sale price, the last bid or asked price, the mean between the last bid and asked prices, the official closing price, an auction price, or the pricing convention accepted as the official closing price by MSCI for their index calculations. If there are unexpected disruptions in the primary market or valuations from the primary market are deemed suspect, equity securities may be valued based on a pricing composite or valuations from another exchange as of the close of the regular trading hours on the appropriate exchange or other designated time. The market value of exchange-traded securities is determined by using prices provided by one or more independent pricing services, or, as needed, by obtaining market quotations from independent broker-dealers. Short-term debt instruments (i.e., debt instruments whose maturities or expiration dates at the time of acquisition are one year or less) or money market instruments are valued at the latest bid quotation or an evaluated price from an independent pricing service. If a bid quotation or evaluated price from a pricing vendor is
Oakmark.com 77
Oakmark Funds
Notes to Financial Statements (continued)
not available for short-term debt instrument or money market instrument maturing in 60 days or less from date of valuation, such instruments are valued at amortized cost, which approximates market value. All other debt instruments are valued at the latest bid quotation or at an evaluated price provided by an independent pricing service. The pricing service may use standard inputs, such as benchmark yields, reported trades, broker-dealer quotes, issuer spreads, two-sided markets, benchmark securities, bids, offers, and reference data, including market research publications. For certain security types, additional inputs may be used or some of the standard inputs may not be applicable. Additionally, the pricing service monitors market indicators and industry and economic events, which may serve as a trigger to gather and possibly use additional market data. Options are valued at the mean of the most recent bid and asked quotations. In the event an option is out-of-the-money and no bid is available, a zero value may be assumed as the bid for purposes of calculating the mean of the most recent bid and ask quotations. In the event that designated pricing vendors are unable to provide valuations or timely valuations for Flexible Exchange ("FLEX") options on a given day, each FLEX option purchased or written may be valued using the Option Valuation ("OVME") function on Bloomberg. The OVME function requires objective inputs (strike price, exercise style and expiration dates) to derive a valuation using Bloomberg's proprietary calculations. FLEX options shall be valued at the mid of the buy and sell valuations produced by OVME. If values or prices are not readily available or are deemed unreliable, or if an event that is expected to affect the value of a portfolio security occurs after the close of the primary market or exchange on which that security is traded and before the close of the NYSE, the security will be valued at a fair value determined in good faith in accordance with Fund policies and procedures approved by the Board. The Funds may use a systematic fair valuation model provided by an independent pricing service to value securities of non-U.S. issuers in order to adjust for changes in value that may occur between the close of certain foreign exchanges and the NYSE. All assets and liabilities initially expressed in foreign currencies are converted into U.S. dollars at a current exchange price quoted by an independent pricing service or any major bank or dealer. If such quotations are not available, the rate of exchange will be determined in good faith in accordance with Fund policies and procedures. Although fair valuation may be more commonly used with equity securities of non-U.S. issuers, it also may be used in a range of other circumstances, including thinly-traded domestic securities or fixed-income securities. When fair value pricing is employed, the value of a portfolio security used by a Fund to calculate its NAV may differ from quoted or published prices for the same security.
Fair value measurement
Various inputs are used in determining the value of each Fund's investments. These inputs are prioritized into three broad levels as follows:
Level 1—quoted prices in active markets for identical securities
Level 2—other significant observable inputs (including quoted prices for similar investments, interest rates, prepayment speeds, credit risk and others)
Level 3—significant unobservable inputs (including the assumptions of the Adviser in determining the fair value of investments)
Observable inputs are those based on market data obtained from independent sources and unobservable inputs reflect the Adviser's own assumptions based on the best information available. The input levels are not necessarily an indication of risk or liquidity associated with investing in those securities.
The following is a summary of the inputs used as of March 31, 2022, in valuing each Fund's assets and liabilities. Except for the industries or investment types separately stated below, the total amounts for common stocks, fixed income and short-term investments in the table below are presented by industry or investment type in each Fund's Schedule of Investments. Information on forward foreign currency contracts is presented in each Fund's Schedule of Investments.
|
(in thousands) |
Quoted Prices in Active Markets for Identical Assets (Level 1) |
Other Significant Observable Inputs (Level 2) |
Significant Unobservable Inputs (Level 3) |
||||||||||||
|
Oakmark |
|||||||||||||||
|
Common Stocks |
$ |
16,818,658 |
$ |
0 |
$ |
0 |
|||||||||
|
Short-Term Investments |
0 |
1,148,716 |
0 |
||||||||||||
|
Call Options Written |
(16,541 |
) |
0 |
0 |
|||||||||||
|
Put Options Written |
(19,547 |
) |
0 |
0 |
|||||||||||
|
Total |
$ |
16,782,570 |
$ |
1,148,716 |
$ |
0 |
|||||||||
|
Select |
|||||||||||||||
|
Common Stocks |
$ |
4,927,571 |
$ |
0 |
$ |
0 |
|||||||||
|
Short-Term Investments |
0 |
437,120 |
0 |
||||||||||||
|
Call Options Written |
(11,460 |
) |
0 |
0 |
|||||||||||
|
Put Options Written |
(5,240 |
) |
0 |
0 |
|||||||||||
|
Total |
$ |
4,910,871 |
$ |
437,120 |
$ |
0 |
|||||||||
78 OAKMARK FUNDS
Oakmark Funds
Notes to Financial Statements (continued)
|
(in thousands) |
Quoted Prices in Active Markets for Identical Assets (Level 1) |
Other Significant Observable Inputs (Level 2) |
Significant Unobservable Inputs (Level 3) |
||||||||||||
|
Global |
|||||||||||||||
|
Common Stocks |
$ |
756,011 |
$ |
628,527 |
$ |
0 |
|||||||||
|
Preferred Stocks |
0 |
9,451 |
0 |
||||||||||||
|
Short-Term Investments |
0 |
30,011 |
0 |
||||||||||||
|
Forward Foreign Currency Contracts - Assets |
0 |
59 |
0 |
||||||||||||
|
Forward Foreign Currency Contracts - Liabilities |
0 |
(2 |
) |
0 |
|||||||||||
|
Total |
$ |
756,011 |
$ |
668,046 |
$ |
0 |
|||||||||
|
Global Select |
|||||||||||||||
|
Common Stocks |
$ |
810,404 |
$ |
607,339 |
$ |
0 |
|||||||||
|
Preferred Stocks |
0 |
40,431 |
0 |
||||||||||||
|
Short-Term Investments |
0 |
113,938 |
0 |
||||||||||||
|
Forward Foreign Currency Contracts - Assets |
0 |
58 |
0 |
||||||||||||
|
Forward Foreign Currency Contracts - Liabilities |
0 |
(3 |
) |
0 |
|||||||||||
|
Total |
$ |
810,404 |
$ |
761,763 |
$ |
0 |
|||||||||
|
International |
|||||||||||||||
|
Common Stocks |
$ |
1,846,440 |
$ |
21,901,525 |
$ |
0 |
|||||||||
|
Preferred Stocks |
0 |
325,649 |
0 |
||||||||||||
|
Short-Term Investments |
0 |
705,098 |
0 |
||||||||||||
|
Forward Foreign Currency Contracts - Assets |
0 |
1,010 |
0 |
||||||||||||
|
Forward Foreign Currency Contracts - Liabilities |
0 |
(61 |
) |
0 |
|||||||||||
|
Total |
$ |
1,846,440 |
$ |
22,933,221 |
$ |
0 |
|||||||||
|
Int'l Small Cap |
|||||||||||||||
|
Common Stocks |
$ |
193,025 |
$ |
1,206,529 |
$ |
0 |
|||||||||
|
Short-Term Investments |
0 |
33,272 |
0 |
||||||||||||
|
Forward Foreign Currency Contracts - Assets |
0 |
62 |
0 |
||||||||||||
|
Forward Foreign Currency Contracts - Liabilities |
0 |
0 |
0 |
||||||||||||
|
Total |
$ |
193,025 |
$ |
1,239,863 |
$ |
0 |
|||||||||
|
Equity and Income |
|||||||||||||||
|
Common Stocks |
$ |
4,336,243 |
$ |
184,600 |
$ |
0 |
|||||||||
|
Preferred Stocks |
6,079 |
0 |
0 |
||||||||||||
|
Corporate Bonds |
0 |
1,638,251 |
0 |
||||||||||||
|
Government and Agency Securities |
0 |
571,295 |
0 |
||||||||||||
|
Bank Loans |
0 |
64,997 |
0 |
||||||||||||
|
Convertible Bonds |
0 |
13,026 |
0 |
||||||||||||
|
Short-Term Investments |
0 |
568,247 |
0 |
||||||||||||
|
Total |
$ |
4,342,322 |
$ |
3,040,416 |
$ |
0 |
|||||||||
|
Bond |
|||||||||||||||
|
Preferred Stocks |
$ |
937 |
$ |
0 |
$ |
0 |
|||||||||
|
Corporate Bonds |
0 |
45,888 |
0 |
||||||||||||
|
Government and Agency Securities |
0 |
27,383 |
0 |
||||||||||||
|
Bank Loans |
0 |
4,305 |
0 |
||||||||||||
|
Asset Backed Securities |
0 |
3,466 |
0 |
||||||||||||
|
Collateralized Mortgage Obligations |
0 |
1,899 |
0 |
||||||||||||
|
Convertible Bond |
0 |
533 |
0 |
||||||||||||
|
Short-Term Investments |
0 |
1,974 |
0 |
||||||||||||
|
Total |
$ |
937 |
$ |
85,448 |
$ |
0 |
|||||||||
Oakmark.com 79
Oakmark Funds
Notes to Financial Statements (continued)
Offsetting assets and liabilities
ASC 210 requires entities to disclose gross and net information about instruments and transactions eligible for offset on the Statement of Assets and Liabilities and disclose instruments and transactions subject to master netting or similar agreements. This disclosure is limited to derivative instruments, repurchase and reverse repurchase agreements, and securities borrowing and lending transactions.
At March 31, 2022, certain Funds held open forward foreign currency contracts that were subject to a foreign exchange settlement and netting agreement with the same counterparty. The agreement includes provisions for general obligations, representations and certain events of default or termination. The agreement includes provisions for netting arrangements that may reduce credit risk and counterparty risk associated with relevant transactions in the event a counterparty fails to meet its obligations. The net recognized assets or liabilities related to open forward foreign currency contracts are presented in the Statements of Assets and Liabilities. The gross recognized assets (appreciation) and liabilities (depreciation) by contract are presented in the forward foreign currency contract table included in the Fund's Schedule of Investments.
At March 31, 2022, each Fund held investments in repurchase agreements. The gross value of these investments and the value of the related collateral are presented in each Fund's Schedule of Investments. The value of the related collateral for each Fund exceeded the value of the repurchase agreements held at period end.
The value of the securities on loan and the value of the related collateral as of period end, if any, are included in the Securities lending section of Note 1 to Financial Statements.
Foreign currency translations
Certain Funds invest in foreign securities, which may involve a number of risk factors and special considerations not present with investments in securities of U.S. corporations. Values of investments and other assets and liabilities denominated in foreign currencies are translated into U.S. dollars at current exchange rates obtained by a recognized bank, dealer or independent pricing service on the day of valuation. Purchases and sales of investments and dividend and interest income are converted at the prevailing rate of exchange on the respective dates of such transactions.
The Funds do not isolate that portion of the results of operations resulting from changes in foreign exchange rates on investments from the fluctuations arising from changes in market prices of securities held. Such fluctuations are included in net realized gain (loss) on investments and net change in unrealized appreciation (depreciation) on investments in the Statements of Operations. Net realized gains and losses on foreign currency transactions arising from the sale of foreign currencies, currency gains or losses realized between the trade and settlement dates on securities transactions and the difference between the amounts of dividends, interest and tax reclaims recorded and the U.S. dollar equivalent of the amounts actually received or paid are included in net realized gain (loss) on foreign currency transactions in the Statements of Operations. Unrealized gains and losses arising from changes in the fair value of assets and liabilities, other than investments in securities, resulting from changes in exchange rates are included in net change in unrealized appreciation (depreciation) on foreign currency translation in the Statements of Operations.
Forward foreign currency contracts
Forward foreign currency contracts are agreements to exchange one currency for another at a future date and at a specified price. The Funds' transactions in forward foreign currency contracts are limited to transaction and portfolio hedging. The contractual amounts of forward foreign currency contracts do not necessarily represent the amounts potentially subject to risk. The measurement of the risks associated with these instruments is meaningful only when all related and offsetting transactions are considered and could exceed the net unrealized value shown in the tables below. Risks arise from the possible inability of counterparties to meet the terms of their contracts and from movements in currency values. Forward foreign currency contracts are valued at the current day's interpolated foreign exchange rates. Unrealized gain or loss on the contracts, as measured by the difference between the forward foreign exchange rates at the dates of entry into the contracts and the forward rates at the end of the period, is included in the Statements of Assets and Liabilities. Realized gains and losses and the net change in unrealized appreciation (depreciation) on forward foreign currency contracts for the period are included in the Statements of Operations.
At March 31, 2022, Global, Global Select, International and Int'l Small Cap held non-collateralized, forward foreign currency contracts, which are considered derivative instruments. For Global, Global Select and Int'l Small Cap, the counterparties are Goldman Sachs and State Street Bank and Trust Company ("State Street"), and for International, the counterparty is State Street. These forward foreign currency contracts are listed in each Fund's Schedule of Investments.
For the period ended March 31, 2022, the notional value of forward foreign currency contracts opened and the notional value of settled contracts is listed by Fund in the table below (in thousands):
|
Fund |
Currency Contracts Opened |
Currency Contracts Settled |
|||||||||
|
Global |
$ |
18,680 |
$ |
20,819 |
|||||||
|
Global Select |
18,315 |
20,545 |
|||||||||
|
International |
371,436 |
392,871 |
|||||||||
|
Int'l Small Cap |
19,569 |
19,187 |
|||||||||
80 OAKMARK FUNDS
Oakmark Funds
Notes to Financial Statements (continued)
Security transactions and investment income
Security transactions are accounted for on the trade date (date the order to buy or sell is executed) and dividend income is recorded on the ex-dividend date, except that certain dividends from foreign securities are recorded as soon as the information becomes available after the ex-dividend date. Interest income and expenses are recorded on an accrual basis. Discount is accreted on long-term fixed income securities using the yield-to-maturity method. Premium is amortized on long-term fixed income securities using the yield-to-earliest call method. Withholding taxes and tax reclaims on foreign dividends have been provided for in accordance with the Funds' understanding of the applicable country's tax rules and rates. Net realized gains and losses on investments are determined by the specific identification method.
Short sales
Each Fund may sell a security it does not own in anticipation of a decline in the fair value of that security. When a Fund sells a security short, it must borrow the security sold short and deliver it to the broker-dealer through which it made the short sale. A gain, limited to the price at which the Fund sold the security short, or loss, unlimited in size, will be recognized upon the termination of the short sale. Each Fund may sell shares of when-issued securities. Typically, a Fund sells when-issued securities when a company announces a spin-off or re-organization, and the post-spin-off or post-re-organization shares begin trading on a when-issued basis prior to the effective date of the corporate action. A sale of a when-issued security is treated as a short sale for accounting purposes. After the effective date, when shares of the new company are received, any shares sold on a when-issued basis will be delivered to the counterparty. At March 31, 2022, none of the Funds had short sales.
When-issued or delayed-delivery securities
Each Fund may purchase securities on a when-issued or delayed-delivery basis. Although the payment and interest terms of these securities are established at the time a Fund enters into the commitment, the securities may be delivered and paid for a month or more after the date of purchase when their value may have changed. A Fund makes such commitments only with the intention of actually acquiring the securities, but may sell the securities before the settlement date if the Adviser deems it advisable for investment reasons. At March 31, 2022, none of the Funds held when-issued securities.
Accounting for options
When a Fund writes an option, the premium received by the Fund is recorded as a liability and is subsequently adjusted to the current fair value of the option written. Premiums received from writing options that expire are recorded by the Fund on the expiration date as realized gains from option transactions. The difference between the premium and the amount paid on effecting a closing purchase transaction, including brokerage commissions, is also treated as a realized gain, or if the premium is less than the amount paid for the closing purchase transaction, as a realized loss. If a call option is exercised, the premium is added to the proceeds from the sale of the underlying security or currency in determining whether the Fund has realized a gain or a loss. If a put option is exercised, the premium reduces the cost basis of the security or currency purchased by the Fund. In writing an option, the Fund bears the market risk of an unfavorable change in the price of the security or currency underlying the written option. As the writer of a covered call option on a security, a Fund foregoes, during the option's life, the opportunity to profit from increases in the market value of the security covering the call option above the sum of the premium and the exercise price of the call. Exercise of an option written by the Fund could result in the Fund selling or buying a security or currency at a price different from the current fair value. Options written by the Fund do not give rise to counterparty credit risk, as they obligate the Fund, not its counterparties, to perform.
When a Fund purchases an option, the premium paid by the Fund is recorded as an asset and is subsequently adjusted to the current fair value of the option purchased. Purchasing call options tends to increase the Fund's exposure to the underlying instrument. Purchasing put options tends to decrease the Fund's exposure to the underlying instrument. Premiums paid for purchasing options that expire are treated as realized losses. Premiums paid for purchasing options that are exercised or closed are added to the amounts paid or offset against the proceeds on the underlying security to determine the realized gain or loss. The risks associated with purchasing put and call options are potential loss of the premium paid and, in the instances of OTC derivatives, the failure of the counterparty to honor its obligation under the contract.
Oakmark, Select and Global Select used purchased options during the period ended March 31, 2022. Realized gains and losses and the net change in unrealized appreciation (depreciation) on purchased equity options for the period, if any, are included in the Fund's Statement of Operations. Purchased options outstanding, if any, are listed on the Fund's Schedule of Investments.
Oakmark, Select and Global Select used options written during the period ended March 31, 2022. Realized gains and losses and the net change in unrealized appreciation (depreciation) on written equity options for the period, if any, are included in the Fund's Statement of Operations. Written options outstanding, if any, are listed on each Fund's Schedule of Investments and shown as liabilities on the Fund's Statement of Assets and Liabilities.
For the period ended March 31, 2022, the amount of premiums paid (received) for equity options purchased and written are listed by Fund in the table below (in thousands):
|
Fund |
Equity Options Purchased |
Equity Options Written |
|||||||||
|
Oakmark |
$ |
23,639 |
$ |
(114,080 |
) |
||||||
|
Select |
5,161 |
(63,741 |
) |
||||||||
|
Global Select |
2,055 |
(2,438 |
) |
||||||||
Oakmark.com 81
Oakmark Funds
Notes to Financial Statements (continued)
Credit facility
The Trust has a $200 million committed unsecured line of credit and a $300 million uncommitted unsecured discretionary demand line of credit (the "Facility") with State Street. Borrowings under the Facility bear interest at 1.35% above the greater of the Federal Funds Effective Rate or the Overnight Bank Fund Rate, as defined in the credit agreement. To maintain the Facility, an annualized commitment fee of 0.20% on the unused committed portion is charged to the Trust. Fees and interest expense, if any, related to the Facility are included in other expenses in the Statements of Operations. There were no borrowings under the Facility during the period ended March 31, 2022.
Expense offset arrangement
State Street serves as custodian of the Funds. State Street's fee may be reduced by credits that are an earnings allowance calculated on the average daily cash balances each Fund maintains with State Street. Credit balances used to reduce the Funds' custodian fees, if any, are reported as a reduction of total expenses in the Statements of Operations. During the period ended March 31, 2022, none of the Funds received an expense offset credit.
Repurchase agreements
Each Fund may invest in repurchase agreements, which are short-term investments whereby the Fund acquires ownership of a debt security and the seller agrees to repurchase the security at a future date at a specified price.
The Funds' custodian receives delivery of the underlying securities collateralizing repurchase agreements. It is the Funds' policy that the value of the collateral be at least equal to 102% of the repurchase price, including interest. The Adviser is responsible for determining that the value of the collateral is at all times at least equal to 102% of the repurchase price, including interest. Repurchase agreements could involve certain risks in the event of default or insolvency of the counterparty, including possible delays or restrictions upon a Fund's ability to dispose of the underlying securities. At March 31, 2022, all of the Funds held repurchase agreements.
Security lending
Each Fund may lend its portfolio securities to broker-dealers and banks. Any such loan must be continuously secured by collateral in cash, cash equivalents or U.S. Treasury or agency securities maintained on a current basis in an amount at least equal to the fair value of the securities loaned by a Fund. The Fund would continue to receive the equivalent of the interest or dividends paid by the issuer on the securities loaned and would also receive an additional return that may be in the form of a fixed fee or a percentage of the earnings on the collateral. The Fund has the right to call the loan and attempt to obtain the securities loaned at any time on notice of not more than five business days. In the event of bankruptcy or other default of the borrower, the Fund could experience delays in liquidating the loan collateral or recovering the loaned securities and incur expenses related to enforcing its rights. There could also be a decline in the value of the collateral or in the fair value of the securities loaned while the Fund seeks to enforce its rights thereto and the Fund could experience subnormal levels of income or lack of access to income during that period. A Fund may not exercise proxy voting rights for a security that is on loan if it is unable to recall the security prior to the record date. The Trust, on behalf of the Funds, has entered into an agreement with State Street to serve as its agent for the purpose of lending securities and maintaining the collateral account. Security lending income, if any, net of any fees retained by the securities lending agent, is included in the Statements of Operations.
At March 31, 2022, none of the Funds had securities on loan.
Interfund lending
Pursuant to an exemptive order issued by the SEC, the Funds may participate in an interfund lending program. This program provides an alternative credit facility that allows the Funds to lend money to, and borrow money from, each other for temporary purposes (an "Interfund Loan"). All Interfund Loans are subject to conditions pursuant to the SEC exemptive order designed to ensure fair and equitable treatment of participating Funds. Any Interfund Loan would consist only of uninvested cash reserves that the lending Fund otherwise would invest in short-term repurchase agreements or other short-term instruments. There were no interfund loans during the period ended March 31, 2022.
82 OAKMARK FUNDS
Oakmark Funds
Notes to Financial Statements (continued)
3. TRANSACTIONS WITH AFFILIATES
Each Fund has an investment advisory agreement with the Adviser. For management services and facilities furnished, the Adviser receives from each Fund a monthly fee based on that Fund's average daily net assets. Annual fee rates are as follows:
The annual rates of fees as a percentage of each Fund's net assets are as follows:
|
Fund |
Advisory Fees |
||||||
|
Oakmark |
0.686% up to $250 million; 0.661% on the next $250 million; 0.641% on the next 4.5 billion; 0.626% on the next $10 billion; 0.596% on the next $5 billion; 0.566% on the next $5 billion; 0.536% on the next $10 billion; and 0.516% over $35 billion |
||||||
|
Select |
0.778% up to $250 million; 0.753% on the next $250 million; 0.733% on the next $3.5 billion; 0.713% on the next $5 billion; 0.653% on the next $2 billion; and 0.628% over $11 billion |
||||||
|
Global |
0.850% up to $250 million; 0.825% on the next $250 million; 0.805% on the next $4.5 billion; 0.790% on the next $10 billion; and 0.780% over $15 billion |
||||||
|
Global Select |
0.820% up to $250 million; 0.795% up to $250 million; 0.775% on the next $4.5 billion; 0.760% on the next $10 billion; and 0.750% over $15 billion |
||||||
|
Fund |
Advisory Fees |
||||||
|
International |
0.805% up to $250 million; 0.780% on the next $250 million; 0.760% on the next 4.5 billion; 0.745% on the next $10 billion; 0.730% on the next $20 billion; 0.720% on the next $5 billion; 0.710% on the next $5 billion; and 0.700% over $45 billion |
||||||
|
Int'l Small Cap |
1.040% up to $250 million; 1.015% on the next $250 million; 0.995% on the next $4.5 billion; 0.980% on the next $10 billion; and 0.970% over $15 billion |
||||||
|
Equity and Income |
0.600% up to $250 million; 0.575% on the next 250 million; 0.555% on the next $4.5 billion; 0.525% on the next $5 billion; 0.495% on the next $3 billion; 0.465% on the next $3.5 billion; 0.435% on the next $10 billion; and 0.405% over $26.5 billion |
||||||
|
Bond |
0.39% of net assets | ||||||
The Adviser has contractually agreed, through January 27, 2023, to waive the advisory fee otherwise payable to it by 0.02% with respect to each Fund, except Bond Fund. When determining whether a Fund's total expenses exceed the additional contractual expense cap described below, a Fund's net advisory fee, reflecting application of the advisory fee waiver, will be used to calculate a Fund's total expenses. The Adviser is not entitled to collect on or make a claim for waived fees that are the subject of this undertaking at any time in the future. This arrangement may only be modified or amended with approval from a Fund and the Adviser. The advisory fees waived for each Fund are included in the Statements of Operations.
The Adviser has contractually agreed, through January 27, 2023, to reimburse each Fund Class to the extent, but only to the extent that the annualized expenses (excluding taxes, interest, all commissions and other normal charges incident to the purchase and sale of portfolio securities, and extraordinary charges such as litigation costs, but including fees paid to the Adviser) exceed the percent set forth below of average daily net assets of each Fund Class.
|
Fund |
Investor Class |
Advisor Class |
Institutional Class |
R6 Class |
|||||||||||||||
|
Oakmark |
1.40 |
% |
1.15 |
% |
1.10 |
% |
0.95 |
% |
|||||||||||
|
Select |
1.50 |
1.25 |
1.20 |
1.05 |
|||||||||||||||
|
Global |
1.55 |
1.30 |
1.25 |
1.10 |
|||||||||||||||
|
Global Select |
1.55 |
1.30 |
1.25 |
1.10 |
|||||||||||||||
|
International |
1.55 |
1.30 |
1.25 |
1.10 |
|||||||||||||||
|
Int'l Small Cap |
1.75 |
1.50 |
1.45 |
1.30 |
|||||||||||||||
|
Equity and Income |
1.25 |
1.00 |
0.95 |
0.80 |
|||||||||||||||
|
Bond |
0.74 |
0.54 |
0.52 |
0.44 |
|||||||||||||||
Oakmark.com 83
Oakmark Funds
Notes to Financial Statements (continued)
During the six-month period ended March 31, 2022, Fund Class expenses (in thousands) have been reimbursed as follows@:
|
Fund |
Class |
Amount |
|||||||||
|
Bond |
Investor |
$ |
1 |
||||||||
|
Bond |
Advisor |
4 |
|||||||||
|
Bond |
Institutional |
7 |
|||||||||
|
Bond |
R6 Class |
223 |
|||||||||
@ Expenses reimbursed are subject to possible recovery until September 30, 2024.
The Adviser is entitled to recoup from assets attributable to any Fund Class amounts reimbursed to that Fund Class, except to the extent that the Fund Class already has paid such recoupment to the Adviser or such recoupment would cause that Class' total operating expenses to exceed the expense limitation or to exceed any lower limit in effect at the time of recoupment. Any such repayment must be made within three fiscal years after the year in which the reimbursement occurred. As of March 31, 2022, the following amounts are subject to recoupment (in thousands).
|
Amount & Expiration Date |
|||||||||||||||||||
|
Fund |
Class |
09/30/23 |
09/30/24 |
Total |
|||||||||||||||
|
Bond |
Advisor |
$ |
5 |
$ |
5 |
$ |
10 |
||||||||||||
|
Bond |
Institutional |
422 |
85 |
507 |
|||||||||||||||
|
Bond |
R6 |
0 |
339 |
339 |
|||||||||||||||
The Adviser and/or the Funds have entered into agreements with financial intermediaries to provide recordkeeping, processing, shareholder communications and other services to customers of the intermediaries and have agreed to compensate the intermediaries for providing those services. Certain of those services would be provided by the Funds if the shares of those customers were registered directly with the Funds' transfer agent. Accordingly, the Funds pay a portion of the intermediary fees pursuant to an agreement with the Adviser and the Adviser pays the remainder of the fees. The fees incurred by the Funds are reflected as other shareholder servicing fees in the Statements of Operations.
The Independent Trustees of the Trust may participate in the Trust's Deferred Compensation Plan for Independent Trustees. Participants in the plan may elect to defer all or a portion of their compensation. Amounts deferred are retained by the Trust and represent an unfunded obligation of the Trust. The value of a participant's deferral account is determined by reference to the change in value of one or more approved funds as specified by the participant. Benefits would be payable after a stated number of years or retirement from the Board of Trustees. The accrued obligations of the Funds under the plan are reflected as deferred Trustee compensation in the Statements of Assets and Liabilities. The change in the accrued obligations for the period is included in Trustees' fees in the Statements of Operations. The Trust pays the compensation of any trustee who is not an "interested person" of the Trust, and any other Trustee that has been approved by the Governance Committee of the Board of Trustees of the Trust to receive compensation from the Trust for his or her service as a Trustee of the Trust, and all expenses incurred in connection with their services to the Trust. The Trust does not provide any pension or retirement benefits to its Trustees.
The Funds reimburse the Adviser for the compensation paid to the Funds' Chief Compliance Officer ("CCO"). The CCO expenses incurred by the Funds are included in other expenses in the Statements of Operations.
4. FEDERAL INCOME TAXES
It is each Fund's policy to comply with the requirements of the Internal Revenue Code applicable to regulated investment companies and to distribute substantially all of its net taxable income, including any net realized gains on investments, to its shareholders. Therefore, no federal income tax provision is required. The Adviser has determined that no income tax provision for uncertain tax positions is required in the Funds' financial statements. Generally, each of the tax years in the four-year period ended March 31, 2022, remains subject to examination by taxing authorities.
At March 31, 2022, the cost of investments for federal income tax purposes and related composition of unrealized gains and losses for each Fund were as follows (in thousands):
|
Fund |
Cost of Investments for Federal Income Tax Purposes |
Gross Unrealized Appreciation |
Gross Unrealized (Depreciation) |
Net Unrealized Appreciation (Depreciation) |
|||||||||||||||
|
Oakmark |
$ |
11,436,678 |
$ |
6,603,313 |
$ |
(108,706 |
) |
$ |
6,494,607 |
||||||||||
|
Select |
3,394,143 |
1,971,160 |
(17,313 |
) |
1,953,847 |
||||||||||||||
|
Global |
1,012,942 |
486,187 |
(75,130 |
) |
411,057 |
||||||||||||||
|
Global Select |
1,269,076 |
407,932 |
(104,896 |
) |
303,036 |
||||||||||||||
|
International |
25,765,191 |
3,468,627 |
(4,455,106 |
) |
(986,479 |
) |
|||||||||||||
|
Int'l Small Cap |
1,462,570 |
145,869 |
(175,613 |
) |
(29,744 |
) |
|||||||||||||
|
Equity and Income |
5,489,280 |
2,008,235 |
(114,777 |
) |
1,893,458 |
||||||||||||||
|
Bond |
90,924 |
115 |
(4,654 |
) |
(4,539 |
) |
|||||||||||||
84 OAKMARK FUNDS
Oakmark Funds
Notes to Financial Statements (continued)
As of March 31, 2022, the short- and long-term capital losses available to offset future capital gains were as follows (in thousands):
|
Fund CLCF |
Utilized During the Year |
Short-Term |
Long-Term |
Total at Period End |
|||||||||||||||
|
Oakmark |
$ |
— |
$ |
— |
$ |
— |
$ |
— |
|||||||||||
|
Select |
— |
15,006 |
— |
15,006 |
|||||||||||||||
|
Global |
— |
— |
— |
— |
|||||||||||||||
|
Global Select |
— |
— |
— |
— |
|||||||||||||||
|
International |
529,484 |
1,093,900 |
— |
1,093,900 |
|||||||||||||||
|
Intl Small Cap |
110 |
— |
— |
— |
|||||||||||||||
|
Equity & Income |
— |
— |
— |
— |
|||||||||||||||
|
Bond |
— |
— |
— |
— |
|||||||||||||||
At March 31, 2022, the components of distributable earnings on a tax basis (excluding unrealized appreciation (depreciation)) were as follows (in thousands):
|
Undistributed Ordinary Income |
Undistributed Long- Term Gain |
Total Distributable Earnings |
|||||||||||||
|
Oakmark |
$ |
14,236 |
$ |
5,301 |
$ |
19,537 |
|||||||||
|
Select |
31 |
0 |
31 |
||||||||||||
|
Global |
4,003 |
111,672 |
115,675 |
||||||||||||
|
Global Select |
0 |
72,168 |
72,168 |
||||||||||||
|
International |
179,333 |
0 |
179,333 |
||||||||||||
|
Int'l Small Cap |
0 |
22,099 |
22,099 |
||||||||||||
|
Equity and Income |
15,393 |
77,956 |
93,349 |
||||||||||||
|
Bond |
83 |
0 |
83 |
||||||||||||
During the six-month period ended March 31, 2022, and the year ended September 30, 2021, the tax character of distributions paid was as follows (in thousands):
|
Period Ended March 31, 2022 |
Year Ended September 30, 2021 |
||||||||||||||||||
|
Fund |
Distributions Paid from Ordinary Income |
Distributions Paid from Long-Term Capital Gain |
Distributions Paid from Ordinary Income |
Distributions Paid from Long-Term Capital Gain |
|||||||||||||||
|
Oakmark |
$ |
168,401 |
$ |
111,376 |
$ |
30,305 |
$ |
— |
|||||||||||
|
Select |
8,006 |
13,396 |
6,314 |
— |
|||||||||||||||
|
Global |
15,999 |
119,872 |
3,425 |
— |
|||||||||||||||
|
Global Select |
20,529 |
137,185 |
1,355 |
— |
|||||||||||||||
|
International |
380,923 |
0 |
118,038 |
— |
|||||||||||||||
|
Int'l Small Cap |
20,542 |
8,458 |
28,023 |
— |
|||||||||||||||
|
Equity and Income |
81,435 |
546,130 |
90,402 |
232,614 |
|||||||||||||||
|
Bond |
2,350 |
405 |
1,897 |
— |
|||||||||||||||
On March 31, 2022, the Funds had temporary book/tax differences in undistributed earnings that were primarily attributable to trustee deferred compensation expenses, passive foreign investment companies, foreign currency contracts, and deferrals of capital losses on wash sales and straddle adjustments. Temporary differences will reverse over time. The Funds have permanent differences in book/tax undistributed earnings primarily attributable to equalization debits and redemptions in kind.
Oakmark.com 85
Oakmark Funds
Notes to Financial Statements (continued)
Permanent differences incurred during the six-month period ended March 31, 2022, will result in the following reclassifications among the components of net assets for the year ended September 30, 2022 (in thousands):
|
Fund |
Paid in Capital |
Distributable Earnings |
|||||||||
|
Oakmark |
$ |
1,760,765 |
$ |
(1,760,765 |
) |
||||||
|
Select |
483,657 |
(483,657 |
) |
||||||||
|
Global |
8,729 |
(8,729 |
) |
||||||||
|
Global Select |
9,779 |
(9,779 |
) |
||||||||
|
International |
6,051 |
(6,051 |
) |
||||||||
|
Int'l Small Cap |
1,723 |
(1,723 |
) |
||||||||
|
Equity and Income |
625,996 |
(625,996 |
) |
||||||||
|
Bond |
— |
— |
|||||||||
5. INVESTMENT TRANSACTIONS
For the six-month period ended March 31, 2022, transactions in investment securities (excluding short-term, in-kind transactions and U.S. government securities) were as follows (in thousands):
|
Oakmark |
Select |
Global |
Global Select |
International |
Int'l Small Cap |
Equity and Income |
Bond |
||||||||||||||||||||||||||||
|
Purchases |
$ |
3,879,799 |
$ |
986,618 |
$ |
222,271 |
$ |
347,326 |
$ |
5,143,757 |
$ |
283,098 |
$ |
1,240,696 |
$ |
34,039 |
|||||||||||||||||||
|
Proceeds from sales |
855,989 |
239,940 |
308,895 |
447,833 |
4,797,622 |
295,800 |
388,305 |
26,223 |
|||||||||||||||||||||||||||
During the six-month period ended March 31, 2022, Oakmark, Select, and Equity and Income had in-kind sales transactions (in thousands) of $2,597,832; $766,621; and $879,285, respectively. These amounts are included in the Portfolio Turnover Rate presented in the Financial Highlights.
Purchases at cost (in thousands) of long-term U.S. government securities for the period ended March 31, 2022, were $463,248 and $6,169, respectively, for Equity and Income and Bond. Proceeds from sales (in thousands) of long-term U.S. government securities for the period ended March 31, 2022 were $124,430 and $16,246, respectively, for Equity and Income and Bond.
During the six-month period ended March 31, 2022, Int'l Small Cap engaged in purchase transactions (in thousands) totaling $1,450, with funds that have a common investment advisor. International engaged in sale transactions (in thousands) totaling $1,450, with funds that have a common investment advisor. These transactions complied with Rule 17a-7 under the 1940 Act.
6. INVESTMENTS IN AFFILIATED ISSUERS
A company was considered to be an affiliate of a Fund because that Fund owned 5% or more of the company's voting securities during all or part of the six-month period ended March 31, 2022. Purchase and sale transactions and dividend and interest income earned during the period on these securities are listed after the applicable Fund's Schedule of Investments.
7. RUSSIAN INVASION OF UKRAINE
Russia launched a large-scale invasion of Ukraine on February 24, 2022. As a result of this military action, the United States and many other countries have instituted various economic sanctions against Russian individuals and entities. The situation has led to increased financial market volatility and could have severe adverse effects on regional and global economic markets, including the markets for certain securities and commodities, such as oil and natural gas. The extent and duration of the military action, resulting sanctions imposed, other punitive action taken, and the resulting market disruptions cannot be easily predicted.
8. SUBSEQUENT EVENTS
The continued impact of the coronavirus pandemic ("Covid-19") on the financial results of each Fund will depend on future developments, including the duration and spread of Covid-19 and related advisories and restrictions. Covid-19 has resulted, and may continue to result, in significant market volatility, exchange trading suspensions and closures, global financial market declines, higher default rates, and substantial economic downturn in economies throughout the world. These developments and the impact of Covid-19 on the financial markets and the overall economy are highly uncertain and cannot be predicted. The effects of Covid-19 may materially impact the value and performance of each Fund, its ability to buy and sell fund investments at appropriate valuations, and its ability to achieve its investment objectives. If the financial markets and/or the overall economy are impacted for an extended period, the future financial results of each Fund may be materially adversely affected.
86 OAKMARK FUNDS
Oakmark Funds
Notes to Financial Statements (continued)
9. RECENT ACCOUNTING PRONOUNCEMENT
In January 2021, the Financial Accounting Standards Board issued Accounting Standards Update No. 2021-01 ("ASU 2021-01"), "Reference Rate Reform (Topic 848)." ASU 2021-01 is an update of ASU 2020-04, which is in response to concerns about structural risks of interbank offered rates, and particularly the risk of cessation of LIBOR. Regulators have undertaken reference rate reform initiatives to identify alternative reference rates that are more observable or transaction based and less susceptible to manipulation. ASU 2020-04 provides optional guidance for a limited period of time to ease the potential burden in accounting for (or recognizing the effects of) reference rate reform on financial reporting. ASU 2020-04 is elective and applies to all entities, subject to meeting certain criteria, that have contracts, hedging relationships, and other transactions that reference LIBOR or another reference rate expected to be discontinued because of reference rate reform. ASU 2021-01 clarifies that certain optional expedients and exceptions in Topic 848 for contract modifications and hedge accounting apply to derivatives that are affected by the discounting transition. The amendments in this update are effective immediately through December 31, 2022, for all entities. Management is currently evaluating the implications, if any, of the additional requirements and its impact on the Funds' financial statements.
Oakmark.com 87
Oakmark Funds
Financial Highlights
For a share outstanding throughout each period
|
Income from Investment Operations: |
Less Distributions: |
||||||||||||||||||||||||||||||||||
|
Net Asset Value, Beginning of Period |
Net Investment Income |
Net Gain (Loss) on Investments (Both Realized and Unrealized) |
Total from Investment Operations |
Distributions from Net Investment Income |
Distributions from Capital Gains |
Total Distributions |
Redemption Fees |
||||||||||||||||||||||||||||
|
Oakmark Fund |
|||||||||||||||||||||||||||||||||||
|
Investor Class |
|||||||||||||||||||||||||||||||||||
|
10/01/2021-03/31/22+ |
$ |
115.48 |
0.42 |
(a) |
1.88 |
2.30 |
(0.62 |
) |
(1.12 |
) |
(1.74 |
) |
0.00 |
||||||||||||||||||||||
|
09/30/21 |
$ |
72.67 |
0.43 |
(a) |
42.53 |
42.96 |
(0.15 |
) |
0.00 |
(0.15 |
) |
0.00 |
|||||||||||||||||||||||
|
09/30/20 |
$ |
77.89 |
0.58 |
(a) |
0.86 |
1.44 |
(0.65 |
) |
(6.01 |
) |
(6.66 |
) |
0.00 |
||||||||||||||||||||||
|
09/30/19 |
$ |
88.99 |
0.88 |
(a) |
(6.43 |
) |
(5.55 |
) |
(0.50 |
) |
(5.05 |
) |
(5.55 |
) |
0.00 |
||||||||||||||||||||
|
09/30/18 |
$ |
82.85 |
0.58 |
(a) |
8.99 |
9.57 |
(0.40 |
) |
(3.03 |
) |
(3.43 |
) |
0.00 |
||||||||||||||||||||||
|
09/30/17 |
$ |
68.70 |
0.76 |
15.26 |
16.02 |
(0.77 |
) |
(1.10 |
) |
(1.87 |
) |
0.00 |
|||||||||||||||||||||||
|
Advisor Class |
|||||||||||||||||||||||||||||||||||
|
10/01/2021-03/31/22+ |
$ |
115.58 |
0.55 |
(a) |
1.90 |
2.45 |
(0.84 |
) |
(1.12 |
) |
(1.96 |
) |
0.00 |
||||||||||||||||||||||
|
09/30/21 |
$ |
72.67 |
0.61 |
(a) |
42.54 |
43.15 |
(0.24 |
) |
0.00 |
(0.24 |
) |
0.00 |
|||||||||||||||||||||||
|
09/30/20 |
$ |
77.88 |
0.66 |
(a) |
0.87 |
1.53 |
(0.73 |
) |
(6.01 |
) |
(6.74 |
) |
0.00 |
||||||||||||||||||||||
|
09/30/19 |
$ |
89.07 |
0.96 |
(a) |
(6.46 |
) |
(5.50 |
) |
(0.64 |
) |
(5.05 |
) |
(5.69 |
) |
0.00 |
||||||||||||||||||||
|
09/30/18 |
$ |
82.97 |
0.68 |
(a) |
8.99 |
9.67 |
(0.54 |
) |
(3.03 |
) |
(3.57 |
) |
0.00 |
||||||||||||||||||||||
|
09/30/17(b) |
$ |
71.35 |
0.66 |
(a) |
10.96 |
11.62 |
0.00 |
0.00 |
0.00 |
0.00 |
|||||||||||||||||||||||||
|
Institutional Class |
|||||||||||||||||||||||||||||||||||
|
10/01/2021-03/31/22+ |
$ |
115.64 |
0.56 |
(a) |
1.89 |
2.45 |
(0.90 |
) |
(1.12 |
) |
(2.02 |
) |
0.00 |
||||||||||||||||||||||
|
09/30/21 |
$ |
72.72 |
0.70 |
(a) |
42.52 |
43.22 |
(0.30 |
) |
0.00 |
(0.30 |
) |
0.00 |
|||||||||||||||||||||||
|
09/30/20 |
$ |
77.95 |
0.71 |
(a) |
0.87 |
1.58 |
(0.80 |
) |
(6.01 |
) |
(6.81 |
) |
0.00 |
||||||||||||||||||||||
|
09/30/19 |
$ |
89.09 |
1.01 |
(a) |
(6.44 |
) |
(5.43 |
) |
(0.66 |
) |
(5.05 |
) |
(5.71 |
) |
0.00 |
||||||||||||||||||||
|
09/30/18 |
$ |
82.97 |
0.72 |
(a) |
8.99 |
9.71 |
(0.56 |
) |
(3.03 |
) |
(3.59 |
) |
0.00 |
||||||||||||||||||||||
|
09/30/17(b) |
$ |
71.35 |
0.67 |
(a) |
10.95 |
11.62 |
0.00 |
0.00 |
0.00 |
0.00 |
|||||||||||||||||||||||||
|
Class R6 |
|||||||||||||||||||||||||||||||||||
|
10/01/2021-03/31/22+ |
$ |
115.67 |
0.60 |
(a) |
1.88 |
2.48 |
(0.93 |
) |
(1.12 |
) |
(2.05 |
) |
0.00 |
||||||||||||||||||||||
|
09/30/21(c) |
$ |
88.42 |
0.52 |
(a) |
26.73 |
27.25 |
0.00 |
0.00 |
0.00 |
0.00 |
|||||||||||||||||||||||||
|
Oakmark Select Fund |
|||||||||||||||||||||||||||||||||||
|
Investor Class |
|||||||||||||||||||||||||||||||||||
|
10/01/2021-03/31/22+ |
$ |
62.27 |
0.05 |
(a) |
(1.79 |
) |
(1.74 |
) |
(0.03 |
) |
(0.15 |
) |
(0.18 |
) |
0.00 |
||||||||||||||||||||
|
09/30/21 |
$ |
37.98 |
(0.03 |
)(a) |
24.32 |
24.29 |
0.00 |
0.00 |
0.00 |
0.00 |
|||||||||||||||||||||||||
|
09/30/20 |
$ |
39.20 |
0.05 |
(a) |
(0.98 |
) |
(0.93 |
) |
(0.29 |
) |
0.00 |
(0.29 |
) |
0.00 |
|||||||||||||||||||||
|
09/30/19 |
$ |
45.84 |
0.45 |
(a) |
(5.37 |
) |
(4.92 |
) |
(0.06 |
) |
(1.66 |
) |
(1.72 |
) |
0.00 |
||||||||||||||||||||
|
09/30/18 |
$ |
47.84 |
0.09 |
(a) |
(0.08 |
) |
0.01 |
(0.14 |
) |
(1.87 |
) |
(2.01 |
) |
0.00 |
|||||||||||||||||||||
|
09/30/17 |
$ |
40.99 |
0.17 |
8.78 |
8.95 |
(0.40 |
) |
(1.70 |
) |
(2.10 |
) |
0.00 |
|||||||||||||||||||||||
|
Advisor Class |
|||||||||||||||||||||||||||||||||||
|
10/01/2021-03/31/22+ |
$ |
62.21 |
0.09 |
(a) |
(1.80 |
) |
(1.71 |
) |
(0.11 |
) |
(0.15 |
) |
(0.26 |
) |
0.00 |
||||||||||||||||||||
|
09/30/21 |
$ |
37.99 |
0.03 |
(a) |
24.31 |
24.34 |
(0.12 |
) |
0.00 |
(0.12 |
) |
0.00 |
|||||||||||||||||||||||
|
09/30/20 |
$ |
39.21 |
0.10 |
(a) |
(0.97 |
) |
(0.87 |
) |
(0.35 |
) |
0.00 |
(0.35 |
) |
0.00 |
|||||||||||||||||||||
|
09/30/19 |
$ |
45.90 |
0.52 |
(a) |
(5.41 |
) |
(4.89 |
) |
(0.14 |
) |
(1.66 |
) |
(1.80 |
) |
0.00 |
||||||||||||||||||||
|
09/30/18 |
$ |
47.90 |
0.16 |
(a) |
(0.08 |
) |
0.08 |
(0.21 |
) |
(1.87 |
) |
(2.08 |
) |
0.00 |
|||||||||||||||||||||
|
09/30/17(b) |
$ |
41.93 |
0.20 |
(a) |
5.77 |
5.97 |
0.00 |
0.00 |
0.00 |
0.00 |
|||||||||||||||||||||||||
|
Institutional Class |
|||||||||||||||||||||||||||||||||||
|
10/01/2021-03/31/22+ |
$ |
62.29 |
0.11 |
(a) |
(1.79 |
) |
(1.68 |
) |
(0.17 |
) |
(0.15 |
) |
(0.32 |
) |
0.00 |
||||||||||||||||||||
|
09/30/21 |
$ |
38.01 |
0.09 |
(a) |
24.32 |
24.41 |
(0.13 |
) |
0.00 |
(0.13 |
) |
0.00 |
|||||||||||||||||||||||
|
09/30/20 |
$ |
39.23 |
0.13 |
(a) |
(0.98 |
) |
(0.85 |
) |
(0.37 |
) |
0.00 |
(0.37 |
) |
0.00 |
|||||||||||||||||||||
|
09/30/19 |
$ |
45.91 |
0.54 |
(a) |
(5.40 |
) |
(4.86 |
) |
(0.16 |
) |
(1.66 |
) |
(1.82 |
) |
0.00 |
||||||||||||||||||||
|
09/30/18 |
$ |
47.91 |
0.17 |
(a) |
(0.08 |
) |
0.09 |
(0.22 |
) |
(1.87 |
) |
(2.09 |
) |
0.00 |
|||||||||||||||||||||
|
09/30/17(b) |
$ |
41.93 |
0.22 |
(a) |
5.76 |
5.98 |
0.00 |
0.00 |
0.00 |
0.00 |
|||||||||||||||||||||||||
|
R6 Class |
|||||||||||||||||||||||||||||||||||
|
10/01/2021-03/31/22+ |
$ |
62.29 |
0.12 |
(a) |
(1.79 |
) |
(1.67 |
) |
(0.18 |
) |
(0.15 |
) |
(0.33 |
) |
0.00 |
||||||||||||||||||||
|
09/30/21(c) |
$ |
47.61 |
0.08 |
(a) |
14.60 |
14.68 |
0.00 |
0.00 |
0.00 |
0.00 |
|||||||||||||||||||||||||
+ Unaudited.
† Data has been annualized.
(a) Computed using average shares outstanding throughout the period.
(b) Commenced on 11/30/2016.
(c) Commenced on 12/15/2020.
88 OAKMARK FUNDS
Oakmark Funds
Financial Highlights
For a share outstanding throughout each period
|
Ratios/Supplemental Data: |
|||||||||||||||||||||||||||||||
|
Net Asset Value, End of Period |
Total Return |
Net Assets, End of Period ($million) |
Ratio of Net Investment Income to Average Net Assets |
Ratio of Gross Expenses to Average Net Assets |
Ratio of Net Expenses to Average Net Assets |
Portfolio Turnover Rate |
|||||||||||||||||||||||||
|
Oakmark Fund |
|||||||||||||||||||||||||||||||
|
Investor Class |
|||||||||||||||||||||||||||||||
|
10/01/2021-03/31/22+ |
$ |
116.04 |
1.98 |
% |
$ |
8,545.2 |
0.71 |
%† |
0.92 |
%† |
0.90 |
%† |
21 |
% |
|||||||||||||||||
|
09/30/21 |
$ |
115.48 |
59.18 |
% |
$ |
8,486.6 |
0.43 |
% |
0.92 |
% |
0.90 |
% |
19 |
% |
|||||||||||||||||
|
09/30/20 |
$ |
72.67 |
1.18 |
% |
$ |
6,153.4 |
0.79 |
% |
0.96 |
% |
0.92 |
% |
35 |
% |
|||||||||||||||||
|
09/30/19 |
$ |
77.89 |
-5.68 |
% |
$ |
9,044.6 |
1.13 |
% |
0.92 |
% |
0.88 |
% |
51 |
% |
|||||||||||||||||
|
09/30/18 |
$ |
88.99 |
11.84 |
% |
$ |
12,626.2 |
0.68 |
% |
0.89 |
% |
0.85 |
% |
29 |
% |
|||||||||||||||||
|
09/30/17 |
$ |
82.85 |
23.79 |
% |
$ |
14,200.2 |
0.91 |
% |
0.90 |
% |
0.86 |
% |
19 |
% |
|||||||||||||||||
|
Advisor Class |
|||||||||||||||||||||||||||||||
|
10/01/2021-03/31/22+ |
$ |
116.07 |
2.10 |
% |
$ |
3,144.2 |
0.93 |
%† |
0.69 |
%† |
0.67 |
%† |
21 |
% |
|||||||||||||||||
|
09/30/21 |
$ |
115.58 |
59.49 |
% |
$ |
2,822.8 |
0.61 |
% |
0.73 |
% |
0.70 |
% |
19 |
% |
|||||||||||||||||
|
09/30/20 |
$ |
72.67 |
1.30 |
% |
$ |
3,269.5 |
0.90 |
% |
0.85 |
% |
0.81 |
% |
35 |
% |
|||||||||||||||||
|
09/30/19 |
$ |
77.88 |
-5.59 |
% |
$ |
4,786.4 |
1.23 |
% |
0.82 |
% |
0.78 |
% |
51 |
% |
|||||||||||||||||
|
09/30/18 |
$ |
89.07 |
11.96 |
% |
$ |
5,400.6 |
0.79 |
% |
0.77 |
% |
0.73 |
% |
29 |
% |
|||||||||||||||||
|
09/30/17(b) |
$ |
82.97 |
16.29 |
% |
$ |
1,839.8 |
1.01 |
%† |
0.76 |
%† |
0.72 |
%† |
19 |
% |
|||||||||||||||||
|
Institutional Class |
|||||||||||||||||||||||||||||||
|
10/01/2021-03/31/22+ |
$ |
116.07 |
2.10 |
% |
$ |
4,890.9 |
0.95 |
%† |
0.69 |
%† |
0.67 |
%† |
21 |
% |
|||||||||||||||||
|
09/30/21 |
$ |
115.64 |
59.56 |
% |
$ |
4,517.7 |
0.68 |
% |
0.69 |
% |
0.66 |
% |
19 |
% |
|||||||||||||||||
|
09/30/20 |
$ |
72.72 |
1.36 |
% |
$ |
1,839.7 |
0.98 |
% |
0.79 |
% |
0.74 |
% |
35 |
% |
|||||||||||||||||
|
09/30/19 |
$ |
77.95 |
-5.51 |
% |
$ |
2,302.3 |
1.29 |
% |
0.75 |
% |
0.70 |
% |
51 |
% |
|||||||||||||||||
|
09/30/18 |
$ |
89.09 |
12.01 |
% |
$ |
3,330.6 |
0.83 |
% |
0.74 |
% |
0.70 |
% |
29 |
% |
|||||||||||||||||
|
09/30/17(b) |
$ |
82.97 |
16.29 |
% |
$ |
2,569.2 |
1.02 |
%† |
0.73 |
%† |
0.68 |
%† |
19 |
% |
|||||||||||||||||
|
Class R6 |
|||||||||||||||||||||||||||||||
|
10/01/2021-03/31/22+ |
$ |
116.10 |
2.13 |
% |
$ |
1,414.7 |
1.02 |
%† |
0.64 |
%† |
0.62 |
%† |
21 |
% |
|||||||||||||||||
|
09/30/21(c) |
$ |
115.67 |
30.82 |
% |
$ |
1,081.0 |
0.60 |
%† |
0.65 |
%† |
0.63 |
%† |
19 |
% |
|||||||||||||||||
|
Oakmark Select Fund |
|||||||||||||||||||||||||||||||
|
Investor Class |
|||||||||||||||||||||||||||||||
|
10/01/2021-03/31/22+ |
$ |
60.35 |
-2.84 |
% |
$ |
1,794.3 |
0.15 |
%† |
1.00 |
%† |
0.98 |
%† |
19 |
% |
|||||||||||||||||
|
09/30/21 |
$ |
62.27 |
64.01 |
% |
$ |
1,975.3 |
(0.06 |
%) |
1.01 |
% |
0.98 |
% |
20 |
% |
|||||||||||||||||
|
09/30/20 |
$ |
37.98 |
-2.45 |
% |
$ |
1,410.1 |
0.14 |
% |
1.11 |
% |
1.04 |
% |
28 |
% |
|||||||||||||||||
|
09/30/19 |
$ |
39.20 |
-10.34 |
% |
$ |
3,154.9 |
1.14 |
% |
1.08 |
% |
1.00 |
% |
45 |
% |
|||||||||||||||||
|
09/30/18 |
$ |
45.84 |
-0.08 |
% |
$ |
4,376.3 |
0.20 |
% |
1.04 |
% |
0.97 |
% |
41 |
% |
|||||||||||||||||
|
09/30/17 |
$ |
47.84 |
22.61 |
% |
$ |
4,854.7 |
0.39 |
% |
1.03 |
% |
0.96 |
% |
22 |
% |
|||||||||||||||||
|
Advisor Class |
|||||||||||||||||||||||||||||||
|
10/01/2021-03/31/22+ |
$ |
60.24 |
-2.76 |
% |
$ |
2,559.4 |
0.28 |
%† |
0.87 |
%† |
0.85 |
%† |
19 |
% |
|||||||||||||||||
|
09/30/21 |
$ |
62.21 |
64.18 |
% |
$ |
2,454.2 |
0.05 |
% |
0.89 |
% |
0.87 |
% |
20 |
% |
|||||||||||||||||
|
09/30/20 |
$ |
37.99 |
-2.31 |
% |
$ |
1,436.2 |
0.27 |
% |
1.00 |
% |
0.92 |
% |
28 |
% |
|||||||||||||||||
|
09/30/19 |
$ |
39.21 |
-10.24 |
% |
$ |
638.5 |
1.31 |
% |
0.94 |
% |
0.86 |
% |
45 |
% |
|||||||||||||||||
|
09/30/18 |
$ |
45.90 |
0.08 |
% |
$ |
711.4 |
0.34 |
% |
0.89 |
% |
0.82 |
% |
41 |
% |
|||||||||||||||||
|
09/30/17(b) |
$ |
47.90 |
14.24 |
% |
$ |
571.3 |
0.54 |
%† |
0.89 |
%† |
0.81 |
%† |
22 |
% |
|||||||||||||||||
|
Institutional Class |
|||||||||||||||||||||||||||||||
|
10/01/2021-03/31/22+ |
$ |
60.29 |
-2.72 |
% |
$ |
644.8 |
0.35 |
%† |
0.80 |
%† |
0.78 |
%† |
19 |
% |
|||||||||||||||||
|
09/30/21 |
$ |
62.29 |
64.35 |
% |
$ |
638.6 |
0.18 |
% |
0.79 |
% |
0.76 |
% |
20 |
% |
|||||||||||||||||
|
09/30/20 |
$ |
38.01 |
-2.27 |
% |
$ |
550.2 |
0.33 |
% |
0.93 |
% |
0.85 |
% |
28 |
% |
|||||||||||||||||
|
09/30/19 |
$ |
39.23 |
-10.18 |
% |
$ |
660.3 |
1.36 |
% |
0.90 |
% |
0.82 |
% |
45 |
% |
|||||||||||||||||
|
09/30/18 |
$ |
45.91 |
0.10 |
% |
$ |
852.0 |
0.37 |
% |
0.86 |
% |
0.79 |
% |
41 |
% |
|||||||||||||||||
|
09/30/17(b) |
$ |
47.91 |
14.26 |
% |
$ |
768.9 |
0.58 |
%† |
0.87 |
%† |
0.79 |
%† |
22 |
% |
|||||||||||||||||
|
R6 Class |
|||||||||||||||||||||||||||||||
|
10/01/2021-03/31/22+ |
$ |
60.29 |
-2.72 |
% |
$ |
340.0 |
0.37 |
%† |
0.75 |
%† |
0.73 |
%† |
19 |
% |
|||||||||||||||||
|
09/30/21(c) |
$ |
62.29 |
30.85 |
% |
$ |
331.2 |
0.16 |
%† |
0.76 |
%† |
0.74 |
%† |
20 |
% |
|||||||||||||||||
+ Unaudited.
† Data has been annualized.
(a) Computed using average shares outstanding throughout the period.
(b) Commenced on 11/30/2016.
(c) Commenced on 12/15/2020.
Oakmark.com 89
Oakmark Funds
Financial Highlights
For a share outstanding throughout each period
|
Income from Investment Operations: |
Less Distributions: |
||||||||||||||||||||||||||||||||||
|
Net Asset Value, Beginning of Period |
Net Investment Income |
Net Gain (Loss) on Investments (Both Realized and Unrealized) |
Total from Investment Operations |
Distributions from Net Investment Income |
Distributions from Capital Gains |
Total Distributions |
Redemption Fees |
||||||||||||||||||||||||||||
|
Oakmark Global Fund |
|||||||||||||||||||||||||||||||||||
|
Investor Class |
|||||||||||||||||||||||||||||||||||
|
10/01/2021-03/31/22+ |
$ |
36.53 |
0.12 |
(a) |
(0.66 |
) |
(0.54 |
) |
(0.34 |
) |
(2.87 |
) |
(3.21 |
) |
0.00 |
||||||||||||||||||||
|
09/30/21 |
$ |
24.73 |
0.11 |
(a) |
11.74 |
11.85 |
(0.05 |
) |
0.00 |
(0.05 |
) |
0.00 |
|||||||||||||||||||||||
|
09/30/20 |
$ |
27.52 |
0.02 |
(a) |
(1.72 |
) |
(1.70 |
) |
(0.40 |
) |
(0.69 |
) |
(1.09 |
) |
0.00 |
||||||||||||||||||||
|
09/30/19 |
$ |
32.21 |
0.50 |
(a) |
(1.71 |
) |
(1.21 |
) |
(0.29 |
) |
(3.19 |
) |
(3.48 |
) |
0.00 |
||||||||||||||||||||
|
09/30/18 |
$ |
34.32 |
0.25 |
0.12 |
0.37 |
(0.30 |
) |
(2.18 |
) |
(2.48 |
) |
0.00 |
|||||||||||||||||||||||
|
09/30/17 |
$ |
26.36 |
0.29 |
(a) |
7.97 |
8.26 |
(0.30 |
) |
0.00 |
(0.30 |
) |
0.00 |
|||||||||||||||||||||||
|
Advisor Class |
|||||||||||||||||||||||||||||||||||
|
10/01/2021-03/31/22+ |
$ |
36.57 |
0.15 |
(a) |
(0.66 |
) |
(0.51 |
) |
(0.42 |
) |
(2.87 |
) |
(3.29 |
) |
0.00 |
||||||||||||||||||||
|
09/30/21 |
$ |
24.74 |
0.18 |
(a) |
11.74 |
11.92 |
(0.09 |
) |
0.00 |
(0.09 |
) |
0.00 |
|||||||||||||||||||||||
|
09/30/20 |
$ |
27.53 |
0.07 |
(a) |
(1.73 |
) |
(1.66 |
) |
(0.44 |
) |
(0.69 |
) |
(1.13 |
) |
0.00 |
||||||||||||||||||||
|
09/30/19 |
$ |
32.22 |
0.49 |
(a) |
(1.66 |
) |
(1.17 |
) |
(0.33 |
) |
(3.19 |
) |
(3.52 |
) |
0.00 |
||||||||||||||||||||
|
09/30/18 |
$ |
34.36 |
0.30 |
0.10 |
0.40 |
(0.36 |
) |
(2.18 |
) |
(2.54 |
) |
0.00 |
|||||||||||||||||||||||
|
09/30/17(b) |
$ |
27.22 |
0.24 |
(a) |
6.90 |
7.14 |
0.00 |
0.00 |
0.00 |
0.00 |
|||||||||||||||||||||||||
|
Institutional Class |
|||||||||||||||||||||||||||||||||||
|
10/01/2021-03/31/22+ |
$ |
36.58 |
0.16 |
(a) |
(0.66 |
) |
(0.50 |
) |
(0.44 |
) |
(2.87 |
) |
(3.31 |
) |
0.00 |
||||||||||||||||||||
|
09/30/21 |
$ |
24.75 |
0.18 |
(a) |
11.76 |
11.94 |
(0.11 |
) |
0.00 |
(0.11 |
) |
0.00 |
|||||||||||||||||||||||
|
09/30/20 |
$ |
27.54 |
0.08 |
(a) |
(1.73 |
) |
(1.65 |
) |
(0.45 |
) |
(0.69 |
) |
(1.14 |
) |
0.00 |
||||||||||||||||||||
|
09/30/19 |
$ |
32.25 |
0.59 |
(a) |
(1.75 |
) |
(1.16 |
) |
(0.36 |
) |
(3.19 |
) |
(3.55 |
) |
0.00 |
||||||||||||||||||||
|
09/30/18 |
$ |
34.38 |
0.31 |
0.12 |
0.43 |
(0.38 |
) |
(2.18 |
) |
(2.56 |
) |
0.00 |
|||||||||||||||||||||||
|
09/30/17(b) |
$ |
27.22 |
0.26 |
6.90 |
7.16 |
0.00 |
0.00 |
0.00 |
0.00 |
||||||||||||||||||||||||||
|
R6 Class |
|||||||||||||||||||||||||||||||||||
|
10/01/2021-03/31/22+ |
$ |
36.58 |
0.16 |
(a) |
(0.67 |
) |
(0.51 |
) |
(0.44 |
) |
(2.87 |
) |
(3.31 |
) |
0.00 |
||||||||||||||||||||
|
09/30/21(c) |
$ |
31.38 |
0.23 |
(a) |
4.97 |
5.20 |
0.00 |
0.00 |
0.00 |
0.00 |
|||||||||||||||||||||||||
|
Oakmark Global Select Fund |
|||||||||||||||||||||||||||||||||||
|
Investor Class |
|||||||||||||||||||||||||||||||||||
|
10/01/2021-03/31/22+ |
$ |
24.45 |
0.11 |
(a) |
(1.22 |
) |
(1.11 |
) |
(0.20 |
) |
(2.01 |
) |
(2.21 |
) |
0.00 |
||||||||||||||||||||
|
09/30/21 |
$ |
16.86 |
0.06 |
(a) |
7.53 |
7.59 |
0.00 |
0.00 |
0.00 |
0.00 |
|||||||||||||||||||||||||
|
09/30/20 |
$ |
16.81 |
0.03 |
(a) |
0.24 |
0.27 |
(0.22 |
) |
0.00 |
(0.22 |
) |
0.00 |
|||||||||||||||||||||||
|
09/30/19 |
$ |
18.58 |
0.31 |
(a) |
(1.31 |
) |
(1.00 |
) |
(0.22 |
) |
(0.55 |
) |
(0.77 |
) |
0.00 |
||||||||||||||||||||
|
09/30/18 |
$ |
19.78 |
0.22 |
(a) |
(0.36 |
) |
(0.14 |
) |
(0.17 |
) |
(0.89 |
) |
(1.06 |
) |
0.00 |
||||||||||||||||||||
|
09/30/17 |
$ |
15.81 |
0.26 |
3.88 |
4.14 |
(0.17 |
) |
0.00 |
(0.17 |
) |
0.00 |
||||||||||||||||||||||||
|
Advisor Class |
|||||||||||||||||||||||||||||||||||
|
10/01/2021-03/31/22+ |
$ |
24.44 |
0.12 |
(a) |
(1.20 |
) |
(1.08 |
) |
(0.24 |
) |
(2.01 |
) |
(2.25 |
) |
0.00 |
||||||||||||||||||||
|
09/30/21 |
$ |
16.85 |
0.09 |
(a) |
7.52 |
7.61 |
(0.02 |
) |
0.00 |
(0.02 |
) |
0.00 |
|||||||||||||||||||||||
|
09/30/20 |
$ |
16.80 |
0.05 |
(a) |
0.24 |
0.29 |
(0.24 |
) |
0.00 |
(0.24 |
) |
0.00 |
|||||||||||||||||||||||
|
09/30/19 |
$ |
18.60 |
0.37 |
(a) |
(1.37 |
) |
(1.00 |
) |
(0.25 |
) |
(0.55 |
) |
(0.80 |
) |
0.00 |
||||||||||||||||||||
|
09/30/18 |
$ |
19.81 |
0.25 |
(a) |
(0.37 |
) |
(0.12 |
) |
(0.20 |
) |
(0.89 |
) |
(1.09 |
) |
0.00 |
||||||||||||||||||||
|
09/30/17(b) |
$ |
16.39 |
0.25 |
(a) |
3.17 |
3.42 |
0.00 |
0.00 |
0.00 |
0.00 |
|||||||||||||||||||||||||
|
Institutional Class |
|||||||||||||||||||||||||||||||||||
|
10/01/2021-03/31/22+ |
$ |
24.46 |
0.14 |
(a) |
(1.21 |
) |
(1.07 |
) |
(0.26 |
) |
(2.01 |
) |
(2.27 |
) |
0.00 |
||||||||||||||||||||
|
09/30/21 |
$ |
16.86 |
0.11 |
(a) |
7.53 |
7.64 |
(0.04 |
) |
0.00 |
(0.04 |
) |
0.00 |
|||||||||||||||||||||||
|
09/30/20 |
$ |
16.81 |
0.06 |
(a) |
0.24 |
0.30 |
(0.25 |
) |
0.00 |
(0.25 |
) |
0.00 |
|||||||||||||||||||||||
|
09/30/19 |
$ |
18.61 |
0.35 |
(a) |
(1.34 |
) |
(0.99 |
) |
(0.26 |
) |
(0.55 |
) |
(0.81 |
) |
0.00 |
||||||||||||||||||||
|
09/30/18 |
$ |
19.81 |
0.27 |
(a) |
(0.37 |
) |
(0.10 |
) |
(0.21 |
) |
(0.89 |
) |
(1.10 |
) |
0.00 |
||||||||||||||||||||
|
09/30/17(b) |
$ |
16.39 |
0.23 |
(a) |
3.19 |
3.42 |
0.00 |
0.00 |
0.00 |
0.00 |
|||||||||||||||||||||||||
|
Class R6 |
|||||||||||||||||||||||||||||||||||
|
10/01/2021-03/31/22+ |
$ |
24.47 |
0.14 |
(a) |
(1.21 |
) |
(1.07 |
) |
(0.27 |
) |
(2.01 |
) |
(2.28 |
) |
0.00 |
||||||||||||||||||||
|
09/30/21(c) |
$ |
20.65 |
0.15 |
(a) |
3.67 |
3.82 |
0.00 |
0.00 |
0.00 |
0.00 |
|||||||||||||||||||||||||
+ Unaudited.
† Data has been annualized.
(a) Computed using average shares outstanding throughout the period.
(b) Commenced on 11/30/2016.
(c) Commenced on 12/15/2020.
90 OAKMARK FUNDS
Oakmark Funds
Financial Highlights
For a share outstanding throughout each period
|
Ratios/Supplemental Data: |
|||||||||||||||||||||||||||||||
|
Net Asset Value, End of Period |
Total Return |
Net Assets, End of Period ($million) |
Ratio of Net Investment Income to Average Net Assets |
Ratio of Gross Expenses to Average Net Assets |
Ratio of Net Expenses to Average Net Assets |
Portfolio Turnover Rate |
|||||||||||||||||||||||||
|
Oakmark Global Fund |
|||||||||||||||||||||||||||||||
|
Investor Class |
|||||||||||||||||||||||||||||||
|
10/01/2021-03/31/22+ |
$ |
32.78 |
-1.81 |
% |
$ |
734.3 |
0.67 |
%† |
1.13 |
%† |
1.11 |
%† |
15 |
% |
|||||||||||||||||
|
09/30/21 |
$ |
36.53 |
47.96 |
% |
$ |
802.1 |
0.31 |
% |
1.16 |
% |
1.13 |
% |
40 |
% |
|||||||||||||||||
|
09/30/20 |
$ |
24.73 |
-6.73 |
% |
$ |
645.2 |
0.10 |
% |
1.26 |
% |
1.20 |
% |
24 |
% |
|||||||||||||||||
|
09/30/19 |
$ |
27.52 |
-2.48 |
% |
$ |
1,077.3 |
1.82 |
% |
1.23 |
% |
1.17 |
% |
20 |
% |
|||||||||||||||||
|
09/30/18 |
$ |
32.21 |
1.02 |
% |
$ |
1,492.7 |
0.68 |
% |
1.21 |
% |
1.15 |
% |
25 |
% |
|||||||||||||||||
|
09/30/17 |
$ |
34.32 |
31.64 |
% |
$ |
1,811.8 |
0.96 |
% |
1.21 |
% |
1.15 |
% |
32 |
% |
|||||||||||||||||
|
Advisor Class |
|||||||||||||||||||||||||||||||
|
10/01/2021-03/31/22+ |
$ |
32.77 |
-1.73 |
% |
$ |
205.8 |
0.87 |
%† |
0.93 |
%† |
0.91 |
%† |
15 |
% |
|||||||||||||||||
|
09/30/21 |
$ |
36.57 |
48.25 |
% |
$ |
214.6 |
0.51 |
% |
0.96 |
% |
0.93 |
% |
40 |
% |
|||||||||||||||||
|
09/30/20 |
$ |
24.74 |
-6.61 |
% |
$ |
209.0 |
0.26 |
% |
1.14 |
% |
1.08 |
% |
24 |
% |
|||||||||||||||||
|
09/30/19 |
$ |
27.53 |
-2.35 |
% |
$ |
263.0 |
1.79 |
% |
1.10 |
% |
1.05 |
% |
20 |
% |
|||||||||||||||||
|
09/30/18 |
$ |
32.22 |
1.10 |
% |
$ |
440.2 |
0.89 |
% |
1.12 |
% |
1.06 |
% |
25 |
% |
|||||||||||||||||
|
09/30/17(b) |
$ |
34.36 |
26.23 |
% |
$ |
499.9 |
0.89 |
%† |
1.07 |
%† |
1.01 |
%† |
32 |
% |
|||||||||||||||||
|
Institutional Class |
|||||||||||||||||||||||||||||||
|
10/01/2021-03/31/22+ |
$ |
32.77 |
-1.71 |
% |
$ |
399.2 |
0.90 |
%† |
0.90 |
%† |
0.88 |
%† |
15 |
% |
|||||||||||||||||
|
09/30/21 |
$ |
36.58 |
48.31 |
% |
$ |
432.4 |
0.53 |
% |
0.92 |
% |
0.89 |
% |
40 |
% |
|||||||||||||||||
|
09/30/20 |
$ |
24.75 |
-6.57 |
% |
$ |
313.4 |
0.33 |
% |
1.08 |
% |
1.02 |
% |
24 |
% |
|||||||||||||||||
|
09/30/19 |
$ |
27.54 |
-2.30 |
% |
$ |
313.8 |
2.17 |
% |
1.06 |
% |
1.00 |
% |
20 |
% |
|||||||||||||||||
|
09/30/18 |
$ |
32.25 |
1.18 |
% |
$ |
333.5 |
0.93 |
% |
1.04 |
% |
0.98 |
% |
25 |
% |
|||||||||||||||||
|
09/30/17(b) |
$ |
34.38 |
26.30 |
% |
$ |
309.6 |
1.55 |
%† |
1.02 |
%† |
0.96 |
%† |
32 |
% |
|||||||||||||||||
|
R6 Class |
|||||||||||||||||||||||||||||||
|
10/01/2021-03/31/22+ |
$ |
32.76 |
-1.72 |
% |
$ |
88.0 |
0.93 |
%† |
0.87 |
%† |
0.85 |
%† |
15 |
% |
|||||||||||||||||
|
09/30/21(c) |
$ |
36.58 |
16.57 |
% |
$ |
91.9 |
0.77 |
%† |
0.89 |
%† |
0.87 |
%† |
40 |
% |
|||||||||||||||||
|
Oakmark Global Select Fund |
|||||||||||||||||||||||||||||||
|
Investor Class |
|||||||||||||||||||||||||||||||
|
10/01/2021-03/31/22+ |
$ |
21.13 |
-4.99 |
% |
$ |
516.1 |
0.95 |
%† |
1.10 |
%† |
1.08 |
%† |
22 |
% |
|||||||||||||||||
|
09/30/21 |
$ |
24.45 |
45.02 |
% |
$ |
574.8 |
0.27 |
% |
1.12 |
% |
1.09 |
% |
49 |
% |
|||||||||||||||||
|
09/30/20 |
$ |
16.86 |
1.50 |
% |
$ |
483.7 |
0.16 |
% |
1.25 |
% |
1.19 |
% |
33 |
% |
|||||||||||||||||
|
09/30/19 |
$ |
16.81 |
-4.90 |
% |
$ |
798.4 |
1.88 |
% |
1.25 |
% |
1.18 |
% |
21 |
% |
|||||||||||||||||
|
09/30/18 |
$ |
18.58 |
-0.86 |
% |
$ |
1,404.8 |
1.15 |
% |
1.19 |
% |
1.12 |
% |
26 |
% |
|||||||||||||||||
|
09/30/17 |
$ |
19.78 |
26.41 |
% |
$ |
2,035.3 |
1.25 |
% |
1.18 |
% |
1.12 |
% |
39 |
% |
|||||||||||||||||
|
Advisor Class |
|||||||||||||||||||||||||||||||
|
10/01/2021-03/31/22+ |
$ |
21.11 |
-4.89 |
% |
$ |
221.8 |
1.05 |
%† |
0.93 |
%† |
0.91 |
%† |
22 |
% |
|||||||||||||||||
|
09/30/21 |
$ |
24.44 |
45.21 |
% |
$ |
257.6 |
0.43 |
% |
0.95 |
% |
0.92 |
% |
49 |
% |
|||||||||||||||||
|
09/30/20 |
$ |
16.85 |
1.64 |
% |
$ |
392.7 |
0.29 |
% |
1.14 |
% |
1.07 |
% |
33 |
% |
|||||||||||||||||
|
09/30/19 |
$ |
16.80 |
-4.85 |
% |
$ |
449.0 |
2.25 |
% |
1.14 |
% |
1.07 |
% |
21 |
% |
|||||||||||||||||
|
09/30/18 |
$ |
18.60 |
-0.75 |
% |
$ |
457.6 |
1.32 |
% |
1.09 |
% |
1.02 |
% |
26 |
% |
|||||||||||||||||
|
09/30/17(b) |
$ |
19.81 |
20.87 |
% |
$ |
148.4 |
1.58 |
%† |
1.07 |
%† |
1.00 |
%† |
39 |
% |
|||||||||||||||||
|
Institutional Class |
|||||||||||||||||||||||||||||||
|
10/01/2021-03/31/22+ |
$ |
21.12 |
-4.88 |
% |
$ |
657.4 |
1.18 |
%† |
0.89 |
%† |
0.87 |
%† |
22 |
% |
|||||||||||||||||
|
09/30/21 |
$ |
24.46 |
45.33 |
% |
$ |
762.7 |
0.46 |
% |
0.89 |
% |
0.86 |
% |
49 |
% |
|||||||||||||||||
|
09/30/20 |
$ |
16.86 |
1.70 |
% |
$ |
414.3 |
0.36 |
% |
1.07 |
% |
1.00 |
% |
33 |
% |
|||||||||||||||||
|
09/30/19 |
$ |
16.81 |
-4.79 |
% |
$ |
538.8 |
2.15 |
% |
1.07 |
% |
1.01 |
% |
21 |
% |
|||||||||||||||||
|
09/30/18 |
$ |
18.61 |
-0.66 |
% |
$ |
780.8 |
1.39 |
% |
1.03 |
% |
0.96 |
% |
26 |
% |
|||||||||||||||||
|
09/30/17(b) |
$ |
19.81 |
20.87 |
% |
$ |
608.0 |
1.46 |
%† |
1.00 |
%† |
0.94 |
%† |
39 |
% |
|||||||||||||||||
|
Class R6 |
|||||||||||||||||||||||||||||||
|
10/01/2021-03/31/22+ |
$ |
21.12 |
-4.85 |
% |
$ |
116.3 |
1.20 |
%† |
0.84 |
%† |
0.82 |
%† |
22 |
% |
|||||||||||||||||
|
09/30/21(c) |
$ |
24.47 |
18.50 |
% |
$ |
124.1 |
0.76 |
%† |
0.84 |
%† |
0.82 |
%† |
49 |
% |
|||||||||||||||||
+ Unaudited.
† Data has been annualized.
(a) Computed using average shares outstanding throughout the period.
(b) Commenced on 11/30/2016.
(c) Commenced on 12/15/2020.
Oakmark.com 91
Oakmark Funds
Financial Highlights
For a share outstanding throughout each period
|
Income from Investment Operations: |
Less Distributions: |
||||||||||||||||||||||||||||||||||
|
Net Asset Value, Beginning of Period |
Net Investment Income |
Net Gain (Loss) on Investments (Both Realized and Unrealized) |
Total from Investment Operations |
Distributions from Net Investment Income |
Distributions from Capital Gains |
Total Distributions |
Redemption Fees |
||||||||||||||||||||||||||||
|
Oakmark International Fund |
|||||||||||||||||||||||||||||||||||
|
Investor Class |
|||||||||||||||||||||||||||||||||||
|
10/01/2021-03/31/22+ |
$ |
28.17 |
0.17 |
(a) |
(2.34 |
) |
(2.17 |
) |
(0.35 |
) |
0.00 |
(0.35 |
) |
0.00 |
|||||||||||||||||||||
|
09/30/21 |
$ |
19.91 |
0.27 |
(a) |
8.08 |
8.35 |
(0.09 |
) |
0.00 |
(0.09 |
) |
0.00 |
|||||||||||||||||||||||
|
09/30/20 |
$ |
22.88 |
0.08 |
(a) |
(2.60 |
) |
(2.52 |
) |
(0.45 |
) |
0.00 |
(0.45 |
) |
0.00 |
|||||||||||||||||||||
|
09/30/19 |
$ |
26.14 |
0.64 |
(a) |
(2.43 |
) |
(1.79 |
) |
(0.44 |
) |
(1.03 |
) |
(1.47 |
) |
0.00 |
||||||||||||||||||||
|
09/30/18 |
$ |
28.77 |
0.60 |
(2.36 |
) |
(1.76 |
) |
(0.39 |
) |
(0.48 |
) |
(0.87 |
) |
0.00 |
|||||||||||||||||||||
|
09/30/17 |
$ |
21.66 |
0.44 |
7.01 |
7.45 |
(0.34 |
) |
0.00 |
(0.34 |
) |
0.00 |
||||||||||||||||||||||||
|
Advisor Class |
|||||||||||||||||||||||||||||||||||
|
10/01/2021-03/31/22+ |
$ |
28.15 |
0.20 |
(a) |
(2.34 |
) |
(2.14 |
) |
(0.38 |
) |
0.00 |
(0.38 |
) |
0.00 |
|||||||||||||||||||||
|
09/30/21 |
$ |
19.89 |
0.27 |
(a) |
8.11 |
8.38 |
(0.12 |
) |
0.00 |
(0.12 |
) |
0.00 |
|||||||||||||||||||||||
|
09/30/20 |
$ |
22.86 |
0.12 |
(a) |
(2.61 |
) |
(2.49 |
) |
(0.48 |
) |
0.00 |
(0.48 |
) |
0.00 |
|||||||||||||||||||||
|
09/30/19 |
$ |
26.17 |
0.76 |
(a) |
(2.54 |
) |
(1.78 |
) |
(0.50 |
) |
(1.03 |
) |
(1.53 |
) |
0.00 |
||||||||||||||||||||
|
09/30/18 |
$ |
28.82 |
0.70 |
(a) |
(2.44 |
) |
(1.74 |
) |
(0.43 |
) |
(0.48 |
) |
(0.91 |
) |
0.00 |
||||||||||||||||||||
|
09/30/17(b) |
$ |
21.96 |
0.53 |
(a) |
6.33 |
6.86 |
0.00 |
0.00 |
0.00 |
0.00 |
|||||||||||||||||||||||||
|
Institutional Class |
|||||||||||||||||||||||||||||||||||
|
10/01/2021-03/31/22+ |
$ |
28.19 |
0.21 |
(a) |
(2.35 |
) |
(2.14 |
) |
(0.42 |
) |
0.00 |
(0.42 |
) |
0.00 |
|||||||||||||||||||||
|
09/30/21 |
$ |
19.92 |
0.37 |
(a) |
8.04 |
8.41 |
(0.14 |
) |
0.00 |
(0.14 |
) |
0.00 |
|||||||||||||||||||||||
|
09/30/20 |
$ |
22.89 |
0.13 |
(a) |
(2.60 |
) |
(2.47 |
) |
(0.50 |
) |
0.00 |
(0.50 |
) |
0.00 |
|||||||||||||||||||||
|
09/30/19 |
$ |
26.19 |
0.73 |
(a) |
(2.50 |
) |
(1.77 |
) |
(0.50 |
) |
(1.03 |
) |
(1.53 |
) |
0.00 |
||||||||||||||||||||
|
09/30/18 |
$ |
28.82 |
0.63 |
(a) |
(2.35 |
) |
(1.72 |
) |
(0.43 |
) |
(0.48 |
) |
(0.91 |
) |
0.00 |
||||||||||||||||||||
|
09/30/17(b) |
$ |
21.96 |
0.46 |
(a) |
6.40 |
6.86 |
0.00 |
0.00 |
0.00 |
0.00 |
|||||||||||||||||||||||||
|
Class R6 |
|||||||||||||||||||||||||||||||||||
|
10/01/2021-03/31/22+ |
$ |
28.20 |
0.22 |
(a) |
(2.35 |
) |
(2.13 |
) |
(0.43 |
) |
0.00 |
(0.43 |
) |
0.00 |
|||||||||||||||||||||
|
09/30/21(c) |
$ |
25.83 |
0.38 |
(a) |
1.99 |
2.37 |
0.00 |
0.00 |
0.00 |
0.00 |
|||||||||||||||||||||||||
|
Oakmark International Small Cap Fund |
|||||||||||||||||||||||||||||||||||
|
Investor Class |
|||||||||||||||||||||||||||||||||||
|
10/01/2021-03/31/22+ |
$ |
19.92 |
0.03 |
(a) |
(2.07 |
) |
(2.04 |
) |
(0.32 |
) |
0.00 |
(0.32 |
) |
0.00 |
|||||||||||||||||||||
|
09/30/21 |
$ |
13.67 |
0.22 |
(a) |
6.35 |
6.57 |
(0.32 |
) |
0.00 |
(0.32 |
) |
0.00 |
|||||||||||||||||||||||
|
09/30/20 |
$ |
14.61 |
0.31 |
(a) |
(1.22 |
) |
(0.91 |
) |
(0.03 |
) |
0.00 |
(0.03 |
) |
0.00 |
|||||||||||||||||||||
|
09/30/19 |
$ |
16.34 |
0.27 |
(a) |
(0.89 |
) |
(0.62 |
) |
(0.20 |
) |
(0.91 |
) |
(1.11 |
) |
0.00 |
(d) |
|||||||||||||||||||
|
09/30/18 |
$ |
18.12 |
0.23 |
(a) |
(1.37 |
) |
(1.14 |
) |
(0.14 |
) |
(0.50 |
) |
(0.64 |
) |
0.00 |
(d) |
|||||||||||||||||||
|
09/30/17 |
$ |
14.84 |
0.23 |
(a) |
3.50 |
3.73 |
(0.36 |
) |
(0.09 |
) |
(0.45 |
) |
0.00 |
(d) |
|||||||||||||||||||||
|
Advisor Class |
|||||||||||||||||||||||||||||||||||
|
10/01/2021-03/31/22+ |
$ |
19.96 |
0.05 |
(a) |
(2.09 |
) |
(2.04 |
) |
(0.35 |
) |
0.00 |
(0.35 |
) |
0.00 |
|||||||||||||||||||||
|
09/30/21 |
$ |
13.69 |
0.23 |
(a) |
6.38 |
6.61 |
(0.34 |
) |
0.00 |
(0.34 |
) |
0.00 |
|||||||||||||||||||||||
|
09/30/20 |
$ |
14.64 |
0.30 |
(a) |
(1.19 |
) |
(0.89 |
) |
(0.06 |
) |
0.00 |
(0.06 |
) |
0.00 |
|||||||||||||||||||||
|
09/30/19 |
$ |
16.33 |
0.31 |
(a) |
(0.90 |
) |
(0.59 |
) |
(0.19 |
) |
(0.91 |
) |
(1.10 |
) |
0.00 |
(d) |
|||||||||||||||||||
|
09/30/18 |
$ |
18.14 |
0.25 |
(1.38 |
) |
(1.13 |
) |
(0.18 |
) |
(0.50 |
) |
(0.68 |
) |
0.00 |
(d) |
||||||||||||||||||||
|
09/30/17(b) |
$ |
14.16 |
0.19 |
(a) |
3.79 |
3.98 |
0.00 |
0.00 |
0.00 |
0.00 |
(d) |
||||||||||||||||||||||||
|
Institutional Class |
|||||||||||||||||||||||||||||||||||
|
10/01/2021-03/31/22+ |
$ |
19.91 |
0.05 |
(a) |
(2.07 |
) |
(2.02 |
) |
(0.37 |
) |
0.00 |
(0.37 |
) |
0.00 |
|||||||||||||||||||||
|
09/30/21 |
$ |
13.65 |
0.26 |
(a) |
6.35 |
6.61 |
(0.35 |
) |
0.00 |
(0.35 |
) |
0.00 |
|||||||||||||||||||||||
|
09/30/20 |
$ |
14.59 |
0.33 |
(a) |
(1.21 |
) |
(0.88 |
) |
(0.06 |
) |
0.00 |
(0.06 |
) |
0.00 |
|||||||||||||||||||||
|
09/30/19 |
$ |
16.36 |
0.29 |
(a) |
(0.90 |
) |
(0.61 |
) |
(0.25 |
) |
(0.91 |
) |
(1.16 |
) |
0.00 |
(d) |
|||||||||||||||||||
|
09/30/18 |
$ |
18.15 |
0.26 |
(1.36 |
) |
(1.10 |
) |
(0.19 |
) |
(0.50 |
) |
(0.69 |
) |
0.00 |
(d) |
||||||||||||||||||||
|
09/30/17(b) |
$ |
14.16 |
0.21 |
(a) |
3.78 |
3.99 |
0.00 |
0.00 |
0.00 |
0.00 |
(d) |
||||||||||||||||||||||||
|
R6 Class |
|||||||||||||||||||||||||||||||||||
|
10/01/2021-03/31/22+ |
$ |
19.91 |
0.06 |
(a) |
(2.08 |
) |
(2.02 |
) |
(0.37 |
) |
0.00 |
(0.37 |
) |
0.00 |
|||||||||||||||||||||
|
09/30/21(c) |
$ |
16.66 |
0.25 |
(a) |
3.00 |
3.25 |
0.00 |
0.00 |
0.00 |
0.00 |
|||||||||||||||||||||||||
+ Unaudited.
† Data has been annualized.
(a) Computed using average shares outstanding throughout the period.
(b) Commenced on 11/30/2016.
(c) Commenced on 12/15/2020.
(d) Amount rounds to less than $0.01 per share.
92 OAKMARK FUNDS
Oakmark Funds
Financial Highlights
For a share outstanding throughout each period
|
Ratios/Supplemental Data: |
|||||||||||||||||||||||||||||||
|
Net Asset Value, End of Period |
Total Return |
Net Assets, End of Period ($million) |
Ratio of Net Investment Income to Average Net Assets |
Ratio of Gross Expenses to Average Net Assets |
Ratio of Net Expenses to Average Net Assets |
Portfolio Turnover Rate |
|||||||||||||||||||||||||
|
Oakmark International Fund |
|||||||||||||||||||||||||||||||
|
Investor Class |
|||||||||||||||||||||||||||||||
|
10/01/2021-03/31/22+ |
$ |
25.65 |
-7.79 |
% |
$ |
7,568.4 |
1.24 |
%† |
1.06 |
%† |
1.04 |
%† |
18 |
% |
|||||||||||||||||
|
09/30/21 |
$ |
28.17 |
41.96 |
% |
$ |
8,756.6 |
0.99 |
% |
1.05 |
% |
1.02 |
% |
42 |
% |
|||||||||||||||||
|
09/30/20 |
$ |
19.91 |
-11.37 |
% |
$ |
7,959.9 |
0.39 |
% |
1.05 |
% |
1.00 |
% |
32 |
% |
|||||||||||||||||
|
09/30/19 |
$ |
22.88 |
-6.41 |
% |
$ |
14,446.5 |
2.84 |
% |
1.04 |
% |
0.98 |
% |
35 |
% |
|||||||||||||||||
|
09/30/18 |
$ |
26.14 |
-6.33 |
% |
$ |
24,866.2 |
1.84 |
% |
1.01 |
% |
0.96 |
% |
36 |
% |
|||||||||||||||||
|
09/30/17 |
$ |
28.77 |
34.88 |
% |
$ |
31,058.2 |
1.72 |
% |
1.00 |
% |
0.95 |
% |
41 |
% |
|||||||||||||||||
|
Advisor Class |
|||||||||||||||||||||||||||||||
|
10/01/2021-03/31/22+ |
$ |
25.63 |
-7.69 |
% |
$ |
3,105.6 |
1.44 |
%† |
0.88 |
%† |
0.86 |
%† |
18 |
% |
|||||||||||||||||
|
09/30/21 |
$ |
28.15 |
42.22 |
% |
$ |
3,316.0 |
1.03 |
% |
0.88 |
% |
0.85 |
% |
42 |
% |
|||||||||||||||||
|
09/30/20 |
$ |
19.89 |
-11.28 |
% |
$ |
6,282.8 |
0.59 |
% |
0.95 |
% |
0.90 |
% |
32 |
% |
|||||||||||||||||
|
09/30/19 |
$ |
22.86 |
-6.34 |
% |
$ |
6,701.4 |
3.35 |
% |
0.95 |
% |
0.90 |
% |
35 |
% |
|||||||||||||||||
|
09/30/18 |
$ |
26.17 |
-6.25 |
% |
$ |
5,757.4 |
2.53 |
% |
0.88 |
% |
0.83 |
% |
36 |
% |
|||||||||||||||||
|
09/30/17(b) |
$ |
28.82 |
31.24 |
% |
$ |
914.3 |
2.42 |
%† |
0.86 |
%† |
0.81 |
%† |
41 |
% |
|||||||||||||||||
|
Institutional Class |
|||||||||||||||||||||||||||||||
|
10/01/2021-03/31/22+ |
$ |
25.63 |
-7.66 |
% |
$ |
10,721.4 |
1.50 |
%† |
0.81 |
%† |
0.79 |
%† |
18 |
% |
|||||||||||||||||
|
09/30/21 |
$ |
28.19 |
42.30 |
% |
$ |
11,748.6 |
1.34 |
% |
0.80 |
% |
0.77 |
% |
42 |
% |
|||||||||||||||||
|
09/30/20 |
$ |
19.92 |
-11.19 |
% |
$ |
7,233.5 |
0.62 |
% |
0.87 |
% |
0.82 |
% |
32 |
% |
|||||||||||||||||
|
09/30/19 |
$ |
22.89 |
-6.27 |
% |
$ |
9,457.3 |
3.20 |
% |
0.86 |
% |
0.81 |
% |
35 |
% |
|||||||||||||||||
|
09/30/18 |
$ |
26.19 |
-6.16 |
% |
$ |
12,174.4 |
2.25 |
% |
0.84 |
% |
0.79 |
% |
36 |
% |
|||||||||||||||||
|
09/30/17(b) |
$ |
28.82 |
31.24 |
% |
$ |
7,658.7 |
2.06 |
%† |
0.83 |
%† |
0.77 |
%† |
41 |
% |
|||||||||||||||||
|
Class R6 |
|||||||||||||||||||||||||||||||
|
10/01/2021-03/31/22+ |
$ |
25.64 |
-7.64 |
% |
$ |
3,470.0 |
1.55 |
%† |
0.77 |
%† |
0.75 |
%† |
18 |
% |
|||||||||||||||||
|
09/30/21(c) |
$ |
28.20 |
9.18 |
% |
$ |
2,997.8 |
1.62 |
%† |
0.77 |
%† |
0.75 |
%† |
42 |
% |
|||||||||||||||||
|
Oakmark International Small Cap Fund |
|||||||||||||||||||||||||||||||
|
Investor Class |
|||||||||||||||||||||||||||||||
|
10/01/2021-03/31/22+ |
$ |
17.56 |
-10.38 |
% |
$ |
443.5 |
0.28 |
%† |
1.35 |
%† |
1.33 |
%† |
18 |
% |
|||||||||||||||||
|
09/30/21 |
$ |
19.92 |
48.51 |
% |
$ |
560.1 |
1.18 |
% |
1.37 |
% |
1.35 |
% |
48 |
% |
|||||||||||||||||
|
09/30/20 |
$ |
13.67 |
-6.23 |
% |
$ |
388.9 |
2.21 |
% |
1.45 |
% |
1.45 |
% |
42 |
% |
|||||||||||||||||
|
09/30/19 |
$ |
14.61 |
-2.91 |
% |
$ |
546.4 |
1.88 |
% |
1.38 |
% |
1.38 |
% |
39 |
% |
|||||||||||||||||
|
09/30/18 |
$ |
16.34 |
-6.43 |
% |
$ |
1,013.6 |
1.32 |
% |
1.36 |
% |
1.36 |
% |
45 |
% |
|||||||||||||||||
|
09/30/17 |
$ |
18.12 |
25.98 |
% |
$ |
1,835.5 |
1.40 |
% |
1.36 |
% |
1.36 |
% |
34 |
% |
|||||||||||||||||
|
Advisor Class |
|||||||||||||||||||||||||||||||
|
10/01/2021-03/31/22+ |
$ |
17.57 |
-10.35 |
% |
$ |
171.2 |
0.48 |
%† |
1.17 |
%† |
1.15 |
%† |
18 |
% |
|||||||||||||||||
|
09/30/21 |
$ |
19.96 |
48.76 |
% |
$ |
189.3 |
1.26 |
% |
1.20 |
% |
1.19 |
% |
48 |
% |
|||||||||||||||||
|
09/30/20 |
$ |
13.69 |
-6.16 |
% |
$ |
155.7 |
2.14 |
% |
1.35 |
% |
1.35 |
% |
42 |
% |
|||||||||||||||||
|
09/30/19 |
$ |
14.64 |
-2.72 |
% |
$ |
142.5 |
2.13 |
% |
1.26 |
% |
1.26 |
% |
39 |
% |
|||||||||||||||||
|
09/30/18 |
$ |
16.33 |
-6.39 |
% |
$ |
346.6 |
1.41 |
% |
1.32 |
% |
1.32 |
% |
45 |
% |
|||||||||||||||||
|
09/30/17(b) |
$ |
18.14 |
28.11 |
% |
$ |
388.5 |
1.29 |
%† |
1.21 |
%† |
1.21 |
%† |
34 |
% |
|||||||||||||||||
|
Institutional Class |
|||||||||||||||||||||||||||||||
|
10/01/2021-03/31/22+ |
$ |
17.52 |
-10.29 |
% |
$ |
461.8 |
0.53 |
%† |
1.10 |
%† |
1.08 |
%† |
18 |
% |
|||||||||||||||||
|
09/30/21 |
$ |
19.91 |
48.93 |
% |
$ |
526.9 |
1.41 |
% |
1.11 |
% |
1.09 |
% |
48 |
% |
|||||||||||||||||
|
09/30/20 |
$ |
13.65 |
-6.09 |
% |
$ |
614.2 |
2.37 |
% |
1.26 |
% |
1.26 |
% |
42 |
% |
|||||||||||||||||
|
09/30/19 |
$ |
14.59 |
-2.75 |
% |
$ |
735.8 |
2.03 |
% |
1.23 |
% |
1.23 |
% |
39 |
% |
|||||||||||||||||
|
09/30/18 |
$ |
16.36 |
-6.23 |
% |
$ |
863.3 |
1.49 |
% |
1.17 |
% |
1.17 |
% |
45 |
% |
|||||||||||||||||
|
09/30/17(b) |
$ |
18.15 |
28.18 |
% |
$ |
839.1 |
1.47 |
%† |
1.14 |
%† |
1.14 |
%† |
34 |
% |
|||||||||||||||||
|
R6 Class |
|||||||||||||||||||||||||||||||
|
10/01/2021-03/31/22+ |
$ |
17.52 |
-10.27 |
% |
$ |
368.3 |
0.58 |
%† |
1.07 |
%† |
1.05 |
%† |
18 |
% |
|||||||||||||||||
|
09/30/21(c) |
$ |
19.91 |
19.51 |
% |
$ |
367.6 |
1.55 |
%† |
1.09 |
%† |
1.07 |
%† |
48 |
% |
|||||||||||||||||
+ Unaudited.
† Data has been annualized.
(a) Computed using average shares outstanding throughout the period.
(b) Commenced on 11/30/2016.
(c) Commenced on 12/15/2020.
(d) Amount rounds to less than $0.01 per share.
Oakmark.com 93
Oakmark Funds
Financial Highlights
For a share outstanding throughout each period
|
Income from Investment Operations: |
Less Distributions: |
||||||||||||||||||||||||||||||||||
|
Net Asset Value, Beginning of Period |
Net Investment Income |
Net Gain (Loss) on Investments (Both Realized and Unrealized) |
Total from Investment Operations |
Distributions from Net Investment Income |
Distributions from Capital Gains |
Total Distributions |
Redemption Fees |
||||||||||||||||||||||||||||
|
Oakmark Equity and Income Fund |
|||||||||||||||||||||||||||||||||||
|
Investor Class |
|||||||||||||||||||||||||||||||||||
|
10/01/2021-03/31/22+ |
$ |
35.94 |
0.16 |
(a) |
(0.20 |
) |
(0.04 |
) |
(0.29 |
) |
(2.61 |
) |
(2.90 |
) |
0.00 |
||||||||||||||||||||
|
09/30/21 |
$ |
27.50 |
0.32 |
(a) |
9.40 |
9.72 |
(0.35 |
) |
(0.93 |
) |
(1.28 |
) |
0.00 |
||||||||||||||||||||||
|
09/30/20 |
$ |
30.30 |
0.42 |
(a) |
(0.56 |
) |
(0.14 |
) |
(0.51 |
) |
(2.15 |
) |
(2.66 |
) |
0.00 |
||||||||||||||||||||
|
09/30/19 |
$ |
32.52 |
0.52 |
(a) |
(0.04 |
) |
0.48 |
(0.50 |
) |
(2.20 |
) |
(2.70 |
) |
0.00 |
|||||||||||||||||||||
|
09/30/18 |
$ |
33.41 |
0.49 |
(a) |
1.22 |
1.71 |
(0.43 |
) |
(2.17 |
) |
(2.60 |
) |
0.00 |
||||||||||||||||||||||
|
09/30/17 |
$ |
30.20 |
0.58 |
3.89 |
4.47 |
(0.47 |
) |
(0.79 |
) |
(1.26 |
) |
0.00 |
|||||||||||||||||||||||
|
Advisor Class |
|||||||||||||||||||||||||||||||||||
|
10/01/2021-03/31/22+ |
$ |
35.98 |
0.21 |
(a) |
(0.22 |
) |
(0.01 |
) |
(0.38 |
) |
(2.61 |
) |
(2.99 |
) |
0.00 |
||||||||||||||||||||
|
09/30/21 |
$ |
27.51 |
0.39 |
(a) |
9.40 |
9.79 |
(0.39 |
) |
(0.93 |
) |
(1.32 |
) |
0.00 |
||||||||||||||||||||||
|
09/30/20 |
$ |
30.31 |
0.46 |
(a) |
(0.56 |
) |
(0.10 |
) |
(0.55 |
) |
(2.15 |
) |
(2.70 |
) |
0.00 |
||||||||||||||||||||
|
09/30/19 |
$ |
32.55 |
0.55 |
(a) |
(0.03 |
) |
0.52 |
(0.56 |
) |
(2.20 |
) |
(2.76 |
) |
0.00 |
|||||||||||||||||||||
|
09/30/18 |
$ |
33.46 |
0.56 |
(a) |
1.20 |
1.76 |
(0.50 |
) |
(2.17 |
) |
(2.67 |
) |
0.00 |
||||||||||||||||||||||
|
09/30/17(b) |
$ |
29.97 |
0.55 |
(a) |
2.94 |
3.49 |
0.00 |
0.00 |
0.00 |
0.00 |
|||||||||||||||||||||||||
|
Institutional Class |
|||||||||||||||||||||||||||||||||||
|
10/01/2021-03/31/22+ |
$ |
35.99 |
0.21 |
(a) |
(0.21 |
) |
0.00 |
(0.40 |
) |
(2.61 |
) |
(3.01 |
) |
0.00 |
|||||||||||||||||||||
|
09/30/21 |
$ |
27.52 |
0.41 |
(a) |
9.40 |
9.81 |
(0.41 |
) |
(0.93 |
) |
(1.34 |
) |
0.00 |
||||||||||||||||||||||
|
09/30/20 |
$ |
30.33 |
0.47 |
(a) |
(0.56 |
) |
(0.09 |
) |
(0.57 |
) |
(2.15 |
) |
(2.72 |
) |
0.00 |
||||||||||||||||||||
|
09/30/19 |
$ |
32.56 |
0.59 |
(a) |
(0.05 |
) |
0.54 |
(0.57 |
) |
(2.20 |
) |
(2.77 |
) |
0.00 |
|||||||||||||||||||||
|
09/30/18 |
$ |
33.46 |
0.58 |
(a) |
1.19 |
1.77 |
(0.50 |
) |
(2.17 |
) |
(2.67 |
) |
0.00 |
||||||||||||||||||||||
|
09/30/17(b) |
$ |
29.97 |
0.59 |
(a) |
2.90 |
3.49 |
0.00 |
0.00 |
0.00 |
0.00 |
|||||||||||||||||||||||||
|
R6 Class |
|||||||||||||||||||||||||||||||||||
|
10/01/2021-03/31/22+ |
$ |
36.00 |
0.24 |
(a) |
(0.24 |
) |
0.00 |
(0.40 |
) |
(2.61 |
) |
(3.01 |
) |
0.00 |
|||||||||||||||||||||
|
09/30/21(c) |
$ |
30.24 |
0.49 |
(a) |
5.27 |
5.76 |
0.00 |
0.00 |
0.00 |
0.00 |
|||||||||||||||||||||||||
|
Oakmark Bond Fund |
|||||||||||||||||||||||||||||||||||
|
Investor Class |
|||||||||||||||||||||||||||||||||||
|
03/31/22+(d) |
$ |
9.89 |
0.04 |
(a) |
(0.19 |
) |
(0.15 |
) |
(0.03 |
) |
(0.19 |
) |
(0.22 |
) |
0.00 |
||||||||||||||||||||
|
Advisor Class |
|||||||||||||||||||||||||||||||||||
|
10/01/2021-03/31/22+ |
$ |
10.35 |
0.10 |
(a) |
(0.63 |
) |
(0.53 |
) |
(0.10 |
) |
(0.19 |
) |
(0.29 |
) |
0.00 |
||||||||||||||||||||
|
09/30/21 |
$ |
10.16 |
0.16 |
(a) |
0.24 |
0.40 |
(0.16 |
) |
(0.05 |
) |
(0.21 |
) |
0.00 |
||||||||||||||||||||||
|
09/30/20(e) |
$ |
10.00 |
0.04 |
(a) |
0.15 |
0.19 |
(0.03 |
) |
0.00 |
(0.03 |
) |
0.00 |
|||||||||||||||||||||||
|
Institutional Class |
|||||||||||||||||||||||||||||||||||
|
10/01/2021-03/31/22+ |
$ |
10.35 |
0.10 |
(a) |
(0.63 |
) |
(0.53 |
) |
(0.10 |
) |
(0.19 |
) |
(0.29 |
) |
0.00 |
||||||||||||||||||||
|
09/30/21 |
$ |
10.17 |
0.18 |
(a) |
0.22 |
0.40 |
(0.17 |
) |
(0.05 |
) |
(0.22 |
) |
0.00 |
||||||||||||||||||||||
|
09/30/20(e) |
$ |
10.00 |
0.04 |
(a) |
0.17 |
0.21 |
(0.04 |
) |
0.00 |
(0.04 |
) |
0.00 |
|||||||||||||||||||||||
|
R6 Class |
|||||||||||||||||||||||||||||||||||
|
10/01/2021-03/31/22+ |
$ |
10.35 |
0.10 |
(a) |
(0.63 |
) |
(0.53 |
) |
(0.10 |
) |
(0.19 |
) |
(0.29 |
) |
0.00 |
||||||||||||||||||||
|
09/30/21(c) |
$ |
10.32 |
0.14 |
(a) |
0.04 |
0.18 |
(0.15 |
) |
0.00 |
(0.15 |
) |
0.00 |
|||||||||||||||||||||||
+ Unaudited.
† Data has been annualized.
(a) Computed using average shares outstanding throughout the period.
(c) Commenced on 12/15/2020.
(d) Commenced on 01/28/2022.
(e) Commenced on 06/20/2020.
94 OAKMARK FUNDS
Oakmark Funds
Financial Highlights
For a share outstanding throughout each period
|
Ratios/Supplemental Data: |
|||||||||||||||||||||||||||||||
|
Net Asset Value, End of Period |
Total Return |
Net Assets, End of Period ($million) |
Ratio of Net Investment Income to Average Net Assets |
Ratio of Gross Expenses to Average Net Assets |
Ratio of Net Expenses to Average Net Assets |
Portfolio Turnover Rate |
|||||||||||||||||||||||||
|
Oakmark Equity and Income Fund |
|||||||||||||||||||||||||||||||
|
Investor Class |
|||||||||||||||||||||||||||||||
|
10/01/2021-03/31/22+ |
$ |
33.00 |
-0.27 |
% |
$ |
5,346.5 |
0.94 |
%† |
0.85 |
%† |
0.83 |
%† |
20 |
% |
|||||||||||||||||
|
09/30/21 |
$ |
35.94 |
36.19 |
% |
$ |
5,587.1 |
0.97 |
% |
0.87 |
% |
0.84 |
% |
14 |
% |
|||||||||||||||||
|
09/30/20 |
$ |
27.50 |
-0.90 |
% |
$ |
5,492.4 |
1.52 |
% |
0.94 |
% |
0.84 |
% |
15 |
% |
|||||||||||||||||
|
09/30/19 |
$ |
30.30 |
2.29 |
% |
$ |
9,006.7 |
1.74 |
% |
0.91 |
% |
0.81 |
% |
11 |
% |
|||||||||||||||||
|
09/30/18 |
$ |
32.52 |
5.29 |
% |
$ |
12,159.5 |
1.51 |
% |
0.88 |
% |
0.78 |
% |
23 |
% |
|||||||||||||||||
|
09/30/17 |
$ |
33.41 |
15.30 |
% |
$ |
14,249.1 |
1.71 |
% |
0.87 |
% |
0.78 |
% |
18 |
% |
|||||||||||||||||
|
Advisor Class |
|||||||||||||||||||||||||||||||
|
10/01/2021-03/31/22+ |
$ |
32.98 |
-0.19 |
% |
$ |
873.4 |
1.20 |
%† |
0.60 |
%† |
0.58 |
%† |
20 |
% |
|||||||||||||||||
|
09/30/21 |
$ |
35.98 |
36.49 |
% |
$ |
868.4 |
1.20 |
% |
0.66 |
% |
0.62 |
% |
14 |
% |
|||||||||||||||||
|
09/30/20 |
$ |
27.51 |
-0.76 |
% |
$ |
951.9 |
1.65 |
% |
0.81 |
% |
0.71 |
% |
15 |
% |
|||||||||||||||||
|
09/30/19 |
$ |
30.31 |
2.41 |
% |
$ |
1,347.6 |
1.86 |
% |
0.78 |
% |
0.68 |
% |
11 |
% |
|||||||||||||||||
|
09/30/18 |
$ |
32.55 |
5.42 |
% |
$ |
1,720.5 |
1.72 |
% |
0.74 |
% |
0.64 |
% |
23 |
% |
|||||||||||||||||
|
09/30/17(b) |
$ |
33.46 |
11.64 |
% |
$ |
724.7 |
2.07 |
%† |
0.71 |
%† |
0.61 |
%† |
18 |
% |
|||||||||||||||||
|
Institutional Class |
|||||||||||||||||||||||||||||||
|
10/01/2021-03/31/22+ |
$ |
32.98 |
-0.19 |
% |
$ |
1,124.5 |
1.20 |
%† |
0.60 |
%† |
0.58 |
%† |
20 |
% |
|||||||||||||||||
|
09/30/21 |
$ |
35.99 |
36.57 |
% |
$ |
1,138.5 |
1.22 |
% |
0.62 |
% |
0.58 |
% |
14 |
% |
|||||||||||||||||
|
09/30/20 |
$ |
27.52 |
-0.73 |
% |
$ |
844.3 |
1.72 |
% |
0.75 |
% |
0.65 |
% |
15 |
% |
|||||||||||||||||
|
09/30/19 |
$ |
30.33 |
2.49 |
% |
$ |
1,188.9 |
1.96 |
% |
0.72 |
% |
0.63 |
% |
11 |
% |
|||||||||||||||||
|
09/30/18 |
$ |
32.56 |
5.47 |
% |
$ |
1,035.0 |
1.77 |
% |
0.69 |
% |
0.59 |
% |
23 |
% |
|||||||||||||||||
|
09/30/17(b) |
$ |
33.46 |
11.64 |
% |
$ |
536.3 |
2.19 |
%† |
0.69 |
%† |
0.59 |
%† |
18 |
% |
|||||||||||||||||
|
R6 Class |
|||||||||||||||||||||||||||||||
|
10/01/2021-03/31/22+ |
$ |
32.99 |
-0.17 |
% |
$ |
91.4 |
1.39 |
%† |
0.56 |
%† |
0.54 |
%† |
20 |
% |
|||||||||||||||||
|
09/30/21(c) |
$ |
36.00 |
19.05 |
% |
$ |
87.3 |
1.78 |
%† |
0.57 |
%† |
0.55 |
%† |
14 |
% |
|||||||||||||||||
|
Ratios/Supplemental Data: |
|||||||||||||||||||||||||||||||||||
|
Net Asset Value, End of Period |
Total Return |
Net Assets, End of Period ($million) |
Ratio of Net Investment Income to Average Net Assets |
Ratio of Gross Expenses to Average Net Assets |
Ratio of Waiver/ Reimbursement to Average Net Assets |
Ratio of Net Expenses to Average Net Assets |
Portfolio Turnover Rate |
||||||||||||||||||||||||||||
|
Oakmark Bond Fund |
|||||||||||||||||||||||||||||||||||
|
Investor Class |
|||||||||||||||||||||||||||||||||||
|
03/31/22+(d) |
$ |
9.52 |
-3.39 |
% |
$ |
0.7 |
2.11 |
%† |
1.73 |
%† |
(0.99 |
%)† |
0.74 |
%† |
44 |
% |
|||||||||||||||||||
|
Advisor Class |
|||||||||||||||||||||||||||||||||||
|
10/01/2021-03/31/22+ |
$ |
9.53 |
-5.25 |
% |
$ |
1.6 |
1.93 |
%† |
0.95 |
%† |
(0.41 |
%)† |
0.54 |
%† |
44 |
% |
|||||||||||||||||||
|
09/30/21 |
$ |
10.35 |
3.81 |
% |
$ |
2.4 |
1.59 |
% |
0.93 |
% |
(0.37 |
%) |
0.57 |
% |
112 |
% |
|||||||||||||||||||
|
09/30/20(e) |
$ |
10.16 |
2.04 |
% |
$ |
0.6 |
1.19 |
%† |
3.14 |
%† |
(2.60 |
%)† |
0.54 |
%† |
25 |
% |
|||||||||||||||||||
|
Institutional Class |
|||||||||||||||||||||||||||||||||||
|
10/01/2021-03/31/22+ |
$ |
9.53 |
-5.25 |
% |
$ |
3.1 |
1.97 |
%† |
0.96 |
%† |
(0.44 |
%)† |
0.52 |
%† |
44 |
% |
|||||||||||||||||||
|
09/30/21 |
$ |
10.35 |
3.88 |
% |
$ |
3.3 |
1.75 |
% |
0.89 |
% |
(0.43 |
%) |
0.46 |
% |
112 |
% |
|||||||||||||||||||
|
09/30/20(e) |
$ |
10.17 |
2.07 |
% |
$ |
79.0 |
1.32 |
%† |
2.42 |
%† |
(1.98 |
%)† |
0.44 |
%† |
25 |
% |
|||||||||||||||||||
|
R6 Class |
|||||||||||||||||||||||||||||||||||
|
10/01/2021-03/31/22+ |
$ |
9.53 |
-5.21 |
% |
$ |
82.9 |
2.05 |
%† |
0.94 |
%† |
(0.50 |
%)† |
0.44 |
%† |
44 |
% |
|||||||||||||||||||
|
09/30/21(c) |
$ |
10.35 |
1.74 |
% |
$ |
91.3 |
1.71 |
%† |
0.93 |
%† |
(0.49 |
%)† |
0.44 |
%† |
112 |
% |
|||||||||||||||||||
+ Unaudited.
† Data has been annualized.
(a) Computed using average shares outstanding throughout the period.
(c) Commenced on 12/15/2020.
(d) Commenced on 01/28/2022.
(e) Commenced on 06/20/2020.
Oakmark.com 95
The Oakmark Funds Disclosure Regarding the Board of Trustees' Approval of Investment Advisory Agreements as Approved October 27, 2021
On an annual basis, the Board of Trustees (the "Board" or "Trustees") of Harris Associates Investment Trust (the "Trust"), including a majority of the Trustees who are not "interested persons" of the Trust or of Harris Associates L.P. (the "Adviser") (including its affiliates), as such term is defined under the Investment Company Act of 1940, as amended (the "1940 Act") (the "Independent Trustees"), considers whether to continue the investment advisory agreements with the Adviser (each, an "Agreement," and collectively, the "Agreements") with respect to each series of the Trust (each a "Fund"), except the Oakmark Small Cap Fund. At a meeting held on October 27, 2021, the Board, including all of the Independent Trustees, determined that the continuation of the Agreement for each Fund was in the best interest of the Fund and its shareholders, and approved the continuation of each Agreement through October 31, 2022.
In evaluating the Agreements with respect to each Fund, the Board's Committee on Contracts (the "Committee"), together with the other Independent Trustees, requested, received, reviewed and considered extensive materials provided by the Adviser in response to questions submitted by the Independent Trustees that they believed to be relevant to the continuation of the Agreements with respect to each Fund in light of (i) legal advice furnished to them by their legal counsel that is experienced in 1940 Act matters and that is independent from the Adviser ("Independent Counsel"); (ii) their own business judgment; and (iii) developments in the industry, the markets and mutual fund regulation and litigation. The Committee leads the Board in its evaluation of the Agreements. The Committee is comprised entirely of Independent Trustees, and more than 75% of the Board is comprised of Independent Trustees. During the annual contract approval process, the Committee and the other Independent Trustees met multiple times specifically to review and consider materials related to the proposed continuation of each Agreement; and to ensure that the Adviser had time to respond to questions from the Independent Trustees and that the Independent Trustees had time to consider those responses. They also met with senior representatives of the Adviser regarding, among other things, its personnel, operations and financial condition as they relate to the Funds. In addition, the Board retained Broadridge Financial Solutions, Inc. ("Broadridge"), an independent consulting firm that specializes in the analysis of fund industry data, to provide performance and expense information for each Fund and a peer group of comparable funds, as selected by Broadridge. Additionally, the Board considered the impact of significant market volatility that occurred during and after the period for which information was requested in conducting its evaluation of the Adviser. While the Board considered the continuation of the Agreements for all of the Funds at the same meetings, the Board considered each Fund's Agreement separately from those of each other Fund.
In connection with its deliberations, the Board also considered a broad range of information relevant to the annual contract approval process that is provided to the Board (including its various standing committees) at meetings throughout the year, including investment performance and liquidity management reports and related portfolio information for each Fund, as well as reports on, among other matters, pricing and valuation; quality and cost of portfolio trade execution; compliance; and shareholder support and other services provided by the Adviser and its affiliates.
The Independent Trustees were advised by Independent Counsel throughout the annual contract approval process and they received a memorandum from Independent Counsel discussing the legal standards for their consideration of the proposed continuation of the Agreements. During the course of the year and during their deliberations regarding the annual contract approval process, the Committee and the other Independent Trustees met with Independent Counsel separately from representatives of the Adviser.
Provided below is a description of the Board's annual contract approval process and material factors that the Board considered regarding continuation of the Agreements and the compensation to be paid thereunder. The Board's determination to approve the continuation of the Agreements was based on a comprehensive consideration of all information provided to the Board throughout the year and specifically in connection with the annual contract approval process.
This description is not intended to include all of the factors considered by the Board. The Trustees did not identify any particular information or factor that was all-important or controlling, and each Trustee may have attributed different weights to the various factors. The Board focused on the costs and benefits of the Agreements to each Fund and, through the Fund, its shareholders.
Nature, Extent and Quality of Services
The Board's consideration of the nature, extent and quality of the Adviser's services to the Funds took into account the knowledge the Board gained during meetings with the Adviser throughout the year. In addition, the Board considered: the Adviser's long-term history of care and conscientiousness in the management of the Funds; the consistency of its investment approach; the qualifications, experience and capabilities of, and the resources available to, the Adviser's investment and other personnel responsible for managing the Funds; the Adviser's performance as administrator of the Funds; and the Adviser's compliance program. The Board also considered the Adviser's resources and reviewed key personnel involved in providing investment management services to the Funds, including the time that investment personnel devoted to each Fund, and the investment results produced as a result of the Adviser's in-house research. The Trustees also reviewed information regarding each Fund's "active share" in relation to its benchmark index.
The Board noted the extensive range of services that the Adviser provides to the Funds beyond the investment management services. The Board considered that, pursuant to each Agreement, the Adviser provides administrative services, including, among others, oversight of shareholder communications, fund administration and accounting services, regulatory and legal obligation oversight, supervision of Fund operations, and Board support. The Board also considered the Adviser's policies and practices regarding brokerage, commissions, trade execution, transaction and other trading costs, and allocation of portfolio transactions. The Board noted that the Adviser is also responsible for monitoring compliance with each Fund's investment objectives, policies and restrictions, as well as compliance with applicable law, including implementing rulemaking initiatives of the U.S. Securities and Exchange Commission. The Board also considered that the Adviser's responsibilities include continual management of investment, operational, enterprise, legal, regulatory and compliance risks as they relate to the Funds, and on a regular basis it considers information regarding the Adviser's processes for identifying, monitoring and managing risk. The Board also noted the Adviser's oversight of the Funds' various outside service providers, including its negotiation of certain service providers' fees and its evaluation of service
96 OAKMARK FUNDS
providers' infrastructure, cybersecurity programs, compliance programs and business continuity programs, among other matters. The Board further noted the additional responsibilities of the Adviser in administering the Funds' liquidity risk management program. The Board also considered the Adviser's ongoing development of its own internal infrastructure, including, among other things, its operational and trading capabilities, and its information technology to support the Funds' compliance structure through, among other things, cybersecurity programs, business continuity planning and risk management. The Board also noted the Adviser's largely seamless implementation of its business continuity plan in response to the Covid-19 pandemic, and its success in continuously providing services to the Funds not withstanding the disruptions caused by the pandemic. In addition, the Board noted the positive compliance history of the Adviser.
The Board also considered the general structure of the Adviser's compensation program for portfolio managers, analysts and certain other employees, and whether this structure provides appropriate incentives to act in the best interests of the Funds. In addition, the Board considered the ability of the Adviser to attract and retain qualified personnel to service the Funds. The Board also noted the significant personal investments that the Adviser's personnel have made in the Funds, which serve to further align the interests of the Adviser and its personnel with those of the Funds' shareholders.
The Board also considered the manner in which the Adviser addressed various matters that arose during the year. These matters may have been the result of developments in the broader fund industry or the regulations governing it. In addition, the Board considered the Adviser's response to recent market conditions, such as the economic dislocation and rise in volatility that accompanied shutdowns related to the efforts to stem the spread of Covid-19 and considered the overall performance of the Adviser in this context.
Investment Performance of the Funds
The Board considered each Fund's investment performance over various time periods, net of the Fund's fees and expenses, both on an absolute basis and compared to the performance of a broader group of comparable funds pursuing generally similar strategies with the same investment classification and/or objective as each Fund (the Fund's "Performance Universe"), as selected by Broadridge. As a general matter, the Board considered each Fund's performance and fees in light of the limitations inherent in the methodology for constructing such comparative groups and determining which investment companies should be included in the comparative groups. The performance periods considered by the Board were those ended April 30, 2021. The Board considered the 1-, 3-, 5- and 10-year performance for each Fund.
Further detail considered by the Board regarding the investment performance of each Fund is set forth below:
Oakmark Fund. The Board considered that the Oakmark Fund outperformed the median annualized return of its respective Performance Universe during the 1-, 3-, 5- and 10-year periods ending April 30, 2021.
Oakmark Select Fund. The Board considered that the Oakmark Select Fund outperformed the median annualized return of its respective Performance Universe during the 1-, 3-, 5- and 10-year periods ending April 30, 2021.
Oakmark Global Fund. The Board considered that the Oakmark Global Fund outperformed the median annualized return of its respective Performance Universe during the 1-, 3-, 5- and 10-year periods ending April 30, 2021.
Oakmark Global Select Fund. The Board considered that the Oakmark Global Select Fund outperformed the median annualized return of its respective Performance Universe during the 1-, 5- and 10-year periods ending April 30, 2021 and was the same as the median annual return of its respective Performance Universe during the 3-year period ending April 30, 2021.
Oakmark International Fund. The Board considered that the Oakmark International Fund outperformed the median annualized return of its respective Performance Universe during the 1-, 3-, 5- and 10-year periods ending April 30, 2021.
Oakmark International Small Cap Fund. The Board considered that the Oakmark International Small Cap Fund outperformed the median annualized return of its respective Performance Universe during the 1-, 3-, 5- and 10-year periods ending April 30, 2021.
Oakmark Equity and Income Fund. The Board considered that the Oakmark Equity and Income Fund outperformed the median annualized return of its respective Performance Universe during the 1-, 3-, 5- and 10-year periods ending April 30, 2021.
Oakmark Bond Fund. The Board considered that the Oakmark Bond Fund outperformed the median annualized return of its respective Performance Universe since inception and during the year-to-date period ending April 30, 2021. The Fund was launched in June 2020 and therefore does not have 1-, 3-, 5-, or 10-year performance as of April 30, 2021.
The Board also considered the quintile ranking of each Fund against its Performance Universe for the 1-year period ended April 30, 2021. In addition to considering each Fund's performance as compared to that of its respective Performance Universe, the Board also considered each Fund's performance as compared to that of its benchmark, and other comparative data provided by Broadridge, including each Fund's total return and performance relative to risk and separate comparative data provided by the Adviser. The Board also considered updated performance information at its October meeting at which the Agreements were approved. The Board met quarterly with the portfolio managers of each Fund to discuss the Fund's performance during the year prior to voting on the contract renewal. The Board recognized that the performance data reflects a snapshot of a period as of a particular date and that selecting a different performance period could produce significantly different results. The Board further acknowledged that long-term performance could be impacted by even one period of significant outperformance or underperformance, and that a single investment theme could disproportionately affect performance.
Costs of Services Provided and Profits Realized by the Adviser
The Board considered the fee structure for each Fund under its Agreement as compared to the peer group provided by Broadridge, including funds that the Adviser identified as comparable peer funds. Specifically, using the information provided by Broadridge, the Board considered each Fund's management fee and the management fees for other mutual funds comparable in fund type, investment classification/objective, load type and asset size to each Fund (the Fund's "Expense Group"), and considered each Fund's total expense ratio, which reflects the total fees paid by an investor (excluding any 12b-1/non-12b-1 service fees), and those of its Expense Group.
Oakmark.com 97
Further detail considered by the Board regarding each Fund's management fee and total expense ratio as of the conclusion of its fiscal year ended September 30, 2020, is set forth below:
Oakmark Fund. The Board considered that the Oakmark Fund's management fee net of fees waived by the Adviser and the Fund's total expense ratio were both higher than the corresponding medians of its respective Expense Group.
Oakmark Select Fund. The Board considered that the Oakmark Select Fund's management fee net of fees waived by the Adviser and the Fund's total expense ratio were both higher than the corresponding medians of its respective Expense Group.
Oakmark Global Fund. The Board considered that the Oakmark Global Fund's management fee net of fees waived by the Adviser and the Fund's total expense ratio were both higher than the corresponding medians of its respective Expense Group.
Oakmark Global Select Fund. The Board considered that the Oakmark Global Select Fund's management fee net of fees waived by the Adviser and the Fund's total expense ratio were both higher than the corresponding medians of its respective Expense Group.
Oakmark International Fund. The Board considered that the Oakmark International Fund's management fee net of fees waived by the Adviser and the Fund's total expense ratio were both higher than the corresponding medians of its respective Expense Group.
Oakmark International Small Cap Fund. The Board considered that the Oakmark International Small Cap Fund's management fee and the Fund's total expense ratio were both higher than the corresponding medians of its respective Expense Group.
Oakmark Equity and Income Fund. The Board considered that the Oakmark Equity and Income Fund's management fee net of fees waived by the Adviser and the Fund's total expense ratio were both higher than the corresponding medians of its respective Expense Group.
Oakmark Bond Fund. The Board considered that the Oakmark Bond Fund's management fee was higher than the corresponding median of its respective Expense Group and the Fund's total expense ratio was the same as the corresponding median of its respective Expense Group.
In considering this comparative information, the Board took into account the impact that recent changes to the Funds' share class and fee structures, which took effect on December 15, 2020 (the "Fee Restructure"), had on each Fund's management fees and total expense ratios relative to its Expense Group. Specifically, using supplemental information provided by Broadridge, the Board also considered each Fund's management fee and total expense ratio compared to its Expense Group, based on an assumption that the Fee Restructure had been in effect during the fiscal year ended September 30, 2020. The Board noted that under the Fee Restructure, the management fee (net of fees waived, if applicable) quintile ranking for each Fund improved or stayed the same, and the total expense ratios for most Funds' share classes improved or stayed the same. The Board further noted that Oakmark Fund, Oakmark Select Fund, Oakmark Global Fund, Oakmark Global Select Fund, Oakmark International Fund, Oakmark International Small Cap Fund, and Oakmark Equity and Income Fund all decreased their management fees as part of the Fee Restructure.
The Board also reviewed the Adviser's management fees for comparable institutional separate account clients and sub-advised funds (for which the Adviser provides portfolio management services only). The Board considered the appropriateness and reasonableness of any differences between the fees charged to a Fund and any such comparable separate account clients and/or sub-advised funds, including any breakpoints, and noted the Adviser's explanation that, although in most instances the fees paid by those other clients were lower than the fees paid by the Funds, the differences reflected the Adviser's significantly greater level of responsibilities and broader scope of services with respect to the Funds. The Board further noted the more extensive regulatory obligations and the various risks (e.g., operational, enterprise, legal, regulatory, compliance) associated with managing the Funds as compared to any such comparable separate account clients and/or sub-advised funds.
The Board also noted that each Fund's management fee is a single fee that compensates the Adviser for its services as investment adviser and manager under the Agreements, and further noted that, for comparative purposes, where possible, Broadridge aggregated the separate investment advisory and administrative fees into a single management fee for the mutual funds in the Expense Group that clearly identify two separate fees. The Board noted that some mutual funds in the Expense Group may pay directly from fund assets for certain services that the Adviser is compensated for out of the management fee for the Funds. Accordingly, the Board also considered each Fund's total expense ratio as compared with its respective Expense Group as a way of taking account of these differences. The Board also considered the Adviser's agreement to continue the expense limitation agreement for each Fund. In addition, the Board considered the Adviser's agreement to continue the investment advisory fee waiver agreement for Oakmark Fund, Oakmark Select Fund, Oakmark Global Fund, Oakmark Global Select Fund, Oakmark International Fund, Oakmark International Small Cap Fund, and Oakmark Equity and Income Fund.
The Board also considered the Adviser's costs in serving as the Funds' investment adviser and manager, including costs associated with technology, infrastructure and compliance necessary to manage the Funds. Finally, the Board considered the Adviser's profitability analysis, as well as an Investment Management Industry Profitability Analysis prepared by Broadridge. The Board examined the estimated pre-tax profits realized by the Adviser and its affiliates from their relationship with each Fund, as presented in the profitability analyses, as well as the financial condition of the Adviser. The Board reviewed the Adviser's methodology for allocating costs among the Adviser's lines of business and among the Funds, for purposes of calculating its estimated profitability, and recognized that the methodology may not reflect all of the costs or risks associated with offering and managing a mutual fund complex. The Board also recognized that the Adviser and its affiliates are entitled to earn a reasonable level of profits for services they provide to each Fund.
Economies of Scale
The Board considered whether each Fund's management fee structure reflects any potential economies of scale that may be realized by the Adviser for the benefit of each Fund's shareholders. The Board reviewed each Agreement, which includes breakpoints that decrease the management fee rate as Fund assets increase. In addition, the Board considered each Fund's expense limitation agreement and the investment advisory fee waiver agreement for Oakmark Fund, Oakmark Select Fund, Oakmark Global Fund, Oakmark Global Select Fund, Oakmark International Fund, Oakmark International Small Cap Fund, and Oakmark Equity and Income Fund that reduces each Fund's expenses at all asset levels, which can have an effect similar to breakpoints in sharing economies of scale with shareholders and provides protection from an increase in expenses if a Fund's assets decline. The Board also considered that the
98 OAKMARK FUNDS
Adviser has provided, at no added cost to the Funds, certain additional services, including but not limited to, services required by new regulations or regulatory interpretations, services impelled by changes in the securities markets or the business landscape and/or services requested by the Board. The Board considered that this is a way of sharing economies of scale with the Funds and their shareholders.
Other Benefits Derived from the Relationship with the Funds
The Board considered any fall-out benefits likely to accrue to the Adviser or its affiliates from their relationship with each Fund. The Board noted that an affiliate of the Adviser serves as the Funds' distributor, without compensation, pursuant to a written agreement the Board evaluates annually. The Board also considered the Adviser's use of a portion of the commissions paid by the Funds on their portfolio brokerage transactions to obtain research and brokerage products and services benefiting the Funds and/or other clients of the Adviser, and considered the Adviser's assertion that its use of "soft" commission dollars to obtain research and brokerage products and services was consistent with regulatory requirements.
Conclusion
After full consideration of the above factors, as well as other factors that were instructive in evaluating the Agreements, the Board, including all of the Independent Trustees, in its business judgment, concluded that approval of the continuation of each Agreement was in the best interests of the respective Fund and its shareholders. In reaching this determination, the Board considered that the nature, extent and quality of the services provided by the Adviser to each Fund were appropriate and consistent with the Fund's Agreement and that each Fund was likely to continue to benefit from services provided under its Agreement with the Adviser; that the Adviser was delivering performance for each Fund that was consistent with the long-term investment strategies being pursued by the Fund, and that the Fund and its shareholders were benefiting from the Adviser's investment management of the Fund; that the management fees paid by each Fund to the Adviser were reasonable in light of the services provided; that the breakpoints in the fee schedule for each Fund allow shareholders to benefit from potential economies of scale that may be achieved by the Adviser; that the profitability of the Adviser's relationship with each Fund appeared to be reasonable in relation to the services performed; and that the benefits accruing to the Adviser and its affiliates by virtue of their relationship with the Funds were reasonable in light of the costs and risks associated with providing the investment advisory and other services to each Fund and the benefits accruing to each Fund. The Board's conclusions are based in part on its consideration of materials prepared in connection with the approval or continuance of the Agreements in prior years and on the Board's ongoing regular review of Fund performance and operations throughout the year, in addition to material prepared specifically for the most recent annual contract approval process.
Oakmark.com 99
Disclosures and Endnotes
Reporting to Shareholders. The Funds reduce the number of duplicate prospectuses, annual and semi-annual reports your household receives by sending only one copy of each to those addresses shared by two or more accounts. Call the Funds at 1-800-OAKMARK (625-6275) to request individual copies of these documents. The Funds will begin sending individual copies 30 days after receiving your request.
Before investing in any Oakmark Fund, you should carefully consider the Fund's investment objectives, risks, management fees and other expenses. This and other important information is contained in the Funds' prospectus and a Fund's summary prospectus. Please read the prospectus and summary prospectus carefully before investing. For more information, please visit www.oakmark.com or call 1-800-OAKMARK (625-6275).
The discussion of the Funds' investments and investment strategy (including current investment themes, the portfolio managers' research and investment process, and portfolio characteristics) represents the Funds' investments and the views of the portfolio managers and Harris Associates L.P., the Funds' investment adviser, at the time of this report, and are subject to change without notice.
All Oakmark Funds: Investing in value stocks presents the risk that value stocks may fall out of favor with investors and under-perform growth stocks during given periods.
Oakmark, Oakmark Equity and Income, Oakmark Global, Oakmark International, Oakmark International Small Cap, and Oakmark Bond Funds: The Funds' portfolios tend to be invested in a relatively small number of stocks. As a result, the appreciation or depreciation of any one security held will have a greater impact on the Funds' net asset value than it would if the Funds invest in a larger number of securities. Although that strategy has the potential to generate attractive returns over time, it also increases the Funds' volatility.
Oakmark Select and Oakmark Equity and Income Funds: The stocks of medium-sized companies tend to be more volatile than those of large companies and have underperformed the stocks of small and large companies during some periods.
Because the Oakmark Select and Oakmark Global Select Funds are non-diversified, the performance of each holding will have a greater impact on the Funds' total return and may make the Funds' returns more volatile than a more diversified fund.
Oakmark Global, Oakmark Global Select, Oakmark International, Oakmark International Small Cap and Oakmark Bond Funds: Investing in foreign securities presents risks which in some ways may be greater than U.S. investments. Those risks include: currency fluctuation; different regulation, accounting standards, trading practices and levels of available information; generally higher transaction costs; and political risks.
The percentages of hedge exposure for each foreign currency are calculated by dividing the market value of all same-currency forward contracts by the market value of the underlying equity exposure to that currency.
Oakmark Equity and Income and Oakmark Bond Funds invest in medium- and lower quality debt securities that have higher yield potential but present greater investment and credit risk than higher quality securities. These risks may result in greater share price volatility.
Oakmark International Small Cap Fund: The stocks of smaller companies often involve more risk than the stocks of larger companies. Stocks of small companies tend to be more volatile and have a smaller public market than stocks of larger companies.
Small companies may have a shorter history of operations than larger companies, may not have as great an ability to raise additional capital and may have a less diversified product line, making them more susceptible to market pressure.
Oakmark Equity and Income and Oakmark Bond Funds: The Funds' may be subject to prepayment and extension risk, which may shorten or lengthen the duration of the Funds' investments. The Funds' may also be subject to credit risk, which is the risk the issuer or guarantor of a debt security will be unable or unwilling to make timely payments of interest or principal or to otherwise honor its obligations. The Funds' yield and share price will fluctuate in response to changes in interest rates and there is a risk of loss due to changes in interest rates. Investing in when-issued or forward-settling transactions may be less favorable than the price or yield available in the market when the transaction takes place. The Funds' exposure to loan interests may be subject to restrictions on transfer, illiquid and difficult to value.
Endnotes:
1. The S&P 500 Total Return Index is a float-adjusted, capitalization-weighted index of 500 U.S. large-capitalization stocks representing all major industries. It is a widely recognized index of broad U.S. equity market performance. Returns reflect the reinvestment of dividends. This index is unmanaged and investors cannot invest directly in this index.
2. The Dow Jones Industrial Average is a price-weighted measure of 30 U.S. blue-chip companies. The index covers all industries except transportation and utilities. This index is unmanaged and investors cannot invest directly in this index.
3. The Lipper Large-Cap Value Funds Index measures the equal-weighted performance of the 30 largest U.S. large-cap value funds as defined by Lipper. This index is unmanaged and investors cannot invest directly in this index.
4. Portfolio holdings are subject to change without notice and are not intended as recommendations of individual stocks.
5. EPS refers to Earnings Per Share and is calculated by dividing total earnings by the number of shares outstanding.
6. The Lipper Multi-Cap Value Fund Index measures the equal-weighted performance of the 30 largest U.S. multi-cap value funds as defined by Lipper. This index is unmanaged and investors cannot invest directly in this index.
7. The Price-Earnings Ratio ("P/E") is the most common measure of the expensiveness of a stock.
8. The MSCI World Index (Net) is a free float-adjusted, market capitalization-weighted index that is designed to measure the global equity market performance of developed markets. The index covers approximately 85% of the free float-adjusted market capitalization in each country. This benchmark calculates reinvested dividends net of withholding taxes. This index is unmanaged and investors cannot invest directly in this index.
9. The Lipper Global Fund Index measures the equal-weighted performance of the 30 largest global equity funds as defined by Lipper. This index is unmanaged and investors cannot invest directly in this index.
100 OAKMARK FUNDS
Disclosures and Endnotes (continued)
10. EBITDA refers to Earnings Before the deduction of payments for Interest, Taxes, Depreciation and Amortization, which is a measure of operating income.
11. The MSCI EAFE Index (Net) is designed to represent the performance of large- and mid-cap securities across 21 developed markets, including countries in Europe, Australasia and the Far East, excluding the U.S. and Canada. The index covers approximately 85% of the free float-adjusted market capitalization in each of the 21 countries. This benchmark calculates reinvested dividends net of withholding taxes. This index is unmanaged and investors cannot invest directly in this index.
12. The MSCI World ex U.S. Index (Net) is a free float-adjusted, market capitalization-weighted index that is designed to measure international developed market equity performance, excluding the U.S. The index covers approximately 85% of the free float-adjusted market capitalization in each country. This benchmark calculates reinvested dividends net of withholding taxes. This index is unmanaged and investors cannot invest directly in this index.
13. The Lipper International Fund Index measures the equal-weighted performance of the 30 largest international equity funds as defined by Lipper. This index is unmanaged and investors cannot invest directly in this index.
14. The MSCI World ex U.S. Small Cap Index (Net) is designed to measure performance of small-cap stocks across 22 of 23 developed markets (excluding the U.S.). The index covers approximately 14% of the free float-adjusted market capitalization in each country. This benchmark calculates reinvested dividends net of withholding taxes. This index is unmanaged and investors cannot invest directly in this index.
15. The Lipper International Small-Cap Fund Index measures the equal-weighted performance of the 30 largest international small-cap equity funds as defined by Lipper. This index is unmanaged and investors cannot invest directly in this index.
16. The Lipper Balanced Fund Index measures the equal-weighted performance of the 30 largest U.S. balanced funds as defined by Lipper. This index is unmanaged and investors cannot invest directly in this index.
17. The Barclays U.S. Government/Credit Index measures the non-securitized component of the U.S. Aggregate Index. It includes investment grade, U.S. dollar-denominated, fixed-rate Treasurys, government-related and corporate securities. This index is unmanaged and investors cannot invest directly in this index.
18. The compound return is the rate of return, usually expressed as a percentage that represents the cumulative effect that a series of gains or losses has on an original amount of capital over a period of time. Compound returns are usually expressed in annual terms, meaning that the percentage number that is reported represents the annualized rate at which capital has compounded over time.
19. The Bloomberg U.S. Aggregate Bond Index is a broad-based benchmark that measures the investment grade, U.S. dollar-denominated, fixed-rate taxable bond market. The index includes Treasurys, government-related and corporate securities, mortgage-backed securities (agency fixed-rate and
hybrid ARM pass-throughs), asset-backed securities and commercial mortgage-backed securities (agency and non-agency). This index is unmanaged and investors cannot invest directly in this index.
20. The Lipper Core Plus Bond Funds Index is an equally weighted performance index of the largest qualifying funds (based on net assets) in the Lipper Core Plus Bond Funds classification. There are currently 30 funds represented in this Index.
Oakmark.com 101

This page intentionally left blank.
102 OAKMARK FUNDS

This page intentionally left blank.
Oakmark.com 103

This page intentionally left blank.
104 OAKMARK FUNDS
Oakmark Funds
Trustees and Officers
Trustees
Thomas H. Hayden—Chair
Hugh T. Hurley, III
Patricia Louie
Christine M. Maki
Laurence C. Morse, Ph.D.
Mindy M. Posoff
Steven S. Rogers
Kristi L. Rowsell
Rana J. Wright
Officers
Rana J. Wright—President and Principal Executive Officer
Adam D. Abbas—Vice President
Joseph J. Allessie—Vice President, Secretary and Chief Legal Officer
Anthony P. Coniaris—Executive Vice President
Rick J. Dercks—Vice President and Assistant Treasurer*
Kathleen O. Gerdes—Vice President
Justin D. Hance—Vice President
David G. Herro—Vice President
M. Colin Hudson—Vice President
John J. Kane—Vice President, Chief Compliance Officer, Assistant Secretary and Anti-Money Laundering Officer
Christopher W. Keller—Vice President
Eric Liu—Vice President
Jason E. Long—Vice President
Michael L. Manelli—Vice President
Clyde S. McGregor—Vice President
Michael J. Neary—Vice President
Michael A. Nicolas—Vice President
William C. Nygren—Vice President
Howard M. Reich—Vice President
Zachary D. Weber—Vice President, Principal Accounting Officer, Principal Financial Officer and Treasurer
* Mr. Dercks became Assistant Treasurer effective January 26, 2022.
Other Information
Investment Adviser
Harris Associates L.P.
111 S. Wacker Drive
Chicago, Illinois 60606-4319
Transfer Agent
DST Asset Manager Solutions, Inc.
Quincy, Massachusetts
Legal Counsel
K&L Gates LLP
Washington, D.C.
Independent Registered Public Accounting Firm
Deloitte & Touche LLP
Chicago, Illinois
Contact Us
Please call 1-800-OAKMARK
(1-800-625-6275)
or 617-483-8327
Website
www.oakmark.com
@HarrisOakmark
To obtain a prospectus, an application or periodic reports, access our website at Oakmark.com or call 1-800-OAKMARK (625-6275) or 617-483-8327.
Each Fund files its complete schedule of portfolio holdings with the Securities and Exchange Commission ("SEC") for the first and third quarters of each fiscal year as an exhibit on Form N-PORT. The Funds' Form N-PORTs are available on the SEC's website at www.sec.gov.
A description of the policies and procedures the Funds use to determine how to vote proxies relating to portfolio securities is available without charge, upon request, by calling toll free 1-800-625-6275; on the Funds' website at www.oakmark.com; and on the SEC's website at www.sec.gov.
No later than August 31 of each year, information regarding how the Adviser, on behalf of the Funds, voted proxies relating to the Funds' portfolio securities for the 12 months ended the preceding June 30 will be available through a link on the Funds' website at www.oakmark.com and on the SEC's website at www.sec.gov.
This report is submitted for the general information of the shareholders of the Funds. The report is not authorized for distribution to prospective investors in the Funds unless it is accompanied or preceded by a currently effective prospectus of the Funds.
No sales charge to the shareholder or to the new investor is made in offering the shares of the Funds.
Oakmark.com 105


Oakmark.com
SAN (06/22)
| (b) | Not applicable to the Registrant. |
Item 2. Code of Ethics.
Not required in this filing.
Item 3. Audit Committee Financial Expert.
Not required in this filing.
Item 4. Principal Accountant Fees and Services.
Not required in this filing.
Item 5. Audit Committee of Listed Registrants.
Not applicable.
Item 6. Investments.
| (a) | The Schedule of Investments in securities of unaffiliated issuers as of the close of the reporting period is included as part of the semi-annual report to shareholders filed under Item 1 of this Form. |
| (b) | Not applicable. |
Item 7. Disclosure of Proxy Voting Policies and Procedures for Closed-End Management Investment Companies.
Not applicable.
Item 8. Portfolio Managers of Closed-End Management Investment Companies.
Not applicable.
Item 9. Purchases of Equity Securities by Closed-End Management Investment Company and Affiliated Purchasers.
Not applicable.
Item 10. Submission of Matters to a Vote of Security Holders.
During the period covered by this report, no material changes were made to the procedures by which shareholders may recommend nominees to the Registrant’s board of trustees.
Item 11. Controls and Procedures.
| (a) | Based on an evaluation of the Registrant’s disclosure controls and procedures (as defined in Rule 30a-3(c) under the Investment Company Act of 1940, the “Disclosure Controls”), the Disclosure Controls are effectively designed to ensure that information required to be disclosed by the Registrant in this report is recorded, processed, summarized, and reported within 90 days prior to the filing of this report, including ensuring that information required to be disclosed in this report is accumulated and communicated to the Registrant's management, including the Registrant's principal executive officer and principal financial officer, as appropriate to allow timely decisions regarding required disclosure. |
| (b) | There were no changes in the Registrant's internal controls over financial reporting (as defined in Rule 30a-3(d) under the Investment Company Act of 1940) that occurred during the Registrant’s most recent fiscal half-year period covered by this report that has materially affected, or is reasonably likely to materially affect, the Registrant's internal control over financial reporting. |
Item 12. Disclosure of Securities Lending Activities for Closed-End Management Investment Companies.
Not applicable.
Item 13. Exhibits.
| (a)(1) | A copy of the Code is incorporated by reference to the Registrant’s Form N-CSR, Investment Company Act file number 811-06279 (filed November 25, 2019). |
| (3) Not applicable. |
| (4) Not applicable. |
SIGNATURES
Pursuant to the requirements of the Securities Exchange Act of 1934 and the Investment Company Act of 1940, the Registrant has duly caused this report to be signed on its behalf by the undersigned, thereunto duly authorized.
Harris Associates Investment Trust
| By: | /s/ Rana J. Wright | |
| Rana J. Wright | ||
| Principal Executive Officer | ||
| Date: | June 2, 2022 |
Pursuant to the requirements of the Securities Exchange Act of 1934 and the Investment Company Act of 1940, this report has been signed below by the following persons on behalf of the Registrant and in the capacities and on the dates indicated.
| By: | /s/ Rana J. Wright | |
| Rana J. Wright | ||
| Principal Executive Officer | ||
| Date: | June 2, 2022 | |
| By: | /s/ Zachery D. Weber | |
| Zachary D. Weber | ||
| Principal Financial Officer, Principal Accounting Officer and Treasurer | ||
| Date: | June 2, 2022 | |