OAKMARK FUNDS
FIRST QUARTER REPORT | DECEMBER 31, 2019
OAKMARK FUND
OAKMARK SELECT FUND
OAKMARK EQUITY AND INCOME FUND
OAKMARK GLOBAL FUND
OAKMARK GLOBAL SELECT FUND
OAKMARK INTERNATIONAL FUND
OAKMARK INTERNATIONAL SMALL CAP FUND

Oakmark Funds
2020 First Quarter Report
TABLE OF CONTENTS
|
Commentary on Oakmark and Oakmark Select Funds |
1 |
||||||
|
Oakmark Fund |
|||||||
|
Summary Information |
4 |
||||||
|
Portfolio Manager Commentary |
5 |
||||||
|
Schedule of Investments |
6 |
||||||
|
Oakmark Select Fund |
|||||||
|
Summary Information |
8 |
||||||
|
Portfolio Manager Commentary |
9 |
||||||
|
Schedule of Investments |
10 |
||||||
|
Oakmark Equity and Income Fund |
|||||||
|
Summary Information |
12 |
||||||
|
Portfolio Manager Commentary |
13 |
||||||
|
Schedule of Investments |
15 |
||||||
|
Oakmark Global Fund |
|||||||
|
Summary Information |
20 |
||||||
|
Portfolio Manager Commentary |
21 |
||||||
|
Schedule of Investments |
23 |
||||||
|
Oakmark Global Select Fund |
|||||||
|
Summary Information |
26 |
||||||
|
Portfolio Manager Commentary |
27 |
||||||
|
Schedule of Investments |
28 |
||||||
|
Commentary on Oakmark International and Oakmark International Small Cap Funds |
30 |
||||||
|
Oakmark International Fund |
|||||||
|
Summary Information |
32 |
||||||
|
Portfolio Manager Commentary |
33 |
||||||
|
Schedule of Investments |
34 |
||||||
|
Oakmark International Small Cap Fund |
|||||||
|
Summary Information |
38 |
||||||
|
Portfolio Manager Commentary |
39 |
||||||
|
Schedule of Investments |
40 |
||||||
|
Disclosures and Endnotes |
43 |
||||||
|
Trustees and Officers |
45 |
||||||
|
Beginning on January 1, 2021, as permitted by regulations adopted by the U.S. Securities and Exchange Commission, paper copies of the Oakmark Funds' annual and semi-annual shareholder reports will no longer be sent by mail, unless you specifically request paper copies of the reports. Instead, the reports will be made available on Oakmark.com, and you will be notified by mail each time a report is posted and provided with a website link to access the report. If you already elected to receive shareholder reports electronically, you will not be affected by this change and you need not take any action. You may elect to receive shareholder reports and other communications from the Funds electronically anytime by contacting your financial intermediary (such as a broker-dealer or bank) or, if you hold your shares directly with the Funds, by calling 1-800-OAKMARK (625-6275) or visiting Oakmark.com. |
|||
You may elect to receive all future reports in paper free of charge. If you invest through a financial intermediary, you can contact your financial intermediary to request that you continue to receive paper copies of your shareholder reports. If you hold your shares directly with the Funds, you can call 1-800-OAKMARK (625-6275) to let the Funds know you wish to continue receiving paper copies of your shareholder reports. Your election to receive reports in paper will apply to all Funds you hold directly or all Funds you hold through your financial intermediary, as applicable.
FORWARD-LOOKING STATEMENT DISCLOSURE
One of our most important responsibilities as mutual fund managers is to communicate with shareholders in an open and direct manner. Some of our comments in our letters to shareholders are based on current management expectations and are considered "forward-looking statements." Actual future results, however, may prove to be different from our expectations. You can identify forward-looking statements by words such as "estimate", "may", "will", "expect", "believe",
"plan" and other similar terms. We cannot promise future returns. Our opinions are a reflection of our best judgment at the time this report is compiled, and we disclaim any obligation to update or alter forward-looking statements as a result of new information, future events, or otherwise.
Oakmark.com
Oakmark and Oakmark Select Funds December 31, 2019
Portfolio Manager Commentary

William C. Nygren, CFA
Portfolio Manager
oakmx@oakmark.com
oaklx@oakmark.com
oakwx@oakmark.com
At Oakmark, we are long-term investors. We attempt to identify growing businesses that are managed to benefit their shareholders. We will purchase stock in those businesses only when priced substantially below our estimate of intrinsic value. After purchase, we patiently wait for the gap between stock price and intrinsic value to close.
"What is smart at one price is stupid at another."
-Warren Buffett
The S&P 5001 returned 31% in 2019. With the exception of its 32% return in 2013, this was the S&P 500's largest annual gain in the past 20 years. The Oakmark Fund produced a return of 27% for the year and Oakmark Select returned 28%. Compared to almost anything other than the S&P 500, those are very good numbers and exceeded almost all beginning-of-the-year predictions for what a mutual fund would return in 2019. Still, for the third straight year, both Oakmark and Oakmark Select returned less than the S&P 500. We are encouraged that the past quarter showed signs of a turn—both funds outperformed a strong market. But given that we and our shareholders expect our Funds to outperform the S&P 500 over the long term, we wanted to focus this report on our relative performance as opposed to our strong absolute performance. We hope this will help our shareholders answer this important question: "Did Oakmark trail because value investing is, as a strategy, underperforming? Or is Oakmark doing a poor job of implementing its strategy?"
To answer these questions, let's first look at how value performed in 2019. You've probably heard of the "Dogs of the Dow" theory, which states that the 10 cheapest stocks in the Dow Jones Industrial Average2 (based on dividend yield) tend to outperform that index over the following year. And from 2000 through 2018, this held true: the "Dogs" outperformed the Dow by an average of 150 basis points per year. But in 2019, the 10 "Dogs" underperformed the other 20 stocks in the Dow by a whopping 1770 basis points, returning 13% versus 30%.
Using another value measure, if, at the beginning of 2019, you had bought the 50 cheapest S&P 500 stocks based on price-to-book3 value, you would have underperformed the rest of the S&P 500 by over 500 basis points for the year. Similarly, if you bought the 50 stocks with the lowest expected 2019 EPS4 growth, your portfolio would have underperformed the 50 highest expected growth stocks by 830 basis points over the year. Consistent with that, the Russell 1000 Value Index5, an index composed of lower priced stocks relative to earnings and book value, underperformed the Russell 1000 Growth Index6 by 990 basis points in 2019. Given these results, it's no surprise that Morningstar reports7 that large-cap value funds as an aggregate underperformed large-cap growth funds by 690 basis points in 2019.
Undoubtedly, we made our share of mistakes at Oakmark in 2019. But the data suggest that our much bigger problem was that investors were not very concerned about valuation levels. Though this can be frustrating, it also gives us the opportunity to start the year with a portfolio of stocks that our research suggests is at a larger discount to the market than is typical.
To examine these opportunities, let's take a step back and compare U.S. equities with the bond market. Many investors think a 10-year U.S. Treasury bond is a riskless investment because the U.S. Treasury not paying its debts is unthinkable. And if you rule out default, except for inflation risk, it would be risk-free—but only if it is held to maturity. However, if you hold that bond for a shorter period, its total return will be a combination of its coupon yield plus the change in value caused by interest rate changes. For example, if interest rates rise to just 2.1%, a 10-year Treasury bond that currently yields 1.9% will generate a negative one-year return. And good luck to those pension funds relying on 30-year Treasuries repeating their 7% annualized return from the past decade. That will only happen if their yield, starting at 2.3% today, goes to negative 1.2% a decade from now. I guess nothing is impossible, but this outcome seems highly unlikely. Fixed income investors who ignore the impact of interest rate changes have a lot in common with equity investors who ignore the impact that movement in P/E8 multiples have on stock prices.
I sometimes get frustrated with legal edits that don't allow me to say things like, "Alphabet is a great business." Despite the company's demonstrably superior financial metrics, that statement is an opinion, not a fact. So, when my writing comes back from editing, it is often filled with new insertions like, "we believe," "in our opinion," "it could be the case" and so on. At times, it feels as if I have to write, "Two plus two, in our opinion, equals four." (To be clear, our lawyers aren't to blame. Rather, it's our industry's history of bad actors who stretched the truth that have led to increased regulation.) Because of this, I'm excited that I can write something definitive about stock prices: a stock's price always equals its price-to-earnings ratio times its earnings-per-share, or P= P/E x EPS.
As value investors, we pay close attention to P/E and base most of our investments on the premise that a stock's current P/E ratio is too low. If a stock moves to what we believe is a fair multiple, the result is a higher price. Occasionally, we have a strong non-consensus view on earnings potential, such as when we believed that Baxter's new management team had an opportunity to nearly double margins. Likewise, as the 2008 recession came to a close, we believed that earnings would get back to "normal" over our seven-year time horizon—a decidedly more positive outlook than most investors had at the time.
Usually, however, we don't quarrel much with consensus earnings forecasts. Instead, we believe that our stocks will benefit from higher P/E multiples. That was our view in 2000 when we avoided technology stocks that were selling above the S&P 500's 30 times multiple and instead owned single-digit P/E stocks, such as consumer packaged goods, industrials and financials. Today, you can see this same logic at work in our bank and cyclical holdings, with many selling at single-digit P/Es, and our
See accompanying Disclosures and Endnotes on page 43.
Oakmark.com 1
Oakmark and Oakmark Select Funds December 31, 2019
Portfolio Manager Commentary (continued)
avoidance of utilities, consumer packaged goods and REITs9 that trade at P/Es in the 20s.
Although the formula P=P/E x EPS highlights that estimating future P/E is just as important as forecasting EPS, investors typically alternate being obsessed with one factor and then the other. The collapse of the tech bubble in 2000 was a time when investors stopped paying higher and higher prices for the fastest growers and quickly pivoted to low P/E stocks. And today, just like during the height of the tech bubble, analysts are focusing much more on a company's earnings than on the company's appropriate P/E multiple. It's not the analysts' fault. After all, their job is to earn commissions from their clients, and today, most of their clients are paying them to focus on earnings predictions.
But this focus on earnings instead of valuation has led to some very—shall we say—interesting analyst reports, including the following "takes" we've seen on our own holdings:
• One analyst wrote that he believed, as we do, that DXC's new CEO will restructure the company and largely eliminate the quality gap between DXC and its public peers over the next three years. Yet, in the same report, the analyst set the company's target P/E at a 30% discount to its peers—unchanged from its historical average, despite its improved competitive stance.
• An in-depth report on Lear highlighted the company's many advantages compared to other auto parts businesses that sell for between 5 and 11 times EBITDA10. But then the analyst computed Lear's new target price using a multiple of 4.8 times EBITDA. Why? That was left to the reader's imagination.
• A report on CBRE Group touted the company's improved business mix. Over the past few years, CBRE's maintenance outsourcing segment has grown rapidly compared to its more cyclical brokerage segment—historically the larger part of the business. Importantly, the market tends to value recurring income, like that from service businesses, at a much higher P/E than businesses based on one-time transactions. Nevertheless, this still concluded that CBRE is fairly priced because its current P/E is approximately at its 15-year average.
• A report on Constellation Brands kept the company's target P/E the same—at 17 times—despite the company's recent purchase of a large interest in Canopy Growth Corporation. Canopy's losses reduce Constellation's reported EPS by about $0.85 so the analyst is inadvertently valuing Constellation's Canopy investment at negative $14 per Constellation share, despite its market value being positive $14.
• Another report noted that big banks are safer and more competitively advantaged today than at any time in recent history. Yet it concluded that these banks are fully valued at their current price of 10 times earnings—which is a P/E roughly the same as their 30-year average. The report never explained why the improved business fundamentals shouldn't be rewarded with a higher P/E multiple.
The largest industry weighting in our portfolios, financials, demonstrates why we believe our Funds will benefit when
valuations become a bigger determinant of prices. In the Oakmark Fund, for example, we own 10 stocks in the financials sector, comprising about 30% of the portfolio. Their median P/E on expected 2021 earnings is 9 times, compared to the S&P 500 at 16 times. Median price-to-book is 1.2 times and dividend yield is 2.3%, compared to the S&P 500 at 3.6 times book and a 1.9% yield. So, on earnings, assets and yield, the banks appear much cheaper than the S&P 500. Normally, stocks that look that cheap are expected to grow much slower than the market or even experience declining earnings. In this case, however, we expect our median financial stock to have annual EPS growth of 8%, which exceeds the consensus expectation for the S&P 500. To us, faster growth, higher yield and cheaper price translate to win, win and win. We believe that the market will eventually reflect our view by narrowing the gap between the S&P 500's and the financials sector's P/E ratios.
Our portfolio is filled with stocks whose stories sound similar and our research leads us to believe are selling at bargain prices—relative to both other stocks and to the absolute returns we expect in assets other than equities.
One year ago in this commentary, after the market fell 14% in the fourth quarter, I wrote:
"The stock market looks more attractive to us than it usually does, and the divergence among individual stocks allowed us to structure a portfolio that we believe is more undervalued relative to the market than it usually is. Though the decline has made watching the market painful, we are all gritting our teeth and adding to our personal holdings."
With hindsight, we were right about the market being unusually attractive, but we have yet to prove that our portfolio was more attractive than the market.
It is frustrating when market performance doesn't reflect our estimates of business value, but that's what creates opportunity. Since our longest tenured mutual fund, the Oakmark Fund, started in 1991, its annualized return has been 12.5% versus 10.0% for the S&P 500. Yet during those 28 years, our trailing three-year return has lagged behind the market 49% of the time. That number falls to 35% for 5-year and just 22% for 10-year time periods.
We understand that patience is in short supply when a fund underperforms. In addition to our strong long-term record, consider a few other issues when evaluating our recent returns. First, most value funds have underperformed over the past three years at least in part because investors have shown little concern for valuation as some high growth stocks have surged. Second, the relative values that are available today in sectors like financials (our largest exposure) seem historically unusual. And, finally, our investment philosophy and team have been remarkably consistent throughout our history. In our view, this consistency is a major factor behind our long-term outperformance. We believe our long-term returns have been higher because we have applied our value approach consistently as opposed to following current market trends. Based on what we've seen in the past, we believe today's market offers the opportunity to profit from a potential narrowing of the gap between business value and stock price. That's exactly what we've been exploiting for the past 28 years.
See accompanying Disclosures and Endnotes on page 43.
2 OAKMARK FUNDS

This page intentionally left blank.
Oakmark.com 3
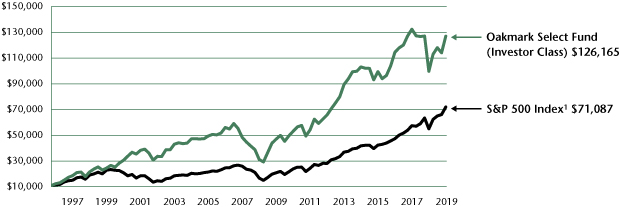
Oakmark Fund December 31, 2019
Summary Information
VALUE OF A $10,000 INVESTMENT
Since Inception - 08/05/91 (Unaudited)

PERFORMANCE
|
Average Annual Total Returns (as of 12/31/19) |
|||||||||||||||||||||||||||||||
| (Unaudited) |
Total Return Last 3 Months |
1-year |
3-year |
5-year |
10-year |
Since Inception |
Inception Date |
||||||||||||||||||||||||
|
Oakmark Fund (Investor Class) |
11.33 |
% |
26.98 |
% |
10.32 |
% |
8.82 |
% |
12.43 |
% |
12.48 |
% |
08/05/91 |
||||||||||||||||||
|
S&P 500 Index |
9.07 |
% |
31.49 |
% |
15.27 |
% |
11.70 |
% |
13.56 |
% |
10.00 |
% |
|||||||||||||||||||
|
Dow Jones Industrial Average2 |
6.67 |
% |
25.34 |
% |
15.73 |
% |
12.59 |
% |
13.40 |
% |
10.87 |
% |
|||||||||||||||||||
|
Lipper Large Cap Value Fund Index11 |
7.92 |
% |
26.19 |
% |
10.62 |
% |
8.70 |
% |
11.14 |
% |
8.99 |
% |
|||||||||||||||||||
|
Oakmark Fund (Advisor Class) |
11.38 |
% |
27.09 |
% |
10.44 |
% |
N/A |
N/A |
10.72 |
% |
11/30/16 |
||||||||||||||||||||
|
Oakmark Fund (Institutional Class) |
11.38 |
% |
27.19 |
% |
10.50 |
% |
N/A |
N/A |
10.76 |
% |
11/30/16 |
||||||||||||||||||||
|
Oakmark Fund (Service Class) |
11.27 |
% |
26.65 |
% |
10.02 |
% |
8.50 |
% |
12.09 |
% |
8.28 |
% |
04/05/01 |
||||||||||||||||||
The graph and table above do not reflect the deduction of taxes that a shareholder would pay on Fund distributions or the redemption of Fund shares.
Past performance is no guarantee of future results. The performance data quoted represents past performance. Current performance may be lower or higher than the performance data quoted. Total return includes change in share prices and, in each case, includes reinvestment of dividends and capital gain distributions. The investment return and principal value vary so that an investor's shares, when redeemed, may be worth more or less than the original cost. To obtain the most recent month-end performance, please visit Oakmark.com.
|
TOP TEN EQUITY HOLDINGS12 |
% of Net Assets | ||||||
|
Citigroup, Inc. |
3.6 |
||||||
|
Bank of America Corp. |
3.6 |
||||||
|
Capital One Financial Corp. |
3.1 |
||||||
|
Netflix, Inc. |
3.1 |
||||||
|
Regeneron Pharmaceuticals, Inc. |
2.9 |
||||||
|
Ally Financial, Inc. |
2.9 |
||||||
|
State Street Corp. |
2.8 |
||||||
|
Charter Communications, Inc., Class A |
2.7 |
||||||
|
Alphabet, Inc., Class A |
2.6 |
||||||
|
The Charles Schwab Corp. |
2.6 |
||||||
|
FUND STATISTICS |
|||||||
|
Ticker* |
OAKMX |
||||||
|
Number of Equity Holdings |
51 |
||||||
|
Net Assets |
$16.8 billion | ||||||
|
Weighted Average Market Cap |
$152.6 billion | ||||||
|
Median Market Cap |
$48.5 billion | ||||||
|
Gross Expense Ratio - Investor Class (as of 09/30/19)* |
0.92% | ||||||
|
Net Expense Ratio - Investor Class (as of 09/30/19)*† |
0.88% | ||||||
* This information is related to the Investor Class. Please visit Oakmark.com for information related to the Advisor, Institutional and Service Classes.
† The net expense ratio reflects a contractual advisory fee waiver agreement through January 27, 2021.
|
SECTOR ALLOCATION |
% of Net Assets | ||||||
|
Financials |
29.7 |
||||||
|
Communication Services |
14.4 |
||||||
|
Consumer Discretionary |
13.6 |
||||||
|
Information Technology |
13.3 |
||||||
|
Industrials |
10.2 |
||||||
|
Health Care |
7.6 |
||||||
|
Energy |
5.5 |
||||||
|
Consumer Staples |
1.8 |
||||||
|
Short-Term Investments and Other |
3.9 |
||||||
See accompanying Disclosures and Endnotes on page 43.
4 OAKMARK FUNDS
Oakmark Fund December 31, 2019
Portfolio Manager Commentary


William C. Nygren, CFA
Portfolio Manager
oakmx@oakmark.com
Kevin Grant, CFA
Portfolio Manager
oakmx@oakmark.com
The Oakmark Fund generated an 11% return during the fourth quarter, outperforming the S&P 500 Index's1 return of 9% over the same time period. We were encouraged that investors rewarded several of our key holdings within the financials sector, our largest and top contributing sector during the fourth quarter. As discussed in this quarter's market commentary, we continue to believe that our holdings within the financials sector offer an attractive risk/reward proposition, given their safer balance sheets and stronger competitive positions relative to recent history. We believe the prices of our financial holdings do not accurately reflect this dynamic. For the calendar year 2019, the Oakmark Fund returned 27% versus the 31% return for the S&P 500. Despite our strong absolute performance for the year, our long-term followers will know that we take little solace in this result, given our expectation to generate market-beating returns.
During the fourth quarter, we eliminated positions in Chesapeake Energy and Halliburton. These sales do not reflect a change in our view of the energy sector's overall attractiveness. Instead, they were executed to recognize a tax loss and deploy the proceeds from the sales into more attractive holdings in the industry that offers stronger cash flow profiles, better balance sheets and more compelling risk-adjusted expected returns. The energy sector has significantly underperformed the price of oil over the past several years. Since early 2016, the price of oil has risen over 100%, while the returns from the S&P Oil & Gas Exploration and Production ETF (ticker: XOP) have dropped. Yet demand for oil has continued to grow and we expect a more balanced global supply outlook. Therefore, we believe that attractive opportunities remain in this out-of-favor industry.
We did not add any names to the portfolio during the fourth quarter, but we did take advantage of the relative price differential within Alphabet's dual share class structure by swapping a portion of our non-voting Class C shares for voting Class A shares, which were offered at a slight discount to the non-voting shares. We believe that the voting rights afforded to the Class A shares should trade at a modest premium to the non-voting C shares—not a discount. We were happy to express this view by performing a like-kind exchange that didn't trigger a taxable event.
Regeneron Pharmaceuticals and State Street were the best individual contributors for the quarter and the lowest contributors were Ally Financial and American International Group. No single position cost the Fund more than 28 basis points during the period. Our strongest contributing sectors were financials and health care and our lowest contributing sectors were energy and consumer staples, the latter of which is among our smallest sector allocations. For the calendar year, our best individual contributors were Citigroup and Apple, while our biggest detractors were Qurate Retail Class A and DXC Technology.
We thank our fellow shareholders for your investment and continued support of the Oakmark Fund.
See accompanying Disclosures and Endnotes on page 43.
Oakmark.com 5
Oakmark Fund December 31, 2019 (Unaudited)
Schedule of Investments (in thousands)
|
Shares |
Value |
||||||||||
|
COMMON STOCKS - 96.1% |
|||||||||||
|
FINANCIALS - 29.7% |
|||||||||||
|
DIVERSIFIED FINANCIALS - 18.2% |
|||||||||||
|
Capital One Financial Corp. |
5,031 |
$ |
517,699 |
||||||||
|
Ally Financial, Inc. |
15,923 |
486,610 |
|||||||||
|
State Street Corp. |
5,857 |
463,297 |
|||||||||
|
The Charles Schwab Corp. |
9,180 |
436,591 |
|||||||||
|
Moody's Corp. |
1,471 |
349,294 |
|||||||||
|
The Bank of New York Mellon Corp. |
6,158 |
309,908 |
|||||||||
|
The Goldman Sachs Group, Inc. |
1,105 |
254,073 |
|||||||||
|
S&P Global, Inc. |
842 |
229,794 |
|||||||||
|
3,047,266 |
|||||||||||
|
BANKS - 9.4% |
|||||||||||
|
Citigroup, Inc. |
7,591 |
606,453 |
|||||||||
|
Bank of America Corp. |
17,174 |
604,858 |
|||||||||
|
Wells Fargo & Co. |
6,944 |
373,560 |
|||||||||
|
1,584,871 |
|||||||||||
|
INSURANCE - 2.1% |
|||||||||||
|
American International Group, Inc. |
6,908 |
354,573 |
|||||||||
|
4,986,710 |
|||||||||||
|
COMMUNICATION SERVICES - 14.4% |
|||||||||||
|
MEDIA & ENTERTAINMENT - 14.4% |
|||||||||||
|
Netflix, Inc. (a) |
1,586 |
513,182 |
|||||||||
|
Charter Communications, Inc., Class A (a) |
941 |
456,315 |
|||||||||
|
Alphabet, Inc., Class A (a) |
332 |
444,357 |
|||||||||
|
Comcast Corp., Class A |
8,873 |
399,028 |
|||||||||
|
Facebook, Inc., Class A (a) |
1,927 |
395,537 |
|||||||||
|
Alphabet, Inc., Class C (a) |
154 |
205,935 |
|||||||||
|
2,414,354 |
|||||||||||
|
CONSUMER DISCRETIONARY - 13.6% |
|||||||||||
|
AUTOMOBILES & COMPONENTS - 5.7% |
|||||||||||
|
Fiat Chrysler Automobiles N.V. |
24,924 |
366,131 |
|||||||||
|
General Motors Co. |
9,229 |
337,770 |
|||||||||
|
Aptiv PLC |
2,149 |
204,043 |
|||||||||
|
Delphi Technologies PLC (a) |
3,646 |
46,777 |
|||||||||
|
954,721 |
|||||||||||
|
RETAILING - 4.3% |
|||||||||||
|
Booking Holdings, Inc. (a) |
191 |
391,235 |
|||||||||
|
eBay, Inc. |
6,348 |
229,219 |
|||||||||
|
Qurate Retail, Inc., Class A (a) |
12,406 |
104,584 |
|||||||||
|
725,038 |
|||||||||||
|
CONSUMER SERVICES - 3.6% |
|||||||||||
|
MGM Resorts International |
9,180 |
305,412 |
|||||||||
|
Hilton Worldwide Holdings, Inc. |
2,714 |
301,010 |
|||||||||
|
606,422 |
|||||||||||
|
2,286,181 |
|||||||||||
|
Shares |
Value |
||||||||||
|
INFORMATION TECHNOLOGY - 13.3% |
|||||||||||
|
SOFTWARE & SERVICES - 6.3% |
|||||||||||
|
Gartner, Inc. (a) |
1,758 |
$ |
270,892 |
||||||||
|
DXC Technology Co. |
6,900 |
259,371 |
|||||||||
|
Automatic Data Processing, Inc. |
1,065 |
181,497 |
|||||||||
|
Visa, Inc., Class A |
929 |
174,616 |
|||||||||
|
MasterCard, Inc., Class A |
572 |
170,853 |
|||||||||
|
1,057,229 |
|||||||||||
|
TECHNOLOGY HARDWARE & EQUIPMENT - 4.1% |
|||||||||||
|
TE Connectivity, Ltd. |
4,301 |
412,174 |
|||||||||
|
Apple, Inc. |
938 |
275,561 |
|||||||||
|
687,735 |
|||||||||||
|
SEMICONDUCTORS & SEMICONDUCTOR EQUIPMENT - 2.9% |
|||||||||||
|
Intel Corp. |
5,053 |
302,434 |
|||||||||
|
Texas Instruments, Inc. |
1,504 |
192,948 |
|||||||||
|
495,382 |
|||||||||||
|
2,240,346 |
|||||||||||
|
INDUSTRIALS - 10.2% |
|||||||||||
|
CAPITAL GOODS - 7.8% |
|||||||||||
|
Parker-Hannifin Corp. |
1,900 |
391,008 |
|||||||||
|
General Electric Co. |
32,589 |
363,690 |
|||||||||
|
Cummins, Inc. |
1,680 |
300,617 |
|||||||||
|
Caterpillar, Inc. |
1,709 |
252,400 |
|||||||||
|
1,307,715 |
|||||||||||
|
TRANSPORTATION - 2.4% |
|||||||||||
|
American Airlines Group, Inc. |
8,080 |
231,737 |
|||||||||
|
FedEx Corp. |
1,104 |
166,876 |
|||||||||
|
398,613 |
|||||||||||
|
1,706,328 |
|||||||||||
|
HEALTH CARE - 7.6% |
|||||||||||
|
HEALTH CARE EQUIPMENT & SERVICES - 4.7% |
|||||||||||
|
CVS Health Corp. |
4,356 |
323,605 |
|||||||||
|
Humana, Inc. |
684 |
250,590 |
|||||||||
|
HCA Healthcare, Inc. |
1,459 |
215,698 |
|||||||||
|
789,893 |
|||||||||||
|
PHARMACEUTICALS, BIOTECHNOLOGY & LIFE SCIENCES - 2.9% |
|||||||||||
|
Regeneron Pharmaceuticals, Inc. (a) |
1,301 |
488,348 |
|||||||||
|
1,278,241 |
|||||||||||
|
ENERGY - 5.5% |
|||||||||||
|
Apache Corp. |
11,391 |
291,485 |
|||||||||
|
Concho Resources, Inc. |
2,616 |
229,118 |
|||||||||
|
EOG Resources, Inc. |
2,553 |
213,856 |
|||||||||
|
Diamondback Energy, Inc. |
2,008 |
186,454 |
|||||||||
|
920,913 |
|||||||||||
6 OAKMARK FUNDS
Oakmark Fund December 31, 2019 (Unaudited)
Schedule of Investments (in thousands) (continued)
|
Shares |
Value |
||||||||||
|
COMMON STOCKS - 96.1% (continued) |
|||||||||||
|
CONSUMER STAPLES - 1.8% |
|||||||||||
|
FOOD, BEVERAGE & TOBACCO - 1.8% |
|||||||||||
|
Constellation Brands, Inc., Class A |
1,611 |
$ |
305,763 |
||||||||
|
TOTAL COMMON STOCKS - 96.1% (COST $9,656,107) |
16,138,836 |
||||||||||
|
Par Value |
Value |
||||||||||
|
SHORT-TERM INVESTMENT - 3.9% |
|||||||||||
|
REPURCHASE AGREEMENT - 3.9% |
|||||||||||
|
Fixed Income Clearing Corp. Repurchase Agreement, 1.55% dated 12/31/19 due 01/02/20, repurchase price $647,928, collateralized by United States Treasury Notes, 1.875% - 2.875% due 11/15/21 - 12/15/21, aggregate value plus accrued interest of $660,830 (Cost: $647,872) |
$ |
647,872 |
647,872 |
||||||||
|
TOTAL SHORT-TERM INVESTMENTS - 3.9% (COST $647,872) |
647,872 |
||||||||||
|
TOTAL INVESTMENTS - 100.0% (COST $10,303,979) |
16,786,708 |
||||||||||
|
Foreign Currencies (Cost $0) - 0.0% (b) |
0 |
(c) |
|||||||||
|
Liabilities In Excess of Other Assets - 0.0% (b) |
(880 |
) |
|||||||||
|
TOTAL NET ASSETS - 100.0% |
$ |
16,785,828 |
|||||||||
(a) Non-income producing security
(b) Amount rounds to less than 0.1%.
(c) Amount rounds to less than $1,000.
Oakmark.com 7
Oakmark Select Fund December 31, 2019
Summary Information
VALUE OF A $10,000 INVESTMENT
Since Inception - 11/01/96 (Unaudited)
PERFORMANCE
|
Average Annual Total Returns (as of 12/31/19) |
|||||||||||||||||||||||||||||||
| (Unaudited) |
Total Return Last 3 Months |
1-year |
3-year |
5-year |
10-year |
Since Inception |
Inception Date |
||||||||||||||||||||||||
|
Oakmark Select Fund (Investor Class) |
11.47 |
% |
27.69 |
% |
3.54 |
% |
4.30 |
% |
10.60 |
% |
11.56 |
% |
11/01/96 |
||||||||||||||||||
|
S&P 500 Index |
9.07 |
% |
31.49 |
% |
15.27 |
% |
11.70 |
% |
13.56 |
% |
8.84 |
% |
|||||||||||||||||||
|
Lipper Multi-Cap Value Fund Index13 |
7.59 |
% |
25.02 |
% |
7.59 |
% |
6.71 |
% |
10.19 |
% |
7.60 |
% |
|||||||||||||||||||
|
Oakmark Select Fund (Advisor Class) |
11.52 |
% |
27.82 |
% |
3.69 |
% |
N/A |
N/A |
4.47 |
% |
11/30/16 |
||||||||||||||||||||
|
Oakmark Select Fund (Institutional Class) |
11.51 |
% |
27.87 |
% |
3.72 |
% |
N/A |
N/A |
4.50 |
% |
11/30/16 |
||||||||||||||||||||
|
Oakmark Select Fund (Service Class) |
11.40 |
% |
27.40 |
% |
3.29 |
% |
4.00 |
% |
10.27 |
% |
8.45 |
% |
12/31/99 |
||||||||||||||||||
The graph and table do not reflect the deduction of taxes that a shareholder would pay on Fund distributions or the redemption of Fund shares.
Past performance is no guarantee of future results. The performance data quoted represents past performance. Current performance may be lower or higher than the performance data quoted. Total return includes change in share prices and, in each case, includes reinvestment of dividends and capital gain distributions. The investment return and principal value vary so that an investor's shares, when redeemed, may be worth more or less than the original cost. To obtain the most recent month-end performance, please visit Oakmark.com.
|
TOP TEN EQUITY HOLDINGS12 |
% of Net Assets | ||||||
|
CBRE Group, Inc., Class A |
9.0 |
||||||
|
Citigroup, Inc. |
7.3 |
||||||
|
Alphabet, Inc., Class A |
7.1 |
||||||
|
Ally Financial, Inc. |
6.5 |
||||||
|
Bank of America Corp. |
5.4 |
||||||
|
Charter Communications, Inc., Class A |
4.9 |
||||||
|
Regeneron Pharmaceuticals, Inc. |
4.8 |
||||||
|
Capital One Financial Corp |
4.7 |
||||||
|
Fiat Chrysler Automobiles N.V. |
4.7 |
||||||
|
TE Connectivity, Ltd. |
4.3 |
||||||
|
FUND STATISTICS |
|||||||
|
Ticker* |
OAKLX |
||||||
|
Number of Equity Holdings |
22 |
||||||
|
Net Assets |
$4.9 billion | ||||||
|
Weighted Average Market Cap |
$161.6 billion | ||||||
|
Median Market Cap |
$36.6 billion | ||||||
|
Gross Expense Ratio - Investor Class (as of 09/30/19)* |
1.08% | ||||||
|
Net Expense Ratio - Investor Class (as of 09/30/19)*† |
1.00% | ||||||
* This information is related to the Investor Class. Please visit Oakmark.com for information related to the Advisor, Institutional and Service Classes.
† The net expense ratio reflects a contractual advisory fee waiver agreement through January 27, 2021.
|
SECTOR ALLOCATION |
% of Net Assets | ||||||
|
Financials |
28.0 |
||||||
|
Communication Services |
18.7 |
||||||
|
Consumer Discretionary |
15.8 |
||||||
|
Real Estate |
9.0 |
||||||
|
Industrials |
7.4 |
||||||
|
Energy |
6.3 |
||||||
|
Information Technology |
5.3 |
||||||
|
Health Care |
4.8 |
||||||
|
Short-Term Investments and Other |
4.7 |
||||||
See accompanying Disclosures and Endnotes on page 43.
8 OAKMARK FUNDS
Oakmark Select Fund December 31, 2019
Portfolio Manager Commentary


William C. Nygren, CFA
Portfolio Manager
oaklx@oakmark.com
Anthony P. Coniaris, CFA
Portfolio Manager
oaklx@oakmark.com
Win Murray
Portfolio Manager
oaklx@oakmark.com
What a difference a year can make! The Oakmark Select Fund returned 11.5% in the fourth quarter compared to the S&P 500's1 9.1% return. Unlike one year ago when fear ruled the day, the fourth quarter of 2019 was a welcome return to a market where business fundamentals mattered. For calendar year 2019, the Oakmark Select Fund increased 27.7% versus 31.5% for the S&P 500. While we still have to make up some ground due to a few years of below-market returns, we are encouraged by these much stronger results.
The largest contributors to performance during the quarter were Regeneron Pharmaceuticals, CBRE Group and Citigroup. After lagging the market considerably despite strong underlying fundamentals, Regeneron (REGN) management announced a large share repurchase authorization to take advantage of a growing gap between the market price and underlying value of REGN. We applaud management's opportunism and, somewhat oddly, the same market that undervalued REGN seems to agree. The largest detractors were Ally Financial, American International Group and Qurate Retail. There was no identifiable news to explain the relative contribution or detraction from the other aforementioned holdings.
A year ago, we took advantage of the spike in market volatility and added four new names to the portfolio. The market environment of 2019 was quite different as was our activity. We didn't add or remove any companies from the portfolio in the fourth quarter of 2019. We did, however, swap more than 70% of our non-voting Alphabet Class C shares for voting Class A shares as they were offered at a small discount to non-voting shares. We believe there should be a modest premium for the higher voting rights of the Class A shares and the swaps were done via like-kind exchange so there wasn't a corresponding capital gain.
Speaking of taxes, despite a portfolio return of nearly 30% this year, we were able to offset all capital gains in 2019 with losses such that there was no capital gains distribution in 2019.
Thank you, our fellow shareholders, for you continued investment in the Oakmark Select Fund.
See accompanying Disclosures and Endnotes on page 43.
Oakmark.com 9
Oakmark Select Fund December 31, 2019 (Unaudited)
Schedule of Investments (in thousands)
|
Shares |
Value |
||||||||||
|
COMMON STOCKS - 95.3% |
|||||||||||
|
FINANCIALS - 28.0% |
|||||||||||
|
BANKS - 12.7% |
|||||||||||
|
Citigroup, Inc. |
4,412 |
$ |
352,475 |
||||||||
|
Bank of America Corp. |
7,501 |
264,171 |
|||||||||
|
616,646 |
|||||||||||
|
DIVERSIFIED FINANCIALS - 11.2% |
|||||||||||
|
Ally Financial, Inc. |
10,280 |
314,157 |
|||||||||
|
Capital One Financial Corp. |
2,235 |
229,993 |
|||||||||
|
544,150 |
|||||||||||
|
INSURANCE - 4.1% |
|||||||||||
|
American International Group, Inc. |
3,885 |
199,427 |
|||||||||
|
1,360,223 |
|||||||||||
|
COMMUNICATION SERVICES - 18.7% |
|||||||||||
|
MEDIA & ENTERTAINMENT - 18.7% |
|||||||||||
|
Alphabet, Inc., Class A (a) |
257 |
344,269 |
|||||||||
|
Charter Communications, Inc., Class A (a) |
494 |
239,629 |
|||||||||
|
Netflix, Inc. (a) |
576 |
186,441 |
|||||||||
|
Alphabet, Inc., Class C (a) |
102 |
136,209 |
|||||||||
|
906,548 |
|||||||||||
|
CONSUMER DISCRETIONARY - 15.8% |
|||||||||||
|
AUTOMOBILES & COMPONENTS - 8.1% |
|||||||||||
|
Fiat Chrysler Automobiles N.V. |
15,434 |
226,727 |
|||||||||
|
Lear Corp. |
1,200 |
164,640 |
|||||||||
|
391,367 |
|||||||||||
|
CONSUMER SERVICES - 6.2% |
|||||||||||
|
MGM Resorts International |
5,147 |
171,240 |
|||||||||
|
Hilton Worldwide Holdings, Inc. |
1,166 |
129,374 |
|||||||||
|
300,614 |
|||||||||||
|
RETAILING - 1.5% |
|||||||||||
|
Qurate Retail, Inc., Class A (a) |
8,717 |
73,484 |
|||||||||
|
765,465 |
|||||||||||
|
REAL ESTATE - 9.0% |
|||||||||||
|
CBRE Group, Inc., Class A (a) |
7,118 |
436,232 |
|||||||||
|
INDUSTRIALS - 7.4% |
|||||||||||
|
CAPITAL GOODS - 4.3% |
|||||||||||
|
General Electric Co. |
18,640 |
208,022 |
|||||||||
|
TRANSPORTATION - 3.1% |
|||||||||||
|
American Airlines Group, Inc. |
5,239 |
150,263 |
|||||||||
|
358,285 |
|||||||||||
|
ENERGY - 6.3% |
|||||||||||
|
Apache Corp. |
6,100 |
156,099 |
|||||||||
|
Concho Resources, Inc. |
1,710 |
149,745 |
|||||||||
|
305,844 |
|||||||||||
|
Shares |
Value |
||||||||||
|
INFORMATION TECHNOLOGY - 5.3% |
|||||||||||
|
TECHNOLOGY HARDWARE & EQUIPMENT - 4.3% |
|||||||||||
|
TE Connectivity, Ltd. |
2,188 |
$ |
209,692 |
||||||||
|
SOFTWARE & SERVICES - 1.0% |
|||||||||||
|
MasterCard, Inc., Class A |
155 |
46,281 |
|||||||||
|
255,973 |
|||||||||||
|
HEALTH CARE - 4.8% |
|||||||||||
|
PHARMACEUTICALS, BIOTECHNOLOGY & LIFE SCIENCES - 4.8% |
|||||||||||
|
Regeneron Pharmaceuticals, Inc. (a) |
620 |
232,798 |
|||||||||
|
TOTAL COMMON STOCKS - 95.3% (COST $2,701,670) |
4,621,368 |
||||||||||
|
Par Value |
Value |
||||||||||
|
SHORT-TERM INVESTMENTS - 4.7% |
|||||||||||
|
REPURCHASE AGREEMENT - 4.7% |
|||||||||||
|
Fixed Income Clearing Corp. Repurchase Agreement, 1.55% dated 12/31/19 due 01/02/20, repurchase price $230,210, collateralized by a United States Treasury Note, 1.625% due 12/31/21, value plus accrued interest of $234,798 (Cost: $230,191) |
$ |
230,191 |
230,191 |
||||||||
|
TOTAL SHORT-TERM INVESTMENTS - 4.7% (COST $230,191) |
230,191 |
||||||||||
|
TOTAL INVESTMENTS - 100.0% (COST $2,931,861) |
4,851,559 |
||||||||||
|
Liabilities In Excess of Other Assets - 0.0% (b) |
(850 |
) |
|||||||||
|
TOTAL NET ASSETS - 100.0% |
$ |
4,850,709 |
|||||||||
(a) Non-income producing security
(b) Amount rounds to less than 0.1%.
10 OAKMARK FUNDS

This page intentionally left blank.
Oakmark.com 11
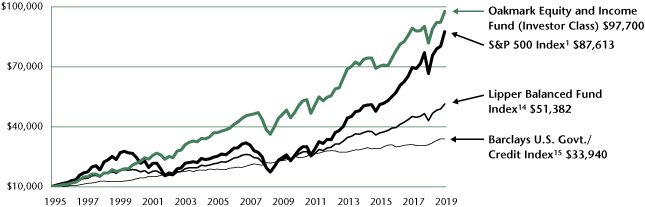
Oakmark Equity and Income Fund December 31, 2019
Summary Information
VALUE OF A $10,000 INVESTMENT
Since Inception - 11/01/95 (Unaudited)
PERFORMANCE
|
Average Annual Total Returns (as of 12/31/19) |
|||||||||||||||||||||||||||||||
| (Unaudited) |
Total Return Last 3 Months |
1-year |
3-year |
5-year |
10-year |
Since Inception |
Inception Date |
||||||||||||||||||||||||
|
Oakmark Equity and Income Fund (Investor Class) |
5.84 |
% |
19.31 |
% |
7.77 |
% |
5.79 |
% |
7.78 |
% |
9.89 |
% |
11/01/95 |
||||||||||||||||||
|
Lipper Balanced Fund Index |
5.12 |
% |
19.44 |
% |
9.11 |
% |
6.76 |
% |
8.12 |
% |
7.01 |
% |
|||||||||||||||||||
|
S&P 500 Index |
9.07 |
% |
31.49 |
% |
15.27 |
% |
11.70 |
% |
13.56 |
% |
9.40 |
% |
|||||||||||||||||||
|
Barclays U.S. Govt./Credit Index |
-0.01 |
% |
9.71 |
% |
4.35 |
% |
3.23 |
% |
3.96 |
% |
5.19 |
% |
|||||||||||||||||||
|
Oakmark Equity and Income Fund (Advisor Class) |
5.88 |
% |
19.43 |
% |
7.92 |
% |
N/A |
N/A |
8.23 |
% |
11/30/16 |
||||||||||||||||||||
|
Oakmark Equity and Income Fund (Institutional Class) |
5.87 |
% |
19.50 |
% |
7.96 |
% |
N/A |
N/A |
8.27 |
% |
11/30/16 |
||||||||||||||||||||
|
Oakmark Equity and Income Fund (Service Class) |
5.76 |
% |
18.99 |
% |
7.49 |
% |
5.49 |
% |
7.46 |
% |
8.31 |
% |
07/12/00 |
||||||||||||||||||
The graph and table above do not reflect the deduction of taxes that a shareholder would pay on Fund distributions or the redemption of Fund shares.
Past performance is no guarantee of future results. The performance data quoted represents past performance. Current performance may be lower or higher than the performance data quoted. Total return includes change in share prices and, in each case, includes reinvestment of dividends and capital gain distributions. The investment return and principal value vary so that an investor's shares, when redeemed, may be worth more or less than the original cost. To obtain the most recent month-end performance, please visit Oakmark.com.
|
TOP TEN EQUITY HOLDINGS12 |
% of Net Assets | ||||||
|
Bank of America Corp. |
5.3 |
||||||
|
General Motors Co. |
4.7 |
||||||
|
TE Connectivity, Ltd. |
4.3 |
||||||
|
MasterCard, Inc., Class A |
3.3 |
||||||
|
Alphabet, Inc., Class C |
3.2 |
||||||
|
Nestlé SA |
3.0 |
||||||
|
CVS Health Corp. |
2.9 |
||||||
|
Citigroup, Inc. |
2.9 |
||||||
|
Philip Morris International, Inc. |
2.7 |
||||||
|
Charter Communications, Inc., Class A |
2.4 |
||||||
|
FUND STATISTICS |
|||||||
|
Ticker* |
OAKBX |
||||||
|
Number of Equity Holdings |
43 |
||||||
|
Net Assets |
$11.6 billion | ||||||
|
Weighted Average Market Cap |
$155.0 billion | ||||||
|
Median Market Cap |
$31.4 billion | ||||||
|
Gross Expense Ratio - Investor Class (as of 09/30/19)* |
0.91% | ||||||
|
Net Expense Ratio - Investor Class (as of 09/30/19)*† |
0.81% | ||||||
* This information is related to the Investor Class. Please visit Oakmark.com for information related to the Advisor, Institutional and Service Classes.
† The net expense ratio reflects a contractual advisory fee waiver agreement through January 27, 2021.
|
SECTOR ALLOCATION |
% of Net Assets | ||||||
|
Equity Investments |
|||||||
|
Financials |
11.8 |
||||||
|
Consumer Discretionary |
11.6 |
||||||
|
Information Technology |
9.1 |
||||||
|
Health Care |
7.7 |
||||||
|
Consumer Staples |
7.3 |
||||||
|
Communication Services |
6.4 |
||||||
|
Industrials |
4.6 |
||||||
|
Energy |
2.5 |
||||||
|
Real Estate |
1.5 |
||||||
|
Materials |
0.9 |
||||||
|
Total Equity Investments |
63.4 |
||||||
|
Preferred Stocks |
0.1 |
||||||
|
Fixed Income Investments |
|||||||
|
Corporate Bonds |
18.0 |
||||||
|
Government and Agency Securities |
11.3 |
||||||
|
Total Fixed Income Investments |
29.3 |
||||||
|
Short-Term Investments and Other |
7.2 |
||||||
See accompanying Disclosures and Endnotes on page 43.
12 OAKMARK FUNDS
Oakmark Equity and Income Fund December 31, 2019
Portfolio Manager Commentary


Clyde S. McGregor, CFA
Portfolio Manager
oakbx@oakmark.com
M. Colin Hudson, CFA
Portfolio Manager
oakbx@oakmark.com
Edward J. Wojciechowski, CFA
Portfolio Manager
oakbx@oakmark.com
Market Inequality
In this politically fraught time, it seems that advocates call out inequality in almost every social and economic endeavor, and now it is the stock market's turn. Many commentators have noted the increasing gap in profit margins favoring the largest U.S. companies over all the rest, a reversal of the outcome in the first decade of this century. Superior profitability has led to superior equity performance for many of the largest companies. The Equity and Income Fund has implicitly recognized this development: we now maintain a higher proportion of large capitalization stocks in the equity allocation of the portfolio than we did in the Fund's early years.
But Hendrik Bessembinder of the Carey School of Business at Arizona State University16 recently discovered an even greater inequality. According to Bessembinder, since 1990, 56% of U.S. stocks have failed to beat the return on cash (as represented by the return on one-month Treasury bills). He also found that the top 1.3% of companies account for almost all of the net increase in global stock market wealth creation over the 30 years he included in his study. Overall, Bessembinder's work shows that the stock market earns returns well in excess of Treasury bills, but it accomplishes this through very large returns to few stocks rather than excess returns to average stocks.
We do not have the ability to study all of Bessembinder's data, but we do consider its implications for our equity portfolio. To review quickly, we are value investors. We attempt to identify companies selling at a discount to our estimate of their intrinsic value per share, that persistently grow their intrinsic value per share, and that have managers who act and think like owners of the business.
Bessembinder's work suggests that our focus on determining whether a company is growing its intrinsic value per share is vital. We well know the danger of "value traps," i.e., businesses that are priced cheaply because their business value is deteriorating over time. Long before Harris Associates introduced the Oakmark family of mutual funds, the firm developed its three-part definition of value, in part to mitigate the risk of potential value traps. Our value discipline might seem at odds with an investing environment where the winners are generating a disproportionate share of return, but this is not necessarily the case. For example, Fund holding Mastercard has increased in price roughly 13 times from our initial purchase. We have been able to maintain a position in the company because our understanding of the growth in its intrinsic value has grown commensurate with its price. Two other long-held names that demonstrate this attribute are Nestlé and UnitedHealth Group. It is our job to seek the issues that can produce this sort of outcome for the portfolio. Although the extreme outcome
inequality that Bessembinder describes makes this search more difficult, it is our challenge.
Year/Quarter Review
2019 proved to be a strong year for U.S. stocks and bonds. Of course, this followed a roughly 20% drop in stock indexes during the fourth quarter of 2018. In 2018, the Federal Reserve increased interest rates four times. Old-timers may remember investment strategist Edson Gould who coined the phrase "three steps and stumble" to describe the stock market's response to a series of Fed interest rate hikes, and 2018 demonstrated the wisdom in that rubric. In the second half of 2019, the Fed apparently took the stock market's message to heart and reversed course by cutting rates three times.
During the year, recession fears and forecasts waxed, and investors began to keep a tally of the number of times the word "recession" appeared in news articles. The Treasury yield curve inverted in the spring, meaning that long-term interest rates fell below short-term rates. This seemed to buttress the recession case because the historic record shows that inverted yield curves have preceded economic downturns. But, later in the year, the economic clouds began to dissipate, the yield curve lost its inversion and economic sentiment rebounded, especially when it appeared that U.S./China trade talks were developing favorably. The renewed confidence helped to support a particularly good fourth quarter for U.S. equities.
The Equity and Income Fund earned 6% in the quarter, which contrasts to a 5% gain for the Lipper Balanced Fund Index14, the Fund's performance benchmark. For calendar 2019 as a whole, the Fund showed a gain of 19%, which matches the return for the Lipper Index. We are pleased to report that the annualized compound rate of return since the Fund's inception in 1995 is 9.9%, while the corresponding return to the Lipper Index is 7.0%.
The largest contributors to portfolio return in the quarter were Bank of America, UnitedHealth Group, CVS Health, Citigroup and Charter Communications. Ally Financial, TD Ameritrade (sold), Foot Locker, American International Group and General Motors detracted most. For all of calendar 2019, Bank of America, Mastercard, Charter Communications, TE Connectivity and Citigroup led the contributors, while Foot Locker, TD Ameritrade, National Oilwell Varco, Diamondback Energy and Qurate Retail (sold) detracted most from return.
Transaction Activity
We made no significant changes to the total asset allocation of the Fund during the quarter. The equity percentage increased somewhat because of the strong rally in share prices. As noted above, the yield curve became "uninverted" in the quarter as short-term rates declined below intermediate and longer term rates. The Fund's fixed income duration, the measure of
See accompanying Disclosures and Endnotes on page 43.
Oakmark.com 13
Oakmark Equity and Income Fund December 31, 2019
Portfolio Manager Commentary (continued)
sensitivity to changes in interest rates, increased modestly in the period. As always, our fixed income team continually works to identify opportunities to improve the Fund's bond allocation.
We initiated one new equity holding while eliminating one in the quarter. The elimination, TD Ameritrade, proved to be badly timed as the company announced a merger agreement not long after our sale. We sold Ameritrade as part of our tax-loss harvesting process that helps moderate the Fund's capital gains' distributions. The company's share price declined after its competitor Charles Schwab announced it was eliminating commissions on equity trades. We took the Ameritrade loss at that time to offset previously realized gains. We regret the infelicitous timing of the sale.
Our new purchase was EOG Resources, the largest independent oil production company in the U.S. onshore region. The company has built a unique decentralized and returns-focused corporate culture, which has produced returns in excess of peers through multiple commodity cycles. This relentless focus on returns has resulted in leading capabilities in land acquisition cost, well design, operating cost efficiency and technology innovation. EOG expects that over 90% of the wells it will drill over the next 10-12 years will generate economic returns at a $40 per barrel oil price. (The price per barrel for West Texas Intermediate was $61 as of January 2.) This low position on the cost curve should allow EOG to grow oil production at a sustained mid-teens rate at today's oil prices, even though its shares trade at just 6x EV/EBITDA17. This compares favorably to the S&P 5001, which historically grows earnings at a mid-single digits pace and trades in a 10-14x EV/EBITDA range. Shares of energy companies performed poorly in 2019, despite the robust stock market rally. We believe that this industry may offer unusual attraction today.
We thank our fellow shareholders for investing in the Equity and Income Fund and invite your comments and questions.
See accompanying Disclosures and Endnotes on page 43.
14 OAKMARK FUNDS
Oakmark Equity and Income Fund December 31, 2019 (Unaudited)
Schedule of Investments (in thousands)
|
Shares |
Value |
||||||||||
|
COMMON STOCKS - 63.4% |
|||||||||||
|
FINANCIALS - 11.8% |
|||||||||||
|
BANKS - 8.2% |
|||||||||||
|
Bank of America Corp. |
17,561 |
$ |
618,495 |
||||||||
|
Citigroup, Inc. |
4,153 |
331,775 |
|||||||||
|
950,270 |
|||||||||||
|
DIVERSIFIED FINANCIALS - 2.7% |
|||||||||||
|
Ally Financial, Inc. |
7,050 |
215,451 |
|||||||||
|
State Street Corp. |
1,239 |
97,997 |
|||||||||
|
313,448 |
|||||||||||
|
INSURANCE - 0.9% |
|||||||||||
|
American International Group, Inc. |
2,077 |
106,595 |
|||||||||
|
1,370,313 |
|||||||||||
|
CONSUMER DISCRETIONARY - 11.6% |
|||||||||||
|
AUTOMOBILES & COMPONENTS - 8.4% |
|||||||||||
|
General Motors Co. |
14,856 |
543,726 |
|||||||||
|
BorgWarner, Inc. |
5,386 |
233,627 |
|||||||||
|
Lear Corp. |
1,433 |
196,544 |
|||||||||
|
973,897 |
|||||||||||
|
RETAILING - 1.9% |
|||||||||||
|
Foot Locker, Inc. |
3,520 |
137,229 |
|||||||||
|
Booking Holdings, Inc. (a) |
41 |
83,258 |
|||||||||
|
220,487 |
|||||||||||
|
CONSUMER SERVICES - 0.7% |
|||||||||||
|
MGM Resorts International |
2,351 |
78,225 |
|||||||||
|
CONSUMER DURABLES & APPAREL - 0.6% |
|||||||||||
|
Carter's, Inc. |
664 |
72,635 |
|||||||||
|
1,345,244 |
|||||||||||
|
INFORMATION TECHNOLOGY - 9.1% |
|||||||||||
|
SOFTWARE & SERVICES - 4.8% |
|||||||||||
|
MasterCard, Inc., Class A |
1,290 |
385,092 |
|||||||||
|
Oracle Corp. |
2,026 |
107,327 |
|||||||||
|
CoreLogic, Inc. (a) |
1,293 |
56,517 |
|||||||||
|
548,936 |
|||||||||||
|
TECHNOLOGY HARDWARE & EQUIPMENT - 4.3% |
|||||||||||
|
TE Connectivity, Ltd. |
5,241 |
502,326 |
|||||||||
|
1,051,262 |
|||||||||||
|
HEALTH CARE - 7.7% |
|||||||||||
|
HEALTH CARE EQUIPMENT & SERVICES - 6.2% |
|||||||||||
|
CVS Health Corp. |
4,585 |
340,646 |
|||||||||
|
UnitedHealth Group, Inc. |
736 |
216,234 |
|||||||||
|
HCA Healthcare, Inc. |
736 |
108,758 |
|||||||||
|
LivaNova PLC (a) |
757 |
57,137 |
|||||||||
|
722,775 |
|||||||||||
|
PHARMACEUTICALS, BIOTECHNOLOGY & LIFE SCIENCES - 1.5% |
|||||||||||
|
Agilent Technologies, Inc. |
998 |
85,114 |
|||||||||
|
Regeneron Pharmaceuticals, Inc. (a) |
219 |
82,230 |
|||||||||
|
167,344 |
|||||||||||
|
890,119 |
|||||||||||
|
Shares |
Value |
||||||||||
|
CONSUMER STAPLES - 7.3% |
|||||||||||
|
FOOD, BEVERAGE & TOBACCO - 7.3% |
|||||||||||
|
Nestlé SA (b) |
3,187 |
$ |
345,035 |
||||||||
|
Philip Morris International, Inc. |
3,642 |
309,923 |
|||||||||
|
Diageo PLC (b) |
960 |
161,683 |
|||||||||
|
Constellation Brands, Inc., Class A |
174 |
32,941 |
|||||||||
|
849,582 |
|||||||||||
|
COMMUNICATION SERVICES - 6.4% |
|||||||||||
|
MEDIA & ENTERTAINMENT - 6.4% |
|||||||||||
|
Alphabet, Inc., Class C (a) |
275 |
367,012 |
|||||||||
|
Charter Communications, Inc., Class A (a) |
577 |
279,746 |
|||||||||
|
Comcast Corp., Class A |
2,120 |
95,336 |
|||||||||
|
742,094 |
|||||||||||
|
INDUSTRIALS - 4.6% |
|||||||||||
|
CAPITAL GOODS - 3.7% |
|||||||||||
|
Arconic, Inc. |
5,364 |
165,057 |
|||||||||
|
Carlisle Cos., Inc. |
718 |
116,233 |
|||||||||
|
Johnson Controls International plc |
2,519 |
102,529 |
|||||||||
|
WESCO International, Inc. (a) |
890 |
52,835 |
|||||||||
|
436,654 |
|||||||||||
|
TRANSPORTATION - 0.9% |
|||||||||||
|
American Airlines Group, Inc. |
2,147 |
61,573 |
|||||||||
|
Southwest Airlines Co. |
755 |
40,749 |
|||||||||
|
102,322 |
|||||||||||
|
538,976 |
|||||||||||
|
ENERGY - 2.5% |
|||||||||||
|
Apergy Corp. (a) |
2,398 |
80,999 |
|||||||||
|
Diamondback Energy, Inc. |
774 |
71,846 |
|||||||||
|
EOG Resources, Inc. |
678 |
56,806 |
|||||||||
|
National Oilwell Varco, Inc. |
2,012 |
50,400 |
|||||||||
|
PDC Energy, Inc. (a) |
1,082 |
28,319 |
|||||||||
|
288,370 |
|||||||||||
|
REAL ESTATE - 1.5% |
|||||||||||
|
The Howard Hughes Corp. (a) |
735 |
93,217 |
|||||||||
|
Gaming and Leisure Properties, Inc. REIT |
1,833 |
78,893 |
|||||||||
|
172,110 |
|||||||||||
|
MATERIALS - 0.9% |
|||||||||||
|
Glencore PLC |
35,440 |
110,483 |
|||||||||
|
TOTAL COMMON STOCKS - 63.4% (COST $3,944,118) |
7,358,553 |
||||||||||
|
PREFERRED STOCKS - 0.1% |
|||||||||||
|
FINANCIALS - 0.1% |
|||||||||||
|
GMAC Capital Trust I (c), 7.69% (3 mo. USD LIBOR + 5.785%), |
498 |
12,960 |
|||||||||
|
TOTAL PREFERRED STOCKS - 0.1% (COST $13,007) |
12,960 |
||||||||||
Oakmark.com 15
Oakmark Equity and Income Fund December 31, 2019 (Unaudited)
Schedule of Investments (in thousands) (continued)
|
Par Value |
Value |
||||||||||
|
FIXED INCOME - 29.3% |
|||||||||||
|
CORPORATE BONDS - 18.0% |
|||||||||||
|
CONSUMER DISCRETIONARY - 4.3% |
|||||||||||
|
Adient US LLC, 144A 7.00%, due 05/15/26 (d) |
$ |
15,965 |
$ |
17,402 |
|||||||
|
Amazon.com, Inc. 3.15%, due 08/22/27 |
9,950 |
10,545 |
|||||||||
|
Booking Holdings, Inc. 3.60%, due 06/01/26 |
14,730 |
15,725 |
|||||||||
|
3.55%, due 03/15/28 |
9,950 |
10,603 |
|||||||||
|
2.75%, due 03/15/23 |
6,965 |
7,117 |
|||||||||
|
BorgWarner, Inc. 4.625%, due 09/15/20 |
10,810 |
10,981 |
|||||||||
|
Boyd Gaming Corp. 6.00%, due 08/15/26 |
4,975 |
5,336 |
|||||||||
|
Caesars Resort Collection LLC / CRC Finco, Inc., 144A 5.25%, due 10/15/25 (d) |
25,870 |
26,775 |
|||||||||
|
CCO Holdings LLC / CCO Holdings Capital Corp., 144A 4.75%, due 03/01/30 (d) |
2,980 |
3,034 |
|||||||||
|
5.125%, due 05/01/27 (d) |
250 |
264 |
|||||||||
|
Charter Communications Operating LLC / Charter Communications Operating Capital 3.579%, due 07/23/20 |
29,148 |
29,334 |
|||||||||
|
4.20%, due 03/15/28 |
9,950 |
10,607 |
|||||||||
|
4.50%, due 02/01/24 |
2,985 |
3,213 |
|||||||||
|
Choice Hotels International, Inc. 3.70%, due 12/01/29 |
9,935 |
10,007 |
|||||||||
|
Delphi Technologies PLC, 144A 5.00%, due 10/01/25 (d) |
20,826 |
19,264 |
|||||||||
|
Dollar Tree, Inc. 2.702% (3 mo. USD LIBOR + 0.700%), due 04/17/20 (c) |
6,965 |
6,966 |
|||||||||
|
Expedia Group, Inc. 5.00%, due 02/15/26 |
28,360 |
31,288 |
|||||||||
|
Expedia Group, Inc., 144A 3.25%, due 02/15/30 (d) |
10,830 |
10,423 |
|||||||||
|
Foot Locker, Inc. 8.50%, due 01/15/22 |
4,340 |
4,807 |
|||||||||
|
General Motors Co. 4.875%, due 10/02/23 |
41,400 |
44,433 |
|||||||||
|
Hasbro, Inc. 3.55%, due 11/19/26 |
4,970 |
5,005 |
|||||||||
|
International Game Technology PLC, 144A 6.50%, due 02/15/25 (d) |
19,600 |
22,001 |
|||||||||
|
6.25%, due 02/15/22 (d) |
14,800 |
15,614 |
|||||||||
|
6.25%, due 01/15/27 (d) |
200 |
225 |
|||||||||
|
KFC Holding Co/Pizza Hut Holdings LLC/Taco Bell of America LLC, 144A 5.25%, due 06/01/26 (d) |
1,000 |
1,055 |
|||||||||
|
5.00%, due 06/01/24 (d) |
1,000 |
1,036 |
|||||||||
|
Lear Corp. 5.25%, due 01/15/25 |
11,060 |
11,370 |
|||||||||
|
4.25%, due 05/15/29 |
7,955 |
8,223 |
|||||||||
|
Lithia Motors, Inc., 144A 4.625%, due 12/15/27 (d) |
2,980 |
3,063 |
|||||||||
|
5.25%, due 08/01/25 (d) |
1,990 |
2,082 |
|||||||||
|
Par Value |
Value |
||||||||||
|
Marriott International, Inc. 4.00%, due 04/15/28 |
$ |
9,761 |
$ |
10,549 |
|||||||
|
3.60%, due 04/15/24 |
6,960 |
7,331 |
|||||||||
|
Penn National Gaming, Inc., 144A 5.625%, due 01/15/27 (d) |
9,950 |
10,515 |
|||||||||
|
Penske Automotive Group, Inc. 5.50%, due 05/15/26 |
11,343 |
11,882 |
|||||||||
|
5.375%, due 12/01/24 |
3,580 |
3,683 |
|||||||||
|
Sands China, Ltd. 5.40%, due 08/08/28 |
5,000 |
5,641 |
|||||||||
|
5.125%, due 08/08/25 |
3,000 |
3,292 |
|||||||||
|
4.60%, due 08/08/23 |
2,000 |
2,111 |
|||||||||
|
Scientific Games International, Inc., 144A 5.00%, due 10/15/25 (d) |
19,910 |
20,831 |
|||||||||
|
Starbucks Corp. 3.80%, due 08/15/25 |
9,950 |
10,722 |
|||||||||
|
4.00%, due 11/15/28 |
2,985 |
3,328 |
|||||||||
|
Station Casinos LLC, 144A 5.00%, due 10/01/25 (d) |
1,990 |
2,025 |
|||||||||
|
Tapestry, Inc. 3.00%, due 07/15/22 |
12,145 |
12,301 |
|||||||||
|
4.125%, due 07/15/27 |
4,975 |
5,085 |
|||||||||
|
Tempur Sealy International, Inc. 5.50%, due 06/15/26 |
3,125 |
3,293 |
|||||||||
|
The Gap, Inc. 5.95%, due 04/12/21 |
1,965 |
2,039 |
|||||||||
|
The William Carter Co., 144A 5.625%, due 03/15/27 (d) |
1,750 |
1,881 |
|||||||||
|
Under Armour, Inc. 3.25%, due 06/15/26 |
12,565 |
12,227 |
|||||||||
|
Wolverine World Wide, Inc., 144A 5.00%, due 09/01/26 (d) |
12,140 |
12,322 |
|||||||||
|
Yum! Brands, Inc. 3.875%, due 11/01/23 |
6,329 |
6,519 |
|||||||||
|
495,375 |
|||||||||||
|
FINANCIALS - 4.2% |
|||||||||||
|
Ally Financial, Inc. 3.875%, due 05/21/24 |
7,950 |
8,328 |
|||||||||
|
American Express Credit Corp. 2.60%, due 09/14/20 |
2,945 |
2,956 |
|||||||||
|
American International Group, Inc. 3.30%, due 03/01/21 |
14,665 |
14,878 |
|||||||||
|
Aon Corp. 5.00%, due 09/30/20 |
14,745 |
15,061 |
|||||||||
|
Bank of America Corp. 4.45%, due 03/03/26 |
5,000 |
5,492 |
|||||||||
|
BNP Paribas SA, 144A 7.625% (USD 5 Year Swap rate + 6.314%) (c) (d) (e) |
5,000 |
5,275 |
|||||||||
|
Citigroup, Inc. 3.352% (3 mo. USD LIBOR + 0.897%), due 04/24/25 (c) |
22,860 |
23,793 |
|||||||||
|
3.40%, due 05/01/26 |
15,000 |
15,760 |
|||||||||
|
4.05%, due 07/30/22 |
13,338 |
13,940 |
|||||||||
|
CNO Financial Group, Inc. 5.25%, due 05/30/25 |
5,895 |
6,529 |
|||||||||
|
Credit Suisse Group AG, 144A 7.50%(USD 5 Year Swap rate + 4.598%) (c) (d) (e) |
30,000 |
33,713 |
|||||||||
|
6.25%(USD 5 Year Swap rate + 3.455%) (c) (d) (e) |
7,000 |
7,614 |
|||||||||
16 OAKMARK FUNDS
Oakmark Equity and Income Fund December 31, 2019 (Unaudited)
Schedule of Investments (in thousands) (continued)
|
Par Value |
Value |
||||||||||
|
FIXED INCOME - 29.3% (continued) |
|||||||||||
|
CORPORATE BONDS - 18.0% (continued) |
|||||||||||
|
Credit Suisse Group Funding Guernsey, Ltd. 3.125%, due 12/10/20 |
$ |
25,000 |
$ |
25,223 |
|||||||
|
3.80%, due 06/09/23 |
14,750 |
15,444 |
|||||||||
|
E*TRADE Financial Corp. 2.95%, due 08/24/22 |
11,965 |
12,190 |
|||||||||
|
3.80%, due 08/24/27 |
4,975 |
5,173 |
|||||||||
|
JPMorgan Chase & Co. 2.972%, due 01/15/23 |
29,765 |
30,328 |
|||||||||
|
3.514%(3 mo. USD LIBOR + 0.610%), due 06/18/22 (c) |
24,870 |
25,409 |
|||||||||
|
3.166%(3 mo. USD LIBOR + 1.230%), due 10/24/23 (c) |
19,910 |
20,249 |
|||||||||
|
Moody's Corp. 4.50%, due 09/01/22 |
13,040 |
13,789 |
|||||||||
|
2.625%, due 01/15/23 |
12,201 |
12,386 |
|||||||||
|
MSCI, Inc., 144A 5.25%, due 11/15/24 (d) |
9,311 |
9,566 |
|||||||||
|
5.375%, due 05/15/27 (d) |
6,965 |
7,505 |
|||||||||
|
4.75%, due 08/01/26 (d) |
5,925 |
6,206 |
|||||||||
|
5.75%, due 08/15/25 (d) |
2,950 |
3,094 |
|||||||||
|
Principal Life Global Funding II, 144A 2.15%, due 01/10/20 (d) |
19,910 |
19,909 |
|||||||||
|
2.375%, due 11/21/21 (d) |
6,970 |
7,010 |
|||||||||
|
Reinsurance Group of America, Inc. 3.95%, due 09/15/26 |
4,905 |
5,205 |
|||||||||
|
S&P Global, Inc. 4.00%, due 06/15/25 |
17,150 |
18,656 |
|||||||||
|
2.95%, due 01/22/27 |
9,810 |
10,134 |
|||||||||
|
4.40%, due 02/15/26 |
1,970 |
2,185 |
|||||||||
|
The Charles Schwab Corp. 3.25%, due 05/21/21 |
19,895 |
20,283 |
|||||||||
|
The Goldman Sachs Group, Inc. 2.35%, due 11/15/21 |
14,616 |
14,674 |
|||||||||
|
3.20%, due 02/23/23 |
7,000 |
7,197 |
|||||||||
|
3.686%(3 mo. USD LIBOR + 1.750%), due 10/28/27 (c) |
2,975 |
3,103 |
|||||||||
|
2.625%, due 04/25/21 |
2,000 |
2,018 |
|||||||||
|
2.875%, due 02/25/21 |
1,000 |
1,010 |
|||||||||
|
Wells Fargo & Co. 3.069%, due 01/24/23 |
14,930 |
15,238 |
|||||||||
|
3.157%(3 mo. USD LIBOR + 1.230%), due 10/31/23 (c) |
8,603 |
8,756 |
|||||||||
|
Wells Fargo Bank NA 3.625%, due 10/22/21 |
10,000 |
10,292 |
|||||||||
|
485,571 |
|||||||||||
|
INDUSTRIALS - 1.9% |
|||||||||||
|
Bacardi, Ltd., 144A 4.45%, due 05/15/25 (d) |
14,900 |
16,069 |
|||||||||
|
BAT Capital Corp. 3.557%, due 08/15/27 |
6,965 |
7,111 |
|||||||||
|
Delta Air Lines, Inc. 3.40%, due 04/19/21 |
11,590 |
11,750 |
|||||||||
|
3.80%, due 04/19/23 |
9,425 |
9,780 |
|||||||||
|
Fortune Brands Home & Security, Inc. 4.00%, due 06/15/25 |
13,430 |
14,394 |
|||||||||
|
4.00%, due 09/21/23 |
9,945 |
10,510 |
|||||||||
|
Par Value |
Value |
||||||||||
|
Hilton Domestic Operating Co., Inc. 5.125%, due 05/01/26 |
$ |
16,915 |
$ |
17,803 |
|||||||
|
Southwest Airlines Co. 2.65%, due 11/05/20 |
12,148 |
12,213 |
|||||||||
|
Stanley Black & Decker, Inc. 4.25%, due 11/15/28 |
6,965 |
7,858 |
|||||||||
|
The Boeing Co. 2.70%, due 02/01/27 |
49,685 |
50,376 |
|||||||||
|
Uber Technologies, Inc., 144A |
|||||||||||
|
8.00%, due 11/01/26 (d) |
21,430 |
22,341 |
|||||||||
|
7.50%, due 09/15/27 (d) |
4,470 |
4,586 |
|||||||||
|
United Technologies Corp. 3.65%, due 08/16/23 |
4,975 |
5,246 |
|||||||||
|
3.95%, due 08/16/25 |
1,990 |
2,170 |
|||||||||
|
3.35%, due 08/16/21 |
1,990 |
2,038 |
|||||||||
|
Welbilt, Inc. 9.50%, due 02/15/24 |
4,915 |
5,210 |
|||||||||
|
WESCO Distribution, Inc. 5.375%, due 06/15/24 |
13,675 |
14,188 |
|||||||||
|
5.375%, due 12/15/21 |
5,305 |
5,318 |
|||||||||
|
Westinghouse Air Brake Technologies Corp. 3.194% (3 mo. USD LIBOR + 1.300%), due 09/15/21 (c) |
4,975 |
4,976 |
|||||||||
|
223,937 |
|||||||||||
|
HEALTH CARE - 1.8% |
|||||||||||
|
AbbVie, Inc. 3.75%, due 11/14/23 |
6,965 |
7,332 |
|||||||||
|
AbbVie, Inc., 144A |
|||||||||||
|
2.95%, due 11/21/26 (d) |
6,955 |
7,081 |
|||||||||
|
2.60%, due 11/21/24 (d) |
2,980 |
3,004 |
|||||||||
|
Becton Dickinson and Co. 3.30%, due 03/01/23 |
11,204 |
11,444 |
|||||||||
|
2.836%(3 mo. USD LIBOR + 0.875%), due 12/29/20 (c) |
7,463 |
7,467 |
|||||||||
|
3.363%, due 06/06/24 |
2,985 |
3,109 |
|||||||||
|
2.894%, due 06/06/22 |
2,985 |
3,035 |
|||||||||
|
Centene Corp. 4.75%, due 05/15/22 |
20,084 |
20,486 |
|||||||||
|
Centene Corp., 144A |
|||||||||||
|
4.25%, due 12/15/27 (d) |
2,980 |
3,066 |
|||||||||
|
4.75%, due 01/15/25 (d) |
994 |
1,032 |
|||||||||
|
Cigna Corp., 144A 3.30%, due 02/25/21 (d) |
4,915 |
4,978 |
|||||||||
|
CVS Health Corp. 5.00%, due 12/01/24 |
6,880 |
7,603 |
|||||||||
|
Edwards Lifesciences Corp. 4.30%, due 06/15/28 |
6,965 |
7,745 |
|||||||||
|
HCA, Inc. 5.00%, due 03/15/24 |
7,465 |
8,160 |
|||||||||
|
5.625%, due 09/01/28 |
2,985 |
3,402 |
|||||||||
|
5.375%, due 09/01/26 |
500 |
557 |
|||||||||
|
IQVIA, Inc., 144A |
|||||||||||
|
5.00%, due 10/15/26 (d) |
7,800 |
8,229 |
|||||||||
|
Johnson & Johnson |
|||||||||||
|
2.90%, due 01/15/28 |
9,955 |
10,393 |
|||||||||
|
McKesson Corp. 3.65%, due 11/30/20 |
19,890 |
20,168 |
|||||||||
|
3.95%, due 02/16/28 |
2,985 |
3,185 |
|||||||||
Oakmark.com 17
Oakmark Equity and Income Fund December 31, 2019 (Unaudited)
Schedule of Investments (in thousands) (continued)
|
Par Value |
Value |
||||||||||
|
FIXED INCOME - 29.3% (continued) |
|||||||||||
|
CORPORATE BONDS - 18.0% (continued) |
|||||||||||
|
Quest Diagnostics, Inc. 4.70%, due 04/01/21 |
$ |
5,128 |
$ |
5,298 |
|||||||
|
Universal Health Services, Inc., 144A 4.75%, due 08/01/22 (d) |
32,695 |
33,022 |
|||||||||
|
5.00%, due 06/01/26 (d) |
12,805 |
13,429 |
|||||||||
|
Zimmer Biomet Holdings, Inc. 2.653%(3 mo. USD LIBOR + 0.750%), due 03/19/21 (c) |
4,975 |
4,975 |
|||||||||
|
3.15%, due 04/01/22 |
3,810 |
3,890 |
|||||||||
|
3.70%, due 03/19/23 |
2,985 |
3,111 |
|||||||||
|
205,201 |
|||||||||||
|
COMMUNICATION SERVICES - 1.7% |
|||||||||||
|
Comcast Corp. 3.45%, due 10/01/21 |
9,950 |
10,242 |
|||||||||
|
3.95%, due 10/15/25 |
4,975 |
5,430 |
|||||||||
|
Discovery Communications LLC 2.80%, due 06/15/20 |
3,930 |
3,940 |
|||||||||
|
Electronic Arts, Inc. 4.80%, due 03/01/26 |
19,655 |
22,091 |
|||||||||
|
3.70%, due 03/01/21 |
14,740 |
15,016 |
|||||||||
|
Live Nation Entertainment, Inc., 144A |
|||||||||||
|
4.875%, due 11/01/24 (d) |
14,935 |
15,458 |
|||||||||
|
5.625%, due 03/15/26 (d) |
4,975 |
5,298 |
|||||||||
|
4.75%, due 10/15/27 (d) |
2,980 |
3,084 |
|||||||||
|
Netflix, Inc. 4.875%, due 04/15/28 |
31,840 |
33,072 |
|||||||||
|
5.875%, due 02/15/25 |
11,940 |
13,313 |
|||||||||
|
5.875%, due 11/15/28 |
6,965 |
7,721 |
|||||||||
|
6.375%, due 05/15/29 |
2,985 |
3,399 |
|||||||||
|
5.375%, due 02/01/21 |
1,990 |
2,052 |
|||||||||
|
Netflix, Inc., 144A 5.375%, due 11/15/29 (d) |
4,970 |
5,293 |
|||||||||
|
Omnicom Group, Inc. / Omnicom Capital, Inc. 3.625%, due 05/01/22 |
30,425 |
31,518 |
|||||||||
|
Twitter, Inc., 144A 3.875%, due 12/15/27 (d) |
700 |
700 |
|||||||||
|
Zayo Group LLC / Zayo Capital, Inc. 6.00%, due 04/01/23 |
14,745 |
15,077 |
|||||||||
|
192,704 |
|||||||||||
|
INFORMATION TECHNOLOGY - 1.5% |
|||||||||||
|
Avnet, Inc. 4.875%, due 12/01/22 |
8,275 |
8,766 |
|||||||||
|
3.75%, due 12/01/21 |
4,710 |
4,834 |
|||||||||
|
Broadcom Corp. / Broadcom Cayman Finance, Ltd. 3.00%, due 01/15/22 |
14,930 |
15,151 |
|||||||||
|
3.625%, due 01/15/24 |
9,955 |
10,318 |
|||||||||
|
2.375%, due 01/15/20 |
9,955 |
9,955 |
|||||||||
|
3.50%, due 01/15/28 |
4,975 |
5,006 |
|||||||||
|
CDW LLC / CDW Finance Corp. 5.00%, due 09/01/25 |
9,955 |
10,403 |
|||||||||
|
CommScope, Inc., 144A 5.50%, due 06/15/24 (d) |
23,854 |
24,153 |
|||||||||
|
6.00%, due 03/01/26 (d) |
3,480 |
3,702 |
|||||||||
|
5.50%, due 03/01/24 (d) |
3,480 |
3,628 |
|||||||||
|
5.00%, due 06/15/21 (d) |
230 |
230 |
|||||||||
|
Par Value |
Value |
||||||||||
|
Dell International LLC / EMC Corp., 144A 5.45%, due 06/15/23 (d) |
$ |
14,725 |
$ |
15,973 |
|||||||
|
4.42%, due 06/15/21 (d) |
2,940 |
3,025 |
|||||||||
|
Itron, Inc., 144A 5.00%, due 01/15/26 (d) |
11,035 |
11,435 |
|||||||||
|
Lam Research Corp. 2.75%, due 03/15/20 |
19,660 |
19,670 |
|||||||||
|
2.80%, due 06/15/21 |
4,910 |
4,963 |
|||||||||
|
Motorola Solutions, Inc. 3.75%, due 05/15/22 |
5,592 |
5,783 |
|||||||||
|
4.60%, due 02/23/28 |
2,985 |
3,237 |
|||||||||
|
NortonLifeLock, Inc.,144A 5.00%, due 04/15/25 (d) |
1,000 |
1,022 |
|||||||||
|
Qorvo, Inc. 5.50%, due 07/15/26 |
4,975 |
5,298 |
|||||||||
|
Tyco Electronics Group SA 3.70%, due 02/15/26 |
9,830 |
10,397 |
|||||||||
|
176,949 |
|||||||||||
|
REAL ESTATE - 1.1% |
|||||||||||
|
CBRE Services, Inc. 5.25%, due 03/15/25 |
24,930 |
28,058 |
|||||||||
|
4.875%, due 03/01/26 |
19,665 |
21,926 |
|||||||||
|
GLP Capital, LP / GLP Financing II, Inc. REIT 5.375%, due 11/01/23 |
12,000 |
13,057 |
|||||||||
|
5.75%, due 06/01/28 |
4,975 |
5,649 |
|||||||||
|
5.25%, due 06/01/25 |
4,975 |
5,460 |
|||||||||
|
5.375%, due 04/15/26 |
3,925 |
4,339 |
|||||||||
|
4.375%, due 04/15/21 |
1,965 |
2,003 |
|||||||||
|
MGM Growth Properties Operating Partnership, LP / MGP Finance Co-Issuer, Inc. REIT 5.625%, due 05/01/24 |
2,945 |
3,221 |
|||||||||
|
Omega Healthcare Investors, Inc. REIT |
|||||||||||
|
5.25%, due 01/15/26 |
14,942 |
16,623 |
|||||||||
|
4.375%, due 08/01/23 |
15,046 |
15,964 |
|||||||||
|
The Howard Hughes Corp., 144A 5.375%, due 03/15/25 (d) |
12,440 |
12,969 |
|||||||||
|
Ventas Realty, LP REIT 3.125%, due 06/15/23 |
2,490 |
2,554 |
|||||||||
|
3.50%, due 02/01/25 |
900 |
940 |
|||||||||
|
132,763 |
|||||||||||
|
CONSUMER STAPLES - 0.7% |
|||||||||||
|
Constellation Brands, Inc. 3.15%, due 08/01/29 |
25,995 |
26,293 |
|||||||||
|
Diageo Capital PLC 3.00%, due 05/18/20 |
5,000 |
5,020 |
|||||||||
|
Kraft Heinz Foods Co., 144A 4.875%, due 02/15/25 (d) |
4,276 |
4,393 |
|||||||||
|
Mead Johnson Nutrition Co. 4.125%, due 11/15/25 |
13,955 |
15,255 |
|||||||||
|
3.00%, due 11/15/20 |
6,885 |
6,946 |
|||||||||
|
Mondelez International Holdings Netherlands BV, 144A 2.00%, due 10/28/21 (d) |
8,585 |
8,586 |
|||||||||
|
Post Holdings, Inc., 144A 5.00%, due 08/15/26 (d) |
2,000 |
2,113 |
|||||||||
|
5.75%, due 03/01/27 (d) |
500 |
536 |
|||||||||
|
5.50%, due 03/01/25 (d) |
500 |
524 |
|||||||||
18 OAKMARK FUNDS
Oakmark Equity and Income Fund December 31, 2019 (Unaudited)
Schedule of Investments (in thousands) (continued)
|
Par Value |
Value |
||||||||||
|
FIXED INCOME - 29.3% (continued) |
|||||||||||
|
CORPORATE BONDS - 18.0% (continued) |
|||||||||||
|
Smithfield Foods, Inc., 144A 3.35%, due 02/01/22 (d) |
$ |
4,975 |
$ |
4,990 |
|||||||
|
2.65%, due 10/03/21 (d) |
3,980 |
3,957 |
|||||||||
|
4.25%, due 02/01/27 (d) |
995 |
1,024 |
|||||||||
|
79,637 |
|||||||||||
|
ENERGY - 0.6% |
|||||||||||
|
Apergy Corp. 6.375%, due 05/01/26 |
16,119 |
17,006 |
|||||||||
|
National Oilwell Varco, Inc. 3.60%, due 12/01/29 |
24,835 |
24,911 |
|||||||||
|
Occidental Petroleum Corp. 3.36% (3 mo. USD LIBOR + 1.450%), due 08/15/22 (c) |
9,940 |
9,993 |
|||||||||
|
Oceaneering International, Inc. 4.65%, due 11/15/24 |
8,485 |
8,315 |
|||||||||
|
Schlumberger Holdings Corp., 144A 4.00%, due 12/21/25 (d) |
9,830 |
10,587 |
|||||||||
|
Weatherford International, Ltd., 144A 11.00%, due 12/01/24 (d) |
662 |
716 |
|||||||||
|
71,528 |
|||||||||||
|
MATERIALS - 0.2% |
|||||||||||
|
Glencore Funding LLC, 144A 3.875%, due 10/27/27 (d) |
9,950 |
10,276 |
|||||||||
|
3.00%, due 10/27/22 (d) |
9,950 |
9,979 |
|||||||||
|
20,255 |
|||||||||||
|
Total Corporate Bonds (Cost $2,001,436) |
2,083,920 |
||||||||||
|
GOVERNMENT AND AGENCY SECURITIES - 11.3% |
|||||||||||
|
U.S. GOVERNMENT NOTES - 11.2% |
|||||||||||
|
United States Treasury Bonds (TIPS) 1.25%, due 07/15/20 (f) |
495,345 |
500,078 |
|||||||||
|
United States Treasury Notes 1.75%, due 10/31/20 |
223,550 |
223,733 |
|||||||||
|
2.375%, due 12/31/20 |
198,945 |
200,351 |
|||||||||
|
1.625%, due 07/31/20 |
99,485 |
99,481 |
|||||||||
|
2.00%, due 11/30/22 |
74,625 |
75,467 |
|||||||||
|
1.75%, due 03/31/22 |
74,645 |
74,925 |
|||||||||
|
2.125%, due 12/31/22 |
49,745 |
50,503 |
|||||||||
|
1.875%, due 11/30/21 |
49,785 |
50,075 |
|||||||||
|
2.125%, due 01/31/21 |
24,570 |
24,699 |
|||||||||
|
1,299,312 |
|||||||||||
|
U.S. GOVERNMENT AGENCIES - 0.1% |
|||||||||||
|
Federal Farm Credit Bank, 1.68%, due 08/16/21 |
17,165 |
17,152 |
|||||||||
|
Total Government and Agency Securities (Cost $1,304,557) |
1,316,464 |
||||||||||
|
TOTAL FIXED INCOME - 29.3% (COST $3,305,993) |
3,400,384 |
||||||||||
|
Par Value |
Value |
||||||||||
|
SHORT-TERM INVESTMENTS - 8.7% |
|||||||||||
|
REPURCHASE AGREEMENT - 4.6% |
|||||||||||
|
Fixed Income Clearing Corp. Repurchase Agreement, 1.55% dated 12/31/19 due 01/02/20, repurchase price $529,578, collateralized by United States Treasury Notes, 1.625% - 2.625% due 12/15/21 - 12/31/21, aggregate value plus accrued interest of $540,124 (Cost: $529,532) |
$ |
529,532 |
$ |
529,532 |
|||||||
|
COMMERCIAL PAPER - 4.1% |
|||||||||||
|
General Mills, Inc., 144A, 1.83% - 2.0%, due 01/06/20 - 01/23/20 (d) (g) |
144,320 |
144,218 |
|||||||||
|
Walgreens Boots, 2.06% - 2.3%, due 01/09/20 - 03/25/20 (g) |
109,250 |
109,096 |
|||||||||
|
Anthem, Inc., 144A, 1.83% - 1.90%, due 01/02/20 - 01/06/20 (d) (g) |
108,670 |
108,654 |
|||||||||
|
Campbell Soup Co., 144A, 1.96% - 2.3%, due 01/06/20 - 01/27/20 (d) (g) |
69,550 |
69,494 |
|||||||||
|
Schlumberger Holdings Corp., 144A, 2.03%, due 01/09/20 (d) (g) |
24,750 |
24,739 |
|||||||||
|
MetLife Short Term Funding LLC, 144A, 1.75%, due 01/06/20 (d) (g) |
15,700 |
15,695 |
|||||||||
|
Total Commercial Paper (Cost $471,909) |
471,896 |
||||||||||
|
CORPORATE BONDS - 0.0% (h) |
|||||||||||
|
FINANCIALS - 0.0% (h) |
|||||||||||
|
Ally Financial, Inc., 4.13%, due 03/30/20 (Cost $4,977) |
4,970 |
4,989 |
|||||||||
|
TOTAL SHORT-TERM INVESTMENTS - 8.7% (COST $1,006,418) |
1,006,417 |
||||||||||
|
TOTAL INVESTMENTS - 101.5% (COST $8,269,536) |
11,778,314 |
||||||||||
|
Foreign Currencies - 0.0% (h) |
0 |
(i) |
|||||||||
|
Liabilities In Excess of Other Assets - (1.5)% |
(175,492 |
) |
|||||||||
|
NET ASSETS - 100.0% |
$ |
11,602,822 |
|||||||||
(a) Non-income producing security
(b) Sponsored American Depositary Receipt
(c) Floating Rate Note. Rate shown is as of December 31, 2019.
(d) Security exempt from registration under Rule 144A of the Securities Act of 1933, as amended. These securities may be resold, normally only to qualified institutional buyers.
(e) Security is perpetual and has no stated maturity date.
(f) Interest rate for this security is a stated rate. Interest payments are determined based on an inflation-adjusted principal amount.
(g) The rate shown represents the annualized yield at the time of purchase; not a coupon rate.
(h) Amount rounds to less than 0.1%.
(i) Amount rounds to less than $1,000.
Abbreviations:
REIT: Real Estate Investment Trust
Oakmark.com 19
Oakmark Global Fund December 31, 2019
Summary Information
VALUE OF A $10,000 INVESTMENT
Since Inception - 08/04/99 (Unaudited)
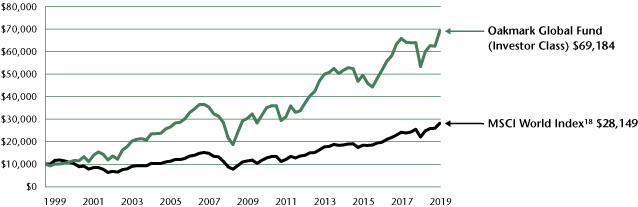
PERFORMANCE
|
Average Annual Total Returns (as of 12/31/19) |
|||||||||||||||||||||||||||||||
| (Unaudited) |
Total Return Last 3 Months |
1-year |
3-year |
5-year |
10-year |
Since Inception |
Inception Date |
||||||||||||||||||||||||
|
Oakmark Global Fund (Investor Class) |
10.77 |
% |
29.60 |
% |
10.10 |
% |
5.96 |
% |
8.60 |
% |
9.94 |
% |
08/04/99 |
||||||||||||||||||
|
MSCI World Index |
8.56 |
% |
27.67 |
% |
12.57 |
% |
8.74 |
% |
9.47 |
% |
5.20 |
% |
|||||||||||||||||||
|
Lipper Global Fund Index19 |
8.58 |
% |
24.33 |
% |
10.83 |
% |
7.69 |
% |
8.39 |
% |
5.62 |
% |
|||||||||||||||||||
|
Oakmark Global Fund (Advisor Class) |
10.83 |
% |
29.78 |
% |
10.23 |
% |
N/A |
N/A |
11.04 |
% |
11/30/16 |
||||||||||||||||||||
|
Oakmark Global Fund (Institutional Class) |
10.83 |
% |
29.83 |
% |
10.30 |
% |
N/A |
N/A |
11.10 |
% |
11/30/16 |
||||||||||||||||||||
|
Oakmark Global Fund (Service Class) |
10.71 |
% |
29.32 |
% |
9.82 |
% |
5.64 |
% |
8.24 |
% |
9.98 |
% |
10/10/01 |
||||||||||||||||||
The graph and table do not reflect the deduction of taxes that a shareholder would pay on Fund distributions or the redemption of Fund shares.
Past performance is no guarantee of future results. The performance data quoted represents past performance. Current performance may be lower or higher than the performance data quoted. Total return includes change in share prices and, in each case, includes reinvestment of dividends and capital gain distributions. The investment return and principal value vary so that an investor's shares, when redeemed, may be worth more or less than the original cost. To obtain the most recent month-end performance, please visit Oakmark.com.
|
TOP TEN EQUITY HOLDINGS12 |
% of Net Assets | ||||||
|
MasterCard, Inc., Class A |
5.2 |
||||||
|
Bank of America Corp. |
4.8 |
||||||
|
Alphabet, Inc., Class C |
4.4 |
||||||
|
CNH Industrial N.V. |
4.3 |
||||||
|
Credit Suisse Group AG |
4.2 |
||||||
|
TE Connectivity, Ltd. |
4.2 |
||||||
|
General Motors Co. |
3.8 |
||||||
|
Lloyds Banking Group PLC |
3.8 |
||||||
|
Daimler AG |
3.7 |
||||||
|
Bayer AG |
3.7 |
||||||
|
FUND STATISTICS |
|||||||
|
Ticker* |
OAKGX |
||||||
|
Number of Equity Holdings |
44 |
||||||
|
Net Assets |
$1.8 billion | ||||||
|
Weighted Average Market Cap |
$119.7 billion | ||||||
|
Median Market Cap |
$31.7 billion | ||||||
|
Gross Expense Ratio - Investor Class (as of 09/30/19)* |
1.23% | ||||||
|
Net Expense Ratio - Investor Class (as of 09/30/19)*† |
1.17% | ||||||
* This information is related to the Investor Class. Please visit Oakmark.com for information related to the Advisor, Institutional and Service Classes.
† The net expense ratio reflects a contractual advisory fee waiver agreement through January 27, 2021.
|
SECTOR ALLOCATION |
% of Net Assets | ||||||
|
Financials |
22.7 |
||||||
|
Consumer Discretionary |
17.7 |
||||||
|
Industrials |
16.4 |
||||||
|
Information Technology |
15.0 |
||||||
|
Communication Services |
14.4 |
||||||
|
Health Care |
5.9 |
||||||
|
Materials |
3.3 |
||||||
|
Energy |
1.6 |
||||||
|
Consumer Staples |
0.8 |
||||||
|
Short-Term Investments and Other |
2.2 |
||||||
|
GEOGRAPHIC ALLOCATION |
|||||||
|
% of Equity |
|||||||
|
North America |
47.2 |
||||||
|
United States |
47.2 |
||||||
|
Europe |
42.0 |
||||||
|
United Kingdom |
15.4 |
||||||
|
Germany* |
12.5 |
||||||
|
Switzerland |
10.3 |
||||||
|
Ireland* |
3.3 |
||||||
|
Netherlands* |
0.5 |
||||||
|
Asia |
4.3 |
||||||
|
Japan |
2.0 |
||||||
|
% of Equity |
|||||||
|
Asia (cont'd) |
|||||||
|
South Korea |
1.2 |
||||||
|
Taiwan |
0.6 |
||||||
|
India |
0.5 |
||||||
|
Africa |
2.7 |
||||||
|
South Africa |
2.7 |
||||||
|
Australasia |
2.2 |
||||||
|
Australia |
2.2 |
||||||
|
Latin America |
1.6 |
||||||
|
Mexico |
1.6 |
||||||
* Euro currency countries comprise 16.3% of equity investments.
See accompanying Disclosures and Endnotes on page 43.
20 OAKMARK FUNDS
Oakmark Global Fund December 31, 2019
Portfolio Manager Commentary


David G. Herro, CFA
Portfolio Manager
oakgx@oakmark.com
Clyde S. McGregor, CFA
Portfolio Manager
oakgx@oakmark.com
Anthony P. Coniaris, CFA
Portfolio Manager
oakgx@oakmark.com
Jason E. Long, CFA
Portfolio Manager
oakgx@oakmark.com
What a Difference!
Do you still remember December of 2018? Market returns were the worst for a December in more than 80 years! On Christmas Eve of 2018, the downturn in the U.S. intensified in a particularly unnerving fashion. At the intraday low on that day, the U.S. market had declined by 20%—the level generally identified as a "bear market." As sometimes happens, however, that day's mini-collapse squeezed the last bit of selling pressure out of the down-cycle, setting the stage for a robust rally in 2019. Technology stocks and more defensive sectors dominated markets for much of this year, but by year's end, the rally had broadened. Even asset classes other than stocks (e.g., bonds, gold, oil) participated.
The past quarter's results were particularly strong: The Oakmark Global Fund gained 11% compared to the MSCI World Index's18 9% return and the Lipper Global Fund Index's19 gain of 9%. For all of calendar 2019, the Fund returned 30%, which contrasts to 28% for the MSCI World Index and 24% for the Lipper Global Fund Index. Since the Fund's inception in 1999, it has achieved a compound annual rate of return of 9.9% compared to 5.2% for the MSCI World Index and 5.6% for the Lipper Global Fund Index.
For the quarter, the countries that contributed the most to the Fund's return were the U.S., U.K. and Germany and the only detracting countries, minimal at that, were the Netherlands and Australia. The five largest equity contributors to return in the quarter were Tenet Healthcare (U.S.), Lloyds Banking Group (U.K.), Bank of America (U.S.), Ryanair Holdings (Ireland) and Travis Perkins (U.K.). The Fund holdings that detracted most were Liberty Global (U.K.), Rolls-Royce Holdings (U.K.), Oracle (U.S.), Johnson Controls (U.S.) and General Motors (U.S.). During the quarter, the U.K. voted in a new Parliament, which will likely complete the arduous Brexit process. This positively affected share prices in several U.K.-domiciled industries, especially banks.
For all of 2019, the U.S., U.K. and Switzerland contributed most to investment return, while Mexico, the Netherlands and Australia, all countries where the Fund owns only one holding, detracted. Leading return contributors for the year were Mastercard (U.S.), Bank of America, Citigroup (U.S.), Lloyds Banking Group and Julius Baer Group (Switzerland). Grupo Televisa (Mexico), Prosus (Netherlands), Rolls-Royce, Incitec Pivot (Australia) and National Oilwell Varco (U.S.) detracted most from return.
We are obviously pleased with the Fund's 2019 absolute return, which is tied for the fourth-best year in the Fund's history.
When 2019 began, we very much liked our holdings, but we did not forecast the substantial multiple expansion that would generate our excellent return. Some readers may be surprised that a nearly 30% return would only be the fourth-best year in the Fund's 20-year history, but this simply illustrates that stocks are volatile. Many investors abhor volatility, but we believe that managing it is part of our job. Volatility goes in both directions, and given the unpredictability of the markets, we believe it is best to stay invested to the limits of your risk tolerance.
Portfolio Activity
Five years ago in this report, we wrote: "At the end of the year we often read quotes such as this from the December 31 New York Times: 'Trading was slow [on December 30] as most investors have closed their books for 2014.' For us as mutual fund managers such a statement is totally perplexing if not absurd. Every hour that equity markets are open for trading we look to improve the Fund whether by tactical adjustments to Fund holdings or through taking advantage of new opportunities that the markets provide. This does not, however, mean that our process typically involves heavy trading, as the Fund's turnover ratio for the past twelve months attests."
We include this paragraph here because it applies to 2019, too. Once again, the portfolio turnover rate was quite low (19%), which clearly did not impair the Fund's ability to generate a strong positive return. But this low turnover rate is deceiving. It obscures our frequent tactical trades that seek to take advantage of intraday price moves along with our trades that are intended to improve the Fund's tax efficiency. Given that we seek to hold a security for about three to five years, our shareholders should expect annualized turnover ratios between 20 and 33%. But understand that our entire investment team is continuously striving to identify superior opportunities with which to populate the portfolio.
We kept the Fund's balance between international and U.S. stocks relatively constant during the quarter. We initiated one new holding while also eliminating one, and both were U.K. companies. We completed the sale of our long-held (17 years) holding in Diageo due to its increasingly expensive valuation. We are always sad to exit a holding that has successfully compounded value for the Fund's shareholders. Nevertheless, our discipline demands that when the share price nears our calculation of the holding's intrinsic value, we prepare to move on, especially when we have replacement candidates selling at large discounts. We thank the management of Diageo for their successful stewardship of our shareholders' capital.
See accompanying Disclosures and Endnotes on page 43.
Oakmark.com 21
Oakmark Global Fund December 31, 2019
Portfolio Manager Commentary (continued)
Rolls-Royce was the one new purchase in the period. The company is a leading producer of engines for the aerospace sector, and it is particularly exposed to wide-body aircraft, where it operates in a duopoly with General Electric. The wide-body market is coming up on a strong replacement cycle. In fact, we estimate that 50% of Rolls' incremental wide-body engine deliveries will come from replacement demand. In civil aviation, the net present value of a new aircraft engine platform involves years of accumulating losses during the development and early production phases, which is followed by a lucrative aftermarket stream (what is referred to as the "razor and razorblade model"). Rolls' current levels of profitability and cash flow are depressed because it is participating in two simultaneous, major development/ramp-up projects while it also addresses its internal inefficiencies. We expect the company's profitability and free-cash-flow generation to improve over the next three years as development costs normalize and the lucrative aftermarket stream begins to contribute. Moreover, we believe there is significant scope for self-help initiatives as CEO Warren East overhauls a weak management team, improves accountability and modifies incentives to emphasize cash-flow generation. We believe the market is overly concerned with short-term profitability and cash flow, particularly given the numerous opportunities to improve both metrics over the medium term. We see a very favorable risk/reward profile, so we established a position during the quarter.
Currency Hedges
We defensively hedge a portion of the Fund's exposure to currencies that we believe to be overvalued versus the U.S. dollar. As of quarter end, we found the Swiss franc to be overvalued and have hedged approximately 10% of the Fund's franc exposure.
Thank you for being our partners in the Oakmark Global Fund. Please feel free to contact us with your questions or comments.
See accompanying Disclosures and Endnotes on page 43.
22 OAKMARK FUNDS
Oakmark Global Fund December 31, 2019 (Unaudited)
Schedule of Investments (in thousands)
|
Shares |
Value |
||||||||||
|
COMMON STOCKS - 97.8% |
|||||||||||
|
FINANCIALS - 22.7% |
|||||||||||
|
BANKS - 12.7% |
|||||||||||
|
Bank of America Corp. (United States) |
2,438 |
$ |
85,859 |
||||||||
|
Lloyds Banking Group PLC (United Kingdom) |
81,636 |
67,585 |
|||||||||
|
Citigroup, Inc. (United States) |
817 |
65,262 |
|||||||||
|
Axis Bank, Ltd. (India) |
805 |
8,504 |
|||||||||
|
227,210 |
|||||||||||
|
DIVERSIFIED FINANCIALS - 7.4% |
|||||||||||
|
Credit Suisse Group AG (Switzerland) |
5,522 |
74,777 |
|||||||||
|
Julius Baer Group, Ltd. (Switzerland) (a) |
1,127 |
58,128 |
|||||||||
|
132,905 |
|||||||||||
|
INSURANCE - 2.6% |
|||||||||||
|
Allianz SE (Germany) |
193 |
47,165 |
|||||||||
|
407,280 |
|||||||||||
|
CONSUMER DISCRETIONARY - 17.7% |
|||||||||||
|
AUTOMOBILES & COMPONENTS - 11.4% |
|||||||||||
|
General Motors Co. (United States) |
1,849 |
67,688 |
|||||||||
|
Daimler AG (Germany) |
1,197 |
66,266 |
|||||||||
|
Continental AG (Germany) |
320 |
41,346 |
|||||||||
|
Toyota Motor Corp. (Japan) |
401 |
28,469 |
|||||||||
|
203,769 |
|||||||||||
|
RETAILING - 4.0% |
|||||||||||
|
Naspers, Ltd. (South Africa) |
294 |
48,028 |
|||||||||
|
Booking Holdings, Inc. (United States) (a) |
7 |
15,351 |
|||||||||
|
Prosus N.V. (Netherlands) (a) |
120 |
8,944 |
|||||||||
|
72,323 |
|||||||||||
|
CONSUMER DURABLES & APPAREL - 2.3% |
|||||||||||
|
Cie Financiere Richemont SA (Switzerland) |
336 |
26,438 |
|||||||||
|
Under Armour, Inc., Class C (United States) (a) |
779 |
14,948 |
|||||||||
|
41,386 |
|||||||||||
|
317,478 |
|||||||||||
|
INDUSTRIALS - 16.4% |
|||||||||||
|
CAPITAL GOODS - 11.8% |
|||||||||||
|
CNH Industrial N.V. (United Kingdom) |
6,950 |
76,316 |
|||||||||
|
Arconic, Inc. (United States) |
1,552 |
47,761 |
|||||||||
|
Rolls-Royce Holdings PLC (United Kingdom) (a) |
3,836 |
34,717 |
|||||||||
|
Travis Perkins PLC (United Kingdom) |
1,625 |
34,472 |
|||||||||
|
Johnson Controls International plc (United States) |
442 |
18,002 |
|||||||||
|
211,268 |
|||||||||||
|
TRANSPORTATION - 4.6% |
|||||||||||
|
Ryanair Holdings PLC (Ireland) (a) (b) |
654 |
57,323 |
|||||||||
|
Southwest Airlines Co. (United States) |
463 |
25,004 |
|||||||||
|
82,327 |
|||||||||||
|
293,595 |
|||||||||||
|
Shares |
Value |
||||||||||
|
INFORMATION TECHNOLOGY - 15.0% |
|||||||||||
|
SOFTWARE & SERVICES - 8.8% |
|||||||||||
|
MasterCard, Inc., Class A (United States) |
315 |
$ |
94,115 |
||||||||
|
Oracle Corp. (United States) |
851 |
45,081 |
|||||||||
|
CoreLogic, Inc. (United States) (a) |
411 |
17,982 |
|||||||||
|
157,178 |
|||||||||||
|
TECHNOLOGY HARDWARE & EQUIPMENT - 5.7% |
|||||||||||
|
TE Connectivity, Ltd. (United States) |
779 |
74,621 |
|||||||||
|
Samsung Electronics Co., Ltd. (South Korea) |
445 |
21,457 |
|||||||||
|
Hirose Electric Co., Ltd. (Japan) |
52 |
6,677 |
|||||||||
|
102,755 |
|||||||||||
|
SEMICONDUCTORS & SEMICONDUCTOR EQUIPMENT - 0.5% |
|||||||||||
|
Taiwan Semiconductor Manufacturing Co., Ltd. (Taiwan) |
853 |
9,419 |
|||||||||
|
269,352 |
|||||||||||
|
COMMUNICATION SERVICES - 14.4% |
|||||||||||
|
MEDIA & ENTERTAINMENT - 14.4% |
|||||||||||
|
Alphabet, Inc., Class C (United States) (a) |
59 |
79,264 |
|||||||||
|
The Interpublic Group of Cos., Inc. (United States) |
1,535 |
35,451 |
|||||||||
|
Liberty Broadband Corp., Class C (United States) (a) |
272 |
34,154 |
|||||||||
|
Liberty Global PLC, Class A (United Kingdom) (a) |
1,360 |
30,935 |
|||||||||
|
Grupo Televisa SAB (Mexico) (b) |
2,437 |
28,592 |
|||||||||
|
Live Nation Entertainment, Inc. (United States) (a) |
337 |
24,101 |
|||||||||
|
Charter Communications, Inc., Class A (United States) (a) |
31 |
14,892 |
|||||||||
|
Liberty Global PLC, Class C (United Kingdom) (a) |
533 |
11,619 |
|||||||||
|
259,008 |
|||||||||||
|
HEALTH CARE - 5.9% |
|||||||||||
|
PHARMACEUTICALS, BIOTECHNOLOGY & LIFE SCIENCES - 3.7% |
|||||||||||
|
Bayer AG (Germany) |
804 |
65,638 |
|||||||||
|
HEALTH CARE EQUIPMENT & SERVICES - 2.2% |
|||||||||||
|
Tenet Healthcare Corp. (United States) (a) |
1,063 |
40,416 |
|||||||||
|
106,054 |
|||||||||||
|
MATERIALS - 3.3% |
|||||||||||
|
Incitec Pivot, Ltd. (Australia) |
17,028 |
38,000 |
|||||||||
|
LafargeHolcim, Ltd. (Switzerland) |
390 |
21,623 |
|||||||||
|
59,623 |
|||||||||||
|
ENERGY - 1.6% |
|||||||||||
|
National Oilwell Varco, Inc. (United States) |
1,129 |
28,284 |
|||||||||
Oakmark.com 23
Oakmark Global Fund December 31, 2019 (Unaudited)
Schedule of Investments (in thousands) (continued)
|
Shares |
Value |
||||||||||
|
COMMON STOCKS - 97.8% (continued) |
|||||||||||
|
CONSUMER STAPLES - 0.8% |
|||||||||||
|
HOUSEHOLD & PERSONAL PRODUCTS - 0.8% |
|||||||||||
|
Reckitt Benckiser Group PLC (United Kingdom) |
174 |
$ |
14,102 |
||||||||
|
TOTAL COMMON STOCKS - 97.8% (COST $1,281,123) |
1,754,776 |
||||||||||
|
Par Value |
Value |
||||||||||
|
SHORT-TERM INVESTMENT - 1.9% |
|||||||||||
|
REPURCHASE AGREEMENT - 1.9% |
|||||||||||
|
Fixed Income Clearing Corp. Repurchase Agreement, 1.55% dated 12/31/19 due 01/02/20, repurchase price $35,194, collateralized by a United States Treasury Note, 1.625% due 12/31/21, value plus accrued interest of $35,895 (Cost: $35,190) |
$ |
35,190 |
35,190 |
||||||||
|
TOTAL SHORT-TERM INVESTMENTS - 1.9% (COST $35,190) |
35,190 |
||||||||||
|
TOTAL INVESTMENTS - 99.7% (COST $1,316,313) |
1,789,966 |
||||||||||
|
Foreign Currencies (Cost $0) - 0.0% (c) |
0 |
(d) |
|||||||||
|
Other Assets In Excess of Liabilities - 0.3% |
4,557 |
||||||||||
|
TOTAL NET ASSETS - 100.0% |
$ |
1,794,523 |
|||||||||
(a) Non-income producing security
(b) Sponsored American Depositary Receipt
(c) Amount rounds to less than 0.1%.
(d) Amount rounds to less than $1,000.
24 OAKMARK FUNDS
Oakmark Global Fund December 31, 2019 (Unaudited)
Schedule of Investments (in thousands) (continued)
FORWARD FOREIGN CURRENCY CONTRACT (in thousands)
|
Local Contract Amount |
Base Contract Amount |
Settlement Date |
Valuation at 12/31/19 |
Unrealized Appreciation/ (Depreciation) |
|||||||||||||||||||
|
Foreign Currency Sold: |
|||||||||||||||||||||||
|
Swiss Franc |
17,063 |
$ |
17,554 |
06/17/20 |
$ |
17,843 |
$ |
(289 |
) |
||||||||||||||
|
$ |
17,843 |
$ |
(289 |
) |
|||||||||||||||||||
Oakmark.com 25
Oakmark Global Select Fund December 31, 2019
Summary Information
VALUE OF A $10,000 INVESTMENT
Since Inception - 10/02/06 (Unaudited)
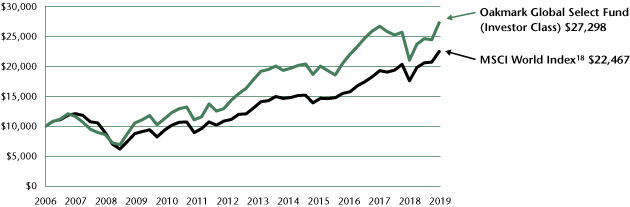
PERFORMANCE
|
Average Annual Total Returns (as of 12/31/19) |
|||||||||||||||||||||||||||||||
| (Unaudited) |
Total Return Last 3 Months |
1-year |
3-year |
5-year |
10-year |
Since Inception |
Inception Date |
||||||||||||||||||||||||
|
Oakmark Global Select Fund (Investor Class) |
11.73 |
% |
29.80 |
% |
7.42 |
% |
6.78 |
% |
9.46 |
% |
7.88 |
% |
10/02/06 |
||||||||||||||||||
|
MSCI World Index |
8.56 |
% |
27.67 |
% |
12.57 |
% |
8.74 |
% |
9.47 |
% |
6.30 |
% |
|||||||||||||||||||
|
Lipper Global Fund Index19 |
8.58 |
% |
24.33 |
% |
10.83 |
% |
7.69 |
% |
8.39 |
% |
5.87 |
% |
|||||||||||||||||||
|
Oakmark Global Select Fund (Advisor Class) |
11.77 |
% |
29.95 |
% |
7.55 |
% |
N/A |
N/A |
8.22 |
% |
11/30/16 |
||||||||||||||||||||
|
Oakmark Global Select Fund (Institutional Class) |
11.77 |
% |
29.94 |
% |
7.60 |
% |
N/A |
N/A |
8.27 |
% |
11/30/16 |
||||||||||||||||||||
The graph and table do not reflect the deduction of taxes that a shareholder would pay on Fund distributions or the redemption of Fund shares.
Past performance is no guarantee of future results. The performance data quoted represents past performance. Current performance may be lower or higher than the performance data quoted. Total return includes change in share prices and, in each case, includes reinvestment of dividends and capital gain distributions. The investment return and principal value vary so that an investor's shares, when redeemed, may be worth more or less than the original cost. To obtain the most recent month-end performance, please visit Oakmark.com.
|
TOP TEN EQUITY HOLDINGS12 |
% of Net Assets | ||||||
|
Bank of America Corp. |
7.1 |
||||||
|
CNH Industrial N.V. |
6.9 |
||||||
|
Daimler AG |
6.7 |
||||||
|
Credit Suisse Group AG |
6.5 |
||||||
|
Charter Communications, Inc., Class A |
5.9 |
||||||
|
Citigroup, Inc. |
5.6 |
||||||
|
Alphabet, Inc., Class A |
5.5 |
||||||
|
Lloyds Banking Group PLC |
5.5 |
||||||
|
TE Connectivity, Ltd. |
5.2 |
||||||
|
Bayer AG |
5.0 |
||||||
|
FUND STATISTICS |
|||||||
|
Ticker* |
OAKWX |
||||||
|
Number of Equity Holdings |
22 |
||||||
|
Net Assets |
$2.0 billion | ||||||
|
Weighted Average Market Cap |
$164.2 billion | ||||||
|
Median Market Cap |
$57.8 billion | ||||||
|
Gross Expense Ratio - Investor Class (as of 09/30/19)* |
1.25% | ||||||
|
Net Expense Ratio - Investor Class (as of 09/30/19)*† |
1.18% | ||||||
* This information is related to the Investor Class. Please visit Oakmark.com for information related to the Advisor, Institutional and Service Classes.
† The net expense ratio reflects a contractual advisory fee waiver agreement through January 27, 2021.
|
SECTOR ALLOCATION |
% of Net Assets | ||||||
|
Financials |
28.4 |
||||||
|
Consumer Discretionary |
19.0 |
||||||
|
Communication Services |
14.2 |
||||||
|
Health Care |
9.3 |
||||||
|
Information Technology |
9.1 |
||||||
|
Industrials |
8.4 |
||||||
|
Materials |
3.2 |
||||||
|
Consumer Staples |
2.6 |
||||||
|
Energy |
2.3 |
||||||
|
Short-Term Investments and Other |
3.5 |
||||||
|
GEOGRAPHIC ALLOCATION |
|||||||
|
% of Equity |
|||||||
|
Europe |
52.0 |
||||||
|
United Kingdom |
19.8 |
||||||
|
Switzerland |
15.7 |
||||||
|
Germany* |
12.2 |
||||||
|
Netherlands* |
4.3 |
||||||
|
% of Equity |
|||||||
|
North America |
43.9 |
||||||
|
United States |
43.9 |
||||||
|
Asia |
4.1 |
||||||
|
South Korea |
2.8 |
||||||
|
Taiwan |
1.3 |
||||||
* Euro currency countries comprise 16.5% of equity investments.
See accompanying Disclosures and Endnotes on page 43.
26 OAKMARK FUNDS
Oakmark Global Select Fund December 31, 2019
Portfolio Manager Commentary


William C. Nygren, CFA
Portfolio Manager
oakwx@oakmark.com
David G. Herro, CFA
Portfolio Manager
oakwx@oakmark.com
Anthony P. Coniaris, CFA
Portfolio Manager
oakwx@oakmark.com
Eric Liu, CFA
Portfolio Manager
oakwx@oakmark.com
The Oakmark Global Select Fund had a strong year of absolute and relative performance, returning 29.8% for the calendar year. The benchmark MSCI World Index18 returned 27.7% for the same one-year period. The Fund also outperformed for the recent quarter end, returning 11.7% compared to the Index return of 8.6%. Lastly, the Fund has returned an average of 7.9% per year since its inception in October 2006, outperforming the MSCI World Index's annualized gain of 6.3% over the same period.
Lloyds Banking Group, a dominant retail bank in the U.K., was the largest contributor to the Fund's quarterly return. In October, the company's share price soared on hopes that a new U.K. Prime Minister could help negotiate a Brexit deal between the U.K. and the European Union (EU). The uncertainty of Brexit has pressured the U.K. economy and Lloyds' stock price for the past few years, despite relatively strong fundamental operating performance from the bank. Additionally, the company's third-quarter results highlighted additional efficiency opportunities and management's focus on creating value for shareholders. Moreover, we expect profitability to improve significantly in FY '20 as the company faces a material drop in non-operating expenses. Despite the share price rebound, we believe Lloyds' shares still provide attractive value for our shareholders.
American International Group (AIG), one of the world's largest insurance firms that is based in the U.S., was the only detractor to the Fund for the quarter. AIG issued third-quarter results that were slightly weaker than we had estimated. This was mostly due to higher than expected catastrophe losses and an actuarial adjustment in the company's life insurance business that depressed quarterly earnings per share. However, AIG's adjusted return on equity (ROE) reached 4.1% during the third quarter (compared with 2.4% in the year-ago period) and CEO Brian Duperreault remains confident that the company can achieve at least 10% core ROE by the end of 2021. Our investment thesis remains intact, and we believe AIG should reward shareholders over the long term.
During the quarter, we did not add or remove any companies from the portfolio. We did, however, swap approximately two-thirds of our non-voting Alphabet Class C shares for voting Class A shares as they were offered at a small discount to non-voting shares. We believe there should be a modest premium for the higher voting rights of the Class A shares and the swaps were done via like-kind exchange so there wasn't a corresponding capital gain.
Geographically, 52% of the Fund's holdings were allocated to equities in Europe and the U.K., while approximately 44% were invested in U.S. companies and 4% in Asian equities.
We continue to believe the Swiss franc is overvalued versus the U.S. dollar. As a result, we defensively hedged a portion of the Fund's exposure. Approximately 10% of the Swiss franc exposure was hedged at quarter end.
We thank you for your continued support.
See accompanying Disclosures and Endnotes on page 43.
Oakmark.com 27
Oakmark Global Select Fund December 31, 2019 (Unaudited)
Schedule of Investments (in thousands)
|
Shares |
Value |
||||||||||
|
COMMON STOCKS - 96.5% |
|||||||||||
|
FINANCIALS - 28.4% |
|||||||||||
|
BANKS - 18.2% |
|||||||||||
|
Bank of America Corp. (United States) |
3,973 |
$ |
139,922 |
||||||||
|
Citigroup, Inc. (United States) |
1,382 |
110,368 |
|||||||||
|
Lloyds Banking Group PLC (United Kingdom) |
132,010 |
109,288 |
|||||||||
|
359,578 |
|||||||||||
|
DIVERSIFIED FINANCIALS - 6.5% |
|||||||||||
|
Credit Suisse Group AG (Switzerland) |
9,423 |
127,596 |
|||||||||
|
INSURANCE - 3.7% |
|||||||||||
|
American International Group, Inc. (United States) |
1,408 |
72,293 |
|||||||||
|
559,467 |
|||||||||||
|
CONSUMER DISCRETIONARY - 19.0% |
|||||||||||
|
AUTOMOBILES & COMPONENTS - 10.9% |
|||||||||||
|
Daimler AG (Germany) |
2,402 |
132,997 |
|||||||||
|
Fiat Chrysler Automobiles N.V. (United Kingdom) |
5,545 |
81,450 |
|||||||||
|
214,447 |
|||||||||||
|
RETAILING - 4.2% |
|||||||||||
|
Prosus N.V. (Netherlands) (a) |
1,102 |
82,201 |
|||||||||
|
CONSUMER DURABLES & APPAREL - 3.9% |
|||||||||||
|
Cie Financiere Richemont SA (Switzerland) |
986 |
77,453 |
|||||||||
|
374,101 |
|||||||||||
|
COMMUNICATION SERVICES - 14.2% |
|||||||||||
|
MEDIA & ENTERTAINMENT - 14.2% |
|||||||||||
|
Charter Communications, Inc., Class A (United States) (a) |
238 |
115,643 |
|||||||||
|
Alphabet, Inc., Class A (United States) (a) |
82 |
109,435 |
|||||||||
|
Alphabet, Inc., Class C (United States) (a) |
42 |
56,049 |
|||||||||
|
281,127 |
|||||||||||
|
HEALTH CARE - 9.3% |
|||||||||||
|
PHARMACEUTICALS, BIOTECHNOLOGY & LIFE SCIENCES - 9.3% |
|||||||||||
|
Bayer AG (Germany) |
1,218 |
99,483 |
|||||||||
|
Regeneron Pharmaceuticals, Inc. (United States) (a) |
223 |
83,582 |
|||||||||
|
183,065 |
|||||||||||
|
INFORMATION TECHNOLOGY - 9.1% |
|||||||||||
|
TECHNOLOGY HARDWARE & EQUIPMENT - 7.9% |
|||||||||||
|
TE Connectivity, Ltd. (United States) |
1,071 |
102,683 |
|||||||||
|
Samsung Electronics Co., Ltd. (South Korea) |
1,113 |
53,718 |
|||||||||
|
156,401 |
|||||||||||
|
SEMICONDUCTORS & SEMICONDUCTOR EQUIPMENT - 1.2% |
|||||||||||
|
Taiwan Semiconductor Manufacturing Co., Ltd. (Taiwan) |
2,159 |
23,839 |
|||||||||
|
180,240 |
|||||||||||
|
Shares |
Value |
||||||||||
|
INDUSTRIALS - 8.4% |
|||||||||||
|
CAPITAL GOODS - 6.9% |
|||||||||||
|
CNH Industrial N.V. (United Kingdom) |
12,401 |
$ |
136,180 |
||||||||
|
TRANSPORTATION - 1.5% |
|||||||||||
|
Kuehne + Nagel International AG (Switzerland) |
172 |
28,971 |
|||||||||
|
165,151 |
|||||||||||
|
MATERIALS - 3.2% |
|||||||||||
|
LafargeHolcim, Ltd. (Switzerland) |
1,157 |
64,207 |
|||||||||
|
CONSUMER STAPLES - 2.6% |
|||||||||||
|
HOUSEHOLD & PERSONAL PRODUCTS - 2.6% |
|||||||||||
|
Reckitt Benckiser Group PLC (United Kingdom) |
623 |
50,562 |
|||||||||
|
ENERGY - 2.3% |
|||||||||||
|
Apache Corp. (United States) |
1,775 |
45,422 |
|||||||||
|
TOTAL COMMON STOCKS - 96.5% (COST $1,500,931) |
1,903,342 |
||||||||||
|
Par Value |
Value |
||||||||||
|
SHORT-TERM INVESTMENTS - 3.4% |
|||||||||||
|
REPURCHASE AGREEMENT - 3.4% |
|||||||||||
|
Fixed Income Clearing Corp. Repurchase Agreement, 1.55% dated 12/31/19 due 01/02/20, repurchase price $66,809, collateralized by a United States Treasury Note, 2.625% due 12/15/21, value plus accrued interest of $68,143 (Cost: $66,803) |
$ |
66,803 |
66,803 |
||||||||
|
TOTAL SHORT-TERM INVESTMENTS - 3.4% (COST $66,803) |
66,803 |
||||||||||
|
TOTAL INVESTMENTS - 99.9% (COST $1,567,734) |
1,970,145 |
||||||||||
|
Foreign Currencies (Cost $0) - 0.0% (b) |
0 |
(c) |
|||||||||
|
Other Assets In Excess of Liabilities - 0.1% |
2,394 |
||||||||||
|
TOTAL NET ASSETS - 100.0% |
$ |
1,972,539 |
|||||||||
(a) Non-income producing security
(b) Amount rounds to less than 0.1%.
(c) Amount rounds to less than $1,000.
28 OAKMARK FUNDS
Oakmark Global Select Fund December 31, 2019 (Unaudited)
Schedule of Investments (in thousands) (continued)
FORWARD FOREIGN CURRENCY CONTRACT (in thousands)
|
Local Contract Amount |
Base Contract Amount |
Settlement Date |
Valuation at 12/31/19 |
Unrealized Appreciation/ (Depreciation) |
|||||||||||||||||||
|
Foreign Currency Sold: |
|||||||||||||||||||||||
|
Swiss Franc |
28,169 |
$ |
28,980 |
06/17/20 |
$ |
29,457 |
$ |
(477 |
) |
||||||||||||||
|
$ |
29,457 |
$ |
(477 |
) |
|||||||||||||||||||
Oakmark.com 29
Oakmark International and Oakmark December 31, 2019
International Small Cap Funds
Portfolio Manager Commentary

David G. Herro, CFA
Portfolio Manager
oakix@oakmark.com
oakex@oakmark.com
Fellow Shareholders,
The year 2019 experienced some of the same volatility that began in early 2018, but with a significant difference in annual performances. In 2019, both the Oakmark International and International Small Cap Funds delivered strong absolute performance numbers and outperformed their respective benchmarks, with the Oakmark International Small Cap Fund delivering even stronger results. The Oakmark Global and Global Select Funds also had strong absolute and relative performances. (See the individual Fund letters for more detail.)
Headline News Continues to Dictate Stock Prices
During 2019, extreme price movements were again the flavor of the day as stock prices around the globe were continually impacted by the latest news on trade, Brexit, European Union (EU) political instability and even a political conflict between South Korea and Japan dating back to World War II! For example, the markets performed strongly during the first four months, excluding March, then a few tweets fueled fear of trade wars, which contributed to a drop of over 10% in the International Fund and 8% in the International Small Cap Fund during May. August also saw measurable declines until markets began to recover and rebound, partially based on better geopolitical headlines.
One huge fear that weighed on the markets was the possibility of a Jeremy Corbyn victory in the U.K. general election along with continued Brexit uncertainty. With a historical, large victory by the Conservative Party, the fear of a Corbyn socialist government has been smashed for the medium term. The Johnson government moved quickly to move its Brexit bill through Parliament and hopefully will take the right steps to ensure a smooth exit from the EU. Meanwhile, China and the U.S. have de-escalated their trade dispute with an agreement of a "Phase One" trade deal. These events have helped global equity market sentiment going into 2020.
It's All About VALUE
Despite the recovery in 2019, I still believe our portfolios offer good value for three reasons. First, the European financials sector has performed well in 2019 but is still well below where it was in early 2018. Many of the headwinds faced by this sector in the last few years should begin to subside or even reverse as the European Central Bank has shifted to tiered deposit rates. In addition, all of our holdings are currently at or above their mandated capital levels, which allows for more capital returns to shareholders. Meanwhile, this sector still offers high dividend yields, which are especially attractive at this time since many long-term government yields are still negative.
Second, the consumer discretionary and industrials sectors—auto, industrial and agriculture equipment, etc.—also recovered from 2018's downturn, but were not as strong as the financials sector. Specifically, we believe the auto-related names still offer value as end markets appear to have bottomed, spending on research and development has generally peaked, and almost all of the companies we are invested in have undertaken serious cost-cutting plans. With any help from rising demand, the benefits of these actions should be reflected in improved bottom-line results.
Third, besides being able to buy companies at attractive valuations in Europe and the U.K., these countries' home currencies are undervalued based on purchasing power parity. The strong dollar has been a big drag on foreign equity returns where, in five years, the dollar has gone from being undervalued to being overvalued compared to most major currencies. This has negatively impacted returns of overseas investing and, at some point, may also provide a tailwind to international investing. We believe that the combination of these three ingredients creates value for our shareholders.
We wish you a prosperous 2020 and are thankful for your continued support!
See accompanying Disclosures and Endnotes on page 43.
30 OAKMARK FUNDS

This page intentionally left blank.
Oakmark.com 31
Oakmark International Fund December 31, 2019
Summary Information
VALUE OF A $10,000 INVESTMENT
Since Inception - 09/30/92 (Unaudited)
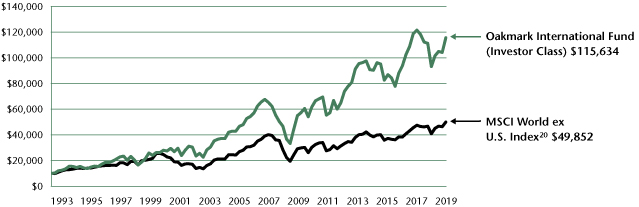
PERFORMANCE
|
Average Annual Total Returns (as of 12/31/19) |
|||||||||||||||||||||||||||||||
| (Unaudited) |
Total Return Last 3 Months |
1-year |
3-year |
5-year |
10-year |
Since Inception |
Inception Date |
||||||||||||||||||||||||
|
Oakmark International Fund (Investor Class) |
11.07 |
% |
24.21 |
% |
7.26 |
% |
5.07 |
% |
7.30 |
% |
9.40 |
% |
09/30/92 |
||||||||||||||||||
|
MSCI World ex U.S. Index |
7.86 |
% |
22.49 |
% |
9.34 |
% |
5.42 |
% |
5.32 |
% |
6.07 |
% |
|||||||||||||||||||
|
MSCI EAFE Index21 |
8.17 |
% |
22.01 |
% |
9.56 |
% |
5.67 |
% |
5.50 |
% |
5.94 |
% |
|||||||||||||||||||
|
Lipper International Fund Index22 |
9.14 |
% |
23.41 |
% |
9.97 |
% |
5.94 |
% |
5.82 |
% |
6.86 |
% |
|||||||||||||||||||
|
Oakmark International Fund (Advisor Class) |
11.12 |
% |
24.33 |
% |
7.38 |
% |
N/A |
N/A |
8.34 |
% |
11/30/16 |
||||||||||||||||||||
|
Oakmark International Fund (Institutional Class) |
11.11 |
% |
24.43 |
% |
7.44 |
% |
N/A |
N/A |
8.40 |
% |
11/30/16 |
||||||||||||||||||||
|
Oakmark International Fund (Service Class) |
11.04 |
% |
23.92 |
% |
6.98 |
% |
4.76 |
% |
6.95 |
% |
7.64 |
% |
11/04/99 |
||||||||||||||||||
The graph and table above do not reflect the deduction of taxes that a shareholder would pay on Fund distributions or the redemption of Fund shares.
Past performance is no guarantee of future results. The performance data quoted represents past performance. Current performance may be lower or higher than the performance data quoted. Total return includes change in share prices and, in each case, includes reinvestment of dividends and capital gain distributions. The investment return and principal value vary so that an investor's shares, when redeemed, may be worth more or less than the original cost. To obtain the most recent month-end performance, please visit Oakmark.com.
|
TOP TEN EQUITY HOLDINGS12 |
% of Net Assets | ||||||
|
Glencore PLC |
4.3 |
||||||
|
BNP Paribas SA |
3.7 |
||||||
|
Intesa Sanpaolo SpA |
3.6 |
||||||
|
Continental AG |
3.6 |
||||||
|
Credit Suisse Group AG |
3.5 |
||||||
|
Daimler AG |
3.5 |
||||||
|
CNH Industrial N.V. |
3.3 |
||||||
|
Bayerische Motoren Werke AG |
3.2 |
||||||
|
Lloyds Banking Group PLC |
3.0 |
||||||
|
Bayer AG |
3.0 |
||||||
|
FUND STATISTICS |
|||||||
|
Ticker* |
OAKIX |
||||||
|
Number of Equity Holdings |
65 |
||||||
|
Net Assets |
$33.0 billion | ||||||
|
Weighted Average Market Cap |
$41.4 billion | ||||||
|
Median Market Cap |
$21.3 billion | ||||||
|
Gross Expense Ratio - Investor Class (as of 09/30/19)* |
1.04% | ||||||
|
Net Expense Ratio - Investor Class (as of 09/30/19)*† |
0.98% | ||||||
* This information is related to the Investor Class. Please visit Oakmark.com for information related to the Advisor, Institutional and Service Classes.
† The net expense ratio reflects a contractual advisory fee waiver agreement through January 27, 2021.
|
SECTOR ALLOCATION |
% of Net Assets | ||||||
|
Consumer Discretionary |
24.1 |
||||||
|
Financials |
24.0 |
||||||
|
Industrials |
21.0 |
||||||
|
Communication Services |
10.2 |
||||||
|
Materials |
9.4 |
||||||
|
Health Care |
3.3 |
||||||
|
Information Technology |
2.1 |
||||||
|
Consumer Staples |
1.6 |
||||||
|
Energy |
1.5 |
||||||
|
Short-Term Investments and Other |
2.8 |
||||||
|
GEOGRAPHIC ALLOCATION |
|||||||
|
% of Equity |
|||||||
|
Europe |
81.8 |
||||||
|
United Kingdom |
21.9 |
||||||
|
Germany* |
18.8 |
||||||
|
Switzerland |
12.5 |
||||||
|
France* |
11.8 |
||||||
|
Sweden |
6.1 |
||||||
|
Italy* |
3.7 |
||||||
|
Netherlands* |
3.1 |
||||||
|
Ireland* |
3.0 |
||||||
|
Finland* |
0.9 |
||||||
|
Asia |
10.5 |
||||||
|
Japan |
3.8 |
||||||
|
South Korea |
3.2 |
||||||
|
China |
1.8 |
||||||
|
% of Equity |
|||||||
|
Asia (cont'd) |
|||||||
|
Indonesia |
0.8 |
||||||
|
India |
0.7 |
||||||
|
Taiwan |
0.2 |
||||||
|
North America |
2.5 |
||||||
|
Canada |
2.3 |
||||||
|
United States |
0.2 |
||||||
|
Australasia |
2.2 |
||||||
|
Australia |
2.2 |
||||||
|
Africa |
2.0 |
||||||
|
South Africa |
2.0 |
||||||
|
Latin America |
1.0 |
||||||
|
Mexico |
1.0 |
||||||
* Euro currency countries comprise 41.3% of equity investments.
See accompanying Disclosures and Endnotes on page 43.
32 OAKMARK FUNDS
Oakmark International Fund December 31, 2019
Portfolio Manager Commentary


David G. Herro, CFA
Portfolio Manager
oakix@oakmark.com
Michael L. Manelli, CFA
Portfolio Manager
oakix@oakmark.com
The Oakmark International Fund had a strong year of absolute and relative performance, returning 24.2% for the calendar year. The benchmark MSCI World ex U.S. Index20 returned 22.5% for the same one-year period. The Fund also outperformed for the recent quarter end, returning 11.1% compared to the Index return of 7.9%. Lastly, the Fund has returned an average of 9.4% per year since its inception in September 1992, outperforming the MSCI World ex U.S. Index, which has averaged 6.1% per year over the same period.
Ryanair Holdings, the leading ultra-low-cost carrier in Europe that is headquartered in Ireland, was the largest contributor for the quarter. The company's fiscal year 2020 second-quarter results exceeded consensus estimates. Ryanair's 11% revenue growth was in line with our expectations and its revenue per available seat mile beat our expectations and also appears well positioned to achieve management's 2-3% growth target for fiscal year 2020. Management expects traffic to grow by 8% to 153 million for the fiscal year, which is slightly ahead of our estimates. We are also glad to see signs of a more rational competitive environment as Ryanair's peers reduce capacity, which should help pricing going forward, and labor relations continue to improve. In addition, despite the reduction in Boeing MAX 737 deliveries, management did not reduce its passenger growth guidance for fiscal year 2021. We believe the lower supply growth should be a tailwind to pricing.
Publicis, a leading global advertising and media services company based in France, was the largest detractor for the quarter. Investors reacted negatively to the company's third-quarter revenue shortfall and management's lower guidance. We believe that the revenue shortfall is partly due to company-specific issues, like a bad quarter for its media division and the Sapient transition led by new management in the U.S. along with broader industry issues. For example, agencies have been reducing their brand spending as more work is being done in-house and internet giant platforms are becoming more dominant. These changes have eroded traditional brands while also providing advertisers with personalization at scale. We believe Publicis's recent acquisition of Epsilon should significantly boost its ability to deliver personalization at scale. And while the company's 2019 organic growth in North America appears poor, it's worth noting that it does not yet include Epsilon's contributions. Despite the company's weak results, Publicis retained its OPM (operating profit margin) target of 17.3% in 2019. The company's margins have expanded as a result of its fast-growing solutions, leaner organization, real estate consolidations and strong performance for Epsilon OPM. Publicis also retains a strong balance sheet and robust cash conversion. We believe it can provide attractive returns for our shareholders over the long term.
During the quarter, we completed the sale of our long-held holdings of Diageo (U.K.) and Akzo Nobel (Netherlands) due to their increasingly expensive valuations. We are always sad to exit holdings that have been successfully compounding value for the Fund's shareholders. Nevertheless, our discipline demands that when the share price nears our calculation of the holdings' intrinsic value, we prepare to move on, especially when we have replacement candidates selling at what we believe are large discounts to intrinsic value. We thank the management of Diageo and Akzo Nobel for their successful stewardship of our shareholders' capital. We initiated a position in Bunzl (U.K.), the largest distributor of not-for-sale items to food service, grocery and cleaning service providers. Not-for-sale items facilitate companies' daily operations but are not sold to end customers, including items like plastic cups, trays, cleaning supplies and paper bags, among others. We also repurchased Trip.com (China), the largest online travel agency in China. We like that Trip.com is more than five times the size of its nearest competitor in an industry where larger companies can negotiate better commissions and lower inventory pricing.
We continue to believe the Swiss franc is overvalued versus the U.S. dollar. As a result, we defensively hedged a portion of the Fund's exposure. Approximately 10% of the Swiss franc exposure was hedged at quarter end.
Geographically, we ended the quarter with approximately 82% of our holdings in Europe and the U.K., 10.5% in Asia and 2% in Australasia. The remaining positions are 2% in South Africa, 2.5% in North America and 1% in Latin America (Mexico).
We thank you for your continued support.
See accompanying Disclosures and Endnotes on page 43.
Oakmark.com 33
Oakmark International Fund December 31, 2019 (Unaudited)
Schedule of Investments (in thousands)
|
Shares |
Value |
||||||||||
|
COMMON STOCKS - 96.8% |
|||||||||||
|
CONSUMER DISCRETIONARY - 24.1% |
|||||||||||
|
AUTOMOBILES & COMPONENTS - 13.7% |
|||||||||||
|
Continental AG (Germany) |
9,090 |
$ |
1,175,274 |
||||||||
|
Daimler AG (Germany) |
20,792 |
1,151,440 |
|||||||||
|
Bayerische Motoren Werke AG (Germany) |
12,993 |
1,065,962 |
|||||||||
|
Valeo SA (France) |
18,331 |
645,846 |
|||||||||
|
Toyota Motor Corp. (Japan) |
6,954 |
493,690 |
|||||||||
|
4,532,212 |
|||||||||||
|
RETAILING - 5.1% |
|||||||||||
|
Hennes & Mauritz AB (H&M) - Class B (Sweden) |
35,391 |
719,736 |
|||||||||
|
Naspers, Ltd. (South Africa) |
3,959 |
647,574 |
|||||||||
|
Prosus N.V. (Netherlands) (a) |
3,160 |
235,822 |
|||||||||
|
Trip.com Group, Ltd. (China) (a) (b) |
2,729 |
91,514 |
|||||||||
|
1,694,646 |
|||||||||||
|
CONSUMER DURABLES & APPAREL - 3.1% |
|||||||||||
|
Cie Financiere Richemont SA (Switzerland) |
5,437 |
427,330 |
|||||||||
|
The Swatch Group AG, Bearer Shares (Switzerland) |
1,344 |
375,061 |
|||||||||
|
EssilorLuxottica SA (France) |
1,493 |
227,435 |
|||||||||
|
1,029,826 |
|||||||||||
|
CONSUMER SERVICES - 2.2% |
|||||||||||
|
Accor SA (France) |
15,125 |
708,324 |
|||||||||
|
7,965,008 |
|||||||||||
|
FINANCIALS - 24.0% |
|||||||||||
|
BANKS - 13.4% |
|||||||||||
|
BNP Paribas SA (France) |
20,862 |
1,236,288 |
|||||||||
|
Intesa Sanpaolo SpA (Italy) |
452,937 |
1,193,178 |
|||||||||
|
Lloyds Banking Group PLC (United Kingdom) |
1,205,596 |
998,082 |
|||||||||
|
Royal Bank of Scotland Group PLC (United Kingdom) |
159,259 |
506,923 |
|||||||||
|
Bank Mandiri Persero Tbk PT (Indonesia) |
466,940 |
258,150 |
|||||||||
|
Axis Bank, Ltd. (India) |
20,001 |
211,303 |
|||||||||
|
4,403,924 |
|||||||||||
|
DIVERSIFIED FINANCIALS - 7.9% |
|||||||||||
|
Credit Suisse Group AG (Switzerland) |
86,517 |
1,171,522 |
|||||||||
|
EXOR N.V. (Netherlands) |
9,396 |
728,098 |
|||||||||
|
Schroders PLC (United Kingdom) |
11,283 |
498,264 |
|||||||||
|
AMP, Ltd. (Australia) |
162,022 |
217,734 |
|||||||||
|
Schroders PLC, Non-Voting (United Kingdom) |
31 |
1,047 |
|||||||||
|
2,616,665 |
|||||||||||
|
INSURANCE - 2.7% |
|||||||||||
|
Allianz SE (Germany) |
3,365 |
824,378 |
|||||||||
|
Willis Towers Watson PLC (United States) |
331 |
66,780 |
|||||||||
|
891,158 |
|||||||||||
|
7,911,747 |
|||||||||||
|
Shares |
Value |
||||||||||
|
INDUSTRIALS - 21.0% |
|||||||||||
|
CAPITAL GOODS - 15.3% |
|||||||||||
|
CNH Industrial N.V. (United Kingdom) |
100,402 |
$ |
1,102,559 |
||||||||
|
Rolls-Royce Holdings PLC (United Kingdom) (a) |
89,562 |
810,503 |
|||||||||
|
Volvo AB, Class B (Sweden) |
40,921 |
685,485 |
|||||||||
|
Ashtead Group PLC (United Kingdom) |
20,088 |
642,318 |
|||||||||
|
Komatsu, Ltd. (Japan) |
23,721 |
576,781 |
|||||||||
|
SKF AB, Class B (Sweden) |
27,207 |
550,162 |
|||||||||
|
Ferguson PLC (United Kingdom) |
2,780 |
252,240 |
|||||||||
|
Smiths Group PLC (United Kingdom) |
11,095 |
247,933 |
|||||||||
|
Bunzl PLC (United Kingdom) |
5,562 |
152,126 |
|||||||||
|
Meggitt PLC (United Kingdom) |
3,536 |
30,765 |
|||||||||
|
5,050,872 |
|||||||||||
|
TRANSPORTATION - 3.3% |
|||||||||||
|
Ryanair Holdings PLC (Ireland) (a) (b) |
10,915 |
956,241 |
|||||||||
|
Kuehne + Nagel International AG (Switzerland) |
809 |
136,388 |
|||||||||
|
1,092,629 |
|||||||||||
|
COMMERCIAL & PROFESSIONAL SERVICES - 2.4% |
|||||||||||
|
G4S PLC (United Kingdom) |
106,181 |
306,611 |
|||||||||
|
Bureau Veritas SA (France) |
11,248 |
293,477 |
|||||||||
|
Brambles, Ltd. (Australia) |
22,010 |
181,024 |
|||||||||
|
781,112 |
|||||||||||
|
6,924,613 |
|||||||||||
|
COMMUNICATION SERVICES - 10.2% |
|||||||||||
|
MEDIA & ENTERTAINMENT - 10.2% |
|||||||||||
|
NAVER Corp. (South Korea) |
4,372 |
705,005 |
|||||||||
|
Publicis Groupe SA (France) |
15,082 |
682,778 |
|||||||||
|
WPP PLC (United Kingdom) |
44,724 |
631,809 |
|||||||||
|
Baidu, Inc. (China) (a) (b) |
3,748 |
473,685 |
|||||||||
|
Liberty Global PLC, Class A (United Kingdom) (a) |
14,803 |
336,626 |
|||||||||
|
Grupo Televisa SAB (Mexico) (b) |
27,065 |
317,475 |
|||||||||
|
Liberty Global PLC, Class C (United Kingdom) (a) |
10,027 |
218,528 |
|||||||||
|
3,365,906 |
|||||||||||
|
MATERIALS - 9.4% |
|||||||||||
|
Glencore PLC (Switzerland) |
460,398 |
1,435,265 |
|||||||||
|
thyssenkrupp AG (Germany) |
46,833 |
632,492 |
|||||||||
|
LafargeHolcim, Ltd. (Switzerland) |
8,107 |
449,841 |
|||||||||
|
Orica, Ltd. (Australia) |
19,655 |
303,169 |
|||||||||
|
UPM-Kymmene OYJ (Finland) |
8,223 |
285,116 |
|||||||||
|
3,105,883 |
|||||||||||
|
HEALTH CARE - 3.3% |
|||||||||||
|
PHARMACEUTICALS, BIOTECHNOLOGY & LIFE SCIENCES - 3.0% |
|||||||||||
|
Bayer AG (Germany) |
12,016 |
981,382 |
|||||||||
|
HEALTH CARE EQUIPMENT & SERVICES - 0.3% |
|||||||||||
|
Olympus Corp. (Japan) |
7,834 |
121,778 |
|||||||||
|
1,103,160 |
|||||||||||
34 OAKMARK FUNDS
Oakmark International Fund December 31, 2019 (Unaudited)
Schedule of Investments (in thousands) (continued)
|
Shares |
Value |
||||||||||
|
COMMON STOCKS - 96.8% (continued) |
|||||||||||
|
INFORMATION TECHNOLOGY - 2.1% |
|||||||||||
|
TECHNOLOGY HARDWARE & EQUIPMENT - 1.0% |
|||||||||||
|
Samsung Electronics Co., Ltd. (South Korea) |
6,785 |
$ |
327,362 |
||||||||
|
Omron Corp. (Japan) |
273 |
16,107 |
|||||||||
|
343,469 |
|||||||||||
|
SOFTWARE & SERVICES - 0.7% |
|||||||||||
|
Open Text Corp. (Canada) |
5,252 |
231,405 |
|||||||||
|
SEMICONDUCTORS & SEMICONDUCTOR EQUIPMENT - 0.4% |
|||||||||||
|
Taiwan Semiconductor Manufacturing Co., Ltd. (Taiwan) |
7,449 |
82,250 |
|||||||||
|
ASML Holding N.V. (Netherlands) |
113 |
33,352 |
|||||||||
|
115,602 |
|||||||||||
|
690,476 |
|||||||||||
|
ENERGY - 1.5% |
|||||||||||
|
Cenovus Energy, Inc. (Canada) |
50,093 |
509,200 |
|||||||||
|
CONSUMER STAPLES - 1.2% |
|||||||||||
|
HOUSEHOLD & PERSONAL PRODUCTS - 1.2% |
|||||||||||
|
Reckitt Benckiser Group PLC (United Kingdom) |
3,750 |
304,464 |
|||||||||
|
Henkel AG & Co. KGaA (Germany) |
896 |
84,424 |
|||||||||
|
388,888 |
|||||||||||
|
FOOD, BEVERAGE & TOBACCO - 0.0% (c) |
|||||||||||
|
Nestlé SA (Switzerland) |
147 |
15,908 |
|||||||||
|
404,796 |
|||||||||||
|
TOTAL COMMON STOCKS - 96.8% (COST $31,530,008) |
31,980,789 |
||||||||||
|
PREFERRED STOCKS - 0.4% |
|||||||||||
|
CONSUMER STAPLES - 0.4% |
|||||||||||
|
HOUSEHOLD & PERSONAL PRODUCTS - 0.4% |
|||||||||||
|
Henkel AG & Co. KGaA (Germany) |
1,335 |
138,067 |
|||||||||
|
TOTAL PREFERRED STOCKS - 0.4% (COST $137,371) |
138,067 |
||||||||||
|
Par Value |
Value |
||||||||||
|
SHORT-TERM INVESTMENTS - 2.6% |
|||||||||||
|
REPURCHASE AGREEMENT - 1.8% |
|||||||||||
|
Fixed Income Clearing Corp. Repurchase Agreement, 1.55% dated 12/31/19 due 01/02/20, repurchase price $592,096, collateralized by a United States Treasury Note, 2.625% due 12/15/21, value plus accrued interest of $603,888 (Cost: $592,045) |
$ |
592,045 |
592,045 |
||||||||
|
Par Value |
Value |
||||||||||
|
COMMERCIAL PAPER - 0.8% |
|||||||||||
|
Anthem, Inc., 144A, 1.83%, due 01/02/20 - 01/03/20 (d) (e) |
$ |
75,000 |
$ |
74,991 |
|||||||
|
General Mills, Inc., 144A, 1.83% - 1.9%, due 01/06/20 - 01/08/20 (d) (e) |
75,000 |
74,973 |
|||||||||
|
Walgreens Boots, 2.06% - 2.16%, due 01/09/20 - 03/23/20 (e) |
63,500 |
63,361 |
|||||||||
|
Campbell Soup Co., 144A, 1.98% - 2.13%, due 01/10/20 - 01/22/20 (d) (e) |
35,000 |
34,968 |
|||||||||
|
Schlumberger Holdings Corp., 144A, 2.03%, due 01/09/20 (d) (e) |
25,000 |
24,989 |
|||||||||
|
TOTAL COMMERCIAL PAPER - 0.8% (COST $273,295) |
273,282 |
||||||||||
|
TOTAL SHORT-TERM INVESTMENTS - 2.6% (COST $865,340) |
865,327 |
||||||||||
|
TOTAL INVESTMENTS - 99.8% (COST $32,532,719) |
32,984,183 |
||||||||||
|
Foreign Currencies (Cost $6,207) - 0.0% (c) |
6,229 |
||||||||||
|
Other Assets In Excess of Liabilities - 0.2% |
47,496 |
||||||||||
|
TOTAL NET ASSETS - 100.0% |
$ |
33,037,908 |
|||||||||
(a) Non-income producing security
(b) Sponsored American Depositary Receipt
(c) Amount rounds to less than 0.1%.
(d) Security exempt from registration under Rule 144A of the Securities Act of 1933, as amended. These securities may be resold, normally only to qualified institutional buyers.
(e) The rate shown represents the annualized yield at the time of purchase; not a coupon rate.
Oakmark.com 35
Oakmark International Fund December 31, 2019 (Unaudited)
Schedule of Investments (in thousands) (continued)
FORWARD FOREIGN CURRENCY CONTRACT (in thousands)
|
Local Contract Amount |
Base Contract Amount |
Settlement Date |
Valuation at 12/31/19 |
Unrealized Appreciation/ (Depreciation) |
|||||||||||||||||||
|
Foreign Currency Sold: |
|||||||||||||||||||||||
|
Swiss Franc |
240,595 |
$ |
247,525 |
06/17/20 |
$ |
251,596 |
$ |
(4,071 |
) |
||||||||||||||
|
$ |
251,596 |
$ |
(4,071 |
) |
|||||||||||||||||||
36 OAKMARK FUNDS

This page intentionally left blank.
Oakmark.com 37
Oakmark International Small Cap Fund December 31, 2019
Summary Information
VALUE OF A $10,000 INVESTMENT
Since 12/31/09 (Unaudited)

PERFORMANCE
|
Average Annual Total Returns (as of 12/31/19) |
|||||||||||||||||||||||||||||||
| (Unaudited) |
Total Return Last 3 Months |
1-year |
3-year |
5-year |
10-year |
Since Inception |
Inception Date |
||||||||||||||||||||||||
|
Oakmark International Small Cap Fund (Investor Class) |
12.49 |
% |
31.90 |
% |
8.25 |
% |
6.32 |
% |
6.76 |
% |
9.07 |
% |
11/01/95 |
||||||||||||||||||
|
MSCI World ex U.S. Small Cap Index |
11.40 |
% |
25.41 |
% |
10.42 |
% |
8.17 |
% |
8.04 |
% |
N/A |
||||||||||||||||||||
|
MSCI World ex U.S. Index20 |
7.86 |
% |
22.49 |
% |
9.34 |
% |
5.42 |
% |
5.32 |
% |
5.35 |
% |
|||||||||||||||||||
|
Lipper International Small Cap Fund Index24 |
10.68 |
% |
24.21 |
% |
10.19 |
% |
7.34 |
% |
8.18 |
% |
N/A |
||||||||||||||||||||
|
Oakmark International Small Cap Fund (Advisor Class) |
12.48 |
% |
32.05 |
% |
8.35 |
% |
N/A |
N/A |
9.21 |
% |
11/30/16 |
||||||||||||||||||||
|
Oakmark International Small Cap Fund (Institutional Class) |
12.56 |
% |
32.01 |
% |
8.44 |
% |
N/A |
N/A |
9.30 |
% |
11/30/16 |
||||||||||||||||||||
|
Oakmark International Small Cap Fund (Service Class) |
12.41 |
% |
31.53 |
% |
7.93 |
% |
6.02 |
% |
6.45 |
% |
9.06 |
% |
01/08/01 |
||||||||||||||||||
The graph and table do not reflect the deduction of taxes that a shareholder would pay on Fund distributions or the redemption of Fund shares.
Past performance is no guarantee of future results. The performance data quoted represents past performance. Current performance may be lower or higher than the performance data quoted. Total return includes change in share prices and, in each case, includes reinvestment of dividends and capital gain distributions. The investment return and principal value vary so that an investor's shares, when redeemed, may be worth more or less than the original cost. The performance of the Fund does not reflect the 2% redemption fee imposed on shares redeemed within 90 days of purchase. To obtain the most recent month-end performance, please visit Oakmark.com.
|
TOP TEN EQUITY HOLDINGS12 |
% of Net Assets | ||||||
|
Duerr AG |
3.9 |
||||||
|
Konecranes OYJ |
3.7 |
||||||
|
Julius Baer Group, Ltd. |
3.5 |
||||||
|
BNK Financial Group, Inc. |
3.2 |
||||||
|
ISS A/S |
3.1 |
||||||
|
Atea ASA |
2.9 |
||||||
|
Incitec Pivot, Ltd. |
2.6 |
||||||
|
Pirelli & C SpA |
2.5 |
||||||
|
Healius, Ltd. |
2.3 |
||||||
|
Controladora Vuela Cia de Aviacion SAB de CV |
2.2 |
||||||
|
FUND STATISTICS |
|||||||
|
Ticker* |
OAKEX |
||||||
|
Number of Equity Holdings |
59 |
||||||
|
Net Assets |
$1.6 billion | ||||||
|
Weighted Average Market Cap |
$3.9 billion | ||||||
|
Median Market Cap |
$3.0 billion | ||||||
|
Gross Expense Ratio - Investor Class (as of 09/30/19)* |
1.38% | ||||||
|
Net Expense Ratio - Investor Class (as of 09/30/19)* |
1.38% | ||||||
* This information is related to the Investor Class. Please visit Oakmark.com for information related to the Advisor, Institutional and Service Classes.
|
SECTOR ALLOCATION |
% of Net Assets | ||||||
|
Industrials |
40.8 |
||||||
|
Financials |
16.0 |
||||||
|
Communication Services |
9.3 |
||||||
|
Consumer Discretionary |
7.7 |
||||||
|
Health Care |
5.3 |
||||||
|
Information Technology |
5.2 |
||||||
|
Materials |
4.7 |
||||||
|
Consumer Staples |
3.8 |
||||||
|
Real Estate |
2.6 |
||||||
|
Short Term Investments and Other |
4.6 |
||||||
|
GEOGRAPHIC ALLOCATION |
|||||||
|
% of Equity |
|||||||
|
Europe |
70.6 |
||||||
|
United Kingdom |
22.4 |
||||||
|
Switzerland |
9.9 |
||||||
|
Finland* |
7.0 |
||||||
|
Italy* |
6.2 |
||||||
|
Sweden |
4.4 |
||||||
|
Denmark |
4.3 |
||||||
|
Germany* |
4.1 |
||||||
|
Spain* |
3.6 |
||||||
|
Norway |
3.0 |
||||||
|
Belgium* |
2.0 |
||||||
|
Netherlands* |
1.7 |
||||||
|
France* |
1.2 |
||||||
|
Portugal* |
0.8 |
||||||
|
% of Equity |
|||||||
|
Asia |
11.6 |
||||||
|
South Korea |
5.1 |
||||||
|
Japan |
3.7 |
||||||
|
Indonesia |
2.8 |
||||||
|
Australasia |
7.9 |
||||||
|
Australia |
7.4 |
||||||
|
New Zealand |
0.5 |
||||||
|
North America |
5.0 |
||||||
|
Canada |
5.0 |
||||||
|
Latin America |
4.9 |
||||||
|
Mexico |
4.9 |
||||||
* Euro currency countries comprise 26.6% of equity investments.
See accompanying Disclosures and Endnotes on page 43.
38 OAKMARK FUNDS
Oakmark International Small Cap Fund December 31, 2019
Portfolio Manager Commentary


David G. Herro, CFA
Portfolio Manager
oakex@oakmark.com
Michael L. Manelli, CFA
Portfolio Manager
oakex@oakmark.com
Justin D. Hance, CFA
Portfolio Manager
oakex@oakmark.com
The Oakmark International Small Cap Fund had a strong year of absolute and relative performance, returning 31.9% for the calendar year. The benchmark, MSCI World ex U.S. Small Cap Index23, returned 25.4% for the same one-year period. The Fund also outperformed for the recent quarter end, returning 12.5% compared to the Index return of 11.4%. Since the Fund's inception in November 1995, it has returned an average of 9.1% per year.
What a difference a quarter can make! In our last shareholder letter, we wrote about Duerr, a German-based global mechanical and plant engineering firm, which was the biggest detractor from the Fund's performance for both the third quarter and previous 12 months. This quarter, the company returned 32% and was the Fund's largest contributor to performance. Investors reacted favorably to Duerr's third-quarter earnings announcement, which indicated stabilization and improvement across several business lines. One of those lines, HOMAG, a producer of woodworking machines, enjoyed significantly increased orders during the quarter. Importantly, these included a large systems order from China, which has been one of HOMAG's most troublesome markets. Duerr also announced a new restructuring plan for HOMAG, which should yield significant cost savings. HOMAG's success is not isolated. Across Duerr's other business lines, orders have increased and operational performance has improved. Its paint and final assembly division also performed particularly well. Orders improved by 30%, year-over-year, in the third quarter and its operating profit improved by over 9%. Even with Duerr's strong returns this quarter, we believe it remains an attractive investment due to its strong market position and effective management team.
The Fund's largest detractor from performance for the quarter was Healius, which operates numerous medical centers, pathology laboratories and diagnostic imaging centers in Australia. At the company's annual general meeting this quarter, management announced lower than anticipated fiscal year 2020 guidance, which caused the stock price to drop. However, after we spoke with CEO Dr. Malcolm Parmenter, we concluded that Healius's guidance was overly conservative. We believe the company's pathology and imaging divisions, which account for over 75% of its earnings and cash flow generation, are performing well and gaining market share. In addition, the company has implemented several growth initiatives over the past two years, which should further boost revenues and lower costs across the company. The most negative part of Healius's 2020 guidance focused on its medical centers division, which suffered due to slowing recruitment of general practitioners to serve its clinics. We believe, however, that this division remains on the right strategic trajectory and that management's decision to appoint a new head for the division should speed up progress. As a result, our investment thesis for Healius remains
intact as we believe its management team is working diligently to enhance shareholder value.
We initiated three new holdings this quarter: two Canadian-based companies, BlackBerry and Gildan Activewear, and Nordic Entertainment, which is headquartered in Sweden. BlackBerry, best known for its smartphones, has transitioned into a communications software and services developer. Its products are used for cell phones and computers as well as by automakers and governmental agencies. BlackBerry also provides messaging, voice encryption, anti-counterfeiting and product authentication services. Gildan Activewear manufactures everyday apparel, including the brands American Apparel, Anvil and Gold Toe, among others. A spin-off from Modern Times Group, Nordic Entertainment is the largest pan-Nordic provider of premium television content, holding the leading market positions in pay television channels, over-the-top streaming, free-to-air channels and content-production studios. During the quarter, we also eliminated positions in Bharti Infratel (India), HKBN Ltd. (Hong Kong), SKY Network Television (New Zealand) and Countrywide (U.K.).
Geographically, we ended the quarter with approximately 67% of our holdings in Europe and the U.K., 11% in Asia and 8% in Australasia. The remaining positions are in the Americas with 5% in Latin America (Mexico) and 5% in North America (Canada).
We continue to believe both the Swiss franc and Norwegian krone are overvalued versus the U.S. dollar, so the Fund remains hedged against these currencies. At the end of December, we were hedging 10% of the Fund's franc exposure and 16% of its krone exposure.
Wishing all of you a very happy and healthy 2020!
See accompanying Disclosures and Endnotes on page 43.
Oakmark.com 39
Oakmark International Small Cap Fund December 31, 2019 (Unaudited)
Schedule of Investments (in thousands)
|
Shares |
Value |
||||||||||
|
COMMON STOCKS - 95.4% |
|||||||||||
|
INDUSTRIALS - 40.8% |
|||||||||||
|
CAPITAL GOODS - 19.7% |
|||||||||||
|
Duerr AG (Germany) |
1,795 |
$ |
61,152 |
||||||||
|
Konecranes OYJ (Finland) |
1,903 |
58,486 |
|||||||||
|
Travis Perkins PLC (United Kingdom) |
1,612 |
34,215 |
|||||||||
|
Sulzer AG (Switzerland) |
253 |
28,196 |
|||||||||
|
Metso OYJ (Finland) |
696 |
27,477 |
|||||||||
|
Morgan Advanced Materials PLC (United Kingdom) |
5,897 |
24,762 |
|||||||||
|
Outotec OYJ (Finland) (a) |
3,028 |
19,556 |
|||||||||
|
Howden Joinery Group PLC (United Kingdom) |
2,103 |
18,737 |
|||||||||
|
Fluidra SA (Spain) (a) |
1,366 |
18,688 |
|||||||||
|
Bucher Industries AG (Switzerland) |
46 |
16,151 |
|||||||||
|
Wajax Corp. (Canada) |
357 |
4,071 |
|||||||||
|
311,491 |
|||||||||||
|
COMMERCIAL & PROFESSIONAL SERVICES - 16.9% |
|||||||||||
|
ISS A/S (Denmark) |
2,053 |
49,254 |
|||||||||
|
Applus Services SA (Spain) |
2,759 |
35,278 |
|||||||||
|
Babcock International Group PLC (United Kingdom) |
3,869 |
32,259 |
|||||||||
|
Pagegroup PLC (United Kingdom) |
4,645 |
32,179 |
|||||||||
|
Mitie Group PLC (United Kingdom) |
16,128 |
30,977 |
|||||||||
|
Hays PLC (United Kingdom) |
11,072 |
26,634 |
|||||||||
|
Randstad N.V. (Netherlands) |
426 |
26,044 |
|||||||||
|
SThree PLC (United Kingdom) |
4,227 |
21,221 |
|||||||||
|
Loomis AB, Class B (Sweden) |
351 |
14,529 |
|||||||||
|
268,375 |
|||||||||||
|
TRANSPORTATION - 4.2% |
|||||||||||
|
Controladora Vuela Cia de Aviacion SAB de CV (Mexico) (a) (b) |
3,394 |
35,365 |
|||||||||
|
DSV PANALPINA A/S (Denmark) |
137 |
15,810 |
|||||||||
|
Freightways, Ltd. (New Zealand) |
1,471 |
8,417 |
|||||||||
|
Signature Aviation PLC (United Kingdom) |
1,752 |
7,361 |
|||||||||
|
66,953 |
|||||||||||
|
646,819 |
|||||||||||
|
FINANCIALS - 16.0% |
|||||||||||
|
DIVERSIFIED FINANCIALS - 11.1% |
|||||||||||
|
Julius Baer Group, Ltd. (Switzerland) (a) |
1,084 |
55,926 |
|||||||||
|
Element Fleet Management Corp. (Canada) |
4,042 |
34,516 |
|||||||||
|
Azimut Holding SpA (Italy) |
1,334 |
31,833 |
|||||||||
|
EFG International AG (Switzerland) |
4,472 |
29,528 |
|||||||||
|
Standard Life Aberdeen PLC (United Kingdom) |
5,593 |
24,306 |
|||||||||
|
176,109 |
|||||||||||
|
BANKS - 4.9% |
|||||||||||
|
BNK Financial Group, Inc. (South Korea) |
7,751 |
51,339 |
|||||||||
|
DGB Financial Group, Inc. (South Korea) |
4,109 |
25,300 |
|||||||||
|
76,639 |
|||||||||||
|
252,748 |
|||||||||||
|
Shares |
Value |
||||||||||
|
COMMUNICATION SERVICES - 9.3% |
|||||||||||
|
MEDIA & ENTERTAINMENT - 6.6% |
|||||||||||
|
Megacable Holdings SAB de CV (Mexico) |
6,805 |
$ |
27,870 |
||||||||
|
oOh!media, Ltd. (Australia) |
7,345 |
18,763 |
|||||||||
|
Criteo SA (France) (a) (b) |
1,048 |
18,165 |
|||||||||
|
Hakuhodo DY Holdings, Inc. (Japan) |
1,081 |
17,586 |
|||||||||
|
NOS SGPS SA (Portugal) |
2,342 |
12,612 |
|||||||||
|
Nordic Entertainment Group AB, Class B (Sweden) |
295 |
9,521 |
|||||||||
|
104,517 |
|||||||||||
|
TELECOMMUNICATION SERVICES - 2.7% |
|||||||||||
|
Sarana Menara Nusantara Tbk PT (Indonesia) |
391,216 |
22,685 |
|||||||||
|
Tower Bersama Infrastructure Tbk PT (Indonesia) |
222,375 |
19,703 |
|||||||||
|
42,388 |
|||||||||||
|
146,905 |
|||||||||||
|
CONSUMER DISCRETIONARY - 7.7% |
|||||||||||
|
AUTOMOBILES & COMPONENTS - 5.2% |
|||||||||||
|
Pirelli & C SpA (Italy) |
6,980 |
40,241 |
|||||||||
|
Autoliv, Inc. (Sweden) |
267 |
22,546 |
|||||||||
|
Dometic Group AB (Sweden) |
1,934 |
19,475 |
|||||||||
|
82,262 |
|||||||||||
|
CONSUMER SERVICES - 1.9% |
|||||||||||
|
Autogrill SpA (Italy) |
2,104 |
22,014 |
|||||||||
|
Dignity PLC (United Kingdom) |
1,099 |
8,522 |
|||||||||
|
30,536 |
|||||||||||
|
CONSUMER DURABLES & APPAREL - 0.6% |
|||||||||||
|
Gildan Activewear, Inc. (Canada) |
333 |
9,856 |
|||||||||
|
122,654 |
|||||||||||
|
HEALTH CARE - 5.3% |
|||||||||||
|
HEALTH CARE EQUIPMENT & SERVICES - 5.3% |
|||||||||||
|
Healius, Ltd. (Australia) |
18,971 |
36,745 |
|||||||||
|
ConvaTec Group PLC (United Kingdom) |
12,597 |
33,113 |
|||||||||
|
Ansell, Ltd. (Australia) |
700 |
14,258 |
|||||||||
|
84,116 |
|||||||||||
|
INFORMATION TECHNOLOGY - 5.2% |
|||||||||||
|
SOFTWARE & SERVICES - 4.6% |
|||||||||||
|
Atea ASA (Norway) (a) |
3,087 |
45,220 |
|||||||||
|
BlackBerry, Ltd. (Canada) (a) |
4,247 |
27,312 |
|||||||||
|
72,532 |
|||||||||||
|
TECHNOLOGY HARDWARE & EQUIPMENT - 0.6% |
|||||||||||
|
Hirose Electric Co., Ltd. (Japan) |
74 |
9,527 |
|||||||||
|
82,059 |
|||||||||||
|
MATERIALS - 4.7% |
|||||||||||
|
Incitec Pivot, Ltd. (Australia) |
18,596 |
41,497 |
|||||||||
|
DS Smith PLC (United Kingdom) |
4,658 |
23,705 |
|||||||||
|
Titan Cement International SA (Belgium) (a) |
420 |
8,991 |
|||||||||
|
74,193 |
|||||||||||
40 OAKMARK FUNDS
Oakmark International Small Cap Fund December 31, 2019 (Unaudited)
Schedule of Investments (in thousands) (continued)
|
Shares |
Value |
||||||||||
|
COMMON STOCKS - 95.4% (continued) |
|||||||||||
|
CONSUMER STAPLES - 3.8% |
|||||||||||
|
HOUSEHOLD & PERSONAL PRODUCTS - 2.0% |
|||||||||||
|
Ontex Group N.V. (Belgium) |
982 |
$ |
20,660 |
||||||||
|
Kimberly-Clark de Mexico SAB de CV, Class A (Mexico) (a) |
5,644 |
11,194 |
|||||||||
|
31,856 |
|||||||||||
|
FOOD & STAPLES RETAILING - 1.8% |
|||||||||||
|
Sugi Holdings Co., Ltd. (Japan) |
551 |
29,188 |
|||||||||
|
61,044 |
|||||||||||
|
REAL ESTATE - 2.6% |
|||||||||||
|
LSL Property Services PLC (United Kingdom) |
5,853 |
21,243 |
|||||||||
|
IWG PLC (Switzerland) |
3,391 |
19,563 |
|||||||||
|
40,806 |
|||||||||||
|
TOTAL COMMON STOCKS - 95.4% (COST $1,380,390) |
1,511,344 |
||||||||||
|
Par Value |
Value |
||||||||||
|
SHORT-TERM INVESTMENT - 4.1% |
|||||||||||
|
REPURCHASE AGREEMENT - 4.1% |
|||||||||||
|
Fixed Income Clearing Corp. Repurchase Agreement, 1.55% dated 12/31/19 due 01/02/20, repurchase price $ 64,747, collateralized by a United States Treasury Note, 2.625% due 12/15/21, value plus accrued interest of $ 66,040 (Cost: $64,742) |
$ |
64,742 |
64,742 |
||||||||
|
TOTAL SHORT-TERM INVESTMENTS - 4.1% (COST $64,742) |
64,742 |
||||||||||
|
TOTAL INVESTMENTS - 99.5% (COST $1,445,132) |
1,576,086 |
||||||||||
|
Foreign Currencies (Cost $22) - 0.0% (c) |
22 |
||||||||||
|
Other Assets In Excess of Liabilities - 0.5% |
7,348 |
||||||||||
|
TOTAL NET ASSETS - 100.0% |
$ |
1,583,456 |
|||||||||
(a) Non-income producing security
(b) Sponsored American Depositary Receipt
(c) Amount rounds to less than 0.1%.
Oakmark.com 41
Oakmark International Small Cap Fund December 31, 2019 (Unaudited)
Schedule of Investments (in thousands) (continued)
FORWARD FOREIGN CURRENCY CONTRACTS (in thousands)
|
Local Contract Amount |
Base Contract Amount |
Settlement Date |
Valuation at 12/31/19 |
Unrealized Appreciation/ (Depreciation) |
|||||||||||||||||||
|
Foreign Currency Sold: |
|||||||||||||||||||||||
|
Norwegian Krona |
62,157 |
$ |
7,208 |
03/18/20 |
$ |
7,082 |
$ |
126 |
|||||||||||||||
|
Swiss Franc |
12,152 |
12,502 |
06/17/20 |
12,708 |
(206 |
) |
|||||||||||||||||
|
$ |
19,790 |
$ |
(80 |
) |
|||||||||||||||||||
42 OAKMARK FUNDS
Disclosures and Endnotes
Reporting to Shareholders. The Funds reduce the number of duplicate prospectuses, annual and semi-annual reports your household receives by sending only one copy of each to those addresses shared by two or more accounts. Call the Funds at 1-800-OAKMARK (625-6275) to request individual copies of these documents. The Funds will begin sending individual copies 30 days after receiving your request.
Before investing in any Oakmark Fund, you should carefully consider the Fund's investment objectives, risks, management fees and other expenses. This and other important information is contained in the Funds' prospectus and a Fund's summary prospectus. Please read the prospectus and summary prospectus carefully before investing. For more information, please visit Oakmark.com or call 1-800-OAKMARK (625-6275).
The discussion of the Funds' investments and investment strategy (including current investment themes, the portfolio managers' research and investment process, and portfolio characteristics) represents the Funds' investments and the views of the portfolio managers and Harris Associates L.P., the Funds' investment adviser, at the time of this report, and are subject to change without notice.
All Oakmark Funds: Investing in value stocks presents the risk that value stocks may fall out of favor with investors and underperform growth stocks during given periods.
Oakmark, Oakmark Equity and Income, Oakmark Global, Oakmark International, and Oakmark International Small Cap Funds: The Funds' portfolios tend to be invested in a relatively small number of stocks. As a result, the appreciation or depreciation of any one security held will have a greater impact on the Funds' net asset value than it would if the Funds invest in a larger number of securities. Although that strategy has the potential to generate attractive returns over time, it also increases the Funds' volatility.
Oakmark Select and Oakmark Equity and Income Funds: The stocks of medium-sized companies tend to be more volatile than those of large companies and have underperformed the stocks of small and large companies during some periods.
Because the Oakmark Select and Oakmark Global Select Funds are non-diversified, the performance of each holding will have a greater impact on the Funds' total return and may make the Funds' returns more volatile than a more diversified fund.
Oakmark Global, Oakmark Global Select, Oakmark International and Oakmark International Small Cap Funds: Investing in foreign securities presents risks which in some ways may be greater than U.S. investments. Those risks include: currency fluctuation; different regulation, accounting standards, trading practices and levels of available information; generally higher transaction costs; and political risks.
The percentages of hedge exposure for each foreign currency are calculated by dividing the market value of all same-currency forward contracts by the market value of the underlying equity exposure to that currency.
The Oakmark Equity and Income Fund invests in medium- and lower quality debt securities that have higher yield potential but present greater investment and credit risk than higher quality securities. These risks may result in greater share price volatility.
Oakmark International Small Cap Fund: The stocks of smaller companies often involve more risk than the stocks of larger companies. Stocks of small companies tend to be more volatile and have a smaller public market than stocks of larger companies. Small companies may have a shorter history of operations than
larger companies, may not have as great an ability to raise additional capital and may have a less diversified product line, making them more susceptible to market pressure.
Endnotes:
1. The S&P 500 Total Return Index is a float-adjusted, capitalization-weighted index of 500 U.S. large-capitalization stocks representing all major industries. It is a widely recognized index of broad U.S. equity market performance. Returns reflect the reinvestment of dividends. This index is unmanaged and investors cannot invest directly in this index.
2. The Dow Jones Industrial Average is a price-weighted measure of 30 U.S. blue-chip companies. The index covers all industries except transportation and utilities. This index is unmanaged and investors cannot invest directly in this index.
3. The Price to Book Ratio is a stock's capitalization divided by its book value.
4. EPS refers to Earnings Per Share and is calculated by dividing total earnings by the number of shares outstanding.
5. The Russell 1000® Value Index measures the performance of the large-cap value segment of the U.S. equity universe. It includes those Russell 1000® companies with lower price-to-book ratios and lower expected growth values. This index is unmanaged and investors cannot invest directly in this index.
6. Russell 1000® Growth Index is an unmanaged index that measures the performance of the large-cap growth segment of the U.S. equity universe. It includes those Russell 1000® companies with higher price-to-book ratios and higher forecasted growth values. This index is unmanaged and investors cannot invest directly in this index.
7. Morningstar Direct [Online]. December 31, 2019
8. The Price-Earnings Ratio ("P/E") is the most common measure of the expensiveness of a stock.
9. A real estate investment trust (REIT) is a company that owns, and in most cases operates, income-producing real estate.
10. EBITDA refers to Earnings Before the Deduction of Payments for Interest, Taxes, Depreciation and Amortization which is a measure of operating income.
11. The Lipper Large-Cap Value Fund Index measures the equal-weighted performance of the 30 largest U.S. large-cap value funds as defined by Lipper. This index is unmanaged and investors cannot invest directly in this index.
12. Portfolio holdings are subject to change without notice and are not intended as recommendations of individual stocks.
13. The Lipper Multi-Cap Value Fund Index measures the equal-weighted performance of the 30 largest U.S. multi-cap value funds as defined by Lipper. This index is unmanaged and investors cannot invest directly in this index.
14. The Lipper Balanced Fund Index measures the equal-weighted performance of the 30 largest U.S. balanced funds as defined by Lipper. This index is unmanaged and investors cannot invest directly in this index.
15. The Barclays U.S. Government/Credit Index measures the non-securitized component of the U.S. Aggregate Index. It
Oakmark.com 43
Disclosures and Endnotes (continued)
includes investment grade, U.S. dollar-denominated, fixed-rate Treasuries, government-related and corporate securities. This index is unmanaged and investors cannot invest directly in this index.
16. Bessembinder, Hendrik and Chen, Te-Feng and Choi, Goeun and Wei, Kuo-Chiang, "Do Global Stocks Outperform US Treasury Bills?" (July 5, 2019).
17. The EV/EBITDA ratio is a comparison of Enterprise Value and Earnings Before the Deduction of Payments for Interest, Taxes, Depreciation and Amortization, which is a measure of operating income.
18. The MSCI World Index (Net) is a free float-adjusted, market capitalization-weighted index that is designed to measure the global equity market performance of developed markets. The index covers approximately 85% of the free float-adjusted market capitalization in each country. This benchmark calculates reinvested dividends net of withholding taxes. This index is unmanaged and investors cannot invest directly in this index.
19. The Lipper Global Fund Index measures the equal-weighted performance of the 30 largest global equity funds as defined by Lipper. This index is unmanaged and investors cannot invest directly in this index.
20. The MSCI World ex U.S. Index (Net) is a free float-adjusted, market capitalization-weighted index that is designed to measure international developed market equity performance, excluding the U.S. The index covers approximately 85% of the free float-adjusted market capitalization in each country. This benchmark calculates reinvested dividends net of withholding taxes. This index is unmanaged and investors cannot invest directly in this index.
21. The MSCI EAFE Index (Net) is designed to represent the performance of large- and mid-cap securities across 21 developed markets, including countries in Europe, Australasia and the Far East, excluding the U.S. and Canada. The index covers approximately 85% of the free float-adjusted market capitalization in each of the 21 countries. This benchmark calculates reinvested dividends net of withholding taxes. This index is unmanaged and investors cannot invest directly in this index.
22. The Lipper International Fund Index measures the equal-weighted performance of the 30 largest international equity funds as defined by Lipper. This index is unmanaged and investors cannot invest directly in this index.
23. The MSCI World ex U.S. Small Cap Index (Net) is designed to measure performance of small-cap stocks across 22 of 23 developed markets (excluding the U.S.). The index covers approximately 14% of the free float-adjusted market capitalization in each country. This benchmark calculates reinvested dividends net of withholding taxes. This index is unmanaged and investors cannot invest directly in this index.
24. The Lipper International Small-Cap Fund Index measures the equal-weighted performance of the 30 largest international small-cap equity funds as defined by Lipper. This index is unmanaged and investors cannot invest directly in this index.
44 OAKMARK FUNDS
Oakmark Funds
Trustees and Officers
Trustees
Allan J. Reich—Chair
Thomas H. Hayden
Hugh T. Hurley, III
Patricia Louie
Christine M. Maki
Laurence C. Morse, Ph.D.
Mindy M. Posoff
Steven S. Rogers
Kristi L. Rowsell
Officers
Kristi L. Rowsell—President and Principal Executive Officer
Anthony P. Coniaris—Executive Vice President
Kevin G. Grant—Executive Vice President
Joseph J. Allessie—Vice President
Megan J. Claucherty—Vice President
Rick Dercks—Vice President
Justin D. Hance—Vice President
David G. Herro—Vice President
M. Colin Hudson—Vice President
John J. Kane—Vice President, Chief Compliance Officer, Assistant Secretary and Anti-Money Laundering Officer
Christopher W. Keller—Vice President
Eric Liu—Vice President
Jason E. Long—Vice President
Michael L. Manelli—Vice President
Clyde S. McGregor—Vice President
Thomas W. Murray—Vice President
Michael J. Neary—Vice President
Michael A. Nicolas—Vice President
William C. Nygren—Vice President
Howard M. Reich—Vice President
Vineeta D. Raketich—Vice President
Zachary D. Weber—Vice President, Principal Financial Officer and Treasurer
Edward J. Wojciechowski—Vice President
Rana J. Wright—Vice President, Secretary and Chief Legal Officer
Other Information
Investment Adviser
Harris Associates L.P.
111 S. Wacker Drive
Chicago, Illinois 60606-4319
Transfer Agent
DST Asset Manager Solutions, Inc.
Quincy, Massachusetts
Legal Counsel
K&L Gates LLP
Washington, D.C.
Independent Registered Public Accounting Firm
Deloitte & Touche LLP
Chicago, Illinois
Contact Us
Please call 1-800-OAKMARK
(1-800-625-6275)
or 617-483-8327
Website
Oakmark.com
@HarrisOakmark
To obtain a prospectus, an application or periodic reports, access our website at Oakmark.com or call 1-800-OAKMARK (625-6275) or 617-483-8327.
Each Fund files its complete schedule of portfolio holdings with the Securities and Exchange Commission ("SEC") for the first and third quarters of each fiscal year on Form N-Q or Form N-PORT (for filings after March 31, 2019). The Funds' Form N-Qs (Form N-PORTs) are available on the SEC's website at www.sec.gov.
A description of the policies and procedures the Funds use to determine how to vote proxies relating to portfolio securities is available without charge, upon request, by calling toll-free 1-800-625-6275; on the Funds' website at Oakmark.com; and on the SEC's website at www.sec.gov.
No later than August 31 of each year, information regarding how the Adviser, on behalf of the Funds, voted proxies relating to the Funds' portfolio securities for the 12 months ended the preceding June 30 will be available through a link on the Funds' website at Oakmark.com and on the SEC's website at www.sec.gov.
This report is submitted for the general information of the shareholders of the Funds. The report is not authorized for distribution to prospective investors in the Funds unless it is accompanied or preceded by a currently effective prospectus of the Funds.
No sales charge to the shareholder or to the new investor is made in offering the shares of the Funds.
Oakmark.com 45


Oakmark.com