OAKMARK FUNDS
THIRD QUARTER REPORT | JUNE 30, 2018
OAKMARK FUND
OAKMARK SELECT FUND
OAKMARK EQUITY AND INCOME FUND
OAKMARK GLOBAL FUND
OAKMARK GLOBAL SELECT FUND
OAKMARK INTERNATIONAL FUND
OAKMARK INTERNATIONAL SMALL CAP FUND

Oakmark Funds
2018 Third Quarter Report
TABLE OF CONTENTS
|
Commentary on Oakmark and Oakmark Select Funds |
1 |
||||||
|
Oakmark Fund |
|||||||
|
Summary Information |
4 |
||||||
|
Portfolio Manager Commentary |
5 |
||||||
|
Schedule of Investments |
6 |
||||||
|
Oakmark Select Fund |
|||||||
|
Summary Information |
10 |
||||||
|
Portfolio Manager Commentary |
11 |
||||||
|
Schedule of Investments |
12 |
||||||
|
Oakmark Equity and Income Fund |
|||||||
|
Summary Information |
14 |
||||||
|
Portfolio Manager Commentary |
15 |
||||||
|
Schedule of Investments |
17 |
||||||
|
Oakmark Global Fund |
|||||||
|
Summary Information |
24 |
||||||
|
Portfolio Manager Commentary |
25 |
||||||
|
Schedule of Investments |
27 |
||||||
|
Oakmark Global Select Fund |
|||||||
|
Summary Information |
30 |
||||||
|
Portfolio Manager Commentary |
31 |
||||||
|
Schedule of Investments |
32 |
||||||
|
Commentary on Oakmark International and Oakmark International Small Cap Funds |
34 |
||||||
|
Oakmark International Fund |
|||||||
|
Summary Information |
36 |
||||||
|
Portfolio Manager Commentary |
37 |
||||||
|
Schedule of Investments |
38 |
||||||
|
Oakmark International Small Cap Fund |
|||||||
|
Summary Information |
42 |
||||||
|
Portfolio Manager Commentary |
43 |
||||||
|
Schedule of Investments |
44 |
||||||
|
Disclosures and Endnotes |
47 |
||||||
|
Trustees and Officers |
49 |
||||||
FORWARD-LOOKING STATEMENT DISCLOSURE
One of our most important responsibilities as mutual fund managers is to communicate with shareholders in an open and direct manner. Some of our comments in our letters to shareholders are based on current management expectations and are considered "forward-looking statements." Actual future results, however, may prove to be different from our expectations. You can identify forward-looking statements by words such as "estimate", "may", "will", "expect", "believe",
"plan" and other similar terms. We cannot promise future returns. Our opinions are a reflection of our best judgment at the time this report is compiled, and we disclaim any obligation to update or alter forward-looking statements as a result of new information, future events, or otherwise.
Oakmark.com
Oakmark and Oakmark Select Funds June 30, 2018
Portfolio Manager Commentary

William C. Nygren, CFA
Portfolio Manager
oakmx@oakmark.com
oaklx@oakmark.com
oakwx@oakmark.com
At Oakmark, we are long-term investors. We attempt to identify growing businesses that are managed to benefit their shareholders. We will purchase stock in those businesses only when priced substantially below our estimate of intrinsic value. After purchase, we patiently wait for the gap between stock price and intrinsic value to close.
"My own thinking has changed drastically from 35 years ago when I was taught to favor tangible assets and to shun businesses whose value depended largely on economic goodwill."
-Warren Buffett1
If you were paging through Value Line2 in February looking for cheap stocks, it would have been easy to skip right past Gartner. Value Line says, "Gartner Inc. is the world's leading information technology research and advisory company..." You would have quickly seen that it is a database-driven, asset-light business that would be expected to command a higher than market P/E ratio.3 Despite the stock falling from $142 to $119, its P/E was still 31 times expected 2018 earnings and its book value was only $2 per share. Gartner didn't look like a value stock and, in fact, it was even included in the Russell 1000 Growth Index.4 But last quarter we bought it for the Oakmark Fund. So, it's fair to ask: has Oakmark changed, or does Gartner somehow meet our value criteria?
A closer look reveals that Gartner stock fell when management opted to substantially increase selling and marketing expenses to pursue accelerated organic growth, which in turn decreased the company's reported earnings. The way GAAP (generally accepted accounting principles) works, because the future benefit of a marketing expense is uncertain, the cost is immediately expensed. But at a company like Gartner, these marketing expenses could easily be seen as long-term investments in company growth. That's because a Gartner customer tends to remain with the company for a long time—a little more than six years, on average. So we adjusted the sales and marketing expenses to reflect a six-year life, just like GAAP would treat the purchase of a machine that was expected to last six years. With that one adjustment, Gartner's expected EPS5 increased by almost $3. Using our adjusted earnings, which we believe reflect a more realistic view of those intangible assets, Gartner appears to be priced as just an ordinary company. And, as we have said many times, buying an extraordinary company at an ordinary price is value investing at its finest.
Throughout Oakmark's history, we've been on the lookout for situations where GAAP obscures economic value. Though value investing has always implied buying at a discount to value, the early descriptions of value relied more on assets than earnings. In 1934, Ben Graham and David Dodd wrote Security Analysis,6 which was quickly adopted as the Bible of value investing. In it, Graham explains his idea of only investing when he had a "margin of safety:" he only purchases a stock when it is priced at a large discount to a company's intrinsic value. The concept remains a core principle of value investing today, even though the idea is almost 100 years old. Then, influenced by just having been through a depression, a company's intrinsic value was defined as its liquidation value, and Graham proposed the following formula for computing it: start with cash; add accounts
receivables, discounted by 10-25%; add inventory, discounted by 25-50%; add all other assets, discounted by 50-100%; and then deduct all liabilities. A stock passed his margin of safety test only if it sold for a large discount to this estimated liquidation value.
Over the next 40 years, stock prices were generally quite tightly tied to their book values and patient investors could often find companies that were out of favor, trading below estimated liquidation value. It was an asset-heavy economy, which made it appropriate to value businesses based on their tangible assets. In fact, as recently as 1975, 83% of the stock market value of the average company was represented by its tangible book value. In an economy where value was derived from fixed assets, it was hard to maintain competitive advantage: If you earned unusually high returns, others would duplicate your fixed assets and your advantage disappeared. That made it difficult for companies temporarily trading at large premiums to book value to sustain their high stock prices. So, an effective investment approach was to buy the stocks priced at discounts to book value and then patiently wait for reversion to the mean.
But, as the economy has become more asset-light, intangible assets—such as brand names, customer lists, R&D spending and patents—have become more important. Today, the relative importance of tangible assets compared to intangibles has completely flip-flopped from what it was 40 years ago. Intangibles now account for over 80% of the average company's market value. But much like Graham, GAAP doesn't even attempt to value those assets.
By the early 1980s, the Berkshire Hathaway investment portfolio, managed by Warren Buffett, looked nothing like the low price-to-book investments favored by his teacher Ben Graham. The portfolio included General Foods, RJ Reynolds, Time Inc. and Washington Post Co. When asked about the apparently high prices he paid for those companies relative to their book value, Buffett was fond of saying that their most valuable assets—their brand names—were not even on their balance sheets. The Buffett quote above, citing the decreasing importance of tangible assets in determining business value, sounds as timely today as it did when it appeared in Berkshire's 1983 Annual Report. What Buffett figured out earlier than most value investors was that conservative accounting rules overlooked the value of intangible assets. In turn, book value didn't fully reflect the economic value of businesses with strong brands.
For companies in the S&P 5007 today, the correlation between stock price and tangible book value has become quite small, just 14%. This is a very big change from 25 years ago, when that correlation was 71%—or 5x stronger than it is now. Unlike 25 years ago, knowing the book value of a company today gives little clue as to its stock price. Investors who have relied primarily on a price-to-book mean reversion strategy have had disappointing performance for the past decade. Some even feel
See accompanying Disclosures and Endnotes on page 47.
Oakmark.com 1
Oakmark and Oakmark Select Funds June 30, 2018
Portfolio Manager Commentary (continued)
they "are due" for an extended positive run. That would indeed be the case if irrational exuberance were the reason that book value is currently disconnected from stock prices.
But we don't see anything irrational about it. If book value still determined earnings power, we would expect P/E ratios to be as widely distributed as price-to-book ratios. However, that isn't the case. Today, the P/E distribution is narrower than it was 25 years ago. That shows that intangible assets are producing earnings and, therefore, investors have been acting rationally by attributing significant value to them. At Oakmark, we believe that the relative importance of intangible assets is more likely to continue than to reverse. As such, we think a portfolio of strictly low price-to-book stocks will continue to produce disappointing results.
Most value investors have come to realize that although book value can still be a useful metric in certain situations, such as analyzing a bank or a utility, it does not offer much insight for most companies. For this reason, book value is no longer used by most investors as a definitive indicator of economic value. Despite that, in our view, many investors have not yet considered what this means for the income statement. Back when GAAP book value was still closely tied to economic value, a company's annual income statement provided a pretty good approximation of the economic value added in that year. But now that economic value is not closely tied to book value, the income statement no longer provides a reliable indication of the value a company created in a particular year.
Since Oakmark's 1991 inception, we have sought out investments whose economic value was not easily seen in the simple GAAP metrics of net income and book value. Over that time, like Buffett, we've owned a lot of packaged food companies when we thought increased brand advertising was understating earnings. (Interestingly, the opposite condition is present today: Some companies have slashed advertising, increasing their GAAP earnings, but still benefit from historical spending that was previously expensed.) We owned cable TV distributors that reported net losses and negative book value while rapidly increasing their subscribers. (As with Gartner, customer acquisition costs were an immediate hit to their income, but their customers were long-lived.) We owned high-growth biotech companies that were selling at lower P/Es than mature pharmaceutical companies—once we treated their R&D expenditures as long-term investments.
As intangibles have grown in importance, so has the number of our holdings for which we adjust earnings to better reflect our view of intangible values. That has led Oakmark to invest in more companies generally owned by growth investors, such as Alphabet, Facebook, Gartner, Netflix and Regeneron. The thought process is no different than what led us to own food and cable stocks early in Oakmark's life. Today, it simply applies to more companies.
Regardless of the changing metrics that determine a company's value, the main concepts of value investing are the same today as 84 years ago when Security Analysis was first published:
-Investors still follow fads, get emotional and overreact,
-Which means stock prices sometimes decouple from intrinsic value,
-Allowing patient investors to invest when price is below value,
-Which creates a margin of safety.
So how can investors today determine which mutual funds are rigorously applying a disciplined value investing process and which ones are simply following trends? The relevant metrics for that have evolved, too. Because we rarely find price-to-book a useful statistic for estimating intrinsic value, our portfolios often don't look cheap on that metric. Low P/E ratios are frequently, but certainly not always, an indication of value. Though our portfolios still typically have a lower P/E than the market, we are more frequently investing in "exceptions" where the GAAP P/E looks expensive.
For those "exceptions," true value investors should be able to explain how they're calculating their margin of safety: What are they getting that they don't think they're paying for? As an example, let's look at the largest holding in both Oakmark and Oakmark Select, Alphabet, a stock that is primarily owned by growth managers. Alphabet's 2018 P/E is 26 times consensus estimates, which to us seems to be in the right ballpark given the expected growth from its search business. However, the company's $115 billion in cash, YouTube and other bets (including Waymo), in total, contribute nothing to our estimate of current earnings, despite having tremendous value. That's what we're getting for free, which creates our margin of safety.
At Oakmark, we commit time to writing these pieces because we want to help our shareholders understand how we think about investing. In a world where business value rests primarily on intangible assets, it's getting harder to use a style box to understand a mutual fund's investment approach. That's why it's more important than ever to spend time reading commentaries or watching interviews. They can explain a fund's investment philosophy far better than a price-to-book ratio ever will.
See accompanying Disclosures and Endnotes on page 47.
2 OAKMARK FUNDS

This page intentionally left blank.
Oakmark.com 3
Oakmark Fund June 30, 2018
Summary Information
VALUE OF A $10,000 INVESTMENT
Since Inception - 08/05/91 (Unaudited)

PERFORMANCE
|
Average Annual Total Returns (as of 06/30/18) |
|||||||||||||||||||||||||||||||
| (Unaudited) |
Total Return Last 3 Months |
1-year |
3-year |
5-year |
10-year |
Since Inception |
Inception Date |
||||||||||||||||||||||||
|
Oakmark Fund (Investor Class) |
2.13 |
% |
13.46 |
% |
11.82 |
% |
13.07 |
% |
12.48 |
% |
12.84 |
% |
08/05/91 |
||||||||||||||||||
|
S&P 500 Index |
3.43 |
% |
14.37 |
% |
11.93 |
% |
13.42 |
% |
10.17 |
% |
9.76 |
% |
|||||||||||||||||||
|
Dow Jones Industrial Average8 |
1.26 |
% |
16.31 |
% |
14.07 |
% |
12.96 |
% |
10.78 |
% |
10.70 |
% |
|||||||||||||||||||
|
Lipper Large-Cap Value Fund Index9 |
1.89 |
% |
9.25 |
% |
8.95 |
% |
10.60 |
% |
8.26 |
% |
8.87 |
% |
|||||||||||||||||||
|
Oakmark Fund (Advisor Class) |
2.16 |
% |
13.60 |
% |
N/A |
N/A |
N/A |
15.08 |
% |
11/30/16 |
|||||||||||||||||||||
|
Oakmark Fund (Institutional Class) |
2.18 |
% |
13.64 |
% |
N/A |
N/A |
N/A |
15.10 |
% |
11/30/16 |
|||||||||||||||||||||
|
Oakmark Fund (Service Class) |
2.07 |
% |
13.15 |
% |
11.49 |
% |
12.71 |
% |
12.15 |
% |
8.49 |
% |
04/05/01 |
||||||||||||||||||
The graph and table above do not reflect the deduction of taxes that a shareholder would pay on Fund distributions or the redemption of Fund shares.
Past performance is no guarantee of future results. The performance data quoted represents past performance. Current performance may be lower or higher than the performance data quoted. Total return includes change in share prices and, in each case, includes reinvestment of dividends and capital gain distributions. The investment return and principal value vary so that an investor's shares when redeemed may be worth more or less than the original cost. To obtain the most recent month-end performance, please visit Oakmark.com.
|
TOP TEN EQUITY HOLDINGS10 |
% of Net Assets | ||||||
|
Citigroup, Inc. |
3.1 |
||||||
|
Alphabet Inc., Class C |
3.0 |
||||||
|
American International Group, Inc. |
2.5 |
||||||
|
Apple, Inc. |
2.5 |
||||||
|
Fiat Chrysler Automobiles N.V. |
2.5 |
||||||
|
Netflix, Inc. |
2.5 |
||||||
|
Bank of America Corp. |
2.5 |
||||||
|
CVS Health Corp. |
2.5 |
||||||
|
General Electric Co. |
2.3 |
||||||
|
Ally Financial, Inc. |
2.2 |
||||||
|
FUND STATISTICS |
|||||||
|
Ticker* |
OAKMX |
||||||
|
Number of Equity Holdings |
56 |
||||||
|
Net Assets |
$20.5 billion | ||||||
|
Weighted Average Market Cap |
$148.5 billion | ||||||
|
Median Market Cap |
$57.3 billion | ||||||
|
Gross Expense Ratio - Investor Class (as of 09/30/17)* |
0.90% | ||||||
|
Net Expense Ratio - Investor Class (as of 09/30/17)*† |
0.86% | ||||||
* This information is related to the Investor Class. Please visit Oakmark.com for information related to the Advisor, Institutional and Service Classes.
† The net expense ratio reflects a contractual advisory fee waiver agreement through January 28, 2019.
|
SECTOR ALLOCATION |
% of Net Assets | ||||||
|
Information Technology |
22.8 |
||||||
|
Financials |
22.4 |
||||||
|
Consumer Discretionary |
16.5 |
||||||
|
Health Care |
13.4 |
||||||
|
Industrials |
8.4 |
||||||
|
Consumer Staples |
5.9 |
||||||
|
Energy |
5.7 |
||||||
|
Short-Term Investments and Other |
4.9 |
||||||
See accompanying Disclosures and Endnotes on page 47.
4 OAKMARK FUNDS
Oakmark Fund June 30, 2018
Portfolio Manager Commentary


William C. Nygren, CFA
Portfolio Manager
oakmx@oakmark.com
Kevin Grant, CFA
Portfolio Manager
oakmx@oakmark.com
The Oakmark Fund increased 2.1% for the second quarter, which lagged behind the 3.4% gain for the S&P 500,7 the Fund's benchmark. Rapid corporate earnings growth, combined with stagnant share prices since the beginning of the calendar year, has brought broad market valuation multiples back down to historical levels. We believe equities remain the most attractive asset class, and due to the increased number of undervalued companies with misunderstood intangible assets (see Bill Nygren's market commentary), our research team has produced an impressive number of new investment ideas. The Oakmark Fund has added 10 new names to the portfolio over the past four quarters.
The Oakmark Fund's best contributing sectors during the second quarter were information technology (with double-digit gains from ADP, MasterCard, Apple, Visa, Facebook and Gartner) and energy (helped by rising commodity prices and improving asset productivity). Our lowest contributing sectors were industrials and financials. The Fund's best contributing individual securities were Netflix and Anadarko, both up over 20%, and the worst contributing securities were American Airlines and MGM Resorts International, down 27% and 17%, respectively. American Airlines was weak due to near-term profitability concerns, following a period of rapidly rising fuel costs. During the quarter, we added new positions in Bristol-Myers Squibb Company, Gartner and Hilton Worldwide Holdings. We eliminated our position in Aflac as the share price approached our estimate of intrinsic value, and we eliminated our position in Harley-Davidson due to deteriorating demand and profitability trends.
Bristol-Myers Squibb Company (BMY-$55)
Bristol-Myers Squibb is a global biopharmaceutical company with leading franchises in oncology, immunoscience and cardiovascular drugs. Long-time shareholders may recall a successful Bristol-Myers Squibb investment that we sold in 2013. We got another opportunity to own this company during the past quarter when investors became fearful that a competing drug would take share in the cancer market. We believe these fears are overstated because cancer remains a dangerous disease that is difficult to treat. The company's two most valuable drugs Opdivo and Yervoy should continue to grow revenue as they maintain effectiveness with new tumor types. Bristol Myers Squibb also has the most new molecular agents and the highest number of combinations of agents in trials. Moreover, the company's R&D and marketing prowess also make it a desired partner for promising academic and small biotech innovators. Collectively, these assets should assure Bristol-Myers Squibb's oncology leadership for many years. We believe intrinsic value is closer to the $70 level it traded for earlier this year than its more recent price in the low $50s.
Gartner, Inc. (IT-$133)
Gartner is the world's leading provider of information technology research and advice for information technology executives. The company's research reports and benchmarking data are used by information technology executives across industries to make mission-critical decisions with potential multi-million dollar ramifications, and the subscription price represents just a fraction of the typical information technology budget. In other words, Gartner is the Consumer Reports of the information technology industry. However, while the Gartner brand has been among the most recognizable in information technology research for more than 35 years, most sizeable enterprises are still not Gartner subscribers. The company is investing heavily in sales and marketing to grow its customer base and based on the excellent long-term track record of Gartner management, we believe these investments are likely to drive years of double-digit growth. While the company trades at a high multiple of GAAP earnings, that multiple falls significantly after adjusting sales and marketing expenses to account for the multi-year life of new customers. (See Bill Nygren's market commentary). On our adjusted earnings estimates, Gartner's price-to-earnings ratio is in line with the S&P 500. We believe this is a bargain price for a high-return, high-growth business with an excellent management team.
Hilton Worldwide Holdings Inc. (HLT-$79)
Hilton Worldwide is a high-quality, well-managed company that was the target of a successful leveraged buyout by Blackstone in 2007. We believe the company's transformation into an asset-light, fee-driven business with a more resilient earnings profile is underappreciated. After spinning off most of the company's owned hotels and timeshare businesses early last year, Hilton now generates over 90% of its profits from fees (requiring minimal capital investment) and produces substantial free cash flow (greater than 100% of net income). The company should generate high single-digit operating income growth for several years. We became interested in Hilton after we determined that its competitive moat is widening. The company's unit growth leads the industry and its global pipeline share is almost 22%—over four times larger than its current share of existing rooms (approximately 5%). We initiated our position at a particularly attractive price due to the temporary pressure created by HNA's sale of its 26% stake in the company for non-fundamental reasons.
See accompanying Disclosures and Endnotes on page 47.
Oakmark.com 5
Oakmark Fund June 30, 2018 (Unaudited)
Schedule of Investments (in thousands)
|
Shares |
Value |
||||||||||
|
COMMON STOCKS - 95.1% |
|||||||||||
|
INFORMATION TECHNOLOGY - 22.8% |
|||||||||||
|
SOFTWARE & SERVICES - 14.3% |
|||||||||||
|
Alphabet, Inc., Class C (a) |
558 |
$ |
622,818 |
||||||||
|
MasterCard, Inc., Class A |
2,320 |
455,926 |
|||||||||
|
Visa, Inc., Class A |
3,435 |
454,966 |
|||||||||
|
Automatic Data Processing, Inc. |
3,320 |
445,345 |
|||||||||
|
Oracle Corp. |
8,765 |
386,186 |
|||||||||
|
Facebook, Inc., Class A (a) |
1,200 |
233,184 |
|||||||||
|
Gartner, Inc. (a) |
1,600 |
212,640 |
|||||||||
|
Alphabet, Inc., Class A (a) |
93 |
105,120 |
|||||||||
|
2,916,185 |
|||||||||||
|
TECHNOLOGY HARDWARE & EQUIPMENT - 5.4% |
|||||||||||
|
Apple, Inc. |
2,787 |
515,902 |
|||||||||
|
TE Connectivity, Ltd. |
4,936 |
444,504 |
|||||||||
|
Flex, Ltd. (a) |
10,000 |
141,100 |
|||||||||
|
1,101,506 |
|||||||||||
|
SEMICONDUCTORS & SEMICONDUCTOR EQUIPMENT - 3.1% |
|||||||||||
|
Intel Corp. |
6,755 |
335,791 |
|||||||||
|
Texas Instruments, Inc. |
2,720 |
299,880 |
|||||||||
|
635,671 |
|||||||||||
|
4,653,362 |
|||||||||||
|
FINANCIALS - 22.4% |
|||||||||||
|
DIVERSIFIED FINANCIALS - 10.9% |
|||||||||||
|
Ally Financial, Inc. |
17,435 |
458,017 |
|||||||||
|
Capital One Financial Corp. |
4,963 |
456,081 |
|||||||||
|
State Street Corp. |
4,700 |
437,523 |
|||||||||
|
The Bank of New York Mellon Corp. |
6,320 |
340,818 |
|||||||||
|
Moody's Corp. |
1,706 |
291,056 |
|||||||||
|
The Goldman Sachs Group, Inc. |
1,105 |
243,730 |
|||||||||
|
2,227,225 |
|||||||||||
|
BANKS - 7.7% |
|||||||||||
|
Citigroup, Inc. |
9,530 |
637,748 |
|||||||||
|
Bank of America Corp. |
18,000 |
507,420 |
|||||||||
|
Wells Fargo & Co. |
7,910 |
438,530 |
|||||||||
|
1,583,698 |
|||||||||||
|
INSURANCE - 3.8% |
|||||||||||
|
American International Group, Inc. |
9,780 |
518,536 |
|||||||||
|
Aon PLC |
1,890 |
259,251 |
|||||||||
|
777,787 |
|||||||||||
|
4,588,710 |
|||||||||||
|
CONSUMER DISCRETIONARY - 16.5% |
|||||||||||
|
AUTOMOBILES & COMPONENTS - 5.0% |
|||||||||||
|
Fiat Chrysler Automobiles N.V. |
27,276 |
515,251 |
|||||||||
|
General Motors Co. |
6,850 |
269,890 |
|||||||||
|
Aptiv PLC |
2,200 |
201,586 |
|||||||||
|
Delphi Technologies PLC |
733 |
33,337 |
|||||||||
|
1,020,064 |
|||||||||||
|
Shares |
Value |
||||||||||
|
MEDIA - 4.9% |
|||||||||||
|
Charter Communications, Inc., Class A (a) |
1,300 |
$ |
381,173 |
||||||||
|
Comcast Corp., Class A |
11,438 |
375,294 |
|||||||||
|
News Corp., Class A |
15,401 |
238,711 |
|||||||||
|
995,178 |
|||||||||||
|
RETAILING - 4.8% |
|||||||||||
|
Netflix, Inc. (a) |
1,300 |
508,859 |
|||||||||
|
Qurate Retail, Inc. (a) |
12,115 |
257,089 |
|||||||||
|
Booking Holdings, Inc. (a) |
110 |
222,980 |
|||||||||
|
988,928 |
|||||||||||
|
CONSUMER SERVICES - 1.8% |
|||||||||||
|
MGM Resorts International |
9,400 |
272,882 |
|||||||||
|
Hilton Worldwide Holdings, Inc. |
1,279 |
101,254 |
|||||||||
|
374,136 |
|||||||||||
|
3,378,306 |
|||||||||||
|
HEALTH CARE - 13.4% |
|||||||||||
|
HEALTH CARE EQUIPMENT & SERVICES - 9.5% |
|||||||||||
|
CVS Health Corp. |
7,865 |
506,115 |
|||||||||
|
HCA Healthcare, Inc. |
4,316 |
442,770 |
|||||||||
|
Baxter International, Inc. |
5,300 |
391,352 |
|||||||||
|
UnitedHealth Group, Inc. |
1,345 |
329,982 |
|||||||||
|
Medtronic PLC |
3,190 |
273,096 |
|||||||||
|
1,943,315 |
|||||||||||
|
PHARMACEUTICALS, BIOTECHNOLOGY & LIFE SCIENCES - 3.9% |
|||||||||||
|
Regeneron Pharmaceuticals, Inc. (a) |
1,262 |
435,307 |
|||||||||
|
Bristol-Myers Squibb Co. |
6,500 |
359,710 |
|||||||||
|
795,017 |
|||||||||||
|
2,738,332 |
|||||||||||
|
INDUSTRIALS - 8.4% |
|||||||||||
|
CAPITAL GOODS - 5.7% |
|||||||||||
|
General Electric Co. |
34,050 |
463,420 |
|||||||||
|
Parker-Hannifin Corp. |
2,439 |
380,159 |
|||||||||
|
Cummins, Inc. |
1,520 |
202,160 |
|||||||||
|
Caterpillar, Inc. |
850 |
115,319 |
|||||||||
|
1,161,058 |
|||||||||||
|
TRANSPORTATION - 2.7% |
|||||||||||
|
American Airlines Group, Inc. |
7,700 |
292,292 |
|||||||||
|
FedEx Corp. |
1,130 |
256,578 |
|||||||||
|
548,870 |
|||||||||||
|
1,709,928 |
|||||||||||
|
CONSUMER STAPLES - 5.9% |
|||||||||||
|
FOOD, BEVERAGE & TOBACCO - 4.0% |
|||||||||||
|
Diageo PLC (b) |
3,000 |
432,030 |
|||||||||
|
Nestlé SA (b) |
4,965 |
384,440 |
|||||||||
|
816,470 |
|||||||||||
|
HOUSEHOLD & PERSONAL PRODUCTS - 1.9% |
|||||||||||
|
Unilever PLC (b) |
7,163 |
395,971 |
|||||||||
|
1,212,441 |
|||||||||||
6 OAKMARK FUNDS
Oakmark Fund June 30, 2018 (Unaudited)
Schedule of Investments (in thousands) (continued)
|
Shares |
Value |
||||||||||
|
COMMON STOCKS - 95.1% (continued) |
|||||||||||
|
ENERGY - 5.7% |
|||||||||||
|
Anadarko Petroleum Corp. |
5,600 |
$ |
410,200 |
||||||||
|
Apache Corp. |
8,540 |
399,240 |
|||||||||
|
National Oilwell Varco, Inc. |
5,929 |
257,314 |
|||||||||
|
Chesapeake Energy Corp. (a) |
20,000 |
104,800 |
|||||||||
|
1,171,554 |
|||||||||||
|
TOTAL COMMON STOCKS - 95.1% (COST $12,253,097) |
19,452,633 |
||||||||||
|
Par Value |
Value |
||||||||||
|
SHORT-TERM INVESTMENTS - 5.5% |
|||||||||||
|
U.S. GOVERNMENT BILL - 3.9% |
|||||||||||
|
United States Treasury Bills, 1.84% - 1.88%, due 07/26/18 - 08/23/18 (c) (Cost $798,381) |
$ |
800,000 |
798,381 |
||||||||
|
GOVERNMENT AND AGENCY SECURITIES - 1.2% |
|||||||||||
|
Federal National Mortgage Association, 1.78%, due 07/02/18 (c) (Cost $249,988) |
250,000 |
249,988 |
|||||||||
|
REPURCHASE AGREEMENT - 0.4% |
|||||||||||
|
Fixed Income Clearing Corp. Repurchase Agreement, 1.10% dated 06/29/18 due 07/02/18, repurchase price $86,996, collateralized by a Federal Home Loan Bank Bond, 2.150% due 02/14/20, value plus accrued interest of $88,733 (Cost: $86,988) |
86,988 |
86,988 |
|||||||||
|
TOTAL SHORT-TERM INVESTMENTS - 5.5% (COST $1,135,357) |
1,135,357 |
||||||||||
|
TOTAL INVESTMENTS - 100.6% (COST $13,388,454) |
20,587,990 |
||||||||||
|
Foreign Currencies (Cost $0) - 0.0% (d) |
0 |
(e) |
|||||||||
|
Liabilities In Excess of Other Assets - (0.6)% |
(122,230 |
) |
|||||||||
|
TOTAL NET ASSETS - 100.0% |
$ |
20,465,760 |
|||||||||
(a) Non-income producing security
(b) Sponsored American Depositary Receipt
(c) The rate shown represents the annualized yield at the time of purchase; not a coupon rate.
(d) Amount rounds to less than 0.1%.
(e) Amount rounds to less than $1,000.
Oakmark.com 7
Oakmark Fund June 30, 2018 (Unaudited)
Schedule of Investments (in thousands) (continued)
WRITTEN OPTIONS
|
Description |
Counterparty |
Exercise Price |
Expiration Date |
Number of Contracts |
Notional Amount |
Market Value |
Premiums Received by Fund |
Unrealized Gain/(Loss) |
|||||||||||||||||||||||||||
|
CALLS |
|||||||||||||||||||||||||||||||||||
|
Netflix, Inc. |
Pershing LLC |
$ |
350.00 |
9/21/2018 |
1,000 |
$ |
(39,143 |
) |
$ |
(5,983 |
) |
$ |
3,254 |
$ |
(2,729 |
) |
|||||||||||||||||||
8 OAKMARK FUNDS

This page intentionally left blank.
Oakmark.com 9
Oakmark Select Fund June 30, 2018
Summary Information
VALUE OF A $10,000 INVESTMENT
Since Inception - 11/01/96 (Unaudited)

PERFORMANCE
|
Average Annual Total Returns (as of 06/30/18) |
|||||||||||||||||||||||||||||||
| (Unaudited) |
Total Return Last 3 Months |
1-year |
3-year |
5-year |
10-year |
Since Inception |
Inception Date |
||||||||||||||||||||||||
|
Oakmark Select Fund (Investor Class) |
-0.41 |
% |
5.55 |
% |
7.58 |
% |
11.13 |
% |
11.94 |
% |
12.40 |
% |
11/01/96 |
||||||||||||||||||
|
S&P 500 Index |
3.43 |
% |
14.37 |
% |
11.93 |
% |
13.42 |
% |
10.17 |
% |
8.46 |
% |
|||||||||||||||||||
|
Lipper Multi-Cap Value Fund Index11 |
1.03 |
% |
7.15 |
% |
7.08 |
% |
9.68 |
% |
7.91 |
% |
7.61 |
% |
|||||||||||||||||||
|
Oakmark Select Fund (Advisor Class) |
-0.37 |
% |
5.72 |
% |
N/A |
N/A |
N/A |
8.62 |
% |
11/30/16 |
|||||||||||||||||||||
|
Oakmark Select Fund (Institutional Class) |
-0.37 |
% |
5.75 |
% |
N/A |
N/A |
N/A |
8.64 |
% |
11/30/16 |
|||||||||||||||||||||
|
Oakmark Select Fund (Service Class) |
-0.53 |
% |
5.21 |
% |
7.22 |
% |
10.77 |
% |
11.62 |
% |
9.17 |
% |
12/31/99 |
||||||||||||||||||
The graph and table do not reflect the deduction of taxes that a shareholder would pay on Fund distributions or the redemption of Fund shares.
Past performance is no guarantee of future results. The performance data quoted represents past performance. Current performance may be lower or higher than the performance data quoted. Total return includes change in share prices and, in each case, includes reinvestment of dividends and capital gain distributions. The investment return and principal value vary so that an investor's shares when redeemed may be worth more or less than the original cost. To obtain the most recent month-end performance, please visit Oakmark.com.
|
TOP TEN EQUITY HOLDINGS10 |
% of Net Assets | ||||||
|
Alphabet, Inc., Class C |
8.2 |
||||||
|
CBRE Group, Inc., Class A |
7.3 |
||||||
|
TE Connectivity, Ltd. |
6.3 |
||||||
|
Citigroup, Inc. |
5.7 |
||||||
|
Fiat Chrysler Automobiles N.V. |
5.5 |
||||||
|
Ally Financial, Inc. |
5.0 |
||||||
|
Apache Corp. |
4.7 |
||||||
|
MasterCard, Inc., Class A |
4.7 |
||||||
|
American International Group, Inc. |
4.6 |
||||||
|
General Electric Co. |
4.1 |
||||||
|
FUND STATISTICS |
|||||||
|
Ticker* |
OAKLX |
||||||
|
Number of Equity Holdings |
22 |
||||||
|
Net Assets |
$6.0 billion | ||||||
|
Weighted Average Market Cap |
$138.4 billion | ||||||
|
Median Market Cap |
$34.4 billion | ||||||
|
Gross Expense Ratio - Investor Class (as of 09/30/17)* |
1.03% | ||||||
|
Net Expense Ratio - Investor Class (as of 09/30/17)*† |
0.96% | ||||||
* This information is related to the Investor Class. Please visit Oakmark.com for information related to the Advisor, Institutional and Service Classes.
† The net expense ratio reflects a contractual advisory fee waiver agreement through January 28, 2019.
|
SECTOR ALLOCATION |
% of Net Assets | ||||||
|
Information Technology |
24.4 |
||||||
|
Financials |
22.5 |
||||||
|
Consumer Discretionary |
19.2 |
||||||
|
Energy |
11.7 |
||||||
|
Real Estate |
7.3 |
||||||
|
Industrials |
7.2 |
||||||
|
Health Care |
3.4 |
||||||
|
Short-Term Investments and Other |
4.3 |
||||||
See accompanying Disclosures and Endnotes on page 47.
10 OAKMARK FUNDS
Oakmark Select Fund June 30, 2018
Portfolio Manager Commentary


William C. Nygren, CFA
Portfolio Manager
oaklx@oakmark.com
Anthony P. Coniaris, CFA
Portfolio Manager
oaklx@oakmark.com
Win Murray
Portfolio Manager
oaklx@oakmark.com
For the quarter, the Oakmark Select Fund declined 0.4%, compared to a 3.4% increase in the S&P 500 Index,7 the Fund's benchmark. Year to date, the Fund declined 4.3%, compared to a 2.7% increase for the S&P 500.
Most of this quarter's underperformance was driven by our consumer discretionary holdings, although the reasons for the decline of individual companies within that sector varied. The largest detractors were American Airlines (–27%), MGM Resorts (–17%) and Adient (–18%). American Airlines shares were hurt by rising oil prices, which we believe will only have a temporary impact on profits as the airline industry adjusts its prices and capacity throughout the rest of this year. During the quarter, MGM modestly lowered its annual profit forecast due to financial issues that we believe are temporary and somewhat immaterial, related to the renovation of the Monte Carlo Resort and a slow resumption of occupancy at the Mandalay Bay Resort, following the tragic shooting. Adient's fundamentals continue to be damaged by a non-core segment, its seating structures business, but its board is acting with appropriate urgency. On the positive side, the largest contributors to performance were Chesapeake Energy (+72%), Apache (+22%) and Weatherford (+46%). Whereas higher oil prices negatively impacted American Airlines, it was a distinct positive for our energy holdings.
We eliminated the final portion of our Harley-Davidson position for reasons discussed in last quarter's letter. We initiated a new position in Regeneron Pharmaceuticals—a biotech company with industry-leading research and development (R&D) productivity and a proven management team. The company is led by its founder Len Schleifer who maintains a culture focused on internal development of novel drugs. Schleifer also holds a significant equity stake in the company. Over the past decade, Regeneron has received approval for six drugs, all of which were developed in-house. Furthermore, Regeneron has a reputation for responsible drug pricing. Recent approvals of some of its new drugs provide a strong path for long-term growth. Meanwhile, its largest drug, Eylea, has additional opportunities for growth and retains patent protection through 2027. Regeneron spends significantly more on R&D than its peers, and, due to several recent drug launches, Regeneron's selling, general and administrative (SG&A) spending is relatively high, too. We believe Regeneron's R&D spending provides a great return on investment, and we
expect launch costs to normalize over time. Although the company's consensus P/E3 multiple appears high, if its R&D and SG&A costs are adjusted to average levels, Regeneron would trade at a low-teens P/E. We believe this is a compelling valuation for a growing business with a strong management team that is aligned with its shareholders.
Thank you, our fellow shareholders, for your continued investment in the Oakmark Select Fund.
See accompanying Disclosures and Endnotes on page 47.
Oakmark.com 11
Oakmark Select Fund June 30, 2018 (Unaudited)
Schedule of Investments (in thousands)
|
Shares |
Value |
||||||||||
|
COMMON STOCKS - 95.7% |
|||||||||||
|
INFORMATION TECHNOLOGY - 24.4% |
|||||||||||
|
SOFTWARE & SERVICES - 18.0% |
|||||||||||
|
Alphabet, Inc., Class C (a) |
444 |
$ |
494,958 |
||||||||
|
MasterCard, Inc., Class A |
1,439 |
282,792 |
|||||||||
|
Oracle Corp. |
5,167 |
227,658 |
|||||||||
|
Alphabet, Inc., Class A (a) |
73 |
82,514 |
|||||||||
|
1,087,922 |
|||||||||||
|
TECHNOLOGY HARDWARE & EQUIPMENT - 6.4% |
|||||||||||
|
TE Connectivity, Ltd. |
4,243 |
382,119 |
|||||||||
|
1,470,041 |
|||||||||||
|
FINANCIALS - 22.5% |
|||||||||||
|
BANKS - 9.4% |
|||||||||||
|
Citigroup, Inc. |
5,112 |
342,095 |
|||||||||
|
Bank of America Corp. |
8,001 |
225,537 |
|||||||||
|
567,632 |
|||||||||||
|
DIVERSIFIED FINANCIALS - 8.5% |
|||||||||||
|
Ally Financial, Inc. |
11,500 |
302,105 |
|||||||||
|
Capital One Financial Corp. |
2,285 |
209,982 |
|||||||||
|
512,087 |
|||||||||||
|
INSURANCE - 4.6% |
|||||||||||
|
American International Group, Inc. |
5,195 |
275,450 |
|||||||||
|
1,355,169 |
|||||||||||
|
CONSUMER DISCRETIONARY - 19.2% |
|||||||||||
|
AUTOMOBILES & COMPONENTS - 8.8% |
|||||||||||
|
Fiat Chrysler Automobiles N.V. |
17,434 |
329,330 |
|||||||||
|
Adient PLC |
4,116 |
202,453 |
|||||||||
|
531,783 |
|||||||||||
|
CONSUMER SERVICES - 3.6% |
|||||||||||
|
MGM Resorts International |
7,584 |
220,178 |
|||||||||
|
MEDIA - 3.5% |
|||||||||||
|
Charter Communications, Inc., Class A (a) |
720 |
211,111 |
|||||||||
|
RETAILING - 3.3% |
|||||||||||
|
Qurate Retail, Inc. (a) |
9,293 |
197,195 |
|||||||||
|
1,160,267 |
|||||||||||
|
ENERGY - 11.7% |
|||||||||||
|
Apache Corp. |
6,071 |
283,819 |
|||||||||
|
Chesapeake Energy Corp. (a) |
44,860 |
235,069 |
|||||||||
|
Weatherford International PLC (a) |
57,380 |
188,781 |
|||||||||
|
707,669 |
|||||||||||
|
REAL ESTATE - 7.3% |
|||||||||||
|
CBRE Group, Inc., Class A (a) |
9,248 |
441,476 |
|||||||||
|
INDUSTRIALS - 7.2% |
|||||||||||
|
CAPITAL GOODS - 4.2% |
|||||||||||
|
General Electric Co. |
18,268 |
248,627 |
|||||||||
|
Shares |
Value |
||||||||||
|
TRANSPORTATION - 3.0% |
|||||||||||
|
American Airlines Group, Inc. |
4,800 |
$ |
182,208 |
||||||||
|
430,835 |
|||||||||||
|
HEALTH CARE - 3.4% |
|||||||||||
|
PHARMACEUTICALS, BIOTECHNOLOGY & LIFE SCIENCES - 3.4% |
|||||||||||
|
Regeneron Pharmaceuticals, Inc. (a) |
600 |
206,994 |
|||||||||
|
TOTAL COMMON STOCKS - 95.7% (COST $3,894,470) |
5,772,451 |
||||||||||
|
Par Value |
Value |
||||||||||
|
SHORT-TERM INVESTMENTS - 4.2% |
|||||||||||
|
GOVERNMENT AND AGENCY SECURITIES - 3.3% |
|||||||||||
|
Federal National Mortgage Association, 1.78%, due 07/02/18 (b) (Cost $199,990) |
$ |
200,000 |
199,990 |
||||||||
|
REPURCHASE AGREEMENT - 0.9% |
|||||||||||
|
Fixed Income Clearing Corp. Repurchase Agreement, 1.10% dated 06/29/18 due 07/02/18, repurchase price $55,947, collateralized by a Federal National Mortgage Association, 1.500% due 06/22/20 and a United States Treasury Note, 1.375% due 05/31/20, aggregate value plus accrued interest of $57,061 (Cost: $55,942) |
55,942 |
55,942 |
|||||||||
|
TOTAL SHORT-TERM INVESTMENTS - 4.2% (COST $255,932) |
255,932 |
||||||||||
|
TOTAL INVESTMENTS - 99.9% (COST $4,150,402) |
6,028,383 |
||||||||||
|
Other Assets In Excess of Liabilities - 0.1% |
6,522 |
||||||||||
|
TOTAL NET ASSETS - 100.0% |
$ |
6,034,905 |
|||||||||
(a) Non-income producing security
(b) The rate shown represents the annualized yield at the time of purchase; not a coupon rate.
12 OAKMARK FUNDS
Oakmark Select Fund June 30, 2018 (Unaudited)
Schedule of Investments (in thousands) (continued)
WRITTEN OPTIONS
|
Description |
Counterparty |
Exercise Price |
Expiration Date |
Number of Contracts |
Notional Amount |
Market Value |
Premiums Received by Fund |
Unrealized Gain/(Loss) |
|||||||||||||||||||||||||||
|
PUTS |
|||||||||||||||||||||||||||||||||||
|
Charter Communications, Inc., Class A |
Pershing LLC |
$ |
285.00 |
7/18/2018 |
4,000 |
$ |
117,284 |
$ |
(1,780 |
) |
$ |
3,992 |
$ |
2,212 |
|||||||||||||||||||||
Oakmark.com 13
Oakmark Equity and Income Fund June 30, 2018
Summary Information
VALUE OF A $10,000 INVESTMENT
Since Inception - 11/01/95 (Unaudited)

PERFORMANCE
|
Average Annual Total Returns (as of 06/30/18) |
|||||||||||||||||||||||||||||||
| (Unaudited) |
Total Return Last 3 Months |
1-year |
3-year |
5-year |
10-year |
Since Inception |
Inception Date |
||||||||||||||||||||||||
|
Oakmark Equity and Income Fund (Investor Class) |
0.22 |
% |
6.56 |
% |
5.77 |
% |
8.16 |
% |
6.47 |
% |
10.08 |
% |
11/01/95 |
||||||||||||||||||
|
Lipper Balanced Fund Index |
1.13 |
% |
7.01 |
% |
6.37 |
% |
7.60 |
% |
6.44 |
% |
6.88 |
% |
|||||||||||||||||||
|
S&P 500 Index |
3.43 |
% |
14.37 |
% |
11.93 |
% |
13.42 |
% |
10.17 |
% |
9.07 |
% |
|||||||||||||||||||
|
Barclays U.S. Govt./Credit Index |
-0.33 |
% |
-0.63 |
% |
1.83 |
% |
2.29 |
% |
3.78 |
% |
5.04 |
% |
|||||||||||||||||||
|
Oakmark Equity and Income Fund (Advisor Class) |
0.28 |
% |
6.76 |
% |
N/A |
N/A |
N/A |
9.17 |
% |
11/30/16 |
|||||||||||||||||||||
|
Oakmark Equity and Income Fund (Institutional Class) |
0.25 |
% |
6.74 |
% |
N/A |
N/A |
N/A |
9.18 |
% |
11/30/16 |
|||||||||||||||||||||
|
Oakmark Equity and Income Fund (Service Class) |
0.19 |
% |
6.33 |
% |
5.47 |
% |
7.84 |
% |
6.14 |
% |
8.43 |
% |
07/12/00 |
||||||||||||||||||
The graph and table above do not reflect the deduction of taxes that a shareholder would pay on Fund distributions or the redemption of Fund shares.
Past performance is no guarantee of future results. The performance data quoted represents past performance. Current performance may be lower or higher than the performance data quoted. Total return includes change in share prices and, in each case, includes reinvestment of dividends and capital gain distributions. The investment return and principal value vary so that an investor's shares when redeemed may be worth more or less than the original cost. To obtain the most recent month-end performance, please visit Oakmark.com.
|
TOP TEN EQUITY HOLDINGS10 |
% of Net Assets | ||||||
|
General Motors Co. |
5.2 |
||||||
|
Bank of America Corp. |
4.6 |
||||||
|
TE Connectivity, Ltd. |
3.8 |
||||||
|
MasterCard, Inc., Class A |
3.2 |
||||||
|
Nestlé SA |
2.8 |
||||||
|
UnitedHealth Group, Inc. |
2.4 |
||||||
|
Citigroup, Inc. |
2.2 |
||||||
|
National Oilwell Varco, Inc. |
2.1 |
||||||
|
Philip Morris International, Inc. |
2.1 |
||||||
|
Diageo PLC |
2.0 |
||||||
|
FUND STATISTICS |
|||||||
|
Ticker* |
OAKBX |
||||||
|
Number of Equity Holdings |
45 |
||||||
|
Net Assets |
$15.5 billion | ||||||
|
Weighted Average Market Cap |
$116.2 billion | ||||||
|
Median Market Cap |
$31.5 billion | ||||||
|
Gross Expense Ratio - Investor Class (as of 09/30/17)* |
0.88% | ||||||
|
Net Expense Ratio - Investor Class (as of 09/30/17)*† |
0.78% | ||||||
* This information is related to the Investor Class. Please visit Oakmark.com for information related to the Advisor, Institutional and Service Classes.
† The net expense ratio reflects a contractual advisory fee waiver agreement through January 28, 2019.
|
SECTOR ALLOCATION |
% of Net Assets | ||||||
|
Equity Investments |
|||||||
|
Consumer Discretionary |
12.5 |
||||||
|
Financials |
12.2 |
||||||
|
Information Technology |
12.1 |
||||||
|
Consumer Staples |
6.9 |
||||||
|
Health Care |
6.8 |
||||||
|
Industrials |
4.9 |
||||||
|
Energy |
4.6 |
||||||
|
Materials |
1.1 |
||||||
|
Real Estate |
0.9 |
||||||
|
Total Equity Investments |
62.0 |
||||||
|
Preferred Stocks |
0.1 |
||||||
|
Fixed Income Investments |
|||||||
|
Corporate Bonds |
14.5 |
||||||
|
Government and Agency Securities |
13.5 |
||||||
|
Convertible Bond |
0.1 |
||||||
|
Total Fixed Income Investments |
28.1 |
||||||
|
Short-Term Investments and Other |
9.8 |
||||||
See accompanying Disclosures and Endnotes on page 47.
14 OAKMARK FUNDS
Oakmark Equity and Income Fund June 30, 2018
Portfolio Manager Commentary


Clyde S. McGregor, CFA
Portfolio Manager
oakbx@oakmark.com
M. Colin Hudson, CFA
Portfolio Manager
oakbx@oakmark.com
Edward J. Wojciechowski, CFA
Portfolio Manager
oakbx@oakmark.com
Fund Fundamentals
Each year at the end of June, the investment industry experiences a curious phenomenon: the reconstitution of the Russell Indexes. Russell is a large investment industry consultant that began constructing broad market indexes in the 1980s, of which the best known may be the Russell 2000 Index.14 Russell constructs these indexes in an objective and transparent manner, basically using market capitalization as the guide. Over time, approximately $1 trillion has been committed to passively investing in line with the Russell Indexes and Keefe, Bruyette & Woods estimates they are used as benchmarks for $8.5 trillion in managed assets. Rather than changing its indexes every time a company outgrows its classification or ceases to exist, Russell chooses to reconstitute each index once per year at the end of June.
A sort of cottage industry has grown up around these reclassifications. As the end of June nears, investors begin anticipating index changes. This works to push up the prices of companies likely to move into a higher valuation index, while depressing the prices of those likely to move down or out from their current index. This has the effect of making the valuation characteristics of the actual indexes slightly higher than they otherwise would have been if the changes had taken place more organically. In a June 23 article titled "Rise in Passive Funds Sees Tail Wagging the Dog in Index World," Financial Times columnist John Authers notes, "Indices no longer merely measure markets. They move them...Generally, new additions to the Russell 2000 handily beat the market in the days leading up to the reconstitution."15
As we have often written, we fundamental investors are glad that this sort of trading is a regular market feature. We are happy to purchase shares from market participants who are selling a stock due to factors that have nothing to do with the business's intrinsic value. And again to repeat ourselves, we have seldom met the investor whose economic goal was to match or beat an index. One cannot live on relative returns. Investors instead want positive absolute returns like what we strive to obtain for the Equity and Income Fund. Observing non-fundamental activity in the securities market suggests that now would be an appropriate time to review our guiding principles for managing the Fund.
The Equity and Income Fund is a balanced fund—i.e., a fund invested in several asset classes—that has the goal of producing income while preserving and growing capital. Over time, the Fund's equity allocation has tended to constitute about 60% of the total portfolio with various types of fixed income investments making up the remainder. Many decades of experience have shown that this 60:40 asset allocation buffers volatility such that investors may adhere to a long-term strategy rather than buckling in times of adversity. As well, this allocation has
proven sufficient to mediate between the need for current income and long-term growth. Many balanced funds have similar asset allocations, so what are the factors that make Oakmark Equity and Income distinctive?
The most distinctive factor for any fund in the Oakmark Family is the investment philosophy that we at Harris Associates have employed for more than 40 years. For any security we ask, "What is it worth?" and "What is its price?" If a security can be purchased at a sufficient discount to our estimate of its value such that we have a margin of safety, we consider it for investment. For our equity investments, we attempt to determine whether the company shows persistent growth in intrinsic value per share and whether its managers think and act like owners and treat their shareholder-partners appropriately.
Our concept of a balanced fund is also somewhat idiosyncratic. In our industry today, you often hear or see the word "sleeves." Many target-date funds, for example, are composed of independent asset pools (sleeves) that are mixed together in whatever way the investment manager thinks is appropriate to achieve a particular purpose. Such a fund might be categorized as "balanced," since it, like our Fund, holds multiple types of assets. We, however, understand a balanced fund to be an integrated portfolio where every holding competes for space with every other holding, actual or potential. We do not have an equity sleeve and a bond sleeve. Instead, the portfolio asset allocation itself will fluctuate depending on our ability to populate the portfolio with dominant investments. Although 60:40 is the typical ratio for the equity/fixed income allocations, equities have at times comprised as much as 75% and as little as 45% of the total portfolio.
Other Distinguishing Characteristics:
Our investment horizon is very long term. The ability to think and act with a long-term horizon is a great advantage. We can also be relatively inactive for long periods. In our view, sometimes the best course of action is to do nothing.
The Fund's diversification is an outcome of our bottom-up investing process. Our Fund is typically more focused in its holdings than other balanced funds are. Outstanding investment opportunities are scarce, in our opinion.
Although income is always desirable, value is determinative. Income itself is a factor to which we assign value, and like other characteristics, it can be over-priced or undervalued. We have generally found income to be overvalued in the current decade and this has significantly influenced our approach to investing in fixed income securities.
Quality, like income, is a factor to which we ascribe value. We can and will own low-grade fixed income investments in
See accompanying Disclosures and Endnotes on page 47.
Oakmark.com 15
Oakmark Equity and Income Fund June 30, 2018
Portfolio Manager Commentary (continued)
the Fund, but only when we perceive their potential return to be competitive with equities. Similarly, with highly leveraged equities, we demand a substantially higher discount to value before investing.
We are relatively indifferent to the size or domicile of an opportunity. We have the ability to invest the Fund in small-cap, medium-cap and large-cap company shares, and we can invest as much as 35% of the portfolio in international securities.
Finally, benchmarks do not drive our investing. Investors in the Fund should expect results to differ from benchmarks, especially over short time periods.
For investors in mutual funds, the question of "fit" is of paramount importance. Investors make the best decisions when they have invested with funds whose style and philosophy mesh well with their own character and needs. Perhaps the most useful advice we can give fund investors is that they should often check to see if they understand their funds and, if so, consider whether they still fit.
Quarter Review
The Equity and Income Fund earned 0.2% in the quarter, while the Lipper Balanced Fund Index,12 the Fund's performance benchmark, gained 1.1%. (Although we are not benchmark driven, we are required to have one.) For the calendar six months, the Fund lost 1.4% compared to a 0.1% increase for the Lipper. The Fund's nine-month fiscal year return was 2.8%, compared to 3.7% for the Lipper. The annualized compound rate of return since the Fund's inception in 1995 is 10.1%, while the corresponding return to the Lipper Index is 6.9%.
General Motors, UnitedHealth Group, Mastercard, National Oilwell Varco and Foot Locker led the list of contributors for the quarter. The largest detractors were TE Connectivity, Philip Morris International, Arconic, Bank of America and CommScope Holding. Short-term earnings concerns hurt Philip Morris International, Arconic and CommScope, while banks in general retreated as the fixed income yield curve flattened. Trade war fears also roiled markets and individual stocks. For the calendar six months, Mastercard, National Oilwell Varco, UnitedHealth Group, HCA Healthcare and Foot Locker contributed most while Arconic, Philip Morris International, Nestlé, CVS Health and Citigroup were the biggest detractors from return. For the nine months of the Fund's fiscal year, Mastercard, Bank of America, UnitedHealth Group, Foot Locker and National Oilwell Varco led the contributors list and Philip Morris International, CVS Health, Arconic, Baker Hughes and Oracle detracted.
Transaction Activity
During the quarter, the Fund added three new positions and exited four holdings. The three new positions are Apergy, American Airlines and Charter. Apergy was obtained through a spin-off from long-time holding Dover. Apergy provides equipment and technologies that help companies drill for and produce oil and gas. The company's two main product segments manufacture polycrystalline diamond cutters and equipment for artificial lift, both of which are crucial for non-conventional exploration and production. Apergy has generated free cash flow throughout the downturn and we expect a rapid recovery
in earnings and free cash flow as North American drilling activity rebounds. Trading at less than 15x our estimate of normalized earnings per share, this high-quality equipment company offers an attractive valuation, in our view.
Our investment in American Airlines is predicated on an evolution and improvement in the industry. Historically, airlines have not made for good investments, despite the usefulness of their services. At issue was the lack of pricing power and poor corporate cultures. However, after years of consolidation, capped by the merger of US Airways and American Airlines in 2013, the industry is now becoming more mature and rational. The three major hub-and-spoke carriers each have strength in their respective hubs and their management teams are all behaving in a healthier manner in terms of capacity additions and capital allocation. Our choice in the sector is American Airlines, due to the unusually large opportunity still in front of the company as it finishes off its merger integration. Also, CEO Doug Parker is in the process of improving the culture and restoring credibility with employees. Parker believes that American Airlines has around $5 billion of pre-tax earnings power and he has bought back 37% of the company's shares since the merger closed. With the stock selling for a single-digit multiple of normal earnings power, we believe that it is an attractive investment.
Charter gives us the opportunity to invest in what we believe is a strong business with exceptional management at an attractive price. Because of their valuable infrastructure, U.S. cable companies are benefiting from strong demand for high-speed internet access. In many markets, Charter has the only fiber-rich network capable of providing consumers with the high internet speeds they demand. We believe that new competitors are unlikely to enter the market as they will have to invest massive amounts of capital for fractional penetration. This should provide a long runway for continued growth at Charter. The stock has lagged behind the broader market as investors appear to be frustrated with the pace of operational improvement at recently acquired Time Warner Cable. Our experience investing in turnarounds reminds us that it takes more than a couple of quarters to make meaningful progress. We take a more positive, longer term view of the business, and believe Charter is valued at a discount to peer companies and private market transactions.
Besides being an attractive investment, the purchase of Charter also allowed us to lower our capital gain position as we sold Liberty Broadband at a loss. The main asset of Liberty Broadband is Charter stock, so we were able to effectively keep our economic position in Charter, while recognizing a tax loss. We have always actively managed the tax position of the Fund with a goal of maximizing after-tax returns.
The four positions eliminated during the quarter were Fidelity National Financial, Jones Lang LaSalle, and Liberty Broadband A and C shares. Both Fidelity National Financial and Jones Lang LaSalle were strong performers and reached our sell targets. As described above, the two classes of Liberty stock were sold to realize tax losses and we used the proceeds to purchase Charter stock.
As always, we thank our shareholders for entrusting their assets to the Fund and welcome your questions and comments.
See accompanying Disclosures and Endnotes on page 47.
16 OAKMARK FUNDS
Oakmark Equity and Income Fund June 30, 2018 (Unaudited)
Schedule of Investments (in thousands)
|
Shares |
Value |
||||||||||
|
COMMON STOCKS - 62.0% |
|||||||||||
|
CONSUMER DISCRETIONARY - 12.5% |
|||||||||||
|
AUTOMOBILES & COMPONENTS - 8.0% |
|||||||||||
|
General Motors Co. |
20,307 |
$ |
800,111 |
||||||||
|
Lear Corp. |
1,400 |
260,103 |
|||||||||
|
BorgWarner, Inc. |
4,282 |
184,807 |
|||||||||
|
1,245,021 |
|||||||||||
|
MEDIA - 1.9% |
|||||||||||
|
Charter Communications, Inc., Class A (a) |
749 |
219,703 |
|||||||||
|
Comcast Corp., Class A |
2,120 |
69,557 |
|||||||||
|
289,260 |
|||||||||||
|
RETAILING - 1.7% |
|||||||||||
|
Foot Locker, Inc. |
4,066 |
214,096 |
|||||||||
|
Qurate Retail, Inc. (a) |
2,327 |
49,389 |
|||||||||
|
263,485 |
|||||||||||
|
CONSUMER DURABLES & APPAREL - 0.5% |
|||||||||||
|
Carter's, Inc. |
664 |
72,004 |
|||||||||
|
CONSUMER SERVICES - 0.4% |
|||||||||||
|
MGM Resorts International |
2,351 |
68,256 |
|||||||||
|
1,938,026 |
|||||||||||
|
FINANCIALS - 12.2% |
|||||||||||
|
BANKS - 7.2% |
|||||||||||
|
Bank of America Corp. |
25,084 |
707,104 |
|||||||||
|
Citigroup, Inc. |
5,165 |
345,635 |
|||||||||
|
Wells Fargo & Co. |
1,203 |
66,716 |
|||||||||
|
1,119,455 |
|||||||||||
|
DIVERSIFIED FINANCIALS - 3.7% |
|||||||||||
|
Ally Financial, Inc. |
9,973 |
261,978 |
|||||||||
|
The Bank of New York Mellon Corp. |
3,030 |
163,389 |
|||||||||
|
State Street Corp. |
1,551 |
144,401 |
|||||||||
|
569,768 |
|||||||||||
|
INSURANCE - 1.3% |
|||||||||||
|
American International Group, Inc. |
3,646 |
193,295 |
|||||||||
|
1,882,518 |
|||||||||||
|
INFORMATION TECHNOLOGY - 12.1% |
|||||||||||
|
SOFTWARE & SERVICES - 7.4% |
|||||||||||
|
MasterCard, Inc., Class A |
2,502 |
491,771 |
|||||||||
|
Oracle Corp. |
6,705 |
295,427 |
|||||||||
|
Alphabet, Inc., Class C (a) |
263 |
293,193 |
|||||||||
|
CoreLogic, Inc. (a) |
1,293 |
67,107 |
|||||||||
|
1,147,498 |
|||||||||||
|
TECHNOLOGY HARDWARE & EQUIPMENT - 4.4% |
|||||||||||
|
TE Connectivity, Ltd. |
6,483 |
583,868 |
|||||||||
|
CommScope Holding Co., Inc. (a) |
3,280 |
95,798 |
|||||||||
|
679,666 |
|||||||||||
|
SEMICONDUCTORS & SEMICONDUCTOR EQUIPMENT - 0.3% |
|||||||||||
|
Qorvo, Inc. (a) |
609 |
48,856 |
|||||||||
|
1,876,020 |
|||||||||||
|
Shares |
Value |
||||||||||
|
CONSUMER STAPLES - 6.9% |
|||||||||||
|
FOOD, BEVERAGE & TOBACCO - 6.9% |
|||||||||||
|
Nestlé SA (b) |
5,623 |
$ |
435,389 |
||||||||
|
Philip Morris International, Inc. |
3,956 |
319,432 |
|||||||||
|
Diageo PLC (b) |
2,198 |
316,548 |
|||||||||
|
1,071,369 |
|||||||||||
|
HEALTH CARE - 6.8% |
|||||||||||
|
HEALTH CARE EQUIPMENT & SERVICES - 6.2% |
|||||||||||
|
UnitedHealth Group, Inc. |
1,506 |
369,590 |
|||||||||
|
CVS Health Corp. |
4,911 |
316,045 |
|||||||||
|
HCA Healthcare, Inc. |
2,186 |
224,253 |
|||||||||
|
LivaNova PLC (a) |
567 |
56,576 |
|||||||||
|
966,464 |
|||||||||||
|
PHARMACEUTICALS, BIOTECHNOLOGY & LIFE SCIENCES - 0.6% |
|||||||||||
|
Regeneron Pharmaceuticals, Inc. (a) |
271 |
93,527 |
|||||||||
|
1,059,991 |
|||||||||||
|
INDUSTRIALS - 4.9% |
|||||||||||
|
CAPITAL GOODS - 4.2% |
|||||||||||
|
Dover Corp. |
3,545 |
259,457 |
|||||||||
|
Johnson Controls International plc |
5,047 |
168,809 |
|||||||||
|
Arconic, Inc. |
7,096 |
120,701 |
|||||||||
|
Carlisle Cos., Inc. |
560 |
60,632 |
|||||||||
|
WESCO International, Inc. (a) |
682 |
38,919 |
|||||||||
|
648,518 |
|||||||||||
|
TRANSPORTATION - 0.7% |
|||||||||||
|
American Airlines Group, Inc. |
2,907 |
110,335 |
|||||||||
|
758,853 |
|||||||||||
|
ENERGY - 4.6% |
|||||||||||
|
National Oilwell Varco, Inc. |
7,573 |
328,677 |
|||||||||
|
PDC Energy, Inc. (a) |
1,900 |
114,879 |
|||||||||
|
Anadarko Petroleum Corp. |
1,417 |
103,773 |
|||||||||
|
Baker Hughes a GE Co. |
2,682 |
88,570 |
|||||||||
|
Apergy Corp. (a) |
1,772 |
73,992 |
|||||||||
|
709,891 |
|||||||||||
|
MATERIALS - 1.1% |
|||||||||||
|
Glencore PLC |
35,440 |
168,262 |
|||||||||
|
REAL ESTATE - 0.9% |
|||||||||||
|
The Howard Hughes Corp. (a) |
555 |
73,479 |
|||||||||
|
Gaming and Leisure Properties, Inc. REIT |
1,833 |
65,607 |
|||||||||
|
139,086 |
|||||||||||
|
TOTAL COMMON STOCKS - 62.0% (COST $5,659,761) |
9,604,016 |
||||||||||
|
PREFERRED STOCKS - 0.1% |
|||||||||||
|
FINANCIALS - 0.1% |
|||||||||||
|
GMAC Capital Trust I (c), 8.13% (3 mo. USD LIBOR + 5.785%), |
498 |
13,084 |
|||||||||
|
TOTAL PREFERRED STOCKS - 0.1% (COST $13,007) |
13,084 |
||||||||||
Oakmark.com 17
Oakmark Equity and Income Fund June 30, 2018 (Unaudited)
Schedule of Investments (in thousands) (continued)
|
Par Value |
Value |
||||||||||
|
FIXED INCOME - 28.1% |
|||||||||||
|
CORPORATE BONDS - 14.5% |
|||||||||||
|
CONSUMER DISCRETIONARY - 3.8% |
|||||||||||
|
Adient Global Holdings, Ltd., 144A 4.875%, due 08/15/26 (d) |
$ |
7,000 |
$ |
6,282 |
|||||||
|
Amazon.com, Inc. 3.15%, due 08/22/27 |
9,950 |
9,529 |
|||||||||
|
Booking Holdings, Inc. 3.60%, due 06/01/26 |
14,730 |
14,334 |
|||||||||
|
3.55%, due 03/15/28 |
9,950 |
9,471 |
|||||||||
|
2.75%, due 03/15/23 |
6,965 |
6,720 |
|||||||||
|
BorgWarner, Inc. 4.625%, due 09/15/20 |
10,810 |
11,082 |
|||||||||
|
Boyd Gaming Corp, 144A 6.00%, due 08/15/26 (d) |
4,975 |
4,925 |
|||||||||
|
Caesars Resort Collection LLC / CRC Finco, Inc., 144A 5.25%, due 10/15/25 (d) |
25,870 |
24,479 |
|||||||||
|
CCO Holdings LLC / CCO Holdings Capital Corp., 144A 5.125%, due 05/01/27 (d) |
250 |
234 |
|||||||||
|
Charter Communications Operating LLC / Charter Communications Operating Capital 3.579%, due 07/23/20 |
29,148 |
29,111 |
|||||||||
|
4.20%, due 03/15/28 |
9,950 |
9,315 |
|||||||||
|
4.50%, due 02/01/24 |
2,985 |
2,982 |
|||||||||
|
Dana, Inc. 6.00%, due 09/15/23 |
3,925 |
4,053 |
|||||||||
|
Delphi Technologies PLC, 144A 5.00%, due 10/01/25 (d) |
1,000 |
954 |
|||||||||
|
Dollar Tree, Inc. 3.055% (3 mo. USD LIBOR + 0.70%), due 04/17/20 (c) |
6,965 |
6,979 |
|||||||||
|
EMI Music Publishing Group North America Holdings, Inc., 144A 7.625%, due 06/15/24 (d) |
4,910 |
5,313 |
|||||||||
|
Expedia Group, Inc. 5.00%, due 02/15/26 |
28,360 |
28,887 |
|||||||||
|
Foot Locker, Inc. 8.50%, due 01/15/22 |
4,340 |
4,958 |
|||||||||
|
General Motors Co. 4.875%, due 10/02/23 |
41,400 |
42,561 |
|||||||||
|
3.50%, due 10/02/18 |
29,525 |
29,581 |
|||||||||
|
General Motors Financial Co., Inc. 3.50%, due 07/10/19 |
4,975 |
5,000 |
|||||||||
|
3.10%, due 01/15/19 |
4,915 |
4,920 |
|||||||||
|
International Game Technology PLC, 144A 6.50%, due 02/15/25 (d) |
19,600 |
20,237 |
|||||||||
|
6.25%, due 02/15/22 (d) |
14,800 |
15,170 |
|||||||||
|
5.625%, due 02/15/20 (d) |
9,800 |
9,922 |
|||||||||
|
KFC Holding Co/Pizza Hut Holdings LLC/ Taco Bell of America LLC, 144A 5.00%, due 06/01/24 (d) |
1,000 |
987 |
|||||||||
|
5.25%, due 06/01/26 (d) |
1,000 |
985 |
|||||||||
|
Lear Corp. 5.25%, due 01/15/25 |
11,060 |
11,375 |
|||||||||
|
5.375%, due 03/15/24 |
10,512 |
10,904 |
|||||||||
|
Lithia Motors, Inc., 144A 5.25%, due 08/01/25 (d) |
1,990 |
1,940 |
|||||||||
|
Par Value |
Value |
||||||||||
|
Live Nation Entertainment, Inc., 144A 4.875%, due 11/01/24 (d) |
$ |
14,935 |
$ |
14,450 |
|||||||
|
5.625%, due 03/15/26 (d) |
4,975 |
4,938 |
|||||||||
|
5.375%, due 06/15/22 (d) |
2,000 |
2,035 |
|||||||||
|
Marriott International, Inc. 4.00%, due 04/15/28 |
4,975 |
4,858 |
|||||||||
|
Mattel Inc., 144A 6.75%, due 12/31/25 (d) |
4,980 |
4,849 |
|||||||||
|
MGM Resorts International 8.625%, due 02/01/19 |
3,532 |
3,620 |
|||||||||
|
Netflix, Inc. 5.875%, due 02/15/25 |
11,940 |
12,248 |
|||||||||
|
Netflix, Inc., 144A 4.875%, due 04/15/28 (d) |
31,840 |
30,349 |
|||||||||
|
5.875%, due 11/15/28 (d) |
6,965 |
7,033 |
|||||||||
|
Omnicom Group, Inc. / Omnicom Capital, Inc. 3.625%, due 05/01/22 |
30,425 |
30,203 |
|||||||||
|
6.25%, due 07/15/19 |
2,950 |
3,043 |
|||||||||
|
Penn National Gaming, Inc., 144A 5.625%, due 01/15/27 (d) |
9,950 |
9,378 |
|||||||||
|
Penske Automotive Group, Inc. 5.50%, due 05/15/26 |
11,343 |
11,116 |
|||||||||
|
5.375%, due 12/01/24 |
3,580 |
3,517 |
|||||||||
|
Scientific Games International, Inc. 10.00%, due 12/01/22 |
19,665 |
20,982 |
|||||||||
|
Station Casinos LLC, 144A 5.00%, due 10/01/25 (d) |
1,990 |
1,871 |
|||||||||
|
Tapestry, Inc. 3.00%, due 07/15/22 |
12,145 |
11,753 |
|||||||||
|
4.125%, due 07/15/27 |
4,975 |
4,744 |
|||||||||
|
Tempur Sealy International, Inc. 5.50%, due 06/15/26 |
1,965 |
1,901 |
|||||||||
|
The Gap, Inc. 5.95%, due 04/12/21 |
1,965 |
2,058 |
|||||||||
|
The William Carter Co. 5.25%, due 08/15/21 |
36,132 |
36,584 |
|||||||||
|
Tribune Media Co. 5.875%, due 07/15/22 |
1,000 |
1,009 |
|||||||||
|
Under Armour, Inc. 3.25%, due 06/15/26 |
12,565 |
11,276 |
|||||||||
|
Wolverine World Wide, Inc., 144A 5.00%, due 09/01/26 (d) |
12,140 |
11,533 |
|||||||||
|
Yum! Brands, Inc. 3.875%, due 11/01/23 |
6,329 |
6,044 |
|||||||||
|
584,582 |
|||||||||||
|
FINANCIALS - 3.7% |
|||||||||||
|
Aflac, Inc. 2.875%, due 10/15/26 |
980 |
920 |
|||||||||
|
Ally Financial, Inc. 3.75%, due 11/18/19 |
9,940 |
9,928 |
|||||||||
|
4.75%, due 09/10/18 |
4,743 |
4,752 |
|||||||||
|
American Express Credit Corp. 1.875%, due 11/05/18 |
4,915 |
4,904 |
|||||||||
|
2.60%, due 09/14/20 |
2,945 |
2,908 |
|||||||||
|
American International Group, Inc. 3.30%, due 03/01/21 |
14,665 |
14,655 |
|||||||||
|
Aon Corp. 5.00%, due 09/30/20 |
14,745 |
15,258 |
|||||||||
18 OAKMARK FUNDS
Oakmark Equity and Income Fund June 30, 2018 (Unaudited)
Schedule of Investments (in thousands) (continued)
|
Par Value |
Value |
||||||||||
|
FIXED INCOME - 28.1% (continued) |
|||||||||||
|
CORPORATE BONDS - 14.5% (continued) |
|||||||||||
|
FINANCIALS - 3.7% (continued) |
|||||||||||
|
Bank of America Corp. 2.151%, due 11/09/20 |
$ |
6,970 |
$ |
6,809 |
|||||||
|
4.45%, due 03/03/26 |
5,000 |
5,012 |
|||||||||
|
Capital One Bank USA NA 2.15%, due 11/21/18 |
3,768 |
3,761 |
|||||||||
|
Capital One NA 1.85%, due 09/13/19 |
39,255 |
38,701 |
|||||||||
|
2.35%, due 08/17/18 |
5,000 |
4,998 |
|||||||||
|
Citigroup, Inc. 2.45%, due 01/10/20 |
19,910 |
19,686 |
|||||||||
|
3.40%, due 05/01/26 |
15,000 |
14,214 |
|||||||||
|
4.05%, due 07/30/22 |
13,338 |
13,410 |
|||||||||
|
2.05%, due 12/07/18 |
2,098 |
2,094 |
|||||||||
|
CNO Financial Group, Inc. 4.50%, due 05/30/20 |
9,830 |
9,818 |
|||||||||
|
5.25%, due 05/30/25 |
5,895 |
5,851 |
|||||||||
|
Credit Suisse Group AG, 144A 7.50%(USD 5 Year Swap rate + 4.598%) (c) (d) (e) |
30,000 |
30,975 |
|||||||||
|
6.25%(USD 5 Year Swap rate + 3.455%) (c) (d) (e) |
7,000 |
6,843 |
|||||||||
|
Credit Suisse Group Funding Guernsey, Ltd. 3.125%, due 12/10/20 |
25,000 |
24,819 |
|||||||||
|
3.80%, due 06/09/23 |
14,750 |
14,559 |
|||||||||
|
E*TRADE Financial Corp. 2.95%, due 08/24/22 |
6,965 |
6,747 |
|||||||||
|
3.80%, due 08/24/27 |
4,975 |
4,762 |
|||||||||
|
JPMorgan Chase & Co. 2.972%, due 01/15/23 |
29,765 |
28,990 |
|||||||||
|
3.514%(3 mo. USD LIBOR + 0.61%), due 06/18/22 (c) |
24,870 |
24,889 |
|||||||||
|
3.589%(3 mo. USD LIBOR + 1.230%), due 10/24/23 (c) |
19,910 |
20,269 |
|||||||||
|
Moody's Corp. 2.625%, due 01/15/23 |
12,201 |
11,688 |
|||||||||
|
4.50%, due 09/01/22 |
9,820 |
10,148 |
|||||||||
|
5.50%, due 09/01/20 |
3,780 |
3,959 |
|||||||||
|
MSCI, Inc., 144A 5.25%, due 11/15/24 (d) |
24,830 |
25,078 |
|||||||||
|
5.375%, due 05/15/27 (d) |
6,965 |
6,965 |
|||||||||
|
4.75%, due 08/01/26 (d) |
5,925 |
5,732 |
|||||||||
|
5.75%, due 08/15/25 (d) |
2,950 |
3,039 |
|||||||||
|
Principal Life Global Funding II, 144A 2.15%, due 01/10/20 (d) |
19,910 |
19,639 |
|||||||||
|
2.375%, due 11/21/21 (d) |
6,970 |
6,745 |
|||||||||
|
Reinsurance Group of America, Inc. 3.95%, due 09/15/26 |
4,905 |
4,806 |
|||||||||
|
S&P Global, Inc. 4.00%, due 06/15/25 |
17,150 |
17,219 |
|||||||||
|
2.95%, due 01/22/27 |
9,810 |
9,087 |
|||||||||
|
4.40%, due 02/15/26 |
1,970 |
2,020 |
|||||||||
|
3.30%, due 08/14/20 |
1,970 |
1,972 |
|||||||||
|
The Bear Stearns Cos. LLC 4.65%, due 07/02/18 |
8,205 |
8,205 |
|||||||||
|
The Charles Schwab Corp. 3.25%, due 05/21/21 |
19,895 |
19,975 |
|||||||||
|
Par Value |
Value |
||||||||||
|
The Goldman Sachs Group, Inc. 2.35%, due 11/15/21 |
$ |
14,616 |
$ |
14,056 |
|||||||
|
2.30%, due 12/13/19 |
6,970 |
6,897 |
|||||||||
|
3.20%, due 02/23/23 |
7,000 |
6,821 |
|||||||||
|
4.109%(3 mo. USD LIBOR + 1.750%), due 10/28/27 (c) |
2,975 |
3,034 |
|||||||||
|
2.625%, due 04/25/21 |
2,000 |
1,956 |
|||||||||
|
2.875%, due 02/25/21 |
1,000 |
987 |
|||||||||
|
2.55%, due 10/23/19 |
980 |
974 |
|||||||||
|
Voya Financial, Inc. 3.65%, due 06/15/26 |
1,960 |
1,854 |
|||||||||
|
Wells Fargo & Co. 3.069%, due 01/24/23 |
14,930 |
14,519 |
|||||||||
|
3.589%(3 mo. USD LIBOR + 1.230%), due 10/31/23 (c) |
8,603 |
8,777 |
|||||||||
|
Wells Fargo Bank NA 1.80%, due 11/28/18 |
9,900 |
9,868 |
|||||||||
|
2.15%, due 12/06/19 |
9,900 |
9,792 |
|||||||||
|
576,344 |
|||||||||||
|
INFORMATION TECHNOLOGY - 1.8% |
|||||||||||
|
Activision Blizzard, Inc., 144A 6.125%, due 09/15/23 (d) |
70,853 |
73,412 |
|||||||||
|
Avnet, Inc. 4.875%, due 12/01/22 |
8,275 |
8,487 |
|||||||||
|
3.75%, due 12/01/21 |
4,710 |
4,693 |
|||||||||
|
Broadcom Corp. / Broadcom Cayman Finance, Ltd. 3.00%, due 01/15/22 |
14,930 |
14,522 |
|||||||||
|
2.375%, due 01/15/20 |
9,955 |
9,825 |
|||||||||
|
3.625%, due 01/15/24 |
9,955 |
9,636 |
|||||||||
|
3.50%, due 01/15/28 |
4,975 |
4,530 |
|||||||||
|
CDW LLC / CDW Finance Corp. 5.00%, due 09/01/25 |
9,955 |
9,781 |
|||||||||
|
5.00%, due 09/01/23 |
6,965 |
6,971 |
|||||||||
|
CommScope Technologies LLC, 144A 5.00%, due 03/15/27 (d) |
14,438 |
13,590 |
|||||||||
|
CommScope, Inc., 144A 5.50%, due 06/15/24 (d) |
2,985 |
3,000 |
|||||||||
|
5.00%, due 06/15/21 (d) |
995 |
995 |
|||||||||
|
Dell International LLC / EMC Corp., 144A 5.45%, due 06/15/23 (d) |
14,725 |
15,412 |
|||||||||
|
4.42%, due 06/15/21 (d) |
2,940 |
2,983 |
|||||||||
|
Electronic Arts, Inc. 4.80%, due 03/01/26 |
19,655 |
20,614 |
|||||||||
|
3.70%, due 03/01/21 |
14,740 |
14,878 |
|||||||||
|
Itron Inc., 144A 5.00%, due 01/15/26 (d) |
11,035 |
10,480 |
|||||||||
|
Lam Research Corp. 2.75%, due 03/15/20 |
19,660 |
19,545 |
|||||||||
|
2.80%, due 06/15/21 |
4,910 |
4,826 |
|||||||||
|
Motorola Solutions, Inc. 3.75%, due 05/15/22 |
9,950 |
9,918 |
|||||||||
|
4.60%, due 02/23/28 |
2,985 |
2,969 |
|||||||||
|
Symantec Corp., 144A 5.00%, due 04/15/25 (d) |
1,000 |
969 |
|||||||||
|
Tyco Electronics Group SA 3.70%, due 02/15/26 |
9,830 |
9,647 |
|||||||||
|
2.35%, due 08/01/19 |
1,812 |
1,803 |
|||||||||
|
273,486 |
|||||||||||
Oakmark.com 19
Oakmark Equity and Income Fund June 30, 2018 (Unaudited)
Schedule of Investments (in thousands) (continued)
|
Par Value |
Value |
||||||||||
|
FIXED INCOME - 28.1% (continued) |
|||||||||||
|
CORPORATE BONDS - 14.5% (continued) |
|||||||||||
|
HEALTH CARE - 1.8% |
|||||||||||
|
Abbott Laboratories 2.90%, due 11/30/21 |
$ |
16,625 |
$ |
16,364 |
|||||||
|
2.35%, due 11/22/19 |
2,597 |
2,582 |
|||||||||
|
Becton Dickinson and Co. 2.675%, due 12/15/19 |
12,811 |
12,715 |
|||||||||
|
2.133%, due 06/06/19 |
11,828 |
11,770 |
|||||||||
|
3.30%, due 03/01/23 |
11,204 |
10,924 |
|||||||||
|
3.211%(3 mo. USD LIBOR + 0.875%), due 12/29/20 (c) |
9,950 |
9,966 |
|||||||||
|
2.894%, due 06/06/22 |
2,985 |
2,887 |
|||||||||
|
3.363%, due 06/06/24 |
2,985 |
2,867 |
|||||||||
|
Centene Corp. 4.75%, due 05/15/22 |
20,084 |
20,210 |
|||||||||
|
CVS Health Corp. 4.00%, due 12/05/23 |
18,198 |
18,274 |
|||||||||
|
5.00%, due 12/01/24 |
6,880 |
7,161 |
|||||||||
|
4.75%, due 12/01/22 |
6,880 |
7,137 |
|||||||||
|
2.25%, due 08/12/19 |
2,884 |
2,860 |
|||||||||
|
Edwards Lifesciences Corp. 4.30%, due 06/15/28 |
6,965 |
6,954 |
|||||||||
|
Express Scripts Holding Co. 3.30%, due 02/25/21 |
4,915 |
4,897 |
|||||||||
|
HCA, Inc. 6.50%, due 02/15/20 |
9,895 |
10,272 |
|||||||||
|
5.00%, due 03/15/24 |
7,465 |
7,465 |
|||||||||
|
3.75%, due 03/15/19 |
3,965 |
3,980 |
|||||||||
|
4.25%, due 10/15/19 |
1,990 |
2,005 |
|||||||||
|
IQVIA, Inc., 144A 5.00%, due 10/15/26 (d) |
7,800 |
7,595 |
|||||||||
|
Johnson & Johnson 2.90%, due 01/15/28 |
14,925 |
14,245 |
|||||||||
|
McKesson Corp. 3.95%, due 02/16/28 |
2,985 |
2,886 |
|||||||||
|
Quest Diagnostics, Inc. 4.70%, due 04/01/21 |
5,128 |
5,296 |
|||||||||
|
St Jude Medical LLC 2.00%, due 09/15/18 |
13,485 |
13,450 |
|||||||||
|
Thermo Fisher Scientific, Inc. 3.00%, due 04/15/23 |
1,970 |
1,915 |
|||||||||
|
Universal Health Services, Inc., 144A 4.75%, due 08/01/22 (d) |
32,695 |
32,899 |
|||||||||
|
5.00%, due 06/01/26 (d) |
12,805 |
12,469 |
|||||||||
|
3.75%, due 08/01/19 (d) |
6,970 |
6,970 |
|||||||||
|
Zimmer Biomet Holdings, Inc. 3.076%(3 mo. USD LIBOR + 0.750%), due 03/19/21 (c) |
4,975 |
4,983 |
|||||||||
|
3.15%, due 04/01/22 |
3,810 |
3,740 |
|||||||||
|
3.70%, due 03/19/23 |
2,985 |
2,964 |
|||||||||
|
270,702 |
|||||||||||
|
REAL ESTATE - 1.1% |
|||||||||||
|
CBRE Services, Inc. 5.25%, due 03/15/25 |
24,930 |
26,239 |
|||||||||
|
4.875%, due 03/01/26 |
19,665 |
20,349 |
|||||||||
|
Par Value |
Value |
||||||||||
|
GLP Capital, LP / GLP Financing II, Inc. REIT 4.375%, due 11/01/18 |
$ |
39,180 |
$ |
39,211 |
|||||||
|
4.875%, due 11/01/20 |
14,975 |
15,143 |
|||||||||
|
5.375%, due 11/01/23 |
12,000 |
12,255 |
|||||||||
|
5.75%, due 06/01/28 |
4,975 |
5,012 |
|||||||||
|
5.25%, due 06/01/25 |
4,975 |
4,975 |
|||||||||
|
5.375%, due 04/15/26 |
3,925 |
3,886 |
|||||||||
|
4.375%, due 04/15/21 |
1,965 |
1,965 |
|||||||||
|
MGM Growth Properties Operating Partnership, LP / MGP Finance Co-Issuer, Inc. REIT 5.625%, due 05/01/24 |
2,945 |
2,982 |
|||||||||
|
Omega Healthcare Investors, Inc. REIT 4.375%, due 08/01/23 |
15,046 |
14,938 |
|||||||||
|
5.25%, due 01/15/26 |
9,835 |
9,919 |
|||||||||
|
The Howard Hughes Corp., 144A 5.375%, due 03/15/25 (d) |
11,945 |
11,721 |
|||||||||
|
Ventas Realty, LP REIT 3.125%, due 06/15/23 |
2,490 |
2,412 |
|||||||||
|
3.50%, due 02/01/25 |
1,000 |
958 |
|||||||||
|
171,965 |
|||||||||||
|
INDUSTRIALS - 0.9% |
|||||||||||
|
Bacardi, Ltd., 144A 4.45%, due 05/15/25 (d) |
14,900 |
14,849 |
|||||||||
|
BAT Capital Corp., 144A 2.297%, due 08/14/20 (d) |
19,900 |
19,447 |
|||||||||
|
3.557%, due 08/15/27 (d) |
6,965 |
6,480 |
|||||||||
|
CH Robinson Worldwide, Inc. 4.20%, due 04/15/28 |
2,985 |
2,932 |
|||||||||
|
Delta Air Lines, Inc. 3.40%, due 04/19/21 |
11,590 |
11,538 |
|||||||||
|
3.80%, due 04/19/23 |
1,990 |
1,966 |
|||||||||
|
Hilton Domestic Operating Co., Inc., 144A 5.125%, due 05/01/26 (d) |
14,925 |
14,664 |
|||||||||
|
IHS Markit, Ltd., 144A 4.75%, due 02/15/25 (d) |
100 |
99 |
|||||||||
|
Southwest Airlines Co. 2.65%, due 11/05/20 |
12,148 |
11,984 |
|||||||||
|
Stanley Black & Decker, Inc. 2.451%, due 11/17/18 |
6,875 |
6,866 |
|||||||||
|
Union Pacific Corp. 3.75%, due 07/15/25 |
9,950 |
9,942 |
|||||||||
|
3.20%, due 06/08/21 |
6,965 |
6,986 |
|||||||||
|
3.50%, due 06/08/23 |
6,965 |
6,970 |
|||||||||
|
USG Corp., 144A 4.875%, due 06/01/27 (d) |
6,965 |
7,122 |
|||||||||
|
Welbilt, Inc. 9.50%, due 02/15/24 |
4,915 |
5,413 |
|||||||||
|
WESCO Distribution, Inc. 5.375%, due 06/15/24 |
13,675 |
13,436 |
|||||||||
|
5.375%, due 12/15/21 |
5,305 |
5,404 |
|||||||||
|
146,098 |
|||||||||||
|
CONSUMER STAPLES - 0.7% |
|||||||||||
|
Diageo Capital PLC 3.875%, due 05/18/28 |
5,000 |
5,042 |
|||||||||
|
3.00%, due 05/18/20 |
5,000 |
5,007 |
|||||||||
|
3.50%, due 09/18/23 |
4,800 |
4,816 |
|||||||||
|
General Mills, Inc. 4.00%, due 04/17/25 |
1,990 |
1,960 |
|||||||||
20 OAKMARK FUNDS
Oakmark Equity and Income Fund June 30, 2018 (Unaudited)
Schedule of Investments (in thousands) (continued)
|
Par Value |
Value |
||||||||||
|
FIXED INCOME - 28.1% (continued) |
|||||||||||
|
CORPORATE BONDS - 14.5% (continued) |
|||||||||||
|
CONSUMER STAPLES - 0.7% (continued) |
|||||||||||
|
Kraft Heinz Foods Co, 144A 4.875%, due 02/15/25 (d) |
$ |
6,260 |
$ |
6,382 |
|||||||
|
Kraft Heinz Foods Co. 2.00%, due 07/02/18 |
34,173 |
34,173 |
|||||||||
|
Mead Johnson Nutrition Co. 4.125%, due 11/15/25 |
13,955 |
14,217 |
|||||||||
|
3.00%, due 11/15/20 |
6,885 |
6,851 |
|||||||||
|
Mondelez International Holdings Netherlands BV, 144A 2.00%, due 10/28/21 (d) |
8,585 |
8,191 |
|||||||||
|
1.625%, due 10/28/19 (d) |
7,764 |
7,630 |
|||||||||
|
Post Holdings, Inc., 144A 5.00%, due 08/15/26 (d) |
2,000 |
1,865 |
|||||||||
|
5.50%, due 03/01/25 (d) |
500 |
488 |
|||||||||
|
5.75%, due 03/01/27 (d) |
500 |
485 |
|||||||||
|
Smithfield Foods, Inc., 144A 2.70%, due 01/31/20 (d) |
6,420 |
6,328 |
|||||||||
|
3.35%, due 02/01/22 (d) |
4,975 |
4,804 |
|||||||||
|
2.65%, due 10/03/21 (d) |
3,980 |
3,792 |
|||||||||
|
4.25%, due 02/01/27 (d) |
995 |
957 |
|||||||||
|
112,988 |
|||||||||||
|
ENERGY - 0.4% |
|||||||||||
|
Apergy Corp., 144A 6.375%, due 05/01/26 (d) |
4,975 |
5,056 |
|||||||||
|
Cameron International Corp. 6.375%, due 07/15/18 |
2,375 |
2,378 |
|||||||||
|
Cenovus Energy, Inc. 5.70%, due 10/15/19 |
9,470 |
9,712 |
|||||||||
|
Oceaneering International, Inc. 4.65%, due 11/15/24 |
5,895 |
5,631 |
|||||||||
|
Schlumberger Holdings Corp., 144A 2.35%, due 12/21/18 (d) |
14,740 |
14,711 |
|||||||||
|
4.00%, due 12/21/25 (d) |
9,830 |
9,797 |
|||||||||
|
Weatherford International LLC, 144A 9.875%, due 03/01/25 (d) |
9,950 |
10,000 |
|||||||||
|
57,285 |
|||||||||||
|
TELECOMMUNICATION SERVICES - 0.2% |
|||||||||||
|
AT&T, Inc. 5.00%, due 03/01/21 |
16,710 |
17,323 |
|||||||||
|
Zayo Group LLC / Zayo Capital, Inc. 6.00%, due 04/01/23 |
14,745 |
15,003 |
|||||||||
|
32,326 |
|||||||||||
|
MATERIALS - 0.1% |
|||||||||||
|
Glencore Funding LLC, 144A 3.00%, due 10/27/22 (d) |
9,950 |
9,536 |
|||||||||
|
3.875%, due 10/27/27 (d) |
9,950 |
9,195 |
|||||||||
|
18,731 |
|||||||||||
|
COMMUNICATIONS - 0.0% (f) |
|||||||||||
|
Discovery Communications LLC, 144A 2.80%, due 06/15/20 (d) |
3,930 |
3,882 |
|||||||||
|
Total Corporate Bonds (Cost $2,260,345) |
2,248,389 |
||||||||||
|
Par Value |
Value |
||||||||||
|
GOVERNMENT AND AGENCY SECURITIES - 13.5% |
|||||||||||
|
U.S. GOVERNMENT NOTES - 13.2% |
|||||||||||
|
United States Treasury Bonds (TIPS) 1.25%, due 07/15/20 |
$ |
482,226 |
$ |
490,070 |
|||||||
|
1.375%, due 07/15/18 |
436,220 |
436,811 |
|||||||||
|
2.125%, due 01/15/19 |
232,639 |
234,411 |
|||||||||
|
United States Treasury Notes 1.00%, due 09/15/18 |
199,000 |
198,618 |
|||||||||
|
1.625%, due 04/30/19 |
199,000 |
197,857 |
|||||||||
|
1.375%, due 12/15/19 |
99,500 |
97,941 |
|||||||||
|
1.25%, due 11/30/18 |
73,725 |
73,472 |
|||||||||
|
2.00%, due 11/30/22 |
74,625 |
72,427 |
|||||||||
|
1.75%, due 03/31/22 |
74,645 |
72,172 |
|||||||||
|
1.875%, due 11/30/21 |
49,785 |
48,519 |
|||||||||
|
2.125%, due 12/31/22 |
49,745 |
48,496 |
|||||||||
|
1.50%, due 11/30/19 |
24,875 |
24,540 |
|||||||||
|
2.125%, due 01/31/21 |
24,570 |
24,277 |
|||||||||
|
1.75%, due 10/31/20 |
24,570 |
24,110 |
|||||||||
|
2,043,721 |
|||||||||||
|
U.S. GOVERNMENT AGENCIES - 0.3% |
|||||||||||
|
Federal National Mortgage Association, 1.25%, due 09/27/18 |
24,680 |
24,636 |
|||||||||
|
Federal Farm Credit Banks, 1.68%, due 08/16/21 |
17,165 |
16,586 |
|||||||||
|
41,222 |
|||||||||||
|
Total Government and Agency Securities (Cost $2,087,691) |
2,084,943 |
||||||||||
|
CONVERTIBLE BOND - 0.1% |
|||||||||||
|
Chesapeake Energy Corp., 5.50%, due 09/15/26 (Cost $14,492) |
14,915 |
15,158 |
|||||||||
|
TOTAL FIXED INCOME - 28.1% (COST $4,362,528) |
4,348,490 |
||||||||||
|
SHORT-TERM INVESTMENTS - 9.7% |
|||||||||||
|
COMMERCIAL PAPER - 7.4% |
|||||||||||
|
General Mills, Inc., 144A, 2.13% - 2.29%, due 07/02/18 - 07/24/18 (d) (g) |
333,490 |
333,227 |
|||||||||
|
Walgreens Boots, 2.23% - 2.65%, due 07/02/18 - 08/08/18 (g) |
147,900 |
147,723 |
|||||||||
|
Schlumberger Holdings Corp., 144A, 2.29% - 2.55%, due 07/19/18 - 08/27/18 (d) (g) |
123,550 |
123,284 |
|||||||||
|
Campbell Soup Co., 144A, 2.25% - 2.5%, due 07/03/18 - 08/31/18 (d) (g) |
109,750 |
109,585 |
|||||||||
|
MetLife Short Term Funding LLC, 144A, 2.03% - 2.14%, due 07/09/18 - 08/07/18 (d) (g) |
95,000 |
94,867 |
|||||||||
|
Kellogg Co., 144A, 2.18% - 2.25%, due 07/02/18 - 07/06/18 (d) (g) |
86,124 |
86,107 |
|||||||||
|
Abbvie, Inc., 144A, 2.23%, due 07/10/18 - 07/11/18 (d) (g) |
74,750 |
74,708 |
|||||||||
Oakmark.com 21
Oakmark Equity and Income Fund June 30, 2018 (Unaudited)
Schedule of Investments (in thousands) (continued)
|
Par Value |
Value |
||||||||||
|
SHORT-TERM INVESTMENTS - 9.7% (continued) |
|||||||||||
|
COMMERCIAL PAPER - 7.4% (continued) |
|||||||||||
|
Toyota Motor Credit Corp., 2.05% - 2.07%, due 08/03/18 - 08/08/18 (g) |
$ |
74,620 |
$ |
74,474 |
|||||||
|
John Deere Capital Co., 144A, 2.03%, due 07/20/18 - 07/26/18 (d) (g) |
67,470 |
67,385 |
|||||||||
|
Anthem, Inc., 144A, 2.29% - 2.34%, due 07/18/18 - 07/20/18 (d) (g) |
29,850 |
29,815 |
|||||||||
|
Total Commercial Paper (Cost $1,141,185) |
1,141,175 |
||||||||||
|
GOVERNMENT AND AGENCY SECURITIES - 1.5% |
|||||||||||
|
Federal National Mortgage Association, 1.78%, due 07/02/18 (g) (Cost $224,989) |
225,000 |
224,989 |
|||||||||
|
REPURCHASE AGREEMENT - 0.6% |
|||||||||||
|
Fixed Income Clearing Corp. Repurchase Agreement, 1.10% dated 06/29/18 due 07/02/18, repurchase price $95,051, collateralized by a Federal Home Loan Mortgage Corp., 2.500%, due 04/23/20 and a United States Treasury Note, 1.375%, due 03/31/20, aggregate value plus accrued interest of $96,948 (Cost: $95,043) |
95,043 |
95,043 |
|||||||||
|
CORPORATE BONDS - 0.2% |
|||||||||||
|
CONSUMER DISCRETIONARY - 0.1% |
|||||||||||
|
Expedia, Inc., 7.456%, due 08/15/18 |
14,752 |
14,853 |
|||||||||
|
HEALTH CARE - 0.1% |
|||||||||||
|
CVS Health Corp., 1.90%, due 07/20/18 |
21,990 |
21,985 |
|||||||||
|
Total Corporate Bonds (Cost $36,838) |
36,838 |
||||||||||
|
TOTAL SHORT-TERM INVESTMENTS - 9.7% (COST $1,498,055) |
1,498,045 |
||||||||||
|
TOTAL INVESTMENTS - 99.9% (COST $11,533,351) |
15,463,635 |
||||||||||
|
Foreign Currencies - 0.0% (f) |
0 |
(h) |
|||||||||
|
Other Assets In Excess of Liabilities - 0.1% |
16,014 |
||||||||||
|
NET ASSETS - 100.0% |
$ |
15,479,649 |
|||||||||
Securities of aggregate value of $168,262 were valued at a fair value in accordance with procedures established by the Board of Trustees (in thousands).
(a) Non-income producing security
(b) Sponsored American Depositary Receipt
(c) Floating Rate Note. Rate shown is as of June 30, 2018.
(d) These securities may be resold subject to restrictions on resale under federal securities law.
(e) Security is perpetual and has no stated maturity date.
(f) Amount rounds to less than 0.1%.
(g) The rate shown represents the annualized yield at the time of purchase; not a coupon rate.
(h) Amount rounds to less than $1,000.
Abbreviations:
REIT: Real Estate Investment Trust
22 OAKMARK FUNDS

This page intentionally left blank.
Oakmark.com 23
Oakmark Global Fund June 30, 2018
Summary Information
VALUE OF A $10,000 INVESTMENT
Since Inception - 08/04/99 (Unaudited)
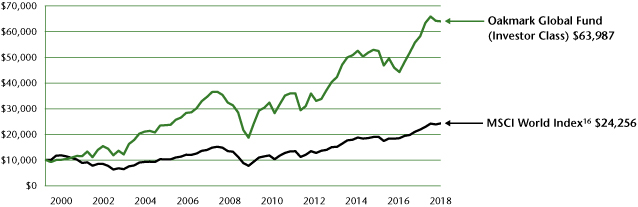
PERFORMANCE
|
Average Annual Total Returns (as of 06/30/18) |
|||||||||||||||||||||||||||||||
| (Unaudited) |
Total Return Last 3 Months |
1-year |
3-year |
5-year |
10-year |
Since Inception |
Inception Date |
||||||||||||||||||||||||
|
Oakmark Global Fund (Investor Class) |
-0.31 |
% |
9.99 |
% |
6.86 |
% |
8.63 |
% |
7.42 |
% |
10.32 |
% |
08/04/99 |
||||||||||||||||||
|
MSCI World Index |
1.73 |
% |
11.09 |
% |
8.48 |
% |
9.94 |
% |
6.26 |
% |
4.80 |
% |
|||||||||||||||||||
|
Lipper Global Fund Index17 |
0.36 |
% |
8.88 |
% |
7.77 |
% |
9.32 |
% |
6.11 |
% |
5.46 |
% |
|||||||||||||||||||
|
Oakmark Global Fund (Advisor Class) |
-0.28 |
% |
10.07 |
% |
N/A |
N/A |
N/A |
16.61 |
% |
11/30/16 |
|||||||||||||||||||||
|
Oakmark Global Fund (Institutional Class) |
-0.28 |
% |
10.15 |
% |
N/A |
N/A |
N/A |
16.69 |
% |
11/30/16 |
|||||||||||||||||||||
|
Oakmark Global Fund (Service Class) |
-0.41 |
% |
9.66 |
% |
6.52 |
% |
8.27 |
% |
7.05 |
% |
10.43 |
% |
10/10/01 |
||||||||||||||||||
The graph and table do not reflect the deduction of taxes that a shareholder would pay on Fund distributions or the redemption of Fund shares.
Past performance is no guarantee of future results. The performance data quoted represents past performance. Current performance may be lower or higher than the performance data quoted. Total return includes change in share prices and, in each case, includes reinvestment of dividends and capital gain distributions. The investment return and principal value vary so that an investor's shares when redeemed may be worth more or less than the original cost. To obtain the most recent month-end performance, please visit Oakmark.com.
|
TOP TEN EQUITY HOLDINGS10 |
% of Net Assets | ||||||
|
Alphabet, Inc., Class C |
4.8 |
||||||
|
Daimler AG |
4.4 |
||||||
|
Lloyds Banking Group PLC |
4.4 |
||||||
|
Bank of America Corp. |
4.2 |
||||||
|
General Motors Co. |
4.2 |
||||||
|
MasterCard, Inc., Class A |
4.1 |
||||||
|
TE Connectivity, Ltd. |
4.1 |
||||||
|
Allianz SE |
4.0 |
||||||
|
Citigroup, Inc. |
3.9 |
||||||
|
Credit Suisse Group AG |
3.5 |
||||||
|
FUND STATISTICS |
|||||||
|
Ticker* |
OAKGX |
||||||
|
Number of Equity Holdings |
42 |
||||||
|
Net Assets |
$2.4 billion | ||||||
|
Weighted Average Market Cap |
$104.5 billion | ||||||
|
Median Market Cap |
$29.5 billion | ||||||
|
Gross Expense Ratio - Investor Class (as of 09/30/17)* |
1.21% | ||||||
|
Net Expense Ratio - Investor Class (as of 09/30/17)*† |
1.15% | ||||||
* This information is related to the Investor Class. Please visit Oakmark.com for information related to the Advisor, Institutional and Service Classes.
† The net expense ratio reflects a contractual advisory fee waiver agreement through January 28, 2019.
|
SECTOR ALLOCATION |
% of Net Assets | ||||||
|
Consumer Discretionary |
28.7 |
||||||
|
Financials |
23.6 |
||||||
|
Information Technology |
19.1 |
||||||
|
Industrials |
12.9 |
||||||
|
Materials |
5.4 |
||||||
|
Health Care |
4.4 |
||||||
|
Energy |
2.1 |
||||||
|
Consumer Staples |
1.3 |
||||||
|
Short-Term Investments and Other |
2.5 |
||||||
|
GEOGRAPHIC ALLOCATION |
|||||||
|
% of Equity |
|||||||
|
North America |
47.9 |
||||||
|
United States |
47.9 |
||||||
|
Europe |
37.3 |
||||||
|
United Kingdom |
15.6 |
||||||
|
Germany* |
11.5 |
||||||
|
Switzerland |
10.2 |
||||||
|
Asia |
6.1 |
||||||
|
Japan |
4.2 |
||||||
|
India |
1.0 |
||||||
|
% of Equity |
|||||||
|
Asia (cont'd) |
6.1 |
||||||
|
China |
0.9 |
||||||
|
Africa |
3.2 |
||||||
|
South Africa |
3.2 |
||||||
|
Australasia |
3.0 |
||||||
|
Australia |
3.0 |
||||||
|
Latin America |
2.5 |
||||||
|
Mexico |
2.5 |
||||||
* Euro currency countries comprise 11.5% of equity investments.
See accompanying Disclosures and Endnotes on page 47.
24 OAKMARK FUNDS
Oakmark Global Fund June 30, 2018
Portfolio Manager Commentary


David G. Herro, CFA
Portfolio Manager
oakgx@oakmark.com
Clyde S. McGregor, CFA
Portfolio Manager
oakgx@oakmark.com
Anthony P. Coniaris, CFA
Portfolio Manager
oakgx@oakmark.com
Jason E. Long, CFA
Portfolio Manager
oakgx@oakmark.com
Private Versus Public Equity
A recent Wall Street Journal article discussed the current strength of the private equity market where secondhand stakes in private equity funds are being sold for 10-35% premiums (as opposed to the more typical discount) to most recent portfolio valuations.18 This had us thinking, wouldn't it be nice...
As you know, our process applies a private equity approach to public markets—like private equity, we value businesses based on our estimate of their intrinsic value, buy them at a substantial discount and then later sell when they are fully valued. Unlike private equity, however, we don't mark our portfolio companies based on where peers trade or our estimate of the long-term fundamental outlook of the business—we mark according to current public stock prices no matter how different than an arguably better representation of fair value. (If we did, the value of the Fund would be far higher than the current stock prices dictate.) Furthermore, we give daily liquidity to our investors and we certainly never demand a premium to invest in our portfolio. So for instance, if an investor were to buy a portfolio of publicly traded businesses valued at 60 cents on the dollar and that portfolio were to get marketed to fair value and sold for an additional 20% premium, the return would be an instantaneous 100%. Wouldn't it be nice, indeed!
Performance
The Oakmark Global Fund's three-month return declined 0.3%, compared to a 1.7% return for the MSCI World Index16 during the period and the Lipper Global Fund Index's17 gain of 0.4%. Calendar year to date, the Fund returned –2.9%, versus a 0.4% return for the MSCI World Index and –0.7% for the Lipper Global Fund Index. Since inception, the Fund has achieved a compound annual return of 10.3% vs. 4.8% for the MSCI World Index and 5.5% for the Lipper Global Fund Index.
Holdings in the U.S., Mexico and China contributed the most to the Fund's return in the quarter, while holdings in Germany, the U.K. and Switzerland were the largest detractors. The five largest individual contributors during the quarter were Tenet Healthcare (+38%), Mastercard (+12%), Grupo Televisa (+19%), General Motors (+9%) and Alphabet (+8%). The five largest detractors were Daimler (–21%), CNH Industrial (–13%), TE Connectivity (–9%), Arconic (–26%) and Credit Suisse Group (–8%).
Calendar year to date, holdings in the U.S., China and Mexico contributed the most to the Fund's return, while holdings in the U.K., Germany and Switzerland were the largest detractors.
The leading contributors were Tenet Healthcare (+121%), Mastercard (+30%), Interpublic Group (+18%), National Oilwell Varco (+21%) and Under Armour (+58%). The leading detractors were Daimler (–21%), CNH Industrial (–20%), Arconic (–37%), Credit Suisse (–14%) and Liberty Global, Class C (–21%).
Portfolio Activity
We initiated two entirely new positions during the quarter—Southwest Airlines and Reckitt Benckiser—and eliminated only one holding, Phillips, due to its price. We also added Liberty Broadband and sold our high-cost Charter shares to generate a tax loss. This enabled us to maintain exposure to Charter as Liberty Broadband has the preponderance of its value in Charter shares.
Southwest Airlines Co. (LUV)
LUV is the largest and most profitable airline in the U.S. with 24% total domestic market share and 66% share in its top 100 city pairs. LUV has been profitable for 45 consecutive years, despite competing in an industry that has been littered with bankruptcies. The company has been on Fortune's list of "World's Most Admired Companies" every year for nearly a quarter of a century. LUV's brand recognition and strong customer loyalty stem from its outstanding service, efficient operations and refusal to nickel-and-dime on fees. The company's above-average operating margins are enabled by a lower cost model compared to network carriers. LUV has a strong balance sheet and returns most of its free cash flow to shareholders through significant share repurchases and dividends. Despite these positive characteristics, we were able to purchase the shares at only a mid-single digit multiple of normal operating income due to short-term pressure from the run-up in fuel prices and the suspension of marketing following the recent passenger fatality.
Reckitt Benckiser (RB)
RB is a leading global consumer products company with $15 billion of sales in 2017 and strong brands in health, infant nutrition, home care and hygiene. RB has successfully expanded its presence in high-value health products categories and increased its operating profitability via premiumization and excellent cost discipline. RB's historical best-in-class performance can in part be attributed to its significant insider ownership: the CEO and CFO are required to own shares worth more than 40 times and 20 times their salaries, respectively. RB's share price recently declined due to transitory factors as well as weakness in its relatively small home care division.
See accompanying Disclosures and Endnotes on page 47.
Oakmark.com 25
Oakmark Global Fund June 30, 2018
Portfolio Manager Commentary (continued)
Management is restructuring the home care division to provide greater accountability and may sell the division to an owner who can extract greater operational synergies. Moreover, many of the transitory factors affecting the share price are expected to disappear in fiscal year 2019. Therefore, in our view, the current share price does not reflect the company's strong underlying value or its potential for increased profits, so we initiated a position in RB during the past quarter.
We thank you for being our partners in the Oakmark Global Fund, and, as always, we invite your comments and questions.
See accompanying Disclosures and Endnotes on page 47.
26 OAKMARK FUNDS
Oakmark Global Fund June 30, 2018 (Unaudited)
Schedule of Investments (in thousands)
|
Shares |
Value |
||||||||||
|
COMMON STOCKS - 97.5% |
|||||||||||
|
CONSUMER DISCRETIONARY - 28.7% |
|||||||||||
|
MEDIA - 14.0% |
|||||||||||
|
Naspers, Ltd. (South Africa) |
298 |
$ |
75,073 |
||||||||
|
The Interpublic Group of Cos., Inc. (United States) |
2,549 |
59,748 |
|||||||||
|
Grupo Televisa SAB (Mexico) (a) |
2,999 |
56,838 |
|||||||||
|
Liberty Global PLC, Class C (United Kingdom) (b) |
1,705 |
45,375 |
|||||||||
|
Liberty Global PLC, Class A (United Kingdom) (b) |
1,026 |
28,253 |
|||||||||
|
Live Nation Entertainment, Inc. (United States) (b) |
558 |
27,118 |
|||||||||
|
Liberty Broadband Corp., Class C (United States) (b) |
300 |
22,716 |
|||||||||
|
Charter Communications, Inc., Class A (United States) (b) |
67 |
19,616 |
|||||||||
|
334,737 |
|||||||||||
|
AUTOMOBILES & COMPONENTS - 11.1% |
|||||||||||
|
Daimler AG (Germany) |
1,628 |
104,304 |
|||||||||
|
General Motors Co. (United States) |
2,515 |
99,099 |
|||||||||
|
Toyota Motor Corp. (Japan) |
934 |
60,401 |
|||||||||
|
263,804 |
|||||||||||
|
CONSUMER DURABLES & APPAREL - 2.3% |
|||||||||||
|
Cie Financiere Richemont SA (Switzerland) |
398 |
33,611 |
|||||||||
|
Under Armour, Inc., Class C (United States) (b) |
1,023 |
21,571 |
|||||||||
|
55,182 |
|||||||||||
|
RETAILING - 1.3% |
|||||||||||
|
CarMax, Inc. (United States) (b) |
431 |
31,436 |
|||||||||
|
685,159 |
|||||||||||
|
FINANCIALS - 23.6% |
|||||||||||
|
BANKS - 13.5% |
|||||||||||
|
Lloyds Banking Group PLC (United Kingdom) |
125,689 |
104,286 |
|||||||||
|
Bank of America Corp. (United States) |
3,553 |
100,153 |
|||||||||
|
Citigroup, Inc. (United States) |
1,406 |
94,076 |
|||||||||
|
Axis Bank, Ltd. (India) |
3,257 |
24,319 |
|||||||||
|
322,834 |
|||||||||||
|
DIVERSIFIED FINANCIALS - 6.1% |
|||||||||||
|
Credit Suisse Group AG (Switzerland) |
5,593 |
83,637 |
|||||||||
|
Julius Baer Group, Ltd. (Switzerland) |
1,057 |
61,899 |
|||||||||
|
145,536 |
|||||||||||
|
INSURANCE - 4.0% |
|||||||||||
|
Allianz SE (Germany) |
464 |
95,614 |
|||||||||
|
563,984 |
|||||||||||
|
Shares |
Value |
||||||||||
|
INFORMATION TECHNOLOGY - 19.1% |
|||||||||||
|
SOFTWARE & SERVICES - 13.4% |
|||||||||||
|
Alphabet, Inc., Class C (United States) (b) |
103 |
$ |
114,649 |
||||||||
|
MasterCard, Inc., Class A (United States) |
502 |
98,732 |
|||||||||
|
Oracle Corp. (United States) |
1,327 |
58,463 |
|||||||||
|
CoreLogic, Inc. (United States) (b) |
524 |
27,185 |
|||||||||
|
Baidu, Inc. (China) (a) (b) |
86 |
20,808 |
|||||||||
|
319,837 |
|||||||||||
|
TECHNOLOGY HARDWARE & EQUIPMENT - 5.7% |
|||||||||||
|
TE Connectivity, Ltd. (United States) |
1,093 |
98,417 |
|||||||||
|
Hirose Electric Co., Ltd. (Japan) |
293 |
36,225 |
|||||||||
|
134,642 |
|||||||||||
|
454,479 |
|||||||||||
|
INDUSTRIALS - 12.9% |
|||||||||||
|
CAPITAL GOODS - 12.4% |
|||||||||||
|
CNH Industrial N.V. (United Kingdom) |
7,792 |
82,312 |
|||||||||
|
Travis Perkins PLC (United Kingdom) |
3,876 |
72,635 |
|||||||||
|
USG Corp. (United States) (b) |
1,085 |
46,795 |
|||||||||
|
Arconic, Inc. (United States) |
2,301 |
39,132 |
|||||||||
|
Johnson Controls International plc (United States) |
1,159 |
38,759 |
|||||||||
|
MTU Aero Engines AG (Germany) |
84 |
16,070 |
|||||||||
|
295,703 |
|||||||||||
|
TRANSPORTATION - 0.5% |
|||||||||||
|
Southwest Airlines Co. (United States) |
255 |
12,995 |
|||||||||
|
308,698 |
|||||||||||
|
MATERIALS - 5.4% |
|||||||||||
|
Incitec Pivot, Ltd. (Australia) |
26,378 |
70,772 |
|||||||||
|
LafargeHolcim, Ltd. (Switzerland) |
1,167 |
56,764 |
|||||||||
|
127,536 |
|||||||||||
|
HEALTH CARE - 4.4% |
|||||||||||
|
HEALTH CARE EQUIPMENT & SERVICES - 2.3% |
|||||||||||
|
Tenet Healthcare Corp. (United States) (b) |
1,628 |
54,642 |
|||||||||
|
PHARMACEUTICALS, BIOTECHNOLOGY & LIFE SCIENCES - 2.1% |
|||||||||||
|
Bayer AG (Germany) |
468 |
51,352 |
|||||||||
|
105,994 |
|||||||||||
|
ENERGY - 2.1% |
|||||||||||
|
National Oilwell Varco, Inc. (United States) |
1,142 |
49,541 |
|||||||||
|
CONSUMER STAPLES - 1.3% |
|||||||||||
|
FOOD, BEVERAGE & TOBACCO - 0.9% |
|||||||||||
|
Diageo PLC (United Kingdom) |
603 |
21,678 |
|||||||||
|
HOUSEHOLD & PERSONAL PRODUCTS - 0.4% |
|||||||||||
|
Reckitt Benckiser Group PLC (United Kingdom) |
102 |
8,414 |
|||||||||
|
30,092 |
|||||||||||
|
TOTAL COMMON STOCKS - 97.5% (COST $1,785,383) |
2,325,483 |
||||||||||
Oakmark.com 27
Oakmark Global Fund June 30, 2018 (Unaudited)
Schedule of Investments (in thousands) (continued)
|
Par Value |
Value |
||||||||||
|
SHORT-TERM INVESTMENT - 2.3% |
|||||||||||
|
REPURCHASE AGREEMENT - 2.3% |
|||||||||||
|
Fixed Income Clearing Corp. Repurchase Agreement, 1.10% dated 06/29/18 due 07/02/18, repurchase price $55,185, collateralized by a Federal Home Loan Mortgage Corp., 2.500% due 04/23/20, and a United States Treasury Note, 1.375 due 05/31/20, aggregate value plus accrued interest of $56,288 (Cost: $55,179) |
$ |
55,179 |
$ |
55,179 |
|||||||
|
TOTAL SHORT-TERM INVESTMENTS - 2.3% (COST $55,179) |
55,179 |
||||||||||
|
TOTAL INVESTMENTS - 99.8% (COST $1,840,562) |
2,380,662 |
||||||||||
|
Foreign Currencies (Cost $0) - 0.0% (c) |
0 |
(d) |
|||||||||
|
Other Assets In Excess of Liabilities - 0.2% |
4,907 |
||||||||||
|
TOTAL NET ASSETS - 100.0% |
$ |
2,385,569 |
|||||||||
Securities of aggregate value of $1,059,366 were valued at a fair value in accordance with procedures established by the Board of Trustees (in thousands).
(a) Sponsored American Depositary Receipt
(b) Non-income producing security
(c) Amount rounds to less than 0.1%.
(d) Amount rounds to less than $1,000.
28 OAKMARK FUNDS
Oakmark Global Fund June 30, 2018 (Unaudited)
Schedule of Investments (in thousands) (continued)
FORWARD FOREIGN CURRENCY CONTRACT
|
Local Contract Amount |
Base Contract Amount |
Settlement Date |
Valuation at 6/30/18 |
Unrealized Appreciation/ (Depreciation) |
|||||||||||||||||||
|
Foreign Currency Sold: |
|||||||||||||||||||||||
|
Swiss Franc |
59,915 |
$ |
63,782 |
09/19/18 |
$ |
60,927 |
$ |
2,855 |
|||||||||||||||
|
$ |
60,927 |
$ |
2,855 |
||||||||||||||||||||
Oakmark.com 29
Oakmark Global Select Fund June 30, 2018
Summary Information
VALUE OF A $10,000 INVESTMENT
Since Inception - 10/02/06 (Unaudited)
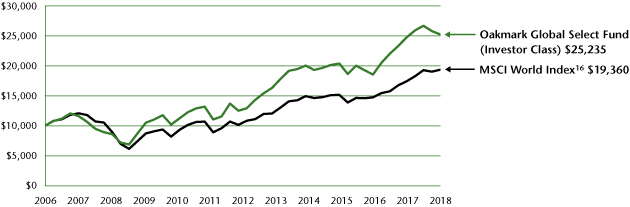
PERFORMANCE
|
Average Annual Total Returns (as of 06/30/18) |
|||||||||||||||||||||||||||||||
| (Unaudited) |
Total Return Last 3 Months |
1-year |
3-year |
5-year |
10-year |
Since Inception |
Inception Date |
||||||||||||||||||||||||
|
Oakmark Global Select Fund (Investor Class) |
-2.20 |
% |
1.97 |
% |
7.36 |
% |
9.10 |
% |
10.93 |
% |
8.20 |
% |
10/02/06 |
||||||||||||||||||
|
MSCI World Index |
1.73 |
% |
11.09 |
% |
8.48 |
% |
9.94 |
% |
6.26 |
% |
5.79 |
% |
|||||||||||||||||||
|
Lipper Global Fund Index17 |
0.36 |
% |
8.88 |
% |
7.77 |
% |
9.32 |
% |
6.11 |
% |
5.64 |
% |
|||||||||||||||||||
|
Oakmark Global Select Fund (Advisor Class) |
-2.14 |
% |
2.07 |
% |
N/A |
N/A |
N/A |
10.90 |
% |
11/30/16 |
|||||||||||||||||||||
|
Oakmark Global Select Fund (Institutional Class) |
-2.14 |
% |
2.17 |
% |
N/A |
N/A |
N/A |
10.96 |
% |
11/30/16 |
|||||||||||||||||||||
The graph and table do not reflect the deduction of taxes that a shareholder would pay on Fund distributions or the redemption of Fund shares.
Past performance is no guarantee of future results. The performance data quoted represents past performance. Current performance may be lower or higher than the performance data quoted. Total return includes change in share prices and, in each case, includes reinvestment of dividends and capital gain distributions. The investment return and principal value vary so that an investor's shares when redeemed may be worth more or less than the original cost. To obtain the most recent month-end performance, please visit Oakmark.com.
|
TOP TEN EQUITY HOLDINGS10 |
% of Net Assets | ||||||
|
Lloyds Banking Group PLC |
7.3 |
||||||
|
CNH Industrial N.V. |
6.5 |
||||||
|
Daimler AG |
6.4 |
||||||
|
MasterCard, Inc., Class A |
5.9 |
||||||
|
Alphabet, Inc., Class C |
5.8 |
||||||
|
TE Connectivity, Ltd. |
5.5 |
||||||
|
Bank of America Corp. |
5.4 |
||||||
|
Credit Suisse Group AG |
5.1 |
||||||
|
Citigroup, Inc. |
5.0 |
||||||
|
Charter Communications, Inc., Class A |
4.9 |
||||||
|
FUND STATISTICS |
|||||||
|
Ticker* |
OAKWX |
||||||
|
Number of Equity Holdings |
21 |
||||||
|
Net Assets |
$2.7 billion | ||||||
|
Weighted Average Market Cap |
$128.6 billion | ||||||
|
Median Market Cap |
$58.2 billion | ||||||
|
Gross Expense Ratio - Investor Class (as of 09/30/17)* |
1.19% | ||||||
|
Net Expense Ratio - Investor Class (as of 09/30/17)*† |
1.12% | ||||||
* This information is related to the Investor Class. Please visit Oakmark.com for information related to the Advisor, Institutional and Service Classes.
† The net expense ratio reflects a contractual advisory fee waiver agreement through January 28, 2019.
|
SECTOR ALLOCATION |
% of Net Assets | ||||||
|
Financials |
32.0 |
||||||
|
Information Technology |
18.3 |
||||||
|
Consumer Discretionary |
17.4 |
||||||
|
Industrials |
14.3 |
||||||
|
Consumer Staples |
5.8 |
||||||
|
Materials |
4.6 |
||||||
|
Energy |
4.3 |
||||||
|
Short-Term Investments and Other |
3.3 |
||||||
|
GEOGRAPHIC ALLOCATION |
|||||||
|
% of Equity |
|||||||
|
North America |
53.6 |
||||||
|
United States |
53.6 |
||||||
|
Europe |
46.4 |
||||||
|
United Kingdom |
23.4 |
||||||
|
% of Equity |
|||||||
|
Europe (cont'd) |
46.4 |
||||||
|
Switzerland |
16.4 |
||||||
|
Germany* |
6.6 |
||||||
* Euro currency countries comprise 6.6% of equity investments.
See accompanying Disclosures and Endnotes on page 47.
30 OAKMARK FUNDS
Oakmark Global Select Fund June 30, 2018
Portfolio Manager Commentary


William C. Nygren, CFA
Portfolio Manager
oakwx@oakmark.com
David G. Herro, CFA
Portfolio Manager
oakwx@oakmark.com
Anthony P. Coniaris, CFA
Portfolio Manager
oakwx@oakmark.com
Eric Liu, CFA
Portfolio Manager
oakwx@oakmark.com
The Oakmark Global Select Fund declined 2.2% for the quarter ended June 30, 2018, compared to the MSCI World Index,16 which returned 1.7%. However, the Fund has returned an average of 8.2% per year since its inception in October 2006, outperforming the MSCI World Index's annualized gain of 5.8% over the same period.
Apache, a global oil and gas exploration company, was the top contributor for the quarter, returning 22%. Rising oil prices during the quarter helped boost the company's share price. Additionally, shares reacted positively to an increase in full-year production guidance and to first-quarter results, which beat production estimates. Apache's well results have met and, in some cases, exceeded our expectations. Overall, we believe that the company's valuation remains attractive, offering a compelling reason to hold the stock.
Daimler, the company best known for its passenger car business under the Mercedes-Benz brand, was the largest detractor for the quarter. During the quarter, Daimler issued a profit warning and indicated that it expects this year's group EBIT to be slightly below 2017's level. The company has faced some near-term challenges due to higher raw material costs, adverse effects from currency movements and minor difficulties with U.S. suppliers. Management largely mitigated these issues through cost cutting. However, Daimler now faces a threat of a tariff on vehicles imported from Europe to the U.S. The company also expects that reciprocal tariffs between the U.S. and China will impact its U.S.-built SUVs intended for delivery to China. Daimler's management is evaluating methods to redirect auto shipments into China from other geographies as a possible work-around strategy to avoid tariffs. There is no certainty that tariffs will be imposed; the matter remains fluid. Emissions concerns have also put pressure on Daimler's share price. To date, the company has recalled 750,000 vehicles to address emission issues, but has paid no fines. The company continues to insist that it did not illegally use its cars' software to cheat emissions tests. On a positive front, Daimler held a capital markets day for the trucks division that highlighted the opportunity for margin expansion and management continues to explore the potential for separation of the group via Project Future. Despite the current geopolitical noise, Daimler still meets our operational performance expectations and is trading at a significant discount to our estimate of intrinsic value.
Geographically, 54% of the Fund's holdings were invested in U.S. companies as of June 30, while approximately 46% were allocated to equities in Europe and the U.K.
We continue to believe the Swiss franc is overvalued versus the U.S. dollar. As a result, we defensively hedged a portion of the Fund's exposure. Approximately 21% of the Swiss franc exposure was hedged at quarter end.
We thank you, our shareholders, for your continued support and confidence.
See accompanying Disclosures and Endnotes on page 47.
Oakmark.com 31
Oakmark Global Select Fund June 30, 2018 (Unaudited)
Schedule of Investments (in thousands)
|
Shares |
Value |
||||||||||
|
COMMON STOCKS - 96.7% |
|||||||||||
|
FINANCIALS - 32.0% |
|||||||||||
|
BANKS - 17.7% |
|||||||||||
|
Lloyds Banking Group PLC (United Kingdom) |
238,053 |
$ |
197,517 |
||||||||
|
Bank of America Corp. (United States) |
5,237 |
147,631 |
|||||||||
|
Citigroup, Inc. (United States) |
2,036 |
136,249 |
|||||||||
|
481,397 |
|||||||||||
|
INSURANCE - 9.2% |
|||||||||||
|
Willis Towers Watson PLC (United States) |
831 |
125,934 |
|||||||||
|
American International Group, Inc. (United States) |
2,347 |
124,438 |
|||||||||
|
250,372 |
|||||||||||
|
DIVERSIFIED FINANCIALS - 5.1% |
|||||||||||
|
Credit Suisse Group AG (Switzerland) |
9,308 |
139,183 |
|||||||||
|
870,952 |
|||||||||||
|
INFORMATION TECHNOLOGY - 18.3% |
|||||||||||
|
SOFTWARE & SERVICES - 12.8% |
|||||||||||
|
MasterCard, Inc., Class A (United States) |
822 |
161,480 |
|||||||||
|
Alphabet, Inc., Class C (United States) (a) |
142 |
158,841 |
|||||||||
|
Alphabet, Inc., Class A (United States) (a) |
24 |
27,128 |
|||||||||
|
347,449 |
|||||||||||
|
TECHNOLOGY HARDWARE & EQUIPMENT - 5.5% |
|||||||||||
|
TE Connectivity, Ltd. (United States) |
1,654 |
148,950 |
|||||||||
|
496,399 |
|||||||||||
|
CONSUMER DISCRETIONARY - 17.4% |
|||||||||||
|
MEDIA - 7.9% |
|||||||||||
|
Charter Communications, Inc., Class A (United States) (a) |
450 |
131,945 |
|||||||||
|
WPP PLC (United Kingdom) |
5,359 |
84,196 |
|||||||||
|
216,141 |
|||||||||||
|
AUTOMOBILES & COMPONENTS - 6.4% |
|||||||||||
|
Daimler AG (Germany) |
2,700 |
172,954 |
|||||||||
|
CONSUMER DURABLES & APPAREL - 3.1% |
|||||||||||
|
Cie Financiere Richemont SA (Switzerland) |
985 |
83,226 |
|||||||||
|
472,321 |
|||||||||||
|
INDUSTRIALS - 14.3% |
|||||||||||
|
CAPITAL GOODS - 11.2% |
|||||||||||
|
CNH Industrial N.V. (United Kingdom) |
16,624 |
175,602 |
|||||||||
|
General Electric Co. (United States) |
9,500 |
129,295 |
|||||||||
|
304,897 |
|||||||||||
|
TRANSPORTATION - 3.1% |
|||||||||||
|
Kuehne + Nagel International AG (Switzerland) |
565 |
84,804 |
|||||||||
|
389,701 |
|||||||||||
|
Shares |
Value |
||||||||||
|
CONSUMER STAPLES - 5.8% |
|||||||||||
|
HOUSEHOLD & PERSONAL PRODUCTS - 3.5% |
|||||||||||
|
Reckitt Benckiser Group PLC (United Kingdom) |
1,167 |
$ |
95,870 |
||||||||
|
FOOD, BEVERAGE & TOBACCO - 2.3% |
|||||||||||
|
Diageo PLC (United Kingdom) |
1,715 |
61,624 |
|||||||||
|
157,494 |
|||||||||||
|
MATERIALS - 4.6% |
|||||||||||
|
LafargeHolcim, Ltd. (Switzerland) |
2,588 |
125,828 |
|||||||||
|
ENERGY - 4.3% |
|||||||||||
|
Apache Corp. (United States) |
2,515 |
117,576 |
|||||||||
|
TOTAL COMMON STOCKS - 96.7% (COST $2,274,029) |
2,630,271 |
||||||||||
|
Par Value |
Value |
||||||||||
|
SHORT-TERM INVESTMENTS - 2.7% |
|||||||||||
|
REPURCHASE AGREEMENT - 1.8% |
|||||||||||
|
Fixed Income Clearing Corp. Repurchase Agreement, 1.10% dated 06/29/18 due 07/02/18, repurchase price $49,705, collateralized by United States Treasury Notes, 1.375% - 8.500% due 02/15/20 - 03/31/20, aggregate value plus accrued interest of $50,700 (Cost: $49,700) |
$ |
49,700 |
49,700 |
||||||||
|
GOVERNMENT AND AGENCY SECURITIES - 0.9% |
|||||||||||
|
Federal National Mortgage Association, 1.78%, due 07/02/18 (b) (Cost $24,999) |
25,000 |
24,999 |
|||||||||
|
TOTAL SHORT-TERM INVESTMENTS - 2.7% (COST $74,699) |
74,699 |
||||||||||
|
TOTAL INVESTMENTS - 99.4% (COST $2,348,728) |
2,704,970 |
||||||||||
|
Foreign Currencies (Cost $0) - 0.0% (c) |
0 |
(d) |
|||||||||
|
Other Assets In Excess of Liabilities - 0.6% |
15,378 |
||||||||||
|
TOTAL NET ASSETS - 100.0% |
$ |
2,720,348 |
|||||||||
Securities of aggregate value of $1,220,804 were valued at a fair value in accordance with procedures established by the Board of Trustees (in thousands).
(a) Non-income producing security
(b) The rate shown represents the annualized yield at the time of purchase; not a coupon rate.
(c) Amount rounds to less than 0.1%.
(d) Amount rounds to less than $1,000.
32 OAKMARK FUNDS
Oakmark Global Select Fund June 30, 2018 (Unaudited)
Schedule of Investments (in thousands) (continued)
FORWARD CURRENCY CONTRACTS
|
Local Contract Amount |
Base Contract Amount |
Settlement Date |
Valuation at 6/30/18 |
Unrealized Appreciation/ (Depreciation) |
|||||||||||||||||||
|
Foreign Currency Sold: |
|||||||||||||||||||||||
|
Swiss Franc |
92,381 |
$ |
98,344 |
09/19/18 |
$ |
93,941 |
$ |
4,403 |
|||||||||||||||
|
$ |
93,941 |
$ |
4,403 |
||||||||||||||||||||
Oakmark.com 33
Oakmark International and Oakmark June 30, 2018
International Small Cap Funds
Portfolio Manager Commentary

David G. Herro, CFA
Portfolio Manager
oakix@oakmark.com
oakex@oakmark.com
oakgx@oakmark.com
oakwx@oakmark.com
Oakmark International Fund – Investor Class
Average Annual Total Returns (06/30/18)
Since Inception (9/30/92) 9.85%
10-year 8.36%
5-year 6.83%
1-year 3.13%
3-month –5.04%
Gross Expense Ratio as of 09/30/17 was 1.00%
Net Expense Ratio as of 09/30/17 was 0.95%
Oakmark International Small Cap Fund – Investor Class
Average Annual Total Returns (06/30/18)
Since Inception (11/1/95) 9.48%
10-year 6.84%
5-year 7.34%
1-year 1.32%
3-month –0.58%
Net and Gross Expense Ratios as of 09/30/17 were 1.36%
Past performance is no guarantee of future results. The performance data quoted represents past performance. Current performance may be lower or higher than the performance data quoted. The investment return and principal value vary so that an investor's shares when redeemed may be worth more or less than the original cost. To obtain the most recent month-end performance data, please visit Oakmark.com.
Fellow Shareholders,
This quarter, both international Funds delivered weak results. The Oakmark International Fund lost 5.0% and underperformed its benchmark,19 whereas the Oakmark International Small Cap Fund dropped 0.6%, though it outperformed its benchmark20 for the quarter. In fact, after a strong start to 2018, international equity markets have weakened throughout the year based on factors that I will discuss below. Please see the company-specific reports for more details on Fund performances.
The Return of Instability
The VIX Index,21 a common measure of market instability, spiked dramatically in the month of February. All kinds of macro/geopolitical factors led to this change of environment. Also of note, markets had been unusually quiet for the better part of two years, with the exception of the spike in volatility caused by Brexit in the summer of 2016. Other than that, perhaps, it had been too quiet for too long.
Early in the year, headlines were consumed with news of North Korea testing intercontinental ballistic missiles that could have the capacity to deliver nuclear warheads. As the year progressed, confidence in the economic recovery in Europe came into question as well. Then came political instability in Italy as a result of an election that bore no outright winner, leading, after months of negotiations, to the formation of a government that is a bit EU unfriendly. The rhetoric coming out of the new government's formation spooked the European markets and the euro, which severely negatively impacted prices of financial service companies with Italian exposure. This hit the Oakmark International Fund particularly hard, as we have stakes in both the Italian bank, Intesa Sanpaolo, and the French bank, BNP, which has a large business in Italy. Additionally, we are overweight in the euro area, and the weakness in the euro currency hurt our performance. Despite the rhetoric out of the politicians in Italy (note: Italy has never been known for political stability with 66 different governments since 1945), we don't believe the sharp fall in share prices of high-quality financials like Intesa and BNP is at all warranted or matched by a similar decline in business value. As happens often during market instability, an exploitable value gap is created by the fall in "price" that is inconsistent with changes in business value.
Of Trade Disputes, Disagreements and "Wars"
Another factor negatively impacting short-term performance has been the threat by the U.S. to use tariffs and other barriers to correct what is believed by the U.S. to be a global trade system that is biased against the U.S. These threats and, to some degree, actual implementation of tariffs on certain metals have
caused retaliation by other countries, thereby triggering a disruption of global trade. I have mentioned in the past and truly believe that the restriction of goods, services and capital from freely moving across sovereign states is detrimental to global economic growth. The purpose of the U.S.'s confrontational approach is to "level the trade playing field" and hopefully this will be the outcome in the end. But if this objective is not reached, or if a global trade war escalates and persists, growth will certainly be negatively impacted and will hurt the earnings of many of the companies in which both Funds are invested.
One of the sectors feeling the brunt of the fall in prices has been the European auto sector. Despite some positive factors, such as recent weakness in the euro and lower Chinese tariffs on cars imported from Europe, the recent threat of tariffs on German cars being exported to the U.S. and Chinese tariff threats for German-badged cars made in the U.S. but exported to China have pummeled the share prices of two of our auto holdings, BMW and Daimler (parent of Mercedes). Additionally, the threat of tariffs on U.S. agriculture products has hurt agriculture equipment maker CNH. Clearly, if tariffs are implemented and stay for the long term, these companies will decline in intrinsic value. However, keep in mind that free trade is not "zero sum," and it would be difficult to imagine that parties will be unable to find a way to iron out differences, as it will be beneficial to all involved to do so.
Despite all of the geopolitical uncertainty that has hit where we are exposed, I am quite confident that this environment is providing opportunity. It is very difficult to imagine, for example, a country like Italy leaving the eurozone and, thus, the euro
See accompanying Disclosures and Endnotes on page 47.
34 OAKMARK FUNDS
Oakmark International and Oakmark June 30, 2018
International Small Cap Funds
Portfolio Manager Commentary (continued)
currency, given its high level of national debt and what this exit would do to Italy's interest rates and payments. Though it is possible for a trade war to persist, I feel it is unlikely given that national self-interest of all involved would actually be harmed by this event. As such, we are still quite confident in our business valuations and see opportunity with the decline in international share prices.
We are appreciative of your patience during this volatile period and believe that this is another somewhat typical period of short-term share price weakness. Sadly, share price movements are not always positive! But we will keep looking for opportunities when changes in price do not match changes in value.
See accompanying Disclosures and Endnotes on page 47.
Oakmark.com 35
Oakmark International Fund June 30, 2018
Summary Information
VALUE OF A $10,000 INVESTMENT
Since Inception - 09/30/92 (Unaudited)
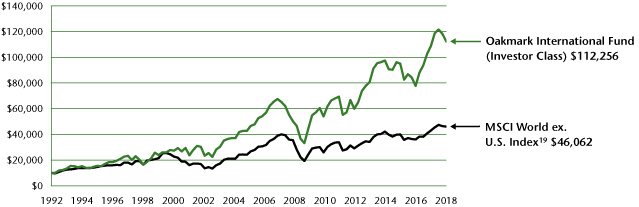
PERFORMANCE
|
Average Annual Total Returns (as of 06/30/18) |
|||||||||||||||||||||||||||||||
| (Unaudited) |
Total Return Last 3 Months |
1-year |
3-year |
5-year |
10-year |
Since Inception |
Inception Date |
||||||||||||||||||||||||
|
Oakmark International Fund (Investor Class) |
-5.04 |
% |
3.13 |
% |
5.69 |
% |
6.83 |
% |
8.36 |
% |
9.85 |
% |
09/30/92 |
||||||||||||||||||
|
MSCI World ex U.S. Index |
-0.75 |
% |
7.04 |
% |
4.87 |
% |
6.23 |
% |
2.63 |
% |
6.11 |
% |
|||||||||||||||||||
|
MSCI EAFE Index22 |
-1.24 |
% |
6.84 |
% |
4.90 |
% |
6.44 |
% |
2.84 |
% |
5.98 |
% |
|||||||||||||||||||
|
Lipper International Fund Index23 |
-1.93 |
% |
6.99 |
% |
5.21 |
% |
6.83 |
% |
3.44 |
% |
6.97 |
% |
|||||||||||||||||||
|
Oakmark International Fund (Advisor Class) |
-5.00 |
% |
3.24 |
% |
N/A |
N/A |
N/A |
14.64 |
% |
11/30/16 |
|||||||||||||||||||||
|
Oakmark International Fund (Institutional Class) |
-4.96 |
% |
3.34 |
% |
N/A |
N/A |
N/A |
14.71 |
% |
11/30/16 |
|||||||||||||||||||||
|
Oakmark International Fund (Service Class) |
-5.08 |
% |
2.84 |
% |
5.37 |
% |
6.47 |
% |
8.02 |
% |
8.13 |
% |
11/04/99 |
||||||||||||||||||
The graph and table above do not reflect the deduction of taxes that a shareholder would pay on Fund distributions or the redemption of Fund shares.
Past performance is no guarantee of future results. The performance data quoted represents past performance. Current performance may be lower or higher than the performance data quoted. Total return includes change in share prices and, in each case, includes reinvestment of dividends and capital gain distributions. The investment return and principal value vary so that an investor's shares when redeemed may be worth more or less than the original cost. To obtain the most recent month-end performance, please visit Oakmark.com.
|
TOP TEN EQUITY HOLDINGS10 |
% of Net Assets | ||||||
|
BNP Paribas SA |
4.8 |
||||||
|
Daimler AG |
4.5 |
||||||
|
Lloyds Banking Group PLC |
4.4 |
||||||
|
Allianz SE |
4.0 |
||||||
|
Credit Suisse Group AG |
3.9 |
||||||
|
Intesa Sanpaolo SPA |
3.8 |
||||||
|
Bayerische Motoren Werke (BMW) AG |
3.8 |
||||||
|
Hennes & Mauritz AB (H&M) - Class B |
3.5 |
||||||
|
Glencore PLC |
2.9 |
||||||
|
CNH Industrial N.V. |
2.8 |
||||||
|
FUND STATISTICS |
|||||||
|
Ticker* |
OAKIX |
||||||
|
Number of Equity Holdings |
59 |
||||||
|
Net Assets |
$44.6 billion | ||||||
|
Weighted Average Market Cap |
$53.9 billion | ||||||
|
Median Market Cap |
$22.7 billion | ||||||
|
Gross Expense Ratio - Investor Class (as of 09/30/17)* |
1.00% | ||||||
|
Net Expense Ratio - Investor Class (as of 09/30/17)*† |
0.95% | ||||||
* This information is related to the Investor Class. Please visit Oakmark.com for information related to the Advisor, Institutional and Service Classes.
† The net expense ratio reflects a contractual advisory fee waiver agreement through January 28, 2019.
|
SECTOR ALLOCATION |
% of Net Assets | ||||||
|
Financials |
31.5 |
||||||
|
Consumer Discretionary |
31.0 |
||||||
|
Industrials |
12.8 |
||||||
|
Materials |
6.8 |
||||||
|
Consumer Staples |
5.1 |
||||||
|
Health Care |
4.6 |
||||||
|
Information Technology |
2.9 |
||||||
|
Energy |
0.4 |
||||||
|
Short-Term Investments and Other |
4.9 |
||||||
|
GEOGRAPHIC ALLOCATION |
|||||||
|
% of Equity |
|||||||
|
Europe |
81.4 |
||||||
|
United Kingdom |
22.2 |
||||||
|
Germany* |
18.0 |
||||||
|
Switzerland |
14.0 |
||||||
|
France* |
12.8 |
||||||
|
Sweden |
5.7 |
||||||
|
Italy* |
4.1 |
||||||
|
Netherlands* |
3.9 |
||||||
|
Ireland* |
0.7 |
||||||
|
Asia |
9.5 |
||||||
|
Japan |
4.4 |
||||||
|
India |
1.5 |
||||||
|
Indonesia |
1.3 |
||||||
|
% of Equity |
|||||||
|
Asia (cont'd) |
9.5 |
||||||
|
Taiwan |
1.3 |
||||||
|
China |
0.8 |
||||||
|
South Korea |
0.2 |
||||||
|
Africa |
2.9 |
||||||
|
South Africa |
2.9 |
||||||
|
North America |
2.9 |
||||||
|
United States |
2.1 |
||||||
|
Canada |
0.8 |
||||||
|
Australasia |
2.1 |
||||||
|
Australia |
2.1 |
||||||
|
Latin America |
1.2 |
||||||
|
Mexico |
1.2 |
||||||
* Euro currency countries comprise 39.5% of equity investments.
See accompanying Disclosures and Endnotes on page 47.
36 OAKMARK FUNDS
Oakmark International Fund June 30, 2018
Portfolio Manager Commentary


David G. Herro, CFA
Portfolio Manager
oakix@oakmark.com
Michael L. Manelli, CFA
Portfolio Manager
oakix@oakmark.com
The Oakmark International Fund declined 5.0% for the quarter ended June 30, 2018, underperforming the MSCI World ex U.S. Index,19 which declined 0.8% over the same period. However, the Fund has returned an average of 9.9% per year since its inception in September 1992, outperforming the MSCI World ex U.S. Index, which has averaged 6.1% per year over the same period.
Experian, a leading worldwide credit bureau, was the top contributor to performance for the quarter. Investors were pleased with Experian's full fiscal-year results, as its revenue growth and operating profit margins were in line with market expectations. Fiscal-year organic growth was driven by the North American B2B segment and picked up substantially in the fourth quarter due to structural demand for data and analytics, coupled with new product introductions. Management is expecting continued organic growth in the 6-8% range over the next three years. Experian is gaining market share in the core North American consumer credit market after combining its credit services and decision analytics businesses, thereby providing a greater value-added solution to its clients. Management continues to be mindful of shareholder returns as evidenced by the new share repurchase program of up to $400 million. We believe Experian is an excellent business with good returns and strong free cash flow conversion that trades at a discount to our estimate of intrinsic value.
Daimler, the company best known for its passenger car business under the Mercedes-Benz brand, was the largest detractor for the quarter. During the quarter, Daimler issued a profit warning and indicated that it expects this year's group EBIT to be slightly below 2017's level. The company has faced some near-term challenges due to higher raw material costs, adverse effects from currency movements and minor difficulties with U.S. suppliers. Management largely mitigated these issues through cost cutting. However, Daimler now faces a threat of a tariff on vehicles imported from Europe to the U.S. The company also expects that reciprocal tariffs between the U.S. and China will impact its U.S.-built SUVs intended for delivery to China. Daimler's management is evaluating methods to redirect auto shipments into China from other geographies as a possible work-around strategy to avoid tariffs. There is no certainty that tariffs will be imposed; the matter remains fluid. Emissions concerns have also put pressure on Daimler's share price. To date, the company has recalled 750,000 vehicles to address emission issues, but has paid no fines. The company continues to insist that it did not illegally use its cars' software to cheat emissions tests. On a more positive front, Daimler held a capital markets day for the trucks division that highlighted the opportunity for margin expansion and management continues to explore the potential for separation of the group via Project Future. Despite the current geopolitical noise,
Daimler still meets our operational performance expectations and is trading at a significant discount to our estimate of intrinsic value.
During the quarter, we added two new names to the portfolio: Alimentation Couche-Tard (Canada), the largest independent operator of fuel and convenience stores in North America; and Reckitt Benckiser (U.K.), a large global consumer products company.
Geographically, we ended the quarter with 81% of our holdings in Europe and the U.K., 4% in Japan and 2% in Australia. The remaining positions are in South Africa, the U.S., India, Indonesia, Taiwan, Mexico, Canada, China and South Korea.
We continue to believe the Swiss franc is overvalued versus the U.S. dollar. As a result, we defensively hedged a portion of the Fund's exposure. Approximately 20% of the Swiss franc exposure was hedged at quarter end.
Thank you for your support!
See accompanying Disclosures and Endnotes on page 47.
Oakmark.com 37
Oakmark International Fund June 30, 2018 (Unaudited)
Schedule of Investments (in thousands)
|
Shares |
Value |
||||||||||
|
COMMON STOCKS - 95.1% |
|||||||||||
|
FINANCIALS - 31.5% |
|||||||||||
|
BANKS - 17.6% |
|||||||||||
|
BNP Paribas SA (France) |
34,274 |
$ |
2,120,060 |
||||||||
|
Lloyds Banking Group PLC (United Kingdom) |
2,358,156 |
1,956,601 |
|||||||||
|
Intesa Sanpaolo SPA (Italy) |
591,765 |
1,712,134 |
|||||||||
|
Royal Bank of Scotland Group PLC (United Kingdom) (a) |
252,499 |
850,047 |
|||||||||
|
Axis Bank, Ltd. (India) |
84,027 |
627,340 |
|||||||||
|
Bank Mandiri Persero Tbk PT (Indonesia) |
1,197,929 |
573,123 |
|||||||||
|
7,839,305 |
|||||||||||
|
DIVERSIFIED FINANCIALS - 7.9% |
|||||||||||
|
Credit Suisse Group AG (Switzerland) |
115,418 |
1,725,848 |
|||||||||
|
EXOR N.V. (Netherlands) |
13,904 |
930,408 |
|||||||||
|
Schroders PLC (United Kingdom) |
11,263 |
467,370 |
|||||||||
|
AMP, Ltd. (Australia) |
145,462 |
382,593 |
|||||||||
|
Schroders PLC, Non-Voting (United Kingdom) |
31 |
1,023 |
|||||||||
|
3,507,242 |
|||||||||||
|
INSURANCE - 6.0% |
|||||||||||
|
Allianz SE (Germany) |
8,615 |
1,775,202 |
|||||||||
|
Willis Towers Watson PLC (United States) |
5,999 |
909,497 |
|||||||||
|
2,684,699 |
|||||||||||
|
14,031,246 |
|||||||||||
|
CONSUMER DISCRETIONARY - 31.0% |
|||||||||||
|
AUTOMOBILES & COMPONENTS - 15.0% |
|||||||||||
|
Daimler AG (Germany) |
31,127 |
1,993,891 |
|||||||||
|
Bayerische Motoren Werke AG (Germany) |
18,663 |
1,686,976 |
|||||||||
|
Toyota Motor Corp. (Japan) |
19,018 |
1,229,875 |
|||||||||
|
Continental AG (Germany) |
4,572 |
1,040,508 |
|||||||||
|
Valeo SA (France) |
13,955 |
760,899 |
|||||||||
|
6,712,149 |
|||||||||||
|
MEDIA - 10.9% |
|||||||||||
|
Naspers, Ltd. (South Africa) |
4,948 |
1,247,683 |
|||||||||
|
Publicis Groupe SA (France) (b) |
15,080 |
1,034,844 |
|||||||||
|
WPP PLC (United Kingdom) |
59,575 |
936,019 |
|||||||||
|
Liberty Global PLC, Class C (United Kingdom) (a) |
31,890 |
848,591 |
|||||||||
|
Grupo Televisa SAB (Mexico) (c) |
27,033 |
512,275 |
|||||||||
|
Liberty Global PLC, Class A (United Kingdom) (a) |
10,367 |
285,502 |
|||||||||
|
4,864,914 |
|||||||||||
|
RETAILING - 3.5% |
|||||||||||
|
Hennes & Mauritz AB (H&M) - Class B (Sweden) |
103,833 |
1,545,556 |
|||||||||
|
CONSUMER DURABLES & APPAREL - 1.6% |
|||||||||||
|
Cie Financiere Richemont SA (Switzerland) |
8,021 |
678,047 |
|||||||||
|
The Swatch Group AG, Bearer Shares (Switzerland) |
48 |
22,627 |
|||||||||
|
700,674 |
|||||||||||
|
13,823,293 |
|||||||||||
|
Shares |
Value |
||||||||||
|
INDUSTRIALS - 12.8% |
|||||||||||
|
CAPITAL GOODS - 8.5% |
|||||||||||
|
CNH Industrial N.V. (United Kingdom) |
118,460 |
$ |
1,251,345 |
||||||||
|
SKF AB, Class B (Sweden) |
28,176 |
521,600 |
|||||||||
|
Ashtead Group PLC (United Kingdom) |
17,384 |
517,676 |
|||||||||
|
Smiths Group PLC (United Kingdom) |
18,498 |
413,187 |
|||||||||
|
Volvo AB, Class B (Sweden) |
23,004 |
365,609 |
|||||||||
|
Meggitt PLC (United Kingdom) |
45,818 |
297,320 |
|||||||||
|
Safran SA (France) |
2,222 |
269,059 |
|||||||||
|
Ferguson PLC (United Kingdom) |
1,571 |
127,138 |
|||||||||
|
3,762,934 |
|||||||||||
|
COMMERCIAL & PROFESSIONAL SERVICES - 2.8% |
|||||||||||
|
Bureau Veritas SA (France) |
18,395 |
490,367 |
|||||||||
|
Experian PLC (United Kingdom) |
16,089 |
396,895 |
|||||||||
|
G4S PLC (United Kingdom) |
103,817 |
365,689 |
|||||||||
|
1,252,951 |
|||||||||||
|
TRANSPORTATION - 1.5% |
|||||||||||
|
Kuehne + Nagel International AG (Switzerland) |
2,475 |
371,580 |
|||||||||
|
Ryanair Holdings PLC (Ireland) (a) (c) |
2,717 |
310,379 |
|||||||||
|
681,959 |
|||||||||||
|
5,697,844 |
|||||||||||
|
MATERIALS - 6.8% |
|||||||||||
|
Glencore PLC (Switzerland) |
273,219 |
1,297,187 |
|||||||||
|
LafargeHolcim, Ltd. (Switzerland) |
22,847 |
1,110,851 |
|||||||||
|
Orica, Ltd. (Australia) |
37,811 |
496,404 |
|||||||||
|
Akzo Nobel N.V. (Netherlands) |
1,757 |
149,823 |
|||||||||
|
3,054,265 |
|||||||||||
|
CONSUMER STAPLES - 5.1% |
|||||||||||
|
FOOD, BEVERAGE & TOBACCO - 4.3% |
|||||||||||
|
Nestlé SA (Switzerland) |
9,603 |
744,277 |
|||||||||
|
Diageo PLC (United Kingdom) |
13,298 |
477,739 |
|||||||||
|
Danone SA (France) |
6,321 |
461,528 |
|||||||||
|
Pernod Ricard SA (France) (b) |
1,340 |
218,753 |
|||||||||
|
1,902,297 |
|||||||||||
|
HOUSEHOLD & PERSONAL PRODUCTS - 0.5% |
|||||||||||
|
Reckitt Benckiser Group PLC (United Kingdom) |
2,695 |
221,451 |
|||||||||
|
FOOD & STAPLES RETAILING - 0.3% |
|||||||||||
|
Alimentation Couche-Tard, Inc., Class B (Canada) |
3,110 |
135,107 |
|||||||||
|
2,258,855 |
|||||||||||
|
HEALTH CARE - 4.6% |
|||||||||||
|
PHARMACEUTICALS, BIOTECHNOLOGY & LIFE SCIENCES - 2.7% |
|||||||||||
|
Bayer AG (Germany) |
10,228 |
1,123,316 |
|||||||||
|
Sanofi (France) |
839 |
67,297 |
|||||||||
|
1,190,613 |
|||||||||||
|
HEALTH CARE EQUIPMENT & SERVICES - 1.9% |
|||||||||||
|
Olympus Corp. (Japan) |
17,103 |
639,790 |
|||||||||
|
Koninklijke Philips N.V. (Netherlands) |
5,292 |
224,217 |
|||||||||
|
864,007 |
|||||||||||
|
2,054,620 |
|||||||||||
38 OAKMARK FUNDS
Oakmark International Fund June 30, 2018 (Unaudited)
Schedule of Investments (in thousands) (continued)
|
Shares |
Value |
||||||||||
|
COMMON STOCKS - 95.1% (continued) |
|||||||||||
|
INFORMATION TECHNOLOGY - 2.9% |
|||||||||||
|
SEMICONDUCTORS & SEMICONDUCTOR EQUIPMENT - 2.0% |
|||||||||||
|
Taiwan Semiconductor Manufacturing Co., Ltd. (Taiwan) |
77,003 |
$ |
546,804 |
||||||||
|
ASML Holding N.V. (Netherlands) |
1,795 |
355,110 |
|||||||||
|
901,914 |
|||||||||||
|
SOFTWARE & SERVICES - 0.7% |
|||||||||||
|
Baidu, Inc. (China) (a) (c) |
1,318 |
320,343 |
|||||||||
|
TECHNOLOGY HARDWARE & EQUIPMENT - 0.2% |
|||||||||||
|
Samsung Electronics Co., Ltd. (South Korea) |
2,116 |
88,653 |
|||||||||
|
1,310,910 |
|||||||||||
|
ENERGY - 0.4% |
|||||||||||
|
Cenovus Energy, Inc. (Canada) |
19,133 |
198,653 |
|||||||||
|
TOTAL COMMON STOCKS - 95.1% (COST $41,520,183) |
42,429,686 |
||||||||||
|
RIGHTS - 0.0% (d) |
|||||||||||
|
FINANCIALS - 0.0% (d) |
|||||||||||
|
BANKS - 0.0% (d) |
|||||||||||
|
Intesa Sanpaolo SPA (Italy) (a) |
591,765 |
0 |
|||||||||
|
Par Value |
Value |
||||||||||
|
SHORT-TERM INVESTMENTS - 4.4% |
|||||||||||
|
U.S. GOVERNMENT BILL - 2.6% |
|||||||||||
|
United States Treasury Bill, 1.73% - 1.91%, due 07/12/18 - 08/16/18 (e) (Cost $1,148,267) |
$ |
1,150,000 |
1,148,267 |
||||||||
|
COMMERCIAL PAPER - 0.9% |
|||||||||||
|
Toyota Motor Credit Corp., 2.05% - 2.07%, due 08/03/18 - 08/08/18 (e) |
75,000 |
74,853 |
|||||||||
|
American Honda Finance Corp., 2.11%, due 07/05/18 (e) |
50,000 |
49,989 |
|||||||||
|
Abbvie, Inc., 144A, 2.23%, due 07/11/18 (e) (f) |
50,000 |
49,969 |
|||||||||
|
MetLife Short Term Funding LLC, 144A, 2.09% - 2.14%, due 07/17/18 - 08/01/18 (e) (f) |
50,000 |
49,932 |
|||||||||
|
J.P. Morgan Securities LLC, 2.34%, due 09/21/18 (e) |
50,000 |
49,732 |
|||||||||
|
General Mills, Inc., 144A, 2.25%, due 07/18/18 (e) (f) |
30,000 |
29,969 |
|||||||||
|
John Deere Capital Co., 144A, 2.03%, due 07/20/18 (e) (f) |
25,000 |
24,974 |
|||||||||
|
Walgreens Boots, 2.65%, due 08/02/18 (e) |
25,000 |
24,942 |
|||||||||
|
Schlumberger Holdings Corp., 144A, 2.29%, due 08/14/18 (e) (f) |
25,000 |
24,931 |
|||||||||
|
Kellogg Co., 144A, 2.24%, due 07/09/18 (e) (f) |
20,000 |
19,990 |
|||||||||
|
Total Commercial Paper (Cost $399,287) |
399,281 |
||||||||||
|
Par Value |
Value |
||||||||||
|
GOVERNMENT AND AGENCY SECURITIES - 0.6% |
|||||||||||
|
Federal National Mortgage Association, 1.78%, due 07/02/18 (e) (Cost $249,988) |
$ |
250,000 |
$ |
249,988 |
|||||||
|
REPURCHASE AGREEMENT - 0.3% |
|||||||||||
|
Fixed Income Clearing Corp. Repurchase Agreement, 1.10% dated 06/29/18 due 07/02/18, repurchase price $154,991, collateralized by a Federal Home Loan Bank Bond, 2.150% due 02/14/20, and a United States Treasury Note, 8.500% due 02/15/20, aggregate value plus accrued interest of $158,077 (Cost: $154,977) |
154,977 |
154,977 |
|||||||||
|
TOTAL SHORT-TERM INVESTMENTS - 4.4% (COST $1,952,519) |
1,952,513 |
||||||||||
|
TOTAL INVESTMENTS - 99.5% (COST $43,472,702) |
44,382,199 |
||||||||||
|
Foreign Currencies (Cost $26,565) - 0.1% |
26,565 |
||||||||||
|
Other Assets In Excess of Liabilities - 0.4% |
187,949 |
||||||||||
|
TOTAL NET ASSETS - 100.0% |
$ |
44,596,713 |
|||||||||
Securities of aggregate value of $38,909,339 were valued at a fair value in accordance with procedures established by the Board of Trustees (in thousands).
(a) Non-income producing security
(b) A portion of the security out on loan.
(c) Sponsored American Depositary Receipt
(d) Amount rounds to less than 0.1%.
(e) The rate shown represents the annualized yield at the time of purchase; not a coupon rate.
(f) These securities may be resold subject to restrictions on resale under federal securities law.
Oakmark.com 39
Oakmark International Fund June 30, 2018 (Unaudited)
Schedule of Investments (in thousands) (continued)
FORWARD FOREIGN CURRENCY CONTRACT
|
Local Contract Amount |
Base Contract Amount |
Settlement Date |
Valuation at 6/30/18 |
Unrealized Appreciation/ (Depreciation) |
|||||||||||||||||||
|
Foreign Currency Sold: |
|||||||||||||||||||||||
|
Swiss Franc |
917,182 |
$ |
976,385 |
09/19/18 |
$ |
932,673 |
$ |
43,712 |
|||||||||||||||
|
$ |
932,673 |
$ |
43,712 |
||||||||||||||||||||
40 OAKMARK FUNDS

This page intentionally left blank.
Oakmark.com 41
Oakmark International Small Cap Fund June 30, 2018
Summary Information
VALUE OF A $10,000 INVESTMENT
Since 06/30/08 (Unaudited)
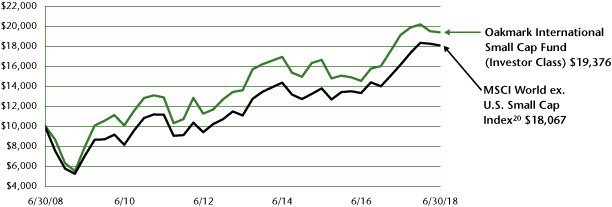
PERFORMANCE
|
Average Annual Total Returns (as of 06/30/18) |
|||||||||||||||||||||||||||||||
| (Unaudited) |
Total Return Last 3 Months |
1-year |
3-year |
5-year |
10-year |
Since Inception |
Inception Date |
||||||||||||||||||||||||
|
Oakmark International Small Cap Fund (Investor Class) |
-0.58 |
% |
1.32 |
% |
5.23 |
% |
7.34 |
% |
6.84 |
% |
9.48 |
% |
11/01/95 |
||||||||||||||||||
|
MSCI World ex U.S. Small Cap Index |
-0.94 |
% |
11.87 |
% |
9.45 |
% |
10.28 |
% |
6.09 |
% |
N/A |
||||||||||||||||||||
|
MSCI World ex U.S. Index19 |
-0.75 |
% |
7.04 |
% |
4.87 |
% |
6.23 |
% |
2.63 |
% |
5.35 |
% |
|||||||||||||||||||
|
Lipper International Small Cap Fund Index24 |
-2.15 |
% |
10.76 |
% |
8.34 |
% |
9.54 |
% |
6.19 |
% |
N/A |
||||||||||||||||||||
|
Oakmark International Small Cap Fund (Advisor Class) |
- |
0.53% |
1.43 |
% |
N/A |
N/A |
N/A |
15.24 |
% |
11/30/16 |
|||||||||||||||||||||
|
Oakmark International Small Cap Fund (Institutional Class) |
- |
0.53% |
1.53 |
% |
N/A |
N/A |
N/A |
15.31 |
% |
11/30/16 |
|||||||||||||||||||||
|
Oakmark International Small Cap Fund (Service Class) |
- |
0.76% |
0.94 |
% |
4.90 |
% |
6.99 |
% |
6.51 |
% |
9.61 |
% |
01/08/01 |
||||||||||||||||||
The graph and table do not reflect the deduction of taxes that a shareholder would pay on Fund distributions or the redemption of Fund shares.
Past performance is no guarantee of future results. The performance data quoted represents past performance. Current performance may be lower or higher than the performance data quoted. Total return includes change in share prices and, in each case, includes reinvestment of dividends and capital gain distributions. The investment return and principal value vary so that an investor's shares when redeemed may be worth more or less than the original cost. The performance of the Fund does not reflect the 2% redemption fee imposed on shares redeemed within 90 days of purchase. To obtain the most recent month-end performance, please visit Oakmark.com.
|
TOP TEN EQUITY HOLDINGS10 |
% of Net Assets | ||||||
|
IWG PLC |
4.2 |
||||||
|
Travis Perkins PLC |
3.8 |
||||||
|
Azimut Holding SPA |
3.5 |
||||||
|
BNK Financial Group, Inc. |
3.5 |
||||||
|
Incitec Pivot, Ltd. |
3.4 |
||||||
|
Konecranes OYJ |
3.1 |
||||||
|
Ontex Group N.V. |
3.1 |
||||||
|
Criteo SA |
2.9 |
||||||
|
Element Fleet Management Corp. |
2.9 |
||||||
|
Julius Baer Group, Ltd. |
2.6 |
||||||
|
FUND STATISTICS |
|||||||
|
Ticker* |
OAKEX |
||||||
|
Number of Equity Holdings |
57 |
||||||
|
Net Assets |
$2.8 billion | ||||||
|
Weighted Average Market Cap |
$3.7 billion | ||||||
|
Median Market Cap |
$2.4 billion | ||||||
|
Gross Expense Ratio - Investor Class (as of 09/30/17)* |
1.36% | ||||||
|
Net Expense Ratio - Investor Class (as of 09/30/17)* |
1.36% | ||||||
* This information is related to the Investor Class. Please visit Oakmark.com for information related to the Advisor, Institutional and Service Classes.
|
SECTOR ALLOCATION |
% of Net Assets | ||||||
|
Industrials |
39.6 |
||||||
|
Financials |
18.5 |
||||||
|
Consumer Discretionary |
15.0 |
||||||
|
Information Technology |
7.4 |
||||||
|
Consumer Staples |
5.4 |
||||||
|
Materials |
4.5 |
||||||
|
Health Care |
2.8 |
||||||
|
Telecommunication Services |
2.1 |
||||||
|
Real Estate |
1.4 |
||||||
|
Short-Term Investments and Other |
3.3 |
||||||
|
GEOGRAPHIC ALLOCATION |
|||||||
|
% of Equity |
|||||||
|
Europe |
69.3 |
||||||
|
United Kingdom |
19.9 |
||||||
|
Switzerland |
10.9 |
||||||
|
France* |
5.7 |
||||||
|
Netherlands* |
5.5 |
||||||
|
Finland* |
5.5 |
||||||
|
Italy* |
4.9 |
||||||
|
Denmark |
3.3 |
||||||
|
Belgium* |
3.2 |
||||||
|
Spain* |
2.3 |
||||||
|
Norway |
2.2 |
||||||
|
Portugal* |
2.1 |
||||||
|
Germany* |
1.4 |
||||||
|
Turkey |
1.3 |
||||||
|
% of Equity |
|||||||
|
Europe (cont'd) |
69.3 |
||||||
|
Greece* |
1.1 |
||||||
|
Asia |
14.4 |
||||||
|
South Korea |
6.3 |
||||||
|
Japan |
5.8 |
||||||
|
Indonesia |
2.2 |
||||||
|
China |
0.1 |
||||||
|
Australasia |
9.4 |
||||||
|
Australia |
7.1 |
||||||
|
New Zealand |
2.3 |
||||||
|
North America |
3.6 |
||||||
|
Canada |
3.6 |
||||||
|
Latin America |
3.3 |
||||||
|
Mexico |
2.3 |
||||||
|
Brazil |
1.0 |
||||||
* Euro currency countries comprise 31.7% of equity investments.
See accompanying Disclosures and Endnotes on page 47.
42 OAKMARK FUNDS
Oakmark International Small Cap Fund June 30, 2018
Portfolio Manager Commentary


David G. Herro, CFA
Portfolio Manager
oakex@oakmark.com
Michael L. Manelli, CFA
Portfolio Manager
oakex@oakmark.com
Justin D. Hance, CFA
Portfolio Manager
oakex@oakmark.com
The Oakmark International Small Cap Fund declined 0.6% for the quarter ended June 30, 2018, slightly outperforming the MSCI World ex U.S. Small Cap Index,20 which declined 0.9% for the same period. Since the Fund's inception in November 1995, it has returned an annualized average return of 9.5% per year.
The largest contributor to the Fund for the quarter was U.K.-based IWG, a global flexible workplace provider. IWG's share price soared in May, following news it had received three separate indicative takeover proposals. The three prospective buyers were given until June 8 to announce a firm intention to make an offer. However, since the May announcement, one of the firms has walked away from the takeover and two new suitors have entered the picture. At the request of IWG, the deadline for offers from these remaining firms has been extended by the U.K. takeover panel twice and the deadline is now July 21. The company currently trades at an attractive discount to our estimate of its underlying value, given its strong returns and attractive growth opportunities. We continue to monitor the takeover situation closely and find IWG to be a compelling opportunity even with the recent share price increase.
The largest detractor from performance for the quarter was Italian-based Azimut Holdings. Azimut offers financial and investment management services through financial consultants in northern and central Italy. In May, the Timone Fiduciaria (a trust composed of Azimut employees) issued a press release indicating that it intended to proceed with its previously announced plan to increase its current 15% stake in the company by up to an additional 10%. In June, the deal completed and the Timone Trust raised enough capital to increase its stake in Azimut to 24%, a transaction which we viewed very favorably. However, investors were displeased with the results from Azimut's first-quarter earnings report, including selling, general and administrative expenses that were on pace to exceed our estimate for the full-year period. Additionally, the recent Italian elections created uncertainty over investor confidence, which in turn affected Azimut's cash flows and asset performance. Despite the recent share price weakness, our investment thesis for Azimut remains intact.
We initiated positions in two European-based holdings this quarter—ISS and Duerr. Denmark-based ISS is a global provider of outsourced facilities management services, including catering, cleaning, facility management and property services, directly operating in 44 countries and with the ability to serve more than 70 countries. German-based Duerr is a global mechanical and plant engineering firm consisting of five main divisions. While new to the Fund this quarter, Duerr was previously held in the Fund from approximately 2007 to 2013. Since we last owned the stock, the company completed a value-accretive takeover in October 2014 of HOMAG Group AG—the world's largest maker of wood processing machines for wood-based furniture. We eliminated
positions in Amplifon (Italy), ALS Limited (Australia) and QIAGEN (U.S.) during the quarter.
Geographically, we ended the quarter with approximately 15% of our holdings in Asia, 69% in Europe and the U.K., and 9% in Australasia. The remaining positions are 4% in North America (Canada) and 3% in Latin America (Mexico and Brazil).
We continue to believe the Swiss franc and Norwegian krone are overvalued versus the U.S. dollar. As a result, we defensively hedged 19% of the Fund's franc exposure and 26% of the krone exposure.
Thank you for your continued confidence and support.
See accompanying Disclosures and Endnotes on page 47.
Oakmark.com 43
Oakmark International Small Cap Fund June 30, 2018 (Unaudited)
Schedule of Investments (in thousands)
|
Shares |
Value |
||||||||||
|
COMMON STOCKS - 96.7% |
|||||||||||
|
INDUSTRIALS - 39.6% |
|||||||||||
|
COMMERCIAL & PROFESSIONAL SERVICES - 20.1% |
|||||||||||
|
IWG PLC (Switzerland) |
27,890 |
$ |
117,198 |
||||||||
|
ISS A/S (Denmark) |
2,045 |
70,059 |
|||||||||
|
Randstad N.V. (Netherlands) |
1,163 |
68,250 |
|||||||||
|
Applus Services SA (Spain) |
4,615 |
61,512 |
|||||||||
|
Pagegroup PLC (United Kingdom) |
7,352 |
54,516 |
|||||||||
|
Babcock International Group PLC (United Kingdom) |
4,931 |
52,983 |
|||||||||
|
Mitie Group PLC (United Kingdom) |
25,587 |
52,653 |
|||||||||
|
Hays PLC (United Kingdom) |
18,116 |
44,487 |
|||||||||
|
SThree PLC (United Kingdom) |
5,757 |
27,733 |
|||||||||
|
Brunel International N.V. (Netherlands) |
799 |
13,491 |
|||||||||
|
562,882 |
|||||||||||
|
CAPITAL GOODS - 16.2% |
|||||||||||
|
Travis Perkins PLC (United Kingdom) |
5,731 |
107,393 |
|||||||||
|
Konecranes OYJ (Finland) |
2,132 |
87,473 |
|||||||||
|
Howden Joinery Group PLC (United Kingdom) |
8,655 |
61,037 |
|||||||||
|
Metso OYJ (Finland) |
1,735 |
57,861 |
|||||||||
|
Sulzer AG (Switzerland) |
329 |
39,835 |
|||||||||
|
Morgan Advanced Materials PLC (United Kingdom) |
7,333 |
31,606 |
|||||||||
|
Duerr AG (Germany) |
579 |
26,793 |
|||||||||
|
Wajax Corp. (Canada) |
938 |
17,768 |
|||||||||
|
MTU Aero Engines AG (Germany) |
52 |
9,922 |
|||||||||
|
dormakaba Holding AG (Switzerland) |
11 |
7,904 |
|||||||||
|
Outotec OYJ (Finland) (a) |
459 |
3,640 |
|||||||||
|
451,232 |
|||||||||||
|
TRANSPORTATION - 3.3% |
|||||||||||
|
Panalpina Welttransport Holding AG (Switzerland) |
209 |
28,484 |
|||||||||
|
Freightways, Ltd. (New Zealand) |
4,901 |
25,940 |
|||||||||
|
DSV AS (Denmark) |
244 |
19,606 |
|||||||||
|
Controladora Vuela Cia de Aviacion SAB de CV (Mexico) (a) (b) |
3,562 |
18,094 |
|||||||||
|
92,124 |
|||||||||||
|
1,106,238 |
|||||||||||
|
FINANCIALS - 18.5% |
|||||||||||
|
DIVERSIFIED FINANCIALS - 12.4% |
|||||||||||
|
Azimut Holding SPA (Italy) |
6,429 |
99,078 |
|||||||||
|
Element Fleet Management Corp. (Canada) |
17,067 |
80,231 |
|||||||||
|
Julius Baer Group, Ltd. (Switzerland) |
1,258 |
73,655 |
|||||||||
|
Haci Omer Sabanci Holding AS (Turkey) |
18,407 |
35,340 |
|||||||||
|
Standard Life Aberdeen PLC (United Kingdom) |
7,048 |
30,180 |
|||||||||
|
EFG International AG (Switzerland) |
3,659 |
27,315 |
|||||||||
|
345,799 |
|||||||||||
|
BANKS - 6.1% |
|||||||||||
|
BNK Financial Group, Inc. (South Korea) |
11,803 |
98,901 |
|||||||||
|
DGB Financial Group, Inc. (South Korea) |
7,669 |
70,529 |
|||||||||
|
169,430 |
|||||||||||
|
515,229 |
|||||||||||
|
Shares |
Value |
||||||||||
|
CONSUMER DISCRETIONARY - 15.0% |
|||||||||||
|
MEDIA - 10.1% |
|||||||||||
|
Criteo SA (France) (a) (b) |
2,500 |
$ |
82,138 |
||||||||
|
NOS SGPS SA (Portugal) |
10,462 |
57,223 |
|||||||||
|
Megacable Holdings SAB de CV (Mexico) |
11,016 |
45,389 |
|||||||||
|
Hakuhodo DY Holdings, Inc. (Japan) |
2,652 |
42,527 |
|||||||||
|
SKY Network Television, Ltd. (New Zealand) |
19,852 |
34,924 |
|||||||||
|
APN Outdoor Group, Ltd. (Australia) |
4,171 |
19,357 |
|||||||||
|
281,558 |
|||||||||||
|
RETAILING - 2.4% |
|||||||||||
|
GrandVision N.V., (Netherlands) |
3,031 |
67,958 |
|||||||||
|
CONSUMER DURABLES & APPAREL - 1.3% |
|||||||||||
|
Salvatore Ferragamo SPA (Italy) |
1,339 |
32,562 |
|||||||||
|
Cosmo Lady China Holdings Co., Ltd., (China) |
5,340 |
2,656 |
|||||||||
|
35,218 |
|||||||||||
|
CONSUMER SERVICES - 1.2% |
|||||||||||
|
Dignity PLC (United Kingdom) |
2,528 |
33,521 |
|||||||||
|
418,255 |
|||||||||||
|
INFORMATION TECHNOLOGY - 7.4% |
|||||||||||
|
TECHNOLOGY HARDWARE & EQUIPMENT - 4.4% |
|||||||||||
|
Ingenico Group SA (France) |
794 |
71,224 |
|||||||||
|
Hirose Electric Co., Ltd. (Japan) |
406 |
50,272 |
|||||||||
|
121,496 |
|||||||||||
|
SOFTWARE & SERVICES - 3.0% |
|||||||||||
|
Atea ASA (Norway) |
4,101 |
59,062 |
|||||||||
|
Totvs SA (Brazil) |
3,703 |
25,990 |
|||||||||
|
85,052 |
|||||||||||
|
206,548 |
|||||||||||
|
CONSUMER STAPLES - 5.4% |
|||||||||||
|
HOUSEHOLD & PERSONAL PRODUCTS - 3.1% |
|||||||||||
|
Ontex Group N.V. (Belgium) |
3,930 |
86,137 |
|||||||||
|
FOOD & STAPLES RETAILING - 2.3% |
|||||||||||
|
Sugi Holdings Co., Ltd. (Japan) |
1,102 |
63,762 |
|||||||||
|
149,899 |
|||||||||||
|
MATERIALS - 4.5% |
|||||||||||
|
Incitec Pivot, Ltd. (Australia) |
35,675 |
95,716 |
|||||||||
|
Titan Cement Co. SA (Greece) |
1,181 |
29,877 |
|||||||||
|
125,593 |
|||||||||||
|
HEALTH CARE - 2.8% |
|||||||||||
|
HEALTH CARE EQUIPMENT & SERVICES - 2.8% |
|||||||||||
|
Primary Health Care, Ltd. (Australia) |
21,178 |
54,610 |
|||||||||
|
Ansell, Ltd. (Australia) |
1,161 |
23,325 |
|||||||||
|
77,935 |
|||||||||||
44 OAKMARK FUNDS
Oakmark International Small Cap Fund June 30, 2018 (Unaudited)
Schedule of Investments (in thousands) (continued)
|
Shares |
Value |
||||||||||
|
COMMON STOCKS - 96.7% (continued) |
|||||||||||
|
TELECOMMUNICATION SERVICES - 2.1% |
|||||||||||
|
Tower Bersama Infrastructure Tbk PT (Indonesia) |
110,865 |
$ |
38,592 |
||||||||
|
Sarana Menara Nusantara Tbk PT (Indonesia) |
492,638 |
21,314 |
|||||||||
|
59,906 |
|||||||||||
|
REAL ESTATE - 1.4% |
|||||||||||
|
LSL Property Services PLC (United Kingdom) |
10,024 |
35,197 |
|||||||||
|
Countrywide PLC (United Kingdom) (a) |
10,212 |
5,074 |
|||||||||
|
40,271 |
|||||||||||
|
TOTAL COMMON STOCKS - 96.7% (COST $2,745,853) |
2,699,874 |
||||||||||
|
Par Value |
Value |
||||||||||
|
SHORT-TERM INVESTMENTS - 3.1% |
|||||||||||
|
REPURCHASE AGREEMENT - 2.2% |
|||||||||||
|
Fixed Income Clearing Corp. Repurchase Agreement, 1.10% dated 06/29/18 due 07/02/18, repurchase price $62,861, collateralized by a Federal Home Loan Mortgage Corp., 2.500%, due 04/23/20, value plus accrued interest of $64,113 (Cost: $62,855) |
$ |
62,855 |
62,855 |
||||||||
|
GOVERNMENT AND AGENCY SECURITIES - 0.9% |
|||||||||||
|
Federal National Mortgage Association, 1.78%, due 07/02/18 (d) (Cost $24,999) |
25,000 |
24,999 |
|||||||||
|
TOTAL SHORT-TERM INVESTMENTS - 3.1% (COST $87,854) |
87,854 |
||||||||||
|
TOTAL INVESTMENTS - 99.8% (COST $2,833,707) |
2,787,728 |
||||||||||
|
Foreign Currencies (Cost $887) - 0.0% (c) |
889 |
||||||||||
|
Other Assets In Excess of Liabilities - 0.2% |
4,447 |
||||||||||
|
TOTAL NET ASSETS - 100.0% |
$ |
2,793,064 |
|||||||||
Securities of aggregate value of $2,344,537 were valued at a fair value in accordance with procedures established by the Board of Trustees (in thousands).
a) Non-income producing security
(b) Sponsored American Depositary Receipt
(c) Amount rounds to less than 0.1%.
(d) The rate shown represents the annualized yield at the time of purchase; not a coupon rate.
Oakmark.com 45
Oakmark International Small Cap Fund June 30, 2018 (Unaudited)
Schedule of Investments (in thousands) (continued)
FORWARD FOREIGN CURRENCY CONTRACTS
|
Local Contract Amount |
Base Contract Amount |
Settlement Date |
Valuation at 6/30/18 |
Unrealized Appreciation/ (Depreciation) |
|||||||||||||||||||
|
Foreign Currency Sold: |
|||||||||||||||||||||||
|
Norwegian Krona |
127,161 |
$ |
16,565 |
09/19/18 |
$ |
15,664 |
$ |
901 |
|||||||||||||||
|
Swiss Franc |
33,136 |
35,275 |
09/19/18 |
33,696 |
1,579 |
||||||||||||||||||
|
$ |
49,360 |
$ |
2,480 |
||||||||||||||||||||
46 OAKMARK FUNDS
Disclosures and Endnotes
Reporting to Shareholders. The Funds reduce the number of duplicate prospectuses, annual and semi-annual reports your household receives by sending only one copy of each to those addresses shared by two or more accounts. Call the Funds at 1-800-OAKMARK (625-6275) to request individual copies of these documents. The Funds will begin sending individual copies 30 days after receiving your request.
Before investing in any Oakmark Fund, you should carefully consider the Fund's investment objectives, risks, management fees and other expenses. This and other important information is contained in the Funds' prospectus and a Fund's summary prospectus. Please read the prospectus and summary prospectus carefully before investing. For more information, please visit Oakmark.com or call 1-800-OAKMARK (625-6275).
The discussion of the Funds' investments and investment strategy (including current investment themes, the portfolio managers' research and investment process, and portfolio characteristics) represents the Funds' investments and the views of the portfolio managers and Harris Associates L.P., the Funds' investment adviser, at the time of this report, and are subject to change without notice.
All Oakmark Funds: Investing in value stocks presents the risk that value stocks may fall out of favor with investors and underperform growth stocks during given periods.
Oakmark, Oakmark Equity and Income, Oakmark Global, Oakmark International and Oakmark International Small Cap Funds: The Funds' portfolios tend to be invested in a relatively small number of stocks. As a result, the appreciation or depreciation of any one security held will have a greater impact on the Funds' net asset value than it would if the Funds invest in a larger number of securities. Although that strategy has the potential to generate attractive returns over time, it also increases the Funds' volatility.
Oakmark Select and Oakmark Equity and Income Funds: The stocks of medium-sized companies tend to be more volatile than those of large companies and have underperformed the stocks of small and large companies during some periods.
Because the Oakmark Select and Oakmark Global Select Funds are non-diversified, the performance of each holding will have a greater impact on the Funds' total return, and may make the Funds' returns more volatile than a more diversified fund.
Oakmark Global, Oakmark Global Select, Oakmark International and Oakmark International Small Cap Funds: Investing in foreign securities presents risks which in some ways may be greater than U.S. investments. Those risks include: currency fluctuation; different regulation, accounting standards, trading practices and levels of available information; generally higher transaction costs; and political risks.
The percentages of hedge exposure for each foreign currency are calculated by dividing the market value of all same-currency forward contracts by the market value of the underlying equity exposure to that currency.
The Oakmark Equity and Income Fund invests in medium- and lower-quality debt securities that have higher yield potential but present greater investment and credit risk than higher-quality securities. These risks may result in greater share price volatility.
Oakmark International Small Cap Fund: The stocks of smaller companies often involve more risk than the stocks of larger companies. Stocks of small companies tend to be more volatile and have a smaller public market than stocks of larger companies.
Small companies may have a shorter history of operations than larger companies, may not have as great an ability to raise additional capital and may have a less diversified product line, making them more susceptible to market pressure.
Endnotes:
1. Buffett, Warren. "Chairman's Letter - 1983." Berkshire Hathaway Inc. March 14, 1984. Accessed June, 2018. http://www.berkshirehathaway.com/letters/1983.html.
2. The Value Line Investment Survey consists of professional research and recommendations on approximately 1,700 stocks. According to Value Line, this represents approximately 95% of the trading volume of all stocks traded in U.S. markets.
3. The Price-Earnings Ratio ("P/E") is the most common measure of the expensiveness of a stock.
4. The Russell 1000® Growth Index measures the performance of the large-cap growth segment of the U.S. equity universe. It includes those Russell 1000® companies with higher price-to-book ratios and higher expected growth values. This index is unmanaged and investors cannot invest directly in this index.
5. EPS refers to Earnings Per Share and is calculated by dividing total earnings by the number of shares outstanding.
6. Graham, Benjamin, and David Dodd. Security Analysis. New York, NY.: McGraw-Hill Book Company, 1934.
7. The S&P 500 Total Return Index is a float-adjusted, capitalization-weighted index of 500 U.S. large-capitalization stocks representing all major industries. It is a widely recognized index of broad, U.S. equity market performance. Returns reflect the reinvestment of dividends. This index is unmanaged and investors cannot invest directly in this index.
8. The Dow Jones Industrial Average is a price-weighted measure of 30 U.S. blue-chip companies. The index covers all industries except transportation and utilities. This index is unmanaged and investors cannot invest directly in this index.
9. The Lipper Large-Cap Value Fund Index measures the equal-weighted performance of the 30 largest U.S. large-cap value funds as defined by Lipper. This index is unmanaged and investors cannot invest directly in this index.
10. Portfolio holdings are subject to change without notice and are not intended as recommendations of individual stocks.
11. The Lipper Multi-Cap Value Fund Index measures the equal-weighted performance of the 30 largest U.S. multi-cap value funds as defined by Lipper. This index is unmanaged and investors cannot invest directly in this index.
12. The Lipper Balanced Fund Index measures the equal-weighted performance of the 30 largest U.S. balanced funds as defined by Lipper. This index is unmanaged and investors cannot invest directly in this index.
13. The Barclays U.S. Government/Credit Index measures the non-securitized component of the U.S. Aggregate Index. It includes investment grade, U.S. dollar-denominated, fixed-rate Treasuries, government-related and corporate securities. This index is unmanaged and investors cannot invest directly in this index.
Oakmark.com 47
Disclosures and Endnotes (continued)
14. The Russell 2000® Index measures the performance of the small-cap segment of the U.S. equity universe. The Russell 2000® Index is a subset of the Russell 3000® Index and includes approximately 2,000 of the smallest securities based on a combination of their market cap and current index membership. This index is unmanaged and investors cannot invest directly in this index.
15. Authers, John. "Rise in Passive Funds Sees Tail Wagging the Dog in Index World." Financial Times (London), June 23, 2018.
16. The MSCI World Index (Net) is a free float-adjusted, market capitalization-weighted index that is designed to measure the global equity market performance of developed markets. The index covers approximately 85% of the free float-adjusted market capitalization in each country. This benchmark calculates reinvested dividends net of withholding taxes. This index is unmanaged and investors cannot invest directly in this index.
17. The Lipper Global Fund Index measures the equal-weighted performance of the 30 largest global equity funds as defined by Lipper. This index is unmanaged and investors cannot invest directly in this index.
18. Davies, Paul J. "Private Equity: So Hot Even Second-Hand Funds Can Sell at a Premium." The Wall Street Journal. June 25, 2018. https://www.wsj.com/articles/private-equity-so-hot-even-second-hand-funds-can-sell-at-a-premium-1529924400.
19. The MSCI World ex U.S. Index (Net) is a free float-adjusted, market capitalization-weighted index that is designed to measure international developed market equity performance, excluding the U.S. The index covers approximately 85% of the free float-adjusted market capitalization in each country. This benchmark calculates reinvested dividends net of withholding taxes. This index is unmanaged and investors cannot invest directly in this index.
20. The MSCI World ex U.S. Small Cap Index (Net) is designed to measure performance of small-cap stocks across 22 of 23 developed markets (excluding the U.S.). The index covers approximately 14% of the free float-adjusted market capitalization in each country. This benchmark calculates reinvested dividends net of withholding taxes. This index is unmanaged and investors cannot invest directly in this index.
21. VIX is the ticker symbol for the CBOE Market Volatility Index. The index is designed to measure the market's expectation of future volatility based on options of the S&P 500 index. This index is unmanaged and investors cannot invest directly in this index.
22. The MSCI EAFE Index (Net) is designed to represent the performance of large- and mid-cap securities across 21 developed markets countries in Europe, Australasia and the Far East, excluding the U.S. and Canada. The index covers approximately 85% of the free float-adjusted market capitalization in each of the 21 countries. This benchmark calculates reinvested dividends net of withholding taxes. This index is unmanaged and investors cannot invest directly in this index.
23. The Lipper International Fund Index measures the equal-weighted performance of the 30 largest international equity funds, as defined by Lipper. This index is unmanaged and investors cannot invest directly in this index.
24. The Lipper International Small-Cap Fund Index measures the equal-weighted performance of the 30 largest international small-cap equity funds as defined by Lipper. This index is unmanaged and investors cannot invest directly in this index.
48 OAKMARK FUNDS
Oakmark Funds
Trustees and Officers
Trustees
Allan J. Reich—Chair
Thomas H. Hayden
Christine M. Maki
Laurence C. Morse, Ph. D.
Mindy M. Posoff
Steven S. Rogers
Kristi L. Rowsell
Peter S. Voss
Officers
Kristi L. Rowsell—President and Principal Executive Officer
Anthony P. Coniaris—Executive Vice President
Kevin G. Grant—Executive Vice President
Judson H. Brooks—Vice President
Megan J. Claucherty—Vice President
Justin D. Hance—Vice President
David G. Herro—Vice President
M. Colin Hudson—Vice President
John J. Kane—Vice President, Principal Financial Officer and
Treasurer
Chris W. Keller—Vice President
Eric Liu—Vice President
Jason E. Long—Vice President
Michael L. Manelli—Vice President
Colin P. McFarland—Chief Compliance Officer and Anti-Money Laundering Officer
Clyde S. McGregor—Vice President
Ian J. McPheron—Vice President
Thomas W. Murray—Vice President
Michael J. Neary—Vice President
William C. Nygren—Vice President
Vineeta D. Raketich—Vice President
Andrew J. Tedeschi—Vice President and Assistant Treasurer
Zachary D. Weber—Vice President
Edward J. Wojciechowski—Vice President
Rana J. Wright—Vice President, Secretary and Chief Legal Officer
Other Information
Investment Adviser
Harris Associates L.P.
111 S. Wacker Drive
Chicago, Illinois 60606-4319
Transfer Agent
DST Asset Manager Solutions, Inc.
Quincy, Massachusetts
Legal Counsel
K&L Gates LLP
Washington, D.C.
Independent Registered Public Accounting Firm
Deloitte & Touche LLP
Chicago, Illinois
Contact Us
Please call 1-800-OAKMARK
(1-800-625-6275)
or 617-483-8327
Website
Oakmark.com
@HarrisOakmark
To obtain a prospectus, an application or periodic reports, access our website at Oakmark.com or call 1-800-OAKMARK (625-6275) or (617) 483-8327.
Each Fund will file its complete schedule of portfolio holdings with the Securities and Exchange Commission ("SEC") for the first and third quarters of each fiscal year on Form N-Q. The Funds' Form N-Qs are available on the SEC's website at www.sec.gov. The Funds' Form N-Qs may be reviewed and copied at the SEC's Public Reference Room in Washington, DC, and information on the operation of the Public Reference Room may be obtained by calling 1-800-SEC-0330.
A description of the policies and procedures the Funds use to determine how to vote proxies relating to portfolio securities is available without charge, upon request, by calling toll-free 1-800-625-6275; on the Funds' website at Oakmark.com; and on the SEC's website at www.sec.gov.
No later than August 31 of each year, information regarding how the Adviser, on behalf of the Funds, voted proxies relating to the Funds' portfolio securities for the twelve months ended the preceding June 30 will be available through a link on the Funds' website at Oakmark.com and on the SEC's website at www.sec.gov.
This report is submitted for the general information of the shareholders of the Funds. The report is not authorized for distribution to prospective investors in the Funds unless it is accompanied or preceded by a currently effective prospectus of the Funds.
No sales charge to the shareholder or to the new investor is made in offering the shares of the Funds; however, a shareholder of the Oakmark International Small Cap Fund may incur a 2% redemption fee on an exchange or redemption of shares held for 90 days or less.
Oakmark.com 49


Oakmark.com