
OAKMARK FUNDS
FIRST QUARTER REPORT | DECEMBER 31, 2015
OAKMARK FUND
OAKMARK SELECT FUND
OAKMARK EQUITY AND INCOME FUND
OAKMARK GLOBAL FUND
OAKMARK GLOBAL SELECT FUND
OAKMARK INTERNATIONAL FUND
OAKMARK INTERNATIONAL SMALL CAP FUND
Oakmark Funds
2016 First Quarter Report
TABLE OF CONTENTS
|
President's Letter |
1 |
||||||
|
Commentary on Oakmark and Oakmark Select Funds |
2 |
||||||
|
Oakmark Fund |
|||||||
|
Summary Information |
4 |
||||||
|
Portfolio Manager Commentary |
5 |
||||||
|
Schedule of Investments |
6 |
||||||
|
Oakmark Select Fund |
|||||||
|
Summary Information |
8 |
||||||
|
Portfolio Manager Commentary |
9 |
||||||
|
Schedule of Investments |
10 |
||||||
|
Oakmark Equity and Income Fund |
|||||||
|
Summary Information |
12 |
||||||
|
Portfolio Manager Commentary |
13 |
||||||
|
Schedule of Investments |
15 |
||||||
|
Oakmark Global Fund |
|||||||
|
Summary Information |
20 |
||||||
|
Portfolio Manager Commentary |
21 |
||||||
|
Schedule of Investments |
23 |
||||||
|
Oakmark Global Select Fund |
|||||||
|
Summary Information |
26 |
||||||
|
Portfolio Manager Commentary |
27 |
||||||
|
Schedule of Investments |
28 |
||||||
|
Commentary on Oakmark International and Oakmark Int'l Small Cap Funds |
30 |
||||||
|
Oakmark International Fund |
|||||||
|
Summary Information |
32 |
||||||
|
Portfolio Manager Commentary |
33 |
||||||
|
Schedule of Investments |
34 |
||||||
|
Oakmark International Small Cap Fund |
|||||||
|
Summary Information |
38 |
||||||
|
Portfolio Manager Commentary |
39 |
||||||
|
Schedule of Investments |
40 |
||||||
|
Disclosures and Endnotes |
42 |
||||||
|
Trustees and Officers |
44 | ||||||
FORWARD-LOOKING STATEMENT DISCLOSURE
One of our most important responsibilities as mutual fund managers is to communicate with shareholders in an open and direct manner. Some of our comments in our letters to shareholders are based on current management expectations and are considered "forward-looking statements." Actual future results, however, may prove to be different from our expectations. You can identify forward-looking statements by words such as "estimate", "may", "will", "expect", "believe",
"plan" and other similar terms. We cannot promise future returns. Our opinions are a reflection of our best judgment at the time this report is compiled, and we disclaim any obligation to update or alter forward-looking statements as a result of new information, future events, or otherwise.
OAKMARK FUNDS
Oakmark Funds December 31, 2015
President's Letter

Kristi L. Rowsell
President of Oakmark Funds
President of Harris Associates L.P.
Dear Shareholders,
The year 2015 proved to be challenging for U.S.-based stock investors. While the fourth quarter's performance was strongly positive, the calendar year ended with most benchmark indexes in negative territory. Market participants encountered a full mix of negative headlines during the year, such as slowing global growth, declining commodity prices, volatile currencies and reduced monetary stimulus in the United States. However, not all of the news today is negative. The U.S. unemployment rate continues to fall. Global inflation and interest rates remain low. And both households and companies around the world benefit from today's lower energy prices. These factors, plus significant monetary stimulation from many non-U.S. countries, lead most estimates of global growth to be between two and three percent.
Your Oakmark Funds also had a challenging performance year. Our managers discuss the factors and individual companies that impacted the portfolios in their letters this quarter. They provide valuable context for our shareholders, reflecting on their experience through full market cycles and their long tenure as managers for the Funds. We have always believed that the key to capturing equity market returns is to stay disciplined and focused. We invest in companies that we believe are priced below our estimate of intrinsic value. Our research teams use fundamental analysis to identify companies that we believe offer excellent business models, good management teams, strong balance sheets and attractive valuations. Our conviction in this philosophy is unwavering and has been repeatedly affirmed over our company's 40-year history as investment managers. Experience tells us that in weak performance periods like last year, good opportunities often arise and that our patience is typically rewarded.
One of our central investment tenets is to invest in companies that have management teams whose interests are aligned with their shareholders. This principle applies at Harris Associates with respect to the Oakmark Funds as well. Each year, we voluntarily report the level of personal assets the employees of the firm and trustees of the Funds collectively invest in the Oakmark Funds because we believe it demonstrates our commitment to our investing philosophy. This alignment of our interests with yours fosters stewardship of the Funds, a responsibility that we take very seriously. We are proud to tell you that, as of December 31, 2015, the employees of Harris Associates, our families and the Funds' trustees have more than $440 million invested in the Oakmark Funds, reflecting significant share purchases during the year. We hope that this level of investment demonstrates to you our confidence that the Funds remain attractive investments for the future.
Happy New Year to you all! We wish you a healthy and prosperous 2016.
Oakmark.com 1
Oakmark and Oakmark Select Funds December 31, 2015
Portfolio Manager Commentary

William C. Nygren, CFA
Portfolio Manager
oakmx@oakmark.com
oaklx@oakmark.com
At Oakmark, we are long-term investors. We attempt to identify growing businesses that are managed to benefit their shareholders. We will purchase stock in those businesses only when priced substantially below our estimate of intrinsic value. After purchase, we patiently wait for the gap between stock price and intrinsic value to close.
"Don't keep all your eggs in one basket."
-Old Italian Proverb
"Put all your eggs in one basket and watch that basket."
-Mark Twain
Active managers had a disappointing 2015. Following 2014, when 90% of actively managed mutual funds underperformed the S&P 5001, there was little improvement in 2015. The majority of mutual funds lost money this past year despite a small gain in the S&P. Most stocks declined, and that created a tough environment for active managers to make money. Unfortunately, the list of declining funds included most of the Oakmark Funds.
The poor mutual fund industry results led to an acceleration of investors redeeming shares from their actively managed funds and reinvesting in index funds. In my March commentary, I wrote that the inevitability of index funds outperforming the average actively managed fund didn't imply that identifying superior funds was destined to fail. In fact, we concluded that the long-term rewards from active management can be as high as they have ever been.
Disappointments during the year also included some high profile funds suffering substantial setbacks due to a lack of succession planning, poor tax management or excessive concentration in top holdings. Many mutual fund industry observers highlighted those issues, threw their hands up in frustration and hopped on the indexing bandwagon.
When we launched the Oakmark Select Fund in 1996, I wrote a paper outlining our belief that a more concentrated fund of our best stock selections was likely to produce better long-term returns, albeit with higher short-term volatility, than our more diversified funds. To conclude that paper, I selected a quote that Warren Buffett had used in his 1991 annual report to the shareholders of Berkshire Hathaway:
"John Maynard Keynes, whose brilliance as a practicing investor matched his brilliance in thought, wrote a letter to a business associate, F.C. Scott, on August 15, 1934, that says it all: 'As time goes on, I get more and more convinced that the right method in investment is to put fairly large sums into enterprises which one thinks one knows something about and in the management of which one thoroughly believes. It is a mistake to think that one limits one's risk by spreading too much between enterprises about which one knows little and has no reason for special confidence.'"
Is the more than 80-year-old quote from Keynes and nearly 25-year-old quote from Buffett, two of the greatest investors of all time, still valid today? In 2016, we will celebrate the 20th anniversary of Oakmark Select and the 10th of Oakmark Global Select. As one of the early advocates for concentrated investing
in mutual funds, we at Oakmark thought this would be a good opportunity to revisit the case for concentration.
Academic theory states there is no such thing as over-diversification. If all stocks are always priced appropriately—meaning there is no way to increase return without increasing risk—then diversification is a free good. The more stocks you add to your portfolio, the less risky the portfolio is. According to that theory, it makes sense that investors should own lots of stocks. Effectively, your eggs should be spread across as many baskets as you can find. And that is why most mutual fund portfolios own well over 100 stocks. The problem with this line of thinking is that if stock selection doesn't add value, then active management doesn't add value either, and low-cost index funds become a superior choice.
But what if stocks aren't always appropriately priced? What if, because investors occasionally are confused or overcome by emotions, some stocks get mispriced and offer a different risk-return tradeoff than other stocks? Then diversification theory gets stood on its head. Then some stocks are superior to others. Then there is a difference between one's favorite stocks and all the other stocks. Then diversifying away from those favorite stocks reduces expected return. Instead of more diversification always being better, it becomes a trade-off of risk versus return: Holding more stocks in a portfolio lowers risk, but at the cost of also lowering expected return. You still wouldn't want all your eggs in just one basket, but you'd recognize there is a cost for using too many baskets.
At Oakmark, we believe that the academic view on stocks is largely, but not completely, correct: We think that most of the time, most stocks are priced about right—but not always, and never each and every stock. We believe that misunderstood and "out of favor" stocks exist and that by using a disciplined approach to finding them and having the patience to hold them long-term, we can reap the excess rewards those stocks offer.
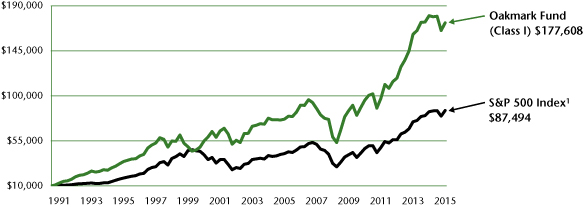
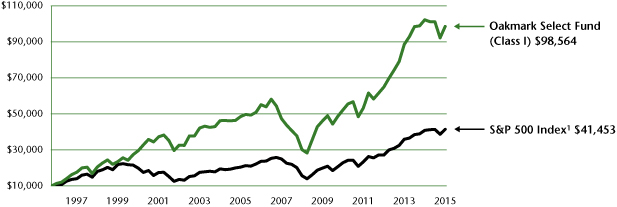
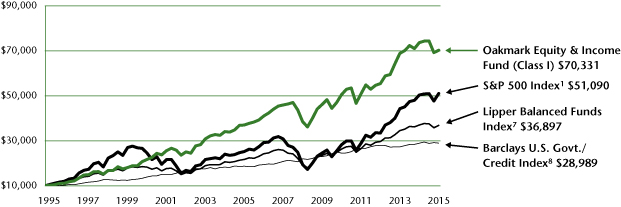
If you don't think that is possible, I encourage you to look at the performance graphs showing how a $10,000 investment has fared in each of our Funds. Then compare that performance to the relevant benchmark index shown on each graph. All Oakmark Funds use the same long-term value philosophy. But these Funds were started at different times, and they invest in different geographies and varied asset classes. The graphs show actual returns to shareholders, meaning they already deduct all expenses.
Because we believe our stock selection adds value, we own fewer stocks than most other mutual funds. Our diversified funds (Oakmark, Oakmark International, Oakmark Global, Oakmark Equity and Income, and Oakmark International Small Cap) generally own 40-60 stocks each. Typical mutual funds own two to three times that many. We believe adding more stocks to our
2 OAKMARK FUNDS
Oakmark and Oakmark Select Funds December 31, 2015
Portfolio Manager Commentary (continued)
portfolios would decrease their expected returns and only slightly reduce their volatility.
When I started in the investment business, in the days before Morningstar made information on mutual funds so easily accessible, many fund investors picked just one fund and invested most of their assets in that one fund. Today, most mutual fund investors build portfolios of mutual funds. When we started Oakmark Select, I used to bring a prop when I spoke to investors. It answered a simple question: What would the portfolio look like for an individual who put $10,000 into the top-rated fund in each of Morningstar's nine style boxes? And I didn't mean just a listing of nine funds. I wanted to show the portfolio of all the stocks held through ownership of the nine funds. So I printed out that portfolio, listing each stock and showing how much of the $90,000 was invested in it. For those of you too young to remember, computer printers back then didn't use regular paper; they used a continuous roll of paper with perforations for page breaks rather than separate pages. In any event, that printout showed a portfolio with over 1,000 stocks, and it was more than 30 feet long. Over-diversifying is not a good recipe for beating the market!
I don't think the mutual fund industry has changed to reflect how most investors now use funds. Because investors are diversifying their assets across multiple funds, their ability to outperform the market is lessened if each fund holds over 100 securities. That's why our diversified funds generally hold only 40-60 stocks, and our two Select funds generally own only 20 stocks. That magnifies the importance, both good and bad, of our stock selection. It also makes our Select funds great complements to holdings that are primarily indexed or to an investor's portfolio of funds. Because the Select funds have higher volatility, they are not as appropriate for "one-stop shopping" as our other funds are.
Nearly 20 years ago, in the first quarterly report I wrote introducing the Oakmark Select Fund, I said, "By concentrating in my favorite stocks, I hope to increase the probability of achieving our outperformance goal. The downside is that the short-term results will show more ups and downs." We've delivered on both goals. Our shareholders have definitely endured bigger ups and downs, but in return, they have enjoyed results that exceeded the Oakmark Fund in 14 of 19 calendar years and achieved significantly greater cumulative returns.
In that same report I also said, "We currently plan that at most times the Oakmark Select Fund will own 20 or fewer stocks, with about half of its assets in its five largest positions." Almost 20 years later, we still aim to own about 20 stocks. But we have made one change. Graphs of portfolio volatility at the time of the Fund's inception showed that most of the benefit of diversification was obtained by owning just 7-10 independent securities, implying weightings of 10-15% each. Now, because stocks have become more correlated with each other and somewhat more volatile, today's graphs show that 10-15 securities are needed to get the same reduction in portfolio volatility. Based on that, we believe somewhat smaller position sizes are prudent, so we now generally limit our largest positions to 7-10% of assets. The result is that our top five positions account for about 35% of assets instead of 50%.
In 2006, when David Herro and I started the Oakmark Global Select Fund, we wrote the following in our introductory shareholder letter. I'll quote at length because it still accurately explains how we manage the Fund today:
"As with all Oakmark Funds, we believe that we can add value via our stock selection and therefore believe that we can magnify that value via concentration. We expect the portfolio to generally contain about 20 stocks, and we expect that, over time, about half will be U.S.-based businesses and half will be based outside the U.S. When we find it easier to identify cheap stocks in the U.S., we will invest more heavily there, and we will shift to more international stocks when we believe non-U.S. opportunities are more abundant... We are not going to be benchmark sensitive and we will not attempt to minimize tracking error—the amount our performance differs from index performance. To us, that just isn't a useful measure of risk. We will attempt to select securities that provide undervaluation, growing values, and managements that work to maximize business value. We believe those features lessen what we define as risk—which is the chance of losing money. Our goal will be to maximize the long-term, after-tax growth of shareholder capital. And as with all other Oakmark Funds, 'shareholder capital' includes our own."
The Oakmark Global Select Fund has outperformed the average of Oakmark and Oakmark International in six of the nine ensuing calendar years and has also achieved a higher cumulative return. When stock selection is good, concentration makes it better.
We know it is painful to lose money. The past two years, during which most of our Funds have underperformed their respective indexes, have been difficult, and the first week of 2016 wasn't any better. But if you again look at the performance graphs I referenced earlier, you'll see that all of our Funds have endured periods, sometimes for several years, when they have either lost money or lost ground relative to their benchmarks. Though these times are frustrating for our shareholders—and, remember, that includes all of the portfolio managers—these periods of weak performance have been opportunities for additional investment rather than reasons to give up on our investment philosophy.
We are invested side-by-side with you, we share your frustration with recent results and we appreciate your patience. We believe that our Funds are positioned to continue delivering on their dual long-term goals of growing investor capital and performing better than index funds. You might be interested to know that every portfolio manager of every Oakmark Fund purchased more shares in the past twelve months. Actions speak louder than words.
Oakmark.com 3
Oakmark Fund December 31, 2015
Summary Information
VALUE OF A $10,000 INVESTMENT
Since Inception - 08/05/91 (Unaudited)
PERFORMANCE
|
Average Annual Total Returns (as of 12/31/15) |
|||||||||||||||||||||||||||||||
|
(Unaudited) |
Total Return Last 3 Months |
1-year |
3-year |
5-year |
10-year |
Since Inception |
Inception Date |
||||||||||||||||||||||||
|
Oakmark Fund (Class I) |
4.64 |
% |
-3.95 |
% |
13.71 |
% |
12.61 |
% |
8.49 |
% |
12.51 |
% |
08/05/91 |
||||||||||||||||||
|
S&P 500 Index |
7.04 |
% |
1.38 |
% |
15.13 |
% |
12.57 |
% |
7.31 |
% |
9.29 |
% |
|||||||||||||||||||
|
Dow Jones Industrial Average2 |
7.70 |
% |
0.21 |
% |
12.66 |
% |
11.30 |
% |
7.75 |
% |
10.07 |
% |
|||||||||||||||||||
|
Lipper Large Cap Value Funds Index3 |
5.64 |
% |
-3.65 |
% |
12.53 |
% |
10.07 |
% |
5.71 |
% |
8.50 |
% |
|||||||||||||||||||
|
Oakmark Fund (Class II) |
4.58 |
% |
-4.26 |
% |
13.36 |
% |
12.26 |
% |
8.15 |
% |
7.30 |
% |
04/05/01 |
||||||||||||||||||
The graph and table above do not reflect the deduction of taxes that a shareholder would pay on Fund distributions or the redemption of Fund shares.
Past performance is no guarantee of future results. The performance data quoted represents past performance. Current performance may be lower or higher than the performance data quoted. Total return includes change in share prices and, in each case, includes reinvestment of dividends and capital gain distributions. The investment return and principal value vary so that an investor's shares when redeemed may be worth more or less than the original cost. To obtain the most recent month-end performance, please visit Oakmark.com.
|
TOP TEN EQUITY HOLDINGS4 |
% of Net Assets |
||||||
|
Bank of America Corp. |
3.5 |
||||||
|
General Electric Co. |
2.8 |
||||||
|
Citigroup, Inc. |
2.7 |
||||||
|
American International Group, Inc. |
2.7 |
||||||
|
JPMorgan Chase & Co. |
2.6 |
||||||
|
MasterCard, Inc., Class A |
2.5 |
||||||
|
Visa, Inc., Class A |
2.4 |
||||||
|
Intel Corp. |
2.3 |
||||||
|
Alphabet Inc., Class C |
2.3 |
||||||
|
Microsoft Corp. |
2.2 |
||||||
|
FUND STATISTICS |
|||||||
|
Ticker |
OAKMX |
||||||
|
Inception |
08/05/1991 |
||||||
|
Number of Equity Holdings |
55 |
||||||
|
Net Assets |
$17.1 billion | ||||||
|
Benchmark |
S&P 500 Index |
||||||
|
Weighted Average Market Cap |
$120.4 billion | ||||||
|
Median Market Cap |
$45.1 billion | ||||||
|
Portfolio Turnover (for the 12-months ended 09/30/15) |
33% | ||||||
|
Expense Ratio - Class I (as of 09/30/14) |
0.87% | ||||||
|
Expense Ratio - Class I (as of 09/30/15) |
0.85% | ||||||
|
SECTOR ALLOCATION |
% of Net Assets |
||||||
|
Financials |
30.5 |
||||||
|
Information Technology |
25.3 |
||||||
|
Industrials |
10.9 |
||||||
|
Consumer Discretionary |
9.8 |
||||||
|
Energy |
5.9 |
||||||
|
Consumer Staples |
5.8 |
||||||
|
Health Care |
5.1 |
||||||
|
Materials |
1.7 |
||||||
|
Short-Term Investments and Other |
5.0 |
||||||
4 OAKMARK FUNDS
Oakmark Fund December 31, 2015
Portfolio Manager Commentary


William C. Nygren, CFA
Portfolio Manager
oakmx@oakmark.com
Kevin Grant, CFA
Portfolio Manager
oakmx@oakmark.com
The Oakmark Fund returned 5% during the fourth quarter of 2015, bringing the calendar year to a loss of 4%. These results lagged behind the S&P 5001, which was up 7% for the fourth quarter and up 1% for the calendar year. We are disappointed with the Fund's full-year results, which were hurt by significant declines in energy-related shares and relative underperformance from financials. As portfolio managers and large shareholders of the Fund, we're not satisfied with losses, but we remain confident in our time-tested philosophy, investment process and our research team. As we have said in the past, our analysts look for three characteristics in every investment: (1) businesses selling at a discount to fair value, (2) businesses that produce sustainable value growth over time and (3) management teams that think and act like value-maximizing owners. We typically buy businesses that are trading at a significant discount to our estimate of a company's intrinsic value and sell when the price approaches intrinsic value. With recent underperformance in several of our sectors, the valuation of the Oakmark Fund portfolio is attractively positioned toward the "buy" end of the range.
Our biggest contributing sectors for the fourth quarter were information technology and financials, with General Electric and Amazon being the best individual contributors. Our worst contributing sectors for the quarter were energy and healthcare, and our worst individual securities were Anadarko and Cummins. For the calendar year, the highest contributing securities were Amazon and Alphabet (formerly known as Google), and the worst contributing securities were Chesapeake and Qualcomm. Chesapeake was affected by another 30% drop in crude oil prices in 2015, to what we feel is an unsustainable level, and Qualcomm was pressured by foreign disputes in their highly profitable wireless royalty business.
During the quarter, we added a new position in Ally Financial (see below), and we eliminated positions in Accenture, Amazon and Omnicom Group. Amazon has been a great holding for the Fund, and with the share price more than doubling in 2015, we believe the business is now fairly valued. With minimal reported earnings and a very high P/E5 ratio, Amazon may have looked like an unusual purchase for a value-based fund when we initiated a position in April 2014. We looked past reported earnings, which were tempered by large investments for future growth, and found that the scale and core earnings power of Amazon's business were quite impressive and under-appreciated. Omnicom Group has also been a strong performer for the Fund. We have held Omnicom since late 2008, and we eliminated the position in the fourth quarter as the share price approached our estimate of fair value.
Ally Financial (ALLY-$18.79)
Ally was founded nearly a century ago as General Motors Acceptance Corporation. Its purpose then was to provide financing to GM dealers and retail customers. Today, Ally's
business is largely the same except that it is no longer owned by GM and now serves dealers and customers of many other automobile manufacturers, such as Ford, Chrysler and Toyota. Since Ally's initial public offering in spring 2014, its shares have fallen over 20% while the S&P 500 has returned over 15%. Over this period, some investors have grown concerned that the business is at a cyclical peak, as U.S. auto sales are near record levels and credit losses are below long-term averages; as a result, some believe Ally's earnings have nowhere to go but down. We believe cyclical pressures will be offset by continued internal improvements, such as funding cost reductions (as "legacy" liabilities are replaced with lower cost borrowings) and improving their capital structure. With Ally's stock trading at just 80% of tangible book value, we believe Ally is a compelling addition to the Oakmark Fund.
Oakmark.com 5
Oakmark Fund December 31, 2015 (Unaudited)
Schedule of Investments (in thousands)
|
Shares |
Value |
||||||||||
|
COMMON STOCKS - 95.0% |
|||||||||||
|
FINANCIALS - 30.5% |
|||||||||||
|
DIVERSIFIED FINANCIALS - 12.5% |
|||||||||||
|
State Street Corp. Asset Management & Custody Banks |
5,180 |
$ |
343,745 |
||||||||
|
American Express Co. Consumer Finance |
4,800 |
333,840 |
|||||||||
|
The Goldman Sachs Group, Inc. Investment Banking & Brokerage |
1,740 |
313,600 |
|||||||||
|
Capital One Financial Corp. Consumer Finance |
4,113 |
296,862 |
|||||||||
|
Bank of New York Mellon Corp. Asset Management & Custody Banks |
6,450 |
265,854 |
|||||||||
|
Franklin Resources, Inc. Asset Management & Custody Banks |
5,339 |
196,564 |
|||||||||
|
Ally Financial, Inc. (a) Consumer Finance |
10,456 |
194,909 |
|||||||||
|
T Rowe Price Group, Inc. Asset Management & Custody Banks |
2,547 |
182,069 |
|||||||||
|
2,127,443 |
|||||||||||
|
BANKS - 10.5% |
|||||||||||
|
Bank of America Corp. Diversified Banks |
35,500 |
597,465 |
|||||||||
|
Citigroup, Inc. Diversified Banks |
9,030 |
467,303 |
|||||||||
|
JPMorgan Chase & Co. Diversified Banks |
6,740 |
445,042 |
|||||||||
|
Wells Fargo & Co. Diversified Banks |
5,290 |
287,564 |
|||||||||
|
1,797,374 |
|||||||||||
|
INSURANCE - 7.5% |
|||||||||||
|
American International Group, Inc. Multi-line Insurance |
7,305 |
452,691 |
|||||||||
|
Aflac, Inc. Life & Health Insurance |
5,670 |
339,633 |
|||||||||
|
Aon PLC Insurance Brokers |
3,080 |
284,007 |
|||||||||
|
Principal Financial Group, Inc. Life & Health Insurance |
4,609 |
207,327 |
|||||||||
|
1,283,658 |
|||||||||||
|
5,208,475 |
|||||||||||
|
Shares |
Value |
||||||||||
|
INFORMATION TECHNOLOGY - 25.3% |
|||||||||||
|
SOFTWARE & SERVICES - 14.6% |
|||||||||||
|
MasterCard, Inc., Class A Data Processing & Outsourced Services |
4,450 |
$ |
433,252 |
||||||||
|
Visa, Inc., Class A Data Processing & Outsourced Services |
5,280 |
409,464 |
|||||||||
|
Alphabet, Inc., Class C (a) Internet Software & Services |
524 |
397,274 |
|||||||||
|
Microsoft Corp. Systems Software |
6,650 |
368,942 |
|||||||||
|
Automatic Data Processing, Inc. Data Processing & Outsourced Services |
4,320 |
365,990 |
|||||||||
|
Oracle Corp. Systems Software |
9,445 |
345,026 |
|||||||||
|
Alphabet, Inc., Class A (a) Internet Software & Services |
217 |
168,515 |
|||||||||
|
2,488,463 |
|||||||||||
|
SEMICONDUCTORS & SEMICONDUCTOR EQUIPMENT - 5.4% |
|||||||||||
|
Intel Corp. Semiconductors |
11,580 |
398,931 |
|||||||||
|
Texas Instruments, Inc. Semiconductors |
6,365 |
348,866 |
|||||||||
|
Applied Materials, Inc. Semiconductor Equipment |
9,260 |
172,884 |
|||||||||
|
920,681 |
|||||||||||
|
TECHNOLOGY HARDWARE & EQUIPMENT - 5.3% |
|||||||||||
|
Apple, Inc. Technology Hardware, Storage & Peripherals |
3,307 |
348,095 |
|||||||||
|
TE Connectivity, Ltd. Electronic Manufacturing Services |
5,036 |
325,353 |
|||||||||
|
QUALCOMM, Inc. Communications Equipment |
4,845 |
242,177 |
|||||||||
|
915,625 |
|||||||||||
|
4,324,769 |
|||||||||||
|
INDUSTRIALS - 10.9% |
|||||||||||
|
CAPITAL GOODS - 7.6% |
|||||||||||
|
General Electric Co. Industrial Conglomerates |
15,500 |
482,825 |
|||||||||
|
Caterpillar, Inc. Construction Machinery & Heavy Trucks |
4,400 |
299,024 |
|||||||||
|
Cummins, Inc. Construction Machinery & Heavy Trucks |
3,000 |
264,030 |
|||||||||
|
Parker-Hannifin Corp. Industrial Machinery |
2,539 |
246,257 |
|||||||||
|
1,292,136 |
|||||||||||
|
TRANSPORTATION - 3.3% |
|||||||||||
|
FedEx Corp. Air Freight & Logistics |
2,200 |
327,778 |
|||||||||
|
Union Pacific Corp. Railroads |
2,950 |
230,690 |
|||||||||
|
558,468 |
|||||||||||
|
1,850,604 |
|||||||||||
6 OAKMARK FUNDS
Oakmark Fund December 31, 2015 (Unaudited)
Schedule of Investments (in thousands) (continued)
|
Shares |
Value |
||||||||||
|
COMMON STOCKS - 95.0% (continued) |
|||||||||||
|
CONSUMER DISCRETIONARY - 9.8% |
|||||||||||
|
AUTOMOBILES & COMPONENTS - 3.7% |
|||||||||||
|
General Motors Co. Automobile Manufacturers |
7,850 |
$ |
266,978 |
||||||||
|
Fiat Chrysler Automobiles N.V. (a) Automobile Manufacturers |
16,000 |
223,840 |
|||||||||
|
Harley-Davidson, Inc. Motorcycle Manufacturers |
3,102 |
140,800 |
|||||||||
|
631,618 |
|||||||||||
|
MEDIA - 2.5% |
|||||||||||
|
News Corp., Class A Publishing |
19,704 |
263,247 |
|||||||||
|
Comcast Corp., Class A Cable & Satellite |
2,944 |
166,141 |
|||||||||
|
429,388 |
|||||||||||
|
RETAILING - 1.9% |
|||||||||||
|
Liberty Interactive Corp. QVC Group, Class A (a) Catalog Retail |
11,891 |
324,860 |
|||||||||
|
CONSUMER DURABLES & APPAREL - 1.7% |
|||||||||||
|
Whirlpool Corp. Household Appliances |
2,000 |
293,740 |
|||||||||
|
1,679,606 |
|||||||||||
|
ENERGY - 5.9% |
|||||||||||
|
Apache Corp. Oil & Gas Exploration & Production |
8,274 |
367,940 |
|||||||||
|
Anadarko Petroleum Corp. Oil & Gas Exploration & Production |
4,900 |
238,042 |
|||||||||
|
Halliburton Co. Oil & Gas Equipment & Services |
6,801 |
231,506 |
|||||||||
|
National Oilwell Varco, Inc. Oil & Gas Equipment & Services |
3,580 |
119,894 |
|||||||||
|
Chesapeake Energy Corp. Oil & Gas Exploration & Production |
12,000 |
54,000 |
|||||||||
|
1,011,382 |
|||||||||||
|
CONSUMER STAPLES - 5.8% |
|||||||||||
|
FOOD, BEVERAGE & TOBACCO - 4.4% |
|||||||||||
|
Nestle SA (b) Packaged Foods & Meats |
3,540 |
263,447 |
|||||||||
|
Diageo PLC (b) Distillers & Vintners |
2,250 |
245,407 |
|||||||||
|
General Mills, Inc. Packaged Foods & Meats |
4,066 |
234,447 |
|||||||||
|
743,301 |
|||||||||||
|
HOUSEHOLD & PERSONAL PRODUCTS - 1.4% |
|||||||||||
|
Unilever PLC (b) Personal Products |
5,613 |
242,032 |
|||||||||
|
985,333 |
|||||||||||
|
Shares |
Value |
||||||||||
|
HEALTH CARE - 5.1% |
|||||||||||
|
HEALTH CARE EQUIPMENT & SERVICES - 3.7% |
|||||||||||
|
Medtronic PLC Health Care Equipment |
4,190 |
$ |
322,295 |
||||||||
|
UnitedHealth Group, Inc. Managed Health Care |
2,590 |
304,687 |
|||||||||
|
626,982 |
|||||||||||
|
PHARMACEUTICALS, BIOTECHNOLOGY & LIFE SCIENCES - 1.4% |
|||||||||||
|
Sanofi (b) Pharmaceuticals |
5,670 |
241,826 |
|||||||||
|
868,808 |
|||||||||||
|
MATERIALS - 1.7% |
|||||||||||
|
Monsanto Co. Fertilizers & Agricultural Chemicals |
3,000 |
295,560 |
|||||||||
|
TOTAL COMMON STOCKS - 95.0% (COST $12,634,021) |
16,224,537 |
||||||||||
|
Par Value |
Value |
||||||||||
|
SHORT TERM INVESTMENTS - 5.0% |
|||||||||||
|
REPURCHASE AGREEMENT - 3.8% |
|||||||||||
|
Fixed Income Clearing Corp. Repurchase Agreement, 0.08% dated 12/31/15 due 01/04/16, repurchase price $648,078, collateralized by United States Treasury Notes, 1.375% - 1.750%, due 07/31/20 - 12/31/20, aggregate value plus accrued interest of $661,037 (Cost: $648,073) |
$ |
648,073 |
648,073 |
||||||||
|
GOVERNMENT AND AGENCY SECURITIES - 0.6% |
|||||||||||
|
United States Treasury Note, 0.02%, due 01/31/16 (c) (Cost $100,161) |
100,000 |
100,161 |
|||||||||
|
U.S. GOVERNMENT BILLS - 0.6% |
|||||||||||
|
United States Treasury Bills, 0.26%, due 03/10/16 (c) (Cost $99,950) |
100,000 |
99,978 |
|||||||||
|
TOTAL SHORT TERM INVESTMENTS - 5.0% (COST $848,184) |
848,212 |
||||||||||
|
TOTAL INVESTMENTS - 100.0% (COST $13,482,205) |
17,072,749 |
||||||||||
|
Other Assets In Excess of Liabilities - 0.0% (d) |
681 |
||||||||||
|
TOTAL NET ASSETS - 100.0% |
$ |
17,073,430 |
|||||||||
(a) Non-income producing security
(b) Sponsored American Depositary Receipt
(c) The rate shown represents the annualized yield at the time of purchase; not a coupon rate.
(d) Amount rounds to less than 0.1%.
Oakmark.com 7
Oakmark Select Fund December 31, 2015
Summary Information
VALUE OF A $10,000 INVESTMENT
Since Inception - 11/01/96 (Unaudited)
PERFORMANCE
|
Average Annual Total Returns (as of 12/31/15) |
|||||||||||||||||||||||||||||||
|
(Unaudited) |
Total Return Last 3 Months |
1-year |
3-year |
5-year |
10-year |
Since Inception |
Inception Date |
||||||||||||||||||||||||
|
Oakmark Select Fund (Class I) |
6.90 |
% |
-3.58 |
% |
14.95 |
% |
13.56 |
% |
7.34 |
% |
12.68 |
% |
11/01/96 |
||||||||||||||||||
|
S&P 500 Index |
7.04 |
% |
1.38 |
% |
15.13 |
% |
12.57 |
% |
7.31 |
% |
7.70 |
% |
|||||||||||||||||||
|
Lipper Multi-Cap Value Funds Index6 |
3.76 |
% |
-4.53 |
% |
12.24 |
% |
9.71 |
% |
5.23 |
% |
7.16 |
% |
|||||||||||||||||||
|
Oakmark Select Fund (Class II) |
6.80 |
% |
-3.94 |
% |
14.60 |
% |
13.22 |
% |
7.04 |
% |
9.05 |
% |
12/31/99 |
||||||||||||||||||
The graph and table do not reflect the deduction of taxes that a shareholder would pay on Fund distributions or the redemption of Fund shares.
Past performance is no guarantee of future results. The performance data quoted represents past performance. Current performance may be lower or higher than the performance data quoted. Total return includes change in share prices and, in each case, includes reinvestment of dividends and capital gain distributions. The investment return and principal value vary so that an investor's shares when redeemed may be worth more or less than the original cost. To obtain the most recent month-end performance, please visit Oakmark.com.
|
TOP TEN EQUITY HOLDINGS4 |
% of Net Assets |
||||||
|
Alphabet Inc., Class C |
8.0 |
||||||
|
General Electric Co. |
7.7 |
||||||
|
American International Group, Inc. |
6.5 |
||||||
|
Bank of America Corp. |
6.1 |
||||||
|
TE Connectivity, Ltd. |
6.0 |
||||||
|
JPMorgan Chase & Co. |
5.9 |
||||||
|
Citigroup, Inc. |
5.8 |
||||||
|
CBRE Group, Inc. Class A |
5.3 |
||||||
|
MasterCard, Inc., Class A |
5.1 |
||||||
|
FNF Group |
4.7 |
||||||
|
FUND STATISTICS |
|||||||
|
Ticker |
OAKLX |
||||||
|
Inception |
11/01/96 |
||||||
|
Number of Equity Holdings |
19 |
||||||
|
Net Assets |
$5.8 billion | ||||||
|
Benchmark |
S&P 500 Index |
||||||
|
Weighted Average Market Cap |
$140.1 billion | ||||||
|
Median Market Cap |
$43.3 billion | ||||||
|
Portfolio Turnover (for the 12-months ended 09/30/15) |
46% | ||||||
|
Expense Ratio - Class I (as of 09/30/14) |
0.95% | ||||||
|
Expense Ratio - Class I (as of 09/30/15) |
0.95% | ||||||
|
SECTOR ALLOCATION |
% of Net Assets |
||||||
|
Financials |
38.1 |
||||||
|
Information Technology |
27.0 |
||||||
|
Consumer Discretionary |
8.2 |
||||||
|
Industrials |
7.8 |
||||||
|
Energy |
6.4 |
||||||
|
Materials |
3.4 |
||||||
|
Utilities |
3.2 |
||||||
|
Short-Term Investments and Other |
5.9 |
||||||
8 OAKMARK FUNDS
Oakmark Select Fund December 31, 2015
Portfolio Manager Commentary


William C. Nygren, CFA
Portfolio Manager
oaklx@oakmark.com
Anthony P. Coniaris, CFA
Portfolio Manager
oaklx@oakmark.com
Win Murray
Portfolio Manager
oaklx@oakmark.com
The Oakmark Select Fund returned 7% for the quarter which matched the S&P 500 Index's1 return. For all of calendar 2015, the Oakmark Select Fund declined by 4%, compared to a 1% gain for the S&P 500 Index.
Our top performers in the quarter, each up by at least 24%, were Alphabet (formerly known as Google), General Electric (GE), and Amazon. Alphabet and GE ended the quarter as the two largest positions in the Fund, and we believe both investments remain substantively undervalued, possess strong fundamentals, and are run by excellent management teams. We've always believed that Alphabet's highly valuable search business makes more money than investors give it credit for, and the company's new reporting structure should better highlight this profit stream. General Electric, meanwhile, is completing its portfolio transformation by selling off finance assets, acquiring what we believe is a quality industrial asset at a great price (Alstom), and buying back stock with proceeds from its Synchrony share exchange. We expect the newly refocused GE to have significant margin expansion potential over the next few years.
We eliminated our Amazon stake during the quarter, as the stock's rapid climb in 2015 brought the shares up to our estimate of intrinsic value. While our holding period for Amazon (first purchased in the Fund in the second quarter of 2014) was much shorter than is typical for us, we've always said that turnover is simply a byproduct of the length of time required for price to converge with value. We'll happily show high turnover when it is the result of rapid stock price appreciation. We reinvested the Amazon proceeds across existing holdings, ending the quarter with investments in 19 companies; the Fund generally holds about 20 positions.
Our worst quarterly performer by far was Chesapeake Energy, down 39%, while only two other positions declined—FNF Group down 2% and Calpine down 1%. In our opinion, commodity prices have fallen to levels which, if permanent, would bankrupt much of the exploration and production sector of the oil and gas industry. However, we believe commodity prices will rise and that many investments made today in this industry will prove quite rewarding. That said, given Chesapeake's financial obligations, it is without question a much riskier investment than we normally hold. Securities across Chesapeake's capital structure have all declined sharply and, in our opinion, are now all attractively priced. We've shifted some of our position from common stock to somewhat less risky preferred stock, which we believe reduces risk without forfeiting upside potential.
While the Fund's full-year performance wasn't as strong as we would've liked, it's worth noting that our pre-tax and after-tax returns were very similar, despite realizing large gains throughout the year in investments such as FedEx, Medtronic, and Amazon. We actively monetized losses, where appropriate, so that we could eliminate the need for capital gains distributions this year.
Thank you, our fellow shareholders, for your continued investment in our Fund. Best wishes for a happy and prosperous 2016.
Oakmark.com 9
Oakmark Select Fund December 31, 2015 (Unaudited)
Schedule of Investments (in thousands)
|
Shares |
Value |
||||||||||
|
COMMON STOCKS - 93.1% |
|||||||||||
|
FINANCIALS - 38.1% |
|||||||||||
|
BANKS - 17.8% |
|||||||||||
|
Bank of America Corp. Diversified Banks |
20,979 |
$ |
353,070 |
||||||||
|
JPMorgan Chase & Co. Diversified Banks |
5,230 |
345,337 |
|||||||||
|
Citigroup, Inc. Diversified Banks |
6,577 |
340,360 |
|||||||||
|
1,038,767 |
|||||||||||
|
INSURANCE - 11.2% |
|||||||||||
|
American International Group, Inc. Multi-line Insurance |
6,145 |
380,818 |
|||||||||
|
FNF Group Property & Casualty Insurance |
7,821 |
271,161 |
|||||||||
|
651,979 |
|||||||||||
|
REAL ESTATE - 5.3% |
|||||||||||
|
CBRE Group, Inc., Class A (a) Real Estate Services |
8,964 |
309,975 |
|||||||||
|
DIVERSIFIED FINANCIALS - 3.8% |
|||||||||||
|
Capital One Financial Corp. Consumer Finance |
3,050 |
220,149 |
|||||||||
|
2,220,870 |
|||||||||||
|
INFORMATION TECHNOLOGY - 27.0% |
|||||||||||
|
SOFTWARE & SERVICES - 17.2% |
|||||||||||
|
Alphabet, Inc., Class C (a) Internet Software & Services |
616 |
467,205 |
|||||||||
|
MasterCard, Inc., Class A Data Processing & Outsourced Services |
3,075 |
299,382 |
|||||||||
|
Oracle Corp. Systems Software |
6,540 |
238,906 |
|||||||||
|
1,005,493 |
|||||||||||
|
TECHNOLOGY HARDWARE & EQUIPMENT - 6.0% |
|||||||||||
|
TE Connectivity, Ltd. Electronic Manufacturing Services |
5,394 |
348,502 |
|||||||||
|
SEMICONDUCTORS & SEMICONDUCTOR EQUIPMENT - 3.8% |
|||||||||||
|
Intel Corp. Semiconductors |
6,447 |
222,099 |
|||||||||
|
1,576,094 |
|||||||||||
|
INDUSTRIALS - 7.8% |
|||||||||||
|
CAPITAL GOODS - 7.8% |
|||||||||||
|
General Electric Co. Industrial Conglomerates |
14,500 |
451,675 |
|||||||||
|
CONSUMER DISCRETIONARY - 7.3% |
|||||||||||
|
RETAILING - 4.3% |
|||||||||||
|
Liberty Interactive Corp. QVC Group, Class A (a) Catalog Retail |
9,214 |
251,723 |
|||||||||
|
Shares |
Value |
||||||||||
|
AUTOMOBILES & COMPONENTS - 3.0% |
|||||||||||
|
Fiat Chrysler Automobiles N.V. (a) Automobile Manufacturers |
12,470 |
$ |
174,462 |
||||||||
|
426,185 |
|||||||||||
|
ENERGY - 6.3% |
|||||||||||
|
Apache Corp. Oil & Gas Exploration & Production |
5,310 |
236,136 |
|||||||||
|
Chesapeake Energy Corp. (b) Oil & Gas Exploration & Production |
29,075 |
130,837 |
|||||||||
|
366,973 |
|||||||||||
|
MATERIALS - 3.4% |
|||||||||||
|
Monsanto Co. Fertilizers & Agricultural Chemicals |
2,000 |
197,040 |
|||||||||
|
UTILITIES - 3.2% |
|||||||||||
|
Calpine Corp. (a) Independent Power Producers & Energy Traders |
13,004 |
188,174 |
|||||||||
|
TOTAL COMMON STOCKS - 93.1% (COST $3,934,205) |
5,427,011 |
||||||||||
|
PREFERRED STOCKS - 0.1% |
|||||||||||
|
ENERGY - 0.1% |
|||||||||||
|
Chesapeake Energy Corp., 5.75% Oil & Gas Exploration & Production |
37 |
7,021 |
|||||||||
|
TOTAL PREFERRED STOCKS - 0.1% (COST $7,522) |
7,021 |
||||||||||
|
Par Value |
Value |
||||||||||
|
FIXED INCOME - 0.9% |
|||||||||||
|
CONVERTIBLE BOND - 0.9% |
|||||||||||
|
Fiat Chrysler Automobiles N.V., 7.875%, due 12/15/16 (Cost $57,052) |
$ |
45,779 |
53,029 |
||||||||
|
TOTAL FIXED INCOME - 0.9% (COST $57,052) |
53,029 |
||||||||||
|
SHORT TERM INVESTMENTS - 5.8% |
|||||||||||
|
REPURCHASE AGREEMENT - 5.8% |
|||||||||||
|
Fixed Income Clearing Corp. Repurchase Agreement, 0.08% dated 12/31/15 due 01/04/16, repurchase price $337,837, collateralized by United States Treasury Notes, 1.625% - 3.125%, due 10/31/16 - 07/31/20, aggregate value plus accrued interest of $344,594 (Cost: $337,834) |
337,834 |
337,834 |
|||||||||
|
TOTAL SHORT TERM INVESTMENTS - 5.8% (COST $337,834) |
337,834 |
||||||||||
|
TOTAL INVESTMENTS - 99.9% (COST $4,336,613) |
5,824,895 |
||||||||||
|
Other Assets In Excess of Liabilities - 0.1% |
4,463 |
||||||||||
|
TOTAL NET ASSETS - 100.0% |
$ |
5,829,358 |
|||||||||
(a) Non-income producing security
(b) A portion of the security out on loan.
10 OAKMARK FUNDS

This page intentionally left blank.
Oakmark.com 11
Oakmark Equity and Income Fund December 31, 2015
Summary Information
VALUE OF A $10,000 INVESTMENT
Since Inception - 11/01/95 (Unaudited)
PERFORMANCE
|
Average Annual Total Returns (as of 12/31/15) |
|||||||||||||||||||||||||||||||
|
(Unaudited) |
Total Return Last 3 Months |
1-year |
3-year |
5-year |
10-year |
Since Inception |
Inception Date |
||||||||||||||||||||||||
|
Oakmark Equity and Income Fund (Class I) |
1.55 |
% |
-4.60 |
% |
8.22 |
% |
6.82 |
% |
6.62 |
% |
10.16 |
% |
11/01/95 |
||||||||||||||||||
|
Lipper Balanced Funds Index |
2.98 |
% |
-0.42 |
% |
7.51 |
% |
6.98 |
% |
5.43 |
% |
6.69 |
% |
|||||||||||||||||||
|
S&P 500 Index |
7.04 |
% |
1.38 |
% |
15.13 |
% |
12.57 |
% |
7.31 |
% |
8.42 |
% |
|||||||||||||||||||
|
Barclays U.S. Govt./Credit Index |
-0.74 |
% |
0.15 |
% |
1.21 |
% |
3.39 |
% |
4.47 |
% |
5.42 |
% |
|||||||||||||||||||
|
Oakmark Equity and Income Fund (Class II) |
1.46 |
% |
-4.90 |
% |
7.87 |
% |
6.48 |
% |
6.27 |
% |
8.32 |
% |
07/12/00 |
||||||||||||||||||
The graph and table above do not reflect the deduction of taxes that a shareholder would pay on Fund distributions or the redemption of Fund shares.
Past performance is no guarantee of future results. The performance data quoted represents past performance. Current performance may be lower or higher than the performance data quoted. Total return includes change in share prices and, in each case, includes reinvestment of dividends and capital gain distributions. The investment return and principal value vary so that an investor's shares when redeemed may be worth more or less than the original cost. To obtain the most recent month-end performance, please visit Oakmark.com.
|
TOP TEN EQUITY HOLDINGS4 |
% of Net Assets |
||||||
|
General Motors Co. |
4.2 |
||||||
|
Bank of America Corp. |
4.1 |
||||||
|
Oracle Corp. |
3.7 |
||||||
|
Nestle ADR |
3.4 |
||||||
|
TE Connectivity, Ltd. |
2.8 |
||||||
|
CVS Health Corp. |
2.8 |
||||||
|
Foot Locker, Inc. |
2.4 |
||||||
|
Dover Corp. |
2.2 |
||||||
|
MasterCard, Inc., Class A |
2.0 |
||||||
|
TD Ameritrade Holding Corp. |
1.9 |
||||||
|
FUND STATISTICS |
|||||||
|
Ticker |
OAKBX |
||||||
|
Inception |
11/01/95 |
||||||
|
Number of Equity Holdings |
49 |
||||||
|
Net Assets |
$17.6 billion | ||||||
|
Benchmark |
Lipper Balanced Funds Index |
||||||
|
Weighted Average Market Cap |
$74.5 billion | ||||||
|
Median Market Cap |
$13.2 billion | ||||||
|
Portfolio Turnover (for the 12-months ended 09/30/15) |
25% | ||||||
|
Expense Ratio - Class I (as of 09/30/14) |
0.74% | ||||||
|
Expense Ratio - Class I (as of 09/30/15) |
0.75% | ||||||
|
SECTOR ALLOCATION |
% of Net Assets |
||||||
|
Equity Investments |
|||||||
|
Financials |
16.3 |
||||||
|
Consumer Discretionary |
10.8 |
||||||
|
Industrials |
10.3 |
||||||
|
Consumer Staples |
9.5 |
||||||
|
Information Technology |
9.1 |
||||||
|
Energy |
2.7 |
||||||
|
Health Care |
2.2 |
||||||
|
Materials |
0.4 |
||||||
|
Total Equity Investments |
61.3 |
||||||
|
Fixed Income Investments |
|||||||
|
Corporate Bonds |
9.2 |
||||||
|
Government and Agency Securities |
8.9 |
||||||
|
Asset Backed Securities |
0.1 |
||||||
|
Total Fixed Income Investments |
18.2 |
||||||
|
Short-Term Investments and Other |
20.5 |
||||||
12 OAKMARK FUNDS
Oakmark Equity and Income Fund December 31, 2015
Portfolio Manager Commentary


Clyde S. McGregor, CFA
Portfolio Manager
oakbx@oakmark.com
M. Colin Hudson, CFA
Portfolio Manager
oakbx@oakmark.com
Matthew A. Logan, CFA
Portfolio Manager
oakbx@oakmark.com
Edward J. Wojciechowski, CFA
Portfolio Manager
oakbx@oakmark.com
A Very Narrow Year
2015 was a year that market technicians describe as having bad breadth. Simply put, this means that the capitalization-weighted averages earned positive returns, but the majority of stocks lost money. This phenomenon occurs occasionally (see 1999, for example), but 2015 was probably a more extreme case in that a very small number of stocks succeeded in holding the market up. If one owned equal amounts of the 10 largest companies as of the end of the calendar year, the return was approximately 20%. Owning the remaining 490 issues in the S&P 5001 resulted in a loss (before dividends) of roughly 3%. The composite outcome in this circumstance was a very tight return range for the year, and momentum and growth factors trounced traditional value characteristics.
After the market's decline in the September quarter, the December quarter experienced a recovery, albeit with the momentum-versus-value dichotomy still firmly in place. Perhaps the defining event of the quarter (in financial terms) was the Federal Reserve's decision to increase short-term interest rates. This was the first rate increase since 2006. A prominent bank CEO noted that the majority of his employees had never seen a rate increase during their professional careers.
The Equity and Income Fund earned 2% in the quarter, which contrasts to a 3% gain for the Lipper Balanced Fund Index7, the Fund's performance benchmark. For calendar 2015 as a whole, the Fund showed a loss of 5%, compared to a small loss for the Lipper Index. We are pleased to report that the annualized compound rate of return since the Fund's inception in 1995 is 10% while the corresponding return to the Lipper Index is 7%.
As noted above, for investors to thrive in 2015, they needed to own a small group of the largest companies. We did not, finding those companies' valuations to be inconsistent with the Equity and Income Fund's mandate. Weak energy and commodity markets hurt a wide range of companies in the Fund, including companies with rather indirect exposure. In our opinion, these share price declines were out of proportion with any actual reduction in business value.
General Motors, Bank of America, TE Connectivity, Lear and Bruker led the list of contributors to return in the quarter. Foot Locker led the detractors (despite reporting strong earnings). Other detractors included Baker Hughes, Union Pacific, HSN and Reinsurance Group of America. For calendar 2015, Glencore, National Oilwell Varco, Oracle, Union Pacific and Flowserve detracted most from return. The largest contributors to annual portfolio return were Lear, United Health Group,
Omnicare (which CVS Health purchased for cash during the year), Foot Locker and MasterCard Class A.
20-Year Retrospective
For the writer of this section, it is hard to believe that the Equity and Income Fund opened for business just over 20 years ago. In the first quarterly report for the Fund, I stated objectives of producing attractive rates of return with attention to preservation of capital and current income. As noted above, the Fund has generated a compound rate of return of 10% over its 20-year history. While I certainly would like to have done better, I am satisfied that clients could meet their economic needs with that rate of return, particularly given that price inflation in the general economy has stayed low. Compared to my expectations in 1995, both the volatility of this return stream and the equity contribution to portfolio return have been higher. Perhaps the key macro factor that I did not foresee was the long-term suppression of interest rates that began nine years ago. Back in 1995, I naively believed that fixed income investments could be expected to produce yields of 6% over the Fund's life. I also did not predict the shift in emphasis at many companies from dividends to share repurchases. Although share repurchase has been helpful to the total return of many of the Fund's equity holdings, it does nothing for the Fund's current income generation. As I look back, it is this shortfall of current income that has disappointed me most.
The Fund's first report set three guiding principles for investing that are still in force today:
1. A balanced fund such as the Equity and Income Fund is an integrated unit. We understand the portfolio in its entirety, not as an aggregation of different types of securities. All securities appropriate for the objectives of this Fund compete for space within the portfolio. A word sometimes used in our industry that we find objectionable is "silo." In this Fund, there are no silos.
2. Our ability to identify attractive investment opportunities drives the Fund's asset allocation. At Harris Associates, our investing process has always moved from the bottom up, and this is a key differentiating factor for the Equity and Income Fund. If attractive stocks are plentiful, the Fund's equity allocation will approach its maximum. Or, should expected returns from bonds become compelling, we will move the Fund in that direction. Accordingly, the Fund's asset allocation to equities has ranged from a high of 75% (the prospectus maximum) to a low of around 48% over the Fund's history. Investors should
Oakmark.com 13
Oakmark Equity and Income Fund December 31, 2015
Portfolio Manager Commentary (continued)
expect consistency of investing philosophy and style, not a stable asset allocation.
3. We do not equate volatility with risk. For us, fluctuations in share prices do not define the riskiness of an issue. We think of risk as the probability of losing money in an investment. For all 20 years, we have focused on minimizing downside risk while positioning the portfolio to capture upside volatility.
We still believe that this sort of multi-asset class fund offers considerable utility to investors. It can be a complete investing program or the core holding of a more complex portfolio.
To close this retrospective, I must thank the scores of colleagues who have helped this Fund to be successful. Harris Associates' research department originates all of the ideas that eventually populate the Fund. I am deeply grateful for the many good recommendations that our team of analysts has provided over the past 20 years. I also thank my team of co-managers for the past 21/2 years, and I look forward to more years of collaboration. Finally, I must again express my deep gratitude to my retired co-manager of the Fund, Edward A. Studzinski, for his many years of contributing to the Fund's success.
Transaction Activity
We initiated three new holdings in the quarter: Ally Financial, Gaming and Leisure Properties, and Oshkosh. Ally was originally founded nearly a century ago as General Motors Acceptance Corporation. Its purpose then was to provide financing to GM dealers and retail customers. Today, Ally's purpose is largely the same except that it is no longer owned by GM and now serves dealers and customers of many other automobile manufacturers, such as Ford, Chrysler, and Toyota. Since Ally's initial public offering in spring 2014, its shares have fallen over 20% while the S&P 500 has increased by over 15%. Over this period, some investors have grown concerned that the business is at a cyclical peak, as U.S. auto sales are near record levels and credit losses are below long-term averages; as a result, some believe Ally's earnings have nowhere to go but down. But we believe cyclical pressures will be offset by continued internal improvements, such as funding cost reductions (as "legacy" liabilities are replaced with lower cost borrowings) and capital actions. With Ally's stock trading at just 80% of tangible book value, we believe Ally is a compelling investment opportunity.
Gaming and Leisure Properties (GLPI) is a triple net real estate investment trust (REIT), formed from the tax-free spin-off of the real estate assets of Penn National Gaming. It is currently trading at a sizable discount to our estimate of its intrinsic worth, as well as peer valuations. The discount stems from the newness of the regional gaming industry to the REIT category, interest rate concerns and the overhang created by an upcoming equity issuance associated with a recent acquisition. In our opinion, regional casinos' cash flows are well suited to the REIT structure, and we expect investors to appreciate this better in time. We believe that the equity financing will be completed in the first half of 2016, which will reduce investor uncertainty. GLPI is run by CEO Peter Carlino and CFO Bill Clifford—two proven value creators. With their leadership, GLPI should have significant consolidation opportunities ahead. Finally, GLPI pays an attractive dividend with a yield of 7.7%.
Oshkosh manufactures aerial work platforms (access equipment), fire and emergency vehicles, heavy-duty commercial vehicles, and military vehicles. Access equipment generates the majority of corporate profits. This business correlates closely with non-residential housing construction but also benefits from increasing housing starts. The defense business offers significant upside to Oshkosh. In August, the Department of Defense awarded Oshkosh the contract for its Joint Light Tactical Vehicle program, which will replace the Humvees currently used by the Army and Marines. Lockheed Martin has protested this contract award, so the ultimate outcome is uncertain. In the event that Oshkosh prevails, the large size of this program should prove quite rewarding.
As always, we thank our fellow shareholders for investing in the Equity and Income Fund. We especially thank those of you who have been with us for the past 20 years.
14 OAKMARK FUNDS
Oakmark Equity and Income Fund December 31, 2015 (Unaudited)
Schedule of Investments (in thousands)
|
Shares |
Value |
||||||||||
|
COMMON STOCKS - 61.3% |
|||||||||||
|
FINANCIALS - 16.3% |
|||||||||||
|
BANKS - 6.4% |
|||||||||||
|
Bank of America Corp. Diversified Banks |
42,798 |
$ |
720,282 |
||||||||
|
U.S. Bancorp Diversified Banks |
5,169 |
220,574 |
|||||||||
|
Wells Fargo & Co. Diversified Banks |
3,299 |
179,344 |
|||||||||
|
1,120,200 |
|||||||||||
|
DIVERSIFIED FINANCIALS - 5.4% |
|||||||||||
|
TD Ameritrade Holding Corp. Investment Banking & Brokerage |
9,880 |
342,937 |
|||||||||
|
The Goldman Sachs Group, Inc. Investment Banking & Brokerage |
1,568 |
282,637 |
|||||||||
|
Bank of New York Mellon Corp. Asset Management & Custody Banks |
5,340 |
220,134 |
|||||||||
|
Ally Financial, Inc. (a) Consumer Finance |
4,267 |
79,541 |
|||||||||
|
T Rowe Price Group, Inc. Asset Management & Custody Banks |
474 |
33,881 |
|||||||||
|
959,130 |
|||||||||||
|
INSURANCE - 4.0% |
|||||||||||
|
FNF Group Property & Casualty Insurance |
8,081 |
280,182 |
|||||||||
|
Principal Financial Group, Inc. Life & Health Insurance |
5,061 |
227,657 |
|||||||||
|
Reinsurance Group of America, Inc. Reinsurance |
2,402 |
205,500 |
|||||||||
|
713,339 |
|||||||||||
|
REAL ESTATE - 0.5% |
|||||||||||
|
The Howard Hughes Corp. (a) Real Estate Development |
479 |
54,209 |
|||||||||
|
Gaming and Leisure Properties, Inc. Specialized REIT's |
982 |
27,286 |
|||||||||
|
81,495 |
|||||||||||
|
2,874,164 |
|||||||||||
|
CONSUMER DISCRETIONARY - 10.8% |
|||||||||||
|
AUTOMOBILES & COMPONENTS - 6.9% |
|||||||||||
|
General Motors Co. Automobile Manufacturers |
21,666 |
736,874 |
|||||||||
|
BorgWarner, Inc. Auto Parts & Equipment |
7,718 |
333,662 |
|||||||||
|
Lear Corp. Auto Parts & Equipment |
1,161 |
142,634 |
|||||||||
|
1,213,170 |
|||||||||||
|
RETAILING - 3.1% |
|||||||||||
|
Foot Locker, Inc. Apparel Retail |
6,369 |
414,558 |
|||||||||
|
HSN, Inc. Catalog Retail |
2,491 |
126,231 |
|||||||||
|
540,789 |
|||||||||||
|
Shares |
Value |
||||||||||
|
CONSUMER DURABLES & APPAREL - 0.8% |
|||||||||||
|
Kate Spade & Co. (a) Apparel, Accessories & Luxury Goods |
4,691 |
$ |
83,364 |
||||||||
|
Carter's, Inc. Apparel, Accessories & Luxury Goods |
664 |
59,143 |
|||||||||
|
142,507 |
|||||||||||
|
1,896,466 |
|||||||||||
|
INDUSTRIALS - 10.3% |
|||||||||||
|
CAPITAL GOODS - 8.7% |
|||||||||||
|
Dover Corp. Industrial Machinery |
6,366 |
390,284 |
|||||||||
|
Flowserve Corp. Industrial Machinery |
7,338 |
308,775 |
|||||||||
|
Rockwell Automation, Inc. Electrical Components & Equipment |
2,145 |
220,099 |
|||||||||
|
Parker-Hannifin Corp. Industrial Machinery |
1,638 |
158,849 |
|||||||||
|
Precision Castparts Corp. Aerospace & Defense |
612 |
141,897 |
|||||||||
|
General Electric Co. Industrial Conglomerates |
3,834 |
119,432 |
|||||||||
|
The Manitowoc Co., Inc. Construction Machinery & Heavy Trucks |
6,243 |
95,827 |
|||||||||
|
WESCO International, Inc. (a) Trading Companies & Distributors |
1,118 |
48,817 |
|||||||||
|
Oshkosh Corp. Construction Machinery & Heavy Trucks |
912 |
35,589 |
|||||||||
|
Blount International, Inc. (a) Industrial Machinery |
1,913 |
18,771 |
|||||||||
|
1,538,340 |
|||||||||||
|
TRANSPORTATION - 1.4% |
|||||||||||
|
Union Pacific Corp. Railroads |
3,086 |
241,341 |
|||||||||
|
COMMERCIAL & PROFESSIONAL SERVICES - 0.2% |
|||||||||||
|
Herman Miller, Inc. Office Services & Supplies |
1,350 |
38,742 |
|||||||||
|
1,818,423 |
|||||||||||
|
CONSUMER STAPLES - 9.5% |
|||||||||||
|
FOOD, BEVERAGE & TOBACCO - 6.8% |
|||||||||||
|
Nestle SA (b) Packaged Foods & Meats |
7,993 |
594,839 |
|||||||||
|
Philip Morris International, Inc. Tobacco |
3,806 |
334,612 |
|||||||||
|
Diageo PLC (b) Distillers & Vintners |
2,441 |
266,288 |
|||||||||
|
1,195,739 |
|||||||||||
|
FOOD & STAPLES RETAILING - 2.7% |
|||||||||||
|
CVS Health Corp. Drug Retail |
4,993 |
488,122 |
|||||||||
|
1,683,861 |
|||||||||||
Oakmark.com 15
Oakmark Equity and Income Fund December 31, 2015 (Unaudited)
Schedule of Investments (in thousands) (continued)
|
Shares |
Value |
||||||||||
|
COMMON STOCKS - 61.3% (continued) |
|||||||||||
|
INFORMATION TECHNOLOGY - 9.1% |
|||||||||||
|
SOFTWARE & SERVICES - 6.1% |
|||||||||||
|
Oracle Corp. Systems Software |
17,795 |
$ |
650,052 |
||||||||
|
MasterCard, Inc., Class A Data Processing & Outsourced Services |
3,703 |
360,483 |
|||||||||
|
Broadridge Financial Solutions, Inc. Data Processing & Outsourced Services |
1,261 |
67,750 |
|||||||||
|
1,078,285 |
|||||||||||
|
TECHNOLOGY HARDWARE & EQUIPMENT - 3.0% |
|||||||||||
|
TE Connectivity, Ltd. Electronic Manufacturing Services |
7,641 |
493,685 |
|||||||||
|
Knowles Corp. (a) Electronic Components |
1,857 |
24,751 |
|||||||||
|
518,436 |
|||||||||||
|
1,596,721 |
|||||||||||
|
ENERGY - 2.7% |
|||||||||||
|
Baker Hughes, Inc. Oil & Gas Equipment & Services |
6,736 |
310,844 |
|||||||||
|
Oceaneering International, Inc. Oil & Gas Equipment & Services |
2,312 |
86,735 |
|||||||||
|
National Oilwell Varco, Inc. Oil & Gas Equipment & Services |
1,700 |
56,920 |
|||||||||
|
Rowan Cos. PLC Oil & Gas Drilling |
1,491 |
25,279 |
|||||||||
|
479,778 |
|||||||||||
|
HEALTH CARE - 2.2% |
|||||||||||
|
HEALTH CARE EQUIPMENT & SERVICES - 1.6% |
|||||||||||
|
UnitedHealth Group, Inc. Managed Health Care |
2,445 |
287,634 |
|||||||||
|
PHARMACEUTICALS, BIOTECHNOLOGY & LIFE SCIENCES - 0.6% |
|||||||||||
|
Bruker Corp. (a) Life Sciences Tools & Services |
4,077 |
98,941 |
|||||||||
|
386,575 |
|||||||||||
|
MATERIALS - 0.4% |
|||||||||||
|
Glencore PLC Diversified Metals & Mining |
55,555 |
74,103 |
|||||||||
|
Southern Copper Corp. Diversified Metals & Mining |
98 |
2,562 |
|||||||||
|
76,665 |
|||||||||||
|
TOTAL COMMON STOCKS - 61.3% (COST $7,639,331) |
10,812,653 |
||||||||||
|
Par Value |
Value |
||||||||||
|
FIXED INCOME - 18.2% |
|||||||||||
|
CORPORATE BONDS - 9.2% |
|||||||||||
|
Kinetic Concepts, Inc., 10.50%, due 11/01/18 |
$ |
47,940 |
46,742 |
||||||||
|
Par Value |
Value |
||||||||||
|
JPMorgan Chase & Co., 3.15%, due 07/05/16 |
$ |
44,592 |
$ |
45,053 |
|||||||
|
Mondelez International, Inc., 4.125%, due 02/09/16 |
43,567 |
43,679 |
|||||||||
|
General Motors Co., 4.875%, due 10/02/23 |
41,400 |
42,338 |
|||||||||
|
Omega Healthcare Investors, Inc., 5.875%, due 03/15/24 |
39,292 |
40,667 |
|||||||||
|
Zimmer Biomet Holdings, Inc., 1.45%, due 04/01/17 |
37,671 |
37,488 |
|||||||||
|
The Manitowoc Co., Inc., 8.50%, due 11/01/20 |
35,655 |
36,903 |
|||||||||
|
The William Carter Co., 5.25%, due 08/15/21 |
35,137 |
36,103 |
|||||||||
|
Credit Suisse Group AG, 144A, 7.50% (c) (d) (e) |
30,000 |
31,495 |
|||||||||
|
Bank of America Corp., 5.625%, due 10/14/16 |
29,855 |
30,800 |
|||||||||
|
Omnicom Group, Inc., 3.625%, due 05/01/22 |
30,425 |
30,712 |
|||||||||
|
CVS Health Corp., 4.00%, due 12/05/23 |
29,325 |
30,475 |
|||||||||
|
1011778 BC ULC / New Red Finance, Inc., 144A, 6.00%, due 04/01/22 (c) |
29,500 |
30,385 |
|||||||||
|
Live Nation Entertainment, Inc., 144A, 7.00%, due 09/01/20 (c) |
28,930 |
29,943 |
|||||||||
|
General Motors Co., 3.50%, due 10/02/18 |
29,525 |
29,821 |
|||||||||
|
Toyota Motor Credit Corp., 1.45%, due 01/12/18 |
29,495 |
29,439 |
|||||||||
|
Activision Blizzard, Inc., 144A, 5.625%, due 09/15/21 (c) |
26,745 |
28,015 |
|||||||||
|
Credit Suisse Group Funding Guernsey, Ltd., 144A, 3.125%, due 12/10/20 (c) |
25,000 |
24,886 |
|||||||||
|
Credit Suisse New York, 1.75%, due 01/29/18 |
24,700 |
24,631 |
|||||||||
|
Penn National Gaming, Inc., 5.875%, due 11/01/21 |
23,704 |
22,993 |
|||||||||
|
Whirlpool Corp., 7.75%, due 07/15/16 |
22,256 |
22,947 |
|||||||||
|
Expedia, Inc., 144A, 5.00%, due 02/15/26 (c) |
23,445 |
22,881 |
|||||||||
|
E*TRADE Financial Corp., 5.375%, due 11/15/22 |
20,605 |
21,584 |
|||||||||
|
Thermo Fisher Scientific, Inc., 2.25%, due 08/15/16 |
21,438 |
21,555 |
|||||||||
|
Delphi Corp., 5.00%, due 02/15/23 |
20,277 |
21,453 |
|||||||||
|
Anadarko Petroleum Corp., 5.95%, due 09/15/16 |
20,821 |
21,395 |
|||||||||
|
Bank of America Corp., 3.75%, due 07/12/16 |
20,295 |
20,549 |
|||||||||
|
JPMorgan Chase Bank NA, 0.902%, due 06/14/17 (d) |
19,750 |
19,672 |
|||||||||
|
CBRE Services, Inc., 4.875%, due 03/01/26 |
19,665 |
19,589 |
|||||||||
|
JPMorgan Chase & Co., 1.70%, due 03/01/18 |
19,665 |
19,570 |
|||||||||
|
Centene Corp., 4.75%, due 05/15/22 |
20,084 |
19,431 |
|||||||||
16 OAKMARK FUNDS
Oakmark Equity and Income Fund December 31, 2015 (Unaudited)
Schedule of Investments (in thousands) (continued)
|
Par Value |
Value |
||||||||||
|
FIXED INCOME - 18.2% (continued) |
|||||||||||
|
CORPORATE BONDS - 9.2% (continued) |
|||||||||||
|
Lam Research Corp., 2.75%, due 03/15/20 |
$ |
19,660 |
$ |
19,013 |
|||||||
|
DIRECTV Holdings LLC / DIRECTV Financing Co., Inc., 5.00%, due 03/01/21 |
16,710 |
18,020 |
|||||||||
|
Dollar General Corp., 4.125%, due 07/15/17 |
17,095 |
17,555 |
|||||||||
|
McGraw Hill Financial, Inc., 4.00%, due 06/15/25 |
17,150 |
17,192 |
|||||||||
|
Aon Corp., 5.00%, due 09/30/20 |
14,745 |
16,115 |
|||||||||
|
Anthem, Inc., 5.875%, due 06/15/17 |
15,150 |
16,014 |
|||||||||
|
CBRE Services, Inc., 5.25%, due 03/15/25 |
14,975 |
15,169 |
|||||||||
|
Valeant Pharmaceuticals International, Inc., 144A, 5.625%, due 12/01/21 (c) |
16,370 |
15,060 |
|||||||||
|
CBRE Services, Inc., 5.00%, due 03/15/23 |
14,639 |
14,713 |
|||||||||
|
Pentair Finance SA, 2.90%, due 09/15/18 |
14,750 |
14,684 |
|||||||||
|
Schlumberger Holdings Corp., 144A, 2.35%, due 12/21/18 (c) |
14,740 |
14,644 |
|||||||||
|
Activision Blizzard, Inc., 144A, 6.125%, due 09/15/23 (c) |
13,615 |
14,432 |
|||||||||
|
Mead Johnson Nutrition Co., 4.125%, due 11/15/25 |
13,955 |
14,060 |
|||||||||
|
Scientific Games International, Inc., 10.00%, due 12/01/22 |
19,665 |
13,962 |
|||||||||
|
Zayo Group LLC / Zayo Capital, Inc., 6.00%, due 04/01/23 |
14,745 |
13,934 |
|||||||||
|
Anthem, Inc., 2.375%, due 02/15/17 |
13,725 |
13,847 |
|||||||||
|
International Game Technology PLC, 144A, 6.25%, due 02/15/22 (c) |
14,800 |
13,838 |
|||||||||
|
Medtronic, Inc., 3.15%, due 03/15/22 |
13,228 |
13,372 |
|||||||||
|
Royal Caribbean Cruises, Ltd., 7.25%, due 06/15/16 |
13,053 |
13,325 |
|||||||||
|
Kinetic Concepts, Inc., 12.50%, due 11/01/19 |
14,360 |
13,068 |
|||||||||
|
International Game Technology PLC, 144A, 6.50%, due 02/15/25 (c) |
14,800 |
12,987 |
|||||||||
|
GLP Capital, LP / GLP Financing II, Inc., 5.375%, due 11/01/23 |
12,000 |
11,700 |
|||||||||
|
BorgWarner, Inc., 4.625%, due 09/15/20 |
10,810 |
11,571 |
|||||||||
|
Howard Hughes Corp., 144A, 6.875%, due 10/01/21 (c) |
10,000 |
10,200 |
|||||||||
|
Valeant Pharmaceuticals International, Inc., 144A, 6.375%, due 10/15/20 (c) |
10,540 |
10,171 |
|||||||||
|
Six Flags Entertainment Corp., 144A, 5.25%, due 01/15/21 (c) |
9,970 |
10,095 |
|||||||||
|
Omega Healthcare Investors, Inc., 144A, 5.25%, due 01/15/26 (c) |
9,835 |
10,039 |
|||||||||
|
CNO Financial Group, Inc., 4.50%, due 05/30/20 |
9,830 |
10,027 |
|||||||||
|
Kellogg Co., 4.45%, due 05/30/16 |
9,835 |
9,964 |
|||||||||
|
Par Value |
Value |
||||||||||
|
GLP Capital, LP / GLP Financing II, Inc., 4.875%, due 11/01/20 |
$ |
10,000 |
$ |
9,800 |
|||||||
|
Chevron Corp., 1.365%, due 03/02/18 |
9,835 |
9,756 |
|||||||||
|
Schlumberger Holdings Corp., 144A, 4.00%, due 12/21/25 (c) |
9,830 |
9,700 |
|||||||||
|
International Game Technology PLC, 144A, 5.625%, due 02/15/20 (c) |
9,800 |
9,653 |
|||||||||
|
Boston Scientific Corp., 5.125%, due 01/12/17 |
9,237 |
9,532 |
|||||||||
|
Sirius XM Radio, Inc., 144A, 5.25%, due 08/15/22 (c) |
8,895 |
9,384 |
|||||||||
|
Tempur Sealy International, Inc., 6.875%, due 12/15/20 |
8,819 |
9,238 |
|||||||||
|
Ultra Petroleum Corp., 144A, 5.75%, due 12/15/18 (c) |
37,809 |
9,074 |
|||||||||
|
Health Net, Inc., 6.375%, due 06/01/17 |
8,680 |
9,027 |
|||||||||
|
E*TRADE Financial Corp., 4.625%, due 09/15/23 |
7,865 |
7,993 |
|||||||||
|
Glencore Funding LLC, 144A, 1.70%, due 05/27/16 (c) |
8,060 |
7,979 |
|||||||||
|
CVS Health Corp, 144A, 5.00%, due 12/01/24 (c) |
6,880 |
7,443 |
|||||||||
|
CVS Health Corp, 144A, 4.75%, due 12/01/22 (c) |
6,880 |
7,372 |
|||||||||
|
Credit Suisse Group AG, 144A, 6.25% (c) (d) (e) |
7,000 |
6,995 |
|||||||||
|
Omnicom Group, Inc., 5.90%, due 04/15/16 |
6,862 |
6,950 |
|||||||||
|
Stanley Black & Decker, Inc., 2.451%, due 11/17/18 |
6,875 |
6,902 |
|||||||||
|
Mead Johnson Nutrition Co., 3.00%, due 11/15/20 |
6,885 |
6,883 |
|||||||||
|
Level 3 Financing, Inc., 144A, 5.375%, due 05/01/25 (c) |
6,895 |
6,861 |
|||||||||
|
Level 3 Financing, Inc., 144A, 5.125%, due 05/01/23 (c) |
6,895 |
6,843 |
|||||||||
|
Whirlpool Corp., 6.50%, due 06/15/16 |
6,610 |
6,752 |
|||||||||
|
Scientific Games International, Inc., 144A, 7.00%, due 01/01/22 (c) |
6,885 |
6,575 |
|||||||||
|
Zayo Group LLC / Zayo Capital, Inc., 10.125%, due 07/01/20 |
5,995 |
6,460 |
|||||||||
|
Concho Resources, Inc., 5.50%, due 10/01/22 |
6,980 |
6,352 |
|||||||||
|
Reynolds American, Inc., 6.75%, due 06/15/17 |
5,900 |
6,298 |
|||||||||
|
CNO Financial Group, Inc., 5.25%, due 05/30/25 |
5,895 |
5,998 |
|||||||||
|
Yum! Brands, Inc., 3.875%, due 11/01/23 |
6,329 |
5,605 |
|||||||||
|
Quest Diagnostics, Inc., 4.70%, due 04/01/21 |
5,128 |
5,430 |
|||||||||
|
Glencore Finance Canada, Ltd., 144A, 3.60%, due 01/15/17 (c) |
5,590 |
5,400 |
|||||||||
|
Serta Simmons Bedding LLC, 144A, 8.125%, due 10/01/20 (c) |
4,990 |
5,215 |
|||||||||
|
Foot Locker, Inc., 8.50%, due 01/15/22 |
4,340 |
5,208 |
|||||||||
|
The Sun Products Corp., 144A, 7.75%, due 03/15/21 (c) |
5,895 |
5,114 |
|||||||||
Oakmark.com 17
Oakmark Equity and Income Fund December 31, 2015 (Unaudited)
Schedule of Investments (in thousands) (continued)
|
Par Value |
Value |
||||||||||
|
FIXED INCOME - 18.2% (continued) |
|||||||||||
|
CORPORATE BONDS - 9.2% (continued) |
|||||||||||
|
USG Corp., 6.30%, due 11/15/16 |
$ |
4,896 |
$ |
5,058 |
|||||||
|
Penske Truck Leasing Co., LP / PTL Finance Corp., 144A, 3.75%, due 05/11/17 (c) |
4,920 |
5,019 |
|||||||||
|
Capital One NA, 2.35%, due 08/17/18 |
5,000 |
5,009 |
|||||||||
|
The Goldman Sachs Group, Inc., 1.048%, due 05/22/17 (d) |
5,000 |
4,993 |
|||||||||
|
GLP Capital, LP / GLP Financing II, Inc., 4.375%, due 11/01/18 |
5,000 |
4,950 |
|||||||||
|
General Motors Financial Co., Inc., 3.10%, due 01/15/19 |
4,915 |
4,908 |
|||||||||
|
American Express Credit Corp., 1.875%, due 11/05/18 |
4,915 |
4,902 |
|||||||||
|
Schlumberger Holdings Corp., 144A, 1.90%, due 12/21/17 (c) |
4,915 |
4,897 |
|||||||||
|
Ultra Petroleum Corp., 144A, 6.125%, due 10/01/24 (c) |
19,665 |
4,474 |
|||||||||
|
Scripps Networks Interactive, Inc., 2.80%, due 06/15/20 |
3,930 |
3,834 |
|||||||||
|
Valeant Pharmaceuticals International, Inc., 144A, 6.75%, due 08/15/18 (c) |
3,855 |
3,820 |
|||||||||
|
Omnicom Group, Inc., 6.25%, due 07/15/19 |
2,950 |
3,299 |
|||||||||
|
Dollar Tree, Inc., 144A, 5.75%, due 03/01/23 (c) |
2,950 |
3,053 |
|||||||||
|
MSCI, Inc., 144A, 5.75%, due 08/15/25 (c) |
2,950 |
3,024 |
|||||||||
|
American Express Credit Corp., 2.60%, due 09/14/20 |
2,945 |
2,952 |
|||||||||
|
Medtronic, Inc., 1.50%, due 03/15/18 |
2,950 |
2,948 |
|||||||||
|
CVS Health Corp., 2.25%, due 08/12/19 |
2,884 |
2,880 |
|||||||||
|
The Goldman Sachs Group, Inc., 5.625%, due 01/15/17 |
2,095 |
2,176 |
|||||||||
|
McGraw Hill Financial, Inc., 4.40%, due 02/15/26 |
1,970 |
2,016 |
|||||||||
|
Ecolab, Inc., 3.00%, due 12/08/16 |
1,970 |
1,998 |
|||||||||
|
McGraw Hill Financial, Inc., 3.30%, due 08/14/20 |
1,970 |
1,987 |
|||||||||
|
McGraw Hill Financial, Inc., 2.50%, due 08/15/18 |
1,970 |
1,982 |
|||||||||
|
Live Nation Entertainment, Inc., 144A, 5.375%, due 06/15/22 (c) |
2,000 |
1,970 |
|||||||||
|
Valeant Pharmaceuticals International, Inc., 144A, 6.75%, due 08/15/21 (c) |
1,960 |
1,891 |
|||||||||
|
Tyco Electronics Group SA, 6.55%, due 10/01/17 |
1,385 |
1,493 |
|||||||||
|
Post Holdings, Inc., 7.375%, due 02/15/22 |
1,000 |
1,043 |
|||||||||
|
Dollar Tree, Inc., 144A, 5.25%, due 03/01/20 (c) |
1,000 |
1,033 |
|||||||||
|
Post Holdings, Inc., 144A, 6.75%, due 12/01/21 (c) |
1,000 |
1,020 |
|||||||||
|
Level 3 Financing, Inc., 144A, 5.375%, due 01/15/24 (c) |
1,000 |
1,005 |
|||||||||
|
Par Value |
Value |
||||||||||
|
Tribune Media Co., 144A, 5.875%, due 07/15/22 (c) |
$ |
1,000 |
$ |
1,000 |
|||||||
|
The Goldman Sachs Group, Inc., 2.55%, due 10/23/19 |
980 |
980 |
|||||||||
|
Ventas Realty, LP REIT, 3.50%, due 02/01/25 |
1,000 |
958 |
|||||||||
|
Post Holdings, Inc., 144A, 7.75%, due 03/15/24 (c) |
500 |
524 |
|||||||||
|
Valeant Pharmaceuticals International, Inc., 144A, 5.875%, due 05/15/23 (c) |
500 |
446 |
|||||||||
|
Valeant Pharmaceuticals International, Inc., 144A, 6.125%, due 04/15/25 (c) |
250 |
223 |
|||||||||
|
Total Corporate Bonds (Cost $1,681,436) |
1,623,522 |
||||||||||
|
GOVERNMENT AND AGENCY SECURITIES - 8.9% |
|||||||||||
|
U.S. GOVERNMENT NOTES - 8.7% |
|||||||||||
|
1.375%, due 07/15/18, Inflation Indexed |
468,366 |
484,899 |
|||||||||
|
1.25%, due 07/15/20, Inflation Indexed |
457,835 |
476,107 |
|||||||||
|
2.125%, due 01/15/19, Inflation Indexed |
220,871 |
233,721 |
|||||||||
|
1.00%, due 09/30/16 |
199,380 |
199,777 |
|||||||||
|
1.25%, due 11/30/18 |
73,725 |
73,601 |
|||||||||
|
2.125%, due 01/31/21 |
24,570 |
24,933 |
|||||||||
|
1.75%, due 10/31/20 |
24,570 |
24,532 |
|||||||||
|
0.75%, due 06/30/17 |
24,585 |
24,508 |
|||||||||
|
1,542,078 |
|||||||||||
|
U.S. GOVERNMENT AGENCIES - 0.2% |
|||||||||||
|
Federal National Mortgage Association, 1.25%, due 09/27/18 |
24,680 |
24,557 |
|||||||||
|
Federal National Mortgage Association, 1.25%, due 01/30/20 |
9,525 |
9,481 |
|||||||||
|
34,038 |
|||||||||||
|
Total Government and Agency Securities (Cost $1,536,543) |
1,576,116 |
||||||||||
|
ASSET BACKED SECURITIES - 0.1% |
|||||||||||
|
Cabela's Master Credit Card Trust, 144A, 0.881%, due 10/15/19 (c) (d) (Cost $11,450) |
11,450 |
11,457 |
|||||||||
|
TOTAL FIXED INCOME - 18.2% (COST $3,229,429) |
3,211,095 |
||||||||||
|
SHORT TERM INVESTMENTS - 20.2% |
|||||||||||
|
COMMERCIAL PAPER - 14.7% |
|||||||||||
|
Toyota Motor Credit Corp., 0.20% - 0.55%, due 01/07/16 - 03/08/16 (f) |
950,000 |
949,653 |
|||||||||
|
MetLife Short Term Funding LLC, 144A, 0.15% - 0.41%, due 01/05/16 - 02/10/16 (c) (f) |
378,000 |
377,950 |
|||||||||
|
BMW US Capital LLC, 144A, 0.19% - 0.26%, due 01/04/16 - 02/04/16 (c) (f) |
345,000 |
344,953 |
|||||||||
|
Kellogg Co., 144A, 0.39% - 0.66%, due 01/04/16 - 01/29/16 (c) (f) |
187,570 |
187,545 |
|||||||||
18 OAKMARK FUNDS
Oakmark Equity and Income Fund December 31, 2015 (Unaudited)
Schedule of Investments (in thousands) (continued)
|
Par Value |
Value |
||||||||||
|
SHORT TERM INVESTMENTS - 20.2% (continued) |
|||||||||||
|
COMMERCIAL PAPER - 14.7% (CONTINUED) |
|||||||||||
|
American Honda Finance Corp., 0.20% - 0.33%, due 01/22/16 - 02/05/16 (f) |
$ |
170,570 |
$ |
170,537 |
|||||||
|
Chevron Corp., 144A, 0.21% - 0.39%, due 01/19/16 - 02/03/16 (c) (f) |
150,000 |
149,966 |
|||||||||
|
Anthem, Inc., 144A, 0.53% - 0.69%, due 01/04/16 - 02/26/16 (c) (f) |
122,500 |
122,448 |
|||||||||
|
John Deere Capital Co., 144A, 0.30% - 0.31%, due 01/19/16 - 01/21/16 (c) (f) |
100,000 |
99,985 |
|||||||||
|
Wal-Mart Stores, Inc., 144A, 0.23%, due 01/25/16 - 01/27/16 (c) (f) |
100,000 |
99,984 |
|||||||||
|
J.P. Morgan Securities LLC, 144A, 0.51% - 0.53%, due 05/02/16 - 05/04/16 (c) (f) |
100,000 |
99,821 |
|||||||||
|
Total Commercial Paper (Cost $2,602,837) |
2,602,842 |
||||||||||
|
REPURCHASE AGREEMENT - 2.3% |
|||||||||||
|
Fixed Income Clearing Corp. Repurchase Agreement, 0.08% dated 12/31/15 due 01/04/16, repurchase price $401,797, collateralized by a United States Treasury Note, 1.750%, due 12/31/20, value plus accrued interest of $409,832 (Cost: $401,794) |
401,794 |
401,794 |
|||||||||
|
CORPORATE BONDS - 1.8% |
|||||||||||
|
ConAgra Foods, Inc., 1.30%, due 01/25/16 |
49,951 |
49,965 |
|||||||||
|
Bank of America Corp., 6.50%, due 08/01/16 |
44,888 |
46,197 |
|||||||||
|
Citigroup, Inc., 1.30%, due 04/01/16 |
35,713 |
35,763 |
|||||||||
|
The Goldman Sachs Group, Inc., 5.35%, due 01/15/16 |
33,875 |
33,933 |
|||||||||
|
Yum! Brands, Inc., 6.25%, due 04/15/16 |
29,125 |
29,490 |
|||||||||
|
Mohawk Industries, Inc., 6.125%, due 01/15/16 |
22,336 |
22,379 |
|||||||||
|
Aon Corp., 3.125%, due 05/27/16 |
19,920 |
20,074 |
|||||||||
|
Willis Group Holdings PLC, 4.125%, due 03/15/16 |
17,433 |
17,527 |
|||||||||
|
Capital One Financial Corp., 6.15%, due 09/01/16 |
12,919 |
13,312 |
|||||||||
|
Comerica Bank, 5.75%, due 11/21/16 |
12,750 |
13,207 |
|||||||||
|
Morgan Stanley, 1.75%, due 02/25/16 |
9,830 |
9,840 |
|||||||||
|
Bank of America Corp., 6.05%, due 05/16/16 |
7,890 |
8,020 |
|||||||||
|
Capital One Financial Corp., 3.15%, due 07/15/16 |
3,513 |
3,545 |
|||||||||
|
JPMorgan Chase & Co., 3.45%, due 03/01/16 |
3,440 |
3,454 |
|||||||||
|
Par Value |
Value |
||||||||||
|
The Bank of New York Mellon Corp., 2.30%, due 07/28/16 |
$ |
2,945 |
$ |
2,970 |
|||||||
|
Schlumberger Investment SA, 144A, 1.95%, due 09/14/16 (c) |
1,970 |
1,980 |
|||||||||
|
Philip Morris International, Inc., 2.50%, due 05/16/16 |
1,350 |
1,358 |
|||||||||
|
Express Scripts Holding Co., 3.125%, due 05/15/16 |
1,320 |
1,329 |
|||||||||
|
Total Corporate Bonds (Cost $314,597) |
314,343 |
||||||||||
|
U.S. GOVERNMENT BILLS - 1.4% |
|||||||||||
|
United States Treasury Bills, 0.22% - 0.26%, due 03/10/16 - 04/21/16 (f) (Cost $245,565) |
245,710 |
245,607 |
|||||||||
|
TOTAL SHORT TERM INVESTMENTS - 20.2% (COST $3,564,793) |
3,564,586 |
||||||||||
|
TOTAL INVESTMENTS - 99.7% (COST $14,433,553) |
17,588,334 |
||||||||||
|
Other Assets In Excess of Liabilities - 0.3% |
47,740 |
||||||||||
|
NET ASSETS - 100.0% |
$ |
17,636,074 |
|||||||||
(a) Non-income producing security
(b) Sponsored American Depositary Receipt
(c) These restricted securities may be resold subject to restrictions on resale under federal securities laws.
(d) Floating Rate Note. Rate shown is as of December 31, 2015.
(e) Security is perpetual and has no stated maturity date.
(f) The rate shown represents the annualized yield at the time of purchase; not a coupon rate.
Abbreviations:
REIT: Real Estate Investment Trust
Oakmark.com 19
Oakmark Global Fund December 31, 2015
Summary Information
VALUE OF A $10,000 INVESTMENT
Since Inception - 08/04/99 (Unaudited)
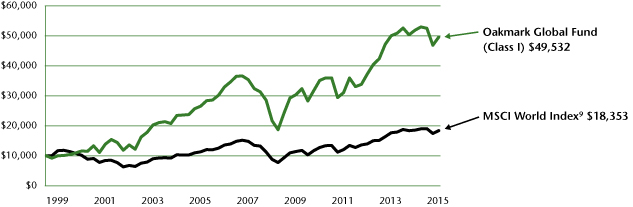
PERFORMANCE
|
Average Annual Total Returns (as of 12/31/15) |
|||||||||||||||||||||||||||||||
|
(Unaudited) |
Total Return Last 3 Months |
1-year |
3-year |
5-year |
10-year |
Since Inception |
Inception Date |
||||||||||||||||||||||||
|
Oakmark Global Fund (Class I) |
5.85 |
% |
-4.38 |
% |
9.97 |
% |
7.14 |
% |
6.45 |
% |
10.24 |
% |
08/04/99 |
||||||||||||||||||
|
MSCI World Index |
5.50 |
% |
-0.87 |
% |
9.63 |
% |
7.59 |
% |
4.98 |
% |
3.77 |
% |
|||||||||||||||||||
|
Lipper Global Funds Index10 |
4.88 |
% |
-1.15 |
% |
8.88 |
% |
6.14 |
% |
4.80 |
% |
4.57 |
% |
|||||||||||||||||||
|
Oakmark Global Fund (Class II) |
5.76 |
% |
-4.76 |
% |
9.56 |
% |
6.75 |
% |
6.06 |
% |
10.42 |
% |
10/10/01 |
||||||||||||||||||
The graph and table do not reflect the deduction of taxes that a shareholder would pay on Fund distributions or the redemption of Fund shares.
Past performance is no guarantee of future results. The performance data quoted represents past performance. Current performance may be lower or higher than the performance data quoted. Total return includes change in share prices and, in each case, includes reinvestment of dividends and capital gain distributions. The investment return and principal value vary so that an investor's shares when redeemed may be worth more or less than the original cost. To obtain the most recent month-end performance, please visit Oakmark.com.
|
TOP TEN EQUITY HOLDINGS4 |
% of Net Assets |
||||||
|
Credit Suisse Group |
5.4 |
||||||
|
Alphabet Inc., Class C |
4.5 |
||||||
|
TE Connectivity, Ltd. |
4.0 |
||||||
|
Julius Baer Group, Ltd. |
4.0 |
||||||
|
Bank of America Corp. |
4.0 |
||||||
|
General Motors Co. |
3.9 |
||||||
|
Daimler AG |
3.7 |
||||||
|
MasterCard, Inc., Class A |
3.6 |
||||||
|
The Interpublic Group of Cos., Inc. |
3.6 |
||||||
|
Toyota Motor Corp. |
3.5 |
||||||
|
FUND STATISTICS |
|||||||
|
Ticker |
OAKGX |
||||||
|
Inception |
08/04/99 |
||||||
|
Number of Equity Holdings |
39 |
||||||
|
Net Assets |
$3.1 billion | ||||||
|
Benchmark |
MSCI World Index |
||||||
|
Weighted Average Market Cap |
$82.7 billion | ||||||
|
Median Market Cap |
$23.8 billion | ||||||
|
Portfolio Turnover (for the 12-months ended 09/30/15) |
36% | ||||||
|
Expense Ratio - Class I (as of 09/30/14) |
1.11% | ||||||
|
Expense Ratio - Class I (as of 09/30/15) |
1.12% | ||||||
|
SECTOR ALLOCATION |
% of Net Assets |
||||||
|
Financials |
26.4 |
||||||
|
Information Technology |
26.4 |
||||||
|
Consumer Discretionary |
18.9 |
||||||
|
Industrials |
11.6 |
||||||
|
Materials |
6.7 |
||||||
|
Health Care |
4.8 |
||||||
|
Energy |
2.1 |
||||||
|
Consumer Staples |
1.9 |
||||||
|
Short-Term Investments and Other |
1.2 |
||||||
|
GEOGRAPHIC ALLOCATION |
|||||||
|
% of Equity |
|||||||
|
North America |
41.3 |
||||||
|
United States |
41.3 |
||||||
|
Europe |
39.9 |
||||||
|
Switzerland |
19.4 |
||||||
|
Germany* |
8.5 |
||||||
|
U.K. |
6.4 |
||||||
|
France* |
3.5 |
||||||
|
Netherlands* |
2.1 |
||||||
|
% of Equity |
|||||||
|
Asia |
14.7 |
||||||
|
Japan |
10.6 |
||||||
|
South Korea |
2.6 |
||||||
|
China |
1.5 |
||||||
|
Australasia |
3.5 |
||||||
|
Australia |
3.5 |
||||||
|
Latin America |
0.6 |
||||||
|
Mexico |
0.6 |
||||||
* Euro currency countries comprise 14.1% of equity investments
20 OAKMARK FUNDS
Oakmark Global Fund December 31, 2015
Portfolio Manager Commentary


Clyde S. McGregor, CFA
Portfolio Manager
oakgx@oakmark.com
Robert A. Taylor, CFA
Portfolio Manager
oakgx@oakmark.com
Another Year of Divergences
Last year at this time, we wrote about the divergence between solid U.S. stock market returns and the losses realized in most other countries. Despite more modest results overall, 2015 also experienced its share of divergences, but these divergences had different characteristics. The strength of the U.S. dollar in 2015 made it more difficult for U.S. investors to produce positive international returns. Many European markets, along with China and Japan, were solidly profitable for local investors, but translation to dollars minimized or negated these returns. Emerging markets, as well as developed countries with significant exposure to commodity prices (e.g., Australia), suffered meaningful declines. In terms of economic sectors, the significant losses in energy and materials pulled the MSCI World Index9 into negative territory despite gains for consumer, technology and health care stocks, which have larger index weights. Market capitalization also proved divergent. In the U.S., large capitalization issues bested their smaller counterparts, while in non-U.S. markets small cap issues outperformed. Once again, it was a challenging year to be a U.S.-domiciled diversified global investor.
Although the year ended on a sour note, the fourth quarter as a whole was solidly positive. The Oakmark Global Fund's three-month return was 6%, which matched the MSCI World Index's return in the period and outperformed the Lipper Global Fund Index's10 gain of 5%. For all of calendar 2015, the Fund declined 4%, which contrasts to 1% losses for the MSCI World Index and the Lipper Global Fund Index. Since its inception in 1999, the Fund has achieved a compound annual rate of return of 10%, which compares to 4% for the MSCI World Index and 5% for the Lipper Global Fund Index.
The U.S., Germany and China contributed most to the Fund's return in the quarter, while France and Mexico were the only countries that contributed negatively. The five largest contributors to the Fund's quarterly return were Baidu (China), Alphabet (U.S.), Interpublic Group (U.S.), Samsung Electronics (Korea) and Daimler (Germany). The Fund holdings that detracted most were Tenet Healthcare (U.S.), Credit Suisse (Switzerland), Chesapeake Energy (U.S.), LafargeHolcim (Switzerland) and Union Pacific (U.S.).
Germany, China and Australia contributed most to investment return this year, while the U.S., the U.K. and Japan detracted most. Demonstrating the year's idiosyncratic character, all but two of the top five 2015 contributors and detractors were U.S.-domiciled companies. The leading contributors from the U.S. were Alphabet, Health Net and Interpublic Group. Baidu (China) and Julius Baer (Switzerland) were the non-U.S. entries to the contributors list. The largest detractors were Tenet Healthcare, Chesapeake Energy, Union Pacific, National Oilwell Varco and Applied Materials.
Portfolio Activity
Although most developed markets closed out the year with modest or negative returns (when expressed in U.S. dollars), considerable volatility occurred beneath the surface of the market averages. This has availed us plentiful opportunities to reorient the portfolio. We initiated three new international holdings in the quarter and eliminated two positions, one international and one U.S. Despite this trading activity, the U.S. portfolio weight actually grew in the period as the domestic market rebounded from its summer swoon. The Fund remains underweight in the U.S. relative to its position in the MSCI World Index, an outcome of our search for the best available values. We look for value wherever that search takes us, and if we stray from benchmark weights, so be it. Switzerland continues to be the Fund's meaningful overweight allocation relative to the index.
Concerns of slowing growth in emerging markets has allowed us to add what we believe is yet another well-run, dominant company with solid secular trends at an attractive price. Based in Mexico, Grupo Televisa is a media company and the world's largest producer of Spanish-language content. Not only is Televisa the dominant content provider in Mexico, with approximately 70% of the viewership market share, it also controls over 60% of the pay television market via its ownership of several cable assets and Sky Mexico. Considering that pay television and broadband in Mexico have only reached about 50% and 45% of their respective markets, we believe these factions will drive Televisa's growth and boost its earnings in the coming year. Additionally, we find Televisa's target audience in Mexico and the U.S. to be attractive, as the population is young and growing with increasing wealth.
We also initiated a position in MTU Aero Engines (Germany). The company develops and manufactures engines, as well as offers commercial and military engine services and support. We like that MTU Aero Engines is a trusted partner of aircraft engine original equipment manufacturers, such as General Electric and Pratt & Whitney, which have attractive long-term secular growth prospects. We believe MTU will also benefit from exposure to Pratt's geared turbofan (GTF) concept, giving it a 15-year head start on its competitors to take market share in this new technology. Lower profit margins in the short term, related to the ramp-up of these new engines, have caused the share price to drop well below our estimate of intrinsic value. Over the medium and long term, we expect higher margin service revenues to boost profitability and create a large, steady stream of cash flow.
We recently started repurchasing OMRON, a successful investment that we sold two years ago when it hit our perception of fair value. OMRON's share price has been weak recently given cyclical headwinds facing some of the company's smaller businesses. Despite these weaknesses, we find OMRON very
Oakmark.com 21
Oakmark Global Fund December 31, 2015
Portfolio Manager Commentary (continued)
attractive, especially its Industrial Automation Business (IAB), which accounts for about 40% of its overall revenues. In our assessment, IAB will be a key growth driver for the company going forward, as the division continues to improve its operating margins following the financial crisis. In a recent meeting with OMRON's management team, they reiterated their focus on increasing shareholder value by reinvesting in higher return-on-capital businesses and, unlike many other Japanese corporations, using the company's strong balance sheet to regularly return capital to shareholders via dividends and stock repurchases.
Franklin Resources was our one U.S. elimination. Franklin's management, brand name, global network and rock-solid balance sheet had attracted us, but the company's exposure to emerging markets, combined with the broad move away from actively managed funds, has impaired the company's ability to grow. We still find Franklin to be a desirable enterprise and look forward to better opportunities to own the shares.
We also sold our long-term holding in Nestlé to help fund our new names. We continue to believe this is a high quality business, but it is less attractive at current prices.
Currency Hedges
We continue to believe some currencies are overvalued versus the U.S. dollar. We maintained our defensive currency hedges and ended the quarter with approximately 26% of the Swiss franc and 9% of the Australian dollar hedged.
Thank you for being our partners in the Oakmark Global Fund. Please feel free to contact us with your questions or comments.
22 OAKMARK FUNDS
Oakmark Global Fund December 31, 2015 (Unaudited)
Schedule of Investments (in thousands)
|
Shares |
Value |
||||||||||
|
COMMON STOCKS - 98.8% |
|||||||||||
|
FINANCIALS - 26.4% |
|||||||||||
|
DIVERSIFIED FINANCIALS - 12.1% |
|||||||||||
|
Credit Suisse Group AG (Switzerland) Diversified Capital Markets |
7,650 |
$ |
165,664 |
||||||||
|
Julius Baer Group, Ltd. (Switzerland) Asset Management & Custody Banks |
2,523 |
122,583 |
|||||||||
|
Daiwa Securities Group, Inc. (Japan) Investment Banking & Brokerage |
13,334 |
82,626 |
|||||||||
|
370,873 |
|||||||||||
|
BANKS - 10.9% |
|||||||||||
|
Bank of America Corp. (United States) Diversified Banks |
7,243 |
121,900 |
|||||||||
|
Citigroup, Inc. (United States) Diversified Banks |
2,057 |
106,434 |
|||||||||
|
BNP Paribas SA (France) Diversified Banks |
1,850 |
105,030 |
|||||||||
|
333,364 |
|||||||||||
|
INSURANCE - 3.4% |
|||||||||||
|
Allianz SE (Germany) Multi-line Insurance |
578 |
102,786 |
|||||||||
|
807,023 |
|||||||||||
|
INFORMATION TECHNOLOGY - 26.4% |
|||||||||||
|
SOFTWARE & SERVICES - 12.5% |
|||||||||||
|
Alphabet, Inc., Class C (United States) (a) Internet Software & Services |
180 |
136,677 |
|||||||||
|
MasterCard, Inc., Class A (United States) Data Processing & Outsourced Services |
1,116 |
108,654 |
|||||||||
|
Oracle Corp. (United States) Systems Software |
2,445 |
89,323 |
|||||||||
|
Baidu, Inc. (China) (a) (b) Internet Software & Services |
241 |
45,615 |
|||||||||
|
380,269 |
|||||||||||
|
TECHNOLOGY HARDWARE & EQUIPMENT - 11.8% |
|||||||||||
|
TE Connectivity, Ltd. (Switzerland) Electronic Manufacturing Services |
1,901 |
122,804 |
|||||||||
|
Samsung Electronics Co., Ltd. (South Korea) Technology Hardware, Storage & Peripherals |
73 |
78,611 |
|||||||||
|
OMRON Corp. (Japan) Electronic Components |
2,081 |
70,376 |
|||||||||
|
Hirose Electric Co., Ltd. (Japan) Electronic Components |
478 |
58,662 |
|||||||||
|
Itron, Inc. (United States) (a) Electronic Equipment & Instruments |
829 |
30,008 |
|||||||||
|
360,461 |
|||||||||||
|
SEMICONDUCTORS & SEMICONDUCTOR EQUIPMENT - 2.1% |
|||||||||||
|
Intel Corp. (United States) Semiconductors |
1,860 |
64,091 |
|||||||||
|
804,821 |
|||||||||||
|
Shares |
Value |
||||||||||
|
CONSUMER DISCRETIONARY - 18.9% |
|||||||||||
|
AUTOMOBILES & COMPONENTS - 11.1% |
|||||||||||
|
General Motors Co. (United States) Automobile Manufacturers |
3,529 |
$ |
120,007 |
||||||||
|
Daimler AG (Germany) Automobile Manufacturers |
1,323 |
111,517 |
|||||||||
|
Toyota Motor Corp. (Japan) Automobile Manufacturers |
1,731 |
107,858 |
|||||||||
|
339,382 |
|||||||||||
|
MEDIA - 5.4% |
|||||||||||
|
The Interpublic Group of Cos., Inc. (United States) Advertising |
4,662 |
108,529 |
|||||||||
|
Live Nation Entertainment, Inc. (United States) (a) Movies & Entertainment |
1,622 |
39,864 |
|||||||||
|
Grupo Televisa SAB (Mexico) (b) Broadcasting |
658 |
17,904 |
|||||||||
|
166,297 |
|||||||||||
|
CONSUMER DURABLES & APPAREL - 2.4% |
|||||||||||
|
Cie Financiere Richemont SA (Switzerland) Apparel, Accessories & Luxury Goods |
997 |
71,790 |
|||||||||
|
577,469 |
|||||||||||
|
INDUSTRIALS - 11.6% |
|||||||||||
|
CAPITAL GOODS - 9.4% |
|||||||||||
|
CNH Industrial N.V. (United Kingdom) Agricultural & Farm Machinery |
14,757 |
101,675 |
|||||||||
|
Koninklijke Philips NV (Netherlands) Industrial Conglomerates |
2,446 |
62,614 |
|||||||||
|
USG Corp. (United States) (a) Building Products |
2,028 |
49,267 |
|||||||||
|
MTU Aero Engines AG (Germany) Aerospace & Defense |
430 |
42,065 |
|||||||||
|
Smiths Group PLC (United Kingdom) Industrial Conglomerates |
2,395 |
33,169 |
|||||||||
|
288,790 |
|||||||||||
|
TRANSPORTATION - 2.2% |
|||||||||||
|
Union Pacific Corp. (United States) Railroads |
779 |
60,902 |
|||||||||
|
Kuehne + Nagel International AG (Switzerland) Marine |
42 |
5,779 |
|||||||||
|
66,681 |
|||||||||||
|
355,471 |
|||||||||||
|
MATERIALS - 6.7% |
|||||||||||
|
Incitec Pivot, Ltd. (Australia) Diversified Chemicals |
36,545 |
105,455 |
|||||||||
|
LafargeHolcim, Ltd. (Switzerland) Construction Materials |
1,946 |
97,720 |
|||||||||
|
203,175 |
|||||||||||
Oakmark.com 23
Oakmark Global Fund December 31, 2015 (Unaudited)
Schedule of Investments (in thousands) (continued)
|
Shares |
Value |
||||||||||
|
COMMON STOCKS - 98.8% (continued) |
|||||||||||
|
HEALTH CARE - 4.8% |
|||||||||||
|
HEALTH CARE EQUIPMENT & SERVICES - 4.8% |
|||||||||||
|
Health Net, Inc. (United States) (a) Managed Health Care |
1,212 |
$ |
82,981 |
||||||||
|
Tenet Healthcare Corp. (United States) (a) Health Care Facilities |
2,126 |
64,432 |
|||||||||
|
147,413 |
|||||||||||
|
ENERGY - 2.1% |
|||||||||||
|
Oceaneering International, Inc. (United States) Oil & Gas Equipment & Services |
744 |
27,913 |
|||||||||
|
National Oilwell Varco, Inc. (United States) Oil & Gas Equipment & Services |
615 |
20,580 |
|||||||||
|
Chesapeake Energy Corp. (United States) Oil & Gas Exploration & Production |
3,250 |
14,625 |
|||||||||
|
63,118 |
|||||||||||
|
CONSUMER STAPLES - 1.9% |
|||||||||||
|
FOOD, BEVERAGE & TOBACCO - 1.9% |
|||||||||||
|
Diageo PLC (United Kingdom) Distillers & Vintners |
2,115 |
57,895 |
|||||||||
|
TOTAL COMMON STOCKS - 98.8% (COST $2,605,347) |
3,016,385 |
||||||||||
|
Par Value |
Value |
||||||||||
|
SHORT TERM INVESTMENT - 0.8% |
|||||||||||
|
REPURCHASE AGREEMENT - 0.8% |
|||||||||||
|
Fixed Income Clearing Corp. Repurchase Agreement, 0.08% dated 12/31/15 due 01/04/16, repurchase price $22,747, collateralized by a United States Treasury Note, 1.625%, due 07/31/20, value plus accrued interest of $23,204 (Cost: $22,746) |
$ |
22,746 |
22,746 |
||||||||
|
TOTAL SHORT TERM INVESTMENTS - 0.8% (COST $22,746) |
22,746 |
||||||||||
|
TOTAL INVESTMENTS - 99.6% (COST $2,628,093) |
3,039,131 |
||||||||||
|
Other Assets In Excess of Liabilities - 0.4% |
12,713 |
||||||||||
|
TOTAL NET ASSETS - 100.0% |
$ |
3,051,844 |
|||||||||
(a) Non-income producing security
(b) Sponsored American Depositary Receipt
24 OAKMARK FUNDS

This page intentionally left blank.
Oakmark.com 25
Oakmark Global Select Fund December 31, 2015
Summary Information
VALUE OF A $10,000 INVESTMENT
Since Inception - 10/02/06 (Unaudited)
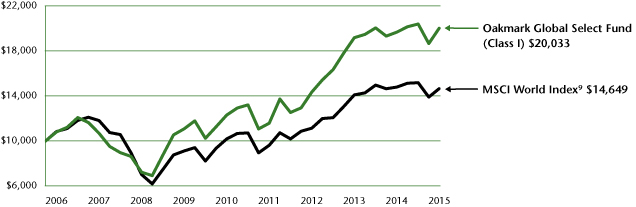
PERFORMANCE
|
Average Annual Total Returns (as of 12/31/15) |
|||||||||||||||||||||||||||
|
(Unaudited) |
Total Return Last 3 Months |
1-year |
3-year |
5-year |
Since Inception |
Inception Date |
|||||||||||||||||||||
|
Oakmark Global Select Fund (Class I) |
7.42 |
% |
1.85 |
% |
11.81 |
% |
10.28 |
% |
7.80 |
% |
10/02/06 |
||||||||||||||||
|
MSCI World Index |
5.50 |
% |
-0.87 |
% |
9.63 |
% |
7.59 |
% |
4.22 |
% |
|||||||||||||||||
|
Lipper Global Funds Index10 |
4.88 |
% |
-1.15 |
% |
8.88 |
% |
6.14 |
% |
4.12 |
% |
|||||||||||||||||
The graph and table do not reflect the deduction of taxes that a shareholder would pay on Fund distributions or the redemption of Fund shares.
Past performance is no guarantee of future results. The performance data quoted represents past performance. Current performance may be lower or higher than the performance data quoted. Total return includes change in share prices and, in each case, includes reinvestment of dividends and capital gain distributions. The investment return and principal value vary so that an investor's shares when redeemed may be worth more or less than the original cost. To obtain the most recent month-end performance, please visit Oakmark.com.
|
TOP TEN EQUITY HOLDINGS4 |
% of Net Assets |
||||||
|
Alphabet Inc., Class C |
7.6 |
||||||
|
General Electric Co. |
6.1 |
||||||
|
Daimler AG |
5.8 |
||||||
|
American International Group, Inc. |
5.3 |
||||||
|
JPMorgan Chase & Co. |
5.1 |
||||||
|
Credit Suisse Group |
5.1 |
||||||
|
Bank of America Corp. |
5.0 |
||||||
|
Kering SA |
4.9 |
||||||
|
LafargeHolcim, Ltd. |
4.9 |
||||||
|
MasterCard, Inc., Class A |
4.7 |
||||||
|
FUND STATISTICS |
|||||||
|
Ticker |
OAKWX |
||||||
|
Inception |
10/02/06 |
||||||
|
Number of Equity Holdings |
20 |
||||||
|
Net Assets |
$2.3 billion | ||||||
|
Benchmark |
MSCI World Index |
||||||
|
Weighted Average Market Cap |
$129.1 billion | ||||||
|
Median Market Cap |
$56.6 billion | ||||||
|
Portfolio Turnover (for the 12-months ended 09/30/15) |
48% | ||||||
|
Expense Ratio - Class I (as of 09/30/14) |
1.13% | ||||||
|
Expense Ratio - Class I (as of 09/30/15) |
1.13% | ||||||
|
SECTOR ALLOCATION |
% of Net Assets |
||||||
|
Information Technology |
25.4 |
||||||
|
Financials |
24.4 |
||||||
|
Consumer Discretionary |
14.6 |
||||||
|
Industrials |
12.8 |
||||||
|
Consumer Staples |
7.5 |
||||||
|
Materials |
4.9 |
||||||
|
Energy |
4.1 |
||||||
|
Short-Term Investments and Other |
6.3 |
||||||
|
GEOGRAPHIC ALLOCATION |
|||||||
|
% of Equity |
|||||||
|
Europe |
46.4 |
||||||
|
Switzerland |
22.8 |
||||||
|
France* |
9.1 |
||||||
|
U.K. |
8.3 |
||||||
|
Germany* |
6.2 |
||||||
|
North America |
44.7 |
||||||
|
United States |
44.7 |
||||||
|
% of Equity |
|||||||
|
Asia |
8.9 |
||||||
|
South Korea |
4.7 |
||||||
|
Japan |
4.2 |
||||||
* Euro currency countries comprise 15.3% of equity investments
26 OAKMARK FUNDS
Oakmark Global Select Fund December 31, 2015
Portfolio Manager Commentary


William C. Nygren, CFA
Portfolio Manager
oakwx@oakmark.com
David G. Herro, CFA
Portfolio Manager
oakwx@oakmark.com
The Oakmark Global Select Fund returned 7% for the quarter ended December 31, 2015, outperforming the MSCI World Index's9 6% return. For the calendar year, the Fund returned 2%, outperforming the MSCI World Index, which lost 0.9%. The Fund has returned an average of 8% per year since its inception in October 2006, outperforming the MSCI World Index's annualized gain of 4% over the same period.
Amazon (U.S.), one of the largest online companies in the world, was the largest contributor to Fund performance for the year, returning over 100% during our holding period. We sold our shares of Amazon in early November as it reached our estimate of intrinsic value.
Alphabet (formerly Google) (U.S.), the leading Internet search engine, was the top contributor for the quarter, returning 25%. Alphabet's share price reacted positively to third-quarter results in which both earnings and revenues exceeded market expectations. Importantly, the company also reported accelerating constant currency revenue growth of 21%. This high quality growth was the product of gains across all important segments; the fastest growth occurred in Google Sites (Search, YouTube, Gmail, etc.), which provide the company's most profitable revenue. Alphabet's mobile division also grew substantially, which eased concerns that the shift to mobile computing would harm the company's profitability. We believe that Alphabet will benefit from a very strong tailwind as advertising continues to move online.
Credit Suisse Group (Switzerland) was the largest detractor for the quarter, falling 7%. Credit Suisse Group's net new money and profits from its wealth management and asset management divisions increased in the third quarter, indicating that its fundamental performance remains solid. However, its share price suffered during the quarter due to the convergence of the preceding stock price with the new rights offering price of CHF 18 per share. Its share price was also likely hurt by external factors, especially the Financial Stability Board (FSB)'s announcement of higher capital buffer recommendations for systemically important banks. The FSB is calling for increasing the capital buffer to 16% of a banking group's equity and debt risk-weighted assets by 2019 and to 18% by January 2022. As we have stated previously, we believe that given adequate notice, Credit Suisse Group is well equipped to contend with future capital requirements.
The largest detractor for the year was Apache (U.S.), a global oil and gas exploration and production company, whose shares fell 28%. As with most oil and gas exploration and production companies, Apache's share price has been adversely affected by persistently weak oil and natural gas prices. In this challenging environment, the company is focused on improving capital efficiency, both through the efficient development of U.S. shale assets and the low-cost growth of international assets. Firm-wide operating costs continue to fall, and capex has decreased
by almost 60% this year. We believe Apache's capital productivity is improving at a faster pace than its global peers, which helps its position on the cost curve. Apache has what we consider to be a healthy balance sheet, which should allow the company to endure a prolonged downturn, and we expect that an eventual commodity price recovery will highlight the growing value of Apache's underappreciated asset base.
Geographically, 45% of the Fund's holdings were invested in U.S.-domiciled companies as of December 31, while approximately 46% were allocated to equities in Europe, 4% in Japan and 5% in South Korea.
We continue to believe some currencies are overvalued versus the U.S. dollar. We maintained our defensive currency hedges and ended the quarter with approximately 21% of the Swiss franc hedged.
We would like to thank our shareholders for continuing to support us and our value investing philosophy. We wish you all a happy and prosperous new year!
Oakmark.com 27
Oakmark Global Select Fund December 31, 2015 (Unaudited)
Schedule of Investments (in thousands)
|
Shares |
Value |
||||||||||
|
COMMON STOCKS - 93.7% |
|||||||||||
|
INFORMATION TECHNOLOGY - 25.4% |
|||||||||||
|
SOFTWARE & SERVICES - 16.3% |
|||||||||||
|
Alphabet, Inc., Class C (United States) (a) Internet Software & Services |
228 |
$ |
173,309 |
||||||||
|
MasterCard, Inc., Class A (United States) Data Processing & Outsourced Services |
1,100 |
107,096 |
|||||||||
|
Oracle Corp. (United States) Systems Software |
2,450 |
89,499 |
|||||||||
|
369,904 |
|||||||||||
|
TECHNOLOGY HARDWARE & EQUIPMENT - 9.1% |
|||||||||||
|
TE Connectivity, Ltd. (Switzerland) Electronic Manufacturing Services |
1,654 |
106,858 |
|||||||||
|
Samsung Electronics Co., Ltd. (South Korea) Technology Hardware, Storage & Peripherals |
92 |
99,372 |
|||||||||
|
206,230 |
|||||||||||
|
576,134 |
|||||||||||
|
FINANCIALS - 24.4% |
|||||||||||
|
BANKS - 10.1% |
|||||||||||
|
JPMorgan Chase & Co. (United States) Diversified Banks |
1,762 |
116,345 |
|||||||||
|
Bank of America Corp. (United States) Diversified Banks |
6,737 |
113,384 |
|||||||||
|
229,729 |
|||||||||||
|
DIVERSIFIED FINANCIALS - 9.0% |
|||||||||||
|
Credit Suisse Group AG (Switzerland) Diversified Capital Markets |
5,300 |
114,774 |
|||||||||
|
Daiwa Securities Group, Inc. (Japan) Investment Banking & Brokerage |
14,601 |
90,476 |
|||||||||
|
205,250 |
|||||||||||
|
INSURANCE - 5.3% |
|||||||||||
|
American International Group, Inc. (United States) Multi-line Insurance |
1,922 |
119,106 |
|||||||||
|
554,085 |
|||||||||||
|
CONSUMER DISCRETIONARY - 14.6% |
|||||||||||
|
CONSUMER DURABLES & APPAREL - 8.8% |
|||||||||||
|
Kering SA (France) Apparel, Accessories & Luxury Goods |
643 |
110,355 |
|||||||||
|
Cie Financiere Richemont SA (Switzerland) Apparel, Accessories & Luxury Goods |
1,260 |
90,730 |
|||||||||
|
201,085 |
|||||||||||
|
AUTOMOBILES & COMPONENTS - 5.8% |
|||||||||||
|
Daimler AG (Germany) Automobile Manufacturers |
1,557 |
131,228 |
|||||||||
|
332,313 |
|||||||||||
|
Shares |
Value |
||||||||||
|
INDUSTRIALS - 12.8% |
|||||||||||
|
CAPITAL GOODS - 10.1% |
|||||||||||
|
General Electric Co. (United States) Industrial Conglomerates |
4,450 |
$ |
138,618 |
||||||||
|
CNH Industrial N.V. (United Kingdom) Agricultural & Farm Machinery |
13,078 |
90,104 |
|||||||||
|
228,722 |
|||||||||||
|
TRANSPORTATION - 2.7% |
|||||||||||
|
Kuehne + Nagel International AG (Switzerland) Marine |
450 |
61,897 |
|||||||||
|
290,619 |
|||||||||||
|
CONSUMER STAPLES - 7.5% |
|||||||||||
|
FOOD, BEVERAGE & TOBACCO - 7.5% |
|||||||||||
|
Diageo PLC (United Kingdom) Distillers & Vintners |
3,119 |
85,371 |
|||||||||
|
Danone SA (France) Packaged Foods & Meats |
1,236 |
83,668 |
|||||||||
|
169,039 |
|||||||||||
|
MATERIALS - 4.9% |
|||||||||||
|
LafargeHolcim, Ltd. (Switzerland) Construction Materials |
2,192 |
110,090 |
|||||||||
|
ENERGY - 4.1% |
|||||||||||
|
Apache Corp. (United States) Oil & Gas Exploration & Production |
2,100 |
93,387 |
|||||||||
|
TOTAL COMMON STOCKS - 93.7% (COST $2,008,337) |
2,125,667 |
||||||||||
|
Par Value |
Value |
||||||||||
|
SHORT TERM INVESTMENTS - 5.1% |
|||||||||||
|
REPURCHASE AGREEMENT - 5.1% |
|||||||||||
|
Fixed Income Clearing Corp. Repurchase Agreement, 0.08% dated 12/31/15 due 01/04/16, repurchase price $116,511, collateralized by a United States Treasury Note, 3.125%, due 10/31/16, value plus accrued interest of $118,844 (Cost: $116,510) |
$ |
116,510 |
116,510 |
||||||||
|
TOTAL SHORT TERM INVESTMENTS - 5.1% (COST $116,510) |
116,510 |
||||||||||
|
TOTAL INVESTMENTS - 98.8% (COST $2,124,847) |
2,242,177 |
||||||||||
|
Other Assets In Excess of Liabilities - 1.2% |
26,085 |
||||||||||
|
TOTAL NET ASSETS - 100.0% |
$ |
2,268,262 |
|||||||||
(a) Non-income producing security
28 OAKMARK FUNDS

This page intentionally left blank.
Oakmark.com 29
Oakmark International and Oakmark December 31, 2015
International Small Cap Funds
Portfolio Manager Commentary

David G. Herro, CFA
Portfolio Manager
oakix@oakmark.com
oakex@oakmark.com
Fellow Shareholders,
In the final quarter of 2015, both Oakmark International Funds generated positive returns; however, only the Oakmark International Small Cap Fund was positive for the year. Certainly, the strong dollar was one of the major negative forces for holders of all foreign equity funds, given the negative currency impact that started in mid-2014 and persisted through 2015. For further details, please see individual Fund letters.
2015: Not a "Feel Good" Year—Share Prices Reflect Mood
Clearly, 2015 lacked positive feelings. First of all, the leadership vacuum in the U.S. and Western Europe created a global ripple effect. This effect is exemplified by people's mistrust in their leaders, most of whom were elected. In these countries, people appear to want something more—and less typical—out of their political leaders. "Third Party" types, whether left, right or center, are faring quite well around the world, including the U.S., Europe and Latin America.
Tragically, 2015 started with the terrorist attack in France at the offices of the satirical newspaper, Charlie Hebdo. The year proceeded with two elections in Greece, continued political crisis in Brazil, depressed energy and commodity prices, and the continued slowdown in the BRIC economies, with China's slower growth causing the greatest concern. We also witnessed the expansion of ISIS, which launched another terrorist attack in France and inspired the mass shooting in San Bernardino, California. With so much turmoil, share prices often reflect "mood" in the short term, and this negativity could contribute to the lack of buoyancy in global equity markets.
Cause for Optimism
There is still reason for optimism. I mentioned the collapse of commodity prices as a negative factor above, but for many, this is a positive. Low energy prices are a windfall for consumers who now pay less to fill their gas tanks and heat their homes. The eurozone is slowly coming out of its funk, led by some limited reforms (especially in the periphery countries such as Ireland, Spain and Portugal), a stabilized situation in Greece, a weaker euro that aids in comparative competitiveness and an easier monetary policy.
Even in Latin America, reformers have won elections in Argentina and, of all places, Venezuela. In the U.S., the world's largest economy, we are approaching full employment, increasing our energy resources, and continuing to build a large pool of hard-working and innovative people who are developing new products, services and conveniences that make the U.S. more productive, competitive and efficient. Overall, despite the
negatives I cited above, the world economy is still expected to grow at a 3% rate.
We Carry On
It's natural to instinctively react to all of the macro and geopolitical events that occur, but we believe it is a mistake to focus on these events when making investment decisions. As I have mentioned countless times in past letters, these events rarely impact long-term business value in a meaningful way. Rather, they are distractions to investors. In fact, these events should be used to exploit short-term traders, as they enable real investors to buy into businesses at low entry prices.
At Harris Associates, our job is to measure and determine intrinsic value, buying when prices are low and selling when prices are high. By focusing on these fundamentals, rather than the exogenous events mentioned above, we believe we will continue to earn, over time, acceptable rates of return for those who entrust us with their funds.
Happy 2016 to all! We remain grateful for your confidence and trust, and will continue to work hard to earn it.
30 OAKMARK FUNDS

This page intentionally left blank.
Oakmark.com 31
Oakmark International Fund December 31, 2015
Summary Information
VALUE OF A $10,000 INVESTMENT
Since Inception - 09/30/92 (Unaudited)
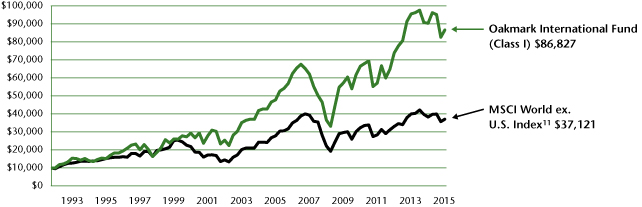
PERFORMANCE
|
Average Annual Total Returns (as of 12/31/15) |
|||||||||||||||||||||||||||||||
|
(Unaudited) |
Total Return Last 3 Months |
1-year |
3-year |
5-year |
10-year |
Since Inception |
Inception Date |
||||||||||||||||||||||||
|
Oakmark International Fund (Class I) |
5.19 |
% |
-3.83 |
% |
5.57 |
% |
5.49 |
% |
6.16 |
% |
9.74 |
% |
09/30/92 |
||||||||||||||||||
|
MSCI World ex U.S. Index |
3.91 |
% |
-3.04 |
% |
3.93 |
% |
2.79 |
% |
2.92 |
% |
5.80 |
% |
|||||||||||||||||||
|
MSCI EAFE Index12 |
4.71 |
% |
-0.81 |
% |
5.01 |
% |
3.60 |
% |
3.03 |
% |
5.70 |
% |
|||||||||||||||||||
|
Lipper International Funds Index13 |
3.70 |
% |
-1.34 |
% |
4.63 |
% |
3.23 |
% |
3.63 |
% |
6.70 |
% |
|||||||||||||||||||
|
Oakmark International Fund (Class II) |
5.10 |
% |
-4.17 |
% |
5.20 |
% |
5.11 |
% |
5.80 |
% |
7.76 |
% |
11/04/99 |
||||||||||||||||||
The graph and table above do not reflect the deduction of taxes that a shareholder would pay on Fund distributions or the redemption of Fund shares.
Past performance is no guarantee of future results. The performance data quoted represents past performance. Current performance may be lower or higher than the performance data quoted. Total return includes change in share prices and, in each case, includes reinvestment of dividends and capital gain distributions. The investment return and principal value vary so that an investor's shares when redeemed may be worth more or less than the original cost. To obtain the most recent month-end performance, please visit Oakmark.com.
|
TOP TEN EQUITY HOLDINGS4 |
% of Net Assets |
||||||
|
Credit Suisse Group |
4.8 |
||||||
|
Honda Motor Co., Ltd. |
3.8 |
||||||
|
BNP Paribas SA |
3.7 |
||||||
|
Nomura Holdings, Inc. |
3.5 |
||||||
|
Daimler AG |
3.2 |
||||||
|
Toyota Motor Corp. |
3.2 |
||||||
|
Allianz SE |
2.9 |
||||||
|
Bayerische Motoren Werke (BMW) AG |
2.7 |
||||||
|
Glencore PLC |
2.7 |
||||||
|
Kering SA |
2.6 |
||||||
|
FUND STATISTICS |
|||||||
|
Ticker |
OAKIX |
||||||
|
Inception |
09/30/92 |
||||||
|
Number of Equity Holdings |
60 |
||||||
|
Net Assets |
$26.5 billion | ||||||
|
Benchmark |
MSCI World ex U.S. Index |
||||||
|
Weighted Average Market Cap |
$42.7 billion | ||||||
|
Median Market Cap |
$16.3 billion | ||||||
|
Portfolio Turnover (for the 12-months ended 09/30/15) |
48% | ||||||
|
Expense Ratio - Class I (as of 09/30/14) |
0.95% | ||||||
|
Expense Ratio - Class I (as of 09/30/15) |
0.95% | ||||||
|
SECTOR ALLOCATION |
% of Net Assets |
||||||
|
Financials |
30.9 |
||||||
|
Consumer Discretionary |
28.5 |
||||||
|
Industrials |
18.2 |
||||||
|
Materials |
7.0 |
||||||
|
Information Technology |
6.3 |
||||||
|
Consumer Staples |
4.8 |
||||||
|
Health Care |
0.8 |
||||||
|
Short-Term Investments and Other |
3.5 |
||||||
|
GEOGRAPHIC ALLOCATION |
|||||||
|
% of Equity |
|||||||
|
Europe |
65.8 |
||||||
|
Switzerland |
15.9 |
||||||
|
France* |
13.7 |
||||||
|
U.K. |
13.3 |
||||||
|
Germany* |
9.3 |
||||||
|
Italy* |
5.7 |
||||||
|
Sweden |
3.7 |
||||||
|
Netherlands* |
2.5 |
||||||
|
Ireland* |
1.7 |
||||||
|
Asia |
27.6 |
||||||
|
Japan |
19.6 |
||||||
|
South Korea |
2.5 |
||||||
|
% of Equity |
|||||||
|
Asia (cont'd) |
27.6 |
||||||
|
Indonesia |
2.2 |
||||||
|
Hong Kong |
1.9 |
||||||
|
China |
1.4 |
||||||
|
Australasia |
3.2 |
||||||
|
Australia |
3.2 |
||||||
|
North America |
2.2 |
||||||
|
United States |
2.2 |
||||||
|
Latin America |
1.0 |
||||||
|
Mexico |
1.0 |
||||||
|
Middle East |
0.2 |
||||||
|
Israel |
0.2 |
||||||
* Euro currency countries comprise 32.9% of equity investments
32 OAKMARK FUNDS
Oakmark International Fund December 31, 2015
Portfolio Manager Commentary


David G. Herro, CFA
Portfolio Manager
oakix@oakmark.com
Robert A. Taylor, CFA
Portfolio Manager
oakix@oakmark.com
The Oakmark International Fund returned 5% for the quarter ended December 31, 2015, outperforming the MSCI World ex U.S. Index11, which returned 4% over the same period. The Fund's calendar year performance was weak in absolute and relative terms, declining 4% versus the MSCI World ex U.S. Index's loss of 3%. Most importantly, the Fund has returned an average of 10% per year since its inception in September 1992, outperforming the MSCI World ex U.S. Index, which has averaged 6% per year over the same period.
Baidu, China's largest Internet search engine that commands over 70% market share, was the top contributor for the quarter, returning 38%. Shares reacted positively to the company's nine-month earnings release in October and to the company's plans to combine their majority-controlled travel business Qunar with Ctrip. This important deal will combine the top two online travel sites in China and should lead to significantly lower subsidies and higher profitability. Additionally, the shareholder-focused management team announced a new $2 billion share repurchase program during the quarter. Finally, we believe that management's significant investments in new businesses, such as online-to-offline services (e.g., food delivery, ride sharing, etc.), are masking the strength of the core search business, which continues to grow at a healthy rate and generates significant profits. For these reasons, we believe today's valuation neither reflects the fair value of the company's search business nor gives any credit for its many non-search businesses; therefore, the stock price underestimates the company's true value.
Prada, the Italian fashion and luxury goods brand, was a top detractor for the quarter, declining 19%. The company reported fiscal third-quarter results that disappointed investors, as revenue and earnings figures fell short of analysts' expectations. Sales in China, particularly of leather goods, continued to decline, and the company has struggled to find the right product offering to generate top-line growth. Management believes that Chinese customers are transitioning from just wanting global products found in the West to wanting bespoke products. The company's plans to tailor clothing by geographic region should appeal to Chinese consumers, whose propensity toward travel should help them be aware that these products are exclusive to them. Prada's lean and efficient distribution network will enable the company to move new product offerings from the design stage to the retail floor quickly—approximately four to five weeks' time. We think that while Prada may face some short-term obstacles, its long-term outlook is promising and it is trading at a meaningful discount to its intrinsic value.
During the quarter we sold our positions in Meitec, SAP and adidas as they approached or hit our estimates of intrinsic value. We added a few new names to the portfolio for the quarter: Grupo Televisa, a Mexican media company and the most dominant producer of Spanish-language content in the world; SMFG (Sumitomo Mitsui Financial Group), the third largest bank in
Japan; and Wolseley, the world's largest traded distributor of plumbing and heating products and leading supplier of building materials based in the U.K.
Geographically, we ended the quarter with 66% of our holdings in Europe, 20% in Japan and 3% in Australia. The remaining positions are in North America (United States), South Korea, China, Hong Kong, Indonesia, Mexico and the Middle East (Israel).
We continue to believe some currencies are overvalued versus the U.S. dollar. We maintained our defensive currency hedges and ended the quarter with approximately 22% of the Swiss franc and 10% of the Australian dollar hedged.
We would like to thank our shareholders for continuing to support us and our value investing philosophy. We wish you all a very happy and prosperous new year!
Oakmark.com 33
Oakmark International Fund December 31, 2015 (Unaudited)
Schedule of Investments (in thousands)
|
Shares |
Value |
||||||||||
|
COMMON STOCKS - 96.5% |
|||||||||||
|
FINANCIALS - 30.9% |
|||||||||||
|
DIVERSIFIED FINANCIALS - 13.6% |
|||||||||||
|
Credit Suisse Group AG (Switzerland) Diversified Capital Markets |
58,882 |
$ |
1,275,120 |
||||||||
|
Nomura Holdings, Inc. (Japan) Investment Banking & Brokerage |
163,909 |
926,085 |
|||||||||
|
EXOR SPA (Italy) Multi-Sector Holdings |
13,318 |
609,192 |
|||||||||
|
Daiwa Securities Group, Inc. (Japan) Investment Banking & Brokerage |
87,280 |
540,839 |
|||||||||
|
Schroders PLC (United Kingdom) Asset Management & Custody Banks |
5,829 |
255,713 |
|||||||||
|
Schroders PLC, Non-Voting (United Kingdom) Asset Management & Custody Banks |
31 |
1,047 |
|||||||||
|
3,607,996 |
|||||||||||
|
BANKS - 10.7% |
|||||||||||
|
BNP Paribas SA (France) Diversified Banks |
17,454 |
990,682 |
|||||||||
|
Lloyds Banking Group PLC (United Kingdom) Diversified Banks |
536,545 |
577,965 |
|||||||||
|
Bank Mandiri Persero Tbk PT (Indonesia) Diversified Banks |
815,618 |
547,295 |
|||||||||
|
Intesa Sanpaolo SPA (Italy) Diversified Banks |
132,323 |
444,059 |
|||||||||
|
Sumitomo Mitsui Financial Group, Inc. (Japan) Diversified Banks |
7,114 |
272,604 |
|||||||||
|
2,832,605 |
|||||||||||
|
INSURANCE - 6.6% |
|||||||||||
|
Allianz SE (Germany) Multi-line Insurance |
4,394 |
780,910 |
|||||||||
|
Willis Group Holdings PLC (United States) Insurance Brokers |
11,480 |
557,594 |
|||||||||
|
AMP, Ltd. (Australia) Life & Health Insurance |
100,048 |
425,035 |
|||||||||
|
1,763,539 |
|||||||||||
|
8,204,140 |
|||||||||||
|
CONSUMER DISCRETIONARY - 28.5% |
|||||||||||
|
AUTOMOBILES & COMPONENTS - 14.1% |
|||||||||||
|
Honda Motor Co., Ltd. (Japan) Automobile Manufacturers |
31,407 |
1,021,675 |
|||||||||
|
Daimler AG (Germany) Automobile Manufacturers |
10,227 |
862,264 |
|||||||||
|
Toyota Motor Corp. (Japan) Automobile Manufacturers |
13,733 |
855,561 |
|||||||||
|
Bayerische Motoren Werke (BMW) AG (Germany) Automobile Manufacturers |
6,870 |
728,935 |
|||||||||
|
Valeo SA (France) Auto Parts & Equipment |
1,786 |
276,742 |
|||||||||
|
3,745,177 |
|||||||||||
|
Shares |
Value |
||||||||||
|
CONSUMER DURABLES & APPAREL - 10.1% |
|||||||||||
|
Kering SA (France) Apparel, Accessories & Luxury Goods |
4,042 |
$ |
693,854 |
||||||||
|
Cie Financiere Richemont SA (Switzerland) Apparel, Accessories & Luxury Goods |
8,014 |
576,876 |
|||||||||
|
Swatch Group AG, Bearer Shares (Switzerland) Apparel, Accessories & Luxury Goods |
1,246 |
435,582 |
|||||||||
|
Prada SPA (Italy) Apparel, Accessories & Luxury Goods |
132,274 |
411,327 |
|||||||||
|
LVMH Moet Hennessy Louis Vuitton SE (France) Apparel, Accessories & Luxury Goods |
2,192 |
345,123 |
|||||||||
|
Burberry Group PLC (United Kingdom) Apparel, Accessories & Luxury Goods |
12,261 |
216,004 |
|||||||||
|
2,678,766 |
|||||||||||
|
CONSUMER SERVICES - 1.8% |
|||||||||||
|
Melco Crown Entertainment, Ltd. (Hong Kong) (b) Casinos & Gaming |
28,848 |
484,639 |
|||||||||
|
MEDIA - 1.6% |
|||||||||||
|
Grupo Televisa SAB (Mexico) (b) Broadcasting |
9,586 |
260,824 |
|||||||||
|
WPP PLC (United Kingdom) Advertising |
6,792 |
156,495 |
|||||||||
|
417,319 |
|||||||||||
|
RETAILING - 0.9% |
|||||||||||
|
Hennes & Mauritz AB (H&M) - Class B (Sweden) Apparel Retail |
6,725 |
240,669 |
|||||||||
|
7,566,570 |
|||||||||||
|
INDUSTRIALS - 18.2% |
|||||||||||
|
CAPITAL GOODS - 12.5% |
|||||||||||
|
CNH Industrial N.V. (United Kingdom) Agricultural & Farm Machinery |
93,721 |
645,736 |
|||||||||
|
Komatsu, Ltd. (Japan) Construction Machinery & Heavy Trucks |
34,544 |
572,498 |
|||||||||
|
Koninklijke Philips NV (Netherlands) Industrial Conglomerates |
21,517 |
550,921 |
|||||||||
|
SKF AB (Sweden) Industrial Machinery |
24,358 |
395,892 |
|||||||||
|
Smiths Group PLC (United Kingdom) Industrial Conglomerates |
22,771 |
315,380 |
|||||||||
|
Atlas Copco AB, Series B (Sweden) Industrial Machinery |
12,352 |
285,781 |
|||||||||
|
Meggitt PLC (United Kingdom) Aerospace & Defense |
42,505 |
234,792 |
|||||||||
|
Ashtead Group PLC (United Kingdom) Trading Companies & Distributors |
10,446 |
172,317 |
|||||||||
|
Schindler Holding AG (Switzerland) Industrial Machinery |
369 |
61,948 |
|||||||||
|
Safran SA (France) Aerospace & Defense |
859 |
59,122 |
|||||||||
|
Wolseley PLC (United Kingdom) Trading Companies & Distributors |
526 |
28,616 |
|||||||||
|
3,323,003 |
|||||||||||
34 OAKMARK FUNDS
Oakmark International Fund December 31, 2015 (Unaudited)
Schedule of Investments (in thousands) (continued)
|
Shares |
Value |
||||||||||
|
COMMON STOCKS - 96.5% (continued) |
|||||||||||
|
INDUSTRIALS - 18.2% (continued) |
|||||||||||
|
COMMERCIAL & PROFESSIONAL SERVICES - 4.5% |
|||||||||||
|
Bureau Veritas SA (France) Research & Consulting Services |
23,362 |
$ |
466,887 |
||||||||
|
Experian PLC (Ireland) Research & Consulting Services |
24,638 |
436,211 |
|||||||||
|
G4S PLC (United Kingdom) Security & Alarm Services |
67,492 |
224,366 |
|||||||||
|
Secom Co., Ltd. (Japan) Security & Alarm Services |
1,158 |
79,353 |
|||||||||
|
1,206,817 |
|||||||||||
|
TRANSPORTATION - 1.2% |
|||||||||||
|
Kuehne + Nagel International AG (Switzerland) Marine |
2,221 |
305,565 |
|||||||||
|
4,835,385 |
|||||||||||
|
MATERIALS - 7.0% |
|||||||||||
|
Glencore PLC (Switzerland) Diversified Metals & Mining |
543,853 |
725,422 |
|||||||||
|
LafargeHolcim, Ltd. (Switzerland) Construction Materials |
12,636 |
634,592 |
|||||||||
|
Orica, Ltd. (Australia) Commodity Chemicals |
35,886 |
405,332 |
|||||||||
|
Akzo Nobel NV (Netherlands) Specialty Chemicals |
1,259 |
84,418 |
|||||||||
|
1,849,764 |
|||||||||||
|
INFORMATION TECHNOLOGY - 6.3% |
|||||||||||
|
TECHNOLOGY HARDWARE & EQUIPMENT - 4.7% |
|||||||||||
|
Samsung Electronics Co., Ltd. (South Korea) Technology Hardware, Storage & Peripherals |
604 |
648,902 |
|||||||||
|
OMRON Corp. (Japan) Electronic Components |
17,817 |
602,568 |
|||||||||
|
1,251,470 |
|||||||||||
|
SOFTWARE & SERVICES - 1.6% |
|||||||||||
|
Baidu, Inc. (China) (a) (b) Internet Software & Services |
1,885 |
356,416 |
|||||||||
|
Check Point Software Technologies, Ltd. (Israel) (a) Systems Software |
651 |
52,954 |
|||||||||
|
409,370 |
|||||||||||
|
1,660,840 |
|||||||||||
|
Shares |
Value |
||||||||||
|
CONSUMER STAPLES - 4.8% |
|||||||||||
|
FOOD, BEVERAGE & TOBACCO - 4.8% |
|||||||||||
|
Diageo PLC (United Kingdom) Distillers & Vintners |
18,480 |
$ |
505,759 |
||||||||
|
Danone SA (France) Packaged Foods & Meats |
5,523 |
373,783 |
|||||||||
|
Pernod Ricard SA (France) Distillers & Vintners |
2,746 |
313,882 |
|||||||||
|
Nestle SA (Switzerland) Packaged Foods & Meats |
886 |
65,915 |
|||||||||
|
Swedish Match AB (Sweden) Tobacco |
402 |
414,288 |
|||||||||
|
1,273,627 |
|||||||||||
|
HEALTH CARE - 0.8% |
|||||||||||
|
HEALTH CARE EQUIPMENT & SERVICES - 0.5% |
|||||||||||
|
Olympus Corp. (Japan) Health Care Equipment |
3,636 |
145,208 |
|||||||||
|
PHARMACEUTICALS, BIOTECHNOLOGY & LIFE SCIENCES - 0.3% |
|||||||||||
|
GlaxoSmithKline PLC (United Kingdom) Pharmaceuticals |
3,501 |
70,871 |
|||||||||
|
216,079 |
|||||||||||
|
TOTAL COMMON STOCKS - 96.5% (COST $27,077,199) |
25,606,405 |
||||||||||
|
Par Value |
Value |
||||||||||
|
SHORT TERM INVESTMENTS - 3.1% |
|||||||||||
|
GOVERNMENT AND AGENCY SECURITIES - 0.9% |
|||||||||||
|
United States Treasury Floating Rate Note, 0.319%, due 04/30/16 (c) (Cost $250,000) |
$ |
250,000 |
250,056 |
||||||||
|
Total Government and Agency Securities (Cost $250,000) |
250,056 |
||||||||||
|
COMMERCIAL PAPER - 0.9% |
|||||||||||
|
J.P. Morgan Securities LLC, 144A, 0.48% - 0.76%, due 03/17/16 - 06/07/16 (d) (e) (Cost $249,486) |
250,000 |
249,533 |
|||||||||
|
REPURCHASE AGREEMENT - 0.9% |
|||||||||||
|
Fixed Income Clearing Corp. Repurchase Agreement, 0.08% dated 12/31/15 due 01/04/16, repurchase price $227,815, collateralized by a United States Treasury Note, 1.750%, due 12/31/20, value plus accrued interest of $232,369 (Cost: $227,813) |
227,813 |
227,813 |
|||||||||
Oakmark.com 35
Oakmark International Fund December 31, 2015 (Unaudited)
Schedule of Investments (in thousands) (continued)
|
Par Value |
Value |
||||||||||
|
SHORT TERM INVESTMENTS - 3.1% (continued) |
|||||||||||
|
U.S. GOVERNMENT BILLS - 0.4% |
|||||||||||
|
United States Treasury Bill, 0.14%, due 02/04/16 (d) (Cost $99,987) |
$ |
100,000 |
$ |
99,987 |
|||||||
|
TOTAL SHORT TERM INVESTMENTS - 3.1% (COST $827,286) |
827,389 |
||||||||||
|
TOTAL INVESTMENTS - 99.6% (COST $27,904,485) |
26,433,794 |
||||||||||
|
Foreign Currencies (Cost $2) - 0.0% (f) |
2 |
||||||||||
|
Other Assets In Excess of Liabilities - 0.4% |
106,161 |
||||||||||
|
TOTAL NET ASSETS - 100.0% |
$ |
26,539,957 |
|||||||||
(a) Non-income producing security
(b) Sponsored American Depositary Receipt
(c) Floating Rate Note. Rate shown is as of December 31, 2015.
(d) The rate shown represents the annualized yield at the time of purchase; not a coupon rate.
(e) These restricted securities may be resold subject to restrictions on resale under federal securities laws.
(f) Amount rounds to less than 0.1%.
36 OAKMARK FUNDS

This page intentionally left blank.
Oakmark.com 37
Oakmark International Small Cap Fund December 31, 2015
Summary Information
VALUE OF A $10,000 INVESTMENT
Since 12/31/05 (Unaudited)
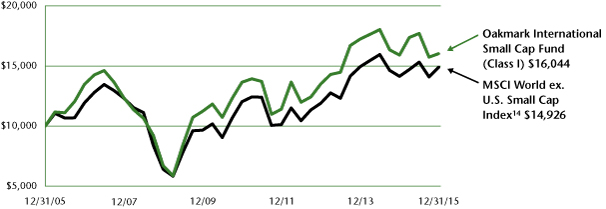
PERFORMANCE
|
Average Annual Total Returns (as of 12/31/15) |
|||||||||||||||||||||||||||||||
|
(Unaudited) |
Total Return Last 3 Months |
1-year |
3-year |
5-year |
10-year |
Since Inception |
Inception Date |
||||||||||||||||||||||||
|
Oakmark International Small Cap Fund (Class I) |
1.84 |
% |
0.74 |
% |
5.88 |
% |
3.26 |
% |
4.84 |
% |
9.34 |
% |
11/01/95 |
||||||||||||||||||
|
MSCI World ex U.S. Small Cap Index |
5.82 |
% |
5.46 |
% |
7.82 |
% |
4.39 |
% |
4.09 |
% |
N/A |
||||||||||||||||||||
|
MSCI World ex U.S. Index11 |
3.91 |
% |
-3.04 |
% |
3.93 |
% |
2.79 |
% |
2.92 |
% |
4.90 |
% |
|||||||||||||||||||
|
Lipper International Small Cap Funds Index15 |
5.01 |
% |
5.72 |
% |
8.53 |
% |
5.71 |
% |
5.71 |
% |
N/A |
||||||||||||||||||||
|
Oakmark International Small Cap Fund (Class II) |
1.84 |
% |
0.53 |
% |
5.58 |
% |
2.97 |
% |
4.58 |
% |
9.50 |
% |
01/08/01 |
||||||||||||||||||
The graph and table do not reflect the deduction of taxes that a shareholder would pay on Fund distributions or the redemption of Fund shares.
Past performance is no guarantee of future results. The performance data quoted represents past performance. Current performance may be lower or higher than the performance data quoted. Total return includes change in share prices and, in each case, includes reinvestment of dividends and capital gain distributions. The investment return and principal value vary so that an investor's shares when redeemed may be worth more or less than the original cost. The performance of the Fund does not reflect the 2% redemption fee imposed on shares redeemed within 90 days of purchase. To obtain the most recent month-end performance, please visit Oakmark.com.
|
TOP TEN EQUITY HOLDINGS4 |
% of Net Assets |
||||||
|
Julius Baer Group, Ltd. |
4.1 |
||||||
|
Incitec Pivot, Ltd. |
4.0 |
||||||
|
Konecranes Plc |
3.0 |
||||||
|
Melco International Development, Ltd. |
2.8 |
||||||
|
MTU Aero Engines AG |
2.8 |
||||||
|
Sugi Holdings Co., Ltd. |
2.7 |
||||||
|
Hirose Electric Co., Ltd. |
2.7 |
||||||
|
EFG International AG |
2.6 |
||||||
|
Metso OYJ |
2.6 |
||||||
|
Bucher Industries AG |
2.6 |
||||||
|
FUND STATISTICS |
|||||||
|
Ticker |
OAKEX |
||||||
|
Inception |
11/01/95 |
||||||
|
Number of Equity Holdings |
60 |
||||||
|
Net Assets |
$2.8 billion | ||||||
|
Benchmark |
MSCI World ex U.S. Small Cap Index |
||||||
|
Weighted Average Market Cap |
$2.9 billion | ||||||
|
Median Market Cap |
$1.6 billion | ||||||
|
Portfolio Turnover (for the 12-months ended 09/30/15) |
46% | ||||||
|
Expense Ratio - Class I (as of 09/30/14) |
1.31% | ||||||
|
Expense Ratio - Class I (as of 09/30/15) |
1.35% | ||||||
|
SECTOR ALLOCATION |
% of Net Assets |
||||||
|
Industrials |
43.4 |
||||||
|
Financials |
18.0 |
||||||
|
Information Technology |
10.6 |
||||||
|
Consumer Discretionary |
7.8 |
||||||
|
Materials |
6.8 |
||||||
|
Consumer Staples |
4.9 |
||||||
|
Health Care |
3.6 |
||||||
|
Energy |
0.5 |
||||||
|
Short-Term Investments and Other |
4.4 |
||||||
|
GEOGRAPHIC ALLOCATION |
|||||||
|
% of Equity |
|||||||
|
Europe |
60.1 |
||||||
|
U.K. |
17.2 |
||||||
|
Switzerland |
16.1 |
||||||
|
Finland* |
7.2 |
||||||
|
Germany* |
3.6 |
||||||
|
Italy* |
3.5 |
||||||
|
Netherlands* |
2.6 |
||||||
|
France* |
2.5 |
||||||
|
Norway |
2.4 |
||||||
|
Spain* |
2.3 |
||||||
|
Denmark |
1.5 |
||||||
|
Greece* |
1.2 |
||||||
|
Austria* |
0.0 |
(a) |
|||||
|
% of Equity |
|||||||
|
Asia |
20.3 |
||||||
|
Japan |
10.0 |
||||||
|
South Korea |
5.0 |
||||||
|
Hong Kong |
4.3 |
||||||
|
China |
1.0 |
||||||
|
Australasia |
13.0 |
||||||
|
Australia |
10.8 |
||||||
|
New Zealand |
2.2 |
||||||
|
North America |
3.4 |
||||||
|
Canada |
3.4 |
||||||
|
Latin America |
2.0 |
||||||
|
Brazil |
2.0 |
||||||
|
Middle East |
1.2 |
||||||
|
Israel |
1.2 |
||||||
* Euro currency countries comprise 22.9% of equity investments
(a) Amount rounds to less than 0.1%
38 OAKMARK FUNDS
Oakmark International Small Cap Fund December 31, 2015
Portfolio Manager Commentary


David G. Herro, CFA
Portfolio Manager
oakex@oakmark.com
Michael L. Manelli, CFA
Portfolio Manager
oakex@oakmark.com
The Oakmark International Small Cap Fund returned 2% for the quarter ended December 31, 2015, underperforming the MSCI World ex U.S. Small Cap Index14, which returned 6% for the same period. For the year ended December 31, the Fund was up 1% while the MSCI World ex U.S. Small Cap Index returned 5%. Since the Fund's inception in November 1995, it has returned an average of 9% per year.
A top-performing stock for the quarter (and calendar year) was Japanese drugstore chain Sugi Holdings. We met with the president of Sugi on a recent trip to Japan and discussed how growth remains solid, the returns are very good and the board is returning to what we believe is the right balance of independent outside members. Sugi's management team plans to invest in store expansions and logistic centers, as well as to commit existing stores' floor space to wellness initiatives that are gaining popularity in Japan. We remain pleased with Sugi's ability to drive results and are confident that the leadership team will continue to increase overall value in order to benefit shareholders.
Treasury Wine Estates (Australia), the world's largest listed wine company, also significantly contributed to performance for the year (and quarter). As we indicated in our last letter, the company reported what we consider strong fiscal-year results in August, and they successfully resolved inventory issues in North America, allowing management to focus on growing the business. As a result, during the fourth quarter, the company announced they were acquiring wine assets from Diageo in the U.S. and Europe. The U.S. business acquired was the primary motivation for the deal. That acquisition brings a large inventory of wine, more than half of which comes from luxury and masstige grapes that generate 83% of the revenue in the U.S. These cases were sold under a number of brands that will also transfer to Treasury, and the company can now additionally use some of that high quality fruit to blend into its existing brands and expand capacity and margin. Another appeal of the U.S. business is that it is capital-light, as Treasury will own only 2% of the agricultural assets used to produce the fruit with the rest coming from long-term leases and grower contracts. In addition, the company expects to achieve cost synergies of at least $25 million and avoid $80 million of capital expenditure that would have been needed for a new bottling facility in the U.S. We believe this transaction will create additional shareholder value over time.
A large detractor in the Fund for the quarter and year-end periods was BNK Financial Group, a banking, securities and financial services provider in the southeast region of South Korea. BNK Financial Group's third-quarter net profit was slightly better than market expectations. Its turnaround efforts for recently acquired Kyungnam Bank appear to be on track, as the net interest margin increased and helped results for the period. However, BNK announced a new 70 million rights issuance that will increase shares outstanding by approximately 27% and
dilute the value of currently owned shares. This move surprised both the market and us, prompting a significant share price decline. While we find the rights issuance extremely frustrating, BNK's strong competitive position, high levels of normal profitability and low valuation make this an attractive stock in our opinion.
During the quarter we initiated new positions in Element Financial, QIAGEN and SKY Network Television. Element Financial is a financial services company based in Canada. The company originates, funds and manages asset-based financings in Canada and the U.S., and it conducts fleet management operations in Mexico, Australia and New Zealand. Based in the U.S., QIAGEN provides solutions that make biological samples easier for researchers to see and analyze. New Zealand-based SKY Network Television is a pay television provider that offers about 100 channels via ultra-high frequency and digital broadcast satellite across the country. During the quarter, we eliminated our positions in Alten (France), Capcom (Japan) and Asatsu-DK (Japan).
Geographically, we ended the quarter with 20% of our holdings in Asia, 60% in Europe and 13% in Australasia. The remaining positions are in North America (Canada and the U.S.), Latin America (Brazil) and the Middle East (Israel).
While the U.S. dollar strengthened over the year, we still maintain hedge positions on two of the Fund's currency exposures. As of the most recent quarter end, the Fund's Australian dollar hedge was 11% and the Swiss franc exposure was 22%.
We thank you for your continued confidence and support, and wish all of you a very happy and healthy 2016!
Oakmark.com 39
Oakmark International Small Cap Fund December 31, 2015 (Unaudited)
Schedule of Investments (in thousands)
|
Shares |
Value |
||||||||||
|
COMMON STOCKS - 95.6% |
|||||||||||
|
INDUSTRIALS - 43.4% |
|||||||||||
|
CAPITAL GOODS - 23.5% |
|||||||||||
|
Konecranes OYJ (Finland) Industrial Machinery |
3,381 |
$ |
84,139 |
||||||||
|
MTU Aero Engines AG (Germany) Aerospace & Defense |
796 |
77,912 |
|||||||||
|
Metso OYJ (Finland) Industrial Machinery |
3,195 |
71,863 |
|||||||||
|
Bucher Industries AG (Switzerland) Construction Machinery & Heavy Trucks |
315 |
71,220 |
|||||||||
|
Sulzer AG (Switzerland) Industrial Machinery |
596 |
56,140 |
|||||||||
|
Morgan Advanced Materials PLC (United Kingdom) Industrial Machinery |
14,521 |
52,961 |
|||||||||
|
Saft Groupe SA (France) Electrical Components & Equipment |
1,661 |
50,702 |
|||||||||
|
Melrose Industries PLC (United Kingdom) Industrial Machinery |
10,014 |
42,946 |
|||||||||
|
Travis Perkins PLC (United Kingdom) Trading Companies & Distributors |
1,304 |
37,937 |
|||||||||
|
Outotec OYJ (Finland) (b) Construction & Engineering |
9,337 |
34,499 |
|||||||||
|
Finning International, Inc. (Canada) Trading Companies & Distributors |
2,455 |
33,137 |
|||||||||
|
Prysmian SpA (Italy) Electrical Components & Equipment |
1,041 |
22,920 |
|||||||||
|
Wajax Corp. (Canada) Trading Companies & Distributors |
1,162 |
14,099 |
|||||||||
|
650,475 |
|||||||||||
|
COMMERCIAL & PROFESSIONAL SERVICES - 13.3% |
|||||||||||
|
Applus Services SA (Spain) Research & Consulting Services |
6,645 |
60,295 |
|||||||||
|
ALS, Ltd. (Australia) Research & Consulting Services |
19,526 |
53,642 |
|||||||||
|
Mitie Group PLC (United Kingdom) Environmental & Facilities Services |
10,577 |
48,493 |
|||||||||
|
Michael Page International PLC (United Kingdom) Human Resource & Employment Services |
6,593 |
47,071 |
|||||||||
|
Transpacific Industries Group, Ltd. (Australia) Environmental & Facilities Services |
60,595 |
34,883 |
|||||||||
|
SThree PLC (United Kingdom) Human Resource & Employment Services |
6,359 |
30,562 |
|||||||||
|
Brunel International N.V. (Netherlands) Human Resource & Employment Services |
1,460 |
26,661 |
|||||||||
|
Randstad Holding N.V. (Netherlands) Human Resource & Employment Services |
407 |
25,445 |
|||||||||
|
Dorma+Kaba Holding AG (Switzerland) Security & Alarm Services |
30 |
20,605 |
|||||||||
|
gategroup Holding AG (Switzerland) Diversified Support Services |
443 |
19,526 |
|||||||||
|
367,183 |
|||||||||||
|
Shares |
Value |
||||||||||
|
TRANSPORTATION - 6.6% |
|||||||||||
|
Panalpina Welttransport Holding AG (Switzerland) Air Freight & Logistics |
633 |
$ |
71,115 |
||||||||
|
DSV AS (Denmark) Trucking |
1,028 |
40,665 |
|||||||||
|
BBA Aviation PLC (United Kingdom) Airport Services |
14,553 |
40,570 |
|||||||||
|
Freightways, Ltd. (New Zealand) Air Freight & Logistics |
7,383 |
31,356 |
|||||||||
|
183,706 |
|||||||||||
|
1,201,364 |
|||||||||||
|
FINANCIALS - 18.0% |
|||||||||||
|
DIVERSIFIED FINANCIALS - 9.6% |
|||||||||||
|
Julius Baer Group, Ltd. (Switzerland) Asset Management & Custody Banks |
2,332 |
113,294 |
|||||||||
|
EFG International AG (Switzerland) Asset Management & Custody Banks |
6,926 |
72,948 |
|||||||||
|
Element Financial Corp. (Canada) Specialized Finance |
3,464 |
41,808 |
|||||||||
|
Ichiyoshi Securities Co., Ltd. (Japan) Investment Banking & Brokerage |
2,221 |
20,622 |
|||||||||
|
MLP AG (Germany) Asset Management & Custody Banks |
4,209 |
16,786 |
|||||||||
|
265,458 |
|||||||||||
|
BANKS - 4.8% |
|||||||||||
|
DGB Financial Group, Inc. (South Korea) Regional Banks |
7,909 |
67,784 |
|||||||||
|
BNK Financial Group, Inc. (South Korea) Regional Banks |
8,792 |
63,138 |
|||||||||
|
BNK Financial Group, Inc. Rights (South Korea) (a) (c) Regional Banks |
1,924 |
2,376 |
|||||||||
|
133,298 |
|||||||||||
|
REAL ESTATE - 3.6% |
|||||||||||
|
Countrywide PLC (United Kingdom) Real Estate Services |
9,573 |
56,367 |
|||||||||
|
LSL Property Services PLC (United Kingdom) Real Estate Services |
10,416 |
43,762 |
|||||||||
|
100,129 |
|||||||||||
|
498,885 |
|||||||||||
|
INFORMATION TECHNOLOGY - 10.6% |
|||||||||||
|
TECHNOLOGY HARDWARE & EQUIPMENT - 5.8% |
|||||||||||
|
Hirose Electric Co., Ltd. (Japan) Electronic Components |
598 |
73,373 |
|||||||||
|
Premier Farnell PLC (United Kingdom) Technology Distributors |
22,425 |
32,398 |
|||||||||
|
Orbotech, Ltd. (Israel) (a) Electronic Equipment & Instruments |
1,433 |
31,704 |
|||||||||
|
Electrocomponents PLC (United Kingdom) Technology Distributors |
6,296 |
22,119 |
|||||||||
|
159,594 |
|||||||||||
40 OAKMARK FUNDS
Oakmark International Small Cap Fund December 31, 2015 (Unaudited)
Schedule of Investments (in thousands) (continued)
|
Shares |
Value |
||||||||||
|
COMMON STOCKS - 95.6% (continued) |
|||||||||||
|
INFORMATION TECHNOLOGY - 10.6% (continued) |
|||||||||||
|
SOFTWARE & SERVICES - 4.8% |
|||||||||||
|
Atea ASA (Norway) IT Consulting & Other Services |
7,741 |
$ |
64,275 |
||||||||
|
Totvs SA (Brazil) Systems Software |
6,853 |
53,749 |
|||||||||
|
Altran Technologies SA (France) IT Consulting & Other Services |
1,222 |
16,390 |
|||||||||
|
134,414 |
|||||||||||
|
294,008 |
|||||||||||
|
CONSUMER DISCRETIONARY - 7.8% |
|||||||||||
|
CONSUMER SERVICES - 2.8% |
|||||||||||
|
Melco International Development, Ltd. (Hong Kong) Casinos & Gaming |
52,129 |
78,294 |
|||||||||
|
MEDIA - 2.8% |
|||||||||||
|
Hakuhodo DY Holdings, Inc. (Japan) Advertising |
4,572 |
50,168 |
|||||||||
|
SKY Network Television, Ltd. (New Zealand) Cable & Satellite |
8,295 |
26,042 |
|||||||||
|
76,210 |
|||||||||||
|
RETAILING - 2.2% |
|||||||||||
|
Hengdeli Holdings, Ltd. (Hong Kong) Specialty Stores |
232,369 |
33,881 |
|||||||||
|
China ZhengTong Auto Services Holdings, Ltd. (China) Automotive Retail |
56,471 |
25,940 |
|||||||||
|
59,821 |
|||||||||||
|
214,325 |
|||||||||||
|
MATERIALS - 6.8% |
|||||||||||
|
Incitec Pivot, Ltd. (Australia) Diversified Chemicals |
38,694 |
111,658 |
|||||||||
|
Kansai Paint Co., Ltd. (Japan) Specialty Chemicals |
3,027 |
46,465 |
|||||||||
|
Titan Cement Co. SA (Greece) Construction Materials |
1,587 |
30,366 |
|||||||||
|
188,489 |
|||||||||||
|
CONSUMER STAPLES - 4.9% |
|||||||||||
|
FOOD & STAPLES RETAILING - 2.7% |
|||||||||||
|
Sugi Holdings Co., Ltd. (Japan) Drug Retail |
1,339 |
74,640 |
|||||||||
|
FOOD, BEVERAGE & TOBACCO - 2.2% |
|||||||||||
|
Treasury Wine Estates, Ltd. (Australia) Distillers & Vintners |
5,834 |
35,284 |
|||||||||
|
Davide Campari-Milano SPA (Italy) Distillers & Vintners |
2,840 |
24,693 |
|||||||||
|
59,977 |
|||||||||||
|
134,617 |
|||||||||||
|
Shares |
Value |
||||||||||
|
HEALTH CARE - 3.6% |
|||||||||||
|
HEALTH CARE EQUIPMENT & SERVICES - 3.4% |
|||||||||||
|
Primary Health Care, Ltd. (Australia) Health Care Services |
29,491 |
$ |
50,287 |
||||||||
|
Amplifon S.p.A. (Italy) Health Care Distributors |
5,203 |
45,206 |
|||||||||
|
95,493 |
|||||||||||
|
PHARMACEUTICALS, BIOTECHNOLOGY & LIFE SCIENCES - 0.2% |
|||||||||||
|
QIAGEN N.V. (Netherlands) (a) Life Sciences Tools & Services |
188 |
5,201 |
|||||||||
|
100,694 |
|||||||||||
|
ENERGY - 0.5% |
|||||||||||
|
Fugro NV (Netherlands) (a) Oil & Gas Equipment & Services |
769 |
12,594 |
|||||||||
|
Schoeller-Bleckmann Oilfield Equipment AG (Austria) Oil & Gas Equipment & Services |
9 |
518 |
|||||||||
|
13,112 |
|||||||||||
|
TOTAL COMMON STOCKS - 95.6% (COST $2,894,511) |
2,645,494 |
||||||||||
|
Par Value |
Value |
||||||||||
|
SHORT TERM INVESTMENTS - 3.8% |
|||||||||||
|
REPURCHASE AGREEMENT - 3.8% |
|||||||||||
|
Fixed Income Clearing Corp. Repurchase Agreement, 0.08% dated 12/31/15 due 01/04/16, repurchase price $106,018, collateralized by a United States Treasury Note, 1.750%, due 12/31/20, value plus accrued interest of $108,140 (Cost: $106,017) |
$ |
106,017 |
106,017 |
||||||||
|
TOTAL SHORT TERM INVESTMENTS - 3.8% (COST $106,017) |
106,017 |
||||||||||
|
TOTAL INVESTMENTS - 99.4% (COST $3,000,528) |
2,751,511 |
||||||||||
|
Other Assets In Excess of Liabilities - 0.6% |
16,366 |
||||||||||
|
TOTAL NET ASSETS - 100.0% |
$ |
2,767,877 |
|||||||||
(a) Non-income producing security
(b) A portion of the security out on loan.
(c) Fair value is determined in good faith in accordance with procedures established by the Board of Trustees.
Oakmark.com 41
Disclosures and Endnotes
Reporting to Shareholders. The Funds reduce the number of duplicate prospectuses, annual and semi-annual reports your household receives by sending only one copy of each to those addresses shared by two or more accounts. Call the Funds at 1-800-OAKMARK to request individual copies of these documents. The Funds will begin sending individual copies thirty days after receiving your request.
Before investing in any Oakmark Fund, you should carefully consider the Fund's investment objectives, risks, management fees and other expenses. This and other important information is contained in the Funds' prospectus and a Fund's summary prospectus. Please read the prospectus and summary prospectus carefully before investing. For more information, please visit oakmark.com or call 1-800-OAKMARK (625-6275).
The discussion of the Funds' investments and investment strategy (including current investment themes, the portfolio managers' research and investment process, and portfolio characteristics) represents the Funds' investments and the views of the portfolio managers and Harris Associates L.P., the Funds' investment adviser, at the time of this report, and are subject to change without notice.
All Oakmark Funds: Investing in value stocks presents the risk that value stocks may fall out of favor with investors and underperform growth stocks during given periods.
Oakmark, Oakmark Equity and Income, Oakmark Global, Oakmark International and Oakmark International Small Cap Funds: The Funds' portfolios tend to be invested in a relatively small number of stocks. As a result, the appreciation or depreciation of any one security held will have a greater impact on the Funds' net asset value than it would if the Funds invest in a larger number of securities. Although that strategy has the potential to generate attractive returns over time, it also increases the Funds' volatility.
Because the Oakmark Select and Oakmark Global Select Funds are non-diversified, the performance of each holding will have a greater impact on the Funds' total return, and may make the Fund's returns more volatile than a more diversified fund.
Oakmark Global, Oakmark Global Select, Oakmark International and Oakmark International Small Cap Funds: Investing in foreign securities presents risks which in some ways may be greater than U.S. investments. Those risks include: currency fluctuation; different regulation, accounting standards, trading practices and levels of available information; generally higher transaction costs; and political risks.
The Oakmark Equity and Income Fund invests in medium- and lower-quality debt securities that have higher yield potential but present greater investment and credit risk than higher-quality securities. These risks may result in greater share price volatility. Harris Associates L.P., the Fund's adviser, contractually agreed to limit Oakmark Equity and Income Fund's annual expenses to 1% of its average net assets through January 31, 2002. Absent this expense limitation, the Fund's total return would have been lower.
Oakmark International Small Cap Fund: The stocks of smaller companies often involve more risk than the stocks of larger companies. Stocks of small companies tend to be more volatile and have a smaller public market than stocks of larger companies. Small companies may have a shorter history of operations than larger companies, may not have as great an ability to raise additional capital and may have a less diversified product line, making them more susceptible to market pressure.
Endnotes:
1. The S&P 500 Total Return Index is a market capitalization-weighted index of 500 large-capitalization stocks commonly used to represent the U.S. equity market. All returns reflect reinvested dividends and capital gains distributions. This index is unmanaged and investors cannot invest directly in this index.
2. The Dow Jones Industrial Average is an index that includes only 30 U.S. blue-chip companies. This index is unmanaged and investors cannot invest directly in this index.
3. The Lipper Large Cap Value Funds Index is an equally-weighted index of the largest 30 funds within the large cap value funds investment objective as defined by Lipper Inc. The index is adjusted for the reinvestment of capital gains and income dividends. This index is unmanaged and investors cannot invest directly in this index.
4. Portfolio holdings are subject to change without notice and are not intended as recommendations of individual stocks.
5. The Price-Earnings Ratio ("P/E") is the most common measure of the expensiveness of a stock.
6. The Lipper Multi-Cap Value Funds Index tracks the results of the 30 largest mutual funds in the Lipper Multi-Cap Value Funds category. This index is unmanaged and investors cannot invest directly in this index.
7. The Lipper Balanced Funds Index measures the performance of the 30 largest U.S. balanced funds tracked by Lipper. This index is unmanaged and investors cannot invest directly in this index.
8. The Barclays U.S. Government / Credit Index is a benchmark index made up of the Barclays U.S. Government and U.S. Corporate Bond indices, including U.S. government Treasury and agency securities as well as corporate and Yankee bonds. This index is unmanaged and investors cannot invest directly in this index.
9. The MSCI World Index (Net) is a free float-adjusted market capitalization weighted index that is designed to measure the global equity market performance of developed markets. This benchmark calculates reinvested dividends net of withholding taxes using Luxembourg tax rates. This index is unmanaged and investors cannot invest directly in this index.
10. The Lipper Global Funds Index measures the performance of the 30 largest mutual funds that invest in securities throughout the world. This index is unmanaged and investors cannot invest directly in this index.
11. The MSCI World ex U.S. Index (Net) is a free float-adjusted market capitalization index that is designed to measure international developed market equity performance, excluding the U.S. This benchmark calculates reinvested dividends net of withholding taxes using Luxembourg tax rates. This index is unmanaged and investors cannot invest directly in this index.
12. The MSCI EAFE (Europe, Australasia, Far East) Index (Net) is a free float-adjusted market capitalization index that is designed to measure the international equity market performance of developed markets, excluding the U.S. & Canada. This benchmark calculates reinvested dividends net of withholding taxes using Luxembourg tax rates. This
42 OAKMARK FUNDS
Disclosures and Endnotes (continued)
index is unmanaged and investors cannot invest directly in this index.
13. The Lipper International Funds Index reflects the net asset value weighted total return of the 30 largest international equity funds. This index is unmanaged and investors cannot invest directly in this index.
14. The MSCI World ex U.S. Small Cap Index (Net) is a free float-adjusted market capitalization index that is designed to measure global developed market equity performance, excluding the U.S. The MSCI Small Cap Indices target 40% of the eligible Small Cap universe within each industry group, within each country. MSCI defines the Small Cap universe as all listed securities that have a market capitalization in the range of USD200-1,500 million. This benchmark calculates reinvested dividends net of withholding taxes using Luxembourg tax rates. This index is unmanaged and investors cannot invest directly in this index.
15. The Lipper International Small Cap Funds Index measures the performance of the 10 largest international small-cap funds tracked by Lipper. This index is unmanaged and investors cannot invest directly in this index.
OAKMARK, OAKMARK FUNDS, OAKMARK INTERNATIONAL, and OAKMARK and tree design are trademarks owned or registered by Harris Associates L.P. in the U.S. and/or other countries.
Oakmark.com 43
Oakmark Funds
Trustees and Officers
Trustees
Allan J. Reich—Chair
Thomas H. Hayden
Christine M. Maki
Laurence C. Morse, Ph. D.
Steven S. Rogers
Kristi L. Rowsell
Burton W. Ruder*
Peter S. Voss
Officers
Kristi L. Rowsell—President and Principal Executive Officer
Robert M. Levy—Executive Vice President
Judson H. Brooks—Vice President
Anthony P. Coniaris—Vice President
Richard J. Gorman—Vice President, Chief Compliance
Officer, Anti-Money Laundering Officer and Assistant Secretary
Kevin G. Grant—Vice President
Thomas E. Herman—Principal Financial Officer
David G. Herro—Vice President
M. Colin Hudson—Vice President
John J. Kane—Treasurer
Chris W. Keller—Vice President
Matthew A. Logan—Vice President
Michael L. Manelli—Vice President
Clyde S. McGregor—Vice President
Ian J. McPheron—Vice President
Thomas W. Murray—Vice President
Michael J. Neary—Vice President
William C. Nygren—Vice President
Vineeta D. Raketich—Vice President
Janet L. Reali—Vice President, Secretary and Chief Legal Officer**
Robert A. Taylor—Vice President
Andrew J. Tedeschi—Assistant Treasurer
Edward J. Wojciechowski—Vice President
* Mr. Ruder retired from the Board of Trustees on December 31, 2015.
** Ms. Reali retired on December 31, 2015.
Other Information
Investment Adviser
Harris Associates L.P.
111 S. Wacker Drive
Chicago, Illinois 60606-4319
Transfer Agent
Boston Financial Data Services, Inc.
Quincy, Massachusetts
Legal Counsel
K&L Gates LLP
Chicago, Illinois
Independent Registered Public Accounting Firm
Deloitte & Touche LLP
Chicago, Illinois
Contact Us
Please call 1-800-OAKMARK
(1-800-625-6275)
or 617-483-8327
Website
oakmark.com
@HarrisOakmark
To obtain a prospectus, an application or periodic reports, access our website at oakmark.com, or call 1-800-OAKMARK (625-6275) or (617) 483-8327.
Each Fund will file its complete schedule of portfolio holdings with the Securities and Exchange Commission ("SEC") for the first and third quarters of each fiscal year on Form N-Q. The Funds' Form N-Qs are available on the SEC's website at www.sec.gov. The Funds' Form N-Qs may be reviewed and copied at the SEC's Public Reference Room in Washington, DC, and information on the operation of the Public Reference Room may be obtained by calling 1-800-SEC-0330.
A description of the policies and procedures the Funds use to determine how to vote proxies relating to portfolio securities is available without charge, upon request, by calling toll-free 1-800-625-6275; on the Funds' website at oakmark.com; and on the SEC's website at www.sec.gov.
No later than August 31 of each year, information regarding how the Adviser, on behalf of the Funds, voted proxies relating to the Funds' portfolio securities for the twelve months ended the preceding June 30 will be available through a link on the Funds' website at oakmark.com and on the SEC's website at www.sec.gov.
This report is submitted for the general information of the shareholders of the Funds. The report is not authorized for distribution to prospective investors in the Funds unless it is accompanied or preceded by a currently effective prospectus of the Funds.
No sales charge to the shareholder or to the new investor is made in offering the shares of the Funds; however, a shareholder of the Oakmark International Small Cap Fund may incur a 2% redemption fee on an exchange or redemption of Class I Shares and Class II Shares held for 90 days or less.
44 OAKMARK FUNDS