Exhibit 99.1

FOR IMMEDIATE RELEASE Contact:
Jack McGinnis
+1.414.906.7977
jack.mcginnis@manpowergroup.com
ManpowerGroup Reports 1st Quarter 2019 Results
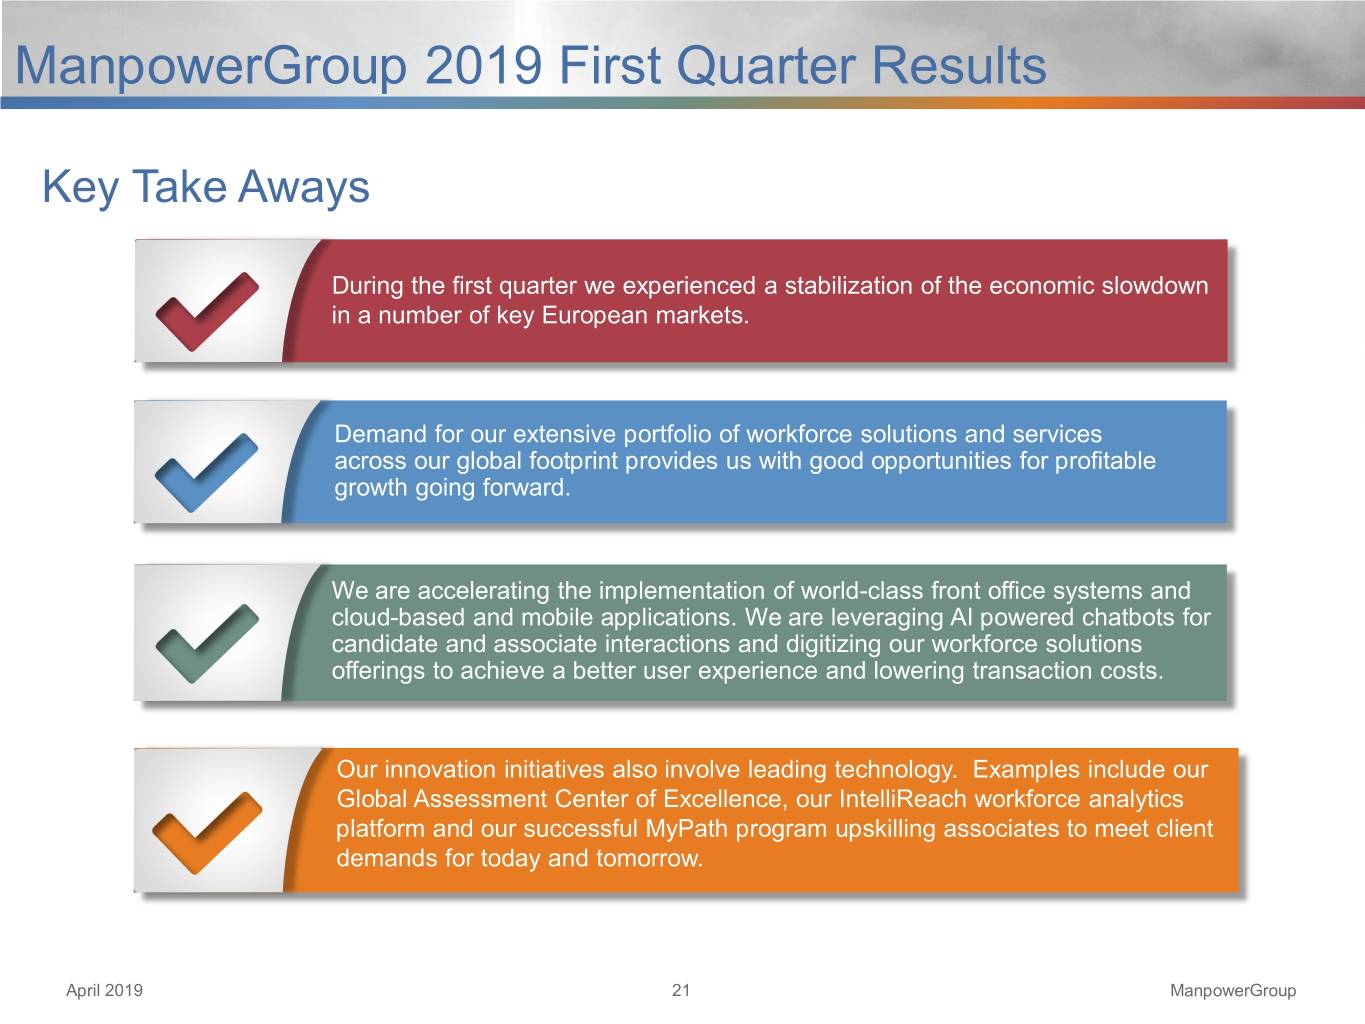
• | Revenue trends stabilized in a number of key European markets |
• | Acquired remaining interest in the Switzerland Manpower franchise in April 2019, representing approximately $500 million in annual revenues |
• | Lowering cost run rate in markets with weaker demand through restructuring actions in the first quarter |
• | Repurchased $101 million of common stock in the quarter |
• | Effective tax rate increased in 2019 due to termination of French tax exempt CICE subsidy at end of last year |
Financial Overview:
MILWAUKEE, April 18, 2019 -- ManpowerGroup (NYSE: MAN) today reported net earnings of $0.88 per diluted share for the three months ended March 31, 2019 compared to $1.45 per diluted share in the prior year period. Net earnings in the quarter were $53.5 million compared to $97.0 million a year earlier. Revenues for the first quarter were $5.0 billion, a 9% decline from the prior year period.
The current year quarter included restructuring costs which reduced earnings per share by 51 cents.
Financial results in the quarter were also impacted by the stronger U.S. dollar relative to foreign currencies compared to the prior year period. On a constant currency basis, revenues decreased 2% and net earnings per diluted share decreased 34%, or 12% excluding the impact of restructuring costs. Earnings per share in the quarter were negatively impacted 7 cents by changes in foreign currencies compared to the prior year, or 12 cents excluding the restructuring costs.
Jonas Prising, ManpowerGroup Chairman & CEO, said, “Our global team executed well and delivered solid first quarter results against the backdrop of a slow global growth environment. Demand for our extensive portfolio of workforce solutions and services across our global footprint provides us with good opportunities for profitable growth going forward”.
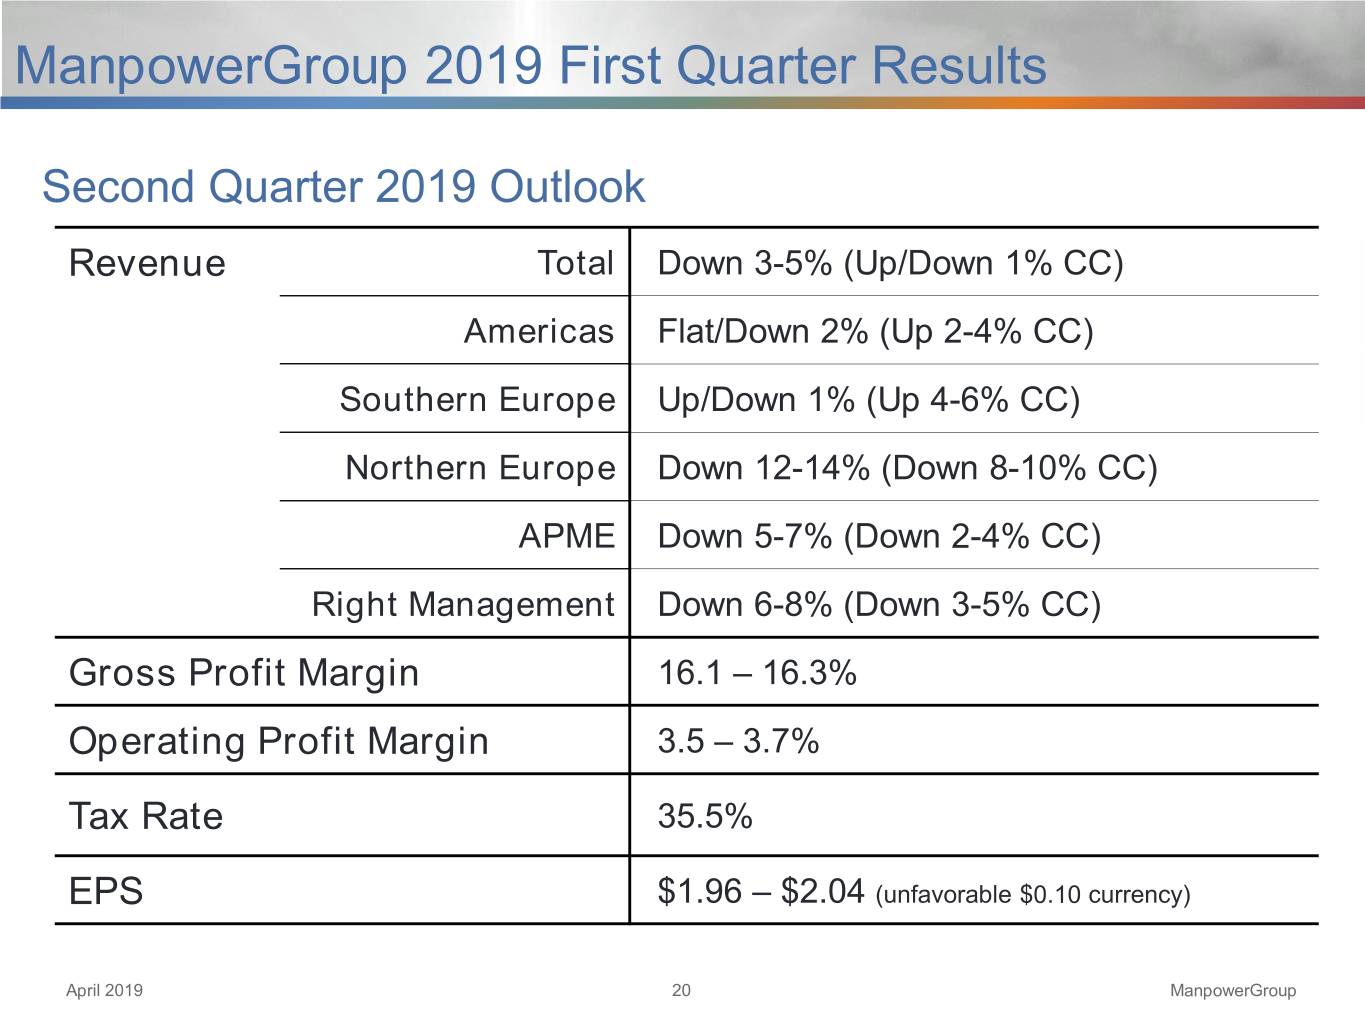
“We anticipate diluted earnings per share in the second quarter will be between $1.96 and $2.04, which includes an estimated unfavorable currency impact of 10 cents.”
ManpowerGroup purchased the remaining interest in the Switzerland Manpower business with
annual revenues of approximately $500 million during April 2019. During the first quarter, ManpowerGroup repurchased 1.2 million shares of common stock for $101 million. The effective tax rate for the first quarter equaled 42.8%, or 36.4% excluding the impact of restructuring costs. The effective tax rate increased in 2019 following the termination of the French tax exempt CICE subsidy in 2018.
In conjunction with its first quarter earnings release, ManpowerGroup will broadcast its conference call live over the Internet on April 18, 2019 at 7:30 a.m. CDT (8:30 a.m. EDT). Interested parties are invited to listen to the webcast and view the presentation by logging on to http://investor.manpowergroup.com/ in the section titled “Investor Relations.”
Supplemental financial information referenced in the conference call can be found at http://investor.manpowergroup.com/ .
About ManpowerGroup
ManpowerGroup® (NYSE: MAN), the leading global workforce solutions company, helps organizations transform in a fast-changing world of work by sourcing, assessing, developing and managing the talent that enables them to win. We develop innovative solutions for hundreds of thousands of organizations every year, providing them with skilled talent while finding meaningful, sustainable employment for millions of people across a wide range of industries and skills. Our expert family of brands - Manpower®, Experis®, Right Management® and ManpowerGroup® Solutions - creates substantially more value for candidates and clients across 80 countries and territories and has done so for 70 years. In 2019, ManpowerGroup was named one of the World's Most Ethical Companies for the tenth year and one of Fortune's Most Admired Companies for the seventeenth year, confirming our position as the most trusted and admired brand in the industry. See how ManpowerGroup is powering the future of work: www.manpowergroup.com
Forward-Looking Statements
This news release contains statements, including earnings projections and the effect of restructuring actions, that are forward-looking in nature and, accordingly, are subject to risks and uncertainties regarding the Company’s expected future results. The Company’s actual results may differ materially from those described or contemplated in the forward-looking statements. Factors that may cause the Company’s actual results to differ materially from those contained in the forward-looking statements can be found in the Company’s reports filed with the SEC, including the information under the heading ‘Risk Factors’ in its Annual Report on Form 10-K for the year ended December 31, 2018, which information is incorporated herein by reference.
###
ManpowerGroup | |||||||||||||
Results of Operations | |||||||||||||
(In millions, except per share data) | |||||||||||||
Three Months Ended March 31 | |||||||||||||
% Variance | |||||||||||||
Amount | Constant | ||||||||||||
2019 | 2018 | Reported | Currency | ||||||||||
(Unaudited) | |||||||||||||
Revenues from services (a) | $ | 5,044.9 | $ | 5,522.4 | -8.6 | % | -2.2 | % | |||||
Cost of services | 4,240.1 | 4,637.0 | -8.6 | % | -2.0 | % | |||||||
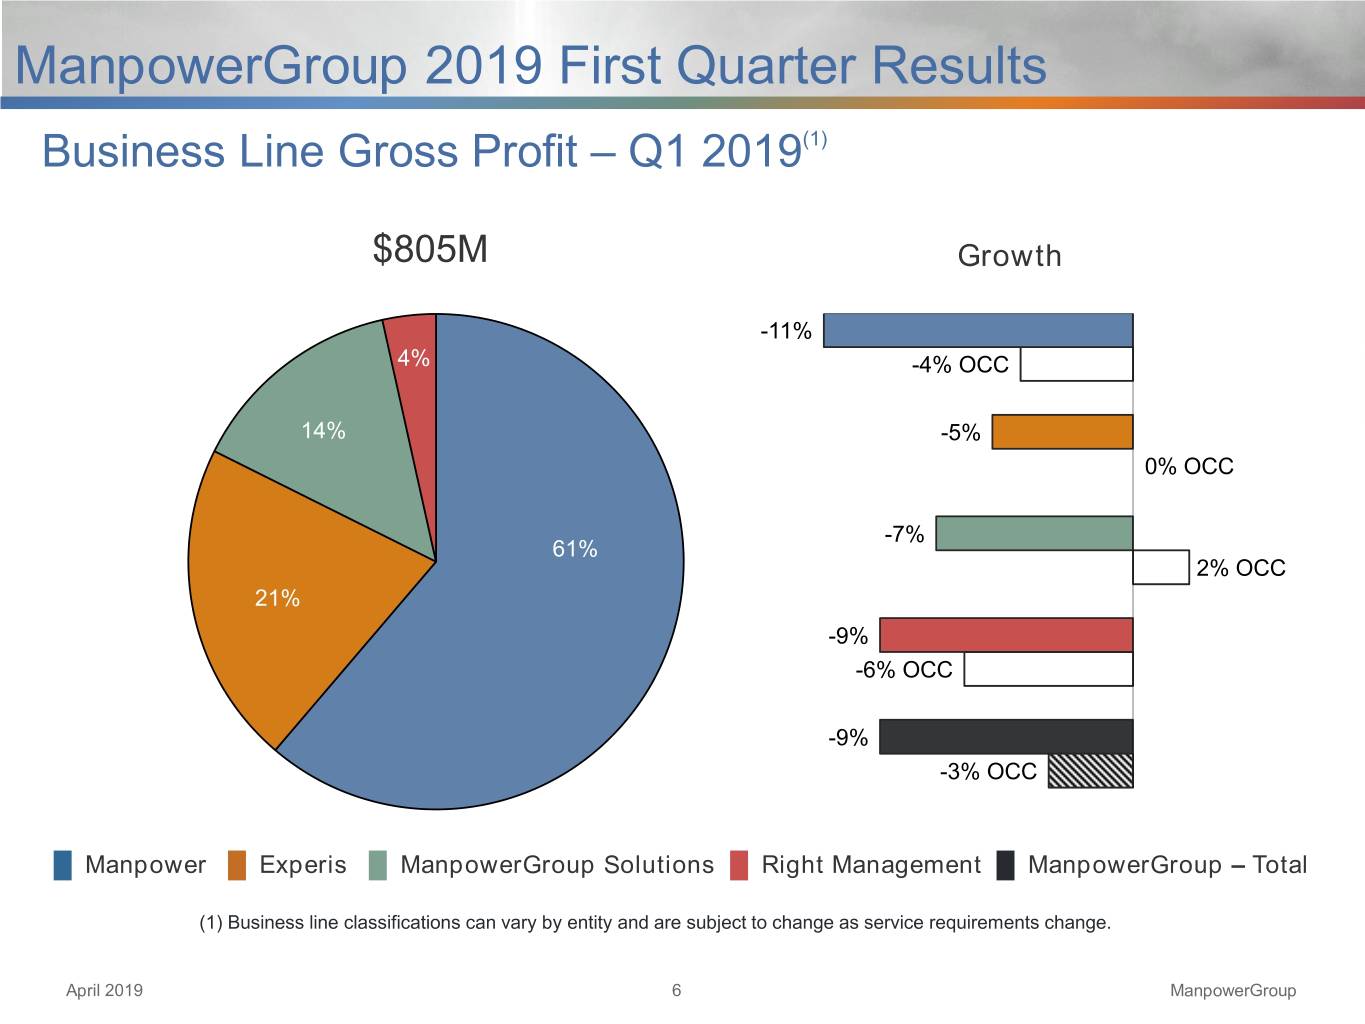
Gross profit | 804.8 | 885.4 | -9.1 | % | -3.0 | % | |||||||
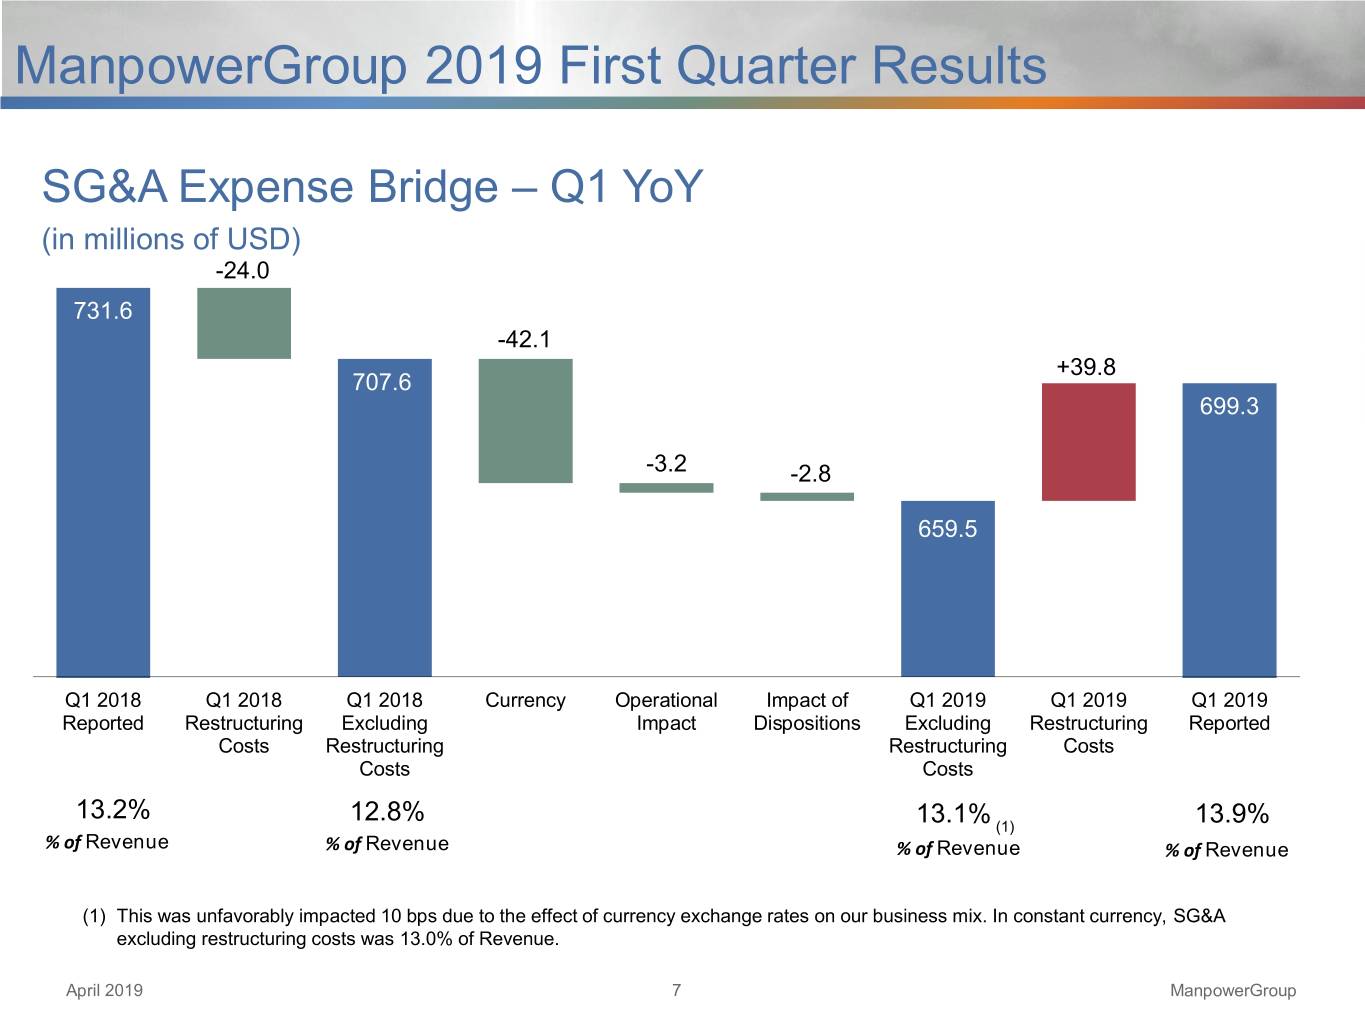
Selling and administrative expenses | 699.3 | 731.6 | -4.4 | % | 1.9 | % | |||||||
Operating profit | 105.5 | 153.8 | -31.4 | % | -26.0 | % | |||||||
Interest and other expenses | 11.9 | 16.1 | -26.6 | % | |||||||||
Earnings before income taxes | 93.6 | 137.7 | -32.0 | % | -26.5 | % | |||||||
Provision for income taxes | 40.1 | 40.7 | -1.4 | % | |||||||||
Net earnings | $ | 53.5 | $ | 97.0 | -44.8 | % | -40.4 | % | |||||
Net earnings per share - basic | $ | 0.88 | $ | 1.46 | -39.7 | % | |||||||
Net earnings per share - diluted | $ | 0.88 | $ | 1.45 | -39.3 | % | -34.5 | % | |||||
Weighted average shares - basic | 61.1 | 66.3 | -7.9 | % | |||||||||
Weighted average shares - diluted | 61.0 | 66.9 | -8.9 | % | |||||||||
(a) Revenues from services include fees received from our franchise offices of $5.6 million and $5.2 million for the three months ended March 31, 2019 and 2018, respectively. These fees are primarily based on revenues generated by the franchise offices, which were $243.0 million and $236.8 million for the three months ended March 31, 2019 and 2018, respectively. | |||||||||||||
ManpowerGroup | |||||||||||||
Operating Unit Results | |||||||||||||
(In millions) | |||||||||||||
Three Months Ended March 31 | |||||||||||||
% Variance | |||||||||||||
Amount | Constant | ||||||||||||
2019 | 2018 | Reported | Currency | ||||||||||
(Unaudited) | |||||||||||||
Revenues from Services: | |||||||||||||
Americas: | |||||||||||||
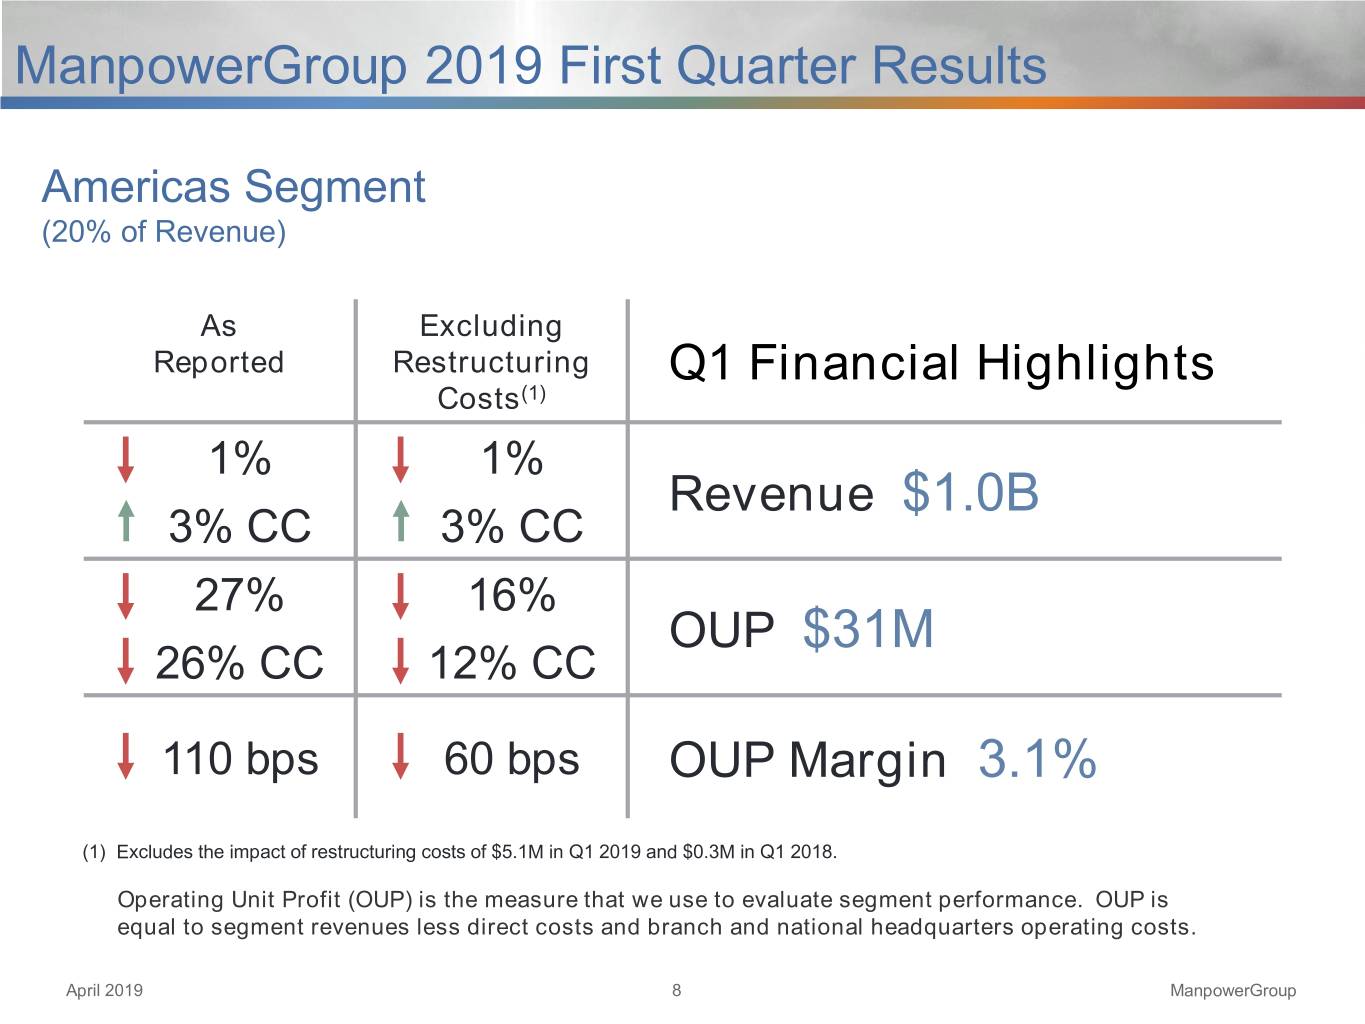
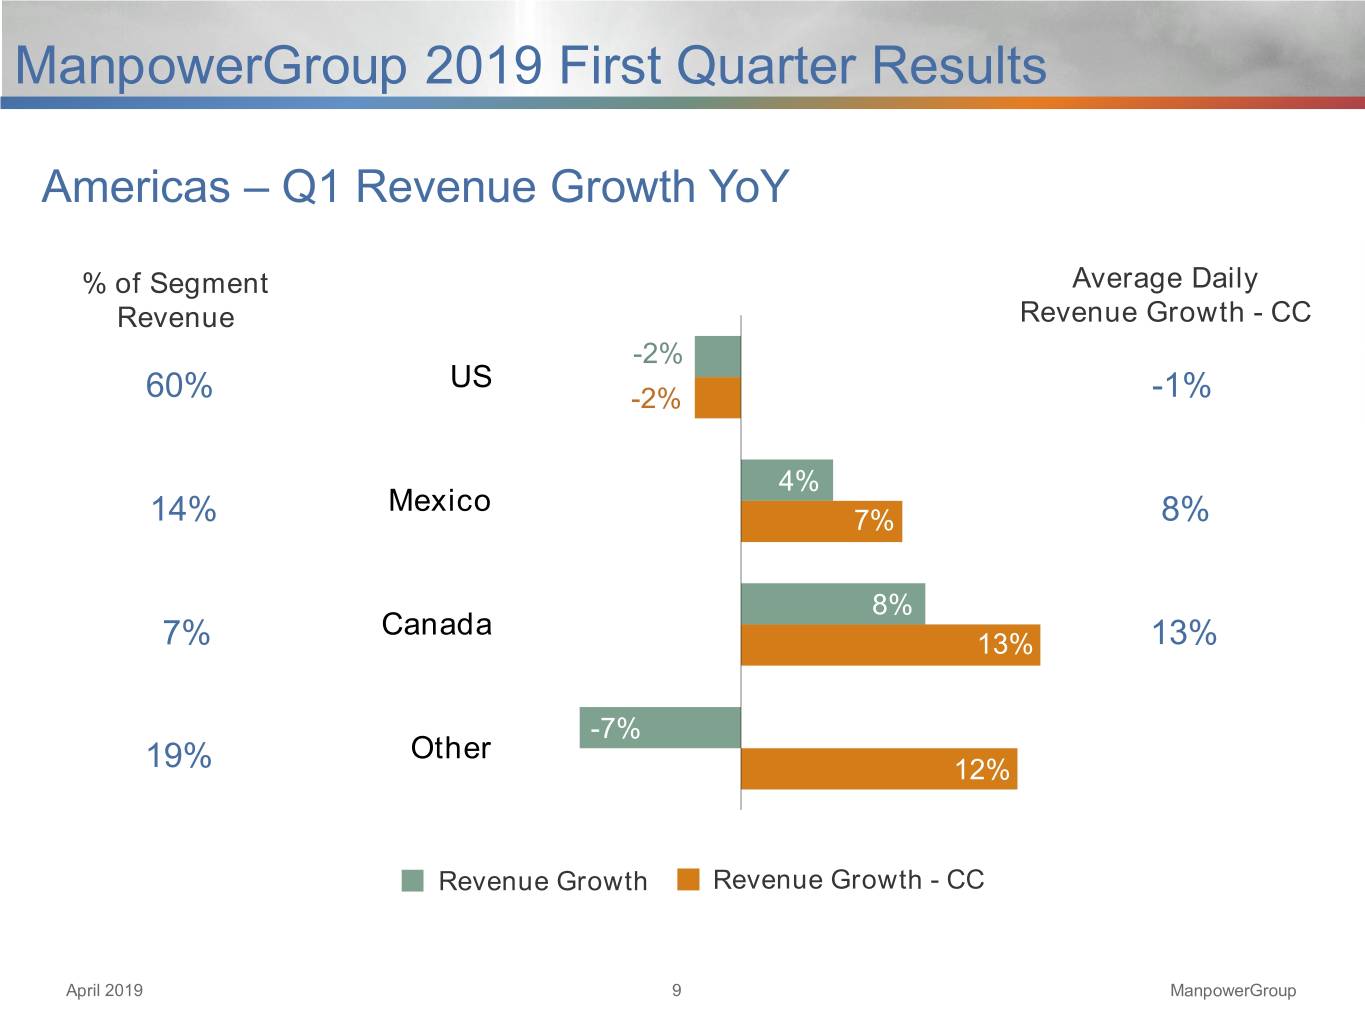
United States (a) | $ | 603.6 | $ | 616.3 | -2.1 | % | -2.1 | % | |||||
Other Americas | 403.7 | 406.3 | -0.6 | % | 10.7 | % | |||||||
1,007.3 | 1,022.6 | -1.5 | % | 3.0 | % | ||||||||
Southern Europe: | |||||||||||||
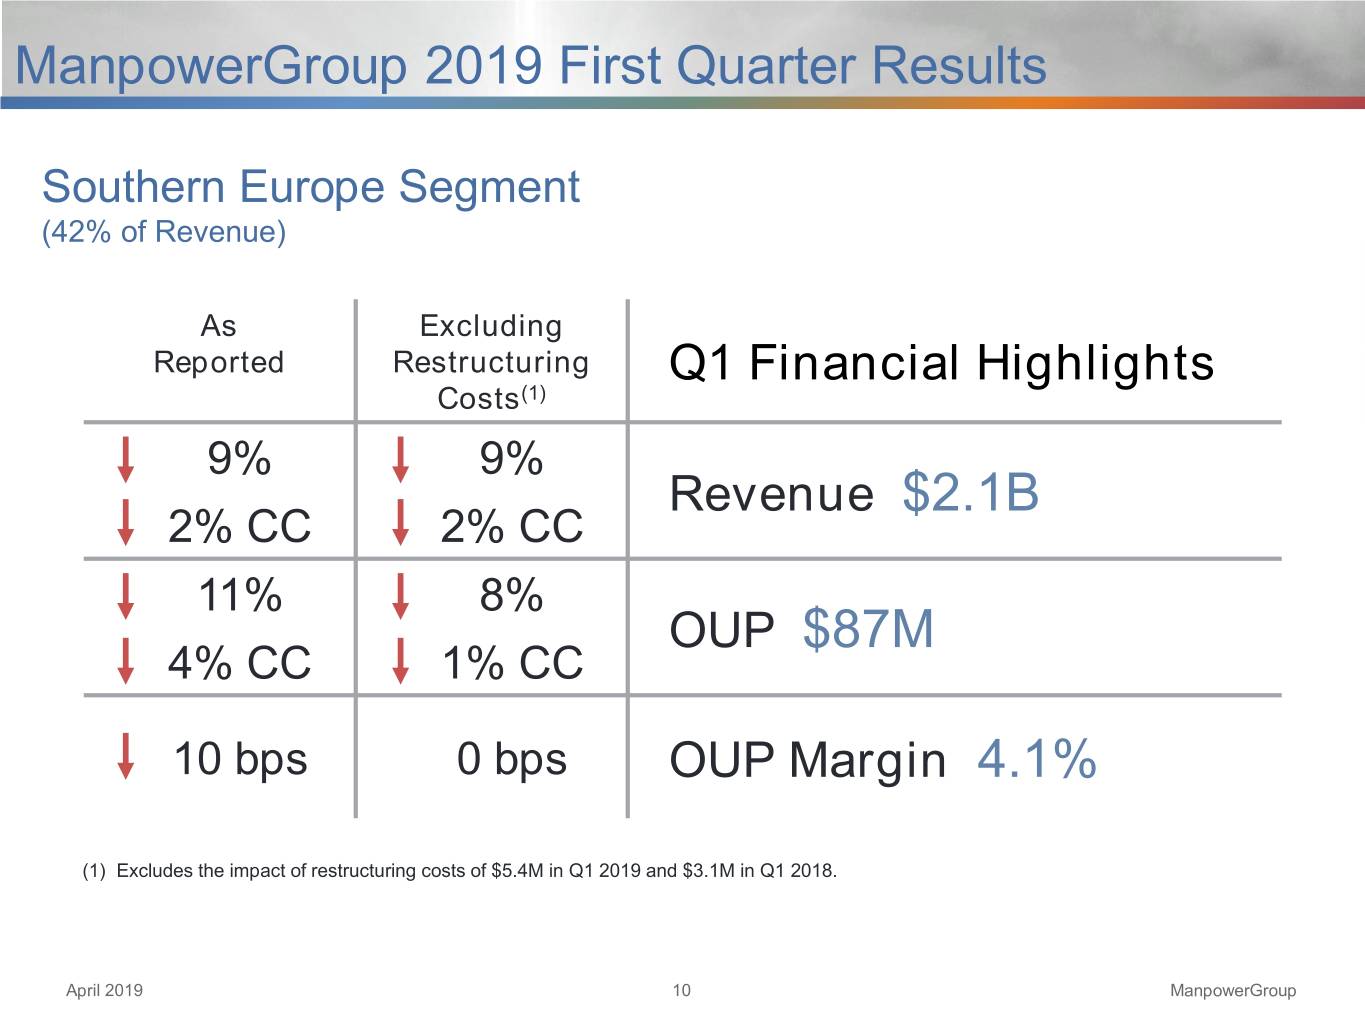
France | 1,301.4 | 1,424.0 | -8.6 | % | -1.1 | % | |||||||
Italy | 355.9 | 413.6 | -14.0 | % | -6.9 | % | |||||||
Other Southern Europe | 444.9 | 474.4 | -6.2 | % | 1.5 | % | |||||||
2,102.2 | 2,312.0 | -9.1 | % | -1.6 | % | ||||||||
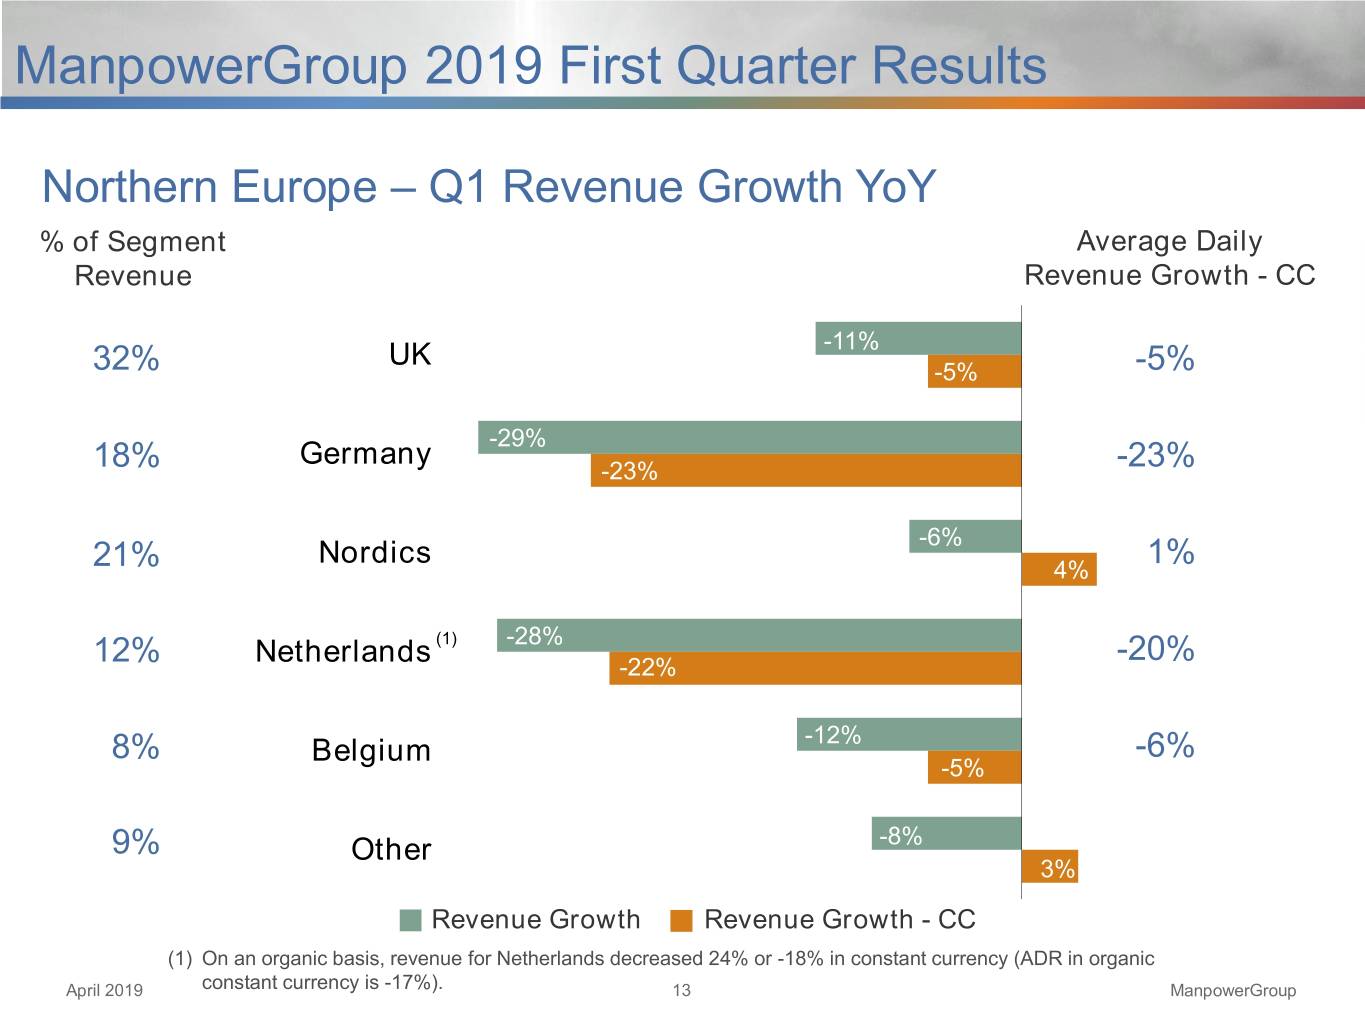
Northern Europe | 1,189.7 | 1,417.6 | -16.1 | % | -8.8 | % | |||||||
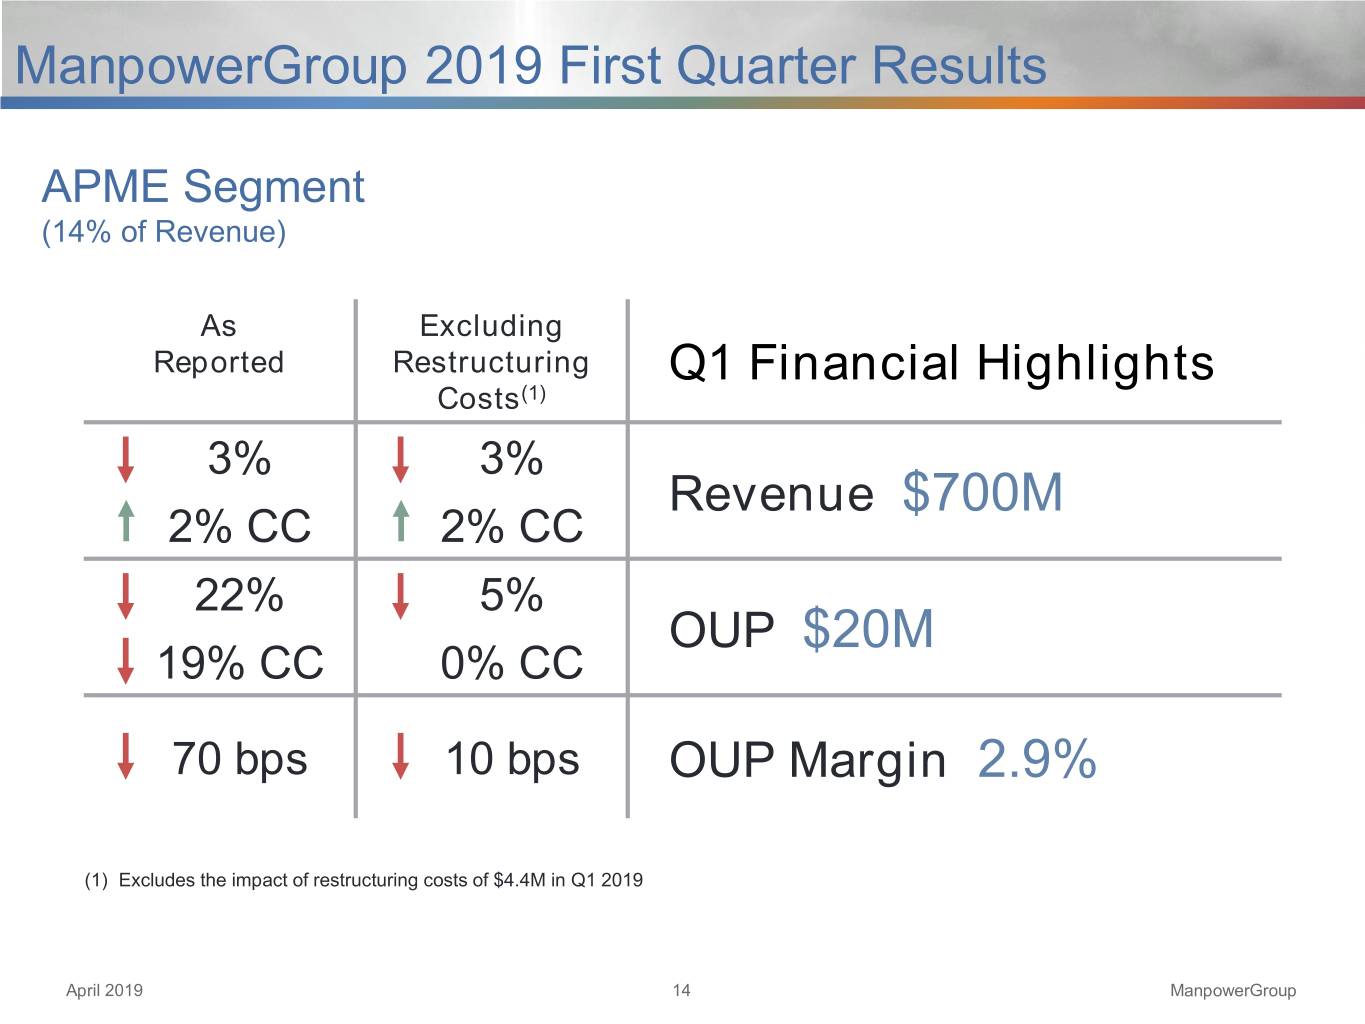
APME | 699.9 | 720.2 | -2.8 | % | 1.9 | % | |||||||
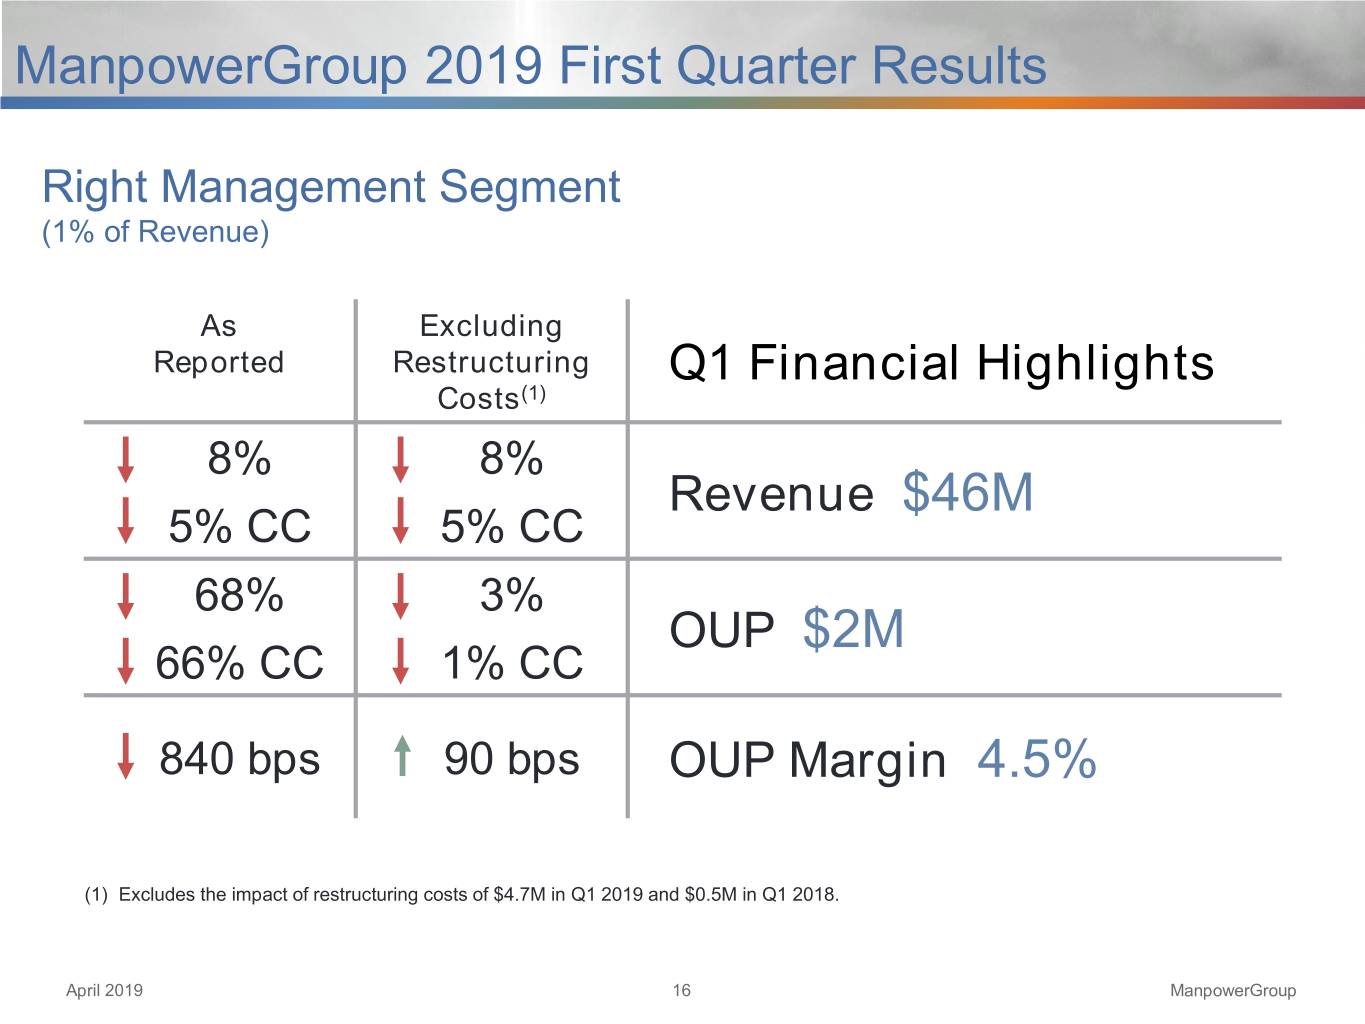
Right Management | 45.8 | 50.0 | -8.4 | % | -4.5 | % | |||||||
$ | 5,044.9 | $ | 5,522.4 | -8.6 | % | -2.2 | % | ||||||
Operating Unit Profit: | |||||||||||||
Americas: | |||||||||||||
United States | $ | 16.4 | $ | 26.7 | -38.6 | % | -38.6 | % | |||||
Other Americas | 14.8 | 16.2 | -8.4 | % | -5.5 | % | |||||||
31.2 | 42.9 | -27.2 | % | -26.1 | % | ||||||||
Southern Europe: | |||||||||||||
France | 55.5 | 57.7 | -3.8 | % | 4.1 | % | |||||||
Italy | 20.4 | 25.2 | -18.8 | % | -12.2 | % | |||||||
Other Southern Europe | 11.0 | 14.8 | -26.1 | % | -20.7 | % | |||||||
86.9 | 97.7 | -11.1 | % | -3.9 | % | ||||||||
Northern Europe | 0.6 | 16.6 | -96.2 | % | -95.3 | % | |||||||
APME | 20.1 | 25.9 | -22.3 | % | -19.1 | % | |||||||
Right Management | 2.1 | 6.4 | -67.7 | % | -66.0 | % | |||||||
140.9 | 189.5 | ||||||||||||
Corporate expenses | (27.9 | ) | (26.8 | ) | |||||||||
Intangible asset amortization expense | (7.5 | ) | (8.9 | ) | |||||||||
Operating profit | 105.5 | 153.8 | -31.4 | % | -26.0 | % | |||||||
Interest and other expenses (b) | (11.9 | ) | (16.1 | ) | |||||||||
Earnings before income taxes | $ | 93.6 | $ | 137.7 | |||||||||
(a) In the United States, revenues from services include fees received from our franchise offices of $3.6 million and $3.2 million for the three months ended March 31, 2019 and 2018, respectively. These fees are primarily based on revenues generated by the franchise offices, which were $156.9 million and $149.0 million for the three months ended March 31, 2019 and 2018, respectively. | |||||||||||||
(b) The components of interest and other expenses were: | |||||||||||||
2019 | 2018 | ||||||||||||
Interest expense | $ | 10.2 | $ | 13.6 | |||||||||
Interest income | (1.5 | ) | (1.2 | ) | |||||||||
Foreign exchange loss (gain) | 2.9 | (0.1 | ) | ||||||||||
Miscellaneous expense, net | 0.3 | 3.8 | |||||||||||
$ | 11.9 | $ | 16.1 | ||||||||||
ManpowerGroup | |||||||
Consolidated Balance Sheets | |||||||
(In millions) | |||||||
Mar. 31 | Dec. 31 | ||||||
2019 | 2018 | ||||||
(Unaudited) | |||||||
ASSETS | |||||||
Current assets: | |||||||
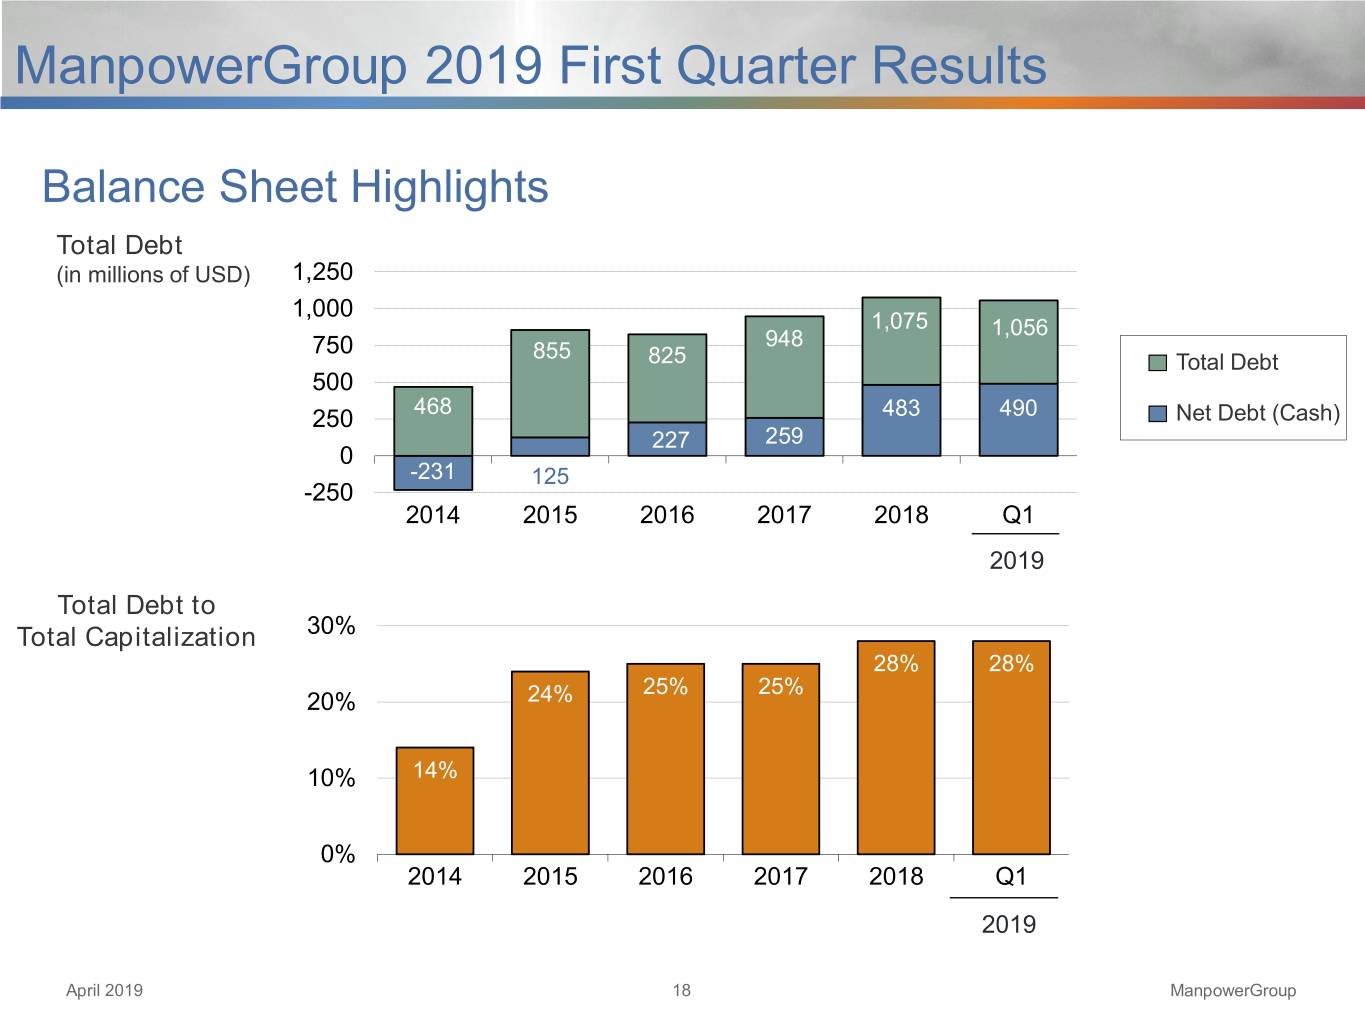
Cash and cash equivalents | $ | 566.3 | $ | 591.9 | |||
Accounts receivable, net | 5,186.3 | 5,276.1 | |||||
Prepaid expenses and other assets | 282.8 | 129.1 | |||||
Total current assets | 6,035.4 | 5,997.1 | |||||
Other assets: | |||||||
Goodwill | 1,293.6 | 1,297.1 | |||||
Intangible assets, net | 238.2 | 246.3 | |||||
Operating lease right-of-use asset | 432.6 | — | |||||
Other assets | 670.8 | 826.7 | |||||
Total other assets | 2,635.2 | 2,370.1 | |||||
Property and equipment: | |||||||
Land, buildings, leasehold improvements and equipment | 601.3 | 613.6 | |||||
Less: accumulated depreciation and amortization | 454.9 | 461.0 | |||||
Net property and equipment | 146.4 | 152.6 | |||||
Total assets | $ | 8,817.0 | $ | 8,519.8 | |||
LIABILITIES AND SHAREHOLDERS' EQUITY | |||||||
Current liabilities: | |||||||
Accounts payable | $ | 2,299.9 | $ | 2,266.7 | |||
Employee compensation payable | 185.9 | 209.7 | |||||
Accrued liabilities | 563.0 | 411.0 | |||||
Accrued payroll taxes and insurance | 633.7 | 729.8 | |||||
Value added taxes payable | 490.4 | 508.6 | |||||
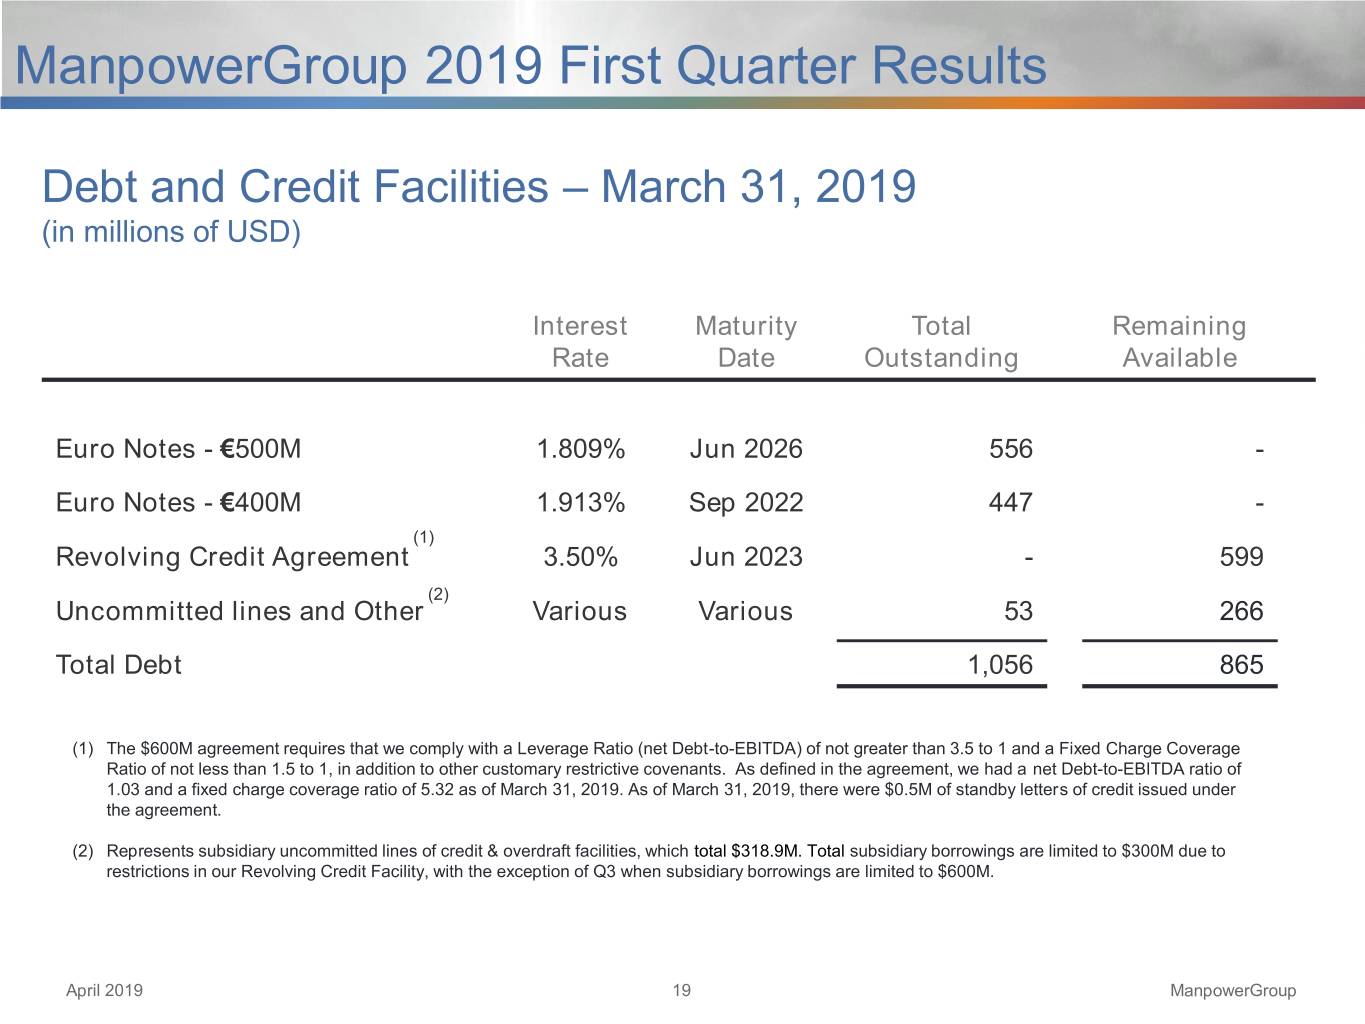
Short-term borrowings and current maturities of long-term debt | 52.6 | 50.1 | |||||
Total current liabilities | 4,225.5 | 4,175.9 | |||||
Other liabilities: | |||||||
Long-term debt | 1,003.3 | 1,025.3 | |||||
Long-term operating lease liability | 309.4 | — | |||||
Other long-term liabilities | 628.9 | 620.1 | |||||
Total other liabilities | 1,941.6 | 1,645.4 | |||||
Shareholders' equity: | |||||||
ManpowerGroup shareholders' equity | |||||||
Common stock | 1.2 | 1.2 | |||||
Capital in excess of par value | 3,343.0 | 3,337.5 | |||||
Retained earnings | 3,211.2 | 3,157.7 | |||||
Accumulated other comprehensive loss | (401.8 | ) | (399.8 | ) | |||
Treasury stock, at cost | (3,578.0 | ) | (3,471.7 | ) | |||
Total ManpowerGroup shareholders' equity | 2,575.6 | 2,624.9 | |||||
Noncontrolling interests | 74.3 | 73.6 | |||||
Total shareholders' equity | 2,649.9 | 2,698.5 | |||||
Total liabilities and shareholders' equity | $ | 8,817.0 | $ | 8,519.8 | |||
ManpowerGroup | |||||||
Consolidated Statements of Cash Flows | |||||||
(In millions) | |||||||
Three Months Ended | |||||||
March 31 | |||||||
2019 | 2018 | ||||||
(Unaudited) | |||||||
Cash Flows from Operating Activities: | |||||||
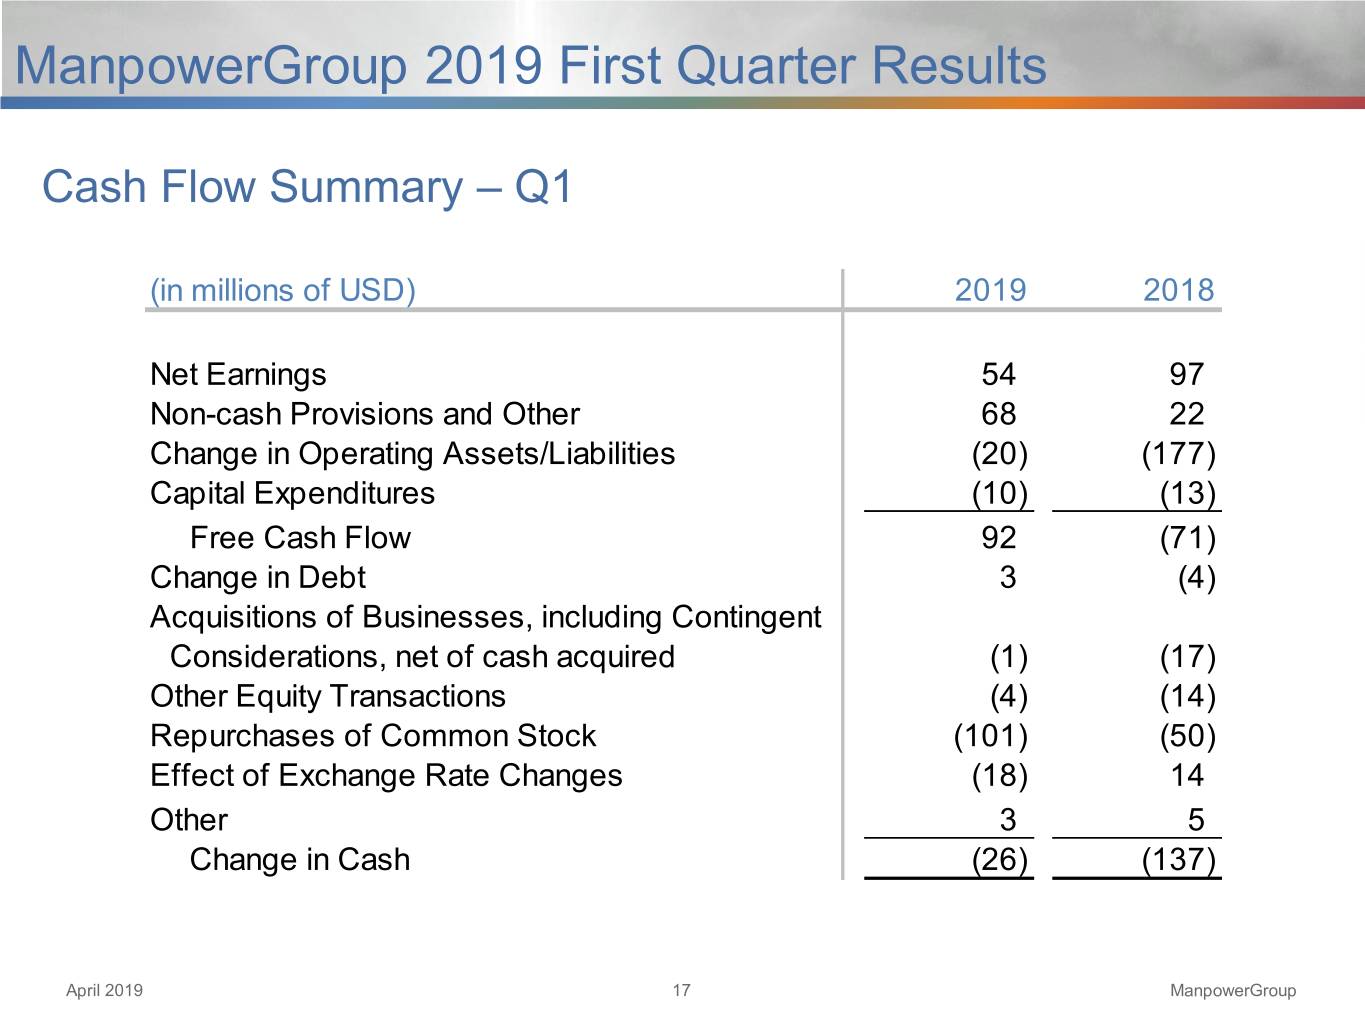
Net earnings | $ | 53.5 | $ | 97.0 | |||
Adjustments to reconcile net earnings to net cash provided by (used in) operating activities: | |||||||
Depreciation and amortization | 19.4 | 21.7 | |||||
Noncash lease expense | 37.5 | — | |||||
Deferred income taxes | 2.0 | (11.9 | ) | ||||
Provision for doubtful accounts | 4.3 | 5.1 | |||||
Share-based compensation | 4.6 | 7.5 | |||||
Changes in operating assets and liabilities, excluding the impact of acquisitions: | |||||||
Accounts receivable | 29.4 | 66.7 | |||||
Other assets | (19.3 | ) | (72.6 | ) | |||
Other liabilities | (29.5 | ) | (171.9 | ) | |||
Cash provided by (used in) operating activities | 101.9 | (58.4 | ) | ||||
Cash Flows from Investing Activities: | |||||||
Capital expenditures | (10.0 | ) | (12.7 | ) | |||
Acquisitions of businesses, net of cash acquired | — | (8.2 | ) | ||||
Proceeds from the sale of investments, property and equipment | 3.5 | 5.9 | |||||
Cash used in investing activities | (6.5 | ) | (15.0 | ) | |||
Cash Flows from Financing Activities: | |||||||
Net change in short-term borrowings | 2.3 | (4.3 | ) | ||||
Proceeds from long-term debt | 0.4 | — | |||||
Repayments of long-term debt | (0.1 | ) | (0.1 | ) | |||
Payments of contingent consideration for acquisitions | (0.6 | ) | (8.7 | ) | |||
Proceeds from share-based awards and other equity transactions | 0.9 | 3.6 | |||||
Payments to noncontrolling interests | — | (0.7 | ) | ||||
Other share-based award transactions | (5.4 | ) | (16.8 | ) | |||
Repurchases of common stock | (101.0 | ) | (50.1 | ) | |||
Cash used in financing activities | (103.5 | ) | (77.1 | ) | |||
Effect of exchange rate changes on cash | (17.5 | ) | 13.7 | ||||
Change in cash and cash equivalents | (25.6 | ) | (136.8 | ) | |||
Cash and cash equivalents, beginning of period | 591.9 | 689.0 | |||||
Cash and cash equivalents, end of period | $ | 566.3 | $ | 552.2 | |||

