UNITED STATES
SECURITIES AND EXCHANGE COMMISSION
Washington, D.C. 20549
FORM
CURRENT REPORT
Pursuant to Section 13 or 15(d) of the Securities Exchange Act of 1934
Date of Report (Date of earliest event reported):
(Exact name of issuer of securities held pursuant to the plan)
Commission File Number
(State or other jurisdiction of incorporation) |
(I.R.S. Employer Identification No.) |
(Address of Principal Executive Office, including Zip Code)
+46 (
Registrant’s telephone number, including area code:
Not Applicable
(Former name or former address, if changed since last report)
Check the appropriate box below if the Form 8-K filing is intended to simultaneously satisfy the filing obligation of the registrant under any of the following provisions (see General Instruction A.2. below):
Written communications pursuant to Rule 425 under the Securities Act (17 CFR 230.425) |
Soliciting material pursuant to Rule 14a-12 under the Exchange Act (17 CFR 240.14a-12) |
Pre-commencement communications pursuant to Rule 14d-2(b) under the Exchange Act (17 CFR 240.14d-2(b)) |
Pre-commencement communications pursuant to Rule 13e-4(c) under the Exchange Act (17 CFR 240.13e-4(c)) |
Securities registered pursuant to Section 12(b) of the Act:
Title of each class | Trading Symbol(s) | Name of each exchange on which registered | ||
The |
Indicate by check mark whether the registrant is an emerging growth company as defined in Rule 405 of the Securities Act of 1933 (§230.405 of this chapter) or Rule 12b-2 of the Securities Exchange Act of 1934 (§240.12b-2 of this chapter).
Emerging growth company
If an emerging growth company, indicate by check mark if the registrant has elected not to use the extended transition period for complying with any new or revised financial accounting standards provided pursuant to Section 13(a) of the Exchange Act. ☐
Item 2.02. Results of Operations and Financial Condition.
On November 10, 2022, Neonode Inc. (the “Company”) reported its earnings for the three and nine months ended September 30, 2022 (the “Earnings Release”) and posted on the Neonode website the Third Quarter 2022 Presentation (the “Presentation”). A copy of the Earnings Release and the Presentation are attached hereto as Exhibits 99.1 and 99.2, respectively, and are incorporated herein by reference.
The information furnished pursuant to this Item 2.02, including Exhibits 99.1 and 99.2, shall not be deemed “filed” for purposes of Section 18 of the Securities Exchange Act of 1934, as amended (the “Exchange Act”), or otherwise subject to the liabilities under that Section, or incorporated by reference in any filing under the Securities Act of 1933, as amended (the “Securities Act”), or the Exchange Act, except as shall be expressly set forth by specific reference in such a filing.
Item 7.01 Regulation FD Disclosure
As previously announced, the Company will conduct a conference call today, Thursday, November 10, 2022 at 10:00 a.m. ET. The presentation slides to be used during the call, attached hereto as Exhibit 99.2, will be available on the “Investor Relations” section of the Company’s website at www.neonode.com immediately prior to the call. The information contained in, or that can be accessed through the Company’s website is not a part of this filing.
The information furnished pursuant to this Item 7.01, including Exhibit 99.2, shall not be deemed “filed” for purposes of Section 18 of the Exchange Act, or otherwise subject to the liabilities under that Section, or incorporated by reference in any filing under the Securities Act or the Exchange Act, except as shall be expressly set forth by specific reference in such a filing.
Item 9.01. Financial Statements and Exhibits.
(d) Exhibits
Exhibit No. | Description | |
Exhibit 99.1 | Earnings Release of the Company dated November 10, 2022 | |
Exhibit 99.2 | Third Quarter 2022 Presentation of Neonode | |
104 | Cover Page Interactive Data File (embedded within the Inline XBRL document) |
1
SIGNATURES
Pursuant to the requirements of the Securities Exchange Act of 1934, the Registrant has duly caused this report to be signed on its behalf by the undersigned thereunto duly authorized.
Date: November 10, 2022 | NEONODE INC. | |
By: | /s/ Fredrik Nihlén | |
Name: | Fredrik Nihlén | |
Title: | Chief Financial Officer |
2
Exhibit 99.1
Press Release
For Release, 09:10AM ET November 10, 2022
Neonode Reports Quarter Ended September 30, 2022 Financial Results
STOCKHOLM, SWEDEN, November 10, 2022 — Neonode Inc. (NASDAQ: NEON), today reported financial results for the three and nine months ended September 30, 2022.
FINANCIAL SUMMARY FOR THE THREE MONTHS ENDED SEPTEMBER 30, 2022:
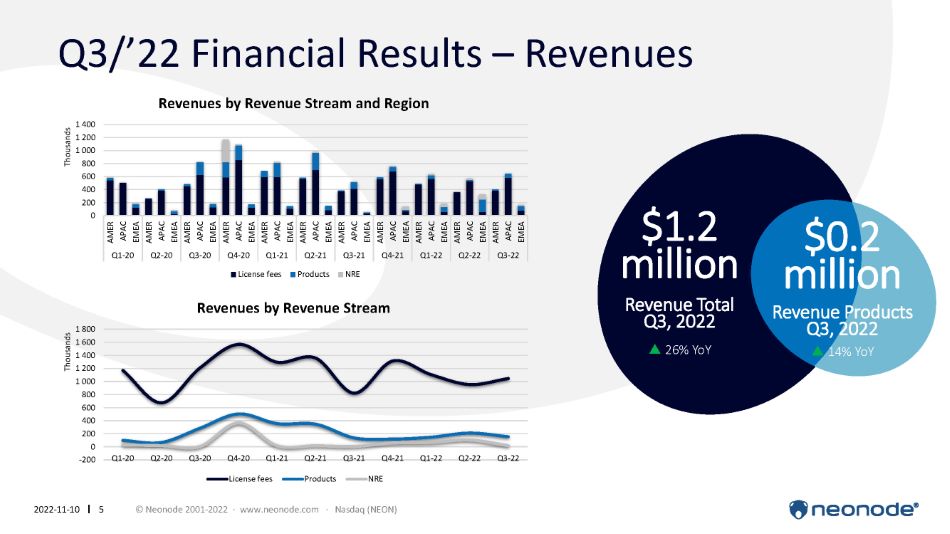
● | Revenue of $1.2 million, an increase of 26.4% compared to the same period in the prior year. |
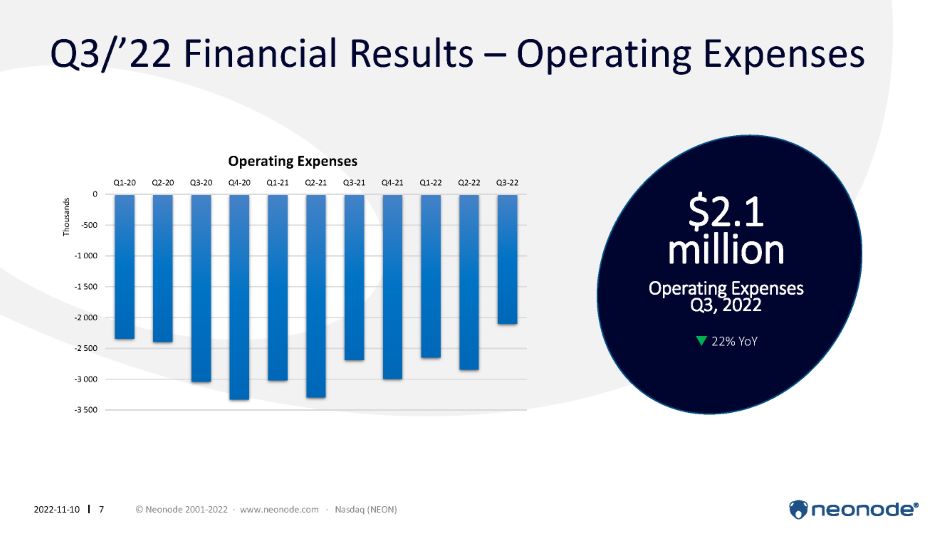
● | Operating expenses of $2.1 million, a decrease of 21.8% compared to the same period in the prior year. |
● | Net loss of $0.8 million, or $0.06 per share, compared to $1.7 million, or $0.15 per share, for the same period in the prior year. |
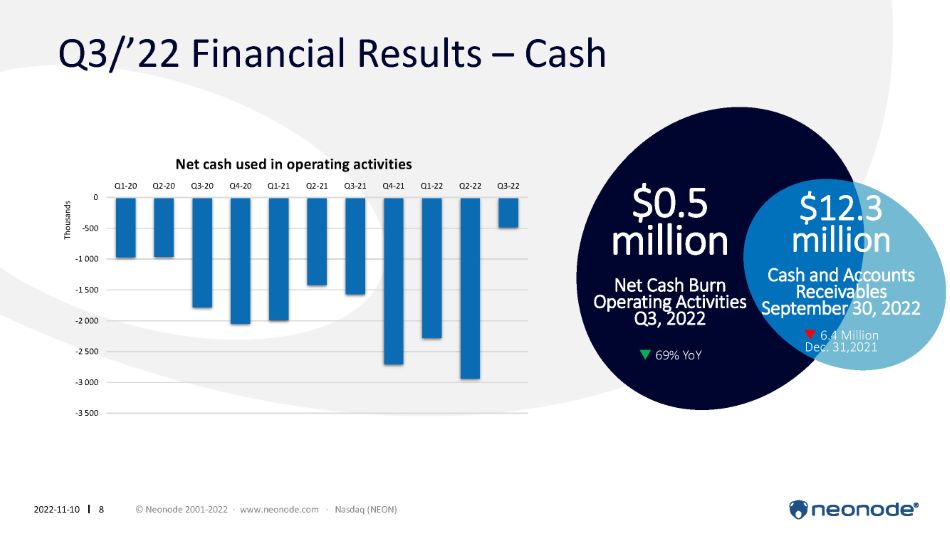
● | Cash used by operations of $0.5 million compared to $1.6 million for the same period in the prior year. |
● | Cash and accounts receivable of $12.3 million as of September 30, 2022, compared to $18.7 million as of December 31, 2021. |
FINANCIAL SUMMARY FOR THE NINE MONTHS ENDED SEPTEMBER 30, 2022:
● | Revenue of $3.8 million, a decrease of 12.6% compared to the same period in the prior year. |
● | Operating expenses of $7.6 million, a decrease of 15.6% compared to the same period in the prior year. |
● | Net loss of $3.7 million, or $0.27 per share, compared to $4.9 million, or $0.43 per share, for the same period in the prior year. |
● | Cash used by operations of $5.7 million compared to $5.0 million for the same period in the prior year. |
THE CEO’S COMMENTS
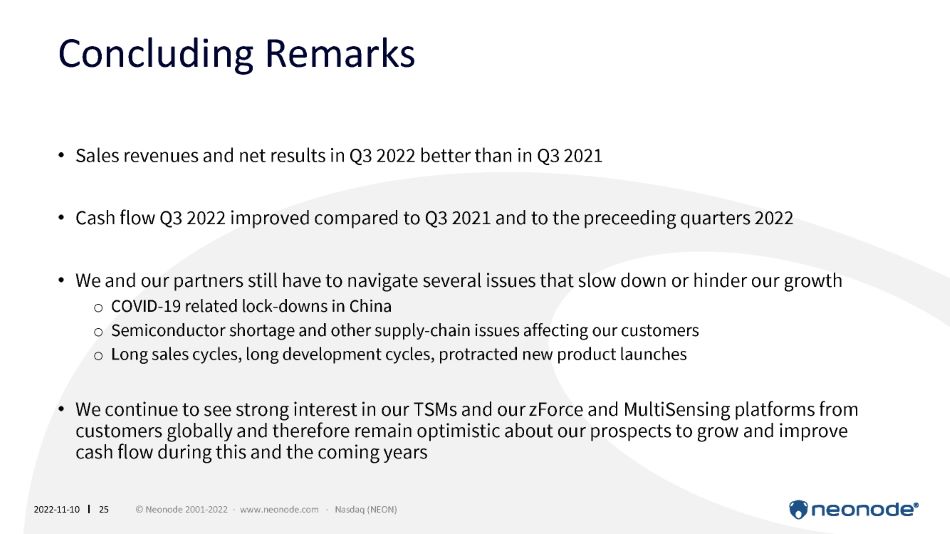
“Our net revenues were higher and our operating expenses were lower during the third quarter than in the corresponding period last year. We are pleased to see that our efforts to grow sales and control costs generated results. We continue our focused work to expand our business and remain optimistic about the potential of our products and technology platforms. This said, we are not satisfied with the results we have achieved so far. Our sales and growth continue to be affected by several factors, including long sales and product launch cycles in the segments where we are active. Our business is also affected by COVID-19 lockdowns and semi-conductor shortage issues that our customers must navigate. We continue to take measures to mitigate these issues,” said Dr. Urban Forssell, Neonode’s CEO.
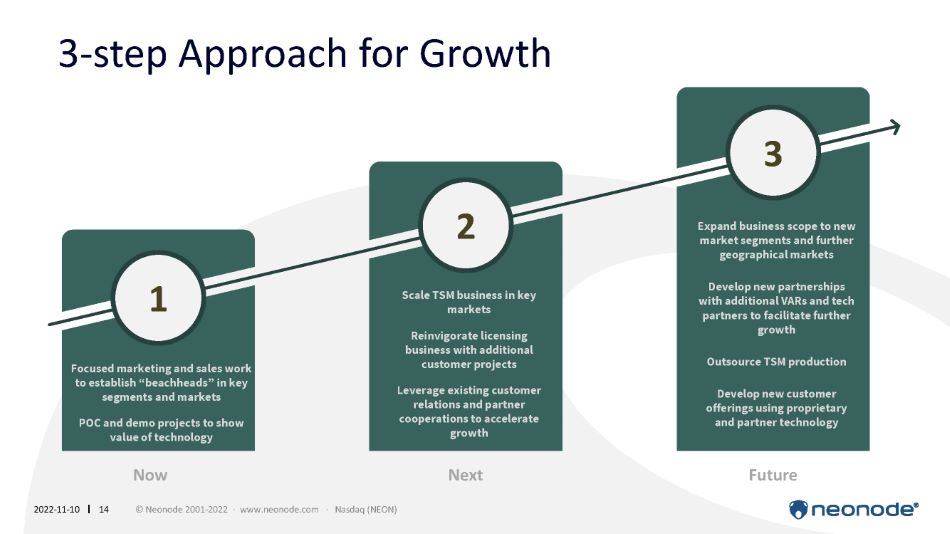
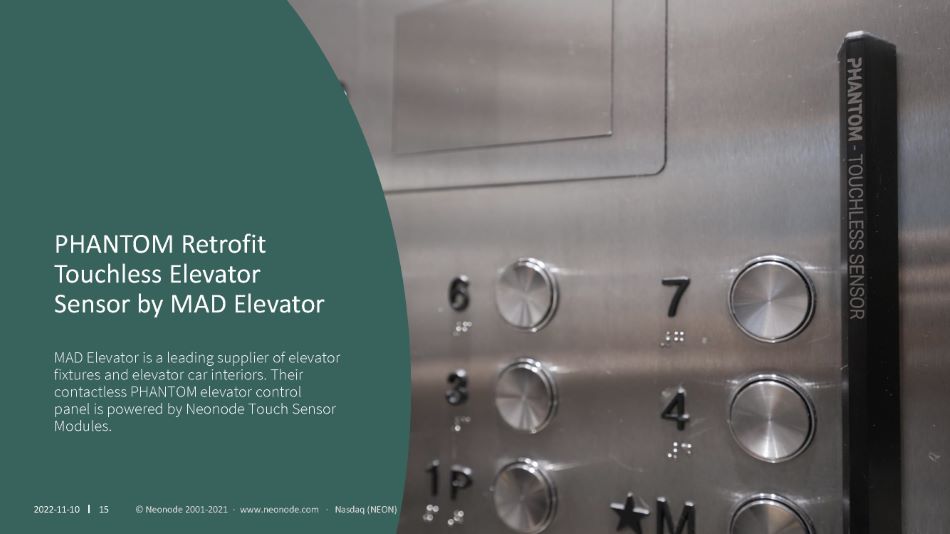
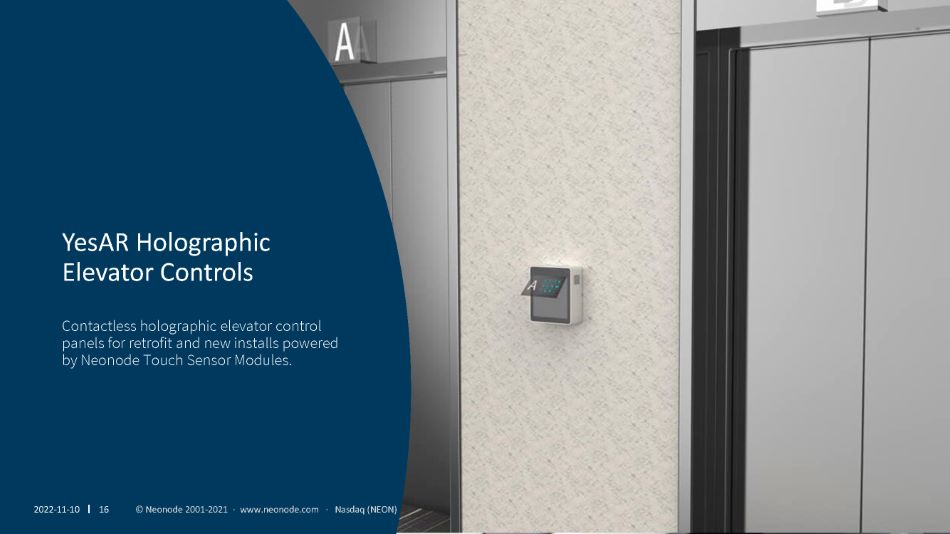
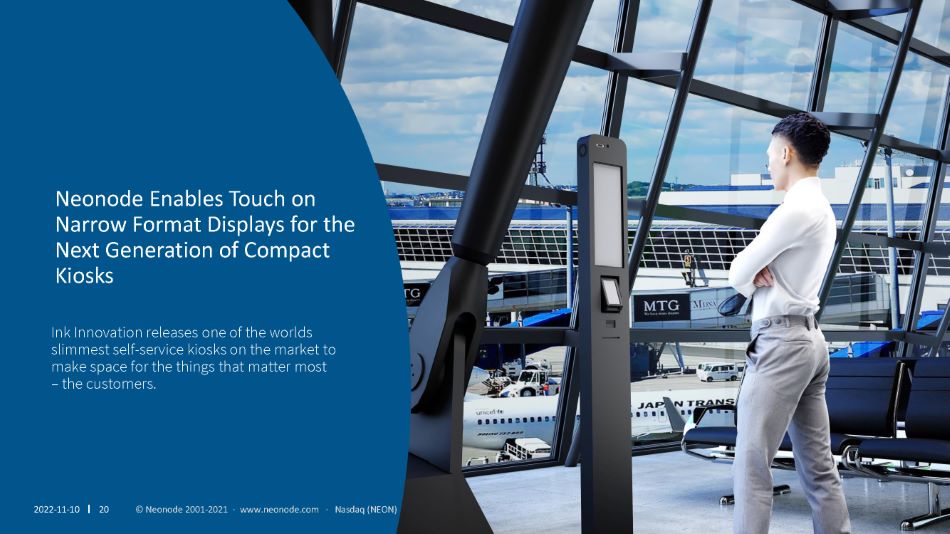
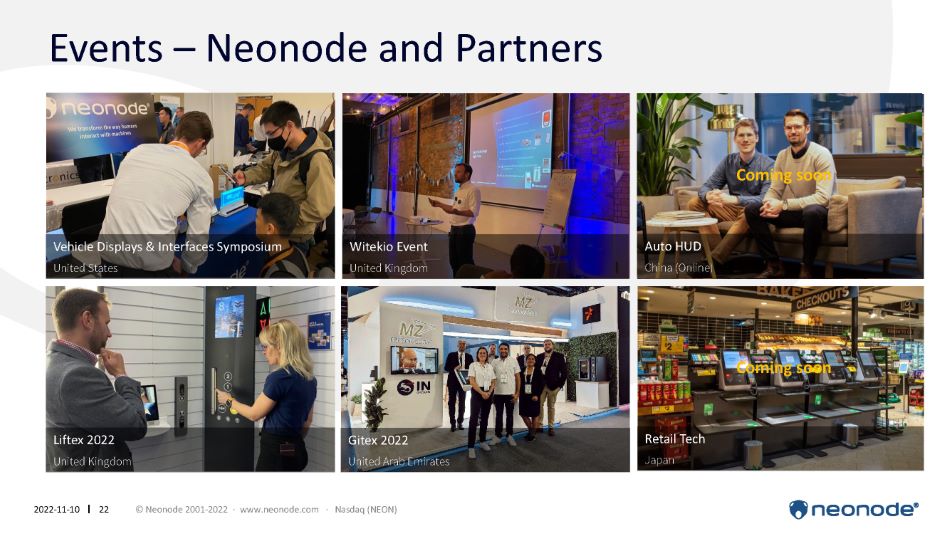
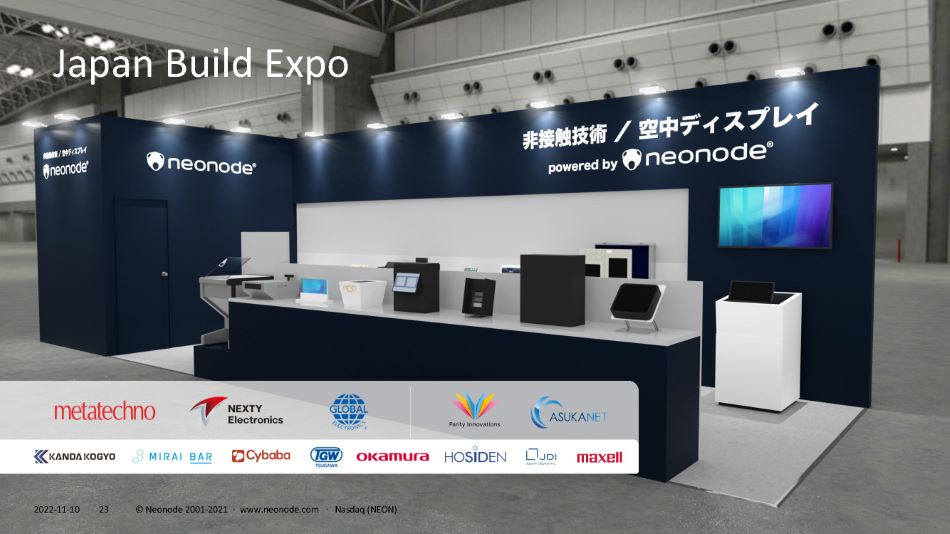
“Our products business continues to develop and we are seeing a growing interest in our Touch Sensor Modules (“TSM”) from both elevator and interactive kiosk customers. One driver is the increased interest for holographic display applications we are seeing from different equipment manufacturers and end customers. We continue to work to expand the TSM business and increase our sales volumes in Japan, South Korea, and in other markets,” continued Dr. Forssell.
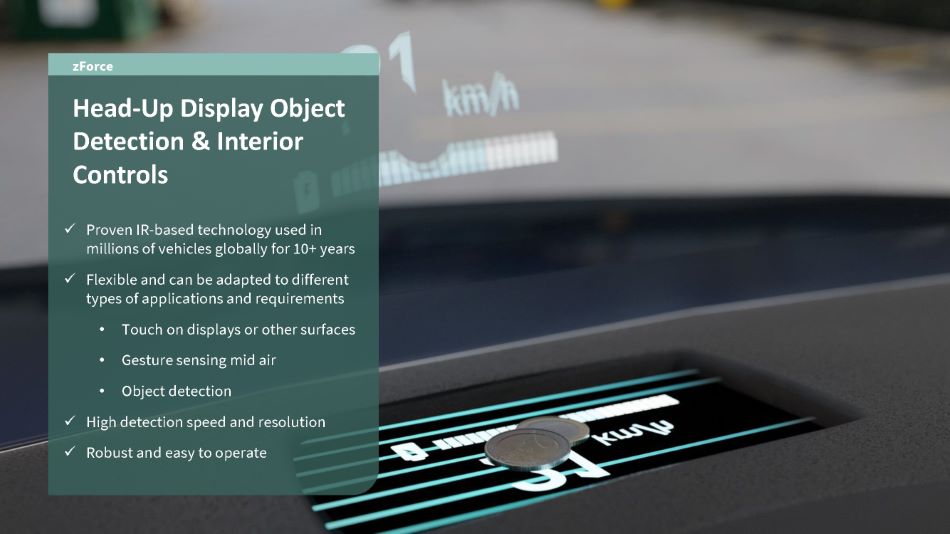
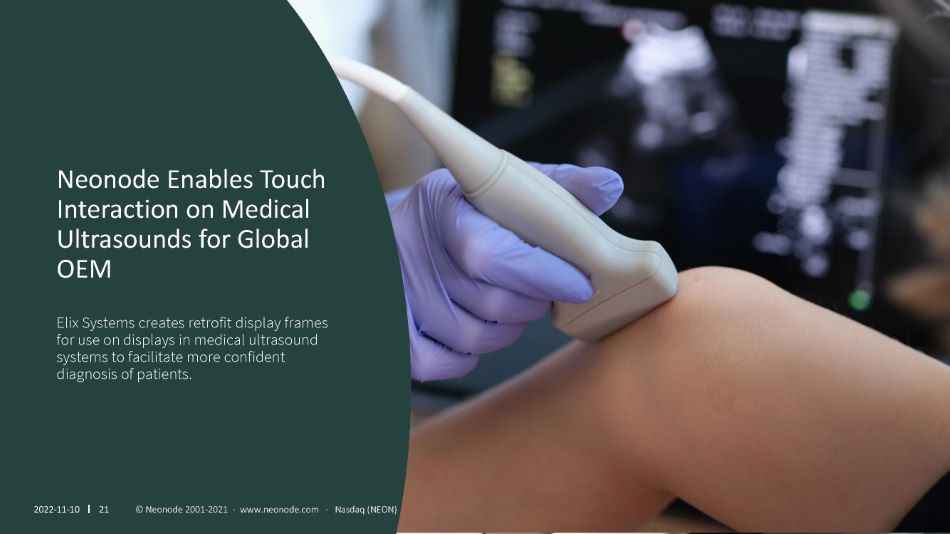
“In developing our licensing business we focus on automotive OEM and tier 1 customers mainly, and we are encouraged by the interest we are seeing for our object detection, gesture sensing, and driver and in-cabin monitoring solutions. Short- and medium-term the revenue potential in this segment is from sales of non-recurring engineering services in application development projects linked to new vehicle platforms. Long-term these projects may lead to increased license revenues, typically through royalty payments per vehicle produced,” concluded Dr. Forssell.
FINANCIAL OVERVIEW FOR THE THREE MONTHS ENDED SEPTEMBER 30, 2022
Net revenues for the quarter ended September 30, 2022 were $1.2 million, a 26.4% increase compared to the same period in 2021. For the 2022 period, license revenues were $1.0 million, an increase of 27.3% compared to the same period in 2021. We saw a recovery of license revenues from legacy customers in the printer and automotive markets compared to the same period in 2021, primarily due to increased sales volumes from these customers.
Revenues from product sales during the third quarter were $0.2 million, an increase of 14.0% compared to the same period in 2021. We saw a slight recovery for the third quarter compared to the third quarter of 2021, but our product sales continue to be negatively impacted by COVID-19 driven lock-downs in Asia. We are also affected by the comparatively long development and launch periods, often 12 to 18 months, or longer, for customer new equipment solutions, which slows our sales growth.
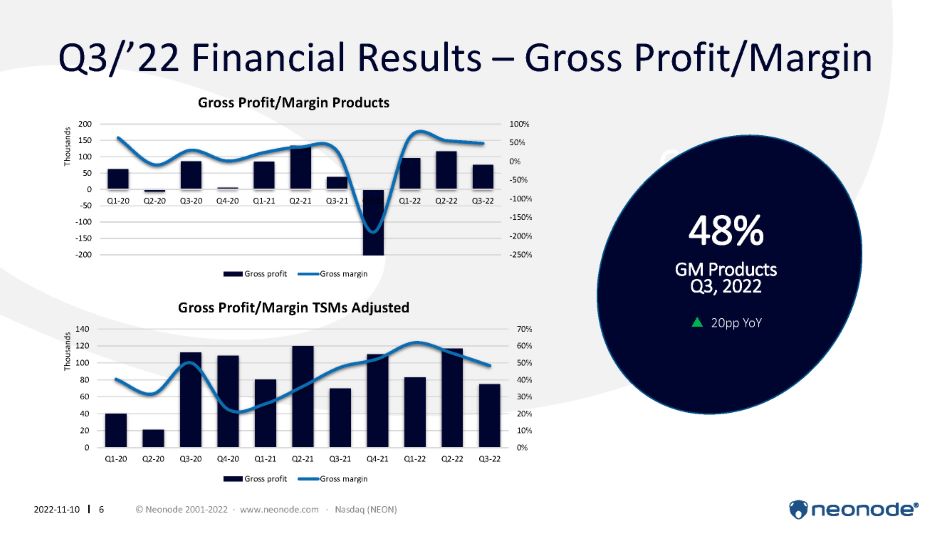
Gross margin related to products was 48.4% for the third quarter of 2022 compared to 27.9% for the same period in 2021. Our operating expenses decreased 21.8% for the third quarter of 2022 compared to the same period in 2021, primarily due to lower staff expenses and depreciation and amortization.
Net loss attributable to Neonode for the three months ended September 30, 2022 was $0.8 million, or $0.06 per share, compared to a net loss of $1.7 million, or $0.15 per share, for the same period in 2021. Cash used by operations was $0.5 million in the third quarter compared to $1.6 million for the same period in 2021. The decrease was primarily the result of decreased net loss.
Cash and accounts receivable totaled $12.3 million and working capital was $15.5 million as of September 30, 2022 compared to $18.7 million and $19.1 million as of December 31, 2021, respectively.
For more information, please contact:
Chief Financial Officer
Fredrik Nihlén
E-mail: fredrik.nihlen@neonode.com
Phone: +46 703 97 21 09
Chief Executive Officer
Urban Forssell
E-mail: urban.forssell@neonode.com
Phone: +46 734 10 03 59
About Neonode
Neonode Inc. (NASDAQ:NEON) is a publicly traded company, headquartered in Stockholm, Sweden and established in 2001. The company provides advanced optical sensing solutions for contactless touch, touch, gesture control, and in-cabin monitoring. Building on experience acquired during years of advanced R&D and technology licensing, Neonode’s technology is currently deployed in more than 80 million products and the company holds more than 100 patents worldwide. Neonode’s customer base includes some of the world’s best-known Fortune 500 companies in the consumer electronics, office equipment, automotive, elevator, and self-service kiosk markets.
NEONODE and the NEONODE logo are trademarks of Neonode Inc. registered in the United States and other countries.
For further information please visit www.neonode.com
Follow us at:
Cision
2
Safe Harbor Statement
This press release contains forward-looking statements within the meaning of the Private Securities Litigation Reform Act of 1995. These include, but are not limited to, statements relating to our expectations for growth and the growing demand for our products, future performance or future events. These statements are based on current assumptions, expectations and information available to Neonode management and involve a number of known and unknown risks, uncertainties and other factors that may cause Neonode’s actual results, levels of activity, performance or achievements to be materially different from any expressed or implied by these forward-looking statements.
These risks, uncertainties, and factors include risks related to our reliance on the ability of our customers to design, manufacture and sell their products with our touch technology, the length of a customer’s product development cycle, our dependence and our customers’ dependence on suppliers, the global economy generally and other risks discussed under “Risk Factors” and elsewhere in Neonode’s public filings with the SEC from time to time, including Neonode’s annual reports on Form 10-K, quarterly reports on Form 10-Q, and current reports on Form 8-K. You are advised to carefully consider these various risks, uncertainties and other factors. Although Neonode management believes that the forward-looking statements contained in this press release are reasonable, it can give no assurance that its expectations will be fulfilled. Forward-looking statements are made as of today’s date, and Neonode undertakes no duty to update or revise them.
3
NEONODE INC.
CONDENSED CONSOLIDATED BALANCE SHEETS
(In thousands, except share and per share amounts)
September 30, | December 31, | |||||||
2022 | 2021 | |||||||
(Unaudited) | (Audited) | |||||||
ASSETS | ||||||||
Current assets: | ||||||||
Cash | $ | 11,302 | $ | 17,383 | ||||
Accounts receivable and unbilled revenues, net | 1,014 | 1,293 | ||||||
Inventory | 4,342 | 2,520 | ||||||
Prepaid expenses and other current assets | 671 | 836 | ||||||
Total current assets | 17,329 | 22,032 | ||||||
Property and equipment, net | 281 | 376 | ||||||
Operating lease right-of-use assets, net | 182 | 584 | ||||||
Total assets | $ | 17,792 | $ | 22,992 | ||||
LIABILITIES AND STOCKHOLDERS’ EQUITY | ||||||||
Current liabilities: | ||||||||
Accounts payable | $ | 357 | $ | 776 | ||||
Accrued payroll and employee benefits | 800 | 1,037 | ||||||
Accrued expenses | 316 | 371 | ||||||
Contract liabilities | 92 | 106 | ||||||
Current portion of finance lease obligations | 109 | 258 | ||||||
Current portion of operating lease obligations | 127 | 425 | ||||||
Total current liabilities | 1,801 | 2,973 | ||||||
Finance lease obligations, net of current portion | 52 | 65 | ||||||
Operating lease obligations, net of current portion | 49 | 117 | ||||||
Total liabilities | 1,902 | 3,155 | ||||||
Commitments and contingencies | ||||||||
Stockholders’ equity: | ||||||||
Common stock, 25,000,000 shares authorized, with par value of $0.001; 13,569,700 and 13,575,952 shares issued and outstanding at September 30, 2022 and December 31, 2021, respectively | 14 | 14 | ||||||
Additional paid-in capital | 226,957 | 226,880 | ||||||
Accumulated other comprehensive loss | (304 | ) | (408 | ) | ||||
Accumulated deficit | (206,336 | ) | (202,608 | ) | ||||
Total Neonode Inc. stockholders’ equity | 20,331 | 23,878 | ||||||
Noncontrolling interests | (4,441 | ) | (4,041 | ) | ||||
Total stockholders’ equity | 15,890 | 19,837 | ||||||
Total liabilities and stockholders’ equity | $ | 17,792 | $ | 22,992 |
4
NEONODE INC.
CONDENSED CONSOLIDATED STATEMENTS OF OPERATIONS
(In thousands, except per share amounts)
(Unaudited)
Three months ended September 30, | Nine months ended September 30, | |||||||||||||||
2022 | 2021 | 2022 | 2021 | |||||||||||||
Revenues: | ||||||||||||||||
License fees | $ | 1,045 | $ | 821 | $ | 3,102 | $ | 3,474 | ||||||||
Products | 155 | 136 | 512 | 837 | ||||||||||||
Non-recurring engineering | 16 | 5 | 187 | 36 | ||||||||||||
Total revenues | 1,216 | 962 | 3,801 | 4,347 | ||||||||||||
Cost of revenues: | ||||||||||||||||
Products | 80 | 98 | 224 | 580 | ||||||||||||
Non-recurring engineering | (2 | ) | 1 | 24 | 17 | |||||||||||
Total cost of revenues | 78 | 99 | 248 | 597 | ||||||||||||
Total gross margin | 1,138 | 863 | 3,553 | 3,750 | ||||||||||||
Operating expenses: | ||||||||||||||||
Research and development | 792 | 1,015 | 2,961 | 3,536 | ||||||||||||
Sales and marketing | 348 | 640 | 1,608 | 2,197 | ||||||||||||
General and administrative | 960 | 1,030 | 3,023 | 3,264 | ||||||||||||
Total operating expenses | 2,100 | 2,685 | 7,592 | 8,997 | ||||||||||||
Operating loss | (962 | ) | (1,822 | ) | (4,039 | ) | (5,247 | ) | ||||||||
Other income (expense): | ||||||||||||||||
Interest expense | - | (3 | ) | (6 | ) | (11 | ) | |||||||||
Other income | - | - | 21 | - | ||||||||||||
Total other income (expense) | - | (3 | ) | 15 | (11 | ) | ||||||||||
Loss before provision for income taxes | (962 | ) | (1,825 | ) | (4,024 | ) | (5,258 | ) | ||||||||
Provision for income taxes | 32 | 31 | 104 | 104 | ||||||||||||
Net loss including noncontrolling interests | (994 | ) | (1,856 | ) | (4,128 | ) | (5,362 | ) | ||||||||
Less: Net loss attributable to noncontrolling interests | 194 | 135 | 400 | 416 | ||||||||||||
Net loss attributable to Neonode Inc. | $ | (800 | ) | $ | (1,721 | ) | $ | (3,728 | ) | $ | (4,946 | ) | ||||
Loss per common share: | ||||||||||||||||
Basic and diluted loss per share | $ | (0.06 | ) | $ | (0.15 | ) | $ | (0.27 | ) | $ | (0.43 | ) | ||||
Basic and diluted – weighted average number of common shares outstanding | 13,580 | 11,542 | 13,577 | 11,517 |
5
NEONODE INC.
CONDENSED CONSOLIDATED STATEMENTS OF COMPREHENSIVE LOSS
(In thousands)
(Unaudited)
Three months ended September 30, | Nine months ended September 30, | |||||||||||||||
2022 | 2021 | 2022 | 2021 | |||||||||||||
Net loss | $ | (994 | ) | $ | (1,856 | ) | $ | (4,128 | ) | $ | (5,362 | ) | ||||
Other comprehensive income (loss): | ||||||||||||||||
Foreign currency translation adjustments | 30 | (37 | ) | 104 | (147 | ) | ||||||||||
Comprehensive loss | (964 | ) | (1,893 | ) | (4,024 | ) | (5,509 | ) | ||||||||
Less: Comprehensive loss attributable to noncontrolling interests | 194 | 135 | 400 | 416 | ||||||||||||
Comprehensive loss attributable to Neonode Inc. | $ | (770 | ) | $ | (1,758 | ) | $ | (3,624 | ) | $ | (5,093 | ) |
6
NEONODE INC.
CONDENSED CONSOLIDATED STATEMENTS OF STOCKHOLDERS’ EQUITY
(In thousands)
(Unaudited)
For the Quarter to Date periods ended March 31, 2021 through September 30, 2022
Common Stock Shares Issued | Common Stock Amount | Additional Paid-in Capital | Accumulated Other Comprehensive Income (Loss) | Accumulated Deficit | Total Neonode Inc. Stockholders’ Equity | Noncontrolling Interests | Total Stockholders’ Equity | |||||||||||||||||||||||||
Balances, December 31, 2020 | 11,504 | $ | 12 | $ | 211,663 | $ | (404 | ) | $ | (196,158 | ) | $ | 15,113 | $ | (3,223 | ) | $ | 11,890 | ||||||||||||||
Stock-based compensation | - | - | 23 | - | - | 23 | - | 23 | ||||||||||||||||||||||||
Foreign currency translation adjustment | - | - | - | (166 | ) | - | (166 | ) | - | (166 | ) | |||||||||||||||||||||
Net loss | - | - | - | - | (1,568 | ) | (1,568 | ) | (102 | ) | (1,670 | ) | ||||||||||||||||||||
Balances, March 31, 2021 | 11,504 | $ | 12 | $ | 211,686 | $ | (570 | ) | $ | (197,726 | ) | $ | 13,402 | $ | (3,325 | ) | $ | 10,077 | ||||||||||||||
Stock-based compensation | - | - | 22 | - | - | 22 | - | 22 | ||||||||||||||||||||||||
Foreign currency translation adjustment | - | - | - | 56 | - | 56 | - | 56 | ||||||||||||||||||||||||
Net loss | - | - | - | - | (1,657 | ) | (1,657 | ) | (179 | ) | (1,836 | ) | ||||||||||||||||||||
Balances, June 30, 2021 | 11,504 | $ | 12 | $ | 211,708 | $ | (514 | ) | $ | (199,383 | ) | $ | 11,823 | $ | (3,504 | ) | $ | 8,319 | ||||||||||||||
Issuance of common stock under the ATM, net | 94 | - | 593 | - | - | 593 | - | 593 | ||||||||||||||||||||||||
Stock-based compensation | 13 | - | 46 | - | - | 46 | - | 46 | ||||||||||||||||||||||||
Foreign currency translation adjustment | - | - | - | (37 | ) | - | (37 | ) | - | (37 | ) | |||||||||||||||||||||
Net loss | - | - | - | - | (1,721 | ) | (1,721 | ) | (135 | ) | (1,856 | ) | ||||||||||||||||||||
Balances, September 30, 2021 | 11,611 | $ | 12 | $ | 212,347 | $ | (551 | ) | $ | (201,104 | ) | $ | 10,704 | $ | (3,639 | ) | $ | 7,065 | ||||||||||||||
Issuance of shares for cash, net of offering costs | 1,950 | 2 | 14,467 | - | - | 14,469 | - | 14,469 | ||||||||||||||||||||||||
Stock-based compensation | 15 | - | 66 | - | - | 66 | - | 66 | ||||||||||||||||||||||||
Foreign currency translation adjustment | - | - | - | 143 | - | 143 | - | 143 | ||||||||||||||||||||||||
Net loss | - | - | - | - | (1,504 | ) | (1,504 | ) | (402 | ) | (1,906 | ) | ||||||||||||||||||||
Balances, December 31, 2021 | 13,576 | $ | 14 | $ | 226,880 | $ | (408 | ) | $ | (202,608 | ) | $ | 23,878 | $ | (4,041 | ) | $ | 19,837 | ||||||||||||||
Stock-based compensation | - | - | 39 | - | - | 39 | - | 39 | ||||||||||||||||||||||||
Foreign currency translation adjustment | - | - | - | 33 | - | 33 | - | 33 | ||||||||||||||||||||||||
Net loss | - | - | - | - | (1,380 | ) | (1,380 | ) | (57 | ) | (1,437 | ) | ||||||||||||||||||||
Balances, March 31, 2022 | 13,576 | $ | 14 | $ | 226,919 | $ | (375 | ) | $ | (203,988 | ) | $ | 22,570 | $ | (4,098 | ) | $ | 18,472 | ||||||||||||||
Stock-based compensation | 4 | - | 45 | - | - | 45 | - | 45 | ||||||||||||||||||||||||
Foreign currency translation adjustment | - | - | - | 41 | - | 41 | - | 41 | ||||||||||||||||||||||||
Net loss | - | - | - | - | (1,548 | ) | (1,548 | ) | (149 | ) | (1,697 | ) | ||||||||||||||||||||
Balances, June 30, 2022 | 13,580 | $ | 14 | $ | 226,964 | $ | (334 | ) | $ | (205,536 | ) | $ | 21,108 | $ | (4,247 | ) | $ | 16,861 | ||||||||||||||
Stock-based compensation | - | - | 5 | - | - | 5 | - | 5 | ||||||||||||||||||||||||
Repurchase and retirement of stock | (10 | ) | - | (12 | ) | - | - | (12 | ) | - | (12 | ) | ||||||||||||||||||||
Foreign currency translation adjustment | - | - | - | 30 | - | 30 | - | 30 | ||||||||||||||||||||||||
Net loss | - | - | - | - | (800 | ) | (800 | ) | (194 | ) | (994 | ) | ||||||||||||||||||||
Balances, September 30, 2022 | 13,570 | $ | 14 | $ | 226,957 | $ | (304 | ) | $ | (206,336 | ) | $ | 20,331 | $ | (4,441 | ) | $ | 15,890 |
7
NEONODE INC.
CONDENSED CONSOLIDATED STATEMENTS OF CASH FLOWS
(In thousands)
(Unaudited)
Nine months ended September 30, | ||||||||
2022 | 2021 | |||||||
Cash flows from operating activities: | ||||||||
Net loss (including noncontrolling interests) | $ | (4,128 | ) | $ | (5,362 | ) | ||
Adjustments to reconcile net loss to net cash used in operating activities: | ||||||||
Stock-based compensation expense | 89 | 91 | ||||||
Depreciation and amortization | 104 | 530 | ||||||
Amortization of operating lease right-of-use assets | 327 | 386 | ||||||
Recoveries of bad debt | (45 | ) | - | |||||
Changes in operating assets and liabilities: | ||||||||
Accounts receivable and unbilled revenue, net | 294 | 970 | ||||||
Inventory | (1,691 | ) | (1,249 | ) | ||||
Prepaid expenses and other current assets | 45 | 524 | ||||||
Accounts payable and accrued expenses | (386 | ) | (371 | ) | ||||
Deferred revenues | (6 | ) | (1 | ) | ||||
Operating lease obligations | (297 | ) | (492 | ) | ||||
Net cash used in operating activities | (5,694 | ) | (4,974 | ) | ||||
Cash flows from investing activities: | ||||||||
Purchase of property and equipment | (54 | ) | (67 | ) | ||||
Net cash used in investing activities | (54 | ) | (67 | ) | ||||
Cash flows from financing activities: | ||||||||
Proceeds from issuance of common stock, net of offering costs | - | 593 | ||||||
Repurchase of common stock | (12 | ) | - | |||||
Principal payments on finance lease obligations | (135 | ) | (426 | ) | ||||
Net cash (used in) provided by financing activities | (147 | ) | 167 | |||||
Effect of exchange rate changes on cash | (186 | ) | (103 | ) | ||||
Net decrease in cash | (6,081 | ) | (4,977 | ) | ||||
Cash at beginning of period | 17,383 | 10,473 | ||||||
Cash at end of period | $ | 11,302 | $ | 5,496 | ||||
Supplemental disclosure of cash flow information: | ||||||||
Cash paid for income taxes | $ | 2 | $ | 104 | ||||
Cash paid for interest | $ | 6 | $ | 11 | ||||
Supplemental disclosure of non-cash investing and financial activities: | ||||||||
Property and equipment obtained in exchange for finance lease obligations | $ | 24 | $ | - |
8
Exhibit 99.2
Q3 2022 Earnings Call November 10, 2022 2022 - 11 - 10 © Neonode 2001 - 2022 · www.neonode.com · Nasdaq (NEON) 1
Today’s Presenters 2022 - 11 - 10 © Neonode 2001 - 2022 · www.neonode.com · Nasdaq (NEON) 2 Urban Forssell CEO Fredrik Nihlén CFO
Legal Disclaimer 2022 - 11 - 10 © Neonode 2001 - 2022 · www.neonode.com · Nasdaq (NEON) 3 This presentation contains, and related oral and written statements of Neonode Inc. (the “Company”) and its management may contain, forward - looking statements within the meaning of the Private Securities Litigation Reform Act of 1995. Forward - looking statements include information about current expectations, strategy, plans, potential financial performance or future events. They also may include statements about market opportunity and sales growth, financial results, use of cash, product development and introduction, regulatory matters and sales efforts. Forward - looking statements are based on assumptions, expectations and information available to the Company and its management and involve a number of known and unknown risks, uncertainties and other factors that may cause the Company’s actual results, levels of activity, performance or achievements to be materially different from any expressed or implied by these forward - looking statements. These uncertainties and risks include, but are not limited to, our ability to secure financing when needed on acceptable terms, ris ks related to new product development, our ability to protect our intellectual property, our ability to compete, general economi c conditions including as a result of the ongoing COVID - 19 pandemic or geopolitical conflicts such as the war in Ukraine, as well as other risks outlined in filings of the Company with the U.S. Securities and Exchange Commission (the “SEC”) under the Securities Exchange Act of 1934, as amended, including the sections entitled “Risk Factors” and “Management’s Discussion and Analysis of Financial Condition and Results of Operations.” Prospective investors are advised to carefully consider these various risks, uncertainties and other factors. Any forward - looking statements included in this presentation are made as of today’s date. The Company and its management undertake no duty to update or revise forward - looking statements. This presentation has been prepared by the Company based on its own information, as well as information from public sources. Certain of the information contained herein may be derived from information provided by industry sources. The Company believes such information is accurate and that the sources from which it has been obtained are reliable. However, the Company has not independently verified such information and cannot guarantee the accuracy of such information.
Agenda 2022 - 11 - 10 4 © Neonode 2001 - 2022 · www.neonode.com · Nasdaq (NEON) 1. Q3 2022 Financial Results 2. Strategy and Business Update 3. Concluding Remarks 4. Q&A Neonode Inc. Q3 2022 | November 10, 2022
Q3/’22 Financial Results – Revenues 2022 - 11 - 10 © Neonode 2001 - 2022 · www.neonode.com · Nasdaq (NEON) 5 Lorem $1.2 million Revenue Total Q3, 2022 ▲ 26 % YoY $0.2 million Revenue Products Q3, 2022 ▲ 14 % YoY 0 200 400 600 800 1,000 1,200 1,400 AMER APAC EMEA AMER APAC EMEA AMER APAC EMEA AMER APAC EMEA AMER APAC EMEA AMER APAC EMEA AMER APAC EMEA AMER APAC EMEA AMER APAC EMEA AMER APAC EMEA AMER APAC EMEA Q1-20 Q2-20 Q3-20 Q4-20 Q1-21 Q2-21 Q3-21 Q4-21 Q1-22 Q2-22 Q3-22 Thousands Revenues by Revenue Stream and Region License fees Products NRE -200 0 200 400 600 800 1,000 1,200 1,400 1,600 1,800 Q1-20 Q2-20 Q3-20 Q4-20 Q1-21 Q2-21 Q3-21 Q4-21 Q1-22 Q2-22 Q3-22 Thousands Revenues by Revenue Stream License fees Products NRE
Q3/’22 Financial Results – Gross Profit/Margin 2022 - 11 - 10 © Neonode 2001 - 2022 · www.neonode.com · Nasdaq (NEON) 6 6% GM Products Q2, 2022 ▲ 17pp YoY 48% GM Products Q3, 2022 ▲ 20pp YoY -250% -200% -150% -100% -50% 0% 50% 100% -200 -150 -100 -50 0 50 100 150 200 Q1-20 Q2-20 Q3-20 Q4-20 Q1-21 Q2-21 Q3-21 Q4-21 Q1-22 Q2-22 Q3-22 Thousands Gross Profit/Margin Products Gross profit Gross margin 0% 10% 20% 30% 40% 50% 60% 70% 0 20 40 60 80 100 120 140 Q1-20 Q2-20 Q3-20 Q4-20 Q1-21 Q2-21 Q3-21 Q4-21 Q1-22 Q2-22 Q3-22 Thousands Gross Profit/Margin TSMs Adjusted Gross profit Gross margin
Q3/’22 Financial Results – Operating Expenses 2022 - 11 - 10 © Neonode 2001 - 2022 · www.neonode.com · Nasdaq (NEON) 7 Lorem $2.1 million Operating Expenses Q3, 2022 ▼ 22 % YoY -3,500 -3,000 -2,500 -2,000 -1,500 -1,000 -500 0 Q1-20 Q2-20 Q3-20 Q4-20 Q1-21 Q2-21 Q3-21 Q4-21 Q1-22 Q2-22 Q3-22 Thousands Operating Expenses
Q3/’22 Financial Results – Cash 2022 - 11 - 10 © Neonode 2001 - 2022 · www.neonode.com · Nasdaq (NEON) 8 Lorem $0.5 million Net Cash Burn Operating Activities Q3, 2022 ▼ 69 % YoY $12.3 million Cash and Accounts Receivables September 30, 2022 ▼ 6.4 Million Dec. 31,2021 -3,500 -3,000 -2,500 -2,000 -1,500 -1,000 -500 0 Q1-20 Q2-20 Q3-20 Q4-20 Q1-21 Q2-21 Q3-21 Q4-21 Q1-22 Q2-22 Q3-22 Thousands Net cash used in operating activities
Agenda 2022 - 11 - 10 9 © Neonode 2001 - 2022 · www.neonode.com · Nasdaq (NEON) 1. Q3 2022 Financial Results 2. Strategy and Business Update 3. Concluding Remarks 4. Q&A Neonode Inc. Q3 2022 | November 10, 2022
Business Strategy: Technology Licensing and Product Sales 2022 - 11 - 10 © Neonode 2001 - 2022 · www.neonode.com · Nasdaq (NEON) 10 INTERACTIVE KIOSKS ELEVATORS PRINTER AUTOMOTIVE TARGET SEGMENTS BUSINESS MODELS SALES OF NRE SERVICES + PRODUCT SALES SALES OF NRE SERVICES + TECHNOLOGY LICENSING CUSTOMER OFFERINGS TOUCH SENSOR MODULES (ZFORCE) ZFORCE MULTISENSING
© Neonode 2001 - 2022 · www.neonode.com · Nasdaq (NEON) 2022 - 11 - 10 11 zForce Head - Up Display Object Detection & Interior Controls x Proven IR - based technology used in millions of vehicles globally for 10+ years x Flexible and can be adapted to different types of applications and requirements • Touch on displays or other surfaces • Gesture sensing mid air • Object detection x High detection speed and resolution x Robust and easy to operate
2022 - 11 - 10 © Neonode 2001 - 2022 · www.neonode.com · Nasdaq (NEON) MultiSensing Driver & In - cabin Monitoring x Flexible, scalable software framework x Hardware agnostic solution with small computational footprint x GSR compatible x Advanced AI algorithms and smart toolkit support efficient and controlled development of new applications and features x Preconfigured driver attributes for driver monitoring applications, including eye openness, hand positioning, blink frequency, gaze direction, and head posture.
2022 - 11 - 10 © Neonode 2001 - 2021 · www.neonode.com · Nasdaq (NEON) 13 Touch Sensor Modules Standardized COTS products featuring Neonode’s patended zForce Reflective technology. Using infrared lasers with a configurable scanning frequency of up to 900Hz, Neonode’s Touch Sensor Modules track movement with 1.5mm accuracy and a response time as fast as 10 milliseconds.
3 - step Approach for Growth 2022 - 11 - 10 © Neonode 2001 - 2022 · www.neonode.com · Nasdaq (NEON) 14 3 Focused marketing and sales work to establish “beachheads” in key segments and markets POC and demo projects to show value of technology Scale TSM business in key markets Reinvigorate licensing business with additional customer projects Leverage existing customer relations and partner cooperations to accelerate growth Expand business scope to new market segments and further geographical markets Develop new partnerships with additional VARs and tech partners to facilitate further growth Outsource TSM production Develop new customer offerings using proprietary and partner technology 2 1 Now Next Future
2022 - 11 - 10 15 © Neonode 2001 - 2021 · www.neonode.com · Nasdaq (NEON) PHANTOM Retrofit Touchless Elevator Sensor by MAD Elevator MAD Elevator is a leading supplier of elevator fixtures and elevator car interiors. Their contactless PHANTOM elevator control panel is powered by Neonode Touch Sensor Modules.
2022 - 11 - 10 16 © Neonode 2001 - 2021 · www.neonode.com · Nasdaq (NEON) YesAR Holographic Elevator Controls Contactless holographic elevator control panels for retrofit and new installs powered by Neonode Touch Sensor Modules.
2022 - 11 - 10 17 © Neonode 2001 - 2021 · www.neonode.com · Nasdaq (NEON) 7 - Eleven Goes Holographic in Japan Holographic checkouts in selected 7 - Eleven stores offer a totally touch - free experience where customers scan their goods, then finalize their purchase by simply poking the air to interact with the holographic display. Payment is also accepted by cashless methods, such as credit cards, e - money cards and QR codes.
2022 - 11 - 10 18 © Neonode 2001 - 2021 · www.neonode.com · Nasdaq (NEON) Holo Industries and ASKA3D Develop Holographic POS Payment System with Mastercard Using Neonode Touch Sensor Module https://www.holoind.com/2022/09/13/holographic - payment - terminals - the - new - way - to - pay - %F0%9F%92%B8/
HY - LINE Virtual Keyless Keyboard The AnySurface keyboard developed by HY - LINE is an innovative solution for alphanumeric input anywhere it is needed. The keyboard can be placed on any surface material where it then realizes a ‘virtual keyboard’ feature over the surface using Neonode’s infrared technology. 2022 - 11 - 10 19 © Neonode 2001 - 2021 · www.neonode.com · Nasdaq (NEON)
2022 - 11 - 10 20 © Neonode 2001 - 2021 · www.neonode.com · Nasdaq (NEON) Neonode Enables Touch on Narrow Format Displays for the Next Generation of Compact Kiosks Ink Innovation releases one of the worlds slimmest self - service kiosks on the market to make space for the things that matter most – the customers.
Neonode Enables Touch Interaction on Medical Ultrasounds for Global OEM Elix Systems creates retrofit display frames for use on displays in medical ultrasound systems to facilitate more confident diagnosis of patients. 2022 - 11 - 10 21 © Neonode 2001 - 2021 · www.neonode.com · Nasdaq (NEON)
Events – Neonode and Partners 2022 - 11 - 10 © Neonode 2001 - 2022 · www.neonode.com · Nasdaq (NEON) 22 © Neonode 2001 - 2022 · www Witekio Event United Kingdom Vehicle Displays & Interfaces Symposium United States Liftex 2022 United Kingdom Gitex 2022 United Arab Emirates Auto HUD China (Online) Coming soon Retail Tech Japan Coming soon
2022 - 11 - 10 © Neonode 2001 - 2021 · www.neonode.com · Nasdaq (NEON) 23 Japan Build Expo
Agenda 2022 - 11 - 10 24 © Neonode 2001 - 2022 · www.neonode.com · Nasdaq (NEON) 1. Q3 2022 Financial Results 2. Strategy and Business Update 3. Concluding Remarks 4. Q&A Neonode Inc. Q3 2022 | November 10, 2022
Concluding Remarks • Sales revenues and net results in Q3 2022 better than in Q3 2021 • Cash flow Q3 2022 improved compared to Q3 2021 and to the preceeding quarters 2022 • We and our partners still have to navigate several issues that slow down or hinder our growth o COVID - 19 related lock - downs in China o Semiconductor shortage and other supply - chain issues affecting our customers o Long sales cycles, long development cycles, protracted new product launches • We continue to see strong interest in our TSMs and our zForce and MultiSensing platforms from customers globally and therefore remain optimistic about our prospects to grow and improve cash flow during this and the coming years 2022 - 11 - 10 © Neonode 2001 - 2022 · www.neonode.com · Nasdaq (NEON) 25
Agenda 2022 - 11 - 10 26 © Neonode 2001 - 2022 · www.neonode.com · Nasdaq (NEON) 1. Q3 2022 Financial Results 2. Strategy and Business Update 3. Concluding Remarks 4. Q&A Neonode Inc. Q3 2022 | November 10, 2022
2022 - 11 - 10 27 © Neonode 2001 - 2021 · www.neonode.com · Nasdaq (NEON) info@neonode.com neonode.com Subscribe to Neonode newsletter 2022 - 11 - 10 27 © Neonode 2001 - 2022 · www.neonode.com · Nasdaq (NEON) Thank you.
Appendix 2022 - 11 - 10 28 © Neonode 2001 - 2021 · www.neonode.com · Nasdaq (NEON)
Non - GAAP Financial Measures 2022 - 11 - 10 © Neonode 2001 - 2022 · www.neonode.com · Nasdaq (NEON) 29 In addition to presenting our financial results in accordance with accounting principles generally accepted in the United Sta tes (“GAAP”), we use adjusted gross margin to measure our financial performance. We define adjusted gross margin as gross margin excluding AirBar sales revenues and costs and adjusting for costs and lost revenues caused by a quality issue and one - time write - down of inventory. We believe a djusted gross margin is a meaningful measure because it reflects the performance of our TSM business, which is our current focus. Non - GAAP fin ancial measures should not be considered as alternatives to the most directly comparable GAAP financial measures. Our use of adjuste d g ross margin, a non - GAAP financial measure, has important limitations as an analytical tool because it excludes some, but not all, items that affect the most directly comparable GAAP financial measure. You should not consider adjusted gross margin in isolation or as substitutes for ana lysis of our results as reported under GAAP. Our definition of non - GAAP adjusted gross margin may not be comparable to similarly titled measu res of other companies, thereby diminishing its utility. The following tables presents a reconciliation of adjusted gross margin to gross margin, the most directly comparable GAAP fi nan cial measure. kUSD Q1-20 Q2-20 Q3-20 Q4-20 Q1-21 Q2-21 Q3-21 Q4-21 Q1-22 Q2-22 Q3-22 Revenue Products 98 66 284 502 355 346 136 118 147 210 155 Cost of Sales Products -36 -72 -198 -496 -270 -212 -98 -342 -51 -93 -80 Gross Profit Products 62 -6 86 6 85 134 38 -224 96 117 75 Lost revenues TSM quality issue - - - - - -14 12 92 - - - Cost of sales TSM quality issue - - - - - 4 27 -61 - - - Inventory write-down TSM quality issue - - - - - - - 154 - - - Revenue AirBar 1 -0 -60 -21 -43 - - - -13 - - Cost of Sales AirBar -23 27 86 123 39 -4 -7 149 - - - Adjusted Gross Profit Products 40 21 112 109 81 120 70 110 83 117 75 Gross Margin Products 63,3% -9,1% 30,3% 1,2% 23,9% 38,7% 27,9% -189,8% 65,3% 55,7% 48,4% Adjusted Gross Margin Products 40,4% 31,7% 50,1% 22,6% 25,9% 36,2% 47,3% 52,4% 61,9% 55,7% 48,4%
D!
M\@'Z @,"# (4 AT")@(O C@"00)+ E0"70)G G$">@*$ HX"F *B JP"M@+!
M LL"U0+@ NL"]0, PL#%@,A RT#. -# T\#6@-F W(#?@.* Y8#H@.N [H#
MQP/3 ^ #[ /Y! 8$$P0@!"T$.P1(!%4$8P1Q!'X$C 2:!*@$M@3$!-,$X03P
M!/X%#044%]@8&!A8&)P8W!D@&
M609J!GL&C :=!J\&P ;1!N,&]0<'!QD'*P<]!T\'80=T!X8'F0>L![\'T@?E
M!_@("P@?"#((1@A:"&X(@@B6"*H(O@C2".<(^PD0"24).@E/"60)>0F/":0)
MN@G/">4)^PH1"B<*/0I4"FH*@0J8"JX*Q0K<"O,+"PLB"SD+40MI"X +F NP
M"\@+X0OY#!(,*@Q##%P,=0R.#*<,P S9#/,-#0TF#4 -6@UT#8X-J0W##=X-
M^ X3#BX.20YD#G\.FPZV#M(.[@\)#R4/00]>#WH/E@^S#\\/[! )$"800Q!A
M$'X0FQ"Y$-<0]1$3$3$13Q%M$8P1JA')$>@2!Q(F$D429!*$$J,2PQ+C$P,3
M(Q-#$V,3@Q.D$\43Y10&%"<4211J%(L4K13.%/ 5$A4T%585>!6;%;T5X!8#
M%B86219L%H\6LA;6%OH7'1=!%V47B1>N%](7]Q@;&$ 891B*&*\8U1CZ&2 9
M11EK&9$9MQG=&@0:*AI1&G<:GAK%&NP;%!L[&V,;BANR&]H< APJ'%(<>QRC
M',P<]1T>'4<=:AZ4'KX>Z1\3'SX?:1^4'[\?ZB 5($$@
M;""8(,0@\"$<(4@A=2&A( &YXS'DJ>8EYYWI&
M>J5[!'MC>\)\(7R!?.%]07VA?@%^8G["?R-_A'_E@$> J($*@6N!S8(P@I*"
M](-7@[J$'82 A..%1X6KA@Z& I0B6
MQTNZEB(R'"84_0G@UK_"O0K?6-=EN-253I]A$9Y@PRK'L#[=3^%)K_Q UN_U
M*1[*]EL[-6(AAA.P*G;..IJ92=^6)K"E!04ZCWVL '[?1+-O'7B@-#IME\UC"V UW-SC:#V!Z?GT!K/\$:[)K?QHTW5]14/)=WV
M2I;A<@J@!_V?EQ]!7:^/;SP-XPNK?S_''V2PM4\NVLX=/D"1#_OGD\#\J\O\
M2V^C>']7T^?PCKKZH8R)C,8&B,4BME>".>F:P@_:7 D!
M\@'Z @,"# (4 AT")@(O C@"00)+ E0"70)G G$">@*$ HX"F *B JP"M@+!
M LL"U0+@ NL"]0, PL#%@,A RT#. -# T\#6@-F W(#?@.* Y8#H@.N [H#
MQP/3 ^ #[ /Y! 8$$P0@!"T$.P1(!%4$8P1Q!'X$C 2:!*@$M@3$!-,$X03P
M!/X%#044%]@8&!A8&)P8W!D@&
M609J!GL&C :=!J\&P ;1!N,&]0<'!QD'*P<]!T\'80=T!X8'F0>L![\'T@?E
M!_@("P@?"#((1@A:"&X(@@B6"*H(O@C2".<(^PD0"24).@E/"60)>0F/":0)
MN@G/">4)^PH1"B<*/0I4"FH*@0J8"JX*Q0K<"O,+"PLB"SD+40MI"X +F NP
M"\@+X0OY#!(,*@Q##%P,=0R.#*<,P S9#/,-#0TF#4 -6@UT#8X-J0W##=X-
M^ X3#BX.20YD#G\.FPZV#M(.[@\)#R4/00]>#WH/E@^S#\\/[! )$"800Q!A
M$'X0FQ"Y$-<0]1$3$3$13Q%M$8P1JA')$>@2!Q(F$D429!*$$J,2PQ+C$P,3
M(Q-#$V,3@Q.D$\43Y10&%"<4211J%(L4K13.%/ 5$A4T%585>!6;%;T5X!8#
M%B86219L%H\6LA;6%OH7'1=!%V47B1>N%](7]Q@;&$ 891B*&*\8U1CZ&2 9
M11EK&9$9MQG=&@0:*AI1&G<:GAK%&NP;%!L[&V,;BANR&]H< APJ'%(<>QRC
M',P<]1T>'4<=:AZ4'KX>Z1\3'SX?:1^4'[\?ZB 5($$@
M;""8(,0@\"$<(4@A=2&A( &YXS'DJ>8EYYWI&
M>J5[!'MC>\)\(7R!?.%]07VA?@%^8G["?R-_A'_E@$> J($*@6N!S8(P@I*"
M](-7@[J$'82 A..%1X6KA@Z&_P#[,*^.[.9K:ZAG0D-$
MZN".H(.:RP"O3?J:8]VJ(^]JQO$?AC1O$L<*:Y8178A),>\D%<]<$$'L/RK0
MTR\CU#3;6\@8-%<1+*A'0A@"/YUQ?Q<\::AX)TRRO+"PANHYI3%(\I("'&0.
M/7!_*O-IQDYJ,=ST:DHJ#E+8L?\ "K/!?_0"@_[^R?\ Q5+_ ,*N\&?] *#_
M +^2?_%5Y%-\?=?9!Y&EZ6C9Y+B1ACZ!A40^/'B?_GQT7_OS+_\ '*[/J^*[
M_B<3Q.%[?@>Q?\*O\&_] *#_ +^2?_%58T_X=^%-/O8;NTT6!+B%@\;%G;:P
MZ'!)%>+_ /"]_$__ #XZ-_WYE_\ CE*/CMXF/_+CHW_?F7_XY0\-B>K_ !%]
M:PJUM^!])U\G?&01+\2M:\EMR[T)/^UY:[A^!S6Y/\%$L+HEMI,+,,"1(7
M++[C+D9^H->:WEU->W
UK_D,7W_7>3_T(U2KW
MEL=+W$I*6D-, I*6BA@-I*6DI#"FFE-)2 2BBBAC$HHHI#0E%%% PHHI,T@"
MDI:2@84444 %.IM+F@!:**,T +2BD%.IB%%+2"EH)8HIPIHIPIB8ZG"FTX4$
MCJ44VG"J$/%**:*<*$2.%.%,%.!IB8\4X4T&E%,D>M/%,6G"F2R04[-1@T\&
M@D>*<#48-/!H)8\4X5'3P:1+'BG@YJ*G]*!,D!IX-1 T^ADM$@IPJ,&G TB;
M$H-.!J, ]5?BS';Z]X5\.>-(($ANK]3;W
MJH,!I%X!_P#'6_#'I4QJR=G):,)T8I-1>JW//-,TG4=3#?V=875T%^\88F<#
MZX%0W5M/:3M!=PRP3+PR2*58?@:[.\^*&LQ6=G9>'%BT.QMXPODVHSO;'S,S
M-DG)_P GK72^)KP^,?@S%XAUE$&L:?>"U6X"[3<(<9^OWNW=3[TW4G%KF6C(
M]E"2?*]5J>5V-G
H]ZY[5/#$]IKMKI5A=6NJ7%P
M!L-H^]022,$]L8R?:I52+T3+EAJD5=HQ :<#7=M\-V63[(?$&D?VIT-IYF#N
MQ]W/K^%<-
IXGNI-U>U:OIFD^._!GAC6+;2++1
M-0O-;729OL2[8V1OXL>HX_6J_CGQ9IG@CQ3>^'-#\'^'I;*P*PM+?6YFFF.T
M$DMN'K0IWT2%R]3QW=1G/2O<;OP!H?B+Q=X"N[*W_LW3_$D#SW-E&WRQM&NY
M@A[!NGM6'XC^(.GZ7XCO-)T[P5X:_LNTN&M@D]J6E<*VW)?.03BA3OL@Y;;G
MF^K:9?Z-=+;:I:36L[()!'*NTE3T./2J6[-?4.M^$]/\6?'"X?4K=)[:PT.&
MZ2T:3:LK]%5C_=YY_#-4M/TG5[W4(;37_!_@--$D<)+]FFC2:)#P65P^<@<]
M*E558KV9\[+IUZ;$W@MI3; ;O,V\8SC/TSQGUJINKN_&6M?V!<:MX5T]H[FR
MM;B2*&X#[@R$%
U,- *?
M$I=PH[TRM+1[?S&,I'RKWH V+*(10J.G%237,<*Y9A63>ZKL)2+KTK%N9Y93
MEV- &KJ&L;LI#^=8DTK2'+,33"#WIIH :324N":4+0 BC-3*VWO49.*8ST 6
M#+Q43R8%0;N:1CNH &