Exhibit 99.1

Neonode Reports First Quarter
Ended March 31, 2019 Financial Results
STOCKHOLM, SWEDEN
– May 8, 2019 – Neonode Inc. (NASDAQ: NEON), the optical interactive sensing technology company, today reported financial
results for the three months ended March 31, 2019.
“We are executing on our
business plan, and see a growing number of customer design activities for both licensing and module projects. I am happy with the
progress we are making and I am confident that we are on the right track to achieve revenue growth and profitability,”
said Håkan Persson, CEO of Neonode Inc.
FINANCIAL SUMMARY FIRST QUARTER 2019
| ● | Net sales totaled $2.0 million compared to $2.4 million
for the same period last year. |
| ● | Net loss totaled $0.6 million compared to a net loss of
$0.7 million for the same period last year. |
| ● | Loss per share totaled $0.07 compared to a loss per share
of $0.12 for the same period last year. |
| ● | Net
cash used in operating activities totaled $0.5 million compared to $0.6 million for the same period last year. |
BUSINESS HIGHLIGHTS DURING THE QUARTER
| ● | Release of zForce CORE 1.5 with strong customer interest. |
| ● | Signed agreement with Convergence to sell zForce sensor
modules in North America. |
BUSINESS HIGHLIGHTS SINCE THE END OF THE QUARTER
| ● | Signed collaboration agreement with FineTek who will serve
as a system integrator and future electronic manufacturing partner for Neonode zForce technology. |
| ● | Assigned
a portfolio of patents to Aequitas Technologies LLC as part of an agreement to share potential proceeds generated from a licensing
and monetization program. |
| ● | Received
purchase order for sensor modules of approximately $0.6 million from industry leading medical device OEM who will use our sensor
module in a retrofit touch display system for an X-Ray machine. Delivery expected to begin in June 2019. |
THE CEO’S COMMENTS
We have reshaped our business,
working methodology and processes to become more market and customer focused. Our business plan now targets specific markets
and use cases providing a solid customer base and pathway to future growth and profitability. There are no shortcuts or easy fixes in the
development of our embedded sensor business, but I am satisfied with the progress we are making.
Our strategy going
forward is centered around the following initiatives:
| ● | Capitalize and build
on our successful Touch Interaction business by increasing our market position and sales reach. We provide solutions for both
high and low volume product implementations through an expanded use case offering. We have an established track record with our
touch on display solutions and will use our strong presence to grow our market share. |
| |
● |
Capture growth opportunities for our Mid-Air Interaction and Object Sensing solutions in automotive entry systems. The automotive market is one of the new technology frontiers and represents a significant market opportunity for us to leverage our existing relationships with Tier 1 suppliers and OEMs to gain additional market share. |
Our targeted
use cases for basic touch, high-image quality display touch, ruggedized display touch and entry systems for automotive systems
allow us to capitalize on our competitive advantages in high value markets.
We have a growing number of design activities
for both sensor modules and licensing applications with existing and new customers. The latest release of our touch on display
license technology has been very well received and is generating opportunities for printers, e-readers and automotive in-vehicle
infotainment (IVI) systems. We expect that two of our most important printer customers will increase and expand printer shipments
with our technology. We are also in final license negotiations with a new Chinese printer customer for a solution targeting the
Chinese market. We are performing an in-depth analysis of the automotive IVI market and are engaging with all relevant OEM and
Tier 1 supplier partners for discussions and pre-design activities.
In our module
business, we are beginning to receive initial orders for production volumes from our medical device, taximeter and aircraft instrumentation
customers. We anticipate that order volumes will expand over time. Our tailgate solution for automotive entry systems has been
well received and we expect to be entering into first evaluation projects soon. We are completing relevant testing to meet automotive ISO9001, ISO 16750 and GMW 3175 certification requirements.
Increasing our reach and effectiveness
of marketing and sales is a continuous activity. In order to improve our sales presence in the U.S. market we have signed a marketing
and sales agreement with Convergence Promotions LLC to coordinate our expanding network of sales representatives in the U.S. We
have increased our marketing and trade show activities to support this new sales relationship and to increase awareness of our
selected use case offerings. After the quarter ended we entered into a system integrator and manufacturing partner cooperation
agreement with Finetek Co. Ltd of Korea supporting both our licensing and module business in Asia and globally. We plan to further
grow our presence in Asia by replicating our model with Convergence and are evaluating and negotiating with qualified sales and
marketing partners in the region.
In summary, we are executing on our plan and see
positive customer response with numerous discussions ongoing and actual shipments happening. This makes me confident that we are
on the right track to achieve revenue growth and profitability.
FINANCIAL OVERVIEW FOR THE QUARTER
Revenues for the first quarter of 2019 decreased
by 15% year over year, mainly due to a $0.3 million decrease in license fees from one printer customer, as a result of their decision
to move to an alternative technology platform. Operating expenses continued on a run rate below plan, down by
20%, and net loss decreased by 24% compared to the first quarter 2018. Cash used by operations decreased by 18% year over year,
and cash and accounts receivables totaling $7.6 million allows us to continue to execute according to our plan. Our first quarter
Form 10Q is available for download from the Investors section of our website at neonode.com.
Financial Overview
| | |
2019 | | |
2018 | | |
2017 | | |
2018 | | |
2017 | |
| Amounts in USD thousand unless otherwise stated | |
Q1 | | |
Q1 | | |
Q1 | | |
Full year | | |
Full year | |
| Net sales | |
$ | 2,012 | | |
$ | 2,375 | | |
$ | 2,332 | | |
$ | 8,538 | | |
$ | 10,241 | |
| Net sales growth % | |
| (15.3 | )% | |
| 1.8 | % | |
| (25.5 | )% | |
| (16.6 | )% | |
| 0.3 | % |
| Gross margin % | |
| 95.0 | % | |
| 98.1 | % | |
| 95.5 | % | |
| 89.2 | % | |
| 77.1 | % |
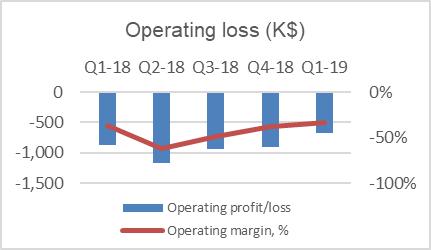
| Operating profit/loss | |
$ | (668 | ) | |
$ | (879 | ) | |
$ | (878 | ) | |
$ | (3,877 | ) | |
$ | (5,476 | ) |
| Operating margin % | |
| (33.2 | )% | |
| (37.0 | )% | |
| (37.7 | )% | |
| (45.4 | )% | |
| (53.5 | )% |
| Net cash used in operating activities | |
$ | (454 | ) | |
$ | (561 | ) | |
$ | (104 | ) | |
$ | (2,859 | ) | |
$ | (5,581 | ) |
| Cash and cash equivalents | |
$ | 5,822 | | |
$ | 4,907 | | |
$ | 5,796 | | |
$ | 6,555 | | |
$ | 5,796 | |
| Total Assets | |
$ | 12,947 | | |
$ | 12,963 | | |
$ | 13,127 | | |
$ | 13,242 | | |
$ | 13,127 | |
| Equity ratio | |
| 469.0 | % | |
| 65.3 | % | |
| 59.9 | % | |
| 74.0 | % | |
| 59.9 | % |
Revenue Distribution by Business Model
| | |
2019 | | |
2018 | | |
2017 | | |
2018 | | |
2017 | |
| Revenue Distribution By Business Model | |
Q1 | | |
Q1 | | |
Q1 | | |
Full year | | |
Full year | |
| License fees | |
$ | 1,942 | | |
$ | 2,323 | | |
$ | 2,121 | | |
$ | 7,954 | | |
$ | 8,684 | |
| Sensor modules | |
| 50 | | |
| 52 | | |
| 210 | | |
| 227 | | |
| 814 | |
| Non-recurring engineering | |
| 20 | | |
| 0 | | |
| 1 | | |
| 357 | | |
| 743 | |
License Fee Revenue Distribution per Market
| | |
2019 | | |
2018 | | |
2017 | | |
2018 | | |
2017 | |
| License Fee Revenue Distribution Per Market | |
Q1 | | |
Q1 | | |
Q1 | | |
Full year | | |
Full year | |
| Printers | |
$ | 1,283 | | |
$ | 1,570 | | |
$ | 1,124 | | |
$ | 5,490 | | |
$ | 5,330 | |
| E-Readers and Tablets | |
| 163 | | |
| 234 | | |
| 400 | | |
| 837 | | |
| 1 206 | |
| Automotive | |
| 496 | | |
| 519 | | |
| 597 | | |
| 1,627 | | |
| 2,148 | |
PATENTS
On May 6, 2019, Neonode assigned a portfolio
of patents to Aequitas Technologies LLC. The portfolio contains two patent families comprising nine US patents, five non-U.S. patents
and three pending U.S. patent applications. The assignment provides Neonode the right to share potential proceeds generated from
a licensing and monetization program.
ORGANIZATION AND STAFF
Neonode Inc., a Delaware Incorporated Company,
with its executive head office in Stockholm, Sweden are organized in four wholly owned subsidiaries located in Sweden, Japan, Korea
and Taiwan and with a majority owned subsidiary in Kungsbacka, Sweden. At the end of the first quarter, our company had a workforce
of 55 people, including ten consultants compared to a workforce of 53 people at the same date last year. Our workforce primarily
is located in Sweden.
FUTURE REPORTING DATES
| Q2 Interim Report 2019 |
August 14, 2019 |
| Q3 Interim Report 2019 |
November 6, 2019 |
FOR MORE INFORMATION, PLEASE CONTACT:
Investor Relations
David Brunton
Email: david.brunton@neonode.com
Chief Financial Officer
Lars Lindqvist
E-mail: lars.lindqvist@neonode.com
ABOUT NEONODE
Neonode Inc. (NASDAQ:NEON) develops, manufactures
and sells advanced sensor modules based on our company’s proprietary ZFORCE AIR technology. Neonode ZFORCE AIR Sensor Modules enable
touch interaction, mid-air interaction and object sensing and are ideal for integration in a wide range of applications within
the automotive, consumer electronics, medical, robotics and other markets. Our company also develops and licenses user interfaces
and optical interactive touch solutions based on its patented ZFORCE CORE technology. To date, Neonode’s technology has been
deployed in approximately 70 million products, including 4 million cars and 66 million consumer devices.
NEONODE, the NEONODE logo, ZFORCE and ZFORCE AIR are
trademarks of Neonode Inc. registered in the United States and other countries. ZFORCE CORE is a trademark of Neonode Inc.
For further information please visit www.neonode.com
Follow us:
Subscribe to our news here
Linkedin.com/company/neonode
News.cision.com/neonode
SAFE HARBOR STATEMENT
This press release contains forward-looking
statements within the meaning of the Private Securities Litigation Reform Act of 1995. These include, but are not limited to, statements
relating to expectations, future performance or future events, business plan and strategy, revenue guidance for 2019 from license
fees and module sales, proceed from patent licensing, revenue from patent monetization, customer shipments and orders, and product
cost, performance, and functionality matters. These statements are based on current assumptions, expectations and information available
to Neonode management and involve a number of known and unknown risks, uncertainties and other factors that may cause Neonode’s
actual results, levels of activity, performance or achievements to be materially different from any expressed or implied by these
forward-looking statements.
These risks, uncertainties,
and factors are discussed under “Risk Factors” and elsewhere in Neonode’s public filings with the U.S. Securities and
Exchange Commission from time to time, including Neonode’s annual report on Form 10-K, quarterly reports on Form 10-Q, and current
reports on Form 8-K. You are advised to carefully consider these various risks, uncertainties and other factors. Although Neonode
management believes that the forward-looking statements contained in this press release are reasonable, it can give no assurance
that its expectations will be fulfilled. Forward-looking are made as today’s date, and Neonode undertakes no duty to update
or revise them.
NEONODE INC.
CONDENSED CONSOLIDATED BALANCE SHEETS
(In thousands, except share and per share
amounts)
| | |
March 31, | | |
December 31, | |
| | |
2019 | | |
2018 | |
| | |
(Unaudited) | | |
(Audited) | |
| | |
| | |
| |
| ASSETS | |
| | |
| |
| Current assets: | |
| | |
| |
| Cash | |
$ | 5,822 | | |
$ | 6,555 | |
| Accounts receivable and unbilled revenue, net | |
| 1,737 | | |
| 1,830 | |
| Projects in process | |
| 8 | | |
| - | |
| Inventory | |
| 1,188 | | |
| 1,219 | |
| Prepaid expenses and other current assets | |
| 946 | | |
| 890 | |
| Total current assets | |
| 9,701 | | |
| 10,494 | |
| | |
| | | |
| | |
| Investment in joint venture | |
| 3 | | |
| 3 | |
| Property and equipment, net | |
| 2,196 | | |
| 2,484 | |
| Operating lease - right-of-use assets | |
| 798 | | |
| - | |
| Other assets | |
| 249 | | |
| 261 | |
| Total assets | |
$ | 12,947 | | |
$ | 13,242 | |
| | |
| | | |
| | |
| LIABILITIES AND STOCKHOLDERS’ EQUITY | |
| | | |
| | |
| Current liabilities: | |
| | | |
| | |
| Accounts payable | |
$ | 547 | | |
$ | 501 | |
| Accrued payroll and employee benefits | |
| 943 | | |
| 902 | |
| Accrued expenses | |
| 126 | | |
| 265 | |
| Deferred revenues | |
| 104 | | |
| 75 | |
| Current portion of finance lease obligations | |
| 546 | | |
| 570 | |
| Current portion of operating lease obligations | |
| 455 | | |
| | |
| Total current liabilities | |
| 2,721 | | |
| 2,313 | |
| | |
| | | |
| | |
| Finance lease obligations, net of current portion | |
| 944 | | |
| 1,133 | |
| Operating lease obligations, net of current portion | |
| 351 | | |
| | |
| Total liabilities | |
| 4,016 | | |
| 3,446 | |
| | |
| | | |
| | |
| Commitments and contingencies | |
| | | |
| | |
| | |
| | | |
| | |
| Stockholders’ equity: | |
| | | |
| | |
| Series B Preferred stock, 54,425 shares authorized with par value $0.001 per share; 82 shares issued and outstanding at March 31, 2019 and December 31, 2018. (In the event of dissolution, each share of Series B Preferred stock has a liquidation preference equal to par value of $0.001 per share over the shares of common stock) | |
| - | | |
| - | |
| Common stock, 10,000,000 shares authorized with par value $0.001 per share; 8,800,313 shares issued and outstanding at March 31, 2019 and December 31, 2018, respectively | |
| 9 | | |
| 9 | |
| Additional paid-in capital | |
| 197,507 | | |
| 197,507 | |
| Accumulated other comprehensive loss | |
| (637 | ) | |
| (456 | ) |
| Accumulated deficit | |
| (185,795 | ) | |
| (185,222 | ) |
| Total Neonode Inc. stockholders’ equity | |
| 11,084 | | |
| 11,838 | |
| Noncontrolling interests | |
| (2,153 | ) | |
| (2,042 | ) |
| Total stockholders’ equity | |
| 8,931 | | |
| 9,796 | |
| Total liabilities and stockholders’ equity | |
$ | 12,947 | | |
$ | 13,242 | |
NEONODE INC.
CONDENSED CONSOLIDATED STATEMENTS OF
OPERATIONS
(In thousands, except per share amounts)
(Unaudited)
| | |
Three months ended
March 31, | |
| | |
2019 | | |
2018 | |
| Revenue: | |
| | |
| |
| License fees | |
$ | 1,942 | | |
$ | 2,323 | |
| Sensor modules | |
| 50 | | |
| 52 | |
| Non-recurring engineering | |
| 20 | | |
| - | |
| Total revenues | |
| 2,012 | | |
| 2,375 | |
| Cost of revenues: | |
| | | |
| | |
| Sensor modules | |
| (16 | ) | |
| 45 | |
| Non-recurring engineering | |
| 117 | | |
| 1 | |
| Total cost of revenues | |
| 101 | | |
| 46 | |
| | |
| | | |
| | |
| Total gross margin | |
| 1,911 | | |
| 2,329 | |
| | |
| | | |
| | |
| Operating expenses: | |
| | | |
| | |
| Research and development | |
| 1,259 | | |
| 1,518 | |
| Sales and marketing | |
| 449 | | |
| 556 | |
| General and administrative | |
| 871 | | |
| 1,134 | |
| | |
| | | |
| | |
| Total operating expenses | |
| 2,579 | | |
| 3,208 | |
| Operating loss | |
| (668 | ) | |
| (879 | ) |
| | |
| | | |
| | |
| Other expense: | |
| | | |
| | |
| Interest expense | |
| 10 | | |
| 14 | |
| Total other expense, net | |
| 10 | | |
| 14 | |
| | |
| | | |
| | |
| Loss before provision for income taxes | |
| (678 | ) | |
| (893 | ) |
| | |
| | | |
| | |
| Provision for income taxes | |
| 6 | | |
| 7 | |
| Net loss including noncontrolling interests | |
| (684 | ) | |
| (900 | ) |
| Less: Net loss attributable to noncontrolling interests | |
| 111 | | |
| 207 | |
| Net loss attributable to Neonode Inc. | |
$ | (573 | ) | |
$ | (693 | ) |
| | |
| | | |
| | |
| Loss per common share: | |
| | | |
| | |
| Basic and diluted loss per share | |
$ | (0.07 | ) | |
$ | (0.12 | ) |
| Basic and diluted – weighted average number of common shares outstanding | |
| 8,800 | | |
| 5,860 | |
NEONODE INC.
CONDENSED CONSOLIDATED STATEMENTS OF
COMPREHENSIVE LOSS
(In thousands)
(Unaudited)
| | |
Three months ended
March 31, | |
| | |
2019 | | |
2018 | |
| | |
| | |
| |
| Net loss | |
$ | (684 | ) | |
$ | (900 | ) |
| Other comprehensive loss: | |
| | | |
| | |
| Foreign currency translation adjustments | |
| (181 | ) | |
| (94 | ) |
| Comprehensive loss | |
| (865 | ) | |
| (994 | ) |
| Less: Comprehensive loss attributable to noncontrolling interests | |
| 111 | | |
| 207 | |
| Comprehensive loss attributable to Neonode Inc. | |
$ | (754 | ) | |
$ | (787 | ) |
NEONODE INC.
CONSOLIDATED STATEMENTS OF STOCKHOLDERS’
EQUITY
(In thousands)
For the Quarter to Date periods ended
March 31, 2018 through March 31, 2019
| | |
Series B Preferred Stock Shares Issued | | |
Series B Preferred Stock Amount | | |
Common Stock Shares Issued | | |
Common Stock Amount | | |
Additional Paid-in Capital | | |
Accumulated Other Comprehensive Income (Loss) | | |
Accumulated Deficit | | |
Total
Neonode Inc. Stockholders’ Equity | | |
Noncontrolling Interests | | |
Total
Stockholders’ Equity | |
| | |
| | |
| | |
| | |
| | |
| | |
| | |
| | |
| | |
| | |
| |
| Balances, January 1, 2018 | |
| 83 | | |
$ | - | | |
| 5,859 | | |
$ | 6 | | |
$ | 192,861 | | |
$ | (99 | ) | |
$ | (183,745 | ) | |
$ | 9,023 | | |
$ | (1,160 | ) | |
$ | 7,863 | |
| | |
| | | |
| | | |
| | | |
| | | |
| | | |
| | | |
| | | |
| | | |
| | | |
| | |
| Adjustment related to adoption of ASC 606 revenue recognition | |
| - | | |
| - | | |
| - | | |
| - | | |
| - | | |
| - | | |
| 1,583 | | |
| 1,583 | | |
| - | | |
| 1,583 | |
| | |
| | | |
| | | |
| | | |
| | | |
| | | |
| | | |
| | | |
| | | |
| | | |
| | |
| Stock option and warrant compensation expense to employees and directors | |
| - | | |
| - | | |
| - | | |
| - | | |
| 2 | | |
| - | | |
| - | | |
| 2 | | |
| - | | |
| 2 | |
| | |
| | | |
| | | |
| | | |
| | | |
| | | |
| | | |
| | | |
| | | |
| | | |
| | |
| Foreign currency translation adjustment | |
| - | | |
| - | | |
| - | | |
| - | | |
| - | | |
| (94 | ) | |
| - | | |
| (94 | ) | |
| - | | |
| (94 | ) |
| | |
| | | |
| | | |
| | | |
| | | |
| | | |
| | | |
| | | |
| | | |
| | | |
| | |
| Net loss | |
| - | | |
| - | | |
| - | | |
| - | | |
| - | | |
| - | | |
| (693 | ) | |
| (693 | ) | |
| (207 | ) | |
| (900 | ) |
| | |
| | | |
| | | |
| | | |
| | | |
| | | |
| | | |
| | | |
| | | |
| | | |
| | |
| Balances, March 31, 2018 | |
| 83 | | |
$ | - | | |
| 5,859 | | |
$ | 6 | | |
$ | 192,873 | | |
$ | (193 | ) | |
$ | (182,855 | ) | |
$ | 9,831 | | |
$ | (1,367 | ) | |
$ | 8,464 | |
| | |
| | | |
| | | |
| | | |
| | | |
| | | |
| | | |
| | | |
| | | |
| | | |
| | |
| Stock option and warrant compensation expense to employees and directors | |
| - | | |
| - | | |
| - | | |
| - | | |
| 18 | | |
| - | | |
| - | | |
| 18 | | |
| - | | |
| 18 | |
| | |
| | | |
| | | |
| | | |
| | | |
| | | |
| | | |
| | | |
| | | |
| | | |
| | |
| Foreign currency translation adjustment | |
| - | | |
| - | | |
| - | | |
| - | | |
| - | | |
| (336 | ) | |
| - | | |
| (336 | ) | |
| - | | |
| (336 | ) |
| | |
| | | |
| | | |
| | | |
| | | |
| | | |
| | | |
| | | |
| | | |
| | | |
| | |
| Net loss | |
| - | | |
| - | | |
| - | | |
| - | | |
| - | | |
| - | | |
| (964 | ) | |
| (964 | ) | |
| (211 | ) | |
| (1,175 | ) |
| | |
| | | |
| | | |
| | | |
| | | |
| | | |
| | | |
| | | |
| | | |
| | | |
| | |
| Balances, June 30, 2018 | |
| 83 | | |
$ | - | | |
| 5,859 | | |
$ | 6 | | |
$ | 192,891 | | |
$ | (529 | ) | |
$ | (183,819 | ) | |
$ | 8,549 | | |
$ | (1,578 | ) | |
$ | 6,971 | |
| | |
Series B Preferred Stock Shares Issued | | |
Series B Preferred Stock Amount | | |
Common Stock Shares Issued | | |
Common Stock Amount | | |
Additional Paid-in Capital | | |
Accumulated Other Comprehensive Income (Loss) | | |
Accumulated Deficit | | |
Total
Neonode Inc. Stockholders’ Equity | | |
Noncontrolling Interests | | |
Total
Stockholders’ Equity | |
| | |
| | |
| | |
| | |
| | |
| | |
| | |
| | |
| | |
| | |
| |
| Foreign currency translation adjustment | |
| - | | |
| - | | |
| - | | |
| - | | |
| - | | |
| 13 | | |
| - | | |
| 13 | | |
| - | | |
| 13 | |
| | |
| | | |
| | | |
| | | |
| | | |
| | | |
| | | |
| | | |
| | | |
| | | |
| | |
| Net loss | |
| - | | |
| - | | |
| - | | |
| - | | |
| - | | |
| - | | |
| (810 | ) | |
| (810 | ) | |
| (142 | ) | |
| (952 | ) |
| | |
| | | |
| | | |
| | | |
| | | |
| | | |
| | | |
| | | |
| | | |
| | | |
| | |
| Balances, September 30, 2018 | |
| 83 | | |
$ | - | | |
| 5,859 | | |
$ | 6 | | |
$ | 192,891 | | |
$ | (516 | ) | |
$ | (184,629 | ) | |
$ | 7,752 | | |
$ | (1,720 | ) | |
$ | 6,032 | |
| | |
| | | |
| | | |
| | | |
| | | |
| | | |
| | | |
| | | |
| | | |
| | | |
| | |
| Conversion of series B Preferred Stock to common stock | |
| (1 | ) | |
| - | | |
| - | | |
| - | | |
| - | | |
| - | | |
| - | | |
| - | | |
| - | | |
| - | |
| | |
| | | |
| | | |
| | | |
| | | |
| | | |
| | | |
| | | |
| | | |
| | | |
| | |
| Proceeds from sale of common stock, net of offering expenses | |
| - | | |
| - | | |
| 2,941 | | |
| 3 | | |
| 4,616 | | |
| - | | |
| - | | |
| 4,619 | | |
| - | | |
| 4,619 | |
| | |
| | | |
| | | |
| | | |
| | | |
| | | |
| | | |
| | | |
| | | |
| | | |
| | |
| Foreign currency translation adjustment | |
| - | | |
| - | | |
| - | | |
| - | | |
| - | | |
| 60 | | |
| - | | |
| 60 | | |
| - | | |
| 60 | |
| | |
| | | |
| | | |
| | | |
| | | |
| | | |
| | | |
| | | |
| | | |
| | | |
| | |
| Net loss | |
| - | | |
| - | | |
| - | | |
| - | | |
| - | | |
| - | | |
| (593 | ) | |
| (593 | ) | |
| (322 | ) | |
| (915 | ) |
| | |
| | | |
| | | |
| | | |
| | | |
| | | |
| | | |
| | | |
| | | |
| | | |
| | |
| Balances, December 31, 2018 | |
| 82 | | |
$ | - | | |
| 8,800 | | |
$ | 9 | | |
$ | 197,507 | | |
$ | (456 | ) | |
$ | (185,222 | ) | |
$ | 11,838 | | |
$ | (2,042 | ) | |
$ | 9,796 | |
| Foreign currency translation adjustment | |
| - | | |
| - | | |
| - | | |
| - | | |
| - | | |
| (181 | ) | |
| - | | |
| (181 | ) | |
| - | | |
| (181 | ) |
| | |
| | | |
| | | |
| | | |
| | | |
| | | |
| | | |
| | | |
| | | |
| | | |
| | |
| Net loss | |
| - | | |
| - | | |
| - | | |
| - | | |
| - | | |
| - | | |
| (573 | ) | |
| (573 | ) | |
| (111 | ) | |
| (684 | ) |
| | |
| | | |
| | | |
| | | |
| | | |
| | | |
| | | |
| | | |
| | | |
| | | |
| | |
| Balances, March 31, 2019 | |
| 82 | | |
$ | - | | |
| 8,800 | | |
$ | 9 | | |
$ | 197,507 | | |
$ | (637 | ) | |
$ | (185,795 | ) | |
$ | 11,084 | | |
$ | (2,153 | ) | |
$ | 8,931 | |
NEONODE INC.
CONDENSED CONSOLIDATED STATEMENTS OF
CASH FLOWS
(In thousands)
(Unaudited)
| | |
Three months ended
March 31, | |
| | |
2019 | | |
2018 | |
| Cash flows from operating activities: | |
| | |
| |
| Net loss (including noncontrolling interests) | |
$ | (684 | ) | |
$ | (900 | ) |
| Adjustments to reconcile net loss to net cash used in operating activities: | |
| | | |
| | |
| Stock-based compensation expense | |
| - | | |
| 12 | |
| Depreciation and amortization | |
| 222 | | |
| 278 | |
| Amortization of operating lease right-of-use assets | |
| 120 | | |
| - | |
| | |
| | | |
| | |
| Changes in operating assets and liabilities: | |
| | | |
| | |
| Accounts receivable and unbilled revenue, net | |
| 90 | | |
| 224 | |
| Projects in process | |
| (8 | ) | |
| (34 | ) |
| Inventory | |
| (63 | ) | |
| (114 | ) |
| Prepaid expenses and other current assets | |
| (72 | ) | |
| 163 | |
| Accounts payable and accrued expenses | |
| 16 | | |
| 122 | |
| Deferred revenues | |
| 30 | | |
| (312 | ) |
| Operating lease obligations | |
| (111 | ) | |
| - | |
| Net cash used in operating activities | |
| (460 | ) | |
| (561 | ) |
| | |
| | | |
| | |
| Cash flows from investing activities: | |
| | | |
| | |
| Purchase of property and equipment | |
| (47 | ) | |
| (133 | ) |
| Net cash used in investing activities | |
| (47 | ) | |
| (133 | ) |
| | |
| | | |
| | |
| Cash flows from financing activities: | |
| | | |
| | |
| Principal payments on finance lease obligations | |
| (137 | ) | |
| (143 | ) |
| Net cash used in financing activities | |
| (137 | ) | |
| (143 | ) |
| | |
| | | |
| | |
| Effect of exchange rate changes on cash | |
| (89 | ) | |
| (52 | ) |
| | |
| | | |
| | |
| Net decrease in cash | |
| (733 | ) | |
| (889 | ) |
| Cash at beginning of period | |
| 6,555 | | |
| 5,796 | |
| Cash at end of period | |
$ | 5,822 | | |
$ | 4,907 | |
| | |
| | | |
| | |
| Supplemental disclosure of cash flow information: | |
| | | |
| | |
| Cash paid for income taxes | |
$ | 6 | | |
$ | 7 | |
| Cash paid for interest | |
$ | 10 | | |
$ | 14 | |
11