| Label |
Element |
Value |
| Prospectus [Line Items] |
rr_ProspectusLineItems |
|
|
| Document Type |
dei_DocumentType |
485BPOS
|
|
| Document Period End Date |
dei_DocumentPeriodEndDate |
Dec. 31, 2018
|
|
| Entity Registrant Name |
dei_EntityRegistrantName |
PUTNAM INTERNATIONAL EQUITY FUND
|
|
| Entity Central Index Key |
dei_EntityCentralIndexKey |
0000868648
|
|
| Amendment Flag |
dei_AmendmentFlag |
false
|
|
| Entity Inv Company Type |
dei_EntityInvCompanyType |
N-1A
|
|
| Trading Symbol |
dei_TradingSymbol |
POVSX
|
|
| Document Creation Date |
dei_DocumentCreationDate |
Oct. 25, 2019
|
|
| Document Effective Date |
dei_DocumentEffectiveDate |
Oct. 30, 2019
|
|
| Prospectus Date |
rr_ProspectusDate |
Oct. 30, 2019
|
|
| Putnam International Equity Fund |
|
|
|
| Prospectus [Line Items] |
rr_ProspectusLineItems |
|
|
| Risk/Return [Heading] |
rr_RiskReturnHeading |
Fund summary
|
|
| Objective [Heading] |
rr_ObjectiveHeading |
Goal
|
|
| Objective, Primary [Text Block] |
rr_ObjectivePrimaryTextBlock |
Putnam International
Equity Fund seeks capital appreciation.
|
|
| Expense [Heading] |
rr_ExpenseHeading |
Fees and expenses
|
|
| Expense Narrative [Text Block] |
rr_ExpenseNarrativeTextBlock |
The following
table describes the fees and expenses you may pay if you buy and hold shares of the fund. You may qualify for sales charge discounts
if you and your family invest, or agree to invest in the future, at least $50,000 in Putnam funds. More information about these
and other discounts is available from your financial advisor and in How do I buy fund shares? beginning on page 15 of the
fund’s prospectus, in the Appendix to the fund’s prospectus, and in How to buy shares beginning on page II-1
of the fund’s statement of additional information (SAI).
|
|
| Shareholder Fees Caption [Text] |
rr_ShareholderFeesCaption |
Shareholder fees (fees paid directly from your investment)
|
|
| Operating Expenses Caption [Text] |
rr_OperatingExpensesCaption |
Annual fund operating expenses (expenses you pay each year as a percentage of the value of your investment)
|
|
| Portfolio Turnover [Heading] |
rr_PortfolioTurnoverHeading |
Portfolio turnover
|
|
| Portfolio Turnover [Text Block] |
rr_PortfolioTurnoverTextBlock |
The fund pays
transaction-related costs, such as commissions, when it buys and sells securities (or “turns over” its portfolio).
A higher turnover rate may indicate higher transaction costs and may result in higher taxes when the fund’s shares are held
in a taxable account. These costs, which are not reflected in annual fund operating expenses or the above example, affect fund performance. The fund’s
turnover rate in the most recent fiscal year was 77%.
|
|
| Portfolio Turnover, Rate |
rr_PortfolioTurnoverRate |
77.00%
|
|
| Expense Breakpoint Discounts [Text] |
rr_ExpenseBreakpointDiscounts |
You may qualify for sales charge discounts if you and your family invest, or agree to invest in the future, at least $50,000 in Putnam funds. More information about these and other discounts is available from your financial advisor and in How do I buy fund shares? beginning on page 15 of the fund's prospectus, in the Appendix to the fund's prospectus, and in How to buy shares beginning on page II-1 of the fund's statement of additional information (SAI).
|
|
| Expense Breakpoint, Minimum Investment Required [Amount] |
rr_ExpenseBreakpointMinimumInvestmentRequiredAmount |
$ 50,000
|
|
| Expense Example [Heading] |
rr_ExpenseExampleHeading |
Example
|
|
| Expense Example Narrative [Text Block] |
rr_ExpenseExampleNarrativeTextBlock |
The following
hypothetical example is intended to help you compare the cost of investing in the fund with the cost of investing in other funds.
It assumes that you invest $10,000 in the fund for the time periods indicated and then, except as indicated, redeem all your shares
at the end of those periods. It assumes a 5% return on your investment each year and that the fund’s operating expenses remain
the same. Your actual costs may be higher or lower.
|
|
| Strategy [Heading] |
rr_StrategyHeading |
Investments, risks, and performance
|
|
| Strategy Narrative [Text Block] |
rr_StrategyNarrativeTextBlock |
Investments
We invest mainly
in common stocks (growth or value stocks or both) of large and midsize companies outside the United States that we believe have
favorable investment potential. For example, we may purchase stocks of companies with stock prices that reflect a value lower than
that which we place on the company. Under normal circumstances, we invest at least 80% of the fund’s net assets in equity
investments. This policy may be changed only after 60 days’ notice to shareholders. We invest mainly in developed countries,
but may invest in emerging markets. We may consider, among other factors, a company’s valuation, financial strength, growth
potential, competitive position in its industry, projected future earnings, cash flows and dividends when deciding whether to buy
or sell investments. We may also consider other factors that we believe will cause the stock price to rise. We may also use derivatives,
such as futures, options, certain foreign currency transactions, warrants and swap contracts, for both hedging and non-hedging
purposes.
|
|
| Risk [Heading] |
rr_RiskHeading |
Risks
|
|
| Risk Narrative [Text Block] |
rr_RiskNarrativeTextBlock |
It is important
to understand that you can lose money by investing in the fund.
The value of
investments in the fund’s portfolio may fall or fail to rise over extended periods of time for a variety of reasons, including
general economic, political or financial market conditions, investor sentiment and market perceptions, government actions, geopolitical
events or changes, and factors related to a specific issuer, geography, industry or sector. These and other factors may lead to
increased volatility and reduced liquidity in the fund’s portfolio holdings. Growth stocks may be more susceptible to earnings
disappointments, and value stocks may fail to rebound. These risks are generally greater for small and midsize companies. The value
of international investments traded in foreign currencies may be adversely impacted by fluctuations in exchange rates. International
investments, particularly investments in emerging markets, may carry risks associated with potentially less stable economies or
governments (such as the risk of seizure by a foreign government, the imposition of currency or other restrictions, or high levels
of inflation), and may be or become illiquid.
Investments
focused in a single region may be affected by common economic forces and other factors. In addition, events in any one country
within the region may impact the other countries or the region as a whole. Because the fund currently invests, and may in the future
invest, significantly in European companies, the fund is particularly susceptible to economic, political, regulatory and other
events or conditions affecting issuers in Europe. European financial markets have in recent years experienced increased volatility
due to concerns with some countries’ high levels of sovereign debt, budget deficits, and unemployment.
Our use of
derivatives may increase the risks of investing in the fund by increasing investment exposure (which may be considered leverage)
or, in the case of many over-the-counter instruments, because of the potential inability to terminate or sell derivatives positions
and the potential failure of the other party to the instrument to meet its obligations.
The fund may
not achieve its goal, and it is not intended to be a complete investment program. An investment in the fund is not insured or guaranteed
by the Federal Deposit Insurance Corporation or any other government agency.
|
|
| Risk Lose Money [Text] |
rr_RiskLoseMoney |
It is important
to understand that you can lose money by investing in the fund.
|
|
| Risk Not Insured Depository Institution [Text] |
rr_RiskNotInsuredDepositoryInstitution |
An investment in the fund is not insured or guaranteed
by the Federal Deposit Insurance Corporation or any other government agency.
|
|
| Bar Chart and Performance Table [Heading] |
rr_BarChartAndPerformanceTableHeading |
Performance
|
|
| Performance Narrative [Text Block] |
rr_PerformanceNarrativeTextBlock |
The performance
information below gives some indication of the risks associated with an investment in the fund by showing the fund’s performance
year to year and over time. The bar chart does not reflect the impact of sales charges. If it did, performance would be lower.
Please remember that past performance is not necessarily an indication of future results. Monthly performance figures for the fund
are available at putnam.com.
|
|
| Performance Information Illustrates Variability of Returns [Text] |
rr_PerformanceInformationIllustratesVariabilityOfReturns |
The performance
information below gives some indication of the risks associated with an investment in the fund by showing the fund’s performance
year to year and over time.
|
|
| Performance Availability Website Address [Text] |
rr_PerformanceAvailabilityWebSiteAddress |
putnam.com
|
|
| Performance Past Does Not Indicate Future [Text] |
rr_PerformancePastDoesNotIndicateFuture |
Please remember that past performance is not necessarily an indication of future results.
|
|
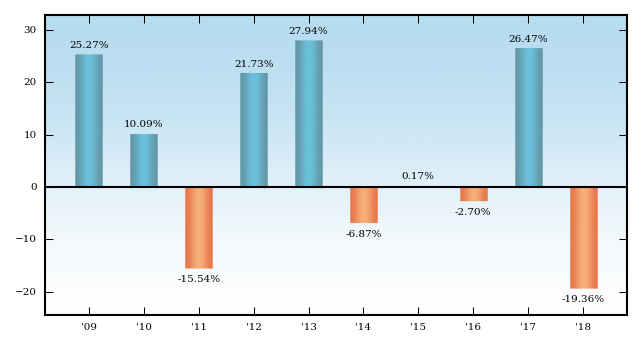
| Bar Chart [Heading] |
rr_BarChartHeading |
Annual total returns for class A shares before sales charges
|
|
| Bar Chart Does Not Reflect Sales Loads [Text] |
rr_BarChartDoesNotReflectSalesLoads |
The bar chart does not reflect the impact of sales charges. If it did, performance would be lower.
|
|
| Bar Chart Closing [Text Block] |
rr_BarChartClosingTextBlock |
Year-to-date performance
through 9/30/19 14.90%
Best calendar quarter
Q2 2009 23.24%
Worst calendar quarter
Q3 2011 −23.03%
|
|
| Year to Date Return, Label |
rr_YearToDateReturnLabel |
Year-to-date performance
|
|
| Bar Chart, Year to Date Return, Date |
rr_BarChartYearToDateReturnDate |
Sep. 30, 2019
|
|
| Bar Chart, Year to Date Return |
rr_BarChartYearToDateReturn |
14.90%
|
|
| Highest Quarterly Return, Label |
rr_HighestQuarterlyReturnLabel |
Best calendar quarter
|
|
| Highest Quarterly Return, Date |
rr_BarChartHighestQuarterlyReturnDate |
Jun. 30, 2009
|
|
| Highest Quarterly Return |
rr_BarChartHighestQuarterlyReturn |
23.24%
|
|
| Lowest Quarterly Return, Label |
rr_LowestQuarterlyReturnLabel |
Worst calendar quarter
|
|
| Lowest Quarterly Return, Date |
rr_BarChartLowestQuarterlyReturnDate |
Sep. 30, 2011
|
|
| Lowest Quarterly Return |
rr_BarChartLowestQuarterlyReturn |
(23.03%)
|
|
| Performance Table Heading |
rr_PerformanceTableHeading |
Average annual total returns after sales charges (for periods ended 12/31/18)
|
|
| Performance Table Uses Highest Federal Rate |
rr_PerformanceTableUsesHighestFederalRate |
After-tax returns reflect the historical highest individual federal marginal income tax rates and do not reflect state and local taxes.
|
|
| Performance Table Not Relevant to Tax Deferred |
rr_PerformanceTableNotRelevantToTaxDeferred |
Actual after-tax returns depend on an investor's tax situation and may differ from those shown.
|
|
| Performance Table One Class of after Tax Shown [Text] |
rr_PerformanceTableOneClassOfAfterTaxShown |
After-tax returns are shown for class A shares only and will vary for other classes.
|
|
| Performance Table Closing [Text Block] |
rr_PerformanceTableClosingTextBlock |
After-tax returns
reflect the historical highest individual federal marginal income tax rates and do not reflect state and local taxes. Actual after-tax
returns depend on an investor’s tax situation and may differ from those shown. After-tax returns are shown for class A shares
only and will vary for other classes. These after-tax returns do not apply if you hold your fund shares through a 401(k) plan,
an IRA, or another tax-advantaged arrangement.
Class B share
performance reflects conversion to class A shares after eight years.
|
|
| Putnam International Equity Fund | MSCI EAFE Index (ND) (no deduction for fees, expenses or taxes other than withholding taxes on reinvested dividends) |
|
|
|
| Prospectus [Line Items] |
rr_ProspectusLineItems |
|
|
| 1 Year |
rr_AverageAnnualReturnYear01 |
(13.79%)
|
|
| 5 Years |
rr_AverageAnnualReturnYear05 |
0.53%
|
|
| 10 Years |
rr_AverageAnnualReturnYear10 |
6.32%
|
|
| Putnam International Equity Fund | Class A |
|
|
|
| Prospectus [Line Items] |
rr_ProspectusLineItems |
|
|
| Maximum sales charge (load) imposed on purchases (as a percentage of offering price) |
rr_MaximumSalesChargeImposedOnPurchasesOverOfferingPrice |
5.75%
|
|
| Maximum deferred sales charge (load) (as a percentage of original purchase price or redemption proceeds, whichever is lower) |
rr_MaximumDeferredSalesChargeOverOther |
1.00%
|
[1] |
| Management fees |
rr_ManagementFeesOverAssets |
0.61%
|
[2] |
| Distribution and service (12b-1) fees |
rr_DistributionAndService12b1FeesOverAssets |
0.25%
|
|
| Other expenses |
rr_OtherExpensesOverAssets |
0.32%
|
[3] |
| Total annual fund operating expenses |
rr_ExpensesOverAssets |
1.18%
|
|
| Expense Example, with Redemption, 1 Year |
rr_ExpenseExampleYear01 |
$ 688
|
|
| Expense Example, with Redemption, 3 Years |
rr_ExpenseExampleYear03 |
928
|
|
| Expense Example, with Redemption, 5 Years |
rr_ExpenseExampleYear05 |
1,187
|
|
| Expense Example, with Redemption, 10 Years |
rr_ExpenseExampleYear10 |
$ 1,924
|
|
| Annual Return 2009 |
rr_AnnualReturn2009 |
25.27%
|
|
| Annual Return 2010 |
rr_AnnualReturn2010 |
10.09%
|
|
| Annual Return 2011 |
rr_AnnualReturn2011 |
(15.54%)
|
|
| Annual Return 2012 |
rr_AnnualReturn2012 |
21.73%
|
|
| Annual Return 2013 |
rr_AnnualReturn2013 |
27.94%
|
|
| Annual Return 2014 |
rr_AnnualReturn2014 |
(6.87%)
|
|
| Annual Return 2015 |
rr_AnnualReturn2015 |
0.17%
|
|
| Annual Return 2016 |
rr_AnnualReturn2016 |
(2.70%)
|
|
| Annual Return 2017 |
rr_AnnualReturn2017 |
26.47%
|
|
| Annual Return 2018 |
rr_AnnualReturn2018 |
(19.36%)
|
|
| Label |
rr_AverageAnnualReturnLabel |
before taxes
|
|
| 1 Year |
rr_AverageAnnualReturnYear01 |
(24.00%)
|
|
| 5 Years |
rr_AverageAnnualReturnYear05 |
(2.69%)
|
|
| 10 Years |
rr_AverageAnnualReturnYear10 |
4.70%
|
|
| Putnam International Equity Fund | Class A | after taxes on distributions |
|
|
|
| Prospectus [Line Items] |
rr_ProspectusLineItems |
|
|
| 1 Year |
rr_AverageAnnualReturnYear01 |
(24.92%)
|
|
| 5 Years |
rr_AverageAnnualReturnYear05 |
(3.13%)
|
|
| 10 Years |
rr_AverageAnnualReturnYear10 |
4.30%
|
|
| Putnam International Equity Fund | Class A | after taxes on distributions and sale of fund shares |
|
|
|
| Prospectus [Line Items] |
rr_ProspectusLineItems |
|
|
| 1 Year |
rr_AverageAnnualReturnYear01 |
(13.25%)
|
|
| 5 Years |
rr_AverageAnnualReturnYear05 |
(1.86%)
|
|
| 10 Years |
rr_AverageAnnualReturnYear10 |
3.91%
|
|
| Putnam International Equity Fund | Class B |
|
|
|
| Prospectus [Line Items] |
rr_ProspectusLineItems |
|
|
| Maximum sales charge (load) imposed on purchases (as a percentage of offering price) |
rr_MaximumSalesChargeImposedOnPurchasesOverOfferingPrice |
none
|
|
| Maximum deferred sales charge (load) (as a percentage of original purchase price or redemption proceeds, whichever is lower) |
rr_MaximumDeferredSalesChargeOverOther |
5.00%
|
[4] |
| Management fees |
rr_ManagementFeesOverAssets |
0.61%
|
[2] |
| Distribution and service (12b-1) fees |
rr_DistributionAndService12b1FeesOverAssets |
1.00%
|
|
| Other expenses |
rr_OtherExpensesOverAssets |
0.32%
|
[3] |
| Total annual fund operating expenses |
rr_ExpensesOverAssets |
1.93%
|
|
| Expense Example, with Redemption, 1 Year |
rr_ExpenseExampleYear01 |
$ 696
|
|
| Expense Example, with Redemption, 3 Years |
rr_ExpenseExampleYear03 |
906
|
|
| Expense Example, with Redemption, 5 Years |
rr_ExpenseExampleYear05 |
1,242
|
|
| Expense Example, with Redemption, 10 Years |
rr_ExpenseExampleYear10 |
2,059
|
|
| Expense Example, No Redemption, 1 Year |
rr_ExpenseExampleNoRedemptionYear01 |
196
|
|
| Expense Example, No Redemption, 3 Years |
rr_ExpenseExampleNoRedemptionYear03 |
606
|
|
| Expense Example, No Redemption, 5 Years |
rr_ExpenseExampleNoRedemptionYear05 |
1,042
|
|
| Expense Example, No Redemption, 10 Years |
rr_ExpenseExampleNoRedemptionYear10 |
$ 2,059
|
|
| Label |
rr_AverageAnnualReturnLabel |
before taxes
|
|
| 1 Year |
rr_AverageAnnualReturnYear01 |
(23.72%)
|
|
| 5 Years |
rr_AverageAnnualReturnYear05 |
(2.62%)
|
|
| 10 Years |
rr_AverageAnnualReturnYear10 |
4.69%
|
|
| Putnam International Equity Fund | Class C |
|
|
|
| Prospectus [Line Items] |
rr_ProspectusLineItems |
|
|
| Maximum sales charge (load) imposed on purchases (as a percentage of offering price) |
rr_MaximumSalesChargeImposedOnPurchasesOverOfferingPrice |
none
|
|
| Maximum deferred sales charge (load) (as a percentage of original purchase price or redemption proceeds, whichever is lower) |
rr_MaximumDeferredSalesChargeOverOther |
1.00%
|
[5] |
| Management fees |
rr_ManagementFeesOverAssets |
0.61%
|
[2] |
| Distribution and service (12b-1) fees |
rr_DistributionAndService12b1FeesOverAssets |
1.00%
|
|
| Other expenses |
rr_OtherExpensesOverAssets |
0.32%
|
[3] |
| Total annual fund operating expenses |
rr_ExpensesOverAssets |
1.93%
|
|
| Expense Example, with Redemption, 1 Year |
rr_ExpenseExampleYear01 |
$ 296
|
|
| Expense Example, with Redemption, 3 Years |
rr_ExpenseExampleYear03 |
606
|
|
| Expense Example, with Redemption, 5 Years |
rr_ExpenseExampleYear05 |
1,042
|
|
| Expense Example, with Redemption, 10 Years |
rr_ExpenseExampleYear10 |
2,254
|
|
| Expense Example, No Redemption, 1 Year |
rr_ExpenseExampleNoRedemptionYear01 |
196
|
|
| Expense Example, No Redemption, 3 Years |
rr_ExpenseExampleNoRedemptionYear03 |
606
|
|
| Expense Example, No Redemption, 5 Years |
rr_ExpenseExampleNoRedemptionYear05 |
1,042
|
|
| Expense Example, No Redemption, 10 Years |
rr_ExpenseExampleNoRedemptionYear10 |
$ 2,254
|
|
| Label |
rr_AverageAnnualReturnLabel |
before taxes
|
|
| 1 Year |
rr_AverageAnnualReturnYear01 |
(20.72%)
|
|
| 5 Years |
rr_AverageAnnualReturnYear05 |
(2.26%)
|
|
| 10 Years |
rr_AverageAnnualReturnYear10 |
4.53%
|
|
| Putnam International Equity Fund | Class M |
|
|
|
| Prospectus [Line Items] |
rr_ProspectusLineItems |
|
|
| Maximum sales charge (load) imposed on purchases (as a percentage of offering price) |
rr_MaximumSalesChargeImposedOnPurchasesOverOfferingPrice |
3.50%
|
|
| Maximum deferred sales charge (load) (as a percentage of original purchase price or redemption proceeds, whichever is lower) |
rr_MaximumDeferredSalesChargeOverOther |
none
|
|
| Management fees |
rr_ManagementFeesOverAssets |
0.61%
|
[2] |
| Distribution and service (12b-1) fees |
rr_DistributionAndService12b1FeesOverAssets |
0.75%
|
|
| Other expenses |
rr_OtherExpensesOverAssets |
0.32%
|
[3] |
| Total annual fund operating expenses |
rr_ExpensesOverAssets |
1.68%
|
|
| Expense Example, with Redemption, 1 Year |
rr_ExpenseExampleYear01 |
$ 515
|
|
| Expense Example, with Redemption, 3 Years |
rr_ExpenseExampleYear03 |
861
|
|
| Expense Example, with Redemption, 5 Years |
rr_ExpenseExampleYear05 |
1,231
|
|
| Expense Example, with Redemption, 10 Years |
rr_ExpenseExampleYear10 |
$ 2,267
|
|
| Label |
rr_AverageAnnualReturnLabel |
before taxes
|
|
| 1 Year |
rr_AverageAnnualReturnYear01 |
(22.59%)
|
|
| 5 Years |
rr_AverageAnnualReturnYear05 |
(2.72%)
|
|
| 10 Years |
rr_AverageAnnualReturnYear10 |
4.42%
|
|
| Putnam International Equity Fund | Class R |
|
|
|
| Prospectus [Line Items] |
rr_ProspectusLineItems |
|
|
| Maximum sales charge (load) imposed on purchases (as a percentage of offering price) |
rr_MaximumSalesChargeImposedOnPurchasesOverOfferingPrice |
none
|
|
| Maximum deferred sales charge (load) (as a percentage of original purchase price or redemption proceeds, whichever is lower) |
rr_MaximumDeferredSalesChargeOverOther |
none
|
|
| Management fees |
rr_ManagementFeesOverAssets |
0.61%
|
[2] |
| Distribution and service (12b-1) fees |
rr_DistributionAndService12b1FeesOverAssets |
0.50%
|
|
| Other expenses |
rr_OtherExpensesOverAssets |
0.32%
|
[3] |
| Total annual fund operating expenses |
rr_ExpensesOverAssets |
1.43%
|
|
| Expense Example, with Redemption, 1 Year |
rr_ExpenseExampleYear01 |
$ 146
|
|
| Expense Example, with Redemption, 3 Years |
rr_ExpenseExampleYear03 |
452
|
|
| Expense Example, with Redemption, 5 Years |
rr_ExpenseExampleYear05 |
782
|
|
| Expense Example, with Redemption, 10 Years |
rr_ExpenseExampleYear10 |
$ 1,713
|
|
| Label |
rr_AverageAnnualReturnLabel |
before taxes
|
|
| 1 Year |
rr_AverageAnnualReturnYear01 |
(19.57%)
|
|
| 5 Years |
rr_AverageAnnualReturnYear05 |
(1.78%)
|
|
| 10 Years |
rr_AverageAnnualReturnYear10 |
5.05%
|
|
| Putnam International Equity Fund | Class R5 |
|
|
|
| Prospectus [Line Items] |
rr_ProspectusLineItems |
|
|
| Maximum sales charge (load) imposed on purchases (as a percentage of offering price) |
rr_MaximumSalesChargeImposedOnPurchasesOverOfferingPrice |
none
|
|
| Maximum deferred sales charge (load) (as a percentage of original purchase price or redemption proceeds, whichever is lower) |
rr_MaximumDeferredSalesChargeOverOther |
none
|
|
| Management fees |
rr_ManagementFeesOverAssets |
0.61%
|
[2] |
| Other expenses |
rr_OtherExpensesOverAssets |
0.23%
|
[3] |
| Total annual fund operating expenses |
rr_ExpensesOverAssets |
0.84%
|
|
| Expense Example, with Redemption, 1 Year |
rr_ExpenseExampleYear01 |
$ 86
|
|
| Expense Example, with Redemption, 3 Years |
rr_ExpenseExampleYear03 |
268
|
|
| Expense Example, with Redemption, 5 Years |
rr_ExpenseExampleYear05 |
466
|
|
| Expense Example, with Redemption, 10 Years |
rr_ExpenseExampleYear10 |
$ 1,037
|
|
| Label |
rr_AverageAnnualReturnLabel |
before taxes
|
|
| 1 Year |
rr_AverageAnnualReturnYear01 |
(19.06%)
|
[6] |
| 5 Years |
rr_AverageAnnualReturnYear05 |
(1.22%)
|
[6] |
| 10 Years |
rr_AverageAnnualReturnYear10 |
5.64%
|
[6] |
| Putnam International Equity Fund | Class R6 |
|
|
|
| Prospectus [Line Items] |
rr_ProspectusLineItems |
|
|
| Maximum sales charge (load) imposed on purchases (as a percentage of offering price) |
rr_MaximumSalesChargeImposedOnPurchasesOverOfferingPrice |
none
|
|
| Maximum deferred sales charge (load) (as a percentage of original purchase price or redemption proceeds, whichever is lower) |
rr_MaximumDeferredSalesChargeOverOther |
none
|
|
| Management fees |
rr_ManagementFeesOverAssets |
0.61%
|
[2] |
| Other expenses |
rr_OtherExpensesOverAssets |
0.13%
|
[3] |
| Total annual fund operating expenses |
rr_ExpensesOverAssets |
0.74%
|
|
| Expense Example, with Redemption, 1 Year |
rr_ExpenseExampleYear01 |
$ 76
|
|
| Expense Example, with Redemption, 3 Years |
rr_ExpenseExampleYear03 |
237
|
|
| Expense Example, with Redemption, 5 Years |
rr_ExpenseExampleYear05 |
411
|
|
| Expense Example, with Redemption, 10 Years |
rr_ExpenseExampleYear10 |
$ 918
|
|
| Label |
rr_AverageAnnualReturnLabel |
before taxes
|
|
| 1 Year |
rr_AverageAnnualReturnYear01 |
(19.02%)
|
[6] |
| 5 Years |
rr_AverageAnnualReturnYear05 |
(1.11%)
|
[6] |
| 10 Years |
rr_AverageAnnualReturnYear10 |
5.71%
|
[6] |
| Putnam International Equity Fund | Class Y |
|
|
|
| Prospectus [Line Items] |
rr_ProspectusLineItems |
|
|
| Maximum sales charge (load) imposed on purchases (as a percentage of offering price) |
rr_MaximumSalesChargeImposedOnPurchasesOverOfferingPrice |
none
|
|
| Maximum deferred sales charge (load) (as a percentage of original purchase price or redemption proceeds, whichever is lower) |
rr_MaximumDeferredSalesChargeOverOther |
none
|
|
| Management fees |
rr_ManagementFeesOverAssets |
0.61%
|
[2] |
| Other expenses |
rr_OtherExpensesOverAssets |
0.32%
|
[3] |
| Total annual fund operating expenses |
rr_ExpensesOverAssets |
0.93%
|
|
| Expense Example, with Redemption, 1 Year |
rr_ExpenseExampleYear01 |
$ 95
|
|
| Expense Example, with Redemption, 3 Years |
rr_ExpenseExampleYear03 |
296
|
|
| Expense Example, with Redemption, 5 Years |
rr_ExpenseExampleYear05 |
515
|
|
| Expense Example, with Redemption, 10 Years |
rr_ExpenseExampleYear10 |
$ 1,143
|
|
| Label |
rr_AverageAnnualReturnLabel |
before taxes
|
|
| 1 Year |
rr_AverageAnnualReturnYear01 |
(19.13%)
|
|
| 5 Years |
rr_AverageAnnualReturnYear05 |
(1.28%)
|
|
| 10 Years |
rr_AverageAnnualReturnYear10 |
5.58%
|
|
|
|