Exhibit
EXHIBIT 99.1
|
| | |
| | PRESSRELEASE www.HelixESG.com |
Helix Energy Solutions Group, Inc. · 3505 W. Sam Houston Parkway N., Suite 400 · Houston, TX 77043 · 281-618-0400 · fax: 281-618-0505
|
| | | |
For Immediate Release | | | 16-013 |
| | | |
Date: July 19, 2016 | Contact: | Erik Staffeldt | |
| | Vice President - Finance & Accounting | |
Helix Reports Second Quarter 2016 Results
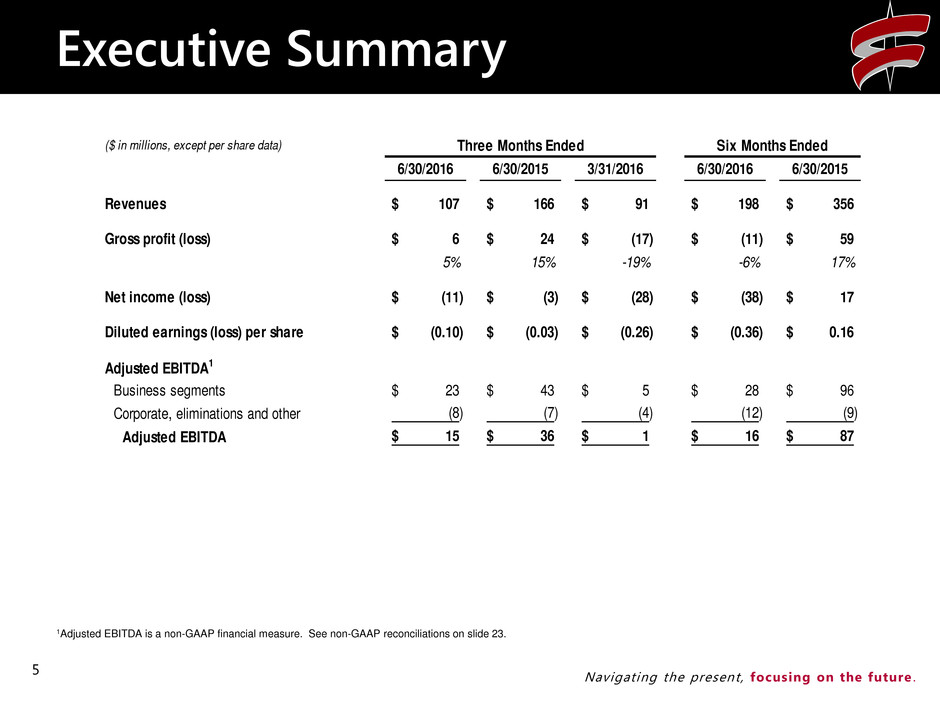
HOUSTON, TX - Helix Energy Solutions Group, Inc. (NYSE: HLX) reported a net loss of $10.7 million, or $(0.10) per diluted share, for the second quarter of 2016 compared to a net loss of $2.6 million, or $(0.03) per diluted share, for the same period in 2015 and a net loss of $27.8 million, or $(0.26) per diluted share, for the first quarter of 2016. The net loss for the six months ended June 30, 2016 was $38.5 million, or $(0.36) per diluted share, compared to net income of $17.0 million, or $0.16 per diluted share, for the six months ended June 30, 2015.
Helix reported adjusted EBITDA1 of $14.9 million for the second quarter of 2016 compared to $35.7 million for the second quarter of 2015 and $1.0 million for the first quarter of 2016. Adjusted EBITDA for the six months ended June 30, 2016 was $16.0 million compared with $87.1 million for the six months ended June 30, 2015.
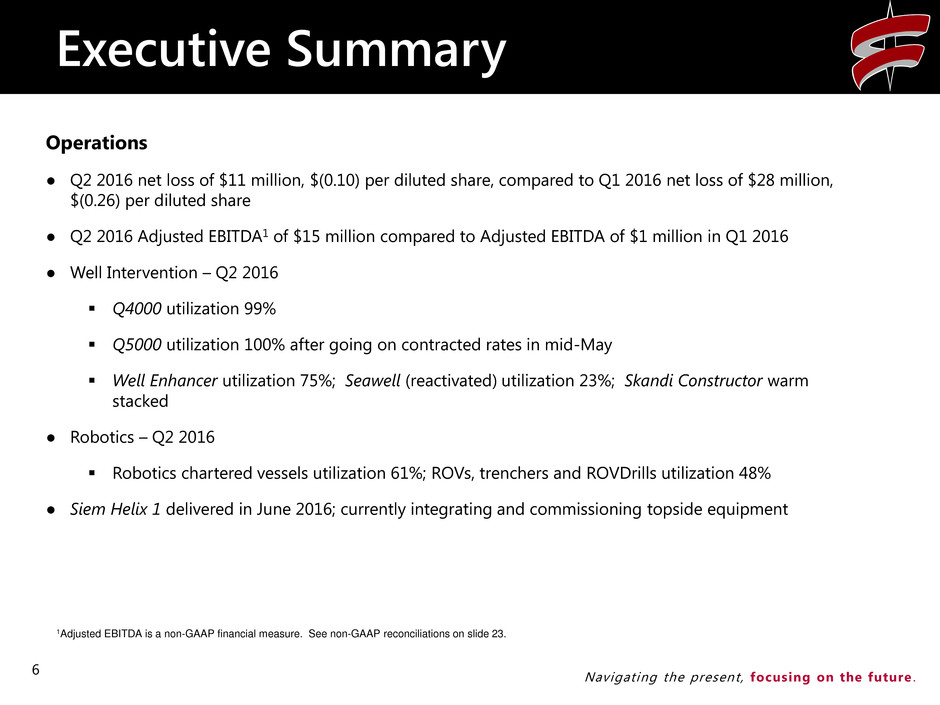
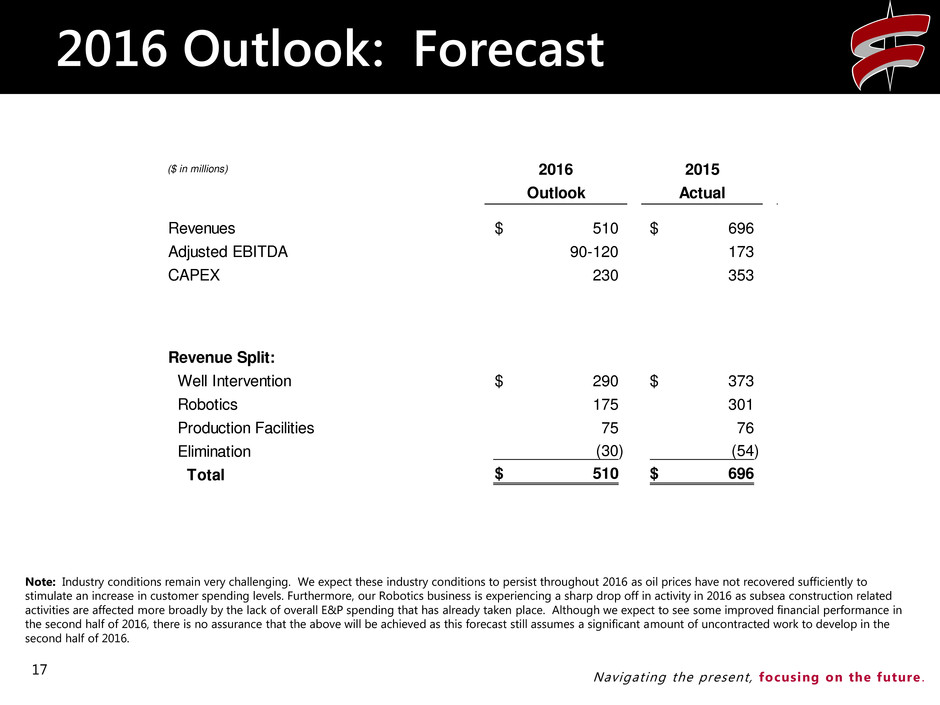
Owen Kratz, President and Chief Executive Officer of Helix, stated, “The market remains very weak, but in the second quarter we started to benefit from the commencement of the Q5000 contract in the Gulf of Mexico and the seasonal pick up in the North Sea. We expect to see improvement in our financial performance for the second half of 2016 compared to the first half of the year driven by the seasonal increase in North Sea activity during the summer and the commencement of the first Petrobras contract in late 2016.”
1 Adjusted EBITDA is a non-GAAP measure. See reconciliation below.
* * * * *
Summary of Results
($ in thousands, except per share amounts, unaudited)
|
| | | | | | | | | | | | | | | | | | | |
| Three Months Ended | | Six Months Ended |
| 6/30/2016 | | 6/30/2015 | | 3/31/2016 | | 6/30/2016 | | 6/30/2015 |
| | | | | | | | | |
Revenues | $ | 107,267 |
| | $ | 166,016 |
| | $ | 91,039 |
| | $ | 198,306 |
| | $ | 355,657 |
|
| | | | | | | | | |
Gross Profit (Loss) | $ | 5,658 |
| | $ | 24,208 |
| | $ | (16,930 | ) | | $ | (11,272 | ) | | $ | 59,155 |
|
| 5 | % | | 15 | % | | -19 | % | | -6 | % | | 17 | % |
| | | | | | | | | |
Net Income (Loss) | $ | (10,671 | ) | | $ | (2,635 | ) | | $ | (27,823 | ) | | $ | (38,494 | ) | | $ | 17,007 |
|
| | | | | | | | | |
Diluted Earnings (Loss) Per Share | $ | (0.10 | ) | | $ | (0.03 | ) | | $ | (0.26 | ) | | $ | (0.36 | ) | | $ | 0.16 |
|
| | | | | | | | | |
Adjusted EBITDA 1 | $ | 14,932 |
| | $ | 35,689 |
| | $ | 1,022 |
| | $ | 15,954 |
| | $ | 87,053 |
|
1 Adjusted EBITDA is a non-GAAP measure. See reconciliation below.
Segment Information, Operational and Financial Highlights
($ in thousands, unaudited)
|
| | | | | | | | | | | |
| Three Months Ended |
| 6/30/2016 | | 6/30/2015 | | 3/31/2016 |
Revenues: | | | | | |
Well Intervention | $ | 59,919 |
| | $ | 85,675 |
| | $ | 46,056 |
|
Robotics | 38,914 |
| | 75,101 |
| | 31,994 |
|
Production Facilities | 18,957 |
| | 20,293 |
| | 18,482 |
|
Intercompany Eliminations | (10,523 | ) | | (15,053 | ) | | (5,493 | ) |
Total | $ | 107,267 |
| | $ | 166,016 |
| | $ | 91,039 |
|
| | | | | |
Income (Loss) from Operations: | |
| | |
| | |
|
Well Intervention | $ | (538 | ) | | $ | 4,135 |
| | $ | (16,688 | ) |
Robotics | (8,823 | ) | | 4,303 |
| | (12,750 | ) |
Production Facilities | 9,730 |
| | 8,444 |
| | 7,183 |
|
Corporate / Other | (9,827 | ) | | (9,009 | ) | | (8,669 | ) |
Intercompany Eliminations | 163 |
| | (199 | ) | | 168 |
|
Total | $ | (9,295 | ) | | $ | 7,674 |
| | $ | (30,756 | ) |
* * * * *
Business Segment Results
|
| |
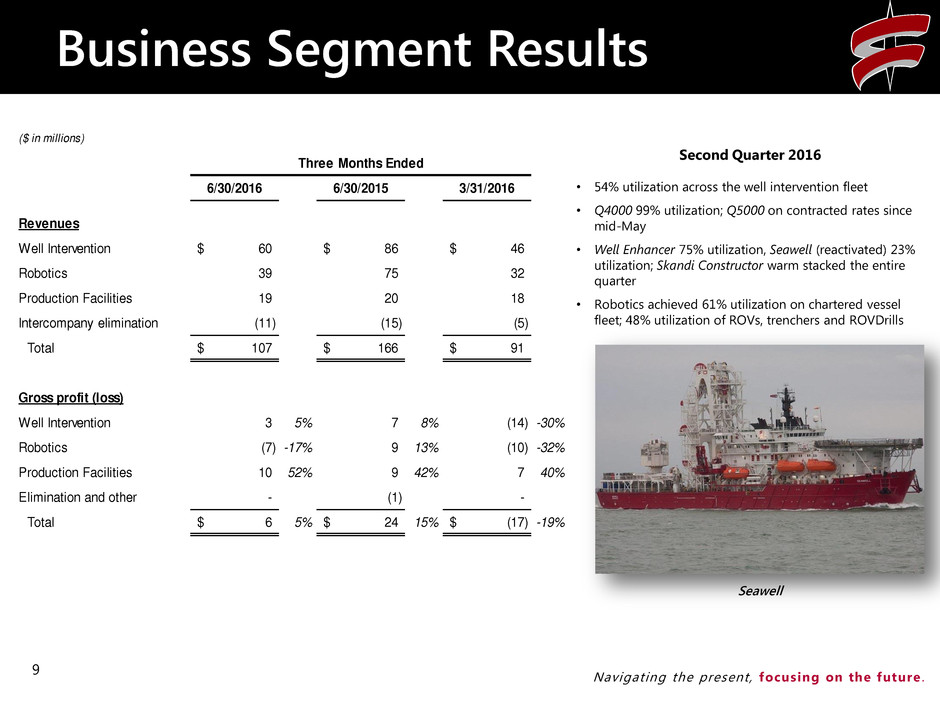
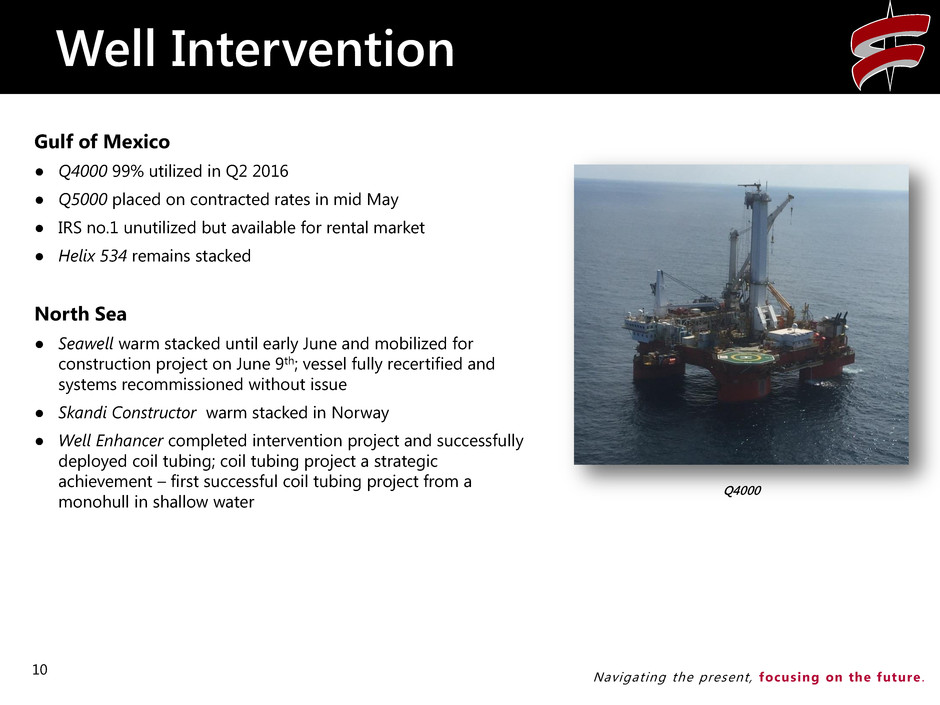
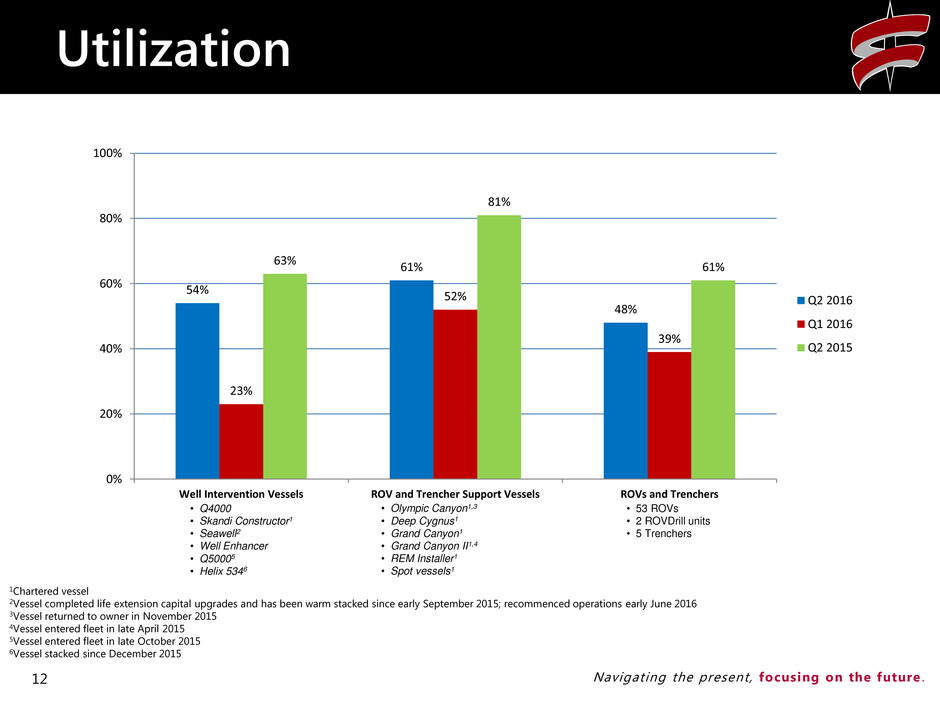
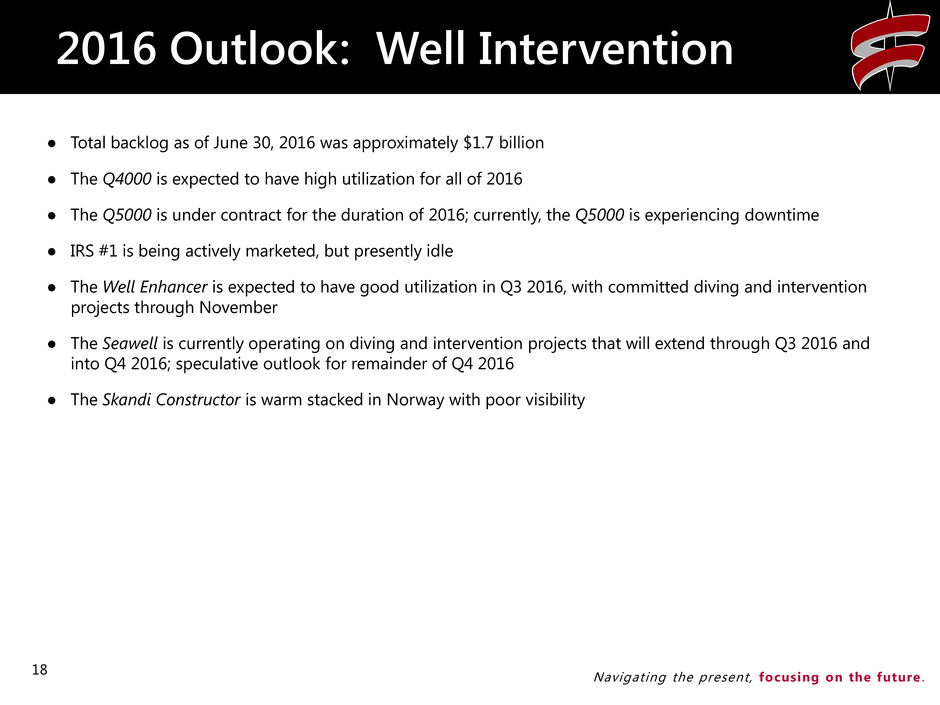
Ÿ | Well Intervention revenues increased 30% in the second quarter of 2016 from revenues in the first quarter of 2016. Overall Well Intervention vessel utilization in the second quarter of 2016 increased to 54% from 23% in the first quarter of 2016. The Q4000 utilization was 99% in the second quarter of 2016 compared to 100% in the first quarter of 2016. The Q5000 utilization was 100% after going on contracted rates mid-May compared to being idle in the first quarter of 2016. In the North Sea, the Well Enhancer utilization increased to 75% in the second quarter of 2016 from 13% in the first quarter of 2016. The Seawell was reactivated in early June and utilization increased to 23% in the second quarter of 2016 compared to being idle in the first quarter of 2016. The Skandi Constructor was idle the entire quarter and remained warm stacked. The two intervention riser systems were idle in the second quarter compared to utilization of 60% in the first quarter. |
|
| |
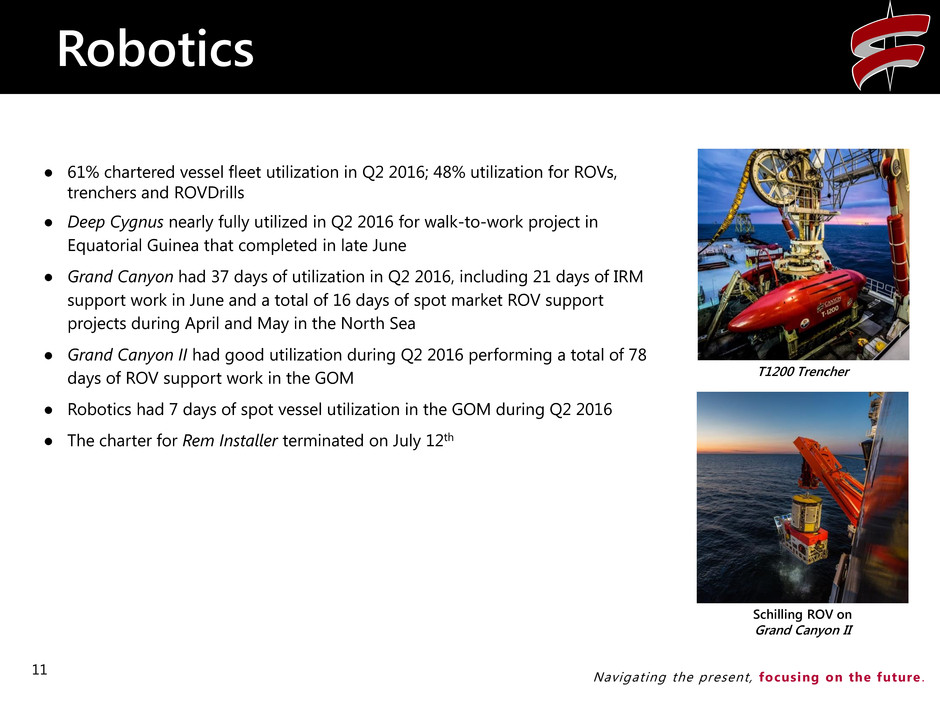
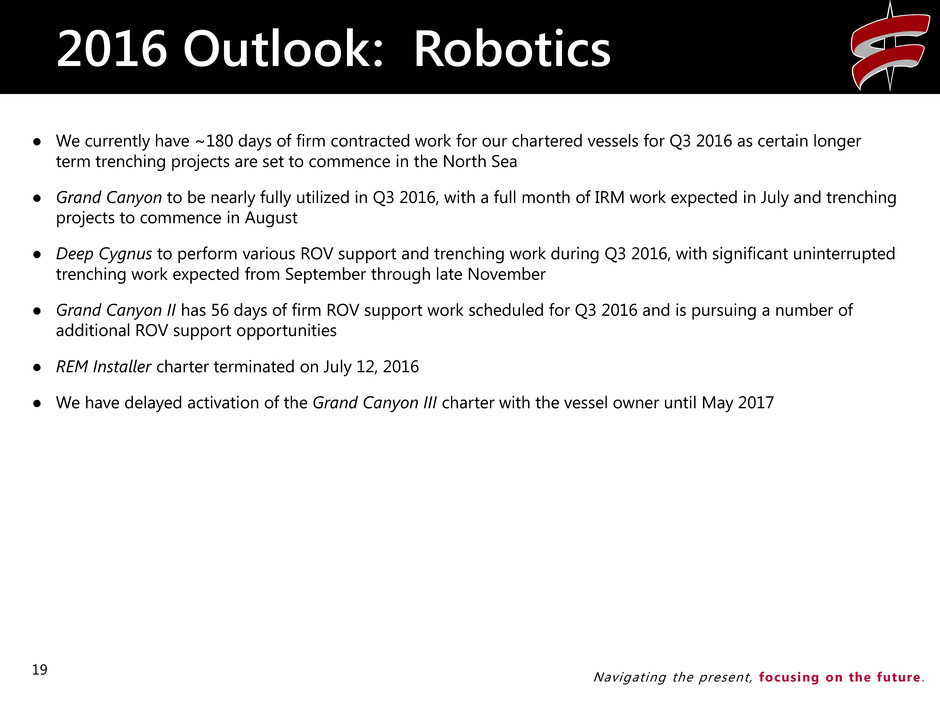
Ÿ | Robotics revenues increased 22% in the second quarter of 2016 compared to the first quarter of 2016. Chartered vessel utilization increased to 61% in the second quarter of 2016 from 52% in the first quarter of 2016, and ROV asset utilization increased to 48% in the second quarter of 2016 from 39% in the first quarter of 2016. The increase in revenue and gross profit was driven by increased seasonal activity in the North Sea. |
Other Expenses
|
| |
Ÿ | Selling, general and administrative expenses were $15.0 million, 13.9% of revenue, in the second quarter of 2016 compared to $13.8 million, 15.2% of revenue, in the first quarter of 2016. |
|
| |
Ÿ | Net interest expense decreased to $7.5 million in the second quarter of 2016 from $10.7 million in the first quarter of 2016. Interest expense in the first quarter of 2016 includes a $2.5 million charge to accelerate a pro-rata portion of the deferred debt issuance costs associated with the reduction of revolver capacity. |
|
| |
Ÿ | We recorded a $0.3 million gain associated with the repurchase of $7.3 million in aggregate principal amount of our Convertible Senior Notes in June 2016. |
|
| |
Ÿ | Other income decreased to $1.3 million in the second quarter of 2016 from $1.9 million in the first quarter of 2016. The decrease in other income for the quarter was primarily driven by unrealized losses on our foreign currency derivative contracts that were not designated as hedges, offset in part by foreign currency gains associated with our non-U.S. dollar functional currencies. |
Financial Condition and Liquidity
|
| |
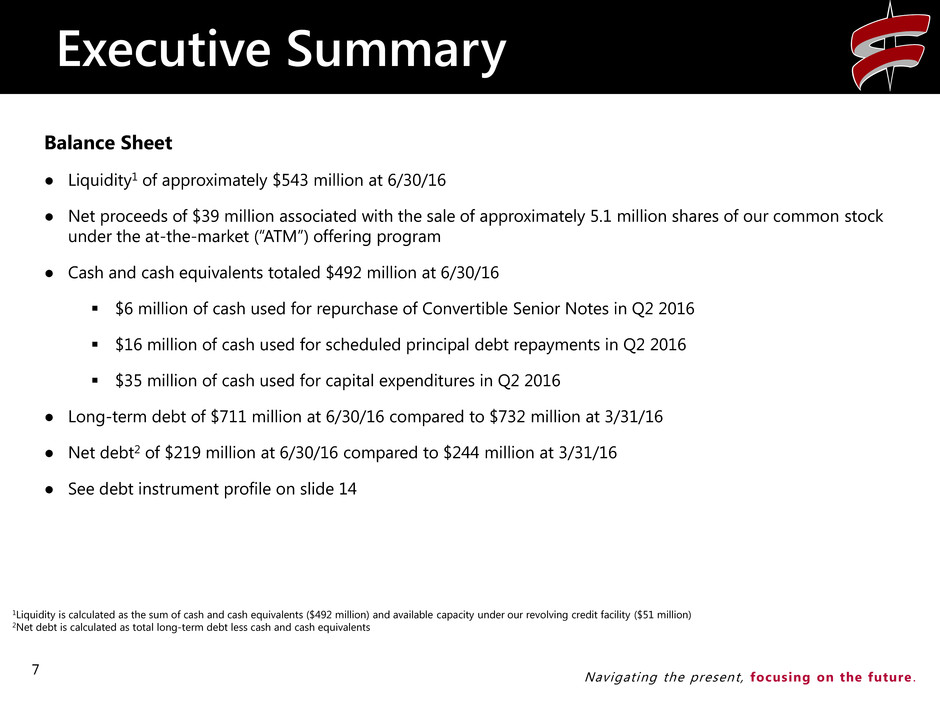
Ÿ | In April 2016, we launched an at-the-market (“ATM”) program for the sale of up to $50 million of common stock. As of June 30, 2016, we sold a total of 5,081,339 shares of our common stock under the ATM program for $40.5 million at an average of $7.98 per share and received proceeds of $38.8 million, net of transaction costs. |
|
| |
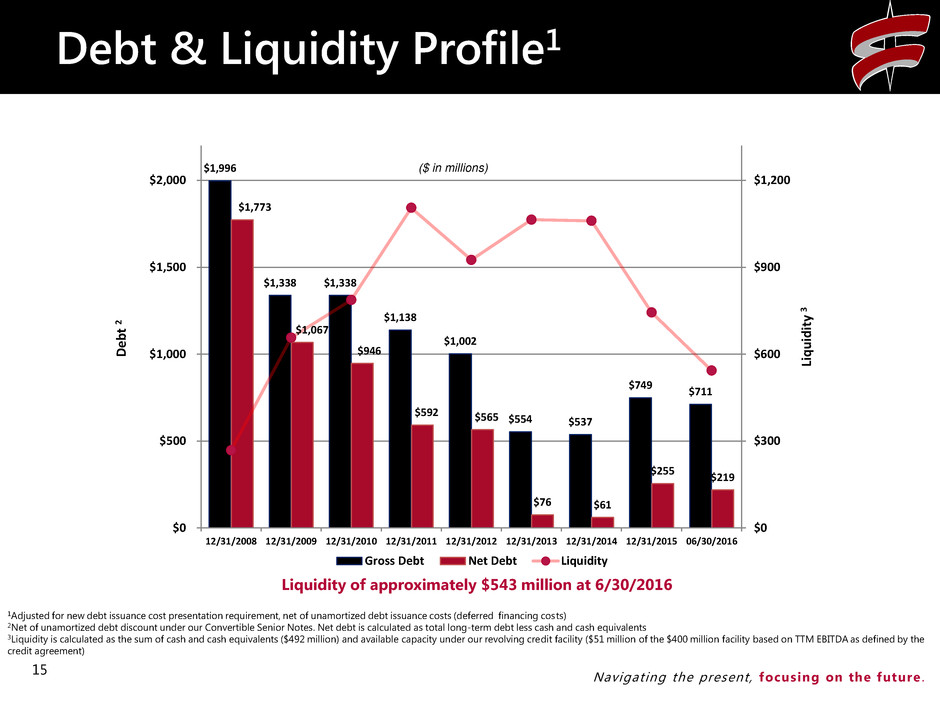
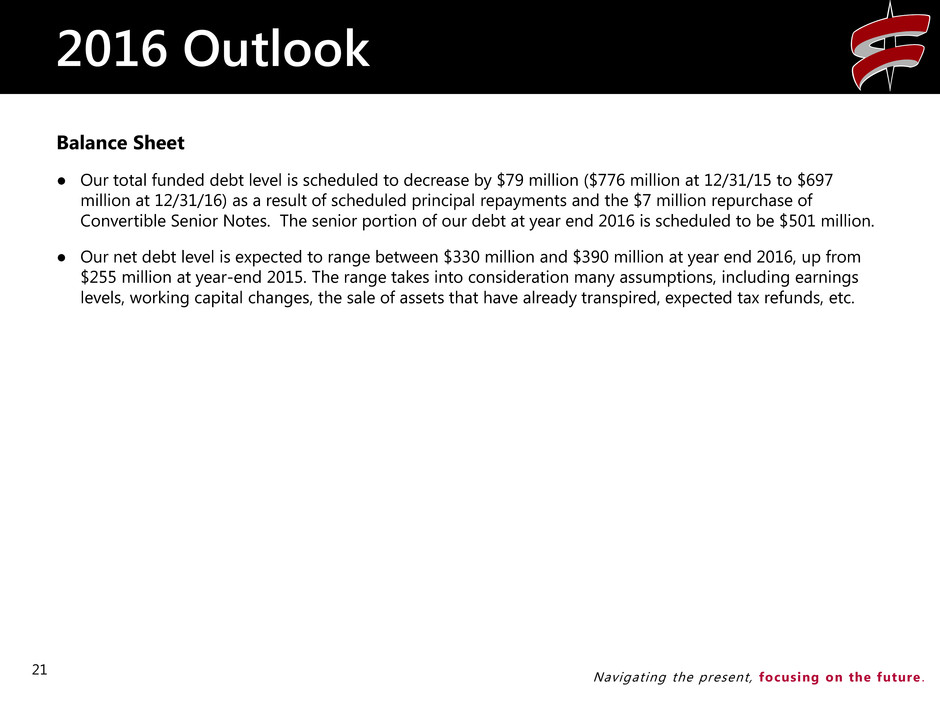
Ÿ | Our total liquidity at June 30, 2016 was approximately $543 million, consisting of $492 million in cash and cash equivalents and $51 million in available capacity under our revolver. Consolidated long-term debt decreased to $711 million in the second quarter of 2016 compared to $732 million in the first quarter of 2016. Consolidated net debt at June 30, 2016 was $219 million. Net debt to book capitalization at June 30, 2016 was 15%. (Net debt and net debt to book capitalization are non-GAAP measures. See reconciliation below.) |
|
| |
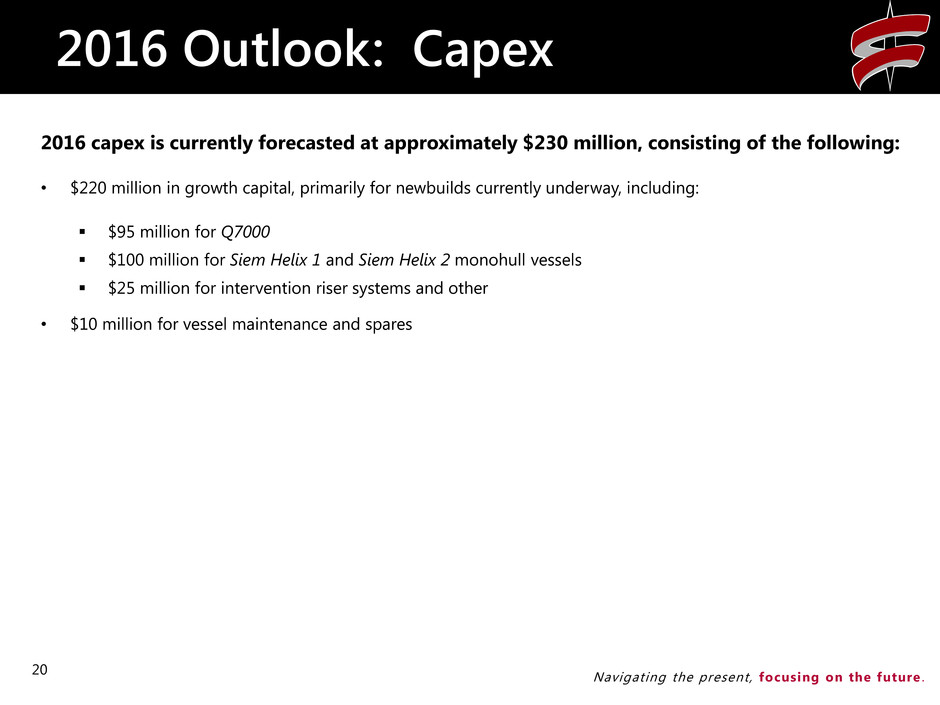
Ÿ | We incurred capital expenditures (including capitalized interest) totaling $32 million in the second quarter of 2016 compared to $21 million in the first quarter of 2016 and $197 million in the second quarter of 2015. |
* * * * *
Conference Call Information
Further details are provided in the presentation for Helix’s quarterly conference call to review its second quarter 2016 results (see the “Investor Relations” page of Helix’s website, www.HelixESG.com). The call, scheduled for 9:00 a.m. Central Daylight Time Wednesday, July 20, 2016, will be audio webcast live from the “Investor Relations” page of Helix’s website. Investors and other interested parties wishing to listen to the conference via telephone may join the call by dialing 800-908-1236 for persons in the United States and 1-212-231-2900 for international participants. The passcode is “Tripodo”. A replay of the conference call will be available under “Investor Relations” by selecting the “Audio Archives” link from the same page beginning approximately two hours after the completion of the conference call.
About Helix
Helix Energy Solutions Group, Inc., headquartered in Houston, Texas, is an international offshore energy services company that provides specialty services to the offshore energy industry, with a focus on well intervention and robotics operations. For more information about Helix, please visit our website at www.HelixESG.com.
Reconciliation of Non-GAAP Financial Measures
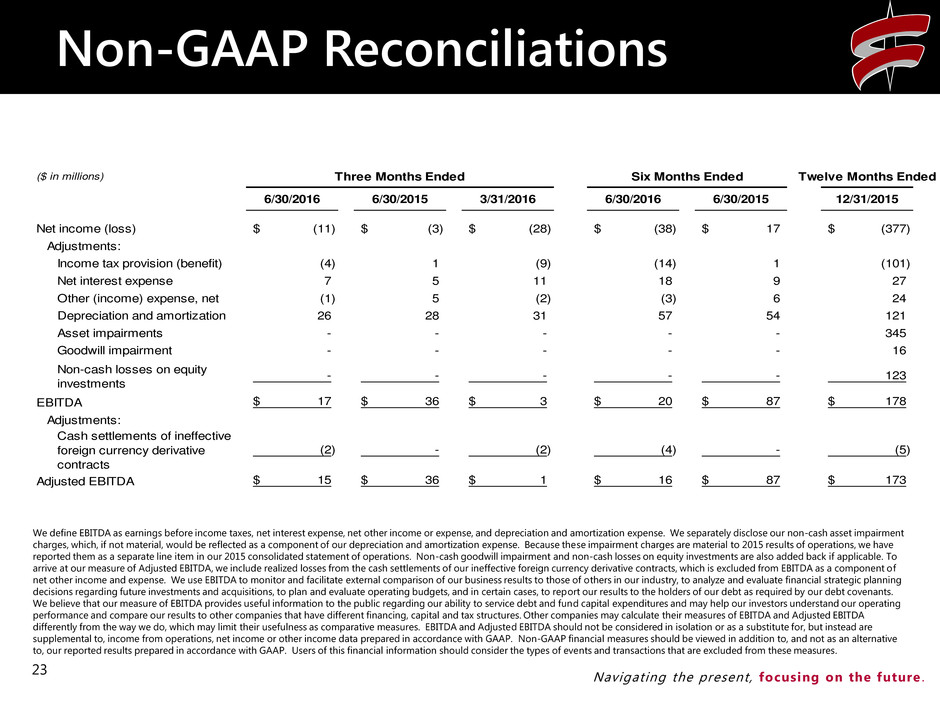
Management evaluates Company performance and financial condition using certain non-GAAP metrics, primarily EBITDA, Adjusted EBITDA, net debt and net debt to book capitalization. We define EBITDA as earnings before income taxes, net interest expense, gain on repurchase of long-term debt, net other income or expense, and depreciation and amortization expense. To arrive at our measure of Adjusted EBITDA, we include realized losses from the cash settlements of our ineffective foreign currency derivative contracts, which are excluded from EBITDA as a component of net other income or expense. Net debt is calculated as total long-term debt less cash and cash equivalents. Net debt to book capitalization is calculated by dividing net debt by the sum of net debt and shareholders’ equity. We use EBITDA to monitor and facilitate external comparison of our business results to those of others in our industry, to analyze and evaluate financial strategic planning decisions regarding future investments and acquisitions, to plan and evaluate operating budgets, and in certain cases, to report our results to the holders of our debt as required by our debt covenants. We believe that our measure of EBITDA provides useful information to the public regarding our ability to service debt and fund capital expenditures and may help our investors understand our operating performance and compare our results to other companies that have different financing, capital and tax structures. Other companies may calculate their measures of EBITDA and Adjusted EBITDA differently from the way we do, which may limit their usefulness as comparative measures. EBITDA and Adjusted EBITDA should not be considered in isolation or as a substitute for, but instead are supplemental to, income from operations, net income or other income data prepared in accordance with GAAP. Non-GAAP financial measures should be viewed in addition to, and not as an alternative to, our reported results prepared in accordance with GAAP. Users of this financial information should consider the types of events and transactions that are excluded from these measures.
Forward-Looking Statements
This press release contains forward-looking statements that involve risks, uncertainties and assumptions that could cause our results to differ materially from those expressed or implied by such forward-looking statements. All statements, other than statements of historical fact, are “forward-looking statements” within the meaning of the Private Securities Litigation Reform Act of 1995, including, without limitation, any statements regarding our strategy; any statements regarding visibility and future utilization; any projections of financial items; future operations expenditures; any statements regarding the plans, strategies and objectives of management for future operations; any statements concerning developments; any statements regarding future economic conditions or performance; any statements of expectation or belief; and any statements of assumptions underlying any of the foregoing. The forward-looking statements are subject to a number of known and unknown risks, uncertainties and other factors including but not limited to the performance of contracts by suppliers, customers and partners; actions by governmental and regulatory authorities; operating hazards and delays; our ultimate ability to realize current backlog; employee management issues; complexities of global political and economic developments; geologic risks; volatility of oil and gas prices and other risks described from time to time in our reports filed with the Securities and Exchange Commission (“SEC”), including the Company’s most recently filed Annual Report on Form 10-K and in the Company’s other filings with the SEC, which are available free of charge on the SEC’s website at www.sec.gov. We assume no obligation and do not intend to update these forward-looking statements except as required by the securities laws.
Social Media
From time to time we provide information about Helix on Twitter (@Helix_ESG) and LinkedIn (www.linkedin.com/company/helix-energy-solutions-group).
HELIX ENERGY SOLUTIONS GROUP, INC.
|
|
Comparative Condensed Consolidated Statements of Operations |
|
| | | | | | | | | | | | | | | | |
| | Three Months Ended Jun. 30, | | Six Months Ended Jun. 30, |
(in thousands, except per share data) | | 2016 | | 2015 | | 2016 | | 2015 |
| | (unaudited) | | (unaudited) |
Net revenues | | $ | 107,267 |
| | $ | 166,016 |
| | $ | 198,306 |
| | $ | 355,657 |
|
Cost of sales | | 101,609 |
| | 141,808 |
| | 209,578 |
| | 296,502 |
|
Gross profit (loss) | | 5,658 |
| | 24,208 |
| | (11,272 | ) | | 59,155 |
|
Selling, general and administrative expenses | | (14,953 | ) | | (16,534 | ) | | (28,779 | ) | | (29,153 | ) |
Income (loss) from operations | | (9,295 | ) | | 7,674 |
| | (40,051 | ) | | 30,002 |
|
Equity in losses of investments | | (121 | ) | | (323 | ) | | (244 | ) | | (302 | ) |
Net interest expense | | (7,480 | ) | | (5,235 | ) | | (18,164 | ) | | (9,305 | ) |
Gain on repurchase of long-term debt | | 302 |
| | — |
| | 302 |
| | — |
|
Other income (expense), net | | 1,308 |
| | (5,036 | ) | | 3,188 |
| | (6,192 | ) |
Other income - oil and gas | | 396 |
| | 899 |
| | 2,968 |
| | 3,825 |
|
Income (loss) before income taxes | | (14,890 | ) | | (2,021 | ) | | (52,001 | ) | | 18,028 |
|
Income tax provision (benefit) | | (4,219 | ) | | 614 |
| | (13,507 | ) | | 1,021 |
|
Net income (loss) | | $ | (10,671 | ) | | $ | (2,635 | ) | | $ | (38,494 | ) | | $ | 17,007 |
|
| | | | | | | | |
Earnings (loss) per share of common stock: | | |
| | |
| | |
| | |
|
Basic | | $ | (0.10 | ) | | $ | (0.03 | ) | | $ | (0.36 | ) | | $ | 0.16 |
|
Diluted | | $ | (0.10 | ) | | $ | (0.03 | ) | | $ | (0.36 | ) | | $ | 0.16 |
|
| | | | | | | | |
Weighted average common shares outstanding: | | |
| | |
| | |
| | |
|
Basic | | 107,767 |
| | 105,357 |
| | 106,838 |
| | 105,324 |
|
Diluted | | 107,767 |
| | 105,357 |
| | 106,838 |
| | 105,324 |
|
|
|
Comparative Condensed Consolidated Balance Sheets |
|
| | | | | | | | | | | | | | | | | | |
ASSETS | | | | | | LIABILITIES & SHAREHOLDERS' EQUITY |
(in thousands) | | Jun. 30, 2016 | | Dec. 31, 2015 | | (in thousands) | | Jun. 30, 2016 | | Dec. 31, 2015 |
| | (unaudited) | | | | | | (unaudited) | | |
Current Assets: | | | | | | Current Liabilities: | | | | |
Cash and cash equivalents (1) | | $ | 492,190 |
| | $ | 494,192 |
| | Accounts payable | | $ | 48,013 |
| | $ | 65,370 |
|
Accounts receivable, net | | 76,104 |
| | 96,752 |
| | Accrued liabilities | | 71,009 |
| | 71,641 |
|
Current deferred tax assets | | 14,211 |
| | 53,573 |
| | Income tax payable | | — |
| | 2,261 |
|
Income tax receivable | | 21,311 |
| | — |
| | Current maturities of long-term debt (1) | | 71,786 |
| | 71,640 |
|
Other current assets | | 41,465 |
| | 39,518 |
| | Total Current Liabilities | | 190,808 |
| | 210,912 |
|
Total Current Assets | | 645,281 |
| | 684,035 |
| | | | | | |
| | | | | | | | | | |
Property & equipment, net | | 1,581,962 |
| | 1,603,009 |
| | Long-term debt (1) | | 638,985 |
| | 677,695 |
|
Equity investments | | — |
| | 26,200 |
| | Deferred tax liabilities | | 166,557 |
| | 180,974 |
|
Goodwill | | 45,107 |
| | 45,107 |
| | Other non-current liabilities | | 52,829 |
| | 51,415 |
|
Other assets, net | | 42,018 |
| | 41,608 |
| | Shareholders' equity (1) | | 1,265,189 |
| | 1,278,963 |
|
Total Assets | | $ | 2,314,368 |
| | $ | 2,399,959 |
| | Total Liabilities & Equity | | $ | 2,314,368 |
| | $ | 2,399,959 |
|
| |
(1) | Net debt to book capitalization - 15% at June 30, 2016. Calculated as net debt (total long-term debt less cash and cash equivalents - $218,581) divided by the sum of net debt and shareholders' equity ($1,483,770). |
Helix Energy Solutions Group, Inc.
Reconciliation of Non-GAAP Measures
|
| | | | | | | | | | | | | | | | | | | | | | |
Earnings Release: | | | | | | | | | | | | |
| | | | | | | | | | | | |
Reconciliation from Net Income (Loss) to Adjusted EBITDA: | | | | | | | | | | |
| | | | | | | | | | | | |
| | | | Three Months Ended | | Six Months Ended |
| | | | 6/30/2016 | | 6/30/2015 | | 3/31/2016 | | 6/30/2016 | | 6/30/2015 |
| | | | (in thousands) |
| | | | | | | | | | | | |
Net income (loss) | | | $ | (10,671 | ) | | $ | (2,635 | ) | | $ | (27,823 | ) | | $ | (38,494 | ) | | $ | 17,007 |
|
Adjustments: | | | |
| | |
| | |
| | |
| | |
|
Income tax provision (benefit) | | | (4,219 | ) | | 614 |
| | (9,288 | ) | | (13,507 | ) | | 1,021 |
|
Net interest expense | | | 7,480 |
| | 5,235 |
| | 10,684 |
| | 18,164 |
| | 9,305 |
|
Gain on repurchase of long-term debt | | (302 | ) | | — |
| | — |
| | (302 | ) | | — |
|
Other (income) expense, net | | | (1,308 | ) | | 5,036 |
| | (1,880 | ) | | (3,188 | ) | | 6,192 |
|
Depreciation and amortization | | | 25,674 |
| | 27,439 |
| | 31,565 |
| | 57,239 |
| | 53,528 |
|
EBITDA | | | 16,654 |
| | 35,689 |
| | 3,258 |
| | 19,912 |
| | 87,053 |
|
Adjustments: | | | |
| | |
| | |
| | |
| | |
|
Realized losses from cash settlements of ineffective foreign currency derivative contracts | | (1,722 | ) | | — |
| | (2,236 | ) | | (3,958 | ) | | — |
|
Adjusted EBITDA | | | $ | 14,932 |
| | $ | 35,689 |
| | $ | 1,022 |
| | $ | 15,954 |
| | $ | 87,053 |
|
We define EBITDA as earnings before income taxes, net interest expense, gain on repurchase of long-term debt, net other income or expense, and depreciation and amortization expense. To arrive at our measure of Adjusted EBITDA, we include realized losses from the cash settlements of our ineffective foreign currency derivative contracts, which are excluded from EBITDA as a component of net other income or expense. We use EBITDA to monitor and facilitate external comparison of our business results to those of others in our industry, to analyze and evaluate financial strategic planning decisions regarding future investments and acquisitions, to plan and evaluate operating budgets, and in certain cases, to report our results to the holders of our debt as required by our debt covenants. We believe that our measure of EBITDA provides useful information to the public regarding our ability to service debt and fund capital expenditures and may help our investors understand our operating performance and compare our results to other companies that have different financing, capital and tax structures. Other companies may calculate their measures of EBITDA and Adjusted EBITDA differently from the way we do, which may limit their usefulness as comparative measures. EBITDA and Adjusted EBITDA should not be considered in isolation or as a substitute for, but instead are supplemental to, income from operations, net income or other income data prepared in accordance with GAAP. Non-GAAP financial measures should be viewed in addition to, and not as an alternative to, our reported results prepared in accordance with GAAP. Users of this financial information should consider the types of events and transactions that are excluded from these measures.