Exhibit 99.2
PSBUSINESSPARKS® psbusinessparks.com I industrial I flex I office I SUPPLEMENTAL INFORMATION SECOND QUARTER 2019 701 WESTERN AVENUE I GLENDALE, CA 91201 I 818.244.8080

ANALYSIS OF OPERATING RESULTS AND FINANCIAL CONDITION FOR
THE THREE AND SIX MONTHS ENDED JUNE 30, 2019
| Page | ||
| Consolidated Balance Sheets |
4 | |
| Consolidated Statements of Income |
6 | |
| Portfolio Summary |
8 | |
| Second Quarter Fact Sheet |
9 | |
| Same Park Cash NOI and NOI by Region and Type |
10 | |
| Analysis of Capital Expenditures |
14 | |
| Funds from Operations (FFO), Core FFO and Funds Available for Distribution (FAD) |
15 | |
| Capital Structure and Financial Condition |
17 | |
| Portfolio Operating Analysis and Statistics |
18 | |
| Lease Expirations |
25 | |
| Quarter- and Year-to-Date Production Statistics |
29 | |
| Multifamily Summary |
30 | |
2

Forward-Looking Statement
When used within this supplemental information package, the words “may,” “believes,” “anticipates,” “plans,” “expects,” “seeks,” “estimates,” “intends” and similar expressions are intended to identify “forward-looking statements.” Such forward-looking statements involve known and unknown risks, uncertainties and other factors, which may cause the actual results and performance of the Company to be materially different from those expressed or implied in the forward-looking statements. Such factors include the impact of competition from new and existing commercial facilities which could impact rents and occupancy levels at the Company’s facilities; the Company’s ability to evaluate, finance and integrate acquired and developed properties into the Company’s existing operations; the Company’s ability to effectively compete in the markets that it does business in; the impact of the regulatory environment as well as national, state and local laws and regulations including, without limitation, those governing REITs; the impact of general economic conditions upon rental rates and occupancy levels at the Company’s facilities; the availability of permanent capital at attractive rates, the outlook and actions of rating agencies and risks detailed from time to time in the Company’s SEC reports, including quarterly reports on Form 10-Q, reports on Form 8-K and annual reports on Form 10-K.
Non-GAAP Disclosures
Provided within this supplemental information package are measures not defined in accordance with U.S. generally accepted accounting principles (“GAAP”). We believe our presentation of these non-GAAP measures assists investors and analysts in analyzing and comparing our operating and financial performance between reporting periods. These non-GAAP measures discussed below are not substitutes of other measures of financial performance presented in accordance with GAAP. In addition, other real estate investment trusts (“REITs”) may compute these measures differently, so comparisons among REITs may not be helpful.
Net operating income (“NOI”) – We utilize NOI, a non-GAAP financial measure, to evaluate the operating performance of our business parks. We define NOI as rental income less adjusted cost of operations (described below). We believe NOI assists investors in analyzing the performance and value of our business parks by excluding (i) corporate overhead (i.e. general and administrative expenses) because it does not relate to the results of our business parks, (ii) depreciation and amortization expense because it does not accurately reflect changes in the fair value of our business parks and (iii) stock compensation expense because this expense item can vary significantly from period to period and thus impact comparability across periods. The GAAP measure most directly comparable to NOI is net income.
Cash NOI – We utilized cash NOI to evaluate the cash flow performance of our business parks. Cash NOI represents NOI adjusted to exclude non-cash items included in revenue and in cost of operations. The non-cash items in revenue include straight-line rent, amortization of above and below market rents, net, and amortization of lease incentives and tenant improvement reimbursements. The non-cash items in cost of operations is equal to stock compensation expense for employees whose compensation expense is recorded in cost of operations. We believe that cash NOI assists investors in analyzing cash flow performance of our business parks. The GAAP measure most directly comparable to cash NOI is net income.
Adjusted Cost of Operations – Adjusted cost of operations represents cost of operations, excluding non-cash stock compensation expense for employees whose compensation expense is recorded in cost of operations, which can vary significantly period to period based upon the performance of the company. The GAAP measure most directly comparable to adjusted cost of operations is cost of operations.
Earnings before Interest, Taxes, Depreciation and Amortization for Real Estate (“EBITDAre”) – EBITDAre is defined by the National Association of Real Estate Investment Trusts (“NAREIT”) and is often utilized to evaluate the performance of real estate companies. EBITDAre is calculated as GAAP net income before interest, depreciation and amortization and adjusted to exclude gains or losses from sales of depreciable real estate assets. We believe our presentation of EBITDAre assists investors and analysts in evaluating the operating performance of our business activities, including the impact of general and administrative expenses, and without the impact from gains or losses from sales of depreciable real estate assets. The GAAP measure most directly comparable EBITDAre is net income.
Funds from Operations (“FFO”) and FFO per share – FFO and FFO per share are non-GAAP measures defined by NAREIT and are considered helpful measures of REIT performance by REITs and many REIT analysts. FFO represents GAAP net income before real estate depreciation and amortization expense, gains or losses on sales of operating properties and land and impairment charges on real estate assets, which are excluded because it does not accurately reflect changes in the value of our business parks. FFO per share represents FFO allocable to common and dilutive shares, divided by aggregate common and dilutive shares. The GAAP measure most directly comparable to FFO and FFO per share are net income and earnings per share, respectively.
Core FFO and Core FFO per share – Core FFO represents FFO excluding the net impact of (i) income allocated to preferred shareholders to the extent redemption value exceeds the related carrying value and (ii) nonrecurring income or expense items. Core FFO per share represents Core FFO allocable to common and dilutive shares divided by the weighted average common and dilutive shares. We believe our presentation of Core FFO and Core FFO per share assists investors and analysts in analyzing and comparing our operating and financial performance between reporting periods. The GAAP measures most directly comparable to Core FFO and Core FFO per share are net income and earnings per share, respectively.
Funds Available for Distribution (“FAD”) – FAD is a non-GAAP measure that represents Core FFO adjusted to (a) deduct recurring capital improvements that maintains the condition of our real estate, tenant improvements and lease commissions and (b) eliminate certain non-cash income or expenses such as straight-line rent and non-cash stock compensation expense. We believe our presentation of FAD assists investors and analysts in analyzing and comparing our operating and financial performance between reporting periods. FAD is not a substitute for GAAP net cash flow in evaluating our liquidity or ability to pay dividends, because they exclude investing and financing activities presented on our statements of cash flows. The GAAP measure most directly comparable to FAD is operating cash flow from our statements of cash flows.
3

| June 30, 2019 | December 31, 2018 | |||||||||||
| ASSETS |
||||||||||||
| Cash and cash equivalents |
$ | 42,046 | $ | 37,379 | (a) | |||||||
| Real estate facilities, at cost |
||||||||||||
| Land |
772,399 | 762,731 | ||||||||||
| Buildings and improvements |
2,171,281 | 2,157,407 | ||||||||||
|
|
|
|
|
|||||||||
| 2,943,680 | 2,920,138 | |||||||||||
| Accumulated depreciation |
(1,135,107) | (1,097,748) | ||||||||||
|
|
|
|
|
|||||||||
| 1,808,573 | 1,822,390 | (b) | ||||||||||
| Properties held for sale, net |
124,680 | 128,093 | (c) | |||||||||
| Land and building held for development |
31,841 | 30,848 | ||||||||||
|
|
|
|
|
|||||||||
| 1,965,094 | 1,981,331 | |||||||||||
| Rent receivable, net |
2,308 | 1,403 | (d) | |||||||||
| Deferred rent receivable, net |
34,572 | 33,308 | ||||||||||
| Other assets |
13,524 | 15,173 | (e) | |||||||||
|
|
|
|
|
|||||||||
| Total assets |
$ | 2,057,544 | $ | 2,068,594 | ||||||||
|
|
|
|
|
|||||||||
| LIABILITIES AND EQUITY |
||||||||||||
| Accrued and other liabilities |
$ | 80,367 | $ | 85,141 | (f) | |||||||
|
|
|
|
|
|||||||||
| Total liabilities |
80,367 | 85,141 | ||||||||||
| Equity |
||||||||||||
| PS Business Parks, Inc.’s shareholders’ equity: |
||||||||||||
| Preferred stock |
959,750 | 959,750 | ||||||||||
| Common stock |
274 | 274 | ||||||||||
| Paid-in capital |
733,777 | 736,131 | (g) | |||||||||
| Accumulated earnings |
67,049 | 69,207 | (h) | |||||||||
|
|
|
|
|
|||||||||
| Total PS Business Parks, Inc.’s shareholders’ equity |
1,760,850 | 1,765,362 | ||||||||||
| Noncontrolling interests |
216,327 | 218,091 | ||||||||||
|
|
|
|
|
|||||||||
| Total equity |
1,977,177 | 1,983,453 | ||||||||||
|
|
|
|
|
|||||||||
| Total liabilities and equity |
$ | 2,057,544 | $ | 2,068,594 | ||||||||
|
|
|
|
|
|||||||||
4

| (a) |
Change in cash and cash equivalents |
|||||||||||||
| Beginning cash balance at December 31, 2018 |
$ | 37,379 | ||||||||||||
| Net cash provided by operating activities |
141,169 | |||||||||||||
| Net cash used in investing activities |
(32,232) | |||||||||||||
| Net cash used in financing activities |
(104,270) | |||||||||||||
|
|
|
|||||||||||||
| Ending cash balance at June 30, 2019 |
$ | 42,046 | ||||||||||||
|
|
|
|||||||||||||
| (b) |
Change in real estate facilities |
|||||||||||||
| Beginning balance at December 31, 2018 |
$ | 1,822,390 | ||||||||||||
| Acquisition of real estate |
13,646 | |||||||||||||
| Recurring capital improvements |
3,608 | |||||||||||||
| Tenant improvements, gross |
8,786 | |||||||||||||
| Capitalized lease commissions |
3,373 | |||||||||||||
| Nonrecurring capital improvements |
1,955 | |||||||||||||
| Depreciation and amortization |
(48,598) | |||||||||||||
| Transfer to properties held for sale |
3,413 | |||||||||||||
|
|
|
|||||||||||||
| Ending balance at June 30, 2019 |
$ | 1,808,573 | ||||||||||||
|
|
|
|||||||||||||
| (c) |
Change in properties held for sale, net: |
|||||||||||||
| Beginning balance at December 31, 2018 |
$ | 128,093 | ||||||||||||
| Recurring capital improvements |
642 | |||||||||||||
| Depreciation and amortization |
(4,055) | |||||||||||||
|
|
|
|||||||||||||
| Ending balance at June 30, 2019 |
$ | 124,680 | ||||||||||||
|
|
|
|||||||||||||
| Increase | ||||||||||||||
| (d) | Change in rent receivable | June 30, 2019 | December 31, 2018 | (Decrease) | ||||||||||
| Non-government customers |
$ | 1,593 | $ | 1,040 | $ | 553 | ||||||||
| U.S. Government customers |
1,115 | 763 | 352 | |||||||||||
| Allowance for doubtful accounts |
(400) | (400) | - | |||||||||||
|
|
|
|
|
|
|
|||||||||
| $ | 2,308 | $ | 1,403 | $ | 905 | |||||||||
|
|
|
|
|
|
|
|||||||||
| Increase | ||||||||||||||
| (e) |
Change in other assets | June 30, 2019 | December 31, 2018 | (Decrease) | ||||||||||
| Lease intangible assets, net |
$ | 9,052 | $ | 8,671 | $ | 381 | ||||||||
| Prepaid property taxes and insurance |
723 | 3,381 | (2,658) | |||||||||||
| Other |
3,749 | 3,121 | 628 | |||||||||||
|
|
|
|
|
|
|
|||||||||
| $ | 13,524 | $ | 15,173 | $ | (1,649) | |||||||||
|
|
|
|
|
|
|
|||||||||
| Increase | ||||||||||||||
| (f) | Change in accrued and other liabilities | June 30, 2019 | December 31, 2018 | (Decrease) | ||||||||||
| Customer security deposits |
$ | 39,722 | $ | 37,557 | $ | 2,165 | ||||||||
| Accrued property taxes |
13,829 | 10,454 | 3,375 | |||||||||||
| Customer prepaid rent |
9,918 | 16,830 | (6,912) | |||||||||||
| Lease intangible labilities, net |
8,798 | 7,870 | 928 | |||||||||||
| Other |
8,100 | 12,430 | (4,330) | |||||||||||
|
|
|
|
|
|
|
|||||||||
| $ | 80,367 | $ | 85,141 | $ | (4,774) | |||||||||
|
|
|
|
|
|
|
|||||||||
| (g) |
Change in paid-in capital |
|||||||||||||
| Beginning paid-in capital |
$ | 736,131 | ||||||||||||
| Exercise of stock options |
709 | |||||||||||||
| Stock compensation expense, net |
1,409 | |||||||||||||
| Cash paid for taxes in lieu of shares upon vesting of restricted stock units |
(5,500) | |||||||||||||
| Adjustment to reflect noncontrolling interests underlying ownership - common units |
1,028 | |||||||||||||
|
|
|
|||||||||||||
| Ending paid in capital |
$ | 733,777 | ||||||||||||
|
|
|
|||||||||||||
| (h) |
Change in accumulated earnings |
|||||||||||||
| Beginning accumulated earnings |
$ | 69,207 | ||||||||||||
| Net income |
81,298 | |||||||||||||
| Distributions to preferred shareholders |
(25,918) | |||||||||||||
| Distributions to common shareholders |
(57,538) | |||||||||||||
|
|
|
|||||||||||||
| Ending accumulated earnings |
$ | 67,049 | ||||||||||||
|
|
|
|||||||||||||
5

| For The Three Months | For the Six Months | |||||||||||||||||
| Ended June 30, | Ended June 30, | |||||||||||||||||
| 2019 | 2018 | 2019 | 2018 | |||||||||||||||
| Rental income |
$ | 107,782 | $ | 101,824 | $ | 215,607 | $ | 205,583 | (a) | |||||||||
| Expenses |
||||||||||||||||||
| Cost of operations (1) |
31,460 | 30,796 | 65,053 | 63,252 | (b) | |||||||||||||
| Depreciation and amortization |
24,768 | 24,416 | 49,643 | 48,298 | ||||||||||||||
| General and administrative (1) |
2,827 | 2,828 | 6,060 | 5,678 | (c) | |||||||||||||
|
|
|
|
|
|
|
|
|
|||||||||||
| Total operating expenses |
59,055 | 58,040 | 120,756 | 117,228 | ||||||||||||||
|
|
|
|
|
|
|
|
|
|||||||||||
| Interest and other income |
764 | 294 | 1,382 | 578 | (d) | |||||||||||||
| Interest and other expense |
(118) | (167) | (285) | (332) | (e) | |||||||||||||
| Gain on sale of real estate facilities |
- | 58,448 | - | 85,283 | ||||||||||||||
|
|
|
|
|
|
|
|
|
|||||||||||
| Net income |
49,373 | 102,359 | 95,948 | 173,884 | ||||||||||||||
| Allocation to noncontrolling interests |
(7,623) | (18,400) | (14,650) | (30,300) | ||||||||||||||
|
|
|
|
|
|
|
|
|
|||||||||||
| Net income allocable to PS Business Parks, Inc. |
41,750 | 83,959 | 81,298 | 143,584 | ||||||||||||||
| Allocation to preferred shareholders |
(12,959) | (12,959) | (25,918) | (25,962) | ||||||||||||||
| Allocation to restricted stock unit holders |
(212) | (779) | (480) | (1,353) | ||||||||||||||
|
|
|
|
|
|
|
|
|
|||||||||||
| Net income allocable to common shareholders |
$ | 28,579 | $ | 70,221 | $ | 54,900 | $ | 116,269 | ||||||||||
|
|
|
|
|
|
|
|
|
|||||||||||
| Net income per common share |
||||||||||||||||||
| Basic |
$ | 1.04 | $ | 2.57 | $ | 2.00 | $ | 4.26 | ||||||||||
| Diluted |
$ | 1.04 | $ | 2.56 | $ | 2.00 | $ | 4.24 | ||||||||||
| Weighted average common shares outstanding |
||||||||||||||||||
| Basic |
27,426 | 27,322 | 27,400 | 27,294 | ||||||||||||||
| Diluted |
27,532 | 27,423 | 27,505 | 27,395 | ||||||||||||||
| (1) | Beginning January 1, 2019, the Company has recorded our divisional vice presidents’ compensation costs within general and administrative expense as we determined that the nature of these individuals’ responsibilities is more consistent with corporate oversight as opposed to direct property operations. As a result of this change, we have reclassified our divisional vice presidents’ compensation costs totaling $460,000 for the three months ended June 30, 2018, consisting of $305,000 of compensation costs and $155,000 of stock compensation expense, and compensation costs totaling $1.0 million for the six months ended June 30, 2018, consisting of $690,000 of compensation costs and $314,000 of stock compensation expense, from cost of operations into general and administrative expenses on our consolidated statements of income in the three and six months ended June 30, 2018 in order to conform to the current periods’ presentation. |
6

| For The Three Months Ended | Increase | For the Six Months Ended | Increase | |||||||||||||||||||||||
| (a) | Rental income: | June 30, 2019 | June 30, 2018 | (Decrease) | June 30, 2019 | June 30, 2018 | (Decrease) | |||||||||||||||||||
| Same Park |
$ | 95,385 | $ | 90,989 | $ | 4,396 | $ | 190,429 | $ | 181,648 | $ | 8,781 | ||||||||||||||
| Same Park non-cash items (1) |
560 | 953 | (393) | 1,209 | 1,972 | (763) | ||||||||||||||||||||
| Non-Same Park |
3,194 | 565 | 2,629 | 5,511 | 565 | 4,946 | ||||||||||||||||||||
| Non-Same Park non-cash items (1) |
235 | 62 | 173 | 399 | 62 | 337 | ||||||||||||||||||||
| Multifamily |
2,474 | 1,720 | 754 | 4,971 | 3,144 | 1,827 | ||||||||||||||||||||
| Multifamily non-cash items (1) |
1 | 18 | (17) | 2 | 18 | (16) | ||||||||||||||||||||
| Revenue from assets sold and held for sale (2) |
5,933 | 7,517 | (1,584) | 13,086 | 18,174 | (5,088) | ||||||||||||||||||||
|
|
|
|
|
|
|
|
|
|
|
|
|
|||||||||||||||
| $ | 107,782 | $ | 101,824 | $ | 5,958 | $ | 215,607 | $ | 205,583 | $ | 10,024 | |||||||||||||||
|
|
|
|
|
|
|
|
|
|
|
|
|
|||||||||||||||
| For The Three Months Ended | Increase | For the Six Months Ended | Increase | |||||||||||||||||||||||
| (b) | Cost of operations: | June 30, 2019 | June 30, 2018 | (Decrease) | June 30, 2019 | June 30, 2018 | (Decrease) | |||||||||||||||||||
| Same Park |
$ | 26,947 | $ | 26,366 | $ | 581 | $ | 55,389 | $ | 53,588 | $ | 1,801 | ||||||||||||||
| Same Park non-cash items (3) |
266 | 312 | (46) | 542 | 647 | (105) | ||||||||||||||||||||
| Non-Same Park |
1,024 | 224 | 800 | 2,167 | 224 | 1,943 | ||||||||||||||||||||
| Non-Same Park non-cash items (3) |
13 | - | 13 | 26 | - | 26 | ||||||||||||||||||||
| Multifamily |
1,002 | 973 | 29 | 2,073 | 1,970 | 103 | ||||||||||||||||||||
| Expenses from assets sold and held for sale (2) |
2,208 | 2,921 | (713) | 4,856 | 6,823 | (1,967) | ||||||||||||||||||||
|
|
|
|
|
|
|
|
|
|
|
|
|
|||||||||||||||
| $ | 31,460 | $ | 30,796 | $ | 664 | $ | 65,053 | $ | 63,252 | $ | 1,801 | |||||||||||||||
|
|
|
|
|
|
|
|
|
|
|
|
|
|||||||||||||||
| For The Three Months Ended | Increase | For the Six Months Ended | Increase | |||||||||||||||||||||||
| (c) | General and administrative expenses: | June 30, 2019 | June 30, 2018 | (Decrease) | June 30, 2019 | June 30, 2018 | (Decrease) | |||||||||||||||||||
| Compensation expense |
$ | 1,278 | $ | 1,643 | $ | (365) | $ | 2,961 | $ | 2,973 | $ | (12) | ||||||||||||||
| Stock compensation expense |
514 | 235 | 279 | 1,075 | 872 | 203 | ||||||||||||||||||||
| Professional fees and other |
1,035 | 950 | 85 | 2,024 | 1,833 | 191 | ||||||||||||||||||||
|
|
|
|
|
|
|
|
|
|
|
|
|
|||||||||||||||
| $ | 2,827 | $ | 2,828 | $ | (1) | $ | 6,060 | $ | 5,678 | $ | 382 | |||||||||||||||
|
|
|
|
|
|
|
|
|
|
|
|
|
|||||||||||||||
| For The Three Months Ended | Increase | For the Six Months Ended | Increase | |||||||||||||||||||||||
| (d) | Interest and other income: | June 30, 2019 | June 30, 2018 | (Decrease) | June 30, 2019 | June 30, 2018 | (Decrease) | |||||||||||||||||||
| Management fee income |
$ | 72 | $ | 112 | $ | (40) | $ | 150 | $ | 238 | $ | (88) | ||||||||||||||
| Interest income |
316 | 42 | 274 | 642 | 109 | 533 | ||||||||||||||||||||
| Other income |
376 | 140 | 236 | 590 | 231 | 359 | ||||||||||||||||||||
|
|
|
|
|
|
|
|
|
|
|
|
|
|||||||||||||||
| $ | 764 | $ | 294 | $ | 470 | $ | 1,382 | $ | 578 | $ | 804 | |||||||||||||||
|
|
|
|
|
|
|
|
|
|
|
|
|
|||||||||||||||
| For The Three Months Ended | Increase | For the Six Months Ended | Increase | |||||||||||||||||||||||
| (e) | Interest and other expense: | June 30, 2019 | June 30, 2018 | (Decrease) | June 30, 2019 | June 30, 2018 | (Decrease) | |||||||||||||||||||
| Credit facility |
$ | - | $ | (13) | $ | (13) | $ | - | $ | (18) | $ | (18) | ||||||||||||||
| Facilities fees & other charges |
(118) | (154) | (36) | (285) | (314) | (29) | ||||||||||||||||||||
|
|
|
|
|
|
|
|
|
|
|
|
|
|||||||||||||||
| $ | (118) | $ | (167) | $ | (49) | $ | (285) | $ | (332) | $ | (47) | |||||||||||||||
|
|
|
|
|
|
|
|
|
|
|
|
|
|||||||||||||||
| (1) | Non-cash items in revenue represent straight-line rent, amortization of above and below market rents, net, and amortization of lease incentives and tenant improvement reimbursements. |
| (2) | Amounts for the three and six months ended June 30, 2019 reflect the operating results related to 1.3 million square feet of flex and office assets held for sale as of June 30, 2019; amounts shown for the three and six months ended June 30, 2018 reflect the operating results related to 1.3 million square feet of flex and office assets held for sale as of June 30, 2019 as well as operating results related to 899,000 square feet of assets sold in 2018. |
| (3) | Non-cash items in cost of operations represent stock compensation expense attributable to employees whose compensation expense is recorded in costs of operations. |
7

| PROPERTY INFORMATION (1) |
| |||||||||||||||||||||||
| For The Three Months Ended June 30, | For the Six Months Ended June 30, | |||||||||||||||||||||||
| 2019 | 2018 | % Change | 2019 | 2018 | % Change | |||||||||||||||||||
| Total Portfolio (2) |
||||||||||||||||||||||||
| Total rentable square footage at period end |
26,940,000 | 26,866,000 | 0.3% | 26,940,000 | 26,866,000 | 0.3% | ||||||||||||||||||
| Weighted average occupancy |
93.8% | 94.3% | (0.5%) | 93.9% | 94.4% | (0.5%) | ||||||||||||||||||
| Period end occupancy |
94.1% | 94.3% | (0.2%) | 94.1% | 94.3% | (0.2%) | ||||||||||||||||||
| Annualized realized rent per occupied sq. ft. (3) (5) |
$ | 15.74 | $ | 15.05 | 4.6% | $ | 15.64 | $ | 15.04 | 4.0% | ||||||||||||||
| RevPAF (4) (5) |
$ | 14.76 | $ | 14.20 | 3.9% | $ | 14.69 | $ | 14.20 | 3.5% | ||||||||||||||
| Same Park Portfolio (6) |
||||||||||||||||||||||||
| Total rentable square footage at period end |
25,809,000 | 25,809,000 | - | 25,809,000 | 25,809,000 | - | ||||||||||||||||||
| Weighted average occupancy |
94.3% | 94.5% | (0.2%) | 94.5% | 94.5% | - | ||||||||||||||||||
| Period end occupancy |
94.5% | 95.0% | (0.5%) | 94.5% | 95.0% | (0.5%) | ||||||||||||||||||
| Annualized realized rent per occupied sq. ft. (3) (5) |
$ | 15.77 | $ | 15.08 | 4.6% | $ | 15.71 | $ | 15.06 | 4.3% | ||||||||||||||
| RevPAF (4) (5) |
$ | 14.87 | $ | 14.25 | 4.4% | $ | 14.85 | $ | 14.23 | 4.4% | ||||||||||||||
| Non-Same Park Portfolio (7) |
||||||||||||||||||||||||
| Total rentable square footage at period end |
1,131,000 | 1,057,000 | 7.0% | 1,131,000 | 1,057,000 | 7.0% | ||||||||||||||||||
| Weighted average occupancy |
82.0% | 76.1% | 7.8% | 80.4% | 76.1% | 5.7% | ||||||||||||||||||
| Period end occupancy |
83.3% | 76.1% | 9.5% | 83.3% | 76.1% | 9.5% | ||||||||||||||||||
| Annualized realized rent per occupied sq. ft. (3) |
$ | 14.97 | $ | 12.35 | 21.2% | 13.52 | 12.29 | 10.0% | ||||||||||||||||
| RevPAF (4) |
$ | 12.28 | $ | 9.39 | 30.8% | 10.87 | 9.36 | 16.1% | ||||||||||||||||
| Multifamily Portfolio |
||||||||||||||||||||||||
| Number of units |
395 | 395 | - | 395 | 395 | - | ||||||||||||||||||
| Period end occupancy |
94.2% | 81.8% | 15.2% | 94.2% | 81.8% | 15.2% | ||||||||||||||||||
| (1) | Excludes 1.3 million rentable square feet of flex and office assets held for sale and 899,000 square feet of assets sold in 2018. |
| (2) | Operating metrics from our multifamily asset are excluded from the total portfolio operating metrics. |
| (3) | Annualized realized rent per occupied square foot represents the annualized revenue earned per occupied square foot. |
| (4) | RevPAF represents the annualized revenue earned per total weighted average available square foot. |
| (5) | Total and Same Park annualized realized rent per occupied square foot and RevPAF include lease buyout income of $780,000 and $122,000 for the three months ended June 30, 2019 and 2018, respectively, and $957,000 and $250,000 for the six months ended June 30, 2019 and 2018, respectively. |
| (6) | Same Park includes assets acquired prior to January 1, 2017. |
| (7) | Non-Same Park reflects assets acquired on or subsequent to January 1, 2017. |
8

NET OPERATING INCOME
| For The Three Months Ended June 30, | For the Six Months Ended June 30, | |||||||||||||||||||||||
| 2019 | 2018 | % Change | 2019 | 2018 | % Change | |||||||||||||||||||
| Rental income |
||||||||||||||||||||||||
| Same Park (1) |
$ | 95,945 | $ | 91,942 | 4.4% | $ | 191,638 | $ | 183,620 | 4.4% | ||||||||||||||
| Non-Same Park (2) |
3,429 | 627 | 446.9% | 5,910 | 627 | 842.6% | ||||||||||||||||||
| Multifamily |
2,475 | 1,738 | 42.4% | 4,973 | 3,162 | 57.3% | ||||||||||||||||||
| Assets sold or held for sale |
5,933 | 7,517 | (21.1%) | 13,086 | 18,174 | (28.0%) | ||||||||||||||||||
|
|
|
|
|
|
|
|
|
|||||||||||||||||
| Total rental income |
107,782 | 101,824 | 5.9% | 215,607 | 205,583 | 4.9% | ||||||||||||||||||
|
|
|
|
|
|
|
|
|
|||||||||||||||||
| Adjusted cost of operations (3) |
||||||||||||||||||||||||
| Same Park (1) |
26,947 | 26,366 | 2.2% | 55,389 | 53,588 | 3.4% | ||||||||||||||||||
| Non-Same Park (2) |
1,024 | 224 | 357.1% | 2,167 | 224 | 867.4% | ||||||||||||||||||
| Multifamily |
1,002 | 973 | 3.0% | 2,073 | 1,970 | 5.2% | ||||||||||||||||||
| Assets sold or held for sale |
2,192 | 2,899 | (24.4%) | 4,823 | 6,763 | (28.7%) | ||||||||||||||||||
|
|
|
|
|
|
|
|
|
|||||||||||||||||
| Total adjusted cost of operations |
31,165 | 30,462 | 2.3% | 64,452 | 62,545 | 3.0% | ||||||||||||||||||
|
|
|
|
|
|
|
|
|
|||||||||||||||||
| Net operating income |
||||||||||||||||||||||||
| Same Park (1) |
68,998 | 65,576 | 5.2% | 136,249 | 130,032 | 4.8% | ||||||||||||||||||
| Non-Same Park (2) |
2,405 | 403 | 496.8% | 3,743 | 403 | 828.8% | ||||||||||||||||||
| Multifamily |
1,473 | 765 | 92.5% | 2,900 | 1,192 | 143.3% | ||||||||||||||||||
| Assets sold or held for sale (4) |
3,741 | 4,618 | (19.0%) | 8,263 | 11,411 | (27.6%) | ||||||||||||||||||
|
|
|
|
|
|
|
|
|
|||||||||||||||||
| Total net operating income |
$ | 76,617 | $ | 71,362 | 7.4% | $ | 151,155 | $ | 143,038 | 5.7% | ||||||||||||||
|
|
|
|
|
|
|
|
|
|||||||||||||||||
| CASH NET OPERATING INCOME |
| |||||||||||||||||||||||
| For The Three Months Ended June 30, | For the Six Months Ended June 30, | |||||||||||||||||||||||
| 2019 | 2018 | % Change | 2019 | 2018 | % Change | |||||||||||||||||||
| Cash rental income (5) |
||||||||||||||||||||||||
| Same Park (1) |
$ | 95,385 | $ | 90,989 | 4.8% | $ | 190,429 | $ | 181,648 | 4.8% | ||||||||||||||
| Non-Same Park (2) |
3,194 | 565 | 465.3% | 5,511 | 565 | 875.4% | ||||||||||||||||||
| Multifamily |
2,474 | 1,720 | 43.8% | 4,971 | 3,144 | 58.1% | ||||||||||||||||||
| Assets sold or held for sale |
5,797 | 7,321 | (20.8%) | 12,749 | 17,753 | (28.2%) | ||||||||||||||||||
|
|
|
|
|
|
|
|
|
|||||||||||||||||
| Total cash rental income |
106,850 | 100,595 | 6.2% | 213,660 | 203,110 | 5.2% | ||||||||||||||||||
|
|
|
|
|
|
|
|
|
|||||||||||||||||
| Adjusted cost of operations (3) |
||||||||||||||||||||||||
| Same Park (1) |
26,947 | 26,366 | 2.2% | 55,389 | 53,588 | 3.4% | ||||||||||||||||||
| Non-Same Park (2) |
1,024 | 224 | 357.1% | 2,167 | 224 | 867.4% | ||||||||||||||||||
| Multifamily |
1,002 | 973 | 3.0% | 2,073 | 1,970 | 5.2% | ||||||||||||||||||
| Assets sold or held for sale |
2,192 | 2,899 | (24.4%) | 4,823 | 6,763 | (28.7%) | ||||||||||||||||||
|
|
|
|
|
|
|
|
|
|||||||||||||||||
| Total adjusted cost of operations |
31,165 | 30,462 | 2.3% | 64,452 | 62,545 | 3.0% | ||||||||||||||||||
|
|
|
|
|
|
|
|
|
|||||||||||||||||
| Cash net operating income |
||||||||||||||||||||||||
| Same Park (1) |
68,438 | 64,623 | 5.9% | 135,040 | 128,060 | 5.5% | ||||||||||||||||||
| Non-Same Park (2) |
2,170 | 341 | 536.4% | 3,344 | 341 | 880.6% | ||||||||||||||||||
| Multifamily |
1,472 | 747 | 97.1% | 2,898 | 1,174 | 146.8% | ||||||||||||||||||
| Assets sold or held for sale (4) |
3,605 | 4,422 | (18.5%) | 7,926 | 10,990 | (27.9%) | ||||||||||||||||||
|
|
|
|
|
|
|
|
|
|||||||||||||||||
| Total cash net operating income |
$ | 75,685 | $ | 70,133 | 7.9% | $ | 149,208 | $ | 140,565 | 6.1% | ||||||||||||||
|
|
|
|
|
|
|
|
|
|||||||||||||||||
| EARNINGS BEFORE INTEREST, TAXES, DEPRECIATION AND AMORTIZATION FOR REAL ESTATE (EBITDAre) |
| |||||||||||||||||||||||
| For The Three Months Ended June 30, | For the Six Months Ended June 30, | |||||||||||||||||||||||
| 2019 | 2018 | % Change | 2019 | 2018 | % Change | |||||||||||||||||||
| Net income |
$ | 49,373 | $ | 102,359 | (51.8%) | $ | 95,948 | $ | 173,884 | (44.8%) | ||||||||||||||
| Net interest (income) expense |
(180) | 98 | (283.7%) | (370) | 171 | (316.4%) | ||||||||||||||||||
| Depreciation and amortization |
24,768 | 24,416 | 1.4% | 49,643 | 48,298 | 2.8% | ||||||||||||||||||
| Gain on sale of real estate facilities and development rights |
- | (58,448) | (100.0%) | - | (85,283) | (100.0%) | ||||||||||||||||||
|
|
|
|
|
|
|
|
|
|||||||||||||||||
| EBITDAre |
$ | 73,961 | $ | 68,425 | 8.1% | $ | 145,221 | $ | 137,070 | 5.9% | ||||||||||||||
|
|
|
|
|
|
|
|
|
|||||||||||||||||
| (1) | Same Park includes assets acquired prior to January 1, 2017. Same Park rental income and cash rental income include lease buyout income of $780,000 and $122,000 for the three months ended June 30, 2019 and 2018, respectively, and $957,000 and $250,000 for the six months ended June 30, 2019 and 2018, respectively. |
| (2) | Non-Same Park reflects assets acquired on or subsequent to January 1, 2017. |
| (3) | Adjusted cost of operations represents cost of operations excluding non-cash stock compensation expense for employees whose compensation expense is recorded in cost of operations. Refer to the “Forward-Looking Statement and Non-GAAP Disclosures” on page 3 for more information. Beginning January 1, 2019, the Company has recorded our divisional vice presidents’ compensation costs within general and administrative expense as we determined that the nature of these individuals’ responsibilities is more consistent with corporate oversight as opposed to direct property operations. As a result of this change, we have reclassified divisional vice presidents’ compensation costs totaling $305,000 and $690,000 for the three and six months ended June 30, 2018, respectively, from adjusted cost of operations into general and administrative expenses in order to conform to the current periods’ presentation. Non-cash compensation expense for our divisional vice presidents, which totaled $155,000 and $314,000 for the three and six months ended June 30, 2018, respectively, had previously been excluded from adjusted cost of operations. |
| (4) | NOI from assets held for sale was $3.7 million and $4.2 million for the three months ended June 30, 2019 and 2018, respectively, and $8.3 million and $8.5 million for the six months ended June 30, 2019 and 2018, respectively. Cash NOI from assets held for sale was $3.6 million and $4.0 million for the three months ended June 30, 2019 and 2018, respectively, and $7.9 million and $8.2 million for the six months ended June 30, 2019 and 2018, respectively. The three and six months 2018 remaining NOI balances relate to assets sold during 2018. |
| (5) | Cash rental income excludes non-cash items, specifically straight-line rent, amortization of above and below market rents, net, amortization of lease incentives and tenant improvement reimbursements. |
9

| For the Three Months Ended | ||||||||||||||||||||||||||||||||
| June 30, 2019 | June 30, 2018 | |||||||||||||||||||||||||||||||
| Industrial | Flex | Office | Total | Industrial | Flex | Office | Total | |||||||||||||||||||||||||
| Cash rental income (1) |
||||||||||||||||||||||||||||||||
| Northern California |
$ | 21,281 | $ | 2,428 | $ | 2,966 | $ | 26,675 | $ | 19,463 | $ | 2,369 | $ | 2,782 | $ | 24,614 | ||||||||||||||||
| Southern California |
8,693 | 4,648 | 185 | 13,526 | 8,624 | 4,489 | 150 | 13,263 | ||||||||||||||||||||||||
| Dallas |
3,146 | 5,442 | — | 8,588 | 2,833 | 4,528 | — | 7,361 | ||||||||||||||||||||||||
| Austin |
2,120 | 5,589 | — | 7,709 | 1,997 | 5,816 | — | 7,813 | ||||||||||||||||||||||||
| Northern Virginia |
1,751 | 6,202 | 10,237 | 18,190 | 1,695 | 6,250 | 9,794 | 17,739 | ||||||||||||||||||||||||
| South Florida |
10,167 | 470 | 26 | 10,663 | 9,785 | 515 | 41 | 10,341 | ||||||||||||||||||||||||
| Suburban Maryland |
1,105 | — | 4,513 | 5,618 | 1,115 | — | 4,462 | 5,577 | ||||||||||||||||||||||||
| Seattle |
2,706 | 1,528 | 182 | 4,416 | 2,636 | 1,461 | 184 | 4,281 | ||||||||||||||||||||||||
|
|
|
|
|
|
|
|
|
|
|
|
|
|
|
|
|
|
|
|
|
|
|
|
|
| ||||||||
| Total |
50,969 | 26,307 | 18,109 | 95,385 | 48,148 | 25,428 | 17,413 | 90,989 | ||||||||||||||||||||||||
|
|
|
|
|
|
|
|
|
|
|
|
|
|
|
|
|
|
|
|
|
|
|
|
|
| ||||||||
| Adjusted cost of operations (2) |
||||||||||||||||||||||||||||||||
| Northern California |
4,377 | 631 | 778 | 5,786 | 4,215 | 613 | 717 | 5,545 | ||||||||||||||||||||||||
| Southern California |
2,210 | 1,204 | 77 | 3,491 | 2,146 | 1,127 | 64 | 3,337 | ||||||||||||||||||||||||
| Dallas |
950 | 1,976 | — | 2,926 | 921 | 1,932 | — | 2,853 | ||||||||||||||||||||||||
| Austin |
722 | 2,164 | — | 2,886 | 683 | 2,099 | — | 2,782 | ||||||||||||||||||||||||
| Northern Virginia |
462 | 1,701 | 3,741 | 5,904 | 501 | 1,815 | 3,722 | 6,038 | ||||||||||||||||||||||||
| South Florida |
2,819 | 146 | 37 | 3,002 | 2,606 | 131 | 15 | 2,752 | ||||||||||||||||||||||||
| Suburban Maryland |
319 | — | 1,566 | 1,885 | 339 | — | 1,613 | 1,952 | ||||||||||||||||||||||||
| Seattle |
628 | 389 | 50 | 1,067 | 676 | 372 | 59 | 1,107 | ||||||||||||||||||||||||
|
|
|
|
|
|
|
|
|
|
|
|
|
|
|
|
|
|
|
|
|
|
|
|
|
| ||||||||
| Total |
12,487 | 8,211 | 6,249 | 26,947 | 12,087 | 8,089 | 6,190 | 26,366 | ||||||||||||||||||||||||
|
|
|
|
|
|
|
|
|
|
|
|
|
|
|
|
|
|
|
|
|
|
|
|
|
| ||||||||
| Cash NOI |
||||||||||||||||||||||||||||||||
| Northern California |
16,904 | 1,797 | 2,188 | 20,889 | 15,248 | 1,756 | 2,065 | 19,069 | ||||||||||||||||||||||||
| Southern California |
6,483 | 3,444 | 108 | 10,035 | 6,478 | 3,362 | 86 | 9,926 | ||||||||||||||||||||||||
| Dallas |
2,196 | 3,466 | — | 5,662 | 1,912 | 2,596 | — | 4,508 | ||||||||||||||||||||||||
| Austin |
1,398 | 3,425 | — | 4,823 | 1,314 | 3,717 | — | 5,031 | ||||||||||||||||||||||||
| Northern Virginia |
1,289 | 4,501 | 6,496 | 12,286 | 1,194 | 4,435 | 6,072 | 11,701 | ||||||||||||||||||||||||
| South Florida |
7,348 | 324 | (11) | 7,661 | 7,179 | 384 | 26 | 7,589 | ||||||||||||||||||||||||
| Suburban Maryland |
786 | — | 2,947 | 3,733 | 776 | — | 2,849 | 3,625 | ||||||||||||||||||||||||
| Seattle |
2,078 | 1,139 | 132 | 3,349 | 1,960 | 1,089 | 125 | 3,174 | ||||||||||||||||||||||||
|
|
|
|
|
|
|
|
|
|
|
|
|
|
|
|
|
|
|
|
|
|
|
|
|
| ||||||||
| Total |
$ | 38,482 | $ | 18,096 | $ | 11,860 | $ | 68,438 | $ | 36,061 | $ | 17,339 | $ | 11,223 | $ | 64,623 | ||||||||||||||||
|
|
|
|
|
|
|
|
|
|
|
|
|
|
|
|
|
|
|
|
|
|
|
|
|
| ||||||||
| (1) | Cash rental income excludes non-cash items, specifically straight-line rent, amortization of above and below market rents, net, amortization of lease incentives and tenant improvement reimbursements. Cash rental income includes lease buyout income of $780,000 and $122,000 for the three months ended June 30, 2019 and 2018, respectively. |
| (2) | Adjusted cost of operations represents cost of operations excluding non-cash stock compensation expense related to employees whose compensation expense is included in costs of operations. Refer to the “Forward-Looking Statement and Non-GAAP Disclosures” on page 3 for more information. Beginning January 1, 2019, the Company has recorded our divisional vice presidents’ compensation costs within general and administrative expense as we determined that the nature of these individuals’ responsibilities is more consistent with corporate oversight as opposed to direct property operations. As a result of this change, we have reclassified divisional vice presidents’ compensation costs totaling $289,000 for the three months ended June 30, 2018 from adjusted cost of operations into general and administrative expenses in order to conform to the current periods’ presentation. Non-cash compensation expense for our divisional vice presidents, which totaled $149,000 for the three months ended June 30, 2018 had previously been excluded from adjusted cost of operations. |
10

| For the Six Months Ended | ||||||||||||||||||||||||||||||||
| June 30, 2019 | June 30, 2018 | |||||||||||||||||||||||||||||||
| Industrial | Flex | Office | Total | Industrial | Flex | Office | Total | |||||||||||||||||||||||||
| Cash rental income (1) |
||||||||||||||||||||||||||||||||
| Northern California |
$ | 41,833 | $ | 4,895 | $ | 5,958 | $ | 52,686 | $ | 38,507 | $ | 4,712 | $ | 5,540 | $ | 48,759 | ||||||||||||||||
| Southern California |
17,484 | 9,286 | 368 | 27,138 | 16,945 | 8,905 | 335 | 26,185 | ||||||||||||||||||||||||
| Dallas |
6,196 | 10,572 | — | 16,768 | 5,643 | 9,358 | — | 15,001 | ||||||||||||||||||||||||
| Austin |
4,181 | 10,997 | — | 15,178 | 3,981 | 11,248 | — | 15,229 | ||||||||||||||||||||||||
| Northern Virginia |
3,544 | 12,528 | 20,819 | 36,891 | 3,452 | 12,497 | 20,090 | 36,039 | ||||||||||||||||||||||||
| South Florida |
20,610 | 926 | 26 | 21,562 | 19,725 | 1,016 | 86 | 20,827 | ||||||||||||||||||||||||
| Suburban Maryland |
2,302 | — | 9,048 | 11,350 | 2,256 | — | 8,802 | 11,058 | ||||||||||||||||||||||||
| Seattle |
5,363 | 3,130 | 363 | 8,856 | 5,271 | 2,915 | 364 | 8,550 | ||||||||||||||||||||||||
|
|
|
|
|
|
|
|
|
|
|
|
|
|
|
|
|
|
||||||||||||||||
| Total |
101,513 | 52,334 | 36,582 | 190,429 | 95,780 | 50,651 | 35,217 | 181,648 | ||||||||||||||||||||||||
|
|
|
|
|
|
|
|
|
|
|
|
|
|
|
|
|
|
||||||||||||||||
| Adjusted cost of operations (2) |
||||||||||||||||||||||||||||||||
| Northern California |
8,972 | 1,310 | 1,548 | 11,830 | 8,525 | 1,261 | 1,450 | 11,236 | ||||||||||||||||||||||||
| Southern California |
4,437 | 2,455 | 145 | 7,037 | 4,143 | 2,283 | 129 | 6,555 | ||||||||||||||||||||||||
| Dallas |
1,897 | 3,941 | — | 5,838 | 1,890 | 3,716 | — | 5,606 | ||||||||||||||||||||||||
| Austin |
1,440 | 4,170 | — | 5,610 | 1,339 | 4,002 | — | 5,341 | ||||||||||||||||||||||||
| Northern Virginia |
1,079 | 3,727 | 8,180 | 12,986 | 1,065 | 3,792 | 8,112 | 12,969 | ||||||||||||||||||||||||
| South Florida |
5,530 | 296 | 59 | 5,885 | 5,346 | 258 | 25 | 5,629 | ||||||||||||||||||||||||
| Suburban Maryland |
700 | — | 3,401 | 4,101 | 707 | — | 3,375 | 4,082 | ||||||||||||||||||||||||
| Seattle |
1,247 | 756 | 99 | 2,102 | 1,337 | 722 | 111 | 2,170 | ||||||||||||||||||||||||
|
|
|
|
|
|
|
|
|
|
|
|
|
|
|
|
|
|
||||||||||||||||
| Total |
25,302 | 16,655 | 13,432 | 55,389 | 24,352 | 16,034 | 13,202 | 53,588 | ||||||||||||||||||||||||
|
|
|
|
|
|
|
|
|
|
|
|
|
|
|
|
|
|
||||||||||||||||
| Cash NOI |
||||||||||||||||||||||||||||||||
| Northern California |
32,861 | 3,585 | 4,410 | 40,856 | 29,982 | 3,451 | 4,090 | 37,523 | ||||||||||||||||||||||||
| Southern California |
13,047 | 6,831 | 223 | 20,101 | 12,802 | 6,622 | 206 | 19,630 | ||||||||||||||||||||||||
| Dallas |
4,299 | 6,631 | — | 10,930 | 3,753 | 5,642 | — | 9,395 | ||||||||||||||||||||||||
| Austin |
2,741 | 6,827 | — | 9,568 | 2,642 | 7,246 | — | 9,888 | ||||||||||||||||||||||||
| Northern Virginia |
2,465 | 8,801 | 12,639 | 23,905 | 2,387 | 8,705 | 11,978 | 23,070 | ||||||||||||||||||||||||
| South Florida |
15,080 | 630 | (33 | ) | 15,677 | 14,379 | 758 | 61 | 15,198 | |||||||||||||||||||||||
| Suburban Maryland |
1,602 | — | 5,647 | 7,249 | 1,549 | — | 5,427 | 6,976 | ||||||||||||||||||||||||
| Seattle |
4,116 | 2,374 | 264 | 6,754 | 3,934 | 2,193 | 253 | 6,380 | ||||||||||||||||||||||||
|
|
|
|
|
|
|
|
|
|
|
|
|
|
|
|
|
|
||||||||||||||||
| Total |
$ | 76,211 | $ | 35,679 | $ | 23,150 | $ | 135,040 | $ | 71,428 | $ | 34,617 | $ | 22,015 | $ | 128,060 | ||||||||||||||||
|
|
|
|
|
|
|
|
|
|
|
|
|
|
|
|
|
|
||||||||||||||||
| (1) | Cash rental income excludes non-cash items, specifically straight-line rent, amortization of above and below market rents, net, amortization of lease incentives and tenant improvement reimbursements. Cash rental income includes lease buyout income of $957,000 and $250,000 for the six months ended June 30, 2019 and 2018, respectively. |
| (2) | Adjusted cost of operations represents cost of operations excluding non-cash stock compensation expense related to employees whose compensation expense is included in costs of operations. Refer to the “Forward-Looking Statement and Non-GAAP Disclosures” on page 3 for more information. Beginning January 1, 2019, the Company has recorded our divisional vice presidents’ compensation costs within general and administrative expense as we determined that the nature of these individuals’ responsibilities is more consistent with corporate oversight as opposed to direct property operations. As a result of this change, we have reclassified divisional vice presidents’ compensation costs totaling $655,000 for the six months ended June 30, 2018 from adjusted cost of operations into general and administrative expenses in order to conform to the current periods’ presentation. Non-cash compensation expense for our divisional vice presidents, which totaled $302,000 for the six months ended June 30, 2018 had previously been excluded from adjusted cost of operations. |
11

| For the Three Months Ended | ||||||||||||||||||||||||||||||||
| June 30, 2019 | June 30, 2018 | |||||||||||||||||||||||||||||||
| Industrial | Flex | Office | Total | Industrial | Flex | Office | Total | |||||||||||||||||||||||||
| Rental income (1) |
||||||||||||||||||||||||||||||||
| Northern California |
$ | 21,421 | $ | 2,402 | $ | 2,960 | $ | 26,783 | $ | 19,610 | $ | 2,364 | $ | 2,812 | $ | 24,786 | ||||||||||||||||
| Southern California |
8,713 | 4,641 | 188 | 13,542 | 8,525 | 4,503 | 150 | 13,178 | ||||||||||||||||||||||||
| Dallas |
3,219 | 5,462 | — | 8,681 | 2,892 | 4,585 | — | 7,477 | ||||||||||||||||||||||||
| Austin |
2,110 | 5,676 | — | 7,786 | 1,989 | 5,820 | — | 7,809 | ||||||||||||||||||||||||
| Northern Virginia |
1,833 | 5,961 | 10,472 | 18,266 | 1,826 | 6,214 | 10,269 | 18,309 | ||||||||||||||||||||||||
| South Florida |
10,219 | 465 | 41 | 10,725 | 9,921 | 492 | 41 | 10,454 | ||||||||||||||||||||||||
| Suburban Maryland |
1,080 | — | 4,683 | 5,763 | 1,118 | — | 4,567 | 5,685 | ||||||||||||||||||||||||
| Seattle |
2,690 | 1,528 | 181 | 4,399 | 2,600 | 1,458 | 186 | 4,244 | ||||||||||||||||||||||||
|
|
|
|
|
|
|
|
|
|
|
|
|
|
|
|
|
|
||||||||||||||||
| Total |
51,285 | 26,135 | 18,525 | 95,945 | 48,481 | 25,436 | 18,025 | 91,942 | ||||||||||||||||||||||||
|
|
|
|
|
|
|
|
|
|
|
|
|
|
|
|
|
|
||||||||||||||||
| Adjusted cost of operations (2) |
||||||||||||||||||||||||||||||||
| Northern California |
4,377 | 631 | 778 | 5,786 | 4,215 | 613 | 717 | 5,545 | ||||||||||||||||||||||||
| Southern California |
2,210 | 1,204 | 77 | 3,491 | 2,146 | 1,127 | 64 | 3,337 | ||||||||||||||||||||||||
| Dallas |
950 | 1,976 | — | 2,926 | 921 | 1,932 | — | 2,853 | ||||||||||||||||||||||||
| Austin |
722 | 2,164 | — | 2,886 | 683 | 2,099 | — | 2,782 | ||||||||||||||||||||||||
| Northern Virginia |
462 | 1,701 | 3,741 | 5,904 | 501 | 1,815 | 3,722 | 6,038 | ||||||||||||||||||||||||
| South Florida |
2,819 | 146 | 37 | 3,002 | 2,606 | 131 | 15 | 2,752 | ||||||||||||||||||||||||
| Suburban Maryland |
319 | — | 1,566 | 1,885 | 339 | — | 1,613 | 1,952 | ||||||||||||||||||||||||
| Seattle |
628 | 389 | 50 | 1,067 | 676 | 372 | 59 | 1,107 | ||||||||||||||||||||||||
|
|
|
|
|
|
|
|
|
|
|
|
|
|
|
|
|
|
||||||||||||||||
| Total |
12,487 | 8,211 | 6,249 | 26,947 | 12,087 | 8,089 | 6,190 | 26,366 | ||||||||||||||||||||||||
|
|
|
|
|
|
|
|
|
|
|
|
|
|
|
|
|
|
||||||||||||||||
| NOI |
||||||||||||||||||||||||||||||||
| Northern California |
17,044 | 1,771 | 2,182 | 20,997 | 15,395 | 1,751 | 2,095 | 19,241 | ||||||||||||||||||||||||
| Southern California |
6,503 | 3,437 | 111 | 10,051 | 6,379 | 3,376 | 86 | 9,841 | ||||||||||||||||||||||||
| Dallas |
2,269 | 3,486 | — | 5,755 | 1,971 | 2,653 | — | 4,624 | ||||||||||||||||||||||||
| Austin |
1,388 | 3,512 | — | 4,900 | 1,306 | 3,721 | — | 5,027 | ||||||||||||||||||||||||
| Northern Virginia |
1,371 | 4,260 | 6,731 | 12,362 | 1,325 | 4,399 | 6,547 | 12,271 | ||||||||||||||||||||||||
| South Florida |
7,400 | 319 | 4 | 7,723 | 7,315 | 361 | 26 | 7,702 | ||||||||||||||||||||||||
| Suburban Maryland |
761 | — | 3,117 | 3,878 | 779 | — | 2,954 | 3,733 | ||||||||||||||||||||||||
| Seattle |
2,062 | 1,139 | 131 | 3,332 | 1,924 | 1,086 | 127 | 3,137 | ||||||||||||||||||||||||
|
|
|
|
|
|
|
|
|
|
|
|
|
|
|
|
|
|
||||||||||||||||
| Total |
$ | 38,798 | $ | 17,924 | $ | 12,276 | $ | 68,998 | $ | 36,394 | $ | 17,347 | $ | 11,835 | $ | 65,576 | ||||||||||||||||
|
|
|
|
|
|
|
|
|
|
|
|
|
|
|
|
|
|
||||||||||||||||
| (1) | Rental income includes lease buyout income of $780,000 and $122,000 for the three months ended June 30, 2019 and 2018, respectively. |
| (2) | Adjusted cost of operations represents cost of operations excluding non-cash stock compensation expense related to employees whose compensation expense is included in cost of operations. Refer to the “Forward-Looking Statement and Non-GAAP Disclosures” on page 3 for more information. Beginning January 1, 2019, the Company has recorded our divisional vice presidents’ compensation costs within general and administrative expense as we determined that the nature of these individuals’ responsibilities is more consistent with corporate oversight as opposed to direct property operations. As a result of this change, we have reclassified divisional vice presidents’ compensation costs totaling $289,000 for the three months ended June 30, 2018 from adjusted cost of operations into general and administrative expenses in order to conform to the current periods’ presentation. Non-cash compensation expense for our divisional vice presidents, which totaled $149,000 for the three months ended June 30, 2018 had previously been excluded from adjusted cost of operations. |
12

| For the Six Months Ended | ||||||||||||||||||||||||||||||||
| June 30, 2019 | June 30, 2018 | |||||||||||||||||||||||||||||||
| Industrial | Flex | Office | Total | Industrial | Flex | Office | Total | |||||||||||||||||||||||||
| Rental income (1) |
||||||||||||||||||||||||||||||||
| Northern California |
$ | 42,043 | $ | 4,849 | $ | 5,947 | $ | 52,839 | $ | 38,698 | $ | 4,706 | $ | 5,617 | $ | 49,021 | ||||||||||||||||
| Southern California |
17,481 | 9,296 | 372 | 27,149 | 16,921 | 8,904 | 333 | 26,158 | ||||||||||||||||||||||||
| Dallas |
6,313 | 10,688 | — | 17,001 | 5,748 | 9,479 | — | 15,227 | ||||||||||||||||||||||||
| Austin |
4,218 | 11,196 | — | 15,414 | 3,968 | 11,277 | — | 15,245 | ||||||||||||||||||||||||
| Northern Virginia |
3,725 | 12,127 | 21,280 | 37,132 | 3,686 | 12,481 | 21,022 | 37,189 | ||||||||||||||||||||||||
| South Florida |
20,622 | 931 | 63 | 21,616 | 19,975 | 970 | 86 | 21,031 | ||||||||||||||||||||||||
| Suburban Maryland |
2,250 | — | 9,444 | 11,694 | 2,258 | — | 9,012 | 11,270 | ||||||||||||||||||||||||
| Seattle |
5,293 | 3,140 | 360 | 8,793 | 5,199 | 2,914 | 366 | 8,479 | ||||||||||||||||||||||||
|
|
|
|
|
|
|
|
|
|
|
|
|
|
|
|
|
|
||||||||||||||||
| Total |
101,945 | 52,227 | 37,466 | 191,638 | 96,453 | 50,731 | 36,436 | 183,620 | ||||||||||||||||||||||||
|
|
|
|
|
|
|
|
|
|
|
|
|
|
|
|
|
|
||||||||||||||||
| Adjusted cost of operations (2) |
||||||||||||||||||||||||||||||||
| Northern California |
8,972 | 1,310 | 1,548 | 11,830 | 8,525 | 1,261 | 1,450 | 11,236 | ||||||||||||||||||||||||
| Southern California |
4,437 | 2,455 | 145 | 7,037 | 4,143 | 2,283 | 129 | 6,555 | ||||||||||||||||||||||||
| Dallas |
1,897 | 3,941 | — | 5,838 | 1,890 | 3,716 | — | 5,606 | ||||||||||||||||||||||||
| Austin |
1,440 | 4,170 | — | 5,610 | 1,339 | 4,002 | — | 5,341 | ||||||||||||||||||||||||
| Northern Virginia |
1,079 | 3,727 | 8,180 | 12,986 | 1,065 | 3,792 | 8,112 | 12,969 | ||||||||||||||||||||||||
| South Florida |
5,530 | 296 | 59 | 5,885 | 5,346 | 258 | 25 | 5,629 | ||||||||||||||||||||||||
| Suburban Maryland |
700 | — | 3,401 | 4,101 | 707 | — | 3,375 | 4,082 | ||||||||||||||||||||||||
| Seattle |
1,247 | 756 | 99 | 2,102 | 1,337 | 722 | 111 | 2,170 | ||||||||||||||||||||||||
|
|
|
|
|
|
|
|
|
|
|
|
|
|
|
|
|
|
||||||||||||||||
| Total |
25,302 | 16,655 | 13,432 | 55,389 | 24,352 | 16,034 | 13,202 | 53,588 | ||||||||||||||||||||||||
|
|
|
|
|
|
|
|
|
|
|
|
|
|
|
|
|
|
||||||||||||||||
| NOI |
||||||||||||||||||||||||||||||||
| Northern California |
33,071 | 3,539 | 4,399 | 41,009 | 30,173 | 3,445 | 4,167 | 37,785 | ||||||||||||||||||||||||
| Southern California |
13,044 | 6,841 | 227 | 20,112 | 12,778 | 6,621 | 204 | 19,603 | ||||||||||||||||||||||||
| Dallas |
4,416 | 6,747 | — | 11,163 | 3,858 | 5,763 | — | 9,621 | ||||||||||||||||||||||||
| Austin |
2,778 | 7,026 | — | 9,804 | 2,629 | 7,275 | — | 9,904 | ||||||||||||||||||||||||
| Northern Virginia |
2,646 | 8,400 | 13,100 | 24,146 | 2,621 | 8,689 | 12,910 | 24,220 | ||||||||||||||||||||||||
| South Florida |
15,092 | 635 | 4 | 15,731 | 14,629 | 712 | 61 | 15,402 | ||||||||||||||||||||||||
| Suburban Maryland |
1,550 | — | 6,043 | 7,593 | 1,551 | — | 5,637 | 7,188 | ||||||||||||||||||||||||
| Seattle |
4,046 | 2,384 | 261 | 6,691 | 3,862 | 2,192 | 255 | 6,309 | ||||||||||||||||||||||||
|
|
|
|
|
|
|
|
|
|
|
|
|
|
|
|
|
|
||||||||||||||||
| Total |
$ | 76,643 | $ | 35,572 | $ | 24,034 | $ | 136,249 | $ | 72,101 | $ | 34,697 | $ | 23,234 | $ | 130,032 | ||||||||||||||||
|
|
|
|
|
|
|
|
|
|
|
|
|
|
|
|
|
|
||||||||||||||||
| (1) | Rental income includes lease buyout income of $957,000 and $250,000 for the six months ended June 30, 2019 and 2018, respectively. |
| (2) | Adjusted cost of operations represents cost of operations excluding non-cash stock compensation expense related to employees whose compensation expense is included in cost of operations. Refer to the “Forward-Looking Statement and Non-GAAP Disclosures” on page 3 for more information. Beginning January 1, 2019, the Company has recorded our divisional vice presidents’ compensation costs within general and administrative expense as we determined that the nature of these individuals’ responsibilities is more consistent with corporate oversight as opposed to direct property operations. As a result of this change, we have reclassified divisional vice presidents’ compensation costs totaling $655,000 for the six months ended June 30, 2018 from adjusted cost of operations into general and administrative expenses in order to conform to the current periods’ presentation. Non-cash compensation expense for our divisional vice presidents, which totaled $302,000 for the six months ended June 30, 2018 had previously been excluded from adjusted cost of operations. |
13

| For the Six Months Ended | Cost per Weighted | |||||||
| June 30, 2019 | Average Square Foot | |||||||
| Commercial recurring capital expenditures (1) |
||||||||
| Same Park |
||||||||
| Capital improvements |
$ | 3,368 | $ | 0.13 | ||||
| Tenant improvements |
7,372 | 0.29 | ||||||
| Lease commissions |
2,977 | 0.12 | ||||||
|
|
|
|
|
|||||
| Total Same Park recurring capital expenditures |
13,717 | $ | 0.54 | |||||
|
|
|
|||||||
| Non-Same Park |
||||||||
| Capital improvements |
54 | $ | 0.05 | |||||
| Tenant improvements |
1,092 | 1.01 | ||||||
| Lease commissions |
171 | 0.16 | ||||||
|
|
|
|
|
|||||
| Total Non-Same Park recurring capital expenditures |
1,317 | $ | 1.22 | |||||
|
|
|
|
|
|||||
| Total recurring capital expenditures |
15,034 | $ | 0.56 | |||||
| Assets sold or held for sale recurring capital expenditures |
514 | |||||||
|
|
|
|||||||
| Total commercial recurring capital expenditures |
15,548 | |||||||
| Non-recurring property renovations (2) |
1,955 | |||||||
|
|
|
|||||||
| Total capital expenditures (excluding multifamily) |
17,503 | |||||||
| Multifamily capital expenditures |
- | |||||||
|
|
|
|||||||
| Total capital expenditures |
$ | 17,503 | ||||||
|
|
|
|||||||
| (1) | The Company defines “recurring capital expenditures” as capitalized costs necessary to continue to operate the property at its current economic value. Capital improvements in excess of $2,000 with a useful life greater than 24 months are capitalized. Lease transaction costs (i.e. tenant improvements and leasing commissions) of $1,000 or more for leases with terms greater than 12 months are capitalized. First generation lease-up costs on acquired properties are also included in recurring capital expenditures. |
| (2) | Non-recurring property renovations represents renovations that substantially enhance the value of a property, including capitalized costs associated with repositioning acquired assets. |
14

| For the Three Months Ended | For the Six Months Ended | |||||||||||||||
| June 30, | June 30, | |||||||||||||||
| 2019 | 2018 | 2019 | 2018 | |||||||||||||
| Net income allocable to common shareholders |
$ | 28,579 | $ | 70,221 | $ | 54,900 | $ | 116,269 | ||||||||
| Adjustments |
||||||||||||||||
| Gain on sale of real estate facilities |
- | (58,448) | - | (85,283) | ||||||||||||
| Depreciation and amortization |
24,768 | 24,416 | 49,643 | 48,298 | ||||||||||||
| Net income allocable to noncontrolling interests |
7,623 | 18,400 | 14,650 | 30,300 | ||||||||||||
| Net income allocable to restricted stock unit holders |
212 | 779 | 480 | 1,353 | ||||||||||||
| FFO (income) loss allocated to joint venture partner |
(37) | (2) | (66) | 11 | ||||||||||||
|
|
|
|
|
|
|
|
|
|||||||||
| FFO allocable to common and dilutive shares |
61,145 | 55,366 | 119,607 | 110,948 | ||||||||||||
| Core FFO allocable to common and dilutive shares |
61,145 | 55,366 | 119,607 | 110,948 | ||||||||||||
| Adjustments |
||||||||||||||||
| Recurring capital improvements |
(2,342) | (2,062) | (3,422) | (3,051) | ||||||||||||
| Tenant improvements |
(4,937) | (3,191) | (8,464) | (5,901) | ||||||||||||
| Capitalized lease commissions |
(1,305) | (1,736) | (3,148) | (3,574) | ||||||||||||
| Total recurring capital expenditures (assets sold) |
(277) | (985) | (514) | (2,451) | ||||||||||||
| Total recurring capital expenditures (multifamily) |
- | (6) | - | (13) | ||||||||||||
| Straight-line rent |
(652) | (609) | (1,309) | (1,344) | ||||||||||||
| In-place lease adjustment |
4 | 16 | 25 | 23 | ||||||||||||
| Tenant improvement reimbursement amortization, net of lease incentive amortization |
(284) | (619) | (663) | (1,134) | ||||||||||||
| Stock compensation expense |
918 | 671 | 1,889 | 1,781 | ||||||||||||
| Cash paid for taxes in lieu of shares upon vesting of restricted stock units |
(6) | - | (5,500) | (4,529) | ||||||||||||
|
|
|
|
|
|
|
|
|
|||||||||
| FAD allocable to common and dilutive shares |
52,264 | 46,845 | 98,501 | 90,755 | ||||||||||||
| Distributions to common shareholders |
(28,801) | (23,225) | (57,538) | (46,396) | ||||||||||||
| Distributions to noncontrolling interests—common units |
(7,670) | (6,209) | (15,341) | (12,419) | ||||||||||||
| Distributions to restricted stock unit holders |
(212) | (241) | (480) | (536) | ||||||||||||
| Distributions to noncontrolling interests—joint venture |
(45) | - | (45) | - | ||||||||||||
|
|
|
|
|
|
|
|
|
|||||||||
| Free cash available after fixed charges |
15,536 | 17,170 | 25,097 | 31,404 | ||||||||||||
| Non-recurring property renovations (1) |
(1,091) | (61) | (1,955) | (93) | ||||||||||||
| Investment in Highgate (2) |
- | (949) | - | (3,709) | ||||||||||||
| Investment in The Mile redevelopment (3) |
(568) | (257) | (993) | (403) | ||||||||||||
|
|
|
|
|
|
|
|
|
|||||||||
| Retained cash |
$ | 13,877 | $ | 15,903 | $ | 22,149 | $ | 27,199 | ||||||||
|
|
|
|
|
|
|
|
|
|||||||||
| Weighted average outstanding: |
||||||||||||||||
| Common shares |
27,426 | 27,322 | 27,400 | 27,294 | ||||||||||||
| Operating partnership units |
7,305 | 7,305 | 7,305 | 7,305 | ||||||||||||
| Restricted stock units |
109 | 156 | 132 | 189 | ||||||||||||
| Common share equivalents |
106 | 101 | 105 | 101 | ||||||||||||
|
|
|
|
|
|
|
|
|
|||||||||
| Total common and dilutive shares |
34,946 | 34,884 | 34,942 | 34,889 | ||||||||||||
|
|
|
|
|
|
|
|
|
|||||||||
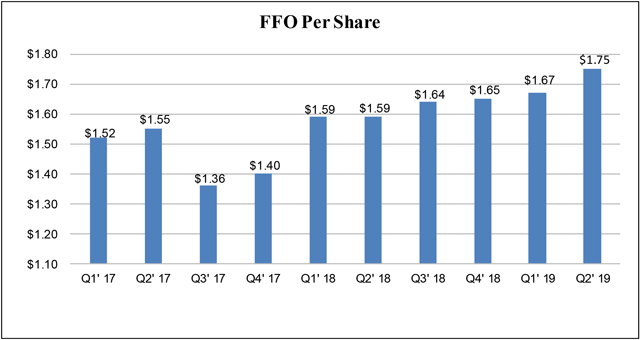
| FFO per common and dilutive share |
$ | 1.75 | $ | 1.59 | $ | 3.42 | $ | 3.18 | ||||||||
| FAD distribution payout ratio (4) |
70.3% | 63.3% | 74.5% | 65.4% | ||||||||||||
| (1) | Non-recurring property renovations represents renovations that substantially enhance the value of a property, including capitalized costs associated with repositioning acquired assets. |
| (2) | Represents development costs related to a 395-unit apartment complex that commenced operations during 2017. |
| (3) | Represents predevelopment costs related to a multifamily redevelopment project on a large contiguous block of real estate located in Tysons, Virginia. |
| (4) | FAD distribution payout ratio is equal to total distributions to common shareholders, unit holders, restricted stock unit holders and joint venture partner divided by FAD during the same reporting period. |
15

16

| As of June 30, 2019 | As of December 31, 2018 | |||||||||||||||||||||||||||
| % of Total | % of Total | |||||||||||||||||||||||||||
| Market | WTD Average | Market | WTD Average | |||||||||||||||||||||||||
| Total | Capitalization | Rate | Total | Capitalization | Rate | |||||||||||||||||||||||
|
|
|
|
|
|||||||||||||||||||||||||
| Unsecured Debt: |
||||||||||||||||||||||||||||
| $250.0 million unsecured credit facility (LIBOR + 0.825%) |
$ | - | - | - | $ | - | - | - | ||||||||||||||||||||
|
|
|
|
|
|||||||||||||||||||||||||
| Total unsecured debt |
- | - | - | - | - | - | ||||||||||||||||||||||
|
|
|
|
|
|||||||||||||||||||||||||
| Preferred Equity: |
||||||||||||||||||||||||||||
| 5.75% Series U preferred stock (9,200,000 depositary shares outstanding) callable 9/14/17 |
230,000 | 3.4 | % | 230,000 | 4.2 | % | ||||||||||||||||||||||
| 5.70% Series V preferred stock (4,400,000 depositary shares outstanding) callable 3/14/18 |
110,000 | 1.6 | % | 110,000 | 2.0 | % | ||||||||||||||||||||||
| 5.20% Series W preferred stock (7,590,000 depositary shares outstanding) callable 10/20/21 |
189,750 | 2.8 | % | 189,750 | 3.4 | % | ||||||||||||||||||||||
| 5.25% Series X preferred stock (9,200,000 depositary shares outstanding) callable 9/21/22 |
230,000 | 3.4 | % | 230,000 | 4.2 | % | ||||||||||||||||||||||
| 5.20% Series Y preferred stock (8,000,000 depositary shares outstanding) callable 12/7/22 |
200,000 | 2.9 | % | 200,000 | 3.6 | % | ||||||||||||||||||||||
|
|
|
|
|
|||||||||||||||||||||||||
| Total preferred equity |
959,750 | 14.1 | % | 5.40 | % | 959,750 | 17.4 | % | 5.40 | % | ||||||||||||||||||
|
|
|
|
|
|||||||||||||||||||||||||
|
|
|
|
|
|||||||||||||||||||||||||
| Total debt and preferred equity |
959,750 | 14.1 | % | 5.40 | % | 959,750 | 17.4 | % | 5.40 | % | ||||||||||||||||||
|
|
|
|
|
|||||||||||||||||||||||||
| Common stock (27,429,756 and 27,362,101 shares outstanding as of June 30, 2019 and December 31, 2018, respectively) |
4,622,737 | 67.8 | % | 3,584,435 | 65.2 | % | ||||||||||||||||||||||
| Common operating partnership units (7,305,355 units outstanding as of June 30, 2019 and December 31, 2018) |
1,231,171 | 18.1 | % | 957,002 | 17.4 | % | ||||||||||||||||||||||
|
|
|
|
|
|||||||||||||||||||||||||
| Total common equity (1) |
5,853,908 | 85.9 | % | 4,541,437 | 82.6 | % | ||||||||||||||||||||||
|
|
|
|
|
|||||||||||||||||||||||||
| Total market capitalization |
$ | 6,813,658 | 100.0 | % | $ | 5,501,187 | 100.0 | % | ||||||||||||||||||||
|
|
|
|
|
|||||||||||||||||||||||||
| Ratio of Debt and Preferred Equity to EBITDAre (2) |
3.3x | 3.5x | ||||||||||||||||||||||||||
| For the six months ended June 30, 2019 | For the year ended December 31, 2018 | |||||||||||||||||||||||||||
| Interest expense and related expenses (3) |
$ | 272 | $ | 555 | ||||||||||||||||||||||||
| Preferred distributions |
25,918 | 51,880 | ||||||||||||||||||||||||||
|
|
|
|
|
|||||||||||||||||||||||||
| Total fixed charges and preferred distributions |
$ | 26,190 | $ | 52,435 | ||||||||||||||||||||||||
|
|
|
|
|
|||||||||||||||||||||||||
| Ratio of EBITDAre to fixed charges and preferred distributions |
5.5x | 5.3x | ||||||||||||||||||||||||||
| Ratio of FFO to fixed charges and preferred distributions |
5.6x | 5.3x | ||||||||||||||||||||||||||
| (1) | Total common equity is calculated as the total number of common stock and operating partnership units outstanding multiplied by the Company’s closing share price at the end of each reporting period. Closing share prices on June 30, 2019 and December 31, 2018 were $168.53 and $131.00, respectively. |
| (2) | Ratio of debt and preferred equity to EBITDAre is calculated as total debt and preferred equity divided by EBITDAre. Ratio of debt and preferred equity to EBITDAre as of June 30, 2019 is calculated using annualized EBITDAre for the six months ended June 30, 2019. |
| (3) | Interest expense and related expenses includes facility fees associated with our unsecured credit facility. |
17

| Industry Concentration as of June 30, 2019 (1) |
| |||||||||||
| Percentage of | ||||||||||||
| Total Rental Income | ||||||||||||
| Business services |
19.5% | |||||||||||
| Warehouse, distribution, transportation and logistics |
12.3% | |||||||||||
| Computer hardware, software and related services |
11.1% | |||||||||||
| Health services |
7.8% | |||||||||||
| Retail, food, and automotive |
7.6% | |||||||||||
| Engineering and construction |
7.6% | |||||||||||
| Government |
7.2% | |||||||||||
| Insurance and financial services |
3.4% | |||||||||||
| Electronics |
2.9% | |||||||||||
| Home furnishings |
2.8% | |||||||||||
| Aerospace/defense products and services |
2.0% | |||||||||||
| Communications |
1.9% | |||||||||||
| Educational services |
1.1% | |||||||||||
| Other |
12.8% | |||||||||||
|
|
|
|||||||||||
| Total |
100.0% | |||||||||||
|
|
|
|||||||||||
| Top 10 Customers by Total Annual Rental Income as of June 30, 2019 (1) |
| |||||||||||
| Square Footage |
Annualized | Percentage of Total | ||||||||||
| Customer |
Rental Income (2) | Annualized Rental Income | ||||||||||
| US Government |
635,000 | $ | 16,867 | 4.2% | ||||||||
| Luminex Corp |
199,000 | 3,992 | 1.0% | |||||||||
| Lockheed Martin Corp |
143,000 | 2,523 | 0.6% | |||||||||
| KZ Kitchen Cabinet & Stone |
191,000 | 2,413 | 0.6% | |||||||||
| CentralColo, LLC |
96,000 | 2,307 | 0.6% | |||||||||
| Applied Materials, Inc. |
162,000 | 2,264 | 0.6% | |||||||||
| Carbel, LLC |
207,000 | 2,078 | 0.5% | |||||||||
| Investorplace Media, LLC |
46,000 | 1,950 | 0.5% | |||||||||
| ECS Federal, LLC |
81,000 | 1,794 | 0.5% | |||||||||
| MAXIMUS, Inc. |
76,000 | 1,702 | 0.4% | |||||||||
|
|
|
|
|
|
|
|||||||
| Total |
1,836,000 | $ | 37,890 | 9.5% | ||||||||
|
|
|
|
|
|
|
|||||||
| Tenant Composition as of June 30, 2019 (1) |
| |||||||||||
| Average Tenant Size | ||||||||||||
| Number | (in square feet) | |||||||||||
| of Tenants | Average square footage | |||||||||||
| Large Tenants (3) |
1,365 | 12,901 | ||||||||||
| Small Tenants (4) |
3,503 | 2,210 | ||||||||||
|
|
|
|||||||||||
| Total Portfolio |
4,868 | 5,208 | ||||||||||
|
|
|
|||||||||||
| (1) | Excludes assets held for sale as of June 30, 2019. |
| (2) | For leases expiring within one year, annualized rental income includes only the income to be received under the existing lease from July 1, 2019 through the respective date of expiration. |
| (3) | Large tenant portfolio consists of properties with average leases greater than or equal to 5,000 square feet. |
| (4) | Small tenant portfolio consists of properties with average leases less than 5,000 square feet. |
18

| Realized Revenue per Occupied Square Foot (1) (2) | ||||||||||||||||||||
| For the Three Months | For the Six Months | |||||||||||||||||||
| Ended June 30, | Ended June 30, | |||||||||||||||||||
|
Region |
2019 | 2018 | % Change | 2019 | 2018 | % Change | ||||||||||||||
| Northern California |
$ | 15.44 | $ | 13.98 | 10.4% | $ | 15.17 | $ | 13.85 | 9.5% | ||||||||||
| Southern California |
$ | 17.43 | $ | 16.34 | 6.7% | $ | 17.38 | $ | 16.29 | 6.7% | ||||||||||
| Dallas |
$ | 12.96 | $ | 11.91 | 8.8% | $ | 12.72 | $ | 11.95 | 6.4% | ||||||||||
| Austin |
$ | 17.38 | $ | 17.14 | 1.4% | $ | 17.26 | $ | 16.59 | 4.0% | ||||||||||
| Northern Virginia |
$ | 19.69 | $ | 20.31 | (3.1%) | $ | 20.12 | $ | 20.75 | (3.0%) | ||||||||||
| South Florida |
$ | 11.74 | $ | 11.24 | 4.4% | $ | 11.72 | $ | 11.31 | 3.6% | ||||||||||
| Suburban Maryland |
$ | 20.36 | $ | 21.68 | (6.1%) | $ | 20.64 | $ | 21.63 | (4.6%) | ||||||||||
| Seattle |
$ | 13.31 | $ | 12.45 | 6.9% | $ | 13.23 | $ | 12.43 | 6.4% | ||||||||||
| Total |
$ | 15.77 | $ | 15.08 | 4.6% | $ | 15.71 | $ | 15.06 | 4.3% | ||||||||||
| Revenue per Available Foot (RevPAF) (1) (3) | ||||||||||||||||||||
| For the Three Months | For the Six Months | |||||||||||||||||||
| Ended June 30, | Ended June 30, | |||||||||||||||||||
|
Region |
2019 | 2018 | % Change | 2019 | 2018 | % Change | ||||||||||||||
| Northern California |
$ | 14.79 | $ | 13.68 | 8.1% | $ | 14.59 | $ | 13.53 | 7.8% | ||||||||||
| Southern California |
$ | 16.50 | $ | 16.06 | 2.7% | $ | 16.54 | $ | 15.94 | 3.8% | ||||||||||
| Dallas |
$ | 12.03 | $ | 10.36 | 16.1% | $ | 11.78 | $ | 10.55 | 11.7% | ||||||||||
| Austin |
$ | 15.87 | $ | 15.91 | (0.3%) | $ | 15.70 | $ | 15.53 | 1.1% | ||||||||||
| Northern Virginia |
$ | 18.65 | $ | 18.70 | (0.3%) | $ | 18.96 | $ | 18.99 | (0.2%) | ||||||||||
| South Florida |
$ | 11.10 | $ | 10.82 | 2.6% | $ | 11.18 | $ | 10.88 | 2.8% | ||||||||||
| Suburban Maryland |
$ | 18.32 | $ | 18.08 | 1.3% | $ | 18.59 | $ | 17.92 | 3.7% | ||||||||||
| Seattle |
$ | 12.66 | $ | 12.21 | 3.7% | $ | 12.65 | $ | 12.20 | 3.7% | ||||||||||
| Total |
$ | 14.87 | $ | 14.25 | 4.4% | $ | 14.85 | $ | 14.23 | 4.4% | ||||||||||
| Realized Revenue per Occupied Square Foot (1) (2) | ||||||||||||||||||||
| For the Three Months | For the Six Months | |||||||||||||||||||
| Ended June 30, | Ended June 30, | |||||||||||||||||||
|
Region |
2019 | 2018 | % Change | 2019 | 2018 | % Change | ||||||||||||||
| Industrial |
$ | 13.09 | $ | 12.14 | 7.8% | $ | 12.94 | $ | 12.10 | 6.9% | ||||||||||
| Flex |
$ | 18.54 | $ | 18.32 | 1.2% | $ | 18.57 | $ | 18.13 | 2.4% | ||||||||||
| Office |
$ | 24.51 | $ | 25.11 | (2.4%) | $ | 24.93 | $ | 25.58 | (2.5%) | ||||||||||
| Total |
$ | 15.77 | $ | 15.08 | 4.6% | $ | 15.71 | $ | 15.06 | 4.3% | ||||||||||
| Revenue per Available Foot (RevPAF) (1) (3) | ||||||||||||||||||||
| For the Three Months | For the Six Months | |||||||||||||||||||
| Ended June 30, | Ended June 30, | |||||||||||||||||||
|
Region |
2019 | 2018 | % Change | 2019 | 2018 | % Change | ||||||||||||||
| Industrial |
$ | 12.46 | $ | 11.78 | 5.8% | $ | 12.38 | $ | 11.72 | 5.6% | ||||||||||
| Flex |
$ | 17.14 | $ | 16.68 | 2.8% | $ | 17.13 | $ | 16.64 | 2.9% | ||||||||||
| Office |
$ | 22.84 | $ | 22.22 | 2.8% | $ | 23.09 | $ | 22.46 | 2.8% | ||||||||||
| Total |
$ | 14.87 | $ | 14.25 | 4.4% | $ | 14.85 | $ | 14.23 | 4.4% | ||||||||||
| (1) | Rental income includes lease buyout income of $780,000 and $122,000 for the three months ended June 30, 2019 and 2018, respectively, and $957,000 and $250,000 for the six months ended June 30, 2019 and 2018, respectively. |
| (2) | Represents revenue earned per occupied square foot. For the three and six month periods ending June 30, 2019 and 2018, rental income amounts have been annualized. |
| (3) | Represents revenue earned per total weighted average available square foot. For the three and six month periods ending June 30, 2019 and 2018, rental income amounts have been annualized. |
19

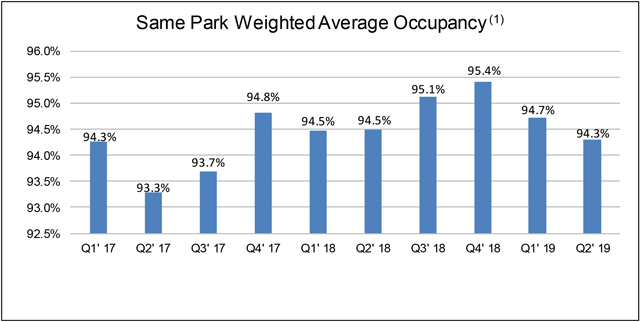
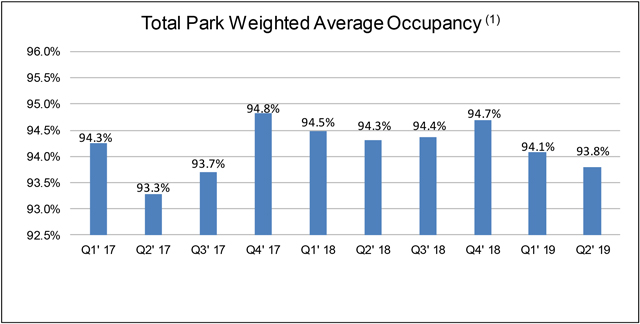
| (1) | Excludes assets held for sale as of June 30, 2019. |
20

| Rentable Square Footage of Same Park Properties as of June 30, 2019 (1) | ||||||||||
|
Markets |
Industrial | Flex | Office | Total | % of Total | |||||||||||||||
| Northern Virginia |
507 | 1,440 | 1,970 | 3,917 | 15.2% | |||||||||||||||
| South Florida |
3,728 | 126 | 12 | 3,866 | 15.0% | |||||||||||||||
| Silicon Valley |
3,094 | 367 | - | 3,461 | 13.4% | |||||||||||||||
| East Bay |
3,297 | 53 | - | 3,350 | 13.0% | |||||||||||||||
| Dallas |
1,300 | 1,587 | - | 2,887 | 11.2% | |||||||||||||||
| Suburban Maryland |
394 | - | 864 | 1,258 | 4.8% | |||||||||||||||
| Austin |
755 | 1,208 | - | 1,963 | 7.6% | |||||||||||||||
| Los Angeles County |
1,256 | 317 | 31 | 1,604 | 6.2% | |||||||||||||||
| Seattle |
1,092 | 270 | 28 | 1,390 | 5.4% | |||||||||||||||
| Orange County |
810 | 101 | - | 911 | 3.5% | |||||||||||||||
| San Diego County |
233 | 535 | - | 768 | 3.0% | |||||||||||||||
| Mid-Peninsula |
- | 94 | 340 | 434 | 1.7% | |||||||||||||||
|
|
|
|
|
|
|
|
|
|
|
|
|
|
|
|
||||||
| Total |
16,466 | 6,098 | 3,245 | 25,809 | 100.0% | |||||||||||||||
|
|
|
|
|
|
|
|
|
|
|
|
|
|
|
|
||||||
| Percentage by Product Type |
63.8% | 23.6% | 12.6% | 100.0% | ||||||||||||||||
| Same Park Weighted Average Occupancy Rates by Product Type for the Three Months Ended June 30, 2019 (1) | ||||||||||||||||||||
| Markets |
Industrial | Flex | Office | Total | ||||||||||||||||
| Northern Virginia |
93.3% | 97.3% | 93.2% | 94.7% | ||||||||||||||||
| South Florida |
94.8% | 85.0% | 100.0% | 94.5% | ||||||||||||||||
| Silicon Valley |
96.9% | 96.9% | - | 96.9% | ||||||||||||||||
| East Bay |
95.0% | 96.1% | - | 95.0% | ||||||||||||||||
| Dallas |
96.1% | 90.0% | - | 92.7% | ||||||||||||||||
| Suburban Maryland |
85.2% | - | 91.8% | 89.7% | ||||||||||||||||
| Austin |
98.9% | 86.5% | - | 91.3% | ||||||||||||||||
| Los Angeles County |
93.6% | 95.8% | 94.0% | 94.1% | ||||||||||||||||
| Seattle |
95.1% | 94.5% | 100.0% | 95.1% | ||||||||||||||||
| Orange County |
94.4% | 100.0% | - | 95.0% | ||||||||||||||||
| San Diego County |
97.3% | 95.0% | - | 95.7% | ||||||||||||||||
| Mid-Peninsula |
- | 89.0% | 94.1% | 93.0% | ||||||||||||||||
| Total |
95.2% | 92.5% | 93.0% | 94.3% | ||||||||||||||||
| Same Park Weighted Average Occupancy Rates by Portfolio Type for the Three Months Ended June 30, 2019 (1) (2) | ||||||||||||||||||||
| Markets |
Large Tenant | Small Tenant | Total | |||||||||||||||||
| Northern Virginia |
94.9% | 94.5% | 94.7% | |||||||||||||||||
| South Florida |
94.7% | 93.6% | 94.5% | |||||||||||||||||
| Silicon Valley |
97.6% | 93.8% | 96.9% | |||||||||||||||||
| East Bay |
94.6% | 99.3% | 95.0% | |||||||||||||||||
| Dallas |
92.7% | 92.7% | 92.7% | |||||||||||||||||
| Suburban Maryland |
91.9% | 87.3% | 89.7% | |||||||||||||||||
| Austin |
93.1% | 78.0% | 91.3% | |||||||||||||||||
| Los Angeles County |
91.2% | 96.4% | 94.1% | |||||||||||||||||
| Seattle |
94.9% | 95.5% | 95.1% | |||||||||||||||||
| Orange County |
93.8% | 96.6% | 95.0% | |||||||||||||||||
| San Diego County |
- | 95.7% | 95.7% | |||||||||||||||||
| Mid-Peninsula |
- | 93.0% | 93.0% | |||||||||||||||||
| Total |
94.6% | 93.6% | 94.3% | |||||||||||||||||
| (1) | Excludes assets held for sale as of June 30, 2019. |
| (2) | The Company’s “large tenant” portfolio consists of properties with average leases greater than or equal to 5,000 square feet while the “small tenant” portfolio consists of properties with average leases less than 5,000 square feet. |
21

| Same Park Weighted Average Occupancy Rates by Product Type for the Six Months Ended June 30, 2019 (1) | ||||||||||||||||||||
| Markets |
Industrial | Office | Flex | Total | ||||||||||||||||
| Northern Virginia |
93.6% | 92.6% | 96.7% | 94.2% | ||||||||||||||||
| South Florida |
95.9% | 82.9% | 88.9% | 95.4% | ||||||||||||||||
| Silicon Valley |
97.0% | - | 96.7% | 97.0% | ||||||||||||||||
| East Bay |
95.7% | - | 96.0% | 95.7% | ||||||||||||||||
| Dallas |
96.3% | - | 89.5% | 92.5% | ||||||||||||||||
| Suburban Maryland |
86.3% | 91.4% | - | 89.8% | ||||||||||||||||
| Austin |
98.5% | - | 86.3% | 91.0% | ||||||||||||||||
| Los Angeles County |
94.9% | 94.9% | 96.0% | 95.1% | ||||||||||||||||
| Seattle |
95.4% | 100.0% | 96.1% | 95.6% | ||||||||||||||||
| Orange County |
94.7% | - | 99.3% | 95.2% | ||||||||||||||||
| San Diego County |
97.5% | - | 94.4% | 95.3% | ||||||||||||||||
| Mid-Peninsula |
- | 94.0% | 90.8% | 93.3% | ||||||||||||||||
| Total |
95.7% | 92.5% | 92.2% | 94.5% | ||||||||||||||||
| Same Park Weighted Average Occupancy Rates by Portfolio Type for the Six Months Ended June 30, 2019 (1) (2) | ||||||||||||||||||||
| Markets |
Large Tenant | Small Tenant | Total | |||||||||||||||||
| Northern Virginia |
94.2% | 94.2% | 94.2% | |||||||||||||||||
| South Florida |
95.8% | 94.3% | 95.4% | |||||||||||||||||
| Silicon Valley |
97.6% | 94.2% | 97.0% | |||||||||||||||||
| East Bay |
95.4% | 99.3% | 95.7% | |||||||||||||||||
| Dallas |
92.4% | 92.8% | 92.5% | |||||||||||||||||
| Suburban Maryland |
91.8% | 87.6% | 89.8% | |||||||||||||||||
| Austin |
92.7% | 78.6% | 91.0% | |||||||||||||||||
| Los Angeles County |
93.7% | 96.2% | 95.1% | |||||||||||||||||
| Seattle |
95.2% | 96.6% | 95.6% | |||||||||||||||||
| Orange County |
94.7% | 95.9% | 95.2% | |||||||||||||||||
| San Diego County |
- | 95.3% | 95.3% | |||||||||||||||||
| Mid-Peninsula |
- | 93.3% | 93.3% | |||||||||||||||||
| Total |
94.9% | 93.7% | 94.5% | |||||||||||||||||
| (1) | Excludes assets held for sale as of June 30, 2019. |
| (2) | The Company’s “large tenant” portfolio consists of properties with average leases greater than or equal to 5,000 square feet while the “small tenant” portfolio consists of properties with average leases less than 5,000 square feet. |
22

| Rentable Square Footage of Properties as of June 30, 2019 (1) | ||||||||||||||||||||
| Markets |
Industrial | Flex | Office | Total | % of Total | |||||||||||||||
| Northern Virginia |
1,564 | 1,440 | 1,970 | 4,974 | 18.5% | |||||||||||||||
| South Florida |
3,728 | 126 | 12 | 3,866 | 14.3% | |||||||||||||||
| Silicon Valley |
3,094 | 367 | - | 3,461 | 12.8% | |||||||||||||||
| East Bay |
3,297 | 53 | - | 3,350 | 12.4% | |||||||||||||||
| Dallas |
1,300 | 1,587 | - | 2,887 | 10.7% | |||||||||||||||
| Suburban Maryland |
394 | - | 864 | 1,258 | 4.7% | |||||||||||||||
| Austin |
755 | 1,208 | - | 1,963 | 7.3% | |||||||||||||||
| Los Angeles County |
1,330 | 317 | 31 | 1,678 | 6.2% | |||||||||||||||
| Seattle |
1,092 | 270 | 28 | 1,390 | 5.2% | |||||||||||||||
| Orange County |
810 | 101 | - | 911 | 3.4% | |||||||||||||||
| San Diego County |
233 | 535 | - | 768 | 2.9% | |||||||||||||||
| Mid-Peninsula |
- | 94 | 340 | 434 | 1.6% | |||||||||||||||
|
|
|
|
|
|
|
|
|
|
|
|
|
|||||||||
| Total |
17,597 | 6,098 | 3,245 | 26,940 | 100.0% | |||||||||||||||
|
|
|
|
|
|
|
|
|
|
|
|
|
|||||||||
| Percentage by Product Type |
65.3% | 22.6% | 12.1% | 100.0% | ||||||||||||||||
| Weighted Average Occupancy Rates by Product Type for the Three Months Ended June 30, 2019 (1) | ||||||||||||||||||||
| Markets | Industrial | Flex | Office | Total | ||||||||||||||||
|
|
|
|
||||||||||||||||||
| Northern Virginia |
85.1% | 97.3% | 93.2% | 91.8% | ||||||||||||||||
| South Florida |
94.8% | 85.0% | 100.0% | 94.5% | ||||||||||||||||
| Silicon Valley |
96.9% | 96.9% | - | 96.9% | ||||||||||||||||
| East Bay |
95.0% | 96.1% | - | 95.0% | ||||||||||||||||
| Dallas |
96.1% | 90.0% | - | 92.7% | ||||||||||||||||
| Suburban Maryland |
85.2% | - | 91.8% | 89.7% | ||||||||||||||||
| Austin |
98.9% | 86.5% | - | 91.3% | ||||||||||||||||
| Los Angeles County |
93.8% | 95.8% | 94.0% | 94.2% | ||||||||||||||||
| Seattle |
95.1% | 94.5% | 100.0% | 95.1% | ||||||||||||||||
| Orange County |
94.4% | 100.0% | - | 95.0% | ||||||||||||||||
| San Diego County |
97.3% | 95.0% | - | 95.7% | ||||||||||||||||
| Mid-Peninsula |
- | 89.0% | 94.1% | 93.0% | ||||||||||||||||
| Total |
94.4% | 92.5% | 93.0% | 93.8% | ||||||||||||||||
| Weighted Average Occupancy Rates by Portfolio Type for the Three Months Ended June 30, 2019 (1) (2) | ||||||||||||||||||||
| Markets | Large Tenant | Small Tenant | Total | |||||||||||||||||
|
|
|
|
| |||||||||||||||||
| Northern Virginia |
90.7% | 94.2% | 91.8% | |||||||||||||||||
| South Florida |
94.7% | 93.6% | 94.5% | |||||||||||||||||
| Silicon Valley |
97.6% | 93.8% | 96.9% | |||||||||||||||||
| East Bay |
94.6% | 99.3% | 95.0% | |||||||||||||||||
| Dallas |
92.7% | 92.7% | 92.7% | |||||||||||||||||
| Suburban Maryland |
91.9% | 87.3% | 89.7% | |||||||||||||||||
| Austin |
93.1% | 78.0% | 91.3% | |||||||||||||||||
| Los Angeles County |
91.2% | 96.5% | 94.2% | |||||||||||||||||
| Seattle |
94.9% | 95.5% | 95.1% | |||||||||||||||||
| Orange County |
93.8% | 96.6% | 95.0% | |||||||||||||||||
| San Diego County |
- | 95.7% | 95.7% | |||||||||||||||||
| Mid-Peninsula |
- | 93.0% | 93.0% | |||||||||||||||||
| Total |
93.8% | 93.6% | 93.8% | |||||||||||||||||
| (1) | Excludes assets held for sale as of June 30, 2019. |
| (2) | The Company’s “large tenant” portfolio consists of properties with average leases greater than or equal to 5,000 square feet while the “small tenant” portfolio consists of properties with average leases less than 5,000 square feet. |
23

| Weighted Average Occupancy Rates by Product Type for the Six Months Ended June 30, 2019 (1) | ||||||||||||||||||
| Markets | Industrial | Office | Flex | Total | ||||||||||||||
|
|
|
|
||||||||||||||||
| Northern Virginia |
84.3% | 92.6% | 96.7% | 91.2% | ||||||||||||||
| South Florida |
95.9% | 82.9% | 88.9% | 95.4% | ||||||||||||||
| Silicon Valley |
97.0% | - | 96.7% | 97.0% | ||||||||||||||
| East Bay |
95.7% | - | 96.0% | 95.7% | ||||||||||||||
| Dallas |
96.3% | - | 89.5% | 92.5% | ||||||||||||||
| Suburban Maryland |
86.3% | 91.4% | - | 89.8% | ||||||||||||||
| Austin |
98.5% | - | 86.3% | 91.0% | ||||||||||||||
| Los Angeles County |
94.9% | 94.9% | 96.0% | 95.1% | ||||||||||||||
| Seattle |
95.4% | 100.0% | 96.1% | 95.6% | ||||||||||||||
| Orange County |
94.7% | - | 99.3% | 95.2% | ||||||||||||||
| San Diego County |
97.5% | - | 94.4% | 95.3% | ||||||||||||||
| Mid-Peninsula |
- | 94.0% | 90.8% | 93.3% | ||||||||||||||
| Total |
94.8% | 92.5% | 92.2% | 93.9% | ||||||||||||||
| Weighted Average Occupancy Rates by Portfolio Type for the Six Months Ended June 30, 2019 (1) (2) | ||||||||||||||||||
| Markets | Large Tenant | Small Tenant | Total | |||||||||||||||
|
|
|
|
||||||||||||||||
| Northern Virginia |
90.0% | 93.6% | 91.2% | |||||||||||||||
| South Florida |
95.8% | 94.3% | 95.4% | |||||||||||||||
| Silicon Valley |
97.6% | 94.2% | 97.0% | |||||||||||||||
| East Bay |
95.4% | 99.3% | 95.7% | |||||||||||||||
| Dallas |
92.4% | 92.8% | 92.5% | |||||||||||||||
| Suburban Maryland |
91.8% | 87.6% | 89.8% | |||||||||||||||
| Austin |
92.7% | 78.6% | 91.0% | |||||||||||||||
| Los Angeles County |
93.7% | 96.2% | 95.1% | |||||||||||||||
| Seattle |
95.2% | 96.6% | 95.6% | |||||||||||||||
| Orange County |
94.7% | 95.9% | 95.2% | |||||||||||||||
| San Diego County |
- | 95.3% | 95.3% | |||||||||||||||
| Mid-Peninsula |
- | 93.3% | 93.3% | |||||||||||||||
| Total |
94.1% | 93.6% | 93.9% | |||||||||||||||
| (1) | Excludes assets held for sale as of June 30, 2019. |
| (2) | The Company’s “large tenant” portfolio consists of properties with average leases greater than or equal to 5,000 square feet while the “small tenant” portfolio consists of properties with average leases less than 5,000 square feet. |
24

| Lease Expirations - Industrial (1) | ||||||||||||||||
| Annualized | % of Total Annualized | |||||||||||||||
| Year of Lease Expiration |
Leased Square Footage | Rental Income (2) | % | Rental Income | ||||||||||||
|
2019 |
2,578 | $ | 32,563 | 14.2% | 7.6% | |||||||||||
|
2020 |
4,017 | 51,510 | 22.4% | 12.2% | ||||||||||||
|
2021 |
2,839 | 40,141 | 17.4% | 9.5% | ||||||||||||
|
2022 |
2,602 | 36,329 | 15.8% | 8.6% | ||||||||||||
|
2023 |
1,971 | 27,282 | 11.9% | 6.5% | ||||||||||||
| Thereafter |
2,830 | 42,102 | 18.3% | 9.9% | ||||||||||||
|
|
|
|
|
|
|
|
|
|
||||||||
|
Total |
16,837 | $ | 229,927 | 100.0% | 54.3% | |||||||||||
|
|
|
|
|
|
|
|
|
|
||||||||
| Lease Expirations - Flex (1) | ||||||||||||||||
| Annualized | % of Total Annualized | |||||||||||||||
| Year of Lease Expiration |
Leased Square Footage | Rental Income (2) | % | Rental Income | ||||||||||||
|
2019 |
750 | $ | 14,244 | 12.7% | 3.5% | |||||||||||
|
2020 |
1,313 | 23,479 | 20.9% | 5.5% | ||||||||||||
|
2021 |
1,156 | 21,967 | 19.5% | 5.2% | ||||||||||||
|
2022 |
1,006 | 21,580 | 19.2% | 5.1% | ||||||||||||
|
2023 |
435 | 8,911 | 7.9% | 2.1% | ||||||||||||
| Thereafter |
1,039 | 22,184 | 19.8% | 5.2% | ||||||||||||
|
|
|
|
|
|
|
|
|
|
||||||||
|
Total |
5,699 | $ | 112,365 | 100.0% | 26.6% | |||||||||||
|
|
|
|
|
|
|
|
|
|
||||||||
| Lease Expirations - Office (1) | ||||||||||||||||
| Annualized | % of Total Annualized | |||||||||||||||
| Year of Lease Expiration |
Leased Square Footage | Rental Income (2) | % | Rental Income | ||||||||||||
|
2019 |
297 | $ | 7,977 | 9.8% | 1.9% | |||||||||||
|
2020 |
784 | 21,127 | 25.9% | 5.0% | ||||||||||||
|
2021 |
458 | 11,115 | 13.6% | 2.6% | ||||||||||||
|
2022 |
450 | 12,664 | 15.5% | 2.9% | ||||||||||||
|
2023 |
399 | 10,205 | 12.5% | 2.4% | ||||||||||||
| Thereafter |
674 | 18,487 | 22.7% | 4.3% | ||||||||||||
|
|
|
|
|
|
|
|
|
|
||||||||
|
Total |
3,062 | $ | 81,575 | 100.0% | 19.1% | |||||||||||
|
|
|
|
|
|
|
|
|
|
||||||||
| (1) | Excludes assets held for sale as of June 30, 2019. |
| (2) | Annualized rental income represents annualized outgoing rents inclusive of related estimated expense recoveries. Actual rental income amounts may vary depending upon re-letting of expiring spaces. |
25

| Lease Expirations - Southern California | ||||||||||||||||
| Annualized | % of Total Annualized | |||||||||||||||
| Year of Lease Expiration |
Leased Square Footage | Rental Income (1) | % | Rental Income | ||||||||||||
|
2019 |
455 | $ | 8,794 | 14.8% | 2.1% | |||||||||||
|
2020 |
1,045 | 17,634 | 29.7% | 4.2% | ||||||||||||
|
2021 |
674 | 12,833 | 21.5% | 3.0% | ||||||||||||
|
2022 |
536 | 10,085 | 17.0% | 2.4% | ||||||||||||
|
2023 |
193 | 4,081 | 6.9% | 1.0% | ||||||||||||
| Thereafter |
289 | 5,983 | 10.1% | 1.4% | ||||||||||||
|
|
|
|
|
|
|
|
|
|||||||||
|
Total |
3,192 | $ | 59,410 | 100.0% | 14.1% | |||||||||||
|
|
|
|
|
|
|
|
|
|||||||||
| Lease Expirations - Northern California | ||||||||||||||||
| Annualized | % of Total Annualized | |||||||||||||||
| Year of Lease Expiration |
Leased Square Footage | Rental Income (1) | % | Rental Income | ||||||||||||
|
2019 |
1,375 | $ | 18,973 | 16.5% | 4.5% | |||||||||||
|
2020 |
1,410 | 24,278 | 21.0% | 5.7% | ||||||||||||
|
2021 |
1,131 | 19,064 | 16.5% | 4.5% | ||||||||||||
|
2022 |
1,031 | 16,765 | 14.5% | 4.0% | ||||||||||||
|
2023 |
782 | 13,019 | 11.3% | 3.1% | ||||||||||||
| Thereafter |
1,361 | 23,333 | 20.2% | 5.5% | ||||||||||||
|
|
|
|
|
|
|
|
|
|||||||||
|
Total |
7,090 | $ | 115,432 | 100.0% | 27.3% | |||||||||||
|
|
|
|
|
|
|
|
|
|||||||||
| Lease Expirations - Austin | ||||||||||||||||
| Annualized | % of Total Annualized | |||||||||||||||
| Year of Lease Expiration |
Leased Square Footage | Rental Income (1) | % | Rental Income | ||||||||||||
|
2019 |
155 | $ | 2,780 | 8.6% | 0.7% | |||||||||||
|
2020 |
341 | 5,271 | 16.2% | 1.2% | ||||||||||||
|
2021 |
318 | 5,655 | 17.4% | 1.3% | ||||||||||||
|
2022 |
310 | 5,398 | 16.7% | 1.3% | ||||||||||||
|
2023 |
176 | 3,063 | 9.4% | 0.7% | ||||||||||||
| Thereafter |
504 | 10,294 | 31.7% | 2.4% | ||||||||||||
|
|
|
|
|
|
|
|
|
|||||||||
|
Total |
1,804 | $ | 32,461 | 100.0% | 7.6% | |||||||||||
|
|
|
|
|
|
|
|
|
|||||||||
| Lease Expirations - Dallas | ||||||||||||||||
| Annualized | % of Total Annualized | |||||||||||||||
| Year of Lease Expiration |
Leased Square Footage | Rental Income (1) | % | Rental Income | ||||||||||||
|
2019 |
350 | $ | 4,513 | 12.6% | 1.1% | |||||||||||
|
2020 |
703 | 8,234 | 23.1% | 1.9% | ||||||||||||
|
2021 |
511 | 6,913 | 19.4% | 1.6% | ||||||||||||
|
2022 |
300 | 4,230 | 11.9% | 1.0% | ||||||||||||
|
2023 |
326 | 4,402 | 12.3% | 1.0% | ||||||||||||
| Thereafter |
505 | 7,391 | 20.7% | 1.7% | ||||||||||||
|
|
|
|
|
|
|
|
|
|||||||||
|
Total |
2,695 | $ | 35,683 | 100.0% | 8.3% | |||||||||||
|
|
|
|
|
|
|
|
|
|||||||||
| (1) | Annualized rental income represents annualized outgoing rents inclusive of related estimated expense recoveries. Actual rental income amounts may vary depending upon re-letting of expiring spaces. |
26

| Lease Expirations - South Florida | ||||||||||||||||
| Annualized | % of Total Annualized | |||||||||||||||
| Year of Lease Expiration |
Leased Square Footage | Rental Income (1) | % | Rental Income | ||||||||||||
|
2019 |
483 | $ | 5,064 | 11.4% | 1.1% | |||||||||||
|
2020 |
834 | 9,923 | 22.4% | 2.4% | ||||||||||||
|
2021 |
736 | 9,135 | 20.6% | 2.2% | ||||||||||||
|
2022 |
596 | 7,099 | 16.0% | 1.6% | ||||||||||||
|
2023 |
545 | 6,682 | 15.1% | 1.6% | ||||||||||||
| Thereafter |
510 | 6,405 | 14.5% | 1.5% | ||||||||||||
|
|
|
|
|
|
|
|
|
|||||||||
|
Total |
3,704 | $ | 44,308 | 100.0% | 10.4% | |||||||||||
|
|
|
|
|
|
|
|
|
|||||||||
| Lease Expirations - Northern Virginia | ||||||||||||||||
| Annualized | % of Total Annualized | |||||||||||||||
| Year of Lease Expiration |
Leased Square Footage | Rental Income (1) | % | Rental Income | ||||||||||||
|
2019 |
640 | $ | 11,693 | 12.7% | 2.8% | |||||||||||
|
2020 |
1,079 | 19,839 | 21.6% | 4.7% | ||||||||||||
|
2021 |
680 | 12,371 | 13.5% | 2.9% | ||||||||||||
|
2022 |
935 | 21,182 | 23.1% | 5.0% | ||||||||||||
|
2023 |
403 | 8,115 | 8.8% | 1.9% | ||||||||||||
| Thereafter |
910 | 18,646 | 20.3% | 4.4% | ||||||||||||
|
|
|
|
|
|
|
|
|
|||||||||
|
Total |
4,647 | $ | 91,846 | 100.0% | 21.7% | |||||||||||
|
|
|
|
|
|
|
|
|
|||||||||
| Lease Expirations - Suburban Maryland (2) | ||||||||||||||||
| Annualized | % of Total Annualized | |||||||||||||||
| Year of Lease Expiration |
Leased Square Footage | Rental Income (1) | % | Rental Income | ||||||||||||
|
2019 |
50 | $ | 866 | 3.4% | 0.2% | |||||||||||
|
2020 |
219 | 4,976 | 19.3% | 1.2% | ||||||||||||
|
2021 |
195 | 3,729 | 14.5% | 0.9% | ||||||||||||
|
2022 |
145 | 2,709 | 10.5% | 0.6% | ||||||||||||
|
2023 |
205 | 4,543 | 17.7% | 1.1% | ||||||||||||
| Thereafter |
336 | 8,896 | 34.6% | 2.1% | ||||||||||||
|
|
|
|
|
|
|
|
|
|||||||||
|
Total |
1,150 | $ | 25,719 | 100.0% | 6.1% | |||||||||||
|
|
|
|
|
|
|
|
|
|||||||||
| Lease Expirations - Seattle | ||||||||||||||||
| Annualized | % of Total Annualized | |||||||||||||||
| Year of Lease Expiration |
Leased Square Footage | Rental Income (1) | % | Rental Income | ||||||||||||
|
2019 |
117 | $ | 2,101 | 11.1% | 0.5% | |||||||||||
|
2020 |
483 | 5,961 | 31.4% | 1.4% | ||||||||||||
|
2021 |
208 | 3,523 | 18.5% | 0.9% | ||||||||||||
|
2022 |
205 | 3,105 | 16.3% | 0.7% | ||||||||||||
|
2023 |
175 | 2,493 | 13.1% | 0.6% | ||||||||||||
| Thereafter |
128 | 1,825 | 9.6% | 0.4% | ||||||||||||
|
|
|
|
|
|
|
|
|
|||||||||
|
Total |
1,316 | $ | 19,008 | 100.0% | 4.5% | |||||||||||
|
|
|
|
|
|
|
|
|
|||||||||
| (1) | Annualized rental income represents annualized outgoing rents inclusive of related estimated expense recoveries. Actual rental income amounts may vary depending upon re-letting of expiring spaces. |
| (2) | Excludes assets held for sale as of June 30, 2019. |
27

| Lease Expirations - Large Tenant Portfolio (1) (2) | ||||||||||||||||
| Annualized | % of Total Annualized | |||||||||||||||
| Year of Lease Expiration |
Leased Square Footage | Rental Income (4) | % | Rental Income | ||||||||||||
|
2019 |
2,356 | $ | 32,557 | 12.1% | 7.8% | |||||||||||
|
2020 |
3,861 | 52,443 | 19.6% | 12.4% | ||||||||||||
|
2021 |
2,688 | 38,823 | 14.5% | 9.2% | ||||||||||||
|
2022 |
2,959 | 48,098 | 17.9% | 11.3% | ||||||||||||
|
2023 |
2,100 | 30,974 | 11.5% | 7.3% | ||||||||||||
| Thereafter |
3,832 | 65,410 | 24.4% | 15.4% | ||||||||||||
|
|
|
|
|
|
|
|
|
|||||||||
|
Total |
17,796 | $ | 268,305 | 100.0% | 63.4% | |||||||||||
|
|
|
|
|
|
|
|
|
|||||||||
| Lease Expirations - Small Tenant Portfolio (1) (3) | ||||||||||||||||
| Annualized | % of Total Annualized | |||||||||||||||
| Year of Lease Expiration |
Leased Square Footage | Rental Income (4) | % | Rental Income | ||||||||||||
|
2019 |
1,269 | $ | 22,227 | 14.3% | 5.2% | |||||||||||
|
2020 |
2,253 | 43,673 | 28.1% | 10.3% | ||||||||||||
|
2021 |
1,765 | 34,400 | 22.1% | 8.1% | ||||||||||||
|
2022 |
1,099 | 22,475 | 14.4% | 5.3% | ||||||||||||
|
2023 |
705 | 15,424 | 9.9% | 3.7% | ||||||||||||
| Thereafter |
711 | 17,363 | 11.2% | 4.0% | ||||||||||||
|
|
|
|
|
|
|
|
|
|||||||||
|
Total |
7,802 | $ | 155,562 | 100.0% | 36.6% | |||||||||||
|
|
|
|
|
|
|
|
|
|||||||||
| Lease Expirations - Total Portfolio (1) | ||||||||||||||||
| Annualized | % of Total Annualized | |||||||||||||||
| Year of Lease Expiration |
Leased Square Footage | Rental Income (4) | % | Rental Income | ||||||||||||
|
2019 |
3,625 | $ | 54,784 | 13.0% | 13.0% | |||||||||||
|
2020 |
6,114 | 96,116 | 22.7% | 22.7% | ||||||||||||
|
2021 |
4,453 | 73,223 | 17.3% | 17.3% | ||||||||||||
|
2022 |
4,058 | 70,573 | 16.6% | 16.6% | ||||||||||||
|
2023 |
2,805 | 46,398 | 11.0% | 11.0% | ||||||||||||
| Thereafter |
4,543 | 82,773 | 19.4% | 19.4% | ||||||||||||
|
|
|
|
|
|
|
|
|
|||||||||
|
Total |
25,598 | $ | 423,867 | 100.0% | 100.0% | |||||||||||
|
|
|
|
|
|
|
|
|
|||||||||
| (1) | Excludes assets held for sale as of June 30, 2019. |
| (2) | Large tenant portfolio consists of properties with average leases greater than or equal to 5,000 square feet. |
| (3) | Small tenant portfolio consists of properties with average leases less than 5,000 square feet. |
| (4) | Annualized rental income represents annualized outgoing rents inclusive of related estimated expense recoveries. Actual rental income amounts may vary depending upon re-letting of expiring spaces. |
28

| Total Portfolio Activity (1) | ||||||||||||||||||||||||||||||||||||||||||||||||
| Wtd. Avg. | Leasing | Customer | Transaction Costs | Transaction | Cash Rental Rate | |||||||||||||||||||||||||||||||||||||||||||
| Occupancy | Volume | Retention | per Executed Foot | Costs (2) | Change (3) | |||||||||||||||||||||||||||||||||||||||||||
| QTD | YTD | QTD | YTD | QTD | YTD | QTD | YTD | QTD | YTD | QTD | YTD | |||||||||||||||||||||||||||||||||||||
| Northern Virginia |
91.8 | % | 91.2 | % | 358,000 | 678,000 | 82.2 | % | 79.8 | % | $ | 6.95 | $ | 6.22 | 9.1 | % | 9.8 | % | 1.0 | % | 0.3 | % | ||||||||||||||||||||||||||
| South Florida |
94.5 | % | 95.4 | % | 228,000 | 447,000 | 33.8 | % | 46.9 | % | $ | 2.65 | $ | 2.15 | 4.7 | % | 4.0 | % | 10.8 | % | 13.3 | % | ||||||||||||||||||||||||||
| Silicon Valley |
96.9 | % | 97.0 | % | 91,000 | 278,000 | 57.9 | % | 64.2 | % | $ | 2.18 | $ | 2.15 | 3.1 | % | 2.3 | % | 9.7 | % | 18.4 | % | ||||||||||||||||||||||||||
| East Bay |
95.0 | % | 95.7 | % | 271,000 | 387,000 | 96.5 | % | 44.1 | % | $ | 2.48 | $ | 2.15 | 3.8 | % | 3.2 | % | 23.6 | % | 24.8 | % | ||||||||||||||||||||||||||
| Dallas |
92.7 | % | 92.5 | % | 150,000 | 434,000 | 65.2 | % | 73.8 | % | $ | 3.49 | $ | 5.34 | 7.5 | % | 11.4 | % | 10.3 | % | 8.1 | % | ||||||||||||||||||||||||||
| Suburban Maryland |
89.7 | % | 89.8 | % | 52,000 | 74,000 | 60.9 | % | 50.6 | % | $ | 10.61 | $ | 11.01 | 14.5 | % | 14.8 | % | -9.2 | % | -7.6 | % | ||||||||||||||||||||||||||
| Austin |
91.3 | % | 91.0 | % | 114,000 | 158,000 | 92.5 | % | 76.2 | % | $ | 4.82 | $ | 4.56 | 9.0 | % | 8.4 | % | 6.3 | % | 6.0 | % | ||||||||||||||||||||||||||
| Los Angeles |
94.2 | % | 95.1 | % | 178,000 | 338,000 | 81.8 | % | 74.2 | % | $ | 1.73 | $ | 1.58 | 3.6 | % | 3.0 | % | 13.6 | % | 15.7 | % | ||||||||||||||||||||||||||
| Seattle |
95.1 | % | 95.6 | % | 74,000 | 151,000 | 86.5 | % | 66.5 | % | $ | 0.87 | $ | 0.90 | 1.8 | % | 1.7 | % | 15.4 | % | 17.2 | % | ||||||||||||||||||||||||||
| Orange County |
95.0 | % | 95.2 | % | 39,000 | 114,000 | 47.6 | % | 62.4 | % | $ | 2.03 | $ | 2.14 | 2.4 | % | 2.7 | % | 7.8 | % | 3.0 | % | ||||||||||||||||||||||||||
| San Diego |
95.7 | % | 95.3 | % | 98,000 | 174,000 | 74.1 | % | 68.7 | % | $ | 1.15 | $ | 2.28 | 2.6 | % | 4.3 | % | 5.4 | % | 7.8 | % | ||||||||||||||||||||||||||
| Mid-Peninsula |
93.0 | % | 93.3 | % | 36,000 | 63,000 | 76.2 | % | 58.4 | % | $ | 1.27 | $ | 1.15 | 1.2 | % | 1.2 | % | 8.5 | % | 8.8 | % | ||||||||||||||||||||||||||
| Company Totals by Market |
93.8 | % | 93.9 | % | 1,689,000 | 3,296,000 | 72.1 | % | 65.3 | % | $ | 3.67 | $ | 3.59 | 5.9 | % | 5.8 | % | 9.0 | % | 9.7 | % | ||||||||||||||||||||||||||
| Industrial |
94.4 | % | 94.8 | % | 1,086,000 | 2,150,000 | 69.1 | % | 62.1 | % | $ | 2.37 | $ | 2.33 | 4.3 | % | 4.1 | % | 13.1 | % | 14.4 | % | ||||||||||||||||||||||||||
| Flex |
92.5 | % | 92.2 | % | 367,000 | 706,000 | 75.8 | % | 69.7 | % | $ | 4.88 | $ | 5.41 | 7.6 | % | 8.7 | % | 8.5 | % | 8.5 | % | ||||||||||||||||||||||||||
| Office |
93.0 | % | 92.5 | % | 236,000 | 440,000 | 78.1 | % | 73.9 | % | $ | 7.77 | $ | 6.86 | 8.4 | % | 8.2 | % | 0.7 | % | 0.6 | % | ||||||||||||||||||||||||||
| Company Totals by Type |
93.8 | % | 93.9 | % | 1,689,000 | 3,296,000 | 72.1 | % | 65.3 | % | $ | 3.67 | $ | 3.59 | 5.9 | % | 5.8 | % | 9.0 | % | 9.7 | % | ||||||||||||||||||||||||||
| (1) | Excludes assets held for sale as of June 30, 2019. |
| (2) | Transaction cost percentages are computed by taking the total transaction costs divided by the total rents (including estimated expense recoveries) over the term of the lease. |
| (3) | Cash rental rate change percentages are computed by taking the percentage difference between outgoing rents (including estimated expense recoveries) and incoming rents (including estimated expense recoveries) for leases executed during the period. Leases executed on spaces vacant for more than the preceding twelve months have been excluded. |
29

| Total Costs (1) | Construction | |||||||||||||||
| Property Information |
Location | Apartment Units | (in thousands) | Completion | ||||||||||||
| Highgate at the Mile |
Tysons, VA | 395 | $ | 115,426 | Q4 2017 | |||||||||||
|
|
||||||||||||||||
| As of June 30, 2019 |
||||||||||||||||
| Period end occupancy |
94.2 | % | ||||||||||||||
| Average rent per unit (2) |
$ | 2,076 | ||||||||||||||
| (1) | The total costs of the project include contributed land value of $21.0 million plus unrealized land appreciation of $6.0 million. The unrealized land appreciation of $6.0 million is not recorded on our balance sheet. |
| (2) | Average rent per unit is defined as the total potential monthly rental revenue (i.e. actual rent for occupied apartment units plus market rent for vacant apartment units) divided by the number of rentable units. |
30