Putnam Sustainable Leaders Fund
Before you invest, you may wish to review the fund’s prospectus, which contains more information about the fund and its risks. You may obtain the prospectus and other information about the fund, including the statement of additional information (SAI) and most recent reports to shareholders, at no cost by visiting putnam.com/funddocuments, calling 1-800-225-1581, or e-mailing Putnam at funddocuments@putnam.com.
The fund’s prospectus and SAI, both dated 10/30/19, are incorporated by reference into this summary prospectus.
Goal
Putnam Sustainable Leaders Fund seeks long-term capital appreciation.
Fees and expenses
The following table describes the fees and expenses you may pay if you buy and hold shares of the fund. You may qualify for sales charge discounts if you and your family invest, or agree to invest in the future, at least $50,000 in Putnam funds. More information about these and other discounts is available from your financial advisor and in How do I buy fund shares? beginning on page 14 of the fund’s prospectus, in the Appendix to the fund’s prospectus, and in How to buy shares beginning on page II-1 of the fund’s statement of additional information (SAI).
Shareholder fees (fees paid directly from your investment)
| Share class | Maximum sales charge (load) imposed on purchases (as a percentage of offering price) | Maximum deferred sales charge (load) (as a percentage of original purchase price or redemption proceeds, whichever is lower) |
| Class A | 5.75% | 1.00%* |
| Class B | NONE | 5.00%** |
| Class C | NONE | 1.00%*** |
| Class M | 3.50% | NONE |
| Class R | NONE | NONE |
| Class R6 | NONE | NONE |
| Class Y | NONE | NONE |
2
Annual
fund operating expenses
(expenses you pay each year as a percentage of the value of your investment)
| Share class | Management fees† | Distribution and service (12b-1) fees | Other expenses | Total annual fund operating expenses |
| Class A | 0.56% | 0.25% | 0.23% | 1.04% |
| Class B | 0.56% | 1.00% | 0.23% | 1.79% |
| Class C | 0.56% | 1.00% | 0.23% | 1.79% |
| Class M | 0.56% | 0.75% | 0.23% | 1.54% |
| Class R | 0.56% | 0.50% | 0.23% | 1.29% |
| Class R6 | 0.56% | N/A | 0.11% | 0.67% |
| Class Y | 0.56% | N/A | 0.23% | 0.79% |
| * | Applies only to certain redemptions of shares bought with no initial sales charge. |
| ** | This charge is phased out over six years. |
| *** | This charge is eliminated after one year. |
| † | Management fees are subject to a performance adjustment. The fund’s base management fee is subject to adjustment, up or down, based on the fund’s performance relative to the performance of the S&P 500 Index for portions of a performance period after August 1, 2019 and the Russell 3000 Growth Index for portions of a performance period prior to August 1, 2019. For the most recent fiscal year, the fund’s base management fee prior to any performance adjustment was 0.551%. |
Example
The following hypothetical example is intended to help you compare the cost of investing in the fund with the cost of investing in other funds. It assumes that you invest $10,000 in the fund for the time periods indicated and then, except as indicated, redeem all your shares at the end of those periods. It assumes a 5% return on your investment each year and that the fund’s operating expenses remain the same. Your actual costs may be higher or lower.
| Share class | 1 year | 3 years | 5 years | 10 years |
| Class A | $675 | $887 | $1,116 | $1,773 |
| Class B | $682 | $863 | $1,170 | $1,908 |
| Class B (no redemption) | $182 | $563 | $970 | $1,908 |
| Class C | $282 | $563 | $970 | $2,105 |
| Class C (no redemption) | $182 | $563 | $970 | $2,105 |
| Class M | $501 | $819 | $1,160 | $2,120 |
| Class R | $131 | $409 | $708 | $1,556 |
| Class R6 | $68 | $214 | $373 | $835 |
| Class Y | $81 | $252 | $439 | $978 |
Portfolio turnover
The fund pays transaction-related costs, such as commissions, when it buys and sells securities (or “turns over” its portfolio). A higher turnover rate may indicate higher transaction costs and may result in higher taxes when the fund’s shares are held in a taxable account. These costs, which are not reflected in annual fund operating expenses or the above example, affect fund performance. The fund’s turnover rate in the most recent fiscal year was 30%.
3
Investments, risks, and performance
Investments
We invest mainly in common stocks of U.S. companies of any size, with a focus on companies that we believe exhibit a commitment to sustainable business practices. Stocks of companies that exhibit a commitment to sustainable business practices are typically, but not always, considered to be growth stocks. Growth stocks are stocks of companies whose earnings are expected to grow faster than those of similar firms, and whose business growth and other characteristics may lead to an increase in stock price. We may consider, among other factors, a company’s sustainable business practices (as described below), valuation, financial strength, growth potential, competitive position in its industry, projected future earnings, cash flows and dividends when deciding whether to buy or sell investments. We may also invest in non-U.S. companies.
Sustainable investing. We believe that companies that exhibit leadership in sustainable business practices also often exhibit more profitable, durable financial returns with lower risk profiles. Accordingly, in selecting investments, we focus on companies that we believe have a demonstrated commitment to sustainable business practices. This commitment may be reflected through environmental, social and/or corporate governance (ESG) policies, practices or outcomes.
Risks
It is important to understand that you can lose money by investing in the fund.
The value of investments in the fund’s portfolio may fall or fail to rise over extended periods of time for a variety of reasons, including general economic, political or financial market conditions, investor sentiment and market perceptions, government actions, geopolitical events or changes, and factors related to a specific issuer, geography, industry or sector. These and other factors may lead to increased volatility and reduced liquidity in the fund’s portfolio holdings. Growth stocks may be more susceptible to earnings disappointments, and the market may not favor growth-style investing. These risks are generally greater for small and midsize companies. From time to time, the fund may invest a significant portion of its assets in companies in one or more related industries or sectors, which would make the fund more vulnerable to adverse developments affecting those industries or sectors. The value of international investments traded in foreign currencies may be adversely impacted by fluctuations in exchange rates. International investments, particularly investments in emerging markets, may carry risks associated with potentially less stable economies or governments (such as the risk of seizure by a foreign government, the imposition of currency or other restrictions, or high levels of inflation), and may be or become illiquid.
Investing with a focus on companies that exhibit a commitment to sustainable business practices may cause the fund to forego otherwise attractive investment opportunities or may increase or decrease the fund’s exposure to certain types of companies and, therefore, to underperform funds that do not invest with a similar focus. In evaluating an investment opportunity, we may make investment decisions based on information and data that is incomplete or inaccurate. In addition, a company’s business practices may change over time. As a result of these possibilities,
4
among others, the fund may temporarily hold securities that are inconsistent with the fund’s sustainable investment criteria.
The fund may not achieve its goal, and it is not intended to be a complete investment program. An investment in the fund is not insured or guaranteed by the Federal Deposit Insurance Corporation or any other government agency.
Performance
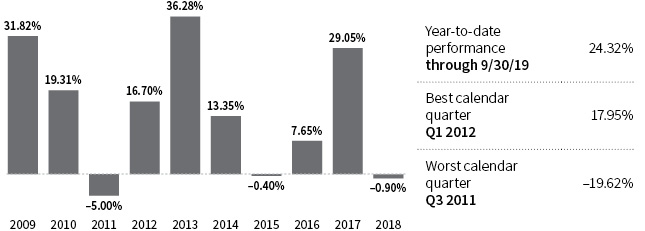
The performance information below gives some indication of the risks associated with an investment in the fund by showing the fund’s performance year to year and over time. Before March 21, 2018, the fund was managed with a materially different investment strategy and may have achieved materially different performance results under its current investment strategy from that shown for periods before this date. The bar chart does not reflect the impact of sales charges. If it did, performance would be lower. Please remember that past performance is not necessarily an indication of future results. Monthly performance figures for the fund are available at putnam.com.
Annual total returns for class A shares before sales charges

Average annual total returns after sales charges (for periods ended 12/31/18)
| Share class | 1 year | 5 years | 10 years |
| Class A before taxes | -6.60% | 7.93% | 13.28% |
| Class A after taxes on distributions | -10.26% | 5.59% | 12.03% |
| Class A after taxes on distributions and sale of fund shares | -1.18% | 5.96% | 11.01% |
| Class B before taxes | -5.54% | 8.16% | 13.28% |
| Class C before taxes | -2.44% | 8.40% | 13.11% |
| Class M before taxes | -4.84% | 7.91% | 12.98% |
| Class R before taxes | -1.14% | 8.95% | 13.67% |
| Class R6 before taxes* | -0.58% | 9.51% | 14.25% |
| Class Y before taxes | -0.65% | 9.49% | 14.24% |
| S&P 500 Index (no deduction for fees, expenses or taxes)** | -4.38% | 8.49% | 13.12% |
| Russell 3000 Growth-S&P 500 Linked Benchmark (no deduction for fees, expenses or taxes)*** | -2.12% | 9.99% | 15.15% |
5
| * | Performance for class R6 shares prior to their inception (5/22/18) is derived from the historical performance of class Y shares and has not been adjusted for the lower investor servicing fees applicable to class R6 shares; had it, returns would have been higher. |
| ** | As of August 1, 2019, the S&P 500 Index (an unmanaged market capitalization weighted index of common stock performance) replaced the Russell 3000 Growth Index (a market capitalization weighted index based on the Russell 3000 Index, used to provide a gauge of the performance of growth stocks in the United States) as the benchmark for this fund because, in Putnam Management’s opinion, the securities tracked by the S&P 500 Index more accurately reflect the types of securities that generally are held by the fund. The average annual total returns of the Russell 3000 Growth Index for the one-year, five-year, and ten-year periods ended on December 31, 2018 were -2.12%, 9.99%, and 15.15%, respectively. Frank Russell Company is the source and owner of the trademarks, service marks and copyrights related to the Russell Indexes. Russell® is a trademark of Frank Russell Company. |
| *** | The Russell 3000 Growth-S&P 500 Linked Benchmark represents performance of the Russell 3000 Growth Index from the inception date of the fund, August 31, 1990, through July 31, 2019 and performance of the S&P 500 Index from August 1, 2019 forward. |
After-tax returns reflect the historical highest individual federal marginal income tax rates and do not reflect state and local taxes. Actual after-tax returns depend on an investor’s tax situation and may differ from those shown. After-tax returns are shown for class A shares only and will vary for other classes. These after-tax returns do not apply if you hold your fund shares through a 401(k) plan, an IRA, or another tax-advantaged arrangement.
Class B share performance reflects conversion to class A shares after eight years.
Your fund’s management
Investment advisor
Putnam Investment Management, LLC
Portfolio managers
Katherine
Collins
Head of Sustainable Investing,
portfolio manager of the fund
since 2018
R. Shepherd
Perkins
Co-Head of Equities, portfolio
manager of the fund since 2018
Assistant portfolio manager
Stephanie
Dobson
Portfolio Manager, Analyst, assistant
portfolio manager of the fund since 2018
Sub-advisor
Putnam Investments Limited*
| * | Though the investment advisor has retained the services of Putnam Investments Limited (PIL), PIL does not currently manage any assets of the fund. |
Purchase and sale of fund shares
You can open an account, purchase and/or sell fund shares, or exchange them for shares of another Putnam fund by contacting your financial advisor or by calling Putnam Investor Services at 1-800-225-1581. Purchases of class B shares are closed to new and existing investors except by exchange from class B shares of another Putnam fund or through dividend and/or capital gains reinvestment.
6
When opening an account, you must complete and mail a Putnam account application, along with a check made payable to the fund, to: Putnam Investments, P.O. Box 219697, Kansas City, MO 64121-9697. The minimum initial investment of $500 is currently waived, although Putnam reserves the right to reject initial investments under $500 at its discretion. There is no minimum for subsequent investments.
You can sell your shares back to the fund or exchange them for shares of another Putnam fund any day the New York Stock Exchange (NYSE) is open. Shares may be sold or exchanged by mail, by phone, or online at putnam.com. Some restrictions may apply.
Tax information
The fund’s distributions will be taxed as ordinary income or capital gains unless you hold the shares through a tax-advantaged arrangement, in which case you will generally be taxed only upon withdrawal of monies from the arrangement.
Financial intermediary compensation
If you purchase the fund through a broker/dealer or other financial intermediary (such as a bank or financial advisor), the fund and its related companies may pay that intermediary for the sale of fund shares and related services. Please bear in mind that these payments may create a conflict of interest by influencing the broker/dealer or other intermediary to recommend the fund over another investment. Ask your advisor or visit your advisor’s website for more information.
Information about the Summary Prospectus, Prospectus, and SAI
The summary prospectus, prospectus, and SAI for a fund provide information concerning the fund. The summary prospectus, prospectus, and SAI are updated at least annually and any information provided in a summary prospectus, prospectus, or SAI can be changed without a shareholder vote unless specifically stated otherwise. The summary prospectus, prospectus, and the SAI are not contracts between the fund and its shareholders and do not give rise to any contractual rights or obligations or any shareholder rights other than any rights conferred explicitly by federal or state securities laws that may not be waived.
Additional information, including current performance, is available at putnam.com/funddocuments, by calling 1-800-225-1581, or by e-mailing Putnam at funddocuments@putnam.com.
7
