UNITED STATES
SECURITIES AND EXCHANGE COMMISSION
Washington, D.C. 20549
FORM 10-K
ANNUAL REPORT PURSUANT TO SECTION 13 OR 15(d)
OF THE SECURITIES EXCHANGE ACT OF 1934
|
For the Fiscal Year Ended December 31, 2012
|
Commission File No. 0-22750
|
ROYALE ENERGY, INC.
(Name of registrant in its charter)
|
California
|
33-0224120
|
|
|
(State or other jurisdiction of
incorporation or organization)
|
(I.R.S. Employer
Identification No.)
|
7676 Hazard Center Drive, Suite 1500
San Diego, CA 92108
(Address of principal executive offices)
Issuer's telephone number: 619-881-2800
Securities registered pursuant to Section 12(b) of the Act:
None
Securities to be registered pursuant to Section 12(g) of the Act:
Common Stock, no par value per share
(Title of Class)
Indicate by check mark if the registrant is a well-known seasoned issuer, as defined in Rule 405 of the Securities Act. Yes o No x
Indicate by check mark if the registrant is not required to file reports pursuant to Section 13 or 15(d) of the Act. Yes o No x
Indicate by check mark whether the registrant (1) has filed all reports required to be filed by Section 13 or 15(d) of the Securities Exchange Act during the past 12 months (or for such shorter period that the registrant was required to file such reports), and (2) has been subject to such filing requirements for the past 90 days. Yes x No o
Indicate by check mark whether the registrant has submitted electronically and posted on its corporate Web site, if any, every Interactive Data File required to be submitted and posted pursuant to Rule 405 of Regulation S-T (§232.405 of this chapter) during the preceding 12 months (or for such shorter period that the registrant was required to submit and post such files). Yes x No o
Indicate by check mark if disclosure of delinquent filers pursuant to Item 405 of Regulation S-B is not contained herein, and will not be contained, to the best or registrant's knowledge, in definitive proxy or information statements incorporated by reference in Part III of this Form 10-K or any amendment to this Form 10-K. o
Indicate by check mark whether the registrant is a large accelerated filer, an accelerated filer, a non-accelerated filer, or a smaller reporting company.
Large accelerated filer o Accelerated filer o
Non-accelerated filer o Smaller Reporting Company x
Indicate by check mark whether the registrant is a shell company (as defined in Rule 12b-2 of the Act). Yes o No x
At June 30, 2012, the end of the registrant’s most recently completed second fiscal quarter; the aggregate market value of common equity held by non-affiliates was $30,568,958.
At December 31, 2012, 12,545,465 shares of registrant's Common Stock were outstanding.
DOCUMENTS INCORPORATED BY REFERENCE: The issuer’s proxy statement for its annual meeting of stockholders, to be filed within 120 days after December 31, 2012, will contain the information required by Part III, Items 10, 11, 12, 13 and 14, which information is hereby incorporated by reference into this Form 10-K.
TABLE OF CONTENTS
|
PART I
|
1
|
||
|
Item 1
|
1
|
||
|
2
|
|||
|
3
|
|||
|
Item 1A
|
3
|
||
|
Item 1B
|
7
|
||
|
Item 2
|
7
|
||
|
7
|
|||
|
7
|
|||
|
8
|
|||
|
9
|
|||
|
9
|
|||
|
Item 3
|
9
|
||
|
Item 4
|
9
|
||
|
PART II
|
10
|
||
|
Item 5
|
10
|
||
|
10
|
|||
|
10
|
|||
|
10
|
|||
|
Item 6
|
11
|
||
|
12
|
|||
|
13
|
|||
|
15
|
|||
|
16
|
|||
|
Item 7
|
17
|
||
|
Item 8
|
17
|
||
|
Item 9
|
17
|
||
|
Item 9A
|
17
|
||
|
17
|
|||
|
17
|
|||
|
18
|
|||
|
18
|
|||
|
PART III
|
19
|
||
|
Item 10
|
19
|
||
|
Item 11
|
19
|
||
|
Item 12
|
19
|
||
|
Item 13
|
19
|
||
|
Item 14
|
19
|
||
|
PART IV
|
20
|
||
|
Item 15
|
20
|
||
| SIGNATURES | 22 | ||
| FINANCIAL STATEMENTS | F-1 | ||
ROYALE ENERGY, INC.
PART I
Item 1 Description of Business
Royale Energy, Inc. ("Royale Energy") is an independent oil and natural gas producer. Royale Energy's principal lines of business are the production and sale of natural gas, acquisition of oil and gas lease interests and proved reserves, drilling of both exploratory and development wells, and sales of fractional working interests in wells to be drilled by Royale Energy. Royale Energy was incorporated in California in 1986 and began operations in 1988. Royale Energy's common stock is traded on the NASDAQ Capital Market System (symbol ROYL). On December 31, 2012, Royale Energy had 20 full time employees.
Royale Energy owns wells and leases located mainly in the Sacramento Basin and San Joaquin Basin in California as well as in Utah, Texas, Oklahoma, Louisiana, and Alaska. Royale Energy usually sells a portion of the working interest in each well it drills or participates in to third party investors and retains a portion of the prospect for its own account. Selling part of the working interest to others allows Royale Energy to reduce its drilling risk by owning a diversified inventory of properties with less of its own funds invested in each drilling prospect, than if Royale Energy owned the whole working interest and paid all drilling and development costs of each prospect itself. Royale Energy generally sells working interests in its prospects to accredited investors in exempt securities offerings. The prospects are bundled into multi-well investments, which permit the third party investors to diversify their investments by investing in several wells at once instead of investing in single well prospects.
During its fiscal year ended December 31, 2012, Royale Energy continued to explore and develop natural gas properties with a concentration in California. We also completed the acquisition of approximately 91,000 acres of prospective shale oil property in the north slope of Alaska. Additionally we own proved developed producing and non-producing reserves of oil and natural gas in Utah, Texas, Oklahoma and Louisiana. In 2012, Royale Energy drilled two wells in northern California; one was commercially productive which at year end was in the process of being completed and the other was a dry hole. Royale Energy's estimated total reserves increased from approximately 4.6 BCFE (billion cubic feet equivalent) at December 31, 2011 to approximately 4.9 BCFE at December 31, 2012. According to the reserve reports furnished to Royale Energy by Netherland, Sewell & Associates, Inc., and Source Energy, LLC, Royale Energy's independent petroleum engineers, the net reserve value of its proved developed and undeveloped reserves was approximately $7.6 million at December 31, 2012, based on natural gas prices ranging from $2.59 per MCF to $3.09 per MCF. Source Energy, LLC, supplied reserve value estimates for Royale Energy’s Utah properties, and Netherland, Sewell & Associates, Inc. provided reserve information for the Company’s California, Texas, Oklahoma and, Louisiana properties.
Of course, net reserve value does not represent the fair market value of our reserves on that date, and we cannot be sure what return we will eventually receive on our reserves. Net reserve value of proved developed and undeveloped reserves was calculated by subtracting estimated future development costs, future production costs and other operating expenses from estimated net future cash flows from our developed and undeveloped reserves.
Our standardized measure of discounted future net cash flows at December 31, 2012, was estimated to be $3,937,621. This figure was calculated by subtracting our estimated future income tax expense from the net reserve value of proved developed and undeveloped reserves, and by further applying a 10% annual discount for estimated timing of cash flows. A detailed calculation of our standardized measure of discounted future net cash flow is contained in Supplemental Information about Oil and Gas Producing Activities – Changes in Standardized Measure of Discounted Future Net Cash Flow from Proved Reserve Quantities, page F-26.
Royale Energy reported gross revenues in connection with the drilling of wells on a "turnkey contract" basis in the amount of $2,028,863 for the year ended December 31, 2012, which represents approximately 46.2% of its total revenues for the year. In 2011, Royale Energy reported $5,794,427 gross revenues from turnkey drilling operations for the year, representing 50.2% of Royale Energy's total revenues for that year.
These amounts are offset by drilling expenses and development costs of $449,536 in 2012, and $3,523,372 in 2011. In addition to Royale Energy's own geological, land, and engineering staff, Royale Energy hires independent contractors to drill, test, complete and equip the wells that it drills. Approximately 38% of Royale Energy's total revenue for the year ended December 31, 2012, came from sales of oil and natural gas from production of its wells in the amount of $1,673,538, in 2011, this amount was $4,879,397, which represented 42% of Royale Energy's total revenues.
Plan of Business
Royale Energy acquires interests in oil and natural gas reserves and sponsors private joint ventures. Royale Energy believes that its stockholders are better served by diversification of its investments among individual drilling prospects. Through its sale of joint ventures, Royale Energy can acquire interests and develop oil and natural gas properties with greater diversification of risk and still receive an interest in the revenues and reserves produced from these properties. By selling some of its working interest in most projects, Royale Energy decreases the amount of its investment in the projects and diversifies its oil and gas property holdings, to reduce the risk of concentrating a large amount of its capital in a few projects that may not be successful.
After acquiring the leases or lease participation, Royale Energy drills or participates in the drilling of development and exploratory oil and natural gas wells on its property. Royale Energy pays its proportionate share of the actual cost of drilling, testing, and completing the project to the extent that it retains all or any portion of the working interest.
Royale Energy also may sell fractional working interests in undeveloped wells to finance part of the drilling cost. A drilling contract that calls for a company to drill a well, for a fixed price, to a specified depth or geological formation is called a "turnkey contract." When Royale Energy sells fractional working interests to raise capital to drill oil and natural gas wells, generally it agrees to drill these wells on a turnkey contract basis, so that the holders of the fractional interests prepay a fixed amount for the drilling and completion of a specified number of wells. Under a turnkey contract, Royale Energy recognizes gross revenue for the amount paid by the purchaser and agrees to pay the expense of drilling and development of the well for the participants. Sometimes the actual drilling and development costs are less than the fixed amount that Royale Energy received from the fractional interest sale.
The fractional working interests that Royale Energy sells to investors are wellbore interests, in which the investor acquires the right to participate in drilling and production from a specific well being drilled on an oil and gas lease. When a wellbore interest is sold, the investor does not receive an interest in the larger leased property, which may include other potential drilling locations and additional development opportunities, but the investor does receive the rights in the leasehold as it relates to the wellbore, including rights and obligations to participate in drilling and production of the particular location in which he purchased the wellbore interest.
Although Royale Energy’s operating agreements do not usually address whether investors have a right to participate in subsequent wells in the same area of interest as a proposed well, it is the Company’s policy to offer to investors in a successful well the right to participate in subsequent wells at the same percentage level as their working interest investment in the prior successful well.
Our revenue recognition policy is to recognize all pre-drilling and drilling services we provide under turnkey drilling agreements at the time drilling of the well is completed. See Note 1 to our Financial Statements, at page F-8.
Once drilling has commenced, it is generally completed within 10-30 days. See Note 1 to Royale Energy's Financial Statements, at page F-8. Royale Energy maintains internal records of the expenditure of each investor's funds for drilling projects.
Royale Energy generally operates the wells it completes. As operator, it receives fees set by industry standards from the owners of fractional interests in the wells and from expense reimbursements. For the year ended December 31, 2012, Royale Energy earned gross revenues from operation of the wells in the amount of $455,396 representing 10.4% of its total revenues for the year. In 2011, the amount was $385,575, which represented about 3.3% of total revenues. At December 31, 2012, Royale Energy operated 56 natural gas wells in California. Royale also owns an interest in seven natural gas wells in Utah and has non-operating interests in 11 oil and gas wells in Texas, two in Oklahoma, one in California, and one in Louisiana.
Royale Energy currently sells most of its California natural gas production through PG&E pipelines to independent customers on a monthly contract basis, while some gas is delivered through privately owned pipelines to independent customers. Since many users are willing to make such purchase arrangements, the loss of any one customer would not affect our overall sales operations.
All oil and natural gas properties are depleting assets in which production naturally decreases over time as the finite amount of existing reserves are produced and sold. It is Royale Energy’s business as an oil and natural gas exploration and production company to continually search for new development properties. The company’s success will ultimately depend on its ability to continue locating and developing new oil and natural gas resources. Natural gas demand and the prices paid for gas are seasonal. In recent years, natural gas demand and prices in Northern California have fluctuated unpredictably throughout the year.
Royale Energy had no subsidiaries in 2012.
Competition, Markets and Regulation
Competition
The exploration and production of oil and natural gas is an intensely competitive industry. The sale of interests in oil and gas projects, like those Royale Energy sells, is also very competitive. Royale Energy encounters competition from other oil and natural gas producers, as well as from other entities which invest in oil and gas for their own account or for others, and many of these companies are substantially larger than Royale Energy.
Markets
Market factors affect the quantities of oil and natural gas production and the price Royale Energy can obtain for the production from its oil and natural gas properties. Such factors include: the extent of domestic production; the level of imports of foreign oil and natural gas; the general level of market demand on a regional, national and worldwide basis; domestic and foreign economic conditions that determine levels of industrial production; political events in foreign oil-producing regions; and variations in governmental regulations including environmental, energy conservation, and tax laws or the imposition of new regulatory requirements upon the oil and natural gas industry.
Regulation
Federal and state laws and regulations affect, to some degree, the production, transportation, and sale of oil and natural gas from Royale Energy’s operations. States in which Royale Energy operates have statutory provisions regulating the production and sale of oil and natural gas, including provisions regarding deliverability. These statutes, along with the regulations interpreting the statutes, generally are intended to prevent waste of oil and natural gas, and to protect correlative rights to produce oil and natural gas by assigning allowable rates of production to each well or proration unit.
The exploration, development, production and processing of oil and natural gas are subject to various federal and state laws and regulations to protect the environment. Various federal and state agencies are considering, and some have adopted, other laws and regulations regarding environmental controls that could increase the cost of doing business. These laws and regulations may require: the acquisition of a permit by operators before drilling commences; the prohibition of drilling activities on certain lands lying within wilderness areas or where pollution arises; and the imposition of substantial liabilities for pollution resulting from drilling operations, particularly operations in offshore waters or on submerged lands. The cost of oil and natural gas development and production also may increase because of the cost of compliance with such legislation and regulations, together with any penalties resulting from failing to comply with the legislation and regulations. Ultimately, Royale Energy may bear some of these costs.
Presently, Royale Energy does not anticipate that compliance with federal, state and local environmental regulations will have a material adverse effect on capital expenditures, earnings, or its competitive position in the oil and natural gas industry; however, changes in the laws, rules or regulations, or the interpretation thereof, could have a materially adverse effect on Royale Energy’s financial condition or results of operation.
Royale Energy files quarterly, yearly and other reports with the Securities Exchange Commission. You may obtain a copy of any materials filed by Royale Energy with the SEC at 450 Fifth Street, N.W., Washington, D.C. 20549, by calling 1-800-SEC-0300. The SEC also maintains an Internet site that contains reports, proxy and information statements, and other information regarding issuers that file electronically with the SEC at http://www.sec.gov. Royale Energy also provides access to its SEC reports and other public announcements on its website, http://www.royl.com.
Item 1A Risk Factors
In addition to the other information contained in this report, the following risk factors should be considered in evaluating our business.
We Depend on Market Conditions and Prices in the Oil and Gas Industry.
Our success depends heavily upon our ability to market oil and gas production at favorable prices. In recent decades, there have been both periods of worldwide overproduction and underproduction of hydrocarbons and periods of increased and relaxed energy conservation efforts. As a result the world has experienced periods of excess supply of, and reduced demand for, crude oil on a worldwide basis and for natural gas on a domestic basis; these periods have been followed by periods of short supply of, and increased demand for, crude oil and, to a lesser extent, natural gas. The excess or short supply of oil and gas has placed pressures on prices and has resulted in dramatic price fluctuations.
Natural gas demand and the prices paid for gas are seasonal. The fluctuations in gas prices and possible new regulations create uncertainty about whether we can continue to produce gas for a profit.
Prices for oil and natural gas affect the amount of cash flow available for capital expenditures and our ability to borrow and raise additional capital. Lower prices may also reduce the amount of oil and natural gas that we can economically produce. Any substantial and extended decline in the price of oil or natural gas would decrease our cash flows, as well as the carrying value of our proved reserves, our borrowing capacity and our ability to obtain additional capital.
The Depressed Price of Natural Gas Is Reducing Our Revenues and Our Reserves.
Large parts of our established production and reserves in California consist of natural gas. The price of natural gas has been depressed recently, and for 2012 the average sales price we received for natural gas was $2.74 per MCF, compared to $4.08 in 2011. Lower gas prices caused a reduction in our revenues in 2012, and it also caused us to write down our total reserves, as yearend reserve values became less than book value of some existing wells. See Management’s Discussion and Analysis of Financial Condition and Results of Operations – Results of Operations for the Twelve Months Ended December 31, 2012, as Compared to the Twelve Months Ended December 31, 2011. If natural gas prices remain low, we may have further reductions to our production revenue from existing wells and further reductions in reserve values. Low natural gas prices also make exploration and development opportunities on our undeveloped properties in northern and central California less attractive.
Variance in Estimates of Oil and Gas Reserves could be Material.
The process of estimating oil and gas reserves is complex, requiring significant decisions and assumptions in the evaluation of available geological, geophysical, engineering and economic data for each reservoir. As a result, such estimates are inherently imprecise. Actual future production, oil and gas prices, revenues, taxes, development expenditures, operating expenses and quantities of recoverable oil and gas reserves may vary substantially from those estimated in reserve reports that we periodically obtain from independent reserve engineers.
You should not construe the standardized measure of proved reserves contained in our annual report as the current market value of the estimated proved reserves of oil and gas attributable to our properties. In accordance with Securities and Exchange Commission requirements, we have based the standardized measure of future net cash flows from the standardized measure of proved reserves on the average price during the 12-month period before the ending date of the period covered by the report, whereas actual future prices and costs may vary significantly. The following factors may also affect actual future net cash flows:
|
·
|
the timing of both production and related expenses;
|
|
·
|
changes in consumption levels; and
|
|
·
|
governmental regulations or taxation.
|
In addition, the calculation of the standardized measure of the future net cash flows using a 10% discount as required by the Securities and Exchange Commission is not necessarily the most appropriate discount rate based on interest rates in effect from time to time and risks associated with our reserves or the oil and gas industry in general. Furthermore, we may need to revise our reserves downward or upward based upon actual production, results of future development, supply and demand for oil and gas, prevailing oil and gas prices and other factors.
Any significant variance in these assumptions could materially affect the estimated quantities and present value of our reserves. In addition, our standardized measure of proved reserves may be revised downward or upward, based upon production history, results of future exploration and development, prevailing oil and gas prices and other factors, many of which are beyond our control. Actual production, revenues, taxes, development expenditures and operating expenses with respect to our reserves will likely vary from the estimates used, and such variances may be material.
Future Acquisitions and Development Activities May Not Result in Additional Proved Reserves, and We May Not be Able to Drill Productive Wells at Acceptable Costs.
In general, the volume of production from oil and gas properties declines as reserves are depleted. Except to the extent that we acquire properties containing proved reserves or conduct successful development and exploration
activities, or both, our proved reserves will decline as reserves are produced. Our future oil and gas production is, therefore, highly dependent upon our ability to find or acquire additional reserves.
The business of acquiring, enhancing or developing reserves is capital intensive. We require cash flow from operations as well as outside investments to fund our acquisition and development activities. If our cash flow from operations is reduced and external sources of capital become limited or unavailable, our ability to make the necessary capital investment to maintain or expand our asset base of oil and gas reserves would be impaired.
The Oil and Gas Industry has Mechanical and Environmental Risks.
Oil and gas drilling and production activities are subject to numerous risks. These risks include the risk that no commercially productive oil or gas reservoirs will be encountered, that operations may be curtailed, delayed or canceled, and that title problems, weather conditions, compliance with governmental requirements, mechanical difficulties or shortages or delays in the delivery of drilling rigs and other equipment may limit our ability to develop, produce or market our reserves. New wells we drill may not be productive and we may not recover all or any portion of our investment in the well. Drilling for oil and gas may involve unprofitable efforts, not only from dry wells but also from wells that are productive but do not produce sufficient net revenues to return a profit after drilling, operating and other costs. In addition, our properties may be susceptible to hydrocarbon drainage from production by other operators on adjacent properties.
Industry operating risks include the risks of fire, explosions, blow outs, pipe failure, abnormally pressured formations and environmental hazards, such as oil spills, natural gas leaks, ruptures or discharges of toxic gases, the occurrence of any of which could result in substantial losses due to injury or loss of life, severe damage to or destruction of property, natural resources and equipment, pollution or other environmental damage, clean up responsibilities, regulatory investigation and penalties and suspension of operations. In accordance with customary industry practice, we maintain insurance for these kinds of risks, but we cannot be sure that our level of insurance will cover all losses in the event of a drilling or production catastrophe. Insurance is not available for all operational risks, such as risks that we will drill a dry hole, fail in an attempt to complete a well or have problems maintaining production from existing wells.
Drilling is a Speculative Activity Even With Newer Technology.
Assessing drilling prospects is uncertain and risky for many reasons. We have grown in the past several years by using 3-D seismic technology to acquire and develop exploratory projects in northern California, as well as by acquiring producing properties for further development. The successful acquisition of such properties depends on our ability to assess recoverable reserves, future oil and gas prices, operating costs, potential environmental and other liabilities and other factors.
Nevertheless, exploratory drilling remains a speculative activity. Even when fully utilized and properly interpreted, 3-D seismic data and other advanced technologies assist geoscientists in identifying subsurface structures but do not enable the interpreter to know whether hydrocarbons are in fact present. In addition, 3-D seismic and other advanced technologies require greater pre-drilling expenditures than traditional drilling strategies, and we could incur losses as a result of these costs.
Therefore, our assessment of drilling prospects are necessarily inexact and their accuracy inherently uncertain. In connection with such an assessment, we perform a review of the subject properties that we believe to be generally consistent with industry practices. Such a review, however, will not reveal all existing or potential problems, nor will it permit us to become sufficiently familiar with the properties to fully assess their deficiencies and capabilities.
Breaches of Contract by Sellers of Properties Could Adversely Affect Operations.
In most cases, we are not entitled to contractual indemnification for pre closing liabilities, including environmental liabilities, and we generally acquire interests in the properties on an "as is" basis with limited remedies for breaches of representations and warranties. In those circumstances in which we have contractual indemnification rights for pre-closing liabilities, the seller may not fulfill those obligations and leave us with the costs.
We May Not be Able to Acquire Producing Oil and Gas Properties Which Contain Economically Recoverable Reserves.
Competition for producing oil and gas properties is intense and many of our competitors have substantially greater financial and other resources than we do. Acquisitions of producing oil and gas properties may be at prices that are too high to be acceptable.
We Require Substantial Capital for Exploration and Development.
We make substantial capital expenditures for our exploration and development projects. We will finance these capital expenditures with cash flow from operations and sales of direct working interests to third party investors. We will need additional financing in the future to fund our developmental and exploration activities. Additional financing that may be required may not be available or continue to be available to us. If additional capital resources are not available to us, our developmental and other activities may be curtailed, which would harm our business, financial condition and results of operations.
Profit Depends on the Marketability of Production.
The marketability of our natural gas production depends in part upon the availability, proximity and capacity of natural gas gathering systems, pipelines and processing facilities. Most of our natural gas is delivered through natural gas gathering systems and natural gas pipelines that we do not own. Federal, state and local regulation of oil and gas production and transportation, tax and energy policies, and/or changes in supply and demand and general economic conditions could adversely affect our ability to produce and market its oil and gas. Any dramatic change in market factors could have a material adverse effect on our financial condition and results of operations.
We Depend on Key Personnel.
Our business will depend on the continued services of our co-presidents and co-chief executive officers, Donald H. Hosmer and Stephen M. Hosmer. Stephen Hosmer is also the chief financial officer. We do not have employment agreements with either Donald or Stephen Hosmer. The loss of the services of either of these individuals would be particularly detrimental to us because of their background and experience in the oil and gas industry.
The Oil and Gas Industry is Highly Competitive.
The oil and gas industry is highly competitive in all its phases. Competition is particularly intense with respect to the acquisition of desirable producing properties, the acquisition of oil and gas prospects suitable for enhanced production efforts, and the hiring of experienced personnel. Our competitors in oil and gas acquisition, development, and production include the major oil companies in addition to numerous independent oil and gas companies, individual proprietors and drilling programs.
Many of our competitors possess and employ financial and personnel resources far greater than those which are available to us. They may be able to pay more for desirable producing properties and prospects and to define, evaluate, bid for, and purchase a greater number of producing properties and prospects than we can. We must compete against these larger companies for suitable producing properties and prospects, to generate future oil and gas reserves.
Governmental Regulations Can Hinder Production.
Domestic oil and gas exploration, production and sales are extensively regulated at both the federal and state levels. Legislation affecting the oil and gas industry is under constant review for amendment or expansion, frequently increasing the regulatory burden. Also, numerous departments and agencies, both federal and state, have legal authority to issue, and have issued, rules and regulations affecting the oil and gas industry which often are difficult and costly to comply with and which carry substantial penalties for noncompliance. State statutes and regulations require permits for drilling operations, drilling bonds, and reports concerning operations. Most states where we operate also have statutes and regulations governing conservation matters, including the unitization or pooling of properties. Our operations are also subject to numerous laws and regulations governing plugging and abandonment, discharging materials into the environment or otherwise relating to environmental protection. The heavy regulatory burden on the oil and gas industry increases its costs of doing business and consequently affects its profitability. Changes in the laws, rules or regulations, or the interpretation thereof, could have a materially adverse effect on our financial condition or results of operation.
Minority or Royalty Interest Purchases Do Not Allow Us to Control Production Completely.
We sometimes acquire less than the controlling working interest in oil and gas properties. In such cases, it is likely that these properties would not be operated by us. When we do not have controlling interest, the operator or the other co-owners might take actions we do not agree with and possibly increase costs or reduce production income in ways we do not agree with.
Environmental Regulations Can Hinder Production.
Oil and gas activities can result in liability under federal, state and local environmental regulations for activities involving, among other things, water pollution and hazardous waste transport, storage, and disposal. Such liability can attach not only to the operator of record of the well, but also to other parties that may be deemed to be current or prior operators or owners of the wells or the equipment involved. We have inspections performed on our properties to assure environmental law compliance, but inspections may not always be performed on every well, and structural and environmental problems are not necessarily observable even when an inspection is undertaken.
Item 1B Unresolved Staff Comments
None
Item 2 Description of Property
Since 1993, Royale Energy has concentrated on development of properties in the Sacramento Basin and the San Joaquin Basin of Northern and Central California. In 2012, Royale Energy drilled two wells in northern California, one of which was a developmental dry hole and the other was waiting completion of the pipeline at year end. In 2012, Royale Energy completed the acquisition of approximately 91,000 acres on the North Slope in a lease sale by the State of Alaska. Out of 13 companies bidding on 178 tracts, Royale won 56 tracts in the heart of the oil window. The company's 91,040 acre position represents 27% of the 334,969 acres leased in this sale.
Following industry standards, Royale Energy generally acquires oil and natural gas acreage without warranty of title except as to claims made by, though, or under the transferor. In these cases, Royale Energy attempts to conduct due diligence as to title before the acquisition, but it cannot assure that there will be no losses resulting from title defects or from defects in the assignment of leasehold rights. Title to property most often carries encumbrances, such as royalties, overriding royalties, carried and other similar interests, and contractual obligations, all of which are customary within the oil and natural gas industry.
During 2012, Royale Energy maintained a revolving credit agreement with Texas Capital Bank, N.A. Under the terms of the agreement, Royale Energy may borrow, repay, and reborrow money from Texas Capital Bank with a total credit line of $14,250,000. The maximum allowable amount of each credit request is governed by a formula in the agreement. The maximum allowable amount at December 31, 2012, was $350,000. At December 31, 2012, Royale Energy owed $350,000 under this credit line. During January 2013, the $350,000 loan balance was paid in full. In February 2013, the revolving credit agreement matured.
Following is a discussion of Royale Energy's significant oil and natural gas properties. Reserves at December 31, 2012, for each property discussed below, have been determined by Netherland, Sewell & Associates, Inc., and Source Energy, LLC, registered professional petroleum engineers, in accordance with reports submitted to Royale Energy on February 12, 2013 and February 15, 2013, respectively.
Northern California
Royale Energy owns lease interests in eleven gas fields with locations ranging from Tehama County in the north to Kern County in the south, in the Sacramento and San Joaquin Basins in California. At December 31, 2012, Royale operated 56 wells in California with estimated total proven, developed, and undeveloped reserves at approximately 4.9 BCF, according to Royale’s independently prepared reserve report as of December 31, 2012.
Developed and Undeveloped Leasehold Acreage
As of December 31, 2012, Royale Energy owned leasehold interests in the following developed and undeveloped properties in both gross and net acreage.
|
Developed
|
Undeveloped
|
|||||||||||||||
|
Gross Acres
|
Net Acres
|
Gross Acres
|
Net Acres
|
|||||||||||||
|
California
|
15,120.43
|
10,550.02
|
9,054.71
|
8,164.85
|
||||||||||||
|
Alaska
|
0
|
0
|
91,039.59
|
91,039.59
|
||||||||||||
|
All Other States
|
3,595.30
|
1,284.83
|
6,090.08
|
4,064.49
|
||||||||||||
|
Total
|
18,715.73
|
11,834.85
|
106,184.38
|
103,268.93
|
||||||||||||
Gross and Net Productive Wells
As of December 31, 2012, Royale Energy owned interests in the following oil and gas wells in both gross and net acreage:
|
Gross Wells
|
Net Wells
|
|||||||
|
Natural Gas
|
70.00 | 34.53 | ||||||
|
Oil
|
7.00 | 0.69 | ||||||
|
Total
|
77.00 | 35.22 | ||||||
Drilling Activities
The following table sets forth Royale Energy's drilling activities during the years ended December 31, 2011 and 2012. All wells are located in the Continental U.S., in California, Texas, Louisiana and Utah.
|
Year
|
Type of Well(a)
|
Gross Wells(e)
|
Net Wells(b)
|
|||||||||||||||||||
|
Total
|
Producing(c)
|
Dry(d)
|
Producing(c)
|
Dry(d)
|
||||||||||||||||||
|
2011
|
Exploratory
|
1
|
0
|
1
|
0.0000
|
0.4965
|
||||||||||||||||
|
Developmental
|
6
|
4
|
2
|
2.5184
|
0.9533
|
|||||||||||||||||
|
2012
|
Exploratory
|
1
|
1
|
0
|
0.5022
|
0.0000
|
||||||||||||||||
|
Developmental
|
1
|
0
|
1
|
0.0000
|
0.4674
|
|||||||||||||||||
|
a)
|
An exploratory well is one that is drilled in search of new oil and natural gas reservoirs, or to test the boundary limits of a previously discovered reservoir. A developmental well is one drilled on a previously known productive area of an oil and natural gas reservoir with the objective of completing that reservoir.
|
|
b)
|
Gross wells represent the number of actual wells in which Royale Energy owns an interest. Royale Energy's interest in these wells may range from 1% to 100%.
|
|
c)
|
A producing well is one that produces oil and/or natural gas that is being purchased on the market.
|
|
d)
|
A dry well is a well that is not deemed capable of producing hydrocarbons in paying quantities.
|
|
e)
|
One "net well" is deemed to exist when the sum of fractional ownership working interests in gross wells or acres equals one. The number of net wells is the sum of the fractional working interests owned in gross wells expressed as a whole number or a fraction.
|
As of December 31, 2012, Royale Energy was in the process of drilling one well in California and had recently finished drilling another California well.
Production
The following table summarizes, for the periods indicated, Royale Energy's net share of oil and natural gas production, average sales price per barrel (BBL), per thousand cubic feet (MCF) of natural gas, and the MCF equivalent (MCFE) for the barrels of oil based on a 6 to 1 ratio of the price per barrel of oil to the price per MCF of natural gas. "Net" production is production that Royale Energy owns either directly or indirectly through partnership or joint venture interests produced to its interest after deducting royalty, limited partner or other similar interests. Royale Energy generally sells its oil and natural gas at prices then prevailing on the "spot market" and does not have any material long term contracts for the sale of natural gas at a fixed price.
|
2012
|
2011
|
|||||||
|
Net volume
|
||||||||
|
Oil (BBL)
|
1,558
|
2,264
|
||||||
|
Gas (MCF)
|
559,590
|
1,144,469
|
||||||
|
MCFE
|
568,938
|
1,158,053
|
||||||
|
Average sales price
|
||||||||
|
Oil (BBL)
|
$
|
90.75
|
$
|
90.48
|
||||
|
Gas (MCF)
|
$
|
2.74
|
$
|
4.08
|
||||
|
Net production costs and taxes
|
$
|
1,139,750
|
$
|
1,517,920
|
||||
|
Lifting costs (per MCFE)
|
$
|
2.00
|
$
|
1.31
|
||||
Net Proved Oil and Natural Gas Reserves
As of December 31, 2012, Royale Energy had proved developed reserves of 3,188 MMCF and total proved reserves of 4,498 MMCF of natural gas on all of the properties Royale Energy leases. For the same period, Royale Energy also had proved developed oil reserves of 1 MBBL and total proved oil reserves of 63 MBBL.
Oil and gas reserve estimates and the discounted present value estimates associated with the reserve estimates are based on numerous engineering, geological and operational assumptions that generally are derived from limited data.
Item 3 Legal Proceedings
National Fuel Corporation (“NFC”) v. Royale Energy, Inc., No. 080800735, Uintah County, Utah. NFC filed this lawsuit seeking to remove Royale as operator of the property in which Royale is the 75% record owner and operator and NFC was a non-operator with a 25% ownership. Trial was held on October 18-21, 2011, at which Royale defended itself vigorously. On February 2, 2012, the Court issued its ruling, denying NFC’s request to remove Royale as operator. On April 6, 2012, judgment pursuant to the ruling was entered, and NFC filed an appeal. Effective February 1, 2013, during the pendency of the appeal, the case was settled. We anticipate that the appeal will be dismissed shortly, and the litigation concluded. There was no cash paid out as a result of the ruling.
Douglas Jones v. Royale Energy, Inc., et.al.
On July 1, 2010, Douglas Jones filed a lawsuit against the Company in the Circuit Court, 17th Judicial District, Broward County, Florida. Mr. Jones was an independent contractor handling certain aspects of sales for the Company prior to July 2, 2008. He asserts that he is entitled to an unspecified amount for commissions and expenses. The Company denies that any money is owed to Mr. Jones, and intends to defend the lawsuit vigorously. On August 16, 2010, the Company through Florida counsel Adam Hodkin, filed a motion to dismiss the lawsuit for lack of jurisdiction in the Florida courts. The Court has set the motion to dismiss for hearing on March 15, 2012, but the hearing was taken off calendar at the request of the plaintiff, Mr. Jones. The court then reset the motion for hearing on February 27, 2013. At the hearing, the judge took the matter under submission to consider whether he needed to hold an evidentiary hearing or whether he could rule on the papers. If the motion to dismiss is denied, Royale intends to answer their complaint and oppose the lawsuit vigorously.
Item 4 Mine Safety Disclosures
Not Applicable
PART II
Item 5 Market for Common Equity and Related Stockholder Matters
Since 1997 Royale Energy’s Common Stock has been traded on the Nasdaq National Market System under the symbol “ROYL”. Since July 1, 2009, Royale Energy’s stock has been listed on the NASDAQ Capital Market, and prior to that, our stock was listed on the NASDAQ Global Market. As of December 31, 2012, 12,545,465 shares of Royale Energy’s Common Stock were held by approximately 7,736 stockholders. The following table reflects the high and low quarterly closing sales prices from January 2011 through December 2012.
|
1st Qtr
|
2nd Qtr
|
3rd Qtr
|
4th Qtr
|
|||||||||||||||||||||||||||||
|
High
|
Low
|
High
|
Low
|
High
|
Low
|
High
|
Low
|
|||||||||||||||||||||||||
|
2012
|
6.59
|
4.27
|
5.21
|
2.58
|
4.32
|
1.93
|
3.89
|
2.45
|
||||||||||||||||||||||||
|
2011
|
7.83
|
2.08
|
5.52
|
2.56
|
3.91
|
2.08
|
5.36
|
1.90
|
||||||||||||||||||||||||
The Board of Directors did not issue cash or stock dividends in 2012 or 2011.
Recent Sales of Unregistered Securities
In February and March 2012, five directors exercised stock options to purchase a total of 76,346 shares of common stock in cashless exercises. The stock options had originally been awarded in 2008 at exercise prices of $3.50 per share. In February and March 2012, one director exercised stock options, which also had been awarded in 2008 and 2010, to purchase 45,000 and 43,692 shares of common stock for cash at an exercise price of $3.50 and $3.25 per share, respectively. The options had been issued and the stock was purchased in reliance on the exemption from registration requirements of the Securities Act of 1933 contained in Section 4(2) thereof.
In November 2011, ownership of 31,667 shares of restricted common stock which had been awarded to the seven directors of Royale Energy for services rendered, vested. The restricted stock originally had been awarded in 2008 in reliance on the exemption from registration requirements of the Securities Act of 1933 contained in Section 4(2) thereof. In March 2011, one director exercised stock options to purchase a total of 18,440 shares of common stock in a cashless exercise. The stock options had originally been awarded in 2008 at an exercise price of $3.50 per share.
Performance Graph
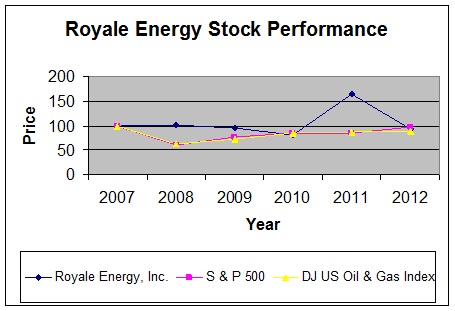
The following stock price performance graph is included in accordance with the SEC’s executive compensation disclosure rules and is intended to allow stockholders to review Royale Energy’s executive compensation policies in light of corresponding stockholder returns, expressed in terms of the appreciation of Royale Energy’s common stock relative to two broad-based stock performance indices. The information is included for historical comparative purposes only and should not be considered indicative of future stock performance. The graph compares total return on $100 value of Royale Energy’s common stock on December 31, 2006, with the cumulative total return of the Standard & Poor’s Composite 500 Stock Index and the Dow Jones U.S. Oil & Gas Index from December 31, 2007 through December 31, 2012.
|
2007
|
2008
|
2009
|
2010
|
2011
|
2012
|
|||||||||||||||||||
|
Royale Energy, Inc.
|
100 | 100 | 95 | 80 | 164 | 92 | ||||||||||||||||||
|
S&P 500 Stock Index
|
100 | 62 | 76 | 86 | 86 | 97 | ||||||||||||||||||
|
DJ US Oil & Gas Index
|
100 | 63 | 73 | 85 | 87 | 90 | ||||||||||||||||||
Item 6 Management’s Discussion and Analysis of Financial Condition and Results of Operations
The following discussion should be read in conjunction with Royale Energy’s Financial Statements and Notes thereto and other financial information relating to Royale Energy included elsewhere in this document.
For the past eighteen years, Royale Energy has primarily acquired and developed producing and non-producing natural gas properties in California. In 2004, Royale Energy began developing leases in Utah. The most significant factors affecting the results of operations are (i) changes in oil and natural gas production levels and reserves, (ii) recording of turnkey drilling revenues and the associated drilling expense, and (iii) the change in commodities price of natural gas and oil reserves owned by Royale Energy.
Critical Accounting Policies
Revenue Recognition
Royale Energy’s financial statements include its pro rata ownership of wells. Royale Energy usually sells a portion of the working interest in each well it drills or participates in to third party investors and retains a portion of the prospect for its own account. Royale Energy generally retains about a 50% working interest. All results, successful or not, are included at its pro rata ownership amounts: revenue, expenses, assets, and liabilities as defined in FASB ASC 932-323-25.
Royale Energy has developed two profit-oriented segments of business: marketing direct working interests (DWI), and producing and selling oil and gas.
Royale Energy derives DWI revenue from sales of working interests in wells to be drilled to high net worth individuals. DWI investments relating to pre-drilling costs are non-refundable. The company holds all funds invested as deferred turnkey drilling until drilling is complete. Occasionally, drilling is delayed due to the permitting process or drilling rig availability. At December 31, 2012 and 2011, Royale Energy had deferred turnkey drilling of $8,693,743 and $6,909,666 respectively.
The primary business segment is oil and gas production. Northern and central California accounted for approximately 99% of the Company’s successful natural gas production in 2012. Natural gas flows from the wells into gathering line systems, which are equipped occasionally with compressor systems, which in turn flow into metered transportation and customer pipelines. Monthly, price data and daily production are used to invoice customers for amounts due to Royale Energy and other working interest owners. Royale Energy operates virtually all of its own wells and receives industry standard operator fees.
Upon the sale or retirement of a complete field of a proved property, the Company eliminates the cost from its books, and the resultant gain or loss is recorded to Royale Energy’s Statement of Operations. Upon the sale of an entire interest in an unproved property where the property has been assessed for impairment individually, a gain or loss is recognized in Royale Energy’s Statement of Operations. If a partial interest in an unproved property is sold, any funds received are accounted for as a reduction of the cost in the interest retained.
Oil and Gas Property and Equipment
Royale Energy follows the successful efforts method of accounting for oil and gas properties. Costs are accumulated on a field-by-field basis. These costs include pre-drilling activities such as leasing rents paid, drilling costs, and post-drilling tangible costs. Costs of unproved properties are excluded from amortization until the properties are evaluated. Royale Energy regularly evaluates its unproved properties on a field-by-field basis for possible impairment. Due to the unpredictable nature of exploration drilling activities, the amount and timing of impairment expenses are difficult to predict with any certainty.
Depletion
The units of production method of accounting uses proved reserves in the calculation of depletion, depreciation and amortization. Proved reserves are estimated quantities of crude oil, natural gas, and natural gas liquids which geological and engineering data demonstrate with reasonable certainty to be recoverable from known reservoirs under existing economic and operating conditions. Proved reserves cannot be measured exactly, and the estimation of reserves involves judgment determinations. Independent engineering reserve estimates must be reviewed and adjusted periodically to reflect additional information gained from reservoir performance, new geological and geophysical data and economic changes. The estimates are based on current technology and economic conditions, and Royale Energy considers such estimates to be reasonable and consistent with current knowledge of the characteristics and extent of production. The independent engineering estimates include only those amounts considered to be proved reserves and do not include additional amounts which may result from new discoveries in the future, or from application of secondary and tertiary recovery processes where facilities are not in place or for which transportation and/or marketing contracts are not in place. Changes in previous estimates of proved reserves result from new information obtained from production history and changes in economic factors.
Impairment Of Assets
Producing property costs are evaluated for impairment and reduced to fair value if the sum of expected undiscounted future cash flows is less than net book value pursuant to the Extractive Activities Topic of the Financial Accounting Standard Board’s (FASB) Accounting Standards Codification. Impairment of non-producing leasehold costs and undeveloped mineral and royalty interests are assessed periodically on a property-by-property basis and any impairment in value are charged to expense. We periodically review for impairment of proved properties on a field-by-field basis. Unamortized capital costs are measured on a field basis and are reduced to fair value if it is determined that the sum of expected future net cash flows are less than the net book value. We determine if impairment has occurred through either adverse changes or as a result of its periodic review for impairment. Impairment is measured on a 10% discounted cash flows basis. We regard impairment costs of undeveloped properties as a component of our turnkey drilling overhead, since impairment costs amount to a write-down of previously acquired property inventory that we were unable to successfully develop as part of our turnkey drilling program.
Estimates
The preparation of financial statements in conformity with accounting principles generally accepted in the United States of America requires management to make estimates and assumptions that affect the reported amounts of assets and liabilities and disclosure of contingent assets and liabilities at the date of the financial statements and the reported amounts of revenues and expenses during the reporting period. The most significant estimates pertain to proved oil, plant products and gas reserve volumes and the future development costs. Actual results could differ from those estimates.
Deferred Income Taxes
Deferred income taxes reflect the net tax effects, calculated at currently enacted rates, of (a) future deductible/taxable amounts attributable to events that have been recognized on a cumulative basis in the financial statements or income tax returns, and (b) operating loss and tax credit carry forwards. All available evidence, both positive and negative, shall be considered to determine whether, based on the weight of that evidence, a valuation allowance for deferred tas assets is needed. Information about the company’s financial position and its results of operations for the current and preceding years will be used.
The company shall use judgment in considering the relative impact of negative and positive evidence. The weight given to the potential effect of negative and positive evidence shall be commensurate with the extent to which it can be objectively verified. The more negative evidence that exists, the more positive evidence is necessary and the more difficult it is to support a conclusion that a valuation allowance is not needed for some portion or all of the deferred tax asset. A cumulative loss in recent years is a significant piece of negative evidence that is difficult to overcome.
Future realization of a tax benefit sometimes will be expected for a portion, but not all of a deferred tax asset, and the dividing line between the two portions may be unclear. In those circumstances, application of judgment based on a careful assessment of all available evidence is required to determine the portion of a deferred tax asset for which it is more likely than not a tax benefit will not be realized.
Results of Operations for the Twelve Months Ended December 31, 2012, as Compared to the Restated Twelve Months Ended December 31, 2011
For the year ended December 31, 2012, we recorded a net loss before taxes of $4,526,117 a $1,394,630 improvement when compared to a net loss before taxes of $5,920,747 during 2011. Total revenues from operations in 2012 were $4,394,745, a decrease of $7,137,665, or 61.9%, from the total revenues of $11,532,410 in 2011, the result of both lower turnkey drilling revenues and oil and natural gas sales. Total expenses from operations in 2012 were $8,741,001, a decrease of $9,333,701, or 51.6%, from the total expenses of $18,074,702 in 2011, due mainly to decreases in both drilling and impairment costs in 2012. At year end 2012, management reviewed the realizability of the Company’s net deferred tax assets and concluded that certain conditions were met, as outlined above in the Certain Accounting Policy’s Deferred Income Tax section and in FASB ASC 740-10, under which it was appropriate for Royale to record a valuation allowance against the net deferred tax assets of $10,176,227, resulting in a net loss of $11,961,026 in 2012 compared to a net loss of $4,188,241 in 2011.
In 2012, revenues from oil and gas production decreased by 65.7% to $1,673,538 from $4,879,397 in 2011, due to lower oil and natural gas production. This decrease in production was due to the natural declines of our existing wells and lower commodity prices received in 2012. The net sales volume of natural gas for the year ended December 31, 2012, was approximately 559,590 MCF with an average price of $2.74 per MCF, versus 1,144,469 MCF with an average price of $4.08 per MCF for 2011. This represents a decrease in net sales volume of 584,879 MCF or 51.1%. The net sales volume for oil and condensate (natural gas liquids) production was approximately 1,558 barrels with an average price of $90.75 per barrel for the year ended December 31, 2012, compared to 2,264 barrels at an average price of $90.48 per barrel for the year in 2011. This represents a decrease in net sales volume of 706 barrels, or 31.2%. This decrease was mainly due to the sale of several oil producing wells in the first quarter of 2011.
Oil and gas lease operating expenses decreased by $378,170, or 24.9%, to $1,139,750 for the year ended December 31, 2012, from $1,517,920 for the year in 2011. This decrease was mainly due to lower transportation costs due to the decrease in production volumes and lower plugging costs during 2012. When measuring lease operating costs on a production or lifting cost basis, in 2012, the $1,139,750 equates to a $2.00 per MCFE lifting cost versus a $1.31 per MCFE lifting cost in 2011, a 52.7% increase, due to the lower production volumes in 2012.
For the year ended December 31, 2012, turnkey drilling revenues decreased $3,765,564 to $2,028,863 from $5,794,427 in 2011, or 65.0%. We also had a $3,073,836 or 87.2% decrease in turnkey drilling and development costs to $449,536 in 2012 from $3,523,372 in 2011. These decreases in both turnkey revenues and costs were due to the drilling of two wells in 2012, one developmental and one exploratory well versus the drilling of seven wells in 2011, six developmental and one exploratory well. Our gross margins, or profits, on drilling depend on our ability to accurately estimate the costs associated with the development of projects in which we sell working interests and to acquire viable properties that can be successfully developed. Costs associated with contract drilling depend on location, well depth, weather, and availability of drilling contractors and equipment. Our gross margin on drilling increased to 77.8% from 39.2% for the years ended December 31, 2012 and 2011, respectively. Gross margin is calculated as the difference between turnkey drilling revenue and turnkey drilling expense. However, management believes that a portion of its impairment losses should also be considered as a cost of drilling in determining the profitability of this segment, because impairment costs are incurred in the selection of higher quality prospects for ultimate development.
Impairment losses of $200,778 and $4,529,058 were recorded in 2012 and 2011, respectively. In both years, we recorded impairments in wells or fields where year-end reserve values were less than the net book values of wells or where lease and land costs were no longer viable. In 2012, one Utah well and two California wells were impaired by $ 11,276 and $60,,789 respectively. Also in 2012, we recorded lease impairments of $119,322 on various capitalized lease and land costs that were no longer viable. In 2011, two California fields, the Lonestar and Bowerbank fields were impaired $3,776,385 and $28,566, respectively, while our Utah field was also impaired by $710,124. These impairments were due to lower proved developed reserves than current book values primarily due to a substantial drop in the price of natural gas. Additionally in 2011, we recorded lease impairments of $12,959 on various capitalized lease and land costs that were no longer viable.
Bad debt expense for 2012 and 2011 were $263,767 and $86,294, respectively. These expenses arose from identified uncollectable receivables relating to our oil and natural gas properties either plugged and abandoned or scheduled for plugging and abandonment. We periodically review our accounts receivable from working interest owners to determine whether collection of any of these charges where doubtful. By contract, the Company may not collect some charges from its Direct Working Interest owners for certain wells that ceased production or had been sold during the year, to the extent that these charges exceed production revenue
The aggregate of supervisory fees and other income was $692,344 for the year ended December 31, 2012, a decrease of $166,242 (19.4%) from $858,586 during the year in 2011. This decrease was mainly due to lower pipeline and compressor revenues generated from the decrease in natural gas production. Supervisory fees are charged in accordance with the Council for Petroleum Accountants Societies (COPAS) policy for reimbursement of expenses associated with the joint accounting for billing, revenue disbursement, and payment of taxes and royalties. These charges are reevaluated each year and adjusted up or down as deemed appropriate by a published report to the industry by Ernst & Young, LLP, Certified Public Accountants. Supervisory fees increased $69,821 or 18.1%, to $455,396 in 2012 from $385,575 in 2011.
Depreciation, depletion and amortization expense decreased to $1,448,002 from $2,362,065 a decrease of $914,063 (38.7%) for the year ended December 31, 2012, as compared to 2011. The depletion rate is calculated using production as a percentage of reserves. This increase in depletion expense was due to the lower natural gas production during 2012 and a lower oil and gas asset base due to our 2011 impairments, resulting in a decreased depletion of our oil and natural gas properties.
General and administrative expenses decreased by $398,873 or 9.9%, from $4,039,209 for the year ended December 31, 2011, to $3,640,336 for the year in 2012. This decrease was primarily due to lower employee related costs. Legal and accounting expense decreased to $518,511 for the year, compared to $933,856 for 2011, a $415,345 or 44.5% decrease. This decrease was the result of lower legal fees in 2012 primarily related to the conclusion of the Mountain West and National Fuel litigation in 2011.
Marketing expense for the year ended December 31, 2012, decreased $119,377 or 16.7%, to $594,118, compared to $713,495 for the year in 2011. Marketing expense usually varies from period to period according to the number of marketing events attended by personnel and their associated costs. During 2012, in an effort to control costs, we attended fewer marketing conferences and attempted to negotiate lower conference fees.
During the years in 2012 and 2011, we incurred $423,459 and $111,390, respectively, in geological and geophysical costs in order to increase our oil and natural gas prospect base. These costs were incurred at the same seismic survey in Northern California. Additionally during 2012, we had a write down of $62,744 on certain oil and gas inventory to its estimated current market value. In 2011, we also had a write down of $258,043 on certain oil and gas pipeline inventory to its estimated current market value. In 2011, we sold our working interest in two separate non-core properties and other equipment resulting in a gain of $759,763. The properties were located in Kern County, California and Gaines County, Texas.
During 2012, interest expense increased to $195,009 from $138,218 in 2011, a $56,791 or 41.1% increase. This increase was mainly due to the interest on a new convertible note payable obtained during the fourth quarter of 2012. Further details concerning Royale’s notes payable and line of credit usage can be found in the Capital Resources and Liquidity section below.
In 2012, we had income tax expense of $ 7,434,909 due to the valuation allowance recognized against our net deferred tax assets. In 2011, we had an income tax benefit of $ 1,732,506 due to our net loss before taxes of $ 5,920,747. For 2012, the use of a percentage depletion carryover valuation allowance created from the current and past operations results in an effective tax rate less than the normal federal rate of 34% plus the relevant state rates (mostly California, 9.3%).
Capital Resources and Liquidity
At December 31, 2012, Royale Energy had current assets totaling $6,540,592 and current liabilities totaling $ 15,886,654, a $6,978,713 working capital deficit. We had cash and cash equivalents at December 31, 2012 of $1,489,930 compared to $2,946,131 at December 31, 2011.
Our capital expenditure commitments occur as we decide to drill wells to develop our prospects. We generally do not decide to drill any prospect until we have sold a portion of the working interest in a prospect to third parties to diversify our risk and receive a portion of the funds to drill each prospect. We place funds that we receive from third party investors into a separate cash account until they are required for expenditures on each well.
The Company has traditionally relied on available credit and cash flows from operation for capital expenditures for oil and gas drilling and development, in addition to the cash generated from selling a portion of the working interest in prospects to third parties. As discussed in Results of Operations, page 14, the Company’s revenues both from oil and gas sales and from sales of working interests declined in 2012. As a result of the decline in natural gas prices, we curtailed our drilling efforts in 2012, drilling only two wells in 2012, compared to seven wells in 2011. The decline in revenue also led the Company to seek alternative financing sources for its drilling activities.
To finance development of reserves, the Company took the following actions:
|
·
|
In October 2012, the Company obtained $3 million from sale of a convertible note. See, The Company’s Prospectus Supplement filed pursuant to Rule 424(b) on October 29, 2012, and the Company’s Form 8-K filed on October 29, 2012. The Company used these proceeds for general corporate purposes, including the reduction of outstanding bank debt and for capital expenditures on oil and gas development. The note may, at the Company’s option, be repaid by converting the interest and principal amounts due to common stock, thus reducing the Company’s cash needs to service its debt.
|
|
·
|
In February 2012, the Company entered into a sales agreement with C. K. Cooper & Company, Inc., to sell up to $10 million of common stock in an “at the market” offering as defined in Rule 415. In 2012, the Company sold approximately $4.6 million of common stock pursuant to the sales agreement. The Company expects to sell additional common stock pursuant to the sales agreement in 2013.
|
|
·
|
Beginning in January 2012, the Company began extensive cost cutting measures in General and Administrative, Legal and Accounting, and Marketing expense. These measures enabled us to reduce our operating expenses by approximately $1 million for 2012, compared to 2011, and expect that these measures will carry forward into 2013.
|
We expect that these measures will be sufficient to meet our liquidity demands for the foreseeable future.
At the end of 2012, our accounts receivable totaled $3,969,160 compared to $1,872,067 at December 31, 2011, a $2,097,093 or 112.02% increase. This was primarily due to an approximately $2,500,000 receivable, as part of the sale of common stock discussed above, due at December 31, 2012. This common stock receivable was collected on January 4, 2013. At December 31, 2012, our accounts payable and accrued expenses totaled $4,932,469, an increase of $389,728 or 8.6% over the accounts payable at the end of 2011 of $4,542,741. This increase was mainly due to increased drilling activity at year end 2012 when compared to year end 2011.
In February 2009, we entered into an agreement with Texas Capital Bank, N.A. for a new revolving line of credit and letter of credit facility, also secured by our oil and gas properties, of up to $14,250,000 and separate letter of credit facility of up to $750,000, for the purposes of refinancing Royale’s existing debt and to fund development, exploration and acquisition activities as well as other general corporate purposes. The scheduled maturity date for the loan was February 13, 2013. At December 31, 2012, we had a current borrowing base and outstanding indebtedness on this loan of $350,000. During January 2013, the balance of $350,000 on this credit facility was paid in full. In February 2013, the revolving credit agreement matured.
We do not engage in hedging activities or use derivative instruments to manage market risks.
The following schedule summarizes our known contractual cash obligations at December 31, 2012, and the effect such obligations are expected to have on our liquidity and cash flow in future periods.
|
Total Obligations
|
2013
|
2014-2015
|
2016
|
Beyond
|
||||||||||||||||
|
Office lease
|
$
|
1,066,614
|
$
|
403,873
|
$
|
662,741
|
$
|
-
|
$
|
-
|
||||||||||
|
Revolving Line of Credit
|
350,000
|
350,000
|
-
|
-
|
-
|
|||||||||||||||
|
Convertible Note
|
3,333,333
|
3,333,333
|
||||||||||||||||||
|
Total
|
$
|
4,749,947
|
$
|
4,087,206
|
$
|
662,741
|
$
|
-
|
$
|
-
|
||||||||||
Operating Activities. For the years ended December 31, 2012 and 2011, cash provided by operating activities totaled $226,193 and $1,578,482, respectively. This difference in cash was from our lower oil and natural gas sales due to lower production volumes and price received during the year in 2012.
Investing Activities. For the year ended December 31, 2012, cash used by investing activities was $4,486,093 compared to $3,948,464 used by investing activities in 2011, an increase of $537,629 or 13.6%. This increase in cash used was mainly due to finalizing and funding our agreement with the State of Alaska to obtain approximately 90,000 lease acres, in addition to the drilling two wells during 2012. In 2011, we drilled or participated in the drilling of seven wells and received proceeds of $806,353 relating to the sale of certain oil and gas properties in Kern County, California and Gaines County, Texas. As part of the sale, we retained an overriding royalty interest in the acreage.
Financing Activities. Net cash provided by financing activities totaled $2,803,699 and $601,488 for the years ended December 31, 2012 and 2011, respectively. The increase in cash provided was due to the obtaining of a new note payable and the sales of common stock during the year in 2012. In 2012, options were exercised by one director for a total of 88,692 shares of the Company’s common stock in exchange for proceeds of $299,500. Additionally during the year, Royale received proceeds, net of fees, of $2,119,510 and issued 528,996 shares of its common stock relating to its market equity offering program. As discussed above, the Company received approximately $2.8 million from a convertible note payable during the year in 2012. These proceeds were added to working capital and used for ordinary operating expense. Also during the period in 2012, five directors exchanged 195,000 options in a cashless exercise for 76,346 common shares. In 2011 several warrants were exchanged for shares of Royale’s common stock. Royale received $1,051,488 and issued 468,928 shares of its common stock relating to these exercises. Additionally during the period in 2011, we issued 18,440 shares of common stock to a member of the board of directors in a cashless stock options exercise.
Changes in Reserve Estimates
During 2012, our overall proved developed and undeveloped reserves decreased by 1.6% and our previously estimated proved developed and undeveloped reserve quantities were revised downward by approximately 0.4 million cubic feet of natural gas. This downward revision was primarily due to two California wells, drilled in 2011, which had lower than previously estimated proved producing and non-producing natural gas reserves. See Supplemental Information about Oil and Gas Producing Activities (Unaudited), page F-30.
During 2011, our overall proved developed and undeveloped reserves decreased by 25.5% and our previously estimated proved developed and undeveloped reserve quantities were revised downward by approximately 1 million cubic feet of natural gas. This downward revision was primarily due four California wells in our Lonestar field, one of which was drilled in 2009 and the other three drilled in 2010, which had lower than previously estimated proved producing and non-producing gas reserves.
Item 7 Qualitative and Quantitative Disclosures About Market Risk
Royale Energy is exposed to market risk from changes in commodity prices and in interest rates. In 2012, we sold a majority of our natural gas at the daily market rate through the Pacific Gas & Electric pipeline. In 2012, our natural gas revenues were approximately $1.5 million with an average price of $2.74 per MCF. At current production levels, a 10% per MCF increase or decrease in our average price received could potentially increase or decrease our natural gas revenues by approximately $150,000. At our current production levels of oil and natural gas condensate, a 10% increase or decrease in our average price per barrel could potentially increase or decrease our oil and natural gas revenues by approximately $14,100. We currently do not sell any of our natural gas or oil through hedging contracts.
Item 8 Financial Statements and Supplementary Data
See pages F-1, et seq., included herein.
Item 9 Changes in and Disagreements With Accountants on Accounting and Financial Disclosure
None
Item 9A Controls and Procedures
Disclosure Controls
Disclosure controls are controls and other procedures that are designed to ensure that information required to be disclosed by us in reports that we file or submit under the Securities Exchange Act of 1934 is recorded, processed, summarized and reported within the time periods specified in the SEC’s rules and forms. Our disclosure controls and procedures are designed to insure that the information required to be filed is accumulated and communicated to our management in a manner designed to enable them to make timely decisions regarding required disclosure.
Our co-chief executive officers, Donald H. Hosmer and Stephen M. Hosmer (who is also our chief financial officer), evaluated the effectiveness or our disclosure controls and procedures as of the end of the 2012 fiscal year. Based on their evaluation, they concluded that our disclosure controls are effective as of December 31, 2012.
Management Report on Internal Control over Financial Reporting
Our management is responsible for establishing and maintaining adequate internal control over financial reporting to provide reasonable assurance regarding the reliability of our financial reporting and the preparation of financial statements for external purposes in accordance with generally accepted accounting principles. Internal control over financial reporting includes those policies and procedures that (i) pertain to the maintenance of records that in reasonable detail accurately and fairly reflect the transactions and dispositions of the assets of the company, (ii) provide reasonable assurance that transactions are recorded as necessary to permit preparation of financial statements in accordance with generally accepted accounting principles, and that receipts and expenditures of the Company are being made only in accordance with authorizations of management and directors of the Company; and (iii) provide reasonable assurance regarding prevention or timely detection of unauthorized acquisition, use or disposition of the Company’s assets that could have a material effect on the financial statements. Management assessed our internal control over financial reporting as of December 31, 2012, which was the end of our fiscal year. Management based its assessment on criteria established in the SEC Commission Guidance Regarding Management’s Report on Internal Control Over Financial Reporting Under Section 13(a) or 15(d) of the Securities Exchange Act of 1934. The guidance sets forth an approach by which management can conduct a top-down, risk-based evaluation of internal control over financial reporting. Management’s assessment included an evaluation of risks to reliable financial reporting, whether controls exist to address those risks and evaluated evidence about the operation of the controls included in the evaluation based on its assessment of risk.
Based on our assessment, management has concluded that our internal control over financial reporting was effective as of the end of the fiscal year to provide reasonable assurance regarding the reliability of financial reporting and the preparation of financial statements for external reporting purposes in accordance with generally accepted accounting principles. We reviewed the results of management’s assessment with the Audit Committee of our Board of Directors.
This annual report does not include an attestation report of the company's registered public accounting firm regarding internal control over financial reporting. Management's report was not subject to attestation by the company's registered public accounting firm pursuant to temporary rules of the Securities and Exchange Commission that permit the company to provide only management's report in this annual report.
Changes in Internal Control over Financial Reporting
No changes in our internal control over financial reporting occurred during the last fiscal quarter of 2012 that have materially affected, or are reasonably likely to materially affect, our internal control over financial reporting.
Limitations on Effectiveness of Controls
Our management, including our CEO’s and CFO, does not expect that our disclosure controls or internal controls over financial reporting will prevent all error or fraud. A control system, no matter how well conceived and operated, can provide only reasonable, but not absolute, assurance that the objectives of a control system are met. Any control system contains limitations imposed by resources and relevant cost considerations. Because of the inherent limitations in all control systems, no evaluation of controls can provide absolute assurance that all control issues have been addressed. These inherent limitations include the realities that judgments can be faulty and that breakdowns can occur because of simple error or mistake. In addition, controls can be circumvented by the individual acts of some persons, by collusion of two or more people, or by management override of a control. Our control system design is also based on assumptions about the likelihood of future events, and we cannot be sure that we have considered all possible future circumstances and events.
PART III
Item 10 Directors and Executive Officers of the Registrant
The information required by this Item will be contained in, and incorporated by reference to, the Proxy Statement for the annual meeting of Royale Energy, which will be filed with the SEC and mailed to stockholders within 120 days of December 31, 2012.
Item 11 Executive Compensation
The information required by this Item will be contained in, and incorporated by reference to, the Proxy Statement for the annual meeting of Royale Energy, which will be filed with the SEC and mailed to stockholders within 120 days of December 31, 2012.
Item 12 Security Ownership of Certain Beneficial Owners and Management
The information required by this Item will be contained in, and incorporated by reference to, the Proxy Statement for the annual meeting of Royale Energy, which will be filed with the SEC and mailed to stockholders within 120 days of December 31, 2012.
Item 13 Certain Relationships and Related Transactions
The information required by this Item will be contained in, and incorporated by reference to, the Proxy Statement for the annual meeting of Royale Energy, which will be filed with the SEC and mailed to stockholders within 120 days of December 31, 2012.
Item 14 Principal Accountant Fees and Services
The information required by this Item will be contained in, and incorporated by reference to, the Proxy Statement for the annual meeting of Royale Energy, which will be filed with the SEC and mailed to stockholders within 120 days of December 31, 2012.
PART IV
Item 15 Exhibits and Financial Statement Schedules
The agreements included as exhibits to this report are included to provide information about their terms and not to provide any other factual or disclosure information about Royale Energy or the other parties to the agreements. The agreements contain representations and warranties by each of the parties to the applicable agreement that were made solely for the benefit of the other agreement parties and:
|
·
|
should not be treated as categorical statements of fact, but rather as a way of allocating the risk among the parties if those statements prove to be inaccurate;
|
|
·
|
have been qualified by disclosures that were made to the other party in connection with the negotiation of the applicable agreement, which disclosures are not necessarily reflected in the agreement;
|
|
·
|
may apply standards of materiality in a way that is different from the way investors may view materiality; and
|
|
·
|
were made only as of the date of the applicable agreement or such other date or dates as may be specified in the agreement and are subject to more recent developments.
|
|
1.
|
Financial Statements. See Index to Financial Statements, page F-1
|
|
2.
|
Schedules. Supplemental Information About Oil and Gas Producing Activities (Unaudited) begins on page F-26.
|
|
3.
|
Exhibits. Certain of the exhibits listed in the following index are incorporated by reference.
|
|
1.1
|
Placement Agent Agreement between the Company and C.K. Cooper & Company, Inc., dated October 25, 2012, incorporated by reference to Exhibit 10.2 of the Company’s Form 8-K filed October 29, 2012.
|
|
3.1
|
Restated Articles of Incorporation of Royale Energy, Inc., incorporated by reference to Exhibit 3.1 of Royale Energy’s Form 10-Q filed August 14, 2009.
|
|
3.2
|
Amended and Restated Bylaws of Royale Energy, Inc., incorporated by reference to Exhibit 3.2 of Royale Energy’s Form 10-K filed March 27, 2009.
|
|
4.1
|
Series A-1 Warrant issued to Cranshire Capital, L.P., incorporated by reference to Exhibit 4.2 of the Company’s Form 8-K filed August 6, 2009.
|
|
4.2
|
Series C Warrant issued to Cranshire Capital, L.P., incorporated by reference to Exhibit 4.4 of the Company’s Form 8-K filed August 6, 2009.
|
|
4.3
|
Series D Warrant issued to Cranshire Capital, L.P., incorporated by reference to Exhibit 4.1 of the Company’s Form 8-K filed October 21, 2009.
|
|
4.4
|
Series E Warrant issued to certain affiliates of Cranshire Capital, L.P., incorporated by reference to Exhibit 4.2 of the Company’s Form 8-K filed October 29, 2012.
|
|
4.5
|
Certificate of Determination of the Series AA Convertible Preferred Stock, incorporated by reference to Exhibit 4.2 of Royale Energy's Form 10-SB Registration Statement.
|
|
10.1
|
Form of Indemnification Agreement, incorporated by reference to Exhibit 10.3 of Royale Energy's Form 10-SB Registration Statement.
|
|
10.2
|
Amended and Restated Credit Agreement between Royale Energy and Texas Capital Bank, N.A. (February 13, 2009), incorporated by reference to Exhibit 310.2 of Royale Energy’s Form 10-K filed March 27, 2009.
|
|
10.3
|
Form of Promissory Note between Royale Energy and Texas Capital Bank, N.A., incorporated by reference to Exhibit 10.3 of Royale Energy’s Form 10-K filed March 27, 2009.
|
|
10.4
|
Securities Purchase Agreement between the Company and Cranshire Capital, L.P., dated as of August 4, 2009, incorporated by reference to Exhibit 10.1 of the Company’s Form 8-K filed August 6, 2009.
|
|
10.5
|
Registration Rights Agreement between the Company and Cranshire Capital, L.P., dated as of August 5, 2009, incorporated by reference to Exhibit 10.2 of the Company’s Form 8-K filed August 6, 2009.
|
|
10.6
|
Securities Purchase Agreement between the Company and Cranshire Capital, L.P., dated as of October 16, 2009, incorporated by reference to Exhibit 10.1 of the Company’s Form 8-K filed October 21, 2009.
|
|
10.7
|
Registration Rights Agreement between the Company and Cranshire Capital, L.P., dated as of October 16, 2009, incorporated by reference to Exhibit 10.2 of the Company’s Form 8-K filed October 21, 2009.
|
|
10.8
|
Sales Agreement between the Company and C.K. Cooper & Company, Inc., dated February 17, 2012, incorporated by reference to Exhibit 10.1 of the Company’s Form 8-K filed February 17, 2012.
|
|
10.9
|
Securities Purchase Agreement between the Company and certain buyers dated as of October 28, 2012, incorporated by reference to Exhibit 4.3 of the Company’s Form 8-K filed October 29, 2012.
|
|
10.10
|
Convertible Note issued to certain affiliates of Cranshire Capital, L.P., incorporated by reference to Exhibit 4.1 of the Company’s Form 8-K filed October 29, 2012.
|
|
23.1
|
|
|
23.2
|
|
|
23.3
|
|
|
31.1
|
|
|
31.2
|
|
|
32.1
|
|
|
32.2
|
|
|
99.1
|
|
|
99.2
|
|
|
99.3
|
Waiver Letter from Cranshire Capital, L.P. to the Company dated October 28, 2012, incorporated by reference to Exhibit 99.1 of the Company’s Form 8-K filed October 29, 2012.
|
|
101.INS*
|
XBRL Instance Document
|
|
101.SCH*
|
XBRL Taxonomy Extension Schema
|
|
101.CAL*
|
XBRL Taxonomy Extension Calculation Linkbase
|
|
101.DEF*
|
XBRL Taxonomy Extension Definition Linkbase
|
|
101.LAB*
|
XBRL Taxonomy Extension Label Linkbase
|
|
101.PRE*
|
XBRL Taxonomy Extension Presentation Linkbase
|
* Pursuant to Rule 406T of Regulation S-T, these interactive data files are deemed not filed or part of a registration statement or prospectus for purposes of Sections 11 or 12 of the Securities Act of 1933 or Section 18 of the Securities Exchange Act of 1934 and otherwise are not subject to liability.
Pursuant to the requirements of Section 13 or 15(d) of the Securities Exchange Act of 1934, the registrant has duly caused this report to be signed on its behalf by the undersigned, thereunto duly authorized.
|
Royale Energy, Inc.
|
||
|
Date:
|
April 15, 2013
|
/s/ Donald H.. Hosmer
|
|
Donald H.. Hosmer
|
||
|
Co-President and Co-Chief Executive Officer
|
Pursuant to the requirements of the Securities Exchange Act of 1934, this report has been signed by the following persons on behalf of the registrant and in the capacities and on the dates indicated.
|
Date:
|
April 15, 2013
|
/s/ Harry E. Hosmer
|
|
Harry E. Hosmer
|
||
|
Chairman of the Board of Directors
|
||
|
Date:
|
April 15, 2013
|
/s/ Donald H. Hosmer
|
|
Donald H. Hosmer
|
||
|
Director, Co-President, Co-Chief Executive Officer
|
||
|
Date:
|
April 15, 2013
|
/s/ Stephen M. Hosmer
|
|
Stephen M. Hosmer
|
||
|
Director, Co-President, Co-Chief Executive Officer, Chief Financial Officer and Secretary
|
||
|
Date:
|
April 15, 2013
|
/s/ Tony Hall
|
|
Tony Hall
|
||
|
Director
|
||
|
Date:
|
April 15, 2013
|
/s/ Oscar A. Hildebrandt
|
|
Oscar A. Hildebrandt
|
||
|
Director
|
||
|
Date:
|
April 15, 2013
|
/s/ Gary Grinsfelder
|
|
Gary Grinsfelder
|
||
|
Director
|
||
|
Date:
|
April 15, 2013
|
/s/ George M. Watters
|
|
George M. Watters
|
||
|
Director
|
ROYALE ENERGY, INC.
INDEX TO FINANCIAL STATEMENTS
AND SUPPLEMENTARY DATA
TABLE OF CONTENTS
|
F-2
|
|
|
F-3
|
|
|
F-5
|
|
|
F-6
|
|
|
F-7
|
|
|
F-8
|
Report of Independent Registered Public Accounting Firm
To the Board of Directors and Stockholders
of Royale Energy, Inc.
We have audited the accompanying balance sheets of Royale Energy, Inc. (the “Company”) as of December 31, 2012 and 2011, and the related statements of comprehensive loss, stockholders' equity, and cash flows for the years then ended. These financial statements are the responsibility of the Company's management. Our responsibility is to express an opinion on these financial statements based on our audits.
We conducted our audits in accordance with the standards of the Public Company Accounting Oversight Board (United States). Those standards require that we plan and perform the audit to obtain reasonable assurance about whether the financial statements are free of material misstatement. The Company is not required to have, nor were we engaged to perform an audit of its internal control over financial reporting. Our audits included consideration of internal control over financial reporting as a basis for designing audit procedures that are appropriate in the circumstances, but not for the purpose of expressing an opinion on the effectiveness of the Company’s internal control over financial reporting. Accordingly, we express no such opinion. An audit also includes examining, on a test basis, evidence supporting the amounts and disclosures in the financial statements, assessing the accounting principles used and significant estimates made by management, as well as evaluating the overall financial statement presentation. We believe that our audits provide a reasonable basis for our opinion.
In our opinion, the financial statements referred to above present fairly, in all material respects, the financial position of Royale Energy, Inc. as of December 31, 2012 and 2011, and the results of its operations and its cash flows for the yearsthen ended in conformity with accounting principles generally accepted in the United States of America.
As disclosed in Note 19 to the financial statements, the 2011 financial statements have been restated to reflect the correction of an error related to revenue recognition.
Padgett, Stratemann & Co., L.L.P.
San Antonio, Texas
April 15, 2013
ROYALE ENERGY, INC
BALANCE SHEETS
DECEMBER 31, 2012 AND 2011
ASSETS
|
2012
|
2011-Restated
|
|||||||
|
Current Assets
|
||||||||
|
Cash and Cash Equivalents
|
$
|
1,489,930
|
$
|
2,946,131
|
||||
|
Accounts Receivable, net
|
3,969,160
|
1,872,067
|
||||||
|
Prepaid Expenses
|
469,038
|
432,168
|
||||||
|
Deferred Tax Asset
|
0
|
661,645
|
||||||
|
Available for Sale Securities
|
0
|
31,027
|
||||||
|
Inventory
|
612,464
|
664,458
|
||||||
|
Total Current Assets
|
6,540,592
|
6,607,496
|
||||||
|
Other Assets
|
6,946
|
6,946
|
||||||
|
Deferred Tax Asset - Noncurrent
|
0
|
6,771,474
|
||||||
|
Oil And Gas Properties (Successful Efforts Basis) and
Equipment and Fixtures |
10,955,797
|
8,075,344
|
||||||
|
Total Assets
|
$
|
17,503,335
|
$
|
21,461,260
|
||||
The accompanying notes are an integral part of these financial statements.
ROYALE ENERGY, INC.
BALANCE SHEETS
DECEMBER 31, 2012 AND 2011
LIABILITIES AND STOCKHOLDERS' EQUITY
|
2012
|
2011-Restated
|
|||||||
|
Current Liabilities:
|
||||||||
|
Accounts Payable and Accrued Expenses
|
$
|
4,932,468
|
$
|
4,542,741
|
||||
|
Current Portion of Long-Term Debt, Net
|
2,258,668
|
0
|
||||||
|
Current Portion of Deferred Tax Liability
|
1,775
|
1,240
|
||||||
|
Deferred Revenue from Turnkey Drilling
|
8,693,743
|
6,909,666
|
||||||
|
Total Current Liabilities
|
15,886,654
|
11,453,647
|
||||||
|
Noncurrent Liabilities:
|
||||||||
|
Asset Retirement Obligation
|
954,088
|
575,612
|
||||||
|
Long-Term Debt
|
0
|
2,750,000
|
||||||
|
Total Noncurrent Liabilities
|
954,088
|
3,325,612
|
||||||
|
Total Liabilities
|
16,840,742
|
14,779,259
|
||||||
|
Stockholders' Equity
|
||||||||
|
Common Stock, No Par Value, 20,000,000 Shares Authorized; 12,545,465 and 10,823,050 Shares Issued, 12,545,465 and 10,790,431 Shares Outstanding, Respectively
|
33,247,571
|
28,298,228
|
||||||
|
Convertible Preferred Stock, Series AA, No Par Value, 147,500 Shares Authorized; 52,784 Shares Issued and Outstanding, Respectively
|
154,014
|
154,014
|
||||||
|
Accumulated (Deficit)
|
(34,186,930
|
)
|
(22,225,904
|
)
|
||||
|
Paid in Capital
|
1,447,938
|
632,004
|
||||||
|
Accumulated Other Comprehensive Income
|
0
|
3,035
|
||||||
|
Total Paid in Capital and Accumulated Deficit
|
662,593
|
6,861,377
|
||||||
|
Less Cost of Treasury Stock, 0 and 32,619 Shares, respectively
|
0
|
(179,376
|
)
|
|||||
|
Total Stockholders' Equity
|
662,593
|
6,682,001
|
||||||
|
Total Liabilities and Stockholders' Equity
|
$
|
17,503,335
|
$
|
21,461,260
|
||||
The accompanying notes are an integral part of these financial statements.
ROYALE ENERGY, INC.
STATEMENTS OF COMPREHENSIVE LOSS
FOR THE YEARS ENDED DECEMBER 31, 2012, AND 2011
|
2012
|
2011-Restated
|
|||||||
|
Revenues:
|
||||||||
|
Sale of Oil and Gas
|
$
|
1,673,538
|
$
|
4,879,397
|
||||
|
Turnkey Drilling
|
2,028,863
|
5,794,427
|
||||||
|
Supervisory Fees and Other
|
692,344
|
858,586
|
||||||
|
Total Revenues
|
$
|
4,394,745
|
$
|
11,532,410
|
||||
|
Costs and Expenses:
|
||||||||
|
General and Administrative
|
3,640,336
|
4,039,209
|
||||||
|
Turnkey Drilling & Development
|
449,536
|
3,523,372
|
||||||
|
Lease Operating
|
1,139,750
|
1,517,920
|
||||||
|
Lease Impairment
|
200,778
|
4,529,058
|
||||||
|
Geological and Geophysical
|
423,459
|
111,390
|
||||||
|
Inventory Write Down
|
62,744
|
258,043
|
||||||
|
Bad Debt Expense
|
263,767
|
86,294
|
||||||
|
Legal and Accounting
|
518,511
|
933,856
|
||||||
|
Marketing
|
594,118
|
713,495
|
||||||
|
Depreciation, Depletion and Amortization
|
1,448,002
|
2,362,065
|
||||||
|
Total Costs and Expenses
|
$
|
8,741,001
|
$
|
18,074,702
|
||||
|
Gain on Sale of Assets
|
8,100
|
759,763
|
||||||
|
Loss from Operations
|
(4,338,156
|
)
|
(5,782,529
|
)
|
||||
|
Other Income (Expense):
|
||||||||
|
Interest Expense
|
(195,009
|
)
|
(138,218
|
)
|
||||
|
Gain on sale of Marketable Securities
|
7,048
|
0
|
||||||
|
Income (Loss) Before Income Tax Expense
|
(4,526,117
|
)
|
(5,920,747
|
)
|
||||
|
Income Tax Expense (Benefit)
|
7,434,909
|
(1,732,506
|
)
|
|||||
|
Net Loss
|
$
|
(11,961,026
|
)
|
$
|
(4,188,241
|
)
|
||
|
Basic Earnings Per Share:
|
||||||||
|
Net Loss Available To Common Stock
|
$
|
(1.07
|
)
|
$
|
(0.39
|
)
|
||
|
Diluted Loss Per Share
|
$
|
(1.07
|
)
|
$
|
(0.39
|
)
|
||
|
Other Comprehensive Income
|
||||||||
|
Unrealized Gain on Equity Securities
|
$
|
0
|
$
|
4,275
|
||||
|
Less: Reclassification Adjustment for Gains Included in Net Income
|
(3,035)
|
0
|
||||||
|
Other Comprehensive Income , before tax
|
(3,035)
|
4,275
|
||||||
|
Income Tax Expense Related to Items of Other Comprehensive Income
|
0
|
1,240
|
||||||
|
Other Comprehensive Income (Loss), net of tax
|
(3,035)
|
3,035
|
||||||
|
Comprehensive Loss
|
$
|
(11,964,061
|
)
|
$
|
(4,185,206
|
)
|
||
The accompanying notes are an integral part of these financial statements.
ROYALE ENERGY, INC.
STATEMENTS OF STOCKHOLDERS' EQUITY
FOR THE YEARS ENDED DECEMBER 31, 2012, and 2011
|
Common Stock
|
Preferred Stock Series AA
|
Treasury Stock
|
||||||||||||||||||||||||||||||||||||||
|
Shares Issued
|
Amount
|
Shares Outstanding
|
Amount
|
Shares Acquired
|
Amount
|
Paid in Capital
|
Accumulated Deficit
|
Accumulated Other Comprehensive Income (Loss)
|
Total
|
|||||||||||||||||||||||||||||||
|
Balance, December 31, 2010, as previously reported
|
10,307,350 | $ | 27,246,740 | 52,784 | $ | 154,014 | 32,619 | $ | (179,376 | ) | $ | 524,406 | $ | (16,807,424 | ) | $ | 0 | $ | 10,938,360 | |||||||||||||||||||||
|
Prior period adjustment
|
(1,230,239 | ) | (1,230,239 | ) | ||||||||||||||||||||||||||||||||||||
|
Balance, December 31, 2010, as restated
|
10,307,350 | 27,246,740 | 52,784 | 154,014 | 32,619 | (179,376 | ) | 524,406 | (18,037,663 | ) | 0 | 9,708,121 | ||||||||||||||||||||||||||||
|
Common Stock Warrant Exercise
|
468,928 | $ | 1,051,488 | - | - | - | - | - | - | - | 1,051,488 | |||||||||||||||||||||||||||||
|
Directors’ Stock Option Grant
|
18,440 | - | - | - | - | - | 40,015 | - | - | 40,015 | ||||||||||||||||||||||||||||||
|
Directors’ Stock Grant
|
28,332 | - | - | - | - | - | 67,583 | - | - | 67,583 | ||||||||||||||||||||||||||||||
|
Available for Sale Securities – Unrealized Gain (Loss), net of tax
|
- | - | - | - | - | - | - | - | 3,035 | 3,035 | ||||||||||||||||||||||||||||||
|
Net Loss (Restated)
|
(4,188,241 | ) | (4,188,241 | ) | ||||||||||||||||||||||||||||||||||||
|
Balance, December 31, 2011-Restated
|
10,823,050 | $ | 28,298,228 | 52,784 | $ | 154,014 | 32,619 | $ | (179,376 | ) | $ | 632,004 | $ | (22,225,904 | ) | $ | 3,035 | $ | 6,682,001 | |||||||||||||||||||||
|
Common Stock Options Exercise
|
165,038 | $ | 299,500 | - | - | - | - | - | - | - | 299,500 | |||||||||||||||||||||||||||||
|
Directors’ Stock Options Grant
|
- | - | - | - | - | - | 39,260 | - | - | 39,260 | ||||||||||||||||||||||||||||||
|
Common Stock Private Placement Sale
|
1,562,352 | $ | 4,649,843 | - | - | (26,644 | ) | $ | 146,515 | (174,451 | ) | - | - | 4,621,907 | ||||||||||||||||||||||||||
|
Treasury Stock Retirement
|
(4,975 | ) | - | - | - | (4,975 | ) | $ | 27,361 | (173,876 | ) | - | - | (146,515 | ) | |||||||||||||||||||||||||
|
Discount on Warrant Value
|
- | - | - | - | - | - | 1,127,111 | - | - | 1,127,111 | ||||||||||||||||||||||||||||||
|
Treausry Stock Donation
|
- | - | - | - | (1,000 | ) | $ | 5,500 | (2,110 | ) | - | - | 3,390 | |||||||||||||||||||||||||||
|
Available for Sale Securities – Realized Gain, net of tax
|
- | - | - | - | - | - | - | - | (3,035 | ) | (3,035 | ) | ||||||||||||||||||||||||||||
|
Net Loss
|
- | - | - | - | (11,961,026 | ) | (11,961,026 | ) | ||||||||||||||||||||||||||||||||
|
Balance, December 31, 2012
|
12,545,465 | $ | 33,247,571 | 52,784 | $ | 154,014 | 0 | $ | 0 | $ | 1,447,938 | $ | (34,186,930 | ) | $ | 0 | $ | 662,593 | ||||||||||||||||||||||
The accompanying notes are an integral part of these financial statements.
ROYALE ENERGY, INC.
STATEMENTS OF CASH FLOWS
FOR THE YEARS ENDED DECEMBER 31, 2012, and 2011
|
2012
|
2011-Restated
|
|||||||
|
CASH FLOWS FROM OPERATING ACTIVITIES:
|
||||||||
|
Net Loss
|
$
|
(11,961,026
|
)
|
$
|
(4,188,241
|
)
|
||
|
Adjustments to Reconcile Net Loss to Net Cash Provided by Operating Activities:
|
||||||||
|
Depreciation, Depletion, and Amortization
|
1,448,002
|
2,362,065
|
||||||
|
Lease Impairment
|
200,778
|
4,529,058
|
||||||
|
(Gain) Loss on Sale of Assets
|
(8,100
|
)
|
(759,763
|
)
|
||||
|
Realized (Gain) Loss on Equity Securities
|
(7,048
|
)
|
0
|
|||||
|
Bad Debt Expense
|
263,767
|
86,294
|
||||||
|
Stock-Based Compensation
|
39,260
|
107,598
|
||||||
|
Debt Discount Amortization,
|
100,779
|
0
|
||||||
|
Inventory Write Down
|
62,744
|
258,043
|
||||||
|
Treasury Stock Donation
|
3,390
|
0
|
||||||
|
(Increase) Decrease in:
|
||||||||
|
Deferred Income Taxes
|
7,433,654
|
(1,735,594)
|
||||||
|
Accounts Receivable
|
145,333
|
492,686
|
||||||
|
Prepaid Expenses and Other Assets
|
(47,620
|
) |
82,202
|
|||||
|
Increase (Decrease) in:
|
||||||||
|
Accounts Payable and Accrued Expenses
|
768,203
|
(724,133
|
)
|
|||||
|
Deferred Revenues - DWI
|
1,784,077
|
1,152,170
|
||||||
|
Net Cash Provided by Operating Activities
|
226,193
|
1,662,385
|
||||||
|
CASH FLOWS FROM INVESTING ACTIVITIES:
|
||||||||
|
Expenditures For Oil And Gas Properties and
Other Capital Expenditures
|
(4,536,358
|
) |
(4,754,817
|
)
|
||||
|
Proceeds from Sale of Assets
|
14,690
|
806,353
|
||||||
|
Sale of Equity Securities
|
35,575
|
0
|
||||||
|
Net Cash Used in Investing Activities
|
(4,486,093
|
) |
(3,948,464
|
)
|
||||
|
CASH FLOWS FROM FINANCING ACTIVITIES:
|
||||||||
|
Proceeds from Long-Term Debt
|
2,784,689
|
700,000
|
||||||
|
Principal Payments on Long-Term Debt
|
(2,400,000
|
)
|
(1,150,000
|
)
|
||||
|
Proceeds from Stock Options and Warrant Exercises
|
299,500
|
1,051,488
|
||||||
|
Proceeds from Sale of Common Stock
|
2,119,510
|
0
|
||||||
|
Net Cash Provided by Financing Activities
|
2,803,699
|
601,488
|
||||||
|
Net Decrease in Cash and Cash Equivalents
|
(1,456,201
|
)
|
(1,684,591)
|
|
||||
|
Cash & Cash Equivalents at Beginning of Year
|
2,946,131
|
4,630,722
|
||||||
|
Cash & Cash Equivalents at End of Year
|
$
|
1,489,930
|
$
|
2,946,131
|
||||
|
Cash Paid for Interest
|
$
|
94,229
|
138,793
|
|||||
|
Cash Paid for Taxes
|
$
|
800
|
3,180
|
|||||
|
Receivable from sale of common stock
|
$
|
2,506,023
|
0
|
|||||
|
Unrealized Gain on Available-for-Sale Securities, net of tax effect
|
$
|
0
|
$
|
3,035
|
||||
The accompanying notes are an integral part of these financial statements.
ROYALE ENERGY, INC.
NOTES TO FINANCIAL STATEMENTS
NOTE 1 - SUMMARY OF SIGNIFICANT ACCOUNTING POLICIES
This summary of significant accounting policies of Royale Energy, Inc. (“Royale Energy” or the “Company”) is presented to assist in understanding Royale Energy's financial statements. The financial statements and notes are representations of Royale Energy's management, which is responsible for their integrity and objectivity. These accounting policies conform to accounting principles generally accepted in the United States of America and have been consistently applied in the preparation of the financial statements.
Description of Business
Royale Energy is an independent oil and gas producer which also has operations in the area of turnkey drilling. Royale Energy owns wells and leases in major geological basins located primarily in California, Texas, and Utah. Royale Energy offers fractional working interests and seeks to minimize the risks of oil and gas drilling by selling multiple well drilling projects which do not include the use of debt financing.
Use of Estimates
The preparation of financial statements in conformity with accounting principles generally accepted in the United States of America requires management to make estimates and assumptions that affect the reported amounts of assets and liabilities and disclosure of contingent assets and liabilities at the date of the financial statements and the reported amounts of revenues and expenses during the reporting period. Actual results could differ from those estimates.
Material estimates that are particularly susceptible to significant change relate to the estimate of Company oil and gas reserves prepared by an independent engineering consultant. Such estimates are subject to numerous uncertainties inherent in the estimation of quantities of proven reserves. Estimated reserves are used in the calculation of depletion, depreciation and amortization, unevaluated property costs, impairment of oil and natural gas properties, estimated future net cash flows, taxes, and contingencies.
Joint Ventures
The accompanying financial statements as of December 31, 2012 and 2011 include the accounts of Royale Energy and its proportionate share of the assets, liabilities and results of operations as described in FASB ASC 932-323. Royale Energy generally retains an ownership interest of approximately 50% in wells it drills with its joint venture projects. Royale Energy is the operator of the majority of properties in which it has an ownership interest. In connection with the drilling and operation of wells, the Company receives industry standard COPAS fees, which are recorded as supervisory fee income.
Revenue Recognition
Royale Energy recognizes revenues from the sales of oil and natural gas upon transfer of title, net of royalties, in the period of delivery. Settlements for oil and natural gas sales can occur up to two months after the end of the month in which the oil and natural gas were produced. We estimate and accrue for the value of these sales using information available to us at the time our financial statements are generated.
Royale Energy recognizes revenues from the sale of natural gas in which the Company has an interest with other producers using the entitlements method of accounting. Under this method we recognize revenue based on our entitled ownership percentage of sales of natural gas delivered to purchasers. Gas imbalances occur when we sell more or less than our entitled ownership percentage of total natural gas production. When we receive more than our entitled share, a liability is recorded. Gas imbalances on our production at December 31, 2012 and 2011 were not significant.
Upon the sale or retirement of a complete field of a proved property, the Company eliminates the cost from its books, and the resultant gain or loss is recorded to Royale Energy’s Statement of Operations. Upon the sale of an entire interest in an unproved property where the property has been assessed for impairment individually, a gain or loss is recognized in Royale Energy’s Statement of Operations. If a partial interest in an unproved property is sold, any funds received are accounted for as a reduction of the cost in the interest retained.
Royale Energy enters into turnkey drilling agreements with investors to develop leasehold acreage it has acquired. In these arrangements, Royale Energy acquires a working interest in a prospect pursuant to an oil and gas lease, and then sells a portion of a well’s working interest on the acquired lease to investors with a turnkey drilling agreement. Title to the lease property is not conveyed to the investor. The investor purchases a working interest directly in the well bore. The working interest purchased in the turnkey drilling agreements is an ownership interest in which the working interest holder is responsible to bear the cost of drilling, testing completing, equipping and operating the well. Royale Energy typically retains 50% of the working interest and acts as operator of the projects in which it sells working interests to investors.
In a turnkey drilling agreement, Royale Energy agrees to sell a percentage of the well’s working interest to investors and to pay for all costs of identifying, acquiring mineral rights to, drilling, testing, completing and equipping the well for initial production at a fixed price. If the actual costs of these activities exceed the turnkey price Royale charged to the investors, Royale is responsible to pay the excess cost. If the actual costs are less than the turnkey price, Royale retains the excess of the turnkey price over actual costs. Royale bears 100% of the risk should actual costs exceed estimated costs of a project for both Royale’s working interest and the working interest sold to investors in a well. When the well is completed as a commercially productive well, Royale Energy and the investors bear the cost of operating the well according to each party’s proportionate working interest percentage.
When Royale Energy sponsors a turnkey drilling project for sale, investors enter into a signed contract with Royale Energy. In this agreement, the investor agrees to share in the pre-drilling costs, which are non-refundable, and drilling costs. Pre-drilling costs include geophysical & geographical costs, selling costs, spoilage costs, third party broker commission fees, and other costs as required so the drilling of the project can proceed. Drilling costs are those costs to lease the mineral rights, build the drilling location, drill, and log the well, and if the wells is successful, to complete and test the well. The investment is held and reported by Royale Energy as deferred revenue from turnkey drilling. Once drilling begins, it is generally completed within 10-30 days.
Royale Energy bases the price at which it sells working interests under the turnkey drilling agreement on its estimates of the costs, described above, and is based upon the historical cost to complete those activities. Revenues covering the pre-drilling and drilling costs are recognized in the period in which a well is drilled and logged.
Since the investor’s interest in the prospect is limited to the well, and not the lease, the investor does not have a legal right to participate in additional wells drilled within the same lease. However, it is the Company’s policy to offer to investors in a successful well the right to participate in subsequent wells at the same percentage level as their working interest investment in the prior successful well with similar turnkey drilling agreement terms.
If Royale Energy is unable to drill the wells, and a suitable replacement well is not found, Royale would retain the non-refundable portion of the contact and return the remaining funds to the investors. Included in cash and cash equivalents are amounts for use in completion of turnkey drilling programs in progress.
Oil and Gas Property and Equipment (Successful Efforts)
Royale Energy accounts for its oil and gas exploration and development costs using the successful efforts method. Leasehold acquisition costs are capitalized. If proved reserves are found on an undeveloped property, leasehold cost is transferred to proved properties. Significant undeveloped leases are reviewed periodically and a valuation allowance is provided for any estimated decline in value. Cost of other undeveloped leases is expensed over the estimated average life of the leases. Cost of exploratory drilling is initially capitalized. In the absence of a determination that proved reserves are found, the costs of drilling such exploratory wells are charged to expense. Royale Energy makes this determination within one year following the completion of drilling. Other exploratory costs are charged to expense as incurred. Development costs, including unsuccessful development wells, are capitalized. Depletion, depreciation and amortization of oil and gas producing properties are computed on an aggregate basis using the units-of-production method.
As required by the Extractive Activities Topic of the Financial Accounting Standards Board (FASB), long-lived assets are reviewed for impairment whenever events or changes in circumstances indicate that the carrying amount of an asset may not be recoverable. It establishes guidelines for determining recoverability based on future net cash flows from the use of the asset and for the measurement of the impairment loss. Impairment loss under the Topic is calculated as the difference between the carrying amount of the asset and its fair value. Any impairment loss is recorded in the current period in which the recognition criteria are first applied and met. Under the successful efforts method of accounting for oil and gas operations, Royale Energy periodically assessed its proved properties for impairments by comparing the aggregate net book carrying amount of all proved properties with their aggregate future net cash flows. The statement requires that the impairment review be performed on the lowest level of asset groupings for which there are identifiable cash flows.
Royale Energy performs a periodic review for impairment of proved properties on a field-by-field basis. Unamortized capital costs are measured on a field basis and are reduced to fair value if it is determined that the sum of expected future net cash flows are less than the net book value. Royale Energy determines if impairment has occurred through either adverse changes or as a result of its periodic review for impairment. Impairment is measured on a 10% discounted cash flows basis. Impairment losses of $200,778, and $4,529,058, were recorded in 2012 and 2011, respectively.
Upon the sale of oil and gas reserves in place, costs and accumulated amortization of such property are removed from the accounts and resulting gain or loss on sale is reflected in operations. Impairment of unproved properties is assessed periodically on a property-by-property basis, and any impairment in value is currently charged to expense. In addition, capitalized costs of unproved properties are assessed periodically to determine whether their value has been impaired below the capitalized costs. Loss is recognized to the extent that such impairment is indicated. In making these assessments, factors such as exploratory drilling results, future drilling plans, and lease expiration terms are considered. When an entire interest in an unproved property is sold, gain or loss is recognized, taking into consideration any recorded impairment. When a partial interest in an unproved property is sold, funds received are accounted for as a reduction of the costs in the interest retained. Upon abandonment of properties, the reserves are deemed fully depleted and any unamortized costs are recorded in the statement of operations under impairment expense.
During 2012, impairment losses of $200,778 were recorded in wells or fields where year-end reserve values were less than the net book values of wells or where lease and land costs were no longer viable. In 2012, one Utah well and two California wells were impaired by $ 11,276 and $ 60,789, respectively. These impairments were due to lower proved developed reserves than current book values due to the natural declines of the wells. Also in 2012, we recorded lease impairments of $119,322 on various capitalized lease and land costs that were no longer viable.
In 2011, Royale Energy recorded an impairment of $4,516,098 in fields where year-end reserve values no longer supported net book values of the related wells in those fields. Royale had impairments in its Lone Star and Bowerbank fields in the amounts of $3,776,385, and $28,566, respectively. The impairments were the result of natural declines and lower natural gas prices. Additionally, an impairment of $710,124 was recognized for our Moon Ridge field in Utah, where recently reduced gas prices and a reevaluation of the reservoir significantly lowered proved reserves than originally estimated. Moreover, 2011 impairments also include impairments of nonviable geological lease and land costs of $12,959.
Cash and Cash Equivalents
Cash and cash equivalents include cash on hand and on deposit, and highly liquid debt instruments with maturities of three months or less.
Inventory
Inventory consists of well supplies, pipeline and spare parts and is carried at lower of cost or market. During 2012, we had a write down of $62,744 on certain oil and gas inventory and in 2011 we had a write down of $258,043 on certain oil and gas pipeline inventory to its estimated current market value.
Accounts Receivable
The Company provides for uncollectible accounts receivable using the allowance method of accounting for bad debts. Under this method of accounting, a provision for uncollectible accounts is charged to earnings. The allowance account is increased or decreased based on past collection history and management’s evaluation of accounts receivable. All amounts considered uncollectible are charged against the allowance account and recoveries of previously charged off accounts are added to the allowance. At December 31, 2012 and 2011, net accounts receivable was $3,969,160 and $1,872,067 respectively. Approximately $2,500,000 of the receivable reported for the year ended 2012 related to the sale of Royale’s common stock. The receivable was collected on January 4, 2013. At December 31, 2012 and 2011, the Company established an allowance for uncollectable accounts of $934,876 and $671,109, respectively for receivables from direct working interest investors whose expenses on non-producing wells were unlikely to be collected from revenue.
Equipment and Fixtures
Equipment and fixtures are stated at cost and depreciated over the estimated useful lives of the assets, which range from three to seven years, using the straight-line method. Repairs and maintenance are charged to expense as incurred. When assets are sold or retired, the cost and related accumulated depreciation are removed from the accounts and any resulting gain or loss is included in income. Maintenance and repairs, which neither materially add to the value of the property nor appreciably prolong its life, are charged to expense as incurred. Gains or losses on dispositions of property and equipment, other than oil and gas, are reflected in operations.
Loss Per Share
Basic and diluted losses per share are calculated as follows:
|
For the Year Ended December 31, 2012
|
||||||||||||
|
Income
(Numerator)
|
Shares
(Denominator)
|
Per-Share
Amount
|
||||||||||
|
Basic Loss Per Share:
|
||||||||||||
|
Net loss available to common stock
|
$
|
(11,961,026
|
)
|
11,133,377
|
$
|
(1.07
|
)
|
|||||
|
Cumulative effect of accounting change
|
-
|
-
|
-
|
|||||||||
|
Diluted Loss Per Share:
|
||||||||||||
|
Effect of dilutive securities and stock options
|
||||||||||||
|
Net loss available to common stock
|
$
|
(11,961,026
|
)
|
11,133,377
|
$
|
(1.07
|
)
|
|||||
|
For the Year Ended December 31, 2011
|
||||||||||||
|
Income
(Numerator)
|
Shares
(Denominator)
|
Per-Share
Amount
|
||||||||||
|
Basic Loss Per Share:
|
||||||||||||
|
Net loss available to common stock
|
$
|
(4,188,241
|
)
|
10,655,258
|
$
|
(0.39
|
)
|
|||||
|
Cumulative effect of accounting change
|
-
|
-
|
-
|
|||||||||
|
Diluted Loss Per Share:
|
||||||||||||
|
Effect of dilutive securities and stock options
|
-
|
-
|
- |
|
||||||||
|
Net loss available to common stock
|
$
|
(4,188,241
|
)
|
10,655,258
|
$
|
(0.39
|
)
|
|||||
For the years ended December 31, 2012 and 2011, Royale Energy had dilutive securities of 1,104,314 and 842,859 respectively. These securities were not included in the dilutive earnings per share due to their anti-dilutive nature.
Stock Based Compensation
Royale Energy has a stock-based employee compensation plan, which is more fully described in Note 13. Effective January 1, 2006, the Company adopted the Compensation – Stock Compensation Topic of the FASB Accounting Standards Codification, which addresses the accounting for stock-based payment transactions in which an enterprise receives employee services in exchange for (a) equity instruments of the enterprise or (b) liabilities that are based on the fair value of the enterprise’s equity instruments or that may be settled by the issuance of such equity instruments. The Company uses the Black-Scholes option-pricing model to determine the fair value of stock-based awards, consistent with that used for pro forma disclosures under the Topic..
During the year ended December 31, 2008, the Board of Directors authorized approximately 550,000 shares to be issued for equity awards through a stock grant plan adopted in November 2008 and stock option grant plan adopted in March 2008.
Income Taxes
Royale utilizes the asset and liability approach to measure deferred tax assets and liabilities based on temporary differences existing at each balance sheet date using currently enacted tax rates in accordance with the Income Taxes Topic of the FASB Accounting Standards Codification. Deferred tax assets and liabilities are adjusted for the effects of changes in tax laws and rates on the date of enactment. Under the Topic, deferred tax assets are reduced by a valuation allowance when, in the opinion of management, it is more likely than not that some portion or all of the deferred tax assets will not be realized.
The provision for income taxes is based on pretax financial accounting income. Deferred tax assets and liabilities are recognized for the expected tax consequences of temporary differences between the tax basis of assets and liabilities and their reported net amounts.
Fair Values of Financial Instruments
Disclosure of the estimated fair value of financial instruments is required under the Fair Value Measurements and Disclosures Topic of the FASB Accounting Standards Codification. The fair value estimates are made at discrete points in time based on relevant market information and information about the financial instruments. These estimates may be subjective in nature and involve uncertainties and significant judgment and therefore cannot be determined with precision.
Royale Energy includes fair value in the notes to financial statements when the fair value of its financial instruments is different from the book value. Royale Energy assumes that the book value of financial instruments that are classified as current approximate fair value because of the short maturity of these instruments. For noncurrent financial instruments, Royale Energy uses quoted market prices or, to the extent that there are no available quoted market prices, market prices for similar instruments.
Fair Value Measurements
According to Fair Value Measurements and Disclosures Topic of the FASB Accounting Standards Codification, assets and liabilities that are measured at fair value on a recurring and nonrecurring basis in period subsequent to initial recognition, the reporting entity shall disclose information that enable users of its financial statements to assess the inputs used to develop those measurements and for recurring fair value measurements using significant unobservable inputs, the effect of the measurements on earnings for the period.
At December 31, 2011, Royale Energy reported the fair value of $31,027 in available for sale securities. The fair value was determined using the number of shares owned as of December 31, 2011, multiplied by the market price of those securities on December 31, 2011. These securities were sold during the fourth quarter in 2012.
The table below summarizes Royale’s fair value measurements and the level within the fair value hierarchy in which the fair value measurements fall. At December 31, 2011, Royale Energy quoted prices in active markets for identical assets when determining the fair value measurements at the reporting date.
|
Description
|
12/31/2012
|
Level 1
|
12/31/2011
|
Level 1
|
||||||||||||
|
Available for Sale Securities
|
$
|
0
|
$
|
0
|
$
|
31,027
|
$
|
31,027
|
||||||||
Treasury Stock
The Company records acquisition of its capital stock for treasury at cost. Differences between proceeds for reissuance of treasury stock and average cost are charged to retained earnings or credited thereto to the extent of prior charges and thereafter to capital in excess of par value.
Recently Issued Accounting Pronouncements
The Company has reviewed the updates issued by the Financial Accounting Standards Board (FASB) during the year ended December 31, 2012, and have determined that the updates are not applicable to the Company.
NOTE 2 - OIL AND GAS PROPERTIES, EQUIPMENT AND FIXTURES
Oil and gas properties, equipment and fixtures consist of the following at December 31:
|
2012
|
2011
|
|||||||
|
Oil and Gas
|
||||||||
|
Producing properties, including intangible drilling costs
|
$
|
24,327,806
|
$
|
23,684,048
|
||||
|
Undeveloped properties
|
4,034,292
|
994,687
|
||||||
|
Lease and well equipment
|
9,724,602
|
10,284,315
|
||||||
|
38,086,700
|
34,963,050
|
|||||||
|
Accumulated depletion, depreciation and amortization
|
(27,756,493
|
)
|
(27,553,222
|
)
|
||||
|
10,330,207
|
$
|
7,409,828
|
||||||
|
2012
|
2011
|
|||||||
|
Commercial and Other
|
||||||||
|
Real estate, including furniture and fixtures
|
$
|
502,344
|
$
|
502,344
|
||||
|
Vehicles
|
151,669
|
151,669
|
||||||
|
Furniture and equipment
|
1,299,300
|
1,307,299
|
||||||
|
1,953,313
|
1,961,312
|
|||||||
|
Accumulated depreciation
|
(1,327,723
|
)
|
(1,295,796
|
)
|
||||
|
625,590
|
665,516
|
|||||||
|
$
|
10,955,797
|
8,075,344
|
||||||
The following sets forth costs incurred for oil and gas property acquisition and development activities, whether capitalized or expensed:
|
2012
|
2011
|
|||||||
|
Acquisition - Proved
|
$
|
24,298
|
145,746
|
|||||
|
Acquisition- Unproved
|
$
|
24,606
|
33,749
|
|||||
|
Development
|
$
|
577,708
|
6,493,013
|
|||||
|
Exploration
|
$
|
1,077,001
|
538,247
|
|||||
The guidance set forth in the Continued Capitalization of Exploratory Well Costs paragraph of the Extractive Activities Topic of the FASB Accounting Standards Codification requires that we evaluate all existing capitalized exploratory well costs and disclose the extent to which any such capitalized costs have become impaired and are expensed or reclassified during a fiscal period. We did not make any additions to capitalized exploratory well costs pending a determination of proved reserves during 2012 or 2011. We did not charge any previously capitalized exploratory well costs to expense upon adoption of Topic.
|
12 Months Ended December 31,
|
||||||||
|
2012
|
2011
|
|||||||
|
Beginning balance at January 1
|
$
|
0
|
$
|
0
|
||||
|
Additions to capitalized exploratory well costs pending the determination of proved reserves
|
$
|
556,446
|
$
|
0
|
||||
|
Reclassifications to wells, facilities, and equipment based on the determination of proved reserves
|
$
|
(556,446
|
)
|
$
|
0
|
|||
|
Ending balance at December 31
|
$
|
0
|
$
|
0
|
||||
Results of Operations from Oil and Gas Producing and Exploration Activities
The results of operations from oil and gas producing and exploration activities (excluding corporate overhead and interest costs) for the two years ended December 31, are as follows:
|
2012
|
2011
|
|||||||
|
Oil and gas sales
|
$ | 1,673,538 | 4,879,397 | |||||
|
Production related costs
|
(1,139,750 | ) | (1,517,920 | ) | ||||
|
Lease Impairment
|
(200,778 | ) | (4,529,058 | ) | ||||
|
Depreciation, depletion and amortization
|
(1,448,002 | ) | (2,362,065 | ) | ||||
|
Results of operations from producing and
|
||||||||
|
exploration activities
|
$ | (1,114,992 | ) | (3,529,646 | ) | |||
|
Income Taxes (Benefit)
|
1,831,562 | (1,032,831 | ) | |||||
|
Net Results
|
$ | (2,946,554 | ) | (2,496,815 | ) | |||
NOTE 3 – ASSET RETIREMENT OBLIGATION
The Asset Retirement and Environmental Obligations Topic of the FASB Accounting Standards Codification requires that an asset retirement obligation (ARO) associated with the retirement of a tangible long-lived asset be recognized as a liability in the period in which it is incurred or becomes determinable (as defined by the standard), with an associated increase in the carrying amount of the related long-lived asset. The cost of the tangible asset, including the initially recognized asset retirement cost, is depreciated over the useful life of the asset. The ARO is recorded at fair value, and accretion expense will be recognized over time as the discounted liability is accreted to its expected settlement value. The fair value of the ARO is measured using expected future cash outflows discounted at the Company’s credit-adjusted risk-free interest rate. The provisions of this Topic apply to legal obligations associated with the retirement of long-lived assets that result from the acquisition, development, and operation of a long-lived asset.
|
2012
|
2011
|
|||||||
| Asset retirement obligation Beginning of the year |
$
|
575,612
|
$
|
580,568
|
||||
|
Liabilities incurred during the period
|
347,947
|
21,173
|
||||||
|
Settlements
|
0
|
(24,690
|
)
|
|||||
|
Accretion expense
|
6,741
|
9,266
|
||||||
|
Revisions in estimated cash flow
|
23,788
|
(10,705
|
) | |||||
|
Asset retirement obligation End of year
|
$
|
954,088
|
$
|
575,612
|
||||
NOTE 4 - TURNKEY DRILLING CONTRACTS
Royale Energy receives funds under turnkey drilling contracts, which require Royale Energy to drill oil and gas wells within a reasonable time period from the date of receipt of the funds. As of December 31, 2012 and 2011 Royale Energy had recorded deferred turnkey drilling associated with undrilled wells of $8,693,743 and $6,909,666, respectively, as a current liability.
NOTE 5 - FINANCIAL INFORMATION RELATING TO INDUSTRY SEGMENTS
Royale Energy identifies reportable segments by product and country, although Royale Energy currently does not have foreign country segments. Royale Energy includes revenues from both external customers and revenues from transactions with other operating segments in its measure of segment profit or loss. Royale Energy also includes interest revenue and expense, DD&A, and other operating expenses in its measure of segment profit or loss.
The accounting policies of the reportable segments are the same as those described in the Summary of Significant Accounting Principles (see Note 1).
Royale Energy's operations are classified into two principal industry segments. Following is a summary of segmented information for 2012 and 2011 :
|
Oil and Gas
Producing
and
Exploration
|
Turnkey
Drilling
Services
|
Total
|
||||||||||
|
Year Ended December 31, 2012
|
||||||||||||
|
Revenues from External Customers
|
$
|
1,673,538
|
$
|
2,028,863
|
$
|
3,702,401
|
||||||
|
Supervisory Fees
|
686,261
|
0
|
686,261
|
|||||||||
|
Interest Revenue
|
0
|
6,083
|
6,083
|
|||||||||
|
Interest Expense
|
97,505
|
97,504
|
195,009
|
|||||||||
|
Operating Expenses for Segment Assets
|
4,079,672
|
3,012,549
|
7,092,221
|
|||||||||
|
Depreciation, Depletion, and Amortization
|
1,375,602
|
72,400
|
1,448,002
|
|||||||||
|
Lease Impairment
|
100,389
|
100,389
|
200,778
|
|||||||||
|
Gain on Sale of Assets
|
0
|
8,100
|
8,100
|
|||||||||
|
Gain on Marketable Securities
|
7,048
|
0
|
7,048
|
|||||||||
|
Income Tax Expense
|
|
5,398,335
|
2,036,574
|
7,434,909
|
||||||||
|
Total Assets
|
16,628,168
|
875,167
|
17,503,335
|
|||||||||
|
Net Loss
|
$
|
(8,684,656
|
)
|
(3,276,370
|
)
|
(11,961,026
|
)
|
|||||
|
Year Ended December 31, 2011 (restated)
|
||||||||||||
|
Revenues from External Customers
|
$
|
4,879,397
|
$
|
5,794,427
|
$
|
10,673,824
|
||||||
|
Supervisory Fees
|
834,372
|
-
|
834,372
|
|||||||||
|
Interest Revenue
|
-
|
24,214
|
24,214
|
|||||||||
|
Interest Expense
|
69,109
|
69,109
|
138,218
|
|||||||||
|
Operating Expenses for Segment Assets
|
4,821,462
|
6,362,117
|
11,183,579
|
|||||||||
|
Depreciation, Depletion, and Amortization
|
2,243,962
|
118,103
|
2, 362,065
|
|||||||||
|
Lease Impairment
|
4,522,578
|
6,480
|
4,529,058
|
|||||||||
|
Gain on Sale of Assets
|
759,763
|
-
|
759,763
|
|||||||||
|
Income Tax (Benefit)
|
(1,516,799
|
)
|
(215,707
|
) |
(1,732,506
|
) | ||||||
|
Total Assets
|
20,388,197
|
1,073,063
|
21,461,260
|
|||||||||
|
Net Loss
|
$
|
(3,666,780
|
)
|
$
|
(521,461
|
) |
$
|
(4,188,241
|
) | |||
NOTE 6 - LONG-TERM DEBT
|
2012
|
2011
|
|||||||
|
Revolving line of credit secured by oil and gas properties, with a maximum available of $14,250,000 at December 31, 2011, issued by Texas Capital Bank, N.A. for the purposes of refinancing Royale’s existing debt and to fund development, exploration and acquisition activities as well as other general corporate purposes. The agreement was entered into on February 13, 2009. Interest is at Texas Capital Bank’s “Base Rate” plus 1.00% with an “Adjusted Base Rate” of 5.00%, resulting in a rate of 5.00% at December 31, 2012 and 2011, payable monthly with borrowing base reductions of $100,000 commencing on January 1, 2011. As part of this agreement, Texas Capital Bank has issued letters of credit in the amount of $750,000 on behalf of the Company to various agencies. At December 31, 2012, Royale’s borrowing base with Texas Capital Bank was $350,000. The revolving line of credit matured in February 2013.
|
$
|
350,000
|
$
|
2,750,000
|
||||
|
Note Payable convertible into shares of Royale’s Common stock and a Warrant Agreement with certain institutional investors. The Note has a face value of $3,333,333.33 and issued with an original issue discount of 10% for an aggregate purchase price of $3 million. The Note is not interest bearing unless Royale is in default of the Note, in which case the Note carries an interest rate of 18% per annum. During each calendar quarter from January 1, 2013 through December 31, 2013, the holder of the Note intends to require Royale to redeem 25% of the original principal amount each quarter. Accordingly, the note has been classified as current. Once notification is received, Royale, in its sole discretion, may satisfy its obligation either in cash or in shares of its common stock. However, at the Note’s maturity on December 31, 2014, any outstanding balance on the Note is required to be repaid in cash. Note is net of the Discount of Warrant Value in the amount of $1,229,354.
|
1,908,668
|
-
|
||||||
|
Total Long Term Debt
|
$
|
2,258,668
|
$
|
2,750,000
|
||||
|
Less Current Maturity
|
2,258,668
|
$
|
-
|
|||||
|
Long Term Debt Less Current Portion
|
$
|
-
|
$
|
2,750,000
|
||||
Significant covenants under the terms of the Texas Capital Bank, Inc. line of credit agreement include that the Company will have a tangible net worth not less than $5,424,014 as of December 31, 2008, plus 75% of positive quarterly net income thereafter, an interest coverage ratio not less than 3.00:1, and a bank defined current ratio not less than 1:1. The Company was not in compliance with the terms of this agreement at December 31, 2012, but has obtained a waiver from Texas Capital Bank, Inc. In June 2009, a joint and several guarantee of the $750,000 Letter of Credit Facility by and between Stephen Hosmer and Harry Hosmer was added the loan agreement. Guarantors will be required to collectively maintain unencumbered liquidity in the form of cash or marketable securities equal to 150% of the line amount.
The Warrant Agreement entitles the holder to purchase, in whole or in part, an aggregate of 500,000 shares of Royale’s Common stock at an initial exercise price of $3.00 per share. The warrant has a three year term and becomes exercisable on April 29, 2013. The value of the warrant was determined using the Black-Scholes pricing method utilizing a strike price of $3.00, 3 year maturity, a risk free interest of 0.8805%, and expected volatility of 107.7%. Based upon these inputs, the value of each warrant share was calculated to be $1.9536.
In addition to the Note and Warrant Agreement, Royale also agreed to (i) not issue any securities for each period commencing on the date of receipt of an optional redemption notice and ending 20 trading days following the redemption required by such optional redemption notice, subject to certain limited exceptions, (ii) not to enter into a variable rate transaction at any time until the earlier of two years from the closing date or the date on which none of the Notes or Warrants are outstanding, and (iii) to allow the investors to participate in future issuances of securities, subject to certain exceptions, for a period of one year from the date hereof. In addition, we have agreed to hold a shareholders’ meeting no later than June 30, 2013, to approve: (A) an amendment of our Articles of Incorporation to increase the Company’s authorized capital stock to 51,000,000 shares, including 50,000,000 shares of common stock and 1,000,000 shares of preferred stock; and (B) making the exchange cap in the Notes and the floor price on the exercise price of the Warrants inapplicable with respect to issuances of common stock in excess of the exchange cap in the Notes and below the floor price in the Warrants in accordance with Nasdaq rules.
NOTE 7 - INCOME TAXES
Deferred tax assets and liabilities reflect the net tax effect of temporary differences between the carrying amount of assets and liabilities for financial reporting purposes and amounts used for income tax purposes. Deferred tax assets are reduced by a valuation allowance when, in the opinion of management, it is more likely than not that some portion or all of the deferred tax assets will not be realized. Deferred tax assets and liabilities are adjusted for the effects of changes in tax laws and rates on the date of enactment.
Significant components of the Company’s deferred assets and liabilities at December 31, 2012 and 2011, respectively, are as follows:
|
2012
|
2011
|
|||||||
|
Deferred Tax Assets (Liabilities):
|
||||||||
|
Statutory Depletion Carry Forward
|
$
|
776,534
|
$
|
839,572
|
||||
|
Net Operating Loss
|
4,951,344
|
2,860,706
|
||||||
|
Other
|
212,798
|
375,881
|
||||||
|
Share-Based Compensation
|
58,558
|
42,321
|
||||||
|
Mark to Market Securities
|
-
|
(1,240
|
)
|
|||||
|
Capital Loss / AMT Credit Carry Forward
|
76,410
|
76,410
|
||||||
|
Charitable Contributions Carry Forward
|
16,022
|
14,416
|
||||||
|
Allowance for Doubtful Accounts
|
372,772
|
263,966
|
||||||
|
Oil and Gas Properties and Fixed Assets
|
3,711,789
|
3,799,419
|
||||||
|
$
|
10,176,227
|
$
|
8,271,451
|
|||||
|
Valuation Allowance
|
(10,176,227
|
)
|
(839,572
|
)
|
||||
|
Net Deferred Tax Asset
|
$
|
-
|
$
|
7,431,879
|
||||
|
Deferred Tax Assets:
|
||||||||
|
Current
|
$
|
107,563
|
$
|
661,645
|
||||
|
Non-current
|
(107,563
|
)
|
6,771,474
|
|||||
|
Deferred Tax Liabilities:
|
||||||||
|
Current
|
(1,240
|
)
|
||||||
|
Non-current
|
-
|
|||||||
|
Net Deferred Tax Asset
|
$
|
-
|
$
|
7,431,879
|
||||
At the end of 2012, management reviewed the realizability of the Company’s net deferred tax assets. Due to the Company’s cumulative losses in recent years, and its inability to conclude a transaction concerning its Alaska acreage by the end of 2012, Royale and its management concluded that it is not “more-likely-than-not” its deferred tax assets will be realized. As a result, the Company recorded a full valuation allowance against the net deferred tax assets in 2012. The Company will assess the realizability of the deferred tax assets at least yearly and make appropriate updates as needed. The Company had statutory percentage depletion carry forwards of approximately $1,900,000 at December 31, 2012. The depletion has no expiration date. The Company also has a net operating loss carry forward of approximately $10,900,000 at December 31, 2012, which will begin to expire in 2027.
A reconciliation of Royale Energy's provision for income taxes and the amount computed by applying the statutory income tax rates at December 31, 2012 and 2011, respectively, to pretax income is as follows:
|
2012
|
2011
|
|||||||
|
Tax (benefit) computed at statutory rate of 34%
|
$
|
(1,538,880
|
)
|
$
|
(2,013,054
|
)
|
||
|
Increase (decrease) in taxes resulting from:
|
||||||||
|
State tax / percentage depletion / other
|
1,128,788
|
(263,772
|
)
|
|||||
|
Other non-deductible expenses
|
2,888
|
2,942
|
||||||
|
Change in valuation allowance
|
7,842,113
|
541,378
|
||||||
|
Provision (benefit)
|
$
|
7,434,909
|
$
|
(1,732,506
|
)
|
|||
The components of the Company’s tax provision are as follows:
|
2012
|
2011
|
|||||||
|
Current tax provision (benefit) – federal
|
$ | - | - | |||||
|
Current tax provision (benefit) – state
|
1,790 | 3,090 | ||||||
|
Deferred tax provision (benefit) – federal
|
6,265,479 | (1,409,034 | ) | |||||
|
Deferred tax provision (benefit) – state
|
1,167,640 | (326,562 | ) | |||||
|
Total provision (benefit)
|
$ | 7,434,909 | (1,732,506 | ) | ||||
In January 2007, Royale adopted additional provisions from the Income Taxes Topic of the FASB Accounting Standards Codification, which clarified the accounting for uncertainty in income taxes recognized in an entity’s financial statements and prescribes a recognition threshold and measurement attribute for financial statement disclosure of tax positions taken or expected to be taken on a tax return. As a result of our implementation of the Topic at the time of adoption and at December 31, 2012, the Company did not recognize a liability for uncertain tax positions. Currently, the only differences between our financial statements and our income tax returns relate to normal timing differences such as depreciation, depletion and amortization, which are recorded as deferred taxes on our consolidated balance sheets. We do not expect our unrecognized tax benefits to change significantly over the next 12 months. The tax years 2009 through 2011 remain open to examination by the taxing jurisdictions in which we file income tax returns.
NOTE 8 - SERIES AA PREFERRED STOCK
In April 1992, Royale Energy's Board of Directors authorized the sale of Series AA Convertible Preferred Stock. Holders of Series AA Convertible Preferred Stock have dividend, conversion and preference rights identical to Series A Convertible Preferred Stockholders. The Series AA Convertible Preferred Stock does not have the right of redemption at the stockholders' option. During the years ending December 31, 2012, and 2011, there were no conversions of Series AA Preferred stock, and as of December 31, 2012, and 2011 there were 52,784 shares of Series AA Preferred stock issued and outstanding.
NOTE 9 - COMMON STOCK
In February 2012, Royale Energy entered into a Sales Agreement with C. K. Cooper & Company, Inc. (“CKCC”), under which the Company may issue and sell shares of its common stock for consideration of up to $10,000,000, from time to time in an at the market equity offering program with CKCC acting as the Company’s sales agent (the “Offering”). Sales of common stock if any, under the program will depend upon market conditions and other factors to be determined by the Company and may be made in negotiated transactions or transactions that are deemed to be “at the market offerings” as defined in Rule 415 under the Securities Act of 1933, as amended, including sales made directly on the NASDAQ Capital Market, on any other existing trading market for the common stock or through a market maker. The Company has no obligation to sell any common shares in the program and may at any time suspend solicitation and offers under the program or terminate the program. The Company will pay CKCC a commission equal to 3.5% of the gross sales price of any such shares sold, through it as sales agent, as set forth in the Sales Agreement. The Company has also agreed to reimburse CKCC for certain expenses incurred in connection with entering into the Sales Agreement and has provided CKCC with customary indemnification rights.
In June 2008, Royale Energy entered into a Securities Purchase Agreement with Cranshire Capital, L.P. to issue and sell 547,945 shares of its common stock in exchange for approximately $4,000,000 (i.e. $7.30 per share). As part of the agreement, Cranshire was also issued a warrant to acquire additional shares of its common stock. The warrant, which expires on June 10, 2013, is exercisable for an aggregate of 191,781 shares at an exercise price of $7.30 per share. The $7.30 per share price was negotiated as a 15% discount from the 10 day dollar volume weighted average price of the Company’s Common Stock on the NASDAQ Global Market. In conjunction with the August 2009 agreement (see below) the price of these share were adjusted to an exercise price of $1.99 per share. In March 2011, warrants were exercised for 71,918 shares of the Company’s common stock for approximately $143,117 ($1.99 per share). The net proceeds from the private placement and warrant exercise went towards general corporate purposes, including the acquisition of oil and natural gas properties for future development.
On August 4, 2009, Royale Energy, Inc., entered into a Securities Purchase Agreement with Cranshire Capital, L.P. The terms of the agreement include the sale of 552,764 shares of common stock at $1.99 per share. The warrants include: (i) Series A Warrants, which are immediately exercisable for a period of 5 years into 329,850 shares at $2.19 per share; (ii) Series A-1 Warrants, which are exercisable beginning February 6, 2010 for a period of 5 years into 1,808 shares at $2.19 per share, (iii) Series B Warrants, which are immediately exercisable for a period of up to 1 year into 511,628 shares at $2.15 per share and (iv) Series C Warrants, which are immediately exercisable for a period of 5 years into 306,977 shares at $2.19 per share but only to the extent that the Series B Warrants are exercised and only in the same percentage that the Series B Warrants are exercised. All of such warrants contain customary adjustments for corporate events such as reorganizations, splits, dividends, and the exercise prices of all such warrants are subject to weighted-average anti-dilution adjustments in the event of additional issuances of common stock below the exercise price then in effect. The exercise price of the Series B Warrants is also subject to increases if the market price of the common stock equals or exceeds $2.40, in which case the exercise price of such Series B warrant will be increased to 90% of the closing sale price of the common stock on the trading day immediately preceding the date of exercise thereof. The Company will also provide customary registration rights in connection with the transaction. In September and October 2009, the Series B warrants were exercised for 511,628 shares of Royale Energy common stock. The net proceeds received for the shares, $1,080,650, were used for general working capital purposes. During March and April 2011, the Series A warrants were exercised for 329,850 shares of Royale Energy common stock. The net proceeds received for the shares, approximately $722,372, were used for general working capital purposes. During February and March 2011, in a separate exercise, warrants were exercised for 67,160 of the Company’s common stock. The net proceeds of approximately $185,999 were used for general working capital purposes.
NOTE 10 - OPERATING LEASES
Royale Energy occupies office space through the use of two leases, one for their office in San Diego, CA and one for an office and yard in Woodland, CA. The San Diego lease is under a 120 month noncancellable lease contract, which expires in July 2015. The San Diego lease calls for monthly payments ranging from $27,010 to $35,271, and the Woodland lease calls for monthly payments of $900. Future minimum lease obligations as of December 31, 2012 are as follows:
|
Year Ended
|
||||
|
December 31,
|
||||
|
2013
|
$
|
403,873
|
||
|
2014
|
$
|
415,842
|
||
|
2015
|
$
|
246,900
|
||
|
Thereafter
|
$
|
-
|
||
|
Total
|
$
|
1,066,615
|
||
Rental expense for the years ended December 31, 2012 and 2011 was $ 370,750 and $371,520 respectively.
NOTE 11 - RELATED PARTY TRANSACTIONS
Significant Ownership Interests
Donald H. Hosmer, Royale Energy’s co-president and co-chief executive officer owns 8.59% of Royale Energy common stock. Donald H. Hosmer is the brother of Stephen M. Hosmer, and son of Harry E. Hosmer.
Stephen M. Hosmer, Royale Energy’s co-president, co-chief executive officer and chief financial officer, owns 11.64% of Royale Energy common stock. Stephen M. Hosmer is the brother of Donald H. Hosmer and son of Harry E. Hosmer.
Harry E. Hosmer, Royale Energy's former president and former chief executive officer, owns 6.28% of Royale Energy common stock. Donald H. and Stephen M. Hosmer are sons of Harry E. Hosmer. Donald H. Hosmer and Stephen M. Hosmer are also officers and directors of Royale Energy.
The Board of Directors adopted a policy in 1989 that permits directors and officers of the Company to purchase from the Company, at the Company’s actual costs, up to one percent of a fractional interest in any well to be drilled by the Company. Current and former officers and directors were billed $3,451 and $23,010 for their interests for the years ended December 31, 2012 and 2011, respectively.
NOTE 12 - STOCK COMPENSATION PLAN
During the Board of Directors meeting held in December 2010, directors and executive officers of Royale Energy were each granted 50,000 stock options, a total of 400,000 options, to purchase common stock at an exercise or base price of $3.25 per share. These options are to vest in two parts; the first 200,000 options vested on January 1, 2011; the remaining 200,000 options vested on January 1, 2012. The options were granted with a legal life of five years, and a service period of two years beginning January 1, 2011. During 2012 and 2011, Royale recognized compensation costs of $39,260 and $40,015, respectively and a tax expense of $38,652 and tax benefit of $11,611, respectively relating to this option grant.
The fair value of the options was calculated using the Black-Scholes option pricing method. Since, at the time of option grant, there was currently no market for options of Royale’s common stock, expected volatilities are based on historical volatility of the Company’s stock and other factors. Royale Energy uses historical data to estimate option exercise and board member turnover within the valuation model. The risk-free rate for the periods within the contractual life of the option is based on the U.S. Treasury yield curve in effect at the time of the grant.
A summary of the status of Royale Energy's stock option plan as of December 31, 2012 and 2011, and changes during the years ending on those dates is presented below:
|
2012
|
2011
|
|||||||||||||||
|
Weighted-
|
Weighted-
|
|||||||||||||||
|
Average
|
Average
|
|||||||||||||||
|
Exercise
|
Exercise
|
|||||||||||||||
|
Shares
|
Price
|
Shares
|
Price
|
|||||||||||||
|
Options
|
||||||||||||||||
|
Outstanding at Beginning of Year
|
675,000 | $ | 3.36 | 320,000 | $ | 3.50 | ||||||||||
|
Granted
|
- | $ | 400,000 | 3.25 | ||||||||||||
|
Exercised
|
(283,692 | ) | $ | 3.46 | (45,000 | ) | 3.44 | |||||||||
|
Expired or Ineligible
|
(45,000 | ) | 3.50 | - | ||||||||||||
|
Outstanding at End of Year
|
346,308 | $ | 3.25 | 675,000 | $ | 3.36 | ||||||||||
|
Options Exercisable at Year End
|
346,308 | $ | 3.25 | 475,000 | $ | 3.40 | ||||||||||
|
Weighted-average Fair Value of Options
Granted During the Year |
$ | - | - | $ | 0.21 | |||||||||||
The weighted-average grant-date fair value of options granted during 2011 was $0.21 per share, and the fair value of the options vested in 2011 was $40,015. The total intrinsic value of options exercised during 2011 was $112,050. . At December 31, 2011, Royale’s stock price was $4.58 creating an intrinsic value of $823,500 and $560,500 for the options outstanding and exercisable at year end, respectively. At December 31, 2012, Royale Energy’s stock price, $2.58, was less than the weighted average exercise price, and as such the outstanding and exercisable stock options had no intrinsic value. These stock options have a weighted-average remaining contractual term of 3 years as of December 31, 2012. There were no new stock options granted during 2012.
In November 2008, the Board of Directors granted the directors and executive officers of Royale Energy 95,000 shares of restricted common stock. The number of granted shares will double to 190,000 shares of common stock if Royale’s stock price reaches $15 a share during the period. The grant is to be vested in three parts. Each part of 31,665 shares vested on November 30, 2009, 2010, and 2011. . Royale recognized share-based compensation of $67,583 and $19,610 as a tax benefit for this stock grant in the year ended December 31, 2011.
A summary of the status of Royale Energy's restricted stock grant plans as of December 31, 2012 and 2011, and changes during the years ending on those dates is presented below:
|
2012
|
2011
|
|||||||||||||||
|
Weighted-
|
Weighted-
|
|||||||||||||||
|
Average
|
Average
|
|||||||||||||||
|
Grant-Date
|
Grant-Date
|
|||||||||||||||
|
Shares
|
Fair Value
|
Shares
|
Fair Value
|
|||||||||||||
|
Non-vested Shares
|
||||||||||||||||
|
Non-vested at Beginning of Year
|
- | $ | - | 31,670 | $ | 3.31 | ||||||||||
|
Granted
|
- | - | ||||||||||||||
|
Reinstated
|
- | - | ||||||||||||||
|
Vested
|
- | 31,670 | $ | 3.31 | ||||||||||||
|
Expired or Ineligible
|
- | $ | - | |||||||||||||
|
Non-vested at End of Year
|
- | - | $ | 3.31 | ||||||||||||
NOTE 13 - SIMPLE IRA PLAN
In April 1998, the Company established a Simple IRA pension plan covering all employees. The Company will contribute a matching contribution to each eligible employee’s Simple IRA equal to the employee’s salary reduction contributions up to a limit of 3% of the employee’s compensation for the year. The employer contribution for the years ending December 31, 2012 and 2011, were $57,405, and $60,366 respectively.
NOTE 14 - ENVIRONMENTAL MATTERS
Royale Energy has established procedures for the continuing evaluation of its operations to identify potential environmental exposures and assure compliance with regulatory policies and procedures. Management monitors these laws and regulations and periodically assesses the propriety of its operational and accounting policies related to environmental issues. The nature of Royale Energy's business requires routine day-to-day compliance with environmental laws and regulations. Royale Energy incurred no material environmental investigation, compliance and remediation costs in 2012 or 2011.
Royale Energy is unable to predict whether its future operations will be materially affected by these laws and regulations. It is believed that legislation and regulations relating to environmental protection will not materially affect the results of operations of Royale Energy.
NOTE 15 - CONCENTRATIONS OF CREDIT RISK
The Company bids its gas sales on a month to month basis and generally sells to a single customer without commitment to future gas sales to any particular customer. The Company normally sells approximately 83% of its monthly natural gas production to one customer on a month to month basis. Since we are able to sell our natural gas to other readily available customers, the loss of any one customer would not have an adverse effect on our overall sales operations.
The Company maintains cash in depository institutions that are guaranteed by the Federal Deposit Insurance Corporation (FDIC) up to $250,000 per institution for our interest bearing accounts in the years ended December 31, 2012, and 2011. At December 31, 2012, and 2011, the Company’s non-interest bearing accounts were fully insured by the FDIC. At December 31, 2012 and 2011, cash in banks exceeded the FDIC limits by approximately $1.2 million and $2.4 million, respectively. The Company has not experienced any losses on deposits.
NOTE 16 - COMMITMENTS AND CONTINGENCIES
The Company may become involved from time to time in litigation on various matters, which are routine to the conduct of its business. The Company believes that none of these actions, individually or in the aggregate, will have a material adverse effect on its financial position or results of operations, though any adverse decision in these cases or the costs of defending or settling such claims could have a material effect on its business.
National Fuel Corporation (“NFC”) v. Royale Energy, Inc., No. 080800735, Uintah County, Utah. NFC filed this lawsuit seeking to remove Royale as operator of the property in which Royale is the 75% record owner and operator and NFC was a non-operator with a 25% ownership. Trial was held on October 18-21, 2011, at which Royale defended itself vigorously. On February 2, 2012, the Court issued its ruling, denying NFC’s request to remove Royale as operator. On April 6, 2012, judgment pursuant to the ruling was entered, and NFC filed an appeal. Effective February 1, 2013, during the pendency of the appeal, the case was settled. We anticipate that the appeal will be dismissed shortly, and the litigation concluded. There was no cash paid out as a result of the ruling.
Douglas Jones v. Royale Energy, Inc., et.al.
On July 1, 2010, Douglas Jones filed a lawsuit against the Company in the Circuit Court, 17th Judicial District, Broward County, Florida. Mr. Jones was an independent contractor handling certain aspects of sales for the Company prior to July 2, 2008. He asserts that he is entitled to an unspecified amount for commissions and expenses. The Company denies that any money is owed to Mr. Jones, and intends to defend the lawsuit vigorously. On August 16, 2010, the Company through Florida counsel Adam Hodkin, filed a motion to dismiss the lawsuit for lack of jurisdiction in the Florida courts. The Court has set the motion to dismiss for hearing on March 15, 2012, but the hearing was taken off calendar at the request of the plaintiff, Mr. Jones. The court then reset the motion for hearing on February 27, 2013. At the hearing, the judge took the matter under submission to consider whether he needed to hold an evidentiary hearing or whether he could rule on the papers. If the motion to dismiss is denied, Royale intends to answer their complaint and oppose the lawsuit vigorously.
NOTE 17 - SUBSEQUENT EVENTS
On January 2, 2013 and on April 4, 2013, Royale’s convertible note holders exercised their put option to redeem 25% of the original principal amount. Royale paid $854,167, which included a 2.5% premium because the obligation was met in cash, on January 7, 2013, and issued 479,589 of its common stock on April 5, 2013 to satisfy each notice to redeem 25% of the original principal amount. As of April 15, 2013, Royale has an outstanding balance of approximately $1,666,667 related to the convertible notes.
NOTE 18 – RESTATEMENT TO REFLECT CHANGE IN REVENUE RECOGNITION POLICY
The Company has restated its previously issued 2011 financial statements for the correction of an error in the method of revenue recognition. The effect on the Company’s issued 2011 financial statements is summarized below:
|
As Previously
|
||||||||
|
Reported
|
As Restated
|
|||||||
|
Balance sheet as of December 31, 2010:
|
||||||||
|
Accumulated deficit
|
(16,807,424
|
)
|
(18,037,663
|
)
|
||||
|
Balance sheet as of December 31, 2011:
|
||||||||
|
Deferred Tax Asset
|
6,055,803
|
6,771,474
|
||||||
|
Total Assets
|
20,745,589
|
21,461,260
|
||||||
|
Deferred Revenue from Turnkey Drilling
|
4,879,853
|
6,909,666
|
||||||
|
Total Current Liabilities
|
9,423,834
|
11,453,647
|
||||||
|
Total Liabilities
|
12,749,446
|
14,779,259
|
||||||
|
Accumulated Deficit
|
20,911,762
|
22,225,904
|
||||||
|
Total paid in capital and accumulated deficit
|
7,543,515
|
6,861,377
|
||||||
|
Total Stockholder’s Equity
|
7,996,143
|
6,682,001
|
||||||
|
Total Liabilities and Stockholder’s Equity
|
20,745,589
|
21,461,260
|
||||||
|
Statement of Operations for the year ended December 31, 2011:
|
||||||||
|
Turnkey Drilling
|
5,933,065
|
5,794,427
|
||||||
|
Total Revenues
|
11,671,048
|
11,532,410
|
||||||
|
Income From Operations
|
(5,643,891
|
) |
(5,782,529
|
) | ||||
|
Income Before Income Tax Expense
|
(5,782,109
|
) |
(5,920,747
|
) | ||||
|
Income Tax Provision (Benefit)
|
(1,677,771
|
) |
(1,732,506
|
) | ||||
|
Net Income (Loss)
|
(4,104,338
|
) |
(4,188,241
|
) | ||||
|
Comprehensive Income (Loss)
|
(4,101,303
|
) |
(4,185,206
|
) | ||||
ROYALE ENERGY, INC.
SUPPLEMENTAL INFORMATION ABOUT OIL AND GAS PRODUCING ACTIVITIES (UNAUDITED)
The following estimates of proved oil and gas reserves, both developed and undeveloped, represent interests owned by Royale Energy which are located solely in the United States. Proved reserves represent estimated quantities of crude oil and natural gas which geological and engineering data demonstrate to be reasonably certain to be recoverable in the future from known reservoirs under existing economic and operating conditions. Proved developed oil and gas reserves are reserves that can be expected to be recovered through existing wells, with existing equipment and operating methods. Proved undeveloped oil and gas reserves are reserves that are expected to be recovered from new wells on undrilled acreage, or from existing wells for which relatively major expenditures are required for completion.
Disclosures of oil and gas reserves, which follow, are based on estimates prepared by independent petroleum engineering consultants Netherland, Sewell & Associates, Inc. and Source Energy, LLC, the net reserve value of its proved developed and undeveloped reserves was approximately $7.6 million at December 31, 2012, based on natural gas prices ranging from $2.59 per MCF to $3.09 per MCF as applied on a field-by-field basis. Source Energy, LLC supplied reserve value estimates for Royale Energy’s Utah properties, and Netherland, Sewell & Associates, Inc. provided reserve information for the Company’s California, Texas, Oklahoma, and Louisiana properties. Such estimates are subject to numerous uncertainties inherent in the estimation of quantities of proved reserves and in the projection of future rates of production and the timing of development expenditures. These estimates do not include probable or possible reserves.
The technical persons responsible for preparing the reserves estimates presented in the report of Netherland, Sewell & Associates, Inc., meet the requirements regarding qualifications, independence, objectivity, and confidentiality set forth in the Standards Pertaining to the Estimating and Auditing of Oil and Gas Reserves Information promulgated by the Society of Petroleum Engineers. Netherland, Sewell & Associates, Inc. is a firm of independent petroleum engineers, geologists, geophysicists, and petrophysicists; and do not own an interest in our properties and are not employed on a contingent basis. All activities and reports performed and completed by Netherland, Sewell & Associates, Inc. with regards to our reserve valuation estimates are managed and reviewed by Royale’s Chief Geologist and Vice President of Exploration. This person earned a Ph.D. in geosciences from the University of Sheffield, England, and has over 30 years of experience in the petroleum exploration industry. After our Chief Geologist and Vice President of Exploration completes his review and analysis of the estimates from Netherland, Sewell & Associates, the estimates are reviewed again by Royale’s Co-CEO, Co-President, and CFO.
These estimates are furnished and calculated in accordance with requirements of the Financial Accounting Standards Board and the Securities and Exchange Commission (SEC). Because of unpredictable variances in expenses and capital forecasts, crude oil and natural gas price changes, largely influenced and controlled by U.S. and foreign government actions, and the fact that the bases for such estimates vary significantly, management believes the usefulness of these projections is limited. Estimates of future net cash flows presented do not represent management's assessment of future profitability or future cash flows to Royale Energy. Management's investment and operating decisions are based upon reserve estimates that include proved reserves prescribed by the SEC as well as probable reserves, and upon different price and cost assumptions from those used here.
It should be recognized that applying current costs and prices and a 10 percent standard discount rate does not convey absolute value. The discounted amounts arrived at are only one measure of the value of proved reserves.
Changes in Estimated Reserve Quantities
The net interest in estimated quantities of proved developed reserves of crude oil and natural gas at December 31, 2012 and 2011 and changes in such quantities during each of the years then ended, were as follows:
|
2012
|
2011
|
|||||||||||||||
|
Oil (BBL)
|
Gas (MCF)
|
Oil (BBL)
|
Gas (MCF)
|
|||||||||||||
|
Proved developed and undeveloped reserves:
|
||||||||||||||||
|
Beginning of period
|
4,900
|
4,569,850
|
16,830
|
5,733,873
|
||||||||||||
|
Revisions of previous estimates
|
(2,658
|
) |
(436,443
|
)
|
2,205
|
(1,044,000
|
) | |||||||||
|
Production
|
(1,558
|
)
|
(559,590
|
)
|
(2,264
|
)
|
(1,144,469
|
) | ||||||||
|
Extensions, discoveries and improved recovery
|
63,200
|
892,990
|
1,024,446
|
|||||||||||||
|
Purchase of minerals in place
|
16
|
31,162
|
||||||||||||||
|
Sales of minerals in place
|
(11,871
|
) | ||||||||||||||
|
Proved reserves end of period
|
63,900
|
4,497,970
|
4,900
|
4,569,850
|
||||||||||||
|
2012
|
2011
|
|||||||||||||||
|
Oil (BBL)
|
Gas (MCF)
|
Oil (BBL)
|
Gas (MCF)
|
|||||||||||||
|
Proved developed reserves:
|
||||||||||||||||
|
Beginning of period
|
4,900
|
4,174,050
|
16,830
|
5,041,179
|
||||||||||||
|
End of period
|
700
|
3,188,390
|
4,900
|
4,174,050
|
||||||||||||
|
2012
|
2011
|
|||||||||||||||
|
Oil (BBL)
|
Gas (MCF)
|
Oil (BBL)
|
Gas (MCF)
|
|||||||||||||
|
Proved undeveloped reserves:
|
||||||||||||||||
|
Beginning of period
|
-
|
395,800
|
-
|
692,694
|
||||||||||||
|
End of period
|
63,200
|
1,309,580
|
-
|
395,800
|
||||||||||||
For December 31, 2012, natural gas extensions, discoveries and improved recovery amounted to 892,990 MCF which was mainly the result of drilling one new exploratory well in 2012, which consisted of 856,030 MCF of proved undeveloped reserves. Another location, carried over from December 31, 2011, which was not drilled in 2012, was revised upward to 416,590 MCF in proved undeveloped reserves at year end 2012. Additionally in 2012, oil extensions, discoveries and improved recovery came to 63,200 BBL which was due to four new locations, on previously owned leases, which during 2012 were proven by new outside development in the area. Each of the four locations has approximately 15,800 BBL and 9,240 MCF of proved undeveloped reserves. A location which had 347,000 MCF in proved developed reserves at December 31, 2011, was drilled and began producing in 2011, was revised downward 306,837 MCF at December 31, 2012. An additional location, which was also drilled and began producing in 2011, had proved developed reserves of 379,300 at December 31, 2011, revised downward 126,653 MCF at December 31, 2012.
For December 31, 2011, extensions, discoveries and improved recovery came to 1,024,446 MCF which was added as a result of drilling three new developmental wells in 2011. These consisted of 127,846 MCF of proved developed producing reserves on one location and 896,600 MCF of proved developed non-producing reserves on three locations. Another location which had 300,683 MCF in proved undeveloped reserves at December 31, 2010, was drilled and began producing in 2011, was revised downward 270,560 MCF at December 31, 2011. Another location, carried over from December 31, 2010, was not drilled in 2011, has 395,800 MCF in proved undeveloped reserves.
Standardized Measure of Discounted Future Net Cash Flows Relating to Proved Oil and Gas Reserves
The standardized measure of discounted future net cash flows is presented below for the two years ended December 31, 2012.
The future net cash inflows are developed as follows:
|
•
|
Estimates are made of quantities of proved reserves and the future periods during which they are expected to be produced based on year-end economic conditions.
|
|
•
|
The estimated future production of proved reserves is priced on the basis of year-end prices.
|
|
•
|
The resulting future gross revenue streams are reduced by estimated future costs to develop and to produce proved reserves, based on year-end estimates. Estimated future development costs by year are as follows:
|
|
2013
|
$
|
2,311,210
|
||
|
2014
|
1,455,100
|
|||
|
2015
|
22,000
|
|||
|
Thereafter
|
167,200
|
|||
|
Total
|
$
|
3,955,510
|
The resulting future net revenue streams are reduced to present value amounts by applying a ten percent discount.
Disclosure of principal components of the standardized measure of discounted future net cash flows provides information concerning the factors involved in making the calculation. In addition, the disclosure of both undiscounted and discounted net cash flows provides a measure of comparing proved oil and gas reserves both with and without an estimate of production timing. The standardized measure of discounted future net cash flow relating to proved reserves reflects estimated income taxes.
Changes in standardized measure of discounted future net cash flow from proved reserve quantities
This statement discloses the sources of changes in the standardized measure from year to year. The amount reported as “Net changes in prices and production costs” represents the present value of changes in prices and production costs multiplied by estimates of proved reserves as of the beginning of the year. The “accretion of discount” was computed by multiplying the ten percent discount factor by the standardized measure on a pretax basis as of the beginning of the year. The “Sales of oil and gas produced, net of production costs” are expressed in actual dollar amounts. “Revisions of previous quantity estimates” is expressed at year-end prices. The “Net change in income taxes” is computed as the change in present value of future income taxes.
|
2012
|
2011
|
|||||||
|
Future cash inflows
|
$
|
18,248,440
|
19.133,280
|
|||||
|
Future production costs
|
(6,661,330
|
)
|
(7,698,630
|
) | ||||
|
Future development costs
|
(3,955,510
|
)
|
(1,181,010
|
) | ||||
|
Future income tax expense
|
(2,289,480
|
)
|
(3,076,065
|
) | ||||
|
Future net cash flows
|
5,342,120
|
7,177,575
|
||||||
|
10% annual discount for estimated timing of cash flows
|
(1,404,499
|
)
|
(1,619,267
|
) | ||||
|
Standardized measure of discounted future net cash flows
|
$
|
3,937,621
|
5,558,308
|
|||||
|
Sales of oil and gas produced, net of production costs
|
$
|
(344,130
|
)
|
(1,130,540
|
) | |||
|
Revisions of previous quantity estimates
|
(2,813,520
|
)
|
(4,115,420
|
) | ||||
|
Net changes in prices and production costs
|
(1,158,708
|
)
|
(1,068,429
|
) | ||||
|
Sales of minerals in place
|
-
|
(307,644
|
) | |||||
|
Purchases of minerals in place
|
-
|
-
|
||||||
|
Extensions, discoveries and improved recovery
|
1,480,350
|
1,459,973
|
||||||
|
Accretion of discount
|
520,741
|
688,468
|
||||||
|
Net change in income tax
|
694,580
|
1,342,077
|
||||||
|
Net decrease
|
$
|
(1,620,687
|
)
|
(3,131,515
|
) | |||
Future Development Costs
In order to realize future revenues from our proved reserves estimated in our reserve report, it will be necessary to incur future costs to develop and produce the proved reserves. The following table estimates the costs to develop and produce our proved reserves in the years 2013 through 2015.
|
Future development cost of:
|
2013
|
2014
|
2015
|
|||||||||
|
Proved developed reserves
|
$
|
14,010
|
$
|
-
|
$
|
-
|
||||||
|
Proved non-producing reserves
|
57,100
|
55,100
|
22,000
|
|||||||||
|
Proved undeveloped reserves
|
2,240,100
|
1,400,000
|
-
|
|||||||||
|
Total
|
$
|
2,311,210
|
$
|
1,455,100
|
$
|
22,000
|
||||||
Common assumptions include such matters as the real extent and average thickness of a particular reservoir, the average porosity and permeability of the reservoir, the anticipated future production from existing and future wells, future development and production costs and the ultimate hydrocarbon recovery percentage. As a result, oil and gas reserve estimates and discounted present value estimates are frequently revised in subsequent periods to reflect production data obtained after the date of the original estimate. If the reserve estimates are inaccurate, production rates may decline more rapidly than anticipated, and future production revenues may be less than estimated.
Additional data relating to Royale Energy's oil and natural gas properties is disclosed in Supplemental Information About Oil and Gas Producing Activities (Unaudited), attached to Royale Energy's Financial Statements, beginning on page F-1
Historic Development Costs for Proved Reserves
In each year we expend funds to drill and develop some of our proved undeveloped reserves. The following table summarizes our historic costs incurred in each of the past three fiscal years to drill and develop reserves that were classified as proved undeveloped reserves as of December 31 of the immediately preceding year:
|
2012
|
$
|
0
|
||
|
2011
|
$
|
1,560,735
|
||
|
2010
|
$
|
0
|