UNITED STATES
SECURITIES AND EXCHANGE COMMISSION
Washington, D.C. 20549
FORM N-CSR
CERTIFIED SHAREHOLDER REPORT OF REGISTERED
MANAGEMENT INVESTMENT COMPANIES
Investment Company Act file number 811-06111
The Mexico Equity and Income Fund, Inc.
(Exact name of registrant as specified in charter)
615 E. Michigan Street
Milwaukee, WI 53202
(Address of principal executive offices) (Zip code)
Mr. Gerald Hellerman
c/o U.S. Bancorp Fund Services, LLC
615 E. Michigan Street
Milwaukee, WI 53202
(Name and address of agent for service)
(866) 700-6104
Registrant's telephone number, including area code
Date of fiscal year end: July 31, 2013
Date of reporting period: January 31, 2013
Item 1. Reports to Stockholders.
The Mexico Equity
and Income Fund, Inc.
Semi-Annual Report
January 31, 2013
The Mexico Equity and Income Fund Inc.
March 27, 2013
Dear Fellow Stockholders:
Mexico has changed quite a bit in the thirty-eight years since James Taylor sang about a sleepy laid-back country where Americanos could go to escape the hustle and bustle of the real world:
Way down here you need a reason to move
Feel a fool running your stateside games
Lose your load, leave your mind behind, baby James
Oh, Mexico
It sounds so simple I just got to go
The sun’s so hot I forgot to go home
Guess I’ll have to go now*
Although that imagery has been hard to shake, the fact is that Mexico is no longer a poor nation. It is the world’s 13th largest economy. Yet, the transformation from a small insulated economy to an open and more diverse one has largely gone unnoticed. Over the last 20 years, the Mexican government has made improvements to infrastructure and fostered competition in sectors such as transportation and energy. Just recently, legislation has been proposed to increase competition in Mexico’s telecommunications monopolies that could lead to a Ma Bell-style breakup of Carlos Slim’s dominant America Movil SAB.
These improvements along with a stable peso, a fiscally sound banking system, and free trade policies have encouraged investment, especially in manufacturing. That in turn, has generated middle class jobs. As Mexican economist Luis de la Calle and Mexican political scientist Luis Rubio argue in a recent book, Mexico: A Middle Class Society, family incomes and things like housing rental and ownership, appliance purchases, Internet access and trips to the cinema demonstrate that “the middle-class population is the majority in Mexico.” And to meet the demands of the new middle class for consumer goods, Wal-Marts, Costcos, and Sam’s Clubs have been sprouting up throughout the country. While Mexico still has impediments to economic growth, like inflexible labor laws, Mexico looks a lot better to investors than it used to, and the trend is positive.
For all these reasons, I believe Mexican stocks are likely to outperform in the coming years and one of the best ways for long-term investors to gain exposure to Mexico is through the Mexico Equity and Income Fund, which has been, and continues to be, well managed by Pichardo Asset Management, the Fund’s investment advisor.
Sincerely yours,

Phillip Goldstein
Chairman
________________
* “Mexico” written by Chip Taylor © EMI Music Publishing, Universal Music Publishing Group
1
THE MEXICO EQUITY AND INCOME FUND, INC.
The Mexico Equity and Income Fund, Inc.
Report of Pichardo Asset Management (“PAM”),
The Investment Adviser.
Dear Fund Stockholders,
We are pleased to present you with the semi-annual report for the Mexico Equity and Income Fund, Inc. (the “Fund”) for the six-month period ended January 31, 2013.
We are sending you the Fund’s semi-annual report amid the Euro Zone sovereign debt crisis with public demonstrations occurring in several countries due to government tightening and rising unemployment, and a Cyprus’ banking bailout.
In contrast, the U.S. economy continues to register better jobs data and a healthier housing sector along with an improving consumer balance sheet. (Source: the Economist, March 16, 2013).
Mexico’s Gross Domestic Product maintained its brisk pace in the fourth quarter of 2012, reporting an annualized YoY growth rate of 3.2%. (Source: INEGI).
The DJI (+11.44%) and S&P (+9.96%) rallied during the year-to-date period, through March 15, 2013 in dollar terms. The MSCI Mexico–Index yielded a +1.53 dollar return for the same period, mainly reflecting America Movil (-19.18%) and Televisa (-1.02%) stocks which account for approximately 23% and 7%, respectively, of the MSCI Mexico-Index (as of March 15, 2013), due to Mexico’s telecom reform aimed at opening up competition in the sector. The Fund returned +11.51% for the same period. (Source: Bloomberg).
However, dysfunction in Washington (according to the Economist, March 16, 2013) and the prospect of the U.S. debt ceiling’s May revision, may constitute a good profit-taking call given relatively fairly valued Mexican stocks that are trading at all-time highs on a 12-month forward EV/EBITDA basis. (See: Exhibit F).
Despite this background, your investment in the Fund returned 25.54% in dollar terms for the six-month period ended January 31, 2013 (a 908 basis point outperformance compared to the MSCI Mexico-Index). (Source: Bloomberg).
The excess dollar return of the Fund for the six-month period ended January 31, 2013 (based on our internal assessment reports), can be attributed to the Fund’s overweight in discretionary consumption, infrastructure and material sectors.
The Fund has consistently underweighted (relative to the MSCI Mexico-Index) telecommunications (cell telephony), retail store chains, and housing for the Fund’s six-month period ended January 31, 2013.
2
THE MEXICO EQUITY AND INCOME FUND, INC.
The Fund has tactically increased its fixed income allocation since the last quarter of 2012.
|
MXE’S Portfolio Allocation
|
January 31, 2013
|
March 15, 2013
|
|
Equities
|
86.47%
|
81.07%
|
|
Mexican REITS
|
7.22%
|
8.91%
|
|
US dollar Denominated Bonds
|
1.55%
|
2.34%
|
|
MXN pesos Denominated Bonds
|
2.03%
|
3.96%
|
|
Overnight Instruments
|
0.73%
|
1.68%
|
|
Private Equity Fund
|
2.00%
|
2.04%
|
The Fund repurchased 215,118 shares during its semi-annual period. (Source: U.S. Bancorp).
The Fund’s annualized total expense ratio for the semi-annual period was 1.47%. (Source: U.S. Bancorp).
From a long-term perspective (two to three years), we believe that the appeal Mexican equities are currently enjoying among the global investment community is warranted given:
|
i)
|
Mexico’s undisputed story of macroeconomic stability for more than a decade.
|
|
ii)
|
The support the Peña Nieto administration mustered from all three political parties to launch the “Pacto por Mexico” on December 2, 2012. The Pact details long-awaited structural reform initiatives (labor, education, public administration, telecommunications, fiscal, financial and energy) that will be voted on in Congress according to a specific timetable.(See: Exhibit G).
|
PAM’s team continued to produce an excess dollar return for the Fund compared to the MSCI Mexico-Index.
At the close of the Fund’s six-month period ended January 31, 2013
|
Total Annual Average Dollar Return
|
|||||||
|
(dividends reinvested)
|
|||||||
|
Since
|
|||||||
|
1 Month
|
6 Month
|
1 Year
|
3 Years
|
5 Years
|
10 Years
|
Inception In
|
|
|
FUND
|
August 30, 1990
|
||||||
|
MXE NAV
|
6.41%
|
25.54%
|
41.92%
|
25.35%
|
5.63%
|
23.31%
|
15.85%
|
|
MXE Market Price
|
10.53%
|
31.79%
|
45.75%
|
29.06%
|
9.18%
|
25.35%
|
14.89%
|
|
MSCI Mexico Index
|
5.51%
|
16.46%
|
26.76%
|
17.61%
|
6.73%
|
20.56%
|
13.37%
|
|
Excess Return (bps)
|
90
|
908
|
1,516
|
774
|
-110
|
275
|
248
|
Source: U.S. Bancorp, Bloomberg, and Thomson.
Performance data quoted represents past per formance; past performance does not guaran tee future results. The investment return and principal value of an investment will fluctuate so that an investor’s shares, when redeemed, may be worth more or less than their original cost. The current performance of the Fund may be lower or higher than the performance quoted. Performance data to the most recent month’s end may be obtained by calling U.S. Bancorp Fund Services, LLC, (414) 765-4255.
3
THE MEXICO EQUITY AND INCOME FUND, INC.
According to PAM’s internal semi-annual performance report, global and domestic conglomerates as well as discretionary consumption sectors were the largest contributors to the Fund’s 908 basis point outperformance of the MSCI–Mexico Index for the six-month period ended January 31, 2013.
In our view, the following factors were decisive to the Fund’s outperformance:
|
i)
|
PAM’s systematic investment strategy factors.(See: PAM’s web page: paminversion.com/English).
|
|
ii)
|
An investment strategy based on three equity class categories, as classified by PAM (Alpha, Beta and Special Situations) set up at the beginning of 2009, as well as PAM’s adherence to systematic investment strategy factors.
|
|
iii)
|
A highly diversified portfolio.
|
As of January 31, 2013, the Fund portfolio’s composition by equity class and companies’ market cap was as follows:
|
Category
|
% Overall Portfolio
|
Sectors and Equity Class Categories as classified by PAM
|
|
Small
|
12%
|
Financials, discretionary consumption and car insurance
|
|
Medium
|
26%
|
Discretionary consumption and industrials
|
|
Large
|
56%
|
Materials, industrials and discretionary consumption
|
|
Alpha
|
23%
|
High total return, dividend + share purchase + capital increase
|
|
Beta
|
47%
|
Infrastructure related with internal free cash flow
|
|
Special Situation
|
17%
|
Value-oversold stocks. Below its intrinsic value and determined by PAM. Less than 1 times P/BV
|
We have included two alternative investments in the portfolio, described below:
|
i)
|
REITs. High yield real estate investment trusts:
|
|
GLA
|
Dividend
|
One-year
|
||||
|
million
|
Market Cap
|
EV/EBITDA
|
yield
|
return to
|
||
|
Name
|
square feet
|
Cap rate %
|
billion USD
|
2013e
|
2013e
|
Jan. 31, 2013
|
|
Fibra Uno
|
8.19
|
4.7
|
5.06
|
21.5
|
3.80%
|
67.25%
|
|
Vesta
|
12.5
|
6.5
|
0.789
|
16.8
|
2.70%
|
78.19%*
|
*Annualized US Dollar return.
GLA: Gross Leasable Area.
As of fourth quarter 2012.
(Source: Bloomberg, Santander, Credit Suisse).
4
THE MEXICO EQUITY AND INCOME FUND, INC.
|
Funo is a real estate trust, approximately 45% industrial, 40% commercial and 15% office, with a 8.19 million square feet GLA (gross leasable area). Funo’s estimated 2014 and 2015 annual dividend yields are 4% and 5% according to Santander Mexico.
|
||
|
VESTA is a real estate corporation. It is a leading developer of industrial real estate properties with a strong presence in several strategic markets located in key logistic and trade corridors. (Bombardier). Vesta projections include doubling its existing GLA over the next three years. (Source: Santander Mexico).
|
||
|
ii)
|
Private Equity. ADMEXCK-09 is the private equity trust Discovery Americas managed by Atlas Capital (Harry Krensky and Carlos Mendoza former Officer of Nafinsa, a development bank in Mexico) launched on December 24, 2009, with a total initial capital of approximately US $90 million. Private equity trusts are listed in the Mexican market in the form of CKD’s (Development Companies).
|
|
|
Since its inception, the trust has invested in five companies in the health, education, school buses, freight transport and low airline carrier sectors. Two of these companies are leaders in their sectors. Approximately 60% of the ADMEXCK-09 total assets are currently invested in underlying companies.
|
The Mexican Stock Exchange registered a record high EV/EBITDA multiple of 9.7 times during the Fund’s six-month period ended January 31, 2013, situating it at the 95th percentile (in the last four years this multiple has only risen above 9.19 times 5% of the time). (Source: Bloomberg).
The Mexican Bolsa Index was a leading performer within the Latam region with a 16.89% dollar gain for the Fund’s six-month period, ended January 31, 2013. (MSCI Mexico – Index + 16.46%).
Total public offerings, including IPOs, secondary and block trades (mainly in the financial and industrial sectors) amounted to approximately US $9 bn. for the Fund’s semi-annual period ended January 31, 2013. (Source: Bloomberg).
The Mexican Stock Exchange’s market cap is US $372 bn., and average daily turnover is US $455 million as of January 31, 2013. (Source: Bloomberg, Infosel).
The Mexican economy began 2013 with solid fundamentals and a promising long-term outlook based on fiscal and energy reforms. (See: Exhibits from A to E at the end of this report).
Annual GDP growth was 3.9% for 2012 and the International Monetary Fund estimates 3.5% growth for 2013.
(See: paminversion.com/English/publicaciones.html for the Agenda for Economic Growth, Employment and Competitiveness).
5
THE MEXICO EQUITY AND INCOME FUND, INC.
Challenges the Mexican economy is currently facing are:
An abrupt slowdown in the US Economy would affect manufacturing activity in Mexico: Mexico’s manufacturing activity is an integral part of North America’s productive chain. A slowdown in U.S. production would severely impact Mexico’s economic growth prospects for the year. Some analysts believe that the Obama administration’s public spending cuts may have an industry-wide impact on the U.S., slashing 100 basis points or more off Mexico’s expected GDP growth.
The (ongoing) European public debt crisis could trigger a major default event: So far, the European debt crisis appears under control, but a major default could produce a domino effect that could cause a depreciation of the Mexican peso.
Structural reforms may not have the expected reach and depth: The recent rally in the Mexican Stock Exchange may have mostly priced in the prospect of structural reforms.
Finally, we reiterate our commitment to continuing to execute the Fund’s investment strategy to the best of our ability for the benefit of its stockholders.
Sincerely yours,

Eugenia Pichardo
Portfolio Manager
6
THE MEXICO EQUITY AND INCOME FUND, INC.
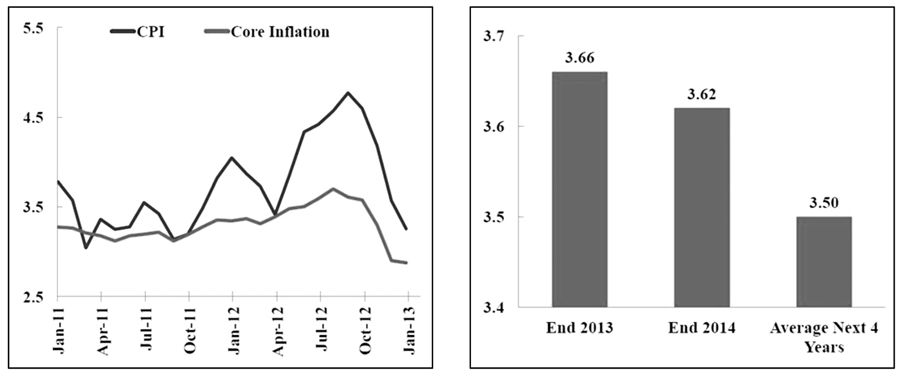
Exhibit A. Strong Fundamentals: Low and Stable Inflation
|
Consumer Price Index
|
Annual Inflation Forecasts
|
||
|
(Annual growth, %)
|
(%)
|
||
|
Source: Central Bank, INEGI, SHCP, SHF.
|
Medium-term inflation expectations are anchored around Banco de Mexico’s 3 (+-1%) targets.
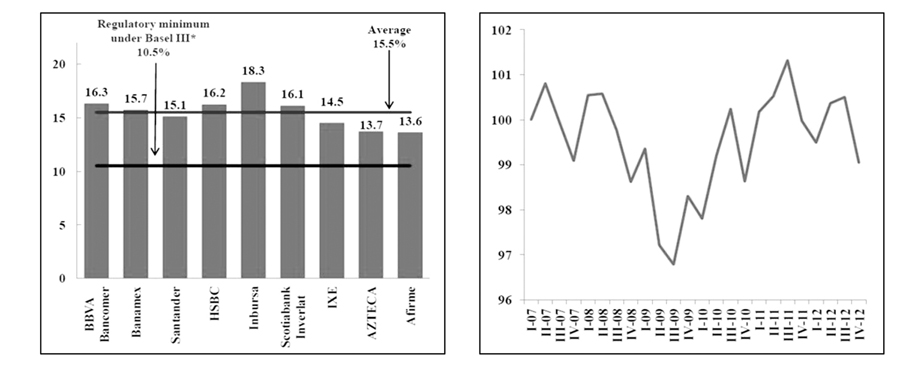
Exhibit B. Strong Fundamentals: Financial Sectors
|
Capitalization Index of Mexican banks
|
Housing Relative Prices
|
|
|
(Jan-12, %)
|
(relative to the CPI, index / -07=100)
|
|
|
Source: Central Bank Survey, SHCP.
|
7
THE MEXICO EQUITY AND INCOME FUND, INC.
The Mexican banking system is well capitalized, in full compliance with Basel III requirements and does not show signs of asset price bubbles.
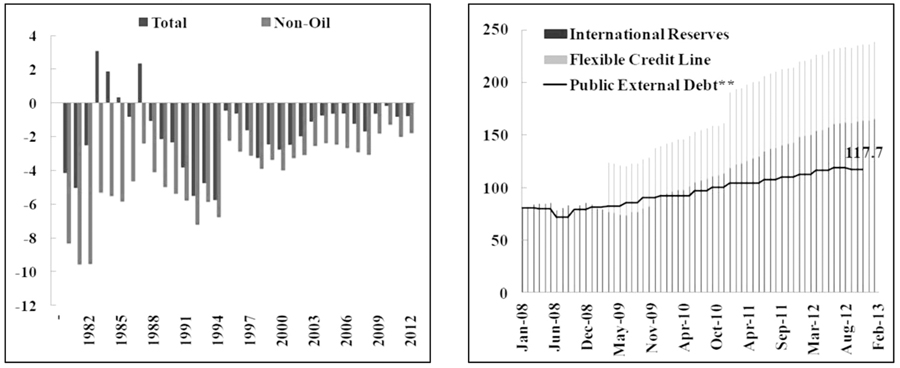
Exhibit C. Strong Fundamentals: External Sector
|
Current Account Balance
|
Foreign Exchange Reserves
|
|
|
(% of GDP)
|
(billion USD)
|
|
|
Source: Central Bank, SHCP.
|
The current account deficit is moderate and international reserves are at historical maxima.
8
THE MEXICO EQUITY AND INCOME FUND, INC.
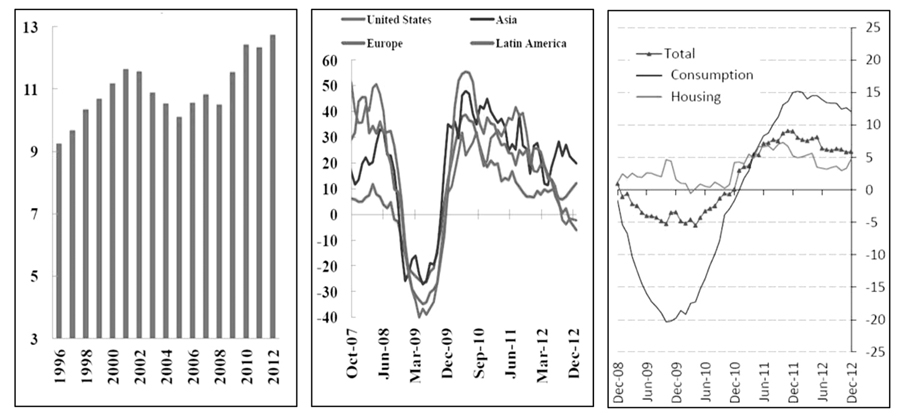
Exhibit D. Strong Fundamentals: External Sector
|
Mexican
|
||||
|
Participation of Mexico
|
Non-Oil Exports
|
Participation of Mexican
|
||
|
Exports in US Imports
|
(Annual growth, 3m
|
Non-Oil Exports to US
|
||
|
(Non-oil, annual average, %)
|
moving average, %)
|
(% of total Non-oil exports)
|
||
|
Source: Central Bank, SHCP, U.S. Census Bureau.
|
|||
Mexico has gained share in the U.S. imports while exports to countries different from the U.S. have expanded, contributing to commercial diversification.
9
THE MEXICO EQUITY AND INCOME FUND, INC.
Exhibit E. Strong Fundamentals: Exchange Rate
USD Dollar-Mexican Peso Exchange Rate and VIX
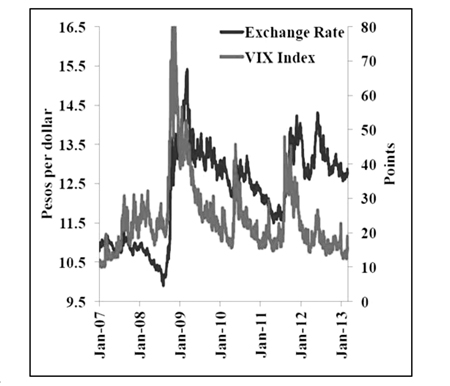
Source: Central Bank, Bloomberg, SHCP.
The current account deficit is moderate and international reserves are at historical maxima.
Exhibit F. Mexican stocks’ 12-month forward EV/EBITDA
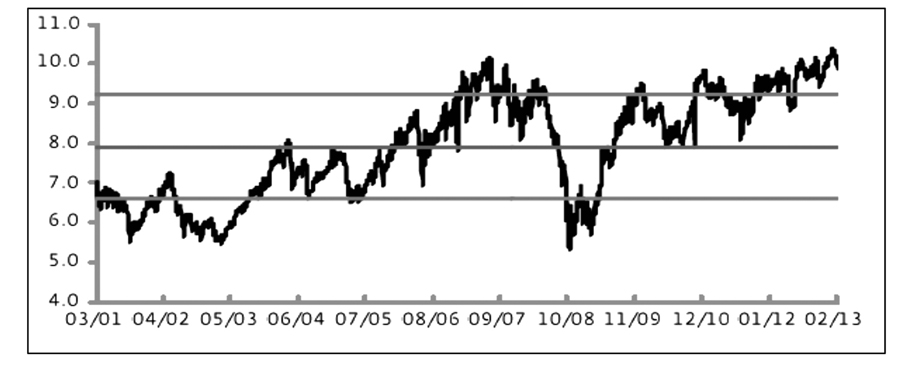
Source: Bloomberg, PAM
10
THE MEXICO EQUITY AND INCOME FUND, INC.
Exhibit G. Scheduled Reforms for 2013
Executive’s Reforms passed to the House of Representatives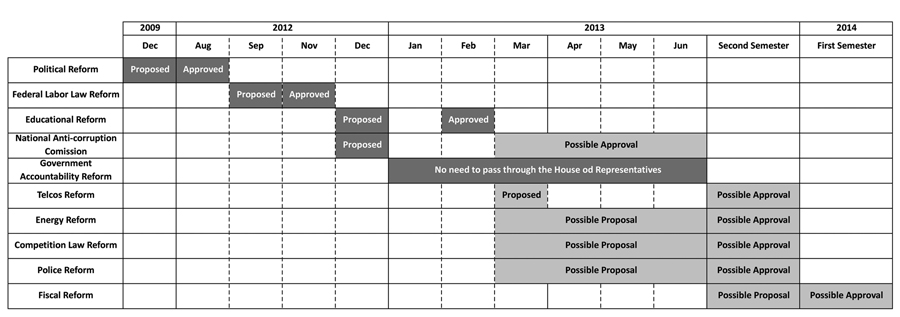
Source: Mexican Congress, Accival estimates.
The information provided herein represents the opinion of Pichardo Asset Management and not the Fund’s Board of Directors and is not intended to be a forecast of future events, a guarantee of future results, or investment advice.
The Fund’s investment objectives, risks, charges and expenses must be considered carefully before investing. The prospectus contains this and other important information about the investment company, and it may be obtained by calling U.S. Bancorp Fund Services, LLC, (414) 765-4255 or visiting www.themexicoequityandincomefund.com. Read it carefully before investing.
Investing in Foreign Securities
Investment in Mexican securities involves special considerations and risks that are not normally associated with investments in U.S. securities, including (1) relatively higher price volatility, lower liquidity and the small market capitalization of Mexican securities markets; (2) currency fluctuations and the cost of converting Mexican pesos into U.S. dollars; (3) restrictions on foreign investment; (4) political, economic and social risks and uncertainties (5) higher rates of inflation, and interest rates than in the United States.
Mexican Economic and Political Factors. Although Mexico’s economy has strengthened in recent years and Mex ico’s sovereign debt was recently upgraded to “investment-grade” by the three most prominent rating agencies, Mexico continues to be classified as a developing economy and investments in developing countries are subject to certain economic risks. Nonetheless, on March 12, 2013 Standard & Poor’s revised upward its sovereign foreign currency credit outlook on Mexico from stable to positive. The current rating is BBB. The agency stated that higher odds of reforms being approved was the main reason to revise upwards.
11
THE MEXICO EQUITY AND INCOME FUND, INC.
A REIT’s share price may decline because of adverse developments affecting the real estate industry. Investing in dividend-paying stocks involves the risk that such stocks may fall out favor with investors and underperform the market. In addition, there is the possibility that such companies could reduce or eliminate the payment of dividends in the future or the anticipated acceleration of dividends could not occur.
Diversification does not assure a profit or protect against a loss in a declining market.
The Portfolio Securities are denominated in pesos. As a result, the Portfolio Securities must increase in market value at a rate in excess of the rate of any decline in the value of the peso against the U.S. dollar in order to avoid a decline in their equivalent U.S. dollar value.
Fund’s holdings and sector allocations are subject to change at any time, and should not be considered recommendations to buy or sell any security. Please refer to the Schedule of Investments in this report for a complete list of fund holdings. Current and future portfolio holdings are subject to risk.
Definitions
|
•
|
Mexbol Total Return Index is the Mexican Bolsa index that calculates the performance of constituents assuming that all dividends and distributions are reinvested. The Mexican Bolsa Index, MEXBOL or the IPC (Indice de Precios y Cotizaciones), is a capitalization-weighted in dex of the leading stocks traded on the Mexican Stock Exchange. The index was developed with a base level of 0.78 on October 30th, 1978.
|
|
•
|
MSCI MEXICO-Index: The Morgan Stanley Capital International Index Mexico is a capitalization weighted index that monitors the perfor mance of stocks traded in Mexico.
|
|
•
|
S&P Index: An index of 500 stocks chosen for market size, liquidity and industry grouping, among other factors. The S&P 500 is designed to be a leading indicator of U.S. equities and is meant to reflect the risk/return characteristics of the large cap universe.
|
|
•
|
DJI: The Dow Jones Industrial Average is a price-weighted average of 30 significant stocks traded on the New York Stock Exchange and the Nasdaq. The DJIA was invented by Charles Dow back in 1896.
|
|
•
|
VIX Index: The Chicago Board Options Exchange Volatility Indez reflects a market estimate of future volatility, based on the weighted average of the implied volatilities for a wide range of strikes.
|
|
•
|
Cap rate: Capitalization rate is a rate of return on a real estate investment property based on the expected income that the property will generate. Capitalization rate is used to estimate the investor’s potential return on his or her investment. This is done by dividing the income the property will generate (after fixed costs and variable costs) by the total value of the property.
|
|
•
|
Consumer Confidence Index is an indicator designed to measure the degree of optimism that consumers feel about the overall state of the economy and their personal financial situation. How confident people are about stability of their incomes determines their spending activity and therefore serves as one of the key indicators for the overall shape of the economy. If consumer confidence is higher, consumers are making more purchases, boosting the economic expansion. On the other hand,
|
12
THE MEXICO EQUITY AND INCOME FUND, INC.
|
if confidence is lower, consumers tend to save more than they spend, prompting the contraction of the economy.
|
|
|
•
|
Industrial Production Index is an indicator designed to measure the output of businesses integrated in industrial sector of the economy such as manufacturing, mining, and utilities (electricity, gas and water) but excluding construction.
|
|
•
|
An investment cannot be made directly in an index.
|
|
•
|
Basis point (bps) is one hundredth of a percentage point (0.01%).
|
|
•
|
The net asset value per share (NAV) is calculated as the total market value of all the securities and other assets held by a fund minus total liabilities divided by the total number of common shares outstanding. The NAV of an investment company will fluctuate due to changes in the market prices of the underlying securities.
|
|
•
|
The market price of the common share of a closed-end fund is determined in the open market by buyers and sellers, and is the price at which investors may purchase or sell the common shares of a closed-end fund, which fluctuates throughout the day. Market price of common share may differ from the Fund’s Net Asset Value; shares of a closed-end fund may trade at a premium to (higher than) or a discount to (lower than) NAV. The difference between the market price and NAV is expressed as a percentage that is either a discount or a premium to NAV.
|
|
•
|
Alpha stocks is an equity class as classified by PAM based on the following criteria:. High Total Return. Dividend + share repurchase + capital increase.
|
|
•
|
Beta stocks is an equity class as classified by PAM based on the following criteria: Infrastructure related with internal free cash flow.
|
|
•
|
Special Situation stocks is an equity class as classified by PAM based on the following criteria: Value-oversold stocks. Below its intrinsic value as determined by PAM. Less than 1 times book value.
|
|
•
|
P/E: Price to Earnings Ratio. A valuation ratio of a company’s current share market price divided by its last 12 months earnings per shares compare to its per-share earnings.
|
|
•
|
EV/EBITDA: Enterprise value to EBIIDA (earnings before interest and amortization) is a valuation multiple used in finance and investment to measure the value of a company. It is the most widely used valuation multiple based on enterprise value.
|
|
•
|
Free Cash Flow: A measure of financial performance calculated as operating cash flow minus capital expenditures. Free cash flow (FCF) represents the cash that a company is able to generate after laying out the money required to maintain or expand its asset base.
|
|
•
|
REIT: Real estate investment trusts, a security that trades on the major exchanges and invests in real estate directly, either through properties or mortgages. REITs receive special tax considerations and typically offer investors high yields, as well as a highly liquid method of investing in real estate.
|
|
•
|
GLA: Gross Leasable Area, the total area available for lease.
|
|
•
|
References to other funds should not be considered a recommendation to buy or sell any security.
|
13
THE MEXICO EQUITY AND INCOME FUND, INC.
|
Real Activity (million US$)
|
2012
|
2011
|
2010
|
2009
|
2008
|
|||||||||||||||
|
Real GDP Growth (y-o-y)
|
3.90 | % | 3.90 | % | 5.50 | % | -6.50 | % | 1.30 | % | ||||||||||
|
Industrial Production (y-o-y Average)
|
3.90 | % | 3.80 | % | 6.06 | % | 7.29 | % | -0.04 | % | ||||||||||
|
Trade Balance (US billions)
|
$ | 0.20 | $ | -1.17 | $ | -3.12 | $ | -4.70 | $ | 15.53 | ||||||||||
|
Exports
|
$ | 370.90 | $ | 349.68 | $ | 298.36 | $ | 229.70 | $ | 291.81 | ||||||||||
|
Export growth (y-o-y)
|
6.20 | % | 17.20 | % | 28.20 | % | -18.10 | % | 7.30 | % | ||||||||||
|
Imports
|
$ | 370.80 | $ | 350.84 | $ | 301.48 | $ | 234.40 | $ | 308.65 | ||||||||||
|
Import growth (y-o-y)
|
5.70 | % | 16.40 | % | 25.00 | % | -19.90 | % | 9.50 | % | ||||||||||
|
Financial Variables and Prices
|
||||||||||||||||||||
|
28-Day CETES (T-bills) Average
|
4.29 | % | 4.81 | % | 4.40 | % | 4.51 | % | 7.97 | % | ||||||||||
|
Exchange rate (Pesos/US$) Average
|
13.15 | 12.60 | 12.63 | 13.50 | 11.16 | |||||||||||||||
|
Inflation IPC, 12 month trailing
|
3.60 | % | 3.82 | % | 4.40 | % | 3.57 | % | 6.53 | % | ||||||||||
|
Mexbol Index
|
||||||||||||||||||||
|
USD Return
|
28.97 | % | -13.46 | % | 28.79 | % | 55.34 | % | -40.48 | % | ||||||||||
|
Market Cap- (US billions)
|
$ | 372.29 | $ | 300.00 | $ | 281.56 | $ | 257.88 | $ | 172.14 | ||||||||||
|
EV/EBITDA
|
9.21 | x | 9.0 | x | 9.48 | x | 7.86 | x | 7.4 | x | ||||||||||
|
Fund’s NAV & Common Share
|
||||||||||||||||||||
|
Market Price Performance
|
||||||||||||||||||||
|
NAV’s per share
|
47.13 | % | -13.81 | % | 41.91 | % | 40.12 | % | -52.89 | % | ||||||||||
|
Share Price
|
45.13 | % | -12.18 | % | 48.41 | % | 22.20 | % | -41.85 | % | ||||||||||
Sources: Banamex, Banco de Mexico, Bloomberg, INEGI
14
THE MEXICO EQUITY AND INCOME FUND, INC.
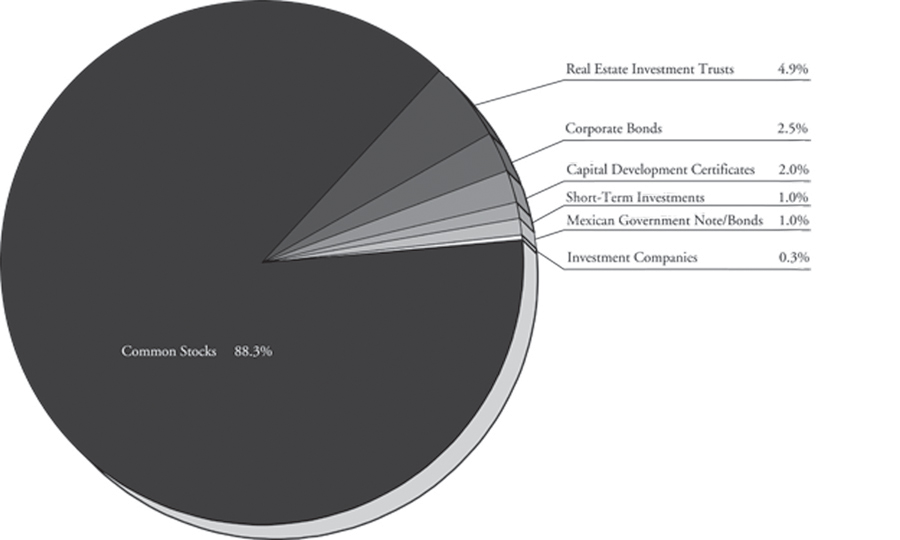
|
Allocation of Portfolio Assets
|
January 31, 2013
(Unaudited)
|
(Calculated as a percentage of Total Investments)
15
THE MEXICO EQUITY AND INCOME FUND, INC.
|
Schedule of Investments
|
January 31, 2013
(Unaudited)
|
|
MEXICO – 100.24%
|
Shares
|
Value
|
||||||
|
COMMON STOCKS – 88.74%
|
||||||||
|
Airports – 2.38%
|
||||||||
|
Grupo Aeroportuario del Centro Norte, S.A. de C.V.
|
750,000 | $ | 2,504,011 | |||||
|
Beverages – 4.37%
|
||||||||
|
Arca Continental S.A.B. de C.V.
|
269,053 | 2,051,765 | ||||||
|
Fomento Economico Mexicano, S.A.B. de C.V.
|
236,150 | 2,549,906 | ||||||
| 4,601,671 | ||||||||
|
Building Materials – 3.54%
|
||||||||
|
Cemex, S.A.B. de C.V. (a)
|
3,408,556 | 3,718,298 | ||||||
|
Cable & Satellite – 3.83%
|
||||||||
|
Megacable Holdings S.A.B. de C.V.
|
1,528,014 | 4,031,969 | ||||||
|
Chemical Products – 6.42%
|
||||||||
|
Mexichem, S.A.B. de C.V.
|
1,194,000 | 6,753,848 | ||||||
|
Construction and Infrastructure – 5.50%
|
||||||||
|
Empresas ICA Sociedad Conroladora, S.A.B. de C.V. (a)
|
615,000 | 1,842,398 | ||||||
|
Impulsora del Desarrollo y el Empleo en America Latina, S.A.B. de C.V. (a)
|
978,455 | 2,127,812 | ||||||
|
Promotora y Operadora de Infraestructura, S.A.B. de C.V. (a)
|
253,426 | 1,813,603 | ||||||
| 5,783,813 | ||||||||
|
Consumer Products – 1.14%
|
||||||||
|
Kimberly-Clark de Mexico S.A.B. de C.V.
|
430,000 | 1,203,632 | ||||||
|
Financial Groups – 8.18%
|
||||||||
|
Banregio Grupo Financiero S.A.B. de C.V.
|
649,481 | 3,066,423 | ||||||
|
Grupo Financiero Banorte, S.A.B. de C.V. – Class O
|
430,850 | 2,970,807 | ||||||
|
Grupo Financiero Santander Mexico S.A.B. de C.V.
|
831,900 | 2,568,731 | ||||||
| 8,605,961 | ||||||||
|
Food Manufacturing – 1.37%
|
||||||||
|
Gruma, S.A.B. de C.V. (a)
|
431,000 | 1,439,311 | ||||||
|
Health Care – 0.97%
|
||||||||
|
Genomma Lab Internacional S.A.B. de C.V. (a)
|
448,550 | 1,024,130 | ||||||
The accompanying notes are an integral part of these financial statements.
16
THE MEXICO EQUITY AND INCOME FUND, INC.
|
Schedule of Investments (continued)
|
January 31, 2013
(Unaudited)
|
|
COMMON STOCKS (continued)
|
Shares
|
Value
|
||||||
|
Holding Companies – 11.86%
|
||||||||
|
Alfa, S.A.B. de C.V. – Class A
|
2,557,190 | $ | 6,140,265 | |||||
|
Grupo Carso, S.A.B. de C.V.
|
1,093,580 | 5,309,384 | ||||||
|
Grupo KUO S.A.B. de C.V. – Series B
|
389,660 | 1,025,131 | ||||||
| 12,474,780 | ||||||||
|
Hotels, Restaurants, and Recreation – 6.57%
|
||||||||
|
Alsea, S.A.B. de C.V. – Class A (a)
|
1,794,511 | 4,160,743 | ||||||
|
Grupe, S.A.B. de C.V. (a)
|
2,328,277 | 2,746,776 | ||||||
| 6,907,519 | ||||||||
|
Insurance Services – 4.32%
|
||||||||
|
Qualitias Controladora S.A.B. de C.V. (a)
|
2,577,947 | 4,541,709 | ||||||
|
Media – 1.93%
|
||||||||
|
Grupo Televisa, S.A.B. de C.V.
|
362,800 | 2,032,771 | ||||||
|
Mining – 6.26%
|
||||||||
|
Grupo Mexico, S.A.B. de C.V. – Series B
|
1,767,800 | 6,587,574 | ||||||
|
Real Estate Services – 2.31%
|
||||||||
|
Corporacion Inmobiliaria Vesta S.A.B. de C.V. (a)
|
1,258,496 | 2,433,928 | ||||||
|
Retail – 9.03%
|
||||||||
|
Corporativo Fragua S.A.B. de C.V.
|
101,290 | 1,688,884 | ||||||
|
El Puerto de Liverpool S.A.B. de C.V.
|
512,438 | 5,679,112 | ||||||
|
Wal-Mart de Mexico, S.A.B. de C.V. – Class V
|
656,338 | 2,127,810 | ||||||
| 9,495,806 | ||||||||
|
Rubber and Plastic Manufacturing – 2.18%
|
||||||||
|
Grupo Pochteca S.A.B. de C.V. (a)
|
5,103,673 | 2,287,994 | ||||||
|
Telecommunication Services – 6.58%
|
||||||||
|
America Movil, S.A.B. de C.V. – Class L
|
5,512,598 | 6,924,023 | ||||||
|
TOTAL COMMON STOCKS (Cost $77,512,395)
|
93,352,748 | |||||||
The accompanying notes are an integral part of these financial statements.
17
THE MEXICO EQUITY AND INCOME FUND, INC.
|
Schedule of Investments (continued)
|
January 31, 2013
(Unaudited)
|
|
REAL ESTATE INVESTMENT TRUSTS – 4.92%
|
Shares
|
Value
|
||||||
|
Fibra Uno Administracion S.A. de C.V.
|
759,147 | $ | 2,378,716 | |||||
|
Mexico Real Estate Management S.A. de C.V. (a)
|
1,194,000 | 2,794,696 | ||||||
|
TOTAL REAL ESTATE INVESTMENT TRUSTS (Cost $4,063,303)
|
5,173,412 | |||||||
|
CAPITAL DEVELOPMENT CERTIFICATES – 2.00%
|
||||||||
|
Atlas Discovery Trust II (b)
|
300,000 | 2,102,843 | ||||||
|
TOTAL CAPITAL DEVELOPMENT CERTIFICATES (Cost $2,317,515)
|
2,102,843 | |||||||
|
CORPORATE BONDS – 2.55%
|
||||||||
|
America Movil, S.A.B. de C.V. – Class L
|
||||||||
|
6.450%, 12/05/2022
|
2,600 | 2,151,066 | ||||||
|
Mexichem, S.A.B. de C.V.
|
||||||||
|
4.875%, 09/19/2022
|
500,000 | 526,875 | ||||||
|
TOTAL CORPORATE BONDS (Cost $2,640,489)
|
2,677,941 | |||||||
|
MEXICAN GOVERNMENT NOTES/BONDS – 1.05%
|
||||||||
|
Mexican Government International Bond
|
||||||||
|
4.750%, 03/08/2044
|
1,048,000 | 1,101,972 | ||||||
|
TOTAL MEXICAN GOVERNMENT NOTES/BONDS (Cost $1,118,503)
|
1,101,972 | |||||||
|
RIGHTS – 0.00%
|
||||||||
|
Grupo Pochteca S.A.B. de C.V. (a)
|
242,004 | 0 | ||||||
|
TOTAL RIGHTS (Cost $0)
|
0 | |||||||
|
SHORT-TERM INVESTMENTS – 0.98%
|
||||||||
|
Mexican INAFIN
|
||||||||
|
0.000% Coupon, 4.646% Effective Yield, 02/05/13 (c)
|
13,087,763 | * | 1,028,837 | |||||
|
TOTAL SHORT-TERM INVESTMENTS (Cost $1,027,592)
|
1,028,837 | |||||||
|
TOTAL MEXICO (Cost $88,679,797)
|
105,437,753 | |||||||
The accompanying notes are an integral part of these financial statements.
18
THE MEXICO EQUITY AND INCOME FUND, INC.
|
Schedule of Investments (concluded)
|
January 31, 2013
(Unaudited)
|
|
UNITED STATES – 0.30%
|
Shares
|
Value
|
||||||
|
INVESTMENT COMPANIES – 0.30%
|
||||||||
|
First American Treasury Obligation – Class A
|
312,171 | $ | 312,171 | |||||
|
TOTAL INVESTMENT COMPANIES (Cost $312,171)
|
312,171 | |||||||
|
TOTAL UNITED STATES (Cost $312,171)
|
312,171 | |||||||
|
TOTAL INVESTMENTS (Cost $88,991,968) – 100.54%
|
105,749,924 | |||||||
|
LIABILITIES IN EXCESS OF OTHER ASSETS – (0.54)%
|
(563,861 | ) | ||||||
|
TOTAL NET ASSETS – 100.00%
|
$ | 105,186,063 | ||||||
Percentages are stated as a percent of net assets.
|
(a)
|
Non-income producing security.
|
|
(b)
|
The Advisor has determined these securities to be illiquid. The total value of illiquid securities at January 31, 2013 was $2,102,843 comprising 2.00% of net assets, while the remainder of the Fund’s net assets 98.00% were liquid.
|
|
(c)
|
Effective Yield based on the purchase price. The calculation assumes the security is held to maturity.
|
|
*
|
Principal amount in Mexican Pesos.
|
The accompanying notes are an integral part of these financial statements.
19
THE MEXICO EQUITY AND INCOME FUND, INC.
(This Page Intentionally Left Blank.)
20
THE MEXICO EQUITY AND INCOME FUND, INC.
|
Statement of Assets & Liabilities
|
January 31, 2013
(Unaudited)
|
|
ASSETS:
|
||||
|
Investments, at value (cost $88,991,968)
|
$ | 105,749,924 | ||
|
Receivables for investments sold
|
2,041,637 | |||
|
Dividends and interest receivable
|
67,003 | |||
|
Other assets
|
17,903 | |||
|
Total Assets
|
107,876,467 | |||
|
LIABILITIES:
|
||||
|
Payable for securities purchased
|
2,476,628 | |||
|
Advisory fees payable
|
99,374 | |||
|
Administration fees payable
|
21,314 | |||
|
Payable to Custodian
|
18,817 | |||
|
NYSE fees payable
|
17,616 | |||
|
Audit fees payable
|
15,778 | |||
|
Fund accounting fees payable
|
10,035 | |||
|
Director fees payable
|
8,655 | |||
|
Custody fees payable
|
8,467 | |||
|
Transfer Agent fees and expenses payable
|
8,365 | |||
|
CCO fees payable
|
2,439 | |||
|
Accrued expenses and other liabilities
|
2,916 | |||
|
Total Liabilities
|
2,690,404 | |||
|
Net Assets
|
$ | 105,186,063 | ||
|
Net Asset Value Per Preferred Share ($985,433 / 57,639)
|
$ | 17.10 | ||
|
Net Asset Value Per Common Share ($104,200,630 / 6,094,804)
|
$ | 17.10 | ||
|
NET ASSETS CONSIST OF:
|
||||
|
Preferred stock, $0.001 par value; 57,639 shares outstanding
|
||||
|
(1,855,128 shares authorized)
|
$ | 58 | ||
|
Common stock, $0.001 par value; 6,094,804 shares outstanding
|
||||
|
(98,144,872 shares authorized)
|
6,095 | |||
|
Paid-in capital
|
80,871,602 | |||
|
Accumulated net investment loss
|
(452,677 | ) | ||
|
Accumulated net realized gain on investments and foreign currency
|
8,006,784 | |||
|
Net unrealized appreciation on investments and foreign currency
|
16,754,201 | |||
|
Net Assets
|
$ | 105,186,063 | ||
The accompanying notes are an integral part of these financial statements.
21
THE MEXICO EQUITY AND INCOME FUND, INC.
|
Statement of Operations
|
For the Six Months Ended
January 31, 2013 (Unaudited)
|
|
INVESTMENT INCOME
|
||||
|
Dividends(1)
|
$ | 316,843 | ||
|
Interest(2)
|
79,482 | |||
|
Total Investment Income
|
396,325 | |||
|
EXPENSES
|
||||
|
Advisory fees (Note B)
|
409,724 | |||
|
Directors’ fees and expenses (Note B)
|
65,935 | |||
|
Administration fees (Note B)
|
57,716 | |||
|
Custodian fees (Note B)
|
28,598 | |||
|
Fund accounting fees (Note B)
|
24,458 | |||
|
Legal fees
|
23,207 | |||
|
CCO fees and expenses (Note B)
|
19,852 | |||
|
Audit fees
|
15,637 | |||
|
NYSE fees
|
14,520 | |||
|
Printing and mailing
|
14,146 | |||
|
Insurance expense
|
13,411 | |||
|
Transfer agent fees and expenses (Note B)
|
10,969 | |||
|
Miscellaneous
|
520 | |||
|
Total expenses
|
698,693 | |||
|
NET INVESTMENT LOSS
|
(302,368 | ) | ||
|
NET REALIZED AND UNREALIZED GAIN ON INVESTMENTS
|
||||
|
Net realized gain from investments and foreign currency transactions
|
10,588,532 | |||
|
Net change in unrealized appreciation on investments and foreign currency transactions
|
10,976,563 | |||
|
Net gain from investments and foreign currency transactions
|
21,565,095 | |||
|
Net increase in net assets resulting from operations
|
$ | 21,262,727 | ||
|
(1)
|
Net of $25,500 in dividend withholding tax.
|
|
|
(2)
|
Net of $1,603 In interest withholding tax.
|
The accompanying notes are an integral part of these financial statements.
22
THE MEXICO EQUITY AND INCOME FUND, INC.
Statements of Changes in Net Assets
|
For the Six
|
||||||||
|
Months Ended
|
For the
|
|||||||
|
January 31, 2013
|
Year Ended
|
|||||||
|
(Unaudited)
|
July 31, 2012
|
|||||||
|
INCREASE (DECREASE) IN NET ASSETS
|
||||||||
|
Operations:
|
||||||||
|
Net investment loss
|
$ | (302,368 | ) | $ | (341,110 | ) | ||
|
Net realized gain on investments and foreign currency transactions
|
10,588,532 | 3,526,903 | ||||||
|
Net change in unrealized appreciation (depreciation) in value
|
||||||||
|
of investments and foreign currency transactions
|
10,976,563 | (703,551 | ) | |||||
|
Net increase in net assets resulting from operations
|
21,262,727 | 2,482,242 | ||||||
|
Distributions to Shareholders from:
|
||||||||
|
Net realized gains
|
||||||||
|
Common stock
|
(1,158,013 | ) | — | |||||
|
Preferred stock
|
(10,951 | ) | — | |||||
|
Decrease in net assets from distributions
|
(1,168,964 | ) | — | |||||
|
Capital Share Transactions
|
||||||||
|
Repurchase of common stock (Note D)
|
(2,671,807 | ) | (4,666,313 | ) | ||||
|
Decrease in net assets from capital share transactions
|
(2,671,807 | ) | (4,666,313 | ) | ||||
|
Total increase/(decrease) in net assets
|
17,421,956 | (2,184,071 | ) | |||||
|
Net Assets:
|
||||||||
|
Beginning of period
|
87,764,107 | 89,948,178 | ||||||
|
End of period*
|
$ | 105,186,063 | $ | 87,764,107 | ||||
|
* Including accumulated net investment loss of
|
$ | (452,677 | ) | $ | (150,309 | |||
The accompanying notes are an integral part of these financial statements.
23
THE MEXICO EQUITY AND INCOME FUND, INC.
Financial Highlights
For a Common Share Outstanding Throughout Each Period
|
For the Six
|
||||||||||||||||||||||||
|
Months Ended
|
||||||||||||||||||||||||
|
January 31,
|
For the Year Ended July 31,
|
|||||||||||||||||||||||
|
2013
|
||||||||||||||||||||||||
|
(Unaudited)
|
2012
|
2011
|
2010
|
2009
|
2008
|
|||||||||||||||||||
|
Per Share Operating Performance
|
||||||||||||||||||||||||
|
Net asset value, beginning of period
|
$ | 13.78 | $ | 13.26 | $ | 10.48 | $ | 7.37 | $ | 28.29 | $ | 38.18 | ||||||||||||
|
Net investment income (loss)
|
(0.05 | ) | (0.05 | ) | (0.03 | ) | (0.01 | ) | 0.07 | 0.03 | ||||||||||||||
|
Net realized and unrealized
|
||||||||||||||||||||||||
|
gains (losses) on investments
|
||||||||||||||||||||||||
|
and foreign currency transactions
|
3.50 | 0.48 | 2.75 | 3.00 | (13.95 | ) | (2.57 | ) | ||||||||||||||||
|
Net increase (decrease)
|
||||||||||||||||||||||||
|
from investment operations
|
3.45 | 0.43 | 2.72 | 2.99 | (13.88 | ) | (2.54 | ) | ||||||||||||||||
|
Less: Distributions
|
||||||||||||||||||||||||
|
Dividends from net investment income
|
— | — | (0.02 | ) | — | (0.25 | ) | — | ||||||||||||||||
|
Distributions from net realized gains
|
(0.19 | ) | — | — | — | (6.52 | ) | (7.41 | ) | |||||||||||||||
|
Total dividends and distributions
|
(0.19 | ) | — | (0.02 | ) | — | (6.77 | ) | (7.41 | ) | ||||||||||||||
|
Capital Share Transactions
|
||||||||||||||||||||||||
|
Anti-dilutive effect of Common
|
||||||||||||||||||||||||
|
Share Repurchase Program
|
0.06 | 0.09 | 0.08 | 0.12 | 0.04 | 0.15 | ||||||||||||||||||
|
Anti-dilutive effect of Common
|
||||||||||||||||||||||||
|
Rights Offering
|
— | — | — | — | — | 0.06 | ||||||||||||||||||
|
Anti-dilutive effect of Preferred
|
||||||||||||||||||||||||
|
In-Kind Tender Offer
|
— | — | — | — | — | 0.02 | ||||||||||||||||||
|
Dilutive effect of Preferred
|
||||||||||||||||||||||||
|
In-Kind Tender Offer
|
— | — | — | (0.00 | )(3) | (0.02 | ) | — | ||||||||||||||||
|
Dilutive effect of Reinvestment of
|
||||||||||||||||||||||||
|
Distributions by Common Stockholders
|
— | — | — | — | (0.29 | ) | (0.17 | ) | ||||||||||||||||
|
Total capital share transactions
|
0.06 | 0.09 | 0.08 | 0.12 | (0.27 | ) | 0.06 | |||||||||||||||||
|
Net Asset Value, end of period
|
$ | 17.10 | $ | 13.78 | $ | 13.26 | $ | 10.48 | $ | 7.37 | $ | 28.29 | ||||||||||||
|
Per share market value, end of period
|
$ | 15.75 | $ | 12.11 | $ | 11.64 | $ | 9.25 | $ | 6.08 | $ | 24.39 | ||||||||||||
|
Total Investment Return Based on
|
||||||||||||||||||||||||
|
Market Value, end of period(1)
|
31.79 | % | 4.04 | % | 26.09 | % | 52.14 | % | (43.10 | )% | (28.38 | )% | ||||||||||||
The accompanying notes are an integral part of these financial statements.
24
THE MEXICO EQUITY AND INCOME FUND, INC.
Financial Highlights (continued)
For a Common Share Outstanding Throughout Each Period
|
For the Six
|
||||||||||||||||||||||||
|
Months Ended
|
||||||||||||||||||||||||
|
January 31,
|
For the Year Ended July 31,
|
|||||||||||||||||||||||
|
2013
|
||||||||||||||||||||||||
|
(Unaudited)
|
2012
|
2011
|
2010
|
2009
|
2008
|
|||||||||||||||||||
|
Ratios/Supplemental Data
|
||||||||||||||||||||||||
|
Net assets, end of period (000’s)
|
$ | 104,201 | $ | 86,970 | $ | 89,184 | $ | 74,609 | $ | 56,980 | $ | 106,484 | ||||||||||||
|
Ratios of expenses to average net assets
|
1.47 | % | 1.57 | % | 1.51 | % | 1.68 | % | 1.82 | % | 1.50 | % | ||||||||||||
|
Ratios of net investment income (loss)
|
||||||||||||||||||||||||
|
to average net assets
|
(0.64 | )% | (0.42 | )% | (0.20 | )% | (0.02 | )% | 0.97 | % | 0.09 | % | ||||||||||||
|
Portfolio turnover rate(2)
|
91.70 | % | 277.48 | %(2) | 253.20 | %(2) | 365.58 | %(2) | 335.64 | %(2) | 224.10 | % | ||||||||||||
|
(1)
|
Total investment return is calculated assuming a purchase of common stock at the current market price on the first day and a sale at the current market price on the last day of each year reported. Dividends and distributions, if any, are assumed for purposes of this calculation to be reinvested at prices obtained under the Fund’s dividend reinvestment plan. Total investment does not reflect brokerage commissions.
|
|
|
(2)
|
Calculated on the basis of the Fund as a whole without distinguishing between shares issued.
|
|
|
(3)
|
Less than 0.5 cent per share.
|
The accompanying notes are an integral part of these financial statements.
25
THE MEXICO EQUITY AND INCOME FUND, INC.
Financial Highlights
For a Preferred Share Outstanding Throughout the Period
|
For the Six
|
||||||||||||||||||||||||
|
Months Ended
|
||||||||||||||||||||||||
|
January 31,
|
For the Year Ended July 31,
|
|||||||||||||||||||||||
|
2013
|
||||||||||||||||||||||||
|
(Unaudited)
|
2012
|
2011
|
2010
|
2009
|
2008
|
|||||||||||||||||||
|
Per Share Operating Performance
|
||||||||||||||||||||||||
|
Net asset value, beginning of period
|
$ | 13.78 | $ | 13.26 | $ | 10.48 | $ | 7.37 | $ | 28.29 | $ | 38.18 | ||||||||||||
|
Net investment income
|
(0.05 | ) | (0.05 | ) | (0.03 | ) | (0.01 | ) | 0.07 | 0.03 | ||||||||||||||
|
Net realized and unrealized
|
||||||||||||||||||||||||
|
gains (losses) on investments
|
||||||||||||||||||||||||
|
and foreign currency transactions
|
3.50 | 0.48 | 2.75 | 3.00 | (13.95 | ) | (2.57 | ) | ||||||||||||||||
|
Net increase (decrease)
|
||||||||||||||||||||||||
|
from investment operations
|
3.45 | 0.43 | 2.72 | 2.99 | (13.88 | ) | (2.54 | ) | ||||||||||||||||
|
Less: Distributions
|
||||||||||||||||||||||||
|
Dividends from net investment income
|
— | — | (0.02 | ) | — | (0.25 | ) | — | ||||||||||||||||
|
Distributions from net realized gains
|
(0.19 | ) | — | — | — | (6.52 | ) | (7.41 | ) | |||||||||||||||
|
Total dividends and distributions
|
(0.19 | ) | — | (0.02 | ) | — | (6.77 | ) | (7.41 | ) | ||||||||||||||
|
Capital Share Transactions
|
||||||||||||||||||||||||
|
Anti-dilutive effect of Common
|
||||||||||||||||||||||||
|
Share Repurchase Program
|
0.06 | 0.09 | 0.08 | 0.12 | 0.04 | 0.15 | ||||||||||||||||||
|
Anti-dilutive effect of Common
|
||||||||||||||||||||||||
|
Rights Offering
|
— | — | — | — | — | 0.06 | ||||||||||||||||||
|
Anti-dilutive effect of Preferred
|
||||||||||||||||||||||||
|
In-Kind Tender Offer
|
— | — | — | — | — | 0.02 | ||||||||||||||||||
|
Dilutive effect of Preferred
|
||||||||||||||||||||||||
|
In-Kind Tender Offer
|
— | — | — | (0.00 | )(3) | (0.02 | ) | — | ||||||||||||||||
|
Dilutive effect of Reinvestment of
|
||||||||||||||||||||||||
|
Distributions by Common Stockholders
|
— | — | — | — | (0.29 | ) | (0.17 | ) | ||||||||||||||||
|
Total capital share transactions
|
0.06 | 0.09 | 0.08 | 0.12 | (0.27 | ) | 0.06 | |||||||||||||||||
|
Net Asset Value, end of period
|
$ | 17.10 | $ | 13.78 | $ | 13.26 | $ | 10.48 | $ | 7.37 | $ | 28.29 | ||||||||||||
|
Per share market value, end of period
|
$ | 15.01 | * | $ | 16.03 | * | $ | 11.93 | * | $ | 9.17 | * | $ | 6.85 | $ | 25.50 | ||||||||
|
Total Investment Return Based on
|
||||||||||||||||||||||||
|
Market Value, end of period(1)
|
(5.11 | )%* | 34.37 | %* | 30.36 | %* | 33.87 | %* | (38.67 | )% | (8.25 | )% | ||||||||||||
The accompanying notes are an integral part of these financial statements.
26
THE MEXICO EQUITY AND INCOME FUND, INC.
Financial Highlights (continued)
For a Preferred Share Outstanding Throughout Each Period
|
For the Six
|
||||||||||||||||||||||||
|
Months Ended
|
||||||||||||||||||||||||
|
January 31,
|
For the Year Ended July 31,
|
|||||||||||||||||||||||
|
2013
|
||||||||||||||||||||||||
|
(Unaudited)
|
2012
|
2011
|
2010
|
2009
|
2008
|
|||||||||||||||||||
|
Ratios/Supplemental Data
|
||||||||||||||||||||||||
|
Net assets, end of period (000’s)
|
$ | 985 | $ | 794 | $ | 764 | $ | 739 | $ | 4,444 | $ | 22,742 | ||||||||||||
|
Ratios of expenses to average net assets
|
1.47 | % | 1.57 | % | 1.51 | % | 1.68 | % | 1.82 | % | 1.50 | % | ||||||||||||
|
Ratios of net investment income (loss)
|
||||||||||||||||||||||||
|
to average net assets
|
(0.64 | )% | (0.42 | )% | (0.20 | )% | (0.02 | )% | 0.97 | % | 0.09 | % | ||||||||||||
|
Portfolio turnover rate(2)
|
91.70 | % | 277.48 | %(2) | 253.20 | %(2) | 365.58 | %(2) | 335.64 | %(2) | 224.10 | % | ||||||||||||
|
(1)
|
Total investment return is calculated assuming a purchase of preferred stock at the current market price on the first day and a sale at the current market price on the last day of each year reported. Dividends and distributions, if any, are assumed for purposes of this calculation to be reinvested at prices obtained under the Fund’s dividend reinvestment plan. Total investment does not reflect brokerage commissions.
|
|
|
(2)
|
Calculated on the basis of the Fund as a whole without distinguishing between shares issued.
|
|
|
(3)
|
Less than 0.5 cent per share.
|
|
|
*
|
Based on the mean of the bid and ask.
|
The accompanying notes are an integral part of these financial statements.
27
THE MEXICO EQUITY AND INCOME FUND, INC.
|
Notes to Financial Statements
|
January 31, 2013
(Unaudited)
|
NOTE A: SUMMARY OF SIGNIFICANT ACCOUNTING POLICIES
The Mexico Equity and Income Fund, Inc. (the “Fund”) was incorporated in Maryland on May 24, 1990, and commenced operations on August 21, 1990. The Fund is registered under the Investment Company Act of 1940, as amended, as a closed-end, non-diversified management investment company.
The preparation of financial statements in accordance with accounting principles generally accepted in the United States of America requires management to make estimates and assumptions that affect the reported amounts and disclosures in the financial statements. Actual results could differ from those estimates.
Significant accounting policies are as follows:
Portfolio Valuation. Investments are stated at value in the accompanying financial statements. All securities for which market quotations are readily available are valued at the last sales price prior to the time of determination of net asset value, or, if no sales price is available at that time, at the closing price last quoted for the securities (but if bid and asked quotations are available, at the mean between the current bid and asked prices, rather than the quoted closing price). Securities that are traded over-the-counter are valued, if bid and asked quotations are available, at the mean between the current bid and asked prices. Investments in short-term debt securities having a maturity of 60 days or less are valued at amortized cost if their term to maturity from the date of purchase was less than 60 days, or by amortizing their value on the 61st day prior to maturity if their term to maturity from the date of purchase when acquired by the Fund was more than 60 days. Other assets and securities for which no quotations are readily available will be valued in good faith at fair value using methods determined by the Board of Directors. These methods include, but are not limited to, the fundamental analytical data relating to the investment; the nature and duration of restrictions in the market in which they are traded (including the time needed to dispose of the security, methods of soliciting offers and mechanics of transfer); the evaluation of the forces which influence the market in which these securities may be purchased or sold, including the economic outlook and the condition of the industry in which the issuer participates. The Fund has a Valuation Committee comprised of independent directors which oversees the valuation of portfolio securities.
Investment Transactions and Investment Income. The cost of investments sold is determined by use of the specific identification method for both financial reporting and income tax purposes. Interest income, including the accretion of discount and amortization of premium on investments, is recorded on an accrual basis; dividend income is recorded on the ex-dividend date or, using reasonable diligence, when known to the Fund. The collectibility of income receivable from foreign securities is evaluated periodically, and any resulting allowances for uncollectible amounts are reflected currently in the determination of investment income. There was no allowance for uncollectible amounts at January 31, 2013.
Tax Status. No provision is made for U.S. Federal income or excise taxes as it is the Fund’s intention to continue to qualify as a regulated investment company and to make the requisite distributions to its
28
THE MEXICO EQUITY AND INCOME FUND, INC.
|
Notes to Financial Statements (continued)
|
January 31, 2013
(Unaudited)
|
shareholders that will be sufficient to relieve it from all or substantially all U.S. Federal income and excise taxes.
The Fund is subject to the following withholding taxes on income from Mexican sources:
|
Dividends distributed by Mexican companies are subject to withholding tax at an effective rate of 0.00%.
|
|
|
Interest income on debt issued by the Mexican federal government is generally not subject to withholding. Withholding tax on interest from other debt obligations such as publicly traded bonds and loans by banks or insurance companies is at a rate of 4.9% under the tax treaty between Mexico and the United States.
|
|
|
Gains realized from the sale or disposition of debt securities may be subject to a 4.9% withholding tax. Gains realized by the Fund from the sale or disposition of equity securities that are listed and traded on the Mexican Stock Exchange (“MSE”) are exempt from Mexican withholding tax if sold through the stock exchange. Gains realized on transactions outside of the MSE may be subject to withholding at a rate of 25% (20% rate prior to January 1, 2002) of the value of the shares sold or, upon the election of the Fund, at 35% (40% rate prior to January 1, 2002) of the gain. If the Fund has owned less than 25% of the outstanding stock of the issuer of the equity securities within the 12 month period preceding the disposition, then such disposition will not be subject to capital gains taxes as provided for in the treaty to avoid double taxation between Mexico and the United States.
|
Summary of Fair Value Exposure at January 31, 2013. The Fund follows the FASB ASC Topic 820 hierarchy, under which various inputs are used in determining the value of the Fund’s investments.
The basis of the hierarchy is dependent upon various “inputs” used to determine the value of the Fund’s investments. These inputs are summarized in the three broad levels listed below:
|
Level 1 –
|
Unadjusted quoted prices in active markets for identical assets or liabilities that the company has the ability to access.
|
|
|
Level 2 –
|
Observable inputs other than quoted prices included in level 1 that are observable for the asset or liability, either directly or indirectly. These inputs may include quoted prices for the identical instrument on an inactive market, prices for similar instruments, interest rates, prepayment speeds, credit risk, yield curves, default rates and similar data.
|
|
|
Level 3 –
|
Unobservable inputs for the asset or liability, to the extent relevant observable inputs are not available, representing the company’s own assumptions about the assumptions a market participant would use in valuing the asset or liability, and would be based on the best information available.
|
29
THE MEXICO EQUITY AND INCOME FUND, INC.
|
Notes to Financial Statements (continued)
|
January 31, 2013
(Unaudited)
|
The availability of observable inputs can vary from security to security and is affected by a wide variety of factors, including, for example, the type of security, whether the security is new and not yet established in the marketplace, the liquidity of markets, and other characteristics particular to the security. To the extent that valuation is based on models or inputs that are less observable or unobservable in the market, the determination of fair value requires more judgment. Accordingly, the degree of judgment exercised in determining fair value is greatest for instruments categorized in level 3.
The inputs used to measure fair value may fall into different levels of the fair value hierarchy. In such cases, for disclosure purposes, the level in the fair value hierarchy within which the fair value measurement falls in its entirety, is determined based on the lowest level input that is significant to the fair value measurement in its entirety.
The inputs or methodology used for valuing securities are not necessarily an indication of the risk associated with investing in those securities. The following is a summary of the inputs used to value the Fund’s investments carried at fair value as of January 31, 2013:
30
THE MEXICO EQUITY AND INCOME FUND, INC.
|
Notes to Financial Statements (continued)
|
January 31, 2013
(Unaudited)
|
|
Level 1*
|
Level 2*
|
Level 3
|
Total
|
|||||||||||||
|
Equity
|
||||||||||||||||
|
Airports
|
$ | 2,504,011 | $ | — | $ | — | $ | 2,504,011 | ||||||||
|
Beverages
|
4,601,671 | — | — | 4,601,671 | ||||||||||||
|
Building Materials
|
3,718,298 | — | — | 3,718,298 | ||||||||||||
|
Cable & Satellite
|
4,031,969 | — | — | 4,031,969 | ||||||||||||
|
Capital Development Certificates
|
— | — | 2,102,843 | 2,102,843 | ||||||||||||
|
Chemical Products
|
6,753,848 | — | — | 6,753,848 | ||||||||||||
|
Construction and Infrastructure
|
5,783,813 | — | — | 5,783,813 | ||||||||||||
|
Consumer Products
|
1,203,632 | — | — | 1,203,632 | ||||||||||||
|
Financial Groups
|
8,605,961 | — | — | 8,605,961 | ||||||||||||
|
Food Manufacturing
|
1,439,311 | — | — | 1,439,311 | ||||||||||||
|
Health Care
|
1,024,130 | — | — | 1,024,130 | ||||||||||||
|
Holding Companies
|
12,474,780 | — | — | 12,474,780 | ||||||||||||
|
Hotels, Restaurants, and Recreation
|
4,160,743 | 2,746,776 | — | 6,907,519 | ||||||||||||
|
Insurance Services
|
4,541,709 | — | — | 4,541,709 | ||||||||||||
|
Media
|
2,032,771 | — | — | 2,032,771 | ||||||||||||
|
Mining
|
6,587,574 | — | — | 6,587,574 | ||||||||||||
|
Real Estate Services
|
2,433,928 | — | — | 2,433,928 | ||||||||||||
|
Retail
|
9,495,806 | — | — | 9,495,806 | ||||||||||||
|
Rubber and Plastic Manufacturing
|
2,287,994 | — | — | 2,287,994 | ||||||||||||
|
Telecommunication Services
|
6,924,023 | — | — | 6,924,023 | ||||||||||||
|
Total Equity
|
90,605,972 | 2,746,776 | 2,102,843 | 95,455,591 | ||||||||||||
|
Real Estate Investment Trusts
|
$ | 5,173,412 | $ | — | $ | — | $ | 5,173,412 | ||||||||
|
Corporate Bonds
|
$ | — | $ | 2,677,941 | $ | — | $ | 2,677,941 | ||||||||
|
Mexican Government Note/Bonds
|
$ | — | $ | 1,101,972 | $ | — | $ | 1,101,972 | ||||||||
|
Rights
|
$ | — | $ | — | $ | — | $ | — | ||||||||
|
Short-Term Investments
|
$ | 312,171 | $ | 1,028,837 | $ | — | $ | 1,341,008 | ||||||||
|
Total Investment in Securities
|
$ | 96,091,555 | $ | 7,555,526 | $ | 2,102,843 | $ | 105,749,924 | ||||||||
|
*
|
There were no significant transfers between levels 1 and 2 during the period. Transfers between levels are recognized at the end of the reporting period.
|
Level 3 Reconciliation Disclosure
Following is a reconciliation of Level 3 assets for which significant unobservable inputs were used to determine fair value.
31
THE MEXICO EQUITY AND INCOME FUND, INC.
|
Notes to Financial Statements (continued)
|
January 31, 2013
(Unaudited)
|
|
Description
|
Investments in Securities
|
|
Balance as of July 31, 2012
|
$ | 1,914,447 | |||
|
Acquisition/Purchase
|
— | ||||
|
Sales
|
— | ||||
|
Realized gain
|
— | ||||
|
Change in unrealized appreciation (depreciation)(1)
|
(188,396 | ) | |||
|
Balance as of January 31, 2013
|
$ | 2,102,843 |
|
(1)
|
Included in the net change of unrealized appreciation (depreciation) on investments in the Statement of Operations.
|
The following table presents additional information about valuation methodologies and inputs used for investments that are measured at fair value and categorized within Level 3 as of January 31, 2013:
|
Impact to
|
||||
|
Valuation from
|
||||
|
Fair Value
|
Valuation
|
Unobservable
|
an increase in
|
|
|
January 31, 2013
|
Methodologies
|
Input(1)
|
Input(2)
|
|
|
Capital Development Certificates
|
$2,102,843
|
Market
|
Sum of the Parts
|
Increase
|
|
Comparables/
|
Valuation
|
|||
|
Sum of the Parts
|
||||
|
Valuation
|
|
(1)
|
In determining certain of these inputs, management evaluates a variety of factors including economic conditions, foreign exchange rates, industry and market developments, market valuations of comparable companies and company specific developments.
|
|
|
(2)
|
This column represents the directional change in the fair value of the Level 3 investments that would result from an increase to the corresponding unobservable input. A decrease to the unobservable input would have the opposite effect.
|
Federal Income Taxes. The Fund intends to comply with the requirements of the Internal Revenue Code necessary to qualify as a regulated investment company and to make the requisite distributions of income and capital gains to its shareholders sufficient to relieve it from all or substantially all federal income taxes. Therefore, no federal income tax provision is required. Accounting principles generally accepted in the United States of America require that permanent differences between financial reporting and tax reporting be reclassified between various components of net assets.
The Fund recognizes the tax benefits of uncertain tax positions only where the position is “more-likely-than-not” to be sustained assuming examination by tax authorities. The Adviser has analyzed the Fund’s tax positions, and has concluded that no liability for unrecognized tax benefits should be recorded related to uncertain tax positions taken on returns filed for open tax years (2009-2011), or expected to be taken in the Fund’s 2012 tax returns. The Fund identifies its major tax jurisdictions as U.S. Federal, New York
32
THE MEXICO EQUITY AND INCOME FUND, INC.
|
Notes to Financial Statements (continued)
|
January 31, 2013
(Unaudited)
|
State and foreign jurisdictions where the Fund makes significant investments; however, the Fund is not aware of any tax positions for which it is reasonably possible that the total amounts of unrecognized tax benefits will change materially in the next twelve months.
As of July 31, 2012, the Fund deferred post-October currency losses of $150,309, which will be recognized in the fiscal year ending July 31, 2013.
Reclassification of Capital Accounts. Accounting Principles generally accepted in the United States of America require certain components of net assets relating to permanent differences be reclassified between financial and tax reporting. These reclassifications have no effect on net assets or net asset value per share. The permanent differences are primarily attributed to foreign currency gain reclassifications. For the year ended July 31, 2012, the Fund decreased undistributed net investment loss by $190,801, decreased accumulated realized loss by $596,977 and decreased paid in capital by $787,778.
Foreign Currency Translation. The books and records of the Fund are maintained in U.S. dollars. Foreign currency amounts are translated into U.S. dollars on the following basis:
|
(i)
|
market value of investment securities, assets and liabilities at the current Mexican peso exchange rate on the valuation date, and
|
||
|
(ii)
|
purchases and sales of investment securities, income and expenses at the Mexican peso exchange rate prevailing on the respective dates of such transactions. Fluctuations in foreign currency rates, however, when determining the gain or loss upon the sale of foreign currency denominated debt obligations pursuant to U.S. Federal income tax regulations; such amounts are categorized as foreign exchange gain or loss for income tax reporting purposes.
|
The Fund reports realized foreign exchange gains and losses on all other foreign currency related transactions as components of realized gains and losses for financial reporting purposes, whereas such gains and losses are treated as ordinary income or loss for Federal income tax purposes.
Securities denominated in currencies other than U.S. dollars are subject to changes in value due to fluctuations in the foreign exchange rate. Foreign security and currency transactions may involve certain considerations and risks not typically associated with those of domestic origin as a result of, among other factors, the level of governmental supervision and regulation of foreign securities markets and the possibilities of political or economic instability.
Distribution of Income and Gains. The Fund intends to distribute to shareholders, at least annually, substantially all of its net investment income, including foreign currency gains. The Fund also intends to distribute annually any net realized capital gains in excess of net realized capital losses (including any capital loss carryovers), except in circumstances where the Directors of the Fund determine that the decrease in the size of the Fund’s assets resulting from the distribution of the gains would generally not be
33
THE MEXICO EQUITY AND INCOME FUND, INC.
|
Notes to Financial Statements (continued)
|
January 31, 2013
(Unaudited)
|
in the interest of the Fund’s shareholders. An additional distribution may be made to the extent necessary to avoid payment of a 4% U.S. Federal excise tax.
Distributions to shareholders are recorded on the ex-dividend date. The amount of dividends and distributions from net investment income and net realized gains are determined in accordance with U.S. Federal income tax regulations, which may differ from accounting principles generally accepted in the United States of America. These “book/tax” differences are either considered temporary or permanent in nature. To the extent these differences are permanent in nature, such amounts are reclassified within the capital accounts based on their Federal tax-basis treatment; temporary differences do not require reclassification. To the extent they exceed net investment income and net realized gains for tax purposes, they are reported as distributions from additional paid-in capital.
Distributions to Shareholders. The tax character of distributions paid to shareholders during the periods ended July 31, 2012 and July 31, 2011 were as follows:
|
Distributions paid from:
|
7/31/12
|
7/31/11
|
||||||
|
Ordinary Income
|
$ | — | $ | 161,853 | ||||
|
Long-Term Capital Gain
|
— | — | ||||||
|
Total
|
$ | — | $ | 161,853 | ||||
As of July 31, 2012, the components of distributable earnings on a tax basis were as follows:
|
Cost of Investments for tax purposes(a)
|
$ | 81,732,426 | |||
|
Gross tax unrealized appreciation on investments
|
6,603,950 | ||||
|
Gross tax unrealized depreciation on investments
|
(2,239,096 | ) | |||
|
Net tax unrealized appreciation (depreciation) on investments
|
4,364,854 | ||||
|
Net tax unrealized appreciation (depreciation) on
|
|||||
|
investments
|
$ | 4,364,854 | |||
|
Other accumulated gains(losses)
|
$ | (150,309 | ) | ||
|
Total accumulated earnings(losses)
|
$ | 4,214,545 |
|
(a)
|
Represents cost for federal income tax purposes. Differences between the Fund’s cost basis of investments at July 31, 2012, for book and tax purposes, relates primarily to the deferral of losses related to wash sales.
|
NOTE B: MANAGEMENT, INVESTMENT ADVISORY AND ADMINISTRATIVE SERVICES
Pichardo Asset Management, S.A. de C.V. serves as the Fund’s Investment Adviser (the “Investment Adviser”) under the terms of the Investment Advisory Agreement (the “Advisory Agreement”) effective
34
THE MEXICO EQUITY AND INCOME FUND, INC.
|
Notes to Financial Statements (continued)
|
January 31, 2013
(Unaudited)
|
July 1, 2003. Pursuant to the Advisory Agreement, the Investment Adviser makes investment decisions for the Fund and supervises the acquisition and disposition of securities by the Fund. For its services, the Investment Adviser receives a monthly fee at an annual rate of 0.80% of the Fund’s average daily net assets. Beginning January 2013 the Adviser is paid a base fee, accrued daily at the annual rate of 1.00%, subject to a performance fee adjustment which increases or decreases the fee depending upon how well the Fund has performed relative to the MSCI Mexico Index (the “Index”). The fee adjustment will be calculated using a monthly adjustment rate that is based upon the Fund’s relative performance to the Index. The performance adjustment rate will be limited to a 0.15% fee adjustment, positive or negative. For the six months ended January 31, 2013, these fees amounted to $409,724.
Effective January 1, 2013, the Fund pays each of its directors who is not a director, officer or employee of the Investment Adviser, the Administrator or any affiliate thereof an annual fee of $30,000, paid pro rata, quarterly plus a fee of $500 for each meeting held telephonically. As additional annual compensation, the Chairman of the Fund will receive $5,000, the Audit Committee Chairman and Valuation Committee Chairman will receive $3,000, and the Nomination Committee Chairman will receive $2,000. For serving the Fund as Chief Compliance Officer, in addition to the aforementioned Directors’ fees, Mr. Hellerman receives annual compensation in the amount of $35,000. In addition, the Fund reimburses the directors and Chief Compliance Officer (“CCO”) for travel and out-of-pocket expenses incurred in connection with Board of Directors’ meetings and CCO due diligence requirements.
U.S. Bancorp Fund Services, LLC (“USBFS”), an indirect wholly-owned subsidiary of U.S. Bancorp, serves as the Fund’s Administrator and, in that capacity, performs various administrative services for the Fund. USBFS also serves as the Fund’s Fund Accountant (the “Fund Accountant”) and Transfer Agent. U.S. Bank, N.A. serves as the Fund’s custodian (the “Custodian”). The Custodian is an affiliate of the Administrator. The Administrator prepares various federal and state regulatory filings, reports and returns for the Fund; prepares reports and materials to be supplied to the directors; monitors the activities of the Fund’s Custodian and Fund Accountant; coordinates the preparation and payment of the Fund’s expenses and reviews the Fund’s expense accruals.
For the six months ended January 31, 2013, the Mexico Equity and Income Fund, Inc. incurred Administra tion fees of $57,716; Fund Accounting fees and expenses of $24,458, Transfer Agent fees and expenses of $10,969 and Custody fees of $28,598.
At January 31, 2013, fees of $21,314, $10,035, $8,365 and $8,467 were owed for Fund Administration, Accounting, Transfer Agency, and Custody fees, respectively.
NOTE C: PORTFOLIO ACTIVITY
Purchases and sales of securities other than short-term obligations, aggregated $89,184,440 and $83,928,542 respectively, for the six months ended January 31, 2013.
35
THE MEXICO EQUITY AND INCOME FUND, INC.
|
Notes to Financial Statements (continued)
|
January 31, 2013
(Unaudited)
|
At January 31, 2013 approximately 100.2% of the Fund’s net assets were invested in Mexican securities. The Mexican securities markets are substantially smaller, less liquid, and more volatile than the major securities markets in the United States. Consequently, acquisitions and dispositions of securities by the Fund may be limited.
NOTE D: CAPITAL STOCK
During the six months ended January 31, 2012 the Fund purchased 215,118 shares of capital stock in the open market at a cost of $2,671,807. The weighted average discount of these purchases comparing the average purchase price to net asset value at the close of the New Stock Exchange was 12.82%.
During the year ended July 31, 2012 the Fund purchased 413,960 shares of capital stock in the open market at a cost of $4,666,313. The weighted average discount of these purchases comparing the average purchase price to net asset value at the close of the New Stock Exchange was 11.39%.
During the six months ended January 31, 2013 the Fund offered to convert any outstanding preferred shares to common shares on a one-for-one basis. There were no conversions of preferred shares to common shares during the period.
During the year ended July 31, 2012 the Fund offered to convert any outstanding preferred shares to common shares on a one-for-one basis. There were no conversions of preferred shares to common shares during the period.
Notice is hereby given in accordance with Section 23(c) of the Investment Company Act of 1940 that the Fund may purchase, from time to time, shares of its common and preferred stock in the open market.
NOTE E: PREFERRED STOCK
Shares of the Preferred Stock have identical rights, voting powers, restrictions, and qualifications of the common stock of the Fund except for repurchase and conversion preference features and the ability to elect two directors.
Subsequent event
Note to preferred shareholders. The New York Stock Exchange (“NYSE”) announced March 21, 2013 that the staff of NYSE Regulation, Inc. has determined that the Preferred Stock is no longer suitable for listing because it does not meet the minimum continued listing distribution requirement of 100,000 publicly held shares outstanding as set forth in Section 802.01 of the NYSE Listed Company Manual. Trading on the NYSE in the Fund’s Preferred Stock was suspended prior to the opening of trading on March 22, 2013.
36
THE MEXICO EQUITY AND INCOME FUND, INC.
|
Additional Information
|
January 31, 2013
(Unaudited)
|
NOTE 1: INFORMATION ABOUT PROXY VOTING
Information regarding how the Fund votes proxies relating to portfolio securities is available without charge upon request by calling toll-free at 1-877-785-0376 and the SEC’s website at www.sec.gov. Information regarding how the Fund voted proxies relating to portfolio securities during the most recent twelve month period ended June 30 is available on the SEC’s website at www.sec.gov or by calling the toll-free number listed above.
NOTE 2: AVAILABILITY OF QUARTERLY PORTFOLIO SCHEDULE
The Fund files its complete schedule of portfolio holdings with the SEC for the first and third quarters of each fiscal year on Form N-Q. The filing will be available, upon request, by calling 1-877-785-0376. Furthermore, you will be able to obtain a copy of the filing on the SEC’s website at http://www.sec.gov beginning with the filing for the period ended October 31, 2004. The Fund’s Forms N-Q may also be reviewed and copied at the SEC’s Public Reference Room in Washington, DC and information on the operation of the Public Reference Room may be obtained by calling 1-800-SEC-0330.
NOTE 3: INFORMATION ABOUT CERTIFICATIONS
In December 2012, the Fund submitted a CEO annual certification to the NYSE in which the Fund’s principal executive officer certified that she was not aware, as of the date of the certification, of any violation by the Fund of the NYSE’s Corporate Governance listing standards. In addition, as required by Section 302 of the Sarbanes-Oxley Act of 2002 and related SEC rules, the Fund’s principal executive and principal financial officers have made quarterly certifications, included in the filing with the SEC on Forms N-CSR and N-Q, relating to, among other things, the Fund’s disclosure controls and procedures and internal control over financial reporting.
NOTE 4: INFORMATION ON FORWARD LOOKING STATEMENTS
Except for historical information contained in this report for the Fund, the matters discussed in this report may constitute forward-looking statements made pursuant to the safe-harbor provisions of the Private Securities Litigation Reform Act of 1995. These include any adviser or portfolio manager predictions, assessments, analyses or outlooks for individual securities, industries, market sectors and/or markets. These statements involve risks and uncertainties. In addition to the general risks described for the Fund in the most recent Prospectus, other factors bearing on this report include the accuracy of the adviser’s or portfolio manager’s data, forecasts and predictions, and the appropriateness of the investment programs designed by the adviser or portfolio manager to implement their strategies efficiently and effectively. Any one or more of these factors, as well as other risks affecting the securities markets and investment instruments generally, could cause the actual results of the Fund to differ materially as compared to benchmarks associated with the Fund.
37
THE MEXICO EQUITY AND INCOME FUND, INC.
|
Additional Information (concluded)
|
January 31, 2013
(Unaudited)
|
ADDITIONAL INFORMATION APPLICABLE TO FOREIGN SHAREHOLDERS ONLY
The percent of ordinary income distributions designated as interest related dividends for the fiscal year ended July 31, 2012 was 0.00%. (unaudited)
The percentage of taxable ordinary income distributions that are designated as short-term capital gain distributions under Internal Revenue Section 871(k)(2)(C) was 0.00%. (unaudited)
The Fund designates 0.00% of dividends declared for the fiscal year July 31, 2012 from net investment income as qualified dividend income under the Jobs and Growth Tax Relief Reconciliation Act of 2003. (unaudited)
38
THE MEXICO EQUITY AND INCOME FUND, INC.
|
Dividends and Distributions
|
January 31, 2013
(Unaudited)
|
DIVIDEND REINVESTMENT PLAN
The Fund intends to distribute to shareholders substantially all of its net investment company taxable income at least annually. Investment company taxable income, as defined in section 852 of the Internal Revenue Service Code of 1986, includes all of the Fund’s taxable income minus the excess, if any, of its net realized long-term capital gains over its net realized short-term capital losses (including any capital loss carryovers), plus or minus certain other required adjustments. The Fund also expects to distribute annually substantially all of its net realized long-term capital gains in excess of net realized short-term capital losses (including any capital loss carryovers), except in circumstances where the Fund realizes very large capital gains and where the Directors of the Fund determine that the decrease in the size of the Fund’s assets resulting from the distribution of the gains would not be in the interest of the Fund’s shareholders generally.
Pursuant to the Fund’s Dividend Reinvestment Plan (the “Plan”), each shareholder will be deemed to have elected, unless the Plan Agent (as defined below) is otherwise instructed by the shareholder in writing, to have all distributions, net of any applicable U.S. withholding tax, automatically reinvested in additional shares of the Fund by U.S. Bancorp Fund Services, LLC, the Fund’s transfer agent, as the Plan Agent (the “Plan Agent”). Shareholders who do not participate in the Plan will receive all dividends and distributions in cash, net of any applicable U.S. withholding tax, paid in U.S. dollars by check mailed directly to the shareholder by the Plan Agent, as dividend-paying agent. Shareholders who do not wish to have dividends and distributions automatically reinvested should notify the Plan Agent for The Mexico Equity and Income Fund, Inc., c/o U.S. Bancorp Fund Services, ATTN: Ms. Casey Sauer, 615 East Michigan Street, Milwaukee, WI 53202. Dividends and distributions with respect to shares of the Fund’s Common Stock and Preferred Stock registered in the name of a broker-dealer or other nominee (i.e., in “street name”) will be reinvested under the Plan unless the service is not provided by the broker or nominee or the shareholder elects to receive dividends and distributions in cash. A shareholder whose shares are held by a broker or nominee that does not provide a dividend reinvestment program may be required to have his shares registered in his own name to participate in the Plan. Investors who own shares of the Fund’s Common Stock and Preferred Stock registered in street name should contact the broker or nominee for details.
The Plan Agent serves as agent for the shareholders in administering the Plan. If the Directors of the Fund declare an income dividend or a capital gains distribution payable either in the Fund’s Common Stock, Preferred Stock, or in cash, as shareholders may have elected, nonparticipants in the Plan will receive cash and participants in the Plan will receive Common Stock or Preferred Stock, respectively, to be issued by the Fund. If the market price per share on the valuation date equals or exceeds net asset value per share on that date, the Fund will issue new shares to participants at net asset value; or, if the net asset value is less than 95% of the market price on the valuation date, then such shares will be issued at 95% of the market price.
If net asset value per share on the valuation date exceeds the market price per share on that date, participants in the Plan will receive shares of Common Stock or Preferred Stock from the Fund valued at
39
THE MEXICO EQUITY AND INCOME FUND, INC.
|
Dividends and Distributions (concluded)
|
January 31, 2013
(Unaudited)
|
market price. The valuation date is the dividend or distribution payment date or, if that date is not a New York Stock Exchange trading day, the next preceding trading day. If the Fund should declare an income dividend or capital gains distribution payable only in cash, the Plan Agent will, as agent for the participants, buy Fund shares in the open market on the New York Stock Exchange or elsewhere, for the participants’ accounts on, or shortly after, the payment date.
The Plan Agent maintains all shareholder accounts in the Plan and furnishes written confirmations of all transactions in an account, including information needed by shareholders for personal and tax records. Shares in the account of each Plan participant will be held by the Plan Agent in noncertified form in the name of the participant, and each shareholder’s proxy will include those shares purchased pursuant to the Plan.
In the case of shareholders such as banks, brokers or nominees that hold shares for others who are beneficial owners, the Plan Agent will administer the Plan on the basis of the number of shares certified from time to time by the shareholders as representing the total amount registered in the shareholder’s name and held for the account of beneficial owners who participate in the Plan.
There is no charge to participants for reinvesting dividends or capital gains distributions payable in either Common Stock, Preferred Stock or cash. The Plan Agent’s fees for the handling or reinvestment of such dividends and capital gains distributions will be paid by the Fund. There will be no brokerage charges with respect to shares issued directly by the Fund as a result of dividends or capital gains distributions payable either in stock or in cash. However, each participant will pay a pro rata share of brokerage commissions incurred with respect to the Plan Agent’s open market purchases in connection with the reinvestment of dividends or capital gains distributions payable in cash.
Brokerage charges for purchasing small amounts of Common Stock and Preferred Stock for individual accounts through the Plan are expected to be less than usual brokerage charges for such transactions because the Plan Agent will be purchasing stock for all participants in blocks and prorating the lower commissions thus attainable. Brokerage commissions will vary based on, among other things, the broker selected to effect a particular purchase and the number of participants on whose behalf such purchase is being made.
The receipt of dividends and distributions in Common Stock or Preferred Stock under the Plan will not relieve participants of any income tax (including withholding tax) that may be payable on such dividends or distributions.
Experience under the Plan may indicate that changes in the Plan are desirable. Accordingly, the Fund and the Plan Agent reserve the right to terminate the Plan as applied to any dividend or distribution paid subsequent to notice of the termination sent to participants at least 30 days before the record date for such dividend or distribution. The Plan also may be amended by the Fund or the Plan Agent, but (except when necessary or appropriate to comply with applicable law, or rules or policies of a regulatory authority) only upon at least 30 days’ written notice to participants. All correspondence concerning the Plan should be directed to the Plan Agent at the address above.
40
THE MEXICO EQUITY AND INCOME FUND, INC.
Results of Annual
|
Stockholders Meeting
|
January 31, 2013
(Unaudited)
|
The Fund’s Annual Stockholders meeting was held on December 4, 2012, at the offices of U.S. Bancorp Fund Services, 777 E. Wisconsin Avenue, Milwaukee, WI 53202. As of October 17, 2012, the record date, outstanding shares of common and preferred stock were 6,230,817 and 57,639 respectively. Holders of 5,545,932 shares of the Fund were present at the meeting either in person or by proxy. These holders, as being holders of a majority of the outstanding shares of the Fund, constituted a quorum. The stockholders voted on two proposals. The stockholders elected two Directors to the Board of Directors by each share class. The following table provides information concerning the matters voted on at the meeting:
|
I. (A)
|
Election of Directors – Common and Preferred
|
||
|
Votes For
|
Votes Against
|
||
|
Andrew Dakos
|
3,326,776
|
2,219,156
|
|
|
I. (B)
|
Election of Directors – Preferred
|
||
|
Votes For
|
Votes Against
|
||
|
Rajeev Das
|
31,965
|
21,358
|
41
THE MEXICO EQUITY AND INCOME FUND, INC.
|
Privacy Policy
|
January 31, 2013
(Unaudited)
|
|
FACTS
|
WHAT DOES THE MEXICO EQUITY AND INCOME FUND, INC. (THE “FUND”),
|
|||
|
AND SERVICE PROVIDERS TO THE FUND, ON THE FUND’S BEHALF, DO WITH YOUR PERSONAL INFORMATION?
|
||||
|
Why?
|
Financial companies choose how they share your personal information. Federal law gives consumers the right to limit some but not all sharing. Federal law also requires us to tell you how we collect, share, and protect your personal information. Please read this notice carefully to understand what we do.
|
|||
|
What?
|
The types of personal information we, and our service providers, on our behalf, collect and share depends on the product or service you have with us. This information can include:
|
|||
|
• Social Security number
|
||||
|
• account balances
|
||||
|
• account transactions
|
||||
|
• transaction history
|
||||
|
• wire transfer instructions
|
||||
|
• checking account information
|
||||
|
When you are no longer our customer, we continue to share your information as described in this notice.
|
||||
|
How?
|
All financial companies need to share customers' personal information to run their everyday business. In the section below, we list the reasons financial companies can share their customers’ personal information; the reasons the Fund, and our service providers, on our behalf, choose to share; and whether you can limit this sharing.
|
|
Reasons we can share your personal information
|
Does the Fund share?
|
Can you limit this sharing?
|
||
|
For our everyday business purposes –
|
||||
|
such as to process your transactions, maintain your account(s),
|
||||
|
respond to court orders and legal investigations, or report to
|
||||
|
credit bureaus
|
Yes
|
No
|
||
|
For our marketing purposes –
|
||||
|
to offer our products and services to you
|
No
|
We don’t share
|
||
|
For joint marketing with other financial companies
|
No
|
We don’t share
|
||
|
For our affiliates’ everyday business purposes –
|
||||
|
information about your transactions and experiences
|
Yes
|
No
|
||
|
For our affiliates’ everyday business purposes –
|
||||
|
information about your creditworthiness
|
No
|
We don’t share
|
||
|
For our affiliates to market to you
|
No
|
We don’t share
|
||
|
For nonaffiliates to market to you
|
No
|
We don’t share
|
|
Questions?
|
Call (877) 785-0376
|
42
THE MEXICO EQUITY AND INCOME FUND, INC.
|
Privacy Policy (concluded)
|
January 31, 2013
(Unaudited)
|
|
What we do
|
||||
|
Who is providing this notice?
|
The Mexico Equity and Income Fund, Inc. (the “Fund”)
|
|||
|
How does the Fund, and the
|
To protect your personal information from unauthorized access and use,
|
|||
|
Fund’s service providers, on the
|
we and our service providers use security measures that comply with
|
|||
|
Fund’s behalf, protect my
|
federal law. These measures include computer safeguards and secured
|
|||
|
personal information?
|
files and buildings.
|
|||
|
How does the Fund, and the
|
We collect your personal information, for example, when you:
|
|||
|
Fund’s service providers, on
|
• open an account
|
|||
|
the Fund’s behalf, collect my
|
• provide account information
|
|||
|
personal information?
|
• give us your contact information
|
|||
|
• make a wire transfer
|
||||
|
We also collect your information from others, such as credit bureaus, affiliates, or other companies.
|
||||
|
Why can’t I limit all sharing?
|
Federal law gives you the right to limit only
|
|||
|
• sharing for affiliates’ everyday business purposes – information about your creditworthiness
|
||||
|
• affiliates from using your information to market to you
|
||||
|
• sharing for nonaffiliates to market to you
|
||||
|
State laws and individual companies may give you additional rights to limit sharing.
|
||||
|
Definitions
|
||||
|
Affiliates
|
Companies related by common ownership or control. They can be financial and nonfinancial companies.
|
|||
|
• None
|
||||
|
Nonaffiliates
|
Companies not related by common ownership or control. They can be financial and nonfinancial companies.
|
|||
|
• The Fund does not share with nonaffiliates so they can market to you.
|
||||
|
Joint marketing
|
A formal agreement between nonaffiliated financial companies that together market financial products or services to you.
|
|||
|
• The Fund does not jointly market.
|
43
THE MEXICO EQUITY AND INCOME FUND, INC.
|
Management of the Fund
|
January 31, 2013
(Unaudited)
|
Board of Directors. The management and affairs of the Fund are supervised by the Board of Directors. The Board consists of six individuals, five of whom are not “interested persons” of the Fund as the term is defined in the Investment Company Act of 1940, as amended (the “1940 Act”). The Directors are fiduciaries for the Fund’s shareholders and are governed by the laws of the State of Maryland in this regard. The Board establishes policies for the operation of the Fund and appoints the officers who conduct the daily business of the Fund. The Directors and Interested Officers of the Fund are listed below with their addresses, present position(s) with the Fund, length of time served, principal occupations over at least the last five years, and any other Directorships held. Please note that the Fund is not part of a fund complex.
|
Term of
|
|||||
|
Year
|
Position(s)
|
Office/Length
|
Principal Occupation
|
Other Directorships
|
|
|
Name and Address
|
Born
|
with the Fund
|
of Time Served
|
During the Past Five Years
|
Held by Director
|
|
Gerald Hellerman
|
1937
|
Director, Chief
|
2010 / 11 years
|
Managing Director,
|
Director, AirNet
|
|
615 E. Michigan Street
|
Financial Officer
|
Hellerman Associates
|
Systems Inc.;
|
||
|
Milwaukee, WI 53202
|
and Chief
|
Director, Brantley
|
|||
|
Compliance
|
Capital Corporation;
|
||||
|
Officer
|
Director, Ironsides
|
||||
|
Partners Opportunity
|
|||||
|
Offshore Fund Ltd.;
|
|||||
|
Director, MVC
|
|||||
|
Capital, Inc.;
|
|||||
|
Director, Old Mutual
|
|||||
|
Absolute Return and
|
|||||
|
Emerging managers
|
|||||
|
Fund Complex
|
|||||
|
(consisting of six
|
|||||
|
funds); Director,
|
|||||
|
Special Opportunities
|
|||||
|
Fund Inc.; Director,
|
|||||
|
TM Entertainment
|
|||||
|
and Media, Inc.;
|
|||||
|
Director, Imperial
|
|||||
|
Holdings, Inc.
|
44
THE MEXICO EQUITY AND INCOME FUND, INC.
|
Management of the Fund (continued)
|
January 31, 2013
(Unaudited)
|
|
Term of
|
|||||
|
Year
|
Position(s)
|
Office/Length
|
Principal Occupation
|
Other Directorships
|
|
|
Name and Address
|
Born
|
with the Fund
|
of Time Served
|
During the Past Five Years
|
Held by Director
|
|
Phillip Goldstein
|
1945
|
Director
|
2011 / 12 years
|
Member of Bulldog
|
Director, ASA Ltd.;
|
|
Park 80 West, Plaza Two,
|
Holdings, LLC, the
|
Director, MVC
|
|||
|
250 Pehle Avenue,
|
owner of several entities
|
Capital Inc.; Director,
|
|||
|
Suite 708,
|
serving as the general
|
Imperial Holdings,
|
|||
|
Saddle Brook, NJ 07663
|
partner of several private
|
Inc.; Chairman,
|
|||
|
investment partnerships in
|
Special Opportunities
|
||||
|
the Bulldog Investors group
|
Fund, Inc.; Chairman,
|
||||
|
of funds, and the owner of
|
Brantley Capital
|
||||
|
Kimball & Winthrop, LLC,
|
Corporation;
|
||||
|
the managing general partner
|
Chairman, Special
|
||||
|
of Bulldog Investors
|
Opportunities
|
||||
|
General Partnership, since
|
Fund Inc.; Chairman,
|
||||
|
2012. From 1992-2012,
|
Brantley Capital
|
||||
|
Mr. Goldstein was a
|
Corporation;
|
||||
|
member of the general
|
Director, Korea
|
||||
|
partner of several private
|
Equity Fund, Inc.
|
||||
|
investment partnerships
|
|||||
|
in the Bulldog Investors
|
|||||
|
group of funds. Member
|
|||||
|
of the investment advisor to
|
|||||
|
the Special Opportunities
|
|||||
|
Fund, Inc. since 2009.
|
|||||
|
Glenn Goodstein
|
1963
|
Director
|
2010 / 11 years
|
Registered Investment
|
None
|
|
2308 Camino Robledo
|
Advisor; held numerous
|
||||
|
Carlsbad, CA 92009
|
executive positions with
|
||||
|
Automatic Data Processing
|
|||||
|
until 1996.
|
|||||
|
Rajeev Das
|
1968
|
Director
|
2009 / 11 years
|
Since 2004, Mr. Das has
|
None
|
|
68 Lafayette Avenue
|
been a Principal of the
|
||||
|
Dumont, NJ 07628
|
entities serving as the general
|
||||
|
partner of the private
|
|||||
|
investment partnerships in
|
|||||
|
the Bulldog Investors group
|
|||||
|
of investment funds. Head
|
|||||
|
Trader of the investment
|
|||||
|
advisor to the Special
|
|||||
|
Opportunities Fund, Inc.
|
|||||
|
since 2009. Treasurer of
|
|||||
|
Special Opportunities Fund,
|
|||||
|
Inc. since 2009.
|
45
THE MEXICO EQUITY AND INCOME FUND, INC.
|
Management of the Fund (concluded)
|
January 31, 2013
(Unaudited)
|
|
Term of
|
|||||
|
Year
|
Position(s)
|
Office/Length
|
Principal Occupation
|
Other Directorships
|
|
|
Name and Address
|
Born
|
with the Fund
|
of Time Served
|
During the Past Five Years
|
Held by Director
|
|
Andrew Dakos
|
1966
|
Director
|
2009 / 11 years
|
Member of Bulldog
|
Director, Special
|
|
Park 80 West, Plaza Two
|
Holdings, LLC, the owner
|
Opportunities
|
|||
|
250 Pehle Avenue,
|
of several entities serving
|
Fund Inc.; Director,
|
|||
|
Suite 708
|
as the general partner of
|
Brantley Capital
|
|||
|
Saddle Brook, NJ 07663
|
several private investment
|
Corporation;
|
|||
|
partnerships in the Bulldog
|
Director, Imperial
|
||||
|
Investors group of funds,
|
Holdings, Inc.
|
||||
|
and the owner of Kimball
|
|||||
|
& Winthrop, LLC, the
|
|||||
|
managing general partner
|
|||||
|
of Bulldog Investors General
|
|||||
|
Partnership, since 2012.
|
|||||
|
From 1992-2012, Mr. Dakos
|
|||||
|
was a member of the general
|
|||||
|
partner of several private
|
|||||
|
investment partnerships in
|
|||||
|
the Bulldog Investors group
|
|||||
|
of funds. Member of the
|
|||||
|
investment advisor to the
|
|||||
|
Special Opportunities Fund,
|
|||||
|
Inc. since 2009, and Chief
|
|||||
|
Compliance Officer of the
|
|||||
|
investment advisor to the
|
|||||
|
Special Opportunities Fund
|
|||||
|
from 2009-2012.
|
|||||
|
Maria Eugenia Pichardo
|
1950
|
Interested
|
2011 / 2 years
|
Portfolio Manager of the
|
None
|
|
Paseo de Tamarindos 45-201
|
Director,
|
Fund since the Fund’s
|
|||
|
Bosques de las Lomas
|
Officer,
|
Indefinite / 8 years
|
Inception; President and
|
||
|
Mexico DF 05120
|
President
|
General Partner, Pichardo
|
|||
|
Asset Management, S.A. de
|
|||||
|
C.V. since 2003; Managing
|
|||||
|
Director, Acciones y Valores
|
|||||
|
de Mexico, S.A. de C.V.
|
|||||
|
from 1979 to 2002.
|
|||||
|
Luis Calzada
|
1965
|
Secretary
|
Indefinite / 1 year
|
Administrative and
|
None
|
|
Paseo de Tamarindos 45-201
|
Compliance Director,
|
||||
|
Bosques de las Lomas
|
Pichardo Asset
|
||||
|
Mexico DF 05120
|
Management S.A. de C.V.
|
46
(This Page Intentionally Left Blank.)
THE MEXICO EQUITY
AND INCOME FUND, INC.
Investment Adviser:
Pichardo Asset Management, S.A. de C.V.
Paseo de Tamarindos 45-201
Bosques de las Lomas
Delegación Cuajimalpa
Mexico DF 05120
Independent Registered Public
Accounting Firm:
Tait, Weller & Baker LLP
1818 Market Street, Suite 2400
Philadelphia, PA 19103
Transfer Agent and Registrar,
Fund Administrator
and Fund Accountant:
U.S. Bancorp Fund Services, LLC
615 East Michigan Street
Milwaukee, WI 53202
Custodian:
U.S. Bank, N.A.
Custody Operations
1555 Rivercenter Drive, Suite 302
Milwaukee, WI 53212
Board of Directors:
Andrew Dakos
Rajeev Das
Phillip Goldstein
Glenn Goodstein
Gerald Hellerman
Eugenia Pichardo
Item 2. Code of Ethics.
Not applicable for semi-annual reports.
Item 3. Audit Committee Financial Expert.
Not applicable for semi-annual reports.
Item 4. Principal Accountant Fees and Services.
Not applicable for semi-annual reports.
Item 5. Audit Committee of Listed Registrants.
The standing audit committee is comprised of Mr. Andrew Dakos, Mr. Phillip Goldstein, Mr. Glenn Goodstein, and Mr. Rajeev Das.
Item 6. Investments.
Schedule of Investments is included as part of the report to shareholders filed under Item 1 of this Form.
Item 7. Disclosure of Proxy Voting Policies and Procedures for Closed-End Management Investment Companies.
PROXY VOTING POLICIES AND GUIDELINES
The Proxy Voting Policies and Guidelines contained in this document summarize The Mexico Equity and Income Fund, Inc.’s (the “Fund”) positions on various issues of concern to the Fund’s shareholders. These Guidelines give general indication as to how the Fund’s Advisor will vote Fund shares on each issue listed. However, this listing does not address all potential voting issues or the intricacies that may surround individual proxy votes. For that reason there may be instances in which votes may vary from the guidelines presented here. The Fund endeavors to vote Fund shares in accordance with the Fund’s investment objectives and strategies.
|
I.
|
CORPORATE GOVERNANCE
|
|
A.
|
Board and Governance Issues
|
|
1.
|
Board of Director/Trustee Composition
|
The Board of Directors is responsible for the overall governance of the corporation.
The Fund advisor will oppose slates without at least a majority of independent directors (1/3 of directors who are outsiders to the corporation).
The Fund advisor will vote for shareholder proposals that request that the board audit, compensation and/or nominating committees include independent directors exclusively.
2. Increase Authorized Common Stock
The Fund advisor will generally support the authorization of additional common stock necessary to facilitate a stock split.
The Fund advisor will generally support the authorization of additional common stock, if the company already has a large amount of stock authorized but not issued or reserved for its stock option plans. In this latter instance, there is a concern that the authorized but unissued shares will be used as a poison pill or other takeover defense, which will be opposed. In addition, we will require the company to provide a specific purpose for any request to increase shares by more than 100 percent of the current authorization.
3. Blank Check Preferred Stock
Blank check preferred is stock with a fixed dividend and a preferential claim on company assets relative to common shares. The terms of the stock (voting dividend and conversion rights) are set by the Board at a future date without further shareholder action. While such an issue can in theory have legitimate corporate purposes, most often it has been used as a takeover defense since the stock has terms that make the entire company less attractive.
The Fund advisor will generally oppose the creation of blank check preferred stock.
4. Classified or “Staggered” Board
On a classified (or staggered) board, directors are divided into separate classes (usually three) with directors in each class elected to overlapping three-year terms. Companies argue that such Boards offer continuity in direction which promotes long-term planning. However, in some instances they may serve to deter unwanted takeovers since a potential buyer would have to wait at least two years to gain a majority of Board seats.
The Fund advisor will vote on a case-by-case basis on issues involving classified boards.
5. Supermajority Vote Requirements
Supermajority vote requirements in a company’s charter or bylaws require a level of voting approval in excess of a simple majority. Generally, supermajority provisions require at least 2/3 affirmative vote for passage of issues.
The Fund advisor will vote on a case-by-case issues involving supermajority voting.
6. Restrictions on Shareholders to Act by Written Consent
Written consent allows shareholders to initiate and carry out a shareholder action without waiting until the annual meeting or by calling a special meeting. It permits action to be taken by the written consent of the same percentage of outstanding shares that would be required to effect the proposed action at a shareholder meeting.
The Fund advisor will generally oppose proposals to limit or eliminate the right of shareholders to act by written consent.
7. Restrictions on Shareholders to Call Meetings
The Fund advisor will generally oppose such a restriction as it limits the right of the shareholder.
8. Limitations, Director Liability and Indemnification
Because of increased litigation brought against directors of corporations and the increased costs of director’s liability insurance, many states have passed laws limiting director liability for those acting in good faith. Shareholders however must opt into such statutes. In addition, many companies are seeking to add indemnification of directors to corporate bylaws.
The Fund advisor will generally support director liability and indemnification resolutions because it is important for companies to be able to attract the most qualified individuals to their Boards. Note: Those directors acting fraudulently would remain liable for their actions irrespective of this resolution.
9. Reincorporation
Corporations are in general bound by the laws of the state in which they are incorporated. Companies reincorporate for a variety of reasons including shifting incorporation to a state where the company has its most active operations or corporate headquarters, or shifting incorporation to take advantage of state corporate takeover laws.
While each reincorporation proposal will be evaluated based on its own merits, the Fund advisor will generally support reincorporation resolutions for valid business reasons (such as reincorporating in the same state as the corporate headquarters).
10. Cumulative Voting
Cumulative voting allows shareholders to “stack” their votes behind one or a few directors running for the board, thereby helping a minority of shareholders to win board representation. Cumulative voting gives minority shareholders a voice in corporate affairs proportionate to their actual strength in voting shares.
The Fund advisor will generally support proposals calling for cumulative voting in the election of directors.
11. Dual Classes of Stock
In order to maintain corporate control in the hands of a certain group of shareholders, companies may seek to create multiple classes of stock with differing rights pertaining to voting and dividends.
The Fund advisor will generally oppose dual classes of stock. However, the advisor will support classes of stock offering different dividend rights (such as one class which pays cash dividends and a second which pays stock dividends) depending on the circumstances.
12. Limit Directors’ Tenure
In general corporate directors may stand for re-election indefinitely. Opponents of this practice suggest that limited tenure would inject new perspectives into the boardroom as well as possibly creating room for directors from diverse backgrounds; however, continuity is important to corporate leadership and in some instances alternative means may be explored for injecting new ideas or members from diverse backgrounds into corporate boardrooms.
Accordingly, the Fund advisor will vote on a case-by-case basis attempts to limit director tenure.
13. Minimum Director Stock Ownership
The director share ownership proposal requires that all corporate directors own a minimum number of shares in the corporation. The purpose of this resolution is to encourage directors to have the same interest as other shareholders.
The Fund advisor will support resolutions that require corporate directors to own shares in the company.
14. Selection of Auditor
Annual election of the outside accountants is standard practice. While it is recognized that the company is in the best position to evaluate the competence of the outside accountants, we believe that outside accountants must ultimately be accountable to shareholders. Furthermore, audit committees have been the subject of a report released by the Blue Ribbon Commission on Improving the Effectiveness of Corporate Audit Committees in conjunction with the NYSE and the National Association of Securities Dealers. The Blue Ribbon Commission concluded that audit committees must improve their current level of oversight of independent accountants. Given the rash of accounting irregularities that were not detected by audit panels or auditors, shareholder ratification is an essential step in restoring investor confidence.
The Fund advisor will oppose the resolutions seeking ratification of the auditor when fees for financial systems design and implementation exceed audit and all other fees, as this can compromise the independence of the auditor.
The Fund advisor will oppose the election of the audit committee chair if the audit committee recommends an auditors whose fees for financial systems design and implementation exceed audit and all other fees, as this can compromise the independence of the auditor.
B. Executive Compensation
1. Disclosure of CEO, Executive, Board and Management Compensation
On a case-by-case basis, the Fund advisor will support shareholder resolutions requesting companies to disclose the salaries of top management and the Board of Directors.
2. Compensation for CEO, Executive, Board and Management
The Fund advisor will oppose an executive compensation proposal if we believe the compensation does not reflect the economic and social circumstances of the company (i.e. at times of layoffs, downsizing, employee wage freezes, etc.).
3. Formation and Independence of Compensation Review Committee
The Fund advisor will support shareholder resolutions requesting the formation of a committee of independent directors to review and examine executive compensation.
4. Stock Options for Board and Executives
The Fund advisor will generally oppose stock option plans that in total offer greater than 15% of shares outstanding because of voting and earnings dilution.
The Fund advisor will generally oppose option programs that allow the repricing of underwater options. (Repricing divides shareholder and employee interests. Shareholders cannot “reprice” their stock and, therefore, optionees should not be treated differently).
The Fund advisor will generally oppose stock option plans that have option exercise prices below the marketplace on the day of the grant.
The Fund advisor will generally support options programs for outside directors subject to the same constraints previously described.
5. Employee Stock Ownership Plan (ESOPs)
The Fund advisor will support ESOPs created to promote active employee ownership. However, they will oppose any ESOP whose purpose is to prevent a corporate takeover.
6. Pay Equity
The Fund advisor will support shareholder resolutions that request that management provide a race and/or gender pay equity report.
7. Ratio Between CEO and Worker Pay
The Fund advisor will generally support shareholder resolutions requesting that management report on the ratio between CEO and employee compensation.
8. Maximum Ratio Between CEO and Worker Compensation and/or Cap on CEO Compensation
The Fund advisor will vote on a case-by-case basis shareholder resolutions requesting management to set a maximum ratio between CEO and employee compensation and/or a cap on CEO compensation.
9. Changes to Charter or By-Laws
The Fund advisor will conduct a case-by-case review of the proposed changes with the voting decision resting on whether the proposed changes are in shareholder’s best interests.
10. Confidential Voting
Typically, proxy voting differs from voting in political elections in that the company is made aware of shareholder votes as they are cast. This enables management to contact dissenting shareholders in an attempt to get them to change their votes.
The Fund advisor will support confidential voting because the voting process should be free of coercion.
11. Equal Access to Proxy
Equal access proposals ask companies to give shareholders access to proxy materials to state their views on contested issues, including director nominations. In some cases, they would actually allow shareholders to nominate directors. Companies suggest that such proposals would make an increasingly complex process even more burdensome.
In general, the Fund advisor will oppose resolutions for equal access proposals.
12. Golden Parachutes
Golden parachutes are severance payments to top executives who are terminated or demoted pursuant to a takeover. Companies argue that such provisions are necessary to keep executives from “jumping ship” during potential takeover attempts.
The Fund advisor will support the right of shareholders to vote on golden parachutes because they go above and beyond ordinary compensation practices. In evaluating a particular golden parachute, we will examine total management compensation, the employees covered by the plan, and the quality of management.
C. Mergers and Acquisitions
1. Considering the Non-Financial Effects of a Merger Proposal
Such a proposal allows or requires the Board to consider the impact of merger decisions on various “stakeholders,” such as employees, communities, customers and business partners. This proposal gives the Board the right to reject a tender offer on the grounds that it would adversely affect the company’s stakeholders.
The Fund advisor will support shareholder resolutions that consider non-financial impacts of mergers.
2. Mergers, Restructuring and Spin-offs
A merger, restructuring, or spin-off in some way affects a change in control of the company’s assets. In evaluating the merit of each issue, we will consider the terms of each proposal. This will include an analysis of the potential long-term value of the investment.
The Fund advisor will support management proposals for merger or restructuring if the transaction appears to offer fair value and other proxy voting policies stated are not violated. For example, the advisor may oppose restructuring resolution which include in it significant takeover defenses and may again oppose the merger of a non-nuclear and a nuclear utility if it poses potential liabilities.
3. Poison Pills
Poison pills (or shareholder rights plans) are triggered by an unwanted takeover attempt and cause a variety of events to occur which may make the company financially less attractive to the suitor. Typically, directors have enacted these plans without shareholder approval. Most poison pill resolutions deal with putting poison pills up for a vote or repealing them altogether.
The Fund advisor will support proposals to put rights plans up for a shareholder vote. In general, poison pills will be opposed unless management is able to present a convincing case fur such a plan.
4. Anti-Greenmail Proposals
Greenmail is the payment a corporate raider receives in exchange for his/her shares. This payment is usually at a premium to the market price, so while greenmail can ensure the continued independence of the company, it discriminates against other shareholders.
The Fund advisor will generally support greenmail provisions.
5. Opt-Out of State Anti-Takeover Law
A strategy for dealing with anti-takeover issues has been a shareholder resolution asking for a company to opt-out of a particular state’s anti-takeover laws.
The Fund advisor will generally support bylaws changes requiring a company to opt-out of state anti-takeover laws. However, resolutions requiring companies to opt-into state anti-takeover statutes will be opposed.
Item 8. Portfolio Managers of Closed-End Management Investment Companies.
Information is presented as of January 31, 2013.
Portfolio Manager. Mrs. Maria Eugenia Pichardo is the Portfolio Manager responsible for the day-to-day management of the Fund making portfolio management decisions.
Mrs. Pichardo has been the Fund's Portfolio Manager since the Fund's inception (1990). She is also the President and General Partner of Pichardo Asset Management, S.A. de C.V. ("PAM”) (the Fund's Investment Adviser) since February 2003.
Mrs. Pichardo was Managing Director of Acciones y Valores de Mèxico, S.A. de C.V., from 1983 to 1993 acting as head and portfolio manager of the International Area. Her main responsibilities were: i) portfolio management at AcciWorldwide (US$ AUM $ 600 million), ii) fundamental analysis, iii) trading for institutional-international investors, and iv) back-office.
From 1989 to 1990, Mrs. Pichardo was also appointed General Director of Acci-Worldwide S.A. de C. V., a wholly owned subsidiary of Acciones y Valores de Mexico, S. A. de C.V. (the asset management unit of Acciones y Valores, mainly Latam and Closed-end Funds in the U.S.A. (MXE and Emerging Mexico Fund), as well as other Funds in London and Canada for approximately US$ 600 million AUM). Accival is a wholly owned subsidiary of Banamex Citigroup.
|
Portfolio Manager Name
|
Registered Investment
Company (dollar amount
and number of accounts)
|
Other Pooled Investments
(dollar amount and
number of accounts)
|
Other Accounts
(dollar amount and
number of accounts)
|
|
Ms. Maria Eugenia Pichardo
|
$105,203,162 (1)
|
$0 (0)
|
$3,000.000 (3)
|
Material Conflict of Interest. The Portfolio Manager has day-to-day management responsibilities with respect to other accounts and accordingly may be presented with potential or actual conflicts of interest. Conflicts of interest can arise in the allocation of securities to the various accounts when a security is purchased or sold over a period of time. “PAM” has established policies and procedures to reduce the conflict of interest.
The management of other accounts may result in the Portfolio Manager devoting unequal time and attention to the management of the Fund and/or other accounts. In approving the Advisory Agreement, the Board of Directors was satisfied that the Portfolio Manager would be able to devote sufficient attention to the management of the Fund, and that PAM seeks to manage such competing interests for the time and attention of the portfolio manager.
Compensation. Ms. Pichardo receives an annual fee from PAM.
Securities Owned in the Fund by Portfolio Manager. As of January 31, 2013, the Portfolio Manager owned the following securities in the Fund:
|
Portfolio Manager Name
|
Dollar Range of Equity Securities in the Fund
(None, $1-$10,000, $10,001-$50,000,
$50,001-$100,000, $100,001 - $500,000,
$500,001 to $1,000,000, Over $1,000,000)
|
Aggregate Dollar Range of Securities in
all Registered Investment Companies
Overseen by Portfolio Manager in
Family of Investment Companies
|
|
Ms. Maria Eugenia Pichardo
|
None
|
None
|
Item 9. Purchases of Equity Securities by Closed-End Management Investment Company and Affiliated Purchasers.
|
Period
|
(a)
Total Number of Shares
(or Units) Purchased
|
(b)
Average Price Paid
per Share (or Unit)
|
(c)
Total Number of Shares
(or Units) Purchased as
Part of Publicly Announced Plans or Programs
|
(d)
Maximum Number
(or Approximate Dollar Value) of Shares (or Units) that
May Yet Be Purchased Under the Plans or Programs
|
|
8/1/12 to 8/31/12
|
13,607
|
12.24
|
||
|
9/1/12 to 9/30/12
|
61,362
|
12.26
|
||
|
10/1/12 to 10/31/12
|
6,736
|
13.36
|
||
|
11/1/12 to 11/30/12
|
133,413
|
12.46
|
||
|
12/1/12 to 12/31/12
|
0
|
0
|
||
|
1/1/13 to 1/31/13
|
0
|
0
|
||
|
Total
|
215,118 (1)
|
12.42
|
(1) 215,118 common shares were purchased pursuant to the Fund’s Stock Repurchase Program.
Item 10. Submission of Matters to a Vote of Security Holders.
The registrant’s independent directors serve as its nominating committee, however they do not make use of a nominating committee charter.
Item 11. Controls and Procedures.
|
(a)
|
The Registrant’s President and Chief Financial Officer have reviewed the Registrant's disclosure controls and procedures (as defined in Rule 30a-3(c) under the Investment Company Act of 1940 (the “Act”)) as of a date within 90 days of the filing of this report, as required by Rule 30a-3(b) under the Act and Rules 13a-15(b) or 15d-15(b) under the Securities Exchange Act of 1934. Based on their review, such officers have concluded that the disclosure controls and procedures are effective in ensuring that information required to be disclosed in this report is appropriately recorded, processed, summarized and reported and made known to them by others within the Registrant and by the Registrant’s service provider.
|
|
(b)
|
There were no changes in the Registrant's internal control over financial reporting (as defined in Rule 30a-3(d) under the Act) that occurred during the second fiscal quarter of the period covered by this report that has materially affected, or is reasonably likely to materially affect, the Registrant's internal control over financial reporting.
|
Item 12. Exhibits.
|
(a)
|
(1) Any code of ethics or amendment thereto, that is the subject of the disclosure required by Item 2, to the extent that the registrant intends to satisfy Item 2 requirements through filing an exhibit. Not applicable.
|
(2) A separate certification for each principal executive and principal financial officer pursuant to Section 302 of the Sarbanes-Oxley Act of 2002. Filed herewith.
(3) Any written solicitation to purchase securities under Rule 23c-1 under the Act sent or given during the period covered by the report by or on behalf of the registrant to 10 or more persons. None.
|
(b)
|
Certifications pursuant to Section 906 of the Sarbanes-Oxley Act of 2002. Furnished herewith.
|
SIGNATURES
Pursuant to the requirements of the Securities Exchange Act of 1934 and the Investment Company Act of 1940, the registrant has duly caused this report to be signed on its behalf by the undersigned, thereunto duly authorized.
(Registrant) The Mexico Equity and Income Fund, Inc.
By (Signature and Title)* /s/ Maria Eugenia Pichardo
Maria Eugenia Pichardo, President
Date March 19, 2013
Pursuant to the requirements of the Securities Exchange Act of 1934 and the Investment Company Act of 1940, this report has been signed below by the following persons on behalf of the registrant and in the capacities and on the dates indicated.
By (Signature and Title)* /s/ Maria Eugenia Pichardo
Maria Eugenia Pichardo, President
Date March 19, 2013
By (Signature and Title)* /s/ Gerald Hellerman
Gerald Hellerman, Chief Financial Officer
Date April 4, 2013
* Print the name and title of each signing officer under his or her signature.