UNITED STATES
SECURITIES AND EXCHANGE COMMISSION
Washington, D.C. 20549
FORM 8-K
CURRENT REPORT
Pursuant to Section 13 or 15(d) of
the Securities Exchange Act of 1934
Date of Report (Date of earliest event reported): October 13, 2017
BENCHMARK ELECTRONICS, INC.
(Exact name of registrant as specified in its charter)
Texas (State or other jurisdiction of incorporation) |
1-10560 (Commission File Number) |
74-2211011 (I.R.S. Employer Identification No.) |
4141 N. Scottsdale Road, Scottsdale, Arizona 85251
(Address of principal executive offices) (Zip code)
Registrant’s telephone number, including area code: (623) 300-7000
Check the appropriate box below if the Form 8-K filing is intended to simultaneously satisfy the filing obligation of the registrant under any of the following provisions (see General Instruction A.2. below):
[ ] Written communications pursuant to Rule 425 under the Securities Act (17 CFR 230.425)
[ ] Soliciting material pursuant to Rule 14a-12 under the Exchange Act (17 CFR 240.14a-12)
[ ] Pre-commencement communications pursuant to Rule 14d-2(b) under the Exchange Act (17 CFR 240.14d-2(b))
[ ] Pre-commencement communications pursuant to Rule 13e-4(c) under the Exchange Act (17 CFR 240.13e-4(c))
Indicate by check mark whether the registrant is an emerging growth company as defned in Rule 405 of the Securities Act of 1933 (§230.405 of this chapter) or Rule 12b-2 of the Securities Exchange Act of 1934 (§240.12b-2 of this chapter).
Emerging growth company [ ]
If an emerging growth company, indicate by check mark if the registrant has elected not to use the extended transition period for complying with any new or revised financial accounting standards provided pursuant to Section 13(a) of the Exchange Act. [ ]
On October 18, 2017, we issued a press release announcing our results of operations for the quarter ended September 30, 2017. The press release, attached as Exhibit 99.1 and incorporated herein by reference, is being furnished to the SEC.
Item 5.02. Departure of Directors or Certain Officers; Election of Directors; Appointment of Certain Officers; Compensatory Arrangements of Certain Officers.
Don Adam, our Chief Financial Officer, notified the Company on October 13, 2017 of his decision to retire. As indicated in the press release, his retirement is expected to be effective by the end of the year, and a search is underway for his successor.
Item 7.01. Regulation FD Disclosure.
On October 18, 2017, we held an earnings conference call. The presentation slides used in connection with the conference call are being furnished to the SEC, are attached as Exhibit 99.2 to this report and are hereby incorporated herein by reference.
Item 9.01. Financial Statements and Exhibits.
(d) Exhibits
Exhibit 99.1 Press release
Exhibit 99.2 Presentation slides
SIGNATURE
Pursuant to the requirements of the Securities Exchange Act of 1934, the registrant has duly caused this report to be signed on its behalf by the undersigned hereunto duly authorized.
|
BENCHMARK ELECTRONICS, INC. |
Dated: October 18, 2017 |
By: /s/ Scott R. Peterson |
|
Scott R. Peterson |
|
General Counsel |
|
|
EXHIBIT INDEX |
||
|
|
|
Exhibit Number |
|
Description |
|
|
|
99.1 |
|
Press release |
99.2 |
|
Presentation slides |
|
|
|
-1-
· Quarterly revenue of $604 million
· Quarterly operating margin of 3.4% (4.1% non-GAAP)
· Quarterly EPS of $0.35 ($0.39 non-GAAP)
SCOTTSDALE, AZ, October 18, 2017 – Benchmark Electronics, Inc. (NYSE: BHE) today announced financial results for the third quarter ended September 30, 2017.
|
|
|
Three Months Ended |
|
||||||
|
|
|
Sep 30, |
|
|
Jun 30, |
|
|
Sep 30, |
|
In millions, except EPS |
|
2017 |
|
|
2017 |
|
|
2016 |
|
|
Net sales |
|
$604 |
|
|
$617 |
|
|
$574 |
|
|
Net income |
|
$18 |
|
|
$17 |
|
|
$22 |
|
|
Net income – non-GAAP |
|
$20 |
|
|
$19 |
|
|
$18 |
|
|
Diluted EPS |
|
$0.35 |
|
|
$0.34 |
|
|
$0.44 |
|
|
Diluted EPS – non-GAAP |
|
$0.39 |
|
|
$0.38 |
|
|
$0.36 |
|
|
|
|
|
|
|
|
|
|
|
|
|
Operating margin |
|
3.4% |
|
|
3.6% |
|
|
3.1% |
|
|
Operating margin – non-GAAP |
|
4.1% |
|
|
4.1% |
|
|
4.3% |
|
A reconciliation of GAAP and non-GAAP results is included below.
“I am pleased by the Company’s performance in the third quarter, meeting or exceeding each of our commitments. Revenues exceeded our guidance and marked the third consecutive quarter that we experienced year-on-year revenue growth. Non-GAAP EPS of $0.39 exceeded the high-end of our guidance by $0.03; cash cycle days ended at 72, within our target range, and an eight-day improvement from the year ago period; and we achieved 9.9% ROIC, a 40 bps quarter‐over‐quarter improvement,” said Paul Tufano, Benchmark’s President and CEO.
“As we work to reposition the Company to achieve our business model objectives, we remain focused on the key initiatives critical to our success, namely the optimization of our global network; the implementation of our market-sector sales organization; and the expansion of our engineering and solutions capabilities,” added Tufano. “The transition of our headquarters to the Phoenix area is substantially complete, and we are making progress on our operational excellence and customer care initiatives. Our market-sector sales focus and incremental go-to-market investments are beginning to yield results as reflected in our third quarter bookings, which were above the $150 million level for the first time in 12 quarters.”
“We continue to emphasize our engineering-led customer engagements including the recent announcement that Benchmark was named Qualcomm Life’s partner to commercialize their new product line of interconnected biometric sensors and to be the FDA manufacturer of
1
record,” said Tufano. “We will work with Qualcomm to have the device ready for FDA submission in 2018 with a goal of commercial availability to customers next year. This engagement is a pivotal milestone, which reinforces our engineering-led solutions business model and supports our ongoing IoT investment strategy.”
“Today, we also announce with mixed emotions that Don Adam, Chief Financial Officer, will be retiring from the Company. Don has determined that a permanent relocation to Phoenix would not be in the best interest of his family and will be departing by the end of the year. A search for his successor is currently underway,” said Tufano. “Don has been a devoted Benchmark employee for the past 15 years and has been invaluable to me this past year as we have formulated plans to transform Benchmark. We are indebted to Don for his service and wish him all the best in his future endeavors.”
Third Quarter 2017 Financial Highlights
· Operating margin was 3.4% (non-GAAP 4.1%).
· Cash conversion cycle improved 8 days from 80 at September 30, 2016 to 72 days at September 30, 2017.
· Cash was $730 million at September 30, of which $75 million was available in the U.S.
Cash Conversion Cycle
|
|
Sep 30, |
|
|
|
Jun 30, |
|
|
|
Sep 30, |
|
|
|
2017 |
|
|
|
2017 |
|
|
|
2016 |
|
Accounts receivable days |
|
61 |
|
|
|
57 |
|
|
|
65 |
|
Inventory days |
|
70 |
|
|
|
67 |
|
|
|
68 |
|
Accounts payable days |
|
(55) |
|
|
|
(55) |
|
|
|
(53) |
|
Customer deposits |
|
(4) |
|
|
|
(4) |
|
|
|
- |
|
|
|
72 |
|
|
|
65 |
|
|
|
80 |
|
Third Quarter 2017 Industry Sector Update
Revenue by industry sector (dollars in millions) was as follows.
|
|
|
Sep 30, |
|
|
|
Jun 30, |
|
|
|
Sep 30, |
|
||||||
|
Higher-Value Markets |
|
2017 |
|
|
|
2017 |
|
|
|
2016 |
|
||||||
Industrials |
$ |
124 |
|
20 |
% |
|
$ |
124 |
|
20 |
% |
|
$ |
141 |
|
25 |
% |
|
A&D |
|
96 |
|
16 |
|
|
|
100 |
|
16 |
|
|
|
82 |
|
14 |
|
|
Medical |
|
101 |
|
17 |
|
|
|
86 |
|
14 |
|
|
|
86 |
|
15 |
|
|
Test & Instrumentation |
|
88 |
|
15 |
|
|
|
89 |
|
15 |
|
|
|
66 |
|
11 |
|
|
|
|
$ |
409 |
|
68 |
% |
|
$ |
399 |
|
65 |
% |
|
$ |
375 |
|
65 |
% |
|
|
|
|
|
|
|
|
|
|
|
|
|
|
|
|
|
|
|
|
|
|
|
|
|
|
|
|
|
|
|
|
|
|
|
|
|
|
|
|
|
Sep 30, |
|
|
|
Jun 30, |
|
|
|
Sep 30, |
|
||||||
|
Traditional Markets |
|
2017 |
|
|
|
2017 |
|
|
|
2016 |
|
||||||
Computing |
$ |
124 |
|
20 |
% |
|
$ |
142 |
|
23 |
% |
|
$ |
107 |
|
19 |
% |
|
Telecommunications |
|
71 |
|
12 |
|
|
|
76 |
|
12 |
|
|
|
92 |
|
16 |
|
|
|
|
$ |
195 |
|
32 |
% |
|
$ |
218 |
|
35 |
% |
|
$ |
199 |
|
35 |
% |
|
Total |
$ |
604 |
|
100 |
% |
|
$ |
617 |
|
100 |
% |
|
$ |
574 |
|
100 |
% |
2
Overall revenue increased 5% year-over-year driven by continued strong demand in Test & Instrumentation serving the semi-capital equipment market, Computing growth from existing and new customers, Medical growth from new programs and Aerospace and Defense (A&D) growth from defense programs. Industrials and Telecommunications growth remained muted year-over-year from softness across several of our top customers.
Third Quarter 2017 Bookings Update
· New program bookings of $138 to $165 million.
· 14 engineering awards supporting early engagement opportunities.
· 31 manufacturing wins across all market sectors.
The Company projects that new program bookings for the third quarter will result in annualized revenue of $138 to $165 million when fully launched in the next 12-18 months. The new program bookings align with Benchmark’s strategic focus on higher-value markets.
Fourth Quarter 2017 Outlook
· Revenue between $590 - $610 million.
· Diluted GAAP earnings per share between $0.29 - $0.33.
· Diluted non-GAAP earnings per share between $0.34 - $0.38 (excluding restructuring charges and amortization of intangibles expected to approximate $0.05 per share). The income tax impact of the non-GAAP adjustments using the applicable effective tax rates is $0.02 per share.
Third Quarter 2017 Results Conference Call Details
A conference call hosted by Benchmark management will be held today at 5:00 p.m. Eastern Time to discuss the Company’s financial results and outlook. This call will be broadcast via the internet and may be accessed by logging on to the Company’s website at www.bench.com.
About Benchmark Electronics, Inc.
Benchmark provides worldwide integrated electronics manufacturing services (EMS), engineering and design services, and precision machining services to original equipment manufacturers in the following industries: industrial controls, aerospace and defense, telecommunications, computers and related products for business enterprises, medical devices, and test and instrumentation. Benchmark’s global operations include facilities in eight countries, and its common shares trade on the New York Stock Exchange under the symbol BHE.
For More Information, Please Contact:
Lisa K. Weeks, VP of Strategy & Investor Relations
623-300-7052 or lisa.weeks@bench.com
Non-GAAP Financial Measures
This press release includes financial measures that exclude certain items and therefore do not follow U.S. generally accepted accounting principles (GAAP). A detailed reconciliation between the GAAP results and results excluding special items (non-GAAP) is included at the end of this
3
press release. Management discloses non-GAAP information to provide investors with additional information to analyze the Company’s performance and underlying trends. Management uses non-GAAP measures that exclude certain items in order to better assess operating performance and help investors compare results with our previous guidance. Benchmark’s non-GAAP information is not necessarily comparable to the non-GAAP information used by other companies. Non-GAAP information should not be viewed as a substitute for, or superior to, net income or other data prepared in accordance with GAAP as a measure of the Company’s profitability or liquidity. Readers should consider the types of events and transactions for which adjustments have been made.
Forward-Looking Statements
This press release contains certain forward-looking statements within the scope of the Securities Act of 1933 and the Securities Exchange Act of 1934. The words “project,” “expect,” “estimate,” “plan,” “anticipate,” “predict,” “goals,” “targeting” and similar terms, and the negatives thereof, often identify forward-looking statements, which are not limited to historical facts. The Company’s forward-looking statements include, among other things, projections relating to the future value of bookings and fourth quarter 2017 revenues and diluted earnings per share. Although Benchmark believes these statements are based upon reasonable assumptions, they involve risks and uncertainties relating to operations, markets and the business environment generally. If one or more of these risks or uncertainties materializes or underlying assumptions prove incorrect, actual outcomes may vary materially from those indicated.
All forward-looking statements included in this release are based upon information available to Benchmark as of the date hereof, and the Company assumes no obligation to update them. Readers are advised to consult further disclosures on related subjects, particularly in Item 1A, “Risk Factors” of the Company’s Annual Report on Form 10-K for the year ended December 31, 2016, in its other filings with the Securities and Exchange Commission and in its press releases.
###
4
|
|
|
|
|
|
|
|
|
|
|
|
|
Benchmark Electronics, Inc. and Subsidiaries |
||||||||||||
|
|
|
|
|
|
|
|
|
|
|
|
|
Reconciliation of GAAP to Non-GAAP Financial Results |
||||||||||||
(Amounts in Thousands, Except Per Share Data) |
||||||||||||
(UNAUDITED) |
||||||||||||
|
|
|
|
|
|
|
|
|
|
|
|
|
|
|
|
Three Months Ended |
|
|
Nine Months Ended |
||||||
|
|
|
Sep 30, |
|
Jun 30, |
|
Sep 30, |
|
|
September 30, |
||
|
|
|
2017 |
|
2017 |
|
2016 |
|
|
2017 |
|
2016 |
|
|
|
|
|
|
|
|
|
|
|
|
|
Income from operations (GAAP) |
$ |
20,815 |
$ |
22,227 |
$ |
18,082 |
|
$ |
55,459 |
$ |
52,090 |
|
Restructuring charges and other costs |
|
2,511 |
|
1,544 |
|
3,485 |
|
|
5,566 |
|
9,876 |
|
Customer insolvency (recovery) |
|
(1,514) |
|
(710) |
|
- |
|
|
2,896 |
|
- |
|
Amortization of intangible assets |
|
2,736 |
|
2,481 |
|
3,170 |
|
|
7,698 |
|
8,945 |
|
Non-GAAP income from operations |
$ |
24,548 |
$ |
25,542 |
$ |
24,737 |
|
$ |
71,619 |
$ |
70,911 |
|
|
|
|
|
|
|
|
|
|
|
|
|
|
|
|
|
|
|
|
|
|
|
|
|
|
|
Net income (GAAP) |
$ |
17,512 |
$ |
17,176 |
$ |
21,742 |
|
$ |
44,375 |
$ |
45,479 |
|
Restructuring charges and other costs |
|
2,511 |
|
1,544 |
|
3,485 |
|
|
5,566 |
|
9,876 |
|
Customer insolvency (recovery) |
|
(1,514) |
|
(710) |
|
- |
|
|
2,896 |
|
- |
|
Amortization of intangible assets |
|
2,736 |
|
2,481 |
|
3,170 |
|
|
7,698 |
|
8,945 |
|
Income tax adjustments(1) |
|
(1,674) |
|
(1,265) |
|
(2,207) |
|
|
(4,519) |
|
(5,935) |
|
Discrete tax benefits |
|
- |
|
- |
|
(8,270) |
|
|
- |
|
(8,270) |
|
Non-GAAP net income |
$ |
19,571 |
$ |
19,226 |
$ |
17,920 |
|
$ |
56,016 |
$ |
50,095 |
|
|
|
|
|
|
|
|
|
|
|
|
|
|
Earnings per share: (GAAP) |
|
|
|
|
|
|
|
|
|
|
|
|
|
Basic |
$ |
0.35 |
$ |
0.35 |
$ |
0.44 |
|
$ |
0.89 |
$ |
0.92 |
|
Diluted |
$ |
0.35 |
$ |
0.34 |
$ |
0.44 |
|
$ |
0.88 |
$ |
0.91 |
|
|
|
|
|
|
|
|
|
|
|
|
|
Earnings per share: (Non-GAAP) |
|
|
|
|
|
|
|
|
|
|
|
|
|
Basic |
$ |
0.39 |
$ |
0.39 |
$ |
0.37 |
|
$ |
1.13 |
$ |
1.01 |
|
Diluted |
$ |
0.39 |
$ |
0.38 |
$ |
0.36 |
|
$ |
1.11 |
$ |
1.00 |
|
|
|
|
|
|
|
|
|
|
|
|
|
Weighted-average number of shares used in |
|
|
|
|
|
|
|
|
|
|
||
calculating earnings per share: |
|
|
|
|
|
|
|
|
|
|
||
|
Basic |
|
49,865 |
|
49,766 |
|
48,965 |
|
|
49,716 |
|
49,377 |
|
Diluted |
|
50,330 |
|
50,239 |
|
49,414 |
|
|
50,292 |
|
49,878 |
(1) This amount represents the tax impact of the non-GAAP adjustments using the applicable effective tax rates.
5
|
|
|
|
|
|
|
|
|
|
|
Benchmark Electronics, Inc. and Subsidiaries |
||||||||||
|
|
|
|
|
|
|
|
|
|
|
Condensed Consolidated Statements of Income |
||||||||||
(Amounts in Thousands, Except Per Share Data) |
||||||||||
(UNAUDITED) |
||||||||||
|
||||||||||
|
|
|
Three Months Ended |
|
|
Nine Months Ended |
||||
|
|
|
September 30, |
|
|
September 30, |
||||
|
|
2017 |
|
2016 |
|
|
2017 |
|
2016 |
|
Sales |
$ |
603,550 |
$ |
574,341 |
|
$ |
1,786,955 |
$ |
1,702,908 |
|
Cost of sales |
|
545,395 |
|
521,519 |
|
|
1,621,153 |
|
1,546,915 |
|
|
Gross profit |
|
58,155 |
|
52,822 |
|
|
165,802 |
|
155,993 |
Selling, general and administrative expenses |
|
32,093 |
|
28,085 |
|
|
97,079 |
|
85,082 |
|
Amortization of intangible assets |
|
2,736 |
|
3,170 |
|
|
7,698 |
|
8,945 |
|
Restructuring charges and other costs |
|
2,511 |
|
3,485 |
|
|
5,566 |
|
9,876 |
|
|
Income from operations |
|
20,815 |
|
18,082 |
|
|
55,459 |
|
52,090 |
Interest expense |
|
(2,324) |
|
(2,302) |
|
|
(6,861) |
|
(6,935) |
|
Interest income |
|
1,334 |
|
577 |
|
|
3,621 |
|
1,170 |
|
Other expense, net |
|
(394) |
|
(383) |
|
|
(1,305) |
|
(535) |
|
|
Income before income taxes |
|
19,431 |
|
15,974 |
|
|
50,914 |
|
45,790 |
Income tax expense (benefit) |
|
1,919 |
|
(5,768) |
|
|
6,539 |
|
311 |
|
|
Net income |
$ |
17,512 |
$ |
21,742 |
|
$ |
44,375 |
$ |
45,479 |
|
|
|
|
|
|
|
|
|
|
|
Earnings per share: |
|
|
|
|
|
|
|
|
|
|
|
Basic |
$ |
0.35 |
$ |
0.44 |
|
$ |
0.89 |
$ |
0.92 |
|
Diluted |
$ |
0.35 |
$ |
0.44 |
|
$ |
0.88 |
$ |
0.91 |
|
|
|
|
|
|
|
|
|
|
|
Weighted-average number of shares used in calculating |
|
|
|
|
|
|
|
|
||
earnings per share: |
|
|
|
|
|
|
|
|
||
|
Basic |
|
49,865 |
|
48,965 |
|
|
49,716 |
|
49,377 |
|
Diluted |
|
50,330 |
|
49,414 |
|
|
50,292 |
|
49,878 |
6
|
|
|
|
|
|
|
|
|
Benchmark Electronics, Inc. and Subsidiaries |
||||||||
|
|
|
|
|
|
|
|
|
Condensed Consolidated Balance Sheets |
||||||||
(UNAUDITED) |
||||||||
(in thousands) |
||||||||
|
|
|
|
|
|
September 30, |
|
December 31, |
|
|
|
|
|
|
2017 |
|
2016 |
Assets |
|
|
|
|
||||
|
Current assets: |
|
|
|
|
|||
|
|
Cash and cash equivalents |
$ |
730,146 |
$ |
681,433 |
||
|
|
Accounts receivable, net |
|
411,550 |
|
440,692 |
||
|
|
Inventories |
|
421,858 |
|
381,334 |
||
|
|
Other current assets |
|
42,349 |
|
28,203 |
||
|
|
|
|
Total current assets |
|
1,605,903 |
|
1,531,662 |
|
Property, plant and equipment, net |
|
178,122 |
|
166,148 |
|||
|
Goodwill and other, net |
|
292,681 |
|
300,858 |
|||
|
|
|
|
Total assets |
$ |
2,076,706 |
$ |
1,998,668 |
|
|
|
|
|
|
|
|
|
Liabilities and Shareholders’ Equity |
|
|
|
|
||||
|
Current liabilities: |
|
|
|
|
|||
|
|
Current installments of long-term debt and capital lease obligations |
$ |
16,804 |
$ |
12,396 |
||
|
|
Accounts payable |
|
335,315 |
|
326,249 |
||
|
|
Accrued liabilities |
|
93,674 |
|
73,736 |
||
|
|
|
|
Total current liabilities |
|
445,793 |
|
412,381 |
|
Long-term debt and capital lease obligations, less current installments |
|
197,766 |
|
211,252 |
|||
|
Other long-term liabilities |
|
8,236 |
|
9,570 |
|||
|
Shareholders’ equity |
|
1,424,911 |
|
1,365,465 |
|||
|
|
|
|
Total liabilities and shareholders’ equity |
$ |
2,076,706 |
$ |
1,998,668 |
7
|
|
|
|
|
|
|
|
|
Benchmark Electronics, Inc. and Subsidiaries |
||||||||
|
|
|
|
|
|
|
|
|
Condensed Consolidated Statement of Cash Flows |
||||||||
(in thousands) |
||||||||
(UNAUDITED) |
||||||||
|
|
|
|
|
|
|
|
|
|
|
|
|
|
|
Nine Months Ended |
||
|
|
|
|
|
|
September 30, |
||
|
|
|
|
|
|
2017 |
|
2016 |
Cash flows from operating activities:
|
|
|
|
|
||||
|
Net income |
$ |
44,375 |
$ |
45,479 |
|||
|
Depreciation and amortization |
|
36,591 |
|
42,002 |
|||
|
Stock-based compensation expense |
|
6,819 |
|
4,302 |
|||
|
Accounts receivable, net |
|
30,926 |
|
61,776 |
|||
|
Inventories |
|
(38,778) |
|
13,991 |
|||
|
Accounts payable |
|
3,922 |
|
59,183 |
|||
|
Other changes in working capital and other |
|
6,035 |
|
1,851 |
|||
|
|
Net cash provided by operations |
|
89,890 |
|
228,584 |
||
|
|
|
|
|
|
|||
Cash flows from investing activities:
|
|
|
|
|
||||
|
Additions to property, plant and equipment and software |
|
(37,736) |
|
(25,398) |
|||
|
Business acquisition, net of cash acquired |
|
- |
|
10,750 |
|||
|
Other investing activities, net |
|
364 |
|
213 |
|||
|
|
Net cash used in investing activities |
|
(37,372) |
|
(14,435) |
||
|
|
|
|
|
|
|
|
|
Cash flows from financing activities:
|
|
|
|
|
||||
|
Share repurchases
|
|
(5,887) |
|
(40,862) |
|||
|
Net debt activity |
|
(9,288) |
|
(9,224) |
|||
|
Other financing activities, net |
|
9,012 |
|
5,289 |
|||
|
|
Net cash used in financing activities |
|
(6,163) |
|
(44,797) |
||
Effect of exchange rate changes
|
|
2,358 |
|
336 |
||||
Net increase in cash and cash equivalents |
|
48,713 |
|
169,688 |
||||
|
Cash and cash equivalents at beginning of year |
|
681,433 |
|
465,995 |
|||
|
Cash and cash equivalents at end of period |
$ |
730,146 |
$ |
635,683 |
8
Exhibit 99.2
design develop deliver advanced technology Q3 2017 Earnings Presentation October 18, 2017
design develop deliver advanced technology 2 Forward - Looking Statements This document contains forward - looking statements within the scope of the Securities Act of 1933 and the Securities Exchange Act of 1934. The words “expect,” “estimate,” “anticipate,” “predict” and similar expressions, and the negatives thereof, often identify forward - looking statements, which are not limited to historical facts. F orward - looking statements include, among other things: guidance for the fourth quarter of 2017 relating to sales; statements , express or implied, concerning future operating results or margins, the ability to generate sales and income or cash flow; and Benchmark’s business and growth strategies and expected growth and performance. Although Benchmark believes these statements are based upon reasonable assumptions, they involve risks and uncertainties relating to operations , markets and the business environment generally. If one or more of these risks or uncertainties materializes, or underlying assumptions prove incorrect, actual outcomes may vary materially from those indicated. All forward - looking statements included in this document are based upon information available to the Company as of the date of this document, and it assumes no obligation to update them. Readers are advised to consult further disclosures on related subjects, particularly in Item 1A, “Risk Factors”, of the Company’s annual report on Form 10 - K for the year ended December 31, 2016, in its other filings with the Securities and Exchange Commission and in its press releases. Non - GAAP Financial Information This document includes certain financial measures, such as operating margin, that exclude items and therefore are not in accordance with generally accepted accounting principles (“GAAP”). A detailed reconciliation between GAAP results and results excluding special items (“non - GAAP”) is included in the Appendix of this document. Management discloses non - GAAP information to provide investors with additional information to analyze the Company’s performance and underlying trends. Management uses non - GAAP measures of net income and earnings per share that exclude certain items in order to better assess operating performance and help investors compare results with our previous guidance. This document also references “free cash flow”, which the Company defines as net cash provided by operations (GAAP) less capital expenditures.
design develop deliver advanced technology 3 CEO Update
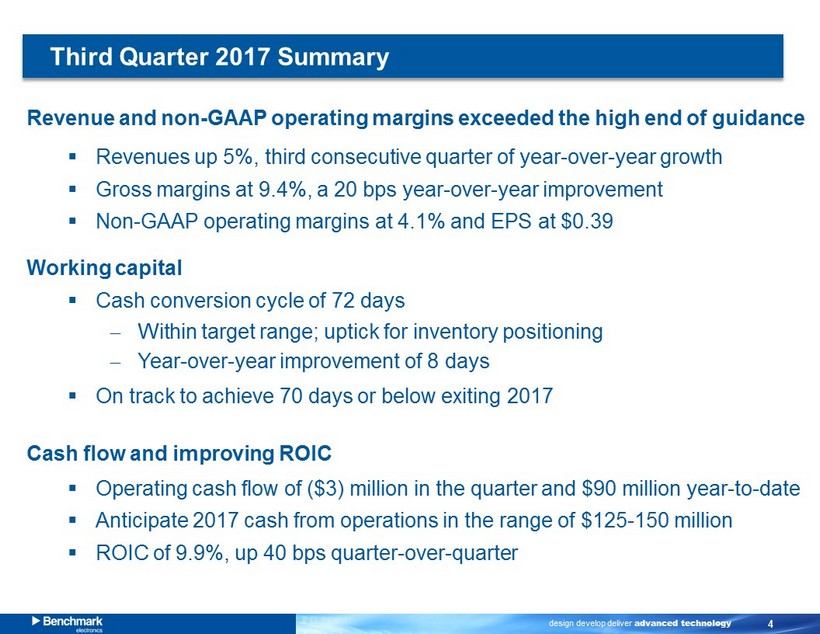
design develop deliver advanced technology 4 Third Quarter 2017 Summary Revenue and non - GAAP operating margins exceeded the high end of guidance ▪ Revenues up 5 %, third consecutive quarter of year - over - year growth ▪ Gross margins at 9.4%, a 2 0 bps year - over - year improvement ▪ Non - GAAP operating margins at 4.1% and EPS at $0.39 W orking capital ▪ Cash conversion cycle of 72 days Within target range; uptick for inventory positioning Year - over - year improvement of 8 days ▪ On track to achieve 70 days or below exiting 2017 Cash flow and improving ROIC ▪ Operating cash flow of ($3) million in the quarter and $90 million year - to - date ▪ Anticipate 2017 cash from operations in the range of $125 - 150 million ▪ ROIC of 9.9%, up 40 bps quarter - over - quarter
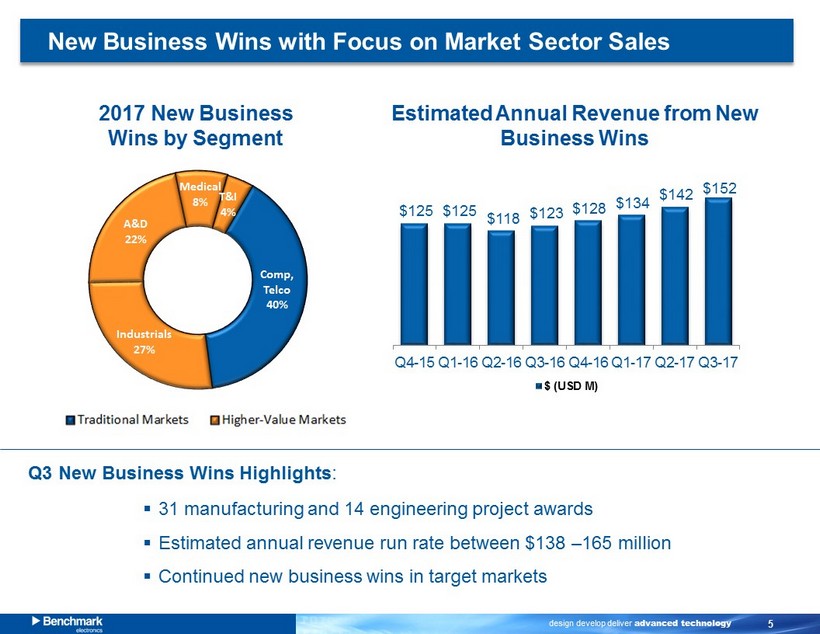
design develop deliver advanced technology 5 2017 New Business Wins by Segment ▪ 31 manufacturing and 14 engineering project awards ▪ Estimated annual revenue run rate between $138 – 165 million ▪ Continued new business wins in target markets Estimated Annual Revenue from New Business Wins New Business Wins with Focus on Market Sector Sales Q3 New Business Wins Highlights : $125 $125 $118 $123 $128 $134 $142 $152 $- $10 $20 $30 $40 $50 $60 $70 $80 $90 $100 $110 $120 $130 $140 $150 $160 Q4-15 Q1-16 Q2-16 Q3-16 Q4-16 Q1-17 Q2-17 Q3-17 $ (USD M)
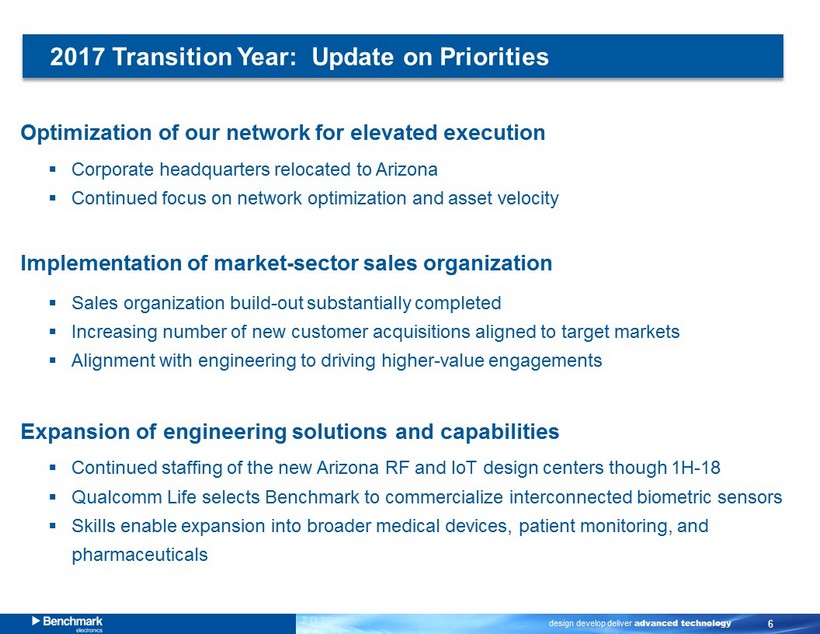
design develop deliver advanced technology 6 2017 Transition Year: Update on Priorities Optimization of our n etwork for elevated e xecution ▪ C orporate headquarters relocated to Arizona ▪ Continued focus on network optimization and asset velocity Implementation of market - sector sales organization ▪ Sales organization build - out substantially completed ▪ Increasing number of new customer acquisitions aligned to target markets ▪ Alignment with engineering to driving higher - value engagements Expansion of engineering solutions and capabilities ▪ Continued staffing of the new Arizona RF and IoT design centers though 1H - 18 ▪ Qualcomm Life selects Benchmark to commercialize interconnected biometric sensors ▪ Skills enable expansion into broader medical devices, patient monitoring, and pharmaceuticals
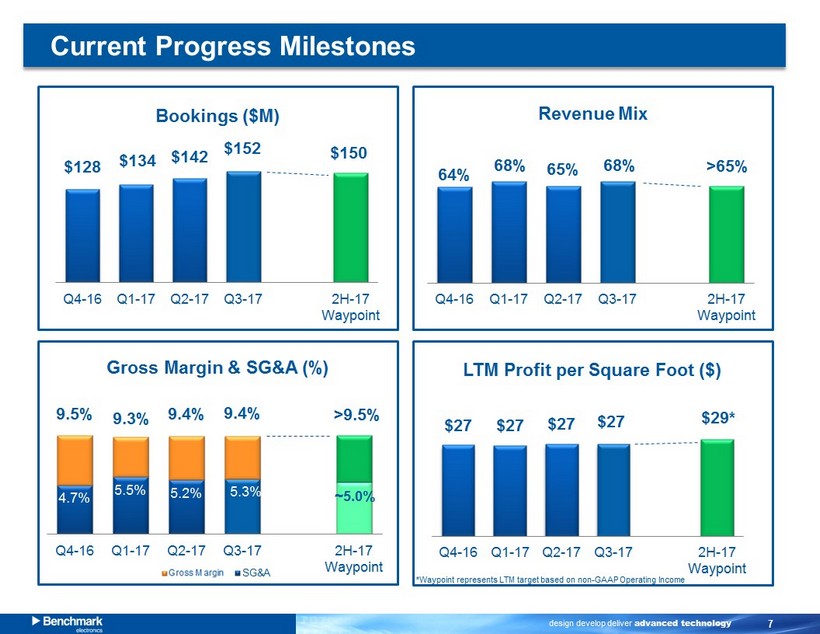
design develop deliver advanced technology 7 Current Progress Milestones * Waypoint r epresents LTM target based on non - GAAP Operating Income
design develop deliver advanced technology 8 Q3 2017 Financial Highlights
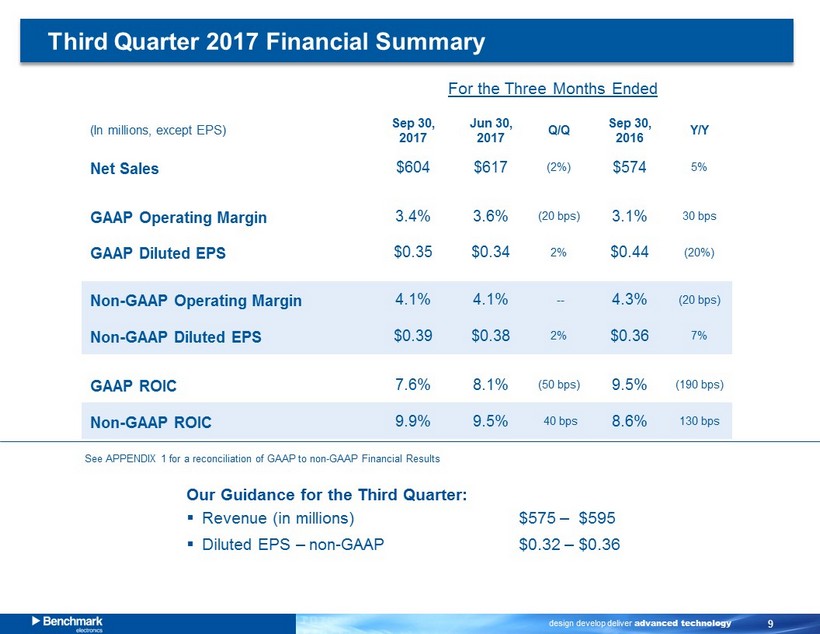
design develop deliver advanced technology 9 (In millions, except EPS) Sep 30 , 2017 Jun 30 , 2017 Q/Q Sep 30 , 2016 Y/Y Net Sales $604 $617 (2%) $574 5% GAAP Operating Margin 3.4% 3.6% (20 bps) 3.1% 30 bps GAAP Diluted EPS $0.35 $0.34 2% $0.44 (20%) Non - GAAP Operating Margin 4.1% 4.1% -- 4.3% (20 bps) Non - GAAP Diluted EPS $0.39 $0.38 2% $0.36 7% GAAP ROIC 7.6% 8.1% (50 bps) 9.5% (190 bps) Non - GAAP ROIC 9.9% 9.5% 40 bps 8.6% 130 bps For the Three Months Ended Our Guidance for the Third Quarter : ▪ Revenue (in millions) $575 – $595 ▪ Diluted EPS – non - GAAP $0.32 – $0.36 Third Quarter 2017 Financial Summary See APPENDIX 1 for a reconciliation of GAAP to non - GAAP Financial Results
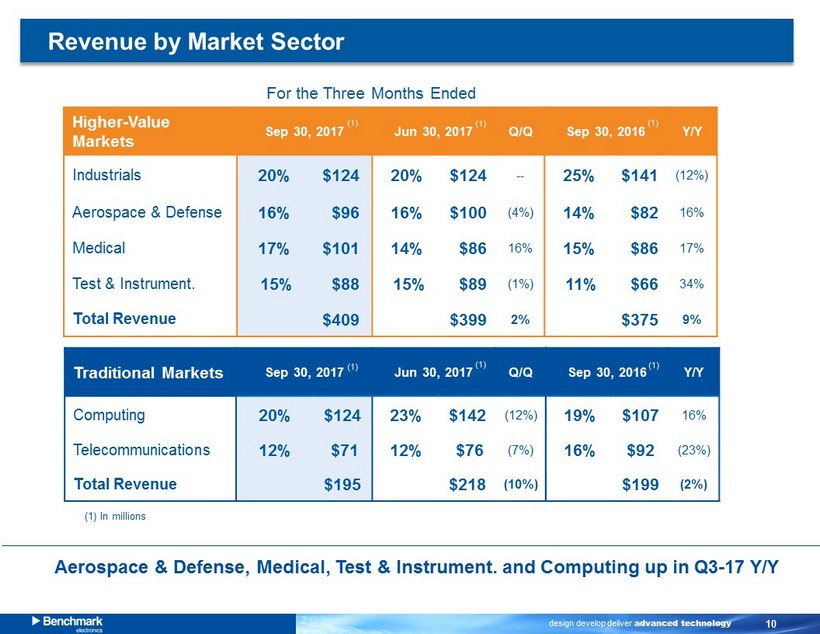
design develop deliver advanced technology 10 Higher - Value Markets Sep 30 , 2017 Jun 30 , 2017 Q/Q Industrials 20% $124 20% $124 -- Aerospace & Defense 16% $96 16% $100 (4%) Medical 17% $101 14% $86 16% Test & Instrument. 15% $88 15% $89 (1%) Total Revenue $409 $399 2% Traditional Markets Sep 30 , 2017 Jun 30 , 2017 Q/Q Computing 20% $124 23% $142 (12%) Telecommunication s 12% $71 12% $76 (7%) Total Revenue $195 $218 (10%) Revenue by Market Sector For the Three Months Ended Aerospace & Defense, Medical, Test & Instrument. and Computing u p in Q3 - 17 Y/Y (1) (1) (1) In millions (1) (1) Sep 30 , 2016 Y/Y 25% $141 (12%) 14% $82 16% 15% $86 17% 11% $66 34% $375 9% Sep 30 , 2016 Y/Y 19% $107 16% 16% $92 (23%) $199 (2%) (1) (1)
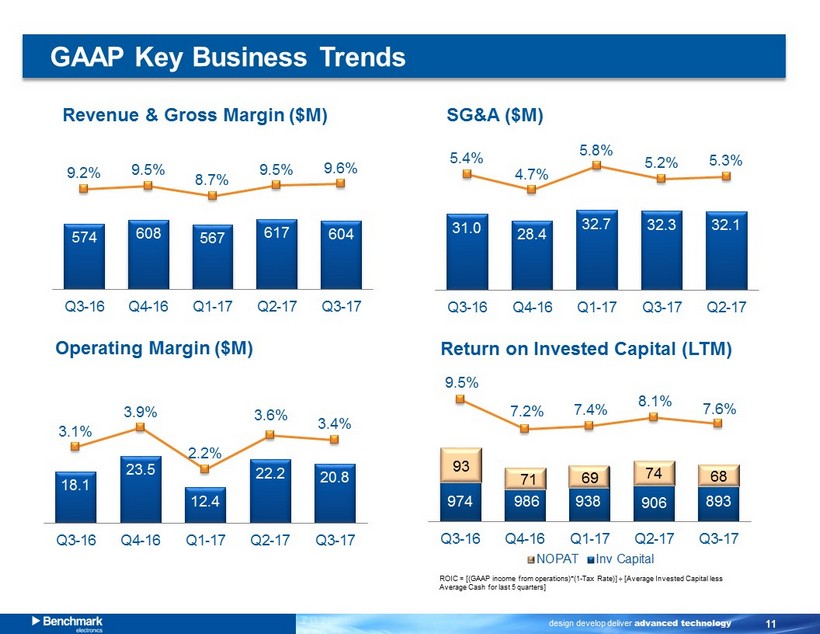
design develop deliver advanced technology 11 18.1 23.5 12.4 22.2 20.8 3.1% 3.9% 2.2% 3.6% 3.4% 0.0% 1.0% 2.0% 3.0% 4.0% 5.0% 6.0% 7.0% 0.0 10.0 20.0 30.0 40.0 50.0 60.0 Q3-16 Q4-16 Q1-17 Q2-17 Q3-17 574 608 567 617 604 9.2% 9.5% 8.7% 9.5% 9.6% 1.0% 3.0% 5.0% 7.0% 9.0% 11.0% 13.0% 15.0% 0 200 400 600 800 1,000 1,200 1,400 Q3-16 Q4-16 Q1-17 Q2-17 Q3-17 9.5% 7.2% 7.4% 8.1% 7.6% 0.0% 2.0% 4.0% 6.0% 8.0% 10.0% 0.0% 2.0% 4.0% 6.0% 8.0% 10.0% 12.0% 14.0% 16.0% 18.0% 20.0% Q3-16 Q4-16 Q1-17 Q2-17 Q3-17 974 986 938 906 893 Revenue & Gross Margin ($ M ) GAAP Key Business Trends Return on Invested Capital (LTM) ROIC = [(GAAP income from operations)*(1 - Tax Rate)] ÷ [ Average Invested Capital less Average Cash for last 5 quarters] Operating Margin ($M) 31.0 28.4 32.7 32.3 32.1 5.4% 4.7% 5.8% 5.2% 5.3% 0.0% 1.0% 2.0% 3.0% 4.0% 5.0% 6.0% 7.0% 8.0% 0.0 10.0 20.0 30.0 40.0 50.0 60.0 70.0 Q3-16 Q4-16 Q1-17 Q3-17 Q2-17 SG&A ($M) 93 71 69 74 68
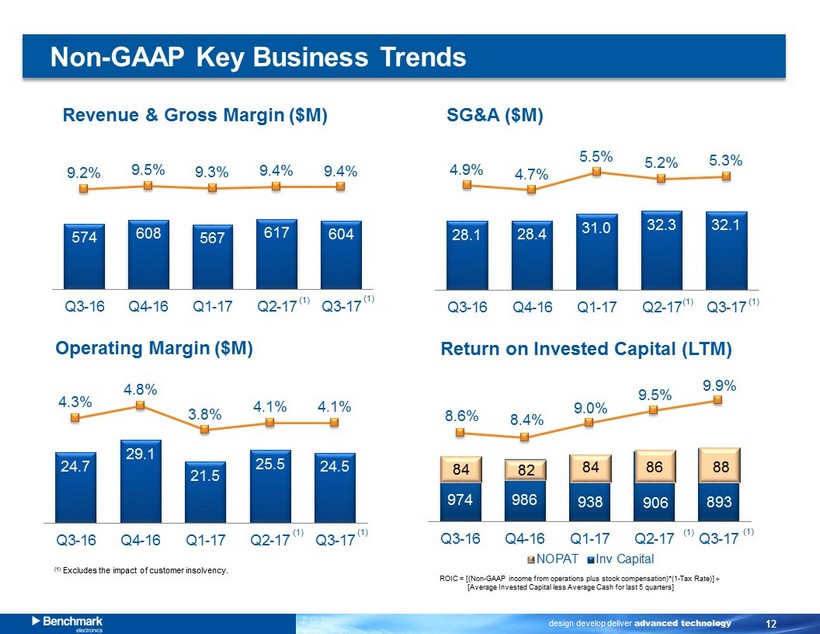
design develop deliver advanced technology 12 24.7 29.1 21.5 25.5 24.5 4.3% 4.8% 3.8% 4.1% 4.1% 0.0% 1.0% 2.0% 3.0% 4.0% 5.0% 6.0% 7.0% 0.0 10.0 20.0 30.0 40.0 50.0 60.0 Q3-16 Q4-16 Q1-17 Q2-17 Q3-17 574 608 567 617 604 9.2% 9.5% 9.3% 9.4% 9.4% 1.0% 3.0% 5.0% 7.0% 9.0% 11.0% 13.0% 15.0% 0 200 400 600 800 1,000 1,200 1,400 Q3-16 Q4-16 Q1-17 Q2-17 Q3-17 8.6% 8.4% 9.0% 9.5% 9.9% 5.0% 6.0% 7.0% 8.0% 9.0% 10.0% 11.0% 0.0% 2.0% 4.0% 6.0% 8.0% 10.0% 12.0% 14.0% 16.0% 18.0% 20.0% Q3-16 Q4-16 Q1-17 Q2-17 Q3-17 974 986 938 906 893 Revenue & Gross Margin ($ M ) Non - GAAP Key Business Trends Return on Invested Capital (LTM) ROIC = [(Non - GAAP income from operations plus stock compensation )*( 1 - Tax Rate )] ÷ [ Average Invested Capital less Average Cash for last 5 quarters] Operating Margin ($M) 28.1 28.4 31.0 32.3 32.1 4.9% 4.7% 5.5% 5.2% 5.3% 0.0% 1.0% 2.0% 3.0% 4.0% 5.0% 6.0% 7.0% 8.0% 0.0 10.0 20.0 30.0 40.0 50.0 60.0 70.0 Q3-16 Q4-16 Q1-17 Q2-17 Q3-17 SG&A ($M) (1) Excludes the impact of customer insolvency. (1) (1) (1) (1) (1) (1) (1) (1) 84 82 84 86 88
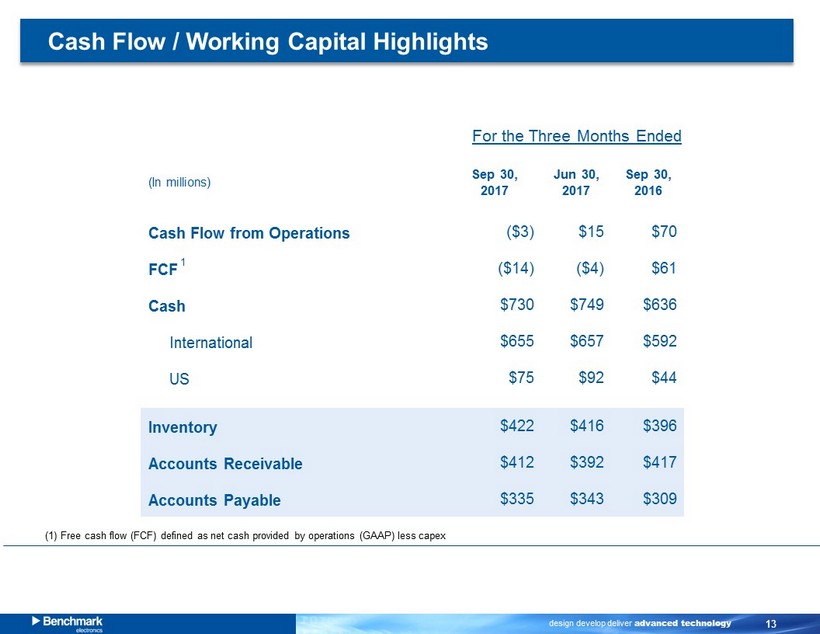
design develop deliver advanced technology 13 (In millions) Sep 30 , 2017 Jun 30 , 2017 Sep 30, 2016 Cash Flow from Operations ($3) $15 $70 FCF ($14) ($4) $61 Cash $730 $749 $636 International $655 $657 $592 US $75 $92 $44 Inventory $422 $416 $396 Accounts Receivable $412 $392 $417 Accounts Payable $335 $343 $309 Cash Flow / Working Capital Highlights For the Three Months Ended (1) Free cash flow (FCF) defined as net cash provided by operations (GAAP) less capex 1
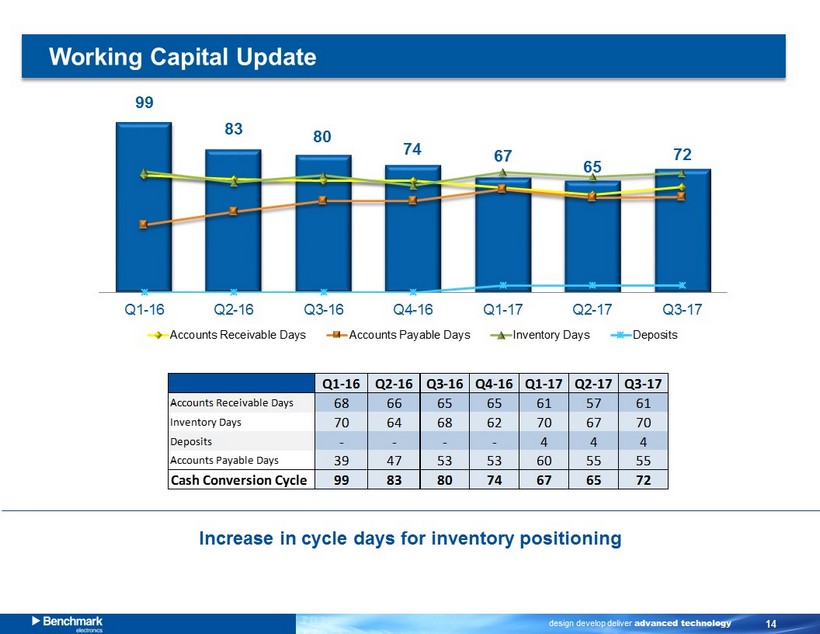
design develop deliver advanced technology 14 Working Capital Update Increase in cycle days for inventory positioning 99 83 80 74 67 65 72 0 20 40 60 80 100 120 Q1-16 Q2-16 Q3-16 Q4-16 Q1-17 Q2-17 Q3-17 Accounts Receivable Days Accounts Payable Days Inventory Days Deposits Q1-16 Q2-16 Q3-16 Q4-16 Q1-17 Q2-17 Q3-17 Accounts Receivable Days 68 66 65 65 61 57 61 Inventory Days 70 64 68 62 70 67 70 Deposits - - - - 4 4 4 Accounts Payable Days 39 47 53 53 60 55 55 Cash Conversion Cycle 99 83 80 74 67 65 72
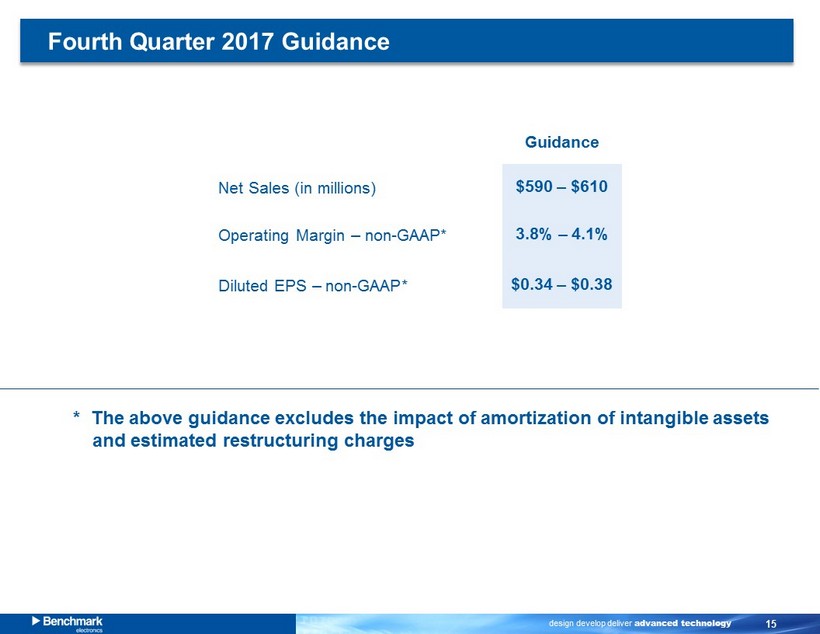
design develop deliver advanced technology 15 Guidance Net Sales (in millions) $590 – $610 Operating Margin – non - GAAP* 3.8% – 4.1% Diluted EPS – non - GAAP* $0.34 – $0.38 * The above guidance excludes the impact of amortization of intangible assets and estimated restructuring charges Fourth Quarter 2017 Guidance
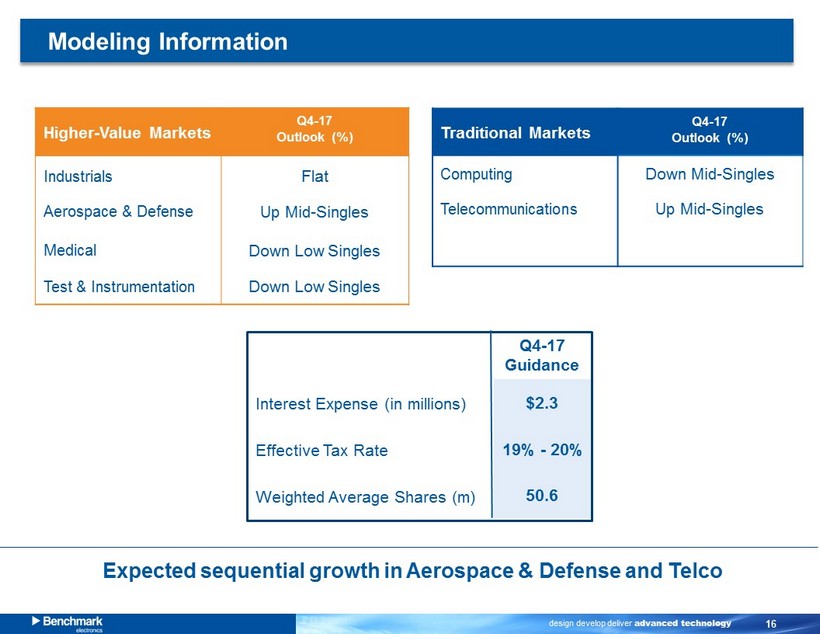
design develop deliver advanced technology 16 Higher - Value Markets Q4 - 17 Outlook (%) Industrials Aerospace & Defense Flat Up Mid - Singles Medical Down Low Singles Test & Instrumentation Down Low Singles Traditional Markets Q4 - 17 Outlook (%) Computing Down Mid - Singles Telecommunication s Up Mid - Singles Modeling Information Expected sequential growth in Aerospace & Defense and Telco (1) Q4 - 17 Guidance Interest Expense (in millions) $2.3 Effective Tax Rate 19% - 20% Weighted Average Shares (m) 50.6
design develop deliver advanced technology 17 Appendix
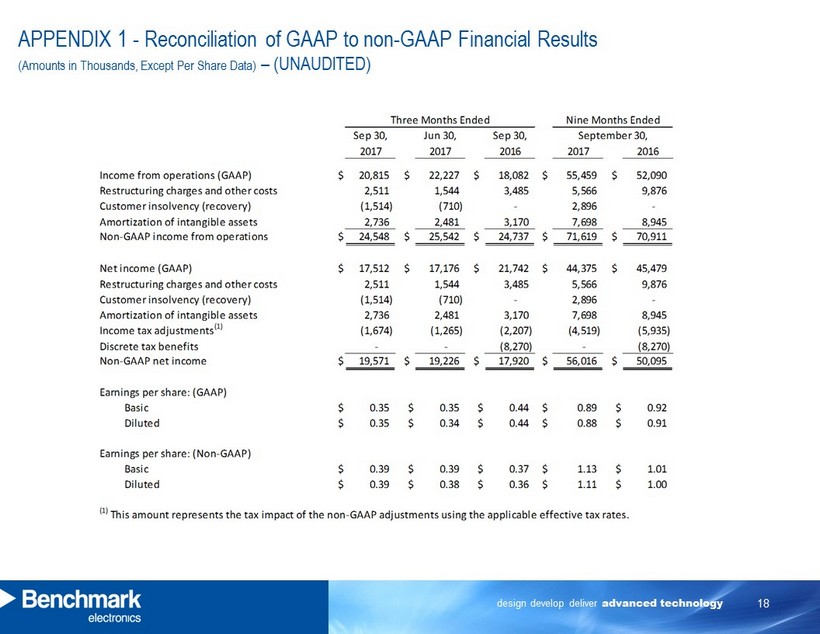
design develop deliver advanced technology 18 APPENDIX 1 - Reconciliation of GAAP to non - GAAP Financial Results (Amounts in Thousands, Except Per Share Data) – (UNAUDITED)
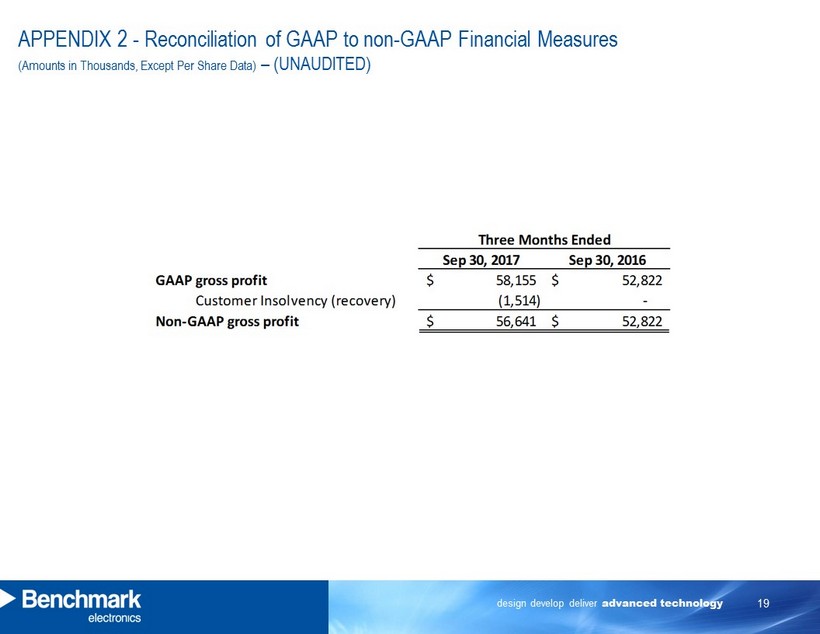
design develop deliver advanced technology 19 APPENDIX 2 - Reconciliation of GAAP to non - GAAP Financial Measures (Amounts in Thousands, Except Per Share Data) – (UNAUDITED)
H^A=MZV=$G10L;EEOUD.IO)P!6=AR\8Z>]Q71RZQBUQ M0/[25%SX+,!YQUA[B-HS%/Q@LBP$S*I &ULBX]#VY9C03_;^IP^ MQ(MZV&?S_H2GNOZFNA87P<\U+-S*O+9A 2Z5 "[0UTWVCEW%&)ZICRK,5&LO M"8F69=$HVH)M9I%\H)-R3J=2;QU1[M.7!P?A6^@%1=]'P4 ++Y-G;EUGVF56?#QP-R1+C*BRE $ M3S4F$I -H]%*U=$>4LL5:Y8QE9$#AI!:E,HI4IG !=5HVCY1Y^ B7## YY,'>NW\DB'DZ:[.OE:B5K4;J6>) MBUT^DMRB 5#M0>2D2%(98:4X\K1*&TE2E> %S&Q<)=#%2K\LNH5>;;P]2&S8 MNN@.ONGB$- \+[JL.&L+OU-6GCNMEA#:Z-1K);*8Y_SU]"@+>(!"= ("HE0U M]1$;=7T7T6LM)%/$S(R[&9(FGU9W9I5K75L$I!UT'&VL:[E\,U!Z8<9:DIA] MQ"RA0994H @V.PA%&MHU";B\8]?!-5V9J-'A26<^KDA.H2LW"1?G80Y90\VD MI0ZX@'0A"U)!]1BP_J76VQ=5%GP.?DR_9#1R2 ,5C&E-\J:EGLV4H);.E M[WUBR@FWC#6 (VCE*37*/L XC\8M-$6XIA;;A!*5W2?X3"W)[LLQT M.2FU,?VL01P@$W*M/J4E]I#IV[2=?7#MIDK6-.P#=1X"!NN!Q:E6L"=HM3Y- MV,\%&KU%%.>0XV26'-!W'E$6@6B]UF01.R#B/C)!6CQBE!LW TY&';\HY6IK MV2RNC NH*%#,+<1<6OX0D)((*24GF#8Q EFIT]LNM( >V;2Z&>"VSSY,@9F@SDK ?X#G M&YL'8-E7PW-U,_"FRD2"]"D_Q\_"&>$^CB7P8I2ID"9JJ?.?([*.Y X>.\68 MM.**#D5VO--MXYNHU*EQ7T]8ZK31_%8/JI(E#W7-( 0JPRIX&)*7"BTC,