| REGISTRATION STATEMENT PURSUANT TO SECTION 12(b) OR 12(g) OF THE SECURITIES EXCHANGE ACT OF 1934 | |||||
ANNUAL REPORT PURSUANT TO SECTION 13 OR 15(d) OF THE SECURITIES EXCHANGE ACT OF 1934 For the fiscal year ended: | |||||
TRANSITION REPORT PURSUANT TO SECTION 13 OR 15(d) OF THE SECURITIES EXCHANGE ACT OF 1934 | |||||
SHELL COMPANY REPORT PURSUANT TO SECTION 13 OR 15(d) OF THE SECURITIES EXCHANGE ACT OF 1934 Date of event requiring this shell company report For the transition period from: to | |||||
Commission file number: | Commission file number: | ||||
ABN 96 004 458 404 | |||||
| (Exact Name of Registrant as Specified in Its Charter) | (Exact Name of Registrant as Specified in Its Charter) | ||||
England and Wales (Jurisdiction of Incorporation or Organization) | Victoria, (Jurisdiction of Incorporation or Organization) | ||||
(Address of Principal Executive Offices) | (Address of Principal Executive Offices) | ||||
| Title of Each Class | Trading Symbol | Name of Each Exchange On Which Registered | ||||||
| * | Evidenced by American Depositary Receipts. Each American Depositary Share Represents one Rio Tinto plc Ordinary Shares of 10p each. | ||||
| ** | Not for trading, but only in connection with the listing of American Depositary Shares, pursuant to the requirements of the Securities and Exchange Commission | ||||
| Title of Class | Title of Class Shares | ||||||||||
| None | None | ||||||||||
| Title of Class | Title of Class of Shares | ||||||||||
| None | None | ||||||||||
| Title of each class | Rio Tinto plc - Number | Rio Tinto Limited - Number | Title of each class | ||||||||
| Ordinary Shares of 10p each | Shares | ||||||||||
| DLC Dividend Share of 10p | 1 | 1 | DLC Dividend Share | ||||||||
| Special Voting Share of 10p | 1 | 1 | Special Voting Share | ||||||||
| Accelerated Filer ☐ | Non-Accelerated Filer ☐ | |||||||
Emerging growth company | ||||||||
| Auditor Name | Auditor Location | Auditor Firm ID | ||||||
Item | Form 20-F Caption | Location in this document | Page | |||
1 | Identity of directors, senior management and advisers | Not applicable | – | |||
2 | Offer statistics and expected timetable | Not applicable | – | |||
3 | Key information | |||||
3.A - [Reserved] | Not applicable | – | ||||
3.B – Capitalisation and indebtedness | Not applicable | – | ||||
3.C – Reasons for the offer and use of proceeds | Not applicable | – | ||||
3.D – Risk factors | Risk factors | |||||
4 | Information on the company | |||||
4.A – History and development of the company | Contents | Cover | ||||
At a glance | 2-3 | |||||
Chair’s statement | 4-5 | |||||
Chief Executive’s Q&A | 6-7 | |||||
Our purpose in action | 10-11 | |||||
Our stakeholders | 12-13 | |||||
Strategic context | 14-15 | |||||
Progressing our strategy | 17 | |||||
Progressing our four objectives | 18-19 | |||||
Key performance indicators | 20-22 | |||||
Chief Financial Officer’s statement | 23 | |||||
Financial review | 24-29 | |||||
Portfolio management | 30-31 | |||||
Iron Ore | 32-33 | |||||
Aluminium | 34-35 | |||||
Copper | 36-37 | |||||
Minerals | 38-39 | |||||
Our approach to ESG | 40-77 | |||||
Governance – Additional statutory disclosure – Operating and financial review | 146-147 | |||||
Financial statements – Note 1 – Our financial performance by segment – Note 5 – Acquisitions and disposals | ||||||
Rio Tinto Financial Information by Business Unit | ||||||
Shareholder Information – Organisational structure – Nomenclature and financial data – History – Dual-listed companies structure | 347 347 347 347 | |||||
Additional information – US disclosure – Document on display – Registered offices | 357 382 | |||||
Annual Report on Form 20-F 2023 | riotinto.com | i |
Item | Form 20-F Caption | Location in this document | Page | |||
4.B – Business overview | At a glance | 2-3 | ||||
Chair’s statement | 4-5 | |||||
Chief Executive’s Q&A | 6-7 | |||||
Creating value by living our purpose | 8-9 | |||||
Our purpose in action | 10-11 | |||||
Our stakeholders | 12-13 | |||||
Strategic context | 14-15 | |||||
Our strategy | 16 | |||||
Progressing our strategy | 17 | |||||
Progressing our four objectives | 18-19 | |||||
Key performance indicators | 20-22 | |||||
Chief Financial Officer’s statement | 23 | |||||
Financial review | 24-29 | |||||
Iron Ore | 32-33 | |||||
Aluminium | 34-35 | |||||
Copper | 36-37 | |||||
Minerals | 38-39 | |||||
Our approach to ESG | 40-77 | |||||
Governance – Additional statutory disclosure – Government regulations – Environmental regulations | 150 150 | |||||
Financial statements Note 6 – Revenue by destination and product | ||||||
Metals and minerals production | 297-298 | |||||
Mineral Resources and Mineral Reserves | 299-322 | |||||
Qualified Persons | 323 | |||||
Mines and production facilities | 324-342 | |||||
Additional information – US disclosure – Disclosure pursuant to Section 13(r) of the Securities Exchange Act of 1934 | 354 | |||||
4.C Organisational structure | Financial statements – Note 30 – Principal subsidiaries – Note 31 – Principal joint operations – Note 32 – Principal joint ventures and associates | |||||
Shareholder Information – Organisational structure – Dual-listed companies structure | 347 347 | |||||
4.D – Property, plants and equipment | Key performance indicators | 20-22 | ||||
Portfolio management | 30-31 | |||||
Iron Ore | 32-33 | |||||
Aluminium | 34-35 | |||||
Copper | 36-37 | |||||
Minerals | 38-39 | |||||
Our approach to ESG | 40-77 | |||||
Governance – Additional statutory disclosure – Environmental regulations – Energy efficiency action | 150 150 | |||||
Financial statements Note 13 – Property, plant and equipment | ||||||
Metals and minerals production | 297-298 | |||||
Mineral Resources and Mineral Reserves | 299-322 | |||||
Qualified persons | 323 | |||||
Mines and production facilities | 324-342 | |||||
Additional information – US disclosure – Summary disclosure of operations pursuant to Item 1303 of SK-1300 under Securities Act of 1933 | 363 | |||||
Additional information – US disclosure – Individual property disclosure pursuant to Item 1304 of SK-1300 under Securities Act of 1933 | 363-380 | |||||
Additional information – US disclosure – Internal controls disclosure pursuant to Item 1305 of SK-1300 under Securities Act of 1933 | 380 | |||||
See Exhibit 96.4 | – |
ii | Annual Report on Form 20-F 2023 | riotinto.com |
Item | Form 20-F Caption | Location in this document | Page | |||
4A | Unresolved staff comments | None | – | |||
5 | Operating and financial review and prospects | |||||
5.A – Operating results | Chair’s statement | 4-5 | ||||
Financial review | 24-29 | |||||
Iron Ore | 32-33 | |||||
Aluminium | 34-35 | |||||
Copper | 36-37 | |||||
Minerals | 38-39 | |||||
Our approach to ESG | 40-77 | |||||
Governance – Additional statutory disclosure – Operating and financial review – Government regulations – Environmental regulations | 146-147 150 150 | |||||
Financial statements –h. Impact of Climate Change on the Group –Note 24 – Financial instruments and risk management | ||||||
Rio Tinto Financial Information by Business Unit | 286-288 | |||||
Alternative Performance Measures | 289-294 | |||||
5.B – Liquidity and capital resources | Portfolio management | 30-31 | ||||
Copper – Oyu Tolgoi underground project | 37 | |||||
Financial statements – Note 14 – Close-down and restoration provisions – Our capital and liquidity – Note 19 - Net debt – Note 20 – Borrowings – Note 21 – Leases – Note 22 – Cash and cash equivalents – Note 23 – Other financial assets and liabilities – Note 24 – Financial instruments and risk management – Note 28 – Post-retirement benefits – Note 36 – Other provisions – Note 37 – Contingencies and commitments | ||||||
5.C – Research and development, patents and licenses, etc. | Our strategy | 16 | ||||
Progressing our strategy | 17 | |||||
Progressing our four objectives | 18-19 | |||||
Our approach to ESG - Environmental performance | 44-65 | |||||
Governance – Additional statutory disclosure – Exploration, research and development | 150 | |||||
Financial statements – Note 7 – Net operating costs (excluding items disclosed separately) – Note 13 - Property, plant and equipment -Impact of climate change on our business - Useful economic lives of our power generating assets | ||||||
5.D – Trend information | At a glance | 2-3 | ||||
Chair’s statement | 4-5 | |||||
Chief Executive's Q&A | 6-7 | |||||
Creating value by living our purpose | 8-9 | |||||
Our purpose in action | 10-11 | |||||
Our stakeholders | 12-13 | |||||
Strategic context | 14-15 | |||||
Our strategy | 16 | |||||
Progressing our strategy | 17 | |||||
Progressing our four objectives | 18-19 | |||||
Key performance indicators | 20-22 | |||||
Chief Financial Officer’s statement | 23 | |||||
Financial review | 24-29 | |||||
Iron Ore | 32-33 | |||||
Aluminium | 34-35 | |||||
Copper | 36-37 | |||||
Minerals | 38-39 | |||||
5.E – Critical accounting estimates | Not Applicable | – | ||||
6 | Directors, senior management and employees | |||||
Annual Report on Form 20-F 2023 | riotinto.com | iii |
Item | Form 20-F Caption | Location in this document | Page | |||
6.A – Directors and senior management | Governance – Board of Directors – Executive Committee | 92-93 94-95 | ||||
Additional statutory disclosure – Directors and executives | 147 | |||||
6.B – Compensation | Governance – Remuneration at a glance - Policy changes – Remuneration Policy – Implementation report – Implementation report tables | 115-117 119-126 127-140 141-145 | ||||
Financial statements – Note 26 – Employment costs and provisions – Note 27 – Share-based payments – Note 28 – Post-retirement benefits | ||||||
6.C – Board practices | Governance | 90-156 | ||||
Governance – Board of Directors – Executive Committee – Audit & Risk Committee report – Remuneration Policy – Executives’ service contracts and termination – Compliance with governance codes and standards | 92-93 94-95 107-110 124-125 152-156 | |||||
Shareholder information – Directors – Appointment and removal of Directors | 352 | |||||
6.D – Employees | Our stakeholders – Workforce | 12 | ||||
Our approach to ESG – Talent, diversity and inclusion | 73 | |||||
Financial statements – Note 25 – Average number of employees – Note 26 – Employment costs and provisions | ||||||
Rio Tinto financial Information by Business Unit | ||||||
6.E – Share ownership | Governance – Implementation report – Executive Directors’ shareholding – Non-Executive Directors’ share ownership – Other share plans | 136 140 140 | ||||
Financial statements - Note 27 – Share-based payments | ||||||
6.F – Disclosure of a registrant’s action to recover erroneously awarded compensation | Governance – Remuneration policy – Executive remuneration structure - Policy table See Exhibit 96.5 | 120-122 | ||||
7 | Major shareholders and related party transactions | |||||
7.A – Major shareholders | Shareholder information - Shareownership – Substantial shareholders in Rio Tinto plc – Substantial shareholders in Rio Tinto Limited – Analysis of ordinary shareholders – Twenty largest registered shareholders | 349 349 350 350 | ||||
7.B – Related party transactions | Financial review | 24-29 | ||||
Financial statements Note 33 – Related-party transactions | ||||||
7.C – Interests of experts and counsel | Not applicable | – | ||||
iv | Annual Report on Form 20-F 2023 | riotinto.com |
Item | Form 20-F Caption | Location in this document | Page | |||
8 | Financial Information | |||||
8.A – Consolidated statements and other financial information | Financial review – Our shareholder returns policy | 29 | ||||
Additional statutory disclosure - Operating and Financial Review | 146-147 | |||||
Financial statements Note 37 – Contingencies and commitments | ||||||
See Item 18 | – | |||||
8.B – Significant changes | Financial statements Note 39 – Events after the balance sheet date | |||||
9 | The offer and listing | |||||
9.A – Offer and listing details | Additional statutory disclosure – Operating and financial review | 146-147 | ||||
Shareholder information – Organisational structure – Markets | 347 348 | |||||
9.B – Plan of distribution | Not applicable | – | ||||
9.C – Markets | Shareholder information – Markets | 348 | ||||
See Exhibit 2.1 | – | |||||
9.D – Selling shareholders | Not applicable | – | ||||
9.E – Dilution | Not applicable | – | ||||
9.F – Expenses of the issue | Not applicable | – | ||||
10 | Additional information | |||||
10.A – Share capital | Not applicable | – | ||||
10.B – Memorandum and articles of association | Financial review – Our shareholder returns policy | 28 | ||||
Governance – Compliance with governance codes and standards | 152-156 | |||||
Shareholder information – Dual-listed companies structures – Material contracts – Exchange controls and foreign investment – Directors | 347-348 351-352 352 352-353 | |||||
See Exhibit 2.1 | – | |||||
10.C – Material contracts | Financial statements – Our capital and liquidity | |||||
Shareholder information – Material contracts | 351-352 | |||||
10.D – Exchange controls | Shareholder information – Exchange controls and foreign investment | 352 | ||||
10.E – Taxation | Additional information – US disclosure – Taxation | 354-356 | ||||
10.F – Dividends and paying agents | Not applicable | – | ||||
10.G – Statement by experts | Not applicable | – | ||||
10.H – Documents on display | Additional information – US disclosure – Document on display | 357 | ||||
10.I – Subsidiary information | Not applicable | – | ||||
10.J – Annual report to security holders | Additional information – US disclosure – Document on display | 357 | ||||
11 | Quantitative and qualitative disclosure about market risk | Risk factors | 81-88 | |||
Financial statements Note 24 – Financial instruments and risk management | ||||||
Cautionary statement about forward-looking statements | 383 | |||||
12 | Description of securities other than equity securities | |||||
12.A – Debt securities | Not applicable | – | ||||
12.B – Warrants and rights | Not applicable | – | ||||
12.C – Other securities | Not applicable | – | ||||
12.D – American depositary shares | Additional information – US disclosure – American Depositary Shares - American depositary receipts (ADRs) | 356-357 | ||||
13 | Defaults, dividend arrearages and delinquencies | Not applicable | – | |||
Annual Report on Form 20-F 2023 | riotinto.com | v |
Item | Form 20-F Caption | Location in this document | Page | |||
14 | Material modifications to the rights of security holders and use of proceeds | Not applicable | ||||
15 | Controls and Procedures | Governance – Additional statutory disclosure – Disclosure controls and procedures – Management’s report on internal control over financial reporting | 151 151 | |||
See Item 18 for the Report of the Independent Registered Public Accounting Firm | – | |||||
16 | [Reserved] | Not applicable | – | |||
16A | Audit committee financial expert | Governance – Audit & Risk Committee report – US listing requirements – Compliance with governance codes and standards | 107 152-156 | |||
16B | Code of ethics | Our approach to ESG – Governance performance | 76-77 | |||
16C | Principal accountant fees and services | Governance – Audit & Risk Committee report – External auditors | 109-110 | |||
Financial statements – Note 38 – Auditors’ remuneration | ||||||
16D | Exemptions from the listing standards for audit committees | Not applicable | – | |||
16E | Purchase of equity securities by the issuer and affiliated purchasers | Governance – Additional statutory disclosure – Purchases | 149 | |||
Financial statements – Note 34 – Share capital | ||||||
16F | Change in registrant’s certifying accountant | Not applicable | – | |||
16G | Corporate Governance | Governance – Compliance with governance codes and standards | 152-156 | |||
16H | Mine safety disclosure | See Exhibit 16.1 | – | |||
16I | Disclosure regarding foreign jurisdictions that prevent inspections | Not applicable | – | |||
16J | Insider trading policies | Not applicable | – | |||
16K | Cybersecurity | Our approach to risk management | 79-80 | |||
Risk factors – Preventing material business disruption and data breaches due to cyber events | ||||||
Additional information – US disclosure – Cybersecurity | 358-362 | |||||
17 | Financial statements | Not applicable | – | |||
18 | Financial statements | About Rio Tinto | ||||
About the presentation of our financial statements | ||||||
Group Income Statement | ||||||
Group Statement of Comprehensive Income | ||||||
Group Cash Flow Statement | ||||||
Group Balance Sheet | ||||||
Group Statement of Changes in Equity | ||||||
Financial statements – Notes 1 to 40 | ||||||
Report of Independent Registered Public Accounting Firms | 267-269 | |||||
19 | Exhibits | See Exhibit List at the end of this document | ||||
vi | Annual Report on Form 20-F 2023 | riotinto.com |

Strategic report | |
2023 year in review | 1 |
At a glance | 2 |
Chair's statement | 4 |
From the Chief Executive | 6 |
Creating value by living our purpose | 8 |
Finding better waysTM in 2023 | 10 |
Our stakeholders | 12 |
Strategic context | 14 |
Our strategy | 16 |
Progressing our strategy | 17 |
Progressing our four objectives | 18 |
Key performance indicators | 20 |
Chief Financial Officer's statement | 23 |
Financial review | 24 |
Portfolio management | 30 |
Iron Ore | 32 |
Aluminium | 34 |
Copper | 36 |
Minerals | 38 |
Our approach to ESG | 40 |
Environmental performance | 44 |
Social performance | 66 |
Governance performance | 76 |
Our approach to risk | 78 |
Our approach to risk management | 79 |
Risk factors | 81 |
Five-year review | 89 |
Directors’ report | |
Governance | 90 |
Chair's introduction | 91 |
Board of Directors | 92 |
Executive Committee | 94 |
Our stakeholders - Section 172(1) statement | 96 |
How the Board monitors culture | 101 |
Board activities in 2023 | 102 |
Governance framework | 103 |
Evaluating our performance | 104 |
Nominations Committee report | 105 |
Audit & Risk Committee report | 107 |
Sustainability Committee report | 111 |
Remuneration report | |
Annual statement by the People & Remuneration Committee Chair | 113 |
Remuneration Policy | 119 |
Implementation report | 127 |
Additional statutory disclosure | 146 |
Compliance with governance codes and standards | 152 |
Financial statements | |
About Rio Tinto | 158 |
About the presentation of our financial results | 158 |
Group primary statements | 168 |
Notes to the 2023 financial statements | 173 |
Other information | |
Report of independent registered public accounting firms | 267 |
Financial information by business unit | 286 |
Alternative Performance Measures | 289 |
Production, Reserves, Resources and Operations | |
Metals and minerals production | 297 |
Mineral Resources and Mineral Reserves | 299 |
Qualified Persons | 323 |
Mines and production facilities | 324 |
Additional information | |
Independent limited assurance report | 344 |
Shareholder information | 347 |
US disclosure | 354 |
Contact details | 382 |
Cautionary statement about forward-looking statements | 383 |
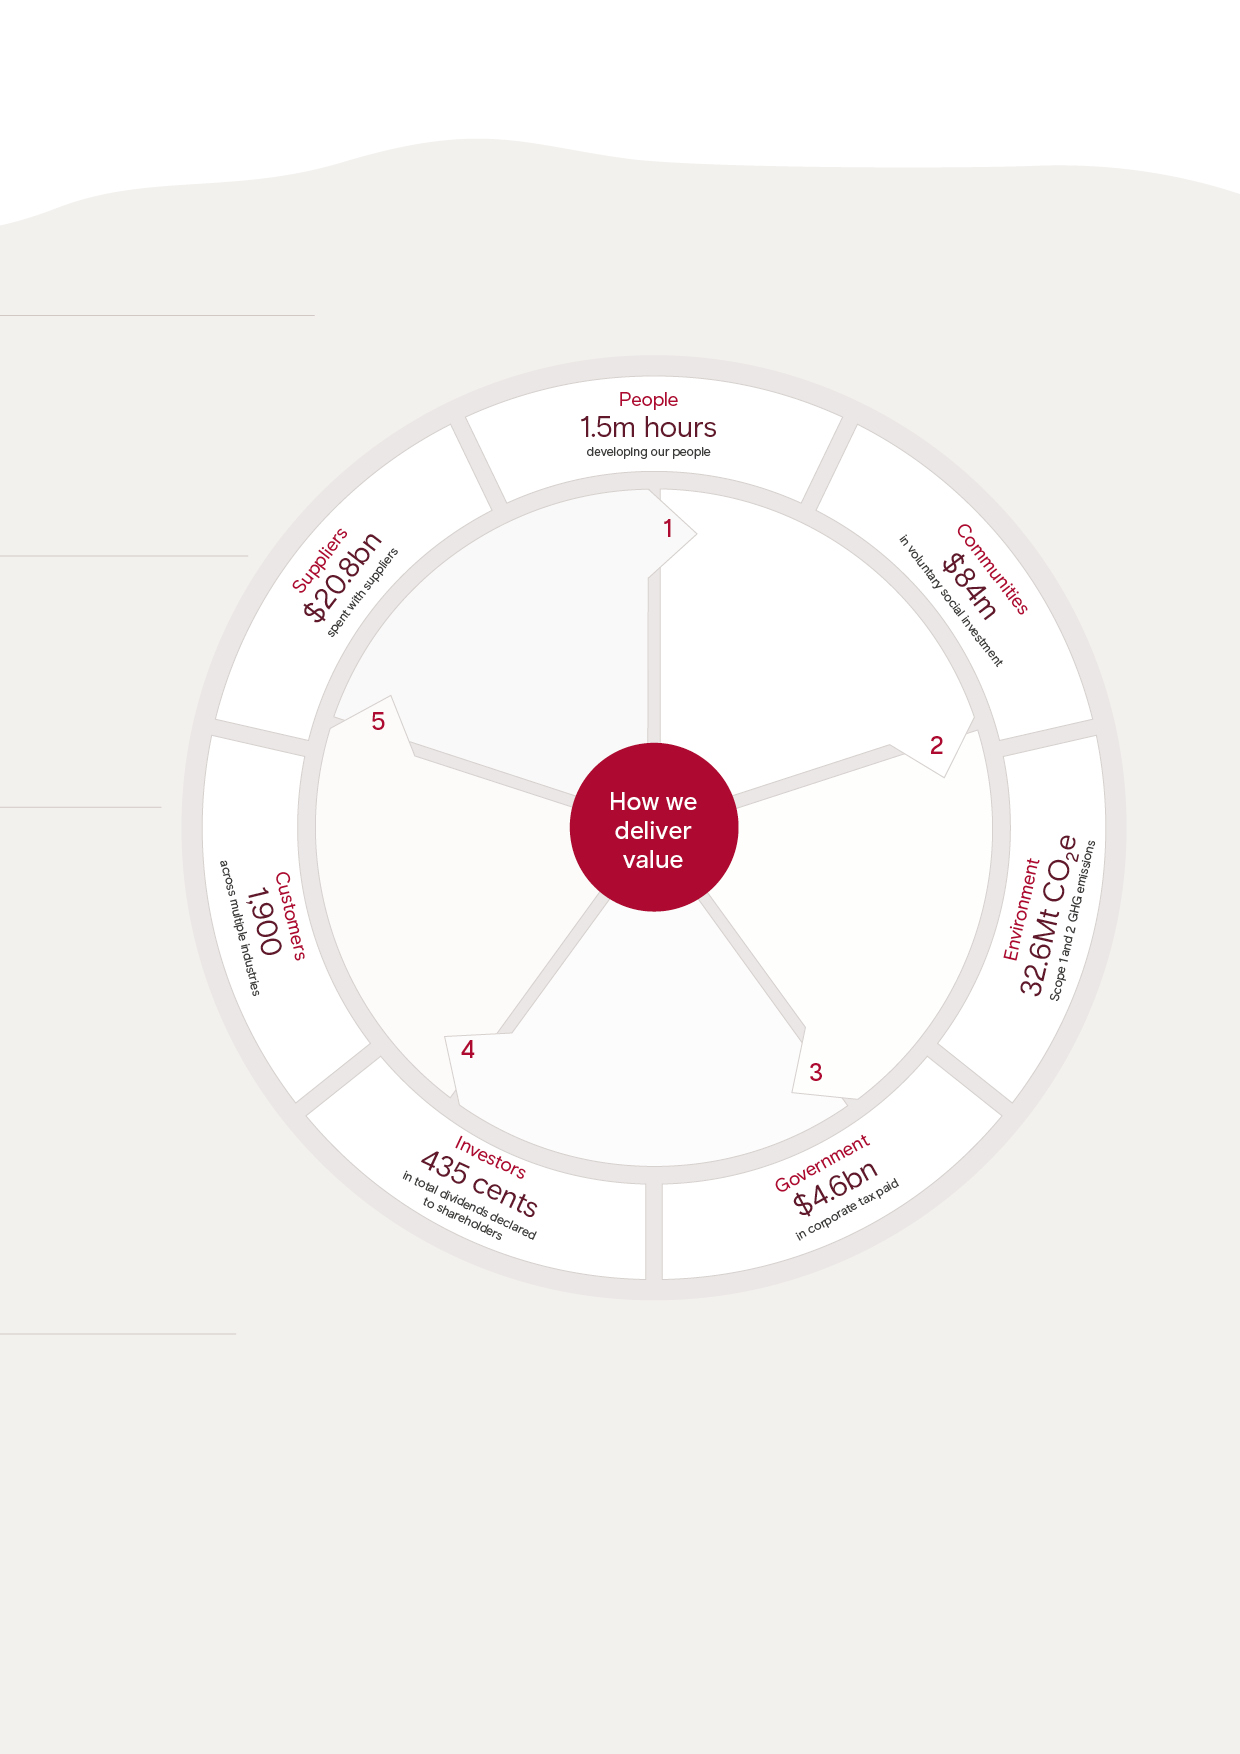
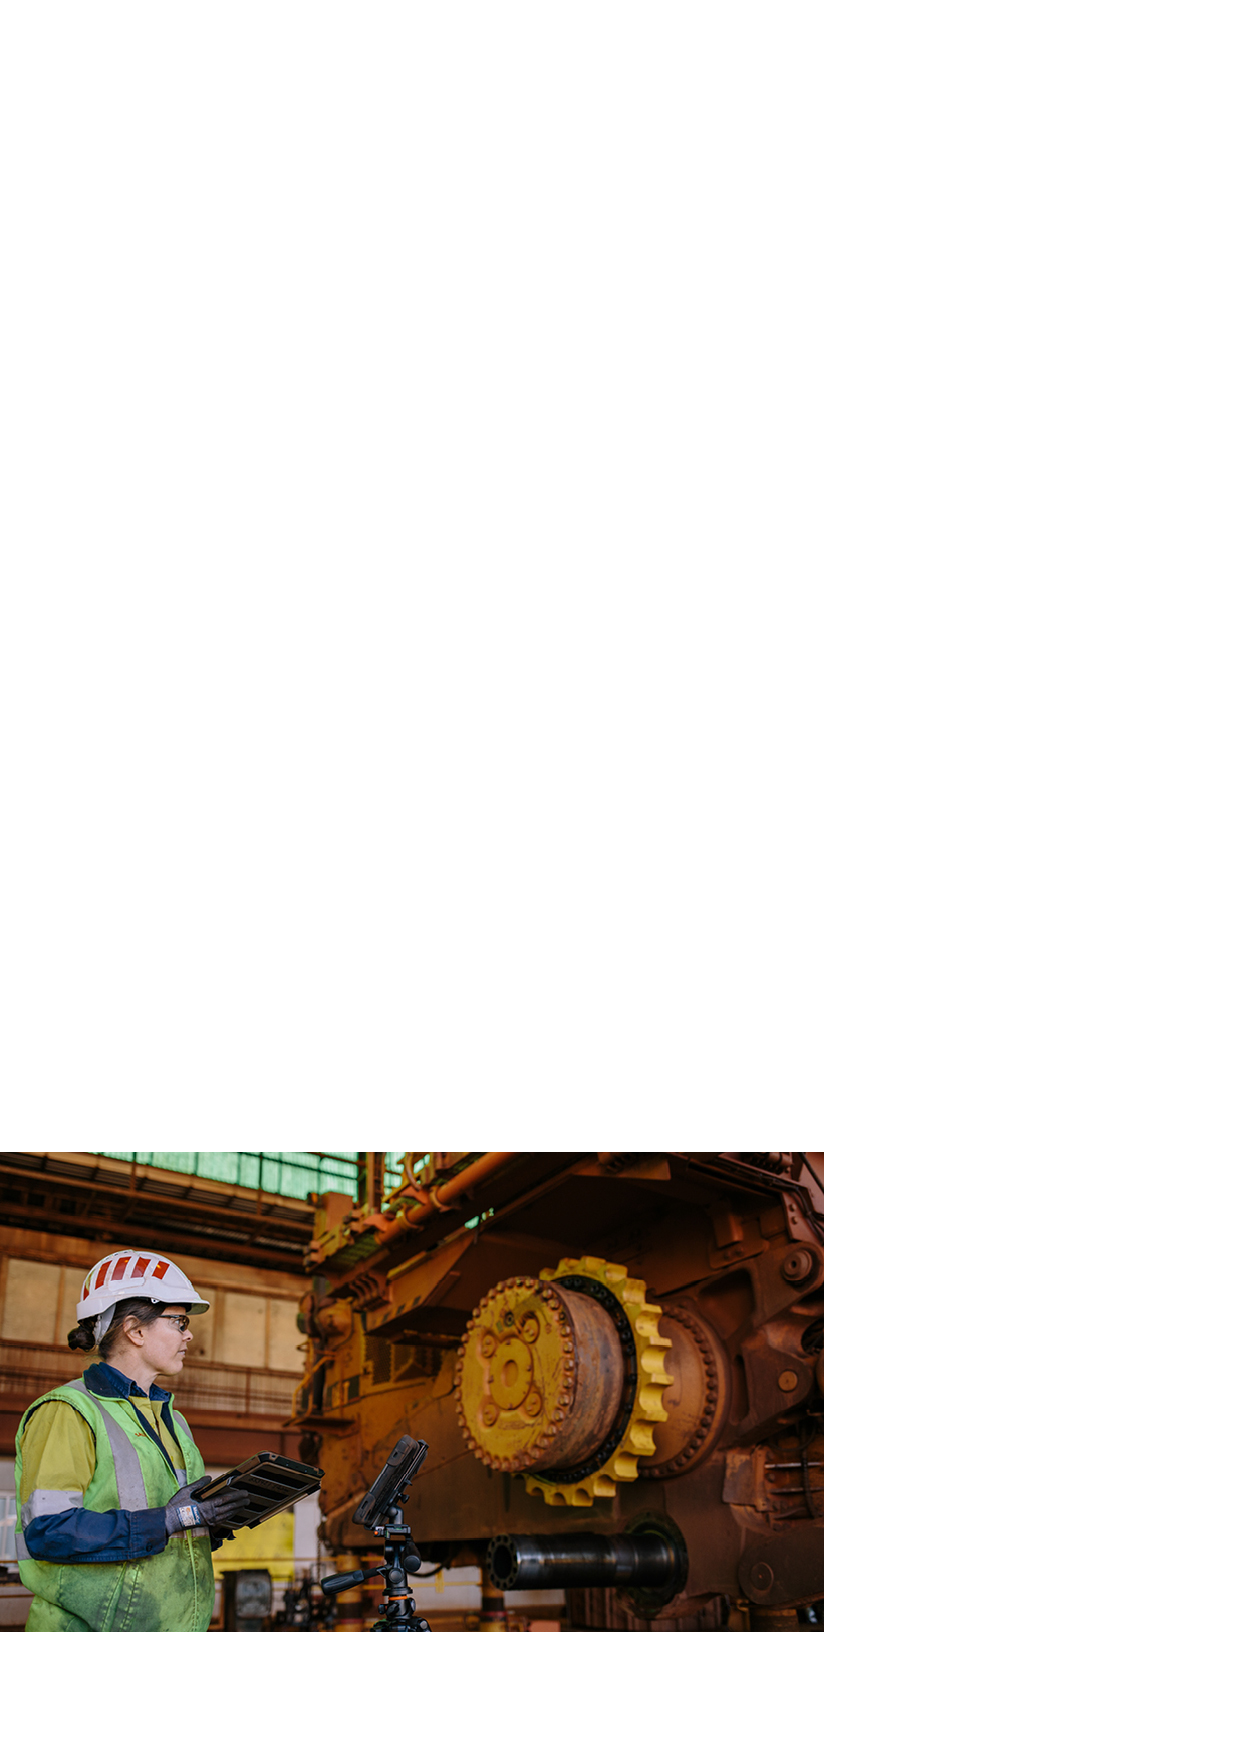
2023 year in review We are finding better waysTM to provide the materials the world needs. In 2023, our teams around the world sought opportunities to reduce our carbon footprint, to partner to develop technologies to decarbonise steel and aluminium production, to find more efficient ways to supply copper and critical minerals essential for the energy transition, and to create new products from waste. We explore, we mine, we process, and our ambition continues to be a business with a commodity mix aligned with evolving customer demand in a decarbonising world. But we cannot do it on our own. So we strive to create partnerships that solve problems and create solutions with lower societal and environmental impact. The approach applies as much to large-scale, transformational innovation as it does to incremental everyday progress, such as our safety and operational performance. | All-injury frequency rate | Consolidated sales revenue | ||
0.37 | $54.0bn | |||
(2022: 0.40) | (2022: $55.6bn) | |||
Women in our workforce | Profit after tax attributable to owners of Rio Tinto | |||
24.3% | $10.1bn | |||
(2022: 22.9%) | (net earnings) (2022: $12.4bn)1 | |||
Scope 1 and 2 greenhouse gas emissions | Net cash generated from operating activities | |||
32.6Mt | $15.2bn | |||
(equity CO2e) (2022: 32.7Mt)2 | (2022: $16.1bn) | |||
Increase in spend with Indigenous businesses in Australia | Underlying EBITDA3 | |||
28% | $23.9bn | |||
(2023 A$725 million increased from A$565 million in 2022) | (2022: $26.3bn) | |||
Completion rate of “Building Everyday Respect” employee learning module | Total dividend per share | |||
83.5% | 435 cents | |||
(2022 comparative dataset is not available due to new program) | (2022: 492 cents) |
 | For more information about our environmental, social and governance (ESG) performance see page 43. | | For more information about our financial review see page 24. | ||
1.Comparative information has been restated to reflect the adoption of narrow scope amendments to IAS12 “Income Taxes”. Refer to page 166 for details. 2.In 2023, we improved our carbon emissions reporting and now use the market-based method as our primary measure for assessing performance against our targets. We have restated prior year numbers and our 2018 baseline accordingly. We exclude reductions achieved by divesting assets and increases associated with acquisitions from our target and so also adjust our 2018 baseline to take this into account. For comparison purposes, we have disclosed our 2022 emissions on the same basis. Our adjusted 2022 figures are 32.7Mt CO2e and our actual 2022 emissions (unadjusted for acquisitions) are 32.3Mt CO2e. 3.Underlying EBITDA is a non-IFRS measure. A definition of underlying EBITDA and a reconciliation to its closest IFRS measure is presented in note 1 (pages 174-175). | |||||
Our 2023 reporting suite Our Annual Report is part of our broader 2023 reporting suite. You can find this report and others, including our 2023 Climate Change Report, Sustainability Fact Book, 2023 Addendum - Scope 1, 2 and 3 Emissions Calculation Methodology and Industry Association Disclosure, on our website. Some of our reports are published on our website later in the year, including our 2023 Taxes Paid Report, Country-by-Country Report, Modern Slavery Statement, and our Voluntary Principles on Security and Human Rights report. | |
 | To view and download these documents see riotinto.com/reports. |
 |  |  |  |  | |||||
2023 Annual Report | 2023 Climate Change Report | 2023 Sustainability Fact Book | 2023 Addendum - Scope 1, 2 and 3 Emissions Calculation Methodology | 2023 Industry Association Disclosure | |||||
Annual Report on Form 20-F 2023 | riotinto.com | 1 |

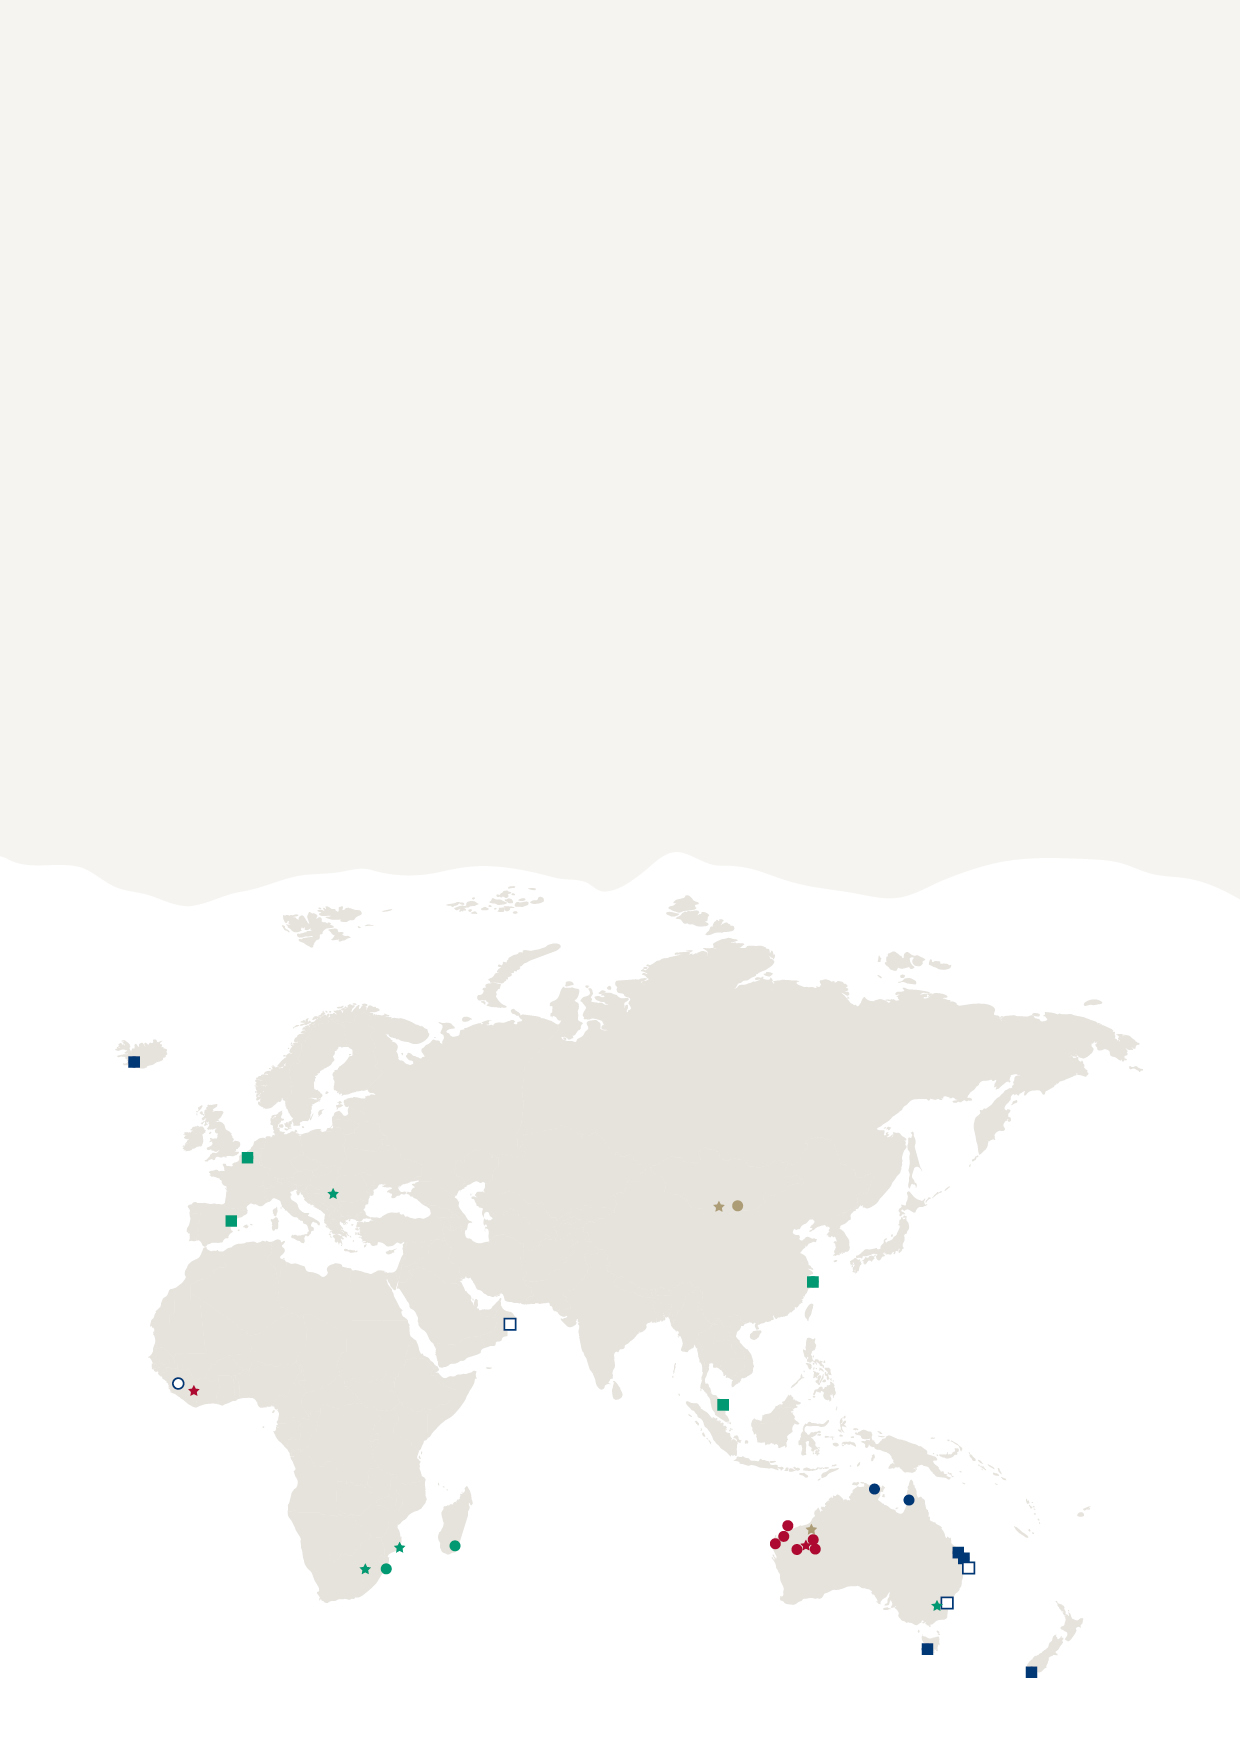
Our business We operate in 351 countries where our 57,000 employees2 are working to find better ways to provide the materials the world needs. Our portfolio includes iron ore, copper, aluminium and a range of other minerals and materials needed for people, communities and nations to grow and prosper, and for the world to cut carbon emissions to net zero. We continuously search for new projects that can support the energy transition, currently exploring for eight commodities in 18 countries. We have more than 150 years of mining and processing experience guiding our work. Today, our business relies on technology such as automation and artificial intelligence to help us run safer, more efficient operations and leave a lighter footprint. | |
Iron Ore | Aluminium | |||||||||||
Segmental revenue $32.2bn (2022: $30.9bn) | Underlying EBITDAn $20.0bn (2022: $18.6bn) | Production (100% basis) 331.5Mt Pilbara iron ore (2022: 324.1Mt) | Segmental revenue $12.3bn (2022: $14.1bn) | Underlying EBITDA $2.3bn (2022: $3.7bn) | Production (our share) 54.6Mt bauxite (2022: 54.6Mt) 3,272kt aluminium (2022: 3,009kt) | |||||||
Employees2 16,000 (2022: 15,000) | Employees2 15,000 (2022: 15,000) | |||||||||||
Our products Our portfolio includes iron ore, aluminium, bauxite, alumina, copper, diamonds, titanium dioxide, lithium, salt and borates. | ||||||||||||
| For more information see pages 32-39. |
Iron Ore |
Aluminium |
Copper |
Minerals |
1.Includes our mines and production facilities, main exploration activities and countries where we have a significant presence through activities including research and development, commercial, sales, and corporate functions. 2.This represents the average number of employees for the year, including the Group's share of non-managed operations and joint ventures. Refer to page 215 for more information. 3.The map indicates the location of our global operations and projects, however it does not identify all individual facilities included in an operation. It does not include our offices, research and development centres and some processing and shipping facilities. Operations and projects are indicated according to their product group. The Iron Ore Company of Canada is an iron ore operation but is reported under Minerals due to the management structure. The dots on the map are indicative and in some locations we have more assets than visually represented due to the size of the map. 4.2022 underlying EBITDA for Copper has been adjusted to reflect a change in management responsibility for the Simandou iron ore project from Copper to the Chief Technical Officer. As a result, we have moved Simandou outside of reportable segments and accordingly adjusted prior period comparatives. |
2 | Annual Report on Form 20-F 2023 | riotinto.com |
Outlook We have a strong portfolio of assets across six continents. Our focus is on growing our business while decarbonising, providing products to our customers that support the transition to a low-carbon economy, and delivering attractive returns to our shareholders. Many of our products are essential for the energy transition: we expect this new source of demand, combined with traditional sources, to drive significant volume growth in our products over the coming decades. In developed markets, customer demand for low-carbon and recycled materials is growing with supply security top of mind. In developing economies, reliable access to raw materials for domestic processing is critical. We have the people, orebodies, technology, processing capabilities, access to capital and relationships to meet these diversifying needs. |
Copper | Minerals | |||||||||||
Segmental revenue $6.7bn (2022: $6.7bn) | Underlying EBITDA $1.9bn (2022: $2.6bn)4 | Production (consolidated basis) 620kt mined copper (2022: 607kt) | Segmental revenue $5.9bn (2022: $6.8bn) | Underlying EBITDA $1.4bn (2022: $2.4bn) | Production (our share) 1,111kt titanium dioxide slag (2022: 1,200kt) 9.7Mt iron ore pellets and concentrate (2022: 10.3Mt) | |||||||
Employees2 8,000 (2022: 8,000) | Employees2 10,000 (2022: 9,500) | |||||||||||
Annual Report on Form 20-F 2023 | riotinto.com | 3 |

4 | Annual Report on Form 20-F 2023 | riotinto.com |

Annual Report on Form 20-F 2023 | riotinto.com | 5 |

6 | Annual Report on Form 20-F 2023 | riotinto.com |

“Nothing is more important than the safety of our employees, contractors and communities. We remain committed to evolving our culture and processes to ensure everyone goes home safely every day.” | |||||

Annual Report on Form 20-F 2023 | riotinto.com | 7 |
Grow in materials essential for the energy transition Aim to grow in commodities such as copper, aluminium, high-grade iron ore, lithium and other critical minerals. | Accelerate the decarbonisation of our assets Switch to renewable power, electrifying processing and running electric mobile fleets. | Develop products and technologies that help our customers decarbonise Partner with customers and suppliers and invest in R&D to reduce emissions across our value chains. | ||
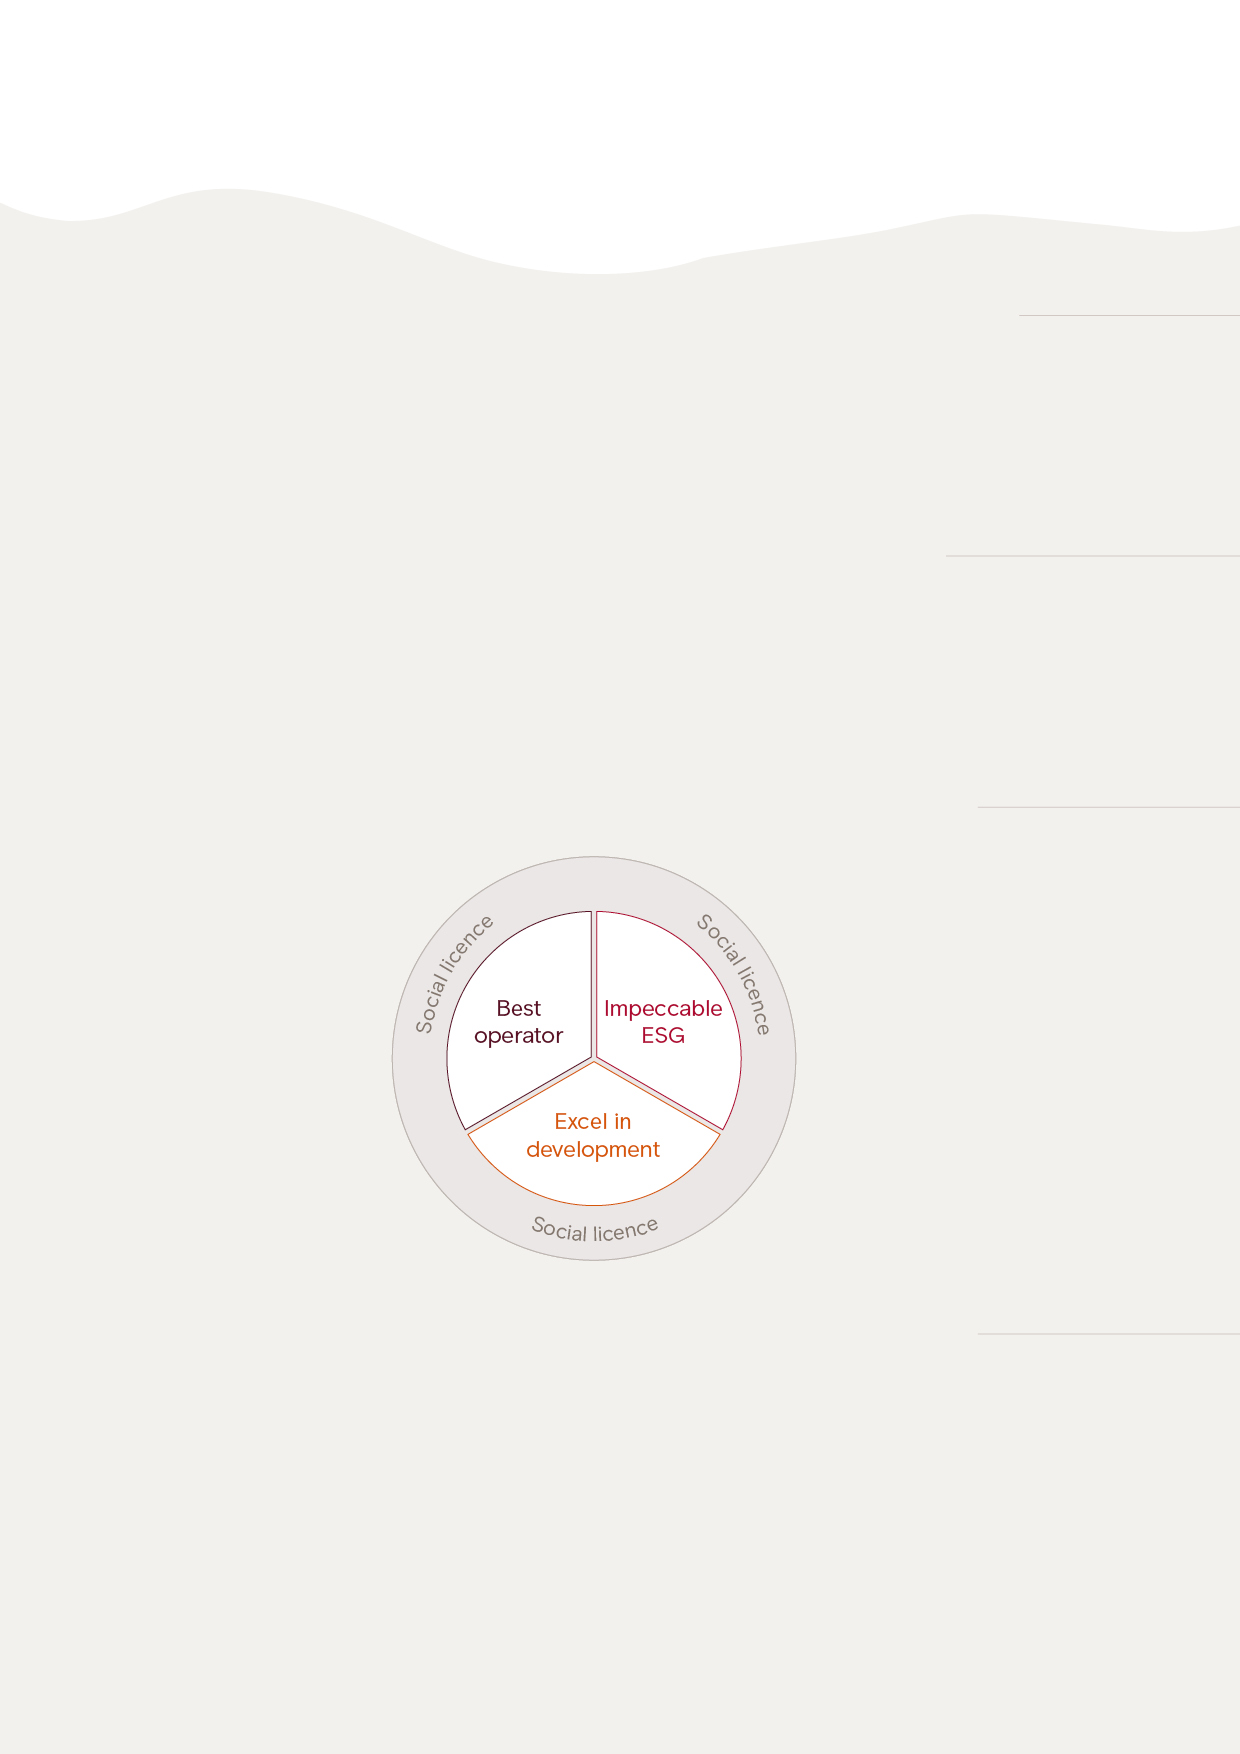
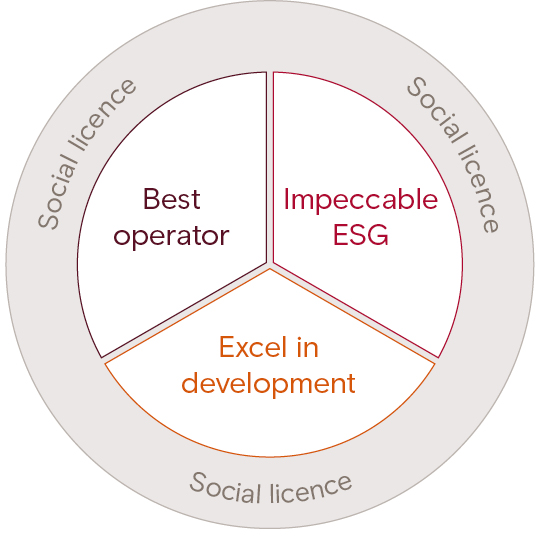
Become the best operator Expand our capabilities and empower our people to improve our operational performance. | Achieve impeccable ESG Align our priorities with community expectations and consider sustainability in all decisions. | |
Excel in development Grow and develop our pipeline of opportunities, and build our capabilities and partnerships for capital-efficient delivery. | Strengthen our social licence Earn trust by building meaningful relationships and partnerships, continuing to listen and learn. | |
Care about the safety of ourselves and others, creating an environment of trust, and the impact we have on our colleagues and others, communities and the environment. | Courage to show vulnerability, speak up and challenge when we can do better, and take ownership of our actions and outcomes to drive performance. | Curiosity to learn and grow in our fields of expertise, look for opportunities to solve problems with everyday innovation, and be open to different perspectives. |
8 | Annual Report on Form 20-F 2023 | riotinto.com |
| For more information about our business model see riotinto.com/ourbusiness. |
Annual Report on Form 20-F 2023 | riotinto.com | 9 |

Continuous improvement and innovation are part of our DNA. Right across the business, we are finding better ways to provide the materials the world needs while reducing our carbon footprint, developing technologies needed to make net zero a reality, and continuing to support our people and the communities where we live and work. |
| For more highlights from 2023 see our end-of-year video at riotinto.com/ annualreport. |
 |  |  | |||||
BioIronTM – pioneering breakthrough technologies | Connecting with Country | Accelerating innovation: bringing the outside world in | |||||
In 2023, we continued developing BioIronTM, which has the potential to reduce CO2 emissions by more than 95% during steelmaking. BioIronTM uses raw biomass produced from agricultural by-products (instead of metallurgical coal) and microwave energy, to convert Pilbara iron ore to metallic iron during steel making. It also uses approximately 65% less electricity during steel making when compared to other green hydrogen1 technologies. We have proved BioIronTM works on a small scale through a successful collaboration with the University of Nottingham and Metso Corporation. Now we have secured a site to continue testing on a larger scale, and are progressing regulatory approvals for the BioIronTM Continuous Pilot Plant which will have the capacity of one tonne per hour. | In 2023, we commenced cultural immersion secondments with JawunTM, a non-profit partnership program with Indigenous organisations and communities across Australia. Every year, 24 of our people will contribute their skills to support Aboriginal economic development as part of the program, while also learning about Aboriginal culture and history. This two-way learning opportunity has already deepened our cultural understanding and contributes to a more culturally aware workplace. “You have an opportunity to provide back to an Indigenous organisation, and in return you get to explore this beautiful Country and learn a lot of things from the local Indigenous Peoples.” Travis Creed, Superintendent Capability Development. | In 2023, we established an Innovation Advisory Committee, bringing together experts in innovation and research and development. The Committee is helping us accelerate our innovation portfolio and offers guidance on emerging technologies in areas such as health and safety, environmental, social and governance, growth, carbon abatement and productivity. To help us find innovative ways to provide the materials the world needs for the energy transition, we have also committed $150 million over ten years to create a Centre for Future Materials led by Imperial College London. | |||||
| For more information about BioIronTM see riotinto.com/bioiron. |
10 | Annual Report on Form 20-F 2023 | riotinto.com |

Global 25% improvement in AIFR1 in the second half of 2023 at SPS sites, when compared to the first half | Iron Ore 5Mt year-on-year production uplift at Pilbara iron ore sites, attributable to SPS | Copper 90% record performance of concentrator effective utilisation at Kennecott across Q3 and Q4 | ||
Aluminium 8% year-on-year increase in casting operating time at Grande Baie (excluding shutdowns) | Iron Ore 34% decreased variability in processing operating time year-on-year at Hope Downs | Minerals 32% year-on-year improvement in AIFR1 at Iron Ore Company of Canada |
1.All-injury frequency rate. | | For more information about SPS see riotinto.com/innovation. |
 |  | |||
First open pit mine in the world to move to renewable diesel | Investing in recycled aluminium | |||
Our Boron operation in California has fully transitioned their heavy machinery from fossil diesel to renewable diesel. We expect this to reduce our CO2 equivalent by up to 45,000 tonnes per year, similar to eliminating the emissions of 9,600 cars. In the first quarter of 2024, we will begin to replace our entire fossil diesel consumption with renewable diesel at our Kennecott copper operation in Utah. It will reduce emissions by around 495,000 tonnes of CO2 equivalent per year, similar to eliminating the emissions of more than 107,000 cars. Note: emissions-to-cars conversion source - Greenhouse Gas Equivalencies Calculator | US EPA. | We have formed a joint venture with Giampaolo Group to purchase a 50% stake in Matalco. Aluminium is an essential metal needed to decarbonise, but its production requires vast amounts of electricity and accounts for about 3% of the world’s CO2. The partnership will help us provide a broader range of high-quality and low- carbon, primary, recycled, and blended aluminium products, at a time when customers are looking for solutions to lower their carbon footprint. This move follows other recent investments in our aluminium business in North America, including $1.1 billion to expand AP60 smelter equipped with low-carbon technology at Complexe Jonquière in Canada, and $107 million to install a new alumina conveyor at Kitimat. | |||
Annual Report on Form 20-F 2023 | riotinto.com | 11 |

1.Includes our total workforce based on managed operations (excludes the Group’s share of non-managed operations and joint ventures) as of 31 December 2023 rounded to nearest 1,000. 2.When combined with royalties and other taxes, and with our share of taxes and royalties paid by equity accounted units, this resulted in payments to governments of around $8.5 billion (2022: $10.8 billion), including around $6.5 billion paid in Australia (2022: $8.5 billion). |
12 | Annual Report on Form 20-F 2023 | riotinto.com |
| For more information about our local procurement strategy see riotinto.com/sustainableprocurement. |
Annual Report on Form 20-F 2023 | riotinto.com | 13 |

Our scenario approach We use global scenarios in our strategy and capital allocation processes to stress test our portfolio and investment decisions under alternative macroeconomic settings. Our scenario framework focuses on two prevailing forces: the speed of global economic growth and the trajectory of climate action, each heavily influenced by global geopolitics and governance. Our central reference case commodity forecasts and valuations are informed by a blend of our two core scenarios (Competitive Leadership and Fragmented Leadership). These are used to derive critical accounting estimates and are included as inputs for impairment testing; estimating remaining economic life for units of production, depreciation and discounting; and closure and rehabilitation provisions. Further detail is provided in the “Impact of climate change on the Group” section to the financial statements on pages 162-165. We use additional scenarios (including our Aspirational Leadership scenario, which provides our view of a pathway aligned with 1.5°C by 2100) to further stress test decisions and assess potential risks to our portfolio. Our two core scenarios Competitive Leadership reflects a world of high growth and stronger climate action, particularly after 2030, with change driven by policy and competitive innovation. A proactive reform environment encourages business innovation and helps boost investment and productivity. This allows global GDP to continue growing at near recent historical levels with an increasing contribution from India and other developing countries. Fragmented Leadership represents a world where economic growth and climate action are constrained by ineffective policy and rising social and geopolitical tensions. In this world, investment in new technologies slows and their global adoption is highly inconsistent. This, combined with more significant climate damage, results in weaker long-term productivity growth. | ||||
| For more information about our scenarios, methodology and portfolio implications see pages 47-48. | |||
Oyu Tolgoi copper-gold mine, Mongolia. |
14 | Annual Report on Form 20-F 2023 | riotinto.com |

Community engagement, Simandou, Guinea. |
Annual Report on Form 20-F 2023 | riotinto.com | 15 |
16 | Annual Report on Form 20-F 2023 | riotinto.com |
Grow in materials essential for the energy transition | |
High-grade iron ore –Progressed the Simandou high-grade iron ore project in Guinea with our partners. We announced plans to invest $6.2 billion1 (Rio Tinto share) on mine, port and rail infrastructure development. Production is expected to ramp up over 30 months from 2025 to a capacity of 60 million dry tonnes2 annually (27 million dry tonnes Rio Tinto share). –Approved $77 million for a pre-feasibility study to progress the development of the Rhodes Ridge project in the East Pilbara in Western Australia, one of the world’s most attractive undeveloped iron ore deposits. Aluminium –Acquired a 50% equity stake in Matalco from Giampaolo Group for $738 million. The Matalco joint venture combines the strengths of North America's largest primary and secondary aluminium producers to meet growing demand for low-carbon products. –Announced we will invest $1.1 billion to expand our AP60 aluminium smelter equipped with low-carbon technology at the Complexe Jonquière with financial support from the Quebec government. | Copper –Started production from the Oyu Tolgoi underground mine in Mongolia, which will make Oyu Tolgoi one of the most important producers of copper in the world. –Approved investment to significantly increase production from underground mining at Kennecott. Production is expected to deliver around 250 thousand tonnes3 of additional mined copper over the next ten years (2023-2033). –Formed a joint venture with First Quantum Minerals to unlock the development of the La Granja project in Peru, one of the largest undeveloped copper deposits in the world. Minerals –Progressed development of a three thousand tonne per annum lithium carbonate starter plant at the Rincon lithium project with production expected by the end of 2024. –Acquired the high-grade BurraTM Scandium Project in New South Wales, Australia. The project could produce up to 40 tonnes of scandium oxide per year. |
Accelerate the decarbonisation of our assets | |
Decarbonisation spend –Spent a total of $425 million on decarbonisation in 2023 (2022: $299 million). We estimate a total capital spend of $5-6 billion over the period 2022-2030, including $1.5 billion cumulative spend over the period 2024-2026. Pacific Operations repowering –Signed a power purchase agreement (PPA) to buy 1.1GW of renewable energy from the Upper Calliope Solar Farm project which could provide part of a solution to repower our three Gladstone production assets. Renewable energy –Constructed a 5MW solar plant pilot project at Kennecott Copper. –Approved, subject to regulatory approvals, a 12.4MW solar photovoltaic system and a 2.1Mwh battery storage system via long- term PPA for Amrun operations. –Signed a memorandum of understanding (MoU) with the Yindjibarndi Energy Corporation (YEC) to explore opportunities to collaborate on renewable energy projects on Yindjibarndi Country in the Pilbara. | Diesel transition –Advanced our diesel transition at Boron and Kennecott. Boron became the world’s first open-cut mine to fully transition 100% of its heavy machinery to renewable diesel. Alumina processing –Approved the Yarwun Hydrogen Calcination Pilot Demonstration Program. –Progressed a double digestion pre-feasibility study at Queensland Alumina Limited (QAL). Minerals processing –Commissioned the BlueSmeltingTM demonstration plant at Rio Tinto Iron and Titanium Quebec Operations, with the first tonne of pre-reduced ore produced. The project is part of a partnership with the Government of Canada. Nature-based solutions –Continued to develop pilot projects in Madagascar and progressed pre-feasibility and feasibility work for opportunities in South Africa, Guinea, US and Argentina. |
Develop products and technologies that help our customers decarbonise | |
Steel value chain decarbonisation –Progressed partnerships on various low-carbon pathways, including our collaboration with the world’s largest steel producer – Baowu. –Completed a feasibility study for the BioIronTM Continuous Pilot Plant and secured a location, completed an Electric Smelting Furnace concept study with BlueScope, and progressed design of the Baowu Meishan microwave lump drying pilot plant. Shipping decarbonisation –Lowered shipping emissions intensity by 37% (relative to 2008 baseline) and introduced five liquified natural gas vessels into the fleet in 2023. –Completed a 12-month biofuel trial. | Aluminium value chain decarbonisation –ELYSIS started commissioning activities following completion of construction work and expects to start the first 450kA cell in 2024. –Defined potential areas of collaboration to help decarbonise alumina refining with customers, representing 47% of global bauxite sales. Procurement –Completed a study to understand the sources of our procurement- related emissions. |
| For more information about our projects see the Portfolio management section on pages 30-31. |
Annual Report on Form 20-F 2023 | riotinto.com | 17 |
Relevant KPIs | ||
All-injury frequency rate | ||
Underlying earnings & underlying EBITDA | ||
Net cash generated from operating activities | ||
Underlying return on capital employed | ||
Free cash flow | ||
Net (debt)/cash | ||
Scope 1 and 2 greenhouse gas emissions | ||
Gender diversity | ||
Total shareholder return |
 | For more information about our ESG progress see pages 40-77. |
Relevant KPIs | ||
All-injury frequency rate | ||
Total shareholder return | ||
Scope 1 and 2 greenhouse gas emissions | ||
Gender diversity |
18 | Annual Report on Form 20-F 2023 | riotinto.com |
| For more information about our capital projects and future options see pages 30-31. |
Relevant KPIs | ||
Total shareholder return | ||
Underlying return on capital employed | ||
Free cash flow | ||
Net (debt)/cash | ||
Scope 1 and 2 greenhouse gas emissions |
| For more information about our community engagement see pages 66-70. |
Relevant KPIs | ||
Total shareholder return | ||
Scope 1 and 2 greenhouse gas emissions | ||
Gender diversity |
Annual Report on Form 20-F 2023 | riotinto.com | 19 |
l | Best operator | l | Impeccable ESG | l | Excel in development | l | Social licence |


20 | Annual Report on Form 20-F 2023 | riotinto.com |

Underlying earnings | ||
Underlying EBITDA | ||
Annual Report on Form 20-F 2023 | riotinto.com | 21 |

22 | Annual Report on Form 20-F 2023 | riotinto.com |


Annual Report on Form 20-F 2023 | riotinto.com | 23 |
At year end | 2023 | 2022 | Change |
Net cash generated from operating activities (US$ millions) | 15,160 | 16,134 | (6)% |
Purchases of property, plant and equipment and intangible assets (US$ millions) | 7,086 | 6,750 | 5% |
Free cash flow¹ (US$ millions) | 7,657 | 9,010 | (15)% |
Consolidated sales revenue (US$ millions) | 54,041 | 55,554 | (3)% |
Underlying EBITDA¹ (US$ millions) | 23,892 | 26,272 | (9)% |
Profit after tax attributable to owners of Rio Tinto (net earnings)² (US$ millions) | 10,058 | 12,392 | (19)% |
Underlying earnings per share (EPS)¹, ² (US cents) | 725.0 | 824.7 | (12)% |
Ordinary dividend per share (US cents) | 435.0 | 492.0 | (12)% |
Underlying return on capital employed (ROCE)¹, ² | 20% | 25% | |
Net debt¹ (US$ millions) | 4,231 | 4,188 | 1% |
US$bn | |
2022 underlying EBITDA | 26.3 |
Prices | (1.5) |
Exchange rates | 0.6 |
Volumes and mix | 0.4 |
General inflation | (0.4) |
Energy | 0.4 |
Operating cash unit costs | (1.4) |
Higher exploration and evaluation expenditure (net of profit from disposal of interests in undeveloped projects) | (0.3) |
Non-cash costs/other | (0.2) |
Change in underlying EBITDA | (2.4) |
2023 underlying EBITDA | 23.9 |
24 | Annual Report on Form 20-F 2023 | riotinto.com |
US$bn | |
2022 net earnings | 12.4 |
Changes in underlying EBITDA (see above) | (2.4) |
Increase in depreciation and amortisation (pre-tax) in underlying earnings | (0.1) |
Decrease in interest and finance items (pre-tax) in underlying earnings | 0.2 |
Increase in tax on underlying earnings | (0.2) |
Decrease in underlying earnings attributable to outside interests | 0.8 |
Total changes in underlying earnings | (1.6) |
Changes in items excluded from underlying earnings (see below) | (0.7) |
2023 net earnings | 10.1 |
Annual Report on Form 20-F 2023 | riotinto.com | 25 |
2023 | 2022 | |
Year ended 31 December | US$bn | US$bn |
Underlying earnings | 11.8 | 13.4 |
Items excluded from underlying earnings | ||
Net impairment charges | (0.7) | (0.1) |
Change in closure estimates (non-operating and fully impaired sites) | (1.1) | (0.2) |
Foreign exchange and derivative gains on net debt and intragroup balances and derivatives not qualifying for hedge accounting | (0.3) | (0.1) |
Deferred tax arising on internal sale of assets in Canadian operations | 0.4 | – |
Gains recognised by Kitimat relating to LNG Canada's project | – | 0.1 |
Loss on disposal of interest in subsidiary | – | (0.1) |
Gain on sale of Cortez royalty | – | 0.3 |
Write-off of Federal deferred tax assets in the United States | – | (0.9) |
Total items excluded from underlying earnings | (1.7) | (1.0) |
Net earnings | 10.1 | 12.4 |
Underlying EBITDA | Underlying earnings | |||||
2023 | 2022 | Change | 2023 | 2022 | Change | |
Year ended 31 December | US$bn | US$bn | % | US$bn | US$bn | % |
Iron Ore | 20.0 | 18.6 | 7% | 11.9 | 11.2 | 6% |
Aluminium | 2.3 | 3.7 | (38)% | 0.5 | 1.5 | (64)% |
Copper | 1.9 | 2.6 | (26)% | 0.1 | 0.7 | (81)% |
Minerals | 1.4 | 2.4 | (42)% | 0.3 | 0.9 | (63)% |
Reportable segment total | 25.6 | 27.3 | (6)% | 12.9 | 14.3 | (10)% |
Simandou iron ore project | (0.5) | (0.2) | 185% | (0.2) | (0.1) | 10% |
Other operations | – | – | —% | (0.3) | (0.3) | (28)% |
Central pension costs, share-based payments, insurance and derivatives | 0.2 | 0.4 | (55)% | – | 0.4 | (87)% |
Restructuring, project and one-off costs | (0.2) | (0.2) | 10% | (0.1) | (0.1) | 32% |
Other central costs | (1.0) | (0.8) | 29% | (0.9) | (0.7) | 29% |
Central exploration and evaluation | (0.1) | (0.3) | (60)% | (0.1) | (0.2) | (71)% |
Net interest | 0.3 | 0.1 | 130% | |||
Total | 23.9 | 26.3 | (9)% | 11.8 | 13.4 | (12)% |
26 | Annual Report on Form 20-F 2023 | riotinto.com |
2023 | 2022 | |
Year ended 31 December | US$bn | US$bn |
Net cash generated from operating activities | 15.2 | 16.1 |
Purchases of property, plant and equipment and intangible assets | (7.1) | (6.8) |
Lease principal payments | (0.4) | (0.4) |
Free cash flow¹ | 7.7 | 9.0 |
Dividends paid to equity shareholders | (6.5) | (11.7) |
Acquisitions | (0.8) | (0.9) |
Purchase of the minority interest in Turquoise Hill Resources Ltd | – | (3.0) |
Disposals | – | 0.1 |
Cash receipt from sale of Cortez royalty | – | 0.5 |
Other | (0.4) | 0.2 |
Movement in net debt/cash¹ | – | (5.8) |
Annual Report on Form 20-F 2023 | riotinto.com | 27 |
28 | Annual Report on Form 20-F 2023 | riotinto.com |
2023 US$bn | 2022 US$bn | |
Ordinary dividend | ||
Interim1 | 2.9 | 4.3 |
Final1 | 4.2 | 3.7 |
Full-year ordinary dividend | 7.1 | 8.0 |
Payout ratio on ordinary dividend | 60% | 60% |
Ordinary dividend per share declared | 2023 | 2022 |
Rio Tinto Group | ||
Interim (US cents) | 177.00 | 267.00 |
Final (US cents) | 258.00 | 225.00 |
Full-year (US cents) | 435.00 | 492.00 |
Rio Tinto plc | ||
Interim (UK pence) | 137.67 | 221.63 |
Final (UK pence) | 203.77 | 185.35 |
Full-year (UK pence) | 341.44 | 406.98 |
Rio Tinto Limited | ||
Interim (Australian cents) | 260.89 | 383.70 |
Final (Australian cents) | 392.78 | 326.49 |
Full-year (Australian cents) | 653.67 | 710.19 |
Annual Report on Form 20-F 2023 | riotinto.com | 29 |
Project (Rio Tinto 100% owned unless otherwise stated) | Total capital cost (100% unless otherwise stated) | Status/Milestones | |
Ongoing | |||
Iron ore | |||
Investment in the Western Range iron ore project, a joint venture between Rio Tinto (54%) and China Baowu Steel Group Co. Ltd (46%) in the Pilbara to sustain production of the Pilbara BlendTM from Rio Tinto's existing Paraburdoo hub. First production is anticipated in 2025. | $1.3bn (Rio Tinto share)1 | Approved in September 2022, the mine will have a capacity of 25 million tonnes per year. The project includes construction of a primary crusher and an 18 kilometre conveyor connection to the Paraburdoo processing plant. Construction is currently on schedule with civil work well advanced, while we continue to progress primary crusher works, bulk earthworks and mine pre-strip. | |
Investment in the Simandou iron ore project in Guinea in partnership with CIOH, a Chinalco-led consortium (the Simfer joint venture) and co-development of the rail and port infrastructure with Winning Consortium Simandou2 (WCS), Baowu and the Republic of Guinea (the partners). Overall, the co-developed infrastructure represents more than 600 kilometres of new multi-user (including passenger and general freight services) rail together with port facilities to be co-developed by the partners to allow the export of up to 120 million tonnes per year of iron ore mined by Simfer's and WCS's respective mining concessions.3 | $6.2bn4 (estimated Rio Tinto share) | Announced in December 2023, the Simfer joint venture5 will develop, own and operate a 60 million tonne per year6 mine in blocks 3 & 4. First production at the mine is expected in 2025, ramping up over 30 months to an annualised capacity of 60 million tonnes per year (27 million tonnes Rio Tinto share). WCS will construct the project's ~536 kilometre dual track main line as well as the WCS barge port, while Simfer will construct the ~70 kilometre spur line, connecting its mining concession to the main rail line. Pending completion and commissioning of its 60 million tonne per year transhipment vessel port, Simfer will be able to export its ore using WCS's barge port. The Rio Tinto Board has approved the project, subject to the remaining conditions being met, including joint venture partner approvals and regulatory approvals7 from China and Guinea. | |
Aluminium | |||
Investment to expand the low-carbon AP60 aluminium smelter at the Complexe Jonquière in Quebec. The investment includes up to $113 million of financial support from the Quebec government. | $1.1bn | Approved in June 2023, the investment will add 96 AP60 pots, representing 160,000 tonnes of primary aluminium per year, replacing the Arvida smelter which is set to gradually close from 2024. We continued early works for the expansion of the AP60 smelter. Commissioning is expected in the first half of 2026, with the smelter fully ramped up by the end of that year. Once completed, it is expected to be in the first quartile of the industry operating cost curve. | |
Copper | |||
Phase two of the south wall pushback to extend mine life at Kennecott in Utah by a further six years. | $1.8bn | Approved in December 2019, the investment will further extend strip waste rock mining and support additional infrastructure development. This will allow mining to continue into a new area of the orebody between 2026 and 2032. In March 2023, a further $0.3 billion was approved to primarily mitigate the risk of failure in an area of geotechnical instability known as Revere, necessary to both protect open pit value and enable underground development. | |
Investment in the Kennecott underground development of the North Rim Skarn (NRS) area. | $0.5bn | Approved in June 2023, production from NRS8 will commence in the first quarter of 2025 (previously 2024) and is expected to ramp up over two years, to deliver around 250,000 tonnes of additional mined copper over the next 10 years9 alongside open cut operations. | |
Development of the Oyu Tolgoi underground copper-gold mine in Mongolia (Rio Tinto 66%), which is expected to produce (from the open pit and underground) an average of ~500,000 tonnes10 of copper per year from 2028 to 2036. | $7.06bn | We delivered first sustainable underground production from Panel 0 in March 2023. The commissioning of infrastructure for ramp-up to full capacity remains on target: we expect shafts 3 and 4 and the conveyor to surface in the second half of 2024, while the concentrator conversion is expected to be progressively completed from the fourth quarter of 2024 through to the second quarter of 2025. Construction of primary crusher 2 commenced in December 2023 and is due to be complete by the end of 2025. |
30 | Annual Report on Form 20-F 2023 | riotinto.com |
Status | ||
Iron Ore: Pilbara brownfields | ||
Over the medium term, our Pilbara system capacity remains between 345 and 360 million tonnes per year. Meeting this range, and the planned product mix, will require the approval and delivery of the next tranche of replacement mines over the next five years. | In addition to Western Range (Greater Paraburdoo), which is under construction, we continue to progress studies for Hope Downs 1 (Hope Downs 2 and Bedded Hilltop), Brockman 4 (Brockman Syncline 1), Greater Nammuldi and West Angelas. We continue to work closely with local communities, Traditional Owners and governments to progress approvals for these new mining projects. | |
Iron Ore: Rhodes Ridge | ||
In October 2022, Rio Tinto (50%) and Wright Prospecting Pty Ltd (50%) agreed to modernise the joint venture covering the Rhodes Ridge project in the Eastern Pilbara, providing a pathway for development utilising Rio Tinto’s rail, port and power infrastructure. | A resource-drilling program is currently underway to support future project studies. In December 2023, we announced approval of a $77 million pre-feasibility study (PFS). This follows completion of an Order of Magnitude study that considered development of an operation with initial capacity of up to 40 million tonnes per year, subject to relevant approvals. Completion of the PFS is expected by the end of 2025 and will be followed by a feasibility study, with first ore expected by the end of the decade. Longer term, the resource could support a world-class mining hub with a potential capacity of more than 100 million tonnes of high-quality iron ore a year. | |
Lithium: Jadar | ||
Development of the greenfield Jadar lithium-borates project in Serbia will include an underground mine with associated infrastructure and equipment, including electric haul trucks, as well as a beneficiation chemical processing plant. | The Board committed funding in July 2021, subject to receiving all relevant approvals, permits and licences. We are focused on consultation with all stakeholders to explore all options following the Government of Serbia's cancellation of the Spatial Plan in January 2022. | |
Lithium: Rincon | ||
We completed the acquisition of the Rincon Lithium project in Salta province, Argentina in March 2022. Development of a 3,000 tonne per year battery-grade lithium carbonate starter plant is ongoing with first saleable production expected at the end of 2024. Studies are continuing on the full-scale plant, which will have benefits of economies of scale, with the capital intensity, based on current stage of studies, forecast to be in line with regional lithium industry benchmarks. | In July 2022, we approved $140 million of investment and $54 million for early works to support a full-scale operation. To date, the majority of costs have been expensed through exploration and evaluation expenditure. In July 2023, we approved a further $195 million to complete the starter plant: the increase was driven by the project now being fully defined (previously conceptual), scope adjustments to design (including column performance improvements and changes to waste and spent brine disposal facilities), rising capital costs across the lithium industry, particularly for processing equipment and from broad cost escalation in Argentina. | |
Mineral Sands: Zulti South | ||
Development of the Zulti South project at Richards Bay Minerals (RBM) in South Africa (Rio Tinto 74%). | Approved in April 2019 to underpin RBM’s supply of zircon and ilmenite over the life of the mine. The project remains on full suspension. | |
Copper: Resolution | ||
The Resolution Copper project is a proposed underground copper mine in the Copper Triangle, in Arizona, US (Rio Tinto 55%). It has the potential to supply up to 25% of US copper demand. | The United States Forest Service (USFS) continued work to progress the Final Environmental Impact Statement and complete actions necessary for the land exchange. We continued to advance partnership discussions with several federally- recognised Native American Tribes who are part of the formal consultation process. We are also monitoring the Apache Stronghold versus USFS case held in the US Ninth Circuit Court of Appeals. While there is significant local support for the project, we respect the views of groups who oppose it and will continue our efforts to address and mitigate these concerns. | |
Copper: Winu | ||
In late 2017, we discovered copper-gold mineralisation at the Winu project in the Paterson Province in Western Australia. In 2021, we reported our first Indicated Mineral Resource. The pathway remains subject to regulatory and other required approvals. In parallel, we continue to explore options aimed at enhancing project value, including further optimisation of the current pathway and alternative development models and partnerships. | In 2023, Project Planning Agreements were executed with the Nyangumarta and Martu groups, the Traditional Owners of the land on which the proposed Winu mine and airstrip will be located. Study activities, drilling and fieldwork progressed sufficiently to commence Winu’s formal Western Australian Environmental Protection Authority approval process. The environmental approval deliverables and Project Agreement negotiations with both Traditional Owner groups remain the priority. | |
Copper: La Granja | ||
In August 2023, we completed a transaction to form a joint venture with First Quantum Minerals that will work to unlock the development of the La Granja project in Peru, one of the largest undeveloped copper deposits in the world, with potential to be a large, long-life operation. | First Quantum Minerals acquired a 55% stake in the project for $105 million and will invest up to a further $546 million into the joint venture to sole fund capital and operational costs to take the project through a feasibility study and toward development. All subsequent expenditures will be applied on a pro-rata basis in line with shared ownership. | |
Aluminium: ELYSIS | ||
ELYSIS, our joint venture with Alcoa, supported by Apple, the Government of Canada and the Government of Quebec, is developing a breakthrough inert anode technology that eliminates all direct greenhouse gases from the aluminium smelting process. | ELYSIS has started commissioning activities following completion of the construction of the first commercial-scale prototype cells. ELYSIS expects to start the first 450kA cell in 2024. |
Annual Report on Form 20-F 2023 | riotinto.com | 31 |

Iron Ore | ||||
We are one of the world’s leading producers of iron ore, the primary raw material in steelmaking. In the Pilbara region of Western Australia, we operate a network of 17 iron ore mines, four port terminals and a rail network spanning 1,900 kilometres. Steel remains essential for ongoing urbanisation and will support the global shift to decarbonise. | ||||
Snapshot of the year | ||||
0.61 AIFR (2022: 0.68) | 69% Pilbara underlying FOB EBITDA margin (2022: 68%) | $20.0bn Underlying EBITDA (2022: $18.6bn) | $32.2bn Segmental revenue (2022: $30.9bn) | |
$2.6bn Capital expenditure (2022: $2.9bn) | $14.0bn Net cash generated from operating activities (2022: $14.0bn) | 3.2Mt Scope 1 and 2 GHG emissions (equity Mt CO2e) (2022: 3.1Mt) | 16,000 Employee numbers1 (2022: 15,000) | |
 | For more information about our global health and safety initiatives see pages 71-72. |
 | For more information about our decarbonisation efforts in the Iron Ore product group, see our 2023 Climate Change Report at riotinto.com/ climatereport. |
From customer to strategic partner In 2023, we extended a key climate partnership with our largest customer, China Baowu, to accelerate efforts to decarbonise the steel value chain and reduce our Scope 3 emissions. This is the result of a coordinated approach across our sales, marketing, and research and development teams based on decades of deep relationship building with the world’s biggest steelmaker, who is also a joint venture partner in the Western Range and Simandou projects. | |||
| For more information see riotinto.com/baowu. | ||
32 | Annual Report on Form 20-F 2023 | riotinto.com |
Year ended 31 December | 2023 | 2022 | Change |
Pilbara production (million tonnes — 100%) | 331.5 | 324.1 | 2% |
Pilbara shipments (million tonnes — 100%) | 331.8 | 321.6 | 3% |
Salt production (million tonnes — Rio Tinto share)¹ | 6.0 | 5.8 | 4% |
Segmental revenue (US$ millions) | 32,249 | 30,906 | 4% |
Average realised price (US$ per dry metric tonne, FOB basis) | 108.4 | 106.1 | 2% |
Underlying EBITDA (US$ millions) | 19,974 | 18,612 | 7% |
Pilbara underlying FOB EBITDA margin² | 69% | 68% | |
Underlying earnings (US$ millions)³ | 11,882 | 11,213 | 6% |
Net cash generated from operating activities (US$ millions) | 14,045 | 14,005 | –% |
Capital expenditure (US$ millions)⁴ | (2,588) | (2,940) | (12%) |
Free cash flow (US$ millions) | 11,374 | 11,033 | 3% |
Underlying return on capital employed³, ⁵ | 64% | 61% |
 | For more information about our capital projects and future growth options, see pages 30-31. |
Annual Report on Form 20-F 2023 | riotinto.com | 33 |

Aluminium | ||||
As a global leader in low-carbon aluminium, we are uniquely positioned to further decarbonise our business and support the world’s transition towards a lower-carbon footprint. A critical material – lightweight and highly recyclable – aluminium is found in diverse products ranging from solar panels and transmission lines to jet engines, electric vehicles and smartphones. | ||||
Snapshot of the year | ||||
0.33 AIFR (2022: 0.35) | 21% Underlying EBITDA margin (integrated operations) (2022: 29%) | $2.3bn Underlying EBITDA (2022: $3.7bn) | $12.3bn Segmental revenue (2022: $14.1bn) | |
$1.3bn Capital expenditure (2022: $1.4bn) | $2.0bn Net cash generated from operating activities (2022: $3.1bn) | 24.2Mt Scope 1 and 2 GHG emissions (equity Mt CO2e) (2022: 23.3Mt) | 15,000 Employee numbers1 (2022: 15,000) | |
 | For more information about our global health and safety initiatives, see pages 71-72. |
 | For more information about our decarbonisation efforts in the Aluminium product group, see our 2023 Climate Change Report at riotinto.com/ climatereport. |
34 | Annual Report on Form 20-F 2023 | riotinto.com |
Year ended 31 December | 2023 | 2022 | Change |
Bauxite production ('000 tonnes — Rio Tinto share) | 54,619 | 54,618 | —% |
Alumina production ('000 tonnes — Rio Tinto share) | 7,537 | 7,544 | —% |
Aluminium production ('000 tonnes — Rio Tinto share) | 3,272 | 3,009 | 9% |
Segmental revenue (US$ millions) | 12,285 | 14,109 | (13%) |
Average realised aluminium price (US$ per tonne) | 2,738 | 3,330 | (18%) |
Underlying EBITDA (US$ millions) | 2,282 | 3,672 | (38%) |
Underlying EBITDA margin (integrated operations) | 21% | 29% | |
Underlying earnings (US$ millions)¹ | 538 | 1,504 | (64%) |
Net cash generated from operating activities (US$ millions) | 1,980 | 3,055 | (35%) |
Capital expenditure — excluding EAUs (US$ millions)² | (1,331) | (1,377) | (3%) |
Free cash flow (US$ millions) | 619 | 1,652 | (63%) |
Underlying return on capital employed¹, ³ | 3% | 10% |
 | For more information about our capital projects and future growth options, see pages 30-31. |
Annual Report on Form 20-F 2023 | riotinto.com | 35 |

Copper | |||||
Copper is essential to creating a sustainable, low-carbon world. Rapid electrification across all aspects of daily life is set to drive long-term demand for copper. With assets spanning the globe and an evolving suite of technologies to enable low-carbon production, we are accelerating growth and decarbonisation by producing the materials that enable a cleaner future. | |||||
Snapshot of the year | |||||
0 . X X A I F R ( 2 0 2 2 : 0 . 2 2 ) | 0.35 AIFR (2022: 0.22) | 42% Underlying EBITDA margin (product group operations) (2022: 49%) | $1.9bn Underlying EBITDA (2022: $2.6bn)1 | $6.7bn Segmental revenue (2022: $6.7bn) | |
$ X . X b n C a p i t a l e x p e n d i t u r e ( 2 0 2 2 : $ 1 . 6 b n ) | $2.0bn Capital expenditure (2022: $1.6bn) | $0.5bn Net cash generated from operating activities (2022: $1.5bn)1 | 1.0Mt Scope 1 and 2 GHG emissions (equity Mt CO2e) (2022: 1.7Mt) | 8,000 Employee numbers2 (2022: 8,000) | |
 | For more information about our global health and safety initiatives, see pages 71-72. |
 | For more information about our decarbonisation efforts in the Copper product group, see our 2023 Climate Change Report at riotinto.com/ climatereport. |
36 | Annual Report on Form 20-F 2023 | riotinto.com |
Year ended 31 December | 2023 | 2022 | Change |
Mined copper production ('000 tonnes — consolidated basis) | 620 | 607 | 2% |
Refined copper production ('000 tonnes — Rio Tinto share) | 175 | 209 | (16%) |
Segmental revenue (US$ millions) | 6,678 | 6,699 | –% |
Average realised copper price (US cents per pound)¹ | 390 | 403 | (3%) |
Underlying EBITDA (US$ millions) | 1,904 | 2,565 | (26%) |
Underlying EBITDA margin (product group operations) | 42% | 49% | |
Underlying earnings (US$ millions) | 133 | 687 | (81%) |
Net cash generated from operating activities (US$ millions)² | 545 | 1,523 | (64%) |
Capital expenditure — excluding EAUs³ (US$ millions) | (1,976) | (1,622) | 22% |
Free cash flow (US$ millions) | (1,438) | (116) | |
Underlying return on capital employed (product group operations)⁴ | 3% | 6% |
 | For more information about our capital projects and future growth options, see pages 30-31. |
Nuevo Cobre exploration joint venture agreement We have entered into a joint venture with Corporación Nacional del Cobre de Chile (Codelco) following the acquisition of PanAmerican Silver’s 57.74% stake in Agua de la Falda S.A. The new joint venture, known as Nuevo Cobre (New Copper), will allow us to explore and potentially develop Nuevo Cobre’s assets in partnership with Codelco in Chile’s prospective Atacama region. Chile has the largest copper reserves in the world, and currently is the leading copper producer. Chile is also a leader in other critical minerals that the world needs for the energy transition and to achieve net zero carbon emissions. The partnership builds on a collaboration agreement with Codelco, which first commenced in 2007, that encourages best practices, innovation, and technology to improve safety and productivity in underground mining. | ||
Annual Report on Form 20-F 2023 | riotinto.com | 37 |

Minerals | |||||
Our Minerals portfolio includes a global suite of businesses producing materials essential to a low-carbon future and projects well-positioned to meet the growing demand for electric vehicles. We produce high-grade, low-impurity iron ore pellets and concentrate, titanium dioxide, diamonds and borates from our operations in Canada, Madagascar, South Africa and the US. | |||||
Snapshot of the year | |||||
0 . X X A I F R ( 2 0 2 2 : 0 . 3 8 ) | 0.24 AIFR (2022: 0.38) | 30% Underlying EBITDA margin (product group operations) (2022: 40%) | $1.4bn Underlying EBITDA (2022: $2.4bn) | $5.9bn Segmental revenue (2022: $6.8bn) | |
$ X . X b n C a p i t a l e x p e n d i t u r e ( 2 0 2 2 : $ 0 . 7 b n ) | $0.7bn Capital expenditure (2022: $0.7bn) | $0.5bn Net cash generated from operating activities (2022: $1.5bn) | 3.7Mt Scope 1 and 2 GHG emissions (equity Mt CO2e) (2022: 4.0Mt) | 10,000 Employee numbers1 (2022: 9,500) | |
 | For more information about our global health and safety initiatives, see pages 71-72. |
 | For more information about our decarbonisation efforts in the Minerals product group, see our 2023 Climate Change Report at riotinto.com/ climatereport. |
38 | Annual Report on Form 20-F 2023 | riotinto.com |
Year ended 31 December | 2023 | 2022 | Change |
Iron ore pellets and concentrates production¹ (million tonnes — Rio Tinto share) | 9.7 | 10.3 | (6%) |
Titanium dioxide slag production ('000 tonnes — Rio Tinto share) | 1,111 | 1,200 | (7%) |
Borates production ('000 tonnes — Rio Tinto share) | 495 | 532 | (7%) |
Diamonds production ('000 carats — Rio Tinto share) | 3,340 | 4,651 | (28%) |
Segmental revenue (US$ millions) | 5,934 | 6,754 | (12%) |
Underlying EBITDA (US$ millions) | 1,414 | 2,419 | (42%) |
Underlying EBITDA margin (product group operations) | 30% | 40% | |
Underlying earnings (US$ millions)² | 312 | 854 | (63%) |
Net cash generated from operating activities (US$ millions) | 548 | 1,522 | (64%) |
Capital expenditure (US$ millions)³ | (746) | (679) | 10% |
Free cash flow (US$ millions) | (229) | 814 | (128%) |
Underlying return on capital employed (product group operations)2, 4 | 13% | 22% |
 | For more information about our capital projects and future growth options, see pages 30-31. |
Breakthrough technology: Scandium, a case in point Scandium is a critical mineral in increasing demand for the energy transition and modern technologies such as aerospace, lasers and microelectronics due to its alloying and emerging high-tech properties. We are combining scandium with our low- carbon aluminium to produce an alloy that is stronger, more flexible and more resistant to heat and corrosion. Today, our commercial scale demonstration plant in Quebec uses an innovative process to extract and produce high-purity scandium oxide from the waste streams of the existing TiO2 production, without any additional mining. This will make Rio Tinto one of the largest producers of scandium in the Western world. In two years, we have gone from testing the extraction process in a laboratory, to being able to supply a large share of the global scandium market. In 2023, we acquired a high-grade scandium resource in New South Wales, Australia. The BurraTM Scandium Project is a small, high-value physical scandium asset, with a small environmental footprint. When operational, Burra will significantly increase, and geographically and operationally diversify, our annual scandium production. Scandium is emblematic of Rio Tinto’s transformation in terms of what we mine and how we mine. | ||
Annual Report on Form 20-F 2023 | riotinto.com | 39 |

Solar panel plant at Gudai-Darri, the Pilbara, Western Australia. See our 2023 Climate Change Report for further information about this project. | ||
40 | Annual Report on Form 20-F 2023 | riotinto.com | |

Environment | Social | Governance | ||||||||||||||
 |  |  | ||||||||||||||
Low intensity materials | Environmental stewardship | Mining & metals practices | Heritage, culture & Indigenous Peoples | Human rights | Talent, diversity & inclusion | Health, safety & wellbeing | Supporting social & economic opportunity | Transparent, values-based ethical business | ||||||||
Climate change | Water management | Tailings & mineral waste management | Cultural & heritage site management | Respecting human rights | Inclusion, diversity & equity | Health, safety & wellbeing | Local community relations | Business integrity & governance | ||||||||
End-to-end materials management | Biodiversity & ecosystems | Closure, post- mining & land rehabilitation | Employment & talent retention | Pandemic response & public health | Impact of technology | ESG transparency & disclosure | ||||||||||
Future-proof assets | Industrial environment impacts | Business performance | ||||||||||||||
Key l Higher materiality l Medium materiality l Lower materiality | Risk management & cybersecurity | |||||||||||||||
Responsible tax & royalty payments | ||||||||||||||||
Supply chain transparency | ||||||||||||||||
Each material topic above appears under either the environment, social or governance theme to which it primarily relates. However, there is crossover among ESG themes, meaning some material topics can be relevant to two or even all three themes. Accordingly, we work with themes and topics holistically, not in silos. | ||||||||||||||||
 | For more information about our approach to the UN SDGs see riotinto.com/sustainabilityapproach. |
Annual Report on Form 20-F 2023 | riotinto.com | 41 |
 | For more information see our 2023 Sustainability Fact Book at riotinto.com/sustainabilityreporting. |
 | For more information about our Sustainability Committee see pages 111-112. |
| For more information about our external auditors and internal assurance see page 109. |
Annual Report | Climate change reports1 | Tax reports2 | Human rights reports3 | Sustainability Fact Book | |
Linking sustainability to purpose and strategy | l | l | |||
Materiality and material topics | l | ||||
Climate change | l | l | l | ||
Economic contribution | l | l | l | ||
Human rights | l | l | l | ||
Indigenous Peoples | l | l | |||
Memberships and certifications | l | ||||
Sustainability data and trends | l |
| For more information see riotinto.com/sustainabilityreporting. |
42 | Annual Report on Form 20-F 2023 | riotinto.com |

Targets | 2023 performance | |
Reach zero fatalities and eliminate workplace injuries and catastrophic events. | Zero fatalities at managed operations (2022: 0 fatalities). –All-injury frequency rate (AIFR) at 0.37 (target: 0.40). (2022: 0.40). –1.53 million critical risk management (CRM) verifications. (2022: 1.37 million). | |
Have all of our businesses identify at least one critical health hazard material to their business and demonstrate a year-on-year reduction of exposure to that hazard. | 6 assets achieved an exposure reduction to known health risks (airborne contaminants and noise). (2022: 9 assets). | |
Reduce the rate of new occupational illnesses each year. | 27.15% increase in the rate of new occupational illnesses since 2022 | |
Reduce our absolute Scope 1 and 2 greenhouse gas emissions by 15% by 2025 and by 50% by 2030 (when compared to 2018 levels), and achieve net zero emissions from our operations by 2050.1 | 5.5% reduction in Scope 1 and 2 greenhouse gas emissions below our 2018 baseline (2022: 5.2%). | |
Disclose permitted surface water allocation volumes, annual allocation usage and the estimated surface water allocation catchment runoff from average annual rainfall for all managed operations by 2023. Achieve local water stewardship targets for selected sites by 2023. | 5 of the 7 water stewardship targets attained by 2023 (2022: 5 of 7). For more information about individual water target performance in 2023, see pages 60-61. | |
Achieve our global Communities and Social Performance (CSP) targets by 2026: –Year-on-year increase in contestable spend sourced from suppliers local² to our operations. –All sites to co-manage cultural heritage with communities and knowledge holders by 2026. –70% of total social investment to be made through strategic, outcomes-focused partnerships by 2026. –All employees in high risk human rights roles to complete job-specific human rights training by 2024. –All employees to complete general human rights training by 2026. | –We sourced 16.8% of contestable spend from suppliers local to our operations. This was a 2.3% increase from 2022. Progress for each product group is included in the 2023 Sustainability Fact Book. –We independently assessed 25 assets against the cultural heritage co- management maturity framework with 8 assets performing at level 4 (integrated), 7 at level 3 (defined), 9 at level 2 (emerging) and 1 at level 1 (learning)3. –Outcome indicator framework and strategic partnering principles were developed and endorsed in 2023 with self-assessment and baseline data to be collected in 2024. –Our human rights team delivered 35 tailored training sessions, targeting 11 assets and 12 functional teams globally. We recorded 2,441 completions of our modern slavery e-learning module, representing 66% of employees and contractors4 in modern slavery high-risk roles. | |
Improve diversity5 in our business by: –Increasing women in the business (including in senior leadership6) each year. –Aiming for 50% women in our graduate intake. –Aiming for 30% of our graduate intake to be from places where we are developing new businesses. | –24.3% of our workforce were women, up 1.4% from 2022. –25% of executive leaders were women, no change from 2022. –30.1% of senior leadership were women, up 1.8% from 2022. –30.8% of Board roles were held by women, up 0.8% from 2022. –51.6% of our graduate intake were women, down 1.6% from 2022. –37.6% of our graduate intake were from places where we are developing new businesses7, up 1.6% from 2022. | |
Improve our employee engagement and satisfaction. | 1 point increase in our employee satisfaction score (eSAT8) since 2022 (from 73 to 74) (2022: 2 point increase). |
Annual Report on Form 20-F 2023 | riotinto.com | 43 |

Environmental performance | Our purpose is to find better ways to provide the materials the world needs. The low-carbon transition is at the heart of our business strategy: we are focusing on growing production of the materials essential for the energy transition; decarbonising our operations; and partnering with our customers and suppliers to decarbonise our value chains. |
Environmental monitoring. Kennecott, US | ||
44 | Annual Report on Form 20-F 2023 | riotinto.com | |

Climate-related governance A)Describe the board’s oversight of climate-related risks and opportunities B)Describe management’s role in assessing and managing climate-related risks and opportunities | ||
Board, committee and management structure related to climate change | Summary of 2023 activities | ||
The Board | |||
Direct and monitor | Climate change is a material and strategic topic for our business and is part of ongoing discussion and analysis at the most senior levels of management and the Board. It is also an important topic when the Board and Executive Committee engage with investors and civil society organisations. The Board approves our overall strategy, policy positions and climate disclosures within this report and the Climate Change Report. The Board set the 2025, 2030 and 2050 emissions targets, and monitors performance against targets and operational resilience. The Chair of the Board is responsible for our overall approach to climate change. The Board delegates specific responsibilities to Board committees and the Chief Executive. Climate change and the low-carbon transition are routinely on the Board’s agenda, including as part of strategy discussions, risk management, financial reporting and executive remuneration. The Board considers climate-related matters as we develop and implement our strategy and make investment decisions. The low-carbon transition is at the heart of our business strategy and aligned with our four objectives. For additional information, see our Strategic context and Our strategy sections on pages 14-16. | –Held dedicated meetings to focus on decarbonisation including large-scale renewable projects and repowering our Pacific Aluminium Operations. –Reaffirmed our strategy and engaged with investors and civil society organisations following the publication of our 2022 Climate Change Report. –Approved the 2022 Climate Change Report and climate-related disclosures in the 2022 Annual Report notes to the financial statements. | |
 | For more information on the Board, their activities, and composition see pages 92-104. | ||
Sustainability Committee The Sustainability Committee maintains oversight of key sustainability areas that may be impacted by climate change, such as biodiversity and water. This includes assessing the effectiveness of associated controls and ensuring the operational-level resilience of the Group. | –Received and discussed the following reports: Physical resilience to climate change, Boron water control framework follow-up, Environment performance and maturity update, and Proposed approach to nature commitments. | ||
| For more information see pages 111-112. | ||
Inform and report | Audit & Risk Committee The Audit & Risk Committee addresses how climate issues (such as climate policy and our scenarios) impact the financial statements. The committee review all material accounting estimates and judgements relating to financial reporting, including those where climate issues are relevant and also appoint the external auditors, who assure greenhouse gas (GHG) emissions and ensure the effectiveness of the risk management framework. | –Reviewed and approved material climate- related accounting estimates and judgements relating to financial reporting. –Considered the relevance of climate- related risks when preparing and approving the Group’s Annual Report. | |
| For more information see page 107-110. | ||
People & Remuneration Committee The People & Remuneration Committee ensures the Group’s remuneration structure and policies include climate-related performance metrics and reward individual executives fairly and responsibly. | –Assessed the annual executive performance against climate metrics and approved incentives and remuneration revisions related to the way climate change is incorporated into incentives. | ||
| For more information see page 113-145. | ||
Management role | |||
Investment Committee The Investment Committee reviews and approves the Group’s capital expenditure in relation to abatement projects and climate change research and development. Decarbonisation investment decisions are made under a dedicated evaluation framework which considers the value of the investment and impact on cost base, the level of abatement, the maturity of the technology, the competitiveness of the asset and its policy context and alternative options on the pathway to net zero. Projects are also assessed against our approach to a just transition, with consideration to the impact on employees, local communities and industry. | |||
Chief Executive and Executive Committee The Chief Executive is responsible for delivering the CAP, as approved by the Board, with the Executive Committee supporting this role. Risk management, portfolio reviews, capital investments, annual financial planning and our approach to government engagement integrate our approach to climate change and emissions targets. The annual plan process focuses on the short-term (up to two years). The new growth and decarbonisation strategy is part of the medium term planning process. The Chief Executive leads the strategy process with the Executive Committee each year and, in 2023, reaffirmed the decision to put the low-carbon transition at the heart of our business strategy. Remuneration: Our Chief Executive’s performance objectives in the short-term incentive plan (STIP) includes delivery of the Group’s strategy on climate change. These are cascaded down into the annual objectives of relevant members of the Executive Committee, including the Chief Technical Officer, and other members of senior management. Decarbonisation is also included as a performance measure in the long-term incentive plan (LTIP). See pages 119-141 for our Remuneration Policy, 2023 outcomes, and the incorporation of climate-related measures in the LTIP and STIP. | |||
Energy and Climate Team In 2022, we established a central team, Rio Tinto Energy and Climate (RTEC), to deliver progress on our CAP. This is led by the Chief Decarbonisation Officer, who reports to the Chief Technical Officer and is accountable for all aspects of the CAP. The RTEC team is structured according to the 6+1 programs that drive decarbonisation across our operations. Two additional teams complete the RTEC organisation: a Decarbonisation Office that monitors and forecasts GHG emissions, tracks investment decisions and coordinates our approach to physical climate risks; and a Climate Policy and Advocacy team. Rio Tinto Commercial drives the approach to Scope 3 emissions, given its responsibility for procurement, shipping and sales to our customers. The Decarbonisation Office prepares a quarterly progress report for the Executive Committee, which includes operational emissions and progress on abatement projects across the 6+1 programs and other areas of our CAP. | |||
Annual Report on Form 20-F 2023 | riotinto.com | 45 |
Strategy A)Describe the climate-related risks* and opportunities the organisation has identified over the short, medium, and long term. B)Describe the impact of climate- related risks and opportunities on the organisation’s businesses, strategy and financial planning. C)Describe the resilience of the organisation’s strategy, taking into consideration different climate- related scenarios, including a 2°C or lower scenario. Risk management A)Describe the organisation’s processes for identifying and assessing climate-related risks. B)Describe the organisation’s processes for managing climate- related risks. C)Describe how processes for identifying, assessing, and managing climate-related risks are integrated into the organisation’s overall risk management. *We typically refer to risks as both threats and opportunities, but follow TCFD wording in this section. | ||
| For more information on financial reporting considerations and sensitivities related to climate change and the low-carbon transition, see the notes to our financial statements on pages 162-165. |
46 | Annual Report on Form 20-F 2023 | riotinto.com |
Aspirational Leadership | Competitive Leadership | Fragmented Leadership |
Aspirational Leadership reflects our view of a world of high growth, significant social change and accelerated climate action with all countries setting new Nationally Determined Contributions (NDCs) that collectively achieve net zero emissions by mid-century. We believe that despite geopolitical differences, major economies tend to work together through multilateral frameworks and proactively work towards limiting temperature change to 1.5°C by 2100. While there may be temperature overshoot in many 1.5°C scenarios, there is limited risk of this in Aspirational Leadership. Although Aspirational and Competitive Leadership share similar GDP growth, higher carbon prices under Aspirational Leadership result in lower global emissions. | Competitive Leadership reflects a world of high growth and strong climate action post-2030, with change driven by policy and competitive innovation. A proactive reform environment encourages stronger business innovation, higher investment and improved productivity. This allows global GDP to continue growing at close to recent historical levels with a growing contribution from India and other developing countries. Carbon emissions are slightly higher than those in Fragmented Leadership by 2030 due to increased GDP growth. However, these decline over time as carbon prices continue to rise post-2030. Nations drive toward achieving their Glasgow Climate Pact commitments, resulting in global GHG emissions falling from 54Gt CO2e today to 21Gt in 2050. | Fragmented Leadership is characterised by limited progress on policy reform with volatile low growth. The business environment is defined by weak final demand and greater uncertainty, and requires close ties with governments to manage risk. It is a world defined by geopolitical and domestic tensions, spurred by populist agendas that offer leaders little opportunity to build consensus around reform and environmental agendas. Nations eventually achieve their 2030 NDCs as agreed in Paris in 2015, but abandon further progress resulting in flat global emissions post-2030. Carbon prices track alongside Competitive Leadership levels until 2030, but remain constant subsequent to this, resulting in increased global emissions. |
Key scenario metrics1 | Aspirational Leadership | Competitive Leadership | Fragmented Leadership | ||||
Global temperature outcome in 2100 | 1.5°C | 1.6-2.0°C | 2.1-2.5°C | ||||
2030 Outcome | 2021-2050 CAGR | 2030 Outcome | 2021-2050 CAGR | 2030 Outcome | 2021-2050 CAGR | ||
Global average carbon prices in 2030, (2021 US$/t CO2e) | 59 | 9% | 42 | 8% | 42 | 3% | |
Global emissions, Gt CO2e | 40 | -11%2 | 50 | -4% | 50 | -1% | |
Global energy demand, mtoe | 10,500 | 0.3% | 11,000 | 1% | 10,300 | 0.2% | |
Global GDP growth (PPP), % | 4% | 4% | 4% | 4% | 3% | 2% | |
Energy intensity of global GDP, toe/$1,000 2015 PPP | 0.1 | -3% | 0.1 | -3% | 0.1 | -2% | |
Carbon intensity of total energy, gCO2/MJ | 40 | -13% | 45 | -5% | 45 | -2% | |
Global energy from electricity, mtoe | 2,900 | 4% | 2,900 | 4% | 2,700 | 2% | |
Global wind and solar capacity, GW | 9,800 | 11% | 7,500 | 10% | 5,700 | 7% | |
EV penetration by 2030 (%)3 | 70 | 11% | 60 | 10% | 40 | 10% | |
Finished steel demand (relative to 2021) | >110 | 1% | >110 | 1% | <100 | –% | |
Aluminium demand (relative to 2021) | >130 | 2% | >130 | 2% | >120 | 1% | |
Copper demand (relative to 2021) | >150 | 3% | >150 | 3% | >130 | 2% | |
Annual Report on Form 20-F 2023 | riotinto.com | 47 |

Aspirational Leadership | Competitive Leadership | Fragmented Leadership | ||||
Iron Ore |  | Short term: There is limited transition risk or opportunity to the Iron Ore business in the short term as the impacts of carbon pricing regulation is relatively low. Slow transition in the steel sector towards low-carbon technology limits risk to Pilbara operations. GDP growth has a stronger influence on iron ore price than climate change policy | ||||
 | Lower medium-term demand versus Competitive Leadership due to higher scrap-use affecting Pilbara products (recovers post 2040) |  | Strong global GDP growth and continued urbanisation support iron ore demand including for Pilbara products |  | Slowdown in China and global GDP growth erode demand, creating margin pressure across the portfolio | |
 | Large increases in carbon pricing and penalties drive demand for high-grade iron ore supporting Simandou and Iron Ore Company of Canada (IOC) |  | Stronger customer preference for Simandou and IOC ores for lower-carbon traditional and emerging steelmaking |  | Smaller regional increases in carbon prices relative to the other scenarios help preserve longer-term margins for low-cost, Tier 1 Pilbara ores | |
Aluminium |  | Short term: Current carbon pricing regulation raises operational costs for carbon intensive assets, notably our refineries and smelters in Eastern Australia. Limited transition related short-term demand growth for aluminium | ||||
| Higher carbon penalties put pressure on emissions intensive refining and smelting operations |  | Competition to secure large-scale firmed renewable electricity to repower coal- based Pacific Aluminium Operations | | China slowdown and production cap on primary aluminium reduce demand for seaborne bauxite | |
| Strong GDP growth and EV penetration support demand with value upside for hydro-based smelters (more pronounced in Aspirational Leadership) |  | Slowing demand and low-carbon penalties greatly reduce value upside of ELYSISTM and hydro-based smelters | |||
| Higher carbon penalties support ELYSIS™, hydro-based smelting assets in Quebec and repowering projects in Australia | |||||
Copper |  | Short term: limited risk of carbon pricing regulation on copper operations given their location in the US, Mongolia and Chile. Some transition related short-term demand growth for copper given increasing electrification energy system | ||||
| Strong GDP growth and accelerated EV penetration and global electrification (backed by renewable electricity) support demand growth and margins across the portfolio | | Lower demand growth and poor carbon policy reduce margins and upside for low- carbon smelting and refining (Kennecott and Escondida) | |||
| Pressure to meet rapid demand growth supports growth projects (and NutonTM) if they satisfy environmental and social requirements | |||||
| Environmental and social approval hurdles for new projects including Resolution Copper and La Granja | | Geopolitical tensions could reduce joint venture partnership opportunities and create potential engineering, procurement and construction and logistical issues | |||
Minerals | | Short term: Potential for carbon penalties to raise operational costs for emissions intensive minerals operations in Canada and South Africa. Some transition-related short-term demand growth for minerals that support electrification | ||||
| Accelerated uptake of EVs and battery storage solutions supports growth projects (Rincon and Tamarack joint venture) | | Strong outlook for battery materials but international competition for greenfield and mergers and acquisitions opportunities limit growth options | | Reduced battery material growth opportunities but resilience from operating high-grade TiO2 assets | |
| Increasing ESG scrutiny of new projects and more stringent regulations | | Supply disruption risks and volatility bolster demand for precious metal and critical mineral by-products | |||
| Potential for carbon penalties to raise operational costs for emissions intensive downstream processing of TiO2 and battery materials | |||||
48 | Annual Report on Form 20-F 2023 | riotinto.com |
Short term (less than 2 years) | Medium term (2-10 years) | Medium and long term | Long term (beyond 10 years) | No risk |
High opportunity | Moderate opportunity | Moderate risk | High risk |
Weather/climate analytics and insights | –Short (days) and medium (weeks-months) term: weather forecasting, climate outlooks and natural catastrophe models. –Long term (decades): downscaled latest-generation global climate models considering a range of future emission scenarios and time horizons. –Location information: exposure and vulnerability. | Scope (physical and financial) | |||||||||
Physical risk and resilience assessment | –Identify: determine location-specific physical climate risks (threats and opportunities) considering present-day and short, medium and long- term time horizons and multiple emission scenarios. –Evaluate: assess identified risks in terms of their potential consequence (financial and non-financial) and likelihood. –Prioritise: prioritise risks based on materiality. | ||||||||||
Top-down assessment Group-wide | Bottom-up assessment Asset level | ||||||||||
Resilience planning and adaptation | –Options: explore and identify the most appropriate resilience and adaptation measures to mitigate risk. –Consider: cost-benefit, principles of adaptive management, modularity and long-term sustainability. –Prioritise: critical and high-impact measures for implementation. –Decide and implement: decide and implement adaptation measures. | ||||||||||
Monitoring and evaluation | –Accountability: clearly define roles and responsibilities. –Metrics: evaluate performance against established metrics and indicators to assess success and impact. –Review: revisit this approach regularly, or if there is a material change to the economic, social, environmental, or physical context of the subject/risk. | Operations Environment People Community Supply chain | |||||||||
Annual Report on Form 20-F 2023 | riotinto.com | 49 |

Product | Time horizon | Variables | Detail and use |
Weather forecasts | Short term: hours to days | Atmospheric conditions: temperature, precipitation, wind | Weather and severe weather forecasts used at site-level to inform short-term operational planning and trigger emergency response planning. |
Severe weather forecasts | Short term: hours to days | Extreme events: storms, tropical cyclones, flash floods, hail, lightning | |
Climate outlooks | Short term: weeks to months | Atmospheric conditions (rainfall outlooks) and extreme events (tropical cyclone outlooks) | Climate outlooks inform operational mine planning and bolster operational resilience and rainy season preparations across our portfolio. |
Catastrophe modelling | Short, medium and long term (years to decades) | Extreme events: tropical cyclone, flood | Modelling to estimate potential financial losses and damages that can result from extreme climate events like tropical cyclones and floods. |
Climate change projections | Long term: decades | Atmospheric, climatic, oceanic and extreme events | Long-term projections of how acute and chronic hazards may change in the future. Projections are used to inform our asset-level and Global Industry Standard on Tailings Management (GISTM) physical risk and resilience assessments, operations, closure planning and execution, exploration, projects, mine water management, and Group finance and insurance. |
50 | Annual Report on Form 20-F 2023 | riotinto.com |
Key | l | Short term (0-2 years) | l | Medium term (2-10 years) | l | Long term (10+ years) |
Risk, impact and time horizon | Environmental triggers | Risk management |
Tailings storage facility (TSF) containment breach/failure due to geotechnical instability or significant erosion event  | Extreme rainfall, flooding | Our facilities comply with local laws and regulations and have risk management protocols in place, including a Group safety standard for tailings and water storage facilities. We regularly update this standard and undergo internal and external assurance checks. Our operational TSFs have, or are developing, tailings response plans and follow strict business resilience and communications protocols. In accordance with the relevant climate change requirements from the GISTM, all TSFs will conduct a climate change resilience assessment by August 2025. |
Water shortages, supply and availability impacting operations and production, water treatment and environmental compliance, dust control and community relations | Rainfall, temperature | We use a water risk framework to identify, assess and manage water risks across our portfolio of managed operations. For more information on the water risk framework, see page 59. The framework covers four themes, one of which relates to water supply (water resource). The supply theme requires us to consider whether sufficient water is available to supply both our operational demands and the demands of other stakeholders within the broader catchment, under the range of conditions that are likely to occur over the asset's life. We apply rigorous standards and processes to ensure effective controls are in place at all sites. This includes our Group water quality protection and water management standard, and a standardised Group water management control library which describes all controls identified to manage our water risks. Asset-specific climate change risk and resilience assessments further enable continued improvement of water risk management over time. |
Damage to critical coastal infrastructure (shipping berths, ship loaders, stackers/reclaimers, conveyors) resulting in operational and supply chain disruption  | Tropical cyclone/ storm, wind, storm surge | Our coastal infrastructure is designed to withstand the wind loading and other impacts associated with extreme events, including severe tropical cyclones. Established business resilience management plans offer frameworks for response, continuity, and recovery in the event of a natural catastrophe scenario, aiming to minimise damage and resume operations swiftly. Our engineering risk assessment program, including asset-level critical risk assessments, considers natural catastrophe modelling and associated risks, if appropriate. |
Damage and outages of critical electrical (motors, generators, cooling systems) and power (substations, transformers, transmission lines) infrastructure | Tropical cyclone/ storm, extreme rainfall, flooding, extreme temperatures, lightning | Electrical and power infrastructure is designed in accordance with local engineering and design standards and internal electrical safety standards and is considered in our asset- specific climate change risk and resilience assessments. Flood risk modelling (surface water, riverine and coastal inundation) incorporating future climate change projections has been completed across our portfolio of managed and non-managed operations. |
Damage to critical mining and production infrastructure (eg fixed plant, conveyors) resulting in operational disruption | Tropical cyclone/ storm, extreme rainfall and/or flooding | Critical mining and production infrastructure is designed in accordance with local engineering and design standards and are considered in our asset-specific climate change risk and resilience assessments. Assets located in tropical cyclone-affected regions have appropriate controls to minimise damage and operational downtime. Flood risk modelling (surface water, riverine and coastal inundation) incorporating future climate change projections has been completed across our portfolio of managed and non- managed operations. |
Health and safety and productivity of workforce | Extreme heat | Controls are in place to manage the risk of extreme heat for our workforce, including adequate acclimatisation prior to commencing work. Those undertaking high-risk heat tasks are monitored daily for signs or symptoms of heat illness/stress. Operator checklists ensure adequate hydration and work area management. Provision is made for cool rest areas with access to cool drinking water. Our workforce is able to self-pace their workload ensuring regular work/rest breaks. |
Disruption to transport routes (maritime, rail, air and road access) and supply chain (supplies and critical spares and access to direct customers) | Tropical cyclone/ storm, extreme heat, extreme rainfall, flooding | We are working to better understand the interdependencies across our entire operation. In 2023, we operationalised analytics that provides real-time natural hazard impacts for over 50% of our tier 1-3 goods suppliers. Being alerted of potential supply disruption in real- time allows our teams to make informed decisions to reduce supply chain disruption. This work aims to identify critical components of our product group supply chains and manage the potential adverse impacts from physical climate risk. |
Acute and chronic climate change impacting closure objectives | Tropical cyclones/ storms, temperature, rainfall, flooding, sea level rise | The physical impacts of climate change are considered when planning and executing closure. Latest-generation climate change projections specific to the site are used to inform appropriate landform design, water management and vegetation selection. This is to support modelling as per local regulatory requirements and internal closure standards. Ongoing and regular monitoring and maintenance of the site is essential to ensure the effectiveness of closure measures, including monitoring water quality, soil erosion, vegetation growth and any potential contamination or instability issues. |
Annual Report on Form 20-F 2023 | riotinto.com | 51 |
A)Disclose the metrics used by the organisation to assess climate- related risks and opportunities in line with its strategy and risk management process. B)Disclose Scope 1, Scope 2, and, if appropriate, Scope 3 GHG emissions, and the related risks. C)Describe the targets used by the organisation to manage climate- related risks and opportunities and performance against targets. | ||
52 | Annual Report on Form 20-F 2023 | riotinto.com |
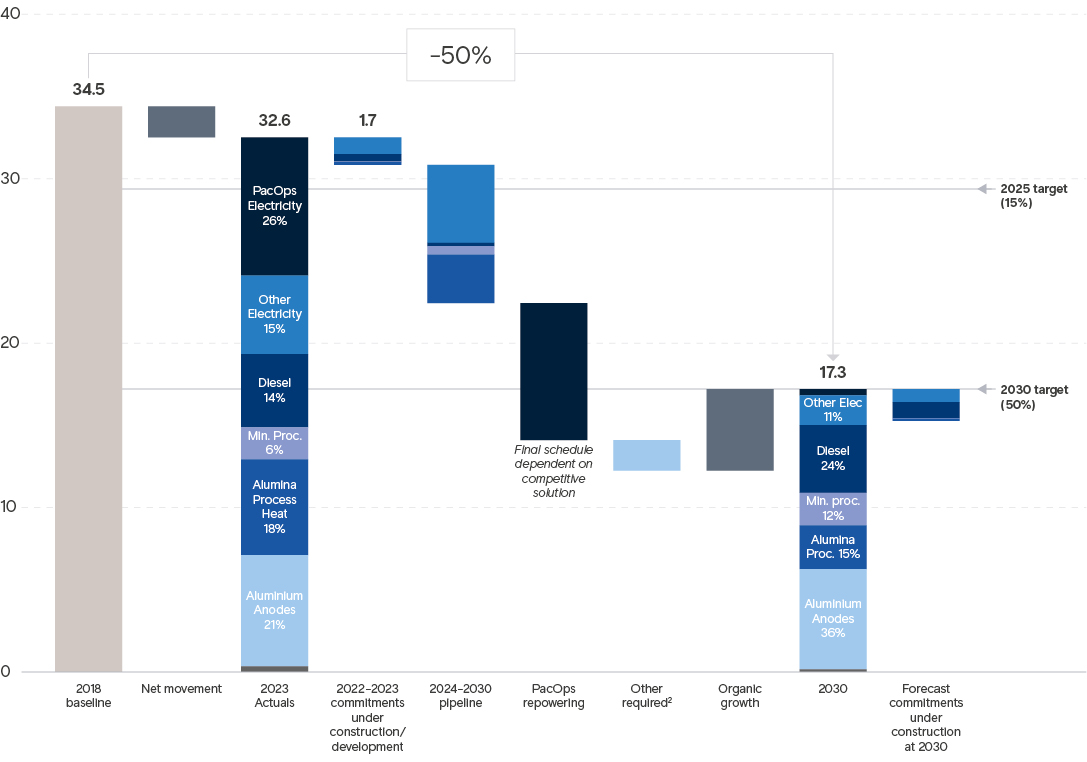
Annual Report on Form 20-F 2023 | riotinto.com | 53 |

54 | Annual Report on Form 20-F 2023 | riotinto.com |
Equity greenhouse gas emissions (Mt CO2e) | 2023 | 2022 | 2018 |
Baseline Scope 1 and 2 emissions | 32.6 | 32.7 | |
Carbon offsets retired | 0 | 0.0 | |
Baseline net Scope 1 and 2 emissions2 | 32.6 | 32.7 | |
2018 emissions target baseline (adjusted for acquisitions and divestments) | 34.5 |
Equity greenhouse gas emissions (Mt CO2e) | 2023 | 2022 | 2021 | 2020 | 2019 |
Scope 1 emissions | 23.3 | 22.7 | 22.9 | 23 | 23.1 |
Scope 2: Market-based emissions1 | 9.3 | 9.6 | 10.1 | 10.4 | 9.9 |
Total Scope 1 and 2 emissions | 32.6 | 32.3 | 33 | 33.4 | 33 |
Carbon offsets retired2 | 0 | 0 | 0 | 0 | 0 |
Total net Scope 1 and 2 emissions (with offsets retired) | 32.6 | 32.3 | 33 | 33.4 | 33 |
Scope 2: Location-based emissions3 | 7.8 | 8.2 | 8.5 | 8.6 | 8.1 |
Scope 3 emissions | 578.1 | 583.9 | 558.3 | 576.2 | — |
Operational emissions intensity (tCO2e/t Cu-eq)(equity)4 | 6.8 | 7 | 7.2 | 7 | 6.8 |
Direct CO2 emissions from biologically sequested carbon (eg CO2 from burning biofuels/biomass)5 | 0.03 | 0 | 0 | 0 | 0 |
2023 equity greenhouse gas emissions by location (Mt CO2e) | Scope 1 Emissions (Mt CO2e) | Scope 2 Emissions1 (Mt CO2e) | Total Emissions (Mt CO2e) |
Australia | 13.0 | 6.3 | 19.2 |
Canada | 6.4 | 0.0 | 6.4 |
Africa | 0.5 | 1.3 | 1.8 |
US | 0.9 | 0.0 | 0.9 |
Europe | 0.3 | 1.7 | 2.0 |
South America | 0.5 | 0.0 | 0.5 |
Mongolia | 0.2 | 0.0 | 0.2 |
New Zealand | 0.5 | 0.0 | 0.5 |
Other | 0.9 | 0.1 | 0.9 |
Total | 23.3 | 9.3 | 32.6 |
Annual Report on Form 20-F 2023 | riotinto.com | 55 |
Commodity | Classification | Year ended 31 December | Production1 | Revenue2 US$m | Capital expenditure3 $m | Operating assets4 $m | Emissions Mt CO2e5,6 | 2024 Guidance Rio Tinto production share, unless otherwise stated |
Lithium | KTM | 2023 | – | – | 27 | 834 | – | – |
('000 tonnes) | 2022 | – | – | 15 | 835 | – | – | |
Copper7 (Mined) | KTM | 2023 | 562 | 2023: 6,625 2022: 6,618 | 2023: 2.474 2022: 1,942 | 2023: 21.046 2022: 18,463 | 2023: 1.1 2022: 1.7 | Mined copper: 660 to 720kt Refined copper: 230 to 260kt |
('000 tonnes) | 2022 | 521 | ||||||
Copper7 (Refined) | KTM | 2023 | 175 | |||||
('000 tonnes) | 2022 | 209 | ||||||
Silver (Mined) | OTM | 2023 | 3,811 | |||||
('000 ounces) | 2022 | 3,940 | ||||||
Silver (Refined) | OTM | 2023 | 1,407 | |||||
('000 ounces) | 2022 | 1,950 | ||||||
Molybdenum | OTM | 2023 | 2 | |||||
('000 tonnes) | 2022 | 3 | ||||||
Gold (Mined) | TNM | 2023 | 282 | |||||
('000 ounces) | 2022 | 235 | ||||||
Gold (Refined) | TNM | 2023 | 74 | |||||
('000 ounces) | 2022 | 114 | ||||||
Aluminium8 | OTM | 2023 | 3,272 | 9,272 | 906 | 11,919 | 17.2 | 3.2 to 3.4Mt |
('000 tonnes) | 2022 | 3,009 | 10,738 | 925 | 10,131 | 16.5 | ||
Alumina8 | OTM | 2023 | 7,537 | 1,288 | 325 | 1,315 | 5.9 | 7.6 to 7.9Mt |
('000 tonnes) | 2022 | 7,544 | 1,636 | 356 | 2,400 | 5.7 | ||
Bauxite8 | OTM | 2023 | 54,619 | 1,648 | 226 | 2,649 | 0.9 | 53 to 56Mt |
('000 tonnes) | 2022 | 54,618 | 1,607 | 204 | 2,458 | 0.9 | ||
Minerals9 | OTM/TNM | 2023 | See footnote 10 | 3,240 | 380 | 4,102 | 2.8 | Titanium dioxide slag: 0.9 to 1.1Mt |
(‘000 tonnes/carats) | 2022 | 3,485 | 332 | 3,955 | 3.0 | |||
Iron Ore | TNM | 2023 | 290,171 | 33,772 | 3,193 | 20,581 | 3.7 | IOC11 iron ore pellets and concentrate: 9.8 to 11.5Mt Pilbara iron ore (shipments, 100% basis): 323 to 338Mt |
('000 tonnes) | 2022 | 283,247 | 32,801 | 3,273 | 19,525 | 3.7 | ||
Metallurgical Coal | Not applicable | 2023 | – | – | – | – | – | – |
('000 tonnes) | 2022 | – | – | – | – | – | – | |
Thermal Coal | Not applicable | 2023 | – | – | – | – | – | – |
('000 tonnes) | 2022 | – | – | – | – | – | – |
56 | Annual Report on Form 20-F 2023 | riotinto.com |

Emission scenario | Description and outcome |
Intermediate emissions scenario IPCC Representative Concentration Pathway 4.5 (RCP4.5) | Emissions peak around 2040, then decline. Relative to the 1986-2005 period, global mean surface temperature changes are likely to be 1.1°C-2.6°C by 2100. |
High emissions scenario IPCC Representative Concentration Pathway 8.5 (RCP8.5) | Emissions continue to rise throughout the 21st century and is considered a worst- case climate change scenario. Relative to the 1986-2005 period, global mean surface temperature changes are likely to be 2.6°C-4.8°C by 2100. |
Annual Report on Form 20-F 2023 | riotinto.com | 57 |
Intermediate emissions scenario | High emissions scenario | ||||||||||||||||
Present | 2030 | 2040 | 2050 | 2030 | 2040 | 2050 | |||||||||||
Rio Tinto Group | |||||||||||||||||
Africa | |||||||||||||||||
Asia | |||||||||||||||||
Australia East and New Zealand | |||||||||||||||||
Australia West | |||||||||||||||||
Canada East | |||||||||||||||||
Canada West | |||||||||||||||||
Europe and Middle East | |||||||||||||||||
South America | |||||||||||||||||
US | |||||||||||||||||
Low risk (<0.2%) | Medium risk (0.2-1%) | High risk (>1%) | |||||||
 | For more information on physical risk and resilience see riotinto.com/climaterisk. |
58 | Annual Report on Form 20-F 2023 | riotinto.com |
As environmental stewards, we focus on responsibly managing shared resources to protect the health, safety and livelihoods of local communities. We manage risk to minimise adverse environmental impacts from our operations and to sustain our shared ecosystems, planet and natural resources for future generations. 2023 progress In 2023, we continued to strengthen our approach to environmental risk management by updating and implementing a shared language, developing a standardised set of controls and associated performance requirements and ensuring we are assessing the full breadth of potential environmental impacts in a consistent way across our business. This is evident in our Group environmental risk taxonomy and consequence descriptions for risk and incidents. As a forum member of the Taskforce on Nature-related Financial Disclosures (TNFD), we have undertaken pilots of the prototype risk management and opportunity disclosure framework at our Simandou site in Guinea and at Greater Hope Downs in Australia. The final framework was released in September 2023. Through our membership with ICMM, we are engaging with our industry peers to develop mining sector-specific guidance for TNFD. We have also refreshed our approach to managing nature-related risk and are developing a pathway to increasing our environment- related disclosures in line with the requirements of TNFD. As part of the Health, Safety, Environment and Security Transformation Program, we continue to improve how we manage our environmental data. Access to trusted and timely environmental data across all Saguenay– Lac-St-Jean sites is supporting decision making, meeting the growing demand for transparency and enabling us to set meaningful targets for continuous improvement in environmental performance. A project is underway to optimise environmental data collection across the business, leveraging existing tools as much as possible. We have also worked to build a more consistent approach to environmental management and embed it across our business processes throughout the lifecycle of our operations. To support our assets in managing their overall health, safety and environmental performance, we continue to evolve our approach. We recently incorporated environmental and health risk ownership and performance management into our safety maturity model (SMM). | Water Water is a shared resource critical to sustaining biodiversity, people and economic prosperity. Increasingly disrupted weather patterns and more extreme weather events due to climate change, and a growing world population, mean efficiently managing water is more important than ever. The way we think about water and manage associated risks reflects the diversity of our operations and geographic locations. A small proportion of our assets operate in water-scarce regions, while others must remove excess water to allow safe mining operations. These are examples of the many potential risks we manage across the lifecycle of our diverse operations. | We share water with the communities and ecosystems surrounding our operations, so we aim to avoid permanent impacts on water resources by carefully managing the quality and quantity of the water we use and return to the environment. This means balancing the needs of our operations with those of the local communities and ecosystems. We do this while considering the impact of climate change, already felt in the level of rainfall and water security at some of our operations. We understand this responsibility extends beyond the life of our operations. To address this complexity, we adopt a catchment-level approach to developing potential solutions and managing our risks and impacts within our operations. We use 2030 water stress as determined by the World Resource Institute (WRI) to identify operational catchments of most concern. | ||||
| For more information see www.riotinto.com/water. | |||||
 | ||||||
First major mining company to publish site-by-site water usage data In 2023, on World Water Day, we became the first major mining company to release our site-by-site water usage. The interactive online map shows surface water usage across our global network of managed sites in 35 countries. For each site included, the database shows permitted surface water allocation volumes, annual allocation usage and the associated catchment runoff from average annual rainfall estimates. These disclosures allow us to engage closer with our stakeholders and be even more transparent, while we continue to focus on becoming better water and land stewards for future generations. | ||||||
| For more information see www.riotinto.com/watermanagement. | |||||
Annual Report on Form 20-F 2023 | riotinto.com | 59 |
 | ||
Water resource Is there enough water available for both environment needs, community needs and our operational use? | The water resource risk at Oyu Tolgoi in Mongolia is assessed as moderate, even though it is located in the Gobi Desert. Oyu Tolgoi sources its water requirements from a deep water supply, the Gunii Hooloi aquifer, a 150-metre deep resource holding around 6.8 billion cubic metres of non-drinkable saline water. Oyu Tolgoi uses this water source efficiently with water recycling and conservation practices implemented across the operation. | |
Water quality and quantity Does the way we manage water on site, or discharge excess water, cause environmental impacts or operational constraints? | Our QIT Madagascar Minerals (QMM) operation in Madagascar operates in a highly sensitive area from a water, broader environment and community perspective. The discharges from our operation have the potential to impact receiving water quality and, therefore, the water quality risk is assessed as high. We are working to improve management activities on site, including our ability to more accurately measure our water discharge quality, and the deployment of a dedicated water treatment plant to adjust the discharge pH. | |
Dewatering Does the removal of water from the operational areas of our sites impact regional aquifers or our mine plans? | Impacts associated with dewatering and water supply activities in the Pilbara are recognised as a very high risk for our business. Returning water to the aquifers impacted by our mining activities in a controlled manner is the focus of a number of studies. We are working with Traditional Owners on water management. | |
Long-term obligations Do our operational activities generate long-term or ongoing obligations related to water? | We may sometimes generate impacts that we are required to manage over the long term, such as post-closure pit lakes in the Pilbara, or potential seepage from our waste rock or tailings facilities in our aluminium and copper sites. Our systems and standards aim to ensure that risks are identified early and managed appropriately and responsibly throughout the asset lifecycle. | |
 | For more information see our 2023 Sustainability Fact Book at riotinto.com/sustainabilityreporting. |
60 | Annual Report on Form 20-F 2023 | riotinto.com |


Group target | Water risk theme | Status | Commentary |
Rio Tinto Group (Tier 11) | |||
By 2023, we will disclose – for all managed operations – permitted surface water allocation volumes, annual allocation usage and the associated surface water allocation catchment rainfall-runoff volume estimate. | Water resource | Attained | A disclosure platform was developed and released in 2023, making public detailed information about annual surface water usage across our global network of managed sites in 35 countries. |
Site-based target | Water risk theme | Status | Commentary |
Pilbara operations, Iron Ore (Tier 1) | |||
Our Iron Ore product group will complete six managed aquifer recharge investigations by 2023. | Dewatering (aquifer reinjection) | Attained | Successful completion of six managed aquifer recharge investigations with another three investigations underway. Two of the investigations resulted in ongoing recharge programs. |
Oyu Tolgoi, Copper (Tier 1) | |||
Oyu Tolgoi will maintain average annual water use efficiency at 550L/tonne of ore to concentrator from 2019-23. | Water resource (intensity and efficiency) | Attained | Oyu Tolgoi maintained its average annual water use efficiency below 550L/ tonne for the period 2019-23. Oyu Tolgoi remains one of the most efficient copper operations in the industry. |
Kennecott Utah Copper, Copper (Tier 1) | |||
Kennecott will reduce average annual imported water per ton of ore milled by 5% over the 2014-18 baseline of 393 gal/ton (1,487L/ton) at the Copperton Concentrator by 2023. | Water resource (import reduction) | Not attained | With the exception of 2019, annual concentrator water intensity has remained above the 2014-2018 target baseline. Required changes to the concentrator process during 2020 resulted in increased water usage compared to the initial target baseline. Kennecott’s water usage has trended down since the implementation of these changes. Kennecott’s commitment to improve water efficiency through the concentrator successfully reduced intensity in 2022 and 2023 to approximately 10% lower than the period peak recorded in 2021. |
Ranger Mine2, Energy Resources of Australia Limited (ERA), Closure (Tier 1) | |||
ERA will achieve the planned total process water inventory treatment volume by 2023, as assumed in the Ranger water model. | Quantity/quality (inventory reduction) | Not attained | Since the commencement of the Water Target in 2019, ERA has implemented the process water treatment capacity upgrades that were envisaged in the Ranger closure plan of the time, including an upgrade to the capacity of its Brine Concentrator and the construction and subsequent upgrade of a Brine Squeezer. Despite these upgrades, process water treatment rates have not met expectations. Other changes in project schedule mean that the assumptions behind the Ranger water model used to set the Water Target are no longer valid. A feasibility study refresh completed in 2023 identified that ERA should move to a program management approach to the rehabilitation of Ranger, with additional studies required for the later stages of the project. The outcome of these additional studies will ultimately lead to an updated Ranger water model and a revised plan for process water treatment. |
QIT Madagascar Minerals (QMM), Minerals (Tier 23) | |||
QMM will develop and implement an improved integrated site water management approach by 2023. | Quantity/quality (discharge quality) | Attained | Actions committed to and in-progress as part delivery of the site-based water target include: –updated water management strategy and vision –host community engagement in water management activities –establishing a water treatment plant –improvements in data integrity and capability in testing controls –improved transparency and disclosure of water information –improvements in host community access to potable water. |
Queensland Alumina Limited (QAL), Aluminium (non-managed joint venture) (Tier 2) | |||
QAL will complete the following four water-related improvement projects from the QAL five-year environment strategy by 2023: –Project L1: integrity of bunds and drains –Project W3: caustic pipe and wasteline 4 integrity –Project W6: residue disposal area surface/ ground water impacts –Project W7: residue disposal area release to receiving environment. | Quality/quantity (discharge quality) Joint venture performance improvement | Attained | Progress of nominated water-related improvement projects is aligned with current project schedules. Refer to the 5-Year Environment Strategy on QAL’s website for further details. |
| For more information about our progress against our site-based water targets see www.riotinto.com/water. |
Annual Report on Form 20-F 2023 | riotinto.com | 61 |
| For more information about our biodiversity work see riotinto.com/biodiversity. |
| For more information about our closure work see page 64. |
| For more information about tailings see page 64. |
62 | Annual Report on Form 20-F 2023 | riotinto.com |
 | Turning slime into solar panels Tellurium is one of the rarest elements on Earth, usually found in small, sparse rock deposits, making it difficult to mine at scale. But at our Kennecott copper operations near Salt Lake City, Utah, we have discovered a way to extract tellurium from an unlikely source – slime waste material. And while we know we have more to do to eliminate waste completely, Kennecott’s tellurium plant is the latest example of work we are doing globally to minimise our waste by finding a use for every material we dig from the ground or creating new products from the waste itself. | |
| For more information about how we extract tellurium from slime see riotinto.com/telluriumfromwaste. | |
2023 | 2022 | 2021 | 2020 | 2019 | |
Significant environmental incidents1 | 1 | 0 | 3 | 0 | 0 |
Fines and prosecutions – environment ($’000)2 | 987 | 110 | 7 | 27 | 19 |
Land footprint – disturbed (cumulative square kilometres) | 3,848 | 3,810 | 3,735 | 3,630 | 3,627 |
Land footprint – rehabilitated (cumulative square kilometres) | 552 | 522 | 494 | 490 | 489 |
Mineral waste disposed or stored (million tonnes) | 977 | 978 | 1,005 | 987 | 905 |
Non-mineral waste disposed or stored (million tonnes) | 0.73 | 0.75 | 0.65 | 0.47 | 0.28 |
SOx emissions (thousand tonnes) | 72.5 | 66.2 | 70.2 | 75.7 | 76.8 |
NOx emissions (thousand tonnes) | 64.8 | 64.6 | 62.3 | 65.2 | 63.4 |
Fluoride emissions (thousand tonnes) | 2.61 | 2.36 | 2.36 | 2.27 | 2.34 |
Particulate (PM10) emissions (thousand tonnes) | 146.0 | 146.3 | 142.3 | 143.2 | 130.7 |
Annual Report on Form 20-F 2023 | riotinto.com | 63 |
| For more information about our most recent tailings facilities disclosures see our interactive map at riotinto.com/tailings. |
| For more information about our closure risks see page 88. |
64 | Annual Report on Form 20-F 2023 | riotinto.com |
| For more information about closure provisions and financial statements see page 196. |
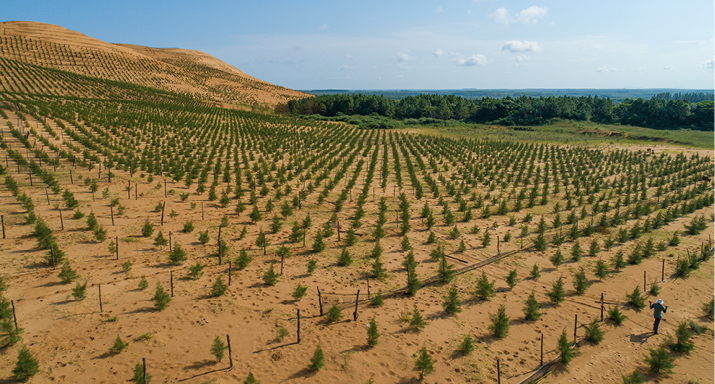 | Building capability in closure Mine closure is a complex challenge that we face as an industry. Changing societal expectations mean the landscape is evolving and we need to develop specialist skills and capability in closure. We developed the Leadership in Sustainable Mine Closure Program in partnership with the University of British Columbia, Curtin University and Ernst & Young to help meet this need and create opportunities to share best practices and learnings. Learn how some of our first program participants are finding better ways to incorporate closure into their work. | ||
| For more information see riotinto.com/closure. | ||
Annual Report on Form 20-F 2023 | riotinto.com | 65 |

Social performance | Our operations can have far-reaching impacts on society. We work hard to avoid or minimise adverse impacts and seek to understand, and invest in, the diverse knowledge, cultures and resources that exist in areas where we operate. Our ambition is to contribute to positive and enduring outcomes for our workforce and the communities and countries where we operate. |
 | For more information about our CSP targets see page 43. |
Yinjaa-Barni Art, Roebourne, Australia | ||
66 | Annual Report on Form 20-F 2023 | riotinto.com | |

| For more information visit Resolution Copper’s website resolutioncopper.com/cultural-heritage. |
Annual Report on Form 20-F 2023 | riotinto.com | 67 |
| For more information about our partnerships and community engagement see riotinto.com/ socialeconomicdevelopment |
| For more information see our 2021 and 2022 Communities and Social Performance Commitments Disclosures at riotinto.com/cspreport. |
68 | Annual Report on Form 20-F 2023 | riotinto.com |

| For more information see the results from the Independent Cultural Heritage Management Audit at riotinto/culturalheritage. |
Annual Report on Form 20-F 2023 | riotinto.com | 69 |

2023 | 2022 | 2021 | 2020 | 2019 | |
Consolidated sales revenue | 54,041 | 55,554 | 63,495 | 44,611 | 43,165 |
Net cash generated from operating activities1 | 15,160 | 16,134 | 25,345 | 15,875 | 14,912 |
Profit after tax for the year2 | 9,953 | 13,048 | 22,597 | 10,400 | 6,972 |
Underlying earnings2 | 11,755 | 13,359 | 21,401 | 12,448 | 10,373 |
Underlying earnings per share (US cents)2 | 725.0 | 824.7 | 1,322.4 | 769.6 | 636.3 |
Net (debt)/cash | (4,231) | (4,188) | 1,576 | (664) | (3,651) |
Capital expenditure3 | (7,086) | (6,750) | (7,384) | (6,189) | (5,488) |
Employment costs | (6,636) | (6,002) | (5,513) | (4,770) | (4,522) |
Payables to governments4 | (7,881) | (9,313) | (12,789) | (8,224) | (7,175) |
Amounts paid by Rio Tinto | N/A5 | (10,779) | (13,334) | (8,404) | (7,635) |
Amounts paid by Rio Tinto on behalf of its employees | N/A5 | (1,622) | (1,486) | (1,353) | (1,284) |
2023 | 2022 | 2021 | 2020 | 2019 | |
Community investment1 (discretionary) | 84* | 62.6 | 72.1 | 47.0 | 36.4 |
Development contributions2 (non-discretionary) | 17.6 | 18.2 | 19.1 | 12.8 | 12.0 |
Payment to landowners3 (non-discretionary) | 231.9 | 299.0 | 222.9 | 165.9 | 147.0 |
70 | Annual Report on Form 20-F 2023 | riotinto.com |
Demonstrating leadership of maritime safety and crew welfare As the first initiative of its kind for the dry bulk industry, we launched the Designated Owners and Operators Program. It provides us and our shipping value chain partners, including shipowners and operators, a structured platform to work together on improving maritime safety and crew welfare standards. Although we have not had any fatalities across our owned vessels since the formation of Rio Tinto Marine in 1989, over the past four years, seven seafarers have tragically lost their lives on chartered vessels. As part of the program, our partners commit to improving everyday practices to prevent fatalities and injuries, and improve crew welfare. So far we have onboarded 16 owners/operators, representing around 36% of our shipped volumes. | ||
Annual Report on Form 20-F 2023 | riotinto.com | 71 |
2023 | 2022 | 2021 | 2020 | 2019 | |
Fatalities at managed operations | 0 | 0 | 0 | 0 | 0 |
All-injury frequency rate (per 200,000 hours worked) | 0.37 | 0.40 | 0.40 | 0.37 | 0.42 |
Number of lost-time injuries | 236 | 225 | 216 | 187 | 227 |
Lost-time injury frequency rate (per 200,000 hours worked) | 0.23 | 0.25 | 0.25 | 0.22 | 0.27 |
Safety maturity model score1 | 5.2 | 4.7 | 5.7 | 5.4 | 4.5 |
Rate of new cases of occupational illness (per 10,000 employees)2 | 19.2 | 15.1 | 15.2 | 16.8 | 20.7 |
Number of employees3 | 57000 | 54,000 | 49,000 | 47,500 | 46,000 |
Fines and prosecutions – safety ($’000)4 | 330.0 | 339.0 | 646.2 | 25.4 | 40.7 |
Fines and prosecutions – health ($’000)5 | 0.9 | 0.0 | 5.0 | 0.0 | 1.4 |
2023 | 2022 | 2021 | 2020 | 2019 | |
Noise induced hearing loss | 28 | 20 | 16 | 23 | 34 |
Musculoskeletal disorders | 46 | 32 | 32 | 29 | 29 |
Mental stress | 4 | 5 | 1 | 2 | 2 |
Others | 20 | 13 | 15 | 14 | 16 |
72 | Annual Report on Form 20-F 2023 | riotinto.com |
 | For more information about our work to support employees’ psychological health and safety see the health, safety and wellbeing section on pages 71-72. |
| For more information about how we are increasing Indigenous leadership in our business see the CSP commitments section on page 69. |
| For more information about the Everyday Respect initiative see riotinto.com/everydayrespect. |
55,000¹ people |
make up our workforce of employees and contractors, an increase of 5.8% since 2022 (52,000). |
9,166 new hires |
joined the business in 2023, of which 2,718 were contractors becoming permanent employees. (2022: 11,062 new hires of which 4,317 were contractors). |
24.3% women |
in our workforce, an increase of 1.4% since 2022 (22.9%). Workforce breakdown: 13,396 women; 41,660 men; 8 undeclared gender. |
62% employees |
participated in myShare2, an increase of 3% (2022: 59%). |
Annual Report on Form 20-F 2023 | riotinto.com | 73 |
| For more information about the BCO, myVoice and Care Hub see page 77. |
| For more information about our commitment to pay equity see riotinto.com/payequity. |
Region | Average employee headcount(3) | Headcount distribution % | Absenteeism(4) | Average contractor headcount(5) | Headcount distribution % |
Africa | 3,058 | 6.0% | 3.1% | 134 | 2.8% |
Americas | 16,174 | 31.9% | 0.6% | 845 | 17.7% |
Asia | 5,834 | 11.5% | 1.2% | 137 | 2.9% |
Australia/New Zealand | 24,535 | 48.3% | 4.7% | 3,594 | 75.3% |
Europe | 1,168 | 2.3% | 0.7% | 64 | 1.3% |
Total⁶ | 50,768 | 100.0% | 2.9% | 4,773 | 100.0% |
Headcount distribution % | Gender(3) | Age Group(4) | Region(4) | ||||||||||||||
Women (count) | Men (count) | Undeclared (count) | Women % | Men % | Under 30 | 30-39 | 40-49 | Over 50 | Africa | Americas | Asia | Australia /NZ | Europe | ||||
Senior leaders | 1.1% | 175 | 407 | 0 | 30.1% | 69.9% | 0.2% | 6.4% | 44.9% | 48.5% | 4.5% | 26.0% | 10.6% | 43.8% | 15.1% | ||
Managers | 8.2% | 1,526 | 3,005 | 2 | 33.7% | 66.3% | 0.5% | 25.3% | 44.2% | 30.0% | 5.1% | 34.1% | 11.3% | 43.5% | 6.0% | ||
Supervisory and professional | 37.2% | 6,282 | 14,173 | 5 | 30.7% | 69.3% | 11.7% | 36.7% | 30.3% | 21.3% | 6.4% | 24.7% | 16.9% | 50.0% | 2.0% | ||
Operations and general support | 52.6% | 5,138 | 23,831 | 1 | 17.7% | 82.3% | 17.8% | 28.8% | 26.6% | 26.8% | 6.4% | 35.5% | 9.1% | 47.5% | 1.5% | ||
Graduates | 0.9% | 275 | 244 | 0 | 53.0% | 47.0% | 84.9% | 13.3% | 1.8% | —% | 5.7% | 32.4% | 14.6% | 46.3% | 1.0% | ||
Total | 100.0% | 13,396 | 41,660 | 8 | 24.3% | 75.7% | 14.5% | 31.1% | 29.4% | 25.0% | 6.3% | 31.3% | 12.2% | 48.0% | 2.2% | ||
Gender(4) | Age group | Region | |||||||||||||
Total | Women | Men | Under 30 | 30-39 | 40-49 | Over 50 | Africa | Americas | Asia | Australia /NZ | Europe | ||||
Employee hiring rate(5)(6) | 17.6% | 35.0% | 65.0% | 42.8% | 30.8% | 17.8% | 8.6% | 7.4% | 26.2% | 14.2% | 49.0% | 3.2% | |||
Employee turnover rate(7) | 8.4% | 8.7% | 8.3% | 11.1% | 7.9% | 6.8% | 9.5% | 5.2% | 6.0% | 3.8% | 11.3% | 7.9% | |||
74 | Annual Report on Form 20-F 2023 | riotinto.com |
| For more information about our human rights commitments see our Human Rights Policy. |
| For more information about our security and human rights program see our annual VPSHR statement. |
| For more information about our human rights and modern slavery approach see our annual Modern Slavery Statement. |
| For more information about how we engaged with our key stakeholders, including civil society organisations see pages 12. |
Annual Report on Form 20-F 2023 | riotinto.com | 75 |

Governance performance | We expect our people and partners to uphold the highest standard of integrity, act ethically and do the right thing. The way we treat our people, our partners, the environment, the communities where we work, and how we conduct business is what makes us a responsible partner of choice. |
Operations Centre in Perth, Australia | ||
76 | Annual Report on Form 20-F 2023 | riotinto.com | |
| For more information about our voluntary commitments, accreditations and memberships see riotinto.com/sustainabilityapproach. |
2023 | 2022 | 2021 | 2020 | 2019 | ||||||
Case rate | 29.1 | 28.1 | 25.7 | 14.5 | 15.9 | |||||
Reports received¹ | 1,613 | 1,459 | 1,246 | 748 | 804 | |||||
Reports received | Reports substantiated² | Reports received | Reports substantiated | Reports received | Reports substantiated | Reports received | Reports substantiated | Reports received | Reports substantiated | |
Business integrity | 254 | 48% | 211 | 52% | 154 | 36% | 102 | 51% | 134 | 36% |
Personnel | 1,196 | 55% | 1,034 | 65% | 819 | 57% | 421 | 38% | 454 | 31% |
Health, safety, environment³ | 109 | 61% | 120 | 47% | 186 | 22% | 68 | 35% | 52 | 46% |
Communities | 4 | 0% | 10 | 0% | 6 | 0% | 25 | 0% | 3 | 0% |
Information security | 22 | 0% | 16 | 67% | 18 | 36% | 99 | 47% | 111 | 81% |
Finance | 2 | 50% | 1 | 0% | 0 | 0% | 2 | 68% | 5 | 33% |
Other | 26 | 0% | 67 | 33% | 63 | 14% | 31 | 50% | 45 | 0% |
Annual Report on Form 20-F 2023 | riotinto.com | 77 |
Our approach to risk | Taking risks responsibly is key to delivering our strategy in a way that creates value for our customers, shareholders, employees and partners. |
Port Dampier, Australia | ||
78 | Annual Report Form 20-F 2023 | riotinto.com | |

Set strategy, objectives and risk appetite | Risk analysis Identify and evaluate risks to our strategy and objectives | Risk management Implement controls and actions to manage risks within risk appetite | Assurance Check and verify that controls and actions are effective in managing the risks | Communication Communicate current and emerging risks and escalate as appropriate | Improve & embed Build risk capability and culture so active management is embedded in how we run our business | |||||
Plan | Do | Check | Act | |||||||
Board and sub-committees | |||
Full Board | Audit & Risk Committee | Sustainability Committee | People & Remuneration Committee |
Executive management committees | ||||
Risk Management Committee | Ore Reserves Steering Committee | Evaluation & Investment Committee | Ethics & Compliance Committee | Disclosure Committee |
Major Hazards Technical Committee | Closure Steering Committee | Safety & Operations Committee | Cyber Security Steering Committee | Financial Risk Management Committee |
Operational management committees | ||||
Management steering committees providing oversight of risk management in their areas of responsibility | ||||
Strategic and portfolio risks | People, partnerships and operational performance risks | Financial and commercial risks | |
–Resources to Reserves risks –Capital project risks –Technology risks –Portfolio opportunities –Low-carbon transition risks | –People and culture risks –Major hazards risks –Health, safety, environment and security (HSES) risks –Communities and social performance (CSP) risks –Climate change and natural disaster risks | –Cyber risks –Ethics and compliance risks –Third-party risks –Non-managed asset risks –Managed asset risks –Closure risks | –Liquidity risks –Market risks –Credit risks –Tax risks –Disclosure risks |
Annual Report on Form 20-F 2023 | riotinto.com | 79 |
Assessment of viability The material risks and key assumptions considered in our longer-term viability assessment are as follows: Material Risk A Remaining competitive through economic cycles or shocks Scenario assumptions: A global financial crisis takes place in 2024, akin to the one that took place in 2008, albeit not as severe, and extends through to the end of the assessment period. It assumes commodity prices experience large negative pricing shocks in 2024, which is sustained through 2028. Material Risk B Group material major hazard or cyber risk Scenario assumptions: A singular catastrophic event occurs, resulting from a major operational failure or cyber security breach, such as a tailings and water storage facility failure, extreme weather event, or underground or geotechnical event. It results in multiple fatalities, cessation of operations and significant financial impacts. We have assumed two such events occur within the assessment period. It relates to material risks 1 (Preventing fatalities, permanent disablements, and illness) and 12 (Preventing material business disruption and data breaches due to cyber events). Material Risk C Delivery of our growth projects Scenario assumptions: A risk impacting our ESG credentials materialises (for example, material risks 6 (Building trusted relationships with Indigenous Peoples) and 3 (Building trusted relationships with communities), impacting our ability to deliver our growth strategy. We have assumed an impact on our near-term key projects and considered available alternatives. The financial impact assumed here is in addition to any non-financial impact, such as reputational damage. | ||
80 | Annual Report on Form 20-F 2023 | riotinto.com |
Material risk | Key objective | Oversight | ||||
1 | Preventing fatalities, permanent disablements, and illness from a major hazard or safety event | l | Best operator | Sustainability Committee | ||
2 | Preparing our Iron Ore business to meet the demand for green steel | l | Best operator | Board | ||
3 | Building trusted relationships with communities | l | Social licence | Sustainability Committee | ||
4 | Minimising our impact on the environments we work in and building physical resilience to changes in those environments, including climate change and natural disasters | l | Impeccable ESG | Sustainability Committee | ||
5 | Leaving a positive legacy for future generations, embedding closure considerations throughout the lifespan of our assets | l | Social licence | Sustainability Committee | ||
6 | Building trusted relationships with Indigenous Peoples | l | Social licence | Sustainability Committee | ||
7 | Delivering on our growth projects | l | Excel in development | Board | ||
8 | Achieving our decarbonisation targets competitively | l | Impeccable ESG | Board | ||
9 | Conducting our business with integrity, complying with all laws, regulations and obligations | l | Impeccable ESG | Board | ||
10 | Transforming our culture, enabling us to live our values | l | Best operator | Board | ||
11 | Remaining competitive through economic cycles or shocks | l | Best operator | Audit & Risk Committee | ||
12 | Preventing material business disruption and data breaches due to cyber events | l | Best operator | Board | ||
13 | Attracting, developing and retaining people with the requisite skills | l | Best operator | People & Remuneration Committee | ||
14 | Withstanding the impacts of geopolitics on our trade or investments | l | Best operator | Board | ||
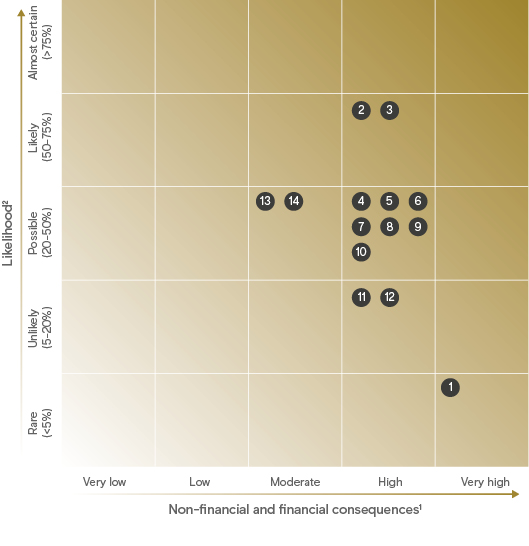
Annual Report on Form 20-F 2023 | riotinto.com | 81 |
Strategic alignment | Change vs 2022 | |
l | Best operator | Stable |
Strategic alignment | Change vs 2022 | |
l | Best operator | Stable |
82 | Annual Report on Form 20-F 2023 | riotinto.com |
Strategic alignment | Change vs 2022 | |
l | Best operator | Stable |
Strategic alignment | Change vs 2022 | |
l | Best operator | Stable |
Annual Report on Form 20-F 2023 | riotinto.com | 83 |
Strategic alignment | Change vs 2022 | |
l | Best operator | Stable |
Strategic alignment | Change vs 2022 | |
l | Best operator | Stable |
84 | Annual Report on Form 20-F 2023 | riotinto.com |
Strategic alignment | Change vs 2022 | |
l | Best operator | Stable |
Strategic alignment | Change vs 2022 | |
l | Impeccable ESG | Increasing |
Annual Report on Form 20-F 2023 | riotinto.com | 85 |
Strategic alignment | Change vs 2022 | |
l | Impeccable ESG | Stable |
Strategic alignment | Change vs 2022 | |
l | Impeccable ESG | Stable |
86 | Annual Report on Form 20-F 2023 | riotinto.com |
Strategic alignment | Change vs 2022 | |
l | Excel in development | Stable |
Strategic alignment | Change vs 2022 | |
l | Social licence | Increasing |
Annual Report on Form 20-F 2023 | riotinto.com | 87 |
Strategic alignment | Change vs 2022 | |
l | Social licence | Increasing |
Strategic alignment | Change vs 2022 | |
l | Social licence | Stable |
88 | Annual Report on Form 20-F 2023 | riotinto.com |
For the years ending 31 December Amounts in accordance with IFRS | 2023 $m | 20222 $m | 20212 $m | 2020 $m | 2019 $m |
Consolidated sales revenue | 54,041 | 55,554 | 63,495 | 44,611 | 43,165 |
Group operating profit1 | 14,823 | 19,933 | 29,817 | 16,829 | 11,466 |
Profit after tax for the year2 | 9,953 | 13,048 | 22,597 | 10,400 | 6,972 |
Basic earnings for the year per share (US cents)2 | 620.3 | 765.0 | 1,304.7 | 604.0 | 491.4 |
Diluted earnings for the year per share (US cents)2 | 616.5 | 760.4 | 1,296.3 | 599.8 | 487.8 |
Dividends per share | |||||
Dividends declared during the year | |||||
US cents | |||||
–interim | 177.0 | 267.0 | 376.0 | 155.0 | 151.0 |
–interim special | – | – | 185.0 | – | 61.0 |
–final | 258.0 | 225.0 | 417.0 | 309.0 | 231.0 |
–special | – | – | 62.0 | 93.0 | |
UK pence | |||||
–interim | 137.67 | 221.63 | 270.84 | 119.74 | 123.32 |
–interim special | – | – | 133.26 | – | 49.82 |
–final | 203.77 | 185.35 | 306.72 | 221.86 | 177.47 |
–special | – | – | 45.60 | 66.77 | |
Australian cents | |||||
–interim | 260.89 | 383.70 | 509.42 | 216.47 | 219.08 |
–interim special | — | – | 250.64 | — | 88.50 |
–final | 392.78 | 326.49 | 577.04 | 397.48 | 349.74 |
–special | – | – | 85.80 | 119.63 | |
Dividends paid during the year (US cents) | |||||
–ordinary | 402.0 | 684.0 | 685.0 | 386.0 | 331.0 |
–special | – | 62.0 | 278.0 | – | 304.0 |
Weighted average number of shares basic (millions) | 1,621.4 | 1,619.8 | 1,618.4 | 1,617.4 | 1,630.1 |
Weighted average number of shares diluted (millions) | 1,631.5 | 1,629.6 | 1,628.9 | 1,628.6 | 1,642.1 |
Share buy-back ($ million) | – | – | 208 | 1,552 | |
Balance sheet data | |||||
Total assets | 103,549 | 96,744 | 102,896 | 97,390 | 87,802 |
Share capital/premium | 7,908 | 7,859 | 8,097 | 8,302 | 7,968 |
Total equity/net assets2 | 56,341 | 52,741 | 57,113 | 51,903 | 45,242 |
Equity attributable to owners of Rio Tinto2 | 54,586 | 50,634 | 51,947 | 47,054 | 40,532 |

Annual Report on Form 20-F 2023 | riotinto.com | 89 |
Governance | |
Chair’s introduction | 91 |
Board of Directors | 92 |
Executive Committee | 94 |
Our stakeholders – Section 172(1) statement | 96 |
How the Board has considered stakeholders in their decision-making | 100 |
How the Board monitors culture | 101 |
Board activities in 2023 | 102 |
Governance framework | 103 |
Evaluating our performance | 104 |
Nominations Committee report | 105 |
Audit & Risk Committee report | 107 |
Sustainability Committee report | 111 |
Remuneration report | |
Annual statement by the People & Remuneration Committee Chair | 113 |
Remuneration Policy | 119 |
Implementation report | 127 |
Additional statutory disclosure | 146 |
Compliance with governance codes and standards | 152 |
Alma, Canada | ||
90 | Annual Report on Form 20-F 2023 | riotinto.com | |
Annual Report on Form 20-F 2023 | riotinto.com | 91 |
 | Dominic Barton BBM Chair |
BA (Hons), MPhil. Age 61. Appointed April 2022; Chair from May 2022. | |
Skills and experience: Dominic spent over 30 years at McKinsey & Company, including nine years as the Global Managing Partner, and has also held a broad range of public sector leadership positions. He has served as Canada’s Ambassador to China, Chair of Canada’s Advisory Council for Economic Growth, and Chair of the International Advisory Committee to the President of South Korea on National Future and Vision. Dominic brings a wealth of global business experience, including deep insight of geopolitics, corporate sustainability and governance. His business acumen and public sector experience position him to provide balanced guidance to Rio Tinto’s leadership team. Dominic believes in the competitive advantage of putting people at the heart of strategy and the role culture change will play in Rio Tinto’s future success. Current external appointments: Chair of LeapFrog Investments and Chancellor of the University of Waterloo. | |
 | Simon Henry Independent Non-Executive Director |
MA, FCMA. Age 62. Appointed April 2017. | |
Skills and experience: Simon has significant experience in global finance, corporate governance, mergers and acquisitions, international relations, and strategy. He draws on over 30 years’ experience at Royal Dutch Shell plc, where he was Chief Financial Officer between 2009 and 2017. Current external appointments: Senior Independent Director of Harbour Energy plc, Adviser to the Board of Oxford Flow Ltd, member of the Board of the Audit Committee Chairs’ Independent Forum, member of the Advisory Board of the Centre for European Reform and Advisory Panel of the Chartered Institute of Management Accountants (CIMA), and trustee of the Cambridge China Development Trust. | |
 | Jakob Stausholm Chief Executive |
Ms Economics. Age 55. Appointed Chief Financial Officer September 2018; Chief Executive from January 2021. | |
Skills and experience: As Chief Executive, Jakob brings strategic and commercial expertise and governance experience. He is committed to rebuilding trust with communities, Traditional Owners and engaging broadly with stakeholders, including governments, partners and other business leaders. He continues to focus on improving operational performance, including through the Safe Production System, creating and progressing value-accretive growth options while remaining disciplined on capital allocation and delivering returns for shareholders. Jakob joined Rio Tinto in 2018 as Chief Financial Officer. He has over 20 years’ experience, primarily in senior finance roles at Maersk Group and Royal Dutch Shell plc, including in capital-intensive, long-cycle businesses, as well as in innovative technology and supply chain optimisation. He was also a Non- Executive Director of Woodside Petroleum and Statoil (now Equinor). Current external appointments: None. | |
 | Kaisa Hietala Independent Non-Executive Director |
MPhil, MS. Age 53. Appointed March 2023. | |
Skills and experience: Kaisa is an experienced executive with a strong track record of helping companies transform the challenges of environmental megatrends into business opportunities and growth. She began her career in upstream oil and gas exploration and, as Executive Vice President of Renewable Products at Neste Corporation, she played a central role in its commercial transformation into the world’s largest and most profitable producer of renewable products. She was formerly a Board member of Kemira Corporation. Current external appointments: Senior Independent Director of Smurfit Kappa Group plc, Non-Executive Director of Exxon Mobil Corporation, Chair of the Board of Tracegrow Ltd and a member of the Supervisory Board of Oulu University. | |
 | Peter Cunningham Chief Financial Officer |
BA (Hons), Chartered Accountant (England and Wales). Age 57. Chief Financial Officer from June 2021. | |
Skills and experience: As Chief Financial Officer, Peter brings extensive commercial expertise from working across the Group in various geographies. He is strongly focused on the decarbonisation of our assets, investing in the commodities essential for the energy transition, and delivering attractive returns to shareholders while maintaining financial discipline. During almost three decades with Rio Tinto, Peter has held a number of senior leadership roles, including Group Controller, Chief Financial Officer – Organisational Resources, Global Head of Health, Safety, Environment & Communities, Head of Energy and Climate Strategy, and Head of Investor Relations. Current external appointments: None. | |
 | Sam Laidlaw Independent Non-Executive Director |
MA, MBA. Age 68. Appointed February 2017; Senior Independent Director from May 2019. | |
Skills and experience: Sam has more than 40 years’ experience of long-cycle, capital- intensive industries in which safety, the low-carbon transition, and stakeholder management are critical. Sam has held a number of senior roles in the energy industry, including as CEO of both Enterprise Oil plc and Centrica plc. He was also a member of the UK Prime Minister’s Business Advisory Group. Current external appointments: Chair of Neptune Energy Group Holdings Ltd, Chair of the National Centre of Universities & Business and Board member of Oxford Saïd Business School. | |
 | Dean Dalla Valle Independent Non-Executive Director |
MBA. Age 64. Appointed June 2023. | |
Skills and experience: Dean brings over four decades of operational and project management experience in the resources and infrastructure sectors. He draws on 40 years’ experience at BHP where he was Chief Commercial Officer, President of Coal and Uranium, President and Chief Operating Officer Olympic Dam, President Cannington, Vice President Ports Iron Ore and General Manager Illawarra Coal. He has had direct operating responsibility in 11 countries, working across major mining commodities, and brings a wealth of experience in engaging with a broad range of stakeholders globally, including governments, investors and communities. Dean was Chief Executive Officer of Pacific National from 2017 to 2021. Current external appointments: Chair of Hysata. | |
 | Susan Lloyd- Hurwitz Independent Non-Executive Director |
BA (Hons), MBA (Dist). Age 56. Appointed June 2023. | |
Skills and experience: Susan brings significant experience in the built environment sector with a global career spanning over 30 years. Most recently Susan was Chief Executive Officer and Managing Director of Mirvac Group for over a decade. Prior to this, she was Managing Director at LaSalle Investment Management, and held senior executive positions at MGPA, Macquarie Group and Lendlease Corporation. Susan is known for her transformational leadership on cultural change, gender equity, diversity and inclusion, and sustainability, while at the same time delivering financial results. Current external appointments: President of Chief Executive Women, Chair of the Australian National Housing Supply & Affordability Council, Non- Executive Director of Macquarie Group, Member of the Sydney Opera House Trust, Global Board member at leading international business school, INSEAD and Non-Executive Director of Spacecube. | |
92 | Annual Report on Form 20-F 2023 | riotinto.com |
Board and Secretary changes Megan Clark stepped down from the Board on 15 December 2023. Steve Allen stepped down as Group Company Secretary on 29 August 2023. Sharon Thorne will join the Board on 1 July 2024. | Past external appointments over the last three years For details of each Director’s previous directorships of other listed companies see the Directors’ report on page 147. | Board committee membership key | |||||||
 | Committee Chair | l | Nominations Committee | ||||||
l | Audit & Risk Committee | l | Sustainability Committee | ||||||
l | People & Remuneration Committee | ||||||||
 | Simon McKeon AO Independent Non-Executive Director |
BCom, LLB, FAICD. Age 68. Appointed January 2019; Senior Independent Director, Rio Tinto Limited from September 2020. Designated Non-Executive Director for workforce engagement from January 2021. | |
Skills and experience: Simon brings insights into sectors, including financial services, for purpose, law and government. He practised as a solicitor before working at Macquarie Group for 30 years, including as Executive Chair of its business in Victoria, Australia. Simon served as Chair of AMP Limited, MYOB Limited, and the Commonwealth Scientific and Industrial Research Organisation (CSIRO) and was the first President of the Australian Takeovers Panel. Current external appointments: Chancellor of Monash University, Chair of the Australian Industry Energy Transitions Initiative Steering Group, and Non-Executive Director of National Australia Bank Limited. | |
 | Ngaire Woods CBE Independent Non-Executive Director |
BA/LLB, DPhil. Age 61. Appointed September 2020. | |
Skills and experience: Ngaire is the founding Dean of the Blavatnik School of Government, Professor of Global Economic Governance and the Founder of the Global Economic Governance Programme at Oxford University. As a recognised expert in public policy, international development and governance, she has served as an adviser to the African Development Bank, the Asian Infrastructure Investment Bank, the Center for Global Development, the International Monetary Fund, and the European Union. Current external appointments: Vice-Chair of the Governing Council of the Alfred Landecker Foundation and Board member of the Mo Ibrahim Foundation, the Van Leer Foundation, and the Schwarzman Education Foundation. Member of the Conseil d’administration of L’Institut national du service public. | |
 | Martina Merz Independent Non-Executive Director |
B.Eng. Age 61. Appointed February 2024. | |
Skills and experience: Martina brings over 38 years of extensive leadership and operational experience, most recently as CEO of industrial engineering and steel production conglomerate ThyssenKrupp AG. She has held numerous leadership roles, including at Robert Bosch GmbH and at Chassis Brakes International. Martina also has extensive listed company experience and is known for her expertise in the areas of strategy, risk management, legal/compliance and human resources. Current external appointments: Member of the supervisory board at AB Volvo and Siemens Aktiengesellschaft and Member of the Shareholder Council of the Foundation Carl-Zeiss-Stiftung as the owner of Zeiss AG and Schott AG. | |
 | Ben Wyatt Independent Non-Executive Director |
LLB, MSc. Age 49. Appointed September 2021. | |
Skills and experience: Ben had a prolific career in the Western Australian Parliament before retiring in March 2021. He held a number of ministerial positions and became the first Indigenous treasurer of an Australian parliament. His extensive knowledge of public policy, finance, international trade and Indigenous affairs brings valuable insight and adds to the depth of knowledge on the Board. Ben was previously an officer in the Australian Army Reserves, and went on to have a career in the legal profession as a barrister and solicitor. Current external appointments: Non-Executive Director of Woodside Energy Ltd, APM Human Services International Limited, Telethon Kids Institute and West Coast Eagles. Member of the Advisory Committee of Australian Capital Equity. | |
 | Jennifer Nason Independent Non-Executive Director |
BA, BCom (Hons). Age 63. Appointed March 2020. | |
Skills and experience: Jennifer has over 37 years of experience in corporate finance and capital markets. She is the Global Chair of Investment Banking at JP Morgan, based in the US, where she sits on the Investment Bank’s Executive Committee. For the past 20 years, she has led the Technology, Media and Telecommunications global client practice. During her time at JP Morgan, she has also worked in the metals and mining sector team in both the US and Australia. Jennifer co-founded and chaired the company’s Investment Banking Women’s Network. Current external appointments: Co-Chair of the American Australian Business Council. | |
 | Andy Hodges Group Company Secretary |
Associate of the Chartered Governance Institute UK and Ireland; MBA. Age: 56. Appointed August 2023. | |
Skills and experience: Andy joined Rio Tinto in 2018 and became Group Company Secretary in 2023. Andy brings with him nearly 20 years of experience in senior company secretarial roles, including as Head of Secretariat at Centrica, Deputy Company Secretary at Anglo American and Assistant Company Secretary at Aviva. Current external appointments: None. | |
 | Joc O’Rourke Independent Non- Executive Director | |
BSc, EMBA. Age 63. Appointed October 2023. | ||
Skills and experience: Joc has over 35 years of experience across the mining and minerals industry. He was the Chief Executive Officer of The Mosaic Company, the world’s leading integrated producer and marketer of concentrated phosphate and potash, from 2015 to December 2023. He also served as President of Mosaic until recently and previously held roles there including Executive Vice President of Operations and Chief Operating Officer. Prior to this, he was President of Australia Pacific at Barrick Gold Corporation, leading gold and copper mines in Australia and Papua New Guinea. Joc is known for his deep knowledge of the mining industry, and passion for improving safety and operational performance. Current external appointments: Non-Executive Director at the Toro Company and The Weyerhaeuser Company. | ||
 | Tim Paine Company Secretary, Rio Tinto Limited | |
BEc, LLB, FGIA, FCIS. Age 60. Appointed January 2013. | ||
Skills and experience: Tim joined Rio Tinto in 2012 and became Joint Company Secretary of Rio Tinto Limited in January 2013. He has over 30 years of experience in corporate counsel and company secretary roles, including as General Counsel and Company Secretary at Mayne Group, Symbion Health and Skilled Group. Tim also spent 12 years at ANZ Bank, including as Acting General Counsel and Company Secretary. Current external appointments: Joint Company Secretary for Australia-Japan Innovation Fund and member of the Governance Institute of Australia’s Legislation Review Committee. | ||
Annual Report on Form 20-F 2023 | riotinto.com | 93 |
Executive Committee Day-to-day management of the business is delegated by the Board to the Chief Executive and, through him, to other members of the Executive Committee and to certain management committees. |
 | Jakob Stausholm Chief Executive Biography can be found on page 92. |
 | Peter Cunningham Chief Financial Officer Biography can be found on page 92. |
 | Mark Davies Chief Technical Officer |
Mark was appointed to the Executive Committee in 2020 and became Chief Technical Officer in October 2021. Mark joined Rio Tinto in 1995 as a Senior Mechanical Engineer and has worked in operational and functional leadership roles, including in our Iron and Titanium business unit, Group Risk, and Global Procurement. Mark is responsible for our development teams, including Exploration, Studies and Major Capital Construction, Energy, Climate and Closure teams working to rehabilitate and repurpose mines and facilities at the end of the development cycle. Mark’s remit also includes our technical centres of excellence as well as the Office of the Chief Scientist, which drives our global research and development activities. Mark is our representative on the Champions of Change Coalition, a group of business and community leaders working to achieve a significant and sustainable increase in the representation of women in leadership. | |
 | Bold Baatar Chief Executive, Copper |
Bold was appointed Chief Executive, Copper in February 2021. Prior to this, he led the Energy & Minerals product group, a position he had held since 2016. Since joining Rio Tinto in 2013, he has held a number of leadership positions across operations, marine, iron ore sales and marketing, and Copper. Bold brings deep experience across geographies, commodities and markets. A passionate advocate for integrating ESG into decision making across the business landscape, he combines strong commercial and business development expertise with a focus on developing markets and partnerships with our host communities and nations. | |
 | Isabelle Deschamps Chief Legal Officer, Governance & Corporate Affairs |
Isabelle joined Rio Tinto in November 2021. She has extensive international experience, most recently as General Counsel of the AkzoNobel Group and a member of its Executive Committee, with responsibility across Legal, Strategy and M&A activities. Prior to this, Isabelle worked at Unilever in the UK and the Netherlands, holding various legal and compliance leadership roles. Alongside leading our global Legal, Communication, and External Affairs teams, Isabelle oversees a range of governance functions, including Company Secretariat, Ethics & Compliance, and the Technical Evaluation group. She champions Everyday Respect and drives our integrated social licence agenda. Isabelle is a pragmatic, transparent leader with a passion for equal opportunities, inclusion and diversity, continuous learning, and driving a culture of integrity. | |
 | Alf Barrios Chief Commercial Officer |
Alf was appointed Chief Commercial Officer, Chair for China and Chairman for Japan in 2021. He joined Rio Tinto in 2014 as Chief Executive, Aluminium. Alf has over 30 years of global experience in the resources sector across operations, marketing, trading and business development. The Commercial team is accountable for our sales and marketing, procurement, marine and logistics activities, and creates value and growth across Rio Tinto by working closely with our assets, customers and suppliers. Alf is focused on building industry-leading customer and supplier partnerships to deliver innovation and ESG leadership and create future value for the company. | |
 | Sinead Kaufman Chief Executive, Minerals |
Sinead became Chief Executive, Minerals in March 2021. Since Sinead joined Rio Tinto in 1997 as a geologist, she has held senior leadership and operational roles across Aluminium, Copper & Diamonds, Energy & Minerals, and Iron Ore. She joined the Executive Committee in early 2021. Sinead brings strong operational expertise combined with a track record of delivering future- focused sustainability outcomes. Sinead has led the Minerals business to play a central role in driving growth, for example, through the acquisition of the Rincon Lithium Project in Argentina, which supports our battery materials strategy. She is also playing a leading role in many sustainability initiatives to help us reach our decarbonisation ambition. | |
94 | Annual Report on Form 20-F 2023 | riotinto.com |

 | James Martin Chief People Officer |
James joined our Executive Committee as Chief People Officer in April 2021. Prior to this, James was at Egon Zehnder for 21 years. He led a range of global practices and specialised in coaching, talent management and leadership development. Prior to this, he worked in equity research after a career as an air force pilot. James has been supporting our culture evolution, from building a new leadership program, to paving the way to a more inclusive work environment and helping create our new values. His vision is to help unlock more of our potential and to inspire even more of our colleagues to feel the pride in Rio Tinto that many already do. | |
 | Jérôme Pécresse Chief Executive, Aluminium |
Jérôme was appointed Chief Executive, Aluminium in October 2023. Prior to joining Rio Tinto, Jérôme was President & CEO of General Electric (GE) Renewable Energy, where he helped define and implement GE’s strategy to support the decarbonisation of the energy sector. He brings a wealth of global experience, primarily in energy, mining, business development and strategy from his previous roles at GE, Alstom and Imerys. Jérôme is committed to the energy transition and is focused on decarbonising our operations while growing our business to support new material needs for the future. Building a strong work culture around diversity and entrepreneurship, and forging partnerships with First Nations and Indigenous Peoples, communities and governments is fundamental to his approach. | |
 | Kellie Parker Chief Executive, Australia |
Kellie was appointed Chief Executive, Australia in 2021, after a 20-year career at Rio Tinto. Before this, Kellie was Managing Director, Pacific Operations, Aluminium, a role she took after more than a decade of leadership, safety and operational roles across the Iron Ore and Aluminium businesses. Kellie represents our Australian interests with all stakeholders, and brings her operational experience and community values to listen, respond and set the direction for the business. Kellie also has responsibility for Health, Safety, Environment & Security (HSES) and Communities and Social Performance (CSP). She has a people-centric approach, with a strong commercial background, and she is an advocate for Indigenous Australians. | |
 | Simon Trott Chief Executive, Iron Ore |
As Chief Executive – Iron Ore, Simon leads the world’s largest and most innovative integrated bulk commodity producer, achieving exceptional financial performance by finding better ways to provide the materials the world needs. Drawing on 25 years’ mining industry experience across operating, commercial and business development roles, Simon is driving the Iron Ore business to develop a values-based performance culture and reach its vision to become the most valued resource business. He is focused on building the Iron Ore business we need for the future, by transforming its safe operating performance, leading the field in mine development, building valued partnerships, respecting, trusting and supporting self- determined outcomes for Traditional Owners, as well as positioning for a green future and decarbonising the Pilbara. | |
Former Executive Committee members Ivan Vella resigned from Rio Tinto in 2023 and ceased to be a member of the Executive Committee on 13 June 2023. He continued as Chief Executive, Aluminium until 23 October 2023, when Jérôme Pécresse succeeded him. Arnaud Soirat stepped down as Chief Operating Officer on 31 January 2024, ahead of his retirement from Rio Tinto. | |
Annual Report on Form 20-F 2023 | riotinto.com | 95 |
Our stakeholders This section, together with the information on pages 12-13, constitutes our Section 172(1) statement. The Board is required by the UK Companies Act 2006 to promote the success of the company for the benefit of our shareholders, and in doing so, take into account the interests of our wider stakeholders. Our key stakeholders are our workforce, the communities in which we operate, civil society organisations, governments, our investors, our customers, and our suppliers. | |||||
How we engage | |||||
Workforce Engaged people are key to our success. | –Intranet, emails and newsletter updates on subjects such as safety and mental health shares, financial results and Group news. –Twice-yearly people surveys. –myVoice, our confidential reporting program. –Sessions with members of the Board and employees. –In-person and virtual town halls with the Board and Executive Committee members. | –The Board engaged with our workforce while visiting several sites and offices throughout the year, including in Mongolia, London, France, Perth and China. For more information about some of these visits, see page 101. –In May 2023, members of the Board met with three employee groups at our Perth office. Two groups included emerging talent, while the third was employees from our Development & Technology team. These sessions allowed Board members and our teams to exchange insights and reflections about the business. | |||
Communities The communities where we live and work are fundamental to our business – without their support, we cannot operate. | We continue to strengthen our social performance structure, governance approach and processes. We have increased engagement between Indigenous Peoples and our senior operational leaders and teams. Our engagement activities include: –Community liaison teams. –Various meeting formats to reflect local expectations. –myVoice, our confidential whistleblower program, which provides a way for anyone, internal or external, to raise concerns about the Group. | –Executive members regularly meet with Indigenous communities as part of site visits. –Since 2021, we have asked Traditional Owner groups in the Pilbara to share yearly feedback on our progress on some of the commitments we made as part of the Rio Tinto Board Review in 2020 on cultural heritage management. In 2023, six out of ten Pilbara Traditional Owner entities chose to respond. The feedback is presented at riotinto.com/juukangorge. | |||
Civil society organisations Civil society organisations (CSOs) play an important role in society. They hold us to account and help us understand societal expectations across ESG issues, identify risks and opportunities to collaborate. | –We engage regularly with a wide range of CSOs to understand and respond to areas of interest and concern, communicate progress, share challenges and advance common goals. In 2023, we expanded our outreach to CSOs in Argentina, Serbia, Guinea, the US and Canada. –We engage locally, nationally and globally on specific issues related to an operation. –We attend industry forums where CSOs are present to understand the latest trends and expectations on ESG issues. | –Since 2018, we have held annual roundtables with CSO leaders and members of the Board and Executive Committee. The roundtables provide a dedicated forum for our most senior leaders to engage directly with CSOs and discuss strategic issues. –We continue to have issue-specific conversations with CSOs to explore issues in depth and gain detailed insights to inform our approach to each topic. In 2023, these included two sessions on decarbonisation progress, three sessions about the Jadar project, and two sessions about the Resolution Copper project. | |||
96 | Annual Report on Form 20-F 2023 | riotinto.com |

What was important in 2023 | How the Board has taken account of these interests | |
–Company culture and the Everyday Respect report –Training and career opportunities –Compensation and inflation –Health, safety and wellbeing –Business growth and operational performance –Societal issues | –Simon McKeon, our designated Non-Executive Director for workforce engagement, oversees our program of workforce engagement events. –An engaged and diverse workforce is imperative to the success of the business. The Board reviews the implementation activities and progress of the 26 recommendations of the Everyday Respect report quarterly. For more information about the Everyday Respect initiative and how the Board monitors our culture, see pages 100 and 101. –The health, safety and wellbeing of our people is a key priority for the Board. The Board considers this in all decisions to ensure we continually evolve our assets’ safety maturity and aim to create a physically and psychologically safe workplace. –The Board considers our workforce when making decisions on new ventures, projects and other growth opportunities, and aims to support job opportunities and fair work. For more information about how the Board engages with employees to understand their interests and concerns, see page 101. | |
–Job creation and procurement opportunities –Land access –Socioeconomic development projects –Environmental management, tailings storage facilities, operational impacts and potential site closures –Security | –The Board oversees and receives regular updates on many projects and the impact they have or will have on communities. Supporting economic opportunities for our host communities and regions is a key priority for us and, in addition to our social investment programs, we strive to employ local people and engage local services. –We have developed the Western Australian Indigenous Participation Strategy, designed to support a more collaborative approach to attracting and developing Indigenous employees. –We have undertaken independent cultural management audits to help us improve our cultural heritage management and performance, and our engagement with Indigenous communities. –The Australian Advisory Group guides us on current and emerging issues, which helps us better manage policies and positions important to Australian communities and our broader business. For more information about our work with communities, see page 66-70. | |
–Decarbonisation, offsets and Scope 3 –Water management, biodiversity protection and nature-based solutions –Cultural heritage protection, Indigenous economic advancement, community consultation, consent and free, prior and informed consent (FPIC) –EU due diligence regulation –Transparency and anti-corruption –Advocacy on policy | –The Board and its sub-committees consider issues raised by CSOs throughout the year, particularly through the Sustainability Committee. The Board is represented at the CSO roundtables through the Chair and other Directors. –The Board considers ESG issues and our social licence to operate when making decisions on new ventures, projects and other growth opportunities. –The Chair and executives engaged extensively with investors on the topic of environment and water. In 2023, we published our transparent water data platform which was well received by CSOs and other stakeholders. |
Annual Report on Form 20-F 2023 | riotinto.com | 97 |
How we engage | |||||
Governments Governments – national, state and provincial, and local – are important stakeholders for our business. They provide the legal and policy framework that supports our businesses, and ensures that our communities and people are protected. | –We provide updates on issues relevant to our industry, either directly or as part of industry associations. –We participate in multi-stakeholder organisations, initiatives and roundtables, such as the Extractive Industry Transparency Initiative (EITI), and the ICMM. –We have innovative partnerships with governments, such as ELYSIS with the Governments of Canada and Quebec. We also partner with governments on projects, such as with the Government of Guinea on the Simandou iron ore deposit. –Government representatives regularly visit our sites. | –In Australia, we engage with governments on issues such as project approvals and cultural heritage protection. –In the US, we advocate on public policy related to the North American supply chain and alignment on climate change, critical minerals and materials, renewable energy, and trade. –In China, we partner and engage with a range of government and state-owned entities on issues related to climate change, innovation, training, procurement, and product supply. –We contribute to UK and EU public policy development. | |||
Investors Our strategy and long-term success depend on the support of our investors. | –Regular calls, one-on-one meetings and group events, roadshows, presentations and attendance at investor conferences. –Webinars and online Q&A sessions. –Our corporate reporting suite and regular updates on our website and social media. –We held two annual general meetings (AGMs), one in Australia and one in the UK, where institutional and retail investors could engage directly with the Board and management, giving them the opportunity to ask questions and vote on our Remuneration Report. | –In 2023, our Chair, Dominic Barton, met with investors from the UK, the US and Australia to convey how our strategy integrates the net zero transition into our business, including our portfolio, capital investment decisions, and business planning. | |||
Customers The needs of our customers are central to our operational decision-making. | –Our Commercial team engages with customers through direct engagements and via business and industry forums. –We periodically seek feedback from our customers through a customer survey, supplementary to the regular feedback we receive as part of ongoing customer interactions. The next customer survey will be conducted in 2024. Results from these surveys will be shared with the Board. | –Decarbonisation is one of our customers’ biggest challenges. We partner to find innovative solutions to help produce sustainable products that support their net zero ambitions. For example, in 2023 we signed a memorandum of understanding with the BMW Group to deliver low-carbon aluminium, while also enabling a more sustainable and traceable supply chain for aluminium products through our START blockchain technology. –In December 2023, the Board visited China and met with Chinalco, China Baowu and BYD. Board members visited their operations, demonstrating our commitment to continuing to strengthen our partnerships with China. | |||
Suppliers Our suppliers are critical to our ability to run efficient and safe global operations. | –Our Commercial team manages contracts and engages with our suppliers in a range of ways, including regular meetings and site visits, supplier events, local and host community procurement forums, annual awards, and supplier capability development initiatives. –We partner with suppliers to co-develop technologies and applications, such as renewable diesel with Neste and Rolls- Royce. | –We periodically seek feedback from our suppliers through a supplier survey to improve our engagement and to strengthen our partnerships. The next supplier survey will be conducted in 2024. Results from these surveys are shared with the Board. |
98 | Annual Report on Form 20-F 2023 | riotinto.com |
What was important in 2023 | How the Board has taken account of these interests | |
–Tax and royalty payments –Compliance with laws and regulations –Local employment, procurement, health and safety –ESG issues, decarbonisation opportunities and socioeconomic development projects –Operational environmental management –Transparency and human rights –Industrial policy –New technology –Security | –We engage with government officials to understand their expectations, concerns, and policies. This helps us align our activities with government interests. The Board receives regular updates regarding all our projects and, in doing so, oversees our engagement with governments. –Board meetings were held in Australia, Mongolia, US and China in 2023, with significant engagement with government stakeholders. –The Board oversees our financial management to ensure we comply with tax obligations and fair contribution to our host country's revenue. We comply with regulations and contribute positively to the economic and social development of the regions where we operate. | |
–Financial and operational performance. –Our ESG performance, including the impact of climate change and how we are decarbonising our business. –Compliance with laws and regulations. –Human rights. –Remuneration policy. | –With regard to capital allocation and shareholder returns, the Board is committed to maintaining an appropriate balance between cash returns to shareholders and investment in the business, with the intention of maximising long-term shareholder value. –Given investor interest in ESG issues, including climate change and our work with communities around the world, the Board considers these issues during its yearly strategy sessions when assessing our portfolio positions. –The Board’s engagement in CSO roundtables and some investor events provides a sounding board as we implement our strategy, respond to requisitioned resolutions and develop our reporting. –The People & Remuneration Committee Chair consulted extensively with shareholders and proxy advisers in 2023 to update them on proposals for the Remuneration Policy which is due for renewal at the 2024 AGMs, taking their feedback into consideration. | |
–Supply security. –Responsible sourcing and supply. –Transparency in the supply chain. –Human rights. –Compliance with laws and regulations. –Competitive pricing. –Product quality. –Strategic partnerships. –Evidence of ESG traceability. –Participation in responsible mining certification systems. | –The Chief Commercial Officer updates the Board annually on the key priorities and vision for Commercial, its role in supporting the Group strategy, and our customer engagement initiatives. –The Board approved a $700 million1 investment to acquire a 50% equity stake in Giampaolo Group’s wholly-owned Matalco business. For more information on the Board’s decision-making on the investment in Matalco, see page 100. | |
–Responsible sourcing and supply. –Transparency in the supply chain. –Human rights. –Compliance with laws and regulations. –Competitive pricing. –Performance. –Payment terms. –Strategic partnerships. | –The Chief Commercial Officer provides an annual update to the Board on the Group’s activities with suppliers, including metrics regarding how the Group has supported initiatives aimed at Indigenous groups. –With support from the Board, we facilitated a distribution deal between Wuxi Boton, one of our largest suppliers in China, and the entrepreneurial subsidiary of the Innu communities of Uashat mak Mani-utenam for the resale and after- sales service of industrial conveyors in Quebec, Canada. |
Annual Report on Form 20-F 2023 | riotinto.com | 99 |
How the Board has considered stakeholders in their decision-making |
Our Board believes that we can only achieve long-term sustainable success if we consider relevant stakeholders in our decision-making and ensure that decisions align with our purpose and values. Below are three examples of how our Board has considered stakeholders in 2023. |
| For more information about how we manage water, see page 59. |
| For more information about our progress to implement the recommendations from the Everyday Respect Report see riotinto.com/everydayrespect. |
l | Best operator | l | Impeccable ESG | l | Excel in development | l | Social licence |
100 | Annual Report on Form 20-F 2023 | riotinto.com |
| For more information about Everyday Respect see riotinto.com/ everydayrespect. |
 | Western Australia town hall: celebrating 150 years Dominic Barton, Jakob Stausholm, Peter Cunningham and Kellie Parker, Chief Executive, Australia, had the opportunity to celebrate Rio Tinto’s 150 years during a Perth town hall, hosted by Simon Trott, Chief Executive, Iron Ore. More than 2,100 of our people attended the town hall, joining in-person and online. They had the opportunity to ask questions and hear the Board and Executive Committee members’ reflections, who, in turn, gained insight into what is top of mind for our people. | |
Annual Report on Form 20-F 2023 | riotinto.com | 101 |
102 | Annual Report on Form 20-F 2023 | riotinto.com |
Board of Directors We are finding better ways to provide the materials the world needs. By doing so efficiently, effectively and sustainably, we aim to create long-term value for all stakeholders. Our purpose is supported by three core values – care, courage and curiosity. The Board is collectively responsible for pursuing this purpose and approves the strategy, budget and plans proposed by the Chief Executive to achieve this objective. | ||||
Board Charter See the Board Charter for more information on the role of the Board and the delegation to management. | ||||
| For more information see riotinto.com/corporategovernance. | |||

Audit & Risk Committee Helps the Board to monitor decisions and processes designed to ensure the integrity of financial reporting, the independence and effectiveness of the external auditors, and robust systems of internal control and risk management. | Nominations Committee Helps the Board determine its composition, and that of its committees. They are regularly reviewed and refreshed, so they are able to operate effectively and have the right mixture of skills, experience and background. | People & Remuneration Committee Helps the Board ensure the Remuneration Policy and practices reward employees and executives fairly and responsibly, with a clear link to corporate and individual performance, and a focus on people and culture. | Sustainability Committee Helps the Board oversee the Group’s integrated approach to sustainability and strategies designed to manage health and safety, and social and environmental risks, including management processes and standards. | Chair’s Committee Supports the functioning of the Board and will consider urgent matters between Board meetings. | Chief Executive Has delegated responsibility for the executive management of Rio Tinto, consistent with the Group’s purpose and strategy, and subject to matters reserved for the Board, as set out in the Schedule of Matters Reserved for the Board (available at riotinto.com), and in accordance with the Group’s delegation of authority framework. | ||||||||||||
See page 107 | See page 105 | See page 113 | See page 111 | ||||||||||||||
Annual Report on Form 20-F 2023 | riotinto.com | 103 |
Committee Appointments | Board | Audit & Risk | Nominations | People & Remuneration | Sustainability | |
Chair and Executive Directors | ||||||
Dominic Barton2 |    | 7/7 | 3/3 | 4/5 | 4/4 | |
Jakob Stausholm | 7/7 | |||||
Peter Cunningham | 7/7 | |||||
Non-Executive Directors | ||||||
Megan Clark - retired 15 December 20233 |  | 7/7 | 3/3 | 5/5 | 4/4 | |
Dean Dalla Valle - joined 1 June 20234 |  | 4/4 | 2/2 | 1/1 | 2/2 | |
Simon Henry5 |  | 7/7 | 6/6 | 2/3 | ||
Kaisa Hietala - joined 1 March 2023 | | 6/6 | 2/2 | 3/3 | ||
Sam Laidlaw6 |  | 7/7 | 3/3 | 5/5 | 4/4 | |
Susan Lloyd-Hurwitz - joined 1 June 2023 | | 4/4 | 2/2 | 3/3 | ||
Simon McKeon |  | 7/7 | 6/6 | 3/3 | 5/5 | |
Jennifer Nason | | 7/7 | 3/3 | 5/5 | ||
Joc O’Rourke - joined 25 October 2023 | | 2/2 | ||||
Ngaire Woods | | 7/7 | 3/3 | 5/5 | 4/4 | |
Ben Wyatt | | 7/7 | 6/6 | 3/3 |
 | Committee Chair | | Audit & Risk Committee |
| Nominations Committee | | People & Remuneration Committee |
| Sustainability Committee |
104 | Annual Report on Form 20-F 2023 | riotinto.com |

Mining, operations and projects | |
38% women | 13% ethnic background |
Renewables and the energy transition | |
60% women | 9% ethnic background |
Finance/accounting | |
74% women | 10% ethnic background |
| For more information about our new Non-Executive Directors, see the Board biographies on pages 92-93. |
Dominic Barton (Chair) | Simon McKeon |
Megan Clark1 | Martina Merz4 |
Dean Dalla Valle2 | Jennifer Nason |
Simon Henry | Joc O’Rourke5 |
Kaisa Hietala3 | Ngaire Woods |
Sam Laidlaw | Ben Wyatt |
Susan Lloyd-Hurwitz2 |
Annual Report on Form 20-F 2023 | riotinto.com | 105 |

Appointments to the Board – our policy We base our appointments to the Board on merit, and on objective selection criteria, with the aim of bringing a range of skills, knowledge and experience to Rio Tinto. This involves a formal and rigorous process to source strong candidates from diverse backgrounds and conducting appropriate background and reference checks on the shortlisted candidates. We aim to appoint people who will help us address the operational and strategic challenges and opportunities facing the company and ensure that our Board is diverse in terms of experience, gender, nationality, social background and cognitive style. As such, we engage only recruitment agencies that are signed up to the Voluntary Code of Conduct on diversity best practice. We believe that an effective Board combines a range of perspectives with strong oversight, combining the experience of Directors who have developed a deep understanding of our business over several years with the fresh insights of newer appointees. We aim for the Board’s composition to reflect the global nature of our business - we currently have eight different nationalities (including dual nationalities) on a Board of 14. The Committee engaged Spencer Stuart to support the search for our new Non- Executive Directors. The Committee is satisfied that Spencer Stuart does not have any connections with the company or individual Directors that may impair their independence. When recruiting government or former government officials to join the Rio Tinto Board, we comply with any restrictions and obligations existing pursuant to relevant laws and regulations, including with respect to confidentiality, lobbying and conflicts of interest. The key skills and experience of our Board are set out on this page of the report. Our key responsibilities The purpose of the Nominations Committee is to review the composition of the Board. The Committee leads the process for appointments, making recommendations to the Board as part of succession planning for Non-Executive Directors. It also approves proposals for appointments to the Executive Committee. | Membership of the Committee All Non-Executive Directors are currently members of the Nominations Committee. The Chief Executive and the Chief People Officer are invited to attend all or part of meetings, as appropriate. The Committee is chaired by the Chair of the Board, unless the matter under consideration relates to the role of the Chair. The Committee had three formal meetings in 2023 and received regular and detailed updates on the status of the various searches, as required. Attendance at the formal meetings is included in the table on page 104. Diversity The Board recognises that it has a critical role to play in creating an environment in which all contributions are valued, different perspectives are embraced, and biases are acknowledged and overcome. The Board shares ownership with the Executive Committee of the Group’s Inclusion and Diversity Policy, which can be found at riotinto.com/policies. | The proportion of women on the Board is currently 36% (five women and nine men) and will be 43% following the commencement of Sharon Thorne’s appointment in July 2024. The Group has continued to set measurable gender diversity objectives for the composition of senior leadership and graduate intake and achievement of these targets contributes to the variable remuneration of senior executives. Progress on diversity is shown in the Our approach to ESG section on page 43, where we show a breakdown by seniority. The number of Directors who identify themselves as being from an ethnic background is one (Ben Wyatt). For further information on the gender and ethnic diversity of the Board and Executive Committee please see page 153 of the Compliance with governance codes and standards section. | ||||||
| Progress on diversity is shown in the Talent, diversity and inclusion section on pages 73-74. | |||||||
Skills and experience of the Chair and Non-Executive Directors | ||||||||
Skills and Experience | Some experience | Extensive experience | Total | |||||
Chief Executive experience Chief Executive-level experience of a major corporation. | 3 | 5 | 8 | |||||
Chief Financial Officer & audit experience Experience in financial accounting and reporting, corporate finance, internal controls, treasury and associated risk management. | 3 | 2 | 5 | |||||
Mining and broader industrial operations Senior executive experience in a large, global mining or industrial organisation. | 1 | 5 | 6 | |||||
Major projects Experience in developing large-scale, long-cycle capital projects. | 5 | 5 | 10 | |||||
Corporate governance Experience on the Board of a major quoted corporation subject to rigorous corporate governance standards. | 1 | 9 | 10 | |||||
Global experience, including multinational and geopolitical experience Experience working in multiple global locations, exposed to a range of cultural, business, regulatory and political environments and/or in-depth understanding of public policy and government relations. | 1 | 9 | 10 | |||||
Relevant country/regional expertise Knowledge of countries or regions of strategic relevance to the Group. | 7 | 1 | 8 | |||||
Downstream customer markets Understanding of value chain development, including consumers, customers and marketing demand drivers. | 5 | 3 | 8 | |||||
ESG Experience of issues associated with environmental and social responsibility, including communities and social performance, government relations, workplace health and safety and stakeholder engagement. | 6 | 6 | 12 | |||||
Energy transition Knowledge and experience of managing climate-related threats and opportunities including climate science, the low-carbon transition and public policy. | 8 | 1 | 9 | |||||
Industrial technology & innovation Experience of nurturing and harnessing research, development and innovation, including digital technology and cybersecurity. | 5 | 2 | 7 | |||||
Mergers and acquisitions & private equity/investing Experience of mergers, acquisitions, disposals, joint ventures, private equity and investing. | 7 | 1 | 8 | |||||
106 | Annual Report on Form 20-F 2023 | riotinto.com |

Simon Henry (Chair) | |
Simon McKeon | |
Ben Wyatt |
Annual Report on Form 20-F 2023 | riotinto.com | 107 |
Matters considered | Conclusion |
Review of carrying value of cash-generating units and impairment charges/reversals | The Committee assessed management’s determination of cash-generating units, review of impairment triggers, and consideration of potential impairment charges and reversals over the course of the year. In the first half of the year impairment triggers were identified at the Gladstone alumina refineries. The Committee considered the key judgements made by management, in particular the valuation sensitivity to the cost of carbon credits. In the second half of the year an impairment reversal trigger was identified at the Simandou iron ore project in Guinea. The key matters discussed with management were the timing of cost capitalisation and the perimeter of previously impaired assets that continue to be relevant to the project development. |
Application of the policy for items excluded from underlying EBITDA | The Committee reviewed the Group’s policy for exclusion of certain items from underlying earnings and confirmed the consistent application of this policy year on year. The items excluded from underlying earnings comprised charges of US$2.1 billion and income of US$0.4 billion. A reconciliation of net earnings to underlying earnings is presented in the Alternative Performance Measures. |
Estimate for provision for closure, restoration and environmental obligations | The Committee reviewed the significant changes in the estimated provision for closure, restoration and environmental obligations by product group and Rio Tinto Closure. The Committee received updates on the closure studies completed in the period and the significant reforecast of costs in relation to the Ranger mine by Energy Resources of Australia. The Committee reviewed economic assumptions assessed by management, including inflation during the period and supported changes to the discount rate. |
Climate change | The Committee received an overview of the work that management is undertaking in relation to climate change and the potential financial reporting implications thereof. The Committee reviewed the climate change summary in the Financial Statements and the impacts of climate change throughout the notes, with particular emphasis on the impact to impairment charges and the related disclosure of sensitivities. |
108 | Annual Report on Form 20-F 2023 | riotinto.com |
Annual Report on Form 20-F 2023 | riotinto.com | 109 |
2023 $m | 2022 $m | |
Audit fees | 26.6 | 25.7 |
Non-audit service fees: | ||
Assurance services | 4.1 | 3.3 |
All other fees | 0.1 | 0.3 |
Total non-audit service fees | 4.2 | 3.6 |
Non-audit: audit fees (in-year) | 16% | 14% |
110 | Annual Report on Form 20-F 2023 | riotinto.com |

Annual Report on Form 20-F 2023 | riotinto.com | 111 |

Dean Dalla Valle (Chair)1 | Sam Laidlaw |
Megan Clark2 | Ngaire Woods |
Dominic Barton | Joc O’Rourke4 |
Kaisa Hietala3 |
n | Health and safety |
n | Environment, including tailings management, water, and biodiversity |
n | Assurance, risk management, global sustainability trends |
n | Communities and social performance (including cultural heritage and human rights) |
n | Governance and disclosure |
n | Other (including closure and remediation, and security) |
| Our approach to ESG is described in detail on pages 40-77. |
| For more information and to access our 2023 Sustainability Fact Book see riotinto.com/sustainability. |
| Our 2023 Climate Change Report can be found at riotinto.com/climatereport. |
| Our 2022 Communities and Social Performance Commitments Disclosure can be found at riotinto.com/cspreport. |
| Our 2022 Modern Slavery Statement can be found at riotinto.com/modernslavery. |
112 | Annual Report on Form 20-F 2023 | riotinto.com |
Annual Report on Form 20-F 2023 | riotinto.com | 113 |

114 | Annual Report on Form 20-F 2023 | riotinto.com |
Element | 2021 Policy summary | Proposed changes for 2024 and implementation | |||
Base salary | –Base salaries are set to reflect broad alignment with comparable roles in the global external market and the executive’s qualifications, responsibilities and experience. –Base salaries are reviewed annually by the Committee, and any increase is normally aligned with the wider workforce, with a maximum individual annual increase of 5% plus Consumer Price Index (CPI). –An individual increase may be higher in specific circumstances, such as promotion, increased responsibilities or market competitiveness. | –Remove the cap on individual salary increases to better align with market practice where the use of salary caps is uncommon and to ensure the Policy provides sufficient flexibility where appropriate. –It is intended that salary increases remain in line with the wider workforce, and for any additional increases to continue to be in specific circumstances. –For 2024, salaries for the Executive Directors will be increased by 4% which aligns with the increase for UK employees. Salaries as at 1 March 2024 will be: –Chief Executive - £1,285k –Chief Financial Officer - £761k | |||
Pension or superannuation | –Rio Tinto may choose to offer participation in a pension plan, superannuation fund, or a cash allowance in lieu. –The maximum annual benefit is set to reflect the pension arrangements for the wider employee population and is currently capped at 14% of base salary. | –No change. | |||
Other benefits | –Executives are eligible to receive benefits which may include private healthcare cover, life and accident insurances, professional advice, and other minor benefits. –Secondment, relocation and localisation benefits may also be made to and on behalf of executives living outside their home country. | –No change. | |||
STIP | –Measures and weightings for the scorecard are selected by the Committee for each financial year. At least 50% of the measures will relate to financial performance, and a significant component will relate to safety. Other strategic, environmental, social and governance (ESG) and individual business outcomes may be included. –For financial performance, threshold performance results in a nil award (25% of award pays out for threshold performance for non-financial measures) and outstanding performance results in maximum payout. The payout for specific metrics may be varied to reflect the stretch of the underlying target. –Maximum opportunity is capped at 200% of base salary for each executive. –Normally, 50% of the STIP is delivered in cash and the balance is delivered in shares that are deferred for three years as a Bonus Deferral Award (BDA). –Dividends (or equivalents) may accrue in respect of any BDA that vest. –The Committee retains the right to exercise discretion to ensure that the level of award payable is appropriate. –Malus, clawback and suspension provisions apply to the STIP and BDA. | –Replace the earnings-based measure with EBITDA, half of which is adjusted for commodity prices in the same way as the current earnings measure. | |||
LTIP | –Performance is measured against TSR relative to the EMIX Global Mining Index and to the MSCI World Index. –The Committee will set performance conditions aligned with the Group’s long- term strategic objectives for each PSA grant. Relative TSR has been chosen as the predominant measure of long-term performance. The Committee retains the discretion to adjust the performance measures and weightings as appropriate. –Awards have a maximum face value of 400% of base salary. Threshold vesting is 22.5% of face value. Target is 50% of face value. –Dividends (or equivalents) may accrue in respect of any PSA that vest. –The Committee retains the right to exercise discretion and seeks to ensure that outcomes are fair and reflective of the overall performance of the company during the performance period. –Malus, clawback and suspension provisions apply to LTIP awards. | –Opportunity increased from 400% to 500% of base salary with the additional 100% of base salary linked to tangible decarbonisation targets. –Performance period reduced from five to three years, followed by a holding period of two years. –Following the decommissioning of the EMIX Global Mining Index in 2023, our TSR will be measured against the S&P Global Mining Index and the MSCI World Index. –Clawback provisions updated to comply with SEC requirements. | |||
Shareholding requirements | –Over a five-year period, executives should reach a share ownership in Rio Tinto shares equivalent in value to: –Chief Executive: 400% of base salary. –Other executives: 300% of base salary. –Longer periods may be accepted for new appointments. –Executive Directors are required to retain a holding for two years after leaving the Group in line with the shareholding requirements. | –Requirement for all executives increased by 100% of base salary. –Requirement expressed as a fixed number of Rio Tinto shares, calibrated based on the existing requirement after applying the 100% increase of base salary to shareholding requirements. –Fixed number of shares subject to review every two years. |
Annual Report on Form 20-F 2023 | riotinto.com | 115 |
Year 1 2023 | Year 2 2024 | Year 3 2025 | Year 4 2026 | Year 5 2027 | Year 6 2028 | |||||
Base salary | Salary | |||||||||
Benefits | Benefits, pension, etc. | |||||||||
STIP | 2023 performance year | 50% cash | 50% deferred shares (BDA) | |||||||
LTIP (PSA) | Five-year performance period | Vests February 2028 | ||||||||
Performance period starts | March PSA grant | March STIP cash + BDA grant | December BDA vest | December Performance period ends | February PSA vest | |||||
Year 1 2024 | Year 2 2025 | Year 3 2026 | Year 4 2027 | Year 5 2028 | Year 6 2029 | |||||
Base salary | Salary | |||||||||
Benefits | Benefits, pension, etc. | |||||||||
STIP | 2024 performance year | 50% cash | 50% deferred shares (BDA) | |||||||
LTIP (PSA) | Three-year performance period | Two-year holding period | Released February 2029 | |||||||
Performance period starts | March PSA grant | March STIP cash + BDA grant | December Performance period ends | December BDA vest | February PSA released | |||||
Incentive | Reflection in scorecard | |
Strategic priorities | ||
People and culture | STIP | Focuses on “how” we do things as well as “what” we achieve as a critical lever of accelerating our culture change and building an inclusive workplace environment. |
Excel in development | STIP | Measures progress in relation to exploration, studies and project execution. |
Impeccable ESG | STIP / LTIP | Safety in all its aspects remains a key priority alongside progressing the work on our decarbonisation pathways towards achieving our 2030 ambition. The new decarbonisation scorecard in the LTIP is structured around our multi-year and ambitious decarbonisation strategy, with a focus on a combination of offensive and defensive metrics to incentivise long-term competitive advantage. |
Social licence | STIP | Measures our progress in building trust and meaningful relationships with our community of stakeholders. |
Best operator – flexed financials | STIP | Focuses on achievement of financial plan commitments. |
Shareholder experience | ||
Unflexed financials | STIP | Aligned to market conditions for our commodities. |
Total shareholder return | LTIP | Measures performance relative to sector peers and wider market. |
116 | Annual Report on Form 20-F 2023 | riotinto.com |
+ |

How does the new Policy support Rio Tinto’s strategy? | Have the changes made to STIP last year been effective? | |
We have a clear strategy to build a stronger business by focusing on four objectives, which will help improve our productivity, reduce capital intensity and assist us in becoming a partner of choice for a range of stakeholders globally. Although our existing framework remains broadly fit for purpose, the Committee has identified a number of refinements to better align remuneration with these strategic priorities, including an increased focus on decarbonisation. The Committee is also proposing a range of simplifications to ensure our remuneration arrangements are appropriate and allow us to be competitive in the global talent market. | In 2022, we undertook a detailed review of incentives which resulted in the introduction of a much simpler STIP design for the approximately 26,000 employees that participate in the STIP, with clearer alignment to our strategy. The STIP targets help to make our goals relevant to day-to- day actions, and the level of engagement from participants over the past year has been encouraging. For 2024, we are maintaining this design and are taking the opportunity to refine the financial metrics by replacing the current earnings measure with EBITDA. This is a key measure of our underlying financial performance that is less subject to adjustment and well understood by both internal and external stakeholders. | |
How do incentives support Rio Tinto’s low-carbon transition agenda? | Why aren’t you including Scope 3 emissions? | |
Climate change and the low-carbon transition are at the heart of our strategy. The Committee recognises the importance of including ESG metrics in our incentives, alongside a continued focus on operational and financial performance to deliver long-term shareholder returns. Impeccable ESG is a significant part of our STIP scorecard, with an increased focus on achieving our decarbonisation ambitions while maintaining a material focus on continued safety performance. In recognition of the long-term nature of the carbon journey, the Committee believes now is the right time to introduce decarbonisation metrics into the long- term incentives, by linking the additional PSA opportunity to the execution of our value accretive climate change strategy. | Measuring and incentivising Scope 3 emissions is inevitably challenging. These emissions are primarily from our customers in Asia, processing our iron ore into steel, and bauxite into aluminium, so our level of control is limited. The best way to tackle these emissions is to work in partnerships to develop the technologies needed to produce low-carbon metals and minerals. While Scope 3 emissions are not within our direct control and are not specifically measured under the incentive schemes, the breadth of the decarbonisation scorecard for the PSA, particularly the focus on transition strategy and R&D, will ensure focus is given to developing new technologies that may support the longer-term reduction of Scope 3 emissions. | |
What is the rationale for increasing the PSA opportunity? | ||
In recent years we have reduced executive pay. Meanwhile, our UK and Australian competitors have increased pay for executives. Our target pay is no longer competitive and, after years of good retention, we are starting to lose executives and may be at risk of losing more after having significant invested in their development. Given the scale of our strategic ambition, it is vital that we secure, retain and attract the talent required to achieve our goals. Increasing the PSA opportunity moves us closer to our competitors’ pay levels, in a way that is only realised with sustained long-term performance, enabling a focus on our decarbonisation strategy for competitive advantage. Further, we are requiring that the increased opportunity be added to mandatory shareholding requirements, increasing it by 100% of base salary for all executives. | CEO total remuneration at target  | |
Why are you moving to a three-year performance period for the PSA? | How do the Policy proposals align executives with the wider workforce? | |
The use of a three-year performance period aligns our approach with typical market practice in the UK and the US while in Australia this approach is used by around one-third of larger companies. The inclusion of a two-year holding period will mean awards will continue to be released only after five years subject to achievement of the relevant performance conditions. The combined five-year time horizon aligns with UK market practice and is longer than most US and Australian companies. Participants will also continue to be strongly aligned with shareholders via increased share ownership requirements. The PSA is a critical tool for retaining, incentivising and motivating staff at many levels of management. The Committee believe that a three- year time horizon will be more tangible to participants below the Executive Committee and will therefore increase the competitiveness of the package and maximise the effectiveness of the PSA. | The new Policy maintains the strong alignment of the current policy between executive reward and reward in the broader organisation. The approach to base salary is consistent across the organisation. No changes are proposed to benefits, keeping executive pensions in line with the broader employee population. The STIP applies in a consistent manner across a population of 26,000 eligible employees, while the PSA objectives ensure senior leaders are focused on creating sustainable long-term value for our shareholders. | |
Annual Report on Form 20-F 2023 | riotinto.com | 117 |
Chief Executive | |||
Jakob Stausholm | |||
2023 Actual remuneration (percentage of maximum) | |||
100% | 56% | 94.1% | |

2023 Threshold remuneration (percentage of maximum) | |||
100% | 25% | 22.5% | |

2023 Maximum remuneration | |||
100% | 100% | 100% | |

n | Fixed | n | STIP | n | LTIP |
Chief Financial Officer | |||
Peter Cunningham | |||
2023 Actual remuneration (percentage of maximum) | |||
100% | 56% | 94.1% | |

2023 Threshold remuneration (percentage of maximum) | |||
100% | 25% | 22.5% | |

2023 Maximum remuneration | |||
100% | 100% | 100% | |

n | Fixed | n | STIP | n | LTIP |

Group financial scorecard | ||
n | Weighting | 50% |
n | Weighted performance | 22.4% |
Group strategic scorecard | ||
n | Weighting | 50% |
n | Weighted performance | 33.6% |


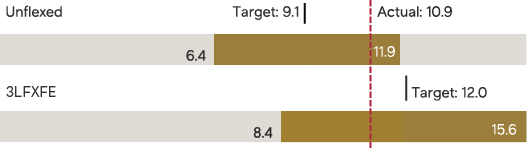
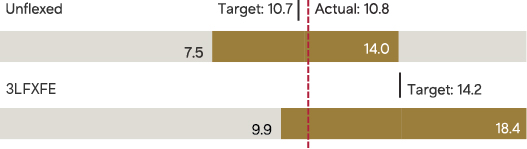

TSR relative to EMIX/S&P Global Mining Index | ||
n | Weighting | 50% |
n | Weighted performance | 44% |
TSR relative to MSCI World Index | ||
n | Weighting | 50% |
n | Weighted performance | 50% |


118 | Annual Report on Form 20-F 2023 | riotinto.com |
Impeccable ESG 20% | 69% |
Excel in development 10% | 75% |
People and culture 10% | 73% |
Social licence 10% | 50% |
Alignment with the UK Corporate Governance Code The UK Corporate Governance Code principles for developing a remuneration policy have been addressed as follows: | |||
Principle | Focus | ||
Clarity | Our Policy is set out in a fully transparent manner. Communications and engagement with stakeholders promotes clarity around all elements of the Policy. | ||
Simplicity | Our Policy retains key features of transparency, alignment with our strategic objectives and simplicity to aid understanding. | ||
Risk | The incentive arrangements have been structured to support effective risk management. This includes a strong focus on long-term success. Risks include non-financial risk, such as safety, the environment and heritage protection. Malus, clawback and suspension provisions apply to all variable remuneration, which allow for adjustment of rewards in the event of risk management failures. | ||
Predictability | The remuneration outcomes under the different performance scenarios (threshold, target, and outstanding) are clearly set out with an estimate of potential maximum outcome if the share price increased by 50%. See charts on page 123. | ||
Proportionality | The Policy maintains a strong link to strategy and performance. This is set out in the Policy table on page 116. The Committee also has discretion over all variable remuneration outcomes. | ||
Alignment to culture | Our incentive plans are aligned with our strategic focus on long-term sustainable growth and a focus on values and behaviours. | ||
Annual Report on Form 20-F 2023 | riotinto.com | 119 |
Remuneration arrangements – Fixed |
Base salary Link to Group performance and strategy –We pay competitive salaries to hire, motivate and retain highly competent executives from a global talent pool. Operation –Base salary is the main fixed element of the remuneration package. –Base salaries are reviewed annually. We determine any increases based on Group and individual performance, global economic conditions, role responsibilities, an assessment against relevant comparator groups and internal relativities. Any increase is generally aligned with the average base salary increases applying to the broader employee population unless there were significant changes to an individual’s role and/or responsibilities during the year. Such changes may include a promotion or increase in responsibility or where the executive’s base salary is significantly below market positioning. –Benchmarking is undertaken periodically but not annually, and our intention is to apply judgement in evaluating market data. |
Pension or superannuation Link to Group performance and strategy –We provide competitive post-employment benefits in a cost-efficient manner in order to hire and retain. Operation –Employment benefits typically include participation in a pension plan, superannuation fund, or a cash allowance to contribute to a personal pension or superannuation fund, which are aligned with the arrangements for the broader workforce in the country of employment. –The maximum annual benefit is currently capped at 14% of base salary but may be adjusted to reflect changes in arrangements for the wider employee population. |
Other benefits Link to Group performance and strategy –We provide competitive other benefits in a cost-efficient manner in order to hire and retain. Operation –Other benefits may include, but are not limited to, private healthcare cover for the executive and their dependants, life insurance, accident insurance, professional advice, participation in local flexible benefit programs and certain other minor benefits (including modest retirement gifts in applicable circumstances, occasional spouse travel in support of the business, any Rio Tinto business expenses which are deemed to be taxable, and any resulting tax on the benefits). –Secondment, relocation and localisation benefits, including payment of transfer allowances, may also be made to and on behalf of executives living outside their home country. –Given the nature and variety of the items that make up benefits, there is no formal maximum level of company contribution. |
Remuneration arrangements – Short-term performance-related (at risk) |
Short-term incentive plan Link to Group performance and strategy –STIP focuses participants on achieving demanding annual performance goals, which are based on the Group’s priorities, in pursuit of the creation of sustainable value for our stakeholders. –We require that sustainable business practices are adhered to, particularly in the context of safety and ESG. –We consider the individual performance of our executives against our values. The Way We Work outlines how we deliver both our purpose and strategy. It makes clear how all employees are expected to behave, in accordance with our values of care, courage and curiosity. Operation –The level of award for threshold performance is normally set at either nil or 25% of maximum, but may be adapted to reflect the stretch of the underlying targets. –The award is normally pro-rated on a straight-line basis between threshold, target and outstanding points. –The maximum award is capped at 200% of base salary for all executives. Any outcome from the formulaic STIP calculation is subject to discretion by the Committee. –A scorecard based on the Group’s priorities is established at the commencement of the financial year. The measures and the relative weightings are selected by the Committee in order to drive business performance for the current year, including the achievement of strategic and financial business outcomes that are priorities for the financial year in question. At least 50% of the measures will relate to financial performance, a significant component will relate to safety performance and any work-related fatality will have a material impact on the STIP result for all executives. –At the beginning of each year, we expect to disclose the measures and weightings only, with targets deemed commercially sensitive. We intend to disclose these targets and outcomes retrospectively. –An individual performance multiplier may be applied to the STIP outcome, but the final payout may not exceed 200% of salary. |
120 | Annual Report on Form 20-F 2023 | riotinto.com |
Remuneration arrangements – Short-term performance-related (at risk) continued |
Operation continued –In making its year-end determination of STIP awards, the Committee seeks to ensure that actual performance is directly comparable to the targets set at the beginning of the year. This may result in adjustments to the targets or to the assessed results being made by the Committee (in particular to take account of events outside management’s control), to ensure a like-for-like comparison. Both upward and downward adjustments can be made, with reference to principles agreed by the Committee, to ensure the outcomes are fair. –Malus, clawback and suspension provisions apply and are set out later in the Policy. |
Bonus deferral Link to Group performance and strategy –Provides ongoing alignment between executives and shareholders through deferral of part of the STIP award into Rio Tinto shares. Operation –50% of the STIP will normally be delivered in deferred shares (known as Bonus Deferral Awards (BDA)) with the remainder delivered in cash. –BDA normally vest in the December of the third year after the end of the STIP performance year to which they relate. –Dividends (or equivalents) may accrue in respect of any BDA that vest. –Where permitted by the plan rules, and where the Committee so decides, awards may be made or satisfied in cash in lieu of shares. Awards are normally, but not exclusively, granted with an intention to settle in shares. –BDA vest on a change of control. –Malus, clawback and suspension provisions apply and are set out later in the Policy. |
Remuneration arrangements – Long-term performance-related (at risk) |
Performance share awards under the long-term incentive plan Link to Group performance and strategy –Performance share awards (PSA) are designed to provide a simple and transparent mechanism for aligning executive reward with the execution of an effective business strategy and delivery of superior long-term shareholder returns. –Award levels are set to provide substantive focus on and reward long-term performance. PSA are the most significant component within the remuneration package and are calibrated so as to ensure the overall competitiveness of the remuneration package. Operation –PSA are conditional share awards (or economic equivalent) that vest subject to the achievement of stretching performance conditions and continued employment. –The Committee will set performance conditions aligned with the Group’s long-term strategic objectives for each PSA grant. –For the 2024 awards, relative TSR has been retained as the primary measure as it provides an objective external assessment over a sustained period on a basis that is familiar to shareholders. In addition, metrics linked to decarbonisation have been introduced to reflect the importance of climate change and low-carbon transition to the Group’s strategy. –While we expect TSR and decarbonisation will remain key performance metrics, the Committee retains the discretion to adjust the performance measures and weightings as appropriate. –PSA are normally only released five years after grant. From 2024, PSA are subject to a three-year performance period followed by a holding period of two years, with awards usually only released to executives five years after the award was granted. –Awards have a maximum face value of 500% of base salary when granted which is currently determined using the average share price of the prior financial year. Actual annual award levels may vary for each executive. –Threshold performance would result in the vesting of up to 22.5% of the award. –Dividends (or equivalents) may accrue in respect of any PSA that vest. –Where permitted by the plan rules, and where the Committee so decides, awards may be made or satisfied in cash in lieu of shares. Awards are normally, but not exclusively, granted with an intention to settle in shares. –Awards and performance conditions may be adjusted to take account of variations of share capital and other transactions. Subject to this Policy, performance conditions may also be amended in other circumstances if the Committee considers that a changed performance condition would be a fairer measure of performance. –If there is a change of control, awards will vest to the extent performance conditions are then satisfied. Unless the Committee determines otherwise, if the change of control happens prior to the vesting of the award, the number of shares that can vest will be reduced pro rata for the period from grant to change of control relative to the vesting period. The Committee may, alternatively, with agreement of an acquiring company, replace PSA with equivalent new awards over shares in the acquiring company. –The Committee retains the discretion, where circumstances warrant, to amend performance conditions under the relevant plan rules. The Committee will seek to ensure that outcomes are fair and that they take account of the overall performance of the company during the performance period. –Malus, clawback and suspension provisions apply and are set out later in the Policy. |
Annual Report on Form 20-F 2023 | riotinto.com | 121 |
Shareholding requirements |
Link to Group performance and strategy –Shareholding requirements align executives’ interests with those of shareholders. Operation –The Group understands the importance of and expects executives to build up and maintain a material shareholding in Rio Tinto. –Executives should aim to reach a share ownership in Rio Tinto shares, which is set as a fixed number of shares with reference to the following levels: –Chief Executive: 5 x base salary –Chief Financial Officer: 4 x base salary –Other executives: 4 x base salary –From an operational perspective these requirements are converted into a fixed number of shares. For 2024, the required holdings are as follows: –Chief Executive: 120,000 Rio Tinto plc shares –Chief Financial Officer: 60,000 Rio Tinto plc shares –Other executives (requirement varies by individual): 46,000-54,000 Rio Tinto plc shares or 40,000-46,000 Rio Tinto Limited shares –The applicable number of shares will be reviewed at least every two years to account for salary and share price movements. –Executives are expected to build up their shareholding over a five-year period. Longer periods may be accepted for new appointments. –Shares are treated as “owned” once vested and where beneficial and/or legal ownership of the shares is held by the executive. A beneficial interest includes any shares for which an executive receives the benefit of ownership (such as a right to receive dividends) without directly owning the shares. Given the mandatory nature and absence of performance conditions, 50% of the unvested BDA will be treated as owned accounting for likely effects of taxation. –Executive Directors are expected to continue to meet the shareholding requirements for two years after ceasing to be an Executive Director (or if the holding requirement is not met at this date, the relevant holding at the time). When considered alongside the existing leaver provisions for share awards, this will ensure that Executive Directors will remain aligned with shareholders for an extended period. –The Committee retains the discretion to enforce shareholding requirements through the application of malus to unvested share awards and/or scale back of future grants. |
Consequence management framework |
In 2021, the consequence management framework was introduced as a framework to assist with the application of Committee discretion and the potential recovery of incentives in exceptional circumstances. Malus, clawback and suspension provisions will apply to all STIP and LTIP awards in cash or shares. Under both the malus and clawback provisions, where the Committee determines that exceptional circumstances exist, the Committee may, at its discretion, reduce the number of shares to be received on vesting of an award, or, for a period of two years after the vesting, the end of any holding period or payment of a share or cash award, the Committee can clawback value from a participant. The circumstances under which the Committee may exercise such discretion may include, inter alia: –any fraud or misconduct by a participant or an exceptional event which has had, or may have, a material effect on the value or reputation of any member of the Group (excluding an exceptional event or events which have a material adverse effect on global macroeconomic conditions). –an error in the Group’s financial statements, which requires a material downward restatement or is otherwise material, or where information has emerged since the award date, which would have affected the size of the award granted or vested. –where the Committee determines that the personal performance of a participant, of their product group or of the Group does not justify vesting or where the participant’s conduct or performance has been in breach of their employment contract, any laws, rules or codes of conduct applicable to them or the standards reasonably expected of a person in their position. –the performance of the company, business or undertaking in which a participant worked or works or for which they were or are directly or indirectly responsible for is found to have been misstated or subject to a material misrepresentation. Consequently, the award being granted and/or vesting has resulted in a greater number of shares than would otherwise have been the case. –where any team, business area, member of the Group or profit centre in which the participant works or worked has been found guilty in connection with any regulatory investigation or has been in breach of any laws, rules or codes of conduct applicable to it or the standards reasonably expected of it. –where the Committee determines that there has been material damage to the Group’s social licence to operate. –a catastrophic safety or environmental event or events occurring in any part of the Group. Under the suspension provisions, the Committee may suspend the vesting or payment of an award (for up to five years) until the outcome of any internal or external investigation is concluded and may then reduce or lapse the participant’s award based on the outcome of that investigation. Note that where suspension applies, the 24-month clawback period will not extend beyond the period commencing from the original vesting date or end of holding period. Remuneration delivered under this Policy is also subject to any additional malus and clawback provisions operated by the company, including but not limited to the Incentive-Based Compensation Clawback Policy adopted in compliance with the US SEC legislation requiring the clawback of incentives erroneously awarded as a result of material misstatements for up to three financial years. |
Discretion |
The Committee recognises the importance of ensuring that the outcomes of the Group’s executive pay arrangements described in this Policy, properly reflect the Group’s overall performance and risk appetite. The Committee therefore reserves the right to review all remuneration outcomes arising from mechanistic application of performance conditions and to exercise discretion to make adjustments where such outcomes do not properly reflect underlying performance or the experience of shareholders or other stakeholders. The Committee will also be mindful of broader diversity and inclusion ambitions. The Committee may, at its discretion, adjust and/or set different performance measures if events occur (such as a change in strategy, a material acquisition or divestment, a catastrophic safety or environmental incident, a change in control, or other unexpected event) which cause the Committee to determine that the measures are no longer appropriate or in the best interests of shareholders or other stakeholders, and that amendment is required so that the measures, as far as possible, achieve their original purpose. Such discretion will be exercised judiciously and clearly disclosed and explained in the Implementation report. Any discretionary adjustments for directors will be disclosed in the Implementation report for the relevant financial period. |
122 | Annual Report on Form 20-F 2023 | riotinto.com |
n | Fixed pay | n | STIP | n | PSA | n | 50% share price growth |

n | Fixed pay | n | STIP | n | PSA | n | 50% share price growth |
Fixed pay (stated in £’000) | Base salary1 | Pension | Benefits2 | Total |
Jakob Stausholm | £1,285 | £180 | £110 | £1,575 |
Peter Cunningham | £761 | £107 | £43 | £911 |
Performance-related pay | |
Target STIP and LTIP performance | –A STIP award of 50% of the maximum award, equating to 100% of base salary –Expected value of 2024 PSA of 50% of face value, calculated as 250% of base salary |
Maximum STIP and LTIP performance | –A maximum STIP award of 200% of base salary –Full vesting of 2024 PSA, calculated as 500% of base salary |
Annual Report on Form 20-F 2023 | riotinto.com | 123 |
100% |
26% | 21% | 53% |
15% | 24% | 61% |
11% | 19% | 47% | 23% |
100% |
26% | 21% | 53% |
15% | 24% | 61% |
11% | 19% | 47% | 23% |
Element | Recruitment policy | |
Base salary | We aim to position base salary at an appropriate level, taking into consideration a range of factors including the executive’s current remuneration and experience, internal relativities, an assessment against relevant comparator groups and cost. If a new Executive Director is initially appointed at a lower rate, the Committee retains the ability to award larger increases in subsequent years in order to realign the salary over time as the individual develops in the role. | |
Pension or superannuation | Consistent with Policy table. | |
Other benefits | Consistent with Policy table. | |
STIP | Eligible to take part in our STIP with maximum opportunity capped at 200% of base salary. | |
PSA under LTIP | Maximum face value of 500% of base salary in line with our Policy. | |
Buy-out awards | Any compensation provided to an executive recruited from outside the Group, for the forfeiture of remuneration arrangements on joining, is considered separately to the establishment of forward-looking annual remuneration arrangements. Our approach with respect to such “buy-outs” is to determine a reasonable level of award, on a like-for- like basis, consisting primarily of equity-based awards, but also potentially cash, taking into consideration the quantum of forfeited awards, their performance conditions and vesting schedules. The Committee will obtain an independent external assessment of the value of awards proposed to be bought out and retains discretion, subject to the considerations noted above, to make such compensation arrangements as it deems necessary and appropriate to secure the relevant executive’s employment. The Committee’s intention is that buy-out compensation should include, where appropriate, performance conditions and equivalent timeframes for release. | |
Relocation-related support | If the Committee concludes that it is necessary and appropriate to secure an appointment, relocation-related support and international mobility benefits may be provided, depending on the circumstances and in line with the Group’s broader approach. Any relocation arrangements will be set out in the Implementation report. |
124 | Annual Report on Form 20-F 2023 | riotinto.com |

Element | Termination policy |
Base salary, pension and other benefits | Base salary will be paid in lieu of any unexpired notice and may be paid progressively in instalments over the notice period. For Executive Directors the Committee will (to the extent permitted by relevant law) have regard to the Executive Director’s ability to mitigate their loss in assessing the payment to be made. Executive Directors and their dependants may also be eligible for post-retirement benefits such as medical and life insurance. The company may also agree to continue certain other benefits for a period following termination where the arrangements are provided under term contracts or in accordance with the terms of the service contract, for example, payment for financial advice, tax advice and preparation of tax returns for a tax year. In some cases, they may receive a modest leaving gift. |
Short-term incentive plan (STIP) | If an eligible leaver leaves the Group during a performance year, the Committee may determine in its absolute discretion to award a pro rata portion of the STIP based on the amount of the year served and based on actual assessment of performance against the scorecard targets. Any cash payment will be made at the normal STIP payment date and no portion of the award will be deferred into shares. If an executive provides the company notice of their resignation during the performance year, but does not leave the Group until after the end of the performance year, the Committee may determine in its absolute discretion to make an award under the STIP. In these circumstances, the executive will only be eligible to receive the cash portion of the award and will forfeit any deferred shares portion. Any cash payment will be made at the normal STIP payment date. No STIP award will be made where an executive who is not an eligible leaver leaves the Group, resigns or is terminated for cause prior to the end of the performance year. |
Bonus deferral awards (BDA) | BDA will normally vest on the scheduled vesting date. There will be no pro-rating of BDA. Termination as an ineligible leaver at any point during the vesting period will result in forfeiture of BDA. |
Performance share awards (PSA) | PSA will normally vest on the scheduled vesting date, subject to performance conditions. PSA will be reduced pro rata to reflect the period of employment between the date of grant of the award and the normal vesting date (in February following end of the three-year performance period). Leaver provisions apply until the release date of the awards at the end of the holding period. Termination as an ineligible leaver at any point during the five-year time horizon will therefore result in forfeiture of PSA. |
Management share awards (MSA) | Any MSA granted prior to appointment will normally be retained, and vest, at the Committee’s discretion, at the scheduled vesting date (although awards for US taxpayers may vest on leaving). MSA will be reduced pro rata to reflect the period of employment between the date of grant of the award and the normal vesting date. Termination as an ineligible leaver at any point during the vesting period will result in forfeiture of MSA. |
All-employee share plans | All-employee share awards will normally vest on or shortly after leaving. There will be no pro rata reduction of awards. Termination as an ineligible leaver at any point during the vesting period will result in forfeiture of awards. |
Dividend shares | Any dividend equivalent shares will be calculated on the vesting of all share awards. |
Repatriation | On termination, the company will pay relocation or expatriation benefits as agreed at the time of the original expatriation and/or in accordance with applicable legislation and internal policies on travel and relocation. |
Accrued but untaken leave | Accrued but untaken annual leave and any long service leave will be paid out on termination, in accordance with the relevant country legislation and practice applicable to all employees. |
Legal expenses | The company may pay reasonable legal and other professional fees (including outplacement support) to, or in respect of, an executive concerning the termination of their employment. |
Settlement claims | Subject to the approval of the Committee, the company may pay such amount as it determines is reasonable to settle any claims that an executive may have in connection with the termination of their employment. |
Restrictive covenants | While our employment agreements include appropriate restrictive covenants as a matter of practice, the Policy provides additional flexibility to make payments in respect of expanding or enhancing existing covenants to protect Rio Tinto and its shareholders. The amount of such payment will be determined by the Committee based on the content and duration of the covenant. |
Annual Report on Form 20-F 2023 | riotinto.com | 125 |
Area | Chair | Non-Executive Directors | |
Setting of fees | The Committee (excluding the Chair, if they are a member) determines the terms of service and remuneration of the Chair. | The Non-Executive Directors’ fees and other terms are set by the Board upon the recommendation of the Chair’s Committee (which includes the Chair, Chief Executive and Chief Financial Officer). | |
Fees | It is Rio Tinto’s policy that the Chair should be remunerated on a competitive basis and at a level that reflects the complexity of the business and their contribution to the Group, as assessed by the Board. The Chair receives a fixed annual fee and does not receive any additional fee or allowance either for committee membership or being a committee chair, or for travel. The Chair does not participate in the Group’s incentive plans. | Non-Executive Directors receive a base fee with additional fees paid for further Board responsibilities such as committee membership, being a committee chair or taking on the senior independent director role. Allowances may be paid for attending meetings that involve medium or long-distance air travel. They do not participate in any of the Group’s incentive plans. Fees paid to Non-Executive Directors reflect their respective duties and responsibilities, and the time required for them to make a meaningful and effective contribution to Rio Tinto affairs. | |
Pension and superannuation | Rio Tinto does not pay retirement or post- employment benefits to the Chair. | Where the payment of statutory minimum superannuation contributions for Australian Non-Executive Directors is required by Australian superannuation law, these contributions are deducted from the director’s overall fee entitlements. | |
Benefits | The Chair may on occasion receive reimbursement for costs incurred in relation to the provision of professional advice. Other benefits include accident insurance (note this is neither contractual nor a taxable benefit), other minor benefits (including modest retirement gifts in applicable circumstances), occasional spouse travel in support of the business, any Rio Tinto business- related expenses that are deemed to be taxable and any tax the company has paid on their behalf. | Non-Executive Directors may on occasion receive reimbursement for costs incurred in relation to the provision of professional advice. Other benefits provided include accident insurance (note this is neither contractual nor a taxable benefit), other minor benefits (including modest retirement gifts in applicable circumstances), occasional spouse travel in support of the business and any Rio Tinto business-related expenses that are deemed to be taxable and any tax the company has paid on their behalf. |
126 | Annual Report on Form 20-F 2023 | riotinto.com |
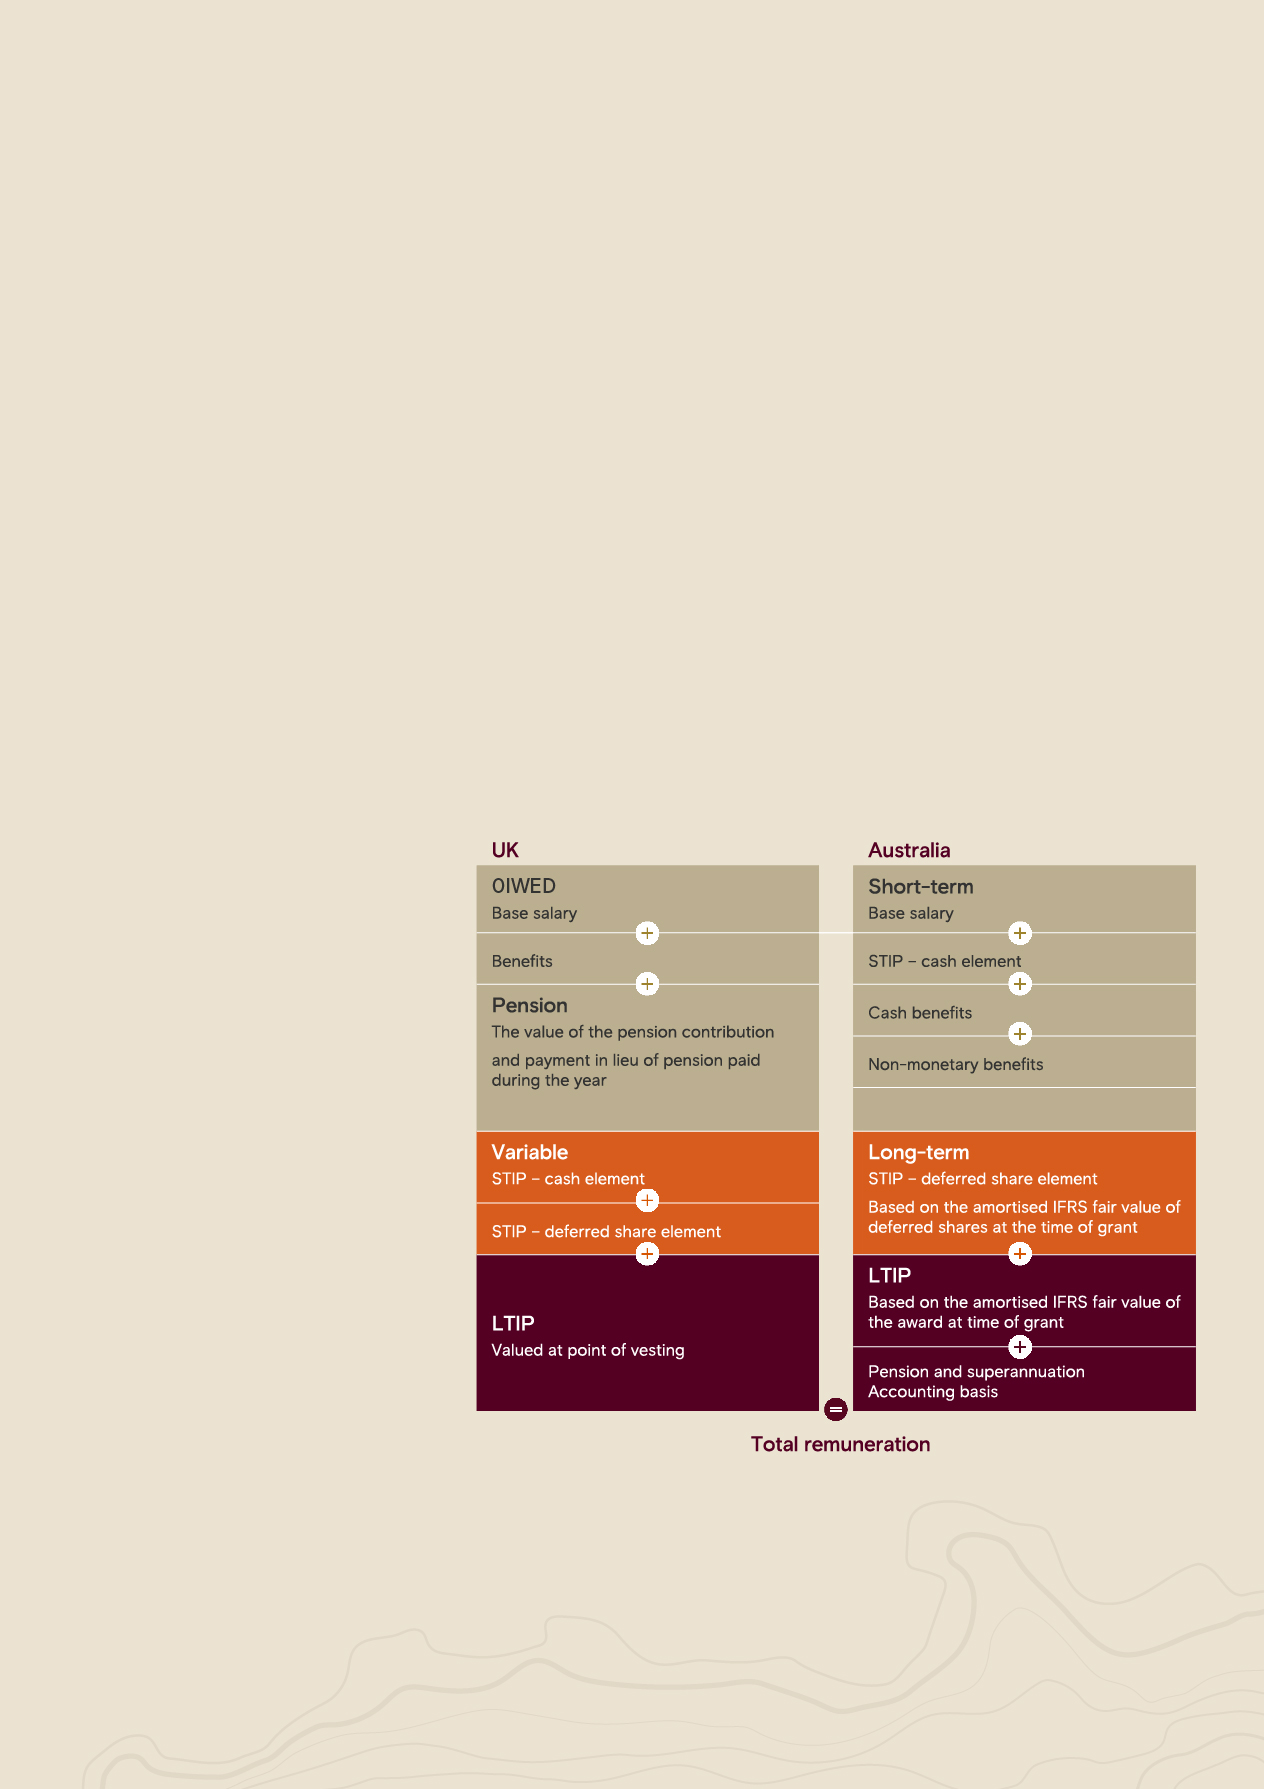
Annual Report on Form 20-F 2023 | riotinto.com | 127 |
Sam Laidlaw (Committee Chair) | Dominic Barton |
Megan Clark (to 15 December 2023) | Dean Dalla Valle (from 1 November 2023) |
Susan Lloyd-Hurwitz (from 1 June 2023) | Simon McKeon |
Jennifer Nason | Ngaire Woods |
128 | Annual Report on Form 20-F 2023 | riotinto.com |
Incentive - STIP payment | Value of LTIP awards vesting1 | ||||||||||
Executive Director | Year | Base salary | Benefits | Pension | Total fixed | Cash | Deferred shares | Face value | Share price appreciation | Total variable | Single total figure |
Jakob Stausholm (Chief Executive) | 2023 | 1,227 | 110 | 172 | 1,509 | 692 | 692 | 4,425 | 1,132 | 6,941 | 8,450 |
Jakob Stausholm (Chief Executive) | 2022 | 1,177 | 130 | 165 | 1,472 | 575 | 576 | 1,360 | 1,027 | 3,538 | 5,010 |
Peter Cunningham (Chief Financial Officer) | 2023 | 726 | 43 | 102 | 871 | 409 | 410 | 361 | 92 | 1,272 | 2,143 |
Peter Cunningham (Chief Financial Officer) | 2022 | 700 | 39 | 98 | 837 | 320 | 320 | 333 | 251 | 1,224 | 2,061 |
Executive Director | Annual base salary 1 March 2023 £'000 | Annual base salary 1 March 2024 £'000 | % change |
Jakob Stausholm | 1,235 | 1,285 | 4% |
Peter Cunningham | 732 | 761 | 4% |
Executive Director | Pension contributions paid to the Rio Tinto pension fund £'000 | Cash in lieu of pension contributions paid £'000 | Total £'000 | Pension provision (% of base salary) |
Jakob Stausholm | 8.4 | 163.4 | 172 | 14% |
Peter Cunningham | 8.4 | 93.3 | 102 | 14% |
Executive Director | Weighted result (out of 100%) | Fatality deduction (%) | STIP (% of base salary) | Base salary £’000 | STIP outcome £’000 | Delivered in: | Percentage of: | |||||||
Financial (50%)1 | Strategic (50%)2 | Group Scorecard result % | Cash £’000 | Deferred shares £’000 | Max awarded | Max forfeited | Target awarded | |||||||
Jakob Stausholm | 22.4% | 33.6% | 56% | —% | 112% | 1,235 | 1,384 | 692 | 692 | 56% | 44% | 112% | ||
Peter Cunningham | 22.4% | 33.6% | 56% | —% | 112% | 732 | 819 | 409 | 410 | 56% | 44% | 112% | ||
Annual Report on Form 20-F 2023 | riotinto.com | 129 |
Performance categories | Weighting | Commentary |
Financial | 50% | For 2023, the financial measures were STIP underlying earnings and STIP free cash flow. The first, STIP underlying earnings, gives insight to cost management, production and performance efficiency. This is calculated as underlying earnings of $11.7 billion adjusted for items not reflective of performance in the year as described on page 131. A reconciliation of underlying earnings to net earnings is provided on pages 290-291. STIP free cash flow demonstrates how we convert underlying earnings to cash and provides further insight into how we are managing costs, efficiency and productivity. STIP free cash flow comprises free cash flow (as reported on page 293), adjusted to exclude dividends paid to holders of non-controlling interests in subsidiaries ($0.5 billion) and development capital expenditure, to include development capital expenditure on decarbonisation ($2.7 billion). This adjusted metric excludes the impact of those components of free cash flow that are not directly related to performance in the year and therefore better represents underlying business performance. |
Strategic | 50% | Impeccable ESG (20%) aims to promote safety in all its aspects and progress decarbonisation efforts as we work towards achieving our ambition to reduce Scope 1 and 2 emissions by 2030. Safety measures a combination of our safety maturity model (SMM) and all injury frequency rate (AIFR). The safety outcome is underpinned by an assessment of conformance with the GISTM for “very high” and “extreme” classification tailings facilities. Decarbonisation measures progress of carbon abatement projects against incremental stages of development. People and culture (10%) aims to improve diversity, create an inclusive work environment in which people can thrive, accelerate our culture change, and reinforce our values. It encompasses gender diversity and Everyday Respect metrics. Gender diversity measures the year-on-year increase in representation of women in our organisation. Everyday Respect reflects the completion rate of the “Building Everyday Respect” employee training program. Excel in development (10%) aims to incentivise a growth mindset by focusing on exploring new opportunities, prospecting new sites, technology, and innovation. It measures performance in exploration, studies and project execution. Exploration focuses on the opportunities coming out of the exploration pipeline and moving into formal studies. Studies assesses the number of studies approved to progress to project execution phase. Project delivery measures our execution progress in creating growth opportunities and closure projects across the Rio Tinto portfolio. Social licence (10%) is included as an indicator of our ability to build trust and acceptance of Rio Tinto with our external community of stakeholders. The general public perception in key countries is reflected by a reputation score currently measured via a third-party survey provider, RepTrak. |
Weighting (out of 100%) | 2023 performance1 | Outcome | Result (% of maximum) | Weighted result (out of 100%) | ||||
Threshold | Target | Outstanding | ||||||
STIP Underlying earnings | Unflexed | 12.5% | $6.4 billion | $9.1 billion | $11.9 billion | 10.9 | 83.1% | 10.4% |
Flexed | 12.5% | $8.4 billion | $12.0 billion | $15.6 billion | 34.7% | 4.3% | ||
STIP Free cash flow | Unflexed | 12.5% | $7.5 billion | $10.7 billion | $14.0 billion | 10.8 | 50.9% | 6.4% |
Flexed | 12.5% | $9.9 billion | $14.2 billion | $18.4 billion | 10.4% | 1.3% | ||
Total Financials | 50% | 44.8% | 22.4% | |||||
Impeccable ESG | AIFR2 | 3.3% | 0.46 | 0.40 | 0.32 | 0.37 | 50% | 1.7% |
SMM3 | 6.7% | 4.6 | 5.1 | 6.1 | 5.2 | 55% | 3.7% | |
Decarbonisation4 | 10.0% | 7Mt CO2e | 10Mt CO2e | 13Mt CO2e | 12 | 83.5% | 8.4% | |
People and culture | Everyday Respect | 5.0% | 30% of employees | 40% of employees | 50% of employees | 83.5% | 100% | 5.0% |
Gender diversity | 5.0% | 1% improvement | 1.5% improvement | 2% improvement | 1.4% | 45% | 2.3% | |
Excel in development | Exploration progression5 | 2.5% | 1 | 2 | 3 | 3 | 100% | 2.5% |
Project execution | 5.0% | 25% | 50% | 75% | 50% | 50% | 2.5% | |
Studies progression | 2.5% | 1 study | 2 studies | 3 studies | 6 | 100% | 2.5% | |
Social licence | Reputation | 10.0% | 55.9 or below | 57.9 to 59.9 (inclusive) | 60.9 or above | 58.8 | 50% | 5.0% |
Total Strategic | 50% | 67.2% | 33.6% | |||||
Total Group | 100% | 56% | ||||||
130 | Annual Report on Form 20-F 2023 | riotinto.com |
Annual Report on Form 20-F 2023 | riotinto.com | 131 |
Strategic objectives | Assessment | |
Impeccable ESG | –Substantial efforts to progress our decarbonisation commitments, with two sites transitioning to renewable diesel (Boron complete and Kennecott to commence in early 2024), with continued focus on progressing new technologies including BlueSmelting at Sorel-Tracy, Nuton and BioIronTM. Key to achieving our 2030 decarbonisation target is the repowering of our Gladstone operations and, with substantial effort made in 2023, this has resulted in driving the development of the largest solar farm in Australia, announced in early 2024. –Publishing of our Water Data platform, delivering market-leading transparency and disclosure at the asset level. Water discharges are monitored at the vast majority of our operations, with a number of sites already undertaking significant water monitoring programs as part of regulatory processes. –Progress on safety marred by three permanent damage injuries. | |
Excel in development | –Significant progress of the Simandou project, to unlock the largest known undeveloped, high-grade iron ore resource globally. –Successful completion of the Matalco recycling joint venture, strengthening the ability for our North American business to meet the growing demand for low-carbon materials. –Commenced early works on the $1.1 billion expansion of our AP60 smelter in Quebec. –Strengthened the future of our Pilbara iron ore portfolio with Western Range construction on schedule, Rhodes Ridge moving to pre- feasibility phase and productivity improvements at Gudai Darri resulting in an expected uplift in capacity. These steps are pivotal to us meeting our mid-term capacity target of 345–360 million tonnes. –Development of lithium business behind plan. | |
People and culture | –Strong leadership continues to develop and is focussed on culture. Employee satisfaction (eSat) and recommend scores exceeded 2022 levels. –Implementation of the 26 recommendations from the Everyday Respect report remain on track, and, in line with these recommendations, we are completing an independent progress review in 2024. –Establishment of the global leadership collective for our most senior employees to further drive cultural change. –Improvement in representation of women at all levels of the organisation, but further work required on gender diversity across the workforce. | |
Social licence | –The Pilbara renewables MoU was signed with Yindjibarndi Energy, an important step to mark a change from the past in our engagement with Traditional Owners. Co-management of replacement mines in the Pilbara remains a key focus for the Group. –Iron Ore Company of Canada signed an agreement to establish a mutually beneficial relationship with the Naskapi Nation of Kawawachikamach. –Relationships with government and civil society continue to improve and deepen. Regular roundtables with global civil society organisation (CSO) in each of our key regions continue to improve transparency and trust and our understanding of society’s needs. | |
Best operator | –The Group’s total copper equivalent production increased by over 3% from 2022 despite extended shutdown at Kennecott. –Delivered the second highest year of shipments from the Pilbara, driven by the ramp up of Gudai-Darri and the implementation of the Rio Tinto Safe Production System. –Achieved first sustainable production at our Oyu Tolgoi underground mine in March 2023, with strong performance throughout the year as the underground mine continues through a ramp up phase. –Completed the largest rebuild of the smelter and refinery in Kennecott’s history, demonstrating continued investment in our existing assets to enhance resilience. –Exceeded the deployment targets set for the Safe Production System, driving forward operational improvements across the Group. –Production volumes impacted by equipment reliability and furnace shutdowns. |
Strategic objectives | Assessment | |
Impeccable ESG | –Strengthened investment approach to carbon abatement. This led to a significant increase in the number of projects that we were able to progress. –Supported the simplification of decarbonisation investment pathways resulting in greater use of commercial solutions and partnerships, easing capital expenditure requirements this decade. –Supported investments in renewable energy (Australia, South Africa), renewables diesel (Kennecott, Boron), research and development investment in hard to abate processing emissions, as well as nature-based solutions partnerships generating high quality carbon credits to complement our decarbonisation efforts. | |
Excel in development | –Key contributor to the formation of the Matalco recycling joint venture through leadership of the Business Development, Treasury and Evaluation teams. –Played a critical role in the execution of strategy and shaping the portfolio, including progressing the high-grade iron ore Simandou project and studies for Pilbara replacement mines, investing in AP60 expansion, partnering to develop the La Granja copper mine, and progressing Kennecott underground. –Maintained financial strength with consistent capital allocation, balancing essential capital expenditure with shareholder returns and growth. | |
People and culture | –The performance management framework was improved during the year, with more comprehensive and integrated reporting but further work needed to fully embed across the organisation. –Has been a strong advocate for simplification and standardisation, as well as removing complexity through rule changes, technology and innovation, system interventions and in-sourcing of some key activities. –Has promoted an owner’s mindset, with comprehensive communications throughout the year, focused on the performance of our STIP scorecard. | |
Social licence | –Further developed a comprehensive capital allocation processes to promote investment decisions and further build partnerships and capabilities. –Supported investment for creating growth options and social licence through targeted exploration and evaluation, communities and social performance (CSP) and social investment, decarbonisation, and research and development. | |
Best operator | –Led the simplification and continuous improvement with a strong focus on the transformation of business productivity through increased use of digital. –Continued to streamline the investment approval process to dedicate time to the most complex decisions. –Supported investments that improved asset discipline and performance management, resulting in 3% copper equivalent production growth at the Group level. |
132 | Annual Report on Form 20-F 2023 | riotinto.com |
Financial scorecard dimension | Weighting | What does it measure? | Commentary | |||
Underlying EBITDA – Unflexed | 12.5% | Underlying EBITDA is a segmental performance measure and represents profit before tax, net finance items, depreciation and amortisation. | Underlying EBITDA is the prominent financial measure of underlying business performance on an income statement basis. The core objectives of robust operational performance and careful cost management are well reflected in Underlying EBITDA. The EBITDA target for STIP purposes equates to the EBITDA of the Group’s annual plan. | |||
Underlying EBITDA – Flexed | 12.5% | Underlying EBITDA, adjusted for the impact of commodity prices and foreign exchange rates. | Removing the impact of commodity prices and foreign exchange rates gives us a stronger indication of the EBITDA outcome of our underlying business performance, aligned to the core objective of Best Operator. | |||
STIP free cash flow – Unflexed | 12.5% | STIP free cash flow comprises free cash flow adjusted to exclude dividends paid to holders of non-controlling interests in subsidiaries and development capital expenditure. | STIP free cash flow demonstrates how we convert underlying EBITDA to cash and provides further insight into how we are managing efficiency and productivity, including working capital and sustaining capital. The STIP free cash flow target for STIP purposes equates to the same measure of the Group’s annual plan. | |||
STIP free cash flow – Flexed | 12.5% | STIP free cash flow, adjusted for the impact of commodity prices and foreign exchange rates. | Removing the impact of commodity prices and foreign exchange rates gives us a stronger indication of the free cash flow outcome of our underlying business performance, aligned to the core objective of Best Operator. | |||
Total weighting | 50% |
Strategic scorecard dimension | Weighting | What does it measure? | Commentary | |||
Impeccable ESG | ||||||
Decarbonisation | 10% | Progress of moving carbon abatement projects through the various stages of development all the way to execution to meet our decarbonisation ambition. | Provides focus on progressing at pace and optimising resources deployment of decarbonisation projects. | |||
Safety index | 10% | AIFR as a lag indicator and SMM at our assets as a lead indicator, which includes maturity of safety leadership, including psychological safety. Conformance to GISTM is set as an underpin. | Safety is at the heart of everything we do. The safety index provides focus on the importance of continuing to embed and strengthen our safety culture. | |||
People and culture | ||||||
Diversity | 5% | Improving representation of women at Rio Tinto. | The ongoing focus on improving gender representation is an important contributor to advancing our culture change agenda. | |||
Culture | 5% | Measuring progress in our culture change journey. | Using trends in responses and scores to our engagement surveys to demonstrate to what extent our culture is changing. | |||
Excel in development | ||||||
Exploration, studies and project execution | 10% | Performance in exploration, studies and project delivery. | Exploration, studies and project execution identifies opportunities for growth and enhancing orebody reserves across our portfolio while keeping focus on the importance of executing to time and budget. | |||
Social licence | ||||||
Reputation | 10% | Indicators of progress made in building acceptance and trust with our community of external stakeholders, including but not only communities, governments, customers, suppliers, and civil society. General public perception in key countries is measured by a reputation score. | Assesses trust and acceptance of us by a broad community of stakeholders. We are developing further tools to assess social licence beyond 2024. | |||
Total weighting | 50% | |||||
Annual Report on Form 20-F 2023 | riotinto.com | 133 |
Index | Threshold (22.5% of maximum) | Maximum (100% of maximum) | Actual TSR outperformance | Weighting | Vesting outcome |
S&P Global Mining Index1 | Equal to Index | Index + 6% p.a. | Index + 5.1% p.a. | 50% | 88.2% |
MSCI World Index | Equal to Index | Index + 6% p.a. | Index + 8.6% p.a. | 50% | 100% |
Executive Director | Year included in single figure | Award | Overall vesting % | Dividend equivalents | Dividend equivalents (% of shares vesting) | Shares (including dividend equivalents) | Share price | PSA outcome (£’000)1 |
Jakob Stausholm | 2023 | 2019 PSA | 94.1% | 28,796 | 38% | 103,708 | £53.59 | £5,558 |
Peter Cunningham | 2023 | 2019 PSA | 94.1% | 2,347 | 38% | 8,453 | £53.59 | £453 |
Executive Director | Type of award | Grant date | Face value of award (% of base salary) | Face value of award (£’000) | % of vesting at threshold performance | Grant price1 | Conditional shares awarded | End of the period over which the performance conditions have to be fulfilled | Vesting month |
Jakob Stausholm | PSA | 22 March 2023 | 400% | 4,942 | 22.5% | £53.07 | 93,114 | 31 December 2027 | February 2028 |
Peter Cunningham | PSA | 22 March 2023 | 400% | 2,926 | 22.5% | £53.07 | 55,134 | 31 December 2027 | February 2028 |
Executive Director | Type of award | Face value of award (% of base salary) | Face value of award (£’000) | % of vesting at threshold performance | Grant price1 | Conditional shares to be awarded | End of the period over which the performance conditions have to be fulfilled | End of holding period |
Jakob Stausholm | PSA | 500% | 6,424 | 22.5% | £53.43 | 120,232 | 31 December 2026 | February 2029 |
Peter Cunningham | PSA | 500% | 3,804 | 22.5% | £53.43 | 71,195 | 31 December 2026 | February 2029 |
Performance measures | Threshold (22.5% of maximum) | Maximum (100% of maximum) | Weighting |
Relative TSR vs S&P Global Mining Index | Median | Upper Quartile | 53.3% |
Relative TSR vs MSCI World Index | Median | Upper Quartile | 26.7% |
Decarbonisation scorecard | see below | see below | 20% |
134 | Annual Report on Form 20-F 2023 | riotinto.com |
Objective | Details |
Residual emissions | –This provides a measure of actual reduction in Scope 1 and 2 emissions with targets set taking into account the Group’s stated ambition of a 50% reduction by 2030 (relative to our 2018 baseline). Achieving the maximum outcome would be consistent with the linear trajectory required to achieve the 2030 ambition. –The Committee will take into account the relative contribution of nature-based offsets directly associated with Rio Tinto landholdings or those of its joint ventures when assessing performance. The contribution will be capped at 10% and for any outcome above target the contribution from offsets will be ignored. |
Project delivery | –The successful delivery of abatement projects will be fundamental to achieving our stretching decarbonisation objectives. –Working with the Decarbonisation Office the Committee have identified a number of priority decarbonisation projects for which investment approval has been granted, or is expected to be granted in 2024. Examples of projects to be included for 2024 - 2026 performance period are the commissioning of a BioIronTM continuous pilot plant and an electric boiler at IOC, both of which have been noted at previous investor seminars and are further defined in our 2023 Climate Change Report. The projects included will be planned for execution within the performance period and will typically have a duration of 1-3 years. These will be physical projects, potentially including renewable energy project delivery, alumina process heat reductions, minerals processing solutions or projects that support our partners with Scope 3 emissions reductions. Commercial solutions such as power purchase agreements or procuring biofuels would not be considered in this metric. –At the end of the three-year performance period, there will be a qualitative assessment of project delivery measuring conformance to plan for both spend and schedule. Using a pre-determined framework, each project will be assigned a score out of ten and vesting will be determined based on the average score of the projects. |
Technology development | –Progressing towards net zero will require technology advancement and research and development breakthroughs that convert into implemented projects. –This metric assesses Group spend committed to research and development and the successful implementation of projects that have a meaningful impact on the abatement of emissions (including spend associated with reducing Scope 3 emissions). |
Transition strategy | –This measure will align decarbonisation activity with our value creation strategy, specifically in building new capabilities or commitments towards new growth assets. –Three transition strategy outcomes have been identified that are significant to Group value, namely, Pacific Operations (PacOps) decarbonisation, ELYSISTM implementation, and aluminium and copper recycling. Working with the Chief Scientist, each project has been assigned a bespoke scorecard that enables a qualitative assessment of progress and performance. –At the end of the three-year performance period, each transition strategy will be assigned a score out of ten using a predetermined framework and vesting will be determined based on the average score of the transition objectives. |
Objective | LTIP weighting | Threshold (22.5% of maximum) | Target (50% of maximum) | Maximum (100% of maximum) |
Residual emissions Reduction in residual emissions relative to 2018 baseline | 5% | 3.6Mt CO2e | 5.1Mt CO2e | 6.6Mt CO2e |
Project delivery Conformance to plan for priority decarbonisation projects | 5% | Average score of at least six out of ten being a maximum deviation of 25% from planned cost and schedule | Average score of at least eight out of ten being a maximum deviation of 15% from planned cost and schedule | Average score of at least nine out of ten being less than 10% deviation from planned cost and schedule |
Technology development Technology advancements and research and development breakthroughs that convert into implemented projects | 5% | 0.2% of Group revenue on decarbonisation research and development spend At least one project into implementation totalling 250kt annual abatement | 0.4% of Group revenue on decarbonisation research and development spend At least one project into implementation totalling 500kt annual abatement | 0.5% of Group revenue on decarbonisation research and development spend At least two projects into implementation totalling 750kt annual abatement |
Transition strategy Alignment of decarbonisation activity with value creation | 5% | Average score of at least six out of ten representing more limited progress | Average score of at least eight out of ten representing good progress towards strategic goals, some areas of outperformance, substantially achieved or on track to deliver major objectives, or progress with no major failures or impacts on broader performance of the Group | Average score of at least nine out of ten representing significant outperformance of expectations, implementation achieved or a major new advancement with scope for material benefits |
Annual Report on Form 20-F 2023 | riotinto.com | 135 |
Executive Director | Multiple of base salary | Holding of ordinary shares | ||||
31 December 2023 | Requirement | Year requirement needs to be met | 31 December 2023 | 31 December 2022 | ||
Jakob Stausholm | 5.1 | 4.0 | 2024 | 95,363 | 56,337 | |
Peter Cunningham | 5.5 | 3.0 | 2026 | 63,053 | 52,815 | |
Executive Director | Position held during 2023 | Date of appointment to position | Notice period |
Jakob Stausholm | Chief Executive | 1 January 2021 | 12 months |
Peter Cunningham | Chief Financial Officer | 17 June 2021 | 12 months |
Year | Chief Executive | Single total figure of remuneration (’000) | Annual STIP award against maximum opportunity | Long-term incentive vesting against maximum opportunity (PSA) | |
2014 | Sam Walsh | A$10,476 | 88.4% | 49% | |
2015 | Sam Walsh | A$9,141 | 81.9% | 43.6% | |
2016 | Sam Walsh1 | A$5,772 | 68.2% | 50.5% | |
2016 | Jean-Sébastien Jacques | £3,116 | 82.4% | 50.5% | |
2017 | Jean-Sébastien Jacques | £3,821 | 73.4% | 66.7% | |
2018 | Jean-Sébastien Jacques | £4,551 | 70.1% | 43% | |
2019 | Jean-Sébastien Jacques | £5,999 | 74.8% | 76% | |
2020 | Jean-Sébastien Jacques | £8,670 | 0% | 66.7% | |
2021 | Jakob Stausholm2 | £2,788 | 61.3% | – | |
2022 | Jakob Stausholm3 | £5,010 | 48.7% | 100% | |
2023 | Jakob Stausholm | £8,450 | 56% | 94.1% |
Year | Underlying earnings | Underlying EBITDA | Dividends paid per share | Share price – Rio Tinto plc pence | Share price – Rio Tinto Limited A$ | TSR | ||||||
$ millions | $ millions | $ cents | 1 Jan | 31 Dec | 1 Jan | 31 Dec | Group % | |||||
2019 | 10,373 | 21,197 | 635 | 3,730 | 4,503 | 78.47 | 100.40 | 38.7% | ||||
2020 | 12,448 | 23,902 | 386 | 4,503 | 5,470 | 100.40 | 113.83 | 34.0% | ||||
2021 | 21,401 | 37,720 | 963 | 5,470 | 4,892 | 113.83 | 100.11 | (3.8)% | ||||
2022 | 13,359 | 26,272 | 746 | 4,892 | 5,798 | 100.11 | 116.41 | 18.3% | ||||
2023 | 11,755 | 23,892 | 402 | 5,798 | 5,842 | 116.41 | 135.66 | 15.8% | ||||
136 | Annual Report on Form 20-F 2023 | riotinto.com |


n | Fixed pay | n | STIP – Cash | n | STIP – BDA | n | LTIP |
Performance-related (at risk) | |
Target STIP and LTIP performance | –STIP award of 50% of the maximum award (equates to 100% of base salary) –PSA expected value of 50% of face value, calculated as 200% of base salary |
Maximum STIP and LTIP performance | –Maximum STIP award of 200% of base salary –Maximum PSA face value of 400% of base salary |
Name | Position(s) held during 2023 | Date of appointment to position |
Bold Baatar | Chief Executive Copper | 1 February 2021 |
Alfredo Barrios | Chief Commercial Officer | 1 March 2021 |
Sinead Kaufman | Chief Executive Minerals | 1 March 2021 |
Jérôme Pécresse | Chief Executive Aluminium | 23 October 2023 |
Simon Trott | Chief Executive Iron Ore | 1 March 2021 |
Ivan Vella1 | Chief Executive Aluminium | 1 March 2021 |
Annual Report on Form 20-F 2023 | riotinto.com | 137 |
Percentage of: | ||||
2023 STIP award (% of salary) | 2023 STIP award ('000) | Maximum STIP awarded | Maximum STIP forfeited | |
Bold Baatar | 140% | £941 | 70% | 30% |
Alfredo Barrios | 84% | SGD981 | 42% | 58% |
Sinead Kaufman | 112% | A$1,188 | 56% | 44% |
Jérôme Pécresse | 112% | C$258 | 56% | 44% |
Simon Trott | 140% | A$1,650 | 70% | 30% |
Share ownership level at 31 December 2023 as a multiple of base salary | |
Bold Baatar | 5.9 |
Alfredo Barrios | 4.5 |
Sinead Kaufman | 6.2 |
Jérôme Pécresse | 0.4 |
Simon Trott | 5.4 |
Lower quartile | Median | Upper quartile | |
2023 | 116 | 97 | 81 |
2022 1 | 76 | 52 | 42 |
Stated in US$m | 2023 | 2022 | Difference in spend |
Remuneration paid1 | 6,636 | 6,002 | 634 |
Distributions to shareholders2 | 6,470 | 11,727 | (5,257) |
Purchase of property, plant and equipment, and intangible assets3 | 7,086 | 6,750 | 336 |
Corporate income tax paid3 | 4,627 | 6,909 | (2,282) |
138 | Annual Report on Form 20-F 2023 | riotinto.com |
2019 to 2020 | 2020 to 2021 | 2021 to 2022 | 2022 to 2023 | |||||||||
a1 | b | c | a1 | b | c | a1 | b | c | a1 | b2 | c3 | |
Executive Directors | ||||||||||||
Jakob Stausholm | 2% | 34% | 29% | 46% | (19)% | 25% | 2% | 94% | (18)% | 4% | (15)% | 20% |
Peter Cunningham | – | – | – | – | – | – | – | 18% | 47% | 4% | 10% | 28% |
Non-Executive Directors | ||||||||||||
Dominic Barton4 | – | – | – | – | – | – | – | – | – | 50% | (84)% | –% |
Megan Clark | 1% | (54)% | –% | (3)% | (93)% | –% | (1)% | 1,651% | –% | (1)% | 52% | –% |
Simon Henry | 3% | (88)% | –% | –% | 64% | –% | (6)% | 98% | –% | (7)% | 189% | –% |
Sam Laidlaw | 8% | (87)% | –% | –% | (51)% | –% | –% | 779% | –% | –% | 242% | –% |
Simon McKeon | 9% | (72)% | –% | 15% | (91)% | –% | (6)% | 1,487% | –% | 6% | 78% | –% |
Jennifer Nason | – | – | – | – | – | – | (6)% | 58% | –% | (8)% | 59% | –% |
Ngaire Woods | – | – | – | – | – | – | –% | 273% | –% | –% | 201% | –% |
Ben Wyatt | – | – | – | – | – | – | 12% | –% | –% | –% | 52% | –% |
Kaisa Hietala5 | – | – | – | – | – | – | – | – | – | – | – | – |
Susan Lloyd-Hurwitz5 | – | – | – | – | – | – | – | – | – | – | – | – |
Dean Dalla Valle5 | – | – | – | – | – | – | – | – | – | – | – | – |
Joc O’Rourke5 | – | – | – | – | – | – | – | – | – | – | – | – |
Australian workforce6 | 4% | 5% | 19% | 4% | –% | (18)% | 7% | 6% | 15% | 8% | (1)% | 16% |
Name | Title |
Dominic Barton | Chair |
Megan Clark | Non-Executive Director (to 15 December 2023) |
Dean Dalla Valle | Non-Executive Director (from 1 June 2023) |
Simon Henry | Non-Executive Director |
Kaisa Hietala | Non-Executive Director (from 1 March 2023) |
Sam Laidlaw | Non-Executive Director |
Susan Lloyd-Hurwitz | Non-Executive Director (from 1 June 2023) |
Simon McKeon | Non-Executive Director |
Jennifer Nason | Non-Executive Director |
Joc O’Rourke | Non-Executive Director (from 25 October 2023) |
Ngaire Woods | Non-Executive Director |
Ben Wyatt | Non-Executive Director |
2024 | 2023 | |
Director fees | ||
Chair’s fee | £800,000 | £730,000 |
Non-Executive Director base fee | £115,000 | £95,000 |
Non-Executive Director base fee for Australian residents | £115,000 | £105,000 |
Senior Independent Director | £45,000 | £45,000 |
Committee fees | ||
Audit & Risk Committee Chair | £50,000 | £40,000 |
Audit & Risk Committee member | £30,000 | £25,000 |
People & Remuneration Committee Chair | £45,000 | £35,000 |
People & Remuneration Committee member | £25,000 | £20,000 |
Sustainability Committee Chair | £45,000 | £35,000 |
Sustainability Committee member | £25,000 | £20,000 |
Nominations Committee member | £8,000 | £7,500 |
Meeting allowances | ||
Long distance (flights over 10 hours per journey) | £10,000 | £10,000 |
Medium distance (flights of 5-10 hours per journey) | £5,000 | £5,000 |
Annual Report on Form 20-F 2023 | riotinto.com | 139 |

Director | Share ownership level at 31 December 2023 as a multiple of base fee | Share ownership level at 31 December 2022 as a multiple of base fee |
Dominic Barton | 1.2 | 1.1 |
Megan Clark1 | 4.4 | 3.9 |
Dean Dalla Valle2 | 0.0 | N/A |
Simon Henry | 1.2 | 0.9 |
Kaisa Hietala3 | 0.3 | N/A |
Sam Laidlaw | 4.6 | 4.6 |
Susan Lloyd-Hurwitz2 | 1.0 | N/A |
Simon McKeon | 7.7 | 6.8 |
Jennifer Nason | 1.1 | 1.1 |
Joc O’Rourke4 | 0.0 | N/A |
Ben Wyatt | 0.3 | 0.2 |
Ngaire Woods | 0.9 | 0.3 |
Resolution | Votes for | Votes against | Votes withheld1 |
Approval of the Directors Remuneration report: Implementation report | 96% | 4% | 21,075,873 |
Approval of the Remuneration Policy (2021) | 97% | 3% | 22,272,424 |
Approval of the Directors’ Remuneration report | 96% | 4% | 21,100,383 |
140 | Annual Report on Form 20-F 2023 | riotinto.com |
Stated in US$‘0001 | Short-term benefits | |||||
Base salary | Cash bonus2 | Other cash- based benefits3 | Non-monetary benefits4 | Total short-term benefits | ||
Executive Directors | ||||||
Jakob Stausholm | 2023 | 1,525 | 860 | 203 | 129 | 2,717 |
2022 | 1,456 | 694 | 199 | 153 | 2,502 | |
Peter Cunningham | 2023 | 903 | 523 | 116 | 47 | 1,589 |
2022 | 866 | 386 | 151 | 41 | 1,444 | |
Other executives | ||||||
Bold Baatar | 2023 | 824 | 601 | 105 | 79 | 1,609 |
2022 | 760 | 361 | 114 | 34 | 1,269 | |
Alfredo Barrios | 2023 | 864 | 373 | 43 | 98 | 1,378 |
2022 | 811 | 368 | 47 | 112 | 1,338 | |
Sinead Kaufman | 2023 | 700 | 408 | 80 | 91 | 1,279 |
2022 | 707 | 340 | 86 | 52 | 1,185 | |
Jérôme Pécresse | 2023 | 170 | 98 | 537 | 6 | 811 |
Simon Trott | 2023 | 772 | 566 | 90 | 56 | 1,484 |
2022 | 749 | 372 | 93 | 106 | 1,320 | |
Ivan Vella8 | 2023 | 616 | – | 70 | 129 | 815 |
2022 | 765 | 286 | 94 | 102 | 1,247 | |
Stated in US$’0001 | Long-term benefits: Value of shared-based awards5 | Post-employment benefits9 | ||||||||
BDA6 | PSA | MSA | Others7 | Pension and superannuation | Other post- employment benefits | Termination benefits | Total remuneration10 | Currency of actual payment | ||
Executive Directors | ||||||||||
Jakob Stausholm | 2023 | 783 | 2,556 | – | 8 | 10 | – | – | 6,074 | £ |
2022 | 701 | 2,020 | – | 7 | 5 | – | – | 5,235 | £ | |
Peter Cunningham | 2023 | 338 | 691 | 132 | 7 | 10 | – | – | 2,767 | £ |
2022 | 224 | 342 | 192 | 6 | 5 | – | – | 2,213 | £ | |
Other executives | ||||||||||
Bold Baatar | 2023 | 473 | 1,531 | – | 8 | 10 | – | – | 3,631 | £ |
2022 | 419 | 1,360 | – | 7 | 5 | – | – | 3,060 | £ | |
Alfredo Barrios | 2023 | 428 | 1,578 | – | 4 | 43 | – | – | 3,431 | S$ |
2022 | 423 | 1,404 | – | 3 | 97 | – | – | 3,265 | S$ | |
Sinead Kaufman | 2023 | 293 | 856 | 13 | 3 | 18 | – | – | 2,462 | A$ |
2022 | 227 | 557 | 126 | 3 | 19 | – | – | 2,117 | A$ | |
Jérôme Pécresse | 2023 | 22 | – | – | – | 23 | – | – | 856 | C$ |
Simon Trott | 2023 | 436 | 1,465 | – | – | 18 | – | – | 3,403 | A$ |
2022 | 408 | 1,461 | – | 1 | 19 | – | – | 3,209 | A$ | |
Ivan Vella8 | 2023 | (323) | (1,003) | 6 | (1) | 23 | – | 155 | (328) | C$ |
2022 | 204 | 695 | 52 | 4 | 24 | – | – | 2,226 | C$ | |
Annual Report on Form 20-F 2023 | riotinto.com | 141 |
Stated in US$’0001 | Fees and allowances2 | Non-monetary benefits3 | Post- employment benefits | Single total figure of remuneration4 | Currency of actual payment | 1.Remuneration is reported in US$. The amounts have been converted using the 2023 annual average exchange rates of £1 = US$1.24329 and A$1 = US$0.66441. 2.“Fees and allowances” comprises the total fees for the Chair and all Non-Executive Directors (NED), and travel allowances for the NED. The statutory minimum superannuation contributions required by the Australian superannuation law and paid for the Australia based NED are included in “Fees and allowances”. 3.“Non-monetary benefits” include, as in previous years, amounts that are deemed by the UK tax authorities to be benefits in kind relating largely to the costs of directors’ expenses in attending Board meetings held at the company’s UK registered office (including associated accommodation and subsistence expenses) and professional tax compliance services/advice. Given these expenses are incurred by directors in the fulfilment of their duties, the company pays the tax on them. 4.Represents disclosure of the single total figure of remuneration under Schedule 8 of the Large- and Medium- sized Companies and Groups (Accounts and Reports) Regulations 2008 (as amended) and total remuneration under the Australian Corporations Act 2001 and applicable accounting standards. 5.The amounts reported for Dean Dalla Valle and Susan Lloyd- Hurwitz reflect the period of active Board memberships from 1 June 2023 to 31 December 2023. 6.The amounts reported for Kaisa Hietala reflect the period of active Board memberships from 1 March 2023 to 31 December 2023. 7.The amounts reported for Joc O’Rourke reflect the period of active Board memberships from 25 October 2023 to 31 December 2023. | |||
Chair | |||||||||
Dominic Barton | 2023 | 908 | 30 | – | 938 | £ | |||
2022 | 600 | 192 | 792 | £ | |||||
Non-Executive Directors | |||||||||
Megan Clark | 2023 | 222 | 8 | 24 | 254 | A$ | |||
2022 | 221 | 2 | 23 | 246 | A$ | ||||
Dean Dalla Valle5 | 2023 | 109 | 6 | 10 | 125 | A$ | |||
Simon Henry | 2023 | 221 | 3 | – | 224 | £ | |||
2022 | 202 | 4 | – | 206 | £ | ||||
Kaisa Hietala6 | 2023 | 163 | 18 | – | 181 | £ | |||
Sam Laidlaw | 2023 | 308 | 5 | – | 313 | £ | |||
2022 | 263 | 5 | – | 268 | £ | ||||
Susan Lloyd-Hurwitz5 | 2023 | 114 | 3 | 9 | 126 | A$ | |||
Simon McKeon | 2023 | 302 | 7 | – | 309 | A$ | |||
2022 | 275 | 3 | – | 278 | A$ | ||||
Jennifer Nason | 2023 | 202 | 6 | – | 208 | £ | |||
2022 | 196 | 4 | – | 200 | £ | ||||
Joc O’Rourke7 | 2023 | 23 | – | – | 23 | £ | |||
Ngaire Woods | 2023 | 221 | 5 | – | 226 | £ | | For more information further details in relation to aggregate compensation for executives, including directors, are included in note 29 (Directors’ and key management remuneration). | |
2022 | 188 | 9 | – | 197 | £ | ||||
Ben Wyatt | 2023 | 220 | 10 | – | 230 | A$ | |||
2022 | 203 | 4 | 4 | 211 | A$ | ||||
Rio Tinto plc1 | Rio Tinto Limited | Movements | ||||||||
1 Jan 20232 | 31 Dec 20233 | 7 Feb 20244 | 1 Jan 20232 | 31 Dec 20233 | 7 Feb 20244 | Compensation5 | Other6 | |||
Directors | ||||||||||
Dominic Barton | – | – | – | 11,900 | 11,900 | 11,900 | – | – | ||
Megan Clark7 | – | – | N/A | 6,370 | 6,370 | N/A | – | – | ||
Peter Cunningham | 52,815 | 63,053 | 63,065 | – | – | – | 16,173 | (5,923) | ||
Dean Dalla Valle8 | – | – | – | – | – | – | – | – | ||
Simon Henry | 1,500 | 2,000 | 2,000 | – | – | – | – | 500 | ||
Kaisa Hietala8 | – | 500 | 500 | – | – | – | – | 500 | ||
Sam Laidlaw | 7,500 | 7,500 | 7,500 | – | – | – | – | – | ||
Susan Lloyd-Hurwitz8 | – | – | – | – | 1,380 | 1,380 | – | 1,380 | ||
Simon McKeon | – | – | – | 10,000 | 10,000 | 10,000 | – | – | ||
Jennifer Nason | 1,765 | 1,765 | 1,765 | – | – | – | – | – | ||
Joc O'Rourke8 | – | – | – | – | – | – | – | – | ||
Jakob Stausholm | 56,337 | 95,363 | 95,389 | – | – | – | 52,047 | (12,995) | ||
Ngaire Woods | 572 | 1,482 | 1,482 | – | – | – | – | 910 | ||
Ben Wyatt | – | – | – | 300 | 400 | 400 | – | 100 | ||
Executives | ||||||||||
Bold Baatar | 76,111 | 61,216 | 61,242 | – | – | – | 93,458 | (108,327) | ||
Alfredo Barrios | 62,392 | 47,888 | 47,922 | – | – | – | 98,601 | (113,071) | ||
Sinead Kaufman | – | – | – | 39,511 | 43,633 | 43,633 | 15,232 | (11,109) | ||
Jérôme Pécresse | – | 5,000 | 5,000 | – | – | – | – | 5,000 | ||
Simon Trott | 9,780 | 19,338 | 19,338 | 26,006 | 26,090 | 26,090 | 85,161 | (75,519) | ||
Ivan Vella7 | 94 | 160 | N/A | 17,569 | 23,986 | N/A | 19,997 | (13,513) | ||
142 | Annual Report on Form 20-F 2023 | riotinto.com |
Name | Award/ grant date | Market price at award1,2 | 1 January 2023 | Awarded | Lapsed/ cancelled | Dividend units | Vested | 31 December 2023 | 7 February 2024 | Vesting period concludes | Date of release | Market price at release | Market value of award at release US$3 |
Bold Baatar | |||||||||||||
Bonus Deferral Awards | 18 Mar 2021 | £55.58 | 6,583 | – | – | 1,575 | (8,158) | – | – | 1 Dec 2023 | 1 Dec 2023 | £55.57 | 563,631 |
23 Mar 2022 | £58.00 | 6,956 | – | – | – | – | 6,956 | 6,956 | 1 Dec 2024 | – | – | – | |
22 Mar 2023 | £53.19 | – | 5,463 | – | – | – | 5,463 | 5,463 | 1 Dec 2025 | – | – | – | |
Performance Share Awards4 | 15 May 2018 | £42.30 | 63,039 | – | – | 22,104 | (85,143) | – | – | 31 Dec 2022 | 23 Feb 2023 | £59.22 | 6,268,859 |
18 Mar 2019 | £42.67 | 51,752 | – | – | – | – | 51,752 | 51,752 | 31 Dec 2023 | – | – | – | |
16 Mar 2020 | £33.58 | 53,272 | – | – | – | – | 53,272 | 53,272 | 31 Dec 2024 | – | – | – | |
18 Mar 2021 | £55.58 | 54,005 | – | – | – | – | 54,005 | 54,005 | 31 Dec 2025 | – | – | – | |
23 Mar 2022 | £58.00 | 44,414 | – | – | – | – | 44,414 | 44,414 | 31 Dec 2026 | – | – | – | |
22 Mar 2023 | £53.19 | – | 50,672 | – | – | – | 50,672 | 50,672 | 31 Dec 2027 | – | – | – | |
Alfredo Barrios | |||||||||||||
Bonus Deferral Awards | 18 Mar 2021 | £55.58 | 7,497 | – | – | 1,794 | (9,291) | – | – | 1 Dec 2023 | 1 Dec 2023 | £55.57 | 641,910 |
23 Mar 2022 | £58.00 | 6,466 | – | – | – | – | 6,466 | 6,466 | 1 Dec 2024 | – | – | – | |
22 Mar 2023 | £53.19 | – | 5,549 | – | – | – | 5,549 | 5,549 | 1 Dec 2025 | – | – | – | |
Performance Share Awards4 | 15 May 2018 | £42.30 | 66,050 | – | – | 23,159 | (89,209) | – | – | 31 Dec 2022 | 23 Feb 2023 | £59.22 | 6,568,228 |
18 Mar 2019 | £42.67 | 57,011 | – | – | – | – | 57,011 | 57,011 | 31 Dec 2023 | – | – | – | |
16 Mar 2020 | £33.58 | 53,236 | – | – | – | – | 53,236 | 53,236 | 31 Dec 2024 | – | – | – | |
18 Mar 2021 | £55.58 | 54,652 | – | – | – | – | 54,652 | 54,652 | 31 Dec 2025 | – | – | – | |
23 Mar 2022 | £58.00 | 43,707 | – | – | – | – | 43,707 | 43,707 | 31 Dec 2026 | – | – | – | |
22 Mar 2023 | £53.19 | – | 51,626 | – | – | – | 51,626 | 51,626 | 31 Dec 2027 | – | – | – | |
Peter Cunningham | |||||||||||||
Bonus Deferral Awards | 18 Mar 2021 | £55.58 | 1,402 | – | – | 335 | (1,737) | – | – | 1 Dec 2023 | 1 Dec 2023 | £55.57 | 120,008 |
23 Mar 2022 | £58.00 | 5,203 | – | – | – | – | 5,203 | 5,203 | 1 Dec 2024 | – | – | – | |
22 Mar 2023 | £53.19 | – | 5,827 | – | – | – | 5,827 | 5,827 | 1 Dec 2025 | – | – | – | |
Management Share Awards | 16 Mar 2020 | £33.58 | 3,713 | – | – | 838 | (4,551) | – | – | 23 Feb 2023 | 23 Feb 2023 | £59.22 | 335,078 |
18 Mar 2021 | £55.58 | 4,781 | – | – | – | – | 4,781 | 4,781 | 22 Feb 2024 | – | – | – | |
Performance Share Awards4 | 15 May 2018 | £42.30 | 7,229 | – | – | 2,534 | (9,763) | – | – | 31 Dec 2022 | 23 Feb 2023 | £59.22 | 718,824 |
18 Mar 2019 | £42.67 | 6,489 | – | – | – | – | 6,489 | 6,489 | 31 Dec 2023 | – | – | – | |
16 Mar 2020 | £33.58 | 7,426 | – | – | – | – | 7,426 | 7,426 | 31 Dec 2024 | – | – | – | |
18 Mar 2021 | £55.58 | 9,564 | – | – | – | – | 9,564 | 9,564 | 31 Dec 2025 | – | – | – | |
23 Mar 2022 | £58.00 | 50,405 | – | – | – | – | 50,405 | 50,405 | 31 Dec 2026 | – | – | – | |
22 Mar 2023 | £53.19 | – | 55,134 | – | – | – | 55,134 | 55,134 | 31 Dec 2027 | – | – | – | |
Sinead Kaufman | |||||||||||||
Bonus Deferral Awards | 18 Mar 2021 | A$110.80 | 1,408 | – | – | 269 | (1,677) | – | – | 1 Dec 2023 | 1 Dec 2023 | A$124.69 | 138,932 |
23 Mar 2022 | A$113.68 | 4,711 | – | – | – | – | 4,711 | 4,711 | 1 Dec 2024 | – | – | – | |
22 Mar 2023 | A$115.45 | – | 4,278 | – | – | – | 4,278 | 4,278 | 1 Dec 2025 | – | – | – | |
Management Share Awards | 16 Mar 2020 | A$77.65 | 4,289 | – | – | 871 | (5,160) | – | – | 23 Feb 2023 | 23 Feb 2023 | A$122.58 | 420,249 |
Performance Share Awards4 | 15 May 2018 | A$83.61 | 6,322 | – | – | 2,002 | (8,324) | – | – | 31 Dec 2022 | 23 Feb 2023 | A$122.58 | 677,937 |
18 Mar 2019 | A$93.32 | 6,291 | – | – | – | – | 6,291 | 6,291 | 31 Dec 2023 | – | – | – | |
16 Mar 2020 | A$77.65 | 8,579 | – | – | – | – | 8,579 | 8,579 | 31 Dec 2024 | – | – | – | |
18 Mar 2021 | A$110.80 | 41,207 | – | – | – | – | 41,207 | 41,207 | 31 Dec 2025 | – | – | – | |
23 Mar 2022 | A$113.68 | 36,042 | – | – | – | – | 36,042 | 36,042 | 31 Dec 2026 | – | – | – | |
22 Mar 2023 | A$115.45 | – | 40,045 | – | – | – | 40,045 | 40,045 | 31 Dec 2027 | – | – | – | |
Annual Report on Form 20-F 2023 | riotinto.com | 143 |
Name | Award/ grant date | Market price at award1,2 | 1 January 2023 | Awarded | Lapsed/ cancelled | Dividend units | Vested | 31 December 2023 | 7 February 2024 | Vesting period concludes | Date of release | Market price at release | Market value of award at release US$3 |
Jakob Stausholm | |||||||||||||
Bonus Deferral Awards | 18 Mar 2021 | £55.58 | 9,680 | – | – | 2,316 | (11,996) | – | – | 1 Dec 2023 | 1 Dec 2023 | £55.57 | 828,797 |
23 Mar 2022 | £58.00 | 13,017 | – | – | – | – | 13,017 | 13,017 | 1 Dec 2024 | – | £– | – | |
22 Mar 2023 | £53.19 | – | 10,488 | – | – | – | 10,488 | 10,488 | 1 Dec 2025 | – | £– | – | |
Performance Share Awards4 | 10 Sep 2018 | £35.16 | 29,886 | – | – | 10,008 | (39,894) | – | – | 31 Dec 2022 | 23 Feb 2023 | £59.22 | 2,937,292 |
18 Mar 2019 | £42.67 | 79,609 | – | – | – | – | 79,609 | 79,609 | 31 Dec 2023 | – | – | – | |
16 Mar 2020 | £33.58 | 74,711 | – | – | – | – | 74,711 | 74,711 | 31 Dec 2024 | – | – | – | |
18 Mar 2021 | £55.58 | 103,510 | – | – | – | – | 103,510 | 103,510 | 31 Dec 2025 | – | – | – | |
23 Mar 2022 | £58.00 | 85,126 | – | – | – | – | 85,126 | 85,126 | 31 Dec 2026 | – | – | – | |
22 Mar 2023 | £53.19 | – | 93,114 | – | – | – | 93,114 | 93,114 | 31 Dec 2027 | – | – | – | |
Simon Trott | |||||||||||||
Bonus Deferral Awards | 18 Mar 2021 | £55.58 | 6,392 | – | – | 1,529 | (7,921) | – | – | 1 Dec 2023 | 1 Dec 2023 | £55.57 | 547,257 |
23 Mar 2022 | A$113.68 | 5,494 | – | – | – | – | 5,494 | 5,494 | 1 Dec 2024 | – | – | – | |
22 Mar 2023 | A$115.45 | – | 4,683 | – | – | – | 4,683 | 4,683 | 1 Dec 2025 | – | – | – | |
Performance Share Awards4 | 15 May 2018 | £42.30 | 57,188 | – | – | 20,052 | (77,240) | – | – | 31 Dec 2022 | 23 Feb 2023 | £59.22 | 5,686,981 |
18 Mar 2019 | £42.67 | 50,598 | – | – | – | – | 50,598 | 50,598 | 31 Dec 2023 | – | – | – | |
16 Mar 2020 | £33.58 | 52,838 | – | – | – | – | 52,838 | 52,838 | 31 Dec 2024 | – | – | – | |
18 Mar 2021 | £55.58 | 49,571 | – | – | – | – | 49,571 | 49,571 | 31 Dec 2025 | – | – | – | |
23 Mar 2022 | A$113.68 | 38,204 | – | – | – | – | 38,204 | 38,204 | 31 Dec 2026 | – | – | – | |
22 Mar 2023 | A$115.45 | – | 44,488 | – | – | – | 44,488 | 44,488 | 31 Dec 2027 | – | – | – | |
Ivan Vella5 | |||||||||||||
Bonus Deferral Awards | 18 Mar 2021 | £55.58 | 1,525 | – | (1,525) | – | – | – | – | 1 Dec 2023 | – | – | – |
23 Mar 2022 | £58.00 | 5,288 | – | (5,288) | – | – | – | – | 1 Dec 2024 | – | – | – | |
22 Mar 2023 | £53.19 | – | 4,261 | (4,261) | – | – | – | – | 1 Dec 2025 | – | – | – | |
Management Share Awards | 16 Mar 2020 | A$77.65 | 1,931 | – | – | 392 | (2,323) | – | – | 23 Feb 2023 | 23 Feb 2023 | A$122.58 | 189,194 |
Performance Share Awards4 | 15 May 2018 | A$83.61 | 13,376 | – | – | 4,237 | (17,613) | – | – | 31 Dec 2022 | 23 Feb 2023 | A$122.58 | 1,434,467 |
18 Mar 2019 | A$93.32 | 8,570 | – | (8,570) | – | – | – | – | 31 Dec 2023 | – | – | – | |
16 Mar 2020 | A$77.65 | 3,862 | – | (3,862) | – | – | – | – | 31 Dec 2024 | – | – | – | |
18 Mar 2021 | £55.58 | 51,025 | – | (51,025) | – | – | – | – | 31 Dec 2025 | – | – | – | |
23 Mar 2022 | £58.00 | 41,731 | – | (41,731) | – | – | – | – | 31 Dec 2026 | – | – | – | |
22 Mar 2023 | £53.19 | – | 48,648 | (48,648) | – | – | – | – | 31 Dec 2027 | – | – | – | |
144 | Annual Report on Form 20-F 2023 | riotinto.com |

myShare | UK Share Plan | Total activity in 2023 | ||||||||
Plan interests at 1 January 20231 | Value of Matching shares awarded in year2 (U$‘000) | Value of Matching shares vested in year3 (U$‘000) | Value of Matching shares awarded in year2 (U$‘000) | Value of Matching shares vested in year3 (U$‘000) | Value of Free shares awarded in year4 (U$‘000) | Value of Free shares vested in year4 (U$‘000) | Grants in year (U$‘000) | Vesting in year (U$‘000) | Plan interests at 31 December 20231 | |
Bold Baatar | 388.5 | 2 | 3 | 2 | 2 | 4 | 6 | 8 | 11 | 357.6 |
Alfredo Barrios | 196.4 | 5 | 6 | 0 | 0 | 0 | 0 | 5 | 6 | 205.4 |
Peter Cunningham | 300.5 | 2 | 3 | 0 | 0 | 4 | 6 | 6 | 9 | 274.6 |
Sinead Kaufman | 158.7 | 4 | 6 | 0 | 0 | 0 | 0 | 4 | 6 | 148.8 |
Jakob Stausholm | 388.5 | 2 | 3 | 2 | 2 | 4 | 6 | 8 | 11 | 357.6 |
Simon Trott5 | 0 | 0 | 0 | 0 | 0 | 0 | 0 | 0 | 0 | 0.0 |
Ivan Vella | 152.9 | 4 | 5 | 0 | 0 | 0 | 0 | 4 | 5 | 0.0 |

Annual Report on Form 20-F 2023 | riotinto.com | 145 |
146 | Annual Report on Form 20-F 2023 | riotinto.com |
Annual Report on Form 20-F 2023 | riotinto.com | 147 |

148 | Annual Report on Form 20-F 2023 | riotinto.com |
Total number of shares purchased1 | Average price per share US$2 | Total number of shares purchased to satisfy company dividend reinvestment plans | Total number of shares purchased to satisfy employee share plans | Total number of shares purchased as part of publicly announced plans or programs3 | Maximum number of shares that may be purchased under plans or programs | |
2023 | ||||||
1 to 31 Jan | – | – | – | – | – | 124,921,5735 |
1 to 28 Feb | – | – | – | – | – | 124,921,5735 |
1 to 31 Mar | – | – | – | – | – | 124,921,5735 |
1 to 30 Apr | 586,662 | 67.61 | 393,248 | 193,414 | – | 125,083,2176 |
1 to 31 May | 56,348 | 61.77 | – | 56,348 | – | 125,083,2176 |
1 to 30 Jun | – | – | – | – | – | 125,083,2176 |
1 to 31 Jul | – | – | – | – | – | 125,083,2176 |
1 to 31 Aug | – | – | – | – | – | 125,083,2176 |
1 to 30 Sep | 503,079 | 63.37 | 342,910 | 160,169 | – | 125,083,2176 |
1 to 31 Oct | 28,991 | 61.54 | – | 28,991 | – | 125,083,2176 |
1 to 30 Nov | – | – | – | – | – | 125,083,2176 |
1 to 31 Dec | – | – | – | – | – | 125,083,2176 |
Total | 1,175,0804 | 65.36 | 736,158 | 438,922 | – | – |
2024 | ||||||
1 to 31 Jan | – | – | – | – | – | 125,083,2176 |
1 to 07 Feb | – | – | – | – | – | 125,083,2176 |
Total number of shares purchased1 | Average price per share $2 | Total number of shares purchased to satisfy company dividend reinvestment plans | Total number of shares purchased to satisfy employee share plans7 | Total number of shares purchased as part of publicly announced plans or programs3 | Maximum number of shares that may be purchased under plans or programs | |
2023 | ||||||
1 to 31 Jan | – | – | – | – | – | 55,600,0008 |
1 to 28 Feb | – | – | – | – | – | 55,600,0008 |
1 to 31 Mar | – | – | – | – | – | 55,600,0008 |
1 to 30 Apr | 733,797 | 77.39 | 572,918 | 160,879 | – | 55,600,0008 |
1 to 31 May | 41,021 | 71.54 | – | 41,021 | – | 55,600,0009 |
1 to 30 Jun | – | – | – | – | – | 55,600,0009 |
1 to 31 Jul | – | – | – | – | – | 55,600,0009 |
1 to 31 Aug | – | – | – | – | – | 55,600,0009 |
1 to 30 Sep | 595,223 | 73.31 | 459,671 | 135,552 | – | 55,600,0009 |
1 to 31 Oct | 167,043 | 71.79 | – | 167,043 | – | 55,600,0009 |
1 to 30 Nov | – | – | – | – | – | 55,600,0009 |
1 to 31 Dec | 705,351 | 90.06 | – | 705,351 | – | 55,600,0009 |
Total | 2,242,436 | 79.77 | 1,032,589 | 1,209,847 | – | – |
2024 | ||||||
1 to 31 Jan | – | – | – | – | – | 55,600,0009 |
1 to 07 Feb | – | – | – | – | – | 55,600,0009 |
Annual Report on Form 20-F 2023 | riotinto.com | 149 |
Energy consumption in GWh | 2023 | 20225 |
From activities including the combustion of fuel and the operation of facilities | 85,463 | 84,619 |
From the net purchase of electricity, heat, steam or cooling | 27,421 | 25,065 |
Total energy consumed4 | 112,884 | 109,684 |
2023 | 202213 | |
Scope 19 | 23.3 | 22.7 |
Scope 210 | 9.3 | 9.6 |
Net GHG emissions11 | 32.6 | 32.314 |
Operational emissions intensity (tCO2e/t Cu-eq)(equity)12 | 6.8 | 7.0 |
150 | Annual Report on Form 20-F 2023 | riotinto.com |

Annual Report on Form 20-F 2023 | riotinto.com | 151 |
152 | Annual Report on Form 20-F 2023 | riotinto.com |
| For more information see page 104. |
Gender | Number of Board members | % of Board | Number of senior positions on the board (e.g. CEO/CFO, SID & Chair) | Number in executive management | % of executive management |
Men | 9 | 69% | 4 | 9 | 75% |
Women | 4 | 31%¹ | – | 3 | 25% |
Non-binary | – | – | – | – | – |
Not specified/prefer not to say | – | – | – | – | – |
ONS ethnicity category | Number of Board members | % of Board | Number of senior positions on the board (e.g. CEO/CFO, SID & Chair) | Number in executive management | % of executive management |
White British or White Other | 12 | 92% | 4 | 7 | 58% |
Mixed/Multiple Ethnic Groups | – | – | – | 1 | 8% |
Asian/Asian British | – | – | – | – | – |
Black/African/Caribbean/Black British | – | – | – | – | – |
Other Ethnic Group | 1 | 8% | – | – | – |
Not specified/prefer not to say | – | – | – | 4 | 33% |
Annual Report on Form 20-F 2023 | riotinto.com | 153 |
154 | Annual Report on Form 20-F 2023 | riotinto.com |
Annual Report on Form 20-F 2023 | riotinto.com | 155 |
156 | Annual Report on Form 20-F 2023 | riotinto.com |
2023 Financial Statements | ||||
Our people | ||||
Group primary statements | ||||
Note 29 Directors’ and key management remuneration | ||||
Our group structure | ||||
Notes to the 2023 financial statements | ||||
Our financial performance | ||||
Note 1 Our financial performance by segment | ||||
Our equity | ||||
Note 3 Dividends | ||||
Note 4 Impairment charges net of reversals | ||||
Note 5 Acquisitions and disposals | ||||
Note 6 Revenue by destination and product | Other notes | |||
Our operating assets | Other information outside of the consolidated financial statements | |||
Rio Tinto Financial Information by Business Unit | ||||
Our capital and liquidity | ||||
Note 19 Net debt | ||||
Note 24 Financial instruments and risk management | ||||
Simandou iron ore project, Guinea | ||
Annual Report on Form 20-F 2023 | riotinto.com | 157 | |
158 | Annual Report on Form 20-F 2023 | riotinto.com |
Key judgements | 2023 | 2022 | Context | ||
Indicators of impairment and impairment reversals (note 4) | a | a | Various cash-generating units of the Group have been impaired in previous years and are, therefore, monitored closely for indicators of further impairment or impairment reversal as such adjustments would likely be material to our results. | ||
Deferral of stripping costs (note 13) | a | a | The deferral of stripping costs is a key judgement in open-pit mining operations as it impacts the amortisation base for these costs, calculated on a units of production basis; this involves determining whether multiple pits are considered separate or integrated operations, which in turn influences the classification of stripping activities as pre-production or production phase. This judgement relies on various factors that are based on the unique characteristics and circumstances of each mine. | ||
Estimation of asset lives (note 13) | a | a | The useful lives of major assets are often linked to the life of the orebody they relate to, which is in turn based on the life-of-mine plan. Where the major assets are not dependent on the life of a related orebody, management applies judgement in estimating the remaining service potential of long-lived assets. The accuracy of estimating these useful lives is essential for determining the appropriate allocation of costs over time, reflecting the consumption of the asset’s economic benefits. | ||
Close-down, restoration and environmental obligations (note 14) | a | a | Significant judgement is required to assess the possible extent of closure rehabilitation work needed to fulfil the Group’s legal, statutory, and constructive obligations, along with other commitments to stakeholders. This involves leveraging our experience in evaluating available options and techniques to meet these obligations, associated costs and their likely timing and, crucially, determining when that estimate is sufficiently reliable to make or adjust a closure provision. | ||
Annual Report on Form 20-F 2023 | riotinto.com | 159 |
Other relevant judgements | 2023 | 2022 | Context | ||
Identification of functional currencies (f below) | a | a | The determination of functional currency is a relevant judgement as it affects the measurement of non-current assets included in the balance sheet and, as a consequence, the depreciation and amortisation of those assets included in the income statement. It also impacts exchange gains and losses included in the income statement and in equity. | ||
Exclusions from underlying EBITDA (note 1) | a | a | Judgement is required in excluding items from profit after tax as they are gains and losses that, individually or in aggregate with similar items, are of a nature and size to require exclusion in order to provide additional insight into the underlying business performance. | ||
Determination of cash-generating units (CGUs) (note 4) | a | a | Judgement is applied to identify the Group’s CGUs, particularly when assets belong to integrated operations. Changes in asset allocations to CGUs could impact impairment charges and reversals. | ||
Uncertain tax positions (note 10) | a | a | Where the amount of tax payable or recoverable is uncertain in any of the jurisdictions in which the Group operates, whether due to the local tax authority challenge or due to uncertainty regarding the appropriate treatment, judgement is required to assess the probability that the adopted treatment will be accepted. | ||
Assessment of indefinite-lived water rights in Quebec (note 12) | a | a | We continue to judge the water rights in Quebec to have an indefinite life because we expect the contractual rights to contribute to the efficiency and cost effectiveness of our operations for the foreseeable future. This determination is a relevant judgement as intangible assets that are deemed to have indefinite lives are not amortised; they are reviewed annually for impairment or more frequently if events or changes in circumstances indicate a potential impairment. | ||
Recoverability of deferred tax assets (note 15) | a | a | In considering the recoverability of deferred tax assets, judgement is required regarding the extent to which certain risk factors are likely to affect the recovery of these assets, including future profit forecasts. | ||
Lease assessment (note 21) | a | 0 | The Group has entered into renewable energy power purchase agreements that require judgements to assess whether the arrangement contains a lease for the relevant power generating assets. | ||
Accounting for the Pilbara Iron Arrangements (note 31) | a | a | In assessing the Pilbara Iron Arrangements, judgement is required in concluding whether they collectively constitute a joint arrangement. | ||
Basis of consolidation of Queensland Alumina Limited (note 31) | 0 | a | Judgement is required to assess how we consolidate Queensland Alumina Limited (QAL). As a result of the Australian government imposing Trade Sanctions against Russia, QAL is not able to process bauxite on behalf of Rusal entities. Rio Tinto has contributed additional bauxite tonnes to ensure that 100% of production capacity is maintained. We continue to account for QAL as a joint operation. | ||
Accounting for Minera Escondida Ltda (note 32) | a | a | Judgement is required in our determination that Escondida is a joint venture as this impacts the classification of the entity in the financial statements. | ||
Recognition of contingencies (note 37) | a | a | Judgement is required to determine whether disclosure is made for material contingent liabilities depending on whether the possibility of any loss arising is considered remote, and whether these can be reliably estimated in order to be quantified. | ||
160 | Annual Report on Form 20-F 2023 | riotinto.com |
Key accounting estimates | 2023 | 2022 | Context | ||
Estimation of the close-down, restoration and environmental cost obligations (note 14) | a | a | Close-down, restoration and environment obligations are based on cash flow projections derived from studies that incorporate planned rehabilitation activities, cost estimates and discounting for the time value. Closure studies are performed to a rolling schedule with increased frequency and engineering accuracy for sites approaching end of life. Information from these studies can result in a material change to the associated provisions. The most significant closure provision update related to the Ranger mine at Energy Resources of Australia. The provision is based on reforecast cash flows, these are subject to further study which could result in material adjustment in the near term. | ||
Estimation of obligations for post- employment costs (note 28) | a | a | The value of the Group’s obligations for post-employment benefits is dependent on the amount of benefits that are expected to be paid out, discounted to the balance sheet date. There is significant estimation uncertainty pertaining to the most significant assumptions used in accounting for pension plans, namely the discount rate, the long-term inflation rate and mortality rates. | ||
Other relevant judgements - identification of functional currency We present our financial statements in US dollars, as that presentation currency most reliably reflects the global business performance of the Group as a whole. The functional currency for each subsidiary, unincorporated arrangement, joint operation and equity accounted unit is the currency of the primary economic environment in which it operates. For businesses that reside in developed economies, the functional currency is generally the currency of the country in which it operates because of the dominance of locally incurred costs. If the business resides in an emerging economy, the US dollar is generally identified to be the functional currency as a higher proportion of costs, particularly imported goods and services, are agreed and paid in US dollars, in common with other international investors. Determination of functional currency involves judgement, and other companies may make different judgements based on similar facts. The determination of functional currency affects the measurement of non-current assets included in the balance sheet and, as a consequence, the depreciation and amortisation of those assets included in the income statement. It also impacts exchange gains and losses included in the income statement and in equity. We also apply judgement in determining whether settlement of certain intragroup loans is neither planned nor likely in the foreseeable future and, therefore, whether the associated exchange gains and losses can be taken to equity. During 2023, A$ | ||
Full-year average | Year-end | |||||
One unit of local currency buys the following number of US dollars | 2023 | 2022 | 2021 | 2023 | 2022 | 2021 |
Pound sterling | ||||||
Australian dollar | ||||||
Canadian dollar | ||||||
Euro | ||||||
South African rand | ||||||
Annual Report on Form 20-F 2023 | riotinto.com | 161 |
162 | Annual Report on Form 20-F 2023 | riotinto.com |
Annual Report on Form 20-F 2023 | riotinto.com | 163 |
164 | Annual Report on Form 20-F 2023 | riotinto.com |
Financial reporting considerations and sensitivities related to climate change | Page | ||
Recoverable value of our assets, asset obsolescence, impairment and use of sensitivities (note 4) | |||
Operating expenditure spend on decarbonisation (note 7 - footnote (h)) | |||
Water rights - climate impact on indefinite life (note 12) | |||
Carbon abatement spend on procurement of carbon units and renewable energy certificates (note 12 - footnote (a)) | |||
Estimation of asset lives (note 13) | |||
Additions to property, plant and equipment with a primary purpose of reducing carbon emissions (note 13 - footnote (d)) | |||
Useful economic lives of power generating assets (note 13) | |||
Close-down, restoration and environmental cost (note 14) | |||
Upper Calliope Solar Farm PPA in Queensland (note 24 (iv)) | |||
Coal royalty receivables (note 24) | |||
Decarbonisation capital commitments (note 37) | |||
Annual Report on Form 20-F 2023 | riotinto.com | 165 |
At 1 January | 2023 US$m | 2022 US$m | 2021 US$m |
Equity attributable to owners of Rio Tinto (previously reported) | |||
Impact of IAS 12 amendments(a) | |||
Restated equity attributable to owners of Rio Tinto |
31 December 2022 | |
US$m | |
Deferred tax assets (previously reported) | |
Impact of IAS 12 amendments | |
Deferred tax assets (restated) | |
Deferred tax liabilities (previously reported) | ( |
Impact of IAS 12 amendments | |
Deferred tax liabilities (restated) | ( |
Net impact of IAS 12 amendments on deferred tax balances | |
Comprising, prior to offsetting of balances: | |
Deferred tax assets arising from: | |
- Provisions and other liabilities | |
- Capital allowances | ( |
Deferred tax liabilities arising from Capital allowances | ( |
166 | Annual Report on Form 20-F 2023 | riotinto.com |
Annual Report on Form 20-F 2023 | riotinto.com | 167 |
Note | 2023 US$m | 2022 US$m Restated (a) | 2021 US$m Restated (a) | |
Consolidated operations | ||||
Consolidated sales revenue | 1, 6 | |||
Net operating costs (excluding items disclosed separately) | 7 | ( | ( | ( |
Net impairment (charges)/reversals | 4 | ( | ( | |
Loss on disposal of interest in subsidiary | 5 | ( | ||
Exploration and evaluation expenditure (net of profit from disposal of interests in undeveloped projects) | 8 | ( | ( | ( |
Operating profit | ||||
Share of profit after tax of equity accounted units | ||||
Impairment of investments in equity accounted units | 4 | ( | ||
Profit before finance items and taxation | ||||
Finance items | ||||
Net exchange (losses)/gains on external net debt and intragroup balances | ( | |||
Losses on derivatives not qualifying for hedge accounting | ( | ( | ( | |
Finance income | 9 | |||
Finance costs | 9 | ( | ( | ( |
Amortisation of discount on provisions | 14, 36 | ( | ( | ( |
( | ( | ( | ||
Profit before taxation | ||||
Taxation | 10 | ( | ( | ( |
Profit after tax for the year | ||||
– attributable to owners of Rio Tinto (net earnings) | ||||
– attributable to non-controlling interests | ( | |||
Basic earnings per share | 2 | |||
Diluted earnings per share | 2 |
168 | Annual Report on Form 20-F 2023 | riotinto.com |
Note | 2023 US$m | 2022 US$m Restated (a) | 2021 US$m Restated (a) | |
Profit after tax for the year | ||||
Other comprehensive income/(loss) | ||||
Items that will not be reclassified to the income statement: | ||||
Re-measurement (losses)/gains on pension and post-retirement healthcare plans | 28 | ( | ||
Changes in the fair value of equity investments held at fair value through other comprehensive income (FVOCI) | ( | |||
Tax relating to these components of other comprehensive income | 10 | ( | ( | |
Share of other comprehensive (losses)/income of equity accounted units, net of tax | ( | |||
( | ||||
Items that have been/may be subsequently reclassified to the income statement: | ||||
Currency translation adjustment(b) | ( | ( | ||
Currency translation on subsidiary disposed of, transferred to the income statement | ||||
Fair value movements: | ||||
– Cash flow hedge gains/(losses) | ( | ( | ||
– Cash flow hedge (gains)/losses transferred to the income statement | ( | |||
Net change in costs of hedging reserve | 35 | ( | ||
Tax relating to these components of other comprehensive loss | 10 | |||
Share of other comprehensive income/(losses) of equity accounted units, net of tax | ( | ( | ||
( | ( | |||
Total other comprehensive income/(loss) for the year, net of tax | ( | ( | ||
Total comprehensive income for the year | ||||
– attributable to owners of Rio Tinto | ||||
– attributable to non-controlling interests | ( |
Annual Report on Form 20-F 2023 | riotinto.com | 169 |
Note | 2023 US$m | 2022 US$m | 2021 US$m | |
Cash flows from consolidated operations(a) | ||||
Dividends from equity accounted units | ||||
Cash flows from operations | ||||
Net interest paid | ( | ( | ( | |
Dividends paid to holders of non-controlling interests in subsidiaries | ( | ( | ( | |
Tax paid | ( | ( | ( | |
Net cash generated from operating activities | ||||
Cash flows from investing activities | ||||
Purchases of property, plant and equipment and intangible assets | 1 | ( | ( | ( |
Sales of property, plant and equipment and intangible assets | ||||
Acquisitions of subsidiaries, joint ventures and associates | 5 | ( | ( | |
Disposals of subsidiaries, joint ventures, joint operations and associates | 5 | |||
Purchases of financial assets | ( | ( | ( | |
Sales of financial assets(b)(c) | ||||
Net (funding of)/receipts from equity accounted units | ( | ( | ||
Other investing cash flows(d) | ( | |||
Net cash used in investing activities | ( | ( | ( | |
Cash flows before financing activities | ||||
Cash flows from financing activities | ||||
Equity dividends paid to owners of Rio Tinto | 3 | ( | ( | ( |
Proceeds from additional borrowings(e) | 19, 20 | |||
Repayment of borrowings and associated derivatives(e) | 19, 20 | ( | ( | ( |
Lease principal payments | 19 | ( | ( | ( |
Proceeds from issue of equity to non-controlling interests | ||||
Purchase of non-controlling interest(f) | 5, 30 | ( | ( | |
Other financing cash flows | ( | |||
Net cash used in financing activities | ( | ( | ( | |
Effects of exchange rates on cash and cash equivalents | ( | |||
Net increase/(decrease) in cash and cash equivalents | ( | |||
Opening cash and cash equivalents less overdrafts | ||||
Closing cash and cash equivalents less overdrafts | 22 |
Notes to the Group Cash Flow Statement | ||||
(a) Cash flows from consolidated operations | Note | 2023 US$m | 2022 US$m | 2021 US$m |
Profit after tax for the year (comparative restated)(g) | ||||
Adjustments for: | ||||
– Taxation (comparative restated)(g) | ||||
– Finance items | ||||
– Share of profit after tax of equity accounted units | ( | ( | ( | |
– Loss on disposal of interest in subsidiary | 5 | |||
– Impairment charges of investments in equity accounted units after tax | 4 | |||
– Net impairment charges/(reversals) | 4 | ( | ||
– Depreciation and amortisation | ||||
– Provisions (including exchange differences on provisions) | ||||
– Pension settlement | ( | |||
Utilisation of other provisions | 36 | ( | ( | ( |
Utilisation of provisions for close-down and restoration | 14 | ( | ( | ( |
Utilisation of provisions for post-retirement benefits and other employment costs | 26 | ( | ( | ( |
Change in inventories | ( | ( | ( | |
Change in receivables and other assets(h) | ( | ( | ||
Change in trade and other payables | ( | |||
Other items(i) | ( | ( | ( | |
170 | Annual Report on Form 20-F 2023 | riotinto.com |
Note | 2023 US$m | 2022 US$m Restated (a) | |
Non-current assets | |||
Goodwill | 11 | ||
Intangible assets | 12 | ||
Property, plant and equipment | 13 | ||
Investments in equity accounted units | |||
Inventories | 16 | ||
Deferred tax assets | 15 | ||
Receivables and other assets | 17 | ||
Other financial assets | 23 | ||
Current assets | |||
Inventories | 16 | ||
Receivables and other assets | 17 | ||
Tax recoverable | |||
Other financial assets | 23 | ||
Cash and cash equivalents | 22 | ||
Total assets | |||
Current liabilities | |||
Borrowings | 20 | ( | ( |
Leases | 21 | ( | ( |
Other financial liabilities | 23 | ( | ( |
Trade and other payables | 18 | ( | ( |
Tax payable | ( | ( | |
Close-down and restoration provisions | 14 | ( | ( |
Provisions for post-retirement benefits and other employment costs | 26 | ( | ( |
Other provisions | 36 | ( | ( |
( | ( | ||
Non-current liabilities | |||
Borrowings | 20 | ( | ( |
Leases | 21 | ( | ( |
Other financial liabilities | 23 | ( | ( |
Trade and other payables | 18 | ( | ( |
Tax payable | ( | ( | |
Deferred tax liabilities | 15 | ( | ( |
Close-down and restoration provisions | 14 | ( | ( |
Provisions for post-retirement benefits and other employment costs | 26 | ( | ( |
Other provisions | 36 | ( | ( |
( | ( | ||
Total liabilities | ( | ( | |
Net assets | |||
Capital and reserves | |||
Share capital | |||
– Rio Tinto plc | 34 | ||
– Rio Tinto Limited | 34 | ||
Share premium account | |||
Other reserves | 35 | ||
Retained earnings | 35 | ||
Equity attributable to owners of Rio Tinto | |||
Attributable to non-controlling interests | |||
Total equity |
 |  |  | ||
Dominic Barton Chair | Jakob Stausholm Chief Executive | Peter Cunningham Chief Financial Officer |
Annual Report on Form 20-F 2023 | riotinto.com | 171 |
Year ended 31 December 2023 | Attributable to owners of Rio Tinto | ||||||
Share capital (note 34) US$m | Share premium account US$m | Other reserves (note 35) US$m | Retained earnings (note 35) US$m | Total US$m | Non- controlling interests US$m | Total equity US$m | |
Opening balance as previously reported | |||||||
Adjustment for transition to new accounting pronouncements(a) | — | — | ( | ||||
Restated opening balance | |||||||
Total comprehensive income for the year(b) | — | — | ( | ||||
Currency translation arising on Rio Tinto Limited's share capital | — | — | — | — | |||
Dividends (note 3) | — | — | — | ( | ( | ( | ( |
Newly consolidated operation (note 5) | — | — | — | — | — | ||
Own shares purchased from Rio Tinto shareholders to satisfy share awards to employees(c) | — | — | ( | ( | ( | — | ( |
Change in equity interest held by Rio Tinto (note 30) | — | — | — | ( | ( | — | |
Treasury shares reissued and other movements | — | — | — | — | |||
Equity issued to holders of non-controlling interests | — | — | — | — | — | ||
Employee share awards charged to the income statement | — | — | — | ||||
Closing balance | |||||||
Year ended 31 December 2022 | Attributable to owners of Rio Tinto | ||||||
Share capital (note 34) US$m | Share premium account US$m | Other reserves (note 35) US$m | Retained earnings (note 35) US$m | Total US$m | Non- controlling interests US$m | Total equity US$m | |
Opening balance as previously reported(d) | |||||||
Adjustment for transition to new accounting pronouncements(a) | — | — | ( | ||||
Restated opening balance | |||||||
Total comprehensive income for the year(b) | — | — | ( | ||||
Currency translation arising on Rio Tinto Limited's share capital | ( | — | — | — | ( | — | ( |
Dividends (note 3) | — | — | — | ( | ( | ( | ( |
Own shares purchased from Rio Tinto shareholders to satisfy share awards to employees(c) | — | — | ( | ( | ( | — | ( |
Change in equity interest held by Rio Tinto | — | — | — | ( | ( | ||
Treasury shares reissued and other movements | — | — | — | — | |||
Equity issued to holders of non-controlling interests | — | — | — | ( | ( | ||
Employee share awards charged to the income statement | — | — | — | ||||
Transfers and other movements | — | — | — | — | — | ( | ( |
Closing balance (restated) | |||||||
Year ended 31 December 2021 | Attributable to owners of Rio Tinto | ||||||
Share capital (note 34) US$m | Share premium account US$m | Other reserves (note 35) US$m | Retained earnings (note 35) US$m | Total US$m | Non- controlling interests US$m | Total equity US$m | |
Opening balance as previously reported | |||||||
Adjustment for transition to new accounting pronouncements(a) | — | — | — | ||||
Restated opening balance | |||||||
Total comprehensive income for the year(b) | — | — | ( | ||||
Currency translation arising on Rio Tinto Limited's share capital | ( | — | — | — | ( | — | ( |
Dividends (note 3) | — | — | — | ( | ( | ( | ( |
Share buyback | — | — | — | — | — | — | — |
Own shares purchased from Rio Tinto shareholders to satisfy share awards to employees(c) | — | — | ( | ( | ( | — | ( |
Change in equity interest held by Rio Tinto | — | — | — | ( | — | ||
Treasury shares reissued and other movements | — | — | — | — | |||
Equity issued to holders of non-controlling interests | — | — | — | — | — | ||
Employee share awards charged to the income statement | — | — | — | ||||
Closing balance | |||||||
172 | Annual Report on Form 20-F 2023 | riotinto.com |
Reportable segment | Principal activities |
Iron Ore | Iron ore mining and salt and gypsum production in Western Australia. |
Aluminium | Bauxite mining; alumina refining; aluminium smelting. |
Copper | Mining and refining of copper, gold, silver, molybdenum, other by-products and exploration activities. |
Minerals | Includes mining and processing of borates, titanium dioxide feedstock, and iron concentrate and pellets from the Iron Ore Company of Canada. Also includes diamond mining, sorting and marketing and development projects for battery materials, such as lithium. |
2023 | |||
Segmental revenue US$m | Underlying EBITDA US$m | Capital expenditure(a) US$m | |
Iron Ore | |||
Aluminium | |||
Copper | |||
Minerals | |||
Reportable segments total | |||
Other operations | ( | ||
Inter-segment transactions | ( | ||
Share of equity accounted units(b) | ( | ||
Central pension costs, share-based payments, insurance and derivatives | |||
Restructuring, project and one-off costs | ( | ||
Central costs | ( | ||
Central exploration and evaluation expenditures | ( | ||
Proceeds from disposal of property, plant and equipment | |||
Other items | |||
Consolidated sales revenue/Purchases of property, plant and equipment and intangible assets | |||
Underlying EBITDA | |||
Annual Report on Form 20-F 2023 | riotinto.com | 173 |
2022 Adjusted(a) | 2021 Adjusted(a) | |||||
Segmental revenue US$m | Underlying EBITDA US$m | Capital expenditure(b) US$m | Segmental revenue US$m | Underlying EBITDA US$m | Capital expenditure(b) US$m | |
Iron Ore | ||||||
Aluminium | ||||||
Copper | ||||||
Minerals | ||||||
Reportable segments total | ||||||
Other operations | ( | ( | ( | |||
Inter-segment transactions | ( | ( | ||||
Share of equity accounted units(c) | ( | ( | ||||
Central pension costs, share-based payments, insurance and derivatives | ||||||
Restructuring, project and one-off costs | ( | ( | ||||
Central costs | ( | ( | ||||
Central exploration and evaluation expenditures | ( | ( | ||||
Proceeds from disposal of property, plant and equipment | ||||||
Other items | ||||||
Consolidated sales revenue/Purchases of property, plant and equipment and intangible assets | ||||||
Underlying EBITDA | ||||||
Other relevant judgements - Exclusions from underlying EBITDA Items excluded from profit after tax are those gains and losses that, individually or in aggregate with similar items, are of a nature and size to require exclusion in order to provide additional insight into the underlying business performance. The following items are excluded from profit after tax in arriving at underlying EBITDA in each year irrespective of materiality: –Depreciation and amortisation in subsidiaries and equity accounted units; –Taxation and finance items in equity accounted units; –Taxation and finance items relating to subsidiaries; –Unrealised gains/(losses) on embedded derivatives not qualifying for hedge accounting; –Net gains/(losses) on disposal of interests in subsidiaries; –Impairment charges net of reversals; –The underlying EBITDA of discontinued operations; –Adjustments to closure provisions where the adjustment is associated with an impairment charge and for legacy sites where the disturbance or environmental contamination relates to the pre-acquisition period. In addition, there is a final judgemental category which includes, where applicable, other credits and charges that, individually or in aggregate if of a similar type, are of a nature or size to require exclusion in order to provide additional insight into underlying business performance. In 2023, this includes all re-estimates of the closure provisions for fully impaired sites identified in the second half of the year due to the materiality of the adjustment in aggregate. In 2022 this category included the gain recognised by Kitimat relating to LNG Canada's project and the gain recognised upon sale of the Cortez royalty. In 2021 the category included the changes in closure estimates at Energy Resources of Australia and Gove Refinery. | ||
174 | Annual Report on Form 20-F 2023 | riotinto.com |
2023 US$m | 2022 US$m Restated(a) | 2021 US$m Restated(a) | |
Profit after tax for the year | |||
Taxation | |||
Profit before taxation | |||
Depreciation and amortisation in subsidiaries excluding capitalised depreciation(b) | |||
Depreciation and amortisation in equity accounted units | |||
Finance items in subsidiaries | |||
Taxation and finance items in equity accounted units | |||
(Gains)/losses on embedded commodity derivatives not qualifying for hedge accounting (including foreign exchange) | ( | ( | |
Impairment charges net of reversals(c) | |||
Gain recognised by Kitimat relating to LNG Canada's project(d) | ( | ( | |
Change in closure estimates (non-operating and fully impaired sites)(e) | |||
Loss on disposal of interests in subsidiary(c) | |||
Gain on sale of the Cortez royalty(f) | ( | ||
Underlying EBITDA |
2023 | 2022 Restated(a) | 2021 Restated(a) | |
Net earnings attributable to owners of Rio Tinto (US$ million) | |||
Weighted average number of shares (millions)(b) | |||
Basic earnings per ordinary share (cents) |
2023 | 2022 Restated(a) | 2021 Restated(a) | |
Net earnings attributable to owners of Rio Tinto (US$ million) | |||
Weighted average number of shares (millions)(b) | |||
Diluted earnings per share attributable to ordinary shareholders of Rio Tinto (cents) |
Annual Report on Form 20-F 2023 | riotinto.com | 175 |
2023 | 2022 | 2021 | |
Ordinary dividends per share: announced with the results for the year | |||
Special dividends per share: announced with the results for the year(a) |
Dividends per share 2023 | Dividends per share 2022 | Dividends per share 2021 | |
Previous year final - paid during the year (US cents) | |||
Previous year special - paid during the year (US cents) | |||
Interim - paid during the year (US cents) | |||
Interim special - paid during the year (US cents) | |||
Total paid during the year (US cents) |
Dividends per share 2023 | Dividends per share 2022 | Dividends per share 2021 | |
Rio Tinto plc previous year final (pence) | |||
Rio Tinto plc previous year special (pence) | |||
Rio Tinto plc interim (pence) | |||
Rio Tinto plc interim special (pence) | |||
Total paid during the year (pence) | |||
Rio Tinto Limited previous year final – fully franked at | |||
Rio Tinto Limited previous year special – fully franked at | |||
Rio Tinto Limited interim – fully franked at | |||
Rio Tinto Limited interim special – fully franked at | |||
Total paid during the year (Australian cents) |
2023 US$m | 2022 US$m | 2021 US$m | |
Rio Tinto plc previous year final dividend payable | |||
Rio Tinto plc previous year special dividend payable | |||
Rio Tinto plc interim dividend payable | |||
Rio Tinto plc interim special dividend payable | |||
Rio Tinto Limited previous year final dividend payable | |||
Rio Tinto Limited previous year special dividend payable | |||
Rio Tinto Limited interim dividend payable | |||
Rio Tinto Limited interim special dividend payable | |||
Dividends payable during the year | |||
Net movement of unclaimed dividends in the year | ( | ||
Dividends paid during the year(b) |
176 | Annual Report on Form 20-F 2023 | riotinto.com |
Other relevant judgements - determination of CGUs Judgement is applied to identify the Group’s CGUs, particularly when assets belong to integrated operations, and changes in CGUs could impact impairment charges and reversals. The most relevant judgement continues to relate to the grouping of Rio Tinto Iron and Titanium Quebec Operations and QIT Madagascar Minerals (QMM) as a single CGU on the basis that they are vertically integrated operations and there is no active market for QMM’s ilmenite. | ||
Key judgement - indicators of impairment and impairment reversals The Oyu Tolgoi and Kitimat cash-generating units have both been impaired in previous years and are therefore monitored closely for indicators of further impairment or impairment reversal as such adjustments would likely be material to our results. At the time of their impairment, the carrying value and fair value for these CGUs were equal, making the CGUs sensitive to changes in economic assumptions, albeit headroom may have subsequently arisen due to the passage of time. Oyu Tolgoi We assessed the Oyu Tolgoi CGU for internal sources of information that could indicate impairment or impairment reversal by reference to the operational performance of the mine and development progress for the underground operation. For external sources of information that could indicate impairment or impairment reversal, we considered current and projected commodity prices. We concluded that there were no indicators of impairment or impairment reversal. Kitimat The Kitimat smelter was impaired in 2013 and 2014 during the construction phase as cost overruns were not expected to be recovered through economic performance. The plant was further impaired in 2021 (refer to page 180 for details) as operational performance was adversely impacted by a workforce strike in June 2021 that has reduced the capacity over a prolonged period. In 2023, the operational performance of the plant was considered as part of the assessment of internal sources of information for evidence of impairment or impairment reversal. As highlighted in the climate change section, the economic performance of assets in the aluminium segment has the potential to perform more strongly as the world transitions to a lower carbon future; however, our assessment of external sources of information did not indicate that this had yet been priced into asset valuations. We concluded that there were no indicators of impairment or impairment reversal. | ||
Annual Report on Form 20-F 2023 | riotinto.com | 177 |
178 | Annual Report on Form 20-F 2023 | riotinto.com |
2023 | 2022 | 2021 | |||||
Note | Pre-tax amount US$m | Taxation US$m | Non- controlling interest US$m | Net amount US$m | Pre-tax amount US$m | Pre-tax amount US$m | |
Aluminium - Alumina refineries | ( | ( | |||||
Aluminium – Pacific Aluminium | ( | ||||||
Aluminium - Kitimat | ( | ||||||
Other operations - Simandou | ( | ||||||
Other operations - Roughrider | |||||||
Total impairment charges net of reversals | ( | ( | ( | ( | ( | ||
Allocated as: | |||||||
Intangible assets | 12 | ||||||
Property, plant and equipment | 13 | ( | ( | ||||
Investment in equity accounted units (EAUs) | ( | ||||||
Total impairment charges net of reversals | ( | ( | ( | ||||
Comprising: | |||||||
Net impairment (charges)/reversals of consolidated balances | ( | ( | |||||
Impairment (charges) related to EAUs (pre-tax) | ( | ||||||
Total impairment charges net of reversals | ( | ( | ( | ||||
Taxation (including related to EAUs) | |||||||
Non-controlling interests | ( | ||||||
Total impairment charges net of reversals in the income statement | ( | ( | ( | ||||
Impact of climate change on our business - Gladstone alumina refineries We are committed to the decarbonisation of our assets to reduce Scope 1 and 2 emissions by 2050 relative to our 2018 equity baseline. We anticipate that further carbon action may be necessary to align with the goals of the Paris agreement to limit temperature increases to 1.5oC. To illustrate the sensitivity of the refinery valuations to the cost of carbon credits, we have modelled a 2023 impairment valuation remaining constant. For QAL, this sensitivity indicated a reduction in the pre-tax value by US$ this is expected to be largely mitigated by decarbonisation projects, including double digestion. There was no impact at Yarwun as all property, plant and equipment was already fully impaired. | |||
Annual Report on Form 20-F 2023 | riotinto.com | 179 |
180 | Annual Report on Form 20-F 2023 | riotinto.com |
Annual Report on Form 20-F 2023 | riotinto.com | 181 |
182 | Annual Report on Form 20-F 2023 | riotinto.com |
2023 % | 2022 % | 2021 % | 2023 US$m | 2022 US$m | 2021 US$m | |
Greater China (includes Taiwan) | ||||||
United States of America | ||||||
Asia (excluding Greater China and Japan) | ||||||
Japan | ||||||
Europe (excluding UK) | ||||||
Canada | ||||||
Australia | ||||||
UK | ||||||
Other countries | ||||||
Consolidated sales revenue |
2023 | |||
Revenue from contracts with customers US$m | Other revenue(a) US$m | Consolidated sales revenue US$m | |
Iron ore | |||
Aluminium, alumina and bauxite | ( | ||
Copper | ( | ||
Industrial minerals (comprising titanium dioxide slag, borates and salt) | ( | ||
Gold | |||
Diamonds | |||
Other products and freight services(b) | ( | ||
Consolidated sales revenue | |||
2022 | 2021 | |||||
Revenue from contracts with customers US$m | Other revenue(a) US$m | Consolidated sales revenue US$m | Revenue from contracts with customers US$m | Other revenue(a) US$m | Consolidated sales revenue US$m | |
Iron ore | ( | ( | ||||
Aluminium, alumina and bauxite | ( | |||||
Copper | ( | |||||
Industrial minerals (comprising titanium dioxide slag, borates and salt) | ( | |||||
Gold | ||||||
Diamonds | ||||||
Other products and freight services(b) | ( | |||||
Consolidated sales revenue | ( | ( | ||||
Annual Report on Form 20-F 2023 | riotinto.com | 183 |
Note | 2023 US$m | 2022 US$m | 2021 US$m | |
Raw materials, consumables, repairs and maintenance | ||||
Amortisation of intangible assets | 12 | |||
Depreciation of property, plant and equipment | 13 | |||
Employment costs | 26 | |||
Shipping and other freight costs | ||||
Decrease in finished goods and work in progress(a) | ||||
Royalties | ||||
Amounts charged by equity accounted units(b) | ||||
Net foreign exchange (gains)/losses | ( | ( | ||
Gain on sale of the Cortez Royalty(c) | ( | |||
Gains recognised by Kitimat relating to LNG Canada’s project(d) | ( | ( | ||
Provisions (including exchange differences on provisions) | ||||
Research and development | ||||
Other external costs(e) | ||||
Costs included above capitalised or shown on a separate line item(f) | ( | ( | ( | |
Other operating income(g) | ( | ( | ( | |
Net operating costs (excluding items disclosed separately)(h) |
2023 US$m | 2022 US$m | 2021 US$m | |
Expenditure in the year (inclusive of net cash proceeds of US$ disposal of undeveloped projects)(a) | ( | ( | ( |
Non-cash movements and non-cash proceeds on disposal of undeveloped projects | ( | ( | |
Amount capitalised during the year | |||
Exploration and evaluation expenditure (net of profit from disposal of interests in undeveloped projects) per income statement | ( | ( | ( |
Comprising: | |||
Exploration and evaluation expenditures | ( | ( | ( |
Profit from disposal of interests in undeveloped projects(a) |
184 | Annual Report on Form 20-F 2023 | riotinto.com |
Note | 2023 US$m | 2022 US$m | 2021 US$m | |
Finance income from loans to equity accounted units | ||||
Other finance income (including bank deposits, net investment in leases, and other financial assets) | ||||
Total finance income | ||||
Interest on: | ||||
– Financial liabilities at amortised cost (excluding lease liabilities) and associated derivatives | ( | ( | ( | |
– Lease liabilities | ( | ( | ( | |
Fair value movements: | ||||
– Bonds designated as hedged items in fair value hedges(a) | ( | |||
– Derivatives designated as hedging instruments in fair value hedges(a) | ( | ( | ||
Loss on early redemption of bonds | ( | |||
Amounts capitalised(b) | 12, 13 | |||
Total finance costs | ( | ( | ( |
Other relevant judgements - uncertain tax positions The Group operates across a large number of jurisdictions and is subject to review and challenge by local tax authorities on a range of tax matters. Where the amount of tax payable or recoverable is uncertain, whether due to local tax authority challenge or due to uncertainty regarding the appropriate treatment, judgement is required to assess the probability that the adopted treatment will be accepted. In accordance with IFRIC 23 “Uncertainty over Income Tax Treatments”, if it is not probable that the treatment will be accepted, the Group accounts for uncertain tax provisions for all matters worldwide based on the Group’s judgement of the most likely amount of the liability or recovery, or, where there is a wide range of possible outcomes, using a probability weighted average approach. Uncertain tax provisions include any related interest and penalties. The Mongolian Tax Authority has issued a number of tax assessments covering the fiscal years 2013 to 2020, the most recent of which was received in December 2023, which are inconsistent with the Oyu Tolgoi Investment Agreement and Mongolian legislation. We have not booked any uncertain tax provisions for the matters under dispute, which have been referred to international arbitration. As required by Mongolian law we have paid US$ amounts, adjusted for exchange rate movements, are included within our non-current receivables and other assets on the balance sheet. The interpretation of the Investment Agreement and Mongolian legislation has been, and is expected to continue to be, subject to dispute. Differences in interpretation of the Investment Agreement and Mongolian legislation could have a material impact on the recovery of the amounts paid and of certain deferred tax assets, further details of which are provided in Note 15. | ||
Note | 2023 US$m | 2022 US$m Restated(a) | 2021 US$m Restated(a) | |
– Current | ||||
– Deferred | 15 | ( | ||
Total taxation charge |
Annual Report on Form 20-F 2023 | riotinto.com | 185 |
2023 US$m | 2022 US$m Restated(a) | 2021 US$m Restated(a) | |
Profit before taxation(b) | |||
Prima facie tax payable at UK rate of 23.5% (2022: 19%; 2021: 19%)(c) | |||
Higher rate of taxation of 30% on Australian earnings (2022: 30%; 2021: 30%) | |||
Other tax rates applicable outside the UK and Australia | ( | ( | |
Tax effect of profit from equity accounted units, related impairments and expenses(b) | ( | ( | ( |
Impact of changes in tax rates | ( | ( | |
Resource depletion allowances | ( | ( | ( |
Recognition of previously unrecognised deferred tax assets(d) | ( | ( | ( |
Write-down of previously recognised deferred tax assets(e) | |||
Utilisation of previously unrecognised deferred tax assets(f) | ( | ( | ( |
Unrecognised current year operating losses(g) | |||
Deferred tax arising on internal sale of assets in Canadian operations(h) | ( | ||
Adjustments in respect of prior periods(i) | ( | ||
Other items | |||
Total taxation charge |
2023 US$m | 2022 US$m | 2021 US$m | |
Tax on fair value movements: | |||
– Cash flow hedge fair value gains | |||
Tax credit/(charge) on re-measurement gains/(losses) on pension and post-retirement healthcare plans | ( | ( | |
Deferred tax relating to components of other comprehensive income for the year (note 15) | ( | ( |
186 | Annual Report on Form 20-F 2023 | riotinto.com |
2023 US$m | 2022 US$m Restated(b) | |
Australia | ||
Canada | ||
Mongolia | ||
United States of America | ||
Africa | ||
South America | ||
Europe (excluding UK) | ||
UK | ||
Other countries | ||
Total non-current assets other than excluded items | ||
Non-current assets excluded from analysis above: | ||
Deferred tax assets | ||
Other financial assets | ||
Quasi-equity loans to equity accounted units(a) | ||
Receivables and other assets | ||
Total non-current assets per balance sheet |
Annual Report on Form 20-F 2023 | riotinto.com | 187 |
2023 US$m | 2022 US$m | |
Net book value | ||
At 1 January | ||
Adjustment on currency translation | ( | ( |
At 31 December | ||
– cost | ||
– accumulated impairment | ( | ( |
At 1 January | ||
– cost | ||
– accumulated impairment | ( | ( |
2023 US$m | 2022 US$m | |
Net book value | ||
Richards Bay Minerals | ||
Pilbara | ||
Dampier Salt | ||
2023 US$m | 2022 US$m | |
( | ( | |
188 | Annual Report on Form 20-F 2023 | riotinto.com |
Other relevant judgements - assessment of indefinite-lived water rights in Quebec, Canada We continue to judge the water rights in Quebec to have an indefinite life because we expect the contractual rights to contribute to the efficiency and cost effectiveness of our operations for the foreseeable future. Accordingly, the rights are not subject to amortisation but are tested annually for impairment. We have no other indefinite-lived assets. The remaining carrying value of the water rights of US$ US$ using discounted cash flows. The recoverable amount of the Quebec smelters is classified as level 3 under the fair value hierarchy. In arriving at its FVLCD, post-tax cash flows expressed in real terms have been estimated over the expected useful economic lives of the underlying smelting assets and discounted using a real post-tax discount rate of The recoverable amounts were determined to be significantly in excess of carrying value, and there are no reasonably possible changes in key assumptions that would cause the remaining water rights to be impaired. | ||
Impact of climate change on our business - water rights To manage the uncertainties of climate change and our impact on the area, our team of hydrologists in Quebec analyse different weather scenarios on a daily basis. We monitor the water resource available to us along with the impact that our operation is having on the water quality and quantity, and on the environment when we return the water following use. Based on our analysis to date, we do not consider the renewal of our contractual water rights to be at risk from climate change for the foreseeable future. | |||
Annual Report on Form 20-F 2023 | riotinto.com | 189 |
2023 | |||||
Exploration and evaluation US$m | Trademarks, patented and non-patented technology US$m | Contract-based intangible assets US$m | Other intangible assets(a) US$m | Total US$m | |
Net book value | |||||
At 1 January 2023 | |||||
Adjustment on currency translation | |||||
Additions(b) | |||||
Amortisation for the year | ( | ( | ( | ( | |
Impairment reversal(c) | |||||
Newly consolidated operations(d) | |||||
Disposals, transfers and other movements | ( | ( | |||
At 31 December 2023 | |||||
– cost (c) | |||||
– accumulated amortisation and impairment (c) | ( | ( | ( | ( | ( |
2022 | |||||
Exploration and evaluation US$m | Trademarks, patented and non-patented technology US$m | Contract-based intangible assets US$m | Other intangible assets (a) US$m | Total US$m | |
Net book value | |||||
At 1 January 2022 | |||||
Adjustment on currency translation | ( | ( | ( | ( | ( |
Additions | |||||
Amortisation for the year | ( | ( | ( | ( | |
Impairment reversal(c) | |||||
Subsidiaries no longer consolidated(c) | ( | ( | |||
Newly consolidated operations(d) | |||||
Disposals, transfers and other movements | ( | ( | ( | ||
At 31 December 2022 | |||||
– cost | |||||
– accumulated amortisation and impairment | ( | ( | ( | ( | ( |
Trademarks, patented and non-patented technology | Contract-based intangible assets | Other intangible assets | ||||
Type of intangible | Trademarks | Patented and non-patented technology | Power contracts/water rights | Other purchase and customer contracts | Internally generated intangible assets and computer software | Other intangible assets |
Amortisation profile | ||||||
190 | Annual Report on Form 20-F 2023 | riotinto.com |
Type of Property, plant and equipment | Land and buildings | Plant and equipment | ||
Land | Buildings | Power-generating assets | Other plant and equipment | |
Depreciation profile | Not depreciated | See Power note below on page 195 | ||
Annual Report on Form 20-F 2023 | riotinto.com | 191 |
Key judgement - estimation of asset lives The useful lives of the major assets of a cash-generating unit are often dependent on the life of the orebody to which they relate. Where this is the case, the lives of mining properties, and their associated refineries, concentrators and other long-lived processing equipment are generally limited to the expected life of the orebody. The life of the orebody, in turn, is estimated on the basis of the life-of-mine plan. Where the major assets of a cash-generating unit are not dependent on the life of a related orebody, management applies judgement in estimating the remaining service potential of long-lived assets. Factors affecting the remaining service potential of smelters include, for example, smelter technology and electricity purchase contracts when power is not sourced from the Group, or in some cases from local governments permitting electricity generation from hydropower stations. | ||
Impact of climate change on our business - estimation of asset lives We expect there to be a higher demand for copper, aluminium, lithium and high-grade iron ore in order to meet demand for the minerals required to transition to a low carbon economic environment, consistent with the climate change commitments of the Paris Agreement. We expect this to exceed new supply to the market and therefore increase prices. Under the Aspirational Leadership scenario, the economic cut- off grade for our Mineral Reserves is expected to be lower; in effect we would mine a greater volume of material before the mines are depleted. We cannot quantify the difference this would make without undue cost as it would require revised mine plans, but for property, plant and equipment this increased volume of material would reduce the depreciation charge during any given period for assets that use the “Units of production” depreciation basis. | |||
Key judgement - deferral of stripping costs We apply judgement as to whether multiple pits at a mine are considered separate or integrated operations. This determines whether the stripping activities of a pit are classified as pre-production or production phase stripping and, therefore, the amortisation base for those costs. The analysis depends on each mine’s specific circumstances and requires judgement: another mining company could make a different judgement even when the fact pattern appears to be similar. The following factors would point towards the initial stripping costs for the individual pits being accounted for separately: –if mining of the second and subsequent pits is conducted consecutively following that of the first pit, rather than concurrently; –if separate investment decisions are made to develop each pit, rather than a single investment decision being made at the outset; –if the pits are operated as separate units in terms of mine planning and the sequencing of overburden removal and ore mining, rather than as an integrated unit; –if expenditures for additional infrastructure to support the second and subsequent pits are relatively large; and –if the pits extract ore from separate and distinct orebodies, rather than from a single orebody. If the designs of the second and subsequent pits are significantly influenced by opportunities to optimise output from several pits combined, including the co-treatment or blending of the output from the pits, then this would point to treatment as an integrated operation for the purposes of accounting for initial stripping costs. The relative importance of each of the above factors is considered in each case. In order for production phase stripping costs to qualify for capitalisation as a stripping activity asset, three criteria must be met: –it must be probable that there will be an economic benefit in a future accounting period because the stripping activity has improved access to the orebody; –it must be possible to identify the “component” of the orebody for which access has been improved; and –it must be possible to reliably measure the costs that relate to the stripping activity. A “component” is a specific section of the orebody that is made more accessible by the stripping activity. It will typically be a subset of the larger orebody that is distinguished by a separate useful economic life (for example, a pushback). | ||
192 | Annual Report on Form 20-F 2023 | riotinto.com |
Phase | Development Phase | Production Phase | |
Stripping activity | Overburden and other waste removal during the development of a mine before production commences. | Production phase stripping can give access to two benefits: the extraction of ore in the current period and improved access to ore which will be extracted in future periods. | |
Period of benefit | After commissioning of the mine. | Future periods after first phase is complete. | Current and future benefit are indistinguishable. |
Capitalised to mining properties and leases in property, plant and equipment | During the development of a mine, stripping costs relating to a component of an orebody are capitalised as part of the cost of construction of the mine. | It may be the case that subsequent phases of stripping will access additional ore and that these subsequent phases are only possible after the first phase has taken place. Where applicable, the Group considers this on a mine-by-mine basis. Generally, the only ore attributed to the stripping activity asset for the purposes of calculating the life-of-component ratio is the ore to be extracted from the originally identified component. | Stripping costs for the component are deferred to the extent that the current period ratio exceeds the life-of-component ratio. |
Allocation to inventory | Not applicable | Not applicable | The stripping cost is allocated to inventory based on a relevant production measure using a life-of-component strip ratio. The ratio divides the tonnage of waste mined for the component for the period either by the quantity of ore mined for the component or by the quantity of minerals contained in the ore mined for the component. In some operations, the quantity of ore is a more appropriate basis for allocating costs, particularly when there are significant by- products. |
Component | A “component” is a specific section of the orebody that is made more accessible by the stripping activity. It will typically be a subset of the larger orebody that is distinguished by a separate useful economic life (for example, a pushback). | ||
Life-of-component ratio | The life-of-component ratios are based on the mineral reserves of the mine (and for some mines, other mineral resources) and the annual mine plan; they are a function of the mine design and, therefore, changes to that design will generally result in changes to the ratios. Changes in other technical or economic parameters that impact the mineral reserves (and for some mines, other mineral resources) may also have an impact on the life-of-component ratios even if they do not affect the mine design. Changes to the ratios are accounted for prospectively. | ||
Depreciation basis | Depreciated on a “units of production” basis based on expected production of either ore or minerals contained in the ore over the life of the component unless another method is more appropriate. | ||
2023 US$m | 2022 US$m | |
Property, plant and equipment – owned | ||
Right-of-use assets – leased | ||
Net book value |
Annual Report on Form 20-F 2023 | riotinto.com | 193 |
2023 | ||||||
Note | Mining properties and leases(a) US$m | Land and buildings US$m | Plant and equipment US$m | Capital works in progress US$m | Total US$m | |
Net book value | ||||||
At 1 January 2023 | ||||||
Adjustment on currency translation(b) | ||||||
Adjustments to capitalised closure costs | 14 | ( | ( | |||
Interest capitalised(c) | 9 | |||||
Additions(d) | ||||||
Depreciation for the year(a) | ( | ( | ( | ( | ||
Impairment charges(e) | ( | ( | ( | ( | ( | |
Disposals | ( | ( | ( | ( | ||
Transfers and other movements(f) | ( | |||||
At 31 December 2023 | ||||||
Balance sheet analysis | ||||||
– cost | ||||||
– accumulated depreciation and impairment | ( | ( | ( | ( | ( | |
Non-current assets pledged as security(g) | ||||||
2022 | ||||||
Note | Mining properties and leases(a) US$m | Land and buildings US$m | Plant and equipment US$m | Capital works in progress US$m | Total US$m | |
Net book value | ||||||
At 1 January 2022 | ||||||
Adjustment on currency translation(b) | ( | ( | ( | ( | ( | |
Adjustments to capitalised closure costs | 14 | |||||
Interest capitalised(c) | 9 | |||||
Additions(d) | ||||||
Depreciation for the year(a) | ( | ( | ( | ( | ||
Disposals | ( | ( | ( | ( | ( | |
Newly consolidated operations(h) | ||||||
Transfers and other movements(f) | ( | ( | ||||
At 31 December 2022 | ||||||
Balance sheet analysis | ||||||
– cost | ||||||
– accumulated depreciation and impairment | ( | ( | ( | ( | ( | |
Non-current assets pledged as security(g) | ||||||
194 | Annual Report on Form 20-F 2023 | riotinto.com |
Impact of climate change on our business - useful economic lives of our power generating assets The Group has committed to reducing Scope 1 and Scope 2 carbon emissions by net 2022 and 2030 (revised from US$ principally renewables is critical to achieving that goal. The carrying value of power generating assets is set out in the table below. The weighted average remaining useful economic life of plant and equipment for fossil fuel-based power generating assets is years). Given the technical limitations of intermittent renewable energy generation and energy storage systems, and our need for reliable baseload electricity, we expect our current generation assets will be integral to those needs for the foreseeable future. We are investing in research and development and evaluating new market options that may overcome these technical challenges. Should pathways for eliminating fossil fuel power generating assets be identified we may need to accelerate depreciation or impair the assets; however, at this present moment the requirement for fossil fuel powered back-up means that early retirement of the assets is not expected and no change to depreciation rates is required. | ||||||
2023 | 2022 | |||||
Net book value | Land and buildings US$m | Plant and equipment US$m | Land and buildings US$m | Plant and equipment US$m | ||
Fossil fuels | ||||||
Renewables(a) | ||||||
(a)The increase of US$ manufacture of low-carbon aluminium in our newly expanded facility at Complexe Jonquière in Saguenay-Lac-Saint-Jean, as well as the Kemano hydropower station which continues to ensure the long-term, sustainable production of low-carbon aluminium at our smelter in Kitimat. Both assets are items of property, plant and equipment which are owned by Rio Tinto. | ||||||
2023 | 2022 | |||||
Land and buildings US$m | Plant and equipment US$m | Total US$m | Land and buildings US$m | Plant and equipment US$m | Total US$m | |
Net book value | ||||||
At 1 January | ||||||
Adjustment on currency translation | ( | ( | ( | |||
Additions | ||||||
Depreciation for the year | ( | ( | ( | ( | ( | ( |
Impairment charges(a) | ( | ( | ( | |||
Disposals | ( | ( | ||||
Transfers and other movements | ( | ( | ||||
At 31 December | ||||||
Annual Report on Form 20-F 2023 | riotinto.com | 195 |
196 | Annual Report on Form 20-F 2023 | riotinto.com |
Note | 2023 US$m | 2022 US$m | |
At 1 January | |||
Adjustment on currency translation | ( | ||
Adjustments to mining properties/right-of-use assets: | 13 | ||
– increases to existing and new provisions | |||
– change in discount rate | ( | ||
Charged/(credited) to profit: | |||
– increases to existing and new provisions(a) | |||
– change in discount rate | ( | ||
– unused amounts reversed | ( | ( | |
– exchange (gains)/losses on provisions | ( | ||
– amortisation of discount | |||
Utilised in year | ( | ( | |
Transfers and other movements | ( | ||
At 31 December(b) | |||
Balance sheet analysis: | |||
Current | |||
Non-current | |||
Total |
Key judgement - Close-down, restoration and environmental obligations We use our judgement and experience to determine the potential scope of closure rehabilitation work required to meet the Group’s legal, statutory and constructive obligations, and any other commitments made to stakeholders, and the options and techniques available to meet those obligations in order to estimate the associated costs and the likely timing of those costs. Significant judgement is also required to then determine both the costs associated with that work and the other assumptions used to calculate the provision. External experts support the cost estimation process where appropriate but there remains significant estimation uncertainty. The key judgement in applying this accounting policy is determining when an estimate is sufficiently reliable to make or adjust a closure provision. Adjustments are made to provisions when the range of possible outcomes becomes sufficiently narrow to permit reliable estimation. Depending on the materiality of the change, adjustments may require review and endorsement by the Group’s Closure Steering Committee before the provision is updated. Cost provisions are updated throughout the life of the operation with conceptual study estimates reviewed every five years. Within ten years from the expected closure date, closure cost estimates must comply with the Group’s Capital Project Framework. This means, for example, that where an Order of Magnitude (OoM) study is required for closure, it must be of the same standard as an OoM study for a new mine, smelter or refinery. In 2023, a reforecast for the Ranger Uranium mine operated by Energy Resources of Australia has resulted in an increase to the closure provision of US$ achieve Pit 3 consolidation coupled with transition to a lower risk approach which adversely impacts achievement of final landform and the quantity of water to be processed. When operations ceased at the end of 2020, rehabilitation was expected to be complete by 2026; we now expect the final completion will be delayed until 2034, subject to permitting. The majority of the provision increase is attributable to rehabilitation activities post 2027 and is subject to further study which could result in material change to the provision. These activities remain subject to a number of studies and are also potentially sensitive to external events such as rainfall. A previous study was completed in early 2022 and the preliminary information from that study resulted in an increase to closure liabilities of US$ In some cases, the closure study may indicate that monitoring and, potentially, remediation will be required indefinitely - for example, ground water treatment. In these cases, the underlying cash flows for the provision may be restricted to a period for which the costs can be reliably estimated, which on average is around confidence, this period may be shorter. | ||
Annual Report on Form 20-F 2023 | riotinto.com | 197 |
2023 US$m | 2022 US$m | |
Undiscounted close-down and environmental restoration obligations | ||
Impact of discounting | ( | ( |
Present value of close-down and restoration obligations | ||
Attributable to: | ||
Operating sites | ||
Non-operating sites | ||
Total close-down and restoration provisions |
Closure cost composition as at 31 December | 2023 US$m | 2022 US$m |
Decommissioning, decontamination and demolition | ||
Closure and rehabilitation earthworks(a) | ||
Long-term water management costs(b) | ||
Post closure monitoring and maintenance | ||
Indirect costs, owners' costs and contingency(c) | ||
Total |
Geographic composition as at 31 December | 2023 US$m | 2022 US$m |
Australia | ||
USA | ||
Canada | ||
Other countries | ||
Total |
<1 year US$m | 1-3 years US$m | 3-5 years US$m | > 5 years US$m | Total US$m | |
At 31 December 2023 | |||||
At 31 December 2022 |
198 | Annual Report on Form 20-F 2023 | riotinto.com |
Key accounting estimate - close-down, restoration and environmental obligations The most significant assumptions and estimates used in calculating the provision are: –Closure timeframes. The weighted average remaining lives of operations is shown on the previous page. Some expenditure may be incurred before closure while the operation as a whole is in production. –The length of any post-closure monitoring period. This will depend on the specific site requirements and the availability of alternative commercial arrangements; some expenditure can continue into perpetuity. The Rio Tinto Kennecott closure and environmental remediation provision includes an allowance for ongoing monitoring and remediation costs, including ground water treatment, of approximately US$ billion. –The probability weighting of possible closure scenarios. The most significant impact of probability weighting is at the Pilbara operations (Iron Ore) relating to infrastructure and incorporates the expectation that some infrastructure will be retained by the relevant State authorities post closure. The assignment of probabilities to this scenario reduces the closure provision by US$ –Appropriate sources on which to base the calculation of the discount rate. The discount rate by nature is subjective and therefore sensitivities are shown below for how the provision balance, which at 31 December 2023 was US$ at alternative discount rates. There is significant estimation uncertainty in the calculation of the provision and cost estimates can vary in response to many factors including: –Changes to the relevant legal or local/national government requirements and any other commitments made to stakeholders; –Review of remediation and relinquishment options; –Additional remediation requirements identified during the rehabilitation; –The emergence of new restoration techniques; –Precipitation rates and climate change; –Change in foreign exchange rates; –Change in the expected closure date; and –Change in the discount rate. Experience gained at other mine or production sites may also change expected methods or costs of closure, although elements of the restoration and rehabilitation can be unique to each site. Generally, there is relatively limited restoration and rehabilitation activity and historical precedent elsewhere in the Group, or in the industry as a whole, against which to benchmark cost estimates. The expected timing of expenditure can also change for other reasons, for example because of changes to expectations relating to Mineral reserves and mineral resources, production rates, renewal of operating licences or economic conditions. Changes in closure cost estimates at the Group’s ongoing operations could result in a material adjustment to assets and liabilities in the next 12 months and would also impact the depreciation and the unwinding of discount in future years. Changes to closure cost estimates for closed operations, and changes to environmental cost estimates at any operation, could cause a material adjustment to the income statement and closure liability. We do not consider that there is significant risk of a change in estimates for these liabilities causing a material adjustment to the income statement in the next 12 months. Any new environmental incidents may require a material provision but cannot be predicted. Project specific risks are embedded within the cash flows which are based on a central case estimate of closure activities assuming that the obligation is fulfilled by the Group. These cash flows are then discounted using a discount rate specific to the class of obligations. | ||
Impact of climate change on our business - close-down, restoration and environmental costs The underlying costs for closure have been estimated with varying degrees of precision based on a function of the age of the underlying asset and proximity to closure. For assets within ten years of closure, closure plans and cost estimates are supported by detailed studies which are refined as the closure date approaches. These closure studies consider climate change and plan for resilience to expected climate conditions with a particular focus on precipitation rates. For new developments, consideration of climate change and ultimate closure conditions are an important part of the approval process. For longer-lived assets, closure provisions are typically based on conceptual level studies that are refreshed at least every five years; these are evolving to incorporate greater consideration of forecast climate conditions at closure. | |||
Annual Report on Form 20-F 2023 | riotinto.com | 199 |
At 31 December 2023 | At 31 December 2022 | |||||
Capitalised within “Property, plant and equipment” US$m | Charged/(credited) to the income statement US$m | Total increase/ (decrease) in provision US$m | Capitalised within “Property, plant and equipment” US$m | Charged/(credited) to the income statement US$m | Total increase/ (decrease) in provision US$m | |
Discount rate decreased to | ||||||
Discount rate increased to | ( | ( | ( | ( | ( | ( |
2023 US$m | 2022 US$m Restated(a) | |
At 1 January | ( | |
Adjustment on currency translation | ||
Credited/(charged) to the income statement | ( | |
Credited/(charged) to statement of comprehensive income(b) | ( | |
Other movements(c) | ( | |
At 31 December | ( | |
Comprising: | ||
– deferred tax assets(d)(e) | ||
– deferred tax liabilities(f) | ( | ( |
200 | Annual Report on Form 20-F 2023 | riotinto.com |
2023 US$m | 2022 US$m Restated(a) | |
Deferred tax assets arising from: | ||
Tax losses(b) | ||
Provisions and other liabilities | ||
Capital allowances | ||
Post-retirement benefits | ||
Unrealised exchange losses | ||
Other temporary differences(c) | ||
Total | ||
Deferred tax liabilities arising from: | ||
Capital allowances | ( | ( |
Unremitted earnings(d) | ( | ( |
Capitalised interest | ( | ( |
Post-retirement benefits | ( | ( |
Unrealised exchange gains | ( | ( |
Other temporary differences | ( | ( |
Total | ( | ( |
Credited/(charged) to the income statement | ||
Unrealised exchange losses | ( | |
Tax losses | ( | |
Provisions and other liabilities | ||
Capital allowances | ||
Tax on unremitted earnings | ||
Post-retirement benefits | ( | ( |
Other temporary differences | ( | |
Total | ( |
Other relevant judgements - Recoverability of deferred tax assets In considering the recoverability of deferred tax assets, judgement is required regarding the extent to which certain risk factors are likely to affect the recovery of these assets. These risk factors include the risk of expiry of losses prior to utilisation, the impact of other legislation or tax regimes, such as minimum taxes, and consideration of factors that lead to the generation of losses or other deferred tax assets. IAS 12 requires us to consider whether taxable profits will be available against which deferred tax assets may be utilised. The Mongolian Tax Authority has issued a number of tax assessments covering the fiscal years 2013 to 2020, the most recent of which was received in December 2023, which are inconsistent with the Oyu Tolgoi Investment Agreement and Mongolian legislation. The interpretation of the Investment Agreement and Mongolian legislation has been, and is expected to continue to be, subject to dispute through international arbitration. Differences in interpretation of the Investment Agreement and Mongolian legislation could have a material impact on the amount and recovery of recognised deferred tax items, including tax losses. The arbitration process on matters of this complexity can typically take over 12 months to conclude. | ||
Annual Report on Form 20-F 2023 | riotinto.com | 201 |
Recognised | Unrecognised | |||
At 31 December | 2023 US$m | 2022 US$m Restated (a) | 2023 US$m | 2022 US$m Restated (a) |
France | ||||
Canada | ||||
US(b) | ||||
Australia | ||||
Mongolia(c) | ||||
Other countries | ||||
Total(d)(e) | ||||
2023 US$m | 2022 US$m | |
Raw materials and purchased components | ||
Consumable stores | ||
Work in progress | ||
Finished goods and goods for resale | ||
Total inventories | ||
Comprising: | ||
Expected to be used within one year | ||
Expected to be used after more than one year | ||
Total inventories |
202 | Annual Report on Form 20-F 2023 | riotinto.com |
2023 | 2022 | |||||
Non-current US$m | Current US$m | Total US$m | Non-current US$m | Current US$m | Total US$m | |
Trade receivables(a) | ||||||
Other financial receivables(a) | ||||||
Other receivables(b) | ||||||
Prepayment of tolling charges to jointly controlled entities(c) | ||||||
Pension surpluses (note 28) | ||||||
Other prepayments | ||||||
Total(d) | ||||||
2023 | 2022 | |||||
Non-current US$m | Current US$m | Total US$m | Non-current US$m | Current US$m | Total US$m | |
Trade payables | ||||||
Other financial payables | ||||||
Other payables | ||||||
Deferred income(a) | ||||||
Accruals | ||||||
Employee entitlements | ||||||
Royalties and mining taxes | ||||||
Amounts owed to equity accounted units | ||||||
Total | ||||||
Annual Report on Form 20-F 2023 | riotinto.com | 203 |
Note | 2023 US$m | 2022 US$m | |
Equity attributable to owners of Rio Tinto (see Group balance sheet) | |||
Equity attributable to non-controlling interests (see Group balance sheet) | |||
Net debt | 19 | ||
Total capital |
2023 | 2022 | |
Long-term rating | A/A1 | A/A2 |
Short-term rating | A-1/P-1 | A-1/P-1 |
Outlook | Stable/Stable | Stable/Stable |
2023 | 2022 | |||||||||
(Outflows)/Inflows | Within 1 year or on demand US$m | Between 1 and 2 years US$m | Between 2 and 5 years US$m | After 5 years US$m | Total US$m | Within 1 year or on demand US$m | Between 1 and 2 years US$m | Between 2 and 5 years US$m | After 5 years US$m | Total US$m |
Non-derivative financial liabilities | ||||||||||
Trade and other financial payables(a) | ( | ( | ( | ( | ( | ( | ( | ( | ( | ( |
Expected lease liability payments | ( | ( | ( | ( | ( | ( | ( | ( | ( | ( |
Borrowings before swaps | ( | ( | ( | ( | ( | ( | ( | ( | ( | ( |
Expected future interest payments(a) | ( | ( | ( | ( | ( | ( | ( | ( | ( | ( |
Other financial liabilities | ( | ( | ||||||||
Derivative financial liabilities(b) | ||||||||||
Derivatives related to net debt – net settled | ( | ( | ( | ( | ( | ( | ( | ( | ( | |
Derivatives related to net debt – gross settled(a) | ||||||||||
– gross inflows | ||||||||||
– gross outflows | ( | ( | ( | ( | ( | ( | ( | ( | ( | ( |
Derivatives not related to net debt – net settled | ( | ( | ( | ( | ( | ( | ( | ( | ( | ( |
Derivatives not related to net debt – gross settled | ||||||||||
– gross inflows | ||||||||||
– gross outflows | ( | ( | ( | ( | ||||||
Total | ( | ( | ( | ( | ( | ( | ( | ( | ( | ( |
204 | Annual Report on Form 20-F 2023 | riotinto.com |
2023 | ||||||
Financial liabilities | Other assets | |||||
Borrowings excluding overdrafts (note 20)(a) US$m | Lease liabilities (note 21)(b) US$m | Derivatives related to net debt (note 23)(c) US$m | Cash and cash equivalents including overdrafts (note 22)(a) US$m | Other investments (note 23)(d) US$m | Net debt US$m | |
At 1 January | ( | ( | ( | ( | ||
Foreign exchange adjustment | ( | ( | ( | ( | ||
Cash movements excluding exchange movements | ( | ( | ( | |||
Other non-cash movements | ( | ( | ( | |||
At 31 December | ( | ( | ( | ( | ||
2022 | ||||||
Financial liabilities | Other assets | |||||
Borrowings excluding overdrafts (note 20)(a) US$m | Lease liabilities (note 21)(b) US$m | Derivatives related to net debt (note 23)(c) US$m | Cash and cash equivalents including overdrafts (note 22)(a) US$m | Other investments (note 23)(d) US$m | Net cash/(debt) US$m | |
At 1 January | ( | ( | ( | |||
Foreign exchange adjustment | ( | |||||
Cash movements excluding exchange movements | ( | ( | ( | ( | ||
Other non-cash movements | ( | ( | ( | ( | ||
At 31 December | ( | ( | ( | ( | ||
2023 | 2022 | ||||||
Net debt by currency | Borrowings excluding overdrafts US$m | Lease liabilities US$m | Derivatives related to net debt US$m | Cash and cash equivalents US$m | Other investments US$m | Net debt US$m | Net debt US$m |
US dollar | ( | ( | ( | ( | ( | ||
Australian dollar | ( | ( | ( | ( | |||
Canadian dollar | ( | ( | ( | ( | |||
South African rand | ( | ||||||
Other | ( | ( | |||||
Total | ( | ( | ( | ( | ( | ||
Annual Report on Form 20-F 2023 | riotinto.com | 205 |
Carrying value 2023 US$m | Carrying value 2022 US$m | Nominal value of hedged item 2023 US$m | Nominal value of hedged item 2022 US$m | Weighted average interest rate after swaps (where applicable)(b) | Swap maturity (where applicable) | |
Rio Tinto Finance plc Euro Bonds | 3 month SOFR + | 2024 | ||||
Rio Tinto Finance (USA) Limited Bonds | 3 month SOFR + | 2028 | ||||
Alcan Inc. Debentures | 3 month SOFR + | 2024 | ||||
Rio Tinto Finance plc Sterling Bonds | 3 month SOFR + | 2024 | ||||
Alcan Inc. Debentures | 3 month SOFR + | 2025 | ||||
Rio Tinto Finance (USA) plc Bonds | ||||||
Alcan Inc. Global Notes | 3 month SOFR + | 2025 | ||||
Alcan Inc. Global Notes | 3 month SOFR + | 2025 | ||||
Rio Tinto Finance (USA) Limited Bonds | 6 month SOFR + | 2033 | ||||
Rio Tinto Finance (USA) plc Bonds | ||||||
Rio Tinto Finance (USA) plc Bonds | ||||||
Rio Tinto Finance (USA) Limited Bonds | 6 month SOFR + | 2028 | ||||
Rio Tinto Finance (USA) plc Bonds | 6 month SOFR + | 2033 | ||||
Oyu Tolgoi LLC MIGA Insured Loan SOFR plus | ||||||
Oyu Tolgoi LLC Commercial Banks “B Loan” SOFR plus | ||||||
Oyu Tolgoi LLC Export Credit Agencies Loan | ||||||
Oyu Tolgoi LLC Export Credit Agencies Loan SOFR plus | ||||||
Oyu Tolgoi LLC International Financial Institutions “A Loan” SOFR plus due 2035(j) | ||||||
Other secured loans | ||||||
Other unsecured loans | ||||||
Bank overdrafts | ||||||
Total borrowings(k) | ||||||
Current borrowings | ||||||
Non-current borrowings | ||||||
Total borrowings(k) |
206 | Annual Report on Form 20-F 2023 | riotinto.com |
Other relevant judgements - lease assessment We have to apply judgement for certain contractual arrangements, such as renewable energy power purchase agreements (PPAs), in evaluating whether we have the right to obtain substantially all of the economic benefits from the use of the renewable energy assets, including the right to obtain physical energy these assets generate. Based on our evaluation, we determine whether an arrangement is a lease, an executory contract or a derivative. An immaterial amount was recognised as a lease at year end for a fixed component of the QMM renewable PPA. Amrun PPA is a lease, which has not yet commenced and is included in capital commitments (note 37). | ||
Description of payment | Included within | 2023 US$m | 2022 US$m |
Principal lease payments | Cash flows from financing activities | ||
Interest payments on leases | Cash flows from operating activities | ||
Payments for short-term leases | Net operating costs | ||
Payments for variable lease components | Net operating costs | ||
Payments for low value leases (>12 months in duration) | Net operating costs | ||
Total lease payments |
Annual Report on Form 20-F 2023 | riotinto.com | 207 |
2023 US$m | 2022 US$m | |
Lease liabilities | ||
Due within 1 year | ||
Between 1 and 3 years | ||
Between 3 and 5 years | ||
More than 5 years | ||
Total undiscounted cash payments expected to be made | ||
Effect of discounting | ( | ( |
Present value of minimum lease payments | ||
Comprising: | ||
Current lease liability per the balance sheet | ||
Non-current lease liability per the balance sheet | ||
Total lease liability |
Note | 2023 US$m | 2022 US$m | |
Cash at bank and in hand | |||
Money market funds, reverse repurchase agreements and other cash equivalents | |||
Total cash and cash equivalents per Group balance sheet | |||
Bank overdrafts repayable on demand (unsecured) | 20 | ( | ( |
Total cash and cash equivalents per Group cash flow statement |
208 | Annual Report on Form 20-F 2023 | riotinto.com |
2023 | 2022 | |||||
Non-current US$m | Current US$m | Total US$m | Non-current US$m | Current US$m | Total US$m | |
Derivatives not related to net debt | ||||||
Derivatives related to net debt | ||||||
Equity shares and quoted funds | ||||||
Other investments, including loans(a) | ||||||
Total other financial assets | ||||||
2023 | 2022 | |||||
Non-current US$m | Current US$m | Total US$m | Non-current US$m | Current US$m | Total US$m | |
Derivatives not related to net debt | ||||||
Derivatives related to net debt | ||||||
Other financial liabilities | ||||||
Total other financial liabilities | ||||||
Classification of financial asset | Amortised cost | Fair value through profit and loss | Fair value through other comprehensive income |
Recognition and initial measurement | At initial recognition, trade receivables that do not have a significant financing component are recognised at their transaction price. Other financial assets are initially recognised at fair value plus related transaction costs. | The asset is initially recognised at fair value with transaction costs immediately expensed to the income statement. | The asset is initially recognised at fair value. |
Subsequent measurement | Amortised cost using the effective interest method. | Fair value movements are recognised in the income statement. | Fair value gains or losses on revaluation of such equity investments, including any foreign exchange component, are recognised in other comprehensive income. Dividends are recognised in the income statement when the right to receive payment is established. |
Derecognition | Any gain or loss on derecognition or modification of a financial asset held at amortised cost is recognised in the income statement. | Not applicable. | When the equity investment is derecognised, there is no recycling of fair value gains or losses previously recognised in other comprehensive income to the income statement. |
Annual Report on Form 20-F 2023 | riotinto.com | 209 |
210 | Annual Report on Form 20-F 2023 | riotinto.com |
2023 | ||||
Total | Within 1 year | Between 1 and 5 years | Between 5 and 10 years | |
Notional amount (in tonnes) | ||||
Notional amount (in US$ millions) | ||||
Average hedged rate (in US$ per tonne) | ||||
2022 | ||||
Total | Within 1 year | Between 1 and 5 years | Between 5 and 10 years | |
Notional amount (in tonnes) | ||||
Notional amount (in US$ millions) | ||||
Average hedged rate (in US$ per tonne) | ||||
Aluminium embedded derivatives separated from the power contract (Hedging instrument)(a) | Highly probable forecast aluminium sales (Hedged item) | |||||||
Nominal US$m | Carrying amount US$m | Change in fair value in the period US$m | Cash flow hedge reserve(b) US$m | Change in fair value in the period US$m | Total hedging losses recognised in reserves US$m | Hedge ineffective- ness in the period gains/ (losses)(c) US$m | Losses reclassified from reserves to income statement(d) US$m | |
2023 | ( | ( | ( | ( | ( | |||
2022 | ( | ( | ( | ( | ( | |||
Change in market prices | 2023 US$m | 2022 US$m | |
Effect on net earnings | + | ( | ( |
( | |||
Effect on equity | + | ( | ( |
( |
Impact of climate change on our business - Upper Calliope Solar Farm power purchase agreement in Queensland On 22 December 2023, as part of the program to develop renewable energy solutions for our Queensland aluminium assets, we entered into a long-term renewable 1.1GW power purchase agreement to buy renewable electricity and associated green products to be generated in the future from Upper Calliope Solar Farm. The contract is accounted for as a financial derivative with a zero fair value at inception and an immaterial fair value at year-end. It will require complex derivative measurement over the contract’s term categorised under level 3 with significant unobservable inputs related to future energy prices. | |||
Annual Report on Form 20-F 2023 | riotinto.com | 211 |
2023 | 2022 | |||||
Currency exposure | Closing exchange rate US cents | Effect on net earnings US$m | Impact directly on equity US$m | Closing exchange rate US cents | Effect on net earnings US$m | Impact directly on equity US$m |
Australian dollar | ( | ( | ( | |||
Canadian dollar | ( | ( | ||||
212 | Annual Report on Form 20-F 2023 | riotinto.com |
2023 | 2022 | ||||||||||
Held at fair value | Held at amortised cost US$m | Total US$m | Held at fair value | Held at amortised cost US$m | Total US$m | ||||||
Note | Level 1(a) US$m | Level 2(b) US$m | Level 3(c) US$m | Level 1(a) US$m | Level 2(b) US$m | Level 3(c) US$m | |||||
Assets | |||||||||||
Cash and cash equivalents(d) | 22 | ||||||||||
Investments in equity shares and funds(e) | 23 | ||||||||||
Other investments, including loans(f) | 23 | ||||||||||
Trade and other financial receivables(g) | 17 | ||||||||||
Forward, option and embedded derivatives contracts, not designated as hedges(h) | 23 | ||||||||||
Derivatives related to net debt(i) | 23 | ||||||||||
Liabilities | |||||||||||
Trade and other financial payables(j) | 18 | ( | ( | ( | ( | ( | ( | ||||
Forward, option and embedded derivatives contracts, designated as hedges(h) | 23 | ( | ( | ( | ( | ||||||
Forward, option and embedded derivatives contracts, not designated as hedges(h) | 23 | ( | ( | ( | ( | ( | ( | ||||
Derivatives related to net debt(i) | 23 | ( | ( | ( | ( | ||||||
2023 | 2022 | |
Level 3 financial assets and liabilities | US$m | US$m |
Opening balance | ||
Currency translation adjustments | ( | ( |
Total realised gains/(losses) included in: | ||
– consolidated sales revenue | ||
– net operating costs | ( | |
Total unrealised gains included in: | ||
– net operating costs | ||
Total unrealised losses transferred into other comprehensive income through cash flow hedges | ( | ( |
Additions to financial assets | ||
Disposals/maturity of financial instruments | ( | ( |
Closing balance | ||
Net gains included in the income statement for assets and liabilities held at year end |
Annual Report on Form 20-F 2023 | riotinto.com | 213 |
2023 | 2022 | |||
Description | Fair value US$m | Fair value US$ | Valuation technique | Significant Inputs |
Level 2 | ||||
Interest rate swaps | ( | ( | Discounted cash flows | –Applicable market quoted swap yield curves –Credit default spread |
Cross currency interest rate swaps | ( | ( | Discounted cash flows | –Applicable market quoted swap yield curves –Credit default spread –Market quoted FX rate |
Provisionally priced receivables | Closely related listed product | –Applicable forward quoted metal price | ||
Level 3 | ||||
Derivatives embedded in electricity contracts | ( | ( | Option pricing model | –LME forward aluminium price –Midwest premium and billet premium |
Royalty receivables | Discounted cash flows | –Forward commodity price –Mine production |
Impact of climate change on our business - coal royalty receivables At 31 December 2023, royalty receivables include amounts arising from our divested coal businesses with a carrying value of US$ (2022: US$ 3 unobservable inputs. These royalty receivables include US$ for potential changes in production rates that could occur due to climate change targets impacting the operator. The main unobservable input is the long-term coal price used over the life of these royalty receivables. A would result in a US$ US$ represents the annual coal price movement that we deem to be reasonably probable (on an annual basis over the long run). | |||
2023 | 2022 | |||
Carrying value US$m | Fair value US$m | Carrying value US$m | Fair value US$m | |
Listed bonds | ||||
Oyu Tolgoi project finance | ||||
Other | ||||
Total borrowings (including overdrafts) | ||||
214 | Annual Report on Form 20-F 2023 | riotinto.com |
Subsidiaries and joint operations | Equity accounted units (Rio Tinto share) | |||||
2023 | 2022 | 2021 | 2023 | 2022 | 2021 | |
Principal locations of employment: | ||||||
Australia and New Zealand | ||||||
Canada | ||||||
UK | ||||||
Europe | ||||||
Africa | ||||||
US | ||||||
Mongolia | ||||||
South America | ||||||
India | ||||||
Singapore | ||||||
Other countries(a) | ||||||
Total | ||||||
Note | 2023 US$m | 2022 US$m | 2021 US$m | |
Total employment costs | ||||
– Wages and salaries | ||||
– Social security costs | ||||
– Net post-retirement charge | 28 | |||
– Share-based payment charge | 27 | |||
Less: charged within movement in provisions (see below) | ( | ( | ( | |
Total employment costs | 7 |
2023 | 2022 | |||
Employment provisions | Pensions and post-retirement healthcare(a) US$m | Other employee entitlements(b) US$m | Total US$m | Total US$m |
At 1 January | ||||
Adjustment on currency translation | ( | |||
Charged/(credited) to profit: | ||||
– increases to existing and new provisions | ||||
– unused amounts reversed | ( | ( | ( | ( |
Utilised in year | ( | ( | ( | ( |
Re-measurement losses/(gains) recognised in other comprehensive income | ( | |||
Transfers and other movements | ( | ( | ||
At 31 December | ||||
Balance sheet analysis: | ||||
Current | ||||
Non-current | ||||
Total employment provisions | ||||
Annual Report on Form 20-F 2023 | riotinto.com | 215 |
Charge recognised for the year | Liability at the end of the year | ||||
2023 US$m | 2022 US$m | 2021 US$m | 2023 US$m | 2022 US$m | |
Equity-settled awards | |||||
Cash-settled awards | |||||
Total | |||||
216 | Annual Report on Form 20-F 2023 | riotinto.com |
Rio Tinto plc awards | Rio Tinto Limited awards | |||||||
2023 number | Weighted average fair value at grant date 2023 £ | 2022 number | Weighted average fair value at grant date 2022 £ | 2023 number | Weighted average fair value at grant date 2023 A$ | 2022 number | Weighted average fair value at grant date 2022 A$ | |
Unvested awards at 1 January | ||||||||
Awarded | ||||||||
Forfeited | ( | ( | ( | ( | ||||
Failed performance conditions | ( | ( | ||||||
Vested | ( | ( | ( | ( | ||||
Unvested awards at 31 December | ||||||||
Rio Tinto plc awards | Rio Tinto Limited awards | |||||||
2023 number | Weighted average share price at vesting 2023 £ | 2022 number | Weighted average share price at vesting 2022 £ | 2023 number | Weighted average share price at vesting 2023 A$ | 2022 number | Weighted average share price at vesting 2022 A$ | |
Vested awards settled in shares during the year (including dividend shares applied on vesting) | ||||||||
Vested awards settled in cash during the year (including dividend shares applied on vesting) | ||||||||
Rio Tinto plc awards(a) | Rio Tinto Limited awards | |||||||
2023 number | Weighted average fair value at grant date 2023 £ | 2022 number | Weighted average fair value at grant date 2022 £ | 2023 number | Weighted average fair value at grant date 2023 A$ | 2022 number | Weighted average fair value at grant date 2022 A$ | |
Unvested awards at 1 January(b) | ||||||||
Awarded | ||||||||
Forfeited | ( | ( | ( | ( | ||||
Cancelled | ( | ( | ( | ( | ||||
Vested | ( | ( | ( | ( | ||||
Unvested awards at 31 December(b) | ||||||||
Comprising: | ||||||||
– Management Share Awards | ||||||||
– Bonus Deferral Awards | ||||||||
– Global Employee Share Plan | ||||||||
– UK Share Plan | ||||||||
Unvested awards at 31 December(b) | ||||||||
Annual Report on Form 20-F 2023 | riotinto.com | 217 |
Rio Tinto plc awards(a) | Rio Tinto Limited awards | |||||||
2023 number | Weighted average share price at vesting 2023 £ | 2022 number | Weighted average share price at vesting 2022 £ | 2023 number | Weighted average share price at vesting 2023 A$ | 2022 number | Weighted average share price at vesting 2022 A$ | |
Vested awards settled in shares during the year (including dividend shares applied on vesting): | ||||||||
– Management Share Awards | ||||||||
– Bonus Deferral Awards | ||||||||
– Global Employee Share Plan | ||||||||
– UK Share Plan | ||||||||
Vested awards settled in cash during the year (including dividend shares applied on vesting): | ||||||||
– Bonus Deferral Awards | ||||||||
Uncertainty in benefit payments | The value of the Group’s liabilities for post-retirement benefits will ultimately depend on the amount of benefits paid out. This in turn will depend on the level of future pay increases, the level of inflation (for those benefits that are subject to some form of inflation protection) and how long individuals live. |
Volatility in asset values | The Group is exposed to future movements in the values of assets held in pension plans to meet future benefit payments. |
Uncertainty in cash funding | Movements in the values of the obligations or assets may result in the Group being required to provide higher levels of cash funding, although changes in the level of cash required can often be spread over a number of years. In some countries control over the rate of cash funding or over the investment policy for pension assets might rest to some extent with a trustee body or other body that is not under the Group’s direct control. In addition the Group is also exposed to adverse changes in pension regulation. |
218 | Annual Report on Form 20-F 2023 | riotinto.com |
Calculation of benefit | Regulatory requirements | Governing body | |
Canada | Linked to final average pay for non- unionised employees. For unionised employees linked to final average pay or to a flat monetary amount per year of service. | Regulatory requirements in the relevant provinces and territories (predominantly Quebec). | Pension committee, a number of members are appointed by the sponsor and a number appointed by plan participants. In some cases, independent committee members are also appointed. |
UK | Linked to final pay, subject to an earnings cap. | Regulatory requirements that apply to UK pension plans. | Trustee board, a number of directors appointed by the sponsor and a number appointed by plan participants and an independent trustee director. |
US | Linked to final average pay for non- unionised employees and to a flat monetary amount per year of service for unionised employees. | US regulations. | Benefit Governance Committee. Members are appointed by the sponsor. |
Switzerland | Linked to final average pay. | Swiss regulations. | Trustee board. Members are appointed by the plan sponsor, by employees and by retirees. |
Australia | Linked to final pay and typically paid in lump sum form. | Local regulations in Australia. | An independent financial institution. One third of the board positions are nominated by employers. Remaining positions are filled by independent directors and directors nominated by participants. |
Annual Report on Form 20-F 2023 | riotinto.com | 219 |
2023 | 2022 | |||
Equities | ||||
– Quoted(a) | ||||
– Private(b) | ||||
Bonds(c) | ||||
– Government fixed income | ||||
– Government inflation-linked | ||||
– Corporate and other publicly quoted | ||||
– Private | ||||
Property(d) | ||||
– Quoted property funds | ||||
– Unquoted property funds | ||||
Qualifying insurance policies(e) | ||||
Cash and other(f)(g) | ||||
Total | ||||
220 | Annual Report on Form 20-F 2023 | riotinto.com |
Pension benefits | Other benefits | 2023 Total | 2022 Total | 2021 Total | |
Proportion relating to current employees | |||||
Proportion relating to former employees not yet retired | |||||
Proportion relating to retirees | |||||
Total | |||||
Average duration of obligations (years) |
Pension benefits | Other benefits | 2023 Total | 2022 Total | 2021 Total | |
Canada | |||||
UK | |||||
US | |||||
Switzerland | |||||
Other | |||||
Total |
Pension benefits US$m | Other benefits US$m | 2023 Total US$m | 2022 Total US$m | 2021 Total US$m | |
Current employer service cost for defined benefit plans | ( | ( | ( | ( | ( |
Past service credit/(cost) | ( | ( | |||
Settlement losses | ( | ||||
Net interest on net defined benefit liability | ( | ( | ( | ( | |
Non-investment expenses paid from the plans | ( | ( | ( | ( | |
Total defined benefit credit/(expense) | ( | ( | ( | ( | |
Current employer service cost for defined contribution and industry-wide plans | ( | ( | ( | ( | ( |
Total expense recognised in the income statement | ( | ( | ( | ( | ( |
2023 US$m | 2022 US$m | 2021 US$m | |
Actuarial (losses)/gains | ( | ||
Impact of buy-in(a) | ( | ||
Return on assets, net of interest on assets | ( | ||
Losses on application of asset ceiling | ( | ( | |
Re-measurement (losses)/gains on pension and post-retirement healthcare plans | ( |
Annual Report on Form 20-F 2023 | riotinto.com | 221 |
2023 | 2022 | |||
Pension benefits US$m | Other benefits US$m | Total US$m | Total US$m | |
Total fair value of plan assets | ||||
Present value of obligations – funded | ( | ( | ( | |
Present value of obligations – unfunded | ( | ( | ( | ( |
Present value of obligations – total | ( | ( | ( | ( |
Effect of asset ceiling | ( | ( | ( | |
Net deficit to be shown in the balance sheet | ( | ( | ( | ( |
Comprising: | ||||
– Deficits | ( | ( | ( | ( |
– Surpluses | ||||
Net (deficit)/surplus on pension plans | ( | ( | ||
Unfunded post-retirement healthcare obligation | ( | ( | ( | |
2023 | 2022 | 2021 | |||
Pension benefits US$m | Other benefits US$m | Total US$m | Total US$m | Total US$m | |
Contributions to defined benefit plans | |||||
Contributions to defined contribution plans | |||||
Total | |||||
222 | Annual Report on Form 20-F 2023 | riotinto.com |
2023 | 2022 | |||
Pension benefits US$m | Other benefits US$m | Total US$m | Total US$m | |
Change in the net defined benefit liability | ||||
Net defined benefit surplus/(liability) at the start of the year | ( | ( | ( | |
Amounts recognised in income statement | ( | ( | ( | |
Amounts recognised in other comprehensive income | ( | ( | ||
Employer contributions | ||||
Assets transferred to defined contribution section | ( | ( | ( | |
Currency exchange rate gains/(losses) | ( | ( | ||
Net defined benefit liability at the end of the year | ( | ( | ( | ( |
2023 | 2022 | |||
Pension benefits US$m | Other benefits US$m | Total US$m | Total US$m | |
Change in present value of obligation | ||||
Present value of obligation at the start of the year | ( | ( | ( | ( |
Current employer service costs | ( | ( | ( | ( |
Past service credit/(cost) | ( | |||
Settlements | ||||
Interest on obligation | ( | ( | ( | ( |
Contributions by plan participants | ( | ( | ( | |
Benefits paid | ||||
Experience (losses)/gains | ( | ( | ( | |
Changes in financial assumptions (losses)/gains | ( | ( | ( | |
Changes in demographic assumptions gains | ||||
Currency exchange rate (losses)/gains | ( | ( | ( | |
Present value of obligation at the end of the year | ( | ( | ( | ( |
2023 | 2022 | |||
Pension benefits US$m | Other benefits US$m | Total US$m | Total US$m | |
Change in plan assets | ||||
Fair value of plan assets at the start of the year | ||||
Settlements | ( | ( | ||
Interest on assets | ||||
Contributions by plan participants | ||||
Contributions by employer | ||||
Benefits paid | ( | ( | ( | ( |
Non-investment expenses | ( | ( | ( | |
Return on plan assets, net of interest on assets | ( | |||
Impact of buy-in | ( | ( | ||
Assets transferred to defined contribution section | ( | ( | ( | |
Currency exchange rate gains/(losses) | ( | |||
Fair value of plan assets at the end of the year | ||||
Annual Report on Form 20-F 2023 | riotinto.com | 223 |
Key estimate - Estimation of obligations for post-employment costs The value of the Group’s obligations for post-employment benefits is dependent on the amount of benefits that are expected to be paid out, discounted to the balance sheet date. The most significant assumptions used in accounting for pension plans are: –The discount rate - used to determine the net present value of the obligations, the interest cost on the obligations and the interest income on plan assets. We use the yield from high-quality corporate bonds with maturities and terms that match those of the post-employment obligations as closely as possible. Where there is no developed corporate bond market in a currency, the rate on government bonds is used. –The long-term inflation rate - used to project increases in future benefit payments for those plans that have benefits linked to inflation. The assumption regarding future inflation is based on market yields on inflation linked instruments, where possible, combined with consensus views. –The mortality rates - used to project the period over which benefits will be paid, which is then discounted to arrive at the net present value of the obligations. The Group reviews the actual mortality rates of retirees in its major pension plans on a regular basis and uses these rates to set its current mortality assumptions. It also uses its judgement with respect to allowances for future improvements in longevity having regard to standard improvement scales in each relevant country and after taking external actuarial advice. The weighted-average assumptions used for the valuation at year end are summarised below: | ||||||
Canada | UK | US | Switzerland | |||
At 31 December 2023 | ||||||
Discount rate | ||||||
Long-term inflation(a) | ||||||
Rate of increase in pensions | ||||||
At 31 December 2022 | ||||||
Discount rate | ||||||
Long-term inflation(a) | ||||||
Rate of increase in pensions | ||||||
(a)The long-term inflation assumption shown for the UK is for the Retail Price Index. The assumption for the Consumer Price Index at 31 December 2023 was | ||||||
2023 | 2022 | ||||
Approximate (increase)/ decrease in obligations | Approximate (increase)/ decrease in obligations | ||||
Assumption | Change in assumption | Pensions US$m | Other US$m | Pensions US$m | Other US$m |
Discount rate | Increase of | ||||
Decrease of | ( | ( | ( | ( | |
Long-term inflation | Increase of | ( | ( | ( | ( |
Decrease of | |||||
Demographic – allowance for future improvements in longevity | Participants assumed to have the mortality rates of individuals who are | ||||
Participants assumed to have the mortality rates of individuals who are | ( | ( | ( | ( | |
224 | Annual Report on Form 20-F 2023 | riotinto.com |
2023 US$'000 | 2022 US$'000 | 2021 US$'000 | |
Emoluments | |||
Long-term incentive plans | |||
Pension contributions: defined contribution plans |
2023 US$'000 | 2022 US$'000 | 2021 US$'000 | |
Short-term employee benefits and costs | |||
Post-employment benefits | |||
Employment termination benefits | |||
Share-based payments | |||
Total |
Annual Report on Form 20-F 2023 | riotinto.com | 225 |
Company and country of incorporation/operation | Principal activities | Class of shares held | Proportion of class held (%) | Group interest (voting %) | Other interest (voting %) | ||||
Australia | |||||||||
Argyle Diamonds Limited | Mining and processing of diamonds (until November 2020) | Class A | — | ||||||
Class B | |||||||||
Dampier Salt Limited | Salt and gypsum production | Ordinary | |||||||
Energy Resources of Australia Ltd | Uranium processing (until January 2021) | Class A | |||||||
Ordinary | |||||||||
Hamersley Iron Pty Limited | Iron ore mining | Ordinary | — | ||||||
North Mining Limited(a) | Iron ore mining | Ordinary | — | ||||||
Preference | |||||||||
Rio Tinto Aluminium (Holdings) Limited | Bauxite mining, alumina production, primary aluminium smelting | Ordinary | — | ||||||
Robe River Mining Co Pty Ltd(a) | Iron ore mining | Class A | |||||||
Class B | |||||||||
Argentina | |||||||||
Rincon Mining Pty Limited(b) | Exploration and development of lithium asset. | Ordinary | – | ||||||
Brazil | |||||||||
Rio Tinto do Brasil Ltda.(c) | Alumina production and bauxite mining | Quota | — | ||||||
Canada | |||||||||
Diavik Diamond Mines (2012) Inc. | Diamond mining and processing | Common | — | ||||||
Iron Ore Company of Canada(d) | Iron ore mining; iron ore pellets production | Series A | |||||||
Series E | |||||||||
Series F | |||||||||
Rio Tinto Alcan Inc. | Bauxite mining; alumina refining; aluminium smelting | Common | — | ||||||
Rio Tinto Fer et Titane Inc. | Titanium dioxide feedstock; high purity iron and steel production | Common | — | ||||||
Class B preference | |||||||||
Preference | |||||||||
Guinea | |||||||||
Simfer Jersey Limited(e) | Iron ore project | Ordinary | |||||||
Madagascar | |||||||||
QIT Madagascar Minerals SA(f) | Ilmenite mining | Common | |||||||
Investment certificates | |||||||||
Mongolia | |||||||||
Oyu Tolgoi LLC | Copper and gold mining | Common | |||||||
Singapore | |||||||||
Rio Tinto Singapore Holdings Pte Ltd | Commercial activities | Ordinary | – | ||||||
South Africa | |||||||||
Richards Bay Titanium (Proprietary) Limited(g) | Titanium dioxide, high purity iron production | B Ordinary | |||||||
B Preference | |||||||||
Parent Preference | |||||||||
Richards Bay Mining (Proprietary) Limited(g) | Ilmenite, rutile and zircon mining | B Ordinary | |||||||
B Preference | |||||||||
Parent Preference | |||||||||
United States | |||||||||
Kennecott Holdings Corporation (including Kennecott Utah Copper and Kennecott Exploration) | Copper and gold mining, smelting and refining and exploration activities | Common | — | ||||||
Nuton LLC | Technology venture including investments and collaborations related to proprietary nature-based copper leach technologies and capabilities | Unit shares | — | ||||||
U.S. Borax Inc. | Mining, refining and marketing of borates | Common | – | ||||||
Resolution Copper Mining LLC | Exploration and development of copper | - | – |
226 | Annual Report on Form 20-F 2023 | riotinto.com |
Income statement summary for the year ended 31 December | Iron Ore Company of Canada 2023 US$m | Iron Ore Company of Canada 2022 US$m restated(a) | Oyu Tolgoi LLC (b)(c) 2023 US$m | Oyu Tolgoi LLC (b)(c) 2022 US$m restated(a) |
Revenue | ||||
Profit/(loss) after tax | ( | ( | ||
– attributable to non-controlling interests | ( | ( | ||
– attributable to Rio Tinto | ( | ( | ||
Other comprehensive income/(loss) | ( | |||
Total comprehensive income/(loss) | ( | ( |
Balance sheet summary as at 31 December | 2023 US$m | 2022 US$m | 2023 US$m | 2022 US$m |
Non-current assets | ||||
Current assets | ||||
Current liabilities | ( | ( | ( | ( |
Non-current liabilities | ( | ( | ( | ( |
Net assets | ( | ( | ||
– attributable to non-controlling interests | ( | ( | ||
– attributable to Rio Tinto | ( | ( |
Cash flow statement summary for the year ended 31 December | 2023 US$m | 2022 US$m | 2023 US$m | 2022 US$m |
Cash flow from operations | ||||
Dividends paid to non-controlling interests | ( | ( |
Annual Report on Form 20-F 2023 | riotinto.com | 227 |
Income statement summary for the year ended 31 December | Robe River Mining Co Pty 2023 US$m | Robe River Mining Co Pty 2022 US$m restated(a) | Other companies and eliminations(b) 2023 US$m | Other companies and eliminations(b) 2022 US$m restated(a) | Robe River 2023 US$m | Robe River 2022 US$m restated(a) |
Revenue | ||||||
Profit after tax | ||||||
– attributable to non-controlling interests | ||||||
– attributable to Rio Tinto | ||||||
Other comprehensive loss | ( | ( | ( | |||
Total comprehensive income |
Balance sheet summary as at 31 December | 2023 US$m | 2022 US$m | 2023 US$m | 2022 US$m | 2023 US$m | 2022 US$m |
Non-current assets | ||||||
Current assets | ||||||
Current liabilities | ( | ( | ( | ( | ( | ( |
Non-current liabilities | ( | ( | ( | ( | ( | ( |
Net assets | ||||||
– attributable to non-controlling interests | ||||||
– attributable to Rio Tinto |
Cash flow statement summary for the year ended 31 December | 2023 US$m | 2022 US$m | 2023 US$m | 2022 US$m | 2023 US$m | 2022 US$m |
Cash flow from operations | ||||||
Dividends paid to non-controlling interests | ( | ( | ( | ( |
Company and country of incorporation/operation | Principal activities | Group interest (%) |
See other relevant judgements call out box below | ||
228 | Annual Report on Form 20-F 2023 | riotinto.com |
Other relevant judgements - accounting for the Pilbara Iron Arrangements A number of arrangements are in place amongst the Australian Iron Ore operations, managed by Rio Tinto, which allow their respective assets to be operated as a single integrated network across the Pilbara region. In assessing the Pilbara Iron Arrangements, it has been concluded that they collectively constitute a joint operation on the basis that decisions about relevant activities require unanimous consent. The resulting efficiencies are shared between Rio Tinto and Robe River Iron Associates (Robe River), and the parties fund all of the cash flow requirements of Pilbara Iron (Company) Services Pty Ltd and Pilbara Iron Pty Ltd. Each of the partners in the joint operation is able to request the other to construct assets on their tenure to increase the capacity of the rail and port infrastructure network. The requesting partner’s (Asset User’s) share of the capacity of the network will increase by the capacity of the newly constructed asset, but generally that capacity may be provided from any of the network assets. The Asset User will pay an annual charge, Committed Use Charge (CUC) over a contractually specified period irrespective of network usage. The constructing partner (Asset Owner) has an ongoing obligation to make available capacity from those assets and to maintain the assets in good working order as required under relevant State Agreements and associated tenure. The arrangements are managed through two wholly-owned subsidiaries: Pilbara Iron (Company) Services Pty Ltd and Pilbara Iron Pty Ltd. We have also considered whether the CUC arrangements give rise to a lease between the Asset Owner and the Asset User. We have concluded that they do not, as there is no specified asset; rather the Asset User has a first priority right to the capacity in the CUC asset. This treatment was grandfathered on adoption of IFRS 16 on 1 January 2019, following an assessment under the preceding standards IAS 17 “Leases” and IFRIC 4 “Determining whether an arrangement contains a lease”, with no change to the conclusion under IFRS 16 for subsequent expenditure subject to the existing CUC arrangements. Management considers that these arrangements are unique and has used judgement to apply the principles of IFRS to the accounting for the arrangements as described above. The obligation of the Asset Owner to make capacity available is fulfilled over time and not at a point in time. The CUC arrangement is therefore an executory contract as defined under IAS 37, whereby neither party has performed any of its obligations, or both parties have partially performed their obligations to an equal extent, and so the CUC payments are expensed as incurred. An alternative interpretation of the fact pattern could have resulted in a gross presentation in the Group’s balance sheet with an asset and a corresponding liability to reflect the present value of the CUC payments. The Asset User is a wholly-owned subsidiary of Rio Tinto, whereas the Asset Owner is a joint operation. This impact would be some US$ million (calculated on the basis of grossing up the tax written down value of the CUC assets). Other methods of calculating the gross-up might give rise to different numbers. | ||
Company and country of incorporation/operation | Principal activities | Number of shares held | Class of shares held | Proportion of class held (%) | Group interest (%) |
Canada | |||||
Matalco Canada Inc. | Aluminium recycling | Class B Common | |||
Chile | |||||
Minera Escondida Ltda(a) | Copper mining and refining | — | — | — | |
Oman | |||||
Sohar Aluminium Co. L.L.C.(b) | Aluminium smelting, power generation | Ordinary | |||
United States | |||||
Matalco USA, LLC | Aluminium recycling | Unit shares |
Other relevant judgements - accounting for Minera Escondida Ltda Judgement has been applied on the determination that Escondida is a joint venture. We have based this on the nature of significant commercial decisions, including those in relation to capital expenditure, which require approval of both Rio Tinto and its partner BHP (holders of a rights to direct relevant activities. Adoption of the equivalent judgement by the Group would result in reclassification of Escondida from a joint venture to an associate, with no other financial reporting consequence since accounting under the equity method would remain in place. | ||
Annual Report on Form 20-F 2023 | riotinto.com | 229 |
Minera Escondida Ltda(a) 2023 US$m | Minera Escondida Ltda(a) 2022 US$m | |
Revenue | ||
Depreciation and amortisation | ( | ( |
Other operating costs | ( | ( |
Operating profit | ||
Finance expense | ( | ( |
Income tax(b) | ( | ( |
Profit after tax | ||
Other comprehensive (loss)/income | ( | |
Total comprehensive income | ||
Non-current assets | ||
Current assets | ||
Current liabilities | ( | ( |
Non-current liabilities | ( | ( |
Net assets | ||
Assets and liabilities above include: | ||
– cash and cash equivalents | ||
– current financial liabilities | ( | ( |
– non-current financial liabilities | ( | ( |
Dividends received from joint venture (Rio Tinto share) |
Group interest | ||
Net assets (100%) | ||
Group’s ownership interest | ||
Carrying value of Group’s interest |
230 | Annual Report on Form 20-F 2023 | riotinto.com |
Company and country of incorporation/operation | Principal activities | Number of shares held | Class of shares held | Proportion of class held (%) | Group interest (%) | ||
Ordinary | |||||||
Ordinary | |||||||
Preferred | |||||||
Common |
2023 US$m | 2022 US$m adjusted(a) | |
Carrying value of Group's interest(b) | ||
Profit after tax | ||
Other comprehensive income/(loss) | ( | |
Total comprehensive income/(loss) | ( |
2023 US$m | 2022 US$m | 2021 US$m | ||
Income statement items | ||||
Purchases from equity accounted units | ( | ( | ( | |
Sales to equity accounted units | ||||
Cash flow statement items | ||||
Dividends from equity accounted units | ||||
Net (funding of)/receipts from equity accounted units | ( | ( | ||
Balance sheet items | ||||
Investments in equity accounted units(a) | ||||
Loans related to equity accounted units(b) | ||||
Trade and other receivables: amounts due from equity accounted units(c) | ||||
Trade and other payables: amounts due to equity accounted units | ( | ( | ( |
Annual Report on Form 20-F 2023 | riotinto.com | 231 |
2023 Number (million) | 2022 Number (million) | 2021 Number (million) | 2023 US$m | 2022 US$m | 2021 US$m | |
Issued and fully paid up share capital of 10p each | ||||||
At 1 January | ||||||
Ordinary shares issued under the Global Employee Share plan (GESP) | ||||||
Shares purchased and cancelled(a) | ||||||
At 31 December | ||||||
Shares held by public | ||||||
At 1 January | ||||||
Shares reissued from treasury under the GESP | ||||||
Ordinary shares issued under the GESP | ||||||
Shares purchased and cancelled(a) | ||||||
At 31 December | ||||||
Shares held in treasury | ||||||
Shares held by public | ||||||
Total share capital | ||||||
Other share classes | ||||||
Special Voting Share of 10p each(b) | ||||||
DLC Dividend Share of 10p each(b) |
2023 Number (million) | 2022 Number (million) | 2021 Number (million) | 2023 US$m | 2022 US$m | 2021 US$m | |
Issued and fully paid up share capital | ||||||
At 1 January | ||||||
Adjustment on currency translation | ( | ( | ||||
At 31 December | ||||||
– Special Voting Share(a) | ||||||
– DLC Dividend Share(a) | ||||||
Total share capital |
232 | Annual Report on Form 20-F 2023 | riotinto.com |
2023 US$m | 2022 US$m restated(a) | 2021 US$m restated(a) | |
Capital redemption reserve(b) | |||
At 1 January and 31 December | |||
Cash flow hedge reserve | |||
At 1 January | ( | ( | |
Cash flow hedge gains/(losses) | ( | ( | |
Cash flow hedge (gains)/losses transferred to the income statement | ( | ||
Tax on the above | |||
At 31 December | ( | ( | ( |
Fair value through other comprehensive income reserve | |||
At 1 January | ( | ||
(Losses)/gains on equity investments | ( | ||
At 31 December | ( | ||
Cost of hedging reserve | |||
At 1 January | ( | ( | ( |
Cost of hedging deferred to reserves during the year | ( | ||
Transfer of cost of hedging to the income statement | |||
At 31 December | ( | ( | ( |
Other reserves(c) | |||
At 1 January | |||
Own shares purchased from Rio Tinto Limited shareholders to satisfy share awards | ( | ( | ( |
Employee share options: value of services | |||
Deferred tax on share options | ( | ||
At 31 December | |||
Foreign currency translation reserve(d) | |||
At 1 January | ( | ( | |
Parent and subsidiaries' currency translation and exchange adjustments | ( | ( | |
Equity accounted units currency translation adjustments | ( | ( | |
Currency translation reclassified on disposal(e) | |||
At 31 December | ( | ( | ( |
Total other reserves per balance sheet |
Retained earnings(f) | |||
At 1 January as previously reported(g) | |||
Adjustment for transition to new accounting pronouncements(h) | |||
Revised 1 January | |||
Parent and subsidiaries' profit for the year | |||
Equity accounted units' profit after tax for the year | |||
Re-measurement (losses)/gains on pension and post-retirement healthcare plans(i) | ( | ||
Tax relating to components of other comprehensive income | ( | ( | |
Total comprehensive income for the year | |||
Dividends paid | ( | ( | ( |
Change in equity interest held by Rio Tinto(j) | ( | ||
Own shares purchased/treasury shares reissued for share awards and other movements | ( | ( | ( |
Equity issued to holders of non-controlling interests(j) | ( | ||
Employee share options and other IFRS 2 charges taken to the income statement | |||
At 31 December |
Annual Report on Form 20-F 2023 | riotinto.com | 233 |
2023 US$m | 2022 US$m | |
Opening balance at 1 January as previously reported | ||
Adjustment on currency translation | ( | |
Adjustments to mining properties/right-of-use assets: | ||
– decrease to existing and new provisions | ||
Charged/(credited) to profit: | ||
– increases to existing and new provisions | ||
– change in discount rate | ( | |
– unused amounts reversed | ( | ( |
– exchange gain on provisions | ( | |
– amortisation of discount | ||
Utilised in year | ( | ( |
Transfers and other movements(a) | ( | |
Closing balance at 31 December | ||
Balance sheet analysis: | ||
Current | ||
Non-current | ||
Total |
Other relevant judgements - contingencies Disclosure is made for material contingent liabilities unless the possibility of any loss arising is considered remote based on our judgement and legal advice. These are quantified unless, in our judgement, the amount cannot be reliably estimated. The unit of account for claims is the matter taken as a whole and therefore when a provision has been recorded for the best estimate of the cost to settle the obligation there is no further contingent liability component. This means that when a provision is recognised for the best estimate of the expenditure required to settle the present obligation from a single past event, a further contingent liability is not reported for the maximum potential exposure in excess of that already provided. We have not established provisions for certain additional legal claims in cases where we have assessed that a payment is either not probable or cannot be reliably estimated. A number of our companies are, and will likely continue to be, subject to various legal proceedings and investigations that arise from time to time. As a result, the Group may become subject to substantial liabilities that could affect our business, financial position and reputation. Litigation is inherently unpredictable and large judgements may at times occur. The Group may in the future incur judgements or enter into settlements of claims that could lead to material cash outflows. We do not believe that any of these proceedings will have a materially adverse effect on our financial position. | ||
2023 US$m | 2022 US$m | |
Contingent liabilities, indemnities and other performance guarantees(a) |
234 | Annual Report on Form 20-F 2023 | riotinto.com |
Litigation matter | Latest update |
2011 Contractual payments in Guinea | On 6 March 2023, we resolved a previously self-disclosed investigation by the SEC into certain contractual payments totalling US$ services in 2011, relating to the Simandou project in the Republic of Guinea. Without admitting to or denying the SEC’s findings, Rio Tinto paid a US$ books and records and internal controls provisions of the Foreign Corrupt Practices Act. In August 2023, the UK Serious Fraud Office announced that it was not in the public interest to proceed with a prosecution and closed its case. It also announced that the Australian Federal Police maintains a live investigation into the matter. Rio Tinto continues to co-operate fully with relevant authorities in connection with open investigations. In August 2018, the court dismissed a related US class action commenced on behalf of securities holders. No provision has been recognised for other related investigations. |
Impact of climate change on our business - decarbonisation capital commitments Capital commitments do not include the estimated incremental capital expenditure relating to decarbonisation projects of US$ billion between 2022 and 2030 unless otherwise contractually committed (revised from US$ commitments in 2023 are contractually committed decarbonisation capital commitments of US$ Amrun power purchase agreement, which is a treated as a lease, which has not yet commenced (disclosed in note 21). | |||
Annual Report on Form 20-F 2023 | riotinto.com | 235 |
2023 US$m | 2022 US$m | |
Capital commitments excluding the Group's share of joint venture capital commitments | ||
Within 1 year | ||
Between 1 and 3 years | ||
Between 3 and 5 years | ||
After 5 years | ||
Total | ||
Group's share of joint venture capital commitments | ||
Within 1 year | ||
Between 1 and 3 years | ||
Total |
2023 US$m | 2022 US$m | |
Within 1 year | ||
Between 1 and 2 years | ||
Between 2 and 3 years | ||
Between 3 and 4 years | ||
Between 4 and 5 years | ||
After 5 years | ||
Total |
236 | Annual Report on Form 20-F 2023 | riotinto.com |
2023 US$m | 2022 US$m | 2021 US$m | |
Audit of the Group | |||
Audit of subsidiaries | |||
Total audit | |||
Audit-related assurance service | |||
Other assurance services(b) | |||
Total assurance services | |||
Tax compliance | |||
Other non-audit services not covered above | |||
Total non-audit services | |||
Total Group auditors’ remuneration | |||
Audit fees payable to other accounting firms | |||
Audit of the financial statements of the Group’s subsidiaries | |||
Fees in respect of pension scheme audits | |||
Total audit fees payable to other accounting firms |
Annual Report on Form 20-F 2023 | riotinto.com | 237 |
Annual Report on Form 20-F 2023 | riotinto.com | 267 |
268 | Annual Report on Form 20-F 2023 | riotinto.com |
/s/ KPMG LLP | /s/ KPMG Perth, |
London, United Kingdom | Australia |
London, United Kingdom February 23, 2024 | Perth, Australia February 23, 2024 |
In respect of the Board of directors and shareholders for Rio Tinto plc | In respect of the Board of directors and shareholders for Rio Tinto Limited |
Annual Report on Form 20-F 2023 | riotinto.com | 269 |
Segmental revenue(c) for the year ended 31 December | Underlying EBITDA(c) for the year ended 31 December | Depreciation and amortisation for the year ended 31 December | Underlying earnings(c) for the year ended 31 December | ||||||||||
Rio Tinto interest % | 2023 US$m | 2022 US$m Adjusted(a) | 2021 US$m Adjusted(a) | 2023 US$m | 2022 US$m Adjusted(a) | 2021 US$m Adjusted(a) | 2023 US$m | 2022 US$m Adjusted(a) | 2021 US$m Adjusted(a) | 2023 US$m | 2022 US$m Restated(a)(b) | 2021 US$m Restated(a)(b) | |
Iron Ore | |||||||||||||
Pilbara | (d) | 30,867 | 29,313 | 39,111 | 19,828 | 18,474 | 27,837 | 2,128 | 2,011 | 2,003 | 11,945 | 11,106 | 17,568 |
Dampier Salt | 68.4 | 422 | 352 | 298 | 120 | 56 | 39 | 21 | 19 | 20 | 49 | 19 | 10 |
Evaluation projects/other | (e) | 2,701 | 2,711 | 2,147 | 57 | 33 | (81) | — | — | — | (89) | 53 | (79) |
Intra-segment | (e) | (1,741) | (1,470) | (1,974) | (31) | 49 | (203) | — | — | — | (23) | 35 | (152) |
Total Iron Ore Segment | 32,249 | 30,906 | 39,582 | 19,974 | 18,612 | 27,592 | 2,149 | 2,030 | 2,023 | 11,882 | 11,213 | 17,347 | |
Aluminium | |||||||||||||
Bauxite | 2,390 | 2,396 | 2,203 | 662 | 618 | 619 | 373 | 361 | 328 | 141 | 101 | 187 | |
Alumina | 2,882 | 3,215 | 2,743 | 136 | 289 | 569 | 170 | 200 | 165 | (56) | 18 | 307 | |
North American Aluminium (m) | 6,581 | 7,561 | 6,706 | 1,480 | 2,426 | 2,592 | 710 | 704 | 694 | 566 | 1,266 | 1,454 | |
Pacific Aluminium | 2,613 | 3,102 | 2,947 | 169 | 497 | 693 | 165 | 135 | 103 | 18 | 261 | 396 | |
Intra-segment and other | (2,953) | (3,138) | (2,718) | (11) | 12 | 14 | — | — | (1) | (15) | (8) | 192 | |
Integrated operations | 11,513 | 13,136 | 11,881 | 2,436 | 3,842 | 4,487 | 1,418 | 1,400 | 1,289 | 654 | 1,638 | 2,536 | |
Other product group items | 772 | 973 | 814 | 9 | 25 | 26 | — | — | — | 5 | 15 | 17 | |
Product group operations | 12,285 | 14,109 | 12,695 | 2,445 | 3,867 | 4,513 | 1,418 | 1,400 | 1,289 | 659 | 1,653 | 2,553 | |
Evaluation projects/other | — | — | — | (163) | (195) | (131) | — | — | — | (121) | (149) | (101) | |
Total Aluminium Segment | 12,285 | 14,109 | 12,695 | 2,282 | 3,672 | 4,382 | 1,418 | 1,400 | 1,289 | 538 | 1,504 | 2,452 | |
Copper | |||||||||||||
Kennecott | 100.0 | 1,430 | 1,923 | 2,528 | 178 | 857 | 1,142 | 500 | 624 | 538 | (328) | 12 | 531 |
Escondida | 30.0 | 2,756 | 2,628 | 2,935 | 1,619 | 1,641 | 2,013 | 355 | 330 | 348 | 684 | 798 | 1,003 |
Oyu Tolgoi | (f) | 1,625 | 1,424 | 1,971 | 639 | 449 | 1,213 | 476 | 194 | 213 | 161 | 130 | 326 |
Product group operations | 5,811 | 5,975 | 7,434 | 2,436 | 2,947 | 4,368 | 1,331 | 1,148 | 1,099 | 517 | 940 | 1,860 | |
Evaluation projects/other(a) | 867 | 724 | 393 | (532) | (382) | (341) | 5 | 5 | 4 | (384) | (253) | (219) | |
Total Copper Segment | 6,678 | 6,699 | 7,827 | 1,904 | 2,565 | 4,027 | 1,336 | 1,153 | 1,103 | 133 | 687 | 1,641 | |
Minerals | |||||||||||||
Iron Ore Company of Canada | 58.7 | 2,500 | 2,818 | 3,526 | 942 | 1,381 | 2,026 | 214 | 207 | 197 | 293 | 475 | 734 |
Rio Tinto Iron & Titanium | (g) | 2,172 | 2,366 | 1,791 | 582 | 799 | 470 | 222 | 224 | 213 | 221 | 374 | 176 |
Rio Tinto Borates | 100.0 | 802 | 742 | 592 | 212 | 155 | 89 | 58 | 54 | 51 | 125 | 80 | 32 |
Diamonds | (h) | 444 | 816 | 501 | 44 | 330 | 180 | 35 | 45 | 12 | 26 | 151 | 99 |
Product group operations | 5,918 | 6,742 | 6,410 | 1,780 | 2,665 | 2,765 | 529 | 530 | 473 | 665 | 1,080 | 1,041 | |
Evaluation projects/other | 16 | 12 | 71 | (366) | (246) | (162) | 1 | 1 | 1 | (353) | (226) | (153) | |
Total Minerals Segment | 5,934 | 6,754 | 6,481 | 1,414 | 2,419 | 2,603 | 530 | 531 | 474 | 312 | 854 | 888 | |
Reportable segments total | 57,146 | 58,468 | 66,585 | 25,574 | 27,268 | 38,604 | 5,433 | 5,114 | 4,889 | 12,865 | 14,258 | 22,328 | |
Simandou iron ore project | (i) | — | — | — | (539) | (189) | (58) | — | — | — | (160) | (145) | (43) |
Other operations | (j) | 142 | 192 | 251 | (39) | (16) | (28) | 290 | 272 | 199 | (250) | (347) | (88) |
Inter-segment transactions | (231) | (256) | (268) | 8 | 24 | 42 | 4 | 26 | 19 | ||||
Central pension costs, share-based payments, insurance and derivatives | 168 | 377 | 110 | 48 | 374 | 133 | |||||||
Restructuring, project and one-off costs | (190) | (173) | (80) | (112) | (85) | (53) | |||||||
Central costs | (990) | (766) | (613) | 95 | 94 | 106 | (898) | (651) | (585) | ||||
Central exploration and evaluation | (100) | (253) | (257) | (60) | (209) | (215) | |||||||
Net interest | 318 | 138 | (95) | ||||||||||
Underlying EBITDA/earnings | 23,892 | 26,272 | 37,720 | 11,755 | 13,359 | 21,401 | |||||||
Items excluded from underlying EBITDA/earnings | (1,257) | 269 | (811) | (1,697) | (967) | (286) | |||||||
Reconciliation to Group income statement | |||||||||||||
Share of equity accounted unit sales and intra- subsidiary/equity accounted unit sales | (3,016) | (2,850) | (3,073) | ||||||||||
Impairment charges | (936) | (52) | (269) | ||||||||||
Depreciation and amortisation in subsidiaries excluding capitalised depreciation | (4,976) | (4,871) | (4,525) | ||||||||||
Depreciation and amortisation in equity accounted units | (484) | (470) | (497) | (484) | (470) | (497) | |||||||
Taxation and finance items in equity accounted units | (741) | (640) | (759) | ||||||||||
Finance items | (1,713) | (1,846) | (26) | ||||||||||
Consolidated sales revenue/profit before taxation/depreciation and amortisation/net earnings | 54,041 | 55,554 | 63,495 | 13,785 | 18,662 | 30,833 | 5,334 | 5,010 | 4,697 | 10,058 | 12,392 | 21,115 | |
286 | Annual Report on Form 20-F 2023 | riotinto.com |
Capital expenditure(c)(k) for the year ended 31 December | Operating assets(l) as at 31 December | Employees for the year ended 31 December | ||||||||
Rio Tinto interest % | 2023 US$m | 2022 US$m Adjusted(a) | 2021 US$m Adjusted(a) | 2023 US$m | 2022 US$m Restated(a)(b) | 2021 US$m Restated(a)(b) | 2023 | 2022 Adjusted(a) | 2021 Adjusted(a) | |
Iron Ore | ||||||||||
Pilbara | (d) | 2,563 | 2,906 | 3,928 | 17,959 | 17,785 | 17,113 | 15,181 | 14,319 | 12,810 |
Dampier Salt | 68.4 | 25 | 34 | 19 | 146 | 153 | 159 | 430 | 436 | 388 |
Evaluation projects/other | (e) | — | — | — | 780 | 835 | 1,283 | 22 | 20 | 16 |
Intra-segment | (e) | — | — | — | (243) | (220) | (255) | — | — | — |
Total Iron Ore Segment | 2,588 | 2,940 | 3,947 | 18,642 | 18,553 | 18,300 | 15,633 | 14,775 | 13,214 | |
Aluminium | ||||||||||
Bauxite | 159 | 161 | 155 | 2,649 | 2,458 | 2,591 | 3,008 | 2,966 | 2,972 | |
Alumina | 325 | 356 | 362 | 1,315 | 2,400 | 2,287 | 2,600 | 2,626 | 2,463 | |
North American Aluminium (m) | 748 | 752 | 690 | 10,582 | 9,343 | 9,734 | 6,886 | 6,693 | 6,280 | |
Pacific Aluminium | 99 | 108 | 93 | 340 | 159 | 218 | 2,563 | 2,480 | 2,450 | |
Intra-segment and other | — | — | — | 997 | 629 | 839 | 256 | 234 | 185 | |
Total Aluminium Segment | 1,331 | 1,377 | 1,300 | 15,883 | 14,989 | 15,669 | 15,313 | 14,999 | 14,350 | |
Copper | ||||||||||
Kennecott | 100.0 | 735 | 563 | 411 | 2,606 | 2,027 | 2,513 | 2,411 | 2,176 | 2,051 |
Escondida | 30.0 | — | — | — | 2,844 | 2,792 | 2,515 | 1,203 | 1,205 | 1,166 |
Oyu Tolgoi | (f) | 1,230 | 1,056 | 911 | 15,334 | 13,479 | 9,000 | 4,515 | 4,060 | 3,508 |
Product group operations | 1,965 | 1,619 | 1,322 | 20,784 | 18,298 | 14,028 | 8,129 | 7,441 | 6,725 | |
Evaluation projects/other (a) | 11 | 3 | 6 | 262 | 165 | 210 | 333 | 245 | 228 | |
Total Copper Segment | 1,976 | 1,622 | 1,328 | 21,046 | 18,463 | 14,238 | 8,462 | 7,686 | 6,953 | |
Minerals | ||||||||||
Iron Ore Company of Canada | 58.7 | 364 | 366 | 377 | 1,347 | 1,147 | 1,077 | 3,206 | 3,075 | 2,877 |
Rio Tinto Iron & Titanium | (g) | 240 | 217 | 184 | 3,386 | 3,351 | 3,367 | 4,415 | 4,273 | 4,129 |
Rio Tinto Borates | 100.0 | 49 | 34 | 43 | 502 | 496 | 491 | 1,013 | 1,009 | 978 |
Diamonds | (h) | 66 | 48 | 25 | 29 | (84) | 4 | 871 | 853 | 646 |
Product group operations | 719 | 665 | 629 | 5,264 | 4,910 | 4,939 | 9,505 | 9,210 | 8,630 | |
Evaluation projects/other | 27 | 14 | 15 | 873 | 874 | 43 | 328 | 224 | 136 | |
Total Minerals Segment | 746 | 679 | 644 | 6,137 | 5,784 | 4,982 | 9,833 | 9,434 | 8,766 | |
Reportable segments total | 6,641 | 6,618 | 7,219 | 61,708 | 57,789 | 53,189 | 49,241 | 46,894 | 43,283 | |
Simandou iron ore project | (i) | 266 | — | — | 738 | (22) | 13 | 571 | 343 | 101 |
Other operations | (j) | 57 | 53 | (13) | (2,634) | (1,850) | (1,489) | 665 | 630 | 297 |
Inter-segment transactions | 20 | 12 | (12) | |||||||
Other items | 113 | 79 | 117 | (1,015) | (1,107) | (1,330) | 6,697 | 5,859 | 5,664 | |
Total | 7,077 | 6,750 | 7,323 | 58,817 | 54,822 | 50,371 | 57,174 | 53,726 | 49,345 | |
Add back: Proceeds from disposal of property, plant and equipment | 9 | — | 61 | |||||||
Total purchases of property, plant & equipment and intangibles as per cash flow statement | 7,086 | 6,750 | 7,384 | |||||||
Add: Net (debt)/cash | (4,231) | (4,188) | 1,576 | |||||||
Equity attributable to owners of Rio Tinto | 54,586 | 50,634 | 51,947 | |||||||
Total employees | 57,174 | 53,726 | 49,345 | |||||||
Annual Report on Form 20-F 2023 | riotinto.com | 287 |
288 | Annual Report on Form 20-F 2023 | riotinto.com |
2023 US$m | 2022 US$m | 2021 US$m | |
Underlying EBITDA | 23,892 | 26,272 | 37,720 |
Consolidated sales revenue | 54,041 | 55,554 | 63,495 |
Share of equity accounted unit sales and inter-subsidiary/equity accounted unit sales eliminations | 3,016 | 2,850 | 3,073 |
57,057 | 58,404 | 66,568 | |
Underlying EBITDA margin | 42% | 45% | 57% |
2023 US$m | 2022 US$m | 2021 US$m | |
Pilbara | |||
Underlying EBITDA | 19,828 | 18,474 | 27,837 |
Pilbara segmental revenue | 30,867 | 29,313 | 39,111 |
Less: Freight revenue | (2,098) | (2,206) | (2,707) |
Pilbara segmental revenue, excluding freight revenue | 28,769 | 27,107 | 36,404 |
Pilbara underlying FOB EBITDA margin | 69% | 68% | 76% |
Annual Report on Form 20-F 2023 | riotinto.com | 289 |
2023 US$m | 2022 US$m | 2021 US$m | |
Aluminium | |||
Underlying EBITDA - integrated operations | 2,436 | 3,842 | 4,487 |
Segmental revenue - integrated operations | 11,513 | 13,136 | 11,881 |
Underlying EBITDA margin from integrated operations | 21% | 29% | 38% |
2023 US$m | 2022 US$m | 2021 US$m | |
Copper | |||
Underlying EBITDA - product group operations | 2,436 | 2,947 | 4,368 |
Segmental revenue - product group operations | 5,811 | 5,975 | 7,434 |
Underlying EBITDA margin - product group operations | 42% | 49% | 59% |
2023 US$m | 2022 US$m | 2021 US$m | |
Minerals | |||
Underlying EBITDA - product group operations | 1,780 | 2,665 | 2,765 |
Segmental revenue - product group operations | 5,918 | 6,742 | 6,410 |
Underlying EBITDA margin - product group operations | 30% | 40% | 43% |
290 | Annual Report on Form 20-F 2023 | riotinto.com |
Pre-tax 2023 US$m | Taxation 2023 US$m | Non- controlling interests 2023 US$m | Net amount 2023 US$m | Net amount 2022 US$m Restated(a) | Net amount 2021 US$m Restated(a) | |
Net earnings | 13,785 | (3,832) | 105 | 10,058 | 12,392 | 21,115 |
Items excluded from underlying earnings | ||||||
Impairment charges net of reversals (note 4) | 936 | (499) | 215 | 652 | 52 | 197 |
Foreign exchange and derivative (losses)/gains: | ||||||
– Exchange losses/(gains) on external net debt, intragroup balances and derivatives(b) | 253 | (12) | 2 | 243 | (216) | (726) |
– Losses on currency and interest rate derivatives not qualifying for hedge accounting(c) | 58 | 30 | (1) | 87 | 373 | 127 |
– (Gains)/losses on embedded commodity derivatives not qualifying for hedge accounting(d) | (21) | 6 | (8) | (23) | (20) | 53 |
Change in closure estimates (non-operating and fully impaired sites)(e) | 1,272 | (51) | (119) | 1,102 | 178 | 971 |
Deferred tax arising on internal sale of assets in Canadian operations(f) | — | (364) | — | (364) | — | — |
Gains recognised by Kitimat relating to LNG Canada’s project(g) | — | — | — | — | (106) | (336) |
Loss on disposal of interest in subsidiary (note 4) | — | — | — | — | 105 | — |
Gain on sale of the Cortez royalty(h) | — | — | — | — | (331) | — |
Write-off of Federal deferred tax assets in the United States(i) | — | — | — | — | 932 | — |
Total excluded from underlying earnings | 2,498 | (890) | 89 | 1,697 | 967 | 286 |
Underlying earnings | 16,283 | (4,722) | 194 | 11,755 | 13,359 | 21,401 |
Annual Report on Form 20-F 2023 | riotinto.com | 291 |
2023 (cents) | 2022 (cents) Restated(a) | 2021 (cents) Restated(a) | |
Basic earnings per ordinary share | 620.3 | 765.0 | 1,304.7 |
Items excluded from underlying earnings per share(b) | 104.7 | 59.7 | 17.7 |
Basic underlying earnings per ordinary share | 725.0 | 824.7 | 1,322.4 |
2023 US$m | 2022 US$m | |
Profit before taxation | 13,785 | 18,662 |
Add back | ||
Finance income | (536) | (179) |
Finance costs | 967 | 335 |
Share of profit after tax of equity accounted units | (675) | (777) |
Items excluded from underlying earnings | 2,498 | (49) |
Add: Dividends from equity accounted units | 610 | 879 |
Calculated earnings | 16,649 | 18,871 |
Finance income | 536 | 179 |
Finance costs | (967) | (335) |
Add: Amounts capitalised | (279) | (416) |
Total net finance costs before capitalisation | (710) | (572) |
Interest cover | 23 | 33 |
2023 (cents) | 2022 (cents) Restated(a) | |
Interim dividend declared per share | 177.0 | 267.0 |
Final dividend declared per share | 258.0 | 225.0 |
Total dividend declared per share for the year | 435.0 | 492.0 |
Underlying earnings per share | 725.0 | 824.7 |
Payout ratio | 60% | 60% |
292 | Annual Report on Form 20-F 2023 | riotinto.com |
2023 US$m | 2022 US$m | 2021 US$m | |
Purchase of property, plant and equipment and intangible assets | 7,086 | 6,750 | 7,384 |
Less: Equity or shareholder loan financing received/due from non-controlling interests | (125) | — | — |
Rio Tinto share of capital investment | 6,961 | 6,750 | 7,384 |
2023 US$m | 2022 US$m | 2021 US$m | |
Net cash generated from operating activities | 15,160 | 16,134 | 25,345 |
Less: Purchase of property, plant and equipment and intangible assets | (7,086) | (6,750) | (7,384) |
Less: Lease principal payments | (426) | (374) | (358) |
Add: Sales of property, plant and equipment and intangible assets | 9 | — | 61 |
Free cash flow | 7,657 | 9,010 | 17,664 |
Annual Report on Form 20-F 2023 | riotinto.com | 293 |
2023 US$m | 2022 US$m Restated(a) | |
Net debt | (4,231) | (4,188) |
Net debt | (4,231) | (4,188) |
Total equity | (56,341) | (52,741) |
Net debt plus total equity | (60,572) | (56,929) |
Net gearing ratio | 7% | 7% |
2023 US$m | 2022 US$m Restated(a) | |
Profit after tax attributable to owners of Rio Tinto (net earnings) | 10,058 | 12,392 |
1,697 | 967 | |
Underlying earnings | 11,755 | 13,359 |
Add/(deduct): | ||
Finance income per the income statement | (536) | (179) |
Finance costs per the income statement | 967 | 335 |
Tax on finance cost | (373) | (238) |
Non-controlling interest share of net finance costs | (429) | (98) |
Net interest cost in equity accounted units (Rio Tinto share) | 53 | 42 |
Net interest | (318) | (138) |
Adjusted underlying earnings | 11,437 | 13,221 |
Equity attributable to owners of Rio Tinto - beginning of the year (restated, refer to page 166) | 50,634 | 51,930 |
Net debt/(cash) - beginning of the year | 4,188 | (1,576) |
Operating assets - beginning of the year | 54,822 | 50,354 |
Equity attributable to owners of Rio Tinto - end of the year (restated, refer to page 166) | 54,586 | 50,634 |
Net debt - end of the year | 4,231 | 4,188 |
Operating assets - end of the year | 58,817 | 54,822 |
Average operating assets | 56,820 | 52,588 |
Underlying return on capital employed | 20% | 25% |
294 | Annual Report on Form 20-F 2023 | riotinto.com |

Metals and minerals production | 297 |
Mineral Resources and Mineral Reserves | ##289 299 |
Qualified Persons | 323 |
Mines and production facilities | 324 |
Oyu Tolgoi, Mongolia | ||
296 | Annual Report on Form 20-F 2023 | riotinto.com | |
Rio Tinto % share1 at 31 Dec 2023 | 2023 Production | 2022 Production | 2021 Production | ||||
Total | Rio Tinto share | Total | Rio Tinto share | Total | Rio Tinto share | ||
ALUMINA (‘000 tonnes) | |||||||
Jonquière (Vaudreuil) (Canada)2 | 100.0 % | 1,392 | 1,392 | 1,364 | 1,364 | 1,364 | 1,364 |
Jonquière (Vaudreuil) specialty plant (Canada) | 100.0 % | 109 | 109 | 114 | 114 | 107 | 107 |
Queensland Alumina (Australia) | 80.0 % | 3,366 | 2,693 | 3,425 | 2,740 | 3,705 | 2,964 |
São Luis (Alumar) (Brazil) | 10.0 % | 3,375 | 338 | 3,771 | 377 | 3,662 | 366 |
Yarwun (Australia) | 100.0 % | 3,006 | 3,006 | 2,949 | 2,949 | 3,093 | 3,093 |
Rio Tinto total | 7,537 | 7,544 | 7,894 | ||||
ALUMINIUM (‘000 tonnes) | |||||||
Alma (Canada) | 100.0 % | 484 | 484 | 482 | 482 | 471 | 471 |
Alouette (Sept-Îles) (Canada) | 40.0 % | 634 | 253 | 628 | 251 | 629 | 251 |
Arvida (Canada) | 100.0 % | 172 | 172 | 171 | 171 | 168 | 168 |
Arvida AP60 (Canada) | 100.0 % | 59 | 59 | 58 | 58 | 60 | 60 |
Bécancour (Canada) | 25.1 % | 465 | 117 | 459 | 115 | 463 | 116 |
Bell Bay (Australia) | 100.0 % | 186 | 186 | 185 | 185 | 189 | 189 |
Boyne Island (Australia) | 59.4 % | 496 | 295 | 450 | 267 | 502 | 298 |
Grande-Baie (Canada) | 100.0 % | 229 | 229 | 232 | 232 | 230 | 230 |
ISAL (Reykjavik) (Iceland) | 100.0 % | 209 | 209 | 202 | 202 | 203 | 203 |
Kitimat (Canada) | 100.0 % | 377 | 377 | 145 | 145 | 263 | 263 |
Laterrière (Canada) | 100.0 % | 244 | 244 | 253 | 253 | 252 | 252 |
Sohar (Oman) | 20.0 % | 398 | 80 | 395 | 79 | 395 | 79 |
Tiwai Point (New Zealand) | 79.4 % | 334 | 265 | 336 | 267 | 333 | 264 |
Tomago (Australia) | 51.6 % | 589 | 304 | 586 | 302 | 592 | 305 |
Rio Tinto total | 3,272 | 3,009 | 3,151 | ||||
BAUXITE (‘000 tonnes) | |||||||
Gove (Australia) | 100.0 % | 11,566 | 11,566 | 11,510 | 11,510 | 11,763 | 11,763 |
Porto Trombetas (MRN) (Brazil)3 | 22.0 % | 11,472 | 1,502 | 11,100 | 1,332 | 11,383 | 1,366 |
Sangarédi (Guinea)4 | 23.0 % | 14,278 | 6,425 | 16,115 | 7,252 | 15,797 | 7,109 |
Weipa (Australia) | 100.0 % | 35,126 | 35,126 | 34,525 | 34,525 | 34,088 | 34,088 |
Rio Tinto total | 54,619 | 54,618 | 54,326 | ||||
BORATES (‘000 tonnes)5 | |||||||
Rio Tinto Borates – Boron (US) | 100.0 % | 495 | 495 | 532 | 532 | 488 | 488 |
COPPER (mined) (‘000 tonnes) | |||||||
Bingham Canyon (US) | 100.0 % | 151.6 | 151.6 | 179.2 | 179.2 | 159.4 | 159.4 |
Escondida (Chile) | 30.0 % | 999.7 | 299.9 | 995.3 | 298.6 | 931.8 | 279.5 |
Oyu Tolgoi (Mongolia)6 | 66.0 % | 168.1 | 110.9 | 129.5 | 43.4 | 163.0 | 54.6 |
Rio Tinto total | 562.4 | 521.1 | 493.5 | ||||
COPPER (refined) (‘000 tonnes) | |||||||
Escondida (Chile) | 30.0 % | 222.2 | 66.7 | 203.1 | 60.9 | 195.3 | 58.6 |
Kennecott (US) | 100.0 % | 108.6 | 108.6 | 148.3 | 148.3 | 143.3 | 143.3 |
Rio Tinto total | 175.2 | 209.2 | 201.9 | ||||
DIAMONDS (‘000 carats) | |||||||
Diavik (Canada)7 | 100.0 % | 3,340 | 3,340 | 4,651 | 4,651 | 5,843 | 3,847 |
GOLD (mined) (‘000 ounces) | |||||||
Bingham Canyon (US) | 100.0 % | 104.8 | 104.8 | 122.7 | 122.7 | 139.5 | 139.5 |
Escondida (Chile) | 30.0 % | 199.2 | 59.7 | 168.7 | 50.6 | 161.7 | 48.5 |
Oyu Tolgoi (Mongolia)6 | 66.0 % | 177.3 | 117.0 | 183.8 | 61.6 | 468.1 | 156.9 |
Rio Tinto total | 281.5 | 235.0 | 344.9 | ||||
Annual Report on Form 20-F 2023 | riotinto.com | 297 |
Rio Tinto % share1 at 31 Dec 2023 | 2023 Production | 2022 Production | 2021 Production | ||||
Total | Rio Tinto share | Total | Rio Tinto share | Total | Rio Tinto share | ||
GOLD (refined) (‘000 ounces) | |||||||
Kennecott (US) | 100.0 % | 74.2 | 74.2 | 113.9 | 113.9 | 176.4 | 176.4 |
IRON ORE (‘000 tonnes) | |||||||
Hamersley mines (Australia) | (see note 8) | 225,898 | 225,898 | 218,304 | 218,304 | 210,329 | 210,329 |
Hope Downs (Australia) | 50.0 % | 46,482 | 23,241 | 48,850 | 24,425 | 49,284 | 24,642 |
Robe River – Robe Valley (Australia) | 53.0 % | 29,162 | 15,456 | 25,558 | 13,546 | 25,497 | 13,514 |
Robe River – West Angelas (Australia) | 53.0 % | 29,999 | 15,899 | 31,435 | 16,660 | 34,613 | 18,345 |
Iron Ore Company of Canada (Canada) | 58.7 % | 16,478 | 9,676 | 17,562 | 10,312 | 16,564 | 9,727 |
Rio Tinto total | 290,171 | 283,247 | 276,557 | ||||
MOLYBDENUM (‘000 tonnes) | |||||||
Bingham Canyon (US) | 100 % | 1.8 | 1.8 | 3.3 | 3.3 | 7.6 | 7.6 |
SALT (‘000 tonnes) | |||||||
Dampier Salt (Australia) | 68.4 % | 8,737 | 5,973 | 8,422 | 5,757 | 8,555 | 5,848 |
SILVER (mined) (‘000 ounces) | |||||||
Bingham Canyon (US) | 100.0 % | 1,618 | 1,618 | 2,057 | 2,057 | 2,228 | 2,228 |
Escondida (Chile) | 30.0 % | 4,921 | 1,476 | 5,301 | 1,590 | 5,305 | 1,591 |
Oyu Tolgoi (Mongolia)6 | 66.0 % | 1,086 | 717 | 871 | 292 | 977 | 328 |
Rio Tinto total | 3,811 | 3,940 | 4,148 | ||||
SILVER (refined) (‘000 ounces) | |||||||
Kennecott (US) | 100.0 % | 1,407 | 1,407 | 1,950 | 1,950 | 2,671 | 2,671 |
TITANIUM DIOXIDE SLAG (‘000 tonnes) | |||||||
Rio Tinto Iron and Titanium | |||||||
(Canada/South Africa)9 | 100.0 % | 1,111 | 1,111 | 1,200 | 1,200 | 1,014 | 1,014 |
URANIUM (‘000 lbs U3O8) | |||||||
Energy Resources of Australia (Australia)10 | 86.3 % | – | – | – | – | 75 | 65 |
Rio Tinto total | – | – | 65 | ||||
298 | Annual Report on Form 20-F 2023 | riotinto.com |
Annual Report on Form 20-F 2023 | riotinto.com | 299 |
Type of mine1 | Proven Mineral Reserves as at 31 December 2023 | Probable Mineral Reserves as at 31 December 2023 | |||||
Tonnage | Grade | Tonnage | Grade | ||||
Bauxite2 | Mt | % Al2O3 | % SiO2 | Mt | % Al2O3 | % SiO2 | |
Rio Tinto Aluminium (Australia)3 4 | |||||||
– Amrun | O/P | 263 | 53.9 | 9.2 | 688 | 54.5 | 9.0 |
– East Weipa and Andoom | O/P | 69 | 50.5 | 7.9 | 3 | 49.5 | 8.7 |
– Gove | O/P | 57 | 50.2 | 6.4 | 0.7 | 50.5 | 5.0 |
Total (Australia) | 388 | 52.8 | 8.6 | 692 | 54.4 | 9.0 | |
Porto Trombetas (MRN) (Brazil)5 6 | O/P | 10 | 48.9 | 4.9 | 0.6 | 49.0 | 4.9 |
Sangarédi (Guinea)7 8 | O/P | 76 | 47.0 | 1.9 | 4 | 48.9 | 2.5 |
Total bauxite | 474 | 51.8 | 7.4 | 696 | 54.4 | 9.0 | |
 |
300 | Annual Report on Form 20-F 2023 | riotinto.com |
Total Mineral Reserves as at 31 December 2023 | Rio Tinto share recoverable mineral | Total Mineral Reserves as at 31 December 2022 | |||||||
Tonnage | Grade | Tonnage | Grade | ||||||
Mt | % Al2O3 | % SiO2 | % | Mt | Mt | % Al2O3 | % SiO2 | ||
950 | 54.3 | 9.1 | 100.0 | 950 | 801 | 54.6 | 8.9 | ||
72 | 50.5 | 8.0 | 100.0 | 72 | 59 | 51.7 | 7.1 | ||
58 | 50.2 | 6.4 | 100.0 | 58 | 56 | 50.5 | 5.8 | ||
1,080 | 53.8 | 8.8 | 1,080 | 916 | 54.2 | 8.6 | |||
10 | 48.9 | 4.9 | 22.0 | 10 | 6 | 48.2 | 5.1 | ||
80 | 47.1 | 1.9 | 23.0 | 80 | 83 | 47.1 | 1.9 | ||
1,170 | 53.3 | 8.3 | 1,170 | 1,005 | 53.6 | 8.0 | |||
 |
Annual Report on Form 20-F 2023 | riotinto.com | 301 |
Type of mine1 | Proven Mineral Reserves as at 31 December 2023 | Probable Mineral Reserves as at 31 December 2023 | |||||||||||
Tonnage | Grade | Tonnage | Grade | ||||||||||
Iron ore2 | Mt | % Fe | % SiO2 | % Al2O3 | % P | % LOI | Mt | % Fe | % SiO2 | % Al2O3 | % P | % LOI | |
Australia3 4 | |||||||||||||
– Brockman Ore | O/P | 436 | 62.1 | 3.3 | 1.9 | 0.14 | 5.4 | 815 | 61.4 | 3.7 | 2.0 | 0.13 | 5.7 |
– Marra Mamba Ore | O/P | 226 | 62.8 | 2.7 | 1.6 | 0.06 | 5.2 | 330 | 61.6 | 3.3 | 2.1 | 0.06 | 5.9 |
– Pisolite (Channel Iron) Ore | O/P | 399 | 57.7 | 4.8 | 1.9 | 0.06 | 10.3 | 55 | 56.6 | 5.2 | 2.3 | 0.05 | 11.0 |
Total (Australia)5 6 | 1,060 | 60.6 | 3.7 | 1.8 | 0.09 | 7.2 | 1,200 | 61.3 | 3.7 | 2.0 | 0.10 | 6.0 | |
Iron Ore Company of Canada (Canada)7 8 | O/P | 79 | 65.0 | 2.8 | – | – | – | 129 | 65.0 | 2.8 | – | – | – |
Simandou (Guinea)9 10 | O/P | 123 | 66.4 | 1.0 | 1.2 | 0.07 | 2.5 | 552 | 65.0 | 0.9 | 1.8 | 0.10 | 3.9 |
Total iron ore | 1,262 | 61.4 | 3.4 | 1.7 | 0.08 | 6.3 | 1,881 | 62.6 | 2.8 | 1.8 | 0.10 | 5.0 | |
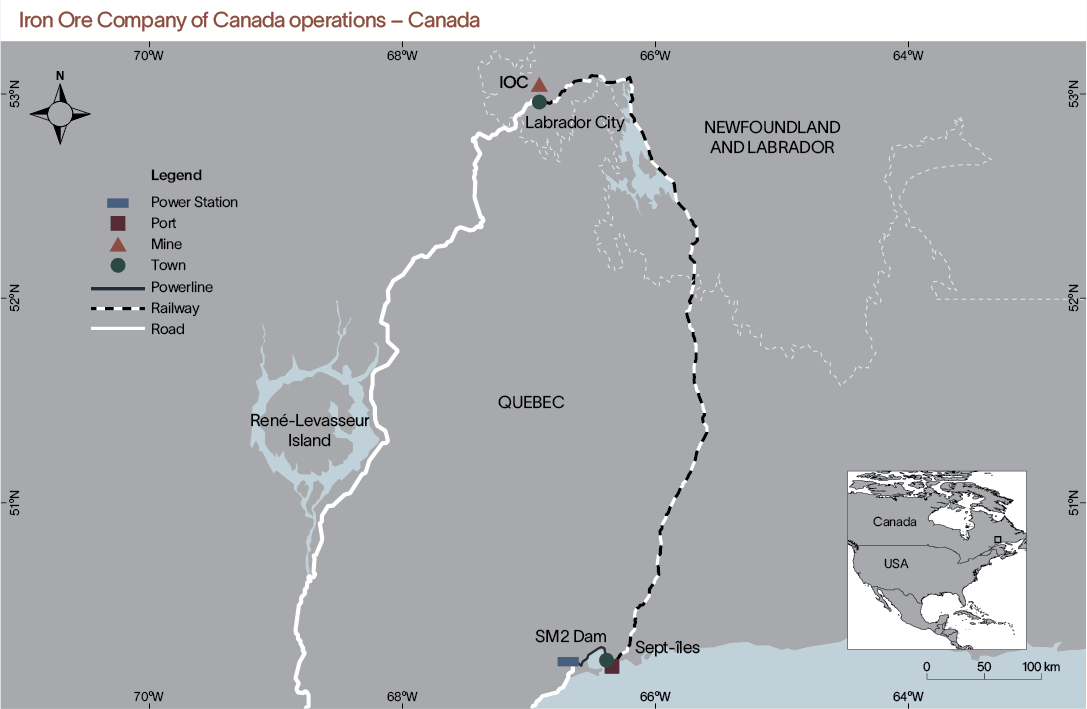 |
302 | Annual Report on Form 20-F 2023 | riotinto.com |
Total Mineral Reserves as at 31 December 2023 | Rio Tinto interest | Rio Tinto share marketable product | Total Mineral Reserves as at 31 December 2022 | ||||||||||||
Tonnage | Grade | Tonnage | Grade | ||||||||||||
Mt | % Fe | % SiO2 | % Al2O3 | % P | % LOI | % | Mt | Mt | % Fe | % SiO2 | % Al2O3 | % P | % LOI | ||
1,251 | 61.7 | 3.6 | 2.0 | 0.13 | 5.6 | 87.7 | 1,251 | 1,163 | 61.8 | 3.5 | 2.0 | 0.13 | 5.5 | ||
555 | 62.1 | 3.1 | 1.9 | 0.06 | 5.6 | 80.9 | 555 | 581 | 62.0 | 3.1 | 1.9 | 0.06 | 5.7 | ||
453 | 57.6 | 4.8 | 1.9 | 0.05 | 10.4 | 80.0 | 453 | 498 | 57.8 | 4.7 | 1.9 | 0.05 | 10.4 | ||
2,260 | 60.9 | 3.7 | 2.0 | 0.10 | 6.6 | 2,260 | 2,242 | 60.9 | 3.7 | 1.9 | 0.09 | 6.6 | |||
208 | 65.0 | 2.8 | – | – | – | 58.7 | 208 | 266 | 65.0 | 3.0 | – | – | – | ||
675 | 65.3 | 0.9 | 1.7 | 0.09 | 3.6 | 45.1 | 675 | – | – | – | – | – | – | ||
3,143 | 62.1 | 3.0 | 1.8 | 0.09 | 5.5 | 3,143 | 2,508 | 61.4 | 3.6 | 1.7 | 0.08 | 5.9 | |||
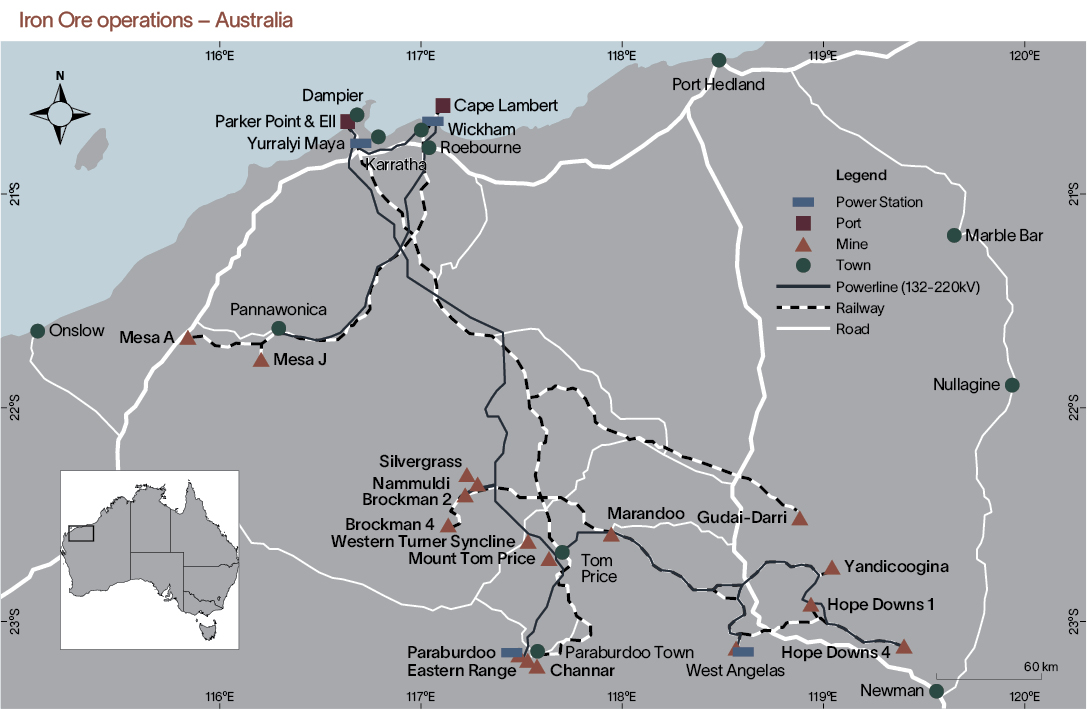 |
Annual Report on Form 20-F 2023 | riotinto.com | 303 |
Type of mine1 | Proven Mineral Reserves as at 31 December 2023 | Probable Mineral Reserves as at 31 December 2023 | |||||||||
Tonnage | Grade | Tonnage | Grade | ||||||||
Copper2 | Mt | % Cu | g/t Au | g/t Ag | % Mo | Mt | % Cu | g/t Au | g/t Ag | % Mo | |
Bingham Canyon (US)3 | |||||||||||
– Bingham Open Pit4 | O/P | 470 | 0.37 | 0.18 | 1.98 | 0.038 | 360 | 0.36 | 0.18 | 1.98 | 0.028 |
– Underground Skarns | U/G | – | – | – | – | – | 5 | 2.22 | 1.39 | 15.52 | 0.022 |
Total (US) | 470 | 0.37 | 0.18 | 1.98 | 0.038 | 364 | 0.38 | 0.20 | 2.16 | 0.028 | |
Escondida (Chile)5 | |||||||||||
– oxide | O/P | 30 | 0.50 | – | – | – | 10 | 0.51 | – | – | – |
– sulphide | O/P | 676 | 0.72 | – | – | – | 615 | 0.55 | – | – | – |
– sulphide leach | O/P | 384 | 0.44 | – | – | – | 109 | 0.42 | – | – | – |
Total (Chile) | 1,089 | 0.61 | – | – | – | 735 | 0.53 | – | – | – | |
Oyu Tolgoi (Mongolia)6 | |||||||||||
– Hugo Dummett North7 | U/G | – | – | – | – | – | 265 | 1.55 | 0.31 | 3.21 | – |
– Hugo Dummett North Extension | U/G | – | – | – | – | – | 21 | 1.60 | 0.56 | 3.80 | – |
– Oyut open pit | O/P | 159 | 0.53 | 0.39 | 1.30 | – | 247 | 0.41 | 0.25 | 1.14 | – |
– Oyut stockpiles | S/P | – | – | – | – | – | 38 | 0.31 | 0.12 | 1.04 | – |
Total (Mongolia) | 159 | 0.53 | 0.39 | 1.30 | – | 571 | 0.98 | 0.28 | 2.19 | – | |
Total copper | 1,717 | 0.54 | 0.08 | 0.66 | 0.010 | 1,670 | 0.65 | 0.14 | 1.22 | 0.006 | |
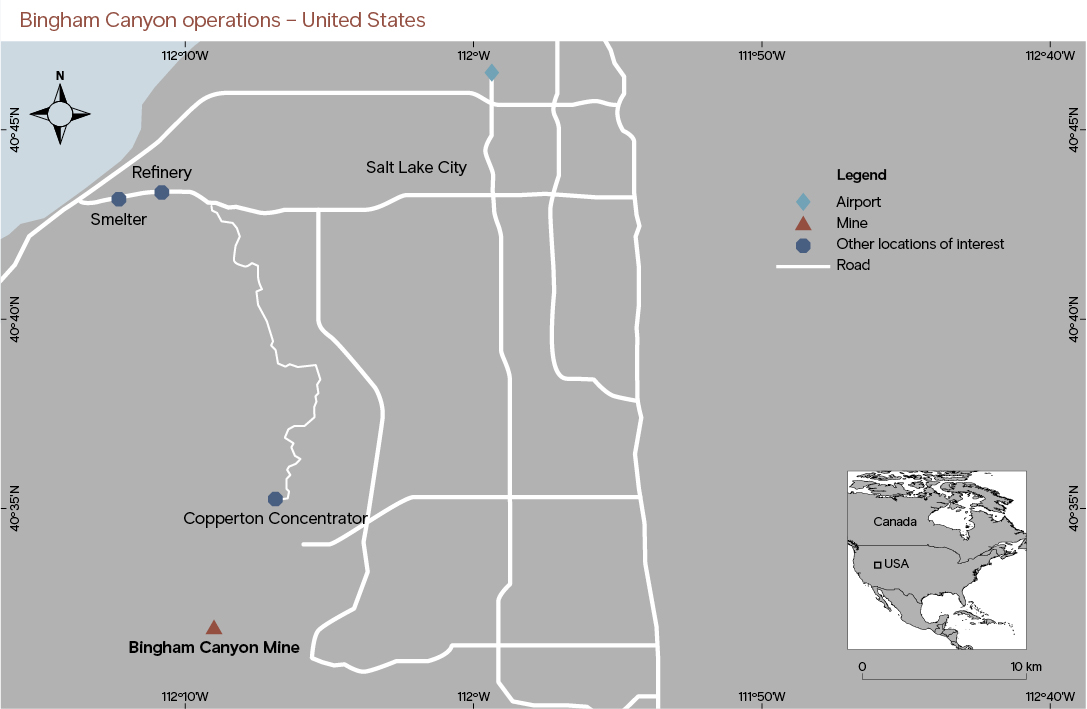 |
304 | Annual Report on Form 20-F 2023 | riotinto.com |
Total Mineral Reserves as at 31 December 2023 | Average mill recovery % | Rio Tinto interest | Rio Tinto share recoverable metal | Total Mineral Reserves as at 31 December 2022 | |||||||||||||||
Tonnage | Grade | Tonnage | Grade | ||||||||||||||||
Mt | % Cu | g/t Au | g/t Ag | % Mo | Cu | Au | Ag | Mo | % | Mt Cu | Moz Au | Moz Ag | Mt Mo | Mt | % Cu | g/t Au | g/t Ag | % Mo | |
829 | 0.37 | 0.18 | 1.98 | 0.033 | 89 | 69 | 71 | 63 | 100.0 | 2.681 | 3.257 | 37.686 | 0.176 | 880 | 0.38 | 0.18 | 1.97 | 0.033 | |
5 | 2.22 | 1.39 | 15.52 | 0.022 | 92 | 70 | 68 | 54 | 100.0 | 0.096 | 0.146 | 1.596 | 0.001 | 1.7 | 1.90 | 0.71 | 10.07 | 0.044 | |
834 | 0.38 | 0.19 | 2.06 | 0.033 | 2.777 | 3.403 | 39.281 | 0.176 | 881 | 0.38 | 0.18 | 1.99 | 0.033 | ||||||
40 | 0.51 | – | – | – | 56 | – | – | – | 30.0 | 0.113 | – | – | – | 52 | 0.54 | – | – | – | |
1,291 | 0.64 | – | – | – | 84 | – | – | – | 30.0 | 6.889 | – | – | – | 1,280 | 0.65 | – | – | – | |
493 | 0.43 | – | – | – | 41 | – | – | – | 30.0 | 0.871 | – | – | – | 489 | 0.45 | – | – | – | |
1,824 | 0.58 | – | – | – | 7.872 | – | – | – | 1,821 | 0.59 | – | – | – | ||||||
265 | 1.55 | 0.31 | 3.21 | – | 92 | 79 | 81 | – | 66.0 | 3.804 | 2.068 | 22.094 | – | 271 | 1.54 | 0.30 | 3.18 | – | |
21 | 1.60 | 0.56 | 3.80 | – | 92 | 81 | 83 | – | 56.1 | 0.312 | 0.310 | 2.149 | – | 21 | 1.61 | 0.56 | 3.82 | – | |
406 | 0.46 | 0.30 | 1.20 | – | 76 | 67 | 55 | – | 66.0 | 1.411 | 2.648 | 8.576 | – | 427 | 0.45 | 0.30 | 1.20 | – | |
38 | 0.31 | 0.12 | 1.04 | – | 71 | 52 | 51 | – | 66.0 | 0.083 | 0.079 | 0.641 | – | 36 | 0.32 | 0.12 | 1.04 | – | |
730 | 0.88 | 0.30 | 2.00 | – | 5.611 | 5.105 | 33.460 | – | 755 | 0.87 | 0.30 | 1.98 | – | ||||||
3,387 | 0.59 | 0.11 | 0.94 | 0.008 | 16.260 | 8.508 | 72.741 | 0.176 | 3,457 | 0.60 | 0.11 | 0.94 | 0.008 | ||||||
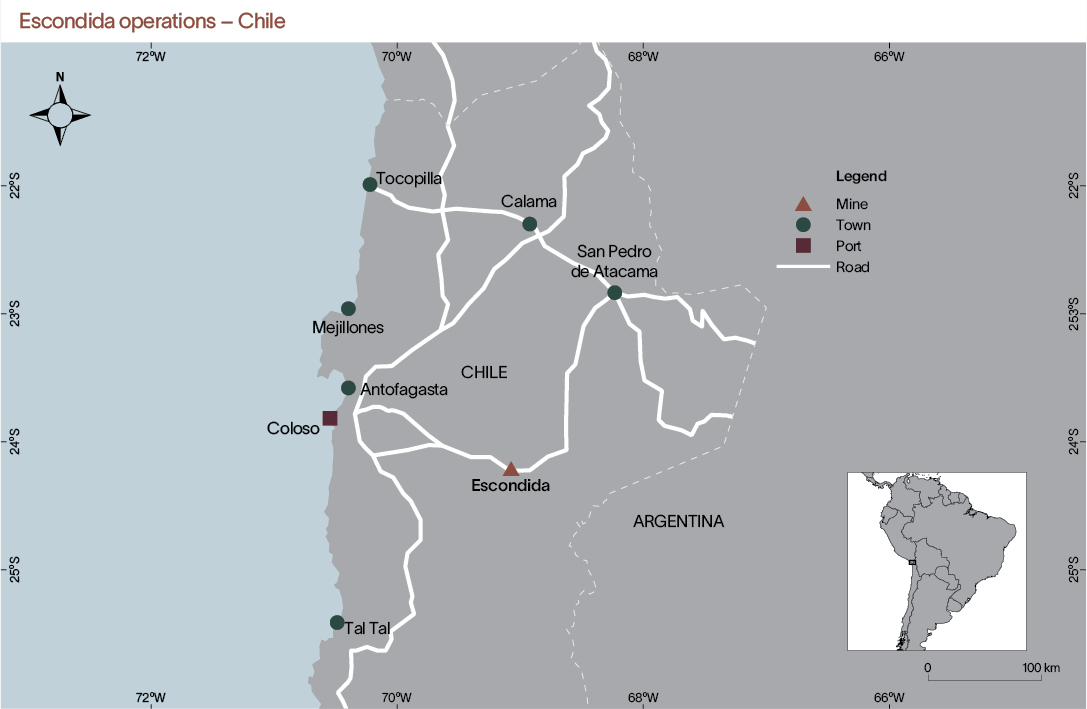 |
Annual Report on Form 20-F 2023 | riotinto.com | 305 |

306 | Annual Report on Form 20-F 2023 | riotinto.com |
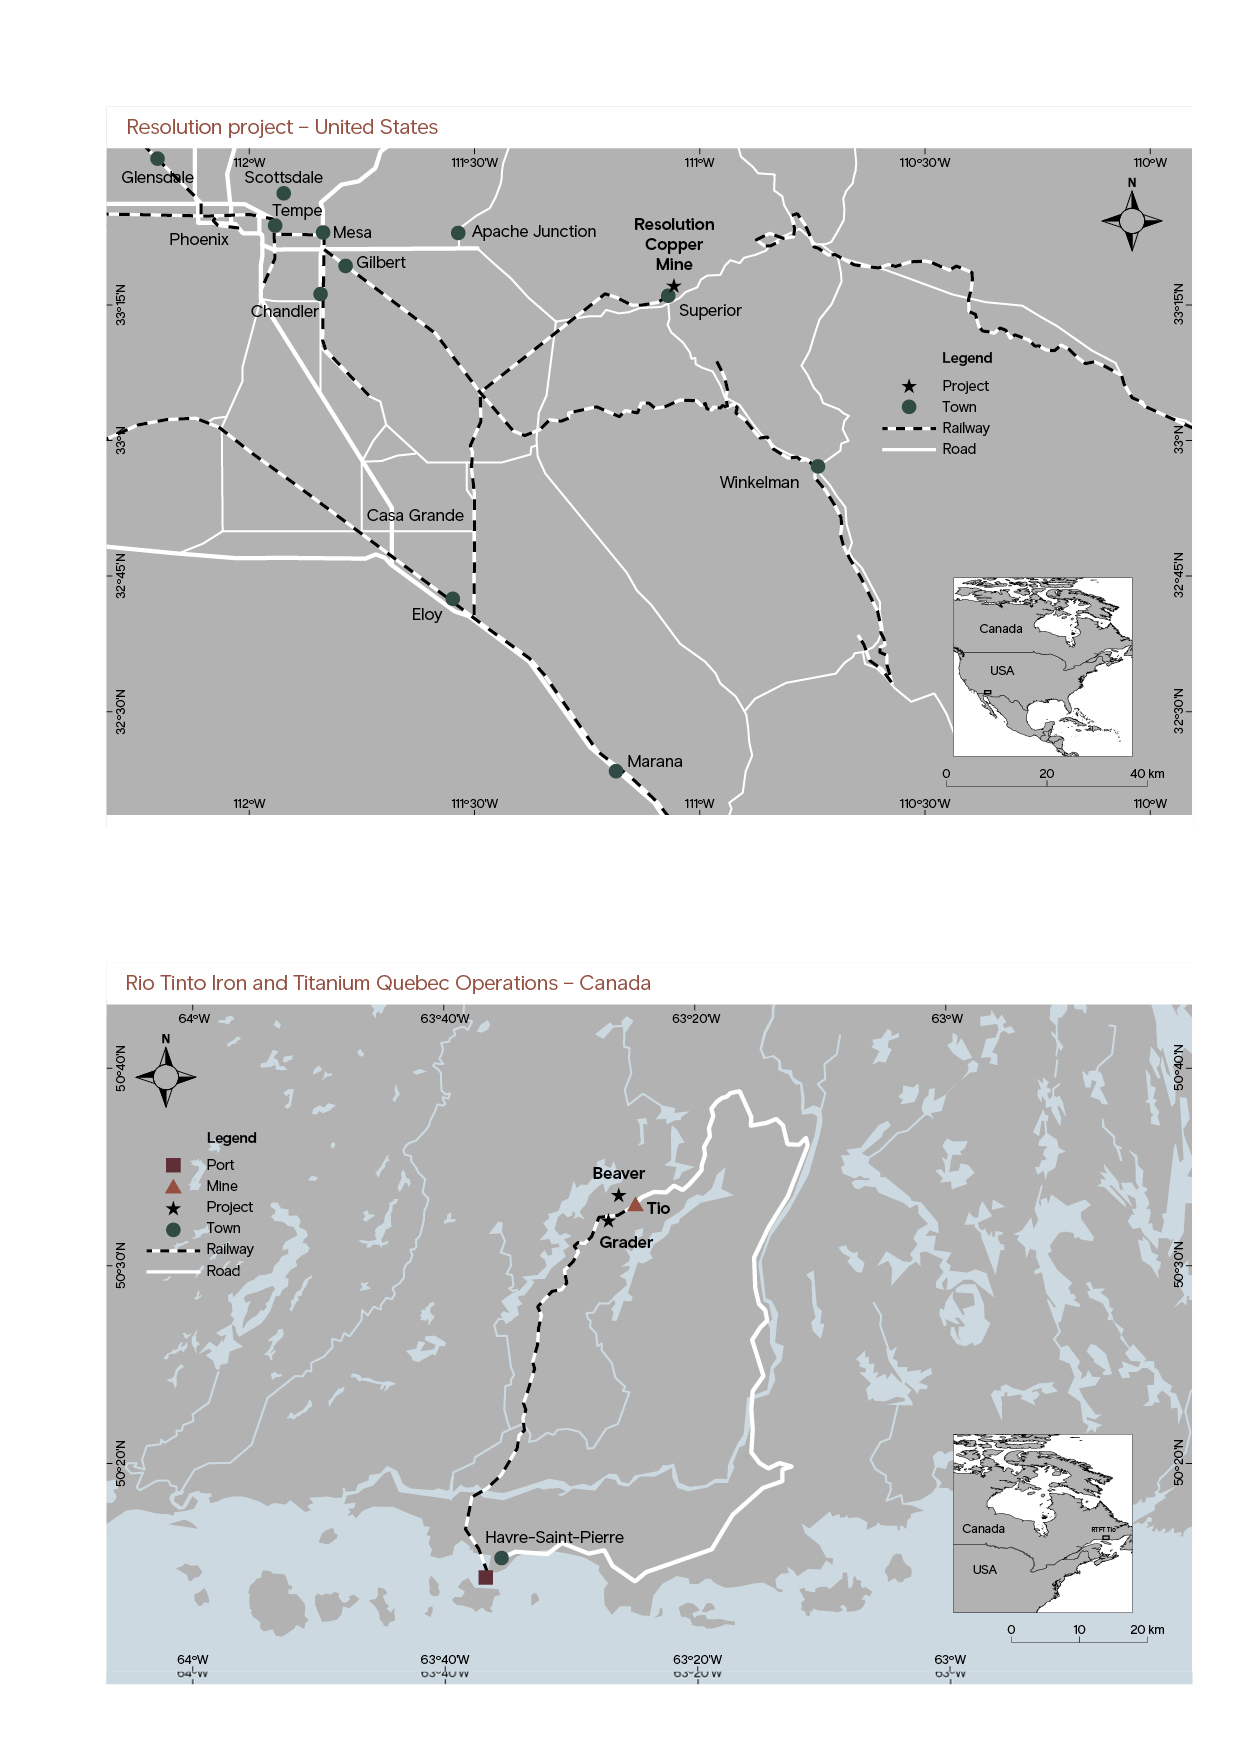
Annual Report on Form 20-F 2023 | riotinto.com | 307 |
Type of mine1 | Proven Mineral Reserves as at 31 December 2023 | Probable Mineral Reserves as at 31 December 2023 | |||||
Tonnage | Grade | Tonnage | Grade | ||||
Titanium dioxide feedstock 2 3 | Mt | % Ti minerals | % Zircon | Mt | % Ti minerals | % Zircon | |
QIT Madagascar Minerals (QMM) (Madagascar) | O/P | 169 | 3.4 | 0.2 | 70 | 3.0 | 0.1 |
Richards Bay Minerals (RBM) (South Africa) | O/P | 359 | 1.5 | 0.2 | 520 | 3.1 | 0.4 |
Rio Tinto Iron and Titanium (RTIT) Quebec Operations (Canada) | O/P | – | – | – | 151 | 80.0 | – |
Total titanium dioxide feedstock | 529 | 2.1 | 0.2 | 740 | 18.8 | 0.3 | |
 |
308 | Annual Report on Form 20-F 2023 | riotinto.com |
Total Mineral Reserves as at 31 December 2023 | Rio Tinto interest | Rio Tinto share marketable product | Total Mineral Reserves as at 31 December 2022 | |||||||
Tonnage | Grade | Tonnage | Grade | |||||||
Mt | % Ti minerals | % Zircon | % | Mt Titanium dioxide feedstock | Mt Zircon | Mt | % Ti minerals | % Zircon | ||
239 | 3.3 | 0.1 | 80.0 | 3.6 | 0.2 | 266 | 3.4 | 0.2 | ||
879 | 2.5 | 0.3 | 74.0 | 9.8 | 2.3 | 950 | 2.4 | 0.3 | ||
151 | 80.0 | – | 100.0 | 47.8 | – | 152 | 80.0 | – | ||
1,269 | 11.9 | 0.3 | 61.2 | 2.5 | 1,368 | 11.2 | 0.3 | |||
 |
Annual Report on Form 20-F 2023 | riotinto.com | 309 |
Borates2 | Type of mine1 | Proven Mineral Reserves as at 31 December 2023 | Probable Mineral Reserves as at 31 December 2023 | Total Mineral Reserves as at 31 December 2023 | |||
Tonnage | Tonnage | Tonnage | |||||
Mt | Mt | Mt | |||||
Boron (US)3 | O/P | 8 | 5 | 13 | |||
Diamonds4 | Type of mine1 | Proven Mineral Reserves as at 31 December 2023 | Probable Mineral Reserves as at 31 December 2023 | Total Mineral Reserves as at 31 December 2023 | |||
Tonnage | Grade | Tonnage | Grade | Tonnage | Grade | ||
Mt | Carats per tonne | Mt | Carats per tonne | Mt | Carats per tonne | ||
Diavik (Canada)5 6 | O/P & U/G | 1.9 | 2.1 | 1.3 | 2.3 | 3.1 | 2.2 |
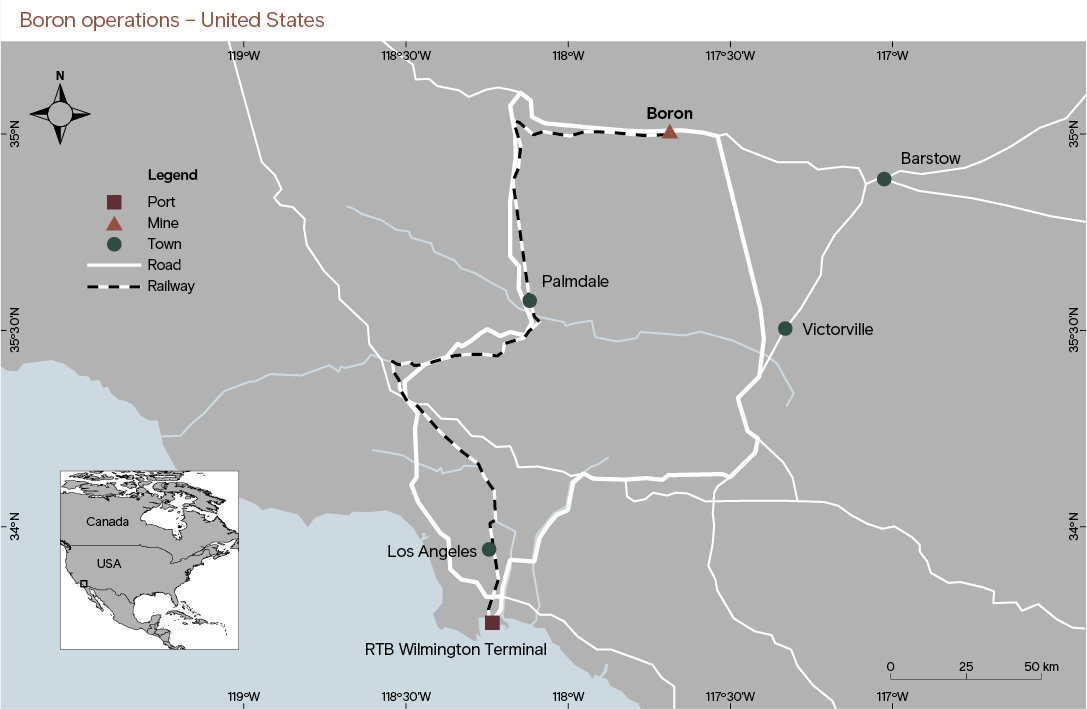 |
310 | Annual Report on Form 20-F 2023 | riotinto.com |
Rio Tinto interest | Rio Tinto share marketable product | Total Mineral Reserves as at 31 December 2022 | |||
Tonnage | |||||
% | Mt | Mt | |||
100.0 | 13 | 14 | |||
Rio Tinto interest | Rio Tinto share recoverable diamonds | Total Mineral Reserves as at 31 December 2022 | |||
Tonnage | Grade | ||||
% | M carats | Mt | Carats per tonne | ||
100.0 | 7 | 4.4 | 2.1 | ||
 |
Annual Report on Form 20-F 2023 | riotinto.com | 311 |
Bauxite | Likely mining method1 | Measured Mineral Resources as at 31 December 2023 | Indicated Mineral Resources as at 31 December 2023 | ||||
Tonnage | Grade | Tonnage | Grade | ||||
Mt | % Al2O3 | % SiO2 | Mt | % Al2O3 | % SiO2 | ||
Rio Tinto Aluminium (Australia)2 3 | |||||||
– Amrun | O/P | 115 | 49.2 | 11.7 | 388 | 49.7 | 11.7 |
– East Weipa and Andoom | O/P | 43 | 49.9 | 8.8 | – | – | – |
– Gove | O/P | 9 | 48.1 | 8.9 | 0.4 | 47.8 | 8.9 |
– North of Weipa | O/P | – | – | – | 202 | 52.0 | 11.1 |
Total (Australia) | 167 | 49.3 | 10.8 | 591 | 50.5 | 11.5 | |
Porto Trombetas (MRN) (Brazil)4 5 | O/P | 93 | 47.3 | 5.3 | 0.8 | 48.9 | 2.5 |
Sangarédi (Guinea)6 7 | O/P | – | – | – | 1,351 | 46.6 | 2.3 |
Total bauxite | 260 | 48.6 | 8.9 | 1,943 | 47.8 | 5.1 | |
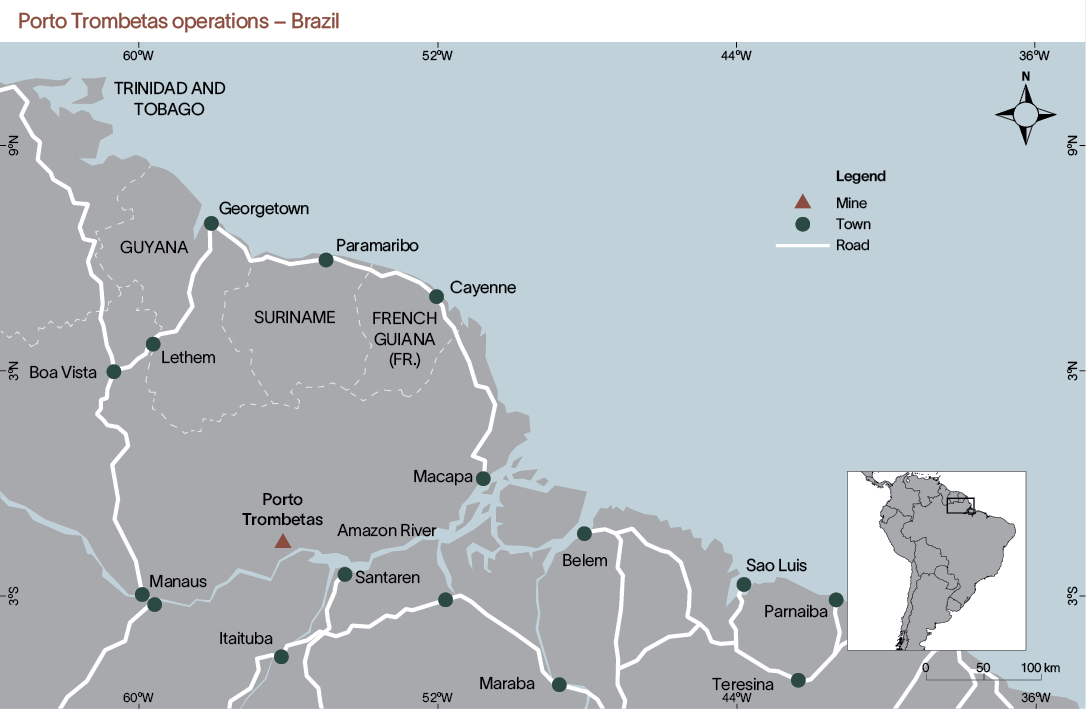 |
312 | Annual Report on Form 20-F 2023 | riotinto.com |
Total Measured and Indicated Mineral Resources as at 31 December 2023 | Inferred Mineral Resources as at 31 December 2023 | Rio Tinto interest | |||||
Tonnage | Grade | Tonnage | Grade | ||||
Mt | % Al2O3 | % SiO2 | Mt | % Al2O3 | % SiO2 | % | |
504 | 49.6 | 11.7 | 285 | 51.7 | 12.1 | 100.0 | |
43 | 49.9 | 8.8 | – | – | – | 100.0 | |
9 | 48.1 | 8.9 | 0.01 | 46.9 | 8.1 | 100.0 | |
202 | 52.0 | 11.1 | 1,248 | 51.8 | 11.4 | 100.0 | |
759 | 50.2 | 11.4 | 1,533 | 51.8 | 11.5 | ||
94 | 47.3 | 5.3 | 32 | 49.5 | 4.0 | 22.0 | |
1,351 | 46.6 | 2.3 | 168 | 45.8 | 2.4 | 23.0 | |
2,203 | 47.9 | 5.5 | 1,733 | 51.2 | 10.5 | ||
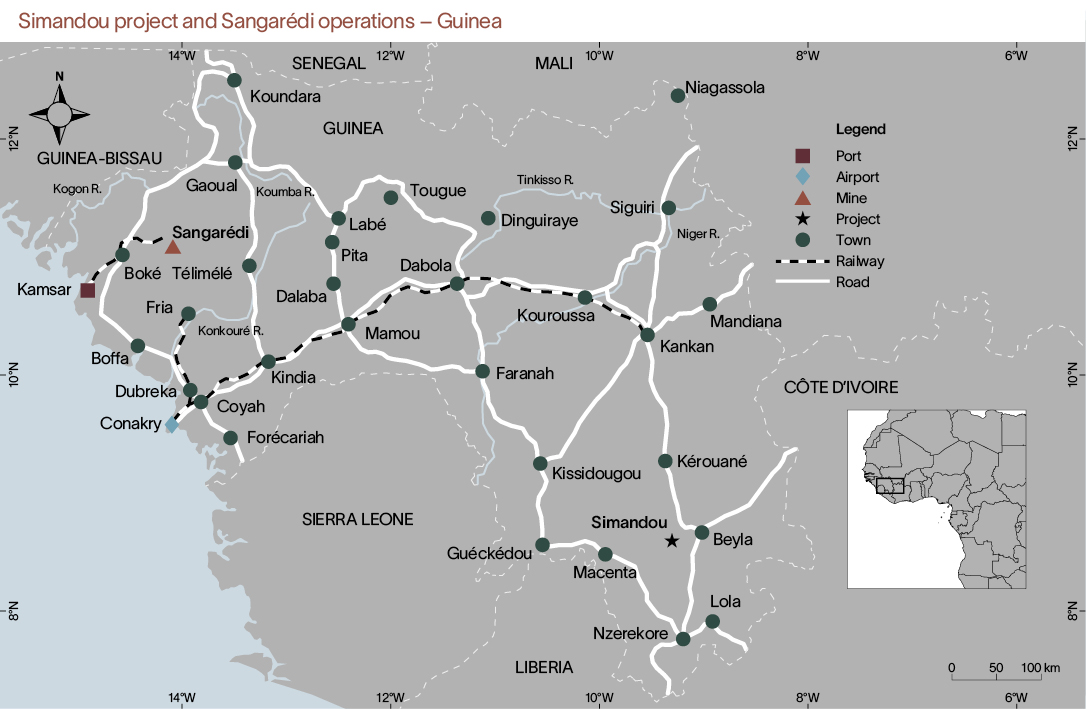 |
Annual Report on Form 20-F 2023 | riotinto.com | 313 |
Iron ore2 | Likely mining method1 | Measured Mineral Resources as at 31 December 2023 | Indicated Mineral Resources as at 31 December 2023 | ||||||||||
Tonnage | Grade | Tonnage | Grade | ||||||||||
Mt | % Fe | % SiO2 | % Al2O3 | % P | % LOI | Mt | % Fe | % SiO2 | % Al2O3 | % P | % LOI | ||
Australia3 | |||||||||||||
– Boolgeeda | O/P | – | – | – | – | – | – | – | – | – | – | – | – |
– Brockman | O/P | 416 | 62.4 | 3.4 | 1.8 | 0.13 | 5.0 | 638 | 62.5 | 3.4 | 1.8 | 0.13 | 4.6 |
– Brockman Process Ore | O/P | 209 | 57.2 | 6.2 | 4.0 | 0.16 | 7.0 | 353 | 56.7 | 6.3 | 4.1 | 0.15 | 7.4 |
– Channel Iron Deposit | O/P | 627 | 56.4 | 5.9 | 2.5 | 0.05 | 10.3 | 1,267 | 57.6 | 5.0 | 2.7 | 0.07 | 9.3 |
– Detrital | O/P | 7 | 61.9 | 4.1 | 3.5 | 0.06 | 3.2 | 62 | 61.1 | 4.9 | 3.5 | 0.06 | 3.4 |
– Marra Mamba | O/P | 158 | 62.4 | 2.9 | 1.5 | 0.07 | 5.9 | 421 | 62.7 | 2.6 | 1.5 | 0.06 | 5.8 |
Total (Australia)4 | 1,417 | 59.0 | 4.8 | 2.4 | 0.09 | 7.7 | 2,741 | 59.5 | 4.4 | 2.5 | 0.09 | 7.3 | |
Iron Ore Company of Canada (Canada)5 6 | O/P | 125 | 40.2 | 36.1 | 0.2 | 0.02 | – | 283 | 38.8 | 37.1 | 0.2 | 0.03 | – |
Simandou (Guinea)7 | O/P | 66 | 67.1 | 1.9 | 1.1 | 0.04 | 1.0 | 198 | 66.2 | 1.8 | 1.5 | 0.05 | 1.8 |
Total iron ore | 1,609 | 57.8 | 7.2 | 2.2 | 0.09 | 6.9 | 3,222 | 58.1 | 7.1 | 2.2 | 0.09 | 6.3 | |
314 | Annual Report on Form 20-F 2023 | riotinto.com |
Total Measured and Indicated Mineral Resources as at 31 December 2023 | Inferred Mineral Resources as at 31 December 2023 | Rio Tinto interest % | |||||||||||
Tonnage | Grade | Tonnage | Grade | ||||||||||
Mt | % Fe | % SiO2 | % Al2O3 | % P | % LOI | Mt | % Fe | % SiO2 | % Al2O3 | % P | % LOI | ||
– | – | – | – | – | – | 532 | 57.9 | 4.8 | 3.9 | 0.17 | 7.6 | 100.0 | |
1,054 | 62.5 | 3.4 | 1.8 | 0.13 | 4.8 | 4,425 | 62.3 | 3.2 | 1.8 | 0.13 | 5.3 | 74.6 | |
563 | 56.9 | 6.3 | 4.1 | 0.15 | 7.3 | 1,676 | 56.9 | 5.9 | 4.1 | 0.16 | 7.7 | 66.9 | |
1,894 | 57.2 | 5.3 | 2.6 | 0.07 | 9.6 | 3,421 | 56.3 | 6.0 | 3.1 | 0.08 | 9.7 | 68.6 | |
69 | 61.2 | 4.8 | 3.5 | 0.06 | 3.4 | 1,126 | 60.7 | 4.2 | 3.7 | 0.06 | 4.2 | 72.2 | |
579 | 62.6 | 2.6 | 1.5 | 0.06 | 5.9 | 2,619 | 61.6 | 3.1 | 1.8 | 0.07 | 6.4 | 61.4 | |
4,158 | 59.3 | 4.6 | 2.5 | 0.09 | 7.5 | 13,799 | 59.7 | 4.3 | 2.6 | 0.11 | 6.9 | ||
408 | 39.2 | 36.8 | 0.2 | 0.03 | – | 251 | 38.8 | 37.5 | 0.2 | 0.03 | – | 58.7 | |
264 | 66.5 | 1.8 | 1.4 | 0.05 | 1.6 | 340 | 65.8 | 1.4 | 1.4 | 0.07 | 2.8 | 45.1 | |
4,831 | 58.0 | 7.1 | 2.2 | 0.09 | 6.5 | 14,391 | 59.5 | 4.8 | 2.6 | 0.11 | 6.7 | ||
Annual Report on Form 20-F 2023 | riotinto.com | 315 |
Copper2 3 | Likely mining method1 | Measured Mineral Resources as at 31 December 2023 | Indicated Mineral Resources as at 31 December 2023 | ||||||||
Tonnage | Grade | Tonnage | Grade | ||||||||
Mt | % Cu | g/t Au | g/t Ag | % Mo | Mt | % Cu | g/t Au | g/t Ag | % Mo | ||
Winu (Australia) | O/P | – | – | – | – | – | 222 | 0.45 | 0.35 | 2.73 | – |
Bingham Canyon (US)4 | |||||||||||
– Bingham Open Pit | O/P | 38 | 0.47 | 0.15 | 2.47 | 0.020 | 22 | 0.39 | 0.16 | 2.66 | 0.016 |
– Underground Skarns | U/G | 0.2 | 2.52 | 1.27 | 10.56 | 0.056 | 12 | 2.75 | 1.17 | 60.67 | 0.010 |
Resolution (US) | U/G | – | – | – | – | – | 398 | 1.89 | – | 3.70 | 0.042 |
Total (US) | 38 | 0.48 | 0.16 | 2.50 | 0.020 | 432 | 1.84 | 0.04 | 5.23 | 0.040 | |
Escondida (Chile)5 | |||||||||||
– Escondida - mixed | O/P | 4 | 0.39 | – | – | – | 6 | 0.45 | – | – | – |
– Escondida - oxide | O/P | 4 | 0.32 | – | – | – | 2 | 0.58 | – | – | – |
– Escondida - sulphide | O/P | 462 | 0.57 | – | – | – | 378 | 0.50 | – | – | – |
Total (Chile) | 470 | 0.57 | – | – | – | 386 | 0.50 | – | – | – | |
La Granja (Peru) | O/P | – | – | – | – | – | 59 | 0.85 | – | – | – |
Oyu Tolgoi (Mongolia)6 | |||||||||||
– Heruga ETG | U/G | – | – | – | – | – | – | – | – | – | – |
– Heruga OT | U/G | – | – | – | – | – | – | – | – | – | – |
– Hugo Dummett North7 | U/G | 38 | 1.90 | 0.50 | 4.30 | – | 251 | 1.39 | 0.35 | 3.24 | – |
– Hugo Dummett North Extension | U/G | – | – | – | – | – | 48 | 1.62 | 0.55 | 4.21 | – |
– Hugo Dummett South | U/G | – | – | – | – | – | – | – | – | – | – |
– Oyut Open Pit | O/P | 11 | 0.41 | 0.38 | 1.10 | – | 61 | 0.33 | 0.30 | 1.13 | – |
– Oyut Underground | U/G | 6 | 0.48 | 0.91 | 1.31 | – | 33 | 0.38 | 0.61 | 1.18 | – |
Total (Mongolia) | 55 | 1.44 | 0.53 | 3.33 | – | 393 | 1.17 | 0.39 | 2.86 | – | |
Total Copper | 563 | 0.65 | 0.06 | 0.49 | 0.001 | 1,491 | 1.07 | 0.17 | 2.67 | 0.012 | |
316 | Annual Report on Form 20-F 2023 | riotinto.com |
Total Measured and Indicated Mineral Resources as at 31 December 2023 | Inferred Mineral Resources as at 31 December 2023 | Rio Tinto interest | |||||||||
Tonnage | Grade | Tonnage | Grade | ||||||||
Mt | % Cu | g/t Au | g/t Ag | % Mo | Mt | % Cu | g/t Au | g/t Ag | % Mo | % | |
222 | 0.45 | 0.35 | 2.73 | – | 499 | 0.38 | 0.33 | 1.98 | – | 100.0 | |
59 | 0.44 | 0.15 | 2.54 | 0.018 | 12 | 0.26 | 0.20 | 2.56 | 0.005 | 100.0 | |
12 | 2.75 | 1.17 | 60.03 | 0.011 | 14 | 2.51 | 0.91 | 15.41 | 0.008 | 100.0 | |
398 | 1.89 | – | 3.70 | 0.042 | 624 | 1.28 | – | 2.74 | 0.031 | 55.0 | |
470 | 1.73 | 0.05 | 5.01 | 0.038 | 650 | 1.29 | 0.02 | 3.01 | 0.030 | ||
10 | 0.43 | – | – | – | 7 | 0.47 | – | – | – | 30.0 | |
6 | 0.41 | – | – | – | 2 | 0.65 | – | – | – | 30.0 | |
840 | 0.54 | – | – | – | 3,070 | 0.53 | – | – | – | 30.0 | |
856 | 0.54 | – | – | – | 3,079 | 0.53 | – | – | – | ||
59 | 0.85 | – | – | – | 1,886 | 0.50 | – | – | – | 45.0 | |
– | – | – | – | – | 842 | 0.41 | 0.40 | 1.44 | 0.012 | 56.1 | |
– | – | – | – | – | 71 | 0.42 | 0.30 | 1.58 | 0.011 | 66.0 | |
289 | 1.46 | 0.37 | 3.38 | – | 474 | 0.83 | 0.29 | 2.47 | – | 66.0 | |
48 | 1.62 | 0.55 | 4.21 | – | 90 | 1.05 | 0.37 | 2.85 | – | 56.1 | |
– | – | – | – | – | 483 | 0.83 | 0.07 | 1.87 | – | 66.0 | |
72 | 0.34 | 0.31 | 1.12 | – | 210 | 0.29 | 0.19 | 1.01 | – | 66.0 | |
39 | 0.40 | 0.66 | 1.20 | – | 95 | 0.41 | 0.42 | 1.25 | – | 66.0 | |
448 | 1.20 | 0.41 | 2.91 | – | 2,265 | 0.60 | 0.28 | 1.76 | 0.005 | ||
2,054 | 0.95 | 0.14 | 2.08 | 0.009 | 8,379 | 0.59 | 0.10 | 0.83 | 0.004 | ||
Annual Report on Form 20-F 2023 | riotinto.com | 317 |
Likely mining method1 | Measured Mineral Resources as at 31 December 2023 | Indicated Mineral Resources as at 31 December 2023 | |||||
Tonnage | Grade | Tonnage | Grade | ||||
Titanium dioxide feedstock2 3 | Mt | % Ti minerals | % Zircon | Mt | % Ti minerals | % Zircon | |
QIT Madagascar Minerals (QMM) (Madagascar) | O/P | 356 | 4.3 | 0.2 | 318 | 4.0 | 0.2 |
Richards Bay Minerals (RBM) (South Africa) | O/P | — | — | — | 8 | 12.0 | 8.1 |
Rio Tinto Iron and Titanium (RTIT) Quebec Operations (Canada) | O/P | — | — | — | 11 | 84.9 | — |
Total titanium dioxide feedstock | 356 | 4.3 | 0.2 | 337 | 6.8 | 8.3 | |
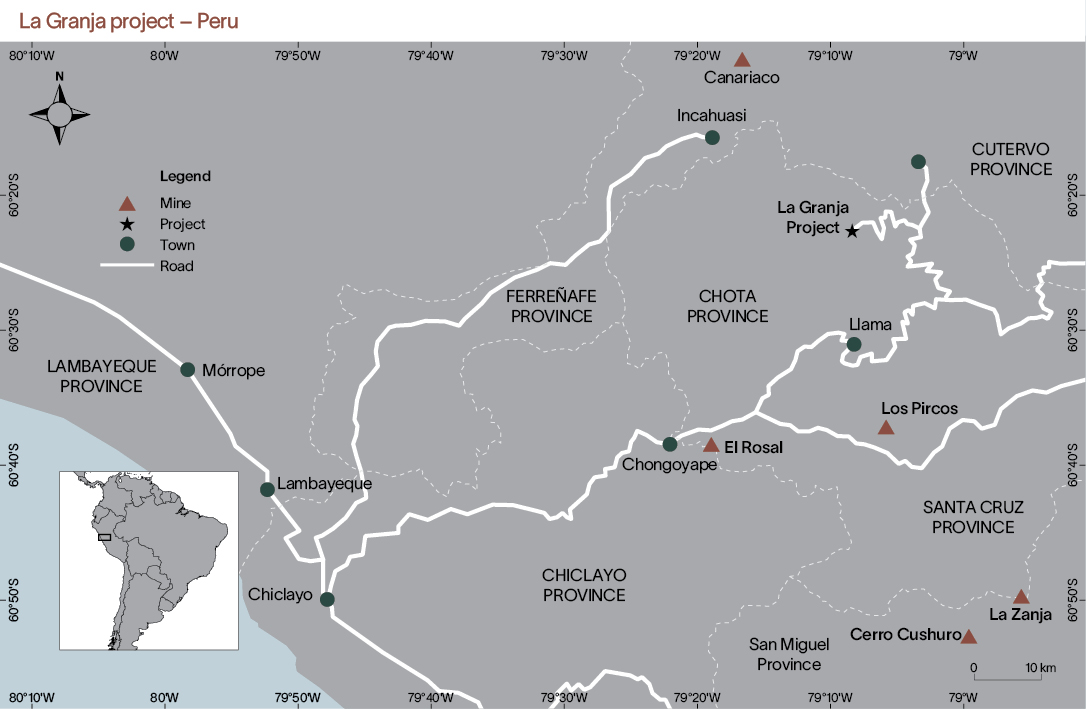 |
318 | Annual Report on Form 20-F 2023 | riotinto.com |
Total Measured and Indicated Mineral Resources as at 31 December 2023 | Inferred Mineral Resources as at 31 December 2023 | Rio Tinto interest | |||||
Tonnage | Grade | Tonnage | Grade | ||||
Mt | % Ti minerals | % Zircon | Mt | % Ti minerals | % Zircon | % | |
674 | 4.2 | 0.2 | 477 | 3.9 | 0.2 | 80.0 | |
8 | 12.0 | 8.1 | – | – | – | 74.0 | |
11 | 84.9 | – | 16 | 79.2 | – | 100.0 | |
693 | 5.5 | 4.1 | 492 | 6.3 | 0.2 | ||
Annual Report on Form 20-F 2023 | riotinto.com | 319 |
Likely mining method1 | Measured Mineral Resources as at 31 December 2023 | Indicated Mineral Resources as at 31 December 2023 | |||
Tonnage | Tonnage | ||||
Borates2 | Mt | Mt | |||
Jadar (Serbia)3 4 | U/G | – | 14 | ||
Likely mining method1 | Measured Mineral Resources as at 31 December 2023 | Indicated Mineral Resources as at 31 December 2023 | |||
Tonnage | Grade | Tonnage | Grade | ||
Diamonds5 | Mt | Carats per tonne | Mt | Carats per tonne | |
Diavik (Canada)6 | U/G | 1.5 | 2.4 | 1.2 | 2.7 |
Likely mining method1 | Measured Mineral Resources as at 31 December 2023 | Indicated Mineral Resources as at31 December 2023 | |||
Tonnage | Grade | Tonnage | Grade | ||
Lithium5 | Mt | % Li2O | Mt | % Li2O | |
Jadar (Serbia)4 | U/G | – | – | 85 | 1.76 |
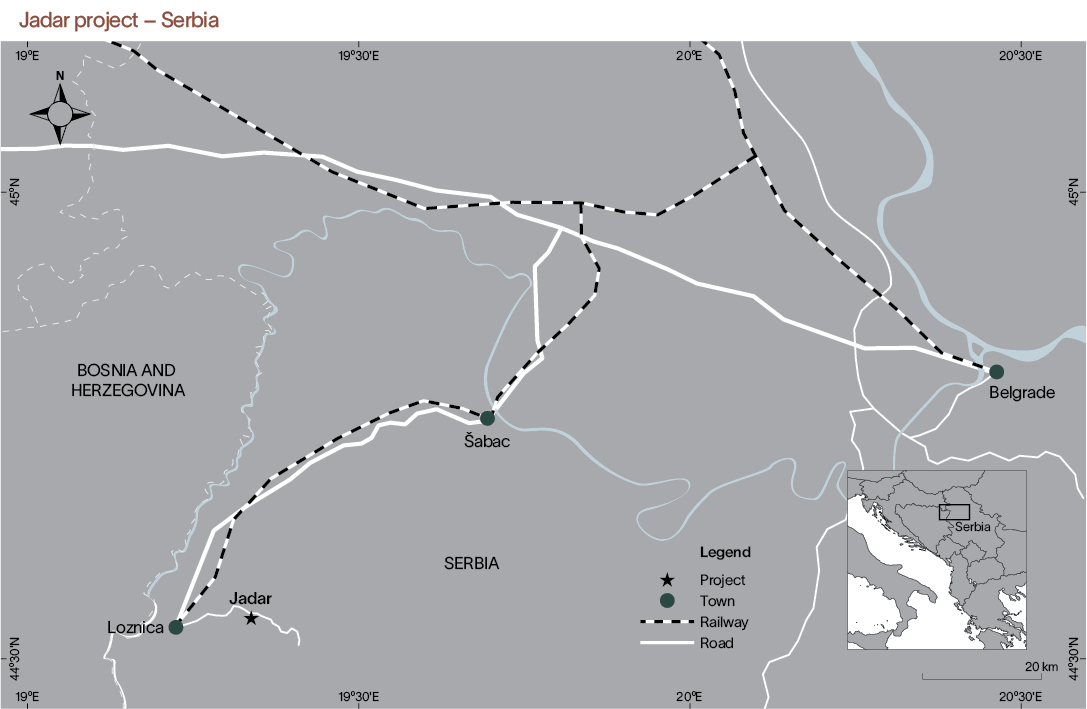 |
320 | Annual Report on Form 20-F 2023 | riotinto.com |
Total Measured and Indicated Mineral Resources as at 31 December 2023 | Inferred Mineral Resources as at 31 December 2023 | Rio Tinto interest | |||
Tonnage | Tonnage | ||||
Mt | Mt | % | |||
14 | 7 | 100.0 | |||
Total Measured and Indicated Mineral Resources as at 31 December 2023 | Inferred Mineral Resources as at 31 December 2023 | Rio Tinto interest | |||
Tonnage | Grade | Tonnage | Grade | ||
Mt | Carats per tonne | Mt | Carats per tonne | % | |
2.7 | 2.5 | 0.3 | 2.1 | 100.0 | |
Total Measured and Indicated Mineral Resources as at 31 December 2023 | Inferred Mineral Resources as at 31 December 2023 | Rio Tinto interest | |||
Tonnage | Grade | Tonnage | Grade | ||
Mt | % Li2O | Mt | % Li2O | % | |
85 | 1.76 | 58 | 1.87 | 100.0 | |
Annual Report on Form 20-F 2023 | riotinto.com | 321 |
322 | Annual Report on Form 20-F 2023 | riotinto.com |
Association(a) | Employer | Accountability | Deposits | |||
Bauxite | ||||||
A McIntyre | AusIMM | Rio Tinto | Resources | Gove, East Weipa and Andoom, North of Weipa, Amrun | ||
W Saba | AusIMM | Reserves | Gove, East Weipa and Andoom, Amrun | |||
M Alpha DIALLO | EFG | Compagnie des Bauxites de Guinée | Resources | Sangaredi | ||
M Keersemaker | AusIMM | External consultant to Compagnie des Bauxites de Guinée | Reserves | |||
R Aglinskas | AusIMM | External consultants to Mineração Rio do Norte | Resources | Trombetas | ||
L H Costa | AusIMM | Reserves | ||||
Borates | ||||||
B Griffiths | SME | Rio Tinto | Reserves | Boron | ||
Copper | ||||||
H Martin | AusIMM | Rio Tinto | Resources | Resolution(b)(c) | ||
J Marshall | AusIMM | Resources | ||||
A Schwarz | AusIMM | Resources | ||||
O Togtokhbayar | AusIMM | Rio Tinto | Resources | Oyu Tolgoi(b) (c) (d) | ||
B Ndlovu | AusIMM | Reserves | ||||
N Robinson | AusIMM | Reserves | ||||
R Hayes | AusIMM | Rio Tinto | Resources | Bingham Canyon(b) (c) (d) | ||
A Chiquini | AusIMM | Resources | ||||
P Rodriguez | AusIMM | Resources | ||||
C McArthur | AusIMM | Reserves | ||||
B Pett | AusIMM | Reserves | ||||
R Maureira | AusIMM | Minera Escondida Ltda. | Resources | Escondida, Escondida – Chimborazo – sulphide, Pampa Escondida – sulphide(d), Pinta Verde | ||
P Castillo | AusIMM | Reserves | Escondida | |||
J Marshall | AusIMM | Rio Tinto | Resources | La Granja | ||
J Pocoe | AusIMM | Rio Tinto | Resources | Winu(b) (d) | ||
Diamonds | ||||||
K Pollock | NAPEG | Rio Tinto | Resources & Reserves | Diavik | ||
C Auld | NAPEG | Reserves | ||||
Iron ore | ||||||
M Styles | AusIMM | Rio Tinto | Resources | Simandou | ||
M Apfel | AusIMM | Reserves | ||||
M McDonald | PEGNL | Rio Tinto | Resources | Iron Ore Company of Canada | ||
B Power | PEGNL | Resources | ||||
R Way | PEGNL | Resources | ||||
R Williams | PEGNL | Reserves | ||||
S Roche | AusIMM | Reserves | ||||
N Brajkovich | AusIMM | Rio Tinto | Resources | Rio Tinto Iron Ore – Boolgeeda, Brockman, Brockman Process Ore, Channel Iron Deposit, Detrital, Marra Mamba | ||
M Judge | AusIMM | Resources | ||||
E Barron | AusIMM | Resources | ||||
AA Latscha | AusIMM | Resources | ||||
P Savory | AusIMM | Resources | ||||
P Barnes | AusIMM | Reserves | Rio Tinto Iron Ore – Brockman Ore, Marra Mamba Ore, Pisolite (Channel Iron) Ore | |||
R Bleakley | AusIMM | Reserves | ||||
B Satria Yudha | AusIMM | Reserves | ||||
L Vilela Couto | AusIMM | Reserves | ||||
Lithium | ||||||
I Misailovic | EFG | Rio Tinto | Resources | Jadar(e) | ||
D Tanaskovic | EFG | Resources | ||||
Titanium dioxide feedstock | ||||||
J Dumouchel | OGQ | Rio Tinto | Resources | Rio Tinto Iron and Titanium Quebec Operations (RTIT Quebec Operations) | ||
D Gallant | OIQ | Reserves | ||||
A Cawthorn-Blazeby | SACNASP | Rio Tinto | Resources | Richards Bay Minerals (RBM)(f) | ||
S Mnunu | SACNASP | Reserves | ||||
A Louw | AusIMM | Rio Tinto | Resources | QIT Madagascar Minerals (QMM)(f) | ||
H Rakotonindrainy | IOM3 | Reserves |
Annual Report on Form 20-F 2023 | riotinto.com | 323 |
Property Australian Pilbara Operations Mine Hamersley Iron: –Brockman 2 –Brockman 4 –Channar –Gudai-Darri –Marandoo –Mount Tom Price –Nammuldi –Paraburdoo –Silvergrass –Western Turner Syncline –Yandicoogina Ownership 100% Rio Tinto Operator Rio Tinto Location Pilbara region, Western Australia | Access and infrastructure Access and infrastructure within the property includes: –a network of sealed and unsealed roads connecting to public roads and highways –public and Rio Tinto-operated airports –a Hamersley and Robe owned integrated heavy haulage rail network, operated by Pilbara Iron comprising in excess of 1,890km of rail, multiple rail cars and locomotives –four shipping terminals, located at Dampier and Cape Lambert and managed as a single port system –water piping networks for both abstracted water and supply of fresh water to sites –managed accommodation villages for fly-in fly-out (FIFO) sites –a housing portfolio managing properties in the towns of Dampier, Wickham, Karratha, Pannawonica, Paraburdoo and Tom Price –tailings storage facilities at several mine sites. All assets are subject to routine inspections and ongoing investment and maintenance programs to ensure these remain fit-for-purpose. Title/lease/acreage Agreements for life of mine with Government of Western Australia, save for the Yandicoogina mining lease, which expires in 2039 with an option to extend for 21 years. Mount Tom Price, Marandoo, Brockman 2, Brockman 4, Nammuldi and Western Turner Syncline Mineral and Mining Leases held under Iron Ore (Hamersley Range) Agreement Act 1963. Area of ML4SA approximately 79,329 hectares (ha). Area of M272SA approximately 14,136ha. Gudai-Darri Mineral Lease held under Iron Ore (Mount Bruce) Agreement Act 1972. Area of ML252SA 47,406ha. Paraburdoo and Eastern Range Mineral Lease held under Iron Ore (Hamersley Range) Agreement Act 1968. Area of ML246SA approximately 12,950ha. Channar Mining Lease held under Iron Ore (Channar Joint Venture) Agreement Act 1987. Mining lease expires in 2028 with an option to extend by up to five years. Area of M265SA approximately 5,965ha. Yandicoogina Mining Lease held under Iron Ore (Yandicoogina) Agreement Act 1996. Area of M274SA approximately 30,550ha. Key permit conditions State Agreement conditions are set by the Western Australian Government and broadly comprise environmental compliance and reporting obligations; closure and rehabilitation considerations; local procurement and community initiatives/ investment requirements; and payment of taxes and government royalties. The current business also operates under an Indigenous Land Use Agreement (ILUA) which includes commitments for payments made to trust accounts; Indigenous employment and business opportunities; and heritage and cultural protections. | History Mount Tom Price began operations in 1966, followed by Paraburdoo in 1974. During the 1990s, Channar (1990), Brockman 2 (1992), Marandoo (1994) and Yandicoogina (1998) achieved first ore. Nammuldi achieved first ore in 2006 followed by Brockman 4 (2010), Western Turner Syncline (2011) and Silvergrass (2017). The latest addition to the network of Hamersley Iron mines, Gudai-Darri, had first ore railed in December 2021, and commissioned its primary crusher in the second quarter of 2022. Property description/type of mine All mines operated by Rio Tinto within the property are open pit mines. The mining method employed uses conventional surface mining, whereby shovels and loaders are used to load drilled and blasted material into trucks for removal to waste dumps and stockpiles or feed to process plants. In addition to mining activities, Rio Tinto conducts both exploration and development drilling across the property. This Property is considered a production stage property for SK-1300 reporting purposes. Type of mineralisation Brockman 2, Brockman 4, Channar, Gudai-Darri, Tom Price, Paraburdoo and Western Turner Syncline: mineralisation is haematite/goethite mineralisation hosted within the banded iron formations of the Brockman Formation. Detrital deposits also occur at these sites. At Tom Price and Western Turner Syncline, some goethite/haematite mineralisation hosted within the Marra Mamba Formation also occurs. Marandoo, Nammuldi and Silvergrass: mineralisation occurs as goethite/haematite within the banded iron formations of the Marra Mamba Formation. Some detrital mineralisation also occurs. Yandicoogina: goethite mineralisation occurs as pisolite ores within the paleo-channel of a channel iron formation. Processing plants and other available facilities At Brockman 2, Brockman 4, the Nammuldi dry plant and Gudai- Darri, dry crushing and screening is used to produce lump and fines iron ore products. Ore from the Silvergrass and Nammuldi mines is blended and processed through a wet scrubbing and screening plant, ahead of desliming of the fines product using hydrocyclones. At Marandoo, wet scrubbing and screening is used to produce lump and fines iron ore products, prior to desliming of fines products using hydrocyclones. Ore from the Channar and Paraburdoo mines is crushed and then processed through a central tertiary crushing and dry screening plant to produce a dry lump product, with further wet processing of the fines using hydrocyclones to remove slimes. Ore from the Tom Price and Western Turner Syncline mines is directed to either the high-grade plant for dry crushing and screening to dry lump and fines products, or to the low grade plant for beneficiation. Heavy media separation is used to beneficiate low-grade lump, and a combination of heavy media hydrocyclones and spirals is used to beneficiate the low-grade fines. At Yandicoogina, ore is crushed to fines product only through a combination of dry crushing and screening, or crushing and wet processing of ore using classification to remove finer particles. The processing plants within the Hamersley Iron network vary considerably in age, and many plants have been subject to brownfields development since original construction. All plants are subject to an ongoing regime of sustaining capital investment and maintenance, underpinned by asset integrity audits, engineering inspections, engineering life cycles for key equipment and safety inspections and audits. Power source Supplied through the integrated Hamersley and Robe power network operated by Pilbara Iron. | ||||
324 | Annual Report on Form 20-F 2023 | riotinto.com |
Property Australian Pilbara Operations Mine Bao-HI Joint Venture: –Eastern Range and Western Range mines Ownership 54% Rio Tinto. Rio Tinto owns 54% of the Bao-Hi joint venture with the remaining 46% held by China Baowu Group. Operator Rio Tinto Location Pilbara region, Western Australia | Access and infrastructure Access and infrastructure within the property includes: –a network of sealed and unsealed roads connecting to public roads and highways –public and Rio Tinto-operated airports –a Hamersley and Robe owned integrated heavy haulage rail network, operated by Pilbara Iron comprising in excess of 1,890km of rail, multiple rail cars and locomotives –four shipping terminals, located at Dampier and Cape Lambert and managed as a single port system –water piping networks for both abstracted water and supply of fresh water to sites –managed accommodation villages for FIFO sites –a housing portfolio managing properties in the towns of Dampier, Wickham, Karratha, Pannawonica, Paraburdoo and Tom Price –tailings storage facilities at several mine sites. All assets are subject to routine inspections and ongoing investment and maintenance programs to ensure these remain fit-for-purpose. Title/lease/acreage Paraburdoo and Eastern Range and Western Range Mineral Lease held under Iron Ore (Hamersley Range) Agreement Act 1968. Key permit conditions State Agreement conditions are set by the Western Australian Government and broadly comprise environmental compliance and reporting obligations; closure and rehabilitation considerations; local procurement and community initiatives/investment requirements; and payment of taxes and government royalties. The current business also operates under an ILUA which includes commitments for payments made to trust accounts; Indigenous employment and business opportunities; and heritage and cultural protections. | History The Bao-HI joint venture was established in 2002 and has delivered sales of more than 200 million tonnes of iron ore to China. First ore from Eastern Range was delivered in 2004. In 2022, the Bao-HI joint venture was extended with a commitment to deliver 275 million tonnes of sales of iron ore to China. First ore from Western Range is planned for 2024 utilising existing infrastructure, with a new crusher at Western Range mine planned to be operational in 2025. Property description/type of mine All mines operated by Rio Tinto within the property are open pit mines. The mining method employed uses conventional surface mining, whereby shovels and loaders are used to load drilled and blasted material into trucks for removal to waste dumps or feed to process plants. In addition to mining activities, Rio Tinto conducts both exploration and development drilling across the property. This Property is considered a production stage property for SK-1300 reporting purposes. Type of mineralisation Mineralisation at Eastern Range and Western Range occurs as haematite/goethite mineralisation hosted within the banded iron formations of the Brockman Formation. Processing plants and other available facilities Ore from the Eastern Range mine is crushed and then processed through the central Paraburdoo tertiary crushing and dry screening plant to produce a dry lump product, with further wet processing of the fines product using hydrocyclones to remove slimes. The same process flow is planned for ore from Western Range. The processing plants within the Hamersley Iron network vary considerably in age, and many plants have been subject to brownfields development since original construction. All plants are subject to an ongoing regime of sustaining capital investment and maintenance, underpinned by asset integrity audits, engineering inspections, engineering life cycles for key equipment and safety inspections and audits. Power source Supplied through the integrated Hamersley and Robe power network operated by Pilbara Iron. | ||||
Property Australian Pilbara Operations Mine Hope Downs 1 Ownership 50% Rio Tinto 50% Hancock Prospecting Pty Ltd Operator Rio Tinto Location Pilbara region, Western Australia | Access and infrastructure Access and infrastructure within the property includes: –a network of sealed and unsealed roads connecting to public roads and highways –public and Rio Tinto-operated airports –a Hamersley and Robe owned integrated heavy haulage rail network, operated by Pilbara Iron comprising in excess of 1,890km of rail, multiple rail cars and locomotives –four shipping terminals, located at Dampier and Cape Lambert and managed as a single port system –water piping networks for both abstracted water and supply of fresh water to sites –managed accommodation villages for FIFO sites –tailings storage facilities at several mine sites. All assets are subject to routine inspections and ongoing investment and maintenance programs to ensure these remain fit-for-purpose. | Title/lease/acreage Mining lease expires in 2027 with two options to extend of 21 years each. Mining lease held under Iron Ore (Hope Downs) Agreement Act 1992. Key permit conditions State Agreement conditions are set by the Western Australian Government and broadly comprise environmental compliance and reporting obligations; closure and rehabilitation considerations; local procurement and community initiatives/ investment requirements; and payment of taxes and government royalties. The current business also operates under an ILUA which includes commitments for payments made to trust accounts; Indigenous employment and business opportunities; and heritage and cultural protections. History Joint venture between Rio Tinto and Hancock Prospecting. Construction of Stage 1 to 22Mtpa commenced 2006 and first production occurred 2007. Stage 2 to 30Mtpa completed 2009. | ||||
Annual Report on Form 20-F 2023 | riotinto.com | 325 |
Property Australian Pilbara Operations Mine Hope Downs 1 Ownership 50% Rio Tinto 50% Hancock Prospecting Pty Ltd Operator Rio Tinto Location Pilbara region, Western Australia | Property description/type of mine All mines operated by Rio Tinto within the property are open pit mines. The mining method employed uses conventional surface mining, whereby shovels and loaders are used to load drilled and blasted material into trucks for removal to waste dumps or feed to process plants. In addition to mining activities, Rio Tinto conducts both exploration and development drilling across the property. This Property is considered a production stage property for SK-1300 reporting purposes. Type of mineralisation Mineralisation at Hope Downs 1 occurs as goethite/haematite within the banded iron formations of the Marra Mamba and Brockman Formation. Some detrital mineralisation also occurs. | Processing plants and other available facilities Ore from Hope Downs 1 is processed through the Hope Downs 1 processing plant, which utilises dry crushing and screening to produce lump and fines iron ore products. The processing plants within the Hamersley Iron network vary considerably in age, and many plants have been subject to brownfields development since original construction. All plants are subject to an ongoing regime of sustaining capital investment and maintenance, underpinned by asset integrity audits, engineering inspections, engineering life cycles for key equipment and safety inspections and audits. Power source Supplied through the integrated Hamersley and Robe power network operated by Pilbara Iron. | ||||
Property Australian Pilbara Operations Mine Hope Downs 4 Ownership 50% Rio Tinto 50% Hancock Prospecting Pty Ltd Operator Rio Tinto Location Pilbara region, Western Australia | Access and infrastructure Access and infrastructure within the property includes: –a network of sealed and unsealed roads connecting to public roads and highways –public and Rio Tinto-operated airports –a Hamersley and Robe owned integrated heavy haulage rail network, operated by Pilbara Iron comprising in excess of 1,890km of rail, multiple rail cars and locomotives –four shipping terminals, located at Dampier and Cape Lambert and managed as a single port system –water piping networks for both abstracted water and supply of fresh water to sites –managed accommodation villages for FIFO sites –tailings storage facilities at several mine sites. All assets are subject to routine inspections and ongoing investment and maintenance programs to ensure these remain fit-for-purpose. Title/lease/acreage Mining lease expires in 2027 with two options to extend of 21 years each. Mining lease held under Iron Ore (Hope Downs) Agreement Act 1992. Key permit conditions State Agreement conditions are set by the Western Australian Government and broadly comprise environmental compliance and reporting obligations; closure and rehabilitation considerations; local procurement and community initiatives/ investment requirements; and payment of taxes and government royalties. The current business also operates under an ILUA which includes commitments for payments made to trust accounts; Indigenous employment and business opportunities; and heritage and cultural protections. | History Joint venture between Rio Tinto and Hancock Prospecting. Construction of wet plant processing to 15Mtpa commenced 2011 and first production occurred 2013. Property description/type of mine All mines operated by Rio Tinto within the property are open pit mines. The mining method employed uses conventional surface mining, whereby shovels and loaders are used to load drilled and blasted material into trucks for removal to waste dumps or feed to process plants. In addition to mining activities, Rio Tinto conducts both exploration and development activities across the property. This Property is considered a production stage property for SK-1300 reporting purposes. Type of mineralisation Mineralisation at Hope Downs 4 occurs as haematite/goethite mineralisation hosted within the banded iron formations of the Brockman Formation. Processing plants and other available facilities Ore from Hope Downs 4 is processed through the Hope Downs 4 processing plant. Wet scrubbing and screening are used to separate lump and fines products, prior to desliming of fines product using hydrocyclones. The processing plants within the Hamersley Iron network vary considerably in age, and many plants have been subject to brownfields development since original construction. All plants are subject to an ongoing regime of sustaining capital investment and maintenance, underpinned by asset integrity audits, engineering inspections, engineering life cycles for key equipment and safety inspections and audits. Power source Supplied through the integrated Hamersley and Robe power network operated by Pilbara Iron. | ||||
326 | Annual Report on Form 20-F 2023 | riotinto.com |
Property Australian Pilbara Operations Mine Robe River Iron Associates: Robe Valley mines: –Mesa A –Mesa J –West Angelas Ownership 53% Rio Tinto Robe River is a joint venture between Rio Tinto (53%), Mitsui Iron Ore Development (33%), and Nippon Steel Corporation (14%) Operator Rio Tinto Location Pilbara region, Western Australia | Access and infrastructure Access and infrastructure within the property includes: –a network of sealed and unsealed roads connecting to public roads and highways –public and Rio Tinto-operated airports –a Hamersley and Robe owned integrated heavy haulage rail network, operated by Pilbara Iron comprising in excess of 1,890km of rail, multiple rail cars and locomotives –four shipping terminals, located at Dampier and Cape Lambert and managed as a single port system –water piping networks for both abstracted water and supply of fresh water to sites –managed accommodation villages for FIFO sites –a housing portfolio managing properties in the towns of Dampier, Wickham, Karratha, Pannawonica, Paraburdoo and Tom Price –tailings storage facilities at several mine sites. All assets are subject to routine inspections and ongoing investment and maintenance programmes to ensure these remain fit-for-purpose. Title/lease/acreage Agreements for life of mine with Government of Western Australia. Mineral lease held under Iron Ore (Robe River) Agreement Act 1964. Key permit conditions State Agreement conditions are set by the Western Australian Government and broadly comprise environmental compliance and reporting obligations; closure and rehabilitation considerations; local procurement and community initiatives/ investment requirements; and payment of taxes and government royalties. The current business also operates under an ILUA which includes commitments for payments made to trust accounts; Indigenous employment and business opportunities; and heritage and cultural protections. | History The first shipment from Robe Valley was in 1972. Interest acquired in 2000 through North Limited acquisition. First ore was shipped from West Angelas in 2002. Property description/type of mine All mines operated by Rio Tinto within the property are open pit mines. The mining method employed uses conventional surface mining, whereby shovels and loaders are used to load drilled and blasted material into trucks for removal to waste dumps or feed to process plants. In addition to mining activities, Rio Tinto conducts both exploration and development drilling across the property. This Property is considered a production stage property for SK-1300 reporting purposes. Type of mineralisation Robe Valley deposits: goethite mineralisation occurs as pisolite ores within the paleo-channel of a channel iron formation. West Angelas deposit: mineralisation occurs as goethite/ haematite within the banded iron formations of the Marra Mamba Formation. Some detrital mineralisation also occurs. Processing plants and other available facilities Ore from the Robe Valley mines of Mesa A and Mesa J is processed through either dry crushing and screening plants or through wet processing plants using scrubbing and screening to remove finer particles. Crushed and deslimed ore from the Robe Valley mines is railed to Cape Lambert, where further dry crushing and screening through a dedicated processing plant produces lump and fines iron ore products. At West Angelas mine, dry crushing and screening is used to produce lump and fines iron ore products. The processing plants within the Hamersley Iron network vary considerably in age, and many plants have been subject to brownfields development since original construction. All plants are subject to an ongoing regime of sustaining capital investment and maintenance, underpinned by asset integrity audits, engineering inspections, engineering life cycles for key equipment and safety inspections and audits. Power source Supplied through the integrated Hamersley and Robe power network operated by Pilbara Iron. | ||||
Property Dampier Salt Port Hedland, Dampier and Lake Macleod Mine – Ownership 68.4% Rio Tinto Dampier Salt is a joint venture between Rio Tinto (68%), Marubeni Corporation (22%) and Sojitz (10%) Operator Rio Tinto (Dampier Salt Limited) Location Gascoyne and Pilbara regions, Western Australia | Access and infrastructure Road and port. Title/lease/acreage Mining and mineral leases expiring in 2034 at Dampier, 2029 at Port Hedland and 2031 at Lake MacLeod. Mineral leases are held under Dampier Solar Salt Industry Agreement Act 1967, Leslie Solar Salt Industry Agreement Act 1966 and Evaporites (Lake MacLeod) Agreement Act 1967 respectively. Key permit conditions State Agreement conditions are set by the Western Australian Government and broadly comprise environmental compliance and reporting obligations; closure and rehabilitation considerations; local procurement and community initiatives/investment requirements; and payment of taxes and government royalties. History Construction of the Dampier field started in 1969; first shipment in 1972. Lake MacLeod was acquired in 1978 as an operating field. Port Hedland was acquired in 2001 as an operating field. In January 2024, Dampier Salt entered into a sales agreement for Lake MacLeod with privately owned salt company Leichhardt Industrials Group. Completion of the sale is conditional on certain commercial and regulatory conditions being satisfied, and this is expected to occur by the end of the year. Property description/type of mine Solar evaporation of seawater at Dampier and Port Hedland; underground brine at Lake MacLeod; extraction of gypsum at Lake MacLeod. | Type of mineralisation Salt is grown every year through solar evaporation in permanent crystallising pans. Gypsum is present in the top layer covering most of Lake Macleod. Processing plants and other available facilities Salt is processed through a washing plant, consisting of screening washbelts at Lake MacLeod, Screwbowl classifiers and static screens at Port Hedland and sizing screens, counter- current classifiers with dewatering screens and centrifuges at Dampier. Dampier produces shipping-ready product for immediate shiploading. Washed salt at Lake MacLeod and Port Hedland is dewatered on stockpiles. Lake Macleod also mines and processes gypsum in leaching heaps. Power source Long-term contracts with Hamersley Iron and Horizon Power and on-site generation. | ||||
Annual Report on Form 20-F 2023 | riotinto.com | 327 |
Property Escondida Ownership 30% Rio Tinto – 57.5% BHP, 10% JECO Corporation consortium comprising Mitsubishi, JX Nippon Mining and Metals (10%), 2.5% JECO 2 Ltd Operator BHP Location Atacama Desert, Chile | Access and infrastructure Road and rail, including a pipeline and road to the deep sea port at Coloso: –One concentrate pipeline from mine site to port facility at Coloso –Two desalinisation plants at Coloso port along with water treatment plant for concentrate filtrate, –Two water pipelines and four pump stations for freshwater supply to site, –Roadway to site, rail line for supplies and cathode transport, power transport facilities to tie site to power grid, –Site offices, housing, and cafeteria facilities to support employees and contractors on site, –Warehouse buildings and laydown facilities to support operations and projects on site. Title/lease/acreage Rights conferred by Government under Chilean Mining Code. Eighteen mineral rights leases with a total of 58,934ha. Key permit conditions Annual tenement payments (due March each year). The current business operates under the rights conferred by the Government under Chilean Mining Code and includes key underlying documents such as the Environmental Impact Assessment Permit as well as the Closure Plan Permit. History Production started in 1990 and since then capacity has been expanded numerous times. In 1998 first cathode was produced from the oxide leach plant, and during 2006 the sulphide leach plant was inaugurated, a year after the start of Escondida Norte pit production. In 2016, the third concentrator plant was commissioned. | Property description/type of mine Two active surface open pit mines in production, Escondida and Escondida Norte with ore being processed via three processing options, Oxide leach, Sulfide RoM leach, or conventional flotation concentrators. This Property is considered a production stage property for SK-1300 reporting purposes. Type of mineralisation Consists of a series of porphyry deposits containing copper, minor gold, silver, and molybdenum. Processing plants and other available facilities Los Colorados, Laguna Seca Line 1, and Laguna Seca Line 2 Concentrators. Oxide leach facility (OLAP), SL RoM leach facility and SX/EW facility. Power source Supplied from grid under various contracts with local generating companies. | ||||
Property Rio Tinto Kennecott Ownership 100% Rio Tinto Operator Rio Tinto (Kennecott Utah Copper LLC) Location Near Salt Lake City, Utah, US | Access and infrastructure Pipeline, road and rail. Title/lease/acreage Wholly owned – approximately 95,000 acres in total. Key permit conditions Permit conditions are established by Utah and US Government agencies and comprise: –environmental compliance and reporting –closure and reclamation requirements History Interest acquired in 1989. In 2012, the pushback of the south wall commenced, extending the mine life from 2018 to 2032. Approval for underground mining at Lower Commercial Skarn was obtained in 2022. | Property description/type of mine Open pit and underground (beginning in 2023). This Property is considered a production stage property for SK-1300 reporting purposes. Type of mineralisation Porphyry and associated skarn deposits containing copper, gold, silver, molybdenum and tellurium. Processing plants and other available facilities Copperton concentrator, Garfield smelter, refinery, and precious metals plant, assay lab and tailings storage facilities. Power source Supply contract with Rocky Mountain Power. | ||||
328 | Annual Report on Form 20-F 2023 | riotinto.com |
Property Oyu Tolgoi Ownership Rio Tinto owns a 66% interest in Oyu Tolgoi LLC; the remaining 34% interest is held by the Government of Mongolia through Erdenes Oyu Tolgoi LLC Rio Tinto is responsible for the day-to-day operational management and development of the project Operator Rio Tinto Location Khanbogd soum, Umnugovi province, Mongolia | Access and infrastructure Air and road. Title/lease/acreage Three mining licences are 100% held by Oyu Tolgoi LLC: MV-006708 (the Manakht licence: 4,533ha), MV-006709 (the Oyu Tolgoi licence: 8,490ha), and MV-006710 (the Khukh Khad licence: 1,763ha). Two further licences are held in joint venture with Entrée Gold LLCMV-015226 (the Shivee Tolgoi Licence) and MV-015225 (the Javkhlant Licence). The licence term under the Minerals Law of Mongolia is 30 years with two 20-year extensions. First renewals are due in 2033 and 2039 for the Oyu Tolgoi and Entrée Gold licences respectively. Key permit conditions Investment Agreement dated 6 October 2009, between the Government of Mongolia, Oyu Tolgoi LLC, Turquoise Hill Resources (TRQ), and Rio Tinto in respect of Oyu Tolgoi (Investment Agreement). Amended and Restated Shareholders Agreement dated 8 June 2011 among Oyu Tolgoi LLC, THR Oyu Tolgoi Ltd. (formerly Ivanhoe Oyu Tolgoi (BVI) Ltd.), Oyu Tolgoi Netherlands B.V. and Erdenes MGL LLC (ARSHA). Erdenes MGL LLC since transferred its shares in Oyu Tolgoi LLC and its rights and obligations under the ARSHA to its subsidiary, Erdenes Oyu Tolgoi LLC. Power Source Framework Agreement dated 31 December 2018, between the Government of Mongolia and Oyu Tolgoi LLC, including the amendment to the PSFA dated 26 June 2020. Electricity Supply Agreement dated 26 January 2022, between Southern Region Electricity Distribution Network SOSC, National Power Transmission Grid SOSC, National Dispatching Center LLC and Oyu Tolgoi LLC. In terms of key government permits, Oyu Tolgoi LLC secured a land use permit until 2035 and water use permit until 2039 as well as the mineral rights. | History Oyu Tolgoi was first discovered in 1996. Construction began in late 2009 after signing of an Investment Agreement with the Government of Mongolia, and first concentrate was produced in 2012. First sales of concentrate were made to Chinese customers in 2013. The first drawbell of the Hugo North underground mine was fired in 2022. In December 2022, Rio Tinto acquired 100% ownership of TRQ Sustainable production from underground commenced in March 2023. Property description/type of mine Ore Reserves have been reported at the Oyut and Hugo North Deposits. The Oyut deposit is currently mined as an open pit using a conventional drill, blast, load, and haul method. The Hugo North deposit is currently being developed as an underground mine. This Property is considered a production stage property for SK-1300 reporting purposes. Type of mineralisation Consists of a series of porphyry deposits containing copper, gold, silver, and molybdenum. Processing plants and other available facilities One copper concentrator with a nominal feed capacity of 100 ktpd currently comprising two SAG mills, four ball mills, rougher and cleaner flotation circuits and up to 1 Mtpa copper concentrate capacity. Other major facilities that support the isolated operations include maintenance workshops, heating plant, sealed airstrip and terminal, and camp facilities with up to 6,000 person capacity to accommodate current operations and the underground construction project. Underground infrastructure in place includes several shafts for ore haulage, personnel haulage and ventilation plus a conveyor decline to surface and associated surface infrastructure. Power source Oyu Tolgoi obtains its electricity from the Western Grid of the Inner Mongolia Autonomous Region (IMAR) in the People's Republic of China. This power is delivered through a cross- border 220kV double-circuit transmission line. The electricity is provided by Inner Mongolia Power International Cooperation Co., Ltd (IMPIC), a subsidiary of Inner Mongolia Power (Group) Co., Ltd. This company is responsible for the ownership and operation of IMAR's Western Grid. The current power supply agreement is a collaborative arrangement involving IMPIC and the National Power Transmission Grid SOSC (NPTG) of Mongolia, which holds the necessary import license. Additionally, Oyu Tolgoi maintains an on-site diesel generator that functions as a 24/7 standby emergency power source. | ||||
Annual Report on Form 20-F 2023 | riotinto.com | 329 |
Property Resolution Ownership 55% Rio Tinto, 45% BHP Operator Rio Tinto Location Superior, Arizona, Pinal County, US | Access and infrastructure Road, rail and water pipeline. Title/lease/acreage Unpatented mining claims: –2,242 unpatented claims –44,840 acres To hold the unpatented lode/placer mining claims, a ‘Notice of Intent to Hold’ and a Maintenance Fee is filed annually for each claim with the Bureau of Land Management. These claims are also recorded in the Arizona counties of Pinal and Gila. Resolution Copper Mining LLC (RCML) have a total of 55 mineral exploration permits: eight permits with a total 4162.89 acres in exploration areas and 47 permits with a total 23,046.63 acres in tailings, tailings corridor, and tailings buffer areas. RCML have a total of seven special land use permits with a total of 5840.60 acres in stream monitoring, groundwater monitoring, and tailings surface investigation areas. Fee simple owned property: 12,631 acres. Key permit conditions Resolution is in the permitting and study stage of the project. It is currently at the end of a multi-year process to complete its Environmental Impact Statement under the National Environmental Protection Act. Future permits will be required for operations such as air quality permits and aquifer protection permits. | History The Magma Vein (formerly Silver Queen) was discovered in the 1870s and underground mining continued at the Magma Mine until 1998. In 1996, the Resolution deposit was discovered via an underground drillhole directed south from the Magma Mine workings. Kennecott Exploration (Rio Tinto) entered the project in 2001 and through an exploration “earn-in” agreement became operator in 2004. Property description/type of mine Block cave underground mining method. This Property is considered an exploration stage property for SK-1300 reporting purposes. Type of mineralisation Porphyry copper and molybdenum deposit. Processing plants and other available facilities Water treatment and reverse osmosis plant, historic tailings impoundments from the Magma Mine No. 9 and No. 10 ventilation shafts. Power source 115kV power lines to East and West Plant sites with supply contract with Salt River Project (SRP). | ||||
Property Winu Ownership 100% Rio Tinto Operator Rio Tinto Location Great Sandy Desert, Western Australia, Australia | Access and infrastructure Road is the primary means of access. Flights are being trialled on the gravel airstrip. Title/lease/acreage Exploration Licence E45/4833 hosts the deposit. Several Miscellaneous Licences cover the road access route, associated roads and the emergency-use airstrip. A Mining Lease Application (M45/1288; 7,500 hectares) has been made and is awaiting formal approval. Key permit conditions Annual rental payments for licences are required under the Western Australian Mining Act 1978, along with other standard reporting obligations relating to expenditure and works undertaken on the exploration licence. History The exploration licence was granted to Rio Tinto in October 2017 and Winu was discovered in December 2017. The first Inferred Mineral Resource was announced in July 2020 and updated to an Indicated and Inferred Mineral Resource in February 2022. | Property description/type of mine Winu is currently undergoing technical studies and all required stakeholder negotiations and applications to secure the necessary approvals for a potential open pit mining operation. This Property is considered an exploration stage property for SK-1300 reporting purposes. Type of mineralisation Copper-gold-silver mineralisation hosted within sulphide breccias and quartz veins. A supergene enrichment profile caps most of the primary mineralisation. Processing plants and other available facilities Winu comprises camp facilities for up to 112 people, unimproved access roads and trails, and a gravel airstrip. Power source Power is provided by diesel generators. | ||||
330 | Annual Report on Form 20-F 2023 | riotinto.com |
Property La Granja Ownership 45% Rio Tinto, 55% First Quantum Minerals Operator First Quantum Minerals Location Cajamarca, Northern Peru | Access and infrastructure Mountain road access only, six hours from Chiclayo. Title/lease/acreage The present La Granja Mining Concession grants its titleholders the right to explore and exploit all existing mineral resources within the 3,900 hectares it covers. Key permit conditions The Transfer Agreement (in respect of the acquisition of the La Granja mineral concession dated 31 January 2006, between La Granja Limitada S.A.C. (formerly known as Rio Tinto Minera Peru Limitada S.A.C.) and Activos Mineros S.A.C. requires an annual fee ($5 million per semester split by the Peruvian Government 50:50 between the special federal government fees and the establishment of a social fund). Title is subject to completion and delivery of a feasibility study (FS), and implementation of a mine subject to approval of the FS by the Peruvian Government within the timelines established in the Transfer Agreement. The Transfer Agreement was extended in April 2023 and is scheduled to expire (delivery of FS) in January 2028. History Rio Tinto received the Mining Concession in 2006, after BHP and Cambior had returned the leases to the Peruvian Government. Numerous studies have been completed by Rio Tinto, up to pre-feasibility study. In August 2023, Rio Tinto and First Quantum Minerals announced the completion of a transaction that will work to unlock the development of the La Granja project. Under the terms of the transaction, First Quantum Minerals acquired a 55% interest in the project and became the project operator, assuming all key permit obligations. | Property description/type of mine La Granja is currently undergoing technical studies and engagement with host communities, local and national governments focused on development of a potential open pit mining operation. This Property is considered an exploration stage property for SK-1300 reporting purposes. Type of mineralisation Porphyry copper and associated skarn deposits, with high grade breccias with minor silver, and molybdenum. Processing plants and other available facilities La Granja comprises an exploration camp and water treatment infrastructure. Power source Currently powered by diesel generators. An upgraded power supply is required for development of the asset. | ||||
Annual Report on Form 20-F 2023 | riotinto.com | 331 |
Property Rio Tinto Borates – Boron Ownership 100% Rio Tinto Operator Rio Tinto Location Boron, California, US | Access and infrastructure Road and rail. Title/lease/acreage Land holdings include 13,493 acres (owned, including mineral rights) for the mining operation, plant infrastructure and tailings storage facility. Key permit conditions Boron operations currently have all State and Federal environmental and operational permits in place to continue the mining and processing operation. Regular updates to permits are ongoing. History Deposit discovered in 1906, underground mining operations began in 1925, three underground mining operations were consolidated and the mining method switched to open pit mining in 1956. Assets were acquired by Rio Tinto in 1967. | Property description/type of mine Open pit. This Property is considered a production stage property for SK-1300 reporting purposes. Type of mineralisation Sedimentary sequence of tincal and kernite containing interbedded claystone enveloped by facies consisting of ulexite and colemanite bearing claystone, and barren claystone. Processing plants and other available facilities Boron operations consists of the open pit mine, an ore crushing and conveying system, two process plants (Primary Process and Boric Acid Plant), shipping facility and tailings storage facilities. Power source On-site co-generation units and local power grid. | ||||
Property Rio Tinto Iron and Titanium (RTIT) Quebec Operations – Lac Tio Ownership 100% Rio Tinto Operator Rio Tinto Location Havre-Saint-Pierre, Quebec, Canada | Access and infrastructure Rail, road and port (St Lawrence River). Title/lease/acreage A total of 6,534 hectares of licences including two mining concessions of total 609ha, granted by Province of Quebec in 1949 and 1951 which, subject to certain Mining Act restrictions, confer rights and obligations of an owner. Key permit conditions The property is held under Quebec provincial government mining concession permits (Concession minière No 368 and 381). Each is of one year duration renewable as long as the mine is in operation. RTIT Quebec Operations – Lac Tio have also a number of claims (exclusive exploration permits) covering ilmenite occurrences in the region of the mine. These claims are renewable every two years. | History Production started 1950; interest acquired in 1989. Property description/type of mine Open pit. This Property is considered a production stage property for SK-1300 reporting purposes. Type of mineralisation Magmatic intrusion. Processing plants and other available facilities Lac Tio has a crushing facility, dedicated railway, stockpile at the train terminal, ship loader, office buildings at the mine and at the terminal and waste dumps. Power source Supplied by Hydro-Québec at regulated tariff. | ||||
Property QIT Madagascar Minerals (QMM) Ownership QIT Madagascar Minerals is 80% owned by Rio Tinto and 20% owned by the Government of Madagascar Operator Rio Tinto Location Fort-Dauphin, Madagascar | Access and infrastructure Road and port. Title/lease/acreage Mining lease covering 56,200ha, granted by central government. Key permit conditions The permit has a validity of 30 years as of 12 December 1996. Additional renewal for 10-years each period are granted at QMM’s request. An annual fee is payable to government authorities following notification at the beginning of January. History Exploration project started in 1986; construction approved 2005. Ilmenite and zirsil production started 2008. QMM intends to extract ilmenite and zirsil from heavy mineral sands over an area of about 6,000 hectares along the coast over the next 40 years. | Property description/type of mine Mineral sand dredging. This Property is considered a production stage property for SK-1300 reporting purposes. Type of mineralisation Coastal mineralised sands. Processing plants and other available facilities QMM has an operating Dredge, Dry Mine Unit, Heavy Mineral Concentrator, Mineral Separation Plant, Port and bulk loading facilities. Power source On-site heavy fuel oil generators; wind and solar project agreements with independent power producer Crossboundary Energy are expected to take the asset to 50% renewable energy by 2024. The 8MW photovoltaic (PV) solar plant and 8.25 MWh lithium-ion battery energy storage system were successfully commissioned in 2023, and the mine received its first renewable electricity supply. Construction of the 16MW wind project began in the third quarter of 2023 and is scheduled for completion by 2025. | ||||
332 | Annual Report on Form 20-F 2023 | riotinto.com |
Property Richards Bay Minerals (RBM) (Richards Bay Mining (Pty) Limited and Richards Bay Titanium (Pty) Limited) Ownership RBM is a joint venture between Rio Tinto (74%) and Blue Horizon – a consortium of investors and our host communities Mbonambi, Sokhulu, Mkhwanazi and Dube (24%). The remaining shares are held in an employee trust (2%). Operator Rio Tinto Location Richards Bay, KwaZulu-Natal, South Africa | Access and infrastructure Rail, road and port. Title/lease/acreage Mineral rights for Reserve 4 and Reserve 10 issued by South African State and converted to new order mining rights from 9 May 2012. Mining rights run until 8 May 2041 and covers 11,645ha, including the mined Tisand area. Key permit conditions RBM operates in three lease areas, Tisand, Zulti North and Zulti South, by means of a notarial deed. Tisand (which contains the stockpiled tails) and Zulti North leases are held by Richards Bay Mining (Pty) Ltd. RBM is owned by a consortium of local communities and businesses in line with South Africa’s Broad-Based Black Economic Empowerment legislation. History Production started 1977; initial interest acquired 1989. Fifth mining plant commissioned in 2000. One mining plant decommissioned in 2008. In September 2012, Rio Tinto doubled its holding in RBM to 74% following the acquisition of BHP Billiton’s entire interests. | Property description/type of mine Mineral sand dredging. This Property is considered a production stage property for SK-1300 reporting purposes. Type of mineralisation Coastal mineralised sands. Processing plants and other available facilities RBM manages and operates several dredges, dry mining units, heavy mineral concentrators and a mineral separation plant. RBM also has a smelter with furnaces to produce titania slag, pig iron in addition to rutile and zircon. Power source Contract with ESKOM. | ||||
Property Iron Ore Company of Canada (IOC) Ownership IOC is a joint venture between Rio Tinto (58.7%), Mitsubishi Corporation (26.2%) and the Labrador Iron Ore Royalty Corporation (15.1%). Operator Rio Tinto Location Labrador City, Newfoundland and Labrador, Canada | Access and infrastructure –Railway and port facilities in Sept-Îles, Quebec (owned and operated by IOC). –Public highway. –Public airport. Title/lease/acreage Mining leases, surface rights and a tailings disposal licence are held by the Labrador Iron Ore Royalty Corporation (LIORC), under the Labrador Mining and Exploration Act. LIORC subleases these rights to IOC. The mining leases cover 10,356ha, the surface rights cover 8,805ha and the tailings licence covers 2,784ha. These sub-leased rights are valid until 2050. IOC also directly holds three small mining leases, but none produce saleable products. In addition to the above rights, IOC also holds a number of mineral licences, either directly or under sub-lease from LIORC. Key permit conditions IOC holds numerous permits with the Federal, provincial and local governments, covering all aspects of the operation. Key permit conditions include: –Maintaining effluent quality within MDMER criteria –Maintaining air quality criteria specified in the certificate of approval (for dust, NOx, SO2, CO) –Prudent resource management –Progressive rehabilitation –Monitoring groundwater quality around permitted landfill –Restricting tailings discharge to the permitted area. | History Interest acquired in 2000 through acquisition of North Ltd. Current operation began in 1962 and has processed over one billion tonnes of crude ore. Annual capacity 23 Mt of concentrate of which 12-13Mt can be pelletised. Property description/type of mine Open pit. This property is considered a production stage property for SK-1300 reporting purposes. Type of mineralisation Oxide iron (specular hematite and magnetite). Processing plants and other available facilities Concentrator (gravity and magnetic separation circuits), pellet plant, warehouses, workshops, heating plant and ore delivery system (crusher/conveyor and automated train system). Explosives plant, train loadout facilities, rail line (Labrador City to Sept-Îles), stockyards and shiploaders. Power source Supplied by Newfoundland and Labrador Hydro for the Labrador City operations and by Hydro-Québec and the IOC owned SM2 power station for the Sept-Îles operations. | ||||
Annual Report on Form 20-F 2023 | riotinto.com | 333 |
Property Diavik Ownership 100% owned by Diavik Diamond Mines (2012) Inc. Operator Diavik Diamond Mines (2012) Inc. is a Yellowknife-based Canadian subsidiary of Rio Tinto plc in London, UK Location Northwest Territories (NWT), Canada | Access and infrastructure Airstrip and winter road access. Title/lease/acreage Three mineral rights leases with a total acreage of 8,016 (3,244ha). Mining leases are issued by the NWT Government. One lease was renewed in 2017 and two leases were renewed in February 2018. The new leases will expire after 21 years. Key permit conditions Our key permit conditions are local employment, procurement and benefit sharing commitments, environmental compliance and reporting, environmental security and closure and rehabilitation planning, and payment of taxes and government royalties. History Deposits discovered in 1994-95. Construction approved in 2000. Diamond production started in 2003. Fourth pipe commenced production in 2018. Mine life through early 2026. In November 2021, Rio Tinto became the sole owner of Diavik Diamond Mine. This followed the completion of a transaction for Rio Tinto’s acquisition of the 40% share held by Dominion Diamond Mines in Diavik, with the Court of Queen’s Bench of Alberta’s approval. | Property description/type of mine Open pit and underground operations (blast-hole stoping and sub-level cave methods). This Property is considered a production stage property for SK-1300 reporting purposes. Type of mineralisation Diamondiferous kimberlite deposit. Processing plants and other available facilities Includes processing plant and accommodation facilities on-site. Power source On-site diesel generators; installed capacity 44MW and 9.2MW of wind capacity. | ||||
334 | Annual Report on Form 20-F 2023 | riotinto.com |
Property Rincon Ownership 100% Rio Tinto Operator Rio Tinto Location Rincon Salar, Salta, Argentina | Access and infrastructure Road and air. Title/lease/acreage Two separate mineral leases for a total of 82,905ha, the largest one being the Grupo Minero Proyecto Rincon with 80,032ha. Mining concessions are issued by the Provincial Mining Court and have lifelong exploitation rights. Key permit conditions Key permit conditions are environmental compliance and reporting, including independent authorisations for industrial water and brine extraction, spent brine disposal facilities, processing plant and ancillary infrastructure. History Rincon Salar was initially explored by Admiralty Resources NL, who acquired mining leases covering approximately 85% of the Salar in 2001. Admiralty demerged the project into a separate Australian Securities Exchange (ASX) listed entity called Rincon Lithium Ltd in October 2007, and sold the company to the private equity group Sentient Equity Partners in December 2008. The project was under evaluation by Sentient until the sale of the property to Rio Tinto in March 2022. | Property description/type of mine Mining will comprise brine extracted from a production wellfield and fed to a central processing facility for lithium recovery. Type of mineralisation Lithium mineralisation occurs as a brine within a sedimentary sequence in a mature salar, composed of halite, volcaniclastic sand and variable amounts of clay/sand. The brine is hosted in two separate aquifers: an upper unconfined fractured halitic aquifer and a lower semi-confined aquifer composed mainly of volcaniclastic sand. Processing plants and other available facilities The project includes a wellfield for brine extraction and a chemical plant for the production of lithium carbonate, a spent brine disposal facility, wellfield for the extraction of process water and water pre-treatment equipment, camp and office buildings, warehouses and loading/unloading facilities. Power source Connected to the national electric grid with access to power from nearby solar farms. Option for the construction of a solar farm under agreement with a third party on a build/own/operate model under consideration. | ||||
Property Jadar Ownership 100% Rio Tinto Operator Rio Tinto Location Loznica town, Serbia | Access and infrastructure Road and rail. Title/lease/acreage The last extension of the Jadar exploration licence expired on 14 February 2020, with no legal basis for further extension of its term. During the feasibility study the project has completed the Elaborate on Resources and Reserves (declaration based on Serbian law), obtained the Certificate on Resources and Reserves on 6 January 2021 and has submitted the request for exploitation field licence (with Serbian Feasibility Study being one of the supporting documents to this request). In January 2022, the Government of Serbia cancelled the Spatial Plan for the Jadar project and required all related permits to be revoked. Key permit conditions The project is governed by two main pieces of Serbian legislation: Mining Law is administered by the Ministry of Mining and Energy (MME) and Planning and Construction Law is administered by the Ministry of Construction, Transportation and Infrastructure (MCTI). The permitting process base case foresees the following: –Mine, beneficiation plant and mine surface facilities are subject to the permitting procedure of MME –Processing plant, industrial waste landfill and infrastructure (rail, roads, power and water pipelines) are subject to the unified permitting procedure under MCTI. | History The Jadar deposit was discovered in 2004 by Rio Tinto Exploration geologists during a regional exploration program for borates in the Balkans. The deposit is in its majority composed of a mineral new to science named Jadarite with high concentrations of lithium and boron. Resource definition and processing workflow development and testing were conducted for over a decade. The pre-feasibility study (PFS) completed in July 2020 has shown that the Jadar project has the potential to produce both battery grade lithium carbonate and boric acid. In January 2022, the Government of Serbia cancelled the Spatial Plan for the Jadar project and required all related permits to be revoked. Property description/type of mine Underground mine. This Property is considered an exploration stage property for SK-1300 reporting purposes. Type of mineralisation Jadarite mineralisation is present in three broad zones containing stratiform lenses of variable thickness. These units are hosted in a much thicker gently dipping sequence mainly composed of fine-grained sediments affected by syn and post depositional faulting. Processing plants and other available facilities The planned site layout includes a concentrator to beneficiate the primary ore, a chemical plant to produce boric acid and lithium carbonate, paste plant, water and waste treatment plants, surface waste storage (dry stack), railroad spur and warehouses for product storage and loading/unloading, and office buildings. Power source Connected to the national electric grid. Electricity planned to be sourced from nearby hydroelectrical power plant. | ||||
Annual Report on Form 20-F 2023 | riotinto.com | 335 |
Property CBG Sangaredi Ownership Rio Tinto Group 22.95%, Guinean Government 49%, Alcoa 22.95%, Dadco Investments Limited 5.1% Operator La Compagnie des Bauxites de Guinée (CBG) Location Sangaredi, Guinea | Access and infrastructure Road, air and port. Sangaredi-Kamsar railway (leasing rail infrastructure from ANAIM, wholly-owned by Government of Guinea). Title/lease/acreage Mining concession expires in 2040. Leases comprise 2,939 km2. Key permit conditions The obligations of CBG relative to health and safety of workers and to the environment and to the rehabilitation of mined out areas are subject to the Mining Code (2011) and Environmental Code of the Republic of Guinea. History CBG is a joint venture created in 1963 and is registered in US (Delaware). Bauxite mining commenced in 1973. Shareholders are 51% Halco and 49% Government of Guinea. Rio Tinto holds a 45% interest in Halco. Expansion of the CBG bauxite mine, processing plant, port facility and associated infrastructure is currently near completion with ramp up to 18.5 Mtpa underway. In 2015, CBG entered into an agreement to share the rail infrastructure in Multi-User Operation Agreement (MUOA) with other bauxite companies, GAC (EGA) and COBAD (RUSAL). | Property description/type of mine Open cut. This Property is considered a production stage property for SK-1300 reporting purposes. Type of mineralisation Bauxite. Processing plants and other available facilities The Sangaredi site is an open cut mine including the following operations: stripping, drilling, blasting, loading, hauling. Then, the bauxite is transported by railway cars approximately 135 km away from Sangaredi to Kamsar. In Kamsar, the installations include the following assets: locomotive repair shop, railway cars unloader, primary crusher, secondary crusher, scrubbers, conveyors, stacker, reclaimer, bauxite dryers, dry bauxite storage, bauxite sampling tower, power house, wharf, ship loader, etc. The crushing plant is used only to reduce oversize material – no screening required. Four bauxite dryers are installed in order to reduce the moisture content of the bauxite before shipping. Power source On-site generation (fuel oil). | ||||
Property Gove Ownership 100% Rio Tinto Operator Rio Tinto through Rio Tinto Alumina Gove P/L Location Gove, Northern Territory, Australia | Access and infrastructure Road, air and port. Title/lease/acreage All leases were renewed in 2011 for a further period of 42 years. The residue disposal area is leased from the Arnhem Land Aboriginal Land Trust. The Northern Territory Government is the lessor of the balance of the leases; however, on expiry of the 42- year renewed term, the land subject to the balances of the leases will all vest to the Arnhem Land Aboriginal Land Trust. Leases comprise 233.5 km2. Key permit conditions Key permit conditions are prescribed by the Northern Territory Government in the form of a Mine Management Plan (MMP). The current MMP runs for a period of 12 years, until 2031, and authorises all activities at the operation. Lease payments are prescribed by the terms of the relevant leases. History Bauxite mining commenced in 1970, feeding both the Gove refinery and export market, capped at 2 million tonnes per annum. Bauxite export ceased in 2006 with feed intended for the expanded Gove refinery. Bauxite exports recommenced in 2008 and will increase in the coming years following the curtailment of the refinery production in 2014 and a permanent shut decision made by the Board of Rio Tinto in October 2017. Current annual production capacity is 12.5 Mt on a dry basis. | Property description/type of mine Open cut. This Property is considered a production stage property for SK-1300 reporting purposes. Type of mineralisation Bauxite. Processing plants and other available facilities Crushing plant only to reduce oversize material – no screening required. Power source On-site diesel fired power station. | ||||
336 | Annual Report on Form 20-F 2023 | riotinto.com |
Property MRN Porto Trombetas Ownership MRN’s shareholders are: Rio Tinto (22%), Glencore (45%) and South32 (33%) Operator Mineração Rio do Norte (MRN) is a non- managed JV. All decisions are approved by shareholders BoD Location Porto Trombetas, Para, Brazil | Access and infrastructure Air and port. Title/lease/acreage Mining concession granted by Brazilian Mining Agency (ANM), following the Brazilian mining code with no expiration date. The current 44 MRN mining leases cover 22 major plateaus, which spread across 143,000ha and all of them have the status of a mining concession. Key permit conditions With the exception of concessions from Amazonas State, the MRN mining leases are within the Saracá-Taquera National Forest, a preservation environmental area. However, the right of mining is preserved initially by the Federal law which created the National Forest (that is subsequent to mining concessions), as well by the management plan, which acknowledges a formal mining zone within the confines of the National Forest. Environmental licensing is granted by Brazilian Environmental Agency (IBAMA) for East Zone. MRN is working with IBAMA on permitting to extend the life of the mine from East Zone to West Zone. | History Mineral extraction commenced in 1979. Initial production capacity was 3.4 Mtpa. From 2003, production capacity went up to 16 Mtpa on a dry basis. and in 2008, up to 18 Mtpa. Due to market and tailings facilities restrictions, the planned production is 12 Mtpa on dry basis (up to 2027) and from 2027 to 2040 is 12.5 Mtpa on a dry basis. The deposit has two mine planning sequences: East Zone (1979-2027) and West Zone Phase 1 (2027-2040). On 30 November 2023 Rio Tinto completed an acquisition of Companhia Brasileira de Alumínio’s 10% equity in the MRN bauxite mine in Brazil, raising the Rio Tinto stake from 12% to 22%. Property description/type of mine Open cut. This Property is considered a production stage property for SK-1300 reporting purposes. Type of mineralisation Consists of a series of bauxite tabular deposits. Processing plants and other available facilities The beneficiation process is formed by a primary crusher, conveyors, scrubbers, secondary crushers, screenings, hydrocyclones and vacuum filters. The superfines tailings are pumped to a tailings storage facility. Power source On-site generation fuel (oil + diesel). | ||||
Property Weipa/Ely Ownership 100% Rio Tinto Operator Rio Tinto through Rio Tinto Alumina Weipa P/L Location Weipa, Queensland, Australia | Access and infrastructure Road, air and port. Title/lease/acreage The Queensland Government Comalco (ML7024) lease expires in 2042 with an option of a 21-year extension, then two years’ notice of termination; the Queensland Government Alcan lease (ML7031) expires in 2048 with a 21-year right of renewal with a two-year notice period. Leases comprise 2,716.9 km2 (ML7024 = 1340.8 km2; ML7031 = 1376.1 km2). This property with the associated 2 leases, includes the deposits known as Andoom, East Weipa, Amrun, Norman Creek and North of Weipa. Key permit conditions The respective leases are subject to the Comalco Agreement Act (Comalco Agreement) and Alcan Agreement Act (Alcan Agreement); the relevant State Agreements for the Weipa operations. Key permit conditions are prescribed by the Queensland Government in the relevant Environmental Authority applicable to each lease (ML7024 and ML7031, respectively). Lease payments are subject to the terms of the leases and the respective State Agreements. | History Bauxite mining commenced in 1961 at Weipa. Major upgrade completed in 1998. Rio Tinto interest increased from 72.4% to 100% in 2000. In 1997, Ely Bauxite Mining Project Agreement signed with local Aboriginal land owners. Bauxite Mining and Exchange Agreement signed in 1998 with Comalco to allow for extraction of ore at Ely. The Western Cape Communities Co-Existence Agreement, an ILUA, was signed in 2001. Following the ramp up to full production of Amrun the current annual production of the Weipa mine is 35.5 Mt. Property description/type of mine Open cut. This Property is considered a production stage property for SK-1300 reporting purposes. Type of mineralisation Bauxite. Processing plants and other available facilities Andoom, East Weipa and Amrun – wet crushing and screening plants to remove ultra fine proportion. Power source On-site generation (diesel) supplemented by a solar generation facility. | ||||
Annual Report on Form 20-F 2023 | riotinto.com | 337 |
Property Simandou, Blocks 3 & 4 Ownership 85% Simfer Jersey; 15% Republic of Guinea Simfer Jersey is a joint venture between Rio Tinto (53%) and CIOH (47%), a Chinalco-led joint venture with Baowu, CCC Group and CRC Group. Operator Rio Tinto (mine) Location The Simandou South Mining Concession is located ~550km east- southeast of Conakry in the Republic of Guinea | Access and infrastructure The site has road access and is readily accessible for power, water, and additional infrastructure requirements. Camp facilities are in place with a current workforce involved in further geological sampling and early construction works for the project. Planned expansion of the camp facilities including a dedicated airstrip are planned for the project construction phase. Iron ore extracted from the Simfer mine concession (and Simandou Blocks 1 & 2 which are owned by Winning Consortium Simandou [WCS]) will be exported through a rail and port infrastructure to be co-developed by the State, Simfer Jersey and WCS. It includes a purpose-built port facility to be constructed at Morebaya estuary (south of Conakry) to be accessed by a 536km main rail line with rail spurs connecting our Concession (68km) and WCS’s (16km) respectively. The main rail line will have an initial capacity of up to 120 Mtpa. The ultimate owner and operator of the infrastructure will be the Compagnie du Transguinéen (CTG) (The TransGuinean Company), an incorporated joint venture between Simfer Jersey (42.5%), WCS (42.5%) and the State (15%). Title/lease/acreage Simandou South Mining Concession was granted by Presidential Decree on 22 April 2011 under the conditions of the Amended and Consolidated Basic Convention (ACBC), which was ratified by the Guinean National Assembly on 26 May 2014. The Concession duration is 25 years, renewed automatically for a further period of 25 years followed by further ten year periods in accordance with the Guinean Mining Code and the ACBC. The Concession covers an area of 369km2. Simfer also holds a BOT Convention to enable development of the rail and port infrastructure. Simfer has signed agreements with the State and WCS, the owner of Simandou Blocks 1 & 2 deposits, to enable co-development of the rail and port infrastructure for the Simandou iron ore projects. The Co-Development Convention, which, along with bipartite amendments for each of the Simfer and WCS Mine Conventions, adapts the existing investment frameworks of Simfer and WCS. These conventions require ratification and are subject to a number of conditions, including regulatory approvals. Key permit conditions In addition to the Concession, the ACBC, as amended by the mine bipartite agreement, establishes the legal regime for the mine project and sets out Simfer’s key legal rights and protections. The Simandou mine SEIA was approved in 2012 and has since been maintained in accordance with applicable law. An updated SEIA for the mine and rail spur was submitted for regulatory review in July 2023 and an update to the SEIA for the port was submitted in November 2023. History Simfer submitted a bankable feasibility study to the State in 2016, with further feasibility studies for mine and infrastructure to reflect the infrastructure co-development arrangements completed in 2022, 2023 and 2024, and which are currently pending approval by the State as part of the infrastructure co-development arrangements. | Property description/type of mine Open pit. This Property is considered a development stage property for SK-1300 reporting purposes. Type of mineralisation Supergene-enriched itabirite hosted iron ore deposits. The deposits are part of a supracrustal belt with the banded iron formation proto-ore likely deposited in a shallow marine setting within a forearc basin. The age of deposition is considered to be between 2.7Ga and 2.2Ga. Processing plants and other available facilities Current plans are for the run-of-mine ore to be coarsely crushed at the Ouéléba mine site at a maximum rate of 60 Mtpa phase 1 capacity to P100 of -100 mm through two identical primary and secondary crushing stations in a staged arrangement. The coarsely crushed ore will then be conveyed to the mine stockyard. The ore will be reclaimed from the stockpiles and conveyed to the train load-out facility for loading into trains which transport materials to the port facility where it will be likely shipped by bulk carrier to several ports including in China. Other major facilities that will support the operations include power generation, explosives facilities, fuel and lubricants facilities, administration buildings, workshops and a permanent village. Power source Current designs contemplate that power for the mine site and other areas will be supplied by a hybrid power plant consisting of diesel generators and solar generation powered fuel station. Further, there is a plan to connect the facility to the power grid local operator Électricité de Guinée. This will require an approximately 20km connection line to the main grid once it is available and would substantially reduce energy costs and fuel consumption. | ||||
338 | Annual Report on Form 20-F 2023 | riotinto.com |
Smelter/refinery/facility | Location | Title/lease | Plant type / Product | Capacity (based on 100% ownership) |
Aluminium | ||||
Alma | Alma, Quebec, Canada | 100% freehold | Aluminium smelter producing aluminium rod, t-foundry, molten metal, high purity, remelt | 473,000 tonnes per year aluminium |
Alouette (40%) | Sept-Îles, Quebec, Canada | 100% freehold | Aluminium smelter producing aluminium high purity, remelt | 627,000 tonnes per year aluminium |
Arvida | Saguenay, Quebec, Canada | 100% freehold | Aluminium smelter producing aluminium billet, molten metal, remelt | 174,000 tonnes per year aluminium |
Arvida AP60 | Saguenay, Quebec, Canada | 100% freehold | Aluminium smelter producing aluminium high purity, remelt | 60,000 tonnes per year aluminium |
Bécancour (25.1%) | Bécancour, Quebec, Canada | 100% freehold | Aluminium smelter producing aluminium slab, billet, t-foundry, remelt, molten metal | 460,000 tonnes per year aluminium |
Bell Bay | Bell Bay, Northern Tasmania, Australia | 100% freehold | Aluminium smelter producing aluminium slab, molten metal, small form and t-foundry, remelt | 195,000 tonnes per year aluminium |
Boyne Smelters (59.4%) | Boyne Island, Queensland, Australia | 100% freehold | Aluminium smelter producing aluminium billet, EC grade, small form and t-foundry, remelt | 584,000 tonnes per year aluminium |
ELYSIS (48.24%) | Saguenay, Quebec, Canada | 100% freehold | Aluminium zero-carbon smelting pilot cell producing aluminium high purity | 275 tonnes per year aluminium |
Grande-Baie | Saguenay, Quebec, Canada | 100% freehold | Aluminium smelter producing aluminium slab, molten metal, high purity, remelt | 235,000 tonnes per year aluminium |
ISAL | Reykjavik, Iceland | 100% freehold | Aluminium smelter producing aluminium remelt, billet | 212,000 tonnes per year aluminium |
Jonquière (Vaudreuil) | Jonquière, Quebec, Canada | 100% freehold | Smelter grade alumina | 1,560,000 tonnes per year alumina |
Kitimat | Kitimat, British Columbia, Canada | 100% freehold | Aluminium smelter producing aluminium slab, remelt, high purity | 432,000 tonnes per year aluminium |
Laterrière | Saguenay, Quebec, Canada | 100% freehold | Aluminium smelter producing aluminium slab, remelt, molten metal | 255,000 tonnes per year aluminium |
Queensland Alumina (80%) | Gladstone, Queensland, Australia | 73.3% freehold; 26.7% leasehold (of which more than 80% expires in 2026 and after) | Refinery producing alumina | 3,950,000 tonnes per year alumina |
São Luis (Alumar) (10%) | São Luis, Maranhão, Brazil | 100% freehold | Refinery producing alumina | 3,830,000 tonnes per year alumina |
Sohar (20%) | Sohar, Oman | 100% leasehold (expiring 2039) | Aluminium smelter producing aluminium, high purity, remelt | 395,000 tonnes per year aluminium |
Tiwai Point (New Zealand Aluminium Smelters) (79.4%) | Invercargill, Southland, New Zealand | 19.6% freehold; 80.4% leasehold (expiring in 2029 and use of certain Crown land) | Aluminium smelter producing aluminium billet, slab, small form foundry, high purity, remelt | 373,000 tonnes per year aluminium |
Tomago (51.6%) | Tomago, New South Wales, Australia | 100% freehold | Aluminium smelter producing aluminium billet, slab, remelt | 590,000 tonnes per year aluminium |
Yarwun | Gladstone, Queensland, Australia | 97% freehold; 3% leasehold (expiring 2101 and after) | Refinery producing alumina | 3,250,000 tonnes per year alumina |
Matalco Bluffton Manufacturing (50%) | Bluffton, Indiana, US | 100% freehold | Remelt and manufacture of aluminium billet and slab | 104,000 tonnes per year |
Matalco Brampton Manufacturing (50%) | Brampton, Ontario, Canada | 100% freehold | Remelt and manufacture of aluminium billet | 113,000 tonnes per year |
Matalco Canton Manufacturing (50%) | Canton, Ohio, US | 100% freehold | Remelt and manufacture of aluminium billet | 59,000 tonnes per year |
Matalco Franklin Manufacturing (50%) | Franklin, Kentucky, US | 100% freehold | Remelt and manufacture of aluminium slab | 177,000 tonnes per year |
Matalco Lordstown Manufacturing (50%) | Lordstown, Ohio, US | 100% freehold | Remelt and manufacture of aluminium billet | 159,000 tonnes per year |
Matalco Shelbyville Manufacturing (50%) | Shelbyville, Kentucky, US | 100% freehold | Remelt and manufacture of aluminium billet | 154,000 tonnes per year |
Matalco Wisconsin Rapids Manufacturing (50%) | Wisconsin Rapids, Wisconsin, US | 100% freehold | Remelt and manufacture of aluminium billet and slab | 104,000 tonnes per year |
Annual Report on Form 20-F 2023 | riotinto.com | 339 |
Smelter/refinery/facility | Location | Title/lease | Plant type / Product | Capacity (based on 100% ownership) |
Copper | ||||
Rio Tinto Kennecott | Magna, Salt Lake City, Utah, US | 100% freehold | Flash smelting furnace/Flash convertor furnace copper refinery and precious metals plant | 335,000 tonnes per year refined copper |
Minerals | ||||
Boron | Boron, California, US | 100% freehold | Borates refinery | 576,000 tonnes per year boric oxide |
IOC Pellet plant (58.7%) | Labrador City, Newfoundland and Labrador, Canada | 100% freehold (asset), 100% freehold (land) under sublease from Labrador Iron Ore Royalty Corporation for life of mine. | Pellet induration furnaces producing multiple iron ore pellet types | 13.5 million tonnes per year pellet |
Richards Bay Minerals (74%) | Richards Bay, South Africa | 100% freehold | Ilmenite smelter | 1,050,000 tonnes per year titanium dioxide slag, 565,000 tonnes per year iron |
Rio Tinto Iron and Titanium Quebec Operations - Sorel-Tracy Plant | Sorel-Tracy, Quebec, Canada | 100% freehold | Ilmenite smelter | 1,300,000 tonnes per year titanium dioxide slag, 1,000,000 tonnes per year iron |
340 | Annual Report on Form 20-F 2023 | riotinto.com |
Power plant | Location | Title/lease | Plant type / Product | Capacity (based on 100% ownership) |
Iron Ore | ||||
Cape Lambert power station (67%) | Cape Lambert, Western Australia, Australia | Lease | Two LM6000PF dual-fuel turbines | 80MW |
Paraburdoo power station | Paraburdoo, Western Australia, Australia | Lease | Three LM6000PC gas-fired turbines | 120MW |
West Angelas power station (67%) | West Angelas, Western Australia, Australia | Miscellaneous licence | Two LM6000PF dual-fuel turbines | 80MW |
Yurralyi Maya power station (84.2%) | Dampier, Western Australia, Australia | Miscellaneous licence | Four LM6000PD gas-fired turbines One LM6000PF gas-fired turbine | 200MW |
Gudai-Darri Solar Farm | Gudai-Darri, Western Australia, Australia | Miscellaneous licence | Solar PV single-axis tracking | up to 34 MW |
Aluminium | ||||
Amrun power station | Amrun, Australia | 100% leasehold | Diesel generation | 24MW |
Gladstone power station (42%) | Gladstone, Queensland, Australia | 100% freehold | Thermal power station | 1,680MW |
Gove power station | Nhulunbuy, Northern Territory, Australia | 100% leasehold | Diesel generation | 24MW |
Kemano power station | Kemano, British Columbia, Canada | 100% freehold | Hydroelectric power | 1,014MW installed capacity |
Quebec power stations | Saguenay, Quebec, Canada (Chute-à-Caron, Chute-à-la- Savane, Chute-des-Passes, Chute-du-Diable, Isle- Maligne, Shipshaw) | 100% freehold (certain facilities leased from Quebec Government until 2058 pursuant to Peribonka Lease) | Hydroelectric power | 3,147MW installed capacity |
Weipa power stations and solar generation facility | Lorim Point, Andoom, and Weipa, Australia | 100% leasehold | Diesel generation supplemented by solar generation facility | 38MW |
Yarwun alumina refinery co-generation plant | Gladstone, Queensland, Australia | 100% freehold | Gas turbine and heat recovery steam generator | 160MW |
Annual Report on Form 20-F 2023 | riotinto.com | 341 |
Power plant | Location | Title/lease | Plant type / Product | Capacity (based on 100% ownership) |
Copper | ||||
Rio Tinto Kennecott power stations | Salt Lake City, Utah, United States | 100% freehold | Thermal power station | 75MW |
Steam turbine running off waste heat boilers at the copper smelter | 31.8MW | |||
Combined heat and power plant supplying steam to the copper refinery | 6.2MW | |||
Minerals | ||||
Boron co-generation plant | Boron, California, United States | 100% freehold | Co-generation uses natural gas to generate steam and electricity, used to run Boron’s refining operations | 48MW |
Energy Resources of Australia (86.3%) | Ranger Mine, Jabiru, Northern Territory, Australia | Lease | Five diesel generator sets rated at 5.17MW; one diesel generator set rated at 2MW; four additional diesel generator sets rated at 2MW | 35.8MW |
IOC power station (58.7%) | Sept-Îles, Quebec, Canada | Statutory grant | Hydroelectric power | 22MW |
QMM power plant | Fort Dauphin, Madagascar | 100% freehold | Diesel generation supplemented by solar generation facility | 32MW |
342 | Annual Report on Form 20-F 2023 | riotinto.com |
Independent Assurance Report | 3433 344 |
Shareholder information | 347 |
US disclosure | 354 |
Contact details | 382 |
Cautionary statement about forward-looking statements | 383 |
Arvida, Canada | ||
Annual Report on Form 20-F 2023 | riotinto.com | 343 | |
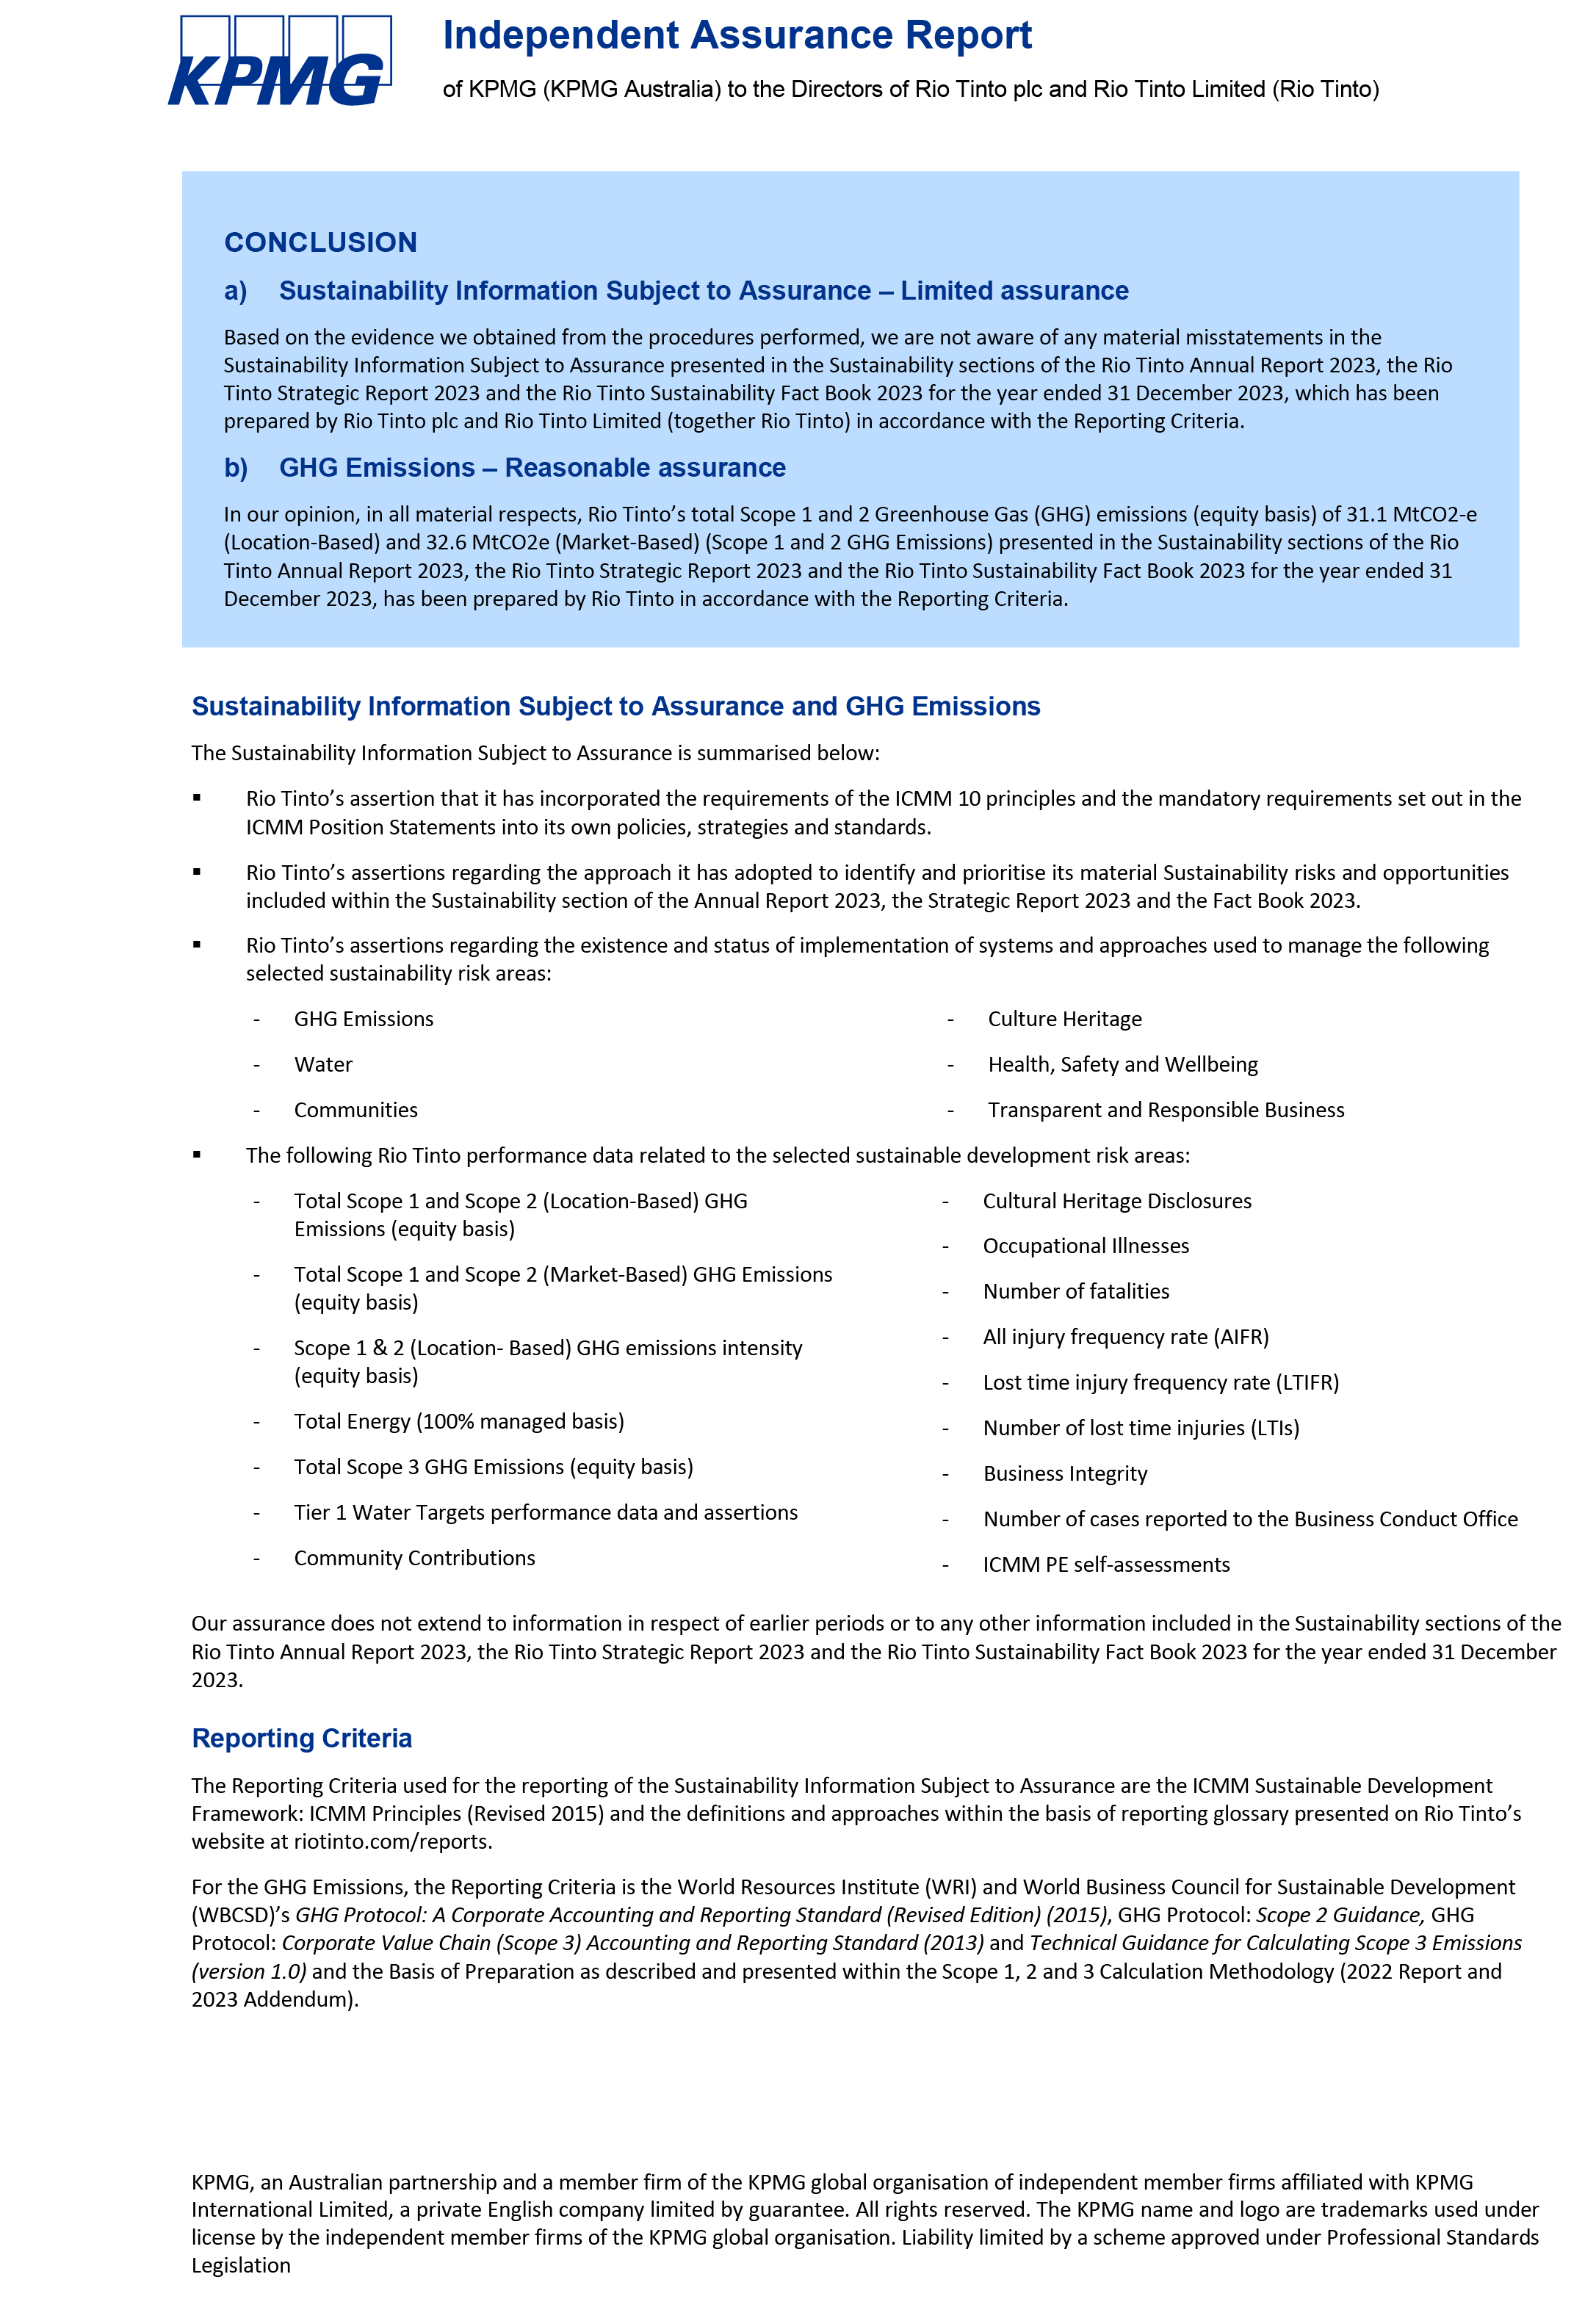
344 | Annual Report on Form 20-F 2023 | riotinto.com |
Annual Report on Form 20-F 2023 | riotinto.com | 345 |

346 | Annual Report on Form 20-F 2023 | riotinto.com |
Annual Report on Form 20-F 2023 | riotinto.com | 347 |
348 | Annual Report on Form 20-F 2023 | riotinto.com |
Rio Tinto plc | Date of notice | Number of shares | Percentage of capital |
BlackRock, Inc.1 | 4 Dec 2009 | 127,744,871 | 8.38 |
Shining Prospect Pte. Ltd | 7 Dec 2018 | 182,550,329 | 14.02 |
The Capital Group Companies, Inc. | 6 Jul 2022 | 51,648,733 | 4.13 |
Rio Tinto Limited | Date of notice | Number of shares | Percentage of capital2 |
State Street Corporation | 30 May 2023 | 23,628,115 | 6.37 |
BlackRock, Inc.3, 4 | 5 Dec 2022 | 26,031,175 | 7.01 |
The Vanguard Group, Inc. | 11 Apr 2022 | 18,564,679 | 5.00 |
Shining Prospect Pte. Ltd | 9 Feb 2018 | see footnote5 | see footnote5 |
Annual Report on Form 20-F 2023 | riotinto.com | 349 |
Rio Tinto plc | Rio Tinto Limited | ||||||||
As at 7 February 2024 | No. of accounts | % | Shares | % | No. of accounts | % | Shares | % | |
1 to 1,000 shares | 18,075 | 74.48 | 5,689,892 | 0.48 | 151,767 | 86.29 | 38,369,451 | 10.34 | |
1,001 to 5,000 shares | 4,459 | 18.10 | 9,060,384 | 0.76 | 21,644 | 12.31 | 42,936,178 | 11.57 | |
5,001 to 10,000 shares | 512 | 2.10 | 3,613,306 | 0.30 | 1,723 | 0.98 | 11,854,363 | 3.19 | |
10,001 to 25,000 shares | 368 | 1.43 | 5,973,286 | 0.48 | 587 | 0.33 | 8,626,863 | 2.32 | |
25,001 to 125,000 shares | 442 | 1.98 | 26,567,395 | 2.48 | 118 | 0.07 | 5,419,916 | 1.46 | |
125,001 to 250,000 shares | 149 | 0.56 | 26,501,660 | 2.06 | 7 | 0.00 | 1,353,164 | 0.36 | |
250,001 to 1,250,000 shares | 231 | 0.90 | 125,718749 | 10.22 | 20 | 0.01 | 8,455,431 | 2.28 | |
1,250,001 to 2,500,000 shares | 50 | 0.19 | 87,970,403 | 6.87 | 5 | 0.00 | 8,524,474 | 2.30 | |
2,500,001 shares and over | 65 | 0.26 | 964,808,5121 | 76.35 | 8 | 0.00 | 245,666,374 | 66.18 | |
1,255,903,5872 | 100.00 | 371,216,2143 | 100.00 | ||||||
Number of holdings less than marketable parcel of A$500 | 2,064 | ||||||||
Rio Tinto Limited | Number of shares | Percentage of issued share capital |
HSBC Custody Nominees (Australia) Limited | 118,071,649 | 31.81 |
J. P. Morgan Nominees Australia Pty Limited | 53,752,889 | 14.48 |
Citicorp Nominees Pty Ltd | 38,696,031 | 10.42 |
BNP Paribas Nominees Pty Ltd (Agency Lending A/C) | 11,526,786 | 3.11 |
National Nominees Limited | 9,266,881 | 2.50 |
BNP Paribas Noms Pty Ltd | 8,814,302 | 2.37 |
Citicorp Nominees Pty Limited (Colonial First State Inv A/C) | 3,507,755 | 0.94 |
HSBC Custody Nominees (Australia) Limited (NT-Comnwlth Super Corp A/C) | 2,607,208 | 0.70 |
Argo Investments Limited | 2,197,139 | 0.59 |
Australian Foundation Investment Company Limited | 1,928,853 | 0.52 |
BNP Paribas Nominees Pty Ltd (ACF Clearstream) | 1,772,094 | 0.48 |
Netwealth Investments Limited (WRAP Services A/C) | 1,357,603 | 0.37 |
BNP Paribas Nominees Pty Ltd Hub24 Custodial Serv Ltd | 1,335,622 | 0.36 |
Custodial Services Limited | 1,202,875 | 0.32 |
BNP Paribas Nominees Pty Ltd Barclays | 664,305 | 0.18 |
Mutual Trust Pty Ltd | 590,089 | 0.16 |
BNP Paribas Noms (NZ) Ltd | 557,963 | 0.15 |
CGU Insurance | 539,674 | 0.15 |
Washington H Soul Pattinson and Company Limited | 431,120 | 0.12 |
Australian United Investment Co Ltd | 400,000 | 0.11 |
Diversified United Investment Ltd | 400,000 | 0.11 |
350 | Annual Report on Form 20-F 2023 | riotinto.com |
Annual Report on Form 20-F 2023 | riotinto.com | 351 |
352 | Annual Report on Form 20-F 2023 | riotinto.com |
Listing rule | Description of listing rule | Reference in report |
9.8.4 (1) | A statement of any interest capitalised by the Group during the year | Note 9 Finance income and finance costs and note 15 Deferred taxation |
9.8.4 (12) | Details of any arrangement under which a shareholder has waived or agreed to waive any dividends | See page 148. |
Metal prices – average for the year | 2023 | 2022 | Increase/ (Decrease) | |
Copper | – US cents/lb | 386 | 398 | (3)% |
Aluminium | – $/tonne | 2,250 | 2,703 | (17)% |
Gold | – $/troy oz | 1,941 | 1,800 | 8% |
Average exchange rates against the US dollar | ||||
Sterling | 1.24 | 1.24 | —% | |
Australian dollar | 0.66 | 0.69 | (4)% | |
Canadian dollar | 0.74 | 0.77 | (4)% | |
Euro | 1.08 | 1.05 | 3% | |
South African rand | 0.054 | 0.061 | (12)% | |
Year-end exchange rates against the US dollar | ||||
Sterling | 1.28 | 1.21 | 6% | |
Australian dollar | 0.69 | 0.68 | 1% | |
Canadian dollar | 0.76 | 0.74 | 3% | |
Euro | 1.11 | 1.07 | 4% | |
South African rand | 0.054 | 0.059 | (9)% |
Annual Report on Form 20-F 2023 | riotinto.com | 353 |
354 | Annual Report on Form 20-F 2023 | riotinto.com |
Annual Report on Form 20-F 2023 | riotinto.com | 355 |
356 | Annual Report on Form 20-F 2023 | riotinto.com |
Category | Depositary actions | Associated fee |
Issuance of ADSs against the deposit of shares, including deposits and issuance in respect of: –Share distributions, stock split, rights, merger –Exchange of securities or other transactions –Other events or distributions affecting the ADSs or the deposited securities | $5.00 or less per 100 ADSs (or portion thereof) evidenced by the new ADSs delivered | |
Selling or exercising rights | Distribution or sale of securities, the fee being in an amount equal to the fee for the execution and delivery of ADSs which would have been charged as a result of the deposit of such securities | $5.00 or less for each 100 ADSs |
Distributing dividends | Distribution of cash or other dividends | $0.02 or less per ADS |
Withdrawing an underlying share | Acceptance of ADSs surrendered for withdrawal of deposited securities | $5.00 or less for each 100 ADSs evidenced by the ADSs surrendered |
Transferring, splitting or grouping receipts | Transfers, combining or grouping of depositary receipts | $1.50 per ADS |
General depositary services, particularly those charged on an annual basis | Other services performed by the depositary in administering the ADRs Provide information about the depositary’s right, if any, to collect fees and charges by offsetting them against dividends received and deposited securities | $0.02 or less per ADS not more than once each calendar year and payable at the sole discretion of the depositary by billing holders or deducting such charge from one or more cash dividends or other cash distributions |
Expenses of the depositary | Expenses incurred on behalf of holders in connection with: –Compliance with foreign exchange control regulations or any law or regulation relating to foreign investment –The depositary’s or its custodian’s compliance with applicable law, rule or regulation –Stock transfer or other taxes and other governmental charges –Cable, telex, facsimile and electronic transmission/delivery –Expenses of the depositary in connection with the conversion of foreign currency into US dollars (which are paid out of such foreign currency) –Any other charge payable by the depositary or its agents | Expenses payable at the sole discretion of the depositary by billing holders or by deducting charges from one or more cash dividends or other cash distributions |
Annual Report on Form 20-F 2023 | riotinto.com | 357 |
Objective 1: Maintain a ”best-in-class” cyber security capability Continue to uplift and align our cyber security capabilities with industry standards through ongoing assurance and benchmarking. |
Objective 2: Realise and sustain essential control improvements for our core technology platforms Embed robust frameworks for continuous monitoring, assurance and improvement of the cyber security operational control environment. |
Objective 3: Build a culture of cyber security resilience and consciousness Increase our visibility, security consciousness and ensure everyone is aware of and understands their responsibilities and obligations. |
Objective 4: Secure our digital future Adopt effective cyber control measures in new and emerging technologies critical to our digital future. |
Threat intelligence | Understanding the latest cyber security threats and assessing our potential exposure. |
Vulnerability management | Maintaining awareness of and continuously resolving security vulnerabilities before they can be exploited, including a dedicated internal function to test our defences against the latest vulnerabilities. |
Security risk and advisory | Ensuring information technology (IT) projects and changes stay within our risk appetite by assessing and advising on appropriate and effective cybersecurity controls. |
Security operations | Keeping core information security platforms and services available, accessible and operating effectively at all times. |
Security architecture | Ensuring solution designs and our overall technology architecture are in line with good cyber security practice to be robust, resilient, and sustainable. |
Incident response | Persistent monitoring, alerting and triage of cyber security events. As required, initiating appropriate responses to contain threats, resolve vulnerabilities, and recover services. |
Cyber governance | Facilitating the definition, dissemination and monitoring of our security policies, standards and control environment. |
Education and awareness | Educating employees and third parties we work with about keeping information technology secure and being vigilant against social engineering. |
358 | Annual Report on Form 20-F 2023 | riotinto.com |
Name | Title | Relevant experience |
Peter Cunningham | Chief Financial Officer | Peter joined Rio Tinto in March 1993 and was appointed Chief Financial Officer and Executive Director in June 2021. As Chair of the Cyber Security Steering Committee, he has presided over regular cyber security threat intelligence briefings, the active monitoring of key cyber risks, and progress of our cyber security improvement and assurance initiatives since assuming the duties of the Chair of the CSSC in 2021. With his leadership of our IT, Group Risk and Group Internal Audit functions, he maintains strong oversight of our broader risk management processes and internal controls. |
Daniel Evans | Chief Information Officer | Daniel has 12 years' cyber security leadership experience in senior, cyber intelligence and operational leadership roles. |
Scott Brown | Chief Information Security Officer | Scott has more than 14 years' cyber security experience in both senior leadership and operational roles. |
Isabelle Deschamps | Chief Legal Officer, Governance and Corporate Affairs | Isabelle, Mark, Belinda and Richard bring operational and business risk expertise that is relevant to cyber security and their respective roles on the CSSC. |
Mark Davies | Chief Technical Officer | |
Belinda Taylor | Head of Group Risk | |
Richard Cohen | Operational Managing Director from a Product Group (currently Rio Tinto Iron Ore). |
Annual Report on Form 20-F 2023 | riotinto.com | 359 |
360 | Annual Report on Form 20-F 2023 | riotinto.com |
Annual Report on Form 20-F 2023 | riotinto.com | 361 |
362 | Annual Report on Form 20-F 2023 | riotinto.com |
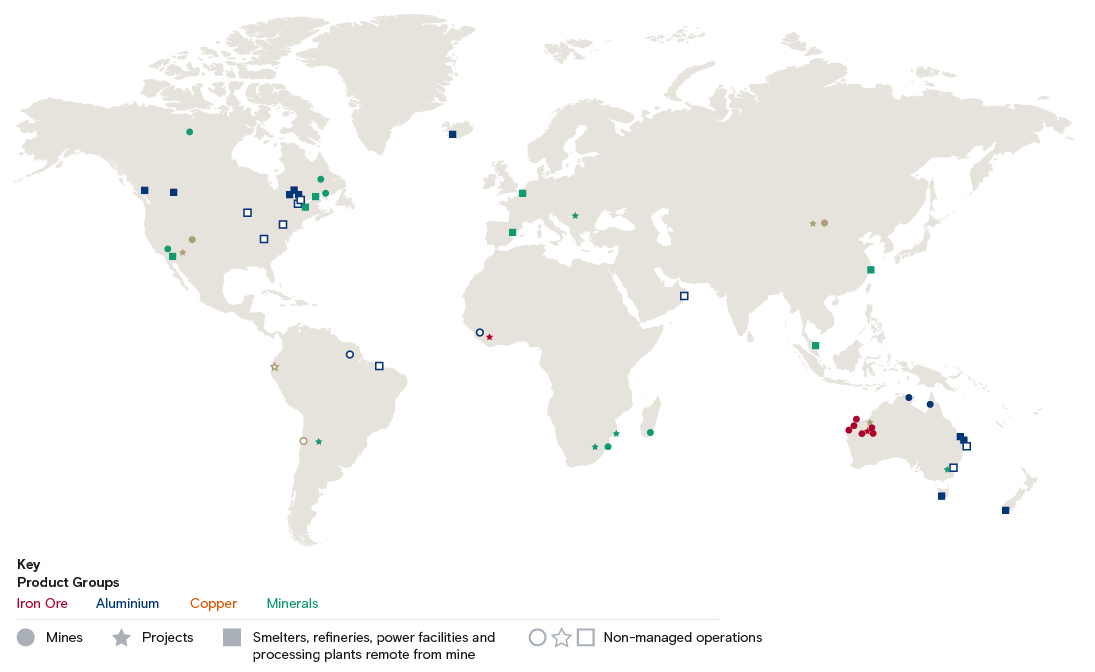
Annual Report on Form 20-F 2023 | riotinto.com | 363 |
364 | Annual Report on Form 20-F 2023 | riotinto.com |
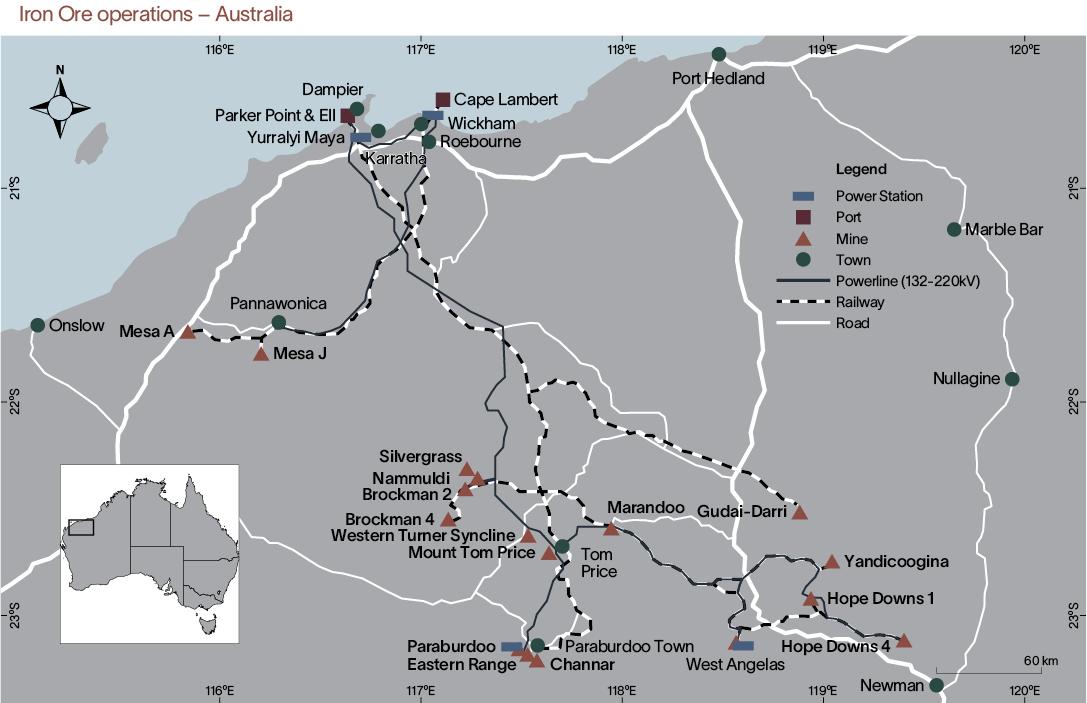
Annual Report on Form 20-F 2023 | riotinto.com | 365 |
366 | Annual Report on Form 20-F 2023 | riotinto.com |
Lease | Holder | Type | Area (Ha) |
ML4SA | Hamersley Iron Pty. Limited | SA Mineral Lease | 79,329 |
M272SA | Hamersley Iron Pty. Limited | SA Mineral Lease | 14,136 |
ML252SA | Mount Bruce Mining Pty Limited | SA Mineral Lease | 47,406 |
ML246SA | Hamersley Iron Pty. Limited | SA Mineral Lease | 12,950 |
M265SA | Channar JV | SA Mineral Lease | 5,956 |
M274SA | Hamersley Iron - Yandi Pty Limited | SA Mineral Lease | 30,550 |
M282SA | Hope Downs JV | SA Mineral Lease | 57,222 |
ML248SA | Robe River Ltd | SA Mineral Lease | 78,600 |
Annual Report on Form 20-F 2023 | riotinto.com | 367 |
Ore Type | Cut-off Range (Fe%) |
Yandicoogina Pisolite | 55% |
Robe Valley Pisolite | 53-55% |
Brockman | 57-60% |
Marra Mamba | 56-58% |
Exploration / Mining Area | Total drill holes by drill type | Total drill metres by drill type | |||||||
P/A/V | RC | DD | U | P/A/V | RC | DD | U | ||
Greater Brockman | 2,600 | 36,357 | 1,836 | 81 | 147,700 | 2,598,790 | 152,430 | 2,383 | |
Greater Tom Price | 8,267 | 10,898 | 1,298 | 61 | 493,017 | 855,565 | 117,814 | 2,958 | |
Greater Paraburdoo | 6,950 | 9,616 | 861 | 29 | 501,178 | 672,824 | 89,378 | 2,947 | |
Robe Valley | 1,457 | 26,594 | 8,194 | 3,467 | 34,517 | 1,040,595 | 412,453 | 91,953 | |
West Pilbara | 584 | 5,333 | 272 | 146 | 26,567 | 338,853 | 11,839 | 5,061 | |
Greater West Angelas | 615 | 26,383 | 1,776 | 3,291 | 20,647 | 2,033,011 | 152,001 | 221,291 | |
Gudai-Darri | 774 | 16,122 | 565 | 17 | 40,734 | 1,026,073 | 36,837 | 252 | |
Greater Hope Downs | 173 | 19,217 | 1,261 | 157 | 5,154 | 1,500,525 | 120,056 | 7,685 | |
Yandicoogina | 211 | 4,441 | 5,647 | 25 | 9,722 | 300,923 | 308,305 | 1,385 | |
East Pilbara | 1,816 | 9,642 | 410 | 26 | 136,305 | 914,509 | 44,335 | 2,360 | |
368 | Annual Report on Form 20-F 2023 | riotinto.com |
Annual Report on Form 20-F 2023 | riotinto.com | 369 |
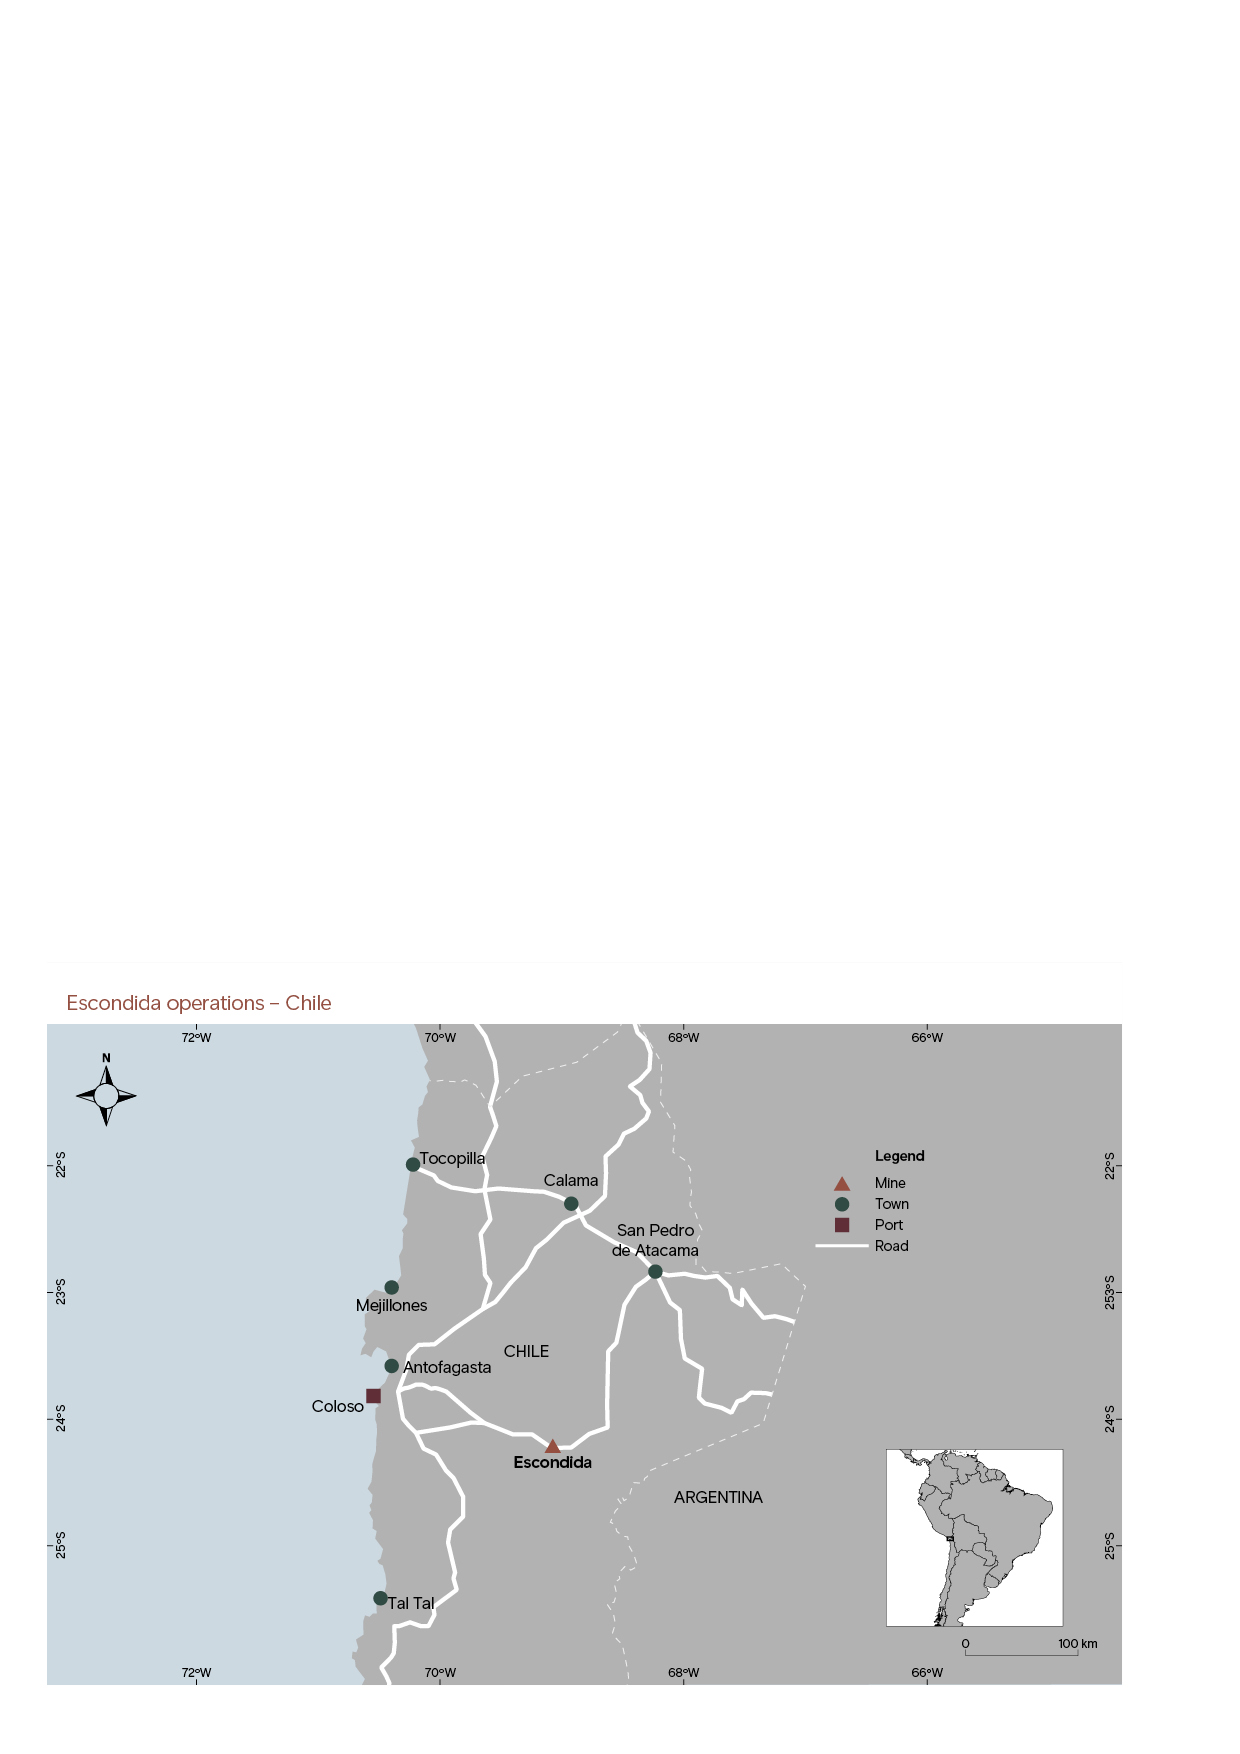
370 | Annual Report on Form 20-F 2023 | riotinto.com |
Lease name | Registered tenement holder | Expiry date | Surface area (ha) |
Alexis 1/1424 | Minera Escondida Ltda. | Permanent | 7,059 |
Amelia 1/1049 | Minera Escondida Ltda. | Permanent | 5,235 |
Catita 1/376 | Minera Escondida Ltda. | Permanent | 1,732 |
Claudia 1/70 | Minera Escondida Ltda. | Permanent | 557 |
Colorado 501/977 | Minera Escondida Ltda. | Permanent | 2,385 |
Costa 1/1861 | Minera Escondida Ltda. | Permanent | 9,159 |
Donaldo 1/612 | Minera Escondida Ltda. | Permanent | 3,060 |
Ela 1/100 | Minera Escondida Ltda. | Permanent | 500 |
Gata 1 1/100 | Minera Escondida Ltda. | Permanent | 400 |
Gata 2 1/50 | Minera Escondida Ltda. | Permanent | 200 |
Guillermo 1/368 | Minera Escondida Ltda. | Permanent | 1,785 |
Hole 14 | Minera Escondida Ltda. | Permanent | 1 |
Naty 1/46 | Minera Escondida Ltda. | Permanent | 230 |
Paola 1/3000 | Minera Escondida Ltda. | Permanent | 15,000 |
Pista 1/22 | Minera Escondida Ltda. | Permanent | 22 |
Pistita 1/5 | Minera Escondida Ltda. | Permanent | 9 |
Ramón 1/640 | Minera Escondida Ltda. | Permanent | 3,200 |
Rola 1/1680 | Minera Escondida Ltda. | Permanent | 8,400 |
Total | 58,934 |
Infrastructure | Surface rights identifier1 | Register | Regional office | Surface area (ha) | ||
Folio | Number | Year | ||||
Pits, waste dumps, leach pads, plants | 619 V | 964 | 1984 | Hipotecas y Gravámenes | Bienes Raíces Antofagasta | 22,084 |
Energy transmission lines, aqueducts, mineral pipelines, roads | 1121 V | 1,117 | 2018 | Hipotecas y Gravámenes | Bienes Raíces Antofagasta | 26,988 |
Annual Report on Form 20-F 2023 | riotinto.com | 371 |
372 | Annual Report on Form 20-F 2023 | riotinto.com |
Annual Report on Form 20-F 2023 | riotinto.com | 373 |

374 | Annual Report on Form 20-F 2023 | riotinto.com |
Tenure Number | Tenure Name | Tenure Type | Holder Group | Oyu Tolgoi’s Interest | Tenure Status | Expiry Date | Current Area (ha) |
MV-006708 | Manakht | Mining Licence | Oyu Tolgoi LLC | 100% | Live | 23 Dec 2033 | 4,533 |
MV-006709 | Oyu Tolgoi | Mining Licence | Oyu Tolgoi LLC | 100% | Live | 23 Dec 2033 | 8,490 |
MV-006710 | Khukh Khad | Mining Licence | Oyu Tolgoi LLC | 100% | Live | 23 Dec 2033 | 1,763 |
MV-015225 | Javkhlant | Mining Licence | Entrée LLC | 70% from the surface to 560 m below the surface; and 80% from below 560 m | Live | 27 Oct 2039 | 20,327 |
MV-015226 | Shivee Tolgoi | Mining Licence | Entrée LLC | 70% from the surface to 560 m below the surface; and 80% from below 560 m | Live | 27 Oct 2039 | 42,593 |
Annual Report on Form 20-F 2023 | riotinto.com | 375 |
376 | Annual Report on Form 20-F 2023 | riotinto.com |

Annual Report on Form 20-F 2023 | riotinto.com | 377 |
Tenure Number | Tenure Name | Tenure Type | Holder Group | Rio Tinto’s Interest | Tenure Status | Expiry Date | Current Area (ha) |
A2011/011/ DIGM CPDM | Simandou Blocks 3 and 4 | Mining concession | Simfer Jersey Limited (shareholders RT Simfer UK Ltd and CIOH) of which we have a 53% interest in 85% of the project => 45.05% | 45.05% | Live | 07 Jul 1964 | 36,900 |
378 | Annual Report on Form 20-F 2023 | riotinto.com |
Annual Report on Form 20-F 2023 | riotinto.com | 379 |
380 | Annual Report on Form 20-F 2023 | riotinto.com |
2024 | ||
15 | January | Fourth quarter 2023 operations review |
29 | January | Closing date for receipt of nominations for candidates other than those recommended by the board to be elected as directors at the 2024 annual general meetings |
21 | February | Announcement of results for 2023 |
7 | March | Rio Tinto plc and Rio Tinto Limited ordinary shares and Rio Tinto plc ADRs quoted “ex-dividend” for the 2023 final dividend |
8 | March | Record date for the 2023 final dividend for Rio Tinto plc and Rio Tinto Limited ordinary shares and Rio Tinto plc ADRs |
26 | March | Final date for elections under the Rio Tinto plc and Rio Tinto Limited dividend reinvestment plans and under facilities for dividends to be paid in alternative currency for the 2023 final dividend |
4 | April | Annual general meeting for Rio Tinto plc, UK |
11 | April | Dividend currency conversion date |
16 | April | First quarter 2024 operations review |
18 | April | Payment date for the 2023 final dividend to holders of ordinary shares and ADRs |
2 | May | Annual general meeting for Rio Tinto Limited, Australia |
15 | July | Second quarter operations review 2024 |
31 | July | Announcement of half-year results for 2024 |
15 | August | Rio Tinto plc and Rio Tinto Limited ordinary shares and Rio Tinto plc ADRs quoted “ex-dividend” for the 2023 interim dividend1 |
16 | August | Record date for the 2024 interim dividend for Rio Tinto plc and Rio Tinto Limited ordinary shares and Rio Tinto plc ADRs |
5 | September | Final date for elections under the Rio Tinto plc and Rio Tinto Limited dividend reinvestment plans and under facilities for dividends to be paid in alternative currency for the 2024 interim dividend |
19 | September | Dividend currency conversion date |
26 | September | Payment date for the 2024 interim dividend to holders of ordinary shares and ADRs |
15 | October | Third quarter 2024 operations review |
Annual Report on Form 20-F 2023 | riotinto.com | 381 |
382 | Annual Report on Form 20-F 2023 | riotinto.com |
Annual Report on Form 20-F 2023 | riotinto.com | 383 |
riotinto.com | |
 | This report is printed on paper certified in accordance with the FSC® (Forest Stewardship Council®) and is recyclable and acid-free. Pureprint Ltd is FSC certified and ISO 14001 certified showing that it is committed to all round excellence and improving environmental performance is an important part of this strategy. Pureprint Ltd aims to reduce at source the effect its operations have on the environment and is committed to continual improvement, prevention of pollution and compliance with any legislation or industry standards. Pureprint Ltd is a Carbon / Neutral® Printing Company. Report produced by Black Sun Global, part of the Positive Change Group. |
| Exhibit Number | Description | ||||
| 1.1 | |||||
| 1.2 | |||||
| 2.1* | |||||
| 3.1** | DLC Merger Implementation Agreement, dated 3 November 1995 between CRA Limited and The RTZ Corporation PLC relating to the implementation of the DLC merger (incorporated by reference to Exhibit 2.1 of Rio Tinto plc's Annual report on Form 20-F for the financial year ended 31 December 1995, File No. 1‑10533) | ||||
| 3.2 | |||||
| 3.3 | |||||
| 3.4 | |||||
| 4.1* | |||||
| 4.2* | |||||
| 8.1* | |||||
| 12.1* | |||||
| 13.1* | |||||
| 15.1* | |||||
| 15.2* | |||||
| 16.1* | |||||
| 17.1* | |||||
| 96.1 | |||||
| 96.2 | |||||
| 96.3 | |||||
| 96.4* | |||||
| 96.5* | |||||
| 101* | Interactive data files | ||||
| Rio Tinto plc | Rio Tinto Limited | ||||
| (Registrant) | (Registrant) | ||||
| /s/ Andy Hodges | /s/ Tim Paine | ||||
| Name: Andy Hodges | Name: Tim Paine | ||||
| Title: Company Secretary | Title: Company Secretary | ||||
| Date: 23 February 2024 | Date: 23 February 2024 | ||||