false2022FY0000863064P1Y00008630642022-01-012022-12-310000863064rio:RioTintoLimitedMember2022-01-012022-12-310000863064dei:BusinessContactMember2022-01-012022-12-310000863064rio:AmericanDepositarySharesMember2022-01-012022-12-310000863064ifrs-full:OrdinarySharesMember2022-01-012022-12-310000863064rio:SevenPointOneTwoFivePercentNotesDueTwoThousandTwentyEightMember2022-01-012022-12-310000863064rio:FivePointTwoZeroZeroPercentNotesDueTwoThousandFortyMember2022-01-012022-12-310000863064rio:FourPointSevenFiveZeroPercentNotesDueTwoThousandFortyTwoMember2022-01-012022-12-310000863064rio:FourPointOneTwoFivePercentNotesDueTwoThousandFortyTwoMember2022-01-012022-12-310000863064rio:TwoPointSevenFiveZeroPercentNotesDueTwoThousandFiftyOneMember2022-01-012022-12-3100008630642022-12-31xbrli:shares0000863064rio:RioTintoLimitedMember2022-12-310000863064rio:KPMGMember2022-01-012022-12-310000863064rio:RioTintoLimitedMemberrio:SevenPointOneTwoFivePercentNotesDueTwoThousandTwentyEightMember2022-01-012022-12-310000863064rio:TwoPointSevenFiveZeroPercentNotesDueTwoThousandFiftyOneMemberrio:RioTintoLimitedMember2022-01-012022-12-310000863064rio:FourPointSevenFiveZeroPercentNotesDueTwoThousandFortyTwoMemberrio:RioTintoLimitedMember2022-01-012022-12-310000863064rio:RioTintoLimitedMemberrio:FourPointOneTwoFivePercentNotesDueTwoThousandFortyTwoMember2022-01-012022-12-310000863064rio:RioTintoLimitedMemberrio:FivePointTwoZeroZeroPercentNotesDueTwoThousandFortyMember2022-01-012022-12-3100008630642021-01-012021-12-31iso4217:USDiso4217:AUD0000863064currency:GBP2022-01-012022-12-31xbrli:pure0000863064currency:GBP2021-01-012021-12-310000863064currency:GBP2020-01-012020-12-310000863064currency:GBP2022-12-310000863064currency:GBP2021-12-310000863064currency:GBP2020-12-310000863064currency:AUD2022-01-012022-12-310000863064currency:AUD2021-01-012021-12-310000863064currency:AUD2020-01-012020-12-310000863064currency:AUD2022-12-310000863064currency:AUD2021-12-310000863064currency:AUD2020-12-310000863064currency:CAD2022-01-012022-12-310000863064currency:CAD2021-01-012021-12-310000863064currency:CAD2020-01-012020-12-310000863064currency:CAD2022-12-310000863064currency:CAD2021-12-310000863064currency:CAD2020-12-310000863064currency:EUR2022-01-012022-12-310000863064currency:EUR2021-01-012021-12-310000863064currency:EUR2020-01-012020-12-310000863064currency:EUR2022-12-310000863064currency:EUR2021-12-310000863064currency:EUR2020-12-310000863064currency:ZAR2022-01-012022-12-310000863064currency:ZAR2021-01-012021-12-310000863064currency:ZAR2020-01-012020-12-310000863064currency:ZAR2022-12-310000863064currency:ZAR2021-12-310000863064currency:ZAR2020-12-310000863064rio:PacificAluminiumMemberrio:AluminiumMember2022-01-012022-12-310000863064ifrs-full:IncreaseDecreaseDueToChangesInAccountingPolicyRequiredByIFRSsCumulativeEffectAtDateOfInitialApplicationMemberrio:GuddaiDariAndOyuTolgoiMember2022-01-012022-12-310000863064ifrs-full:IncreaseDecreaseDueToChangesInAccountingPolicyRequiredByIFRSsCumulativeEffectAtDateOfInitialApplicationMember2021-12-3100008630642020-01-012020-12-31iso4217:USDxbrli:shares00008630642021-12-3100008630642020-12-3100008630642019-12-310000863064rio:FixedIncomeInstrumentsMember2022-01-012022-12-310000863064rio:FixedIncomeInstrumentsMember2021-01-012021-12-310000863064rio:FixedIncomeInstrumentsMember2020-01-012020-12-310000863064rio:CortezRoyaltyMember2022-01-012022-12-310000863064rio:EnergyResourcesOfAustraliaMember2020-01-012020-12-310000863064rio:DiavikJointVentureMember2021-01-012021-12-310000863064rio:RioTintoFinanceUSALimitedBondsTwoPointSevenFiveTwoThousandAndFiftyOneMember2021-12-310000863064rio:RioTintoFinanceUSALimitedBondsTwoPointSevenFiveTwoThousandAndFiftyOneMemberifrs-full:FixedInterestRateMember2021-01-012021-12-310000863064rio:RioTintoFinanceUsaLimitedBondsThreePointSevenFivePercentageTwoThousandAndTwentyFiveMember2021-01-012021-12-310000863064rio:RioTintoFinancePlcEuroBondsTwoPointZeroPercentageDueTwoThousandAndTwentyMember2020-01-012020-12-31iso4217:EUR0000863064rio:TurquoiseHillMember2022-12-160000863064rio:TurquoiseHillMember2022-01-012022-12-310000863064rio:OyuTolgoiLlcMembercountry:MN2021-01-012021-12-310000863064rio:CortezRoyaltyMember2021-01-012021-12-310000863064rio:NotDesignatedAsHedgingInstrumentMember2021-01-012021-12-310000863064rio:RioTintoPlcMember2022-12-310000863064rio:RioTintoPlcMember2021-12-310000863064rio:RioTintoLimitedMember2021-12-310000863064ifrs-full:IssuedCapitalMember2021-12-310000863064ifrs-full:SharePremiumMember2021-12-310000863064ifrs-full:OtherReservesMember2021-12-310000863064ifrs-full:RetainedEarningsMember2021-12-310000863064ifrs-full:EquityAttributableToOwnersOfParentMember2021-12-310000863064ifrs-full:NoncontrollingInterestsMember2021-12-310000863064ifrs-full:IncreaseDecreaseDueToChangesInAccountingPolicyRequiredByIFRSsCumulativeEffectAtDateOfInitialApplicationMemberifrs-full:RetainedEarningsMember2021-12-310000863064ifrs-full:EquityAttributableToOwnersOfParentMemberifrs-full:IncreaseDecreaseDueToChangesInAccountingPolicyRequiredByIFRSsCumulativeEffectAtDateOfInitialApplicationMember2021-12-310000863064ifrs-full:OpeningBalanceAfterAdjustmentCumulativeEffectAtDateOfInitialApplicationMemberifrs-full:IssuedCapitalMember2021-12-310000863064ifrs-full:SharePremiumMemberifrs-full:OpeningBalanceAfterAdjustmentCumulativeEffectAtDateOfInitialApplicationMember2021-12-310000863064ifrs-full:OpeningBalanceAfterAdjustmentCumulativeEffectAtDateOfInitialApplicationMemberifrs-full:OtherReservesMember2021-12-310000863064ifrs-full:OpeningBalanceAfterAdjustmentCumulativeEffectAtDateOfInitialApplicationMemberifrs-full:RetainedEarningsMember2021-12-310000863064ifrs-full:OpeningBalanceAfterAdjustmentCumulativeEffectAtDateOfInitialApplicationMemberifrs-full:EquityAttributableToOwnersOfParentMember2021-12-310000863064ifrs-full:OpeningBalanceAfterAdjustmentCumulativeEffectAtDateOfInitialApplicationMemberifrs-full:NoncontrollingInterestsMember2021-12-310000863064ifrs-full:OpeningBalanceAfterAdjustmentCumulativeEffectAtDateOfInitialApplicationMember2021-12-310000863064ifrs-full:OtherReservesMember2022-01-012022-12-310000863064ifrs-full:RetainedEarningsMember2022-01-012022-12-310000863064ifrs-full:EquityAttributableToOwnersOfParentMember2022-01-012022-12-310000863064ifrs-full:NoncontrollingInterestsMember2022-01-012022-12-310000863064ifrs-full:IssuedCapitalMember2022-01-012022-12-310000863064ifrs-full:SharePremiumMember2022-01-012022-12-310000863064ifrs-full:IssuedCapitalMember2022-12-310000863064ifrs-full:SharePremiumMember2022-12-310000863064ifrs-full:OtherReservesMember2022-12-310000863064ifrs-full:RetainedEarningsMember2022-12-310000863064ifrs-full:EquityAttributableToOwnersOfParentMember2022-12-310000863064ifrs-full:NoncontrollingInterestsMember2022-12-310000863064ifrs-full:IssuedCapitalMember2020-12-310000863064ifrs-full:SharePremiumMember2020-12-310000863064ifrs-full:OtherReservesMember2020-12-310000863064ifrs-full:RetainedEarningsMember2020-12-310000863064ifrs-full:EquityAttributableToOwnersOfParentMember2020-12-310000863064ifrs-full:NoncontrollingInterestsMember2020-12-310000863064ifrs-full:OtherReservesMember2021-01-012021-12-310000863064ifrs-full:RetainedEarningsMember2021-01-012021-12-310000863064ifrs-full:EquityAttributableToOwnersOfParentMember2021-01-012021-12-310000863064ifrs-full:NoncontrollingInterestsMember2021-01-012021-12-310000863064ifrs-full:IssuedCapitalMember2021-01-012021-12-310000863064ifrs-full:SharePremiumMember2021-01-012021-12-310000863064ifrs-full:IssuedCapitalMember2019-12-310000863064ifrs-full:SharePremiumMember2019-12-310000863064ifrs-full:OtherReservesMember2019-12-310000863064ifrs-full:RetainedEarningsMember2019-12-310000863064ifrs-full:EquityAttributableToOwnersOfParentMember2019-12-310000863064ifrs-full:NoncontrollingInterestsMember2019-12-310000863064ifrs-full:OtherReservesMember2020-01-012020-12-310000863064ifrs-full:RetainedEarningsMember2020-01-012020-12-310000863064ifrs-full:EquityAttributableToOwnersOfParentMember2020-01-012020-12-310000863064ifrs-full:NoncontrollingInterestsMember2020-01-012020-12-310000863064ifrs-full:IssuedCapitalMember2020-01-012020-12-310000863064ifrs-full:SharePremiumMember2020-01-012020-12-310000863064ifrs-full:OperatingSegmentsMemberrio:IronOreMember2022-01-012022-12-310000863064ifrs-full:OperatingSegmentsMemberrio:AluminiumMember2022-01-012022-12-310000863064ifrs-full:OperatingSegmentsMemberrio:CopperAndDiamondsMember2022-01-012022-12-310000863064ifrs-full:OperatingSegmentsMemberrio:EnergyAndMineralsMember2022-01-012022-12-310000863064ifrs-full:ReportableSegmentsMemberifrs-full:OperatingSegmentsMember2022-01-012022-12-310000863064rio:OtherOperationsMember2022-01-012022-12-310000863064ifrs-full:EliminationOfIntersegmentAmountsMember2022-01-012022-12-310000863064rio:ShareOfEquityAccountedUnitsAndAdjustmentsMember2022-01-012022-12-310000863064rio:CentralPensionCostsShareBasedPaymentsInsuranceAndDerivativesMember2022-01-012022-12-310000863064rio:RestructuringProjectAndOneOffCostsMember2022-01-012022-12-310000863064rio:CentralCostsMember2022-01-012022-12-310000863064rio:ExplorationAndEvaluationNotAttributedToProductGroupsMember2022-01-012022-12-310000863064rio:OtherItemsMember2022-01-012022-12-310000863064ifrs-full:OperatingSegmentsMemberrio:IronOreMember2021-01-012021-12-310000863064ifrs-full:OperatingSegmentsMemberrio:AluminiumMember2021-01-012021-12-310000863064ifrs-full:OperatingSegmentsMemberrio:CopperAndDiamondsMember2021-01-012021-12-310000863064ifrs-full:OperatingSegmentsMemberrio:EnergyAndMineralsMember2021-01-012021-12-310000863064ifrs-full:ReportableSegmentsMemberifrs-full:OperatingSegmentsMember2021-01-012021-12-310000863064rio:OtherOperationsMember2021-01-012021-12-310000863064ifrs-full:EliminationOfIntersegmentAmountsMember2021-01-012021-12-310000863064rio:ShareOfEquityAccountedUnitsAndAdjustmentsMember2021-01-012021-12-310000863064rio:CentralPensionCostsShareBasedPaymentsInsuranceAndDerivativesMember2021-01-012021-12-310000863064rio:RestructuringProjectAndOneOffCostsMember2021-01-012021-12-310000863064rio:CentralCostsMember2021-01-012021-12-310000863064rio:ExplorationAndEvaluationNotAttributedToProductGroupsMember2021-01-012021-12-310000863064rio:OtherItemsMember2021-01-012021-12-310000863064ifrs-full:OperatingSegmentsMemberrio:IronOreMember2020-01-012020-12-310000863064ifrs-full:OperatingSegmentsMemberrio:AluminiumMember2020-01-012020-12-310000863064ifrs-full:OperatingSegmentsMemberrio:CopperAndDiamondsMember2020-01-012020-12-310000863064ifrs-full:OperatingSegmentsMemberrio:EnergyAndMineralsMember2020-01-012020-12-310000863064ifrs-full:ReportableSegmentsMemberifrs-full:OperatingSegmentsMember2020-01-012020-12-310000863064rio:OtherOperationsMember2020-01-012020-12-310000863064ifrs-full:EliminationOfIntersegmentAmountsMember2020-01-012020-12-310000863064rio:ShareOfEquityAccountedUnitsAndAdjustmentsMember2020-01-012020-12-310000863064rio:CentralPensionCostsShareBasedPaymentsInsuranceAndDerivativesMember2020-01-012020-12-310000863064rio:RestructuringProjectAndOneOffCostsMember2020-01-012020-12-310000863064rio:CentralCostsMember2020-01-012020-12-310000863064rio:ExplorationAndEvaluationNotAttributedToProductGroupsMember2020-01-012020-12-310000863064rio:OtherItemsMember2020-01-012020-12-310000863064ifrs-full:SubsidiariesMember2022-01-012022-12-310000863064ifrs-full:SubsidiariesMember2021-01-012021-12-310000863064ifrs-full:SubsidiariesMember2020-01-012020-12-310000863064rio:GrossProductSalesMember2022-01-012022-12-310000863064rio:GrossProductSalesMember2021-01-012021-12-310000863064rio:GrossProductSalesMember2020-01-012020-12-310000863064rio:GoveRefineryMember2020-01-012020-12-310000863064rio:RioTintoPlcMember2022-01-012022-12-310000863064rio:RioTintoPlcMember2021-01-012021-12-310000863064rio:RioTintoPlcMember2020-01-012020-12-310000863064rio:RioTintoLimitedMember2021-01-012021-12-310000863064rio:RioTintoLimitedMember2020-01-012020-12-310000863064ifrs-full:PotentialOrdinaryShareTransactionsMember2023-02-222023-02-220000863064rio:FinalDividendsMember2022-01-012022-12-310000863064rio:FinalDividendsMember2021-01-012021-12-310000863064rio:FinalDividendsMember2020-01-012020-12-310000863064rio:SpecialDividendsMember2022-01-012022-12-310000863064rio:SpecialDividendsMember2021-01-012021-12-310000863064rio:SpecialDividendsMember2020-01-012020-12-310000863064rio:FinalDividendsMemberrio:RioTintoPlcMember2022-01-012022-12-310000863064rio:FinalDividendsMemberrio:RioTintoPlcMember2021-01-012021-12-310000863064rio:FinalDividendsMemberrio:RioTintoPlcMember2020-01-012020-12-310000863064rio:RioTintoPlcMemberrio:SpecialDividendsMember2022-01-012022-12-310000863064rio:RioTintoPlcMemberrio:SpecialDividendsMember2021-01-012021-12-310000863064rio:RioTintoPlcMemberrio:SpecialDividendsMember2020-01-012020-12-31iso4217:GBPxbrli:shares0000863064rio:FinalDividendsMemberrio:RioTintoLimitedMember2020-12-310000863064rio:FinalDividendsMemberrio:RioTintoLimitedMember2022-12-310000863064rio:FinalDividendsMemberrio:RioTintoLimitedMember2021-12-310000863064rio:FinalDividendsMemberrio:RioTintoLimitedMember2022-01-012022-12-31iso4217:AUDxbrli:shares0000863064rio:FinalDividendsMemberrio:RioTintoLimitedMember2021-01-012021-12-310000863064rio:FinalDividendsMemberrio:RioTintoLimitedMember2020-01-012020-12-310000863064rio:RioTintoLimitedMemberrio:SpecialDividendsMember2022-12-310000863064rio:RioTintoLimitedMemberrio:SpecialDividendsMember2020-12-310000863064rio:RioTintoLimitedMemberrio:SpecialDividendsMember2021-12-310000863064rio:RioTintoLimitedMemberrio:SpecialDividendsMember2022-01-012022-12-310000863064rio:RioTintoLimitedMemberrio:SpecialDividendsMember2021-01-012021-12-310000863064rio:RioTintoLimitedMemberrio:SpecialDividendsMember2020-01-012020-12-310000863064rio:RioTintoLimitedMember2020-12-310000863064rio:RoughriderMemberrio:OtherOperationsMember2022-01-012022-12-310000863064rio:RoughriderMemberrio:OtherOperationsMember2021-01-012021-12-310000863064rio:RoughriderMemberrio:OtherOperationsMember2020-01-012020-12-310000863064rio:PacificAluminiumMemberrio:AluminiumMember2021-01-012021-12-310000863064rio:PacificAluminiumMemberrio:AluminiumMember2020-01-012020-12-310000863064rio:KitimatMemberrio:AluminiumMember2022-01-012022-12-310000863064rio:KitimatMemberrio:AluminiumMember2021-01-012021-12-310000863064rio:KitimatMemberrio:AluminiumMember2020-01-012020-12-310000863064rio:SoharAluminiumCoLlcMemberrio:AluminiumMember2022-01-012022-12-310000863064rio:SoharAluminiumCoLlcMemberrio:AluminiumMember2021-01-012021-12-310000863064rio:SoharAluminiumCoLlcMemberrio:AluminiumMember2020-01-012020-12-310000863064rio:ISALSmelterMemberrio:AluminiumMember2022-01-012022-12-310000863064rio:ISALSmelterMemberrio:AluminiumMember2021-01-012021-12-310000863064rio:ISALSmelterMemberrio:AluminiumMember2020-01-012020-12-310000863064rio:DiavikJointVentureMemberrio:MineralsMember2022-01-012022-12-310000863064rio:DiavikJointVentureMemberrio:MineralsMember2021-01-012021-12-310000863064rio:DiavikJointVentureMemberrio:MineralsMember2020-01-012020-12-310000863064rio:IntangibleAssetsExcludingGoodwillMember2022-01-012022-12-310000863064rio:IntangibleAssetsExcludingGoodwillMember2021-01-012021-12-310000863064rio:IntangibleAssetsExcludingGoodwillMember2020-01-012020-12-310000863064rio:PropertyPlantAndEquipmentsMember2022-01-012022-12-310000863064rio:PropertyPlantAndEquipmentsMember2021-01-012021-12-310000863064rio:PropertyPlantAndEquipmentsMember2020-01-012020-12-310000863064ifrs-full:TradingEquitySecuritiesMember2022-01-012022-12-310000863064ifrs-full:TradingEquitySecuritiesMember2021-01-012021-12-310000863064ifrs-full:TradingEquitySecuritiesMember2020-01-012020-12-310000863064country:CA2022-10-170000863064country:CA2022-10-172022-10-170000863064country:CArio:UraniumEnergyCorpMember2022-10-172022-10-170000863064rio:PacificAluminiumMemberrio:AluminiumMember2022-12-310000863064rio:KitimatMemberrio:AluminiumMember2021-12-030000863064rio:KitimatMemberrio:AluminiumMember2021-12-310000863064rio:PacificAluminiumMember2020-07-092020-07-090000863064rio:PacificAluminiumMemberrio:AluminiumMember2020-12-310000863064rio:PacificAluminumSmelterMemberrio:AluminiumMember2020-01-012020-12-310000863064rio:SoharAluminiumCoLlcMemberrio:AluminiumMember2020-09-300000863064ifrs-full:TradingEquitySecuritiesMemberrio:SoharAluminiumCoLlcMemberrio:AluminiumMember2020-01-012020-09-300000863064rio:ISALSmelterMemberrio:AluminiumMember2020-12-310000863064rio:ISALSmelterMemberrio:AluminiumMember2020-01-012020-06-300000863064rio:CopperAndDiamondsMemberrio:DiavikJointVentureMember2020-06-302020-06-300000863064rio:RinconMiningPtyLimitedMember2022-03-292022-03-290000863064rio:McEwenCopperIncMember2022-08-302022-08-300000863064srt:ScenarioForecastMemberrio:TurquoiseHillMember2023-01-012023-12-310000863064rio:TurquoiseHillMemberrio:DissentingShareholdersMember2022-01-012022-12-31iso4217:CADxbrli:shares0000863064rio:TurquoiseHillMemberrio:OtherShareholdersMember2022-01-012022-12-310000863064rio:DiavikJointVentureMember2021-11-182021-11-180000863064rio:DiavikJointVentureMember2021-01-012021-11-170000863064rio:GreaterChinaMember2022-01-012022-12-310000863064rio:GreaterChinaMember2021-01-012021-12-310000863064rio:GreaterChinaMember2020-01-012020-12-310000863064country:US2022-01-012022-12-310000863064country:US2021-01-012021-12-310000863064country:US2020-01-012020-12-310000863064rio:AsiaExcludingGreaterChinaAndJapanMember2022-01-012022-12-310000863064rio:AsiaExcludingGreaterChinaAndJapanMember2021-01-012021-12-310000863064rio:AsiaExcludingGreaterChinaAndJapanMember2020-01-012020-12-310000863064country:JP2022-01-012022-12-310000863064country:JP2021-01-012021-12-310000863064country:JP2020-01-012020-12-310000863064rio:EuropeExcludingUkMember2022-01-012022-12-310000863064rio:EuropeExcludingUkMember2021-01-012021-12-310000863064rio:EuropeExcludingUkMember2020-01-012020-12-310000863064country:CA2022-01-012022-12-310000863064country:CA2021-01-012021-12-310000863064country:CA2020-01-012020-12-310000863064country:AU2022-01-012022-12-310000863064country:AU2021-01-012021-12-310000863064country:AU2020-01-012020-12-310000863064country:GB2022-01-012022-12-310000863064country:GB2021-01-012021-12-310000863064country:GB2020-01-012020-12-310000863064rio:OtherCountriesMember2022-01-012022-12-310000863064rio:OtherCountriesMember2021-01-012021-12-310000863064rio:OtherCountriesMember2020-01-012020-12-310000863064rio:IronOreMember2022-01-012022-12-310000863064rio:AluminiumAluminaAndBauxiteMember2022-01-012022-12-310000863064rio:CopperMember2022-01-012022-12-310000863064rio:IndustrialMineralsMember2022-01-012022-12-310000863064rio:GoldMember2022-01-012022-12-310000863064rio:DiamondsMember2022-01-012022-12-310000863064rio:OtherProductMember2022-01-012022-12-310000863064rio:IronOreMember2021-01-012021-12-310000863064rio:IronOreMember2020-01-012020-12-310000863064rio:AluminiumAluminaAndBauxiteMember2021-01-012021-12-310000863064rio:AluminiumAluminaAndBauxiteMember2020-01-012020-12-310000863064rio:CopperMember2021-01-012021-12-310000863064rio:CopperMember2020-01-012020-12-310000863064rio:IndustrialMineralsMember2021-01-012021-12-310000863064rio:IndustrialMineralsMember2020-01-012020-12-310000863064rio:GoldMember2021-01-012021-12-310000863064rio:GoldMember2020-01-012020-12-310000863064rio:DiamondsMember2021-01-012021-12-310000863064rio:DiamondsMember2020-01-012020-12-310000863064rio:OtherProductMember2021-01-012021-12-310000863064rio:OtherProductMember2020-01-012020-12-310000863064rio:CortezRoyaltyMember2022-08-022022-08-020000863064country:AU2022-12-310000863064country:AU2021-12-310000863064country:CA2022-12-310000863064country:CA2021-12-310000863064country:MN2022-12-310000863064country:MN2021-12-310000863064country:US2022-12-310000863064country:US2021-12-310000863064srt:AfricaMember2022-12-310000863064srt:AfricaMember2021-12-310000863064srt:SouthAmericaMember2022-12-310000863064srt:SouthAmericaMember2021-12-310000863064rio:EuropeExcludingTheUKMember2022-12-310000863064rio:EuropeExcludingTheUKMember2021-12-310000863064country:GB2022-12-310000863064country:GB2021-12-310000863064rio:OtherCountriesMember2022-12-310000863064rio:OtherCountriesMember2021-12-310000863064rio:NonCurrentAssetsMember2022-12-310000863064rio:NonCurrentAssetsMember2021-12-310000863064ifrs-full:GrossCarryingAmountMember2022-12-310000863064ifrs-full:GrossCarryingAmountMember2021-12-310000863064ifrs-full:AccumulatedImpairmentMember2022-12-310000863064ifrs-full:AccumulatedImpairmentMember2021-12-310000863064ifrs-full:GrossCarryingAmountMember2020-12-310000863064ifrs-full:AccumulatedImpairmentMember2020-12-310000863064rio:RichardsBayMineralsMember2022-12-310000863064rio:RichardsBayMineralsMember2021-12-310000863064rio:PilbaraMember2022-12-310000863064rio:PilbaraMember2021-12-310000863064rio:DampierSaltMember2022-12-310000863064rio:DampierSaltMember2021-12-310000863064rio:RichardsBayMineralsMember2022-01-012022-12-310000863064rio:RichardsBayMineralsMember2021-01-012021-12-310000863064rio:FivePercentageIncreaseInTheTitaniumSlagPriceMemberrio:TitaniumMemberrio:RichardsBayMineralsMember2022-01-012022-12-310000863064rio:FivePercentageIncreaseInTheTitaniumSlagPriceMemberrio:RichardsBayMineralsMember2022-12-310000863064rio:OnePercentageIncreaseInTheDiscountRateAppliedToPosttaxCashFlowsMemberrio:RichardsBayMineralsMember2022-12-310000863064rio:TenPercentageStrengtheningOfSouthAfricanRandMemberrio:RichardsBayMineralsMember2022-01-012022-12-310000863064rio:TenPercentageStrengtheningOfSouthAfricanRandMemberrio:RichardsBayMineralsMember2022-12-310000863064rio:QuebecSmeltersMemberrio:WaterRightsMember2022-12-310000863064rio:QuebecSmeltersMemberrio:WaterRightsMember2021-12-310000863064rio:QuebecSmeltersMember2022-12-310000863064rio:QuebecSmeltersMember2021-12-310000863064ifrs-full:IntangibleExplorationAndEvaluationAssetsMember2021-12-310000863064rio:TrademarksPatentedAndNonpatentedTechnologyMember2021-12-310000863064rio:ContractBasedIntangibleAssetMember2021-12-310000863064ifrs-full:OtherIntangibleAssetsMember2021-12-310000863064ifrs-full:IntangibleExplorationAndEvaluationAssetsMember2022-01-012022-12-310000863064rio:TrademarksPatentedAndNonpatentedTechnologyMember2022-01-012022-12-310000863064rio:ContractBasedIntangibleAssetMember2022-01-012022-12-310000863064ifrs-full:OtherIntangibleAssetsMember2022-01-012022-12-310000863064ifrs-full:IntangibleExplorationAndEvaluationAssetsMember2022-12-310000863064rio:TrademarksPatentedAndNonpatentedTechnologyMember2022-12-310000863064rio:ContractBasedIntangibleAssetMember2022-12-310000863064ifrs-full:OtherIntangibleAssetsMember2022-12-310000863064ifrs-full:GrossCarryingAmountMemberifrs-full:IntangibleExplorationAndEvaluationAssetsMember2022-12-310000863064ifrs-full:GrossCarryingAmountMemberrio:TrademarksPatentedAndNonpatentedTechnologyMember2022-12-310000863064ifrs-full:GrossCarryingAmountMemberrio:ContractBasedIntangibleAssetMember2022-12-310000863064ifrs-full:GrossCarryingAmountMemberifrs-full:OtherIntangibleAssetsMember2022-12-310000863064ifrs-full:AccumulatedDepreciationAmortisationAndImpairmentMemberifrs-full:IntangibleExplorationAndEvaluationAssetsMember2022-12-310000863064ifrs-full:AccumulatedDepreciationAmortisationAndImpairmentMemberrio:TrademarksPatentedAndNonpatentedTechnologyMember2022-12-310000863064rio:ContractBasedIntangibleAssetMemberifrs-full:AccumulatedDepreciationAmortisationAndImpairmentMember2022-12-310000863064ifrs-full:AccumulatedDepreciationAmortisationAndImpairmentMemberifrs-full:OtherIntangibleAssetsMember2022-12-310000863064ifrs-full:AccumulatedDepreciationAmortisationAndImpairmentMember2022-12-310000863064ifrs-full:IntangibleExplorationAndEvaluationAssetsMember2020-12-310000863064rio:TrademarksPatentedAndNonpatentedTechnologyMember2020-12-310000863064rio:ContractBasedIntangibleAssetMember2020-12-310000863064ifrs-full:OtherIntangibleAssetsMember2020-12-310000863064ifrs-full:IntangibleExplorationAndEvaluationAssetsMember2021-01-012021-12-310000863064rio:TrademarksPatentedAndNonpatentedTechnologyMember2021-01-012021-12-310000863064rio:ContractBasedIntangibleAssetMember2021-01-012021-12-310000863064ifrs-full:OtherIntangibleAssetsMember2021-01-012021-12-310000863064ifrs-full:GrossCarryingAmountMemberifrs-full:IntangibleExplorationAndEvaluationAssetsMember2021-12-310000863064ifrs-full:GrossCarryingAmountMemberrio:TrademarksPatentedAndNonpatentedTechnologyMember2021-12-310000863064ifrs-full:GrossCarryingAmountMemberrio:ContractBasedIntangibleAssetMember2021-12-310000863064ifrs-full:GrossCarryingAmountMemberifrs-full:OtherIntangibleAssetsMember2021-12-310000863064ifrs-full:AccumulatedDepreciationAmortisationAndImpairmentMemberifrs-full:IntangibleExplorationAndEvaluationAssetsMember2021-12-310000863064ifrs-full:AccumulatedDepreciationAmortisationAndImpairmentMemberrio:TrademarksPatentedAndNonpatentedTechnologyMember2021-12-310000863064rio:ContractBasedIntangibleAssetMemberifrs-full:AccumulatedDepreciationAmortisationAndImpairmentMember2021-12-310000863064ifrs-full:AccumulatedDepreciationAmortisationAndImpairmentMemberifrs-full:OtherIntangibleAssetsMember2021-12-310000863064ifrs-full:AccumulatedDepreciationAmortisationAndImpairmentMember2021-12-310000863064rio:TrademarkMemberifrs-full:BottomOfRangeMember2022-01-012022-12-310000863064rio:TrademarkMemberifrs-full:TopOfRangeMember2022-01-012022-12-310000863064rio:PatentedAndNonpatentedTechnologyMemberifrs-full:BottomOfRangeMember2022-01-012022-12-310000863064rio:PatentedAndNonpatentedTechnologyMemberifrs-full:TopOfRangeMember2022-01-012022-12-310000863064rio:PowerContractsWaterRightsMemberifrs-full:BottomOfRangeMember2022-01-012022-12-310000863064rio:PowerContractsWaterRightsMemberifrs-full:TopOfRangeMember2022-01-012022-12-310000863064rio:OtherPurchaseAndCustomerContractsMemberifrs-full:BottomOfRangeMember2022-01-012022-12-310000863064rio:OtherPurchaseAndCustomerContractsMemberifrs-full:TopOfRangeMember2022-01-012022-12-310000863064ifrs-full:ComputerSoftwareMemberifrs-full:BottomOfRangeMember2022-01-012022-12-310000863064ifrs-full:ComputerSoftwareMemberifrs-full:TopOfRangeMember2022-01-012022-12-310000863064ifrs-full:OtherIntangibleAssetsMemberifrs-full:BottomOfRangeMember2022-01-012022-12-310000863064ifrs-full:OtherIntangibleAssetsMemberifrs-full:TopOfRangeMember2022-01-012022-12-310000863064ifrs-full:BuildingsMemberifrs-full:BottomOfRangeMember2022-01-012022-12-310000863064ifrs-full:BuildingsMemberifrs-full:TopOfRangeMember2022-01-012022-12-310000863064ifrs-full:OtherPropertyPlantAndEquipmentMemberifrs-full:BottomOfRangeMember2022-01-012022-12-310000863064ifrs-full:OtherPropertyPlantAndEquipmentMemberifrs-full:TopOfRangeMember2022-01-012022-12-310000863064ifrs-full:MiningAssetsMember2021-12-310000863064ifrs-full:LandAndBuildingsMember2021-12-310000863064ifrs-full:OtherPropertyPlantAndEquipmentMember2021-12-310000863064ifrs-full:ConstructionInProgressMember2021-12-310000863064ifrs-full:MiningAssetsMember2022-01-012022-12-310000863064ifrs-full:LandAndBuildingsMember2022-01-012022-12-310000863064ifrs-full:OtherPropertyPlantAndEquipmentMember2022-01-012022-12-310000863064ifrs-full:ConstructionInProgressMember2022-01-012022-12-310000863064ifrs-full:MiningAssetsMember2022-12-310000863064ifrs-full:LandAndBuildingsMember2022-12-310000863064ifrs-full:OtherPropertyPlantAndEquipmentMember2022-12-310000863064ifrs-full:ConstructionInProgressMember2022-12-310000863064ifrs-full:GrossCarryingAmountMemberifrs-full:MiningAssetsMember2022-12-310000863064ifrs-full:GrossCarryingAmountMemberifrs-full:LandAndBuildingsMember2022-12-310000863064ifrs-full:GrossCarryingAmountMemberifrs-full:OtherPropertyPlantAndEquipmentMember2022-12-310000863064ifrs-full:GrossCarryingAmountMemberifrs-full:ConstructionInProgressMember2022-12-310000863064ifrs-full:AccumulatedDepreciationAmortisationAndImpairmentMemberifrs-full:MiningAssetsMember2022-12-310000863064ifrs-full:AccumulatedDepreciationAmortisationAndImpairmentMemberifrs-full:LandAndBuildingsMember2022-12-310000863064ifrs-full:OtherPropertyPlantAndEquipmentMemberifrs-full:AccumulatedDepreciationAmortisationAndImpairmentMember2022-12-310000863064ifrs-full:AccumulatedDepreciationAmortisationAndImpairmentMemberifrs-full:ConstructionInProgressMember2022-12-310000863064ifrs-full:MiningAssetsMember2020-12-310000863064ifrs-full:LandAndBuildingsMember2020-12-310000863064ifrs-full:OtherPropertyPlantAndEquipmentMember2020-12-310000863064ifrs-full:ConstructionInProgressMember2020-12-310000863064ifrs-full:MiningAssetsMember2021-01-012021-12-310000863064ifrs-full:LandAndBuildingsMember2021-01-012021-12-310000863064ifrs-full:OtherPropertyPlantAndEquipmentMember2021-01-012021-12-310000863064ifrs-full:ConstructionInProgressMember2021-01-012021-12-310000863064ifrs-full:GrossCarryingAmountMemberifrs-full:MiningAssetsMember2021-12-310000863064ifrs-full:GrossCarryingAmountMemberifrs-full:LandAndBuildingsMember2021-12-310000863064ifrs-full:GrossCarryingAmountMemberifrs-full:OtherPropertyPlantAndEquipmentMember2021-12-310000863064ifrs-full:GrossCarryingAmountMemberifrs-full:ConstructionInProgressMember2021-12-310000863064ifrs-full:AccumulatedDepreciationAmortisationAndImpairmentMemberifrs-full:MiningAssetsMember2021-12-310000863064ifrs-full:AccumulatedDepreciationAmortisationAndImpairmentMemberifrs-full:LandAndBuildingsMember2021-12-310000863064ifrs-full:OtherPropertyPlantAndEquipmentMemberifrs-full:AccumulatedDepreciationAmortisationAndImpairmentMember2021-12-310000863064ifrs-full:AccumulatedDepreciationAmortisationAndImpairmentMemberifrs-full:ConstructionInProgressMember2021-12-310000863064rio:CapitalisedProductionPhaseStrippingCostsMember2022-01-012022-12-310000863064rio:CapitalisedProductionPhaseStrippingCostsMemberrio:PropertyPlantAndEquipmentsMember2022-01-012022-12-310000863064rio:CapitalisedProductionPhaseStrippingCostsMemberifrs-full:InvestmentsAccountedForUsingEquityMethodMember2022-01-012022-12-310000863064rio:CapitalisedProductionPhaseStrippingCostsMember2021-01-012021-12-310000863064rio:CapitalisedProductionPhaseStrippingCostsMemberrio:PropertyPlantAndEquipmentsMember2021-01-012021-12-310000863064rio:CapitalisedProductionPhaseStrippingCostsMemberifrs-full:InvestmentsAccountedForUsingEquityMethodMember2021-01-012021-12-310000863064ifrs-full:SubsidiariesMemberrio:CapitalisedProductionPhaseStrippingCostsMember2022-01-012022-12-310000863064ifrs-full:SubsidiariesMemberrio:CapitalisedProductionPhaseStrippingCostsMember2021-01-012021-12-310000863064ifrs-full:SubsidiariesMemberrio:CapitalisedProductionPhaseStrippingCostsMember2020-01-012020-12-310000863064rio:FossilFuelsMember2022-01-012022-12-310000863064rio:FossilFuelsMember2021-01-012021-12-310000863064rio:FossilFuelsMemberifrs-full:LandAndBuildingsMember2022-12-310000863064rio:FossilFuelsMemberifrs-full:PropertyPlantAndEquipmentSubjectToOperatingLeasesMember2022-12-310000863064rio:FossilFuelsMemberifrs-full:LandAndBuildingsMember2021-12-310000863064rio:FossilFuelsMemberifrs-full:PropertyPlantAndEquipmentSubjectToOperatingLeasesMember2021-12-310000863064rio:RenewablesMemberifrs-full:LandAndBuildingsMember2022-12-310000863064rio:RenewablesMemberifrs-full:PropertyPlantAndEquipmentSubjectToOperatingLeasesMember2022-12-310000863064rio:RenewablesMemberifrs-full:LandAndBuildingsMember2021-12-310000863064rio:RenewablesMemberifrs-full:PropertyPlantAndEquipmentSubjectToOperatingLeasesMember2021-12-310000863064rio:RenewablesMemberifrs-full:PropertyPlantAndEquipmentSubjectToOperatingLeasesMember2022-01-012022-12-310000863064ifrs-full:PropertyPlantAndEquipmentSubjectToOperatingLeasesMember2022-12-310000863064ifrs-full:PropertyPlantAndEquipmentSubjectToOperatingLeasesMember2021-12-310000863064ifrs-full:PropertyPlantAndEquipmentSubjectToOperatingLeasesMember2022-01-012022-12-310000863064ifrs-full:PropertyPlantAndEquipmentSubjectToOperatingLeasesMember2021-01-012021-12-310000863064ifrs-full:ProvisionForDecommissioningRestorationAndRehabilitationCostsMember2021-12-310000863064ifrs-full:ProvisionForDecommissioningRestorationAndRehabilitationCostsMember2020-12-310000863064ifrs-full:ProvisionForDecommissioningRestorationAndRehabilitationCostsMember2022-01-012022-12-310000863064ifrs-full:ProvisionForDecommissioningRestorationAndRehabilitationCostsMember2021-01-012021-12-310000863064ifrs-full:ProvisionForDecommissioningRestorationAndRehabilitationCostsMember2022-12-310000863064ifrs-full:ProvisionForDecommissioningRestorationAndRehabilitationCostsMemberrio:DiavikDiamondMines2012IncMember2022-12-310000863064ifrs-full:ProvisionForDecommissioningRestorationAndRehabilitationCostsMemberrio:DiavikDiamondMines2012IncMember2021-12-31rio:Operation0000863064rio:RioTintoKennecottMember2022-01-012022-12-310000863064rio:RangerUraniumMineMember2021-01-012021-12-310000863064rio:OperatingSitesMember2022-12-310000863064rio:OperatingSitesMember2021-12-310000863064rio:NonOperatingSitesMember2022-12-310000863064rio:NonOperatingSitesMember2021-12-310000863064ifrs-full:NotLaterThanOneYearMember2022-12-310000863064ifrs-full:LaterThanOneYearAndNotLaterThanThreeYearsMember2022-12-310000863064ifrs-full:LaterThanThreeYearsAndNotLaterThanFiveYearsMember2022-12-310000863064ifrs-full:LaterThanFiveYearsMember2022-12-310000863064ifrs-full:NotLaterThanOneYearMember2021-12-310000863064ifrs-full:LaterThanOneYearAndNotLaterThanThreeYearsMember2021-12-310000863064ifrs-full:LaterThanThreeYearsAndNotLaterThanFiveYearsMember2021-12-310000863064ifrs-full:LaterThanFiveYearsMember2021-12-310000863064ifrs-full:BottomOfRangeMember2022-01-012022-12-310000863064ifrs-full:TopOfRangeMember2022-01-012022-12-310000863064rio:RioTintoKennecottMember2022-12-310000863064ifrs-full:RestructuringProvisionMember2022-01-012022-12-3100008630642020-09-302020-09-3000008630642020-01-012020-09-300000863064ifrs-full:TopOfRangeMember2022-12-310000863064ifrs-full:ProvisionForDecommissioningRestorationAndRehabilitationCostsMemberifrs-full:TopOfRangeMember2022-12-310000863064ifrs-full:ProvisionForDecommissioningRestorationAndRehabilitationCostsMemberifrs-full:TopOfRangeMember2022-01-012022-12-310000863064ifrs-full:BottomOfRangeMember2022-12-310000863064ifrs-full:ProvisionForDecommissioningRestorationAndRehabilitationCostsMemberifrs-full:BottomOfRangeMember2022-12-310000863064ifrs-full:ProvisionForDecommissioningRestorationAndRehabilitationCostsMemberifrs-full:BottomOfRangeMember2022-01-012022-12-310000863064rio:DecommissioningDecontaminationAndDemolitionMember2022-12-310000863064rio:DecommissioningDecontaminationAndDemolitionMember2021-12-310000863064rio:ClosureAndRehabilitationEarthworksMember2022-12-310000863064rio:ClosureAndRehabilitationEarthworksMember2021-12-310000863064rio:LongTermWaterManagementCostsMember2022-12-310000863064rio:LongTermWaterManagementCostsMember2021-12-310000863064rio:PostClosureMonitoringAndMaintenanceMember2022-12-310000863064rio:PostClosureMonitoringAndMaintenanceMember2021-12-310000863064rio:IndirectCostsOwnersCostsAndEstimatingContingencyMember2022-12-310000863064rio:IndirectCostsOwnersCostsAndEstimatingContingencyMember2021-12-310000863064rio:TaxLossesMember2022-12-310000863064rio:TaxLossesMember2021-12-310000863064rio:ProvisionsMember2022-12-310000863064rio:ProvisionsMember2021-12-310000863064rio:CapitalAllowancesMember2022-12-310000863064rio:CapitalAllowancesMember2021-12-310000863064rio:PostretirementBenefitsMember2022-12-310000863064rio:PostretirementBenefitsMember2021-12-310000863064ifrs-full:UnrealisedForeignExchangeGainsLossesMember2022-12-310000863064ifrs-full:UnrealisedForeignExchangeGainsLossesMember2021-12-310000863064ifrs-full:OtherTemporaryDifferencesMember2022-12-310000863064ifrs-full:OtherTemporaryDifferencesMember2021-12-310000863064rio:UnremittedEarningsMember2022-12-310000863064rio:UnremittedEarningsMember2021-12-310000863064rio:CapitalisedInterestMember2022-12-310000863064rio:CapitalisedInterestMember2021-12-310000863064ifrs-full:UnrealisedForeignExchangeGainsLossesMember2022-01-012022-12-310000863064ifrs-full:UnrealisedForeignExchangeGainsLossesMember2021-01-012021-12-310000863064rio:TaxLossesMember2022-01-012022-12-310000863064rio:TaxLossesMember2021-01-012021-12-310000863064rio:ProvisionsMember2022-01-012022-12-310000863064rio:ProvisionsMember2021-01-012021-12-310000863064rio:CapitalAllowancesMember2022-01-012022-12-310000863064rio:CapitalAllowancesMember2021-01-012021-12-310000863064rio:TaxOnUnremittedEarningsMember2022-01-012022-12-310000863064rio:TaxOnUnremittedEarningsMember2021-01-012021-12-310000863064rio:PostretirementBenefitsMember2022-01-012022-12-310000863064rio:PostretirementBenefitsMember2021-01-012021-12-310000863064ifrs-full:OtherTemporaryDifferencesMember2022-01-012022-12-310000863064ifrs-full:OtherTemporaryDifferencesMember2021-01-012021-12-310000863064ifrs-full:UnusedTaxLossesMember2022-12-310000863064ifrs-full:UnusedTaxLossesMember2021-12-310000863064ifrs-full:UnusedTaxLossesMemberifrs-full:NotLaterThanOneYearMember2022-12-310000863064ifrs-full:UnusedTaxLossesMemberifrs-full:NotLaterThanOneYearMember2021-12-310000863064ifrs-full:UnusedTaxLossesMemberifrs-full:NotLaterThanOneYearMember2022-01-012022-12-310000863064ifrs-full:UnusedTaxLossesMemberifrs-full:LaterThanOneYearAndNotLaterThanFiveYearsMember2022-12-310000863064ifrs-full:UnusedTaxLossesMemberifrs-full:LaterThanOneYearAndNotLaterThanFiveYearsMember2021-12-310000863064srt:MinimumMemberifrs-full:UnusedTaxLossesMemberifrs-full:LaterThanOneYearAndNotLaterThanFiveYearsMember2022-01-012022-12-310000863064srt:MaximumMemberifrs-full:UnusedTaxLossesMemberifrs-full:LaterThanOneYearAndNotLaterThanFiveYearsMember2022-01-012022-12-310000863064ifrs-full:UnusedTaxLossesMemberifrs-full:LaterThanFiveYearsMember2022-12-310000863064ifrs-full:UnusedTaxLossesMemberifrs-full:LaterThanFiveYearsMember2021-12-310000863064ifrs-full:UnusedTaxLossesMemberifrs-full:LaterThanFiveYearsMember2022-01-012022-12-310000863064country:FR2022-12-310000863064country:FR2021-12-310000863064country:MNrio:TaxLossesMember2022-12-310000863064country:MNrio:TaxLossesMember2021-12-310000863064country:MNrio:TaxLossesMember2022-01-012022-12-310000863064rio:RealisedOrUnrealisedCapitalLossesMember2022-12-310000863064rio:RealisedOrUnrealisedCapitalLossesMember2021-12-310000863064rio:RealisedOrUnrealisedCapitalLossesMember2022-01-012022-12-310000863064ifrs-full:PreviouslyStatedMember2022-01-012022-12-310000863064ifrs-full:PreviouslyStatedMember2021-01-012021-12-310000863064rio:TradePayablesSubjectToEarlySettlementElectionMember2022-12-310000863064rio:TradePayablesSubjectToEarlySettlementElectionMember2021-12-310000863064ifrs-full:LiquidityRiskMemberifrs-full:BottomOfRangeMember2022-12-310000863064ifrs-full:LiquidityRiskMemberifrs-full:TopOfRangeMember2022-12-310000863064rio:CapitalAndLiquidityRiskManagementMember2022-12-310000863064rio:CapitalAndLiquidityRiskManagementMember2021-12-310000863064ifrs-full:LiquidityRiskMemberrio:CreditFacilityDueNovember2026Member2021-11-160000863064ifrs-full:LaterThanOneYearAndNotLaterThanTwoYearsMember2022-12-310000863064ifrs-full:LaterThanTwoYearsAndNotLaterThanFiveYearsMember2022-12-310000863064ifrs-full:LaterThanOneYearAndNotLaterThanTwoYearsMember2021-12-310000863064ifrs-full:LaterThanTwoYearsAndNotLaterThanFiveYearsMember2021-12-310000863064ifrs-full:InterestRateRiskMember2022-01-012022-12-310000863064ifrs-full:InterestRateRiskMember2021-01-012021-12-310000863064rio:BorrowingsExcludingOverdraftMember2021-12-310000863064ifrs-full:LeaseLiabilitiesMember2021-12-310000863064rio:DebtRelatedDerivativesMember2021-12-310000863064rio:OverdraftOrCashMember2021-12-310000863064rio:OtherInvestmentMember2021-12-310000863064rio:BorrowingsExcludingOverdraftMember2022-01-012022-12-310000863064ifrs-full:LeaseLiabilitiesMember2022-01-012022-12-310000863064rio:DebtRelatedDerivativesMember2022-01-012022-12-310000863064rio:OverdraftOrCashMember2022-01-012022-12-310000863064rio:OtherInvestmentMember2022-01-012022-12-310000863064rio:BorrowingsExcludingOverdraftMember2022-12-310000863064ifrs-full:LeaseLiabilitiesMember2022-12-310000863064rio:DebtRelatedDerivativesMember2022-12-310000863064rio:OverdraftOrCashMember2022-12-310000863064rio:OtherInvestmentMember2022-12-310000863064rio:BorrowingsExcludingOverdraftMember2020-12-310000863064ifrs-full:LeaseLiabilitiesMember2020-12-310000863064rio:DebtRelatedDerivativesMember2020-12-310000863064rio:OverdraftOrCashMember2020-12-310000863064rio:OtherInvestmentMember2020-12-310000863064rio:BorrowingsExcludingOverdraftMember2021-01-012021-12-310000863064ifrs-full:LeaseLiabilitiesMember2021-01-012021-12-310000863064rio:DebtRelatedDerivativesMember2021-01-012021-12-310000863064rio:OverdraftOrCashMember2021-01-012021-12-310000863064rio:OtherInvestmentMember2021-01-012021-12-310000863064ifrs-full:CurrencyRiskMembercurrency:USD2022-12-310000863064ifrs-full:CurrencyRiskMembercurrency:USD2021-12-310000863064ifrs-full:CurrencyRiskMembercurrency:AUD2022-12-310000863064ifrs-full:CurrencyRiskMembercurrency:AUD2021-12-310000863064currency:CADifrs-full:CurrencyRiskMember2022-12-310000863064currency:CADifrs-full:CurrencyRiskMember2021-12-310000863064ifrs-full:CurrencyRiskMembercurrency:ZAR2022-12-310000863064ifrs-full:CurrencyRiskMembercurrency:ZAR2021-12-310000863064rio:OtherCurrencyMemberifrs-full:CurrencyRiskMember2022-12-310000863064rio:OtherCurrencyMemberifrs-full:CurrencyRiskMember2021-12-310000863064ifrs-full:CurrencyRiskMember2022-12-310000863064ifrs-full:CurrencyRiskMember2021-12-310000863064rio:BorrowingsinaHedgeRelationshipMemberifrs-full:InterestRateRiskMemberrio:RioTintoFinancePlcEuroBondsTwoPointEightSevenFivePercentageDueTwoThousandAndTwentyFourMember2022-12-310000863064rio:RioTintoFinancePlcEuroBondsTwoPointEightSevenFivePercentageDueTwoThousandAndTwentyFourMember2022-12-310000863064rio:RioTintoFinancePlcEuroBondsTwoPointEightSevenFivePercentageDueTwoThousandAndTwentyFourMember2021-12-310000863064rio:BorrowingsinaHedgeRelationshipMemberifrs-full:InterestRateRiskMemberrio:RioTintoFinancePlcEuroBondsTwoPointEightSevenFivePercentageDueTwoThousandAndTwentyFourMember2021-12-310000863064rio:BorrowingsinaHedgeRelationshipMemberifrs-full:InterestRateRiskMemberrio:RioTintoFinanceUSALimitedBondsSevenPointOneTwoFivePercentageTwoThousandAndTwentyEightMember2022-12-310000863064rio:RioTintoFinanceUSALimitedBondsSevenPointOneTwoFivePercentageTwoThousandAndTwentyEightMember2022-12-310000863064rio:RioTintoFinanceUSALimitedBondsSevenPointOneTwoFivePercentageTwoThousandAndTwentyEightMember2021-12-310000863064rio:BorrowingsinaHedgeRelationshipMemberifrs-full:InterestRateRiskMemberrio:RioTintoFinanceUSALimitedBondsSevenPointOneTwoFivePercentageTwoThousandAndTwentyEightMember2021-12-310000863064rio:BorrowingsinaHedgeRelationshipMemberifrs-full:InterestRateRiskMemberrio:AlcanIncDebenturesSevenPointTwoFivePercentageDueTwoThousandAndTwentyEightMember2022-12-310000863064rio:AlcanIncDebenturesSevenPointTwoFivePercentageDueTwoThousandAndTwentyEightMember2022-12-310000863064rio:AlcanIncDebenturesSevenPointTwoFivePercentageDueTwoThousandAndTwentyEightMember2021-12-310000863064rio:BorrowingsinaHedgeRelationshipMemberifrs-full:InterestRateRiskMemberrio:AlcanIncDebenturesSevenPointTwoFivePercentageDueTwoThousandAndTwentyEightMember2021-12-310000863064rio:BorrowingsinaHedgeRelationshipMemberifrs-full:InterestRateRiskMemberrio:RioTintoFinancePlcSterlingBondsFourPointZeroPercentageDueTwoThousandAndTwentyNineMember2022-12-310000863064rio:RioTintoFinancePlcSterlingBondsFourPointZeroPercentageDueTwoThousandAndTwentyNineMember2022-12-310000863064rio:RioTintoFinancePlcSterlingBondsFourPointZeroPercentageDueTwoThousandAndTwentyNineMember2021-12-310000863064rio:BorrowingsinaHedgeRelationshipMemberifrs-full:InterestRateRiskMemberrio:RioTintoFinancePlcSterlingBondsFourPointZeroPercentageDueTwoThousandAndTwentyNineMember2021-12-310000863064rio:BorrowingsinaHedgeRelationshipMemberifrs-full:InterestRateRiskMemberrio:AlcanIncDebenturesSevenPointTwoFivePercentageDueTwoThousandAndThirtyOneMember2022-12-310000863064rio:AlcanIncDebenturesSevenPointTwoFivePercentageDueTwoThousandAndThirtyOneMember2022-12-310000863064rio:AlcanIncDebenturesSevenPointTwoFivePercentageDueTwoThousandAndThirtyOneMember2021-12-310000863064rio:BorrowingsinaHedgeRelationshipMemberifrs-full:InterestRateRiskMemberrio:AlcanIncDebenturesSevenPointTwoFivePercentageDueTwoThousandAndThirtyOneMember2021-12-310000863064rio:BorrowingsinaHedgeRelationshipMemberifrs-full:InterestRateRiskMemberrio:AlcanIncGlobalNotesSixPointOneTwoFiveDueTwoThousandAndThirtyThreeMember2022-12-310000863064rio:AlcanIncGlobalNotesSixPointOneTwoFiveDueTwoThousandAndThirtyThreeMember2022-12-310000863064rio:AlcanIncGlobalNotesSixPointOneTwoFiveDueTwoThousandAndThirtyThreeMember2021-12-310000863064rio:BorrowingsinaHedgeRelationshipMemberifrs-full:InterestRateRiskMemberrio:AlcanIncGlobalNotesSixPointOneTwoFiveDueTwoThousandAndThirtyThreeMember2021-12-310000863064rio:BorrowingsinaHedgeRelationshipMemberifrs-full:InterestRateRiskMemberrio:AlcanIncGlobalNotesFivePointSevenFivePercentagesDueTwoThousandAndThirtyFiveMember2022-12-310000863064rio:AlcanIncGlobalNotesFivePointSevenFivePercentagesDueTwoThousandAndThirtyFiveMember2022-12-310000863064rio:AlcanIncGlobalNotesFivePointSevenFivePercentagesDueTwoThousandAndThirtyFiveMember2021-12-310000863064rio:BorrowingsinaHedgeRelationshipMemberifrs-full:InterestRateRiskMemberrio:AlcanIncGlobalNotesFivePointSevenFivePercentagesDueTwoThousandAndThirtyFiveMember2021-12-310000863064rio:RioTintoFinanceUSALimitedBondsFivePointTwoPercentageTwoThousandAndFortyMemberrio:BorrowingsinaHedgeRelationshipMemberifrs-full:InterestRateRiskMember2022-12-310000863064rio:RioTintoFinanceUSALimitedBondsFivePointTwoPercentageTwoThousandAndFortyMember2022-12-310000863064rio:RioTintoFinanceUSALimitedBondsFivePointTwoPercentageTwoThousandAndFortyMember2021-12-310000863064rio:RioTintoFinanceUSALimitedBondsFivePointTwoPercentageTwoThousandAndFortyMemberrio:BorrowingsinaHedgeRelationshipMemberifrs-full:InterestRateRiskMember2021-12-310000863064rio:BorrowingsinaHedgeRelationshipMemberifrs-full:InterestRateRiskMemberrio:RioTintoFinanceUsaPlcBondsFourPointSevenFivePercentageTwoThousandAndFortyTwoMember2022-12-310000863064rio:RioTintoFinanceUsaPlcBondsFourPointSevenFivePercentageTwoThousandAndFortyTwoMember2022-12-310000863064rio:RioTintoFinanceUsaPlcBondsFourPointSevenFivePercentageTwoThousandAndFortyTwoMember2021-12-310000863064rio:BorrowingsinaHedgeRelationshipMemberifrs-full:InterestRateRiskMemberrio:RioTintoFinanceUsaPlcBondsFourPointSevenFivePercentageTwoThousandAndFortyTwoMember2021-12-310000863064rio:BorrowingsinaHedgeRelationshipMemberifrs-full:InterestRateRiskMemberrio:RioTintoFinanceUSAPlcBondsFourPointOneTwoFiveTwoThousandAndFortyTwoMember2022-12-310000863064rio:RioTintoFinanceUSAPlcBondsFourPointOneTwoFiveTwoThousandAndFortyTwoMember2022-12-310000863064rio:RioTintoFinanceUSAPlcBondsFourPointOneTwoFiveTwoThousandAndFortyTwoMember2021-12-310000863064rio:BorrowingsinaHedgeRelationshipMemberifrs-full:InterestRateRiskMemberrio:RioTintoFinanceUSAPlcBondsFourPointOneTwoFiveTwoThousandAndFortyTwoMember2021-12-310000863064rio:RioTintoFinanceUSALimitedBondsTwoPointSevenFiveTwoThousandAndFiftyOneMemberrio:BorrowingsinaHedgeRelationshipMemberifrs-full:InterestRateRiskMember2022-12-310000863064rio:RioTintoFinanceUSALimitedBondsTwoPointSevenFiveTwoThousandAndFiftyOneMember2022-12-310000863064rio:RioTintoFinanceUSALimitedBondsTwoPointSevenFiveTwoThousandAndFiftyOneMemberrio:BorrowingsinaHedgeRelationshipMemberifrs-full:InterestRateRiskMember2021-12-310000863064rio:OyuTolgoiLLCMIGAInsuredLoanLIBORPlusTwoPointSixFivePercentageDueTwoThousandAndTwentySevenMember2022-12-310000863064rio:OyuTolgoiLLCMIGAInsuredLoanLIBORPlusTwoPointSixFivePercentageDueTwoThousandAndTwentySevenMember2021-12-310000863064rio:OyuTolgoiLLCCommercialBanksBLoanLIBORPlusThreePointFourPercentageDueTwoThousandAndTwentySevenMember2022-12-310000863064rio:OyuTolgoiLLCCommercialBanksBLoanLIBORPlusThreePointFourPercentageDueTwoThousandAndTwentySevenMember2021-12-310000863064rio:OyuTolgoiLLCExportCreditAgenciesLoanTwoPointThreePercentageDueTwoThousandAndTwentyEightMember2022-12-310000863064rio:OyuTolgoiLLCExportCreditAgenciesLoanTwoPointThreePercentageDueTwoThousandAndTwentyEightMember2021-12-310000863064rio:OyuTolgoiLLCExportCreditAgenciesLoanLIBORPlusThreePointSixFivePercentageDueTwoThousandAndTwentyNineMember2022-12-310000863064rio:OyuTolgoiLLCExportCreditAgenciesLoanLIBORPlusThreePointSixFivePercentageDueTwoThousandAndTwentyNineMember2021-12-310000863064rio:OyuTolgoiLLCInternationalFinancialInstitutionsALoanLIBORPlusThreePointSevenEightPercentageDueTwoThousandAndThirtyMember2022-12-310000863064rio:OyuTolgoiLLCInternationalFinancialInstitutionsALoanLIBORPlusThreePointSevenEightPercentageDueTwoThousandAndThirtyMember2021-12-310000863064rio:OtherSecuredLoansMember2022-12-310000863064rio:OtherSecuredLoansMember2021-12-310000863064rio:OtherUnsecuredLoansMember2022-12-310000863064rio:OtherUnsecuredLoansMember2021-12-310000863064rio:BankOverdraftMember2022-12-310000863064rio:BankOverdraftMember2021-12-310000863064rio:EuropeanDebtIssuanceProgrammeMember2022-12-310000863064rio:EuropeanDebtIssuanceProgrammeMember2021-12-310000863064rio:RioTintoFinanceUSALimitedBondsFivePointTwoPercentageTwoThousandAndFortyMemberrio:BorrowingsinaHedgeRelationshipMemberifrs-full:InterestRateRiskMember2022-11-020000863064rio:BorrowingsinaHedgeRelationshipMemberifrs-full:InterestRateRiskMember2022-12-310000863064rio:IFRS16Member2022-12-310000863064rio:IFRS16Member2021-12-310000863064ifrs-full:SubsidiariesMember2022-12-310000863064ifrs-full:SubsidiariesMember2021-12-310000863064rio:DerivativeFinancialInstrumentsNotRelatedToDebtMember2022-12-310000863064rio:DerivativeFinancialInstrumentsNotRelatedToDebtMember2021-12-310000863064rio:DerivativeFinancialInstrumentsRelatedToNetDebtMember2022-12-310000863064rio:DerivativeFinancialInstrumentsRelatedToNetDebtMember2021-12-310000863064rio:OtherFinancialLiabilityMember2022-12-310000863064rio:OtherFinancialLiabilityMember2021-12-310000863064rio:NetOtherFinancialLiabilitiesMember2022-12-310000863064rio:NetOtherFinancialLiabilitiesMember2021-12-310000863064ifrs-full:InterestRateRiskMemberifrs-full:FloatingInterestRateMember2022-12-310000863064ifrs-full:InterestRateRiskMemberifrs-full:FloatingInterestRateMember2021-12-310000863064rio:LIBOROrSOFRMemberifrs-full:InterestRateRiskMember2022-01-012022-12-310000863064ifrs-full:InterestRateRiskMemberrio:LondonInterbankOfferedRateMember2022-01-012022-12-310000863064ifrs-full:InterestRateRiskMemberrio:LondonInterbankOfferedRateMember2021-01-012021-12-310000863064ifrs-full:InterestRateRiskMembercurrency:GBP2022-01-012022-12-310000863064ifrs-full:InterestRateRiskMembercurrency:GBP2021-01-012021-12-310000863064ifrs-full:InterestRateRiskMembercurrency:USD2022-01-012022-12-310000863064ifrs-full:InterestRateRiskMembercurrency:USD2021-01-012021-12-310000863064rio:CopperMemberifrs-full:CommodityPriceRiskMember2022-12-31utr:lb0000863064rio:CopperMemberifrs-full:CommodityPriceRiskMember2021-12-310000863064rio:CopperMemberifrs-full:CommodityPriceRiskMemberifrs-full:Level3OfFairValueHierarchyMember2022-12-310000863064rio:CopperMemberifrs-full:CommodityPriceRiskMember2022-01-012022-12-310000863064rio:CopperMemberifrs-full:CommodityPriceRiskMember2021-01-012021-12-31utr:t0000863064ifrs-full:LaterThanOneYearAndNotLaterThanFiveYearsMember2022-12-310000863064ifrs-full:LaterThanFiveYearsAndNotLaterThanTenYearsMember2022-12-310000863064ifrs-full:LaterThanTenYearsMember2022-12-31rio:uSDollarPerTonne0000863064ifrs-full:LaterThanOneYearAndNotLaterThanFiveYearsMember2021-12-310000863064ifrs-full:LaterThanFiveYearsAndNotLaterThanTenYearsMember2021-12-310000863064ifrs-full:LaterThanTenYearsMember2021-12-310000863064rio:AluminiumForwardContractsEmbeddedInElectricityPurchaseContractsMember2022-12-310000863064rio:AluminiumForwardContractsEmbeddedInElectricityPurchaseContractsMember2022-01-012022-12-310000863064rio:HighlyProbableForecastAluminumSalesMember2022-12-310000863064rio:HighlyProbableForecastAluminumSalesMember2022-01-012022-12-310000863064ifrs-full:ReserveOfCashFlowHedgesMemberrio:HighlyProbableForecastAluminumSalesMember2022-01-012022-12-310000863064rio:AluminiumForwardContractsEmbeddedInElectricityPurchaseContractsMember2021-12-310000863064rio:AluminiumForwardContractsEmbeddedInElectricityPurchaseContractsMember2021-01-012021-12-310000863064rio:HighlyProbableForecastAluminumSalesMember2021-12-310000863064rio:HighlyProbableForecastAluminumSalesMember2021-01-012021-12-310000863064ifrs-full:ReserveOfCashFlowHedgesMemberrio:HighlyProbableForecastAluminumSalesMember2021-01-012021-12-310000863064ifrs-full:CommodityPriceRiskMemberrio:AluminiumMember2022-12-310000863064ifrs-full:CommodityPriceRiskMemberrio:AluminiumMember2021-12-310000863064ifrs-full:CurrencyRiskMember2022-01-012022-12-310000863064ifrs-full:CurrencyRiskMembercurrency:AUD2022-01-012022-12-310000863064currency:CADifrs-full:CurrencyRiskMember2022-01-012022-12-310000863064ifrs-full:CurrencyRiskMember2021-01-012021-12-310000863064ifrs-full:CurrencyRiskMembercurrency:AUD2021-01-012021-12-310000863064currency:CADifrs-full:CurrencyRiskMember2021-01-012021-12-310000863064ifrs-full:AtFairValueMember2022-12-310000863064ifrs-full:AtFairValueMemberifrs-full:Level1OfFairValueHierarchyMember2022-12-310000863064ifrs-full:Level2OfFairValueHierarchyMemberifrs-full:AtFairValueMember2022-12-310000863064ifrs-full:AtFairValueMemberifrs-full:Level3OfFairValueHierarchyMember2022-12-310000863064rio:NotHeldAtFairValueMember2022-12-310000863064ifrs-full:AtFairValueMember2021-12-310000863064ifrs-full:AtFairValueMemberifrs-full:Level1OfFairValueHierarchyMember2021-12-310000863064ifrs-full:Level2OfFairValueHierarchyMemberifrs-full:AtFairValueMember2021-12-310000863064ifrs-full:AtFairValueMemberifrs-full:Level3OfFairValueHierarchyMember2021-12-310000863064rio:NotHeldAtFairValueMember2021-12-310000863064ifrs-full:AtFairValueMemberrio:NotDesignatedAsHedgingInstrumentMember2022-12-310000863064ifrs-full:AtFairValueMemberifrs-full:Level1OfFairValueHierarchyMemberrio:NotDesignatedAsHedgingInstrumentMember2022-12-310000863064ifrs-full:Level2OfFairValueHierarchyMemberifrs-full:AtFairValueMemberrio:NotDesignatedAsHedgingInstrumentMember2022-12-310000863064ifrs-full:AtFairValueMemberifrs-full:Level3OfFairValueHierarchyMemberrio:NotDesignatedAsHedgingInstrumentMember2022-12-310000863064rio:NotDesignatedAsHedgingInstrumentMemberrio:NotHeldAtFairValueMember2022-12-310000863064ifrs-full:AtFairValueMemberrio:NotDesignatedAsHedgingInstrumentMember2021-12-310000863064ifrs-full:AtFairValueMemberifrs-full:Level1OfFairValueHierarchyMemberrio:NotDesignatedAsHedgingInstrumentMember2021-12-310000863064ifrs-full:Level2OfFairValueHierarchyMemberifrs-full:AtFairValueMemberrio:NotDesignatedAsHedgingInstrumentMember2021-12-310000863064ifrs-full:AtFairValueMemberifrs-full:Level3OfFairValueHierarchyMemberrio:NotDesignatedAsHedgingInstrumentMember2021-12-310000863064rio:NotDesignatedAsHedgingInstrumentMemberrio:NotHeldAtFairValueMember2021-12-310000863064ifrs-full:AtFairValueMemberifrs-full:HedgingInstrumentsMember2022-12-310000863064ifrs-full:AtFairValueMemberifrs-full:Level1OfFairValueHierarchyMemberifrs-full:HedgingInstrumentsMember2022-12-310000863064ifrs-full:Level2OfFairValueHierarchyMemberifrs-full:AtFairValueMemberifrs-full:HedgingInstrumentsMember2022-12-310000863064ifrs-full:AtFairValueMemberifrs-full:Level3OfFairValueHierarchyMemberifrs-full:HedgingInstrumentsMember2022-12-310000863064ifrs-full:HedgingInstrumentsMemberrio:NotHeldAtFairValueMember2022-12-310000863064ifrs-full:AtFairValueMemberifrs-full:HedgingInstrumentsMember2021-12-310000863064ifrs-full:AtFairValueMemberifrs-full:Level1OfFairValueHierarchyMemberifrs-full:HedgingInstrumentsMember2021-12-310000863064ifrs-full:Level2OfFairValueHierarchyMemberifrs-full:AtFairValueMemberifrs-full:HedgingInstrumentsMember2021-12-310000863064ifrs-full:AtFairValueMemberifrs-full:Level3OfFairValueHierarchyMemberifrs-full:HedgingInstrumentsMember2021-12-310000863064ifrs-full:HedgingInstrumentsMemberrio:NotHeldAtFairValueMember2021-12-310000863064ifrs-full:Level3OfFairValueHierarchyMember2021-12-310000863064ifrs-full:Level3OfFairValueHierarchyMember2020-12-310000863064ifrs-full:Level3OfFairValueHierarchyMember2022-01-012022-12-310000863064ifrs-full:Level3OfFairValueHierarchyMember2021-01-012021-12-310000863064ifrs-full:Level3OfFairValueHierarchyMember2022-12-310000863064ifrs-full:FinancialAssetsMeasuredAtFairValueThroughOtherComprehensiveIncomeCategoryMember2022-12-310000863064ifrs-full:FinancialAssetsMeasuredAtFairValueThroughOtherComprehensiveIncomeCategoryMember2021-12-310000863064ifrs-full:Level2OfFairValueHierarchyMemberifrs-full:DiscountedCashFlowMemberrio:ApplicableMarketQuotedSwapYieldCurvesAndCreditSpreadMeasurementInputMemberifrs-full:InterestRateSwapContractMember2022-12-310000863064ifrs-full:Level2OfFairValueHierarchyMemberifrs-full:DiscountedCashFlowMemberrio:ApplicableMarketQuotedSwapYieldCurvesCreditSpreadAndMarketQuotedForeignExchangeRateMeasurementInputMemberifrs-full:CurrencySwapContractMember2022-12-310000863064ifrs-full:Level2OfFairValueHierarchyMemberrio:CloselyRelatedListedProductMemberrio:ApplicableForwardQuotedMetalPricesMeasurementInputMemberrio:ProvisionallyPricedReceivablesMember2022-12-310000863064rio:DerivativesEmbeddedInElectricityContractsMemberifrs-full:OptionPricingModelMemberifrs-full:Level3OfFairValueHierarchyMemberrio:LMEForwardAluminumPriceAndMidwestPremiumAndBilletPremiumMeasurementInputMember2022-12-310000863064ifrs-full:DiscountedCashFlowMemberrio:ForwardCommodityPriceAndMineProductionMeasurementInputMemberrio:RoyaltyReceivablesMemberifrs-full:Level3OfFairValueHierarchyMember2022-12-310000863064rio:AluminiumForwardContractsEmbeddedInElectricityPurchaseContractsMemberifrs-full:Level3OfFairValueHierarchyMember2022-12-310000863064rio:AluminiumForwardContractsEmbeddedInElectricityPurchaseContractsMemberifrs-full:Level3OfFairValueHierarchyMember2021-12-310000863064srt:ScenarioForecastMember2022-01-012022-12-310000863064ifrs-full:Level1OfFairValueHierarchyMember2022-12-310000863064ifrs-full:Level1OfFairValueHierarchyMember2021-12-310000863064rio:AustraliaAndNewZealandMemberrio:SubsidiariesAndJointOperationsMember2022-01-012022-12-31rio:employee0000863064rio:AustraliaAndNewZealandMemberrio:SubsidiariesAndJointOperationsMember2021-01-012021-12-310000863064rio:AustraliaAndNewZealandMemberrio:SubsidiariesAndJointOperationsMember2020-01-012020-12-310000863064rio:AustraliaAndNewZealandMemberifrs-full:InvestmentsAccountedForUsingEquityMethodMember2022-01-012022-12-310000863064rio:AustraliaAndNewZealandMemberifrs-full:InvestmentsAccountedForUsingEquityMethodMember2021-01-012021-12-310000863064rio:AustraliaAndNewZealandMemberifrs-full:InvestmentsAccountedForUsingEquityMethodMember2020-01-012020-12-310000863064country:CArio:SubsidiariesAndJointOperationsMember2022-01-012022-12-310000863064country:CArio:SubsidiariesAndJointOperationsMember2021-01-012021-12-310000863064country:CArio:SubsidiariesAndJointOperationsMember2020-01-012020-12-310000863064country:CAifrs-full:InvestmentsAccountedForUsingEquityMethodMember2022-01-012022-12-310000863064country:CAifrs-full:InvestmentsAccountedForUsingEquityMethodMember2021-01-012021-12-310000863064country:CAifrs-full:InvestmentsAccountedForUsingEquityMethodMember2020-01-012020-12-310000863064country:GBrio:SubsidiariesAndJointOperationsMember2022-01-012022-12-310000863064country:GBrio:SubsidiariesAndJointOperationsMember2021-01-012021-12-310000863064country:GBrio:SubsidiariesAndJointOperationsMember2020-01-012020-12-310000863064country:GBifrs-full:InvestmentsAccountedForUsingEquityMethodMember2022-01-012022-12-310000863064country:GBifrs-full:InvestmentsAccountedForUsingEquityMethodMember2021-01-012021-12-310000863064country:GBifrs-full:InvestmentsAccountedForUsingEquityMethodMember2020-01-012020-12-310000863064rio:EuropeMemberMemberrio:SubsidiariesAndJointOperationsMember2022-01-012022-12-310000863064rio:EuropeMemberMemberrio:SubsidiariesAndJointOperationsMember2021-01-012021-12-310000863064rio:EuropeMemberMemberrio:SubsidiariesAndJointOperationsMember2020-01-012020-12-310000863064rio:EuropeMemberMemberifrs-full:InvestmentsAccountedForUsingEquityMethodMember2022-01-012022-12-310000863064rio:EuropeMemberMemberifrs-full:InvestmentsAccountedForUsingEquityMethodMember2021-01-012021-12-310000863064rio:EuropeMemberMemberifrs-full:InvestmentsAccountedForUsingEquityMethodMember2020-01-012020-12-310000863064srt:AfricaMemberrio:SubsidiariesAndJointOperationsMember2022-01-012022-12-310000863064srt:AfricaMemberrio:SubsidiariesAndJointOperationsMember2021-01-012021-12-310000863064srt:AfricaMemberrio:SubsidiariesAndJointOperationsMember2020-01-012020-12-310000863064srt:AfricaMemberifrs-full:InvestmentsAccountedForUsingEquityMethodMember2022-01-012022-12-310000863064srt:AfricaMemberifrs-full:InvestmentsAccountedForUsingEquityMethodMember2021-01-012021-12-310000863064srt:AfricaMemberifrs-full:InvestmentsAccountedForUsingEquityMethodMember2020-01-012020-12-310000863064country:USrio:SubsidiariesAndJointOperationsMember2022-01-012022-12-310000863064country:USrio:SubsidiariesAndJointOperationsMember2021-01-012021-12-310000863064country:USrio:SubsidiariesAndJointOperationsMember2020-01-012020-12-310000863064country:USifrs-full:InvestmentsAccountedForUsingEquityMethodMember2022-01-012022-12-310000863064country:USifrs-full:InvestmentsAccountedForUsingEquityMethodMember2021-01-012021-12-310000863064country:USifrs-full:InvestmentsAccountedForUsingEquityMethodMember2020-01-012020-12-310000863064country:MNrio:SubsidiariesAndJointOperationsMember2022-01-012022-12-310000863064country:MNrio:SubsidiariesAndJointOperationsMember2021-01-012021-12-310000863064country:MNrio:SubsidiariesAndJointOperationsMember2020-01-012020-12-310000863064country:MNifrs-full:InvestmentsAccountedForUsingEquityMethodMember2022-01-012022-12-310000863064country:MNifrs-full:InvestmentsAccountedForUsingEquityMethodMember2021-01-012021-12-310000863064country:MNifrs-full:InvestmentsAccountedForUsingEquityMethodMember2020-01-012020-12-310000863064rio:SubsidiariesAndJointOperationsMembersrt:SouthAmericaMember2022-01-012022-12-310000863064rio:SubsidiariesAndJointOperationsMembersrt:SouthAmericaMember2021-01-012021-12-310000863064rio:SubsidiariesAndJointOperationsMembersrt:SouthAmericaMember2020-01-012020-12-310000863064srt:SouthAmericaMemberifrs-full:InvestmentsAccountedForUsingEquityMethodMember2022-01-012022-12-310000863064srt:SouthAmericaMemberifrs-full:InvestmentsAccountedForUsingEquityMethodMember2021-01-012021-12-310000863064srt:SouthAmericaMemberifrs-full:InvestmentsAccountedForUsingEquityMethodMember2020-01-012020-12-310000863064country:INrio:SubsidiariesAndJointOperationsMember2022-01-012022-12-310000863064country:INrio:SubsidiariesAndJointOperationsMember2021-01-012021-12-310000863064country:INrio:SubsidiariesAndJointOperationsMember2020-01-012020-12-310000863064country:INifrs-full:InvestmentsAccountedForUsingEquityMethodMember2022-01-012022-12-310000863064country:INifrs-full:InvestmentsAccountedForUsingEquityMethodMember2021-01-012021-12-310000863064country:INifrs-full:InvestmentsAccountedForUsingEquityMethodMember2020-01-012020-12-310000863064country:SGrio:SubsidiariesAndJointOperationsMember2022-01-012022-12-310000863064country:SGrio:SubsidiariesAndJointOperationsMember2021-01-012021-12-310000863064country:SGrio:SubsidiariesAndJointOperationsMember2020-01-012020-12-310000863064country:SGifrs-full:InvestmentsAccountedForUsingEquityMethodMember2022-01-012022-12-310000863064country:SGifrs-full:InvestmentsAccountedForUsingEquityMethodMember2021-01-012021-12-310000863064country:SGifrs-full:InvestmentsAccountedForUsingEquityMethodMember2020-01-012020-12-310000863064rio:OtherCountriesMemberrio:SubsidiariesAndJointOperationsMember2022-01-012022-12-310000863064rio:OtherCountriesMemberrio:SubsidiariesAndJointOperationsMember2021-01-012021-12-310000863064rio:OtherCountriesMemberrio:SubsidiariesAndJointOperationsMember2020-01-012020-12-310000863064rio:OtherCountriesMemberifrs-full:InvestmentsAccountedForUsingEquityMethodMember2022-01-012022-12-310000863064rio:OtherCountriesMemberifrs-full:InvestmentsAccountedForUsingEquityMethodMember2021-01-012021-12-310000863064rio:OtherCountriesMemberifrs-full:InvestmentsAccountedForUsingEquityMethodMember2020-01-012020-12-310000863064rio:SubsidiariesAndJointOperationsMember2022-01-012022-12-310000863064rio:SubsidiariesAndJointOperationsMember2021-01-012021-12-310000863064rio:SubsidiariesAndJointOperationsMember2020-01-012020-12-310000863064ifrs-full:InvestmentsAccountedForUsingEquityMethodMember2022-01-012022-12-310000863064ifrs-full:InvestmentsAccountedForUsingEquityMethodMember2021-01-012021-12-310000863064ifrs-full:InvestmentsAccountedForUsingEquityMethodMember2020-01-012020-12-310000863064rio:PensionsAndPostRetirementHealthCareMember2021-12-310000863064rio:OtherEmployeeEntitlementsMember2021-12-310000863064rio:PensionsAndPostRetirementHealthCareMember2022-01-012022-12-310000863064rio:OtherEmployeeEntitlementsMember2022-01-012022-12-310000863064rio:PensionsAndPostRetirementHealthCareMember2022-12-310000863064rio:OtherEmployeeEntitlementsMember2022-12-310000863064rio:OtherEmployeeEntitlementsMember2021-01-012021-12-310000863064rio:PerformanceSharePlansMember2022-01-012022-12-310000863064rio:PerformanceSharePlansMember2021-01-012021-12-310000863064rio:ManagementSharePlansMember2022-01-012022-12-310000863064rio:ManagementSharePlansMember2021-01-012021-12-310000863064rio:BonusDeferralPlansMemberrio:ExecutiveDirectorsAndProductGroupExecutivesMember2022-01-012022-12-310000863064rio:BonusDeferralPlansMember2022-01-012022-12-310000863064rio:BonusDeferralPlansMember2021-01-012021-12-310000863064rio:GlobalEmployeeSharePlansMember2022-01-012022-12-310000863064rio:GlobalEmployeeSharePlansMember2021-01-012021-12-310000863064rio:EquitysettledPlansMember2022-01-012022-12-310000863064rio:EquitysettledPlansMember2021-01-012021-12-310000863064rio:EquitysettledPlansMember2020-01-012020-12-310000863064rio:EquitysettledPlansMember2022-12-310000863064rio:EquitysettledPlansMember2021-12-310000863064rio:CashsettledPlansMember2022-01-012022-12-310000863064rio:CashsettledPlansMember2021-01-012021-12-310000863064rio:CashsettledPlansMember2020-01-012020-12-310000863064rio:CashsettledPlansMember2022-12-310000863064rio:CashsettledPlansMember2021-12-310000863064rio:PerformanceSharePlansMemberrio:RioTintoPlcMember2021-12-310000863064rio:PerformanceSharePlansMemberrio:RioTintoPlcMember2020-12-310000863064rio:RioTintoLimitedMemberrio:PerformanceSharePlansMember2021-12-310000863064rio:RioTintoLimitedMemberrio:PerformanceSharePlansMember2020-12-310000863064rio:PerformanceSharePlansMemberrio:RioTintoPlcMember2022-01-012022-12-310000863064rio:PerformanceSharePlansMemberrio:RioTintoPlcMember2021-01-012021-12-310000863064rio:RioTintoLimitedMemberrio:PerformanceSharePlansMember2022-01-012022-12-310000863064rio:RioTintoLimitedMemberrio:PerformanceSharePlansMember2021-01-012021-12-310000863064rio:PerformanceSharePlansMemberrio:RioTintoPlcMember2022-12-310000863064rio:RioTintoLimitedMemberrio:PerformanceSharePlansMember2022-12-310000863064rio:PerformanceSharePlansMemberrio:RioTintoPlcMemberifrs-full:TopOfRangeMember2021-12-310000863064rio:ShareIncentivePlansMember2022-01-012022-12-310000863064rio:ShareIncentivePlansMemberrio:RioTintoPlcMember2021-12-310000863064rio:ShareIncentivePlansMemberrio:RioTintoPlcMember2020-12-310000863064rio:ShareIncentivePlansMemberrio:RioTintoLimitedMember2021-12-310000863064rio:ShareIncentivePlansMemberrio:RioTintoLimitedMember2020-12-310000863064rio:ShareIncentivePlansMemberrio:RioTintoPlcMember2022-01-012022-12-310000863064rio:ShareIncentivePlansMemberrio:RioTintoPlcMember2021-01-012021-12-310000863064rio:ShareIncentivePlansMemberrio:RioTintoLimitedMember2022-01-012022-12-310000863064rio:ShareIncentivePlansMemberrio:RioTintoLimitedMember2021-01-012021-12-310000863064rio:ShareIncentivePlansMemberrio:RioTintoPlcMember2022-12-310000863064rio:ShareIncentivePlansMemberrio:RioTintoLimitedMember2022-12-310000863064rio:ManagementSharePlansMemberrio:RioTintoPlcMember2022-12-310000863064rio:ManagementSharePlansMemberrio:RioTintoPlcMember2021-12-310000863064rio:RioTintoLimitedMemberrio:ManagementSharePlansMember2022-12-310000863064rio:RioTintoLimitedMemberrio:ManagementSharePlansMember2021-12-310000863064rio:BonusDeferralPlansMemberrio:RioTintoPlcMember2022-12-310000863064rio:BonusDeferralPlansMemberrio:RioTintoPlcMember2021-12-310000863064rio:BonusDeferralPlansMemberrio:RioTintoLimitedMember2022-12-310000863064rio:BonusDeferralPlansMemberrio:RioTintoLimitedMember2021-12-310000863064rio:GlobalEmployeeSharePlansMemberrio:RioTintoPlcMember2022-12-310000863064rio:GlobalEmployeeSharePlansMemberrio:RioTintoPlcMember2021-12-310000863064rio:GlobalEmployeeSharePlansMemberrio:RioTintoLimitedMember2022-12-310000863064rio:GlobalEmployeeSharePlansMemberrio:RioTintoLimitedMember2021-12-310000863064rio:UkSharePlanMemberrio:RioTintoPlcMember2022-12-310000863064rio:UkSharePlanMemberrio:RioTintoPlcMember2021-12-310000863064rio:UkSharePlanMemberrio:RioTintoLimitedMember2022-12-310000863064rio:UkSharePlanMemberrio:RioTintoLimitedMember2021-12-310000863064rio:ManagementSharePlansMemberrio:RioTintoPlcMember2022-01-012022-12-310000863064rio:ManagementSharePlansMemberrio:RioTintoPlcMember2021-01-012021-12-310000863064rio:RioTintoLimitedMemberrio:ManagementSharePlansMember2022-01-012022-12-310000863064rio:RioTintoLimitedMemberrio:ManagementSharePlansMember2021-01-012021-12-310000863064rio:BonusDeferralPlansMemberrio:RioTintoPlcMember2022-01-012022-12-310000863064rio:BonusDeferralPlansMemberrio:RioTintoPlcMember2021-01-012021-12-310000863064rio:BonusDeferralPlansMemberrio:RioTintoLimitedMember2022-01-012022-12-310000863064rio:BonusDeferralPlansMemberrio:RioTintoLimitedMember2021-01-012021-12-310000863064rio:GlobalEmployeeSharePlansMemberrio:RioTintoPlcMember2022-01-012022-12-310000863064rio:GlobalEmployeeSharePlansMemberrio:RioTintoPlcMember2021-01-012021-12-310000863064rio:GlobalEmployeeSharePlansMemberrio:RioTintoLimitedMember2022-01-012022-12-310000863064rio:GlobalEmployeeSharePlansMemberrio:RioTintoLimitedMember2021-01-012021-12-310000863064rio:UkSharePlanMemberrio:RioTintoPlcMember2022-01-012022-12-310000863064rio:UkSharePlanMemberrio:RioTintoPlcMember2021-01-012021-12-310000863064rio:UkSharePlanMemberrio:RioTintoLimitedMember2022-01-012022-12-310000863064rio:UkSharePlanMemberrio:RioTintoLimitedMember2021-01-012021-12-310000863064rio:ShareIncentivePlansMember2022-12-310000863064rio:ShareIncentivePlansMemberifrs-full:TopOfRangeMember2021-12-310000863064ifrs-full:PensionDefinedBenefitPlansMember2022-01-012022-12-310000863064ifrs-full:PostemploymentMedicalDefinedBenefitPlansMember2022-01-012022-12-310000863064country:CAifrs-full:PensionDefinedBenefitPlansMember2022-01-012022-12-310000863064country:CAifrs-full:PostemploymentMedicalDefinedBenefitPlansMember2022-01-012022-12-310000863064country:GBifrs-full:PensionDefinedBenefitPlansMember2022-01-012022-12-310000863064ifrs-full:PostemploymentMedicalDefinedBenefitPlansMembercountry:GB2022-01-012022-12-310000863064country:USifrs-full:PensionDefinedBenefitPlansMember2022-01-012022-12-310000863064country:USifrs-full:PostemploymentMedicalDefinedBenefitPlansMember2022-01-012022-12-310000863064country:CHifrs-full:PensionDefinedBenefitPlansMember2022-01-012022-12-310000863064country:CHifrs-full:PostemploymentMedicalDefinedBenefitPlansMember2022-01-012022-12-310000863064country:CH2022-01-012022-12-310000863064country:CH2021-01-012021-12-310000863064country:CH2020-01-012020-12-310000863064rio:OtherCountriesMemberifrs-full:PensionDefinedBenefitPlansMember2022-01-012022-12-310000863064ifrs-full:PostemploymentMedicalDefinedBenefitPlansMemberrio:OtherCountriesMember2022-01-012022-12-310000863064ifrs-full:PlanAssetsMemberifrs-full:PensionDefinedBenefitPlansMember2022-12-310000863064rio:OtherDefinedBenefitPlansMemberifrs-full:PlanAssetsMember2022-12-310000863064ifrs-full:PlanAssetsMember2022-12-310000863064ifrs-full:PlanAssetsMember2021-12-310000863064ifrs-full:PresentValueOfDefinedBenefitObligationMemberifrs-full:WhollyOrPartlyFundedDefinedBenefitPlansMemberifrs-full:PensionDefinedBenefitPlansMember2022-12-310000863064ifrs-full:PresentValueOfDefinedBenefitObligationMemberifrs-full:WhollyOrPartlyFundedDefinedBenefitPlansMemberrio:OtherDefinedBenefitPlansMember2022-12-310000863064ifrs-full:PresentValueOfDefinedBenefitObligationMemberifrs-full:WhollyOrPartlyFundedDefinedBenefitPlansMember2022-12-310000863064ifrs-full:PresentValueOfDefinedBenefitObligationMemberifrs-full:WhollyOrPartlyFundedDefinedBenefitPlansMember2021-12-310000863064ifrs-full:PresentValueOfDefinedBenefitObligationMemberifrs-full:WhollyUnfundedDefinedBenefitPlansMemberifrs-full:PensionDefinedBenefitPlansMember2022-12-310000863064ifrs-full:PresentValueOfDefinedBenefitObligationMemberifrs-full:WhollyUnfundedDefinedBenefitPlansMemberrio:OtherDefinedBenefitPlansMember2022-12-310000863064ifrs-full:PresentValueOfDefinedBenefitObligationMemberifrs-full:WhollyUnfundedDefinedBenefitPlansMember2022-12-310000863064ifrs-full:PresentValueOfDefinedBenefitObligationMemberifrs-full:WhollyUnfundedDefinedBenefitPlansMember2021-12-310000863064ifrs-full:PresentValueOfDefinedBenefitObligationMemberifrs-full:PensionDefinedBenefitPlansMember2022-12-310000863064ifrs-full:PresentValueOfDefinedBenefitObligationMemberrio:OtherDefinedBenefitPlansMember2022-12-310000863064ifrs-full:PresentValueOfDefinedBenefitObligationMember2022-12-310000863064ifrs-full:PresentValueOfDefinedBenefitObligationMember2021-12-310000863064ifrs-full:PensionDefinedBenefitPlansMember2022-12-310000863064rio:OtherDefinedBenefitPlansMember2022-12-310000863064ifrs-full:WhollyUnfundedDefinedBenefitPlansMemberifrs-full:PensionDefinedBenefitPlansMember2022-12-310000863064ifrs-full:WhollyUnfundedDefinedBenefitPlansMemberrio:OtherDefinedBenefitPlansMember2022-12-310000863064ifrs-full:WhollyUnfundedDefinedBenefitPlansMember2022-12-310000863064ifrs-full:WhollyUnfundedDefinedBenefitPlansMember2021-12-310000863064rio:OtherDefinedBenefitPlansMember2022-01-012022-12-310000863064ifrs-full:PresentValueOfDefinedBenefitObligationMembercountry:FR2021-01-012021-12-310000863064ifrs-full:PensionDefinedBenefitPlansMember2021-12-310000863064rio:OtherDefinedBenefitPlansMember2021-12-310000863064ifrs-full:PresentValueOfDefinedBenefitObligationMemberifrs-full:PensionDefinedBenefitPlansMember2021-12-310000863064ifrs-full:PresentValueOfDefinedBenefitObligationMemberrio:OtherDefinedBenefitPlansMember2021-12-310000863064ifrs-full:PresentValueOfDefinedBenefitObligationMember2020-12-310000863064ifrs-full:PresentValueOfDefinedBenefitObligationMemberifrs-full:PensionDefinedBenefitPlansMember2022-01-012022-12-310000863064ifrs-full:PresentValueOfDefinedBenefitObligationMemberrio:OtherDefinedBenefitPlansMember2022-01-012022-12-310000863064ifrs-full:PresentValueOfDefinedBenefitObligationMember2022-01-012022-12-310000863064ifrs-full:PresentValueOfDefinedBenefitObligationMember2021-01-012021-12-310000863064ifrs-full:PlanAssetsMemberifrs-full:PensionDefinedBenefitPlansMember2021-12-310000863064rio:OtherDefinedBenefitPlansMemberifrs-full:PlanAssetsMember2021-12-310000863064ifrs-full:PlanAssetsMember2020-12-310000863064ifrs-full:PlanAssetsMemberifrs-full:PensionDefinedBenefitPlansMember2022-01-012022-12-310000863064rio:OtherDefinedBenefitPlansMemberifrs-full:PlanAssetsMember2022-01-012022-12-310000863064ifrs-full:PlanAssetsMember2022-01-012022-12-310000863064ifrs-full:PlanAssetsMember2021-01-012021-12-310000863064country:CH2022-12-310000863064country:CH2021-12-310000863064rio:HealthcarePlansMember2022-12-310000863064rio:HealthcarePlansMember2021-12-310000863064ifrs-full:ActuarialAssumptionOfDiscountRatesMemberifrs-full:PensionDefinedBenefitPlansMember2021-12-310000863064ifrs-full:ActuarialAssumptionOfDiscountRatesMemberrio:OtherRetirementBenefitsMember2021-12-310000863064ifrs-full:ActuarialAssumptionOfDiscountRatesMemberrio:OtherRetirementBenefitsMember2022-12-310000863064ifrs-full:ActuarialAssumptionOfDiscountRatesMemberifrs-full:PensionDefinedBenefitPlansMember2022-12-310000863064ifrs-full:ActuarialAssumptionOfExpectedRatesOfInflationMemberifrs-full:PensionDefinedBenefitPlansMember2021-12-310000863064ifrs-full:ActuarialAssumptionOfExpectedRatesOfInflationMemberrio:OtherRetirementBenefitsMember2021-12-310000863064ifrs-full:ActuarialAssumptionOfExpectedRatesOfInflationMemberifrs-full:PensionDefinedBenefitPlansMember2022-12-310000863064ifrs-full:ActuarialAssumptionOfExpectedRatesOfInflationMemberrio:OtherRetirementBenefitsMember2022-12-310000863064rio:ActuarialAssumptionOfAllowanceForFutureImprovementsInLongevityMemberifrs-full:PensionDefinedBenefitPlansMember2021-01-012021-12-310000863064rio:OtherRetirementBenefitsMemberrio:ActuarialAssumptionOfAllowanceForFutureImprovementsInLongevityMember2022-01-012022-12-310000863064rio:ActuarialAssumptionOfAllowanceForFutureImprovementsInLongevityMemberifrs-full:PensionDefinedBenefitPlansMember2022-01-012022-12-310000863064rio:OtherRetirementBenefitsMemberrio:ActuarialAssumptionOfAllowanceForFutureImprovementsInLongevityMember2021-01-012021-12-310000863064rio:ActuarialAssumptionOfAllowanceForFutureImprovementsInLongevityMemberifrs-full:PensionDefinedBenefitPlansMember2022-12-310000863064rio:OtherRetirementBenefitsMemberrio:ActuarialAssumptionOfAllowanceForFutureImprovementsInLongevityMember2022-12-310000863064rio:ActuarialAssumptionOfAllowanceForFutureImprovementsInLongevityMemberifrs-full:PensionDefinedBenefitPlansMember2021-12-310000863064rio:OtherRetirementBenefitsMemberrio:ActuarialAssumptionOfAllowanceForFutureImprovementsInLongevityMember2021-12-310000863064rio:DefinedBenefitPlanMember2022-01-012022-12-31rio:director0000863064rio:DefinedBenefitPlanMember2021-01-012021-12-310000863064rio:DefinedBenefitPlanMember2020-01-012020-12-310000863064rio:DefinedContributionPlansMember2022-01-012022-12-310000863064rio:DefinedContributionPlansMember2021-01-012021-12-310000863064rio:DefinedContributionPlansMember2020-01-012020-12-310000863064rio:ClassASharesMemberrio:ArgyleDiamondsLimitedMember2022-01-012022-12-310000863064rio:ArgyleDiamondsLimitedMemberrio:BClassOfSharesMember2022-01-012022-12-310000863064rio:DampierSaltLimitedMemberifrs-full:OrdinarySharesMember2022-01-012022-12-310000863064rio:EnergyResourcesOfAustraliaLtdMemberifrs-full:OrdinarySharesMember2022-01-012022-12-310000863064rio:HamersleyIronPtyLimitedMemberifrs-full:OrdinarySharesMember2022-01-012022-12-310000863064rio:NorthMiningLimitedMemberifrs-full:OrdinarySharesMember2022-01-012022-12-310000863064rio:NorthMiningLimitedMemberrio:PreferredSharesMember2022-01-012022-12-310000863064ifrs-full:OrdinarySharesMemberrio:RioTintoAluminiumHoldingsLimitedMember2022-01-012022-12-310000863064rio:ClassASharesMemberrio:RobeRiverMiningCoPtyLtdMember2022-01-012022-12-310000863064rio:ClassAandClassBSharesMemberrio:RobeRiverMiningCoPtyLtdMember2022-01-012022-12-310000863064rio:RobeRiverMiningCoPtyLtdMemberrio:BClassOfSharesMember2022-01-012022-12-310000863064rio:QuotaSharesMemberrio:RioTintoDoBrasilLtdaMember2022-01-012022-12-310000863064rio:CommonSharesMemberrio:DiavikDiamondMines2012IncMember2022-01-012022-12-310000863064rio:SeriesASharesMemberrio:IronOreCompanyOfCanadaMember2022-01-012022-12-310000863064rio:IronOreCompanyOfCanadaMemberrio:SeriesAEAndFSharesMember2022-01-012022-12-310000863064rio:SeriesESharesMemberrio:IronOreCompanyOfCanadaMember2022-01-012022-12-310000863064rio:IronOreCompanyOfCanadaMemberrio:SeriesFSharesMember2022-01-012022-12-310000863064rio:CommonSharesMemberrio:RioTintoAlcanMember2022-01-012022-12-310000863064rio:CommonSharesMemberrio:RioTintoFerEtTitaneIncMember2022-01-012022-12-310000863064rio:RioTintoFerEtTitaneIncMemberrio:ClassBPreferenceSharesMember2022-01-012022-12-310000863064rio:RioTintoFerEtTitaneIncMemberrio:PreferredSharesMember2022-01-012022-12-310000863064rio:SimferJerseyLimitedMemberifrs-full:OrdinarySharesMember2022-01-012022-12-310000863064rio:CommonSharesMemberrio:QitMadagascarMineralsSaMember2022-01-012022-12-310000863064rio:CommonSharesAndInvestmentCertificatesMemberrio:QitMadagascarMineralsSaMember2022-01-012022-12-310000863064rio:InvestmentCertificatesMemberrio:QitMadagascarMineralsSaMember2022-01-012022-12-310000863064rio:CommonSharesMemberrio:OyuTolgoiLlcMember2022-01-012022-12-310000863064rio:BOrdinarySharesMemberrio:RichardsBayTitaniumProprietaryLimitedMember2022-01-012022-12-310000863064rio:BOrdinaryBPreferenceAndParentPreferenceSharesMemberrio:RichardsBayTitaniumProprietaryLimitedMember2022-01-012022-12-310000863064rio:BPreferenceSharesMemberrio:RichardsBayTitaniumProprietaryLimitedMember2022-01-012022-12-310000863064rio:ParentPreferenceSharesMemberrio:RichardsBayTitaniumProprietaryLimitedMember2022-01-012022-12-310000863064rio:RichardsBayMiningProprietaryLimitedMemberrio:BOrdinarySharesMember2022-01-012022-12-310000863064rio:RichardsBayMiningProprietaryLimitedMemberrio:BOrdinaryBPreferenceAndParentPreferenceSharesMember2022-01-012022-12-310000863064rio:RichardsBayMiningProprietaryLimitedMemberrio:BPreferenceSharesMember2022-01-012022-12-310000863064rio:ParentPreferenceSharesMemberrio:RichardsBayMiningProprietaryLimitedMember2022-01-012022-12-310000863064rio:KennecottHoldingsCorporationIncludingKennecottUtahCopperKennecottLandAndKennecottExplorationMemberrio:CommonSharesMember2022-01-012022-12-310000863064rio:CommonSharesMemberrio:UsBoraxIncMember2022-01-012022-12-310000863064rio:RobeRiverMiningCoPtyLtdMember2022-01-012022-12-310000863064rio:RobeRiverIronAssociatesMemberrio:RobeRiverMiningCoPtyLtdMember2022-01-012022-12-310000863064rio:RobeRiverIronAssociatesMemberrio:NorthMiningLimitedMember2022-01-012022-12-310000863064rio:RobeRiverIronAssociatesMember2022-01-012022-12-310000863064rio:ConsrcioDeAlumnioDoMaranhoMember2022-01-012022-12-310000863064rio:SimferSaMember2022-01-012022-12-310000863064rio:QitMadagascarMineralsSaMember2022-01-012022-12-310000863064rio:OyuTolgoiLlcMember2022-12-162022-12-160000863064rio:TurquoiseHillResourcesLtdMember2021-01-012021-12-310000863064rio:OyuTolgoiLlcMemberrio:TurquoiseHillResourcesLtdMember2021-01-012021-12-310000863064rio:OyuTolgoiLlcMember2021-01-012021-12-310000863064rio:IronOreCompanyOfCanadaMember2022-01-012022-12-310000863064rio:IronOreCompanyOfCanadaMember2021-01-012021-12-310000863064rio:OyuTolgoiLlcMember2022-01-012022-12-310000863064rio:OyuTolgoiLlcMember2021-01-012021-12-310000863064rio:IronOreCompanyOfCanadaMember2022-12-310000863064rio:IronOreCompanyOfCanadaMember2021-12-310000863064rio:OyuTolgoiLlcMember2022-12-310000863064rio:OyuTolgoiLlcMember2021-12-310000863064rio:RobeRiverMiningCoPtyLtdMember2021-01-012021-12-310000863064rio:OtherCompaniesAndEliminationsMember2022-01-012022-12-310000863064rio:OtherCompaniesAndEliminationsMember2021-01-012021-12-310000863064rio:RobeRiverIronAssociatesMember2022-01-012022-12-310000863064rio:RobeRiverIronAssociatesMember2021-01-012021-12-310000863064rio:RobeRiverMiningCoPtyLtdMember2022-12-310000863064rio:RobeRiverMiningCoPtyLtdMember2021-12-310000863064rio:OtherCompaniesAndEliminationsMember2022-12-310000863064rio:OtherCompaniesAndEliminationsMember2021-12-310000863064rio:RobeRiverIronAssociatesMember2022-12-310000863064rio:RobeRiverIronAssociatesMember2021-12-310000863064rio:RobeRiverIronAssociatesMemberrio:NorthMiningLimitedMember2022-12-310000863064rio:RobeRiverIronAssociatesMemberrio:NorthMiningLimitedMember2021-12-310000863064rio:AmendedandRestatedShareholdersAgreementAmendedJune082011Memberrio:ErdenesOyuTolgoiLlcMember2022-01-252022-01-250000863064rio:HopeDownsJointVentureMember2022-01-012022-12-310000863064rio:GladstonePowerStationJointVentureMember2022-01-012022-12-310000863064rio:TomagoAluminiumJointVentureMember2022-01-012022-12-310000863064rio:PilbaraIronArrangementMember2022-01-012022-12-310000863064rio:QueenslandAluminaLimitedMember2022-01-012022-12-310000863064rio:NewZealandAluminiumSmeltersLimitedMember2022-01-012022-12-310000863064rio:AluminerieAlouetteIncMember2022-01-012022-12-310000863064rio:PechineyReynoldsQuebecIncMember2022-01-012022-12-310000863064rio:AluminerieDeBcancourIncMemberrio:PechineyReynoldsQuebecIncMember2022-01-012022-12-310000863064rio:AluminerieDeBcancourIncMember2022-01-012022-12-310000863064rio:QueenslandAluminaLimitedMemberrio:RioTintoMember2022-01-012022-12-310000863064rio:RUSALMemberrio:QueenslandAluminaLimitedMember2022-01-012022-12-310000863064rio:QueenslandAluminaLimitedMemberrio:RioTintoMember2022-04-020000863064rio:MineraEscondidaLimitadaMember2022-01-012022-12-310000863064rio:SoharAluminiumCoLlcMemberifrs-full:OrdinarySharesMember2022-12-310000863064rio:SoharAluminiumCoLlcMemberifrs-full:OrdinarySharesMember2022-01-012022-12-310000863064rio:SoharAluminiumCoLlcMember2022-01-012022-12-310000863064rio:MineraEscondidaLimitadaMemberrio:BhpBillitonMember2022-01-012022-12-310000863064rio:MineraEscondidaLimitadaMember2021-01-012021-12-310000863064rio:SoharAluminiumCoLlcMember2021-01-012021-12-310000863064rio:MineraEscondidaLimitadaMember2022-12-310000863064rio:MineraEscondidaLimitadaMember2021-12-310000863064rio:SoharAluminiumCoLlcMember2022-12-310000863064rio:SoharAluminiumCoLlcMember2021-12-310000863064ifrs-full:InvestmentsAccountedForUsingEquityMethodMember2022-12-310000863064ifrs-full:InvestmentsAccountedForUsingEquityMethodMember2021-12-310000863064rio:BoyneSmeltersLimitedMember2022-01-012022-12-310000863064rio:BoyneSmeltersLimitedMemberifrs-full:OrdinarySharesMember2022-01-012022-12-310000863064rio:BoyneSmeltersLimitedMemberifrs-full:OrdinarySharesMember2022-12-310000863064rio:MineracaoRioDoNorteSaMember2022-01-012022-12-310000863064rio:MineracaoRioDoNorteSaMemberifrs-full:PreferenceSharesMember2022-01-012022-12-310000863064rio:MineracaoRioDoNorteSaMemberifrs-full:OrdinarySharesMember2022-12-310000863064rio:MineracaoRioDoNorteSaMemberifrs-full:OrdinarySharesMember2022-01-012022-12-310000863064rio:OrdinaryAndPreferredSharesMemberrio:MineracaoRioDoNorteSaMember2022-01-012022-12-310000863064rio:MineracaoRioDoNorteSaMemberifrs-full:PreferenceSharesMember2022-12-310000863064rio:HalcoMiningIncMember2022-01-012022-12-310000863064rio:CommonSharesMemberrio:HalcoMiningIncMember2022-01-012022-12-310000863064rio:CommonSharesMemberrio:HalcoMiningIncMember2022-12-310000863064rio:CompagnieDesBauxitesDeGuineMemberrio:HalcoMiningIncMember2022-01-012022-12-310000863064ifrs-full:AssociatesMember2022-12-310000863064ifrs-full:AssociatesMember2021-12-310000863064ifrs-full:AssociatesMember2022-01-012022-12-310000863064ifrs-full:AssociatesMember2021-01-012021-12-310000863064ifrs-full:InvestmentsAccountedForUsingEquityMethodMember2020-12-310000863064rio:RioTintoPlcMember2020-12-310000863064rio:RioTintoPlcMember2019-12-310000863064rio:SharesHeldByPublicMemberrio:RioTintoPlcMember2021-12-310000863064rio:SharesHeldByPublicMemberrio:RioTintoPlcMember2020-12-310000863064rio:SharesHeldByPublicMemberrio:RioTintoPlcMember2019-12-310000863064rio:SharesHeldByPublicMemberrio:RioTintoPlcMember2022-01-012022-12-310000863064rio:SharesHeldByPublicMemberrio:RioTintoPlcMember2021-01-012021-12-310000863064rio:SharesHeldByPublicMemberrio:RioTintoPlcMember2020-01-012020-12-310000863064rio:SharesHeldByPublicMemberrio:RioTintoPlcMember2022-12-310000863064rio:SpecialVotingSharesMemberrio:RioTintoPlcMember2022-01-012022-12-310000863064rio:SpecialVotingSharesMemberrio:RioTintoPlcMember2021-01-012021-12-310000863064rio:SpecialVotingSharesMemberrio:RioTintoPlcMember2020-01-012020-12-310000863064rio:DualListedCompaniesDividendSharesMemberrio:RioTintoPlcMember2022-01-012022-12-310000863064rio:DualListedCompaniesDividendSharesMemberrio:RioTintoPlcMember2021-01-012021-12-310000863064rio:DualListedCompaniesDividendSharesMemberrio:RioTintoPlcMember2020-01-012020-12-310000863064rio:ShareOfRioTintoPlcAndAmericanDepositoryReceiptsMember2022-01-012022-12-310000863064rio:ShareOfRioTintoPlcAndAmericanDepositoryReceiptsMember2021-01-012021-12-310000863064rio:ShareOfRioTintoPlcAndAmericanDepositoryReceiptsMember2020-01-012020-12-310000863064rio:AmericanDepositoryReceiptsMemberrio:RioTintoPlcMember2022-12-310000863064rio:RioTintoLimitedMember2019-12-310000863064rio:SpecialVotingSharesMemberrio:RioTintoLimitedMember2022-01-012022-12-310000863064rio:SpecialVotingSharesMemberrio:RioTintoLimitedMember2021-01-012021-12-310000863064rio:SpecialVotingSharesMemberrio:RioTintoLimitedMember2020-01-012020-12-310000863064rio:DualListedCompaniesDividendSharesMemberrio:RioTintoLimitedMember2022-01-012022-12-310000863064rio:DualListedCompaniesDividendSharesMemberrio:RioTintoLimitedMember2021-01-012021-12-310000863064rio:DualListedCompaniesDividendSharesMemberrio:RioTintoLimitedMember2020-01-012020-12-310000863064ifrs-full:CapitalRedemptionReserveMember2022-12-310000863064ifrs-full:CapitalRedemptionReserveMember2021-12-310000863064ifrs-full:CapitalRedemptionReserveMember2020-12-310000863064ifrs-full:CapitalRedemptionReserveMember2019-12-310000863064ifrs-full:ReserveOfCashFlowHedgesMember2021-12-310000863064ifrs-full:ReserveOfCashFlowHedgesMember2020-12-310000863064ifrs-full:ReserveOfCashFlowHedgesMember2019-12-310000863064ifrs-full:ReserveOfCashFlowHedgesMember2022-01-012022-12-310000863064ifrs-full:ReserveOfCashFlowHedgesMember2021-01-012021-12-310000863064ifrs-full:ReserveOfCashFlowHedgesMember2020-01-012020-12-310000863064ifrs-full:ReserveOfCashFlowHedgesMember2022-12-310000863064ifrs-full:ReserveOfGainsAndLossesOnFinancialAssetsMeasuredAtFairValueThroughOtherComprehensiveIncomeMember2021-12-310000863064ifrs-full:ReserveOfGainsAndLossesOnFinancialAssetsMeasuredAtFairValueThroughOtherComprehensiveIncomeMember2020-12-310000863064ifrs-full:ReserveOfGainsAndLossesOnFinancialAssetsMeasuredAtFairValueThroughOtherComprehensiveIncomeMember2019-12-310000863064ifrs-full:ReserveOfGainsAndLossesOnFinancialAssetsMeasuredAtFairValueThroughOtherComprehensiveIncomeMember2022-01-012022-12-310000863064ifrs-full:ReserveOfGainsAndLossesOnFinancialAssetsMeasuredAtFairValueThroughOtherComprehensiveIncomeMember2021-01-012021-12-310000863064ifrs-full:ReserveOfGainsAndLossesOnFinancialAssetsMeasuredAtFairValueThroughOtherComprehensiveIncomeMember2020-01-012020-12-310000863064ifrs-full:ReserveOfGainsAndLossesOnFinancialAssetsMeasuredAtFairValueThroughOtherComprehensiveIncomeMember2022-12-310000863064rio:CostsOfHedgingReserveMember2021-12-310000863064rio:CostsOfHedgingReserveMember2020-12-310000863064rio:CostsOfHedgingReserveMember2019-12-310000863064rio:CostsOfHedgingReserveMember2022-01-012022-12-310000863064rio:CostsOfHedgingReserveMember2021-01-012021-12-310000863064rio:CostsOfHedgingReserveMember2020-01-012020-12-310000863064rio:CostsOfHedgingReserveMember2022-12-310000863064ifrs-full:MiscellaneousOtherReservesMember2021-12-310000863064ifrs-full:MiscellaneousOtherReservesMember2020-12-310000863064ifrs-full:MiscellaneousOtherReservesMember2019-12-310000863064ifrs-full:MiscellaneousOtherReservesMember2022-01-012022-12-310000863064ifrs-full:MiscellaneousOtherReservesMember2021-01-012021-12-310000863064ifrs-full:MiscellaneousOtherReservesMember2020-01-012020-12-310000863064ifrs-full:MiscellaneousOtherReservesMember2022-12-310000863064ifrs-full:ReserveOfExchangeDifferencesOnTranslationMember2021-12-310000863064ifrs-full:ReserveOfExchangeDifferencesOnTranslationMember2020-12-310000863064ifrs-full:ReserveOfExchangeDifferencesOnTranslationMember2019-12-310000863064ifrs-full:ReserveOfExchangeDifferencesOnTranslationMember2022-01-012022-12-310000863064ifrs-full:ReserveOfExchangeDifferencesOnTranslationMember2021-01-012021-12-310000863064ifrs-full:ReserveOfExchangeDifferencesOnTranslationMember2020-01-012020-12-310000863064ifrs-full:ReserveOfExchangeDifferencesOnTranslationMember2022-12-310000863064ifrs-full:IncreaseDecreaseDueToChangesInAccountingPolicyRequiredByIFRSsCumulativeEffectAtDateOfInitialApplicationMemberifrs-full:RetainedEarningsMember2020-12-310000863064ifrs-full:IncreaseDecreaseDueToChangesInAccountingPolicyRequiredByIFRSsCumulativeEffectAtDateOfInitialApplicationMemberifrs-full:RetainedEarningsMember2019-12-310000863064ifrs-full:OpeningBalanceAfterAdjustmentCumulativeEffectAtDateOfInitialApplicationMemberifrs-full:RetainedEarningsMember2020-12-310000863064ifrs-full:OpeningBalanceAfterAdjustmentCumulativeEffectAtDateOfInitialApplicationMemberifrs-full:RetainedEarningsMember2019-12-310000863064ifrs-full:MergerReserveMember2022-12-310000863064ifrs-full:MiscellaneousOtherProvisionsMember2021-12-310000863064ifrs-full:MiscellaneousOtherProvisionsMember2020-12-310000863064ifrs-full:MiscellaneousOtherProvisionsMember2022-01-012022-12-310000863064ifrs-full:MiscellaneousOtherProvisionsMember2021-01-012021-12-310000863064ifrs-full:MiscellaneousOtherProvisionsMember2022-12-310000863064rio:RioTintoFinanceUsaLimitedAndRioTintoFinanceUsaPlcMemberifrs-full:ContingentLiabilitiesOfJointVentureMember2022-01-012022-12-310000863064ifrs-full:ContingentLiabilitiesOfJointVentureMemberrio:RioTintoCoalMozambiqueRTCMMember2022-03-062022-03-060000863064ifrs-full:NotLaterThanOneYearMemberifrs-full:JointVenturesMember2022-12-310000863064ifrs-full:NotLaterThanOneYearMemberifrs-full:JointVenturesMember2021-12-310000863064ifrs-full:LaterThanOneYearAndNotLaterThanThreeYearsMemberifrs-full:JointVenturesMember2022-12-310000863064ifrs-full:LaterThanOneYearAndNotLaterThanThreeYearsMemberifrs-full:JointVenturesMember2021-12-310000863064ifrs-full:JointVenturesMember2022-12-310000863064ifrs-full:JointVenturesMember2021-12-310000863064ifrs-full:LaterThanTwoYearsAndNotLaterThanThreeYearsMember2022-12-310000863064ifrs-full:LaterThanTwoYearsAndNotLaterThanThreeYearsMember2021-12-310000863064ifrs-full:LaterThanThreeYearsAndNotLaterThanFourYearsMember2022-12-310000863064ifrs-full:LaterThanThreeYearsAndNotLaterThanFourYearsMember2021-12-310000863064ifrs-full:LaterThanFourYearsAndNotLaterThanFiveYearsMember2022-12-310000863064ifrs-full:LaterThanFourYearsAndNotLaterThanFiveYearsMember2021-12-310000863064rio:RioTintoFinanceUsaLimitedAndRioTintoFinanceUsaPlcMemberifrs-full:ContingentLiabilitiesOfJointVentureMemberrio:BondMemberifrs-full:FinancialGuaranteeContractsMember2022-12-310000863064rio:RioTintoFinanceUsaLimitedAndRioTintoFinanceUsaPlcMemberifrs-full:ContingentLiabilitiesOfJointVentureMemberrio:BondMemberifrs-full:FinancialGuaranteeContractsMember2021-12-310000863064rio:RioTintoFinanceUsaLimitedAndRioTintoFinanceUsaPlcMemberifrs-full:ContingentLiabilitiesOfJointVentureMemberifrs-full:DebtSecuritiesMemberifrs-full:FinancialGuaranteeContractsMember2022-12-310000863064rio:RioTintoFinanceUsaLimitedAndRioTintoFinanceUsaPlcMemberifrs-full:ContingentLiabilitiesOfJointVentureMemberifrs-full:DebtSecuritiesMemberifrs-full:FinancialGuaranteeContractsMember2021-12-310000863064rio:RioTintoFinanceUsaLimitedAndRioTintoFinanceUsaPlcMemberifrs-full:ContingentLiabilitiesOfJointVentureMemberifrs-full:FinancialGuaranteeContractsMember2022-12-310000863064rio:RioTintoFinanceUsaLimitedAndRioTintoFinanceUsaPlcMemberifrs-full:ContingentLiabilitiesOfJointVentureMemberifrs-full:FinancialGuaranteeContractsMember2021-12-310000863064rio:OyuTolgoiLlcMember2022-12-310000863064rio:OyuTolgoiLlcMember2021-12-310000863064rio:OyuTolgoiLlcMember2022-01-012022-12-310000863064rio:ErdenesOyuTolgoiLlcMember2022-01-012022-12-310000863064ifrs-full:ParentMember2022-01-012022-12-310000863064ifrs-full:ParentMember2021-01-012021-12-310000863064ifrs-full:ParentMember2020-01-012020-12-310000863064ifrs-full:SubsidiariesMember2022-01-012022-12-310000863064ifrs-full:SubsidiariesMember2021-01-012021-12-310000863064ifrs-full:SubsidiariesMember2020-01-012020-12-310000863064rio:KPMGMember2022-01-012022-12-310000863064rio:KPMGMember2021-01-012021-12-310000863064rio:KPMGMember2020-01-012020-12-310000863064rio:OyuTolgoiLlcMemberrio:RefinancedProjectFinanceFacilityMember2023-02-160000863064rio:OyuTolgoiLlcMemberrio:RefinancedProjectFinanceFacilityMember2023-02-162023-02-160000863064ifrs-full:IncreaseDecreaseDueToChangesInAccountingPolicyRequiredByIFRSsMemberifrs-full:ProvisionForDecommissioningRestorationAndRehabilitationCostsMember2022-12-310000863064ifrs-full:IncreaseDecreaseDueToChangesInAccountingPolicyRequiredByIFRSsMemberifrs-full:CapitalisedDevelopmentExpenditureMember2022-12-310000863064ifrs-full:IncreaseDecreaseDueToChangesInAccountingPolicyRequiredByIFRSsMemberifrs-full:LeaseLiabilitiesMember2022-12-310000863064ifrs-full:IncreaseDecreaseDueToChangesInAccountingPolicyRequiredByIFRSsMemberifrs-full:RightofuseAssetsMember2022-12-310000863064ifrs-full:IncreaseDecreaseDueToChangesInAccountingPolicyRequiredByIFRSsMember2022-12-310000863064ifrs-full:IncreaseDecreaseDueToChangesInAccountingPolicyRequiredByIFRSsMember2022-01-012022-12-310000863064rio:DepreciationOfClosureAndRightOfUseAssetsAndSettlementOfCloseAndLeaseLiabilitiesMemberifrs-full:IncreaseDecreaseDueToChangesInAccountingPolicyRequiredByIFRSsMember2022-01-012022-12-310000863064rio:DepreciationOfClosureAndRightOfUseAssetsAndSettlementOfCloseAndLeaseLiabilitiesMemberifrs-full:IncreaseDecreaseDueToChangesInAccountingPolicyRequiredByIFRSsMember2021-01-012021-12-310000863064rio:DerecognitionOfDeferredTaxAssetsMemberifrs-full:IncreaseDecreaseDueToChangesInAccountingPolicyRequiredByIFRSsMember2022-01-012022-12-310000863064rio:DerecognitionOfDeferredTaxAssetsMemberifrs-full:IncreaseDecreaseDueToChangesInAccountingPolicyRequiredByIFRSsMember2021-01-012021-12-31
UNITED STATES
SECURITIES AND EXCHANGE COMMISSION
WASHINGTON, DC 20549
FORM 20-F
(Mark One) | | | | | |
| ☐ | REGISTRATION STATEMENT PURSUANT TO SECTION 12(b) OR 12(g) OF THE SECURITIES EXCHANGE ACT OF 1934 |
or | | | | | |
☒ | ANNUAL REPORT PURSUANT TO SECTION 13 OR 15(d) OF THE SECURITIES EXCHANGE ACT OF 1934 For the fiscal year ended: December 31, 2022 |
or | | | | | |
☐ | TRANSITION REPORT PURSUANT TO SECTION 13 OR 15(d) OF THE SECURITIES EXCHANGE ACT OF 1934 For the transition period from: to |
or | | | | | |
☐ | SHELL COMPANY REPORT PURSUANT TO SECTION 13 OR 15(d) OF THE SECURITIES EXCHANGE ACT OF 1934 Date of event requiring this shell company report |
| | | | | |
Commission file number: 001-10533 | Commission file number: 001-34121 |
| |
| Rio Tinto plc | Rio Tinto Limited ABN 96 004 458 404 |
| (Exact Name of Registrant as Specified in Its Charter) | (Exact Name of Registrant as Specified in Its Charter) |
| |
England and Wales (Jurisdiction of Incorporation or Organization) | Victoria, Australia (Jurisdiction of Incorporation or Organization) |
| |
6 St. James's Square London, SW1Y 4AD, United Kingdom (Address of Principal Executive Offices) | Level 43, 120 Collins Street Melbourne, Victoria 3000, Australia (Address of Principal Executive Offices) |
Julie Parent, T: 514-848-8519, E: julie.parent@riotinto.com
(Name, Telephone, E-mail and/or Facsimile number and Address of Company Contact Person)
Securities registered or to be registered pursuant to Section 12(b) of the Act: | | | | | | | | |
| Title of Each Class | Trading Symbol | Name of Each Exchange On Which Registered |
American Depositary Shares* Ordinary Shares of 10p each** 7.125% Notes due 2028 5.200% Notes due 2040 4.750% Notes due 2042 4.125% Notes due 2042 2.750% Notes due 2051 | RIO | New York Stock Exchange New York Stock Exchange New York Stock Exchange New York Stock Exchange New York Stock Exchange New York Stock Exchange New York Stock Exchange |
| | | | | |
| * | Evidenced by American Depositary Receipts. Each American Depositary Share Represents one Rio Tinto plc Ordinary Shares of 10p each. |
| ** | Not for trading, but only in connection with the listing of American Depositary Shares, pursuant to the requirements of the Securities and Exchange Commission |
Securities registered or to be registered pursuant to Section 12(g) of the Act: | | | | | | | | | | | |
| Title of Class | | | Title of Class Shares |
| None | | | None |
Securities for which there is a reporting obligation pursuant to Section 15(d) of the Act: | | | | | | | | | | | |
| Title of Class | | | Title of Class of Shares |
| None | | | None |
Indicate the number of outstanding shares of each of the issuer’s classes of capital or common stock as of the close of the period
covered by the annual report: | | | | | | | | | | | |
| Title of each class | Rio Tinto plc - Number | Rio Tinto Limited - Number | Title of each class |
| Ordinary Shares of 10p each | 1,255,843,808 | 371,216,214 | Shares |
| DLC Dividend Share of 10p | 1 | 1 | DLC Dividend Share |
| Special Voting Share of 10p | 1 | 1 | Special Voting Share |
Indicate by check mark if the registrants are well-known seasoned issuers, as defined in rule 405 of the Securities Act.
Yes ☒ No ☐
If this report is an annual or transition report, indicate by check mark if the registrants are not required to file reports pursuant to
Section 13 or 15(d) of the Securities Exchange Act of 1934.
Yes ☐ No ☒
Note – Checking the box above will not relieve any registrant required to file reports pursuant to Section 13 or 15(d) of the Securities
Exchange Act of 1934 from their obligations under those Sections.
Indicate by check mark whether the registrants (1) have filed all reports required to be filed by Section 13 or 15(d) of the Securities
Exchange Act of 1934 during the preceding 12 months (or for such shorter period that the registrants were required to file such
reports), and (2) have been subject to such filing requirements for the past 90 days:
Yes ☒ No ☐
Indicate by check mark whether the registrants have submitted electronically every
Interactive Data File required to be submitted pursuant to Rule 405 of Regulation S-T (§ 232.405 of this chapter) during
the preceding 12 months (or for such shorter period that the registrants were required to submit such files).
Yes ☒ No ☐
Indicate by check mark whether the registrants are large accelerated filers, accelerated filers, non-accelerated filers, or emerging growth companies. See definition
of “large accelerated filer”, “accelerated filer” and “emerging growth company” and in Rule 12b-2 of the Exchange Act.: | | | | | | | | |
Large Accelerated Filer ☒ | Accelerated Filer ☐ | Non-Accelerated Filer ☐ |
| | Emerging growth company ☐ |
If an emerging growth company that prepares its financial statements in accordance with U.S. GAAP, indicate by check mark
if the registrants have elected not to use the extended transition period for complying with any new or revised
financial accounting standards* provided pursuant to Section 13(a) of the Exchange Act. ☐
*The term “new or revised financial accounting standard” refers to any update issued by the Financial Accounting Standards
Board to its Accounting Standards Codification after April 5, 2012.
Indicate by check mark whether the registrants have filed a report on and attestation to their management’s assessment of the
effectiveness of its internal control over financial reporting under Section 404(b) of the Sarbanes-Oxley Act (15 U.S.C.
7262(b)) by the registered public accounting firm that prepared or issued their audit report. ☒
If securities are registered pursuant to Section 12(b) of the Act, indicate by check mark whether the financial statements of the
registrant included in the filing reflect the correction of an error to previously issued financial statements.
Yes ☐ No ☐
Indicate by check mark whether any of those error corrections are restatements that required a recovery analysis of incentive-based compensation received by any of the registrants' executive officers during the relevant recovery period pursuant to §240.10D-1(b).
Yes ☐ No ☐
Indicate by check mark which basis of accounting the registrants have used to prepare the financial statements included in this filing:
US GAAP ☐ International Financial Reporting Standards as issued by the International Accounting Standards Board ☒
Other ☐
If “Other” has been checked in response to the previous question, indicate by check mark which financial statement item the
registrants have elected to follow:
Item 17 ☐ Item 18 ☐
If this is an annual report, indicate by check mark whether the registrants are a shell company (as defined in Rule 12b-2 of the Exchange
Act).
Yes ☐ No ☒
(APPLICABLE ONLY TO ISSUERS INVOLVED IN BANKRUPTCY PROCEEDINGS DURING THE PAST FIVE YEARS)
Indicate by check mark whether the registrant has filed all documents and reports required to be filed by Sections 12, 13 or
15(d) of the Securities Exchange Act of 1934 subsequent to the distribution of securities under a plan confirmed by a court.
Yes ☐ No ☐
| | | | | | | | |
| Auditor Name | Auditor Location | Auditor Firm ID |
| KPMG LLP | London, United Kingdom | 1118 |
| KPMG | Perth, Australia | 1020 |
| | |
| | |
Annual Report on Form 20-F 2022
iAnnual Report on Form 20-F | riotinto.com Form 20-F cross-reference guide Item Form 20-F Caption Location in this document Page 1 Identity of directors, senior management and advisers Not applicable – 2 Offer statistics and expected timetable Not applicable – 3 Key information 3.A – [Reserved] Not applicable – 3.B – Capitalisation and indebtedness Not applicable – 3.C – Reason for the offer and use of proceeds Not applicable – 3.D – Risk factors Risk factors 79-86 4 Information on the company 4.A – History and development of the company Contents Cover At a glance 2-3 150 years of Rio Tinto 4-5 Chair’s statement 6-7 Chief Executive’s Q&A 8-9 Strategic context 12 Our stakeholders 18-19 Key performance indicators 20-24 Chief Financial Officer’s statement 25 Financial review 26-31 Portfolio management 32-33 Business reviews – Innovation through collaboration – Iron Ore – Aluminium – Copper – Minerals – Commercial 34-35 36-37 38-39 40-41 42-43 44-45 Our approach to sustainability 46-75 Governance – Additional statutory disclosure – Operating and financial review 136-137 Financial statements – Note 1 – Our financial performance by segment – Note 5 – Acquisitions and disposals 161-163 169 Rio Tinto Financial Information by Business Unit 270-272 Shareholder Information – Organisational structure – Nomenclature and financial data – History – Dual-listed companies structure 338 338 338 338-339 Additional information – US disclosure – Document on display – Registered offices 348 362
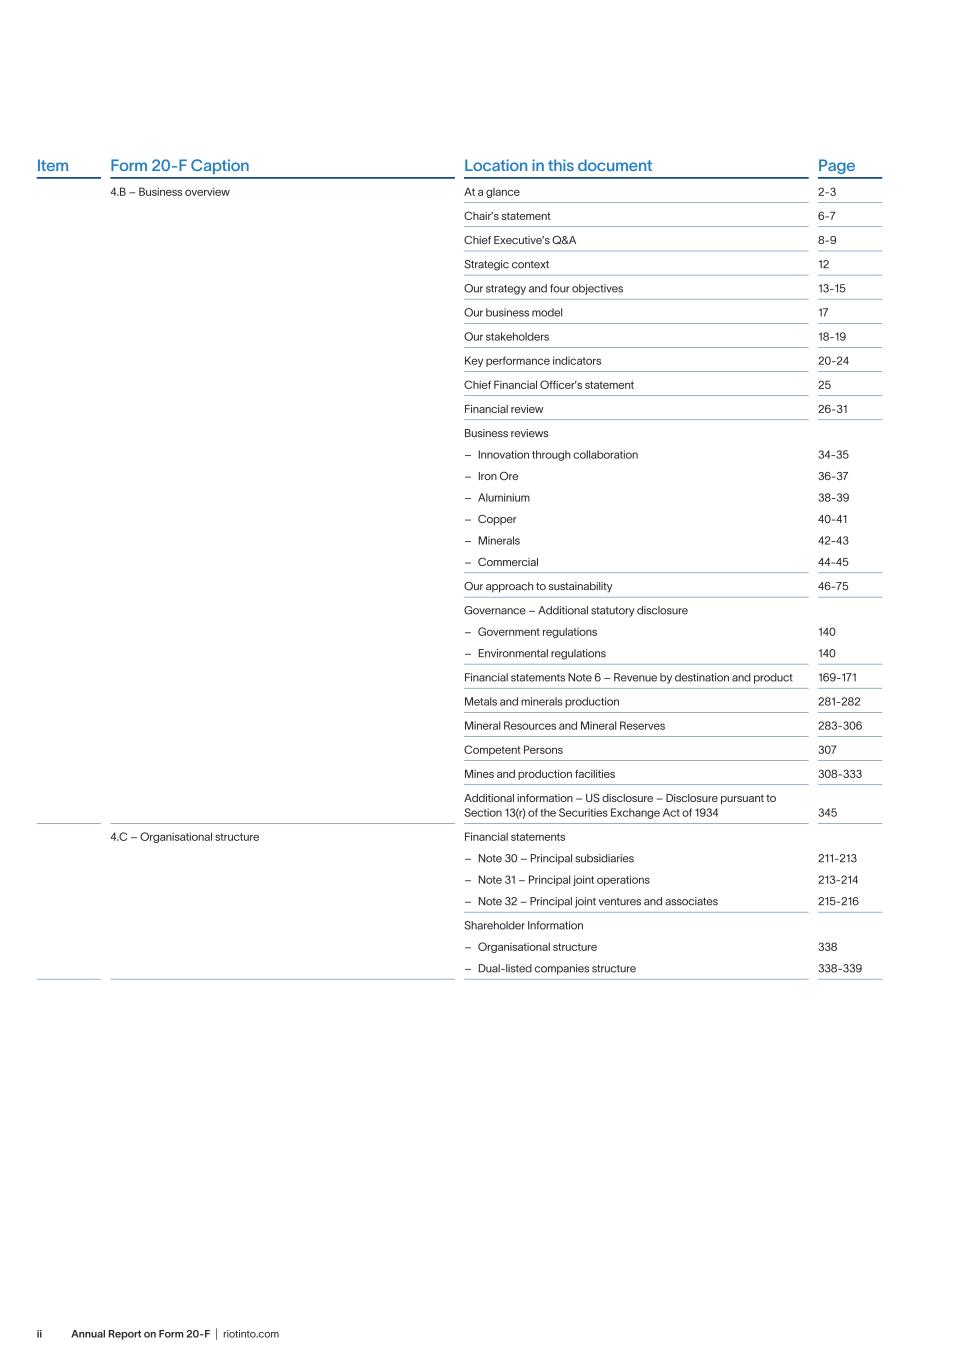
Annual Report on Form 20-F | riotinto.comii Item Form 20-F Caption Location in this document Page 4.B – Business overview At a glance 2-3 Chair’s statement 6-7 Chief Executive’s Q&A 8-9 Strategic context 12 Our strategy and four objectives 13-15 Our business model 17 Our stakeholders 18-19 Key performance indicators 20-24 Chief Financial Officer’s statement 25 Financial review 26-31 Business reviews – Innovation through collaboration – Iron Ore – Aluminium – Copper – Minerals – Commercial 34-35 36-37 38-39 40-41 42-43 44-45 Our approach to sustainability 46-75 Governance – Additional statutory disclosure – Government regulations – Environmental regulations 140 140 Financial statements Note 6 – Revenue by destination and product 169-171 Metals and minerals production 281-282 Mineral Resources and Mineral Reserves 283-306 Competent Persons 307 Mines and production facilities 308-333 Additional information – US disclosure – Disclosure pursuant to Section 13(r) of the Securities Exchange Act of 1934 345 4.C – Organisational structure Financial statements – Note 30 – Principal subsidiaries – Note 31 – Principal joint operations – Note 32 – Principal joint ventures and associates 211-213 213-214 215-216 Shareholder Information – Organisational structure – Dual-listed companies structure 338 338-339
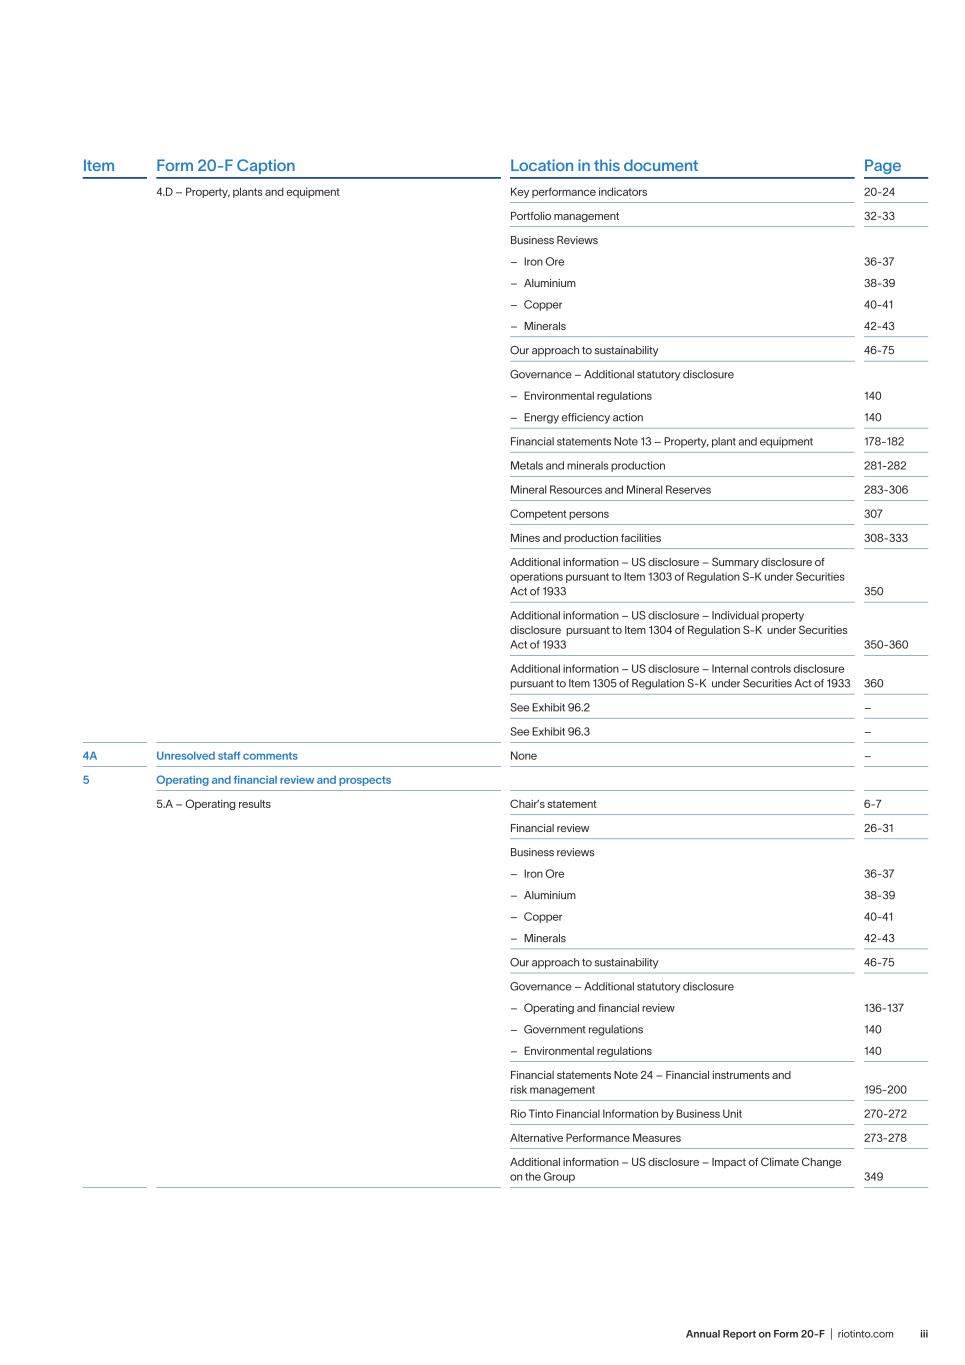
iiiAnnual Report on Form 20-F | riotinto.com Item Form 20-F Caption Location in this document Page 4.D – Property, plants and equipment Key performance indicators 20-24 Portfolio management 32-33 Business Reviews – Iron Ore – Aluminium – Copper – Minerals 36-37 38-39 40-41 42-43 Our approach to sustainability 46-75 Governance – Additional statutory disclosure – Environmental regulations – Energy efficiency action 140 140 Financial statements Note 13 – Property, plant and equipment 178-182 Metals and minerals production 281-282 Mineral Resources and Mineral Reserves 283-306 Competent persons 307 Mines and production facilities 308-333 Additional information – US disclosure – Summary disclosure of operations pursuant to Item 1303 of Regulation S-K under Securities Act of 1933 350 Additional information – US disclosure – Individual property disclosure pursuant to Item 1304 of Regulation S-K under Securities Act of 1933 350-360 Additional information – US disclosure – Internal controls disclosure pursuant to Item 1305 of Regulation S-K under Securities Act of 1933 360 See Exhibit 96.2 – See Exhibit 96.3 – 4A Unresolved staff comments None – 5 Operating and financial review and prospects 5.A – Operating results Chair’s statement 6-7 Financial review 26-31 Business reviews – Iron Ore – Aluminium – Copper – Minerals 36-37 38-39 40-41 42-43 Our approach to sustainability 46-75 Governance – Additional statutory disclosure – Operating and financial review – Government regulations – Environmental regulations 136-137 140 140 Financial statements Note 24 – Financial instruments and risk management 195-200 Rio Tinto Financial Information by Business Unit 270-272 Alternative Performance Measures 273-278 Additional information – US disclosure – Impact of Climate Change on the Group 349
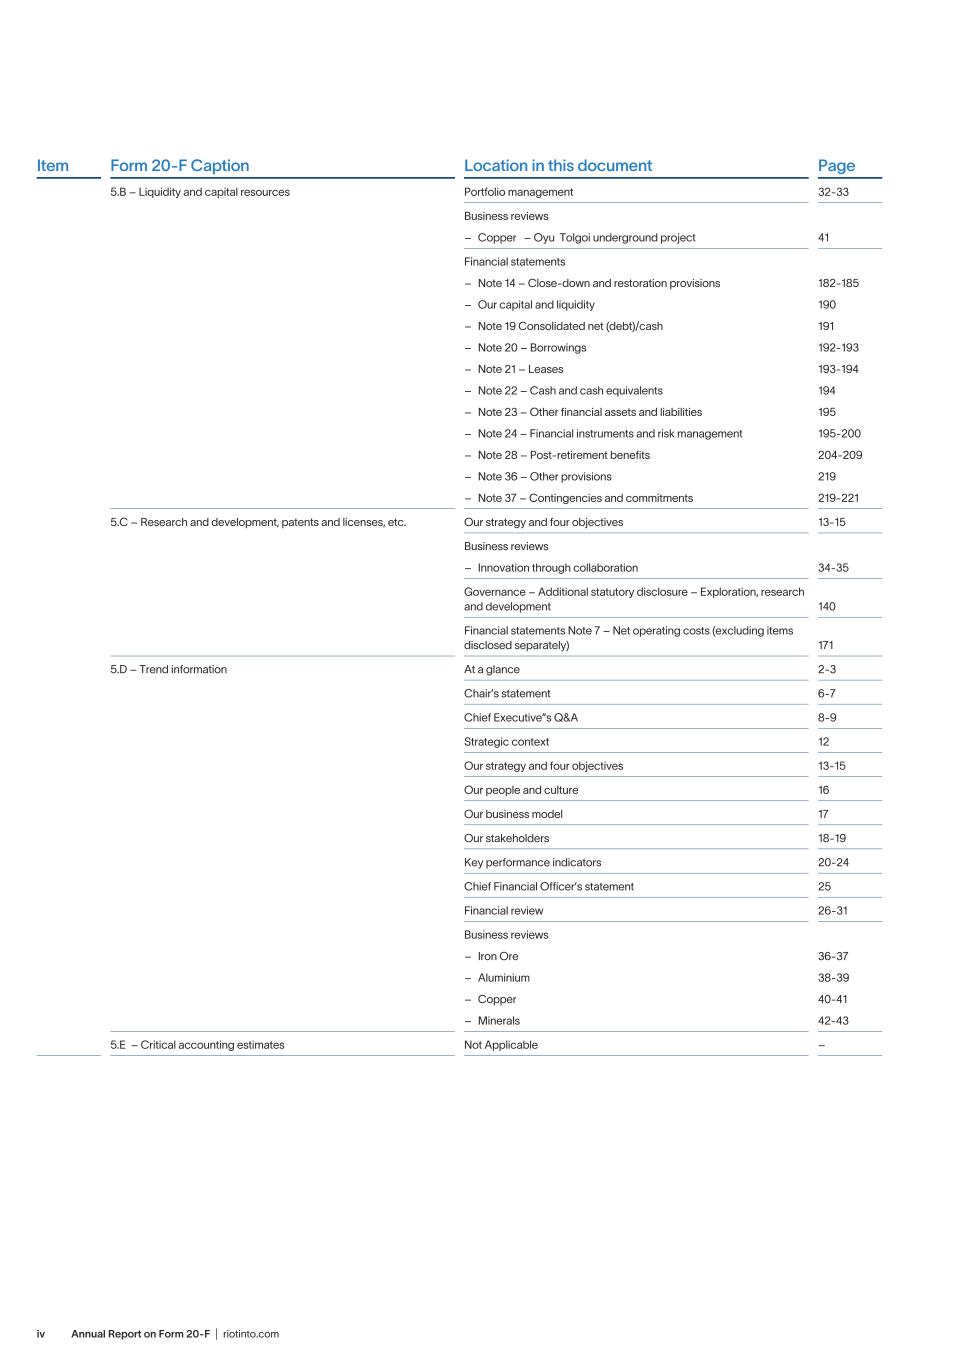
Annual Report on Form 20-F | riotinto.comiv Item Form 20-F Caption Location in this document Page 5.B – Liquidity and capital resources Portfolio management 32-33 Business reviews – Copper – Oyu Tolgoi underground project 41 Financial statements – Note 14 – Close-down and restoration provisions – Our capital and liquidity – Note 19 Consolidated net (debt)/cash – Note 20 – Borrowings – Note 21 – Leases – Note 22 – Cash and cash equivalents – Note 23 – Other financial assets and liabilities – Note 24 – Financial instruments and risk management – Note 28 – Post-retirement benefits – Note 36 – Other provisions – Note 37 – Contingencies and commitments 182-185 190 191 192-193 193-194 194 195 195-200 204-209 219 219-221 5.C – Research and development, patents and licenses, etc. Our strategy and four objectives 13-15 Business reviews – Innovation through collaboration 34-35 Governance – Additional statutory disclosure – Exploration, research and development 140 Financial statements Note 7 – Net operating costs (excluding items disclosed separately) 171 5.D – Trend information At a glance 2-3 Chair’s statement 6-7 Chief Executive”s Q&A 8-9 Strategic context 12 Our strategy and four objectives 13-15 Our people and culture 16 Our business model 17 Our stakeholders 18-19 Key performance indicators 20-24 Chief Financial Officer’s statement 25 Financial review 26-31 Business reviews – Iron Ore – Aluminium – Copper – Minerals 36-37 38-39 40-41 42-43 5.E – Critical accounting estimates Not Applicable –
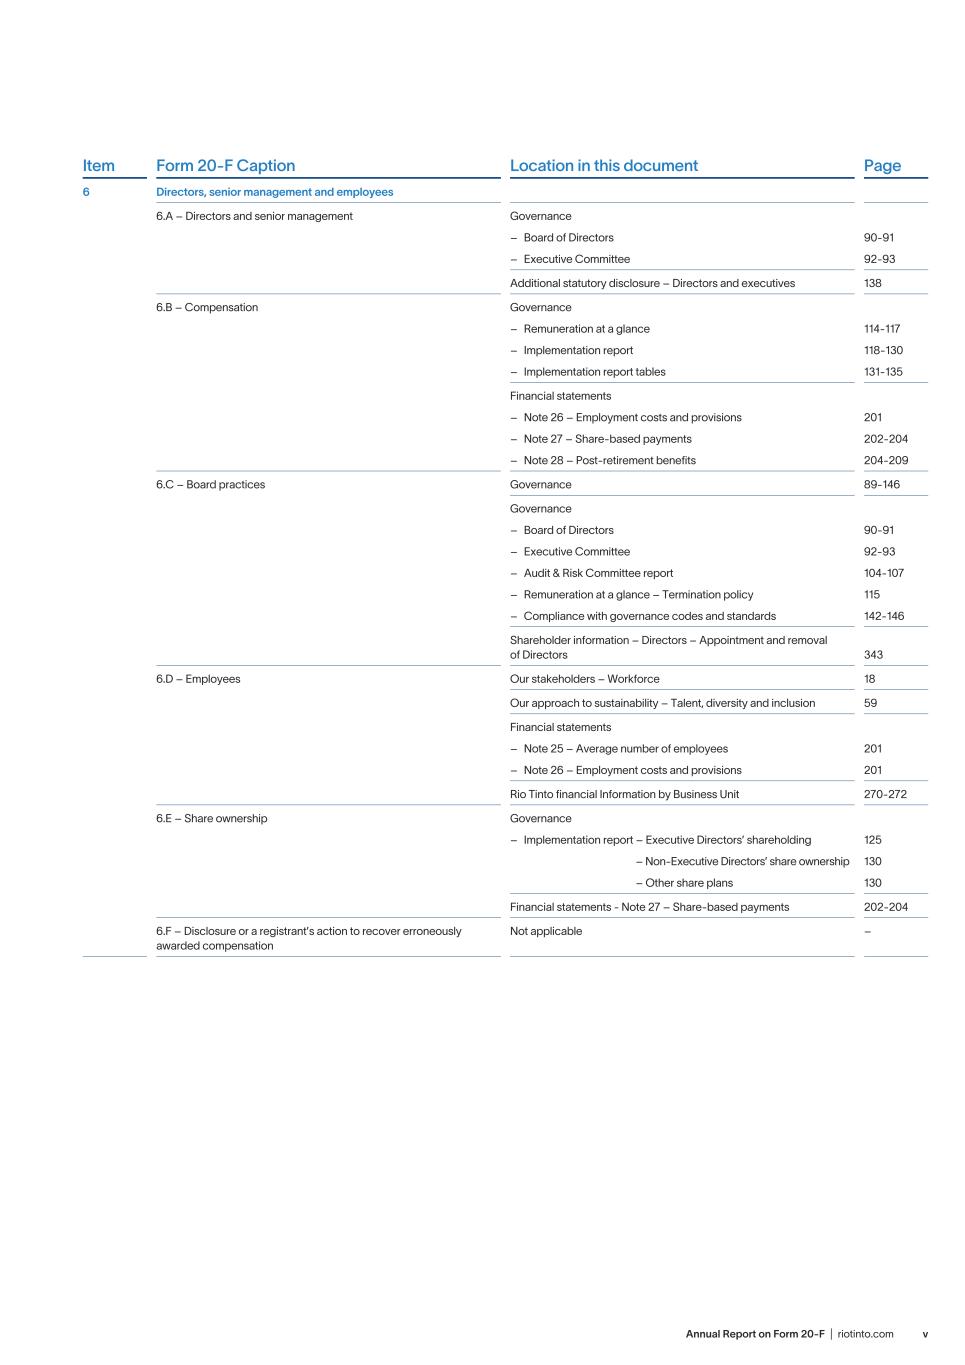
vAnnual Report on Form 20-F | riotinto.com Item Form 20-F Caption Location in this document Page 6 Directors, senior management and employees 6.A – Directors and senior management Governance – Board of Directors – Executive Committee 90-91 92-93 Additional statutory disclosure – Directors and executives 138 6.B – Compensation Governance – Remuneration at a glance – Implementation report – Implementation report tables 114-117 118-130 131-135 Financial statements – Note 26 – Employment costs and provisions – Note 27 – Share-based payments – Note 28 – Post-retirement benefits 201 202-204 204-209 6.C – Board practices Governance 89-146 Governance – Board of Directors – Executive Committee – Audit & Risk Committee report – Remuneration at a glance – Termination policy – Compliance with governance codes and standards 90-91 92-93 104-107 115 142-146 Shareholder information – Directors – Appointment and removal of Directors 343 6.D – Employees Our stakeholders – Workforce 18 Our approach to sustainability – Talent, diversity and inclusion 59 Financial statements – Note 25 – Average number of employees – Note 26 – Employment costs and provisions 201 201 Rio Tinto financial Information by Business Unit 270-272 6.E – Share ownership Governance – Implementation report – Executive Directors’ shareholding – Non-Executive Directors’ share ownership – Other share plans 125 130 130 Financial statements - Note 27 – Share-based payments 202-204 6.F – Disclosure or a registrant’s action to recover erroneously awarded compensation Not applicable –
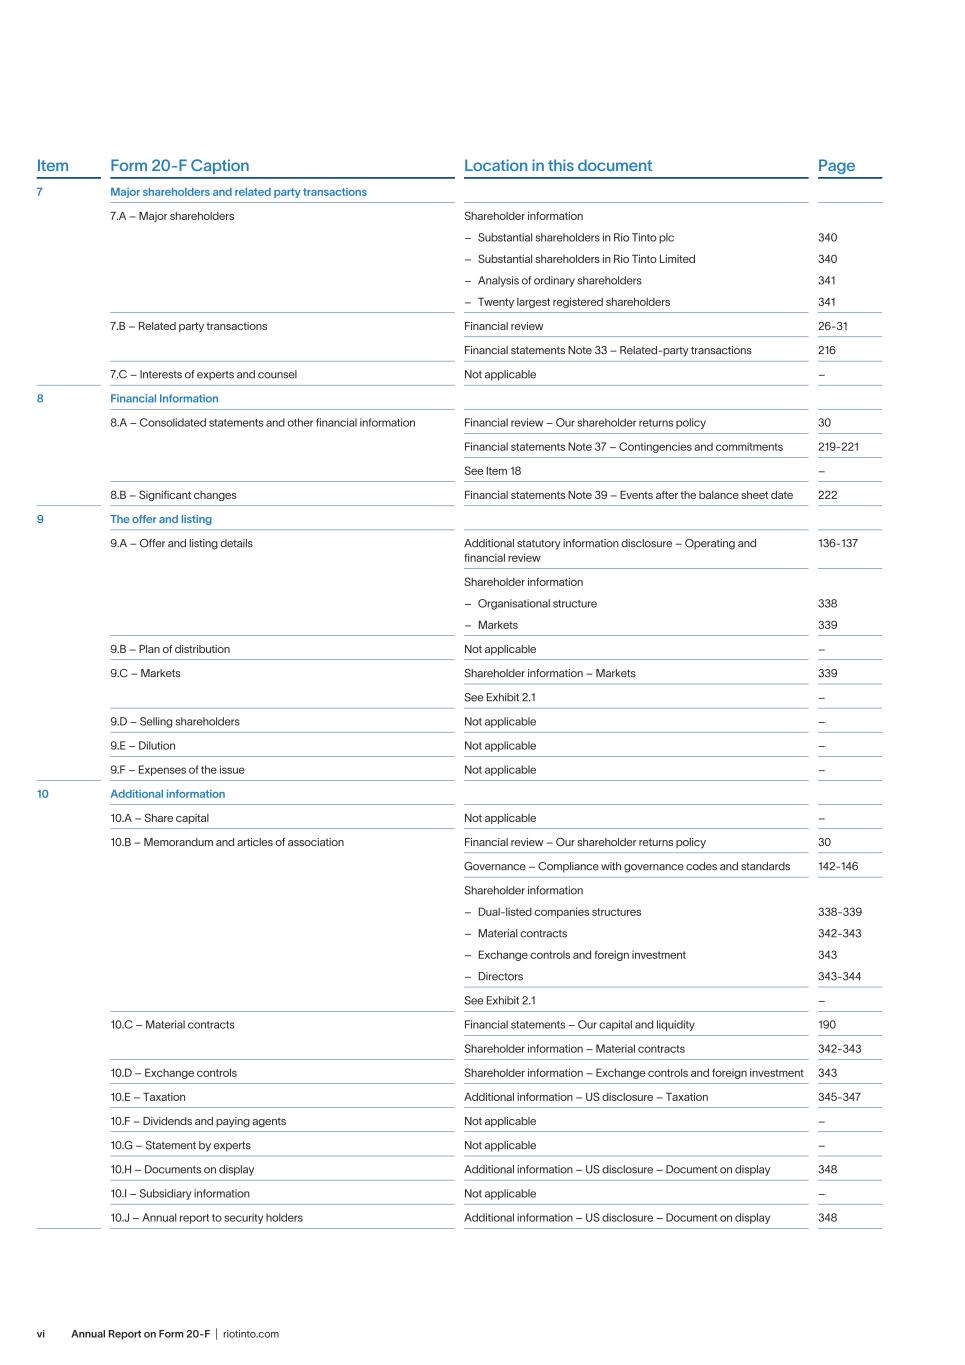
Annual Report on Form 20-F | riotinto.comvi Item Form 20-F Caption Location in this document Page 7 Major shareholders and related party transactions 7.A – Major shareholders Shareholder information – Substantial shareholders in Rio Tinto plc – Substantial shareholders in Rio Tinto Limited – Analysis of ordinary shareholders – Twenty largest registered shareholders 340 340 341 341 7.B – Related party transactions Financial review 26-31 Financial statements Note 33 – Related-party transactions 216 7.C – Interests of experts and counsel Not applicable – 8 Financial Information 8.A – Consolidated statements and other financial information Financial review – Our shareholder returns policy 30 Financial statements Note 37 – Contingencies and commitments 219-221 See Item 18 – 8.B – Significant changes Financial statements Note 39 – Events after the balance sheet date 222 9 The offer and listing 9.A – Offer and listing details Additional statutory information disclosure – Operating and financial review 136-137 Shareholder information – Organisational structure – Markets 338 339 9.B – Plan of distribution Not applicable – 9.C – Markets Shareholder information – Markets 339 See Exhibit 2.1 – 9.D – Selling shareholders Not applicable – 9.E – Dilution Not applicable – 9.F – Expenses of the issue Not applicable – 10 Additional information 10.A – Share capital Not applicable – 10.B – Memorandum and articles of association Financial review – Our shareholder returns policy 30 Governance – Compliance with governance codes and standards 142-146 Shareholder information – Dual-listed companies structures – Material contracts – Exchange controls and foreign investment – Directors 338-339 342-343 343 343-344 See Exhibit 2.1 – 10.C – Material contracts Financial statements – Our capital and liquidity 190 Shareholder information – Material contracts 342-343 10.D – Exchange controls Shareholder information – Exchange controls and foreign investment 343 10.E – Taxation Additional information – US disclosure – Taxation 345-347 10.F – Dividends and paying agents Not applicable – 10.G – Statement by experts Not applicable – 10.H – Documents on display Additional information – US disclosure – Document on display 348 10.I – Subsidiary information Not applicable – 10.J – Annual report to security holders Additional information – US disclosure – Document on display 348
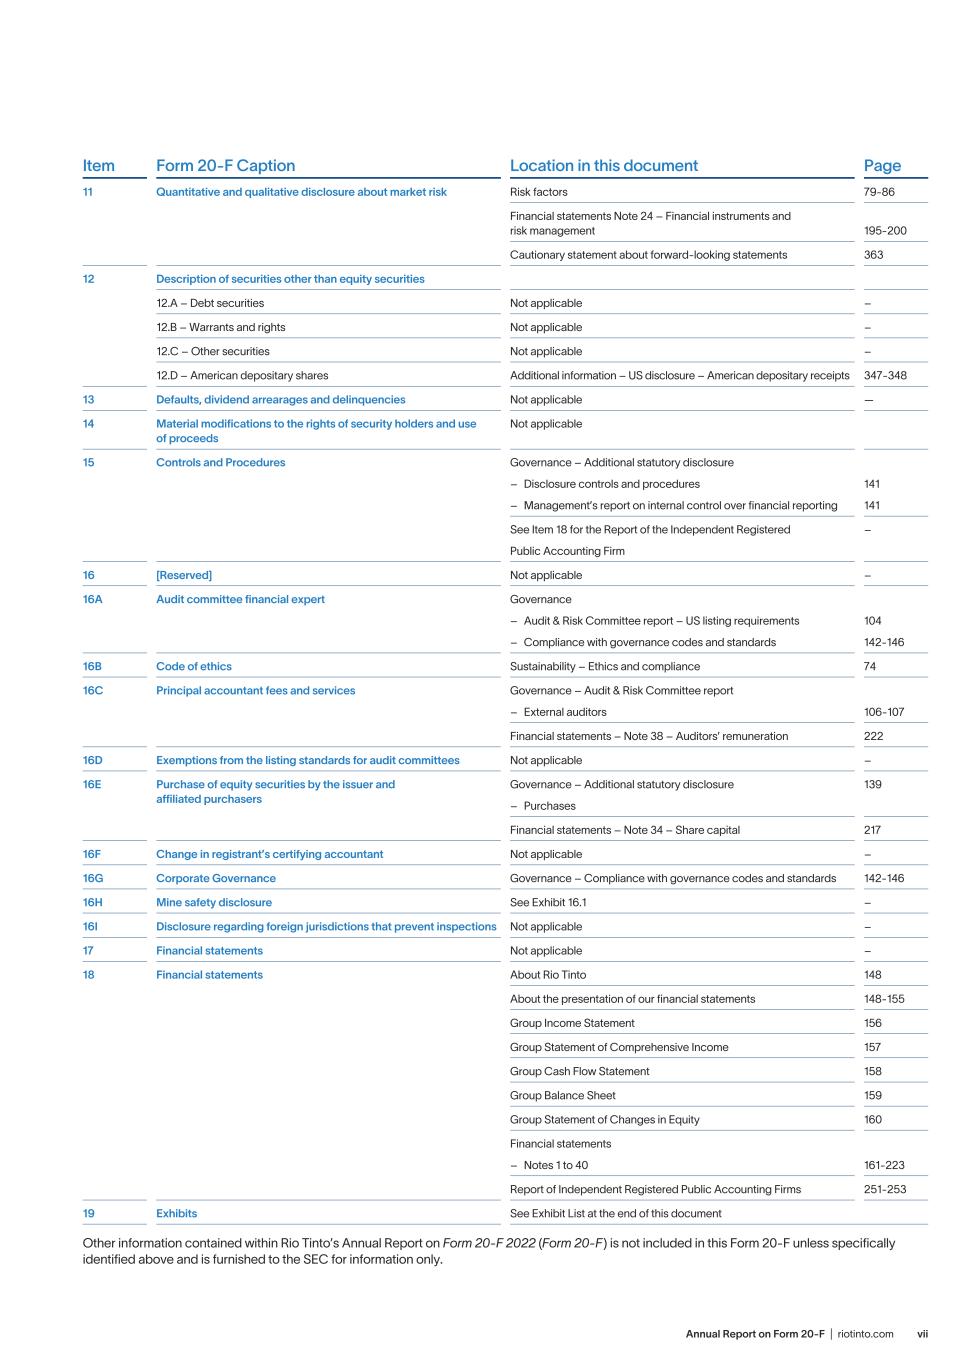
viiAnnual Report on Form 20-F | riotinto.com Item Form 20-F Caption Location in this document Page 11 Quantitative and qualitative disclosure about market risk Risk factors 79-86 Financial statements Note 24 – Financial instruments and risk management 195-200 Cautionary statement about forward-looking statements 363 12 Description of securities other than equity securities 12.A – Debt securities Not applicable – 12.B – Warrants and rights Not applicable – 12.C – Other securities Not applicable – 12.D – American depositary shares Additional information – US disclosure – American depositary receipts 347-348 13 Defaults, dividend arrearages and delinquencies Not applicable — 14 Material modifications to the rights of security holders and use of proceeds Not applicable 15 Controls and Procedures Governance – Additional statutory disclosure – Disclosure controls and procedures – Management’s report on internal control over financial reporting 141 141 See Item 18 for the Report of the Independent Registered Public Accounting Firm – 16 [Reserved] Not applicable – 16A Audit committee financial expert Governance – Audit & Risk Committee report – US listing requirements – Compliance with governance codes and standards 104 142-146 16B Code of ethics Sustainability – Ethics and compliance 74 16C Principal accountant fees and services Governance – Audit & Risk Committee report – External auditors 106-107 Financial statements – Note 38 – Auditors’ remuneration 222 16D Exemptions from the listing standards for audit committees Not applicable – 16E Purchase of equity securities by the issuer and affiliated purchasers Governance – Additional statutory disclosure – Purchases 139 Financial statements – Note 34 – Share capital 217 16F Change in registrant’s certifying accountant Not applicable – 16G Corporate Governance Governance – Compliance with governance codes and standards 142-146 16H Mine safety disclosure See Exhibit 16.1 – 16I Disclosure regarding foreign jurisdictions that prevent inspections Not applicable – 17 Financial statements Not applicable – 18 Financial statements About Rio Tinto 148 About the presentation of our financial statements 148-155 Group Income Statement 156 Group Statement of Comprehensive Income 157 Group Cash Flow Statement 158 Group Balance Sheet 159 Group Statement of Changes in Equity 160 Financial statements – Notes 1 to 40 161-223 Report of Independent Registered Public Accounting Firms 251-253 19 Exhibits See Exhibit List at the end of this document Other information contained within Rio Tinto’s Annual Report on Form 20-F 2022 (Form 20-F ) is not included in this Form 20-F unless specifically identified above and is furnished to the SEC for information only.
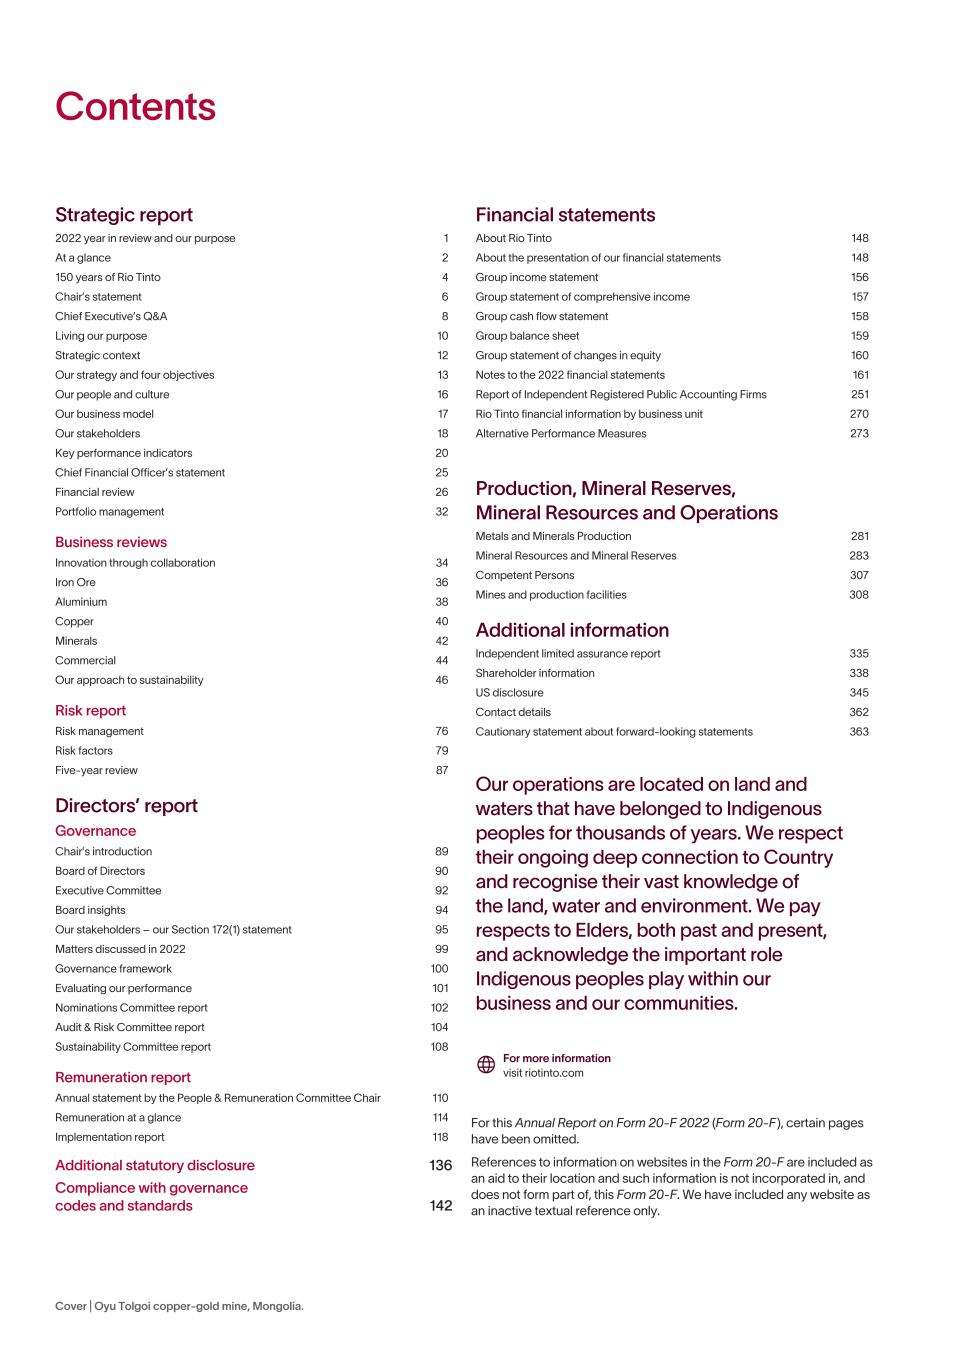
Our operations are located on land and waters that have belonged to Indigenous peoples for thousands of years. We respect their ongoing deep connection to Country and recognise their vast knowledge of the land, water and environment. We pay respects to Elders, both past and present, and acknowledge the important role Indigenous peoples play within our business and our communities. For more information visit riotinto.com Contents Strategic report 2022 year in review and our purpose 1 At a glance 2 150 years of Rio Tinto 4 Chair’s statement 6 Chief Executive’s Q&A 8 Living our purpose 10 Strategic context 12 Our strategy and four objectives 13 Our people and culture 16 Our business model 17 Our stakeholders 18 Key performance indicators 20 Chief Financial Officer’s statement 25 Financial review 26 Portfolio management 32 Business reviews Innovation through collaboration 34 Iron Ore 36 Aluminium 38 Copper 40 Minerals 42 Commercial 44 Our approach to sustainability 46 Risk report Risk management 76 Risk factors 79 Five-year review 87 Directors’ report Governance Chair’s introduction 89 Board of Directors 90 Executive Committee 92 Board insights 94 Our stakeholders – our Section 172(1) statement 95 Matters discussed in 2022 99 Governance framework 100 Evaluating our performance 101 Nominations Committee report 102 Audit & Risk Committee report 104 Sustainability Committee report 108 Remuneration report Annual statement by the People & Remuneration Committee Chair 110 Remuneration at a glance 114 Implementation report 118 Additional statutory disclosure 136 Compliance with governance codes and standards 142 Financial statements About Rio Tinto 148 About the presentation of our financial statements 148 Group income statement 156 Group statement of comprehensive income 157 Group cash flow statement 158 Group balance sheet 159 Group statement of changes in equity 160 Notes to the 2022 financial statements 161 Report of Independent Registered Public Accounting Firms 251 Rio Tinto financial information by business unit 270 Alternative Performance Measures 273 Production, Mineral Reserves, Mineral Resources and Operations Metals and Minerals Production 281 Mineral Resources and Mineral Reserves 283 Competent Persons 307 Mines and production facilities 308 Additional information Independent limited assurance report 335 Shareholder information 338 US disclosure 345 Contact details 362 Cautionary statement about forward-looking statements 363 Cover | Oyu Tolgoi copper-gold mine, Mongolia. For this Annual Report on Form 20-F 2022 (Form 20-F ), certain pages have been omitted. References to information on websites in the Form 20-F are included as an aid to their location and such information is not incorporated in, and does not form part of, this Form 20-F. We have included any website as an inactive textual reference only.
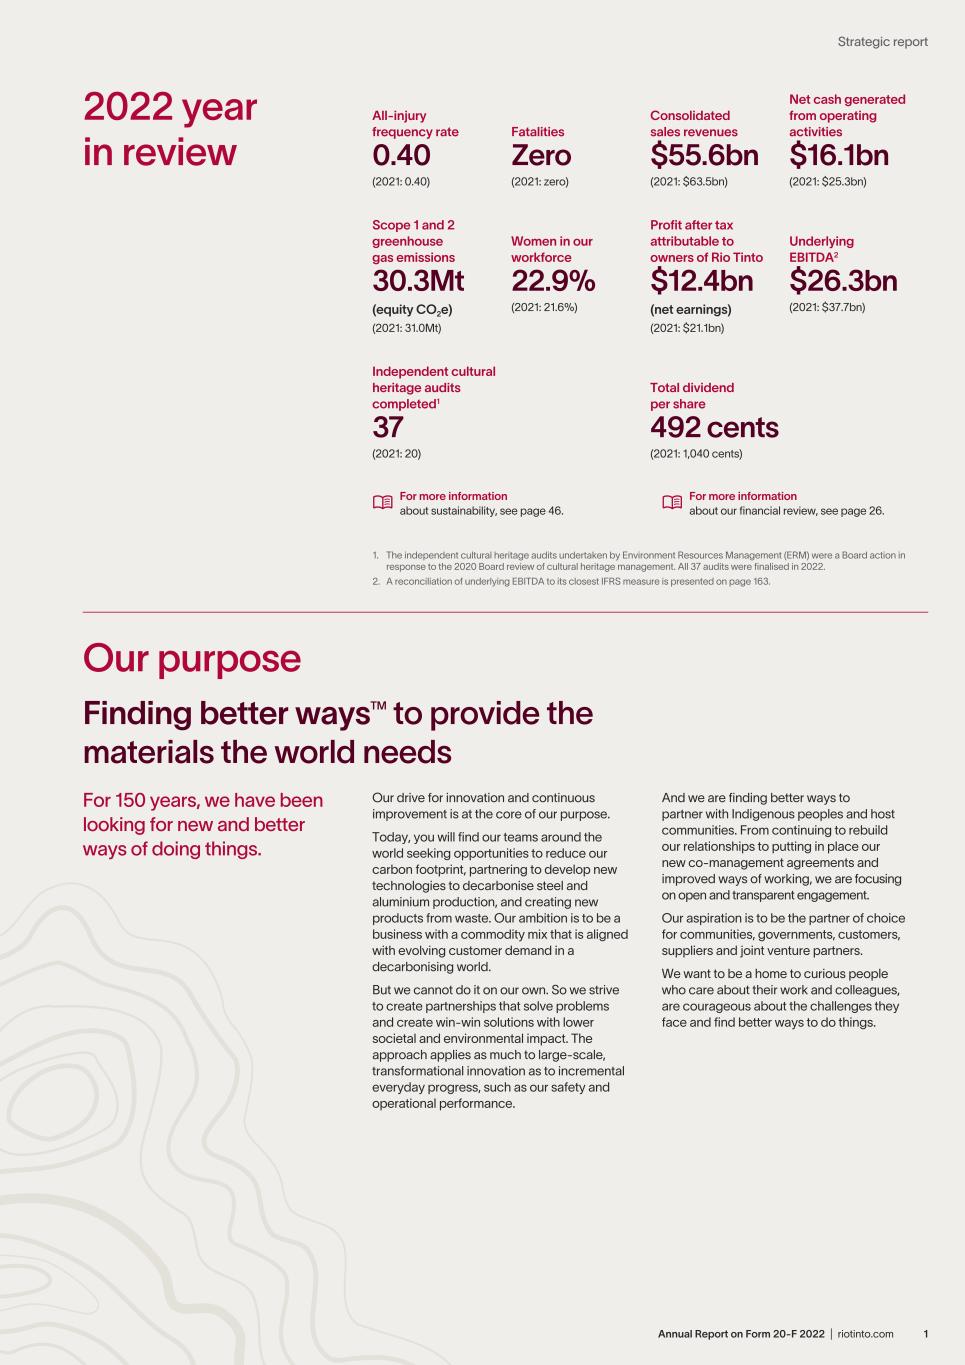
1Annual Report on Form 20-F 2022 | riotinto.com Strategic report 2022 year in review Our purpose Finding better waysTM to provide the materials the world needs For 150 years, we have been looking for new and better ways of doing things. Our drive for innovation and continuous improvement is at the core of our purpose. Today, you will find our teams around the world seeking opportunities to reduce our carbon footprint, partnering to develop new technologies to decarbonise steel and aluminium production, and creating new products from waste. Our ambition is to be a business with a commodity mix that is aligned with evolving customer demand in a decarbonising world. But we cannot do it on our own. So we strive to create partnerships that solve problems and create win-win solutions with lower societal and environmental impact. The approach applies as much to large-scale, transformational innovation as to incremental everyday progress, such as our safety and operational performance. And we are finding better ways to partner with Indigenous peoples and host communities. From continuing to rebuild our relationships to putting in place our new co-management agreements and improved ways of working, we are focusing on open and transparent engagement. Our aspiration is to be the partner of choice for communities, governments, customers, suppliers and joint venture partners. We want to be a home to curious people who care about their work and colleagues, are courageous about the challenges they face and find better ways to do things. For more information about sustainability, see page 46. For more information about our financial review, see page 26. 1. The independent cultural heritage audits undertaken by Environment Resources Management (ERM) were a Board action in response to the 2020 Board review of cultural heritage management. All 37 audits were finalised in 2022. 2. A reconciliation of underlying EBITDA to its closest IFRS measure is presented on page 163. All-injury frequency rate Fatalities Consolidated sales revenues Net cash generated from operating activities 0.40 (2021: 0.40) Zero (2021: zero) $55.6bn (2021: $63.5bn) $16.1bn (2021: $25.3bn) Scope 1 and 2 greenhouse gas emissions Women in our workforce Profit after tax attributable to owners of Rio Tinto Underlying EBITDA2 30.3Mt (equity CO2e) (2021: 31.0Mt) 22.9% (2021: 21.6%) $12.4bn (net earnings) (2021: $21.1bn) $26.3bn (2021: $37.7bn) Independent cultural heritage audits completed1 Total dividend per share 37 (2021: 20) 492 cents (2021: 1,040 cents)
Operations and projects2 Iron Ore Aluminium Copper Operations Projects Minerals Annual Report on Form 20-F 2022 | riotinto.com2 Our products Our portfolio includes iron ore, aluminium, bauxite, alumina, copper, diamonds, titanium dioxide, lithium, salt and borates. For more information see pages 36-43. Our business We operate in 351 countries where our 54,000 employees are working to find better ways to provide the materials the world needs. Our portfolio includes iron ore, copper, aluminium, lithium and other materials needed for people, communities and nations to grow and prosper, and for the world to cut carbon emissions to net zero. We have been mining for 150 years, and we continue to build on a history and knowledge that span generations and continents. Today, our business relies on technology such as automation and artificial intelligence to help us run safer, more efficient operations and leave a lighter footprint. Iron Ore Aluminium At a glance Segmental revenue $30.9bn (2021: $39.6bn) Underlying EBITDA $18.6bn (2021: $27.6bn) Production (100% basis) 324.1Mt iron ore (2021: 319.7Mt) Segmental revenue $14.1bn (2021: $12.7bn) Underlying EBITDA $3.7bn (2021: $4.4bn) Production (our share) 54.6Mt bauxite (2021: 54.3Mt) 3,009kt aluminium (2021: 3,151kt) Employees 15,000 (2021: 13,000) Employees 15,000 (2021: 14,000) 1. Includes our mines and production facilities, main exploration activities and countries where we have a significant presence through activities including research and development, commercial, sales, and corporate functions. 2. This map does not include our offices, processing and shipping facilities, or research and development centres. Operations and projects are indicated according to their product group. For example, Simandou is an iron ore project but is reported under Copper. The Iron Ore Company of Canada is an iron ore operation but is reported under Minerals due to the management structure. The dots on the map are indicative and in some locations we have more assets than visually represented due to the size of the map.
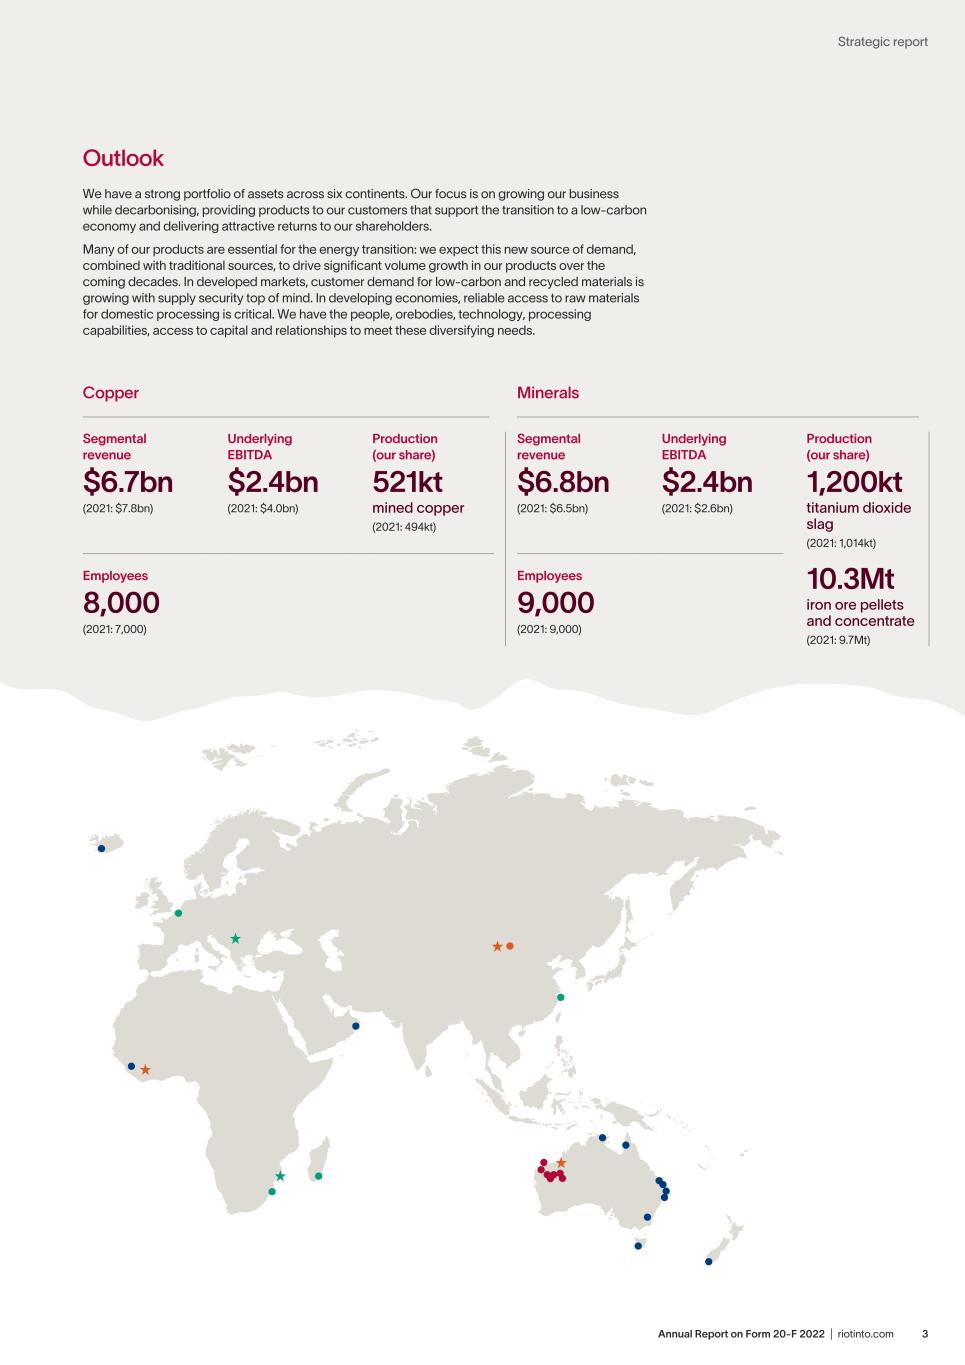
Operations and projects2 Iron Ore Aluminium Copper Operations Projects Minerals 3Annual Report on Form 20-F 2022 | riotinto.com Strategic report Outlook We have a strong portfolio of assets across six continents. Our focus is on growing our business while decarbonising, providing products to our customers that support the transition to a low-carbon economy and delivering attractive returns to our shareholders. Many of our products are essential for the energy transition: we expect this new source of demand, combined with traditional sources, to drive significant volume growth in our products over the coming decades. In developed markets, customer demand for low-carbon and recycled materials is growing with supply security top of mind. In developing economies, reliable access to raw materials for domestic processing is critical. We have the people, orebodies, technology, processing capabilities, access to capital and relationships to meet these diversifying needs. Copper Minerals Segmental revenue $6.7bn (2021: $7.8bn) Underlying EBITDA $2.4bn (2021: $4.0bn) Production (our share) 521kt mined copper (2021: 494kt) Segmental revenue $6.8bn (2021: $6.5bn) Underlying EBITDA $2.4bn (2021: $2.6bn) Production (our share) 1,200kt titanium dioxide slag (2021: 1,014kt) 10.3Mt iron ore pellets and concentrate (2021: 9.7Mt) Employees 8,000 (2021: 7,000) Employees 9,000 (2021: 9,000)
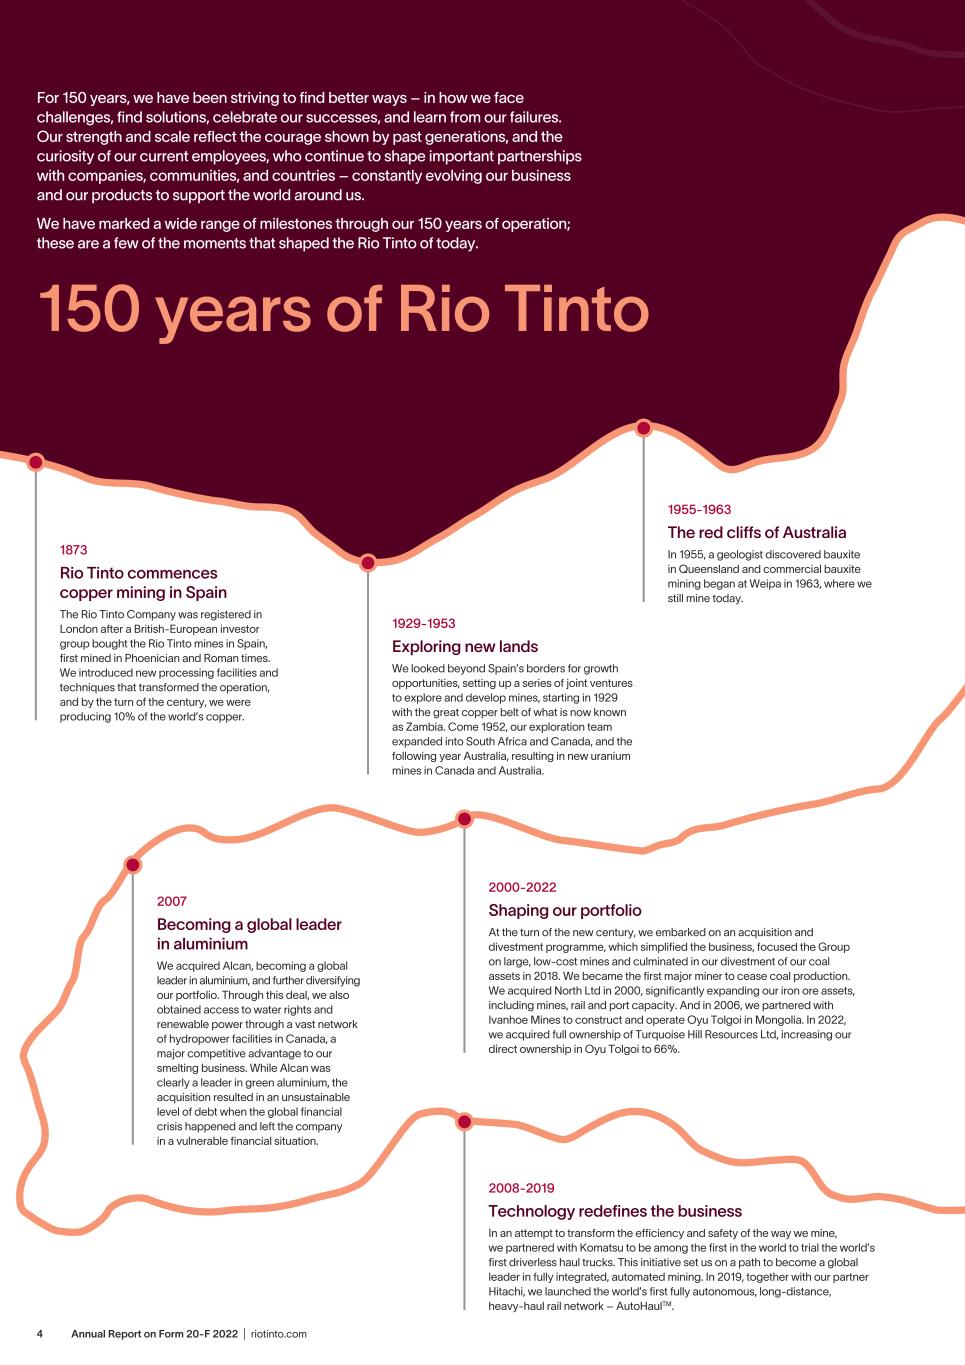
Annual Report on Form 20-F 2022 | riotinto.com4 150 years of Rio Tinto For 150 years, we have been striving to find better ways – in how we face challenges, find solutions, celebrate our successes, and learn from our failures. Our strength and scale reflect the courage shown by past generations, and the curiosity of our current employees, who continue to shape important partnerships with companies, communities, and countries – constantly evolving our business and our products to support the world around us. We have marked a wide range of milestones through our 150 years of operation; these are a few of the moments that shaped the Rio Tinto of today. 1873 Rio Tinto commences copper mining in Spain The Rio Tinto Company was registered in London after a British-European investor group bought the Rio Tinto mines in Spain, first mined in Phoenician and Roman times. We introduced new processing facilities and techniques that transformed the operation, and by the turn of the century, we were producing 10% of the world’s copper. 1929-1953 Exploring new lands We looked beyond Spain’s borders for growth opportunities, setting up a series of joint ventures to explore and develop mines, starting in 1929 with the great copper belt of what is now known as Zambia. Come 1952, our exploration team expanded into South Africa and Canada, and the following year Australia, resulting in new uranium mines in Canada and Australia. 1955-1963 The red cliffs of Australia In 1955, a geologist discovered bauxite in Queensland and commercial bauxite mining began at Weipa in 1963, where we still mine today. 2007 Becoming a global leader in aluminium We acquired Alcan, becoming a global leader in aluminium, and further diversifying our portfolio. Through this deal, we also obtained access to water rights and renewable power through a vast network of hydropower facilities in Canada, a major competitive advantage to our smelting business. While Alcan was clearly a leader in green aluminium, the acquisition resulted in an unsustainable level of debt when the global financial crisis happened and left the company in a vulnerable financial situation. 2000-2022 Shaping our portfolio At the turn of the new century, we embarked on an acquisition and divestment programme, which simplified the business, focused the Group on large, low-cost mines and culminated in our divestment of our coal assets in 2018. We became the first major miner to cease coal production. We acquired North Ltd in 2000, significantly expanding our iron ore assets, including mines, rail and port capacity. And in 2006, we partnered with Ivanhoe Mines to construct and operate Oyu Tolgoi in Mongolia. In 2022, we acquired full ownership of Turquoise Hill Resources Ltd, increasing our direct ownership in Oyu Tolgoi to 66%. 2008-2019 Technology redefines the business In an attempt to transform the efficiency and safety of the way we mine, we partnered with Komatsu to be among the first in the world to trial the world’s first driverless haul trucks. This initiative set us on a path to become a global leader in fully integrated, automated mining. In 2019, together with our partner Hitachi, we launched the world’s first fully autonomous, long-distance, heavy-haul rail network – AutoHaulTM.
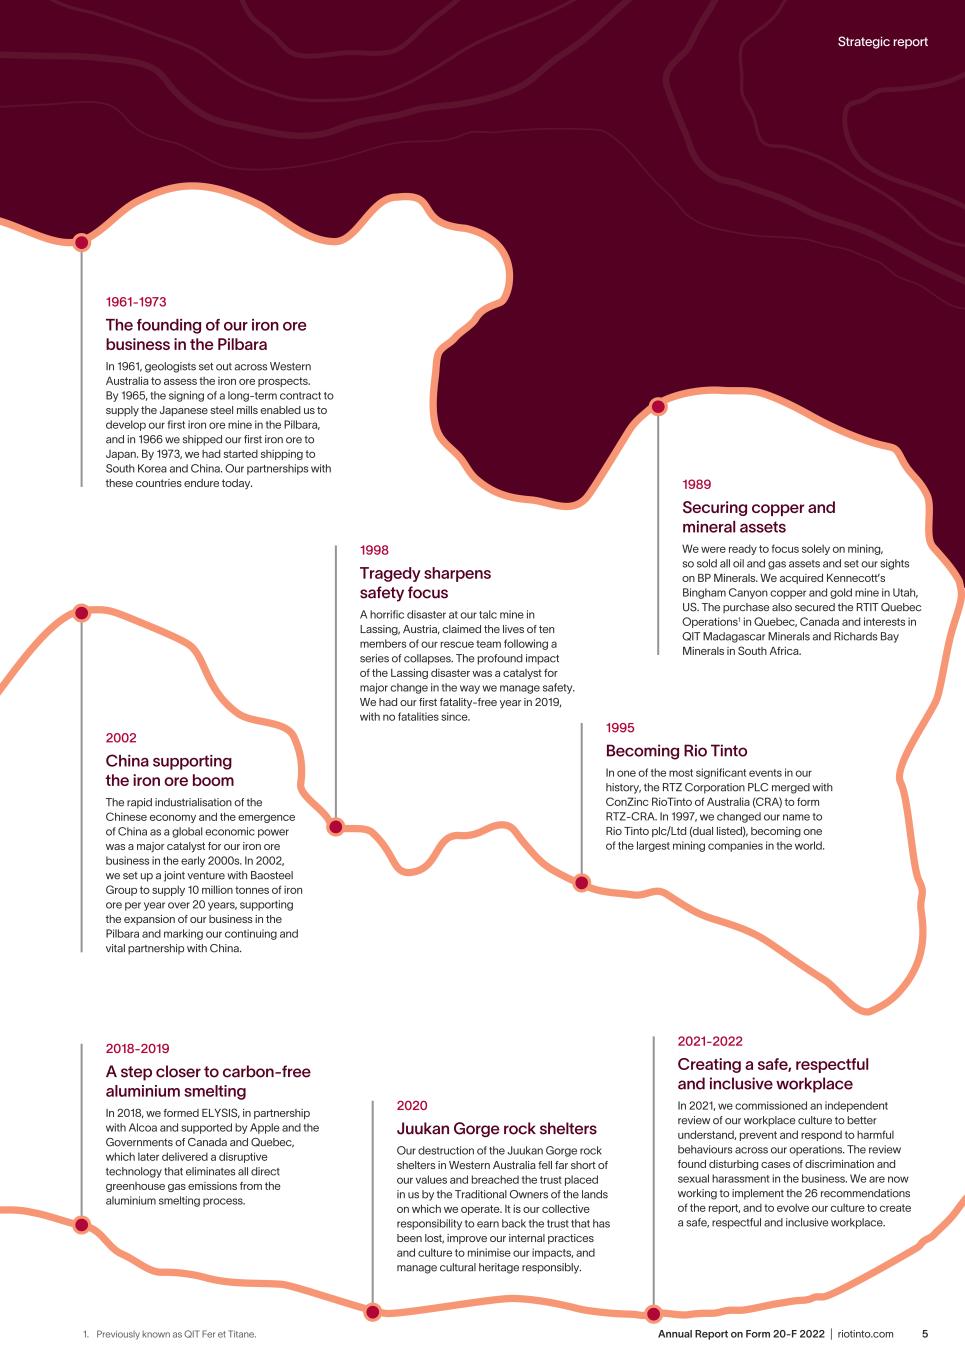
5Annual Report on Form 20-F 2022 | riotinto.com Strategic report 1961-1973 The founding of our iron ore business in the Pilbara In 1961, geologists set out across Western Australia to assess the iron ore prospects. By 1965, the signing of a long-term contract to supply the Japanese steel mills enabled us to develop our first iron ore mine in the Pilbara, and in 1966 we shipped our first iron ore to Japan. By 1973, we had started shipping to South Korea and China. Our partnerships with these countries endure today. 1989 Securing copper and mineral assets We were ready to focus solely on mining, so sold all oil and gas assets and set our sights on BP Minerals. We acquired Kennecott’s Bingham Canyon copper and gold mine in Utah, US. The purchase also secured the RTIT Quebec Operations1 in Quebec, Canada and interests in QIT Madagascar Minerals and Richards Bay Minerals in South Africa. 1995 Becoming Rio Tinto In one of the most significant events in our history, the RTZ Corporation PLC merged with ConZinc RioTinto of Australia (CRA) to form RTZ-CRA. In 1997, we changed our name to Rio Tinto plc/Ltd (dual listed), becoming one of the largest mining companies in the world. 1998 Tragedy sharpens safety focus A horrific disaster at our talc mine in Lassing, Austria, claimed the lives of ten members of our rescue team following a series of collapses. The profound impact of the Lassing disaster was a catalyst for major change in the way we manage safety. We had our first fatality-free year in 2019, with no fatalities since. 2002 China supporting the iron ore boom The rapid industrialisation of the Chinese economy and the emergence of China as a global economic power was a major catalyst for our iron ore business in the early 2000s. In 2002, we set up a joint venture with Baosteel Group to supply 10 million tonnes of iron ore per year over 20 years, supporting the expansion of our business in the Pilbara and marking our continuing and vital partnership with China. 2018-2019 A step closer to carbon-free aluminium smelting In 2018, we formed ELYSIS, in partnership with Alcoa and supported by Apple and the Governments of Canada and Quebec, which later delivered a disruptive technology that eliminates all direct greenhouse gas emissions from the aluminium smelting process. 2020 Juukan Gorge rock shelters Our destruction of the Juukan Gorge rock shelters in Western Australia fell far short of our values and breached the trust placed in us by the Traditional Owners of the lands on which we operate. It is our collective responsibility to earn back the trust that has been lost, improve our internal practices and culture to minimise our impacts, and manage cultural heritage responsibly. 2021-2022 Creating a safe, respectful and inclusive workplace In 2021, we commissioned an independent review of our workplace culture to better understand, prevent and respond to harmful behaviours across our operations. The review found disturbing cases of discrimination and sexual harassment in the business. We are now working to implement the 26 recommendations of the report, and to evolve our culture to create a safe, respectful and inclusive workplace. 1. Previously known as QIT Fer et Titane.
Annual Report on Form 20-F 2022 | riotinto.com6 Chair’s statement 2022 saw Rio Tinto deliver another set of strong financial results, while keeping our operations fatality-free. In recognition of this, the Board is recommending a final dividend of 225 US cents (2021: 417 US cents), taking total dividends declared to shareholders this year to $8 billion. More broadly, Jakob Stausholm and his Executive team have led the Group out of a challenging period, with the foundations now being laid for us to become the global mining company of choice. A lot remains to be done. We must continue to focus on the pursuit of our four key objectives: becoming the best operator, having impeccable environmental, social and governance (ESG) credentials, excelling in development and strengthening the Group’s social licence. In particular, we must continue to strive for greater consistency in our operating performance. This year, we have secured a healthy pipeline of future growth projects – Oyu Tolgoi (with the successful buyout of Turquoise Hill minority shareholders), Rhodes Ridge and Rincon, and the Western Range replacement project. These now need to be successfully developed, while we continue our efforts to realise other critical growth projects, such as Simandou, Resolution and Jadar. Finally, we must focus on embedding the important culture and leadership changes that are such critical enablers for achieving our strategic objectives and to creating the future organisation that we all wish to see. Building a thriving culture I believe everything we aspire to achieve should be underpinned by our people feeling emotionally safe, empowered, included and respected. One of my priorities as Chair is to ensure that we create a work environment where everyone can be at their best. I commend Jakob and the Executive Committee for the care and courage shown in commissioning and openly sharing the external review of the company’s workplace culture at the beginning of 2022. Since then, a great deal has been done to make positive change. The Board and I fully support the implementation of the 26 recommendations made in the Everyday Respect Report, which we are monitoring closely. We are working closely with Elizabeth Broderick, the former Australian Sex Discrimination Commissioner who conducted the report, on how we, as a Board, can help ensure progress and lead by example in embedding the culture changes that we all wish to see. We have also reinforced the Board and the Executive Committee’s commitment in this area, by expanding our new Remuneration & People Committee’s scope to include an ongoing focus on people and culture. Incentivising the things that matter One of the key learnings from the past few years is that how we achieve our strategy is just as important as what we achieve. As our strategy has evolved, so has the need for an appropriate incentive framework to better support it. In 2022, we undertook a review of our incentives and, from 2023, our Group short-term incentive plan (STIP), which applies to around 24,000 employees, will have a greater focus on how outcomes are achieved. By driving delivery of our four objectives in a manner consistent with our values and behaviours and which advance our culture change agenda, we are confident that we will see great progress towards our strategic ambitions. For more information about changes to STIP, see the Remuneration report on pages 112-113. Seizing opportunities Since joining as Chair, I have visited sites around the world and all of our hub offices, interacting with employees across all levels of the organisation. I have been amazed by the calibre of talent – from our engineers to our economists, from our ecologists to our explorers. There has been one common trait among everyone I have met – a focus on finding better ways of working and a determination to innovate. The shift to electric vehicles and renewable power will require more copper, aluminium, lithium and high-quality iron ore to decarbonise society, but developing new mines is becoming more challenging. To excel in this future development, we must seek to partner with a strengthened social licence and to operate with impeccable ESG credentials. Strategically, we must think long term if we are to harness the right opportunities, while also keeping shorter-term opportunities and risks sharply in view. Alongside supplying the materials for the world’s energy transition, we are aiming to reduce our own emissions by 50% by 2030 and to reach net zero by 2050. This a challenging set of targets but ones that we are determined to achieve. We are delivering this through a range of initiatives and partnerships that are helping us decarbonise our existing operations and secure green energy, as we support the development of low-carbon solutions to help our customers meet their own goals. With access to more than four million hectares of land globally, we are looking to implement natural climate solutions on a significant scale. We also have the opportunity to be a leader in environment by finding better ways to manage water, care for species and rehabilitate land. These are areas where our drive to improve can bring significant social and local benefits. As we enter 2023, the global operating environment has certainly become more volatile and complex and yet there is a sense that Rio Tinto has reached an inflection point, with strong momentum in the business.
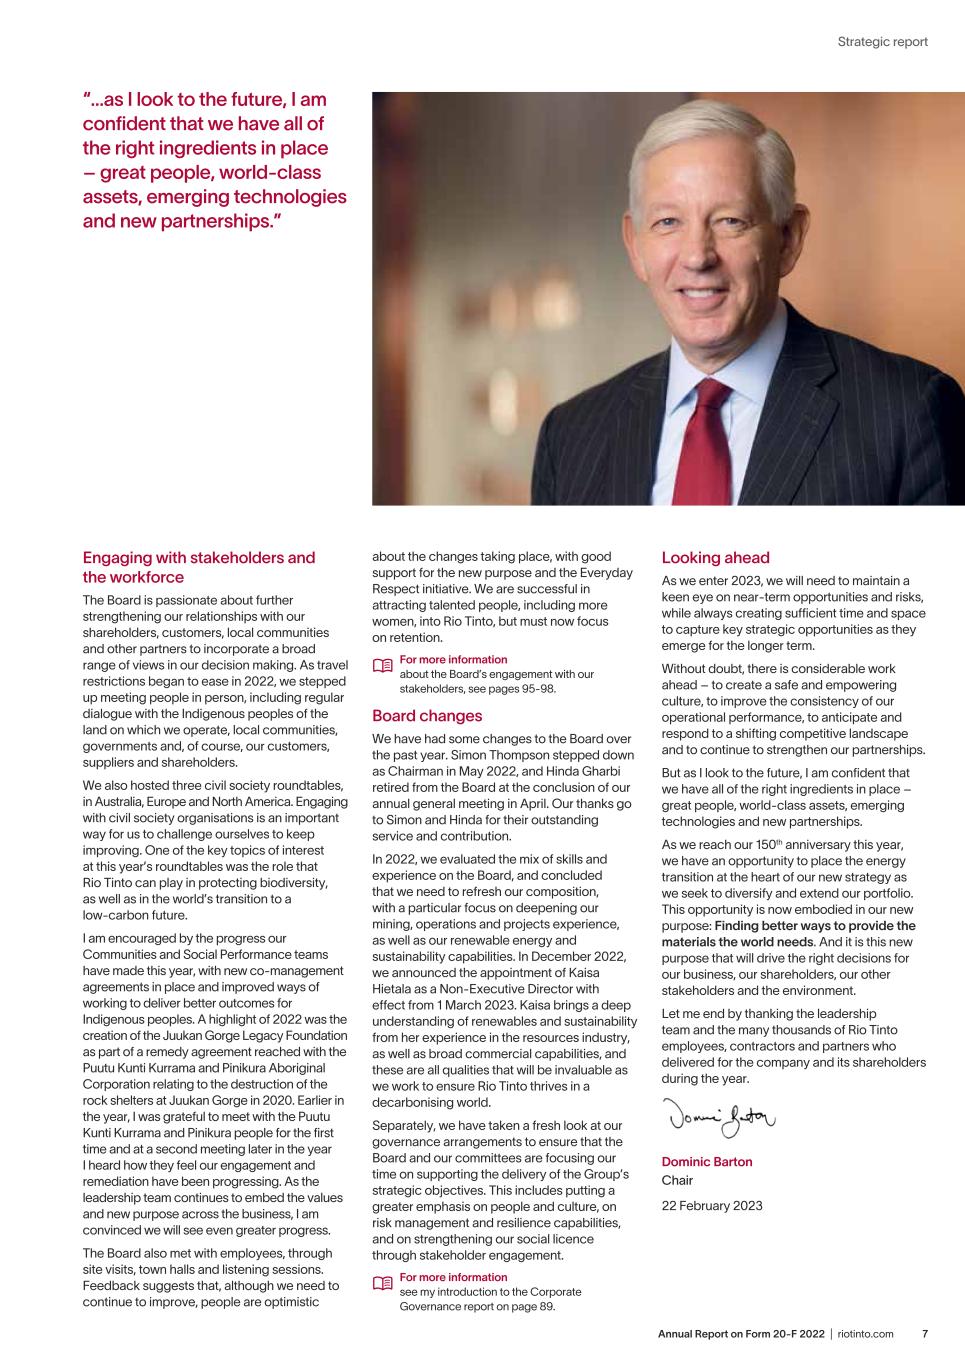
7Annual Report on Form 20-F 2022 | riotinto.com Strategic report Engaging with stakeholders and the workforce The Board is passionate about further strengthening our relationships with our shareholders, customers, local communities and other partners to incorporate a broad range of views in our decision making. As travel restrictions began to ease in 2022, we stepped up meeting people in person, including regular dialogue with the Indigenous peoples of the land on which we operate, local communities, governments and, of course, our customers, suppliers and shareholders. We also hosted three civil society roundtables, in Australia, Europe and North America. Engaging with civil society organisations is an important way for us to challenge ourselves to keep improving. One of the key topics of interest at this year’s roundtables was the role that Rio Tinto can play in protecting biodiversity, as well as in the world’s transition to a low-carbon future. I am encouraged by the progress our Communities and Social Performance teams have made this year, with new co-management agreements in place and improved ways of working to deliver better outcomes for Indigenous peoples. A highlight of 2022 was the creation of the Juukan Gorge Legacy Foundation as part of a remedy agreement reached with the Puutu Kunti Kurrama and Pinikura Aboriginal Corporation relating to the destruction of the rock shelters at Juukan Gorge in 2020. Earlier in the year, I was grateful to meet with the Puutu Kunti Kurrama and Pinikura people for the first time and at a second meeting later in the year I heard how they feel our engagement and remediation have been progressing. As the leadership team continues to embed the values and new purpose across the business, I am convinced we will see even greater progress. The Board also met with employees, through site visits, town halls and listening sessions. Feedback suggests that, although we need to continue to improve, people are optimistic about the changes taking place, with good support for the new purpose and the Everyday Respect initiative. We are successful in attracting talented people, including more women, into Rio Tinto, but must now focus on retention. For more information about the Board’s engagement with our stakeholders, see pages 95-98. Board changes We have had some changes to the Board over the past year. Simon Thompson stepped down as Chairman in May 2022, and Hinda Gharbi retired from the Board at the conclusion of our annual general meeting in April. Our thanks go to Simon and Hinda for their outstanding service and contribution. In 2022, we evaluated the mix of skills and experience on the Board, and concluded that we need to refresh our composition, with a particular focus on deepening our mining, operations and projects experience, as well as our renewable energy and sustainability capabilities. In December 2022, we announced the appointment of Kaisa Hietala as a Non-Executive Director with effect from 1 March 2023. Kaisa brings a deep understanding of renewables and sustainability from her experience in the resources industry, as well as broad commercial capabilities, and these are all qualities that will be invaluable as we work to ensure Rio Tinto thrives in a decarbonising world. Separately, we have taken a fresh look at our governance arrangements to ensure that the Board and our committees are focusing our time on supporting the delivery of the Group’s strategic objectives. This includes putting a greater emphasis on people and culture, on risk management and resilience capabilities, and on strengthening our social licence through stakeholder engagement. For more information see my introduction to the Corporate Governance report on page 89. “...as I look to the future, I am confident that we have all of the right ingredients in place – great people, world-class assets, emerging technologies and new partnerships.” Looking ahead As we enter 2023, we will need to maintain a keen eye on near-term opportunities and risks, while always creating sufficient time and space to capture key strategic opportunities as they emerge for the longer term. Without doubt, there is considerable work ahead – to create a safe and empowering culture, to improve the consistency of our operational performance, to anticipate and respond to a shifting competitive landscape and to continue to strengthen our partnerships. But as I look to the future, I am confident that we have all of the right ingredients in place – great people, world-class assets, emerging technologies and new partnerships. As we reach our 150th anniversary this year, we have an opportunity to place the energy transition at the heart of our new strategy as we seek to diversify and extend our portfolio. This opportunity is now embodied in our new purpose: Finding better ways to provide the materials the world needs. And it is this new purpose that will drive the right decisions for our business, our shareholders, our other stakeholders and the environment. Let me end by thanking the leadership team and the many thousands of Rio Tinto employees, contractors and partners who delivered for the company and its shareholders during the year. Dominic Barton Chair 22 February 2023
Annual Report on Form 20-F 2022 | riotinto.com8 How can evolving our culture unlock improvements needed to make us the best operator? Changing our culture is key to achieving each of our four objectives. When people feel respected and valued, they feel empowered to be their best selves and bring their best ideas. For example, our Safe Production System (SPS) relies on this – unlocking the potential of our employees, their skills and expertise, and creating stable, predictable operations. I’ve been impressed by our progress in 2022, achieving a number of operational records, including a record second half performance across the Pilbara iron ore mine and rail system. We now have 30 deployments at 16 sites and 86 Kaizens (rapid problem-solving activities) completed or in progress. We are seeing excellent results. Where we have been deploying the SPS, we have sites that are safer, more engaged employees, and assets that are more productive. We will continue to deploy the SPS to more sites in 2023. More broadly, we are embedding a change in mindset and behaviours throughout the organisation, with the implementation of the Everyday Respect Report recommendations being absolutely crucial to driving this change. Achieving culture change will take time, but we are heading in the right direction. How are we progressing our objective to achieve impeccable ESG credentials? Starting with our social licence, for the past two years we have been changing the way we partner, especially with Indigenous peoples and the communities where we work. Moving to a model of co-management of land and waters, and improving our agreements, will deliver more enduring socioeconomic, heritage and environmental outcomes and, in turn, greater certainty for mine development. And we have continued to develop cultural competency across the Group to help us become a better partner. How did we perform in 2022? This year has been all about progressing our strategy and delivering against our four objectives to build a stronger Rio Tinto for the long term. The strong foundations of our business – world-class assets, great people and strength of balance sheet – allowed us to achieve solid financial performance despite the challenging environment we faced. We definitely made progress in 2022, but there is lots more to do. Most importantly, 2022 was our fourth consecutive fatality-free year. But we continue to see serious incidents in our business and therefore we must continue to focus, every day, on strengthening our safety culture. This is about bringing together best practices from across the business and beyond to inform and improve our risk management and work planning. In terms of financials, we generated underlying earnings of $13.3 billion (2021: $21.4 billion) and net cash generated from operating activities of $16.1 billion (2021: $25.3 billion). Profit after tax attributable to owners of Rio Tinto was $12.4 billion (2021: $21.1 billion) and our balance sheet remains strong with net debt of $4.2 billion (2021: net cash of $1.6 billion). As a result, the Board has recommended a final ordinary dividend of 225 US cents per share, resulting in total shareholder returns declared this year of $8 billion. This represents a pay-out ratio of 60%, in line with our policy. What was the thinking behind the new purpose, “finding better ways to provide the materials the world needs”? Defining our purpose was an exciting process. We looked at what society needs and then considered our own strengths and found ten words that really capture our contribution to the world. It’s partly in our DNA, and partly about setting the direction for the company to evolve. It speaks to our drive for both innovation and continuous improvement, while also emphasising how materials are produced. Consumers are looking for lower-carbon materials, which must be produced responsibly, and we are continuously seeking ways to do things better. 2022 highlights Zero fatalities (2021: zero) $16.1bn net cash generated from operating activities (2021: $25.3bn) $12.4bn profit after tax attributable to owners of Rio Tinto (2021: $21.1bn) $8bn total dividend declared (2021: $16.8bn) Q&A with Jakob Stausholm Chief Executive’s Q&A
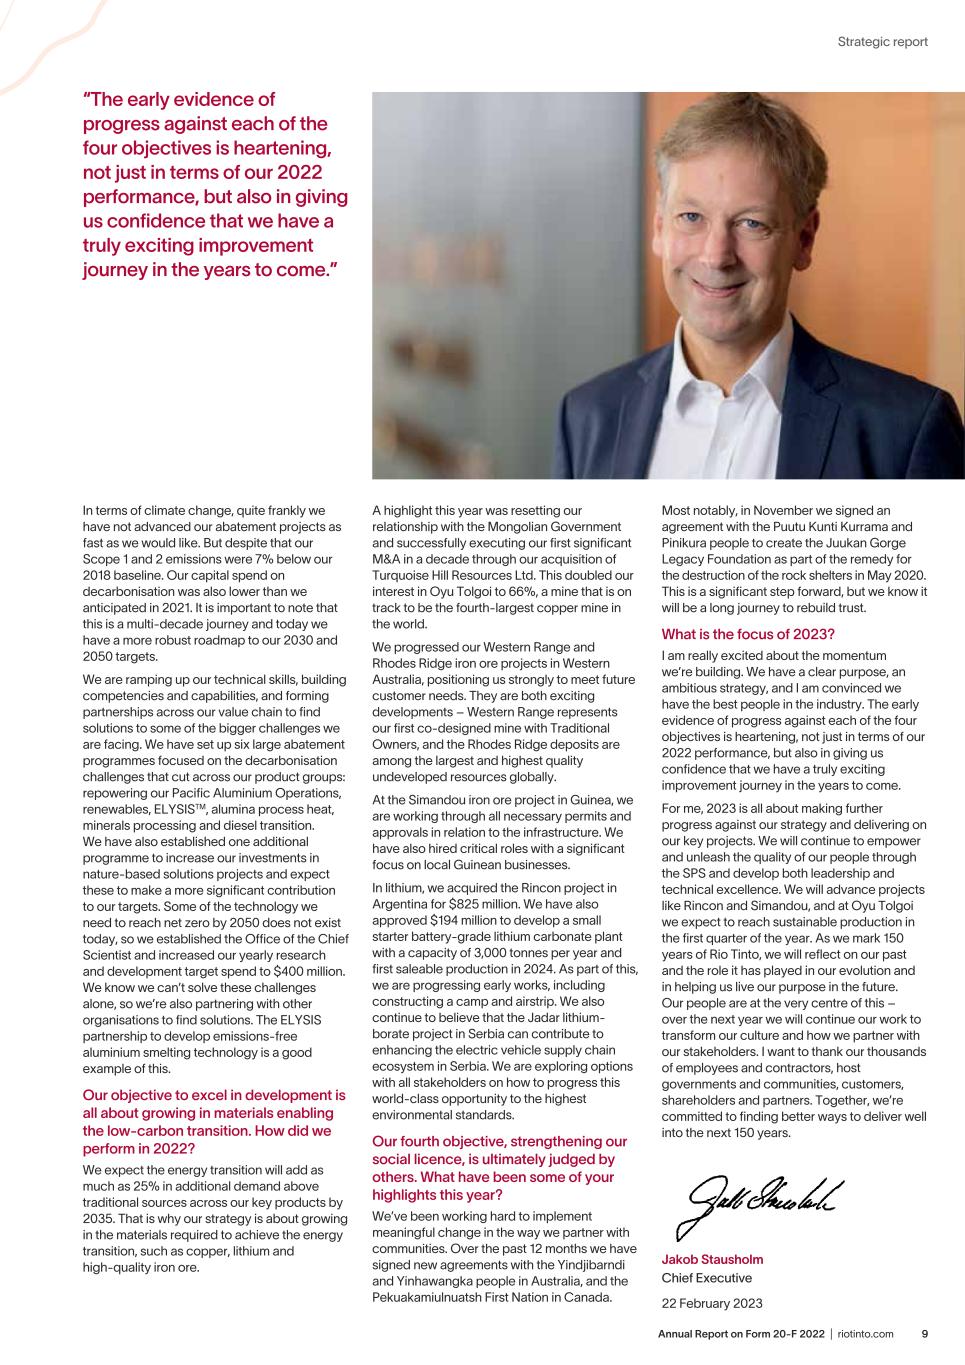
9Annual Report on Form 20-F 2022 | riotinto.com Strategic report In terms of climate change, quite frankly we have not advanced our abatement projects as fast as we would like. But despite that our Scope 1 and 2 emissions were 7% below our 2018 baseline. Our capital spend on decarbonisation was also lower than we anticipated in 2021. It is important to note that this is a multi-decade journey and today we have a more robust roadmap to our 2030 and 2050 targets. We are ramping up our technical skills, building competencies and capabilities, and forming partnerships across our value chain to find solutions to some of the bigger challenges we are facing. We have set up six large abatement programmes focused on the decarbonisation challenges that cut across our product groups: repowering our Pacific Aluminium Operations, renewables, ELYSISTM, alumina process heat, minerals processing and diesel transition. We have also established one additional programme to increase our investments in nature-based solutions projects and expect these to make a more significant contribution to our targets. Some of the technology we need to reach net zero by 2050 does not exist today, so we established the Office of the Chief Scientist and increased our yearly research and development target spend to $400 million. We know we can’t solve these challenges alone, so we’re also partnering with other organisations to find solutions. The ELYSIS partnership to develop emissions-free aluminium smelting technology is a good example of this. Our objective to excel in development is all about growing in materials enabling the low-carbon transition. How did we perform in 2022? We expect the energy transition will add as much as 25% in additional demand above traditional sources across our key products by 2035. That is why our strategy is about growing in the materials required to achieve the energy transition, such as copper, lithium and high-quality iron ore. A highlight this year was resetting our relationship with the Mongolian Government and successfully executing our first significant M&A in a decade through our acquisition of Turquoise Hill Resources Ltd. This doubled our interest in Oyu Tolgoi to 66%, a mine that is on track to be the fourth-largest copper mine in the world. We progressed our Western Range and Rhodes Ridge iron ore projects in Western Australia, positioning us strongly to meet future customer needs. They are both exciting developments – Western Range represents our first co-designed mine with Traditional Owners, and the Rhodes Ridge deposits are among the largest and highest quality undeveloped resources globally. At the Simandou iron ore project in Guinea, we are working through all necessary permits and approvals in relation to the infrastructure. We have also hired critical roles with a significant focus on local Guinean businesses. In lithium, we acquired the Rincon project in Argentina for $825 million. We have also approved $194 million to develop a small starter battery-grade lithium carbonate plant with a capacity of 3,000 tonnes per year and first saleable production in 2024. As part of this, we are progressing early works, including constructing a camp and airstrip. We also continue to believe that the Jadar lithium- borate project in Serbia can contribute to enhancing the electric vehicle supply chain ecosystem in Serbia. We are exploring options with all stakeholders on how to progress this world-class opportunity to the highest environmental standards. Our fourth objective, strengthening our social licence, is ultimately judged by others. What have been some of your highlights this year? We’ve been working hard to implement meaningful change in the way we partner with communities. Over the past 12 months we have signed new agreements with the Yindjibarndi and Yinhawangka people in Australia, and the Pekuakamiulnuatsh First Nation in Canada. Most notably, in November we signed an agreement with the Puutu Kunti Kurrama and Pinikura people to create the Juukan Gorge Legacy Foundation as part of the remedy for the destruction of the rock shelters in May 2020. This is a significant step forward, but we know it will be a long journey to rebuild trust. What is the focus of 2023? I am really excited about the momentum we’re building. We have a clear purpose, an ambitious strategy, and I am convinced we have the best people in the industry. The early evidence of progress against each of the four objectives is heartening, not just in terms of our 2022 performance, but also in giving us confidence that we have a truly exciting improvement journey in the years to come. For me, 2023 is all about making further progress against our strategy and delivering on our key projects. We will continue to empower and unleash the quality of our people through the SPS and develop both leadership and technical excellence. We will advance projects like Rincon and Simandou, and at Oyu Tolgoi we expect to reach sustainable production in the first quarter of the year. As we mark 150 years of Rio Tinto, we will reflect on our past and the role it has played in our evolution and in helping us live our purpose in the future. Our people are at the very centre of this – over the next year we will continue our work to transform our culture and how we partner with our stakeholders. I want to thank our thousands of employees and contractors, host governments and communities, customers, shareholders and partners. Together, we’re committed to finding better ways to deliver well into the next 150 years. Jakob Stausholm Chief Executive 22 February 2023 “The early evidence of progress against each of the four objectives is heartening, not just in terms of our 2022 performance, but also in giving us confidence that we have a truly exciting improvement journey in the years to come.”
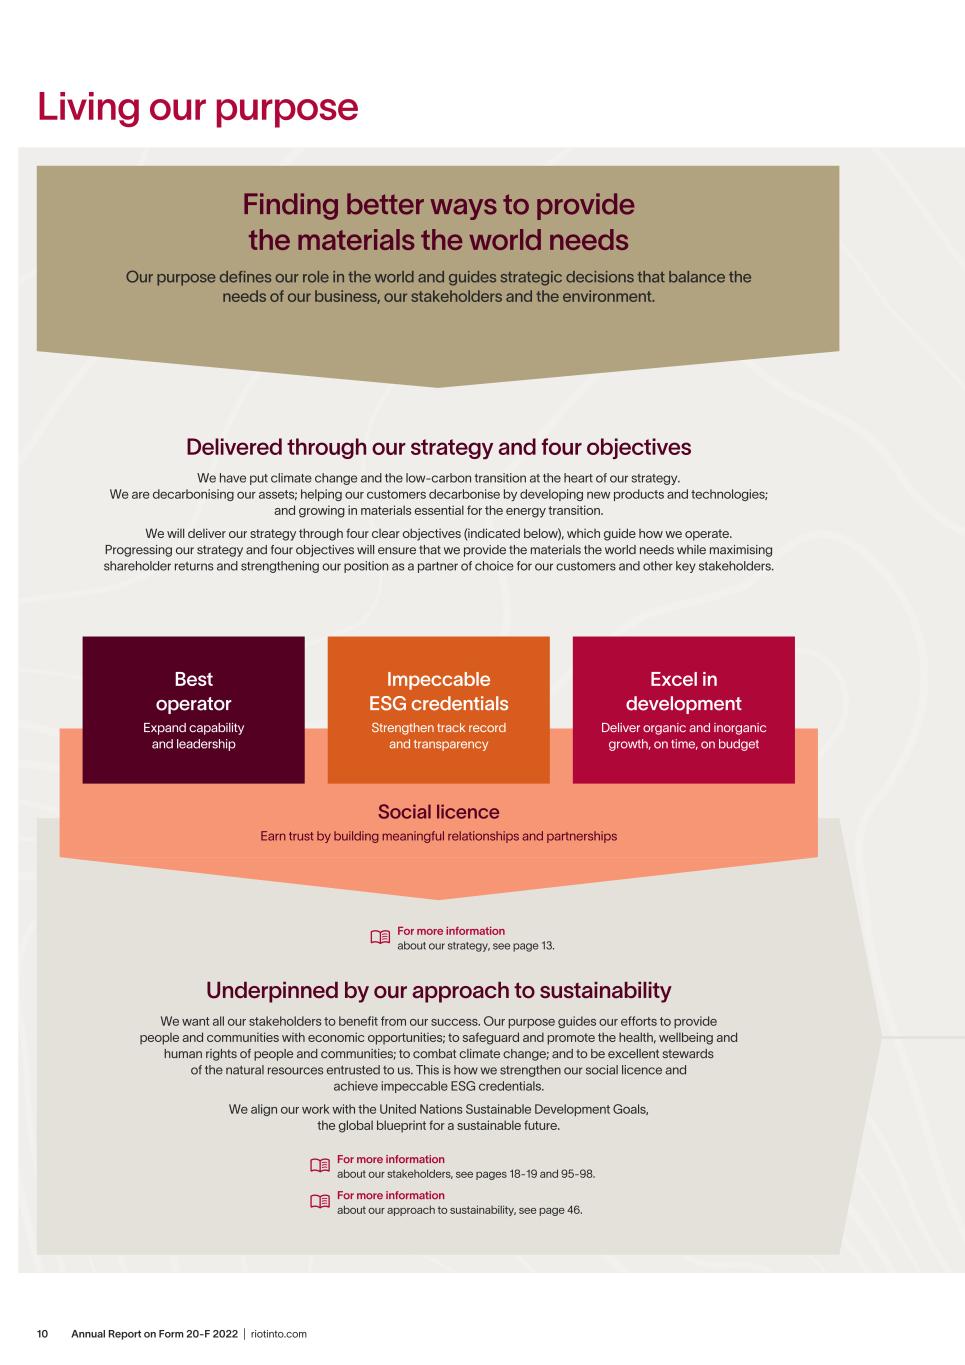
Annual Report on Form 20-F 2022 | riotinto.com10 Living our purpose Delivered through our strategy and four objectives We have put climate change and the low-carbon transition at the heart of our strategy. We are decarbonising our assets; helping our customers decarbonise by developing new products and technologies; and growing in materials essential for the energy transition. We will deliver our strategy through four clear objectives (indicated below), which guide how we operate. Progressing our strategy and four objectives will ensure that we provide the materials the world needs while maximising shareholder returns and strengthening our position as a partner of choice for our customers and other key stakeholders. Finding better ways to provide the materials the world needs Our purpose defines our role in the world and guides strategic decisions that balance the needs of our business, our stakeholders and the environment. Excel in development Deliver organic and inorganic growth, on time, on budget Impeccable ESG credentials Strengthen track record and transparency Best operator Expand capability and leadership Social licence Earn trust by building meaningful relationships and partnerships Underpinned by our approach to sustainability We want all our stakeholders to benefit from our success. Our purpose guides our efforts to provide people and communities with economic opportunities; to safeguard and promote the health, wellbeing and human rights of people and communities; to combat climate change; and to be excellent stewards of the natural resources entrusted to us. This is how we strengthen our social licence and achieve impeccable ESG credentials. We align our work with the United Nations Sustainable Development Goals, the global blueprint for a sustainable future. For more information about our stakeholders, see pages 18-19 and 95-98. For more information about our approach to sustainability, see page 46. For more information about our strategy, see page 13.
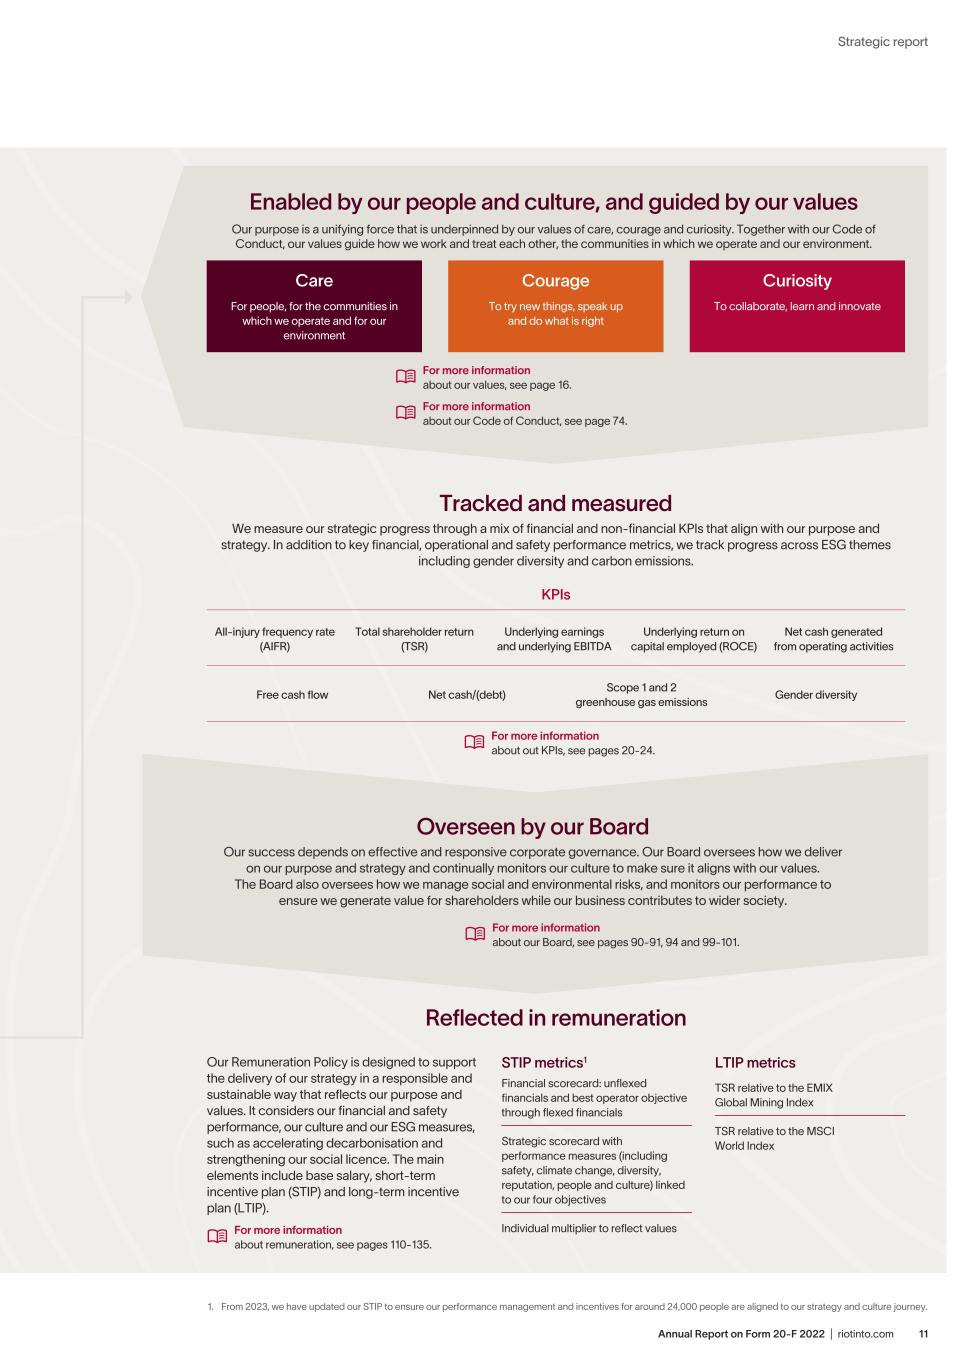
11Annual Report on Form 20-F 2022 | riotinto.com Strategic report Reflected in remuneration STIP metrics1 Financial scorecard: unflexed financials and best operator objective through flexed financials Strategic scorecard with performance measures (including safety, climate change, diversity, reputation, people and culture) linked to our four objectives Individual multiplier to reflect values LTIP metrics TSR relative to the EMIX Global Mining Index TSR relative to the MSCI World Index Enabled by our people and culture, and guided by our values Our purpose is a unifying force that is underpinned by our values of care, courage and curiosity. Together with our Code of Conduct, our values guide how we work and treat each other, the communities in which we operate and our environment. Care For people, for the communities in which we operate and for our environment Courage To try new things, speak up and do what is right Curiosity To collaborate, learn and innovate For more information about our values, see page 16. For more information about our Code of Conduct, see page 74. Tracked and measured We measure our strategic progress through a mix of financial and non-financial KPIs that align with our purpose and strategy. In addition to key financial, operational and safety performance metrics, we track progress across ESG themes including gender diversity and carbon emissions. KPIs Our Remuneration Policy is designed to support the delivery of our strategy in a responsible and sustainable way that reflects our purpose and values. It considers our financial and safety performance, our culture and our ESG measures, such as accelerating decarbonisation and strengthening our social licence. The main elements include base salary, short-term incentive plan (STIP) and long-term incentive plan (LTIP). For more information about remuneration, see pages 110-135. All-injury frequency rate (AIFR) Total shareholder return (TSR) Underlying earnings and underlying EBITDA Underlying return on capital employed (ROCE) Net cash generated from operating activities Free cash flow Net cash/(debt) Scope 1 and 2 greenhouse gas emissions Gender diversity Overseen by our Board Our success depends on effective and responsive corporate governance. Our Board oversees how we deliver on our purpose and strategy and continually monitors our culture to make sure it aligns with our values. The Board also oversees how we manage social and environmental risks, and monitors our performance to ensure we generate value for shareholders while our business contributes to wider society. For more information about our Board, see pages 90-91, 94 and 99-101. 1. From 2023, we have updated our STIP to ensure our performance management and incentives for around 24,000 people are aligned to our strategy and culture journey. For more information about out KPIs, see pages 20-24.
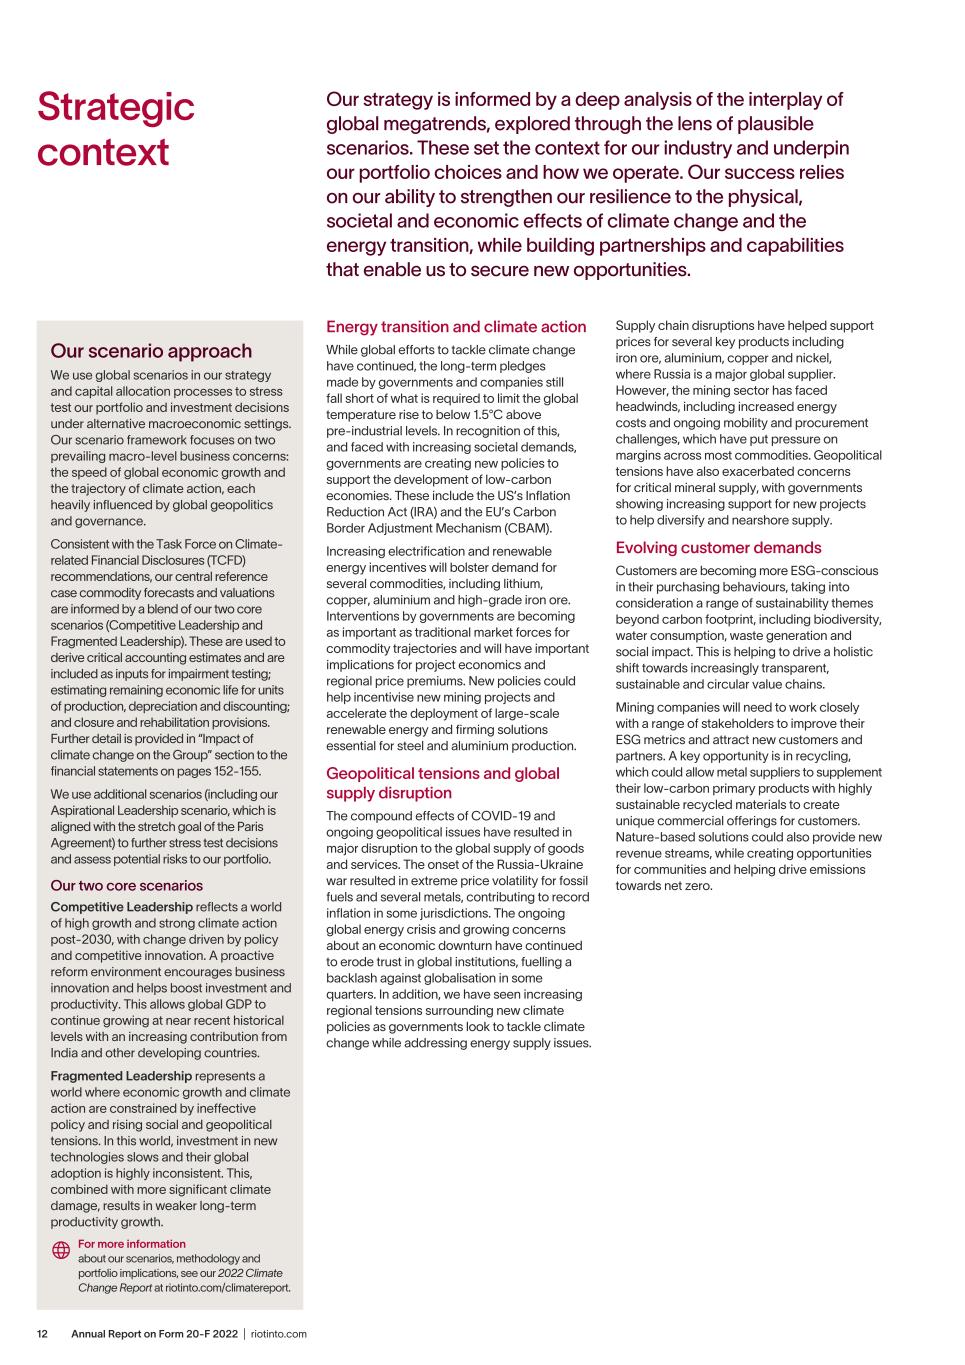
Annual Report on Form 20-F 2022 | riotinto.com12 Strategic context Our strategy is informed by a deep analysis of the interplay of global megatrends, explored through the lens of plausible scenarios. These set the context for our industry and underpin our portfolio choices and how we operate. Our success relies on our ability to strengthen our resilience to the physical, societal and economic effects of climate change and the energy transition, while building partnerships and capabilities that enable us to secure new opportunities. Energy transition and climate action While global efforts to tackle climate change have continued, the long-term pledges made by governments and companies still fall short of what is required to limit the global temperature rise to below 1.5°C above pre-industrial levels. In recognition of this, and faced with increasing societal demands, governments are creating new policies to support the development of low-carbon economies. These include the US’s Inflation Reduction Act (IRA) and the EU’s Carbon Border Adjustment Mechanism (CBAM). Increasing electrification and renewable energy incentives will bolster demand for several commodities, including lithium, copper, aluminium and high-grade iron ore. Interventions by governments are becoming as important as traditional market forces for commodity trajectories and will have important implications for project economics and regional price premiums. New policies could help incentivise new mining projects and accelerate the deployment of large-scale renewable energy and firming solutions essential for steel and aluminium production. Geopolitical tensions and global supply disruption The compound effects of COVID-19 and ongoing geopolitical issues have resulted in major disruption to the global supply of goods and services. The onset of the Russia-Ukraine war resulted in extreme price volatility for fossil fuels and several metals, contributing to record inflation in some jurisdictions. The ongoing global energy crisis and growing concerns about an economic downturn have continued to erode trust in global institutions, fuelling a backlash against globalisation in some quarters. In addition, we have seen increasing regional tensions surrounding new climate policies as governments look to tackle climate change while addressing energy supply issues. Supply chain disruptions have helped support prices for several key products including iron ore, aluminium, copper and nickel, where Russia is a major global supplier. However, the mining sector has faced headwinds, including increased energy costs and ongoing mobility and procurement challenges, which have put pressure on margins across most commodities. Geopolitical tensions have also exacerbated concerns for critical mineral supply, with governments showing increasing support for new projects to help diversify and nearshore supply. Evolving customer demands Customers are becoming more ESG-conscious in their purchasing behaviours, taking into consideration a range of sustainability themes beyond carbon footprint, including biodiversity, water consumption, waste generation and social impact. This is helping to drive a holistic shift towards increasingly transparent, sustainable and circular value chains. Mining companies will need to work closely with a range of stakeholders to improve their ESG metrics and attract new customers and partners. A key opportunity is in recycling, which could allow metal suppliers to supplement their low-carbon primary products with highly sustainable recycled materials to create unique commercial offerings for customers. Nature-based solutions could also provide new revenue streams, while creating opportunities for communities and helping drive emissions towards net zero. Our scenario approach We use global scenarios in our strategy and capital allocation processes to stress test our portfolio and investment decisions under alternative macroeconomic settings. Our scenario framework focuses on two prevailing macro-level business concerns: the speed of global economic growth and the trajectory of climate action, each heavily influenced by global geopolitics and governance. Consistent with the Task Force on Climate- related Financial Disclosures (TCFD) recommendations, our central reference case commodity forecasts and valuations are informed by a blend of our two core scenarios (Competitive Leadership and Fragmented Leadership). These are used to derive critical accounting estimates and are included as inputs for impairment testing; estimating remaining economic life for units of production, depreciation and discounting; and closure and rehabilitation provisions. Further detail is provided in “Impact of climate change on the Group” section to the financial statements on pages 152-155. We use additional scenarios (including our Aspirational Leadership scenario, which is aligned with the stretch goal of the Paris Agreement) to further stress test decisions and assess potential risks to our portfolio. Our two core scenarios Competitive Leadership reflects a world of high growth and strong climate action post-2030, with change driven by policy and competitive innovation. A proactive reform environment encourages business innovation and helps boost investment and productivity. This allows global GDP to continue growing at near recent historical levels with an increasing contribution from India and other developing countries. Fragmented Leadership represents a world where economic growth and climate action are constrained by ineffective policy and rising social and geopolitical tensions. In this world, investment in new technologies slows and their global adoption is highly inconsistent. This, combined with more significant climate damage, results in weaker long-term productivity growth. For more information about our scenarios, methodology and portfolio implications, see our 2022 Climate Change Report at riotinto.com/climatereport.
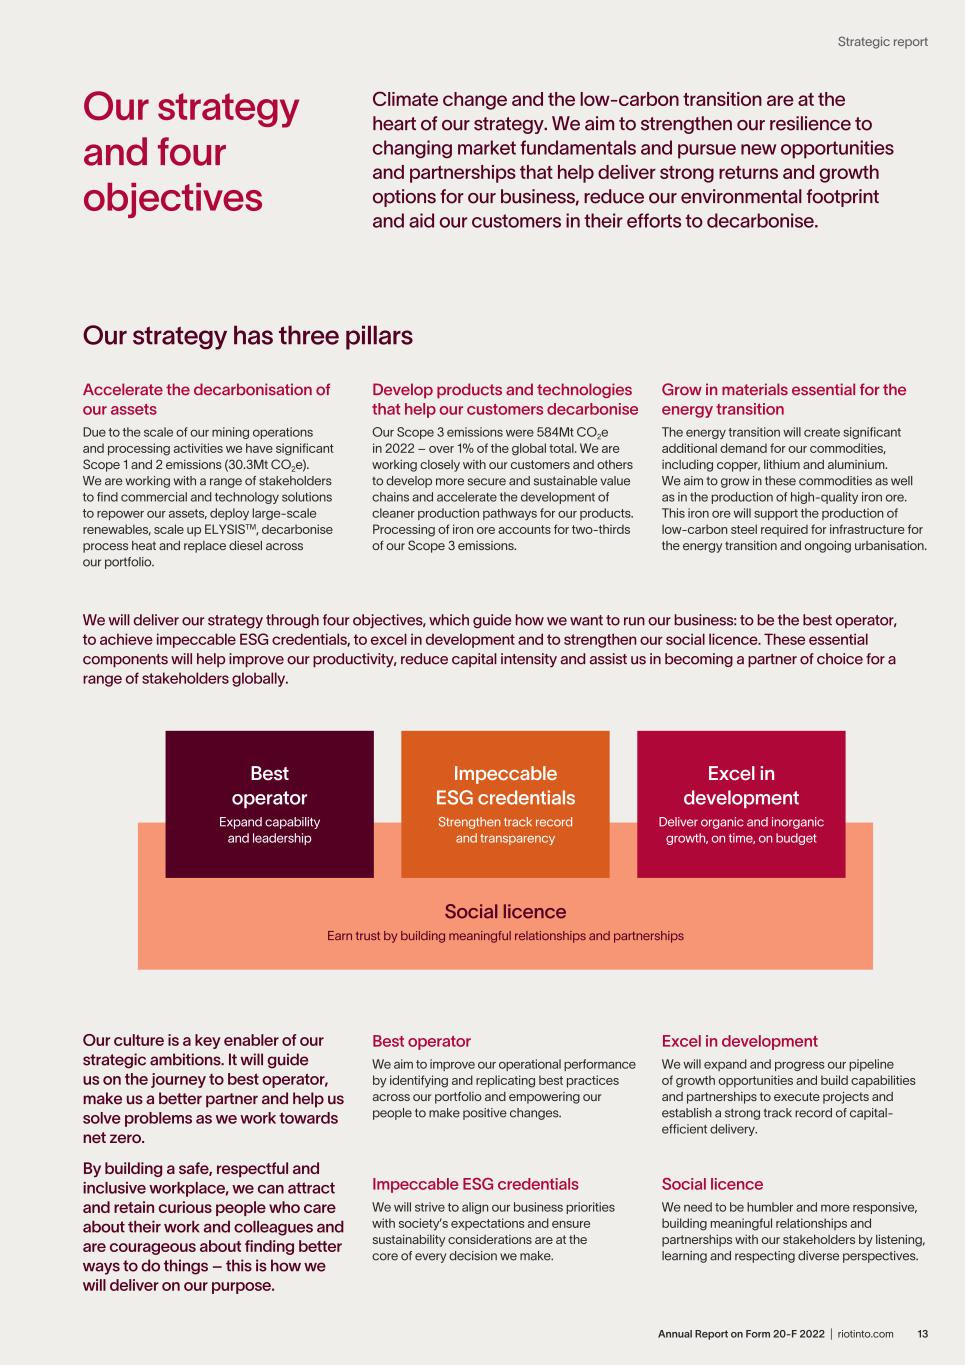
13Annual Report on Form 20-F 2022 | riotinto.com Strategic report Climate change and the low-carbon transition are at the heart of our strategy. We aim to strengthen our resilience to changing market fundamentals and pursue new opportunities and partnerships that help deliver strong returns and growth options for our business, reduce our environmental footprint and aid our customers in their efforts to decarbonise. Our strategy and four objectives Best operator We aim to improve our operational performance by identifying and replicating best practices across our portfolio and empowering our people to make positive changes. Excel in development We will expand and progress our pipeline of growth opportunities and build capabilities and partnerships to execute projects and establish a strong track record of capital- efficient delivery. Impeccable ESG credentials We will strive to align our business priorities with society’s expectations and ensure sustainability considerations are at the core of every decision we make. Social licence We need to be humbler and more responsive, building meaningful relationships and partnerships with our stakeholders by listening, learning and respecting diverse perspectives. Our culture is a key enabler of our strategic ambitions. It will guide us on the journey to best operator, make us a better partner and help us solve problems as we work towards net zero. By building a safe, respectful and inclusive workplace, we can attract and retain curious people who care about their work and colleagues and are courageous about finding better ways to do things – this is how we will deliver on our purpose. Our strategy has three pillars Accelerate the decarbonisation of our assets Due to the scale of our mining operations and processing activities we have significant Scope 1 and 2 emissions (30.3Mt CO2e). We are working with a range of stakeholders to find commercial and technology solutions to repower our assets, deploy large-scale renewables, scale up ELYSISTM, decarbonise process heat and replace diesel across our portfolio. Develop products and technologies that help our customers decarbonise Our Scope 3 emissions were 584Mt CO2e in 2022 – over 1% of the global total. We are working closely with our customers and others to develop more secure and sustainable value chains and accelerate the development of cleaner production pathways for our products. Processing of iron ore accounts for two-thirds of our Scope 3 emissions. Grow in materials essential for the energy transition The energy transition will create significant additional demand for our commodities, including copper, lithium and aluminium. We aim to grow in these commodities as well as in the production of high-quality iron ore. This iron ore will support the production of low-carbon steel required for infrastructure for the energy transition and ongoing urbanisation. We will deliver our strategy through four objectives, which guide how we want to run our business: to be the best operator, to achieve impeccable ESG credentials, to excel in development and to strengthen our social licence. These essential components will help improve our productivity, reduce capital intensity and assist us in becoming a partner of choice for a range of stakeholders globally. Social licence Earn trust by building meaningful relationships and partnerships Excel in development Deliver organic and inorganic growth, on time, on budget Impeccable ESG credentials Strengthen track record and transparency Best operator Expand capability and leadership
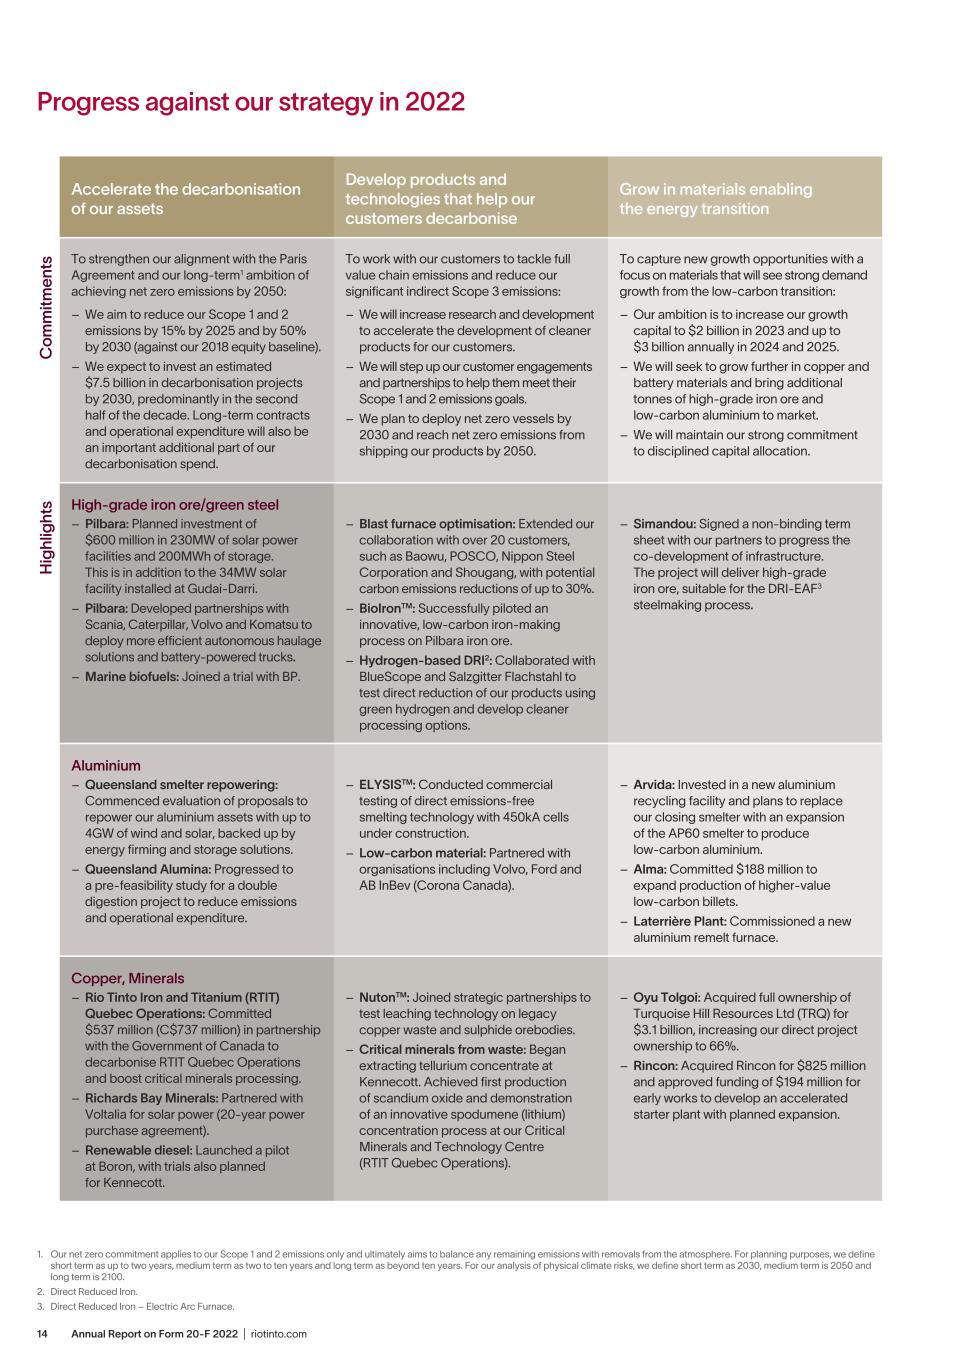
Annual Report on Form 20-F 2022 | riotinto.com14 Progress against our strategy in 2022 Accelerate the decarbonisation of our assets Develop products and technologies that help our customers decarbonise Grow in materials enabling the energy transition C om m itm en ts To strengthen our alignment with the Paris Agreement and our long-term1 ambition of achieving net zero emissions by 2050: – We aim to reduce our Scope 1 and 2 emissions by 15% by 2025 and by 50% by 2030 (against our 2018 equity baseline). – We expect to invest an estimated $7.5 billion in decarbonisation projects by 2030, predominantly in the second half of the decade. Long-term contracts and operational expenditure will also be an important additional part of our decarbonisation spend. To work with our customers to tackle full value chain emissions and reduce our significant indirect Scope 3 emissions: – We will increase research and development to accelerate the development of cleaner products for our customers. – We will step up our customer engagements and partnerships to help them meet their Scope 1 and 2 emissions goals. – We plan to deploy net zero vessels by 2030 and reach net zero emissions from shipping our products by 2050. To capture new growth opportunities with a focus on materials that will see strong demand growth from the low-carbon transition: – Our ambition is to increase our growth capital to $2 billion in 2023 and up to $3 billion annually in 2024 and 2025. – We will seek to grow further in copper and battery materials and bring additional tonnes of high-grade iron ore and low-carbon aluminium to market. – We will maintain our strong commitment to disciplined capital allocation. H ig hl ig ht s High-grade iron ore/green steel – Pilbara: Planned investment of $600 million in 230MW of solar power facilities and 200MWh of storage. This is in addition to the 34MW solar facility installed at Gudai-Darri. – Pilbara: Developed partnerships with Scania, Caterpillar, Volvo and Komatsu to deploy more efficient autonomous haulage solutions and battery-powered trucks. – Marine biofuels: Joined a trial with BP. – Blast furnace optimisation: Extended our collaboration with over 20 customers, such as Baowu, POSCO, Nippon Steel Corporation and Shougang, with potential carbon emissions reductions of up to 30%. – BioIronTM: Successfully piloted an innovative, low-carbon iron-making process on Pilbara iron ore. – Hydrogen-based DRI2: Collaborated with BlueScope and Salzgitter Flachstahl to test direct reduction of our products using green hydrogen and develop cleaner processing options. – Simandou: Signed a non-binding term sheet with our partners to progress the co-development of infrastructure. The project will deliver high-grade iron ore, suitable for the DRI-EAF3 steelmaking process. Aluminium – Queensland smelter repowering: Commenced evaluation of proposals to repower our aluminium assets with up to 4GW of wind and solar, backed up by energy firming and storage solutions. – Queensland Alumina: Progressed to a pre-feasibility study for a double digestion project to reduce emissions and operational expenditure. – ELYSISTM: Conducted commercial testing of direct emissions-free smelting technology with 450kA cells under construction. – Low-carbon material: Partnered with organisations including Volvo, Ford and AB InBev (Corona Canada). – Arvida: Invested in a new aluminium recycling facility and plans to replace our closing smelter with an expansion of the AP60 smelter to produce low-carbon aluminium. – Alma: Committed $188 million to expand production of higher-value low-carbon billets. – Laterrière Plant: Commissioned a new aluminium remelt furnace. Copper, Minerals – Rio Tinto Iron and Titanium (RTIT) Quebec Operations: Committed $537 million (C$737 million) in partnership with the Government of Canada to decarbonise RTIT Quebec Operations and boost critical minerals processing. – Richards Bay Minerals: Partnered with Voltalia for solar power (20-year power purchase agreement). – Renewable diesel: Launched a pilot at Boron, with trials also planned for Kennecott. – NutonTM: Joined strategic partnerships to test leaching technology on legacy copper waste and sulphide orebodies. – Critical minerals from waste: Began extracting tellurium concentrate at Kennecott. Achieved first production of scandium oxide and demonstration of an innovative spodumene (lithium) concentration process at our Critical Minerals and Technology Centre (RTIT Quebec Operations). – Oyu Tolgoi: Acquired full ownership of Turquoise Hill Resources Ltd (TRQ) for $3.1 billion, increasing our direct project ownership to 66%. – Rincon: Acquired Rincon for $825 million and approved funding of $194 million for early works to develop an accelerated starter plant with planned expansion. 1. Our net zero commitment applies to our Scope 1 and 2 emissions only and ultimately aims to balance any remaining emissions with removals from the atmosphere. For planning purposes, we define short term as up to two years, medium term as two to ten years and long term as beyond ten years. For our analysis of physical climate risks, we define short term as 2030, medium term is 2050 and long term is 2100. 2. Direct Reduced Iron. 3. Direct Reduced Iron – Electric Arc Furnace.
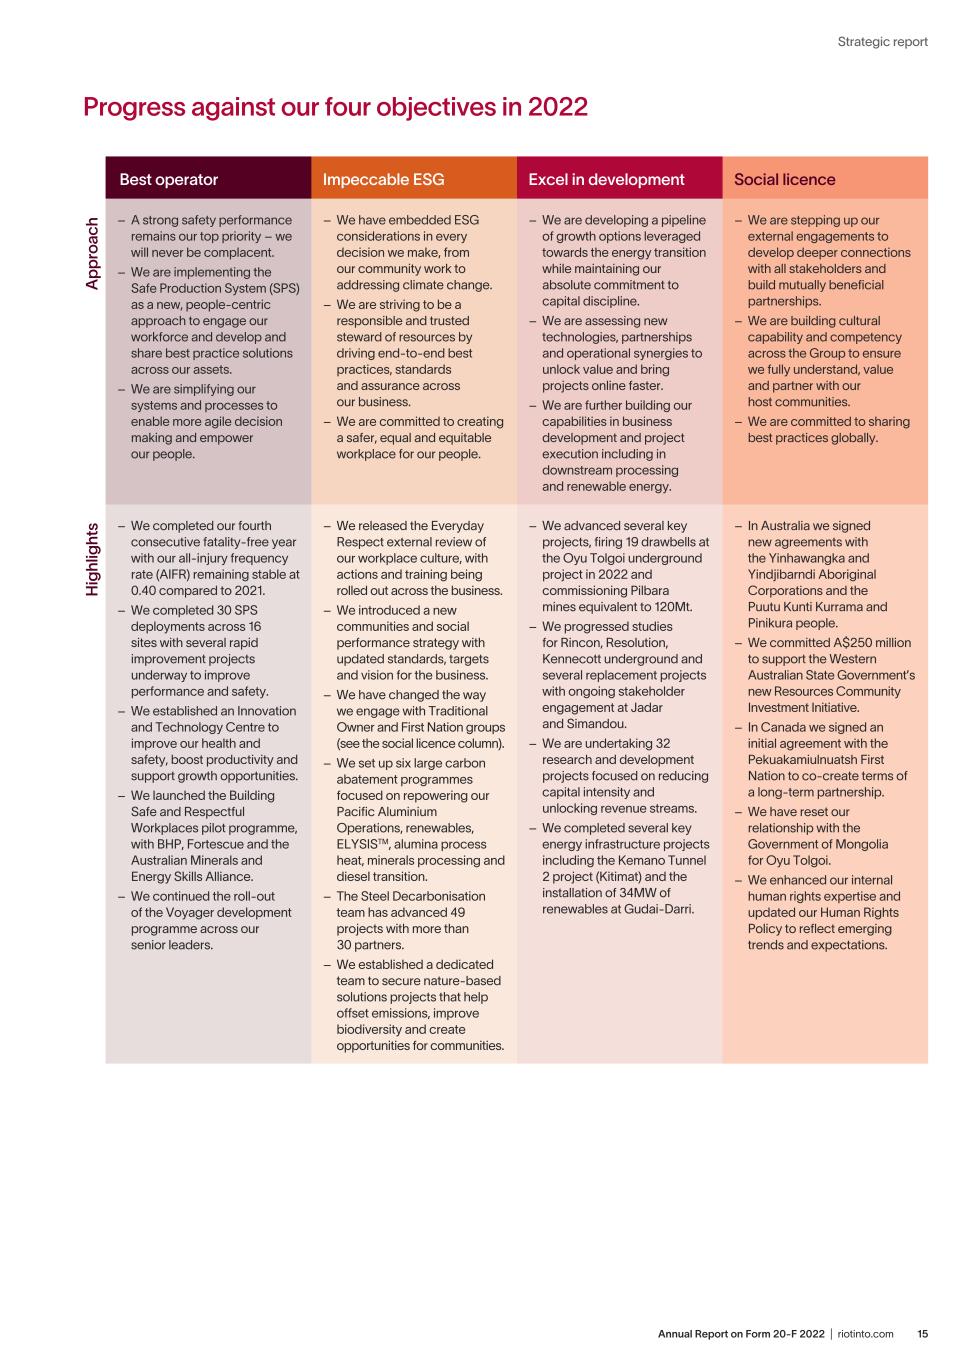
15Annual Report on Form 20-F 2022 | riotinto.com Strategic report Best operator Impeccable ESG Excel in development Social licence A pp ro ac h – A strong safety performance remains our top priority – we will never be complacent. – We are implementing the Safe Production System (SPS) as a new, people-centric approach to engage our workforce and develop and share best practice solutions across our assets. – We are simplifying our systems and processes to enable more agile decision making and empower our people. – We have embedded ESG considerations in every decision we make, from our community work to addressing climate change. – We are striving to be a responsible and trusted steward of resources by driving end-to-end best practices, standards and assurance across our business. – We are committed to creating a safer, equal and equitable workplace for our people. – We are developing a pipeline of growth options leveraged towards the energy transition while maintaining our absolute commitment to capital discipline. – We are assessing new technologies, partnerships and operational synergies to unlock value and bring projects online faster. – We are further building our capabilities in business development and project execution including in downstream processing and renewable energy. – We are stepping up our external engagements to develop deeper connections with all stakeholders and build mutually beneficial partnerships. – We are building cultural capability and competency across the Group to ensure we fully understand, value and partner with our host communities. – We are committed to sharing best practices globally. H ig hl ig ht s – We completed our fourth consecutive fatality-free year with our all-injury frequency rate (AIFR) remaining stable at 0.40 compared to 2021. – We completed 30 SPS deployments across 16 sites with several rapid improvement projects underway to improve performance and safety. – We established an Innovation and Technology Centre to improve our health and safety, boost productivity and support growth opportunities. – We launched the Building Safe and Respectful Workplaces pilot programme, with BHP, Fortescue and the Australian Minerals and Energy Skills Alliance. – We continued the roll-out of the Voyager development programme across our senior leaders. – We released the Everyday Respect external review of our workplace culture, with actions and training being rolled out across the business. – We introduced a new communities and social performance strategy with updated standards, targets and vision for the business. – We have changed the way we engage with Traditional Owner and First Nation groups (see the social licence column). – We set up six large carbon abatement programmes focused on repowering our Pacific Aluminium Operations, renewables, ELYSISTM, alumina process heat, minerals processing and diesel transition. – The Steel Decarbonisation team has advanced 49 projects with more than 30 partners. – We established a dedicated team to secure nature-based solutions projects that help offset emissions, improve biodiversity and create opportunities for communities. – We advanced several key projects, firing 19 drawbells at the Oyu Tolgoi underground project in 2022 and commissioning Pilbara mines equivalent to 120Mt. – We progressed studies for Rincon, Resolution, Kennecott underground and several replacement projects with ongoing stakeholder engagement at Jadar and Simandou. – We are undertaking 32 research and development projects focused on reducing capital intensity and unlocking revenue streams. – We completed several key energy infrastructure projects including the Kemano Tunnel 2 project (Kitimat) and the installation of 34MW of renewables at Gudai-Darri. – In Australia we signed new agreements with the Yinhawangka and Yindjibarndi Aboriginal Corporations and the Puutu Kunti Kurrama and Pinikura people. – We committed A$250 million to support the Western Australian State Government’s new Resources Community Investment Initiative. – In Canada we signed an initial agreement with the Pekuakamiulnuatsh First Nation to co-create terms of a long-term partnership. – We have reset our relationship with the Government of Mongolia for Oyu Tolgoi. – We enhanced our internal human rights expertise and updated our Human Rights Policy to reflect emerging trends and expectations. Progress against our four objectives in 2022
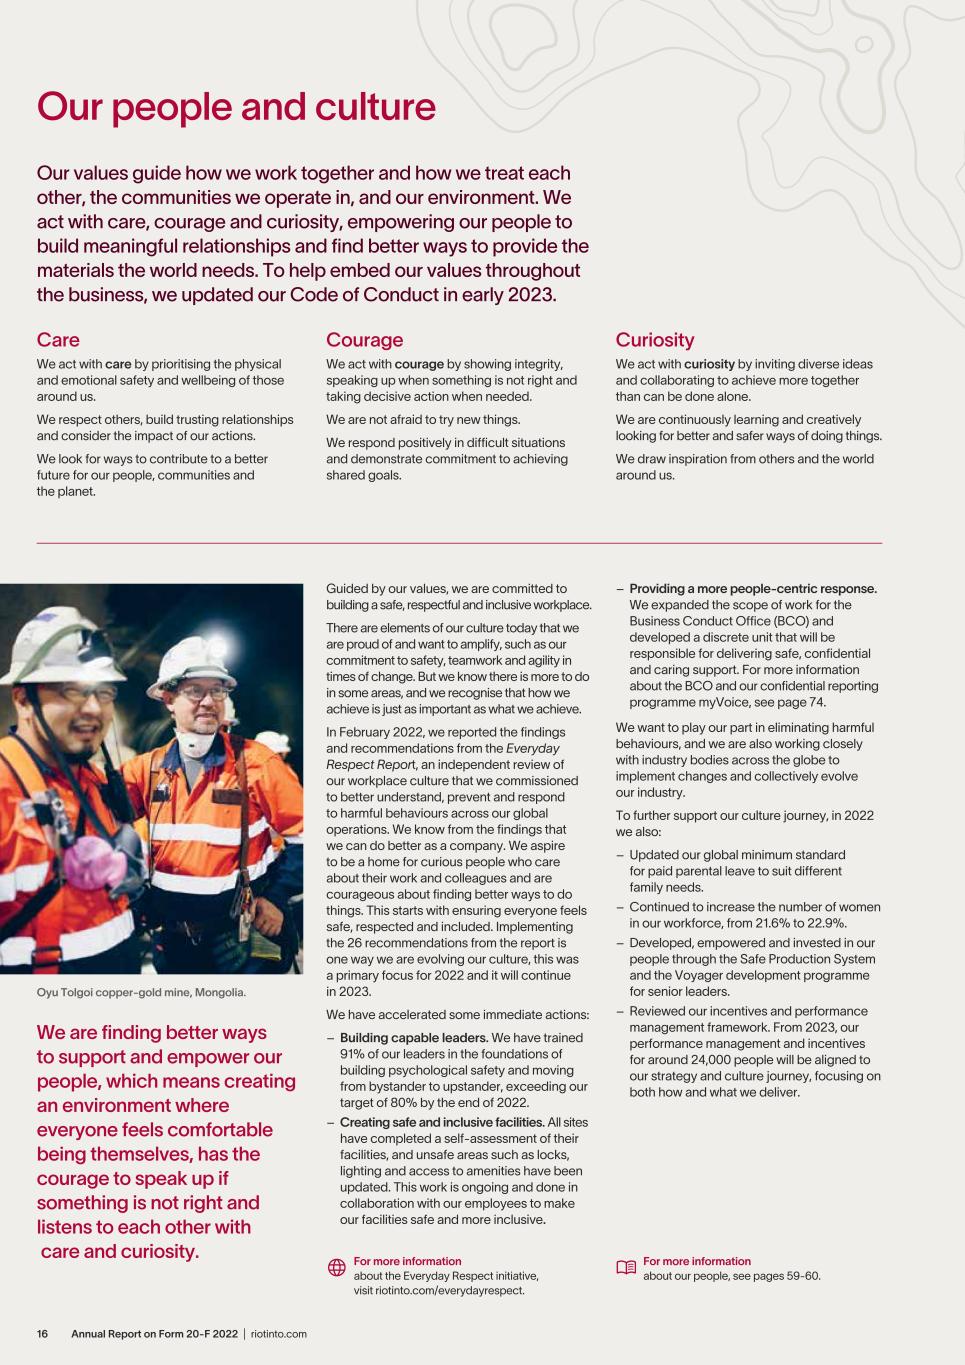
Annual Report on Form 20-F 2022 | riotinto.com16 Our people and culture Our values guide how we work together and how we treat each other, the communities we operate in, and our environment. We act with care, courage and curiosity, empowering our people to build meaningful relationships and find better ways to provide the materials the world needs. To help embed our values throughout the business, we updated our Code of Conduct in early 2023. Care We act with care by prioritising the physical and emotional safety and wellbeing of those around us. We respect others, build trusting relationships and consider the impact of our actions. We look for ways to contribute to a better future for our people, communities and the planet. Courage We act with courage by showing integrity, speaking up when something is not right and taking decisive action when needed. We are not afraid to try new things. We respond positively in difficult situations and demonstrate commitment to achieving shared goals. Curiosity We act with curiosity by inviting diverse ideas and collaborating to achieve more together than can be done alone. We are continuously learning and creatively looking for better and safer ways of doing things. We draw inspiration from others and the world around us. We are finding better ways to support and empower our people, which means creating an environment where everyone feels comfortable being themselves, has the courage to speak up if something is not right and listens to each other with care and curiosity. Oyu Tolgoi copper-gold mine, Mongolia. Guided by our values, we are committed to building a safe, respectful and inclusive workplace. There are elements of our culture today that we are proud of and want to amplify, such as our commitment to safety, teamwork and agility in times of change. But we know there is more to do in some areas, and we recognise that how we achieve is just as important as what we achieve. In February 2022, we reported the findings and recommendations from the Everyday Respect Report, an independent review of our workplace culture that we commissioned to better understand, prevent and respond to harmful behaviours across our global operations. We know from the findings that we can do better as a company. We aspire to be a home for curious people who care about their work and colleagues and are courageous about finding better ways to do things. This starts with ensuring everyone feels safe, respected and included. Implementing the 26 recommendations from the report is one way we are evolving our culture, this was a primary focus for 2022 and it will continue in 2023. We have accelerated some immediate actions: – Building capable leaders. We have trained 91% of our leaders in the foundations of building psychological safety and moving from bystander to upstander, exceeding our target of 80% by the end of 2022. – Creating safe and inclusive facilities. All sites have completed a self-assessment of their facilities, and unsafe areas such as locks, lighting and access to amenities have been updated. This work is ongoing and done in collaboration with our employees to make our facilities safe and more inclusive. – Providing a more people-centric response. We expanded the scope of work for the Business Conduct Office (BCO) and developed a discrete unit that will be responsible for delivering safe, confidential and caring support. For more information about the BCO and our confidential reporting programme myVoice, see page 74. We want to play our part in eliminating harmful behaviours, and we are also working closely with industry bodies across the globe to implement changes and collectively evolve our industry. To further support our culture journey, in 2022 we also: – Updated our global minimum standard for paid parental leave to suit different family needs. – Continued to increase the number of women in our workforce, from 21.6% to 22.9%. – Developed, empowered and invested in our people through the Safe Production System and the Voyager development programme for senior leaders. – Reviewed our incentives and performance management framework. From 2023, our performance management and incentives for around 24,000 people will be aligned to our strategy and culture journey, focusing on both how and what we deliver. For more information about our people, see pages 59-60. For more information about the Everyday Respect initiative, visit riotinto.com/everydayrespect.
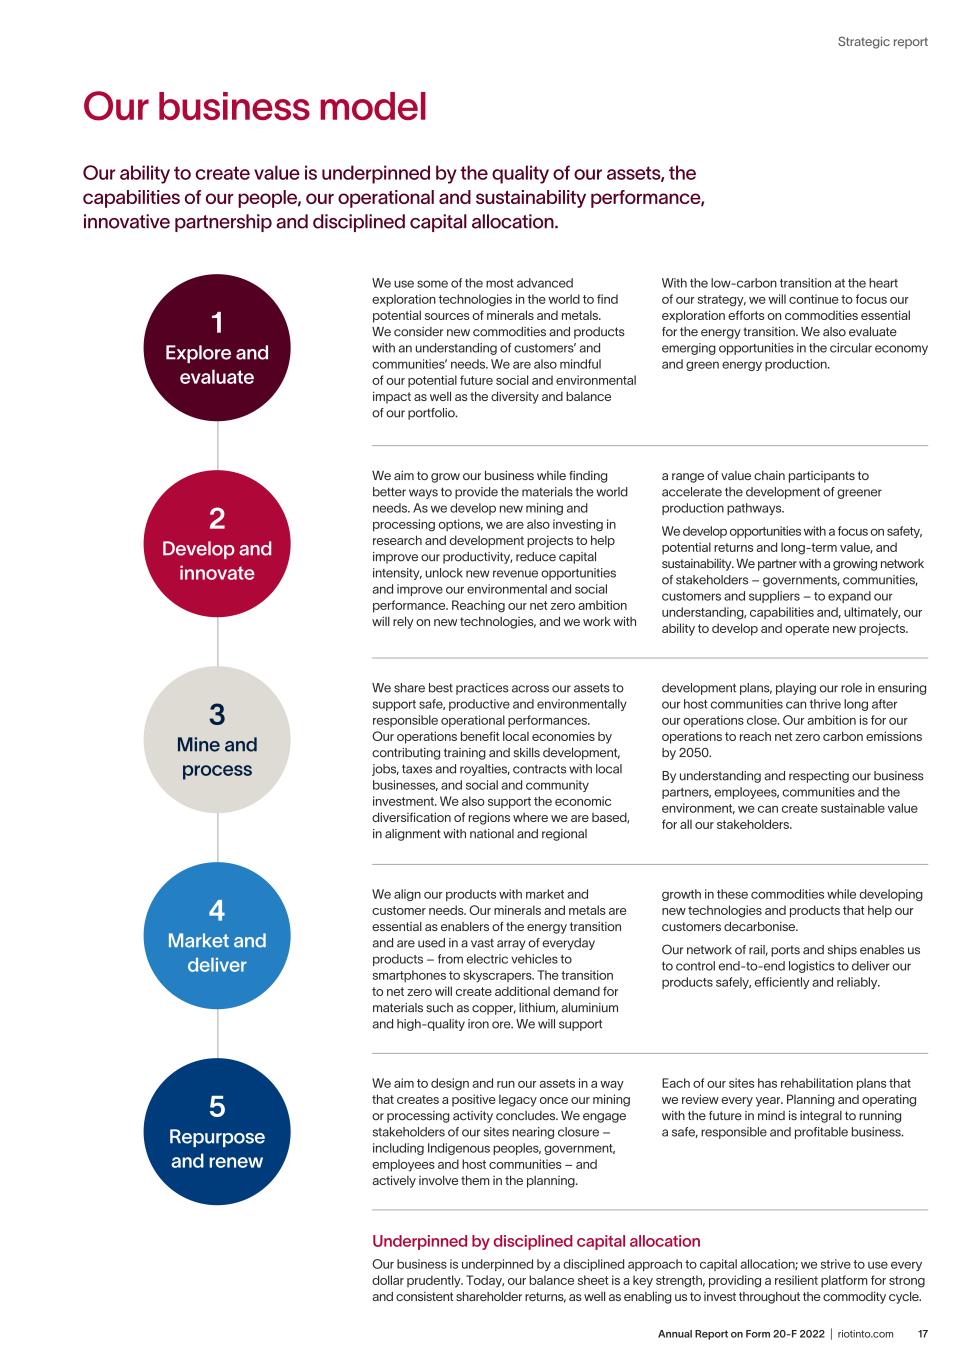
17Annual Report on Form 20-F 2022 | riotinto.com Strategic report Our business model Our ability to create value is underpinned by the quality of our assets, the capabilities of our people, our operational and sustainability performance, innovative partnership and disciplined capital allocation. Underpinned by disciplined capital allocation Our business is underpinned by a disciplined approach to capital allocation; we strive to use every dollar prudently. Today, our balance sheet is a key strength, providing a resilient platform for strong and consistent shareholder returns, as well as enabling us to invest throughout the commodity cycle. 1 Explore and evaluate 2 Develop and innovate 3 Mine and process 4 Market and deliver 5 Repurpose and renew We use some of the most advanced exploration technologies in the world to find potential sources of minerals and metals. We consider new commodities and products with an understanding of customers’ and communities’ needs. We are also mindful of our potential future social and environmental impact as well as the diversity and balance of our portfolio. With the low-carbon transition at the heart of our strategy, we will continue to focus our exploration efforts on commodities essential for the energy transition. We also evaluate emerging opportunities in the circular economy and green energy production. We aim to grow our business while finding better ways to provide the materials the world needs. As we develop new mining and processing options, we are also investing in research and development projects to help improve our productivity, reduce capital intensity, unlock new revenue opportunities and improve our environmental and social performance. Reaching our net zero ambition will rely on new technologies, and we work with a range of value chain participants to accelerate the development of greener production pathways. We develop opportunities with a focus on safety, potential returns and long-term value, and sustainability. We partner with a growing network of stakeholders – governments, communities, customers and suppliers – to expand our understanding, capabilities and, ultimately, our ability to develop and operate new projects. We share best practices across our assets to support safe, productive and environmentally responsible operational performances. Our operations benefit local economies by contributing training and skills development, jobs, taxes and royalties, contracts with local businesses, and social and community investment. We also support the economic diversification of regions where we are based, in alignment with national and regional development plans, playing our role in ensuring our host communities can thrive long after our operations close. Our ambition is for our operations to reach net zero carbon emissions by 2050. By understanding and respecting our business partners, employees, communities and the environment, we can create sustainable value for all our stakeholders. We align our products with market and customer needs. Our minerals and metals are essential as enablers of the energy transition and are used in a vast array of everyday products – from electric vehicles to smartphones to skyscrapers. The transition to net zero will create additional demand for materials such as copper, lithium, aluminium and high-quality iron ore. We will support growth in these commodities while developing new technologies and products that help our customers decarbonise. Our network of rail, ports and ships enables us to control end-to-end logistics to deliver our products safely, efficiently and reliably. We aim to design and run our assets in a way that creates a positive legacy once our mining or processing activity concludes. We engage stakeholders of our sites nearing closure – including Indigenous peoples, government, employees and host communities – and actively involve them in the planning. Each of our sites has rehabilitation plans that we review every year. Planning and operating with the future in mind is integral to running a safe, responsible and profitable business.
Annual Report on Form 20-F 2022 | riotinto.com18 Our stakeholders Partnerships and collaboration are essential to the long-term success of our business. They give us a competitive edge and allow us to work more thoughtfully and responsibly, benefiting from the expertise and insight of others. By engaging with our stakeholders and listening to their views, we can make a more meaningful contribution to society while becoming a more valuable company for our shareholders. Section 172(1) statement This stakeholder section, together with our stakeholder pages in the Governance section (pages 95-98), explains how the Board takes account of stakeholder interests. These comprise our “Section 172(1) statement”. Workforce Our people are key to our success. We are focusing on creating a safe, respectful and inclusive workplace where our people feel empowered and engaged. Guided by our values, we are evolving our culture: we are implementing the recommendations from the Everyday Respect Report, rolling out the Safe Production System, enhancing our safety maturity model, empowering our people, training our leaders and listening to employee feedback through our employee survey. In our most recent survey conducted in October 2022, our employee satisfaction score (eSAT) increased by two points (71 to 73). We are making good progress, but we know there is more to do. Communities Communities are the places and the people who make up where we live, work and call home – from the Gobi Desert in Mongolia, to KwaZulu-Natal, South Africa, and Saguenay–Lac-Saint-Jean, Quebec, Canada. We continue to strive to engage consistently and honestly with communities on a range of issues, such as jobs and local procurement, as well as the impact of our operations on the local environment. Over the past few years, we have focused on our own standards of open and transparent engagement. For example, we are moving to a model of co-management of Country in our Pilbara iron ore business, and we are updating our agreements with Indigenous peoples. Governments Governments – national, state and provincial, and local – are important stakeholders for our business. They regulate our operations, are among our commercial partners, and receive revenue from our taxes and royalties. Our economic contribution can be significant for national budgets and local development priorities, such as job creation and skills training. It is important that we engage with officials on issues such as how we explore, mine and process ore; conditions of land tenure; health, safety and environment; taxation; intellectual property; competition and foreign investment; data privacy; conditions of trade and export; and infrastructure access. For more information see page 97. $75bn Paid in taxes and royalties globally over the past ten years $6.9bn Corporate tax paid in 2022 (2021: $8.5bn)2 $6.1bn Corporate tax paid in Australia in 2022 (2021: $7.7bn) 1. Includes our total workforce based on managed operations (excludes the Group’s share of non-managed operations and joint ventures) as of 31 December 2022. 2. When combined with royalties and other taxes, and with our share of taxes and royalties paid by equity accounted units, this resulted in payments to governments of around $10.5 billion (2021: over $13 billion), including over $8 billion paid in Australia (2021: over $11 billion). 28 Organisations participated in our 2022 CSO roundtable discussions in person 3 Roundtables held in London, Sydney and Montreal in 2022. Topics discussed included climate change, biodiversity, recycling, water management, human rights, cultural heritage, communities and transparency Civil society organisations We can only help to address the world’s many complex environmental, social and governance challenges, such as climate change, human rights violations, bribery and corruption, through collaboration with civil society organisations (CSOs) and other stakeholders. Our senior leaders regularly engage with CSOs, and although our opinions may differ from time to time, we respect their views and value the challenges they set for us to improve performance across our business. We hold yearly roundtable discussions with CSOs in Australia, Europe and North America. In 2022, one of the key topics of discussion was our role in the world’s transition to a low-carbon future. For more information see page 96. $62.6m Voluntary social investment in 2022 (2021: $72.1m) 52,0001 Employees across six continents (2021: 47,000) 73 Employee satisfaction score (eSAT) (2021: 71) For more information see page 95. For more information see page 96.
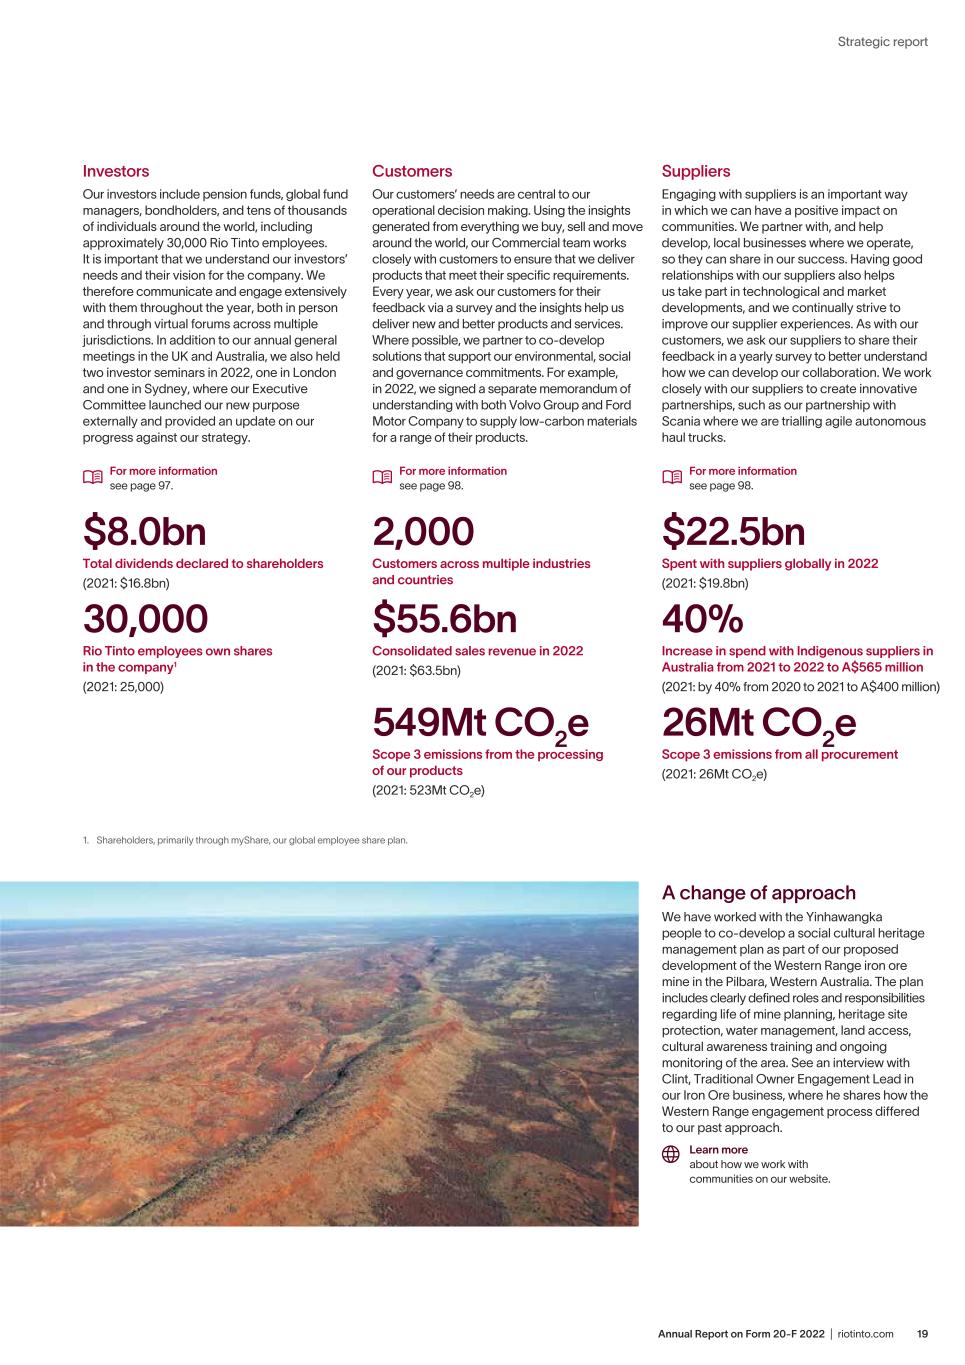
19Annual Report on Form 20-F 2022 | riotinto.com Strategic report Investors Our investors include pension funds, global fund managers, bondholders, and tens of thousands of individuals around the world, including approximately 30,000 Rio Tinto employees. It is important that we understand our investors’ needs and their vision for the company. We therefore communicate and engage extensively with them throughout the year, both in person and through virtual forums across multiple jurisdictions. In addition to our annual general meetings in the UK and Australia, we also held two investor seminars in 2022, one in London and one in Sydney, where our Executive Committee launched our new purpose externally and provided an update on our progress against our strategy. Customers Our customers’ needs are central to our operational decision making. Using the insights generated from everything we buy, sell and move around the world, our Commercial team works closely with customers to ensure that we deliver products that meet their specific requirements. Every year, we ask our customers for their feedback via a survey and the insights help us deliver new and better products and services. Where possible, we partner to co-develop solutions that support our environmental, social and governance commitments. For example, in 2022, we signed a separate memorandum of understanding with both Volvo Group and Ford Motor Company to supply low-carbon materials for a range of their products. 1. Shareholders, primarily through myShare, our global employee share plan. Suppliers Engaging with suppliers is an important way in which we can have a positive impact on communities. We partner with, and help develop, local businesses where we operate, so they can share in our success. Having good relationships with our suppliers also helps us take part in technological and market developments, and we continually strive to improve our supplier experiences. As with our customers, we ask our suppliers to share their feedback in a yearly survey to better understand how we can develop our collaboration. We work closely with our suppliers to create innovative partnerships, such as our partnership with Scania where we are trialling agile autonomous haul trucks. $8.0bn Total dividends declared to shareholders (2021: $16.8bn) 2,000 Customers across multiple industries and countries $22.5bn Spent with suppliers globally in 2022 (2021: $19.8bn) 30,000 Rio Tinto employees own shares in the company1 (2021: 25,000) $55.6bn Consolidated sales revenue in 2022 (2021: $63.5bn) 549Mt CO2e Scope 3 emissions from the processing of our products (2021: 523Mt CO2e) 40% Increase in spend with Indigenous suppliers in Australia from 2021 to 2022 to A$565 million (2021: by 40% from 2020 to 2021 to A$400 million) 26Mt CO2e Scope 3 emissions from all procurement (2021: 26Mt CO2e) For more information see page 98. For more information see page 98. For more information see page 97. A change of approach We have worked with the Yinhawangka people to co-develop a social cultural heritage management plan as part of our proposed development of the Western Range iron ore mine in the Pilbara, Western Australia. The plan includes clearly defined roles and responsibilities regarding life of mine planning, heritage site protection, water management, land access, cultural awareness training and ongoing monitoring of the area. See an interview with Clint, Traditional Owner Engagement Lead in our Iron Ore business, where he shares how the Western Range engagement process differed to our past approach. Learn more about how we work with communities on our website.
Annual Report on Form 20-F 2022 | riotinto.com20 2018 0.44 2020 2019 0.42 2021 0.40 2022 0.40 0.37 Key performance indicators We use a range of financial and non-financial metrics to measure Group performance against our four objectives: to be best operator; to achieve impeccable environmental, social and governance (ESG) credentials; to excel in development; and to strengthen our social licence. Alignment to our four objectives All-injury frequency rate (AIFR) per 200,000 hours worked Definition We define AIFR as the number of injuries per 200,000 hours worked by employees and contractors at the operations that we manage. It includes medical treatment cases, restricted workday and lost-day injuries. Relevance to strategy The safety and wellbeing of our employees and contractors is our number one priority and essential to everything we do. We are committed to having a safe work environment and our focus is on maintaining zero fatalities, preventing catastrophic events and reducing injuries. We continue to implement our safety maturity model (SMM) which, as our blueprint for safety, describes the systems and behaviours we apply to create a strong safety culture. In 2023, we will begin planning for the integration of our SMM with our Safe Production System. This is our new, people-centric approach to engage our workforce and develop and share best practice solutions across our assets. We continue to share learnings and strengthen our partnerships with industry and associated committees (eg the International Council on Mining and Metals), contracting partners and local communities to improve health, safety and wellbeing outcomes. Link to executive remuneration AIFR and SMM are included as performance metrics in the safety component of the short-term incentive plan (see pages 121-122). Our performance in 2022 We had a fourth year in a row of zero fatalities. Our AIFR has remained stable at 0.40 compared to 2021. Forward plan We will renew focus on our critical risk management programme. We will also work on embedding enhancements to the SMM. We will increase our focus on managing psychosocial hazards, and continue to innovate to reduce exposure to safety and health risks. We will continue to implement our major hazard standards, including process safety, underground safety and tailings, and apply strong assurance processes. Alignment to our four objectives and associated risks – Best operator – Impeccable ESG credentials For more information see page 79. Social licence Earn trust by building meaningful relationships and partnerships Excel in development Deliver organic and inorganic growth, on time, on budget Impeccable ESG credentials Strengthen track record and transparency Best operator Expand capability and leadership
21Annual Report on Form 20-F 2022 | riotinto.com Strategic report 2018 Underlying earnings 2019 Underlying earnings 2020 Underlying earnings 2021 Underlying earnings 2022 Underlying earnings Underlying EBITDA Underlying EBITDA Underlying EBITDA Underlying EBITDA Underlying EBITDA 8,808 10,373 12,448 21,380 13,275 26,272 37,720 23,902 21,197 18,136 2018 33.4% 2020 2019 49.6% 2021 263.3% 2022 134.3% 110.1% Total shareholder return (TSR)1 measured over the preceding five years (using annual average share price) Definition TSR is a combination of share price appreciation (using annual average share price) and dividends paid and reinvested to show the total return to the shareholder over the preceding five years. Relevance to strategy Our strategy aims to maximise shareholder returns through the commodity cycle, and TSR is a direct measure of that. Link to executive remuneration TSR is reflected in the long-term incentive plan, measured equally against the EMIX Global Mining Index and the MSCI World Index (see pages 124-125). 1. The TSR calculation for each period is based on the change in the calendar-year average share prices for Rio Tinto plc and Rio Tinto Limited over the preceding five years. This is consistent with the methodology used for calculating the vesting outcomes for Performance Share Awards (PSA). The data presented in this chart accounts for the dual corporate structure of Rio Tinto. Our performance in 2022 TSR performance over the five-year period was driven principally by movements in commodity prices and changes in the global macro environment. Rio Tinto significantly outperformed both the EMIX Global Mining Index and the MSCI World Index over the five-year period. Forward plan We will continue to focus on generating free cash flow from our operations. This allows us to return cash to shareholders (short-term returns) while investing in the business (long-term returns). Alignment to our four objectives and associated risks – Best operator – Impeccable ESG credentials – Excel in development – Social licence For more information see page 79. Underlying earnings and underlying EBITDA $ millions Definition Underlying earnings and underlying EBITDA are non-IFRS measures. Underlying earnings represents net earnings attributable to the owners of Rio Tinto, adjusted to exclude items that do not reflect the underlying performance of the Group’s operations. For more information on these exclusions and a reconciliation to the nearest IFRS measures refer to Alternative Performance Measures (pages 273-278). Underlying EBITDA is a segmental performance measure and represents profit before tax, net finance items, depreciation and amortisation. Exclusions from underlying EBITDA and a reconciliation to the nearest IFRS measures can be found in note 1. Relevance to strategy These financial KPIs measure how well we are managing costs, increasing productivity and generating the most revenue from each of our assets. Link to executive remuneration Underlying earnings are reflected in the short-term incentive plan. In the longer term, both measures influence TSR, which is the primary measure for the long-term incentive plan (see pages 124-125). Our performance in 2022 Underlying earnings of $13.3 billion were $8.1 billion lower than in 2021. Underlying EBITDA of $26.3 billion was $11.4 billion lower than in 2021. The 30% decrease in underlying EBITDA resulted from lower iron ore prices, higher energy and raw material costs, partially offset by movements in sales volumes. Forward plan We will continue to drive attractive margins and returns throughout the cycle through a focus on best operating performance and a disciplined focus on cash costs. Alignment to our four objectives and associated risks – Best operator For more information see page 79.
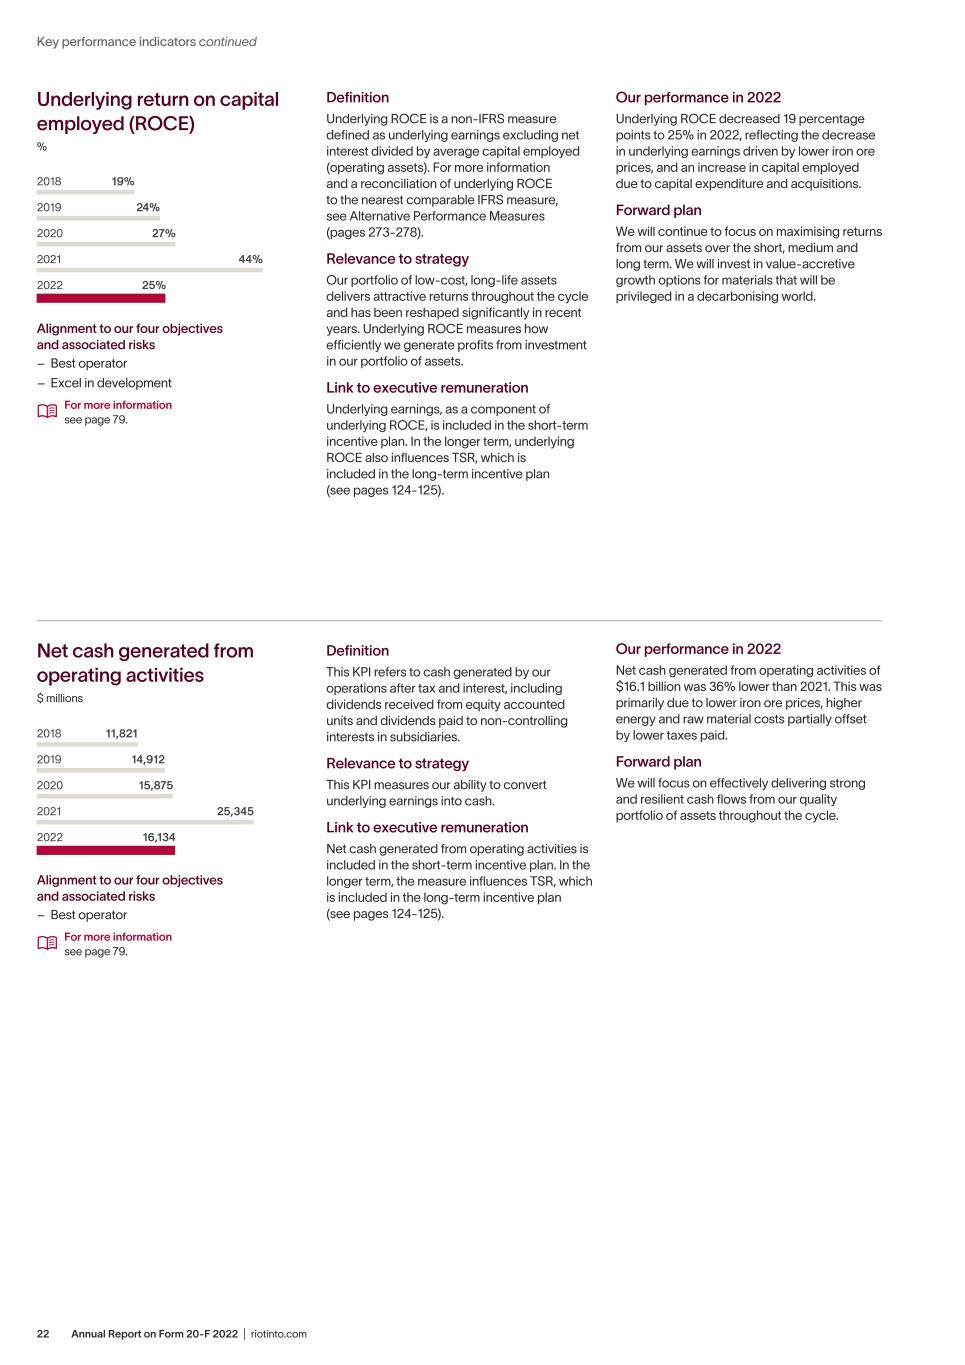
Annual Report on Form 20-F 2022 | riotinto.com22 Key performance indicators continued 2018 11,821 2020 2019 14,912 2021 25,345 2022 16,134 15,875 2018 19% 2020 2019 24% 2021 44% 2022 25% 27% Our performance in 2022 Net cash generated from operating activities of $16.1 billion was 36% lower than 2021. This was primarily due to lower iron ore prices, higher energy and raw material costs partially offset by lower taxes paid. Forward plan We will focus on effectively delivering strong and resilient cash flows from our quality portfolio of assets throughout the cycle. Net cash generated from operating activities $ millions Definition This KPI refers to cash generated by our operations after tax and interest, including dividends received from equity accounted units and dividends paid to non-controlling interests in subsidiaries. Relevance to strategy This KPI measures our ability to convert underlying earnings into cash. Link to executive remuneration Net cash generated from operating activities is included in the short-term incentive plan. In the longer term, the measure influences TSR, which is included in the long-term incentive plan (see pages 124-125). Alignment to our four objectives and associated risks – Best operator For more information see page 79. Underlying return on capital employed (ROCE) % Definition Underlying ROCE is a non-IFRS measure defined as underlying earnings excluding net interest divided by average capital employed (operating assets). For more information and a reconciliation of underlying ROCE to the nearest comparable IFRS measure, see Alternative Performance Measures (pages 273-278). Relevance to strategy Our portfolio of low-cost, long-life assets delivers attractive returns throughout the cycle and has been reshaped significantly in recent years. Underlying ROCE measures how efficiently we generate profits from investment in our portfolio of assets. Link to executive remuneration Underlying earnings, as a component of underlying ROCE, is included in the short-term incentive plan. In the longer term, underlying ROCE also influences TSR, which is included in the long-term incentive plan (see pages 124-125). Our performance in 2022 Underlying ROCE decreased 19 percentage points to 25% in 2022, reflecting the decrease in underlying earnings driven by lower iron ore prices, and an increase in capital employed due to capital expenditure and acquisitions. Forward plan We will continue to focus on maximising returns from our assets over the short, medium and long term. We will invest in value-accretive growth options for materials that will be privileged in a decarbonising world. Alignment to our four objectives and associated risks – Best operator – Excel in development For more information see page 79.
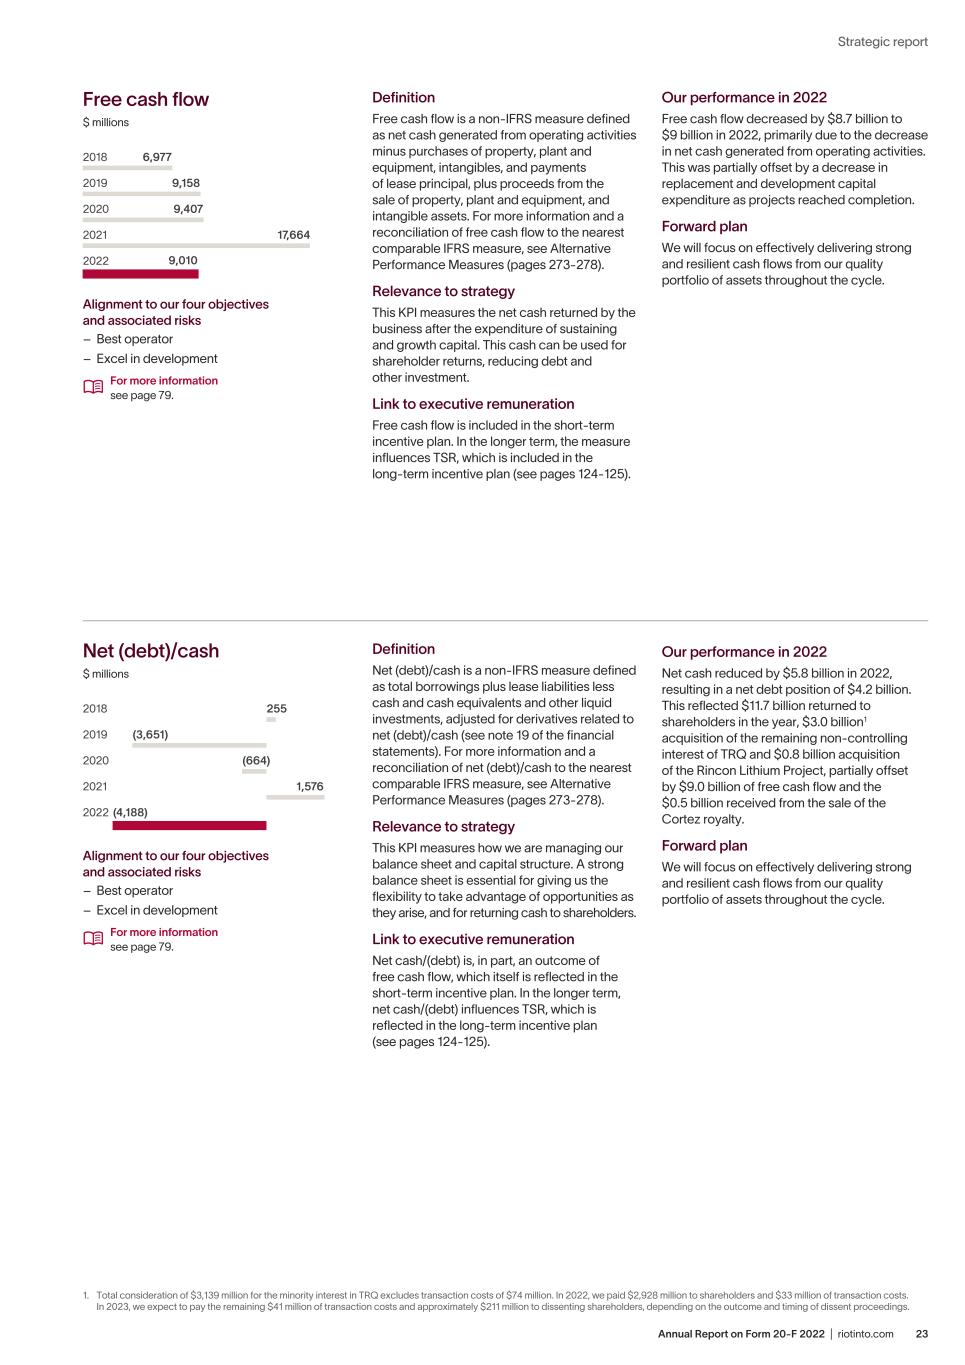
23Annual Report on Form 20-F 2022 | riotinto.com Strategic report 2018 6,977 2020 2019 9,158 2021 17,664 2022 9,010 9,407 2018 2020 2019 2021 2022 255 (3,651) 1,576 (4,188) (664) Free cash flow $ millions Definition Free cash flow is a non-IFRS measure defined as net cash generated from operating activities minus purchases of property, plant and equipment, intangibles, and payments of lease principal, plus proceeds from the sale of property, plant and equipment, and intangible assets. For more information and a reconciliation of free cash flow to the nearest comparable IFRS measure, see Alternative Performance Measures (pages 273-278). Relevance to strategy This KPI measures the net cash returned by the business after the expenditure of sustaining and growth capital. This cash can be used for shareholder returns, reducing debt and other investment. Link to executive remuneration Free cash flow is included in the short-term incentive plan. In the longer term, the measure influences TSR, which is included in the long-term incentive plan (see pages 124-125). Our performance in 2022 Free cash flow decreased by $8.7 billion to $9 billion in 2022, primarily due to the decrease in net cash generated from operating activities. This was partially offset by a decrease in replacement and development capital expenditure as projects reached completion. Forward plan We will focus on effectively delivering strong and resilient cash flows from our quality portfolio of assets throughout the cycle. Alignment to our four objectives and associated risks – Best operator – Excel in development For more information see page 79. Net (debt)/cash $ millions Definition Net (debt)/cash is a non-IFRS measure defined as total borrowings plus lease liabilities less cash and cash equivalents and other liquid investments, adjusted for derivatives related to net (debt)/cash (see note 19 of the financial statements). For more information and a reconciliation of net (debt)/cash to the nearest comparable IFRS measure, see Alternative Performance Measures (pages 273-278). Relevance to strategy This KPI measures how we are managing our balance sheet and capital structure. A strong balance sheet is essential for giving us the flexibility to take advantage of opportunities as they arise, and for returning cash to shareholders. Link to executive remuneration Net cash/(debt) is, in part, an outcome of free cash flow, which itself is reflected in the short-term incentive plan. In the longer term, net cash/(debt) influences TSR, which is reflected in the long-term incentive plan (see pages 124-125). Alignment to our four objectives and associated risks – Best operator – Excel in development For more information see page 79. Our performance in 2022 Net cash reduced by $5.8 billion in 2022, resulting in a net debt position of $4.2 billion. This reflected $11.7 billion returned to shareholders in the year, $3.0 billion1 acquisition of the remaining non-controlling interest of TRQ and $0.8 billion acquisition of the Rincon Lithium Project, partially offset by $9.0 billion of free cash flow and the $0.5 billion received from the sale of the Cortez royalty. Forward plan We will focus on effectively delivering strong and resilient cash flows from our quality portfolio of assets throughout the cycle. 1. Total consideration of $3,139 million for the minority interest in TRQ excludes transaction costs of $74 million. In 2022, we paid $2,928 million to shareholders and $33 million of transaction costs. In 2023, we expect to pay the remaining $41 million of transaction costs and approximately $211 million to dissenting shareholders, depending on the outcome and timing of dissent proceedings.
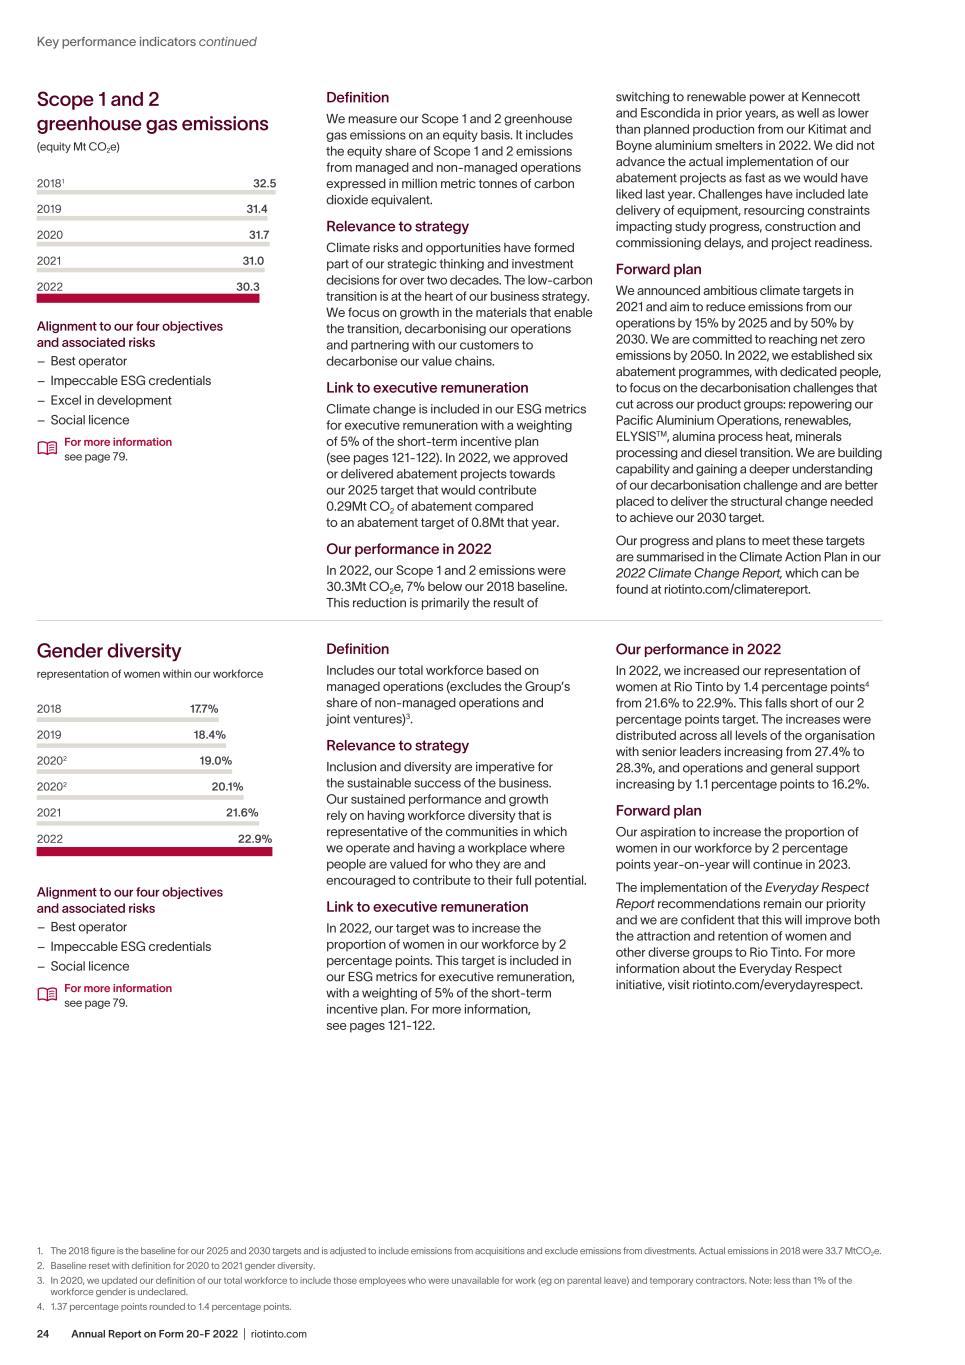
Annual Report on Form 20-F 2022 | riotinto.com24 Key performance indicators continued 2018 17.7% 20202 2019 18.4% 20202 20.1% 2021 2022 21.6% 22.9% 19.0% 2019 31.4 2021 2020 31.7 2022 30.3 31.0 20181 32.5 Scope 1 and 2 greenhouse gas emissions (equity Mt CO2e) Definition We measure our Scope 1 and 2 greenhouse gas emissions on an equity basis. It includes the equity share of Scope 1 and 2 emissions from managed and non-managed operations expressed in million metric tonnes of carbon dioxide equivalent. Relevance to strategy Climate risks and opportunities have formed part of our strategic thinking and investment decisions for over two decades. The low-carbon transition is at the heart of our business strategy. We focus on growth in the materials that enable the transition, decarbonising our operations and partnering with our customers to decarbonise our value chains. Link to executive remuneration Climate change is included in our ESG metrics for executive remuneration with a weighting of 5% of the short-term incentive plan (see pages 121-122). In 2022, we approved or delivered abatement projects towards our 2025 target that would contribute 0.29Mt CO2 of abatement compared to an abatement target of 0.8Mt that year. Our performance in 2022 In 2022, our Scope 1 and 2 emissions were 30.3Mt CO2e, 7% below our 2018 baseline. This reduction is primarily the result of switching to renewable power at Kennecott and Escondida in prior years, as well as lower than planned production from our Kitimat and Boyne aluminium smelters in 2022. We did not advance the actual implementation of our abatement projects as fast as we would have liked last year. Challenges have included late delivery of equipment, resourcing constraints impacting study progress, construction and commissioning delays, and project readiness. Forward plan We announced ambitious climate targets in 2021 and aim to reduce emissions from our operations by 15% by 2025 and by 50% by 2030. We are committed to reaching net zero emissions by 2050. In 2022, we established six abatement programmes, with dedicated people, to focus on the decarbonisation challenges that cut across our product groups: repowering our Pacific Aluminium Operations, renewables, ELYSISTM, alumina process heat, minerals processing and diesel transition. We are building capability and gaining a deeper understanding of our decarbonisation challenge and are better placed to deliver the structural change needed to achieve our 2030 target. Our progress and plans to meet these targets are summarised in the Climate Action Plan in our 2022 Climate Change Report, which can be found at riotinto.com/climatereport. 1. The 2018 figure is the baseline for our 2025 and 2030 targets and is adjusted to include emissions from acquisitions and exclude emissions from divestments. Actual emissions in 2018 were 33.7 MtCO2e. 2. Baseline reset with definition for 2020 to 2021 gender diversity. 3. In 2020, we updated our definition of our total workforce to include those employees who were unavailable for work (eg on parental leave) and temporary contractors. Note: less than 1% of the workforce gender is undeclared. 4. 1.37 percentage points rounded to 1.4 percentage points. Alignment to our four objectives and associated risks – Best operator – Impeccable ESG credentials – Excel in development – Social licence For more information see page 79. Gender diversity representation of women within our workforce Definition Includes our total workforce based on managed operations (excludes the Group’s share of non-managed operations and joint ventures)3. Relevance to strategy Inclusion and diversity are imperative for the sustainable success of the business. Our sustained performance and growth rely on having workforce diversity that is representative of the communities in which we operate and having a workplace where people are valued for who they are and encouraged to contribute to their full potential. Link to executive remuneration In 2022, our target was to increase the proportion of women in our workforce by 2 percentage points. This target is included in our ESG metrics for executive remuneration, with a weighting of 5% of the short-term incentive plan. For more information, see pages 121-122. Our performance in 2022 In 2022, we increased our representation of women at Rio Tinto by 1.4 percentage points4 from 21.6% to 22.9%. This falls short of our 2 percentage points target. The increases were distributed across all levels of the organisation with senior leaders increasing from 27.4% to 28.3%, and operations and general support increasing by 1.1 percentage points to 16.2%. Forward plan Our aspiration to increase the proportion of women in our workforce by 2 percentage points year-on-year will continue in 2023. The implementation of the Everyday Respect Report recommendations remain our priority and we are confident that this will improve both the attraction and retention of women and other diverse groups to Rio Tinto. For more information about the Everyday Respect initiative, visit riotinto.com/everydayrespect. Alignment to our four objectives and associated risks – Best operator – Impeccable ESG credentials – Social licence For more information see page 79.
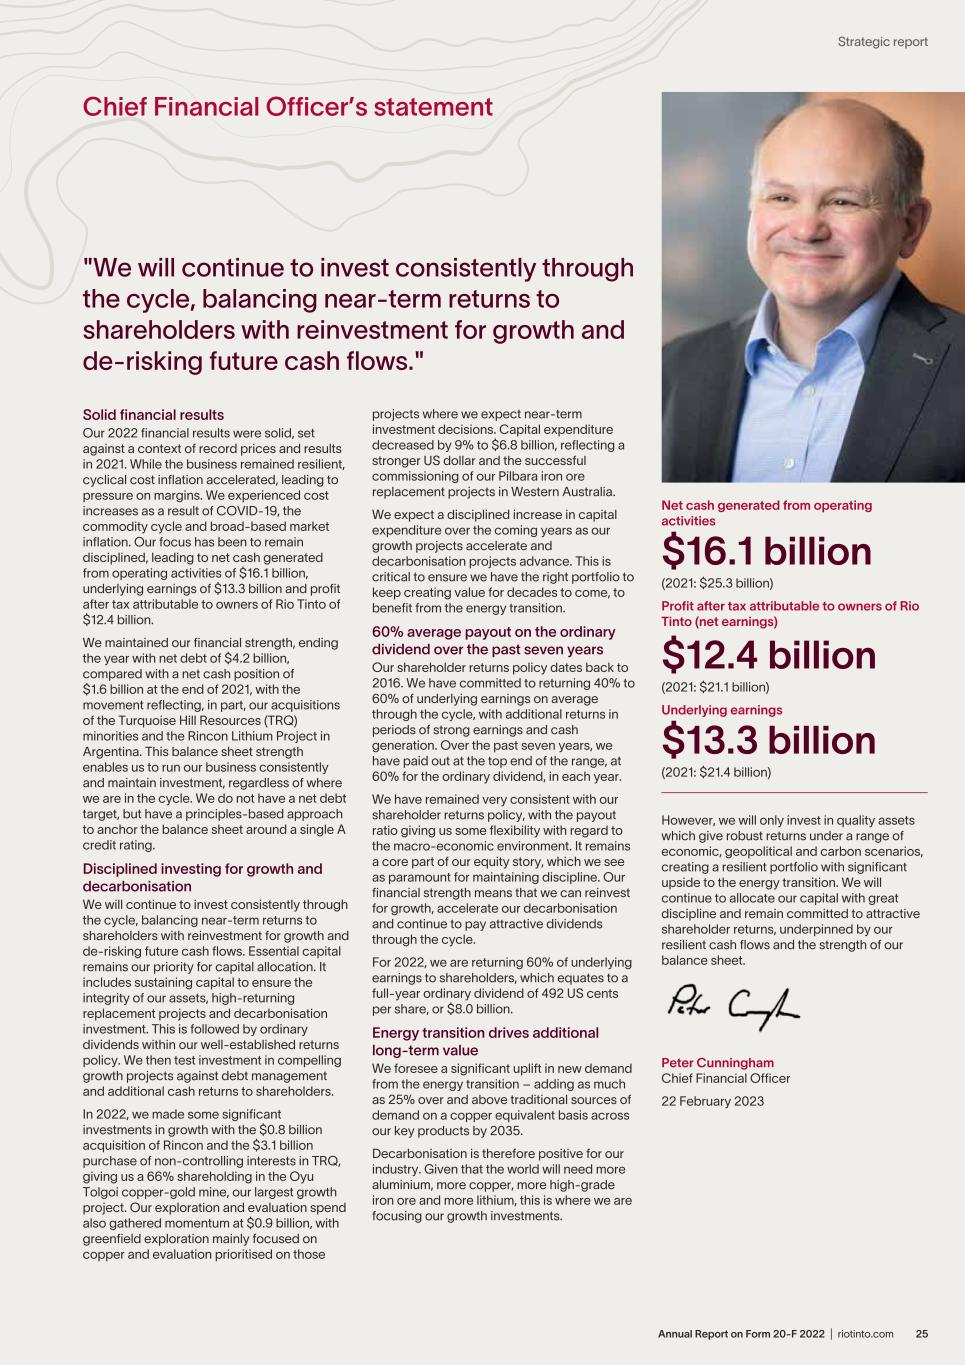
Chief Financial Officer’s statement "We will continue to invest consistently through the cycle, balancing near-term returns to shareholders with reinvestment for growth and de-risking future cash flows." Solid financial results Our 2022 financial results were solid, set against a context of record prices and results in 2021. While the business remained resilient, cyclical cost inflation accelerated, leading to pressure on margins. We experienced cost increases as a result of COVID-19, the commodity cycle and broad-based market inflation. Our focus has been to remain disciplined, leading to net cash generated from operating activities of $16.1 billion, underlying earnings of $13.3 billion and profit after tax attributable to owners of Rio Tinto of $12.4 billion. We maintained our financial strength, ending the year with net debt of $4.2 billion, compared with a net cash position of $1.6 billion at the end of 2021, with the movement reflecting, in part, our acquisitions of the Turquoise Hill Resources (TRQ) minorities and the Rincon Lithium Project in Argentina. This balance sheet strength enables us to run our business consistently and maintain investment, regardless of where we are in the cycle. We do not have a net debt target, but have a principles-based approach to anchor the balance sheet around a single A credit rating. Disciplined investing for growth and decarbonisation We will continue to invest consistently through the cycle, balancing near-term returns to shareholders with reinvestment for growth and de-risking future cash flows. Essential capital remains our priority for capital allocation. It includes sustaining capital to ensure the integrity of our assets, high-returning replacement projects and decarbonisation investment. This is followed by ordinary dividends within our well-established returns policy. We then test investment in compelling growth projects against debt management and additional cash returns to shareholders. In 2022, we made some significant investments in growth with the $0.8 billion acquisition of Rincon and the $3.1 billion purchase of non-controlling interests in TRQ, giving us a 66% shareholding in the Oyu Tolgoi copper-gold mine, our largest growth project. Our exploration and evaluation spend also gathered momentum at $0.9 billion, with greenfield exploration mainly focused on copper and evaluation prioritised on those projects where we expect near-term investment decisions. Capital expenditure decreased by 9% to $6.8 billion, reflecting a stronger US dollar and the successful commissioning of our Pilbara iron ore replacement projects in Western Australia. We expect a disciplined increase in capital expenditure over the coming years as our growth projects accelerate and decarbonisation projects advance. This is critical to ensure we have the right portfolio to keep creating value for decades to come, to benefit from the energy transition. 60% average payout on the ordinary dividend over the past seven years Our shareholder returns policy dates back to 2016. We have committed to returning 40% to 60% of underlying earnings on average through the cycle, with additional returns in periods of strong earnings and cash generation. Over the past seven years, we have paid out at the top end of the range, at 60% for the ordinary dividend, in each year. We have remained very consistent with our shareholder returns policy, with the payout ratio giving us some flexibility with regard to the macro-economic environment. It remains a core part of our equity story, which we see as paramount for maintaining discipline. Our financial strength means that we can reinvest for growth, accelerate our decarbonisation and continue to pay attractive dividends through the cycle. For 2022, we are returning 60% of underlying earnings to shareholders, which equates to a full-year ordinary dividend of 492 US cents per share, or $8.0 billion. Energy transition drives additional long-term value We foresee a significant uplift in new demand from the energy transition – adding as much as 25% over and above traditional sources of demand on a copper equivalent basis across our key products by 2035. Decarbonisation is therefore positive for our industry. Given that the world will need more aluminium, more copper, more high-grade iron ore and more lithium, this is where we are focusing our growth investments. Net cash generated from operating activities $16.1 billion (2021: $25.3 billion) Profit after tax attributable to owners of Rio Tinto (net earnings) $12.4 billion (2021: $21.1 billion) Underlying earnings $13.3 billion (2021: $21.4 billion) However, we will only invest in quality assets which give robust returns under a range of economic, geopolitical and carbon scenarios, creating a resilient portfolio with significant upside to the energy transition. We will continue to allocate our capital with great discipline and remain committed to attractive shareholder returns, underpinned by our resilient cash flows and the strength of our balance sheet. Peter Cunningham Chief Financial Officer 22 February 2023 Annual Report 2022 | riotinto.com 2525Annual Report on Form 20-F 2022 | riotinto.com Strategic report
Financial review Key financial highlights In addition to IFRS 1 measures, management uses non-GAAP 2 measures internally to assess performance. Full reconciliations are provided on page 163 and pages 273 to 278. These measures are highlighted with the symbol • At year end 2022 2021 Change Net cash generated from operating activities (US$ millions) 16,134 25,345 (36) % Purchases of property, plant and equipment and intangible assets (US$ millions) 6,750 7,384 (9) % Free cash flow 3 (US$ millions) • 9,010 17,664 (49) % Consolidated sales revenue (US$ millions) 55,554 63,495 (13) % Underlying EBITDA 3 (US$ millions) • 26,272 37,720 (30) % Profit after tax attributable to owners of Rio Tinto (net earnings) (US$ millions) 12,420 21,094 (41) % Underlying earnings per share (EPS) 3 (US cents) • 819.6 1,321.1 (38) % Ordinary dividend per share (US cents) 492.0 793.0 (38) % Special dividend per share (US cents) — 247.0 (100) % Total dividend per share (US cents) 492.0 1,040.0 (53) % Net (debt)/cash 3 (US$ millions) • (4,188) 1,576 Underlying return on capital employed (ROCE) 3 • 25% 44% Solid financial results in 2022, set against a context of record prices in 2021 – $16.1 billion net cash generated from operating activities, 36% lower than 2021. This included items of a non-recurring nature which were not representative of the underlying strength of the performance of the business, which, in aggregate, reduced operating cash flow by around $2 billion. Free cash flow 3 of $9.0 billion included capital expenditure of $6.8 billion, which decreased 9% as we commissioned our current programme of Pilbara replacement projects, notably Gudai-Darri. – $12.4 billion of net earnings, 41% lower than 2021, reflected the movement in commodity prices, the impact of higher energy and raw materials prices on our operations, and higher rates of inflation on our operating costs and closure liabilities. Effective tax rate on net earnings of 30.9% compared with 27.7% in 2021, with the increase being primarily due to the $0.8 billion write down of deferred tax assets in the US. – $26.3 billion underlying EBITDA 3 was 30% below 2021, with an underlying EBITDA margin 3 of 45%. – $13.3 billion underlying earnings 3 (underlying EPS 3 of 819.6 US cents) were 38% below 2021. – $4.2 billion of net debt 3 at year end, compared with net cash 3 of $1.6 billion at the start of the year, primarily reflected the free cash flow 3 of $9.0 billion, offset by $11.7 billion of cash returns to shareholders and $3.8 billion for the acquisitions of Turquoise Hill Resources (TRQ) 4 and Rincon Lithium Project. – $8.0 billion full-year dividend, equivalent to 492 US cents per share. This represents 60% of underlying earnings, in line with our shareholder returns policy. Resilient cash flow from operations Year ended 31 December 2022 Year ended 31 December 2021 US$m US$m Net cash generated from operating activities 16,134 25,345 Purchases of property, plant and equipment and intangible assets (6,750) (7,384) Sales of property, plant and equipment — 61 Lease principal payments (374) (358) Free cash flow 3 9,010 17,664 Disposals 80 4 Cash receipt from sale of Cortez royalty 525 — Dividends paid to equity shareholders (11,727) (15,357) Acquisitions relating to Rincon and McEwen Copper (850) — Purchase of the minority interest in Turquoise Hill Resources Ltd 4 (2,961) — Other 159 (71) (Decrease)/Increase in net (debt)/cash 3 (5,764) 2,240 1. International Financial Reporting Standards 2. Generally Accepted Accounting Principles 3. This financial performance indicator is a non-IFRS (as defined below) alternative performance measure (APM). It is used internally by management to assess the performance of the business and is therefore considered relevant to readers of this document. It is presented here to give more clarity around the underlying business performance of the Group’s operations. APMs are reconciled to directly comparable IFRS financial measures on pages 273 to 278. Our financial results are prepared in accordance with IFRS — see page 148 for further information. 4. Total consideration of $3,139 million for the minority interest in TRQ excludes transaction costs of $74 million. In 2022, we paid $2,928 million to shareholders and $33 million of transaction costs. In 2023, we expect to pay the remaining $41 million of transaction costs and approximately $211 million to dissenting shareholders, depending on the outcome and timing of dissent proceedings. 26 Annual Report 2022 | riotinto.comAnnual Report on Form 20-F 2022 | riotinto.com26
– $16.1 billion in net cash generated from operating activities, 36% lower than 2021, was primarily driven by price movements for our major commodities and a $0.5 billion rise in working capital, primarily due to elevated prices for raw materials in aluminium inventory. We also incurred some items of a non-recurring nature which were not representative of the underlying strength of the performance of the business. These comprised; higher tax payments (relative to profit) in 2022 as a result of a $1.1 billion (A$1.5 billion) final payment to the Australian Taxation Office (ATO) in respect of 2021 profits; $0.4 billion (A$0.6 billion) settlement with the ATO in respect of 12 historical years; and $0.4 billion of cash losses from currency hedges on our external dividends. At the end of 2022, we had no material outstanding tax payable on Australian profits. – We made some significant investments in growth with the $0.8 billion acquisition of Rincon and the $3.0 billion 2 purchase of non- controlling interests in TRQ (including transaction costs), giving us a 66% shareholding in the Oyu Tolgoi copper-gold mine, our largest growth project. Our capital expenditure of $6.8 billion encompassed $0.6 billion of growth capital, $2.2 billion of replacement capital, $3.9 billion of sustaining capital and $0.1 billion of decarbonisation spend. We funded our capital expenditure from operating activities and expect to continue funding our capital programme from internal sources, except for the Oyu Tolgoi underground development, which is project-financed. – $11.7 billion of dividends paid in 2022, being the 2021 final ordinary and special dividends paid in April 2022 ($7.6 billion) and the 2022 interim ordinary dividend paid in September ($4.1 billion), including foreign exchange impacts. – The above movements, together with disposals including the $525 million of cash received from the sale of the gross production royalty at the Cortez Complex in Nevada, USA (Cortez royalty), resulted in net cash 1 decreasing by $5.8 billion in 2022, and gave rise to net debt 1 of $4.2 billion at 31 December 2022. Underlying EBITDA and underlying earnings by product group Underlying EBITDA Underlying earnings 2022 2021 Change 2022 2021 Change Year ended 31 December US$m US$m % US$m US$m % Iron Ore 18,612 27,592 (33) % 11,182 17,323 (35) % Aluminium 3,672 4,382 (16) % 1,472 2,468 (40) % Copper 2,376 3,969 (40) % 521 1,579 (67) % Minerals 2,419 2,603 (7) % 849 888 (4) % Reportable segment total 27,079 38,546 (30) % 14,024 22,258 (37) % Other operations (16) (28) (43) % (340) (84) 305 % Inter-segment transactions 24 42 (43) % 26 19 37 % Central pension costs, share-based payments, insurance and derivatives 377 110 243 % 374 133 181 % Restructuring, project and one-off costs (173) (80) 116 % (87) (51) 71 % Other central costs (766) (613) 25 % (651) (585) 11 % Central exploration and evaluation (253) (257) (2) % (209) (215) (3) % Net interest 138 (95) (245) % Total 26,272 37,720 (30) % 13,275 21,380 (38) % Underlying EBITDA and underlying earnings are APMs used by management to assess the performance of the business, and provide additional information which investors may find useful. APMs are reconciled to directly comparable IFRS financial measures on pages 273 to 278. Continuing to invest in greenfield exploration We have a strong portfolio of greenfield exploration projects in early exploration and studies stages, with activity in 18 countries across seven commodities. This is reflected in our pre-tax central spend of $253 million in 2022. The bulk of this exploration expenditure was focused on copper projects in Australia, Colombia, Namibia, Peru, the United States and Zambia; diamonds in Angola; and heavy mineral sands projects in Australia and South Africa. Exploration is ongoing for nickel in Canada and Finland and in lithium across all regions, with opportunities emerging in the United States and Africa. Mine- lease exploration continued at Rio Tinto managed businesses, including Pilbara Iron in Australia, Diavik in Canada and Cape York bauxite operations in Australia. Commentary on financial results To provide additional insight into the performance of our business, we report underlying EBITDA and underlying earnings. The principal factors explaining the movements in underlying EBITDA are set out in this table. US$m 2021 underlying EBITDA 37,720 Prices (8,101) Exchange rates 801 Volumes and mix 606 General inflation (1,478) Energy (1,169) Operating cash unit costs (2,202) Higher exploration and evaluation expenditure (171) Non-cash costs/other 266 2022 underlying EBITDA 26,272 1. This financial performance indicator is a non-IFRS (as defined below) alternative performance measure (APM). It is used internally by management to assess the performance of the business and is therefore considered relevant to readers of this document. It is presented here to give more clarity around the underlying business performance of the Group’s operations. APMs are reconciled to directly comparable IFRS financial measures on pages 273 to 278. Our financial results are prepared in accordance with IFRS — see page 148 for further information. 2. Total consideration of $3,139 million for the minority interest in TRQ excludes transaction costs of $74 million. In 2022, we paid $2,928 million to shareholders and $33 million of transaction costs. In 2023, we expect to pay the remaining $41 million of transaction costs and approximately $211 million to dissenting shareholders, depending on the outcome and timing of dissent proceedings. Annual Report 2022 | riotinto.com 2727Annual Report on Form 20-F 2022 | riotinto.com Strategic report
Solid financial results impacted by significant movements in commodity prices We saw significant movement in pricing for our commodities, amidst growing recession fears and a decline in consumer confidence. Movements in commodity prices resulted in a $8,101 million decline in underlying EBITDA overall compared with 2021. This was primarily from lower iron ore prices ($9,155 million) and lower London Metal Exchange (LME) copper prices and a negative provisional pricing impact ($733 million). This was partly offset by a price uplift for our Aluminium business ($886 million), driven by a first-half rise in LME prices, improved product premiums and higher alumina pricing, which fell away sharply in the second half. We have included a table of prices and exchange rates on page 344. The monthly average Platts index for 62% iron fines converted to a Free on Board (FOB) basis was 25% lower on average compared with 2021. The average LME price for copper was 6% lower, while the average LME aluminium price was 9% higher, compared with 2021. The gold price was flat compared with 2021. The midwest premium duty paid for aluminium in the US averaged $655 per tonne, 12% higher than in 2021. Weaker local currencies during 2022 Compared with 2021, on average, the US dollar strengthened by 8% against the Australian dollar and by 4% against the Canadian dollar. Currency movements increased underlying EBITDA by $801 million relative to 2021. Improvement in sales volumes and mix Higher sales volumes and changes in product mix across the portfolio increased underlying EBITDA by $606 million compared to 2021. This was mostly attributable to increased iron ore sales from the ramp-up of Gudai-Darri along with higher portside sales in China, and favourable value-added product premiums for our Aluminium business. Impact of rising inflation and significantly higher energy prices Average movements in energy prices compared with 2021 reduced underlying EBITDA by $1,169 million, mainly due to higher diesel prices for our trucks, trains and ships. In addition, rising general price inflation across our global operations resulted in a $1,478 million reduction in underlying EBITDA, including $0.2 billion for the impact of higher than expected inflation on closure provisions (for closed or fully impaired sites and environmental liabilities). Disciplined focus on costs offset some of the market- linked increases We remained focused on cost control throughout the year, in particular maintaining discipline on fixed costs. However, a rise in our operating cash unit costs reduced underlying EBITDA by $2,202 million (on a unit cost basis) compared with 2021. This mainly reflected cyclical cost pressures from higher market-linked prices for raw materials, in particular in our Aluminium business. We also experienced fixed cost inefficiencies from lower volumes at our Pacific alumina refineries and at the Boyne aluminium smelter due to production disruptions. In addition, we increased resourcing in our iron ore business to support the ramp-up at Gudai-Darri and targeted investment in pit health and asset maintenance across the Pilbara. Increasing our global exploration and evaluation activity We increased our exploration and evaluation expenditure by $171 million, or 24%, to $897 million. This was mainly attributable to increased activity at the Simandou iron ore project in Guinea and the Rincon Lithium Project in Argentina. Non-cash costs/other Movements in non-cash costs, one-off and other items increased underlying EBITDA by $266 million compared with 2021. This mainly reflected the acquisition of the remaining 40% of Diavik in November 2021 (+$163 million), lower incremental COVID-19 costs (+$123 million), gain on asset sale at Kennecott (+$133 million) and lower charges to the income statement on updates to closure cost estimates relating to closed and legacy sites (+$166 million). This was partially offset by reduced capacity at the Kitimat aluminium smelter (-$329 million) as ramp-up activities progressed in 2022 following the strike which commenced in July 2021. Net earnings The principal factors explaining the movements in underlying earnings and net earnings are set out below. US$m 2021 net earnings 21,094 Total changes in underlying EBITDA (11,448) Increase in depreciation and amortisation (pre-tax) in underlying earnings (319) Increase in interest and finance items (pre-tax) in underlying earnings (1,112) Decrease in tax on underlying earnings 3,949 Decrease in underlying earnings attributable to outside interests 825 Total changes in underlying earnings (8,105) Changes in exclusions from underlying earnings: Write-off of Federal deferred tax assets in the United States (820) Movement in exchange differences and gains/losses on derivatives (683) Gain recognised by Kitimat relating to LNG Canada's project (230) Loss on disposal of interest in subsidiary (105) Movement in impairment charges net of reversals 145 Movement in closure estimates (non-operating and fully impaired sites) 793 Gain on sale of Cortez royalty 331 2022 net earnings 12,420 28 Annual Report 2022 | riotinto.comAnnual Report on Form 20-F 2022 | riotinto.com28 Financial review continued
Depreciation and amortisation, net interest and finance items, tax and non-controlling interests The depreciation and amortisation charge was $319 million higher than 2021, mainly due to an increase in capitalised closure costs in 2021 at a number of our Aluminium sites. Our capital base was also higher in Iron Ore, Copper and Minerals as a result of our investment activities. This was partially offset by a stronger US dollar against the Australian dollar. Interest and finance items (pre-tax) were higher mainly as a result of a $1,101 million increase in amortisation of discount on provisions, as higher inflation had an impact on the Group's closure and restoration/ environmental liabilities. The amortisation charge of $1,517 million (2021: $415 million) incorporates an estimate of inflation at the start of each six-month reporting period. At the end of each half year we update the underlying cash flows for the latest estimate of experienced inflation for the current financial year and record this as “changes to existing provisions”. For operating sites this adjustment usually results in a corresponding adjustment to Property, plant and equipment, and for closed and fully impaired sites the adjustment is charged or credited to the Income statement. These income statement amounts are included within underlying earnings except for the re-measurement of provisions for legacy sites that were never operated by Rio Tinto. The 2022 effective corporate income tax rate on pre-tax earnings, excluding equity accounted units, was 30.9%, compared with 27.7% in 2021. The effective tax rate on pre-tax earnings in Australia was 31.7% in 2022, compared with 30.7% in 2021. We reached agreement with the Australian Taxation Office (ATO) on all tax matters in dispute. As part of this agreement, in August we paid the ATO additional tax of A$613 million for the period from 2010 to 2021. Over this 12-year period, we paid nearly A$80 billion in tax and royalties in Australia. Items excluded from underlying earnings The Inflation Reduction Act of 2022 in the United States may give rise to investment credits on some of our existing projects, with longer dated projects potentially becoming more favourable. However, it also includes a new Corporate Alternative Minimum Tax regime, which has led to the Group reviewing the carrying value of US Federal deferred tax balances. The resulting $820 million write down of Federal deferred tax assets has been excluded from underlying earnings on the grounds of materiality. In 2022, we recognised an exchange and derivative loss of $137 million. This includes losses of $373 million on revaluation of certain derivatives which do not qualify for hedge accounting. These include currency hedges relating to our external dividends, and exchange losses of $262 million on US dollar debt in non-US dollar functional currency Group companies, partly offset by $478 million of exchange gains on intragroup balances. These losses compared with a 2021 gain of $546 million, giving rise to an unfavourable year-on-year movement of $683 million. The exchange gains are largely offset by currency translation losses recognised in equity. The quantum of US dollar debt is largely unaffected and we will repay it from US dollar sales receipts. During 2022, LNG Canada elected to terminate their option to purchase additional land at Kitimat, Canada. This resulted in a $106 million gain which includes the release of deferred income and receipt of a cancellation fee payment. During 2021, we recognised a $336 million gain on recognition of a new wharf at Kitimat that was built and paid for by LNG Canada. These gains have been excluded from underlying earnings consistent with prior years, as they are part of a series of material transactions unrelated to the core business. Impairment charges, net of reversals, decreased by $145 million compared with 2021. In 2022, we impaired the remaining full value of the Boyne Smelter in Queensland, Australia, as a result of reduced capacity and the high cost of energy from the coal-fired power station impacting economic performance. In 2022, we also completed the sale of the Roughrider uranium undeveloped project in Saskatchewan, Canada, which resulted in a reversal of previous impairments. There is a detailed explanation of the impairment process on pages 165 to 168. In 2022, we recognised $178 million in closure costs representing adjustments to the closure estimates relating to legacy sites where the disturbance preceded ownership by Rio Tinto, including inflationary increases to provisions for these sites in excess of the unwind of discount. This was $793 million lower than 2021 closure charges, which related to Energy Resources of Australia (ERA), Gove refinery and Diavik closure provision increases, and further increases at a number of the Group's legacy sites where the disturbance preceded our ownership. In 2022, we completed the $525 million sale of a gold royalty which was retained following the disposal of the Cortez mine in 2008. The carrying value of the royalty at 31 December 2021 was $88 million, resulting in a post-tax gain of $331 million. This has been excluded from underlying earnings on the grounds of materiality. Profit Net earnings and underlying earnings refer to amounts attributable to the owners of Rio Tinto. The net profit attributable to the owners of Rio Tinto in 2022 was $12.4 billion (2021: $21.1 billion). We recorded a profit after tax in 2022 of $13.1 billion (2021: $22.6 billion) of which a profit of $0.7 billion (2021: $1.5 billion) was attributable to non-controlling interests. Net earnings and underlying earnings The differences between underlying earnings and net earnings are set out in this table (all numbers are after tax and exclude non-controlling interests). Year ended 31 December 2022 Year ended 31 December 2021 US$m US$m Underlying earnings 13,275 21,380 Items excluded from underlying earnings Impairment charges net of reversals (52) (197) Gains recognised by Kitimat relating to LNG Canada's project 106 336 Loss on disposal of interest in subsidiary (105) — Foreign exchange and derivative gains on net debt and intragroup balances and derivatives not qualifying for hedge accounting (137) 546 Change in closure estimates (non-operating and fully impaired sites) (178) (971) Gain on sale of Cortez royalty 331 — Write-off of Federal deferred tax assets in the United States (820) — Net earnings 12,420 21,094 On pages 274 to 275 there is a detailed reconciliation from underlying earnings to net earnings, including pre-tax amounts and additional explanatory notes. The differences between Profit after tax and underlying EBITDA are set out in the table on page 163. Annual Report 2022 | riotinto.com 2929Annual Report on Form 20-F 2022 | riotinto.com Strategic report
Balance sheet Net cash 1 reduced by $5.8 billion in 2022, resulting in a net debt 1 position of $4.2 billion at 31 December 2022. This reflected $11.7 billion returned to shareholders in the year, $3.0 billion 2 acquisition of the remaining non-controlling interest of TRQ and $0.8 billion acquisition of the Rincon Lithium Project, partially offset by $9.0 billion of free cash flow and the $0.5 billion received from the sale of the Cortez royalty. Our net gearing ratio 1 (net debt/ (cash) to total capital) was 7% at 31 December 2022 (31 December 2021: (3)%), see page 278. Our total financing liabilities excluding net debt derivatives at 31 December 2022 (see page 191) were $12.3 billion (31 December 2021: $13.5 billion) and the weighted average maturity was around 11 years. At 31 December 2022, approximately 77% of these liabilities were at floating interest rates (85% excluding leases). The maximum amount within non-current borrowings maturing in any one calendar year is $1.5 billion, which matures in 2024. We had $8.8 billion in cash and cash equivalents plus other short-term cash investments at 31 December 2022 (31 December 2021: $15.2 billion). Provision for closure costs At 31 December 2022, provisions for close-down and restoration costs and environmental clean-up obligations were $15.8 billion (31 December 2021: $14.5 billion). The principal movements during the year were the result of a remeasurement of underlying cash flows, including the effect of inflation. This was recorded as an increase to mining properties for current operating sites ($0.5 billion) and as a charge to profit for legacy sites ($0.5 billion). Also contributing to the increase in the provision was amortisation of discount ($1.5 billion) which includes the effect of higher inflation in the year. These increases were partly offset by utilisation of the provision through spend (-$0.6 billion) and a weaker Australian dollar, Canadian dollar and South African rand against the US dollar (-$0.7 billion). Of the $15.8 billion in provisions, $11.6 billion relates to operating sites and $4.2 billion is for legacy sites. Remaining lives of operations and infrastructure range from one to over 50 years with an average for all sites, weighted by present closure obligation, of around 15 years (2021: 16 years). The provisions are based on risk-adjusted real cash flows using a real- rate discount rate of 1.5% to reflect obligations at the present value of cash flows on 31 December 2022 terms. In 2023, we expect to utilise around $0.8 billion of the provisions as we advance our closure activities at Argyle, ERA, Gove alumina refinery and legacy sites. Our shareholder returns policy The Board is committed to maintaining an appropriate balance between cash returns to shareholders and investment in the business, with the intention of maximising long-term shareholder value. At the end of each financial period, the Board determines an appropriate total level of ordinary dividend per share. This takes into account the results for the financial year, the outlook for our major commodities, the Board’s view of the long-term growth prospects of the business and the company’s objective of maintaining a strong balance sheet. The intention is that the balance between the interim and final dividend be weighted to the final dividend. The Board expects total cash returns to shareholders over the longer term to be in a range of 40% to 60% of underlying earnings in aggregate through the cycle. Acknowledging the cyclical nature of the industry, it is the Board’s intention to supplement the ordinary dividend with additional returns to shareholders in periods of strong earnings and cash generation. 60% payout ratio on the ordinary dividend 2022 US$ bn 2021 US$ bn Ordinary dividend Interim 4.3 6.1 Final 3.7 6.7 Full-year ordinary dividend 8.0 12.8 Payout ratio on ordinary dividend 60 % 60 % Additional returns Special dividend announced in July 2021, paid in September 2021 n/a 3.0 Special dividend announced in February 2022, paid in April 2022 n/a 1.0 Total cash returns to shareholders declared* 8.0 16.8 Combined total as % of underlying earnings 60 % 79 % * Based on weighted average number of shares and declared dividends per share for the respective periods and excluding foreign exchange impacts on payment. We determine dividends in US dollars. We declare and pay Rio Tinto plc dividends in pounds sterling and Rio Tinto Limited dividends in Australian dollars. The 2022 final dividend has been converted at exchange rates applicable on 21 February 2023 (the latest practicable date before the dividend was declared). American Depositary Receipt (ADR) holders receive dividends at the declared rate in US dollars. 1. This financial performance indicator is a non-IFRS (as defined below) alternative performance measure (APM). It is used internally by management to assess the performance of the business and is therefore considered relevant to readers of this document. It is presented here to give more clarity around the underlying business performance of the Group’s operations. APMs are reconciled to directly comparable IFRS financial measures on pages 273 to 278. Our financial results are prepared in accordance with IFRS — see page 148 for further information. 2. Total consideration of $3,139 million for the minority interest in TRQ excludes transaction costs of $74 million. In 2022, we paid $2,928 million to shareholders and $33 million of transaction costs. In 2023, we expect to pay the remaining $41 million of transaction costs and approximately $211 million to dissenting shareholders, depending on the outcome and timing of dissent proceedings. 30 Annual Report 2022 | riotinto.comAnnual Report on Form 20-F 2022 | riotinto.com30
Ordinary dividend per share declared 2022 2021 Rio Tinto Group Interim (US cents) 267.00 376.00 Final (US cents) 225.00 417.00 Full-year (US cents) 492.00 793.00 Rio Tinto plc Interim (UK pence) 221.63 270.84 Final (UK pence) 306.72 Full-year (UK pence) 406.98 577.56 Rio Tinto Limited Interim (Australian cents) 383.70 509.42 Final (Australian cents) 577.04 Full-year (Australian cents) 710.19 1,086.46 Special dividend per share declared 2022 2021 Rio Tinto Group Interim (US cents) n/a 185.00 Final (US cents) n/a 62.00 Full-year (US cents) n/a 247.00 Rio Tinto plc Interim (UK pence) n/a 133.26 Final (UK pence) n/a 45.60 Full-year (UK pence) n/a 178.86 Rio Tinto Limited Interim (Australian cents) n/a 250.64 Final (Australian cents) n/a 85.80 Full-year (Australian cents) n/a 336.44 The 2022 final ordinary dividend to be paid to our Rio Tinto Limited shareholders will be fully franked. The Board expects Rio Tinto Limited to be in a position to pay fully franked dividends for the foreseeable future. On 20 April 2023, we will pay the 2022 final ordinary dividend to holders of ordinary shares and holders of ADRs on the register at the close of business on 10 March 2023 (record date). The ex-dividend date is 9 March 2023. Rio Tinto plc shareholders may choose to receive their dividend in Australian dollars or New Zealand dollars, and Rio Tinto Limited shareholders may choose to receive theirs in pounds sterling or New Zealand dollars. Currency conversions will be based on the pound sterling, Australian dollar and New Zealand dollar exchange rates five business days before the dividend payment date. Rio Tinto plc and Rio Tinto Limited shareholders must register their currency elections by 28 March 2023. We will operate our Dividend Reinvestment Plans for the 2022 final dividend (visit riotinto.com for details). Rio Tinto plc and Rio Tinto Limited shareholders’ election notice for the Dividend Reinvestment Plans must be received by 28 March 2023. Purchases under the Dividend Reinvestment Plan are made on or as soon as practicable after the dividend payment date and at prevailing market prices. There is no discount available. Our payout ratio has averaged 72% over the past seven years Annual Report 2022 | riotinto.com 31 185.35 326.49 The Financial review and Business review for the year ended 31 December 2020 can be found on pages 32 to 37 and pages 42 to 57, respectively, of our Form 20-F filed with the United States Securities and Exchange Commission on 2 March 2021. 31Annual Report on Form 20-F 2022 | riotinto.com Strategic report 2017 60% 83% 2018 60% 71% 2019 60% 70% 2020 60% 72% 2021 60% 79% 2016 60% 70% 2022 60% Ordinary dividend Additional return r payout ratio has veraged XX% over th past s ven years
Portfolio management Capital projects Approved projects (Rio Tinto 100% owned unless otherwise stated) Total approved capital cost (100% unless otherwise stated) Status/Milestones Completed in 2022 Investment in Gudai-Darri, a new production hub in the Pilbara region of Western Australia. The investment incorporates a processing plant and infrastructure including a 166-kilometre rail line connecting the mine to our existing network. $3.1bn We delivered first ore in June 2022. Production from the mine ramped up in the second half of the year and we expect Gudai-Darri to reach its nameplate capacity of 43 million tonne per year on a sustained basis during 2023. The mine has an expected life of more than 40 years. Investment in the Robe River Joint Venture (West Angelas C and D and Mesa B, C and H at Robe Valley) in the Pilbara to sustain production capacity. $1.0bn (Rio Tinto share) In the third quarter of 2022, Mesa A rectification works were successfully completed, with the plant operating at design rates. Final train load out tie- in works at Mesa J were also completed, with first ore achieved. Investment in a second tunnel at the 1000MW Kemano hydropower facility at Kitimat, British Columbia, Canada, which will ensure the long-term reliability of the power supply to the Kitimat smelter. $0.8bn The new 16-kilometre tunnel produced its first megawatt of electricity in July 2022 after construction was completed in May 2022. Ongoing Iron Ore Investment in the Western Range iron ore project, a joint venture between Rio Tinto (54%) and China Baowu Steel Group Co. Ltd (46%) in the Pilbara to sustain production of the Pilbara Blend from Rio Tinto's existing Paraburdoo hub. $1.3bn (Rio Tinto share) 1 Announced in September 2022, the mine will have a production capacity of 25 million tonnes per year. The project includes construction of a primary crusher and an 18-kilometre conveyor connection to the Paraburdoo processing plant. Early works construction commenced in 2022 and major contracts have been awarded by Rio Tinto. First production is anticipated in 2025. Copper Phase two of the south wall pushback to extend mine life at Kennecott by a further six years. A $108 million investment in underground characterisation studies is ongoing, with $55 million in development capital approved to commence underground mining. $1.5bn Approved in December 2019, the investment will further extend strip waste rock mining and support additional infrastructure development. This will allow mining to continue into a new area of the orebody between 2026 and 2032. Development of the Oyu Tolgoi underground copper/gold mine in Mongolia (Rio Tinto 66%), which is expected to produce (from the open pit and underground) an average of ~500,000 tonnes 2 of copper per year from 2028 to 2036 and an average of ~350,000 tonnes 2 of copper per year for a further five years, compared with 130,000 tonnes in 2022 (open pit). $7.06bn 3 The project was originally approved in May 2016 for $5.3 billion, with an additional $1.45 billion approved by the Rio Tinto Board in December 2020, following completion of the Definitive Estimate. By the end of 2022, a total of 19 drawbells had been fired. Progression accelerated as a result of improvement initiatives implemented by the Oyu Tolgoi teams, bringing projected first sustainable production from Panel 0 forward to the first quarter of 2023. This followed the comprehensive agreement between the Oyu Tolgoi partners announced in January 2022. Minerals Development of the Zulti South project at Richards Bay Minerals (RBM) in South Africa (Rio Tinto 74%). $0.5bn Approved in April 2019 to underpin RBM’s supply of zircon and ilmenite over the life of the mine. The project remains on full suspension. Development of the greenfield Jadar lithium-borates project in Serbia. The development will include an underground mine with associated infrastructure and equipment, including electric haul trucks, as well as a beneficiation chemical processing plant. $2.4bn The Board committed the funding in July 2021, subject to receiving all relevant approvals, permits and licences. We are focused on consultation with all stakeholders to explore all options following the Government of Serbia's cancellation of the Spatial Plan in January 2022. 1. Rio Tinto share includes 100% of funding costs for Paraburdoo plant upgrades. 2. The 500ktpa target (stated as recovered metal) for the Oyu Tolgoi underground and open pit mines is underpinned 21% by Proved Ore Reserves and 79% by Probable Ore Reserves for the years 2028 to 2036. The 350ktpa production target for the following five years is underpinned 22% by Proved Ore Reserves and 78% by Probable Ore Reserves. These production targets have been scheduled from current mine designs by Competent Persons in accordance with the requirements of the Australasian Code for Reporting of Exploration Results, Minerals Resources and Ore Reserves, 2012 Edition (the JORC code). 3. A cost and schedule reforecast was performed in June 2022 and estimates that $7.06 billion is required to complete the Hugo North 1 project (an increase of $0.3 billion beyond the 2020 Definitive Estimate). The 2022 Reforecast excludes impacts of COVID-19 restrictions arising after June 2022. The 2022 reforecast remains subject to Oyu Tolgoi Board approval. 32 Annual Report 2022 | riotinto.comAnnual Report on Form 20-F 2022 | riotinto.com32
Future options Iron Ore: Pilbara brownfields Over the medium term, our Pilbara system capacity remains between 345 and 360 million tonnes per year. Meeting this range, and the planned product mix, will require the approval and delivery of the next tranche of replacement mines. In addition to Western Range (Greater Paraburdoo), which has commenced early works construction, other key projects to be delivered over the next five years include Hope Downs 1 Sustaining (Hope Downs 2 and Bedded Hilltop), West Angelas Sustaining, Greater Nammuldi Sustaining and Brockman 4 Sustaining (Brockman Syncline 1). We continue to work closely with local communities, Traditional Owners and government to progress approvals for the new mining projects. Iron Ore: Rhodes Ridge In October, Rio Tinto (50%) and Wright Prospecting Pty Ltd (50%) agreed to modernise the joint venture covering the Rhodes Ridge project in the Eastern Pilbara, providing a pathway for development utilising Rio Tinto’s rail, port and power infrastructure. Rhodes Ridge contains 5.8 billion tonnes of high grade Mineral Resources at an average grade of 62.3% Fe. The project’s total resource, 6.7 billion tonnes at an average grade of 61.6% Fe, represents approximately one third of our existing Resource base in the Pilbara. 1 A resource-drilling programme is currently underway to support future project studies. The participants have commenced an Order of Magnitude study, conducted by Rio Tinto, which will consider the development of an operation before the end of the decade with initial plant capacity of up to 40 million tonnes annually, subject to the receipt of relevant approvals. We expect to complete the Rhodes Ridge Order of Magnitude study in 2023. Iron Ore: Simandou The Simandou iron ore project in Guinea 2 contains one of the world’s largest known undeveloped high-grade low-impurity iron ore deposits, demand for which is increasing as steelmakers look to reduce carbon emissions. Simandou is set to diversify our strong iron ore portfolio, complementing our high-grade Iron Ore Company of Canada products and supporting the long-term attractiveness of our Pilbara Blend™ offering. Negotiations towards the co-development of project infrastructure progressed further with the December signing of a non-binding term sheet between our Simfer joint venture, Baowu, Winning Consortium Simandou (WCS) and the Government of Guinea 3. The term sheet further establishes the co-development principles following the incorporation of La Compagnie du TransGuinéen on 27 July 2022, and is a pivotal next step towards securing the shareholder agreement, cost estimates and regulatory authority approvals necessary to progress the co-development of rail and port facilities. Lithium: Rincon We completed the acquisition of the Rincon Lithium Project in Salta province, Argentina in March 2022. Development of a small starter, battery- grade lithium carbonate plant with a capacity of 3,000 tonnes per year is underway. In July 2022, we approved $140 million of investment and $54 million for early works to support a full-scale operation to be expensed through exploration and evaluation expenditure. Construction activities progressed on phase one camp facilities with rooms for 250 persons completed. Airstrip permits were received and contractors mobilised. First saleable production from the small starter plant is expected in the first half of 2024. Copper: Resolution The Resolution Copper project is a proposed underground copper mine in the Copper Triangle, in Arizona, United States. It has the potential to supply up to 25% of US copper demand. The US Forest Service continued work to progress the Final Environmental Impact Statement and complete actions necessary for the land exchange. We continued to advance partnership discussions with several federally recognised Native American Tribes who are part of the formal consultation process. Copper: Winu In late 2017, we discovered copper-gold mineralisation at the Winu project in the Paterson Province in Western Australia. In 2021, we reported our first Indicated Mineral Resource. The pathway is expected to take longer than originally anticipated and remains subject to regulatory and other required approvals. We continued to strengthen our relationships and advanced agreement making with our host Traditional Owners, the Martu and Nyangumarta groups. Planned drilling, fieldwork and study activities continued, strengthening the development pathway ahead of applications for regulatory and other required approvals. Aluminium: ELYSIS ELYSIS, our joint venture with Alcoa, supported by Apple, the Government of Canada and the Government of Quebec, is developing a breakthrough inert anode technology that eliminates all direct greenhouse gases from the aluminium smelting process. Construction of the first commercial-scale prototype cells is underway at our Alma smelter and is expected to become operational in 2023. ELYSIS aims to have its technology available for installation from 2024 and production of larger volumes of carbon-free aluminium approximately two years later. 1. The Mineral Resource estimates for the Rhodes Ridge Joint Venture (JV) were reported in our 2020 Annual Report released to the Australian Securities Exchange (ASX) on 22 February 2021 (and form part of the Pilbara Mineral Resource estimates reported in our 2021 Annual Report released to the ASX on 24 February 2022). The Competent Persons responsible for reporting these Mineral Resource estimates were Mr P Savory, who is a Fellow of The Australasian Institute of Mining and Metallurgy, and Ms N Brajkovich and Mr C Kyngdon, who are Members of The Australasian Institute of Mining and Metallurgy. We are not aware of any new information or data that materially affects these Mineral Resource estimates and confirm that all material assumptions and technical parameters underpinning the estimate continue to apply and have not materially changed. The form and context in which the Competent Persons’ findings are presented have not been materially modified from when they were reported. Mineral Resources are quoted in this release on a 100% basis, as dry in-situ tonnes. 2. The Simandou iron ore project operates under the Simfer joint venture where the Government of Guinea holds 15% and Simfer Jersey holds 85%. Simfer Jersey is owned by Rio Tinto (53%) and Chalco Iron Ore Holdings (CIOH) (47%). CIOH is owned by Chinalco (75%), Baowu (20%), China Civil Engineering Construction Corporation (CCECC) (2.5%) and China Harbour Engineering Company (CHEC) (2.5%). This structure has been in place since 2017. 3. This followed notification to Rio Tinto and the Government of Guinea of Baowu’s earlier entry into a term sheet agreement with WCS in respect of an investment into WCS mine (blocks 1 and 2) and infrastructure vehicle – an agreement welcomed by Rio Tinto. Annual Report 2022 | riotinto.com 3333Annual Report on Form 20-F 2022 | riotinto.com Strategic report
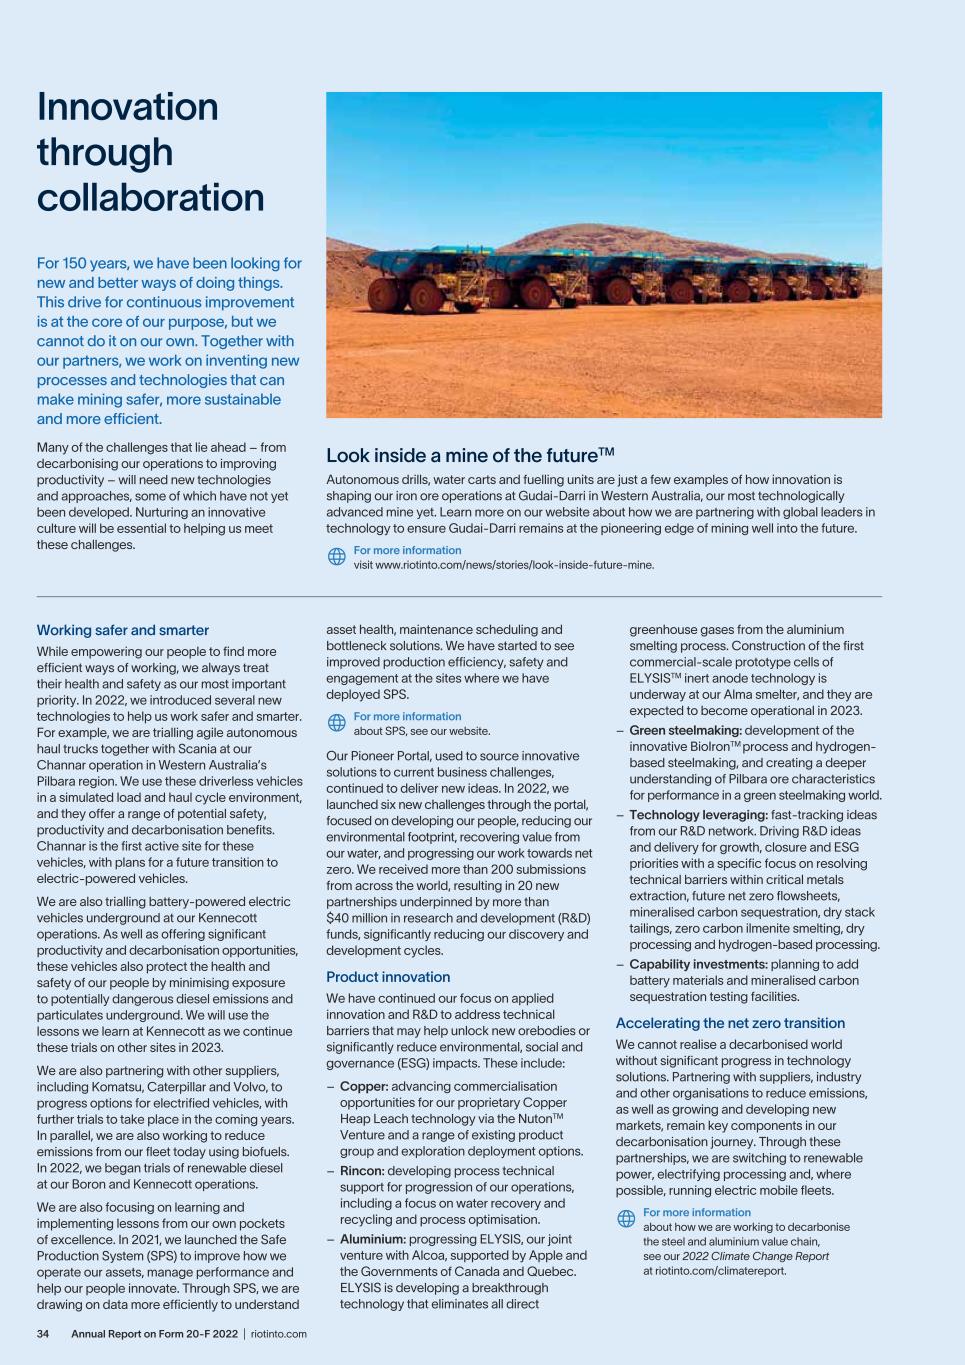
Annual Report on Form 20-F 2022 | riotinto.com34 Innovation through collaboration Working safer and smarter While empowering our people to find more efficient ways of working, we always treat their health and safety as our most important priority. In 2022, we introduced several new technologies to help us work safer and smarter. For example, we are trialling agile autonomous haul trucks together with Scania at our Channar operation in Western Australia’s Pilbara region. We use these driverless vehicles in a simulated load and haul cycle environment, and they offer a range of potential safety, productivity and decarbonisation benefits. Channar is the first active site for these vehicles, with plans for a future transition to electric-powered vehicles. We are also trialling battery-powered electric vehicles underground at our Kennecott operations. As well as offering significant productivity and decarbonisation opportunities, these vehicles also protect the health and safety of our people by minimising exposure to potentially dangerous diesel emissions and particulates underground. We will use the lessons we learn at Kennecott as we continue these trials on other sites in 2023. We are also partnering with other suppliers, including Komatsu, Caterpillar and Volvo, to progress options for electrified vehicles, with further trials to take place in the coming years. In parallel, we are also working to reduce emissions from our fleet today using biofuels. In 2022, we began trials of renewable diesel at our Boron and Kennecott operations. We are also focusing on learning and implementing lessons from our own pockets of excellence. In 2021, we launched the Safe Production System (SPS) to improve how we operate our assets, manage performance and help our people innovate. Through SPS, we are drawing on data more efficiently to understand asset health, maintenance scheduling and bottleneck solutions. We have started to see improved production efficiency, safety and engagement at the sites where we have deployed SPS. For more information about SPS, see our website. Our Pioneer Portal, used to source innovative solutions to current business challenges, continued to deliver new ideas. In 2022, we launched six new challenges through the portal, focused on developing our people, reducing our environmental footprint, recovering value from our water, and progressing our work towards net zero. We received more than 200 submissions from across the world, resulting in 20 new partnerships underpinned by more than $40 million in research and development (R&D) funds, significantly reducing our discovery and development cycles. Product innovation We have continued our focus on applied innovation and R&D to address technical barriers that may help unlock new orebodies or significantly reduce environmental, social and governance (ESG) impacts. These include: – Copper: advancing commercialisation opportunities for our proprietary Copper Heap Leach technology via the NutonTM Venture and a range of existing product group and exploration deployment options. – Rincon: developing process technical support for progression of our operations, including a focus on water recovery and recycling and process optimisation. – Aluminium: progressing ELYSIS, our joint venture with Alcoa, supported by Apple and the Governments of Canada and Quebec. ELYSIS is developing a breakthrough technology that eliminates all direct greenhouse gases from the aluminium smelting process. Construction of the first commercial-scale prototype cells of ELYSISTM inert anode technology is underway at our Alma smelter, and they are expected to become operational in 2023. – Green steelmaking: development of the innovative BioIronTM process and hydrogen- based steelmaking, and creating a deeper understanding of Pilbara ore characteristics for performance in a green steelmaking world. – Technology leveraging: fast-tracking ideas from our R&D network. Driving R&D ideas and delivery for growth, closure and ESG priorities with a specific focus on resolving technical barriers within critical metals extraction, future net zero flowsheets, mineralised carbon sequestration, dry stack tailings, zero carbon ilmenite smelting, dry processing and hydrogen-based processing. – Capability investments: planning to add battery materials and mineralised carbon sequestration testing facilities. Accelerating the net zero transition We cannot realise a decarbonised world without significant progress in technology solutions. Partnering with suppliers, industry and other organisations to reduce emissions, as well as growing and developing new markets, remain key components in our decarbonisation journey. Through these partnerships, we are switching to renewable power, electrifying processing and, where possible, running electric mobile fleets. For more information about how we are working to decarbonise the steel and aluminium value chain, see our 2022 Climate Change Report at riotinto.com/climatereport. For 150 years, we have been looking for new and better ways of doing things. This drive for continuous improvement is at the core of our purpose, but we cannot do it on our own. Together with our partners, we work on inventing new processes and technologies that can make mining safer, more sustainable and more efficient. Many of the challenges that lie ahead – from decarbonising our operations to improving productivity – will need new technologies and approaches, some of which have not yet been developed. Nurturing an innovative culture will be essential to helping us meet these challenges. Look inside a mine of the futureTM Autonomous drills, water carts and fuelling units are just a few examples of how innovation is shaping our iron ore operations at Gudai-Darri in Western Australia, our most technologically advanced mine yet. Learn more on our website about how we are partnering with global leaders in technology to ensure Gudai-Darri remains at the pioneering edge of mining well into the future. For more information visit www.riotinto.com/news/stories/look-inside-future-mine.
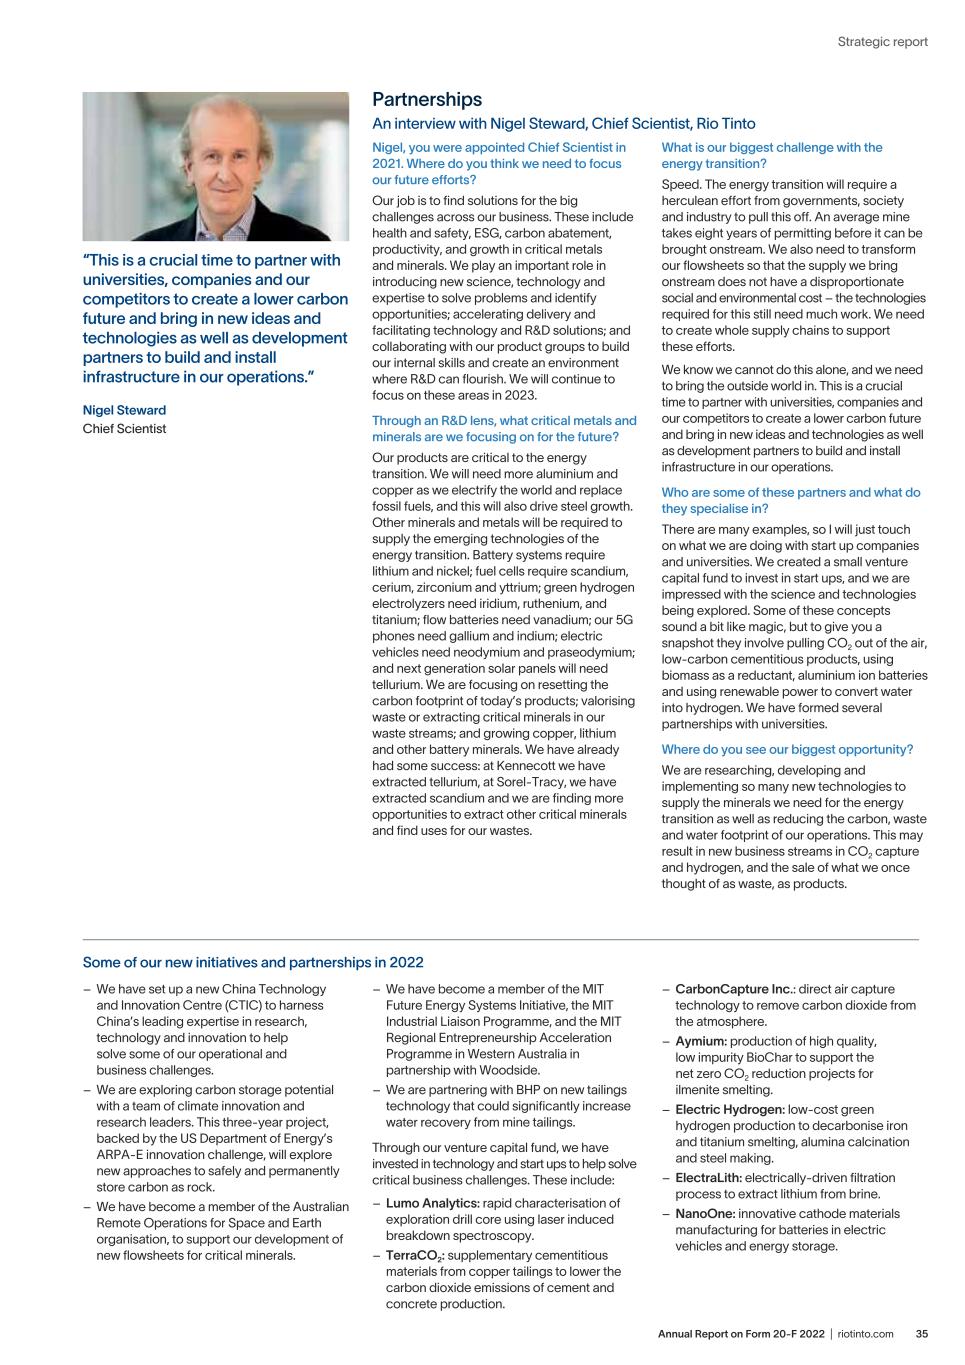
35Annual Report on Form 20-F 2022 | riotinto.com Strategic report What is our biggest challenge with the energy transition? Speed. The energy transition will require a herculean effort from governments, society and industry to pull this off. An average mine takes eight years of permitting before it can be brought onstream. We also need to transform our flowsheets so that the supply we bring onstream does not have a disproportionate social and environmental cost – the technologies required for this still need much work. We need to create whole supply chains to support these efforts. We know we cannot do this alone, and we need to bring the outside world in. This is a crucial time to partner with universities, companies and our competitors to create a lower carbon future and bring in new ideas and technologies as well as development partners to build and install infrastructure in our operations. Who are some of these partners and what do they specialise in? There are many examples, so I will just touch on what we are doing with start up companies and universities. We created a small venture capital fund to invest in start ups, and we are impressed with the science and technologies being explored. Some of these concepts sound a bit like magic, but to give you a snapshot they involve pulling CO2 out of the air, low-carbon cementitious products, using biomass as a reductant, aluminium ion batteries and using renewable power to convert water into hydrogen. We have formed several partnerships with universities. Where do you see our biggest opportunity? We are researching, developing and implementing so many new technologies to supply the minerals we need for the energy transition as well as reducing the carbon, waste and water footprint of our operations. This may result in new business streams in CO2 capture and hydrogen, and the sale of what we once thought of as waste, as products. Nigel, you were appointed Chief Scientist in 2021. Where do you think we need to focus our future efforts? Our job is to find solutions for the big challenges across our business. These include health and safety, ESG, carbon abatement, productivity, and growth in critical metals and minerals. We play an important role in introducing new science, technology and expertise to solve problems and identify opportunities; accelerating delivery and facilitating technology and R&D solutions; and collaborating with our product groups to build our internal skills and create an environment where R&D can flourish. We will continue to focus on these areas in 2023. Through an R&D lens, what critical metals and minerals are we focusing on for the future? Our products are critical to the energy transition. We will need more aluminium and copper as we electrify the world and replace fossil fuels, and this will also drive steel growth. Other minerals and metals will be required to supply the emerging technologies of the energy transition. Battery systems require lithium and nickel; fuel cells require scandium, cerium, zirconium and yttrium; green hydrogen electrolyzers need iridium, ruthenium, and titanium; flow batteries need vanadium; our 5G phones need gallium and indium; electric vehicles need neodymium and praseodymium; and next generation solar panels will need tellurium. We are focusing on resetting the carbon footprint of today’s products; valorising waste or extracting critical minerals in our waste streams; and growing copper, lithium and other battery minerals. We have already had some success: at Kennecott we have extracted tellurium, at Sorel-Tracy, we have extracted scandium and we are finding more opportunities to extract other critical minerals and find uses for our wastes. Partnerships An interview with Nigel Steward, Chief Scientist, Rio Tinto “This is a crucial time to partner with universities, companies and our competitors to create a lower carbon future and bring in new ideas and technologies as well as development partners to build and install infrastructure in our operations.” Nigel Steward Chief Scientist Some of our new initiatives and partnerships in 2022 – We have set up a new China Technology and Innovation Centre (CTIC) to harness China’s leading expertise in research, technology and innovation to help solve some of our operational and business challenges. – We are exploring carbon storage potential with a team of climate innovation and research leaders. This three-year project, backed by the US Department of Energy’s ARPA-E innovation challenge, will explore new approaches to safely and permanently store carbon as rock. – We have become a member of the Australian Remote Operations for Space and Earth organisation, to support our development of new flowsheets for critical minerals. – We have become a member of the MIT Future Energy Systems Initiative, the MIT Industrial Liaison Programme, and the MIT Regional Entrepreneurship Acceleration Programme in Western Australia in partnership with Woodside. – We are partnering with BHP on new tailings technology that could significantly increase water recovery from mine tailings. Through our venture capital fund, we have invested in technology and start ups to help solve critical business challenges. These include: – Lumo Analytics: rapid characterisation of exploration drill core using laser induced breakdown spectroscopy. – TerraCO2: supplementary cementitious materials from copper tailings to lower the carbon dioxide emissions of cement and concrete production. – CarbonCapture Inc.: direct air capture technology to remove carbon dioxide from the atmosphere. – Aymium: production of high quality, low impurity BioChar to support the net zero CO2 reduction projects for ilmenite smelting. – Electric Hydrogen: low-cost green hydrogen production to decarbonise iron and titanium smelting, alumina calcination and steel making. – ElectraLith: electrically-driven filtration process to extract lithium from brine. – NanoOne: innovative cathode materials manufacturing for batteries in electric vehicles and energy storage.
Annual Report on Form 20-F 2022 | riotinto.com36 Enabling the low-carbon transition In 2022, our Iron Ore business’s absolute greenhouse gas (GHG) emissions were 3.1Mt CO2e (on an equity basis), an increase of 0.50Mt CO2e compared to the 2018 emissions baseline. This was driven by an increase in diesel emissions due to increased haul distances, pre-strip ratios and material movement. With abundant wind and solar resources in the Pilbara, we are developing large-scale renewables projects to contribute to our emissions reductions targets. For more information about our decarbonisation efforts in the Iron Ore product group, see our 2022 Climate Change Report at riotinto.com/climatereport. Iron Ore We are one of the world’s leading producers of iron ore, the primary raw material in steelmaking. In the Pilbara region of Western Australia, we operate a network of 17 iron ore mines, four port terminals and a rail network spanning nearly 2,000 kilometres. Steel remains essential for ongoing urbanisation and will support the global shift to decarbonise. Snapshot of the year 0.68 AIFR (2021: 0.67) 68% Pilbara underlying FOB EBITDA margin (2021: 76%) $18.6bn Underlying EBITDA (2021: $27.6bn) $30.9bn Segmental revenue (2021: 39.6bn) $2.9bn Capital expenditure (2021: $3.9bn) $14.0bn Net cash generated from operating activities (2021: $19.2bn) 3.1Mt Scope 1 and 2 GHG emissions (equity Mt CO2e) (2021: 3.0Mt) 15,000 Employee numbers (2021: 13,000) Safety The number of potentially fatal incidents (PFIs) in Iron Ore increased to 25, with vehicle collisions/rollovers and falling objects accounting for the highest number of incidents. Our all-injury frequency rate (AIFR) increased to 0.68 compared to 0.67 for 2021, with the rate of injuries in our contractor workforce decreasing. We are committed to preventing harm to our people. In 2022, we developed the mentally healthy Iron Ore strategy to mature our workplace safety culture and create an environment where our people are both physically and psychologically safe and healthy. With changes in workforce dynamics, in particular levels of experience, we examined underlying organisational and people factors to determine the most critical gaps to be addressed. We made significant progress on influencing mindsets, behaviours and the felt experience; however, more work is underway to strengthen the application of existing safety systems such as critical risk management. For more information about our global health and safety initiatives, see pages 57-58. In January 2023, a radioactive capsule was lost after being sent offsite to Perth. The capsule was subsequently recovered in a search operation led by Western Australia’s Department of Fire and Emergency Services and supported by other agencies. The safety of our communities, our employees, and contractors is our main priority and we are undertaking an investigation, with involvement of the relevant specialist contractor, to ensure it does not happen again. For more information see the media release on our website.
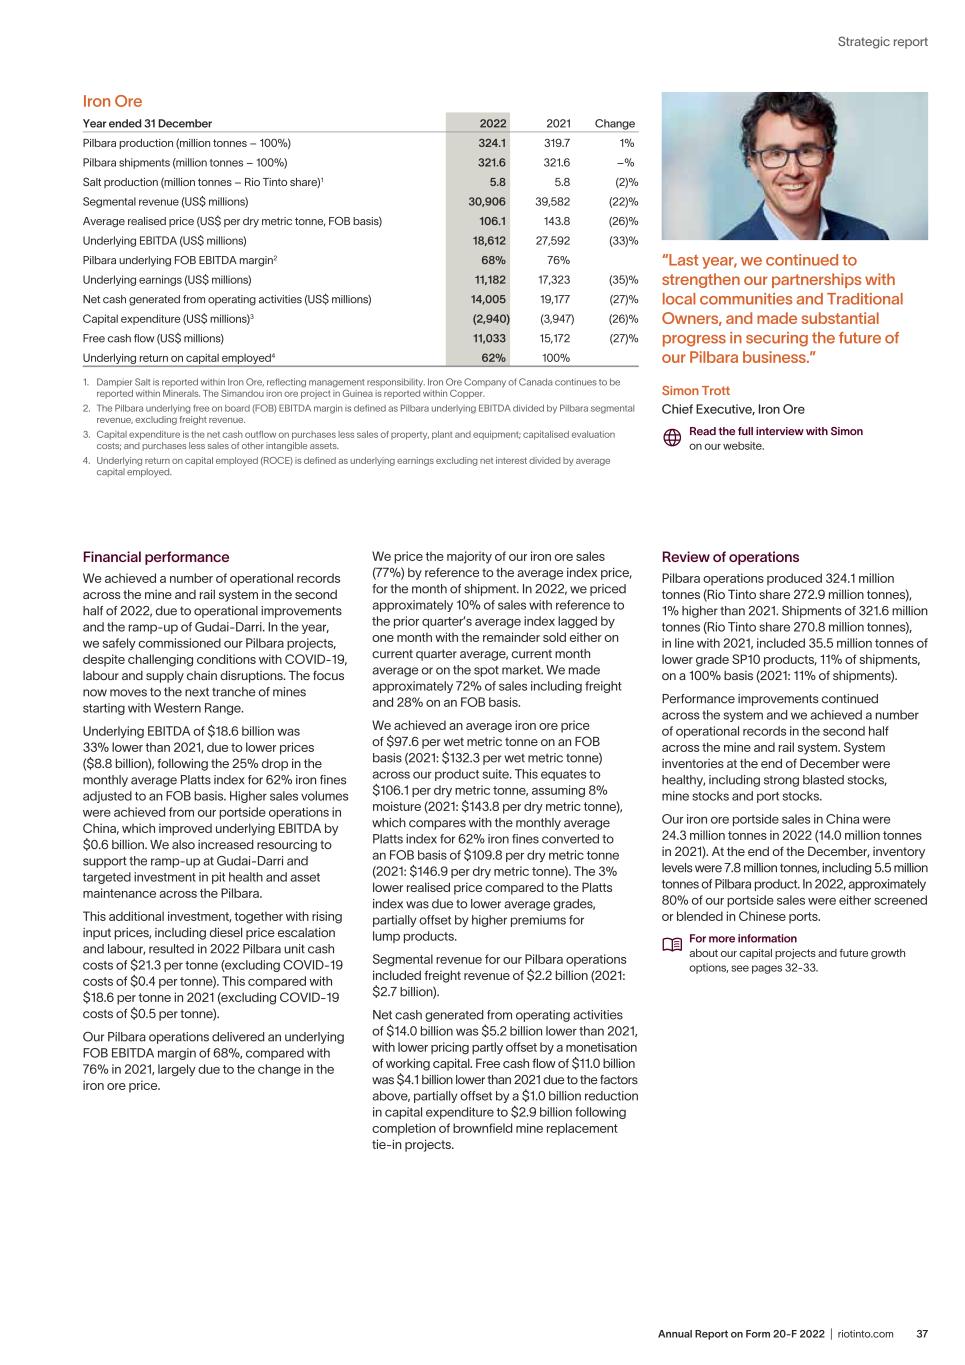
37Annual Report on Form 20-F 2022 | riotinto.com Strategic report “Last year, we continued to strengthen our partnerships with local communities and Traditional Owners, and made substantial progress in securing the future of our Pilbara business.” Simon Trott Chief Executive, Iron Ore Read the full interview with Simon on our website. Financial performance We achieved a number of operational records across the mine and rail system in the second half of 2022, due to operational improvements and the ramp-up of Gudai-Darri. In the year, we safely commissioned our Pilbara projects, despite challenging conditions with COVID-19, labour and supply chain disruptions. The focus now moves to the next tranche of mines starting with Western Range. Underlying EBITDA of $18.6 billion was 33% lower than 2021, due to lower prices ($8.8 billion), following the 25% drop in the monthly average Platts index for 62% iron fines adjusted to an FOB basis. Higher sales volumes were achieved from our portside operations in China, which improved underlying EBITDA by $0.6 billion. We also increased resourcing to support the ramp-up at Gudai-Darri and targeted investment in pit health and asset maintenance across the Pilbara. This additional investment, together with rising input prices, including diesel price escalation and labour, resulted in 2022 Pilbara unit cash costs of $21.3 per tonne (excluding COVID-19 costs of $0.4 per tonne). This compared with $18.6 per tonne in 2021 (excluding COVID-19 costs of $0.5 per tonne). Our Pilbara operations delivered an underlying FOB EBITDA margin of 68%, compared with 76% in 2021, largely due to the change in the iron ore price. We price the majority of our iron ore sales (77%) by reference to the average index price, for the month of shipment. In 2022, we priced approximately 10% of sales with reference to the prior quarter’s average index lagged by one month with the remainder sold either on current quarter average, current month average or on the spot market. We made approximately 72% of sales including freight and 28% on an FOB basis. We achieved an average iron ore price of $97.6 per wet metric tonne on an FOB basis (2021: $132.3 per wet metric tonne) across our product suite. This equates to $106.1 per dry metric tonne, assuming 8% moisture (2021: $143.8 per dry metric tonne), which compares with the monthly average Platts index for 62% iron fines converted to an FOB basis of $109.8 per dry metric tonne (2021: $146.9 per dry metric tonne). The 3% lower realised price compared to the Platts index was due to lower average grades, partially offset by higher premiums for lump products. Segmental revenue for our Pilbara operations included freight revenue of $2.2 billion (2021: $2.7 billion). Net cash generated from operating activities of $14.0 billion was $5.2 billion lower than 2021, with lower pricing partly offset by a monetisation of working capital. Free cash flow of $11.0 billion was $4.1 billion lower than 2021 due to the factors above, partially offset by a $1.0 billion reduction in capital expenditure to $2.9 billion following completion of brownfield mine replacement tie-in projects. Review of operations Pilbara operations produced 324.1 million tonnes (Rio Tinto share 272.9 million tonnes), 1% higher than 2021. Shipments of 321.6 million tonnes (Rio Tinto share 270.8 million tonnes), in line with 2021, included 35.5 million tonnes of lower grade SP10 products, 11% of shipments, on a 100% basis (2021: 11% of shipments). Performance improvements continued across the system and we achieved a number of operational records in the second half across the mine and rail system. System inventories at the end of December were healthy, including strong blasted stocks, mine stocks and port stocks. Our iron ore portside sales in China were 24.3 million tonnes in 2022 (14.0 million tonnes in 2021). At the end of the December, inventory levels were 7.8 million tonnes, including 5.5 million tonnes of Pilbara product. In 2022, approximately 80% of our portside sales were either screened or blended in Chinese ports. For more information about our capital projects and future growth options, see pages 32-33. Iron Ore Year ended 31 December 2022 2021 Change Pilbara production (million tonnes – 100%) 324.1 319.7 1% Pilbara shipments (million tonnes – 100%) 321.6 321.6 –% Salt production (million tonnes – Rio Tinto share)1 5.8 5.8 (2)% Segmental revenue (US$ millions) 30,906 39,582 (22)% Average realised price (US$ per dry metric tonne, FOB basis) 106.1 143.8 (26)% Underlying EBITDA (US$ millions) 18,612 27,592 (33)% Pilbara underlying FOB EBITDA margin2 68% 76% Underlying earnings (US$ millions) 11,182 17,323 (35)% Net cash generated from operating activities (US$ millions) 14,005 19,177 (27)% Capital expenditure (US$ millions)3 (2,940) (3,947) (26)% Free cash flow (US$ millions) 11,033 15,172 (27)% Underlying return on capital employed4 62% 100% 1. Dampier Salt is reported within Iron Ore, reflecting management responsibility. Iron Ore Company of Canada continues to be reported within Minerals. The Simandou iron ore project in Guinea is reported within Copper. 2. The Pilbara underlying free on board (FOB) EBITDA margin is defined as Pilbara underlying EBITDA divided by Pilbara segmental revenue, excluding freight revenue. 3. Capital expenditure is the net cash outflow on purchases less sales of property, plant and equipment; capitalised evaluation costs; and purchases less sales of other intangible assets. 4. Underlying return on capital employed (ROCE) is defined as underlying earnings excluding net interest divided by average capital employed.
Annual Report on Form 20-F 2022 | riotinto.com38 Enabling the low-carbon transition In 2022, our Aluminium business’s absolute greenhouse gas emissions (21.1Mt CO2e) were 4.4% lower than the 2018 equity baseline (22.0Mt CO2e). This reduction includes improvements in processing efficiency, increased use of hydroelectric boilers in refining instead of natural gas boilers, and reduced aluminium production at the Kitimat smelter, which continues to ramp up after a strike in 2021. The 2022 emissions intensity of our managed Atlantic smelters, powered by hydroelectricity, was 2.21Mt CO2e per tonne of aluminium. Our Vaudreuil alumina refinery has one of the lowest carbon footprints of any metallurgical alumina refinery in the world today. For more information about our decarbonisation efforts in the Aluminium product group, see our 2022 Climate Change Report at riotinto.com/climatereport. Aluminium As a global leader in low-carbon aluminium, we are uniquely positioned to further decarbonise our business and support the world’s transition towards a lower-carbon footprint. A critical material – lightweight and infinitely recyclable – aluminium is found in diverse products ranging from solar panels to electric vehicles and smartphones. Snapshot of the year 0.35 AIFR (2021: 0.33) 29% Underlying EBITDA margin (integrated operations) (2021: 38%) $3.7bn Underlying EBITDA (2021: $4.4bn) $14.1bn Segmental revenue (2021: $12.7bn) $1.4bn Capital expenditure (2021: $1.3bn) $3.1bn Net cash generated from operating activities (2021: $3.6bn) 21.1Mt Scope 1 and 2 GHG emissions (equity Mt CO2e) (2021: 21.7Mt) 15,000 Employee numbers (2021: 14,000) Safety In 2022, we continued to progress in our safety maturity journey, expanding our focus on contractors and integrating health and environment into the daily leadership rituals. Our Pacific assets significantly improved their all-injury frequency rate (AIFR) to a best-ever of 0.27, while a difficult year at Kitimat contributed to an AIFR in the Atlantic of 0.43, for an overall AIFR of 0.35 in 2022 compared to 0.33 in 2021. The number of potentially fatal incidents (PFIs) in our business remained steady in 2022 (29), and we remain committed to reducing these risks. The work programme we commenced in 2021 to address overhead crane asset maintenance continued into 2022, and the number of PFIs relating to falling objects has reduced by 47% compared to 2021. We will be integrating the learnings from the 2022 safety maturity model assessments to strengthen our front-line risk assessment and critical risk management programme, as well as our Safe Production System to reduce fatality risk, prevent injuries and stabilise our operations. The occupied building programme helped remove over 2,000 of our workforce from buildings with exposure to process hazards in our business. This programme is a significant step forward for process safety. For more information about our global health and safety initiatives, see pages 57-58.
39Annual Report on Form 20-F 2022 | riotinto.com Strategic report “2022 has been a year of transition for our Aluminium business. We sustained investment to strengthen the health of our assets, and announced several growth projects including AP60, Alma’s billet centre and early stage expansions in recycling.” Ivan Vella Chief Executive, Aluminium Read the full interview with Ivan on our website. Financial performance Strong pricing in the first half fell away sharply in the second, which, together with rising energy and raw materials costs, led to a significant margin squeeze on our Aluminium business and a 16% decrease in underlying EBITDA for the year as a whole. Underlying EBITDA margin fell nine percentage points, but remained robust for the year at 29%. Underlying EBITDA of $3.7 billion benefited from higher product premiums for primary metal in addition to the stronger pricing environment for primary metal and alumina in the first half. However, this was offset by higher coal prices and costs for key materials such as caustic soda, coke, pitch and anodes, leading to an increase in cash costs for alumina and primary metal. We achieved an average realised aluminium price of $3,330 per tonne, 15% higher than 2021 ($2,899 per tonne). Average realised aluminium prices comprise the LME price, a market premium and a value-added product (VAP) premium. The cash LME price averaged $2,703 per tonne, 9% higher than 2021, while in our key US market, the Midwest premium duty paid, which is 57% of our volumes (2021: 55%), increased by 12% to $655 per tonne (2021: $584 per tonne). Our VAP sales were stable at 50% of the primary metal we sold (2021: 50%) and generated product premiums averaging $431 per tonne of VAP sold (2021: $230 per tonne). Our conversion of underlying EBITDA to cash remained relatively strong, with net cash generated from operating activities of $3.1 billion and free cash flow of $1.7 billion. Review of operations Bauxite production of 54.6 million tonnes was 1% higher than 2021, despite equipment reliability issues at Weipa and Gove in Australia. We shipped 38.0 million tonnes of bauxite to third parties in 2022, 1% higher than 2021. In 2022, segmental revenue for bauxite increased 9% to $2.4 billion this includes freight revenue of $635 million (2021: $462 million). Alumina production of 7.5 million tonnes was 4% lower than 2021. The refineries in the Pacific (Yarwun and Queensland Alumina Limited) were impacted by a range of challenges in 2022, including unplanned outages and equipment reliability issues. COVID-19 absenteeism impacted production in early 2022 but eased in the second half. Production at the Vaudreuil refinery in Quebec remained stable. As the result of Queensland Alumina Limited's (QAL) activation of a step-in process following sanction measures by the Australian Government, we have taken on 100% of capacity for as long as the step-in continues. We are using Rusal’s 20% share of capacity under the tolling arrangement with QAL. This additional output is excluded from our production results as QAL remains 80% owned by Rio Tinto and 20% owned by Rusal. Aluminium production of 3.0 million tonnes was 4% lower than 2021, due to reduced output at our Kitimat smelter in British Columbia, Canada and Boyne smelter in Queensland, Australia. The rate of pot restarts at Kitimat picked up in the fourth quarter and Boyne smelter cell recovery efforts continued on plan. Recovery at both smelters is progressing, with full ramp-up expected to be completed during the course of 2023. All of our other aluminium smelters continued to demonstrate stable performance. For more information about our capital projects and future growth options, see pages 32-33. Aluminium Year ended 31 December 2022 2021 Change Bauxite production (‘000 tonnes – Rio Tinto share) 54,618 54,326 1% Alumina production (‘000 tonnes – Rio Tinto share) 7,544 7,894 (4)% Aluminium production (‘000 tonnes – Rio Tinto share) 3,009 3,151 (4)% Segmental revenue (US$ millions) 14,109 12,695 11% Average realised aluminium price (US$ per tonne) 3,330 2,899 15% Underlying EBITDA (US$ millions) 3,672 4,382 (16)% Underlying EBITDA margin (integrated operations) 29% 38% Underlying earnings (US$ millions) 1,472 2,468 (40)% Net cash generated from operating activities (US$ millions) 3,055 3,606 (15)% Capital expenditure – excluding EAUs (US$ millions)1 (1,377) (1,300) 6% Free cash flow (US$ millions) 1,652 2,272 (27)% Underlying return on capital employed2 10% 16% 1. Capital expenditure is the net cash outflow on purchases less sales of property, plant and equipment; capitalised evaluation costs; and purchases less sales of other intangible assets. It excludes equity accounted units (EAUs). 2. Underlying return on capital employed (ROCE) is defined as underlying earnings excluding net interest divided by average capital employed.
Annual Report on Form 20-F 2022 | riotinto.com40 Enabling the low-carbon transition In 2022, our Copper business’s absolute greenhouse gas emissions (1.5Mt CO2e) were 57% lower than the 2018 equity baseline (3.5Mt CO2e). And we were down 33% in emissions year-on-year. The decrease in emissions was mainly driven by the closure of the coal-fired power plant at Kennecott in 2019, with the balance of power met by the utility with commensurate renewable energy certificates. Escondida also completed its repowering in 2021, sourcing green power for its operations. In 2022, we considered long-term sustainable green power solutions, and how to address emissions from diesel haulage with ongoing trials and studies. This has involved collaborative partnerships with third parties. For more information about our decarbonisation efforts in the Copper product group, see our 2022 Climate Change Report at riotinto.com/climatereport. Copper Copper is essential to creating a sustainable, low-carbon world. Rapid electrification across all aspects of daily life is set to drive long-term demand for copper. With assets spanning the globe and an evolving suite of technologies to enable low-carbon production, we are accelerating growth and decarbonisation by producing the materials that enable a cleaner future. Snapshot of the year 0.22 AIFR (2021: 0.21) 49% Underlying EBITDA margin (product group operations) (2021: 59%) $2.4bn Underlying EBITDA (2021: $4.0bn) $6.7bn Segmental revenue (2021: $7.8bn) $1.6bn Capital expenditure (2021: $1.3bn) $1.4bn Net cash generated from operating activities (2021: $2.6bn) 1.5Mt Scope 1 and 2 GHG emissions (equity Mt CO2e) (2021: 2.2Mt) 8,000 Employee numbers (2021: 7,000) Safety Our operations and projects continued to progress on their safety maturity journey throughout 2022. We recorded zero fatalities for the fourth consecutive year; however, we continued to see a steady rate of potentially fatal incidents (PFIs) across our assets and the number of PFIs (18) has not changed compared to 2021. We ended 2022 with an all-injury frequency rate (AIFR) of 0.16 among our employees and 0.26 among our contractors. Our overall AIFR has increased slightly to 0.22 compared to 0.21 in 2021, with significant improvement for employees compared to 2021 (0.26) and a regression for contractors compared to 2021 (0.17). Critical risk management remains a priority. Recognising the disruption caused by the COVID-19 pandemic, we are also increasing our focus on employee wellbeing. For more information about our global health and safety initiatives, see pages 57-58.
41Annual Report on Form 20-F 2022 | riotinto.com Strategic report “2022 has been a year of achievements. In January we reached an agreement with the Government of Mongolia, started the undercut at Oyu Tolgoi and completed the acquisition of Turquoise Hill Resources in December. In Guinea, we signed the infrastructure joint venture with our Chinese partners and the Government to unlock Simandou.” Bold Baatar Chief Executive, Copper Read the full interview with Bold on our website. Financial performance Underlying EBITDA was down 40% to $2.4 billion, with $0.7 billion of the reduction a result of lower copper prices, particularly in the second half of the year. An anticipated decrease in by-product sales volumes (particularly lower gold in concentrate at Oyu Tolgoi), rising cash costs, higher energy prices and an increase in exploration and evaluation expenditure also impacted EBITDA in 2022. Underlying EBITDA margin remained strong at 49%. Our copper unit costs, at 163 cents per pound, increased by 81 cents, largely driven by the decline in by-product credits, together with rising input and higher labour costs, following the implementation of new labour laws in Mongolia and a new five-year collective bargaining agreement at Kennecott. We generated $1.4 billion in net cash from operating activities, a 48% decrease on 2021, from the same drivers as underlying EBITDA, together with a smaller increase in working capital compared to 2021. Negative free cash flow of $0.3 billion reflected the significant investment of $2.0 billion in our projects, an increase of 26% on 2021. This mainly related to the ongoing development of the Oyu Tolgoi underground project, underground growth projects at Kennecott and the Simandou iron ore project in Guinea. Review of operations Mined copper production, at 521 thousand tonnes, was 6% higher than 2021 due to higher grades at Kennecott and Escondida, partly offset by lower grades and recoveries at Oyu Tolgoi as a result of planned mine sequencing. The 4% increase in refined copper production to 209 thousand tonnes mainly reflected a furnace failure in 2021 at Kennecott which resulted in the smelter being offline for the majority of the fourth quarter of 2021. Unplanned maintenance was required in the fourth quarter of 2022 in our anode furnaces, leading to extended downtime and continued poor anode production. Oyu Tolgoi underground project A comprehensive agreement was reached with the Government of Mongolia on 25 January 2022, resetting the relationship between the partners, increasing the value the project delivers for Mongolia, and allowing underground operations to commence. In 2022, Rio Tinto and the Government of Mongolia remained focused on supporting Oyu Tolgoi to reach the sustainable production milestone, and continuing progress on the remaining measures contained in Mongolian Parliamentary Resolution 103. At the end of 2022, a total of 19 drawbells had been fired. Drawbell progression accelerated as a result of improvement initiatives implemented by the Oyu Tolgoi teams, bringing projected first sustainable production from Panel 0 forward to the first quarter of 2023 (previously first half of 2023). At the end of December, shafts 3 and 4 sinking had reached 378 metres and 507 metres below ground level respectively. Operational safety sinking pauses have caused some delays against the 2022 reforecast5 to shaft sinking. Final depths required for shafts 3 and 4 are 1,148 and 1,149 metres below ground level respectively. Construction of conveyor-to- surface works continued with civil scope of works completed and other contractors mobilised to site. Study work for Panels 1 and 2, which are required to support the ramp-up to 95,000 tonnes of ore per day, remains on track to be completed in the first half of 2023. It will incorporate any ventilation impacts due to the shaft 3 and 4 delays as a result of COVID-19 restrictions and reprioritisation of the mobilised workforce over the course of 2022. On 16 December, we completed the acquisition of Turquoise Hill Resources Ltd (TRQ) for consideration of approximately $3.1 billion6, simplifying ownership of the Oyu Tolgoi mine, significantly strengthening our copper portfolio, and demonstrating our long-term commitment to the project and Mongolia. We now hold a 66% direct interest with the remaining 34% owned by the Government of Mongolia through Erdenes Oyu Tolgoi. This is allowing us to focus fully on strengthening our relationship with the Government of Mongolia and moving the project forward with a simpler and more efficient ownership and governance structure. For more information about our capital projects and future growth options, see pages 32-33. Copper Year ended 31 December 2022 2021 Change Mined copper production (‘000 tonnes – Rio Tinto share) 521.1 493.5 6% Refined copper production (‘000 tonnes – Rio Tinto share) 209.2 201.9 4% Segmental revenue (US$ millions) 6,699 7,827 (14)% Average realised copper price (US cents per pound)1 403 424 (5)% Underlying EBITDA (US$ millions) 2,376 3,969 (40)% Underlying EBITDA margin (product group operations) 49% 59% Underlying earnings (US$ millions) 521 1,579 (67)% Net cash generated from operating activities (US$ millions)2 1,374 2,634 (48)% Capital expenditure – excluding EAUs3 (US$ millions) (1,622) (1,328) 22% Free cash flow (US$ millions) (265) 1,295 (120)% Underlying return on capital employed (product group operations)4 6% 14% 1. Average realised price for all units sold. Realised price does not include the impact of the provisional pricing adjustments, which negatively impacted revenues by $175 million (2021: $246 million benefit). 2. Net cash generated from operating activities excludes the operating cash flows of equity accounted units (EAUs) but includes dividends from EAUs (Escondida). 3. Capital expenditure is the net cash outflow on purchases less sales of property, plant and equipment, capitalised evaluation costs and purchases less sales of other intangible assets. It excludes EAUs. 4. Underlying return on capital employed (ROCE) is defined as underlying earnings (product group operations) excluding net interest divided by average capital employed. 5. A cost and schedule reforecast was performed in June 2022 and estimates that $7.06 billion is required to complete the Hugo North 1 project (an increase of $0.3 billion beyond the 2020 Definitive Estimate). The 2022 Reforecast excludes impacts of COVID-19 restrictions arising after June 2022. The 2022 reforecast remains subject to Oyu Tolgoi Board approval. 6. Total consideration of $3,139 million for the minority interest in TRQ excludes transaction costs of $74 million. In 2022, we paid $2,928 million to shareholders and $33 million of transaction costs. In 2023, we expect to pay the remaining $41 million of transaction costs and approximately $211 million to dissenting shareholders, depending on the outcome and timing of dissent proceedings.
Annual Report on Form 20-F 2022 | riotinto.com42 Enabling the low-carbon transition In 2022, our Minerals product group’s absolute greenhouse emissions were 4.0Mt CO2e, an increase of approximately 12.5% from 2021 levels1. The increase in emissions was mainly driven by Richards Bay Minerals (RBM) operating continuously in 2022 as opposed to reduced production in 2021. In 2022, we also advanced several key strategic decarbonisation projects. For example, we signed a 130MW solar power purchase agreement with Voltalia at RBM in South Africa, which would eventually deliver abatement of more than 200kt CO2/year in 2025. We have also partnered with the Government of Canada in support of technological innovations at our Rio Tinto Iron and Titanium Quebec Operations in Sorel-Tracy, such as the BlueSmeltingTM project, a new ilmenite smelting technology that, if fully implemented, has the potential to deliver a reduction of up to 70% in the site’s overall greenhouse gas emissions. For more information about our decarbonisation efforts in the Minerals product group, see our 2022 Climate Change Report at riotinto.com/climatereport. Minerals Our Minerals portfolio includes a global suite of businesses producing materials essential to a low-carbon future and projects well-positioned to meet the growing demand for electric vehicles. We produce high-grade, low-impurity iron ore pellets and concentrate, titanium dioxide, diamonds and borates from our operations in Canada, Madagascar, South Africa and the US. 1. Our baseline emissions have been adjusted to reflect the increase in Rio Tinto’s ownership interest of Diavik Diamond Mine from 60% to 100% in November 2021. Snapshot of the year 0.38 AIFR (2021: 0.38) 40% Underlying EBITDA margin (product group operations) (2021: 43%) $2.4bn Underlying EBITDA (2021: $2.6bn) $6.8bn Segmental revenue (2021: $6.5bn) $0.7bn Capital expenditure (2021: $0.6bn) $1.5bn Net cash generated from operating activities (2021: $1.4bn) 4.0Mt Scope 1 and 2 GHG emissions (equity Mt CO2e) (2021: 3.5Mt) 9,000 Employee numbers (2021: 9,000) Safety For the fourth consecutive year, we recorded zero fatalities. In 2022, we saw an increase in the number of potentially fatal incidents (PFIs) with 19 this year, compared to 16 in 2021. The rate of injuries remained the same, with our all-injury frequency rate (AIFR) at 0.38. However, we ended 2022 with a significant increase in the AIFR of our contractor workforce, going from 0.22 in 2021 to 0.42 in 2022. In 2023, we will continue our improvement journey, enabled by the safety maturity model, including health and environment, to achieve our objectives of creating a safe and productive workplace for our employees and contractor partners. For more information about our global health and safety initiatives, see pages 57-58.
43Annual Report on Form 20-F 2022 | riotinto.com Strategic report “We’re working hard in the critical minerals space. For example, we’re extracting high purity scandium oxide from the waste streams of titanium dioxide production, and we continue to invest in research and development and form key partnerships with experts from industry, academia and government.” Sinead Kaufman Chief Executive, Minerals Read the full interview with Sinead on our website. Financial performance In 2022, we benefited from strong market conditions for titanium dioxide pigment and borates, partially offset by a weaker market for iron ore pellets and concentrate, albeit off record levels. We also saw higher diamond prices compared with 2021, following a pandemic-related build up of demand and low inventory levels. Underlying EBITDA of $2.4 billion was 7% lower than 2021, primarily due to inflationary pressures, energy price increases and Rincon evaluation costs. This was partially offset by prices and higher EBITDA in relation to the increased ownership in Diavik. Net cash generated from operating activities of $1.5 billion was 6% higher than 2021, while free cash flow of $0.8 billion was 7% higher, reflecting a higher EBITDA cash conversion supported by lower dividends paid to holders of non-controlling interests at Iron Ore Company of Canada. Review of operations Production of iron ore pellets and concentrate at IOC was 6% higher than 2021 due to the successful deployment of the Safe Production System (SPS) at the concentrator, which was completed in the year. Record performance metrics were achieved in the year, including monthly records for concentrate production and total material moved in the second quarter. Planning for SPS deployment at the pellet plant commenced in December. Titanium dioxide production of 1.2 million tonnes was 18% higher than 2021 due to community disruptions at Richards Bay Minerals (RBM) in South Africa in 2021, and continued improved performance of operations at Rio Tinto Iron and Titanium Quebec Operations, Canada. Nationwide loadshedding of electrical power caused production constraints at RBM in late 2022. Borates production was 9% higher than 2021, with strong production rates, higher grades and improved equipment reliability. Our share of carats recovered was 21% higher than 2021, from our increased share of production since taking 100% ownership of Diavik in November 2021, partly offset by lower carats recovered due to lower grades. For more information about our capital projects and future growth options, see pages 32-33. Lithium, a material for the future The Rincon Lithium Project – a large, undeveloped lithium-brine project located in the heart of the “lithium triangle” in Argentina – will be a valuable source of rapidly produced, high-quality lithium for the global energy transition. A long-life, scalable resource capable of producing battery-grade lithium carbonate from raw brine, the project will help us deliver this vital resource to the global energy industry while meeting our commitment to decarbonise our operations by 2050. With the Rincon acquisition completed in early 2022, we are now developing a three thousand tonne per annum lithium carbonate starter plant. To optimise the process and recoveries, we also continue to produce battery-grade lithium carbonate from raw brine from the existing pilot plant operating at site. We are now advancing detailed studies for the full scale of operation and progressing exploration activities to further understand Rincon’s basin and brine reservoir. We continue to engage with communities, the province of Salta and the Government of Argentina to ensure an open and transparent dialogue with stakeholders about the works underway. Minerals Year ended 31 December 2022 2021 Change Iron ore pellets and concentrates production1 (million tonnes – Rio Tinto share) 10.3 9.7 6% Titanium dioxide slag production (‘000 tonnes – Rio Tinto share) 1,200 1,014 18% Borates production (‘000 tonnes – Rio Tinto share) 532 488 9% Diamonds production (‘000 carats – Rio Tinto share)2 4,651 3,847 21% Segmental revenue (US$ millions) 6,754 6,481 4% Underlying EBITDA (US$ millions) 2,419 2,603 (7)% Underlying EBITDA margin (product group operations) 40% 43% Underlying earnings (US$ millions) 849 888 (4)% Net cash generated from operating activities (US$ millions) 1,522 1,433 6% Capital expenditure (US$ millions)3 (679) (644) 5% Free cash flow (US$ millions) 814 762 7% Underlying return on capital employed (product group operations)4 22% 21% 1. Iron Ore Company of Canada (IOC) continues to be reported within Minerals. 2. On 17 November 2021, Rio Tinto’s interest in Diavik increased from 60% to 100%. Production and financials reflect this from 1 November 2021. 3. Capital expenditure is the net cash outflow on purchases less sales of property, plant and equipment; capitalised evaluation costs; and purchases less sales of other intangible assets. 4. Underlying return on capital employed (ROCE) is defined as underlying earnings (product group operations) excluding net interest divided by average capital employed.
Annual Report on Form 20-F 2022 | riotinto.com44 Commercial Our Commercial team includes global sales and marketing, procurement, and marine and logistics operations. We are the primary interface with markets, customers and suppliers – local, regional and global – through a network of over 20,000 active suppliers and almost 2,000 customers. As the key interface to the market, our Commercial team works very closely with our customers and suppliers. We generate insights and opportunities to unlock the full commercial potential across our value chains, always striving to find better ways to provide the materials the world needs. Finding solutions to shipping’s global carbon emissions Maritime shipping is responsible for around one billion tonnes of CO2 emissions every year, accounting for nearly 3% of global carbon emissions. As the largest shipper by tonnage in the world, we have a role to play. We are actively exploring partnerships to achieve our commitment to have net zero vessels in our portfolio by 2030, while taking actions to reduce emissions through efficiency initiatives and alternative fuels. For more information visit www.riotinto.com/news/stories/decarbonising-the-high-seas. consumers can see how products were made from the mine to their hands and make more informed choices on what they buy. – Signing a separate MoU with both Shougang Group and Salzgitter Flachstahl, and continuing significant partnerships with Nippon Steel Corporation, BlueScope, and Baowu to develop low-carbon solutions for the steel value chain. We have also successfully proven the effectiveness of BioIronTM, a low-carbon iron-making process using raw sustainable biomass and microwaves. Supplier partnerships In the areas where we operate, we work hard to partner with and develop local businesses so they can share in our success. In 2022, we increased our spend with Indigenous suppliers in Australia by 40% from 2021 to A$565 million. We also actively seek partnerships with our suppliers to reduce our own emissions. In 2022, we have: – Continued our partnership with Scania to develop smaller and more agile autonomous haul trucks. In April 2022, we launched new trials on Scania’s 40-tonne-payload autonomous mining trucks and quickly reached a key milestone of driverless operation in a simulated load and haul cycle environment. These trucks will require less energy and have a smaller infrastructure footprint. – Signed an MoU with Volvo Group to work towards decarbonising our operations through piloting Volvo’s sustainable autonomous hauling solutions. – Joined the First Movers Coalition, a global initiative to help commercialise zero-carbon technologies by harnessing purchasing power and supply chains. For more information about our decarbonisation initiatives, see our 2022 Climate Change Report at riotinto.com/climatereport. Safety and wellbeing In 2022, we recorded zero fatalities and a 0.14 all-injury frequency rate (AIFR), compared to 0.07 for 2021. As we continue to navigate COVID-19 impacts, we have maintained our strong focus on critical risk management and prevention programmes across areas of greatest exposure. We continue to work on our safety performance within our maritime fleet of 17 owned, and more than 230 contracted, vessels. Although we had no fatalities on our managed operations in 2022, tragically, there was a fatality on one of the non-managed marine vessels and, in a separate incident, another mariner suffered a permanent disabling injury. We are determined to improve maritime safety for our industry and we are working closely with our shipping partners, industry associations and other mining companies. Customer partnerships In our mission to find better ways to provide the materials the world needs, we partner with customers to work towards our shared goal of enabling the world’s transition to a low-carbon future. In 2022, some initiatives included: – Signing a separate memorandum of understanding (MoU) with both the Ford Motor Company and Volvo Group, each of which leverages our advantage as a one-stop multi-commodity supplier for sustainable products and solutions in the low-carbon transition. Ford will also explore becoming the foundational customer for our Rincon Lithium Project in Argentina to support its production of electric vehicles. – Strengthening our low-carbon product offering with aluminium produced by ELYSISTM emissions-free smelting technology, used by Apple (in their iPhone SE), and Corona Canada (in Canada’s first specially marked, low-carbon aluminium cans). – Leveraging STARTTM, our blockchain technology, to provide over 110 customers with 14 key ESG metrics. Via a QR code, Snapshot of the year $55.6 billion Group consolidated sales revenue (2021: $63.5bn) 2,600 sea voyages 2,100 contracts under management (2021: 2,100) $20.7 billion in contestable spend globally (2021: $17.9bn) 106,000 shipments by rail, truck and containers A$565 million spent with Indigenous suppliers in Australia, an increase of 40% from 2021 (2021: A$400m) 42% increase in spend with Chinese suppliers from 2021 (2021: 44%)
45Annual Report on Form 20-F 2022 | riotinto.com Strategic report Combined shipments from major producers were effectively unchanged year-on-year in 2022, but remained below the volume delivered in 2018. Meanwhile, a combination of price-related and other external factors reduced overall seaborne supply. These included small-scale, high-cost producers who discontinued operations when prices declined below break-even points; supply disruptions due to the war in Ukraine; and India’s decision to impose export tariffs on iron ore. Despite the introduction of a range of supportive policies and growth targets, China’s domestic iron ore production also declined year-on-year in 2022 following a number of safety accidents and the imposition of operating restrictions. Aluminium The aluminium price rose in the first quarter of 2022 to a multi-year high, on expectations of stronger demand outlook and Russian aluminium supply cuts, both of which eventually did not materialise. The price then fell to its low point in the third quarter as fears of a global economic slowdown set in, and Chinese aluminium production rose on restarts and commissioning of new capacity. Chinese aluminium domestic demand also weakened due to COVID-19 restrictions, especially in the building and construction sector. However, the aluminium price stabilised in the fourth quarter as a result of a high level of smelter curtailments in Europe given high energy costs, and curtailments in Southern China given drought conditions and low hydropower levels. Global aluminium inventories remained low and the market deficit provided support to the aluminium price. Elevated carbon raw material and energy prices resulted in the industry facing a significant margin squeeze in the second half of 2022. Copper After a record quarterly average price was reached in the first quarter of 2022, copper prices trended down from late April, as a wave of uncertainty surrounding the global economy and China’s COVID-zero policy weighed on the prospects for copper demand. The average price in the third quarter was the lowest quarterly average since the fourth quarter of 2020. Global visible copper cathode inventories fell to multi-year lows, providing support to prices. Mine supply growth, while remaining positive, stalled in 2022 due to issues such as water availability, geological and geotechnical challenges, and slower project ramp-ups contributing to a higher level of disruptions to production. Mine supply growth is expected to return over the 2023 to 2024 period, as committed projects get underway after earlier delays. “Commercial is the key interface between our assets and the markets, our customers and suppliers. Our mission is to generate insights and opportunities to unlock Rio Tinto’s full commercial potential across our value chains and future growth opportunities. We will always strive to find better ways to serve our customers and provide the materials the world needs.” Alf Barrios Chief Commercial Officer Read the full interview with Alf on our website. Marine and logistics To deliver our climate commitments on shipping, we are focusing on improving fuel efficiency, increasing the use of transitional fuels and partnering to develop end-state fuels. In 2021, we committed to reduce our CO2 emissions intensity in shipping by 40% by 2025, five years ahead of the International Maritime Organisation (IMO) deadline. To date, we have achieved a 30% intensity reduction in conventional fuel use from an IMO 2008 baseline through operational and technical measures such as weather routing, schedule optimisation and vessel modifications. We have a year-long biofuel trial underway and we recently received the first of nine dual-fuelled liquified natural gas-powered vessels that we are introducing into our fleet. We continue to support new technologies and industry collaborations that will contribute to the industry’s low-carbon transition, including through our strategic partnerships with the Maersk Mc-Kinney Moller Center for Zero Carbon Shipping and the Global Maritime Forum. For more information about our shipping decarbonisation efforts, see our 2022 Climate Change Report at riotinto.com/climatereport. Commercial insight and outlook Economic growth and commodity demand started positively in 2022 as the world continued its recovery from the pandemic downturn. However, the large supply shock brought about by the war in Ukraine led to energy security concerns and exacerbated inflationary pressures, while a resurgence of COVID-19 lockdowns and outbreak in China affected business activities and consumer confidence. High inflation prompted many countries, led by the US, to aggressively tighten monetary policy to re-establish price stability. These risks are carried over to 2023, and the global economy is expected to slow further. China’s economic recovery from COVID-19 remains volatile, while the Chinese Government provides support to stabilise the economy, especially in the infrastructure and real estate sectors. Iron ore Following three consecutive years of growth to a 2021 all-time high, iron ore demand simultaneously contracted in China and the rest of the world for the first time since the beginning of the COVID-19 pandemic. The Chinese property market slump continued to worsen, while extended COVID-19 restrictions impacted China’s steel demand, exerting downward pressure on prices. There were also headwinds to ex-China iron ore demand, which was negatively impacted by sharply higher energy and raw materials costs to steel producers. Iron ore prices were more resilient and market fundamentals tighter than consensus expectations because the demand weakness was offset, and at times outweighed, by even lower supply. Minerals There was low demand growth for titanium dioxide (TiO2) pigment in 2022 as weakness in China and the EU was only partially offset by growth in North America. Nevertheless, prices were supported by tight global high-grade supply. Inventories remained low in 2022 but are expected to grow in 2023. Structural factors relating to orebody depletion remain favourable for high-grade TiO2 feedstock and zircon markets. Lithium prices remained elevated on strong demand. The electric vehicle market continues to experience strong growth, supported by government policies. There was strong buying activity for borates in 2022 due to persistent supply tightness, resulting in prices closing the year at a decade high. In diamonds, prices started 2022 with strong growth but have cooled amid weakening demand. Global diamond supply remains stable, which is resulting in some inventory accumulation through the supply chain.
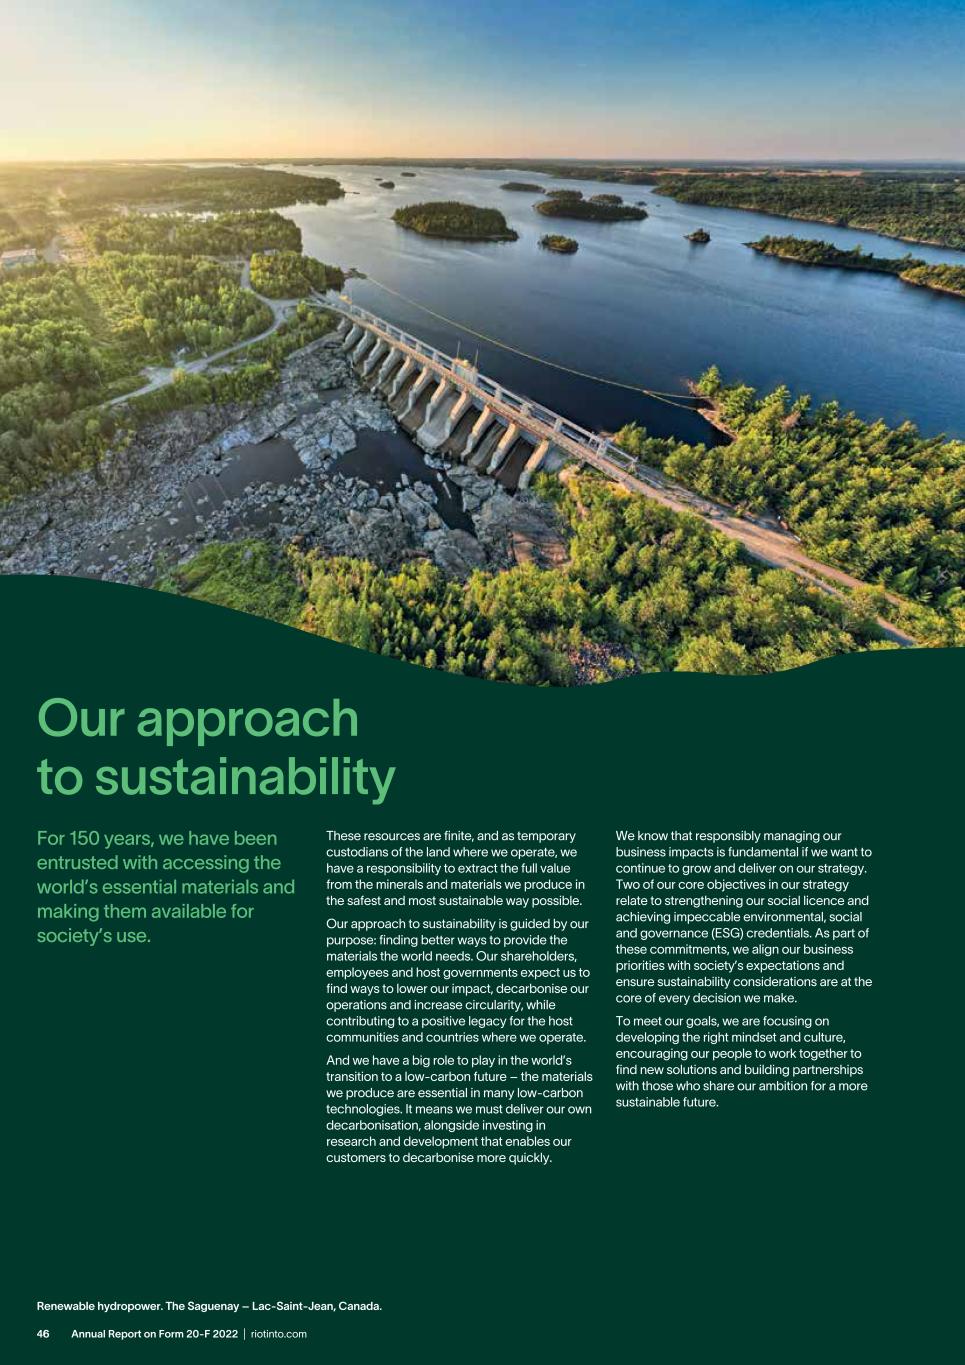
Annual Report on Form 20-F 2022 | riotinto.com46 Our approach to sustainability For 150 years, we have been entrusted with accessing the world’s essential materials and making them available for society’s use. These resources are finite, and as temporary custodians of the land where we operate, we have a responsibility to extract the full value from the minerals and materials we produce in the safest and most sustainable way possible. Our approach to sustainability is guided by our purpose: finding better ways to provide the materials the world needs. Our shareholders, employees and host governments expect us to find ways to lower our impact, decarbonise our operations and increase circularity, while contributing to a positive legacy for the host communities and countries where we operate. And we have a big role to play in the world’s transition to a low-carbon future – the materials we produce are essential in many low-carbon technologies. It means we must deliver our own decarbonisation, alongside investing in research and development that enables our customers to decarbonise more quickly. We know that responsibly managing our business impacts is fundamental if we want to continue to grow and deliver on our strategy. Two of our core objectives in our strategy relate to strengthening our social licence and achieving impeccable environmental, social and governance (ESG) credentials. As part of these commitments, we align our business priorities with society’s expectations and ensure sustainability considerations are at the core of every decision we make. To meet our goals, we are focusing on developing the right mindset and culture, encouraging our people to work together to find new solutions and building partnerships with those who share our ambition for a more sustainable future. Renewable hydropower. The Saguenay – Lac-Saint-Jean, Canada.
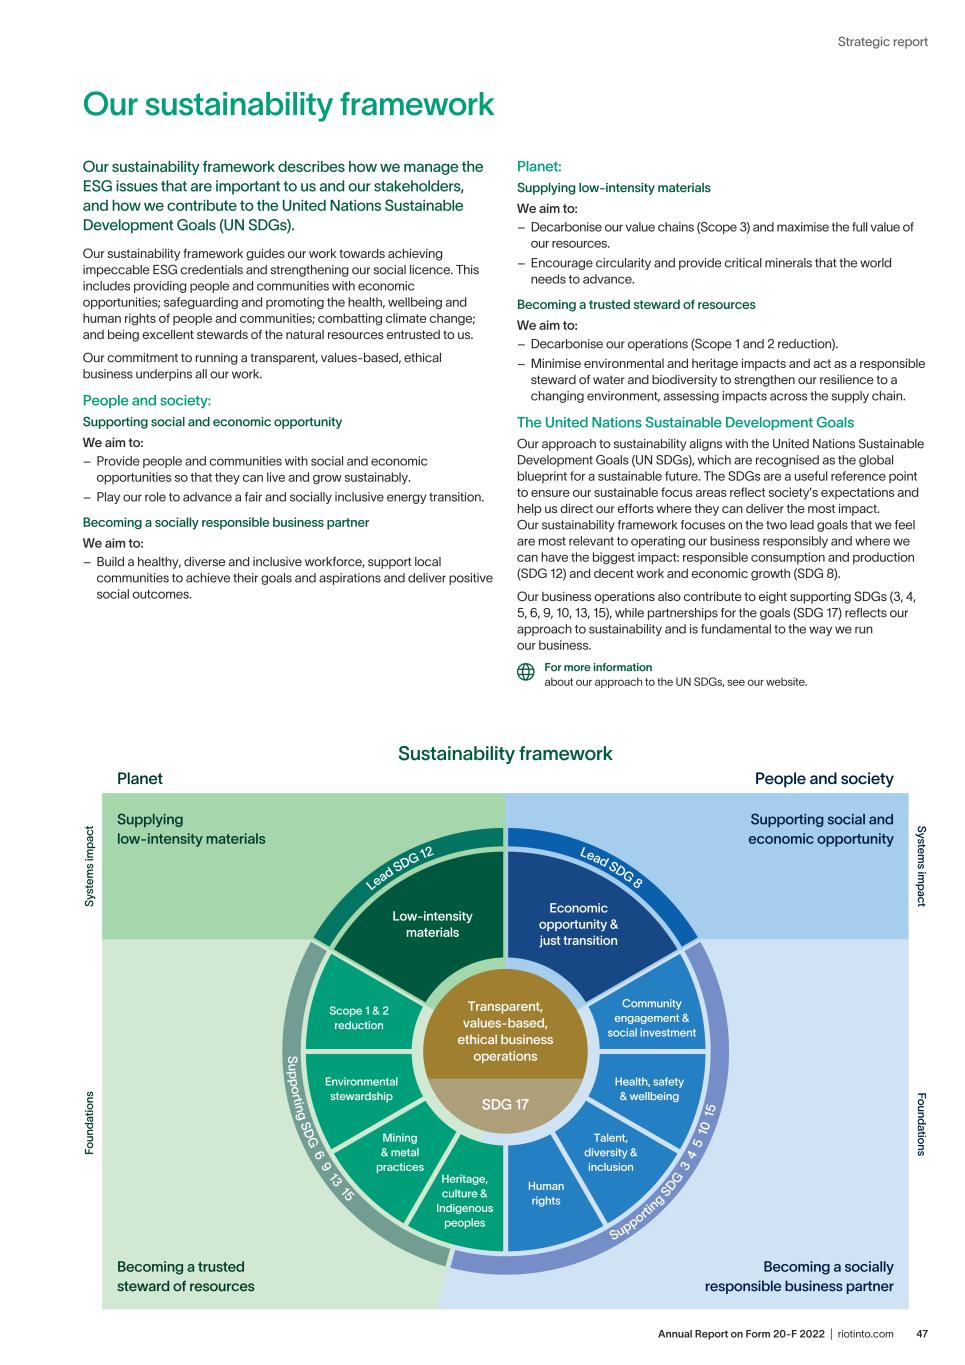
47Annual Report on Form 20-F 2022 | riotinto.com Strategic report Low-intensity materials Economic opportunity & just transition Scope 1 & 2 reduction Community engagement & social investment Environmental stewardship Health, safety & wellbeing Mining & metal practices Talent, diversity & inclusion Heritage, culture & Indigenous peoples Human rights Transparent, values-based, ethical business operations SDG 17 Supportin g SDG 3 4 5 1 0 15 Lead SDG 12 Lead SDG 8 Supporting SD G 6 9 13 15 Sy st em s im pa ct Fo un da tio ns Sustainability framework Planet People and society System s im pact Foundations Becoming a trusted steward of resources Supplying low-intensity materials Supporting social and economic opportunity Becoming a socially responsible business partner Our sustainability framework Our sustainability framework describes how we manage the ESG issues that are important to us and our stakeholders, and how we contribute to the United Nations Sustainable Development Goals (UN SDGs). Our sustainability framework guides our work towards achieving impeccable ESG credentials and strengthening our social licence. This includes providing people and communities with economic opportunities; safeguarding and promoting the health, wellbeing and human rights of people and communities; combatting climate change; and being excellent stewards of the natural resources entrusted to us. Our commitment to running a transparent, values-based, ethical business underpins all our work. People and society: Supporting social and economic opportunity We aim to: – Provide people and communities with social and economic opportunities so that they can live and grow sustainably. – Play our role to advance a fair and socially inclusive energy transition. Becoming a socially responsible business partner We aim to: – Build a healthy, diverse and inclusive workforce, support local communities to achieve their goals and aspirations and deliver positive social outcomes. Planet: Supplying low-intensity materials We aim to: – Decarbonise our value chains (Scope 3) and maximise the full value of our resources. – Encourage circularity and provide critical minerals that the world needs to advance. Becoming a trusted steward of resources We aim to: – Decarbonise our operations (Scope 1 and 2 reduction). – Minimise environmental and heritage impacts and act as a responsible steward of water and biodiversity to strengthen our resilience to a changing environment, assessing impacts across the supply chain. The United Nations Sustainable Development Goals Our approach to sustainability aligns with the United Nations Sustainable Development Goals (UN SDGs), which are recognised as the global blueprint for a sustainable future. The SDGs are a useful reference point to ensure our sustainable focus areas reflect society’s expectations and help us direct our efforts where they can deliver the most impact. Our sustainability framework focuses on the two lead goals that we feel are most relevant to operating our business responsibly and where we can have the biggest impact: responsible consumption and production (SDG 12) and decent work and economic growth (SDG 8). Our business operations also contribute to eight supporting SDGs (3, 4, 5, 6, 9, 10, 13, 15), while partnerships for the goals (SDG 17) reflects our approach to sustainability and is fundamental to the way we run our business. For more information about our approach to the UN SDGs, see our website.
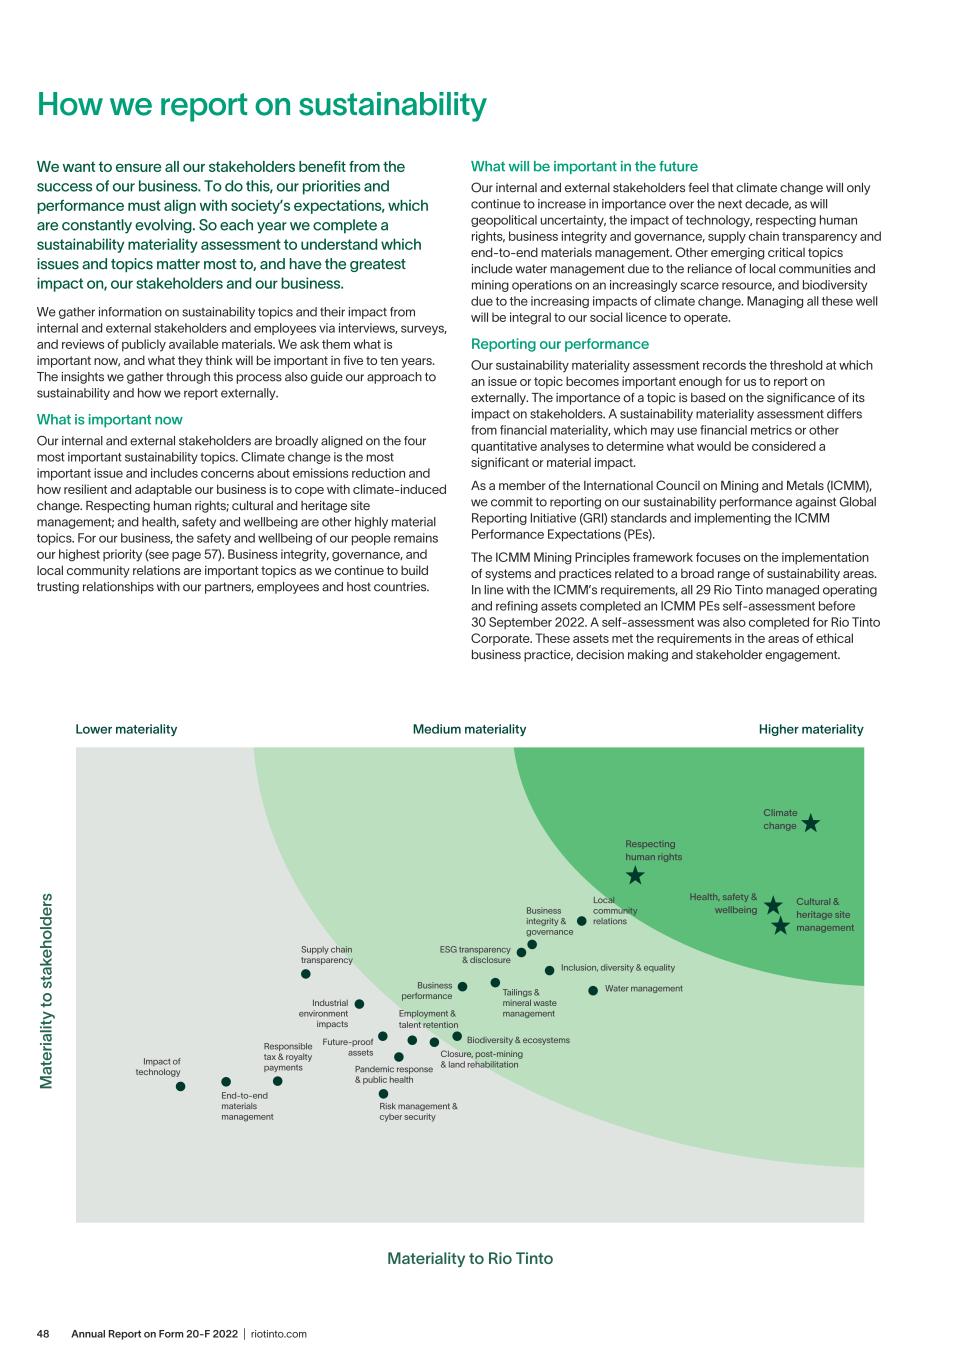
Annual Report on Form 20-F 2022 | riotinto.com48 Materiality to Rio Tinto M at er ia lit y to s ta ke ho ld er s Lower materiality Medium materiality Higher materiality Respecting human rights Climate change Cultural & heritage site management Health, safety & wellbeing Inclusion, diversity & equality ESG transparency & disclosure Water management Business Business performance integrity & governance Local community relations Tailings & mineral waste management Biodiversity & ecosystems Closure, post-mining & land rehabilitationPandemic response & public health Employment & talent retention Supply chain transparency Impact of technology End-to-end materials management Responsible tax & royalty payments Risk management & cyber security Future-proof assets Industrial environment impacts How we report on sustainability We want to ensure all our stakeholders benefit from the success of our business. To do this, our priorities and performance must align with society’s expectations, which are constantly evolving. So each year we complete a sustainability materiality assessment to understand which issues and topics matter most to, and have the greatest impact on, our stakeholders and our business. We gather information on sustainability topics and their impact from internal and external stakeholders and employees via interviews, surveys, and reviews of publicly available materials. We ask them what is important now, and what they think will be important in five to ten years. The insights we gather through this process also guide our approach to sustainability and how we report externally. What is important now Our internal and external stakeholders are broadly aligned on the four most important sustainability topics. Climate change is the most important issue and includes concerns about emissions reduction and how resilient and adaptable our business is to cope with climate-induced change. Respecting human rights; cultural and heritage site management; and health, safety and wellbeing are other highly material topics. For our business, the safety and wellbeing of our people remains our highest priority (see page 57). Business integrity, governance, and local community relations are important topics as we continue to build trusting relationships with our partners, employees and host countries. What will be important in the future Our internal and external stakeholders feel that climate change will only continue to increase in importance over the next decade, as will geopolitical uncertainty, the impact of technology, respecting human rights, business integrity and governance, supply chain transparency and end-to-end materials management. Other emerging critical topics include water management due to the reliance of local communities and mining operations on an increasingly scarce resource, and biodiversity due to the increasing impacts of climate change. Managing all these well will be integral to our social licence to operate. Reporting our performance Our sustainability materiality assessment records the threshold at which an issue or topic becomes important enough for us to report on externally. The importance of a topic is based on the significance of its impact on stakeholders. A sustainability materiality assessment differs from financial materiality, which may use financial metrics or other quantitative analyses to determine what would be considered a significant or material impact. As a member of the International Council on Mining and Metals (ICMM), we commit to reporting on our sustainability performance against Global Reporting Initiative (GRI) standards and implementing the ICMM Performance Expectations (PEs). The ICMM Mining Principles framework focuses on the implementation of systems and practices related to a broad range of sustainability areas. In line with the ICMM’s requirements, all 29 Rio Tinto managed operating and refining assets completed an ICMM PEs self-assessment before 30 September 2022. A self-assessment was also completed for Rio Tinto Corporate. These assets met the requirements in the areas of ethical business practice, decision making and stakeholder engagement.
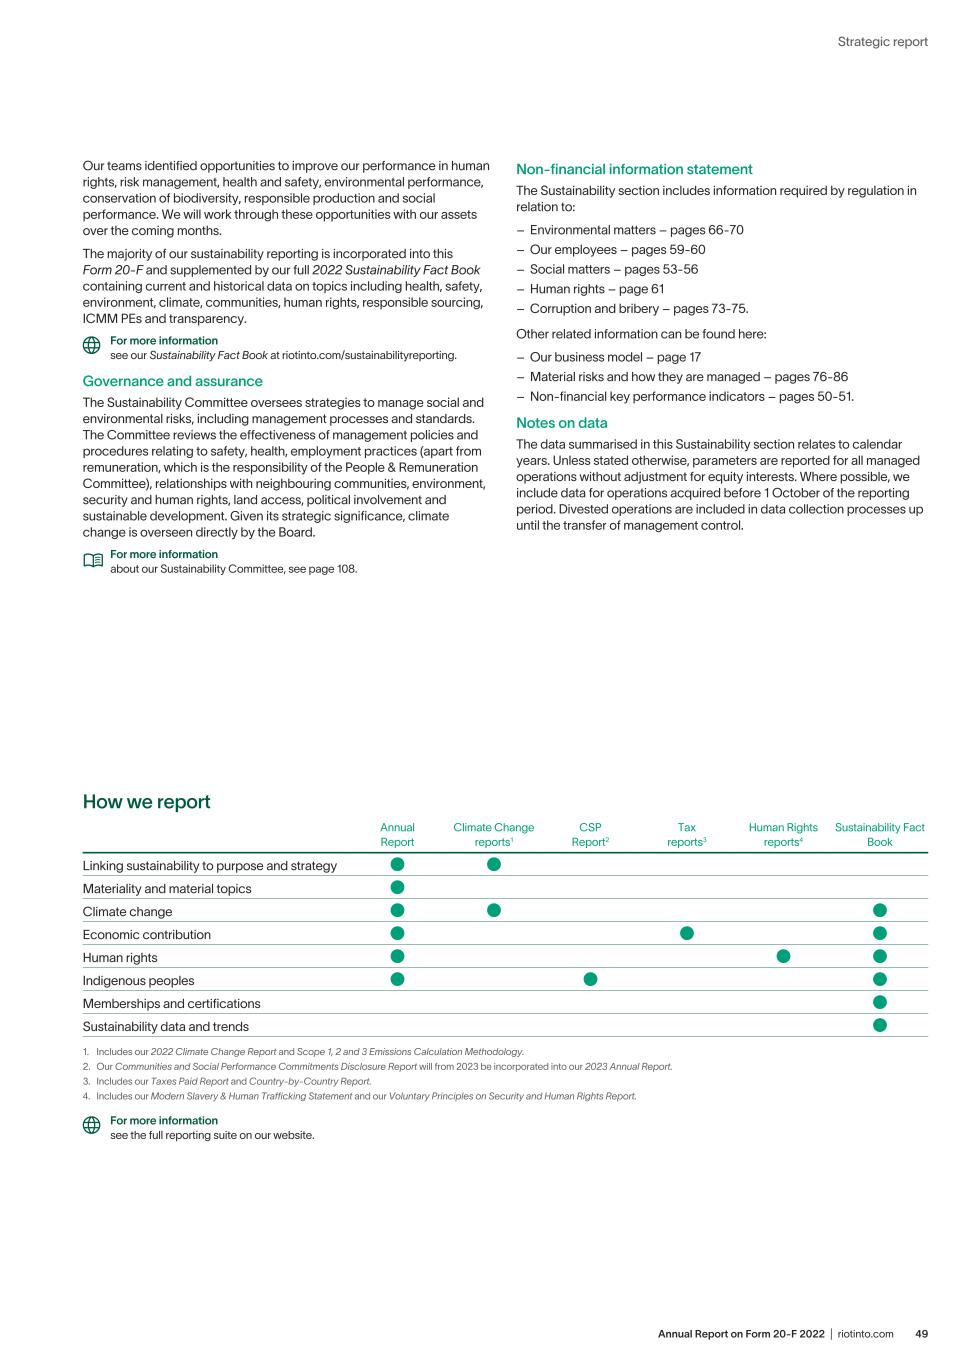
49Annual Report on Form 20-F 2022 | riotinto.com Strategic report How we report Annual Report Climate Change reports1 CSP Report2 Tax reports3 Human Rights reports4 Sustainability Fact Book Linking sustainability to purpose and strategy Materiality and material topics Climate change Economic contribution Human rights Indigenous peoples Memberships and certifications Sustainability data and trends 1. Includes our 2022 Climate Change Report and Scope 1, 2 and 3 Emissions Calculation Methodology. 2. Our Communities and Social Performance Commitments Disclosure Report will from 2023 be incorporated into our 2023 Annual Report. 3. Includes our Taxes Paid Report and Country-by-Country Report. 4. Includes our Modern Slavery & Human Trafficking Statement and our Voluntary Principles on Security and Human Rights Report. For more information see the full reporting suite on our website. Our teams identified opportunities to improve our performance in human rights, risk management, health and safety, environmental performance, conservation of biodiversity, responsible production and social performance. We will work through these opportunities with our assets over the coming months. The majority of our sustainability reporting is incorporated into this Form 20-F and supplemented by our full 2022 Sustainability Fact Book containing current and historical data on topics including health, safety, environment, climate, communities, human rights, responsible sourcing, ICMM PEs and transparency. For more information see our Sustainability Fact Book at riotinto.com/sustainabilityreporting. Governance and assurance The Sustainability Committee oversees strategies to manage social and environmental risks, including management processes and standards. The Committee reviews the effectiveness of management policies and procedures relating to safety, health, employment practices (apart from remuneration, which is the responsibility of the People & Remuneration Committee), relationships with neighbouring communities, environment, security and human rights, land access, political involvement and sustainable development. Given its strategic significance, climate change is overseen directly by the Board. For more information about our Sustainability Committee, see page 108. Non-financial information statement The Sustainability section includes information required by regulation in relation to: – Environmental matters – pages 66-70 – Our employees – pages 59-60 – Social matters – pages 53-56 – Human rights – page 61 – Corruption and bribery – pages 73-75. Other related information can be found here: – Our business model – page 17 – Material risks and how they are managed – pages 76-86 – Non-financial key performance indicators – pages 50-51. Notes on data The data summarised in this Sustainability section relates to calendar years. Unless stated otherwise, parameters are reported for all managed operations without adjustment for equity interests. Where possible, we include data for operations acquired before 1 October of the reporting period. Divested operations are included in data collection processes up until the transfer of management control.
Annual Report on Form 20-F 2022 | riotinto.com50 Supplying low-intensity materials Key achievements Becoming a trusted steward of resources 7% reduction in Scope 1 and 2 greenhouse gas emissions below our 2018 baseline. (2021: 4.3%) 5 of the 7 water stewardship targets remain on track for attainment in 2023. For more information about individual water target performance in 2022, see pages 67-68. (2021: 5 of 7) 8 submissions from technology innovators selected to progress beyond the Charge on Innovation Challenge. 40-tonne-payload agile autonomous haul trucks trialled with Scania at our mine in Western Australia’s Pilbara region, offering potential environmental and productivity benefits. 522km2 cumulative land rehabilitated to end of 2022, mostly at our bauxite mines in Australia, mineral sands mines in South Africa and Madagascar, and at our iron ore mines and exploration areas in the Pilbara, Western Australia. (2021: 494km2) $4 million to explore new approaches in carbon mineralisation technology as a way to safely and permanently store carbon as rock. 2022 sustainability targets and key achievements Supporting SDGsLead SDGs Supporting SDGsLead SDGs $537 million (C$737 million) to be invested over eight years to decarbonise our Rio Tinto Iron and Titanium (RTIT) Quebec Operations in partnership with the Government of Canada. $29 million invested in constructing an aluminium recycling facility at our Arvida Plant in Saguenay–Lac-Saint-Jean, Quebec, Canada to expand our offering of low-carbon aluminium solutions. One-year biofuel trial in partnership with BP to reduce carbon emissions from our marine fleet. First production of spodumene concentrate, a mineral used in the production of lithium for batteries, at a demonstration plant in our RTIT Quebec Operations in Canada. 1.2 million low-carbon beverage cans produced as part of our partnership with Corona Canada. The cans were made using our aluminium leveraging ELYSISTM technology. Around 20 tonnes of tellurium can now be produced every year at Kennecott in Utah, US. Tellurium is a critical mineral used in advanced thin film photovoltaic solar panels. Key achievements Target To achieve net zero emissions from our operations (Scope 1 and 2) by 2050. Targets To reduce our absolute Scope 1 and 2 greenhouse gas emissions by 15% by 2025 and by 50% by 2030. To achieve local water stewardship targets for selected sites by 2023.
51Annual Report on Form 20-F 2022 | riotinto.com Strategic report Key achievements Key achievements Supporting social and economic opportunity Becoming a socially responsible business partner $2.7 billion spent with local1 suppliers, which represents 14.5% of total contestable spend. Zero fatalities at managed operations. (2021: 0 fatalities) 0.40 all-injury frequency rate (AIFR). (2021: 0.40) 1.37 million critical risk management (CRM) verifications. (2021: 1.31 million) $188 million spent with Indigenous suppliers in Canada. 2.8% increase in the rate of new occupational illnesses since 2021. 9 assets achieved an exposure reduction to known health risks (airborne contaminants and noise). (2021: 13 assets) $25.5 million invested through the Rio Tinto COVID-19 Fund between 2020 and 2022 to support global grass-roots, community COVID-19 preparedness and recovery programmes. 22.9% of our workforce are women, up 1.4% from 20212. 25% of executive leaders are women, same as 2021. 28.3% of senior leadership are women, up 0.9% from 2021. 30% of Board roles are held by women, down 6.4% from 2021. $62.6 million contributed to community programmes across a wide range of social and economic categories. (2021: $72.1 million) 2-point increase in our employee satisfaction score (eSAT) since 2021 (from 71 to 73). (2021: 2-point decrease) 6 formal agreements signed with Indigenous rights holders across our global footprint. 53% of our graduate intake are women, down 5% from 2021. 36% of our graduates were from places where we are developing new businesses, up 1% from 2021. 48% increase in Australian Indigenous leaders. (2021: 31 leaders; 2022: 46 leaders) Lead SDGs Supporting SDGs Supporting SDGsLead SDGs Target To increase contestable spend sourced from suppliers local to our operations year-on-year. Targets To reach zero fatalities and to eliminate workplace injuries and catastrophic events. All-injury frequency rate target: 0.38 To have all of our businesses identify at least one critical health hazard material to their business, and demonstrate a year-on-year reduction of exposure to that hazard. To reduce the rate of new occupational illnesses each year. To improve diversity in our business by: – Increasing women in the business (including in senior leadership) by 2% each year. – Aiming for 50% women in our graduate intake. – Aiming for 30% of our graduate intake to be from places where we are developing new businesses. To improve our employee engagement and satisfaction. 1. We take a “site-centric” view of the definition of local, which allows operations to establish their own definition, based on a set of common principles. These principles require that each operation, in defining “local” takes into consideration its geographic, social and economic area of impact as well as ownership. For example, suppliers located within the Pilbara Region of Western Australia are defined as “local” for Rio Tinto Iron Ore’s Pilbara Operations. This approach is consistent with international best practice and aligns with the ICMM Social and Economic Reporting Framework guidance. 2. Women % increase is 1.37% rounded to 1.4%.
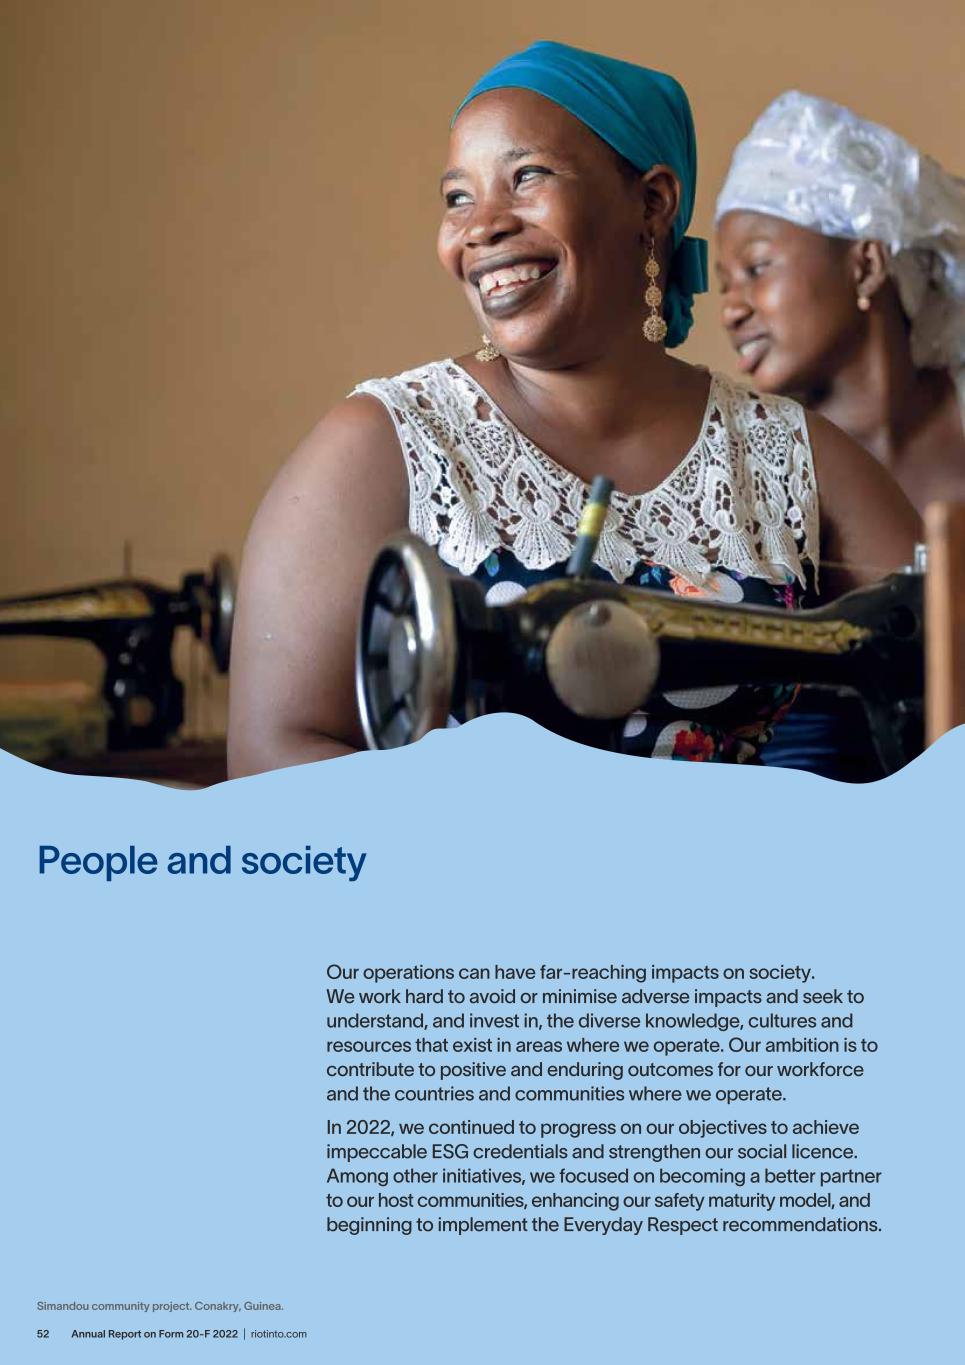
Annual Report on Form 20-F 2022 | riotinto.com52 People and society Our operations can have far-reaching impacts on society. We work hard to avoid or minimise adverse impacts and seek to understand, and invest in, the diverse knowledge, cultures and resources that exist in areas where we operate. Our ambition is to contribute to positive and enduring outcomes for our workforce and the countries and communities where we operate. In 2022, we continued to progress on our objectives to achieve impeccable ESG credentials and strengthen our social licence. Among other initiatives, we focused on becoming a better partner to our host communities, enhancing our safety maturity model, and beginning to implement the Everyday Respect recommendations. Simandou community project. Conakry, Guinea.
53Annual Report on Form 20-F 2022 | riotinto.com Strategic report Community engagement and social investment Communities and social performance targets In 2022 we finalised a new suite of CSP targets, following the end of our previous target reporting period (2016-2021). The new targets will help us monitor progress towards the core objectives of our CSP Group strategy. We have transitioned from having individually set and defined local asset targets to common global targets, which will allow us to see progress across the Group as well as for individual assets. Our assets will continue to maintain local targets and metrics, developed in consultation with local communities, in addition to the global targets. Reporting will evolve over the next 12 months. Communities and social performance targets 2022-2026 Reporting status By 2026, all sites to co-manage cultural heritage with communities and knowledge holders. Progress will be evaluated through a co-management maturity assessment currently in development for reporting from 2023. Year-on-year increase in contestable spend sourced from suppliers local to our operations. Baseline included in the 2022 Sustainability Fact Book for: – Rio Tinto Group – Product groups Progress against target reported annually from 2023. By 2026, 70% of total community investment to be through strategic, outcomes- focused partnerships. Progressive reporting through roll-out of the social investment strategy and framework in 2023. By 2024, 100% of employees in high human rights risk roles to complete yearly job-specific and general human rights training. By 2026, 100% of employees to complete yearly general human rights training. Progressive reporting with 2022 focus on training development and role mapping. Effective communities and social performance (CSP) is fundamental to our business. Without the support of the communities where we live and work, we cannot operate. We aim to contribute to a shared future and positive legacy by developing lasting relationships with people, learning about and supporting their goals and aspirations, avoiding or mitigating adverse impacts, and respecting different cultures and connections to lands and waters. We are finding better ways to work with communities and Indigenous peoples, particularly in how we protect heritage. We are moving to a model of co-management of land and waters, and we are updating our agreements to deliver more enduring socioeconomic, heritage and environmental outcomes. This, in turn, delivers greater certainty for mine development. Our CSP teams span our entire business and work in partnership with communities to understand how the work we do affects their lives, culture and heritage. By doing so, we can optimise benefits and reduce negative impacts, both for local communities and our business. Our teams include people who have a range of expertise, from archaeologists, anthropologists, social scientists and economic development experts to human rights specialists and operational leaders. While these teams lead our technical activities, our social licence is the responsibility of all employees. Everyone has a role to play in our engagement with, and contribution to, host communities and society more broadly. Our CSP and site teams are also starting to work with Indigenous communities to explore opportunities for them to participate in our climate initiatives. For more information about our climate initiatives, see our 2022 Climate Change Report at riotinto.com/climatereport. 2022 progress Strengthening social performance We continue to strengthen our social performance governance, capacity and capability. In 2022, we launched our revised Communities and Social Performance Standard. It applies to all managed operations globally and will help us work thoughtfully, responsibly and transparently. It provides clear direction on what success looks like and the minimum standard expected across our global operations. In 2022, we also launched the 2022 to 2027 Group CSP vision, goal and strategic framework, which will guide our activities over the next five years and help improve our performance. Our CSP vision is to respect and enable communities to realise their goals and aspirations and create long-term shared benefits. We continue to build internal capability and collaboration across our teams working in CSP, Indigenous Affairs and Cultural Heritage. In 2022, we held two global conferences in Brisbane and Montreal for more than 260 CSP employees to explore complex technical issues and share good practice and learnings. These conferences also offered the opportunity to engage with civil society organisations, investors and academia on emerging CSP trends and practice. As we evolve our approach to co-design and co-management, we continue to listen to the wealth of knowledge that resides both inside and outside our business. QIT Madagascar Minerals (QMM) In 2022, QMM worked together with national and local authorities, representatives of the communities and Traditional Owners to address complaints raised by members of the local communities through a grievance management process. Throughout the year, the parties continued to work together to find equitable and sustainable solutions and we will continue to work closely with the community on these issues in 2023. Despite the challenges at QMM, we are implementing initiatives to strengthen our collaboration with the community. One example is our village nursery project, which generates income for the community that is supporting the rehabilitation of the area surrounding the Mandena mine. In 2022, QMM invested over $550,000 to support rehabilitation activities, producing 300 tonnes of compost and providing 1,500,000 seedlings used for commercial tree planting, ecological restoration, greening of the area around Mandena and an offset plantation near the future mining lease in Ambatoatsinana. Community associations are the input suppliers, and some community members are also employed. More than 400 households have benefited from QMM’s rehabilitation activities. In addition, QMM will increase its spending on its Corporate Social Responsibility Policy over the next three years to implement development projects in full collaboration with the communities and for the benefit of all local community members. Resolution Copper project, Arizona, US At our Resolution Copper project in Arizona, we continue to strengthen relationships with local communities and Native American tribes by deepening our engagement and partnership support. We recognise the enduring historical connection Native American tribes have with the land at, or near, the proposed mine and we have partnered with the Tonto National Forest Service and Native American tribes to develop a programme to train tribal members in archaeological surveys and to help us identify sites of special significance to tribes. For more information, see resolutioncopper.com The project is going through comprehensive and independent social and environmental regulatory reviews. The US Forest Service (USFS) published the Final Environmental Impact Statement (FEIS) in January 2021. In March 2021, the US Department of Agriculture (USDA) directed the USFS to retract the FEIS, which allowed the agency to undertake further review and consultation.
Annual Report on Form 20-F 2022 | riotinto.com54 Simandou project, Guinea At our Simandou iron ore project in Guinea, we are working with communities to help them prepare for construction and future operations by identifying and managing our impacts, and designing and delivering local social investment and regional economic development programmes. In addition to implementing environmental and social impact mitigation measures, our teams are working with local communities to enhance social infrastructure, deliver livelihood restoration initiatives and build community resilience. Recognising the cumulative impacts that will occur as a result of the development of Simandou, we are also working with our infrastructure and joint venture partners to ensure the consistent application of internationally recognised environmental and social performance standards across the entire project footprint. We are also working towards raising local capacities to maximise local content. Engaging with local entrepreneurs and investing in training and development of local capacities is key to optimise benefits to our host communities. Oyu Tolgoi, Mongolia We focus on long-term sustainable development in Mongolia, increasing transparency in our business processes and building trust with local communities through community investment and local employment. In 2022, local employment at Oyu Tolgoi increased by 25% from January to September as a result of a comprehensive recruitment process and local talent development. Since 2015, Oyu Tolgoi has made a yearly contribution of $5 million to a Development Support Fund (DSF) – administered jointly by Oyu Tolgoi and the community – for community programmes and projects in the Umnugovi aimag. In 2022, after reaching $38.9 million, the fund invested in constructing a community school, a kindergarten, and a health care centre, increasing accessibility to quality educational and healthcare services for community members and creating more than 480 permanent jobs. The DSF also funded the Gobi History and Nature Museum, which opened in May 2022. It has already benefitted tourism in the region by attracting more than 28,000 people, and it is playing an important role in protecting and promoting Mongolian cultural heritage. We continue to engage with local communities through the Khanbogd Tripartite Council (TPC). In 2022, we focused on herder sustainable livelihood, student scholarships and pastureland water access. Compagnie des Bauxites de Guinée SA (CBG), Guinea CBG is a bauxite operation in Guinea owned by Halco Mining Inc. (51%) and the Guinean Government (49%). Halco is a consortium comprised of Rio Tinto (45%), Alcoa (45%) and Dadco Investments (10%). Rio Tinto participates on the boards of Halco and CBG, with representation on various shareholder oversight committees. Through our Board and committee roles, we monitor and support CBG’s approach to environmental protection, community issues and human rights. We are aware of the concerns regarding access to land and water, and the pace of livelihood restoration programmes as well as concerns regarding CBG’s stakeholder engagement. In 2022, sustainability advisory committees at Halco and CBG levels met regularly, strengthening our oversight and providing support to CBG for the improvement of CBG’s social and environmental practices, including for the development of an ongoing human rights due diligence process. Both the Halco and CBG advisory committees are closely following CBG’s response to a complaint made to the International Finance Corporation’s (IFC) Office of the Compliance Advisor Ombudsman (CAO). The mediation process facilitated by the CAO has conducted seven sessions in 2022 and through a collaborative approach the parties made important progress towards an agreement on the improvement of community access to water. Halco continues to participate in the mediation process as an observer, alongside the IFC. Panguna mine, Bougainville, Papua New Guinea The Panguna mine was operated by Bougainville Copper Limited (BCL), majority-owned by Rio Tinto, for 17 years from 1972 until 1989, when operations were suspended due to a civil war, which lasted until 1998. In 2016, Rio Tinto transferred its 53.83% majority shareholding in BCL to the Autonomous Bougainville Government (ABG) and the Papua New Guinea (PNG) Government for no consideration, enabling the ABG and PNG to hold an equal share in BCL of 36.4% each. In September 2020, the Human Rights Law Centre (HRLC) filed a complaint against Rio Tinto on behalf of 156 Bougainville residents with the Australian National Contact Point (AusNCP) regarding the Panguna site. In 2021, as an outcome of the AusNCP engagement, a joint committee of stakeholders, the Panguna Mine Legacy Impact Assessment Committee, was formed to oversee a detailed independent assessment of the Panguna mine to identify and better understand the environmental and human rights impacts of the mine. The Committee is chaired by an independent facilitator with representatives from the ABG, the Independent State of PNG, clan leaders and landowners, local communities, Rio Tinto, BCL and HRLC. It has met regularly since its formation. In 2021, the Committee commissioned the Panguna Mine Preparatory Phase Report to inform priority areas for the Impact Assessment. Completed in 2022, the report identified risks of potential failure of the levee at the former Main/Pump station, and potential flooding events along the Kawerong and Jaba river. On behalf of the ABG, Tetra Tech Coffey completed on-the-ground investigations in October 2022 and will present findings to the ABG who will determine next steps. In 2022, the Committee selected and endorsed Tetra Tech Coffey to complete phase 1 of the independent environmental, social and human rights Legacy Impact Assessment. The Legacy Impact Assessment began in December 2022 and will provide all parties with a clearer understanding of the impacts, so that together we can consider the best way forward. Jadar lithium-borates project, Serbia We continue to believe that the Jadar lithium- borates project in Serbia can contribute to enhancing the electric vehicle supply chain ecosystem in Serbia. We continue to explore options with all stakeholders on how to progress this world-class opportunity to the highest environmental standards. Group-wide COVID-19 fund In 2021, we committed $25 million to help the communities where we live and work respond to the pandemic. Our assets led the implementation of the fund, supporting grassroots communities across three pillars: response, recovery, and resilience. The remaining funds were allocated in April 2022 to support communities in Madagascar, Mongolia, Serbia and South Africa. More information is available on our website. Social contribution Supporting economic opportunities for our host communities and regions is a key priority for us and we strive to employ local people, buy local products and engage local services. In 2022, our total voluntary global social investment was $62.6 million, covering a wide range of social and economic programmes. In 2022, we spent $2.7 billion with suppliers local to our operations, which is 14.5% of our total contestable spend. 88 Indigenous rangers across 12 Pilbara Traditional Owner groups will be supported to deliver cultural land management, through our contribution of A$11.8 million over five years towards Ranger Programs. Humanitarian support through $5 million donated to humanitarian efforts in Ukraine. We also contributed A$271,530 through our global employee appeal. Residents of 10 towns in the Shire of Ashburton and City of Karratha in the Pilbara region of Western Australia will realise improved social outcomes over the next ten years through our A$75 million contribution. Indigenous history will be preserved through a two-year archaeological partnership with the Cheslatta Carrier Nation in Canada, to better understand the history of Indigenous communities and human migrations. 1,000 people in remote rural communities will have access to mobile health care for the first time, through our contribution of $375,000 to Clinic Mobile des Oubliés, a Guinean social enterprise. 550,000+ students in elementary and high schools in Quebec will have access to a free homework helpline and learning website through our contribution of C$1 million over three years. Culturally safe care for mothers and
children will be made available to First Nations and Inuit patients and families at Sainte-Justine through our C$500,000 donation. People and society continued
55Annual Report on Form 20-F 2022 | riotinto.com Strategic report Update on our communities and social performance commitments In October 2022, we released our final standalone report on our progress on the commitments we made after the tragic destruction of the rock shelters at Juukan Gorge. Significant updates since this report are summarised below under three areas of interest: relationships, governance and process, and leadership and inclusion. For more information see our 2022 Communities and Social Performance Commitments Disclosure Report on our website. In 2023, we will repeat the feedback process with Traditional Owners in the Pilbara. This will provide a three-year longitudinal perspective on our relationships. In parallel, we will undertake a project to design and pilot a community feedback process for host communities where we operate globally. Relationships We have changed the way we engage with Indigenous communities. We are progressively working more closely in partnership with Indigenous peoples across our operations to preserve and protect cultural heritage. We are moving to a model of co-management to ensure Indigenous voices are heard as part of our decision making. Remedy agreement with the Puutu Kunti Kurrama and Pinikura Aboriginal Corporation In November 2022, we agreed with the Puutu Kunti Kurrama and Pinikura Aboriginal Corporation to create the Juukan Gorge Legacy Foundation as part of a remedy agreement relating to the destruction of the rock shelters at Juukan Gorge in the Pilbara region of Western Australia in May 2020. Financial support will be provided to the Traditional Owner-led foundation to progress major cultural and social projects, including a new keeping place for storing important cultural materials. The agreement forms part of our commitment to remedy and rebuild the relationship with the Puutu Kunti Kurrama and Pinikura people. For more information see our website. Updated agreement with the Yindjibarndi people As part of our commitment to modernise our relationships with Traditional Owners, in November 2022, we signed an updated agreement with Yindjibarndi Aboriginal Corporation. The agreement aims to provide better social and economic outcomes for future generations and reflects our commitment to create opportunities for Yindjibarndi people to participate in our operations. The agreement also includes support for Yindjibarndi Aboriginal Corporation to develop community, commercial and cultural projects and programmes to fulfil its aspirations of self-determination. For more information see our website. Pilbara Cultural Land Management project As part of our A$11.8 million investment over five years into Ranger programs in Western Australia, we announced a partnership with the Pilbara Cultural Land Management Project (PCLMP) in October 2022. The PCLMP will enable 12 Pilbara Traditional Owner groups to take part in training programmes to help develop tools that support cultural, heritage and environmental mapping, monitoring and management. The project will provide greater employment opportunities and ongoing social and cultural benefits. For more information, see our website. We are also investing in developing and diversifying individual Ranger Programs across the Pilbara, partnering with Murujuga Aboriginal Corporation, Karlka Nyiyaparli Aboriginal Corporation and Yindjibarndi Aboriginal Corporation. The Aboriginal-led Ranger Programs provide connection to culture, opportunities for healing and strengthening families, and holistic support to achieve generational change. Working with Indigenous communities in Canada We continue to collaborate with Indigenous groups in Canada to implement agreements. We have 11 active long-term impact benefits/ participation agreements, and three potential agreements are in discussion. Our agreements include areas such as training and employment procurement, land and water management, joint environmental monitoring and community investment. We are also working in partnership with Indigenous communities to look at how we protect and preserve cultural heritage. At our Diavik Diamond Mine in the Northwest Territories, we are working with Indigenous partners to develop criteria for water quality to ensure that water is healthy and safe from a western science perspective and from a traditional cultural use perspective. This initiative values both western science and traditional knowledge and it will be evaluated equally by the Wek’èezhìi Land and Water Board and the regulator. It is part of a co-management regulatory regime to ensure future traditional use of the local land and water. In the northern part of British Columbia, we have announced a significant archaeological research project together with the Cheslatta Carrier Nation. The project will excavate sites of remarkable cultural and historical significance that could date back more than 10,000 years. Economic contributions (US$ million) 2022 2021 2020 2019 2018 Profit after tax for the year 13,076 22,575 10,400 6,972 13,925 Underlying earnings 13,275 21,380 12,448 10,373 8,808 Underlying earnings per share (US cents) 819.6 1,321.1 769.6 636.3 512.3 Net cash generated from operating activities1 16,134 25,345 15,875 14,912 11,821 Capital expenditure2 (6,750) (7,384) (6,189) (5,488) (5,430) Net (debt)/cash (4,188) 1,576 (664) (3,651) 255 Consolidated sales revenue 55,554 63,495 44,611 43,165 40,522 Employment costs (6,002) (5,513) (4,770) (4,522) (4,728) Payables to governments3 (9,313) (12,789) (8,224) (7,175) (7,217) Amounts paid by Rio Tinto n/a4 (13,334) (8,404) (7,635) (6,575) Amounts paid by Rio Tinto on behalf of its employees n/a4 (1,486) (1,353) (1,284) (1,342) 1. Data includes dividends from equity accounted units, and is after payments of interest, taxes and dividends to non-controlling interests in subsidiaries. 2. Capital expenditure is presented gross before taking into account any disposals of property, plant and equipment. 3. Payables to governments includes corporate taxes, government royalties and employer payroll taxes. 4. Our Taxes Paid Report will be published later this year on riotinto.com. 2022 2021 2020 2019 Community investment1 (discretionary) 62.6 72.1^ 47 36.4 Development contributions2 (non-discretionary) 18.2 19.1 12.8 12* Payment to landowners3 (non-discretionary) 299 222.9 165.9 147 * In 2019, $13 million was reported for development contributions. This has been revised down to $12 million due to an error noted in reporting. ^ The notable increase in community investment is associated with the completion of the $25 million COVID-19 pledge, a review of social investment strategies across product groups and the launch of a number of significant multi-year partnerships, particularly through Rio Tinto Iron Ore and Rio Tinto corporate teams. 1. Community investments are voluntary financial commitments, including in-kind donations of assets and employee time, made by Rio Tinto managed operations to third parties to address identified community needs or social risks. 2. Development contributions are defined as non-discretionary financial commitments, including in-kind donations of assets and employee time, made by Rio Tinto to a third party to deliver social, economic and/or environmental benefits for a community, which Rio Tinto is mandated to make under a legally binding agreement, by a regulatory authority or otherwise by law. 3. Payment to landowners are non-discretionary compensation payments made by Rio Tinto to third parties under land access, mine development, native title, impact benefit and other legally binding compensation agreements.
Annual Report on Form 20-F 2022 | riotinto.com56 In the Saguenay–Lac-St-Jean region of Quebec, we announced the signing of an agreement with Pekuakamiulnuatsh First Nation in December 2022. This agreement – named Kuessilueu, which means “the wind is turning” in Nelueun – is the start of a collaborative process that will bring Pekuakamiulnuatsh and Rio Tinto representatives together in a co-designed approach to identify priorities and recommendations on governance, jobs and training, business opportunities, cultural heritage, environment, partnerships, and energy transition. The agreement will involve a large group of people and aims to create a movement, with each participant becoming an agent of change in their respective area. As part of this agreement, an Indigenous awareness programme will be launched for our employees in the region. Governance and process During 2022, we continued to revise our standards, systems and processes to ensure we are working responsibly to avoid and minimise impacts and risks to our operations, people and communities. Australian Advisory Group We have established an Australian Advisory Group (AAG) to provide guidance on current and emerging issues, and better manage policies and positions that are important to both Australian communities and our broader business. The group continues to refine its scope and procedures for providing high-quality advice to the Chief Executive Australia and the Executive Committee. Our cultural heritage risks We have now operationalised the set of controls that manage our cultural heritage risks, with an emphasis placed on understanding the control performance at a local level. Our global Communities and Social Performance Area of Expertise continues to provide subject matter advice and support to our assets to strengthen the risk assessment processes across our business. Independent cultural heritage management audit In 2020, we engaged Environmental Resources Management (ERM) to undertake an independent cultural heritage management audit across all our sites. Phase one of the audit was completed in mid-2022 and focused on 20 audits across our Australian assets. Field work for phase two was completed in December 2022 and focused on 17 audits across our non-Australian operations. Phase one of the audit found that the changes introduced over the past two years have improved on-ground management. For example, a number of assets globally are progressing projects with community partners to document intangible cultural heritage values. This includes methodologies such as constellation mapping and training on new methods for recording oral histories. The report identified four areas for improvement: managing water as a cultural resource, managing artefacts, integrating data, and continuing to build our team of experienced cultural heritage practitioners. A summary of audit findings from phase one and two will be released at the end of the first quarter in 2023. Based on the recommendations, we will then work on a response plan in consultation with our cultural heritage teams and cultural heritage knowledge and rights holders. Leadership and inclusion We are evolving our culture to encourage a mindset and behavioural shift at all levels of our organisation. We have a programme of work in progress that focuses on advancing respect for the peoples and cultures on whose land we live and work, which links closely to the work we are doing as part of the Everyday Respect initiative. We continue to increase the number of Indigenous leaders in our business and develop our cultural competency. Reducing the barriers for Indigenous employees in our business and increasing cultural intelligence will help us become a better operator and a more inclusive workplace. For more information see page 59. In October 2022, we launched an internal protocol for the use of Indigenous cultural and intellectual property in Australia to ensure we follow appropriate processes when commissioning or reproducing Indigenous design or artwork within our business and engaging in Indigenous art and design projects. This will continue to be rolled out throughout 2023. Truth and reconciliation in Canada We continue to create learning opportunities for our people in Canada to raise awareness about the history, culture and rights of Indigenous peoples. During National Indigenous History Month, we held a series of events focusing specifically on Indigenous women. In September, we celebrated National Truth and Reconciliation Day and hosted a panel focusing on tangible ways to promote reconciliation and create a more inclusive and culturally safe work environment. Addressing employment barriers in Canada In addition to raising awareness, we have been focusing on identifying and addressing some of the recruitment opportunities and barriers for Indigenous peoples, and particularly Innu First Nations candidates. We prioritised eastern Canada in 2022 and took a number of actions. We established employment and training committees in partnership with Indigenous job placement agencies and we revised our recruitment process, including hiring criteria, pre-employment checks and verification processes. These changes resulted in 31 new Indigenous hires. Indigenous participation In 2021, our Iron Ore product group developed an Indigenous participation strategy to attract and develop Indigenous employees and promote a culturally safe working environment. Throughout 2022, we continued to make significant progress. We have: – Enhanced our recruitment processes. – Updated our employment programme to remove obstacles to employment and provide training and development opportunities for Indigenous peoples. – Delivered a training programme to increase the cultural knowledge of non-Indigenous employees. – Implemented an Indigenous participation dashboard to ensure leaders are enabled to make informed choices on improvement initiatives. – Enhanced our Indigenous Talent Review programme, which in 2022 saw 23 participants from a cohort of 151 promoted to roles of Supervisor or above. Indigenous leadership in Australia As at end of 2022 46 Indigenous leaders in our workforce (A-H band) (November 2020: 6) 39% Women in our Indigenous leader cohort (A-H band) 1,549 Indigenous employees in our workforce (equivalent to 6.6%) 87% Cultural connection programme participation among A-E leaders 16% Indigenous graduates in cohort (26 graduates in total) 94 Indigenous professionals participating in our cultural onboarding programme 17 Indigenous leaders graduating from RioInspire (Emerging Indigenous Executive Leaders) People and society continued
57Annual Report on Form 20-F 2022 | riotinto.com Strategic report Health, safety and wellbeing Caring for one another is one of our values – it is part of who we are and the way we work, every shift, every day. Nothing is more important than the safety and wellbeing of our employees, contractors and communities. 2022 progress We have now exceeded four years without a fatality. Although this is an important milestone, it is not one we take for granted. While we recognise the commitment made by all our employees and contractors to make us a safer company, we continue to believe all incidents and injuries are preventable and focus on identifying, managing and, where possible, eliminating risks. Although we had no fatalities on our managed sites in 2022, we are saddened by the loss of a mariner on board a non-managed chartered vessel, and a permanent disabling injury suffered by another mariner in a separate incident, also on a non-managed chartered vessel. We remain determined to improve maritime safety for our industry through a multi-year programme to identify, manage and eliminate risks in the marine supply chain. We continue to see serious incidents at our own operations. Our main risks relate to falling objects, fall from height, and vehicles and driving. Our all-injury frequency rate (AIFR) remained stable at 0.40, compared to 2021. We continue to see a disparity between the number of injuries among employees and contractors, so we remain focused on including contractors in our safety culture. Critical risk management (CRM) remains our primary fatality elimination tool by helping ensure that critical controls are in place and working where there is a fatal risk. In the last year, we continued to simplify our critical risk content, particularly for risks of rail impact or collision, mooring and drowning. To address risks related to vehicles and driving, in late 2021 we made significant changes to the Group procedure for mass transportation, a component of our vehicles and driving Group standard. These changes included the mandatory implementation of in-vehicle monitoring systems, and fatigue and distraction technology in all buses we operate, as well as increased safety feature requirements for vehicles purchased after January 2022. To tackle risks associated with falling objects, in the last year we also worked to improve the asset integrity of overhead cranes across our operations. In 2023, we will re-focus our attention on CRM to address the frequency of potentially fatal incidents (PFIs) across all critical risks. We will work to enhance the quality and impact of verifications – used for checking that the right critical controls are in place for each task – and we will use the data we collect to understand early trends, so that we can intervene before incidents occur. Across our business, our commitment remains on advancing our safety culture. The safety maturity model (SMM), introduced in 2019, was enhanced in 2022 to provide our leaders and their teams with clear guidance on managing health and environment risks, as well as on integrating contractors in a way that helps keep them safe. We also directed our efforts towards better understanding the felt experience of our workforce and the effectiveness of safety rituals. To help leaders understand and apply the SMM enhancements, we ran a series of “teach-in” sessions covering the key changes, including maturity indicators (systems, symbols, behaviours and felt experience), the importance of mindsets in supporting behaviour and culture change, and the critical steps in the assessment process, including scoring. We also evolved our assessor training programme to reflect these enhancements, as well as to improve assessors’ understanding of the model and consistency in its application. As a result of the enhancements we introduced to the SMM, we also stepped up the requirements for what defines each level of safety maturity across our business. With the inclusion of health, environment and contractors, we have reset our expectations on how to lead for both physical and psychological safety, while also caring for the environment. Although we know this will be a multi-year journey, we are encouraged by the results of the 2022 assessments, which deepened our understanding of the safety culture at each site. In addition, feedback received from site teams confirmed that the assessments provided actionable insight into where to focus to become a safer workplace. Mental health and wellbeing Mental health is a core part of our safety culture. We have a responsibility to support the wellbeing of our people, beyond the traditional areas of health and safety, and we are committed to creating a work environment that is free from psychological harm. We understand that our employees’ mental health can be impacted by psychosocial risks at work, so we continue to strengthen our psychosocial risk management. To support an environment where everyone feels safe, respected and included, we are progressing all 26 recommendations from the Everyday Respect Report, with a focus on training leaders in building psychological safety and becoming upstanders, rectifying any unsafe facilities and building plans to make our facilities more inclusive, and providing a more people-centric response to support those impacted by harmful behaviours and disrespect. For more information about the Everyday Respect initiative, see page 16. We are a member of the Minerals Council of Australia (MCA) Psychosocial Risk Management Working Group, chaired by MCA and industry partners, to improve the understanding and management of psychosocial risk within our industry. Our safety maturity model Much of the success of our safety culture is a result of the implementation of our SMM, now in its fourth year. The SMM, as our blueprint for safety, brings together the best practices from across our business in leadership and engagement, learning and improvement, risk management and work planning. Together, these practices define how we can lead for physical and psychological safety. Since implementing the model, we have evolved our focus from verifying systems and rituals to assessing the impact of the model on people’s mindsets. We believe all our employees and contractors should feel that they can work without injuring themselves, speak up and make decisions to keep themselves safe. We have evolved the SMM accordingly, including the way we train our assessors and perform assessments at our sites. In 2022, we continued our work to help leaders recognise psychosocial hazards; assess the risks; and implement, evaluate and monitor effective controls, just as for any other health or safety risk. We also continued embedding our mental health framework to raise awareness of mental wellbeing, reduce stigma and increase the capacity of our leaders to recognise and support individuals experiencing mental illness. Aligned with our commitment to give our employees the tools and skills they need to support their mental health, we continue to provide and promote the Employee Assistance Programme (EAP), our mental health toolkit and our global Peer Support Programme, which includes more than 1,500 peer supporters worldwide. We also support our people through our domestic violence support programmes, which cover 100% of employees. We continued to support global mental health campaigns such as R U OK? Day and World Mental Health Day. In October 2022, we held our mental health week to support mental wellbeing in the communities where we operate and encourage our people to look out for one another. We ran a programme of activities that included our first-ever global calls dedicated to mental health. The full communications programme reached employees via leader and peer supporter conversations, Yammer posts, intranet articles and a combination of four live and recorded webinars on topics such as resilience and the connection between mental health and menopause. We further encouraged conversations by sharing employees’ stories and experiences with mental health, and having senior leaders and members of our Executive Committee share their personal reflections and commitment to mental health. Rio Tinto is required to disclose mine safety violations or other regulatory matters in accordance with Sections 1503(a) of the Dodd-Frank Wall Street Reform and Consumer Protections Act, which are included in Exhibit 16.1 to this filing.
Annual Report on Form 20-F 2022 | riotinto.com58 Safety and health performance 2022 2021 2020 2019 2018 Fatalities at managed operations 0 0 0 0 3 All-injury frequency rate (per 200,000 hours worked) 0.40 0.40 0.37 0.42 0.44 Number of lost-time injuries2 225 216 187 227 223 Lost-time injury frequency rate (per 200,000 hours worked)3 0.25 0.25 0.22 0.27 0.26 Safety maturity model (SMM) score4 4.7 5.7 5.4 4.5 – Rate of new cases of occupational illness (per 10,000 employees)5 14.9 14.5 17.1 20.5 29.1 Number of employees6 54,000 49,000 47,500 46,000 47,500 Fines and prosecutions – safety (US$’000)7 339.0 646.2 25.4 40.7 59.0 Fines and prosecutions – health (US$’000) 0 5 0 1.4 0 2. Figure in 2018 restated from that originally published to ensure comparability over time. 3. Figures in 2018, 2019 and 2021 restated from those originally published to ensure comparability over time. 4. Figures in the table represent the Rio Tinto Group average SMM score at the end of each year. Each year, assets are added or removed from the SMM programme based on project and closure cycles. New assets to the programme are baselined in the first quarter of each year and added to the Group average at the end of the year. In 2022, enhancements made to the SMM assessment approach significantly raised the bar for assessed maturity. This required a reset of all baseline scores at every operation, which were reduced by 1.5. A revised average maturity of 4.2 served as baseline for 2022 assessments. 5. Rate of new cases of occupational illness (NCOI) = number of all new cases of occupational illnesses x 10,000/number of employees (based on average monthly statistics). 6. These figures include the Group’s share of joint ventures and associates (rounded). 7. In 2022, we paid safety fines resulting from non-compliances identified during MSHA inspections at our Boron Operations, California, US and Kennecott Copper and Bingham Canyon mines, Utah, US. OSHA violations at our Wilmington operations, California US; violation of the Mine Health & Safety Act at Diavik Diamond Mine, Northwest territories Canada and a fine in the Magistrate’s Court of Western Australia for an incident that occurred at our DSL-Port Hedland operations WA, Australia in 2018. Contributing causes for newly reported illness cases (employees) 2022 Noise induced hearing loss 21 Musculoskeletal disorders 30 Mental stress 4 Others 14 Note: There can be one or more illness reported for each employee/contractor. People and society continued We also updated and simplified our guidance notes on Occupational Exposure Limits and Occupational Hygiene Statistics to simplify these processes. This will help our teams manage and report hygiene risks. Recognising the need to improve the transparency and detail of our health data, we performed a Group Internal Audit in 2022. We are now implementing the audit recommendations by working to improve the reporting of our data. These recommendations include reviewing gaps in guidance, updating our existing guidance to address these gaps, re-training our health practitioners and improving the available consolidated reports to enable further insights. Re-doubling our efforts on delivering products that safeguard the environment, health and safety of our communities and end-consumers, we brought together colleagues from our product groups, Health, Environment and Commercial teams to develop a roadmap for future-proofing our product stewardship. HSES transformation The Health, Safety, Environment and Security Transformation Programme, implemented across five sites, is simplifying the way we work and increasing the value we get from the information we collect, ultimately making our business safer. We are piloting the core modules at Bell Bay and Dampier Port in Australia, and Boron in the US. At Saguenay– Lac-St-Jean in Quebec, Canada, we are piloting three of the environment modules: air, water and greenhouse gas. Global deployment of the core modules will start in 2023. COVID-19 In 2022, as we entered the endemic stage of the COVID-19 outbreak, we saw fewer cases across our business. We stood down our COVID-19 global Business Resilience teams and transitioned our strategy for managing the disease to a risk-based approach, in the same way we manage other infectious diseases. We continue to monitor the situation and follow safety precautions to reduce exposure to the virus and protect our people, contractors, their families and the communities where we operate. We also continue to offer support to those impacted by COVID-19, including long COVID and any psychological impacts. Occupational health In 2022, we recorded a higher number of new occupational health illnesses compared to the previous year, with 69 (2021: 611), in line with our increased focus on medical assessments. These assessments are a key requirement in ensuring and maintaining our employees’ fitness for work, addressing legislative requirements and managing risk profiles. In the last year, we began work to standardise and simplify such assessments to help improve our health performance. We also ran two workshops for our global health practitioners to share learnings, best practice and recent technology developments. In 2022, we continued the post-pandemic return to normal for occupational and industrial hygiene sampling. This includes analysis of noise, airborne particulates, gas and other contaminants that can lead to adverse health effects for our employees and contractors. We also reinstated our health surveillance – audiometry, spirometry and biological monitoring – to proactively identify potential occupational illnesses. The data collected over 2022 allows for semi-quantitative assessments of risk and identifies areas where we can implement or enhance control measures. Each product group worked on identifying projects within their assets which, with the support of the Areas of Expertise, will be designed, developed and implemented to reduce exposures for our employees and contractors. 1. Originally reported as 51 in 2021 due to medical diagnosis and/or investigation outcomes finalised after the end of the year, resulting in additional occupational health illnesses reported after the 2021 Annual Report publication.
59Annual Report on Form 20-F 2022 | riotinto.com Strategic report Talent, diversity and inclusion Our culture is a key enabler of our purpose. It will make us a better partner and allow us to attract and retain the people we need to unleash the full potential of our business. We are finding better ways to support and engage our people, which means creating an environment where everyone feels comfortable being themselves, has the courage to speak up if something is not right and listens to each other with care and curiosity. 2022 progress At the beginning of the year, we reported the findings and recommendations from an independent review of our workplace culture to better understand, prevent and respond to harmful behaviours across our global operations. The Everyday Respect Report proposed 26 recommendations, all of which we are implementing. This is just one way we are evolving our culture to create a safe, respectful and inclusive workplace. For more information about the immediate actions we have taken in response to the Everyday Respect Report, see page 16. Continuing to listen and learn To help us understand how our people feel about the company and our direction, we conduct two annual Group-wide employee engagement surveys. Close to 36,000 employees participated in our latest survey in October 2022, and our employee satisfaction score (eSAT)1 improved from 71 in 2021 to 73. The feedback shows that the changes we are making are moving us in the right direction. Evolving a culture takes time and commitment. Continuing to focus on the evolution of our culture will remain a key priority for everyone in 2023. For more information about our work to evolve our culture, see page 16. Building an inclusive and diverse workforce Having an inclusive and diverse workforce is a competitive advantage. It will enable us to find better ways to do things and ensure that we reflect the communities where we work. In 2022, we extended our family-friendly policies by updating our global standard for paid parental leave to meet differing family needs, ensuring that all new parents are eligible for 18 weeks minimum paid parental leave. We have been working on increasing the representation of Indigenous employees in our business and ensuring they have a stronger voice. In 2022, we partnered with the Australian Graduate School of Management at the University of New South Wales to deliver the RioInspire programme (formally known as the Emerging Indigenous Executive Leaders programme). The programme has been tailored to focus on developing executive-ready Indigenous leaders who will have an influential role in shaping the future of our business. The first group of Rio Tinto Indigenous leaders completed the globally recognised, six-month programme in April 2022. We continue to focus on the representation of women across all levels in our business. In 2022, we increased the representation of women in our workforce from 21.6% to 22.9%. We hired 2,982 women in the last 12 months, an 18% increase on 2021. We continued to evolve our award-winning graduate programme in 2022 and recruited our biggest cohort yet with 265 graduate roles. Of these, 53.2% were women and 36% were from nationalities where we are building new businesses2. In Australia, 15% of the graduate intake (up from 10% in 2021) and 2.2% of our vacation student programme (down from 15% in 2021) were Indigenous. Developing our people We continue to invest in our people. Through the Safe Production System (SPS), we are empowering people to develop and share sustainable, best-practice solutions to define how to work safely and optimally. In 2022, our focus has been on upskilling our people with technical knowledge on best practices and encouraging the right mindsets and behaviours to better engage our people. To set us up for a continued successful and rapid rollout of SPS in 2023, we have now trained 20 Mindset and Behaviour Coaches and 218 Change Partners, and certified 61 leaders in SPS deployments. For more information about SPS, see page 34. We know leaders play a critical role in shaping our culture. In 2022, we continued to invest in personal leadership development through the Voyager programme. And as at 31 December 2022, more than 300 senior leaders have experienced the Voyager journey. We have also expanded our technical expertise and now have 130 people formally recognised as a technical RioExpertTM through our RioExcelTM programme. And in partnership with LinkedIn Learning, we launched an online energy and climate change curriculum for employees who want to understand more about how they can contribute to reducing both Rio Tinto’s and their personal carbon footprint. Ensuring equality through pay equity Ensuring that employees with similar skills, knowledge, qualifications, experience and performance are paid equally for the same or comparable work is intrinsically linked to our commitment to inclusion and diversity. Our equal pay gap, the primary lens we use when assessing gender pay, measures the extent to which women and men employed by our company in the same location and performing work of equal value receive the same pay. In 2022, we further reduced our equal pay gap compared to 2021, which is now 1% in favour of men. Gender pay gap is a measure of the difference between the average earnings of women and men across the Group (excluding incentive pay), regardless of role, expressed as a percentage of men’s earnings. In 2022, our gender pay gap was just over 1% in favour of women, consistent with previous years. We are committed to eliminating any residual pay inequities based on gender or other non-legitimate dimensions of difference. For more information about our commitment to pay equity, see our website riotinto.com/payequity 52,000 workforce of employees and contractors, an increase of 9.8% since 2021 (47,000), excludes non-managed operations. 11,062 new hires of which 4,317 were contractors becoming permanent employees (2021: 7,895 new hires of which 3,098 were contractors). 22.9% women in our workforce, an increase of 1.4%3 since 2021 (21.6%). Workforce breakdown: 11,934 women; 40,119 men; 2 undeclared gender. 59% employees participated in myShare4, an increase of 4% (2021: 55%). 1. eSAT (employee satisfaction) is a measure of how happy employees are to work at Rio Tinto (average score). 2. Identifying with a nationality is not mandatory. More than 48% of our graduates have not formally reported a nationality. 3. Women % increase is 1.37% rounded to 1.4%. 4. myShare, our global employee share plan.
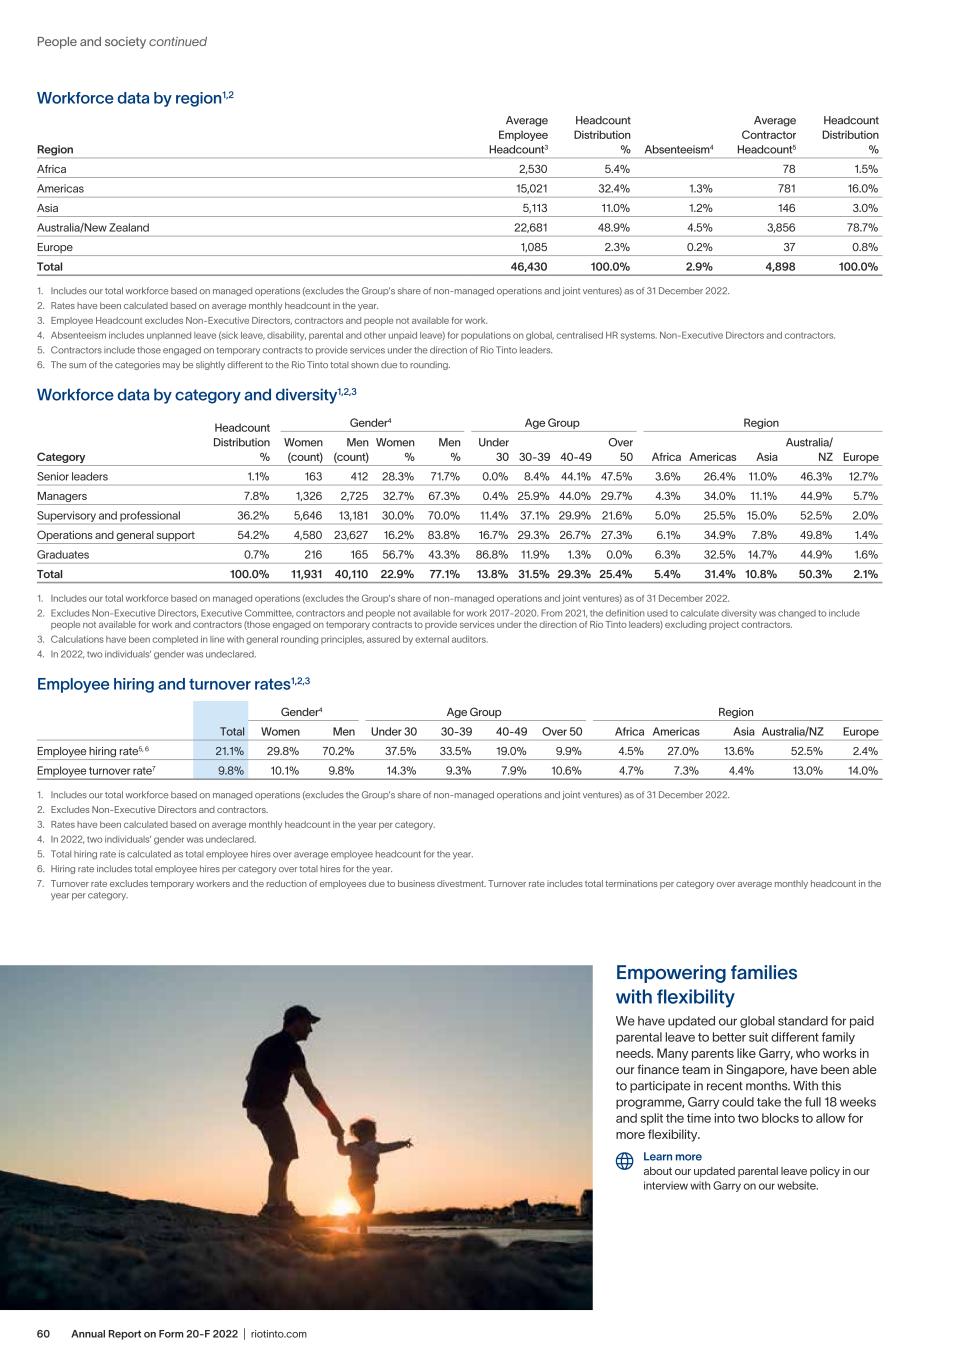
Annual Report on Form 20-F 2022 | riotinto.com60 People and society continued Workforce data by region1,2 Region Average Employee Headcount3 Headcount Distribution % Absenteeism4 Average Contractor Headcount5 Headcount Distribution % Africa 2,530 5.4% 78 1.5% Americas 15,021 32.4% 1.3% 781 16.0% Asia 5,113 11.0% 1.2% 146 3.0% Australia/New Zealand 22,681 48.9% 4.5% 3,856 78.7% Europe 1,085 2.3% 0.2% 37 0.8% Total 46,430 100.0% 2.9% 4,898 100.0% 1. Includes our total workforce based on managed operations (excludes the Group’s share of non-managed operations and joint ventures) as of 31 December 2022. 2. Rates have been calculated based on average monthly headcount in the year. 3. Employee Headcount excludes Non-Executive Directors, contractors and people not available for work. 4. Absenteeism includes unplanned leave (sick leave, disability, parental and other unpaid leave) for populations on global, centralised HR systems. Non-Executive Directors and contractors. 5. Contractors include those engaged on temporary contracts to provide services under the direction of Rio Tinto leaders. 6. The sum of the categories may be slightly different to the Rio Tinto total shown due to rounding. Workforce data by category and diversity1,2,3 Category Headcount Distribution % Gender4 Age Group Region Women (count) Men (count) Women % Men % Under 30 30-39 40-49 Over 50 Africa Americas Asia Australia/ NZ Europe Senior leaders 1.1% 163 412 28.3% 71.7% 0.0% 8.4% 44.1% 47.5% 3.6% 26.4% 11.0% 46.3% 12.7% Managers 7.8% 1,326 2,725 32.7% 67.3% 0.4% 25.9% 44.0% 29.7% 4.3% 34.0% 11.1% 44.9% 5.7% Supervisory and professional 36.2% 5,646 13,181 30.0% 70.0% 11.4% 37.1% 29.9% 21.6% 5.0% 25.5% 15.0% 52.5% 2.0% Operations and general support 54.2% 4,580 23,627 16.2% 83.8% 16.7% 29.3% 26.7% 27.3% 6.1% 34.9% 7.8% 49.8% 1.4% Graduates 0.7% 216 165 56.7% 43.3% 86.8% 11.9% 1.3% 0.0% 6.3% 32.5% 14.7% 44.9% 1.6% Total 100.0% 11,931 40,110 22.9% 77.1% 13.8% 31.5% 29.3% 25.4% 5.4% 31.4% 10.8% 50.3% 2.1% 1. Includes our total workforce based on managed operations (excludes the Group’s share of non-managed operations and joint ventures) as of 31 December 2022. 2. Excludes Non-Executive Directors, Executive Committee, contractors and people not available for work 2017-2020. From 2021, the definition used to calculate diversity was changed to include people not available for work and contractors (those engaged on temporary contracts to provide services under the direction of Rio Tinto leaders) excluding project contractors. 3. Calculations have been completed in line with general rounding principles, assured by external auditors. 4. In 2022, two individuals’ gender was undeclared. Employee hiring and turnover rates1,2,3 Total Gender4 Age Group Region Women Men Under 30 30-39 40-49 Over 50 Africa Americas Asia Australia/NZ Europe Employee hiring rate5, 6 21.1% 29.8% 70.2% 37.5% 33.5% 19.0% 9.9% 4.5% 27.0% 13.6% 52.5% 2.4% Employee turnover rate7 9.8% 10.1% 9.8% 14.3% 9.3% 7.9% 10.6% 4.7% 7.3% 4.4% 13.0% 14.0% 1. Includes our total workforce based on managed operations (excludes the Group’s share of non-managed operations and joint ventures) as of 31 December 2022. 2. Excludes Non-Executive Directors and contractors. 3. Rates have been calculated based on average monthly headcount in the year per category. 4. In 2022, two individuals’ gender was undeclared. 5. Total hiring rate is calculated as total employee hires over average employee headcount for the year. 6. Hiring rate includes total employee hires per category over total hires for the year. 7. Turnover rate excludes temporary workers and the reduction of employees due to business divestment. Turnover rate includes total terminations per category over average monthly headcount in the year per category. Empowering families with flexibility We have updated our global standard for paid parental leave to better suit different family needs. Many parents like Garry, who works in our finance team in Singapore, have been able to participate in recent months. With this programme, Garry could take the full 18 weeks and split the time into two blocks to allow for more flexibility. Learn more about our updated parental leave policy in our interview with Garry on our website.
61Annual Report on Form 20-F 2022 | riotinto.com Strategic report Human rights Respecting human rights relies on good governance, knowing our potential impacts, empowering and enabling our people, and working with others to help avoid adverse human rights impacts from occurring in the first place. Progress in 2022 Governance The Sustainability Committee has overarching accountability for our approach to human rights. We are working on improving our human rights performance, strengthening a range of areas to help prevent our involvement in adverse human rights impacts, and providing for, or cooperating in, remediation when we identify that we have caused or contributed to harm. In 2022, we revised our Human Rights Policy to advance our human rights performance in line with our business objectives and values and to meet external commitments and emerging regulatory requirements. The updated policy reflects emerging human rights areas including just transition, human rights defenders and human rights due diligence. It also reiterates our commitment to implement the UN Guiding Principles on Business and Human Rights (UNGPs), the Organisation for Economic Co-operation and Development (OECD) Guidelines for Multinational Enterprises, the IFC Performance Standards, the UN Global Compact’s ten principles, the Maritime Labour Convention, the ICMM Mining Principles, and the Voluntary Principles on Security and Human Rights (Voluntary Principles). For more information about our security and human rights work programme, see our annual Voluntary Principles Initiative Report, published on our website. Our Group Internal Audit (GIA) team reviewed the design of our modern slavery controls and presented summary observations and opportunities to the Sustainability Committee in October 2022. The internal audit identified opportunities to enhance management of third-party risks across non-financial domains (including modern slavery); to improve governance over the management of modern slavery risk; and to further improve Board visibility of modern slavery disclosures. This was part of a three-year phased approach to provide assurance across our human rights programme. We will implement the actions from the internal audit during 2023, and will continue to work with GIA to provide further assurance over our human rights governance framework. Obtaining feedback from stakeholders, including receiving complaints or registering grievances, is a vital part of our human rights approach. Our stakeholders have access to myVoice, our confidential, anonymous and independently operated whistleblowing programme, through which human rights grievances can be reported. Salient human rights issues Consistent with the UN Declaration on the Rights of Indigenous Peoples, we acknowledge and respect Indigenous peoples’ connection to lands and waters and commit to demonstrate progress towards, or achievement of, Free, Prior and Informed Consent of affected Indigenous communities across all phases of the asset lifecycle. Aligned with the UNGPs, we continue to mature our processes and systems. For example, we identify the priority human rights issues that could severely impact people through our activities or business relationships. These issues, listed below, consider our operational footprint, value chain and external contexts and remain unchanged from 2021: – Land access and use – Indigenous peoples’ rights – Security – Inclusion and diversity – Community health, safety and wellbeing – Workplace health and safety – Labour rights (including modern slavery) – Climate change and just transition (respecting human rights while transitioning to a low-carbon economy). In 2022, several assets, including Simandou, Oyu Tolgoi and those in Gladstone, Queensland, Australia undertook risk assessments to review their priority human rights issues. These assessments provide assets with a more complete understanding of their risk context and are an important part of our commitment to implement the UNGPs. This work will continue into 2023. Our business relationships It is important that we address our potential involvement in human rights harm that may occur through relationships with our suppliers, customers and joint venture partners. We engage and collaborate with our business partners to advance respect for human rights in line with international standards, the UNGPs and our values. Using a risk-based approach, we pre-screen potential business partners on human rights and require suppliers (including subcontractors) to adhere to our Supplier Code of Conduct, which includes respect for human rights. More than 17,000 business partners completed baseline screening in 2022, and over 200 were escalated for human rights review, which is approximately a 60% increase compared to 2021. Our Commercial team also held conversations about human rights with several strategic suppliers at supplier relationship meetings. Modern slavery provisions are included in our standard global supply contract and purchase order terms and conditions, as well as our marine chartering contracts. During 2022, we updated human rights considerations in our Supplier Code of Conduct and contributed to updating our Code of Conduct – The Way We Work, which was launched internally in February 2023. In 2023, we will perform a more detailed review of the Supplier Code of Conduct to further clarify our expectations of suppliers on human rights and other matters. For more information about our human rights and modern slavery approach, see our annual Modern Slavery Statement on our website. Capacity building on human rights In 2022, we enhanced our in-house human rights expertise by establishing a dedicated human rights team within the Communities and Social Performance Area of Expertise. However, we also believe everyone in the business has a role to play in implementing our commitment to respect human rights. Our employees and contractors develop a better understanding of human rights issues through general and targeted training. In 2022, our training objectives were to demystify human rights and identify ways to integrate and operationalise human rights. We hosted 39 human rights workshops for our teams in Ethics and Compliance, the Business Conduct Office, Marine, Communities and Social Performance, as well as joint venture partners and other relevant stakeholders. We also launched an online learning module to raise awareness about modern slavery. This module is compulsory for our Commercial, Legal, Ethics and Integrity, and Communities and Social Performance Area of Expertise teams, but it is available to everyone in the business. Training feedback results indicated that over 90% of participants now understand what modern slavery is, how to report a concern and what we are doing to address risks. Our Marine team continued to develop their Seafarer Welfare and Safety Programme, which included dedicated human rights training for more than 108 marine officers and 77 seafarer crew members in the Philippines and India. We have summarised our human rights training records in the 2022 Sustainability Fact Book. We also participated in a number of collaborative human rights initiatives in 2022 and continued our external engagement with peers, civil society organisations, governments and others to help inform our approach to human rights management. For more information about how we engaged with our key stakeholders, including civil society organisations, see pages 55-56.
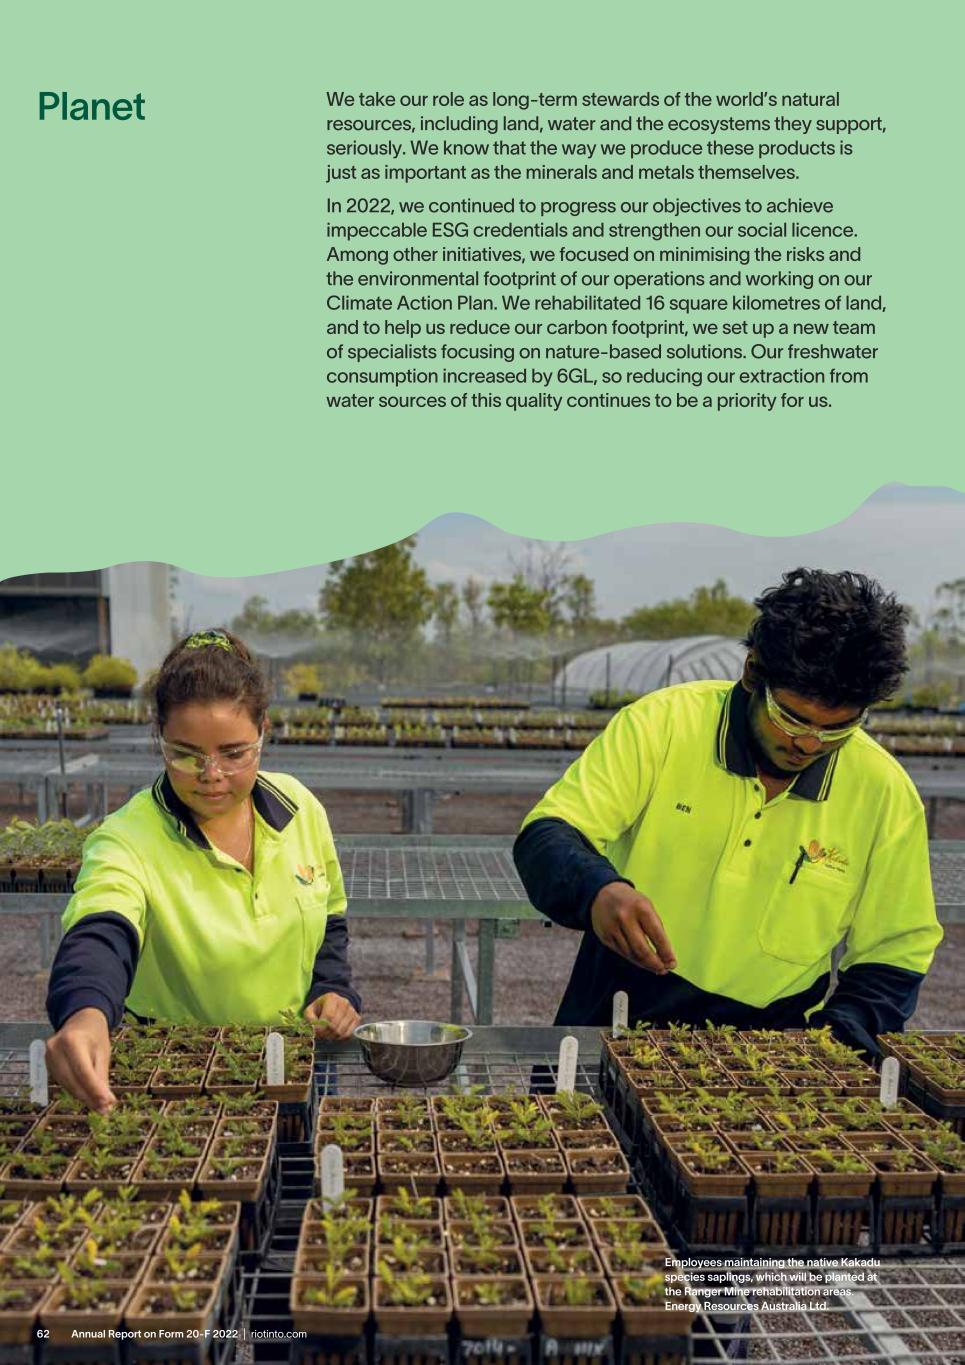
Annual Report on Form 20-F 2022 | riotinto.com62 Planet We take our role as long-term stewards of the world’s natural resources, including land, water and the ecosystems they support, seriously. We know that the way we produce these products is just as important as the minerals and metals themselves. In 2022, we continued to progress our objectives to achieve impeccable ESG credentials and strengthen our social licence. Among other initiatives, we focused on minimising the risks and the environmental footprint of our operations and working on our Climate Action Plan. We rehabilitated 16 square kilometres of land, and to help us reduce our carbon footprint, we set up a new team of specialists focusing on nature-based solutions. Our freshwater consumption increased by 6GL, so reducing our extraction from water sources of this quality continues to be a priority for us. Employees maintaining the native Kakadu species saplings, which will be planted at the Ranger Mine rehabilitation areas. Energy Resources Australia Ltd.
63Annual Report on Form 20-F 2022 | riotinto.com Strategic report Climate change and our related operational expenditure increased to approximately $140 million in 2022. As a result, we are better placed to deliver the complex and large-scale structural changes to our energy system needed to achieve our 2030 target. We are progressing work towards 1GW of renewable power in the Pilbara. In 2022, we installed the first 34MW at Gudai-Darri and are planning investments of $600 million for solar, storage and transmission to deliver a further 230MW solar power and 200MWh storage from 2023 to 2026. Once fully operational, this will displace approximately 30% of our gas usage. In other locations, power purchase agreements can be a better option for us and in 2022 we signed a 130MW solar power purchase agreement for Richards Bay Minerals in South Africa. Our Pacific Aluminium Operations are in coal-based power grids and account for 28% of our Scope 1 and 2 emissions. A formal market Request for Proposals (RFP) was undertaken in June 2022 to support the development of large-scale wind and solar power to supply power to the Boyne smelter through the Queensland grid by 2030. This smelter requires 960MW capacity of reliable power to operate, which equates to at least 4GW of quality wind and solar power capacity with firming. We continue to work with the Queensland Government and energy providers to design a renewable energy solution for this smelter. Our Processing Centre of Excellence focuses on decarbonising our harder-to-abate operations in alumina, iron ore pelletisation and titanium dioxide. In 2022, we agreed to partner with the Government of Canada to invest $537 million (C$737 million) to reduce emissions by up to 70% at the Rio Tinto Iron and Titanium Quebec Operations. This work supports technological innovations, including BlueSmeltingTM, a new ilmenite smelting technology that allows us to reduce and eventually eliminate the use of coal in the process. We also continued our studies with the Australian Renewable Energy Agency and Sumitomo Corporation on the role of hydrogen in alumina refining. Our experience with our abatement projects and progress tracking suggests there will be delays, and that we will require greater use of offsets to achieve our 2025 target. We established one additional programme to increase our investments in nature-based solutions projects. If done well, these projects can play a substantial role in addressing carbon emissions and biodiversity loss, while also providing benefits to local communities. Our people working on these “6+1” programmes, along with our substantial investments in technology development, will drive the innovation and solutions needed to accelerate our low-carbon transition and ensure the long-term resilience of our business. Decarbonising our value chains Our Scope 3 emissions were 584Mt CO2e in 2022 – over 1% of the global total. This is primarily from our customers in Asia processing our iron ore into steel and bauxite into aluminium, so our level of control is limited. Our approach to Scope 3 emissions balances ambition, pragmatism and our level of agency: it is focused on our most significant sources and is grounded in actions where we can have impact. While it is clear that we have a key role to play, we do not set an overall Scope 3 emissions target as we have limited ability to directly influence the production processes of our customers or their customers. In 2022, we increased our engagement with nearly all our direct iron ore and bauxite customers and worked with them to optimise their current operations and to develop the low-carbon technologies needed to reduce emissions across our value chains. It is encouraging that this issue remains very high on the agenda when we meet our customers. An inevitable structural shift toward green steel is underway. In the short term, the industry is predominantly focusing on blast furnace optimisation and we are working closely with customers to support their ambitions. In the medium term, the industry will move towards cleaner processing routes such as Direct Reduced Iron – Electric Arc Furnace (DRI- EAF). Steelmakers will increasingly value higher grade ores with less impurities that are more energy efficient to process. Therefore, we are working in partnerships with customers, technology providers, universities and others to develop low-carbon technologies to process our iron ore into steel. This includes exploring DRI pathways using hydrogen and sustainable biomass. We are also working on options to beneficiate and upgrade our Pilbara ores to be better suited to low-carbon steel making technologies. Learn more about these partnerships in our 2022 Climate Change Report at riotinto.com/climatereport. Our total Scope 3 emissions from shipping and logistics were 8.8Mt CO2e. Our shipping emissions intensity was 30% below our 2008 baseline, putting us on track to meet the International Maritime Organisation (IMO) decarbonisation goal of a 40% reduction in shipping emissions intensity by 2025, which is five years ahead of the IMO deadline. The low-carbon transition is at the heart of our business strategy. We are focused on growth in the materials that enable the transition, decarbonising our operations and partnering with our customers to decarbonise our value chains. Our operational emissions targets are ambitious: to reduce emissions by 15% by 2025 and 50% by 2030, reaching net zero by 2050. Our targets cover more than 95% of our reported Scope 1 and 2 emissions and are aligned with 1.5°C pathways. The Board approves our overall strategy, our policy positions and our Climate Change Report. The Board sets the 2025, 2030 and 2050 emissions targets and monitors performance against the targets and operational resilience. The Chair of the Board is responsible for our overall approach to climate change. The Board and the Risk Management Committee provide oversight of our principal risks and the Audit Committee monitors the overall effectiveness of our system of risk management and internal controls. The Risk factors section in this report considers both physical climate risks and low-carbon transition risks. The Chief Executive is responsible for delivering the Climate Action Plan approved by the Board. Our approach to climate change and target execution considerations integrates risk management, portfolio reviews, capital investments, annual financial planning and government engagement. 2022 progress In 2022, we worked towards our Climate Action Plan that our shareholders approved in a non-binding resolution at our annual general meetings. The low-carbon transition is complex: developing the technologies and implementing the major projects needed to decarbonise our business will take time. In 2022, our Scope 1 and 2 emissions were 30.3Mt CO2e (31.0Mt in 2021). This reduction of 7% below our 2018 baseline is primarily the result of switching to renewable power at Kennecott and Escondida in prior years, as well as lower than planned production from Kitimat and Boyne Smelter in 2022. We did not advance the actual implementation of our abatement projects as fast as we would have liked last year, so our capital expenditure on decarbonisation projects was $94 million, lower than we anticipated when we set our targets. Challenges have included late delivery of equipment, resourcing constraints impacting study progress, construction and commissioning delays, and project readiness. Our “6+1” abatement programmes In response, we established six abatement programmes, with dedicated people, to focus on the decarbonisation challenges that cut across our product groups: repowering our Pacific Aluminium Operations, renewables, ELYSISTM, alumina process heat, minerals processing and diesel transition. We are building capability and gaining a deeper understanding of our decarbonisation challenge (both constraints and opportunities),
Annual Report on Form 20-F 2022 | riotinto.com64 Planet continued Addressing the Task Force on Climate-related Financial Disclosures (TCFD) recommendations Climate-related disclosures on governance, strategy and risk management, as well as metrics and targets, are integrated into this report. However, given constraints in our Annual Report, our 2022 Climate Change Report and our 2022 Sustainability Fact Book supplement these disclosures and are available on our website at riotinto.com/reports. Together, these reports are consistent with the four thematic areas, 11 recommended disclosures and “Guidance for All Sectors” set out in the October 2021 Implementing the Recommendations of the Task Force on Climate-Related Financial Disclosures. We will continually enhance our reporting and further integrate climate disclosures as recommended by the TCFD in future Annual Reports. To aid readers, the key climate-related disclosures can be found in the index here: TCFD recommendation Our response Governance Describe the Board’s oversight of climate-related risks and opportunities. 2022 Annual Report: – Governance framework: page 100 – Evaluating our performance: page 101 – Board skills matrix: page 103 – Audit & Risk Committee report: page 104 – Sustainability Committee report: page 108 2022 Climate Change Report: – Climate governance: page 33 Describe management’s role in assessing and managing climate-related risks and opportunities. 2022 Climate Change Report: – Our strategy and approach to climate change: pages 8-9 – Producing materials essential for the low-carbon transition: pages 10-13 – Enhancing our resilience to physical climate risk: pages 28-31 – Climate governance: page 33 Strategy and risk management Describe the climate-related risks and opportunities the organisation has identified over the short, medium, and long term. 2022 Annual Report: – Strategic context and strategy: pages 12-13 – Corporate information (note h): pages 153-155 2022 Climate Change Report: – Our strategy and approach to climate change: pages 8-9 – Producing materials essential for the low-carbon transition: pages 10-13 – Definition of short, medium, and long-term time horizons: page 6 Describe the impact of climate-related risks and opportunities on the organisation’s businesses, strategy, and financial planning. 2022 Annual Report: – Strategic context and strategy: pages 12-13 – Corporate information (note h): pages 153-155 2022 Climate Change Report: – Our strategy and approach to climate change: pages 8-9 – Producing materials essential for the low-carbon transition: pages 10-13 – Reducing the carbon footprint of our operations: pages 14-18 – Partnering to reduce the carbon footprint across our value chains: pages 22-27 – Capital allocation alignment with our decarbonisation strategy: page 19 Describe the resilience of the organisation’s strategy, taking into consideration different climate-related scenarios, including a 2°C or lower scenario. 2022 Climate Change Report: – Our strategy and approach to climate change: pages 8-9 – How we have considered climate change scenarios in our financial statements: pages 35-36 – Producing materials essential for the low-carbon transition, including our approach to scenarios and implications for our portfolio: pages 10-13 – Enhancing our resilience to physical climate risk: pages 28-31 Describe the organisation’s processes for identifying and assessing climate-related risks. 2022 Annual Report: – Risk management: pages 76-78 – Longer-term viability statement: page 78 – Risk factors: pages 79-81, 85 2022 Climate Change Report: – Enhancing our resilience to physical climate risk: pages 28-31 – Climate governance: page 33 Describe the organisation’s processes for managing climate-related risks. 2022 Annual Report: – Risk management: pages 76-78 – Longer-term viability statement: page 78 – Risk factors: pages 79-81, 85 2022 Climate Change Report: – Enhancing our resilience to physical climate risk: pages 28-31 – Climate governance: page 33 Describe how processes for identifying, assessing, and managing climate-related risks are integrated into the organisation’s overall risk management. 2022 Annual Report: – Risk management: pages 76-78 – Longer-term viability statement: page 78 – Risk factors: pages 79-81, 85 2022 Climate Change Report: – Enhancing our resilience to physical climate risk: page 28-31 – Climate governance: page 33 Metrics and targets Disclose the metrics used by the organisation to assess climate-related risks and opportunities in line with its strategy and risk management process. 2022 Annual Report: – Key performance indicators: page 24 – Emissions metrics: page 65 2022 Climate Change Report: – Capital allocation alignment with our decarbonisation strategy: page 19 – Climate governance: page 33 – Emissions data: pages 37-39 2022 Sustainability Fact Book: – Energy; GHG emissions; water Disclose Scope 1, Scope 2 and, if appropriate, Scope 3 greenhouse gas (GHG) emissions and the related risks. 2022 Annual Report: – Key performance indicators: page 24 – Emissions metrics: page 65 2022 Scope 1, 2 & 3 Emissions Calculation Methodology – pages 3-5 2022 Sustainability Fact Book: – Energy; GHG emissions; water Describe the targets used by the organisation to manage climate-related risks and opportunities and performance against targets. 2022 Annual Report: – Key performance indicators: page 24 – Emissions metrics: page 65 2022 Climate Change Report: – Our Climate Action Plan: pages 6-7 2022 Sustainability Fact Book: – Energy; GHG emissions; water
65Annual Report on Form 20-F 2022 | riotinto.com Strategic report Greenhouse gas emissions (GHG) Scope 1, 2 and 3 GHG – equity basis Equity GHG – million tonnes carbon dioxide equivalent (Mt CO2e) 2022 2021 2020 2019 2018 Scope 1 emissions 22.8 22.8 22.9 23 24.4 Scope 2 emissions 7.5 8.2 8.8 8.4 9.3 Total Scope 1 & 2 emissions 30.3 31 31.7 31.4 33.7 Carbon offsets retired 0.0* Scope 3 emissions 583.9 558.3 576.2 – – Operational emissions intensity (tCO2e / t Cu-eq)(equity)1 6.2 6.3 6.2 6.1 6.1 Our 2030 greenhouse gas emissions targets are to reduce our absolute Scope 1 & 2 emissions by 15% by 2025 and 50% by 2030 compared with our 2018 equity baseline. Please see GHG Emissions Methodology sheet for details of our approach to reporting Scope 1, 2 & 3 emissions. Note that our 2022 equity emissions and our 2018 baseline do not include the additional equity share of the Oyu Tolgoi mine that was purchased in mid-December 2022. Queensland Alumina Limited (QAL) is 80% owned by Rio Tinto and 20% owned by Rusal. However, as a result of QAL’s activation of a step-in process following the Australian Government’s sanction measures, Rio Tinto is currently entitled to utilise 100% of the capacity at QAL, but paying 100% of the costs for as long as that step-in continues. Our 2022 equity emissions and our 2018 baseline include QAL emissions on the basis of Rio Tinto’s 80% ownership. In 2022, the additional emissions associated with the step-in were 0.53Mt. Rusal has commenced proceedings challenging the validity of the step-in and the sanctions regime may change over time, such that the duration of the step-in remains uncertain. Historical Scope 1 and 2 emissions have been restated to reflect improvements in data quality. 1. Historical information for copper equivalent intensity has been restated in line with the 2021 review of commodity pricing to allow comparability over time. * We retired 10,000 offsets in 2022 as part of a trial carbon offset iron ore cargo with a steel producer in China. Further information on this transaction is provided in the 2022 Climate Change Report. Scope 1 and 2 GHG – equity basis. Performance against target Equity greenhouse gas emissions (Mt CO2e) 2022 2018 Baseline Scope 1 & 2 emissions 30.3 2018 emissions target baseline (adjusted for acquisitions & divestments) 32.5 2022 equity GHG by product group and source (Mt CO2e) Electricity1 Anodes & Reductants Process Heat Mobile Diesel Other 2022 Total Emissions (Mt CO2e) Aluminium 9.5 5.0 5.2 0.3 1.2 21.1 Aluminium (Pacific) 7.7 1.7 0.2 0.0 0.2 9.7 Aluminium (Atlantic) 0.5 3.3 0.3 0.0 0.7 4.8 Bauxite & Alumina 1.2 0.0 4.7 0.2 0.3 6.5 Minerals (includes Iron Ore Company of Canada) 1.6 1.4 0.7 0.3 0.0 4.0 Iron Ore (includes Dampier Salt) 0.8 0.0 0.1 2.2 0.0 3.1 Copper 0.5 0.0 0.2 0.8 0.0 1.5 Other (includes Shipping and corporate functions) 0.1 0.0 0.0 0.5 0.0 0.6 Total 12.5 6.3 6.2 4.1 1.2 30.3 Note: The sum of the categories may be slightly different to the Rio Tinto total due to rounding. 1. Electricity includes imported power and own generation; process heat includes diesel consumption from stationary sources such as pumps; mobile diesel sources are haul trucks, locomotives and other mining fleet. 2022 equity GHG by location (Mt CO2e) Scope 1 Emissions (Mt CO2e) Scope 2 Emissions (Mt CO2e) Total Emissions (Mt CO2e) Australia 12.6 5.6 18.2 Canada 6.1 0 6.1 South Africa 0.4 1.3 1.7 USA 1 0 1 Other: Rest of Africa 0.3 0 0.3 Other: Europe 0.3 0 0.3 Other: Asia, New Zealand, Central America, South America 2.1 0.6 2.7 Total 22.8 7.5 30.3 Scope 3 greenhouse gas emissions – equity basis Total equity Scope 3 GHG (M tCO2e) 2022 2021 Restated 2020 Restated Scope 3 emissions – Upstream 32.6 32.3* 30.4* Scope 3 emissions – Downstream 551.3 526 545.8* Total 583.9 558.3 576.2 * Numbers restated from those originally published to ensure comparability over time.
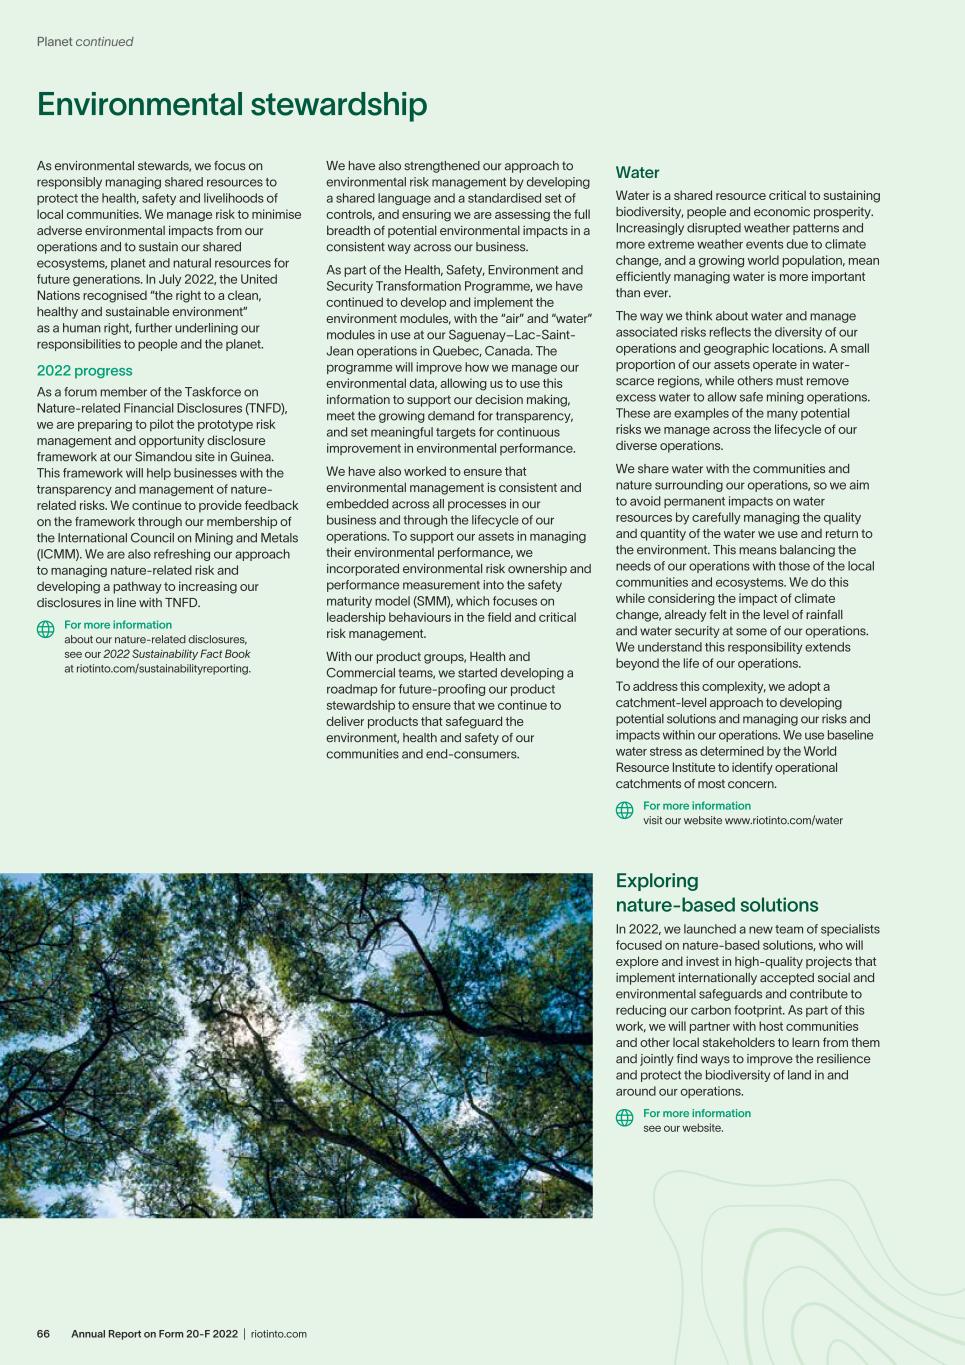
Annual Report on Form 20-F 2022 | riotinto.com66 Environmental stewardship Planet continued We have also strengthened our approach to environmental risk management by developing a shared language and a standardised set of controls, and ensuring we are assessing the full breadth of potential environmental impacts in a consistent way across our business. As part of the Health, Safety, Environment and Security Transformation Programme, we have continued to develop and implement the environment modules, with the “air” and “water” modules in use at our Saguenay–Lac-Saint- Jean operations in Quebec, Canada. The programme will improve how we manage our environmental data, allowing us to use this information to support our decision making, meet the growing demand for transparency, and set meaningful targets for continuous improvement in environmental performance. We have also worked to ensure that environmental management is consistent and embedded across all processes in our business and through the lifecycle of our operations. To support our assets in managing their environmental performance, we incorporated environmental risk ownership and performance measurement into the safety maturity model (SMM), which focuses on leadership behaviours in the field and critical risk management. With our product groups, Health and Commercial teams, we started developing a roadmap for future-proofing our product stewardship to ensure that we continue to deliver products that safeguard the environment, health and safety of our communities and end-consumers. As environmental stewards, we focus on responsibly managing shared resources to protect the health, safety and livelihoods of local communities. We manage risk to minimise adverse environmental impacts from our operations and to sustain our shared ecosystems, planet and natural resources for future generations. In July 2022, the United Nations recognised “the right to a clean, healthy and sustainable environment” as a human right, further underlining our responsibilities to people and the planet. 2022 progress As a forum member of the Taskforce on Nature-related Financial Disclosures (TNFD), we are preparing to pilot the prototype risk management and opportunity disclosure framework at our Simandou site in Guinea. This framework will help businesses with the transparency and management of nature- related risks. We continue to provide feedback on the framework through our membership of the International Council on Mining and Metals (ICMM). We are also refreshing our approach to managing nature-related risk and developing a pathway to increasing our disclosures in line with TNFD. For more information about our nature-related disclosures, see our 2022 Sustainability Fact Book at riotinto.com/sustainabilityreporting. Water Water is a shared resource critical to sustaining biodiversity, people and economic prosperity. Increasingly disrupted weather patterns and more extreme weather events due to climate change, and a growing world population, mean efficiently managing water is more important than ever. The way we think about water and manage associated risks reflects the diversity of our operations and geographic locations. A small proportion of our assets operate in water- scarce regions, while others must remove excess water to allow safe mining operations. These are examples of the many potential risks we manage across the lifecycle of our diverse operations. We share water with the communities and nature surrounding our operations, so we aim to avoid permanent impacts on water resources by carefully managing the quality and quantity of the water we use and return to the environment. This means balancing the needs of our operations with those of the local communities and ecosystems. We do this while considering the impact of climate change, already felt in the level of rainfall and water security at some of our operations. We understand this responsibility extends beyond the life of our operations. To address this complexity, we adopt a catchment-level approach to developing potential solutions and managing our risks and impacts within our operations. We use baseline water stress as determined by the World Resource Institute to identify operational catchments of most concern. For more information visit our website www.riotinto.com/water Exploring nature-based solutions In 2022, we launched a new team of specialists focused on nature-based solutions, who will explore and invest in high-quality projects that implement internationally accepted social and environmental safeguards and contribute to reducing our carbon footprint. As part of this work, we will partner with host communities and other local stakeholders to learn from them and jointly find ways to improve the resilience and protect the biodiversity of land in and around our operations. For more information see our website.
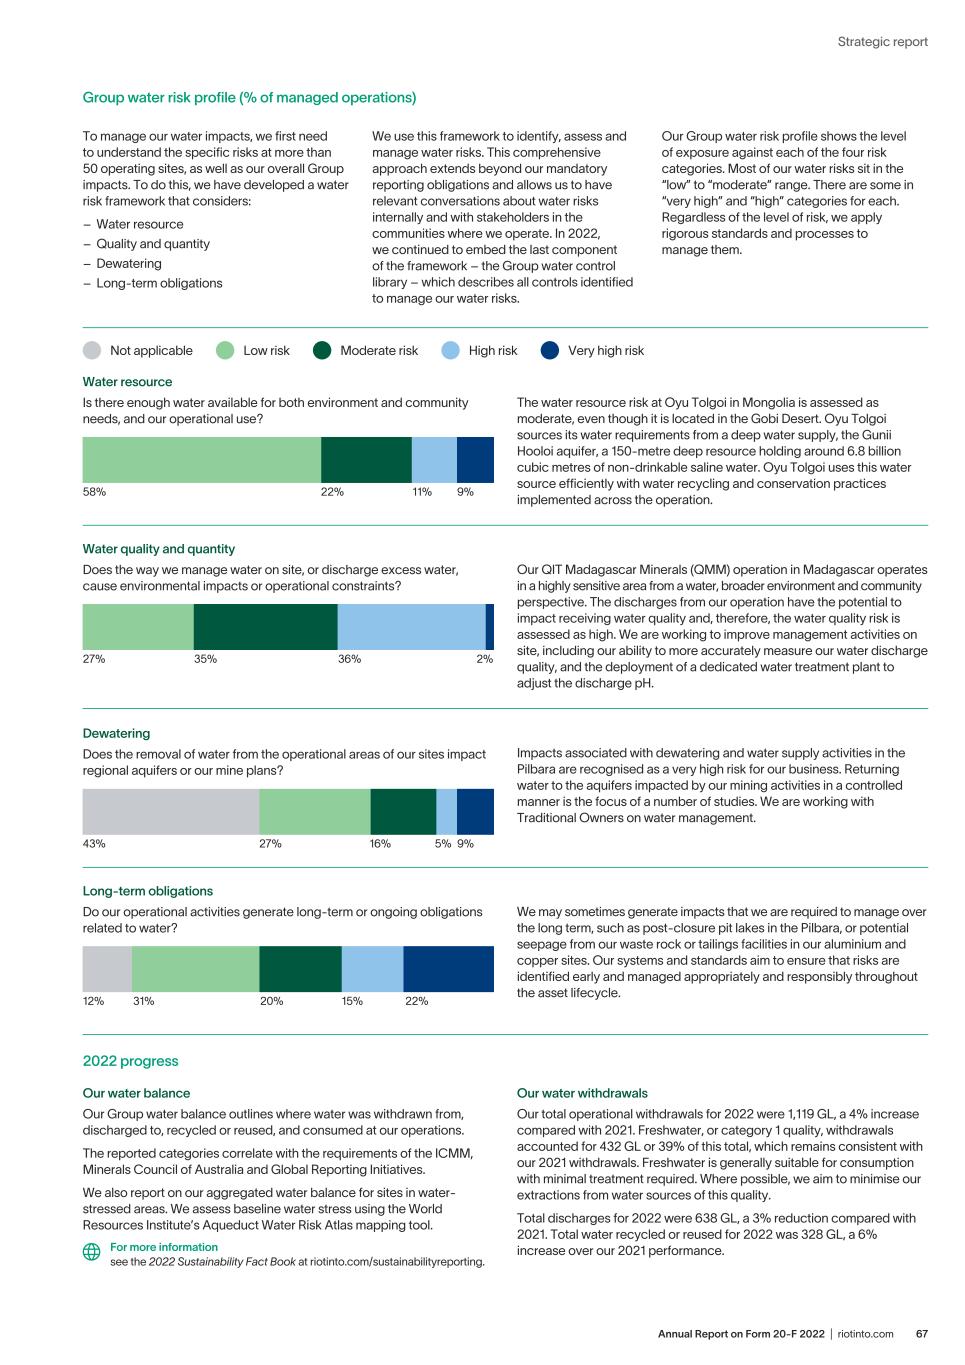
67Annual Report on Form 20-F 2022 | riotinto.com Strategic report 2022 progress Our water balance Our Group water balance outlines where water was withdrawn from, discharged to, recycled or reused, and consumed at our operations. The reported categories correlate with the requirements of the ICMM, Minerals Council of Australia and Global Reporting Initiatives. We also report on our aggregated water balance for sites in water- stressed areas. We assess baseline water stress using the World Resources Institute’s Aqueduct Water Risk Atlas mapping tool. For more information see the 2022 Sustainability Fact Book at riotinto.com/sustainabilityreporting. Group water risk profile (% of managed operations) The water resource risk at Oyu Tolgoi in Mongolia is assessed as moderate, even though it is located in the Gobi Desert. Oyu Tolgoi sources its water requirements from a deep water supply, the Gunii Hooloi aquifer, a 150-metre deep resource holding around 6.8 billion cubic metres of non-drinkable saline water. Oyu Tolgoi uses this water source efficiently with water recycling and conservation practices implemented across the operation. Water resource Is there enough water available for both environment and community needs, and our operational use? 9%11%22%58% Water quality and quantity Does the way we manage water on site, or discharge excess water, cause environmental impacts or operational constraints? Our QIT Madagascar Minerals (QMM) operation in Madagascar operates in a highly sensitive area from a water, broader environment and community perspective. The discharges from our operation have the potential to impact receiving water quality and, therefore, the water quality risk is assessed as high. We are working to improve management activities on site, including our ability to more accurately measure our water discharge quality, and the deployment of a dedicated water treatment plant to adjust the discharge pH. 2%36%35%27% Impacts associated with dewatering and water supply activities in the Pilbara are recognised as a very high risk for our business. Returning water to the aquifers impacted by our mining activities in a controlled manner is the focus of a number of studies. We are working with Traditional Owners on water management. Dewatering Does the removal of water from the operational areas of our sites impact regional aquifers or our mine plans? 5% 9%16%27%43% Low risk Moderate risk High risk Very high riskNot applicable We may sometimes generate impacts that we are required to manage over the long term, such as post-closure pit lakes in the Pilbara, or potential seepage from our waste rock or tailings facilities in our aluminium and copper sites. Our systems and standards aim to ensure that risks are identified early and managed appropriately and responsibly throughout the asset lifecycle. Long-term obligations Do our operational activities generate long-term or ongoing obligations related to water? 15% 22%20%31%12% Our water withdrawals Our total operational withdrawals for 2022 were 1,119 GL, a 4% increase compared with 2021. Freshwater, or category 1 quality, withdrawals accounted for 432 GL or 39% of this total, which remains consistent with our 2021 withdrawals. Freshwater is generally suitable for consumption with minimal treatment required. Where possible, we aim to minimise our extractions from water sources of this quality. Total discharges for 2022 were 638 GL, a 3% reduction compared with 2021. Total water recycled or reused for 2022 was 328 GL, a 6% increase over our 2021 performance. To manage our water impacts, we first need to understand the specific risks at more than 50 operating sites, as well as our overall Group impacts. To do this, we have developed a water risk framework that considers: – Water resource – Quality and quantity – Dewatering – Long-term obligations We use this framework to identify, assess and manage water risks. This comprehensive approach extends beyond our mandatory reporting obligations and allows us to have relevant conversations about water risks internally and with stakeholders in the communities where we operate. In 2022, we continued to embed the last component of the framework – the Group water control library – which describes all controls identified to manage our water risks. Our Group water risk profile shows the level of exposure against each of the four risk categories. Most of our water risks sit in the “low” to “moderate” range. There are some in “very high” and “high” categories for each. Regardless of the level of risk, we apply rigorous standards and processes to manage them.
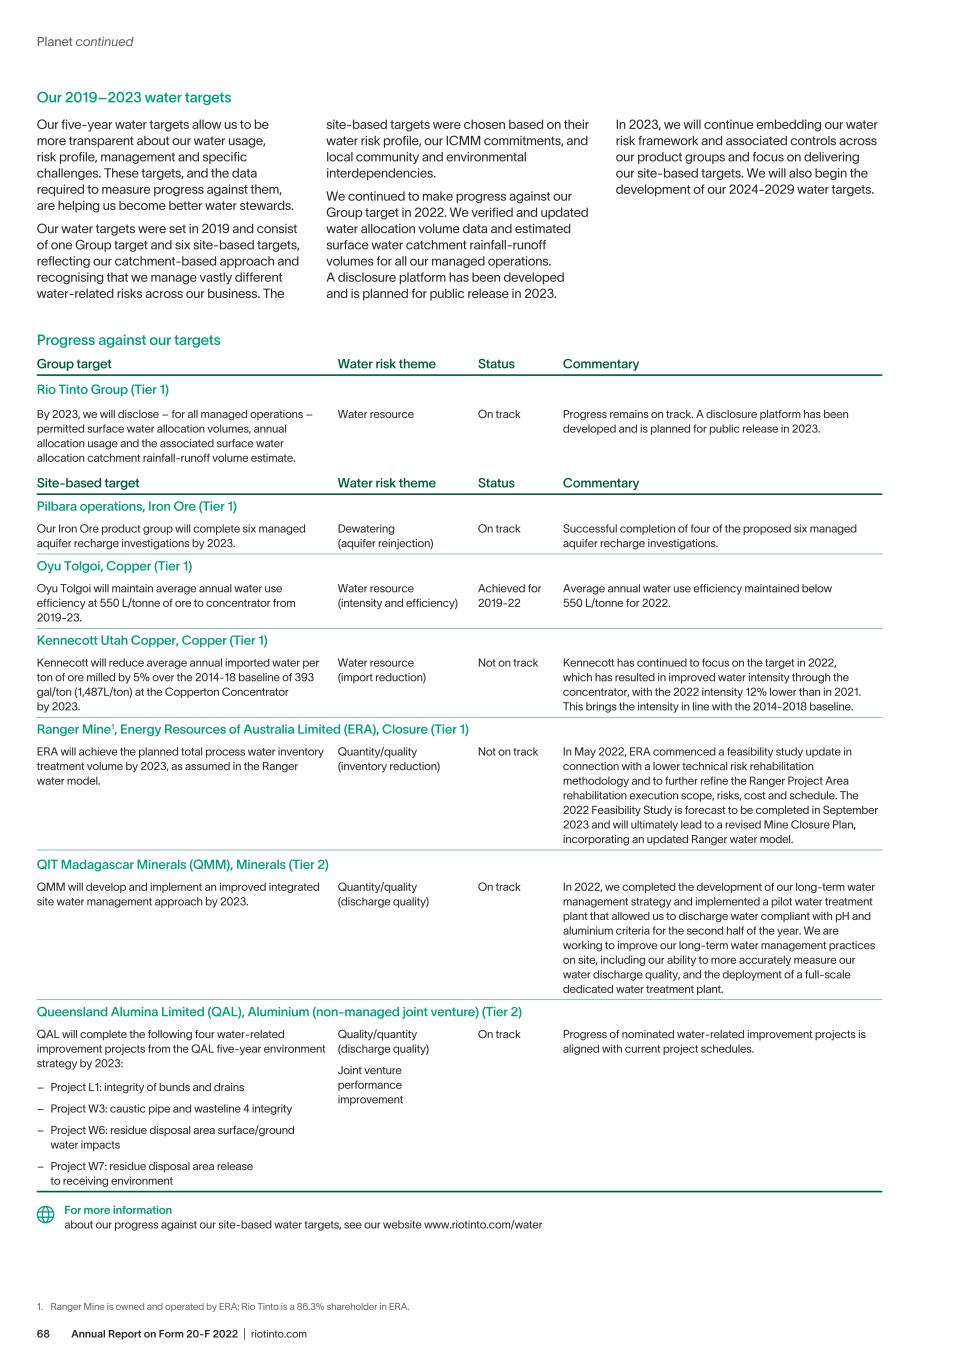
Annual Report on Form 20-F 2022 | riotinto.com68 Our five-year water targets allow us to be more transparent about our water usage, risk profile, management and specific challenges. These targets, and the data required to measure progress against them, are helping us become better water stewards. Our water targets were set in 2019 and consist of one Group target and six site-based targets, reflecting our catchment-based approach and recognising that we manage vastly different water-related risks across our business. The site-based targets were chosen based on their water risk profile, our ICMM commitments, and local community and environmental interdependencies. We continued to make progress against our Group target in 2022. We verified and updated water allocation volume data and estimated surface water catchment rainfall-runoff volumes for all our managed operations. A disclosure platform has been developed and is planned for public release in 2023. In 2023, we will continue embedding our water risk framework and associated controls across our product groups and focus on delivering our site-based targets. We will also begin the development of our 2024-2029 water targets. Our 2019–2023 water targets Planet continued Progress against our targets Group target Water risk theme Status Commentary Rio Tinto Group (Tier 1) By 2023, we will disclose – for all managed operations – permitted surface water allocation volumes, annual allocation usage and the associated surface water allocation catchment rainfall-runoff volume estimate. Water resource On track Progress remains on track. A disclosure platform has been developed and is planned for public release in 2023. Site-based target Water risk theme Status Commentary Pilbara operations, Iron Ore (Tier 1) Our Iron Ore product group will complete six managed aquifer recharge investigations by 2023. Dewatering (aquifer reinjection) On track Successful completion of four of the proposed six managed aquifer recharge investigations. Oyu Tolgoi, Copper (Tier 1) Oyu Tolgoi will maintain average annual water use efficiency at 550 L/tonne of ore to concentrator from 2019-23. Water resource (intensity and efficiency) Achieved for 2019-22 Average annual water use efficiency maintained below 550 L/tonne for 2022. Kennecott Utah Copper, Copper (Tier 1) Kennecott will reduce average annual imported water per ton of ore milled by 5% over the 2014-18 baseline of 393 gal/ton (1,487L/ton) at the Copperton Concentrator by 2023. Water resource (import reduction) Not on track Kennecott has continued to focus on the target in 2022, which has resulted in improved water intensity through the concentrator, with the 2022 intensity 12% lower than in 2021. This brings the intensity in line with the 2014-2018 baseline. Ranger Mine1, Energy Resources of Australia Limited (ERA), Closure (Tier 1) ERA will achieve the planned total process water inventory treatment volume by 2023, as assumed in the Ranger water model. Quantity/quality (inventory reduction) Not on track In May 2022, ERA commenced a feasibility study update in connection with a lower technical risk rehabilitation methodology and to further refine the Ranger Project Area rehabilitation execution scope, risks, cost and schedule. The 2022 Feasibility Study is forecast to be completed in September 2023 and will ultimately lead to a revised Mine Closure Plan, incorporating an updated Ranger water model. QIT Madagascar Minerals (QMM), Minerals (Tier 2) QMM will develop and implement an improved integrated site water management approach by 2023. Quantity/quality (discharge quality) On track In 2022, we completed the development of our long-term water management strategy and implemented a pilot water treatment plant that allowed us to discharge water compliant with pH and aluminium criteria for the second half of the year. We are working to improve our long-term water management practices on site, including our ability to more accurately measure our water discharge quality, and the deployment of a full-scale dedicated water treatment plant. Queensland Alumina Limited (QAL), Aluminium (non-managed joint venture) (Tier 2) QAL will complete the following four water-related improvement projects from the QAL five-year environment strategy by 2023: – Project L1: integrity of bunds and drains – Project W3: caustic pipe and wasteline 4 integrity – Project W6: residue disposal area surface/ground water impacts – Project W7: residue disposal area release to receiving environment Quality/quantity (discharge quality) Joint venture performance improvement On track Progress of nominated water-related improvement projects is aligned with current project schedules. For more information about our progress against our site-based water targets, see our website www.riotinto.com/water 1. Ranger Mine is owned and operated by ERA; Rio Tinto is a 86.3% shareholder in ERA.
69Annual Report on Form 20-F 2022 | riotinto.com Strategic report Biodiversity improved geo-spatial data for our assets, ensuring the protection of sensitive areas in proximity to our activities. As a founding partner of UNEP WCMC’s 19-year-old Proteus Partnership, and aligned with our drive to build our internal capability, we continued to deliver biodiversity training to employees across the business. In 2022, we prioritised QIT Madagascar Minerals (QMM), Simandou and our Commercial team in China to receive biodiversity training, which we delivered in their respective languages. We continue to innovate to help us become better environmental stewards. At QMM and Simandou, we have begun assessing the feasibility of using new environmental DNA technology to help us understand the full scope of species in and around our operations, allowing for more tailored and effective mitigation measures. In 2023, we are looking to expand this approach according to our sites’ risk prioritisation. At our Weipa operations in Australia, we trialled machine learning to help us with monitoring by replicating human identification of the endangered Palm Cockatoo, freeing up resources for increased conservation work. We also invested C$2.67 million to support the Saguenay Fjord Ecosystem Research Group in Quebec, Canada, which brings together researchers and professionals from INREST1, Université du Québec à Chicoutimi, and Université Laval. The group will document and understand the factors that influence the Saguenay Fjord ecosystem, which is both a unique natural ecosystem and a crucial waterway for the economy of the Saguenay– Lac-Saint-Jean region and the province of Quebec. This knowledge will help keep our shipping operations running in a way that is safe for the Saguenay ecosystem. In 2022, we completed an independent review of the monitoring programmes of our high- priority biodiversity sites, which included ensuring that management plans and actions adequately address risks to nature. At the Simandou project in Guinea, and drawing on data collected over the last decade, in 2022 we continued updating our baseline assessments. In the second quarter of 2023, we will publish the revised Environmental and Social Impact Assessment. The interconnected impacts of climate change and biodiversity loss pose significant risks to people and the environment. We recognise our responsibility to effectively mitigate the impact of our operations on nature, and we are mindful of our own dependence on healthy ecosystems to run a successful business. Healthy natural environments with functioning ecosystems are key to climate resilience. They also provide important services to the communities where we operate and our business. We are committed to protecting biodiversity and our ambition is to achieve no net loss. This means striking a balance between negative impacts on biodiversity and positive outcomes achieved through mitigation. 2022 progress We continue to assess the sensitivity of our planned activities using combined global datasets of threatened species and conservation and protected areas, developed by the UN Environment Programme World Conservation Monitoring Centre (UNEP WCMC). This helps inform our risk-prioritisation of assets in areas of high biodiversity, including exploration and project sites, and supports our allocation of resources. In 2022, we enhanced the resolution of our assessments with Land We are temporary custodians of the land on which we operate, and we aim to rehabilitate the land as soon as it becomes available. 2022 progress In 2022, we rehabilitated 16 square kilometres of land, mostly at our bauxite mines in Australia, mineral sands mines in South Africa and Madagascar, and at our iron ore mines and exploration areas in the Pilbara, Western Australia. In the southern Gobi Desert in Mongolia, following successful rehabilitation of the Oyu Tolgoi to Khanbogd Soum old dirt road, we relinquished around 50 hectares of land, returning the land back to its original use of grazing by the local herders. Through the development of our environmental risk control libraries, we are also strengthening how we plan for and implement progressive rehabilitation. In 2022, our land footprint – total disturbed area – was 3,810 square kilometres, an increase of 75 square kilometres compared to 2021. This includes all disturbances to our operating assets and activities, such as exploration activities, smelters, mines and supporting infrastructure. Our rehabilitation teams partner with research centres and universities to refine rehabilitation approaches and improve outcomes. In 2022, as a forum member of the Australian-led Cooperative Research Centre for Transformations in Mining Economies (CRC TiME), we contributed to the coordinated investment into innovative research that addresses the complex challenges underpinning mine closure and relinquishment. For more information about our closure work, see page 71. We also completed several trials using satellite- derived data to determine if we could measure rehabilitation performance at a global scale, while at the same time complementing the monitoring data collected locally. In addition, 16 of our operations completed rehabilitation trials to improve seed germination, erosion and topsoil quality. Waste 2022 progress Waste and residues from our operational activities are key areas of environmental risk management. In 2022, we continued to focus on managing potential contamination from these sources. This included working to remove all use of PFAS (perfluoroalkyl and polyfluoroalkyl substances) in fire-suppression systems at our sites by the end of 2022. Although we removed the use of PFAS in the majority of these systems, in some instances this transition will not be completed until 2024 at the earliest. This is due to delays in starting the retrofit or overhaul of major pieces of infrastructure, as well as challenges in sourcing alternative fluorine free substances for use in fire-suppression systems in some jurisdictions. At some of our long-life assets, we continually evaluate past waste management practices that have led to a need for remediation in the present. For example, in 2022, we remained focused on finding additional ways to transform waste and by-products from our aluminium operations into materials for use in the construction and agricultural sectors. We have assets with chemically reactive mineral waste risks, which we manage by conducting independent reviews to assess the effectiveness of our risk management programmes and identify areas for improvement. In 2022, we conducted reviews at Yarwun in Australia, Oyu Tolgoi in Mongolia, and at Kennecott, Boron, Resolution Copper and the Ridgeway closed site in the US. For more information about tailings, see page 71. 1. Northern Institute for Research in Environment and Occupational Health and Safety.
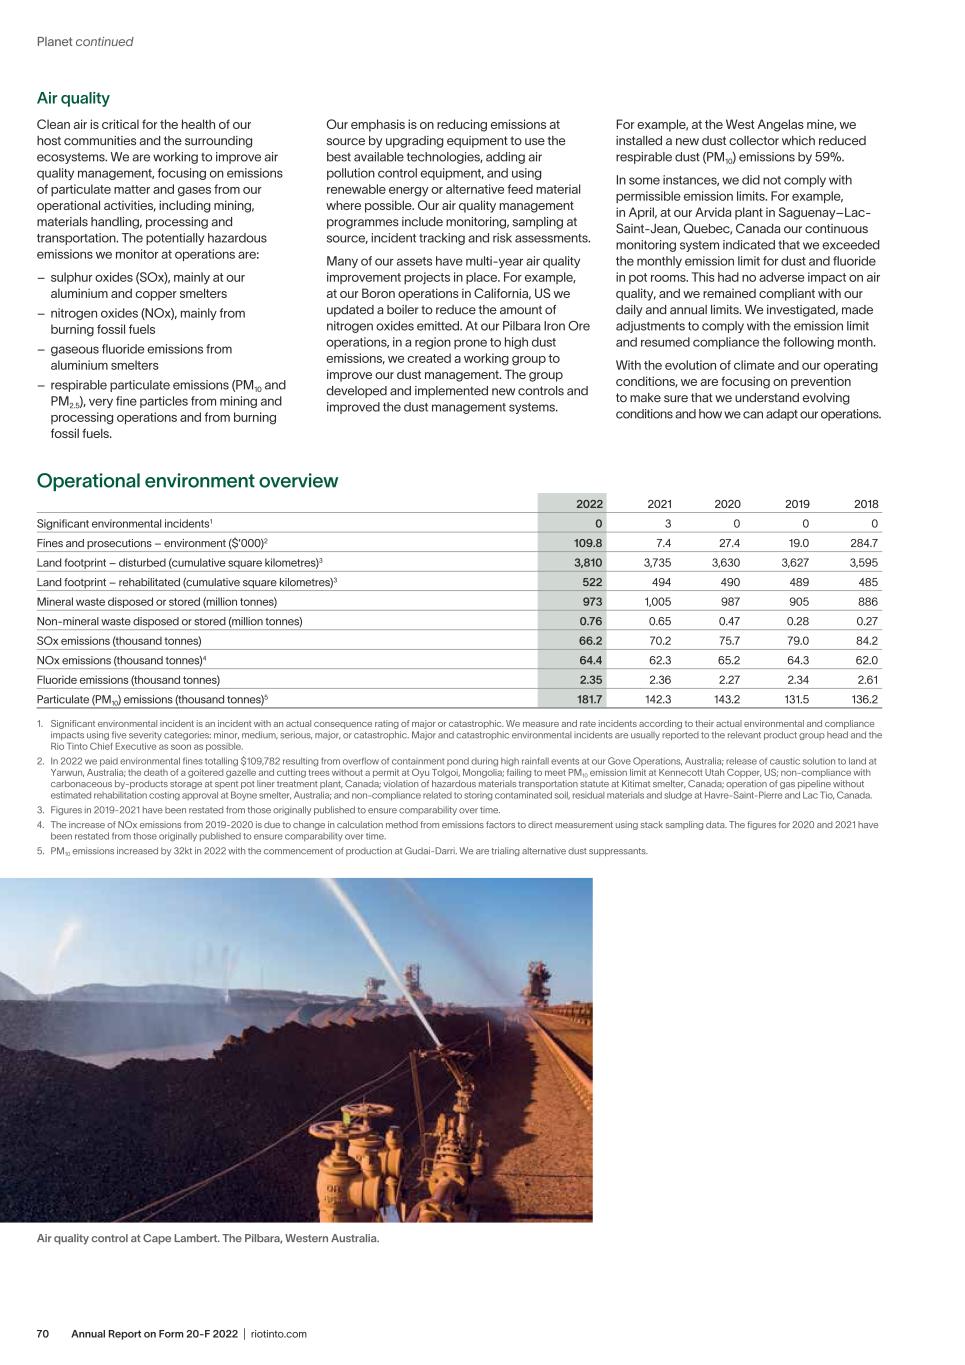
Annual Report on Form 20-F 2022 | riotinto.com70 Air quality Our emphasis is on reducing emissions at source by upgrading equipment to use the best available technologies, adding air pollution control equipment, and using renewable energy or alternative feed material where possible. Our air quality management programmes include monitoring, sampling at source, incident tracking and risk assessments. Many of our assets have multi-year air quality improvement projects in place. For example, at our Boron operations in California, US we updated a boiler to reduce the amount of nitrogen oxides emitted. At our Pilbara Iron Ore operations, in a region prone to high dust emissions, we created a working group to improve our dust management. The group developed and implemented new controls and improved the dust management systems. Operational environment overview 2022 2021 2020 2019 2018 Significant environmental incidents1 0 3 0 0 0 Fines and prosecutions – environment ($’000)2 109.8 7.4 27.4 19.0 284.7 Land footprint – disturbed (cumulative square kilometres)3 3,810 3,735 3,630 3,627 3,595 Land footprint – rehabilitated (cumulative square kilometres)3 522 494 490 489 485 Mineral waste disposed or stored (million tonnes) 973 1,005 987 905 886 Non-mineral waste disposed or stored (million tonnes) 0.76 0.65 0.47 0.28 0.27 SOx emissions (thousand tonnes) 66.2 70.2 75.7 79.0 84.2 NOx emissions (thousand tonnes)4 64.4 62.3 65.2 64.3 62.0 Fluoride emissions (thousand tonnes) 2.35 2.36 2.27 2.34 2.61 Particulate (PM10) emissions (thousand tonnes)5 181.7 142.3 143.2 131.5 136.2 1. Significant environmental incident is an incident with an actual consequence rating of major or catastrophic. We measure and rate incidents according to their actual environmental and compliance impacts using five severity categories: minor, medium, serious, major, or catastrophic. Major and catastrophic environmental incidents are usually reported to the relevant product group head and the Rio Tinto Chief Executive as soon as possible. 2. In 2022 we paid environmental fines totalling $109,782 resulting from overflow of containment pond during high rainfall events at our Gove Operations, Australia; release of caustic solution to land at Yarwun, Australia; the death of a goitered gazelle and cutting trees without a permit at Oyu Tolgoi, Mongolia; failing to meet PM10 emission limit at Kennecott Utah Copper, US; non-compliance with carbonaceous by-products storage at spent pot liner treatment plant, Canada; violation of hazardous materials transportation statute at Kitimat smelter, Canada; operation of gas pipeline without estimated rehabilitation costing approval at Boyne smelter, Australia; and non-compliance related to storing contaminated soil, residual materials and sludge at Havre-Saint-Pierre and Lac Tio, Canada. 3. Figures in 2019-2021 have been restated from those originally published to ensure comparability over time. 4. The increase of NOx emissions from 2019-2020 is due to change in calculation method from emissions factors to direct measurement using stack sampling data. The figures for 2020 and 2021 have been restated from those originally published to ensure comparability over time. 5. PM10 emissions increased by 32kt in 2022 with the commencement of production at Gudai-Darri. We are trialing alternative dust suppressants. Planet continued Clean air is critical for the health of our host communities and the surrounding ecosystems. We are working to improve air quality management, focusing on emissions of particulate matter and gases from our operational activities, including mining, materials handling, processing and transportation. The potentially hazardous emissions we monitor at operations are: – sulphur oxides (SOx), mainly at our aluminium and copper smelters – nitrogen oxides (NOx), mainly from burning fossil fuels – gaseous fluoride emissions from aluminium smelters – respirable particulate emissions (PM10 and PM2.5), very fine particles from mining and processing operations and from burning fossil fuels. For example, at the West Angelas mine, we installed a new dust collector which reduced respirable dust (PM10) emissions by 59%. In some instances, we did not comply with permissible emission limits. For example, in April, at our Arvida plant in Saguenay–Lac- Saint-Jean, Quebec, Canada our continuous monitoring system indicated that we exceeded the monthly emission limit for dust and fluoride in pot rooms. This had no adverse impact on air quality, and we remained compliant with our daily and annual limits. We investigated, made adjustments to comply with the emission limit and resumed compliance the following month. With the evolution of climate and our operating conditions, we are focusing on prevention to make sure that we understand evolving conditions and how we can adapt our operations. Air quality control at Cape Lambert. The Pilbara, Western Australia.
71Annual Report on Form 20-F 2022 | riotinto.com Strategic report Mining and metals practices 90+ legacy assets managed within our portfolio 38 of our assets have asset closure strategies in place We played an active role in the ICMM tailings working group in 2022, which published key guidance materials to support the safe, responsible management of tailings with the goal of eliminating fatalities and catastrophic events. These include: – The Tailings Reduction Roadmap, which provides strategic direction on how to accelerate the development and adoption of technologies to reduce tailings production. – The Tailings Management Good Practice Guide, which provides guidance on good governance and engineering practices to support continuous improvement in tailings management. – The Good Practice Guide training materials, designed to build awareness and capability in good governance and tailings engineering practices. In 2022, we also: – Conducted multi-disciplinary risk assessments for all our “very high” and “extreme” consequence facilities. – Continued to support the Future Tails partnership, a collaboration between Rio Tinto, BHP and the University of Western Australia (UWA). In 2022, the Graduate Certificate in Tailings Management at UWA had 106 enrolled students from 12 countries in micro-credentialled units. Two PhD candidates also commenced their research programmes in 2022. – Partnered with BHP on tailings filtration solutions at very high throughputs for copper operations, which supports our goal of increasing water recovery and recycling. – Continued to regularly convene the Tailings Management Committee with our designated Accountable Executives, which provides coordinated governance of tailings management practices across the Group. Tailings We engage with stakeholders throughout the lifecycle of our tailings storage facilities, from design to closure. We also collaborate closely with external bodies to improve the way tailings are managed across our industry. We manage 95 tailings storage facilities (TSFs) across our global assets. There are a further 43 non-managed TSFs. Altogether, there are 57 active TSFs, 39 are inactive and 42 are closed. There have been no external wall failures at any of our TSFs for more than 20 years. We work through technical committees and joint venture relationships to support leading practice in tailings management. Our full tailings disclosure is available on our website riotinto. com/tailings and we periodically update the list of TSFs to reflect operational and ownership changes, including changes due to the transition to closure or remediation obligations for legacy assets and reclassification of facilities. Our list also includes links to TSFs managed by our joint venture partners. Our facilities are regulated and permitted and have been managed for many years to comply with local laws, regulations, permits, licences and other requirements. Tailings management has been included in the Group risk register since 2010, and our Group safety standard for tailings and water storage facilities has been in place since 2015. Our internal assurance processes verify that our managed TSFs operate in accordance with this standard, which we updated in 2020. Our operational TSFs have emergency response plans – tested through training exercises in collaboration with stakeholders such as local emergency services – and follow strict business resilience and communications protocols. 2022 progress In December 2022, we updated previously disclosed information on our global TSFs. All facilities were assigned a consequence classification in accordance with the regulatory or industry body that oversees tailings in each region or jurisdiction. Additional technical data from updated downstream impact assessments, required under the Global Industry Standard on Tailings Management (GISTM) and our own internal standard for tailings and water storage facilities, resulted in a modification to hazard classifications of some facilities. Consequence classifications are not ratings of the condition of a facility or the likelihood of failure; instead, they rate the potential consequence if the facility were to fail. Since the launch of GISTM in August 2020, we have continued work on our implementation plan. We have completed a gap analysis against our internal tailings management, environment, and communities and social performance standards, and developed improvement plans to close identified gaps. We are working towards having all TSFs with a potential consequence rated “extreme” or “very high” in conformance with GISTM by August 2023, with all remaining facilities in conformance by August 2025. Closure Through safe and responsible asset closure, we are working to deliver shared benefits for host communities, employees and investors; positive ESG outcomes; and innovative solutions that minimise long-term liabilities. We do this in partnership with our stakeholders, embedding closure considerations throughout the lifespan of our assets – in the way we design, build, run, close and transition them. As temporary stewards of the land where we operate, we partner with our stakeholders to develop a shared vision for the future of the lands and host communities. Balancing environmental, financial and social considerations, we look for opportunities associated with progressive closure, remediation and repurposing, and, where appropriate, long-term monitoring and maintenance. At the end of 2022, closure provisions on our balance sheet totalled $15.8 billion (2021: $14.5 billion). 2022 progress Argyle diamond mine We continue to close the Argyle diamond mine in Western Australia. In 2022, we completed the high-reach demolition of structures and processing equipment on site and progressed reprofiling and rehabilitation works. We are engaging with Miriwoong and Gija Traditional Owners on how to best support and expand meaningful participation as we progress closure activities. Gove refinery and residue disposal areas While mining continues at our Gove bauxite operations in the Northern Territory in Australia, we are implementing progressive closure activities, including the decommissioning and demolition of the refinery and progressive capping of the bauxite residue disposal areas. In 2022, we completed the relocation of essential services, including electrical and water, from the refinery footprint to begin safe demolition. This work supports the security of services for the town of Nhulunbuy post closure. Ranger uranium mine Energy Resources of Australia (ERA) is rehabilitating the Ranger uranium mine in the Northern Territory, Australia. We are committed to the successful rehabilitation of Ranger to a standard that will establish an environment similar to the adjacent Kakadu National Park, a World Heritage site. We acknowledge the Traditional Owners, the Mirarr people’s, consistent opposition to developing the Jabiluka uranium deposit and restate our full support for ERA’s commitment that the deposit would never be developed without the Mirarr people’s consent. Our utmost priority and commitment is to the rehabilitation of the Ranger Project Area in a way that is consistent with the wishes of the Mirarr people.
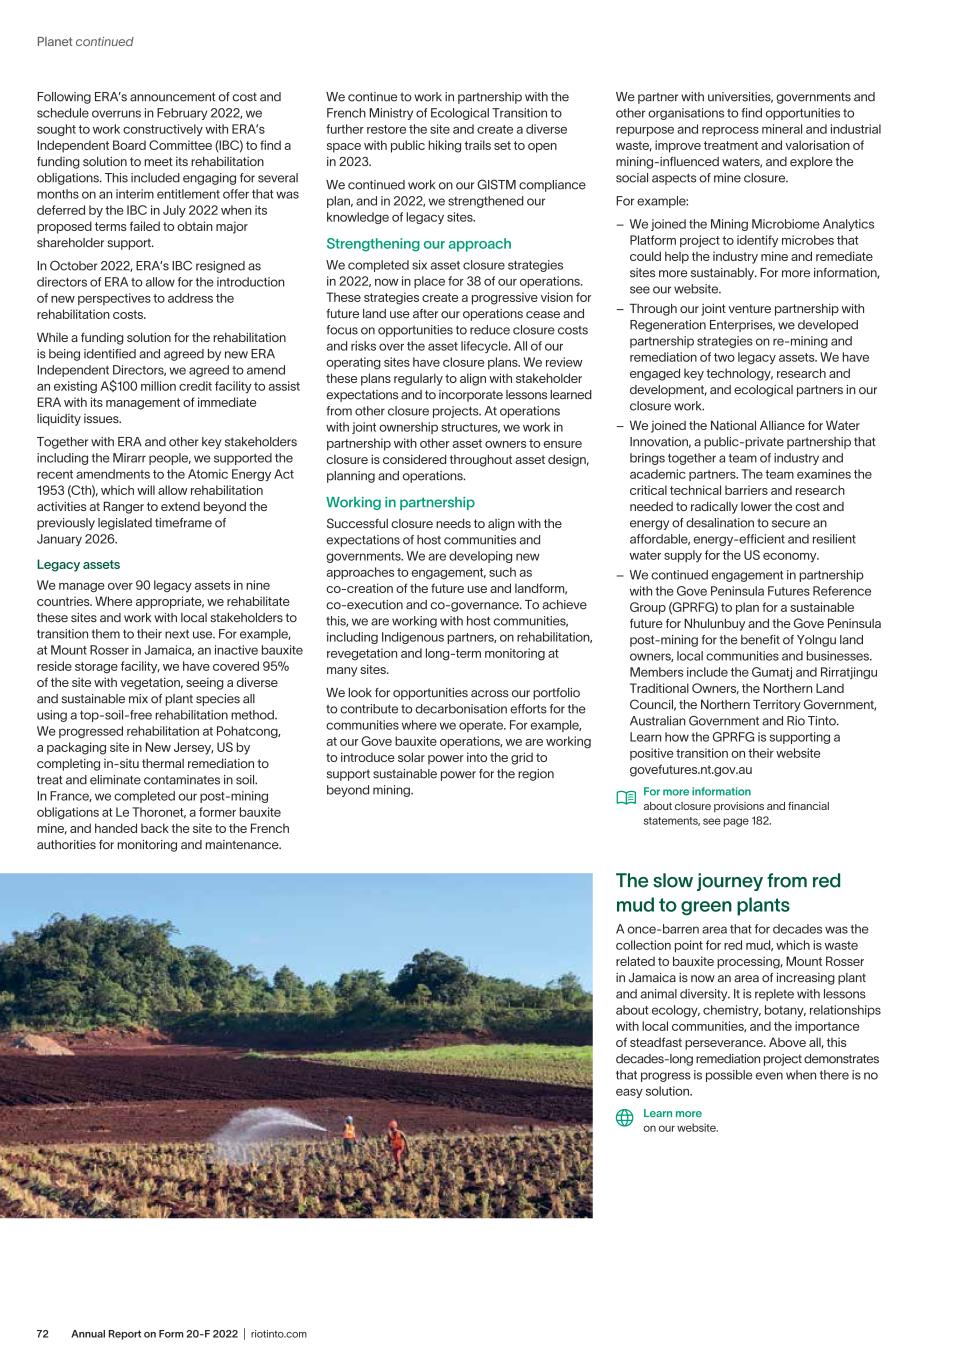
Annual Report on Form 20-F 2022 | riotinto.com72 We partner with universities, governments and other organisations to find opportunities to repurpose and reprocess mineral and industrial waste, improve treatment and valorisation of mining-influenced waters, and explore the social aspects of mine closure. For example: – We joined the Mining Microbiome Analytics Platform project to identify microbes that could help the industry mine and remediate sites more sustainably. For more information, see our website. – Through our joint venture partnership with Regeneration Enterprises, we developed partnership strategies on re-mining and remediation of two legacy assets. We have engaged key technology, research and development, and ecological partners in our closure work. – We joined the National Alliance for Water Innovation, a public-private partnership that brings together a team of industry and academic partners. The team examines the critical technical barriers and research needed to radically lower the cost and energy of desalination to secure an affordable, energy-efficient and resilient water supply for the US economy. – We continued engagement in partnership with the Gove Peninsula Futures Reference Group (GPRFG) to plan for a sustainable future for Nhulunbuy and the Gove Peninsula post-mining for the benefit of Yolngu land owners, local communities and businesses. Members include the Gumatj and Rirratjingu Traditional Owners, the Northern Land Council, the Northern Territory Government, Australian Government and Rio Tinto. Learn how the GPRFG is supporting a positive transition on their website govefutures.nt.gov.au For more information about closure provisions and financial statements, see page 182. Following ERA’s announcement of cost and schedule overruns in February 2022, we sought to work constructively with ERA’s Independent Board Committee (IBC) to find a funding solution to meet its rehabilitation obligations. This included engaging for several months on an interim entitlement offer that was deferred by the IBC in July 2022 when its proposed terms failed to obtain major shareholder support. In October 2022, ERA’s IBC resigned as directors of ERA to allow for the introduction of new perspectives to address the rehabilitation costs. While a funding solution for the rehabilitation is being identified and agreed by new ERA Independent Directors, we agreed to amend an existing A$100 million credit facility to assist ERA with its management of immediate liquidity issues. Together with ERA and other key stakeholders including the Mirarr people, we supported the recent amendments to the Atomic Energy Act 1953 (Cth), which will allow rehabilitation activities at Ranger to extend beyond the previously legislated timeframe of January 2026. Legacy assets We manage over 90 legacy assets in nine countries. Where appropriate, we rehabilitate these sites and work with local stakeholders to transition them to their next use. For example, at Mount Rosser in Jamaica, an inactive bauxite reside storage facility, we have covered 95% of the site with vegetation, seeing a diverse and sustainable mix of plant species all using a top-soil-free rehabilitation method. We progressed rehabilitation at Pohatcong, a packaging site in New Jersey, US by completing in-situ thermal remediation to treat and eliminate contaminates in soil. In France, we completed our post-mining obligations at Le Thoronet, a former bauxite mine, and handed back the site to the French authorities for monitoring and maintenance. We continue to work in partnership with the French Ministry of Ecological Transition to further restore the site and create a diverse space with public hiking trails set to open in 2023. We continued work on our GISTM compliance plan, and in 2022, we strengthened our knowledge of legacy sites. Strengthening our approach We completed six asset closure strategies in 2022, now in place for 38 of our operations. These strategies create a progressive vision for future land use after our operations cease and focus on opportunities to reduce closure costs and risks over the asset lifecycle. All of our operating sites have closure plans. We review these plans regularly to align with stakeholder expectations and to incorporate lessons learned from other closure projects. At operations with joint ownership structures, we work in partnership with other asset owners to ensure closure is considered throughout asset design, planning and operations. Working in partnership Successful closure needs to align with the expectations of host communities and governments. We are developing new approaches to engagement, such as co-creation of the future use and landform, co-execution and co-governance. To achieve this, we are working with host communities, including Indigenous partners, on rehabilitation, revegetation and long-term monitoring at many sites. We look for opportunities across our portfolio to contribute to decarbonisation efforts for the communities where we operate. For example, at our Gove bauxite operations, we are working to introduce solar power into the grid to support sustainable power for the region beyond mining. Planet continued The slow journey from red mud to green plants A once-barren area that for decades was the collection point for red mud, which is waste related to bauxite processing, Mount Rosser in Jamaica is now an area of increasing plant and animal diversity. It is replete with lessons about ecology, chemistry, botany, relationships with local communities, and the importance of steadfast perseverance. Above all, this decades-long remediation project demonstrates that progress is possible even when there is no easy solution. Learn more on our website.
73Annual Report on Form 20-F 2022 | riotinto.com Strategic report Transparent, values-based and ethical business The way we do business is increasingly important to our investors, host communities, workforce and broader society. They want to know that we conduct ourselves responsibly and that suppliers and customers across our value chain do so as well. To help us continue to run a transparent, values-based and ethical business, in 2022 we updated our Code of Conduct – The Way We Work, which we launched internally in February 2023. We also trained 24,857 of our people in how to recognise and manage business integrity dilemmas and further developed our confidential reporting programme myVoice. Team meeting at the Brisbane corporate hub, Australia.
Annual Report on Form 20-F 2022 | riotinto.com74 Transparent, values-based and ethical business continued We want our people and partners to uphold the highest standard of integrity, act ethically and do the right thing. Sometimes this requires courage, which is one of our three values. 2022 progress Business integrity During 2022, we delivered several compliance programme improvements to ensure we continued to be in line with our current business integrity risks. We are exposed to reputational, financial and non-financial risk through the actions of third parties we engage with. We are updating our Third-Party Risk Management programme so we can optimise risk assessments, processes, systems and tools, and improve integration with other associated business processes. We are also managing our risk exposure to economic sanctions, monitoring new sanctions and continuing our ongoing assessment of our supply chains. In 2022, we focused on how we monitor key fraud controls. We conducted a fraud risk assessment and reviewed the current measures we have in place to prevent and detect fraud risk. This will help us better understand the root causes of fraud and how we can improve our response. We also updated our data privacy standard, which sets out the minimum requirements for how to collect and process personal data. Our monitoring now covers requirements of the data privacy programme. Annual training We know that our reputation as a business that acts ethically and with integrity depends on the actions and decisions we make every day. We empower our people to seek guidance when faced with an ethical or business integrity dilemma – both to prevent incidents from occurring, and to protect them and others from harm. To help our workforce navigate grey areas and spot business integrity red flags, we have developed an online training course that challenges them to make ethical decisions through a number of interactive scenarios. Our online business integrity induction training provides all new joiners with an introduction to ethics and compliance as well as the tools they need to recognise and understand business integrity risks. In addition to online training, the Ethics and Compliance team provides ongoing targeted face-to-face sessions on key risk areas including bribery and corruption, data privacy and competition. 24,857 employees undertook compliance training in 2022 Code of Conduct In early 2023, we launched our updated Code of Conduct – The Way We Work, which is available on our website at www.riotinto.com. Our Code of Conduct will work as a central tool in reshaping our culture and it demonstrates what living our values of care, courage and curiosity should look like. The code sets out our commitment to conducting business with integrity and provides clarity about the behaviours we expect and why responsible business conduct matters. The new code is broader in scope than our previous code and reflects changes in both internal and societal expectations regarding business conduct. It will help our people reflect on the potential impacts our decisions may have on the business and others. Updates to our Code of Conduct will be made available on our website pursuant to relevant laws and regulations. myVoice, our confidential reporting programme We have continued to develop our confidential reporting programme myVoice, which is designed to help our people voice concerns about potential misconduct or improper behaviour. Our care for our people and our desire to understand contributing factors for misconduct sit at the core of this programme. The Business Conduct Office (BCO) is working to increase transparency and improve how we capture learnings from the myVoice programme by expanding the team to include a reporting and governance function. We continue to see an increase in reporting and we believe this means that more people are feeling comfortable to share their concerns. In 2022, we received 1,459 reports through the myVoice programme channels. Of these cases, 63% were substantiated, including 77 cases which were reports received in 2021. The BCO is currently implementing two key recommendations from the Everyday Respect Report that was released in February 2022. We are setting up a discrete unit of experts who will support and care for our people who have been impacted by harmful and disrespectful behaviours. The team will also be available to support leaders and human resources professionals in how to respond, and other people who have been affected by those behaviours. Separately we are also redesigning our investigation process to make sure it is trauma-informed, caring and people-centred. The BCO reports to our Chief Legal Officer, Governance & Corporate Affairs; the Board; and the Global Ethics and Compliance Committee. For more information about the Everyday Respect initiative, visit riotinto.com/everydayrespect. Ethics and compliance myVoice* case activity 2022 2021 2020 2019 2018 Number of reports 1,459 1,246 748 805 679 Number of reports per 1,000 employees 28.1 26 16.3 17.9 14.3 Substantiated claims (%) 63% 51% 42% 34% 34% * myVoice (introduced in 2021), replaced the programme formerly known as Talk to Peggy or Speak-OUT.
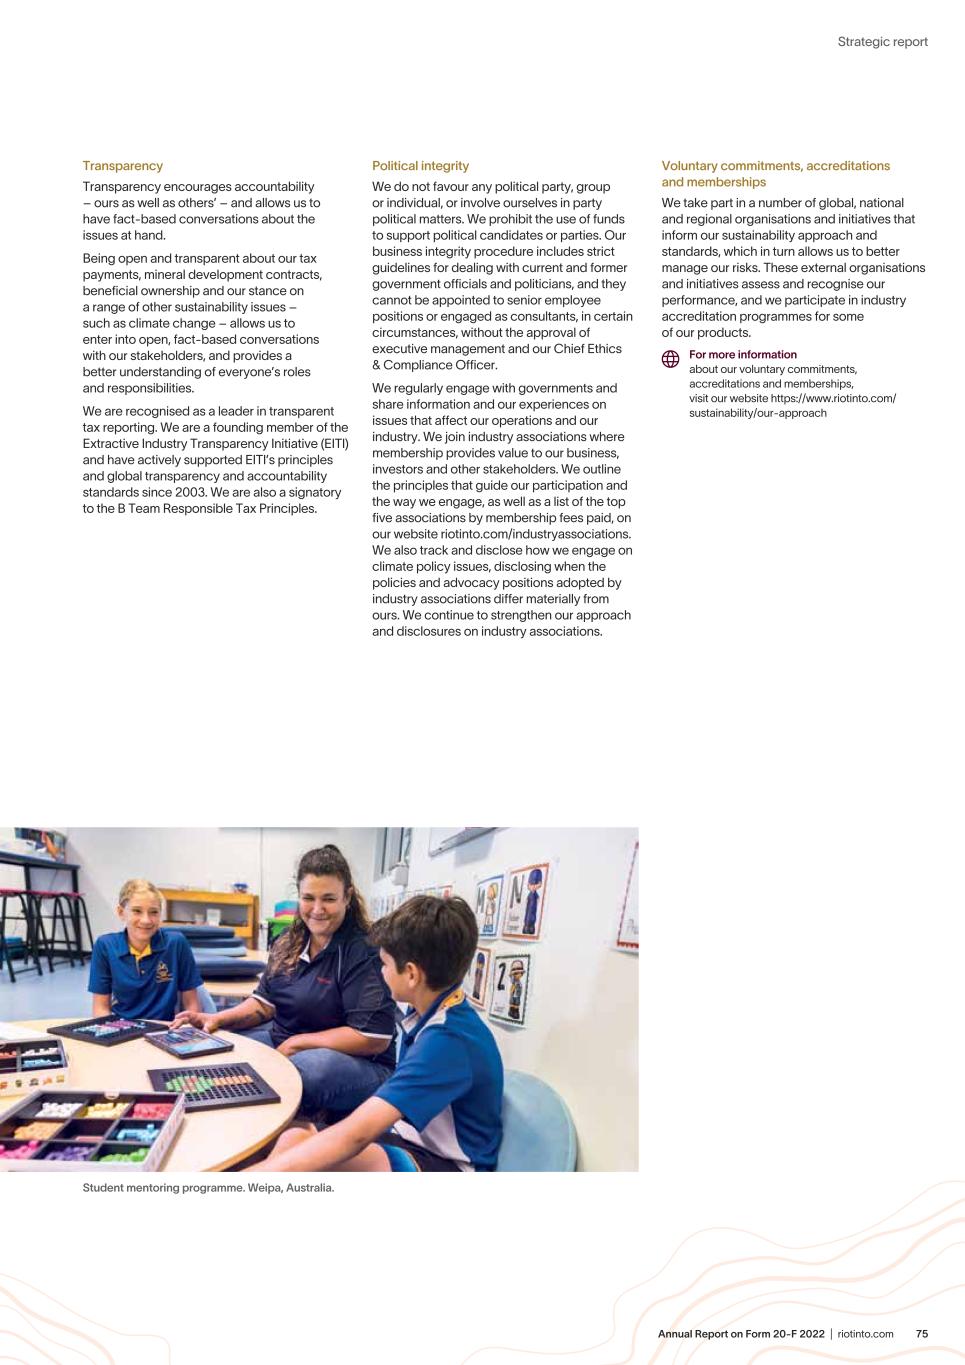
75Annual Report on Form 20-F 2022 | riotinto.com Strategic report Transparency Transparency encourages accountability – ours as well as others’ – and allows us to have fact-based conversations about the issues at hand. Being open and transparent about our tax payments, mineral development contracts, beneficial ownership and our stance on a range of other sustainability issues – such as climate change – allows us to enter into open, fact-based conversations with our stakeholders, and provides a better understanding of everyone’s roles and responsibilities. We are recognised as a leader in transparent tax reporting. We are a founding member of the Extractive Industry Transparency Initiative (EITI) and have actively supported EITI’s principles and global transparency and accountability standards since 2003. We are also a signatory to the B Team Responsible Tax Principles. Political integrity We do not favour any political party, group or individual, or involve ourselves in party political matters. We prohibit the use of funds to support political candidates or parties. Our business integrity procedure includes strict guidelines for dealing with current and former government officials and politicians, and they cannot be appointed to senior employee positions or engaged as consultants, in certain circumstances, without the approval of executive management and our Chief Ethics & Compliance Officer. We regularly engage with governments and share information and our experiences on issues that affect our operations and our industry. We join industry associations where membership provides value to our business, investors and other stakeholders. We outline the principles that guide our participation and the way we engage, as well as a list of the top five associations by membership fees paid, on our website riotinto.com/industryassociations. We also track and disclose how we engage on climate policy issues, disclosing when the policies and advocacy positions adopted by industry associations differ materially from ours. We continue to strengthen our approach and disclosures on industry associations. Voluntary commitments, accreditations and memberships We take part in a number of global, national and regional organisations and initiatives that inform our sustainability approach and standards, which in turn allows us to better manage our risks. These external organisations and initiatives assess and recognise our performance, and we participate in industry accreditation programmes for some of our products. For more information about our voluntary commitments, accreditations and memberships, visit our website https://www.riotinto.com/ sustainability/our-approach Student mentoring programme. Weipa, Australia.
Annual Report on Form 20-F 2022 | riotinto.com76 Risk management Taking risks responsibly is key to delivering our strategy in a way that creates value for our customers, shareholders, employees and partners. Our risk appetite Climate change and the low-carbon transition are at the heart of our strategy to strengthen our resilience and pursue new growth opportunities and partnerships. Partnering to decarbonise our assets Develop products and technologies to support our customers’ decarbonisation We partner with customers, competitors, suppliers, technology developers, governments and universities to find solutions. We aim to spend $400 million every year in research and development on the five components of our technology roadmap: health and safety, lightening our overall environmental footprint, supporting growth, decarbonising our business and our products, and improving productivity. Grow in materials that meet demand for energy transition We focus on excelling in development, and being the best operator in commodities essential for the drive to net zero. We continue to consider higher-risk jurisdictions and broadening our target commodities. We aim to spend up to $3 billion on growth capital every year, while maintaining capital discipline in pursuit of value-accretive opportunities. Our determination to be the best operator and have impeccable environmental, social and governance (ESG) credentials is underpinned by our zero tolerance for non-compliance with our operational procedures, laws and obligations. These expectations are outlined in our Group policies, standards and procedures, which are published on our website at riotinto.com/policies. Our targets are to reduce our Scope 1 and 2 emissions by 15% by 2025, and by 50% by 2030 (relative to 2018 levels) and reach net zero by 2050. We estimate that we will invest $7.5 billion in capital between 2022 and 2030 to deliver our decarbonisation strategy. When we evaluate our decarbonisation projects, we consider five elements: value, materiality of abatement, maturity of emission reduction, competitiveness versus internal and external benchmarks, and alignment with our net zero 2050 target. Sunrise at Yandicoogina. The Pilbara, Western Australia.
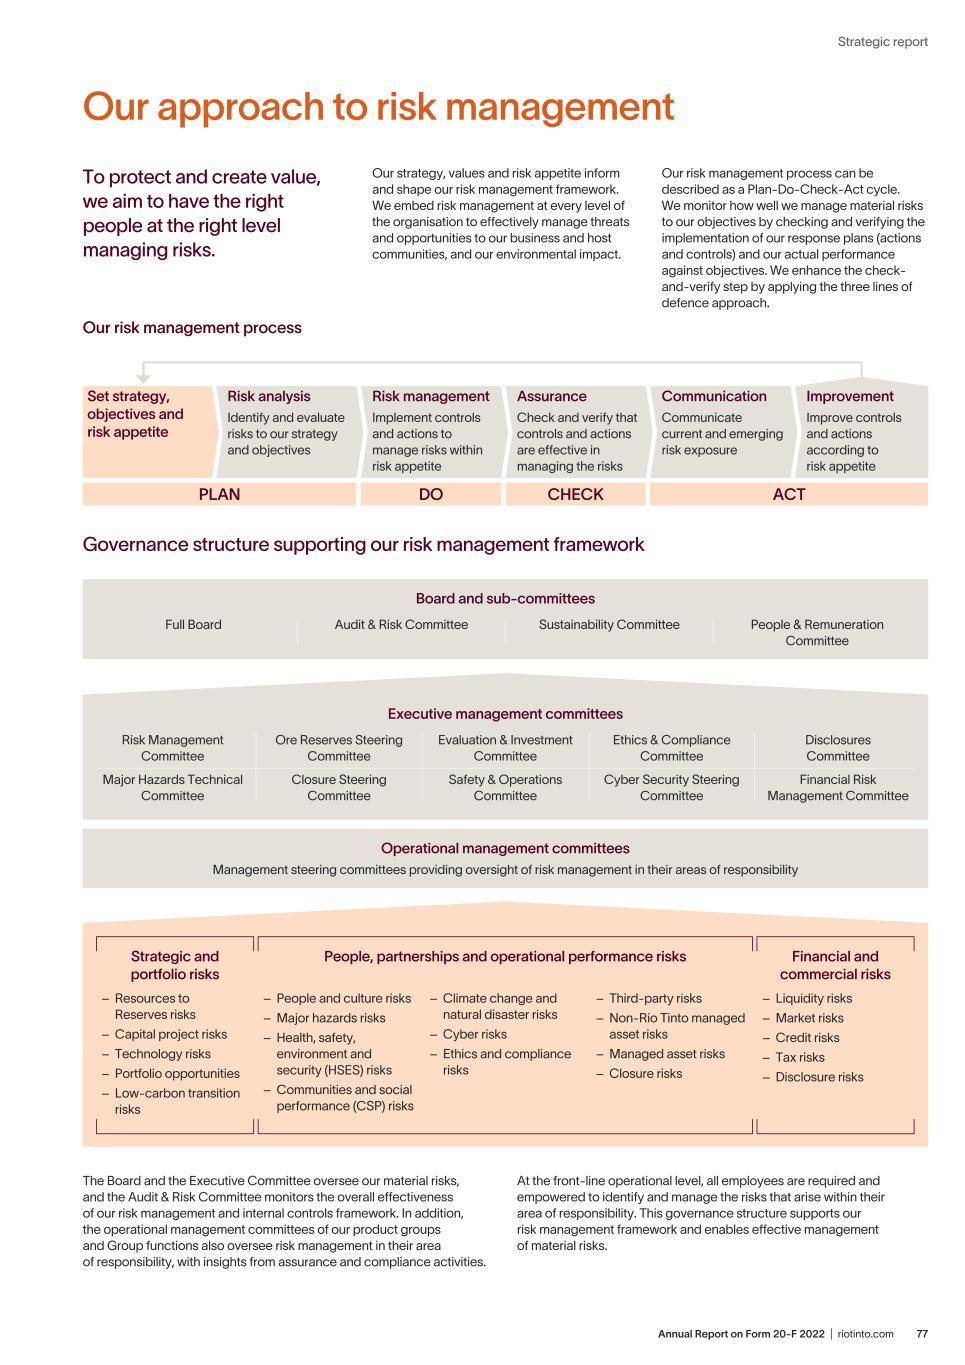
77Annual Report on Form 20-F 2022 | riotinto.com Strategic report To protect and create value, we aim to have the right people at the right level managing risks. Our risk management process PLAN DO CHECK ACT Our strategy, values and risk appetite inform and shape our risk management framework. We embed risk management at every level of the organisation to effectively manage threats and opportunities to our business and host communities, and our environmental impact. Our approach to risk management Board and sub-committees Full Board Audit & Risk Committee Sustainability Committee People & Remuneration Committee Operational management committees Management steering committees providing oversight of risk management in their areas of responsibility Executive management committees Risk Management Committee Major Hazards Technical Committee Ore Reserves Steering Committee Closure Steering Committee Evaluation & Investment Committee Safety & Operations Committee Disclosures Committee Financial Risk Management Committee Ethics & Compliance Committee Cyber Security Steering Committee Strategic and portfolio risks Financial and commercial risks People, partnerships and operational performance risks – People and culture risks – Major hazards risks – Health, safety, environment and security (HSES) risks – Communities and social performance (CSP) risks – Climate change and natural disaster risks – Cyber risks – Ethics and compliance risks – Third-party risks – Non-Rio Tinto managed asset risks – Managed asset risks – Closure risks – Resources to Reserves risks – Capital project risks – Technology risks – Portfolio opportunities – Low-carbon transition risks – Liquidity risks – Market risks – Credit risks – Tax risks – Disclosure risks The Board and the Executive Committee oversee our material risks, and the Audit & Risk Committee monitors the overall effectiveness of our risk management and internal controls framework. In addition, the operational management committees of our product groups and Group functions also oversee risk management in their area of responsibility, with insights from assurance and compliance activities. Governance structure supporting our risk management framework At the front-line operational level, all employees are required and empowered to identify and manage the risks that arise within their area of responsibility. This governance structure supports our risk management framework and enables effective management of material risks. Our risk management process can be described as a Plan-Do-Check-Act cycle. We monitor how well we manage material risks to our objectives by checking and verifying the implementation of our response plans (actions and controls) and our actual performance against objectives. We enhance the check- and-verify step by applying the three lines of defence approach. Set strategy, objectives and risk appetite Risk analysis Identify and evaluate risks to our strategy and objectives Risk management Implement controls and actions to manage risks within risk appetite Assurance Check and verify that controls and actions are effective in managing the risks Communication Communicate current and emerging risk exposure Improvement Improve controls and actions according to risk appetite
Annual Report on Form 20-F 2022 | riotinto.com78 Risk management continued Emerging risks Emerging risks are highly uncertain by nature. As a company, we are exposed to many complex and sometimes interrelated risks, due to the number of commodities we produce and our global footprint. We track leading indicators of emerging risks and their likely impact on us and the communities where we operate. We proactively analyse the impact of these risks through plausible scenarios of the interplay of the global megatrends, as outlined in the Strategy section on page 12. We are impacted by growing geopolitical tensions and macroeconomic uncertainty that could potentially impact global growth and affect market volatility and sentiment. Cyber-security attacks have become more destructive. An emerging area of exposure for the business is the rapid digitalisation and transformation of operational technology environments. Climate change and the low-carbon transition continues to provide both upside and downside uncertainties for us. We address these uncertainties under our material risks 2, 4, 5 and 9 detailed in the following pages. We closely monitor and assess the impact of climate change through scenarios; see pages 152-153. Our 2022 Climate Change Report outlines our current and future initiatives and partnerships, and how we aim to work together to meet our Scope 1 and 2 targets and Scope 3 goals. Longer-term viability statement Delivering our strategy depends on our four objectives: to be the best operator; to achieve impeccable environmental, social and governance (ESG) credentials; to excel in development; and to strengthen our social licence. Our business model supporting our strategy is underpinned by the quality of our assets, the capabilities of our people, our operational and sustainability performance, innovative partnerships, and disciplined capital allocation. For more information about our strategy and business model, see pages 13-17. Our business planning processes include modelling a series of macroeconomic scenarios and using various assumptions that consider internal and external factors. As part of our robust risk management framework, we closely track, monitor and mitigate material risks to our business plan. Viability assessment process and key assumptions The assumptions underlying our business plan and macroeconomic forecast have the greatest level of certainty for the first three years. Our longer-term viability assessment examines the first five years (2023-27) of the business plan. This allows for a detailed analysis of the potential impacts of risks materialising in quick succession in the first three years, and enables us to further stress test the business plan for risk materialising towards the end of the time period, although with less certainty. This allows our Directors to assess the Group’s capacity to exercise financial levers available in both the three-year and five-year time frames to maintain our viability. The Risk factors section outlines risks that could materially affect our performance, future prospects or reputation. For the viability assessment, we have considered our material risks that could severely impact the Group’s liquidity and solvency. Assessment of viability Our longer-term viability assessment considers the following material risks and key assumptions. Material risk A – “Remaining competitive through economic cycles or shocks” Scenario assumptions: Continued elevation of supply-side pressure and sharp interest rate rises triggers stagflation and liquidity crises in developing economies. A housing crisis leads to positive but low growth in China. Commodity prices experience large negative pricing shocks in 2023, sustained through to 2027. Material risk B – “Preventing fatalities, permanent disablements, and illness from a major hazard or safety event” or ”Preventing material business disruption and/or data breaches due to cyber events” Scenario assumptions: Occurrence of a singular catastrophic event resulting from a major cyber-security breach or operational failure, such as a tailings and water storage facility failure, extreme weather event or underground or geotechnical event resulting in multiple fatalities, cessation of operations and significant financial impacts. We have assumed two such events occur within the assessment period, in 2023 and 2026. Material risk C – “Delivering on our growth projects” Scenario assumptions: Materialisation of a risk impacting our ESG credentials (such as “building trusted relationships with Indigenous peoples” and “building trusted relationships with communities”) and our ability to deliver our growth strategy. We have assumed an impact on our near-term key projects and considered available alternatives. The assumed financial impact is in addition to any non-financial impact, such as reputational damage to the Group or disruption to the culture and way of life of the communities where we operate. We quantify the expected financial impact of each risk based on internal macroeconomic and business analysis, as well as internal and external benchmarking on similar risks. The first five years of our business plan have been stress tested for each risk to assess the impact on the Group’s longer-term viability, including whether additional financing facilities would be required. In addition to liquidity and solvency, the assessment also considered other financial performance metrics, as well as dividend payments. These metrics are subject to robust stress tests and reverse stress tests. The most severe scenario, albeit unlikely, considers the financial impact of all three risks materialising at the start of the assessment period, followed by a second major hazard or cyber event occurring towards the end of the five-year period. Without management action, this scenario would create both an immediate and prolonged severe impact, resulting in the Group’s free cash flow performance over the assessment period being materially impacted. We have a suite of management actions available to preserve resilience through the assessment period, including accessing lines of credit, reducing organic and inorganic growth capital expenditure, and raising capital. Our financial flexibility could potentially be limited during the peak of the crisis. The viability of the Group remained sound under all tested scenarios. We have also conducted reverse stress testing by assessing the impact of reducing price levels, and we have concluded that the Group remains viable in the very low probability of prolonged price declines across all commodities. Four factors underpin the resilience of our business model: – The competitive position and diversification of our commodities portfolio. – The disciplined capital allocation framework and commitment to prudent financial policy. – The payout shareholder return policy, which is based on earnings and is, therefore, more sustainable. – The focus on achieving impeccable ESG performance and strengthening our social licence, which allows for growth and maintaining access to debt capital and bank loan markets. Considering our current position and the robust assessment of our material risks, the Directors have assessed the Group’s prospects over the next five years (until 31 December 2027) and reasonably expect that we will continue to operate and meet our liabilities as they fall due over that period. However, in the long term, two material risks with long-dated consequences could potentially have a material impact on our viability: – Growing our iron ore business to meet the demand for green steel. – Leaving a positive legacy for future generations, by embedding closure considerations throughout the lifespan of our assets. For more information see pages 81 and 86.
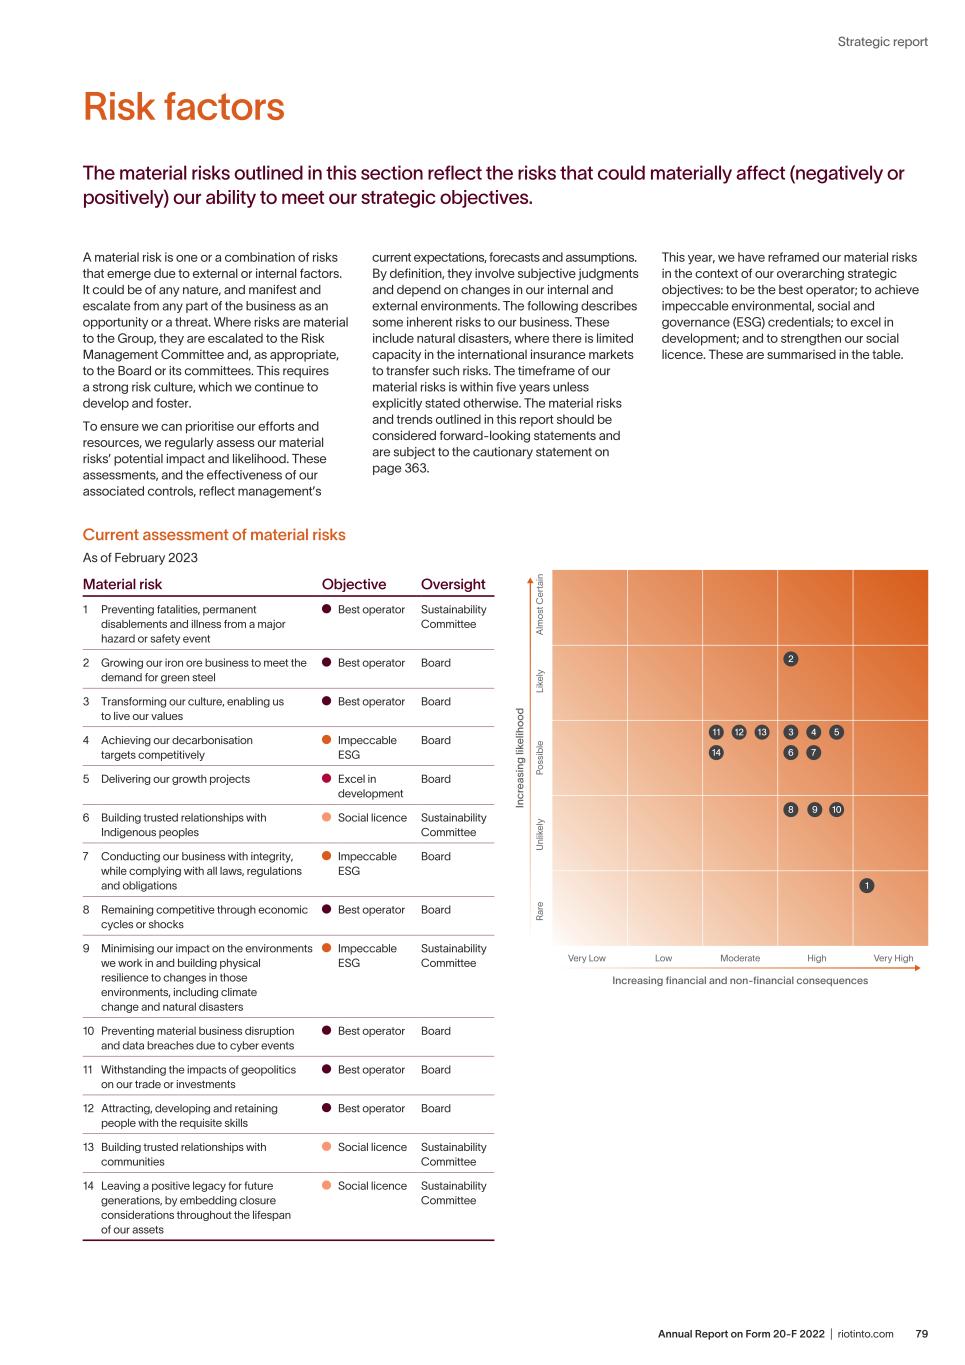
79Annual Report on Form 20-F 2022 | riotinto.com Strategic report The material risks outlined in this section reflect the risks that could materially affect (negatively or positively) our ability to meet our strategic objectives. Risk factors A material risk is one or a combination of risks that emerge due to external or internal factors. It could be of any nature, and manifest and escalate from any part of the business as an opportunity or a threat. Where risks are material to the Group, they are escalated to the Risk Management Committee and, as appropriate, to the Board or its committees. This requires a strong risk culture, which we continue to develop and foster. To ensure we can prioritise our efforts and resources, we regularly assess our material risks’ potential impact and likelihood. These assessments, and the effectiveness of our associated controls, reflect management’s current expectations, forecasts and assumptions. By definition, they involve subjective judgments and depend on changes in our internal and external environments. The following describes some inherent risks to our business. These include natural disasters, where there is limited capacity in the international insurance markets to transfer such risks. The timeframe of our material risks is within five years unless explicitly stated otherwise. The material risks and trends outlined in this report should be considered forward-looking statements and are subject to the cautionary statement on page 363. This year, we have reframed our material risks in the context of our overarching strategic objectives: to be the best operator; to achieve impeccable environmental, social and governance (ESG) credentials; to excel in development; and to strengthen our social licence. These are summarised in the table. Current assessment of material risks As of February 2023 Material risk Objective Oversight 1 Preventing fatalities, permanent disablements and illness from a major hazard or safety event Best operator Sustainability Committee 2 Growing our iron ore business to meet the demand for green steel Best operator Board 3 Transforming our culture, enabling us to live our values Best operator Board 4 Achieving our decarbonisation targets competitively Impeccable ESG Board 5 Delivering our growth projects Excel in development Board 6 Building trusted relationships with Indigenous peoples Social licence Sustainability Committee 7 Conducting our business with integrity, while complying with all laws, regulations and obligations Impeccable ESG Board 8 Remaining competitive through economic cycles or shocks Best operator Board 9 Minimising our impact on the environments we work in and building physical resilience to changes in those environments, including climate change and natural disasters Impeccable ESG Sustainability Committee 10 Preventing material business disruption and data breaches due to cyber events Best operator Board 11 Withstanding the impacts of geopolitics on our trade or investments Best operator Board 12 Attracting, developing and retaining people with the requisite skills Best operator Board 13 Building trusted relationships with communities Social licence Sustainability Committee 14 Leaving a positive legacy for future generations, by embedding closure considerations throughout the lifespan of our assets Social licence Sustainability Committee Very Low Low Moderate Increasing nancial and non-nancial consequences High Very High Ra re U nl ik el y Po ss ib le Li ke ly A lm os t C er ta in In cr ea si ng li ke lih oo d 1 108 3 4 6 7 511 14 12 13 9 2
Annual Report on Form 20-F 2022 | riotinto.com80 Risk factors continued Risk to best operator strategic objective Preventing fatalities, permanent disablements, and illness from a major hazard or safety event Nothing is more important than the safety and wellbeing of our employees, contractors and communities. The mining industry is inherently hazardous, with the potential to cause illness or injury, damage to the environment and disruption to communities. Our objective is first and foremost to have zero fatalities. Strategic alignment Best operator Risks (Threats) Major hazards include process safety, underground mining, slope geotechnical and tailings management. Failure to manage our major hazards could result in a catastrophic event or other long-term damage. Loss of technical capability at complex end-of-life underground mines poses a significant risk. While not considered major hazards, significant risks at our sites are falling objects, fall from height, and vehicles and driving, the top three causes of potentially fatal incidents (PFIs), which could result in multiple fatalities across the Group. Key exposures Our underground operations such as Diavik, Oyu Tolgoi and Kennecott. Process safety at our refineries, smelters, and tailings and water storage facilities, where we are currently implementing the Global Industry Standard on Tailings Management (GISTM). Risk oversight The Major Hazards Steering Committee, the Risk Management Committee and the Sustainability Committee. Growing our iron ore business to meet demand for green steel Steel decarbonisation will affect the value of iron ore. We have an opportunity to unlock business value by optimising our iron ore product strategy, partnering with technology providers and universities, and innovating with our customers to meet future demand for green steel. Strategic alignment Best operator Risks (Threats) The iron and steel process routes required to decarbonise the steel industry may not favour our Pilbara low- and mid-grade ores, impacting the competitiveness of the Iron Ore portfolio. The transition of the steel value chain towards net zero will need new technologies and extensive industry transformation. Risk oversight The Steel Decarbonisation Steering Committee and the Board.
81Annual Report on Form 20-F 2022 | riotinto.com Strategic report Transforming our culture, enabling us to live our values Sharing and demonstrating our values unlocks opportunities in everything we do. We are working on building a workplace where all our people are trusted and empowered to be their best selves and help drive change. Strategic alignment Best operator Risks (Threats) As societal expectations are changing, and higher standards are placed on organisations, we must ensure that we are consistently displaying and living our values. Without change or action, our ability to attract and retain partners and talented people will be negatively impacted. The trust from host communities and countries may also be weakened, limiting our operating licence and growth opportunities. In February 2022, we released the findings and recommendations from an independent review of our workplace culture (Everyday Respect Report). The findings in this report also aligned with the recommended actions coming from the Parliament of Western Australia’s Inquiry into Sexual Harassment in the Mining Industry, released in June 2022. Both reports highlighted the scale of change required in our business and across the resources sector. Risk oversight The Group Executive Committee and the Board. Remaining competitive through economic cycles or shocks We aim to remain competitive, preserve resilience and maintain access to debt capital and bank loan markets by having cost-competitive assets, a diversified commodities portfolio, a strong balance sheet, prudent financial policies and strong ESG credentials. Strategic alignment Best operator Risks (Threats) A deteriorating economic and political environment could lead to cost inflation, falling commodity prices (reduced cash flow, limiting profitability), trade actions (increased tariffs, retaliations and sanctions), and governments’ exerting more control over their natural resources by changing contractual, regulatory or tax measures. This could impact our key markets, operations or investments. Failure to secure mining approvals, replenish reserves, capture the benefits of new technologies or a material reduction in commodity price may reduce the volume of existing reserves and the future conversion of resources to reserves in the required timeframe. Risk oversight The Financial Risk Management Committee, the Risk Management Committee and the Board.
Annual Report on Form 20-F 2022 | riotinto.com82 Risk factors continued Withstanding impacts of geopolitics on our trade or investments Geopolitics has the potential to increase trade tensions and undermine rule-based trading systems and possible trade actions (increased tariffs, retaliation, sanctions) that impact our key markets, operations or investments. It may limit any benefits of being a multinational company with a global footprint and may expose us further to these risks. Any presence in politically unstable countries exacerbates this risk. Strategic alignment Best operator Risks (Threats) A deteriorating economic and political environment could lead to falling commodity prices (reduced cash flow, limiting profitability), trade actions (increased tariffs, retaliations and sanctions), and governments’ exerting more control over their natural resources by changing contractual, regulatory or tax measures. This could impact our key markets, operations or investments. Key exposures A highly uncertain and unstable global macro environment, including Indo-Pacific tensions and the indirect impacts of the war in Ukraine, can impact our business. Rising energy costs across Europe could potentially affect demand in the region, which in turn would impact our aluminium and minerals markets in Europe. Risk oversight The Financial Risk Management Committee, the Risk Management Committee and the Board. Preventing material business disruption and data breaches due to cyber events Cyber-security events could disrupt our operations by interrupting our employees’ work, breaching our data privacy or jeopardising sensitive information relating to our customers, contractors or suppliers. Therefore, we take cyber security seriously and continuously manage risks to safeguard our business. Strategic alignment Best operator Risks (Threats) Cyber breaches can arise from malicious external or internal attacks, but also inadvertently through human error or inconsistently applying controls that are not managed by our Information Systems and Technology (IS&T) team. Although the extent and frequency of cyber-security threats remain in line with growth expectations, new attacks are often more destructive in nature. An emerging area of exposure is the ongoing digitalisation and transformation of operational technology environments, which require data integration and could impact our control mechanism, such as segregation of our technology environments. Key exposures While internal and external factors pose risks, our greatest exposures continue to be through third parties. Risk oversight The Cyber Security Steering Committee and the Board.
83Annual Report on Form 20-F 2022 | riotinto.com Strategic report Attracting, developing and retaining people with the requisite skills Our ability to achieve our business strategy depends on attracting, developing and retaining a wide range of internal and external skilled and experienced people. Strategic alignment Best operator Risks (Threats) Lacking the right capability may result in our business experiencing delays or underperformance. Tight labour markets and entry into new countries result in heightened competition for critical skills; for example, in climate change, energy, decarbonisation, technical mining and processing skills, and community relations. Changing societal expectations place pressure on our brand as an employer, and require us to become better at communicating who we are and what we stand for. Key exposures Since the pandemic, talent is less inclined to relocate, and our reliance on local or national recruitment is therefore increasing, which significantly reduces the market size for sourcing talent. Risk oversight The Board. Achieving our decarbonisation targets competitively Climate change continues to be at the heart of our strategy, and our ability to deliver on our objectives hinges on achieving our Scope 1 and 2 targets between now and 2050. Finding a balance between our ESG commitments and our need to invest for growth will support us in leaving a positive legacy and delivering superior shareholder returns while remaining competitive. Strategic alignment Impeccable ESG Risks (Threats) Delays in priority initiatives will threaten our Scope 1 and 2 target delivery and our ability to respond proactively and competitively. Our ability to successfully engage and partner with governments and other external parties to achieve grid decarbonisation is a fundamental uncertainty, particularly for our 2025 targets as we continue to develop our pipeline of decarbonisation projects. The rate of progress towards our targets could expose us to reputation and litigation risks. Key exposures Our 2026 to 2030 target delivery relies on abatement from technologies still in the research and development phase. Risk oversight The Risk Management Committee and the Board. Risk to impeccable ESG credentials strategic objective
Annual Report on Form 20-F 2022 | riotinto.com84 Risk factors continued Minimise our impact on the environments we work in and build physical resilience to changes in those environments, including climate change and natural disasters By producing the materials the world needs, we have an effect on the environment. Our operations and projects are inherently hazardous, requiring proactive management to minimise potential impact on water resources or biodiversity in existing operations, new asset developments and closures. Strategic alignment Impeccable ESG Risks (Threats) A number of our operations and future development opportunities exist within, or close to, sensitive biodiverse regions. To strengthen our licence to operate, we must demonstrate our capability to protect ecosystems through improved practices and technological solutions. Natural disasters or extreme weather events can also endanger our employees and communities, damage our assets or cause significant operational interruption. Given the inherent uncertainty in future climate projections, longer-term exposures to chronic changes in climate are not yet well understood. Key exposures Our operations in the Pilbara and the Saguenay–Lac-Saint-Jean region, QIT Madagascar Minerals, Simandou and Richards Bay Minerals. Risk oversight The Sustainability Committee. Conducting our business with integrity, while complying with all laws, regulations and obligations Our determination to be the best operator and have impeccable ESG credentials is underpinned by our zero tolerance for non-compliance with our operational procedures, laws and obligations. These expectations are outlined in our Group policies, standards and procedures, published on our website at riotinto.com/policies. Strategic alignment Impeccable ESG Risks (Threats) If our operations or value chain experienced a serious breach in anti-corruption legislation and sanctions, human rights, anti-trust rules or inappropriate business conduct, this could cause serious harm to people and significant reputational and financial damage. Risk oversight The Ethics and Compliance Committee and the Board.
85Annual Report on Form 20-F 2022 | riotinto.com Strategic report Building trusted relationships with Indigenous peoples Our partnerships with Indigenous peoples play a material role in our ability to operate. A breakdown in these relationships could impact our business and our reputation. By building respectful and enduring relationships with Indigenous partners and communities, we remain committed to finding better ways to move forward with the communities that host us. Strategic alignment Social licence Risks (Threats) Mining activities could strain relationships with Indigenous peoples, particularly where actual or perceived damage of significant cultural values (cumulative or acute) occurs without consultation and consent. This could result in a loss of trust and could impact our social licence to operate. This was evident after the destruction of two ancient rock shelters at Juukan Gorge in the Pilbara region in 2020 and the impact it had on the Puutu Kunti Kurrama and Pinikura people. Key exposures Our Resolution Copper project and the modernisation of agreements in the Pilbara. Risk oversight The Ethics and Compliance Committee and the Sustainability Committee. Delivering on our growth projects Our growth strategy relies on the success of our exploration (greenfield and brownfield) and acquisition activities in addition to our ability to develop these resources faster and more competitively than others, while aiming for impeccable ESG credentials. However, developing these projects requires complex multi-year study and execution plans, which carry significant delivery risks. Strategic alignment Excel in development Risks (Threats) New high-quality deposits are increasingly scarce, and those that are known require advances in processing technology, significant capital investment in infrastructure, or would negatively impact our ESG credentials. Additionally, as studies and projects progress, they are susceptible to changes in technical requirements, approvals, societal expectations, or underlying commercial or economic assumptions that could impact economic viability. Key exposures The Oyu Tolgoi underground expansion, and increasing approval time frames in the Pilbara and in projects including Simandou, Resolution Copper, Jadar, Rincon and Winu. Risk oversight The Investment Committee, the Ore Reserves Steering Committee and the Board. Risk to social license strategic objective Risk to excel in development strategic objective
Annual Report on Form 20-F 2022 | riotinto.com86 Risk factors continued Leaving a positive legacy for future generations, by embedding closure considerations throughout the lifespan of our assets We aspire to leave a positive legacy for future generations. We do this in partnership with our stakeholders, by embedding closure considerations throughout the entire lifespan of our assets – in the way we design, build, run, close and transition them. Strategic alignment Social licence Risks (Threats) Plans and financial obligations for closure, reclamation and rehabilitation may be insufficient due to changes in stakeholders’ and communities’ sentiments and expectations, legislation, standards, technical understanding and techniques. In addition to significant health, safety and environmental consequences, the manifestation of a major closure risk could impact the Group’s reputation and our licence to operate globally. The legacy portfolio continues to retain a level of uncertainty due to the lack of historical information and ongoing studies to determine options for future management. Key exposures Our Pilbara near-term closures (including Channar), Argyle, Gove and Energy Resources of Australia, as well as other legacy sites. Risk oversight The Closure Steering Committee and the Sustainability Committee. Building trusted relationships with communities Our relationships with the communities where we operate and broader society can affect our social licence to operate. If communities and host countries do not see us as a trusted partner, it could negatively impact our performance, future prospects and reputation. We develop long-lasting relationships with the communities where we operate and ensure they share in our success. Strategic alignment Social licence Risks (Threats) Access to land and resources could be impacted if we are not considered a trusted partner that respects people’s rights, manages adverse social and environmental impacts, and sustainably improves the social and economic outcomes in host communities where we operate or plan to operate. A loss of trust could also result in operational disruption, security incidents, expropriation, export or foreign investment restrictions, increased government regulation and delays in approvals, which could threaten our prospects and reputation. This was evident after the destruction of two ancient rock shelters at Juukan Gorge in the Pilbara region in 2020 and the impact it had on the Puutu Kunti Kurrama and Pinikura people. Key exposures Richards Bay Minerals, Resolution Copper, QIT Madagascar Minerals, Oyu Tolgoi, Jadar and Simandou. Risk oversight The Sustainability Committee.
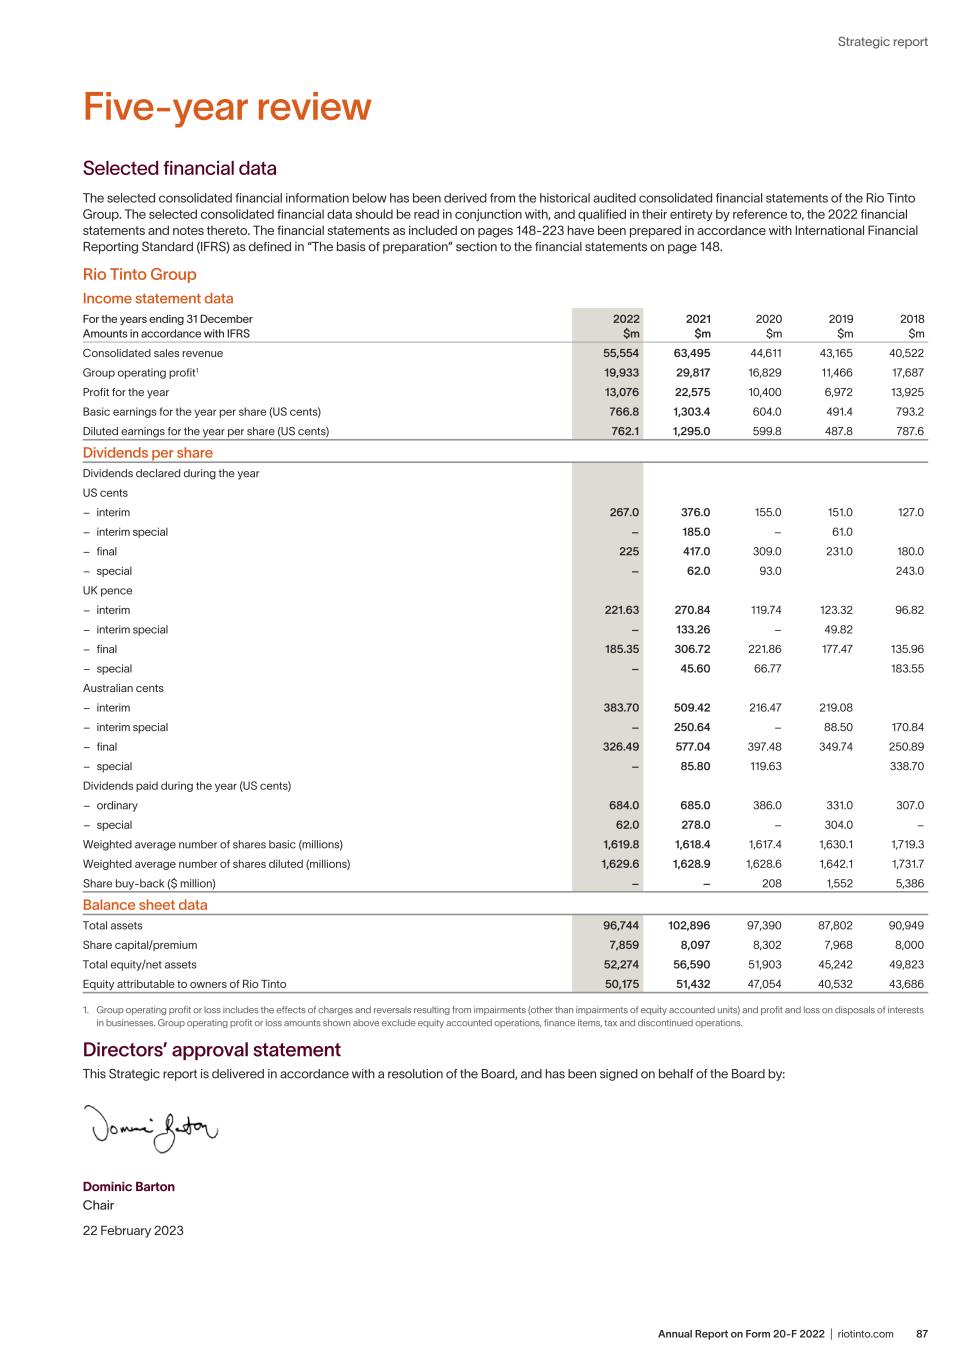
87Annual Report on Form 20-F 2022 | riotinto.com Strategic report Selected financial data The selected consolidated financial information below has been derived from the historical audited consolidated financial statements of the Rio Tinto Group. The selected consolidated financial data should be read in conjunction with, and qualified in their entirety by reference to, the 2022 financial statements and notes thereto. The financial statements as included on pages 148-223 have been prepared in accordance with International Financial Reporting Standard (IFRS) as defined in “The basis of preparation” section to the financial statements on page 148. Rio Tinto Group Income statement data For the years ending 31 December Amounts in accordance with IFRS 2022 $m 2021 $m 2020 $m 2019 $m 2018 $m Consolidated sales revenue 55,554 63,495 44,611 43,165 40,522 Group operating profit1 19,933 29,817 16,829 11,466 17,687 Profit for the year 13,076 22,575 10,400 6,972 13,925 Basic earnings for the year per share (US cents) 766.8 1,303.4 604.0 491.4 793.2 Diluted earnings for the year per share (US cents) 762.1 1,295.0 599.8 487.8 787.6 Dividends per share Dividends declared during the year US cents – interim 267.0 376.0 155.0 151.0 127.0 – interim special – 185.0 – 61.0 – final 225 417.0 309.0 231.0 180.0 – special – 62.0 93.0 243.0 UK pence – interim 221.63 270.84 119.74 123.32 96.82 – interim special – 133.26 – 49.82 – final 185.35 306.72 221.86 177.47 135.96 – special – 45.60 66.77 183.55 Australian cents – interim 383.70 509.42 216.47 219.08 – interim special – 250.64 – 88.50 170.84 – final 326.49 577.04 397.48 349.74 250.89 – special – 85.80 119.63 338.70 Dividends paid during the year (US cents) – ordinary 684.0 685.0 386.0 331.0 307.0 – special 62.0 278.0 – 304.0 – Weighted average number of shares basic (millions) 1,619.8 1,618.4 1,617.4 1,630.1 1,719.3 Weighted average number of shares diluted (millions) 1,629.6 1,628.9 1,628.6 1,642.1 1,731.7 Share buy-back ($ million) – – 208 1,552 5,386 Balance sheet data Total assets 96,744 102,896 97,390 87,802 90,949 Share capital/premium 7,859 8,097 8,302 7,968 8,000 Total equity/net assets 52,274 56,590 51,903 45,242 49,823 Equity attributable to owners of Rio Tinto 50,175 51,432 47,054 40,532 43,686 1. Group operating profit or loss includes the effects of charges and reversals resulting from impairments (other than impairments of equity accounted units) and profit and loss on disposals of interests in businesses. Group operating profit or loss amounts shown above exclude equity accounted operations, finance items, tax and discontinued operations. Directors’ approval statement This Strategic report is delivered in accordance with a resolution of the Board, and has been signed on behalf of the Board by: Dominic Barton Chair 22 February 2023 Five-year review
Annual Report on Form 20-F 2022 | riotinto.com88 Directors’ report Governance Chair’s introduction 89 Board of Directors 90 Executive Committee 92 Board insights 94 Our stakeholders – Section 172(1) statement 95 Matters discussed in 2022 99 Governance framework 100 Evaluating our performance 101 Nominations Committee report 102 Audit & Risk Committee report 104 Sustainability Committee report 108 Remuneration report Annual statement by the People & Remuneration Committee Chair 110 2023 short-term incentive plan redesign 112 Remuneration at a glance 114 Implementation report 118 Additional statutory disclosure 136 Compliance with governance codes and standards 142 Employees at the Andoom Workshop. Weipa Operations, Australia.
89Annual Report on Form 20-F 2022 | riotinto.com Directors’ report Chair’s introduction I am excited at joining a company with great people, world-class assets, emerging technologies and new partnerships, but also a company that is emerging from a challenging period in its near 150-year history. Our ambition is to deliver superior returns for our shareholders by becoming a leader in the global energy transition and finding better ways to provide the materials the world needs. To achieve this, the management team had identified four key strategic objectives: becoming the best operator, having impeccable ESG credentials, excelling in development, and strengthening the Group’s social licence. Culture transformation had also been identified as a critical enabler of the Group’s future success. Meanwhile, externally, the global geopolitical and macroeconomic environments continue to become more volatile and complex. With this backdrop, the Board carried out a comprehensive evaluation in 2022, focused on two key corporate governance priorities we had identified, ensuring that: (i) we have the right mix of skills and experience on the Board for the newly emerging set of opportunities and risks; and (ii) we organise ourselves as a Board and across our committees to focus our time on the right things, at the right time and in the right way so as best to deliver on the purpose, strategy and objectives that we have set for Rio Tinto, all in the context of greater external uncertainty and volatility. In terms of Board composition, we concluded that we needed to refresh the Board, with a particular focus on deepening our mining, operations and projects experience and our renewable energy and sustainability capabilities. We also identified the need to add further accounting and audit expertise while ensuring that, overall, we maintained the right balance of diversity. As a first stage in this process, I was delighted in December of 2022 to welcome Kaisa Hietala as a Non-Executive Director. Kaisa will be joining the Board on 1 March 2023 and brings a deep understanding of renewables and sustainability through her experience in the resources industry, as well as commercial capabilities, all of which will be invaluable as we work to ensure Rio Tinto thrives in a decarbonising world. Further details are set out in our Nominations Committee report on page 102. The wider governance review included external benchmarking analysis of governance structures in peer and other long-cycle companies, interviews with a range of investors and significant Board interaction and discussion on how to improve our overall effectiveness. This included an evaluation questionnaire that was more forward looking than the usual in-year annual evaluation. Given the timing of the strategic governance review, we decided it would be more beneficial to defer the independent third-party evaluation of the Board so that it could take place once these governance enhancements were fully embedded in 2023. The third-party Board evaluation will therefore now take place this year with 2022’s forward-looking evaluation as the new baseline. After several dedicated Board sessions on the revised governance proposals, we agreed to implement a number of enhancements from July 2022. We have refreshed the Board’s forward programme to ensure we are primarily focused on the four strategic objectives and on the Group’s culture transformation. For example, we have expanded the scope of our Remuneration Committee (now our People & Remuneration Committee) to place greater focus on people and culture. We have dedicated more Board and committee time to the assessment of our top emerging risks, with the Audit Committee (now renamed the Audit & Risk Committee) ensuring that our overall approach to risk management at Board level is robust and effective. We also reframed the scope of work of our Sustainability Committee. The Committee will split its time between the critical task of closely monitoring our shorter-term environmental, social and governance (ESG) performance (including safety and tailings), while at the same time considering longer-term strategic issues on sustainability. Finally, in support of the objective to strengthen our social licence, we have stepped up our plans as a Board for stakeholder engagement in 2023 and beyond. Separately, we are also considering how we can bring additional and dedicated focus to enhancing the Group’s social licence in key strategic countries. The following pages set out in more detail the corporate governance arrangements we have in Rio Tinto. I am satisfied that these arrangements are robust and effective but, as set out above, we will continue to explore how we can find better ways for the Board and its committees to ensure the success of the business, for the benefit of shareholders and all of our other stakeholders. Dominic Barton Chair 22 February 2023
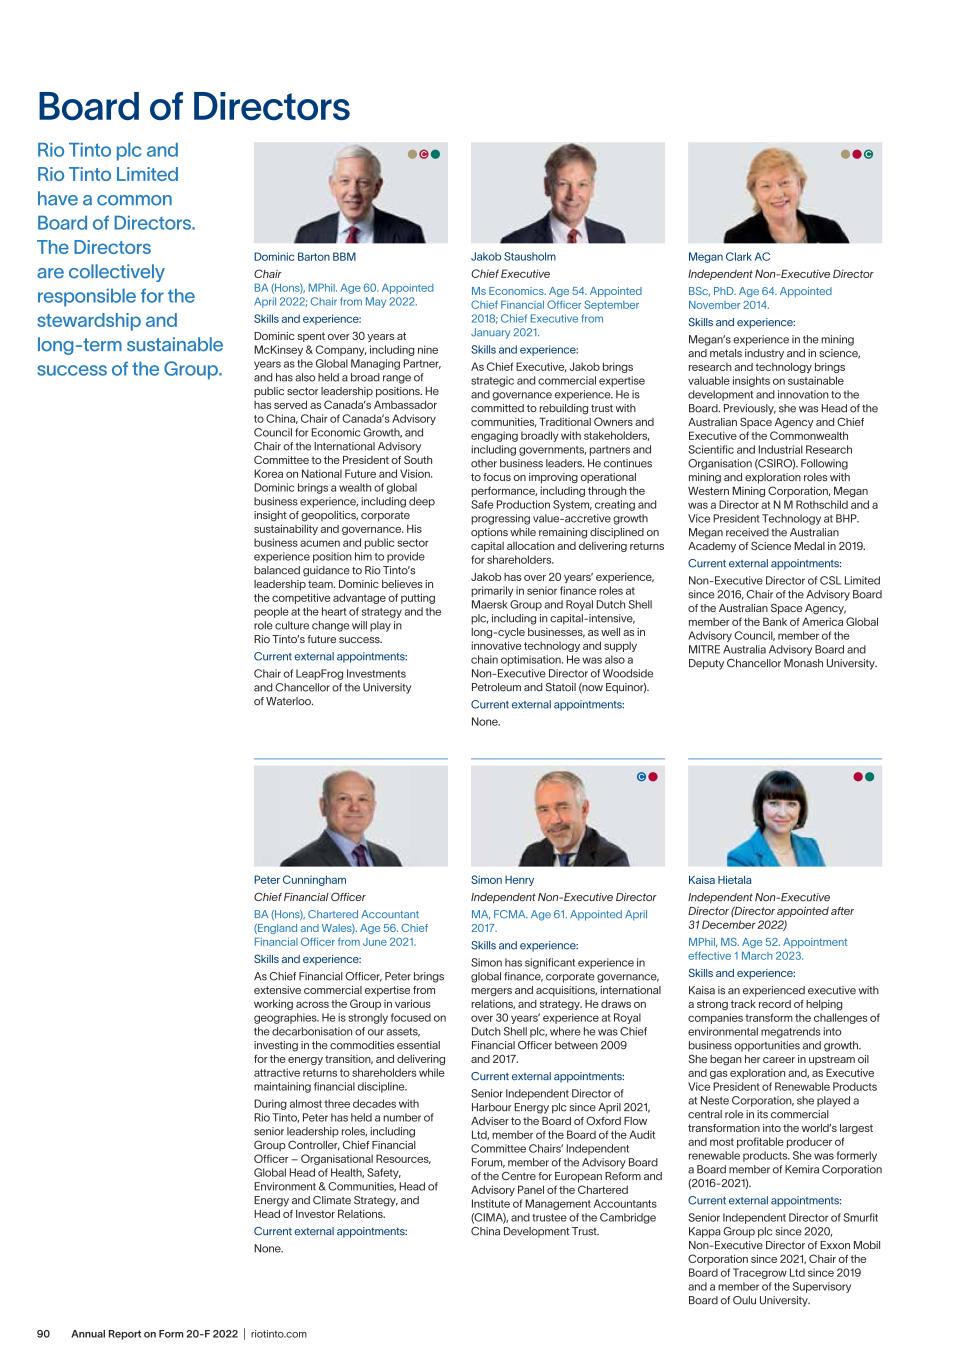
Annual Report on Form 20-F 2022 | riotinto.com90 Board of Directors Rio Tinto plc and Rio Tinto Limited have a common Board of Directors. The Directors are collectively responsible for the stewardship and long-term sustainable success of the Group. Dominic Barton BBM Chair BA (Hons), MPhil. Age 60. Appointed April 2022; Chair from May 2022. Skills and experience: Dominic spent over 30 years at McKinsey & Company, including nine years as the Global Managing Partner, and has also held a broad range of public sector leadership positions. He has served as Canada’s Ambassador to China, Chair of Canada’s Advisory Council for Economic Growth, and Chair of the International Advisory Committee to the President of South Korea on National Future and Vision. Dominic brings a wealth of global business experience, including deep insight of geopolitics, corporate sustainability and governance. His business acumen and public sector experience position him to provide balanced guidance to Rio Tinto’s leadership team. Dominic believes in the competitive advantage of putting people at the heart of strategy and the role culture change will play in Rio Tinto’s future success. Current external appointments: Chair of LeapFrog Investments and Chancellor of the University of Waterloo. Megan Clark AC Independent Non-Executive Director BSc, PhD. Age 64. Appointed November 2014. Skills and experience: Megan’s experience in the mining and metals industry and in science, research and technology brings valuable insights on sustainable development and innovation to the Board. Previously, she was Head of the Australian Space Agency and Chief Executive of the Commonwealth Scientific and Industrial Research Organisation (CSIRO). Following mining and exploration roles with Western Mining Corporation, Megan was a Director at N M Rothschild and a Vice President Technology at BHP. Megan received the Australian Academy of Science Medal in 2019. Current external appointments: Non-Executive Director of CSL Limited since 2016, Chair of the Advisory Board of the Australian Space Agency, member of the Bank of America Global Advisory Council, member of the MITRE Australia Advisory Board and Deputy Chancellor Monash University. Simon Henry Independent Non-Executive Director MA, FCMA. Age 61. Appointed April 2017. Skills and experience: Simon has significant experience in global finance, corporate governance, mergers and acquisitions, international relations, and strategy. He draws on over 30 years’ experience at Royal Dutch Shell plc, where he was Chief Financial Officer between 2009 and 2017. Current external appointments: Senior Independent Director of Harbour Energy plc since April 2021, Adviser to the Board of Oxford Flow Ltd, member of the Board of the Audit Committee Chairs’ Independent Forum, member of the Advisory Board of the Centre for European Reform and Advisory Panel of the Chartered Institute of Management Accountants (CIMA), and trustee of the Cambridge China Development Trust. Peter Cunningham Chief Financial Officer BA (Hons), Chartered Accountant (England and Wales). Age 56. Chief Financial Officer from June 2021. Skills and experience: As Chief Financial Officer, Peter brings extensive commercial expertise from working across the Group in various geographies. He is strongly focused on the decarbonisation of our assets, investing in the commodities essential for the energy transition, and delivering attractive returns to shareholders while maintaining financial discipline. During almost three decades with Rio Tinto, Peter has held a number of senior leadership roles, including Group Controller, Chief Financial Officer – Organisational Resources, Global Head of Health, Safety, Environment & Communities, Head of Energy and Climate Strategy, and Head of Investor Relations. Current external appointments: None. Jakob Stausholm Chief Executive Ms Economics. Age 54. Appointed Chief Financial Officer September 2018; Chief Executive from January 2021. Skills and experience: As Chief Executive, Jakob brings strategic and commercial expertise and governance experience. He is committed to rebuilding trust with communities, Traditional Owners and engaging broadly with stakeholders, including governments, partners and other business leaders. He continues to focus on improving operational performance, including through the Safe Production System, creating and progressing value-accretive growth options while remaining disciplined on capital allocation and delivering returns for shareholders. Jakob has over 20 years’ experience, primarily in senior finance roles at Maersk Group and Royal Dutch Shell plc, including in capital-intensive, long-cycle businesses, as well as in innovative technology and supply chain optimisation. He was also a Non-Executive Director of Woodside Petroleum and Statoil (now Equinor). Current external appointments: None. Kaisa Hietala Independent Non-Executive Director (Director appointed after 31 December 2022) MPhil, MS. Age 52. Appointment effective 1 March 2023. Skills and experience: Kaisa is an experienced executive with a strong track record of helping companies transform the challenges of environmental megatrends into business opportunities and growth. She began her career in upstream oil and gas exploration and, as Executive Vice President of Renewable Products at Neste Corporation, she played a central role in its commercial transformation into the world’s largest and most profitable producer of renewable products. She was formerly a Board member of Kemira Corporation (2016-2021). Current external appointments: Senior Independent Director of Smurfit Kappa Group plc since 2020, Non-Executive Director of Exxon Mobil Corporation since 2021, Chair of the Board of Tracegrow Ltd since 2019 and a member of the Supervisory Board of Oulu University.
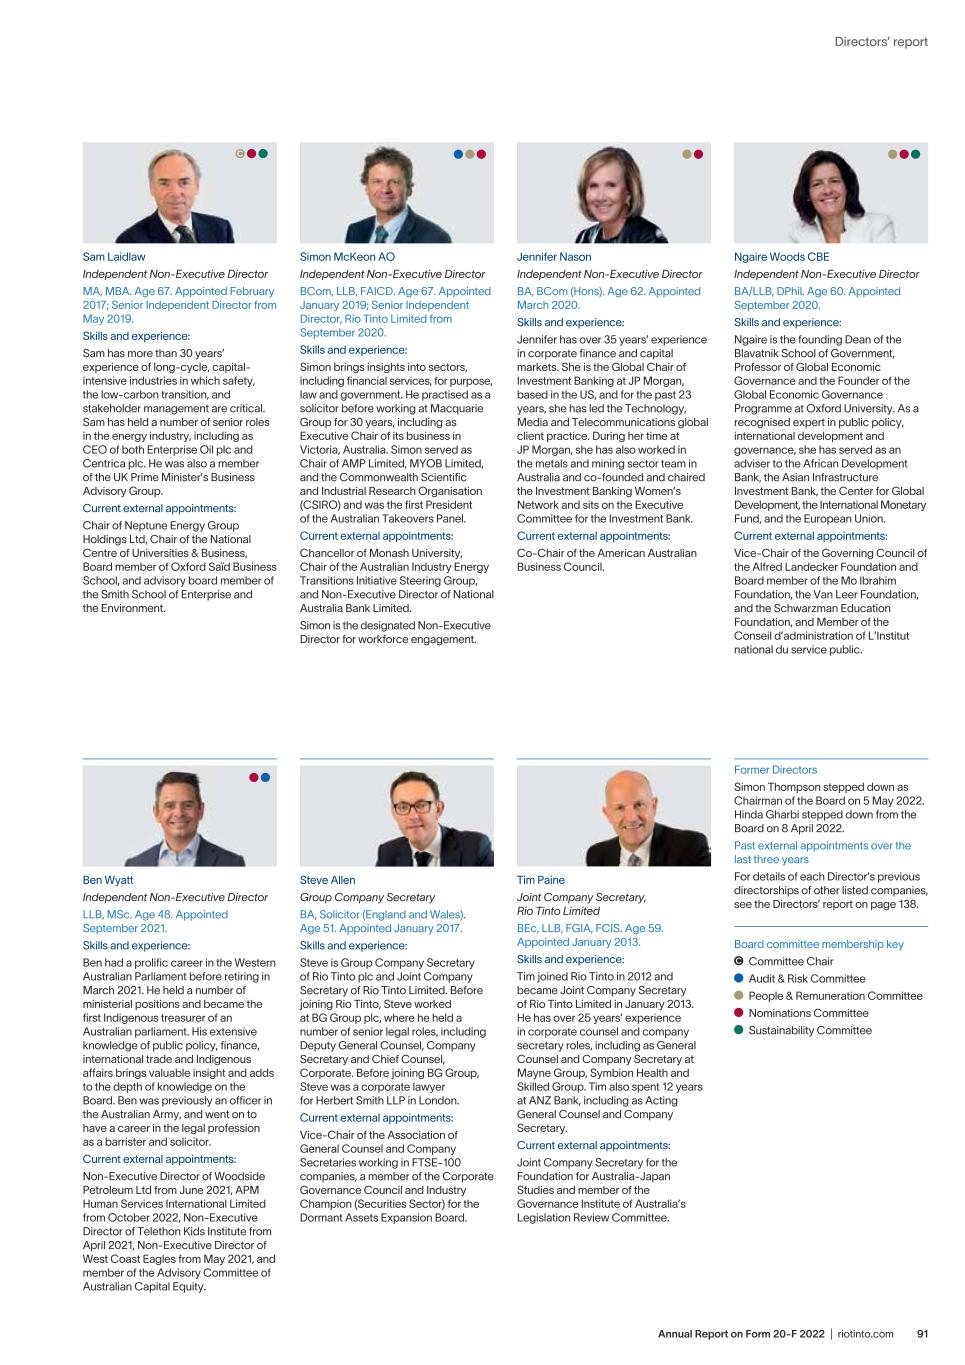
91Annual Report on Form 20-F 2022 | riotinto.com Directors’ report Jennifer Nason Independent Non-Executive Director BA, BCom (Hons). Age 62. Appointed March 2020. Skills and experience: Jennifer has over 35 years’ experience in corporate finance and capital markets. She is the Global Chair of Investment Banking at JP Morgan, based in the US, and for the past 23 years, she has led the Technology, Media and Telecommunications global client practice. During her time at JP Morgan, she has also worked in the metals and mining sector team in Australia and co-founded and chaired the Investment Banking Women’s Network and sits on the Executive Committee for the Investment Bank. Current external appointments: Co-Chair of the American Australian Business Council. Simon McKeon AO Independent Non-Executive Director BCom, LLB, FAICD. Age 67. Appointed January 2019; Senior Independent Director, Rio Tinto Limited from September 2020. Skills and experience: Simon brings insights into sectors, including financial services, for purpose, law and government. He practised as a solicitor before working at Macquarie Group for 30 years, including as Executive Chair of its business in Victoria, Australia. Simon served as Chair of AMP Limited, MYOB Limited, and the Commonwealth Scientific and Industrial Research Organisation (CSIRO) and was the first President of the Australian Takeovers Panel. Current external appointments: Chancellor of Monash University, Chair of the Australian Industry Energy Transitions Initiative Steering Group, and Non-Executive Director of National Australia Bank Limited. Simon is the designated Non-Executive Director for workforce engagement. Sam Laidlaw Independent Non-Executive Director MA, MBA. Age 67. Appointed February 2017; Senior Independent Director from May 2019. Skills and experience: Sam has more than 30 years’ experience of long-cycle, capital- intensive industries in which safety, the low-carbon transition, and stakeholder management are critical. Sam has held a number of senior roles in the energy industry, including as CEO of both Enterprise Oil plc and Centrica plc. He was also a member of the UK Prime Minister’s Business Advisory Group. Current external appointments: Chair of Neptune Energy Group Holdings Ltd, Chair of the National Centre of Universities & Business, Board member of Oxford Saïd Business School, and advisory board member of the Smith School of Enterprise and the Environment. Ngaire Woods CBE Independent Non-Executive Director BA/LLB, DPhil. Age 60. Appointed September 2020. Skills and experience: Ngaire is the founding Dean of the Blavatnik School of Government, Professor of Global Economic Governance and the Founder of the Global Economic Governance Programme at Oxford University. As a recognised expert in public policy, international development and governance, she has served as an adviser to the African Development Bank, the Asian Infrastructure Investment Bank, the Center for Global Development, the International Monetary Fund, and the European Union. Current external appointments: Vice-Chair of the Governing Council of the Alfred Landecker Foundation and Board member of the Mo Ibrahim Foundation, the Van Leer Foundation, and the Schwarzman Education Foundation, and Member of the Conseil d’administration of L’Institut national du service public. Ben Wyatt Independent Non-Executive Director LLB, MSc. Age 48. Appointed September 2021. Skills and experience: Ben had a prolific career in the Western Australian Parliament before retiring in March 2021. He held a number of ministerial positions and became the first Indigenous treasurer of an Australian parliament. His extensive knowledge of public policy, finance, international trade and Indigenous affairs brings valuable insight and adds to the depth of knowledge on the Board. Ben was previously an officer in the Australian Army, and went on to have a career in the legal profession as a barrister and solicitor. Current external appointments: Non-Executive Director of Woodside Petroleum Ltd from June 2021, APM Human Services International Limited from October 2022, Non-Executive Director of Telethon Kids Institute from April 2021, Non-Executive Director of West Coast Eagles from May 2021, and member of the Advisory Committee of Australian Capital Equity. Former Directors Simon Thompson stepped down as Chairman of the Board on 5 May 2022. Hinda Gharbi stepped down from the Board on 8 April 2022. Past external appointments over the last three years For details of each Director’s previous directorships of other listed companies, see the Directors’ report on page 138. Board committee membership key Committee Chair Audit & Risk Committee People & Remuneration Committee Nominations Committee Sustainability Committee Steve Allen Group Company Secretary BA, Solicitor (England and Wales). Age 51. Appointed January 2017. Skills and experience: Steve is Group Company Secretary of Rio Tinto plc and Joint Company Secretary of Rio Tinto Limited. Before joining Rio Tinto, Steve worked at BG Group plc, where he held a number of senior legal roles, including Deputy General Counsel, Company Secretary and Chief Counsel, Corporate. Before joining BG Group, Steve was a corporate lawyer for Herbert Smith LLP in London. Current external appointments: Vice-Chair of the Association of General Counsel and Company Secretaries working in FTSE-100 companies, a member of the Corporate Governance Council and Industry Champion (Securities Sector) for the Dormant Assets Expansion Board. Tim Paine Joint Company Secretary, Rio Tinto Limited BEc, LLB, FGIA, FCIS. Age 59. Appointed January 2013. Skills and experience: Tim joined Rio Tinto in 2012 and became Joint Company Secretary of Rio Tinto Limited in January 2013. He has over 25 years’ experience in corporate counsel and company secretary roles, including as General Counsel and Company Secretary at Mayne Group, Symbion Health and Skilled Group. Tim also spent 12 years at ANZ Bank, including as Acting General Counsel and Company Secretary. Current external appointments: Joint Company Secretary for the Foundation for Australia-Japan Studies and member of the Governance Institute of Australia’s Legislation Review Committee.
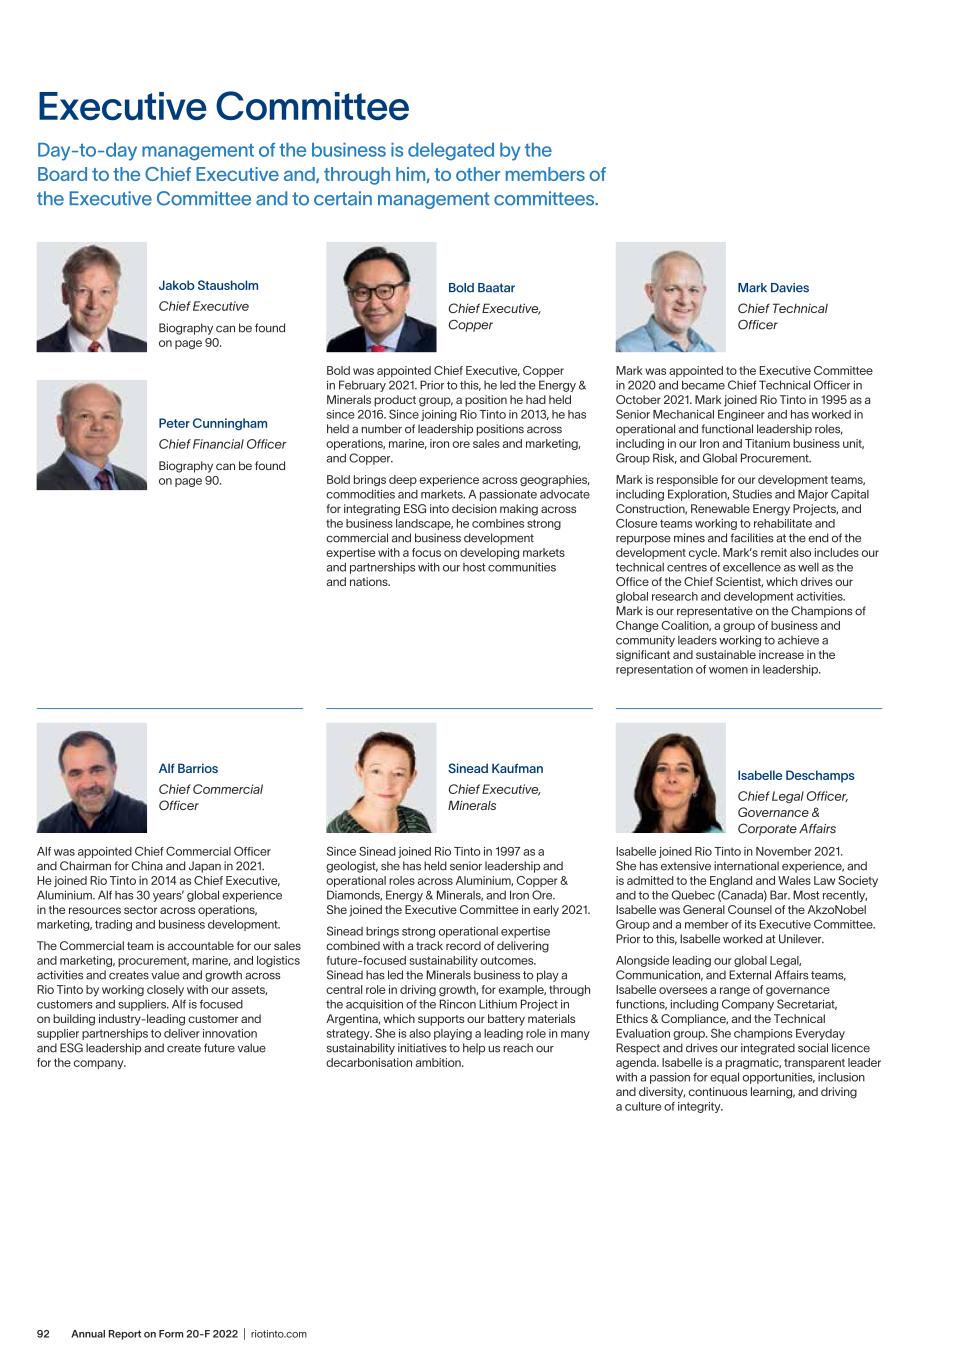
Annual Report on Form 20-F 2022 | riotinto.com92 Executive Committee Day-to-day management of the business is delegated by the Board to the Chief Executive and, through him, to other members of the Executive Committee and to certain management committees. Bold Baatar Chief Executive, Copper Mark Davies Chief Technical Officer Jakob Stausholm Chief Executive Biography can be found on page 90. Peter Cunningham Chief Financial Officer Biography can be found on page 90. Bold was appointed Chief Executive, Copper in February 2021. Prior to this, he led the Energy & Minerals product group, a position he had held since 2016. Since joining Rio Tinto in 2013, he has held a number of leadership positions across operations, marine, iron ore sales and marketing, and Copper. Bold brings deep experience across geographies, commodities and markets. A passionate advocate for integrating ESG into decision making across the business landscape, he combines strong commercial and business development expertise with a focus on developing markets and partnerships with our host communities and nations. Mark was appointed to the Executive Committee in 2020 and became Chief Technical Officer in October 2021. Mark joined Rio Tinto in 1995 as a Senior Mechanical Engineer and has worked in operational and functional leadership roles, including in our Iron and Titanium business unit, Group Risk, and Global Procurement. Mark is responsible for our development teams, including Exploration, Studies and Major Capital Construction, Renewable Energy Projects, and Closure teams working to rehabilitate and repurpose mines and facilities at the end of the development cycle. Mark’s remit also includes our technical centres of excellence as well as the Office of the Chief Scientist, which drives our global research and development activities. Mark is our representative on the Champions of Change Coalition, a group of business and community leaders working to achieve a significant and sustainable increase in the representation of women in leadership. Sinead Kaufman Chief Executive, Minerals Isabelle Deschamps Chief Legal Officer, Governance & Corporate Affairs Alf Barrios Chief Commercial Officer Since Sinead joined Rio Tinto in 1997 as a geologist, she has held senior leadership and operational roles across Aluminium, Copper & Diamonds, Energy & Minerals, and Iron Ore. She joined the Executive Committee in early 2021. Sinead brings strong operational expertise combined with a track record of delivering future-focused sustainability outcomes. Sinead has led the Minerals business to play a central role in driving growth, for example, through the acquisition of the Rincon Lithium Project in Argentina, which supports our battery materials strategy. She is also playing a leading role in many sustainability initiatives to help us reach our decarbonisation ambition. Isabelle joined Rio Tinto in November 2021. She has extensive international experience, and is admitted to the England and Wales Law Society and to the Quebec (Canada) Bar. Most recently, Isabelle was General Counsel of the AkzoNobel Group and a member of its Executive Committee. Prior to this, Isabelle worked at Unilever. Alongside leading our global Legal, Communication, and External Affairs teams, Isabelle oversees a range of governance functions, including Company Secretariat, Ethics & Compliance, and the Technical Evaluation group. She champions Everyday Respect and drives our integrated social licence agenda. Isabelle is a pragmatic, transparent leader with a passion for equal opportunities, inclusion and diversity, continuous learning, and driving a culture of integrity. Alf was appointed Chief Commercial Officer and Chairman for China and Japan in 2021. He joined Rio Tinto in 2014 as Chief Executive, Aluminium. Alf has 30 years’ global experience in the resources sector across operations, marketing, trading and business development. The Commercial team is accountable for our sales and marketing, procurement, marine, and logistics activities and creates value and growth across Rio Tinto by working closely with our assets, customers and suppliers. Alf is focused on building industry-leading customer and supplier partnerships to deliver innovation and ESG leadership and create future value for the company.
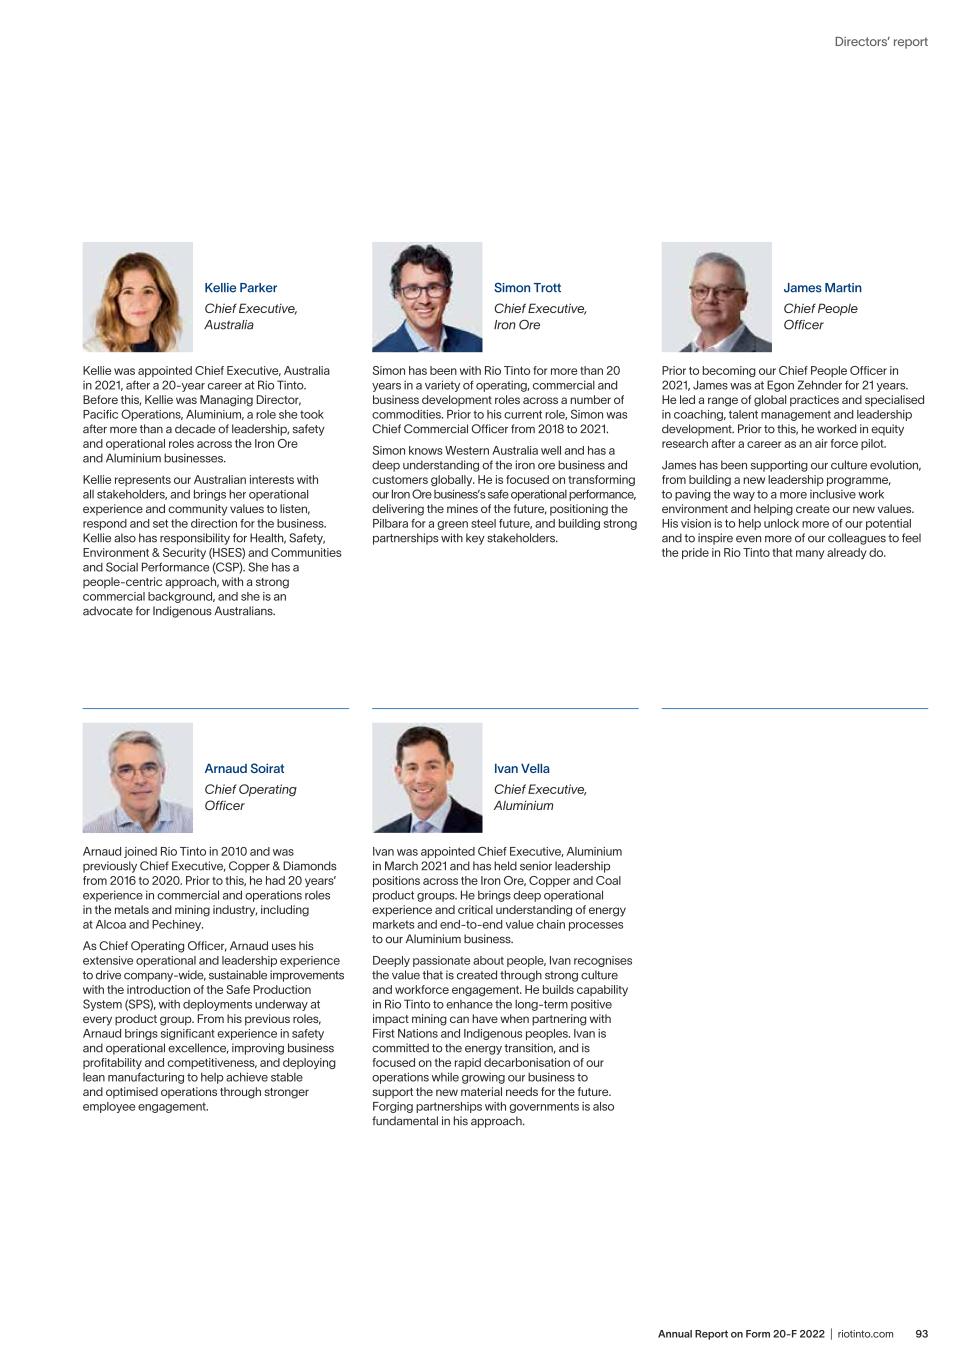
93Annual Report on Form 20-F 2022 | riotinto.com Directors’ report Kellie Parker Chief Executive, Australia Simon Trott Chief Executive, Iron Ore James Martin Chief People Officer Kellie was appointed Chief Executive, Australia in 2021, after a 20-year career at Rio Tinto. Before this, Kellie was Managing Director, Pacific Operations, Aluminium, a role she took after more than a decade of leadership, safety and operational roles across the Iron Ore and Aluminium businesses. Kellie represents our Australian interests with all stakeholders, and brings her operational experience and community values to listen, respond and set the direction for the business. Kellie also has responsibility for Health, Safety, Environment & Security (HSES) and Communities and Social Performance (CSP). She has a people-centric approach, with a strong commercial background, and she is an advocate for Indigenous Australians. Simon has been with Rio Tinto for more than 20 years in a variety of operating, commercial and business development roles across a number of commodities. Prior to his current role, Simon was Chief Commercial Officer from 2018 to 2021. Simon knows Western Australia well and has a deep understanding of the iron ore business and customers globally. He is focused on transforming our Iron Ore business’s safe operational performance, delivering the mines of the future, positioning the Pilbara for a green steel future, and building strong partnerships with key stakeholders. Prior to becoming our Chief People Officer in 2021, James was at Egon Zehnder for 21 years. He led a range of global practices and specialised in coaching, talent management and leadership development. Prior to this, he worked in equity research after a career as an air force pilot. James has been supporting our culture evolution, from building a new leadership programme, to paving the way to a more inclusive work environment and helping create our new values. His vision is to help unlock more of our potential and to inspire even more of our colleagues to feel the pride in Rio Tinto that many already do. Arnaud Soirat Chief Operating Officer Ivan Vella Chief Executive, Aluminium Arnaud joined Rio Tinto in 2010 and was previously Chief Executive, Copper & Diamonds from 2016 to 2020. Prior to this, he had 20 years’ experience in commercial and operations roles in the metals and mining industry, including at Alcoa and Pechiney. As Chief Operating Officer, Arnaud uses his extensive operational and leadership experience to drive company-wide, sustainable improvements with the introduction of the Safe Production System (SPS), with deployments underway at every product group. From his previous roles, Arnaud brings significant experience in safety and operational excellence, improving business profitability and competitiveness, and deploying lean manufacturing to help achieve stable and optimised operations through stronger employee engagement. Ivan was appointed Chief Executive, Aluminium in March 2021 and has held senior leadership positions across the Iron Ore, Copper and Coal product groups. He brings deep operational experience and critical understanding of energy markets and end-to-end value chain processes to our Aluminium business. Deeply passionate about people, Ivan recognises the value that is created through strong culture and workforce engagement. He builds capability in Rio Tinto to enhance the long-term positive impact mining can have when partnering with First Nations and Indigenous peoples. Ivan is committed to the energy transition, and is focused on the rapid decarbonisation of our operations while growing our business to support the new material needs for the future. Forging partnerships with governments is also fundamental in his approach.
Annual Report on Form 20-F 2022 | riotinto.com94 Board insights How the Board considered our values and culture Employee engagement sessions As part of the Board’s ongoing engagement with our people, Directors took part in a range of activities, including employee-listening sessions, podcast recordings and in-person meetings. Non-Executive Directors are invited to provide the Board with any feedback from these engagements at each Board meeting. The employee-listening sessions help the Board understand the concerns, views and ideas of our people in an informal and conversational setting. The following sessions took place during the year: – In April 2022, Megan Clark, Simon McKeon and Ngaire Woods spoke with employees from the Change Partners Network, part of the Safe Production System (SPS), discussing inclusion and diversity and our culture, including the findings of the Everyday Respect Report. – In June 2022, Simon Henry, Sam Laidlaw and Jennifer Nason spoke with our Mindsets and Behaviours Coaches and Change Champions of SPS on the successes, failures and areas of improvement of our processes. – In October 2022, Megan Clark, Ngaire Woods and Ben Wyatt took part in a conversation with our people based in China to better understand their perspectives of our business. Board members also recorded podcasts to give our people more of an insight into who they are, both professionally and personally. During 2022, our then Chairman, Simon Thompson, reflected on his tenure as a member of the Board, and a number of our Non-Executive Directors were interviewed on topical issues for our business. In December 2022, all the Board members visited our Brisbane office for the final Board meeting of the year. While there, our Chair and Chief Executive held a fireside chat, which all employees were invited to attend. Board members also took part in lunches with Indigenous employees, part of our graduate programme and members of the Inclusion & Diversity (I&D) Committee, a voluntary group that organises activities to improve I&D initiatives in the Brisbane office, and the Thrive Committee, which raises awareness and understanding of LGBTI+ issues. Site visits by the Board Members of the Board visit Gudai-Darri On 6 May 2022, members of the Board visited the Gudai-Darri iron ore mine in the Pilbara region of Western Australia. On 21 June 2022, Megan Clark and Simon McKeon also visited for the opening of the mine, one of the most technically advanced in the world. While there, Megan and Simon viewed the automated haul trucks, automated water carts and autonomous train haulage system. They also visited the robotic sample laboratory and saw the digital twin of the process plant, and the advanced crushing facilities and new solar plant. The focus on safety and Everyday Respect was evident in every encounter with the Rio Tinto team and our contractors. The strong partnership with the Banjima people, the Traditional Owners of the land, was a highlight of the opening. Simon McKeon attends the Garma Festival Between 29 July and 1 August 2022, Simon McKeon attended the annual Garma Festival, a celebration of the cultural, artistic and ceremonial traditions of the Yolngu people. It takes place near Nhulunbuy, the town in Australia’s Northern Territory that is the base for our Gove operations. Simon met with Indigenous leaders, and the meeting highlighted that, while considerable progress has been made since the Juukan Gorge rock shelters destruction in improving Rio Tinto’s cultural heritage performance, there is still a considerable way to go. The festival was an opportunity to demonstrate Rio Tinto’s willingness to listen and our commitment to creating long-term relationships with Indigenous partners. Ben Wyatt visits Resolution Copper Ben Wyatt visited Resolution Copper in Arizona in October 2022. He had the privilege to spend time on the ancestral lands of the O’odham, Hopi, Pueblo of Zuni, Western Apache and Yavapai Tribes during his visit. Ben toured the existing underground mine and met with Tribal representatives. Megan Clark visits Kennecott Megan Clark visited our Kennecott copper operations in Utah in the US in November 2022. Kennecott includes open pit and underground mines, and concentrator, smelter and refinery facilities. The visit provided a chance for Megan to review the following: open pit geotechnical management; underground expansion plans; smelter rebuild preparation; process safety management; and implementation of the SPS and our ESG initiatives. Kennecott is investing in upgrading the smelter, and has expansion plans for open pit and underground development of skarn deposits next to the pit. The team’s pride in and commitment to making Kennecott a significant strategic operation for Rio Tinto and the US was a highlight of the visit. Dominic Barton’s first year as Chair Since becoming Chair of Rio Tinto on 5 May 2022, Dominic Barton has undertaken an induction programme and spent time meeting our people across our operations globally, as well as key stakeholders. Some of Dominic’s engagements during 2022 were as follows: April 2022: – met with all of the Board and Executive Committee individually, as well as a number of key management personnel. May 2022: – visited our Western Australian operations, including Gudai-Darri, Dampier Ports, 7 Mile Rail and our Brockman 4 mine. – hosted employee engagement sessions in Perth, Western Australia and met with key external stakeholders. – investor meetings, including meeting with investors in New York, US. June 2022: – attended a Rio Tinto Leadership Team meeting with the Executive Committee in Western Australia. July 2022: – met with officials at the Mongolian Embassy in Washington DC, US. August 2022: – site visits in North America, including Saguenay, Sorel-Tracy, and the Montreal office in Canada, and Boron, Kennecott and Resolution Copper in the US. September 2022: – hosted an employee event at the Natural History Museum in London, UK. – attended an Executive Committee meeting in Spain. – attended government meetings in Washington DC, US. October 2022: – attended a Mobius Leadership session in Tel Aviv, Israel. November 2022: – attended Responsible 100 Forum. – attended civil society organisation (CSO) roundtables in Europe. – attended the Rio Tinto Annual Reception, a stakeholder event in London, UK. December 2022: – attended government meetings in Washington DC, US. – virtually attended CSO roundtables in North America and Australia. – hosted employee engagement sessions in Perth, Western Australia and Brisbane, Queensland and met with key external stakeholders. – attended the Western Australia Business Leaders Dinner. – met with members of the Puutu Kunti Kurrama and Pinikura people alongside the Board at a Senior Leaders lunch.
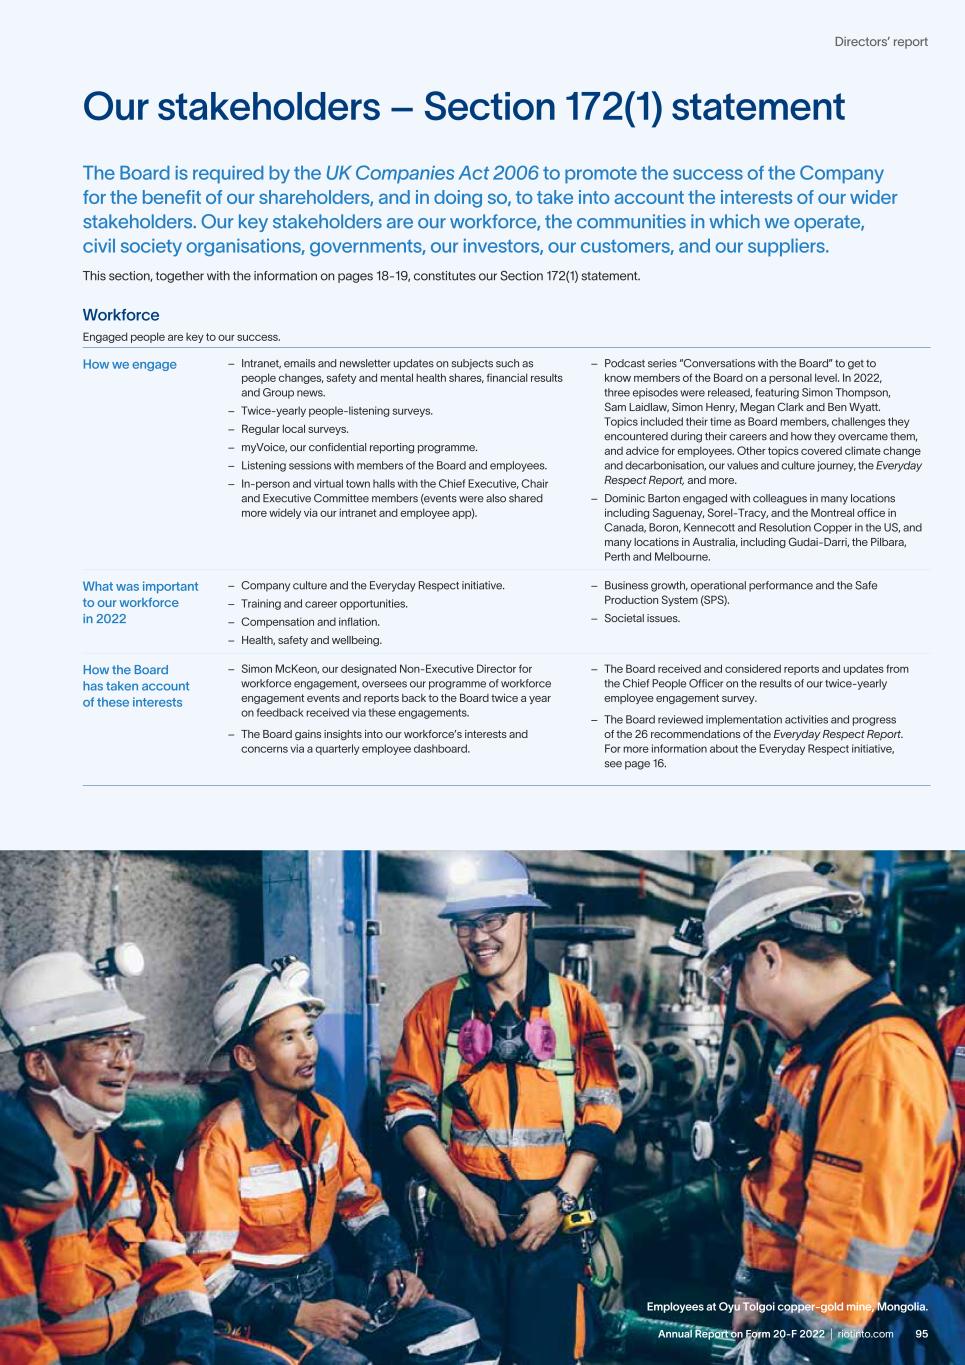
95Annual Report on Form 20-F 2022 | riotinto.com Directors’ report Our stakeholders – Section 172(1) statement The Board is required by the UK Companies Act 2006 to promote the success of the Company for the benefit of our shareholders, and in doing so, to take into account the interests of our wider stakeholders. Our key stakeholders are our workforce, the communities in which we operate, civil society organisations, governments, our investors, our customers, and our suppliers. This section, together with the information on pages 18-19, constitutes our Section 172(1) statement. Workforce Engaged people are key to our success. How we engage – Intranet, emails and newsletter updates on subjects such as people changes, safety and mental health shares, financial results and Group news. – Twice-yearly people-listening surveys. – Regular local surveys. – myVoice, our confidential reporting programme. – Listening sessions with members of the Board and employees. – In-person and virtual town halls with the Chief Executive, Chair and Executive Committee members (events were also shared more widely via our intranet and employee app). – Podcast series “Conversations with the Board” to get to know members of the Board on a personal level. In 2022, three episodes were released, featuring Simon Thompson, Sam Laidlaw, Simon Henry, Megan Clark and Ben Wyatt. Topics included their time as Board members, challenges they encountered during their careers and how they overcame them, and advice for employees. Other topics covered climate change and decarbonisation, our values and culture journey, the Everyday Respect Report, and more. – Dominic Barton engaged with colleagues in many locations including Saguenay, Sorel-Tracy, and the Montreal office in Canada, Boron, Kennecott and Resolution Copper in the US, and many locations in Australia, including Gudai-Darri, the Pilbara, Perth and Melbourne. What was important to our workforce in 2022 – Company culture and the Everyday Respect initiative. – Training and career opportunities. – Compensation and inflation. – Health, safety and wellbeing. – Business growth, operational performance and the Safe Production System (SPS). – Societal issues. How the Board has taken account of these interests – Simon McKeon, our designated Non-Executive Director for workforce engagement, oversees our programme of workforce engagement events and reports back to the Board twice a year on feedback received via these engagements. – The Board gains insights into our workforce’s interests and concerns via a quarterly employee dashboard. – The Board received and considered reports and updates from the Chief People Officer on the results of our twice-yearly employee engagement survey. – The Board reviewed implementation activities and progress of the 26 recommendations of the Everyday Respect Report. For more information about the Everyday Respect initiative, see page 16. Employees at Oyu Tolgoi copper-gold mine, Mongolia.
Annual Report on Form 20-F 2022 | riotinto.com96 Communities The communities where we live and work are fundamental to our business – without their support, we cannot operate. How we engage We continue to strengthen our social performance structure, governance approach and processes. We have increased engagement between Traditional Owners, Indigenous peoples and our senior operational leaders and teams. Our engagement activities include: – Community liaison teams. – Various meeting formats to reflect local expectations. – myVoice, our confidential whistleblower programme, provides a way for anyone, internal or external, to raise a concern about the Group. – Executive members regularly meet with Traditional Owners as part of site visits. – As part of the 2022 Communities and Social Performance Commitments Disclosure Report, we received direct feedback from Traditional Owners in Australia on our activities and engagement. The feedback is included in the report. – Board members met Traditional Owners and communities at four site visits in 2022. More information about the site visits can be found on page 94. What was important to our communities in 2022 – Job creation and procurement opportunities. – Land access. – Socioeconomic development projects. – Environmental management, tailings storage facilities, operational impacts and potential site closures. – Security. How the Board has taken account of these interests The Board oversees and receives regular updates on many projects. – We have developed the Western Australian Indigenous Participation Strategy, designed to support a more collaborative approach to working with our communities in attracting and developing Indigenous employees. – Environmental Resources Management’s independent cultural management audits have identified several ways to improve how we engage with Traditional Owners in Australia. For details on the outcomes on these audits, see page 56. – The Australian Advisory Group brings together a group of independent advisers to provide guidance on current and emerging issues, and better manage policies and positions that are important to Australian communities and our broader business. This is one of the 11 commitments we made as part of our action to strengthen our processes and approach to cultural heritage, following the destruction of the rock shelters at Juukan Gorge in May 2020. – More information is available on page 56. Civil society organisations Civil society organisations (CSOs) play an important role in society. They hold us to account and help us understand societal expectations across ESG issues, detect risks and identify opportunities to collaborate. How we engage – We engage regularly with CSOs to understand and respond to areas of interest and concern, communicate progress, share challenges and advance common goals. – We engage both locally on specific issues related to an operation and nationally on matters such as policy reform, company standards and industry leadership. – We attend CSO forums to understand the latest trends and expectations on ESG issues and engage regularly at CEO level to address concerns or discuss strategy. – Since 2018, we have held annual roundtables with CSO leaders, and members of the Board and Executive Committee. The roundtables provide a dedicated forum for our most senior leaders to engage directly with CSOs and discuss strategic issues. – In 2022, we commenced issue-specific dialogues focused on particular themes, starting with decarbonisation and the Everyday Respect Report. These sessions enabled us to explore issues in depth and gain detailed insights from CSOs to inform our approach to each topic. What was important to our CSOs in 2022 – Climate change and decarbonisation. – Water management, biodiversity protection and nature-based solutions. – Mine rehabilitation. – Circular economy. – Just transition. – Cultural heritage protection, Indigenous economic advancement, and community consultation and consent. – Human rights and modern slavery. – The Everyday Respect Report and workplace culture. – Transparency and political advocacy. How the Board has taken account of these interests The Board and its sub-committees consider issues raised by CSOs throughout the year, particularly through the Sustainability Committee. The Board is represented at the CSO roundtables through the Chair and other Directors. Our stakeholders continued
97Annual Report on Form 20-F 2022 | riotinto.com Directors’ report Governments Governments – national, state and provincial, and local – are important stakeholders for our business. They provide the legal and policy framework that supports our businesses, and ensure that our communities and people are protected. How we engage – We provide information and updates on issues relevant to our industry, either directly or as part of industry associations. – We participate in multi-stakeholder organisations, initiatives and roundtables, such as the Voluntary Principles on Security and Human Rights, and the Extractive Industries Transparency Initiative (EITI) and the International Council on Mining and Metals. – We invite government representatives to visit our sites. – Public reporting. – We engage with governments through innovative partnerships such as with the Governments of Canada and Quebec (on ELYSIS). – We partner with governments on some projects, such as with the Government of Guinea where we are exploring ways to optimise, develop and fund the world-class Simandou iron ore deposit, and the Government of South Africa to support the operational stability at Richards Bay Minerals. – In Australia, engagement with the Australian Government and state governments include issues related to project approvals required for our businesses; climate and energy; cultural heritage protection; international relations, investment and trade; employment, training, skills and migration; critical minerals; closure and rehabilitation requirements; and industrial relations reforms. – We contribute to EU public policy development on issues such as critical minerals strategy, battery legislation, green mining principles and due diligence legislation. – In the US, we advocate on public policy related to the North American supply chain and, specifically, alignment on climate change, critical minerals and materials, renewable energy, and trade. – In China, we partner and engage with a range of government and state-owned entities, on issues related to climate change, innovation, training, procurement, and product supply. What was important to our governments in 2022 – Tax and royalty payments. – Compliance with laws and regulations. – Local employment and procurement. – Operational environmental management, including tailings storage. – Climate change and local emissions. – Security of supply and innovation. – Socioeconomic development projects. – Transparency and human rights. – Public health. – Security. – Permitting of new technology in areas of influence. – Heritage issues, investment and decarbonisation in Australia. – The development of the Oyu Tolgoi underground project in Mongolia. – Decarbonisation opportunities in Canada. – The UK Government’s critical minerals strategy. How the Board has taken account of these interests – The Board receives regular updates regarding all our projects and, in doing so, oversees engagement with governments and considers their interests. – The Board also received two updates on China via the Rio Tinto China Panel. – In 2022, members of the Board engaged directly with representatives of the Governments of Australia, the US, Canada and the UK, and discussed a wide range of issues. Investors Our strategy and long-term success depend on the support of our investors. How we engage – Regular calls, one-on-one meetings and group events, presentations and attendance at investor conferences. – Webinars and online Q&A sessions. – Our reporting suite, including our Annual Report and Climate Change Report. – Two annual general meetings (AGMs), one in Australia and one in the UK. Following the relaxation of restrictions related to COVID-19, both meetings were held in person (and online), which enabled a broad range of shareholders to participate in the meetings. Institutional and retail investors could therefore engage directly with the Board and management. They also give shareholders the opportunity to ask questions and vote on our Remuneration report. – Requesting disclosure of our approach to addressing Scope 3 emissions. – Since joining the Board, our current Chair, Dominic Barton, has met with investors in the UK, the US and Australia and attended three CSO roundtables to convey how our new strategy integrates the net zero transition into our business, including our portfolio, capital investment decisions, and business planning. Our previous Chairman also engaged extensively with investors across multiple markets in advance of our AGMs to understand their perspectives. He led regular meetings each year with the Climate Action 100+ (CA100+) investor groups in Europe and Asia. The discussions focused on the key indicators in the CA100+ Net Zero Company Benchmark, in particular, our Scope 1 and 2 targets, our approach to Scope 3 emissions, capital allocation, governance, and our climate policy engagement. What was important to our investors in 2022 – Financial and operational performance. – Our ESG performance, including the impact of climate change and how we are decarbonising our business. – Compliance with laws and regulations. – Human rights. – Remuneration policy. How the Board has taken account of these interests – The Board is committed to maintaining an appropriate balance between cash returns to shareholders and investment in the business, with the intention of maximising long-term shareholder value. – Given investor interest in ESG issues, including climate change and our work with communities around the world, the Board considers these issues during its yearly strategy sessions when assessing our portfolio positions. – The Board’s engagement with CA100+ provides us with a valuable sounding board as we implement our strategy, respond to requisitioned resolutions and develop our reporting. – The People & Remuneration Committee Chair consulted with shareholders and proxy advisers to explain the rationale for our new short term incentive framework. The final framework was adapted to reflect points raised during the consultation process.
Annual Report on Form 20-F 2022 | riotinto.com98 Our stakeholders continued Customers The needs of our customers are central to our operational decision making. How we engage – Our Commercial team engages with customers through direct engagements and via business and industry forums. – We seek feedback from our customers through a yearly survey. These results are shared with the Board. – Climate change is one of our customers’ biggest challenges, and we partner to find innovative solutions to help produce sustainable products. For example, in 2022 we signed a memorandum of understanding with Shougang, a key customer in China, to jointly develop technologies to transition to a low-carbon emission steel value chain. What was important to our customers in 2022 – Supply security. – Responsible sourcing and supply. – Transparency in the supply chain. – Human rights. – Compliance with laws and regulations. – Competitive pricing. – Product quality. – Strategic partnerships. – Evidence of ESG traceability. – Participation in responsible mining certification systems. How the Board has taken account of these interests – The Chief Executive, Commercial updates the Board annually on the key priorities and vision for Commercial, its role in supporting the Group strategy, and our customer engagement initiatives. Suppliers Our suppliers are critical to our ability to run efficient and safe global operations. How we engage – Our Commercial team engages with our suppliers in a range of ways, including regular meetings and site visits, supplier events, local and host community procurement forums, and supplier capability development initiatives. – We partner with suppliers to co-develop technologies and applications, such as more autonomous haul trucks with Scania. – We seek feedback from our suppliers through a yearly survey to improve our engagement and to strengthen our partnerships. These results are shared with the Board. What was important to our suppliers in 2022 – Responsible sourcing and supply. – Transparency in the supply chain. – Human rights. – Compliance with laws and regulations. – Competitive pricing. – Performance. – Payment terms. – Strategic partnerships. How the Board has taken account of these interests – The Chief Executive, Commercial provides an annual update to the Board on the Group’s activities with suppliers, including metrics regarding how the Group has supported initiatives aimed at Indigenous groups.
99Annual Report on Form 20-F 2022 | riotinto.com Directors’ report The Board had seven scheduled meetings in 2022 and six additional meetings were held to discuss matters outside the Board’s regular agenda items. Set out below are some of the matters that the Board has considered during the year. At every Board meeting, the Chief Executive and Chief Financial Officer report on the safety, operating and business performance of the Group against our key performance indicators, as well as how certain material stakeholder issues are being managed. The Board also receives detailed reports from the management team relating to progress on major growth projects and updates on operations. In addition, the Board invites external subject matter experts to present on issues relevant to major strategic or operational matters. Examples in 2022 included: Growth and sustaining projects – In February, the Board reviewed an update on the Resolution Copper project in the US and approved $598 million in funding (100% basis). – In April, the Board considered a paper providing an update on the Simandou iron ore project in Guinea. – In May, the Board reviewed a paper and a presentation providing an update on the Rhodes Ridge joint venture in Australia. – In May, the Board considered and approved a request for $118 million of early works funding to accelerate first ore and de-risk the Western Range Sustaining project in Australia, taking total early works funding to $174 million. – In July, the Board approved funding for Rincon of $194 million for early works to develop an accelerated starter plant with planned expansion. Operational – In February, the Board reviewed an overview of the Minerals product group’s strategy and how it fits within the broader integrated strategy of the Group. – In April, the Board discussed a paper summarising the main actions to advance Rio Tinto Aluminium’s strategy in 2022. – In April, the Board considered important learnings from the experience to date at Winu in Australia. The learnings will be used to reshape the pathway to launch the project. People The Board receives regular updates on our people-related initiatives to attract, develop and retain the best people, which are crucial to our success and to supporting our strategic objectives. Some of the topics covered in 2022 included: – In July, the Board reviewed and noted a paper regarding the May 2022 employee engagement survey, which showed improvement. – In July, the Board considered the progress on the Everyday Respect Report recommendations and early signs of positive impact. The Board noted the importance of creating a safe workplace that supports intervention. Everyday Respect training was to be organised for the Board. – In December, the Board reviewed an update in relation to Executive Committee succession planning. Strategy and risk Climate change and the low-carbon transition are at the heart of our strategy. The Board considers our strategy twice yearly, receiving updates from the management team in May and September. (See pages 13-14 for details of our strategy.) The topics discussed included: May – Industry trends and applications of the new scenario framework. – Opportunities from the circular economy and the role of recycling to address carbon and environmental challenges across our value chains. – Challenges and implications for the business of the energy transition. – Progress across key elements of the integrated Group strategy: culture, decarbonisation, growth and the four objectives. September – Scenarios and our strategic context. – Technological challenges of decarbonisation. – New approach to evolving customer needs in the West. – The Group’s 2035 Vision. – Culture and product group strategies. Matters discussed in 2022 – In April, the Board considered a paper and a presentation outlining the key priorities and vision for the future of Rio Tinto Commercial, and its role in supporting the delivery of Group strategy. – In October, the Board reviewed a paper regarding existential risk scenarios which, if they were to occur, could substantially threaten the viability of the Group. It was noted that the identification and management of these risks was an important component of the Group’s risk management framework, testing the Group’s resilience to very low likelihood risks, with extremely high impacts. ESG The Board has ultimate oversight of environmental, social and governance matters, but has delegated responsibility for certain matters to the Sustainability Committee. During the year, the Board reviewed its forward agenda of matters to be discussed, considered its constitution, composition and performance, and reviewed any new or amended Group policies. In addition, it considered the following governance matters: – In February, the Board approved the 2021 Climate Change Report and approach to industry associations. – In February, the Board approved the advisory Say on Climate resolution, which was voted on at the 2022 annual general meetings. – In April, the Board reviewed and noted the findings of the annual Perceptions Study to the period ending March 2022. The purpose of the study was to assess the thoughts of institutional investors with respect to the Group, in particular to assess its strengths and weaknesses. – In May, the Board considered a paper regarding the Group’s Modern Slavery Statement, which was approved. – In July, the Board discussed and noted a paper providing a twice-yearly update on the organisation’s Business Conduct Office and myVoice programme. – In July, the Board reviewed and noted a paper providing a twice-yearly update on the organisation’s compliance programme. The Board discussed and considered material compliance risks, compliance programme effectiveness, and received an update on the ethics programme. – In July, the Board received a presentation providing perspectives from an ESG standpoint, on the industry, performance, prospects and imperatives for the Group’s iron ore, copper, aluminium and lithium businesses. – In September, the Board discussed a paper outlining the current and proposed structure of social investment in Australia at national, regional, and local levels. – In December, the Board reviewed our revised climate change policy positions.
Annual Report on Form 20-F 2022 | riotinto.com100 Good governance is about considering the right things, at the right time, with the right people and insights. We have structured the way the Board works to support that objective, to strengthen our strategic focus, and to improve both the challenge and the support that the Board provides to the executive team. Here is a summary of the framework. Governance framework Board of Directors We are finding better ways to provide the materials the world needs. By doing so efficiently, effectively and sustainably, we aim to create long-term value for all stakeholders. Our purpose is supported by three core values – care, courage and curiosity. The Board is collectively responsible for pursuing this purpose and approves the strategy, budget and plans proposed by the Chief Executive to achieve this objective. Board Charter See the Board Charter for more information on the role of the Board and the delegation to management. Available at riotinto.com Executive Committee The Executive Committee supports the Chief Executive in the delivery of strategy, annual plans and commercial objectives, and managing the financial and operational performance of the Group. The following management committees support the Chief Executive in the performance of his duties. Investment Committee Reviews proposals on investments, acquisitions and disposals. Approves capital decisions within delegated authority limits, and otherwise recommends matters for approval to the Board, where appropriate. Risk Management Committee Oversees the management and mitigation of the principal risks that could materially impact the Group’s business objectives and exceed its risk tolerances. Ore Reserves Steering Committee Responsible for standards and control procedures in the Ore Reserves estimation and disclosure process. Ensures that they are effective in meeting internal objectives and regulatory requirements. Closure Steering Committee Oversees the process and controls designed to manage the material risks related to rehabilitation, closure and legacy operations. Disclosure Committee Reviews and approves the release of all significant public disclosures on behalf of the Group. Oversees the Group’s compliance with its disclosure obligations in accordance with all relevant legal and regulatory requirements, including processes to ensure such disclosures are accurate and timely. Audit & Risk Committee Helps the Board to monitor decisions and processes designed to ensure the integrity of financial reporting, the independence and effectiveness of the external auditors, and robust systems of internal control and risk management. Nominations Committee Helps the Board determine its composition, and that of its committees. They are regularly reviewed and refreshed, so they are able to operate effectively and have the right mixture of skills, experience and background. People & Remuneration Committee Helps the Board ensure that Remuneration Policy and practices reward employees and executives fairly and responsibly, with a clear link to corporate and individual performance, and a focus on people and culture. Sustainability Committee Helps the Board oversee the Group’s integrated approach to sustainability and strategies designed to manage health and safety, and social and environmental risks, including management processes and standards. Chair’s Committee Supports the functioning of the Board and will consider urgent matters between Board meetings. Chief Executive Has delegated responsibility for the executive management of Rio Tinto, consistent with the Group’s purpose and strategy, and subject to matters reserved for the Board, as set out in the Schedule of Matters Reserved for the Board (available at riotinto.com), and in accordance with the Group’s delegation of authority framework.See pages 104-107 See pages 102-103 See pages 110-111 See pages 108-109 Australia Forum Advises the Board and the Executive Committee on political, economic and social developments in Australia and how they could affect the business. China Advisory Panel Provides context and analysis to the Board and the Executive Committee on political, commercial and policy developments relevant to our operations in China and with Chinese partners.
101Annual Report on Form 20-F 2022 | riotinto.com Directors’ report Evaluating our performance In line with the UK Governance Code and ASX Corporate Governance Principles and Recommendations (4th edition) (the ASX Principles), we undertake a formal annual evaluation of the Board and, every third year, we engage a professional external adviser to carry out an independent evaluation. In practice, the Chair and the Non-Executive Directors schedule time at the end of each Board meeting, often with the Executive Directors, to reflect on the effectiveness of the suite of Board and committee meetings as part of a process of continuous improvement to the governance arrangements of the Board. As set out in the Chair’s introduction on page 89, we carried out a comprehensive governance review in 2022, based upon two key corporate governance priorities for 2022: a review of our composition as a Board to ensure that we have the right balance of skills and experience for the implementation of Rio Tinto’s strategy; and a review of how to best spend our time in support of that new strategy in the context of greater uncertainty and potential risk. The review comprised external benchmarking analysis of governance structures in peer and other long-cycle companies, including private equity firms, together with a questionnaire for directors on the Board’s current effectiveness. This evaluation questionnaire was more forward looking than the usual in-year annual evaluations. Given the timing of the strategic governance review, we decided it would be more beneficial to defer the independent third-party evaluation of the Board so that it could take place once these governance enhancements were fully embedded. Therefore, the third-party Board evaluation will now take place in 2023 with this year’s forward-looking evaluation as the new baseline. In July 2022, the Board discussed the findings of the governance review and agreed on a number of enhancements. To optimise the investment of our time, we have refreshed the Board’s forward programme to ensure we are primarily focused on supporting the four strategic objectives. We have expanded the scope of our Remuneration Committee (now our People & Remuneration Committee) to place greater focus on people and culture, and we will dedicate more Board and committee time to the assessment of our top emerging risks, with oversight from the Audit Committee (renamed the Audit & Risk Committee). In support of the objective to strengthen our social licence, we have also stepped up our plans for stakeholder engagement in 2023 and beyond. Directors’ attendance at scheduled Board and committee meetings during 20221 Committee appointments Board Audit & Risk Nominations People & Remuneration Sustainability2 Chair and Executive Directors Simon Thompson – retired 5 May 2022 3/3 2/2 2/2 3/3 Dominic Barton – joined 4 April 2022 6/6 3/3 2/2 3/3 Jakob Stausholm 7/7 Peter Cunningham 7/7 Non-Executive Directors Megan Clark 7/7 4/4 5/5 6/6 Hinda Gharbi – retired 8 April 2022 2/2 2/2 2/2 3/3 Simon Henry2 7/7 6/6 3/4 6/6 Sam Laidlaw 7/7 4/4 5/5 6/6 Simon McKeon 7/7 6/6 4/4 5/5 Jennifer Nason2 7/7 4/4 5/5 3/3 Ngaire Woods 7/7 4/4 5/5 6/6 Ben Wyatt2,3 7/7 4/4 4/4 3/3 1. Outside of the scheduled meetings of the Board and Committees for 2022, numerous ad hoc meetings took place to consider more urgent matters, including one Audit & Risk Committee meeting, six Board meetings and one People & Remuneration Committee meeting. 2. Simon Henry, Jennifer Nason and Ben Wyatt ceased to be members of the Sustainability Committee with effect from 1 July 2022. 3. Ben Wyatt became a member of the Audit & Risk Committee with effect from 1 June 2022. Board committee membership key Committee Chair Audit & Risk Committee People & Remuneration Committee Nominations Committee Sustainability Committee In terms of Board composition, we concluded that we should refresh the Board, with a particular focus on deepening mining, sustainability and renewables experience. We were therefore pleased to welcome Kaisa Hietala as a Non-Executive Director, joining the Board on 1 March 2023. She brings a deep understanding of the resources industry, sustainability and renewables that will be invaluable as we work to ensure Rio Tinto thrives in a decarbonising world. Further details are set out in our Nominations Committee report on pages 102-103.
Annual Report on Form 20-F 2022 | riotinto.com102 Nominations Committee report As part of our ongoing Board succession planning, we have been working intensely during the course of the year, and I am pleased to report on the progress we have made in the first eight months of my tenure as Chair. Our main priority as a Committee this year has been on ensuring the right balance of skills and experience in the boardroom to help deliver implementation of the Group’s future strategy and objectives. This will enable us as a Board to anticipate and capture new opportunities as they emerge over the longer term, while also managing any shorter-term risks that may arise from a new global societal and industry context. We currently have ten Board members, eight Non-Executive Directors and two Executive Directors. I believe that the optimal size for a board responsible for overseeing a group of the scale, complexity and international reach as Rio Tinto should be around 12 for the longer term. As we continue to refresh the Board over this next period, it is likely that we will need to accommodate some variance above and below this optimal size, as we seek to bring in additional capability while maintaining the appropriate experience and expertise of our longer-serving Directors. Through this period of transition, our commitment to achieving the right diversity on the Board, including female and ethnic representation, will remain resolute, even if we find ourselves short on the relevant metrics in the immediate term. We are planning to complete the refreshment of the Board by the time I report to you next year, and I look forward to updating you during the course of 2023 on the progress we are making. Separately, we have introduced a number of other important enhancements regarding the Board’s responsibility to monitor the health of our people and talent. The Nominations Committee has ceded responsibility for the monitoring of succession planning of the Executive Committee to the full Board. The Board has launched a longer-term succession planning process for the Executive Committee. In December 2022, we had our first dedicated and extensive session and will now receive regular updates. In 2023, for example, the full Board will systematically monitor the progression of internal candidates as well as the external landscape, to ensure that we have robust plans for the long term, while also being prepared for any shorter-term eventualities. Separately, we have expanded the remit of our Remuneration Committee, now renamed our People & Remuneration Committee, to include a deeper and more regular focus on people and talent within the wider organisation, as well as on how effective we are in embedding the cultural and leadership changes that have been introduced. Further details can be found on page 111 in the Remuneration report. Dominic Barton Nominations Committee Chair 22 February 2023 Board refreshment Criteria After a review of Board composition, led by the new Chair Dominic Barton, a number of areas were identified to strengthen Board composition, with a view to ensuring that the Board benefits from differing perspectives, experiences and skillsets in providing effective oversight and promoting the sustainable success of the business over the long term. The Committee initiated the search for four new Non-Executive Directors and agreed to appoint the executive search firm, Spencer Stuart, to assist. The following areas of expertise were identified when searching for candidates: – mining, operations and projects, preferably a former or current Chief Executive, Chief Operating Officer or Chief Technical Officer providing options for future Committee Chair succession; – renewables and the energy transition; – financial/accounting, strengthening the composition of the Audit & Risk Committee and providing options for future Committee Chair succession; and – knowledge of key countries or regions of operational or strategic relevance to the Group, reflecting our geographic diversity, for example China and Africa. In addition to the above criteria, the continued diversity of our Board composition, including with regard to gender and ethnicity, was identified as a key priority and all searches included a diverse pool of candidates in terms of gender, ethnicity, nationality, life experience and skillset. Over half of the candidates considered were women, and of all candidates, we had representation from six continents and 32 nationalities. Across the four specifications, Spencer Stuart considered around 400 candidates before compiling long-lists of candidates in line with the criteria. These were presented to the Committee in July 2022. Prioritised candidates were endorsed by the Committee, and interested individuals were shortlisted. In total, five candidates have been interviewed by the Chair and other Board members. Technology expertise was also identified as a potential additional skillset for the Board. After careful consideration, it was agreed to establish an Innovation Advisory Council to drive the critical consideration of research and development, science and technology projects for the Group rather than make this a further category of experience for the Board itself. Candidate selection On 19 December 2022, we announced that Kaisa Hietala had been appointed as a Non-Executive Director, with effect from 1 March 2023. Kaisa is an experienced executive with a strong track record of helping companies transform the challenges of environmental megatrends into business opportunities and growth. She is also an experienced Non-Executive Director and brings a deep understanding of renewables and sustainability from her knowledge of the resources industry, as well as commercial capability, all of which will be invaluable to our success in a decarbonising world. As part of the continuing refresh of Board capabilities, the Committee is progressing well with the other categories, and we expect to announce further appointments in due course. For more information about our new Non-Executive Director, see the Board biographies on pages 90-91. Nominations Committee members Dominic Barton (Chair)1 Simon McKeon Megan Clark Jennifer Nason Hinda Gharbi2 Simon Thompson3 Simon Henry Ngaire Woods Sam Laidlaw Ben Wyatt 1. From 5 May 2022. 2. Until retirement from the Board on 8 April 2022. 3. Until retirement from the Board on 5 May 2022.
103Annual Report on Form 20-F 2022 | riotinto.com Directors’ report 0–3 years +3–6 years +6–9 years 5 3 2 Appointments to the Board – our policy We base our appointments to the Board on merit, and on objective selection criteria, with the aim of bringing a range of skills, knowledge and experience to Rio Tinto. This involves a formal and rigorous process to source strong candidates from diverse backgrounds and conducting appropriate background and reference checks on the shortlisted candidates. We aim to appoint people who will help us address the operational and strategic challenges and opportunities facing the company and ensure that our Board is diverse in terms of gender, nationality, social background and cognitive style. As such, we engage only recruitment agencies that are signed up to the Voluntary Code of Conduct on diversity best practice. When recruiting government or former government officials to join the Rio Tinto Board, we comply with any restrictions and obligations existing pursuant to relevant laws and regulations, including with respect to confidentiality, lobbying and conflicts of interest. The timing and terms of the appointment of Dominic Barton during 2022 complied with all relevant restrictions and obligations. We believe that an effective Board combines a range of perspectives with strong oversight, combining the experience of Directors who have developed a deep understanding of our business over several years with the fresh insights of newer appointees. We aim for our Board composition to reflect the global nature of our business. With the announcement of Kaisa Hietala’s appointment, we will have seven different nationalities (including dual nationalities) on a Board of 11. Megan Clark has agreed to remain a Non-Executive Director for a further year and will stand for re-election at our 2023 annual general meetings. Megan is Chair of the Sustainability Committee and one of the longest serving Directors on our Board with significant mining industry experience. In this period of Board renewal, it is critically important that the Board continues to benefit from Megan’s knowledge and experience. The Committee is of the view that Megan continues to make a significant and valuable contribution in the boardroom, and is satisfied that Megan continues to be independent. The Committee engaged Spencer Stuart to support the search for four new Non-Executive Directors, including Kaisa Hietala. The Committee is satisfied that Spencer Stuart does not have any connections with the company or individual Directors that may impair their independence. The key skills and experience of our Board are set out on this page of the report. Our Diversity and Inclusion Policy sets out our expectations around the behaviours needed for an inclusive and diverse workplace. The policy is co-owned and supported by the Board and Executive Committee. At a Group level, we report against gender diversity targets (see page 24) and achievement of these targets contributes to the variable remuneration of senior executives. In addition, each of our operations has locally set employment targets. Their performance against these targets can be found in our 2022 Sustainability Fact Book. For more information read our full policy on our website www.riotinto.com/sustainability/policies Our key responsibilities The purpose of the Nominations Committee is to review the composition of the Board. The Committee leads the process for appointments, making recommendations to the Board as part of succession planning for both Non-Executive and Executive Directors. It also approves proposals for appointments to the Executive Committee. Membership of the Committee All Non-Executive Directors are members of the Nominations Committee. The Chief Executive and the Chief People Officer are invited to attend all or part of meetings, as appropriate. The Committee is chaired by the Chair of the Board, unless the matter under consideration relates to the role of the Chair. During 2022, the former Chairman did not attend meetings where his succession was discussed. The Committee had three formal meetings in 2022 and received regular and detailed updates, including over Board dinners, on the status of the various searches at each scheduled Board meeting. Attendance at the formal meetings is included in the table on page 101. Diversity The Board recognises that it has a critical role to play in creating an environment in which all contributions are valued, different perspectives are embraced, and biases are acknowledged and overcome. The Board shares ownership with the Executive Committee of the Group’s Inclusion and Diversity Policy, which can be found at riotinto.com/sustainability/policies. We also discuss diversity and inclusion in the Sustainability section of this Form 20-F on page 59. The proportion of women on the Board is currently 30% (three women and seven men). However, this will increase to 36.3% upon the appointment of our new Non-Executive Director, Kaisa Hietala, with effect from 1 March 2023. Gender diversity remains a key focus area as we continue to progress further new appointments to the Board with a view to regaining appropriate gender balance as we move forward. The Group has continued to set measurable gender diversity objectives for the composition of senior leadership and graduate intake. Progress on diversity is shown in the Sustainability section on pages 59-60, where we show a breakdown by seniority. The number of Directors who identify themselves as being from a minority ethnic background is one (Ben Wyatt). Ensuring continued ethnic diversity on our Board has been a key consideration in our search for new Non-Executive Directors, as we have outlined on page 102. Progress on diversity is shown in the Sustainability section on pages 59-60. Skills and experience of the Chair and Non-Executive Directors Area of expertise No. of Directors Business leadership Board-level experience in a major corporation. 6 Capital projects Experience of developing large-scale, long-cycle capital projects. 4 Financial Proficiency in financial accounting and reporting, corporate finance, internal controls, treasury and associated risk management. 6 Mergers and acquisitions Experience of mergers, acquisitions, disposals and joint ventures. 6 Global experience Work experience in multiple global locations, exposed to a range of political, cultural, regulatory and business environments. 8 Corporate governance Experience on the Board of a major corporation subject to rigorous corporate governance standards. 8 Government and international relations Interaction with governments and regulators or involvement in public policy development and implementation. 5 ESG/sustainability Familiarity with issues associated with environmental and social responsibility, including asset integrity and workplace health and safety. 5 Climate change Knowledge and experience of climate-related threats and opportunities including climate science, low-carbon transition and public policy. 5 Communities and social performance Experience of working with communities to optimise the benefits and minimise negative impacts of business activities. 7 Marketing Senior executive experience in marketing, and the development of product and/or customer management strategies. 3 Mining Senior executive experience in a large, global mining organisation involved in the discovery, development, operation and closure of mines. 2 HR/remuneration Experience of talent recruitment, retention, development and incentives. 6 Technology/digital Experience of managing research, development and innovation, including digital technology. 3 Length of tenure of Non-Executive Directors
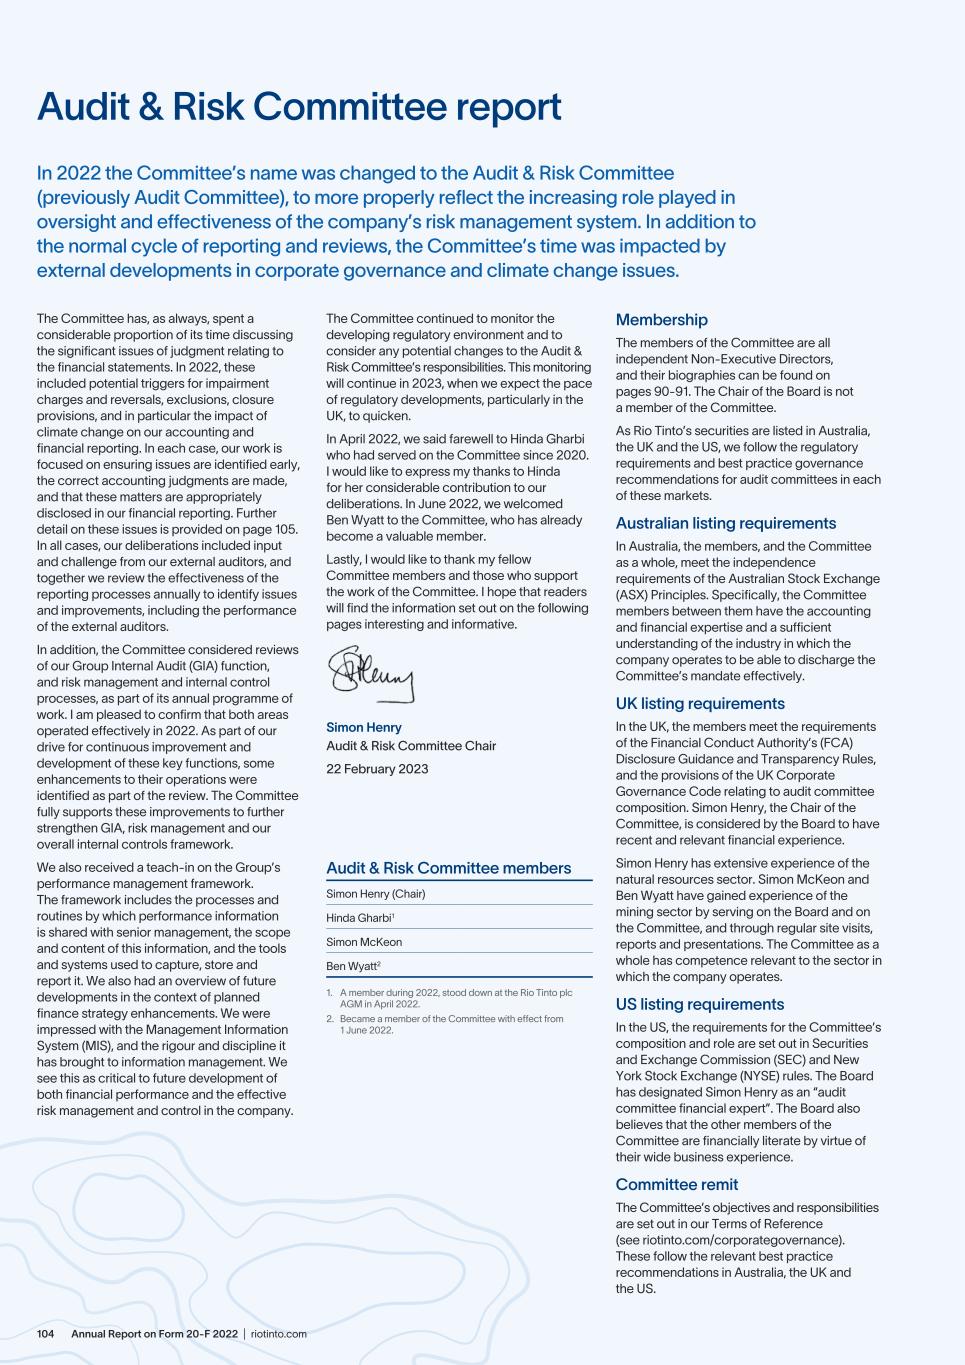
Annual Report on Form 20-F 2022 | riotinto.com104 Audit & Risk Committee report In 2022 the Committee’s name was changed to the Audit & Risk Committee (previously Audit Committee), to more properly reflect the increasing role played in oversight and effectiveness of the company’s risk management system. In addition to the normal cycle of reporting and reviews, the Committee’s time was impacted by external developments in corporate governance and climate change issues. The Committee has, as always, spent a considerable proportion of its time discussing the significant issues of judgment relating to the financial statements. In 2022, these included potential triggers for impairment charges and reversals, exclusions, closure provisions, and in particular the impact of climate change on our accounting and financial reporting. In each case, our work is focused on ensuring issues are identified early, the correct accounting judgments are made, and that these matters are appropriately disclosed in our financial reporting. Further detail on these issues is provided on page 105. In all cases, our deliberations included input and challenge from our external auditors, and together we review the effectiveness of the reporting processes annually to identify issues and improvements, including the performance of the external auditors. In addition, the Committee considered reviews of our Group Internal Audit (GIA) function, and risk management and internal control processes, as part of its annual programme of work. I am pleased to confirm that both areas operated effectively in 2022. As part of our drive for continuous improvement and development of these key functions, some enhancements to their operations were identified as part of the review. The Committee fully supports these improvements to further strengthen GIA, risk management and our overall internal controls framework. We also received a teach-in on the Group’s performance management framework. The framework includes the processes and routines by which performance information is shared with senior management, the scope and content of this information, and the tools and systems used to capture, store and report it. We also had an overview of future developments in the context of planned finance strategy enhancements. We were impressed with the Management Information System (MIS), and the rigour and discipline it has brought to information management. We see this as critical to future development of both financial performance and the effective risk management and control in the company. The Committee continued to monitor the developing regulatory environment and to consider any potential changes to the Audit & Risk Committee’s responsibilities. This monitoring will continue in 2023, when we expect the pace of regulatory developments, particularly in the UK, to quicken. In April 2022, we said farewell to Hinda Gharbi who had served on the Committee since 2020. I would like to express my thanks to Hinda for her considerable contribution to our deliberations. In June 2022, we welcomed Ben Wyatt to the Committee, who has already become a valuable member. Lastly, I would like to thank my fellow Committee members and those who support the work of the Committee. I hope that readers will find the information set out on the following pages interesting and informative. Simon Henry Audit & Risk Committee Chair 22 February 2023 Audit & Risk Committee members Simon Henry (Chair) Hinda Gharbi1 Simon McKeon Ben Wyatt2 1. A member during 2022, stood down at the Rio Tinto plc AGM in April 2022. 2. Became a member of the Committee with effect from 1 June 2022. Membership The members of the Committee are all independent Non-Executive Directors, and their biographies can be found on pages 90-91. The Chair of the Board is not a member of the Committee. As Rio Tinto’s securities are listed in Australia, the UK and the US, we follow the regulatory requirements and best practice governance recommendations for audit committees in each of these markets. Australian listing requirements In Australia, the members, and the Committee as a whole, meet the independence requirements of the Australian Stock Exchange (ASX) Principles. Specifically, the Committee members between them have the accounting and financial expertise and a sufficient understanding of the industry in which the company operates to be able to discharge the Committee’s mandate effectively. UK listing requirements In the UK, the members meet the requirements of the Financial Conduct Authority’s (FCA) Disclosure Guidance and Transparency Rules, and the provisions of the UK Corporate Governance Code relating to audit committee composition. Simon Henry, the Chair of the Committee, is considered by the Board to have recent and relevant financial experience. Simon Henry has extensive experience of the natural resources sector. Simon McKeon and Ben Wyatt have gained experience of the mining sector by serving on the Board and on the Committee, and through regular site visits, reports and presentations. The Committee as a whole has competence relevant to the sector in which the company operates. US listing requirements In the US, the requirements for the Committee’s composition and role are set out in Securities and Exchange Commission (SEC) and New York Stock Exchange (NYSE) rules. The Board has designated Simon Henry as an “audit committee financial expert”. The Board also believes that the other members of the Committee are financially literate by virtue of their wide business experience. Committee remit The Committee’s objectives and responsibilities are set out in our Terms of Reference (see riotinto.com/corporategovernance). These follow the relevant best practice recommendations in Australia, the UK and the US.
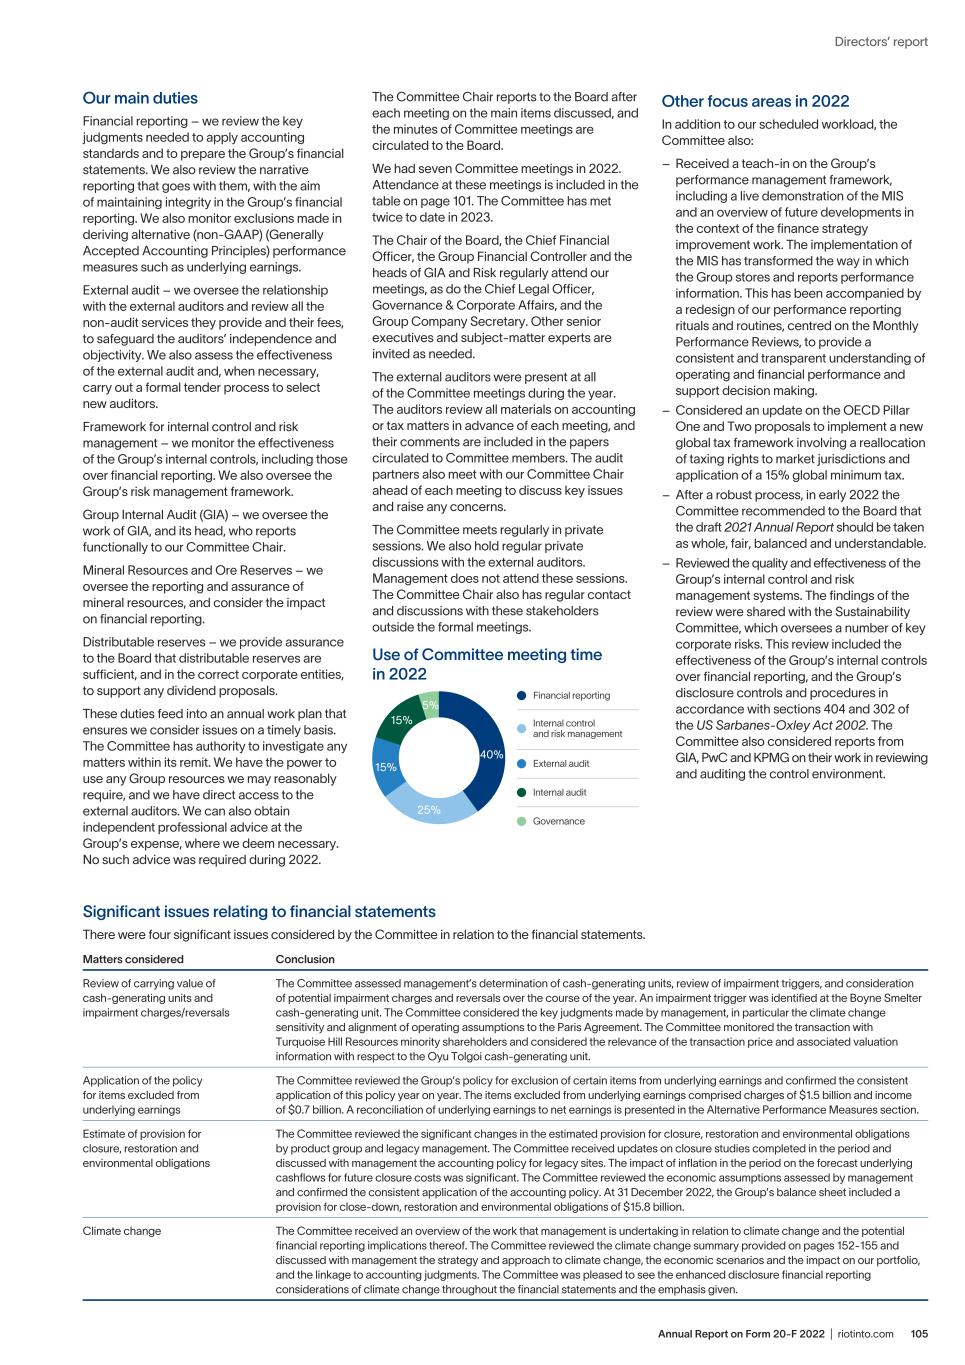
105Annual Report on Form 20-F 2022 | riotinto.com Directors’ report Our main duties Financial reporting – we review the key judgments needed to apply accounting standards and to prepare the Group’s financial statements. We also review the narrative reporting that goes with them, with the aim of maintaining integrity in the Group’s financial reporting. We also monitor exclusions made in deriving alternative (non-GAAP) (Generally Accepted Accounting Principles) performance measures such as underlying earnings. External audit – we oversee the relationship with the external auditors and review all the non-audit services they provide and their fees, to safeguard the auditors’ independence and objectivity. We also assess the effectiveness of the external audit and, when necessary, carry out a formal tender process to select new auditors. Framework for internal control and risk management – we monitor the effectiveness of the Group’s internal controls, including those over financial reporting. We also oversee the Group’s risk management framework. Group Internal Audit (GIA) – we oversee the work of GIA, and its head, who reports functionally to our Committee Chair. Mineral Resources and Ore Reserves – we oversee the reporting and assurance of mineral resources, and consider the impact on financial reporting. Distributable reserves – we provide assurance to the Board that distributable reserves are sufficient, and in the correct corporate entities, to support any dividend proposals. These duties feed into an annual work plan that ensures we consider issues on a timely basis. The Committee has authority to investigate any matters within its remit. We have the power to use any Group resources we may reasonably require, and we have direct access to the external auditors. We can also obtain independent professional advice at the Group’s expense, where we deem necessary. No such advice was required during 2022. The Committee Chair reports to the Board after each meeting on the main items discussed, and the minutes of Committee meetings are circulated to the Board. We had seven Committee meetings in 2022. Attendance at these meetings is included in the table on page 101. The Committee has met twice to date in 2023. The Chair of the Board, the Chief Financial Officer, the Group Financial Controller and the heads of GIA and Risk regularly attend our meetings, as do the Chief Legal Officer, Governance & Corporate Affairs, and the Group Company Secretary. Other senior executives and subject-matter experts are invited as needed. The external auditors were present at all of the Committee meetings during the year. The auditors review all materials on accounting or tax matters in advance of each meeting, and their comments are included in the papers circulated to Committee members. The audit partners also meet with our Committee Chair ahead of each meeting to discuss key issues and raise any concerns. The Committee meets regularly in private sessions. We also hold regular private discussions with the external auditors. Management does not attend these sessions. The Committee Chair also has regular contact and discussions with these stakeholders outside the formal meetings. Use of Committee meeting time in 2022 Financial reporting External audit Internal control and risk management Governance Internal audit 5% 15% 40% 25% 15% Significant issues relating to financial statements There were four significant issues considered by the Committee in relation to the financial statements. Matters considered Conclusion Review of carrying value of cash-generating units and impairment charges/reversals The Committee assessed management’s determination of cash-generating units, review of impairment triggers, and consideration of potential impairment charges and reversals over the course of the year. An impairment trigger was identified at the Boyne Smelter cash-generating unit. The Committee considered the key judgments made by management, in particular the climate change sensitivity and alignment of operating assumptions to the Paris Agreement. The Committee monitored the transaction with Turquoise Hill Resources minority shareholders and considered the relevance of the transaction price and associated valuation information with respect to the Oyu Tolgoi cash-generating unit. Application of the policy for items excluded from underlying earnings The Committee reviewed the Group’s policy for exclusion of certain items from underlying earnings and confirmed the consistent application of this policy year on year. The items excluded from underlying earnings comprised charges of $1.5 billion and income of $0.7 billion. A reconciliation of underlying earnings to net earnings is presented in the Alternative Performance Measures section. Estimate of provision for closure, restoration and environmental obligations The Committee reviewed the significant changes in the estimated provision for closure, restoration and environmental obligations by product group and legacy management. The Committee received updates on closure studies completed in the period and discussed with management the accounting policy for legacy sites. The impact of inflation in the period on the forecast underlying cashflows for future closure costs was significant. The Committee reviewed the economic assumptions assessed by management and confirmed the consistent application of the accounting policy. At 31 December 2022, the Group’s balance sheet included a provision for close-down, restoration and environmental obligations of $15.8 billion. Climate change The Committee received an overview of the work that management is undertaking in relation to climate change and the potential financial reporting implications thereof. The Committee reviewed the climate change summary provided on pages 152-155 and discussed with management the strategy and approach to climate change, the economic scenarios and the impact on our portfolio, and the linkage to accounting judgments. The Committee was pleased to see the enhanced disclosure financial reporting considerations of climate change throughout the financial statements and the emphasis given. Other focus areas in 2022 In addition to our scheduled workload, the Committee also: – Received a teach-in on the Group’s performance management framework, including a live demonstration of the MIS and an overview of future developments in the context of the finance strategy improvement work. The implementation of the MIS has transformed the way in which the Group stores and reports performance information. This has been accompanied by a redesign of our performance reporting rituals and routines, centred on the Monthly Performance Reviews, to provide a consistent and transparent understanding of operating and financial performance and support decision making. – Considered an update on the OECD Pillar One and Two proposals to implement a new global tax framework involving a reallocation of taxing rights to market jurisdictions and application of a 15% global minimum tax. – After a robust process, in early 2022 the Committee recommended to the Board that the draft 2021 Annual Report should be taken as whole, fair, balanced and understandable. – Reviewed the quality and effectiveness of the Group’s internal control and risk management systems. The findings of the review were shared with the Sustainability Committee, which oversees a number of key corporate risks. This review included the effectiveness of the Group’s internal controls over financial reporting, and the Group’s disclosure controls and procedures in accordance with sections 404 and 302 of the US Sarbanes-Oxley Act 2002. The Committee also considered reports from GIA, PwC and KPMG on their work in reviewing and auditing the control environment.
Annual Report on Form 20-F 2022 | riotinto.com106 Contact with regulators during 2022 During the year, the Company received a letter from the Financial Reporting Council (FRC)’s Corporate Reporting Review team advising their intention to include extracts from the Company’s 2021 Annual Report and accounts as examples of best practice in their thematic reviews of “TCFD disclosures and climate in the financial statements” and “Judgments and estimates”. Without entering into substantive dialogue, they also made recommendations for improvements to our disclosures, which we have incorporated in this report. The SEC wrote to us regarding questions they had around our use of multiple performance metrics in our segmental reporting and our disclosure of share of profit after tax of equity-accounted units. At their request, we have reduced some of this voluntary information, including the removal of certain subtotals in the Financial Information by Business Unit. The scope of the review by the FRC was limited to reviewing the 2021 Annual Report and correspondence with management and does not provide assurance that the report and accounts are correct in all material respects. External auditors Engagement of the external auditors For the 2022 financial year, KPMG are serving as our auditors. The UK entity of KPMG audits Rio Tinto plc, and the Australian entity audits Rio Tinto Limited. The UK audit engagement partner, Jonathan Downer, was appointed in March 2021 and the Australian partner, Trevor Hart, was appointed in 2020. We agreed on the scope of the auditors’ review of the half-year accounts, and of their audit of the full-year accounts, taking into consideration the key risks and areas of material judgment for the Group. We also approved the fees for this work and the engagement letters for the auditors. Safeguarding independence and objectivity, and maintaining effectiveness In our relationship with the external auditors, we need to ensure that they retain their independence and objectivity, and are effective in performing the external audits. Use of the external auditors for non-audit services The external auditors have significant knowledge of our business and of how we apply our accounting policies. That means it is sometimes cost-efficient for them to provide non-audit services. There may also be confidentiality reasons that make the external auditors the preferred choice for a particular task. However, safeguarding the external auditors’ objectivity and independence is an overriding priority. For this reason, and in line with the FRC’s Ethical Standard and SEC Independence rules, the Committee ensures that the external auditors do not perform any functions of management, undertake any work that they may later need to audit or rely upon in the audit, or serve in an advocacy role for the Group. We have a policy governing the use of the auditors to provide non-audit services. The cap on the total fees that may be paid to the external auditors for non-audit services in any given year is 70% of the average of the audit fees for the preceding three years. This is in line with the FRC’s Ethical Standard. Non-audit assignments fall into two broad categories: – Audit, audit-related or other “pre-approved” services where we believe there is no threat to auditors’ independence and objectivity, other than through the fees payable. – Other services approved under delegated authority. We apply different approval regimes to these areas of work. Approval of “pre-approved” services is as follows: – Up to $50,000: subject to prior notification to management, this work can be awarded. – From $50,001 to $100,000: requires the Chief Financial Officer’s approval. – Over $100,000 and with a tender process: if the external auditors are successful in the tender, the appointment requires the Chief Financial Officer’s approval. – From $100,001 to $250,000 without a tender process: requires the Chief Financial Officer’s approval. – Over $250,000 without a tender process: requires the Committee’s or Committee Chair’s approval. In each case, the nature of the assignment and the fees payable are reported to the Committee. The Chief Financial Officer can approve other services up to the value of $50,000 and an aggregate value of no more than $100,000. Fees exceeding $100,000 in aggregate require approval from the Committee or the Committee Chair. At the half-year and year-ends, the Chief Financial Officer and the external auditors report to the Committee on non-audit services performed and the fees payable. Individual services are also reported to the Committee at each meeting that have either been approved since the previous meeting, or that require approval for commencement following the meeting. Non-audit services provided by KPMG in 2022 were either within the predetermined approval levels or approved by the Committee and were compatible with the general standard of independence for auditors and the other requirements of the relevant Australian, UK and US regulations with the exception of the following matter: certain KPMG member firms provided local financial statement preparation and translation services, which are prohibited by UK ethical rules, to certain group entities over the period 2020 to 2022. The Committee has considered the administrative nature of the services, and noted that the services were provided after the group audit opinion was issued to entities that are not material to the Group. The Committee concluded that the provision of these services did not impair the independence of KPMG. Audit & Risk Committee report continued Climate change-related financial reporting The Directors have considered the relevance of the risks of climate change and transition risks associated with achieving the goals of the Paris Agreement when preparing and signing off the Company’s accounts. The narrative reporting on climate-related matters is consistent with the accounting assumptions and judgments made in this report. The Audit & Risk Committee reviews and approves all material accounting estimates and judgments relating to financial reporting, including those where climate issues are relevant. The Group’s approach to climate change is supported by strong governance, processes and capabilities. In developing our commodity price forecasts, as part of our annual process, we updated our scenarios and now focus on two core scenarios. They are used to generate a central reference case for commodity forecasts and valuations, used pervasively in our financial processes, including impairment testing, estimating remaining economic life, and discounting closure and rehabilitation provisions, as was the case in the prior year. At the UN Climate Summit in late 2022 (COP27), there was broad recognition that the pace of decarbonisation across the global economy is too slow to limit warming to 1.5°C and that current climate policies in many countries are not yet aligned with their stated ambitions. Consequently, neither of our two core scenarios, Fragmented Leadership and Competitive Leadership, is consistent with the expectation of climate policies required to accelerate the global transition to meet the stretch goal of the Paris Agreement. Although our operational emissions reduction targets align with the goals of the Paris Agreement, our two core scenarios do not. Given this, we also assess our sensitivity, and test the economic performance of our business against a scenario we have developed that reflects our view of the global actions required to meet the stretch goal of the Paris Agreement of limiting warming to 1.5°C. Overall, based on our internally developed pricing outlooks, we do not envisage an adverse impact of the 1.5°C Paris Agreement- aligned sensitivity on asset carrying values, remaining useful life, closure and rehabilitation provisions for our Group. During the year, the assessment performed under the new Physical Resilience Programme, together with our ongoing review processes, including impairment assessments, did not identify any material accounting impacts as a consequence of the physical risks associated with climate change. For more information on climate change impact on our Group, see our 2022 Climate Change Report and page 63 in this report.
107Annual Report on Form 20-F 2022 | riotinto.com Directors’ report Fees for audit and non-audit services The amounts payable to the external auditors, in each of the past two years, were: 2022 $m 2021 $m Audit fees 25.7 21.2 Non-audit service fees: Assurance services 3.3 3.7 Taxation services 0.0 0.0 All other fees 0.3 0.2 Total non-audit service fees 3.6 3.9 Non-audit: audit fees (in-year) 14% 18% For further analysis of these fees, please see note 38 on page 222. None of the individual non-audit assignments was significant, in terms of either the work done or the fees payable. We have reviewed the non-audit work in aggregate. We are satisfied that neither the work done, nor the fees payable, compromised the independence or objectivity of KPMG as our external auditors. Independence of the external auditors KPMG are required to provide a declaration to the Directors in relation to their compliance with the independence requirements of the Australian Corporations Act 2001 and the professional code of conduct for external auditors. A copy of this is on page 251. No person who served as an officer of Rio Tinto during 2022 was a Director or partner of KPMG at a time when they conducted an audit of the Group. Effectiveness of the external auditors We review the effectiveness of the external auditors annually. We consider the results of a survey containing questions on the auditors’ objectivity, quality and efficiency. The survey, conducted in June 2022, was completed by a range of operational and corporate executives across the business, and by Committee members. We are satisfied with the quality and objectivity of KPMG’s 2021 audit. Appointment of the auditors The Committee has reviewed the independence, objectivity and effectiveness of KPMG as external auditors in 2022 and in the year to date. We have recommended to the Board that KPMG should be retained in this role for 2023, which the Board supports. KPMG have indicated that they are willing to continue as auditors of Rio Tinto. A resolution to reappoint them as auditors of Rio Tinto plc will therefore be proposed as a joint resolution at the 2023 AGMs, together with a separate resolution seeking authority for the Committee to determine the external auditors’ remuneration. Subject to the approval of the above resolution, KPMG will continue in office as auditors of Rio Tinto Limited. Risk management and internal controls We review Rio Tinto’s internal control systems and the risk management framework. We also monitor risks falling within our remit, especially those relating to the integrity of financial reporting. A summary of the business’s internal control and risk management systems, and of the material risks we face, is available in the Strategic report on pages 79-86. Importantly, responsibility for operating and maintaining the internal control environment and risk management systems sits at asset level. Leaders of our businesses and functions are required to confirm annually: that adequate internal controls are in place; that these are operating effectively and are designed to identify any failings and weaknesses that may exist; and that any required actions are taken promptly. The Audit & Risk Committee also regularly monitors our risk management and internal control systems (including internal financial controls). We aim to have appropriate policies, standards and procedures in place, and ensure that they operate effectively. As part of considering the risk management framework, the Committee receives regular reports from the Group Financial Controller, the Chief Legal Officer, Governance & Corporate Affairs, and the Head of Tax on material developments in the legal, regulatory and fiscal landscape in which the Group operates. The Board, supported by the Audit & Risk Committee, has completed its annual review of the effectiveness of our risk management and internal control systems. This review included consideration of our material financial, operational and compliance controls. The Board concluded that the Group has an effective system of risk management and internal control. To further strengthen the Group’s risk management and internal control systems, in 2023 the Board and Audit & Risk Committee will focus on ensuring the timely closure of audit and assurance findings. Internal control over financial reporting The main features of our internal control and risk management systems in relation to financial reporting are explained on page 141. Internal audit programme structure GIA provides independent and objective assurance of the adequacy and effectiveness of risk management and internal control systems. It may also recommend improvements. While the head of GIA reports administratively to the Chief Financial Officer, appointment to, or removal from, this role requires the consent of the Audit & Risk Committee Chair. The head of GIA is accountable to the Chairs of the Audit & Risk and the Sustainability Committees, and communicates regularly with both. Our GIA team therefore operates independently of management. Its mandate is set out in a written charter, approved by the Audit & Risk Committee. GIA uses a formal internal audit methodology that is consistent with the Institute of Internal Auditors (IIA)’s internationally recognised standards. When needed, the team brings in external partners to help achieve its goals. There is a clear policy to address any conflicts of interest, which complies with the IIA’s standards on independence. This policy identifies a list of services that need prior approval from the head of GIA. Governance of the annual plan Each year’s internal audit plan is approved by the Audit & Risk Committee and the Sustainability Committee. The plan is focused on higher-risk areas and any specific areas or processes chosen by the committees. It is also aligned with any risks identified by the external auditors. Both committees are given regular updates on progress, including any material findings, and can refine the plans as needed. Effectiveness of the internal audit programme The Audit & Risk Committee monitors the effectiveness of the GIA function throughout the year, with updates on performance at every meeting. In addition, this year PwC conducted an independent quality assessment of GIA, the results of which were reported to the Committee. The assessment concluded that GIA provides strong assurance to the Group, using a comprehensive methodology and thorough process guidance, with good practice evident. The assessment also provided some useful suggestions for further improvement to mature GIA to “trusted adviser” level, which will be actioned. The last such assessment was completed in 2018. We are satisfied that the quality, experience and expertise of GIA are appropriate for the business and that GIA was objective and performed its role effectively. We also monitored management’s response to internal audits during the year. We are satisfied that improvements are being implemented promptly in response to GIA findings, and believe that management supports the effective working of the GIA function.
Annual Report on Form 20-F 2022 | riotinto.com108 Sustainability Committee report Caring for our people, being best operator of our assets, working respectfully with our communities, contributing solutions to the world’s environmental challenges, and finding better ways to provide the materials that the world needs – all underpin Rio Tinto’s approach to sustainable development. The Sustainability Committee supports our sustainable development objectives by overseeing the policies, frameworks, and management systems for ensuring the health and safety of our employees and contractors; managing our key social and environmental risks; and supporting the communities in which we operate. This, in turn, enhances our social licence to operate in the communities and countries in which we work. This year, we recorded our fourth straight year of zero fatalities at our managed operations. We review and learn from every incident that has the potential to result in a fatality. Despite our best efforts, our people continue to be injured at work, and we did not achieve our desired improvement in the number of injuries from the previous year. At the Sustainability Committee, we track our progress in analysing and learning from incidents to prevent them from happening again. Although we had no fatalities at our managed operations in 2022, tragically, there was a fatality at one of our non-managed marine operations. In a separate incident, another mariner suffered a permanent disabling injury. We continue to work with our partners in these operations to align their safety performance with our own. In 2022, the Committee reviewed the progress with our safety maturity model (SMM), a key tool to develop and enhance our safety culture. We integrated contractor partners’ safety maturity into our model and included leadership on health and environment. This year, we shifted the focus from our processes and rituals to the felt experience of our workforce. Our critical risk management (CRM) system, which is embedded in our SMM, enables us to verify that the appropriate controls are in place to prevent fatalities, and over 1.498 million verifications were completed this year to ensure controls were in place. We are increasing our focus on psychosocial health and wellbeing in our business. During 2022, the Committee requested a report on the incidence of suicide amongst our workforce, which examined the unique risk factors for mental health associated with mining operations such as ours and what we can do better to support our people. In addition, the Committee is overseeing the implementation of recommendations and actions outlined in the deeply confronting Everyday Respect Report, which was commissioned to better understand and improve our workplace culture. The independent study by experts Elizabeth Broderick & Co. was released in February 2022, and included a recommendation to embed the principles of Everyday Respect into our SMM. The Group’s Internal Audit (GIA) function undertakes reviews and reports to the Sustainability Committee on matters within the Committee’s scope. In addition, the Group’s auditors, KPMG, report to the Sustainability Committee on their assurance procedures over our 2021 sustainable development reporting. Other key areas of focus for the Committee in 2022 included deep dives into the major hazards and risks, including: – Water: Reviewing our approach to water management and monitoring our progress against our water stewardship targets. – Environment and Health: Reviewing our strategic objectives to advance our approach to our environmental and health performance. – Health, Safety, Environment and Security (HSES) workplan: Receiving regular updates on environment, health, safety and security activities and reviewing the 2023-2024 workplan. – Major hazards: Receiving updates from management on the implementation of the GISTM and implementation of the Group’s underground safety standard, as well as updates on controls relating to Process Safety and Occupied Buildings, and Major Slope Geotechnical Events. – Potentially fatal incidents (PFIs): Reviewing at each meeting PFIs occurring across the Group. Site visits are an important element of the work of the Committee, and this year our Committee members made individual visits to our Iron Ore operations at Brockman, West Angelas, Yandicoogina and Gudai-Darri in the Pilbara, Western Australia; our operations at Saguenay – Lac-Saint-Jean and Sorel-Tracy in Quebec, Canada; and in the US, our operations at Boron in California, Resolution Copper in Arizona, and our Kennecott copper operations in Salt Lake City, Utah. I would like to thank my fellow Committee members for their commitment and dedication, and thank all the executive leaders and specialists for their genuine effort and disciplined preparation for our Committee meetings. Megan Clark Sustainability Committee Chair 22 February 2023 The Committee received updates on our progress towards implementation of the Global Industry Standard on Tailings Management (GISTM), and personally met with each of the executives nominated in accordance with GISTM requirements as having accountability for the safety of tailings facilities within each of the Copper, Minerals, Aluminium and Iron Ore product groups, and across the Closure function. Sustainability is an integral part of our business. To improve our governance and oversight of integrated risk, the Committee hears annually from our product group Chief Executives on their integrated strategies for management of sustainability risks and opportunities. This includes effectiveness of controls associated with these risks and how the risks and associated controls will change over time. The Committee oversaw the implementation of all recommendations arising from the 2020 Rio Tinto Board review of cultural heritage management and the Inquiry into Juukan Gorge by the Australian Government’s Joint Standing Committee on Northern Australia. The Committee continues to oversee actions to strengthen our approach and processes for managing cultural heritage – both within our Australian operations and across our operations globally – and the rebuilding of respectful relationships with the Indigenous peoples on the lands on which we operate. The Committee oversaw the rebuilding of a constructive relationship with the Puutu Kunti Kurrama and Pinikura people, the ongoing rehabilitation works at Juukan Gorge, the progress on an agreement for a co-management of Country approach, and a comprehensive remedy agreement. The Committee also reviewed the progress made towards reaching modernised agreements with the Yinhawangka, Yindjibarndi and Puutu Kunti Kurrama and Pinikura peoples in the Pilbara and the Pekuakamiulnuatsh First Nation in Canada. The Sustainability Committee has overseen the design of a new Communities and Social Performance (CSP) vision and strategic framework; the development of the Group’s CSP targets for 2022-2026; improved transparency in reporting on CSP; and improvements to our CSP control framework. This includes improvements in capability and assurance, enhancements to our second- and third-line assurance activities, and revisions of Group documents, including the CSP standard and the cultural heritage management Group procedure for Australian businesses, as well as the codification of the core principles of the integrated heritage management process into Group-level frameworks.
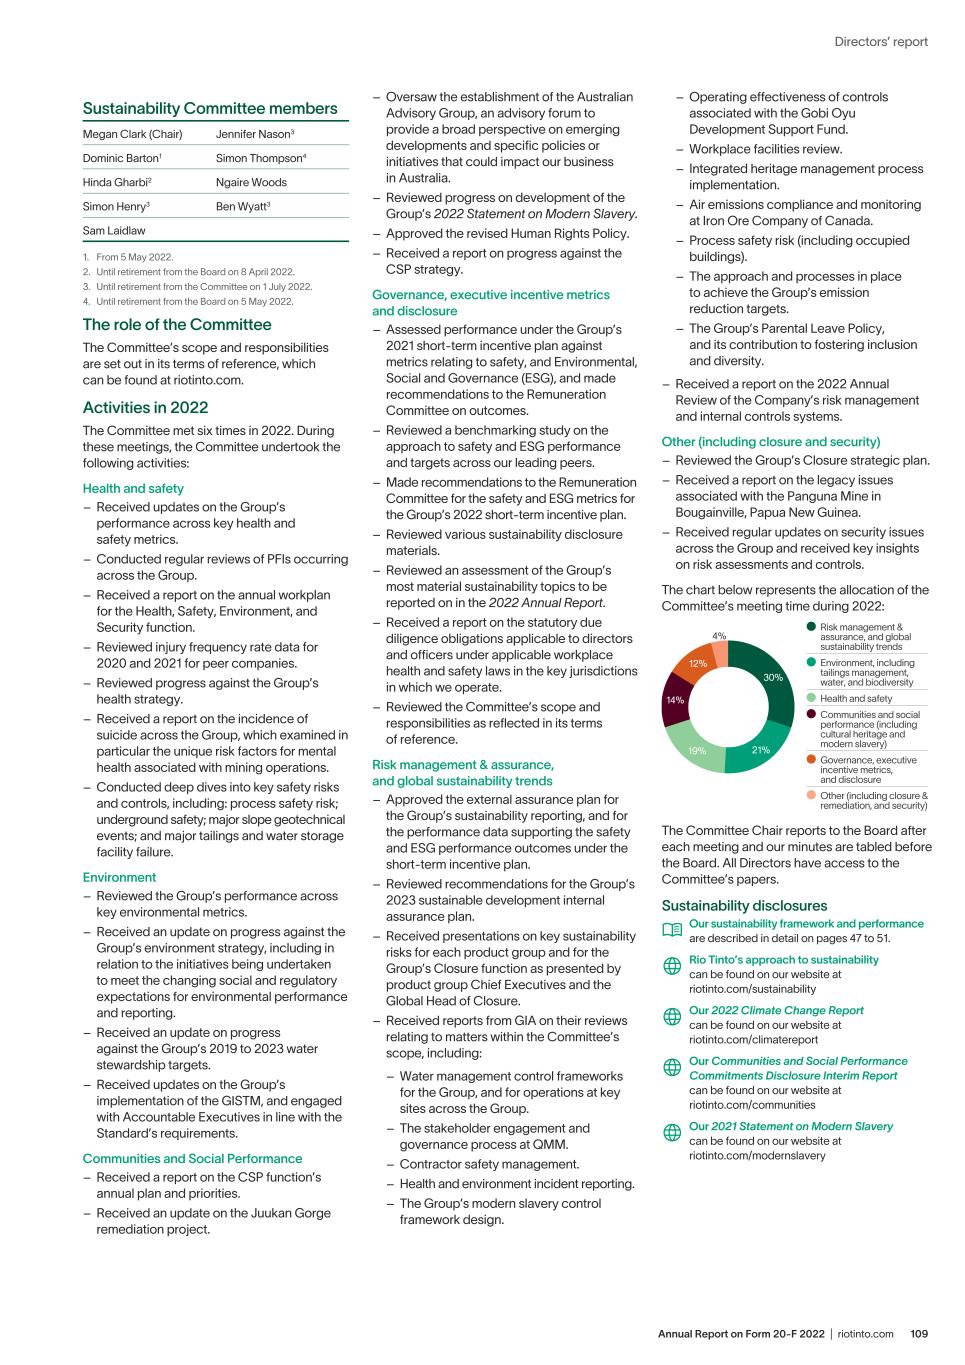
109Annual Report on Form 20-F 2022 | riotinto.com Directors’ report Sustainability Committee members Megan Clark (Chair) Jennifer Nason3 Dominic Barton1 Simon Thompson4 Hinda Gharbi2 Ngaire Woods Simon Henry3 Ben Wyatt3 Sam Laidlaw 1. From 5 May 2022. 2. Until retirement from the Board on 8 April 2022. 3. Until retirement from the Committee on 1 July 2022. 4. Until retirement from the Board on 5 May 2022. The role of the Committee The Committee’s scope and responsibilities are set out in its terms of reference, which can be found at riotinto.com. Activities in 2022 The Committee met six times in 2022. During these meetings, the Committee undertook the following activities: Health and safety – Received updates on the Group’s performance across key health and safety metrics. – Conducted regular reviews of PFIs occurring across the Group. – Received a report on the annual workplan for the Health, Safety, Environment, and Security function. – Reviewed injury frequency rate data for 2020 and 2021 for peer companies. – Reviewed progress against the Group’s health strategy. – Received a report on the incidence of suicide across the Group, which examined in particular the unique risk factors for mental health associated with mining operations. – Conducted deep dives into key safety risks and controls, including: process safety risk; underground safety; major slope geotechnical events; and major tailings and water storage facility failure. Environment – Reviewed the Group’s performance across key environmental metrics. – Received an update on progress against the Group’s environment strategy, including in relation to the initiatives being undertaken to meet the changing social and regulatory expectations for environmental performance and reporting. – Received an update on progress against the Group’s 2019 to 2023 water stewardship targets. – Received updates on the Group’s implementation of the GISTM, and engaged with Accountable Executives in line with the Standard’s requirements. Communities and Social Performance – Received a report on the CSP function’s annual plan and priorities. – Received an update on the Juukan Gorge remediation project. – Oversaw the establishment of the Australian Advisory Group, an advisory forum to provide a broad perspective on emerging developments and specific policies or initiatives that could impact our business in Australia. – Reviewed progress on development of the Group’s 2022 Statement on Modern Slavery. – Approved the revised Human Rights Policy. – Received a report on progress against the CSP strategy. Governance, executive incentive metrics and disclosure – Assessed performance under the Group’s 2021 short-term incentive plan against metrics relating to safety, and Environmental, Social and Governance (ESG), and made recommendations to the Remuneration Committee on outcomes. – Reviewed a benchmarking study on the approach to safety and ESG performance and targets across our leading peers. – Made recommendations to the Remuneration Committee for the safety and ESG metrics for the Group’s 2022 short-term incentive plan. – Reviewed various sustainability disclosure materials. – Reviewed an assessment of the Group’s most material sustainability topics to be reported on in the 2022 Annual Report. – Received a report on the statutory due diligence obligations applicable to directors and officers under applicable workplace health and safety laws in the key jurisdictions in which we operate. – Reviewed the Committee’s scope and responsibilities as reflected in its terms of reference. Risk management & assurance, and global sustainability trends – Approved the external assurance plan for the Group’s sustainability reporting, and for the performance data supporting the safety and ESG performance outcomes under the short-term incentive plan. – Reviewed recommendations for the Group’s 2023 sustainable development internal assurance plan. – Received presentations on key sustainability risks for each product group and for the Group’s Closure function as presented by product group Chief Executives and the Global Head of Closure. – Received reports from GIA on their reviews relating to matters within the Committee’s scope, including: – Water management control frameworks for the Group, and for operations at key sites across the Group. – The stakeholder engagement and governance process at QMM. – Contractor safety management. – Health and environment incident reporting. – The Group’s modern slavery control framework design. – Operating effectiveness of controls associated with the Gobi Oyu Development Support Fund. – Workplace facilities review. – Integrated heritage management process implementation. – Air emissions compliance and monitoring at Iron Ore Company of Canada. – Process safety risk (including occupied buildings). – The approach and processes in place to achieve the Group’s emission reduction targets. – The Group’s Parental Leave Policy, and its contribution to fostering inclusion and diversity. – Received a report on the 2022 Annual Review of the Company’s risk management and internal controls systems. Other (including closure and security) – Reviewed the Group’s Closure strategic plan. – Received a report on the legacy issues associated with the Panguna Mine in Bougainville, Papua New Guinea. – Received regular updates on security issues across the Group and received key insights on risk assessments and controls. The chart below represents the allocation of the Committee’s meeting time during 2022: 12% 4% 30% 19% 21% 14% Risk management & assurance, and global sustainability trends Environment, including tailings management, water, and biodiversity Health and safety Communities and social performance (including cultural heritage and modern slavery) Governance, executive incentive metrics, and disclosure Other (including closure & remediation, and security) The Committee Chair reports to the Board after each meeting and our minutes are tabled before the Board. All Directors have access to the Committee’s papers. Sustainability disclosures Our sustainability framework and performance are described in detail on pages 47 to 51. Rio Tinto’s approach to sustainability can be found on our website at riotinto.com/sustainability Our 2022 Climate Change Report can be found on our website at riotinto.com/climatereport Our Communities and Social Performance Commitments Disclosure Interim Report can be found on our website at riotinto.com/communities Our 2021 Statement on Modern Slavery can be found on our website at riotinto.com/modernslavery
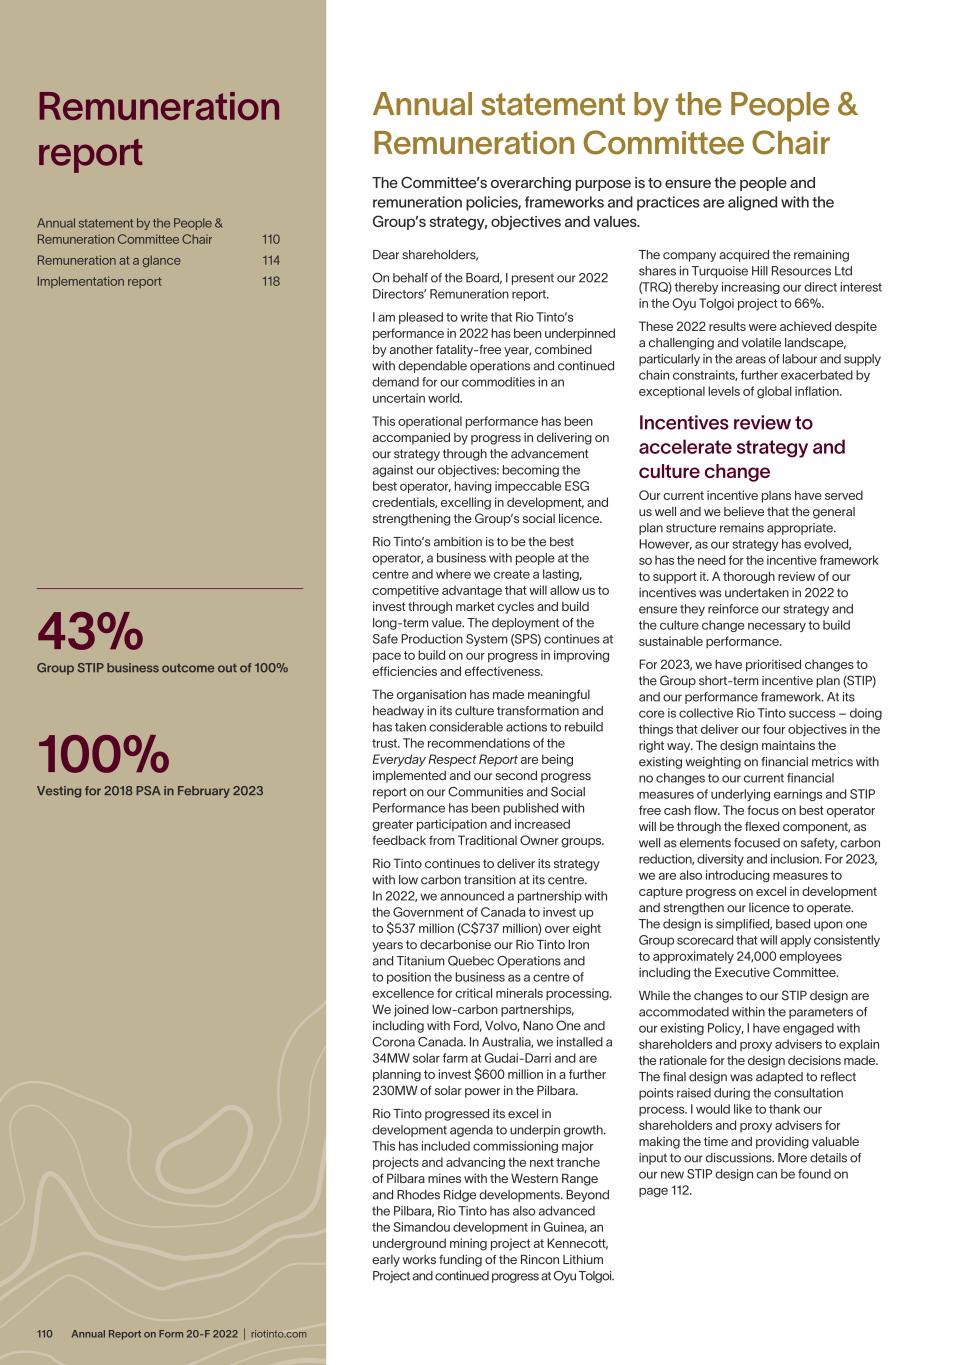
Annual Report on Form 20-F 2022 | riotinto.com110 Remuneration report Annual statement by the People & Remuneration Committee Chair 110 Remuneration at a glance 114 Implementation report 118 Annual statement by the People & Remuneration Committee Chair The Committee’s overarching purpose is to ensure the people and remuneration policies, frameworks and practices are aligned with the Group’s strategy, objectives and values. Dear shareholders, On behalf of the Board, I present our 2022 Directors’ Remuneration report. I am pleased to write that Rio Tinto’s performance in 2022 has been underpinned by another fatality-free year, combined with dependable operations and continued demand for our commodities in an uncertain world. This operational performance has been accompanied by progress in delivering on our strategy through the advancement against our objectives: becoming the best operator, having impeccable ESG credentials, excelling in development, and strengthening the Group’s social licence. Rio Tinto’s ambition is to be the best operator, a business with people at the centre and where we create a lasting, competitive advantage that will allow us to invest through market cycles and build long-term value. The deployment of the Safe Production System (SPS) continues at pace to build on our progress in improving efficiencies and effectiveness. The organisation has made meaningful headway in its culture transformation and has taken considerable actions to rebuild trust. The recommendations of the Everyday Respect Report are being implemented and our second progress report on our Communities and Social Performance has been published with greater participation and increased feedback from Traditional Owner groups. Rio Tinto continues to deliver its strategy with low carbon transition at its centre. In 2022, we announced a partnership with the Government of Canada to invest up to $537 million (C$737 million) over eight years to decarbonise our Rio Tinto Iron and Titanium Quebec Operations and to position the business as a centre of excellence for critical minerals processing. We joined low-carbon partnerships, including with Ford, Volvo, Nano One and Corona Canada. In Australia, we installed a 34MW solar farm at Gudai-Darri and are planning to invest $600 million in a further 230MW of solar power in the Pilbara. Rio Tinto progressed its excel in development agenda to underpin growth. This has included commissioning major projects and advancing the next tranche of Pilbara mines with the Western Range and Rhodes Ridge developments. Beyond the Pilbara, Rio Tinto has also advanced the Simandou development in Guinea, an underground mining project at Kennecott, early works funding of the Rincon Lithium Project and continued progress at Oyu Tolgoi. The company acquired the remaining shares in Turquoise Hill Resources Ltd (TRQ) thereby increasing our direct interest in the Oyu Tolgoi project to 66%. These 2022 results were achieved despite a challenging and volatile landscape, particularly in the areas of labour and supply chain constraints, further exacerbated by exceptional levels of global inflation. Incentives review to accelerate strategy and culture change Our current incentive plans have served us well and we believe that the general plan structure remains appropriate. However, as our strategy has evolved, so has the need for the incentive framework to support it. A thorough review of our incentives was undertaken in 2022 to ensure they reinforce our strategy and the culture change necessary to build sustainable performance. For 2023, we have prioritised changes to the Group short-term incentive plan (STIP) and our performance framework. At its core is collective Rio Tinto success – doing things that deliver our four objectives in the right way. The design maintains the existing weighting on financial metrics with no changes to our current financial measures of underlying earnings and STIP free cash flow. The focus on best operator will be through the flexed component, as well as elements focused on safety, carbon reduction, diversity and inclusion. For 2023, we are also introducing measures to capture progress on excel in development and strengthen our licence to operate. The design is simplified, based upon one Group scorecard that will apply consistently to approximately 24,000 employees including the Executive Committee. While the changes to our STIP design are accommodated within the parameters of our existing Policy, I have engaged with shareholders and proxy advisers to explain the rationale for the design decisions made. The final design was adapted to reflect points raised during the consultation process. I would like to thank our shareholders and proxy advisers for making the time and providing valuable input to our discussions. More details of our new STIP design can be found on page 112. 43% Group STIP business outcome out of 100% 100% Vesting for 2018 PSA in February 2023
111Annual Report on Form 20-F 2022 | riotinto.com Directors’ report With regards to the long-term incentive plan (LTIP), the current measure of relative total shareholder return (TSR) has been unchanged for many years. TSR is an important measure of success that aligns executives to the shareholder experience and against which we continue to track well. We will not be making any changes to the 2023 LTIP awards due to be granted in March but intend to return to it as part of the triennial policy review. Overview of performance and strategic progress in 2022 Short-term incentive plan (STIP) The STIP rewards employees for the past year’s performance. In 2022, the STIP scorecard included ESG (including safety) and financial measures. ESG (including safety) performance The ESG component of STIP includes ambitious targets relating to safety, climate and decarbonisation, improving female representation, implementation of actions from the Everyday Respect Report, the Juukan Gorge Senate Inquiry Report, the 2020 Board Report, as well as the critical elements of the Global Industry Standard on Tailings Management (GISTM). Safety is our number one priority, and we achieved our fourth consecutive fatality-free year in 2022. We have also maintained our all-injury frequency rate (AIFR) performance and enhanced our safety maturity model (SMM) assessment approach as our safety culture has evolved and matured. There are elements of the ESG component where we delivered above-target outcomes, whereas in others, while results were encouraging, we fell short of target. The overall performance outcome of this component is 63.4% of maximum. More information about our ESG performance can be found on page 122. Financial performance In 2022, we saw significant movement in commodity prices amidst growing recession fears and a decline in consumer confidence. We remained focused on cost control throughout the year, but experienced cost pressures over and above general inflation from higher market-linked prices for raw materials, along with the impact of the Russia and Ukraine war causing energy market disruptions that resulted in higher energy prices. Operationally, we achieved slightly lower than expected production, mainly in the first half of 2022 including disruptions associated with COVID-19, resulting in labour supply constraints and delays in replacement projects in the Pilbara. As a result, our reported 2022 financial results of underlying earnings of $13.3 billion and free cash flow of $9.0 billion were below plan. Free cash flow reflected underspend on development capital by $0.9 billion that is excluded from the free cash flow STIP measure. The under performance against financial targets is reflected in the outcome of Group financial performance at 29% of maximum. Further details on our financial performance can be found on page 121. Long-term incentive plan (LTIP) The performance period of the 2018 Performance Share Award (PSA) concluded in December 2022 and vests on 23 February 2023. The vesting outcome of the 2018 PSA is 100%. The Committee considered the vesting outcome in the round of underlying business performance as well as within the context of the consequence management framework which was introduced in 2021, and was satisfied that the outcome was fair and representative of the shareholder experience and that no discretion should be applied. 2023 remuneration decisions Against the backdrop of ongoing high inflation and macroeconomic uncertainty, the Committee is more cognisant than ever of the need to strike an appropriate and careful balance between fairness and competitiveness when making decisions about pay. In recognition of the extraordinary inflationary pressures experienced globally in 2022, we provided a one-off mid-year salary adjustment to approximately 30,000 employees which ranged from 2% to 5% in our major countries. The Executive Committee did not receive this adjustment. Effective 1 March 2023, the Executive Committee will receive salary increases in line with the broader employee populations in their jurisdictions. In addition, Bold Baatar and Simon Trott will receive an additional increase in recognition of market positioning within the limits of the Policy. People & Remuneration Committee Since 1 January 2023, the Committee is known as the People & Remuneration Committee. With the increasing importance of developing the talent, capability and diversity of the organisation in support of the culture change, the Board unanimously agreed that this Committee’s scope will now formally include these areas in addition to remuneration. The expanded scope of the Committee reinforces the Board and organisation’s commitment towards an inclusive and people-centred culture, a key enabler of our strategic ambitions. Further details of the Committee are set out on page 119. Broader employee context The Board continued to engage with employees throughout the year, as detailed on page 95. These engagements enable the Board to hear directly our people’s views on pay. The disruptive impact brought about by increased living costs was a regular topic of engagement in 2022 and we responded by making meaningful and significant investments to ease the strain on employees via the one-off mid-year salary adjustment. The median Chief Executive pay ratio of 52:1 is higher than in 2021, primarily due to the vesting of the first LTIP award granted to Jakob Stausholm when he joined the company in 2018. Our focus on pay equity is evident in our gender pay metrics, in which we continue to make progress. Pay equity is a key pillar of our annual remuneration approach. Gender diversity in senior management roles also remains a key aspect of our broader agenda on diversity and inclusion. Further details on equal pay and gender pay gap, together with a wider discussion on diversity and inclusion, are provided in the Sustainability section of this report on page 59. Looking ahead As I have mentioned earlier, I met with several shareholders and institutions in 2022 in relation to the redesign of our STIP. In preparation for our upcoming triennial Remuneration Policy review, I also took this opportunity to explore initial views on what role alternative measures, for example decarbonisation and culture, might play in our LTIP moving forward. The Committee is mindful of the need to ensure there is focus on the Group’s key strategic priorities, balanced against ongoing focus on shareholder returns, when measuring the outcomes of our long-term incentives for our executive team. These initial discussions were both positive and constructive, and I look forward to continuing this dialogue in preparation for our updated Policy that will be put forward for approval at the 2024 AGMs. As always, I welcome shareholder feedback on our 2022 Directors’ Remuneration report. Yours sincerely, Sam Laidlaw People & Remuneration Committee Chair 22 February 2023
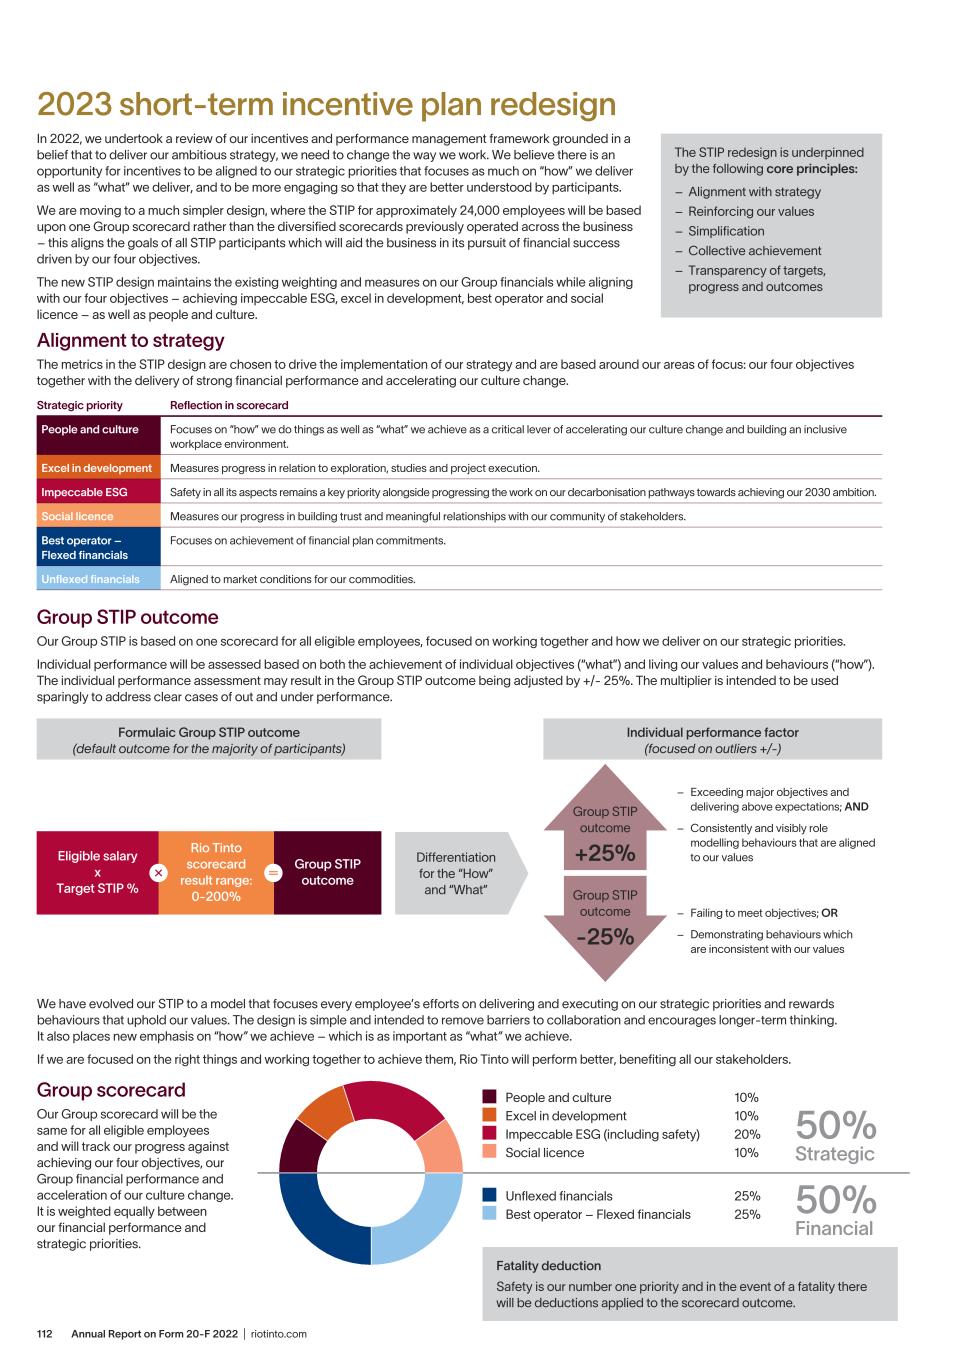
Annual Report on Form 20-F 2022 | riotinto.com112 2023 short-term incentive plan redesign In 2022, we undertook a review of our incentives and performance management framework grounded in a belief that to deliver our ambitious strategy, we need to change the way we work. We believe there is an opportunity for incentives to be aligned to our strategic priorities that focuses as much on “how” we deliver as well as “what” we deliver, and to be more engaging so that they are better understood by participants. We are moving to a much simpler design, where the STIP for approximately 24,000 employees will be based upon one Group scorecard rather than the diversified scorecards previously operated across the business – this aligns the goals of all STIP participants which will aid the business in its pursuit of financial success driven by our four objectives. The new STIP design maintains the existing weighting and measures on our Group financials while aligning with our four objectives – achieving impeccable ESG, excel in development, best operator and social licence – as well as people and culture. The STIP redesign is underpinned by the following core principles: – Alignment with strategy – Reinforcing our values – Simplification – Collective achievement – Transparency of targets, progress and outcomes Group scorecard Our Group scorecard will be the same for all eligible employees and will track our progress against achieving our four objectives, our Group financial performance and acceleration of our culture change. It is weighted equally between our financial performance and strategic priorities. People and culture 10% Excel in development 10% Impeccable ESG (including safety) 20% Social licence 10% Unflexed financials 25% Best operator – Flexed financials 25% 50% Strategic 50% Financial Fatality deduction Safety is our number one priority and in the event of a fatality there will be deductions applied to the scorecard outcome. Eligible salary x Target STIP % Rio Tinto scorecard result range: 0-200% Group STIP outcome Differentiation for the “How” and “What” Individual performance factor (focused on outliers +/-) Formulaic Group STIP outcome (default outcome for the majority of participants) Group STIP outcome +25% Group STIP outcome -25% – Exceeding major objectives and delivering above expectations; AND – Consistently and visibly role modelling behaviours that are aligned to our values – Failing to meet objectives; OR – Demonstrating behaviours which are inconsistent with our values Alignment to strategy The metrics in the STIP design are chosen to drive the implementation of our strategy and are based around our areas of focus: our four objectives together with the delivery of strong financial performance and accelerating our culture change. Strategic priority Reflection in scorecard People and culture Focuses on “how” we do things as well as “what” we achieve as a critical lever of accelerating our culture change and building an inclusive workplace environment. Excel in development Measures progress in relation to exploration, studies and project execution. Impeccable ESG Safety in all its aspects remains a key priority alongside progressing the work on our decarbonisation pathways towards achieving our 2030 ambition. Social licence Measures our progress in building trust and meaningful relationships with our community of stakeholders. Best operator – Flexed financials Focuses on achievement of financial plan commitments. Unflexed financials Aligned to market conditions for our commodities. Group STIP outcome Our Group STIP is based on one scorecard for all eligible employees, focused on working together and how we deliver on our strategic priorities. Individual performance will be assessed based on both the achievement of individual objectives (“what”) and living our values and behaviours (“how”). The individual performance assessment may result in the Group STIP outcome being adjusted by +/- 25%. The multiplier is intended to be used sparingly to address clear cases of out and under performance. We have evolved our STIP to a model that focuses every employee’s efforts on delivering and executing on our strategic priorities and rewards behaviours that uphold our values. The design is simple and intended to remove barriers to collaboration and encourages longer-term thinking. It also places new emphasis on “how” we achieve – which is as important as “what” we achieve. If we are focused on the right things and working together to achieve them, Rio Tinto will perform better, benefiting all our stakeholders.
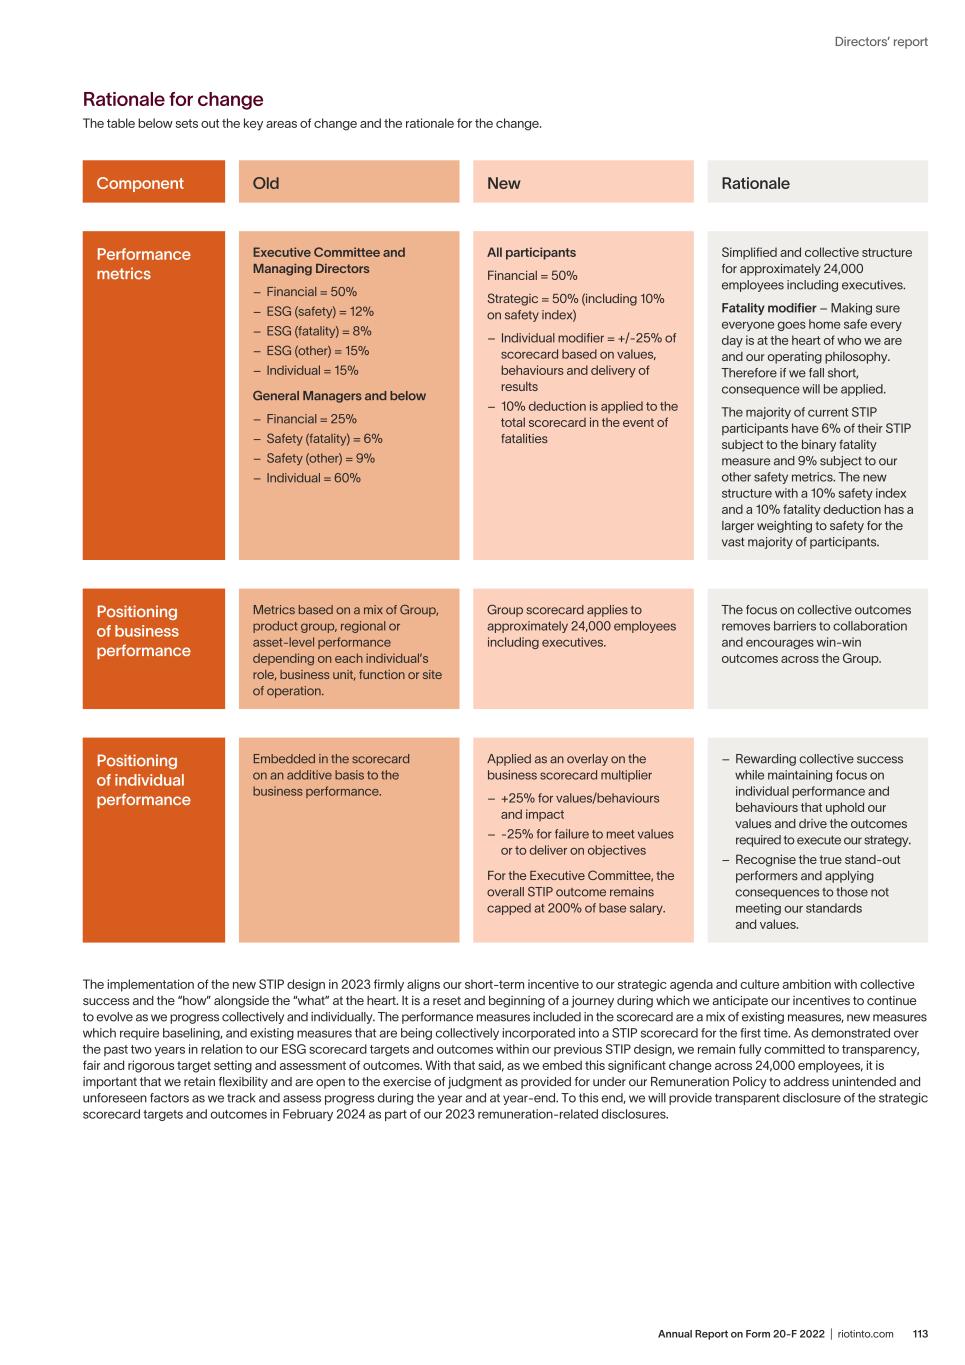
113Annual Report on Form 20-F 2022 | riotinto.com Directors’ report Rationale for change The table below sets out the key areas of change and the rationale for the change. Component Old New Rationale Performance metrics Executive Committee and Managing Directors – Financial = 50% – ESG (safety) = 12% – ESG (fatality) = 8% – ESG (other) = 15% – Individual = 15% General Managers and below – Financial = 25% – Safety (fatality) = 6% – Safety (other) = 9% – Individual = 60% All participants Financial = 50% Strategic = 50% (including 10% on safety index) – Individual modifier = +/-25% of scorecard based on values, behaviours and delivery of results – 10% deduction is applied to the total scorecard in the event of fatalities Simplified and collective structure for approximately 24,000 employees including executives. Fatality modifier – Making sure everyone goes home safe every day is at the heart of who we are and our operating philosophy. Therefore if we fall short, consequence will be applied. The majority of current STIP participants have 6% of their STIP subject to the binary fatality measure and 9% subject to our other safety metrics. The new structure with a 10% safety index and a 10% fatality deduction has a larger weighting to safety for the vast majority of participants. Positioning of business performance Metrics based on a mix of Group, product group, regional or asset-level performance depending on each individual’s role, business unit, function or site of operation. Group scorecard applies to approximately 24,000 employees including executives. The focus on collective outcomes removes barriers to collaboration and encourages win-win outcomes across the Group. Positioning of individual performance Embedded in the scorecard on an additive basis to the business performance. Applied as an overlay on the business scorecard multiplier – +25% for values/behaviours and impact – -25% for failure to meet values or to deliver on objectives For the Executive Committee, the overall STIP outcome remains capped at 200% of base salary. – Rewarding collective success while maintaining focus on individual performance and behaviours that uphold our values and drive the outcomes required to execute our strategy. – Recognise the true stand-out performers and applying consequences to those not meeting our standards and values. The implementation of the new STIP design in 2023 firmly aligns our short-term incentive to our strategic agenda and culture ambition with collective success and the “how” alongside the “what” at the heart. It is a reset and beginning of a journey during which we anticipate our incentives to continue to evolve as we progress collectively and individually. The performance measures included in the scorecard are a mix of existing measures, new measures which require baselining, and existing measures that are being collectively incorporated into a STIP scorecard for the first time. As demonstrated over the past two years in relation to our ESG scorecard targets and outcomes within our previous STIP design, we remain fully committed to transparency, fair and rigorous target setting and assessment of outcomes. With that said, as we embed this significant change across 24,000 employees, it is important that we retain flexibility and are open to the exercise of judgment as provided for under our Remuneration Policy to address unintended and unforeseen factors as we track and assess progress during the year and at year-end. To this end, we will provide transparent disclosure of the strategic scorecard targets and outcomes in February 2024 as part of our 2023 remuneration-related disclosures.
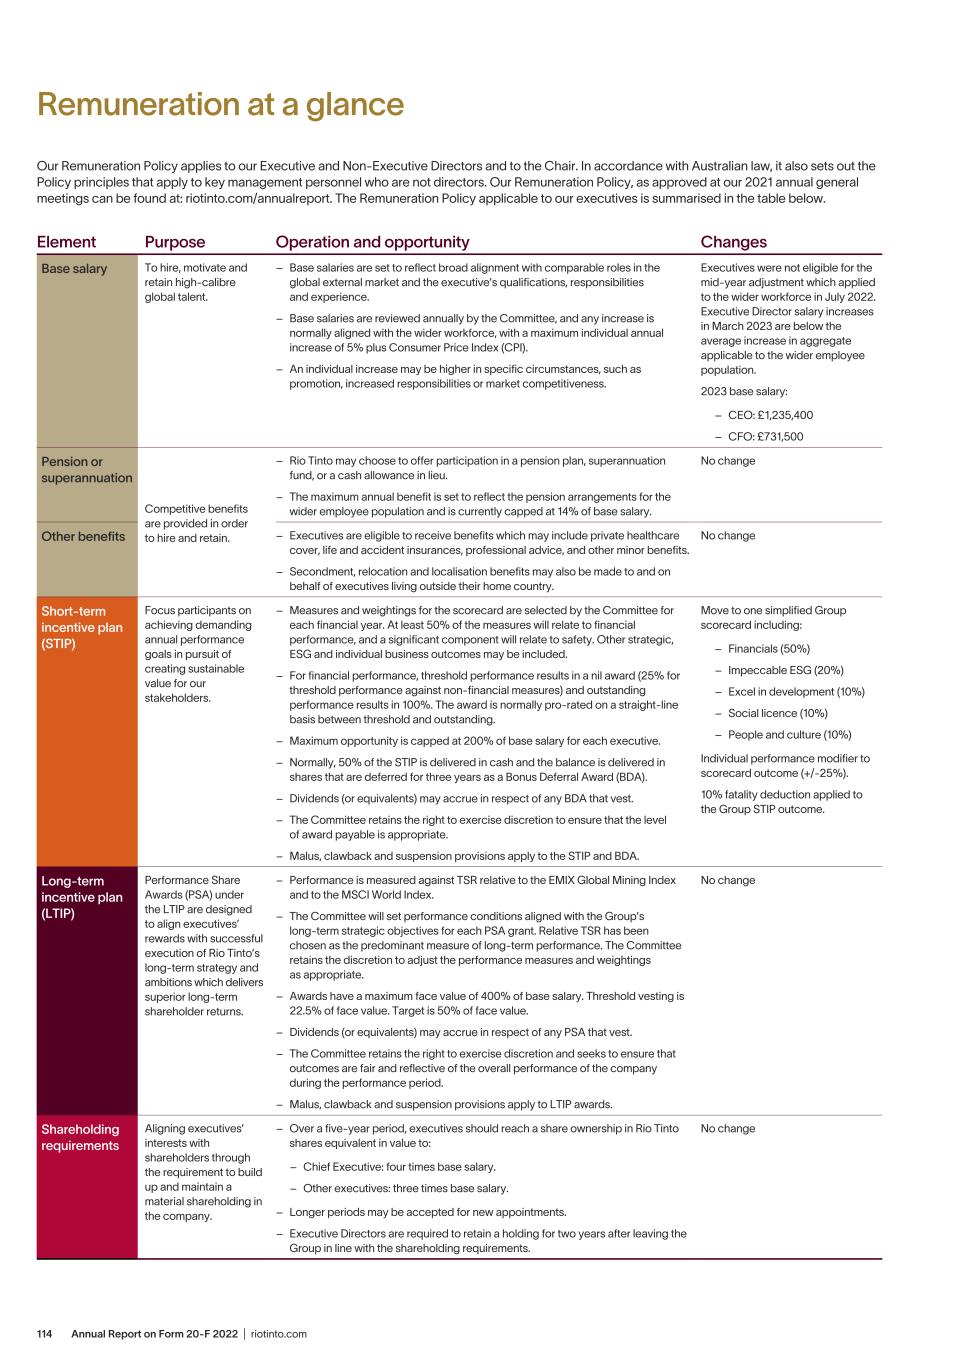
Annual Report on Form 20-F 2022 | riotinto.com114 Remuneration at a glance Our Remuneration Policy applies to our Executive and Non-Executive Directors and to the Chair. In accordance with Australian law, it also sets out the Policy principles that apply to key management personnel who are not directors. Our Remuneration Policy, as approved at our 2021 annual general meetings can be found at: riotinto.com/annualreport. The Remuneration Policy applicable to our executives is summarised in the table below. Element Purpose Operation and opportunity Changes Base salary To hire, motivate and retain high-calibre global talent. – Base salaries are set to reflect broad alignment with comparable roles in the global external market and the executive’s qualifications, responsibilities and experience. – Base salaries are reviewed annually by the Committee, and any increase is normally aligned with the wider workforce, with a maximum individual annual increase of 5% plus Consumer Price Index (CPI). – An individual increase may be higher in specific circumstances, such as promotion, increased responsibilities or market competitiveness. Executives were not eligible for the mid-year adjustment which applied to the wider workforce in July 2022. Executive Director salary increases in March 2023 are below the average increase in aggregate applicable to the wider employee population. 2023 base salary: – CEO: £1,235,400 – CFO: £731,500 Pension or superannuation Competitive benefits are provided in order to hire and retain. – Rio Tinto may choose to offer participation in a pension plan, superannuation fund, or a cash allowance in lieu. – The maximum annual benefit is set to reflect the pension arrangements for the wider employee population and is currently capped at 14% of base salary. No change Other benefits – Executives are eligible to receive benefits which may include private healthcare cover, life and accident insurances, professional advice, and other minor benefits. – Secondment, relocation and localisation benefits may also be made to and on behalf of executives living outside their home country. No change Short-term incentive plan (STIP) Focus participants on achieving demanding annual performance goals in pursuit of creating sustainable value for our stakeholders. – Measures and weightings for the scorecard are selected by the Committee for each financial year. At least 50% of the measures will relate to financial performance, and a significant component will relate to safety. Other strategic, ESG and individual business outcomes may be included. – For financial performance, threshold performance results in a nil award (25% for threshold performance against non-financial measures) and outstanding performance results in 100%. The award is normally pro-rated on a straight-line basis between threshold and outstanding. – Maximum opportunity is capped at 200% of base salary for each executive. – Normally, 50% of the STIP is delivered in cash and the balance is delivered in shares that are deferred for three years as a Bonus Deferral Award (BDA). – Dividends (or equivalents) may accrue in respect of any BDA that vest. – The Committee retains the right to exercise discretion to ensure that the level of award payable is appropriate. – Malus, clawback and suspension provisions apply to the STIP and BDA. Move to one simplified Group scorecard including: – Financials (50%) – Impeccable ESG (20%) – Excel in development (10%) – Social licence (10%) – People and culture (10%) Individual performance modifier to scorecard outcome (+/-25%). 10% fatality deduction applied to the Group STIP outcome. Long-term incentive plan (LTIP) Performance Share Awards (PSA) under the LTIP are designed to align executives’ rewards with successful execution of Rio Tinto’s long-term strategy and ambitions which delivers superior long-term shareholder returns. – Performance is measured against TSR relative to the EMIX Global Mining Index and to the MSCI World Index. – The Committee will set performance conditions aligned with the Group’s long-term strategic objectives for each PSA grant. Relative TSR has been chosen as the predominant measure of long-term performance. The Committee retains the discretion to adjust the performance measures and weightings as appropriate. – Awards have a maximum face value of 400% of base salary. Threshold vesting is 22.5% of face value. Target is 50% of face value. – Dividends (or equivalents) may accrue in respect of any PSA that vest. – The Committee retains the right to exercise discretion and seeks to ensure that outcomes are fair and reflective of the overall performance of the company during the performance period. – Malus, clawback and suspension provisions apply to LTIP awards. No change Shareholding requirements Aligning executives’ interests with shareholders through the requirement to build up and maintain a material shareholding in the company. – Over a five-year period, executives should reach a share ownership in Rio Tinto shares equivalent in value to: – Chief Executive: four times base salary. – Other executives: three times base salary. – Longer periods may be accepted for new appointments. – Executive Directors are required to retain a holding for two years after leaving the Group in line with the shareholding requirements. No change
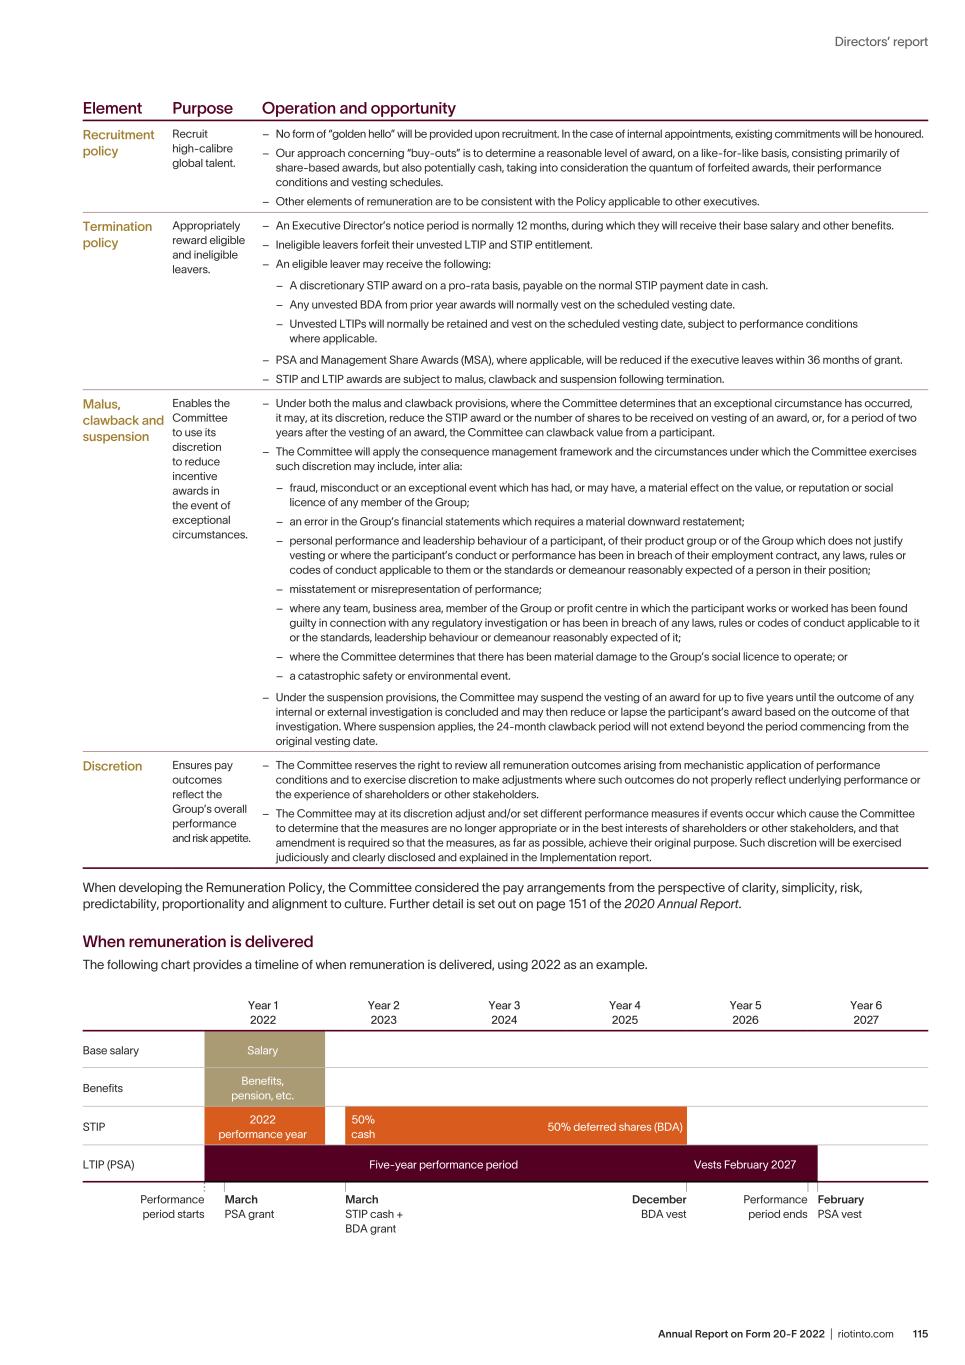
115Annual Report on Form 20-F 2022 | riotinto.com Directors’ report Element Purpose Operation and opportunity Recruitment policy Recruit high-calibre global talent. – No form of “golden hello” will be provided upon recruitment. In the case of internal appointments, existing commitments will be honoured. – Our approach concerning “buy-outs” is to determine a reasonable level of award, on a like-for-like basis, consisting primarily of share-based awards, but also potentially cash, taking into consideration the quantum of forfeited awards, their performance conditions and vesting schedules. – Other elements of remuneration are to be consistent with the Policy applicable to other executives. Termination policy Appropriately reward eligible and ineligible leavers. – An Executive Director’s notice period is normally 12 months, during which they will receive their base salary and other benefits. – Ineligible leavers forfeit their unvested LTIP and STIP entitlement. – An eligible leaver may receive the following: – A discretionary STIP award on a pro-rata basis, payable on the normal STIP payment date in cash. – Any unvested BDA from prior year awards will normally vest on the scheduled vesting date. – Unvested LTIPs will normally be retained and vest on the scheduled vesting date, subject to performance conditions where applicable. – PSA and Management Share Awards (MSA), where applicable, will be reduced if the executive leaves within 36 months of grant. – STIP and LTIP awards are subject to malus, clawback and suspension following termination. Malus, clawback and suspension Enables the Committee to use its discretion to reduce incentive awards in the event of exceptional circumstances. – Under both the malus and clawback provisions, where the Committee determines that an exceptional circumstance has occurred, it may, at its discretion, reduce the STIP award or the number of shares to be received on vesting of an award, or, for a period of two years after the vesting of an award, the Committee can clawback value from a participant. – The Committee will apply the consequence management framework and the circumstances under which the Committee exercises such discretion may include, inter alia: – fraud, misconduct or an exceptional event which has had, or may have, a material effect on the value, or reputation or social licence of any member of the Group; – an error in the Group’s financial statements which requires a material downward restatement; – personal performance and leadership behaviour of a participant, of their product group or of the Group which does not justify vesting or where the participant’s conduct or performance has been in breach of their employment contract, any laws, rules or codes of conduct applicable to them or the standards or demeanour reasonably expected of a person in their position; – misstatement or misrepresentation of performance; – where any team, business area, member of the Group or profit centre in which the participant works or worked has been found guilty in connection with any regulatory investigation or has been in breach of any laws, rules or codes of conduct applicable to it or the standards, leadership behaviour or demeanour reasonably expected of it; – where the Committee determines that there has been material damage to the Group’s social licence to operate; or – a catastrophic safety or environmental event. – Under the suspension provisions, the Committee may suspend the vesting of an award for up to five years until the outcome of any internal or external investigation is concluded and may then reduce or lapse the participant’s award based on the outcome of that investigation. Where suspension applies, the 24-month clawback period will not extend beyond the period commencing from the original vesting date. Discretion Ensures pay outcomes reflect the Group’s overall performance and risk appetite. – The Committee reserves the right to review all remuneration outcomes arising from mechanistic application of performance conditions and to exercise discretion to make adjustments where such outcomes do not properly reflect underlying performance or the experience of shareholders or other stakeholders. – The Committee may at its discretion adjust and/or set different performance measures if events occur which cause the Committee to determine that the measures are no longer appropriate or in the best interests of shareholders or other stakeholders, and that amendment is required so that the measures, as far as possible, achieve their original purpose. Such discretion will be exercised judiciously and clearly disclosed and explained in the Implementation report. When developing the Remuneration Policy, the Committee considered the pay arrangements from the perspective of clarity, simplicity, risk, predictability, proportionality and alignment to culture. Further detail is set out on page 151 of the 2020 Annual Report. When remuneration is delivered The following chart provides a timeline of when remuneration is delivered, using 2022 as an example. Year 1 2022 Year 2 2023 Year 3 2024 Year 4 2025 Year 5 2026 Year 6 2027 Base salary Salary Benefits Benefits, pension, etc. STIP 2022 performance year 50% cash 50% deferred shares (BDA) LTIP (PSA) Five-year performance period Vests February 2027 Performance period starts Performance period ends March PSA grant March STIP cash + BDA grant December BDA vest February PSA vest
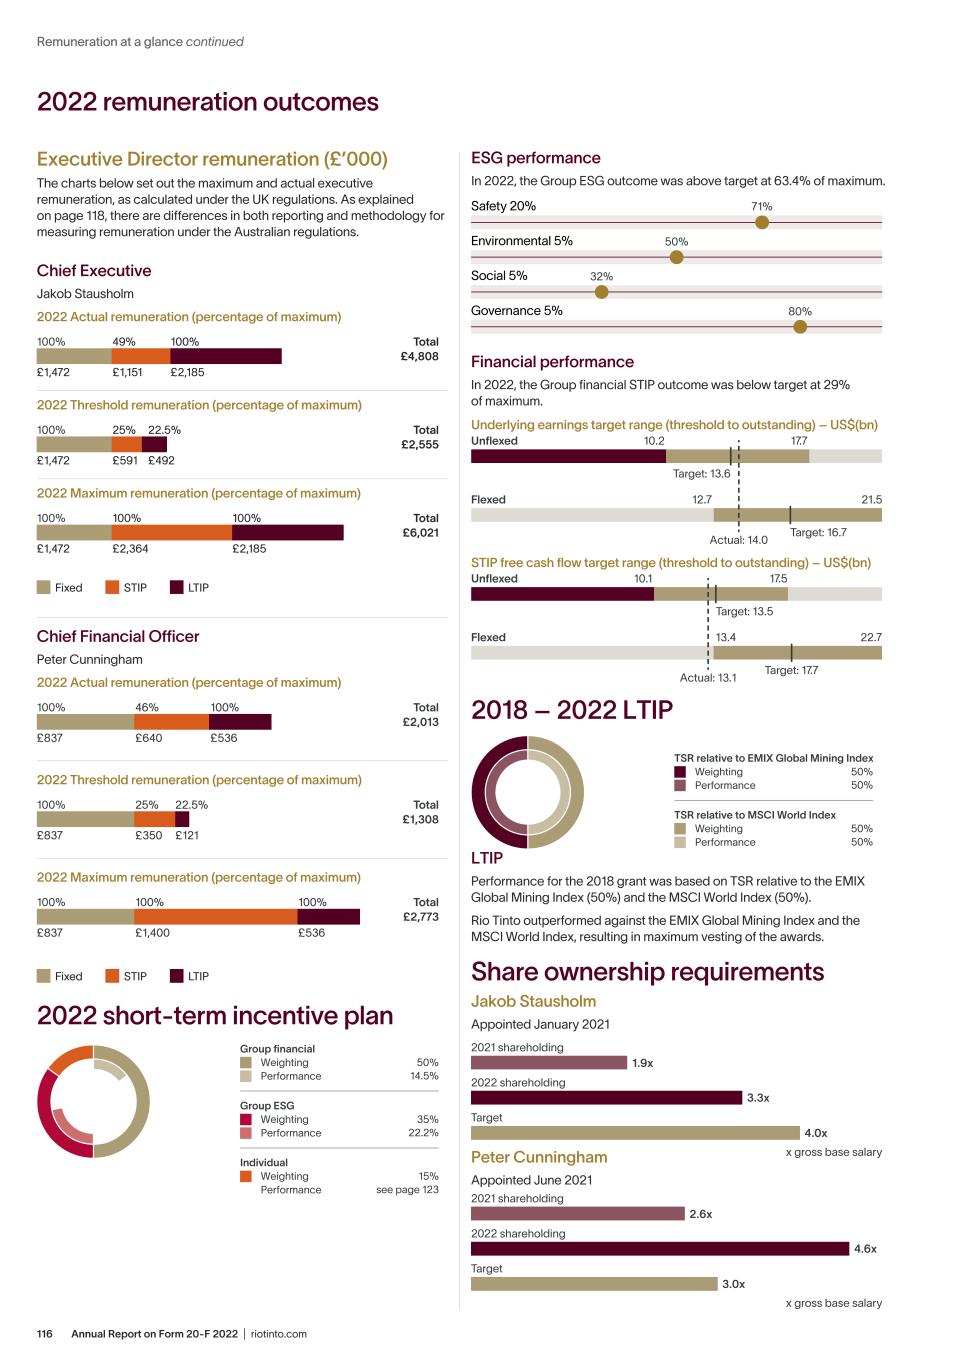
Annual Report on Form 20-F 2022 | riotinto.com116 Remuneration at a glance continued Executive Director remuneration (£’000) The charts below set out the maximum and actual executive remuneration, as calculated under the UK regulations. As explained on page 118, there are differences in both reporting and methodology for measuring remuneration under the Australian regulations. Chief Executive Jakob Stausholm 2022 remuneration outcomes 2022 short-term incentive plan Fixed STIP LTIP 2022 Actual remuneration (percentage of maximum) Total £4,808 £1,472 49% 100% £1,151 £2,185 100% 2022 Threshold remuneration (percentage of maximum) Total £2,555 25% 22.5%100% £1,472 £591 £492 2022 Maximum remuneration (percentage of maximum) £2,185 Total £6,021 £1,472 100% 100% £2,364 100% Chief Financial Officer Peter Cunningham Fixed STIP LTIP 2022 Actual remuneration (percentage of maximum) Total £2,013 £837 46% £640 100% £536 100% 2022 Threshold remuneration (percentage of maximum) Total £1,308 £837 25% £350 22.5% £121 100% 2022 Maximum remuneration (percentage of maximum) Total £2,773 £837 100% £1,400 100% £536 100% 14.5% 50% Group nancial Weighting Performance 22.2% 35% Group ESG Weighting Performance see page 123 15% Individual Weighting Performance LTIP Performance for the 2018 grant was based on TSR relative to the EMIX Global Mining Index (50%) and the MSCI World Index (50%). Rio Tinto outperformed against the EMIX Global Mining Index and the MSCI World Index, resulting in maximum vesting of the awards. Peter Cunningham Appointed June 2021 2018 – 2022 LTIP 50% 50% TSR relative to EMIX Global Mining Index Weighting Performance 50% 50% TSR relative to MSCI World Index Weighting Performance ESG performance In 2022, the Group ESG outcome was above target at 63.4% of maximum. Social 5% Governance 5% Environmental 5% Safety 20% 71% 50% 32% 80% x gross base salary 2021 shareholding 2022 shareholding 3.3x 1.9x Target 4.0x x gross base salary 2021 shareholding 2022 shareholding 4.6x 2.6x Target 3.0x Financial performance In 2022, the Group financial STIP outcome was below target at 29% of maximum. 21.512.7 Target: 16.7 10.2 17.7Unexed Flexed Actual: 14.0 Target: 13.6 STIP free cash flow target range (threshold to outstanding) – US$(bn) 22.713.4 Target: 17.7 Flexed Actual: 13.1 10.1 17.5Unexed Target: 13.5 Underlying earnings target range (threshold to outstanding) – US$(bn) Share ownership requirements Jakob Stausholm Appointed January 2021
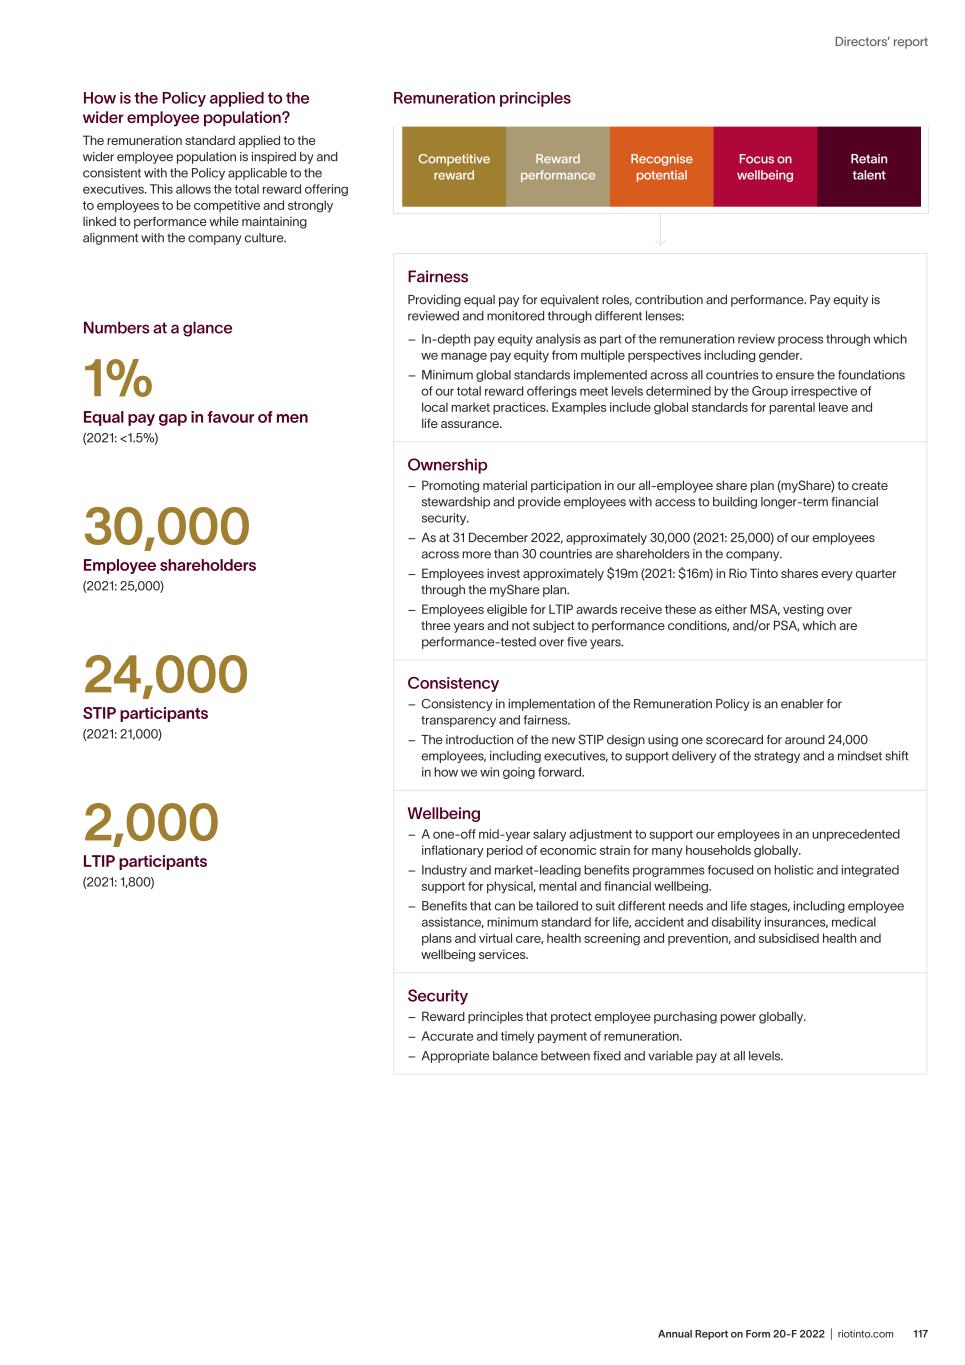
117Annual Report on Form 20-F 2022 | riotinto.com Directors’ report How is the Policy applied to the wider employee population? The remuneration standard applied to the wider employee population is inspired by and consistent with the Policy applicable to the executives. This allows the total reward offering to employees to be competitive and strongly linked to performance while maintaining alignment with the company culture. Remuneration principles Competitive reward Reward performance Recognise potential Focus on wellbeing Retain talent Fairness Providing equal pay for equivalent roles, contribution and performance. Pay equity is reviewed and monitored through different lenses: – In-depth pay equity analysis as part of the remuneration review process through which we manage pay equity from multiple perspectives including gender. – Minimum global standards implemented across all countries to ensure the foundations of our total reward offerings meet levels determined by the Group irrespective of local market practices. Examples include global standards for parental leave and life assurance. Ownership – Promoting material participation in our all-employee share plan (myShare) to create stewardship and provide employees with access to building longer-term financial security. – As at 31 December 2022, approximately 30,000 (2021: 25,000) of our employees across more than 30 countries are shareholders in the company. – Employees invest approximately $19m (2021: $16m) in Rio Tinto shares every quarter through the myShare plan. – Employees eligible for LTIP awards receive these as either MSA, vesting over three years and not subject to performance conditions, and/or PSA, which are performance-tested over five years. Consistency – Consistency in implementation of the Remuneration Policy is an enabler for transparency and fairness. – The introduction of the new STIP design using one scorecard for around 24,000 employees, including executives, to support delivery of the strategy and a mindset shift in how we win going forward. Wellbeing – A one-off mid-year salary adjustment to support our employees in an unprecedented inflationary period of economic strain for many households globally. – Industry and market-leading benefits programmes focused on holistic and integrated support for physical, mental and financial wellbeing. – Benefits that can be tailored to suit different needs and life stages, including employee assistance, minimum standard for life, accident and disability insurances, medical plans and virtual care, health screening and prevention, and subsidised health and wellbeing services. Security – Reward principles that protect employee purchasing power globally. – Accurate and timely payment of remuneration. – Appropriate balance between fixed and variable pay at all levels. Numbers at a glance 1% Equal pay gap in favour of men (2021: <1.5%) 30,000 Employee shareholders (2021: 25,000) 24,000 STIP participants (2021: 21,000) 2,000 LTIP participants (2021: 1,800)
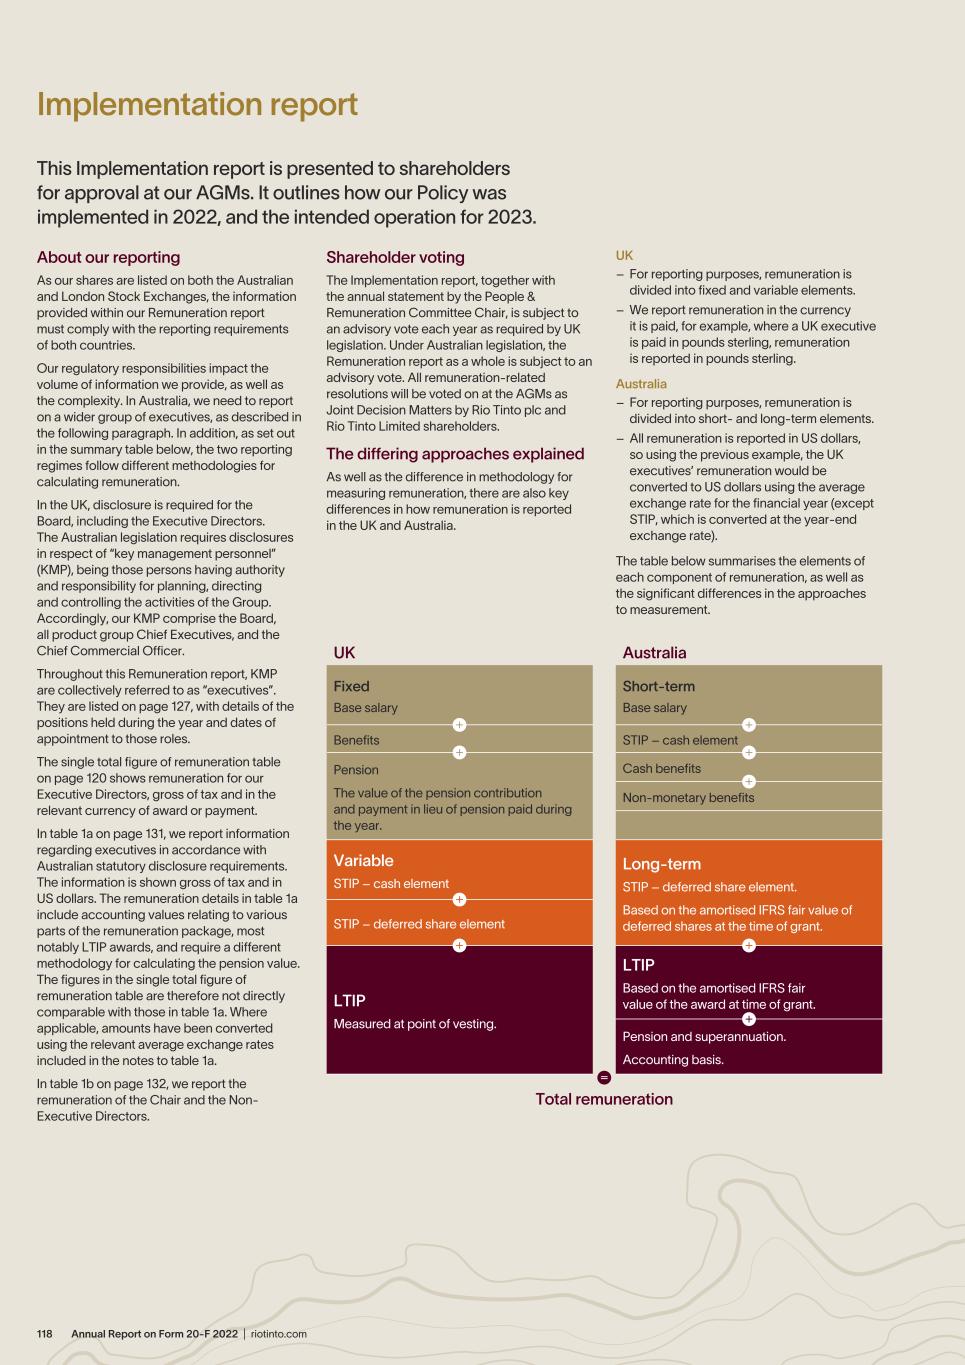
Annual Report on Form 20-F 2022 | riotinto.com118 Implementation report This Implementation report is presented to shareholders for approval at our AGMs. It outlines how our Policy was implemented in 2022, and the intended operation for 2023. About our reporting As our shares are listed on both the Australian and London Stock Exchanges, the information provided within our Remuneration report must comply with the reporting requirements of both countries. Our regulatory responsibilities impact the volume of information we provide, as well as the complexity. In Australia, we need to report on a wider group of executives, as described in the following paragraph. In addition, as set out in the summary table below, the two reporting regimes follow different methodologies for calculating remuneration. In the UK, disclosure is required for the Board, including the Executive Directors. The Australian legislation requires disclosures in respect of “key management personnel” (KMP), being those persons having authority and responsibility for planning, directing and controlling the activities of the Group. Accordingly, our KMP comprise the Board, all product group Chief Executives, and the Chief Commercial Officer. Throughout this Remuneration report, KMP are collectively referred to as “executives”. They are listed on page 127, with details of the positions held during the year and dates of appointment to those roles. The single total figure of remuneration table on page 120 shows remuneration for our Executive Directors, gross of tax and in the relevant currency of award or payment. In table 1a on page 131, we report information regarding executives in accordance with Australian statutory disclosure requirements. The information is shown gross of tax and in US dollars. The remuneration details in table 1a include accounting values relating to various parts of the remuneration package, most notably LTIP awards, and require a different methodology for calculating the pension value. The figures in the single total figure of remuneration table are therefore not directly comparable with those in table 1a. Where applicable, amounts have been converted using the relevant average exchange rates included in the notes to table 1a. In table 1b on page 132, we report the remuneration of the Chair and the Non- Executive Directors. UK – For reporting purposes, remuneration is divided into fixed and variable elements. – We report remuneration in the currency it is paid, for example, where a UK executive is paid in pounds sterling, remuneration is reported in pounds sterling. Australia – For reporting purposes, remuneration is divided into short- and long-term elements. – All remuneration is reported in US dollars, so using the previous example, the UK executives’ remuneration would be converted to US dollars using the average exchange rate for the financial year (except STIP, which is converted at the year-end exchange rate). The table below summarises the elements of each component of remuneration, as well as the significant differences in the approaches to measurement. Shareholder voting The Implementation report, together with the annual statement by the People & Remuneration Committee Chair, is subject to an advisory vote each year as required by UK legislation. Under Australian legislation, the Remuneration report as a whole is subject to an advisory vote. All remuneration-related resolutions will be voted on at the AGMs as Joint Decision Matters by Rio Tinto plc and Rio Tinto Limited shareholders. The differing approaches explained As well as the difference in methodology for measuring remuneration, there are also key differences in how remuneration is reported in the UK and Australia. UK Australia Fixed Base salary Short-term Base salary Benefits STIP – cash element Pension The value of the pension contribution and payment in lieu of pension paid during the year. Cash benefits Non-monetary benefits Variable STIP – cash element Long-term STIP – deferred share element. Based on the amortised IFRS fair value of deferred shares at the time of grant.STIP – deferred share element LTIP Measured at point of vesting. LTIP Based on the amortised IFRS fair value of the award at time of grant. Pension and superannuation. Accounting basis. Total remuneration
119Annual Report on Form 20-F 2022 | riotinto.com Directors’ report People & Remuneration Committee responsibilities Effective 1 January 2023, the Committee will be renamed to the People & Remuneration Committee to reflect its additional responsibilities to include people and culture matters in addition to remuneration. The Committee’s responsibilities have been updated within our terms of reference to reflect the revised scope of responsibilities, which is reviewed annually. The terms of reference are published in the corporate governance section of riotinto.com. Our responsibilities include: People – Strategic workforce planning including talent, succession and development planning within the Group. – Leadership development. – Oversight of the Board’s workforce engagement plan and implementation. Culture – Strategies to implement the Group’s values and to progress implementation of the Everyday Respect Report recommendations. – Strategies, initiatives and performance measures around organisational culture and desired behaviours. – Diversity and inclusion. Remuneration – Determining the Group’s remuneration strategy, policy and framework. – Determining the remuneration of the Chair, Executive Directors and other members of the Executive Committee. – Determining the mix and operation of the Group’s short- and long-term incentive plans and ensuring alignment with the company’s strategic objectives. – Overseeing the operation of the Group’s short- and long-term incentive plans for executives, including approving awards, setting performance criteria, and determining any vesting, and where necessary applying the consequence management framework to current and prior awards. – Determining contractual notice periods and termination commitments, and setting retention and termination arrangements for executives. – Determining awards under the Group’s all-employee share plan. – Responsible for the Annual Remuneration report and shareholder engagement on Remuneration Policy and implementation, and other related matters including gender pay. – Reviewing workforce remuneration and related policies and the alignment of incentives and rewards with culture, taking these into account when setting the Policy for Executive Director remuneration. – Engagement and independence of external remuneration advisers. We consider the level of pay and conditions for all employees across the Group when determining executive remuneration. Committee membership The members of the Committee during the year and to the date of this report were: Sam Laidlaw (Committee Chair) Dominic Barton (from 4 April 2022) Megan Clark Simon McKeon Jennifer Nason Simon Thompson (to 5 May 2022) Ngaire Woods How we work The Group Company Secretary (or their delegate) attends meetings as secretary to the Committee. The Chief Executive, Chief People Officer and Head of Reward attend appropriate parts of the meetings at the invitation of the Committee Chair. No individual is in attendance during discussions about their own remuneration. Independent advisers The Committee has a protocol for engaging and working with remuneration consultants to ensure that “remuneration recommendations” (being advice relating to the elements of remuneration for KMP, as defined under the Australian Corporations Act) are made free from undue influence by key management personnel to whom they may relate. We monitored compliance with these requirements throughout 2022. Deloitte, the appointed advisers to the Committee, gave declarations to the effect that any remuneration recommendations were made free from undue influence by KMP to whom they related, and the Board has received assurance from the Committee and is satisfied that this was the case. Deloitte are members of the Remuneration Consultants’ Group, and voluntarily operate under its Code of Conduct (the Code) in relation to executive remuneration consulting in the UK. The Code is based upon principles of transparency, integrity, objectivity, competence, due care and confidentiality. Deloitte has confirmed that they adhered to the Code throughout 2022 for all remuneration services provided to Rio Tinto. The Code is available online at remunerationconsultantsgroup.com. The Committee is satisfied that the Deloitte team is independent. During 2022, Deloitte’s services also included attending Committee meetings, providing support on the new incentive design and giving advice in relation to management proposals and shareholder consultations. Deloitte was paid $545,620 (2021: $365, 777) for these services. Fees were charged on the basis of time and expenses incurred. We received other services and publications relating to remuneration data from a range of sources. During the year, Deloitte also provided internal audit, tax compliance and other non-audit advisory services. These services were provided under separate engagement terms and the Committee is satisfied that there were no conflicts of interest. How the Committee spent its time in 2022 During 2022, the Committee met ten times. We fulfilled our responsibilities as set out in our terms of reference. Our work in 2022 included: – Determining any base salary adjustments and LTIP grants for executives. – Determining the targets for the 2022 STIP. – Reviewed performance of the accountable executives for GISTM implementation. – Reviewing performance against the 2021 STIP and 2017 PSA targets, including assessing applicable adjustments. – Considering shareholder feedback on the remuneration-related resolutions for the 2022 AGMs. – Determining the terms of appointment for the new Chair. – Development of the STIP redesign, including consultation with shareholders and proxy advisers. – Further refinement of the consequence management framework. – Reviewing executives’ progress towards the Group’s share ownership requirements. – Reviewing the strategy and annual reports on the Group’s global benefit plans. – Consideration of the 2022 mid-year salary adjustment for the broader employee workforce, noting that executives would not receive any adjustment. Performance review process for executives We conduct annual performance reviews for all executives. Our key objectives for the performance review process are to: – Improve organisational effectiveness by creating alignment between the executive’s objectives, Rio Tinto’s strategy, the individual’s leadership behaviours and the company’s values. – Provide a consistent, transparent and balanced approach to measure, recognise and reward executive performance. The Chief Executive conducts the review for members of the Executive Committee and recommends the performance outcomes to the Committee. The Chief Executive’s performance is assessed by the Chair of the Board and it is discussed and considered with the Committee and the full Board. Performance reviews for all executives took place in 2022 and early 2023.
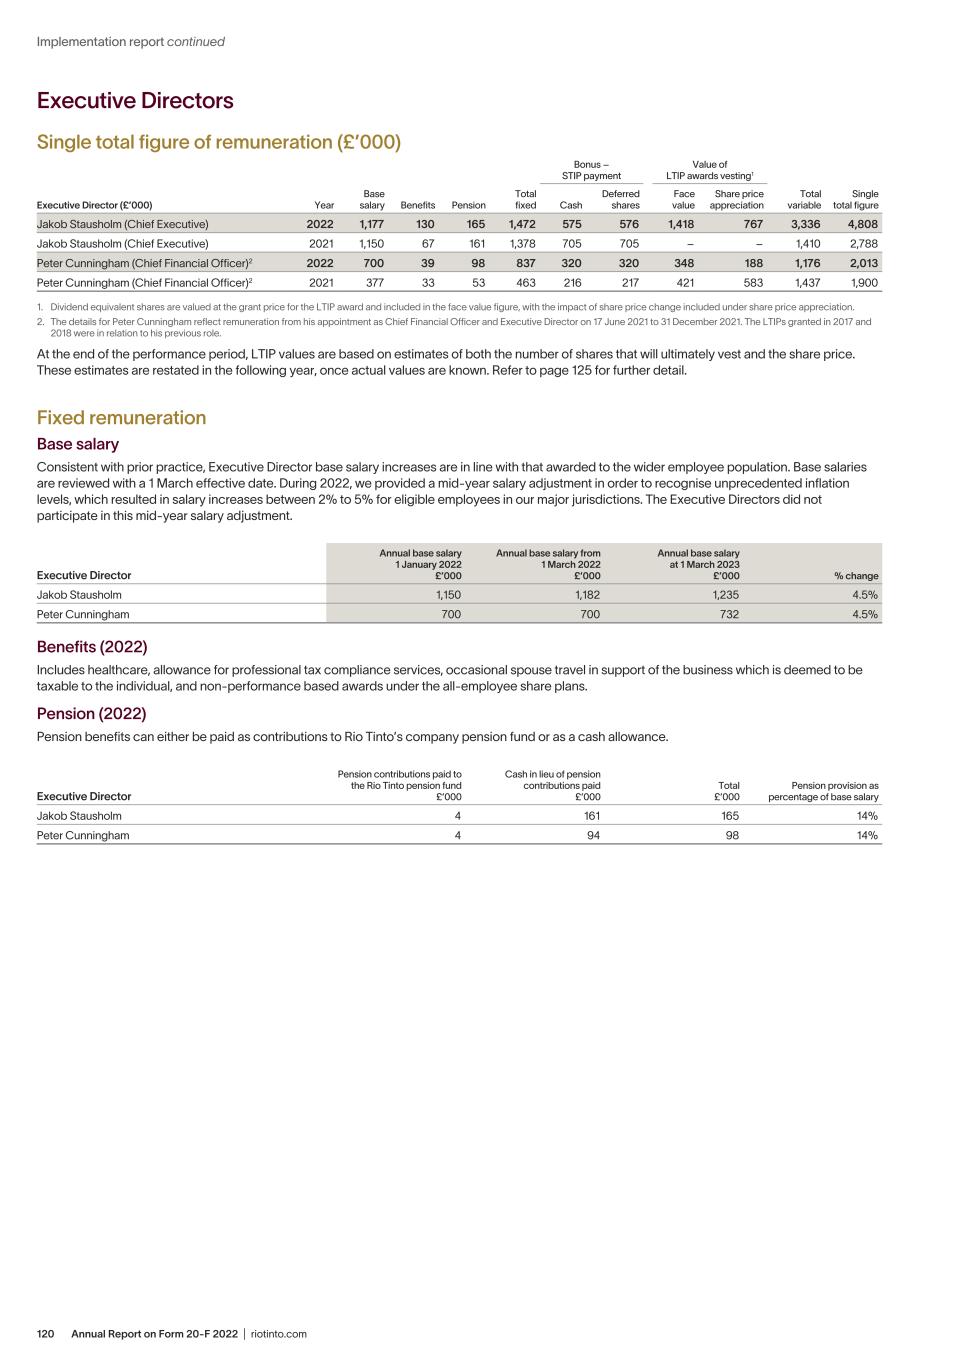
Annual Report on Form 20-F 2022 | riotinto.com120 Implementation report continued Executive Directors Single total figure of remuneration (£’000) Bonus – STIP payment Value of LTIP awards vesting1 Executive Director (£’000) Year Base salary Benefits Pension Total fixed Cash Deferred shares Face value Share price appreciation Total variable Single total figure Jakob Stausholm (Chief Executive) 2022 1,177 130 165 1,472 575 576 1,418 767 3,336 4,808 Jakob Stausholm (Chief Executive) 2021 1,150 67 161 1,378 705 705 – – 1,410 2,788 Peter Cunningham (Chief Financial Officer)2 2022 700 39 98 837 320 320 348 188 1,176 2,013 Peter Cunningham (Chief Financial Officer)2 2021 377 33 53 463 216 217 421 583 1,437 1,900 1. Dividend equivalent shares are valued at the grant price for the LTIP award and included in the face value figure, with the impact of share price change included under share price appreciation. 2. The details for Peter Cunningham reflect remuneration from his appointment as Chief Financial Officer and Executive Director on 17 June 2021 to 31 December 2021. The LTIPs granted in 2017 and 2018 were in relation to his previous role. At the end of the performance period, LTIP values are based on estimates of both the number of shares that will ultimately vest and the share price. These estimates are restated in the following year, once actual values are known. Refer to page 125 for further detail. Fixed remuneration Base salary Consistent with prior practice, Executive Director base salary increases are in line with that awarded to the wider employee population. Base salaries are reviewed with a 1 March effective date. During 2022, we provided a mid-year salary adjustment in order to recognise unprecedented inflation levels, which resulted in salary increases between 2% to 5% for eligible employees in our major jurisdictions. The Executive Directors did not participate in this mid-year salary adjustment. Executive Director Annual base salary 1 January 2022 £’000 Annual base salary from 1 March 2022 £’000 Annual base salary at 1 March 2023 £’000 % change Jakob Stausholm 1,150 1,182 1,235 4.5% Peter Cunningham 700 700 732 4.5% Benefits (2022) Includes healthcare, allowance for professional tax compliance services, occasional spouse travel in support of the business which is deemed to be taxable to the individual, and non-performance based awards under the all-employee share plans. Pension (2022) Pension benefits can either be paid as contributions to Rio Tinto’s company pension fund or as a cash allowance. Executive Director Pension contributions paid to the Rio Tinto pension fund £’000 Cash in lieu of pension contributions paid £’000 Total £’000 Pension provision as percentage of base salary Jakob Stausholm 4 161 165 14% Peter Cunningham 4 94 98 14%
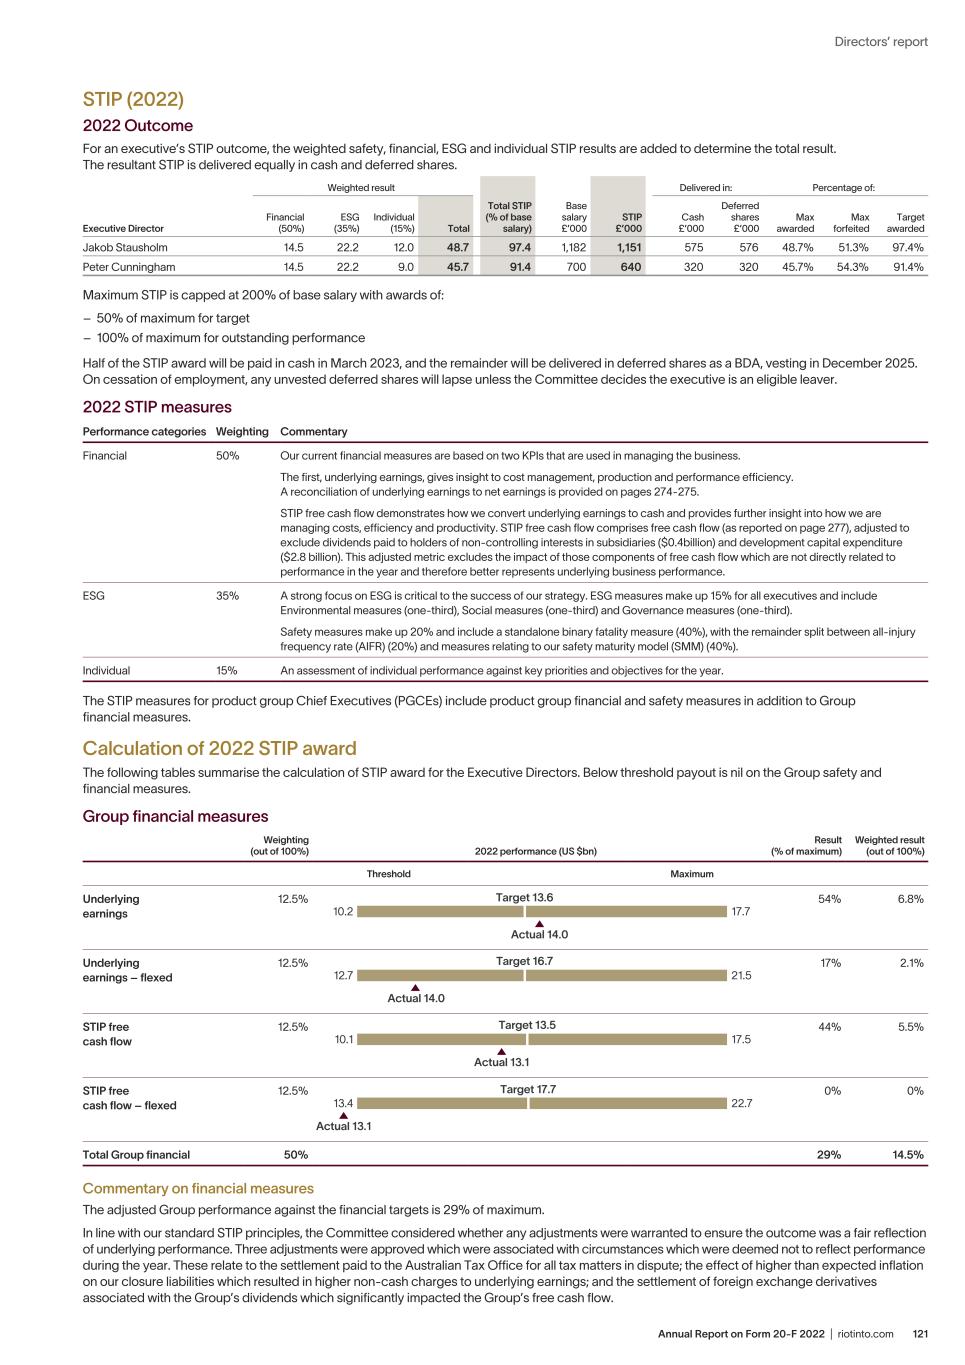
121Annual Report on Form 20-F 2022 | riotinto.com Directors’ report STIP (2022) 2022 Outcome For an executive’s STIP outcome, the weighted safety, financial, ESG and individual STIP results are added to determine the total result. The resultant STIP is delivered equally in cash and deferred shares. Executive Director Weighted result Total STIP (% of base salary) Base salary £’000 STIP £’000 Delivered in: Percentage of: Financial (50%) ESG (35%) Individual (15%) Total Cash £’000 Deferred shares £’000 Max awarded Max forfeited Target awarded Jakob Stausholm 14.5 22.2 12.0 48.7 97.4 1,182 1,151 575 576 48.7% 51.3% 97.4% Peter Cunningham 14.5 22.2 9.0 45.7 91.4 700 640 320 320 45.7% 54.3% 91.4% Maximum STIP is capped at 200% of base salary with awards of: – 50% of maximum for target – 100% of maximum for outstanding performance Half of the STIP award will be paid in cash in March 2023, and the remainder will be delivered in deferred shares as a BDA, vesting in December 2025. On cessation of employment, any unvested deferred shares will lapse unless the Committee decides the executive is an eligible leaver. 2022 STIP measures Performance categories Weighting Commentary Financial 50% Our current financial measures are based on two KPIs that are used in managing the business. The first, underlying earnings, gives insight to cost management, production and performance efficiency. A reconciliation of underlying earnings to net earnings is provided on pages 274-275. STIP free cash flow demonstrates how we convert underlying earnings to cash and provides further insight into how we are managing costs, efficiency and productivity. STIP free cash flow comprises free cash flow (as reported on page 277), adjusted to exclude dividends paid to holders of non-controlling interests in subsidiaries ($0.4billion) and development capital expenditure ($2.8 billion). This adjusted metric excludes the impact of those components of free cash flow which are not directly related to performance in the year and therefore better represents underlying business performance. ESG 35% A strong focus on ESG is critical to the success of our strategy. ESG measures make up 15% for all executives and include Environmental measures (one-third), Social measures (one-third) and Governance measures (one-third). Safety measures make up 20% and include a standalone binary fatality measure (40%), with the remainder split between all-injury frequency rate (AIFR) (20%) and measures relating to our safety maturity model (SMM) (40%). Individual 15% An assessment of individual performance against key priorities and objectives for the year. The STIP measures for product group Chief Executives (PGCEs) include product group financial and safety measures in addition to Group financial measures. Calculation of 2022 STIP award The following tables summarise the calculation of STIP award for the Executive Directors. Below threshold payout is nil on the Group safety and financial measures. Group financial measures Weighting (out of 100%) 2022 performance (US $bn) Result (% of maximum) Weighted result (out of 100%) Threshold Maximum Underlying earnings 12.5% 10.2 17.7 Actual 14.0 Target 13.6 54% 6.8% Underlying earnings – flexed 12.5% 12.7 21.5 Target 16.7 Actual 14.0 17% 2.1% STIP free cash flow 12.5% 10.1 17.5 Actual 13.1 Target 13.5 44% 5.5% STIP free cash flow – flexed 12.5% 13.4 22.7 Actual 13.1 Target 17.7 0% 0% Total Group financial 50% 29% 14.5% Commentary on financial measures The adjusted Group performance against the financial targets is 29% of maximum. In line with our standard STIP principles, the Committee considered whether any adjustments were warranted to ensure the outcome was a fair reflection of underlying performance. Three adjustments were approved which were associated with circumstances which were deemed not to reflect performance during the year. These relate to the settlement paid to the Australian Tax Office for all tax matters in dispute; the effect of higher than expected inflation on our closure liabilities which resulted in higher non-cash charges to underlying earnings; and the settlement of foreign exchange derivatives associated with the Group’s dividends which significantly impacted the Group’s free cash flow.
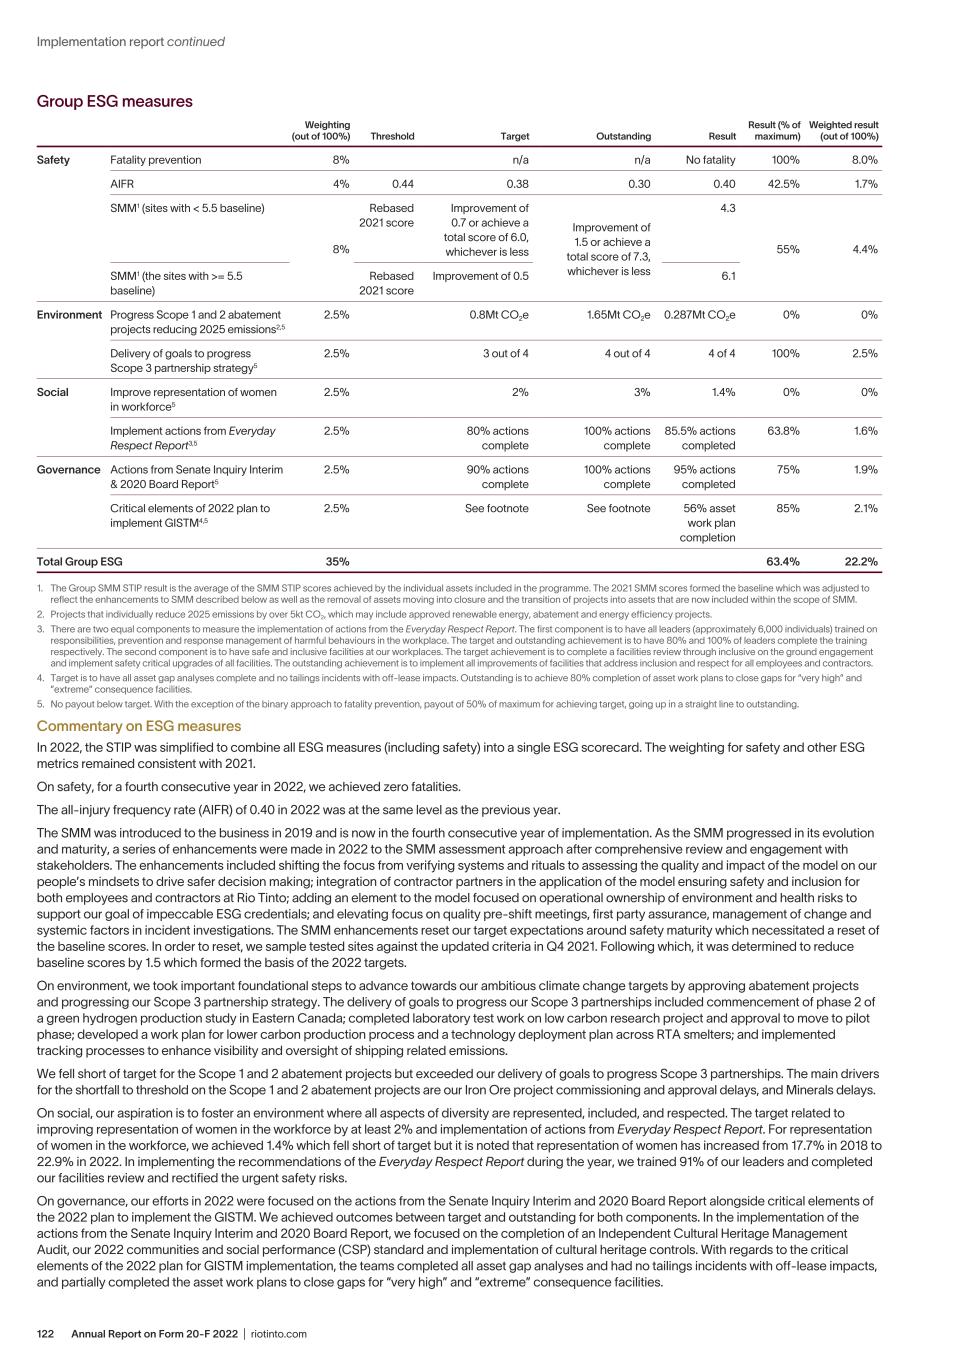
Annual Report on Form 20-F 2022 | riotinto.com122 Group ESG measures Weighting (out of 100%) Threshold Target Outstanding Result Result (% of maximum) Weighted result (out of 100%) Safety Fatality prevention 8% n/a n/a No fatality 100% 8.0% AIFR 4% 0.44 0.38 0.30 0.40 42.5% 1.7% SMM1 (sites with < 5.5 baseline) 8% Rebased 2021 score Improvement of 0.7 or achieve a total score of 6.0, whichever is less Improvement of 1.5 or achieve a total score of 7.3, whichever is less 4.3 55% 4.4% SMM1 (the sites with >= 5.5 baseline) Rebased 2021 score Improvement of 0.5 6.1 Environment Progress Scope 1 and 2 abatement projects reducing 2025 emissions2,5 2.5% 0.8Mt CO2e 1.65Mt CO2e 0.287Mt CO2e 0% 0% Delivery of goals to progress Scope 3 partnership strategy5 2.5% 3 out of 4 4 out of 4 4 of 4 100% 2.5% Social Improve representation of women in workforce5 2.5% 2% 3% 1.4% 0% 0% Implement actions from Everyday Respect Report3,5 2.5% 80% actions complete 100% actions complete 85.5% actions completed 63.8% 1.6% Governance Actions from Senate Inquiry Interim & 2020 Board Report5 2.5% 90% actions complete 100% actions complete 95% actions completed 75% 1.9% Critical elements of 2022 plan to implement GISTM4,5 2.5% See footnote See footnote 56% asset work plan completion 85% 2.1% Total Group ESG 35% 63.4% 22.2% 1. The Group SMM STIP result is the average of the SMM STIP scores achieved by the individual assets included in the programme. The 2021 SMM scores formed the baseline which was adjusted to reflect the enhancements to SMM described below as well as the removal of assets moving into closure and the transition of projects into assets that are now included within the scope of SMM. 2. Projects that individually reduce 2025 emissions by over 5kt CO2, which may include approved renewable energy, abatement and energy efficiency projects. 3. There are two equal components to measure the implementation of actions from the Everyday Respect Report. The first component is to have all leaders (approximately 6,000 individuals) trained on responsibilities, prevention and response management of harmful behaviours in the workplace. The target and outstanding achievement is to have 80% and 100% of leaders complete the training respectively. The second component is to have safe and inclusive facilities at our workplaces. The target achievement is to complete a facilities review through inclusive on the ground engagement and implement safety critical upgrades of all facilities. The outstanding achievement is to implement all improvements of facilities that address inclusion and respect for all employees and contractors. 4. Target is to have all asset gap analyses complete and no tailings incidents with off-lease impacts. Outstanding is to achieve 80% completion of asset work plans to close gaps for “very high” and ”extreme” consequence facilities. 5. No payout below target. With the exception of the binary approach to fatality prevention, payout of 50% of maximum for achieving target, going up in a straight line to outstanding. Commentary on ESG measures In 2022, the STIP was simplified to combine all ESG measures (including safety) into a single ESG scorecard. The weighting for safety and other ESG metrics remained consistent with 2021. On safety, for a fourth consecutive year in 2022, we achieved zero fatalities. The all-injury frequency rate (AIFR) of 0.40 in 2022 was at the same level as the previous year. The SMM was introduced to the business in 2019 and is now in the fourth consecutive year of implementation. As the SMM progressed in its evolution and maturity, a series of enhancements were made in 2022 to the SMM assessment approach after comprehensive review and engagement with stakeholders. The enhancements included shifting the focus from verifying systems and rituals to assessing the quality and impact of the model on our people’s mindsets to drive safer decision making; integration of contractor partners in the application of the model ensuring safety and inclusion for both employees and contractors at Rio Tinto; adding an element to the model focused on operational ownership of environment and health risks to support our goal of impeccable ESG credentials; and elevating focus on quality pre-shift meetings, first party assurance, management of change and systemic factors in incident investigations. The SMM enhancements reset our target expectations around safety maturity which necessitated a reset of the baseline scores. In order to reset, we sample tested sites against the updated criteria in Q4 2021. Following which, it was determined to reduce baseline scores by 1.5 which formed the basis of the 2022 targets. On environment, we took important foundational steps to advance towards our ambitious climate change targets by approving abatement projects and progressing our Scope 3 partnership strategy. The delivery of goals to progress our Scope 3 partnerships included commencement of phase 2 of a green hydrogen production study in Eastern Canada; completed laboratory test work on low carbon research project and approval to move to pilot phase; developed a work plan for lower carbon production process and a technology deployment plan across RTA smelters; and implemented tracking processes to enhance visibility and oversight of shipping related emissions. We fell short of target for the Scope 1 and 2 abatement projects but exceeded our delivery of goals to progress Scope 3 partnerships. The main drivers for the shortfall to threshold on the Scope 1 and 2 abatement projects are our Iron Ore project commissioning and approval delays, and Minerals delays. On social, our aspiration is to foster an environment where all aspects of diversity are represented, included, and respected. The target related to improving representation of women in the workforce by at least 2% and implementation of actions from Everyday Respect Report. For representation of women in the workforce, we achieved 1.4% which fell short of target but it is noted that representation of women has increased from 17.7% in 2018 to 22.9% in 2022. In implementing the recommendations of the Everyday Respect Report during the year, we trained 91% of our leaders and completed our facilities review and rectified the urgent safety risks. On governance, our efforts in 2022 were focused on the actions from the Senate Inquiry Interim and 2020 Board Report alongside critical elements of the 2022 plan to implement the GISTM. We achieved outcomes between target and outstanding for both components. In the implementation of the actions from the Senate Inquiry Interim and 2020 Board Report, we focused on the completion of an Independent Cultural Heritage Management Audit, our 2022 communities and social performance (CSP) standard and implementation of cultural heritage controls. With regards to the critical elements of the 2022 plan for GISTM implementation, the teams completed all asset gap analyses and had no tailings incidents with off-lease impacts, and partially completed the asset work plans to close gaps for “very high” and “extreme” consequence facilities. Implementation report continued
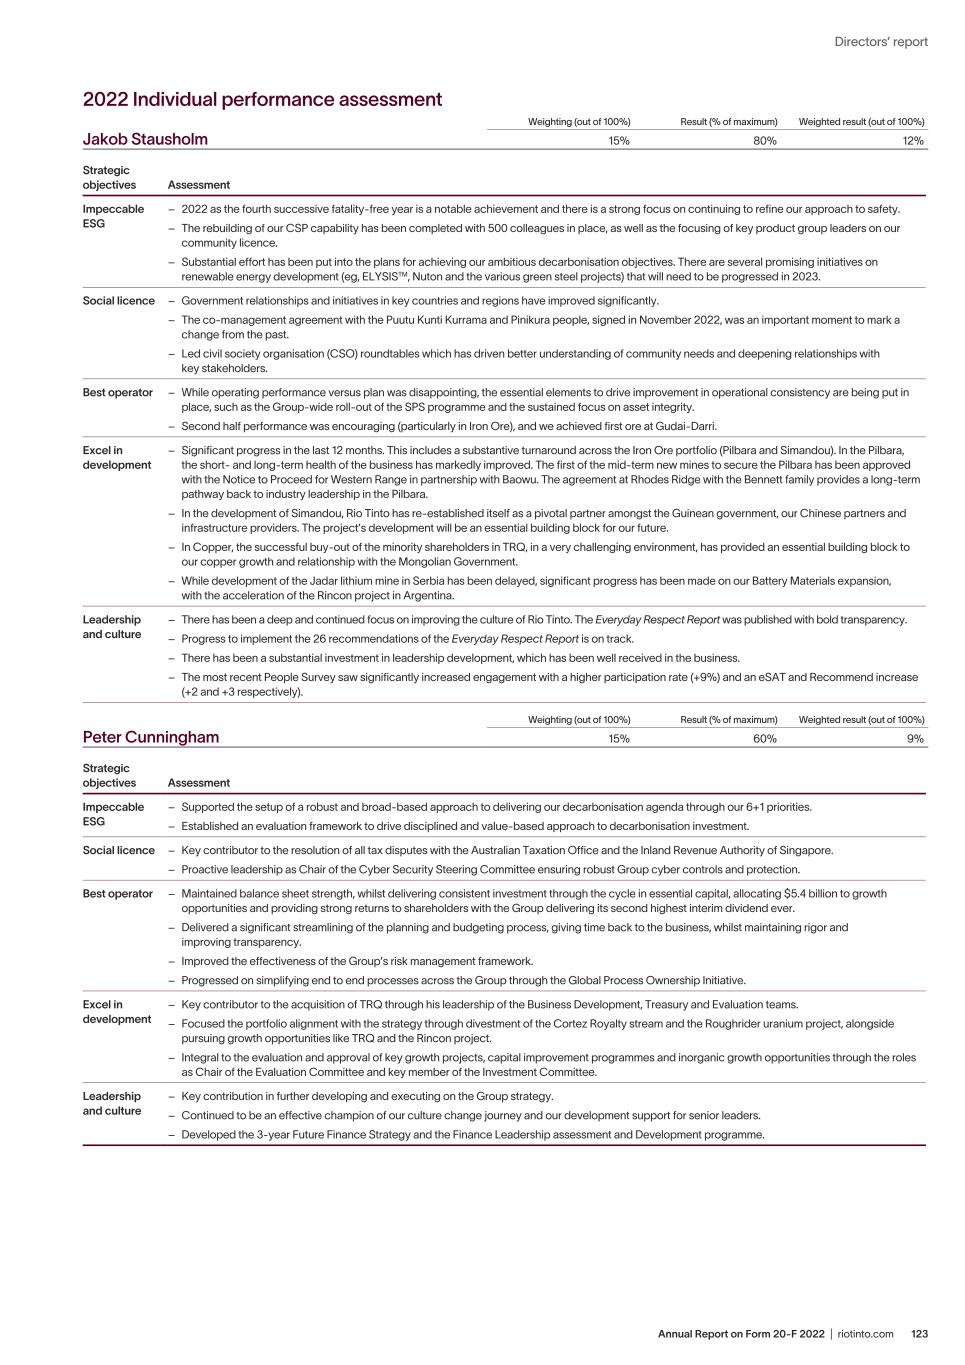
123Annual Report on Form 20-F 2022 | riotinto.com Directors’ report 2022 Individual performance assessment Jakob Stausholm Weighting (out of 100%) Result (% of maximum) Weighted result (out of 100%) 15% 80% 12% Strategic objectives Assessment Impeccable ESG – 2022 as the fourth successive fatality-free year is a notable achievement and there is a strong focus on continuing to refine our approach to safety. – The rebuilding of our CSP capability has been completed with 500 colleagues in place, as well as the focusing of key product group leaders on our community licence. – Substantial effort has been put into the plans for achieving our ambitious decarbonisation objectives. There are several promising initiatives on renewable energy development (eg, ELYSISTM, Nuton and the various green steel projects) that will need to be progressed in 2023. Social licence – Government relationships and initiatives in key countries and regions have improved significantly. – The co-management agreement with the Puutu Kunti Kurrama and Pinikura people, signed in November 2022, was an important moment to mark a change from the past. – Led civil society organisation (CSO) roundtables which has driven better understanding of community needs and deepening relationships with key stakeholders. Best operator – While operating performance versus plan was disappointing, the essential elements to drive improvement in operational consistency are being put in place, such as the Group-wide roll-out of the SPS programme and the sustained focus on asset integrity. – Second half performance was encouraging (particularly in Iron Ore), and we achieved first ore at Gudai-Darri. Excel in development – Significant progress in the last 12 months. This includes a substantive turnaround across the Iron Ore portfolio (Pilbara and Simandou). In the Pilbara, the short- and long-term health of the business has markedly improved. The first of the mid-term new mines to secure the Pilbara has been approved with the Notice to Proceed for Western Range in partnership with Baowu. The agreement at Rhodes Ridge with the Bennett family provides a long-term pathway back to industry leadership in the Pilbara. – In the development of Simandou, Rio Tinto has re-established itself as a pivotal partner amongst the Guinean government, our Chinese partners and infrastructure providers. The project’s development will be an essential building block for our future. – In Copper, the successful buy-out of the minority shareholders in TRQ, in a very challenging environment, has provided an essential building block to our copper growth and relationship with the Mongolian Government. – While development of the Jadar lithium mine in Serbia has been delayed, significant progress has been made on our Battery Materials expansion, with the acceleration of the Rincon project in Argentina. Leadership and culture – There has been a deep and continued focus on improving the culture of Rio Tinto. The Everyday Respect Report was published with bold transparency. – Progress to implement the 26 recommendations of the Everyday Respect Report is on track. – There has been a substantial investment in leadership development, which has been well received in the business. – The most recent People Survey saw significantly increased engagement with a higher participation rate (+9%) and an eSAT and Recommend increase (+2 and +3 respectively). Peter Cunningham Weighting (out of 100%) Result (% of maximum) Weighted result (out of 100%) 15% 60% 9% Strategic objectives Assessment Impeccable ESG – Supported the setup of a robust and broad-based approach to delivering our decarbonisation agenda through our 6+1 priorities. – Established an evaluation framework to drive disciplined and value-based approach to decarbonisation investment. Social licence – Key contributor to the resolution of all tax disputes with the Australian Taxation Office and the Inland Revenue Authority of Singapore. – Proactive leadership as Chair of the Cyber Security Steering Committee ensuring robust Group cyber controls and protection. Best operator – Maintained balance sheet strength, whilst delivering consistent investment through the cycle in essential capital, allocating $5.4 billion to growth opportunities and providing strong returns to shareholders with the Group delivering its second highest interim dividend ever. – Delivered a significant streamlining of the planning and budgeting process, giving time back to the business, whilst maintaining rigor and improving transparency. – Improved the effectiveness of the Group’s risk management framework. – Progressed on simplifying end to end processes across the Group through the Global Process Ownership Initiative. Excel in development – Key contributor to the acquisition of TRQ through his leadership of the Business Development, Treasury and Evaluation teams. – Focused the portfolio alignment with the strategy through divestment of the Cortez Royalty stream and the Roughrider uranium project, alongside pursuing growth opportunities like TRQ and the Rincon project. – Integral to the evaluation and approval of key growth projects, capital improvement programmes and inorganic growth opportunities through the roles as Chair of the Evaluation Committee and key member of the Investment Committee. Leadership and culture – Key contribution in further developing and executing on the Group strategy. – Continued to be an effective champion of our culture change journey and our development support for senior leaders. – Developed the 3-year Future Finance Strategy and the Finance Leadership assessment and Development programme.
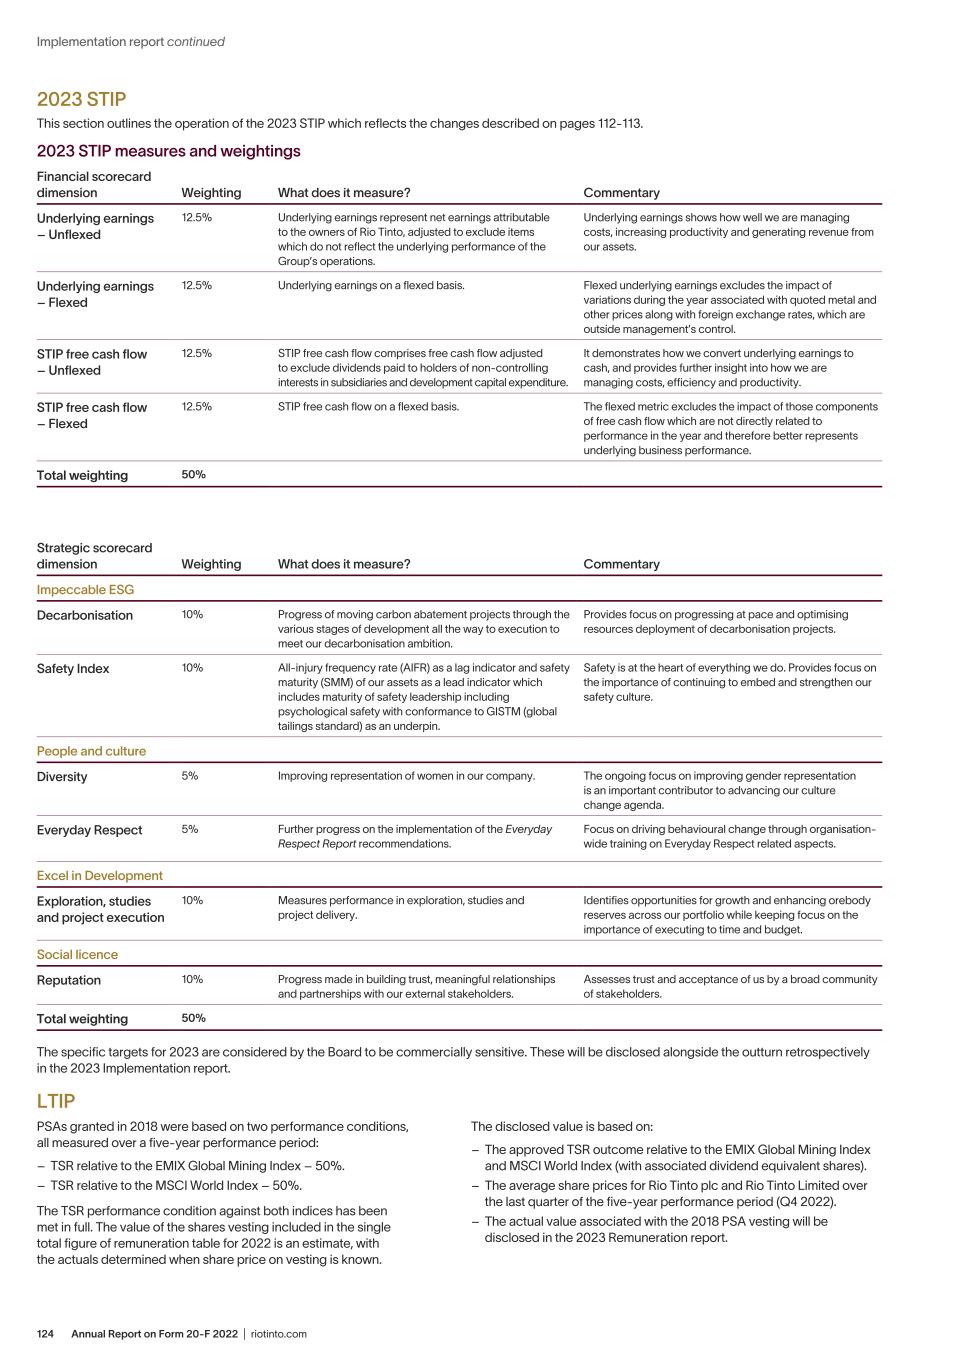
Annual Report on Form 20-F 2022 | riotinto.com124 2023 STIP This section outlines the operation of the 2023 STIP which reflects the changes described on pages 112-113. 2023 STIP measures and weightings Financial scorecard dimension Weighting What does it measure? Commentary Underlying earnings – Unflexed 12.5% Underlying earnings represent net earnings attributable to the owners of Rio Tinto, adjusted to exclude items which do not reflect the underlying performance of the Group’s operations. Underlying earnings shows how well we are managing costs, increasing productivity and generating revenue from our assets. Underlying earnings – Flexed 12.5% Underlying earnings on a flexed basis. Flexed underlying earnings excludes the impact of variations during the year associated with quoted metal and other prices along with foreign exchange rates, which are outside management’s control. STIP free cash flow – Unflexed 12.5% STIP free cash flow comprises free cash flow adjusted to exclude dividends paid to holders of non-controlling interests in subsidiaries and development capital expenditure. It demonstrates how we convert underlying earnings to cash, and provides further insight into how we are managing costs, efficiency and productivity. STIP free cash flow – Flexed 12.5% STIP free cash flow on a flexed basis. The flexed metric excludes the impact of those components of free cash flow which are not directly related to performance in the year and therefore better represents underlying business performance. Total weighting 50% Strategic scorecard dimension Weighting What does it measure? Commentary Impeccable ESG Decarbonisation 10% Progress of moving carbon abatement projects through the various stages of development all the way to execution to meet our decarbonisation ambition. Provides focus on progressing at pace and optimising resources deployment of decarbonisation projects. Safety Index 10% All-injury frequency rate (AIFR) as a lag indicator and safety maturity (SMM) of our assets as a lead indicator which includes maturity of safety leadership including psychological safety with conformance to GISTM (global tailings standard) as an underpin. Safety is at the heart of everything we do. Provides focus on the importance of continuing to embed and strengthen our safety culture. People and culture Diversity 5% Improving representation of women in our company. The ongoing focus on improving gender representation is an important contributor to advancing our culture change agenda. Everyday Respect 5% Further progress on the implementation of the Everyday Respect Report recommendations. Focus on driving behavioural change through organisation- wide training on Everyday Respect related aspects. Excel in Development Exploration, studies and project execution 10% Measures performance in exploration, studies and project delivery. Identifies opportunities for growth and enhancing orebody reserves across our portfolio while keeping focus on the importance of executing to time and budget. Social licence Reputation 10% Progress made in building trust, meaningful relationships and partnerships with our external stakeholders. Assesses trust and acceptance of us by a broad community of stakeholders. Total weighting 50% The specific targets for 2023 are considered by the Board to be commercially sensitive. These will be disclosed alongside the outturn retrospectively in the 2023 Implementation report. Implementation report continued LTIP PSAs granted in 2018 were based on two performance conditions, all measured over a five-year performance period: – TSR relative to the EMIX Global Mining Index – 50%. – TSR relative to the MSCI World Index – 50%. The TSR performance condition against both indices has been met in full. The value of the shares vesting included in the single total figure of remuneration table for 2022 is an estimate, with the actuals determined when share price on vesting is known. The disclosed value is based on: – The approved TSR outcome relative to the EMIX Global Mining Index and MSCI World Index (with associated dividend equivalent shares). – The average share prices for Rio Tinto plc and Rio Tinto Limited over the last quarter of the five-year performance period (Q4 2022). – The actual value associated with the 2018 PSA vesting will be disclosed in the 2023 Remuneration report.
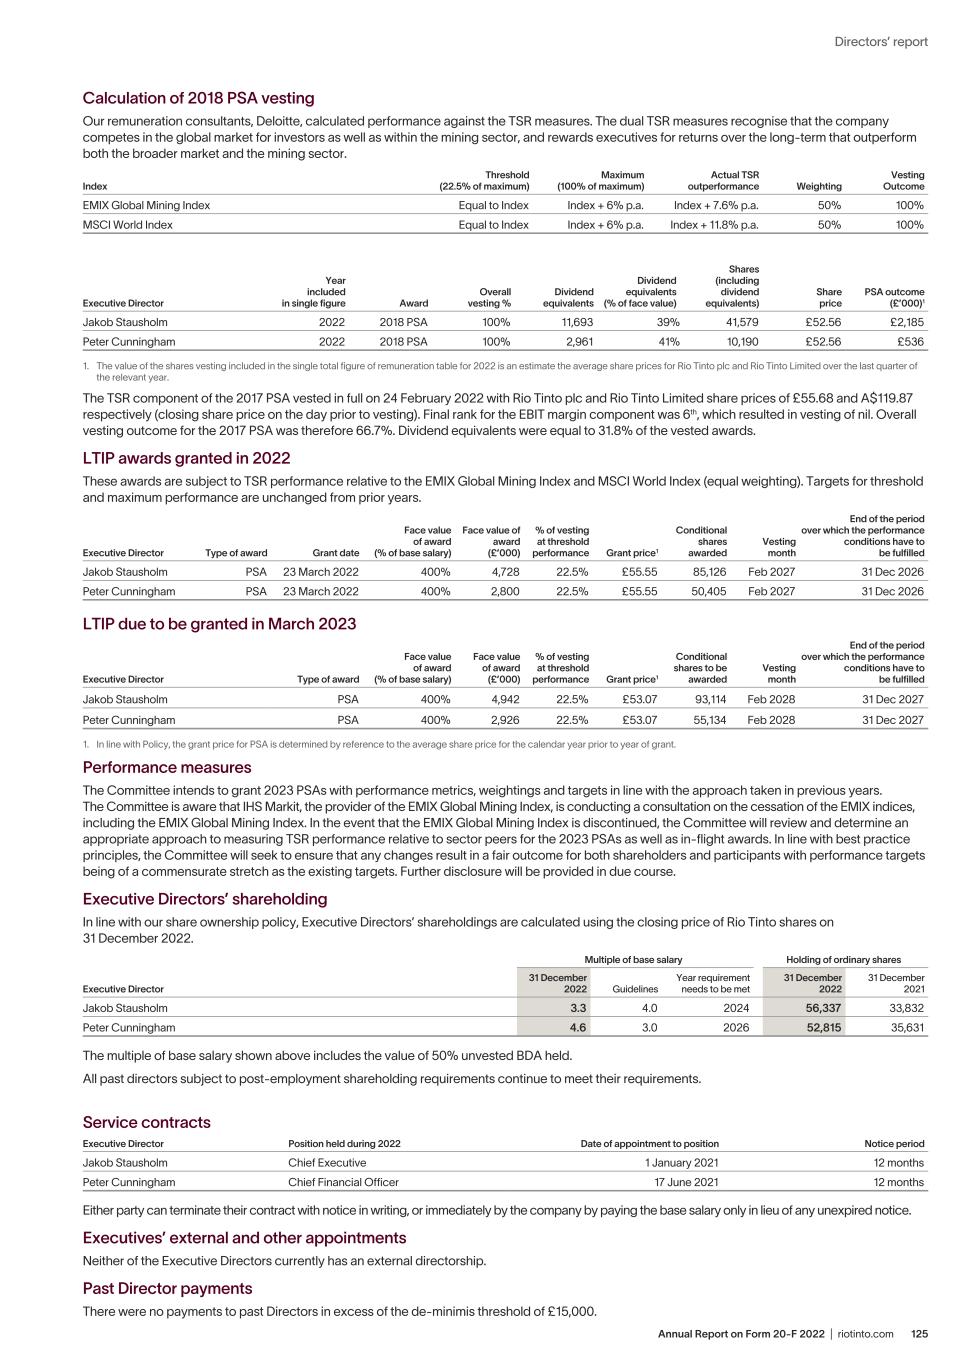
125Annual Report on Form 20-F 2022 | riotinto.com Directors’ report Calculation of 2018 PSA vesting Our remuneration consultants, Deloitte, calculated performance against the TSR measures. The dual TSR measures recognise that the company competes in the global market for investors as well as within the mining sector, and rewards executives for returns over the long-term that outperform both the broader market and the mining sector. Index Threshold (22.5% of maximum) Maximum (100% of maximum) Actual TSR outperformance Weighting Vesting Outcome EMIX Global Mining Index Equal to Index Index + 6% p.a. Index + 7.6% p.a. 50% 100% MSCI World Index Equal to Index Index + 6% p.a. Index + 11.8% p.a. 50% 100% Executive Director Year included in single figure Award Overall vesting % Dividend equivalents Dividend equivalents (% of face value) Shares (including dividend equivalents) Share price PSA outcome (£’000)1 Jakob Stausholm 2022 2018 PSA 100% 11,693 39% 41,579 £52.56 £2,185 Peter Cunningham 2022 2018 PSA 100% 2,961 41% 10,190 £52.56 £536 1. The value of the shares vesting included in the single total figure of remuneration table for 2022 is an estimate the average share prices for Rio Tinto plc and Rio Tinto Limited over the last quarter of the relevant year. The TSR component of the 2017 PSA vested in full on 24 February 2022 with Rio Tinto plc and Rio Tinto Limited share prices of £55.68 and A$119.87 respectively (closing share price on the day prior to vesting). Final rank for the EBIT margin component was 6th, which resulted in vesting of nil. Overall vesting outcome for the 2017 PSA was therefore 66.7%. Dividend equivalents were equal to 31.8% of the vested awards. LTIP awards granted in 2022 These awards are subject to TSR performance relative to the EMIX Global Mining Index and MSCI World Index (equal weighting). Targets for threshold and maximum performance are unchanged from prior years. Executive Director Type of award Grant date Face value of award (% of base salary) Face value of award (£’000) % of vesting at threshold performance Grant price1 Conditional shares awarded Vesting month End of the period over which the performance conditions have to be fulfilled Jakob Stausholm PSA 23 March 2022 400% 4,728 22.5% £55.55 85,126 Feb 2027 31 Dec 2026 Peter Cunningham PSA 23 March 2022 400% 2,800 22.5% £55.55 50,405 Feb 2027 31 Dec 2026 LTIP due to be granted in March 2023 Executive Director Type of award Face value of award (% of base salary) Face value of award (£’000) % of vesting at threshold performance Grant price1 Conditional shares to be awarded Vesting month End of the period over which the performance conditions have to be fulfilled Jakob Stausholm PSA 400% 4,942 22.5% £53.07 93,114 Feb 2028 31 Dec 2027 Peter Cunningham PSA 400% 2,926 22.5% £53.07 55,134 Feb 2028 31 Dec 2027 1. In line with Policy, the grant price for PSA is determined by reference to the average share price for the calendar year prior to year of grant. Performance measures The Committee intends to grant 2023 PSAs with performance metrics, weightings and targets in line with the approach taken in previous years. The Committee is aware that IHS Markit, the provider of the EMIX Global Mining Index, is conducting a consultation on the cessation of the EMIX indices, including the EMIX Global Mining Index. In the event that the EMIX Global Mining Index is discontinued, the Committee will review and determine an appropriate approach to measuring TSR performance relative to sector peers for the 2023 PSAs as well as in-flight awards. In line with best practice principles, the Committee will seek to ensure that any changes result in a fair outcome for both shareholders and participants with performance targets being of a commensurate stretch as the existing targets. Further disclosure will be provided in due course. Executive Directors’ shareholding In line with our share ownership policy, Executive Directors’ shareholdings are calculated using the closing price of Rio Tinto shares on 31 December 2022. Executive Director Multiple of base salary Holding of ordinary shares 31 December 2022 Guidelines Year requirement needs to be met 31 December 2022 31 December 2021 Jakob Stausholm 3.3 4.0 2024 56,337 33,832 Peter Cunningham 4.6 3.0 2026 52,815 35,631 The multiple of base salary shown above includes the value of 50% unvested BDA held. All past directors subject to post-employment shareholding requirements continue to meet their requirements. Service contracts Executive Director Position held during 2022 Date of appointment to position Notice period Jakob Stausholm Chief Executive 1 January 2021 12 months Peter Cunningham Chief Financial Officer 17 June 2021 12 months Either party can terminate their contract with notice in writing, or immediately by the company by paying the base salary only in lieu of any unexpired notice. Executives’ external and other appointments Neither of the Executive Directors currently has an external directorship. Past Director payments There were no payments to past Directors in excess of the de-minimis threshold of £15,000.
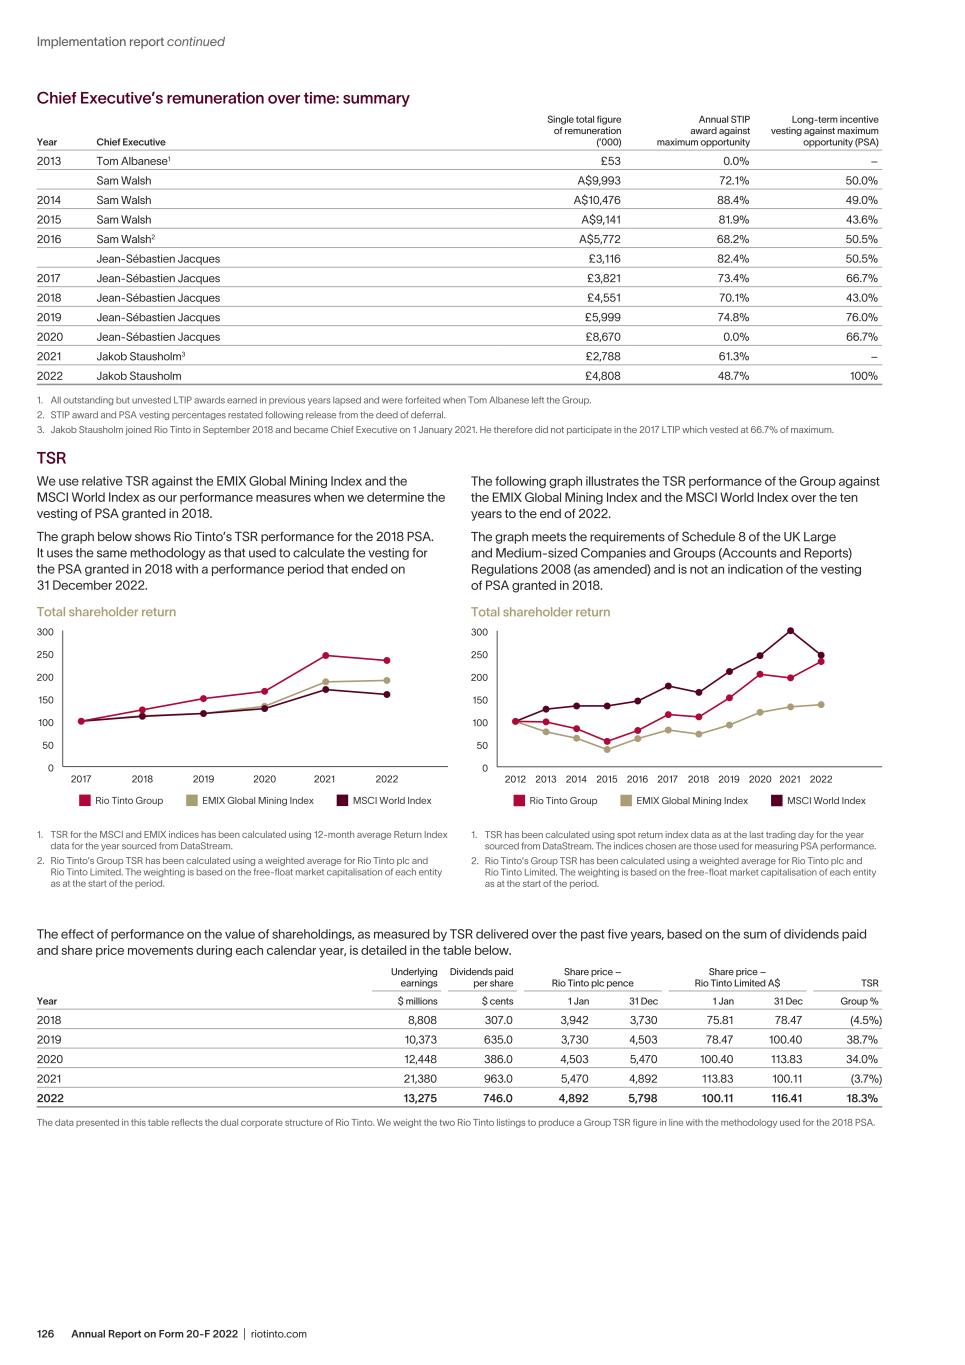
Annual Report on Form 20-F 2022 | riotinto.com126 Chief Executive’s remuneration over time: summary Year Chief Executive Single total figure of remuneration (’000) Annual STIP award against maximum opportunity Long-term incentive vesting against maximum opportunity (PSA) 2013 Tom Albanese1 £53 0.0% – Sam Walsh A$9,993 72.1% 50.0% 2014 Sam Walsh A$10,476 88.4% 49.0% 2015 Sam Walsh A$9,141 81.9% 43.6% 2016 Sam Walsh2 A$5,772 68.2% 50.5% Jean-Sébastien Jacques £3,116 82.4% 50.5% 2017 Jean-Sébastien Jacques £3,821 73.4% 66.7% 2018 Jean-Sébastien Jacques £4,551 70.1% 43.0% 2019 Jean-Sébastien Jacques £5,999 74.8% 76.0% 2020 Jean-Sébastien Jacques £8,670 0.0% 66.7% 2021 Jakob Stausholm3 £2,788 61.3% – 2022 Jakob Stausholm £4,808 48.7% 100% 1. All outstanding but unvested LTIP awards earned in previous years lapsed and were forfeited when Tom Albanese left the Group. 2. STIP award and PSA vesting percentages restated following release from the deed of deferral. 3. Jakob Stausholm joined Rio Tinto in September 2018 and became Chief Executive on 1 January 2021. He therefore did not participate in the 2017 LTIP which vested at 66.7% of maximum. TSR We use relative TSR against the EMIX Global Mining Index and the MSCI World Index as our performance measures when we determine the vesting of PSA granted in 2018. The graph below shows Rio Tinto’s TSR performance for the 2018 PSA. It uses the same methodology as that used to calculate the vesting for the PSA granted in 2018 with a performance period that ended on 31 December 2022. 0 50 100 150 200 250 300 2017 20222018 2019 2020 2021 Rio Tinto Group EMIX Global Mining Index MSCI World Index Total shareholder return 1. TSR for the MSCI and EMIX indices has been calculated using 12-month average Return Index data for the year sourced from DataStream. 2. Rio Tinto’s Group TSR has been calculated using a weighted average for Rio Tinto plc and Rio Tinto Limited. The weighting is based on the free-float market capitalisation of each entity as at the start of the period. The following graph illustrates the TSR performance of the Group against the EMIX Global Mining Index and the MSCI World Index over the ten years to the end of 2022. The graph meets the requirements of Schedule 8 of the UK Large and Medium-sized Companies and Groups (Accounts and Reports) Regulations 2008 (as amended) and is not an indication of the vesting of PSA granted in 2018. 0 50 100 150 200 250 300 2012 2019 2020 2021 2022201520142013 2016 2017 2018 Rio Tinto Group EMIX Global Mining Index MSCI World Index Total shareholder return 1. TSR has been calculated using spot return index data as at the last trading day for the year sourced from DataStream. The indices chosen are those used for measuring PSA performance. 2. Rio Tinto’s Group TSR has been calculated using a weighted average for Rio Tinto plc and Rio Tinto Limited. The weighting is based on the free-float market capitalisation of each entity as at the start of the period. Implementation report continued The effect of performance on the value of shareholdings, as measured by TSR delivered over the past five years, based on the sum of dividends paid and share price movements during each calendar year, is detailed in the table below. Year Underlying earnings Dividends paid per share Share price – Rio Tinto plc pence Share price – Rio Tinto Limited A$ TSR $ millions $ cents 1 Jan 31 Dec 1 Jan 31 Dec Group % 2018 8,808 307.0 3,942 3,730 75.81 78.47 (4.5%) 2019 10,373 635.0 3,730 4,503 78.47 100.40 38.7% 2020 12,448 386.0 4,503 5,470 100.40 113.83 34.0% 2021 21,380 963.0 5,470 4,892 113.83 100.11 (3.7%) 2022 13,275 746.0 4,892 5,798 100.11 116.41 18.3% The data presented in this table reflects the dual corporate structure of Rio Tinto. We weight the two Rio Tinto listings to produce a Group TSR figure in line with the methodology used for the 2018 PSA.
127Annual Report on Form 20-F 2022 | riotinto.com Directors’ report Other executive KMP This section sets out remuneration information pertaining to executive KMP excluding the Chief Executive and the Chief Financial Officer. The Remuneration Policy applicable to the Executive Directors is also applicable to the other executive KMP with variances specified in this section. The remuneration mix for other executive KMP under this Policy is set out in the chart below. Remuneration mix Assumptions The value of benefits is estimated at 11% of base salary. Performance-related (At risk) Target STIP and LTIP performance – STIP award of 50% of the maximum award (equates to 100% of base salary) – PSA expected value of 50% of face value, calculated as 200% of base salary Maximum STIP and LTIP performance – A maximum STIP award of 200% of base salary – Maximum PSA face value of 400% of base salary No assumption has been made for growth in share price and payment of dividend equivalents. The table below outlines the positions held by the other executive KMP and the respective dates of appointment: Name Position(s) held during 2022 Date of appointment to position Bold Baatar Chief Executive Copper 1 February 2021 Alfredo Barrios Chief Commercial Officer 1 March 2021 Sinead Kaufman Chief Executive Minerals 1 March 2021 Simon Trott Chief Executive Iron Ore 1 March 2021 Ivan Vella Chief Executive Aluminium 1 March 2021 Base salary Base salaries for Executive Committee members are reviewed annually by the Committee with increases generally aligned with the wider employee population in the relevant jurisdiction. Variations may occur in instances in which an individual has changed position, or the position’s duties and responsibilities have been enlarged for example as a result of a reorganisation or acquisition, or where an individual’s remuneration has fallen below comparable positions’ market remuneration. In recognition of the extraordinary inflationary pressures experienced globally in 2022, we provided a one-off mid-year salary adjustment to approximately 30,000 employees which ranged from 2% to 5% in our major countries. The Executive Committee did not receive this adjustment. Effective 1 March 2023, the Executive Committee will receive salary increases in line with the broader employee population in their jurisdictions. In addition, Bold Baatar and Simon Trott will receive an additional increase in recognition of market positioning within the limits of the Policy. STIP Overview of 2022 STIP weightings and measures The following table shows the measures and weightings used to determine STIP awards for executives in 2022. Weighting for Executive Directors and Group executives Weighting for PGCEs Financial measures split equally between underlying earnings and STIP free cash flow for the Group 50% 20% Financial measures split equally between underlying earnings and STIP free cash flow for the relevant product group 0% 30% ESG including safety 35% 35% Individual measures based on key strategic initiatives of each role and contribution to overall company performance 15% 15% The 2022 STIP awards are detailed in the table below. Percentage of: 2022 STIP award (% of salary) Adjusted 2022 STIP award (% of salary) 2022 STIP award (’000) Maximum STIP awarded Maximum STIP forfeited Bold Baatar 97.2% 97.2% £600 48.6% 51.4% Alfredo Barrios 88.4% 88.4% S$992 44.2% 55.8% Sinead Kaufman 98.6% 98.6% A$1,006 49.3% 50.7% Simon Trott 101.8% 101.8% A$1,100 50.9% 49.1% Ivan Vella 77.6% 77.6% C$776 38.8% 61.2% Maximum 17% 14% 14% 55% Target 29% 12% 12% 47% Fixed pay STIP – Cash STIP – BDA LTIP
Annual Report on Form 20-F 2022 | riotinto.com128 Share ownership The following table shows the share ownership level for other KMP as a multiple of base salary. Share ownership level at 31 December 2022 as a multiple of base salary Bold Baatar 7.8 Alfredo Barrios 5.9 Sinead Kaufman 4.9 Simon Trott 4.4 Ivan Vella 2.2 Share ownership level is calculated using the market price of Rio Tinto shares on 31 December 2022, and we define “share ownership” in our Remuneration Policy. Service contracts All executives have service contracts which can be terminated by the company with 12 months’ notice in writing, or by the employee with six months’ notice in writing, or immediately by the company by paying base salary only in lieu of any unexpired notice. Other KMP appointments All newly appointed executives have received a remuneration package that is aligned with our Remuneration Policy and is comprised of base salary in line with market benchmarks; target STIP opportunities of 100% of base salary (with maximum opportunities of 200% of base salary); LTIP awards of up to 400% of base salary; company pension contributions of 14% of base salary; and other benefits such as company-provided healthcare coverage, and continued eligibility to participate in the all-employee share plans. A minimum shareholding requirement of 300% of base salary applies on appointment to be built up over subsequent years. Executive departures No executives ceased employment in 2022. Broader employee disclosures Chief Executive pay ratio The ratio of the single total figure of remuneration for the Chief Executive to the lower quartile, median and upper quartile Rio Tinto Australian employee population for 2022 is set out in the table below. Lower quartile Median Upper quartile 2022 76 52 42 20211 49 32 26 1. 2021 pay ratio data has been restated based on actual pay outcomes for the CEO in 2021. The median CEO pay ratio of 52:1 is higher than last year, primarily due to the first vesting of Jakob’s LTIP award from 2018 which vested at the end of the 2022 performance year. The Committee continues to be mindful of the relationship between executive remuneration and that of our broader workforce. The Committee’s decision making will continue to be supported by regular and detailed reporting on these matters. As the company employs fewer than 250 employees in the UK, this analysis has been provided on a voluntary basis. Relative spend on remuneration The table below shows our relative spend on remuneration across our global employee population and distributions to shareholders in the year. We have also shown other significant disbursements of the company’s funds for comparison. Stated in US$m 2022 2021 Difference in spend Remuneration paid1 6,002 5,513 489 Distributions to shareholders2 11,727 15,357 (3,630) Purchase of property, plant and equipment and intangible assets3 6,750 7,384 (634) Corporate income tax paid3 6,909 8,494 (1,585) 1. Total employment costs for the financial year as per note 26 to the financial statements. 2. Distributions to shareholders include equity dividends paid to owners of Rio Tinto as per the Group cash flow statement. 3. Purchase of property, plant and equipment and intangible assets, and corporate income tax paid during the financial year are as per the Group cash flow statement. Implementation report continued
129Annual Report on Form 20-F 2022 | riotinto.com Directors’ report Change in Director and employee pay In the table below, we compare the changes annual from in salary, benefits and annual incentives of the Directors for the past two years, to that of the Australian employee population. The 2021 changes for Jakob Stausholm reflect his promotion to Chief Executive at the start of the 2021. 2019 to 2020 2020 to 2021 2021 to 2022 Percentage change in salary/ fees paid1 Percentage change in other benefits paid Percentage change in annual incentive Percentage change in salary/ fees paid1 Percentage change in other benefits paid Percentage change in annual incentive Percentage change in salary/ fees paid1 Percentage change in other benefits paid2 Percentage change in annual incentive3 Executive Directors Jakob Stausholm 2% 34% 29% 46% (19%) 25% 2% 94% (18%) Peter Cunningham – – – – – – – 18% 47% Non-Executive Directors Simon Thompson5,6 0% 3% – 0% 260% – 0% (32%) – Dominic Barton4 – – – – – – – – – Megan Clark 1% (54%) – (3%) (93%) – (1%) 1,651% – Hinda Gharbi5,6 – – – 0% 174% – – – – Simon Henry 3% (88%) – 0% 64% – (6%) 98% – Sam Laidlaw 8% (87%) – 0% (51%) – 0% 779% – Simon McKeon 9% (72%) – 15% (91%) – (6%) 1,487% – Jennifer Nason – – – 0% – – (6%) 58% – Ngaire Woods – – – 0% – – 0% 273% – Ben Wyatt6 – – – 0% – – 12% – – Australian workforce7 4% 5% 19% 4% 0% (18%) 7% 6% 15% 1. Change in salary and fees compared on an annualised basis to smooth the impact of part year appointments. 2. There was no change in the benefit entitlement for Directors in the year. The material percentage change figures in respect of the benefits for certain Non-Executive Directors reported in 2022 is a result of their reduced travel costs during 2021 in light of COVID 19. 3. The percentage change in annual incentive compares the incentive outcomes for the 2021 performance year to those for the 2022 performance year. 4. No prior year data as appointed as a Non-Executive Director in 2022. 5. Ceased as a Non-Executive Director in 2022. 6. Fees compared on an annualised basis. 7. Since Rio Tinto plc, the statutory entity for which this disclosure is required, does not have any employees, we have included voluntary disclosure of the change in employee pay for our Australian employees who make up more than 40% of our employee population. “–” in the table signifies no reported change as a result of the absence of comparable data. Annual fees payable The table below shows the annual fees paid in 2022 and payable in 2023 to the Chair and Non-Executive Directors. 2023 2022 Director fees Chair’s fee £730,000 £730,000 Non-Executive Director base fee £95,000 £95,000 Non-Executive Director base fee for Australian residents £105,000 £105,000 Senior Independent Director £45,000 £45,000 Committee fees Audit & Risk Committee Chair £40,000 £40,000 Audit & Risk Committee member £25,000 £25,000 People & Remuneration Committee Chair £35,000 £35,000 People & Remuneration Committee member £20,000 £20,000 Sustainability Committee Chair £35,000 £35,000 Sustainability Committee member £20,000 £20,000 Nominations Committee member £7,500 £7,500 Meeting allowances Long distance (flights over 10 hours per journey) £10,000 £10,000 Medium distance (flights of 5-10 hours per journey) £5,000 £5,000 The Chair’s fee is determined by the Committee and was last increased on 1 July 2013. All other fees are subject to review by the Board on the recommendation of the Chair’s Committee. The Chair’s Committee conducted a review of Non-Executive Director fees in November 2022. Following this review, it was determined that all fees and travel allowances should remain unchanged. The additional £10,000 allowance for eligible Australian Directors is to compensate them for additional UK National Insurance contributions which, unlike Directors based in other jurisdictions, they are not able to offset against their local tax payments. Non-Executive Directors What we paid our Chair and Non-Executive Directors Positions held We list the Non-Executive Directors who held office during 2022 below. Each held office for the whole of 2022 unless otherwise indicated. Their years of appointment are reported in “Board of Directors” on pages 90-91. Name Title Simon Thompson Chair (to 5 May 2022) Dominic Barton Chair (from 6 May 2022) Non-Executive Director (from 4 April 2022 to 5 May 2022) Megan Clark Non-Executive Director Hinda Gharbi Non-Executive Director (to 8 April 2022) Simon Henry Non-Executive Director Sam Laidlaw Non-Executive Director Simon McKeon Non-Executive Director Jennifer Nason Non-Executive Director Ngaire Woods Non-Executive Director Ben Wyatt Non-Executive Director Service contracts The Chair and Non-Executive Directors’ letters of appointment from the company stipulate their terms of appointment, including their duties and responsibilities as Directors. Each Non-Executive Director is appointed subject to their election and annual re-election by shareholders. The Chair’s appointment may be terminated by either party giving 12 months’ notice and Non-Executive Directors’ appointments may be terminated by either party giving three months’ notice.
Annual Report on Form 20-F 2022 | riotinto.com130 Other statutory disclosures Other share plans All-employee share plans The Committee believes that all employees should be given the opportunity to become shareholders in our business, and that share plans help engage, retain and motivate employees over the long term. Rio Tinto’s share plans are therefore part of its standard remuneration practice, to encourage employee share ownership and create alignment with the shareholder experience. Executives may participate in broad- based share plans that are available to Group employees generally and to which performance conditions do not apply. A global employee share purchase plan is normally offered to all eligible employees unless there are local jurisdictional restrictions. Under the plan, employees may acquire shares up to the value of $5,250 (or equivalent in other currencies) per year or capped at 15% of their base salary if lower. Each share purchased will be matched by the company, providing the participant holds the shares, and is still employed, at the end of the three-year vesting period. Approximately 30,000 (59%) of our employees are shareholders as a result of participating in these plans. In the UK, these arrangements are partially delivered through the UK Share Plan which is a UK tax approved arrangement. Under this plan, eligible participants may also receive an annual award of Free Shares up to the limits prescribed under UK tax legislation. Management Share Awards (MSA) The MSA are designed to help the Group attract the best staff in a competitive labour market, and to retain key individuals as we deliver our long-term strategy. MSA are conditional awards that are not subject to a performance condition. They vest at the end of three years subject to continued employment. Shares to satisfy the awards are bought in the market or re-issued from treasury. Executive Committee members are not eligible for the MSA after appointment. Shareholder voting In the table below, we set out the results of the remuneration-related resolutions voted on at the Group’s 2022 AGMs. Resolution Votes for Votes against Votes withheld1 Approval of the Directors’ Remuneration report: Implementation report 96% 4% 11,499,374 Approval of the Remuneration Policy (2021) 97% 3% 22,272,424 Approval of the Directors’ Remuneration report 96% 4% 12,359,627 1. A vote “withheld” is not a vote in law and is not counted in the calculation of the proportion of votes for and against the resolution. We set out details of each element of remuneration, and the single total figure of remuneration, paid to the Chair and Non-Executive Directors during 2022 and 2021 in US dollars in table 1b on page 132. No post-employment, termination or share-based payments were made. Statutory minimum superannuation contributions for Non-Executive Directors are deducted from the Director’s overall fee entitlements when these are required by Australian superannuation law. The total fee and allowance payments made to the Chair and Non-Executive Directors in 2022 are within the maximum aggregate annual amount of £3 million set out in the Group’s constitutional documents, approved by shareholders at the 2009 AGMs. Share ownership policy for Non-Executive Directors Rio Tinto has a policy that encourages Non-Executive Directors to build up a shareholding equal in value to one year’s base fee within three years of their appointment. Details of Non-Executive Directors’ share interests in the Group, including total holdings, are set out in table 2 on page 132. Non-Executive Directors’ share ownership The Non-Executive Directors’ shareholdings are calculated using the market price of Rio Tinto shares on 31 December 2022: Director Share ownership level at 31 December 2022 as a multiple of base fee Share ownership level at 31 December 2021 as a multiple of base fee Dominic Barton1 1.1 – Megan Clark 3.9 3.3 Simon Henry 0.9 0.8 Sam Laidlaw 4.6 3.9 Simon McKeon 6.8 5.2 Jennifer Nason 1.1 0.9 Ben Wyatt 0.2 – Ngaire Woods 0.3 0.3 1. Dominic Barton joined the Board on 4 April 2022. Implementation report continued
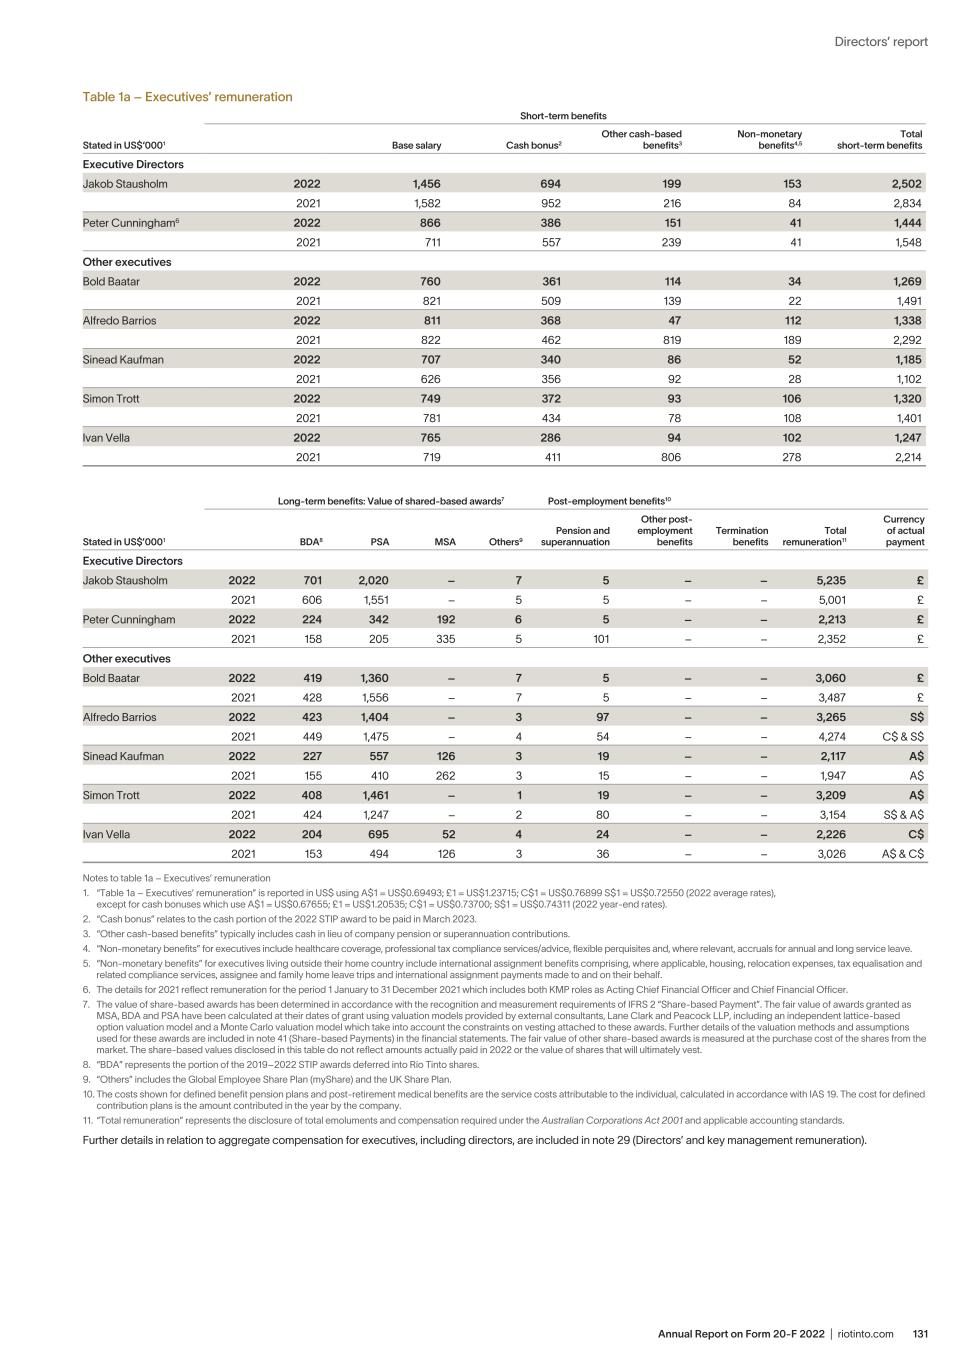
131Annual Report on Form 20-F 2022 | riotinto.com Directors’ report Table 1a – Executives’ remuneration Stated in US$‘0001 Short-term benefits Base salary Cash bonus2 Other cash-based benefits3 Non-monetary benefits4,5 Total short-term benefits Executive Directors Jakob Stausholm 2022 1,456 694 199 153 2,502 2021 1,582 952 216 84 2,834 Peter Cunningham6 2022 866 386 151 41 1,444 2021 711 557 239 41 1,548 Other executives Bold Baatar 2022 760 361 114 34 1,269 2021 821 509 139 22 1,491 Alfredo Barrios 2022 811 368 47 112 1,338 2021 822 462 819 189 2,292 Sinead Kaufman 2022 707 340 86 52 1,185 2021 626 356 92 28 1,102 Simon Trott 2022 749 372 93 106 1,320 2021 781 434 78 108 1,401 Ivan Vella 2022 765 286 94 102 1,247 2021 719 411 806 278 2,214 Stated in US$’0001 Long-term benefits: Value of shared-based awards7 Post-employment benefits10 BDA8 PSA MSA Others9 Pension and superannuation Other post- employment benefits Termination benefits Total remuneration11 Currency of actual payment Executive Directors Jakob Stausholm 2022 701 2,020 – 7 5 – – 5,235 £ 2021 606 1,551 – 5 5 – – 5,001 £ Peter Cunningham 2022 224 342 192 6 5 – – 2,213 £ 2021 158 205 335 5 101 – – 2,352 £ Other executives Bold Baatar 2022 419 1,360 – 7 5 – – 3,060 £ 2021 428 1,556 – 7 5 – – 3,487 £ Alfredo Barrios 2022 423 1,404 – 3 97 – – 3,265 S$ 2021 449 1,475 – 4 54 – – 4,274 C$ & S$ Sinead Kaufman 2022 227 557 126 3 19 – – 2,117 A$ 2021 155 410 262 3 15 – – 1,947 A$ Simon Trott 2022 408 1,461 – 1 19 – – 3,209 A$ 2021 424 1,247 – 2 80 – – 3,154 S$ & A$ Ivan Vella 2022 204 695 52 4 24 – – 2,226 C$ 2021 153 494 126 3 36 – – 3,026 A$ & C$ Notes to table 1a – Executives’ remuneration 1. “Table 1a – Executives’ remuneration” is reported in US$ using A$1 = US$0.69493; £1 = US$1.23715; C$1 = US$0.76899 S$1 = US$0.72550 (2022 average rates), except for cash bonuses which use A$1 = US$0.67655; £1 = US$1.20535; C$1 = US$0.73700; S$1 = US$0.74311 (2022 year-end rates). 2. “Cash bonus” relates to the cash portion of the 2022 STIP award to be paid in March 2023. 3. “Other cash-based benefits” typically includes cash in lieu of company pension or superannuation contributions. 4. “Non-monetary benefits” for executives include healthcare coverage, professional tax compliance services/advice, flexible perquisites and, where relevant, accruals for annual and long service leave. 5. “Non-monetary benefits” for executives living outside their home country include international assignment benefits comprising, where applicable, housing, relocation expenses, tax equalisation and related compliance services, assignee and family home leave trips and international assignment payments made to and on their behalf. 6. The details for 2021 reflect remuneration for the period 1 January to 31 December 2021 which includes both KMP roles as Acting Chief Financial Officer and Chief Financial Officer. 7. The value of share-based awards has been determined in accordance with the recognition and measurement requirements of IFRS 2 “Share-based Payment”. The fair value of awards granted as MSA, BDA and PSA have been calculated at their dates of grant using valuation models provided by external consultants, Lane Clark and Peacock LLP, including an independent lattice-based option valuation model and a Monte Carlo valuation model which take into account the constraints on vesting attached to these awards. Further details of the valuation methods and assumptions used for these awards are included in note 41 (Share-based Payments) in the financial statements. The fair value of other share-based awards is measured at the purchase cost of the shares from the market. The share-based values disclosed in this table do not reflect amounts actually paid in 2022 or the value of shares that will ultimately vest. 8. “BDA” represents the portion of the 2019–2022 STIP awards deferred into Rio Tinto shares. 9. “Others” includes the Global Employee Share Plan (myShare) and the UK Share Plan. 10. The costs shown for defined benefit pension plans and post-retirement medical benefits are the service costs attributable to the individual, calculated in accordance with IAS 19. The cost for defined contribution plans is the amount contributed in the year by the company. 11. “Total remuneration” represents the disclosure of total emoluments and compensation required under the Australian Corporations Act 2001 and applicable accounting standards. Further details in relation to aggregate compensation for executives, including directors, are included in note 29 (Directors’ and key management remuneration).
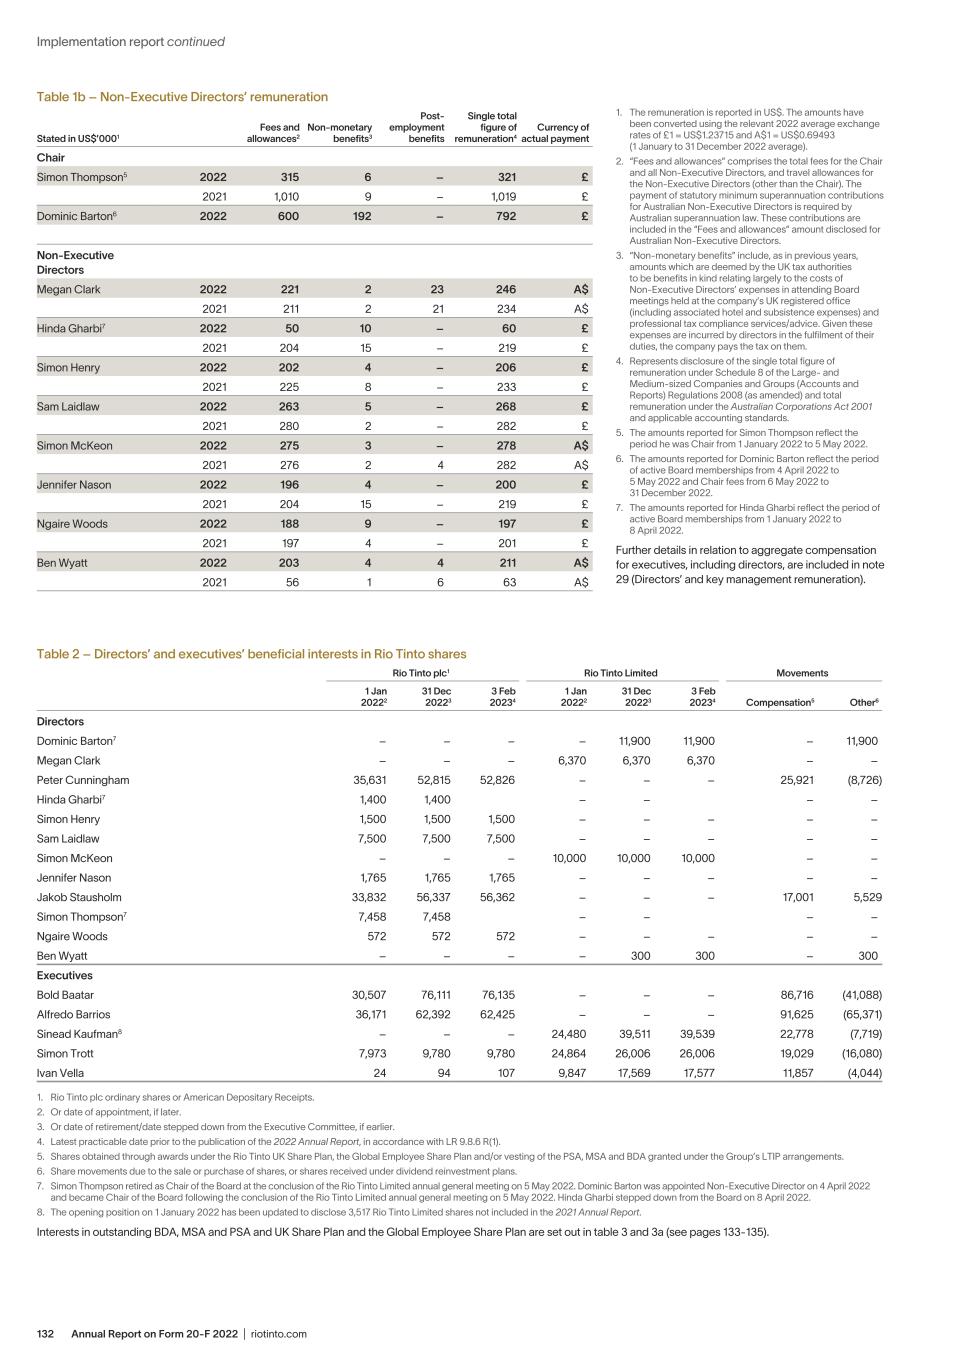
Annual Report on Form 20-F 2022 | riotinto.com132 Table 1b – Non-Executive Directors’ remuneration Stated in US$’0001 Fees and allowances2 Non-monetary benefits3 Post- employment benefits Single total figure of remuneration4 Currency of actual payment Chair Simon Thompson5 2022 315 6 – 321 £ 2021 1,010 9 – 1,019 £ Dominic Barton6 2022 600 192 – 792 £ Non-Executive Directors Megan Clark 2022 221 2 23 246 A$ 2021 211 2 21 234 A$ Hinda Gharbi7 2022 50 10 – 60 £ 2021 204 15 – 219 £ Simon Henry 2022 202 4 – 206 £ 2021 225 8 – 233 £ Sam Laidlaw 2022 263 5 – 268 £ 2021 280 2 – 282 £ Simon McKeon 2022 275 3 – 278 A$ 2021 276 2 4 282 A$ Jennifer Nason 2022 196 4 – 200 £ 2021 204 15 – 219 £ Ngaire Woods 2022 188 9 – 197 £ 2021 197 4 – 201 £ Ben Wyatt 2022 203 4 4 211 A$ 2021 56 1 6 63 A$ 1. The remuneration is reported in US$. The amounts have been converted using the relevant 2022 average exchange rates of £1 = US$1.23715 and A$1 = US$0.69493 (1 January to 31 December 2022 average). 2. “Fees and allowances” comprises the total fees for the Chair and all Non-Executive Directors, and travel allowances for the Non-Executive Directors (other than the Chair). The payment of statutory minimum superannuation contributions for Australian Non-Executive Directors is required by Australian superannuation law. These contributions are included in the “Fees and allowances” amount disclosed for Australian Non-Executive Directors. 3. “Non-monetary benefits” include, as in previous years, amounts which are deemed by the UK tax authorities to be benefits in kind relating largely to the costs of Non-Executive Directors’ expenses in attending Board meetings held at the company’s UK registered office (including associated hotel and subsistence expenses) and professional tax compliance services/advice. Given these expenses are incurred by directors in the fulfilment of their duties, the company pays the tax on them. 4. Represents disclosure of the single total figure of remuneration under Schedule 8 of the Large- and Medium-sized Companies and Groups (Accounts and Reports) Regulations 2008 (as amended) and total remuneration under the Australian Corporations Act 2001 and applicable accounting standards. 5. The amounts reported for Simon Thompson reflect the period he was Chair from 1 January 2022 to 5 May 2022. 6. The amounts reported for Dominic Barton reflect the period of active Board memberships from 4 April 2022 to 5 May 2022 and Chair fees from 6 May 2022 to 31 December 2022. 7. The amounts reported for Hinda Gharbi reflect the period of active Board memberships from 1 January 2022 to 8 April 2022. Further details in relation to aggregate compensation for executives, including directors, are included in note 29 (Directors’ and key management remuneration). Table 2 – Directors’ and executives’ beneficial interests in Rio Tinto shares Rio Tinto plc1 Rio Tinto Limited Movements 1 Jan 20222 31 Dec 20223 3 Feb 20234 1 Jan 20222 31 Dec 20223 3 Feb 20234 Compensation5 Other6 Directors Dominic Barton7 – – – – 11,900 11,900 – 11,900 Megan Clark – – – 6,370 6,370 6,370 – – Peter Cunningham 35,631 52,815 52,826 – – – 25,921 (8,726) Hinda Gharbi7 1,400 1,400 – – – – Simon Henry 1,500 1,500 1,500 – – – – – Sam Laidlaw 7,500 7,500 7,500 – – – – – Simon McKeon – – – 10,000 10,000 10,000 – – Jennifer Nason 1,765 1,765 1,765 – – – – – Jakob Stausholm 33,832 56,337 56,362 – – – 17,001 5,529 Simon Thompson7 7,458 7,458 – – – – Ngaire Woods 572 572 572 – – – – – Ben Wyatt – – – – 300 300 – 300 Executives Bold Baatar 30,507 76,111 76,135 – – – 86,716 (41,088) Alfredo Barrios 36,171 62,392 62,425 – – – 91,625 (65,371) Sinead Kaufman8 – – – 24,480 39,511 39,539 22,778 (7,719) Simon Trott 7,973 9,780 9,780 24,864 26,006 26,006 19,029 (16,080) Ivan Vella 24 94 107 9,847 17,569 17,577 11,857 (4,044) 1. Rio Tinto plc ordinary shares or American Depositary Receipts. 2. Or date of appointment, if later. 3. Or date of retirement/date stepped down from the Executive Committee, if earlier. 4. Latest practicable date prior to the publication of the 2022 Annual Report, in accordance with LR 9.8.6 R(1). 5. Shares obtained through awards under the Rio Tinto UK Share Plan, the Global Employee Share Plan and/or vesting of the PSA, MSA and BDA granted under the Group’s LTIP arrangements. 6. Share movements due to the sale or purchase of shares, or shares received under dividend reinvestment plans. 7. Simon Thompson retired as Chair of the Board at the conclusion of the Rio Tinto Limited annual general meeting on 5 May 2022. Dominic Barton was appointed Non-Executive Director on 4 April 2022 and became Chair of the Board following the conclusion of the Rio Tinto Limited annual general meeting on 5 May 2022. Hinda Gharbi stepped down from the Board on 8 April 2022. 8. The opening position on 1 January 2022 has been updated to disclose 3,517 Rio Tinto Limited shares not included in the 2021 Annual Report. Interests in outstanding BDA, MSA and PSA and UK Share Plan and the Global Employee Share Plan are set out in table 3 and 3a (see pages 133-135). Implementation report continued
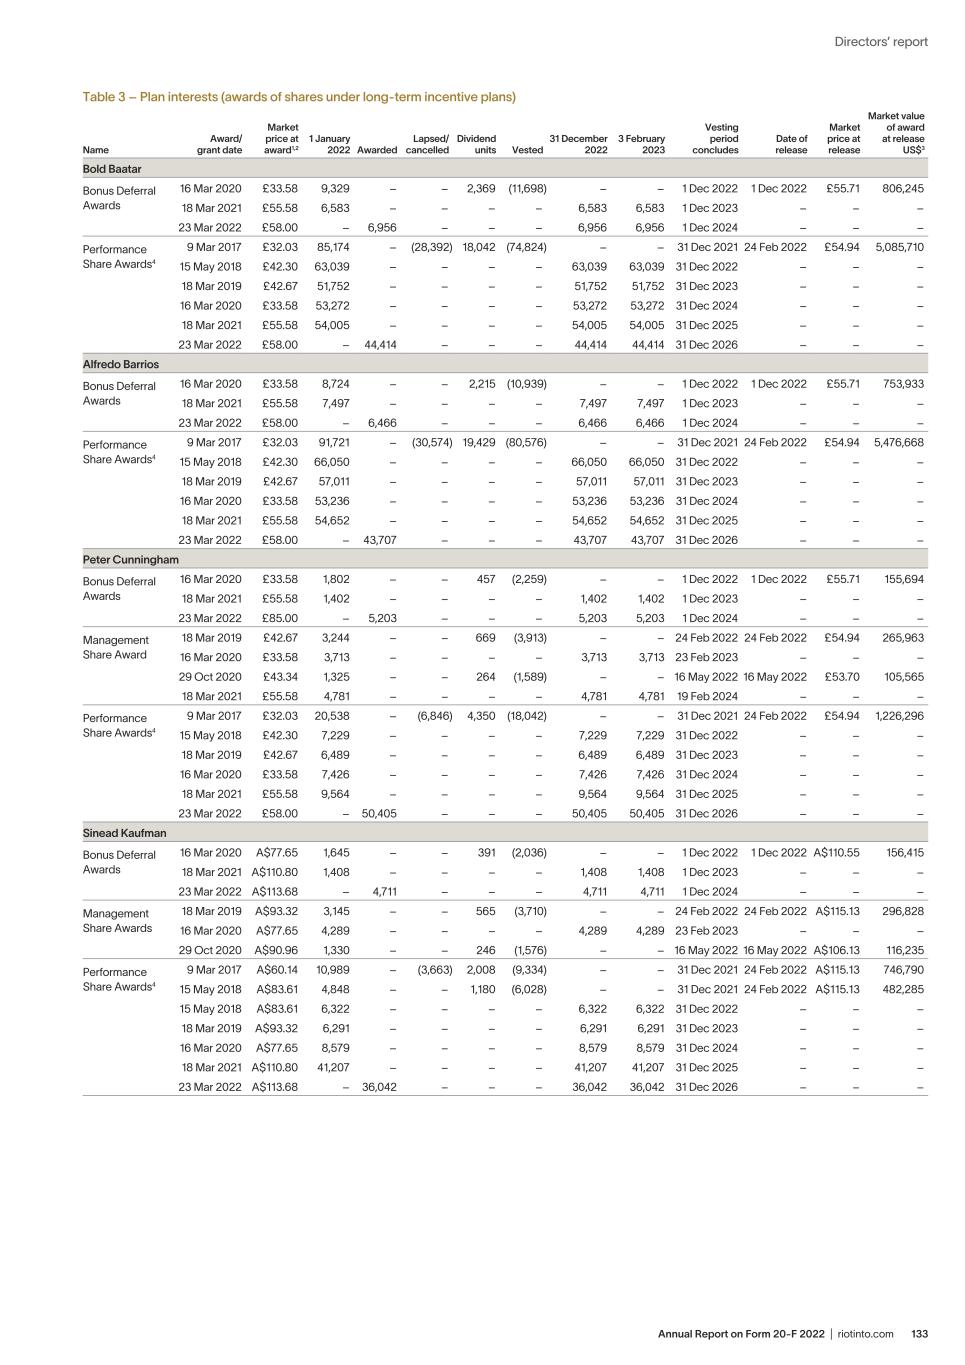
133Annual Report on Form 20-F 2022 | riotinto.com Directors’ report Table 3 – Plan interests (awards of shares under long-term incentive plans) Name Award/ grant date Market price at award1,2 1 January 2022 Awarded Lapsed/ cancelled Dividend units Vested 31 December 2022 3 February 2023 Vesting period concludes Date of release Market price at release Market value of award at release US$3 Bold Baatar Bonus Deferral Awards 16 Mar 2020 £33.58 9,329 – – 2,369 (11,698) – – 1 Dec 2022 1 Dec 2022 £55.71 806,245 18 Mar 2021 £55.58 6,583 – – – – 6,583 6,583 1 Dec 2023 – – – 23 Mar 2022 £58.00 – 6,956 – – – 6,956 6,956 1 Dec 2024 – – – Performance Share Awards4 9 Mar 2017 £32.03 85,174 – (28,392) 18,042 (74,824) – – 31 Dec 2021 24 Feb 2022 £54.94 5,085,710 15 May 2018 £42.30 63,039 – – – – 63,039 63,039 31 Dec 2022 – – – 18 Mar 2019 £42.67 51,752 – – – – 51,752 51,752 31 Dec 2023 – – – 16 Mar 2020 £33.58 53,272 – – – – 53,272 53,272 31 Dec 2024 – – – 18 Mar 2021 £55.58 54,005 – – – – 54,005 54,005 31 Dec 2025 – – – 23 Mar 2022 £58.00 – 44,414 – – – 44,414 44,414 31 Dec 2026 – – – Alfredo Barrios Bonus Deferral Awards 16 Mar 2020 £33.58 8,724 – – 2,215 (10,939) – – 1 Dec 2022 1 Dec 2022 £55.71 753,933 18 Mar 2021 £55.58 7,497 – – – – 7,497 7,497 1 Dec 2023 – – – 23 Mar 2022 £58.00 – 6,466 – – – 6,466 6,466 1 Dec 2024 – – – Performance Share Awards4 9 Mar 2017 £32.03 91,721 – (30,574) 19,429 (80,576) – – 31 Dec 2021 24 Feb 2022 £54.94 5,476,668 15 May 2018 £42.30 66,050 – – – – 66,050 66,050 31 Dec 2022 – – – 18 Mar 2019 £42.67 57,011 – – – – 57,011 57,011 31 Dec 2023 – – – 16 Mar 2020 £33.58 53,236 – – – – 53,236 53,236 31 Dec 2024 – – – 18 Mar 2021 £55.58 54,652 – – – – 54,652 54,652 31 Dec 2025 – – – 23 Mar 2022 £58.00 – 43,707 – – – 43,707 43,707 31 Dec 2026 – – – Peter Cunningham Bonus Deferral Awards 16 Mar 2020 £33.58 1,802 – – 457 (2,259) – – 1 Dec 2022 1 Dec 2022 £55.71 155,694 18 Mar 2021 £55.58 1,402 – – – – 1,402 1,402 1 Dec 2023 – – – 23 Mar 2022 £85.00 – 5,203 – – – 5,203 5,203 1 Dec 2024 – – – Management Share Award 18 Mar 2019 £42.67 3,244 – – 669 (3,913) – – 24 Feb 2022 24 Feb 2022 £54.94 265,963 16 Mar 2020 £33.58 3,713 – – – – 3,713 3,713 23 Feb 2023 – – – 29 Oct 2020 £43.34 1,325 – – 264 (1,589) – – 16 May 2022 16 May 2022 £53.70 105,565 18 Mar 2021 £55.58 4,781 – – – – 4,781 4,781 19 Feb 2024 – – – Performance Share Awards4 9 Mar 2017 £32.03 20,538 – (6,846) 4,350 (18,042) – – 31 Dec 2021 24 Feb 2022 £54.94 1,226,296 15 May 2018 £42.30 7,229 – – – – 7,229 7,229 31 Dec 2022 – – – 18 Mar 2019 £42.67 6,489 – – – – 6,489 6,489 31 Dec 2023 – – – 16 Mar 2020 £33.58 7,426 – – – – 7,426 7,426 31 Dec 2024 – – – 18 Mar 2021 £55.58 9,564 – – – – 9,564 9,564 31 Dec 2025 – – – 23 Mar 2022 £58.00 – 50,405 – – – 50,405 50,405 31 Dec 2026 – – – Sinead Kaufman Bonus Deferral Awards 16 Mar 2020 A$77.65 1,645 – – 391 (2,036) – – 1 Dec 2022 1 Dec 2022 A$110.55 156,415 18 Mar 2021 A$110.80 1,408 – – – – 1,408 1,408 1 Dec 2023 – – – 23 Mar 2022 A$113.68 – 4,711 – – – 4,711 4,711 1 Dec 2024 – – – Management Share Awards 18 Mar 2019 A$93.32 3,145 – – 565 (3,710) – – 24 Feb 2022 24 Feb 2022 A$115.13 296,828 16 Mar 2020 A$77.65 4,289 – – – – 4,289 4,289 23 Feb 2023 – – – 29 Oct 2020 A$90.96 1,330 – – 246 (1,576) – – 16 May 2022 16 May 2022 A$106.13 116,235 Performance Share Awards4 9 Mar 2017 A$60.14 10,989 – (3,663) 2,008 (9,334) – – 31 Dec 2021 24 Feb 2022 A$115.13 746,790 15 May 2018 A$83.61 4,848 – – 1,180 (6,028) – – 31 Dec 2021 24 Feb 2022 A$115.13 482,285 15 May 2018 A$83.61 6,322 – – – – 6,322 6,322 31 Dec 2022 – – – 18 Mar 2019 A$93.32 6,291 – – – – 6,291 6,291 31 Dec 2023 – – – 16 Mar 2020 A$77.65 8,579 – – – – 8,579 8,579 31 Dec 2024 – – – 18 Mar 2021 A$110.80 41,207 – – – – 41,207 41,207 31 Dec 2025 – – – 23 Mar 2022 A$113.68 – 36,042 – – – 36,042 36,042 31 Dec 2026 – – –
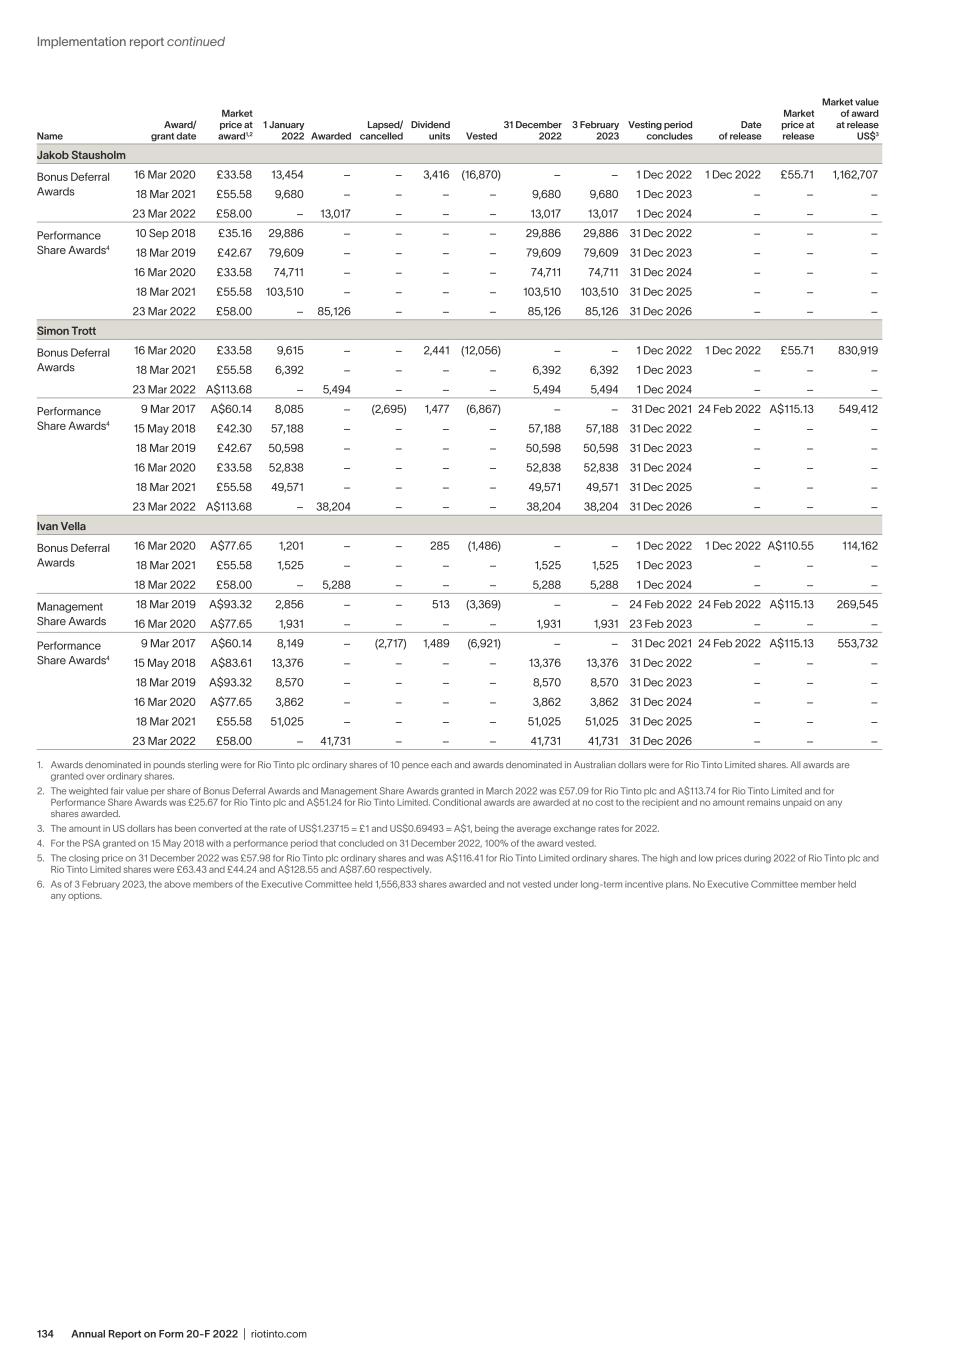
Annual Report on Form 20-F 2022 | riotinto.com134 Name Award/ grant date Market price at award1,2 1 January 2022 Awarded Lapsed/ cancelled Dividend units Vested 31 December 2022 3 February 2023 Vesting period concludes Date of release Market price at release Market value of award at release US$3 Jakob Stausholm Bonus Deferral Awards 16 Mar 2020 £33.58 13,454 – – 3,416 (16,870) – – 1 Dec 2022 1 Dec 2022 £55.71 1,162,707 18 Mar 2021 £55.58 9,680 – – – – 9,680 9,680 1 Dec 2023 – – – 23 Mar 2022 £58.00 – 13,017 – – – 13,017 13,017 1 Dec 2024 – – – Performance Share Awards4 10 Sep 2018 £35.16 29,886 – – – – 29,886 29,886 31 Dec 2022 – – – 18 Mar 2019 £42.67 79,609 – – – – 79,609 79,609 31 Dec 2023 – – – 16 Mar 2020 £33.58 74,711 – – – – 74,711 74,711 31 Dec 2024 – – – 18 Mar 2021 £55.58 103,510 – – – – 103,510 103,510 31 Dec 2025 – – – 23 Mar 2022 £58.00 – 85,126 – – – 85,126 85,126 31 Dec 2026 – – – Simon Trott Bonus Deferral Awards 16 Mar 2020 £33.58 9,615 – – 2,441 (12,056) – – 1 Dec 2022 1 Dec 2022 £55.71 830,919 18 Mar 2021 £55.58 6,392 – – – – 6,392 6,392 1 Dec 2023 – – – 23 Mar 2022 A$113.68 – 5,494 – – – 5,494 5,494 1 Dec 2024 – – – Performance Share Awards4 9 Mar 2017 A$60.14 8,085 – (2,695) 1,477 (6,867) – – 31 Dec 2021 24 Feb 2022 A$115.13 549,412 15 May 2018 £42.30 57,188 – – – – 57,188 57,188 31 Dec 2022 – – – 18 Mar 2019 £42.67 50,598 – – – – 50,598 50,598 31 Dec 2023 – – – 16 Mar 2020 £33.58 52,838 – – – – 52,838 52,838 31 Dec 2024 – – – 18 Mar 2021 £55.58 49,571 – – – – 49,571 49,571 31 Dec 2025 – – – 23 Mar 2022 A$113.68 – 38,204 – – – 38,204 38,204 31 Dec 2026 – – – Ivan Vella Bonus Deferral Awards 16 Mar 2020 A$77.65 1,201 – – 285 (1,486) – – 1 Dec 2022 1 Dec 2022 A$110.55 114,162 18 Mar 2021 £55.58 1,525 – – – – 1,525 1,525 1 Dec 2023 – – – 18 Mar 2022 £58.00 – 5,288 – – – 5,288 5,288 1 Dec 2024 – – – Management Share Awards 18 Mar 2019 A$93.32 2,856 – – 513 (3,369) – – 24 Feb 2022 24 Feb 2022 A$115.13 269,545 16 Mar 2020 A$77.65 1,931 – – – – 1,931 1,931 23 Feb 2023 – – – Performance Share Awards4 9 Mar 2017 A$60.14 8,149 – (2,717) 1,489 (6,921) – – 31 Dec 2021 24 Feb 2022 A$115.13 553,732 15 May 2018 A$83.61 13,376 – – – – 13,376 13,376 31 Dec 2022 – – – 18 Mar 2019 A$93.32 8,570 – – – – 8,570 8,570 31 Dec 2023 – – – 16 Mar 2020 A$77.65 3,862 – – – – 3,862 3,862 31 Dec 2024 – – – 18 Mar 2021 £55.58 51,025 – – – – 51,025 51,025 31 Dec 2025 – – – 23 Mar 2022 £58.00 – 41,731 – – – 41,731 41,731 31 Dec 2026 – – – 1. Awards denominated in pounds sterling were for Rio Tinto plc ordinary shares of 10 pence each and awards denominated in Australian dollars were for Rio Tinto Limited shares. All awards are granted over ordinary shares. 2. The weighted fair value per share of Bonus Deferral Awards and Management Share Awards granted in March 2022 was £57.09 for Rio Tinto plc and A$113.74 for Rio Tinto Limited and for Performance Share Awards was £25.67 for Rio Tinto plc and A$51.24 for Rio Tinto Limited. Conditional awards are awarded at no cost to the recipient and no amount remains unpaid on any shares awarded. 3. The amount in US dollars has been converted at the rate of US$1.23715 = £1 and US$0.69493 = A$1, being the average exchange rates for 2022. 4. For the PSA granted on 15 May 2018 with a performance period that concluded on 31 December 2022, 100% of the award vested. 5. The closing price on 31 December 2022 was £57.98 for Rio Tinto plc ordinary shares and was A$116.41 for Rio Tinto Limited ordinary shares. The high and low prices during 2022 of Rio Tinto plc and Rio Tinto Limited shares were £63.43 and £44.24 and A$128.55 and A$87.60 respectively. 6. As of 3 February 2023, the above members of the Executive Committee held 1,556,833 shares awarded and not vested under long-term incentive plans. No Executive Committee member held any options. Implementation report continued
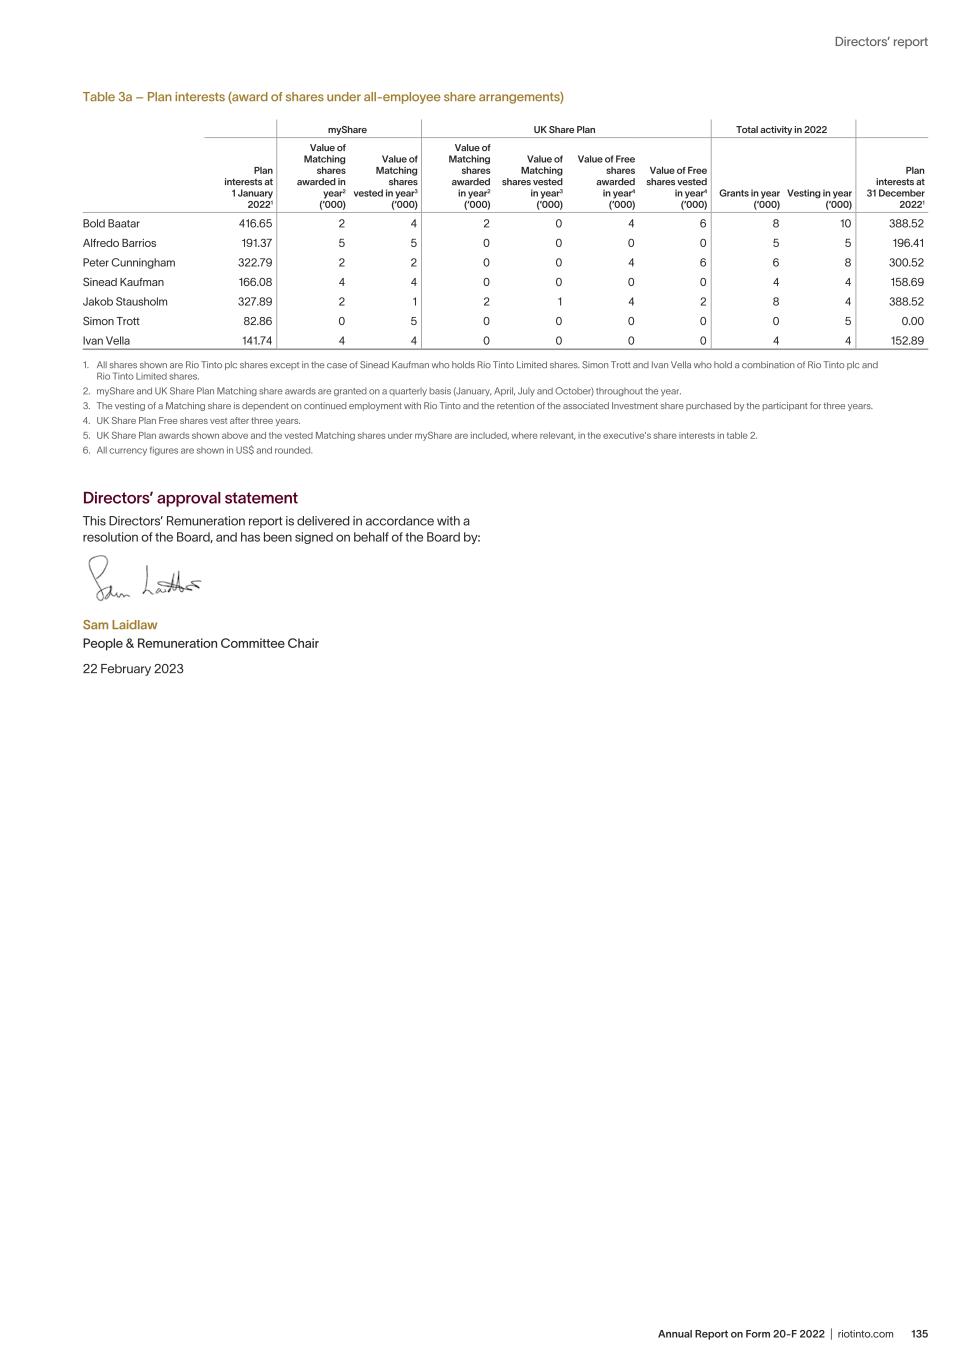
135Annual Report on Form 20-F 2022 | riotinto.com Directors’ report Table 3a – Plan interests (award of shares under all-employee share arrangements) myShare UK Share Plan Total activity in 2022 Plan interests at 1 January 20221 Value of Matching shares awarded in year2 (‘000) Value of Matching shares vested in year3 (‘000) Value of Matching shares awarded in year2 (‘000) Value of Matching shares vested in year3 (‘000) Value of Free shares awarded in year4 (‘000) Value of Free shares vested in year4 (‘000) Grants in year (‘000) Vesting in year (‘000) Plan interests at 31 December 20221 Bold Baatar 416.65 2 4 2 0 4 6 8 10 388.52 Alfredo Barrios 191.37 5 5 0 0 0 0 5 5 196.41 Peter Cunningham 322.79 2 2 0 0 4 6 6 8 300.52 Sinead Kaufman 166.08 4 4 0 0 0 0 4 4 158.69 Jakob Stausholm 327.89 2 1 2 1 4 2 8 4 388.52 Simon Trott 82.86 0 5 0 0 0 0 0 5 0.00 Ivan Vella 141.74 4 4 0 0 0 0 4 4 152.89 1. All shares shown are Rio Tinto plc shares except in the case of Sinead Kaufman who holds Rio Tinto Limited shares. Simon Trott and Ivan Vella who hold a combination of Rio Tinto plc and Rio Tinto Limited shares. 2. myShare and UK Share Plan Matching share awards are granted on a quarterly basis (January, April, July and October) throughout the year. 3. The vesting of a Matching share is dependent on continued employment with Rio Tinto and the retention of the associated Investment share purchased by the participant for three years. 4. UK Share Plan Free shares vest after three years. 5. UK Share Plan awards shown above and the vested Matching shares under myShare are included, where relevant, in the executive’s share interests in table 2. 6. All currency figures are shown in US$ and rounded. Directors’ approval statement This Directors’ Remuneration report is delivered in accordance with a resolution of the Board, and has been signed on behalf of the Board by: Sam Laidlaw People & Remuneration Committee Chair 22 February 2023
Annual Report on Form 20-F 2022 | riotinto.com136 Additional statutory disclosure The Directors present their report and audited consolidated financial statements for the year ended 31 December 2022. Scope of this report For the purposes of UK company law and the Australian Corporations Act 2001: – The additional disclosures under the heading ”Shareholder information” on pages 338-347 are hereby incorporated by reference to, and form part of, this Directors’ report. – The Strategic report on pages 1-87 provides a comprehensive review of Rio Tinto’s operations, its financial position and its business strategies and prospects, and is incorporated by reference into, and forms part of, this Directors’ report. – Certain items that would ordinarily need to be included in this Directors’ report (including an indication of likely future developments in the business of the company and the Group) have, as permitted, instead been discussed in the Strategic report, while details of the Group’s policy on addressing financial risks and details about financial instruments are shown in note 24 to the Group financial statements. – Taken together, the Strategic report and this Directors’ report are intended to provide a fair, balanced and understandable assessment of: the development and performance of the Group’s business during the year and its position at the end of the year; its strategy; likely developments; and any material or emerging risks and uncertainties associated with the Group’s business. For the purposes of compliance with DTR 4.1.5R(2) and DTR 4.1.8R, the required content of the “Management report” can be found in the Strategic report or this Directors’ report, including the material incorporated by reference. A full report on Director and executive remuneration and shareholdings can be found in the Remuneration report on pages 110-135, which, for the purposes of the Australian Corporations Act 2001, forms part of this Directors’ report. Dual listed structure and constitutional documents The dual listed companies (DLC) structure of Rio Tinto plc and Rio Tinto Limited, and their constitutional provisions and voting arrangements – including restrictions that may apply to the shares of either company under specified circumstances – are described on pages 338-339. Operating and financial review Rio Tinto’s principal activities during 2022 were mining minerals and metals throughout the lifecycle from exploration, development, mining and processing, marketing, and repurposing and renewing our assets to create a positive legacy. Subsidiary and associated undertakings, principally affecting the profits or net assets of the Group in the year, are listed in notes 30-32 to the financial statements. The following significant changes and events affected the Group during 2022 and up to the date of this report: – In January 2022, the Government of Serbia cancelled the Spatial Plan for the Jadar project and required all related permits to be revoked. – In January 2022, we announced that we had reached an agreement with Turquoise Hill Resources Ltd (TRQ) and the Government of Mongolia that would move the Oyu Tolgoi project forward, resetting the relationship between the partners and increasing the value the project delivers for Mongolia. Following this, we fired the first and second drawbells from the Hugo North copper-gold underground mine at Oyu Tolgoi in Mongolia. – In February 2022, we published a comprehensive external review of our workplace culture, part of the work being undertaken by Rio Tinto’s Everyday Respect task force launched to better understand, prevent and respond to harmful behaviours. – In February 2022, we announced that we were reviewing the preliminary findings that Energy Resources of Australia Ltd released from its forecast of the cost and schedule for the Ranger rehabilitation project in Australia’s Northern Territory, which have been subject to independent review. – In February 2022, we announced an agreement with the Yinhawangka Aboriginal Corporation on a new co-designed management plan to ensure the protection of significant social and cultural heritage values. This is part of our proposed development of the Western Range iron ore project in the Pilbara region of Western Australia. – In February 2022, we released our 2021 Climate Change Report, including our Climate Action Plan, to the Australian Securities Exchange. – In February 2022, we announced changes to the estimates of Ore Reserves and Mineral Resources at our Winu project in Western Australia; at our aluminium operations at Weipa; and our Jadar project in Serbia. – In February 2022, we announced that Hinda Gharbi had notified the Board of her intention to step down as a Non-Executive Director of Rio Tinto at the conclusion of the Rio Tinto plc AGM on 8 April 2022. – In March 2022, we announced that we had reached a settlement with the Australian Securities and Investment Commission (ASIC) regarding the disclosure of the impairment of Rio Tinto Coal Mozambique (RTCM), which was reflected in Rio Tinto’s 2012 year-end accounts. – In March 2022, we announced that we had made a non-binding all-cash proposal to the TRQ Board to acquire the approximately 49% of the issued and outstanding shares of TRQ that we did not then own. – In March 2022, we announced the lifting of force majeure on customer contracts at Richards Bay Minerals in South Africa. Force majeure commenced on 30 June 2021 following a deterioration in the security situation. – In March 2022, we announced that we had completed the acquisition of the Rincon Lithium Project in Argentina for $825 million, following approval from Australia’s Foreign Investment Review Board (FIRB). Consequently, the Board approved $194 million to develop a small starter battery-grade lithium carbonate plant with a capacity of 3,000 tonnes per year and first saleable production in 2024. – In May 2022, we signed an amendment of the previously agreed funding plan with TRQ (9 April 2021) in order to provide liquidity of up to $400 million in short-term early advances, while the Special Committee of TRQ evaluated Rio Tinto’s C$34 per share all-cash proposal to acquire the approximately 49% of the issued and outstanding shares of TRQ that Rio Tinto did not then own. – In May 2022, we signed a Heads of Agreement with the Puutu Kunti Kurrama and Pinikura (PKKP) people that will guide the co-management of PKKP country where mining takes place.
137Annual Report on Form 20-F 2022 | riotinto.com Directors’ report – In May 2022, we announced that we had published our report on payments to governments made by Rio Tinto plc and its subsidiary undertakings for the year ended 31 December 2021, as required under the UK’s Report on Payments to Governments Regulations 2014 (as amended in December 2015), and it had been filed at Companies House. We paid US$13.3 billion of taxes and royalties and a further US$1.5 billion on behalf of our employees during 2021. – In June 2022, we announced that we had delivered first ore from the Gudai-Darri iron ore mine as the company brought online its first greenfield mine in the Pilbara, Western Australia, in more than a decade. Gudai-Darri will help underpin future production of our flagship Pilbara Blend™ product. – In July 2022, we announced that agreement had been reached with the Australian Taxation Office (ATO) on all tax matters in dispute. – In July 2022, we announced that the Government of the Republic of Guinea, Winning Consortium Simandou (WCS) and Rio Tinto Simfer had incorporated La Compagnie du TransGuinéen (The TransGuinean Company) to further progress plans to co-develop the multi-purpose and multi-user infrastructure for the Simandou iron ore project. – In August 2022, we announced that we had completed the sale of a royalty we hold on an area including the Cortez mine operational area and the Fourmile development project in Nevada to RG Royalties LLC, a direct wholly-owned subsidiary of Royal Gold Inc., for $525 million in cash. – In August 2022, we noted, with disappointment, the TRQ announcement that indicated that the TRQ Special Committee had terminated its review of Rio Tinto’s non-binding proposal to acquire full ownership of TRQ for C$34 in cash per TRQ share. – In August 2022, we announced that we had submitted an improved non-binding proposal of C$40 per share to the TRQ Board to acquire the approximately 49% of the issued and outstanding shares of TRQ that we did not then own. – In September 2022, we announced that we and TRQ Resources Ltd had reached an agreement in principle for Rio Tinto to acquire the approximately 49% of the issued and outstanding common shares of TRQ that we did not then own for C$43 per share in cash. The agreement had the unanimous approval of the independent Special Committee of TRQ’s Board of Directors and valued the TRQ minority share capital at approximately US$3.3 billion. – In September 2022, we announced that we had entered into a binding agreement to acquire all of the remaining shares of TRQ that we did not then own. – In September 2022, we announced that we (54%) and China Baowu Steel Group Co. Ltd (Baowu) (46%) had agreed to enter into a joint venture with respect to the Western Range iron ore project in the Pilbara, Western Australia, investing $2 billion ($1.3 billion Rio Tinto share) to develop the mine. – In September 2022, we announced that we had approved a $55 million investment in development capital to start underground mining and expand production at our Kennecott copper operations in Utah, US. – In October 2022, we announced that we had published our second progress report on Communities and Social Performance (CSP) practices, which included direct feedback from Traditional Owners and detailed the actions the company has taken to rebuild relationships with Indigenous peoples and external stakeholders. – In October 2022, we announced that we (50%) and Wright Prospecting Pty Ltd (50%) had agreed to modernise the joint venture covering the Rhodes Ridge project in the East Pilbara in Western Australia, home to one of the world’s largest and highest quality undeveloped iron ore deposits. – In November 2022, we reached agreement with certain shareholders of TRQ. Under the agreement, the shareholders agreed to withhold their votes at the TRQ Special Meeting and exercise their dissent rights in respect of our acquisition by plan of arrangement. The shareholders were to be paid C$34.40 of the consideration following completion of the acquisition. – In November 2022, we signed an updated agreement with Yindjibarndi Aboriginal Corporation aimed at strengthening ties and delivering improved social and economic outcomes for Yindjibarndi people for generations to come. – In November 2022, we and the PKKP Aboriginal Corporation agreed to create the Juukan Gorge Legacy Foundation after signing a remedy agreement regarding the tragic destruction of two ancient rock shelters at Juukan Gorge in the Pilbara region of Western Australia in 2020. – In November 2022, we declared our intent to invest a further $600 million in renewable energy assets in the Pilbara as part of the company’s efforts to decarbonise its Western Australian iron ore operations. – In December 2022, we announced that we had received the required support from TRQ shareholders for our proposed acquisition of the approximately 49% of the issued and outstanding shares of TRQ that we did not then own. We subsequently announced the completion of the acquisition for a consideration of approximately $3.1 billion. – In December 2022, we announced the appointment of Kaisa Hietala to the Board as a Non-Executive Director. Ms Hietala, a Finnish citizen, will join the Board on 1 March 2023. In 2022 and 2021, the Group did not receive any public takeover offers from third parties in respect of Rio Tinto plc shares or Rio Tinto Limited shares. In 2022, Rio Tinto made, had accepted and completed a takeover offer for all of the remaining shares of TRQ that we did not own. Details regarding the offer, including the price, exchange terms and closing date, are disclosed above. Details of events that took place after the balance sheet date are further described in note 39 to the financial statements. Risk identification, assessment and management The Group’s risk factors are listed on pages 79-86. The Group’s approach to risk management is discussed on pages 76-78. Share capital Details of the Group’s share capital as at 31 December 2022 are described in note 34 to the financial statements. Details of the rights and obligations attached to each class of shares are covered on pages 338-339, under the heading “Voting arrangements”. In situations where an employee share plan is operated by the company and plan participants are the beneficial owners of shares but not the registered owners, voting rights are normally exercised by the registered owner at the direction of the participant. Details of certain restrictions on holding shares in Rio Tinto and certain consequences triggered by a change of control are described on page 339 under the heading “Limitations on ownership of shares and merger obligations”. There are no other restrictions on the transfer of ordinary Rio Tinto shares, save for: – Restrictions that may from time to time be imposed by laws, regulations or Rio Tinto policy (for example, relating to market abuse, insider dealing, share trading or an Australian foreign investment). – Restrictions on the transfer of shares that may be imposed following a failure to supply information required to be disclosed, or where registration of the transfer may breach a court order or a law, or in relation to unmarketable parcels of shares. – Restrictions on the transfer of shares held under certain employee share plans while they remain subject to the plan.
Annual Report on Form 20-F 2022 | riotinto.com138 At the AGMs held in 2022, shareholders authorised: – The on-market purchase by Rio Tinto plc or Rio Tinto Limited or its subsidiaries of up to 124,921,573 Rio Tinto plc shares (representing approximately 10% of Rio Tinto plc’s issued share capital, excluding Rio Tinto plc shares held in Treasury at that time). – The off-market purchase by Rio Tinto plc of up to 124,921,573 Rio Tinto plc shares acquired by Rio Tinto Limited or its subsidiaries under the above authority. – The off-market and/or on-market buy-back by Rio Tinto Limited of up to 55.6 million Rio Tinto Limited shares (representing approximately 15% of Rio Tinto Limited’s issued share capital at that time). Substantial shareholders Details of substantial shareholders are included on page 340. Dividends Details of dividends paid and declared for payment, together with the company’s shareholder returns policy, can be found on pages 30-31. Directors and executives The names of Directors and their periods of appointment are listed on pages 90-91, together with details of each Director’s qualifications, experience and responsibilities, and current directorships. There are no family relationships between any of our Directors or executives. None of our Directors or Executive Committee members are elected or appointed under any arrangement or understanding with any major shareholder, customer, supplier or otherwise. A table of Directors’ attendance at Board and committee meetings during 2022 is on page 101. Previous listed directorships Details of each Director’s previous directorships of other listed companies (where relevant) held in the past three years are set out below: Simon Henry: Lloyds Banking Group plc (June 2014 to September 2020). Directors’ and executives’ beneficial interests A table of Directors’ and executives’ beneficial interests in Rio Tinto shares is on page 132. Secretaries Steve Allen is Company Secretary of Rio Tinto plc and Joint Company Secretary, together with Tim Paine, of Rio Tinto Limited. Steve’s and Tim’s qualifications and experience are described on page 91. Indemnities and insurance The Articles of Association of Rio Tinto plc and the Constitution of Rio Tinto Limited provide for them to indemnify, to the extent permitted by law, Directors and officers of the companies, including officers of certain subsidiaries, against liabilities arising from the conduct of the Group’s business. The Directors, Group Company Secretary and Joint Company Secretary of Rio Tinto Limited, together with employees serving as Directors of eligible subsidiaries at the Group’s request, have also received similar direct indemnities. Former Directors also received indemnities for the period in which they were Directors. These are qualifying third-party indemnity provisions for the purposes of the UK Companies Act 2006, in force during the financial year ended 31 December 2022 and up to the date of this report. During 2022, Rio Tinto paid legal costs under the terms of those indemnities for certain former Directors and officers totalling $8,121,580. Qualifying pension scheme indemnity provisions (as defined by section 235 of the UK Companies Act 2006 and other applicable legal jurisdictions) were in force during the course of the financial year ended 31 December 2022 and up to the date of this Directors’ report, for the benefit of trustees of the Rio Tinto Group pension and superannuation funds across various jurisdictions. No amount has been paid under any of these indemnities during the year. The Group has agreed to pay a premium for Directors’ and officers’ insurance. Disclosure of the nature of the liability covered by the insurance and premium paid is subject to confidentiality requirements under the contract of insurance. Labour relations We also work together with our employees and their unions, and we seek fair solutions while maintaining the competitiveness of our managed operations. In 2022, we had no union activity. Employment of people with a disability We acknowledge the systemic barriers facing people with disabilities in attaining meaningful employment. We further acknowledge the efforts necessary to fully support people who acquire a disability and we seek to implement the accommodations they need to fulfil their role, or an alternative role if required. Our Inclusion and Diversity Policy sets out our expectations around the behaviours needed for an inclusive and diverse workplace, where we embrace different perspectives, valuing diversity as a strength. Our Employment Policy outlines how we are committed to preventing discrimination and that we consider applications based on the job requirements without discriminating on grounds of disability. It also explains how we ensure our people are trained to perform their roles. More information can be found on our website riotinto.com. We remain a member of the IncludeAbility Employer network, which was set up by the Australian Human Rights Commission and aims to increase access to meaningful employment opportunities for people with a disability. We will continue to seek ways to improve how we provide meaningful opportunities for people with a disability and are also working to reduce these barriers as part of our response to the recommendations in the Everyday Respect Report. Engagement with UK employees Our statement on engagement with UK employees is on page 95. Engagement with suppliers, customers and others in a business relationship with the company Our statement on engagement with suppliers, customers and others in a business relationship with the company is on page 98. Waived dividends The number of shares on which Rio Tinto plc dividends are based excludes those held as treasury shares and those held by employee share trusts that waived the right to dividends. Employee share trusts waived dividends on 194,321 Rio Tinto plc ordinary shares and 30,162 American Depository Receipts (ADRs) for the 2021 final dividend, and on 111,443 Rio Tinto plc ordinary shares and 35,132 ADRs for the 2022 interim dividend (2021: on 101,752 Rio Tinto plc ordinary shares and 27,873 ADRs for the 2020 final dividend and on 91,008 Rio Tinto plc ordinary shares and 27,501 ADRs for the 2022 interim dividend; 2020: on 258,779 Rio Tinto plc ordinary shares and 28,743 ADRs for the 2019 final dividend and on 171,213 Rio Tinto plc ordinary shares and 29,634 ADRs for the 2020 interim dividend). In 2022, 2021 and 2020, no Rio Tinto Limited shares were held by Rio Tinto plc. The number of shares on which Rio Tinto Limited dividends are based, excludes those held by shareholders who have waived the rights to dividends. Employee share trusts waived dividends on 36,517 Rio Tinto Limited ordinary shares for the 2021 final dividend and on 31,368 shares for the 2022 interim dividend (2021: on 45,250 shares for the 2020 final dividend and 33,531 shares for the 2021 interim dividend; 2020: on 98,065 shares for the 2019 final dividend and 84,377 shares for the 2020 interim dividend). Additional statutory disclosure continued
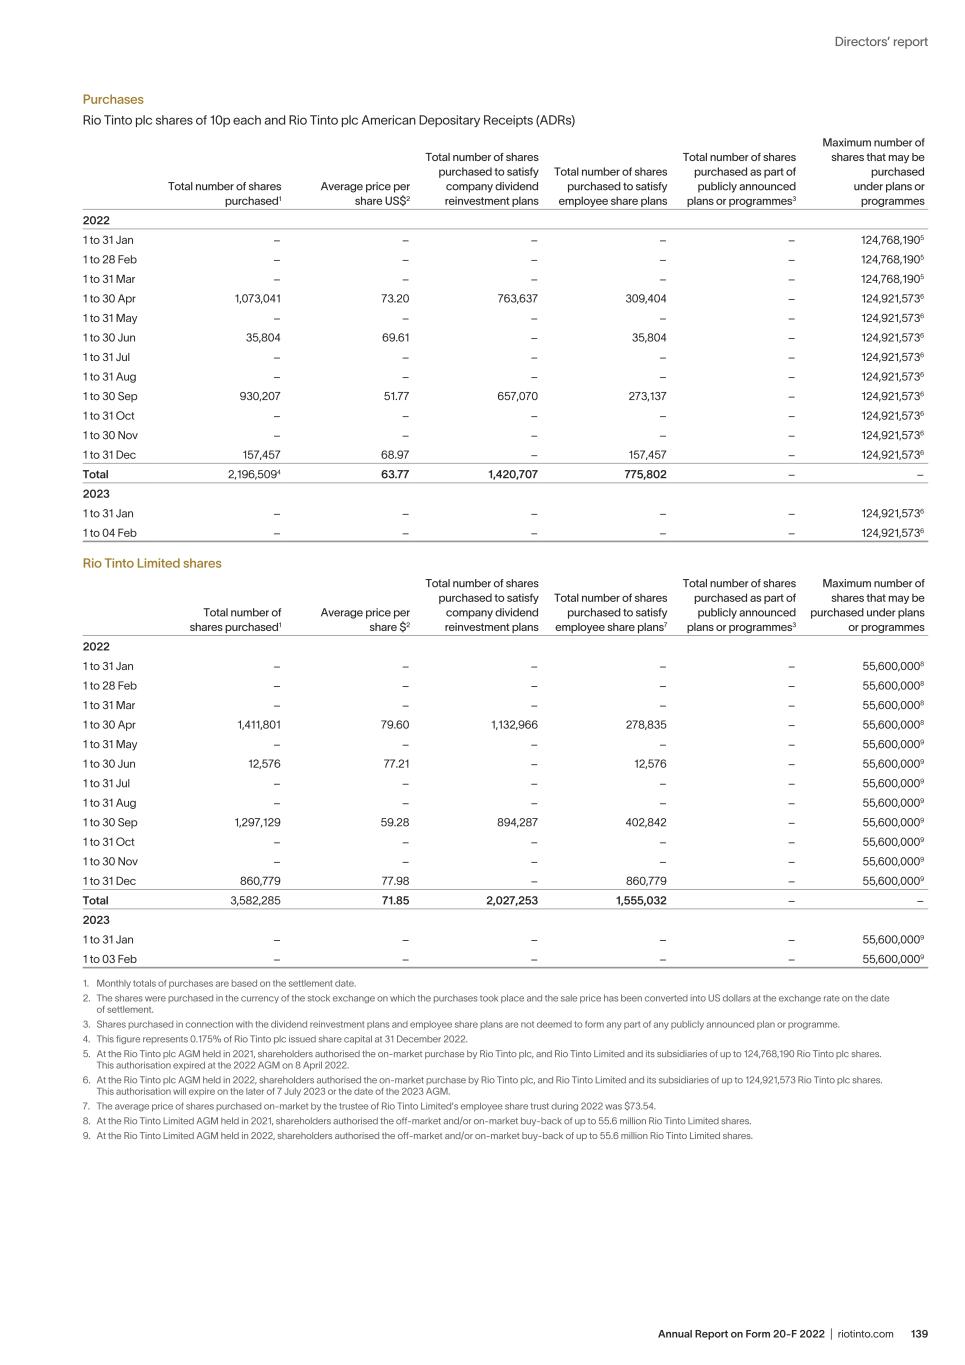
139Annual Report on Form 20-F 2022 | riotinto.com Directors’ report Purchases Rio Tinto plc shares of 10p each and Rio Tinto plc American Depositary Receipts (ADRs) Total number of shares purchased1 Average price per share US$2 Total number of shares purchased to satisfy company dividend reinvestment plans Total number of shares purchased to satisfy employee share plans Total number of shares purchased as part of publicly announced plans or programmes3 Maximum number of shares that may be purchased under plans or programmes 2022 1 to 31 Jan – – – – – 124,768,1905 1 to 28 Feb – – – – – 124,768,1905 1 to 31 Mar – – – – – 124,768,1905 1 to 30 Apr 1,073,041 73.20 763,637 309,404 – 124,921,5736 1 to 31 May – – – – – 124,921,5736 1 to 30 Jun 35,804 69.61 – 35,804 – 124,921,5736 1 to 31 Jul – – – – – 124,921,5736 1 to 31 Aug – – – – – 124,921,5736 1 to 30 Sep 930,207 51.77 657,070 273,137 – 124,921,5736 1 to 31 Oct – – – – – 124,921,5736 1 to 30 Nov – – – – – 124,921,5736 1 to 31 Dec 157,457 68.97 – 157,457 – 124,921,5736 Total 2,196,5094 63.77 1,420,707 775,802 – – 2023 1 to 31 Jan – – – – – 124,921,5736 1 to 04 Feb – – – – – 124,921,5736 Rio Tinto Limited shares Total number of shares purchased1 Average price per share $2 Total number of shares purchased to satisfy company dividend reinvestment plans Total number of shares purchased to satisfy employee share plans7 Total number of shares purchased as part of publicly announced plans or programmes3 Maximum number of shares that may be purchased under plans or programmes 2022 1 to 31 Jan – – – – – 55,600,0008 1 to 28 Feb – – – – – 55,600,0008 1 to 31 Mar – – – – – 55,600,0008 1 to 30 Apr 1,411,801 79.60 1,132,966 278,835 – 55,600,0008 1 to 31 May – – – – – 55,600,0009 1 to 30 Jun 12,576 77.21 – 12,576 – 55,600,0009 1 to 31 Jul – – – – – 55,600,0009 1 to 31 Aug – – – – – 55,600,0009 1 to 30 Sep 1,297,129 59.28 894,287 402,842 – 55,600,0009 1 to 31 Oct – – – – – 55,600,0009 1 to 30 Nov – – – – – 55,600,0009 1 to 31 Dec 860,779 77.98 – 860,779 – 55,600,0009 Total 3,582,285 71.85 2,027,253 1,555,032 – – 2023 1 to 31 Jan – – – – – 55,600,0009 1 to 03 Feb – – – – – 55,600,0009 1. Monthly totals of purchases are based on the settlement date. 2. The shares were purchased in the currency of the stock exchange on which the purchases took place and the sale price has been converted into US dollars at the exchange rate on the date of settlement. 3. Shares purchased in connection with the dividend reinvestment plans and employee share plans are not deemed to form any part of any publicly announced plan or programme. 4. This figure represents 0.175% of Rio Tinto plc issued share capital at 31 December 2022. 5. At the Rio Tinto plc AGM held in 2021, shareholders authorised the on-market purchase by Rio Tinto plc, and Rio Tinto Limited and its subsidiaries of up to 124,768,190 Rio Tinto plc shares. This authorisation expired at the 2022 AGM on 8 April 2022. 6. At the Rio Tinto plc AGM held in 2022, shareholders authorised the on-market purchase by Rio Tinto plc, and Rio Tinto Limited and its subsidiaries of up to 124,921,573 Rio Tinto plc shares. This authorisation will expire on the later of 7 July 2023 or the date of the 2023 AGM. 7. The average price of shares purchased on-market by the trustee of Rio Tinto Limited’s employee share trust during 2022 was $73.54. 8. At the Rio Tinto Limited AGM held in 2021, shareholders authorised the off-market and/or on-market buy-back of up to 55.6 million Rio Tinto Limited shares. 9. At the Rio Tinto Limited AGM held in 2022, shareholders authorised the off-market and/or on-market buy-back of up to 55.6 million Rio Tinto Limited shares.
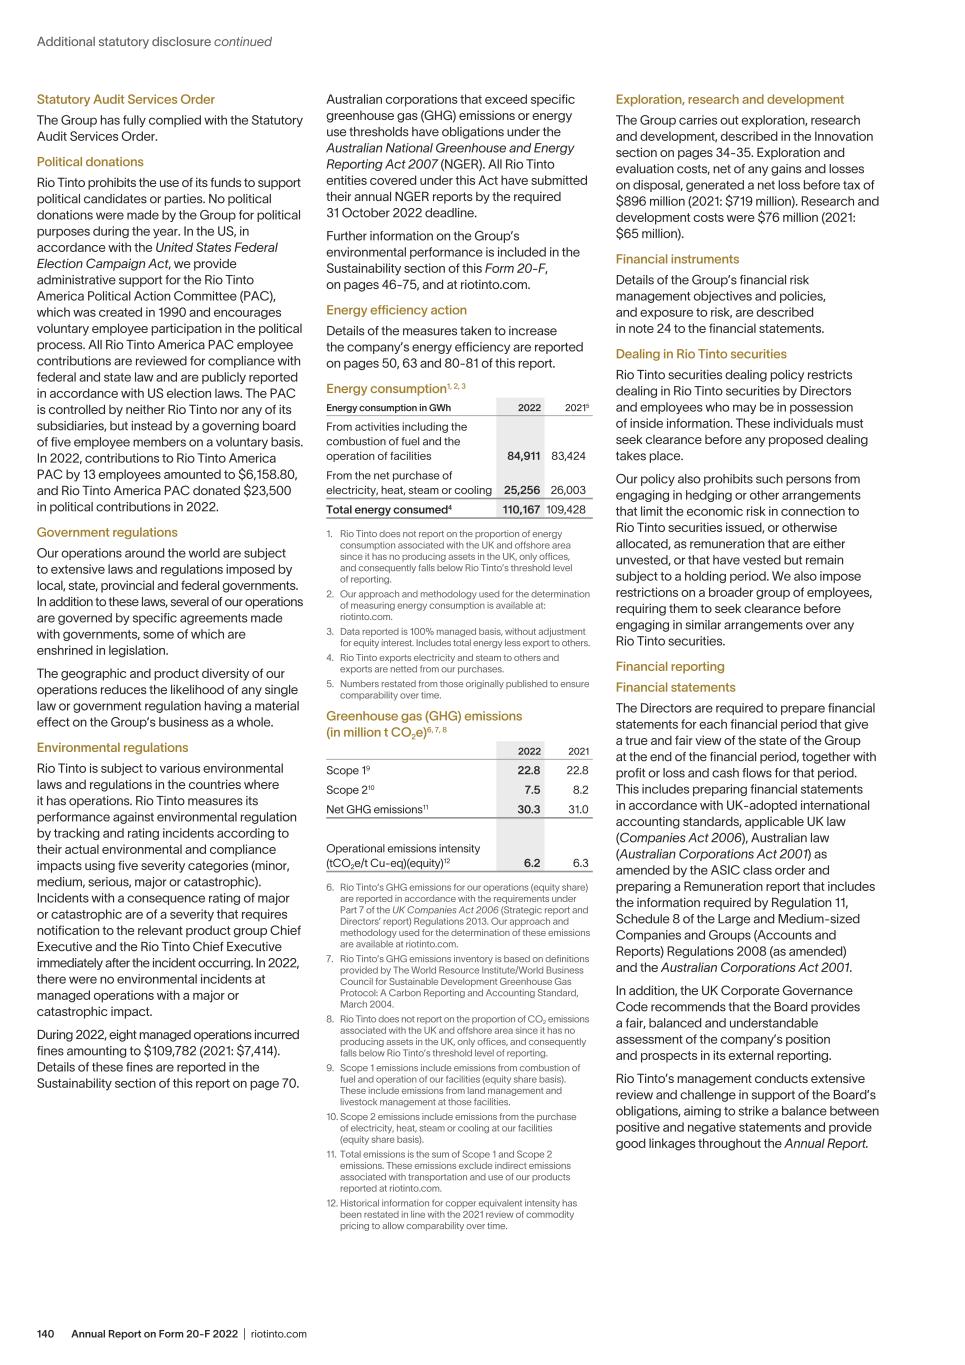
Annual Report on Form 20-F 2022 | riotinto.com140 Statutory Audit Services Order The Group has fully complied with the Statutory Audit Services Order. Political donations Rio Tinto prohibits the use of its funds to support political candidates or parties. No political donations were made by the Group for political purposes during the year. In the US, in accordance with the United States Federal Election Campaign Act, we provide administrative support for the Rio Tinto America Political Action Committee (PAC), which was created in 1990 and encourages voluntary employee participation in the political process. All Rio Tinto America PAC employee contributions are reviewed for compliance with federal and state law and are publicly reported in accordance with US election laws. The PAC is controlled by neither Rio Tinto nor any of its subsidiaries, but instead by a governing board of five employee members on a voluntary basis. In 2022, contributions to Rio Tinto America PAC by 13 employees amounted to $6,158.80, and Rio Tinto America PAC donated $23,500 in political contributions in 2022. Government regulations Our operations around the world are subject to extensive laws and regulations imposed by local, state, provincial and federal governments. In addition to these laws, several of our operations are governed by specific agreements made with governments, some of which are enshrined in legislation. The geographic and product diversity of our operations reduces the likelihood of any single law or government regulation having a material effect on the Group’s business as a whole. Environmental regulations Rio Tinto is subject to various environmental laws and regulations in the countries where it has operations. Rio Tinto measures its performance against environmental regulation by tracking and rating incidents according to their actual environmental and compliance impacts using five severity categories (minor, medium, serious, major or catastrophic). Incidents with a consequence rating of major or catastrophic are of a severity that requires notification to the relevant product group Chief Executive and the Rio Tinto Chief Executive immediately after the incident occurring. In 2022, there were no environmental incidents at managed operations with a major or catastrophic impact. During 2022, eight managed operations incurred fines amounting to $109,782 (2021: $7,414). Details of these fines are reported in the Sustainability section of this report on page 70. Australian corporations that exceed specific greenhouse gas (GHG) emissions or energy use thresholds have obligations under the Australian National Greenhouse and Energy Reporting Act 2007 (NGER). All Rio Tinto entities covered under this Act have submitted their annual NGER reports by the required 31 October 2022 deadline. Further information on the Group’s environmental performance is included in the Sustainability section of this Form 20-F, on pages 46-75, and at riotinto.com. Energy efficiency action Details of the measures taken to increase the company’s energy efficiency are reported on pages 50, 63 and 80-81 of this report. Energy consumption1, 2, 3 Energy consumption in GWh 2022 20215 From activities including the combustion of fuel and the operation of facilities 84,911 83,424 From the net purchase of electricity, heat, steam or cooling 25,256 26,003 Total energy consumed4 110,167 109,428 1. Rio Tinto does not report on the proportion of energy consumption associated with the UK and offshore area since it has no producing assets in the UK, only offices, and consequently falls below Rio Tinto’s threshold level of reporting. 2. Our approach and methodology used for the determination of measuring energy consumption is available at: riotinto.com. 3. Data reported is 100% managed basis, without adjustment for equity interest. Includes total energy less export to others. 4. Rio Tinto exports electricity and steam to others and exports are netted from our purchases. 5. Numbers restated from those originally published to ensure comparability over time. Greenhouse gas (GHG) emissions (in million t CO2e)6, 7, 8 2022 2021 Scope 19 22.8 22.8 Scope 210 7.5 8.2 Net GHG emissions11 30.3 31.0 Operational emissions intensity (tCO2e/t Cu-eq)(equity)12 6.2 6.3 6. Rio Tinto’s GHG emissions for our operations (equity share) are reported in accordance with the requirements under Part 7 of the UK Companies Act 2006 (Strategic report and Directors’ report) Regulations 2013. Our approach and methodology used for the determination of these emissions are available at riotinto.com. 7. Rio Tinto’s GHG emissions inventory is based on definitions provided by The World Resource Institute/World Business Council for Sustainable Development Greenhouse Gas Protocol: A Carbon Reporting and Accounting Standard, March 2004. 8. Rio Tinto does not report on the proportion of CO2 emissions associated with the UK and offshore area since it has no producing assets in the UK, only offices, and consequently falls below Rio Tinto’s threshold level of reporting. 9. Scope 1 emissions include emissions from combustion of fuel and operation of our facilities (equity share basis). These include emissions from land management and livestock management at those facilities. 10. Scope 2 emissions include emissions from the purchase of electricity, heat, steam or cooling at our facilities (equity share basis). 11. Total emissions is the sum of Scope 1 and Scope 2 emissions. These emissions exclude indirect emissions associated with transportation and use of our products reported at riotinto.com. 12. Historical information for copper equivalent intensity has been restated in line with the 2021 review of commodity pricing to allow comparability over time. Exploration, research and development The Group carries out exploration, research and development, described in the Innovation section on pages 34-35. Exploration and evaluation costs, net of any gains and losses on disposal, generated a net loss before tax of $896 million (2021: $719 million). Research and development costs were $76 million (2021: $65 million). Financial instruments Details of the Group’s financial risk management objectives and policies, and exposure to risk, are described in note 24 to the financial statements. Dealing in Rio Tinto securities Rio Tinto securities dealing policy restricts dealing in Rio Tinto securities by Directors and employees who may be in possession of inside information. These individuals must seek clearance before any proposed dealing takes place. Our policy also prohibits such persons from engaging in hedging or other arrangements that limit the economic risk in connection to Rio Tinto securities issued, or otherwise allocated, as remuneration that are either unvested, or that have vested but remain subject to a holding period. We also impose restrictions on a broader group of employees, requiring them to seek clearance before engaging in similar arrangements over any Rio Tinto securities. Financial reporting Financial statements The Directors are required to prepare financial statements for each financial period that give a true and fair view of the state of the Group at the end of the financial period, together with profit or loss and cash flows for that period. This includes preparing financial statements in accordance with UK-adopted international accounting standards, applicable UK law (Companies Act 2006), Australian law (Australian Corporations Act 2001) as amended by the ASIC class order and preparing a Remuneration report that includes the information required by Regulation 11, Schedule 8 of the Large and Medium-sized Companies and Groups (Accounts and Reports) Regulations 2008 (as amended) and the Australian Corporations Act 2001. In addition, the UK Corporate Governance Code recommends that the Board provides a fair, balanced and understandable assessment of the company’s position and prospects in its external reporting. Rio Tinto’s management conducts extensive review and challenge in support of the Board’s obligations, aiming to strike a balance between positive and negative statements and provide good linkages throughout the Annual Report. Additional statutory disclosure continued
141Annual Report on Form 20-F 2022 | riotinto.com Directors’ report The Directors were responsible for the preparation and approval of the Annual Report for the year ended 31 December 2022. They consider the Annual Report, taken as a whole, to be fair, balanced and understandable, and that it provides the information necessary for shareholders to assess the Group’s position, performance, business model and strategy. The Directors are responsible for maintaining proper accounting records, in accordance with UK and Australian legislation. They have a general responsibility to safeguard the assets of the Group, and to prevent and detect fraud and other irregularities. The Directors are also responsible for ensuring that appropriate systems are in place to maintain and preserve the integrity of the Group’s website. Legislation in the UK governing the preparation and dissemination of financial statements may differ from current and future legislation in other jurisdictions. The work carried out by the Group’s external auditors does not take into account such legislation and, accordingly, the external auditors accept no responsibility for any changes to the financial statements after they are made available on the Group’s website. The Directors, senior executives, senior financial managers and other members of staff who are required to exercise judgment while preparing the Group’s financial statements, are required to conduct themselves with integrity and honesty and in accordance with the highest ethical standards, as are all Group employees. The Directors consider that the 2022 Annual Report presents a true and fair view and has been prepared in accordance with applicable accounting standards, using the most appropriate accounting policies for Rio Tinto’s business, and supported by reasonable judgments and estimates. The accounting policies have been consistently applied as described on pages 148-155, and Directors have received a written statement from the Chief Executive and the Chief Financial Officer to this effect. In accordance with the internal control requirements of the Code and the ASX Principles, this written statement confirms that the declarations in the statement are founded on a sound system of risk management and internal controls, and that the system is operating effectively in all material respects in relation to financial reporting risks. Disclosure controls and procedures The Group maintains disclosure controls and procedures, as defined in US Exchange Act Rule 13a-15(e). Management, with the participation of the Chief Executive and Chief Financial Officer, has evaluated the effectiveness of the Group’s disclosure controls and procedures in relation to US Exchange Act Rule 13a-15(b), as of the end of the period covered by this report, and has concluded that the Group’s disclosure controls and procedures were effective at a reasonable assurance level. Management’s report on internal control over financial reporting Management is responsible for establishing and maintaining adequate internal controls over financial reporting. These controls, designed under the supervision of the Chief Executive and Chief Financial Officer, provide reasonable assurance regarding the reliability of the Group’s financial reporting and the preparation and presentation of financial statements for external reporting purposes, in accordance with International Financial Reporting Standards (IFRS) as defined on page 148. The Group’s internal controls over financial reporting include policies and procedures designed to ensure the maintenance of records that: – Accurately and fairly reflect transactions and dispositions of assets. – Provide reasonable assurances that transactions are recorded as necessary, enabling the preparation of financial statements in accordance with IFRS, and that receipts and expenditures are made with the authorisation of management and Directors of each of the companies. – Provide reasonable assurance regarding the prevention or timely detection of unauthorised acquisition, use or disposition of the Group’s assets that could have a material effect on its financial statements. Due to inherent limitations, internal controls over financial reporting cannot provide absolute assurance. Similarly, these controls may not prevent or detect all misstatements, whether caused by error or fraud, within each of Rio Tinto plc and Rio Tinto Limited. There were no changes to internal controls over financial reporting during the relevant period that have materially affected, or were reasonably likely to materially affect, the internal control over financial reporting of Rio Tinto plc and Rio Tinto Limited. Management’s evaluation of the effectiveness of the company’s internal controls over financial reporting was based on criteria established in the Internal Control-Integrated Framework (2013), issued by the Committee of Sponsoring Organizations of the Treadway Commission. Following this evaluation, management concluded that our internal controls over financial reporting were effective as at 31 December 2022. Non-audit services and auditor independence Details of the non-audit services and a statement of independence regarding the provision of non-audit services undertaken by our external auditor, including the amounts paid for non-audit services, are set out on pages 106-107 of the Directors’ report. Going concern The Directors, having made appropriate enquiries, have satisfied themselves that it is appropriate to adopt the going concern basis of accounting in preparing the financial statements. Additionally, the Directors have considered longer-term viability, as described in their statement on page 78. 2023 AGMs The 2023 AGMs will be held on 6 April in London, UK and 4 May in Perth, Australia. Separate notices of the 2023 AGMs will be produced for the shareholders of each company. Directors’ approval statement The Directors’ report is delivered in accordance with a resolution of the Board. Dominic Barton Chair 22 February 2023
Annual Report on Form 20-F 2022 | riotinto.com142 Compliance with governance codes and standards Application of and compliance with governance codes and standards This section sets out our compliance with the applicable governance codes and standards. As our shares are listed on both the Australian Securities Exchange (ASX) and the London Stock Exchange (LSE), we set out how we have complied with the codes and standards of those bodies on the following pages: London Stock Exchange – UK Corporate Governance Code (2018 version) (the UK Code), see pages 142-144. Australian Securities Exchange – ASX Corporate Governance Council’s Corporate Governance Principles and Recommendations (4th edition) (the ASX Principles), see pages 144-146. In addition, as explained below, as a foreign private issuer (FPI) with American Depositary Receipts (ADRs) listed on the New York Stock Exchange (NYSE), we need to report any significant corporate governance differences from the NYSE listing standards (NYSE Standards) followed by US companies. Statement of compliance with the UK Code and ASX Principles Throughout 2022 and as at the date of this report, the Group has applied the Principles of the UK Code and the ASX Principles. The UK Code is available at www.frc.org.uk, and the ASX Principles at www.asx.com/au. For the purposes of ASX Listing Rule 4.10.3 and the ASX Principles, pages 89-109 of this report form our “Corporate Governance Statement”. This statement is current as at 22 February 2023, unless otherwise indicated, and has been approved by the Board. Corporate governance documents and policies referenced can be found at riotinto.com/invest/corporate-governance. We have complied with all relevant provisions of the UK Code and ASX Principles throughout 2022, with the exception only of the independent third-party evaluation element of Code Provision 21. As set out in the Chair’s introduction on page 89, having undertaken a comprehensive strategic governance review in 2022, it was decided it would be more beneficial to defer the independent third-party evaluation of the Board so that it could take place once these governance enhancements were fully embedded in 2023. Difference from NYSE Standards We have reviewed the NYSE Standards and consider that our practices are broadly consistent with them, with the following exceptions where the literal requirements of the NYSE Standards are not met due to differences in corporate governance between the US, UK and Australia: – The NYSE Standards state that US companies must have a nominating/ corporate governance committee which, in addition to identifying individuals qualified to become board members, develops and recommends to the Board a set of corporate governance principles applicable to the company. Our Nominations Committee does not develop corporate governance principles for the Board’s approval. The Board itself develops such principles. – Under US securities law and the NYSE Standards, the company is required to have an audit committee that is directly responsible for the appointment, compensation, retention and oversight of the work of external auditors. While our Audit & Risk Committee makes recommendations to the Board on these matters, and is subject to legal and regulatory requirements on oversight of audit tenders, the ultimate responsibility for the appointment and retention of the external auditors of Rio Tinto rests with the shareholders. – Under US securities law and the NYSE Standards, an audit committee is required to establish procedures for the receipt, retention and treatment of complaints regarding accounting, internal accounting controls and audit matters. The whistleblowing programme (myVoice) enables employees to raise any concerns confidentially or anonymously. The Board has responsibility to ensure that the programme is in place and to review the reports arising from its operations. The UK Code Board leadership and company purpose A. Making the Board effective Our Board provides effective and entrepreneurial leadership. It is collectively responsible for the stewardship and long-term success of the Group. There is a framework of prudent and effective controls that enable risk to be assessed and managed. The Sustainability section on pages 46-75 sets out how we assess our impact on wider society. See page 99 for the key activities undertaken by the Board during the year and the factors that were considered when making decisions. In 2022, the Board undertook a governance review of the composition of the Board, as well as a strategic governance review. Further details can be found on page 101. B. The company’s purpose, values and strategy and alignment with culture Through our Code of Conduct – The Way We Work, the Board sets the company’s purpose, values, and standards for the Group’s employees. Our values are set out on page 16. The Board is committed to acting in accordance with these values, championing and embedding these in the organisation. The Board also seeks to ensure that the culture of the company is aligned with these values and standards. C. Company performance and risk management The Board leads the development of long-term investment plans for the company. It aims to make good quality decisions at the right time, to achieve the company’s objectives, in alignment with our purpose, values and strategy. The role of the Board in establishing and monitoring the internal control environment is set out in the Audit & Risk Committee report on pages 104-107. The way in which the company manages risk is set out on pages 76- 86. For information on the delegation of business to management, please refer to pages 92-93. The formal schedule of matters reserved for the Board’s decision, available at riotinto.com, covers areas including: setting the Group’s purpose and strategic vision; monitoring performance of the delivery of the approved strategy; approving major investments, acquisitions and divestments; the oversight of risk and the setting of the Group’s risk appetite; and reviewing the Group’s governance framework. D. Stakeholder engagement The Chair undertakes regular engagement with our major shareholders, in addition to that carried out by the Chief Executive, the Chief Financial Officer and the investor relations team. The committee Chairs also engage with their relevant stakeholders; details of this engagement are provided in each of the committee reports. We have mapped our key stakeholders and continually work to understand their views, and we take account of our responsibilities to our stakeholders when making business decisions. We explain more about this in our section 172(1) statement, set out on pages 95-98. We also discuss stakeholders in the Strategic report on pages 18-19 and in the Sustainability section. Simon McKeon is the designated Non-Executive Director for workforce engagement. An overview of workforce engagement during 2022 is set out on page 95. At Rio Tinto plc’s AGM on 8 April 2022, Resolution 20 (”Authority to purchase Rio Tinto plc shares”) was passed with less than 80% of votes in favour, and Shining Prospect (a subsidiary of the Aluminium Corporation of China (Chinalco)) voted against. Chinalco has not sold any Rio Tinto plc shares and now has a holding of over 14%, given its non-participation in Rio Tinto’s significant share buy-back programmes over the last four years. This places Chinalco close to the 14.99% threshold agreed with the Australian Government at the time of Chinalco’s original investment in 2008. E. Our workforce policies and practices Group workforce policies are approved by the Board. All the policies relating to our workforce take account of the global nature of our company. Our whistleblowing process is overseen by the Board. Every member of the workforce has access to the whistleblower programme (myVoice); details of this programme are on page 74.
143Annual Report on Form 20-F 2022 | riotinto.com Directors’ report Division of responsibilities F. The role of the Chair The Chair leads the Board and is responsible for its overall effectiveness. He was independent on the date of his appointment and we consider he remains independent for the purposes of the Code. This was also the case for our former Chairman, Simon Thompson, who stepped down on 5 May 2022. The Chair recognises the importance of creating a boardroom culture that encourages openness and debate and ensures constructive relations between executive and Non-Executive Directors. The Chair is responsible for: the management of the Board and its committees; Director performance; induction; training and development; succession planning; engagement with external stakeholders; and attendance by the Board at shareholder meetings. The Chair is supported by the Senior Independent Directors, the Group Company Secretary and the Chief Executive. In line with the UK Code, the Senior Independent Director, Rio Tinto plc is responsible for acting as a sounding board for the Chair and engages with shareholders to develop a balanced understanding of their interests and concerns. For further details, please see our Board Charter on riotinto.com, which sets out the role, responsibilities, structure, compositions and conduct of the Board, as well as the role of the Chair, the Senior Independent Director, Rio Tinto plc and the Senior Independent Director, Rio Tinto Limited. G. Composition of the Board As at the date of this report, the Board comprises ten members: seven independent Non-Executive Directors, the Chair, the Chief Executive, and the Chief Financial Officer. As detailed in the Nominations Committee report, we engaged Spencer Stuart to support the search for four new Non-Executive Directors, including Kaisa Hietala who will join the Board on 1 March 2023. The Committee is satisfied that Spencer Stuart does not have any connections with the company or individual Directors that may impair their independence. The Board is satisfied that it has the appropriate balance of skills, experience, independence, and knowledge of the company to enable its members to discharge their respective duties and responsibilities effectively, and that no individual or group can dominate the Board’s decision making. There is a clear division of responsibilities between the leadership of the Board and the executive leadership of our business. The Chief Executive is responsible for the day-to-day management of the business and, under a Group delegation of authority framework, delegates to other members of the Executive Committee. Megan Clark has agreed to remain a Non- Executive Director for a further year and will stand for re-election at our 2023 AGMs. On 20 November 2024, Megan will have served for over nine years as a Non-Executive Director on the Board. Megan is Chair of the Sustainability Committee and one of the longest serving Directors on our Board, with significant mining industry experience. In this period of Board renewal, it is critically important that the Board continues to benefit from Megan’s knowledge and experience. The Board is of the view that Megan continues to make a significant and valuable contribution in the boardroom. In accordance with Code Provision 10, the Board has considered Megan’s continuing independence and is satisfied that Megan remains independent. Details of the Board renewal can be found in the Nominations Committee report on page 102. H. Role of Non-Executive Directors We list all of the Non-Executive Directors that we consider to be independent on pages 90-91 of this report. Over 50% of the Board (excluding the Chair) are Non-Executive Directors. The Non-Executive Directors constructively challenge and help develop proposals on strategy. They are also responsible for scrutinising management performance and ensuring that financial information, risks and controls, and systems of risk management are robust. In order to enhance Board engagement in Australia, the role of Senior Independent Director Rio Tinto Limited was established in 2021. Simon McKeon was appointed to this position and the terms of this appointment were agreed on by the Board. Each Director has undertaken to allocate sufficient time to the Group in order to discharge their responsibilities effectively, and this is kept under review by the Nominations Committee. The Directors’ other appointments are listed on pages 90-91. I. Board processes and role of the Company Secretary The governance framework on page 100 explains the governance structure of the Board and sets out the relationship with the Chief Executive. The roles and responsibilities of each committee are explained. The Board insights section provides some examples of the decision-making process of the Board and the steps it takes to function effectively, including how it considers stakeholders in this process. The Group Company Secretary is the trusted interlocutor within the Board and its committees, and between senior leadership and the Non-Executive Directors. He is responsible for advising the Board, through the Chair, on all governance matters. He supports the Chair in ensuring that the information provided to the Board is of sufficient quality and appropriate detail in order for the Board to function effectively and efficiently. Composition, succession and evaluation J. Appointments to the Board The Nominations Committee ensures a formal, rigorous and transparent procedure for the appointment of new Directors. It is also responsible for Board succession planning, regularly assessing the balance of skills, experience, diversity and capacity required to oversee the delivery of Rio Tinto’s strategy. This year, the Nominations Committee oversaw the appointment of our new Non-Executive Director, Kaisa Hietala, effective 1 March 2023, and the ongoing search for more Non-Executive Directors. Details of this process are provided in the Nominations Committee report on page 103. The Nominations Committee also reviews proposed appointments to the Executive Committee but has ceded responsibility to the full Board for the process and monitoring of Executive Committee succession planning. As a result, the Board has launched a longer-term succession planning process for the Executive Committee, including the roles of the Chief Executive and the Chief Financial Officer. Further details can be found on page 102. All Non-Executive Directors are members of the Nominations Committee. The Committee is chaired by the Chair, apart from when the Committee is dealing with the appointment of his or her successor. Only the Chair and Committee members have the right to attend the meetings of the Nominations Committee; attendance by all other individuals is by invitation only. The Nominations Committee report sets out the Board’s approach to succession planning and how this supports the development of a diverse pipeline, at all levels. All Directors are subject to annual re-election at the AGMs. Details of external search consultancies used for Board appointments can be found in the Nominations Committee report on page 103. K. Skills, experience and knowledge of the Board and its committees In our succession planning, we aim to bring a diverse and complementary range of skills, knowledge and experience to the Board, so that we are equipped to navigate the operational, social, regulatory and geopolitical complexity in which our business operates. Achieving the right blend of skills and diversity to support effective decision making is a continuing process. Further details of tenure and experience of the Board are set out in the Nominations Committee report on page 103. The Board biographies set out the specific skills and experience that each Director brings to the Board (pages 90-91). L. Board evaluation The performance of the Board, its committees and individual Directors is evaluated annually. In accordance with Code Provision 21, every third year, an external adviser is engaged to carry out a formal independent evaluation of the Board and its committees. An independent evaluation by an external adviser was due to be undertaken in 2022. However, following the appointment of our new Chair in 2022, a comprehensive strategic governance review of the Board and committees was carried out. This review focused on the composition of the Board, the balance of skills and experience and how Directors should best spend their time supporting the new Group strategy
in the context of greater uncertainty and potential risk. Given the timing of this review, a decision was made to defer the external Board evaluation to 2023. For more information see page 101.
Annual Report on Form 20-F 2022 | riotinto.com144 Audit, risk and internal control M. Internal and external audit The Audit & Risk Committee monitors the independence and effectiveness of the Internal Audit function and external auditors. The Committee is responsible for reviewing key judgments within the Group’s financial statements and narrative reporting, with the aim of maintaining the integrity of the Group’s financial reporting. For further detail, please refer to the Audit & Risk Committee report on pages 104-107. The appointment of KPMG as external auditor for the 2022 financial year was approved by shareholders at our AGMs in 2022. N. Fair, balanced and understandable assessment The Board is responsible for the presentation of a fair, balanced and understandable assessment of the company’s position and prospects, not only in the Annual Report. We have a robust process in place, including through the Disclosure Committee, to ensure that this is the case. O. Risk management and internal control framework The Board is ultimately responsible for aligning our long-term strategic objectives with the risk appetite of the company, taking into account the material and emerging risks faced by the company. Please refer to pages 76-86 for further details of our business planning cycle and risk management framework and how these support our longer-term viability statement. For further details of our approach to risk, please refer to the Risk section on page 77. Remuneration P. Remuneration policies and practices The People & Remuneration Committee supports the Board by setting our Remuneration Policy. Through long-term and short-term incentives, our Remuneration Policy is designed to help drive a performance culture that incentivises executives to deliver the Group’s long-term strategy and create superior shareholder value over the short, medium and long term. The overarching aim is to ensure our remuneration structure and policies reward fairly and responsibly with a clear link to corporate and individual performance, and to the company’s long-term strategy and values. We have worked to ensure that we have a clear policy that can be understood by shareholders and stakeholders. Q. Procedure for developing remuneration policy We have a formal and transparent procedure for developing our Remuneration Policy, and no Director is involved in deciding their own remuneration. Executive remuneration is set with regard to the wider workforce and through market benchmarking. For further detail, please refer to the People & Remuneration Committee report on pages 110-135. The Committee is supported by remuneration consultant Deloitte. The Board received assurance from the Committee and from Deloitte that Deloitte did not have any connections with Rio Tinto or the Board that would have impaired its independence. Please refer to page 119 of this Form 20-F for further detail. R. Exercising independent judgment The People & Remuneration Committee comprises six Non-Executive Directors to ensure independent judgment with regard to remuneration outcomes. The Committee considers remuneration on an annual basis and determines outcomes by assessing executive performance against performance criteria, details of which can be found in the People & Remuneration Committee report on pages 110- 135 of this Form 20-F. This states how our Remuneration Policy has been applied and sets out details of any adjustments made or discretions exercised. ASX Principles Principle 1: Lay solid foundations for management and oversight Recommendation 1.1 Rio Tinto plc and Rio Tinto Limited have a common Board of Directors. The principal role of the Board is to set the Group’s strategy and to review its strategic direction regularly. The Board also has responsibility for corporate governance. A Board Charter setting out the role of the Board and management and matters reserved for the Board is available at riotinto.com. The Board delegates responsibility for day-to-day management of the business to the Chief Executive and other members of the Executive Committee. A number of management committees support the Chief Executive and the Executive Committee. The structure of these committees is set out on page 100. Recommendation 1.2 The Nominations Committee, on behalf of the Board, ensures a formal, rigorous and transparent procedure for the appointment of new Directors. A similar process is followed with the Executive Committee and senior executive appointments, including a formal and rigorous process to source strong candidates from diverse backgrounds and conducting appropriate background and reference checks on the shortlisted candidates. This year, the Nominations Committee oversaw the appointment of our new Non-Executive Director, Kaisa Hietala effective 1 March 2023, and the ongoing search for three more Non-Executive Directors. Details of this process are provided in the Nominations Committee report on page 103. The notice of AGM provides all material information in Rio Tinto’s possession relevant to decisions on election and re-election of Directors, including a statement from the Board that it considers all Directors continue to perform effectively and demonstrate appropriate levels of commitment. It also provides reasons why each Director is recommended for re-election, highlighting their relevant skills and experience. Further information on the skills and experience of each Director is set out on pages 90-91 of the Form 20-F. Recommendation 1.3 The company has written agreements setting out the terms of appointment for each Director and senior executive. Non-Executive Directors are appointed by letters of appointment. Executive Directors and other senior executives are employed through employment service contracts. Further information is set out on pages 128-129 in the Remuneration report. Recommendation 1.4 The Group Company Secretary is accountable to the Board and advises the Chair, and, through the Chair, the Board on all governance matters. The appointment and removal of the Group Company Secretary is a matter reserved for the Board. Recommendation 1.5 Rio Tinto has a Group-wide, Board-endorsed Inclusion and Diversity Policy. The policy is available at riotinto.com. The Board sets objectives for achieving diversity for the Board, senior executives and the workforce, and annually reviews the Group’s performance against them. Page 51 of the Form 20-F sets out the measurable objectives and our performance against them. The respective proportions of men and women on the Board, in senior executive positions and across the whole organisation, are reported on pages 51 and 103 of the Form 20-F. Compliance with governance codes and standards continued
145Annual Report on Form 20-F 2022 | riotinto.com Directors’ report Recommendation 1.6 The performance of the Board, its committees and individual Directors is evaluated annually. Every third year, an external adviser is engaged to carry out a formal independent evaluation of the Board and its committees. An independent evaluation by an external adviser was due to be undertaken in 2022. However, following the appointment of our new Chair in 2022, a comprehensive strategic governance review of the Board and committees was carried out. This review focused on the composition of the Board, the balance of skills and experience and how Directors should best spend their time supporting the new Group strategy in the context of greater uncertainty and potential risk. Given the timing of this review, a decision was made to defer the external Board evaluation to 2023. For further information, please refer to page 101 of this Form 20-F. Recommendation 1.7 The performance of Executive Committee members, including Directors, is continually evaluated as part of the Group’s performance evaluation cycle. Further details are set out in the Remuneration report on pages 110-135. Principle 2: Structure the Board to be effective and add value Recommendation 2.1 The Nominations Committee includes all Non-Executive Directors and is chaired by the Chair of the Board. The Board is satisfied that all Non-Executive Directors, including the Chair, continue to meet the test for independence under the ASX Principles. The Nominations Committee’s terms of reference are available at riotinto.com. The Nominations Committee report on pages 102-103 provides further details on its role and responsibilities. Details on membership, the number of times the Committee met, and the attendance of members are set out on page 101. Recommendation 2.2 A Board skills matrix showing key attributes in terms of skills, experience and diversity that are relevant to the Board is set out on page 103 of the Annual Report. Recommendations 2.3, 2.4, 2.5 The Nominations Committee is responsible for assessing the independence of each Non-Executive Director against an independence framework that combines the requirements of the UK Code, the ASX Principles and the NYSE Standards. The Committee reviews and approves this framework each year. The Board is satisfied that all of its Non-Executive Directors are independent in character and judgment, and are free from any relationships (material or otherwise) or circumstances that could create a conflict of interest. The Chair was considered independent upon his appointment and, in the Board’s view, he continues to satisfy the tests for independence under the ASX Principles and the NYSE Standards. This was also the case for our former Chairman, Simon Thompson, who stepped down on 5 May 2022. The name, skills and experience of each Director, together with their terms in office, are shown in the biographical details on pages 90-91. Recommendation 2.6 On joining Rio Tinto, all Directors receive a full, formal induction programme. It is delivered over a number of months, and tailored to their specific requirements, taking into account their respective committee responsibilities. All Directors are expected to commit to continuing their development during their tenure. This is supported through a combination of site visits, teach-ins, deep dives, and internal business and operational briefings provided in or around scheduled Board and committee meetings. In addition, the Group Company Secretary provides regular updates on corporate governance developments in the UK, Australia and the US. Further details are set out on pages 101 of the Form 20-F. Principle 3: Instil a culture of acting lawfully, ethically and responsibly Recommendations 3.1, 3.2, 3.3, 3.4 Through our Code of Conduct – The Way We Work, the Board sets the company’s purpose, values, and standards for the Group’s employees. Our values are set out on page 16. The Board is committed to acting in accordance with these values, championing, and embedding them in the organisation. Our Code of Conduct is available at riotinto.com/ethics. Rio Tinto’s confidential and independently operated whistleblowing programme (myVoice) offers an avenue through which our employees, contractors, suppliers and customers can report concerns anonymously, subject to local law. These may include concerns about the business, or behaviour of individuals, including suspicion of violations of financial reporting, safety or environmental procedures or other business integrity issues. The programme features telephone and web submissions, a case management tool, and a reporting tool to allow for better analysis of case statistics. The myVoice procedure explains how concerns regarding matters relating to Rio Tinto, its business and its people can be raised, in confidence and without fear of retaliation. The procedure also sets out who can make a report and what they can expect from Rio Tinto if they do report a concern. The procedure is available at riotinto.com. Further details on myVoice are set out on page 74. Rio Tinto’s business integrity standard sets out the Group’s position on issues relating to bribery and corruption. This is available at riotinto.com. Further information is set out on page 74. Oversight of the Group’s ethics, integrity and compliance programme now falls within the remit of the Board. Principle 4: Safeguard integrity in corporate reports Recommendation 4.1 The Audit & Risk Committee report on pages 104-107 provides details of the role and responsibilities of the Committee. The Committee’s terms of reference are available at riotinto.com. Further details on membership, the number of times the Committee met during 2022 and the attendance of members are set out on pages 90-91 and 101. Recommendation 4.2 Details on compliance with the financial reporting requirements contemplated under this recommendation are set out on pages 140-141 of the Form 20-F. Recommendation 4.3 We have a thorough and rigorous review process in place to ensure integrity of the periodic reports we release to the market. Rio Tinto communicates with the market through accurate, clear, concise and effective reporting, and contents of periodic reports are verified by the subject matter experts and reviewed by the relevant Group functions. Such reports are then reviewed and considered by the Group Disclosure Committee for release to the market. Principle 5: Make timely and balanced disclosure Recommendation 5.1 Rio Tinto recognises the importance of effective and timely communication with shareholders and the wider investment community. It is our policy to make sure that all information disclosed or released by the Group is accurate, complete and timely, and complies with all continuous and other disclosure obligations under applicable listing rules and other relevant legislation. To ensure that trading in our securities takes place in an informed and orderly market, we have established a Disclosure Committee to oversee compliance with our continuous disclosure obligations. The Group Disclosure and Communications Policy, and the terms of reference of our Disclosure Committee, together with our adopted procedures in relation to disclosure and management of relevant information, support compliance with our disclosure obligations. A copy of the Group Disclosure and Communications Policy is available at riotinto.com. The Disclosure Committee is responsible for determining whether information relating to Rio Tinto may require disclosure to the markets under the continuous disclosure requirements in the jurisdictions in which Rio Tinto is listed. In accordance with its terms of reference, the specific focus of the Committee is to consider and determine on a timely basis whether information would, to the extent that the information is not public and relates directly or indirectly to Rio Tinto, be likely to have a material effect on the price of Rio Tinto securities if that information was generally available.
Annual Report on Form 20-F 2022 | riotinto.com146 The members of the Committee are the Chief Executive; the Chief Financial Officer; the Group Company Secretary; the Chief Legal Officer, Governance & Corporate Affairs; the Head of Strategy & Investor Relations; and the Chief Executive Australia. Recommendation 5.2 Consistent with the Group’s disclosure protocols, the Board is provided with copies of all material market announcements promptly after they are released to the market. Recommendation 5.3 As a matter of practice, all our new or substantive investor presentations are released to the market via ASX and LSE market announcement platforms. Principle 6: Respect the rights of security holders Recommendation 6.1 riotinto.com includes pages dedicated to corporate governance, providing information on compliance with governance codes and standards (the UK Code, the ASX Principles and the NYSE Standards); the terms of reference of the committees; risk management and financial reporting; and Board governance, including selection, appointment and re-election of Directors, Directors’ independence, and Board performance evaluation. All information released to the markets is posted in the media section of riotinto.com. riotinto.com also provides general investor information. Annual and half-year results, as well as any major presentations, are webcast and the materials are available at riotinto.com, which also contains presentation material from investor seminars. Recommendation 6.2 Our main channels of communication with the investment community are through the Chair, Chief Executive and Chief Financial Officer, who have regular meetings with the Group’s major shareholders. The Senior Independent Director, Rio Tinto plc, and the Senior Independent Director, Rio Tinto Limited, have a specific responsibility under the UK Code and the Board Charter to be available to shareholders who have concerns that have not been resolved through contact with the Chair, Chief Executive or Chief Financial Officer, or for whom such contact is inappropriate. We have a number of processes and initiatives to ensure that members of the Board understand the views of major shareholders. The Chief Financial Officer reports to the Board at each meeting, and provides regular investor updates. In addition, the Head of Strategy & Investor Relations reports regularly to the Board, and an annual survey of major shareholders’ opinions is presented to the Board by the Group’s investor relations advisers. Further information on engagement with shareholders and investors during 2022 is set out on page 97 of the Form 20-F. Recommendations 6.3, 6.4 The AGMs present an opportunity to provide a summary business presentation, to inform shareholders of recent developments, and to give them the opportunity to ask questions. Generally, the Chairs of all Board committees are available to answer questions raised by shareholders, and all Directors are expected to attend where possible. The AGMs are generally webcast and transcripts of the Chair’s and Chief Executive’s speeches are made available at riotinto.com. A summary of the proceedings at the meetings, and the results of voting on resolutions, are made available as soon as practicable after the meetings. At Rio Tinto AGMs, all resolutions are decided by poll and not by show of hands. In 2022, the Rio Tinto Limited AGM was held in Melbourne as a hybrid meeting. With the use of technology, shareholders who could not attend in person were offered the opportunity to virtually participate at the AGM, ask questions and vote on the resolutions. Recommendation 6.5 Shareholders can choose to communicate electronically with the companies and the share registrars. Contact details for the registrars are set out on page 346 and at riotinto.com. Principle 7: Recognise and manage risk Recommendations 7.1, 7.2 The Board is ultimately responsible for risk management and internal controls, and for ensuring that the systems in place are robust and take into account the material risks faced by the Group. The Board delegates certain matters relating to the Group’s risk management framework to the Audit & Risk Committee, which provides updates to the Board on matters discussed at each meeting. The Sustainability Committee advises the Board on risk appetite tolerance and strategy with respect to sustainable development risks. Further information about the Sustainability Committee is set out on pages 108-109 of the Form 20-F. Terms of reference for the Sustainability Committee are available at riotinto.com. Further details on the Group’s governance framework for risk management and internal control are set out on pages 76-78, 105 and 107 of the Form 20-F. Recommendation 7.3 Further information on Rio Tinto’s Group Internal Audit function is set out on page 107 of the Form 20-F. Recommendation 7.4 A description of the material risks that could affect Rio Tinto (including economic, environmental and social sustainability risks), and of the Group’s governance framework for risk management and internal control, is set on pages 79-86 of the Form 20-F. Further information on sustainability is available on pages 46-75 of the Form 20-F. Principle 8: Remunerate fairly and responsibly Recommendation 8.1 The Remuneration report on pages 110-135 provides details on the role and responsibilities of the People & Remuneration Committee. The Committee’s terms of reference are available at riotinto.com. Further details on membership, the number of times the Committee met during 2022, and the attendance of members are set out on pages 90-91 and 101. Recommendation 8.2 Rio Tinto’s policies and practices regarding remuneration of Non-Executive Directors, Directors and senior executives are set out on pages 110-135 in the Remuneration report. Recommendation 8.3 Rio Tinto’s approach on participating in equity-based remuneration schemes is set out on page 140 of the Form 20-F. This is also addressed in the Rio Tinto Securities Dealing Policy, which is available at riotinto.com. Compliance with governance codes and standards continued
| | | | | | | | | | | | | | |
| 2022 Financial Statements | |
| | | | |
| About Rio Tinto | | | Our people | |
About the presentation of our financial statements | | | | |
| | | | |
| Primary Financial Statements | | | | |
| | | | |
| | | | |
| | | | |
| | | Our group structure | |
| | | | |
| | | | |
| Notes to the 2022 Financial Statements | | | | |
| Our financial performance | | | | |
Note 1 Our financial performance by segment | | | | |
| | | Our equity | |
| | | | |
| | | | |
| | | | |
Note 6 Revenue by destination and product | | | Other notes | |
| | | | |
| | | | |
| | | | |
| | | | |
| | | | |
| | | | |
| Our operating assets | | | Other information outside of the | |
| | | consolidated financial statements | |
| | | | |
| | | | |
| | | | |
| | | | |
| | | | |
| | | | |
| | | | |
| | | | |
| Our capital and liquidity | | | | |
| | | | |
| | | | |
| | | | |
| | | | |
| | | | |
| | | | |
| | | | |
Annual Report on Form 20-F 2022 | riotinto.com 147
Financial statements
Corporate information
About Rio Tinto
In 1995, Rio Tinto plc, incorporated in the UK and listed on the London and New York Stock Exchanges, and Rio Tinto Limited, incorporated in Australia and listed on the Australian Securities Exchange, formed a dual listed companies structure (“DLC”). Under the DLC, Rio Tinto plc and Rio Tinto Limited are viewed as a single economic enterprise, with common boards of directors, and the shareholders of both companies have a common economic interest in the DLC. IFRS-compliant consolidated financial statements of the Rio Tinto Group are prepared on this basis, with interests of shareholders of both companies presented as the equity interests of shareholders in the Rio Tinto Group. This is in accordance with the principles and requirements of International Financial Reporting Standards.
Rio Tinto’s business is finding, mining, and processing mineral resources. Major products are iron ore, aluminium, copper, industrial minerals (borates, titanium dioxide and salt) and diamonds. Activities span the world and are strongly represented in Australia and North America, with significant businesses in Asia, Europe, Africa and South America.
Rio Tinto plc’s registered office is at 6 St James’s Square, London SW1Y 4AD, UK. Rio Tinto Limited’s registered office is at Level 43, 120 Collins Street, Melbourne VIC 3000, Australia.
About the presentation of our financial statements
In the current year we have reviewed our notes to the financial statements taking into account materiality (as described below). We have also re-organised the notes into logical groupings to help users find and understand relevant information. Where possible, related information, such as accounting policies, has been provided in the same section as the relevant note.
All financial statement values are presented in US dollars and rounded to the nearest million (US$m) unless otherwise stated. Where applicable, comparatives have been adjusted to measure or present them on the same basis as current period figures.
Our financial statements for the year ended 31 December 2022 were authorised for issue in accordance with a directors’ resolution on 22 February 2023.
a. The basis of preparation
The financial information included in the financial statements for the year ended 31 December 2022, and for the related comparative periods, has been prepared:
–under the historical cost convention, as modified by the revaluation of certain financial instruments, the impact of fair value hedge accounting on the hedged items and the accounting for post-employment assets and obligations;
–on a going concern basis - Management has prepared detailed cash flow forecasts for at least 12 months and has updated life-of-mine plan models with longer-term cash flow projections which demonstrate that we will have sufficient cash, other liquid resources and undrawn credit facilities to enable us to meet our obligations as they fall due;
–to meet international accounting standards as issued by the International Accounting Standards Board (IASB) and interpretations issued from time to time by the IFRS Interpretations Committee (IFRS IC) which are mandatory at 31 December 2022.
The above accounting standards and interpretations are collectively referred to as “IFRS” in this report and contain the principles we use to create our accounting policies. Where necessary, adjustments are made to the locally reported assets, liabilities, and results of subsidiaries, joint arrangements and associates to bring their accounting policies in line with ours for consistent reporting.
b.The basis of consolidation
The financial statements consolidate the accounts of Rio Tinto plc and Rio Tinto Limited (together “the Companies”) and their respective subsidiaries (together “the Group”, “we”, “our”) and include the Group’s share of joint arrangements and associates.
We consolidate subsidiaries where either of the companies controls the entity. Control exists where either of the companies has: power over the entities, that is, existing rights that give it the current ability to direct the relevant activities of the entities (those that significantly affect the companies’ returns); exposure, or rights, to variable returns from its involvement with the entities; and the ability to use its power to affect those returns. A list of principal subsidiaries is shown in note 30.
A joint arrangement is an arrangement in which two or more parties have joint control. Joint control is the contractually agreed sharing of control such that decisions about the relevant activities of the arrangement (those that significantly affect the companies’ returns) require the unanimous consent of the parties sharing control. We have two types of joint arrangements - joint operations (JOs) and joint ventures (JVs). A JO is a joint arrangement in which the parties that share joint control have rights to the assets, and obligations for the liabilities, relating to the arrangement. This includes situations where the parties benefit from the joint activity through a share of the output, rather than by receiving a share of the results of trading. For our JOs, shown in note 31, we recognise: our share of assets and liabilities; revenue from the sale of our share of the output and our share of any revenue generated from the sale of the output by the JO; and its share of expenses. All such amounts are measured in accordance with the terms of the arrangement, which is usually in proportion to our interest in the JO. These amounts are recorded in our financial statements on the appropriate lines. A JV is a joint arrangement in which the parties that share joint control have rights to the net assets of the arrangement. JVs are accounted for using the equity accounting method.
An associate is an entity over which we have significant influence. Significant influence is presumed to exist where there is neither control nor joint control and the Group has over 20% of the voting rights, unless it can be clearly demonstrated that this is not the case. Significant influence can arise where we hold less than 20% of the voting rights if we have the power to participate in the financial and operating policy decisions affecting the entity. It also includes situations of collective control.
We use the term “equity accounted units” (EAUs) to refer to associates and JVs collectively. Under the equity accounting method, the investment is recorded initially at cost to the Group, including any goodwill on acquisition. In subsequent periods the carrying amount of the investment is adjusted to reflect the Group’s share of the EAUs’ retained post-acquisition profit or loss and other comprehensive income. Our principal JVs and associates are shown in note 32.
In some cases, we participate in unincorporated arrangements and have rights to our share of the assets and obligations for our share of the liabilities of the arrangement rather than a right to a net return, but do not share joint control. In such cases, we account for these arrangements in the same way as our joint operations with all such amounts measured in accordance with the terms of the arrangement, which is usually in proportion to our interest in the arrangement.
All intragroup transactions and balances are eliminated on consolidation.
148 Annual Report on Form 20-F 2022 | riotinto.com
c.Materiality
Our directors consider information to be material if correcting a misstatement, omission or obscuring could, in the light of surrounding circumstances, reasonably be expected to change the judgment of a reasonable person relying on the financial statements. The Group considers both quantitative and qualitative factors in determining whether information is material; the concept of materiality is therefore not driven purely by numerical values.
When considering the potential materiality of information, management makes an initial quantitative assessment using thresholds based on estimates of profit before taxation; for the years ended 31 December 2022 and 31 December 2021 the quantitative threshold was US$700 million. However, other considerations can result in a determination that lower values are material or, occasionally, that higher values are immaterial. These considerations include whether a misstatement, omission or obscuring: masks a change or trend in key performance indicators; causes reported key metrics to change from a positive to a negative values or vice-versa; affects compliance with regulatory requirements or other contractual requirements; could result in an increase to management’s compensation; or might conceal an unlawful transaction.
In assessing materiality, management also applies judgment based on its understanding of the business and its internal and external financial statement users. The assessment will consider user expectations of numerical and narrative reporting. Sources used in making this assessment would include, for example: published analyst consensus measures, experience gained in formal and informal dialogue with users (including regulatory correspondence), and peer group benchmarking.
d.Summary of key judgments or other relevant judgments made in applying the accounting policies
The preparation of the financial statements requires management to use judgment in applying accounting policies and in making critical accounting estimates.
These judgments and estimates are based on management’s best knowledge of the relevant facts and circumstances, having regard to previous experience, but actual results may differ materially from the amounts included in the financial statements. Areas of judgment in the application of accounting policies that have the most significant effect on the amounts recognised in the financial statements and key sources of estimation uncertainty that have a significant risk of causing a material adjustment to the carrying amounts of assets and liabilities within the next financial year are noted below and further information is contained in the accounting policies and/or the notes to the financial statements.
Summarised below are the key judgments which we have taken in the application of the Group’s accounting policies for 2022 and how they compare to the prior year. Taking a different judgment over these matters would lead to a material impact on the 2022 financial statements. More detail on the judgment can be found in the
respective notes.
| | | | | | | | | | | | | | | | | |
| | | | | |
| Key judgments | 2022 | 2021 | Reason for change | |
Indicators of impairment and impairment reversals (note 4) | a | a | No change to the judgment | |
| Uncertain tax positions (note 10) | 0 | a | The settlement in 2022 with the Australian Taxation Office (ATO) has reduced the balance over which judgment is exercised. There have been no material changes in the Group's remaining uncertain tax positions. Therefore uncertain tax positions are not a key judgment in 2022. | |
Deferral of stripping costs (note 13) | a | a | No change to the judgment | |
Estimation of asset lives (note 13) | a | a | No change to the judgment | |
| Close-down, restoration and environmental obligations (note 14) | a | a | No change to the judgment | |
| Recoverability of potential deferred tax assets (note 15) | 0 | a | In 2021 the key judgment related to the recoverability of significant deferred tax asset balances in the United States, Mongolia and Australia. Given the progress towards sustainable underground production at Oyu Tolgoi reducing the risk of tax losses expiring prior to utilisation, and the write down of Federal deferred tax assets in the United States due to the introduction of the Corporate Alternative Minimum Tax under the Inflation Reduction Act, the recoverability of deferred tax assets is not a key judgment in 2022. | |
| | | | | |
Annual Report on Form 20-F 2022 | riotinto.com 149
Financial statements continued
Information on other relevant judgments to help understand the financial statements has been incorporated into the relevant accounting policy sections of each note. We have summarised how these judgments have changed since prior year below:
| | | | | | | | | | | | | | | | | |
| | | | | |
| Other relevant judgments | 2022 | 2021 | Reason for change | |
| Identification of functional currencies (f below) | a | a | No change to the judgment | |
| Exclusions from underlying EBITDA (note 1) | a | a | No change to the judgment | |
| Determination of cash-generating units (CGUs) (note 4) | a | a | No change to the judgment | |
| Uncertain tax positions (note 10) | a | 0 | In 2022 the judgment we have taken on our uncertain tax positions is less significant than in the prior year given the settlement with the Australian Taxation Office (ATO). Where the amount of tax payable or recoverable is uncertain, judgment is required in evaluating the most likely amount of liability or recovery. Where there is a wide range of possible outcomes, judgment is required in evaluating a provision using the probability weighted average approach. See note 10 for further details. | |
| Assessment of indefinite-lived water rights in Quebec (note 12) | a | a | No change to the judgment | |
| Recoverability of potential deferred tax assets (note 15) | a | 0 | Given the progress towards sustainable underground production at Oyu Tolgoi and the write down of Federal deferred tax assets in the United States due to the introduction of the Corporate Alternative Minimum Tax regime the recoverability of deferred tax assets is not a key judgment in 2022. Judgment is required regarding the extent to which certain risk factors are likely to affect the recovery of deferred tax assets. These risk factors include the risk of expiry of losses prior to utilisation, the impact of other legislation or tax regimes, such as minimum taxes, and consideration of factors that lead to the generation of losses or other deferred tax assets. | |
| Accounting for the funding amounts relating to Oyu Tolgoi non-controlling interest (note 30) | 0 | a | The funding balances arising from a carry account loan with Erdenes Oyu Tolgoi were forgiven in 2022. This means the judgment over the accounting for these amounts is no longer applicable. | |
| Accounting for the Pilbara Iron Arrangements (note 31) | a | a | No change to the judgment | |
| Basis of consolidation of Queensland Alumina Limited (note 31) | a | a | The judgment taken on how we consolidate Queensland Alumina Limited (‘QAL’) was reassessed and confirmed in the current year. Following the Australian governments’s imposition of Trade Sanctions against Russia, QAL considered that they were no longer able to process bauxite on behalf of RUSAL and therefore enacted the “step-in” clause of the shareholders agreement that enabled Rio Tinto to contribute additional bauxite tonnes to ensure that 100% of production capacity was maintained. We continue to account for QAL as a joint operation. | |
| Accounting for Minera Escondida Ltda (note 32) | a | a | No change to the judgment | |
| Provisions for onerous contracts (note 36) | 0 | a | We reviewed our onerous contract population and noted the significance of this judgment had diminished. | |
| Recognition of contingencies (note 37) | a | a | No change to the judgment | |
| | | | | |
150 Annual Report on Form 20-F 2022 | riotinto.com
e.Key sources of estimation uncertainty
We define key sources of estimation uncertainty as accounting estimates that have a significant risk of causing a material adjustment to the carrying amounts of assets and liabilities within the next financial year. Summarised below are what we consider to be the key accounting estimates in 2022 compared to those of 2021 and the reason for any changes. Relevant sensitivities are disclosed within the relevant financial statement notes.
| | | | | | | | | | | | | | | | | |
| | | | | |
| Key accounting estimates | 2022 | 2021 | Reason for change | |
| Estimation of the close-down, restoration and environmental cost obligations (note 14) | a | a | No change | |
| Estimation of the cash flow forecasts to support the recognition of deferred tax assets | 0 | a | In 2021 the cash flow forecast used to support the recognition of deferred tax assets in the United States, Mongolia and Australia was considered to be a key estimate. Given the write down of deferred tax assets in the United States as a result of the Corporate Alternative Minimum Tax under the Inflation Reduction Act 2022, and the progress towards sustainable underground production at Oyu Tolgoi reducing the risk of losses expiring prior to utilisation, cash flow forecasts used to support deferred tax recoverability are no longer considered a key estimate in 2022. | |
| Estimation of obligations for post-employment costs
(note 28) | a | a | No change | |
| | | | | |
f.Currency
| | | | | | | | |
| | |
| Other relevant judgments - Identification of functional currency We present our financial statements in US dollars, as that presentation currency most reliably reflects the global business performance of the Group as a whole. The functional currency for each subsidiary, unincorporated arrangement, joint operation and equity accounted unit is the currency of the primary economic environment in which it operates. For businesses that reside in developed economies the functional currency is generally the currency of the country in which it operates because of the dominance of locally incurred costs. If the business resides in an emerging economy, the US dollar is generally identified to be the functional currency as a higher proportion of costs, particularly imported goods and services, are agreed and paid in US dollars, in common with other international investors. Determination of functional currency involves judgment, and other companies may make different judgments based on similar facts. The determination of functional currency affects the measurement of non-current assets included in the balance sheet and, as a consequence, the depreciation and amortisation of those assets included in the income statement. It also impacts exchange gains and losses included in the income statement and in equity. We also apply judgment in determining whether settlement of certain intragroup loans is neither planned nor likely in the foreseeable future and therefore whether the associated exchange gains and losses can be taken to equity. During 2022, A$15 billion of intragroup loans continued to meet these criteria; associated exchange gains and losses are taken to equity. | |
| | |
On consolidation, income statement items for each entity are translated from the functional currency into US dollars at the full-year average rate of exchange, except for material one-off transactions, which are translated at the rate prevailing on the transaction date. Balance sheet items are translated into US dollars at period-end exchange rates.
Exchange differences arising on the translation of the net assets of entities with functional currencies other than the US dollar are recognised directly in the currency translation reserve. These translation differences are shown in the statement of comprehensive income, with the exception of the translation adjustment relating to Rio Tinto Limited’s share capital, which is shown in the statement of changes in equity.
Where an intragroup balance is, in substance, part of the Group’s net investment in an entity, exchange gains and losses on that balance are taken to the currency translation reserve.
Except as noted above, or where exchange differences are deferred as part of a cash flow hedge, all other differences are charged or credited to the income statement in the year in which they arise.
The principal exchange rates used in the preparation of the financial statements were:
| | | | | | | | | | | | | | | | | | | | |
| Full-year average | Year-end |
| One unit of local currency buys the following number of US dollars | 2022 | 2021 | 2020 | 2022 | 2021 | 2020 |
| Pound sterling | 1.24 | | 1.38 | | 1.28 | | 1.21 | | 1.35 | | 1.36 | |
Australian dollar | 0.69 | | 0.75 | | 0.69 | | 0.68 | | 0.73 | | 0.77 | |
Canadian dollar | 0.77 | | 0.80 | | 0.75 | | 0.74 | | 0.78 | | 0.78 | |
Euro | 1.05 | | 1.18 | | 1.14 | | 1.07 | | 1.13 | | 1.23 | |
South African rand | 0.061 | | 0.068 | | 0.061 | | 0.059 | | 0.063 | | 0.068 | |
Annual Report on Form 20-F 2022 | riotinto.com 151
Financial statements continued
g.Ore Reserves and Mineral Resources
A Mineral Resource is a concentration or occurrence of solid material of economic interest in or on the Earth’s crust in such form, grade (or quality), and quantity that there are reasonable prospects for eventual economic extraction. An Ore Reserve is the economically mineable part of a measured or indicated Mineral Resource.
The estimation of Ore Reserves and Mineral Resources requires judgment to interpret available geological data and subsequently to select an appropriate mining method and then to establish an extraction schedule. At least annually, the Competent Persons of the Group (according to the Australasian Code for Reporting of Exploration Results, Mineral Resources and Ore Reserves (the JORC Code)), estimate Ore Reserves and Mineral Resources using assumptions such as:
–Available geological data;
–Expected future commodity price and demand;
–Exchange rates;
–Production costs;
–Transport costs;
–Close-down and restoration costs;
–Recovery rates;
–Discount rates; and
–Renewal of mining licences.
With regard to our future commodity price assumptions, to calculate our Ore Reserves and Mineral Resources for our filing on the Australian Securities Exchange and London Stock Exchange, we use prices generated by our Strategy and Economics team (refer to the Climate change section for further details about our pricing methodology). For our Annual Report on Form 20-F, filed with the Securities Exchange Commission (‘SEC’), we use consensus price or historical pricing and comply with subpart 1300 of Regulation S-K (Regulation S-K), instead of with the JORC code.
We use judgment as to when to include Mineral Resources in accounting estimates, for example, the use of Mineral Resources in our depreciation policy as described in note 13 and in the determination of the date of closure as described in note 14.
There are many uncertainties in the estimation process and assumptions that are valid at the time of estimation may change significantly when new information becomes available. New geological or economic data, or unforeseen operational issues may change estimates of Ore Reserves and Mineral Resources. This could cause material adjustments in our financial statements to:
–Depreciation and amortisation rates;
–Carrying values of intangible assets and property, plant and equipment;
–Deferred stripping costs;
–Provisions for close-down and restoration costs; and
–Recovery of deferred tax assets.
h.Impact of climate change on the Group
The impact of climate change and the execution of our climate change strategy on our financial statements is discussed below:
Climate change scenarios
Our strategy and approach to climate change are informed by an analysis of the interplay of global megatrends, explored through the lens of plausible global scenarios. These set the context for our industry and underpin our commodity price outlooks, portfolio and capital allocation choices and how we operate as a business. There are many plausible scenarios for global energy transition, all with different impacts on future commodity price outcomes. As part of our 2022 strategy process, we replaced our three scenarios described in the 2021 Annual Report and now focus on two core scenarios. These are used to generate a single central Reference Case for use in commodity pricing forecasts, valuation models and reserves and resources determination, as was the case in the prior year. These changes in scenarios represent an evolution of our interpretation and estimations in the current year, not a
change in accounting policy, and as such we have not restated comparative information. Our two core scenarios are:
–Competitive Leadership scenario, limiting global warming to approximately 2°C by 2100, reflects a rapidly developing world of high growth and strong climate action post-2030 with change driven by policy and competitive innovation. As a result, we expect that countries achieve their Glasgow Climate Pact commitments. Global weighted average carbon prices are forecast to rise rapidly at an average of 8% per year over the next three decades, reaching US$42/tCO2e in 2030, and rising rapidly post-2030 to incentivise significant mitigation in industrial sectors post-2030.
–Fragmented Leadership scenario, with global warming exceeding 2.5°C by 2100, is characterised by limited progress on policy reform with volatile low growth. We expect that nations eventually achieve their 2030 Nationally Determined Contributions as agreed in Paris in 2015 but fail to progress towards long term carbon goals agreed at the UN Climate Summit COP26 Glasgow. Global weighted average carbon prices are forecast to rise slowly, at an average of 2.9% per year over the period to 2050, reaching US$42 in 2030; but remain too low post-2030 to incentivise significant mitigation in industrial sectors resulting in flat global emissions post-2030.
At the UN Climate Summit in late 2022 (COP27), there was broad recognition that the pace of decarbonisation across the global economy is too slow to limit warming to 1.5°C and that current climate policies in many countries are not yet aligned with their stated ambitions. Consequently, neither of our two core scenarios is consistent with the expectation of climate policies required to accelerate the global transition to meet the stretch goal of the Paris Agreement. Although our operational emissions reduction targets align with the goals of the Paris Agreement, our two core scenarios do not. Consequently, we also assess our sensitivity and test the economic performance of our business against a scenario we have developed to reflect our view of the global actions required to meet the stretch goal of the Paris Agreement. We refer to this Paris-aligned scenario as the Aspirational Leadership scenario.
Importantly none of our three scenarios are considered a definitive representation for our assessment of the future impact of climate change on the Group. Scenario modelling has inherent limitations and by its nature allows a range of possible outcomes to be considered where it is impossible to predict which outcome is likely.
The Aspirational Leadership scenario reflects a world of high growth, significant social change and accelerated climate action. Global weighted average carbon prices rise rapidly – at an average of 9.3% per year over the next three decades – reaching $59/tCO2e in 2030 and incentivise rapid and deep reductions in industrial emissions post-2030. Despite geopolitical differences, major economies work together through multilateral frameworks and proactively work towards limiting temperature change to 1.5°C by 2050. The Aspirational Leadership scenario is a commodity sales price and carbon tax sensitivity, with all other inputs remaining equal to our Reference Case; and is built by design to reach net-zero emissions globally by 2050 and help us better understand the pathways to meet the Paris Agreement goal, and what this could mean for our business. It is used for strategy and risk discussions, including analysis of sensitivity to our view of a Paris-aligned pathway and comparison of relative economic performance to our core scenarios.
We do not publish the commodity price forecasts associated with these scenarios as to do so would weaken our position in commercial negotiations and might give rise to concerns from other market participants.
152 Annual Report on Form 20-F 2022 | riotinto.com
Physical risk
In 2022, we launched the Physical Resilience Programme across the Group. During the year we commenced a physical risk and resilience assessment across prioritised risk areas: the entire Pilbara iron ore operation and the Saguenay aluminium operations focused on Lac Saint-Jean. Our ongoing review processes, including impairment assessments, have not identified any material accounting impacts to date. For example, in 2022, no write-offs are necessary in the Pilbara, where certain infrastructure assets, such as transmission lines, that have reached the end of their natural lives are being replaced with climate resilient infrastructure. In addition, we do not foresee the renewal of our contractual water rights in Canada that have been classified as indefinite-lived intangible assets to be at risk from climate change (note 12). Further, closure planning considers future climate change projections at each step of the process to support safe and appropriate final landform design. In 2023, we will progress a Group-wide top-down assessment to further understand the risks and opportunities associated with physical climate change and to quantify any financial impacts, in addition to the site-specific bottom-up assessments, which will continue in the foreseeable future.
Accounting judgments and estimates
Global decarbonisation and the world’s energy transition continues to evolve, with the potential to materially impact our future financial results as our significant accounting judgments and key estimates are updated to reflect prevailing circumstances. In response, carrying values of assets and liabilities could be materially affected in future periods. Our current strategy and approach to decarbonise our operations and achieve our scope 1 and 2 emissions targets is considered in our significant judgments and key estimates reflected in these financial results.
Impacts from executing our climate change strategy - accounting for capital expenditure and operating costs underpinning our Climate Action Plan
Given the significant investment we are making to abate our carbon emissions, we have considered the potential for asset obsolescence, with a particular focus on our Pilbara operations where we are prioritising investment in renewables to switch away from natural gas power generation. No material changes to accounting estimates to useful economic lives have been necessary due to the anticipated use of these assets for firming support in the transition (note 13). As the renewable projects progress, it is possible that such adjustments may be identified in the future. The renewable assets in the Pilbara are our own built and operated arrangements and follow normal rules on capitalisation of directly attributable costs. The solar power purchase agreement for RBM is accounted for on an accrual basis as energy is produced.
There are no accounting impacts to date from the programme to develop renewable energy solutions for our Queensland aluminium assets as the work has not been completed and commercial terms have not been agreed. Large scale renewable power off-take arrangements may, in the future, require complex derivative measurement or lease accounting depending on contractual terms.
No adjustments to useful lives of the existing fleet have been identified to date as a result of planned fleet electrification in the Pilbara and the purchase of battery-powered locomotives. The solutions are still in development or pilot stages and the gradual fleet replacement is intended to be part of the normal lifecycle renewal of trucks. Depending on technological development, which is highly uncertain, this could lead to accelerated depreciation in the future. Similarly, our target to have net zero vessels in our portfolio by 2030 has not given rise to accounting adjustments to date, as the replacement is planned as part of the lifecycle renewal. The energy efficiency digestion project at Queensland Alumina refinery does not reduce the economic lives of the underlying alumina assets but could lower operating costs and improve margins. The expenditure on our own carbon abatement projects and technology advancements follows existing accounting policies on cost capitalisation, research and development costs.
Annual Report on Form 20-F 2022 | riotinto.com 153
Financial statements continued
Use of sensitivities to Paris aligned accounting
The forecast commodity prices (including carbon prices) informed by a blend of our two scenarios are used pervasively in our financial processes from budgeting, forecasting, capital allocation and project evaluation to the determination of ore reserves. In turn, these prices are used to derive critical accounting estimates included as inputs to impairment testing, estimation of remaining economic life for units of production depreciation and discounting closure and rehabilitation provisions. These prices represent our best estimate of actual market outcomes based on the range of future economic conditions regarding matters largely outside our control, as required by IFRS. As neither of our core scenarios represents the Group’s view of the goals of the Paris Agreement, our commodity price assumptions used in accounting estimates are not consistent with the expectation of climate policies required to accelerate the global transition to meet the goals of the Paris Agreement. As described above, we use our Aspirational Leadership scenario to understand the sensitivity of these estimates to Paris aligned assumptions.
Under the Aspirational Leadership scenario, which is not used in the preparation of these financial statements, nor for budgeting purposes, the economic performance of copper and aluminium is expected to be stronger under supply and demand forward pricing curves which we believe will be consistent with the Paris Agreement. It is possible therefore, under the right conditions, that historical impairments associated with these assets could reverse. We recognised an impairment of US$202 million during the year for the Boyne smelter cash-generating unit, triggered by economic and operating performance of the smelter (note 4). When measuring the recoverable amount for this cash-generating unit we utilised net present value of cash flows to the end of the existing joint venture agreements in 2029, which also coincides with the Group’s targeted carbon emission reductions by 2030. The Group continues to evaluate lower emission power solutions for the smelter that could extend its life to at least 2040. In such circumstances, the net present value of forecast future cash flows could support the reversal of past impairments. Both the recorded outcome and the sensitivity represent a reduction in emissions that we considered to be Paris-aligned.
In the Aspirational Leadership scenario the prices for lower-grade iron ore are supported in the medium term by an assumed underlying
increase in GDP-driven demand. However, in the longer term we assume the pricing for lower grade iron ore to be weaker than in our core scenarios. This will depend on the development of low-emissions steel technology, the pace of which is uncertain, but is expected to be offset by higher prices for higher-grade iron ore. This is unlikely to give rise to impairment triggers for 2022 or in the foreseeable future due to the high returns on capital employed in the Pilbara.
We completed the divestments of our coal businesses in 2018 and no longer mine coal, but retained a contingent royalty from these divestments. Recent favourable coal prices exceeded contractual benchmark levels and resulted in the cash royalty receipt of US$36 million during 2022. We also carry royalty receivables of US$209 million on our balance sheet at 31 December 2022, measured at fair value (note 24). The fair value of this balance may be adversely impacted in the future by a faster pace of transition to a low carbon economy, but this impact is not expected to be material.
Closure dates and cost of closure are also sensitive to climate assumptions, but no material changes have been identified in the year specific to climate change that would require a material revision to the provisions in 2022. For those commodities with higher forward price curves under the Aspirational Leadership scenario, it may be economical to mine lower mineral grades, which could result in the conversion of additional Mineral Resources to Ore Reserves and therefore longer dated closure.
Overall, based on the Aspirational Leadership scenario pricing outcomes, and with all other assumptions remaining consistent with those applied to our 2022 financial statements, we do not currently envisage a material adverse impact of the 1.5°C Paris-aligned sensitivity on asset carrying values, remaining useful life, or closure and rehabilitation provisions for the Group. It is possible that other factors may arise in the future, which are not known today, that may impact this assessment.
Additional commentary on the impact of climate change on our business is included in the following notes:
154 Annual Report on Form 20-F 2022 | riotinto.com
| | | | | | | | | | | |
| | |
| Financial reporting considerations and sensitivities related to climate change | Page | |
| Recoverable value of our assets, asset obsolescence, impairment and use of sensitivities (note 4) | | |
| Operating expenditure spend on decarbonisation (note 7 - footnote (h)) | | |
| Water rights - climate impact on indefinite life (note 12) | | |
| Estimation of asset lives (note 13) | | |
| Additions to property, plant and equipment with a primary purpose of reducing carbon emissions (note 13 - footnote (d)) | | |
| Useful economic lives of power generating assets (note 13) | | |
| Close-down, restoration and environmental cost (note 14) | | |
| Coal royalty receivables (note 24) | | |
| | | |
i.New standards issued and effective in the current year
Our financial statements have been prepared on the basis of accounting policies consistent with those applied in the financial statements for the year ended 31 December 2021, except for the accounting requirements set out below, effective as at 1 January 2022. These did not have a significant impact on our financial statements.
Proceeds before Intended Use (Amendments to IAS 16 “Property, Plant and Equipment”)
We adopted Proceeds before Intended Use (Amendments to IAS 16 “Property, Plant and Equipment”) at 1 January 2022. The amendment prohibits the deduction, from the cost of major project construction work in progress, of proceeds (net of additional processing costs) from selling items before the related item of property, plant and equipment is available for use. Under the amendment, proceeds from selling items before the related item of property, plant and equipment is available for use are recognised within “Consolidated sales revenue” in the income statement along with the costs of producing those items within “Net operating costs (excluding items disclosed separately)”. We apportion development expenditure in the period to derive the cost associated with pre-production revenue, based on the tonnes produced in the period as a percentage of the total expected production (estimated total ore reserve). During 2021 we completed a review of the impact of these amendments and concluded that adjustments to retained earnings as at 1 January 2020, and restatement of the 2020 and 2021 Group Income Statement and Balance Sheet upon adoption of the amendments, were insignificant and as a result no restatements were made to comparative periods. During the year ended 31 December 2022 we recognised in the income statement pre-production revenue of US$511 million and related costs of US$30 million in relation to Gudai Darri and Oyu Tolgoi.
Onerous Contracts – Cost of Fulfilling a Contract (Amendments to IAS 37 “Provisions, Contingent Liabilities and Contingent Assets”)
We adopted Onerous Contracts – Cost of Fulfilling a Contract (Amendments to IAS 37 “Provisions, Contingent Liabilities and Contingent Assets”) at 1 January 2022. The amendments specify that the costs an entity includes in determining whether a contract is onerous are made up of all directly related costs, including both incremental amounts and an allocation of other directly related expenditure. Previously, we made provision for onerous contracts when the assets dedicated to the contract were fully impaired or the contract became stranded as a result of a business decision. From 2022, we record a provision if a contract is found to be loss-making on a stand-alone basis following allocation of all directly related costs as required by the amendments to IAS 37.
We have applied the amendments without revision to comparative amounts. We have increased other provisions and reduced our retained earnings as at 1 January 2022 by US$17 million.
Annual Report on Form 20-F 2022 | riotinto.com 155
Financial statements continued
Group Income Statement
Years ended 31 December
| | | | | | | | | | | | | | |
| Note | 2022 US$m | 2021 US$m | 2020 US$m |
| | | | |
| Consolidated operations | | | | |
| Consolidated sales revenue | 1, 6 | 55,554 | | 63,495 | | 44,611 | |
| Net operating costs (excluding items disclosed separately) | 7 | (34,770) | | (32,690) | | (26,254) | |
| Impairment reversals/(charges net of reversals) | 4 | 150 | | (269) | | (904) | |
| Loss on disposal of interest in subsidiary | 5 | (105) | | — | | — | |
| | | | |
| | | | |
| Exploration and evaluation expenditure (net of profit relating to interests in undeveloped projects) | 8 | (896) | | (719) | | (624) | |
| Operating profit | | 19,933 | | 29,817 | | 16,829 | |
| Share of profit after tax of equity accounted units | | 777 | | 1,042 | | 652 | |
| | | | |
| | | | |
| Impairment of investments in equity accounted units | 4 | (202) | | — | | (339) | |
| Profit before finance items and taxation | | 20,508 | | 30,859 | | 17,142 | |
| Finance items | | | | |
| Net exchange gains/(losses) on external and intragroup net (debt)/cash balances | | 253 | | 802 | | (1,124) | |
| Net losses on derivatives not qualifying for hedge accounting | | (424) | | (231) | | (123) | |
| Finance income | 9 | 179 | | 64 | | 141 | |
| Finance costs | 9 | (335) | | (243) | | (268) | |
| Amortisation of discount on provisions | 14, 36 | (1,519) | | (418) | | (377) | |
| | (1,846) | | (26) | | (1,751) | |
| Profit before taxation | | 18,662 | | 30,833 | | 15,391 | |
| Taxation | 10 | (5,586) | | (8,258) | | (4,991) | |
| | | | |
| | | | |
| | | | |
| Profit after tax for the year | | 13,076 | | 22,575 | | 10,400 | |
| – attributable to owners of Rio Tinto (net earnings) | | 12,420 | | 21,094 | | 9,769 | |
| – attributable to non-controlling interests | | 656 | | 1,481 | | 631 | |
| | | | |
| Basic earnings per share | 2 | 766.8 | c | 1,303.4 | c | 604.0 | c |
| Diluted earnings per share | 2 | 762.1 | c | 1,295.0 | c | 599.8 | c |
The notes on pages 148 to 155 and pages 161 to 223 are an integral part of these consolidated financial statements. 156 Annual Report on Form 20-F 2022 | riotinto.com
Financial statements
Group Statement of Comprehensive Income
Years ended 31 December
| | | | | | | | | | | | | | |
| Note | 2022 US$m | 2021 US$m | 2020 US$m |
| Profit after tax for the year | | 13,076 | | 22,575 | | 10,400 | |
| | | | |
| Other comprehensive (loss)/income | | | | |
| Items that will not be reclassified to the income statement: | | | | |
| | | | |
| | | | |
| Re-measurement gains/(losses) on pension and post-retirement healthcare plans | 28 | 578 | | 1,026 | | (474) | |
| | | | |
| | | | |
| Changes in the fair value of equity investments held at fair value through other comprehensive income (FVOCI) | | — | | 5 | | 10 | |
| | | | |
| | | | |
| | | | |
| Tax relating to these components of other comprehensive income | 10 | (123) | | (305) | | 112 | |
| | | | |
| | | | |
| | | | |
| | | | |
| Share of other comprehensive income/(losses) of equity accounted units, net of tax | | 5 | | 12 | | (6) | |
| | | | |
| | 460 | | 738 | | (358) | |
| | | | |
| Items that have been/may be subsequently reclassified to the income statement: | | | | |
| | | | |
| | | | |
| | | | |
| | | | |
Currency translation adjustment(a) | | (2,371) | | (1,843) | | 2,967 | |
| Currency translation on subsidiary disposed of, transferred to the income statement | | 105 | | — | | — | |
| Fair value movements: | | | | |
| | | | |
| | | | |
| – Cash flow hedge (losses)/gains | | (167) | | (211) | | 24 | |
| | | | |
| | | | |
| | | | |
| | | | |
| – Cash flow hedge losses/(gains) transferred to the income statement | | 106 | | 14 | | (63) | |
| | | | |
| | | | |
| | | | |
| | | | |
| | | | |
| | | | |
| | | | |
| | | | |
| | | | |
| | | | |
| | | | |
| Net change in costs of hedging reserve | 35 | 4 | | (18) | | 7 | |
| | | | |
| | | | |
| | | | |
| | | | |
| | | | |
| | | | |
| | | | |
| | | | |
| | | | |
| | | | |
| | | | |
| | | | |
| | | | |
| | | | |
| | | | |
| | | | |
| | | | |
| | | | |
| | | | |
| | | | |
| | | | |
| | | | |
| | | | |
| | | | |
| Tax relating to these components of other comprehensive loss | 10 | 21 | | 62 | | 3 | |
| | | | |
| | | | |
| | | | |
| | | | |
| | | | |
| | | | |
| | | | |
| | | | |
| | | | |
| | | | |
| | | | |
| | | | |
| | | | |
| | | | |
| | | | |
| | | | |
| | | | |
| | | | |
| | | | |
| | | | |
| | | | |
| | | | |
| | | | |
| | | | |
| | | | |
| | | | |
| | | | |
| | | | |
| | | | |
| | | | |
| Share of other comprehensive (losses)/income of equity accounted units, net of tax | | (27) | | (12) | | 4 | |
| | (2,329) | | (2,008) | | 2,942 | |
| Total other comprehensive (loss)/income for the year, net of tax | | (1,869) | | (1,270) | | 2,584 | |
| Total comprehensive income for the year | | 11,207 | | 21,305 | | 12,984 | |
| – attributable to owners of Rio Tinto | | 10,705 | | 19,896 | | 12,201 | |
| – attributable to non-controlling interests | | 502 | | 1,409 | | 783 | |
(a)Excludes a currency translation charge of US$240 million (2021: charge of US$211 million; 2020: gain of US$333 million) arising on Rio Tinto Limited’s share capital for the year ended 31 December 2022, which is recognised in the Group statement of changes in equity. Refer to the Group statement of changes in equity on page 160. The notes on pages 148 to 155 and pages 161 to 223 are an integral part of these consolidated financial statements. Annual Report on Form 20-F 2022 | riotinto.com 157
Financial statements continued
Group Cash Flow Statement
Years ended 31 December
| | | | | | | | | | | | | | |
| Note | 2022 US$m | 2021 US$m | 2020 US$m |
Cash flows from consolidated operations(a) | | 23,158 | | 33,936 | | 21,822 | |
| Dividends from equity accounted units | | 879 | | 1,431 | | 594 | |
| Cash flows from operations | | 24,037 | | 35,367 | | 22,416 | |
| | | | |
| Net interest paid | | (573) | | (438) | | (569) | |
| Dividends paid to holders of non-controlling interests in subsidiaries | | (421) | | (1,090) | | (683) | |
| Tax paid | | (6,909) | | (8,494) | | (5,289) | |
| Net cash generated from operating activities | | 16,134 | | 25,345 | | 15,875 | |
| | | | |
| Cash flows from investing activities | | | | |
| Purchases of property, plant and equipment and intangible assets | 1 | (6,750) | | (7,384) | | (6,189) | |
| Sales of property, plant and equipment and intangible assets | | — | | 61 | | 45 | |
| Acquisitions of subsidiaries, joint ventures and associates | 5 | (850) | | — | | — | |
| | | | |
| | | | |
| Disposals of subsidiaries, joint ventures, unincorporated joint operations and associates | 5 | 80 | | 4 | | 10 | |
| Purchases of financial assets | | (55) | | (45) | | (5) | |
Sales of financial assets(b)(c) | | 892 | | 114 | | 63 | |
| Net (funding of)/receipts from equity accounted units | | (75) | | 6 | | (43) | |
Other investing cash flows(d) | | 51 | | 85 | | (437) | |
| Net cash used in investing activities | | (6,707) | | (7,159) | | (6,556) | |
| | | | |
| Cash flows before financing activities | | 9,427 | | 18,186 | | 9,319 | |
| | | | |
| Cash flows from financing activities | | | | |
| Equity dividends paid to owners of Rio Tinto | 3 | (11,727) | | (15,357) | | (6,132) | |
Proceeds from additional borrowings(e) | 19, 20 | 321 | | 1,488 | | 125 | |
| | | | |
| | | | |
Repayment of borrowings and associated derivatives(e) | 19, 20 | (790) | | (1,707) | | (721) | |
| Lease principal payments | 19, 22 | (374) | | (358) | | (324) | |
| Proceeds from issue of equity to non-controlling interests | | 86 | | 66 | | 129 | |
Purchase of non-controlling interest(f) | 5, 30 | (2,961) | | — | | — | |
| Own shares purchased from owners of Rio Tinto | | — | | — | | (208) | |
| | | | |
| | | | |
| | | | |
| Other financing cash flows | | (28) | | 6 | | 1 | |
| Net cash used in financing activities | | (15,473) | | (15,862) | | (7,130) | |
| | | | |
| | | | |
| | | | |
| | | | |
| Effects of exchange rates on cash and cash equivalents | | 15 | | 100 | | 165 | |
| Net (decrease)/increase in cash and cash equivalents | | (6,031) | | 2,424 | | 2,354 | |
| Opening cash and cash equivalents less overdrafts | | 12,805 | | 10,381 | | 8,027 | |
| Closing cash and cash equivalents less overdrafts | 22 | 6,774 | | 12,805 | | 10,381 | |
| | | | |
| | | | |
| | | | |
| | | | |
| | | | |
| | | | |
| | | | |
| | | | |
| | | | |
| | | | |
| | | | |
| | | | |
| | | | |
| | | | |
| | | | |
| | | | |
| | | | |
| | | | |
| | | | |
| | | | |
| | | | |
| | | | |
| | | | |
| | | | |
| | | | |
| | | | |
| | | | |
| | | | |
| | | | |
| | | | |
| | | | | | | | | | | | | | |
| Notes to the Group Cash Flow Statement | | | | |
| (a) Cash flows from consolidated operations | Note | 2022
US$m | 2021
US$m | 2020
US$m |
| Profit after tax for the year | | 13,076 | | 22,575 | | 10,400 | |
| Adjustments for: | | | | |
| – Taxation | | 5,586 | | 8,258 | | 4,991 | |
| | | | |
| | | | |
| | | | |
| | | | |
| – Finance items | | 1,846 | | 26 | | 1,751 | |
| – Share of profit after tax of equity accounted units | | (777) | | (1,042) | | (652) | |
| | | | |
| | | | |
| – Loss on disposal of interest in subsidiary | 5 | 105 | | — | | — | |
| – Impairment charges of investments in equity accounted units after tax | 4 | 202 | | — | | 339 | |
| – Impairment reversal/(charges net of reversals) | 4 | (150) | | 269 | | 904 | |
| – Depreciation and amortisation | | 5,010 | | 4,697 | | 4,279 | |
| – Provisions (including exchange differences on provisions) | | 1,006 | | 1,903 | | 894 | |
| – Pension settlement | | — | | (291) | | — | |
| Utilisation of other provisions | 36 | (176) | | (128) | | (139) | |
| Utilisation of provisions for close-down and restoration | 14 | (609) | | (541) | | (366) | |
| Utilisation of provisions for post-retirement benefits and other employment costs | 26 | (254) | | (231) | | (269) | |
| | | | |
| | | | |
| Change in inventories | | (1,185) | | (1,397) | | (281) | |
Change in receivables and other assets(g) | | 20 | | (367) | | (562) | |
| Change in trade and other payables | | 700 | | 685 | | 558 | |
| | | | |
| | | | |
| | | | |
| | | | |
Other items(h) | | (1,242) | | (480) | | (25) | |
| | 23,158 | | 33,936 | | 21,822 | |
(b)In 2022, we received net proceeds of US$352 million (2021: US$107 million and 2020: US$58 million) from our sales and purchases of investments within a separately managed portfolio of fixed income instruments. Purchases and sales of these securities are reported on a net cash flow basis within “Sales of financial assets” or “Purchases of financial assets” depending on the overall net position at each reporting date.
(c)Sale of financial assets includes US$525 million of cash received from the sale of the gross production royalty at the Cortez Complex in Nevada, USA, refer to note 1 and note 7.
(d)In 2022 other investing cash flows includes inflows relating to payments from a trust fund controlled by the Government of Australia to Energy Resources Australia (‘ERA’) for closure activity that has been completed. In 2020 other investing cash flows included an outflow relating to ERA contributing to this trust fund of US$299 million. At 31 December 2022 the total amount held in the trust fund was US$329 million (31 December 2021: US$388 million). In 2021 other investing cash flows included a net settlement upon completion of a transaction increasing the Group’s 60% share in the Diavik Diamond Mine to sole ownership.
(e)In 2021, we issued US$1.25 billion 30-years fixed rate SEC-registered debt securities with a coupon of 2.75%. The funds were received net of issuance fees and discount. We also completed a US$1.2 billion (nominal value) bond buy-back programme. During 2020, we repaid our €402 million (nominal value) Rio Tinto Finance plc Euro Bonds on their maturity.
(f)On 16 December 2022 we acquired the remaining 49% share of Turquoise Hill Resources for expected consideration of US$3.2 billion inclusive of transaction fees. At 31 December 2022 US$2,961 million had been paid.
(g)In 2021, the Mongolian Tax Authority required payment by Oyu Tolgoi of US$356 million in relation to disputed tax matters. Oyu Tolgoi continues to dispute the matters and has classified amounts subject to international arbitration as prepayments pending resolution.
(h)Other items includes the deduction of the US$432 million relating to the gain recognised on sale of the Cortez royalty shown in “Sale of financial assets” and the recognition of realised losses of US$459 million on currency forwards not designated as hedges (2021: realised losses US$131 million, 2020: realised losses US$179 million). In 2021 other items also included US$336 million relating to a gain on recognition of a new wharf at Kitimat, Canada with no associated cash flow.
The notes on pages 148 to 155 and pages 161 to 223 are an integral part of these consolidated financial statements. 158 Annual Report on Form 20-F 2022 | riotinto.com
Financial statements
Group Balance Sheet
At 31 December
| | | | | | | | | | | |
| Note | 2022 US$m | 2021 US$m |
| Non-current assets | | | |
| Goodwill | 11 | 826 | | 879 | |
| Intangible assets | 12 | 3,645 | | 2,832 | |
| Property, plant and equipment | 13 | 64,734 | | 64,927 | |
| Investments in equity accounted units | | 3,298 | | 3,504 | |
| Inventories | 16 | 203 | | 196 | |
| Deferred tax assets | 15 | 2,766 | | 3,375 | |
| Receivables and other assets | 17 | 1,893 | | 2,194 | |
| Tax recoverable | | — | | 29 | |
| | | |
| | | |
| Other financial assets | 23 | 406 | | 528 | |
| | 77,771 | | 78,464 | |
| Current assets | | | |
| Inventories | 16 | 6,213 | | 5,436 | |
| Receivables and other assets | 17 | 3,478 | | 3,574 | |
| Tax recoverable | | 347 | | 72 | |
| | | |
| | | |
| Other financial assets | 23 | 2,160 | | 2,543 | |
| Cash and cash equivalents | 22 | 6,775 | | 12,807 | |
| | 18,973 | | 24,432 | |
| | | |
| Total assets | | 96,744 | | 102,896 | |
| | | |
| Current liabilities | | | |
| Borrowings | 20 | (923) | | (812) | |
| Leases | 21 | (292) | | (324) | |
| Other financial liabilities | 23 | (69) | | (245) | |
| Trade and other payables | 18 | (8,047) | | (7,733) | |
| Tax payable | | (223) | | (1,407) | |
| Close-down and restoration provisions | 14 | (1,142) | | (1,023) | |
| Provisions for post-retirement benefits and other employment costs | 26 | (353) | | (383) | |
| Other provisions | 36 | (554) | | (700) | |
| | (11,603) | | (12,627) | |
| Non-current liabilities | | | |
| Borrowings | 20 | (10,148) | | (11,356) | |
| Leases | 21 | (908) | | (1,039) | |
| Other financial liabilities | 23 | (904) | | (393) | |
| Trade and other payables | 18 | (604) | | (798) | |
| Tax payable | | (36) | | (660) | |
| Deferred tax liabilities | 15 | (3,601) | | (3,503) | |
| Close-down and restoration provisions | 14 | (14,617) | | (13,519) | |
| Provisions for post-retirement benefits and other employment costs | 26 | (1,305) | | (2,109) | |
| Other provisions | 36 | (744) | | (302) | |
| | (32,867) | | (33,679) | |
| | | |
| Total liabilities | | (44,470) | | (46,306) | |
| Net assets | | 52,274 | | 56,590 | |
| | | |
| Capital and reserves | | | |
| Share capital | | | |
| – Rio Tinto plc | 34 | 207 | | 207 | |
| | | |
| | | |
| | | |
| | | |
| – Rio Tinto Limited | 34 | 3,330 | | 3,570 | |
| Share premium account | | 4,322 | | 4,320 | |
| Other reserves | 35 | 7,805 | | 9,998 | |
| Retained earnings | 35 | 34,511 | | 33,337 | |
| Equity attributable to owners of Rio Tinto | | 50,175 | | 51,432 | |
| Attributable to non-controlling interests | | 2,099 | | 5,158 | |
| Total equity | | 52,274 | | 56,590 | |
The notes on pages 148 to 155 and pages 161 to 223 are an integral part of these consolidated financial statements. The financial statements on pages 148 to 223 were approved by the directors on 22 February 2023 and signed on their behalf by | | | | | | | | | | | | | | |
| | | | |
Dominic Barton Chair | | Jakob Stausholm Chief Executive | | Peter Cunningham Chief Financial Officer |
Annual Report on Form 20-F 2022 | riotinto.com 159
Financial statements continued
Group Statement of Changes in Equity
| | | | | | | | | | | | | | | | | | | | | | | |
| Year ended 31 December 2022 | Attributable to owners of Rio Tinto |
| |
Share capital
(note 34)
US$m | Share premium
account
US$m | Other reserves
(note 35)
US$m | Retained earnings
(note 35)
US$m | Total
US$m | Non-controlling
interests
US$m | Total
equity
US$m |
| | | | | | | |
| | | | | | | |
| Opening balance | 3,777 | | 4,320 | | 9,998 | | 33,337 | | 51,432 | | 5,158 | | 56,590 | |
| Adjustment for transition to new accounting pronouncements | — | | — | | — | | (17) | | (17) | | — | | (17) | |
| Revised opening balance | 3,777 | | 4,320 | | 9,998 | | 33,320 | | 51,415 | | 5,158 | | 56,573 | |
Total comprehensive income for the year(a) | — | | — | | (2,165) | | 12,870 | | 10,705 | | 502 | | 11,207 | |
| Currency translation arising on Rio Tinto Limited's share capital | (240) | | — | | — | | — | | (240) | | — | | (240) | |
| Dividends (note 3) | — | | — | | — | | (11,716) | | (11,716) | | (421) | | (12,137) | |
| | | | | | | |
| | | | | | | |
| | | | | | | |
| | | | | | | |
| | | | | | | |
| | | | | | | |
| Own shares purchased from Rio Tinto shareholders to satisfy share awards to employees | — | | — | | (84) | | (16) | | (100) | | — | | (100) | |
Change in equity interest held by Rio Tinto (note 5) | — | | — | | — | | 701 | | 701 | | (3,907) | | (3,206) | |
| Treasury shares reissued and other movements | — | | 2 | | — | | — | | 2 | | — | | 2 | |
| Equity issued to holders of non-controlling interests (note 30) | — | | — | | — | | (711) | | (711) | | 797 | | 86 | |
| | | | | | | |
| | | | | | | |
| | | | | | | |
| | | | | | | |
| Employee share awards charged to the income statement | — | | — | | 56 | | 63 | | 119 | | — | | 119 | |
| | | | | | | |
| | | | | | | |
| | | | | | | |
| | | | | | | |
| Transfers and other movements | — | | — | | — | | — | | — | | (30) | | (30) | |
| | | | | | | |
| | | | | | | |
| | | | | | | |
| | | | | | | |
| | | | | | | |
| | | | | | | |
| | | | | | | |
| Closing balance | 3,537 | | 4,322 | | 7,805 | | 34,511 | | 50,175 | | 2,099 | | 52,274 | |
| | | | | | | |
| | | | | | | |
| | | | | | | |
| Year ended 31 December 2021 | Attributable to owners of Rio Tinto | | |
Share capital
(note 34)
US$m | Share premium
account
US$m | Other reserves
(note 35)
US$m | Retained earnings
(note 35)
US$m | Total
US$m | Non-controlling
interests
US$m | Total
equity
US$m |
| Opening balance | 3,988 | | 4,314 | | 11,960 | | 26,792 | | 47,054 | | 4,849 | | 51,903 | |
| | | | | | | |
| | | | | | | |
Total comprehensive income for the year(a) | — | | — | | (1,916) | | 21,812 | | 19,896 | | 1,409 | | 21,305 | |
| Currency translation arising on Rio Tinto Limited's share capital | (211) | | — | | — | | — | | (211) | | — | | (211) | |
| Dividends (note 3) | — | | — | | — | | (15,385) | | (15,385) | | (1,090) | | (16,475) | |
| | | | | | | |
| | | | | | | |
| Own shares purchased from Rio Tinto shareholders to satisfy share awards to employees | — | | — | | (95) | | (18) | | (113) | | — | | (113) | |
| Change in equity interest held by Rio Tinto | — | | — | | — | | 76 | | 76 | | (76) | | — | |
| Treasury shares reissued and other movements | — | | 6 | | — | | — | | 6 | | — | | 6 | |
| Equity issued to holders of non-controlling interests | — | | — | | — | | — | | — | | 66 | | 66 | |
| Employee share awards charged to the income statement | — | | — | | 49 | | 60 | | 109 | | — | | 109 | |
| | | | | | | |
| Closing balance | 3,777 | | 4,320 | | 9,998 | | 33,337 | | 51,432 | | 5,158 | | 56,590 | |
| | | | | | | |
| Year ended 31 December 2020 | Attributable to owners of Rio Tinto | | |
Share capital
(note 34)
US$m | Share premium
account
US$m | Other reserves
(note 35)
US$m | Retained earnings
(note 35)
US$m | Total
US$m | Non-controlling
interests
US$m | Total
equity
US$m |
| Opening balance | 3,655 | | 4,313 | | 9,177 | | 23,387 | | 40,532 | | 4,710 | | 45,242 | |
| | | | | | | |
| | | | | | | |
Total comprehensive income for the year(a) | — | | — | | 2,798 | | 9,403 | | 12,201 | | 783 | | 12,984 | |
| Currency translation arising on Rio Tinto Limited's share capital | 333 | | — | | — | | — | | 333 | | — | | 333 | |
| Dividends (note 3) | — | | — | | — | | (6,132) | | (6,132) | | (689) | | (6,821) | |
| Share buy-back | — | | — | | — | | (1) | | (1) | | — | | (1) | |
| | | | | | | |
| Own shares purchased from Rio Tinto shareholders to satisfy share awards to employees | — | | — | | (76) | | (31) | | (107) | | — | | (107) | |
| Change in equity interest held by Rio Tinto | — | | — | | — | | 84 | | 84 | | (84) | | — | |
| Treasury shares reissued and other movements | — | | 1 | | — | | — | | 1 | | — | | 1 | |
| Equity issued to holders of non-controlling interests | — | | — | | — | | — | | — | | 129 | | 129 | |
| Employee share awards charged to the income statement | — | | — | | 61 | | 82 | | 143 | | — | | 143 | |
| | | | | | | |
| Closing balance | 3,988 | | 4,314 | | 11,960 | | 26,792 | | 47,054 | | 4,849 | | 51,903 | |
The notes on pages 148 to 155 and pages 161 to 223 are an integral part of these consolidated financial statements. (a)Refer to the Group statement of comprehensive income for further details. Adjustments to other reserves include currency translation attributable to owners of Rio Tinto, other than that arising on Rio Tinto Limited’s share capital.
160 Annual Report on Form 20-F 2022 | riotinto.com
Financial statements
Notes to the 2022 financial statements
Our financial performance
We use a number of measures, including segmental revenue, underlying EBITDA, and capital expenditure to provide us with a greater understanding of our operations’ underlying business performance including revenue generation, productivity and cost management, on a comparable basis between reporting years.
1 Our financial performance by segment
Our management structure is based on principal product groups (PG) together with global support functions whose leaders make up the Executive Committee. The Executive Committee members each report directly to our Chief Executive who is the chief operating decision maker (CODM) and is responsible for allocating resources and assessing performance of the operating segments. The CODM’s primary measure of profit is underlying EBITDA. Finance costs and net debt are managed on a Group-wide basis and are therefore excluded from the segmental results.
Our reportable segments are as follows:
| | | | | |
| Reportable segment | Principal activities |
| Iron Ore | Iron ore mining and salt and gypsum production in Western Australia. |
| Aluminium | Bauxite mining; alumina refining; aluminium smelting. |
| Copper | Mining and refining of copper, gold, silver, molybdenum and other by-products; exploration activities together with the Simandou iron ore project, which was the responsibility of the Copper product group chief executive during 2022. |
| Minerals | Includes businesses with products such as borates, titanium dioxide feedstock together with the Iron Ore Company of Canada (iron ore mining and iron concentrate/pellet production). Also includes diamond mining, sorting and marketing. |
| | | | | | | | | | | | | |
| Year ended 31 December 2022 | Segmental revenue
US$m | Underlying EBITDA
US$m | | Capital expenditure(a) US$m | |
| Iron Ore | 30,906 | | 18,612 | | | 2,940 | | |
| Aluminium | 14,109 | | 3,672 | | | 1,377 | | |
| Copper | 6,699 | | 2,376 | | | 1,622 | | |
| Minerals | 6,754 | | 2,419 | | | 679 | | |
| Reportable segments total | 58,468 | | 27,079 | | | 6,618 | | |
| Other Operations | 192 | | (16) | | | 53 | | |
| Inter-segment transactions | (256) | | 24 | | | | |
| | | | | |
Share of equity accounted units(b) | (2,850) | | | | | |
| Central pension costs, share-based payments, insurance and derivatives | | 377 | | | | |
| Restructuring, project and one-off costs | | (173) | | | | |
| Central costs | | (766) | | | | |
| Central exploration and evaluation expenditures | | (253) | | | | |
| Other items | | | | 79 | | |
| | | | | |
| | | | | |
| Consolidated sales revenue/Purchases of property, plant and equipment and intangible assets | 55,554 | | | | 6,750 | | |
Underlying EBITDA (page 163) | | 26,272 | | | | |
Annual Report on Form 20-F 2022 | riotinto.com 161
Financial statements continued
Notes to the 2022 financial statements
1 Our financial performance by segment continued
| | | | | | | | | | | | | |
| | |
| Year ended 31 December 2021 | Segmental revenue
US$m | Underlying EBITDA
US$m | | Adjusted Capital expenditure(a) US$m | |
| Iron Ore | 39,582 | | 27,592 | | | 3,947 | | |
| Aluminium | 12,695 | | 4,382 | | | 1,300 | | |
| Copper | 7,827 | | 3,969 | | | 1,328 | | |
| Minerals | 6,481 | | 2,603 | | | 644 | | |
| Reportable segments total | 66,585 | | 38,546 | | | 7,219 | | |
| Other Operations | 251 | | (28) | | | (13) | | |
| Inter-segment transactions | (268) | | 42 | | | | |
| | | | | |
Share of equity accounted units(b) | (3,073) | | | | | |
| Central pension costs, share-based payments, insurance and derivatives | | 110 | | | | |
| Restructuring, project and one-off costs | | (80) | | | | |
| Central costs | | (613) | | | | |
| Central exploration and evaluation expenditures | | (257) | | | | |
| Proceeds from disposal of property, plant and equipment | | | | 61 | | |
| Other items | | | | 117 | | |
| | | | | |
| Consolidated sales revenue/Purchases of property, plant and equipment and intangible assets | 63,495 | | | | 7,384 | | |
Underlying EBITDA (page 163) | | 37,720 | | | | |
| | | | | | | | | | | | | |
| | |
| Year ended 31 December 2020 | Segmental revenue
US$m | Underlying EBITDA
US$m | | Adjusted Capital expenditure(a) US$m | |
| Iron Ore | 27,508 | | 18,837 | | | 2,941 | | |
| Aluminium | 9,314 | | 2,152 | | | 1,009 | | |
| Copper | 4,969 | | 2,084 | | | 1,659 | | |
| Minerals | 5,170 | | 1,710 | | | 455 | | |
| Reportable segments total | 46,961 | | 24,783 | | | 6,064 | | |
| Other Operations | 321 | | 24 | | | 1 | | |
| Inter-segment transactions | (264) | | (94) | | | | |
| | | | | |
Share of equity accounted units(b) | (2,407) | | | | | |
| Central pension costs, share-based payments, insurance and derivatives | | 117 | | | | |
| Restructuring, project and one-off costs | | (133) | | | | |
| Central costs | | (545) | | | | |
| Central exploration and evaluation expenditures | | (250) | | | | |
| Proceeds from disposal of property, plant and equipment | | | | 45 | | |
| Other items | | | | 79 | | |
| | | | | |
| Consolidated sales revenue/Purchases of property, plant and equipment and intangible assets | 44,611 | | | | 6,189 | | |
Underlying EBITDA (page 163) | | 23,902 | | | | |
(a)Capital expenditure for reportable segments includes the net cash outflow on purchases less disposals of property, plant and equipment, capitalised evaluation costs and purchases less disposals of other intangible assets. The details provided include 100% of subsidiaries’ capital expenditure and Rio Tinto’s share of the capital expenditure of joint operations. In 2022, we have excluded capitalised expenditure relating to equity accounted units and have adjusted prior year comparatives for this change in definition.
(b)Consolidated sales revenue includes subsidiary sales of US$50 million (2021: US$44 million; 2020: US$34 million) to equity accounted units which are not included in segmental revenue. Segmental revenue includes the Group’s proportionate share of product sales by equity accounted units (after adjusting for sales to subsidiaries) of US$2,900 million (2021: US$3,117 million; 2020: US$2,441 million) which are not included in consolidated sales revenue.
Segmental revenue
Segmental revenue includes consolidated sales revenue plus the equivalent sales revenue of equity accounted units in proportion to our equity interest (after adjusting for sales to/from subsidiaries).
Segmental revenue measures revenue on a basis that is comparable to our underlying EBITDA metric.
Other segmental reporting
For further information relating to Revenue by destination and product and Non-operating assets by geography refer to note 6 on page 170 and Our operating assets section on page 175 respectively. 162 Annual Report on Form 20-F 2022 | riotinto.com
Underlying EBITDA
Underlying EBITDA represents profit before taxation, net finance items, depreciation and amortisation adjusted to exclude the EBITDA impact of items, which do not reflect the underlying performance of our reportable segments.
| | | | | | | | |
| | |
| Other relevant judgments - Exclusions from underlying EBITDA Items excluded from profit after tax are those gains and losses that, individually or in aggregate with similar items, are of a nature and size to require exclusion in order to provide additional insight into the underlying business performance. The following items are excluded from profit after tax in arriving at underlying EBITDA in each year irrespective of materiality: –Depreciation and amortisation in subsidiaries and equity accounted units; –Taxation and finance items in equity accounted units; –Taxation and finance items relating to subsidiaries; –Unrealised gains/(losses) on embedded derivatives not qualifying for hedge accounting; –Net gains/(losses) on disposal of interests in subsidiaries; –Impairment charges net of reversals; –The underlying EBITDA of discontinued operations; –Adjustments to closure provisions where the adjustment is associated with an impairment charge and for legacy sites where the disturbance or environmental contamination relates to the pre-acquisition period. In addition, there is a final judgmental category which includes, where applicable, other credits and charges that, individually or in aggregate if of a similar type, are of a nature or size to require exclusion in order to provide additional insight into underlying business performance. In 2022 this category included the gain recognised by Kitimat relating to LNG Canada's project and the gain recognised upon sale of the Cortez royalty. In 2021 the category included the changes in closure estimates at Energy Resources of Australia and Gove Refinery. | |
| | |
| | | | | | | | | | | |
| 2022 US$m | 2021 US$m | 2020 US$m |
| Profit after tax for the year | 13,076 | | 22,575 | | 10,400 | |
| Taxation | 5,586 | | 8,258 | | 4,991 | |
| Profit before taxation | 18,662 | 30,833 | 15,391 |
| | | |
| | | |
| | | |
Depreciation and amortisation in subsidiaries excluding capitalised depreciation(a) | 4,871 | | 4,525 | | 4,074 | |
| Depreciation and amortisation in equity accounted units | 470 | | 497 | | 576 | |
| Finance items in subsidiaries | 1,846 | | 26 | | 1,751 | |
| Taxation and finance items in equity accounted units | 640 | | 759 | | 443 | |
| | | |
| | | |
| (Gains)/Losses on embedded commodity derivatives not qualifying for hedge accounting (including foreign exchange) | (6) | | 51 | | (6) | |
Impairment charges net of reversals(b) | 52 | | 269 | | 1,272 | |
Gain recognised by Kitimat relating to LNG Canada's project(c) | (116) | | (336) | | — | |
Change in closure estimates (non-operating and fully impaired sites)(d) | 180 | | 1,096 | | 401 | |
Loss on disposal of interests in subsidiary(b) | 105 | | — | | — | |
| | | |
Gain on sale of the Cortez Royalty(e) | (432) | | — | | — | |
| Underlying EBITDA | 26,272 | | 37,720 | | 23,902 | |
(a)Depreciation and amortisation in subsidiaries for the year ended 31 December 2022 is net of capitalised depreciation of US$139 million (31 December 2021: US$172 million; 31 December 2020: US$205 million).
(b)Refer to note 4
(c)During the first half of 2022, LNG Canada elected to terminate their option to purchase additional land and facilities for expansion of their operations at Kitimat, Canada. The resulting gain has been excluded from underlying EBITDA consistent with prior years as it is part of a series of transactions that together were material. On 3 December 2021 we gained control over a new wharf at Kitimat, Canada that was built and paid for by LNG Canada. The gain on recognition was excluded from underlying EBITDA on the grounds of individual magnitude and consistency with the associated impairment charge in 2021, refer to note 4.
(d)In 2022 the charge relates to re-estimates of underlying closure cash flows for legacy sites where the environmental damage preceded ownership by Rio Tinto. On 2 February 2022, Energy Resources of Australia released preliminary findings from its reforecast of the total undiscounted cost schedule for the Ranger rehabilitation project. Information available from this study resulted in the Group recording an increase to the closure provision of US$510 million at 31 December 2021. Other increases to closure estimates charged to the income statement in 2021 relate to Diavik, Gove refinery, and a number of the Group's legacy sites where the environmental damage preceded ownership by Rio Tinto. The adjustments at Energy Resources Australia and Gove refinery were recognised in the income statement as these are non-operating sites, and excluded from underlying earnings due to the magnitude of the individual updates and materiality when aggregated. In 2020 we recognised an increase in the Diavik closure provision based on preliminary Pre-Feasibility Study findings. On completion of the study in 2021 a true-up was recorded in the income statement and excluded from underlying earnings in line with the treatment of the initial increase in 2020, which was excluded from underlying EBITDA as Diavik was fully impaired during the year. Other closure costs excluded in 2020 were the increase in the Gove refinery closure provision offset by a decrease in the Argyle mine closure provision on completion of Pre-Feasibility Studies at each site. The 2020 comparative also included the underlying EBITDA impact (US$138 million loss) in respect of increases to Closure provisions in legacy and non-operating sites following a reduction to the closure discount rate to 1.5%.
(e)On 2 August 2022, we completed the sale of a gross production royalty which was retained following the disposal of the Cortez Complex in 2008. The gain recognised on sale of the royalty has been excluded from underlying EBITDA on the grounds of individual magnitude.
Annual Report on Form 20-F 2022 | riotinto.com 163
Financial statements continued
Notes to the 2022 financial statements
2 Earnings per ordinary share
Basic earnings per share
| | | | | | | | | | | |
|
2022 | 2021 | 2020 |
| Net earnings attributable to owners of Rio Tinto (US$ million) | 12,420 | 21,094 | 9,769 |
Weighted average number of shares (millions)(a) | 1,619.8 | 1,618.4 | 1,617.4 |
| Basic earnings per ordinary share (cents) | 766.8 | 1,303.4 | 604.0 |
| | | |
| | | |
(a)The weighted average number of shares is calculated as the average number of Rio Tinto plc shares outstanding not held as treasury shares of 1,248.9 million (2021: 1,247.4 million; 2020: 1,246.5 million) plus the average number of Rio Tinto Limited shares outstanding of 370.9 million (2021: 371.0 million; 2020: 370.9 million) over the relevant period. There were no cross holdings of shares between Rio Tinto Limited and Rio Tinto plc at 31 December 2022 (2021: nil; 2020: nil).
Diluted earnings per share
For the purposes of calculating diluted earnings per share, the effect of dilutive securities of 9.8 million shares in 2022 (2021: 10.5 million; 2020: 11.2 million) is added to the weighted average number of shares described in (a) above. This effect is calculated under the treasury stock method, in accordance with IAS 33 “Earnings per Share”. Our only potential dilutive ordinary shares are share awards for which terms and conditions are described in note 27.
| | | | | | | | | | | |
|
2022 | 2021 | 2020 |
| Net earnings attributable to owners of Rio Tinto (US$ million) | 12,420 | 21,094 | 9,769 |
Weighted average number of shares (millions)(a) | 1,629.6 | | 1,628.9 | | 1,628.6 | |
| Diluted earnings per share attributable to ordinary shareholders of Rio Tinto (cents) | 762.1 | 1,295.0 | 599.8 |
3 Dividends
Our directors have announced a final dividend of 225.0 cents per share on 22 February 2023. This is expected to result in payments of US$3.7 billion. The dividend will be paid on 20 April 2023 to Rio Tinto plc and Rio Tinto Limited shareholders on the register at the close of business on 09 March 2023.
| | | | | | | | | | | |
| Dividends
per share
2022 | Dividends
per share
2021 | Dividends
per share
2020 |
Ordinary dividends per share: announced with the results for the year(a) | 225.0 | c | 417.0 | c | 309.0 | c |
Special dividends per share: announced with the results for the year(a) | — | c | 62.0 | c | 93.0 | c |
(a)Dividends are determined in US dollars, which is our functional currency, and declared in British pounds for Rio Tinto Plc and Australian Dollar for Rio Tinto Limited. The applicable currency exchange rate to convert the US dollar dividend into British pounds and Australian dollars is determined with reference to the WMR 4pm (UK) fixings on the day prior to the announcement of our results for the period. Ordinary shareholders of Rio Tinto Limited and Rio Tinto Plc are paid equal cash dividends on a per share basis in line with the terms of the dual listed structure.
Total dividends per share paid in the year
| | | | | | | | | | | |
| Dividends per share 2022 | Dividends per share 2021 | Dividends per share 2020 |
| Previous year final - paid during the year (US cents) | 417.0 | c | 309.0 | c | 231.0 | c |
| Previous year special - paid during the year (US cents) | 62.0 | c | 93.0 | c | — | |
| Interim - paid during the year (US cents) | 267.0 | c | 376.0 | c | 155.0 | c |
| Interim special - paid during the year (US cents) | — | | 185.0 | c | — | |
| Total paid during the year (US cents) | 746.0 | c | 963.0 | c | 386.0 | c |
| | | | | | | | | | | |
| Dividends per share 2022 | Dividends per share 2021 | Dividends per share 2020 |
| Rio Tinto plc previous year final (pence) | 306.7 | p | 221.9 | p | 177.5 | p |
| Rio Tinto plc previous year special (pence) | 45.6 | p | 66.8 | p | — | |
| Rio Tinto plc interim (pence) | 221.6 | p | 270.8 | p | 119.7 | p |
| Rio Tinto plc interim special (pence) | — | | 133.3 | p | — | |
| Total paid during the year | 573.9 | p | 692.8 | p | 297.2 | p |
Rio Tinto Limited previous year final – fully franked at 30% (Australian cents) | 577.0 | c | 397.5 | c | 349.7 | c |
Rio Tinto Limited previous year special – fully franked at 30% (Australian cents) | 85.8 | c | 119.6 | c | — | |
Rio Tinto Limited interim – fully franked at 30% (Australian cents) | 383.7 | c | 509.4 | c | 216.5 | c |
Rio Tinto Limited interim special – fully franked at 30% (Australian cents) | — | | 250.6 | c | — | |
| Total paid during the year | 1,046.5 | c | 1,277.1 | c | 566.2 | c |
The franking credits available to the Group as at 31 December 2022, after allowing for Australian tax payable in respect of the current and prior reporting period’s profit, are estimated to be US$7,246 million (2021: US$6,611 million; 2020 US$6,812 million).
The proposed Rio Tinto Limited dividend will be fully franked based on a tax rate of 30%, and reduce the franking account balance by US$358 million.
164 Annual Report on Form 20-F 2022 | riotinto.com
Reconciliation of dividend declared to dividend paid
| | | | | | | | | | | |
| 2022 US$m | 2021 US$m | 2020 US$m |
| Rio Tinto plc previous year final dividend payable | 5,024 | | 3,809 | | 2,783 | |
| Rio Tinto plc previous year special dividend payable | 747 | | 1,146 | | — | |
| Rio Tinto plc interim dividend payable | 3,162 | | 4,627 | | 1,937 | |
| Rio Tinto plc interim special dividend payable | — | | 2,276 | | — | |
| Rio Tinto Limited previous year final dividend payable | 1,597 | | 1,138 | | 857 | |
| Rio Tinto Limited previous year special dividend payable | 237 | | 343 | | — | |
| Rio Tinto Limited interim dividend payable | 949 | | 1,372 | | 555 | |
| Rio Tinto Limited interim special dividend payable | — | | 674 | | — | |
| Dividends payable during the year | 11,716 | | 15,385 | | 6,132 | |
| Net movement of unclaimed dividends in the year | 11 | | (28) | | — | |
Dividends paid during the year(b) | 11,727 | | 15,357 | | 6,132 | |
| | | |
(b)We economically hedge the dividend cash flows from the announcement date to the payment date in order to reduce our foreign exchange exposure on these cash flows. The realised impact of these hedges is shown within ‘Other items’ in the Cash flows from consolidated operations and is not included in the above.
4 Impairment charges net of reversals
Recognition and measurement
Impairment charges and reversals are assessed at the level of cash-generating units which, in accordance with IAS 36, are identified as the smallest identifiable asset or group of assets that generate cash inflows which are largely independent of the cash inflows from other assets. Separate cash-generating units are identified where an active market exists for intermediate products, even if the majority of those products are further processed internally.
In some cases, individual business units consist of several operations with independent cash-generating streams which constitute separate cash- generating units.
Goodwill acquired through business combinations is allocated to the cash-generating unit or groups of cash-generating units that are expected to benefit from the related business combination, and tested for impairment at the lowest level within the Group at which goodwill is monitored for internal management purposes. All cash-generating units containing goodwill (note 11), indefinite-lived intangible assets and intangible assets that are not ready for use (note 12) are tested annually for impairment as at 30 September, regardless of whether there has been an impairment trigger, or more frequently if events or changes in circumstances indicate a potential impairment.
| | | | | | | | |
| | |
| Other relevant judgments - determination of CGUs Judgment is applied to identify the Group’s CGUs, particularly when assets belong to integrated operations, and changes in CGUs could impact impairment charges and reversals. The most significant judgment continues to relate to the continued grouping of Rio Tinto Iron and Titanium Quebec Operations, Canada and QIT Madagascar Minerals (QMM), Madagascar as a single CGU on the basis that they are vertically integrated operations and there is no active market for ilmenite. During the year we have separated the Gladstone Power Station from the Boyne Smelter cash-generating unit; refer to page 168 for more information. | |
| | |
The carrying values for undeveloped properties are reviewed at each reporting date in accordance with IFRS 6. The indicators of impairment differ from the tests in accordance with IAS 36 “Impairment of Assets” in recognition of the subjectivity of estimating future cash flows for mineral interests under evaluation. Potential indicators of impairment include: expiry of the right to explore, substantive expenditure is no longer planned, commercially viable quantities of mineral resources have not been discovered and exploration activities will be discontinued, or sufficient data exists to indicate a future development would be unlikely to recover the carrying amount in full. When such impairment indicators have been identified, the recoverable amount and impairment charge are measured under IAS 36. Impairment reversals for undeveloped properties are not subject to special conditions within IFRS 6 and are therefore subject to the same monitoring for indicators of impairment reversal as other cash-generating units.
Property, plant and equipment, including right of use assets and intangible assets with finite lives are reviewed for impairment if there is an indication that the carrying amount may not be recoverable. This review starts with an appraisal of the perimeter of cash-generating units to consider changes in the business or strategic direction. Following this, an assessment of internal and external indicators is performed. Internal sources of information considered includes assessment of the financial performance of the CGU and changes in mine plans. External sources of information, include changes in forecast commodity prices, costs and other market factors.
Non-current assets (excluding goodwill) that have suffered impairment are reviewed using the same basis for valuation as explained above whenever events or changes in circumstances indicate that the impairment loss may no longer exist, or may have decreased. If appropriate, an impairment reversal will be recognised. The carrying amount of the cash-generating unit after reversal must be the lower of (a) the recoverable amount, as calculated above, and (b) the carrying amount that would have been determined (net of amortisation or depreciation) had no impairment loss been recognised for the cash-generating unit in prior periods.
If events or changes in circumstances indicate a potential impairment or impairment reversal, assessments are performed more frequently than just annually.
In 2022, we identified indicators of impairment at the Boyne Smelter in the aluminium segment and indicators of impairment reversal at the Roughrider uranium undeveloped project.
Annual Report on Form 20-F 2022 | riotinto.com 165
Financial statements continued
Notes to the 2022 financial statements
4 Impairment charges net of reversals continued
| | | | | | | | |
| | |
| Key judgment - Indicators of impairment and impairment reversals at Oyu Tolgoi and Kitimat The Oyu Tolgoi and Kitimat cash-generating units have both been impaired in previous years and are therefore monitored closely for indicators of further impairment or impairment reversal as such adjustments would likely be material to our results. At the time of their impairment, the carrying value and fair value for these cash-generating units were equal, making the cash-generating units sensitive to changes in economic assumptions, albeit headroom may have subsequently arisen due to inflation and the passage of time. Oyu Tolgoi We assessed the Oyu Tolgoi cash-generating unit for internal sources of information that could indicate impairment by reference to the operational performance of the mine and development progress for the underground operation. For external sources of information that could indicate impairment, we considered current and projected commodity prices and noted the transaction with Turquoise Hill minority shareholders. Whilst the value imputed by extrapolating that transaction price is less than the carrying value of the cash-generating unit, we noted this reflected funding and liquidity risks associated with minority shareholdings rather than information relevant to the underlying assets. Accordingly we concluded that there were no indicators of impairment or impairment reversal. Kitimat The Kitimat smelter was impaired in 2013 and 2014 during the construction phase as cost overruns were not expected to be recovered through economic performance. The plant was further impaired in 2021 (refer to the section below) as operational performance was adversely impacted by a workforce strike in June 2021 that has reduced the capacity over a prolonged period. The ramp-up of operations continuing into 2022 following the strike was anticipated in the determination of the 2021 recoverable amount. In 2022 the operational performance of the plant was considered as part of the assessment of internal sources of information for evidence of impairment. As highlighted in the climate change section, the economic performance of assets in the aluminium segment has the potential to perform more strongly as the world transitions to a lower carbon future; however, our assessment of external sources of information did not indicate that this had yet been priced into asset valuations. We concluded that there were no indicators of impairment or impairment reversal. | |
| | |
Where indication of impairment or impairment reversal exists then an impairment review is undertaken; the recoverable amount is assessed by reference to the higher of value in use (being the net present value of expected future cash flows of the relevant cash-generating unit in its current condition) and fair value less costs of disposal (FVLCD). When the recoverable amount of the cash-generating unit is measured by reference to FVLCD, this amount is further classified in accordance with the fair value hierarchy for observable market data that is consistent with the unit of account for the cash-generating unit being tested. The Group considers that the best evidence of FVLCD is the value obtained from an active market or binding sale agreement and, in this case, the recoverable amount is classified in the fair value hierarchy as level 1. When FVLCD is based on quoted prices for equity instruments but adjusted to reflect factors such as a lack of liquidity in the market, the recoverable amount is classified as level 2 in the fair value hierarchy. No cash-generating units are currently assessed for impairment by reference to a recoverable amount based on FVLCD classified as level 1 or level 2.
Where unobservable inputs are material to the measurement of the recoverable amount, FVLCD is based on the best information available to reflect the amount the Group could receive for the cash-generating unit in an orderly transaction between market participants at the measurement date. This is often estimated using discounted cash flow techniques and is classified as level 3 in the fair value hierarchy.
Where the recoverable amount is assessed using FVLCD based on discounted cash flow techniques, the resulting estimates are based on detailed life-of-mine and long-term production plans. These may include anticipated expansions which are at the evaluation stage of study.
The cash flow forecasts for FVLCD purposes are based on management’s best estimates of expected future revenues and costs, including the future cash costs of production, capital expenditure, and closure, restoration and environmental costs. For the purposes of determining FVLCD from a market participant’s perspective, the cash flows incorporate management’s price and cost assumptions in the short and medium term. In the longer term, operating margins are assumed to remain constant where appropriate, as it is considered unlikely that a market participant would prepare detailed forecasts over a longer term. The cash flow forecasts may include net cash flows expected to be realised from the extraction, processing and sale of
material that does not currently qualify for inclusion in ore reserves. Such non-reserve material is only included when there is a high degree of confidence in its economic extraction. This expectation is usually based on preliminary drilling and sampling of areas of mineralisation that are contiguous with existing ore reserves. Typically, the additional evaluation required to achieve reserves status for such material has not yet been done because this would involve incurring evaluation costs earlier than is required for the efficient planning and operation of the mine.
As noted above, cost levels incorporated in the cash flow forecasts for FVLCD purposes are based on the current life-of-mine plan or long-term production plan for the cash-generating unit. This differs from value in use which requires future cash flows to be estimated for the asset in its current condition and therefore does not include future cash flows associated with improving or enhancing an asset’s performance. Anticipated enhancements to assets may be included in FVLCD calculations and, therefore, generally result in a higher value.
Where the recoverable amount of a cash-generating unit is dependent on the life of its associated orebody, expected future cash flows reflect the current life of mine and long-term production plans, which are based on detailed research, analysis and iterative modelling to optimise the level of return from investment, output and sequence of extraction. The mine plan takes account of all relevant characteristics of the orebody, including waste-to-ore ratios, ore grades, haul distances, chemical and metallurgical properties of the ore impacting process recoveries and capacities of processing equipment that can be used. The life-of-mine plan and long-term production plans are, therefore, the basis for forecasting production output and production costs in each future year.
Forecast cash flows for ore reserve estimation for JORC purposes are generally based on Rio Tinto’s commodity price forecasts, which assume short-term market prices will revert to the Group’s assessment of the long-term price, generally over a period of three to five years. For most commodities, these forecast commodity prices are derived from a combination of analyses of the marginal costs of the producers and the incentive price of these commodities. These assessments often differ from current price levels and are updated periodically. The Group does not believe that published medium- and long-term forward prices necessarily provide a good indication of future levels because they tend to be strongly influenced by spot prices. The price forecasts used for
166 Annual Report on Form 20-F 2022 | riotinto.com
ore reserve estimation are generally consistent with those used for impairment testing unless management deems that in certain economic environments a market participant would not assume Rio Tinto’s view on prices, in which case in preparing FVLCD impairment calculations management estimates the assumptions that a market participant would be expected to use.
Forecast future cash flows of a cash-generating unit take into account the sales prices under existing sales contracts.
The discount rates applied to the future cash flow forecasts represent an estimate of the rate the market participant would apply having regard to the time value of money and the risks specific to the asset for which the future cash flow estimates have not been adjusted. The Group’s weighted average cost of capital is generally used as a starting point for determining the discount rates, with appropriate adjustments for the risk profile of the countries in which the individual cash-generating units operate. For final feasibility studies and ore reserve estimation, internal hurdle rates, which are generally higher than the Group’s weighted average cost of capital, are used. For developments funded with project finance, the debt component of the weighted average cost of capital may be calculated by reference to the specific interest rate of the project finance and anticipated leverage of the project.
For operations with a functional currency other than the US dollar, the impairment review is undertaken in the relevant functional currency. In estimating FVLCD, internal forecasts of exchange rates take into account spot exchange rates, historical data and external forecasts, and are kept constant in real terms after five years. The great majority of
the Group’s sales are based on prices denominated in US dollars. To the extent that the currencies of countries in which the Group produces commodities strengthen against the US dollar without an increase in commodity prices, cash flows and, therefore, net present values are reduced. Management considers that, over the long term, there is a tendency for movements in commodity prices to compensate to some extent for movements in the value of the US dollar, particularly against the Australian dollar and Canadian dollar, and vice versa. However, such compensating changes are not synchronised and do not fully offset each other. In estimating value in use, the present value of future cash flows in foreign currencies is translated at the spot exchange rate on the testing date.
Generally, discounted cash flow models are used to determine the recoverable amount of CGUs. In this case, significant judgment is required to determine the appropriate estimates and assumptions used and there is significant estimation uncertainty. In particular, for fair value less costs of disposal valuations, judgment is required to determine the estimates a market participant would use. The discounted cash flow models are most sensitive to the following estimates: the timing of project expansions; the cost to complete assets under construction; long-term commodity prices; production timing and recovery rates; exchange rates; operating costs; reserve and resource estimates; closure costs; discount rates; allocation of long-term contract revenues between CGUs; and, in some instances, the renewal of mining licences. Some of these variables are unique to an individual CGU. Future changes in these variables may differ from management’s expectations and may materially alter the recoverable amounts of the CGUs.
| | | | | | | | | | | | | | | | | | | | | | | |
| Note | Pre-tax amount 2022 US$m | Taxation 2022 US$m | Non-controlling interest 2022 US$m | Net amount 2022 US$m | Pre-tax amount 2021 US$m | Pre-tax amount 2020 US$m |
| Other operations - Roughrider | | 150 | | — | | — | | 150 | | — | | — | |
| Aluminium – Pacific Aluminium | | (202) | | — | | — | | (202) | | — | | (489) | |
| Aluminium – Kitimat | | — | | — | | — | | — | | (269) | | — | |
| Aluminium – Sohar | | — | | — | | — | | — | | — | | (220) | |
| | | | | | | |
| | | | | | | |
| Aluminium – ISAL | | — | | — | | — | | — | | — | | (93) | |
| Minerals – Diavik | | — | | — | | — | | — | | — | | (441) | |
| | | | | | | |
| | | | | | | |
| | | | | | | |
| Total impairment charges net of reversals | | (52) | | — | | — | | (52) | | (269) | | (1,243) | |
| | | | | | | |
| Allocated as: | | | | | | | |
| | | | | | | |
| | | | | | | |
| | | | | | | |
| | | | | | | |
| | | | | | | |
| | | | | | | |
| | | | | | | |
| | | | | | | |
| | | | | | | |
| Intangible assets | 12 | | 150 | | | | | — | | (4) | |
| | | | | | | |
| | | | | | | |
| | | | | | | |
| | | | | | | |
| | | | | | | |
| | | | | | | |
| | | | | | | |
| | | | | | | |
| | | | | | | |
| | | | | | | |
| | | | | | | |
| | | | | | | |
| | | | | | | |
| | | | | | | |
| | | | | | | |
| Property, plant and equipment | 13 | | — | | | | | (269) | | (900) | |
| Investment in equity accounted units (“EAUs”) | | (202) | | | | | — | | (339) | |
| | | | | | | |
| Total impairment charges net of reversals | | (52) | | | | | (269) | | (1,243) | |
| Comprising: | | | | | | | |
| Impairment reversal/(charges net of reversal) of consolidated balances | | | | | 150 | | (269) | | (904) | |
| Impairment charges related to EAUs (pre-tax) | | | | | (202) | | — | | (368) | |
| Total impairment charges net of reversals | | | | | (52) | | (269) | | (1,272) | |
| Taxation (including related to EAUs) | | | | | — | | 72 | | 157 | |
| | | | | | | |
| Total impairment charges net of reversals in the income statement | | | | | (52) | | (197) | | (1,115) | |
2022
Other operations - Roughrider, Canada
On 17 October 2022, we completed the sale of the Roughrider uranium undeveloped project located in the Athabasca Basin in Saskatchewan, Canada for US$150 million (US$80 million in cash and US$70 million in shares of Uranium Energy Corp.). The project was fully impaired during the year ended 31 December 2017 due to significant uncertainty over whether commercially viable quantities of mineral resources could be identified at a future date. The sale therefore led to an impairment reversal in the current year. It also led to a loss on disposal being recognised of US$105 million arising from the recycling of the currency translation reserve to the income statement.
Annual Report on Form 20-F 2022 | riotinto.com 167
Financial statements continued
Notes to the 2022 financial statements
4 Impairment charges net of reversals continued
Aluminium - Pacific Aluminium, Australia and New Zealand
The operating and economic performance of the Boyne Smelter in Queensland, Australia was below our expectations in 2022. The plant operated with reduced capacity and the economic performance suffered due to the high cost of energy from the coal-fired Gladstone Power Station. These conditions have been identified as an impairment trigger. We have calculated a recoverable amount for the cash-generating unit based on post-tax cash flows, expressed in real terms and discounted using a post-tax rate of 6.6% over the period to 2029. This date was chosen as it coincides with both the remaining term of the Boyne Smelter joint venture agreements and the Group’s Paris-aligned commitment to reduce carbon emissions by 50% by 2030 relative to the 2018 baseline. Despite the recent implementation of temporary energy price caps by the Australian Government, this resulted in an impairment charge of US$202 million, representing a full impairment of the carrying value of the Boyne Smelter investment in equity accounted unit.
| | | | | | | | | | | |
| | | |
| Impact of climate change on our business - Boyne Smelter We are committed to the repowering of our aluminium smelter in Queensland with firmed renewable energy by 2030. For this reason, along with the coal price cap noted above, we have separated the Gladstone Power Station from the Boyne Smelter cash-generating unit. As a sensitivity we have considered the impact of a potential repowering of the smelter using commodity and energy price assumptions from our Aspirational Leadership scenario, with all other assumptions being unchanged. This would result in improved cash flows, including an extension of operations at the Boyne Smelter beyond current joint venture agreements through to 2040. The potential value uplift under this sensitivity is not part of our base valuation as it is dependent upon commercial agreements that are not currently in place, but could support the reversal of past impairments. Both the recorded outcome and the sensitivity, as described in “Impact of climate change on the Group” section on pages 152 to 155, are considered to be Paris-aligned. | |
| | | |
2021
Aluminium – Kitimat, Canada
On 3 December 2021, we announced completion of the newly-constructed wharf at Kitimat. Construction spend was incurred by LNG Canada and therefore a gain of US$336 million representing the estimated fair value of the cost of construction was recorded and the carrying value of the Kitimat cash-generating unit (CGU) increased accordingly. Output from the smelter was reduced to 25% as a result of a workforce strike in mid-2021 and ramp-up to full capacity was expected to extend through into 2022. As a previously impaired CGU, and therefore carrying limited headroom, these factors were identified as conditions that could indicate that the uplifted carrying value may not be supportable and therefore the CGU was tested for impairment.
Using the fair value less cost of disposal methodology and discounting real-terms post-tax cash flows at 6.6%, we recognised a post-tax impairment charge of US$197 million (pre-tax US$269 million) representing the difference between the recoverable amount (US$3,126 million) and the carrying value (US$3,323 million).
2020
Aluminium – Pacific Aluminium, Australia and New Zealand
On 9 July 2020, we announced the conclusion of the NZAS strategic review and gave Meridian Energy 14 months' notice for the termination of the power contract. As a result of the decision to wind down operations, an impairment trigger was identified. The net present value of post-tax cash flows over the remaining life for this CGU was negative and therefore the non-current assets of the smelter were fully impaired.
High operating costs and challenging outlook for the aluminium industry also resulted in impairment triggers being identified at the Bell Bay aluminium smelter in Tasmania, Australia and at Boyne Smelter in Queensland, Australia at 30 June 2020. The forecast net present value of cash flows over the period to anticipated expiry in 2025 of a power contract with Hydro Tasmania was negative taking into account market conditions at the time. The property, plant and equipment of the Bell Bay smelter was therefore fully impaired. We determined the recoverable amount for our share of the Boyne Smelter CGU, which also included the Gladstone Power Station, as US$273 million based on post-tax cash flows expressed in real terms and discounted at 6.6%. Accordingly, our share of impairment after tax in the equity accounted unit was US$119 million (US$148 million pre-tax) related to the smelter and US$26 million (US$36 million pre-tax) related to the power station.
Aluminium – Sohar, Oman
In 2020, the challenging outlook for the Middle Eastern aluminium industry was identified as an impairment trigger at the Sohar aluminium smelter in Oman, an equity accounted unit of the Group.
At 30 September 2020, we determined the recoverable amount for our share of the Sohar CGU to be US$258 million based on post-tax cash flows expressed in real terms and discounted at 7.6%. Accordingly, our share of impairment after tax in the equity accounted unit was US$220 million.
Aluminium – ISAL smelter, Iceland
Our announcement in February 2020 of a strategic review of the ISAL smelter in Iceland, combined with challenging market conditions, was identified as an impairment trigger at 30 June 2020. Subsequent restoration of smelter competitiveness resulting from improved power delivery terms represented an indicator of partial impairment reversal at 31 December 2020. We calculated a post-tax recoverable amount for the CGU of US$139 million at 31 December 2020 based on FVLCD, discounted using a post-tax rate of 6.6%. As a consequence, with full impairment of the CGU and a pre-tax impairment charge of US$204 million in the first half of 2020, followed by reversal of US$111 million to previously recorded pre-tax impairment in the second half of 2020, the full-year results for the year ended 31 December 2020 included a net pre-tax impairment charge of US$93 million.
Minerals – Diavik, Canada
The COVID-19 pandemic significantly disrupted global demand for diamonds, and in April 2020 our then joint venture partner in the Diavik Diamond Mine filed for creditor protection and defaulted on cash calls. These circumstances were identified as an impairment trigger. The net present value of post-tax cash flows projected over the remaining life of the Diavik ‘Diamond Mine’ to 2025 did not support retaining any carrying value. This resulted in the Group's 60% interest in plant and equipment and intangible assets of the CGU being fully impaired at 30 June 2020.
168 Annual Report on Form 20-F 2022 | riotinto.com
5 Acquisitions and disposals
Acquisitions
Recognition and measurement
In determining whether a particular set of activities is a business, an acquired arrangement has to have an input and substantive process which together significantly contribute to the ability to create outputs. Where an acquisition does not meet the definition of a business as defined by IFRS 3 “Business Combinations” each asset is recognised on the balance sheet at fair value. In the Group cash flow statement we assess, based on the substance of the transaction, whether to allocate the cash consideration for these transactions either to “Purchases of property, plant and equipment and intangible assets” or to “Acquisitions of subsidiaries, joint ventures and associates” depending on the type of assets purchased.
For undeveloped mining projects which have arisen through acquisition, the allocation of the purchase price consideration may result in undeveloped properties being recognised at an earlier stage of project evaluation compared with projects arising from the Group’s exploration and evaluation programme. Subsequent expenditure on acquired undeveloped projects is only capitalised if it meets the high degree of confidence threshold discussed in note 12.
Where we increase our ownership interest in a subsidiary, the difference between the purchase price and the carrying value of the share of net assets acquired is recorded in equity. The cash cost of such purchases is included within “financing activities” in the cash flow statement.
2022
Following approval from Australia’s Foreign Investment Review Board (FIRB), on 29 March 2022 we completed the acquisition of Rincon Mining Pty Limited, the owner of a lithium project in Argentina. Total cash consideration was US$825 million. In determining whether Rincon’s set of activities is a business, we have assessed whether it has inputs and substantive processes which together significantly contribute to the ability to create outputs. Based on this assessment, we have concluded that Rincon does not meet the definition of a business as defined by IFRS 3 "Business Combinations" and therefore no goodwill has been recorded. The transaction has therefore been treated as an asset purchase with US$822 million of capitalised exploration and evaluation recorded for the principal economic resource. The balance of total consideration has been allocated to property, plant & equipment and other assets/liabilities. For the Group cash flow statement we determined that, since Rincon constitutes a group of companies, it is appropriate to present the cash outflow as “Acquisitions of subsidiaries, joint ventures and associates” rather than as separate asset purchases even though it did not meet the definition of a business combination.
On 31 August 2022 we made a US$25 million investment in McEwen Copper Inc. through our copper leaching technology venture, Nuton. We accounted for our holding in McEwen Copper Inc as an investment in associate, given our representation on the board.
On 16 December 2022 we acquired the remaining 49% share of Turquoise Hill Resources for expected consideration of US$3.2 billion, inclusive of transaction costs. This transaction was not classified as a business combination as it related to the purchase of non-controlling interests in an entity already consolidated as a subsidiary. Accordingly the transaction did not result in the remeasurement of assets or liabilities and has been accounted for in the statement of equity as an adjustment to non-controlling interests and retained earnings.
At 31 December 2022 consideration paid amounted to US$2,961 million (including US$33 million of transaction costs, with further transaction costs of US$41 million expected to be paid in 2023). Certain shareholders exercised their right to dissent to the transaction. In accordance with the terms of the circular, those dissenting shareholders have received initial consideration of C$34.4 per share, with final consideration depending on the outcome and timing of dissent proceedings. We have included within other provisions (note 36) US$211 million for additional consideration to be paid to the
dissenting shareholders representing the difference between their initial consideration and C$43 per share paid to all other shareholders.
2021
On 18 November 2021, we announced that we had completed the acquisition of the 40% share in the Diavik Diamond Mine in the Northwest Territories of Canada held by Dominion Diamond Mines, becoming the sole owner as a result. The transaction did not meet the definition of a business combination and therefore the incremental assets and liabilities were treated as an asset purchase. Prior to purchase, we recognised our existing 60% share of assets, revenues and expenses, with liabilities recognised according to its contractual obligations, and a corresponding 40% receivable or contingent asset representing the co-owner’s share where applicable. Receivables relating to the co-owner’s share were de-recognised and treated as part of the net purchase consideration on completion.
Disposals
Recognition and measurement
If a group of assets and liabilities (“Disposal group”) is sold the carrying value of the disposal group is de-recognised with the difference between the carrying amount and the consideration received recognised in the income statement. Certain amounts previously recognised in other comprehensive income in respect of the entity disposed of may be recycled to the income statement. The cash proceeds of disposals are included within “Investing activities” in the cash flow statement.
As summarised in note 4, we sold our Roughrider uranium undeveloped project on 17 October 2022 for consideration of US$150 million (US$80 million in cash and US$70 million in shares of Uranium Energy Corp). There were no other material disposals in 2022, 2021 or 2020.
6 Revenue by destination and product
Recognition and measurement
We recognise sales revenue related to the transfer of promised goods or services when control of the goods or services passes to the customer. The amount of revenue recognised reflects the consideration to which the Group is or expects to be entitled in exchange for those goods or services.
Sales revenue is recognised on individual sales when control transfers to the customer. In most instances, control passes and sales revenue is recognised when the product is delivered to the vessel or vehicle on which it will be transported once loaded, the destination port or the customer’s premises. There may be circumstances when judgment is required based on the five indicators of control below:
–The customer has the significant risks and rewards of ownership and has the ability to direct the use of, and obtain substantially all of the remaining benefits from, the good or service.
–The customer has a present obligation to pay in accordance with the terms of the sales contract. For shipments under the Incoterms Cost, Insurance and Freight (CIF)/Carriage Paid to (CPT)/Cost and Freight (CFR) this is generally when the ship is loaded, at which time the obligation for payment is for both product and freight.
–The customer has accepted the asset. Sales revenue may be subject to adjustment if the product specification does not conform to the terms specified in the sales contract but this does not impact the passing of control. Assay and specification adjustments have been immaterial historically.
–The customer has legal title to the asset. The Group usually retains legal title until payment is received for credit risk purposes only.
–The customer has physical possession of the asset. This indicator may be less important as the customer may obtain control of an asset prior to obtaining physical possession, which may be the case for goods in transit.
Annual Report on Form 20-F 2022 | riotinto.com 169
Financial statements continued
Notes to the 2022 financial statements
6 Revenue by destination and product continued
Revenue is principally derived from sale of commodities. We sell the majority of our products on CFR or CIF Incoterms. This means that the Group is responsible (acts as principal) for providing shipping services and, in some instances, insurance after the date at which control of goods passes to the customer at the loading port. The Group, therefore, has separate performance obligations for freight and insurance services that are provided solely to facilitate sale of the products it produces. Other Incoterms commonly used by the Group are Free on Board (FOB), where the Group has no responsibility for freight or insurance once control of the goods has passed at the loading port, and Delivered at Place (DAP), where control of the goods passes when the product is delivered to the agreed destination. For these Incoterms there is only one performance obligation, being the provision of product at the point where control passes.
Within each sales contract, each unit of product shipped is a separate performance obligation. Revenue is generally recognised at the contracted price as this reflects the stand-alone selling price. Sales revenue excludes any applicable sales taxes. Sales of copper concentrate are stated net of the treatment and refining charges which will be required to convert it to an end product.
The Group’s products are sold to customers under contracts which vary in tenure and pricing mechanisms, including some volumes sold on the spot market. Pricing for iron ore is on a range of terms, the majority being either monthly or quarterly average pricing mechanisms, with a smaller proportion of iron ore volumes being sold on the spot market.
Certain of the Group’s products may be provisionally priced at the date revenue is recognised and a provisional invoice issued; however, substantially all iron ore and aluminium sales are reflected at final prices in the results for the period. Provisionally priced receivables are subsequently measured at fair value through the income statement under IFRS 9 “Financial Instruments” as described in note 24. The final selling price for all provisionally priced products is based on the price
for the quotational period stipulated in the contract. Final prices for copper concentrate are normally determined between 30 and 120 days after delivery to the customer. The change in value of the provisionally priced receivable is based on relevant forward market prices and is included in sales revenue; refer to “Other revenue” within the sales by product disclosure below.
Revenues from the sale of significant by-products, such as gold, are included in sales revenue. Third-party commodity swap arrangements principally for delivery and receipt of smelter-grade alumina are offset within operating costs. Sundry revenue incidental to the main revenue-generating activities of the operations is treated as a credit to operating costs.
Typically, the Group has a right to payment before or at the point that control of the goods passes including a right, where applicable, to payment for provisionally priced products and unperformed freight and insurance services. Cash received before control passes is recognised as a contract liability. The amount of consideration does not contain a significant financing component as payment terms are less than one year. We have a number of long-term contracts to supply products to customers in future periods. Generally, revenue is recognised on an invoice basis, as each unit sold is a separate performance obligation and therefore the right to consideration from a customer corresponds directly with our performance completed to date.
We do not disclose sales revenue from freight and insurance services separately as we do not consider that this is necessary in order to understand the impact of economic factors on the Group. Our Chief Executive, the chief operating decision maker as defined under IFRS 8 “Operating Segments”, does not review information specifically relating to these sources of revenue in order to evaluate the performance of business segments and Group information on these sources of revenue is not provided externally.
We apply the practical expedient in paragraph 121 of IFRS 15 and do not include information on the transaction price allocated to performance obligations that are unsatisfied.
Consolidated sales revenue by destination(a) | | | | | | | | | | | | | | | | | | | | |
| | Adjusted(b) | Adjusted(b) | | Adjusted(b) | Adjusted(b) |
| 2022 % |
2021
% |
2020
% | 2022 US$m |
2021
US$m |
2020
US$m |
Greater China(b) | 54.3 | | 59.7 | | 60.4 | | 30,172 | | 37,878 | | 26,951 | |
| United States of America | 15.9 | | 12.6 | | 10.9 | | 8,823 | | 8,012 | | 4,867 | |
| | | | | | |
| | | | | | |
| | | | | | |
| | | | | | |
| | | | | | |
| | | | | | |
| | | | | | |
| | | | | | |
| | | | | | |
| Asia (excluding Greater China and Japan) | 7.1 | | 6.9 | | 7.9 | | 3,937 | | 4,415 | | 3,525 | |
| | | | | | |
| Japan | 7.4 | | 7.9 | | 7.5 | | 4,091 | | 5,012 | | 3,354 | |
| | | | | | |
| | | | | | |
| | | | | | |
| | | | | | |
| | | | | | |
| | | | | | |
| | | | | | |
| Europe (excluding UK) | 6.5 | | 5.2 | | 5.9 | | 3,618 | | 3,271 | | 2,623 | |
| Canada | 3.1 | | 2.6 | | 2.9 | | 1,743 | | 1,677 | | 1,289 | |
| Australia | 1.9 | | 1.8 | | 1.7 | | 1,047 | | 1,122 | | 745 | |
| UK | 0.3 | | 0.4 | | 0.5 | | 182 | | 243 | | 242 | |
| | | | | | |
| | | | | | |
| | | | | | |
| | | | | | |
| | | | | | |
| | | | | | |
| | | | | | |
| | | | | | |
| | | | | | |
| Other countries | 3.5 | | 2.9 | | 2.3 | | 1,941 | | 1,865 | | 1,015 | |
| Consolidated sales revenue | 100 | | 100 | | 100 | | 55,554 | | 63,495 | | 44,611 | |
(a)Consolidated sales revenue by geographical destination is based on the ultimate country of the product's destination, if known. Where the ultimate destination is not known, we have defaulted to the shipping address of the customer. Rio Tinto is domiciled in both the UK and Australia.
(b)Consolidated sales revenue by destination has been adjusted to classify Taiwan and China together as ‘Greater China’; previously Taiwan was included in Asia (excluding Greater China and Japan). This change has resulted in a decrease in 2021 revenue attributable to Asia (excluding Greater China and Japan) of: 2.5% and US$1,570 million (2020: 2.3% and US$1,011 million).
170 Annual Report on Form 20-F 2022 | riotinto.com
Consolidated sales revenue by product
We have sold the following products to external customers during the year:
| | | | | | | | | | | | | |
| Revenue from contracts with customers 2022 US$m | Other revenue(a) 2022 US$m | Consolidated sales revenue 2022 US$m | | |
| Iron ore | 33,068 | | (267) | | 32,801 | | | |
| | | | | |
| | | | | |
| | | | | |
| | | | | |
| | | | | |
| | | | | |
| | | | | |
| | | | | |
| | | | | |
| | | | | |
| | | | | |
| | | | | |
| | | | | |
| | | | | |
| Aluminium, alumina and bauxite | 13,955 | | (165) | | 13,790 | | | |
| | | | | |
| | | | | |
| | | | | |
| | | | | |
| | | | | |
| | | | | |
| | | | | |
| | | | | |
| | | | | |
| | | | | |
| | | | | |
| | | | | |
| | | | | |
| | | | | |
| Copper | 3,276 | | (80) | | 3,196 | | | |
| | | | | |
| | | | | |
| | | | | |
| | | | | |
| | | | | |
| | | | | |
| | | | | |
| | | | | |
| | | | | |
| | | | | |
| | | | | |
| | | | | |
| | | | | |
| | | | | |
| | | | | |
| | | | | |
| | | | | |
| | | | | |
| | | | | |
| | | | | |
| | | | | |
| | | | | |
| | | | | |
| | | | | |
| | | | | |
| | | | | |
| | | | | |
| | | | | |
| | | | | |
| Industrial minerals (comprising titanium dioxide slag, borates and salt) | 2,685 | | (16) | | 2,669 | | | |
| | | | | |
| | | | | |
| | | | | |
| | | | | |
| | | | | |
| | | | | |
| | | | | |
| | | | | |
| | | | | |
| | | | | |
| | | | | |
| | | | | |
| | | | | |
| | | | | |
| Gold | 564 | | 9 | | 573 | | | |
| | | | | |
| | | | | |
| | | | | |
| | | | | |
| | | | | |
| | | | | |
| | | | | |
| | | | | |
| | | | | |
| | | | | |
| | | | | |
| | | | | |
| | | | | |
| | | | | |
| Diamonds | 816 | | — | | 816 | | | |
| | | | | |
| | | | | |
| | | | | |
| | | | | |
| | | | | |
| | | | | |
| | | | | |
| | | | | |
| | | | | |
| | | | | |
| | | | | |
| | | | | |
| | | | | |
| | | | | |
| | | | | |
| | | | | |
| | | | | |
| | | | | |
| | | | | |
| | | | | |
| | | | | |
| | | | | |
| | | | | |
| | | | | |
| | | | | |
| | | | | |
| | | | | |
| | | | | |
| | | | | |
| | | | | |
| | | | | |
| | | | | |
| | | | | |
| | | | | |
| | | | | |
| | | | | |
| | | | | |
| | | | | |
| | | | | |
| | | | | |
| | | | | |
| | | | | |
| | | | | |
| | | | | |
| | | | | |
| | | | | |
| | | | | |
| | | | | |
| | | | | |
| | | | | |
| | | | | |
| | | | | |
| | | | | |
| | | | | |
| | | | | |
| | | | | |
| | | | | |
| | | | | |
| | | | | |
| | | | | |
Other products(b) | 1,710 | | (1) | | 1,709 | | | |
| Consolidated sales revenue | 56,074 | | (520) | | 55,554 | | | |
| | | | | |
| | | | | |
| | | | | | | | | | | | | | | | | | | | |
| Revenue from contracts with customers 2021 US$m | Other revenue(a) 2021 US$m | Consolidated sales revenue 2021 US$m | Revenue from contracts with customers 2020 US$m | Other revenue(a) 2020 US$m |
Consolidated sales revenue 2020 US$m |
| Iron ore | 42,992 | | (796) | | 42,196 | | 28,202 | | 1,000 | | 29,202 | |
| Aluminium, alumina and bauxite | 12,336 | | 103 | | 12,439 | | 9,092 | | 54 | | 9,146 | |
| Copper | 3,229 | | 96 | | 3,325 | | 1,721 | | 64 | | 1,785 | |
| Industrial minerals (comprising titanium dioxide slag, borates and salt) | 2,114 | | 3 | | 2,117 | | 2,054 | | (3) | | 2,051 | |
| Gold | 1,075 | | 2 | | 1,077 | | 471 | | 6 | | 477 | |
| Diamonds | 501 | | — | | 501 | | 459 | | — | | 459 | |
Other products(b) | 1,837 | | 3 | | 1,840 | | 1,493 | | (2) | | 1,491 | |
| Consolidated sales revenue | 64,084 | | (589) | | 63,495 | | 43,492 | | 1,119 | | 44,611 | |
| | | | | | |
| | | | | | |
(a)Consolidated sales revenue includes both revenue from contracts with customers, accounted for under IFRS 15, and subsequent movements in provisionally priced receivables, accounted for under IFRS 9, and included in “other revenue” above.
(b)“Other products” includes metallic co-products, molybdenum, silver and other commodities. Individually the revenue from each of these products is less than 15% of the total Other products category.
7 Net operating costs (excluding items disclosed separately)
| | | | | | | | | | | | | | |
| Note | 2022 US$m | 2021 US$m | 2020 US$m |
| Raw materials, consumables, repairs and maintenance | | 12,477 | | 9,957 | | 8,490 | |
| Amortisation of intangible assets | 12 | 159 | | 178 | | 161 | |
| Depreciation of property, plant and equipment | 13 | 4,851 | | 4,519 | | 4,118 | |
| Employment costs | 26 | 6,002 | | 5,513 | | 4,770 | |
| | | | |
| | | | |
| Shipping and other freight costs | | 3,146 | | 3,275 | | 2,088 | |
Decrease/(increase) in finished goods and work in progress(a) | | 803 | | 29 | | (47) | |
| Royalties | | 2,994 | | 3,878 | | 2,763 | |
Amounts charged by equity accounted units(b) | | 1,429 | | 1,160 | | 958 | |
| Net foreign exchange (gains)/losses | | (42) | | 14 | | 300 | |
| | | | |
| | | | |
(Gains)/losses on sale of property, plant and equipment | | (93) | | 53 | | 50 | |
Gain on sale of the Cortez Royalty(c) | | (432) | | — | | — | |
Gains recognised by Kitimat relating to LNG Canada’s project(d) | | (116) | | (336) | | — | |
| Provisions (including exchange differences on provisions) | | 1,006 | | 1,906 | | 894 | |
| Research and development | | 76 | | 65 | | 45 | |
Other external costs(e) | | 4,254 | | 4,018 | | 3,083 | |
Costs included above capitalised or shown on a separate line item(f) | | (722) | | (646) | | (708) | |
Other operating income(g) | | (1,022) | | (893) | | (711) | |
Net operating costs (excluding items disclosed separately)(h) | | 34,770 | | 32,690 | | 26,254 | |
(a)Includes purchases of third-party material to satisfy sales contracts.
(b)Amounts charged by equity accounted units relate to toll processing and also include purchases from equity accounted units of bauxite, aluminium and copper concentrate which are then processed by the product group or sold to third parties.
(c)On 2 August 2022, we completed the sale for US$525 million of a gold royalty which was retained following the disposal of the Cortez mine in 2008.
(d)During the first half of 2022, LNG Canada elected to terminate their option to purchase additional land and facilities for expansion of their operations at Kitimat, Canada. On 3 December 2021 we recognised a new wharf at Kitimat, Canada within Property, plant and equipment that was built and paid for by LNG Canada.
(e)In 2022, other external costs include US$465 million (2021: US$502 million, 2020: US$314 million) of short-term lease costs and US$50 million (2021: US$34 million, 2020 US$30 million) of variable lease costs recognised in the income statement in accordance with IFRS 16 “Leases”. Refer to note 21.
(f)In 2022, US$485 million (2021: US$445 million; 2020: US$537 million) of operating costs were capitalised, US$190 million (2021: US$154 million; 2020: US$125 million) of costs were shown separately within “Exploration and evaluation costs” in the Group income statement, and US$47 million (2021: $47 million; 2020: US$46 million) of costs were shown within operating costs as “Research and development”.
(g)Other operating income includes sundry revenue incidental to the main revenue-generating activities of the operations.
(h)In 2022, “Net operating costs (excluding items disclosed separately)” includes US$138 million of decarbonisation spend.
Annual Report on Form 20-F 2022 | riotinto.com 171
Financial statements continued
Notes to the 2022 financial statements
8 Exploration and evaluation expenditure
Exploration and evaluation expenditure includes costs that are directly attributable to:
–Researching and analysing existing exploration data;
–Conducting geological studies, exploratory drilling and sampling;
–Examining and testing extraction and treatment methods; and/or
–Compiling various studies (order of magnitude, pre-feasibility and feasibility).
Exploration expenditure relates to the initial search for deposits with economic potential. Expenditure on exploration activity undertaken by the Group is not capitalised.
Evaluation expenditure relates to a detailed assessment of deposits or other projects (including smelter and refinery projects) that have been identified as having economic potential. These costs are also expensed until the business case for the project is sufficiently advanced. For greenfield projects, expensing typically continues to a later phase of study compared with brownfield expansions.
The charge for the year and the net amount of intangible assets capitalised during the year are as follows: | | | | | | | | | | | |
| 2022 US$m | 2021 US$m | 2020 US$m |
Expenditure in the year (inclusive of cash proceeds of US$1 million (2021: US$7 million; 2020: US$1 million) on disposal of undeveloped projects) | (1,097) | | (852) | | (711) | |
| Non-cash movements and non-cash proceeds on disposal of undeveloped projects | (6) | | 23 | | — | |
| Amount capitalised during the year | 207 | | 110 | | 87 | |
| Exploration and evaluation expenditure (net of profit relating to interests in undeveloped projects) per income statement | (896) | | (719) | | (624) | |
| | | |
| | | |
| | | |
| | | |
9 Finance income and finance costs
| | | | | | | | | | | | | | |
| Note | 2022 US$m | 2021 US$m | 2020 US$m |
| Finance income from equity accounted units | | 3 | | 2 | | 4 | |
| | | | |
| | | | |
| | | | |
| | | | |
| | | | |
| | | | |
| | | | |
| | | | |
| | | | |
| Other finance income (including bank deposits, net investment in leases, and other financial assets) | | 176 | | 62 | | 137 | |
| Total finance income | | 179 | | 64 | | 141 | |
| | | | |
| Interest on: | | | | |
| | | | |
| | | | |
| | | | |
| | | | |
| | | | |
| | | | |
| – Financial liabilities at amortised cost (excluding lease liabilities) and associated derivatives | | (713) | | (489) | | (561) | |
| | | | |
| | | | |
| – Lease liabilities | | (49) | | (47) | | (50) | |
| Fair value movements: | | | | |
– Bonds designated as hedged items in fair value hedges(a) | | 526 | | 246 | | (284) | |
– Derivatives designated as hedging instruments in fair value hedges(a) | | (515) | | (242) | | 287 | |
| Loss on early redemption of bonds | | — | | (69) | | — | |
| | | | |
| | | | |
Amounts capitalised(b) | 13 | | 416 | | 358 | | 340 | |
| Total finance costs | | (335) | | (243) | | (268) | |
(a)The main sources of ineffectiveness of the fair value hedges include changes in the timing of the cash flows of the hedging instrument compared to the underlying hedged item, and changes in the credit risk of parties to the hedging relationships.
(b)We capitalise interest based on the Group or relevant subsidiary’s cost of borrowing, refer to note 13, or at the rate of project-specific debt (where applicable).
10 Taxation
Recognition and measurement
The taxation charge contains both current and deferred tax.
Current tax is the tax expected to be payable on the taxable income for the year calculated using rates applicable during the year. It includes adjustments for tax expected to be payable or recoverable in respect of previous periods. Where the amount of tax payable or recoverable is uncertain, we establish provisions based on either: the Group’s judgment of the most likely amount of the liability or recovery; or, when there is a wide range of possible outcomes, a probability weighted average approach.
Deferred tax is calculated in accordance with IAS 12 using rates that have been enacted or substantively enacted at the balance sheet date. Where the recognition of an asset and liability from a single transaction gives rise to equal and off-setting temporary differences, we apply the Initial Recognition Exemption allowed by IAS 12, and consequently recognise neither a deferred tax asset nor a deferred tax liability in respect of these temporary differences. Primarily this occurs with new lease arrangements and changes in closure cost estimates for assets in operation. Under the amendment to IAS 12, deferred tax assets and liabilities will be required to be recognised in respect of such temporary differences (Refer to note 40 on page 222). 172 Annual Report on Form 20-F 2022 | riotinto.com
| | | | | | | | |
| | |
| Other relevant judgments - Uncertain tax positions The Group operates across a large number of jurisdictions and is subject to review and challenge by local tax authorities on a range of tax matters. Where the amount of tax payable or recoverable is uncertain, whether due to the local tax authority challenge or due to uncertainty regarding the appropriate treatment, judgment is required to assess the probability that the adopted treatment will be accepted. In accordance with IFRIC 23, if it is not probable that the treatment will be accepted, the Group accounts for uncertain tax provisions for all matters worldwide based on the Group’s judgment of the most likely amount of the liability or recovery, or where there is a wide range of possible outcomes, using a probability weighted average approach. Uncertain tax provisions include any related interest and penalties. In July 2022 we reached agreement with the Australian Tax Office (ATO) on all tax matters in dispute. We also reached agreement with the Inland Revenue Authority of Singapore in relation to transfer pricing for the same historical years (2010 to 2021). | |
| | |
Taxation charge
| | | | | | | | | | | | | | |
| Note | 2022 US$m | 2021 US$m | 2020 US$m |
| – Current | | 4,851 | | 8,144 | | 5,169 | |
| – Deferred | 15 | | 735 | | 114 | | (178) | |
| Total taxation charge | | 5,586 | | 8,258 | | 4,991 | |
Prima facie tax reconciliation
| | | | | | | | | | | |
| 2022 US$m | 2021 US$m Adjusted(i) | 2020 US$m Adjusted(i) |
Profit before taxation(a) | 18,662 | | 30,833 | | 15,391 | |
| | | |
| | | |
| | | |
| | | |
Prima facie tax payable at UK rate of 19% (2021: 19%; 2020: 19%)(b) | 3,546 | | 5,858 | | 2,924 | |
Higher rate of taxation of 30% on Australian earnings (2021: 30%; 2020: 30%) | 1,550 | | 2,598 | | 1,748 | |
| Other tax rates applicable outside the UK and Australia | (17) | | 103 | | (181) | |
Tax effect of profit from equity accounted units, related impairments and expenses(a) | (109) | | (198) | | (59) | |
| Impact of changes in tax rates | (11) | | — | | — | |
| Resource depletion allowances | (40) | | (52) | | (34) | |
Recognition of previously unrecognised deferred tax assets(c) | (261) | | (212) | | (182) | |
Write-down of previously recognised deferred tax assets(d) | 820 | | — | | 237 | |
Utilisation of previously unrecognised deferred tax assets(e) | (37) | | (200) | | (15) | |
Unrecognised current year operating losses(f) | 212 | | 107 | | 328 | |
Adjustments in respect of prior periods(g) | (222) | | 40 | | 9 | |
Other items(h) | 155 | | 214 | | 216 | |
| Total taxation charge | 5,586 | | 8,258 | | 4,991 | |
(a)The Group profit before tax includes profit after tax of equity accounted units. Consequently, the tax effect on the profit from equity accounted units is included as a separate reconciling item in this prima facie tax reconciliation.
(b)As a UK headquartered and listed Group, the reconciliation of expected tax on accounting profit to tax charge uses the UK corporation tax rate to calculate the prima facie tax payable. Rio Tinto is also listed in Australia, and the reconciliation includes the impact of the higher tax rate in Australia where a significant proportion of the Group's profits are currently earned. The impact of other tax rates applicable outside the UK and Australia is also included. The weighted average statutory corporate tax rate on profit before tax is approximately 29% (2021: 29% 2020: 30%).
(c)The recognition of previously unrecognised deferred tax assets relates primarily to Oyu Tolgoi where ongoing progress towards sustainable underground production in the current and comparative periods reduces the risk of tax losses that expire if not recovered against taxable profits within eight years. In the comparative period to 31 December 2021 the recognition of previously unrecognised deferred tax assets also included the recognition of prior year deferred tax assets in our Australian Aluminium business.
(d)The write-down of previously recognised deferred tax assets relates to deferred tax assets of our US businesses. The enactment of the US Inflation Reduction Act of 2022 in August included a new Corporate Alternative Minimum Tax (CAMT) regime which applies a minimum tax rate of 15% on accounting profits. As a result of the new legislation, which does not give relief for some Federal deferred tax assets, the deferred tax assets previously recognised have been written down. In the comparative period to 31 December 2020 the write-down of previously recognised deferred tax assets relates primarily to the partial de-recognition of deferred tax assets in our Australian Aluminium business.
(e)In 2021, the utilisation of previously unrecognised deferred tax assets arose due to higher than forecast profits in the year at Oyu Tolgoi.
(f)Unrecognised current year operating losses include tax losses around the Group for which no tax benefit is currently recognised due to uncertainty regarding whether suitable taxable profits will be earned in future to obtain value for the tax losses. In 2020, unrecognised current year operating losses included allowable foreign exchange losses in the UK for which no tax benefit was recognised.
(g)In the year to 31 December 2022, adjustments in respect of prior periods includes amounts related to the settlement of all tax disputes with the Australian Tax Office for the years 2010 to 2021.
(h)Other items include non-deductible costs and withholding taxes, and various adjustments to provisions for taxation, the most significant of which relate to transfer pricing matters, including issues previously under discussion with the Australian Tax Office.
(i)The presentation of the prima facie tax reconciliation comparatives has been revised. We have allocated the tax relating to exclusions (historically shown separately in the financial statements) to the appropriate tax line items above. The presentation of the impact of including profit after tax from equity accounted units within the Group profit before tax has also been revised as described in note (a) above.
Annual Report on Form 20-F 2022 | riotinto.com 173
Financial statements continued
Notes to the 2022 financial statements
10 Taxation continued
| | | | | | | | | | | |
| 2022 US$m | 2021 US$m | 2020 US$m |
| | | |
| Tax on fair value movements: | | | |
| | | |
| | | |
| | | |
| – Cash flow hedge fair value gains | 21 | | 62 | | 3 | |
| | | |
| | | |
| | | |
| | | |
| | | |
| | | |
| | | |
| | | |
| | | |
| | | |
| Tax (charge)/credit on re-measurement gains/(losses) on pension and post-retirement healthcare plans | (123) | | (305) | | 112 | |
| | | |
| Deferred tax relating to components of other comprehensive income for the year (note 15) | (102) | | (243) | | 115 | |
Future tax developments
We continue to monitor the Organisation for Economic Co-operation and Development’s (OECD) Two Pillar Solution to address the Tax Challenges Arising from the Digitalisation of the Economy. Pillar Two of those proposals seeks to apply a 15% global minimum tax and is expected to be enacted in 2023 with application to the Group from 1 January 2024. We note the release in July by the UK Government of draft legislation to implement a "Multinational Top-up Tax" on a country-by-country basis in line with Pillar Two.
We are in the process of evaluating the cash tax and accounting implications of the Pillar Two global minimum tax rules under IAS 12. Recognition of any impact will only occur once legislation has been substantively enacted.
174 Annual Report on Form 20-F 2022 | riotinto.com
Our operating assets
We are a diversified mining operation with the majority of our assets being located in Organization for Economic Cooperation and Development (OECD) countries.
Non-current assets other than excluded items(a)
The total of non-current assets other than excluded items is shown by location below.
| | | | | | | | |
| 2022 US$m | 2021 US$m |
| Australia | 31,674 | | 32,807 | |
| Canada | 14,472 | | 15,139 | |
| Mongolia | 12,872 | | 11,653 | |
| United States of America | 6,441 | | 6,141 | |
| Africa | 2,945 | | 3,080 | |
| South America | 3,317 | | 2,451 | |
| | |
| | |
| Europe (excluding UK) | 245 | | 246 | |
| UK | 136 | | 111 | |
| Other countries | 1,159 | | 1,197 | |
| Total non-current assets other than excluded items | 73,261 | | 72,825 | |
| | |
| Non-current assets excluded from analysis above: | | |
| Deferred tax assets | 2,766 | | 3,375 | |
| | |
| | |
| Other financial assets | 406 | | 528 | |
| | |
| | |
Quasi-equity loans to equity accounted units(b) | — | | 97 | |
| Tax recoverable | — | | 29 | |
| | |
| | |
| | |
| Receivables and other assets | 1,338 | | 1,610 | |
| Total non-current assets per balance sheet | 77,771 | | 78,464 | |
(a)Allocation of non-current assets by country is based on the location of the business units holding the assets. It includes investments in equity accounted units totalling US$3,298 million (2021: US$3,407 million) which represents the Group’s share of net assets excluding quasi-equity loans shown separately above.
(b)As part of the impairment of the Boyne Smelter the quasi-equity loan was fully impaired in 2022 (2021: US$97 million).
11 Goodwill
Recognition and measurement
Goodwill is not amortised; it is tested annually at 30 September for impairment or more frequently if events or changes in circumstances indicate a potential impairment, refer to note 4 for further information.
| | | | | | | | |
| 2022 US$m | 2021 US$m |
| Net book value | | |
| At 1 January | 879 | | 946 | |
| Adjustment on currency translation | (53) | | (67) | |
| | |
| | |
| | |
| At 31 December | 826 | | 879 | |
| – cost | 15,974 | | 16,987 | |
| – accumulated impairment | (15,148) | | (16,108) | |
| | |
| At 1 January | | |
| – cost | 16,987 | | 17,341 | |
| – accumulated impairment | (16,108) | | (16,395) | |
At 31 December, goodwill has been allocated as follows: | | | | | | | | |
| 2022 US$m | 2021 US$m |
| Net book value | | |
| Richards Bay Minerals | 405 | | 428 | |
| Pilbara | 337 | | 362 | |
| Dampier Salt | 84 | | 89 | |
| 826 | | 879 | |
Annual Report on Form 20-F 2022 | riotinto.com 175
Financial statements continued
Notes to the 2022 financial statements
11 Goodwill continued
Impairment tests for goodwill
Richards Bay Minerals
Richards Bay Minerals’ annual impairment review resulted in no impairment charge for 2022 (2021: no impairment charge). The recoverable amount has been assessed by reference to FVLCD, in line with the policy set out in note 4 and classified as level 3 under the fair value hierarchy. FVLCD was determined by estimating cash flows until the end of the life-of-mine plan including anticipated expansions. In arriving at FVLCD, a post-tax discount rate of 8.6% (2021: 8.6%) has been applied to the post-tax cash flows expressed in real terms.
The key assumptions to which the calculation of FVLCD for Richards Bay Minerals is most sensitive and the corresponding change in FVLCD are set out below:
| | | | | |
| 2022 US$m |
5% increase in the titanium slag price | 207 |
1% increase in the discount rate applied to post-tax cash flows | (140) | |
10% strengthening of the South African rand | 263 | |
Other assumptions include the long-term pig iron and zircon prices and operating costs. Future selling prices and operating costs have been estimated in line with the policy set out in note 4. The recoverable amount of the cash-generating unit (CGU) exceeds the carrying value when each of these sensitivities is applied while keeping all other assumptions constant.
12 Intangible assets
Recognition and measurement - Intangible assets
Purchased intangible assets are initially recorded at cost. Finite-life intangible assets are amortised over their useful economic lives on a straight line or units of production basis, as appropriate. Intangible assets that are deemed to have indefinite lives and intangible assets that are not yet ready for use are not amortised; they are reviewed annually for impairment or more frequently if events or changes in circumstances indicate a potential impairment.
The majority of our intangible assets relate to capitalised exploration and evaluation spend and contract-based water rights. The water rights were acquired with Alcan in Canada.
Exploration and evaluation
Evaluation expenditure relates to a detailed assessment of deposits or other projects (including smelter and refinery projects) that have been identified as having economic potential. Capitalisation of evaluation expenditure commences when there is a high degree of confidence that the Group will determine that a project is commercially viable; that is, the project will provide a satisfactory return relative to its perceived risks, and therefore it is considered probable that future economic benefits will flow to the Group. The Group’s view is that a high degree of confidence is greater than “more likely than not” (that is, greater than 50% certainty) and less than “virtually certain” (that is, less than 90% certainty).
Assessing whether there is a high degree of confidence that the Group will ultimately determine that an evaluation project is commercially viable requires judgment and consideration of all relevant factors such as the nature and objective of the project; the project’s current stage; project timeline; current estimates of the project’s net present value, including sensitivity analyses for the key assumptions; and the main risks of the project. Development expenditure incurred prior to the decision to proceed is subject to the same criteria for capitalisation, being a high degree of confidence that the Group will ultimately determine that a project is commercially viable.
In some cases, undeveloped projects are regarded as successors to orebodies, smelters or refineries currently in production. Where this is the case, it is intended that these will be developed and go into production when the current source of ore is exhausted or when existing smelters or refineries are closed. Ore reserves may be declared for an undeveloped mining project before its commercial viability has been fully determined. Evaluation costs may continue to be capitalised in between declaration of ore reserves and approval to mine as further work is undertaken in order to refine the development case to maximise the project’s returns.
Contract-based intangible assets
The majority of the carrying value of our contract-based intangible assets relate to water rights in the Quebec region. These contribute to the efficiency and cost effectiveness of our aluminium operations as they enable us to generate electricity from hydropower stations.
| | | | | | | | |
| | |
| Other relevant judgments - Assessment of indefinite-lived water rights in Quebec, Canada We continue to judge the water rights in Quebec to have an indefinite life because we expect the contractual rights to contribute to the efficiency and cost effectiveness of our operations for the foreseeable future. Accordingly, the rights are not subject to amortisation but are tested annually for impairment. We have no other indefinite-lived assets. The remaining carrying value of the water rights of US$1,693 million (included in contract based assets) as at 31 December 2022 (31 December 2021: US$1,796 million) relates wholly to the Quebec smelters cash-generating unit (CGU). The Quebec smelters CGU was tested for impairment by reference to FVLCD using discounted cash flows. The recoverable amount of the Quebec smelters is classified as level 3 under the fair value hierarchy. In arriving at FVLCD, post-tax cash flows expressed in real terms have been estimated over the expected useful economic lives of the underlying smelting assets and discounted using a real post-tax discount rate of 6.6% (2021: 6.6%). The recoverable amounts were determined to be significantly in excess of carrying value, and there are no reasonably possible changes in key assumptions that would cause the remaining water rights to be impaired. | |
| | |
176 Annual Report on Form 20-F 2022 | riotinto.com
| | | | | | | | | | | |
| | | |
| Impact of climate change on our business - Water rights To manage the uncertainties of climate change and our impact on the area, our team of hydrologists in Quebec analyse different weather scenarios on a daily basis. We monitor the water resource available to us along with the impact our operation is having on the water quality and quantity and on the environment when we return the water following use. Based on our analysis to date we do not consider the renewal of our contractual water rights to be at risk from climate change for the foreseeable future. | |
| | | |
| | | | | | | | | | | | | | | | | |
| Year ended 31 December 2022 | Exploration
and
evaluation
US$m | Trademarks, patented and non-patented technology
US$m | Contract-based intangible
assets
US$m | Other
intangible
assets
US$m | Total
US$m |
| Net book value | | | | | |
| At 1 January 2022 | 363 | | 22 | | 2,008 | | 439 | | 2,832 | |
| Adjustment on currency translation | (22) | | (2) | | (114) | | (24) | | (162) | |
| Expenditure during the year | 207 | | 5 | | — | | 106 | | 318 | |
| Amortisation for the year | — | | (13) | | (9) | | (137) | | (159) | |
Impairment reversal(a) | 150 | | — | | — | | — | | 150 | |
| | | | | |
| | | | | |
| | | | | |
| | | | | |
| | | | | |
Subsidiaries no longer consolidated(a) | (150) | | — | | — | | — | | (150) | |
Newly consolidated operations(b) | 822 | | — | | — | | — | | 822 | |
| | | | | |
| | | | | |
| | | | | |
| | | | | |
| | | | | |
| | | | | |
| | | | | |
| | | | | |
| | | | | |
| Disposals, transfers and other movements | (2) | | — | | (10) | | 6 | | (6) | |
| At 31 December 2022 | 1,368 | | 12 | | 1,875 | | 390 | | 3,645 | |
| – cost | 3,030 | | 211 | | 2,908 | | 1,732 | | 7,881 | |
| | | | | |
| | | | | |
| – accumulated amortisation and impairment | (1,662) | | (199) | | (1,033) | | (1,342) | | (4,236) | |
| | | | | | | | | | | | | | | | | |
| Year ended 31 December 2021 | Exploration and evaluation US$m | Trademarks, patented and non-patented technology
US$m | Contract-based intangible assets US$m | Other
intangible
assets
US$m | Total
US$m |
| Net book value | | | | | |
| At 1 January 2021 | 271 | | 33 | | 1,994 | | 457 | | 2,755 | |
| Adjustment on currency translation | (14) | | (2) | | (11) | | (21) | | (48) | |
| Expenditure during the year | 110 | | 5 | | — | | 110 | | 225 | |
| Amortisation for the year | — | | (14) | | (10) | | (154) | | (178) | |
| | | | | |
| Disposals, transfers and other movements | (4) | | — | | 35 | | 47 | | 78 | |
| At 31 December 2021 | 363 | | 22 | | 2,008 | | 439 | | 2,832 | |
| – cost | 2,513 | | 220 | | 3,089 | | 1,725 | | 7,547 | |
| – accumulated amortisation and impairment | (2,150) | | (198) | | (1,081) | | (1,286) | | (4,715) | |
(a)The impairment reversal and disposal relates to our sale of the Roughrider uranium development project, refer to note 4.
(b)The acquisition relates to our purchase of Rincon, a lithium project in Argentina, refer to note 5.
Where amortisation is calculated on a straight line basis, the following useful lives have been determined:
| | | | | | | | | | | | | | | | | | | | |
| Trademarks, patented and non-patented technology | Contract-based intangible assets | Other intangible assets |
| Type of intangible | Trademarks | Patented and
non-patented technology | Power contracts/water rights | Other purchase and customer contracts | Internally generated intangible assets and computer software | Other intangible assets |
| Amortisation profile | 14 to 20 years | 10 to 20 years | 2 to 45 years | 5 to 15 years | 2 to 5 years | 2 to 20 years |
Annual Report on Form 20-F 2022 | riotinto.com 177
Financial statements continued
Notes to the 2022 financial statements
13 Property, plant and equipment
Recognition and measurement
Property, plant and equipment is stated at cost, as defined in IAS 16, less accumulated depreciation and accumulated impairment losses. The cost of property, plant and equipment includes, where applicable, the estimated close-down and restoration costs associated with the asset.
Property, plant and equipment includes right of use assets arising from leasing arrangements, shown separately from owned and leasehold assets.
Once an undeveloped mining project has been determined as commercially viable and approval to mine has been given, expenditure other than that on land, buildings, plant, equipment and capital work in progress is capitalised under “Mining properties and leases” together with any amount transferred from “Exploration and evaluation”.
Costs incurred while commissioning new assets, in the period before they are capable of operating in the manner intended by management, are capitalised unless associated with pre-production revenue (refer to page 155). Development costs incurred after the commencement of production are capitalised to the extent they are expected to give rise to a future economic benefit. Interest on borrowings related to construction or development projects is capitalised, at the rate payable on project-specific debt if applicable or at the Group or subsidiary’s cost of borrowing if not. This is performed until the point when substantially all the activities that are necessary to make the asset ready for its intended use are complete. It may be appropriate to use a subsidiary’s cost of borrowing when the debt was negotiated based on the financing requirements of that subsidiary.
Depreciation of non-current assets
Property, plant and equipment is depreciated over its useful life, or over the remaining life of the mine, smelter or refinery if that is shorter and there is no reasonable alternative use for the asset by the Group. Depreciation commences when an asset is available for use. Assets within operations for which production is not expected to fluctuate significantly from one year to another or which have a physical life shorter than the related mine are depreciated on a straight line basis as follows:
| | | | | | | | | | | | | | | | | | |
| Type of Property, plant and equipment | | Land and Buildings | Plant and equipment | Capital work in progress |
| Land | Buildings | Power assets | Other plant and equipment |
| Depreciation profile | | Not depreciated | 5 to 50 years | See Power note below | 3 to 50 years | Not depreciated |
The useful lives and residual values for material assets and categories of assets are reviewed annually and changes are reflected prospectively.
Units of production basis
For mining properties and leases and certain mining equipment, consumption of the economic benefits of the asset is linked to production. Except as noted below, these assets are depreciated on the units of production basis.
In applying the units of production method, depreciation is normally calculated based on production in the period as a percentage of total expected production in current and future periods based on ore reserves and, for some mines, other mineral resources. Other mineral resources may be included in the calculations of total expected production in limited circumstances where there are very large areas of contiguous mineralisation, for which the economic viability is not sensitive to likely variations in grade, as may be the case for certain iron ore, bauxite and industrial mineral deposits, and where there is a high degree of confidence that the other mineral resources can be extracted economically. This would be the case when the other mineral resources do not yet have the status of ore reserves merely because the necessary detailed evaluation work has not yet been performed and the responsible technical personnel agree that inclusion of a proportion of measured and indicated resources in the calculation of total expected production is appropriate based on historical reserve conversion rates.
The required level of confidence is unlikely to exist for minerals that are typically found in low-grade ore (as compared with the above), such as copper or gold. In these cases, specific areas of mineralisation have to be evaluated in detail before their economic status can be predicted with confidence.
Sometimes the calculation of depreciation for infrastructure assets, primarily rail and port, considers measured and indicated resources. This is because the asset can benefit current and future mines. The measured and indicated resource may relate to mines which are currently in production or to mines where there is a high degree of confidence that they will be brought into production in the future. The quantum of mineral resources is determined taking into account future capital costs as required by the JORC code. The depreciation calculation, however, applies to current mines only and does not take into account future development costs for mines which are not yet in production. Measured and indicated resources are currently incorporated into depreciation calculations in the Group’s Australian iron ore business.
| | | | | | | | |
| | |
| Key judgment - Estimation of asset lives The useful lives of the major assets of a cash-generating unit are often dependent on the life of the orebody to which they relate. Where this is the case, the lives of mining properties, and their associated refineries, concentrators and other long-lived processing equipment are generally limited to the expected life of the orebody. The life of the orebody, in turn, is estimated on the basis of the life-of-mine plan. Where the major assets of a cash-generating unit are not dependent on the life of a related orebody, management applies judgment in estimating the remaining service potential of long-lived assets. Factors affecting the remaining service potential of smelters include, for example, smelter technology and electricity purchase contracts when power is not sourced from the Group, or in some cases from local governments permitting electricity generation from hydro-power stations. | |
| | |
178 Annual Report on Form 20-F 2022 | riotinto.com
| | | | | | | | | | | |
| | | |
| Impact of climate change on our business - Estimation of asset lives We expect there to be a higher demand for copper, aluminium, lithium and high grade iron ore in order to meet demand for the minerals required to transition to a low carbon economic environment, consistent with the climate change commitments of the Paris Agreement. We expect this to exceed new supply to the market and therefore increase prices. Under the Aspirational Leadership scenario, the economic cut-off grade for our Ore Reserves is expected to be lower; in effect we would mine a greater volume of material before the mines are depleted. We cannot quantify the difference this would make without undue cost as it would require revised mine plans, but for property, plant and equipment this increased volume of material would reduce the depreciation charge for assets that use the ‘Units of production’ depreciation method. | |
| | | |
Straight line basis
Assets within operations for which production is not expected to fluctuate significantly from one year to another or which have a physical life shorter than the related mine are depreciated on a straight line basis.
Deferred stripping
In open pit mining operations, overburden and other waste materials must be removed to access ore from which minerals can be extracted economically. The process of removing overburden and waste materials is referred to as stripping. During the development of a mine (or, in some instances, pit; see below), before production commences, stripping costs related to a component of an orebody are capitalised as part of the cost of construction of the mine (or pit). These are then amortised over the life of the mine (or pit) on a units of production basis.
Where a mine operates several open pits that are regarded as separate operations for the purpose of mine planning, initial stripping costs are accounted for separately by reference to the ore from each separate pit. If, however, the pits are highly integrated for the purpose of mine planning, the second and subsequent pits are regarded as extensions of the first pit in accounting for stripping costs. In such cases, the initial stripping (such as overburden and other waste removal) of the second and subsequent pits is considered to be production phase stripping (see below).
| | | | | | | | |
| | |
| Key judgment - Deferral of stripping costs We apply judgment as to whether multiple pits at a mine are considered separate or integrated operations. This determines whether the stripping activities of a pit are classified as pre-production or production phase stripping and, therefore, the amortisation base for those costs. The analysis depends on each mine’s specific circumstances and requires judgment: another mining company could make a different judgment even when the fact pattern appears to be similar. The following factors would point towards the initial stripping costs for the individual pits being accounted for separately: –If mining of the second and subsequent pits is conducted consecutively following that of the first pit, rather than concurrently; –If separate investment decisions are made to develop each pit, rather than a single investment decision being made at the outset; –If the pits are operated as separate units in terms of mine planning and the sequencing of overburden removal and ore mining, rather than as an integrated unit; –If expenditures for additional infrastructure to support the second and subsequent pits are relatively large; and –If the pits extract ore from separate and distinct orebodies, rather than from a single orebody. If the designs of the second and subsequent pits are significantly influenced by opportunities to optimise output from several pits combined, including the co-treatment or blending of the output from the pits, then this would point to treatment as an integrated operation for the purposes of accounting for initial stripping costs. The relative importance of each of the above factors is considered in each case. In order for production phase stripping costs to qualify for capitalisation as a stripping activity asset, three criteria must be met: –It must be probable that there will be an economic benefit in a future accounting period because the stripping activity has improved access to the orebody; –It must be possible to identify the “component” of the orebody for which access has been improved; and –It must be possible to reliably measure the costs that relate to the stripping activity. A “component” is a specific section of the orebody that is made more accessible by the stripping activity. It will typically be a subset of the larger orebody that is distinguished by a separate useful economic life (for example, a pushback). | |
| | |
Annual Report on Form 20-F 2022 | riotinto.com 179
Financial statements continued
Notes to the 2022 financial statements
13 Property, plant and equipment continued
Recognition and measurement
| | | | | | | | | | | |
| Phase | Development Phase | Production Phase |
| Stripping activity | Overburden and other waste removal during the development of a mine before production commences. | Production phase stripping can give access to two benefits: the extraction of ore in the current period and improved access to ore which will be extracted in future periods. |
| Period of benefit | After commissioning of the mine. | Future periods after first phase is complete. | Current and future benefit are indistinguishable. |
| Capitalised to mining properties and leases in property, plant and equipment | During the development of a mine, stripping costs relating to a component of an orebody are capitalised as part of the cost of construction of the mine. | It may be the case that subsequent phases of stripping will access additional ore and that these subsequent phases are only possible after the first phase has taken place. Where applicable, the Group considers this on a mine-by-mine basis. Generally, the only ore attributed to the stripping activity asset for the purposes of calculating the life-of-component ratio is the ore to be extracted from the originally identified component. | Stripping costs for the component are deferred to the extent that the current period ratio exceeds the life-of-component ratio. |
| Allocation to inventory | Not applicable | Not applicable | The stripping cost is allocated to inventory based on a relevant production measure using a life-of-component strip ratio. The ratio divides the tonnage of waste mined for the component for the period either by the quantity of ore mined for the component or by the quantity of minerals contained in the ore mined for the component. In some operations, the quantity of ore is a more appropriate basis for allocating costs, particularly when there are significant by-products. |
| Component | A “component” is a specific section of the orebody that is made more accessible by the stripping activity. It will typically be a subset of the larger orebody that is distinguished by a separate useful economic life (for example, a pushback). |
| Life-of-component ratio | The life-of-component ratios are based on the ore reserves of the mine (and for some mines, other mineral resources) and the annual mine plan; they are a function of the mine design and, therefore, changes to that design will generally result in changes to the ratios. Changes in other technical or economic parameters that impact the ore reserves (and for some mines, other mineral resources) may also have an impact on the life-of-component ratios even if they do not affect the mine design. Changes to the ratios are accounted for prospectively. |
| Depreciation basis | Depreciated on a “units of production” basis based on expected production of either ore or minerals contained in the ore over the life of the component unless another method is more appropriate. |
Property, plant and equipment includes both owned and leased assets. | | | | | | | | | | | | |
| | | | | 2022 US$m | 2021 US$m |
| Property, plant and equipment – owned | | | | | 63,731 | | 63,793 | |
| Right of use assets – leased | | | | | 1,003 | | 1,134 | |
| | | | | | |
| Net book value | | | | | 64,734 | | 64,927 | |
Property, plant and equipment – Owned
| | | | | | | | | | | | | | | | | | | | | | |
| Year ended 31 December 2022 | Note | Mining properties and leases(a) US$m | Land
and
buildings
US$m | Plant
and
equipment
US$m | Capital
works in
progress
US$m | Total
US$m | | |
| Net book value | | | | | | | | |
| At 1 January 2022 | | 10,817 | | 5,995 | | 33,453 | | 13,528 | | 63,793 | | | |
| | | | | | | | |
| | | | | | | | |
Adjustment on currency translation(b) | | (436) | | (344) | | (1,870) | | (311) | | (2,961) | | | |
| Adjustments to capitalised closure costs | 14 | | 520 | | — | | — | | — | | 520 | | | |
Interest capitalised(c) | 9 | | — | | — | | — | | 416 | | 416 | | | |
| | | | | | | | |
Additions(d) | | 360 | | 304 | | 1,111 | | 4,732 | | 6,507 | | | |
Depreciation for the year(a) | | (891) | | (433) | | (3,171) | | — | | (4,495) | | | |
| | | | | | | | |
| | | | | | | | |
| | | | | | | | |
| Disposals | | (3) | | (1) | | (38) | | (4) | | (46) | | | |
Newly consolidated operations(e) | | — | | 1 | | — | | 5 | | 6 | | | |
| | | | | | | | |
| | | | | | | | |
| | | | | | | | |
| | | | | | | | |
| | | | | | | | |
| | | | | | | | |
| | | | | | | | |
| | | | | | | | |
| | | | | | | | |
| | | | | | | | |
| | | | | | | | |
| | | | | | | | |
| | | | | | | | |
| | | | | | | | |
| | | | | | | | |
| | | | | | | | |
Transfers and other movements(f) | | 162 | | 1,177 | | 4,922 | | (6,270) | | (9) | | | |
| At 31 December 2022 | | 10,529 | | 6,699 | | 34,407 | | 12,096 | | 63,731 | | | |
| – cost | | 25,263 | | 12,805 | | 74,562 | | 13,118 | | 125,748 | | | |
| | | | | | | | |
| | | | | | | | |
| – accumulated depreciation and impairment | | (14,734) | | (6,106) | | (40,155) | | (1,022) | | (62,017) | | | |
| | | | | | | | |
| | | | | | | | |
Non-current assets pledged as security(g) | | 1,602 | | 491 | | 5,113 | | 8,876 | | 16,082 | | | |
180 Annual Report on Form 20-F 2022 | riotinto.com
| | | | | | | | | | | | | | | | | | | | |
| Year ended 31 December 2021 |
Note | Mining properties and leases(a) US$m | Land and buildings US$m | Plant
and
equipment
US$m | Capital
works in
progress
US$m | Total
US$m |
| Net book value | | | | | | |
| At 1 January 2021 | | 11,173 | | 6,369 | | 32,754 | | 11,711 | | 62,007 | |
| | | | | | |
| | | | | | |
Adjustment on currency translation(b) | | (385) | | (194) | | (1,097) | | (259) | | (1,935) | |
| Adjustments to capitalised closure costs | 14 | 518 | | — | | — | | — | | 518 | |
Interest capitalised(c) | 9 | — | | — | | — | | 358 | | 358 | |
| Additions | | 227 | | 70 | | 1,841 | | 5,337 | | 7,475 | |
Depreciation for the year(a) | | (736) | | (390) | | (3,061) | | — | | (4,187) | |
Impairment charges(h) | | (2) | | (66) | | (195) | | (6) | | (269) | |
| Disposals | | (2) | | (18) | | (90) | | (7) | | (117) | |
| | | | | | |
Transfers and other movements(f) | | 24 | | 224 | | 3,301 | | (3,606) | | (57) | |
| At 31 December 2021 | | 10,817 | | 5,995 | | 33,453 | | 13,528 | | 63,793 | |
| – cost | | 25,114 | | 12,031 | | 73,415 | | 14,661 | | 125,221 | |
| – accumulated depreciation and impairment | | (14,297) | | (6,036) | | (39,962) | | (1,133) | | (61,428) | |
| | | | | | |
| | | | | | |
Non-current assets pledged as security(g) | | 1,637 | | 457 | | 5,196 | | 7,621 | | 14,911 | |
(a)At 31 December 2022, the net book value of capitalised production phase stripping costs totalled US$2,497 million, with US$2,038 million within “Property, plant and equipment” and a further US$460 million within “Investments in equity accounted units” (2021: total of US$2,432 million, with US$2,017 million in “Property, plant and equipment” and a further US$415 million within “Investments in equity accounted units”). During the year, capitalisation of US$411 million was partly offset by depreciation of US$331 million (including amounts recorded within equity accounted units). Depreciation of deferred stripping costs in respect of subsidiaries of US$246 million (2021: US$201 million; 2020: US$145 million) is included within “Depreciation for the year”.
(b)Adjustment on currency translation represents the impact of exchange differences arising on the translation of the assets of entities with functional currencies other than the US dollar, recognised directly in the currency translation reserve. The adjustment in 2022 arose primarily from the weakening of the Australian dollar against the US dollar.
(c)Our average borrowing rate, excluding any project finance, used for capitalisation of interest is 5.60% (2021: 3.40%).
(d)US$0.1 billion of additions to “Property, plant and equipment” relates to capital spend on carbon abatement in 2022.
(e)In 2022, the acquisition relates to our purchase of Rincon, a lithium project in Argentina, refer to note 5.
(f)“Transfers and other movements” includes reclassifications between categories.
(g)Excludes assets held under capitalised lease arrangements. Non-current assets pledged as security represent amounts pledged as collateral against US$3,965 million (2021: US$4,403 million) of loans, which are included in note 20.
(h)In 2021, the impairment charges related to our Kitimat smelter in Canada, refer to note 4.
| | | | | | | | | | | | | | | | | | | | |
| | | | | | |
| Impact of climate change on our business - Useful economic lives of our power generating assets The Group has committed to reducing scope 1 and scope 2 carbon emissions by 50% relative to our 2018 baseline by 2030 and achieving net zero emission across our operations by 2050. We expect to spend US$7.5 billion between 2022 and 2030. Transitioning electricity from principally fossil fuel-based power generating assets to principally renewables is critical to achieving that goal. The carrying value of power generating assets is set out in the table below. The weighted average remaining useful economic life of plant and equipment for fossil fuel-based power generating assets is 13 years (2021:14 years). Given the technical limitations of intermittent renewable energy generation and energy storage systems, and our need for reliable baseload electricity, we expect our current generation assets will be integral to those needs for the foreseeable future. We are investing in research and development and evaluating new market options that may overcome these technical challenges. Should pathways for eliminating fossil fuel power generating assets be identified we may need to accelerate depreciation or impair the assets; however, at this present moment the requirement for fossil fuel powered back-up means that early retirement of the assets is not expected. | |
| 2022 | 2021 | |
| Net book value | Land
and
buildings
US$m | Plant
and
equipment
US$m | Land
and
buildings
US$m | Plant
and
equipment
US$m | |
| Fossil fuels | 25 | | 882 | | 26 | | 952 | | |
Renewables(a) | 198 | | 2,352 | | 195 | | 1,541 | | |
| (a)The increase of US$0.8 billion in renewable plant & equipment, is attributable to the Kemano T2 hydropower project, following the completion of a second tunnel to supply water to the Kemano hydropower facility in 2022. This project will ensure the long-term, sustainable production of low-carbon aluminium at our smelter in Kitimat. | |
| | | | | | |
Annual Report on Form 20-F 2022 | riotinto.com 181
Financial statements continued
Notes to the 2022 financial statements
13 Property, plant and equipment continued
Right-of-use assets – Leased
| | | | | | | | | | | | | |
| | Land and
buildings
US$m | Plant and
equipment
US$m | | Total
US$m |
| Net book value | | | | | |
| 31 December 2022 | | 515 | | 488 | | | 1,003 | |
| 31 December 2021 | | 549 | | 585 | | | 1,134 | |
| | | | | |
| Additions for the year | | | | | |
| 31 December 2022 | | 49 | | 254 | | | 303 | |
| 31 December 2021 | | 135 | | 407 | | | 542 | |
| | | | | |
| Depreciation for the year (included within operating costs) | | | | | |
| 31 December 2022 | | (61) | | (295) | | | (356) | |
| 31 December 2021 | | (81) | | (251) | | | (332) | |
| | | | | |
| | | | | |
| | | | | |
| | | | | |
The leased assets of the Group include land and buildings (mainly office buildings) and plant and equipment, the majority of which are marine vessels. Lease terms are negotiated on an individual basis and contain a wide range of terms and conditions. Right of use assets are depreciated on a straight line basis over the life of the lease, taking into account any extensions that are likely to be enacted.
14 Close-down and restoration provisions
Recognition and measurement
The Group has provisions for close-down and restoration costs which include the dismantling and demolition of infrastructure, the removal of residual materials and the remediation of disturbed areas for mines and certain refineries and smelters. The obligation may occur during development or during the production phase of a facility. These provisions are based on all regulatory requirements and any other commitments made to stakeholders. The provision excludes the impact of future disturbance which is planned to occur during the life of mine, so that it represents only incurred disturbance as at the balance sheet date.
Closure provisions are not made for those operations that have no known restrictions on their lives as the closure dates cannot be reliably estimated, instead a contingent liability is disclosed, refer to note 37. This applies primarily to certain Canadian smelters which have indefinite-lived water rights from local governments permitting electricity generation from hydro-power stations.
Close-down and restoration costs are a normal consequence of mining or production, and the majority of close-down and restoration expenditure is incurred in the years following closure of the mine, refinery or smelter. Although the ultimate cost to be incurred is uncertain, the Group’s businesses estimate their costs using current restoration standards, techniques and expected climate conditions. The costs are estimated on the basis of a closure plan, and are reviewed at each reporting period during the life of the operation to reflect known developments. The estimates are also subject to formal review, with appropriate external support, at regular intervals.
The timing of closure and the rehabilitation plans for the site can be uncertain and dependent upon future capital allocation decisions which involve estimation of future economic circumstances and business cases. In such circumstances, the closure provision is estimated using probability weighting of the different remediation and closure scenarios.
The initial close-down and restoration provision is capitalised within “Property, plant and equipment”. Subsequent movements in the close-down and restoration provisions for ongoing operations are treated as an adjustment to cost within “Property, plant and equipment”. This includes those resulting from new disturbance related to expansions or other activities qualifying for capitalisation; updated cost estimates; changes to the estimated lives of operations; changes to the timing of closure activities; and revisions to discount rates.
Changes in closure provisions relating to closed operations are charged/credited to “Net operating costs” in the income statement.
Where rehabilitation is conducted systematically over the life of the operation, rather than at the time of closure, provision is made for the estimated outstanding continuous rehabilitation work at each balance sheet date and the cost is charged to the income statement.
The closure provision is represented by forecast future underlying cash flows expressed in real terms at the balance sheet date. These are discounted for the time value of money based on a long-term view of low-risk market yields which includes a review of historic trends plus risks and opportunities for which future cash flows have not been adjusted, namely potential improvements in closure practices between the reporting date and the point at which rehabilitation spend takes place. The real-terms discount rate used is 1.5% (2021: 1.5%) which is applied to all locations since we expect to meet closure cash flows principally from US dollar revenues and financing, with activities co-ordinated by the Group's central closure team.
To roll forward those real-terms cash flows between periods, we identify local rates of inflation based on Producer Price Inflation (PPI) indices and together with the real-terms discount rate unwind the discount through the line “amortisation of discount”, shown within “Finance items” in the income statement. This nominal rate for cost escalation in the current financial year is estimated at the start of each half-year and applied systematically for six months. At the end of each half-year we update the underlying cash flows for the latest estimate of experienced inflation for the current financial year and record this as “changes to existing provisions”. For operating sites this adjustment usually results in a corresponding adjustment to Property, Plant and Equipment and for closed and fully impaired sites the adjustment is charged or credited to the income statement.
In some cases, our subsidiaries make a contribution to trust funds in order to meet or reimburse future environmental and decommissioning costs. Amounts due for reimbursement from trust funds are not offset against the corresponding closure provision unless payments into the fund have the effect of passing the closure obligation to the trust.
Environmental costs result from environmental damage that was not a necessary consequence of operations, and may include remediation, compensation and penalties. Provision is made for the estimated present value of such costs at the balance sheet date. These costs are charged to “Net operating costs”, except for the unwinding of the discount which is shown within “Finance items”.
Remediation procedures may commence soon after the time the disturbance, remediation process and estimated remediation costs become known, but can continue for many years depending on the nature of the disturbance and the remediation techniques used.
182 Annual Report on Form 20-F 2022 | riotinto.com
| | | | | | | | | | | | | | | | |
| Note | | | 2022 US$m | 2021 US$m | | | |
At 1 January | | | | 14,542 | | 13,335 | | | | |
| | | | | | | | |
| | | | | | | | |
Adjustment on currency translation | | | | (699) | | (483) | | | | |
| Adjustments to mining properties/right of use assets: | 13 | | | | | | | | |
| – increases to existing and new provisions | | | | 520 | | 518 | | | | |
| | | | | | | | |
| | | | | | | | |
Charged/(credited) to profit: | | | | | | | | |
– increases to existing and new provisions | | | | 541 | | 1,475 | | | | |
| | | | | | | | |
– unused amounts reversed | | | | (72) | | (192) | | | | |
– exchange losses on provisions | | | | 17 | | 23 | | | | |
– amortisation of discount | | | | 1,517 | | 415 | | | | |
Utilised in year | | | | (609) | | (541) | | | | |
| | | | | | | | |
| | | | | | | | |
| | | | | | | | |
| | | | | | | | |
| | | | | | | | |
| | | | | | | | |
| | | | | | | | |
| | | | | | | | |
| | | | | | | | |
| | | | | | | | |
| | | | | | | | |
| | | | | | | | |
| | | | | | | | |
| Transfers and other movements | | | | 2 | | (8) | | | | |
At 31 December(a) | | | | 15,759 | | 14,542 | | | | |
Balance sheet analysis: | | | | | | | | |
Current | | | | 1,142 | | 1,023 | | | | |
Non-current | | | | 14,617 | | 13,519 | | | | |
Total | | | | 15,759 | | 14,542 | | | | |
(a)Close-down, restoration and environmental liabilities at 31 December 2022 have not been adjusted for closure-related receivables amounting to US$351 million (2021: US$410 million) due from the ERA trust fund and other financial assets held for the purposes of meeting closure obligations. These are included within “Receivables and other assets” on the balance sheet.
| | | | | | | | |
| | |
| Key judgment - Close-down, restoration and environmental obligations We use our judgment and experience to determine the potential scope of closure rehabilitation work required to meet the Group’s legal, statutory and constructive obligations, and any other commitments made to stakeholders, and the options and techniques available to meet those obligations and estimate the associated costs and the likely timing of those costs. Significant judgment is also required to determine both the costs associated with that work and the other assumptions used to calculate the provision. External experts support the cost estimation process where appropriate but there remains significant estimation uncertainty. The key judgment in applying this accounting policy is determining when an estimate is sufficiently reliable to make or adjust a closure provision. Adjustments are made to provisions when the range of possible outcomes becomes sufficiently narrow to permit reliable estimation. Depending on the materiality of the change, adjustments may require review and endorsement by the Group’s Closure Steering Committee before the provision is updated. Cost estimates are updated throughout the life of the operation; generally cost estimates must comply with the Group’s Capital Project Framework once the operation is ten years from expected closure. This means, for example, that where an Order of Magnitude (OoM) study is required for closure it must be of the same standard as an OoM study for a new mine, smelter or refinery. As at 31 December 2022, there are 16 operations with remaining lives of under 10 years before taking into account unapproved extensions. The largest closure study finalised during 2022 related to the Ranger Uranium mine operated by Energy Resources of Australia. In 2021 the preliminary information from this study resulted in an increase to closure liabilities of US$510 million; the finalisation of the study in 2022 did not result in a further significant change. In some cases, the closure study may indicate that monitoring and, potentially, remediation will be required indefinitely - for example, ground water treatment. In these cases the underlying cash flows for the provision may be restricted to a period for which the costs can be reliably estimated, which on average is around 30 years. Where an alternative commercial arrangement to meet our obligations can be predicted with confidence, this period may be shorter. Closure provisions are not made for those operations that have no known restrictions on their lives as the closure dates cannot be reliably estimated. This applies primarily to certain Canadian smelters which have indefinite-lived water rights or power agreements for renewable power sources with local governments, refer to note 37. | |
| | |
Annual Report on Form 20-F 2022 | riotinto.com 183
Financial statements continued
Notes to the 2022 financial statements
14 Close-down and restoration provisions continued
Analysis of close-down and restoration/environmental clean-up provisions
| | | | | | | | |
| As at 31 December |
2022
US$m |
2021
US$m |
| Undiscounted close-down and environmental restoration obligations | 20,433 | | 18,775 | |
| Impact of discounting | (4,674) | | (4,233) | |
| Present closure obligation | 15,759 | | 14,542 | |
| Attributable to: | | |
| Operating sites | 11,598 | | 10,727 | |
| Non-operating sites | 4,161 | | 3,815 | |
| Total | 15,759 | | 14,542 | |
Projected cash spend for the undiscounted close-down and restoration/environmental clean-up provision
| | | | | | | | | | | | | | | | | |
| Undiscounted close-down and environmental restoration cash flows | <1 year
US$m | 1-3 years
US$m | 3-5 years
US$m | > 5 years
US$m | Total
US$m |
| | | | | |
| At 31 December 2022 | 1,142 | | 1,986 | | 1,426 | | 15,879 | | 20,433 | |
| At 31 December 2021 | 1,023 | | 1,652 | | 1,680 | | 14,420 | | 18,775 | |
Remaining lives of operations and infrastructure range from one to over 50 years with an average for all sites, weighted by present closure obligation, of around 15 years. Although the ultimate cost to be incurred is uncertain, the Group’s businesses estimate their respective costs based on current restoration standards, techniques and expected climate conditions.
| | | | | | | | |
| | |
| Key estimate - Close-down, restoration and environmental obligations The most significant assumptions and estimates used in calculating the provision are: –Closure timeframes. The weighted average remaining lives of operations is shown below. Some expenditure may be incurred before closure while the operation as a whole is in production. –The length of any post-closure monitoring period. This will depend on the specific site requirements and the availability of alternative commercial arrangements; some expenditure can continue into perpetuity. The Rio Tinto Kennecott closure and environmental remediation provision includes an allowance for ongoing monitoring and remediation costs, including ground water treatment, of approximately US$0.7 billion. –The probability weighting of possible closure scenarios. The most significant impact of probability weighting is at the Pilbara operations (Iron Ore) relating to infrastructure and incorporates the expectation that some infrastructure will be retained by the relevant State authorities post closure. The assignment of probabilities to this scenario reduces the closure provision by US$0.7 billion. –Appropriate sources on which to base the calculation of the discount rate. The discount rate by nature is subjective and therefore sensitivities are shown below for how the provision balance, which at 31 December 2022 was US$15.8 billion, would change if discounted at alternative discount rates. There is significant estimation uncertainty in the calculation of the provision and cost estimates can vary in response to many factors including: –Changes to the relevant legal or local/national government requirements and any other commitments made to stakeholders; –Review of remediation and relinquishment options; –Additional remediation requirements identified during the rehabilitation; –The emergence of new restoration techniques; –Precipitation rates and climate change; –Change in the expected closure date; and –Change in the discount rate. Experience gained at other mine or production sites may also change expected methods or costs of closure, although elements of the restoration and rehabilitation can be unique to each site. Generally, there is relatively limited restoration and rehabilitation activity and historical precedent elsewhere in the Group, or in the industry as a whole, against which to benchmark cost estimates. The expected timing of expenditure can also change for other reasons, for example because of changes to expectations relating to ore reserves and mineral resources, production rates, renewal of operating licences or economic conditions. Changes in closure estimates at the Group’s ongoing operations could result in a material adjustment to assets and liabilities in the next 12 months and would also impact the depreciation and the unwind of discount in future years. Changes to closure cost estimates for closed operations, and changes to environmental cost estimates at any operation, could cause a material adjustment to the income statement and closure liability. We do not consider that there is significant risk of a change in estimates for these liabilities causing a material adjustment to the income statement in the next 12 months. Any new environmental incidents may require a material provision but cannot be predicted. Project specific risks are embedded within the cash flows which are based on a central case estimate of closure activities assuming that the obligation is fulfilled by the Group. These cash flows are then discounted using a discount rate specific to the class of obligations. | |
| | |
184 Annual Report on Form 20-F 2022 | riotinto.com
Provisions of US$15,759 million (2021: US$14,542 million) for close-down and restoration costs and environmental clean-up obligations are based on risk-adjusted cash flows. We re-assessed the closure discount rate in the current year and continue to consider that real rate of 1.5%, applied prospectively since 30 September 2020, is the most appropriate rate to use. This assumption is based on the currency in which we plan to fund the closures and our expectation of long-term interest rate and exchange rate parity in the locations of our operations. Prior to 30 September 2020 and in recent years, the close-down and restoration costs and environmental clean-up obligations were discounted at a real rate of 2.0%. To illustrate the sensitivity of the provision to discounting, if the discount rate at 31 December 2022 were decreased to 1.0% then the provision would be US$1.5 billion higher, of which approximately US$1.4 billion would be capitalised within “Property, plant and equipment” at operating sites and US$0.1 billion would be charged to the income statement for non-operating and fully impaired sites. If the discount rate were increased to 3.0% then the provision would be US$3.0 billion lower, of which approximately US$2.7 billion would result in a decrease within “Property, plant and equipment” at operating sites and US$0.3 billion would be credited to the income statement for non-operating and fully impaired sites.
| | | | | | | | | | | |
| | | |
| Impact of climate change on our business - Close-down, restoration and environmental cost The underlying costs for closure have been estimated with varying degrees of precision based on a function of the age of the underlying asset and proximity to closure. For assets within ten years of closure, closure plans and cost estimates are supported by detailed studies which are refined as the closure date approaches. These closure studies consider climate change and plan for resilience to expected climate conditions with a particular focus on precipitation rates. For new developments, consideration of climate change and ultimate closure conditions are an important part of the approval process. For longer-lived assets, closure provisions are typically based on conceptual level studies that are refreshed at least every five years; these are evolving to incorporate greater consideration of forecast climate conditions at closure. | |
| | | |
| | | | | | | | |
| Closure cost composition as at 31 December |
2022
US$m |
2021
US$m |
| Decommissioning, decontamination and demolition | 3,386 | | 3,343 | |
Closure and rehabilitation earthworks(a) | 4,760 | | 4,125 | |
Long-term water management costs(b) | 1,092 | | 967 | |
| Post closure monitoring and maintenance | 1,846 | | 1,676 | |
Indirect costs, owners' costs and contingency(c) | 4,675 | | 4,431 | |
| Total | 15,759 | | 14,542 | |
(a)A key component of earthworks rehabilitation involves re-landscaping the area disturbed by mining activities utilising largely diesel powered heavy mobile equipment. In developing low-carbon solutions for our mobile fleet, this may include electrification of the vehicles during the mine life. The forecast cash flows for the heavy mobile equipment in the closure cost estimate are based on existing fuel sources. The cost incurred during closure could reduce if these activities are powered by renewable energy.
(b)Long-term water management relates to the post-closure treatment of water due to acid rock drainage and other environmental commitments and is an area of research and development focus for our Closure team. The cost of this water processing can continue for many years after the bulk earthworks and demolition activities have completed and are therefore exposed to long-term climate change. This could materially affect rates of precipitation and therefore change the volume of water requiring processing. It is not currently possible to forecast accurately the impact this could have on the closure provision as some of our locations could experience drier conditions whereas others could experience greater rainfall. A further consideration relates to the alternative commercial use for the processed water, which could support ultimate transfer of these costs to a third party.
(c)Indirect costs, owners' costs and contingency include adjustments to the underlying cash flows to align the closure provision with a central-case estimate. This excludes allowances for quantitative estimation uncertainties, which are allocated to the underlying cost driver and presented within the respective cost categories above.
| | | | | | | | |
| Geographic composition as at 31 December |
2022
US$m |
2021
US$m |
| Australia | 7,983 | | 7,605 | |
| USA | 4,680 | | 4,057 | |
| Canada | 1,730 | | 1,662 | |
| Rest of World | 1,366 | | 1,218 | |
| Total | 15,759 | | 14,542 | |
The geographic composition of the closure provision shows that our closure obligations are largely in countries with established levels of regulation in respect of mine and site closure.
Annual Report on Form 20-F 2022 | riotinto.com 185
Financial statements continued
Notes to the 2022 financial statements
15 Deferred taxation
| | | | | | | | |
| | |
| Other relevant judgments - Recoverability of deferred tax assets In considering the recoverability of deferred tax assets, judgment is required regarding the extent to which certain risk factors are likely to affect the recovery of these assets. These risk factors include the risk of expiry of losses prior to utilisation, the impact of other legislation or tax regimes, such as minimum taxes, and consideration of factors that lead to the generation of losses or other deferred tax assets. IAS 12 requires us to consider whether taxable profits will be available against which deferred tax assets may be utilised. The enactment in the US of the Corporate Alternative Minimum Tax (CAMT) in the Inflation Reduction Act 2022 has resulted in a position where, whilst the utilisation of Federal deferred tax assets will reduce our Federal corporate tax liabilities, the CAMT legislation will result in the application of the minimum tax on the adjusted financial statement income. Accordingly, whilst our latest projections demonstrate that sufficient taxable profits will be earned in future periods to utilise the existing Federal deferred tax assets, the utilisation of those Federal deferred tax assets is not expected to yield any significant economic benefit due to the application of the minimum tax and the deferred tax assets have been written down. | |
| | |
| | | | | | | | |
| 2022 US$m | 2021 US$m |
| | |
| | |
| At 1 January – deferred tax (liabilities)/assets | (128) | | 146 | |
| Adjustment on currency translation | 124 | | 61 | |
| (Charged)/credited to the income statement | (735) | | (114) | |
(Charged)/credited to statement of comprehensive income(a) | (102) | | (243) | |
| | |
| | |
| | |
| | |
| | |
| | |
| | |
| | |
| | |
Other movements(b) | 6 | | 22 | |
| At 31 December – deferred tax liabilities | (835) | | (128) | |
| | |
| Comprising: | | |
– deferred tax assets(c)(d) | 2,766 | | 3,375 | |
– deferred tax liabilities(e) | (3,601) | | (3,503) | |
186 Annual Report on Form 20-F 2022 | riotinto.com
Deferred tax balances for which there is a right of offset within the same tax jurisdiction are presented net on the face of the balance sheet as permitted by IAS 12. The closing deferred tax assets and liabilities, prior to this offsetting of balances, are shown below.
Analysis of deferred tax | | | | | | | | |
| 2022 US$m |
2021 US$m |
| Deferred tax assets arising from: | | |
| | |
| | |
Tax losses(c) | 922 | | 1,492 | |
| | |
| | |
Provisions | 2,051 | | 2,165 | |
Capital allowances | 984 | | 784 | |
| | |
| | |
Post-retirement benefits | 179 | | 521 | |
Unrealised exchange losses | 189 | | 188 | |
Other temporary differences | 1,265 | | 1,356 | |
| Total | 5,590 | | 6,506 | |
| Deferred tax liabilities arising from: | | |
Capital allowances | (4,873) | | (5,019) | |
| | |
| | |
Unremitted earnings(e) | (372) | | (366) | |
| | |
| | |
Capitalised interest | (330) | | (342) | |
Post-retirement benefits | (149) | | (327) | |
Unrealised exchange gains | (11) | | (3) | |
Other temporary differences | (690) | | (577) | |
| Total | (6,425) | | (6,634) | |
| | |
| (Charged)/credited to the income statement | | |
Unrealised exchange losses | 2 | | — | |
Tax losses | (525) | | (375) | |
Provisions | 14 | | 216 | |
Capital allowances | 65 | | (42) | |
Tax on unremitted earnings | 3 | | (1) | |
Post-retirement benefits | (59) | | 21 | |
| | |
| | |
Other temporary differences | (235) | | 67 | |
| Total | (735) | | (114) | |
(a)The amounts (charged)/credited directly to the statement of comprehensive income include provisions for tax on cash flow hedges and on re-measurement gains/(losses) on pension schemes and on post-retirement healthcare plans.
(b)“Other movements” include deferred tax relating to tax payable recognised by subsidiary holding companies on the profits of the equity accounted units to which it relates.
(c)US$868 million (2021: US$1,152 million) of recognised deferred tax assets are subject to expiry if not recovered within certain time limits as specified in local tax legislation and investment agreements. US$nil (2021: US$nil) of those recognised assets would expire within one year if not used, US$105 million (2021: US$71 million) would expire within one to five years, and US$763 million (2021: US$1,081 million) would expire in more than five years.
(d)Recognised and unrecognised deferred tax assets are shown in the table below and totalled US$7,850 million at 31 December 2022 (2021: US$7,024 million). Of this total, US$2,766 million has been recognised as deferred tax assets (2021: US$3,375 million), leaving US$5,084 million (2021: US$3,649 million) unrecognised, as recovery is not considered probable.
(e)Deferred tax liabilities are not recognised on the unremitted earnings of subsidiaries and joint ventures totalling US$2,730 million (2021: US$2,081 million) where the Group is able to control the timing of the remittance and it is probable that there will be no remittance in the foreseeable future. If these earnings were remitted, tax of US$140 million (2021: US$103 million) would be payable.
The recognised amounts in the table below do not include deferred tax assets that have been netted off against deferred tax liabilities.
Analysis of deferred tax assets
| | | | | | | | | | | | | | |
| Recognised | Unrecognised |
At 31 December | 2022 US$m | 2021 US$m | 2022 US$m | 2021 US$m |
France | — | | — | | 1,204 | | 1,222 | |
Canada | 457 | | 545 | | 580 | | 538 | |
US(a) | 115 | | 851 | | 847 | | 67 | |
Australia | 722 | | 787 | | 533 | | 506 | |
Mongolia(b) | 1,213 | | 954 | | 257 | | 406 | |
| Other | 259 | | 238 | | 1,663 | | 910 | |
Total(c) | 2,766 | | 3,375 | | 5,084 | | 3,649 | |
(a)As noted above, whilst our US group companies expect to generate sufficient taxable profits to utilise existing Federal deferred tax assets, the application of the new Corporate Alternative Minimum Tax rules has resulted in a position where no material future tax benefit will be derived from the utilisation of Federal deferred tax assets and consequently these deferred tax assets are included as 'unrecognised' in this table at 31 December 2022.
(b)Deferred tax assets in Mongolia include US$73 million (2021: US$108 million) from tax losses that expire if not recovered against taxable profits within eight years. Tax losses have been calculated in accordance with the tax stability provisions of the Oyu Tolgoi Investment Agreement and Mongolian laws. The interpretation of the stabilised tax laws by the Mongolian Tax Authority has been, and is expected to continue to be, subject to dispute. Changes to agreements or their interpretation could have a material impact on the amount and period of recovery of deferred tax assets.
(c)US$1,490 million (2021: US$705 million) of the unrecognised assets relate to realised or unrealised capital losses, the recovery of which depends on the existence of capital gains in future years. There are time limits, the shortest of which is one year, for the recovery of US$473 million of the unrecognised assets (2021: US$356 million).
Annual Report on Form 20-F 2022 | riotinto.com 187
Financial statements continued
Notes to the 2022 financial statements
16 Inventories
Recognition and measurement
Inventories are measured at the lower of cost and net realisable value, primarily on a weighted average cost basis. Third-party production purchased for our own use that is ordinarily interchangeable in accordance with IAS 2 is valued on the same basis, jointly with our own production. Average costs are calculated by reference to the cost levels experienced in the relevant month together with those in opening inventory.
The cost of raw materials and consumable stores is the purchase price. The cost of partly-processed and saleable products is generally the cost of production, including directly attributable labour costs, materials and contractor expenses, the depreciation of assets used in production and production overheads.
Work in progress includes ore stockpiles and other partly processed material. Stockpiles represent ore that has been extracted and is available for further processing. If there is significant uncertainty as to if and when the stockpiled ore will be processed, the cost of such ore is expensed as mined. If the ore will not be processed within 12 months after the balance sheet date, it is included within non-current assets and net realisable value is calculated on a discounted cash flow basis. Quantities of stockpiled ore are assessed primarily through surveys and assays. Certain estimates, including expected metal recoveries, are calculated using available industry, engineering and scientific data, and are periodically reassessed, taking into account technical analysis and historical performance.
| | | | | | | | |
| 2022 US$m | 2021 US$m |
| Raw materials and purchased components | 1,235 | | 870 | |
| Consumable stores | 1,327 | | 1,142 | |
| Work in progress | 2,086 | | 1,736 | |
| Finished goods and goods for resale | 1,768 | | 1,884 | |
| Total inventories | 6,416 | | 5,632 | |
| Comprising: | | |
| Expected to be used within one year | 6,213 | | 5,436 | |
| Expected to be used after more than one year | 203 | | 196 | |
| Total inventories | 6,416 | | 5,632 | |
During 2022, the Group recognised a net inventory write-off of US$55 million (2021:US$7 million write-back.) This included inventory write-offs of US$75 million (2021: US$18 million) offset by a write-back of previously written down inventory due to an increase in realisable values amounting to US$20 million (2021: US$25 million).
At 31 December 2022, US$850 million (2021: US$754 million) of inventories were pledged as security for liabilities.
17 Receivables and other assets
Recognition and measurement
The business model for our receivables is primarily “hold to collect” (where assets are held in order to collect contractual cash flows) except those subject to our factoring programme. For our financial instruments, including receivables, held under a hold to collect business model and which have cash flows that meet the solely payments of principal and interest (‘SPPI’) criteria these are recognised at amortised cost. Where our receivables do not meet the SPPI criteria, for example our provisionally priced receivables, these are measured at fair value through profit or loss with subsequent fair value gains or losses are taken to the income statement.
A portion of our receivables participate in receivable factoring and letter of credit discounting programmes. We take advantage of these programmes to balance the impact of extended payment terms requested by our customers with our own working capital objectives or where the acceleration of cash receipts is financially beneficial compared with the cost of borrowing at the operation. We have applied our judgment when considering the business model test as defined in IFRS 9 Financial Instruments and conclude that the business model for receivables under the letter of credit discounting programme has not changed. We continue to hold these receivables at amortised cost because the sale of the letter of credit is made close to maturity of receivables and the discounting costs are immaterial. The business model for receivables subject to the global factoring programme does not meet the “hold to collect” model and therefore are classified as “held for sale”. This means the receivables are held at fair value each reporting period with the remeasurements being recorded in the income statement. Where a portion of our factored receivable is subject to recourse, that part of the receivable is not derecognised from the balance sheet and the cash received in advance is classified as a borrowing. The cash flows relating to the borrowing are shown in financing cash flows. At 31 December 2022 US$457 million (2021: US$504 million) of receivables participated in the global factoring programme and US$430 million (2021: US$418 million) participated in the letter of credit discounting programme.
| | | | | | | | | | | | | | | | | | | | |
| Non-current 2022 US$m | Current 2022 US$m | Total 2022 US$m | Non-current 2021 US$m | Current 2021 US$m | Total 2021 US$m |
Trade receivables(a) | — | | 2,179 | | 2,179 | | — | | 2,241 | | 2,241 | |
| | | | | | |
| | | | | | |
| | | | | | |
| | | | | | |
Other financial receivables(a) | 124 | | 462 | | 586 | | 135 | | 386 | | 521 | |
| | | | | | |
| | | | | | |
| | | | | | |
| | | | | | |
| | | | | | |
| | | | | | |
| | | | | | |
Other receivables(b) | 383 | | 382 | | 765 | | 392 | | 418 | | 810 | |
Prepayment of tolling charges to jointly controlled entities(c) | 218 | | — | | 218 | | 183 | | — | | 183 | |
| Pension surpluses (note 28) | 824 | | — | | 824 | | 1,070 | | — | | 1,070 | |
Other prepayments | 344 | | 455 | | 799 | | 414 | | 529 | | 943 | |
Total(d) | 1,893 | | 3,478 | | 5,371 | | 2,194 | | 3,574 | | 5,768 | |
(a)At 31 December 2022, trade and other financial receivables are stated net of allowances for expected credit losses of US$59 million (2021: US$57 million). We apply the “simplified approach” to trade receivables and receivables relating to net investment in finance leases and a “general approach” to all other financial assets.
(b)At 31 December 2022, other receivables include US$329 million (2021: US$388 million) related to Energy Resources of Australia Ltd (ERA's) deposit held in a trust fund which is controlled by the Government of Australia. ERA are entitled to reimbursement from the fund once specific phases of rehabilitation relating to the Ranger Project are completed. The fund is outside of the scope of IFRS 9 “Financial Instruments”.
(c)These prepayments will be charged to Group operating costs as tolling services are rendered and product processing occurs.
(d)There is no material element of receivables and other assets that is interest-bearing or financing in nature. The fair value of current trade and other receivables and the majority of amounts classified as non-current trade and other receivables approximates to their carrying value.
188 Annual Report on Form 20-F 2022 | riotinto.com
Credit risks related to receivables
Our Commercial team manages customer credit risk subject to our established policy, procedures and controls. The team establishes credit limits for all of our customers. Where customers are rated by an independent credit rating agency, these ratings are used as a guide to set credit limits. Where there are no independent credit ratings available, we assess the credit quality of the customer through a credit rating model and assign appropriate credit limits. The Commercial team monitors outstanding customer receivables regularly and highlights any credit concerns to senior management. Receivables to high risk customers are often secured by letters of credit or other forms of credit enhancement.
The expected credit loss on our trade receivable portfolio is insignificant.
18 Trade and other payables
| | | | | | | | | | | | | | | | | | | | |
| Non-current 2022 US$m | Current 2022 US$m | Total 2022 US$m | Non-current 2021 US$m Adjusted(b) | Current 2021 US$m Adjusted(b) | Total 2021 US$m Adjusted(b) |
Trade payables | 3 | | 3,269 | | 3,272 | | — | | 3,410 | | 3,410 | |
| | | | | | |
| | | | | | |
| | | | | | |
| | | | | | |
| | | | | | |
| | | | | | |
| | | | | | |
| | | | | | |
| | | | | | |
| | | | | | |
| | | | | | |
| | | | | | |
| | | | | | |
| | | | | | |
| | | | | | |
| | | | | | |
| | | | | | |
| | | | | | |
| | | | | | |
Other financial payables | 225 | | 1,083 | | 1,308 | | 254 | | 909 | | 1,163 | |
| | | | | | |
| | | | | | |
| | | | | | |
Other payables | 63 | | 131 | | 194 | | 82 | | 110 | | 192 | |
| | | | | | |
| | | | | | |
| | | | | | |
Deferred income(a)(b) | 114 | | 333 | | 447 | | 205 | | 404 | | 609 | |
| | | | | | |
| | | | | | |
| | | | | | |
| | | | | | |
| | | | | | |
| | | | | | |
| | | | | | |
| | | | | | |
Accruals | — | | 1,611 | | 1,611 | | 42 | | 1,488 | | 1,530 | |
Employee entitlements | — | | 878 | | 878 | | — | | 798 | | 798 | |
Royalties and mining taxes | 3 | | 644 | | 647 | | 2 | | 574 | | 576 | |
| Amounts owed to equity accounted units | 196 | | 98 | | 294 | | 213 | | 40 | | 253 | |
| | | | | | |
| Total | 604 | | 8,047 | | 8,651 | | 798 | | 7,733 | | 8,531 | |
(a)Deferred income includes contract liabilities of US$345 million (2021: US$383 million).
(b)Deferred income includes government grants deferred. This was previously disclosed separately; however, it is no longer material.
The fair value of trade payables and financial instruments within other financial payables approximates their carrying value.
The Group participates in supply chain finance arrangements whereby vendors may elect to receive early payment of their invoice from a third-party bank by factoring their receivable from Rio Tinto. These arrangements do not modify the terms of the original liability with respect to either counterparty terms, settlement date or amount due. Utilisation of the early settlement facility is voluntary and at the vendors' discretion on an invoice-by-invoice basis. Financial liabilities subject to supply chain finance therefore continue to be classified as trade payables with the cash outflows showing in operating cash flows. At 31 December 2022, trade payables included US$819 million (2021: US$782 million) subject to early settlement election by vendors.
Annual Report on Form 20-F 2022 | riotinto.com 189
Financial statements continued
Notes to the 2022 financial statements
Our capital and liquidity
Our overriding objective when managing capital and liquidity is to safeguard the business as a going concern. Capital is allocated in a consistent and disciplined manner. Essential capital remains our priority for capital allocation. It includes sustaining capital to ensure the integrity of our assets, high-returning replacement projects and decarbonisation investment. This is followed by ordinary dividends within our well-established returns policy. We then test investment in compelling growth projects against debt management and additional cash returns to shareholders.
Our Board and senior management regularly review the capital structure and liquidity of the Group. They take into account our strategic priorities, the economic and business conditions, and any identified investment opportunities, along with the expected returns to shareholders. We expect total cash returns to shareholders over the longer term to be in a range of 40–60% of underlying earnings in aggregate through the commodity cycle.
We consider various financial metrics when managing our risk, including net debt, gearing, the overall level of borrowings and their maturity profile, liquidity levels, total capital, future cash flows, underlying EBITDA and interest cover ratios.
Our total capital as at 31 December was:
| | | | | | | | | | | |
| Total capital |
Note | 2022 US$m | 2021 US$m |
Equity attributable to owners of Rio Tinto (see Group balance sheet) | | 50,175 | | 51,432 | |
Equity attributable to non-controlling interests (see Group balance sheet) | | 2,099 | | 5,158 | |
| Net debt/(cash) | 19 | 4,188 | | (1,576) | |
| Total capital | | 56,462 | | 55,014 | |
We have access to various forms of financing including our US Shelf Programme, European Debt Issuance Programme, Commercial Paper and credit facilities.
In 2022, we exercised one of our options to extend the maturity of our US$7.5 billion multi-currency revolving credit facility. The facility now matures in November 2027. The facility remained undrawn throughout the year.
Our credit ratings, as provided by Standard & Poor’s and Moody’s investor services, as at 31 December were: | | | | | | | | |
| 2022 | 2021 |
Long-term rating | A/A2 | A/A2 |
Short-term rating | A-1/P-1 | A-1/P-1 |
Outlook | Stable/Stable | Stable/Stable |
Our unified credit status is maintained through cross guarantees, which mean the contractual obligations of Rio Tinto plc and Rio Tinto Limited are automatically guaranteed by the other.
In the table below, we summarise the maturity profile of our financial liabilities on our balance sheet based on contractual undiscounted payments. When the amount payable is not fixed, the amount disclosed is determined by reference to the conditions existing at the end of the reporting period. This will therefore not necessarily agree with the amounts disclosed as the carrying value.
| | | | | | | | | | | | | | | | | | | | | | | | | | | | | | | | | | | | | | |
| 2022 | 2021 |
Financial liability analysis At 31 December (Outflows)/Inflows | Within 1
year or on
demand
US$m | Between
1 and 2
years
US$m | | | | Between 2 and 5 years
US$m | After
5 years
US$m | Total
US$m | Within 1 year or on demand US$m | Between 1 and 2 years US$m | | | | Between 2 and 5 years
US$m | After 5 years US$m | Total US$m |
| Non-derivative financial liabilities | | | | | | | | | | | | | | | | |
Trade and other financial payables(a) | (5,971) | | (37) | | | | | (57) | | (329) | | (6,394) | | (5,766) | | (31) | | | | | (72) | | (406) | | (6,275) | |
| Expected lease liability payments | (329) | | (235) | | | | | (344) | | (606) | | (1,514) | | (361) | | (266) | | | | | (400) | | (704) | | (1,731) | |
| Borrowings before swaps | (937) | | (1,425) | | | | | (1,839) | | (7,389) | | (11,590) | | (827) | | (746) | | | | | (2,519) | | (8,112) | | (12,204) | |
Expected future interest payments(a) | (668) | | (603) | | | | | (1,468) | | (3,141) | | (5,880) | | (511) | | (486) | | | | | (1,313) | | (3,485) | | (5,795) | |
| Other financial liabilities | — | | — | | | | | — | | — | | — | | (20) | | — | | | | | — | | — | | (20) | |
| | | | | | | | | | | | | | | | |
Derivative financial liabilities(b) | | | | | | | | | | | | | | | | |
Derivatives related to net debt – net settled | (92) | | (106) | | | | | (47) | | (8) | | (253) | | | | | | | | | |
Derivatives related to net debt – gross settled(a) | | | | | | | | | | | | | | | | |
| – gross inflows | 37 | | 481 | | | | | 72 | | 651 | | 1,241 | | 41 | | 41 | | | | | 560 | | 756 | | 1,398 | |
| – gross outflows | (69) | | (615) | | | | | (102) | | (875) | | (1,661) | | (44) | | (44) | | | | | (658) | | (909) | | (1,655) | |
Derivatives not related to net debt – net settled | (78) | | (60) | | | | | (129) | | (77) | | (344) | | (186) | | (77) | | | | | (53) | | (37) | | (353) | |
Derivatives not related to net debt – gross settled: | | | | | | | | | | | | | | 0 | | |
| – gross inflows | 71 | | — | | | | | — | | — | | 71 | | 1,302 | | — | | | | | — | | — | | 1,302 | |
| – gross outflows | (71) | | — | | | | | — | | — | | (71) | | (1,340) | | — | | | | | — | | — | | (1,340) | |
| Total | (8,107) | | (2,600) | | | | | (3,914) | | (11,774) | | (26,395) | | (7,712) | | (1,609) | | | | | (4,455) | | (12,897) | | (26,673) | |
(a)The interest payable at year end was removed from trade and other financial payables and is shown within expected future interest payments and derivatives related to net debt. Interest payments have been projected using interest rates applicable at the end of the applicable financial year. Where debt is subject to variable interest rates, future interest payments are subject to change in line with market rates.
(b)The maturity grouping is based on the earliest payment date.
Our weighted average debt maturity including leases and derivatives related to debt was approximately 11 years (2021: 11 years).
190 Annual Report on Form 20-F 2022 | riotinto.com
19 Consolidated net (debt)/cash
| | | | | | | | | | | | | | | | | | | | | | |
| Financing liabilities | | | Other assets | |
| Year ended 31 December 2022 | Borrowings excluding overdrafts(a) US$m | Lease liabilities(b) US$m | Net debt related derivatives (note 23)(c) US$m | | | Cash and cash equivalents including overdrafts(a) US$m | Other investments(d) US$m | Net (debt)/cash
US$m |
| Analysis of changes in consolidated net (debt)/cash | | | | | | | | |
Opening balance | (12,166) | | (1,363) | | (101) | | | | 12,805 | | 2,401 | | 1,576 | |
| | | | | | | | |
| | | | | | | | |
| | | | | | | | |
Foreign exchange adjustment | 118 | | 69 | | (92) | | | | 15 | | — | | 110 | |
| | | | | | | | |
| | | | | | | | |
| | | | | | | | |
Cash movements excluding exchange movements | 470 | | 374 | | (3) | | | | (6,046) | | (352) | | (5,557) | |
| | | | | | | | |
| | | | | | | | |
| | | | | | | | |
| | | | | | | | |
| | | | | | | | |
| | | | | | | | |
| | | | | | | | |
| | | | | | | | |
| | | | | | | | |
| | | | | | | | |
| | | | | | | | |
| | | | | | | | |
| | | | | | | | |
| | | | | | | | |
| | | | | | | | |
| | | | | | | | |
| | | | | | | | |
| | | | | | | | |
| | | | | | | | |
| | | | | | | | |
| | | | | | | | |
| | | | | | | | |
| | | | | | | | |
Other non-cash movements | 508 | | (280) | | (494) | | | | — | | (51) | | (317) | |
| Closing balance | (11,070) | | (1,200) | | (690) | | | | 6,774 | | 1,998 | | (4,188) | |
| | | | | | | | | | | | | | | | | | | | |
| Year ended 31 December 2021 | Financing liabilities | Other assets |
|
Borrowings excluding overdrafts(a) US$m | Lease liabilities(b) US$m | Net debt related derivatives (note 23)(c) US$m | Cash and cash equivalents including overdrafts(a) US$m | Other investments(d) US$m | Net cash/(debt)
US$m |
| Analysis of changes in consolidated net cash/(debt) | | | | | | |
Opening balance | (12,653) | (1,178) | 248 | | 10,381 | | 2,538 | | (664) | |
| | | | | | |
Foreign exchange adjustment | 67 | 30 | (45) | | 100 | | — | | 152 | |
Cash movements excluding exchange movements | 270 | 358 | (51) | | 2,324 | | (107) | | 2,794 | |
Other non-cash movements | 150 | (573) | | (253) | | — | | (30) | | (706) | |
Closing balance | (12,166) | | (1,363) | | (101) | | 12,805 | | 2,401 | | 1,576 | |
(a)Borrowings excluding overdrafts, of US$11,070 million (2021:US$12,166 million) differs from Borrowings on the balance sheet as it excludes bank overdrafts of US$1 million (2021: US$2 million) which has been included in cash and cash equivalents for the net (debt)/cash reconciliation.
(b)Other non-cash movements in lease liabilities include the net impact of additions, modifications and terminations during the year.
(c)Included within “Net debt related derivatives” are interest rate and cross currency interest rate swaps that are in hedge relationships with the Group's debt.
(d)Other investments includes US$1,998 million (2021: US$2,401 million) of highly liquid financial assets held in managed investment funds classified as held for trading.
The table below summarises, by currency, our net (debt)/cash, after taking into account relevant cross currency interest rate swaps and foreign exchange contracts:
| | | | | | | | | | | | | | | | | | | | | | | |
| Net (debt)/cash by currency | Total
borrowings
excluding
overdrafts
US$m | Lease liabilities
US$m | Derivatives
related to net
debt
US$m | Cash and
cash
equivalents
US$m | Other
investments
US$m | Net debt
2022
US$m | Net cash
2021
US$m |
| | | | | | | |
| | | | | | | |
US dollar | (10,680) | | (360) | | (690) | | 5,803 | | 1,998 | | (3,929) | | 2,201 | |
| | | | | | | |
| | | | | | | |
Australian dollar | (225) | | (429) | | — | | 199 | | — | | (455) | | (499) | |
| | | | | | | |
| | | | | | | |
| Canadian dollar | (165) | | (174) | | — | | 181 | | — | | (158) | | (320) | |
| | | | | | | |
| | | | | | | |
South African rand | — | | (2) | | — | | 173 | | — | | 171 | | 115 | |
| | | | | | | |
| | | | | | | |
| | | | | | | |
Other | — | | (235) | | — | | 418 | | — | | 183 | | 79 | |
| Total | (11,070) | | (1,200) | | (690) | | 6,774 | | 1,998 | | (4,188) | | 1,576 | |
Annual Report on Form 20-F 2022 | riotinto.com 191
Financial statements continued
Notes to the 2022 financial statements
20 Borrowings
Recognition and measurement
Borrowings are recognised initially at fair value, net of transaction costs incurred, and are subsequently measured at amortised cost. Our policy is to predominantly borrow in US dollars at floating interest rates, either directly or through the use of derivatives, as:
–the majority of our sales are in US dollars,
–historically a lower cost of borrowing has been observed from maintaining a floating rate exposure
–historically there is a correlation between interest rates and commodity prices.
For bonds with fixed interest rates, we generally enter into interest rate swaps to convert them to floating rates. The tenor of the interest rate swaps is sometimes shorter than the tenor of the bond which means we remain exposed to long-term fixed-rate funding. As interest rate swaps mature, new medium dated swaps are generally transacted to maintain this floating rate exposure; however, we may elect to maintain fixed interest rates in certain circumstances.
We have designated the swaps to be in fair value hedge relationships with the corresponding period of future interest payments of the respective debt.
Where we borrow non-US denominated debt, we enter into cross currency interest rate swaps to convert the principal and fixed interest coupon to a US dollar notional with a US dollar interest coupon.
The characteristics and carrying value of the Group’s borrowings are summarised below:
Borrowings at 31 December | | | | | | | | | | | | | | | | | | | | | | | | |
| | | Carrying value 2022 US$m | | | Carrying value 2021 US$m | Nominal value of hedged item
2022
US$m | Nominal value of hedged item
2021
US$m | Weighted average interest rate after swaps (where applicable) | Swap maturity (where applicable) |
Rio Tinto Finance plc Euro Bonds 2.875% due 2024(a)(c) | | | 429 | | | | 497 | | 546 | 546 | 3 month LIBOR +1.64% | 2024 |
| | | | | | | | | | |
Rio Tinto Finance (USA) Limited Bonds 7.125% 2028(a) | | | 807 | | | | 934 | | 750 | 750 | 3 month LIBOR +3.27% | 2028 |
Alcan Inc. Debentures 7.25% due 2028(a)(b) | | | 97 | | | | 105 | | 100 | 100 | 3 month SOFR +5.69% | 2024 |
Rio Tinto Finance plc Sterling Bonds 4.0% due 2029(a)(c)(d) | | | 553 | | | | 682 | | 807 | 807 | 3 month LIBOR +2.65% | 2024 |
Alcan Inc. Debentures 7.25% due 2031(a) | | | 384 | | | | 420 | | 400 | 400 | 3 month LIBOR +5.72% | 2025 |
Alcan Inc. Global Notes 6.125% due 2033(a) | | | 673 | | | | 722 | | 750 | 750 | 3 month LIBOR +5.67% | 2025 |
Alcan Inc. Global Notes 5.75% due 2035(a) | | | 264 | | | | 283 | | 300 | 300 | 3 month LIBOR +5.18% | 2025 |
Rio Tinto Finance (USA) Limited Bonds 5.2% 2040(a)(e) | | | 1,144 | | | | 1,156 | | — | 1,150 | | |
Rio Tinto Finance (USA) plc Bonds 4.75% 2042(a) | | | 488 | | | | 495 | | 500 | 500 | 3 month LIBOR +3.42% | 2023 |
Rio Tinto Finance (USA) plc Bonds 4.125% 2042(a) | | | 727 | | | | 735 | | 750 | 750 | 3 month LIBOR +2.83% | 2023 |
Rio Tinto Finance (USA) Limited Bonds 2.75% 2051(a) | | | 1,065 | | | | 1,225 | | 1,250 | | 1,250 | 6 month SOFR +1.57% | 2028 |
Oyu Tolgoi LLC MIGA Insured Loan LIBOR plus 2.65% due 2027(f) | | | 597 | | | | 673 | | | | | |
Oyu Tolgoi LLC Commercial Banks “B Loan” LIBOR plus 3.4% due 2027(f) | | | 1,387 | | | | 1,565 | | | | | |
Oyu Tolgoi LLC Export Credit Agencies Loan 2.3% due 2028(f) | | | 237 | | | | 278 | | | | | |
Oyu Tolgoi LLC Export Credit Agencies Loan LIBOR plus 3.65% due 2029(f) | | | 805 | | | | 866 | | | | | |
Oyu Tolgoi LLC International Financial Institutions “A Loan” LIBOR plus 3.78% due 2030(f) | | | 744 | | | | 776 | | | | | |
| | | | | | | | | | |
| | | | | | | | | | |
| | | | | | | | | | |
| | | | | | | | | | |
| | | | | | | | | | |
| | | | | | | | | | |
Other secured loans | | | 194 | | | | 246 | | | | | |
| | | | | | | | | | |
| | | | | | | | | | |
| | | | | | | | | | |
Other unsecured loans | | | 475 | | | | 508 | | | | | |
| | | | | | | | | | |
| | | | | | | | | | |
| | | | | | | | | | |
| | | | | | | | | | |
| | | | | | | | | | |
| Bank overdrafts | | | 1 | | | | 2 | | | | | |
Total borrowings(g) | | | 11,071 | | | | 12,168 | | | | | |
| Current borrowings | | | 923 | | | | 812 | | | | | |
| Non-current borrowings | | | 10,148 | | | | 11,356 | | | | | |
Total borrowings(g) | | | 11,071 | | | | 12,168 | | | | | |
(a)The fair value movements of our borrowings and interest rate swaps that are in fair value hedge relationships are summarised in note 9.
(b)In 2022, we transitioned the swaps associated to this bond from LIBOR + 5.43% to SOFR + 5.69%.
(c)Rio Tinto has a US$10 billion (2021: US$10 billion) European Debt Issuance Programme against which the cumulative amount utilised was US$1.0 billion equivalent at 31 December 2022 (2021: US$1.1 billion). The carrying value of these bonds after hedge accounting adjustments amounted to US$1.0 billion (2021: US$1.2 billion) in aggregate.
(d)We applied cash flow hedge accounting to this bond and the corresponding cross currency interest rate swap. The hedge is fully effective as the notional amount, maturity, payment and reset dates match. Since 2019, we swapped the resulting fixed US dollar annual interest coupon payments to floating rates. Fair value hedge accounting has been applied to this relationship in addition to the pre-existing cash flow hedge.
(e)On 2 November 2022 our interest rate swap, which converted our fixed coupon interest payments on this bond to 3 month LIBOR +3.79%, matured. Given market conditions, further interest rate swaps were not transacted.
(f)These borrowings relate to the Oyu Tolgoi LLC project finance facility. The project finance facility provides for interest-only payments for the first five years from 2016 followed by minimum repayments according to a stepped amortisation schedule for the remaining life of the facility. The due dates stated represent the final repayment date. The interest rates stated are pre-completion and will increase by 1% post-completion.
(g)The Group’s borrowings of US$11.1 billion (2021: US$12.2 billion) include US$4.0 billion (2021: US$4.4 billion) of subsidiary entity borrowings that are subject to various financial and general covenants with which the respective borrowers were in compliance as at 31 December 2022.
192 Annual Report on Form 20-F 2022 | riotinto.com
Update on interest rate benchmark reform
We adopted, in prior periods, Interest Rate Benchmark Reform Amendments to IFRS 9 Financial Instruments (IFRS 9), IFRS 7 Financial Instruments: Disclosures (IFRS 7), IFRS 4 Insurance Contracts (IFRS 4) and IFRS 16 Leases (IFRS 16). The amendments address the financial reporting impact from reform of the London Interbank Offered Rate (LIBOR) and other benchmark interest rates (collectively “IBOR reform”). We have taken relevant practical reliefs from certain requirements relating to changes in the basis for determining contractual cash flows of financial assets, financial liabilities and hedge accounting, described below.
Our hedging arrangements impacted by the reform of USD LIBOR are part of the International Swaps and Derivatives Association (ISDA) Fallbacks Protocol, which provides a global standardised mechanism for replacement of the current benchmark. During the year we transitioned the swaps, which hedge the Alcan Inc. Debentures, from the LIBOR to SOFR interest benchmark rates (refer to the table above) and applied the relief that preserved the existing hedge accounting. At 31 December 2022, we have interest rate risk exposure including US$4.8 billion nominal values of fixed-rate borrowings swapped to US dollar rates in fair value hedge relationships impacted by the reform. We expect the application of the reliefs to result in continuation of our pre-existing hedge accounting upon amendment of designated arrangements in response to the replacement of USD LIBOR which will occur immediately after 30 June 2023.
In October 2022, as part of the extension of the term loan facility of Richards Bay Minerals, we transitioned from the LIBOR benchmark to an interest rate based on the SOFR reference rate. Our other arrangements which reference IBOR benchmarks and extend beyond 2022 include: third-party borrowings relating to the Oyu Tolgoi LLC project finance, shareholder loan facilities and certain commercial contracts. The amendments to IFRS 9 require that we account for a change in the basis for determining the cash flows of a financial asset or a financial liability measured at amortised cost, by updating their respective effective interest rates as required by the IBOR reform. As a result of the applicable IFRS 9 reliefs, we expect that no material gain or loss will arise from these updates. The accessible revolving lines of credit, which have been extended for a further one year in 2022, now refer to the SOFR and SONIA benchmark rates.
21 Leases
Recognition and measurement
IFRS 16 “Leases” applies to the recognition, measurement, presentation and disclosure of leases. Certain leases are exempt from the standard, including leases to explore for or use minerals, oil, natural gas and similar non-regenerative resources. We apply the scope exemptions in paragraphs 3(e) and 4 of IFRS 16 and do not apply IFRS 16 to leases of any assets which would otherwise fall within the scope of IAS 38 “Intangible Assets”.
A significant proportion by value of our lease arrangements relate to dry bulk vessels and office properties. Other leases include land and non-mining rights, warehouses, ports, equipment and vehicles.
We recognise all lease liabilities and corresponding right of use assets on balance sheet, with the exception of short-term (12 months or fewer) and low value leases, where payments are expensed as incurred. Lease liabilities are recorded at the present value of: fixed payments; variable lease payments that depend on an index or rate; amounts payable under residual value guarantees; and extension options expected to be exercised. Where a lease contains an extension option which we can exercise without negotiation, lease payments for the extension period are included in the liability if we are reasonably certain that we will exercise the option. Variable lease payments not dependent on an index or rate are excluded from the calculation of lease liabilities at initial recognition. Payments are discounted at the incremental borrowing rate of the lessee, unless the interest rate implicit in the lease can be readily determined. For lease agreements relating to vessels, ports and properties, non-lease components are excluded from the projection of future lease payments and recorded separately within operating costs as services are being provided. The lease liability is measured at amortised cost using the effective interest method. The right of use asset arising from a lease arrangement at initial recognition reflects the lease liability, initial direct costs, lease payments made before the commencement date of the lease, and capitalised provision for dismantling and restoration, less any lease incentives.
We recognise depreciation on right of use assets and interest on lease liabilities in the income statement over the lease term. Repayments of lease liabilities are separated into a principal portion (presented within financing activities) and an interest portion (which the Group presents in operating activities) in the cash flow statement. Payments made before the commencement date are included within financing activities unless they in substance represent investing cash flows, for example where pre-commencement cash flows are significant relative to aggregate cash flows of the leasing arrangement.
Lessee arrangements
We have made the following payments associated with leases: | | | | | | | | | | | |
| Description of payment | 2022
US$m | 2021
US$m | Included within |
| Principal lease payments | 374 | | 358 | | Cash flows from financing activities |
| Interest payments on leases | 47 | | 48 | | Cash flows from operating activities |
| Payments for short-term leases | 465 | | 502 | | Net operating costs |
| Payments for variable lease components | 50 | | 34 | | Net operating costs |
| Payments for low value leases (>12 months in duration) | 1 | | 2 | | Net operating costs |
| Total lease payments | 937 | | 944 | |
|
Annual Report on Form 20-F 2022 | riotinto.com 193
Financial statements continued
Notes to the 2022 financial statements
21 Leases continued
Lease liabilities
The maturity profile of lease liabilities recognised at the balance sheet date is: | | | | | | | | | |
| | 2022 US$m | 2021 US$m |
| Lease liabilities | | | |
Due within 1 year | | 329 | | 361 | |
| | | |
| | | |
Between 1 and 3 years | | 388 | | 440 | |
| | | |
| | | |
Between 3 and 5 years | | 191 | | 226 | |
More than 5 years | | 606 | | 704 | |
| Total undiscounted cash payments expected to be made | | 1,514 | | 1,731 | |
Effect of discounting | | (314) | | (368) | |
| Present value of minimum lease payments | | 1,200 | | 1,363 | |
| Current lease liability per the balance sheet | | 292 | | 324 | |
| | | |
| Non-current lease liability per the balance sheet | | 908 | | 1,039 | |
| Total lease liability | | 1,200 | | 1,363 | |
At 31 December 2022, commitments for leases not yet commenced were US$481 million (2021: US$476 million); commitments relating to short-term leases which had already commenced at 31 December 2022 were US$132 million (2021: US$165 million).
22 Cash and cash equivalents
Recognition and measurement
For the purpose of the balance sheet, cash and cash equivalents covers: cash on hand, deposits held with banks, and short-term, highly liquid investments (mainly money market funds) that are readily convertible into known amounts of cash and which are subject to insignificant risk of changes in value. Bank overdrafts are shown as current liabilities on the balance sheet. For the purposes of the cash flow statement, cash and cash equivalents are shown net of overdrafts.
| | | | | | | | | | | |
| | 2022 US$m | 2021 US$m |
Cash at bank and in hand | | 1,889 | | 1,344 | |
| | | |
| | | |
| | | |
| Money market funds, reverse repurchase agreements and other cash equivalents | | 4,886 | | 11,463 | |
| Balance per Group balance sheet | | 6,775 | | 12,807 | |
Bank overdrafts repayable on demand (unsecured) | 20 | (1) | | (2) | |
| | | |
| Balance per Group cash flow statement | | 6,774 | | 12,805 | |
Restricted cash and cash equivalent analysis
Cash and cash equivalents of US$391 million (2021: US$235 million) are held in countries where there are restrictions on remittances. Of this balance, US$268 million (2021: US$165 million) could be used to repay subsidiaries’ third-party borrowings.
There are also restrictions on a further US$576 million (2021: US$981 million) of cash and cash equivalents, the majority of which is held by partially owned subsidiaries and is not available for use in the wider Group due to legal and contractual restrictions currently in place. Of this balance US$336 million (2021: US$752 million) could be used to repay these subsidiaries’ third-party borrowings.
Credit risk related to cash and cash equivalents
Our Treasury team manages credit risk from our investing activities in accordance with credit risk framework which sets the risk appetite. We make investments of surplus funds only with approved investment grade (BBB- and above) counterparties who have been assigned specific credit limits. The limits are set to minimise the concentration of credit risk and therefore mitigate the potential for financial loss through counterparty failure.
At 31 December 2022 we held US$850 million (2021: US$4,520 million) of reverse repurchase agreements, measured at amortised cost and reported within cash and cash equivalents as they are highly liquid products maturing within three months. We accepted collateral of investment grade quality in respect of these reverse repurchase agreements, with a fair value of US$892 million as at 31 December 2022 (2021: US$4,638 million). Collateral is not recognised on our balance sheet and if the counterparty were to default we would be able to sell it.
194 Annual Report on Form 20-F 2022 | riotinto.com
23 Other financial assets and liabilities
Other financial assets
| | | | | | | | | | | | | | | | | | | | |
| Non-current 2022 US$m | Current 2022 US$m | Total 2022 US$m | Non-current 2021 US$m | Current 2021 US$m | Total 2021 US$m |
| Derivatives not related to net debt | 39 | | 28 | | 67 | | 80 | | 53 | | 133 | |
| Derivatives related to net debt | 2 | | — | | 2 | | 130 | | 9 | | 139 | |
Equity shares and quoted funds | 154 | | 68 | | 222 | | 98 | | 19 | | 117 | |
| | | | | | |
| | | | | | |
Other investments, including loans(a) | 211 | | 2,064 | | 2,275 | | 220 | | 2,462 | | 2,682 | |
| | | | | | |
| Total | 406 | | 2,160 | | 2,566 | | 528 | | 2,543 | | 3,071 | |
(a)Current “Other investments, including loans” includes US$1,998 million (2021: US$2,401 million) of highly liquid financial assets held in managed investment funds classified as held for trading and included within our net (debt)/cash definition.
Other financial liabilities | | | | | | | | | | | | | | | | | | | | |
| Non-current 2022 US$m | Current 2022 US$m | Total 2022 US$m | Non-current 2021 US$m | Current 2021 US$m | Total 2021 US$m |
| Derivatives not related to net debt | 220 | | 61 | | 281 | | 153 | | 225 | | 378 | |
| Derivatives related to net debt | 684 | | 8 | | 692 | | 240 | | — | | 240 | |
| | | | | | |
| | | | | | |
| Other financial liabilities | — | | — | | — | | — | | 20 | | 20 | |
| Total other financial liabilities | 904 | | 69 | | 973 | | 393 | | 245 | | 638 | |
| | | | | | |
| | | | | | |
Offsetting and enforceable master netting agreements
When we have a legally enforceable right to offset our financial assets and liabilities and an intention to settle on a net basis, or realise the asset and settle the liability simultaneously, we report the net amount in the consolidated balance sheet. Agreements with derivative counterparties are based on the International Swaps and Derivatives Association master netting agreements that do not meet the criteria for offsetting, but allow for the related amounts to be set-off in certain circumstances. During the year, there were no material amounts offset in the balance sheet.
24 Financial instruments and risk management
Recognition and measurement
We classify our financial assets into those held at amortised cost and those to be measured at fair value either through the profit and loss (FVTPL) or through other comprehensive income (FVOCI) based on the business model for managing the financial assets and the contractual terms of the cash flows.
| | | | | | | | | | | |
| Classification of financial asset | Amortised cost | Fair value through profit and loss | Fair value through other comprehensive income |
| Recognition and measurement | At initial recognition, trade receivables that do not have a significant financing component are recognised at their transaction price. Other financial assets are initially recognised at fair value plus related transaction costs. | The asset is initially recognised at fair value with transaction costs immediately expensed to the income statement. | The asset is initially recognised at fair value. |
| Subsequent measurement | Amortised cost using the effective interest method. | Fair value movements are recognised in the income statement. | Fair value gains or losses on revaluation of such equity investments, including any foreign exchange component, are recognised in other comprehensive income. Dividends are recognised in the income statement when the right to receive payment is established. |
| Derecognition | Any gain or loss on de-recognition or modification of a financial asset held at amortised cost is recognised in the income statement. | Not applicable. | When the equity investment is derecognised, there is no reclassification of fair value gains or losses previously recognised in other comprehensive income to the income statement. |
Borrowings and other financial liabilities (including trade payables but excluding derivative liabilities) are recognised initially at fair value, net of transaction costs incurred, and are subsequently measured at amortised cost.
Annual Report on Form 20-F 2022 | riotinto.com 195
Financial statements continued
Notes to the 2022 financial statements
24 Financial instruments and risk management continued
Financial risk management objectives
Our financial risk management objectives are:
–to have in place a robust capital structure to manage the organisation through the commodity cycle; and
–to allow our financial exposures, mainly commodity price, foreign exchange and interest rates, to, in general, float with the market.
Our Treasury and Commercial teams manage the following key economic risks generated from our operations:
–Capital and Liquidity risk
–Credit risk
–Interest rate risk
–Commodity price risk
–Foreign exchange risk
These teams operate under a strong control environment, within approved limits.
(i) Capital and liquidity risk
Our capital and liquidity risk arises from the possibility that we may not be able to settle or meet our obligations as they fall due. Refer to Our capital and liquidity section on page 190. (ii) Credit risk
Credit risk is the risk that our customers, or institutions that we invest in, are unable to meet their contractual obligations. We are exposed to credit risk in our operating activities (primarily from customer trade receivables); and from our investing activities that include government securities (primarily US Government), corporate and asset-backed securities, reverse re-purchase agreements, money market funds, and balances with banks and financial institutions. Refer to note 17 Receivables and other assets, note 22 Cash and cash equivalents and note 23 Other financial assets and liabilities for an understanding of the size of balance.
(iii) Interest rate risk
Our interest rate management policy is generally to borrow and invest at floating interest rates. After the impact of hedging, 77% (2021: 85%) of our borrowings (including leases) were at floating rates. To understand how we manage interest rate risk refer to note 20.
Sensitivity to interest rate changes
Based on our floating rate financial instruments outstanding at 31 December 2022, the effect on our net earnings of a 100 basis point increase in US dollar LIBOR or SOFR (where applicable) interest rates, with all other variables held constant, would be an expense of US$26 million (2021: income of US$13 million). This reflects the net debt position in 2022 compared to a net cash position in prior year.
We are also exposed to interest rate volatility within shareholders’ equity. This is because we have designated some cross currency interest rate swaps to be in a cash flow hedge relationship with our 2029 GBP loan. As we receive fixed GBP interest and pay fixed USD interest any change in the GBP interest rate or the USD interest rate will have an impact on the fair value of the derivative within shareholders’ equity. With all factors remaining constant, a 100 basis point increase in interest rates in each of the currencies in isolation would impact equity, before tax, by a charge of US$35 million (2021: US$55 million charge) for sterling and a credit of US$48 million (2021: US$65 million credit) for US dollars. A 100 basis point decrease would have broadly the same impact in the opposite direction.
(iv) Commodity price risk
Our broad commodity base means our exposure to commodity prices is diversified. Our normal policy is to sell our products at prevailing market prices. For certain physical commodity transactions for which the price was fixed at the contract date, we enter into derivatives to achieve the prevailing market prices at the point of revenue recognition. We do not generally consider that using derivatives to fix commodity prices would provide a long-term benefit to our shareholders.
Exceptions to this rule are subject to limits, and to defined market risk tolerances and internal controls.
Substantially all iron ore and aluminium sales are reflected at final prices at each reporting period. Final prices for copper concentrate, however, are normally determined between 30 and 180 days after delivery to our customer.
At 31 December 2022, we had 83 million pounds of copper sales (31 December 2021: 81 million pounds), that were provisionally priced at US 380 cents per pound (2021: US 440 cents per pound). The final price of these sales will be determined during the first half of 2023. A 10% change in the price of copper realised on the provisionally priced sales, all other factors held constant, would increase or reduce net earnings by US$19 million (2021: US$26 million).
Power costs represent a significant portion of costs in our aluminium business and therefore we are exposed to fluctuations in power prices.
To mitigate our exposure to changes in the relationship between aluminium prices and power prices, we have a number of electricity purchase contracts which are directly linked to the daily official LME cash ask price for high grade aluminium (“LME price”) and to the US Midwest Transaction Premium (“Midwest premium”).
In accordance with IFRS 9, we apply hedge accounting to two embedded derivatives within our power contracts. The embedded derivatives (notional aluminium forward sales) have been designated as the hedging instrument. The forecast aluminium sales, priced using the LME price and the Midwest premium, represent the hedged item.
The hedging ratio is 1:1, as the quantity of sales designated as being hedged matches the notional amount of the hedging instrument. The hedging instrument’s notional amount, expressed in equivalent metric tonnes of aluminium, is derived from our expected electricity consumption under the power contracts as well as other relevant contract parameters.
196 Annual Report on Form 20-F 2022 | riotinto.com
When we designate such embedded derivatives as the hedging instrument in a cash flow hedge, we recognise the effective portion of the change in the fair value of the hedging instrument in other comprehensive income, and it is accumulated in the cash flow hedge reserve. The amount that is recognised in other comprehensive income is limited to the lesser of the cumulative change in the fair value of the hedging instrument and the cumulative change in the fair value of the hedged item, in absolute terms. On realisation of the hedges, realised amounts are reclassified from reserves to consolidated sales revenue in the income statement.
We recognise any ineffectiveness relating to the hedging relationship immediately in the income statement.
Sources of ineffectiveness include: differences in the timing of the cash flows between the hedged item and the hedging instrument, non-zero initial fair value of the hedging instrument, the existence of a cap on the Midwest premium in the hedging instrument and counterparty credit risk.
We held the following notional aluminium forward sales contracts embedded in the power contracts:
| | | | | | | | | | | | | | | | | |
| At 31 December 2022 | Total | Within 1 year | Between 1 and 5 years | Between 5 and 10 years | After 10 years |
| Notional amount (in tonnes) | 501,498 | | 72,812 | | 289,868 | | 138,818 | | — | |
| Notional amount (in US$ millions) | 1,216 | | 166 | | 697 | | 353 | | — | |
| Average hedged rate (in US$ per tonne) | 2,425 | | 2,282 | | 2,404 | | 2,542 | | — | |
| | | | | | | | | | | | | | | | | |
| At 31 December 2021 | Total | Within 1 year | Between 1
and 5 years | Between 5
and 10 years | After 10 years |
Notional amount (in tonnes) | 573,653 | | 72,555 | | 289,867 | | 211,231 | | — | |
Notional amount (in US$ millions) | 1,377 | | 162 | | 683 | | 532 | | — | |
Average hedged rate (in US$ per tonne) | 2,401 | | 2,234 | | 2,355 | | 2,520 | | — | |
The impact on our financial statements of these hedging instruments and hedging items are:
| | | | | | | | | | | | | | | | | | | | | | | | | | | |
| Aluminium embedded derivatives separated from the power contract (Hedging instrument)(a) | | Highly probable forecast aluminium sales (Hedged item) |
| Nominal
US$m | Carrying amount
US$m | Change in fair value in the period
US$m | | Cash flow hedge reserve(b) US$m | Change in fair value in
the period
US$m | Total hedging losses recognised
in reserves
US$m | Hedge ineffective-ness in the period gains/(losses)(c) US$m | Losses reclassified from reserves to income statement(d) US$m |
| 2022 | 1,216 | | (189) | | (119) | | | (87) | | 133 | | (110) | | (9) | | 34 | |
| 2021 | 1,377 | | (124) | | (201) | | | (11) | | 300 | | (211) | | 10 | | 17 | |
(a)Aluminium embedded derivatives (forward contracts and options) are contained within certain aluminium smelter electricity purchase contracts. The carrying amount of US$189 million (2021: US$124 million) is shown within “Other financial assets and liabilities”.
(b)The difference between this amount and the total cash flow hedge reserve of the Group (shown in note 35) relates to our cash flow hedge on the sterling bond (refer to interest rate risk section).
(c)Hedge ineffectiveness is included in net operating costs (raw materials, consumables, repairs and maintenance) in the income statement.
(d)On realisation of the hedge, realised amounts are reclassified from reserves to consolidated sales revenue in the income statement.
There was no cost of hedging recognised in 2022 or 2021 relating to this hedge relationship.
Sensitivities
Our commodity derivatives are impacted by changes in market prices. The table below summarises the impact that changes in aluminium market prices have on aluminium forward and option contracts embedded in power supply agreements outstanding at 31 December 2022. Any change in price will result in an offsetting change in our future earnings. | | | | | | | | | | | |
| Change in
market prices | 2022 US$m | 2021 US$m |
Effect on net earnings | +10 | % | (57) | | (78) | |
| (10) | % | 83 | | 73 | |
Effect on equity | +10 | % | (90) | | (98) | |
| (10) | % | 65 | | 95 | |
We exclude our “own use contracts” from this sensitivity analysis as they are outside the scope of IFRS 9. Our business units continue to hold these types of contracts to satisfy their expected purchase, sale or usage requirements.
Annual Report on Form 20-F 2022 | riotinto.com 197
Financial statements continued
Notes to the 2022 financial statements
24 Financial instruments and risk management continued
(v) Foreign exchange risk
The broad geographic spread of our sales and operations means that our earnings, cash flows and shareholders’ equity are influenced by a wide variety of currencies. The majority of our sales are denominated in the US dollar.
Our operating costs are influenced by the currencies of those countries where our mines and processing plants are located, and by those currencies in which we buy imported equipment and services. The US dollar, the Australian dollar and the Canadian dollar are the most important currencies influencing our costs. In any particular year, currency fluctuations may have a significant impact on our financial results. A strengthening of the US dollar against the currencies in which our costs are partly denominated has a positive effect on our underlying earnings. However, a strengthening of the US dollar reduces the value of non-US dollar denominated net assets, and therefore total equity.
In most cases our debt and other financial assets and liabilities, including intragroup balances, is held in the functional currency of the relevant subsidiary. There are instances where these balances are held in currencies other than the functional currency of the relevant subsidiary. This means we recognise exchange gains and losses in our income statement (except where they can be taken to equity) as these balances are translated into the functional currency of the relevant subsidiary. Our income statement also includes exchange gains and losses arising on US dollar net debt and intragroup balances. On consolidation, these balances are retranslated to our US dollar presentation currency and there is a corresponding and offsetting exchange difference recognised directly in the currency translation reserve. There is no impact on total equity.
Under normal market conditions, we do not consider that active currency hedging of transactions would provide long-term benefits to shareholders. We review our exposure on a regular basis and will undertake hedging if deemed appropriate. We may deem currency protection measures appropriate in specific commercial circumstances. Capital expenditures and other significant financial items such as acquisitions, disposals, tax and dividend cash flows may be economically hedged.
Sensitivities
The table below shows the estimated retranslation effect on financial assets and financial liabilities, including intragroup balances, of a 10% strengthening in the closing exchange rate of the US dollar against significant currencies. We deem 10% to be the annual exchange rate movement that is reasonably probable (on an annual basis over the long run) for any of our significant currencies and therefore an appropriate representation.
At 31 December 2022
Losses associated with 10% strengthening of the US dollar | | | | | | | | | | | | |
Currency exposure | Closing
exchange
rate
US cents | Effect on
net
earnings
US$m | | Impact
directly
on equity
US$m |
Australian dollar | 68 | | (319) | | | (986) | |
Canadian dollar | 74 | | (219) | | | — | |
| | | | |
| | | | |
At 31 December 2021
Gains/(losses) associated with 10% strengthening of the US dollar | | | | | | | | | | | | |
Currency exposure | Closing
exchange
rate
US cents | Effect on
net
earnings
US$m | | Impact
directly
on equity
US$m |
Australian dollar | 73 | | 379 | | | (1,044) | |
| Canadian dollar | 78 | | (111) | | | — | |
| | | | |
| | | | |
We calculate sensitivities in relation to the functional currencies of our individual entities. We translate the impact of these on net earnings into US dollars at the exchange rates on which the sensitivities are based. The impact to net earnings associated with a 10% weakening of a particular currency, shown above, is broadly offset within equity through movements in the currency translation reserve and therefore generally has no impact on our net assets. The offsetting currency translation movement is not shown in the table above. The impact is expressed in terms of the effect on net earnings and equity, assuming that each exchange rate moves in isolation. The sensitivities are based on financial assets and financial liabilities held at 31 December 2022, where balances are not denominated in the functional currency of the subsidiary or joint operation, and exclude financial assets and liabilities held by equity accounted units. These balances will not remain constant throughout 2023, and therefore the information should be used with care.
198 Annual Report on Form 20-F 2022 | riotinto.com
Valuation hierarchy of financial instruments carried at fair value on a recurring basis
The table below shows the classifications of our financial instruments by valuation method in accordance with IFRS 13 at 31 December 2022 and 31 December 2021.
All instruments shown as being held at fair value have been classified as fair value through the profit and loss unless specifically footnoted.
| | | | | | | | | | | | | | | | | | | | | | | | | | | | | | | | | | | |
| | At 31 December 2022 | At 31 December 2021 |
| | | Held at fair value | | | Held at fair value | |
| Note | Total US$m | Level 1(a) US$m | Level 2(b) US$m | Level 3(c) US$m | Held at amortised cost US$m | Total US$m | Level 1(a) US$m | Level 2(b) US$m | Level 3(c) US$m | Held at amortised costs US$m |
| Assets | | | | | | | | | | | |
| | | | | | | | | | | |
| | | | | | | | | | | |
| | | | | | | | | | | |
Cash and cash equivalents(d) | 22 | 6,775 | | 2,725 | | — | | — | | 4,050 | | 12,807 | | 4,138 | | — | | — | | 8,669 | |
| | | | | | | | | | | |
| | | | | | | | | | | |
Investments in equity shares and funds(e) | 23 | 222 | | 147 | | — | | 75 | | — | | 117 | | 64 | | — | | 53 | | — | |
| | | | | | | | | | | |
| | | | | | | | | | | |
Other investments, including loans(f) | 23 | 2,275 | | 2,018 | | — | | 229 | | 28 | | 2,682 | | 2,422 | | — | | 238 | | 22 | |
| | | | | | | | | | | |
| | | | | | | | | | | |
| | | | | | | | | | | |
| | | | | | | | | | | |
| | | | | | | | | | | |
| | | | | | | | | | | |
| | | | | | | | | | | |
| | | | | | | | | | | |
| | | | | | | | | | | |
| | | | | | | | | | | |
| | | | | | | | | | | |
Trade and other financial receivables(g) | 17 | 2,765 | | 18 | | 1,306 | | — | | 1,441 | | 2,762 | | 1 | | 1,163 | | — | | 1,598 | |
| | | | | | | | | | | |
| | | | | | | | | | | |
Forward, option and embedded derivatives contracts, not designated as hedges(h) | 23 | 67 | | — | | 16 | | 51 | | — | | 133 | | — | | 48 | | 85 | | — | |
Derivatives related to net debt(i) | 23 | 2 | | — | | 2 | | — | | — | | 139 | | — | | 139 | | — | | — | |
| | | | | | | | | | | |
| | | | | | | | | | | |
| | | | | | | | | | | |
| | | | | | | | | | | |
| | | | | | | | | | | |
| | | | | | | | | | | |
| | | | | | | | | | | |
| | | | | | | | | | | |
| | | | | | | | | | | |
| | | | | | | | | | | |
| | | | | | | | | | | |
| | | | | | | | | | | |
| | | | | | | | | | | |
| | | | | | | | | | | |
| Liabilities | | | | | | | | | | | |
| | | | | | | | | | | |
| | | | | | | | | | | |
| | | | | | | | | | | |
Trade and other financial payables(j) | 18 | (6,485) | | — | | (30) | | — | | (6,455) | | (6,356) | | — | | (67) | | — | | (6,289) | |
| | | | | | | | | | | |
| | | | | | | | | | | |
| | | | | | | | | | | |
Forward, option and embedded derivatives contracts, designated as hedges(h) | 23 | (189) | | — | | — | | (189) | | — | | (125) | | — | | — | | (125) | | — | |
Forward, option and embedded derivatives contracts, not designated as hedges(h) | 23 | (92) | | — | | (57) | | (35) | | — | | (253) | | — | | (179) | | (74) | | — | |
Derivatives related to net debt(i) | 23 | (692) | | — | | (692) | | — | | — | | (240) | | — | | (240) | | — | | — | |
| | | | | | | | | | | |
(a)Valuation is based on unadjusted quoted prices in active markets for identical financial instruments.
(b) Valuation is based on inputs that are observable for the financial instruments, which include quoted prices for similar instruments or identical instruments in markets which are not considered to be active, or inputs, either directly or indirectly based on observable market data
(c)Valuation is based on inputs that cannot be observed using market data (unobservable inputs). The change in valuation of our level 3 instruments for the year to 31 December 2022 is below:
| | | | | | | | |
| 2022 | 2021 |
| Level 3 financial assets and liabilities | US$m | US$m |
| Opening balance | 177 | | 395 | |
| | |
| Currency translation adjustments | (4) | | (6) | |
| Total realised gains/(losses) included in: | | |
| – consolidated sales revenue | 16 | | 27 | |
| – net operating costs | 365 | | (50) | |
| Total unrealised gains included in: | | |
| | |
| – net operating costs | 124 | | 68 | |
| Total unrealised losses transferred into other comprehensive income through cash flow hedges | (110) | | (212) | |
| | |
| Additions to financial assets/(liabilities) | 41 | | (21) | |
| | |
| Disposals/maturity of financial instruments | (478) | | (6) | |
| Transfers | — | | (18) | |
| Closing balance | 131 | | 177 | |
| Net gains included in the income statement for assets and liabilities held at year end | 103 | | 20 | |
(d)Our "cash and cash equivalents" of US$6,775 million (31 December 2021:US$12,807 million), includes US$2,725 million (31 December 2021:US$4,138 million) relating to money market funds which are treated as fair value through profit or loss (FVPL) under IFRS 9 with the fair value movements going into finance income.
(e)Investments in equity shares and funds include US$153 million (31 December 2021: US$98 million) of equity shares, not held for trading, where we have irrevocably elected to present fair value gains and losses on revaluation in other comprehensive income (FVOCI). The election is made at an individual investment level.
(f)Other investments, including loans, covers: cash deposits in rehabilitation funds, government bonds, managed investment funds and royalty receivables.
(g)Trade receivables include provisionally priced invoices. The related revenue is initially based on forward market selling prices for the quotation periods stipulated in the contracts with changes between the provisional price and the final price recorded separately within “Other revenue”. The selling price can be measured reliably for the Group's products, as it operates in active and freely traded commodity markets. At 31 December 2022, US$1,234 million (31 December 2021: US$1,114 million) of provisionally priced receivables were recognised.
(h)Level 3 derivatives consist of derivatives embedded in electricity purchase contracts linked to the LME, midwest premium and billet premium with terms expiring between 2025 and 2036 (31 December 2021: 2025 and 2036).
(i)Net debt derivatives include interest rate swaps and cross-currency swaps.
(j)Trade and other financial payables comprise trade payables, other financial payables, accruals and amounts due to equity accounted units within note 18.
There were no material transfers between level 1 and level 2, or between level 2 and level 3 in the year ended 31 December 2022 or in the year ended 31 December 2021.
Annual Report on Form 20-F 2022 | riotinto.com 199
Financial statements continued
Notes to the 2022 financial statements
24 Financial instruments and risk management continued
Valuation techniques and inputs
The techniques used to value our more significant fair value assets/(liabilities) categorised under level 2 and level 3 are summarised below:
| | | | | | | | | | | |
| Description | Fair Value
US$m | Valuation technique | Significant Inputs |
| Level 2 |
| Interest rate swaps | (356) | | Discounted cash flows | Applicable market quoted swap yield curves
Credit default spread |
| Cross currency interest rate swaps | (334) | | Discounted cash flows | Applicable market quoted swap yield curves
Credit default spread
Market quoted FX rate |
| Provisionally priced receivables | 1,234 | | Closely related listed product | Applicable forward quoted metal price |
| Level 3 |
| Derivatives embedded in electricity contracts | (208) | | Option pricing model | LME forward aluminium price
Midwest premium and billet premium |
| Royalty receivables | 209 | | Discounted cash flows | Forward commodity price
Mine production |
| | | |
Sensitivity analysis in respect of level 3 financial instruments
For assets/(liabilities) classified under level 3, the effect of changing the significant unobservable inputs on carrying value has been calculated using a movement that we deem to be reasonably probable.
To value the long-term aluminium embedded power derivatives, we use unobservable inputs when the term of the derivative extends beyond observable market prices. Changing the level 3 inputs to reasonably possible alternative assumptions does not change the fair value significantly, taking into account the expected remaining term of contracts for either reported period. The fair value of these derivatives is a net liability of US$208 million at 31 December 2022 (31 December 2021: US$146 million).
| | | | | | | | | | | |
| | | |
| Impact of climate change on our business - Coal royalty receivables Royalty receivables include amounts arising from our divested coal businesses with a carrying value of US$209 million (31 December 2021: US$136 million). These are classified as “Other investments, including loans” within note 23. The fair values are determined using level 3 unobservable inputs. These royalty receivables include US$81 million from forecast production beyond 2030. These have not been adjusted for potential changes in production rates that could occur due to climate change targets impacting the operator. The main unobservable input is the long-term coal price used over the life of these royalty receivables. A 15% increase in the coal spot price would result in a US$68 million increase (31 December 2021: US$63 million increase) in the carrying value. A 15% decrease in the coal spot price would result in a US$18 million decrease (31 December 2021: US$53 million decrease) in the carrying value. We have used a 15% assumption to calculate our exposure as it represents the annual coal price movement that we deem to be reasonably probable (on an annual basis over the long run). | |
| | | |
Fair values disclosure of financial instruments
The following table shows the carrying amounts and fair values of our borrowings including those which are not carried at an amount which approximates their fair value at 31 December 2022 and 31 December 2021. The fair values of our remaining financial instruments approximate their carrying values because of their short maturity, or because they carry floating rates of interest.
| | | | | | | | | | | | | | |
| 31 December 2022 | 31 December 2021 |
| Carrying
value
US$m | Fair
value
US$m | Carrying
value
US$m | Fair
value
US$m |
| Borrowings (including overdrafts) | 11,071 | | 11,192 | | 12,168 | | 13,904 | |
| | | | |
| | | | |
Total borrowings with a carrying value of US$6.6 billion (31 December 2021: US$7.3 billion) relate to listed bonds with a fair value of US$6.6 billion (31 December 2021: US$8.7 billion) and are categorised as level 1 in the fair value hierarchy. Borrowings with a carrying value of US$3.8 billion (31 December 2021: US$4.2 billion) relate to project finance drawn down by Oyu Tolgoi, with a fair value of US$3.9 billion (31 December 2021: US$4.4 billion) using a number of level 3 valuation inputs. Our remaining borrowings have a fair value measured by discounting estimated cash flows with an applicable market quoted yield, and are categorised as level 2 in the fair value hierarchy.
200 Annual Report on Form 20-F 2022 | riotinto.com
Our people
Summarised below are the key financial metrics relating to our people.
25 Average number of employees
| | | | | | | | | | | | | | | | | | | | | | | |
| Subsidiaries and joint operations | Equity accounted units
(Rio Tinto share) | |
| 2022 | 2021 | 2020 | 2022 | 2021 | 2020 | | | |
| Principal locations of employment: | | | | | | | | | |
Australia and New Zealand | 23,829 | 21,861 | 20,482 | 704 | | 648 | 634 | | | |
Canada | 13,344 | 12,270 | 11,814 | — | | — | | — | | | | |
UK | 202 | 189 | 172 | — | | — | | — | | | | |
| | | | | | | | | |
| | | | | | | | | |
| | | | | | | | | |
| | | | | | | | | |
| | | | | | | | | |
| | | | | | | | | |
| | | | | | | | | |
| | | | | | | | | |
| | | | | | | | | |
| | | | | | | | | |
| | | | | | | | | |
| | | | | | | | | |
| | | | | | | | | |
| | | | | | | | | |
| | | | | | | | | |
| | | | | | | | | |
| | | | | | | | | |
Europe | 994 | 1,003 | 1,020 | — | | — | | — | | | | |
| | | | | | | | | |
| | | | | | | | | |
| | | | | | | | | |
| | | | | | | | | |
| | | | | | | | | |
| | | | | | | | | |
| | | | | | | | | |
| | | | | | | | | |
| | | | | | | | | |
| | | | | | | | | |
| | | | | | | | | |
| | | | | | | | | |
| | | | | | | | | |
| | | | | | | | | |
| | | | | | | | | |
| | | | | | | | | |
Africa | 2,797 | 2,484 | 2,559 | 1,218 | | 1,253 | 1,214 | | | |
US | 3,655 | 3,471 | 3,543 | — | | — | | — | | | | |
Mongolia | 4,175 | 3,513 | 3,465 | — | | — | | — | | | | |
| | | | | | | | | |
| | | | | | | | | |
| | | | | | | | | |
| | | | | | | | | |
| | | | | | | | | |
| | | | | | | | | |
| | | | | | | | | |
| | | | | | | | | |
| | | | | | | | | |
South America | 286 | 213 | 220 | 1,383 | | 1,353 | | 1,293 | | | | |
| | | | | | | | | |
| | | | | | | | | |
| | | | | | | | | |
| | | | | | | | | |
| | | | | | | | | |
| | | | | | | | | |
| | | | | | | | | |
| | | | | | | | | |
| | | | | | | | | |
| | | | | | | | | |
India | 396 | 354 | 324 | — | | — | | — | | | | |
| | | | | | | | | |
| | | | | | | | | |
| | | | | | | | | |
| | | | | | | | | |
| | | | | | | | | |
| | | | | | | | | |
Singapore | 454 | 450 | 456 | — | | — | | — | | | | |
| | | | | | | | | |
| | | | | | | | | |
| | | | | | | | | |
| | | | | | | | | |
Other countries(a) | 289 | 283 | 278 | — | | — | | — | | | | |
| Total | 50,421 | | 46,091 | | 44,333 | | 3,305 | | 3,254 | | 3,141 | | | | |
(a) “Other countries” primarily includes employees in the Middle East (excluding Oman which is included in Africa), and other countries in Asia which are not shown separately in the table above.
Employee numbers, which represent the average for the year, include 100% of employees of subsidiary companies. Employee numbers for joint operations and equity accounted units are proportional to the Group’s interest under contractual agreements. Average employee numbers include a part-year effect for companies acquired or disposed of during the year.
Part-time employees are included on a full-time-equivalent basis. Temporary employees are included in employee numbers.
People employed by contractors are not included.
26 Employment costs and provisions
| | | | | | | | | | | | | | |
| Note | 2022 US$m | 2021 US$m | 2020 US$m |
| Total employment costs | | | | |
| | | | |
| | | | |
| | | | |
| | | | |
| | | | |
| | | | |
| – Wages and salaries | | 5,115 | | 4,699 | | 4,141 | |
| – Social security costs | | 425 | | 386 | | 330 | |
| | | | |
| | | | |
| | | | |
| – Net post-retirement charge | 28 | 559 | | 554 | | 469 | |
| – Share-based payment charge | 27 | 122 | | 126 | | 138 | |
| | 6,221 | | 5,765 | | 5,078 | |
| Less: charged within movement in provisions (see below) | | (219) | | (252) | | (308) | |
| Total employment costs | 7 | 6,002 | | 5,513 | | 4,770 | |
| | | | | | | | | | | | | | | | | |
| | Pensions and post-retirement healthcare(a) US$m | Other employee entitlements(b) US$m | Total 2022 US$m | | | Total 2021 US$m |
| At 1 January | | 2,098 | | 394 | | 2,492 | | | | 3,474 | |
| | | | | | | |
| | | | | | | |
| Adjustment on currency translation | | (73) | | (26) | | (99) | | | | (34) | |
| | | | | | | |
| | | | | | | |
| | | | | | | |
| | | | | | | |
| Charged/(credited) to profit: | | | | | | | |
| – increases to existing and new provisions | | 142 | | 89 | | 231 | | | | 273 | |
| | | | | | | |
| – unused amounts reversed | | — | | (12) | | (12) | | | | (21) | |
| | | | | | | |
| | | | | | | |
| Utilised in year | | (172) | | (82) | | (254) | | | | (231) | |
| Re-measurement gains recognised in other comprehensive income | | (701) | | — | | (701) | | | | (687) | |
| | | | | | | |
| | | | | | | |
| | | | | | | |
| | | | | | | |
| | | | | | | |
| | | | | | | |
| | | | | | | |
| | | | | | | |
| | | | | | | |
| | | | | | | |
| | | | | | | |
| | | | | | | |
| Transfers and other movements | | — | | 1 | | 1 | | | | (282) | |
| At 31 December | | 1,294 | | 364 | | 1,658 | | | | 2,492 | |
| Balance sheet analysis: | | | | | | | |
| Current | | 62 | | 291 | | 353 | | | | 383 | |
| Non-current | | 1,232 | | 73 | | 1,305 | | | | 2,109 | |
| Total | | 1,294 | | 364 | | 1,658 | | | | 2,492 | |
(a)The main assumptions used to determine the provision for pensions and post-retirement healthcare, and other information, including the expected level of future funding payments in respect of those arrangements, are given in note 28.
(b)The provision for other employee entitlements includes a provision for long service leave of US$271 million (2021: US$272 million), based on the relevant entitlements in certain Group operations, and includes US$32 million (2021: US$60 million) of provision for redundancy and severance payments.
Annual Report on Form 20-F 2022 | riotinto.com 201
Financial statements continued
Notes to the 2022 financial statements
27 Share-based payments
The Rio Tinto plc and Rio Tinto Limited share-based incentive plans are as follows:
UK Share Plan
The fair values of Matching and Free Shares awards are the market value of the shares on the date of purchase. The awards are settled in equity.
Equity Incentive Plan
Since 2018, all long-term incentive awards have been granted under the 2018 Equity Incentive Plan which allows for awards in the form of Performance Share Awards (PSA), Management Share Awards (MSA) and Bonus Deferral Awards (BDA) to be granted. In general, these awards will be settled in equity, including the dividends accumulated from date of award to vesting and therefore the awards are accounted for in accordance with the requirements applying to equity-settled share-based payment transactions.
Performance Share Awards (Performance Share Plans prior to 2018)
Participants are generally assigned shares in settlement of their PSA on vesting. Therefore the awards are accounted for in accordance with the requirements applying to equity-settled share-based payment transactions, including the dividends accumulated from date of award to vesting.
For the parts of awards with Total Shareholder Return (TSR) performance conditions, the fair value of the awards is calculated using a Monte Carlo simulation model taking into account the TSR performance conditions. One-third of the awards granted up to 2017 (inclusive) are subject to an earnings margin performance target relative to ten global mining comparators. As a non-market related performance condition, the fair value recognised is reviewed at each accounting date based on the prevailing expected outcome. Forfeitures prior to vesting are assumed at 5% per annum of outstanding awards (2021: 5% per annum).
For grants made from 2018, the earnings margin performance target applying to the PSA was removed. Since 2018, only the TSR performance conditions apply to the PSA.
Management Share Awards
The vesting of these awards is dependent on service conditions being met; no performance conditions apply.
The fair value of each award on the day of grant is equal to the share price on the day of grant. Forfeitures prior to vesting are assumed at 7% per annum of outstanding awards (2021: 7% per annum).
Bonus Deferral Awards
BDAs provide for the mandatory deferral of 50% of the bonuses for executive directors and Executive Committee members .
The vesting of these awards is dependent only on service conditions being met. The fair value of each award on the day of grant is equal to the share price on the day of grant. Forfeitures prior to vesting are assumed at 3% per annum of outstanding awards (2021: 3% per annum).
Global Employee Share Plans
The Global Employee Share Plans were introduced in 2012 and re-approved by shareholders in 2021. Under these Plans, the companies provide a matching share award for each investment share purchased by a participant. The vesting of matching awards is dependent on service conditions being met and the continued holding of investment shares by the participant until vesting. These awards are settled in equity including the dividends accumulated from date of award to vesting. The fair value of each matching share on the day of grant is equal to the share price on the date of purchase less a deduction of 15% for estimated cancellations (caused by employees withdrawing their investment shares prior to vesting. Forfeitures prior to vesting are assumed at 5% per annum of outstanding awards (2021: 5% per annum).
The PSA, MSA, BDA and awards under the Global Employee Share Plans and UK Share Plan together represent 100% (2021: 100%) of the total IFRS 2 charge for Rio Tinto plc and Rio Tinto Limited plans in 2022.
Recognition and measurement:
These plans are accounted for in accordance with the fair value recognition provisions of IFRS 2 “Share-based Payment”.
The fair value of the Group’s share plans is recognised as an expense over the expected vesting period with an offset to retained earnings for Rio Tinto plc plans and to other reserves for Rio Tinto Limited plans.
The Group uses fair values provided by independent actuaries calculated using a Monte Carlo simulation model.
The terms of each plan are considered at the balance sheet date to determine whether the plan should be accounted for as equity-settled or cash-settled. The Group does not operate any material plans as cash-settled although certain awards can be settled in cash at the discretion of the directors or where settling awards in equity is challenging or prohibited by local laws and regulations. The value of these awards is immaterial.
The Group’s equity-settled share plans are settled either by: the issuance of shares by the relevant parent company; the purchase of shares on market; or the use of shares held in treasury. If the cost of shares acquired to satisfy the plans differs from the expense charged, the difference is taken to retained earnings or other reserves, as appropriate.
202 Annual Report on Form 20-F 2022 | riotinto.com
The charge that has been recognised in the income statement for Rio Tinto’s share-based incentive plans, and the related liability (for cash-settled awards), is set out in the table below.
| | | | | | | | | | | | | | | | | |
| Charge recognised for the year | Liability at the end of the year |
| 2022 US$m | 2021 US$m | 2020 US$m | 2022 US$m | 2021 US$m |
| Equity-settled awards | 117 | | 122 | | 131 | | — | | — | |
| Cash-settled awards | 5 | | 4 | | 7 | | 7 | | 6 | |
| Total | 122 | | 126 | | 138 | | 7 | | 6 | |
Performance Share Awards (granted under either the Performance Share Plans or the Equity Incentive Plans)
| | | | | | | | | | | | | | | | | | | | | | | | | | |
| Rio Tinto plc awards | Rio Tinto Limited awards |
| 2022
number | Weighted
average fair
value at grant
date
2022
£ | 2021
number | Weighted
average fair
value at grant
date
2021
£ | 2022
number | Weighted
average fair
value at grant
date
2022
A$ | 2021
number | Weighted
average fair
value at grant
date
2021
A$ |
| Unvested awards at 1 January | 3,376,072 | | 24.26 | | 3,778,041 | | 21.01 | | 1,276,694 | | 50.46 | | 1,391,373 | | 44.40 | |
Awarded | 518,950 | | 25.60 | | 676,296 | | 29.63 | | 256,508 | | 51.21 | | 217,178 | | 60.67 | |
Forfeited | (9,973) | | 31.68 | | (474,878) | | 20.85 | | (38,733) | | 51.09 | | (59,291) | | 46.42 | |
Failed performance conditions | (326,522) | | 32.83 | | (189,799) | | 19.43 | | (149,788) | | 61.40 | | (89,448) | | 44.07 | |
Vested | (655,078) | | 20.49 | | (413,588) | | 9.48 | | (304,441) | | 38.68 | | (183,118) | | 20.96 | |
| | | | | | | | |
| Unvested awards at 31 December | 2,903,449 | | 24.36 | | 3,376,072 | | 24.26 | | 1,040,240 | | 52.51 | | 1,276,694 | | 50.46 | |
| | | | | | | | | | | | | | | | | | | | | | | | | | |
| Rio Tinto plc awards | Rio Tinto Limited awards |
| 2022
number | Weighted
average share price at vesting
2022
£ | 2021
number | Weighted
average share price at vesting
2021
£ | 2022
number | Weighted
average share price at vesting
2022
A$ | 2021
number | Weighted
average share price at vesting
2021
A$ |
Vested awards settled in shares during the year (including dividend shares applied on vesting) | 632,533 | | 54.96 | | 431,682 | | 62.63 | | 247,216 | | 115.25 | | 184,876 | | 127.37 | |
Vested awards settled in cash during the year (including dividend shares applied on vesting) | 230,006 | | 54.67 | | 63,144 | | 62.35 | | 140,479 | | 115.35 | | 29,737 | | 127.5 | |
In addition to the equity-settled awards shown above, there were 26,394 Rio Tinto plc and 23,917 Rio Tinto Limited cash-settled awards outstanding at 31 December 2022 (2021: 20,548 Rio Tinto plc and 27,476 Rio Tinto Limited cash-settled awards outstanding). The total liability for these awards at 31 December 2022 was US$2 million (2021: US$2 million).
Management Share Awards, Bonus Deferral Awards (granted under the Management Share Plans or Equity Incentive Plans), Global Employee Share Plans and UK Share Plan (combined)
| | | | | | | | | | | | | | | | | | | | | | | | | | |
| Rio Tinto plc awards(a) | Rio Tinto Limited awards |
| 2022
number | Weighted
average fair
value at grant
date
2022
£ | 2021
number | Weighted
average fair
value at grant
date
2021
£ | 2022
number | Weighted
average fair
value at grant
date
2022
A$ | 2021
number | Weighted
average fair
value at grant
date
2021
A$ |
Unvested awards at 1 January(b) | 2,493,826 | | 43.55 | | 2,650,861 | | 37.50 | | 2,164,568 | | 92.31 | | 2,216,734 | | 82.52 | |
Awarded | 1,187,887 | | 50.37 | | 987,665 | | 52.07 | | 1,068,556 | | 95.69 | | 887,022 | | 105.47 | |
Forfeited | (146,816) | | 56.66 | | (202,248) | | 23.84 | | (155,631) | | 96.46 | | (130,990) | | 90.01 | |
Cancelled | (65,267) | | 44.99 | | (42,812) | | 45.09 | | (46,300) | | 86.44 | | (46,624) | | 87.08 | |
Vested | (883,951) | | 39.69 | | (899,640) | | 39.44 | | (690,488) | | 86.96 | | (761,574) | | 79.86 | |
Unvested awards at 31 December(b) | 2,585,679 | | 47.22 | | 2,493,826 | | 43.55 | | 2,340,705 | | 95.27 | | 2,164,568 | | 92.31 | |
Comprising: | | | | | | | | |
– Management Share Awards | 1,220,559 | | 48.82 | | 1,241,695 | | 43.63 | | 1,150,641 | | 103.00 | | 1,178,538 | | 95.70 | |
– Bonus Deferral Awards | 139,782 | | 55.96 | | 158,572 | | 42.31 | | 60,862 | | 113.13 | | 46,660 | | 96.08 | |
– Global Employee Share Plan | 1,191,738 | | 44.51 | | 1,060,394 | | 43.49 | | 1,129,202 | | 86.43 | | 939,370 | | 87.86 | |
– UK Share Plan | 33,600 | | 49.05 | | 33,165 | | 47.94 | | — | | — | | — | | — | |
Annual Report on Form 20-F 2022 | riotinto.com 203
Financial statements continued
Notes to the 2022 financial statements
27 Share-based payments continued
| | | | | | | | | | | | | | | | | | | | | | | | | | |
| 2022
number | Weighted
average share price at vesting
2022
£ | 2021
number | Weighted
average share price at vesting
2021
£ | 2022
number | Weighted
average share price at vesting
2022
A$ | 2021
number | Weighted
average share price at vesting
2021
A$ |
Vested awards settled in shares during the year (including dividend shares applied on vesting): | | | | | | | | |
– Management Share Awards | 529,054 | | 54.59 | | 547,487 | | 60.74 | | 486,587 | | 113.18 | | 550,161 | | 122.89 | |
– Bonus Deferral Awards | 136,317 | | 55.11 | | 100,368 | | 47.96 | | 32,080 | | 107.78 | | 34,279 | | 105.55 | |
– Global Employee Share Plan | 478,204 | | 51.52 | | 407,314 | | 54.61 | | 337,782 | | 104.82 | | 312,109 | | 112.33 | |
– UK Share Plan | 12,176 | | 55.20 | | 20,111 | | 57.15 | | — | | — | | — | | — | |
| Vested awards settled in cash during the year (including dividend shares applied on vesting): | | | | | | | | |
| – Bonus Deferral Awards | 23,611 | | 55.98 | | 23,371 | | 46.12 | | 12,699 | | 113.23 | | 19,607 | | 93.5 | |
(a)Awards of Rio Tinto American Depositary Receipts (ADRs) under the Global Employee Share Plan are included within the totals for Rio Tinto plc awards for the purpose of these tables.
(b)These numbers are presented and calculated in accordance with IFRS 2 and represent awards for which an IFRS 2 charge continues to be accrued for.
In addition to the equity-settled awards shown above, there were 90,748 Rio Tinto plc and 9,685 Rio Tinto Limited cash-settled awards outstanding at 31 December 2022 (2021: 89,239 Rio Tinto plc and 12,217 Rio Tinto Limited cash-settled awards outstanding). The total liability for these awards at 31 December 2022 was US$5 million (2021: US$4 million).
28 Post-retirement benefits
Description of plans
The Group operates a number of pension and post-retirement healthcare plans which provide lump sums, pensions, medical benefits and life insurance to retirees. Some of these plans are defined contribution and some are defined benefit, with assets held in separate trusts, foundations and similar entities.
Defined benefit pension and post-retirement healthcare plans expose the Group to a number of risks:
| | | | | |
| Uncertainty in benefit payments | The value of the Group’s liabilities for post-retirement benefits will ultimately depend on the amount of benefits paid out. This in turn will depend on the level of future pay increases, the level of inflation (for those benefits that are subject to some form of inflation protection) and how long individuals live. |
| Volatility in asset values | The Group is exposed to future movements in the values of assets held in pension plans to meet future benefit payments. |
| Uncertainty in cash funding | Movements in the values of the obligations or assets may result in the Group being required to provide higher levels of cash funding, although changes in the level of cash required can often be spread over a number of years. In some countries control over the rate of cash funding or over the investment policy for pension assets might rest to some extent with a trustee body or other body that is not under the Group’s direct control. In addition the Group is also exposed to adverse changes in pension regulation. |
For these reasons the Group has a policy of moving away from defined benefit pension provisions and towards defined contribution arrangements instead. The defined benefit pension plans for salaried employees are closed to new entrants in almost all countries. For unionised employees, some plans remain open.
The Group does not usually participate in multi-employer plans in which the risks are shared with other companies using those plans. The Group’s participation in such plans is immaterial and therefore no detailed disclosures are provided in this note.
Pension plans
The majority of the Group’s defined benefit pension obligations are in Canada, the UK, the US and Switzerland.
In Canada the benefits for salaried staff are generally linked to final average pay and the plans are generally closed to new entrants. Benefits for unionised employees are reviewed in negotiation with unions and are typically linked either to final average pay or to a flat monetary amount per year of service. New employees join arrangements which are defined contribution from the Group’s perspective, with any required additional funding being provided by employees. The plans are subject to the regulatory requirements that apply to Canadian pension plans in the relevant provinces and territories (predominantly Quebec). Pension Committees are responsible for ensuring that the plans operate in a manner that is compliant with the relevant regulations. The Pension Committees generally have a number of members appointed by the sponsor and a number appointed by the plan participants. In some cases, there is also an independent Committee member.
The defined benefit sections of the UK arrangements are linked to final pay. New employees join the defined contribution sections. The plans are subject to the regulatory requirements that apply to UK pension plans. Trustees are responsible for ensuring that the plans operate in a manner that is compliant with UK regulations. The trustee board governing the main UK plans has a number of directors appointed by the sponsor, a number appointed by the plan participants and an independent trustee director.
A defined benefit pension plan is sponsored by the US entities. Benefits for salaried staff are generally linked to final average pay. Benefits for unionised employees are reviewed in negotiation with unions and are typically a flat monetary amount per year of service. New employees are admitted to defined contribution plans. A Benefits Governance Committee is responsible for ensuring that the plans are compliant with US regulations. Members of that Committee are appointed by the sponsor.
The Swiss plan provides benefits linked to final average pay. The Swiss plan is overseen by a Trustee board which is responsible for ensuring that the plan complies with Swiss regulations. Trustee board members are appointed by the plan sponsor, by employees and by retirees.
204 Annual Report on Form 20-F 2022 | riotinto.com
In Australia, the main arrangements are principally defined contribution in nature but there are sections providing defined benefits linked to final pay, typically paid in lump sum form. These arrangements are managed by an independent financial institution, who are responsible for ensuring that the plans are operating in a manner that is compliant with local regulations. We may nominate candidates to be considered for appointment to the governing board, as may other employers. One third of the board positions are nominated by employers, with the remaining positions being filled by independent directors and directors nominated by participants.
The Group also operates a number of unfunded defined benefit plans, which are included in the figures below.
Post-retirement healthcare plans
Certain subsidiaries of the Group, mainly in the US and Canada, provide healthcare and life insurance benefits to retired employees and in some cases to their beneficiaries and covered dependants. Eligibility for coverage is dependent upon certain age and service criteria. These arrangements are unfunded, and are included in the figures below.
Recognition and measurement:
For post-employment defined benefit schemes, in accordance with IAS 19 “Employee Benefits”, local actuaries calculate the fair value of the plan assets and the present value of the plan obligations using a variety of valuation techniques dependent on the type of asset or liability. The difference is recognised as an asset or liability in the balance sheet.
Where appropriate, the recognition of assets may be restricted to the present value of any amounts the Group expects to recover by way of refunds from the plan or reductions in future contributions. In determining the extent to which a refund will be available the Group considers whether any third party, such as a trustee or pension committee, has the power to enhance benefits or to wind up a pension plan without the Group’s consent.
The current service cost, any past service cost and the effect of any curtailment or settlements are recognised in the income statement. The interest cost less interest income on assets held in the plans is also charged to the income statement. All amounts charged to the income statement in respect of these plans are included within “Net operating costs” or in “Share of profit after tax of equity accounted units”, as appropriate. Actuarial gains/losses and returns from assets are recognised in other comprehensive income.
The Group’s contributions to defined contribution plans are charged to the income statement in the period to which the contributions relate. These are included within “Net operating costs” or in “Share of profit after tax of equity accounted units”, as appropriate.
Plan assets
The assets of the pension plans are invested predominantly in a diversified range of equities, bonds and property. Consequently, the funding level of the pension plans is affected by movements in the level of equity markets and also by movements in interest rates. The Group monitors its exposure to changes in interest rates and equity markets and also measures its balance sheet pension risk using a value at risk approach. These measures are considered when deciding whether significant changes in investment strategy are required.
Investment strategy reviews are conducted on a periodic basis to determine the optimal investment mix. This is performed while bearing in mind the risk tolerance of the Group and local sponsor companies, and the views of the Pension Committees and trustee boards who are legally responsible for the plans’ investments. The assets of the pension plans may also be invested in Qualifying Insurance Policies which provide a stream of payments to match the benefits being paid out by the plans. This would therefore remove the investment, inflation and longevity risks.
In Canada, the UK and Switzerland, the Group works with the governing bodies to ensure that the investment policy adopted is consistent with the Group’s tolerance for risk. In the US the Group has direct control over the investment policy, subject to local investment regulations.
The proportions of the total fair value of assets in the pension plans for each asset class at the balance sheet date were:
| | | | | | | | | | | | | | |
| 2022 | 2021 |
Equities | 18.0 | % | | 17.6 | % | |
– Quoted | | 12.3 | % | | 13.4 | % |
– Private | | 5.7 | % | | 4.2 | % |
Bonds | 58.1 | % | | 60.2 | % | |
– Government fixed income | | 24.6 | % | | 23.2 | % |
– Government inflation-linked | | 5.0 | % | | 9.5 | % |
– Corporate and other publicly quoted | | 19.6 | % | | 20.6 | % |
– Private | | 8.9 | % | | 6.9 | % |
Property | 10.0 | % | | 7.9 | % | |
– Quoted property funds | | 2.9 | % | | 3.4 | % |
– Unquoted property funds | | 7.1 | % | | 4.5 | % |
Qualifying insurance policies | 9.7 | % | | 10.5 | % | |
Cash & other | 4.2 | % | | 3.8 | % | |
| Total | 100.0 | % | | 100.0 | % | |
The assets of the plans are managed on a day-to-day basis by external specialist fund managers. These managers may invest in the Group’s securities subject to limits imposed by the relevant fiduciary committees and local legislation. The approximate total holding of Group securities within the plans is US$2 million (2021: US$2 million).
The holdings of quoted equities are invested in either pooled funds or segregated accounts held in the name of the relevant pension funds. These equity portfolios are well diversified in terms of the geographic distribution and market sectors.
Annual Report on Form 20-F 2022 | riotinto.com 205
Financial statements continued
Notes to the 2022 financial statements
28 Post-retirement benefits continued
The holdings of government bonds are generally invested in the debt of the country in which a pension plan is situated. Corporate and other quoted bonds are usually of investment grade. Private debt is mainly held in the North American and UK pension funds and is invested in North American and European companies.
The property funds are invested in a diversified range of properties.
The holdings of cash & other are predominantly cash and short-term money market instruments.
Investments in private equity, private debt and property are less liquid than the other investment classes listed above and therefore the Group’s investment in those asset classes is restricted to a level that does not endanger the liquidity of the pension plans.
Qualifying insurance policies are held with insurance companies that are regulated by the relevant local authorities. The value of those policies is calculated by the local actuaries using assumptions consistent with those adopted for valuing the insured obligations.
The Group makes limited use of futures, repurchase agreements and other instruments to manage the interest rate risk in some of its plans. Fund managers may also use derivatives to hedge currency movements within their portfolios and, in the case of bond managers, to take positions that could be taken using direct holdings of bonds but more efficiently. Exposure to these instruments is closely monitored and maintained at a level that does not endanger the liquidity of any pension plan.
Maturity of defined benefit obligations
An approximate analysis of the maturity of the obligations is given in the table below: | | | | | | | | | | | | | | | | | |
| Pension
benefits | Other
benefits | 2022 Total | 2021 Total | 2020 Total |
Proportion relating to current employees | 19 | % | 16 | % | 18 | % | 20 | % | 21 | % |
Proportion relating to former employees not yet retired | 9 | % | 0 | % | 9 | % | 11 | % | 11 | % |
Proportion relating to retirees | 72 | % | 84 | % | 73 | % | 69 | % | 68 | % |
| Total | 100 | % | 100 | % | 100 | % | 100 | % | 100 | % |
Average duration of obligations (years) | 11.4 | 11.3 | 11.4 | 13.8 | 14.3 |
Most of the Group’s defined benefit pension plans are closed to new entrants, therefore the carrying value of the Group’s post-employment obligations is less sensitive to assumptions about future salary increases than to other assumptions such as future inflation.
Geographical distribution of defined benefit obligations
An approximate analysis of the geographic distribution of the obligations is given in the table below:
| | | | | | | | | | | | | | | | | |
| Pension
benefits | Other
benefits | 2022 Total | 2021 Total | 2020 Total |
Canada | 59 | % | 48 | % | 58 | % | 55 | % | 53 | % |
UK | 25 | % | 1 | % | 24 | % | 28 | % | 28 | % |
US | 8 | % | 48 | % | 10 | % | 10 | % | 10 | % |
Switzerland | 6 | % | 0 | % | 6 | % | 5 | % | 5 | % |
Other | 2 | % | 3 | % | 2 | % | 2 | % | 4 | % |
| Total | 100 | % | 100 | % | 100 | % | 100 | % | 100 | % |
Total expense recognised in the income statement
| | | | | | | | | | | | | | | | | |
| Pension
benefits
US$m | Other
benefits
US$m | 2022 Total US$m | 2021 Total US$m | 2020 Total US$m |
Current employer service cost for defined benefit plans | (136) | | (7) | | (143) | | (167) | | (137) | |
| Past service cost | — | | — | | — | | (2) | | (2) | |
| | | | | |
| Settlement losses | — | | — | | — | | (3) | | (1) | |
Net interest on net defined benefit liability | (12) | | (24) | | (36) | | (52) | | (49) | |
Non-investment expenses paid from the plans | (13) | | — | | (13) | | (15) | | (16) | |
| Total defined benefit expense | (161) | | (31) | | (192) | | (239) | | (205) | |
Current employer service cost for defined contribution and industry-wide plans | (365) | | (2) | | (367) | | (315) | | (264) | |
| Total expense recognised in the income statement | (526) | | (33) | | (559) | | (554) | | (469) | |
The above expense amounts are included as an employee cost within net operating costs. No amounts have been excluded from underlying earnings in 2022, 2021 or 2020.
The settlement loss in 2021 resulted from pension obligations in France being transferred to an external insurance company. A past service cost of US$1 million was recognised in 2020 in relation to the Lloyds Banking Group court judgment addressing the need to equalise historical transfer values in relation to Guaranteed Minimum Pensions.
206 Annual Report on Form 20-F 2022 | riotinto.com
Total amount recognised in other comprehensive income before tax | | | | | | | | | | | |
| 2022 US$m | 2021 US$m | 2020 US$m |
| Actuarial gains/(losses) | 3,410 | | 655 | | (1,242) | |
| Loss on application of asset ceiling | (1) | | — | | — | |
Return on assets, net of interest on assets | (2,831) | | 371 | | 768 | |
| | | |
| Re-measurement gains/(losses) on pension and post-retirement healthcare plans | 578 | | 1,026 | | (474) | |
Amounts recognised in the balance sheet
The following amounts were measured in accordance with IAS 19 at 31 December: | | | | | | | | | | | | | | |
| Pension
benefits
US$m | Other
benefits
US$m | 2022 Total US$m | 2021 Total US$m |
Total fair value of plan assets | 10,708 | | — | | 10,708 | | 14,700 | |
Present value of obligations – funded | (10,226) | | — | | (10,226) | | (14,462) | |
Present value of obligations – unfunded | (329) | | (622) | | (951) | | (1,266) | |
| Present value of obligations – total | (10,555) | | (622) | | (11,177) | | (15,728) | |
| Effect of asset ceiling | (1) | | — | | (1) | | — | |
| Net surplus/(deficit) to be shown in the balance sheet | 152 | | (622) | | (470) | | (1,028) | |
Comprising: | | | | |
– Deficits | (672) | | (622) | | (1,294) | | (2,098) | |
| – Surpluses | 824 | | — | | 824 | | 1,070 | |
| Net surplus/(deficit) on pension plans | 152 | | — | | 152 | | (194) | |
| Unfunded post-retirement healthcare obligation | — | | (622) | | (622) | | (834) | |
The surplus amounts shown above are included in the balance sheet as “Receivables and other assets”. See note 17.
Deficits are shown in the balance sheet within “Provisions (including post-retirement benefits)”. See note 26.
Funding policy and contributions to plans
The Group reviews the funding position of its pension plans on a regular basis and considers whether to provide funding above the minimum level required in each country. In Canada and the US the minimum level is prescribed by legislation. In the UK and Switzerland the minimum level is negotiated with the local trustee in accordance with the funding guidance issued by the local regulators. In deciding whether to provide funding above the minimum level, we consider other possible uses of cash elsewhere, the local sponsoring entity’s tax situation and any strategic advantage we might obtain. The Group does not generally pre-fund post-retirement healthcare arrangements. | | | | | | | | | | | | | | | | | |
| Pension
benefits
US$m | Other
benefits
US$m | 2022 Total US$m | 2021 Total US$m | 2020 Total US$m |
Contributions to defined benefit plans | 171 | | 40 | | 211 | | 464 | | 201 | |
| Contributions to defined contribution plans | 361 | | 2 | | 363 | | 311 | | 261 | |
| | | | | |
| Total | 532 | | 42 | | 574 | | 775 | | 462 | |
The level of surplus in the Rio Tinto Pension Fund in the UK is such that it may be used to pay for the employer contributions to the defined contribution section of that Fund, in accordance with the funding arrangements agreed with the Trustee of that Fund. Consequently, the cash paid to defined contribution plans is lower than the defined contribution service cost by US$4 million. Contributions to defined benefit pension plans are kept under regular review and actual contributions will be determined in line with the Group’s wider financing strategy, taking into account relevant minimum funding requirements. In 2021 additional cash of US$294 million was paid in order to settle pension obligations in France. This amount was paid to an external insurer, along with the transfer of existing pension assets in order to transfer the obligations to that insurer. As contributions to many plans are reviewed on at least an annual basis, the contributions for 2023 and subsequent years cannot be determined precisely in advance. Most of the Group’s largest pension funds are fully funded on their local funding basis and do not require long-term funding commitments at present. Contributions to defined benefit pension plans for 2023 are estimated to be around US$190 million but may be higher or lower than this depending on the evolution of financial markets and voluntary funding decisions taken by the Group. Contributions for subsequent years are expected to be at similar levels. Healthcare plans are generally unfunded and contributions for future years will be equal to benefit payments net of participant contributions. The Group’s contributions in 2023 are expected to be similar to the amounts paid in 2022.
Annual Report on Form 20-F 2022 | riotinto.com 207
Financial statements continued
Notes to the 2022 financial statements
28 Post-retirement benefits continued
Movements in the net defined benefit liability
A summary of the movement in the net defined benefit liability is shown in the first table below. The subsequent tables provide a more detailed analysis of the movements in the present value of the obligations and the fair value of assets.
| | | | | | | | | | | | | | |
| Pension
benefits
US$m | Other
benefits
US$m | 2022 Total US$m | 2021 Total US$m |
| Change in the net defined benefit liability | | | | |
Net defined benefit liability at the start of the year | (194) | | (834) | | (1,028) | | (2,273) | |
| Amounts recognised in income statement | (161) | | (31) | | (192) | | (239) | |
| Amounts recognised in other comprehensive income | 397 | | 181 | | 578 | | 1,026 | |
Employer contributions | 171 | | 40 | | 211 | | 464 | |
| | | | |
Assets transferred to defined contribution section | (4) | | — | | (4) | | (4) | |
| Currency exchange rate (losses)/gains | (57) | | 22 | | (35) | | (2) | |
| Net defined benefit surplus/(liability) at the end of the year | 152 | | (622) | | (470) | | (1,028) | |
| | | | | | | | | | | | | | |
| Pension
benefits
US$m | Other
benefits
US$m | 2022 Total US$m | 2021 Total US$m |
| Change in present value of obligation | | | | |
Present value of obligation at the start of the year | (14,894) | | (834) | | (15,728) | | (17,178) | |
Current employer service costs | (136) | | (7) | | (143) | | (167) | |
Past service cost | — | | — | | — | | (2) | |
| | | | |
Settlements | — | | — | | — | | 380 | |
Interest on obligation | (346) | | (24) | | (370) | | (328) | |
Contributions by plan participants | (20) | | — | | (20) | | (22) | |
Benefits paid | 743 | | 40 | | 783 | | 837 | |
| Experience (losses)/gains | (177) | | 7 | | (170) | | 89 | |
| Changes in financial assumptions gains | 3,390 | | 173 | | 3,563 | | 521 | |
| Changes in demographic assumptions gains | 16 | | 1 | | 17 | | 45 | |
| | | | |
| | | | |
| Currency exchange rate gains | 869 | | 22 | | 891 | | 97 | |
| Present value of obligation at the end of the year | (10,555) | | (622) | | (11,177) | | (15,728) | |
| | | | | | | | | | | | | | |
| Pension
benefits
US$m | Other
benefits
US$m | 2022 Total US$m | 2021 Total US$m |
| Change in plan assets | | | | |
Fair value of plan assets at the start of the year | 14,700 | | — | | 14,700 | | 14,905 | |
Settlements | — | | — | | — | | (383) | |
Interest on assets | 334 | | — | | 334 | | 276 | |
Contributions by plan participants | 20 | | — | | 20 | | 22 | |
Contributions by employer | 171 | | 40 | | 211 | | 464 | |
Benefits paid | (743) | | (40) | | (783) | | (837) | |
Non-investment expenses | (13) | | — | | (13) | | (15) | |
| Return on plan assets, net of interest on assets | (2,831) | | — | | (2,831) | | 371 | |
| | | | |
Assets transferred to defined contribution section | (4) | | — | | (4) | | (4) | |
| Currency exchange rate losses | (926) | | — | | (926) | | (99) | |
| Fair value of plan assets at the end of the year | 10,708 | | — | | 10,708 | | 14,700 | |
The impact of higher interest rates on bonds and qualifying insurance policies explains the return on plan assets, net of interest on assets in 2022. The settlement amounts shown above for 2021 relate to France, where assets and obligations for pensions in payment were transferred to an insurance company.
The resulting effect of applying an asset ceiling is a loss of US$1 million during the year. In determining the extent to which the asset ceiling has an effect, the Group considers the funding legislation in each country and the rules specific to each pension plan. The calculation takes into account any minimum funding requirements that may be applicable to the plan, whether any reduction in future Group contributions is available, and whether a refund of surplus may be available. In considering whether any refund of surplus is available, the Group considers the powers of trustee boards and similar bodies to augment benefits or wind up a plan. Where such powers are unilateral, the Group does not consider a refund to be available at the end of the life of a plan. Where the plan rules and legislation both permit the employer to take a refund of surplus, the asset ceiling may have no effect, although it may be the case that a refund will only be available many years in the future.
208 Annual Report on Form 20-F 2022 | riotinto.com
Main assumptions (rates per annum)
| | | | | | | | |
| | |
| Key estimate - Estimation of obligations for post-employment costs The value of the Group’s obligations for post-employment benefits is dependent on the amount of benefits that are expected to be paid out, discounted to the balance sheet date. The most significant assumptions used in accounting for pension plans are: The discount rate - used to determine the net present value of the obligations, the interest cost on the obligations and the interest income on plan assets. We use the yield from high-quality corporate bonds with maturities and terms that match those of the post-employment obligations as closely as possible. Where there is no developed corporate bond market in a currency, the rate on government bonds is used. The long-term inflation rate - used to project increases in future benefit payments for those plans that have benefits linked to inflation. The assumption regarding future inflation is based on market yields on inflation linked instruments, where possible, combined with consensus views. The mortality rates - used to project the period over which benefits will be paid, which is then discounted to arrive at the net present value of the obligations. The Group reviews the actual mortality rates of retirees in its major pension plans on a regular basis and uses these rates to set its current mortality assumptions. It also uses its judgment with respect to allowances for future improvements in longevity having regard to standard improvement scales in each relevant country and after taking external actuarial advice. The weighted-average assumptions used for the valuation at year end are summarised below: | |
| | |
| | | | | | | | | | | | | | |
| Canada | UK | US | Switzerland |
| At 31 December 2022 | | | | |
Discount rate | 5.0 | % | 4.9 | % | 5.3 | % | 2.3 | % |
Long-term inflation(a) | 2.1 | % | 3.3 | % | 2.4 | % | 1.2 | % |
Rate of increase in pensions | 0.5 | % | 2.8 | % | — | % | 3.4 | % |
| | | | |
| | | | |
| At 31 December 2021 | | | | |
Discount rate | 2.9 | % | 1.9 | % | 2.8 | % | 0.3 | % |
Long-term inflation(a) | 1.9 | % | 3.4 | % | 2.4 | % | 0.9 | % |
Rate of increase in pensions | 0.3 | % | 2.9 | % | — | % | 1.8 | % |
| | | | |
(a)The long-term inflation assumption shown for the UK is for the Retail Price Index. The assumption for the Consumer Price Index at 31 December 2022 was 2.7% (2021: 2.7%).
The main financial assumptions used for the healthcare plans, which are predominantly in the US and Canada, were: discount rate: 5.4% (2021: 3.1%); medical trend rate: 7.1% reducing to 4.8% by the year 2031 broadly on a straight line basis (2021: 6.3%, reducing to 4.7% by the year 2031); claims costs based on individual company experience.
For both the pension and healthcare arrangements, the post-retirement mortality assumptions allow for future improvements in longevity. The mortality tables used imply that a man aged 60 at the balance sheet date has a weighted average expected future lifetime of 27 years (2021: 27 years) and that a man aged 60 in 2041 would have a weighted average expected future lifetime of 28 years (2021: 28 years). The mortality tables are generally based upon the latest standard tables published in each country, adjusted appropriately to reflect the actual mortality experience of the plan participants where credible data is available. Adjustments have been made to some of our plans within the demographic assumptions for the impact of the Covid-19 pandemic based on the 2021 and 2020 experience.
Sensitivity
The values reported for the defined benefit obligations are sensitive to the actuarial assumptions used for projecting future benefit payments and discounting those payments. In order to estimate the sensitivity of the obligations to changes in assumptions, we calculate what the obligations would be if we were to make changes to each of the key assumptions in isolation. The difference between this figure and the figure calculated using our stated assumptions is an indication of the sensitivity to reasonably possible changes in each assumption. The results of this sensitivity analysis are summarised in the table below. Note that this approach is valid for small changes in the assumptions but will be less accurate for larger changes in the assumptions. The sensitivity to inflation includes the impact on pension increases, which are generally linked to inflation where they are granted.
| | | | | | | | | | | | | | | | | |
| | 2022 | 2021 |
| | Approximate
(increase)/decrease in obligations | Approximate
(increase)/
decrease in obligations |
| Assumption | Change in assumption | Pensions
US$m | Other
US$m | Pensions
US$m | Other
US$m |
| Discount rate | Increase of 0.5 percentage points | 483 | | 32 | | 854 | | 51 | |
Decrease of 0.5 percentage points | (510) | | (34) | | (915) | | (55) | |
| Long-term inflation | Increase of 0.5 percentage points | (174) | | (10) | | (393) | | (14) | |
Decrease of 0.5 percentage points | 168 | | 9 | | 374 | | 13 | |
| | | | | |
| | | | |
| Demographic – allowance for future improvements in longevity | Participants assumed to have the mortality rates of individuals who are one year older | 241 | | 8 | | 441 | | 15 | |
Participants assumed to have the mortality rates of individuals who are one year younger | (241) | | (8) | | (441) | | (15) | |
Annual Report on Form 20-F 2022 | riotinto.com 209
Financial statements continued
Notes to the 2022 financial statements
29 Directors’ and key management remuneration
Aggregate remuneration, calculated in accordance with the UK Companies Act 2006, of the directors of the parent companies was as follows:
| | | | | | | | | | | |
| 2022 US$'000 | 2021 US$'000 | 2020 US$'000 |
Emoluments | 6,726 | | 6,568 | | 6,686 | |
Long-term incentive plans | 4,691 | | 1,587 | | 8,974 | |
| 11,417 | | 8,155 | | 15,660 | |
| Pension contributions: defined contribution plans | 10 | | 9 | | 29 | |
| | | |
The Group defines key management personnel as the directors and certain members of the Executive Committee. The Executive Committee includes the executive directors, product group chief executive officers and Group executives.
The aggregate remuneration including pension contributions incurred by Rio Tinto plc in respect of its directors was US$10,692,000 (2021: US$7,522,000; 2020: US$14,983,000). The aggregate pension contribution to defined contribution plans was US$10,000 (2021: US$9,000; 2020: US$29,000). The aggregate remuneration, including pension contributions and other retirement benefits, incurred by Rio Tinto Limited in respect of its directors was US$735,000 (2021: US$642,000; 2020: US$707,000). The aggregate pension contribution to defined contribution plans was US$nil (2021: US$nil; 2020: US$nil).
During 2022, no director (2021: nil; 2020: nil) accrued retirement benefits under defined benefit arrangements, and two directors (2021: two; 2020: two) accrued retirement benefits under defined contribution arrangements.
Emoluments included in the table above have been translated from local currency at the average exchange rate for the year with the exception of bonus payments, which have been translated at the year-end rate.
Aggregate compensation, representing the expense recognised, under IFRS as defined in the “Basis of preparation” section, of the Group’s key management, including directors, was as follows:
| | | | | | | | | | | |
| 2022 US$'000 | 2021 US$'000 | 2020 US$'000 |
Short-term employee benefits and costs | 14,258 | | 18,184 | | 21,685 | |
Post-employment benefits | 174 | | 300 | | 369 | |
Employment termination benefits | — | | — | | 2,789 | |
Share-based payments | 10,846 | | 10,303 | | 34,954 | |
| Total | 25,278 | | 28,787 | | 59,797 | |
The figures shown above include employment costs which cover social security and accident premiums in Canada, the UK and payroll taxes in Australia paid by the employer as a direct additional cost of hire. In total, they amount to US$1,173,000 (2021: US$1,511,000; 2020: US$2,130,000).
210 Annual Report on Form 20-F 2022 | riotinto.com
Our Group structure
The Group’s principal subsidiaries (note 30), joint operations (note 31), joint ventures and associates (note 32) are in most cases held by intermediate holding companies and not directly by Rio Tinto plc or Rio Tinto Limited. This section of the notes only includes those companies that have a more significant impact on the profit or operating assets of the Group.
30 Principal subsidiaries
At 31 December 2022
| | | | | | | | | | | | | | | | | | | | | | | | | | | | | |
| Company and country of incorporation/operation | Principal activities | Class of shares
held | Proportion of class held (%) | | | Group
interest
(voting %) | | | Other
interest (voting %) |
| Australia | | | | | | | | | |
Argyle Diamonds Limited | Mining and processing of diamonds (until November 2020) | Class A | 100 | | | | 100 | | | | — | |
| Class B | 100 | | | | | |
Dampier Salt Limited | Salt and gypsum production | Ordinary | 68.36 | | | | 68.36 | | | | 31.64 | |
| Energy Resources of Australia Ltd | Uranium processing (until January 2021) | Ordinary | 86.33 | | | | 86.33 | | | | 13.67 | |
Hamersley Iron Pty Limited | Iron ore mining | Ordinary | 100 | | | | 100 | | | | — | |
North Mining Limited(a) | Iron ore mining | Ordinary | 100 | | | | 100 | | | | — | |
| Preference | 100 | | | | | |
| | | | | | | | | |
Rio Tinto Aluminium (Holdings) Limited | Bauxite mining; alumina production; primary aluminium smelting | Ordinary | 100 | | | | 100 | | | | — | |
| | | | | | | | | |
Robe River Mining Co Pty Ltd(a) | Iron ore mining | Class A | 40 | | | | 73.61 | | | | 26.39 | |
| Class B | 76.36 | | | |
| | | | | | | | | |
| Brazil | | | | | | | | | |
Rio Tinto do Brasil Ltda.(b) | Alumina production and bauxite mining | Quota | 100 | | | | 100 | | | | — | |
| Canada | | | | | | | | | |
| Diavik Diamond Mines (2012) Inc. | Diamond mining and processing | Common | 100 | | | | 100 | | | | — | |
Iron Ore Company of Canada(c) | Iron ore mining; iron ore pellets production | Series A | 91.41 | | | | 58.72 | | | | 41.28 | |
| Series E | 100 | | | | | |
| Series F | 100 | | | | | |
Rio Tinto Alcan Inc. | Bauxite mining; alumina refining; aluminium smelting | Common | 100 | | | | 100 | | | | — | |
Rio Tinto Fer et Titane Inc. | Titanium dioxide feedstock; high purity iron and steel production | Common | 100 | | | | 100 | | | | — | |
| Class B preference | 100 | | | | | |
| Preference | 100 | | | | | |
| Guinea | | | | | | | | | |
Simfer Jersey Limited(d) | Iron ore project | Ordinary | 53 | | | | 53 | | | | 47 | |
| Madagascar | | | | | | | | | |
| | | | | | | | | |
QIT Madagascar Minerals SA(e) | Ilmenite mining | Common | 84.20 | | | | 79.98 | | | | 20.02 | |
| Investment certificates | 100 | | | | | |
| | | | | | | | | |
| Mongolia |
|
| | | | | | | |
Oyu Tolgoi LLC(f) | Copper and gold mining | Common | 66 | | | | 66 | | | | 34 | |
| South Africa | | | | | | | | | |
| | | | | | | | | |
Richards Bay Titanium (Proprietary) Limited(g) | Titanium dioxide; high purity iron production | B Ordinary | 100 | | | | 73.97 | | | | 26.03 | |
| B Preference | 100 | | | | | |
| Parent Preference | 100 | | | | | |
| | | | | | | | | |
| | | | | | | | | |
Richards Bay Mining (Proprietary) Limited(g) | Ilmenite, rutile and zircon mining | B Ordinary | 100 | | | | 73.97 | | | | 26.03 | |
| B Preference | 100 | | | | | |
| Parent Preference | 100 | | | | | |
| | | | | | | | | |
| US | | | | | | | | | |
Kennecott Holdings Corporation (including Kennecott Utah Copper and Kennecott Exploration) | Copper and gold mining, smelting and refining and exploration activities | Common | 100 | | | | 100 | | | | — | |
| U.S. Borax Inc. | Mining, refining and marketing of borates | Common | 100 | | | | 100 | | | | — | |
(a)Robe River Mining Co Pty Ltd (which is 60% owned by the Group) holds a 30% economic interest in Robe River Iron Associates (Robe River). North Mining Ltd (which is wholly owned by the Group) holds a 35% economic interest in Robe River. Through these companies the Group recognises a 65% share of the assets, liabilities, revenues and expenses of Robe River, with a 12% non-controlling interest. The Group therefore has a 53% economic interest in Robe River.
(b)Rio Tinto do Brasil Ltda holds the Group’s 10% interest in Consórcio De Alumínio Do Maranhão, a joint operation in which the Group participates but is not a joint operator. The Group recognises its share of assets, liabilities, revenues and expenses relating to this arrangement.
(c)Iron Ore Company of Canada is incorporated in the US, but operates in Canada.
(d)Simfer Jersey Limited, a company incorporated in Jersey in which the Group has a 53% interest, has an 85% interest in Simfer S.A., the company that operates the Simandou mining project in Guinea. The Group therefore has a 45.05% indirect interest in Simfer S.A. These entities are consolidated as subsidiaries and together referred to as the Simandou iron ore project.
(e)The Group’s shareholding in QIT Madagascar Minerals SA carries an 80% economic interest and 80% of the total voting rights; a further 5% economic interest is held through non-voting investment certificates to give an economic interest of 85%. The non-controlling interests have a 15% economic interest and 20% of the total voting rights.
(f)On 16 December 2022, we purchased the remaining 49% share of Turquoise Hill Resources Ltd. The Group now holds a 66% direct interest in Oyu Tolgoi LLC (OT). Up until December 2022 the Group had a 50.79% interest in Turquoise Hill Resources Ltd, which held a 66% interest in OT. The Group therefore had a 33.5% indirect interest in OT.
(g)Additional classes of shares issued by Richards Bay Titanium (Proprietary) Limited and Richards Bay Mining (Proprietary) Limited representing non-controlling interests are not shown. The Group’s total legal and beneficial interest in Richards Bay Titanium (Proprietary) Limited and Richards Bay Mining (Proprietary) Limited is 74%.
Annual Report on Form 20-F 2022 | riotinto.com 211
Financial statements continued
Notes to the 2022 financial statements
30 Principal subsidiaries continued
Summary financial information for subsidiaries that have non-controlling interests that are material to the Group
This summarised financial information is shown on a 100% basis. It represents the amounts shown in the subsidiaries’ financial statements prepared in accordance with IFRS under Group accounting policies, including fair value adjustments, and before intercompany eliminations.
| | | | | | | | | | | | | | | | | | |
| Income statement summary for the year ended 31 December | Iron Ore Company of Canada 2022 US$m | Iron Ore Company of Canada 2021 US$m | | | | | Oyu Tolgoi LLC(h)(i)(j) 2022 US$m | Oyu Tolgoi LLC(h)(i)(j) 2021 US$m |
Revenue | 2,634 | | 3,308 | | | | | | 1,424 | | 1,971 | |
| Profit/(loss) after tax | 756 | | 1,193 | | | | | | (224) | | 465 | |
– attributable to non-controlling interests | 312 | | 493 | | | | | | (159) | | 285 | |
– attributable to Rio Tinto | 444 | | 700 | | | | | | (65) | | 180 | |
| | | | | | | | |
| | | | | | | | |
| | | | | | | | |
| | | | | | | | |
| | | | | | | | |
| | | | | | | | |
| | | | | | | | |
| | | | | | | | |
| | | | | | | | |
| | | | | | | | |
| | | | | | | | |
| | | | | | | | |
| Other comprehensive (loss)/income | (111) | | 39 | | | | | | — | | — | |
| Total comprehensive income/(loss) | 645 | | 1,232 | | | | | | (224) | | 465 | |
| | | | | | | | |
| | | | | | | | |
| | | | | | | | |
| | | | | | | | |
| | | | | | | | |
| | | | | | | | |
| | | | | | | | |
| | | | | | | | |
| | | | | | | | |
| | | | | | | | |
| | | | | | | | |
| | | | | | | | |
| | | | | | | | |
| | | | | | | | |
| | | | | | | | |
| | | | | | | | |
| | | | | | | | |
| | | | | | | | | | | | | | | | | | |
| Balance sheet summary as at 31 December | 2022
US$m | 2021
US$m | | | | | 2022
US$m | 2021
US$m |
| | | | | | | | |
| | | | | | | | |
Non-current assets | 2,963 | | 2,974 | | | | | | 13,662 | | 12,199 | |
| | | | | | | | |
| | | | | | | | |
Current assets | 774 | | 599 | | | | | | 753 | | 523 | |
| | | | | | | | |
| | | | | | | | |
Current liabilities | (499) | | (581) | | | | | | (4,253) | | (3,172) | |
| | | | | | | | |
| | | | | | | | |
Non-current liabilities | (974) | | (1,020) | | | | | | (10,731) | | (9,874) | |
| Net assets | 2,264 | | 1,972 | | | | | | (569) | | (324) | |
– attributable to non-controlling interests | 946 | | 818 | | | | | | (210) | | (89) | |
– attributable to Rio Tinto | 1,318 | | 1,154 | | | | | | (359) | | (235) | |
| | | | | | | | | | | | | | | | | | |
| Cash flow statement summary for the year ended 31 December | 2022
US$m | 2021
US$m | | | | | 2022
US$m | 2021
US$m |
| | | | | | | | |
| | | | | | | | |
| Cash flow from operations | 1,153 | | 2,119 | | | | | | 406 | | 851 | |
| Dividends paid to non-controlling interests | (142) | | (495) | | | | | | — | | — | |
(h)On 16 December 2022, we purchased the remaining 49% share of Turquoise Hill Resources Ltd. At 31 December 2022 cash consideration paid totalled US$2,961 million. Certain shareholders exercised their right to dissent to the transaction. In accordance with the terms of the circular, those dissenting shareholders have received initial consideration of C$34.4 per share, with final consideration to be determined by an independent arbitrator. We have included within other provisions US$211 million for additional consideration to be paid to the dissenting shareholders representing the difference between their initial consideration and C$43 per share paid to all other shareholders. As the transaction is with shareholders in their capacity as owners the transaction did not result in an income statement impact; however, re-measurement in future periods could result in an adjustment through the income statement.
(i)Under the terms of the project finance facility held by Oyu Tolgoi LLC, there are certain restrictions on the ability of Oyu Tolgoi LLC to make shareholder distributions.
(j)Refer to the note Oyu Tolgoi: approval for commencement of underground operations below regarding the treatment of funding balances.
| | | | | | | | | | | | | | | | | | | | |
| Income statement summary for the year ended 31 December | Robe River Mining Co Pty
2022
US$m | Robe River Mining Co Pty
2021
US$m | Other companies and eliminations(k) 2022 US$m | Other companies and eliminations(k) 2021 US$m | Robe River 2022 US$m | Robe River 2021 US$m |
Revenue | 1,703 | | 2,454 | | 1,987 | | 2,863 | | 3,690 | | 5,317 | |
Profit after tax | 802 | | 1,352 | | 875 | | 1,518 | | 1,677 | | 2,870 | |
– attributable to non-controlling interests | 322 | | 541 | | — | | — | | 322 | | 541 | |
– attributable to Rio Tinto | 480 | | 811 | | 875 | | 1,518 | | 1,355 | | 2,329 | |
| | | | | | |
| | | | | | |
| | | | | | |
| | | | | | |
| | | | | | |
| | | | | | |
| | | | | | |
| | | | | | |
| | | | | | |
| | | | | | |
| | | | | | |
| | | | | | |
| Other comprehensive loss | (206) | | (183) | | (111) | | (97) | | (317) | | (280) | |
| Total comprehensive income | 596 | | 1,169 | | 764 | | 1,421 | | 1,360 | | 2,590 | |
| | | | | | |
| | | | | | |
| | | | | | |
| | | | | | |
| | | | | | |
| | | | | | |
| | | | | | |
| | | | | | |
| | | | | | |
| | | | | | |
| | | | | | |
| | | | | | |
| | | | | | |
| | | | | | |
| | | | | | |
| | | | | | |
| | | | | | |
| | | | | | | | | | | | | | | | | | | | |
| Balance sheet summary as at 31 December | 2022 US$m |
2021 US$m | 2022 US$m |
2021 US$m | 2022 US$m |
2021 US$m |
| Non-current assets | 2,846 | | 3,472 | | 3,975 | | 4,166 | | 6,821 | | 7,638 | |
| | | | | | |
| | | | | | |
| Current assets | 756 | | 495 | | 609 | | 2,118 | | 1,365 | | 2,613 | |
| | | | | | |
| | | | | | |
| Current liabilities | (112) | | (371) | | (2,724) | | (329) | | (2,836) | | (700) | |
| | | | | | |
| | | | | | |
| Non-current liabilities | (422) | | (421) | | (564) | | (4,378) | | (986) | | (4,799) | |
| Net assets | 3,068 | | 3,175 | | 1,296 | | 1,577 | | 4,364 | | 4,752 | |
| – attributable to non-controlling interests | 1,225 | | 1,268 | | — | | — | | 1,225 | | 1,268 | |
| – attributable to Rio Tinto | 1,843 | | 1,907 | | 1,296 | | 1,577 | | 3,139 | | 3,484 | |
| | | | | | | | | | | | | | | | | | | | |
| Cash flow statement summary for the year ended 31 December | 2022 US$m |
2021 US$m | 2022 US$m |
2021 US$m | 2022 US$m |
2021 US$m |
Cash flow from operations | 1,435 | | 2,130 | | 1,981 | | 2,512 | | 3,416 | | 4,642 | |
Dividends paid to non-controlling interests | (278) | | (589) | | — | | — | | (278) | | (589) | |
(k)“Other companies and eliminations” includes North Mining Limited (a wholly-owned subsidiary of the Group which accounts for its interest in Robe River) and goodwill of US$337 million (2021: US$362 million) that arose on the Group’s acquisition of its interest in Robe River.
212 Annual Report on Form 20-F 2022 | riotinto.com
Oyu Tolgoi: approval for commencement of underground operations
On 25 January 2022, Rio Tinto, Turquoise Hill Resources Ltd (Turquoise Hill) and the Government of Mongolia announced their agreement, and unanimous approval by the Board of Oyu Tolgoi, to commence the underground operations.
As part of a comprehensive project budget and funding package undertaken between the parties in reaching this agreement, Turquoise Hill agreed to waive in full, funding balances arising from a carry account loan with Erdenes Oyu Tolgoi (Erdenes) of US$2.4 billion. This comprised the amount of common share investments in Oyu Tolgoi LLC funded by Turquoise Hill on behalf of Erdenes to build the project to date, plus US$1.0 billion of accrued interest. The waiver took effect on 25 January 2022. Rio Tinto and Turquoise Hill also agreed a plan to deliver the funding required until sustainable underground production is reached.
Prior to the waiver agreement, the funding balances owing from Erdenes to Turquoise Hill were expected to be repaid via a pledge over Erdenes’ share of future Oyu Tolgoi common share dividends. For this reason, and because the arrangement was between Turquoise Hill and Erdenes rather than with Oyu Tolgoi LLC itself, both the principal and interest were treated as transactions with owners acting in their capacity as owners. Consequently, at 31 December 2021, related amounts were recorded as a reduction in the share of equity attributable to non-controlling interests, resulting in an increase to the effective interest in Oyu Tolgoi attributable to owners of Rio Tinto.
Funding balances owing from Erdenes to Turquoise Hill were not classified as loan receivables in the Group Balance Sheet, and there was no interest income shown in the Group Income Statement. Accumulation of interest on the funding balances increased the share of retained earnings attributable to Rio Tinto as it accrued.
Waiving the funding balances owing from Erdenes to Turquoise Hill increases Erdenes’ economic share arising through entitlement to cash flows from future dividends of Oyu Tolgoi. In the 2022 Group results, there is no Income Statement charge for loan forgiveness or write-off as a result of the waiver, and net assets and liabilities for Oyu Tolgoi included in the Group Balance sheet remained unchanged as a result of this transaction. There was no exchange of cash or other financial assets between parties and there has been no change to the underlying free cash flows of the Oyu Tolgoi operations and development project. The waiver did not have an impact on the Group's assessment of impairment indicators for either 2021 or 2022, since it related to the project shareholders' funding arrangements rather than the economic capability of the Cash Generating Unit itself. A reallocation of the net asset value allocation between the owners of Oyu Tolgoi has been recorded in the Group Statement of Changes in Equity for 2022 by reducing equity attributable to owners of Rio Tinto and increasing equity attributable to non-controlling interests.
31 Principal joint operations
At 31 December 2022
| | | | | | | | |
Company and country of incorporation/operation | Principal activities | Group interest (%) |
Australia |
|
|
Tomago Aluminium Joint Venture | Aluminium smelting | 51.6 |
Gladstone Power Station Joint Venture | Power generation | 42.1 |
Hope Downs Joint Venture | Iron ore mining | 50 |
Queensland Alumina Limited(a)(b) | Alumina production | 80 |
Pilbara Iron Arrangements | Infrastructure, corporate and mining services | See other relevant judgments call out box below |
New Zealand | | |
New Zealand Aluminium Smelters Limited(a)(b) | Aluminium smelting | 79.4 |
Canada | | |
Aluminerie Alouette Inc. | Aluminium production | 40 |
US | | |
Pechiney Reynolds Quebec Inc(b)(c) | Aluminium smelting | 50.2 |
(a)Although the Group has a 79.4% interest in New Zealand Aluminium Smelters Limited and an 80% interest in Queensland Alumina Limited, decisions about activities that significantly affect the returns that are generated require agreement of both parties to the arrangements, giving rise to joint control, refer to other relevant judgments below.
(b)Queensland Alumina Limited, New Zealand Aluminium Smelters Limited and Pechiney Reynolds Quebec Inc. are joint arrangements that are primarily designed for the provision of output to the parties sharing joint control; this indicates that the parties have rights to substantially all the economic benefits of the assets. The liabilities of the arrangements are in substance satisfied by cash flows received from the parties; this dependence indicates that the parties in effect have obligations for the liabilities. It is these facts and circumstances that gives rise to the classification of these entities as joint operations.
(c)Pechiney Reynolds Quebec Inc. has a 50.1% interest in the Aluminerie de Bécancour, Inc. aluminium smelter, which is located in Canada. As Rio Tinto owns 50.2% of Pechiney Reynolds Quebec Inc our effective ownership of the Becancour smelter is 25.1%.
Annual Report on Form 20-F 2022 | riotinto.com 213
Financial statements continued
Notes to the 2022 financial statements
31 Principal joint operations continued
| | | | | | | | |
| | |
| Other relevant judgments - Basis of consolidation of Queensland Alumina Limited (‘QAL’) Judgment is sometimes required to assess whether, after considering all relevant factors, we have control or joint control. QAL is 80% owned by Rio Tinto and 20% owned by RUSAL. Typically such ownership interests would provide control; however, we have determined in this case that the shareholders’ agreement, which requires unanimous agreement over certain relevant activities of QAL, means that this non-managed operation is jointly controlled. The entity operates the joint operation on a tolling basis, processing bauxite supplied by the shareholders into alumina, which they off-take in their respective ownership share. Following the Australian Governments’s imposition of Trade Sanctions against Russia, QAL considered that they were no longer able to process bauxite on behalf of RUSAL and therefore enacted the “step-in” clause of the shareholders’ agreement that enabled Rio Tinto to contribute additional bauxite tonnes to ensure that 100% of production capacity was maintained. The decisions requiring unanimous consent referred to above are restricted during the step-in period. Due to the step-in, we have re-assessed whether our conclusion of having joint control is still valid, considering we own 80% of the entity but currently take all plant production. If this resulted in our control of QAL we would need to account for that change as a business combination. Based on the following facts: –RUSAL has commenced proceedings in the Australian Federal Court contending that the sanctions should not apply in these circumstances and therefore the step-in rights should not apply; and –the continued operation of the shareholders’ agreement, incorporating the “step-in” clause, we have concluded that we have joint control of the entity at 31 December 2022 and therefore continue to account for QAL as a joint operation. | |
| | |
| | | | | | | | |
| | |
| Other relevant judgments - Accounting for the Pilbara Iron Arrangements A number of arrangements are in place amongst the Australian Iron Ore operations, managed by Rio Tinto, which allow their respective assets to be operated as a single integrated network across the Pilbara region. In assessing the Pilbara Iron Arrangements, it has been concluded that they collectively constitute a joint operation on the basis that decisions about relevant activities require unanimous consent. The resulting efficiencies are shared between Rio Tinto and Robe River Iron Associates (Robe River), and the parties fund all of the cash flow requirements of Pilbara Iron (Company) Services Pty Ltd and Pilbara Iron Pty Ltd. Each of the partners in the joint operation is able to request the other to construct assets on their tenure to increase the capacity of the rail and port infrastructure network. The requesting partner’s (Asset User’s) share of the capacity of the network will increase by the capacity of the newly constructed asset, but generally that capacity may be provided from any of the network assets. The Asset User will pay an annual charge (Committed Use Charge – “CUC”) over a contractually specified period irrespective of network usage. The constructing partner (Asset Owner) has an ongoing obligation to make available capacity from those assets and to maintain the assets in good working order as required under relevant State Agreements and associated tenure. The arrangements are managed through two wholly owned subsidiaries: Pilbara Iron (Company) Services Pty Ltd and Pilbara Iron Pty Ltd. We have also considered whether the CUC arrangements give rise to a lease between the Asset Owner and the Asset User. We have concluded that they do not, as there is no specified asset; rather the Asset User has a first priority right to the capacity in the CUC asset. This treatment was grandfathered on adoption of IFRS 16 on 1 January 2019, following assessment under the preceding standards IAS 17 “Leases” and IFRIC 4 “Determining whether an arrangement contains a lease”, with no change to the conclusion under IFRS 16 for subsequent expenditure subject to the existing CUC arrangements. Management considers that these arrangements are unique and has used judgment to apply the principles of IFRS to the accounting for the arrangements as described above. The obligation of the Asset Owner to make capacity available is fulfilled over time and not at a point in time. The CUC arrangement is therefore an executory contract as defined under IAS 37, whereby neither party has performed any of its obligations, or both parties have partially performed their obligations to an equal extent, and so the CUC payments are expensed as incurred. An alternative interpretation of the fact pattern could have resulted in a gross presentation in the Group’s balance sheet with an asset and a corresponding liability to reflect the present value of the CUC payments. The Asset User is a wholly owned subsidiary of Rio Tinto, whereas the Asset Owner is a joint operation. This impact would be some US$948 million (calculated on the basis of grossing up the tax written down value of the CUC assets). Other methods of calculating the gross-up might give rise to different numbers. | |
| | |
214 Annual Report on Form 20-F 2022 | riotinto.com
32 Principal joint ventures and associates
Principal joint ventures
At 31 December 2022
| | | | | | | | | | | | | | | | | |
| Company and country of incorporation/operation | Principal activities | Number of
shares held | Class of
shares
held | Proportion
of class
held (%) | Group
interest
(%) |
| Chile |
| | | | |
Minera Escondida Ltda(a) | Copper mining and refining | — | | — | | — | | 30 | |
| Oman | | | | | |
Sohar Aluminium Co. L.L.C.(b) | Aluminium smelting; power generation | 37,500 | | Ordinary | 20 | | 20 | |
(a)The year-end of Minera Escondida Ltda is 30 June. The amounts included in the consolidated financial statements of Rio Tinto are, however, based on financial statements of Minera Escondida Limitada that are coterminous with those of the Group. The Company has no share class.
(b)Although the Group holds a 20% interest in Sohar Aluminium Co. L.L.C, decisions about relevant activities that significantly affect the returns that are generated require agreement of all parties to the arrangement. It is therefore determined that Rio Tinto has joint control.
| | | | | | | | |
| | |
| Other relevant judgments - Accounting for Minera Escondida Ltda Judgment has been applied on the determination that Escondida is a joint venture. We have based this on the nature of significant commercial decisions, including capital expenditure, which require approval of both Rio Tinto and its partner BHP (holders of a 57.5% interest). In contrast, our partner has assessed Rio Tinto’s rights as protective and concluded that it controls Escondida through its rights to direct relevant activities. Adoption of the equivalent judgment by the Group would result in reclassification of Escondida from a joint venture to an associate, with no other financial reporting consequence since accounting under the equity method would remain in place. | |
| | |
Summary information for joint ventures that are material to the Group
This summarised financial information is shown on a 100% basis. It represents the amounts shown in the joint ventures’ financial statements prepared in accordance with IFRS under Group accounting policies, including fair value adjustments and amounts due to and from Rio Tinto.
| | | | | | | | | | | | | | |
| Minera Escondida Ltda(c) 2022 US$m | Minera Escondida Ltda(c) 2021 US$m | Sohar Aluminium Co.L.L.C.(d) 2022 US$m | Sohar Aluminium Co.L.L.C.(d) 2021 US$m |
Revenue | 8,760 | | 9,783 | | 1,130 | | 900 | |
Depreciation and amortisation | (1,100) | | (1,160) | | (120) | | (115) | |
| | | | |
Other operating costs | (3,280) | | (3,066) | | (685) | | (510) | |
| Operating profit | 4,380 | | 5,557 | | 325 | | 275 | |
Finance expense | (207) | | (134) | | (35) | | (30) | |
Income tax | (1,590) | | (2,133) | | (45) | | (35) | |
| Profit after tax | 2,583 | | 3,290 | | 245 | | 210 | |
| | | | |
| | | | |
| Other comprehensive profit | 17 | | 40 | | — | | — | |
| Total comprehensive income | 2,600 | | 3,330 | | 245 | | 210 | |
Non-current assets | 11,853 | | 11,490 | | 1,713 | | 1,765 | |
Current assets | 2,563 | | 2,857 | | 389 | | 360 | |
Current liabilities | (1,450) | | (2,017) | | (167) | | (175) | |
Non-current liabilities | (5,063) | | (4,633) | | (700) | | (730) | |
| Net assets | 7,903 | | 7,697 | | 1,235 | | 1,220 | |
Assets and liabilities above include: | | | | |
– cash and cash equivalents | 377 | | 857 | | 50 | | 45 | |
| | | | |
| | | | |
– current financial liabilities | (340) | | (550) | | (25) | | (40) | |
| | | | |
| | | | |
– non-current financial liabilities | (3,060) | | (2,660) | | (530) | | (560) | |
| Dividends received from joint venture (Rio Tinto share) | 813 | | 1,374 | | 46 | | 47 | |
Reconciliation of the above amounts to the investment recognised in the Group balance sheet
| | | | | | | | | | | | | | |
Group interest | 30 | % | 30 | % | 20 | % | 20 | % |
Net assets | 7,903 | | 7,697 | | 1,235 | | 1,220 | |
Group’s ownership interest | 2,371 | | 2,309 | | 247 | | 244 | |
| | | | |
| | | | |
| Carrying value of Group’s interest | 2,371 | | 2,309 | | 247 | | 244 | |
(c)In addition to its “Investment in equity accounted units”, the Group recognises deferred tax liabilities of US$328 million (2021: US$322 million) relating to tax on unremitted earnings of equity accounted units.
(d)As part of financing agreements, there are certain restrictions on the ability of Sohar Aluminium Co. L.L.C to make shareholder distributions.
Annual Report on Form 20-F 2022 | riotinto.com 215
Financial statements continued
Notes to the 2022 financial statements
Principal associates
At 31 December 2022
| | | | | | | | | | | | | | | | | | | | | | | |
Company and country of incorporation/operation | Principal activities | Number of
shares held | Class of
shares held | Proportion
of class
held (%) | | | Group
interest
(%) |
| Australia | | | | | | | |
Boyne Smelters Limited(a) | Aluminium smelting | 153,679,560 | | Ordinary | 59.4 | | | | 59.4 | |
| Brazil | | | | | | | |
| | | | | | | |
Mineração Rio do Norte S.A.(b) | Bauxite mining | 25,000,000,000 | | Ordinary | 12.5 | | | | 12 | |
| 47,000,000,000 | | Preferred | 11.75 | | | |
| | | | | | | |
| US | | | | | | | |
Halco (Mining) Inc.(c) | Bauxite mining | 4,500 | | Common | 45 | | | | 45 | |
(a)The parties that collectively control Boyne Smelters Limited do so through decisions that are determined on an aggregate voting interest that can be achieved by several combinations of the parties. Although each combination requires Rio Tinto’s approval, this is not joint control as defined under IFRS 11 “Joint Arrangements”. Rio Tinto is therefore determined to have significant influence over this company.
(b)Although the Group holds only 12% of Mineração Rio do Norte S.A., it has representation on its board of directors and a consequent ability to participate in the financial and operating policy decisions. It is therefore determined that Rio Tinto has significant influence.
(c)Halco (Mining) Inc. has a 51% indirect interest in Compagnie des Bauxites de Guinée, a bauxite mine, the core assets of which are located in Guinea.
Summary information for joint ventures and associates that are not individually material to the Group
| | | | | | | | | | |
| | | 2022 US$m | 2021 US$m Adjusted(b) |
Carrying value of Group's interest(a) | | | 680 | | 854 | |
| | | | |
| (Loss)/profit after tax | | | (47) | | 13 | |
| | | | |
| Other comprehensive loss | | | (27) | | (12) | |
| Total comprehensive (loss)/ income | | | (74) | | 1 | |
(a) The decrease in carrying value relates to the impairment of our investment in the Boyne Smelter in 2022, refer to note 4 for further details.
(b) Following the impairment in the Boyne Smelter we no longer consider it a significant equity accounted unit of the Group. Therefore we have updated this disclosure and the 2021 comparatives in the current year.
33 Related-party transactions
Information about material related-party transactions of the Rio Tinto Group is set out below.
Subsidiary companies and joint operations
Details of investments in principal subsidiary companies are disclosed in note 30. Information relating to joint operations can be found in note 31.
Equity accounted units
Transactions and balances with equity accounted units are summarised below. Purchases, trade and other receivables, and trade and other payables, relate largely to amounts charged by equity accounted units for toll processing of alumina and purchasing of bauxite and aluminium. Sales relate largely to sales of alumina to equity accounted units for smelting into aluminium.
| | | | | | | | | | | | | | |
| | 2022 US$m | 2021 US$m | 2020 US$m |
| Income statement items | | | | |
| | | | |
| | | | |
| | | | |
Purchases from equity accounted units | | (1,429) | | (1,167) | | (960) | |
| | | | |
| | | | |
| | | | |
Sales to equity accounted units | | 563 | | 432 | | 271 | |
| | | | |
| Cash flow statement items | | | | |
Dividends from equity accounted units | | 879 | | 1,431 | | 594 | |
| Net (funding of)/receipts from equity accounted units | | (75) | | 6 | | (43) | |
| | | | |
| Balance sheet items | | | | |
| | | | |
| | | | |
Investments in equity accounted units(a) | | 3,298 | | 3,504 | | 3,764 | |
Loans to equity accounted units | | — | | — | | 41 | |
| | | | |
| | | | |
| | | | |
| | | | |
| | | | |
| | | | |
| | | | |
| | | | |
| | | | |
Trade and other receivables: amounts due from equity accounted units(b) | | 297 | | 251 | | 251 | |
| | | | |
| | | | |
Trade and other payables: amounts due to equity accounted units | | (294) | | (253) | | (241) | |
(a)Investments in equity accounted units include quasi-equity loans. Further information about investments in equity accounted units is set out in note 32.
(b)This includes prepayments of tolling charges.
Pension funds
Information relating to pension fund arrangements is set out in note 28.
Directors and key management
Details of directors’ and key management’s remuneration are set out in note 29.
216 Annual Report on Form 20-F 2022 | riotinto.com
Our equity
34 Share capital
Recognition and measurement:
Ordinary shares are classified as equity. Incremental costs directly attributable to the issuance of new shares are shown in equity as a deduction, net of tax, from the proceeds.
Where any Group company purchases the Group’s equity share capital (treasury shares), the consideration paid, including any directly attributable incremental costs (net of income taxes) is deducted from equity attributable to owners of Rio Tinto. Where such shares are subsequently reissued, any consideration received, net of any directly attributable incremental costs and the related income tax effects, is included in equity attributable to owners of Rio Tinto. If purchased Rio Tinto plc shares are cancelled, an amount equal to the nominal value of the cancelled share is credited to the capital redemption reserve.
Rio Tinto plc
| | | | | | | | | | | | | | | | | | | | |
| 2022 Number (million) | 2021 Number (million) | 2020 Number (million) | 2022 US$m | 2021 US$m | 2020 US$m |
| Issued and fully paid up share capital of 10p each | | | | | | |
At 1 January | 1,255.795 | | 1,255.756 | | 1,259.345 | | 207 | | 207 | | 207 | |
Ordinary shares issued under the Global Employee Share plan (GESP) | 0.050 | | 0.039 | | 0.039 | | — | | — | | — | |
Shares purchased and cancelled(a) | — | | — | | (3.628) | | — | | — | | — | |
| At 31 December | 1,255.845 | | 1,255.795 | | 1,255.756 | | 207 | | 207 | | 207 | |
| | | | | | |
| Shares held by public | | | | | | |
At 1 January | 1,248.141 | | 1,246.904 | | 1,249.924 | | | | |
Shares reissued from treasury under the GESP | 1.464 | | 1.198 | | 0.569 | | | | |
| Ordinary shares issued under the GESP | 0.050 | | 0.039 | | 0.039 | | | | |
Shares purchased and cancelled(a) | — | | — | | (3.628) | | | | |
| At 31 December | 1,249.655 | | 1,248.141 | | 1,246.904 | | | | |
| | | | | | |
Shares held in treasury | 6.190 | | 7.654 | | 8.852 | | | | |
Shares held by public | 1,249.655 | | 1,248.141 | | 1,246.904 | | | | |
| Total share capital | 1,255.845 | | 1,255.795 | | 1,255.756 | | | | |
| | | | | | |
| Other share classes | | | | | | |
Special Voting Share of 10p each(b) | 1 only | 1 only | 1 only | | | |
DLC Dividend Share of 10p each(b) | 1 only | 1 only | 1 only | | | |
| | | | | | |
(a)The authority for the company to buy back its ordinary shares was renewed at the 2021 annual general meeting. No shares were bought back and cancelled in 2022 or 2021 under the on-market buy-back programme. 3,627,568 shares were bought back in 2020 under the on-market buy-back programme.
(b)The “Special Voting Share” was issued to facilitate the joint voting by shareholders of Rio Tinto plc and Rio Tinto Limited on Joint Decisions, following the DLC Merger. The “DLC Dividend Share” was issued to a subsidiary of Rio Tinto Limited to facilitate the efficient management of funds within the DLC structure. In addition, an Equalisation Share is authorised but not issued and is governed by the terms of the DLC Merger Sharing Agreement.
During 2022, US$16 million of shares and ADRs (2021: US$18 million; 2020: US$31 million) were purchased by employee share ownership trusts on behalf of Rio Tinto plc to satisfy employee share awards on vesting. At 31 December 2022, 232,621 shares and 49,777 ADRs were held in the employee share ownership trusts on behalf of Rio Tinto plc.
Rio Tinto Limited | | | | | | | | | | | | | | | | | | | | |
| 2022 Number (million) | 2021 Number (million) | 2020 Number (million) | 2022 US$m | 2021 US$m | 2020 US$m |
| Issued and fully paid up share capital | | | | | | |
At 1 January | 371.21 | 371.21 | 371.21 | 3,570 | | 3,781 | | 3,448 | |
| | | | | | |
| | | | | | |
Adjustment on currency translation | | | | (240) | | (211) | | 333 | |
| | | | | | |
| At 31 December | 371.21 | 371.21 | 371.21 | 3,330 | | 3,570 | | 3,781 | |
– Special Voting Share(a) | 1 only | 1 only | 1 only | | | |
– DLC Dividend Share(a) | 1 only | 1 only | 1 only | | | |
| Total share capital | 371.21 | 371.21 | 371.21 | | | |
(a)The “Special Voting Share” was issued to facilitate the joint voting by shareholders of Rio Tinto Limited and Rio Tinto plc on Joint Decisions following the DLC Merger. The “DLC Dividend Share” was issued to facilitate the efficient management of funds within the DLC structure. Directors have the ability to issue an Equalisation Share if that is required under the terms of the DLC Merger Sharing Agreement.
During 2022, US$84 million of shares (2021: US$95 million; 2020: US$76 million) were purchased by employee share ownership trusts on behalf of Rio Tinto Limited to satisfy employee share awards on vesting. At 31 December 2022, 979,495 shares were held in the employee share ownership trusts on behalf of Rio Tinto Limited.
Information relating to share-based incentive schemes is given in note 27.
Annual Report on Form 20-F 2022 | riotinto.com 217
Financial statements continued
Notes to the 2022 financial statements
35 Other reserves and retained earnings
| | | | | | | | | | | |
| 2022 US$m | 2021 US$m | 2020 US$m |
Capital redemption reserve(a) | | | |
| | | |
| | | |
| At 1 January and 31 December | 51 | | 51 | | 51 | |
| Cash flow hedge reserve | | | |
| At 1 January | (11) | | 124 | | 160 | |
| | | |
| Cash flow hedge (losses)/gains | (167) | | (211) | | 24 | |
| | | |
| | | |
| Cash flow hedge losses/(gains) transferred to the income statement | 106 | | 14 | | (63) | |
| | | |
| | | |
| | | |
| | | |
| | | |
| Tax on the above | 21 | | 62 | | 3 | |
| | | |
| At 31 December | (51) | | (11) | | 124 | |
| | | |
| | | |
| | | |
| | | |
| | | |
| | | |
| | | |
| | | |
| | | |
| | | |
| | | |
| Fair value through other comprehensive income reserve | | | |
| At 1 January | 2 | | (2) | | (11) | |
| | | |
| Gains on equity investments | — | | 4 | | 9 | |
| | | |
| At 31 December | 2 | | 2 | | (2) | |
| Cost of hedging reserve | | | |
| At 1 January | (21) | | (3) | | (10) | |
| | | |
| Cost of hedging deferred to reserves during the year | 4 | | (18) | | 7 | |
| | | |
| At 31 December | (17) | | (21) | | (3) | |
Other reserves(b) | | | |
| | | |
| | | |
| At 1 January | 11,582 | | 11,628 | | 11,643 | |
| | | |
| Own shares purchased from Rio Tinto Limited shareholders to satisfy share awards | (84) | | (95) | | (76) | |
| Employee share options: value of services | 56 | | 55 | | 60 | |
| Deferred tax on share options | — | | (6) | | 1 | |
| | | |
| At 31 December | 11,554 | | 11,582 | | 11,628 | |
Foreign currency translation reserve(c) | | | |
| | | |
| | | |
| At 1 January | (1,605) | | 162 | | (2,656) | |
| | | |
| | | |
| Parent and subsidiaries' currency translation and exchange adjustments | (2,207) | | (1,755) | | 2,814 | |
| | | |
| | | |
| Equity accounted units currency translation adjustments | (27) | | (12) | | 4 | |
Currency translation reclassified on disposal(d) | 105 | | — | | — | |
| | | |
| | | |
| | | |
| | | |
| | | |
| At 31 December | (3,734) | | (1,605) | | 162 | |
| | | |
| Total other reserves per balance sheet | 7,805 | | 9,998 | | 11,960 | |
| | | | | | | | | | | |
| 2022 US$m | 2021 US$m | 2020 US$m |
Retained earnings(e) | | | |
| | | |
| | | |
At 1 January | 33,337 | | 26,792 | | 23,387 | |
Adjustment for transition to new accounting pronouncements(f) | (17) | | — | | — | |
| Revised 1 January | 33,320 | | 26,792 | | 23,387 | |
Parent and subsidiaries' profit for the year | 11,845 | | 20,052 | | 9,456 | |
Equity accounted units' profit after tax for the year | 575 | | 1,042 | | 313 | |
Re-measurement gains/(losses) on pension and post-retirement healthcare plans(g) | 568 | | 1,015 | | (482) | |
Tax relating to components of other comprehensive income | (118) | | (297) | | 116 | |
| | | |
| Total comprehensive income for the year | 12,870 | | 21,812 | | 9,403 | |
Share buy-back programme | — | | — | | (1) | |
Dividends paid | (11,716) | | (15,385) | | (6,132) | |
Change in equity interest held by Rio Tinto(h) | 701 | | 76 | | 84 | |
| | | |
| | | |
| | | |
| Own shares purchased/treasury shares reissued for share awards and other movements | (16) | | (18) | | (31) | |
Equity issued to holders of non-controlling interests(h) | (711) | | — | | — | |
| | | |
| | | |
Employee share options and other IFRS 2 charges taken to the income statement | 63 | | 60 | | 82 | |
| | | |
| | | |
| | | |
| | | |
| At 31 December | 34,511 | | 33,337 | | 26,792 | |
(a)The capital redemption reserve was set up to comply with section 733 of the UK Companies Act 2006 (previously section 170 of the UK Companies Act 1985) when shares of a company are redeemed or purchased wholly out of the company’s profits. Balances reflect the amount by which the company’s issued share capital is diminished in accordance with this section.
(b)Other reserves includes US$11,936 million which represents the difference between the nominal value and issue price of the shares issued arising from Rio Tinto plc’s rights issue completed in July 2009. No share premium was recorded in the Rio Tinto plc financial statements through the operation of the merger relief provisions of the UK Companies Act 1985.
Other reserves also include the cumulative amount recognised under IFRS 2 “Share Based Payment” in respect of awards granted but not exercised to acquire shares in Rio Tinto Limited, less, where applicable, the cost of shares purchased to satisfy share awards exercised. The cumulative amount recognised under IFRS 2 in respect of awards granted but not exercised to acquire shares in Rio Tinto plc is recorded in retained earnings.
(c)Exchange differences arising on the translation of the Group’s net investment in foreign controlled companies are taken to the foreign currency translation reserve. The cumulative differences relating to an investment are transferred to the income statement when the investment is disposed of.
(d)The sale of our Roughrider undeveloped project led to us recycling the currency translation reserve loss of US$105 million relating to the entity that incorporated the project.
(e)Retained earnings and movements in reserves of subsidiaries include those arising from the Group’s share of joint operations.
(f)The impact of adopting Amendments to IAS 37 “Provisions, Contingent Liabilities and Contingent Assets” on 1 January 2022.
(g)There were US$5 million re-measurement gains relating to equity accounted units in 2022 (31 December 2021: US$12 million gains, 31 December 2020: US$11 million losses).
(h)Refer to note 5 and 30 for further information regarding the forgiveness by Turquoise Hill Resources Ltd of the accrued interest and funding balances from Erdenes Oyu Tolgoi and the purchase of the non-controlling interest of Turquoise Hill Resources Ltd.
218 Annual Report on Form 20-F 2022 | riotinto.com
Other notes
36 Other provisions
Recognition and measurement
Other provisions are recognised when it is more likely than not that we will become obliged, legally or constructively, to future expenditure because of a past event. The provision reflects the best estimate of the expenditure needed to settle the obligation which existed at the balance sheet date. Where there is sufficient objective evidence of reasonably expected future events (such as changes in technology and new legislation) we reflect this in the amounts recognised.
| | | | | | | | | |
| | 2022 US$m | 2021 US$m |
At 1 January | | 1,002 | | 856 | |
Adjustment to opening balance on transition to new accounting standard (refer to page 155) | | 17 | | — | |
Restated opening balance | | 1,019 | | 856 | |
Adjustment on currency translation | | (43) | | (29) | |
| Adjustments to mining properties/right of use assets: | | | |
| – increases to existing and new provisions | | 4 | | 3 | |
| | | |
| | | |
Charged/(credited) to profit: | | | |
– increases to existing and new provisions | | 365 | | 382 | |
| | | |
– unused amounts reversed | | (66) | | (37) | |
| | | |
– amortisation of discount | | 2 | | 3 | |
Utilised in year | | (176) | | (128) | |
| | | |
| | | |
| | | |
| | | |
| | | |
| | | |
| | | |
| | | |
| | | |
| | | |
| | | |
| | | |
| | | |
Transfers and other movements(a) | | 193 | | (48) | |
At 31 December | | 1,298 | | 1,002 | |
Balance sheet analysis: | | | |
Current | | 554 | | 700 | |
Non-current | | 744 | | 302 | |
Total | | 1,298 | | 1,002 | |
(a)Transfers and other movements includes US$211 million for additional consideration to be paid to the dissenting shareholders of the Turquoise Hill Resources transaction. It represents the difference between their initial consideration of C$34.4 per share and C$43 per share paid to all other shareholders, with the final amount and timing to be determined by dissent proceedings. As a transaction with shareholders of a subsidiary in their capacity as owners, this adjustment has been made through equity.
37 Contingencies and commitments
Recognition and measurement
Contingent liabilities, indemnities and other performance guarantees represent the potential outflow of funds from the Group for the satisfaction of obligations including those under contractual arrangements (for example undertakings related to supplier agreements) not provided for in the balance sheet, where the likelihood of the contingent liabilities, guarantees or indemnities being called is assessed as possible rather than probable or remote.
Contingent liabilities (subsidiaries, joint operations, joint ventures and associates)
| | | | | | | | |
| | |
| Other relevant judgments - Contingencies Disclosure is made for material contingent liabilities unless the possibility of any loss arising is considered remote based on our judgment and legal advice. These are quantified unless, in our judgment, the amount cannot be reliably estimated. The unit of account for claims is the matter taken as a whole and therefore when a provision has been recorded for the best estimate of the cost to settle the obligation there is no further contingent liability component. This means that when a provision is recognised for the best estimate of the expenditure required to settle the present obligation from a single past event, a further contingent liability is not reported for the maximum potential exposure in excess of that already provided. We have not established provisions for certain additional legal claims in cases where we have assessed that a payment is either not probable or cannot be reliably estimated. A number of our companies are, and will likely continue to be, subject to various legal proceedings and investigations that arise from time to time. As a result, the Group may become subject to substantial liabilities that could affect our business, financial position and reputation. Litigation is inherently unpredictable and large judgments may at times occur. The Group may in the future incur judgments or enter into settlements of claims that could lead to material cash outflows. We do not believe that any of these proceedings will have a materially adverse effect on our financial position. | |
| | |
| | | | | | | | |
| 2022 US$m | 2021 US$m |
| | |
| | |
| | |
Contingent liabilities, indemnities and other performance guarantees(a) | 498 | | 441 | |
(a)There were no material contingent liabilities arising in relation to the Group’s joint ventures and associates.
Annual Report on Form 20-F 2022 | riotinto.com 219
Financial statements continued
Notes to the 2022 financial statements
37 Contingencies and commitments continued
Contingent liabilities - not quantifiable
The current status of contingent liabilities where it is not practicable to provide a reliable estimate of possible financial exposure is:
Litigation disputes
| | | | | |
| Litigation matter | Latest update |
| Timing of the impairment of Rio Tinto Coal Mozambique (US securities and exchange commission) | In October 2017, Rio Tinto announced that it had been notified by the U.S. Securities and Exchange Commission (SEC) that the SEC had filed a complaint in relation to Rio Tinto’s disclosures and timing of the impairment of Rio Tinto Coal Mozambique (RTCM). The impairment was reflected in Rio Tinto’s 2012 year-end accounts. The SEC alleges that Rio Tinto, a former chief executive, Tom Albanese, and a former chief financial officer, Guy Elliott, committed violations of the anti-fraud, reporting, books and records, and internal control provisions of the federal securities law by not accurately disclosing the value of RTCM and not impairing it when Rio Tinto published its 2011 year-end accounts in February 2012 or its 2012 interim results in August 2012. In June 2019, the trial court dismissed an associated US class action on behalf of securities holders. In August 2020, the appeals court partially overturned the court’s dismissal and the trial court dismissed the case again in 2022. The securities holders have appealed further to reinstate their claims, and the court has requested briefing in 2023. No provision has been recognised for this case. |
| |
| 2011 Contractual payments in Guinea | Rio Tinto continues to co-operate fully with relevant authorities in connection with their investigations in relation to contractual payments totalling US$10.5 million made to a consultant who had provided advisory services in 2011 on the Simandou project in Guinea. In August 2018, the court dismissed a related US class action commenced on behalf of securities holders. No provision has been recognised for this case. |
At 31 December 2022, the outcomes of the matters remain uncertain, but they could ultimately expose the Group to material financial cost. We believe these cases are unwarranted and will defend the allegations vigorously. A dedicated Board committee continues to monitor the progress of these matters, as appropriate.
On 6 March 2022 we reached a settlement with ASIC regarding the disclosure of the impairment of Rio Tinto Coal Mozambique (RTCM), which was reflected in Rio Tinto’s 2012 year-end accounts. This was previously disclosed as a contingent liability at 31 December 2021. As part of the court approved settlement, we paid a A$750,000 penalty for a single contravention of our continuous disclosure obligations in the period 21 December 2012 to 17 January 2013, immediately preceding the impairment announcement. As part of this court approved settlement between ASIC and Rio Tinto, there were no findings of fraud or any systemic or widespread failure by Rio Tinto. The case against Tom Albanese and Guy Elliott brought by ASIC has been wholly dismissed.
Other contingent liabilities
We are modernising agreements with Traditional Owner groups in response to the Juukan Gorge incident. We have created provisions, within “Other provisions”, based on our best estimate of historical claims; however, the process is incomplete and it is possible that further claims could arise relating to past events.
Close-down and restoration provisions are not recognised for those operations that have no known restrictions on their lives as the date of closure cannot be reliably estimated. This applies primarily to our Canadian aluminium smelters, which are not dependent upon a specific orebody and have access to indefinite-lived power from owned hydro-power stations with water rights permitted by local governments. In these instances, a closure obligation may exist at the reporting date; however, due to the indefinite nature of asset lives it is not possible to arrive at a sufficiently reliable estimate for the purposes of recognising a provision. Close-down and restoration provisions are recognised at these operations for separately identifiable closure activities which can be reasonably estimated, such as the demolition and removal of fixed structures after a pre-determined period. Any contingent liability for these assets will crystallise into a closure provision if and when a decision is taken to cease operations.
Contingent assets
The Group has, from time to time, various insurance claims outstanding with reinsurers. Recognition of any assets arising takes place once the insurance company has agreed to refund the claims and the amount is quantifiable. This is usually in the same period as payment is received.
Capital commitments
Our capital commitments include open purchase orders for managed operations and expenditure on major projects already authorised by our Investment Committee for non-managed operations. It does not include the estimated incremental capital expenditure relating to decarbonisation projects of US$7.5 billion between 2022 and 2030 unless otherwise contractually committed. On a legally enforceable basis, capital commitments would be approximately US$1.0 billion (2021: US$1.1 billion) as many of the contracts relating to the Group’s projects have various cancellation clauses.
220 Annual Report on Form 20-F 2022 | riotinto.com
| | | | | | | | |
| 2022 US$m | 2021 US$m |
| Capital commitments excluding the Group's share of joint venture capital commitments | | |
Within 1 year | 2,313 | | 2,324 | |
Between 1 and 3 years | 866 | | 116 | |
Between 3 and 5 years | 86 | | 38 | |
| | |
| | |
| | |
After 5 years | 89 | | 73 | |
| Total | 3,354 | | 2,551 | |
| | |
| Group's share of joint venture capital commitments | | |
Within 1 year | 15 | | 11 | |
Between 1 and 3 years | — | | — | |
| | |
| | |
| | |
| | |
| | |
| Total | 15 | | 11 | |
Unrecognised commitments to contribute funding or resources to joint ventures
We have a commitment to purchase and market a portion (in excess of the Group’s ownership interest) of the output of Sohar Aluminium Company L.L.C., an aluminium smelter in which the Group is a joint venture partner. The Group immediately sells the purchased products to third parties; in an active market, and therefore does not recognise the purchase obligation.
Along with the other joint venture partners, we have commitments to provide emergency funding (such as funding required to preserve the life or assets of the company or to comply with applicable laws) if required by Sohar Aluminium Company L.L.C., subject to approved thresholds.
At 31 December 2022, Minera Escondida Ltda held an undrawn shareholder line of credit for US$225 million (Rio Tinto share) (31 December 2021: US$225 million). The current facility has been extended during the year and will now mature in September 2023.
Purchase obligations
Purchase obligations are enforceable and legally binding agreements to buy goods or services. They specify all significant terms, including: fixed or minimum quantities to be purchased or consumed; fixed, minimum or variable price provisions; and the approximate timing of the transactions.
Purchase obligations for goods mainly relate to purchases of raw materials and consumables, and purchase obligations for services mainly relate to charges for the use of infrastructure, commitments to purchase power and freight contracts. These goods and services are expected to be used in the business. To the extent that this changes, a provision for onerous obligations may be made.
Purchases from joint arrangements or associates are included if the quantity to be purchased is in excess of our ownership interest in the entity. However, purchase obligations exclude contracted purchases of bauxite, alumina and aluminium from joint arrangements and associates and contracted purchases of alumina from third parties. This is because these purchases are made for commercial reasons and the Group is, overall, a net seller of these commodities.
The aggregate amount of future payment commitments under purchase obligations outstanding at 31 December was:
| | | | | | | | |
| 2022 US$m | 2021 US$m |
Within 1 year | 3,618 | | 3,483 | |
Between 1 and 2 years | 2,091 | | 1,660 | |
Between 2 and 3 years | 1,632 | | 1,345 | |
Between 3 and 4 years | 1,309 | | 1,080 | |
Between 4 and 5 years | 907 | | 1,020 | |
After 5 years | 6,574 | | 7,125 | |
| Total | 16,131 | | 15,713 | |
Guarantees by parent companies
Rio Tinto plc and Rio Tinto Limited have, jointly and severally, fully and unconditionally guaranteed the following securities issued by the following 100% owned finance subsidiaries: US$4.4 billion (31 December 2021: US$4.4 billion) Rio Tinto Finance (USA) Limited and Rio Tinto Finance (USA) plc bonds with maturity dates up to 2051; and US$1 billion (31 December 2021: US$1.1 billion) on the European Debt Issuance Programme. In addition, Rio Tinto Finance plc and Rio Tinto Finance Limited have entered into undrawn facility arrangements for an aggregate amount of US$7.5 billion (31 December 2021: US$7.5 billion). The facilities are guaranteed by Rio Tinto plc and Rio Tinto Limited.
Rio Tinto plc has provided a guarantee, known as the completion support undertaking (CSU), in favour of the Oyu Tolgoi LLC project finance lenders. At 31 December 2022, US$3.9 billion of project finance debt was outstanding under this facility (2021: US$4.3 billion). Rio Tinto plc, through its subsidiaries, owns 66% of Oyu Tolgoi LLC, with the remaining share owned by Erdenes Oyu Tolgoi LLC (34%), which is controlled by the Government of Mongolia. The project finance has been raised for development of the underground mine and the CSU will terminate on the completion of the underground mine according to a set of completion tests set out in the project finance facility.
The Rio Tinto guarantee applies to the extent that Turquoise Hill Resources Ltd cannot satisfy Oyu Tolgoi LLC’s project finance debt servicing obligations under its own guarantee to the lenders, called the sponsor debt service undertaking (DSU). Both the CSU and DSU contain a carve-out for certain political risk events.
Annual Report on Form 20-F 2022 | riotinto.com 221
Financial statements continued
Notes to the 2022 financial statements
38 Auditors’ remuneration
Group auditors’ remuneration(a)
| | | | | | | | | | | |
| 2022 US$m | 2021 US$m | 2020 US$m |
Audit of the Group | 17.3 | | 13.7 | | 11.0 | |
Audit of subsidiaries | 8.4 | | 7.5 | | 6.3 | |
| Total audit | 25.7 | | 21.2 | | 17.3 | |
| | | |
Audit-related assurance service | 1.0 | | 1.0 | | 0.8 | |
Other assurance services(b) | 2.3 | | 2.7 | | 1.4 | |
| Total assurance services | 3.3 | | 3.7 | | 2.2 | |
| Tax compliance | — | | — | | — | |
| | | |
Other non-audit services not covered above | 0.3 | | 0.2 | | 0.1 | |
| Total non-audit services | 3.6 | | 3.9 | | 2.3 | |
| | | |
| Total Group auditors’ remuneration | 29.3 | | 25.1 | | 19.6 | |
| | | |
| Audit fees payable to other accounting firms | | | |
| Audit of the financial statements of the Group’s subsidiaries | 0.2 | | 0.3 | | 0.6 | |
Fees in respect of pension scheme audits | 0.1 | | 0.1 | | 0.1 | |
| Total audit fees payable to other accounting firms | 0.3 | | 0.4 | | 0.7 | |
(a)The remuneration payable to KPMG, the Group auditors, is approved by the Audit Committee. The Committee sets the policy for the award of non-audit work to the auditors and approves the nature and extent of such work, and the amount of the related fees, to ensure that independence is maintained. The fees disclosed above consolidate all payments, including overruns, made to member firms of KPMG by the companies and their subsidiaries, along with fees in respect of joint operations paid for by the Group. Non-audit services arise largely from assurance and regulation related work.
(b)Other assurance services relates to the review of non-statutory financial information including sustainability reporting.
Under SEC regulations, the remuneration to KPMG firms and associates of US$29.3 million (2021: US$25.1 million; 2020: US$19.6 million) is required to be presented as follows: audit fees US$27.0 million (2021: US$22.6 million; 2020: US$18.0 million), audit-related fees US$2.0 million (2021: US$2.3 million; 2020: US$1.6 million), Tax fees US$nil (2021: US$nil; 2020: US$nil) and all other fees US$0.3 million (2021: US$0.2 million; 2020: US$nil)
39 Events after the balance sheet date
On 16 February 2023, we re-financed the US$3.9 billion Oyu Tolgoi project finance facility with a syndicate of international financial institutions, export credit agencies and commercial lenders. The lenders have agreed to a deferral of the principal repayments by three years to June 2026 and to an extension of the final maturity date by five years from 2030 to 2035. The terms and conditions are broadly unchanged and lenders continue to benefit from the Debt Service Undertaking from Turquoise Hill Resources Limited and the Completion Support Undertaking from Rio Tinto plc.
There were no other significant events after the balance sheet date requiring disclosure.
40 New standards issued but not yet effective
We have not early adopted any new accounting standards or amendments that have been issued but are not yet effective.
Deferred Tax related to Assets and Liabilities arising from a Single Transaction (Amendments to IAS 12 Income Taxes, mandatory in 2023 and endorsed by the UK)
The Group will adopt, from January 2023 (the transition date), the narrow-scope amendments to IAS 12, which introduce an exclusion to the initial recognition exemption application for transactions that give rise to equal and offsetting taxable and deductible temporary differences.
Our existing accounting policy states that “where the recognition of an asset and liability from a single transaction gives rise to equal and offsetting temporary differences, Rio Tinto applies the initial recognition exemption allowed by IAS 12, and consequently recognises neither a deferred tax asset nor a deferred tax liability in respect of these temporary differences”. Under the amendments, deferred tax assets and liabilities are required to be recognised in respect of such temporary differences from the transition date, with restatement of comparatives for 2022 and 2021.
The most significant impact of implementing these amendments is expected to be from temporary differences related to the Group's provisions for close-down and restoration (note 14), and lease obligations (note 21) and corresponding capitalised closure costs and right of use assets (note 13). Adjustments to deferred tax assets and liabilities related to these balances will be recognised as at 1 January 2021, being the beginning of the earliest comparative period presented in 2023 financial statements, with the cumulative effect recognised as an adjustment to retained earnings or other components of equity at that date. For other transactions the amendments apply only to those taking place on or after 1 January 2021.
The impact of restatement as at 31 December 2022 is that the Group will recognise additional gross deferred tax liabilities of US$922 million and gross deferred tax assets of US$1.4 billion in relation to close-down and restoration obligations and related capitalised closure costs. The Group will also recognise additional gross deferred tax liabilities of US$140 million and gross deferred tax assets of US$149 million in relation to lease liabilities and related right of use assets (note 15).
After the required offsetting within the same tax jurisdiction, these adjustments result in the Group recognising additional net deferred tax assets of US$30 million and a reduction in net deferred tax liabilities of US$437 million (note 15) with the resulting cumulative impact increasing retained earnings (inclusive of income statement adjustments described below) by US$459 million. As at 1 January 2021 and 31 December 2021, the restatement of gross and net deferred tax balances does not differ materially from the impact as at 31 December 2022.
222 Annual Report on Form 20-F 2022 | riotinto.com
The impact of restatement on net earnings for the year ended 2022 is a net charge of US$28 million, comprising a US$84 million credit (2021:US$22 million) related to depreciation of closure and right of use assets, and settlement of closure and lease liabilities, offset by a US$112 million charge (2021: US$nil) related to the derecognition of deferred tax assets as a result of the recently enacted Corporate Alternative Minimum Tax regime in the USA referred to in note 10 on page 172. There will be no impact on tax cash flows or amounts recognised on the balance sheet as tax recoverable or payable as a result of implementing these amendments. IFRS 17 Insurance Contracts and amendments to IFRS 17 Insurance Contracts (mandatory in 2023 and endorsed by the UK)
The standard provides consistent principles for all aspects of accounting for insurance contracts. We are finalising our assessment and have not identified a material impact to date, particularly in areas of judgment related to reinsurance contracts with EAUs and in substance self-insurance arrangements.
Other amendments
The assessment is ongoing in relation to other amendments, but no material impact has been identified to date. These are listed below:
–Amendments to IAS 1 Presentation of Financial Statements: disclosure of accounting policies (mandatory in 2023 and endorsed by the UK);
–Amendments to IAS 8 Accounting policies, changes in accounting estimates and errors: definition of accounting estimates (mandatory in 2023 and endorsed by the UK)
–Amendments to IAS 1 Presentation of Financial Statements: classification of liabilities (mandatory in 2024 and not yet endorsed by the UK).
Annual Report on Form 20-F 2022 | riotinto.com 223
Pages 224 to 250 have been intentionally omitted.
Report of Independent Registered Public Accounting Firms
To the Stockholders and Board of Directors of Rio Tinto plc and Rio Tinto Limited:
Opinions on the Consolidated Financial Statements and Internal Control Over Financial Reporting
We have audited the accompanying consolidated balance sheet of Rio Tinto Group (comprising of Rio Tinto plc and Rio Tinto Limited, together with their subsidiaries) as of December 31, 2022 and 2021, the related Group Income Statement, Group Statement of Comprehensive Income, Group Cash Flow Statement, and Group Statement of Changes in Equity for each of the years in the three-year period ended December 31, 2022, and the related notes (collectively, the consolidated financial statements). We also have audited the Rio Tinto Group’s internal control over financial reporting as of December 31, 2022, based on criteria established in Internal Control – Integrated Framework (2013) issued by the Committee of Sponsoring Organizations of the Treadway Commission.
In our opinion, the consolidated financial statements referred to above present fairly, in all material respects, the financial position of the Rio Tinto Group as of December 31, 2022, and 2021, and the results of its operations and its cash flows for each of the years in the three-year period ended December 31, 2022, in conformity with International Financial Reporting Standards as issued by the International Accounting Standards Board. Also in our opinion, the Rio Tinto Group maintained, in all material respects, effective internal control over financial reporting as of December 31, 2022, based on criteria established in Internal Control – Integrated Framework (2013) issued by the Committee of Sponsoring Organizations of the Treadway Commission.
Basis for Opinions
The Rio Tinto Group’s management is responsible for these consolidated financial statements, for maintaining effective internal control over financial reporting, and for its assessment of the effectiveness of internal control over financial reporting, included in Management’s report on internal control over financial reporting. Our responsibility is to express an opinion on the Rio Tinto Group’s consolidated financial statements and an opinion on Rio Tinto Group’s internal control over financial reporting based on our audits. We are public accounting firms registered with the Public Company Accounting Oversight Board (United States) (PCAOB) and are required to be independent with respect to the Rio Tinto Group in accordance with the U.S. federal securities laws and the applicable rules and regulations of the Securities and Exchange Commission and the PCAOB.
We conducted our audits in accordance with the standards of the PCAOB. Those standards require that we plan and perform the audits to obtain reasonable assurance about whether the consolidated financial statements are free of material misstatement, whether due to error or fraud, and whether effective internal control over financial reporting was maintained in all material respects.
Our audits of the consolidated financial statements included performing procedures to assess the risks of material misstatement of the consolidated financial statements, whether due to error or fraud, and performing procedures that respond to those risks. Such procedures included examining, on a test basis, evidence regarding the amounts and disclosures in the consolidated financial statements. Our audits also included evaluating the accounting principles used and significant estimates made by management, as well as evaluating the overall presentation of the consolidated financial statements. Our audit of internal control over financial reporting included obtaining an understanding of internal control over financial reporting, assessing the risk that a material weakness exists, and testing and evaluating the design and operating effectiveness of internal control based on the assessed risk. Our audits also included performing such other procedures as we considered necessary in the circumstances. We believe that our audits provide a reasonable basis for our opinions.
Annual Report on Form 20-F 2022 | riotinto.com 251
Report of Independent Registered Public Accounting Firms continued
Definition and Limitations of Internal Control Over Financial Reporting
A company’s internal control over financial reporting is a process designed to provide reasonable assurance regarding the reliability of financial reporting and the preparation of financial statements for external purposes in accordance with generally accepted accounting principles. A company’s internal control over financial reporting includes those policies and procedures that (1) pertain to the maintenance of records that, in reasonable detail, accurately and fairly reflect the transactions and dispositions of the assets of the company; (2) provide reasonable assurance that transactions are recorded as necessary to permit preparation of financial statements in accordance with generally accepted accounting principles, and that receipts and expenditures of the company are being made only in accordance with authorizations of management and directors of the company; and (3) provide reasonable assurance regarding prevention or timely detection of unauthorized acquisition, use, or disposition of the company’s assets that could have a material effect on the financial statements.
Because of its inherent limitations, internal control over financial reporting may not prevent or detect misstatements. Also, projections of any evaluation of effectiveness to future periods are subject to the risk that controls may become inadequate because of changes in conditions, or that the degree of compliance with the policies or procedures may deteriorate.
Critical Audit Matters
The critical audit matters communicated below are matters arising from the current period audit of the consolidated financial statements that were communicated or required to be communicated to the audit committee and that: (1) relate to accounts or disclosures that are material to the consolidated financial statements and (2) involved our especially challenging, subjective, or complex judgments. The communication of critical audit matters does not alter in any way our opinion on the consolidated financial statements, taken as a whole, and we are not, by communicating the critical audit matters below, providing separate opinions on the critical audit matters or on the accounts or disclosures to which they relate.
Evaluation of indicators of impairment or impairment reversals of property, plant and equipment in specific cash generating units (‘CGU’)
As discussed, in Note 13 to the consolidated financial statements, as at December 31, 2022, the Group has US$64,734m of property, plant and equipment, a portion of which relates to the Oyu Tolgoi copper-gold mine (‘Oyu Tolgoi CGU’) and Kitimat aluminium smelter (‘Kitimat CGU’). As discussed in Note 4, external and internal factors are monitored for indicators of impairment or impairment reversal and judgment is required to determine whether the impacts of these factors are significant.
We identified the evaluation of indicators of impairment or impairment reversal of property, plant and equipment related to the Oyu Tolgoi and Kitimat CGUs as a critical audit matter. Significant auditor judgement was required to assess whether certain internal and external factors impacting the Oyu Tolgoi and Kitimat CGUs, including the impact of volatility in forecast long-term commodity prices, result in indicators of impairment or impairment reversal. Specifically, for the Oyu Tolgoi CGU, significant judgement was required to evaluate the transaction to acquire the minority shareholding of Turquoise Hill Resources Limited (‘TRQ’) as well as the development progress of the underground operation. Specifically, for the Kitimat CGU, significant judgement was required to evaluate the forecast operational performance, including the ramp up following the 2021 workforce strike.
The following are the primary procedures we performed to address this critical audit matter. We evaluated the design and tested the operating effectiveness of certain internal controls related to the identification of indicators of impairment or impairment reversal of property, plant and equipment for the Oyu Tolgoi and Kitimat CGUs. We involved valuation professionals with specialised skills and knowledge who assisted in assessing the forecast long-term commodity prices used in the Group’s assessments, by comparing them to market consensus forecasts.
252 Annual Report on Form 20-F 2022 | riotinto.com
Report of Independent Registered Public Accounting Firms continued
Specifically, for the Oyu Tolgoi CGU we assessed the progress of the underground mine development in the current year through comparison with the key assumptions used in the 2021 impairment assessment and making inquiries of key management, including operational personnel; and evaluated the transaction to acquire the minority shareholding of TRQ as a potential indicator of impairment or impairment reversal by considering any implications of the transaction price on the valuation of the Oyu Tolgoi CGU. Specifically, for the Kitimat CGU we evaluated the impact of changes to the forecast operational performance, including the ramp up following the 2021 workforce strikes through comparison with the key assumptions used in the 2021 impairment assessment and making inquiries of key management, including operational personnel.
Evaluation of certain provisions for close-down and restoration
As discussed in Note 14 to the consolidated financial statements, the Group has a provision for close-down and restoration (‘closure provisions’) of US$15,759m as of December 31, 2022, a portion of which related to Iron ore (‘Pilbara’).
We identified the evaluation of closure provisions for certain sites within Pilbara as a critical audit matter. Significant judgement was required to evaluate the Group’s assumptions related to the probability, nature and timing of possible closure and rehabilitation activities; future close-down and restoration costs, including costs associated with post-closure monitoring (‘closure costs’); closure timeframes; and the discount rate.
The following are the primary procedures we performed to address this critical audit matter. We evaluated the design and tested the operating effectiveness of certain internal controls over the Group’s process to estimate provisions for close-down and restoration, including controls over the Group’s selection of key assumptions to be used. We involved valuations professionals with specialised skills and knowledge who assisted in evaluating the discount rate by comparing it to external data including yields on long-term government bonds and external market research. We evaluated the scope, competency and objectivity of the Group’s experts, both internal and/or external to the Group, who produce the closure cost by examining the work they were involved to perform, their professional qualifications and experience. We compared a selection of previous forecast cost assumptions to actual costs to assess the Group’s ability to accurately forecast closure costs. We inspected the most recent closure studies and other technical material prepared by the Group relating to changes in the closure provision to assess the nature and scope of work planned to be undertaken, including assumptions relating to the probability, life of the operation and the nature and timing of closure and rehabilitation activities. We evaluated the completeness of the provisions against the Group’s analysis of where disturbance requires rehabilitation and our understanding of the Pilbara sites, including the probability, nature and timing of possible closure and rehabilitation activities. In addition, we involved environmental professionals with specialised skills and knowledge who assisted in evaluating the methodology applied by the Group’s experts and assisted us in assessing certain assumptions regarding the forecast costs of closure activities based on their experience and familiarity with applicable legislative requirements and industry practice and the Group’s closure commitments.
We have served as the Company’s auditors since 2020.
| | | | | |
/s/ KPMG LLP | /s/ KPMG |
KPMG LLP | KPMG |
| |
London, United Kingdom February 24, 2023 | Perth, Australia February 24, 2023 |
| |
In respect of the Board of Directors and Shareholders of Rio Tinto plc | In respect of the Board of Directors and Shareholders of Rio Tinto Limited |
Annual Report on Form 20-F 2022 | riotinto.com 253
Pages 254 to 269 have been intentionally omitted.
Rio Tinto Financial Information by Business Unit
Rio Tinto Financial Information by Business Unit
| | | | | | | | | | | | | | | | | | | | | | | | | | | | | | | | | | | | | | | | | |
| | Segmental revenue(a) for the year ended 31 December | Underlying EBITDA(a) for the year ended 31 December | Depreciation and amortisation
for the year
ended 31 December | Underlying earnings(a) for the year ended 31 December |
| | | | | | | | | | | | | |
Rio Tinto
interest
% | 2022 US$m | 2021 US$m | 2020 US$m | 2022 US$m | 2021 US$m | 2020 US$m | 2022 US$m | 2021 US$m | 2020 US$m | 2022 US$m | 2021 US$m | 2020 US$m |
| Iron Ore | | | | | | | | | | | | | |
| Pilbara | (b) | 29,313 | | 39,111 | | 27,027 | | 18,474 | | 27,837 | | 18,896 | | 2,011 | | 2,003 | | 1,819 | | 11,075 | | 17,544 | | 11,551 | |
| Dampier Salt | 68.4 | | 352 | | 298 | | 252 | | 56 | | 39 | | 43 | | 19 | | 20 | | 19 | | 19 | | 10 | | 12 | |
| Evaluation projects/other | (c) | 2,711 | | 2,147 | | 657 | | 33 | | (81) | | (32) | | — | | — | | — | | 53 | | (79) | | (112) | |
| Intra-segment | (c) | (1,470) | | (1,974) | | (428) | | 49 | | (203) | | (70) | | — | | — | | — | | 35 | | (152) | | (53) | |
| Total Iron Ore Segment | | 30,906 | | 39,582 | | 27,508 | | 18,612 | | 27,592 | | 18,837 | | 2,030 | | 2,023 | | 1,838 | | 11,182 | | 17,323 | | 11,398 | |
| | | | | | | | | | | | | |
| Aluminium | | | | | | | | | | | | | |
| Bauxite | | 2,396 | | 2,203 | | 2,302 | | 618 | | 619 | | 943 | | 361 | | 328 | | 290 | | 83 | | 174 | | 434 | |
| Alumina | | 3,215 | | 2,743 | | 2,233 | | 289 | | 569 | | 262 | | 200 | | 165 | | 138 | | 17 | | 306 | | 92 | |
| Primary Metal | | 7,561 | | 6,706 | | 4,489 | | 2,426 | | 2,592 | | 904 | | 704 | | 694 | | 643 | | 1,266 | | 1,454 | | 169 | |
| Pacific Aluminium | | 3,102 | | 2,947 | | 1,944 | | 497 | | 693 | | 112 | | 135 | | 103 | | 119 | | 248 | | 426 | | (6) | |
| Intra-segment and other | | (3,138) | | (2,718) | | (2,510) | | 12 | | 14 | | 6 | | — | | (1) | | 1 | | (8) | | 192 | | (159) | |
| Integrated operations | | 13,136 | | 11,881 | | 8,458 | | 3,842 | | 4,487 | | 2,227 | | 1,400 | | 1,289 | | 1,191 | | 1,606 | | 2,552 | | 530 | |
| Other product group items | | 973 | | 814 | | 856 | | 25 | | 26 | | 7 | | — | | — | | — | | 15 | | 17 | | (5) | |
| Product group operations | | 14,109 | | 12,695 | | 9,314 | | 3,867 | | 4,513 | | 2,234 | | 1,400 | | 1,289 | | 1,191 | | 1,621 | | 2,569 | | 525 | |
| Evaluation projects/other | | — | | — | | — | | (195) | | (131) | | (82) | | — | | — | | — | | (149) | | (101) | | (54) | |
| Total Aluminium Segment | | 14,109 | | 12,695 | | 9,314 | | 3,672 | | 4,382 | | 2,152 | | 1,400 | | 1,289 | | 1,191 | | 1,472 | | 2,468 | | 471 | |
| | | | | | | | | | | | | |
| Copper | | | | | | | | | | | | | |
| Kennecott | 100.0 | | 1,923 | | 2,528 | | 1,529 | | 857 | | 1,142 | | 588 | | 624 | | 538 | | 472 | | (9) | | 513 | | 149 | |
| Escondida | 30.0 | | 2,628 | | 2,935 | | 2,296 | | 1,641 | | 2,013 | | 1,462 | | 330 | | 348 | | 428 | | 798 | | 1,003 | | 650 | |
| Oyu Tolgoi and Turquoise Hill | (d) | 1,424 | | 1,971 | | 1,078 | | 449 | | 1,213 | | 390 | | 194 | | 213 | | 189 | | 130 | | 325 | | 160 | |
| | | | | | | | | | | | | |
| Product group operations | | 5,975 | | 7,434 | | 4,903 | | 2,947 | | 4,368 | | 2,440 | | 1,148 | | 1,099 | | 1,089 | | 919 | | 1,841 | | 959 | |
| Simandou iron ore project | (e) | — | | — | | — | | (189) | | (58) | | (14) | | — | | — | | — | | (145) | | (43) | | (6) | |
| Evaluation projects/other | | 724 | | 393 | | 66 | | (382) | | (341) | | (342) | | 5 | | 4 | | 4 | | (253) | | (219) | | (199) | |
| Total Copper Segment | | 6,699 | | 7,827 | | 4,969 | | 2,376 | | 3,969 | | 2,084 | | 1,153 | | 1,103 | | 1,093 | | 521 | | 1,579 | | 754 | |
| | | | | | | | | | | | | |
| Minerals | | | | | | | | | | | | | |
| | | | | | | | | | | | | |
| Iron Ore Company of Canada | 58.7 | | 2,818 | | 3,526 | | 2,444 | | 1,381 | | 2,026 | | 1,130 | | 207 | | 197 | | 170 | | 475 | | 734 | | 383 | |
| Rio Tinto Iron & Titanium | (f) | 2,366 | | 1,791 | | 1,651 | | 799 | | 470 | | 476 | | 224 | | 213 | | 173 | | 369 | | 176 | | 216 | |
| Rio Tinto Borates | 100.0 | | 742 | | 592 | | 564 | | 155 | | 89 | | 126 | | 54 | | 51 | | 49 | | 80 | | 32 | | 65 | |
| Diamonds | (g) | 816 | | 501 | | 459 | | 330 | | 180 | | 83 | | 45 | | 12 | | 60 | | 151 | | 99 | | 9 | |
| Product group operations | | 6,742 | | 6,410 | | 5,118 | | 2,665 | | 2,765 | | 1,815 | | 530 | | 473 | | 452 | | 1,075 | | 1,041 | | 673 | |
| Evaluation projects/other | | 12 | | 71 | | 52 | | (246) | | (162) | | (105) | | 1 | | 1 | | — | | (226) | | (153) | | (93) | |
| Total Minerals Segment | | 6,754 | | 6,481 | | 5,170 | | 2,419 | | 2,603 | | 1,710 | | 531 | | 474 | | 452 | | 849 | | 888 | | 580 | |
| | | | | | | | | | | | | |
| Reportable segments total | | 58,468 | | 66,585 | | 46,961 | | 27,079 | | 38,546 | | 24,783 | | 5,114 | | 4,889 | | 4,574 | | 14,024 | | 22,258 | | 13,203 | |
| Other operations | (h) | 192 | | 251 | | 321 | | (16) | | (28) | | 24 | | 272 | | 199 | | 199 | | (340) | | (84) | | (48) | |
| | | | | | | | | | | | | |
| Inter-segment transactions | | (256) | | (268) | | (264) | | 24 | | 42 | | (94) | | | | | 26 | | 19 | | (32) | |
| | | | | | | | | | | | | |
| | | | | | | | | | | | | |
| Central pension costs, share-based payments, insurance and derivatives | | | | | 377 | | 110 | | 117 | | | | | 374 | | 133 | | 118 | |
| | | | | | | | | | | | | |
| | | | | | | | | | | | | |
| | | | | | | | | | | | | |
| | | | | | | | | | | | | |
| | | | | | | | | | | | | |
| Restructuring, project and one-off costs | | | | | (173) | | (80) | | (133) | | | | | (87) | | (51) | | (108) | |
| Central costs | | | | | (766) | | (613) | | (545) | | 94 | | 106 | | 82 | | (651) | | (585) | | (455) | |
| Central exploration and evaluation | | | | | (253) | | (257) | | (250) | | | | | (209) | | (215) | | (216) | |
| Net interest | | | | | | | | | | | 138 | | (95) | | (14) | |
| Underlying EBITDA/earnings | | | | | 26,272 | | 37,720 | | 23,902 | | | | | 13,275 | | 21,380 | | 12,448 | |
| Items excluded from underlying EBITDA/earnings | | | | | 269 | | (811) | | (395) | | | | | (855) | | (286) | | (2,679) | |
| | | | | | | | | | | | | |
| Reconciliation to Group income statement | | | | | | | | | | | | | |
| | | | | | | | | | | | | |
| Share of equity accounted unit sales and intra-subsidiary/equity accounted unit sales | | (2,850) | | (3,073) | | (2,407) | | | | | | | | | | |
| Impairment charges net of reversals | | | | | (52) | | (269) | | (1,272) | | | | | | | |
| | | | | | | | | | | | | |
| Depreciation and amortisation in subsidiaries excluding capitalised depreciation | | | | | (4,871) | | (4,525) | | (4,074) | | | | | | | |
| Depreciation and amortisation in equity accounted units | | | | | (470) | | (497) | | (576) | | (470) | | (497) | | (576) | | | | |
| Taxation and finance items in equity accounted units | | | | | (640) | | (759) | | (443) | | | | | | | |
| Finance items | | | | | (1,846) | | (26) | | (1,751) | | | | | | | |
| Consolidated sales revenue/profit before taxation/depreciation and amortisation/net earnings | | 55,554 | | 63,495 | | 44,611 | | 18,662 | | 30,833 | | 15,391 | | 5,010 | | 4,697 | | 4,279 | | 12,420 | | 21,094 | | 9,769 | |
270 Annual Report on Form 20-F 2022 | riotinto.com
| | | | | | | | | | | | | | | | | | | | | | | | | | | | | | | | | | | |
| | Capital expenditure(i) for the year ended 31 December | | Operating assets(j) as at 31 December | Employees for the year
ended 31 December |
| | | | | | | | | | | | | |
| Rio Tinto
interest
% | 2022 US$m | Adjusted
2021
US$m | Adjusted
2020
US$m | | | | 2022 US$m | 2021 US$m | 2020 US$m | 2022
| 2021
| 2020
|
| Iron Ore | | | | | | | | | | | | | |
| Pilbara | (b) | 2,906 | | 3,928 | | 2,919 | | | | | 17,510 | | 16,850 | | 16,253 | | 14,319 | | 12,810 | | 11,522 | |
| Dampier Salt | 68.4 | | 34 | | 19 | | 22 | | | | | 153 | | 159 | | 163 | | 436 | | 388 | | 351 | |
| Evaluation projects/other | (c) | — | | — | | — | | | | | 835 | | 1,283 | | 338 | | 20 | | 16 | | 10 | |
| Intra-segment | (c) | — | | — | | — | | | | | (220) | | (255) | | (104) | | — | | — | | — | |
| Total Iron Ore Segment | | 2,940 | | 3,947 | | 2,941 | | | | | 18,278 | | 18,037 | | 16,650 | | 14,775 | | 13,214 | | 11,883 | |
| | | | | | | | | | | | | |
| Aluminium | | | | | | | | | | | | | |
| Bauxite | | 161 | | 155 | | 104 | | | | | 2,395 | | 2,542 | | 2,593 | | 2,966 | | 2,972 | | 2,853 | |
| Alumina | | 356 | | 362 | | 228 | | | | | 2,372 | | 2,258 | | 2,294 | | 2,626 | | 2,463 | | 2,383 | |
| | | | | | | | | | | | | |
| | | | | | | | | | | | | |
| Primary Metal | | 752 | | 690 | | 597 | | | | | 9,343 | | 9,734 | | 9,361 | | 6,693 | | 6,280 | | 6,282 | |
| Pacific Aluminium | | 108 | | 93 | | 82 | | | | | 155 | | 228 | | 455 | | 2,480 | | 2,450 | | 2,469 | |
| Intra-segment and other | | — | | — | | (2) | | | | | 629 | | 839 | | 662 | | 234 | | 185 | | 141 | |
| | | | | | | | | | | | | |
| | | | | | | | | | | | | |
| | | | | | | | | | | | | |
| | | | | | | | | | | | | |
| Total Aluminium Segment | | 1,377 | | 1,300 | | 1,009 | | | | | 14,894 | | 15,601 | | 15,365 | | 14,999 | | 14,350 | | 14,128 | |
| | | | | | | | | | | | | |
| Copper | | | | | | | | | | | | | |
| Kennecott | 100.0 | | 563 | | 411 | | 618 | | | | | 2,006 | | 2,404 | | 2,317 | | 2,176 | | 2,051 | | 2,171 | |
| Escondida | 30.0 | | — | | — | | — | | | | | 2,792 | | 2,515 | | 2,726 | | 1,205 | | 1,166 | | 1,124 | |
| | | | | | | | | | | | | |
| Oyu Tolgoi and Turquoise Hill | (d) | 1,056 | | 911 | | 1,038 | | | | | 13,477 | | 8,998 | | 8,111 | | 4,060 | | 3,508 | | 3,450 | |
| | | | | | | | | | | | | |
| Product group operations | | 1,619 | | 1,322 | | 1,656 | | | | | 18,275 | | 13,917 | | 13,154 | | 7,441 | | 6,725 | | 6,745 | |
| Simandou iron ore project | (e) | — | | — | | (2) | | | | | (22) | | 13 | | 16 | | 343 | | 101 | | 69 | |
| Evaluation projects/other | | 3 | | 6 | | 5 | | | | | 165 | | 210 | | 192 | | 245 | | 228 | | 159 | |
| Total Copper Segment | | 1,622 | | 1,328 | | 1,659 | | | | | 18,418 | | 14,140 | | 13,362 | | 8,029 | | 7,054 | | 6,973 | |
| | | | | | | | | | | | | |
| Minerals | | | | | | | | | | | | | |
| | | | | | | | | | | | | |
| Iron Ore Company of Canada | 58.7 | | 366 | | 377 | | 243 | | | | | 1,146 | | 1,077 | | 1,009 | | 3,075 | | 2,877 | | 2,716 | |
| Rio Tinto Iron & Titanium | (f) | 217 | | 184 | | 144 | | | | | 3,348 | | 3,369 | | 3,390 | | 4,273 | | 4,129 | | 4,151 | |
| Rio Tinto Borates | 100.0 | | 34 | | 43 | | 42 | | | | | 496 | | 487 | | 502 | | 1,009 | | 978 | | 966 | |
| Diamonds | (g) | 48 | | 25 | | 25 | | | | | (106) | | (19) | | (7) | | 853 | | 646 | | 885 | |
| Product group operations | | 665 | | 629 | | 454 | | | | | 4,884 | | 4,914 | | 4,894 | | 9,210 | | 8,630 | | 8,718 | |
| | | | | | | | | | | | | |
| Evaluation projects/other | | 14 | | 15 | | 1 | | | | | 874 | | 43 | | 33 | | 224 | | 136 | | 77 | |
| Total Minerals Segment | | 679 | | 644 | | 455 | | | | | 5,758 | | 4,957 | | 4,927 | | 9,434 | | 8,766 | | 8,795 | |
| | | | | | | | | | | | | |
| Reportable segments total | | 6,618 | | 7,219 | | 6,064 | | | | | 57,348 | | 52,735 | | 50,304 | | 47,237 | | 43,384 | | 41,779 | |
| Other operations | (h) | 53 | | (13) | | 1 | | | | | (1,883) | | (1,533) | | (550) | | 630 | | 297 | | 488 | |
| Inter-segment transactions | | | | | | | | 12 | | (12) | | 129 | | | | |
| | | | | | | | | | | | | |
| | | | | | | | | | | | | |
| | | | | | | | | | | | | |
| | | | | | | | | | | | | |
| Other items | | 79 | | 117 | | 79 | | | | | (1,114) | | (1,334) | | (2,165) | | 5,859 | | 5,664 | | 5,207 | |
| | | | | | | | | | | | | |
| Total | | 6,750 | | 7,323 | | 6,144 | | | | | 54,363 | | 49,856 | | 47,718 | | 53,726 | | 49,345 | | 47,474 | |
| Add back: Proceeds from disposal of property, plant and equipment | | — | | 61 | | 45 | | | | | | | | | | |
| Total purchases of property, plant & equipment and intangibles as per cash flow statement | | 6,750 | | 7,384 | | 6,189 | | | | | | | | | | |
| Add: Net (debt)/cash | | | | | | | | (4,188) | | 1,576 | | (664) | | | | |
| | | | | | | | | | | | | |
| Equity attributable to owners of Rio Tinto | | | | | | | | 50,175 | | 51,432 | | 47,054 | | | | |
| Total employees | | | | | | | | | | | 53,726 | | 49,345 | | 47,474 | |
| | | | | | | | | | | | | |
| | | | | | | | | | | | | |
| | | | | | | | | | | | | |
| | | | | | | | | | | | | |
| | | | | | | | | | | | | |
| | | | | | | | | | | | | |
| | | | | | | | | | | | | |
| | | | | | | | | | | | | |
| | | | | | | | | | | | | |
| | | | | | | | | | | | | |
Annual Report on Form 20-F 2022 | riotinto.com 271
Rio Tinto Financial Information by Business Unit continued
Notes to Financial Information by Business Unit
Business units are classified according to the Group’s management structure.
The disclosures in this note include certain alternative performance measures (APMs). For more information on the APMs used by the Group, including definitions and calculations, please refer to pages 273 to 278. (a)Segmental revenue, Underlying EBITDA and Capital expenditure are defined and calculated in note 1 from pages 161 to 163. Underlying Earnings is defined and calculated within the Alternative performance measures section on pages 274 and 275. (b)Pilbara represents the Group’s 100% holding in Hamersley, 50% holding in Hope Downs Joint Venture and 65% holding in Robe River Iron Associates. The Group’s net beneficial interest in Robe River Iron Associates is 53%, as 30% is held through a 60% owned subsidiary and 35% is held through a 100% owned subsidiary.
(c)Segmental revenue, Underlying EBITDA, Underlying earnings and Operating assets within Evaluation projects/other include activities relating to the shipment and blending of Pilbara and Iron Ore Company of Canada (IOC) iron ore inventories held at portside in China and sold to domestic customers. Transactions between Pilbara and our portside trading business are eliminated through the Iron Ore “intra-segment” line and transactions between IOC and the portside trading business are eliminated through “inter-segment transactions”.
(d)Until 16 December 2022, our interest in Oyu Tolgoi was held indirectly through our 50.8% investment in Turquoise Hill Resources Ltd (TRQ), where TRQ’s principal asset was its 66% investment in Oyu Tolgoi LLC, which owned the Oyu Tolgoi copper-gold mine. Following the purchase of TRQ we now directly hold a 66% investment in Oyu Tolgoi LLC.
(e)Simfer Jersey Limited, a company incorporated in Jersey, in which the Group has a 53% interest, has an 85% interest in Simfer S.A., the company that manages the Simandou project in Guinea. The Group therefore has a 45.05% indirect interest in Simfer S.A. These entities are consolidated as subsidiaries and together referred to as the Simandou iron ore project.
(f)Includes our interests in Rio Tinto Iron and Titanium Quebec Operations (100%), QIT Madagascar Minerals (QMM, 80%) and Richards Bay Minerals (attributable interest of 74%).
(g)Includes our interests in Argyle (100%) residual operations which relates to the sale of remaining inventory and Diavik. Until 18 November 2021 we recognised our 60% share of assets, revenue and expenses relating to the Diavik joint venture. Liabilities were recognised according to Diavik Diamond Mine Inc’s contractual obligations at 100%, with a corresponding 40% receivable or contingent asset representing the co-owner’s share where applicable. Post acquisition, we now consolidate (100%) of the Diavik Diamond Mine. From 1 June 2021, management responsibility for rehabilitation of the Argyle site moved from Minerals to Rio Tinto Closure (RTC), hence the Argyle closure is reported in Other operations effective from 1 January 2021. Refer to (h).
(h)Other operations include our 100% interest in the Gove alumina refinery (under rehabilitation), Rio Tinto Marine, and the remaining legacy liabilities of Rio Tinto Coal Australia. These include provisions for onerous contracts, in relation to rail infrastructure capacity, partly offset by financial assets and receivables relating to contingent royalties and disposal proceeds. From 16 June 2022, Commercial Treasury and related central costs are reported as part of ‘Other operations’ instead of ‘Other items’ in previous periods. We have not restated prior year balances as the impact was not significant. From 1 January 2021, Uranium moved from Minerals to Other operations and Argyle closure has been included in Other operations.
(i)Capital expenditure is the net cash outflow on purchases less sales of property, plant and equipment, capitalised evaluation costs and purchases less sales of other intangible assets as derived from the Group cash flow statement. The details provided include 100% of subsidiaries’ capital expenditure and Rio Tinto’s share of the capital expenditure of joint operations but exclude equity accounted units. We have adjusted the comparatives for this change in definition.
(j)Operating assets of the Group represents equity attributable to Rio Tinto adjusted for net (debt)/cash. Operating assets of subsidiaries, joint operations and the Group’s share relating to equity accounted units are made up of net assets adjusted for net (debt)/cash and post-retirement assets and liabilities, net of tax. Operating assets are stated after the deduction of non-controlling interests; these are calculated by reference to the net assets of the relevant companies (i.e. inclusive of such companies’ debt and amounts due to or from Rio Tinto Group companies).
272 Annual Report on Form 20-F 2022 | riotinto.com
Financial statements
Alternative Performance Measures
The Group presents certain alternative performance measures (APMs) which are reconciled to directly comparable IFRS financial measures below. These APMs are used by management to assess the performance of the business and provide additional information, which investors may find useful. APMs are presented in order to give further insight into the underlying business performance of the Group's operations.
APMs are not consistently defined and calculated by all companies, including those in the Group’s industry. Accordingly, these measures used by the Group may not be comparable with similarly titled measures and disclosures made by other companies. Consequently, these APMs should not be regarded as a substitute for the IFRS measures and should be considered supplementary to those measures.
The following tables present the Group's key financial measures not defined according to IFRS and a reconciliation between those APMs and their nearest respective IFRS measures.
APMs derived from the income statement
The following income statement measures are used by the Group to provide greater understanding of the underlying business performance of its operations and to enhance comparability of reporting periods. They indicate the underlying commercial and operating performance of our assets including revenue generation, productivity and cost management.
Segmental revenue
Segmental revenue includes consolidated sales revenue plus the equivalent sales revenue of equity accounted units in proportion to our equity interest (after adjusting for sales to/from subsidiaries). The reconciliation can be found in “Our financial performance” on page 161. Underlying EBITDA
Underlying EBITDA represents profit before tax, net finance items, depreciation and amortisation adjusted to exclude the EBITDA impact of items that do not reflect the underlying performance of our reportable segments. The reconciliation of profit after tax to underlying EBITDA can be found in “Our financial performance” on page 163. Underlying EBITDA margin
Underlying EBITDA margin is defined as Group underlying EBITDA divided by the aggregate of consolidated sales revenue and our share of equity account unit sales after eliminations. | | | | | | | | | | | |
| 2022
US$m | 2021
US$m | 2020
US$m |
| Underlying EBITDA | 26,272 | 37,720 | 23,902 |
| Consolidated sales revenue | 55,554 | 63,495 | 44,611 |
| | | |
| Share of equity accounted unit sales and inter-subsidiary/equity accounted unit sales eliminations | 2,850 | 3,073 | 2,407 |
| 58,404 | 66,568 | 47,018 |
| Underlying EBITDA margin | 45 | % | 57 | % | 51 | % |
Pilbara underlying FOB EBITDA margin
The Pilbara underlying free on board (FOB) EBITDA margin is defined as Pilbara underlying EBITDA divided by Pilbara segmental revenue, excluding freight revenue.
| | | | | | | | | | | |
| 2022 US$m | 2021 US$m | 2020 US$m |
| Pilbara | | | |
| Underlying EBITDA | 18,474 | 27,837 | 18,896 |
| Pilbara segmental revenue | 29,313 | 39,111 | 27,027 |
| Less: Freight revenue | (2,206) | (2,707) | (1,487) |
| Pilbara segmental revenue, excluding freight revenue | 27,107 | 36,404 | 25,540 |
| Pilbara underlying FOB EBITDA margin | 68 | % | 76 | % | 74 | % |
Annual Report on Form 20-F 2022 | riotinto.com 273
Alternative Performance Measures continued
Alternative Performance Measures
Underlying EBITDA margin from Aluminium integrated operations
Underlying EBITDA margin from integrated operations is defined as underlying EBITDA divided by segmental revenue. | | | | | | | | | | | |
| 2022 US$m | 2021 US$m | 2020 US$m |
| Aluminium | | | |
| Underlying EBITDA - integrated operations | 3,842 | 4,487 | 2,227 |
| Segmental revenue - integrated operations | 13,136 | 11,881 | 8,458 |
| Underlying EBITDA margin from integrated operations | 29 | % | 38 | % | 26 | % |
Underlying EBITDA margin (product group operations)
Underlying EBITDA margin (product group operations) is defined as underlying EBITDA divided by segmental revenue. | | | | | | | | | | | |
| | | |
| 2022
US$m | 2021
US$m | 2020
US$m |
| Copper | | | |
| Underlying EBITDA - product group operations | 2,947 | 4,368 | 2,440 |
| Segmental revenue - product group operations | 5,975 | 7,434 | 4,903 |
| Underlying EBITDA margin - product group operations | 49 | % | 59 | % | 50 | % |
| | | | | | | | | | | |
| | | |
| 2022
US$m | 2021
US$m | 2020
US$m |
| Minerals | | | |
| Underlying EBITDA - product group operations | 2,665 | 2,765 | 1,815 |
| Segmental revenue - product group operations | 6,742 | 6,410 | 5,118 |
| Underlying EBITDA margin - product group operations | 40 | % | 43 | % | 35 | % |
Underlying earnings
Underlying earnings represents net earnings attributable to the owners of Rio Tinto, adjusted to exclude items that do not reflect the underlying performance of the Group’s operations.
| | | | | | | | | | | | | | | | | | | | |
| Pre-tax
2022
US$m | Taxation
2022
US$m | Non-controlling
interests
2022
US$m | Net amount
2022
US$m | Net amount
2021
US$m | Net amount
2020
US$m |
| Net earnings | 18,662 | | (5,586) | | (656) | | 12,420 | | 21,094 | | 9,769 | |
| | | | | | |
| Total excluded from underlying earnings (see below on page 275) | (49) | | 902 | | 2 | | 855 | | 286 | | 2,679 | |
| Underlying earnings | 18,613 | | (4,684) | | (654) | | 13,275 | | 21,380 | | 12,448 | |
Exclusions from underlying earnings are those gains and losses that, individually or in aggregate with similar items, are of a nature and size to require exclusion in order to provide additional insight into underlying business performance.
The following items are excluded from net earnings in arriving at underlying earnings in each year irrespective of materiality:
–Net gains/(losses) on disposal of interests in subsidiaries.
–Impairment charges and reversals.
–Profit/(loss) after tax from discontinued operations.
–Exchange and derivative gains and losses. This exclusion includes exchange gains/(losses) on external net debt and intragroup balances, unrealised gains/(losses) on currency and interest rate derivatives not qualifying for hedge accounting, unrealised gains/(losses) on certain commodity derivatives not qualifying for hedge accounting, and unrealised gains/(losses) on embedded derivatives not qualifying for hedge accounting.
–Adjustments to closure provisions where the adjustment is associated to an impairment charge, for legacy sites where the disturbance or environmental contamination relates to the pre-acquisition period.
In addition, there is a final judgmental category which includes, where applicable, other credits and charges that, individually or in aggregate if of a similar type, are of a nature or size to require exclusion in order to provide additional insight into underlying business performance.
Exclusions from underlying earnings relating to equity accounted units are stated after tax and included in the column “Pre-tax”.
274 Annual Report on Form 20-F 2022 | riotinto.com
| | | | | | | | | | | | | | | | | | | | |
| Pre-tax
2022
US$m | Taxation 2022 US$m | Non-controlling interests 2022 US$m | Net amount 2022 US$m | Net amount 2021 US$m | Net amount 2020 US$m |
| Underlying earnings | 18,613 | | (4,684) | | (654) | | 13,275 | | 21,380 | | 12,448 | |
| | | | | | |
| Items excluded from underlying earnings | | | | | | |
| Impairment charges net of reversals (note 4) | (52) | | — | | — | | (52) | | (197) | | (1,115) | |
| Loss on disposal of interest in subsidiary (note 4) | (105) | | — | | — | | (105) | | — | | — | |
| Foreign exchange and derivative (losses)/gains: | | | | | | |
– Exchange gains/(losses) on external net debt, intragroup balances and derivatives(a) | 244 | | (25) | | (3) | | 216 | | 726 | | (1,125) | |
– Losses on currency and interest rate derivatives not qualifying for hedge accounting(b) | (435) | | 60 | | 2 | | (373) | | (127) | | (157) | |
–Gains/(losses) on embedded commodity derivatives not qualifying for hedge accounting(c) | 29 | | (8) | | (1) | | 20 | | (53) | | 18 | |
Gains recognised by Kitimat relating to LNG Canada’s project(d) | 116 | | (10) | | — | | 106 | | 336 | | — | |
Change in closure estimates (non-operating and fully impaired sites)(e) | (180) | | 2 | | — | | (178) | | (971) | | (300) | |
Gain on sale of the Cortez Royalty(f) | 432 | | (101) | | — | | 331 | | — | | — | |
Write-off of Federal deferred tax assets in the United States(g) | — | | (820) | | — | | (820) | | — | | — | |
| | | | | | |
| | | | | | |
| | | | | | |
| | | | | | |
| Total excluded from underlying earnings | 49 | | (902) | | (2) | | (855) | | (286) | | (2,679) | |
| Net earnings | 18,662 | | (5,586) | | (656) | | 12,420 | | 21,094 | | 9,769 | |
| | | | | | |
(a)Exchange gains on external net debt and intragroup balances included post-tax foreign exchange losses on net debt of US$262 million offset by post-tax gains of US$478 million on intragroup balances, primarily as a result of the Australian dollar weakening against the US dollar. In 2021, exchange gains on external net debt and intragroup balances included post-tax foreign exchange gains on intragroup balances of US$913 million partially offset by post-tax losses of US$187 million on external net debt, primarily as a result of a weakening Australian dollar against the US dollar during the year. In 2020, exchange losses on external net debt and intragroup balances included post-tax foreign exchange losses on intragroup balances of US$1,330 million partially offset by post-tax gains of US$205 million on external net debt, primarily as a result of the Australian dollar strengthening against the US dollar.
(b)Valuation changes on currency and interest rate derivatives, which are ineligible for hedge accounting, other than those embedded in commercial contracts, and the currency revaluation of embedded US dollar derivatives contained in contracts held by entities whose functional currency is not the US dollar.
(c)Valuation changes on derivatives, embedded in commercial contracts that are ineligible for hedge accounting but for which there will be an offsetting change in future Group earnings. Mark-to-market movements on commodity derivatives entered into with the commercial objective of achieving spot pricing for the underlying transaction at the date of settlement are included in underlying earnings.
(d)During the first half of 2022, LNG Canada elected to terminate their option to purchase additional land and facilities for expansion of their operations at Kitimat, Canada. The resulted gain has been excluded from underlying earnings consistent with prior years as it is part of a series of transactions that together were material. On 3 December 2021 we gained control over a new wharf at Kitimat, Canada that was built and paid for by LNG Canada. The gain on recognition was excluded from underlying earnings on the grounds of individual magnitude and consistency with the associated impairment charge, refer to note 4.
(e)In 2022 the charge relates to inflationary increases to the closure provision for non-operating and fully impaired sites in excess of the unwind of the discount. On 2 February 2022, Energy Resources of Australia released preliminary findings from its reforecast of the total undiscounted cost schedule for the Ranger rehabilitation project. Information available from this study resulted in the Group recording an increase to the closure provision of US$510 million at 31 December 2021. Other increases to closure estimates charged to the income statement in 2021 related to Diavik, Gove refinery, and a number of the Group's legacy sites where the environmental damage preceded ownership by Rio Tinto. The adjustments at Energy Resources Australia and Gove refinery were recognised in the income statement as these are non-operating sites, and excluded from underlying earnings due to the magnitude of the individual updates and materiality when aggregated. In 2020 we recognised an increase in the Diavik closure provision based on preliminary Pre-Feasibility Study findings. On completion of the study in 2021 a true-up was recorded in the income statement and excluded from underlying earnings in line with the treatment of the initial increase in 2020, which was excluded from underlying earnings as Diavik was fully impaired during the year. Other closure costs excluded in 2020 were the increase in the Gove refinery closure provision offset by a decrease in the Argyle mine closure provision on completion of Pre-Feasibility Studies at each site. The 2020 comparative also included the net earnings impact (US$138 million loss) in respect of increases to Closure provisions in legacy and non-operating sites following a reduction of the closure discount rate to 1.5%. When further funding is required, no allocation is made to the non-controlling interests of partially owned legacy sites until the funding is received.
(f)On 2 August 2022, we completed the sale of a gross production royalty which was retained following the disposal of the Cortez Complex in 2008. The gain recognised on sale of the royalty has been excluded from underlying earnings on the grounds of individual magnitude.
(g)In 2022 we wrote off US$0.8 billion of our deferred tax assets in the United States following the introduction of the Corporate Alternative Minimum Tax legislation, refer to note 10.
Basic underlying earnings per share
Basic underlying earnings per share is calculated as underlying earnings divided by the weighted average number of shares outstanding during the year.
| | | | | | | | | | | |
| 2022 (cents) | 2021 (cents) | 2020
(cents) |
| Basic earnings per ordinary share | 766.8 | 1,303.4 | 604.0 |
Items excluded from underlying earnings per share(a) | 52.8 | 17.7 | 165.6 |
| Basic underlying earnings per ordinary share | 819.6 | 1,321.1 | 769.6 |
(a)Calculation of items excluded from underlying earnings per share:
| | | | | | | | | | | |
|
2022 | 2021 | 2020 |
| | | |
Income excluded from underlying earnings (refer to pages 274 and 275) | 855 | 286 | 2,679 |
| Weighted average number of shares (millions) | 1,619.8 | 1,618.4 | 1,617.4 |
| Items excluded from underlying earnings per share (cents) | 52.8 | 17.7 | 165.6 |
We have provided basic underlying earnings per share as this allows the comparability of underlying financial performance adjusted to exclude items that do not reflect the underlying performance of the Group's operations.
Annual Report on Form 20-F 2022 | riotinto.com 275
Alternative Performance Measures continued
Alternative Performance Measures
Interest cover
Interest cover is a financial metric used when managing our risk. It represents the number of times finance income and finance costs (including amounts capitalised) are covered by profit before taxation before finance income, finance costs, share of profit after tax of equity accounted units and items excluded from underlying earnings, plus dividends from equity accounted units.
| | | | | | | | |
| 2022 US$m | 2021 US$m |
| Profit before taxation | 18,662 | 30,833 |
| Add back | | |
| | |
| Finance income | (179) | (64) |
| | |
| Finance costs | 335 | | 243 | |
| | |
| Share of profit after tax of equity accounted units | (777) | | (1,042) | |
| | |
| Items excluded from underlying earnings | (49) | | 508 | |
| Add: Dividends from equity accounted units | 879 | | 1,431 | |
| Calculated earnings | 18,871 | | 31,909 | |
| | |
| Finance income | 179 | | 64 | |
| Finance costs | (335) | | (243) | |
| | |
| Add: Amounts capitalised | (416) | | (358) | |
| Total finance income/costs before capitalisation | (572) | | (537) | |
| | |
| Interest cover | 33 | | 59 | |
Payout ratio
The payout ratio is used by us to guide the dividend policy we implemented in 2016, under which we have sought to return 40-60% of underlying earnings, on average through the cycle to shareholders as dividends. It is calculated as total equity dividends per share to owners of Rio Tinto declared in respect of the financial year divided by underlying earnings per share (as defined above). Dividends declared usually include an interim dividend paid in the year, and a final dividend paid after the end of the year. Any special dividends declared in respect of the financial year are also included.
| | | | | | | | |
| 2022
(cents) | 2021
(cents) |
| Interim dividend declared per share | 267.0 | 376.0 |
| Interim special dividend declared per share | — | 185.0 |
| Final dividend declared per share | 225.0 | 417.0 |
| Final special dividend declared per share | — | 62.0 |
| Total dividend declared per share for the year | 492.0 | 1,040.0 |
| | |
| Underlying earnings per share | 819.6 | 1,321.1 |
| | |
| Payout ratio | 60 | % | 79 | % |
276 Annual Report on Form 20-F 2022 | riotinto.com
APMs derived from cash flow statement
Capital expenditure
Capital expenditure includes the net sustaining and development expenditure on property, plant and equipment, and on intangible assets. This is equivalent to “Purchases of property, plant and equipment and intangible assets” in the cash flow statement less “Sales of property, plant and equipment and intangible assets”.
This measure is used to support management's objective of effective and efficient capital allocation as we need to invest in existing assets in order to maintain and improve productive capacity, and in new assets to grow the business.
Rio Tinto share of capital investment
Rio Tinto’s share of capital investment represents the Group’s economic investment in capital projects. It has been newly introduced during the year to better represent the Group’s share of funding for capital projects which are jointly funded with other shareholders and which may differ from the consolidated basis included in the Capital expenditure APM. This better reflects the Group’s approach to capital allocation.
The measure is based upon the Capital expenditure APM, adjusted to deduct equity or shareholder loan financing provided to partially owned subsidiaries by non-controlling interests in respect of major capital projects in the period. Where funding which would otherwise be provided directly by shareholders is replaced with project financing, an adjustment is also made to deduct the share of project financing attributable to the non-controlling interest. This adjustment is not made in cases where Rio Tinto has unilaterally guaranteed this project financing. Lastly, funding contributed by the Group to Equity Accounted Units for its share of investment in their major capital projects is added to the measure. No adjustment is made to the Capital expenditure APM where capital expenditure is funded from the operating cash flows of the subsidiary or Equity Accounted Unit.
In the current and prior years the Capital expenditure APM and Rio Tinto share of capital investment are identical.
Free cash flow
Free cash flow is defined as net cash generated from operating activities minus purchases of property, plant and equipment and intangibles and payments of lease principal, plus proceeds from the sale of property, plant and equipment and intangible assets.
This measures the net cash returned by the business after the expenditure of sustaining and development capital. This cash can be used for shareholder returns, reducing debt and other investing/financing activities.
| | | | | | | | | | | |
| 2022 US$m | 2021 US$m | 2020 US$m |
| Net cash generated from operating activities | 16,134 | | 25,345 | | 15,875 | |
| Less: Purchase of property, plant and equipment and intangible assets | (6,750) | | (7,384) | | (6,189) | |
| Less: Lease principal payments | (374) | | (358) | | (324) | |
| Add: Sales of property, plant and equipment and intangible assets | — | | 61 | | 45 | |
| Free cash flow | 9,010 | | 17,664 | | 9,407 | |
Annual Report on Form 20-F 2022 | riotinto.com 277
Alternative Performance Measures continued
Alternative Performance Measures
APMs derived from the balance sheet
Net (debt)/cash
Net (debt)/cash is total borrowings plus lease liabilities less cash and cash equivalents and other liquid investments, adjusted for derivatives related to net debt.
Net (debt)/cash measures how we are managing our balance sheet and capital structure. Refer to note 19 on page 191 for the reconciliation. Net gearing ratio
Net gearing ratio is defined as net (debt)/cash divided by the sum of net debt and total equity at the end of each year. It demonstrates the degree to which the Group's operations are funded by debt versus equity. | | | | | | | | |
| 2022
US$m | 2021
US$m |
| | |
| Net (debt)/cash | (4,188) | 1,576 |
| | |
| Net (debt)/cash | (4,188) | 1,576 |
| | |
| Total equity | (52,274) | (56,590) |
| Net (debt)/cash plus total equity | (56,462) | (55,014) |
| Net gearing ratio | 7 | % | (3 | %) |
Underlying return on capital employed
Underlying return on capital employed (“ROCE”) is defined as underlying earnings excluding net interest divided by average capital employed (operating assets).
Underlying ROCE measures how efficiently we generate profits from investment in our portfolio of assets.
| | | | | | | | |
| 2022 US$m | 2021 US$m |
| Profit after tax attributable to owners of Rio Tinto (net earnings) | 12,420 | 21,094 |
| | |
Items added back to derive underlying earnings (refer to pages 274 and 275) | 855 | 286 |
| Underlying earnings | 13,275 | 21,380 |
| Add/(deduct): | | |
| | |
| | |
| Finance income per the income statement | (179) | (64) |
| | |
| Finance costs per the income statement | 335 | 243 |
| Tax on finance cost | (238) | (52) |
| Non-controlling interest share of net finance costs | (98) | (64) |
| Net interest cost in equity accounted units (Rio Tinto share) | 42 | 32 |
| Net interest | (138) | 95 |
| Adjusted underlying earnings | 13,137 | 21,475 |
| | |
| Equity attributable to owners of Rio Tinto - beginning of the year | 51,432 | 47,054 |
| | |
| Net (cash)/debt - beginning of the year | (1,576) | 664 |
| Operating assets - beginning of the year | 49,856 | 47,718 |
| Equity attributable to owners of Rio Tinto - end of the year | 50,175 | 51,432 |
| | |
| Net debt/(cash) - end of the year | 4,188 | (1,576) |
| Operating assets - end of the year | 54,363 | 49,856 |
| Average operating assets | 52,110 | 48,787 |
| Underlying return on capital employed | 25 | % | 44 | % |
278 Annual Report on Form 20-F 2022 | riotinto.com
Page 279 have been intentionally omitted.
Annual Report on Form 20-F 2022 | riotinto.com 279
Annual Report on Form 20-F 2022 | riotinto.com280 Production, Mineral Reserves, Mineral Resources and Operations Metals and minerals production 281 Mineral Resources and Mineral Reserves 283 Competent Persons 307 Mines and production facilities 308 Employees at Dampier Port. The Pilbara, Western Australia.
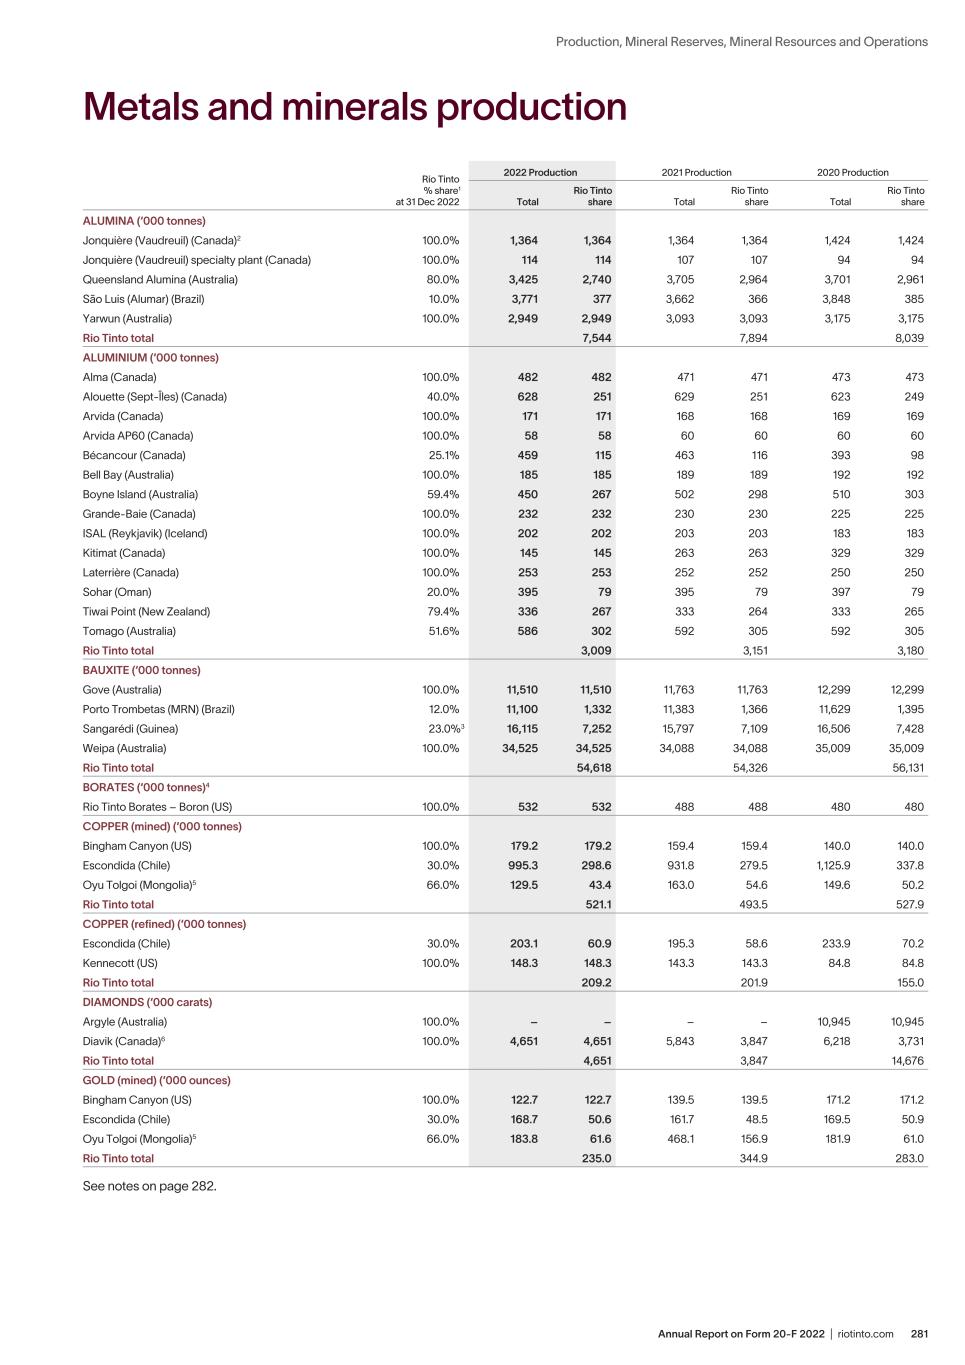
281Annual Report on Form 20-F 2022 | riotinto.com Production, Mineral Reserves, Mineral Resources and Operations Metals and minerals production Rio Tinto % share1 at 31 Dec 2022 2022 Production 2021 Production 2020 Production Total Rio Tinto share Total Rio Tinto share Total Rio Tinto share ALUMINA (‘000 tonnes) Jonquière (Vaudreuil) (Canada)2 100.0% 1,364 1,364 1,364 1,364 1,424 1,424 Jonquière (Vaudreuil) specialty plant (Canada) 100.0% 114 114 107 107 94 94 Queensland Alumina (Australia) 80.0% 3,425 2,740 3,705 2,964 3,701 2,961 São Luis (Alumar) (Brazil) 10.0% 3,771 377 3,662 366 3,848 385 Yarwun (Australia) 100.0% 2,949 2,949 3,093 3,093 3,175 3,175 Rio Tinto total 7,544 7,894 8,039 ALUMINIUM (‘000 tonnes) Alma (Canada) 100.0% 482 482 471 471 473 473 Alouette (Sept-Îles) (Canada) 40.0% 628 251 629 251 623 249 Arvida (Canada) 100.0% 171 171 168 168 169 169 Arvida AP60 (Canada) 100.0% 58 58 60 60 60 60 Bécancour (Canada) 25.1% 459 115 463 116 393 98 Bell Bay (Australia) 100.0% 185 185 189 189 192 192 Boyne Island (Australia) 59.4% 450 267 502 298 510 303 Grande-Baie (Canada) 100.0% 232 232 230 230 225 225 ISAL (Reykjavik) (Iceland) 100.0% 202 202 203 203 183 183 Kitimat (Canada) 100.0% 145 145 263 263 329 329 Laterrière (Canada) 100.0% 253 253 252 252 250 250 Sohar (Oman) 20.0% 395 79 395 79 397 79 Tiwai Point (New Zealand) 79.4% 336 267 333 264 333 265 Tomago (Australia) 51.6% 586 302 592 305 592 305 Rio Tinto total 3,009 3,151 3,180 BAUXITE (‘000 tonnes) Gove (Australia) 100.0% 11,510 11,510 11,763 11,763 12,299 12,299 Porto Trombetas (MRN) (Brazil) 12.0% 11,100 1,332 11,383 1,366 11,629 1,395 Sangarédi (Guinea) 23.0%3 16,115 7,252 15,797 7,109 16,506 7,428 Weipa (Australia) 100.0% 34,525 34,525 34,088 34,088 35,009 35,009 Rio Tinto total 54,618 54,326 56,131 BORATES (‘000 tonnes)4 Rio Tinto Borates – Boron (US) 100.0% 532 532 488 488 480 480 COPPER (mined) (‘000 tonnes) Bingham Canyon (US) 100.0% 179.2 179.2 159.4 159.4 140.0 140.0 Escondida (Chile) 30.0% 995.3 298.6 931.8 279.5 1,125.9 337.8 Oyu Tolgoi (Mongolia)5 66.0% 129.5 43.4 163.0 54.6 149.6 50.2 Rio Tinto total 521.1 493.5 527.9 COPPER (refined) (‘000 tonnes) Escondida (Chile) 30.0% 203.1 60.9 195.3 58.6 233.9 70.2 Kennecott (US) 100.0% 148.3 148.3 143.3 143.3 84.8 84.8 Rio Tinto total 209.2 201.9 155.0 DIAMONDS (‘000 carats) Argyle (Australia) 100.0% – – – – 10,945 10,945 Diavik (Canada)6 100.0% 4,651 4,651 5,843 3,847 6,218 3,731 Rio Tinto total 4,651 3,847 14,676 GOLD (mined) (‘000 ounces) Bingham Canyon (US) 100.0% 122.7 122.7 139.5 139.5 171.2 171.2 Escondida (Chile) 30.0% 168.7 50.6 161.7 48.5 169.5 50.9 Oyu Tolgoi (Mongolia)5 66.0% 183.8 61.6 468.1 156.9 181.9 61.0 Rio Tinto total 235.0 344.9 283.0 See notes on page 282.
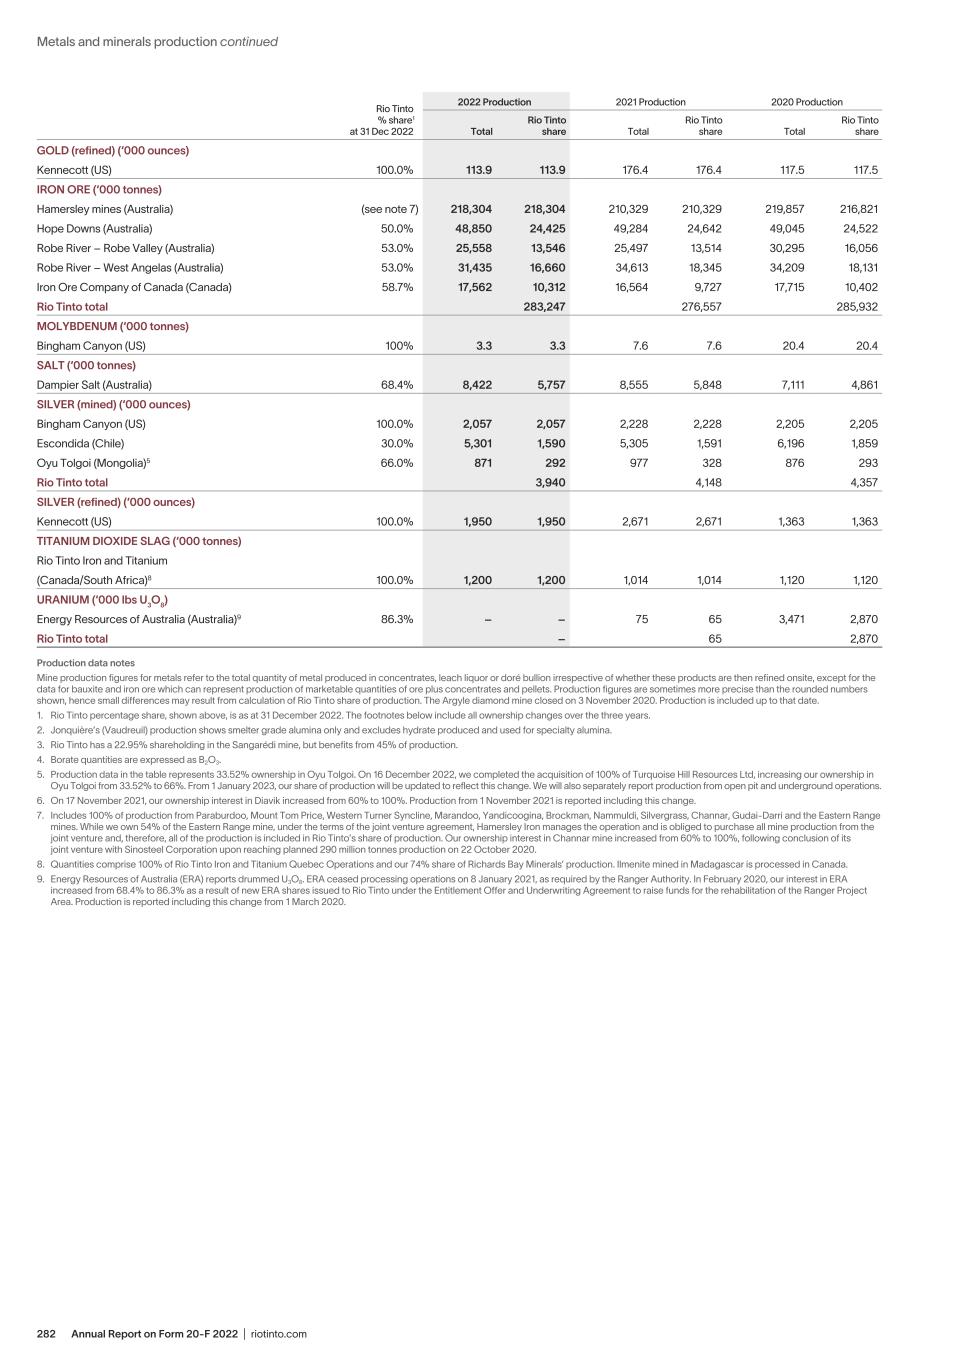
Annual Report on Form 20-F 2022 | riotinto.com282 Metals and minerals production continued Rio Tinto % share1 at 31 Dec 2022 2022 Production 2021 Production 2020 Production Total Rio Tinto share Total Rio Tinto share Total Rio Tinto share GOLD (refined) (‘000 ounces) Kennecott (US) 100.0% 113.9 113.9 176.4 176.4 117.5 117.5 IRON ORE (‘000 tonnes) Hamersley mines (Australia) (see note 7) 218,304 218,304 210,329 210,329 219,857 216,821 Hope Downs (Australia) 50.0% 48,850 24,425 49,284 24,642 49,045 24,522 Robe River – Robe Valley (Australia) 53.0% 25,558 13,546 25,497 13,514 30,295 16,056 Robe River – West Angelas (Australia) 53.0% 31,435 16,660 34,613 18,345 34,209 18,131 Iron Ore Company of Canada (Canada) 58.7% 17,562 10,312 16,564 9,727 17,715 10,402 Rio Tinto total 283,247 276,557 285,932 MOLYBDENUM (‘000 tonnes) Bingham Canyon (US) 100% 3.3 3.3 7.6 7.6 20.4 20.4 SALT (‘000 tonnes) Dampier Salt (Australia) 68.4% 8,422 5,757 8,555 5,848 7,111 4,861 SILVER (mined) (‘000 ounces) Bingham Canyon (US) 100.0% 2,057 2,057 2,228 2,228 2,205 2,205 Escondida (Chile) 30.0% 5,301 1,590 5,305 1,591 6,196 1,859 Oyu Tolgoi (Mongolia)5 66.0% 871 292 977 328 876 293 Rio Tinto total 3,940 4,148 4,357 SILVER (refined) (‘000 ounces) Kennecott (US) 100.0% 1,950 1,950 2,671 2,671 1,363 1,363 TITANIUM DIOXIDE SLAG (‘000 tonnes) Rio Tinto Iron and Titanium (Canada/South Africa)8 100.0% 1,200 1,200 1,014 1,014 1,120 1,120 URANIUM (‘000 lbs U3O8) Energy Resources of Australia (Australia)9 86.3% – – 75 65 3,471 2,870 Rio Tinto total – 65 2,870 Production data notes Mine production figures for metals refer to the total quantity of metal produced in concentrates, leach liquor or doré bullion irrespective of whether these products are then refined onsite, except for the data for bauxite and iron ore which can represent production of marketable quantities of ore plus concentrates and pellets. Production figures are sometimes more precise than the rounded numbers shown, hence small differences may result from calculation of Rio Tinto share of production. The Argyle diamond mine closed on 3 November 2020. Production is included up to that date. 1. Rio Tinto percentage share, shown above, is as at 31 December 2022. The footnotes below include all ownership changes over the three years. 2. Jonquière’s (Vaudreuil) production shows smelter grade alumina only and excludes hydrate produced and used for specialty alumina. 3. Rio Tinto has a 22.95% shareholding in the Sangarédi mine, but benefits from 45% of production. 4. Borate quantities are expressed as B2O3. 5. Production data in the table represents 33.52% ownership in Oyu Tolgoi. On 16 December 2022, we completed the acquisition of 100% of Turquoise Hill Resources Ltd, increasing our ownership in Oyu Tolgoi from 33.52% to 66%. From 1 January 2023, our share of production will be updated to reflect this change. We will also separately report production from open pit and underground operations. 6. On 17 November 2021, our ownership interest in Diavik increased from 60% to 100%. Production from 1 November 2021 is reported including this change. 7. Includes 100% of production from Paraburdoo, Mount Tom Price, Western Turner Syncline, Marandoo, Yandicoogina, Brockman, Nammuldi, Silvergrass, Channar, Gudai-Darri and the Eastern Range mines. While we own 54% of the Eastern Range mine, under the terms of the joint venture agreement, Hamersley Iron manages the operation and is obliged to purchase all mine production from the joint venture and, therefore, all of the production is included in Rio Tinto’s share of production. Our ownership interest in Channar mine increased from 60% to 100%, following conclusion of its joint venture with Sinosteel Corporation upon reaching planned 290 million tonnes production on 22 October 2020. 8. Quantities comprise 100% of Rio Tinto Iron and Titanium Quebec Operations and our 74% share of Richards Bay Minerals’ production. Ilmenite mined in Madagascar is processed in Canada. 9. Energy Resources of Australia (ERA) reports drummed U3O8. ERA ceased processing operations on 8 January 2021, as required by the Ranger Authority. In February 2020, our interest in ERA increased from 68.4% to 86.3% as a result of new ERA shares issued to Rio Tinto under the Entitlement Offer and Underwriting Agreement to raise funds for the rehabilitation of the Ranger Project Area. Production is reported including this change from 1 March 2020.
283Annual Report on Form 20-F 2022 | riotinto.com Production, Mineral Reserves, Mineral Resources and Operations Mineral Resources and Mineral Reserves Mineral Resources and Mineral Reserves for Rio Tinto managed operations are reported in accordance with the Australasian Code for Reporting of Exploration Results, Mineral Resources and Ore Reserves, December 2012 (the JORC Code) as required by the Australian Securities Exchange (ASX). Rio Tinto also files this Form 20-F with the SEC and prepares the Form 20-F Mineral Resources and Mineral Reserves in accordance with subpart 1300 of Regulation S-K (Regulation S-K). Some variations may occur between the reporting in accordance with the JORC Code and Regulation S-K. A Mineral Resource is a concentration or occurrence of solid material of economic interest in or on the Earth’s crust in such form, grade (or quality), and quantity that there are reasonable prospects for eventual economic extraction. Estimates of such material are based largely on geological information with only preliminary consideration of mining, economic and other factors. While in the judgement of the Competent Person there are realistic expectations that all or part of the Mineral Resources will eventually become Proven or Probable Mineral Reserves, there is no guarantee that this will occur as the result depends on further technical and economic studies and prevailing economic conditions in the future. A Mineral Reserve (or Ore Reserve as defined by JORC) is the economically mineable part of a Measured and/or Indicated Mineral Resource. It includes diluting materials and allowances for losses, which may occur when the material is mined or extracted. It is defined by studies at Pre-Feasibility or Feasibility level as appropriate, with the application of Modifying Factors. Such studies demonstrate that, at the time of reporting, extraction can reasonably be justified. Rio Tinto’s Mineral Resources are reported as additional (exclusive) to the reported Mineral Reserves. For Mineral Resource and Mineral Reserve reporting, the JORC Code envisages the use of reasonable investment assumptions to test the economic viability of the Mineral Reserves and the reasonable prospects of eventual economic extraction for the Mineral Resources. To achieve this, Rio Tinto uses internally generated projected long-term commodity prices. Regulation S-K requires the use of a justifiable commodity price to test the economic viability of the Mineral Reserves and the reasonable prospects of economic extraction for the Mineral Resources, and prices used in calculating the estimates must be disclosed. As a result of the commercial sensitivity of Rio Tinto’s long-term commodity prices, Rio Tinto uses commercially available consensus pricing or historical pricing for SEC reporting. For this reason and others, some Mineral Resources and Mineral Reserves reported to the SEC in this Form 20-F may differ from those Mineral Resources and Mineral Reserves reported in the Annual Report. Mineral Resource and Mineral Reserve information in the tables below is based on information compiled by Competent Persons (as defined by the JORC Code), most of whom are full time employees of Rio Tinto or related companies. Each has had a minimum of five years’ relevant experience and is a member of a recognised professional body whose members are bound by a professional code of ethics. These bodies include the Australasian Institute of Mining and Metallurgy (the AusIMM, the Australian Institute of Geoscientists (AIG) and other recognised professional organisations (RPOs). Each Competent Person consents to the inclusion in this Form 20-F of information they have provided in the form and context in which it appears. Competent Persons responsible for the estimates are listed on page 307, by operation, along with their professional affiliation, employer, and accountability for Mineral Resources and/or Mineral Reserves. Mineral Resources and Mineral Reserves from externally managed operations, in which Rio Tinto holds a minority share, are reported as received from the managing entity and in accordance with the JORC code. Mineral Resources and Mineral Reserves from our managed operations are the responsibility of the managing directors of the business units and estimates are carried out by the Competent Persons. The Mineral Resource and Mineral Reserve figures in the following tables are as of 31 December 2022. Summary data for year end 2021 are shown for comparison. Metric units are used throughout. The figures used to calculate Rio Tinto’s Mineral Resources and Mineral Reserves are more precise than the rounded numbers shown in the tables, hence small differences might result if the calculations are repeated using the tabulated figures. JORC Table 1 reports for new or materially changed significant deposits are released to the market; they are also available at riotinto.com. JORC Table 1, SEC Technical Report Summaries and NI 43-101 technical reports generated by non-managed units or joint venture partners are referenced within the reporting footnotes with the location and initial reporting date identified. For SEC reporting purposes, the Pilbara Operations, Oyu Tolgoi and Escondida are considered material to the Group and hence require submission of a Technical Report Summary. The Technical Report Summaries for Escondida and Oyu Tolgoi have been filed as exhibit 96.2 and exhibit 96.3, respectively, to this Form 20-F and the Technical Report Summary for the Pilbara Operations was filed as exhibit 96.1 to the Form 20-F for the year ended 31 December 2021.
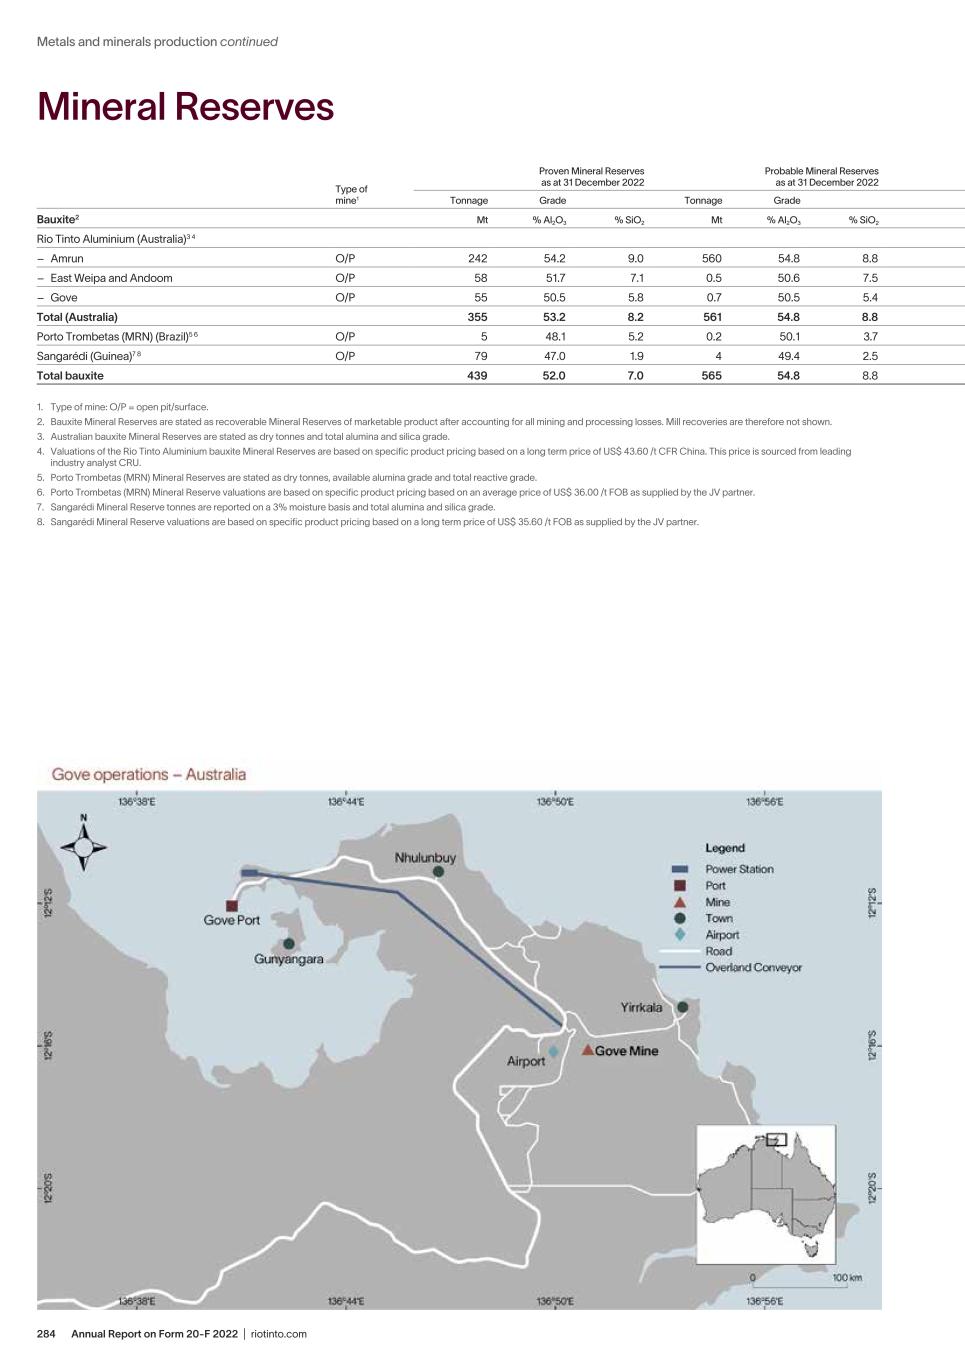
Annual Report on Form 20-F 2022 | riotinto.com284 Metals and minerals production continued 1. Type of mine: O/P = open pit/surface. 2. Bauxite Mineral Reserves are stated as recoverable Mineral Reserves of marketable product after accounting for all mining and processing losses. Mill recoveries are therefore not shown. 3. Australian bauxite Mineral Reserves are stated as dry tonnes and total alumina and silica grade. 4. Valuations of the Rio Tinto Aluminium bauxite Mineral Reserves are based on specific product pricing based on a long term price of US$ 43.60 /t CFR China. This price is sourced from leading industry analyst CRU. 5. Porto Trombetas (MRN) Mineral Reserves are stated as dry tonnes, available alumina grade and total reactive grade. 6. Porto Trombetas (MRN) Mineral Reserve valuations are based on specific product pricing based on an average price of US$ 36.00 /t FOB as supplied by the JV partner. 7. Sangarédi Mineral Reserve tonnes are reported on a 3% moisture basis and total alumina and silica grade. 8. Sangarédi Mineral Reserve valuations are based on specific product pricing based on a long term price of US$ 35.60 /t FOB as supplied by the JV partner. Mineral Reserves Type of mine1 Proven Mineral Reserves as at 31 December 2022 Probable Mineral Reserves as at 31 December 2022 Total Mineral Reserves as at 31 December 2022 Rio Tinto interest Rio Tinto share recoverable mineral Total Mineral Reserves as at 31 December 2021 Tonnage Grade Tonnage Grade Tonnage Grade Tonnage Grade Bauxite2 Mt % Al2O3 % SiO2 Mt % Al2O3 % SiO2 Mt % Al2O3 % SiO2 % Mt Mt % Al2O3 % SiO2 Rio Tinto Aluminium (Australia)3 4 – Amrun O/P 242 54.2 9.0 560 54.8 8.8 801 54.6 8.9 100.0 801 826 54.7 9.1 – East Weipa and Andoom O/P 58 51.7 7.1 0.5 50.6 7.5 59 51.7 7.1 100.0 59 78 51.7 7.4 – Gove O/P 55 50.5 5.8 0.7 50.5 5.4 56 50.5 5.8 100.0 56 64 50.6 5.8 Total (Australia) 355 53.2 8.2 561 54.8 8.8 916 54.2 8.6 916 968 54.2 8.7 Porto Trombetas (MRN) (Brazil)5 6 O/P 5 48.1 5.2 0.2 50.1 3.7 6 48.2 5.1 12.0 6 7 48.8 4.7 Sangarédi (Guinea)7 8 O/P 79 47.0 1.9 4 49.4 2.5 83 47.1 1.9 23.0 83 87 47.2 1.9 Total bauxite 439 52.0 7.0 565 54.8 8.8 1,005 53.6 8.0 1,005 1,061 53.6 8.2
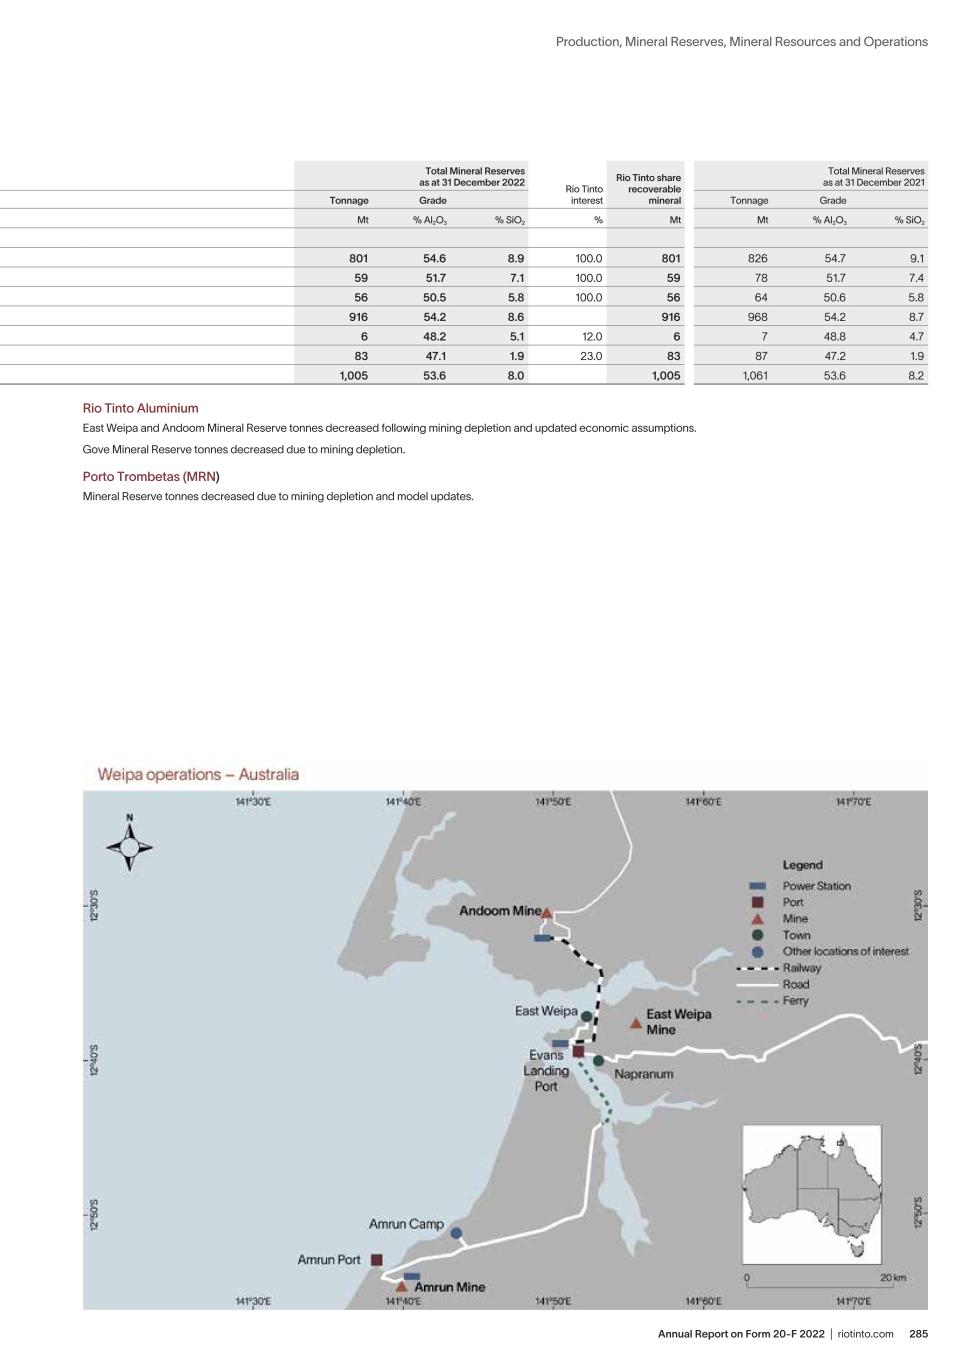
285Annual Report on Form 20-F 2022 | riotinto.com Production, Mineral Reserves, Mineral Resources and Operations Type of mine1 Proven Mineral Reserves as at 31 December 2022 Probable Mineral Reserves as at 31 December 2022 Total Mineral Reserves as at 31 December 2022 Rio Tinto interest Rio Tinto share recoverable mineral Total Mineral Reserves as at 31 December 2021 Tonnage Grade Tonnage Grade Tonnage Grade Tonnage Grade Bauxite2 Mt % Al2O3 % SiO2 Mt % Al2O3 % SiO2 Mt % Al2O3 % SiO2 % Mt Mt % Al2O3 % SiO2 Rio Tinto Aluminium (Australia)3 4 – Amrun O/P 242 54.2 9.0 560 54.8 8.8 801 54.6 8.9 100.0 801 826 54.7 9.1 – East Weipa and Andoom O/P 58 51.7 7.1 0.5 50.6 7.5 59 51.7 7.1 100.0 59 78 51.7 7.4 – Gove O/P 55 50.5 5.8 0.7 50.5 5.4 56 50.5 5.8 100.0 56 64 50.6 5.8 Total (Australia) 355 53.2 8.2 561 54.8 8.8 916 54.2 8.6 916 968 54.2 8.7 Porto Trombetas (MRN) (Brazil)5 6 O/P 5 48.1 5.2 0.2 50.1 3.7 6 48.2 5.1 12.0 6 7 48.8 4.7 Sangarédi (Guinea)7 8 O/P 79 47.0 1.9 4 49.4 2.5 83 47.1 1.9 23.0 83 87 47.2 1.9 Total bauxite 439 52.0 7.0 565 54.8 8.8 1,005 53.6 8.0 1,005 1,061 53.6 8.2 Rio Tinto Aluminium East Weipa and Andoom Mineral Reserve tonnes decreased following mining depletion and updated economic assumptions. Gove Mineral Reserve tonnes decreased due to mining depletion. Porto Trombetas (MRN) Mineral Reserve tonnes decreased due to mining depletion and model updates.
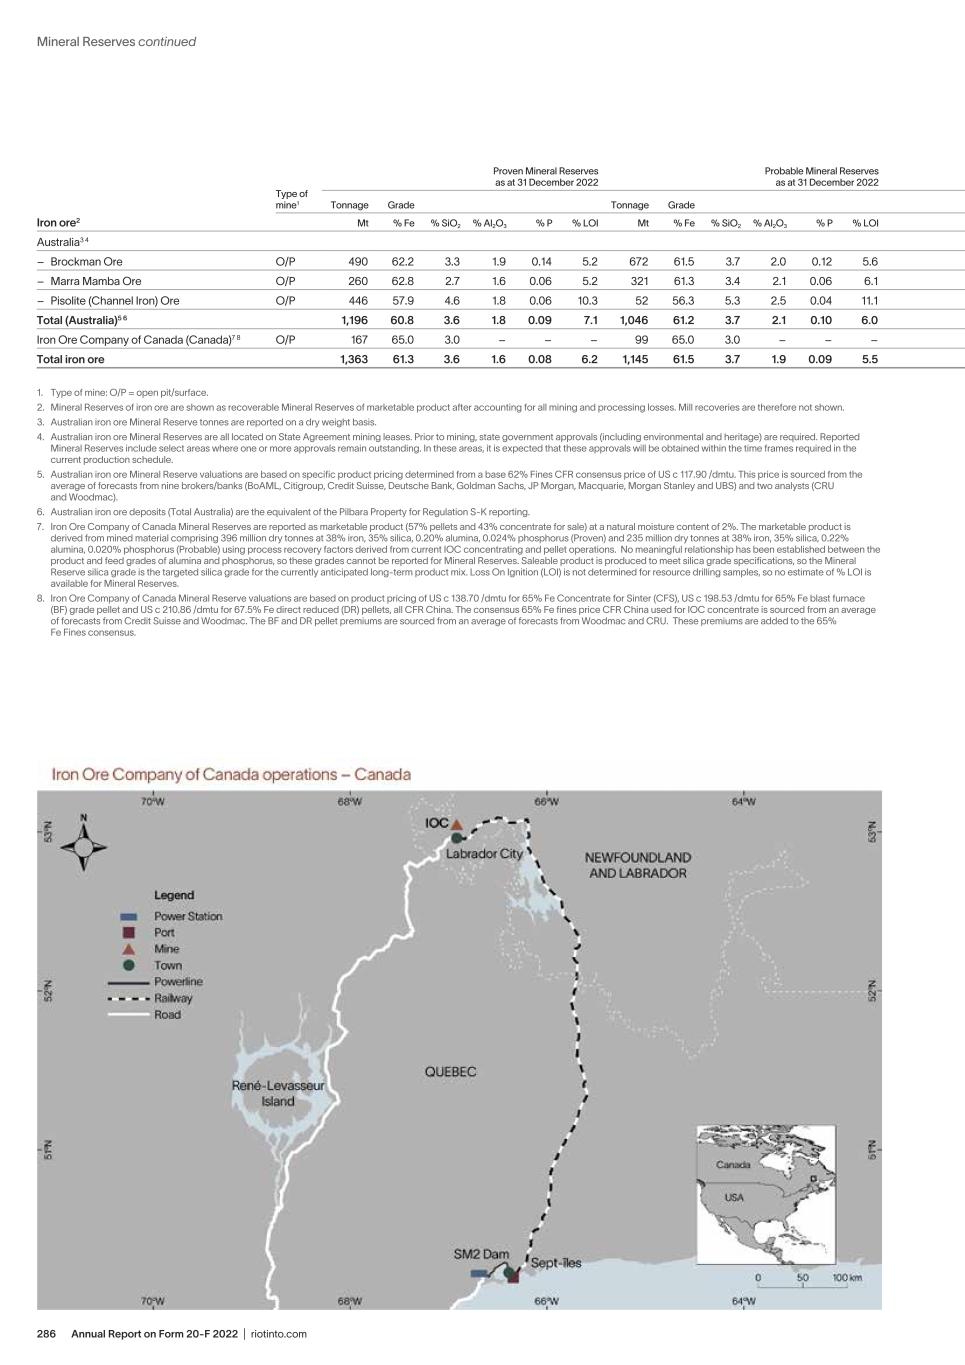
Annual Report on Form 20-F 2022 | riotinto.com286 Mineral Reserves continued Iron ore2 Type of mine1 Proven Mineral Reserves as at 31 December 2022 Probable Mineral Reserves as at 31 December 2022 Total Mineral Reserves as at 31 December 2022 Rio Tinto interest Rio Tinto share marketable product Total Mineral Reserves as at 31 December 2021 Tonnage Grade Tonnage Grade Tonnage Grade Tonnage Grade Mt % Fe % SiO2 % Al2O3 % P % LOI Mt % Fe % SiO2 % Al2O3 % P % LOI Mt % Fe % SiO2 % Al2O3 % P % LOI % Mt Mt % Fe % SiO2 % Al2O3 % P % LOI Australia3 4 – Brockman Ore O/P 490 62.2 3.3 1.9 0.14 5.2 672 61.5 3.7 2.0 0.12 5.6 1,163 61.8 3.5 2.0 0.13 5.5 87.4 1,163 1,296 62.0 3.5 1.9 0.13 5.3 – Marra Mamba Ore O/P 260 62.8 2.7 1.6 0.06 5.2 321 61.3 3.4 2.1 0.06 6.1 581 62.0 3.1 1.9 0.06 5.7 79.7 581 534 62.2 3.0 1.8 0.06 5.6 – Pisolite (Channel Iron) Ore O/P 446 57.9 4.6 1.8 0.06 10.3 52 56.3 5.3 2.5 0.04 11.1 498 57.8 4.7 1.9 0.05 10.4 80.6 498 553 57.8 4.7 1.8 0.05 10.4 Total (Australia)5 6 1,196 60.8 3.6 1.8 0.09 7.1 1,046 61.2 3.7 2.1 0.10 6.0 2,242 60.9 3.7 1.9 0.09 6.6 2,242 2,384 61.1 3.6 1.9 0.10 6.5 Iron Ore Company of Canada (Canada)7 8 O/P 167 65.0 3.0 – – – 99 65.0 3.0 – – – 266 65.0 3.0 – – – 58.7 266 284 65.0 3.2 – – – Total iron ore 1,363 61.3 3.6 1.6 0.08 6.2 1,145 61.5 3.7 1.9 0.09 5.5 2,508 61.4 3.6 1.7 0.08 5.9 2,508 2,667 61.5 3.6 1.7 0.09 5.8 1. Type of mine: O/P = open pit/surface. 2. Mineral Reserves of iron ore are shown as recoverable Mineral Reserves of marketable product after accounting for all mining and processing losses. Mill recoveries are therefore not shown. 3. Australian iron ore Mineral Reserve tonnes are reported on a dry weight basis. 4. Australian iron ore Mineral Reserves are all located on State Agreement mining leases. Prior to mining, state government approvals (including environmental and heritage) are required. Reported Mineral Reserves include select areas where one or more approvals remain outstanding. In these areas, it is expected that these approvals will be obtained within the time frames required in the current production schedule. 5. Australian iron ore Mineral Reserve valuations are based on specific product pricing determined from a base 62% Fines CFR consensus price of US c 117.90 /dmtu. This price is sourced from the average of forecasts from nine brokers/banks (BoAML, Citigroup, Credit Suisse, Deutsche Bank, Goldman Sachs, JP Morgan, Macquarie, Morgan Stanley and UBS) and two analysts (CRU and Woodmac). 6. Australian iron ore deposits (Total Australia) are the equivalent of the Pilbara Property for Regulation S-K reporting. 7. Iron Ore Company of Canada Mineral Reserves are reported as marketable product (57% pellets and 43% concentrate for sale) at a natural moisture content of 2%. The marketable product is derived from mined material comprising 396 million dry tonnes at 38% iron, 35% silica, 0.20% alumina, 0.024% phosphorus (Proven) and 235 million dry tonnes at 38% iron, 35% silica, 0.22% alumina, 0.020% phosphorus (Probable) using process recovery factors derived from current IOC concentrating and pellet operations. No meaningful relationship has been established between the product and feed grades of alumina and phosphorus, so these grades cannot be reported for Mineral Reserves. Saleable product is produced to meet silica grade specifications, so the Mineral Reserve silica grade is the targeted silica grade for the currently anticipated long-term product mix. Loss On Ignition (LOI) is not determined for resource drilling samples, so no estimate of % LOI is available for Mineral Reserves. 8. Iron Ore Company of Canada Mineral Reserve valuations are based on product pricing of US c 138.70 /dmtu for 65% Fe Concentrate for Sinter (CFS), US c 198.53 /dmtu for 65% Fe blast furnace (BF) grade pellet and US c 210.86 /dmtu for 67.5% Fe direct reduced (DR) pellets, all CFR China. The consensus 65% Fe fines price CFR China used for IOC concentrate is sourced from an average of forecasts from Credit Suisse and Woodmac. The BF and DR pellet premiums are sourced from an average of forecasts from Woodmac and CRU. These premiums are added to the 65% Fe Fines consensus.
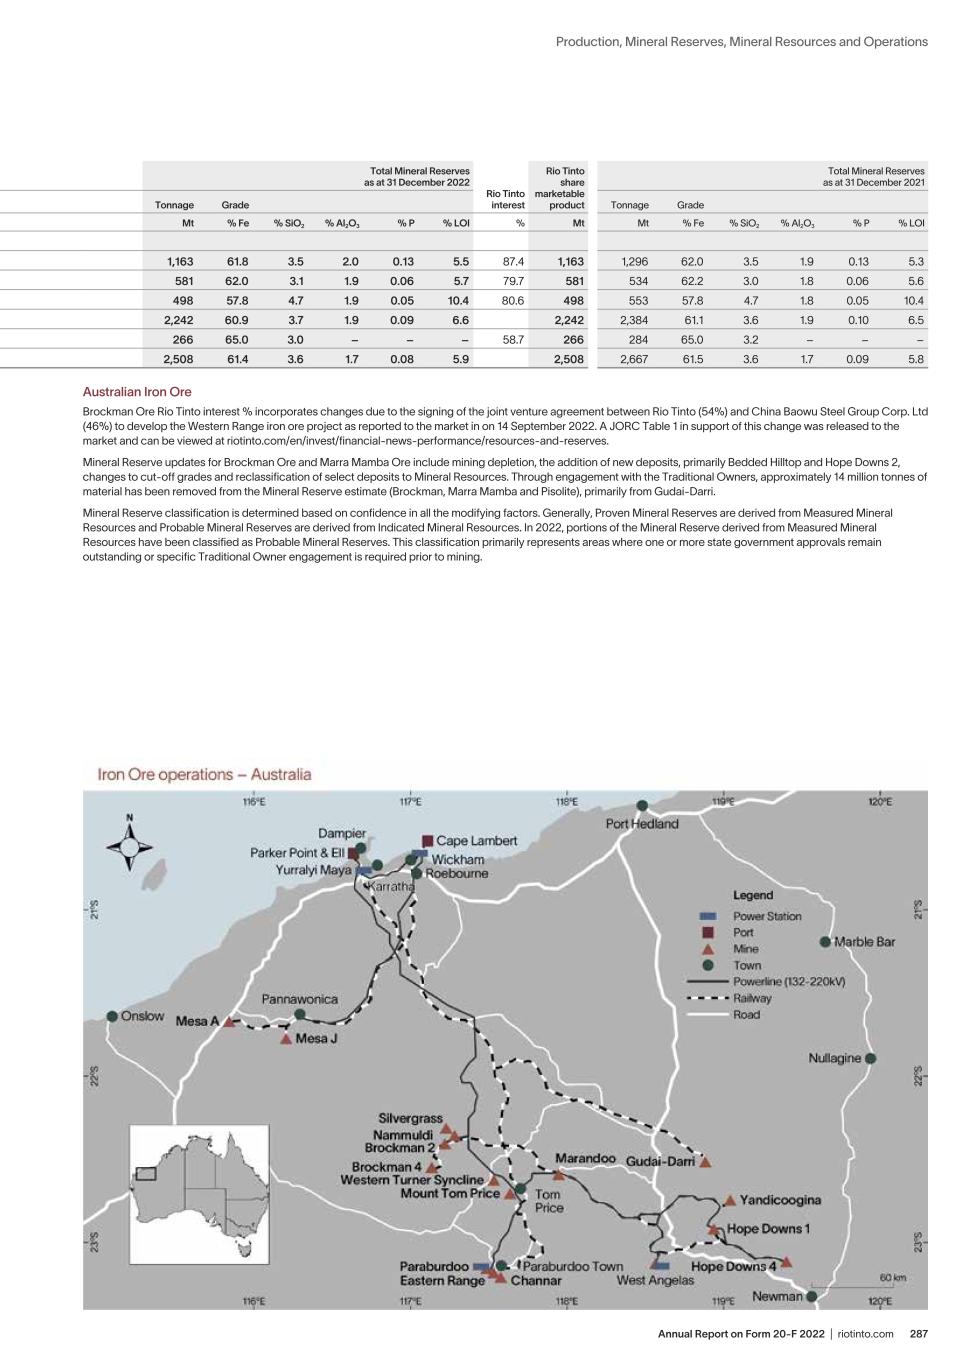
287Annual Report on Form 20-F 2022 | riotinto.com Production, Mineral Reserves, Mineral Resources and Operations Iron ore2 Type of mine1 Proven Mineral Reserves as at 31 December 2022 Probable Mineral Reserves as at 31 December 2022 Total Mineral Reserves as at 31 December 2022 Rio Tinto interest Rio Tinto share marketable product Total Mineral Reserves as at 31 December 2021 Tonnage Grade Tonnage Grade Tonnage Grade Tonnage Grade Mt % Fe % SiO2 % Al2O3 % P % LOI Mt % Fe % SiO2 % Al2O3 % P % LOI Mt % Fe % SiO2 % Al2O3 % P % LOI % Mt Mt % Fe % SiO2 % Al2O3 % P % LOI Australia3 4 – Brockman Ore O/P 490 62.2 3.3 1.9 0.14 5.2 672 61.5 3.7 2.0 0.12 5.6 1,163 61.8 3.5 2.0 0.13 5.5 87.4 1,163 1,296 62.0 3.5 1.9 0.13 5.3 – Marra Mamba Ore O/P 260 62.8 2.7 1.6 0.06 5.2 321 61.3 3.4 2.1 0.06 6.1 581 62.0 3.1 1.9 0.06 5.7 79.7 581 534 62.2 3.0 1.8 0.06 5.6 – Pisolite (Channel Iron) Ore O/P 446 57.9 4.6 1.8 0.06 10.3 52 56.3 5.3 2.5 0.04 11.1 498 57.8 4.7 1.9 0.05 10.4 80.6 498 553 57.8 4.7 1.8 0.05 10.4 Total (Australia)5 6 1,196 60.8 3.6 1.8 0.09 7.1 1,046 61.2 3.7 2.1 0.10 6.0 2,242 60.9 3.7 1.9 0.09 6.6 2,242 2,384 61.1 3.6 1.9 0.10 6.5 Iron Ore Company of Canada (Canada)7 8 O/P 167 65.0 3.0 – – – 99 65.0 3.0 – – – 266 65.0 3.0 – – – 58.7 266 284 65.0 3.2 – – – Total iron ore 1,363 61.3 3.6 1.6 0.08 6.2 1,145 61.5 3.7 1.9 0.09 5.5 2,508 61.4 3.6 1.7 0.08 5.9 2,508 2,667 61.5 3.6 1.7 0.09 5.8 Australian Iron Ore Brockman Ore Rio Tinto interest % incorporates changes due to the signing of the joint venture agreement between Rio Tinto (54%) and China Baowu Steel Group Corp. Ltd (46%) to develop the Western Range iron ore project as reported to the market in on 14 September 2022. A JORC Table 1 in support of this change was released to the market and can be viewed at riotinto.com/en/invest/financial-news-performance/resources-and-reserves. Mineral Reserve updates for Brockman Ore and Marra Mamba Ore include mining depletion, the addition of new deposits, primarily Bedded Hilltop and Hope Downs 2, changes to cut-off grades and reclassification of select deposits to Mineral Resources. Through engagement with the Traditional Owners, approximately 14 million tonnes of material has been removed from the Mineral Reserve estimate (Brockman, Marra Mamba and Pisolite), primarily from Gudai-Darri. Mineral Reserve classification is determined based on confidence in all the modifying factors. Generally, Proven Mineral Reserves are derived from Measured Mineral Resources and Probable Mineral Reserves are derived from Indicated Mineral Resources. In 2022, portions of the Mineral Reserve derived from Measured Mineral Resources have been classified as Probable Mineral Reserves. This classification primarily represents areas where one or more state government approvals remain outstanding or specific Traditional Owner engagement is required prior to mining.
Annual Report on Form 20-F 2022 | riotinto.com288 Mineral Reserves continued Type of mine1 Proven Mineral Reserves as at 31 December 2022 Probable Mineral Reserves as at 31 December 2022 Total Mineral Reserves as at 31 December 2022 Average mill recovery % Rio Tinto interest Rio Tinto share recoverable metal Total Mineral Reserves as at 31 December 2021 Tonnage Grade Tonnage Grade Tonnage Grade Tonnage Grade Copper2 Mt % Cu g/t Au g/t Ag % Mo Mt % Cu g/t Au g/t Ag % Mo Mt % Cu g/t Au g/t Ag % Mo Cu Au Ag Mo % Mt Cu Moz Au Moz Ag Mt Mo Mt % Cu g/t Au g/t Ag % Mo Bingham Canyon (US)3 – Bingham Open Pit4 O/P 484 0.40 0.18 2.10 0.037 395 0.35 0.17 1.82 0.029 880 0.38 0.18 1.97 0.033 87 69 72 59 100.0 2.890 3.406 40.386 0.172 541 0.44 0.17 2.22 0.029 – Underground Skarns U/G – – – – – 1.7 1.90 0.71 10.07 0.044 1.7 1.90 0.71 10.07 0.044 90 71 76 71 100.0 0.029 0.028 0.421 0.001 – – – – – Total (US) 484 0.40 0.18 2.10 0.037 397 0.36 0.17 1.86 0.029 881 0.38 0.18 1.99 0.033 2.920 3.434 40.807 0.172 541 0.44 0.17 2.22 0.029 Escondida (Chile)5 6 – oxide O/P 37 0.56 – – – 16 0.50 – – – 52 0.54 – – – 55 – – – 30.0 0.156 – – – – – – – – – sulphide O/P 793 0.70 – – – 489 0.56 – – – 1,280 0.65 – – – 83 – – – 30.0 6.880 – – – – – – – – – sulphide leach O/P 388 0.46 – – – 101 0.40 – – – 489 0.45 – – – 41 – – – 30.0 0.900 – – – – – – – – Total (Chile) 1,218 0.62 – – – 606 0.53 – – – 1,821 0.59 – – – 7.936 – – – – – – – – Oyu Tolgoi (Mongolia)7 – Hugo Dummett North8 U/G – – – – – 271 1.54 0.30 3.18 – 271 1.54 0.30 3.18 – 92 79 81 – 66.0 3.856 2.077 22.296 – 138 1.55 0.30 3.19 – – Hugo Dummett North Extension U/G – – – – – 21 1.61 0.56 3.82 – 21 1.61 0.56 3.82 – 92 91 83 – 56.0 0.311 0.306 2.132 – 12 1.55 0.54 3.68 – – Oyut open pit O/P 163 0.53 0.39 1.30 – 265 0.41 0.25 1.14 – 427 0.45 0.30 1.20 – 78 67 53 – 66.0 1.507 2.747 8.771 – 238 0.44 0.29 1.19 – – Oyut stockpiles S/P – – – – – 36 0.32 0.12 1.04 – 36 0.32 0.12 1.04 – 71 52 52 – 66.0 0.082 0.074 0.616 – 17 0.31 0.13 0.96 – Total (Mongolia) 163 0.53 0.39 1.30 – 592 0.96 0.28 2.16 – 755 0.87 0.30 1.98 – 5.755 5.204 33.815 – 405 0.84 0.29 1.93 – Total copper 1,865 0.55 0.08 0.66 0.010 1,595 0.65 0.14 1.26 0.007 3,457 0.60 0.11 0.94 0.008 16.611 8.638 74.622 0.172 946 0.61 0.22 2.10 0.017 1. Type of mine: O/P = open pit/surface, S/P = stockpile, U/G = underground. 2. Copper Mineral Reserves are reported as dry mill feed tonnes. 3. Bingham Canyon Mineral Reserve valuations are based on commodity prices of US c 339.89 / lb for copper, US$ 1,439.51 /oz for gold, US$ 19.18 /oz for silver and US$ 11.43/lb for Molybdenum. These prices are sourced from the average of the available forecasts from ten brokers/banks (Barclays, BoAML, Citigroup, Credit Suisse, Deutsche Bank, Goldman Sachs, JP Morgan, Macquarie, Morgan Stanley and UBS) and two analysts (CRU and Woodmac). 4. Bingham Open Pit Mineral Reserves molybdenum grades interpolated from exploration drilling assays have been factored based on a long reconciliation history to blast hole and mill samples. 5. Econdida Mineral Reserves are reported for the first time in accordance with Regulation S-K. 6. Escondida Mineral Reserve valuations are based on a copper price of US c 279 /lb supplied by the JV partner. 7. Oyu Tolgoi Mineral Reserve valuations are based on commodity prices of US c 350.80 /lb for copper, US$ 1,496.75 /oz for gold and US$ 20.43 /oz for silver. These represent January 2022 consensus prices sourced from the average of forecasts from ten brokers/banks (Barclays, BoAML, Citigroup, Credit Suisse, Deutsche Bank, Goldman Sachs, JP Morgan, Macquarie, Morgan Stanley and UBS) and two analysts (CRU and Woodmac). 8. The Hugo Dummett North Mineral Reserves include approximately 1.4 million tonnes of stockpiled material at a grade of 0.51% copper, 0.16 g/t gold and 1.25 g/t silver.
289Annual Report on Form 20-F 2022 | riotinto.com Production, Mineral Reserves, Mineral Resources and Operations Type of mine1 Proven Mineral Reserves as at 31 December 2022 Probable Mineral Reserves as at 31 December 2022 Total Mineral Reserves as at 31 December 2022 Average mill recovery % Rio Tinto interest Rio Tinto share recoverable metal Total Mineral Reserves as at 31 December 2021 Tonnage Grade Tonnage Grade Tonnage Grade Tonnage Grade Copper2 Mt % Cu g/t Au g/t Ag % Mo Mt % Cu g/t Au g/t Ag % Mo Mt % Cu g/t Au g/t Ag % Mo Cu Au Ag Mo % Mt Cu Moz Au Moz Ag Mt Mo Mt % Cu g/t Au g/t Ag % Mo Bingham Canyon (US)3 – Bingham Open Pit4 O/P 484 0.40 0.18 2.10 0.037 395 0.35 0.17 1.82 0.029 880 0.38 0.18 1.97 0.033 87 69 72 59 100.0 2.890 3.406 40.386 0.172 541 0.44 0.17 2.22 0.029 – Underground Skarns U/G – – – – – 1.7 1.90 0.71 10.07 0.044 1.7 1.90 0.71 10.07 0.044 90 71 76 71 100.0 0.029 0.028 0.421 0.001 – – – – – Total (US) 484 0.40 0.18 2.10 0.037 397 0.36 0.17 1.86 0.029 881 0.38 0.18 1.99 0.033 2.920 3.434 40.807 0.172 541 0.44 0.17 2.22 0.029 Escondida (Chile)5 6 – oxide O/P 37 0.56 – – – 16 0.50 – – – 52 0.54 – – – 55 – – – 30.0 0.156 – – – – – – – – – sulphide O/P 793 0.70 – – – 489 0.56 – – – 1,280 0.65 – – – 83 – – – 30.0 6.880 – – – – – – – – – sulphide leach O/P 388 0.46 – – – 101 0.40 – – – 489 0.45 – – – 41 – – – 30.0 0.900 – – – – – – – – Total (Chile) 1,218 0.62 – – – 606 0.53 – – – 1,821 0.59 – – – 7.936 – – – – – – – – Oyu Tolgoi (Mongolia)7 – Hugo Dummett North8 U/G – – – – – 271 1.54 0.30 3.18 – 271 1.54 0.30 3.18 – 92 79 81 – 66.0 3.856 2.077 22.296 – 138 1.55 0.30 3.19 – – Hugo Dummett North Extension U/G – – – – – 21 1.61 0.56 3.82 – 21 1.61 0.56 3.82 – 92 91 83 – 56.0 0.311 0.306 2.132 – 12 1.55 0.54 3.68 – – Oyut open pit O/P 163 0.53 0.39 1.30 – 265 0.41 0.25 1.14 – 427 0.45 0.30 1.20 – 78 67 53 – 66.0 1.507 2.747 8.771 – 238 0.44 0.29 1.19 – – Oyut stockpiles S/P – – – – – 36 0.32 0.12 1.04 – 36 0.32 0.12 1.04 – 71 52 52 – 66.0 0.082 0.074 0.616 – 17 0.31 0.13 0.96 – Total (Mongolia) 163 0.53 0.39 1.30 – 592 0.96 0.28 2.16 – 755 0.87 0.30 1.98 – 5.755 5.204 33.815 – 405 0.84 0.29 1.93 – Total copper 1,865 0.55 0.08 0.66 0.010 1,595 0.65 0.14 1.26 0.007 3,457 0.60 0.11 0.94 0.008 16.611 8.638 74.622 0.172 946 0.61 0.22 2.10 0.017 Bingham Canyon Bingham Open Pit Mineral Reserves increased following conversion of Mineral Resources and previously unclassified mineralisation to Mineral Reserves following the completion of the pre-feasibility study for the Apex cutback. A JORC Table 1 in support of this change will be released to the market contemporaneously with the release of the Annual Report and can be viewed at riotinto.com/en/invest/financial-news-performance/resources-and-reserves. Open Pit Mineral Reserves molybdenum grades interpolated from exploration drilling assays have been factored based on a long reconciliation history to blast hole and mill samples. Underground Skarns Mineral Reserves represent the Lower Commercial Skarns (LCS) Mineral Reserve. An initial Probable Mineral Reserve of 1.7 million tonnes at 1.90% copper, 0.71 g/t gold, 10.07 g/t silver, and 0.044% molybdenum was released to the market by Rio Tinto on 27 September 2022 with a supporting JORC Table 1 and can be viewed at riotinto.com/en/invest/financial-news-performance/resources-and-reserves. Oyu Tolgoi As reported to the market on 16 December 2022, Rio Tinto completed its acquisition of Turquoise Hill Resources Ltd and the Rio Tinto interest % reflects this change. 2021 figures are reported using the previous ownership %. The Hugo Dummett North underground mine is currently under construction.
Annual Report on Form 20-F 2022 | riotinto.com290 Mineral Reserves continued
291Annual Report on Form 20-F 2022 | riotinto.com Production, Mineral Reserves, Mineral Resources and Operations
Annual Report on Form 20-F 2022 | riotinto.com292 Mineral Reserves continued Type of mine1 Proven Mineral Reserves as at 31 December 2022 Probable Mineral Reserves as at 31 December 2022 Total Mineral Reserves as at 31 December 2022 Rio Tinto interest Rio Tinto share marketable product Total Mineral Reserves as at 31 December 2021 Tonnage Grade Tonnage Grade Tonnage Grade Tonnage Grade Titanium dioxide feedstock2 3 Mt % Ti Minerals % Zircon Mt % Ti Minerals % Zircon Mt % Ti Minerals % Zircon % Mt Titanium dioxide feedstock Mt Zircon Mt % Ti Minerals % Zircon QIT Madagascar Minerals (QMM) (Madagascar) O/P 189 3.6 0.2 77 2.9 0.1 266 3.4 0.2 80.0 4.1 0.3 247 3.7 0.2 Richards Bay Minerals (RBM) (South Africa) O/P 409 1.6 0.2 542 3.1 0.4 950 2.4 0.3 74.0 10.4 2.5 1,031 2.3 0.3 Rio Tinto Iron and Titanium (RTIT) Quebec Operations (Canada) O/P – – – 152 80.0 – 152 80.0 – 100.0 48.2 – 153 80.0 – Total titanium dioxide feedstock 597 2.2 0.2 771 18.2 0.3 1,368 11.2 0.3 62.6 2.8 1,431 10.9 0.3 1. Type of mine: O/P = open pit/surface. 2. The marketable product (zircon at RBM and zirsil at QMM) is shown after all mining and processing losses. Titanium dioxide feedstock Mineral Reserves are reported as dry in situ tonnes. 3. QMM and RBM Mineral Reserve valuations are based on commodity prices of US$ 188.94 /t for 53% TiO2 product and US$ 1,297.64 /t for 66.5% Zircon oxide, adjusted for specific products produced. RTIT Quebec Operations Mineral Reserve valuations are based on a commodity price of US$ 188.94 /t for 53% TiO2 product, adjusted for specific products produced. These prices are sourced from TZMI.
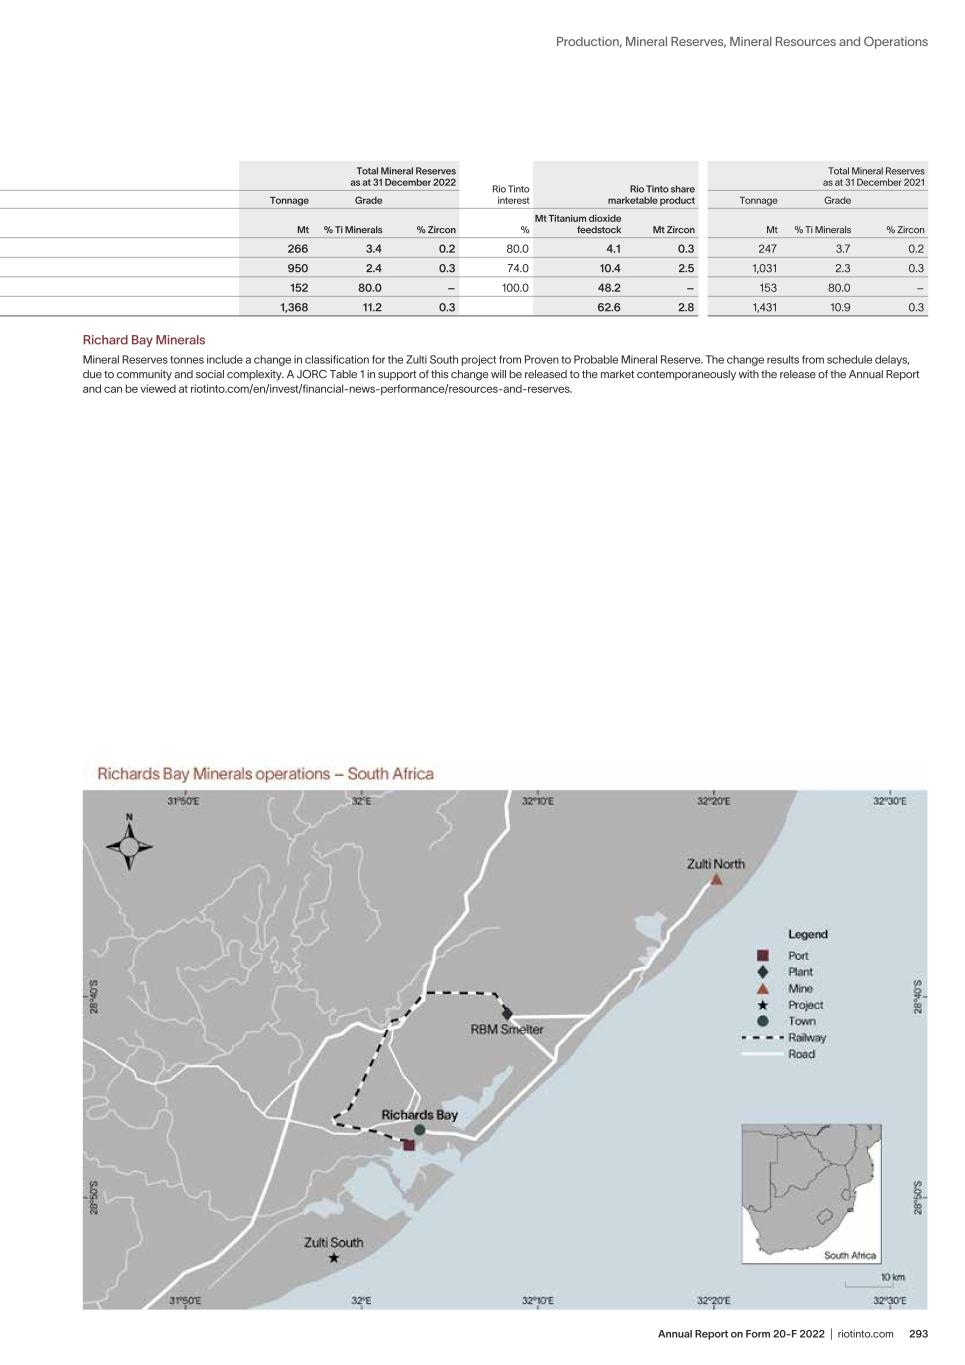
293Annual Report on Form 20-F 2022 | riotinto.com Production, Mineral Reserves, Mineral Resources and Operations Type of mine1 Proven Mineral Reserves as at 31 December 2022 Probable Mineral Reserves as at 31 December 2022 Total Mineral Reserves as at 31 December 2022 Rio Tinto interest Rio Tinto share marketable product Total Mineral Reserves as at 31 December 2021 Tonnage Grade Tonnage Grade Tonnage Grade Tonnage Grade Titanium dioxide feedstock2 3 Mt % Ti Minerals % Zircon Mt % Ti Minerals % Zircon Mt % Ti Minerals % Zircon % Mt Titanium dioxide feedstock Mt Zircon Mt % Ti Minerals % Zircon QIT Madagascar Minerals (QMM) (Madagascar) O/P 189 3.6 0.2 77 2.9 0.1 266 3.4 0.2 80.0 4.1 0.3 247 3.7 0.2 Richards Bay Minerals (RBM) (South Africa) O/P 409 1.6 0.2 542 3.1 0.4 950 2.4 0.3 74.0 10.4 2.5 1,031 2.3 0.3 Rio Tinto Iron and Titanium (RTIT) Quebec Operations (Canada) O/P – – – 152 80.0 – 152 80.0 – 100.0 48.2 – 153 80.0 – Total titanium dioxide feedstock 597 2.2 0.2 771 18.2 0.3 1,368 11.2 0.3 62.6 2.8 1,431 10.9 0.3 Richard Bay Minerals Mineral Reserves tonnes include a change in classification for the Zulti South project from Proven to Probable Mineral Reserve. The change results from schedule delays, due to community and social complexity. A JORC Table 1 in support of this change will be released to the market contemporaneously with the release of the Annual Report and can be viewed at riotinto.com/en/invest/financial-news-performance/resources-and-reserves.
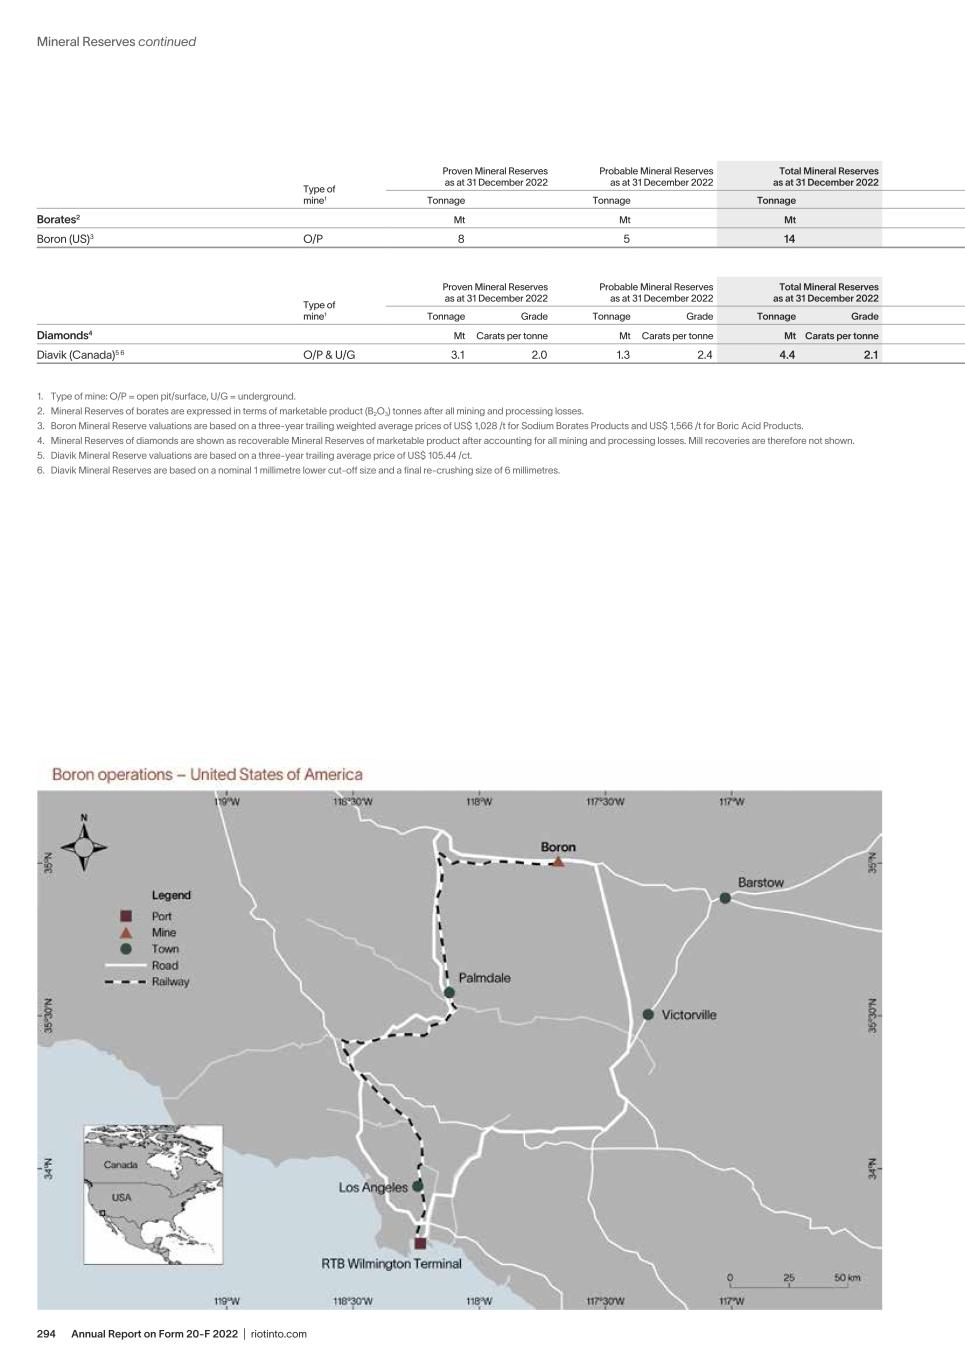
Annual Report on Form 20-F 2022 | riotinto.com294 Mineral Reserves continued Type of mine1 Proven Mineral Reserves as at 31 December 2022 Probable Mineral Reserves as at 31 December 2022 Total Mineral Reserves as at 31 December 2022 Rio Tinto interest Rio Tinto share marketable product Total Mineral Reserves as at 31 December 2021 Tonnage Tonnage Tonnage Tonnage Borates2 Mt Mt Mt % Mt Mt Boron (US)3 O/P 8 5 14 100.0 14 14 Type of mine1 Proven Mineral Reserves as at 31 December 2022 Probable Mineral Reserves as at 31 December 2022 Total Mineral Reserves as at 31 December 2022 Rio Tinto interest Rio Tinto share recoverable diamonds Total Mineral Reserves as at 31 December 2021 Tonnage Grade Tonnage Grade Tonnage Grade Tonnage Grade Diamonds4 Mt Carats per tonne Mt Carats per tonne Mt Carats per tonne % M Carats Mt Carats per tonne Diavik (Canada)5 6 O/P & U/G 3.1 2.0 1.3 2.4 4.4 2.1 100.0 9.5 5.4 2.2 1. Type of mine: O/P = open pit/surface, U/G = underground. 2. Mineral Reserves of borates are expressed in terms of marketable product (B2O3) tonnes after all mining and processing losses. 3. Boron Mineral Reserve valuations are based on a three-year trailing weighted average prices of US$ 1,028 /t for Sodium Borates Products and US$ 1,566 /t for Boric Acid Products. 4. Mineral Reserves of diamonds are shown as recoverable Mineral Reserves of marketable product after accounting for all mining and processing losses. Mill recoveries are therefore not shown. 5. Diavik Mineral Reserve valuations are based on a three-year trailing average price of US$ 105.44 /ct. 6. Diavik Mineral Reserves are based on a nominal 1 millimetre lower cut-off size and a final re-crushing size of 6 millimetres.
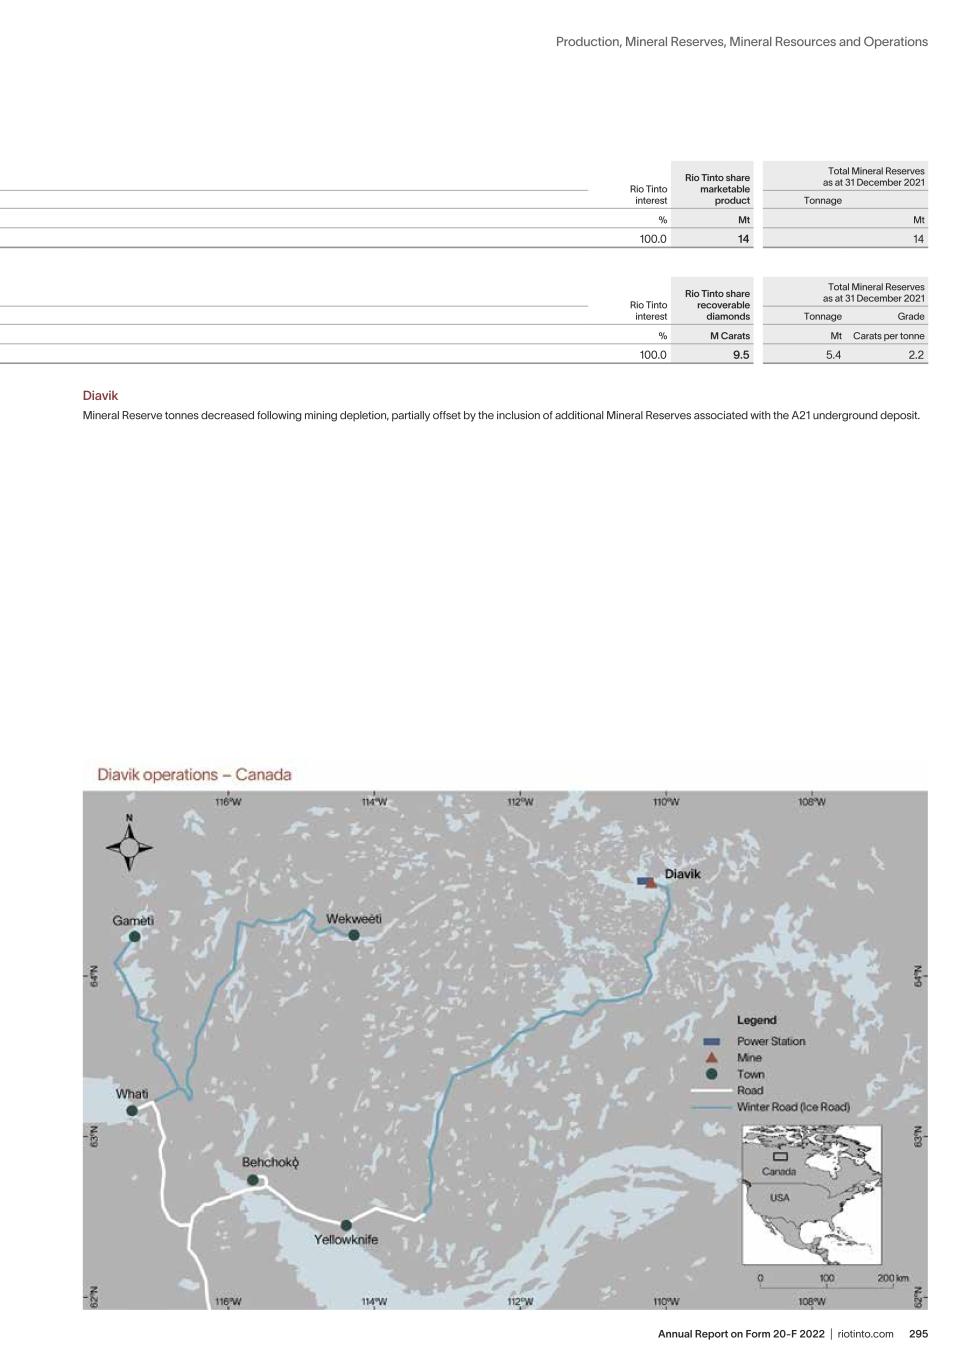
295Annual Report on Form 20-F 2022 | riotinto.com Production, Mineral Reserves, Mineral Resources and Operations Type of mine1 Proven Mineral Reserves as at 31 December 2022 Probable Mineral Reserves as at 31 December 2022 Total Mineral Reserves as at 31 December 2022 Rio Tinto interest Rio Tinto share marketable product Total Mineral Reserves as at 31 December 2021 Tonnage Tonnage Tonnage Tonnage Borates2 Mt Mt Mt % Mt Mt Boron (US)3 O/P 8 5 14 100.0 14 14 Type of mine1 Proven Mineral Reserves as at 31 December 2022 Probable Mineral Reserves as at 31 December 2022 Total Mineral Reserves as at 31 December 2022 Rio Tinto interest Rio Tinto share recoverable diamonds Total Mineral Reserves as at 31 December 2021 Tonnage Grade Tonnage Grade Tonnage Grade Tonnage Grade Diamonds4 Mt Carats per tonne Mt Carats per tonne Mt Carats per tonne % M Carats Mt Carats per tonne Diavik (Canada)5 6 O/P & U/G 3.1 2.0 1.3 2.4 4.4 2.1 100.0 9.5 5.4 2.2 Diavik Mineral Reserve tonnes decreased following mining depletion, partially offset by the inclusion of additional Mineral Reserves associated with the A21 underground deposit.
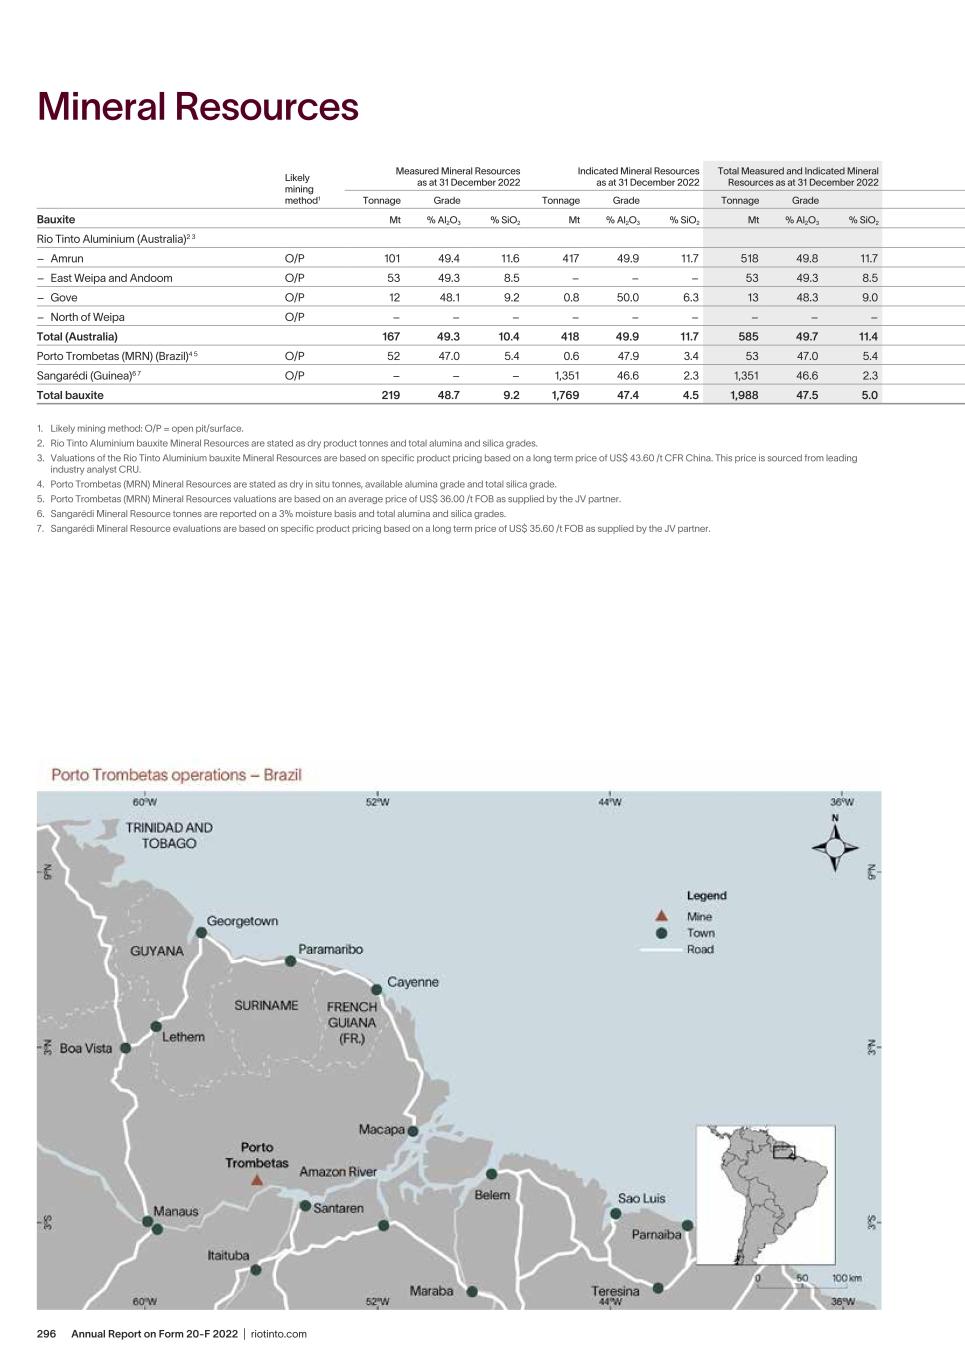
Annual Report on Form 20-F 2022 | riotinto.com296 Likely mining method1 Measured Mineral Resources as at 31 December 2022 Indicated Mineral Resources as at 31 December 2022 Total Measured and Indicated Mineral Resources as at 31 December 2022 Inferred Mineral Resources as at 31 December 2022 Total Mineral Resources as at 31 December 2022 Rio Tinto interest Total Mineral Resources as at 31 December 2021 Tonnage Grade Tonnage Grade Tonnage Grade Tonnage Grade Tonnage Grade Tonnage Grade Bauxite Mt % Al2O3 % SiO2 Mt % Al2O3 % SiO2 Mt % Al2O3 % SiO2 Mt % Al2O3 % SiO2 Mt % Al2O3 % SiO2 % Mt % Al2O3 % SiO2 Rio Tinto Aluminium (Australia)2 3 – Amrun O/P 101 49.4 11.6 417 49.9 11.7 518 49.8 11.7 325 52.1 11.9 843 50.6 11.8 100.0 850 50.6 11.8 – East Weipa and Andoom O/P 53 49.3 8.5 – – – 53 49.3 8.5 – – – 53 49.3 8.5 100.0 63 49.5 8.4 – Gove O/P 12 48.1 9.2 0.8 50.0 6.3 13 48.3 9.0 0.1 50.1 5.8 13 48.3 9.0 100.0 34 49.0 6.8 – North of Weipa O/P – – – – – – – – – 1,330 52.0 11.6 1,330 52.0 11.6 100.0 1,330 52.0 11.6 Total (Australia) 167 49.3 10.4 418 49.9 11.7 585 49.7 11.4 1,655 52.0 11.6 2,240 51.4 11.6 2,276 51.3 11.5 Porto Trombetas (MRN) (Brazil)4 5 O/P 52 47.0 5.4 0.6 47.9 3.4 53 47.0 5.4 18 49.5 4.0 71 47.7 5.0 12.0 50 49.6 4.2 Sangarédi (Guinea)6 7 O/P – – – 1,351 46.6 2.3 1,351 46.6 2.3 168 45.8 2.4 1,519 46.5 2.3 23.0 1,519 46.5 2.3 Total bauxite 219 48.7 9.2 1,769 47.4 4.5 1,988 47.5 5.0 1,841 51.4 10.7 3,829 49.4 7.8 3,845 49.4 7.8 1. Likely mining method: O/P = open pit/surface. 2. Rio Tinto Aluminium bauxite Mineral Resources are stated as dry product tonnes and total alumina and silica grades. 3. Valuations of the Rio Tinto Aluminium bauxite Mineral Resources are based on specific product pricing based on a long term price of US$ 43.60 /t CFR China. This price is sourced from leading industry analyst CRU. 4. Porto Trombetas (MRN) Mineral Resources are stated as dry in situ tonnes, available alumina grade and total silica grade. 5. Porto Trombetas (MRN) Mineral Resources valuations are based on an average price of US$ 36.00 /t FOB as supplied by the JV partner. 6. Sangarédi Mineral Resource tonnes are reported on a 3% moisture basis and total alumina and silica grades. 7. Sangarédi Mineral Resource evaluations are based on specific product pricing based on a long term price of US$ 35.60 /t FOB as supplied by the JV partner. Mineral Resources
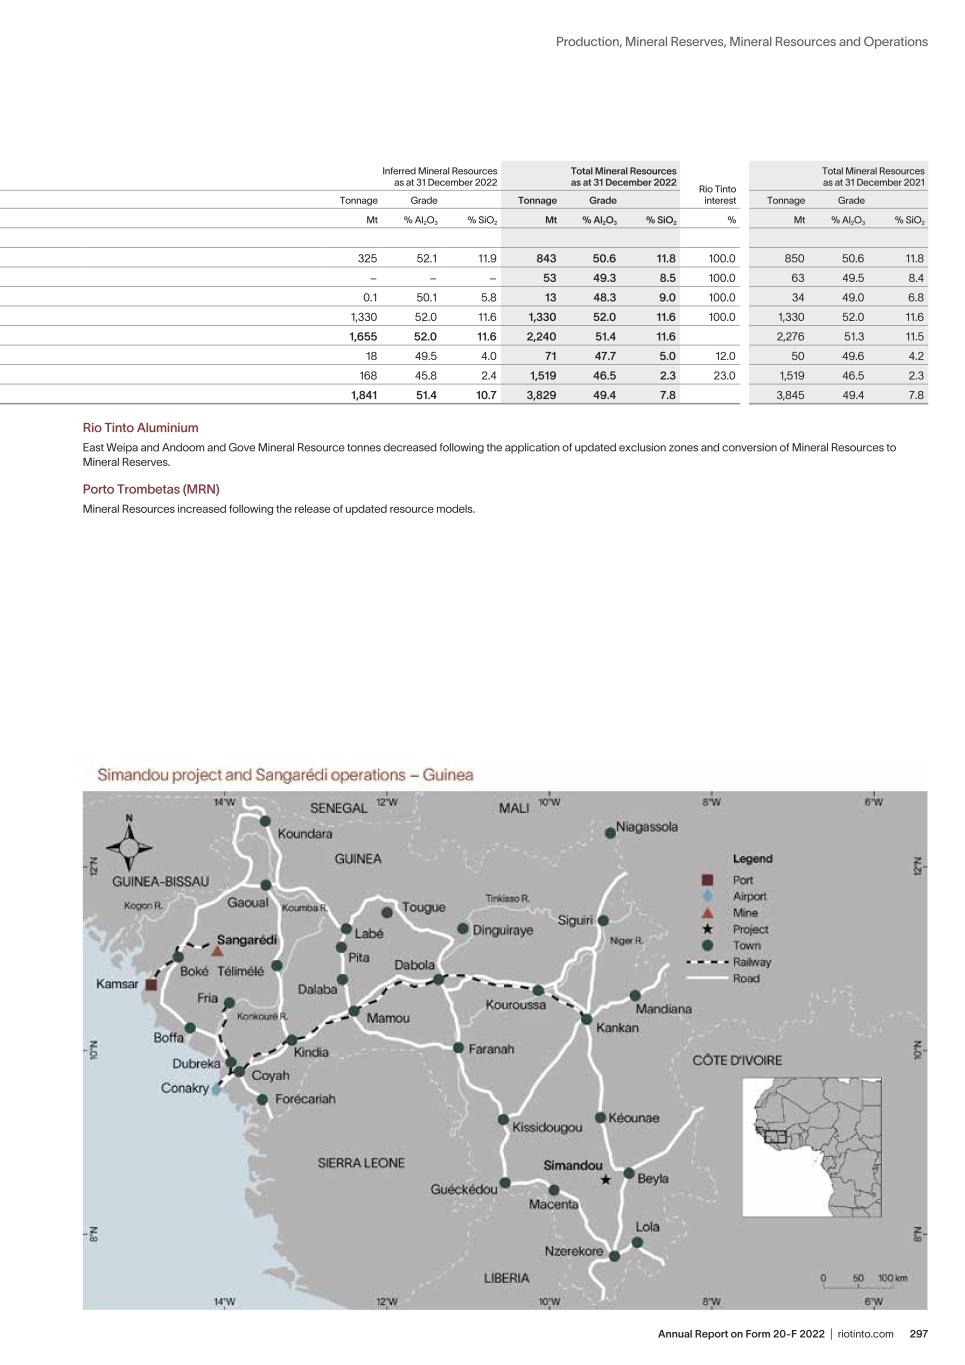
297Annual Report on Form 20-F 2022 | riotinto.com Production, Mineral Reserves, Mineral Resources and Operations Likely mining method1 Measured Mineral Resources as at 31 December 2022 Indicated Mineral Resources as at 31 December 2022 Total Measured and Indicated Mineral Resources as at 31 December 2022 Inferred Mineral Resources as at 31 December 2022 Total Mineral Resources as at 31 December 2022 Rio Tinto interest Total Mineral Resources as at 31 December 2021 Tonnage Grade Tonnage Grade Tonnage Grade Tonnage Grade Tonnage Grade Tonnage Grade Bauxite Mt % Al2O3 % SiO2 Mt % Al2O3 % SiO2 Mt % Al2O3 % SiO2 Mt % Al2O3 % SiO2 Mt % Al2O3 % SiO2 % Mt % Al2O3 % SiO2 Rio Tinto Aluminium (Australia)2 3 – Amrun O/P 101 49.4 11.6 417 49.9 11.7 518 49.8 11.7 325 52.1 11.9 843 50.6 11.8 100.0 850 50.6 11.8 – East Weipa and Andoom O/P 53 49.3 8.5 – – – 53 49.3 8.5 – – – 53 49.3 8.5 100.0 63 49.5 8.4 – Gove O/P 12 48.1 9.2 0.8 50.0 6.3 13 48.3 9.0 0.1 50.1 5.8 13 48.3 9.0 100.0 34 49.0 6.8 – North of Weipa O/P – – – – – – – – – 1,330 52.0 11.6 1,330 52.0 11.6 100.0 1,330 52.0 11.6 Total (Australia) 167 49.3 10.4 418 49.9 11.7 585 49.7 11.4 1,655 52.0 11.6 2,240 51.4 11.6 2,276 51.3 11.5 Porto Trombetas (MRN) (Brazil)4 5 O/P 52 47.0 5.4 0.6 47.9 3.4 53 47.0 5.4 18 49.5 4.0 71 47.7 5.0 12.0 50 49.6 4.2 Sangarédi (Guinea)6 7 O/P – – – 1,351 46.6 2.3 1,351 46.6 2.3 168 45.8 2.4 1,519 46.5 2.3 23.0 1,519 46.5 2.3 Total bauxite 219 48.7 9.2 1,769 47.4 4.5 1,988 47.5 5.0 1,841 51.4 10.7 3,829 49.4 7.8 3,845 49.4 7.8 Rio Tinto Aluminium East Weipa and Andoom and Gove Mineral Resource tonnes decreased following the application of updated exclusion zones and conversion of Mineral Resources to Mineral Reserves. Porto Trombetas (MRN) Mineral Resources increased following the release of updated resource models.
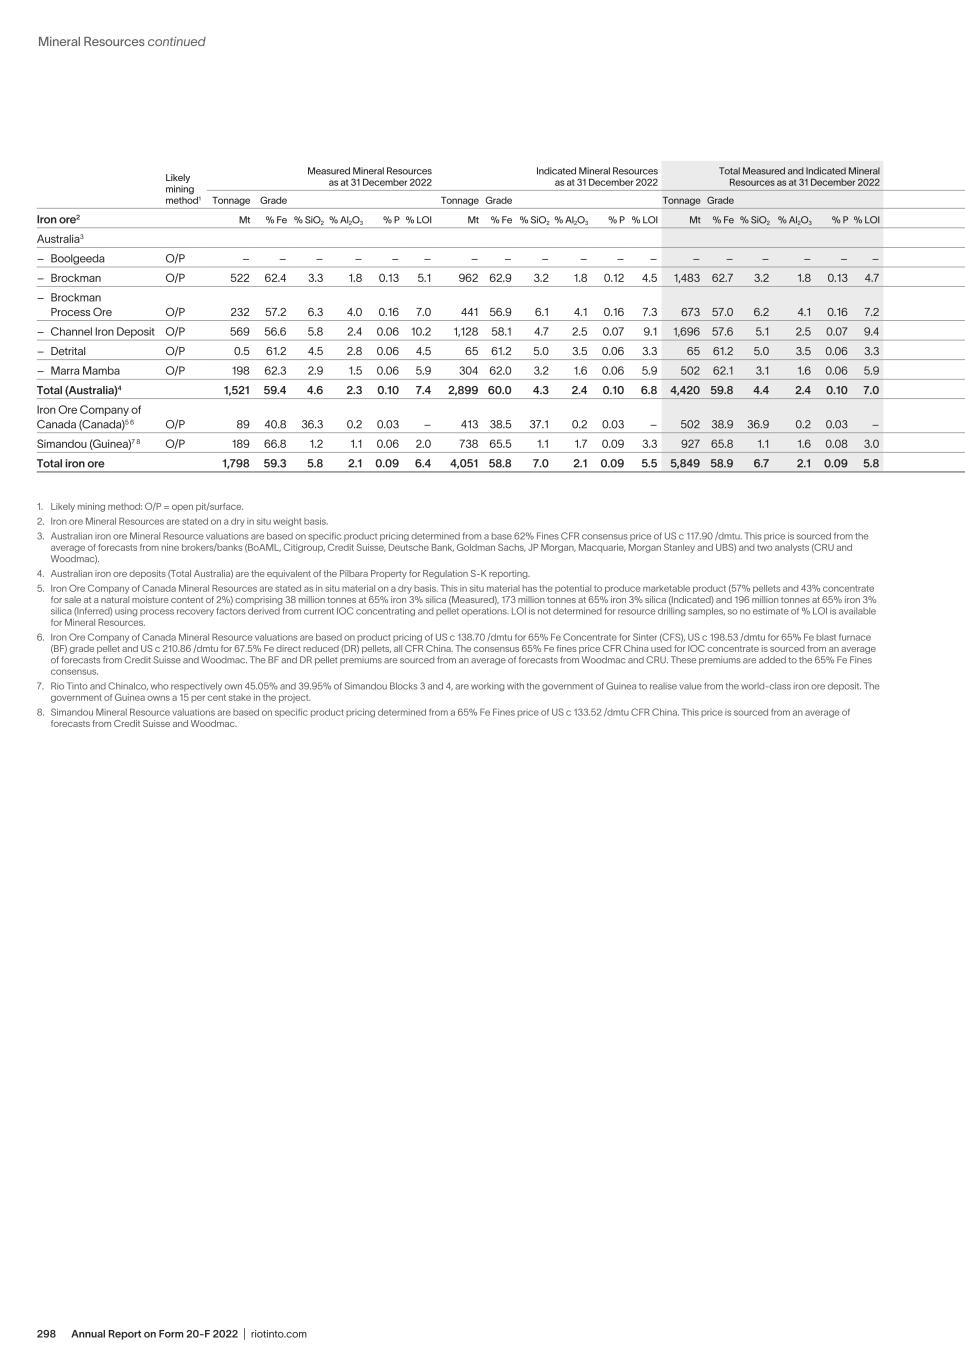
Annual Report on Form 20-F 2022 | riotinto.com298 Mineral Resources continued Likely mining method1 Measured Mineral Resources as at 31 December 2022 Indicated Mineral Resources as at 31 December 2022 Total Measured and Indicated Mineral Resources as at 31 December 2022 Inferred Mineral Resources as at 31 December 2022 Total Mineral Resources as at 31 December 2022 Rio Tinto interest Total Mineral Resources as at 31 December 2021 Tonnage Grade Tonnage Grade Tonnage Grade Tonnage Grade Tonnage Grade Tonnage Grade Iron ore2 Mt % Fe % SiO2 % Al2O3 % P % LOI Mt % Fe % SiO2 % Al2O3 % P % LOI Mt % Fe % SiO2 % Al2O3 % P % LOI Mt % Fe % SiO2 % Al2O3 % P % LOI Mt % Fe % SiO2 % Al2O3 % P % LOI % Mt % Fe % SiO2 % Al2O3 % P % LOI Australia3 – Boolgeeda O/P – – – – – – – – – – – – – – – – – – 532 57.9 4.8 3.9 0.17 7.6 532 57.9 4.8 3.9 0.17 7.6 100.0 532 57.9 4.8 3.9 0.17 7.6 – Brockman O/P 522 62.4 3.3 1.8 0.13 5.1 962 62.9 3.2 1.8 0.12 4.5 1,483 62.7 3.2 1.8 0.13 4.7 3,978 62.2 3.2 1.9 0.14 5.5 5,461 62.3 3.2 1.8 0.13 5.2 73.8 5,437 62.3 3.3 1.9 0.13 5.2 – Brockman Process Ore O/P 232 57.2 6.3 4.0 0.16 7.0 441 56.9 6.1 4.1 0.16 7.3 673 57.0 6.2 4.1 0.16 7.2 1,358 57.0 5.9 4.1 0.17 7.7 2,031 57.0 6.0 4.1 0.16 7.5 68.2 2,143 57.0 6.0 4.1 0.16 7.5 – Channel Iron Deposit O/P 569 56.6 5.8 2.4 0.06 10.2 1,128 58.1 4.7 2.5 0.07 9.1 1,696 57.6 5.1 2.5 0.07 9.4 3,264 56.3 6.1 3.0 0.08 9.7 4,960 56.7 5.8 2.8 0.08 9.6 69.6 5,036 56.8 5.7 2.8 0.08 9.6 – Detrital O/P 0.5 61.2 4.5 2.8 0.06 4.5 65 61.2 5.0 3.5 0.06 3.3 65 61.2 5.0 3.5 0.06 3.3 1,102 60.8 4.1 3.6 0.06 4.2 1,167 60.8 4.2 3.6 0.06 4.2 72.9 1,116 61.0 4.0 3.6 0.06 4.2 – Marra Mamba O/P 198 62.3 2.9 1.5 0.06 5.9 304 62.0 3.2 1.6 0.06 5.9 502 62.1 3.1 1.6 0.06 5.9 2.741 61.6 3.1 1.7 0.07 6.4 3,243 61.7 3.1 1.7 0.06 6.4 62.6 3,410 61.7 3.1 1.7 0.06 6.3 Total (Australia)4 1,521 59.4 4.6 2.3 0.10 7.4 2,899 60.0 4.3 2.4 0.10 6.8 4,420 59.8 4.4 2.4 0.10 7.0 12,974 59.7 4.3 2.6 0.11 7.0 17,395 59.8 4.4 2.5 0.10 7.0 17,674 59.8 4.4 2.5 0.10 7.0 Iron Ore Company of Canada (Canada)5 6 O/P 89 40.8 36.3 0.2 0.03 – 413 38.5 37.1 0.2 0.03 – 502 38.9 36.9 0.2 0.03 – 476 38.3 37.8 0.2 0.03 – 978 38.7 37.4 0.2 0.03 – 58.7 987 38.6 37.5 0.2 0.03 – Simandou (Guinea)7 8 O/P 189 66.8 1.2 1.1 0.06 2.0 738 65.5 1.1 1.7 0.09 3.3 927 65.8 1.1 1.6 0.08 3.0 348 65.8 1.4 1.4 0.07 2.8 1,275 65.8 1.2 1.5 0.08 3.0 45.1 1,294 65.5 2.3 1.2 0.07 2.6 Total iron ore 1,798 59.3 5.8 2.1 0.09 6.4 4,051 58.8 7.0 2.1 0.09 5.5 5,849 58.9 6.7 2.1 0.09 5.8 13,799 59.2 5.4 2.5 0.10 6.6 19,648 59.1 5.8 2.4 0.10 6.4 19,955 59.1 5.9 2.3 0.10 6.3 1. Likely mining method: O/P = open pit/surface. 2. Iron ore Mineral Resources are stated on a dry in situ weight basis. 3. Australian iron ore Mineral Resource valuations are based on specific product pricing determined from a base 62% Fines CFR consensus price of US c 117.90 /dmtu. This price is sourced from the average of forecasts from nine brokers/banks (BoAML, Citigroup, Credit Suisse, Deutsche Bank, Goldman Sachs, JP Morgan, Macquarie, Morgan Stanley and UBS) and two analysts (CRU and Woodmac). 4. Australian iron ore deposits (Total Australia) are the equivalent of the Pilbara Property for Regulation S-K reporting. 5. Iron Ore Company of Canada Mineral Resources are stated as in situ material on a dry basis. This in situ material has the potential to produce marketable product (57% pellets and 43% concentrate for sale at a natural moisture content of 2%) comprising 38 million tonnes at 65% iron 3% silica (Measured), 173 million tonnes at 65% iron 3% silica (Indicated) and 196 million tonnes at 65% iron 3% silica (Inferred) using process recovery factors derived from current IOC concentrating and pellet operations. LOI is not determined for resource drilling samples, so no estimate of % LOI is available for Mineral Resources. 6. Iron Ore Company of Canada Mineral Resource valuations are based on product pricing of US c 138.70 /dmtu for 65% Fe Concentrate for Sinter (CFS), US c 198.53 /dmtu for 65% Fe blast furnace (BF) grade pellet and US c 210.86 /dmtu for 67.5% Fe direct reduced (DR) pellets, all CFR China. The consensus 65% Fe fines price CFR China used for IOC concentrate is sourced from an average of forecasts from Credit Suisse and Woodmac. The BF and DR pellet premiums are sourced from an average of forecasts from Woodmac and CRU. These premiums are added to the 65% Fe Fines consensus. 7. Rio Tinto and Chinalco, who respectively own 45.05% and 39.95% of Simandou Blocks 3 and 4, are working with the government of Guinea to realise value from the world-class iron ore deposit. The government of Guinea owns a 15 per cent stake in the project. 8. Simandou Mineral Resource valuations are based on specific product pricing determined from a 65% Fe Fines price of US c 133.52 /dmtu CFR China. This price is sourced from an average of forecasts from Credit Suisse and Woodmac.
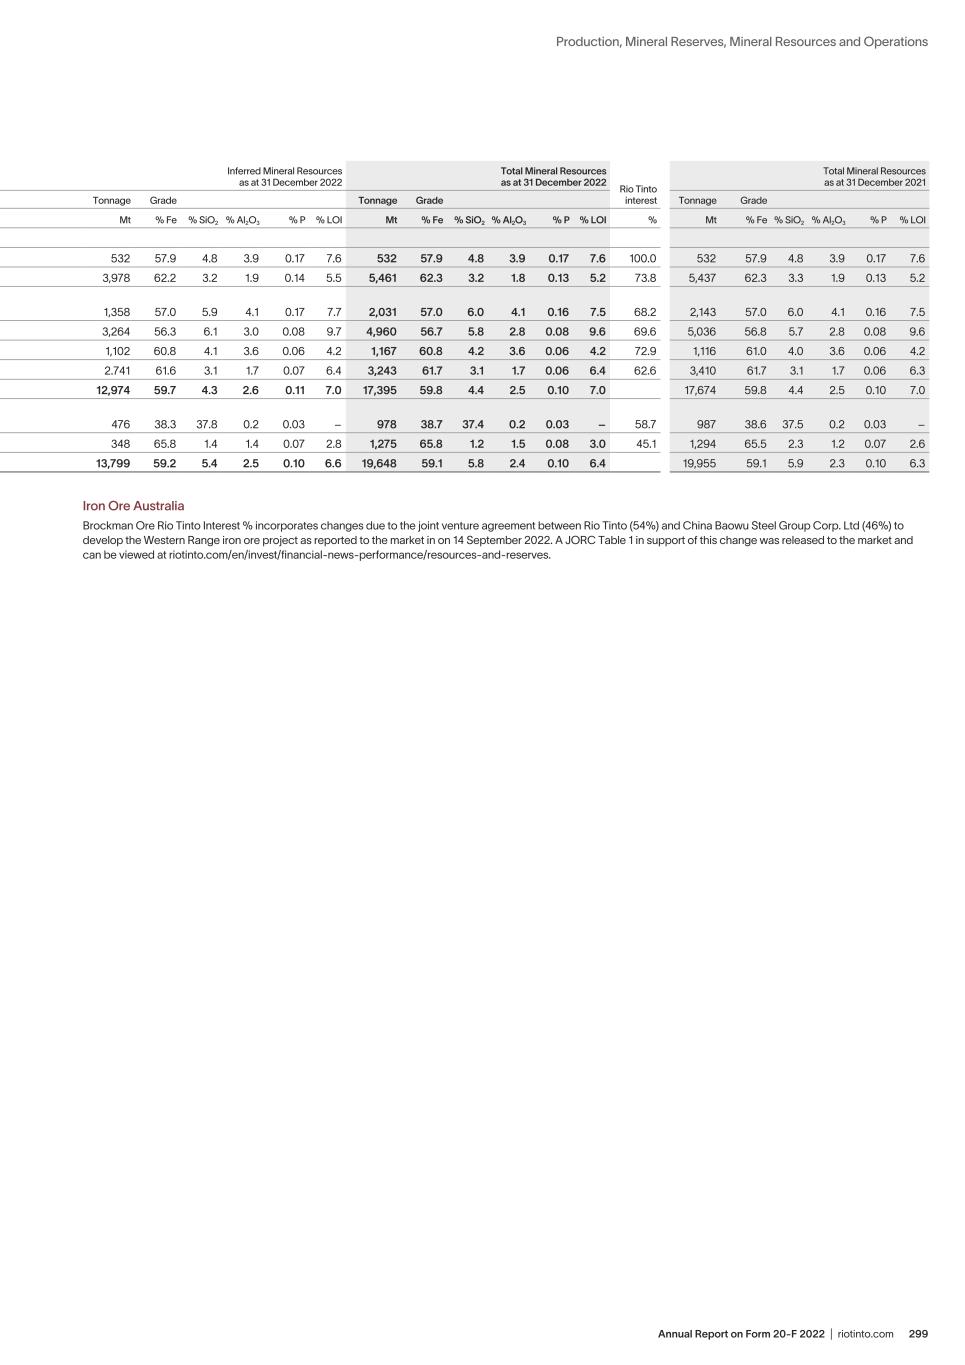
299Annual Report on Form 20-F 2022 | riotinto.com Production, Mineral Reserves, Mineral Resources and Operations Likely mining method1 Measured Mineral Resources as at 31 December 2022 Indicated Mineral Resources as at 31 December 2022 Total Measured and Indicated Mineral Resources as at 31 December 2022 Inferred Mineral Resources as at 31 December 2022 Total Mineral Resources as at 31 December 2022 Rio Tinto interest Total Mineral Resources as at 31 December 2021 Tonnage Grade Tonnage Grade Tonnage Grade Tonnage Grade Tonnage Grade Tonnage Grade Iron ore2 Mt % Fe % SiO2 % Al2O3 % P % LOI Mt % Fe % SiO2 % Al2O3 % P % LOI Mt % Fe % SiO2 % Al2O3 % P % LOI Mt % Fe % SiO2 % Al2O3 % P % LOI Mt % Fe % SiO2 % Al2O3 % P % LOI % Mt % Fe % SiO2 % Al2O3 % P % LOI Australia3 – Boolgeeda O/P – – – – – – – – – – – – – – – – – – 532 57.9 4.8 3.9 0.17 7.6 532 57.9 4.8 3.9 0.17 7.6 100.0 532 57.9 4.8 3.9 0.17 7.6 – Brockman O/P 522 62.4 3.3 1.8 0.13 5.1 962 62.9 3.2 1.8 0.12 4.5 1,483 62.7 3.2 1.8 0.13 4.7 3,978 62.2 3.2 1.9 0.14 5.5 5,461 62.3 3.2 1.8 0.13 5.2 73.8 5,437 62.3 3.3 1.9 0.13 5.2 – Brockman Process Ore O/P 232 57.2 6.3 4.0 0.16 7.0 441 56.9 6.1 4.1 0.16 7.3 673 57.0 6.2 4.1 0.16 7.2 1,358 57.0 5.9 4.1 0.17 7.7 2,031 57.0 6.0 4.1 0.16 7.5 68.2 2,143 57.0 6.0 4.1 0.16 7.5 – Channel Iron Deposit O/P 569 56.6 5.8 2.4 0.06 10.2 1,128 58.1 4.7 2.5 0.07 9.1 1,696 57.6 5.1 2.5 0.07 9.4 3,264 56.3 6.1 3.0 0.08 9.7 4,960 56.7 5.8 2.8 0.08 9.6 69.6 5,036 56.8 5.7 2.8 0.08 9.6 – Detrital O/P 0.5 61.2 4.5 2.8 0.06 4.5 65 61.2 5.0 3.5 0.06 3.3 65 61.2 5.0 3.5 0.06 3.3 1,102 60.8 4.1 3.6 0.06 4.2 1,167 60.8 4.2 3.6 0.06 4.2 72.9 1,116 61.0 4.0 3.6 0.06 4.2 – Marra Mamba O/P 198 62.3 2.9 1.5 0.06 5.9 304 62.0 3.2 1.6 0.06 5.9 502 62.1 3.1 1.6 0.06 5.9 2.741 61.6 3.1 1.7 0.07 6.4 3,243 61.7 3.1 1.7 0.06 6.4 62.6 3,410 61.7 3.1 1.7 0.06 6.3 Total (Australia)4 1,521 59.4 4.6 2.3 0.10 7.4 2,899 60.0 4.3 2.4 0.10 6.8 4,420 59.8 4.4 2.4 0.10 7.0 12,974 59.7 4.3 2.6 0.11 7.0 17,395 59.8 4.4 2.5 0.10 7.0 17,674 59.8 4.4 2.5 0.10 7.0 Iron Ore Company of Canada (Canada)5 6 O/P 89 40.8 36.3 0.2 0.03 – 413 38.5 37.1 0.2 0.03 – 502 38.9 36.9 0.2 0.03 – 476 38.3 37.8 0.2 0.03 – 978 38.7 37.4 0.2 0.03 – 58.7 987 38.6 37.5 0.2 0.03 – Simandou (Guinea)7 8 O/P 189 66.8 1.2 1.1 0.06 2.0 738 65.5 1.1 1.7 0.09 3.3 927 65.8 1.1 1.6 0.08 3.0 348 65.8 1.4 1.4 0.07 2.8 1,275 65.8 1.2 1.5 0.08 3.0 45.1 1,294 65.5 2.3 1.2 0.07 2.6 Total iron ore 1,798 59.3 5.8 2.1 0.09 6.4 4,051 58.8 7.0 2.1 0.09 5.5 5,849 58.9 6.7 2.1 0.09 5.8 13,799 59.2 5.4 2.5 0.10 6.6 19,648 59.1 5.8 2.4 0.10 6.4 19,955 59.1 5.9 2.3 0.10 6.3 Iron Ore Australia Brockman Ore Rio Tinto Interest % incorporates changes due to the joint venture agreement between Rio Tinto (54%) and China Baowu Steel Group Corp. Ltd (46%) to develop the Western Range iron ore project as reported to the market in on 14 September 2022. A JORC Table 1 in support of this change was released to the market and can be viewed at riotinto.com/en/invest/financial-news-performance/resources-and-reserves.
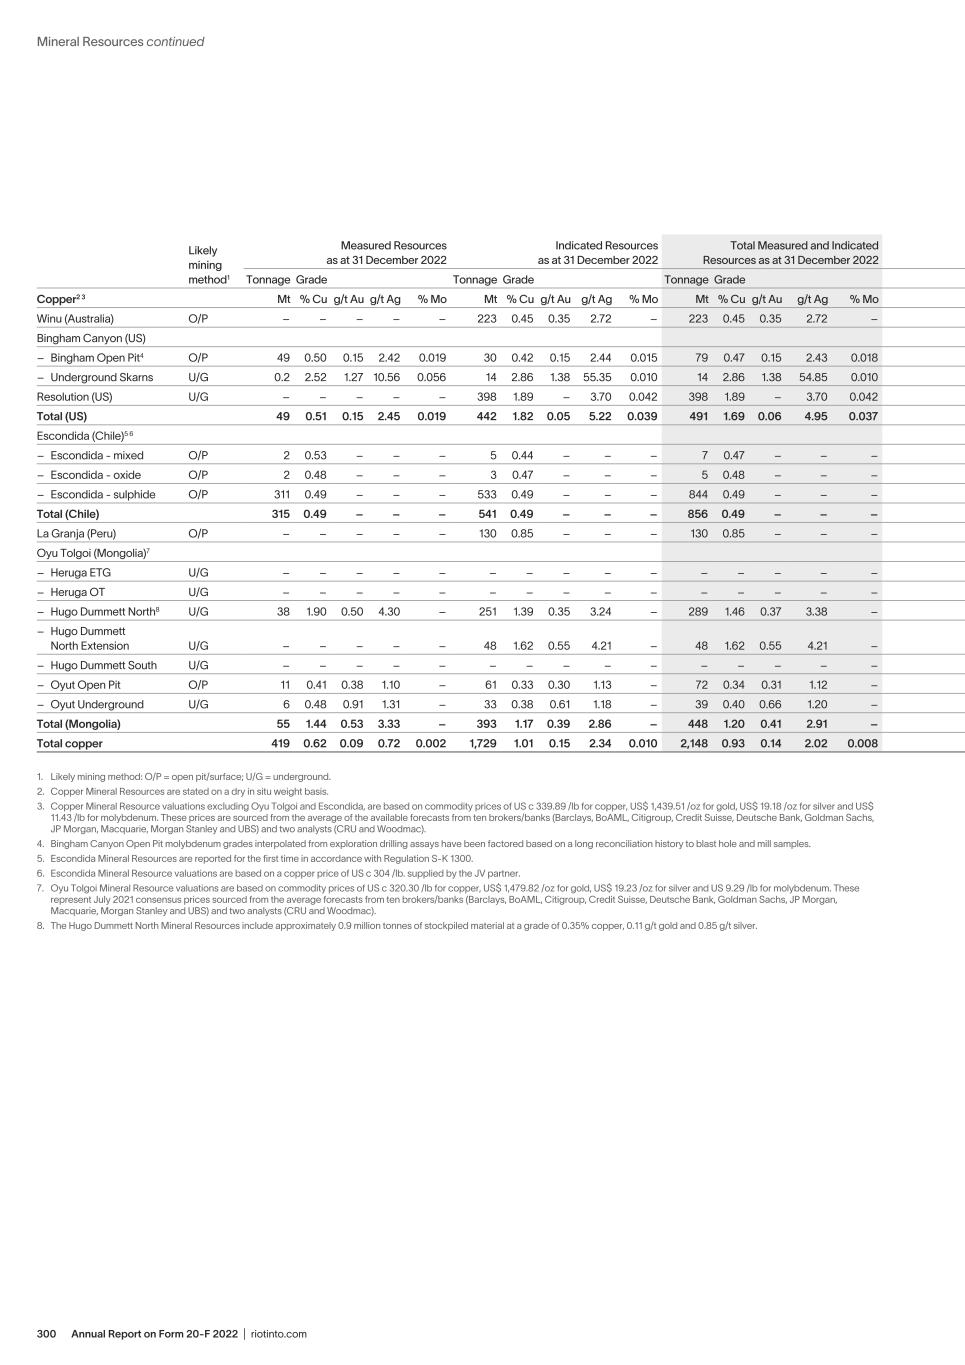
Annual Report on Form 20-F 2022 | riotinto.com300 Mineral Resources continued Likely mining method1 Measured Resources as at 31 December 2022 Indicated Resources as at 31 December 2022 Total Measured and Indicated Resources as at 31 December 2022 Inferred Resources as at 31 December 2022 Total Mineral Resources as at 31 December 2022 Rio Tinto interest Total Mineral Resources as at 31 December 2021 Tonnage Grade Tonnage Grade Tonnage Grade Tonnage Grade Tonnage Grade Tonnage Grade Copper2 3 Mt % Cu g/t Au g/t Ag % Mo Mt % Cu g/t Au g/t Ag % Mo Mt % Cu g/t Au g/t Ag % Mo Mt % Cu g/t Au g/t Ag % Mo Mt % Cu g/t Au g/t Ag % Mo % Mt % Cu g/t Au g/t Ag % Mo Winu (Australia) O/P – – – – – 223 0.45 0.35 2.72 – 223 0.45 0.35 2.72 – 503 0.38 0.33 1.97 – 726 0.40 0.34 2.20 – 100.0 608 0.40 0.30 2.26 – Bingham Canyon (US) – Bingham Open Pit4 O/P 49 0.50 0.15 2.42 0.019 30 0.42 0.15 2.44 0.015 79 0.47 0.15 2.43 0.018 14 0.21 0.16 1.19 0.006 93 0.43 0.15 2.24 0.016 100.0 256 0.39 0.20 1.75 0.017 – Underground Skarns U/G 0.2 2.52 1.27 10.56 0.056 14 2.86 1.38 55.35 0.010 14 2.86 1.38 54.85 0.010 13 2.54 0.91 15.43 0.008 27 2.70 1.15 35.50 0.009 100.0 20 3.65 1.62 20.95 – Resolution (US) U/G – – – – – 398 1.89 – 3.70 0.042 398 1.89 – 3.70 0.042 624 1.28 – 2.74 0.031 1,022 1.52 – 3.12 0.035 55.0 983 1.53 – – 0.036 Total (US) 49 0.51 0.15 2.45 0.019 442 1.82 0.05 5.22 0.039 491 1.69 0.06 4.95 0.037 651 1.28 0.02 2.97 0.030 1,142 1.46 0.04 3.82 0.033 1,259 1.33 0.07 0.69 0.032 Escondida (Chile)5 6 – Escondida - mixed O/P 2 0.53 – – – 5 0.44 – – – 7 0.47 – – – 6 0.49 – – – 13 0.48 – – – 30.0 – – – – – – Escondida - oxide O/P 2 0.48 – – – 3 0.47 – – – 5 0.48 – – – 1 0.75 – – – 6 0.52 – – – 30.0 – – – – – – Escondida - sulphide O/P 311 0.49 – – – 533 0.49 – – – 844 0.49 – – – 2,800 0.53 – – – 3,644 0.52 – – – 30.0 – – – – – Total (Chile) 315 0.49 – – – 541 0.49 – – – 856 0.49 – – – 2,810 0.53 – – – 3,666 0.52 – – – – – – – – La Granja (Peru) O/P – – – – – 130 0.85 – – – 130 0.85 – – – 4,190 0.50 – – – 4,320 0.51 – – – 100.0 4,320 0.51 – – – Oyu Tolgoi (Mongolia)7 – Heruga ETG U/G – – – – – – – – – – – – – – – 841 0.41 0.40 1.44 0.012 841 0.41 0.40 1.44 0.012 56.0 442 0.41 0.40 1.44 0.012 – Heruga OT U/G – – – – – – – – – – – – – – – 71 0.42 0.30 1.58 0.011 71 0.42 0.30 1.58 0.011 66.0 36 0.42 0.30 1.58 0.011 – Hugo Dummett North8 U/G 38 1.90 0.50 4.30 – 251 1.39 0.35 3.24 – 289 1.46 0.37 3.38 – 474 0.83 0.29 2.47 – 763 1.07 0.32 2.82 – 66.0 388 1.06 0.32 2.80 – – Hugo Dummett North Extension U/G – – – – – 48 1.62 0.55 4.21 – 48 1.62 0.55 4.21 – 90 1.05 0.37 2.85 – 137 1.25 0.43 3.32 – 56.0 72 1.24 0.43 3.31 – – Hugo Dummett South U/G – – – – – – – – – – – – – – – 483 0.83 0.07 1.87 – 483 0.83 0.07 1.87 – 66.0 245 0.83 0.07 1.87 – – Oyut Open Pit O/P 11 0.41 0.38 1.10 – 61 0.33 0.30 1.13 – 72 0.34 0.31 1.12 – 215 0.29 0.19 1.01 – 287 0.30 0.22 1.04 – 66.0 149 0.30 0.22 1.05 – – Oyut Underground U/G 6 0.48 0.91 1.31 – 33 0.38 0.61 1.18 – 39 0.40 0.66 1.20 – 95 0.41 0.42 1.25 – 135 0.40 0.49 1.23 – 66.0 68 0.40 0.49 1.23 – Total (Mongolia) 55 1.44 0.53 3.33 – 393 1.17 0.39 2.86 – 448 1.20 0.41 2.91 – 2,269 0.60 0.28 1.76 0.005 2,716 0.70 0.30 1.95 0.004 1,401 0.69 0.30 1.94 0.004 Total copper 419 0.62 0.09 0.72 0.002 1,729 1.01 0.15 2.34 0.010 2,148 0.93 0.14 2.02 0.008 10,423 0.57 0.08 0.66 0.003 12,570 0.63 0.09 0.90 0.004 7,587 0.67 0.09 0.65 0.006 1. Likely mining method: O/P = open pit/surface; U/G = underground. 2. Copper Mineral Resources are stated on a dry in situ weight basis. 3. Copper Mineral Resource valuations excluding Oyu Tolgoi and Escondida, are based on commodity prices of US c 339.89 /lb for copper, US$ 1,439.51 /oz for gold, US$ 19.18 /oz for silver and US$ 11.43 /lb for molybdenum. These prices are sourced from the average of the available forecasts from ten brokers/banks (Barclays, BoAML, Citigroup, Credit Suisse, Deutsche Bank, Goldman Sachs, JP Morgan, Macquarie, Morgan Stanley and UBS) and two analysts (CRU and Woodmac). 4. Bingham Canyon Open Pit molybdenum grades interpolated from exploration drilling assays have been factored based on a long reconciliation history to blast hole and mill samples. 5. Escondida Mineral Resources are reported for the first time in accordance with Regulation S-K 1300. 6. Escondida Mineral Resource valuations are based on a copper price of US c 304 /lb. supplied by the JV partner. 7. Oyu Tolgoi Mineral Resource valuations are based on commodity prices of US c 320.30 /lb for copper, US$ 1,479.82 /oz for gold, US$ 19.23 /oz for silver and US 9.29 /lb for molybdenum. These represent July 2021 consensus prices sourced from the average forecasts from ten brokers/banks (Barclays, BoAML, Citigroup, Credit Suisse, Deutsche Bank, Goldman Sachs, JP Morgan, Macquarie, Morgan Stanley and UBS) and two analysts (CRU and Woodmac). 8. The Hugo Dummett North Mineral Resources include approximately 0.9 million tonnes of stockpiled material at a grade of 0.35% copper, 0.11 g/t gold and 0.85 g/t silver.
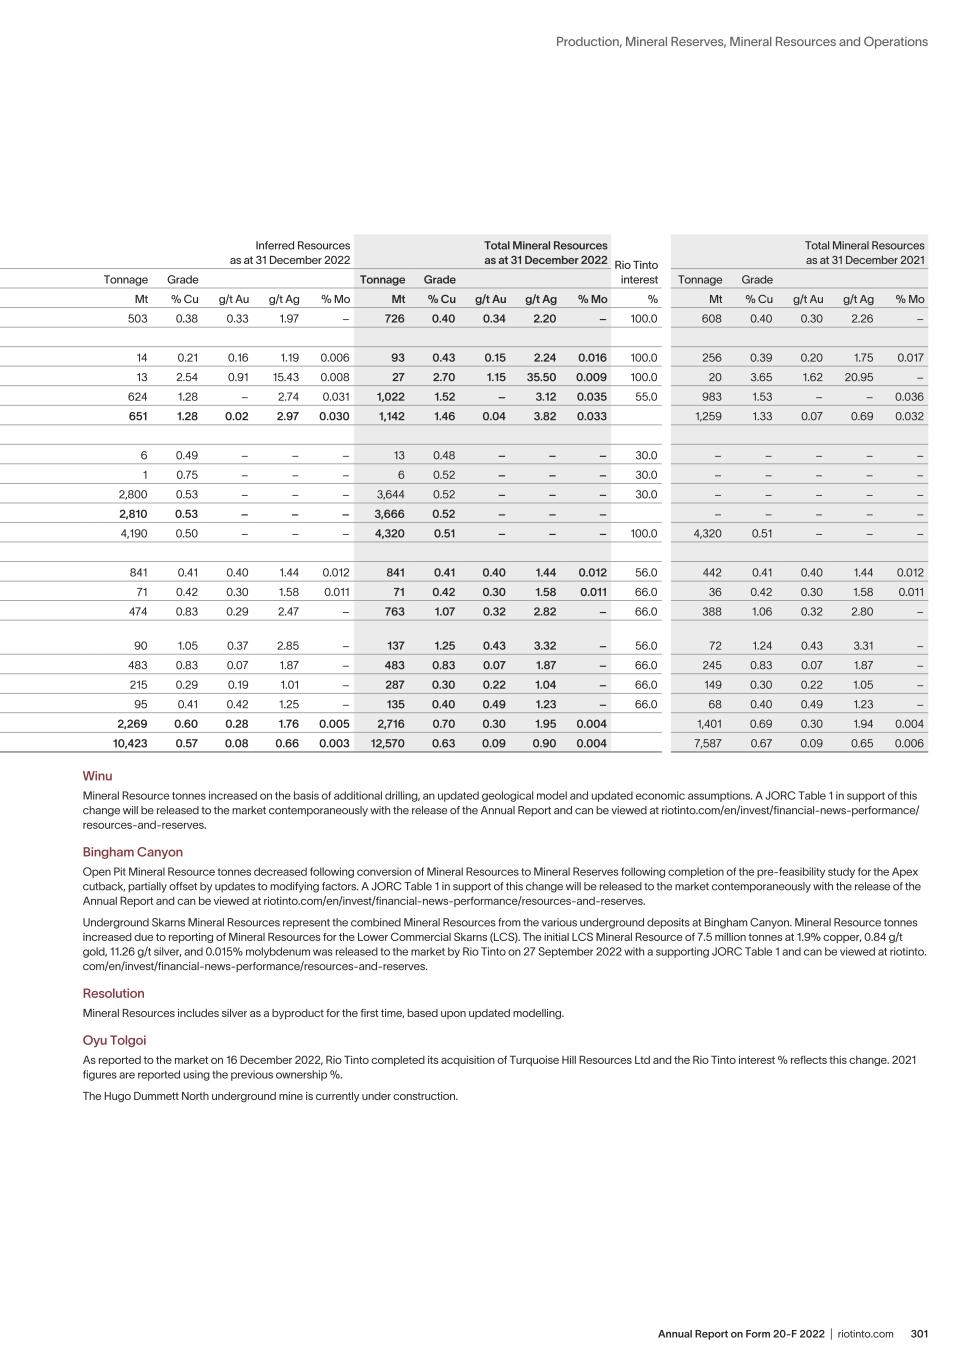
301Annual Report on Form 20-F 2022 | riotinto.com Production, Mineral Reserves, Mineral Resources and Operations Likely mining method1 Measured Resources as at 31 December 2022 Indicated Resources as at 31 December 2022 Total Measured and Indicated Resources as at 31 December 2022 Inferred Resources as at 31 December 2022 Total Mineral Resources as at 31 December 2022 Rio Tinto interest Total Mineral Resources as at 31 December 2021 Tonnage Grade Tonnage Grade Tonnage Grade Tonnage Grade Tonnage Grade Tonnage Grade Copper2 3 Mt % Cu g/t Au g/t Ag % Mo Mt % Cu g/t Au g/t Ag % Mo Mt % Cu g/t Au g/t Ag % Mo Mt % Cu g/t Au g/t Ag % Mo Mt % Cu g/t Au g/t Ag % Mo % Mt % Cu g/t Au g/t Ag % Mo Winu (Australia) O/P – – – – – 223 0.45 0.35 2.72 – 223 0.45 0.35 2.72 – 503 0.38 0.33 1.97 – 726 0.40 0.34 2.20 – 100.0 608 0.40 0.30 2.26 – Bingham Canyon (US) – Bingham Open Pit4 O/P 49 0.50 0.15 2.42 0.019 30 0.42 0.15 2.44 0.015 79 0.47 0.15 2.43 0.018 14 0.21 0.16 1.19 0.006 93 0.43 0.15 2.24 0.016 100.0 256 0.39 0.20 1.75 0.017 – Underground Skarns U/G 0.2 2.52 1.27 10.56 0.056 14 2.86 1.38 55.35 0.010 14 2.86 1.38 54.85 0.010 13 2.54 0.91 15.43 0.008 27 2.70 1.15 35.50 0.009 100.0 20 3.65 1.62 20.95 – Resolution (US) U/G – – – – – 398 1.89 – 3.70 0.042 398 1.89 – 3.70 0.042 624 1.28 – 2.74 0.031 1,022 1.52 – 3.12 0.035 55.0 983 1.53 – – 0.036 Total (US) 49 0.51 0.15 2.45 0.019 442 1.82 0.05 5.22 0.039 491 1.69 0.06 4.95 0.037 651 1.28 0.02 2.97 0.030 1,142 1.46 0.04 3.82 0.033 1,259 1.33 0.07 0.69 0.032 Escondida (Chile)5 6 – Escondida - mixed O/P 2 0.53 – – – 5 0.44 – – – 7 0.47 – – – 6 0.49 – – – 13 0.48 – – – 30.0 – – – – – – Escondida - oxide O/P 2 0.48 – – – 3 0.47 – – – 5 0.48 – – – 1 0.75 – – – 6 0.52 – – – 30.0 – – – – – – Escondida - sulphide O/P 311 0.49 – – – 533 0.49 – – – 844 0.49 – – – 2,800 0.53 – – – 3,644 0.52 – – – 30.0 – – – – – Total (Chile) 315 0.49 – – – 541 0.49 – – – 856 0.49 – – – 2,810 0.53 – – – 3,666 0.52 – – – – – – – – La Granja (Peru) O/P – – – – – 130 0.85 – – – 130 0.85 – – – 4,190 0.50 – – – 4,320 0.51 – – – 100.0 4,320 0.51 – – – Oyu Tolgoi (Mongolia)7 – Heruga ETG U/G – – – – – – – – – – – – – – – 841 0.41 0.40 1.44 0.012 841 0.41 0.40 1.44 0.012 56.0 442 0.41 0.40 1.44 0.012 – Heruga OT U/G – – – – – – – – – – – – – – – 71 0.42 0.30 1.58 0.011 71 0.42 0.30 1.58 0.011 66.0 36 0.42 0.30 1.58 0.011 – Hugo Dummett North8 U/G 38 1.90 0.50 4.30 – 251 1.39 0.35 3.24 – 289 1.46 0.37 3.38 – 474 0.83 0.29 2.47 – 763 1.07 0.32 2.82 – 66.0 388 1.06 0.32 2.80 – – Hugo Dummett North Extension U/G – – – – – 48 1.62 0.55 4.21 – 48 1.62 0.55 4.21 – 90 1.05 0.37 2.85 – 137 1.25 0.43 3.32 – 56.0 72 1.24 0.43 3.31 – – Hugo Dummett South U/G – – – – – – – – – – – – – – – 483 0.83 0.07 1.87 – 483 0.83 0.07 1.87 – 66.0 245 0.83 0.07 1.87 – – Oyut Open Pit O/P 11 0.41 0.38 1.10 – 61 0.33 0.30 1.13 – 72 0.34 0.31 1.12 – 215 0.29 0.19 1.01 – 287 0.30 0.22 1.04 – 66.0 149 0.30 0.22 1.05 – – Oyut Underground U/G 6 0.48 0.91 1.31 – 33 0.38 0.61 1.18 – 39 0.40 0.66 1.20 – 95 0.41 0.42 1.25 – 135 0.40 0.49 1.23 – 66.0 68 0.40 0.49 1.23 – Total (Mongolia) 55 1.44 0.53 3.33 – 393 1.17 0.39 2.86 – 448 1.20 0.41 2.91 – 2,269 0.60 0.28 1.76 0.005 2,716 0.70 0.30 1.95 0.004 1,401 0.69 0.30 1.94 0.004 Total copper 419 0.62 0.09 0.72 0.002 1,729 1.01 0.15 2.34 0.010 2,148 0.93 0.14 2.02 0.008 10,423 0.57 0.08 0.66 0.003 12,570 0.63 0.09 0.90 0.004 7,587 0.67 0.09 0.65 0.006 Winu Mineral Resource tonnes increased on the basis of additional drilling, an updated geological model and updated economic assumptions. A JORC Table 1 in support of this change will be released to the market contemporaneously with the release of the Annual Report and can be viewed at riotinto.com/en/invest/financial-news-performance/ resources-and-reserves. Bingham Canyon Open Pit Mineral Resource tonnes decreased following conversion of Mineral Resources to Mineral Reserves following completion of the pre-feasibility study for the Apex cutback, partially offset by updates to modifying factors. A JORC Table 1 in support of this change will be released to the market contemporaneously with the release of the Annual Report and can be viewed at riotinto.com/en/invest/financial-news-performance/resources-and-reserves. Underground Skarns Mineral Resources represent the combined Mineral Resources from the various underground deposits at Bingham Canyon. Mineral Resource tonnes increased due to reporting of Mineral Resources for the Lower Commercial Skarns (LCS). The initial LCS Mineral Resource of 7.5 million tonnes at 1.9% copper, 0.84 g/t gold, 11.26 g/t silver, and 0.015% molybdenum was released to the market by Rio Tinto on 27 September 2022 with a supporting JORC Table 1 and can be viewed at riotinto. com/en/invest/financial-news-performance/resources-and-reserves. Resolution Mineral Resources includes silver as a byproduct for the first time, based upon updated modelling. Oyu Tolgoi As reported to the market on 16 December 2022, Rio Tinto completed its acquisition of Turquoise Hill Resources Ltd and the Rio Tinto interest % reflects this change. 2021 figures are reported using the previous ownership %. The Hugo Dummett North underground mine is currently under construction.
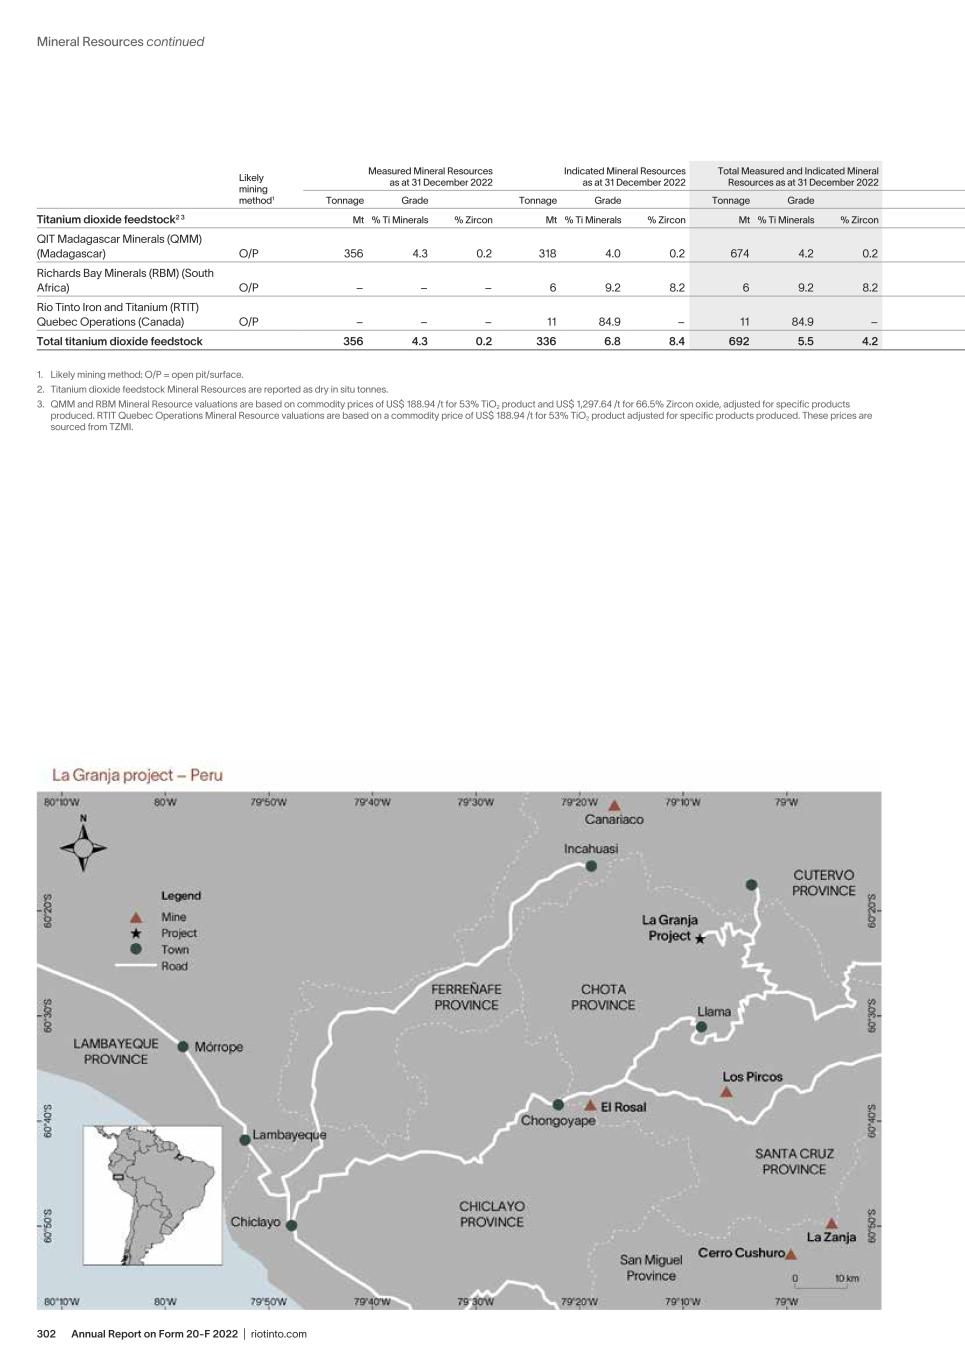
Annual Report on Form 20-F 2022 | riotinto.com302 Mineral Resources continued Likely mining method1 Measured Mineral Resources as at 31 December 2022 Indicated Mineral Resources as at 31 December 2022 Total Measured and Indicated Mineral Resources as at 31 December 2022 Inferred Resources Mineral as at 31 December 2022 Total Mineral Resources as at 31 December 2022 Rio Tinto interest Total Mineral Resources as at 31 December 2021 Tonnage Grade Tonnage Grade Tonnage Grade Tonnage Grade Tonnage Grade Tonnage Grade Titanium dioxide feedstock2 3 Mt % Ti Minerals % Zircon Mt % Ti Minerals % Zircon Mt % Ti Minerals % Zircon Mt % Ti Minerals % Zircon Mt % Ti Minerals % Zircon % Mt % Ti Minerals % Zircon QIT Madagascar Minerals (QMM) (Madagascar) O/P 356 4.3 0.2 318 4.0 0.2 674 4.2 0.2 477 3.9 0.2 1,151 4.1 0.2 80.0 1,176 4.1 0.2 Richards Bay Minerals (RBM) (South Africa) O/P – – – 6 9.2 8.2 6 9.2 8.2 – – – 6 9.2 8.2 74.0 7 9.5 7.8 Rio Tinto Iron and Titanium (RTIT) Quebec Operations (Canada) O/P – – – 11 84.9 – 11 84.9 – 16 79.2 – 27 81.6 – 100.0 27 81.6 – Total titanium dioxide feedstock 356 4.3 0.2 336 6.8 8.4 692 5.5 4.2 492 6.3 0.2 1,184 5.8 2.5 1,210 5.9 4.8 1. Likely mining method: O/P = open pit/surface. 2. Titanium dioxide feedstock Mineral Resources are reported as dry in situ tonnes. 3. QMM and RBM Mineral Resource valuations are based on commodity prices of US$ 188.94 /t for 53% TiO2 product and US$ 1,297.64 /t for 66.5% Zircon oxide, adjusted for specific products produced. RTIT Quebec Operations Mineral Resource valuations are based on a commodity price of US$ 188.94 /t for 53% TiO2 product adjusted for specific products produced. These prices are sourced from TZMI.
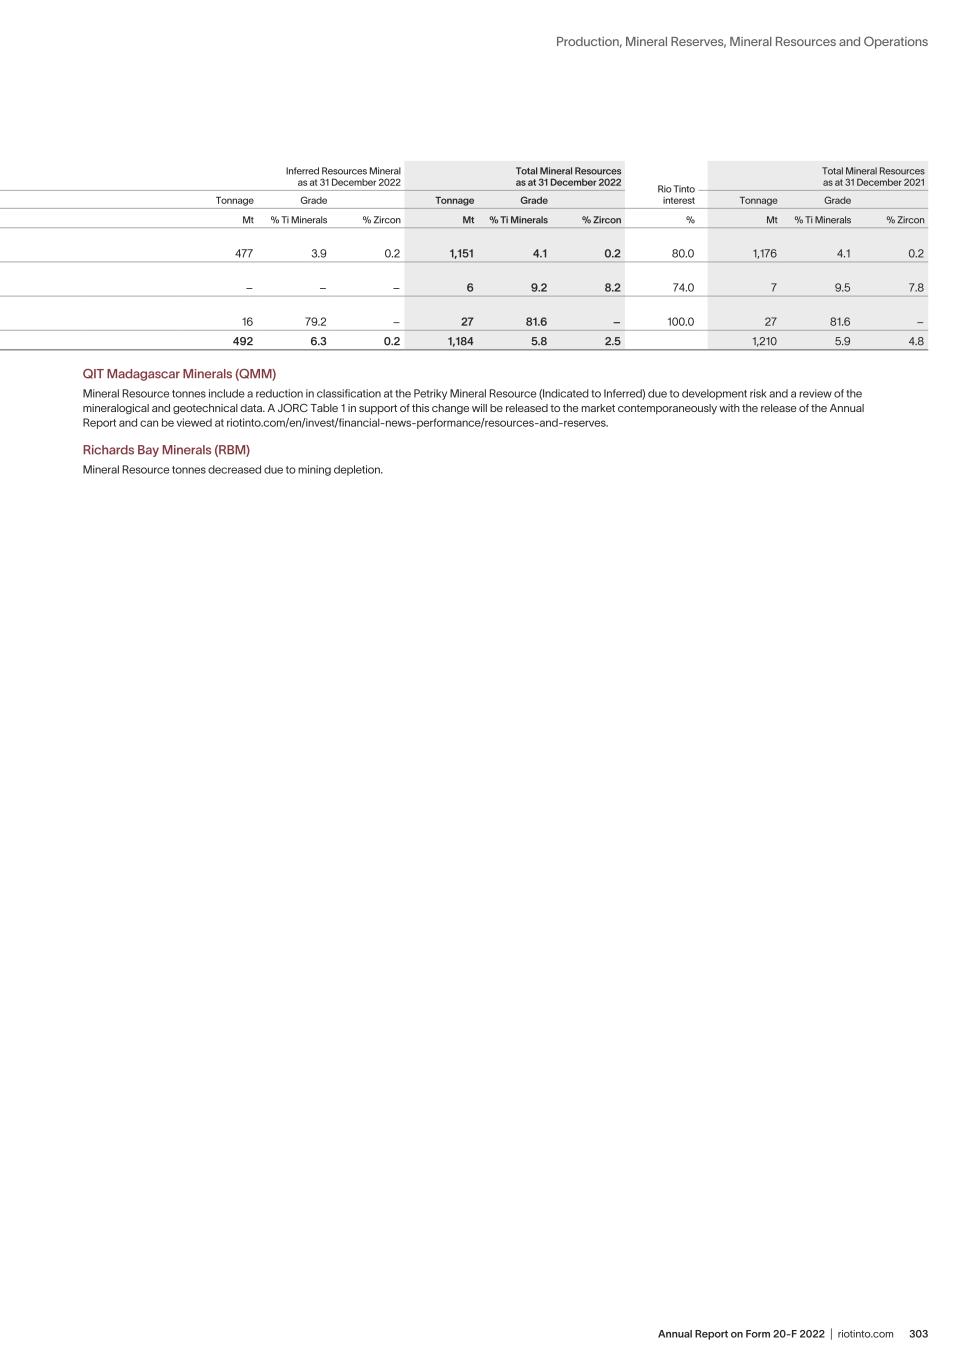
303Annual Report on Form 20-F 2022 | riotinto.com Production, Mineral Reserves, Mineral Resources and Operations Likely mining method1 Measured Mineral Resources as at 31 December 2022 Indicated Mineral Resources as at 31 December 2022 Total Measured and Indicated Mineral Resources as at 31 December 2022 Inferred Resources Mineral as at 31 December 2022 Total Mineral Resources as at 31 December 2022 Rio Tinto interest Total Mineral Resources as at 31 December 2021 Tonnage Grade Tonnage Grade Tonnage Grade Tonnage Grade Tonnage Grade Tonnage Grade Titanium dioxide feedstock2 3 Mt % Ti Minerals % Zircon Mt % Ti Minerals % Zircon Mt % Ti Minerals % Zircon Mt % Ti Minerals % Zircon Mt % Ti Minerals % Zircon % Mt % Ti Minerals % Zircon QIT Madagascar Minerals (QMM) (Madagascar) O/P 356 4.3 0.2 318 4.0 0.2 674 4.2 0.2 477 3.9 0.2 1,151 4.1 0.2 80.0 1,176 4.1 0.2 Richards Bay Minerals (RBM) (South Africa) O/P – – – 6 9.2 8.2 6 9.2 8.2 – – – 6 9.2 8.2 74.0 7 9.5 7.8 Rio Tinto Iron and Titanium (RTIT) Quebec Operations (Canada) O/P – – – 11 84.9 – 11 84.9 – 16 79.2 – 27 81.6 – 100.0 27 81.6 – Total titanium dioxide feedstock 356 4.3 0.2 336 6.8 8.4 692 5.5 4.2 492 6.3 0.2 1,184 5.8 2.5 1,210 5.9 4.8 QIT Madagascar Minerals (QMM) Mineral Resource tonnes include a reduction in classification at the Petriky Mineral Resource (Indicated to Inferred) due to development risk and a review of the mineralogical and geotechnical data. A JORC Table 1 in support of this change will be released to the market contemporaneously with the release of the Annual Report and can be viewed at riotinto.com/en/invest/financial-news-performance/resources-and-reserves. Richards Bay Minerals (RBM) Mineral Resource tonnes decreased due to mining depletion.
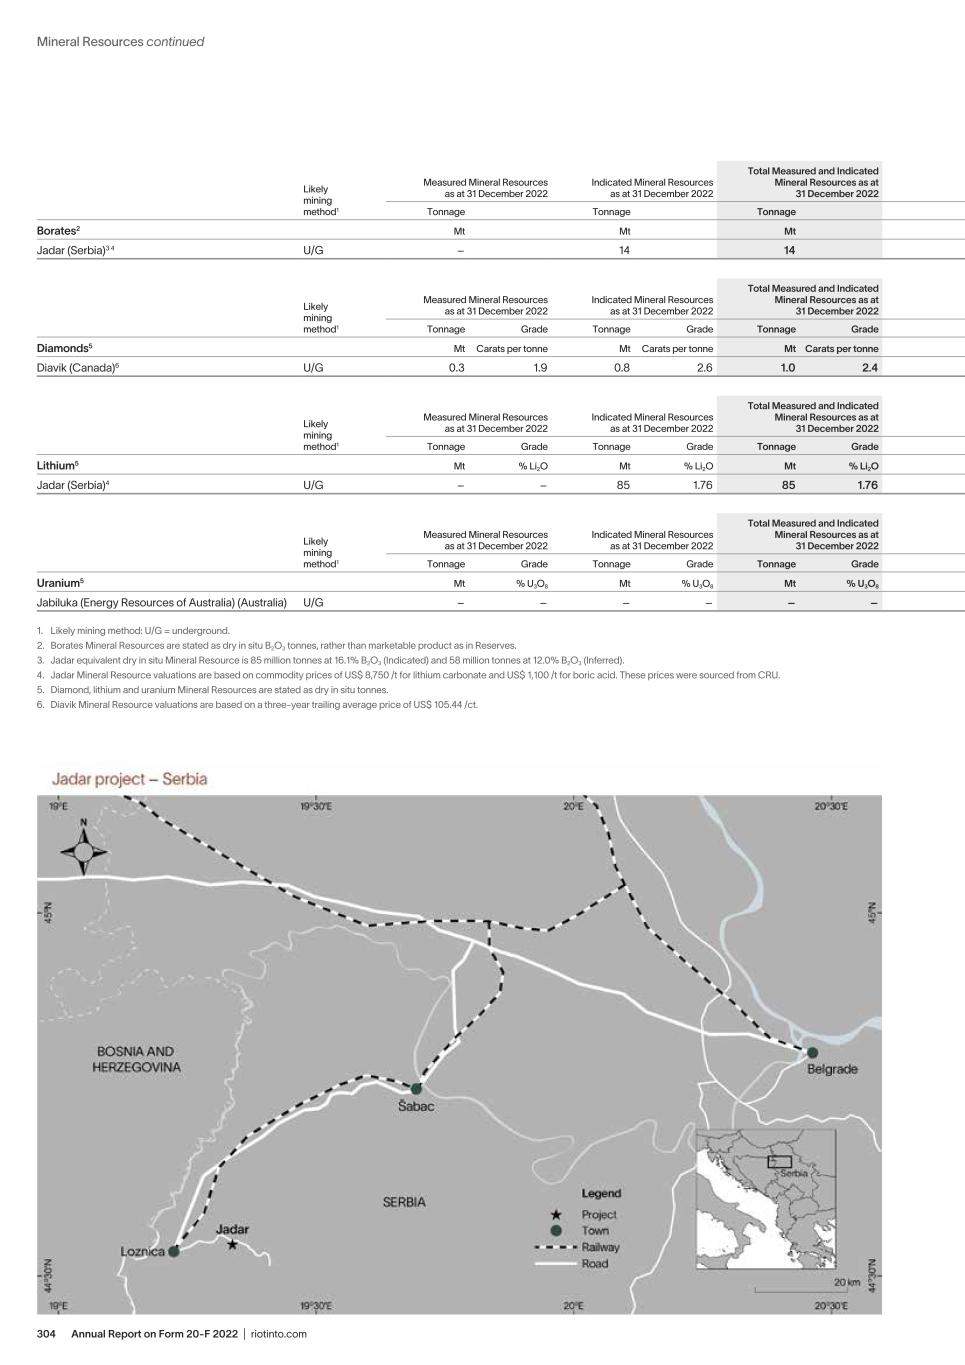
Annual Report on Form 20-F 2022 | riotinto.com304 Mineral Resources continued Likely mining method1 Measured Mineral Resources as at 31 December 2022 Indicated Mineral Resources as at 31 December 2022 Total Measured and Indicated Mineral Resources as at 31 December 2022 Inferred Mineral Resources as at 31 December 2022 Total Mineral Resources as at 31 December 2022 Rio Tinto interest Total Mineral Resources as at 31 December 2021 Tonnage Tonnage Tonnage Tonnage Tonnage Tonnage Borates2 Mt Mt Mt Mt Mt % Mt Jadar (Serbia)3 4 U/G – 14 14 7 21 100.0 21 Likely mining method1 Measured Mineral Resources as at 31 December 2022 Indicated Mineral Resources as at 31 December 2022 Total Measured and Indicated Mineral Resources as at 31 December 2022 Inferred Mineral Resources as at 31 December 2022 Total Mineral Resources as at 31 December 2022 Rio Tinto interest Total Mineral Resources as at 31 December 2021 Tonnage Grade Tonnage Grade Tonnage Grade Tonnage Grade Tonnage Grade Tonnage Grade Diamonds5 Mt Carats per tonne Mt Carats per tonne Mt Carats per tonne Mt Carats per tonne Mt Carats per tonne % Mt Carats per tonne Diavik (Canada)6 U/G 0.3 1.9 0.8 2.6 1.0 2.4 0.3 2.1 1.3 2.3 100.0 2.7 2.4 Likely mining method1 Measured Mineral Resources as at 31 December 2022 Indicated Mineral Resources as at 31 December 2022 Total Measured and Indicated Mineral Resources as at 31 December 2022 Inferred Mineral Resources as at 31 December 2022 Total Mineral Resources as at 31 December 2022 Rio Tinto interest Total Mineral Resources as at 31 December 2021 Tonnage Grade Tonnage Grade Tonnage Grade Tonnage Grade Tonnage Grade Tonnage Grade Lithium5 Mt % Li2O Mt % Li2O Mt % Li2O Mt % Li2O Mt % Li2O % Mt % Li2O Jadar (Serbia)4 U/G – – 85 1.76 85 1.76 58 1.87 144 1.80 100.0 144 1.80 Likely mining method1 Measured Mineral Resources as at 31 December 2022 Indicated Mineral Resources as at 31 December 2022 Total Measured and Indicated Mineral Resources as at 31 December 2022 Inferred Mineral Resources as at 31 December 2022 Total Mineral Resources as at 31 December 2022 Rio Tinto interest Total Mineral Resources as at 31 December 2021 Tonnage Grade Tonnage Grade Tonnage Grade Tonnage Grade Tonnage Grade Tonnage Grade Uranium5 Mt % U3O8 Mt % U3O8 Mt % U3O8 Mt % U3O8 Mt % U3O8 % Mt % U3O8 Jabiluka (Energy Resources of Australia) (Australia) U/G – – – – – – – – – – 86.3 22 0.547 1. Likely mining method: U/G = underground. 2. Borates Mineral Resources are stated as dry in situ B2O3 tonnes, rather than marketable product as in Reserves. 3. Jadar equivalent dry in situ Mineral Resource is 85 million tonnes at 16.1% B2O3 (Indicated) and 58 million tonnes at 12.0% B2O3 (Inferred). 4. Jadar Mineral Resource valuations are based on commodity prices of US$ 8,750 /t for lithium carbonate and US$ 1,100 /t for boric acid. These prices were sourced from CRU. 5. Diamond, lithium and uranium Mineral Resources are stated as dry in situ tonnes. 6. Diavik Mineral Resource valuations are based on a three-year trailing average price of US$ 105.44 /ct.
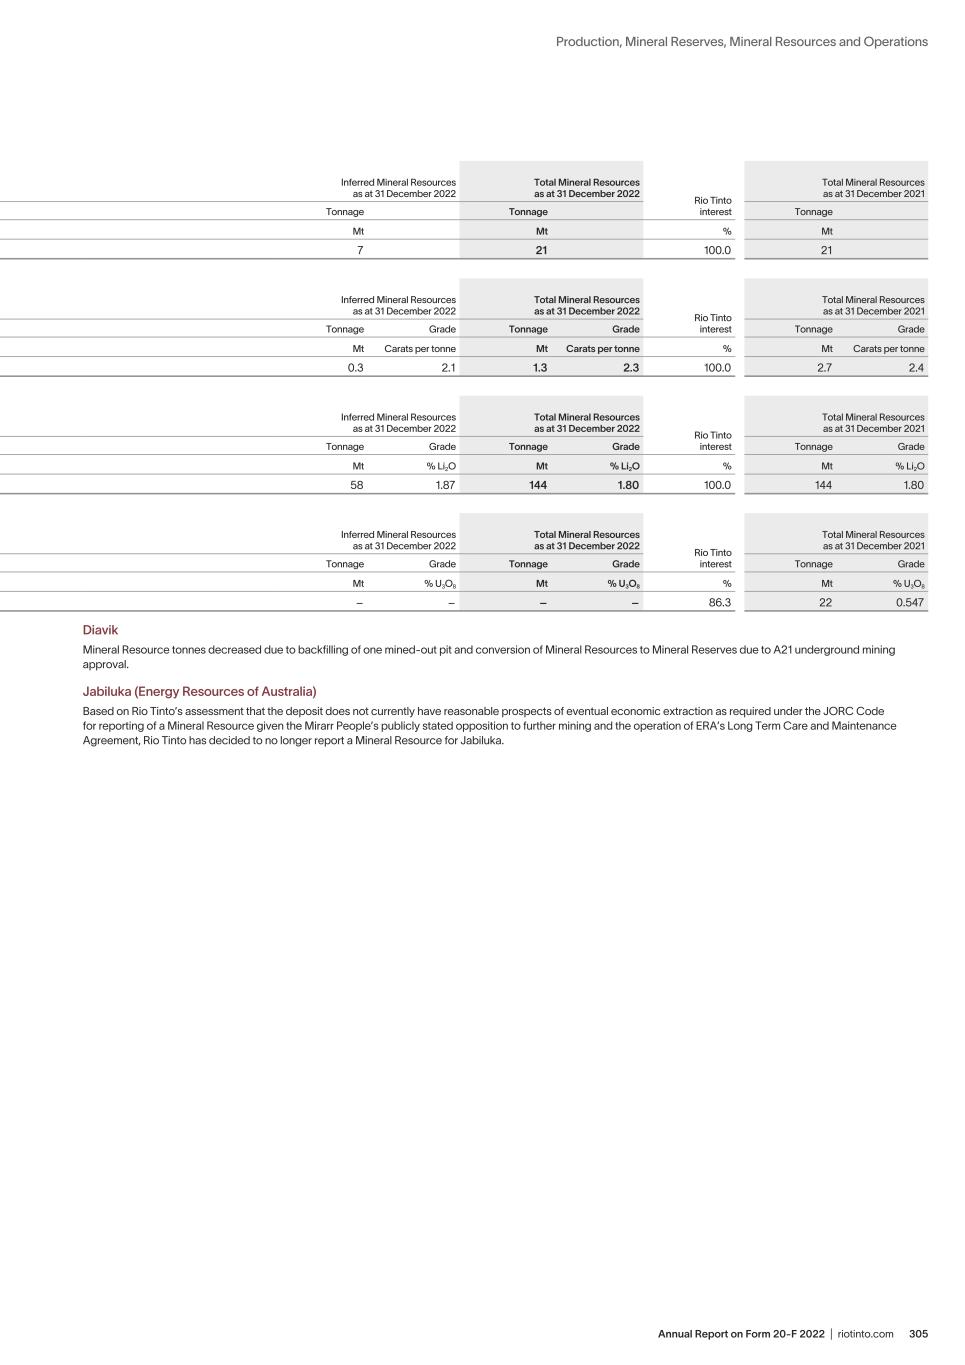
305Annual Report on Form 20-F 2022 | riotinto.com Production, Mineral Reserves, Mineral Resources and Operations Likely mining method1 Measured Mineral Resources as at 31 December 2022 Indicated Mineral Resources as at 31 December 2022 Total Measured and Indicated Mineral Resources as at 31 December 2022 Inferred Mineral Resources as at 31 December 2022 Total Mineral Resources as at 31 December 2022 Rio Tinto interest Total Mineral Resources as at 31 December 2021 Tonnage Tonnage Tonnage Tonnage Tonnage Tonnage Borates2 Mt Mt Mt Mt Mt % Mt Jadar (Serbia)3 4 U/G – 14 14 7 21 100.0 21 Likely mining method1 Measured Mineral Resources as at 31 December 2022 Indicated Mineral Resources as at 31 December 2022 Total Measured and Indicated Mineral Resources as at 31 December 2022 Inferred Mineral Resources as at 31 December 2022 Total Mineral Resources as at 31 December 2022 Rio Tinto interest Total Mineral Resources as at 31 December 2021 Tonnage Grade Tonnage Grade Tonnage Grade Tonnage Grade Tonnage Grade Tonnage Grade Diamonds5 Mt Carats per tonne Mt Carats per tonne Mt Carats per tonne Mt Carats per tonne Mt Carats per tonne % Mt Carats per tonne Diavik (Canada)6 U/G 0.3 1.9 0.8 2.6 1.0 2.4 0.3 2.1 1.3 2.3 100.0 2.7 2.4 Likely mining method1 Measured Mineral Resources as at 31 December 2022 Indicated Mineral Resources as at 31 December 2022 Total Measured and Indicated Mineral Resources as at 31 December 2022 Inferred Mineral Resources as at 31 December 2022 Total Mineral Resources as at 31 December 2022 Rio Tinto interest Total Mineral Resources as at 31 December 2021 Tonnage Grade Tonnage Grade Tonnage Grade Tonnage Grade Tonnage Grade Tonnage Grade Lithium5 Mt % Li2O Mt % Li2O Mt % Li2O Mt % Li2O Mt % Li2O % Mt % Li2O Jadar (Serbia)4 U/G – – 85 1.76 85 1.76 58 1.87 144 1.80 100.0 144 1.80 Likely mining method1 Measured Mineral Resources as at 31 December 2022 Indicated Mineral Resources as at 31 December 2022 Total Measured and Indicated Mineral Resources as at 31 December 2022 Inferred Mineral Resources as at 31 December 2022 Total Mineral Resources as at 31 December 2022 Rio Tinto interest Total Mineral Resources as at 31 December 2021 Tonnage Grade Tonnage Grade Tonnage Grade Tonnage Grade Tonnage Grade Tonnage Grade Uranium5 Mt % U3O8 Mt % U3O8 Mt % U3O8 Mt % U3O8 Mt % U3O8 % Mt % U3O8 Jabiluka (Energy Resources of Australia) (Australia) U/G – – – – – – – – – – 86.3 22 0.547 Diavik Mineral Resource tonnes decreased due to backfilling of one mined-out pit and conversion of Mineral Resources to Mineral Reserves due to A21 underground mining approval. Jabiluka (Energy Resources of Australia) Based on Rio Tinto’s assessment that the deposit does not currently have reasonable prospects of eventual economic extraction as required under the JORC Code for reporting of a Mineral Resource given the Mirarr People’s publicly stated opposition to further mining and the operation of ERA’s Long Term Care and Maintenance Agreement, Rio Tinto has decided to no longer report a Mineral Resource for Jabiluka.
Annual Report on Form 20-F 2022 | riotinto.com306 Mineral Resources continued Mineral Resource and Ore Reserve governance and internal controls Rio Tinto has well-established governance processes and internal controls to support the generation and publication of Mineral Resources and Ore Reserves, including a series of business unit and product group structures and processes independent of operational reporting. Audit Committee The Audit Committee’s remit includes the governance of Mineral Resources and Ore Reserves. This includes an annual review of Mineral Resources and Ore Reserves at a Group level, as well as a review of findings and progress from the Group Internal Audit programme. Ore Reserves Steering Committee The Ore Reserves Steering Committee (ORSC), chaired by the Chief Technical Officer, Development & Technology, meets at least quarterly. The ORSC comprises senior representatives across our technical, financial, governance and business groups, and oversees the appointment of Competent Persons nominated by the business units; reviews Exploration Results, Mineral Resource or Ore Reserve data prior to public reporting; and oversees the development of the Group Mineral Resource and Ore Reserve standards and guidance. Orebody Knowledge Centre of Excellence The Orebody Knowledge Centre of Excellence contains a dedicated Orebody Knowledge Technical Assurance team. Orebody Knowledge Technical Assurance, in conjunction with the ORSC, is the guardian and author of Group Mineral Resource and Ore Reserve standards and guidance, and is responsible for the governance and compilation of Group Mineral Resource, Ore Reserve and reconciliation reporting. The Technical Assurance team also monitors the external reporting environment, facilitates internal audits and monitors actions with Group Internal Audit. Group Internal Audit Mineral Resource and Ore Reserve internal audits are conducted by independent external consulting personnel in a programme managed by Group Internal Audit, with the assistance of the Orebody Knowledge Centre of Excellence and the ORSC. Material findings are reported outside of the product group reporting line to the Audit Committee, and all reports and action plans are reviewed by the ORSC for alignment to internal and external reporting standards. During 2022, two internal Mineral Resource and Ore Reserve audits were completed. Geoscientific information management and assurance We employ industry-standard drilling, sampling, assaying and quality assurance/ quality control (QA/QC) practices supported by formally documented procedures. Diamond core and reverse circulation are our primary drilling methods. We use other methods such as sonic and air core if appropriate for the style of deposit. Drill hole locations are typically confirmed by high- precision differential Global Positioning System (GPS) and down-hole trace positioning is primarily achieved by gyroscopic survey. Drill sample recovery is typically recorded, and all geological data is collected by qualified geoscientific professionals. Geological logging consistency is secured via formal logging procedures and training, reference materials, application of geological code libraries and digital logging directly to the geological database. On-site or commercial laboratories provide appropriate analytical (assaying) techniques, according to the commodity and style of deposit. Reliability of assay data is maintained via QA/QC procedures, which monitor assay accuracy and precision through the analysis of blanks, sample duplicates and matrix-matched certified reference materials. Our geoscientific information management standard is the industry-leading acQuire system and we employ strict QA/QC criteria to ensure only high-quality assay data is uploaded to a project’s database. Mineral Resource and Ore Reserve risk management Risks to our Mineral Resource and Ore Reserve estimates are managed through comprehensive risk assessments undertaken in support of the annual reporting cycle. Risks are identified and managed by verifying controls, determining and undertaking suitable actions to remove or reduce the risk, conducting reviews, and maintaining compliance with standards and procedures. Risks are managed through a commercial risk management solution. At the end of each reporting cycle, we analyse the Mineral Resource and Ore Reserve risks across all business units to ensure both consistency of reporting and determine any Group-wide risks to the various processes.
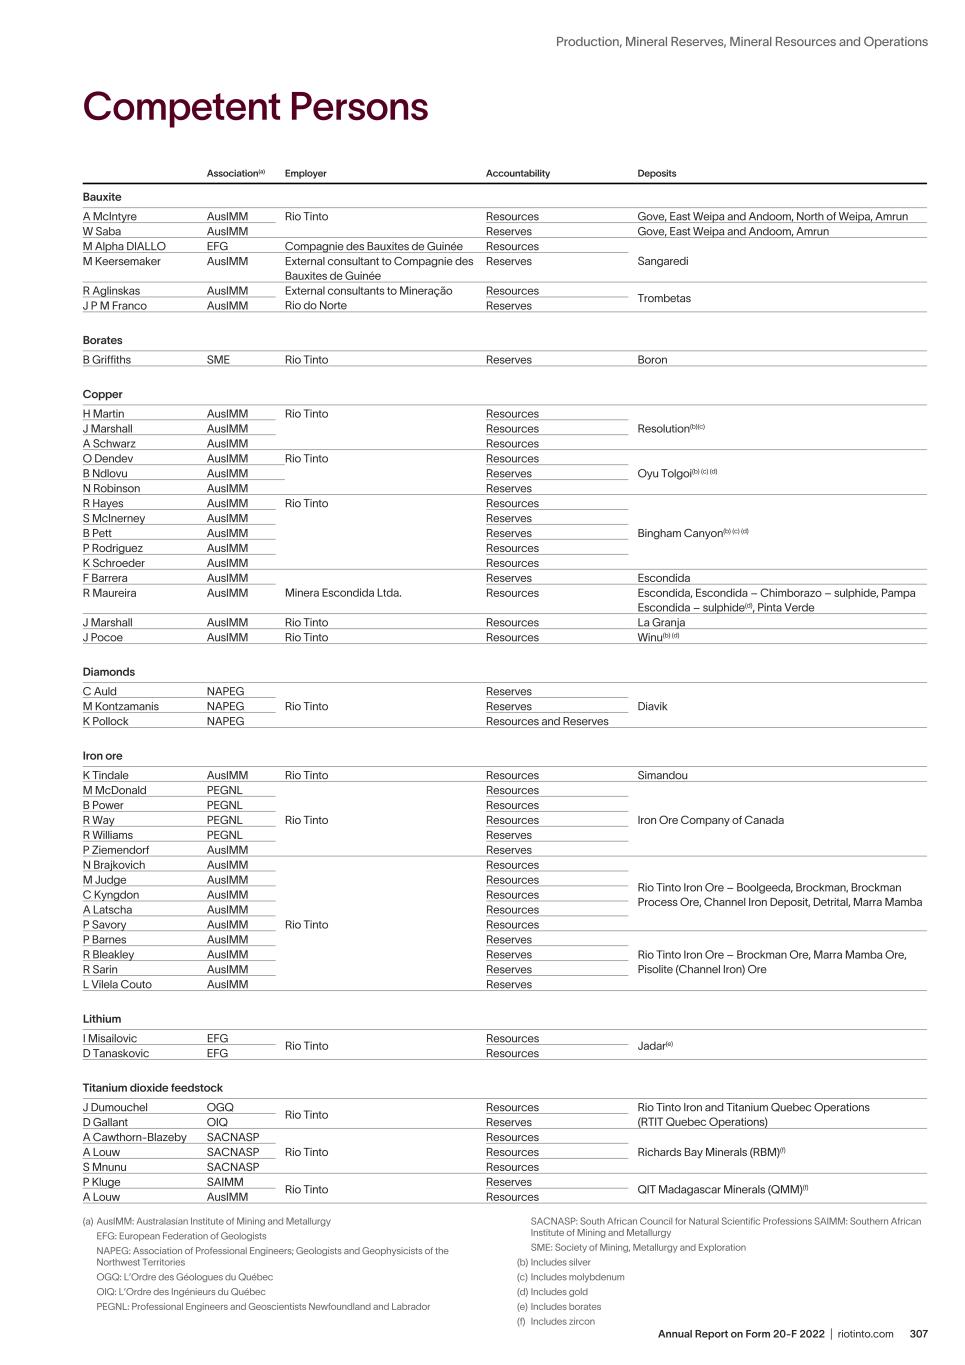
307Annual Report on Form 20-F 2022 | riotinto.com Production, Mineral Reserves, Mineral Resources and Operations Competent Persons Association(a) Employer Accountability Deposits Bauxite A McIntyre AusIMM Rio Tinto Resources Gove, East Weipa and Andoom, North of Weipa, Amrun W Saba AusIMM Reserves Gove, East Weipa and Andoom, Amrun M Alpha DIALLO EFG Compagnie des Bauxites de Guinée Resources SangarediM Keersemaker AusIMM External consultant to Compagnie des Bauxites de Guinée Reserves R Aglinskas AusIMM External consultants to Mineração Rio do Norte Resources Trombetas J P M Franco AusIMM Reserves Borates B Griffiths SME Rio Tinto Reserves Boron Copper H Martin AusIMM Rio Tinto Resources Resolution(b)(c) J Marshall AusIMM Resources A Schwarz AusIMM Resources O Dendev AusIMM Rio Tinto Resources Oyu Tolgoi(b) (c) (d)B Ndlovu AusIMM Reserves N Robinson AusIMM Reserves R Hayes AusIMM Rio Tinto Resources Bingham Canyon(b) (c) (d) S McInerney AusIMM Reserves B Pett AusIMM Reserves P Rodriguez AusIMM Resources K Schroeder AusIMM Resources F Barrera AusIMM Minera Escondida Ltda. Reserves Escondida R Maureira AusIMM Resources Escondida, Escondida – Chimborazo – sulphide, Pampa Escondida – sulphide(d), Pinta Verde J Marshall AusIMM Rio Tinto Resources La Granja J Pocoe AusIMM Rio Tinto Resources Winu(b) (d) Diamonds C Auld NAPEG Rio Tinto Reserves DiavikM Kontzamanis NAPEG Reserves K Pollock NAPEG Resources and Reserves Iron ore K Tindale AusIMM Rio Tinto Resources Simandou M McDonald PEGNL Rio Tinto Resources Iron Ore Company of Canada B Power PEGNL Resources R Way PEGNL Resources R Williams PEGNL Reserves P Ziemendorf AusIMM Reserves N Brajkovich AusIMM Rio Tinto Resources Rio Tinto Iron Ore – Boolgeeda, Brockman, Brockman Process Ore, Channel Iron Deposit, Detrital, Marra Mamba M Judge AusIMM Resources C Kyngdon AusIMM Resources A Latscha AusIMM Resources P Savory AusIMM Resources P Barnes AusIMM Reserves Rio Tinto Iron Ore – Brockman Ore, Marra Mamba Ore, Pisolite (Channel Iron) Ore R Bleakley AusIMM Reserves R Sarin AusIMM Reserves L Vilela Couto AusIMM Reserves Lithium I Misailovic EFG Rio Tinto Resources Jadar(e) D Tanaskovic EFG Resources Titanium dioxide feedstock J Dumouchel OGQ Rio Tinto Resources Rio Tinto Iron and Titanium Quebec Operations (RTIT Quebec Operations)D Gallant OIQ Reserves A Cawthorn-Blazeby SACNASP Rio Tinto Resources Richards Bay Minerals (RBM)(f)A Louw SACNASP Resources S Mnunu SACNASP Resources P Kluge SAIMM Rio Tinto Reserves QIT Madagascar Minerals (QMM)(f) A Louw AusIMM Resources (a) AusIMM: Australasian Institute of Mining and Metallurgy EFG: European Federation of Geologists NAPEG: Association of Professional Engineers; Geologists and Geophysicists of the Northwest Territories OGQ: L’Ordre des Géologues du Québec OIQ: L’Ordre des Ingénieurs du Québec PEGNL: Professional Engineers and Geoscientists Newfoundland and Labrador SACNASP: South African Council for Natural Scientific Professions SAIMM: Southern African Institute of Mining and Metallurgy SME: Society of Mining, Metallurgy and Exploration (b) Includes silver (c) Includes molybdenum (d) Includes gold (e) Includes borates (f) Includes zircon
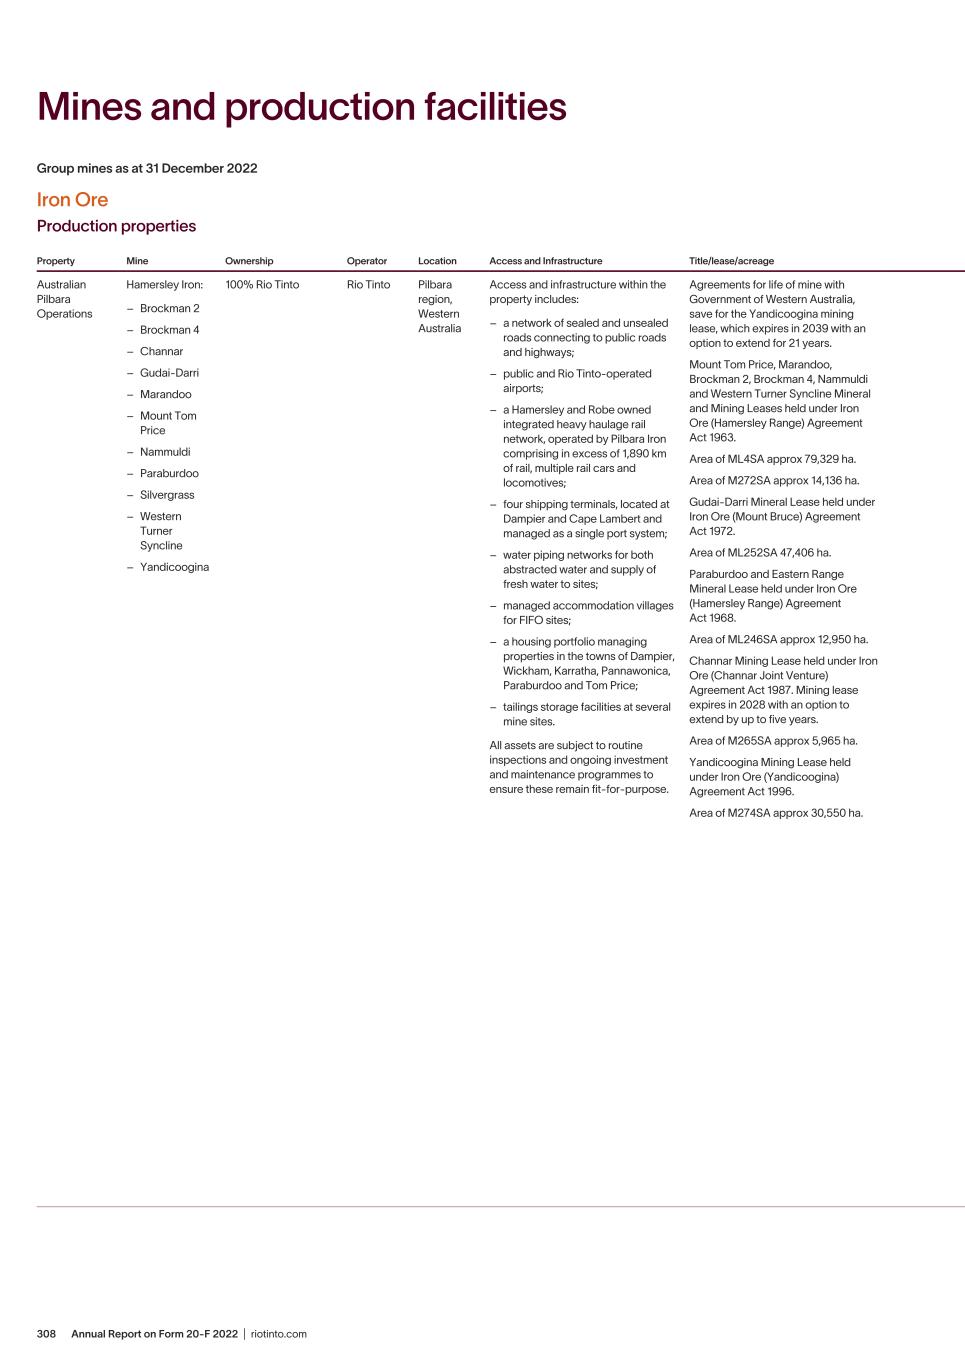
Annual Report on Form 20-F 2022 | riotinto.com308 Group mines as at 31 December 2022 Iron Ore Production properties Property Mine Ownership Operator Location Access and Infrastructure Title/lease/acreage Key permit conditions History Property description / type of mine Type of mineralisation Processing plants and other available facilities Power source Australian Pilbara Operations Hamersley Iron: – Brockman 2 – Brockman 4 – Channar – Gudai-Darri – Marandoo – Mount Tom Price – Nammuldi – Paraburdoo – Silvergrass – Western Turner Syncline – Yandicoogina 100% Rio Tinto Rio Tinto Pilbara region, Western Australia Access and infrastructure within the property includes: – a network of sealed and unsealed roads connecting to public roads and highways; – public and Rio Tinto-operated airports; – a Hamersley and Robe owned integrated heavy haulage rail network, operated by Pilbara Iron comprising in excess of 1,890 km of rail, multiple rail cars and locomotives; – four shipping terminals, located at Dampier and Cape Lambert and managed as a single port system; – water piping networks for both abstracted water and supply of fresh water to sites; – managed accommodation villages for FIFO sites; – a housing portfolio managing properties in the towns of Dampier, Wickham, Karratha, Pannawonica, Paraburdoo and Tom Price; – tailings storage facilities at several mine sites. All assets are subject to routine inspections and ongoing investment and maintenance programmes to ensure these remain fit-for-purpose. Agreements for life of mine with Government of Western Australia, save for the Yandicoogina mining lease, which expires in 2039 with an option to extend for 21 years. Mount Tom Price, Marandoo, Brockman 2, Brockman 4, Nammuldi and Western Turner Syncline Mineral and Mining Leases held under Iron Ore (Hamersley Range) Agreement Act 1963. Area of ML4SA approx 79,329 ha. Area of M272SA approx 14,136 ha. Gudai-Darri Mineral Lease held under Iron Ore (Mount Bruce) Agreement Act 1972. Area of ML252SA 47,406 ha. Paraburdoo and Eastern Range Mineral Lease held under Iron Ore (Hamersley Range) Agreement Act 1968. Area of ML246SA approx 12,950 ha. Channar Mining Lease held under Iron Ore (Channar Joint Venture) Agreement Act 1987. Mining lease expires in 2028 with an option to extend by up to five years. Area of M265SA approx 5,965 ha. Yandicoogina Mining Lease held under Iron Ore (Yandicoogina) Agreement Act 1996. Area of M274SA approx 30,550 ha. State Agreement conditions are set by the Western Australian Government and broadly comprise environmental compliance and reporting obligations; closure and rehabilitation considerations; local procurement and community initiatives/ investment requirements; and payment of taxes and government royalties. The current business also operates under an Indigenous Land Use Agreement (ILUA) which includes commitments for payments made to trust accounts; Indigenous employment and business opportunities; and heritage and cultural protections. Mount Tom Price began operations in 1966, followed by Paraburdoo in 1974. During the 1990s, Channar (1990), Brockman 2 (1992), Marandoo (1994) and Yandicoogina (1998) achieved first ore. Nammuldi achieved first ore in 2006 followed by Brockman 4 (2010), Western Turner Syncline (2011) and Silvergrass (2017). The latest addition to the network of Hamersley Iron mines is Gudai-Darri, had first ore railed in December 2021, and commissioned its primary crusher in Q2 2022. All mines operated by Rio Tinto within the property are open pit mines. The mining method employed uses conventional surface mining, whereby shovels and loaders are used to load drilled and blasted material into trucks for removal to waste dumps and stockpiles or feed to process plants. In addition to mining activities, Rio Tinto conducts both exploration and development drilling across the property. Brockman 2, Brockman 4, Channar, Gudai-Darri, Tom Price, Paraburdoo and Western Turner Syncline: mineralisation is haematite/ goethite mineralisation hosted within the banded iron formations of the Brockman Formation. Detrital deposits also occur at these sites. At Tom Price and Western Turner Syncline, some goethite/haematite mineralisation hosted within the Marra Mamba Formation also occurs. Marandoo and Silvergrass: mineralisation occurs as goethite/ haematite within the banded iron formations of the Marra Mamba Formation. Some detrital mineralisation also occurs. Yandicoogina: goethite mineralisation occurs as pisolite ores within the paleo-channel of a channel iron formation. At Brockman 2, Brockman 4, the Nammuldi dry plant and Gudai-Darri, dry crushing and screening is used to produce lump and fines iron ore products. Ore from the Silvergrass and Nammuldi mines is blended and processed through a wet scrubbing and screening plant, ahead of desliming of the fines product using hydrocyclones. At Marandoo, wet scrubbing and screening is used to produce lump and fines iron ore products, prior to desliming of fines products using hydrocyclones. Ore from the Channar and Paraburdoo mines is crushed and then processed through a central tertiary crushing and dry screening plant to produce a dry lump product, with further wet processing of the fines using hydrocyclones to remove slimes. Ore from the Tom Price and Western Turner Syncline mines is directed to either the high grade plant for dry crushing and screening to dry lump and fines products, or to the low grade plant for beneficiation. Heavy media separation is used to beneficiate low grade lump, and a combination of heavy media hydrocyclones and spirals is used to beneficiate the low grade fines. At Yandi, ore is crushed to fines product only through a combination of dry crushing and screening, or crushing and wet processing of ore using classification to remove finer particles. The processing plants within the Hamersley Iron network vary considerably in age, and many plants have been subject to brownfields development since original construction. All plants are subject to an ongoing regime of sustaining capital investment and maintenance, underpinned by asset integrity audits, engineering inspections, engineering life cycles for key equipment and safety inspections and audits. Supplied through the integrated Hamersley and Robe power network operated by Pilbara Iron. Mines and production facilities
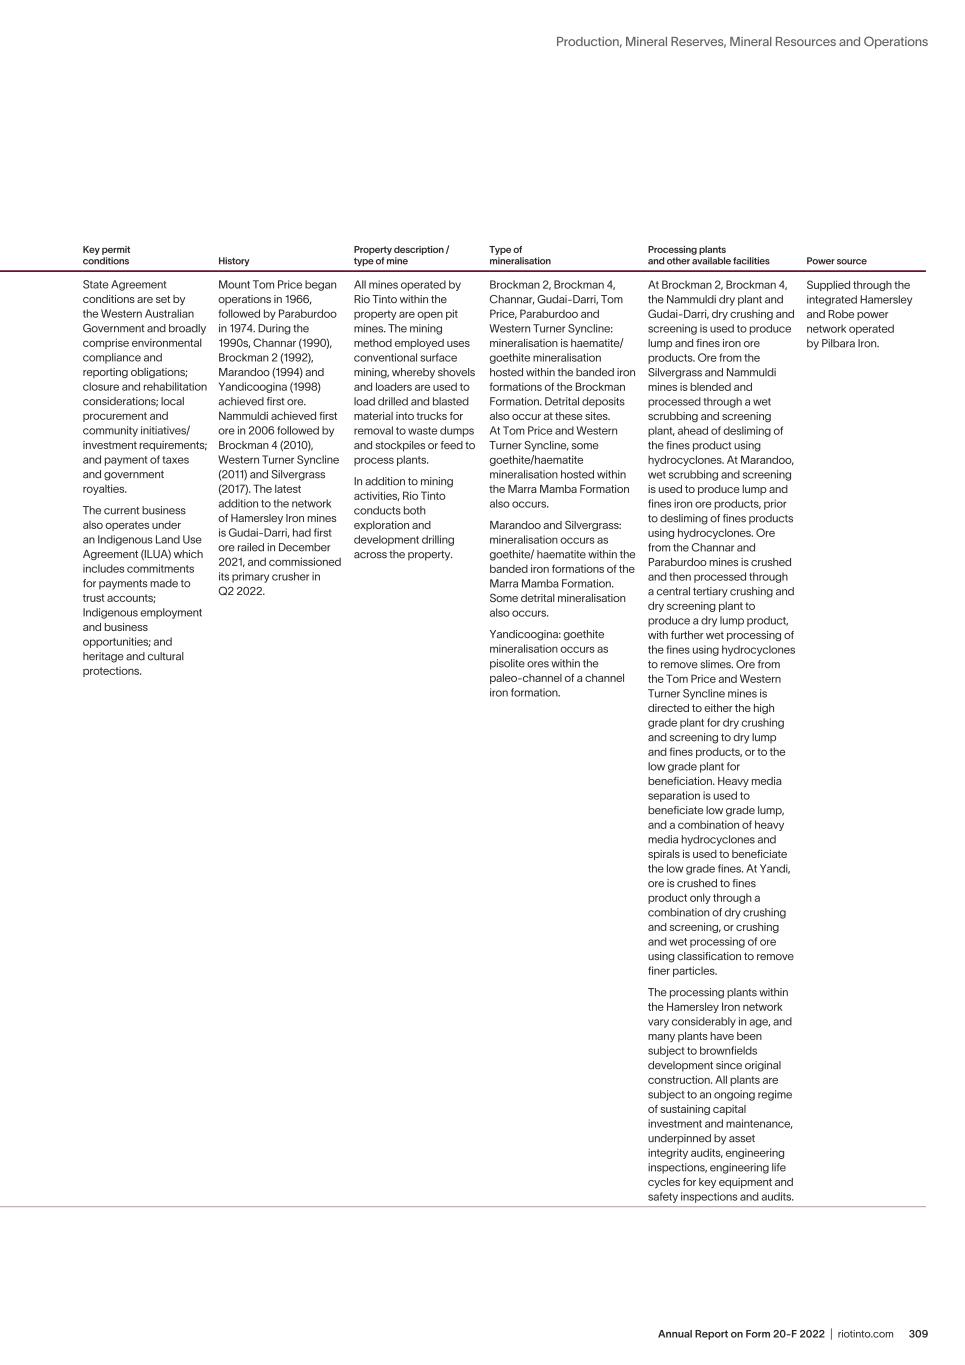
309Annual Report on Form 20-F 2022 | riotinto.com Production, Mineral Reserves, Mineral Resources and Operations Group mines as at 31 December 2022 Iron Ore Production properties Property Mine Ownership Operator Location Access and Infrastructure Title/lease/acreage Key permit conditions History Property description / type of mine Type of mineralisation Processing plants and other available facilities Power source Australian Pilbara Operations Hamersley Iron: – Brockman 2 – Brockman 4 – Channar – Gudai-Darri – Marandoo – Mount Tom Price – Nammuldi – Paraburdoo – Silvergrass – Western Turner Syncline – Yandicoogina 100% Rio Tinto Rio Tinto Pilbara region, Western Australia Access and infrastructure within the property includes: – a network of sealed and unsealed roads connecting to public roads and highways; – public and Rio Tinto-operated airports; – a Hamersley and Robe owned integrated heavy haulage rail network, operated by Pilbara Iron comprising in excess of 1,890 km of rail, multiple rail cars and locomotives; – four shipping terminals, located at Dampier and Cape Lambert and managed as a single port system; – water piping networks for both abstracted water and supply of fresh water to sites; – managed accommodation villages for FIFO sites; – a housing portfolio managing properties in the towns of Dampier, Wickham, Karratha, Pannawonica, Paraburdoo and Tom Price; – tailings storage facilities at several mine sites. All assets are subject to routine inspections and ongoing investment and maintenance programmes to ensure these remain fit-for-purpose. Agreements for life of mine with Government of Western Australia, save for the Yandicoogina mining lease, which expires in 2039 with an option to extend for 21 years. Mount Tom Price, Marandoo, Brockman 2, Brockman 4, Nammuldi and Western Turner Syncline Mineral and Mining Leases held under Iron Ore (Hamersley Range) Agreement Act 1963. Area of ML4SA approx 79,329 ha. Area of M272SA approx 14,136 ha. Gudai-Darri Mineral Lease held under Iron Ore (Mount Bruce) Agreement Act 1972. Area of ML252SA 47,406 ha. Paraburdoo and Eastern Range Mineral Lease held under Iron Ore (Hamersley Range) Agreement Act 1968. Area of ML246SA approx 12,950 ha. Channar Mining Lease held under Iron Ore (Channar Joint Venture) Agreement Act 1987. Mining lease expires in 2028 with an option to extend by up to five years. Area of M265SA approx 5,965 ha. Yandicoogina Mining Lease held under Iron Ore (Yandicoogina) Agreement Act 1996. Area of M274SA approx 30,550 ha. State Agreement conditions are set by the Western Australian Government and broadly comprise environmental compliance and reporting obligations; closure and rehabilitation considerations; local procurement and community initiatives/ investment requirements; and payment of taxes and government royalties. The current business also operates under an Indigenous Land Use Agreement (ILUA) which includes commitments for payments made to trust accounts; Indigenous employment and business opportunities; and heritage and cultural protections. Mount Tom Price began operations in 1966, followed by Paraburdoo in 1974. During the 1990s, Channar (1990), Brockman 2 (1992), Marandoo (1994) and Yandicoogina (1998) achieved first ore. Nammuldi achieved first ore in 2006 followed by Brockman 4 (2010), Western Turner Syncline (2011) and Silvergrass (2017). The latest addition to the network of Hamersley Iron mines is Gudai-Darri, had first ore railed in December 2021, and commissioned its primary crusher in Q2 2022. All mines operated by Rio Tinto within the property are open pit mines. The mining method employed uses conventional surface mining, whereby shovels and loaders are used to load drilled and blasted material into trucks for removal to waste dumps and stockpiles or feed to process plants. In addition to mining activities, Rio Tinto conducts both exploration and development drilling across the property. Brockman 2, Brockman 4, Channar, Gudai-Darri, Tom Price, Paraburdoo and Western Turner Syncline: mineralisation is haematite/ goethite mineralisation hosted within the banded iron formations of the Brockman Formation. Detrital deposits also occur at these sites. At Tom Price and Western Turner Syncline, some goethite/haematite mineralisation hosted within the Marra Mamba Formation also occurs. Marandoo and Silvergrass: mineralisation occurs as goethite/ haematite within the banded iron formations of the Marra Mamba Formation. Some detrital mineralisation also occurs. Yandicoogina: goethite mineralisation occurs as pisolite ores within the paleo-channel of a channel iron formation. At Brockman 2, Brockman 4, the Nammuldi dry plant and Gudai-Darri, dry crushing and screening is used to produce lump and fines iron ore products. Ore from the Silvergrass and Nammuldi mines is blended and processed through a wet scrubbing and screening plant, ahead of desliming of the fines product using hydrocyclones. At Marandoo, wet scrubbing and screening is used to produce lump and fines iron ore products, prior to desliming of fines products using hydrocyclones. Ore from the Channar and Paraburdoo mines is crushed and then processed through a central tertiary crushing and dry screening plant to produce a dry lump product, with further wet processing of the fines using hydrocyclones to remove slimes. Ore from the Tom Price and Western Turner Syncline mines is directed to either the high grade plant for dry crushing and screening to dry lump and fines products, or to the low grade plant for beneficiation. Heavy media separation is used to beneficiate low grade lump, and a combination of heavy media hydrocyclones and spirals is used to beneficiate the low grade fines. At Yandi, ore is crushed to fines product only through a combination of dry crushing and screening, or crushing and wet processing of ore using classification to remove finer particles. The processing plants within the Hamersley Iron network vary considerably in age, and many plants have been subject to brownfields development since original construction. All plants are subject to an ongoing regime of sustaining capital investment and maintenance, underpinned by asset integrity audits, engineering inspections, engineering life cycles for key equipment and safety inspections and audits. Supplied through the integrated Hamersley and Robe power network operated by Pilbara Iron.
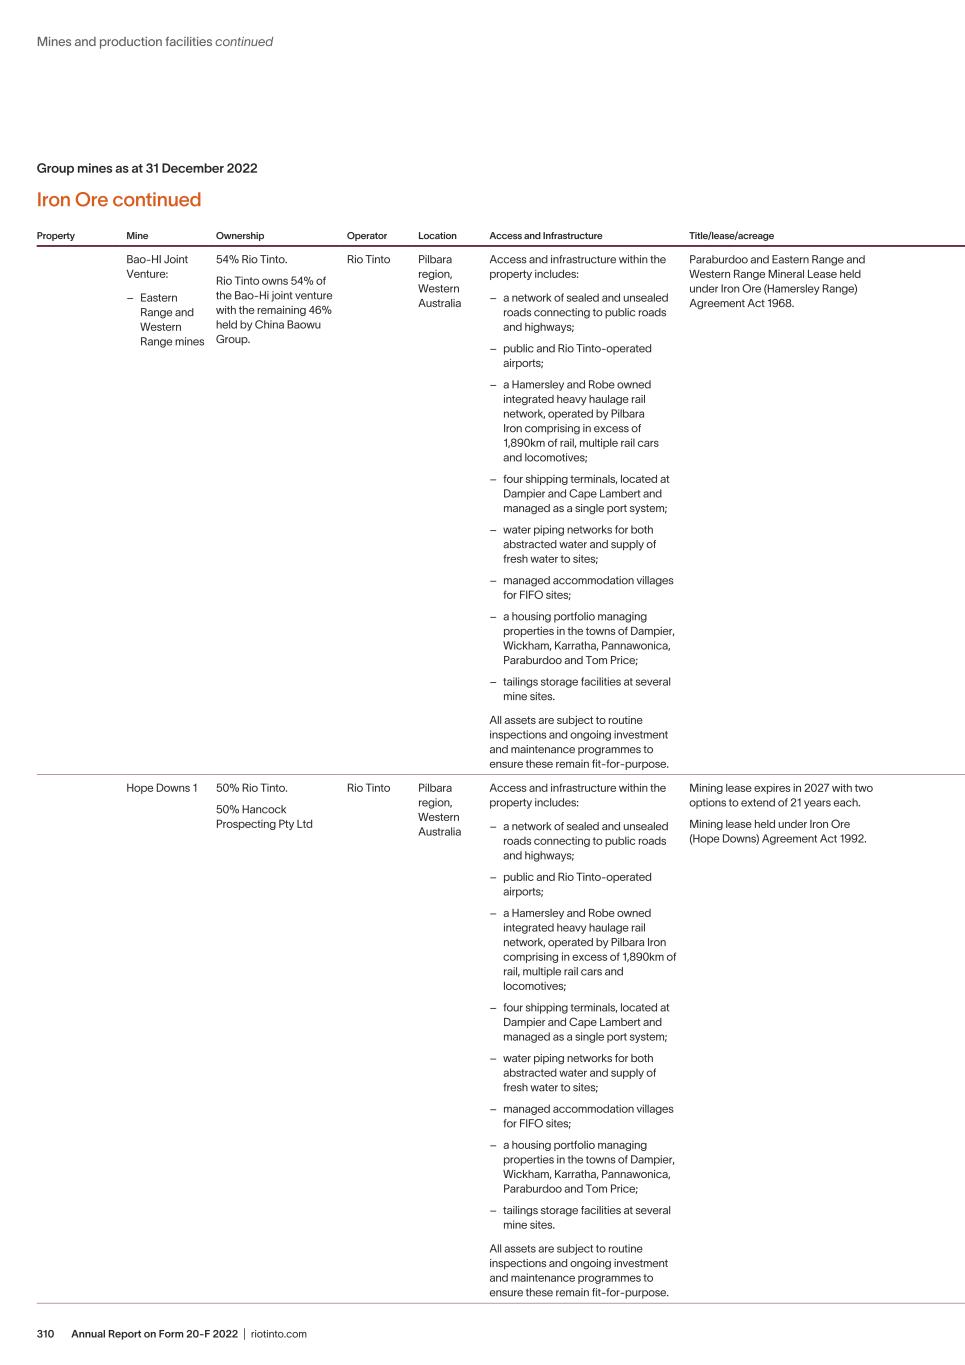
Annual Report on Form 20-F 2022 | riotinto.com310 Group mines as at 31 December 2022 Iron Ore continued Property Mine Ownership Operator Location Access and Infrastructure Title/lease/acreage Key permit conditions History Property description / type of mine Type of mineralisation Processing plants and other available facilities Power source Bao-HI Joint Venture: – Eastern Range and Western Range mines 54% Rio Tinto. Rio Tinto owns 54% of the Bao-Hi joint venture with the remaining 46% held by China Baowu Group. Rio Tinto Pilbara region, Western Australia Access and infrastructure within the property includes: – a network of sealed and unsealed roads connecting to public roads and highways; – public and Rio Tinto-operated airports; – a Hamersley and Robe owned integrated heavy haulage rail network, operated by Pilbara Iron comprising in excess of 1,890km of rail, multiple rail cars and locomotives; – four shipping terminals, located at Dampier and Cape Lambert and managed as a single port system; – water piping networks for both abstracted water and supply of fresh water to sites; – managed accommodation villages for FIFO sites; – a housing portfolio managing properties in the towns of Dampier, Wickham, Karratha, Pannawonica, Paraburdoo and Tom Price; – tailings storage facilities at several mine sites. All assets are subject to routine inspections and ongoing investment and maintenance programmes to ensure these remain fit-for-purpose. Paraburdoo and Eastern Range and Western Range Mineral Lease held under Iron Ore (Hamersley Range) Agreement Act 1968. State Agreement conditions are set by the Western Australian Government and broadly comprise environmental compliance and reporting obligations; closure and rehabilitation considerations; local procurement and community initiatives/ investment requirements; and payment of taxes and government royalties. The current business also operates under an Indigenous Land Use Agreement (ILUA) which includes commitments for payments made to trust accounts; Indigenous employment and business opportunities; and heritage and cultural protections. The Bao-HI joint venture was established in 2002 and has delivered sales of more than 200 million tonnes of iron ore to China. First ore from Eastern Range was delivered in 2004. In 2022, the Bao-HI joint venture was extended with a commitment to deliver 275 Mt of sales if iron ore to China. First ore from Western Range is planned for 2024 utilising existing infrastructure, with a new crusher at Western Range mine planned to be operational in 2025. All mines operated by Rio Tinto within the property are open pit mines. The mining method employed uses conventional surface mining, whereby shovels and loaders are used to load drilled and blasted material into trucks for removal to waste dumps or feed to process plants. In addition to mining activities, Rio Tinto conducts both exploration and development drilling across the property. Mineralisation at Eastern Range and Western Range occurs as haematite/goethite mineralisation hosted within the banded iron formations of the Brockman Formation. Ore from the Eastern Range mine is crushed and then processed through the central Paraburdoo tertiary crushing and dry screening plant to produce a dry lump product, with further wet processing of the fines product using hydrocyclones to remove slimes. The same process flow is planned for ore from Western Range. The processing plants within the Hamersley Iron network vary considerably in age, and many plants have been subject to brownfields development since original construction. All plants are subject to an ongoing regime of sustaining capital investment and maintenance, underpinned by asset integrity audits, engineering inspections, engineering life cycles for key equipment and safety inspections and audits. Supplied through the integrated Hamersley and Robe power network operated by Pilbara Iron. Hope Downs 1 50% Rio Tinto. 50% Hancock Prospecting Pty Ltd Rio Tinto Pilbara region, Western Australia Access and infrastructure within the property includes: – a network of sealed and unsealed roads connecting to public roads and highways; – public and Rio Tinto-operated airports; – a Hamersley and Robe owned integrated heavy haulage rail network, operated by Pilbara Iron comprising in excess of 1,890km of rail, multiple rail cars and locomotives; – four shipping terminals, located at Dampier and Cape Lambert and managed as a single port system; – water piping networks for both abstracted water and supply of fresh water to sites; – managed accommodation villages for FIFO sites; – a housing portfolio managing properties in the towns of Dampier, Wickham, Karratha, Pannawonica, Paraburdoo and Tom Price; – tailings storage facilities at several mine sites. All assets are subject to routine inspections and ongoing investment and maintenance programmes to ensure these remain fit-for-purpose. Mining lease expires in 2027 with two options to extend of 21 years each. Mining lease held under Iron Ore (Hope Downs) Agreement Act 1992. State Agreement conditions are set by the Western Australian Government and broadly comprise environmental compliance and reporting obligations; closure and rehabilitation considerations; local procurement and community initiatives/ investment requirements; and payment of taxes and government royalties. The current business also operates under an Indigenous Land Use Agreement (ILUA) which includes commitments for payments made to trust accounts; Indigenous employment and business opportunities; and heritage and cultural protections. Joint venture between Rio Tinto and Hancock Prospecting. Construction of Stage 1 to 22 Mtpa commenced 2006 and first production occurred 2007. Stage 2 to 30 Mtpa completed 2009. All mines operated by Rio Tinto within the property are open pit mines. The mining method employed uses conventional surface mining, whereby shovels and loaders are used to load drilled and blasted material into trucks for removal to waste dumps or feed to process plants. In addition to mining activities, Rio Tinto conducts both exploration and development drilling across the property. Mineralisation at Hope Downs 1 occurs as goethite/ haematite within the banded iron formations of the Marra Mamba and Brockman Formation. Some detrital mineralisation also occurs. Ore from Hope Downs 1 is processed through the Hope Downs 1 processing plant, which utilises dry crushing and screening to produce lump and fines iron ore products. The processing plants within the Hamersley Iron network vary considerably in age, and many plants have been subject to brownfields development since original construction. All plants are subject to an ongoing regime of sustaining capital investment and maintenance, underpinned by asset integrity audits, engineering inspections, engineering life cycles for key equipment and safety inspections and audits. Supplied through the integrated Hamersley and Robe power network operated by Pilbara Iron Mines and production facilities continued
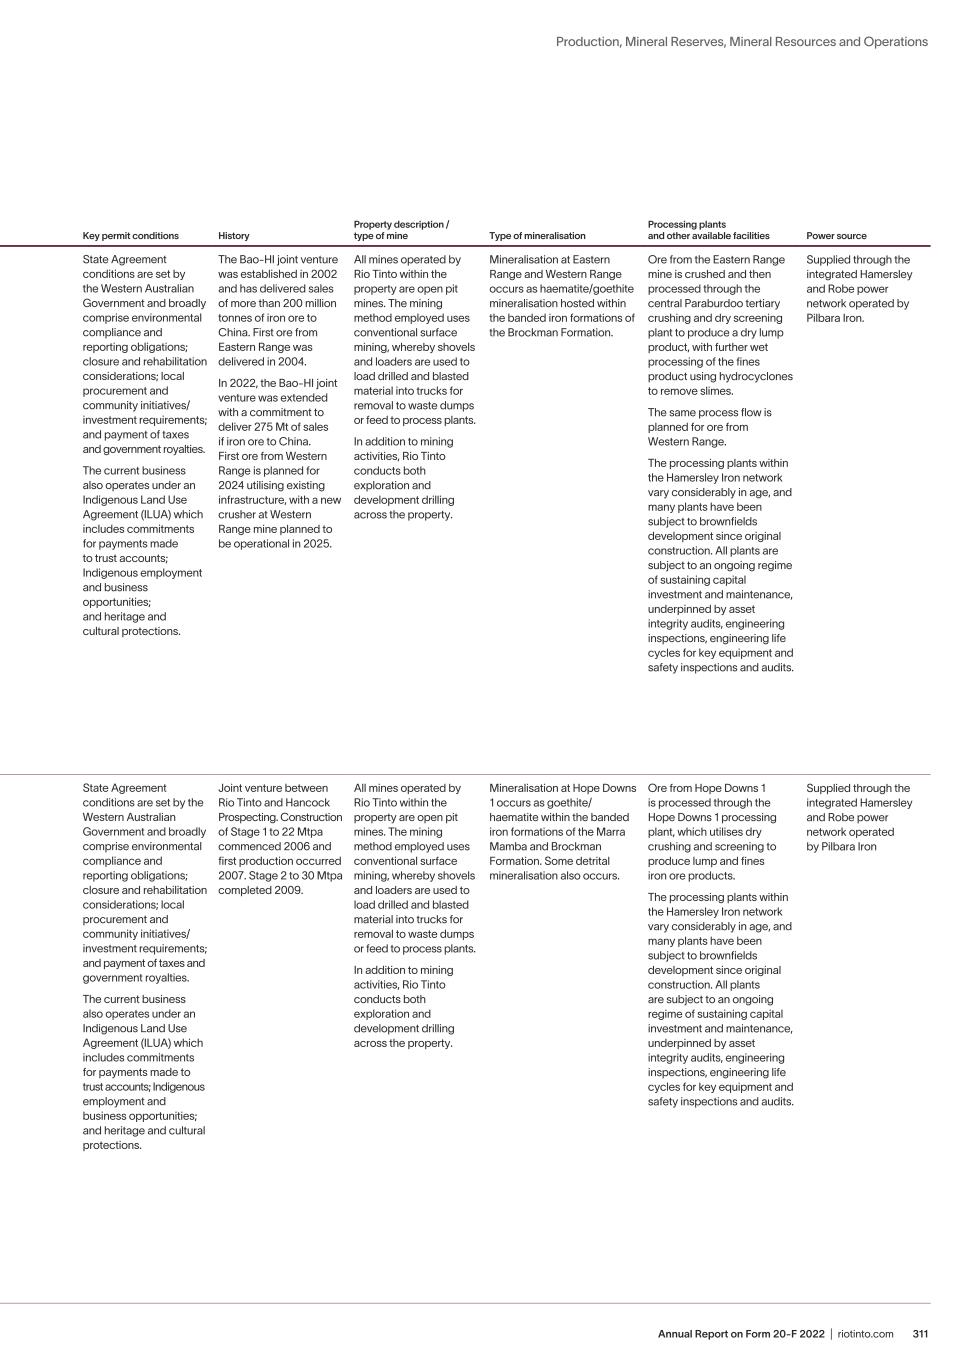
311Annual Report on Form 20-F 2022 | riotinto.com Production, Mineral Reserves, Mineral Resources and Operations Group mines as at 31 December 2022 Iron Ore continued Property Mine Ownership Operator Location Access and Infrastructure Title/lease/acreage Key permit conditions History Property description / type of mine Type of mineralisation Processing plants and other available facilities Power source Bao-HI Joint Venture: – Eastern Range and Western Range mines 54% Rio Tinto. Rio Tinto owns 54% of the Bao-Hi joint venture with the remaining 46% held by China Baowu Group. Rio Tinto Pilbara region, Western Australia Access and infrastructure within the property includes: – a network of sealed and unsealed roads connecting to public roads and highways; – public and Rio Tinto-operated airports; – a Hamersley and Robe owned integrated heavy haulage rail network, operated by Pilbara Iron comprising in excess of 1,890km of rail, multiple rail cars and locomotives; – four shipping terminals, located at Dampier and Cape Lambert and managed as a single port system; – water piping networks for both abstracted water and supply of fresh water to sites; – managed accommodation villages for FIFO sites; – a housing portfolio managing properties in the towns of Dampier, Wickham, Karratha, Pannawonica, Paraburdoo and Tom Price; – tailings storage facilities at several mine sites. All assets are subject to routine inspections and ongoing investment and maintenance programmes to ensure these remain fit-for-purpose. Paraburdoo and Eastern Range and Western Range Mineral Lease held under Iron Ore (Hamersley Range) Agreement Act 1968. State Agreement conditions are set by the Western Australian Government and broadly comprise environmental compliance and reporting obligations; closure and rehabilitation considerations; local procurement and community initiatives/ investment requirements; and payment of taxes and government royalties. The current business also operates under an Indigenous Land Use Agreement (ILUA) which includes commitments for payments made to trust accounts; Indigenous employment and business opportunities; and heritage and cultural protections. The Bao-HI joint venture was established in 2002 and has delivered sales of more than 200 million tonnes of iron ore to China. First ore from Eastern Range was delivered in 2004. In 2022, the Bao-HI joint venture was extended with a commitment to deliver 275 Mt of sales if iron ore to China. First ore from Western Range is planned for 2024 utilising existing infrastructure, with a new crusher at Western Range mine planned to be operational in 2025. All mines operated by Rio Tinto within the property are open pit mines. The mining method employed uses conventional surface mining, whereby shovels and loaders are used to load drilled and blasted material into trucks for removal to waste dumps or feed to process plants. In addition to mining activities, Rio Tinto conducts both exploration and development drilling across the property. Mineralisation at Eastern Range and Western Range occurs as haematite/goethite mineralisation hosted within the banded iron formations of the Brockman Formation. Ore from the Eastern Range mine is crushed and then processed through the central Paraburdoo tertiary crushing and dry screening plant to produce a dry lump product, with further wet processing of the fines product using hydrocyclones to remove slimes. The same process flow is planned for ore from Western Range. The processing plants within the Hamersley Iron network vary considerably in age, and many plants have been subject to brownfields development since original construction. All plants are subject to an ongoing regime of sustaining capital investment and maintenance, underpinned by asset integrity audits, engineering inspections, engineering life cycles for key equipment and safety inspections and audits. Supplied through the integrated Hamersley and Robe power network operated by Pilbara Iron. Hope Downs 1 50% Rio Tinto. 50% Hancock Prospecting Pty Ltd Rio Tinto Pilbara region, Western Australia Access and infrastructure within the property includes: – a network of sealed and unsealed roads connecting to public roads and highways; – public and Rio Tinto-operated airports; – a Hamersley and Robe owned integrated heavy haulage rail network, operated by Pilbara Iron comprising in excess of 1,890km of rail, multiple rail cars and locomotives; – four shipping terminals, located at Dampier and Cape Lambert and managed as a single port system; – water piping networks for both abstracted water and supply of fresh water to sites; – managed accommodation villages for FIFO sites; – a housing portfolio managing properties in the towns of Dampier, Wickham, Karratha, Pannawonica, Paraburdoo and Tom Price; – tailings storage facilities at several mine sites. All assets are subject to routine inspections and ongoing investment and maintenance programmes to ensure these remain fit-for-purpose. Mining lease expires in 2027 with two options to extend of 21 years each. Mining lease held under Iron Ore (Hope Downs) Agreement Act 1992. State Agreement conditions are set by the Western Australian Government and broadly comprise environmental compliance and reporting obligations; closure and rehabilitation considerations; local procurement and community initiatives/ investment requirements; and payment of taxes and government royalties. The current business also operates under an Indigenous Land Use Agreement (ILUA) which includes commitments for payments made to trust accounts; Indigenous employment and business opportunities; and heritage and cultural protections. Joint venture between Rio Tinto and Hancock Prospecting. Construction of Stage 1 to 22 Mtpa commenced 2006 and first production occurred 2007. Stage 2 to 30 Mtpa completed 2009. All mines operated by Rio Tinto within the property are open pit mines. The mining method employed uses conventional surface mining, whereby shovels and loaders are used to load drilled and blasted material into trucks for removal to waste dumps or feed to process plants. In addition to mining activities, Rio Tinto conducts both exploration and development drilling across the property. Mineralisation at Hope Downs 1 occurs as goethite/ haematite within the banded iron formations of the Marra Mamba and Brockman Formation. Some detrital mineralisation also occurs. Ore from Hope Downs 1 is processed through the Hope Downs 1 processing plant, which utilises dry crushing and screening to produce lump and fines iron ore products. The processing plants within the Hamersley Iron network vary considerably in age, and many plants have been subject to brownfields development since original construction. All plants are subject to an ongoing regime of sustaining capital investment and maintenance, underpinned by asset integrity audits, engineering inspections, engineering life cycles for key equipment and safety inspections and audits. Supplied through the integrated Hamersley and Robe power network operated by Pilbara Iron
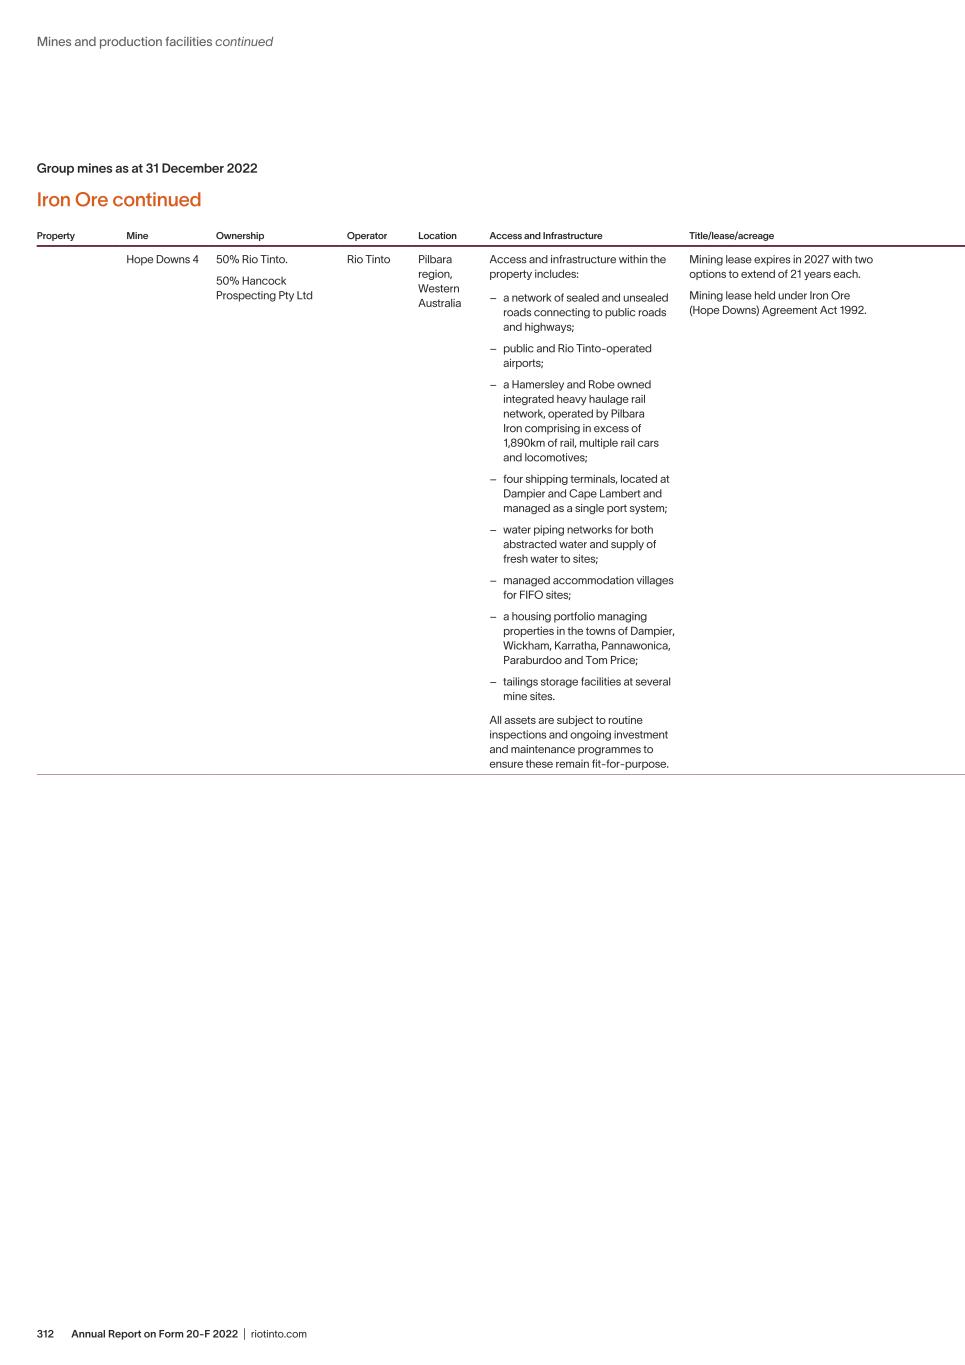
Annual Report on Form 20-F 2022 | riotinto.com312 Group mines as at 31 December 2022 Iron Ore continued Property Mine Ownership Operator Location Access and Infrastructure Title/lease/acreage Key permit conditions History Property description / type of mine Type of mineralisation Processing plants and other available facilities Power source Hope Downs 4 50% Rio Tinto. 50% Hancock Prospecting Pty Ltd Rio Tinto Pilbara region, Western Australia Access and infrastructure within the property includes: – a network of sealed and unsealed roads connecting to public roads and highways; – public and Rio Tinto-operated airports; – a Hamersley and Robe owned integrated heavy haulage rail network, operated by Pilbara Iron comprising in excess of 1,890km of rail, multiple rail cars and locomotives; – four shipping terminals, located at Dampier and Cape Lambert and managed as a single port system; – water piping networks for both abstracted water and supply of fresh water to sites; – managed accommodation villages for FIFO sites; – a housing portfolio managing properties in the towns of Dampier, Wickham, Karratha, Pannawonica, Paraburdoo and Tom Price; – tailings storage facilities at several mine sites. All assets are subject to routine inspections and ongoing investment and maintenance programmes to ensure these remain fit-for-purpose. Mining lease expires in 2027 with two options to extend of 21 years each. Mining lease held under Iron Ore (Hope Downs) Agreement Act 1992. State Agreement conditions are set by the Western Australian Government and broadly comprise environmental compliance and reporting obligations; closure and rehabilitation considerations; local procurement and community initiatives/ investment requirements; and payment of taxes and government royalties. The current business also operates under an Indigenous Land Use Agreement (ILUA) which includes commitments for payments made to trust accounts; Indigenous employment and business opportunities; and heritage and cultural protections. Joint venture between Rio Tinto and Hancock Prospecting. Construction of wet plant processing to 15 Mtpa commenced 2011 and first production occurred 2013. All mines operated by Rio Tinto within the property are open pit mines. The mining method employed uses conventional surface mining, whereby shovels and loaders are used to load drilled and blasted material into trucks for removal to waste dumps or feed to process plants. In addition to mining activities, Rio Tinto conducts both exploration and development activities across the property. Mineralisation at Hope Downs 4 occurs as haematite/ goethite mineralisation hosted within the banded iron formations of the Brockman Formation. Ore from Hope Downs 4 is processed through the Hope Downs 4 processing plant. Wet scrubbing and screening are used to separate lump and fines products, prior to desliming of fines product using hydrocyclones. The processing plants within the Hamersley Iron network vary considerably in age, and many plants have been subject to brownfields development since original construction. All plants are subject to an ongoing regime of sustaining capital investment and maintenance, underpinned by asset integrity audits, engineering inspections, engineering life cycles for key equipment and safety inspections and audits. Supplied through the integrated Hamersley and Robe power network operated by Pilbara Iron. Mines and production facilities continued
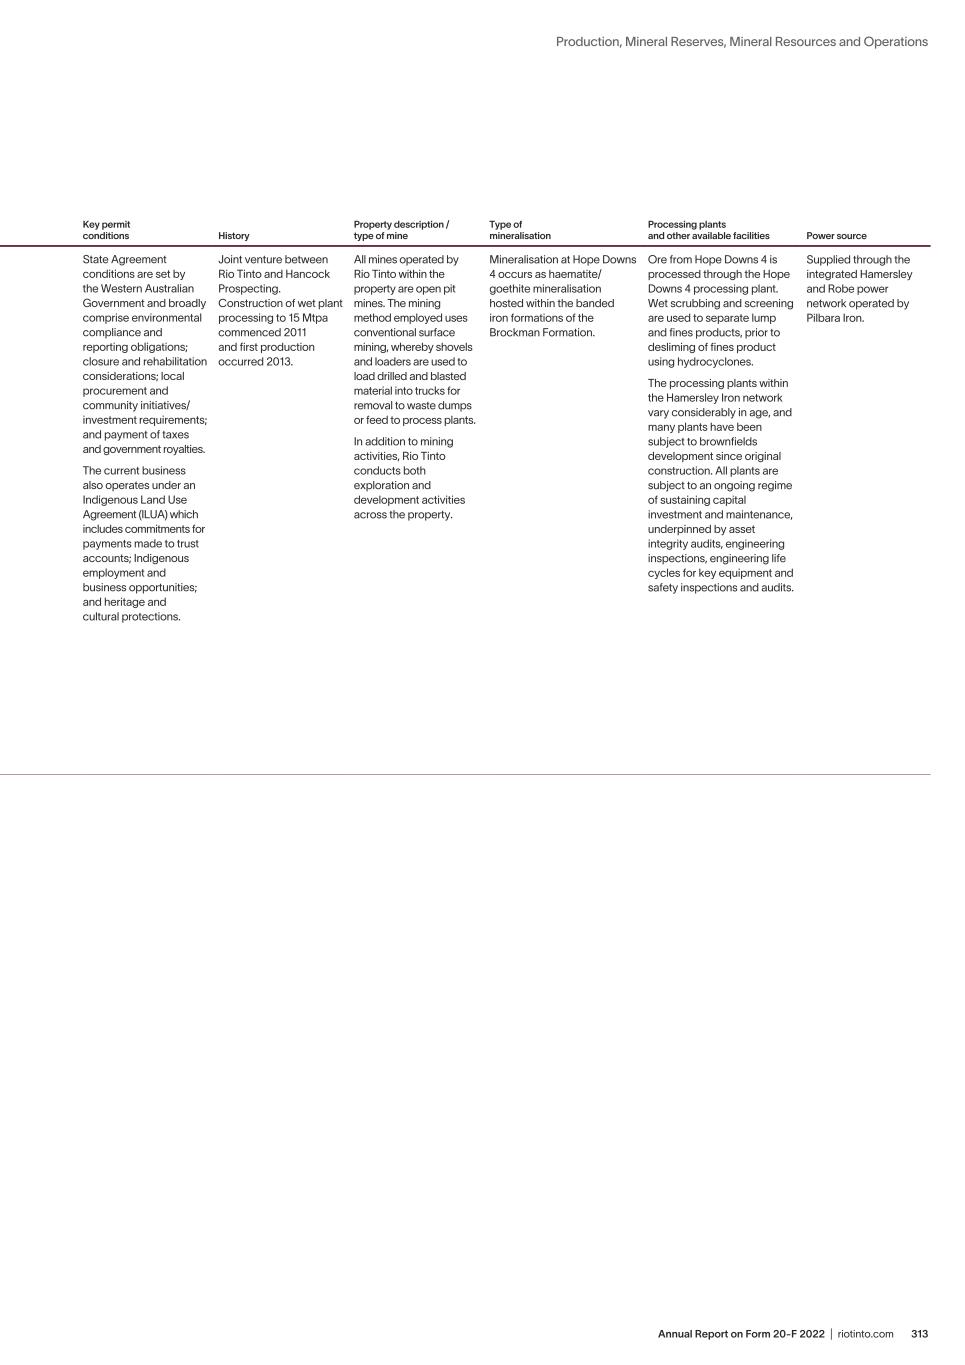
313Annual Report on Form 20-F 2022 | riotinto.com Production, Mineral Reserves, Mineral Resources and Operations Group mines as at 31 December 2022 Iron Ore continued Property Mine Ownership Operator Location Access and Infrastructure Title/lease/acreage Key permit conditions History Property description / type of mine Type of mineralisation Processing plants and other available facilities Power source Hope Downs 4 50% Rio Tinto. 50% Hancock Prospecting Pty Ltd Rio Tinto Pilbara region, Western Australia Access and infrastructure within the property includes: – a network of sealed and unsealed roads connecting to public roads and highways; – public and Rio Tinto-operated airports; – a Hamersley and Robe owned integrated heavy haulage rail network, operated by Pilbara Iron comprising in excess of 1,890km of rail, multiple rail cars and locomotives; – four shipping terminals, located at Dampier and Cape Lambert and managed as a single port system; – water piping networks for both abstracted water and supply of fresh water to sites; – managed accommodation villages for FIFO sites; – a housing portfolio managing properties in the towns of Dampier, Wickham, Karratha, Pannawonica, Paraburdoo and Tom Price; – tailings storage facilities at several mine sites. All assets are subject to routine inspections and ongoing investment and maintenance programmes to ensure these remain fit-for-purpose. Mining lease expires in 2027 with two options to extend of 21 years each. Mining lease held under Iron Ore (Hope Downs) Agreement Act 1992. State Agreement conditions are set by the Western Australian Government and broadly comprise environmental compliance and reporting obligations; closure and rehabilitation considerations; local procurement and community initiatives/ investment requirements; and payment of taxes and government royalties. The current business also operates under an Indigenous Land Use Agreement (ILUA) which includes commitments for payments made to trust accounts; Indigenous employment and business opportunities; and heritage and cultural protections. Joint venture between Rio Tinto and Hancock Prospecting. Construction of wet plant processing to 15 Mtpa commenced 2011 and first production occurred 2013. All mines operated by Rio Tinto within the property are open pit mines. The mining method employed uses conventional surface mining, whereby shovels and loaders are used to load drilled and blasted material into trucks for removal to waste dumps or feed to process plants. In addition to mining activities, Rio Tinto conducts both exploration and development activities across the property. Mineralisation at Hope Downs 4 occurs as haematite/ goethite mineralisation hosted within the banded iron formations of the Brockman Formation. Ore from Hope Downs 4 is processed through the Hope Downs 4 processing plant. Wet scrubbing and screening are used to separate lump and fines products, prior to desliming of fines product using hydrocyclones. The processing plants within the Hamersley Iron network vary considerably in age, and many plants have been subject to brownfields development since original construction. All plants are subject to an ongoing regime of sustaining capital investment and maintenance, underpinned by asset integrity audits, engineering inspections, engineering life cycles for key equipment and safety inspections and audits. Supplied through the integrated Hamersley and Robe power network operated by Pilbara Iron.
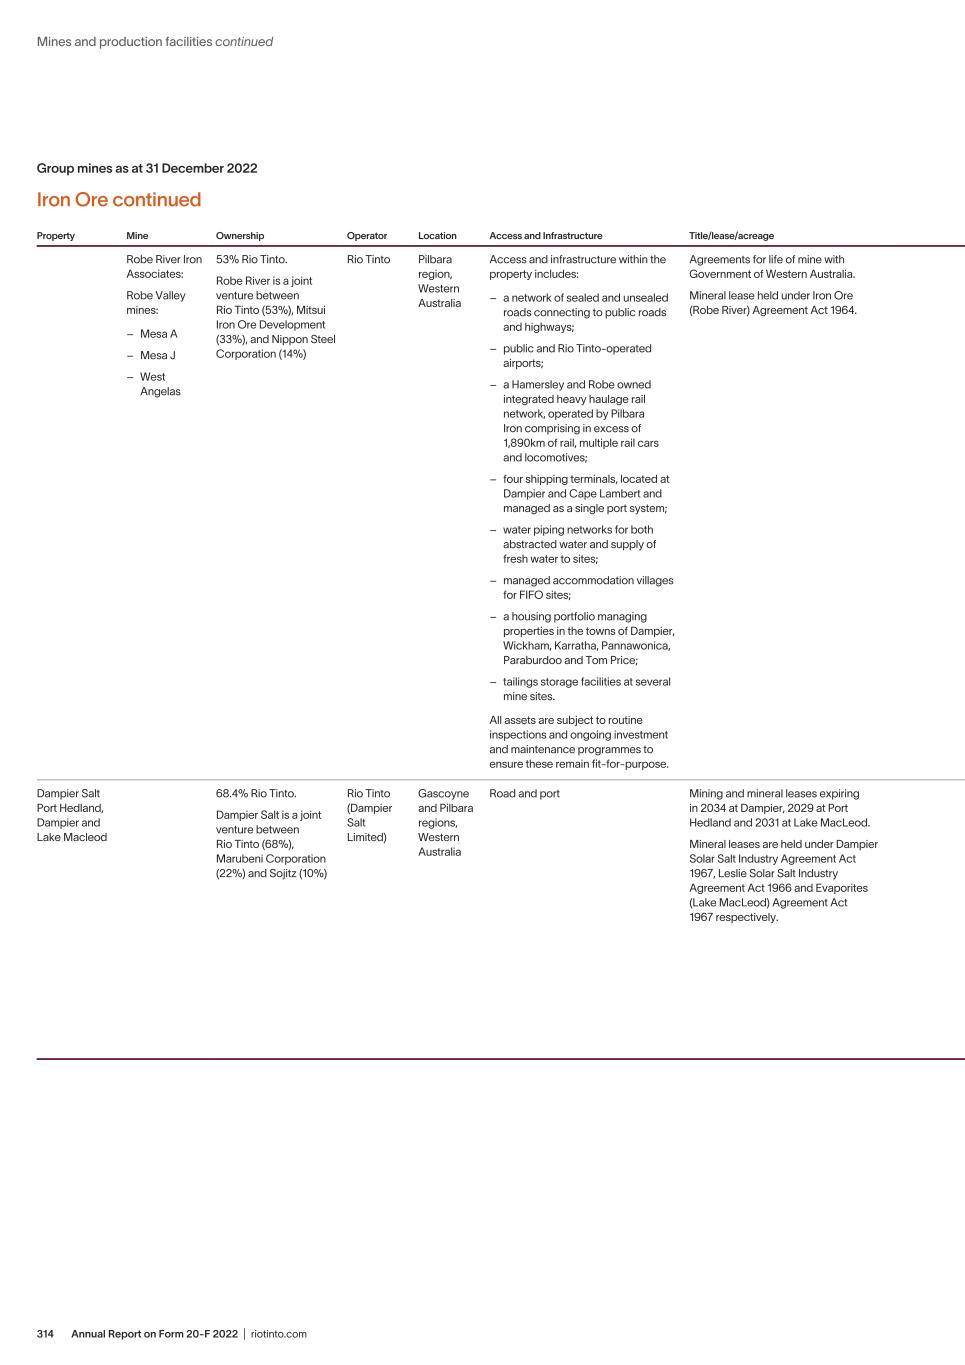
Annual Report on Form 20-F 2022 | riotinto.com314 Group mines as at 31 December 2022 Iron Ore continued Property Mine Ownership Operator Location Access and Infrastructure Title/lease/acreage Key permit conditions History Property description / type of mine Type of mineralisation Processing plants and other available facilities Power source Robe River Iron Associates: Robe Valley mines: – Mesa A – Mesa J – West Angelas 53% Rio Tinto. Robe River is a joint venture between Rio Tinto (53%), Mitsui Iron Ore Development (33%), and Nippon Steel Corporation (14%) Rio Tinto Pilbara region, Western Australia Access and infrastructure within the property includes: – a network of sealed and unsealed roads connecting to public roads and highways; – public and Rio Tinto-operated airports; – a Hamersley and Robe owned integrated heavy haulage rail network, operated by Pilbara Iron comprising in excess of 1,890km of rail, multiple rail cars and locomotives; – four shipping terminals, located at Dampier and Cape Lambert and managed as a single port system; – water piping networks for both abstracted water and supply of fresh water to sites; – managed accommodation villages for FIFO sites; – a housing portfolio managing properties in the towns of Dampier, Wickham, Karratha, Pannawonica, Paraburdoo and Tom Price; – tailings storage facilities at several mine sites. All assets are subject to routine inspections and ongoing investment and maintenance programmes to ensure these remain fit-for-purpose. Agreements for life of mine with Government of Western Australia. Mineral lease held under Iron Ore (Robe River) Agreement Act 1964. State Agreement conditions are set by the Western Australian Government and broadly comprise environmental compliance and reporting obligations; closure and rehabilitation considerations; local procurement and community initiatives/ investment requirements; and payment of taxes and government royalties. The current business also operates under an Indigenous Land Use Agreement (ILUA) which includes commitments for payments made to trust accounts; Indigenous employment and business opportunities; and heritage and cultural protections. Construction of the Dampier field started in 1969; first shipment in 1972. Lake MacLeod was acquired in 1978 as an operating field. Port Hedland was acquired in 2001 as an operating field. All mines operated by Rio Tinto within the property are open pit mines. The mining method employed uses conventional surface mining, whereby shovels and loaders are used to load drilled and blasted material into trucks for removal to waste dumps or feed to process plants. In addition to mining activities, Rio Tinto conducts both exploration and development drilling across the property. Robe Valley deposits: goethite mineralisation occurs as pisolite ores within the paleo-channel of a channel iron formation. West Angelas deposit: mineralisation occurs as goethite/ haematite within the banded iron formations of the Marra Mamba Formation. Some detrital mineralisation also occurs. Ore from the Robe Valley mines of Mesa A and Mesa J is processed through either dry crushing and screening plants or through wet processing plants using scrubbing and screening to remove finer particles. Crushed and deslimed ore from the Robe Valley mines is railed to Cape Lambert, where further dry crushing and screening through a dedicated processing plant produces lump and fines iron ore products. At West Angelas mine, dry crushing and screening is used to produce lump and fines iron ore products. The processing plants within the Hamersley Iron network vary considerably in age, and many plants have been subject to brownfields development since original construction. All plants are subject to an ongoing regime of sustaining capital investment and maintenance, underpinned by asset integrity audits, engineering inspections, engineering life cycles for key equipment and safety inspections and audits. Supplied through the integrated Hamersley and Robe power network operated by Pilbara Iron. Dampier Salt Port Hedland, Dampier and Lake Macleod 68.4% Rio Tinto. Dampier Salt is a joint venture between Rio Tinto (68%), Marubeni Corporation (22%) and Sojitz (10%) Rio Tinto (Dampier Salt Limited) Gascoyne and Pilbara regions, Western Australia Road and port Mining and mineral leases expiring in 2034 at Dampier, 2029 at Port Hedland and 2031 at Lake MacLeod. Mineral leases are held under Dampier Solar Salt Industry Agreement Act 1967, Leslie Solar Salt Industry Agreement Act 1966 and Evaporites (Lake MacLeod) Agreement Act 1967 respectively. State Agreement conditions are set by the Western Australian Government and broadly comprise environmental compliance and reporting obligations; closure and rehabilitation considerations; local procurement and community initiatives/ investment requirements; and payment of taxes and government royalties. Construction of the Dampier field started in 1969; first shipment in 1972. Lake MacLeod was acquired in 1978 as an operating field. Port Hedland was acquired in 2001 as an operating field. Solar evaporation of seawater at Dampier and Port Hedland; underground brine at Lake MacLeod; extraction of gypsum at Lake MacLeod. Salt is grown every year through solar evaporation in permanent crystallising pans. Gypsum is present in the top layer covering most of the Lake Macleod. Salt is processed through a washing plant, consisting of screening washbelts at Lake MacLeod, Screwbowl classifiers and static screens at Port Hedland and sizing screens, counter-current classifiers with dewatering screens and centrifuges at Dampier. Dampier produces shipping-ready product for immediate shiploading. Washed salt at Lake MacLeod and Port Hedland is dewatered on stockpiles. Lake Macleod also mines and processes gypsum in leaching heaps. Long-term contracts with Hamersley Iron and Horizon Power and on-site generation. Mines and production facilities continued
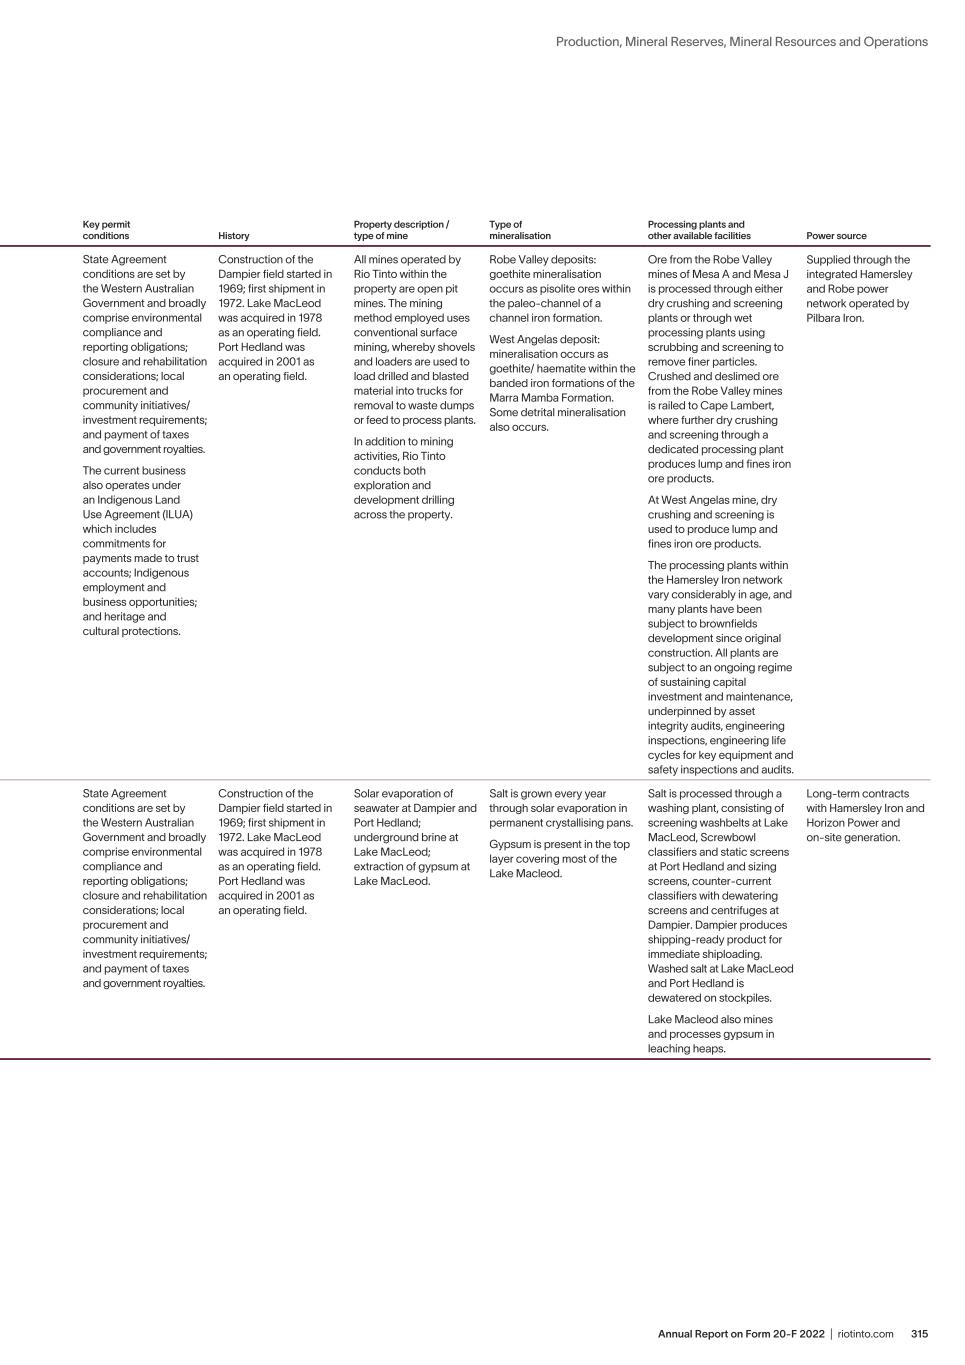
315Annual Report on Form 20-F 2022 | riotinto.com Production, Mineral Reserves, Mineral Resources and Operations Group mines as at 31 December 2022 Iron Ore continued Property Mine Ownership Operator Location Access and Infrastructure Title/lease/acreage Key permit conditions History Property description / type of mine Type of mineralisation Processing plants and other available facilities Power source Robe River Iron Associates: Robe Valley mines: – Mesa A – Mesa J – West Angelas 53% Rio Tinto. Robe River is a joint venture between Rio Tinto (53%), Mitsui Iron Ore Development (33%), and Nippon Steel Corporation (14%) Rio Tinto Pilbara region, Western Australia Access and infrastructure within the property includes: – a network of sealed and unsealed roads connecting to public roads and highways; – public and Rio Tinto-operated airports; – a Hamersley and Robe owned integrated heavy haulage rail network, operated by Pilbara Iron comprising in excess of 1,890km of rail, multiple rail cars and locomotives; – four shipping terminals, located at Dampier and Cape Lambert and managed as a single port system; – water piping networks for both abstracted water and supply of fresh water to sites; – managed accommodation villages for FIFO sites; – a housing portfolio managing properties in the towns of Dampier, Wickham, Karratha, Pannawonica, Paraburdoo and Tom Price; – tailings storage facilities at several mine sites. All assets are subject to routine inspections and ongoing investment and maintenance programmes to ensure these remain fit-for-purpose. Agreements for life of mine with Government of Western Australia. Mineral lease held under Iron Ore (Robe River) Agreement Act 1964. State Agreement conditions are set by the Western Australian Government and broadly comprise environmental compliance and reporting obligations; closure and rehabilitation considerations; local procurement and community initiatives/ investment requirements; and payment of taxes and government royalties. The current business also operates under an Indigenous Land Use Agreement (ILUA) which includes commitments for payments made to trust accounts; Indigenous employment and business opportunities; and heritage and cultural protections. Construction of the Dampier field started in 1969; first shipment in 1972. Lake MacLeod was acquired in 1978 as an operating field. Port Hedland was acquired in 2001 as an operating field. All mines operated by Rio Tinto within the property are open pit mines. The mining method employed uses conventional surface mining, whereby shovels and loaders are used to load drilled and blasted material into trucks for removal to waste dumps or feed to process plants. In addition to mining activities, Rio Tinto conducts both exploration and development drilling across the property. Robe Valley deposits: goethite mineralisation occurs as pisolite ores within the paleo-channel of a channel iron formation. West Angelas deposit: mineralisation occurs as goethite/ haematite within the banded iron formations of the Marra Mamba Formation. Some detrital mineralisation also occurs. Ore from the Robe Valley mines of Mesa A and Mesa J is processed through either dry crushing and screening plants or through wet processing plants using scrubbing and screening to remove finer particles. Crushed and deslimed ore from the Robe Valley mines is railed to Cape Lambert, where further dry crushing and screening through a dedicated processing plant produces lump and fines iron ore products. At West Angelas mine, dry crushing and screening is used to produce lump and fines iron ore products. The processing plants within the Hamersley Iron network vary considerably in age, and many plants have been subject to brownfields development since original construction. All plants are subject to an ongoing regime of sustaining capital investment and maintenance, underpinned by asset integrity audits, engineering inspections, engineering life cycles for key equipment and safety inspections and audits. Supplied through the integrated Hamersley and Robe power network operated by Pilbara Iron. Dampier Salt Port Hedland, Dampier and Lake Macleod 68.4% Rio Tinto. Dampier Salt is a joint venture between Rio Tinto (68%), Marubeni Corporation (22%) and Sojitz (10%) Rio Tinto (Dampier Salt Limited) Gascoyne and Pilbara regions, Western Australia Road and port Mining and mineral leases expiring in 2034 at Dampier, 2029 at Port Hedland and 2031 at Lake MacLeod. Mineral leases are held under Dampier Solar Salt Industry Agreement Act 1967, Leslie Solar Salt Industry Agreement Act 1966 and Evaporites (Lake MacLeod) Agreement Act 1967 respectively. State Agreement conditions are set by the Western Australian Government and broadly comprise environmental compliance and reporting obligations; closure and rehabilitation considerations; local procurement and community initiatives/ investment requirements; and payment of taxes and government royalties. Construction of the Dampier field started in 1969; first shipment in 1972. Lake MacLeod was acquired in 1978 as an operating field. Port Hedland was acquired in 2001 as an operating field. Solar evaporation of seawater at Dampier and Port Hedland; underground brine at Lake MacLeod; extraction of gypsum at Lake MacLeod. Salt is grown every year through solar evaporation in permanent crystallising pans. Gypsum is present in the top layer covering most of the Lake Macleod. Salt is processed through a washing plant, consisting of screening washbelts at Lake MacLeod, Screwbowl classifiers and static screens at Port Hedland and sizing screens, counter-current classifiers with dewatering screens and centrifuges at Dampier. Dampier produces shipping-ready product for immediate shiploading. Washed salt at Lake MacLeod and Port Hedland is dewatered on stockpiles. Lake Macleod also mines and processes gypsum in leaching heaps. Long-term contracts with Hamersley Iron and Horizon Power and on-site generation.
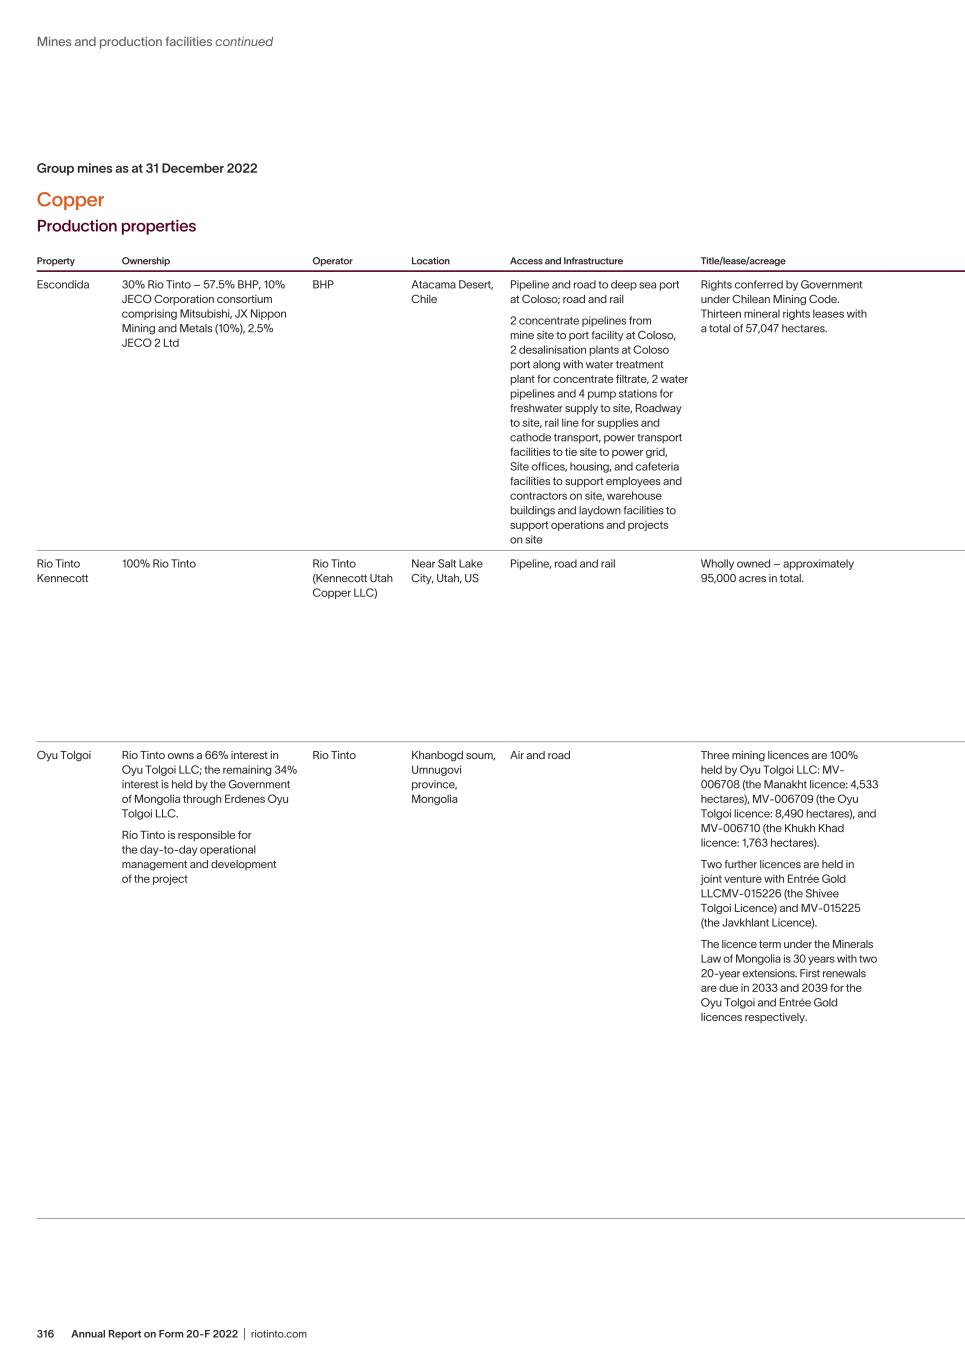
Annual Report on Form 20-F 2022 | riotinto.com316 Group mines as at 31 December 2022 Copper Production properties Property Ownership Operator Location Access and Infrastructure Title/lease/acreage Key permit conditions History Property description / type of mine Type of mineralisation Processing plants and other available facilities Power source Escondida 30% Rio Tinto – 57.5% BHP, 10% JECO Corporation consortium comprising Mitsubishi, JX Nippon Mining and Metals (10%), 2.5% JECO 2 Ltd BHP Atacama Desert, Chile Pipeline and road to deep sea port at Coloso; road and rail 2 concentrate pipelines from mine site to port facility at Coloso, 2 desalinisation plants at Coloso port along with water treatment plant for concentrate filtrate, 2 water pipelines and 4 pump stations for freshwater supply to site, Roadway to site, rail line for supplies and cathode transport, power transport facilities to tie site to power grid, Site offices, housing, and cafeteria facilities to support employees and contractors on site, warehouse buildings and laydown facilities to support operations and projects on site Rights conferred by Government under Chilean Mining Code. Thirteen mineral rights leases with a total of 57,047 hectares. Annual tenement payments (due March each year) Production started in 1990 and since then capacity has been expanded numerous times. In 1998 first cathode was produced from the oxide leach plant, and during 2006 the sulphide leach plant was inaugurated, a year after the start of Escondida Norte pit production. During 2016, the third concentrator plant was commissioned. Two active surface open pit mines in production, Escondida and Escondida Norte with ore being processed via 3 processing options, Oxide leach, Sulfide RoM leach, or conventional flotation concentrators. Consists of a series of porphyry deposits containing copper, gold, silver, and molybdenum. Los Colorados, Laguna Seca Line 1, and Laguna Seca Line 2 Concentrators. OLAP – oxide leach facility, SL Rom leach facility and SX/EW facility. Supplied from grid under various contracts with local generating companies. Rio Tinto Kennecott 100% Rio Tinto Rio Tinto (Kennecott Utah Copper LLC) Near Salt Lake City, Utah, US Pipeline, road and rail Wholly owned – approximately 95,000 acres in total. Permit conditions are established by Utah and US Government agencies and comprise: – Environmental compliance and reporting – Closure and reclamation requirements Interest acquired in 1989. In 2012, the pushback of the south wall commenced, extending the mine life from 2018 to 2032. Approval for underground mining at Lower Commercial Skarn was obtained in 2022. Open pit and underground (beginning in 2023) Porphyry and associated skarn deposits containing copper, gold, silver, and molybdenum. Copperton concentrator, Garfield smelter, refinery, and precious metals plant, assay lab and tailings storage facilities. Supply contract with Rocky Mountain Power. Oyu Tolgoi Rio Tinto owns a 66% interest in Oyu Tolgoi LLC; the remaining 34% interest is held by the Government of Mongolia through Erdenes Oyu Tolgoi LLC. Rio Tinto is responsible for the day-to-day operational management and development of the project Rio Tinto Khanbogd soum, Umnugovi province, Mongolia Air and road Three mining licences are 100% held by Oyu Tolgoi LLC: MV- 006708 (the Manakht licence: 4,533 hectares), MV-006709 (the Oyu Tolgoi licence: 8,490 hectares), and MV-006710 (the Khukh Khad licence: 1,763 hectares). Two further licences are held in joint venture with Entrée Gold LLCMV-015226 (the Shivee Tolgoi Licence) and MV-015225 (the Javkhlant Licence). The licence term under the Minerals Law of Mongolia is 30 years with two 20-year extensions. First renewals are due in 2033 and 2039 for the Oyu Tolgoi and Entrée Gold licences respectively. Investment Agreement dated 6 October 2009, between the Government of Mongolia, Oyu Tolgoi LLC, TRQ, and Rio Tinto in respect of Oyu Tolgoi (Investment Agreement). Amended and Restated Shareholders Agreement dated 8 June 2011 among Oyu Tolgoi LLC, THR Oyu Tolgoi Ltd. (formerly Ivanhoe Oyu Tolgoi (BVI) Ltd.), Oyu Tolgoi Netherlands B.V. and Erdenes MGL LLC (ARSHA). Erdenes MGL LLC since transferred its shares in Oyu Tolgoi LLC and its rights and obligations under the ARSHA to its subsidiary, Erdenes Oyu Tolgoi LLC. Power Source Framework Agreement dated 31 December 2018, between the Government of Mongolia and Oyu Tolgoi LLC, including the amendment to the PSFA dated 26 June 2020. Electricity Supply Agreement dated 26 January 2022, between Southern Region Electricity Distribution Network SOSC, National Power Transmission Grid SOSC, National Dispatching Center LLC and Oyu Tolgoi LLC. In terms of key government permits, Oyu Tolgoi LLC secured a land use permit until 2035 and water use permit until 2039 as well as the mineral rights. Oyu Tolgoi was first discovered in 1996. Construction began in late 2009 after signing of an Investment Agreement with the Government of Mongolia, and first concentrate was produced in 2012. First sales of concentrate were made to Chinese customers in 2013. The first drawbell of the Hugo North underground mine was fired in 2022. In December 2022 Rio Tinto acquired 100% ownership of Turquoise Hill Resources. Mineral Reserves have been reported at the Oyut and Hugo North Deposits. The Oyut deposit is currently mined as an open pit using a conventional drill, blast, load, and haul method. The Hugo North deposit is currently being developed as an underground mine. Consists of a series of porphyry deposits containing copper, gold, silver, and molybdenum. One copper concentrator with a nominal feed capacity of 100 ktpd currently comprising 2 SAG mills, 4 ball mills, rougher and cleaner flotation circuits and up to 1 Mtpa copper concentrate capacity. Other major facilities that support the isolated operations include Maintenance workshops, heating plant, sealed airstrip and terminal, and camp facilities with up to 6,000 person capacity to accommodate current operations and the Underground construction project. Underground infrastructure in place includes several shafts for ore haulage, man haulage and ventilation plus a conveyor decline to surface and associated surface infrastructure. Currently sources its power under an agreement with the Inner Mongolia Power International Cooperation Company Ltd. (IMPIC), via the Mongolian National Power Transmission Grid (NPTG) authority, with Grid power from China and supplementary diesel power generation at site. Mines and production facilities continued
317Annual Report on Form 20-F 2022 | riotinto.com Production, Mineral Reserves, Mineral Resources and Operations Group mines as at 31 December 2022 Copper Production properties Property Ownership Operator Location Access and Infrastructure Title/lease/acreage Key permit conditions History Property description / type of mine Type of mineralisation Processing plants and other available facilities Power source Escondida 30% Rio Tinto – 57.5% BHP, 10% JECO Corporation consortium comprising Mitsubishi, JX Nippon Mining and Metals (10%), 2.5% JECO 2 Ltd BHP Atacama Desert, Chile Pipeline and road to deep sea port at Coloso; road and rail 2 concentrate pipelines from mine site to port facility at Coloso, 2 desalinisation plants at Coloso port along with water treatment plant for concentrate filtrate, 2 water pipelines and 4 pump stations for freshwater supply to site, Roadway to site, rail line for supplies and cathode transport, power transport facilities to tie site to power grid, Site offices, housing, and cafeteria facilities to support employees and contractors on site, warehouse buildings and laydown facilities to support operations and projects on site Rights conferred by Government under Chilean Mining Code. Thirteen mineral rights leases with a total of 57,047 hectares. Annual tenement payments (due March each year) Production started in 1990 and since then capacity has been expanded numerous times. In 1998 first cathode was produced from the oxide leach plant, and during 2006 the sulphide leach plant was inaugurated, a year after the start of Escondida Norte pit production. During 2016, the third concentrator plant was commissioned. Two active surface open pit mines in production, Escondida and Escondida Norte with ore being processed via 3 processing options, Oxide leach, Sulfide RoM leach, or conventional flotation concentrators. Consists of a series of porphyry deposits containing copper, gold, silver, and molybdenum. Los Colorados, Laguna Seca Line 1, and Laguna Seca Line 2 Concentrators. OLAP – oxide leach facility, SL Rom leach facility and SX/EW facility. Supplied from grid under various contracts with local generating companies. Rio Tinto Kennecott 100% Rio Tinto Rio Tinto (Kennecott Utah Copper LLC) Near Salt Lake City, Utah, US Pipeline, road and rail Wholly owned – approximately 95,000 acres in total. Permit conditions are established by Utah and US Government agencies and comprise: – Environmental compliance and reporting – Closure and reclamation requirements Interest acquired in 1989. In 2012, the pushback of the south wall commenced, extending the mine life from 2018 to 2032. Approval for underground mining at Lower Commercial Skarn was obtained in 2022. Open pit and underground (beginning in 2023) Porphyry and associated skarn deposits containing copper, gold, silver, and molybdenum. Copperton concentrator, Garfield smelter, refinery, and precious metals plant, assay lab and tailings storage facilities. Supply contract with Rocky Mountain Power. Oyu Tolgoi Rio Tinto owns a 66% interest in Oyu Tolgoi LLC; the remaining 34% interest is held by the Government of Mongolia through Erdenes Oyu Tolgoi LLC. Rio Tinto is responsible for the day-to-day operational management and development of the project Rio Tinto Khanbogd soum, Umnugovi province, Mongolia Air and road Three mining licences are 100% held by Oyu Tolgoi LLC: MV- 006708 (the Manakht licence: 4,533 hectares), MV-006709 (the Oyu Tolgoi licence: 8,490 hectares), and MV-006710 (the Khukh Khad licence: 1,763 hectares). Two further licences are held in joint venture with Entrée Gold LLCMV-015226 (the Shivee Tolgoi Licence) and MV-015225 (the Javkhlant Licence). The licence term under the Minerals Law of Mongolia is 30 years with two 20-year extensions. First renewals are due in 2033 and 2039 for the Oyu Tolgoi and Entrée Gold licences respectively. Investment Agreement dated 6 October 2009, between the Government of Mongolia, Oyu Tolgoi LLC, TRQ, and Rio Tinto in respect of Oyu Tolgoi (Investment Agreement). Amended and Restated Shareholders Agreement dated 8 June 2011 among Oyu Tolgoi LLC, THR Oyu Tolgoi Ltd. (formerly Ivanhoe Oyu Tolgoi (BVI) Ltd.), Oyu Tolgoi Netherlands B.V. and Erdenes MGL LLC (ARSHA). Erdenes MGL LLC since transferred its shares in Oyu Tolgoi LLC and its rights and obligations under the ARSHA to its subsidiary, Erdenes Oyu Tolgoi LLC. Power Source Framework Agreement dated 31 December 2018, between the Government of Mongolia and Oyu Tolgoi LLC, including the amendment to the PSFA dated 26 June 2020. Electricity Supply Agreement dated 26 January 2022, between Southern Region Electricity Distribution Network SOSC, National Power Transmission Grid SOSC, National Dispatching Center LLC and Oyu Tolgoi LLC. In terms of key government permits, Oyu Tolgoi LLC secured a land use permit until 2035 and water use permit until 2039 as well as the mineral rights. Oyu Tolgoi was first discovered in 1996. Construction began in late 2009 after signing of an Investment Agreement with the Government of Mongolia, and first concentrate was produced in 2012. First sales of concentrate were made to Chinese customers in 2013. The first drawbell of the Hugo North underground mine was fired in 2022. In December 2022 Rio Tinto acquired 100% ownership of Turquoise Hill Resources. Mineral Reserves have been reported at the Oyut and Hugo North Deposits. The Oyut deposit is currently mined as an open pit using a conventional drill, blast, load, and haul method. The Hugo North deposit is currently being developed as an underground mine. Consists of a series of porphyry deposits containing copper, gold, silver, and molybdenum. One copper concentrator with a nominal feed capacity of 100 ktpd currently comprising 2 SAG mills, 4 ball mills, rougher and cleaner flotation circuits and up to 1 Mtpa copper concentrate capacity. Other major facilities that support the isolated operations include Maintenance workshops, heating plant, sealed airstrip and terminal, and camp facilities with up to 6,000 person capacity to accommodate current operations and the Underground construction project. Underground infrastructure in place includes several shafts for ore haulage, man haulage and ventilation plus a conveyor decline to surface and associated surface infrastructure. Currently sources its power under an agreement with the Inner Mongolia Power International Cooperation Company Ltd. (IMPIC), via the Mongolian National Power Transmission Grid (NPTG) authority, with Grid power from China and supplementary diesel power generation at site.
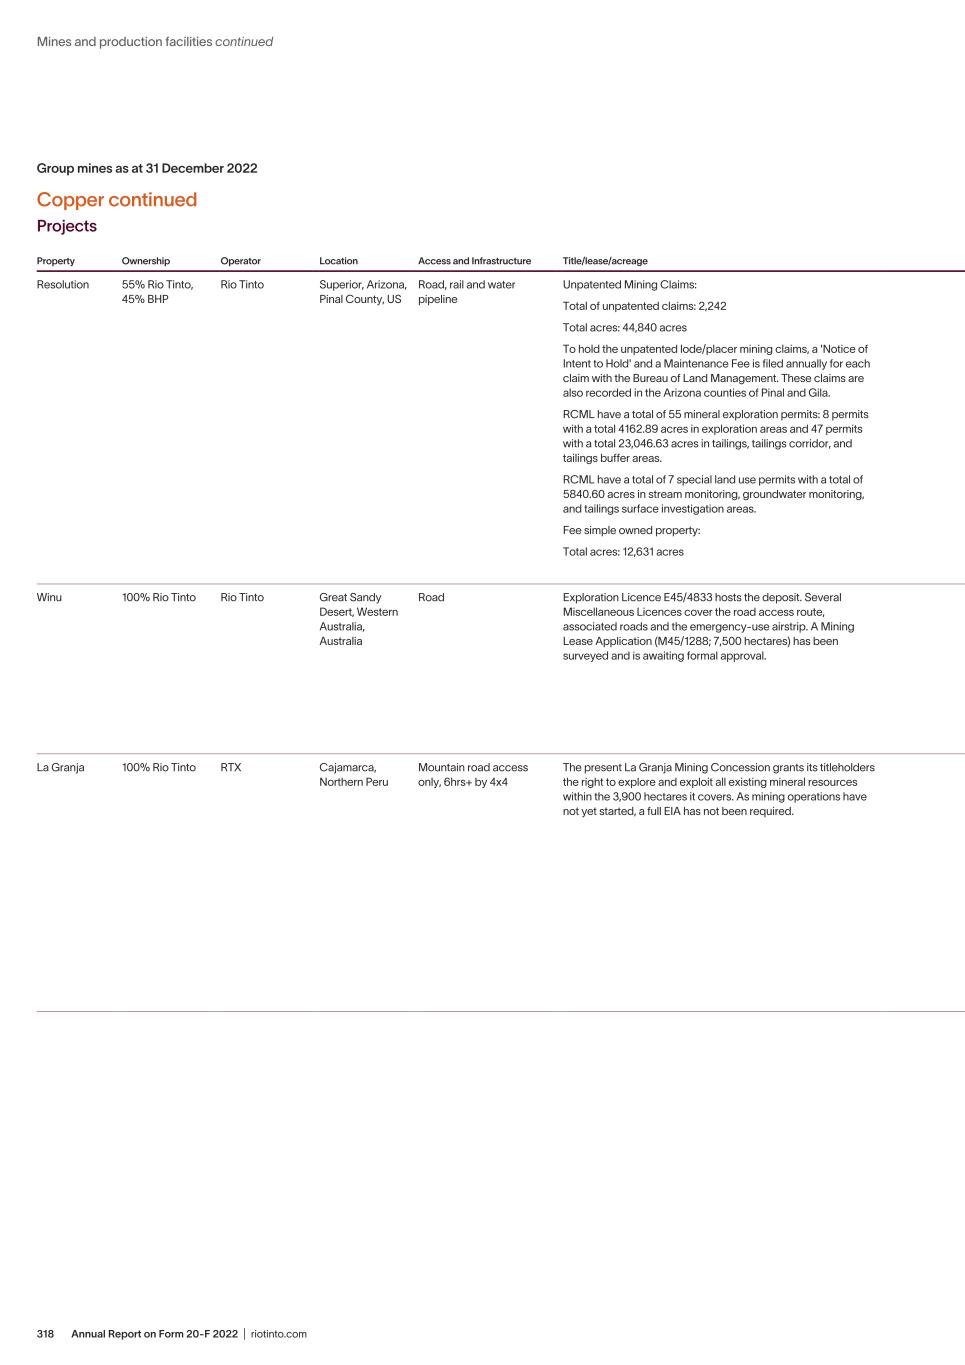
Annual Report on Form 20-F 2022 | riotinto.com318 Group mines as at 31 December 2022 Copper continued Projects Property Ownership Operator Location Access and Infrastructure Title/lease/acreage Key permit conditions History Property description / type of mine Type of mineralisation Processing plants and other available facilities Power source Resolution 55% Rio Tinto, 45% BHP Rio Tinto Superior, Arizona, Pinal County, US Road, rail and water pipeline Unpatented Mining Claims: Total of unpatented claims: 2,242 Total acres: 44,840 acres To hold the unpatented lode/placer mining claims, a 'Notice of Intent to Hold' and a Maintenance Fee is filed annually for each claim with the Bureau of Land Management. These claims are also recorded in the Arizona counties of Pinal and Gila. RCML have a total of 55 mineral exploration permits: 8 permits with a total 4162.89 acres in exploration areas and 47 permits with a total 23,046.63 acres in tailings, tailings corridor, and tailings buffer areas. RCML have a total of 7 special land use permits with a total of 5840.60 acres in stream monitoring, groundwater monitoring, and tailings surface investigation areas. Fee simple owned property: Total acres: 12,631 acres Permitting: Resolution is in the permitting and study stage of the project. It is currently at the end of a multi-year process to complete its Environmental Impact Statement under the National Environmental Protection Act. Future permits will be required for operations such as air quality permits and aquifer protection permits. The Magma Vein (formerly Silver Queen) was discovered in the 1870s and underground mining continued at the Magma Mine until 1998. In 1996, the Resolution deposit was discovered via an underground drillhole directed south from the Magma Mine workings. Kennecott Exploration (Rio Tinto) entered the project in 2001 and through an exploration “earn-in” agreement became operator in 2004. Block Cave Underground mining method. Porphyry copper and molybdenum deposit. Water treatment and reverse osmosis plant, historic tailings impoundments from the Magma Mine. No. 9 and No. 10 ventilation shafts. 115kV power lines to Eat and West Plant sites with supply contract with SRP. Winu 100% Rio Tinto Rio Tinto Great Sandy Desert, Western Australia, Australia Road Exploration Licence E45/4833 hosts the deposit. Several Miscellaneous Licences cover the road access route, associated roads and the emergency-use airstrip. A Mining Lease Application (M45/1288; 7,500 hectares) has been surveyed and is awaiting formal approval. Annual exploration licence rental payments (annually in October). The exploration licence was granted to Rio Tinto in October 2017 and Winu was discovered in December 2017. The Maiden Inferred Mineral Resource was announced in July 2020 and updated to an Indicated and Inferred Mineral Resource in February 2022. Winu is currently undergoing technical studies and all required stakeholder negotiations and applications to secure the necessary approvals for a potential open pit mining operation. Copper-gold-silver mineralisation hosted within sulphide breccias and quartz veins. A supergene enrichment profile caps most of the primary mineralisation. Winu comprises a mobile exploration camp for up to 120 people, unimproved access roads and trails, and an emergency-use only gravel airstrip. Power is provided by diesel generators. La Granja 100% Rio Tinto RTX Cajamarca, Northern Peru Mountain road access only, 6hrs+ by 4x4 The present La Granja Mining Concession grants its titleholders the right to explore and exploit all existing mineral resources within the 3,900 hectares it covers. As mining operations have not yet started, a full EIA has not been required. Because of special status due to acquisition through privatisation, as well as the annual fee ($10m per year split 50:50 between federal government fees and the establishment of a social fund), RTMP’s title on it is subject to completion and delivery of a Feasibility Study, and implementation of a mine of approval of the Feasibility Study by the Peruvian Government. The agreement is scheduled to expire (delivery of FS) in 2025, however, RTMP is seeking to implement a 3 year extension to January 2028. Rio Tinto received the Mining Concession in 2005, after BHP and Cambior had returned the leases to the Peruvian Government. Numerous studies up to PFS occurred between 2005-2015. In 2015 the project was handed over to RTX and returned to Conceptual Study status. In 2017 the project was placed on care and maintenance while commercial options and closure and exit were evaluated by Rio Tinto. This is an exploration site. Open pit is envisaged for exploitation if the business case is positive. Porphyry and associated skarn deposits with high grade breccias. Copper with minor silver, and molybdenum. A Pre-Feasibility Study (PFS) for a Starter Case mining 15 Mt of ore per annum, with dump leach processing only, and an Order of Magnitude (OoM) study for Large Case of approximately 160 Mt of ore per annum, with mill and concentrator as well as dump leaching was completed in 2013. Currently on local grid for exploration activities (incl camp) with back up generators. An upgraded power link would be required for development of the asset. Mines and production facilities continued
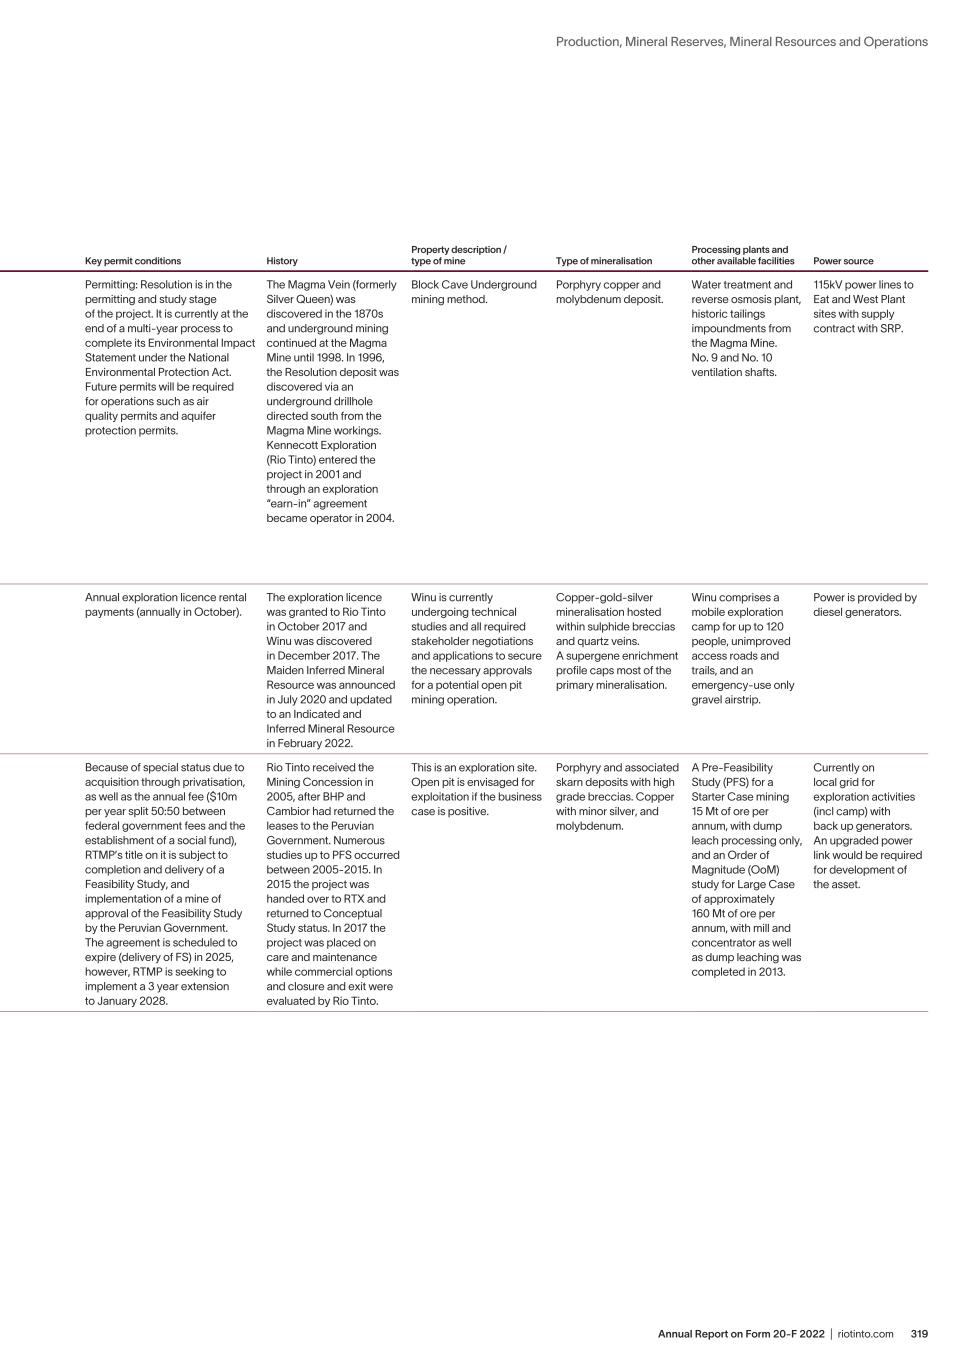
319Annual Report on Form 20-F 2022 | riotinto.com Production, Mineral Reserves, Mineral Resources and Operations Group mines as at 31 December 2022 Copper continued Projects Property Ownership Operator Location Access and Infrastructure Title/lease/acreage Key permit conditions History Property description / type of mine Type of mineralisation Processing plants and other available facilities Power source Resolution 55% Rio Tinto, 45% BHP Rio Tinto Superior, Arizona, Pinal County, US Road, rail and water pipeline Unpatented Mining Claims: Total of unpatented claims: 2,242 Total acres: 44,840 acres To hold the unpatented lode/placer mining claims, a 'Notice of Intent to Hold' and a Maintenance Fee is filed annually for each claim with the Bureau of Land Management. These claims are also recorded in the Arizona counties of Pinal and Gila. RCML have a total of 55 mineral exploration permits: 8 permits with a total 4162.89 acres in exploration areas and 47 permits with a total 23,046.63 acres in tailings, tailings corridor, and tailings buffer areas. RCML have a total of 7 special land use permits with a total of 5840.60 acres in stream monitoring, groundwater monitoring, and tailings surface investigation areas. Fee simple owned property: Total acres: 12,631 acres Permitting: Resolution is in the permitting and study stage of the project. It is currently at the end of a multi-year process to complete its Environmental Impact Statement under the National Environmental Protection Act. Future permits will be required for operations such as air quality permits and aquifer protection permits. The Magma Vein (formerly Silver Queen) was discovered in the 1870s and underground mining continued at the Magma Mine until 1998. In 1996, the Resolution deposit was discovered via an underground drillhole directed south from the Magma Mine workings. Kennecott Exploration (Rio Tinto) entered the project in 2001 and through an exploration “earn-in” agreement became operator in 2004. Block Cave Underground mining method. Porphyry copper and molybdenum deposit. Water treatment and reverse osmosis plant, historic tailings impoundments from the Magma Mine. No. 9 and No. 10 ventilation shafts. 115kV power lines to Eat and West Plant sites with supply contract with SRP. Winu 100% Rio Tinto Rio Tinto Great Sandy Desert, Western Australia, Australia Road Exploration Licence E45/4833 hosts the deposit. Several Miscellaneous Licences cover the road access route, associated roads and the emergency-use airstrip. A Mining Lease Application (M45/1288; 7,500 hectares) has been surveyed and is awaiting formal approval. Annual exploration licence rental payments (annually in October). The exploration licence was granted to Rio Tinto in October 2017 and Winu was discovered in December 2017. The Maiden Inferred Mineral Resource was announced in July 2020 and updated to an Indicated and Inferred Mineral Resource in February 2022. Winu is currently undergoing technical studies and all required stakeholder negotiations and applications to secure the necessary approvals for a potential open pit mining operation. Copper-gold-silver mineralisation hosted within sulphide breccias and quartz veins. A supergene enrichment profile caps most of the primary mineralisation. Winu comprises a mobile exploration camp for up to 120 people, unimproved access roads and trails, and an emergency-use only gravel airstrip. Power is provided by diesel generators. La Granja 100% Rio Tinto RTX Cajamarca, Northern Peru Mountain road access only, 6hrs+ by 4x4 The present La Granja Mining Concession grants its titleholders the right to explore and exploit all existing mineral resources within the 3,900 hectares it covers. As mining operations have not yet started, a full EIA has not been required. Because of special status due to acquisition through privatisation, as well as the annual fee ($10m per year split 50:50 between federal government fees and the establishment of a social fund), RTMP’s title on it is subject to completion and delivery of a Feasibility Study, and implementation of a mine of approval of the Feasibility Study by the Peruvian Government. The agreement is scheduled to expire (delivery of FS) in 2025, however, RTMP is seeking to implement a 3 year extension to January 2028. Rio Tinto received the Mining Concession in 2005, after BHP and Cambior had returned the leases to the Peruvian Government. Numerous studies up to PFS occurred between 2005-2015. In 2015 the project was handed over to RTX and returned to Conceptual Study status. In 2017 the project was placed on care and maintenance while commercial options and closure and exit were evaluated by Rio Tinto. This is an exploration site. Open pit is envisaged for exploitation if the business case is positive. Porphyry and associated skarn deposits with high grade breccias. Copper with minor silver, and molybdenum. A Pre-Feasibility Study (PFS) for a Starter Case mining 15 Mt of ore per annum, with dump leach processing only, and an Order of Magnitude (OoM) study for Large Case of approximately 160 Mt of ore per annum, with mill and concentrator as well as dump leaching was completed in 2013. Currently on local grid for exploration activities (incl camp) with back up generators. An upgraded power link would be required for development of the asset.
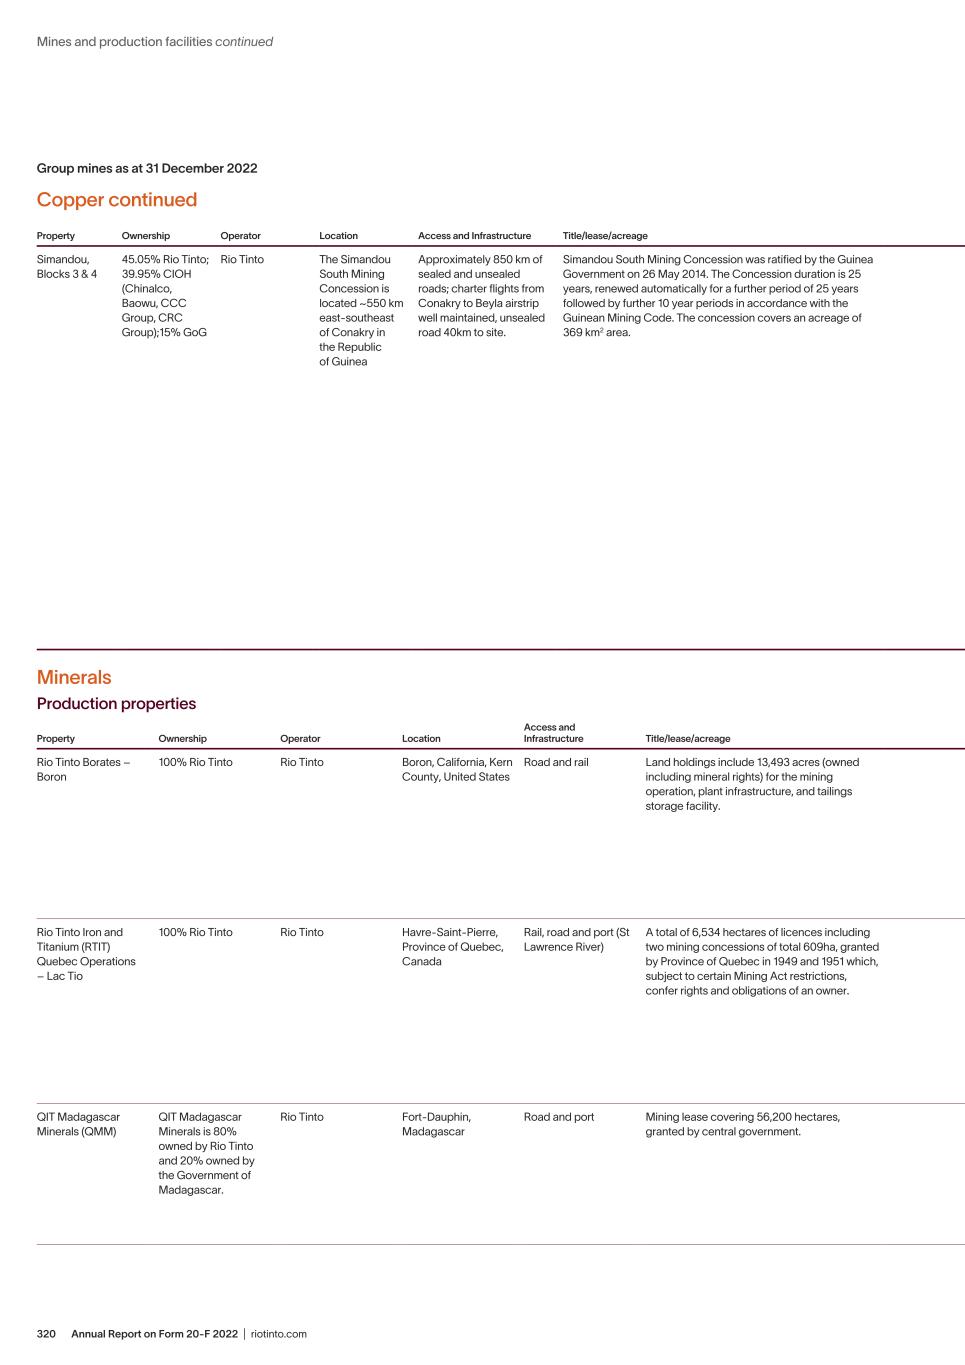
Annual Report on Form 20-F 2022 | riotinto.com320 Group mines as at 31 December 2022 Copper continued Property Ownership Operator Location Access and Infrastructure Title/lease/acreage Key permit conditions History Property description / type of mine Type of mineralisation Processing plants and other available facilities Power source Simandou, Blocks 3 & 4 45.05% Rio Tinto; 39.95% CIOH (Chinalco, Baowu, CCC Group, CRC Group);15% GoG Rio Tinto The Simandou South Mining Concession is located ~550 km east-southeast of Conakry in the Republic of Guinea Approximately 850 km of sealed and unsealed roads; charter flights from Conakry to Beyla airstrip well maintained, unsealed road 40km to site. Simandou South Mining Concession was ratified by the Guinea Government on 26 May 2014. The Concession duration is 25 years, renewed automatically for a further period of 25 years followed by further 10 year periods in accordance with the Guinean Mining Code. The concession covers an acreage of 369 km2 area. In addition to the Concession, Simfer is a party to the Amended and Consolidated Basic Convention entered into with the Republic of Guinea, dated 26 May 2014. The Amended and Consolidated Basic Convention establishes the legal regime for the project and sets out Simfer’s key legal rights and protections. The Simandou mine SEIA was approved in 2012 and has since been maintained in accordance with applicable law. Simfer submitted a BFS to the State in 2016, with efforts since 2020 focused on optimising the project’s technical solution. Since March 2022, Simfer has been pursuing negotiations with the State and Winning Consortium Simandou (owner of blocks 1&2) to establish a joint venture to co-develop the rail and port infrastructure for the Simandou South Mine and the Simandou North Mine. Open pit Supergene-enriched itabirite hosted iron ore deposits. The deposits are part of a supracrustal belt with the BIF proto-ore likely deposited in a shallow marine setting within a forearc basin. The age of deposition is considered to be between 2.7 Ga and 2.2 Ga. Current plans are for the run-of-mine ore to be coarsely crushed at the Ouéléba mine site at a maximum rate of 60 Mtpa phase 1 capacity to P100 of -100 mm through two identical primary and secondary crushing stations in a staged arrangement. The coarsely crushed ore will then be conveyed to the mine stockyard. The ore will be reclaimed from the stockpiles and conveyed to the train load-out facility for loading into trains which transport materials to the port facility where it will be shipped by bulk carrier to several ports in China. Other major facilities that will support the operations include power generation, explosives facilities, fuel and lubricants facilities, administration buildings, workshops and permanent village. Current designs contemplate that power for the mine site and other areas will be supplied by a hybrid power plant consisting of diesel generators and solar generation powered fuel station. Further, there is a plan to connect the facility to the power grid local operator Électricité de Guinée as well. This will require an approx. 20 km connection line to the main grid once it is available and would substantially reduce energy costs and fuel consumption. Minerals Production properties Property Ownership Operator Location Access and Infrastructure Title/lease/acreage Key permit conditions History Property description / type of mine Type of mineralisation Processing plants and other available facilities Power source Rio Tinto Borates – Boron 100% Rio Tinto Rio Tinto Boron, California, Kern County, United States Road and rail Land holdings include 13,493 acres (owned including mineral rights) for the mining operation, plant infrastructure, and tailings storage facility. Boron Operation currently has all State and Federal environmental and operational permits in place to continue the mining and processing operation. Regular updates to permits are ongoing. Deposit discovered in 1906, underground mining operations began in 1925, 3 underground mining operations were consolidated and the mining method switched to open pit mining in 1956. Assets were acquired by Rio Tinto in 1967. Open pit Sedimentary sequence of tincal and kernite containing interbedded claystone enveloped by facies consisting of ulexite and colemanite bearing claystone, and barren claystone. Boron Operation consists of the open pit mine, an ore crushing and conveying system, 2 process plants (Primary Process and Boric Acid Plant), Shipping facility, and tailings storage facilities. On-site co-generation units and local power grid. Rio Tinto Iron and Titanium (RTIT) Quebec Operations – Lac Tio 100% Rio Tinto Rio Tinto Havre-Saint-Pierre, Province of Quebec, Canada Rail, road and port (St Lawrence River) A total of 6,534 hectares of licences including two mining concessions of total 609ha, granted by Province of Quebec in 1949 and 1951 which, subject to certain Mining Act restrictions, confer rights and obligations of an owner. The property is held under Quebec provincial government mining concession permits (Concession minière No 368 and 381). Each is of one year duration renewable as long as the mine is in operation. Rio Tinto Iron and Titanium (RTIT) Quebec Operations – Lac Tio have also a number of claims (exclusive exploration permits) covering ilmenite occurrences in the region of the mine. These claims are renewable every 2 years. Production started 1950; interest acquired in 1989. Open pit Magmatic intrusion. Lac Tio has a crushing facility, dedicated railway, stockpile at the train terminal, ship loader, office buildings at the mine and at the terminal and waste dumps. Supplied by Hydro Quebec at regulated tariff. QIT Madagascar Minerals (QMM) QIT Madagascar Minerals is 80% owned by Rio Tinto and 20% owned by the Government of Madagascar. Rio Tinto Fort-Dauphin, Madagascar Road and port Mining lease covering 56,200 hectares, granted by central government. The permit has a validity of 30 years as of 12 December 1996. Additional renewal for 10-years each period are granted at QMM’s request. An annual fee is payable to government authorities following notification at the beginning of January. Exploration project started in 1986; construction approved 2005. Ilmenite and zirsil production started 2008. QMM intends to extract ilmenite and zirsil from heavy mineral sands over an area of about 6,000 hectares along the coast over the next 40 years. Mineral sand dredging Coastal mineralised sands. QMM has an operating Dredge, Dry Mine Unit, Heavy Mineral Concentrator, Mineral Separation Plant, Port and bulk loading facilities. On-site heavy fuel oil generators; wind and solar project agreements with IPP are expected to take the asset to 50% RE by 2024. Mines and production facilities continued
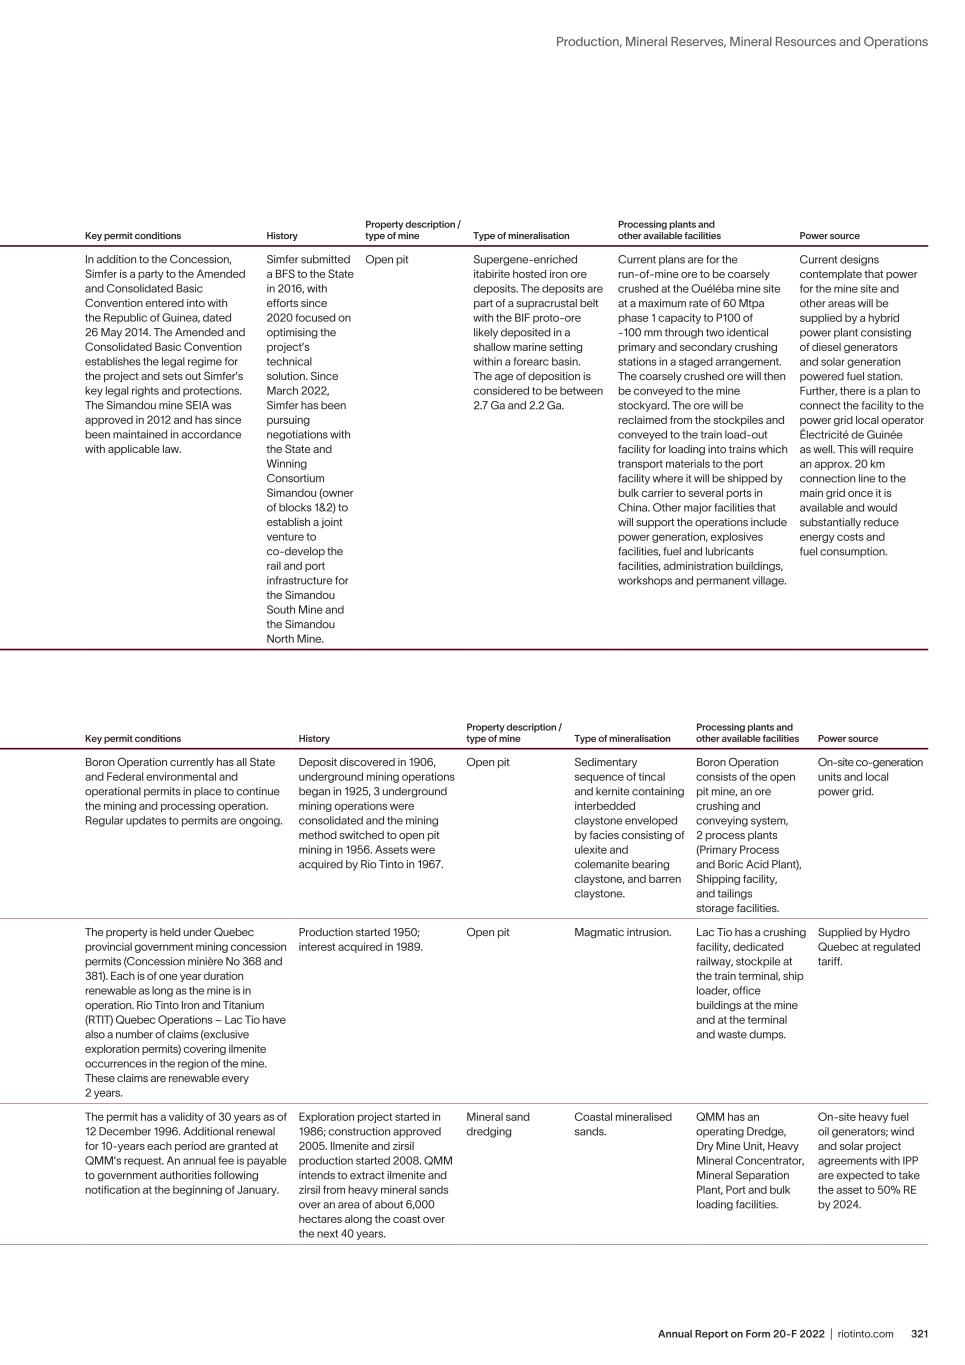
321Annual Report on Form 20-F 2022 | riotinto.com Production, Mineral Reserves, Mineral Resources and Operations Group mines as at 31 December 2022 Copper continued Property Ownership Operator Location Access and Infrastructure Title/lease/acreage Key permit conditions History Property description / type of mine Type of mineralisation Processing plants and other available facilities Power source Simandou, Blocks 3 & 4 45.05% Rio Tinto; 39.95% CIOH (Chinalco, Baowu, CCC Group, CRC Group);15% GoG Rio Tinto The Simandou South Mining Concession is located ~550 km east-southeast of Conakry in the Republic of Guinea Approximately 850 km of sealed and unsealed roads; charter flights from Conakry to Beyla airstrip well maintained, unsealed road 40km to site. Simandou South Mining Concession was ratified by the Guinea Government on 26 May 2014. The Concession duration is 25 years, renewed automatically for a further period of 25 years followed by further 10 year periods in accordance with the Guinean Mining Code. The concession covers an acreage of 369 km2 area. In addition to the Concession, Simfer is a party to the Amended and Consolidated Basic Convention entered into with the Republic of Guinea, dated 26 May 2014. The Amended and Consolidated Basic Convention establishes the legal regime for the project and sets out Simfer’s key legal rights and protections. The Simandou mine SEIA was approved in 2012 and has since been maintained in accordance with applicable law. Simfer submitted a BFS to the State in 2016, with efforts since 2020 focused on optimising the project’s technical solution. Since March 2022, Simfer has been pursuing negotiations with the State and Winning Consortium Simandou (owner of blocks 1&2) to establish a joint venture to co-develop the rail and port infrastructure for the Simandou South Mine and the Simandou North Mine. Open pit Supergene-enriched itabirite hosted iron ore deposits. The deposits are part of a supracrustal belt with the BIF proto-ore likely deposited in a shallow marine setting within a forearc basin. The age of deposition is considered to be between 2.7 Ga and 2.2 Ga. Current plans are for the run-of-mine ore to be coarsely crushed at the Ouéléba mine site at a maximum rate of 60 Mtpa phase 1 capacity to P100 of -100 mm through two identical primary and secondary crushing stations in a staged arrangement. The coarsely crushed ore will then be conveyed to the mine stockyard. The ore will be reclaimed from the stockpiles and conveyed to the train load-out facility for loading into trains which transport materials to the port facility where it will be shipped by bulk carrier to several ports in China. Other major facilities that will support the operations include power generation, explosives facilities, fuel and lubricants facilities, administration buildings, workshops and permanent village. Current designs contemplate that power for the mine site and other areas will be supplied by a hybrid power plant consisting of diesel generators and solar generation powered fuel station. Further, there is a plan to connect the facility to the power grid local operator Électricité de Guinée as well. This will require an approx. 20 km connection line to the main grid once it is available and would substantially reduce energy costs and fuel consumption. Minerals Production properties Property Ownership Operator Location Access and Infrastructure Title/lease/acreage Key permit conditions History Property description / type of mine Type of mineralisation Processing plants and other available facilities Power source Rio Tinto Borates – Boron 100% Rio Tinto Rio Tinto Boron, California, Kern County, United States Road and rail Land holdings include 13,493 acres (owned including mineral rights) for the mining operation, plant infrastructure, and tailings storage facility. Boron Operation currently has all State and Federal environmental and operational permits in place to continue the mining and processing operation. Regular updates to permits are ongoing. Deposit discovered in 1906, underground mining operations began in 1925, 3 underground mining operations were consolidated and the mining method switched to open pit mining in 1956. Assets were acquired by Rio Tinto in 1967. Open pit Sedimentary sequence of tincal and kernite containing interbedded claystone enveloped by facies consisting of ulexite and colemanite bearing claystone, and barren claystone. Boron Operation consists of the open pit mine, an ore crushing and conveying system, 2 process plants (Primary Process and Boric Acid Plant), Shipping facility, and tailings storage facilities. On-site co-generation units and local power grid. Rio Tinto Iron and Titanium (RTIT) Quebec Operations – Lac Tio 100% Rio Tinto Rio Tinto Havre-Saint-Pierre, Province of Quebec, Canada Rail, road and port (St Lawrence River) A total of 6,534 hectares of licences including two mining concessions of total 609ha, granted by Province of Quebec in 1949 and 1951 which, subject to certain Mining Act restrictions, confer rights and obligations of an owner. The property is held under Quebec provincial government mining concession permits (Concession minière No 368 and 381). Each is of one year duration renewable as long as the mine is in operation. Rio Tinto Iron and Titanium (RTIT) Quebec Operations – Lac Tio have also a number of claims (exclusive exploration permits) covering ilmenite occurrences in the region of the mine. These claims are renewable every 2 years. Production started 1950; interest acquired in 1989. Open pit Magmatic intrusion. Lac Tio has a crushing facility, dedicated railway, stockpile at the train terminal, ship loader, office buildings at the mine and at the terminal and waste dumps. Supplied by Hydro Quebec at regulated tariff. QIT Madagascar Minerals (QMM) QIT Madagascar Minerals is 80% owned by Rio Tinto and 20% owned by the Government of Madagascar. Rio Tinto Fort-Dauphin, Madagascar Road and port Mining lease covering 56,200 hectares, granted by central government. The permit has a validity of 30 years as of 12 December 1996. Additional renewal for 10-years each period are granted at QMM’s request. An annual fee is payable to government authorities following notification at the beginning of January. Exploration project started in 1986; construction approved 2005. Ilmenite and zirsil production started 2008. QMM intends to extract ilmenite and zirsil from heavy mineral sands over an area of about 6,000 hectares along the coast over the next 40 years. Mineral sand dredging Coastal mineralised sands. QMM has an operating Dredge, Dry Mine Unit, Heavy Mineral Concentrator, Mineral Separation Plant, Port and bulk loading facilities. On-site heavy fuel oil generators; wind and solar project agreements with IPP are expected to take the asset to 50% RE by 2024.
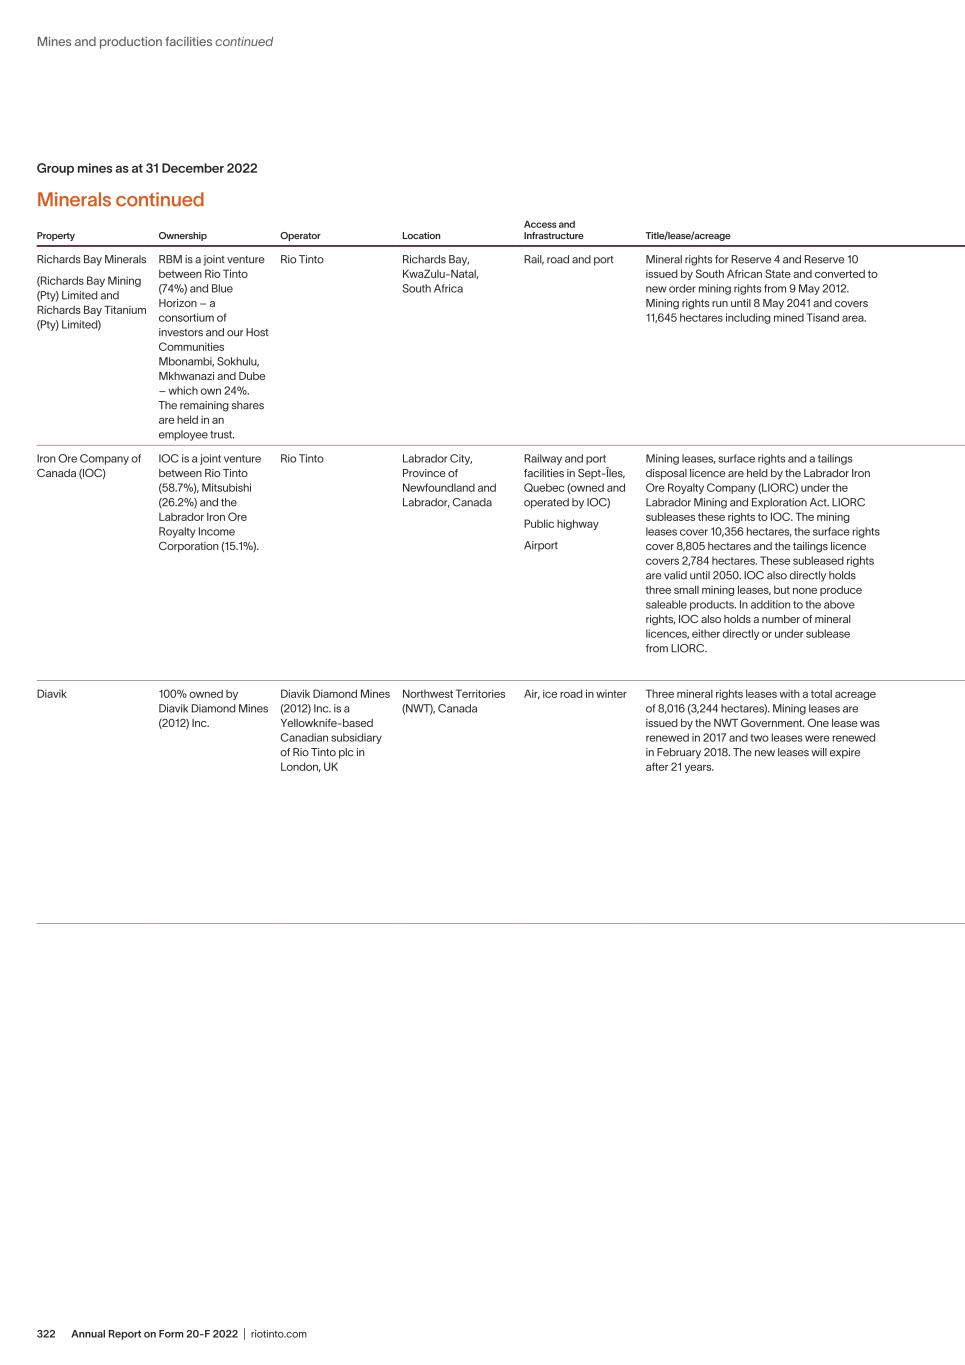
Annual Report on Form 20-F 2022 | riotinto.com322 Group mines as at 31 December 2022 Minerals continued Property Ownership Operator Location Access and Infrastructure Title/lease/acreage Key permit conditions History Property description / type of mine Type of mineralisation Processing plants and other available facilities Power source Richards Bay Minerals (Richards Bay Mining (Pty) Limited and Richards Bay Titanium (Pty) Limited) RBM is a joint venture between Rio Tinto (74%) and Blue Horizon – a consortium of investors and our Host Communities Mbonambi, Sokhulu, Mkhwanazi and Dube – which own 24%. The remaining shares are held in an employee trust. Rio Tinto Richards Bay, KwaZulu-Natal, South Africa Rail, road and port Mineral rights for Reserve 4 and Reserve 10 issued by South African State and converted to new order mining rights from 9 May 2012. Mining rights run until 8 May 2041 and covers 11,645 hectares including mined Tisand area. RBM operates in three lease areas, Tisand, Zulti North and Zulti South, by means of a notarial deed. Tisand (which contains the stockpiled tails) and Zulti North leases are held by Richards Bay Mining (Pty) Ltd. 26% of RBM is owned by a consortium of local communities and businesses (24%) and RBM employees (2%), in line with South Africa’s Broad-Based Black Economic Empowerment legislation. Production started 1977; initial interest acquired 1989. Fifth mining plant commissioned in 2000. One mining plant decommissioned in 2008. In September 2012, Rio Tinto doubled its holding in Richards Bay Minerals to 74% following the acquisition of BHP Billiton’s entire interests. Mineral sand dredging Coastal mineralised sands RBM manages and operates several dredges, dry mining units, heavy mineral concentrators and a mineral separation plant. RBM also has a smelter with furnaces to produce titania slag, pig iron in addition to rutile and zircon. Contract with ESKOM. Iron Ore Company of Canada (IOC) IOC is a joint venture between Rio Tinto (58.7%), Mitsubishi (26.2%) and the Labrador Iron Ore Royalty Income Corporation (15.1%). Rio Tinto Labrador City, Province of Newfoundland and Labrador, Canada Railway and port facilities in Sept-Îles, Quebec (owned and operated by IOC) Public highway Airport Mining leases, surface rights and a tailings disposal licence are held by the Labrador Iron Ore Royalty Company (LIORC) under the Labrador Mining and Exploration Act. LIORC subleases these rights to IOC. The mining leases cover 10,356 hectares, the surface rights cover 8,805 hectares and the tailings licence covers 2,784 hectares. These subleased rights are valid until 2050. IOC also directly holds three small mining leases, but none produce saleable products. In addition to the above rights, IOC also holds a number of mineral licences, either directly or under sublease from LIORC. IOC holds numerous existing and valid Newfoundland and Labrador permits including: TMP Release, Tailings Disposal License, Approval for Asbestos Disposal Site at Main landfill Facility, Mill license, PCB Storage Facility, Landfill, Water withdrawal and use of bodies of water, Dewatering & Excavation of Maggie Lake, Infilling of Carol Lake Lagoon and unnamed water body, Sewage System/ Water Supply for Crusher Building. IOC also holds Federal Permits including: Fish Habitat Compensation Agreement, Tailings Management Plan and dewatering. Interest acquired in 2000 through acquisition of North Ltd. Current operation began in 1962 and has processed over one billion tonnes of crude ore. Annual capacity 23 Mt of concentrate of which 12 to 13 Mt can be pelletised. Open pit Oxide iron (specular hematite and magnetite) Concentrator (gravity and magnetic separation circuits), Pellet plant, Warehouses, Workshops, Heating plant, Ore delivery system (crusher/ conveyor and automated train system) Explosives plant, Train loadout facilities, Rail line (Labrador City to Sept-Îles), Stockyards, Shiploaders Supplied by Newfoundland and Labrador Hydro. Diavik 100% owned by Diavik Diamond Mines (2012) Inc. Diavik Diamond Mines (2012) Inc. is a Yellowknife-based Canadian subsidiary of Rio Tinto plc in London, UK Northwest Territories (NWT), Canada Air, ice road in winter Three mineral rights leases with a total acreage of 8,016 (3,244 hectares). Mining leases are issued by the NWT Government. One lease was renewed in 2017 and two leases were renewed in February 2018. The new leases will expire after 21 years. Our key permit conditions are local employment, procurement and benefit sharing commitments; environmental compliance and reporting; environmental security and closure and rehabilitation planning; and payment of taxes and government royalties. Deposits discovered in 1994-95. Construction approved in 2000. Diamond production started in 2003. Fourth pipe commenced production in 2018. Mine life through 2023-26. In November 2021, Rio Tinto became the sole owner of Diavik Diamond Mine. This followed the completion of a transaction for Rio Tinto’s acquisition of the 40% share held by Dominion Diamond Mines in Diavik, following the Court of Queen’s Bench of Alberta’s approval. Open pit and underground operations (Blast-hole stoping and Sub-level Cave methods) Diamondiferous kimberlite deposit Includes processing plant and accommodation facilities onsite. On-site diesel generators; installed capacity 44MW and 9.2MW of wind capacity. Mines and production facilities continued
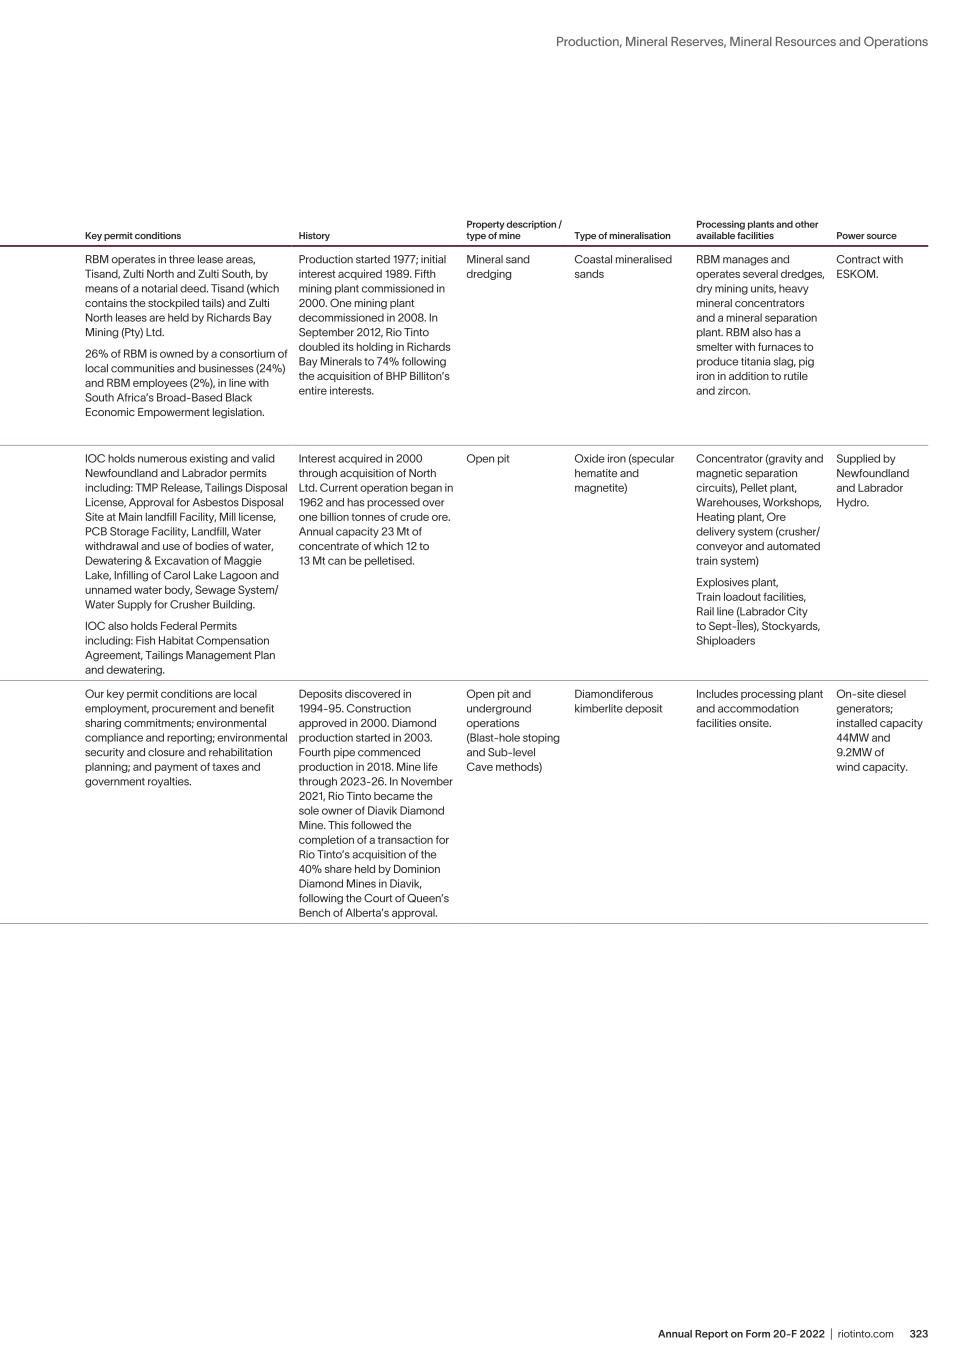
323Annual Report on Form 20-F 2022 | riotinto.com Production, Mineral Reserves, Mineral Resources and Operations Group mines as at 31 December 2022 Minerals continued Property Ownership Operator Location Access and Infrastructure Title/lease/acreage Key permit conditions History Property description / type of mine Type of mineralisation Processing plants and other available facilities Power source Richards Bay Minerals (Richards Bay Mining (Pty) Limited and Richards Bay Titanium (Pty) Limited) RBM is a joint venture between Rio Tinto (74%) and Blue Horizon – a consortium of investors and our Host Communities Mbonambi, Sokhulu, Mkhwanazi and Dube – which own 24%. The remaining shares are held in an employee trust. Rio Tinto Richards Bay, KwaZulu-Natal, South Africa Rail, road and port Mineral rights for Reserve 4 and Reserve 10 issued by South African State and converted to new order mining rights from 9 May 2012. Mining rights run until 8 May 2041 and covers 11,645 hectares including mined Tisand area. RBM operates in three lease areas, Tisand, Zulti North and Zulti South, by means of a notarial deed. Tisand (which contains the stockpiled tails) and Zulti North leases are held by Richards Bay Mining (Pty) Ltd. 26% of RBM is owned by a consortium of local communities and businesses (24%) and RBM employees (2%), in line with South Africa’s Broad-Based Black Economic Empowerment legislation. Production started 1977; initial interest acquired 1989. Fifth mining plant commissioned in 2000. One mining plant decommissioned in 2008. In September 2012, Rio Tinto doubled its holding in Richards Bay Minerals to 74% following the acquisition of BHP Billiton’s entire interests. Mineral sand dredging Coastal mineralised sands RBM manages and operates several dredges, dry mining units, heavy mineral concentrators and a mineral separation plant. RBM also has a smelter with furnaces to produce titania slag, pig iron in addition to rutile and zircon. Contract with ESKOM. Iron Ore Company of Canada (IOC) IOC is a joint venture between Rio Tinto (58.7%), Mitsubishi (26.2%) and the Labrador Iron Ore Royalty Income Corporation (15.1%). Rio Tinto Labrador City, Province of Newfoundland and Labrador, Canada Railway and port facilities in Sept-Îles, Quebec (owned and operated by IOC) Public highway Airport Mining leases, surface rights and a tailings disposal licence are held by the Labrador Iron Ore Royalty Company (LIORC) under the Labrador Mining and Exploration Act. LIORC subleases these rights to IOC. The mining leases cover 10,356 hectares, the surface rights cover 8,805 hectares and the tailings licence covers 2,784 hectares. These subleased rights are valid until 2050. IOC also directly holds three small mining leases, but none produce saleable products. In addition to the above rights, IOC also holds a number of mineral licences, either directly or under sublease from LIORC. IOC holds numerous existing and valid Newfoundland and Labrador permits including: TMP Release, Tailings Disposal License, Approval for Asbestos Disposal Site at Main landfill Facility, Mill license, PCB Storage Facility, Landfill, Water withdrawal and use of bodies of water, Dewatering & Excavation of Maggie Lake, Infilling of Carol Lake Lagoon and unnamed water body, Sewage System/ Water Supply for Crusher Building. IOC also holds Federal Permits including: Fish Habitat Compensation Agreement, Tailings Management Plan and dewatering. Interest acquired in 2000 through acquisition of North Ltd. Current operation began in 1962 and has processed over one billion tonnes of crude ore. Annual capacity 23 Mt of concentrate of which 12 to 13 Mt can be pelletised. Open pit Oxide iron (specular hematite and magnetite) Concentrator (gravity and magnetic separation circuits), Pellet plant, Warehouses, Workshops, Heating plant, Ore delivery system (crusher/ conveyor and automated train system) Explosives plant, Train loadout facilities, Rail line (Labrador City to Sept-Îles), Stockyards, Shiploaders Supplied by Newfoundland and Labrador Hydro. Diavik 100% owned by Diavik Diamond Mines (2012) Inc. Diavik Diamond Mines (2012) Inc. is a Yellowknife-based Canadian subsidiary of Rio Tinto plc in London, UK Northwest Territories (NWT), Canada Air, ice road in winter Three mineral rights leases with a total acreage of 8,016 (3,244 hectares). Mining leases are issued by the NWT Government. One lease was renewed in 2017 and two leases were renewed in February 2018. The new leases will expire after 21 years. Our key permit conditions are local employment, procurement and benefit sharing commitments; environmental compliance and reporting; environmental security and closure and rehabilitation planning; and payment of taxes and government royalties. Deposits discovered in 1994-95. Construction approved in 2000. Diamond production started in 2003. Fourth pipe commenced production in 2018. Mine life through 2023-26. In November 2021, Rio Tinto became the sole owner of Diavik Diamond Mine. This followed the completion of a transaction for Rio Tinto’s acquisition of the 40% share held by Dominion Diamond Mines in Diavik, following the Court of Queen’s Bench of Alberta’s approval. Open pit and underground operations (Blast-hole stoping and Sub-level Cave methods) Diamondiferous kimberlite deposit Includes processing plant and accommodation facilities onsite. On-site diesel generators; installed capacity 44MW and 9.2MW of wind capacity.
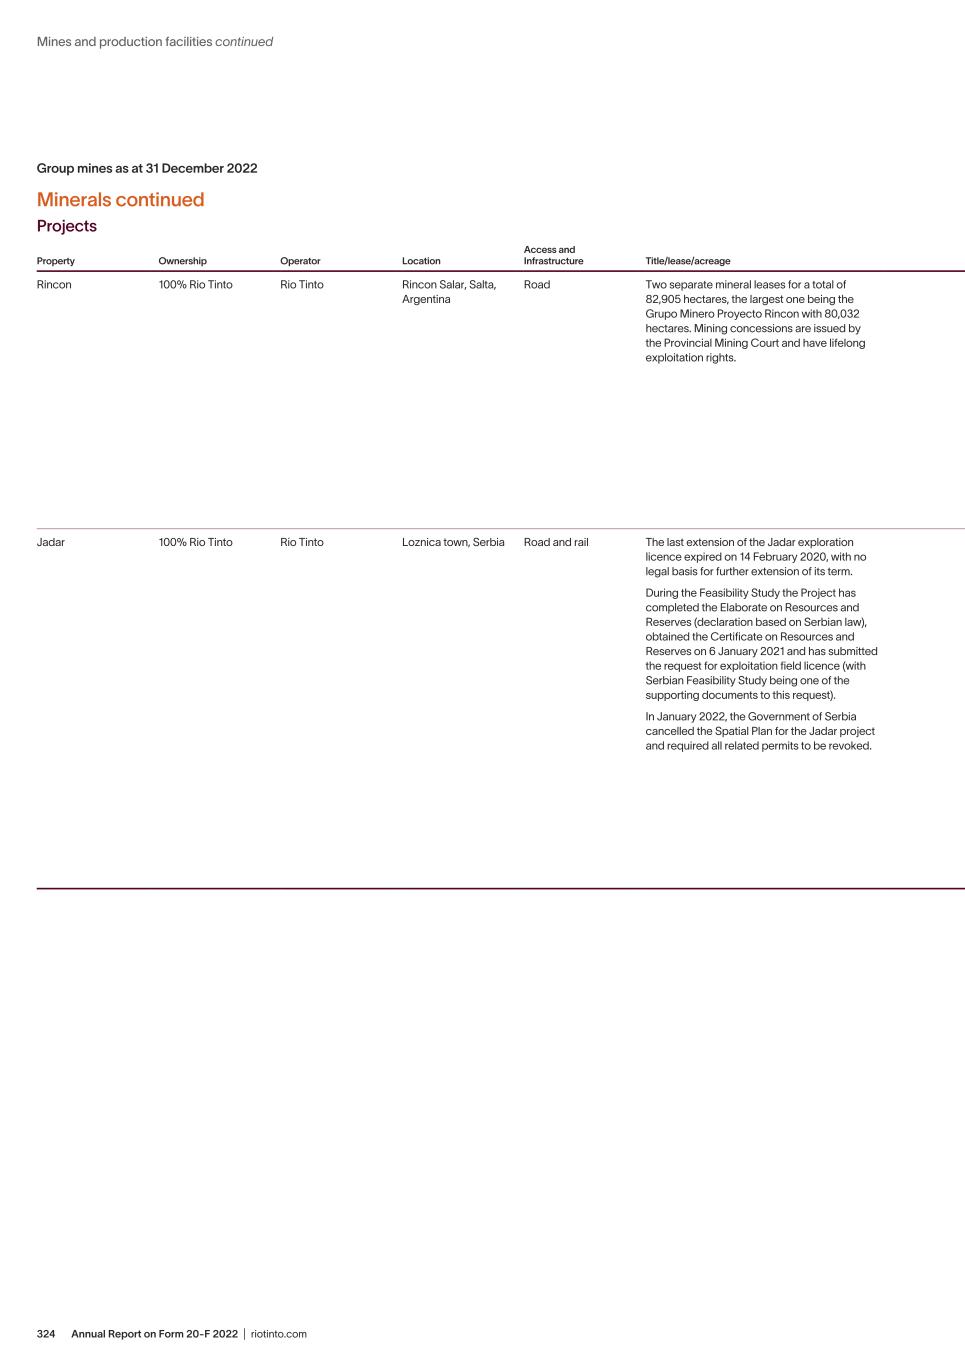
Annual Report on Form 20-F 2022 | riotinto.com324 Group mines as at 31 December 2022 Minerals continued Projects Property Ownership Operator Location Access and Infrastructure Title/lease/acreage Key permit conditions History Property description / type of mine Type of mineralisation Processing plants and other available facilities Power source Rincon 100% Rio Tinto Rio Tinto Rincon Salar, Salta, Argentina Road Two separate mineral leases for a total of 82,905 hectares, the largest one being the Grupo Minero Proyecto Rincon with 80,032 hectares. Mining concessions are issued by the Provincial Mining Court and have lifelong exploitation rights. Key permit conditions are environmental compliance and reporting, including independent authorisations for industrial water and brine extraction, spent brine disposal facilities, processing plant and ancillary infrastructure. Rincon Salar was initially explored by Admiralty Resources NL, who acquired mining leases covering approximately 85% of the Salar in 2001. Admiralty demerged the project into a separate ASX listed entity called Rincon Lithium Ltd in October 2007, and sold the company to the private equity group Sentient Equity Partners in December 2008. The project was under evaluation by Sentient until the sale of the property to Rio Tinto in March 2022. Mining will comprise brine extracted from a production wellfield and fed to a central processing facility for lithium recovery. Lithium mineralisation occurs as a brine within a sedimentary sequence in a mature salar, composed of halite, volcaniclastic sand and variable amounts of clay / sand. The brine is hosted in two separate aquifers: an upper unconfined fracturated halitic aquifer and a lower semi-confined aquifer composed mainly of volcaniclastic sand. The project includes a wellfield for brine extraction and a chemical plant for the production of lithium carbonate, a spent brine disposal facility, wellfield for the extraction of process water and water pre-treatment equipment, camp and office buildings, warehouses and loading / unloading facilities. Connected to the national electric grid with access to power from nearby solar farms. Option for the construction of a solar farm under agreement with a 3rd party on a build / own / opearte model under consideration. Jadar 100% Rio Tinto Rio Tinto Loznica town, Serbia Road and rail The last extension of the Jadar exploration licence expired on 14 February 2020, with no legal basis for further extension of its term. During the Feasibility Study the Project has completed the Elaborate on Resources and Reserves (declaration based on Serbian law), obtained the Certificate on Resources and Reserves on 6 January 2021 and has submitted the request for exploitation field licence (with Serbian Feasibility Study being one of the supporting documents to this request). In January 2022, the Government of Serbia cancelled the Spatial Plan for the Jadar project and required all related permits to be revoked. The project is governed by two main pieces of Serbian legislation: Mining Law is administered by the Ministry of Mining and Energy (MME) and Planning and Construction Law is administered by the Ministry of Construction, Transportation and Infrastructure (MCTI). The permitting process base case foresees the following: – Mine, beneficiation plant and mine surface facilities are subject to the permitting procedure of MME. – Processing plant, industrial waste landfill and infrastructure (rail, roads, power and water pipelines) are subject to the unified permitting procedure under MCTI. The Jadar deposit was discovered in 2004 by Rio Tinto Exploration geologists during a regional exploration program for borates in the Balkans. The deposit is in its majority composed of a mineral new to science named Jadarite with high concentrations of lithium and boron. Resource definition and processing workflow development and testing were conducted for over a decade. The Pre-feasibility Study (PFS) completed in July 2020 has shown that the Jadar project has the potential to produce both battery grade lithium carbonate and boric acid. In January 2022, the Government of Serbia cancelled the Spatial Plan for the Jadar project and required all related permits to be revoked. Underground mine Jadarite mineralisation is present in three broad zones containing stratiform lenses of variable thickness. These units are hosted in a much thicker gently dipping sequence mainly composed of fine-grained sediments affected by syn and post depositional faulting. The planned site layout includes a concentrator to beneficiate the primary ore, a chemical plant to produce boric acid and lithium carbonate, paste plant, water and waste treatment plants, surface waste storage (dry stack), railroad spur and warehouses for product storage and loading / unloading, and office buildings. Connected to the national electric grid. Electricity planned to be sourced from nearby hydroelectrical power plant. Mines and production facilities continued
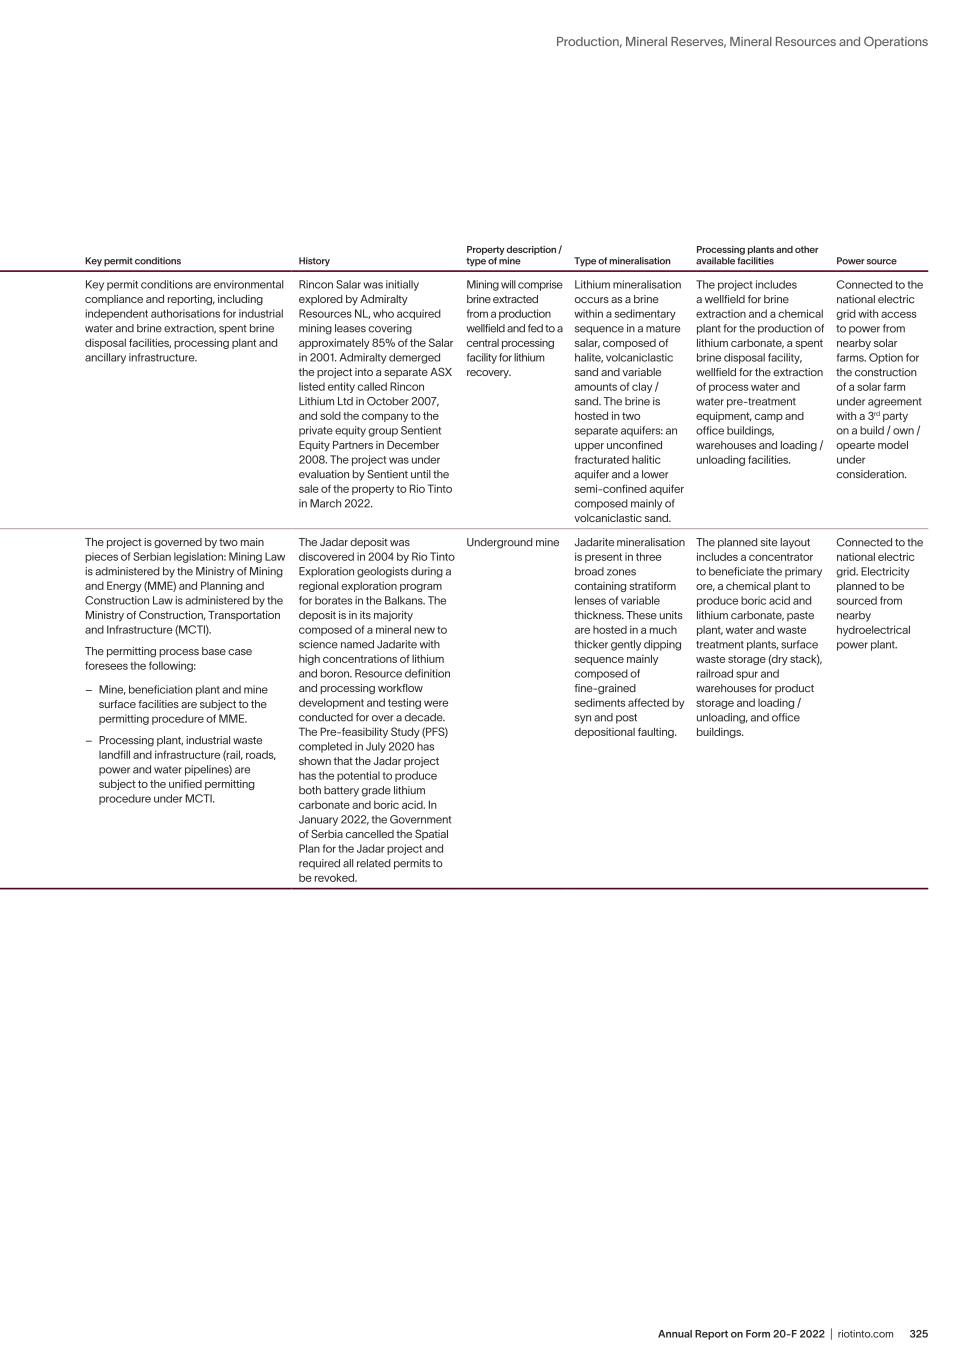
325Annual Report on Form 20-F 2022 | riotinto.com Production, Mineral Reserves, Mineral Resources and Operations Group mines as at 31 December 2022 Minerals continued Projects Property Ownership Operator Location Access and Infrastructure Title/lease/acreage Key permit conditions History Property description / type of mine Type of mineralisation Processing plants and other available facilities Power source Rincon 100% Rio Tinto Rio Tinto Rincon Salar, Salta, Argentina Road Two separate mineral leases for a total of 82,905 hectares, the largest one being the Grupo Minero Proyecto Rincon with 80,032 hectares. Mining concessions are issued by the Provincial Mining Court and have lifelong exploitation rights. Key permit conditions are environmental compliance and reporting, including independent authorisations for industrial water and brine extraction, spent brine disposal facilities, processing plant and ancillary infrastructure. Rincon Salar was initially explored by Admiralty Resources NL, who acquired mining leases covering approximately 85% of the Salar in 2001. Admiralty demerged the project into a separate ASX listed entity called Rincon Lithium Ltd in October 2007, and sold the company to the private equity group Sentient Equity Partners in December 2008. The project was under evaluation by Sentient until the sale of the property to Rio Tinto in March 2022. Mining will comprise brine extracted from a production wellfield and fed to a central processing facility for lithium recovery. Lithium mineralisation occurs as a brine within a sedimentary sequence in a mature salar, composed of halite, volcaniclastic sand and variable amounts of clay / sand. The brine is hosted in two separate aquifers: an upper unconfined fracturated halitic aquifer and a lower semi-confined aquifer composed mainly of volcaniclastic sand. The project includes a wellfield for brine extraction and a chemical plant for the production of lithium carbonate, a spent brine disposal facility, wellfield for the extraction of process water and water pre-treatment equipment, camp and office buildings, warehouses and loading / unloading facilities. Connected to the national electric grid with access to power from nearby solar farms. Option for the construction of a solar farm under agreement with a 3rd party on a build / own / opearte model under consideration. Jadar 100% Rio Tinto Rio Tinto Loznica town, Serbia Road and rail The last extension of the Jadar exploration licence expired on 14 February 2020, with no legal basis for further extension of its term. During the Feasibility Study the Project has completed the Elaborate on Resources and Reserves (declaration based on Serbian law), obtained the Certificate on Resources and Reserves on 6 January 2021 and has submitted the request for exploitation field licence (with Serbian Feasibility Study being one of the supporting documents to this request). In January 2022, the Government of Serbia cancelled the Spatial Plan for the Jadar project and required all related permits to be revoked. The project is governed by two main pieces of Serbian legislation: Mining Law is administered by the Ministry of Mining and Energy (MME) and Planning and Construction Law is administered by the Ministry of Construction, Transportation and Infrastructure (MCTI). The permitting process base case foresees the following: – Mine, beneficiation plant and mine surface facilities are subject to the permitting procedure of MME. – Processing plant, industrial waste landfill and infrastructure (rail, roads, power and water pipelines) are subject to the unified permitting procedure under MCTI. The Jadar deposit was discovered in 2004 by Rio Tinto Exploration geologists during a regional exploration program for borates in the Balkans. The deposit is in its majority composed of a mineral new to science named Jadarite with high concentrations of lithium and boron. Resource definition and processing workflow development and testing were conducted for over a decade. The Pre-feasibility Study (PFS) completed in July 2020 has shown that the Jadar project has the potential to produce both battery grade lithium carbonate and boric acid. In January 2022, the Government of Serbia cancelled the Spatial Plan for the Jadar project and required all related permits to be revoked. Underground mine Jadarite mineralisation is present in three broad zones containing stratiform lenses of variable thickness. These units are hosted in a much thicker gently dipping sequence mainly composed of fine-grained sediments affected by syn and post depositional faulting. The planned site layout includes a concentrator to beneficiate the primary ore, a chemical plant to produce boric acid and lithium carbonate, paste plant, water and waste treatment plants, surface waste storage (dry stack), railroad spur and warehouses for product storage and loading / unloading, and office buildings. Connected to the national electric grid. Electricity planned to be sourced from nearby hydroelectrical power plant.
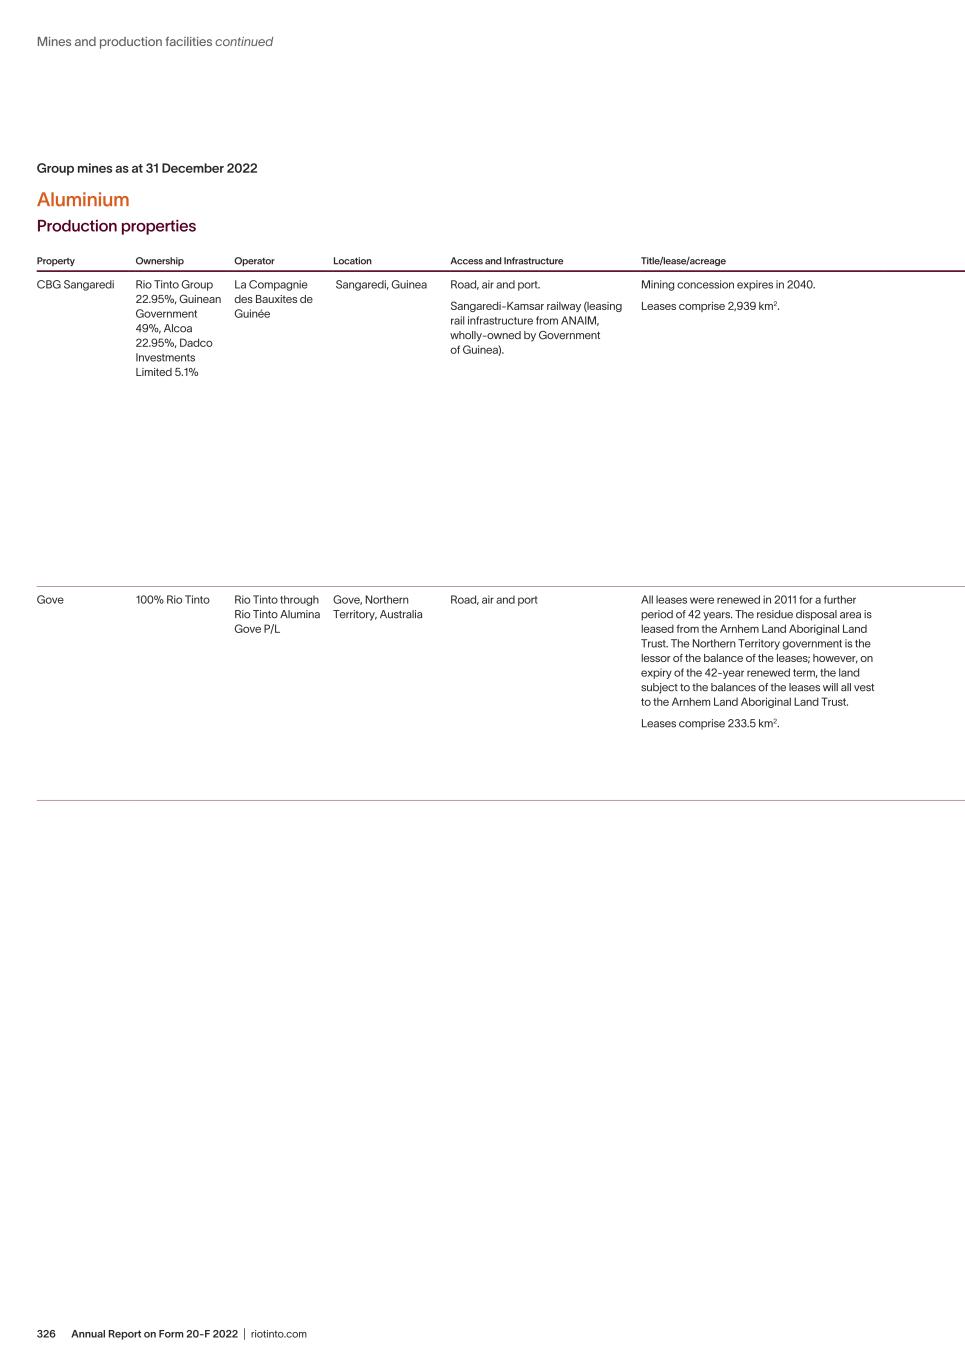
Annual Report on Form 20-F 2022 | riotinto.com326 Group mines as at 31 December 2022 Aluminium Production properties Property Ownership Operator Location Access and Infrastructure Title/lease/acreage Key permit conditions History Property description / type of mine Type of mineralisation Processing plants and other available facilities Power source CBG Sangaredi Rio Tinto Group 22.95%, Guinean Government 49%, Alcoa 22.95%, Dadco Investments Limited 5.1% La Compagnie des Bauxites de Guinée Sangaredi, Guinea Road, air and port. Sangaredi-Kamsar railway (leasing rail infrastructure from ANAIM, wholly-owned by Government of Guinea). Mining concession expires in 2040. Leases comprise 2,939 km2. The obligations of CBG relative to health and safety of workers and to the environment and to the rehabilitation of mined out areas are subject to the Mining Code (2011) and Environmental Code of the Republic of Guinea. CBG is a JV created in 1963 and is registered in US (Delaware). Bauxite mining commenced in 1973. Shareholders are 51% Halco and 49% Government of Guinea. Rio Tinto holds a 45% interest in Halco. Expansion of the CBG bauxite mine, processing plant, port facility and associated infrastructure is currently near completion with ramp up to 18.5 Mtpa underway. In 2015, CBG entered into an agreement to share the rail infrastructure in Multi-User Operation Agreement (MUOA) with other bauxite companies, GAC (EGA) and COBAD (RUSAL). Open cut Bauxite The Sangaredi site is an open cut mine including the following operations: stripping, drilling, blasting, loading, hauling. Then, the bauxite is transported by railway cars approximately 135 km away from Sangaredi to Kamsar. In Kamsar, the installations include the following assets: locomotive repair shop, railway cars unloader, primary crusher, secondary crusher, scrubbers, conveyors, stacker, reclaimer, bauxite dryers, dry bauxite storage, bauxite sampling tower, power house, wharf, ship loader, etc. The crushing plant is used only to reduce oversize material – no screening required. Four bauxite dryers are installed in order to reduce the moisture content of the bauxite before shipping. On-site generation (fuel oil). Gove 100% Rio Tinto Rio Tinto through Rio Tinto Alumina Gove P/L Gove, Northern Territory, Australia Road, air and port All leases were renewed in 2011 for a further period of 42 years. The residue disposal area is leased from the Arnhem Land Aboriginal Land Trust. The Northern Territory government is the lessor of the balance of the leases; however, on expiry of the 42-year renewed term, the land subject to the balances of the leases will all vest to the Arnhem Land Aboriginal Land Trust. Leases comprise 233.5 km2. Key permit conditions are prescribed by the Northern Territory Government in the form of a Mine Management Plan (MMP). The current MMP runs for a period of 12 years, until 2031, and authorises all activities at the operation. Lease payments are prescribed by the terms of the relevant leases. Bauxite mining commenced in 1970, feeding both the Gove refinery and export market, capped at two million tonnes per annum. Bauxite export ceased in 2006 with feed intended for the expanded Gove refinery. Bauxite exports recommenced in 2008 and will increase in the coming years following the curtailment of the refinery production in 2014 and permanent shut decision made by the Board of Rio Tinto in October 2017. Current annual production capacity is 12.5 Mt on a dry basis Open cut Bauxite Crushing plant only to reduce oversize material – no screening required. On-site diesel fired power station. Mines and production facilities continued
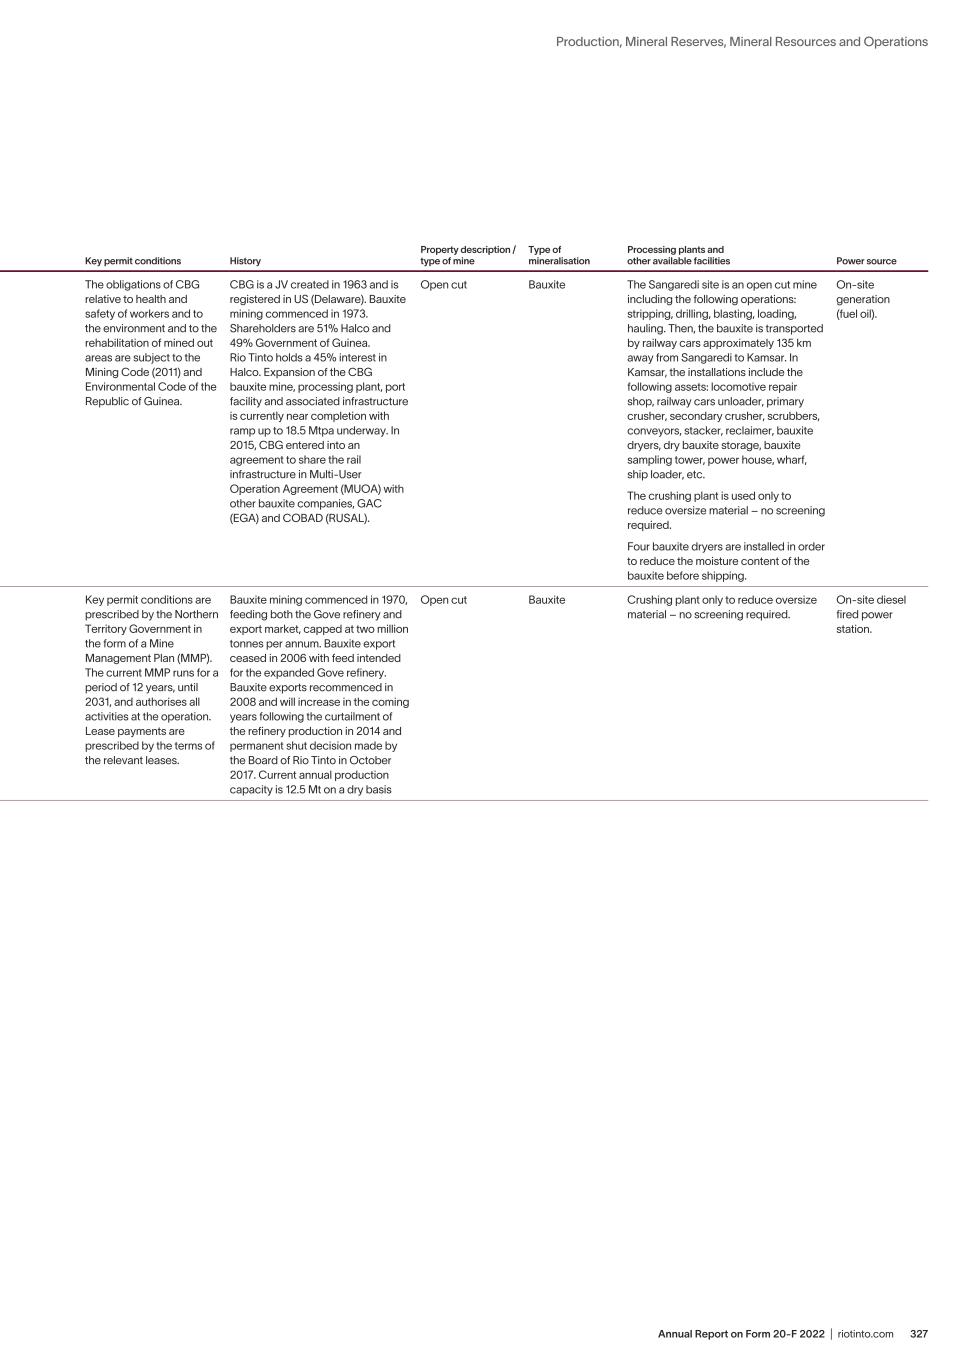
327Annual Report on Form 20-F 2022 | riotinto.com Production, Mineral Reserves, Mineral Resources and Operations Group mines as at 31 December 2022 Aluminium Production properties Property Ownership Operator Location Access and Infrastructure Title/lease/acreage Key permit conditions History Property description / type of mine Type of mineralisation Processing plants and other available facilities Power source CBG Sangaredi Rio Tinto Group 22.95%, Guinean Government 49%, Alcoa 22.95%, Dadco Investments Limited 5.1% La Compagnie des Bauxites de Guinée Sangaredi, Guinea Road, air and port. Sangaredi-Kamsar railway (leasing rail infrastructure from ANAIM, wholly-owned by Government of Guinea). Mining concession expires in 2040. Leases comprise 2,939 km2. The obligations of CBG relative to health and safety of workers and to the environment and to the rehabilitation of mined out areas are subject to the Mining Code (2011) and Environmental Code of the Republic of Guinea. CBG is a JV created in 1963 and is registered in US (Delaware). Bauxite mining commenced in 1973. Shareholders are 51% Halco and 49% Government of Guinea. Rio Tinto holds a 45% interest in Halco. Expansion of the CBG bauxite mine, processing plant, port facility and associated infrastructure is currently near completion with ramp up to 18.5 Mtpa underway. In 2015, CBG entered into an agreement to share the rail infrastructure in Multi-User Operation Agreement (MUOA) with other bauxite companies, GAC (EGA) and COBAD (RUSAL). Open cut Bauxite The Sangaredi site is an open cut mine including the following operations: stripping, drilling, blasting, loading, hauling. Then, the bauxite is transported by railway cars approximately 135 km away from Sangaredi to Kamsar. In Kamsar, the installations include the following assets: locomotive repair shop, railway cars unloader, primary crusher, secondary crusher, scrubbers, conveyors, stacker, reclaimer, bauxite dryers, dry bauxite storage, bauxite sampling tower, power house, wharf, ship loader, etc. The crushing plant is used only to reduce oversize material – no screening required. Four bauxite dryers are installed in order to reduce the moisture content of the bauxite before shipping. On-site generation (fuel oil). Gove 100% Rio Tinto Rio Tinto through Rio Tinto Alumina Gove P/L Gove, Northern Territory, Australia Road, air and port All leases were renewed in 2011 for a further period of 42 years. The residue disposal area is leased from the Arnhem Land Aboriginal Land Trust. The Northern Territory government is the lessor of the balance of the leases; however, on expiry of the 42-year renewed term, the land subject to the balances of the leases will all vest to the Arnhem Land Aboriginal Land Trust. Leases comprise 233.5 km2. Key permit conditions are prescribed by the Northern Territory Government in the form of a Mine Management Plan (MMP). The current MMP runs for a period of 12 years, until 2031, and authorises all activities at the operation. Lease payments are prescribed by the terms of the relevant leases. Bauxite mining commenced in 1970, feeding both the Gove refinery and export market, capped at two million tonnes per annum. Bauxite export ceased in 2006 with feed intended for the expanded Gove refinery. Bauxite exports recommenced in 2008 and will increase in the coming years following the curtailment of the refinery production in 2014 and permanent shut decision made by the Board of Rio Tinto in October 2017. Current annual production capacity is 12.5 Mt on a dry basis Open cut Bauxite Crushing plant only to reduce oversize material – no screening required. On-site diesel fired power station.
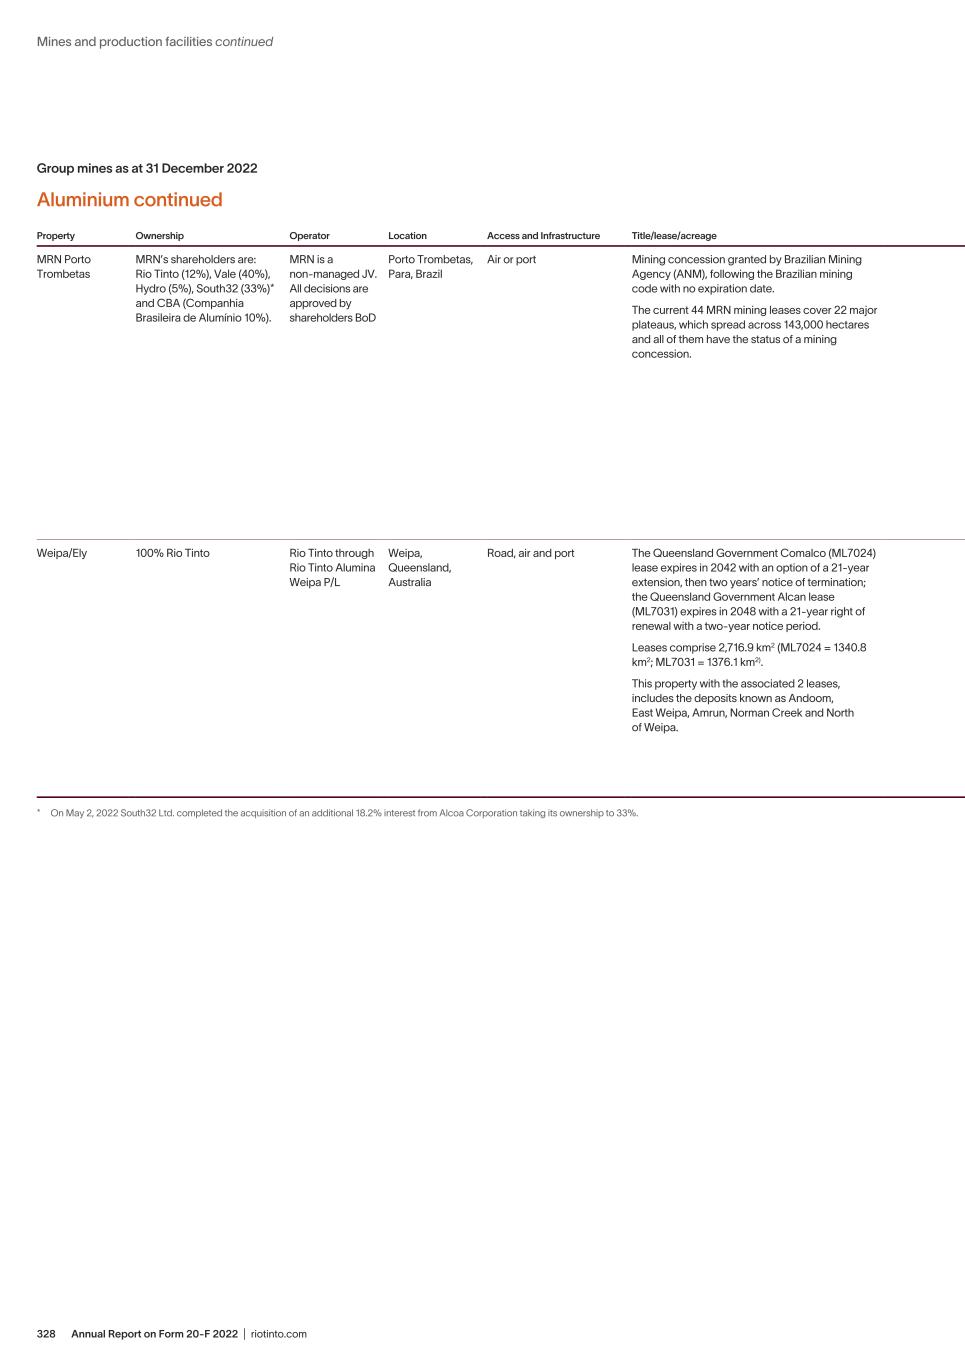
Annual Report on Form 20-F 2022 | riotinto.com328 Group mines as at 31 December 2022 Aluminium continued Property Ownership Operator Location Access and Infrastructure Title/lease/acreage Key permit conditions History Property description / type of mine Type of mineralisation Processing plants and other available facilities Power source MRN Porto Trombetas MRN’s shareholders are: Rio Tinto (12%), Vale (40%), Hydro (5%), South32 (33%)* and CBA (Companhia Brasileira de Alumínio 10%). MRN is a non-managed JV. All decisions are approved by shareholders BoD Porto Trombetas, Para, Brazil Air or port Mining concession granted by Brazilian Mining Agency (ANM), following the Brazilian mining code with no expiration date. The current 44 MRN mining leases cover 22 major plateaus, which spread across 143,000 hectares and all of them have the status of a mining concession. With the exception of concessions from Amazonas State, the MRN mining leases are within the Saracá-Taquera National Forest, a preservation environmental area. However, the right of mining is preserved initially by the Federal law which created the National Forest (that is subsequent to mining concessions), as well by the management plan, which acknowledges a formal mining zone within the confines of the National Forest. Environmental licensing is granted by Brazilian Environmental Agency (IBAMA) up to 2026 for East Zone. For West Zone it will require new licensing from 2027 to 2041. Mineral extraction commenced in 1979. Initial production capacity was 3.4 Mtpa. From 2003, production capacity went up to 16 Mtpa on a dry basis. and in 2008, up to 18 Mtpa. Due to market and tailings facilities restrictions, the planned production is 12 Mtpa on dry basis (up to 2027). and from 2027 to 2040 is 12.5 Mtpa on a dry basis. The deposit has two mine planning sequences: East Zone (1979 - 2027) and West Zone Phase 1 (2027 - 2040). Open cut Consists of a series of bauxite tabular deposits. The beneficiation process is formed by a primary crusher, conveyors, scrubbers, secondary crushers, screenings, hydrocyclones and vacuum filters. The superfines tailings are pumped to a tailing system facility. On-site generation fuel (oil + diesel). Weipa/Ely 100% Rio Tinto Rio Tinto through Rio Tinto Alumina Weipa P/L Weipa, Queensland, Australia Road, air and port The Queensland Government Comalco (ML7024) lease expires in 2042 with an option of a 21-year extension, then two years’ notice of termination; the Queensland Government Alcan lease (ML7031) expires in 2048 with a 21-year right of renewal with a two-year notice period. Leases comprise 2,716.9 km2 (ML7024 = 1340.8 km2; ML7031 = 1376.1 km2). This property with the associated 2 leases, includes the deposits known as Andoom, East Weipa, Amrun, Norman Creek and North of Weipa. The respective leases are subject to the Comalco Agreement Act (Comalco Agreement) and Alcan Agreement Act (Alcan Agreement); the relevant State Agreements for the Weipa operations. Key permit conditions are prescribed by the Queensland Government in the relevant Environmental Authority applicable to each lease (ML7024 and ML7031, respectively). Lease payments are subject to the terms of the leases and the respective State Agreements. Bauxite mining commenced in 1961 at Weipa. Major upgrade completed in 1998. Rio Tinto interest increased from 72.4% to 100% in 2000. In 1997, Ely Bauxite Mining Project Agreement signed with local Aboriginal land owners. Bauxite Mining and Exchange Agreement signed in 1998 with Comalco to allow for extraction of ore at Ely. The Western Cape Communities Co-Existence Agreement, an Indigenous Land Use Agreement, was signed in 2001. Following the ramp up to full production of Amrun the current annual production of the Weipa mine is 35.5 million tonnes. Open cut Bauxite Andoom, East Weipa and Amrun – wet crushing and screening plants to remove ultra fine proportion. On-site generation (diesel) supplemented by a solar generation facility. * On May 2, 2022 South32 Ltd. completed the acquisition of an additional 18.2% interest from Alcoa Corporation taking its ownership to 33%. Mines and production facilities continued
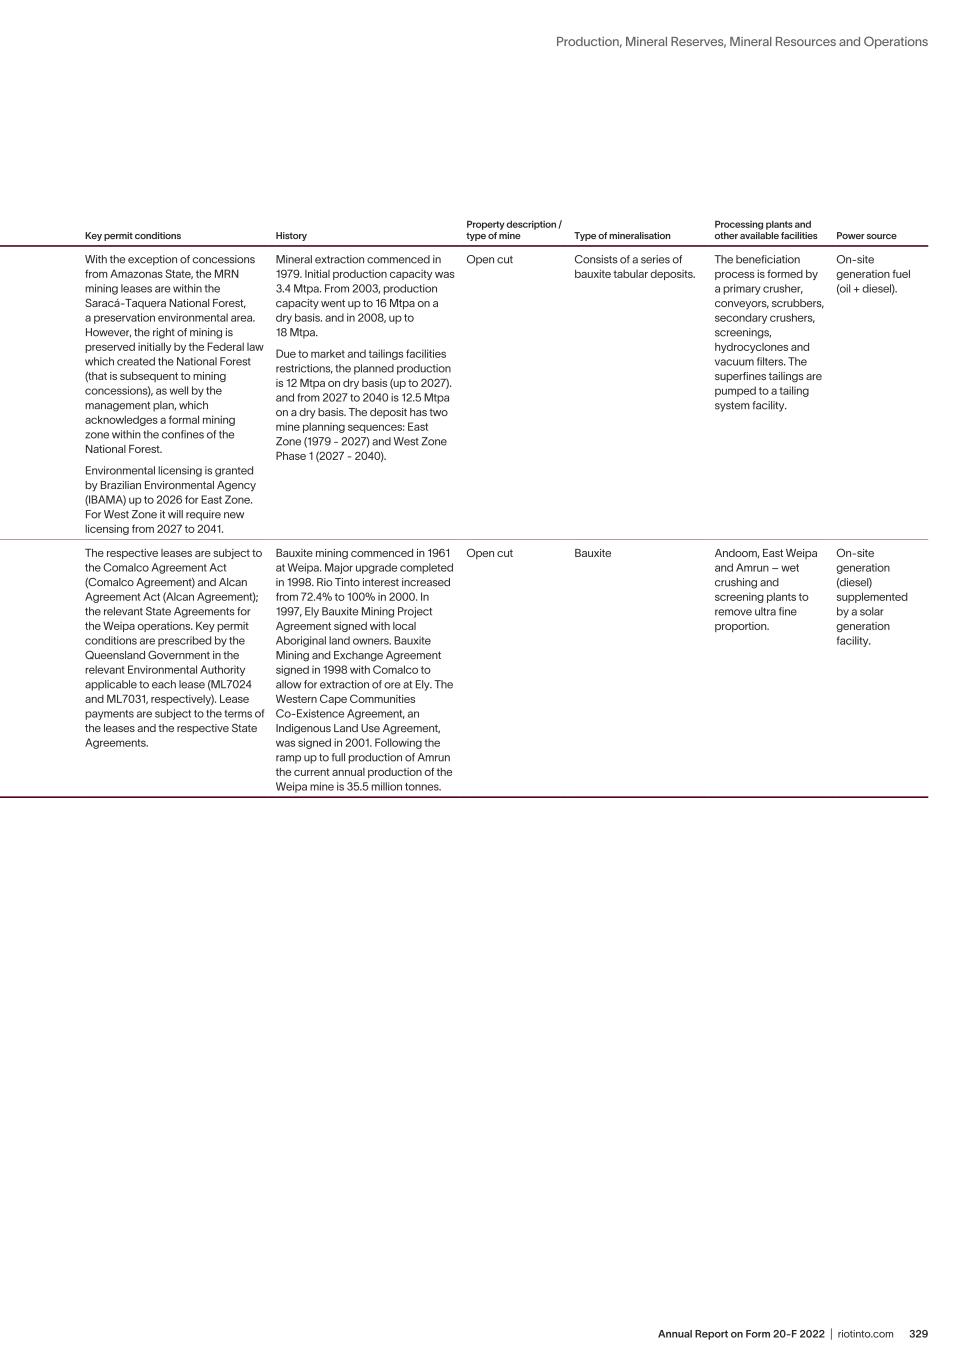
329Annual Report on Form 20-F 2022 | riotinto.com Production, Mineral Reserves, Mineral Resources and Operations Group mines as at 31 December 2022 Aluminium continued Property Ownership Operator Location Access and Infrastructure Title/lease/acreage Key permit conditions History Property description / type of mine Type of mineralisation Processing plants and other available facilities Power source MRN Porto Trombetas MRN’s shareholders are: Rio Tinto (12%), Vale (40%), Hydro (5%), South32 (33%)* and CBA (Companhia Brasileira de Alumínio 10%). MRN is a non-managed JV. All decisions are approved by shareholders BoD Porto Trombetas, Para, Brazil Air or port Mining concession granted by Brazilian Mining Agency (ANM), following the Brazilian mining code with no expiration date. The current 44 MRN mining leases cover 22 major plateaus, which spread across 143,000 hectares and all of them have the status of a mining concession. With the exception of concessions from Amazonas State, the MRN mining leases are within the Saracá-Taquera National Forest, a preservation environmental area. However, the right of mining is preserved initially by the Federal law which created the National Forest (that is subsequent to mining concessions), as well by the management plan, which acknowledges a formal mining zone within the confines of the National Forest. Environmental licensing is granted by Brazilian Environmental Agency (IBAMA) up to 2026 for East Zone. For West Zone it will require new licensing from 2027 to 2041. Mineral extraction commenced in 1979. Initial production capacity was 3.4 Mtpa. From 2003, production capacity went up to 16 Mtpa on a dry basis. and in 2008, up to 18 Mtpa. Due to market and tailings facilities restrictions, the planned production is 12 Mtpa on dry basis (up to 2027). and from 2027 to 2040 is 12.5 Mtpa on a dry basis. The deposit has two mine planning sequences: East Zone (1979 - 2027) and West Zone Phase 1 (2027 - 2040). Open cut Consists of a series of bauxite tabular deposits. The beneficiation process is formed by a primary crusher, conveyors, scrubbers, secondary crushers, screenings, hydrocyclones and vacuum filters. The superfines tailings are pumped to a tailing system facility. On-site generation fuel (oil + diesel). Weipa/Ely 100% Rio Tinto Rio Tinto through Rio Tinto Alumina Weipa P/L Weipa, Queensland, Australia Road, air and port The Queensland Government Comalco (ML7024) lease expires in 2042 with an option of a 21-year extension, then two years’ notice of termination; the Queensland Government Alcan lease (ML7031) expires in 2048 with a 21-year right of renewal with a two-year notice period. Leases comprise 2,716.9 km2 (ML7024 = 1340.8 km2; ML7031 = 1376.1 km2). This property with the associated 2 leases, includes the deposits known as Andoom, East Weipa, Amrun, Norman Creek and North of Weipa. The respective leases are subject to the Comalco Agreement Act (Comalco Agreement) and Alcan Agreement Act (Alcan Agreement); the relevant State Agreements for the Weipa operations. Key permit conditions are prescribed by the Queensland Government in the relevant Environmental Authority applicable to each lease (ML7024 and ML7031, respectively). Lease payments are subject to the terms of the leases and the respective State Agreements. Bauxite mining commenced in 1961 at Weipa. Major upgrade completed in 1998. Rio Tinto interest increased from 72.4% to 100% in 2000. In 1997, Ely Bauxite Mining Project Agreement signed with local Aboriginal land owners. Bauxite Mining and Exchange Agreement signed in 1998 with Comalco to allow for extraction of ore at Ely. The Western Cape Communities Co-Existence Agreement, an Indigenous Land Use Agreement, was signed in 2001. Following the ramp up to full production of Amrun the current annual production of the Weipa mine is 35.5 million tonnes. Open cut Bauxite Andoom, East Weipa and Amrun – wet crushing and screening plants to remove ultra fine proportion. On-site generation (diesel) supplemented by a solar generation facility. * On May 2, 2022 South32 Ltd. completed the acquisition of an additional 18.2% interest from Alcoa Corporation taking its ownership to 33%.
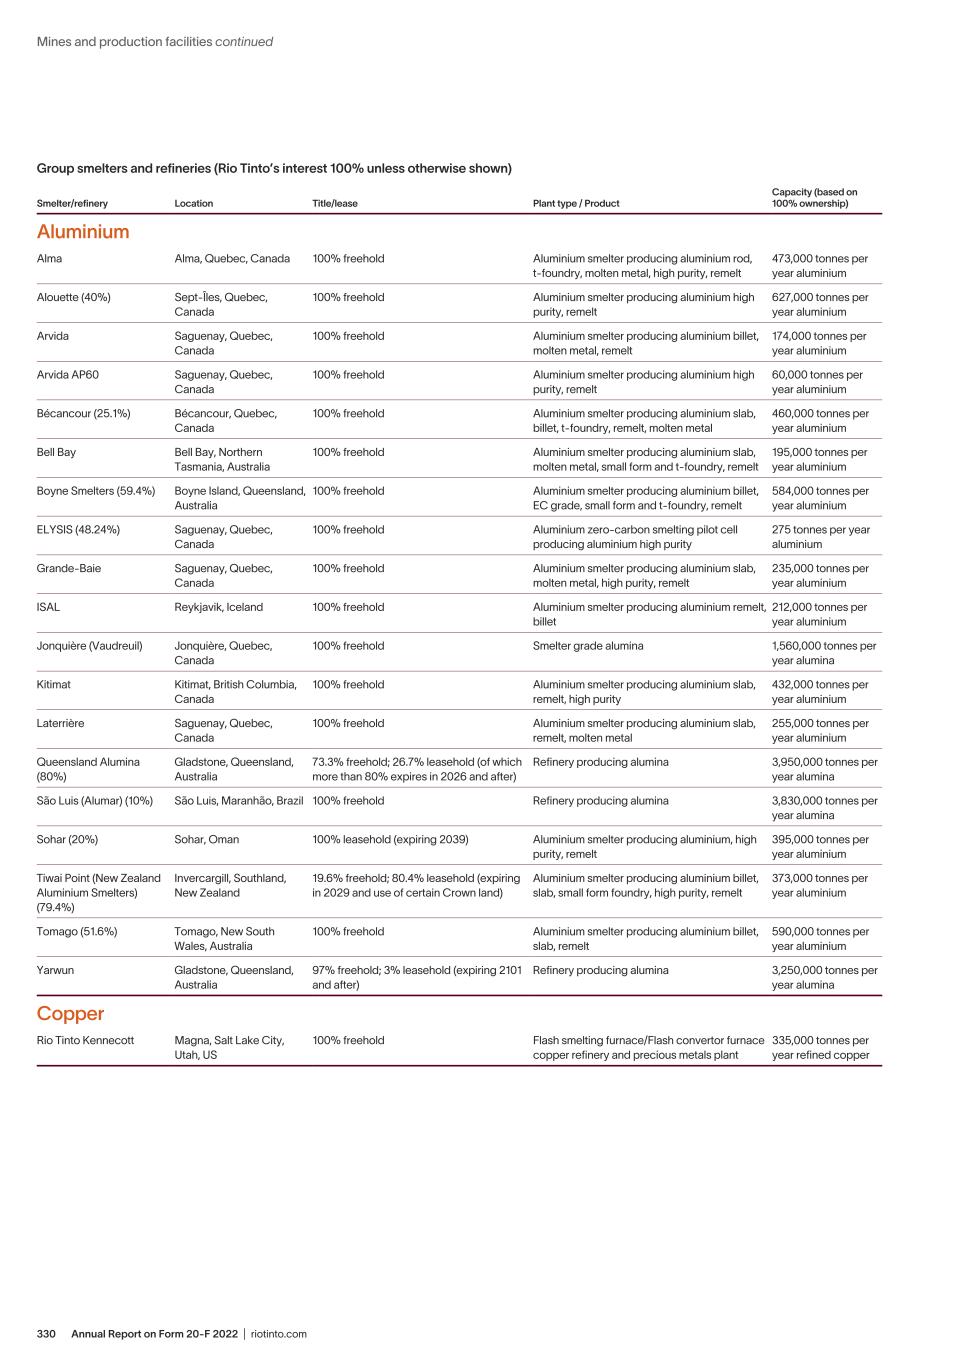
Annual Report on Form 20-F 2022 | riotinto.com330 Group smelters and refineries (Rio Tinto’s interest 100% unless otherwise shown) Smelter/refinery Location Title/lease Plant type / Product Capacity (based on 100% ownership) Aluminium Alma Alma, Quebec, Canada 100% freehold Aluminium smelter producing aluminium rod, t-foundry, molten metal, high purity, remelt 473,000 tonnes per year aluminium Alouette (40%) Sept-Îles, Quebec, Canada 100% freehold Aluminium smelter producing aluminium high purity, remelt 627,000 tonnes per year aluminium Arvida Saguenay, Quebec, Canada 100% freehold Aluminium smelter producing aluminium billet, molten metal, remelt 174,000 tonnes per year aluminium Arvida AP60 Saguenay, Quebec, Canada 100% freehold Aluminium smelter producing aluminium high purity, remelt 60,000 tonnes per year aluminium Bécancour (25.1%) Bécancour, Quebec, Canada 100% freehold Aluminium smelter producing aluminium slab, billet, t-foundry, remelt, molten metal 460,000 tonnes per year aluminium Bell Bay Bell Bay, Northern Tasmania, Australia 100% freehold Aluminium smelter producing aluminium slab, molten metal, small form and t-foundry, remelt 195,000 tonnes per year aluminium Boyne Smelters (59.4%) Boyne Island, Queensland, Australia 100% freehold Aluminium smelter producing aluminium billet, EC grade, small form and t-foundry, remelt 584,000 tonnes per year aluminium ELYSIS (48.24%) Saguenay, Quebec, Canada 100% freehold Aluminium zero-carbon smelting pilot cell producing aluminium high purity 275 tonnes per year aluminium Grande-Baie Saguenay, Quebec, Canada 100% freehold Aluminium smelter producing aluminium slab, molten metal, high purity, remelt 235,000 tonnes per year aluminium ISAL Reykjavik, Iceland 100% freehold Aluminium smelter producing aluminium remelt, billet 212,000 tonnes per year aluminium Jonquière (Vaudreuil) Jonquière, Quebec, Canada 100% freehold Smelter grade alumina 1,560,000 tonnes per year alumina Kitimat Kitimat, British Columbia, Canada 100% freehold Aluminium smelter producing aluminium slab, remelt, high purity 432,000 tonnes per year aluminium Laterrière Saguenay, Quebec, Canada 100% freehold Aluminium smelter producing aluminium slab, remelt, molten metal 255,000 tonnes per year aluminium Queensland Alumina (80%) Gladstone, Queensland, Australia 73.3% freehold; 26.7% leasehold (of which more than 80% expires in 2026 and after) Refinery producing alumina 3,950,000 tonnes per year alumina São Luis (Alumar) (10%) São Luis, Maranhão, Brazil 100% freehold Refinery producing alumina 3,830,000 tonnes per year alumina Sohar (20%) Sohar, Oman 100% leasehold (expiring 2039) Aluminium smelter producing aluminium, high purity, remelt 395,000 tonnes per year aluminium Tiwai Point (New Zealand Aluminium Smelters) (79.4%) Invercargill, Southland, New Zealand 19.6% freehold; 80.4% leasehold (expiring in 2029 and use of certain Crown land) Aluminium smelter producing aluminium billet, slab, small form foundry, high purity, remelt 373,000 tonnes per year aluminium Tomago (51.6%) Tomago, New South Wales, Australia 100% freehold Aluminium smelter producing aluminium billet, slab, remelt 590,000 tonnes per year aluminium Yarwun Gladstone, Queensland, Australia 97% freehold; 3% leasehold (expiring 2101 and after) Refinery producing alumina 3,250,000 tonnes per year alumina Copper Rio Tinto Kennecott Magna, Salt Lake City, Utah, US 100% freehold Flash smelting furnace/Flash convertor furnace copper refinery and precious metals plant 335,000 tonnes per year refined copper Mines and production facilities continued

331Annual Report on Form 20-F 2022 | riotinto.com Production, Mineral Reserves, Mineral Resources and Operations Group smelters and refineries (Rio Tinto’s interest 100% unless otherwise shown) Smelter/refinery Location Title/lease Plant type / Product Capacity (based on 100% ownership) Minerals Boron California, United States 100% freehold Borates refinery 576,000 tonnes per year boric oxide IOC Pellet plant (58.7%) Labrador City, Province of Newfoundland and Labrador, Canada 100% freehold (asset), 100% freehold (land) under sublease from Labrador Iron Ore Royalty Corporation for life of mine. Pellet induration furnaces producing multiple iron ore pellet types 13.5 million tonnes per year pellet Richards Bay Minerals (74%) Richards Bay, South Africa 100% freehold Ilmenite smelter 1,050,000 tonnes per year titanium dioxide slag, 565,000 tonnes per year iron Rio Tinto Iron and Titanium Quebec Operations - Sorel-Tracy Plant Sorel-Tracy, Quebec, Canada 100% freehold Ilmenite smelter 1,300,000 tonnes per year titanium dioxide slag, 1,000,000 tonnes per year iron
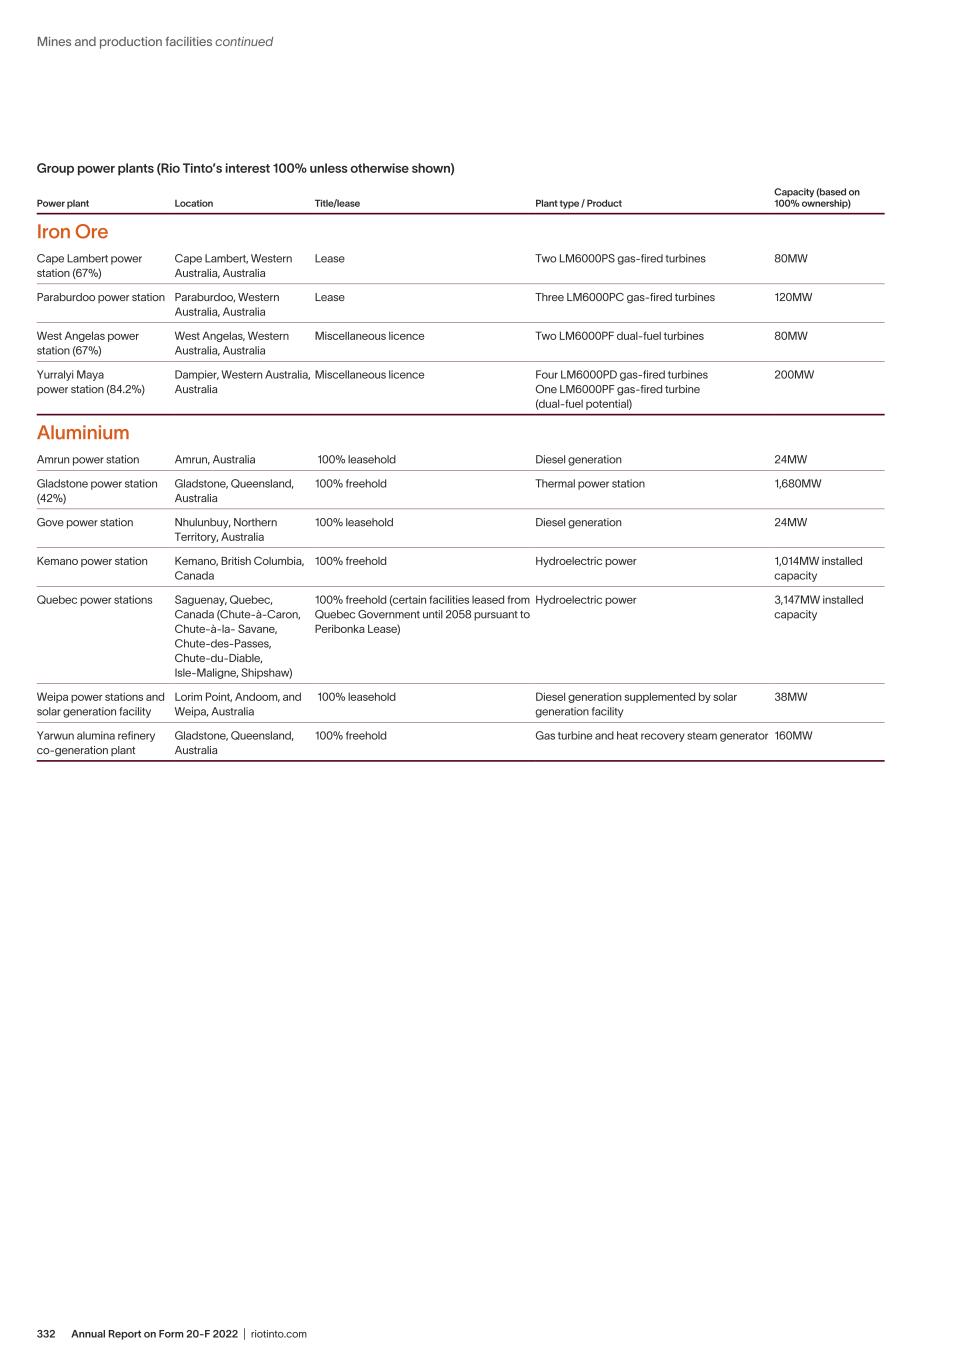
Annual Report on Form 20-F 2022 | riotinto.com332 Group power plants (Rio Tinto’s interest 100% unless otherwise shown) Power plant Location Title/lease Plant type / Product Capacity (based on 100% ownership) Iron Ore Cape Lambert power station (67%) Cape Lambert, Western Australia, Australia Lease Two LM6000PS gas-fired turbines 80MW Paraburdoo power station Paraburdoo, Western Australia, Australia Lease Three LM6000PC gas-fired turbines 120MW West Angelas power station (67%) West Angelas, Western Australia, Australia Miscellaneous licence Two LM6000PF dual-fuel turbines 80MW Yurralyi Maya power station (84.2%) Dampier, Western Australia, Australia Miscellaneous licence Four LM6000PD gas-fired turbines One LM6000PF gas-fired turbine (dual-fuel potential) 200MW Aluminium Amrun power station Amrun, Australia 100% leasehold Diesel generation 24MW Gladstone power station (42%) Gladstone, Queensland, Australia 100% freehold Thermal power station 1,680MW Gove power station Nhulunbuy, Northern Territory, Australia 100% leasehold Diesel generation 24MW Kemano power station Kemano, British Columbia, Canada 100% freehold Hydroelectric power 1,014MW installed capacity Quebec power stations Saguenay, Quebec, Canada (Chute-à-Caron, Chute-à-la- Savane, Chute-des-Passes, Chute-du-Diable, Isle-Maligne, Shipshaw) 100% freehold (certain facilities leased from Quebec Government until 2058 pursuant to Peribonka Lease) Hydroelectric power 3,147MW installed capacity Weipa power stations and solar generation facility Lorim Point, Andoom, and Weipa, Australia 100% leasehold Diesel generation supplemented by solar generation facility 38MW Yarwun alumina refinery co-generation plant Gladstone, Queensland, Australia 100% freehold Gas turbine and heat recovery steam generator 160MW Mines and production facilities continued
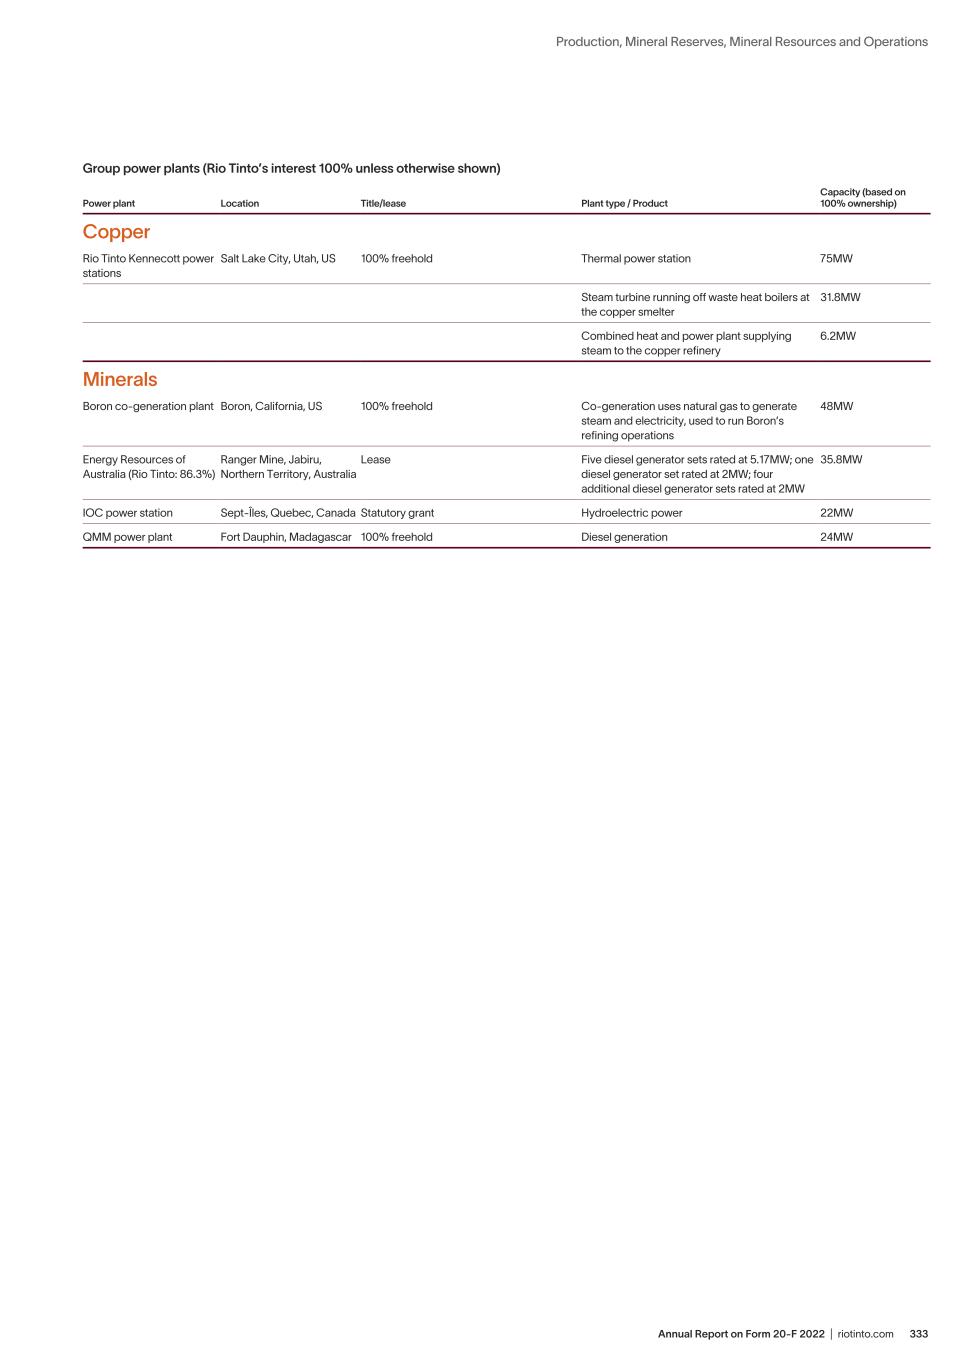
333Annual Report on Form 20-F 2022 | riotinto.com Production, Mineral Reserves, Mineral Resources and Operations Group power plants (Rio Tinto’s interest 100% unless otherwise shown) Power plant Location Title/lease Plant type / Product Capacity (based on 100% ownership) Copper Rio Tinto Kennecott power stations Salt Lake City, Utah, US 100% freehold Thermal power station 75MW Steam turbine running off waste heat boilers at the copper smelter 31.8MW Combined heat and power plant supplying steam to the copper refinery 6.2MW Minerals Boron co-generation plant Boron, California, US 100% freehold Co-generation uses natural gas to generate steam and electricity, used to run Boron’s refining operations 48MW Energy Resources of Australia (Rio Tinto: 86.3%) Ranger Mine, Jabiru, Northern Territory, Australia Lease Five diesel generator sets rated at 5.17MW; one diesel generator set rated at 2MW; four additional diesel generator sets rated at 2MW 35.8MW IOC power station Sept-Îles, Quebec, Canada Statutory grant Hydroelectric power 22MW QMM power plant Fort Dauphin, Madagascar 100% freehold Diesel generation 24MW
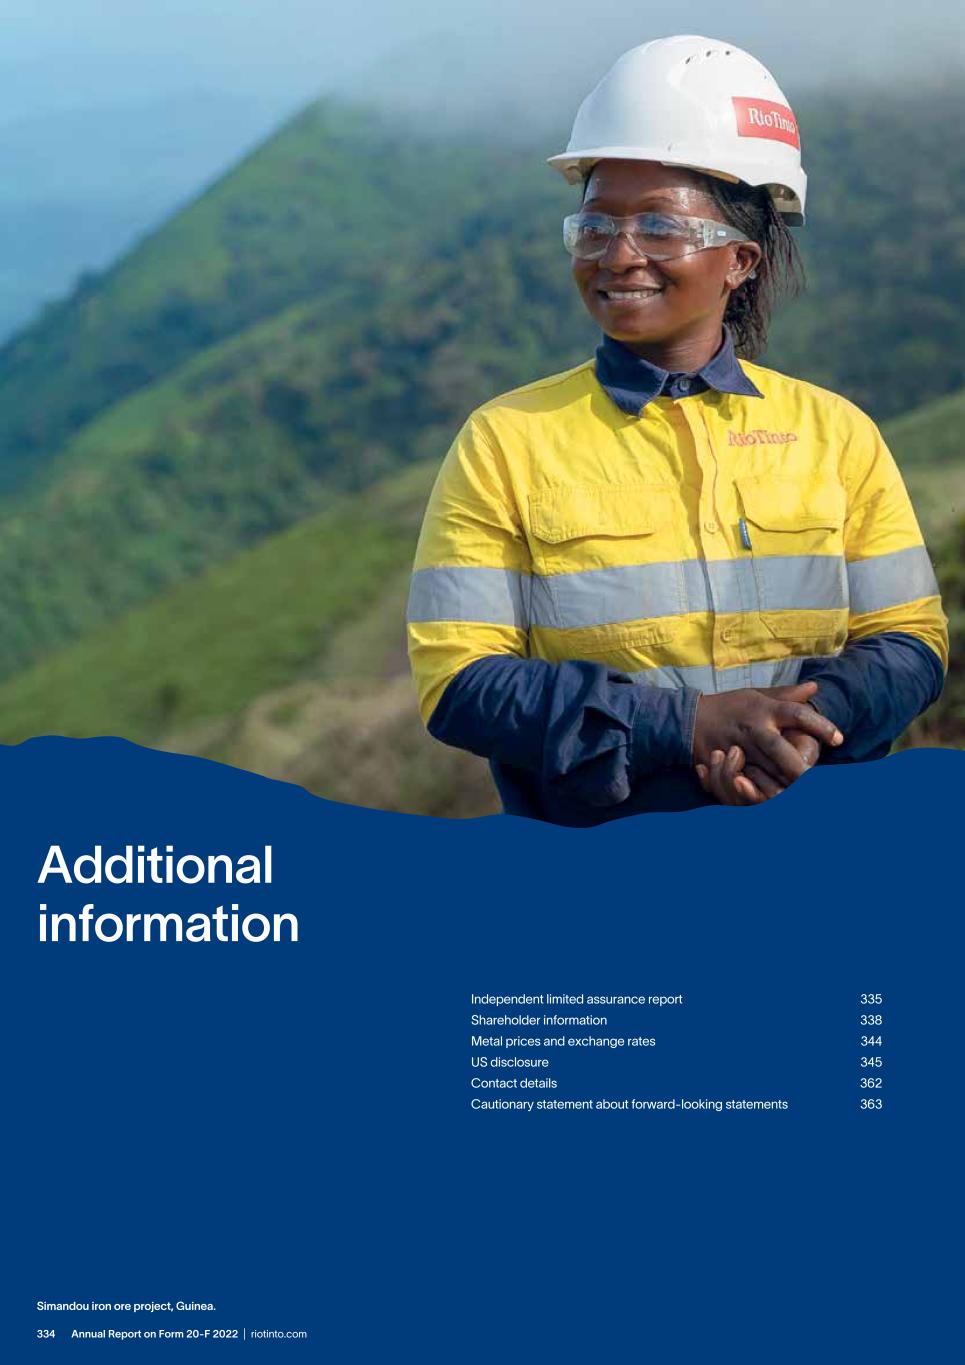
Annual Report on Form 20-F 2022 | riotinto.com334 Additional information Independent limited assurance report 335 Shareholder information 338 Metal prices and exchange rates 344 US disclosure 345 Contact details 362 Cautionary statement about forward-looking statements 363 Simandou iron ore project, Guinea.
335Annual Report on Form 20-F 2022 | riotinto.com Additional information Independent Assurance Report of KPMG (KPMG Australia) to the Directors of Rio Tinto plc and Rio Tinto Limited (Rio Tinto) ©2023 KPMG, an Australian partnership and a member firm of the KPMG global organisation of independent member firms affiliated with KPMG International Limited, a private English company limited by guarantee. All rights reserved. The KPMG name and logo are trademarks used under license by the independent member firms of the KPMG global organisation. Liability limited by a scheme approved under Professional Standards Legislation Sustainability Information Subject to Assurance and GHG Emissions The Sustainability Information Subject to Assurance is summarised below:  Rio Tinto’s assertion that it has incorporated the requirements of the International Council on Mining and Metals (ICMM) 10 Principles for sustainable development, and the mandatory requirements set out in the ICMM Position Statements, into its own policies, strategies and standards.  Rio Tinto’s assertions regarding the approach it has adopted to identify and prioritise its material sustainable development risks and opportunities set out in the Sustainability sections of the Rio Tinto Annual Report 2022, the Rio Tinto Strategic Report 2022 and the Rio Tinto Sustainability Fact Book 2022.  Rio Tinto’s assertions regarding the existence and status of implementation of systems and approaches used to manage the following selected sustainable development risk areas: - Health, safety and wellbeing - Transparent and responsible business - Climate change - Communities - Water - Cultural heritage  The following Rio Tinto performance data related to the selected sustainable development risk areas: - Number of fatalities - All injury frequency rate (AIFR) - Lost time injury frequency rate (LTIFR) - Number of lost time injuries (LTIs) - New cases of occupational illness - Number of cases reported to the Business Conduct Office - ICMM Performance Expectations prioritisation process - GHG emissions intensity (equity basis) - Total energy use (100% managed basis) - Scope 3 emissions (equity basis) - Community contributions - Cultural heritage disclosures - Tier 1 Water Target performance data and assertions The GHG Emissions are Rio Tinto’s total GHG emissions (equity basis) disclosed in the Sustainability sections of the Rio Tinto Annual Report 2022, the Rio Tinto Strategic Report 2022 and the Rio Tinto Sustainability Fact Book 2022. Our assurance does not extend to information in respect of earlier periods or to any other information included in the Sustainability sections of the Rio Tinto Annual Report 2022, the Rio Tinto Strategic Report 2022 and the Rio Tinto Sustainability Fact Book 2022 for the year ended 31 December 2022. Reporting Criteria The Reporting Criteria used for the reporting of the Sustainability Information Subject to Assurance are the ICMM Sustainable Development Framework: ICMM Principles (Revised 2015) and the definitions and approaches within the basis of reporting glossary presented on Rio Tinto’s website at riotinto.com/reports. For the GHG Emissions, the Reporting Criteria is the World Resources Institute (WRI) and World Business Council for Sustainable Development (WBCSD)’s GHG Protocol: A Corporate Accounting and Reporting Standard (Revised Edition) (2015), and the Basis of Preparation as described and presented within the Scope 1, 2 and 3 Emissions Calculation Methodology 2022. CONCLUSION a) Sustainability Information Subject to Assurance – Limited assurance Based on the evidence we obtained from the procedures performed, we are not aware of any material misstatements in the Sustainability Information Subject to Assurance presented in the Sustainability sections of the Rio Tinto Annual Report 2022, the Rio Tinto Strategic Report 2022 and the Rio Tinto Sustainability Fact Book 2022 for the year ended 31 December 2022, which has been prepared by Rio Tinto plc and Rio Tinto Limited (together Rio Tinto) in accordance with the Reporting Criteria. b) GHG Emissions – Reasonable assurance In our opinion, in all material respects, Rio Tinto’s total Greenhouse Gas (GHG) emissions (equity basis) of 30.3 MtCO2-e (Scope 1 and 2) (GHG Emissions) presented in the Sustainability sections of the Rio Tinto Annual Report 2022, the Rio Tinto Strategic Report 2022 and the Rio Tinto Sustainability Fact Book 2022 for the year ended 31 December 2022, has been prepared by Rio Tinto in accordance with the Reporting Criteria.
Annual Report on Form 20-F 2022 | riotinto.com336 Independent Assurance Report of KPMG (KPMG Australia) to the Directors of Rio Tinto plc and Rio Tinto Limited (Rio Tinto) ©2023 KPMG, an Australian partnership and a member firm of the KPMG global organisation of independent member firms affiliated with KPMG International Limited, a private English company limited by guarantee. All rights reserved. The KPMG name and logo are trademarks used under license by the independent member firms of the KPMG global organisation. Liability limited by a scheme approved under Professional Standards Legislation Basis for Conclusion We conducted our work in accordance with International Standard on Assurance Engagements ISAE 3000 and in respect of greenhouse gas emissions, International Standard on Assurance Engagements ISAE 3410 (the Standards). In accordance with the Standards we have:  used our professional judgement to plan and perform the engagement to obtain limited assurance that we are not aware of any material misstatements in the Sustainability Information Subject to Assurance, whether due to fraud or error;  used our professional judgement to assess the risk of material misstatement and plan and perform the engagement to obtain reasonable assurance that the GHG Emissions is free from material misstatement, whether due to fraud or error;  considered relevant internal controls when designing our assurance procedures, however we do not express a conclusion on their effectiveness; and  ensured that the engagement team possess the appropriate knowledge, skills and professional competencies. Summary of Procedures Performed In gathering evidence for our conclusions, our assurance procedures comprised:  enquiries with relevant Rio Tinto personnel to understand and evaluate the design and implementation of the key systems, processes and internal controls to capture, collate, calculate and report the Sustainability Information Subject to Assurance and GHG Emissions;  assessment of the suitability and application of the Reporting Criteria in respect of the Sustainability Information Subject to Assurance and GHG Emissions;  analytical procedures over the Sustainability Information Subject to Assurance and GHG Emissions;  risk analysis to validate the completeness of Rio Tinto’s materiality assessment;  substantively tested performance data within the Sustainability Information Subject to Assurance, on a sample basis at corporate and operational level, which included testing a selection of 6 operations being Weipa, Winu, West Angelas, Kitimat, Iron Ore Company of Canada and Borates – RTM California Operations;  substantively tested the GHG Emissions, on a sample basis at corporate and operational level, which included testing a selection of 15 operations being Weipa, Winu, Gladstone Power Station, Pilbara Rail Operations, Brockman, Yandicoogina, Marandoo, Boyne Smelters Limited, Tomago, Alouette, IOC Processing Plant, Queensland Alumina Limited, RTFT Smelting, Yarwun and Sohar, and how this information is reported and captured at corporate level;  interviews and walkthroughs with site personnel at each of the 15 operations listed above to assess the key systems, processes and internal controls to capture, collate, calculate and report GHG Emissions at an operational level, and how this information is reported and captured at corporate level;  testing the mathematical accuracy of a sample of calculations underlying the GHG Emissions;  assessing the appropriateness of a sample of emissions factors applied in calculating the GHG Emissions;  evaluating the design and effectiveness of controls implemented by the Rio Tinto Health, Safety and Environment (HSE) Services reporting function over the Sustainability Information Subject to Assurance and GHG Emissions;  assessing Rio Tinto’s incorporation of the requirements of the ICMM 10 Principles for sustainable development, and the mandatory requirements set out in the ICMM Position Statements, into its own policies, strategies and standards; and  reviewing the Rio Tinto Annual Report 2022, the Rio Tinto Strategic Report 2022 and the Rio Tinto Sustainability Fact Book 2022 in their entirety to ensure they are consistent with our overall knowledge of Rio Tinto. How the Standard Defines Limited Assurance, Reasonable Assurance and Material Misstatement The procedures performed in a limited assurance engagement vary in nature and timing from, and are less in extent than for a reasonable assurance engagement. Consequently, the level of assurance obtained in a limited assurance engagement is substantially lower than the assurance that would have been obtained had a reasonable assurance engagement been performed. Reasonable assurance is a high level of assurance, but is not a guarantee that it will always detect a material misstatement when it exists. Misstatements, including omissions, are considered material if, individually or in the aggregate, they could reasonably be expected to influence relevant decisions of the Directors of Rio Tinto. Use of this Assurance Report This report has been prepared for the Directors of Rio Tinto for the purpose of providing assurance conclusions on the Sustainability Information Subject to Assurance and GHG Emissions and may not be suitable for another purpose. We disclaim any assumption of responsibility for any reliance on this report, to any person other than the Directors of Rio Tinto, or for any other purpose than that for which it was prepared.
337Annual Report on Form 20-F 2022 | riotinto.com Additional information Independent Assurance Report of KPMG (KPMG Australia) to the Directors of Rio Tinto plc and Rio Tinto Limited (Rio Tinto) ©2023 KPMG, an Australian partnership and a member firm of the KPMG global organisation of independent member firms affiliated with KPMG International Limited, a private English company limited by guarantee. All rights reserved. The KPMG name and logo are trademarks used under license by the independent member firms of the KPMG global organisation. Liability limited by a scheme approved under Professional Standards Legislation Management’s responsibility Management are responsible for:  determining that the Reporting Criteria is appropriate to meet their needs;  preparing and presenting the Sustainability Information Subject to Assurance and GHG Emissions in accordance with the Reporting Criteria;  establishing internal controls that enable the preparation and presentation of the Sustainability Information Subject to Assurance and GHG Emissions that is free from material misstatement, whether due to fraud or error;  ensuring the basis of preparation in accordance with which the Sustainability Information Subject to Assurance and GHG Emissions has been determined and compiled is clearly and unambiguously set out in the Rio Tinto Annual Report 2022, the Rio Tinto Strategic Report 2022 and the Rio Tinto Sustainability Fact Book 2022;  telling us of any known and/or contentious issues relating to the Sustainability Information Subject to Assurance and GHG Emissions; and  Maintaining integrity of the website. Our Responsibility Our responsibility is to perform a limited assurance engagement in relation to the Sustainability Information Subject to Assurance and a reasonable assurance engagement in respect of the GHG Emissions for the year ended 31 December 2022, and to issue an assurance report that includes our conclusions. Our Independence and Quality Control We have complied with our independence and other relevant ethical requirements of the Code of Ethics for Professional Accountants (including Independence Standards) issued by the IFAC Ethical Standards Board, and complied with the applicable requirements of International Standard on Quality Control 1 to maintain a comprehensive system of quality control. KPMG 22 February 2023 Adrian King Partner Melbourne, Australia
Annual Report on Form 20-F 2022 | riotinto.com338 Organisational structure The Rio Tinto Group consists of Rio Tinto plc (registered in England and Wales as company number 719885 under the UK Companies Act 2006 and listed on the London Stock Exchange), and Rio Tinto Limited (registered in Australia as ABN 96 004 458 404 under the Australian Corporations Act 2001 and listed on the Australian Securities Exchange). Rio Tinto is headquartered in London with a corporate office in Melbourne. Rio Tinto plc has a sponsored American Depositary Receipts (ADR) facility, with underlying shares registered with the US Securities and Exchange Commission (SEC) and listed on the New York Stock Exchange. The London Stock Exchange ticker for Rio Tinto plc is RIO.L, the Australian Securities Exchange ticker for Rio Tinto Limited is RIO.AX and the New York Stock Exchange ticker for the ADR is RIO.N. Nomenclature and financial data Rio Tinto plc and Rio Tinto Limited operate together and are referred to in this report as Rio Tinto, the Rio Tinto Group or the Group. These expressions are used for convenience, since both companies, and other companies in which they directly or indirectly own investments, are separate and distinct legal entities. Likewise, the words “we”, “us”, “our” and “ourselves” are used in some places to refer to the companies of the Rio Tinto Group in general. These expressions are also used where no useful purpose is served by identifying any particular company or companies. We usually omit “Limited”, “plc”, “Pty”, “Inc.”, “Limitada”, “L.L.C.”, “A.S.” or “SA” from Group company names, except to distinguish between Rio Tinto plc and Rio Tinto Limited. Financial data in US dollars ($) is derived from, and should be read in conjunction with, the 2022 financial statements. In general, where we have provided financial data in other currencies, it has been translated from the consolidated financial statements, and is provided solely for convenience; exceptions arise where data has been extracted directly from source records. History Rio Tinto plc was incorporated on 30 March 1962, then called The Rio Tinto-Zinc Corporation Limited (RTZ), and was formed by the merger of The Rio Tinto Company Limited and The Consolidated Zinc Corporation Limited. The Rio Tinto Company was incorporated in 1873 to reopen ancient copper workings in Spain. The Consolidated Zinc Corporation Limited began operations in the early twentieth century as part of the Australian mining industry. Based at Broken Hill in New South Wales, it began mining silver, lead and zinc deposits and later expanded into lead and zinc smelting. Rio Tinto Limited was incorporated on 17 December 1959, then called The Rio Tinto Mining Company of Australia Pty Limited. In 1962 the Australian interests of The Consolidated Zinc Corporation Limited and The Rio Tinto Company Limited were merged to form Conzinc Riotinto of Australia Limited, a limited liability company under the laws of the State of Victoria, Australia. In 1980, Conzinc Riotinto of Australia Limited changed its name to CRA Limited. Between 1962 and 1995, both RTZ and CRA discovered important mineral deposits, developed major mining projects and grew through acquisition. RTZ and CRA began operating in 1995 through a dual-listed companies structure. In 1997, RTZ became Rio Tinto plc and CRA became Rio Tinto Limited. Dual-listed companies structure In 1995, Rio Tinto shareholders approved the terms of the dual-listed companies’ merger (the DLC structure). The aim was to put shareholders of both companies in substantially the same position they would be in if they held shares in a single entity owning all assets of both companies. Following the approval of the DLC structure, both companies entered into a DLC Merger Sharing Agreement (the Sharing Agreement). As part of this, both companies agreed to be managed in a unified way, to share the same Board of Directors, and to put in place arrangements to provide shareholders of both companies with a common economic interest in the DLC structure. To achieve this third objective, the Sharing Agreement fixed the ratio of dividend, voting and capital distribution rights attached to each Rio Tinto plc share and each Rio Tinto Limited share at an Equalisation Ratio of 1:1. This has remained unchanged ever since, although the Sharing Agreement makes clear this can be revised in special circumstances, for example where certain modifications are made to the share capital of one company (such as rights issues, bonus issues, share splits and share consolidations) but not to the other. Outside the circumstances specified in the Sharing Agreement, the Equalisation Ratio can only be altered with the approval of shareholders under the class rights action approval procedure, described in the Voting arrangements section below. Any adjustments must be confirmed by the Group’s external auditors. Consistent with the DLC structure, the directors of both companies aim to act in the best interests of Rio Tinto as a whole. The class rights action approval procedure exists to deal with instances where there may be a conflict of interest between the shareholders of the two companies. To ensure that the Boards of both companies are identical, resolutions to appoint or remove Directors must be put to shareholders of both companies as Joint Decisions, described in the Voting arrangements section below. The Articles of Association of Rio Tinto plc and the Constitution of Rio Tinto Limited make clear that a person can only be a Director of one company if he or she is also a Director of the other. This means that if a person were removed as a Director of Rio Tinto plc, he or she would also cease to be a Director of Rio Tinto Limited. One consequence of the DLC merger is that Rio Tinto is subject to a wide range of laws, rules and regulatory reviews across multiple jurisdictions. Where these rules differ, Rio Tinto will comply with the requirements in each jurisdiction at a minimum. Dividend arrangements The Sharing Agreement ensures that dividends paid on Rio Tinto plc and Rio Tinto Limited shares are equalised on a net cash basis without taking into account any associated tax credits. Dividends are determined in US dollars (with the exception of ADR holders, paid in sterling and Australian dollars) and both companies are required to announce and pay dividends and other distributions or as close to at the same time as possible. The payment of dividends between companies and their subsidiaries, including the payment of dividends on the DLC dividend shares, provides the Group with flexibility to manage internal funds and distributable reserves to enable the payment of equalised dividend or equalised capital distributions. If the payment of an equalised dividend would contravene the law applicable to one of the companies, they can depart from the Equalisation Ratio. In that situation, the relevant company must put aside reserves for payment on the relevant shares at a later date. Rio Tinto shareholders have no direct rights to enforce the dividend equalisation provisions of the Sharing Agreement. Voting arrangements In principle, the Sharing Agreement enables the shareholders of Rio Tinto plc and Rio Tinto Limited to vote as a joint electorate on any matters that affect them in similar ways. These are referred to as Joint Decisions, and include the creation of new classes of share capital, the appointment or removal of directors and auditors, and the receiving of annual financial statements. All shareholder resolutions that include Joint Decisions are voted on a poll. The Sharing Agreement also protects shareholders of both companies by requiring joint approval for decisions that do not affect the shareholders of both companies equally. These are known as class rights actions, and are voted on a poll. For example, fundamental elements of the DLC structure cannot be changed unless approved separately by the shareholders of both companies. Shareholder information
339Annual Report on Form 20-F 2022 | riotinto.com Additional information Exceptions to these principles can arise in situations such as where legislation requires the separate approval of a decision by the appropriate majority of shareholders in one company, and where approval of the matter by shareholders of the other company is not required. Where a matter has been expressly categorised as either a Joint Decision or a class rights action, the directors cannot change that categorisation. If a matter falls within both categories, it is treated as a class rights action. In addition, if an issue is not expressly listed in either category, Directors can decide how it should be put to shareholders for approval. To support joint voting arrangements, both companies have entered into shareholder voting agreements, where a Special Voting Share is issued to a special purpose company (SVC) and held in trust for shareholders by a common trustee. Rio Tinto plc (RTP) has issued its Special Voting Share (RTP Special Voting Share) to Rio Tinto Limited (RTL) Shareholder SVC, while Rio Tinto Limited has issued its Special Voting Share (RTL Special Voting Share) to RTP Shareholder SVC. The total number of votes cast on Joint Decisions by the shareholders of one company are decided at a parallel meeting of the other company. The exact role of these SVCs is described below. In exceptional circumstances, certain shareholders can be excluded from voting at their respective company’s general meetings. For example, they may have acquired shares in the other company in excess of a given threshold without making an offer for all the shares in the other company. In this situation, votes cast by these excluded shareholders are disregarded. Following the companies’ general meetings, the overall results of the voting are announced to relevant stock exchanges and the media, and published at riotinto.com. At a Rio Tinto plc shareholders meeting during which a Joint Decision is considered, each Rio Tinto plc share carries one vote. The holder of the Special Voting Share has one vote for each vote cast by the public shareholders of Rio Tinto Limited in their parallel meeting. The holder of the Special Voting Share must vote in accordance with the votes cast by public shareholders for and against the equivalent resolution at the parallel Rio Tinto Limited shareholders’ meeting. The holders of Rio Tinto Limited ordinary shares do not hold voting shares in Rio Tinto plc by virtue of their holding in Rio Tinto Limited, and cannot enforce the voting arrangements relating to the Special Voting Share. Similarly, at a Rio Tinto Limited shareholders meeting during which a Joint Decision is considered, each Rio Tinto Limited share carries one vote and the holder of its Special Voting Share will have one vote for each vote cast by the public shareholders of Rio Tinto plc in their parallel meeting. The holder of the Special Voting Share must vote in accordance with the votes cast for and against the equivalent resolution at the parallel Rio Tinto plc shareholders meeting. The holders of Rio Tinto plc ordinary shares do not hold any voting shares in Rio Tinto Limited by virtue of their holding in Rio Tinto plc, and cannot enforce the voting arrangements relating to the Special Voting Share. Capital distribution arrangements If either company goes into liquidation, the Sharing Agreement ensures a valuation is made of the surplus assets of both companies. If the surplus assets available for distribution by one company on each of the shares held by its shareholders exceed the surplus assets available for distribution by the other company on each of the shares held by its shareholders, then an equalising payment must be made – to the extent permitted by applicable law – such that the amount available for distribution on each share held by shareholders of both companies reflects the Equalisation Ratio. The aim is to ensure the shareholders of both companies have equivalent entitlements to the assets of the combined Group on a per share basis, taking account of the Equalisation Ratio. The Sharing Agreement does not grant any enforceable rights to the shareholders of either company upon liquidation of either company. Limitations on ownership of shares and merger obligations The laws and regulations of the UK and Australia impose restrictions and obligations on persons who control interests in publicly listed companies in excess of defined thresholds. These can include an obligation to make a public offer for all outstanding issued shares of the relevant company. The threshold applicable to Rio Tinto plc under UK law and regulations is 30% and to Rio Tinto Limited under Australian law and regulations is 20% on both a standalone and a Joint Decision basis. As part of the DLC merger, the Articles of Association of Rio Tinto plc and the Constitution of Rio Tinto Limited were amended with the aim of extending these laws and regulations to the combined enterprise. This amendment also ensures that a person cannot exercise control over one company without having made offers to the public shareholders of both companies. This guarantees the equal treatment of both sets of shareholders, and that the two companies are considered as a single economic entity. The Articles of Association of Rio Tinto plc and the Constitution of Rio Tinto Limited impose restrictions on any person who controls, directly or indirectly, 20% or more of the votes on a Joint Decision. If, however, such a person has an interest in either Rio Tinto Limited or Rio Tinto plc only, then the restrictions only apply if they control, directly or indirectly, 30% or more of the votes at that company’s general meetings. If one of these thresholds is exceeded, the person cannot attend or vote at general meetings of the relevant company, cannot receive dividends or other distributions from the relevant company, and may be divested of their interest by the directors of the relevant company (subject to certain limited exceptions and notification by the relevant company). These restrictions continue to apply until that person has either made a public offer for all the publicly held shares of the other company, has reduced their controlling interest below the thresholds specified, or has acquired through a permitted means at least 50% of the publicly held shares of each company. This arrangement ensures that offers for the publicly held shares of both companies would be required to avoid the restrictions set out above, even if the interests which breach the thresholds are held in just one of the companies. The Directors do not have the discretion to exempt a person from the operation of these rules. Under the Sharing Agreement, the companies agree to co-operate to enforce the above restrictions contained in their Articles of Association and Constitution. Guarantees In 1995, each company entered into a deed poll guarantee in favour of creditors of the other company. In addition, each company guaranteed the contractual obligations of the other and the obligations of other persons guaranteed by the other company, subject to certain limited exceptions. Beneficiaries under deed poll guarantees can make demands on the relevant guarantor without first having recourse to the company or persons whose obligations are being guaranteed. The obligations of the guarantor under each deed poll guarantee expire upon termination of the Sharing Agreement and under other limited circumstances, but only in respect of obligations arising after such termination and, in the case of other limited circumstances, the publication and expiry of due notice. Markets Rio Tinto plc The principal market for Rio Tinto plc shares is the London Stock Exchange, with shares trading through the Stock Exchange Electronic Trading Service (SETS) system. Rio Tinto plc American Depositary Receipts (ADRs) are listed on the New York Stock Exchange. Rio Tinto Limited Rio Tinto Limited shares are listed on the Australian Securities Exchange (ASX). The ASX is the principal trading market for Rio Tinto Limited shares. The ASX is a national stock exchange with an automated trading system.
Annual Report on Form 20-F 2022 | riotinto.com340 Share ownership Substantial shareholders in Rio Tinto plc The following table shows holdings of 3% or more of voting rights in Rio Tinto plc’s ordinary shares as per the most recent notification of each respective holder to Rio Tinto plc under the UK Disclosure and Transparency Rule 5. The percentage of voting rights detailed below was calculated as at the date of the relevant disclosures. The following table shows shareholders who have provided this notice or an equivalent as of 3 February 2023. Rio Tinto Plc Date of notice Number of shares Percentage of capital BlackRock, Inc.1 4 Dec 2009 127,744,871 8.38 Shining Prospect Pte. Ltd 7 Dec 2018 182,550,329 14.022 The Capital Group Companies, Inc. 6 Jul 2022 51,648,733 4.13 1. On 7 February 2022, BlackRock, Inc. filed an Amendment to Schedule 13G with the SEC and disclosed beneficial ownership of 108,907,723 ordinary shares in Rio Tinto plc as of 31 December 2021, representing 8.7% of that class of shares. 2. In its notification of major holdings filed on 7 December 2018, Shining Prospect Pte. Ltd, a Singapore-based entity owned by Chinalco (Aluminium Corporation of China), disclosed that its percentage of voting rights in Rio Tinto plc had increased to 14.02% on 18 October 2018. This was due to the on-market share buy-back programme of Rio Tinto plc shares and the number of shares held by Shining Prospect Pte. Ltd has remained unchanged. Substantial shareholders in Rio Tinto Limited Under the Australian Corporations Act 2001, any person with 5% or more voting power in Rio Tinto Limited is required to provide the Company with notice. The following table shows shareholders who have provided this notice or an equivalent as of 3 February 2023: Rio Tinto Limited Date of notice Number of shares Percentage of capital3 BlackRock, Inc. 26 May 2022 see footnote4 see footnote4 The Vanguard Group, Inc. 11 Apr 2022 18,564,679 5.00 State Street Corporation 8 Nov 2021 19,832,353 5.34 Shining Prospect Pte. Ltd 9 Feb 2018 see footnote5 see footnote5 3. The percentage of voting rights detailed was as disclosed in the notice received by the company, calculated at the time of the relevant disclosure. 4. In its substantial holding notice filed on 26 May 2022, BlackRock, Inc. and its associates disclosed a holding of 130,673,276 shares in Rio Tinto plc and 27,921,718 shares in Rio Tinto Limited, which gave BlackRock, Inc. and its associates voting power of 9.78% in the Rio Tinto Group on a Joint Decision Matter. Accordingly, in addition to being substantial shareholders of Rio Tinto Limited by virtue of interests held in Rio Tinto Limited’s shares, through the operation of the Australian Corporations Act 2001 as modified to apply to the DLC structure, these entities disclosed voting power of 9.78% in Rio Tinto Limited. Based on this notification, as at 26 May 2022, BlackRock, Inc. held a 7.52% interest in Rio Tinto Limited. On 1 February 2022, BlackRock, Inc. filed an Amendment to Schedule 13G with the SEC and disclosed beneficial ownership of 24,143,271 ordinary shares in Rio Tinto Limited as of 31 December 2021, representing 6.5% of that class of shares. 5. In its substantial holding notice filed on 9 February 2018, Shining Prospect Pte. Ltd disclosed that its holding of 182,550,329 Rio Tinto plc shares gave Shining Prospect Pte. Ltd and its associates voting power of 10.32% in the Rio Tinto Group on a Joint Decision Matter. Accordingly, through the operation of the Australian Corporations Act 2001 as modified to apply to the DLC structure, these disclosed voting power of 10.32% in Rio Tinto Limited. As far as is known, Rio Tinto plc and Rio Tinto Limited are not directly or indirectly owned or controlled by another corporation or by any government or natural person. Rio Tinto is not aware of any arrangement that may result in a change in control of Rio Tinto plc or Rio Tinto Limited. No shareholder possesses voting rights that differ from those attaching to Rio Tinto plc’s and Rio Tinto Limited’s securities. As of 3 February 2023, the total amount of the Group’s voting securities owned by the Directors and Executives in Rio Tinto plc was 277,830 ordinary shares of 10p each or ADRs. There were 26,097 holders of record of Rio Tinto plc’s shares. Of these holders, 354 had registered addresses in the US and held a total of 297,224 Rio Tinto plc shares, representing 0.02% of the total number of Rio Tinto plc shares issued and outstanding as at such date. In addition, 188,512,732 Rio Tinto plc shares were registered in the name of a custodian account in London which represented 15.1% of Rio Tinto plc shares issued and outstanding. These shares were represented by 188,512,732 Rio Tinto plc ADRs held of record by 411 ADR holders. In addition, certain accounts of record with registered addresses other than in the US hold shares, in whole or in part, beneficially for US persons. As of 3 February 2023, the total amount of the Group’s voting securities owned by Directors and Executives in Rio Tinto Limited was 111,705 shares, in aggregate representing less than 1% of the Group’s total number of ordinary shares in issue. There were 181,553 holders of record of Rio Tinto Limited shares. Of these holders, 258 had registered addresses in the US, representing approximately 0.04% of the total number of Rio Tinto Limited shares issued and outstanding as of such date. In addition, nominee accounts of record with registered addresses other than in the US may hold Rio Tinto Limited shares, in whole or in part, beneficially for US persons. Unquoted equity securities in Rio Tinto Limited As at 3 February 2023, there were Rio Tinto Limited unquoted equity securities on issue, comprising 59,682 unvested Bonus Deferral Awards held by 36 holders; 1,138,595 unvested Management Share Awards held by 1,014 holders; and 1,038,122 unvested Performance Share Awards held by 145 holders, all of which were granted under the Rio Tinto Limited Equity Incentive Plan, and 1,197,334 unvested matching share rights were granted under the Rio Tinto Limited Global Employee Share Plan held by 14,693 holders. This information is provided in compliance with ASX Listing Rule 4.10.16. Shareholder information continued
341Annual Report on Form 20-F 2022 | riotinto.com Additional information Analysis of ordinary shareholders As at 3 February 2023 Rio Tinto plc Rio Tinto Limited No. of accounts % Shares % No. of accounts % Shares % 1 to 1,000 shares 19,437 74.48 5,972,594 0.48 156,609 86.26 40,026,708 10.78 1,001 to 5,000 shares 4,723 18.10 9,598,605 0.76 22,388 12.33 44,454,170 11.98 5,001 to 10,000 shares 547 2.10 3,918,432 0.30 1,775 0.98 12,249,662 3.30 10,001 to 25,000 shares 374 1.43 6,051,908 0.48 616 0.34 9,041,063 2.44 25,001 to 125,000 shares 517 1.98 31,204,883 2.48 125 0.07 5,688,300 1.53 125,001 to 250,000 shares 146 0.56 25,822,840 2.06 7 0.00 1,335,347 0.36 250,001 to 1,250,000 shares 236 0.90 128,299,351 10.22 20 0.01 9,327,060 2.51 1,250,001 to 2,500,000 shares 50 0.19 86,286,938 6.87 5 0.00 9,097,898 2.45 2,500,001 shares and over1 67 0.26 958,798,3702 76.35 8 0.00 239,996,006 64.65 1,255,854,9213 100.00 371,216,2144 100.00 Number of holdings less than marketable parcel of A$500 2,605 1. Excludes shares held in Treasury. 2. This includes 188,512,732 shares held in the name of a nominee on the share register. The shares are listed on the New York Stock Exchange (NYSE) in the form of American Depositary Receipts (ADRs). 3. The total issued share capital is made up of 1,249,756,838 publicly held shares: 6,098,083 shares held in Treasury. 4. Publicly held shares in Rio Tinto Limited. Twenty largest registered shareholders The following table lists the 20 largest registered holders of Rio Tinto Limited shares in accordance with the ASX listing rules, together with the number of shares and the percentage of issued capital each holds, as of 3 February 2023. Rio Tinto Limited Number of shares Percentage of issued share capital HSBC Custody Nominees (Australia) Limited 118,666,233 31.97 J. P. Morgan Nominees Australia Pty Limited 52,829,508 14.23 Citicorp Nominees Pty Ltd 35,930,120 9.68 BNP Paribas Noms Pty Ltd (DRP) 10,828,691 2.92 BNP Paribas Nominees Pty Ltd (Agency Lending DRP A/C) 8,829,598 2.38 National Nominees Limited 8,336,869 2.25 Citicorp Nominees Pty Limited (Colonial First State Inv A/C) 2,661,397 0.72 Buttonwood Nominees Pty Ltd 2,600,000 0.70 Argo Investments Limited 2,197,139 0.59 HSBC Custody Nominees (Australia) Limited (NT-Comnwlth Super Corp A/C) 2,076,027 0.56 Australian Foundation Investment Company Limited 1,915,141 0.52 BNP Paribas Nominees Pty Ltd (ACF Clearstream) 1,686,057 0.45 Custodial Services Limited 1,276,659 0.34 Netwealth Investments Limited (WRAP Services A/C) 1,240,590 0.33 BNP Paribas Nominees Pty Ltd (Hub24 Custodial Serv Ltd DRP A/C) 1,048,240 0.28 CGU Insurance 697,569 0.19 Washington H Soul Pattinson and Company Limited 669,120 0.18 BNP Paribas Noms (NZ) Ltd (DRP) 540,613 0.15 Diversified United Investment Ltd 465,126 0.13 Mutual Trust Pty Ltd 452,980 0.12
Annual Report on Form 20-F 2022 | riotinto.com342 Material contracts Articles of Association, Constitution, and DLC Sharing Agreement As explained on page 338, under the terms of the DLC structure shareholders of Rio Tinto plc and of Rio Tinto Limited entered into certain contractual arrangements designed to place the shareholders of both companies in substantially the same position as if they held shares in a single entity that owned all the assets of both companies. As far as is permitted by the UK Companies Act 2006, the Australian Corporations Act 2001 and ASX Listing Rules, this principle is reflected in the Articles of Association of Rio Tinto plc and in the Constitution of Rio Tinto Limited. The following summaries describe the material rights of shareholders of both Rio Tinto plc and Rio Tinto Limited. Objects At the 2009 AGMs, shareholders of Rio Tinto plc and Rio Tinto Limited approved amendments to their Articles of Association and Constitution whereby the object clauses were removed to allow the companies to have the widest possible scope of activities. Directors’ interests Under Rio Tinto plc’s Articles of Association, a Director may not vote in respect of any proposal in which he or she, or any other person connected with him or her, has any interest, other than by virtue of his or her interests in shares or debentures or other securities of, in or through the company, except in certain circumstances, including in respect of resolutions: – Indemnifying him or her or a third party in respect of obligations incurred by the Director on behalf of, or for the benefit of, the company, or in respect of obligations of the company, for which the Director has assumed responsibility under an indemnity, security or guarantee. – Relating to an offer of securities in which he or she may be interested as a holder of securities or as an underwriter. – Concerning another body corporate in which the Director is beneficially interested in less than 1% of the issued shares of any class of shares of such a body corporate. – Relating to an employee benefit in which the Director will share equally with other employees. – Relating to liability insurance that the company is empowered to purchase for the benefit of Directors of the company in respect of actions undertaken as Directors (or officers) of the company. – Concerning the giving of indemnities in favour of Directors or the funding of expenditure by Directors to defend criminal, civil or regulatory proceedings or actions against a Director. Under Rio Tinto Limited’s Constitution, a Director may be present at a meeting of the Board while a matter in which the Director has a material personal interest is being considered and may vote in respect of that matter, except where a Director is constrained by Australian law. The Directors are empowered to exercise all the powers of the companies to borrow money; to charge any property or business of the companies or all, or any, of their uncalled capital; and to issue debentures or give any other security for a debt, liability or obligation of the companies or of any other person. The Directors shall restrict the borrowings of Rio Tinto plc to the limitation that the aggregate amount of all monies borrowed by the company and its subsidiaries shall not exceed an amount equal to 1.5 times the companies’ share capital plus aggregate reserves unless sanctioned by an ordinary resolution of the company. Directors are not required to hold any shares of either company by way of qualification. The Remuneration Report on pages 110-135 provides information on shareholding policies relating to Executive and Non-Executive Directors. Please refer to the Directors’ Report for information on the appointment of Directors. Rights attaching to shares Under UK law, dividends on shares may only be paid out of profits available for distribution, as determined in accordance with generally accepted accounting principles and by the relevant law. Shareholders are entitled to receive such dividends as may be declared by the Directors. Directors may also pay interim dividends to shareholders as justified by the financial position of the Group. Under the Australian Corporations Act 2001, dividends on shares may only be paid if the company’s assets exceed its liabilities immediately before the dividend is declared, the excess is sufficient for the payment of the dividend, the payment is fair and reasonable to the company’s shareholders as a whole, and the payment does not materially prejudice the company’s ability to pay its creditors. Any Rio Tinto plc dividend unclaimed after 12 years from the date the dividend was declared, or became due for payment, will be forfeited and returned to the company. Any Rio Tinto Limited dividend unclaimed may be invested or otherwise used by the Board for the benefit of the company until claimed or otherwise disposed of according to Australian law. Rio Tinto Limited is governed by the State of Victoria’s unclaimed monies legislation, which requires the company to pay to the state revenue office any unclaimed dividend payments of A$20 or more that on 1 March each year have remained unclaimed for over 12 months. Voting Voting at any general meeting of shareholders on a resolution on which the holder of the Special Voting Share is entitled to vote shall be decided by a poll, and any other resolution shall be decided by a show of hands unless a poll has been duly demanded. On a show of hands, every shareholder who is present in person or by proxy (or other duly authorised representative) and is entitled to vote, has one vote regardless of the number of shares held. The holder of the Special Voting Share is not entitled to vote in a show of hands. On a poll, every shareholder who is present in person or by proxy (or other duly authorised representative) and is entitled to vote, has one vote for every ordinary share for which he or she is the holder. In the case of Joint Decisions, the holder of the Special Voting Share has one vote for each vote cast in respect of the publicly held shares of the other company. A poll may be demanded by any of the following: – The Chair of the meeting. – At least five shareholders entitled to vote on the resolution. – Any shareholder(s) representing in the aggregate not less than one tenth (Rio Tinto plc) or one 20th (Rio Tinto Limited) of the total voting rights of all shareholders entitled to vote on the resolution. – Any shareholder(s) holding Rio Tinto plc shares conferring a right to vote at the meeting on which there have been paid-up sums in the aggregate equal to not less than one tenth of the total sum paid up on all the shares conferring that right. – The holder of the Special Voting Share of either company. A proxy form gives the proxy the authority to demand a poll, or to join others in demanding one. The necessary quorum for a Rio Tinto plc general meeting is three members present (in person or by proxy or other duly authorised representative) and entitled to vote. For a Rio Tinto Limited general meeting it is two members present (in person or by proxy or other duly authorised representative). Matters are transacted at general meetings by the proposing and passing of resolutions as: – Ordinary resolutions (for example the election of Directors), which require the affirmative vote of a majority of persons voting at a meeting for which there is a quorum. – Special resolutions (for example amending the Articles of Association of Rio Tinto plc or the Constitution of Rio Tinto Limited), which require the affirmative vote of not less than three-quarters of the persons voting at a meeting at which there is a quorum. Shareholder information continued
343Annual Report on Form 20-F 2022 | riotinto.com Additional information The Sharing Agreement further classifies resolutions as Joint Decisions and class rights actions as explained on page 338. Annual general meetings must be convened with 21 days’ written notice for Rio Tinto plc and with 28 days’ notice for Rio Tinto Limited. In accordance with the authority granted by shareholders at the Rio Tinto plc AGM in 2021, other meetings of Rio Tinto plc may be convened with 14 days’ written notice for the passing of a special resolution, and with 14 days’ notice for any other resolution, depending on the nature of the business to be transacted. All meetings of Rio Tinto Limited require 28 days’ notice. In calculating the period of notice, any time taken to deliver the notice and the day of the meeting itself are not included. The notice must specify the nature of the business to be transacted. Variation of rights If, at any time, the share capital is divided into different classes of shares, the rights attached to each class may be varied, subject to the provisions of the relevant legislation, the written consent of holders of three-quarters in value of the shares of that class, or upon the adoption of a special resolution passed at a separate meeting of the holders of the shares of that class. At every such meeting, all of the provisions of the Articles of Association and Constitution relating to proceedings at a general meeting apply, except that the quorum for Rio Tinto plc should be two or more persons who hold or represent by proxy not less than one-third in nominal value of the issued shares of the class. Rights upon a winding-up Except as the shareholders have agreed or may otherwise agree, upon a winding-up, the balance of assets available for distribution after the payment of all creditors (including certain preferential creditors, whether statutorily preferred creditors or normal creditors), and subject to any special rights attaching to any class of shares, is to be distributed among the holders of ordinary shares according to the amounts paid-up on the shares held by them. This distribution should generally be made in cash. A liquidator may, however, upon the adoption of a special resolution of the shareholders, divide among the shareholders the whole or any part of the assets in specie or kind. The Sharing Agreement describes the distribution of assets of each of the companies in the event of a liquidation, as explained on page 339. Facility agreement Details of the Group’s $7.5 billion multi-currency committed revolving credit facilities are set out in “Our capital and liquidity” section to the financial statements on page 190. Exchange controls and foreign investment Rio Tinto plc There are no UK foreign exchange controls or other restrictions on the import or export of capital by, or on the payment of dividends to, non-resident holders of Rio Tinto plc shares, or that materially affect the conduct of Rio Tinto plc’s operations. It should be noted, however, that various sanctions, laws, regulations or conventions may restrict the import or export of capital by, or the payment of dividends to, non-resident holders of Rio Tinto plc shares. There are no restrictions under Rio Tinto plc’s Articles of Association or under UK law that specifically limit the right of non-resident owners to hold or vote Rio Tinto plc shares. However, certain of the provisions of the Australian Foreign Acquisitions and Takeovers Act 1975 (the Takeovers Act) described below also apply to the acquisition by non-Australian persons of interests in securities of Rio Tinto plc. Rio Tinto Limited Under current Australian legislation, Australia does not impose general exchange or foreign currency controls. Subject to some specific requirements and restrictions, Australian and foreign currency may be freely brought into and sent out of Australia. There are requirements to report cash transfers in or out of Australia of A$10,000 or more. There is a prohibition on (or in some cases the specific prior approval of the Department of Foreign Affairs and Trade or Minister for Foreign Affairs must be obtained for) certain payments or other dealings connected with countries or parties identified with terrorism, or to whom United Nations or autonomous Australian sanctions apply. Sanction, anti-money laundering and counterterrorism laws may restrict or prohibit payments, transactions and dealings or require reporting of certain transactions. Rio Tinto Limited may be required to deduct withholding tax from foreign remittances of dividends, to the extent that they are unfranked, and from payments of interest. Acquisitions of interests in shares, and certain other equity instruments in Australian companies by non-Australian (“foreign”) persons are subject to review and approval by the Treasurer of the Commonwealth of Australia under the Takeovers Act. In broad terms, the Takeovers Act applies to acquisitions of interests in securities in an Australian entity by a foreign person where, as a result, a single foreign person (and any associate) would control 20% or more of the voting power or potential voting power in the entity. The potential voting power in an entity is determined having regard to the voting shares in the entity that would be issued if all rights (whether or not presently exercisable) in the entity were exercised. The Takeovers Act also applies to direct investments by foreign government investors, in certain circumstances regardless of the size of the investment. Persons who are proposing relevant acquisitions or transactions may be required to provide notice to the Treasurer before proceeding with the acquisition or transaction. The Treasurer has the power to order divestment in cases where relevant acquisitions or transactions have already occurred, including where prior notice to the Treasurer was not required. The Takeovers Act does not affect the rights of owners whose interests are held in compliance with the legislation. Limitations on voting and shareholding Except for the provisions of the Takeovers Act, there are no limitations imposed by law, Rio Tinto plc’s Articles of Association or Rio Tinto Limited’s Constitution, on the rights of non-residents or foreigners to hold the Group’s ordinary shares or ADRs, or to vote that would not apply generally to all shareholders. Directors Appointment and removal of Directors The appointment and replacement of Directors is governed by Rio Tinto plc’s Articles of Association and Rio Tinto Limited’s Constitution, relevant UK and Australian legislation, and the UK Corporate Governance Code. The Board may appoint a Director either to fill a casual vacancy or as an addition to the Board, so long as the total number of Directors does not exceed the limit prescribed in these constitutional documents. An appointed Director must retire and seek election to office at the next AGM of each company. In addition to any powers of removal conferred by the UK Companies Act 2006 and the Australian Corporations Act 2001, the company may by ordinary resolution remove any Director before the expiry of his or her period of office and may, subject to these constitutional documents, by ordinary resolution appoint another person who is willing to act as a Director in their place. In line with the UK Corporate Governance Code, all directors are required to stand for re-election at each AGM.
Annual Report on Form 20-F 2022 | riotinto.com344 Directors’ powers The Board manages the business of Rio Tinto under the powers set out in these constitutional documents. These powers include the Directors’ ability to issue or buy back shares. Shareholders’ authority to empower the Directors to purchase its own ordinary shares is sought at the AGM each year. The constitutional documents can only be amended, or replaced, by a special resolution passed in general meeting by at least 75% of the votes cast. UK listing rules cross-reference table The following table contains only those sections of UK listing rule 9.8.4 C which are relevant. The remaining sections of listing rule 9.8.4 C are not applicable. Listing rule Description of listing rule Reference in report 9.8.4 (1) A statement of any interest capitalised by the Group during the year Note 9 Finance income and finance costs and note 15 Deferred taxation 9.8.4 (12) Details of any arrangement under which a shareholder has waived or agreed to waive any dividends See page 138. Shareholder security Shareholders tell us that they sometimes receive unsolicited approaches, usually by telephone, inviting them to undertake a transaction in shares they own. If a shareholder does not know the source of the call, they should check the details against the Financial Conduct Authority (FCA) website below and, if they have specific information, report it to the FCA using the consumer helpline or the online reporting form. If a shareholder is worried that they are a victim of fraud and is resident in the UK, they should report the facts immediately using the Action Fraud helpline on 0300 123 2040. More information about potential scams and other investment-based fraud can be found at actionfraud.police.uk or fca.org.uk/scamsmart. Metal prices and exchange rates Metal prices – average for the year 2022 2021 Increase/ (decrease) Copper – US cents/lb 398 422 (6)% Aluminium – $/tonne 2,703 2,480 9% Gold – $/troy oz 1,800 1,799 -% Average exchange rates against the US dollar Sterling 1.24 1.38 (10)% Australian dollar 0.69 0.75 (8)% Canadian dollar 0.77 0.80 (4)% Euro 1.05 1.18 (11)% South African rand 0.061 0.068 (10)% Year-end exchange rates against the US dollar Sterling 1.21 1.35 (10)% Australian dollar 0.68 0.73 (7)% Canadian dollar 0.74 0.78 (5)% Euro 1.07 1.13 (5)% South African rand 0.059 0.063 (6)% Shareholder information continued
345Annual Report on Form 20-F 2022 | riotinto.com Additional information Disclosure pursuant to Section 13(r) of the U.S. Securities Exchange Act of 1934 Section 219 of the Iran Threat Reduction and Syria Human Rights Act of 2012 added Section 13(r) to the Securities Exchange Act of 1934 (the “Exchange Act”). Section 13(r) to the Exchange Act requires an issuer to disclose in its annual reports whether it or any of its affiliates knowingly engaged in certain activities, transactions or dealings relating to Iran or with the Government of Iran during the period covered by the report. The Company notes the following in relation to activities that took place in 2022, or in relation to activities the Company became aware of in 2022 relating to disclosable activities prior to the reporting period. The Company routinely takes action to protect its intellectual property rights in many countries throughout the world, including Iran. In connection with such protection efforts, the Company has used, directly or indirectly, intellectual property firms with an agent or branch office in Iran to assist with the filing of patent and trade-mark applications, prosecution activities and maintenance in Iran. Contact with the firms has been minimal and solely limited to these activities. Certain transactions related to patents, trademarks and copyright are authorised activities under US sanctions and regulations against Iran (including the filing of an application to obtain a patent or trademark in Iran) and the Company believes its limited activities in this regard are consistent with this authorisation. Rio Tinto acquired its interest in Namibia- based Rössing Uranium Limited (“Rössing”) in 1970. The Iran Foreign Investments Company (“IFIC”) acquired its original minority shareholding in Rössing in 1975. IFIC’s interest predates the establishment of the Islamic Republic of Iran and the U.S. economic sanctions targeting Iran’s nuclear, energy and ballistic missile programs. IFIC acquired a minority shareholding in Rössing in accordance with Namibian law. The Treasury Department’s Office of Foreign Assets Control designated IFIC as a Specially Designated National on 5 November 2018. On 16 July 2019, the Company completed the sale of its entire interest 68.62 per cent stake in Rössing to China National Uranium Corporation Limited (“CNUC”) for an initial cash payment of $6.5 million and a contingent payment of up to $100 million. The contingent payment is linked to uranium spot prices reaching a certain level and Rössing's net income until calendar year 2026. As a result of the evolution of uranium prices, the contingent payment had not been triggered as of 31 December 2022. In addition, the Company will receive a cash payment if, subject to certain conditions, CNUC sell the Zelda 20 Mineral Deposit during a restricted period. As of 31 December 2022, to the best of Rio Tinto’s knowledge, CNUC had not sold the Zelda Mineral Deposit. Rio Tinto Marketing Pte Ltd has continued to purchase a quantity of uranium produced by Rössing, in order to satisfy existing contractual commitments with customers, pursuant to an ongoing marketing arrangement which will cease on 26 December 2026. Rössing was neither a business partnership nor joint venture between the Company and IFIC. Rössing is a Namibian limited liability company with a number of shareholders which included Rio Tinto. When the Company was a shareholder, IFIC had no uranium product off-take rights. Neither IFIC nor other Government of Iran entities had any supply contracts in place with Rössing and none received any uranium from Rössing. IFIC also did not have access to any technology through its investment in Rössing or rights to such technology. Rio Tinto had no power or authority to divest IFIC’s holding in Rössing. The Rössing board took steps in 2012 to terminate IFIC’s involvement in the governance of Rössing. When Rio Tinto was a shareholder in Rössing, IFIC was entitled under Namibian law to attend annual general meetings of Rössing, which they did attend. IFIC was represented on the board of Rössing by two directors. While this level of board representation did not provide IFIC with the ability to influence the conduct of Rössing’s business on its own, the Rössing board nonetheless determined that, in light of international economic sanctions, it would be in the best interest of Rössing to terminate IFIC’s involvement in board activity. Therefore, on 4 June 2012, at the annual general meeting of Rössing, the shareholders, including the Company, voted not to re-elect the two IFIC board members. This ended IFIC’s participation in Rössing board activities. While IFIC has a notional entitlement to its pro rata share of any dividend that the majority of the board declared for all shareholders in Rössing,such dividend payments have been held in a blocked account in Namibia to ensure compliance with US sanctions legislation. Accordingly, IFIC has not received such monies since early 2008. Simply by maintaining its own shareholding in Rössing, the Company was not engaging in any activity intended or designed to confer any direct or indirect financial support for IFIC. While the Company does not view itself as actively transacting or entering into business dealings with an instrumentality of the Government of Iran or a Specially Designated National, this information has been provided to ensure transparency regarding the passive, minority shareholding in Rössing held by IFIC while the Company was a shareholder. Taxation US residents The following is a summary of the principal UK tax, Australian tax and US federal income tax consequences of the ownership of Rio Tinto plc ADSs, Rio Tinto plc shares and Rio Tinto Limited shares, “the Group’s ADSs and shares”, by a US holder (as defined below). It is not intended to be a comprehensive description of all the tax considerations that are relevant to all classes of taxpayer. This summary does not cover all aspects of US federal income taxation (including the alternative minimum tax or net investment income tax) that may be relevant to, or the actual tax effect that any of the matters described herein will have on, the acquisition, ownership, or disposal of the Group’s ADSs and shares by particular investors. Future changes in legislation may affect the tax consequences of the acquisition, ownership or disposal of the Group’s ADSs and shares. This summary is based in part on representations by the Group’s depositary bank as depositary for the ADRs evidencing the ADSs and assumes that each obligation in the deposit agreements will be performed in accordance with its terms. You are a US holder if you are a beneficial owner of the Group’s ADSs and shares and you are for US federal income tax purposes: a citizen or resident of the United States; a corporation created or organised under the laws of the United States, any state thereof or the District of Columbia; an estate whose income is subject to US federal income tax regardless of its source; or a trust if a US court can exercise primary supervision over the trust’s administration and one or more US persons are authorised to control all substantial decisions of the trust. This section applies to US holders only if the Group’s ADSs or shares are held as capital assets for US federal income tax purposes. This section does not address tax considerations applicable to investors that own (directly, indirectly, or by attribution) 5% or more of the stock of the company (by vote or value) and does not apply to shareholders who are members of a special class of holders subject to special rules, including a dealer in securities, a trader in securities who elects to use a mark-to-market method of accounting for securities holdings, a tax exempt organisation, a life insurance company, a person that holds the Group’s ADSs or shares as part of a straddle or a hedging or conversion transaction, persons that have ceased to be US citizens or lawful permanent residents of the United States, investors holding the Group’s ADSs or shares in connection with a trade or business conducted outside of the United States, US expatriates or a person whose functional currency is not the US dollar. US Disclosure
Annual Report on Form 20-F 2022 | riotinto.com346 US Disclosure continued This section is based on the US Internal Revenue Code of 1986, as amended (the Code), its legislative history, existing and proposed regulations, published rulings and court decisions, Australian tax law and practice, UK tax law as applied in England and Wales and HM Revenue & Customs published practice (which may not be binding on HM Revenue & Customs) and on the convention between the United States and the UK, and the convention between the United States and Australia (together, the Conventions) which may affect the tax consequences of the ownership of the Group’s ADSs and shares, all as of the date hereof. These laws and Conventions are subject to change, possibly on a retroactive basis. The summary describes the treatment applicable under the laws and Conventions in force at the date of this report. UK taxation of shareholdings in Rio Tinto plc This section is based on the assumption that for UK tax purposes a US holder who holds ADRs evidencing ADSs will be treated as the beneficial owner of the underlying shares represented by the ADSs. Case law in the UK has cast doubt on this view; however, HM Revenue & Customs have stated that, except in so far as the relevant US laws (being the laws applicable to the territory in which the ADRs are issued) conclusively dictacte that the holder of an ADR will not have beneficial ownership in the underlying shares, they will continue to apply their practice of regarding the holder of an ADR as having a beneficial interest in the underlying shares. Taxation of dividends Under current UK tax legislation, no withholding tax is required to be withheld from dividends paid by Rio Tinto plc. Where dividends are paid by Rio Tinto plc to a US holder who is not resident in the UK and who does not hold the Group’s ADSs and shares in connection with a branch, agency or permanent establishment in the UK, no liability to UK tax will generally arise to the US holder in respect of such dividends. Capital gains A US holder, who has at no time been resident in the UK, will not normally be liable to UK tax on capital gains realised on the disposition of a Group ADS or share unless the holder carries on a trade, profession or vocation in the UK through a branch, agency or permanent establishment in the UK and the ADS or share has been used for the purposes of the trade, profession or vocation or is acquired, held or used for the purposes of such a branch, agency or permanent establishment. Inheritance tax Under the UK/US Inheritance and Gift Tax Treaty (1978) (UK/US Estate Tax Treaty), a US holder, who is domiciled in the United States and is not a national of the UK, will not (provided any US federal or estate gift tax chargeable has been paid) be subject to UK inheritance tax upon the holder’s death or on a transfer of the Group ADS or share during the holder’s lifetime, unless that ADS or share (i) forms part of the business property of a permanent establishment in the UK, (ii) pertains to a fixed base situated in the UK used in the performance of independent personal services, or (iii) is comprised in a settlement (unless, at the time the settlement was made, the settlor was domiciled in the United States and was not a national of the UK). Where a Group an ADS or share is subject to both UK inheritance tax and US Federal gift or estate tax, tax payments are relieved in accordance with the priority rules set out in the UK/US Estate Tax Treaty. Stamp duty and stamp duty reserve tax UK stamp duty should not be required to be paid in respect of a transfer of Rio Tinto plc ADSs provided that the transfer instrument is not executed in, and at all times remains outside, the UK and does not relate to any property situated or to any matter or thing to be done in the UK. Electronic “paperless” purchases of Rio Tinto plc shares are subject to stamp duty reserve tax (SDRT) at a rate of 0.5% of the amount or value of the consideration payable for the transfer. Purchases of Rio Tinto plc shares using a stock transfer form are subject to stamp duty at a rate of 0.5% of the consideration on transactions over £1,000 (rounded up to the nearest £5). Conversions of Rio Tinto plc shares into Rio Tinto plc ADSs will be subject to additional stamp duty or SDRT at a rate of 1.5% of the amount or value of the consideration given or, in certain circumstances, the value of the shares, on all transfers to the depositary or its nominee. Australian taxation of shareholdings in Rio Tinto Limited Taxation of dividends US holders are not normally liable to Australian withholding tax on dividends paid by Rio Tinto Limited because such dividends are normally fully franked under the Australian dividend imputation system, meaning that they are paid out of income that has borne Australian income tax. Any unfranked dividends would suffer Australian withholding tax which under the Australian income tax convention is limited to 15 per cent of the gross dividend. Capital gains US holders are not normally subject to any Australian tax on the disposal of Rio Tinto Limited ADSs or shares unless they have been used in carrying on a trade or business wholly or partly through a permanent establishment in Australia, or the gain is in the nature of income sourced in Australia. Gift, estate and inheritance tax Australia does not impose any gift, estate or inheritance taxes in relation to gifts of shares or upon the death of a shareholder. Stamp duty An issue or transfer of Rio Tinto Limited shares does not require the payment of Australian stamp duty. US federal income tax In general, taking into account the earlier assumptions that each obligation of the Deposit Agreement and any related agreement will be performed according to its terms, for US federal income tax purposes, if you hold ADRs evidencing ADSs, you will be treated as the owner of the shares represented by those ADRs. Exchanges of shares for ADRs, and ADRs for shares, generally will not be subject to US federal income tax.
347Annual Report on Form 20-F 2022 | riotinto.com Additional information Taxation of dividends Under the US federal income tax laws, and subject to the Passive Foreign Investment Company (PFIC) rules discussed below, if you are a US holder, the gross amount of any distribution a company pays out of its current or accumulated earnings and profits (as determined for US federal income tax purposes) is subject to US federal income taxation as dividend income. The dividend will not be eligible for the dividends-received deduction generally allowed to US corporations in respect of dividends received from certain other corporations. Distributions in excess of current and accumulated earnings and profits, as determined for US federal income tax purposes, will be treated as a non-taxable return of capital to the extent of your tax basis in the Group’s ADSs or shares and thereafter as capital gain. The Group does not maintain calculations of its earnings and profits in accordance with US federal income tax accounting principles. US holders should therefore assume that any distributions that a Group member pays with respect to the Group’s ADSs or Shares will be reported as dividend income. Dividends paid to a non-corporate US holder generally may be taxable at the reduced rate normally applicable to long-term capital gains provided the shares are readily tradable on an established securities market in the United States or the company paying the dividend qualifies for the benefits of an income tax treaty between the United States and the relevant jurisdiction and certain other requirements are met (including certain holding period requirements). Rio Tinto plc ADSs are traded on the NYSE. Rio Tinto Limited believes it qualifies for the benefits of the convention between the United States and Australia. The dividend is taxable to you when you, in the case of shares, or the depositary, in the case of ADSs, receive the dividend, actually or constructively. The amount of the dividend distribution that you must include in your income as a US holder will be the US dollar value of the non-US dollar payments made, determined at the spot UK pound/US dollar rate (in the case of Rio Tinto plc) or the spot Australian dollar/US dollar rate (in the case of Rio Tinto Limited) on the date the dividend distribution is includible in your income, regardless of whether the payment is in fact converted into US dollars. Generally, any gain or loss resulting from currency exchange fluctuations during the period from the date you include the dividend payment in income to the date you convert the payment into US dollars will be treated as ordinary income or loss and will not be eligible for the reduced tax rate normally applicable to capital gains. The gain or loss generally will be income or loss from sources within the US for foreign tax credit limitation purposes. You must include any Australian tax withheld from the dividend payment in this gross amount even though you do not in fact receive it. Subject to certain limitations, any Australian tax withheld may be creditable against your US federal income tax liability. For foreign tax credit purposes, dividends will generally be income from sources outside the United States and will generally constitute “passive category income” for purposes of computing the foreign tax credit allowable to you. In lieu of claiming a tax credit, a US holder may be able to take a deduction for any Australian taxes withheld. An election to deduct foreign taxes instead of claiming a foreign tax credit must be applied to all foreign taxes paid or accrued in the US holder’s taxable year. The rules regarding foreign tax credits are complex and US holders should consult their own tax advisers regarding the application of the foreign tax credit rules to their particular situation. Taxation of capital gains Except if subject to the PFIC rules discussed below, if you are a US holder and you sell or otherwise dispose of the Group’s ADSs or shares, you will recognise a capital gain or loss for US federal income tax purposes equal to the difference between the US dollar value of the amount that you realise and your tax basis, determined in US dollars, in your Group’s ADSs or shares. The capital gain of a non-corporate US holder is generally taxed at preferential rates where the holder has a holding period greater than one year. The gain or loss will generally be income or loss from sources within the United States for foreign tax credit limitation purposes. US holders should consult their own tax advisers about how to account for proceeds received on the sale or other disposition of the Group’s ADSs or shares that are not paid in US dollars. Passive Foreign Investment Company Rules We believe that the Group’s ADSs or shares should not be treated as stock of a PFIC for US federal income tax purposes for the most recent taxable year, and we do not expect the Group ADSs or shares to be treated as stock of a PFIC for the current taxable year or the forseable future. However, this conclusion is a factual determination that is made annually and thus may be subject to change. If we were to be treated as a PFIC, US holders generally would be taxed under one of three recognition provisions which can be elected by the US taxpayer that holds a PFIC interest. The available PFIC recognition regimes include 1) a mark to market regime, 2) an excess distribution regime, or 3) a qualified electing fund regime. These alternative regimes can require the US taxpayer to accelerate the recognition of income, to pay an interest charge on certain tax liabilities and to change the character of the gain recognition from capital gains to ordinary income. As a result, if we were to be treated as a PFIC, dividends that you receive from us will not be eligible for the reduced rate of tax described above under “Taxation of dividends.” US holders should consult their own tax advisers regarding the potential application of the PFIC rules. Backup Withholding and Information Reporting The proceeds of a sale or other disposition, as well as dividends and other proceeds, with respect to the Group’s ADSs or shares by a US paying agent or other US intermediary will be reported to the US Internal Revenue Service and to the US holder as may be required under applicable regulations. Backup withholding may apply to these payments if the US holder fails to provide an accurate taxpayer identification number or certification of exempt status or fails to comply with applicable certification requirements. Certain US holders are not subject to backup withholding. US holders should consult their tax advisers about these rules and any other reporting obligations that may apply to the ownership or disposition of the Group’s ADSs or shares, including requirements related to the holding of certain foreign financial assets. American Depositary Shares American depositary receipts (ADRs) Rio Tinto plc has a sponsored ADR facility with JPMorgan Chase Bank NA (“JPMorgan”) under a Deposit Agreement, dated 13 July 1988, as amended on 11 June 1990, as further amended and restated on 15 February 1999, 18 February 2005 (when JPMorgan became Rio Tinto plc’s depositary), 29 April 2010, 19 February 2016 and 17 June 2021. The ADRs evidence Rio Tinto plc ADSs, each representing one ordinary share. The shares are registered with the US Securities and Exchange Commission (“SEC”), are listed on the NYSE and are traded under the symbol RIO.
Annual Report on Form 20-F 2022 | riotinto.com348 US Disclosure continued Fees and charges payable by a holder of ADSs In accordance with the terms of the Deposit Agreement, JPMorgan may charge holders of Rio Tinto ADSs, either directly or indirectly, fees or charges up to the amounts described in the table below. Category Depositary actions Associated fee Issuance of ADSs against the deposit of shares, including deposits and issuance in respect of: – Share distributions, stock split, rights, merger – Exchange of securities or other transactions – Other events or distributions affecting the ADSs or the deposited securities $5.00 or less per 100 ADSs (or portion thereof) evidenced by the new ADSs delivered Selling or exercising rights Distribution or sale of securities, the fee being in an amount equal to the fee for the execution and delivery of ADSs which would have been charged as a result of the deposit of such securities $5.00 or less for each 100 ADSs Distributing dividends Distribution of cash or other dividends $0.02 or less per ADS Withdrawing an underlying share Acceptance of ADSs surrendered for withdrawal of deposited securities $5.00 or less for each 100 ADSs evidenced by the ADSs surrendered Transferring, splitting or grouping receipts Transfers, combining or grouping of depositary receipts $1.50 per ADS General depositary services, particularly those charged on an annual basis Other services performed by the depositary in administering the ADRs Provide information about the depositary’s right, if any, to collect fees and charges by offsetting them against dividends received and deposited securities $0.02 or less per ADS not more than once each calendar year and payable at the sole discretion of the depositary by billing holders or deducting such charge from one or more cash dividends or other cash distributions Expenses of the depositary Expenses incurred on behalf of holders in connection with: – Compliance with foreign exchange control regulations or any law or regulation relating to foreign investment – The depositary’s or its custodian’s compliance with applicable law, rule or regulation – Stock transfer or other taxes and other governmental charges – Cable, telex, facsimile and electronic transmission/delivery – Expenses of the depositary in connection with the conversion of foreign currency into US dollars (which are paid out of such foreign currency) – Any other charge payable by the depositary or its agents Expenses payable at the sole discretion of the depositary by billing holders or by deducting charges from one or more cash dividends or other cash distributions Fees and payments made by the depositary to the issuer JPMorgan has agreed to reimburse certain company expenses related to the Rio Tinto plc ADR programme and incurred by the Group in connection with the programme. The Group received US $$2,644,689.49 in respect of expenses incurred by the Group in connection with the ADR programme for the year ended 31 December 2022. JPMorgan did not pay any amount on the Group’s behalf to third parties. JPMorgan also waived certain of its standard fees and expenses associated with the administration of the programme relating to routine programme maintenance, reporting, distribution of cash dividends, annual meeting services and report mailing services. Under certain circumstances, including removal of JPMorgan as depositary or termination of the ADR programme by the Company, the Company is required to repay JPMorgan any amounts of administrative fees and expenses waived during the 12-month period prior to notice of removal or termination. Document on display Rio Tinto is subject to the SEC reporting requirements for foreign companies. This Form 20-F, which corresponds with the Form 10-K for US public companies, was filed with the SEC on 24 February 2023. Rio Tinto’s Form 20-F and other filings (including Rio Tinto’s Annual Report 2022 as furnished on Form 6-K) can be viewed on the Rio Tinto website as well as the SEC website at www.sec.gov.
349Annual Report on Form 20-F 2022 | riotinto.com Additional information Impact of climate change on the Group Strategy and approach to climate change Over a year ago, we put the low-carbon transition at the heart of our new strategy, setting a clear pathway to deliver long-term value as well as ambitious targets to decarbonise our business. In 2022, our shareholders supported our Climate Action Plan in a non-binding advisory vote on the Group’s ambitions, emissions targets and actions to achieve them. Further detail of our approach is provided in the front half of our Annual Report and in our 2022 Climate Change Report. Our Scope 1 and 2 emissions reduction targets of 15% by 2025, 50% by 2030 (both relative to our 2018 equity baseline) and the aim to achieve net zero emissions by 2050 are aligned with 1.5°C – the stretch goal of the Paris Agreement. We have set up six large abatement programmes focused on renewables, Pacific aluminium operations, ELYSISTM technology, process heat, minerals processing and diesel alternatives. To deliver our climate targets, we expect to make capital investment of US$7.5 billion in decarbonisation projects over the period to 2030, including around US$1.5 billion in the next three years, mainly relating to the repowering of the Pilbara. Progress towards our Scope 1 and 2 emissions targets is reflected within executive remuneration. In 2022, we delivered the first 34MW of renewable power at Gudai-Darri and announced our plan to invest US$600 million in 200MWh of solar power facilities and 200MWh of battery storage in the Pilbara by 2026. We agreed to test at least four battery-powered locomotives, and pilot battery-powered trucks in the Pilbara in 2024. By 2030, we aim to phase out the purchase of diesel haulage trucks and locomotives across our operations. At the Queensland Alumina refinery we are working to develop an energy efficient digestion process at an estimated cost of US$240 million. In 2022, we continued to work with the Queensland Government and energy providers to design a renewable energy solution for Boyne Smelter. Similarly, in 2022, Tomago Aluminium Company released an expression of interest to work towards a green repowering solution for the Tomago smelter. In addition, we have signed a 130MW solar power purchase agreement for Richards Bay Minerals (RBM) in South Africa. We also intend to decarbonise our shipping fleet and aim to have net zero vessels in our portfolio by 2030. To achieve this, in 2022 we successfully completed a trial of fuel blend with biofuels and in 2023-2024 we plan to incorporate nine LNG dual-fuel chartered vessels into our fleet. Decarbonisation projects are expected to accelerate beyond 2025, which we expect to include further decarbonisation of the Pilbara electricity system (estimated at US$3 billion out of the US$7.5 billion total spend by 2030) and other abatement projects. We are also stepping up our focus on Scope 3 goals, which are explicitly linked to executive remuneration. Over 90% of our Scope 3 emissions are from the downstream processing of iron ore, bauxite and other products by our customers. We have not set an overall quantitative Scope 3 emissions target, but instead engage with our customers to optimise their current operations toward low-emitting, higher efficiency processes; and foster partnerships with them, which we believe are more effective ways to advance actions. The shift toward green steel is underway and we are working on options to beneficiate our Pilbara ores to be better suited to green steel technologies and are exploring DRI pathways using sustainable resources such as hydrogen and biomass. We expect that our annual incremental operating expenditure on building new teams and energy efficiency initiatives will be around US$200 million, in addition to R&D investment. Our ambition is to increase our growth capital expenditure to around US$2 billion in 2023 and up to US$3 billion per year in 2024-2025 to capture new growth opportunities with a focus on materials that are expected to see strong demand growth from the low carbon transition. This includes investment in future production of lithium at Rincon, copper at Oyu Tolgoi and Winu and high-grade iron ore from Simandou. Our budget for central greenfield exploration remains at approximately US$250 million annually, mainly focused on copper with a growing battery minerals programme. For internal capital allocation purposes for major projects, a notional carbon price of US$75/t CO2e is used to incentivise investment in low carbon abatement options. The US$75/t CO2e price is derived from our analysis of the carbon mitigation options across our assets that are needed to achieve our emissions targets. This is unrelated to the different carbon prices we use in our core scenarios which are based on our assessment of climate policy ambition. The Impact of climate change and the execution of our climate change strategy on our financial statements is discussed below and on pages 152-155 of this Form 20-F. Climate change scenarios are discussed on page 152 of this Form 20-F. Impacts of climate change pricing scenarios on our portfolio, low-carbon transition risks and opportunities Through our strategy process we compare the economic performance of our portfolio under our two core scenarios and the Aspirational Leadership scenario and this indicates that overall the economic performance of our portfolio would be stronger in scenarios with proactive climate action, particularly in relation to aluminium, copper and higher-grade iron ore. We anticipate that all our commodities are needed in the low-carbon transition, but estimate that the demand varies significantly between our scenarios. We expect that copper demand will rise from a 2020 base by 65-150% by 2050 across the three scenarios to support a rapid rise in renewable generation while lithium is expected to be a fundamental ingredient in electric vehicle batteries and grid-firming energy storage solutions. Demand for aluminium is expected to grow for use in energy-efficient lightweight vehicles with demand for aluminium semi-fabricated products more than doubling in the period 2021-50 in Aspirational Leadership and Competitive Leadership scenarios, with moderate demand growth in Fragmented Leadership. Our access to self-generated hydro power is a source of competitive advantage for our aluminium business in Canada. We forecast that global iron ore demand will remain strong with a premium on higher grade ore needed for the production of green steel, such as that from our IOC products and the planned investment in Simandou, which increases in our Aspirational Leadership and Competitive Leadership scenarios. In our Aspirational Leadership scenario, accelerated switching to green steel and increasing scrap use reduces the relative value of low-grade iron ore in the Pilbara. We will need to carefully monitor and manage transition risks linked to our operational Scope 1 and 2 emissions and value-chain Scope 3 emissions. In particular, we expect the decarbonisation of our assets to benefit from the implementation of new technologies. The pace of technological development is uncertain, which could delay or increase the cost of our decarbonisation efforts. Our Aspirational Leadership scenario predicts the Group's overall economic performance would fall between the Fragmented Leadership and Competitive Leadership scenarios. This reflects higher estimated economic performance for our copper and aluminium businesses in the Aspirational Leadership scenario, based on their higher price profiles, offset by higher expected carbon penalties across our operating jurisdictions, and lower prices for lower grade iron ore products. Refer below for our assessment of the accounting implications of forecast commodity pricing in the Aspirational Leadership scenario. The physical risk posed by climate change and accounting judgments and estimates related to climate change are described on page 153 of this Form 20-F. For more information about the impact of climate change on our business, financial condition or results of operation, see "Strategic Context", "Key Performance Indicators", "Business Reviews", "Our Approach to Sustainability", "Risk Factors" and "Governance-Additional Statutory Disclosure-Environmental Regulations" on pages 12, 20-24, 34-45, 46-75, 76-86 and 140 of this Form 20-F, respectively, as well as our 2022 Climate
Change Report and 2022 Sustainability Fact Book, which are available on our website at www.riotinto.com/reports.
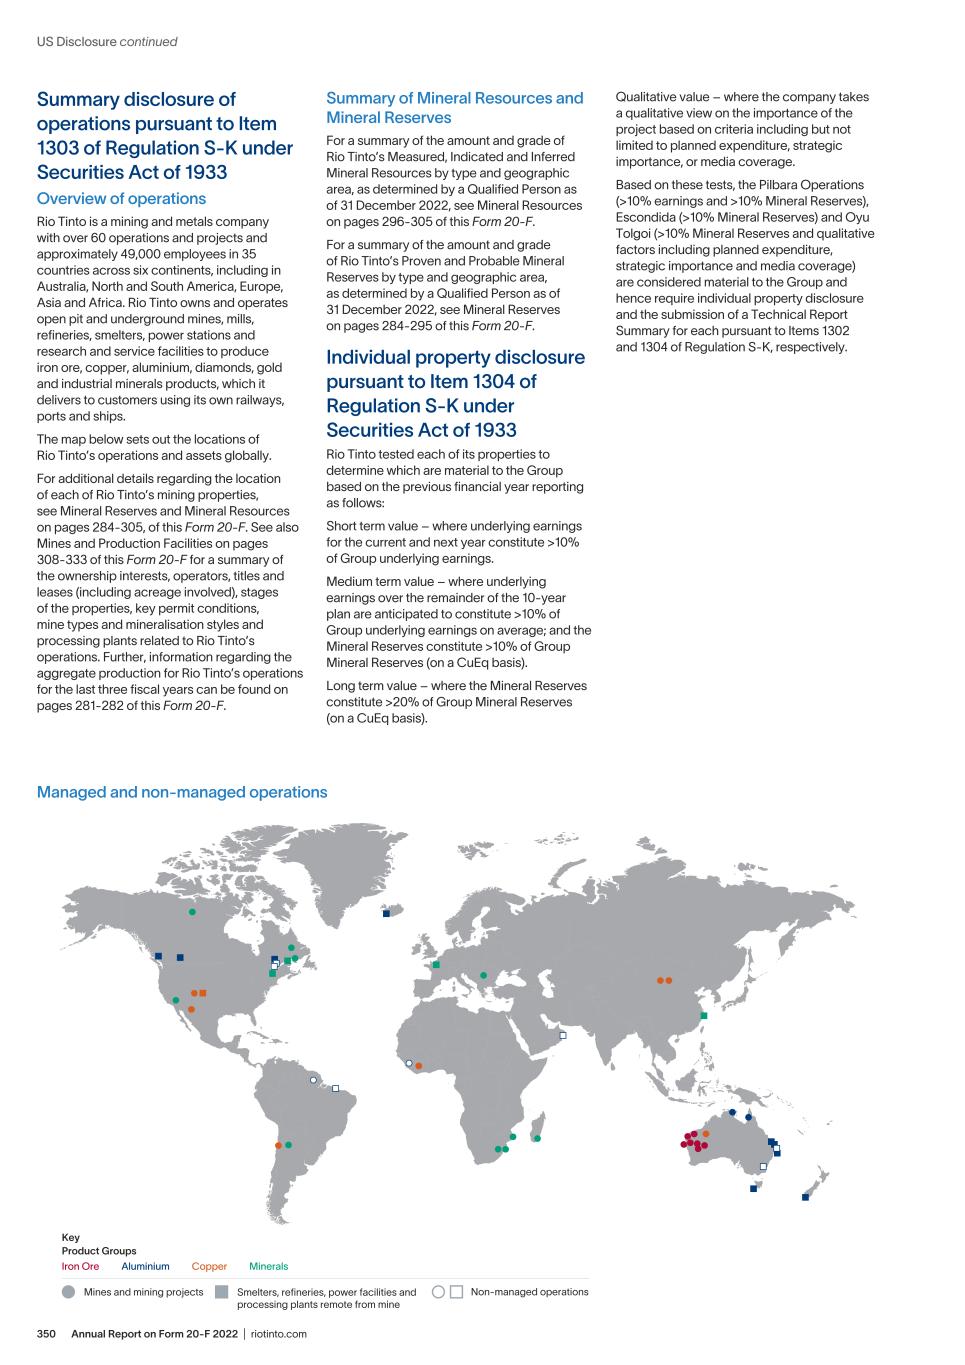
Annual Report on Form 20-F 2022 | riotinto.com350 Summary disclosure of operations pursuant to Item 1303 of Regulation S-K under Securities Act of 1933 Overview of operations Rio Tinto is a mining and metals company with over 60 operations and projects and approximately 49,000 employees in 35 countries across six continents, including in Australia, North and South America, Europe, Asia and Africa. Rio Tinto owns and operates open pit and underground mines, mills, refineries, smelters, power stations and research and service facilities to produce iron ore, copper, aluminium, diamonds, gold and industrial minerals products, which it delivers to customers using its own railways, ports and ships. The map below sets out the locations of Rio Tinto’s operations and assets globally. For additional details regarding the location of each of Rio Tinto’s mining properties, see Mineral Reserves and Mineral Resources on pages 284-305, of this Form 20-F. See also Mines and Production Facilities on pages 308-333 of this Form 20-F for a summary of the ownership interests, operators, titles and leases (including acreage involved), stages of the properties, key permit conditions, mine types and mineralisation styles and processing plants related to Rio Tinto’s operations. Further, information regarding the aggregate production for Rio Tinto’s operations for the last three fiscal years can be found on pages 281-282 of this Form 20-F. Summary of Mineral Resources and Mineral Reserves For a summary of the amount and grade of Rio Tinto’s Measured, Indicated and Inferred Mineral Resources by type and geographic area, as determined by a Qualified Person as of 31 December 2022, see Mineral Resources on pages 296-305 of this Form 20-F. For a summary of the amount and grade of Rio Tinto’s Proven and Probable Mineral Reserves by type and geographic area, as determined by a Qualified Person as of 31 December 2022, see Mineral Reserves on pages 284-295 of this Form 20-F. Individual property disclosure pursuant to Item 1304 of Regulation S-K under Securities Act of 1933 Rio Tinto tested each of its properties to determine which are material to the Group based on the previous financial year reporting as follows: Short term value – where underlying earnings for the current and next year constitute >10% of Group underlying earnings. Medium term value – where underlying earnings over the remainder of the 10-year plan are anticipated to constitute >10% of Group underlying earnings on average; and the Mineral Reserves constitute >10% of Group Mineral Reserves (on a CuEq basis). Long term value – where the Mineral Reserves constitute >20% of Group Mineral Reserves (on a CuEq basis). Qualitative value – where the company takes a qualitative view on the importance of the project based on criteria including but not limited to planned expenditure, strategic importance, or media coverage. Based on these tests, the Pilbara Operations (>10% earnings and >10% Mineral Reserves), Escondida (>10% Mineral Reserves) and Oyu Tolgoi (>10% Mineral Reserves and qualitative factors including planned expenditure, strategic importance and media coverage) are considered material to the Group and hence require individual property disclosure and the submission of a Technical Report Summary for each pursuant to Items 1302 and 1304 of Regulation S-K, respectively. US Disclosure continued Product Groups Key Iron Ore Aluminium Copper Minerals Mines and mining projects Smelters, reneries, power facilities and processing plants remote from mine Non-managed operations Managed and non-managed operations
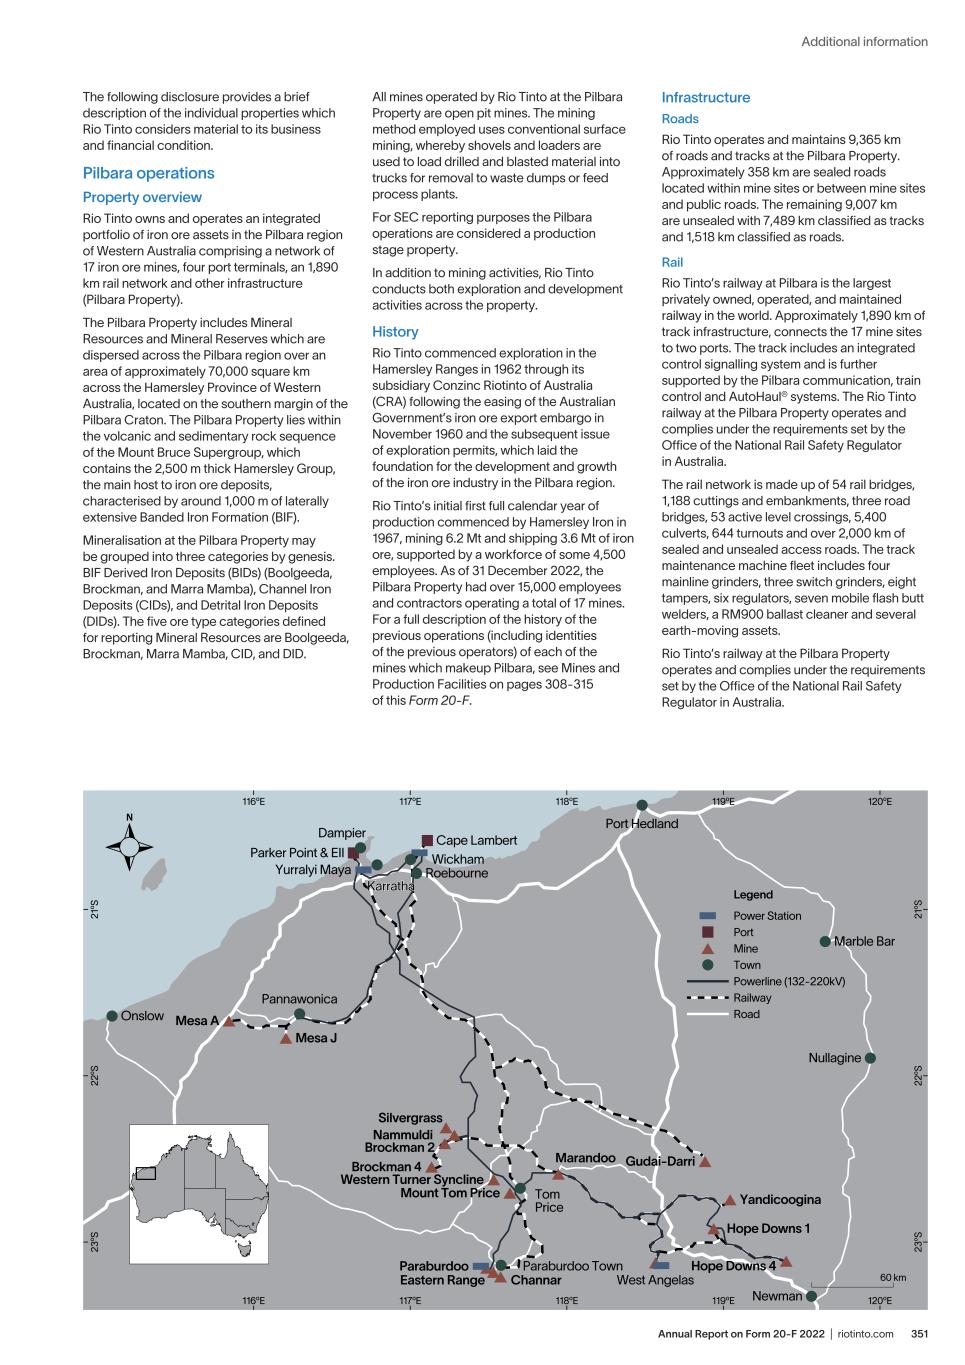
351Annual Report on Form 20-F 2022 | riotinto.com Additional information Parker Point & EII Cape Lambert Marandoo Gudai-Darri Yandicoogina Hope Downs 1 Hope Downs 4 West Angelas Mount Tom Price Western Turner Syncline Mesa J Mesa A Silvergrass Brockman 2 Nammuldi Brockman 4 Paraburdoo ChannarEastern Range Yurralyi Maya Port Hedland Karratha Dampier Roebourne Wickham Pannawonica Tom Price Paraburdoo Town Onslow Newman Nullagine Marble Bar Legend Power Station Port Mine Town Powerline (132-220kV) Railway Road 60 km 116ºE 117ºE 118ºE 119ºE 120ºE 21 ºS 22 ºS 23 ºS 21 ºS 22 ºS 23 ºS 116ºE 117ºE 118ºE 119ºE 120ºE Iron Ore operations – Australia The following disclosure provides a brief description of the individual properties which Rio Tinto considers material to its business and financial condition. Pilbara operations Property overview Rio Tinto owns and operates an integrated portfolio of iron ore assets in the Pilbara region of Western Australia comprising a network of 17 iron ore mines, four port terminals, an 1,890 km rail network and other infrastructure (Pilbara Property). The Pilbara Property includes Mineral Resources and Mineral Reserves which are dispersed across the Pilbara region over an area of approximately 70,000 square km across the Hamersley Province of Western Australia, located on the southern margin of the Pilbara Craton. The Pilbara Property lies within the volcanic and sedimentary rock sequence of the Mount Bruce Supergroup, which contains the 2,500 m thick Hamersley Group, the main host to iron ore deposits, characterised by around 1,000 m of laterally extensive Banded Iron Formation (BIF). Mineralisation at the Pilbara Property may be grouped into three categories by genesis. BIF Derived Iron Deposits (BIDs) (Boolgeeda, Brockman, and Marra Mamba), Channel Iron Deposits (CIDs), and Detrital Iron Deposits (DIDs). The five ore type categories defined for reporting Mineral Resources are Boolgeeda, Brockman, Marra Mamba, CID, and DID. All mines operated by Rio Tinto at the Pilbara Property are open pit mines. The mining method employed uses conventional surface mining, whereby shovels and loaders are used to load drilled and blasted material into trucks for removal to waste dumps or feed process plants. For SEC reporting purposes the Pilbara operations are considered a production stage property. In addition to mining activities, Rio Tinto conducts both exploration and development activities across the property. History Rio Tinto commenced exploration in the Hamersley Ranges in 1962 through its subsidiary Conzinc Riotinto of Australia (CRA) following the easing of the Australian Government’s iron ore export embargo in November 1960 and the subsequent issue of exploration permits, which laid the foundation for the development and growth of the iron ore industry in the Pilbara region. Rio Tinto’s initial first full calendar year of production commenced by Hamersley Iron in 1967, mining 6.2 Mt and shipping 3.6 Mt of iron ore, supported by a workforce of some 4,500 employees. As of 31 December 2022, the Pilbara Property had over 15,000 employees and contractors operating a total of 17 mines. For a full description of the history of the previous operations (including identities of the previous operators) of each of the mines which makeup Pilbara, see Mines and Production Facilities on pages 308-315 of this Form 20-F. Infrastructure Roads Rio Tinto operates and maintains 9,365 km of roads and tracks at the Pilbara Property. Approximately 358 km are sealed roads located within mine sites or between mine sites and public roads. The remaining 9,007 km are unsealed with 7,489 km classified as tracks and 1,518 km classified as roads. Rail Rio Tinto’s railway at Pilbara is the largest privately owned, operated, and maintained railway in the world. Approximately 1,890 km of track infrastructure, connects the 17 mine sites to two ports. The track includes an integrated control signalling system and is further supported by the Pilbara communication, train control and AutoHaul® systems. The Rio Tinto railway at the Pilbara Property operates and complies under the requirements set by the Office of the National Rail Safety Regulator in Australia. The rail network is made up of 54 rail bridges, 1,188 cuttings and embankments, three road bridges, 53 active level crossings, 5,400 culverts, 644 turnouts and over 2,000 km of sealed and unsealed access roads. The track maintenance machine fleet includes four mainline grinders, three switch grinders, eight tampers, six regulators, seven mobile flash butt welders, a RM900 ballast cleaner and several earth-moving assets. Rio Tinto’s railway at the Pilbara Property operates and complies under the requirements set by the Office of the National Rail Safety Regulator in Australia.
Annual Report on Form 20-F 2022 | riotinto.com352 Port facilities The Pilbara Property’s mining assets are facilitated by port facilities in Dampier and Cape Lambert in North-Western Australia. These facilities include car dumping, conveying, stacking, reclaiming, screening and ship loading assets. One facility includes crushing and assets to handle crushed and deslimed ore from the Robe Valley operations. Stockyards allow for product management and blending to obtain the requisite specification requirement. There are seven operational wharf facilities with a total of 14 marine berths protected by berthing dolphins. Cape Lambert marine berths are capable of berthing vessels up to 280,000 deadweight tonnage. Further, Rio Tinto owns 11 tugs for the management of vessels during arrival and departure from the wharfs for the Pilbara Property. Potable water and wastewater Water supply for the towns, mines, rail, ports, and camps at the Pilbara Property is provided by production and dewatering bores at the Pilbara Property, and from the Water Corporation of Western Australia. Water supply systems at the Pilbara Property incorporate drinking water source protection plans, bores, pipelines, pumps and storage tanks and water treatment and disinfection assets. Wastewater from towns, mines, rail, ports and camps at the Pilbara Property is collected by the Rio Tinto managed sewerage systems and treated by onsite wastewater treatment facilities. Water supply and wastewater systems are regulated by Australian regulators (the Economic Regulation Authority, the Department of Water and Environmental Regulation and the Department of Mines, Industry Regulation and Safety). Power supply Rio Tinto operates and maintains the power generation and transmission network within the Pilbara Property. There are four power stations operating twelve gas turbine generators located at Karratha (five gas turbine generators), Cape Lambert (two gas turbine generators), Paraburdoo (three gas turbine generators) and West Angelas (two gas turbine generators). The network load varies seasonally between 200-300 megawatts (MW) with gas provided by the Dampier to Bunbury Nature Gas Pipeline and the Goldfields Gas Pipeline. The transmission network is predominantly 220 kilovolts (kV) with 790 km of overhead transmission line and a 132kV transmission line between Cape Lambert and Pannawonica totalling 175 km. There are three 220kV switching stations and twelve bulk terminal substations located near the port and mine operations where the transmission voltage is stepped down to 33kV for distribution within the facilities. Rio Tinto is also the network operator for the towns of Tom Price, Paraburdoo, Wickham, Dampier, and Pannawonica. Personnel Personnel are engaged on either a residential or fly-in-fly-out basis, sourced from capital and regional centres in Western Australia. Age, modernisation and condition of the equipment and facilities The infrastructure, equipment and facilities within the Pilbara Property vary considerably in age, and many have been subject to brownfields development since original construction. All infrastructure, equipment and facilities within the Pilbara Property are subject to an ongoing regime of sustaining capital investment and maintenance, underpinned by asset integrity audits, engineering inspections, engineering life cycles for key equipment and safety inspections and audits. Book value For the book value for the Pilbara Property, see Rio Tinto Financial Information by Business Unit on pages 270-272 of this Form 20-F. Titles, rights and permits Title details In Western Australia, all minerals are the property of the Crown with few exceptions. A mining title must be obtained before any prospecting, exploration or mining activities can be carried out. In Western Australia, the Mining Act 1978, Mining Act 1904, Mining Regulations 1981 and various State Agreements provide the framework of rights and obligations which govern most of Rio Tinto’s exploration and mining activities. Conditions on the grant of mining tenements include the requirements to meet specific reporting and expenditure commitments, which have been met as of the date of this Form 20-F filing. Mineral rights The Pilbara Property Mineral Resources and Mineral Reserves are held under a combination of State Agreement mining and mineral leases, exploration licences and mining leases under the Mining Act 1978 and temporary reserves held under the Mining Act 1904. State Agreement mining and mineral leases and mining leases under the Mining Act are granted for a period of 21 years and are typically renewable for further periods of 21 years. Exploration licences applied for prior to 10 February 2006 are initially for a five year term and are renewable for two periods of either one or two years and are then renewable for periods of one year. Exploration licences applied for after 10 February 2006 are initially for a five year term and are renewable for an additional five year term and then periods of two years. Renewal of exploration licences is subject to satisfying prescribed criteria. Temporary reserves are renewed for a one year term. The renewal of all tenure at the Pilbara Property is maintained by the tenure and geographical information systems team. Further, a tenement database provides reminder notices of pending renewals and renewal procedures are adhered to in accordance with established guidelines. US Disclosure continued
353Annual Report on Form 20-F 2022 | riotinto.com Additional information Permitting requirements Rio Tinto conducts various environmental studies as needed to support operations and for compliance with regulatory obligations. Baseline studies are undertaken to inform formal impact assessment processes in accordance with provisions under the Environmental Protection Act 1986, and where relevant, the Environment Protection and Biodiversity Conservation Act 1999. Mining related activities require additional approvals under the Mining Act 1978. A significant proportion of the Pilbara Property’s Mineral Reserve estimate is located within existing permitted operating mining areas with two pending proposals covering deposits included in the estimate, Greater Paraburdoo (pending approval) and Brockman Syncline (referred for assessment). Both projects are in advanced stages of study. The Pilbara Property also operates under several Indigenous Land Use Agreements and other agreements with traditional owner groups, which include matters such as, but not limited to, commitments for payments made to trust accounts, indigenous employment and business opportunities and heritage and cultural protections. Encumbrances There are no known significant encumbrances to the Pilbara Property’s Mineral Resources or Mineral Reserves. For further details regarding the titles, leases and rights for each of the mines in the Pilbara Property, see Mines and Production Facilities– Pilbara on pages 308-315 of this Form 20-F. Mineral Resources The table on pages 298-299 of this Form 20-F sets out the amount and grade, of the Pilbara Property’s Measured, Indicated and Inferred Mineral Resources for the year ended 31 December 2022 for the Pilbara Property (Australian Iron Ore operations) are reported as in situ estimates. There is no material change in Mineral Resources compared to 2021 (1.6% increase due to the net effect of reduction in ownership with the signing of the Western Ranges joint venture agreement, the addition of new Mineral Resources and the conversion of Mineral Resources to Mineral Reserves). The Mineral Resource estimate is based on the following assumptions: – Exclusive of Mineral Reserves – Mineral Resources are reported exclusive of Mineral Reserves. – Moisture – All Mineral Resource tonnages are estimated and reported on a dry basis. – Mining Factors or Assumptions – It is assumed that standard open pit load and haul mining operations used by Rio Tinto will be applicable for the mining of Mineral Resource ore. – Cut-off – Currently, Rio Tinto reports Mineral Resources by deposit type (BID further sub-divided by geological formation, CID and DID). In addition to this, Rio Tinto sub-divides iron mineralisation for reporting Mineral Resources typically using the following criteria: – High-grade Brockman Ore using a iron (Fe) cut-off grade (≥ 60% Fe). – Brockman Process Ore is reported as ≥ 50% Fe <60% and ≥ 3% alumina (Al2O3) < 6% where geology is coded as Joffre Member, Dales Gorge Member or Footwall Zone. – High-grade Marra Mamba Ore is reported ≥ 58% Fe where geology is coded as Newman Member, MacLeod Member, or Nammuldi Member. – Boolgeeda Ore is reported as High Grade ≥ 60% Fe and Blending Aluminous as ≥ 55% Fe < 60% and ≥ 3% Al2O3 < 6.5%. – Detrital ores are reported in relation to their Bedded Ore origins; ≥ 58% Fe for Marra Mamba detritals, ≥ 60% Fe for Brockman detritals or Boolgeeda detrital ores are reported as High Grade ≥ 60% Fe and Blending Aluminous as ≥ 55% Fe < 60% and ≥ 3% Al2O3 < 6.5%. – CIDs are reported primarily based on strand (geological subdivision), but with some exceptions where a cut-off grade is applied based on metallurgical processing recovery assumptions. In addition, Mineral Resources are reported for major strands only. – Metallurgical Factors or Assumptions – It is assumed that crushing, screening and beneficiation processes used by Rio Tinto will be applicable for the processing of reported Mineral Resources. Predicted yield and upgrade are deposit specific and are based on metallurgical test work conducted on representative samples collected from those deposits or adjacent analogous deposits. – Environmental Factors or Assumptions – Extensive environmental surveys and studies will be completed during the project study phases to determine if the project requires formal State and Commonwealth environmental assessment and approval. Mapping of oxidised shales, black carbonaceous shales, lignite, and the location of the water table, is used to predict and manage potential environmental impacts. – Heritage Factors or Assumptions – Extensive cultural heritage studies, surveys and engagement with traditional owners will be completed during project study phases to determine if projects require additional assessment, monitoring, or exclusion areas to be maintained during mining, to manage potential impacts to sites and cultural values. For more information regarding the material assumptions for the Mineral Resource estimates, see Section 11 of the Pilbara Operations Technical Report Summary filed as exhibit 96.1 to this Form 20-F for the year ended 31 December 2021 (“2021 Form 20-F”). Mineral Reserves The table on pages 286-287 of this Form 20-F sets out the amount, grade, prices and metallurgical recovery of the Pilbara Property’s Proven and Probable Mineral Reserves for the year ended 31 December 2022 (Australian Iron Ore operations). From 2021, the Mineral Reserve estimate decreased by approximately 6%. The majority of this change was due to mining depletion, which was partially offset by addition of new deposits and changes to cut-off grade. Other minor changes are attributed to updated geology models and changes to pit designs due to protection of cultural heritage. The Mineral Reserves estimates are based on the following assumptions: – Geological model – Orebody block models (OBMs) are developed for Mineral Resource reporting within each mining area and form the basis of the Mineral Reserve estimates. – Moisture – Geology models contain tonnage estimates on a dry in situ basis. During generation of the OBMs, the estimated water content (moisture) for each block model block is added. The moisture estimate includes consideration of material physical properties and hydrogeology. By including both dry tonnes and water content in the block models, estimates for dry and wet tonnages can be determined from the block models as required for planning, reporting or any other purpose. Metallurgical regressions are applied to dry material. From this, expected water content is predicted for each product, allowing reporting of wet product tonnes by combining the dry tonnes and moisture content. The following table lists the Rio Tinto mining leases containing the Pilbara Property Mineral Reserves. This is a subset of the 114 tenements held across the Pilbara Property, covering approximately 409,000 Ha. Lease Holder Type Area (Ha) ML4SA Hamersley Iron Pty. Limited SA Mineral Lease 79,329 M272SA Hamersley Iron Pty. Limited SA Mineral Lease 14,136 ML252SA Mount Bruce Mining Pty Limited SA Mineral Lease 47,406 ML246SA Hamersley Iron Pty. Limited SA Mineral Lease 12,950 M265SA Channar JV SA Mineral Lease 5,956 M274SA Hamersley Iron - Yandi Pty Limited SA Mineral Lease 30,550 M282SA Hope Downs JV SA Mineral Lease 57,222 ML248SA Robe River Ltd SA Mineral Lease 78,600
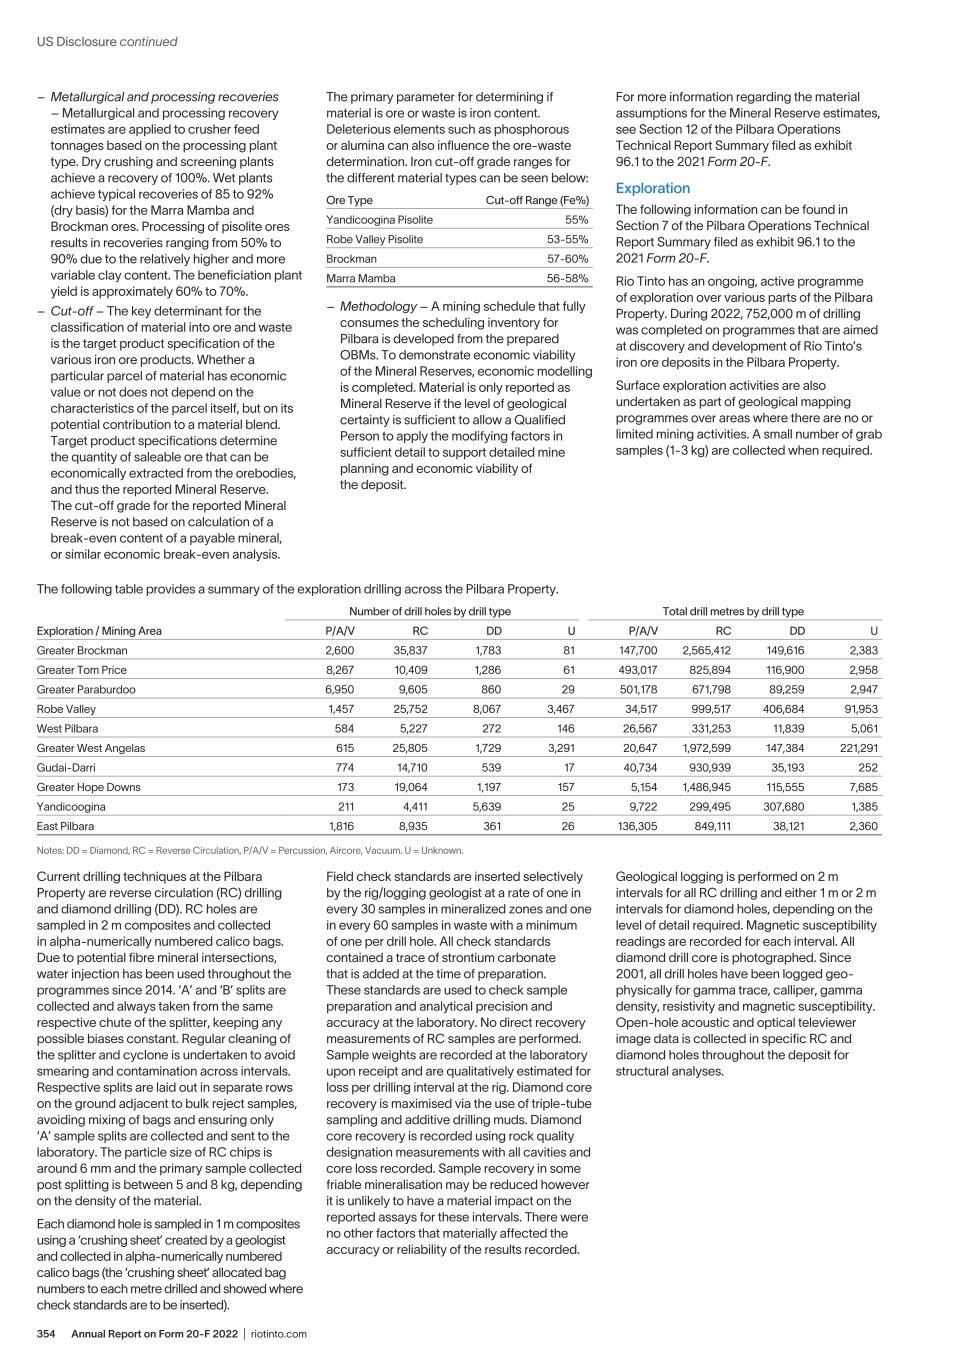
Annual Report on Form 20-F 2022 | riotinto.com354 The primary parameter for determining if material is ore or waste is iron content. Deleterious elements such as phosphorous or alumina can also influence the ore-waste determination. Iron cut-off grade ranges for the different material types can be seen below: Ore Type Cut-off Range (Fe%) Yandicoogina Pisolite 55% Robe Valley Pisolite 53-55% Brockman 57-60% Marra Mamba 56-58% – Methodology – A mining schedule that fully consumes the scheduling inventory for Pilbara is developed from the prepared OBMs. To demonstrate economic viability of the Mineral Reserves, economic modelling is completed. Material is only reported as Mineral Reserve if the level of geological certainty is sufficient to allow a Qualified Person to apply the modifying factors in sufficient detail to support detailed mine planning and economic viability of the deposit. For more information regarding the material assumptions for the Mineral Reserve estimates, see Section 12 of the Pilbara Operations Technical Report Summary filed as exhibit 96.1 to the 2021 Form 20-F. Exploration The following information can be found in Section 7 of the Pilbara Operations Technical Report Summary filed as exhibit 96.1 to the 2021 Form 20-F. Rio Tinto has an ongoing, active programme of exploration over various parts of the Pilbara Property. During 2022, 752,000 m of drilling was completed on programmes that are aimed at discovery and development of Rio Tinto’s iron ore deposits in the Pilbara Property. Surface exploration activities are also undertaken as part of geological mapping programmes over areas where there are no or limited mining activities. A small number of grab samples (1-3 kg) are collected when required. The following table provides a summary of the exploration drilling across the Pilbara Property. Exploration / Mining Area Number of drill holes by drill type Total drill metres by drill type P/A/V RC DD U P/A/V RC DD U Greater Brockman 2,600 35,837 1,783 81 147,700 2,565,412 149,616 2,383 Greater Tom Price 8,267 10,409 1,286 61 493,017 825,894 116,900 2,958 Greater Paraburdoo 6,950 9,605 860 29 501,178 671,798 89,259 2,947 Robe Valley 1,457 25,752 8,067 3,467 34,517 999,517 406,684 91,953 West Pilbara 584 5,227 272 146 26,567 331,253 11,839 5,061 Greater West Angelas 615 25,805 1,729 3,291 20,647 1,972,599 147,384 221,291 Gudai-Darri 774 14,710 539 17 40,734 930,939 35,193 252 Greater Hope Downs 173 19,064 1,197 157 5,154 1,486,945 115,555 7,685 Yandicoogina 211 4,411 5,639 25 9,722 299,495 307,680 1,385 East Pilbara 1,816 8,935 361 26 136,305 849,111 38,121 2,360 Notes: DD = Diamond, RC = Reverse Circulation, P/A/V = Percussion, Aircore, Vacuum. U = Unknown. – Metallurgical and processing recoveries – Metallurgical and processing recovery estimates are applied to crusher feed tonnages based on the processing plant type. Dry crushing and screening plants achieve a recovery of 100%. Wet plants achieve typical recoveries of 85 to 92% (dry basis) for the Marra Mamba and Brockman ores. Processing of pisolite ores results in recoveries ranging from 50% to 90% due to the relatively higher and more variable clay content. The beneficiation plant yield is approximately 60% to 70%. – Cut-off – The key determinant for the classification of material into ore and waste is the target product specification of the various iron ore products. Whether a particular parcel of material has economic value or not does not depend on the characteristics of the parcel itself, but on its potential contribution to a material blend. Target product specifications determine the quantity of saleable ore that can be economically extracted from the orebodies, and thus the reported Mineral Reserve. The cut-off grade for the reported Mineral Reserve is not based on calculation of a break-even content of a payable mineral, or similar economic break-even analysis. Current drilling techniques at the Pilbara Property are reverse circulation (RC) drilling and diamond drilling (DD). RC holes are sampled in 2 m composites and collected in alpha-numerically numbered calico bags. Due to potential fibre mineral intersections, water injection has been used throughout the programmes since 2014. ‘A’ and ‘B’ splits are collected and always taken from the same respective chute of the splitter, keeping any possible biases constant. Regular cleaning of the splitter and cyclone is undertaken to avoid smearing and contamination across intervals. Respective splits are laid out in separate rows on the ground adjacent to bulk reject samples, avoiding mixing of bags and ensuring only ‘A’ sample splits are collected and sent to the laboratory. The particle size of RC chips is around 6 mm and the primary sample collected post splitting is between 5 and 8 kg, depending on the density of the material. Each diamond hole is sampled in 1 m composites using a ‘crushing sheet’ created by a geologist and collected in alpha-numerically numbered calico bags (the ‘crushing sheet’ allocated bag numbers to each metre drilled and showed where check standards are to be inserted). Field check standards are inserted selectively by the rig/logging geologist at a rate of one in every 30 samples in mineralized zones and one in every 60 samples in waste with a minimum of one per drill hole. All check standards contained a trace of strontium carbonate that is added at the time of preparation. These standards are used to check sample preparation and analytical precision and accuracy at the laboratory. No direct recovery measurements of RC samples are performed. Sample weights are recorded at the laboratory upon receipt and are qualitatively estimated for loss per drilling interval at the rig. Diamond core recovery is maximised via the use of triple-tube sampling and additive drilling muds. Diamond core recovery is recorded using rock quality designation measurements with all cavities and core loss recorded. Sample recovery in some friable mineralisation may be reduced however it is unlikely to have a material impact on the reported assays for these intervals. There were no other factors that materially affected the accuracy or reliability of the results recorded. Geological logging is performed on 2 m intervals for all RC drilling and either 1 m or 2 m intervals for diamond holes, depending on the level of detail required. Magnetic susceptibility readings are recorded for each interval. All diamond drill core is photographed. Since 2001, all drill holes have been logged geo- physically for gamma trace, calliper, gamma density, resistivity and magnetic susceptibility. Open-hole acoustic and optical televiewer image data is collected in specific RC and diamond holes throughout the deposit for structural analyses. US Disclosure continued
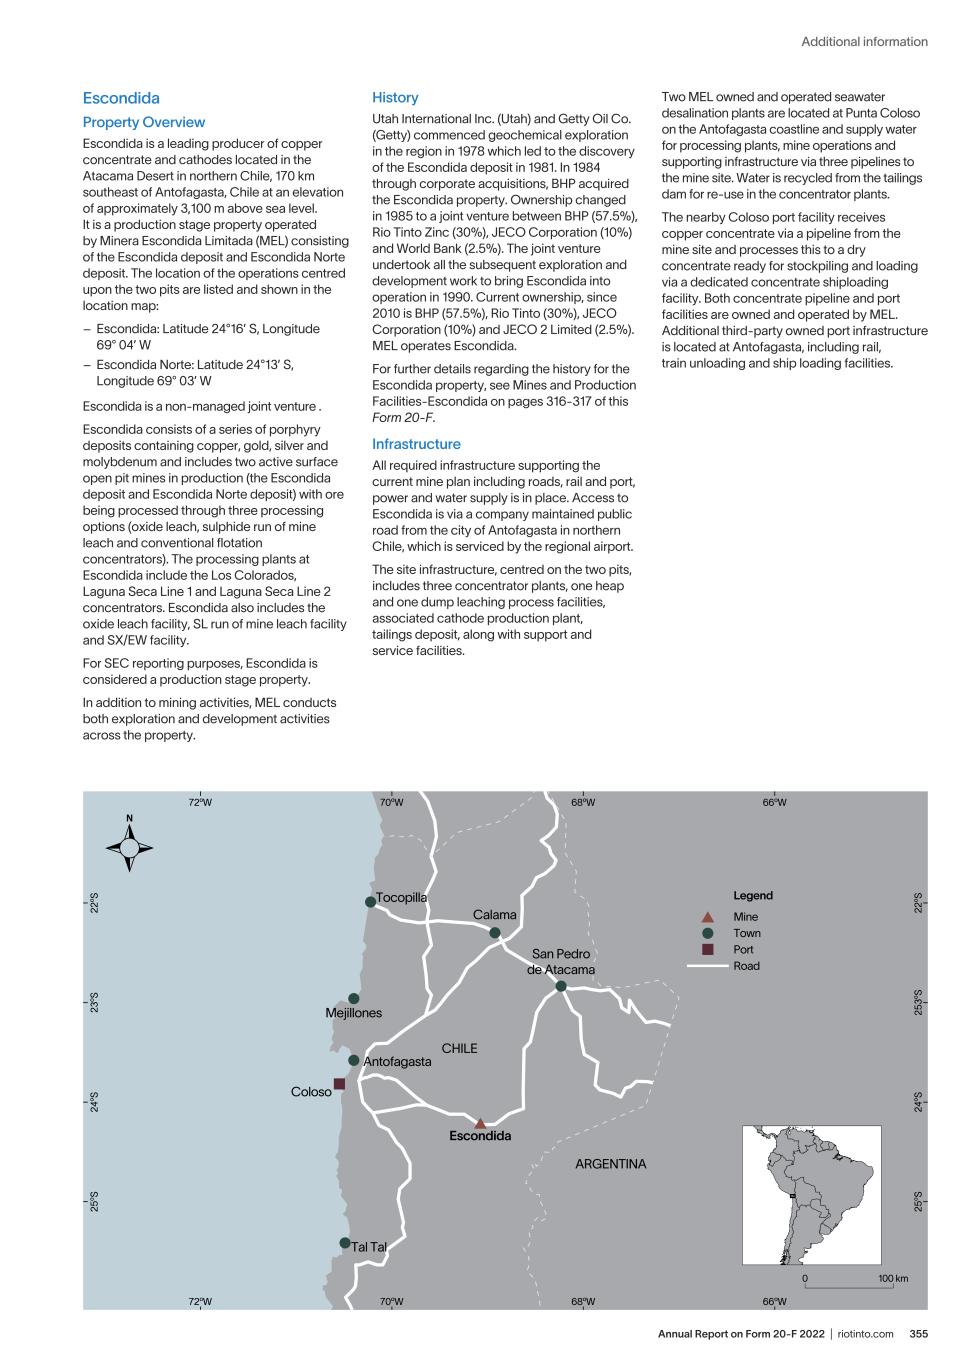
355Annual Report on Form 20-F 2022 | riotinto.com Additional information San Pedro de Atacama Calama CHILE ARGENTINA Mejillones Antofagasta Coloso Tal Tal Tocopilla Escondida Legend Mine Town Port Road 100 km0 68ºW70ºW72ºW 66ºW 25 ºS 24 ºS 25 3º S 22 ºS 72ºW 70ºW 68ºW 66ºW 22 ºS 23 ºS 24 ºS 25 ºS Escondida operations – Chile Escondida Property Overview Escondida is a leading producer of copper concentrate and cathodes located in the Atacama Desert in northern Chile, 170 km southeast of Antofagasta, Chile at an elevation of approximately 3,100 m above sea level. It is a production stage property operated by Minera Escondida Limitada (MEL) consisting of the Escondida deposit and Escondida Norte deposit. The location of the operations centred upon the two pits are listed and shown in the location map: – Escondida: Latitude 24°16’ S, Longitude 69° 04’ W – Escondida Norte: Latitude 24°13’ S, Longitude 69° 03’ W Escondida is a non-managed joint venture . Escondida consists of a series of porphyry deposits containing copper, gold, silver and molybdenum and includes two active surface open pit mines in production (the Escondida deposit and Escondida Norte deposit) with ore being processed through three processing options (oxide leach, sulphide run of mine leach and conventional flotation concentrators). The processing plants at Escondida include the Los Colorados, Laguna Seca Line 1 and Laguna Seca Line 2 concentrators. Escondida also includes the oxide leach facility, SL run of mine leach facility and SX/EW facility. For SEC reporting purposes, Escondida is considered a production stage property. In addition to mining activities, MEL conducts both exploration and development activities across the property. History Utah International Inc. (Utah) and Getty Oil Co. (Getty) commenced geochemical exploration in the region in 1978 which led to the discovery of the Escondida deposit in 1981. In 1984 through corporate acquisitions, BHP acquired the Escondida property. Ownership changed in 1985 to a joint venture between BHP (57.5%), Rio Tinto Zinc (30%), JECO Corporation (10%) and World Bank (2.5%). The joint venture undertook all the subsequent exploration and development work to bring Escondida into operation in 1990. Current ownership, since 2010 is BHP (57.5%), Rio Tinto (30%), JECO Corporation (10%) and JECO 2 Limited (2.5%). MEL operates Escondida. For further details regarding the history for the Escondida property, see Mines and Production Facilities-Escondida on pages 316-317 of this Form 20-F. Infrastructure All required infrastructure supporting the current mine plan including roads, rail and port, power and water supply is in place. Access to Escondida is via a company maintained public road from the city of Antofagasta in northern Chile, which is serviced by the regional airport. The site infrastructure, centred on the two pits, includes three concentrator plants, one heap and one dump leaching process facilities, associated cathode production plant, tailings deposit, along with support and service facilities. Two MEL owned and operated seawater desalination plants are located at Punta Coloso on the Antofagasta coastline and supply water for processing plants, mine operations and supporting infrastructure via three pipelines to the mine site. Water is recycled from the tailings dam for re-use in the concentrator plants. The nearby Coloso port facility receives copper concentrate via a pipeline from the mine site and processes this to a dry concentrate ready for stockpiling and loading via a dedicated concentrate shiploading facility. Both concentrate pipeline and port facilities are owned and operated by MEL. Additional third-party owned port infrastructure is located at Antofagasta, including rail, train unloading and ship loading facilities.
Annual Report on Form 20-F 2022 | riotinto.com356 Escondida utilises an existing privately owned railway system to transport copper cathode product from site and consumables to site through the ports of Antofagasta and Mejillones. Escondida owns a minor rail spur connecting the mine site into the publicly owned railway. Electrical power supplied to site infrastructure was purchased from suppliers Power Angamos and Tamakaya. From 2023, MEL are expected to be supplied via a third-party renewable power purchase agreement, contributing towards reducing the site’s emissions. The contract has two providers Enel Generation (60%) and Colbun (40%). The power is supplied at 220kV and then distributed throughout the operations to the required locations via a series of substations. The power transmission system that supplies the mine site is owned and managed by MEL. The workforce is a combination of employees and contractors supporting the operations. Operational personnel reside in on site accommodation at Escondida and are sourced from Antofagasta or from other parts of Chile. Lease name Registered tenement holder Expiry date Surface area (ha) Alexis 1/1424 Minera Escondida Ltda. Permanent 7,059 Amelia 1/1049 Minera Escondida Ltda. Permanent 5,235 Catita 1/376 Minera Escondida Ltda. Permanent 1,732 Claudia 1/70 Minera Escondida Ltda. Permanent 557 Colorado 501/977 Minera Escondida Ltda. Permanent 2,385 Costa 1/1861 Minera Escondida Ltda. Permanent 9,159 Donaldo 1/612 Minera Escondida Ltda. Permanent 3,060 Ela 1/100 Minera Escondida Ltda. Permanent 500 Gata 1 1/100 Minera Escondida Ltda. Permanent 400 Gata 2 1/50 Minera Escondida Ltda. Permanent 200 Guillermo 1/368 Minera Escondida Ltda. Permanent 1,785 Hole 14 Minera Escondida Ltda. Permanent 1 Naty 1/46 Minera Escondida Ltda. Permanent 230 Paola 1/3000 Minera Escondida Ltda. Permanent 15,000 Pista 1/22 Minera Escondida Ltda. Permanent 22 Pistita 1/5 Minera Escondida Ltda. Permanent 9 Ramón 1/640 Minera Escondida Ltda. Permanent 3,200 Rola 1/1680 Minera Escondida Ltda. Permanent 8,400 Total 58,934 1. Unidad Tributaria Mensual (UTM) is a Chilean state tax unit valued in Chilean pesos (CLP) per hectare. The 2022 rate is 0.1 UTM. Annual payments are made at the end of the Chilean tax year (end of March) for concessions. In addition to mining concessions, Chilean law also regulates, independently of mining concessions, the rights to the use of the land surface. MEL owns 155,000 ha of surface rights at Escondida and these are also renewable on an annual basis. These rights are also obtained through legal process presented to the Chilean state and potentially to other third party owners, including the Chilean “Consejo de Defensa del Estado” as required, MEL’s main surface rights for Escondida cover operational activities such as pits, dumps, leach pads, plant and other infrastructure. MEL also holds maritime concessions for the Coloso port facilities. These concessions are requested through submission of the proposed project to the Chilean Ministry of Defence and are awarded by legal decree. Encumbrances There are no known significant encumbrances to the Escondida property’s Mineral Resources and Mineral Reserves. For further details regarding the titles, leases and rights for the Escondida property, see Mines and Production Facilities-Escondida on pages 316 - 317 of this Form 20-F. Titles, leases and permits MEL holds a total of 764 mining concessions for Escondida covering an area of 406,018 ha. There are 18 principal mining concessions that provide MEL with the right to explore and mine indefinitely at Escondida, subject to payment of annual license fees. All leases were obtained through the legally established process in which judicial requests are presented to the Chilean state. Infrastructure Surface rights identifier1 Register Regional office Surface area (ha)Folio Number Year Pits, waste dumps, leach pads, plants 619 V 964 1984 Hipotecas y Gravámenes Bienes Raíces Antofagasta 22,084 Energy transmission lines, aqueducts, mineral pipelines, roads 1121 V 1117 2018 Hipotecas y Gravámenes Bienes Raíces Antofagasta 26,988 1. As defined by Chilean legal requirements US Disclosure continued
357Annual Report on Form 20-F 2022 | riotinto.com Additional information Present condition of property Continuous resource definition activities are ongoing to upgrade Mineral Resources understanding to support the mine plans and| to develop Mineral Reserves. These activities include drilling and in-pit mapping. Geological understanding of the two deposits is supported by a total of approximately 2,700 km of drilling undertaken in a total of approximately 8,600 drill holes. Surface mining is by drilling and blasting along with shovel/excavator loading and truck haulage from each of the two open pits. Extracted sulphide ore undergoes crushing prior to processing in one of three concentrators with concentrate piped to the Coloso port for drying. Lower grade sulphide ore is directly dumped onto leach pads and is processed by biological leaching. Oxide and transitional ores are processed using heap leaching. Leached products are converted to copper cathode then railed to Antofagasta port. Age modernisation snd condition of the equipment and facilities The infrastructure, equipment and facilities within Escondida are of variable age. Construction commenced at Escondida in 1998 with first production in 1990. A number of expansion phases followed from 1993 onwards which included the development of additional infrastructure to increase production. Key milestones subsequent to first production in 1990 relating to the development of the operations were: – 1998 Acid heap leaching of oxides commenced – 2002 Second concentrator (Phase 4) inaugurated – 2005 Mining commenced at the Escondida Norte deposit – 2006 Dump bio-leaching of sulphides commenced – 2007 First desalination plant commenced pumping – 2016 Third concentrator inaugurated – 2017 Second desalination plant commenced pumping – 2020 Operation converted to 100% use of desalination water MEL undertakes planned maintenance programs at Escondida and implements scheduled replacements of mine fleet and infrastructure components that are intended to maintain continued reliable operation of equipment, facilities and infrastructure to meet operational requirements. Book value For the book value for Escondida, see Rio Tinto Financial Information by Business Unit on pages 270-272 of this Form 20-F. Geology and mineralisation The Escondida deposit and Escondida Norte copper deposit lie in the Escondida-Sierra de Varas shear lens of the Domeyko Fault System. The deposits are supergene-enriched copper porphyries with primary sulphide mineralisation associated with multiple phase intrusions of monzonite to granodiorite composition into host volcanics. Primary mineralisation has undergone secondary supergene leaching and enrichment with associated local formation of copper oxide mineralisation, predominately brochantite. Supergene enrichment generated laterally-continuous and sub-horizontal high-grade sulphide mineralisation zones across the deposit, predominately chalcocite and covellite. The primary hypogene mineralisation, present in the deepest parts of the deposits is chalcopyrite with bornite. Mineral Resources The table on pages 300-301 of this Form 20-F sets out the amount and grade of Escondida’s Measured, Indicated and Inferred Mineral Resources for the year ended 31 December 2022. Mineral Resources for Escondida are reported as in situ estimates and are being reported for the first time in a filing with the SEC in accordance with Regulation S-K for the year ended 31 December 2022. There are no comparable estimates for the preceding year. The Mineral Resource estimate for Escondida is based on the following assumptions: – Exclusive of Mineral Reserves – Mineral Resources are reported exclusive of Mineral Reserves. – Moisture – All Mineral Resource tonnages are estimated and reported on a dry basis. – Mineral Resources are estimated using ordinary kriging. – Escondida point of reference for the Mineral Resources was mine gate. – Escondida Mineral Resources cut-off criteria used was Oxide ≥ 0.20% soluble Cu; Mixed ≥ 0.30% Cu; Sulphide ≥ 0.25% Cu for mineralisation assigned to be processed via leaching or ≥ 0.30% Cu for mineralisation assigned to be processed via the concentrator. – Escondida metallurgical recoveries for Oxide 62%; Mixed 42%; Sulphide 42% for material processed by leaching or 83% for material processed via the concentrator. – The pit optimisation used to determine the resources that have reasonable prospects of economic extraction based on a copper price of US$3.04/lb. For more information regarding the material assumptions for the Mineral Resource estimates for Escondida, see Section 11 of the Escondida Technical Report Summary filed as exhibit 96.2 to this Form 20-F. Mineral Reserves The table on pages 288-289 of this Form 20-F sets out the amount, grade, price and metallurgical recovery of the Escondida Property’s Proven and Probable Mineral Reserves for the year ended 31 December 2022. Mineral Reserves are being reported for the first time in accordance with Regulation S-K for the year ended 31 December 2022. Material assumptions in the estimation of Mineral Reserves for Escondida are: – The resource model reflects the continuity and complexity of the deposit with the confidence stated in the classification. – Variable cut-off grade strategy that maximises throughput for the concentrator, smelter and refinery. – The point of reference for Mineral Reserves was mine gate. – Escondida Mineral Reserves cut-off criteria used was Oxide ≥ 0.20% soluble Cu. For Sulphide ≥ 0.30% Cu and where greater than the variable cut-off of the concentrator. Sulphide ore is processed in the concentrator plants as a result of an optimised mine plan with consideration of technical and economic parameters in order to maximise net present value. Sulphide Leach ≥ 0.25% Cu and 70% or less of copper contained in chalcopyrite and lower than variable cut-off grade. Sulphide leach ore is processed in the leaching plant as an alternative to the concentrator process. – Escondida metallurgical recoveries for Oxide 62%; Sulphide Leach 42%; Sulphide 42% for material processed by leaching or 83% for material processed via the concentrator. – Commodity prices, operating and capital costs. For more information regarding the material assumptions for the Mineral Reserve estimates for Escondida, see Section 12 of Escondida Technical Report Summary filed herewith as exhibit 99.2 to this Form 20-F. Exploration A total of 2,700 km of exploration drilling has been completed (up until December 2021), distributed across 5,764 drill holes for Escondida and distributed across 2,832 drill holes for Escondida Norte. The main objective of the exploration programmes implemented at Escondida has been the exploration of new deposits, as well as to improve mineral resources classification to support the annual planning cycle. The results of these programmes serve as the basis to support planning and growth strategies as well as investment programmes for the modernisation of the mining unit. Additional information can be found in Section 7 of the Escondida Technical Report Summary filed as exhibit 96.2 to this Form 20-F.
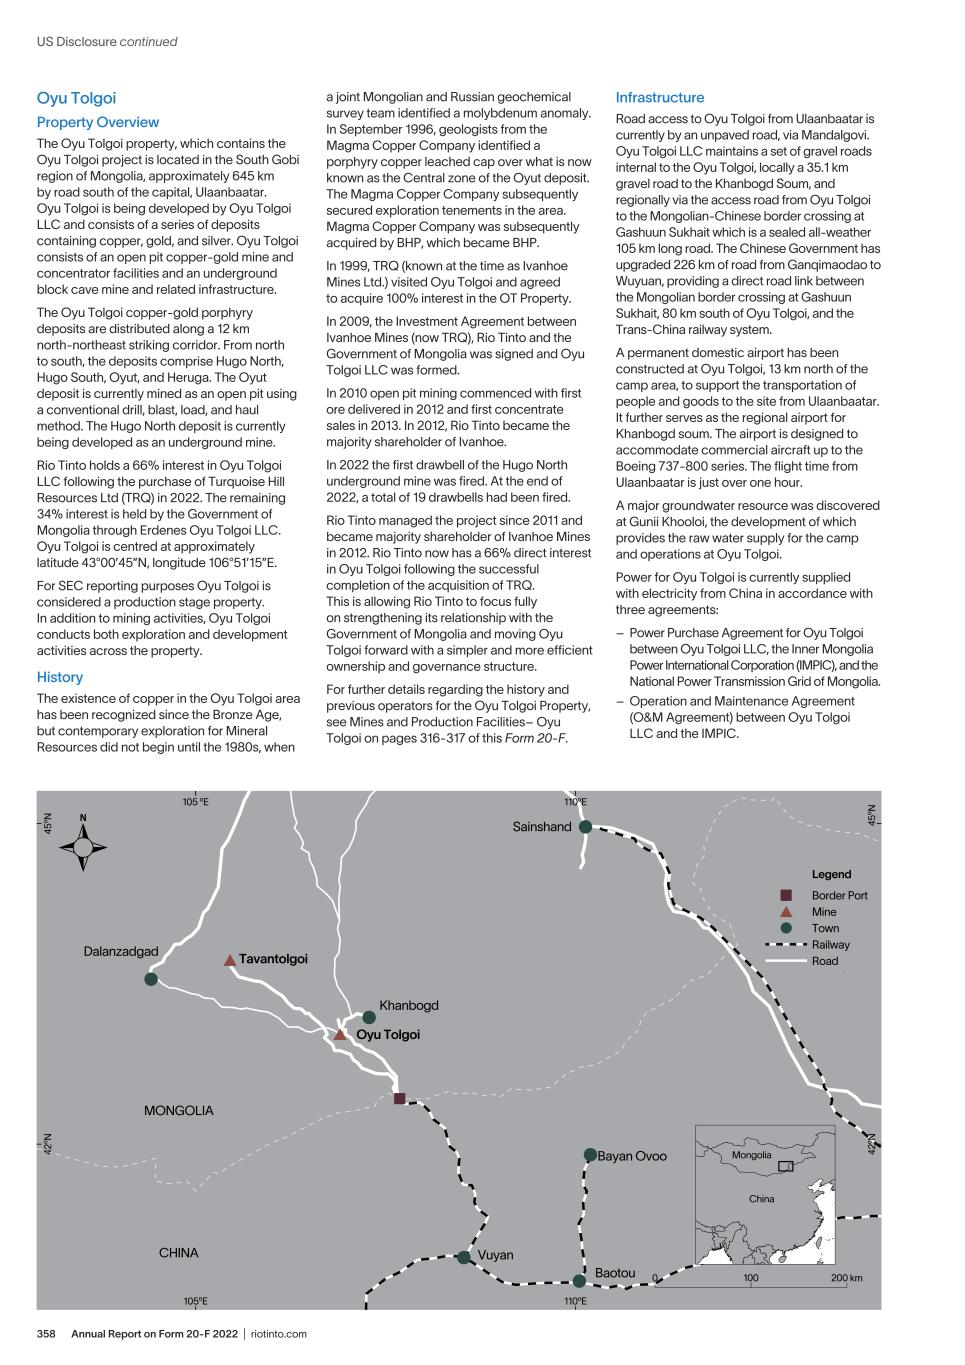
Annual Report on Form 20-F 2022 | riotinto.com358 China Mongolia Vuyan Baotou Bayan Ovoo Khanbogd Sainshand Oyu Tolgoi TavantolgoiDalanzadgad MONGOLIA CHINA Legend Border Port Mine Town Railway Road 200 km1000 105 ºE 110ºE 42 ºN 45 ºN 105ºE 110ºE 42 ºN 45 ºN Oyu Tolgoi operations – Mongolia Oyu Tolgoi Property Overview The Oyu Tolgoi property, which contains the Oyu Tolgoi project is located in the South Gobi region of Mongolia, approximately 645 km by road south of the capital, Ulaanbaatar. Oyu Tolgoi is being developed by Oyu Tolgoi LLC and consists of a series of deposits containing copper, gold, and silver. Oyu Tolgoi consists of an open pit copper-gold mine and concentrator facilities and an underground block cave mine and related infrastructure. The Oyu Tolgoi copper-gold porphyry deposits are distributed along a 12 km north-northeast striking corridor. From north to south, the deposits comprise Hugo North, Hugo South, Oyut, and Heruga. The Oyut deposit is currently mined as an open pit using a conventional drill, blast, load, and haul method. The Hugo North deposit is currently being developed as an underground mine. Rio Tinto holds a 66% interest in Oyu Tolgoi LLC following the purchase of Turquoise Hill Resources Ltd (TRQ) in 2022. The remaining 34% interest is held by the Government of Mongolia through Erdenes Oyu Tolgoi LLC. Oyu Tolgoi is centred at approximately latitude 43°00’45”N, longitude 106°51’15”E. For SEC reporting purposes Oyu Tolgoi is considered a production stage property. In addition to mining activities, Oyu Tolgoi conducts both exploration and development activities across the property. History The existence of copper in the Oyu Tolgoi area has been recognized since the Bronze Age, but contemporary exploration for Mineral Resources did not begin until the 1980s, when a joint Mongolian and Russian geochemical survey team identified a molybdenum anomaly. In September 1996, geologists from the Magma Copper Company identified a porphyry copper leached cap over what is now known as the Central zone of the Oyut deposit. The Magma Copper Company subsequently secured exploration tenements in the area. Magma Copper Company was subsequently acquired by BHP, which became BHP. In 1999, TRQ (known at the time as Ivanhoe Mines Ltd.) visited Oyu Tolgoi and agreed to acquire 100% interest in the OT Property. In 2009, the Investment Agreement between Ivanhoe Mines (now TRQ), Rio Tinto and the Government of Mongolia was signed and Oyu Tolgoi LLC was formed. In 2010 open pit mining commenced with first ore delivered in 2012 and first concentrate sales in 2013. In 2012, Rio Tinto became the majority shareholder of Ivanhoe. In 2022 the first drawbell of the Hugo North underground mine was fired. At the end of 2022, a total of 19 drawbells had been fired. Rio Tinto managed the project since 2011 and became majority shareholder of Ivanhoe Mines in 2012. Rio Tinto now has a 66% direct interest in Oyu Tolgoi following the successful completion of the acquisition of TRQ. This is allowing Rio Tinto to focus fully on strengthening its relationship with the Government of Mongolia and moving Oyu Tolgoi forward with a simpler and more efficient ownership and governance structure. For further details regarding the history and previous operators for the Oyu Tolgoi Property, see Mines and Production Facilities– Oyu Tolgoi on pages 316-317 of this Form 20-F. Infrastructure Road access to Oyu Tolgoi from Ulaanbaatar is currently by an unpaved road, via Mandalgovi. Oyu Tolgoi LLC maintains a set of gravel roads internal to the Oyu Tolgoi, locally a 35.1 km gravel road to the Khanbogd Soum, and regionally via the access road from Oyu Tolgoi to the Mongolian-Chinese border crossing at Gashuun Sukhait which is a sealed all-weather 105 km long road. The Chinese Government has upgraded 226 km of road from Ganqimaodao to Wuyuan, providing a direct road link between the Mongolian border crossing at Gashuun Sukhait, 80 km south of Oyu Tolgoi, and the Trans-China railway system. A permanent domestic airport has been constructed at Oyu Tolgoi, 13 km north of the camp area, to support the transportation of people and goods to the site from Ulaanbaatar. It further serves as the regional airport for Khanbogd soum. The airport is designed to accommodate commercial aircraft up to the Boeing 737-800 series. The flight time from Ulaanbaatar is just over one hour. A major groundwater resource was discovered at Gunii Khooloi, the development of which provides the raw water supply for the camp and operations at Oyu Tolgoi. Power for Oyu Tolgoi is currently supplied with electricity from China in accordance with three agreements: – Power Purchase Agreement for Oyu Tolgoi between Oyu Tolgoi LLC, the Inner Mongolia Power International Corporation (IMPIC), and the National Power Transmission Grid of Mongolia. – Operation and Maintenance Agreement (O&M Agreement) between Oyu Tolgoi LLC and the IMPIC. US Disclosure continued
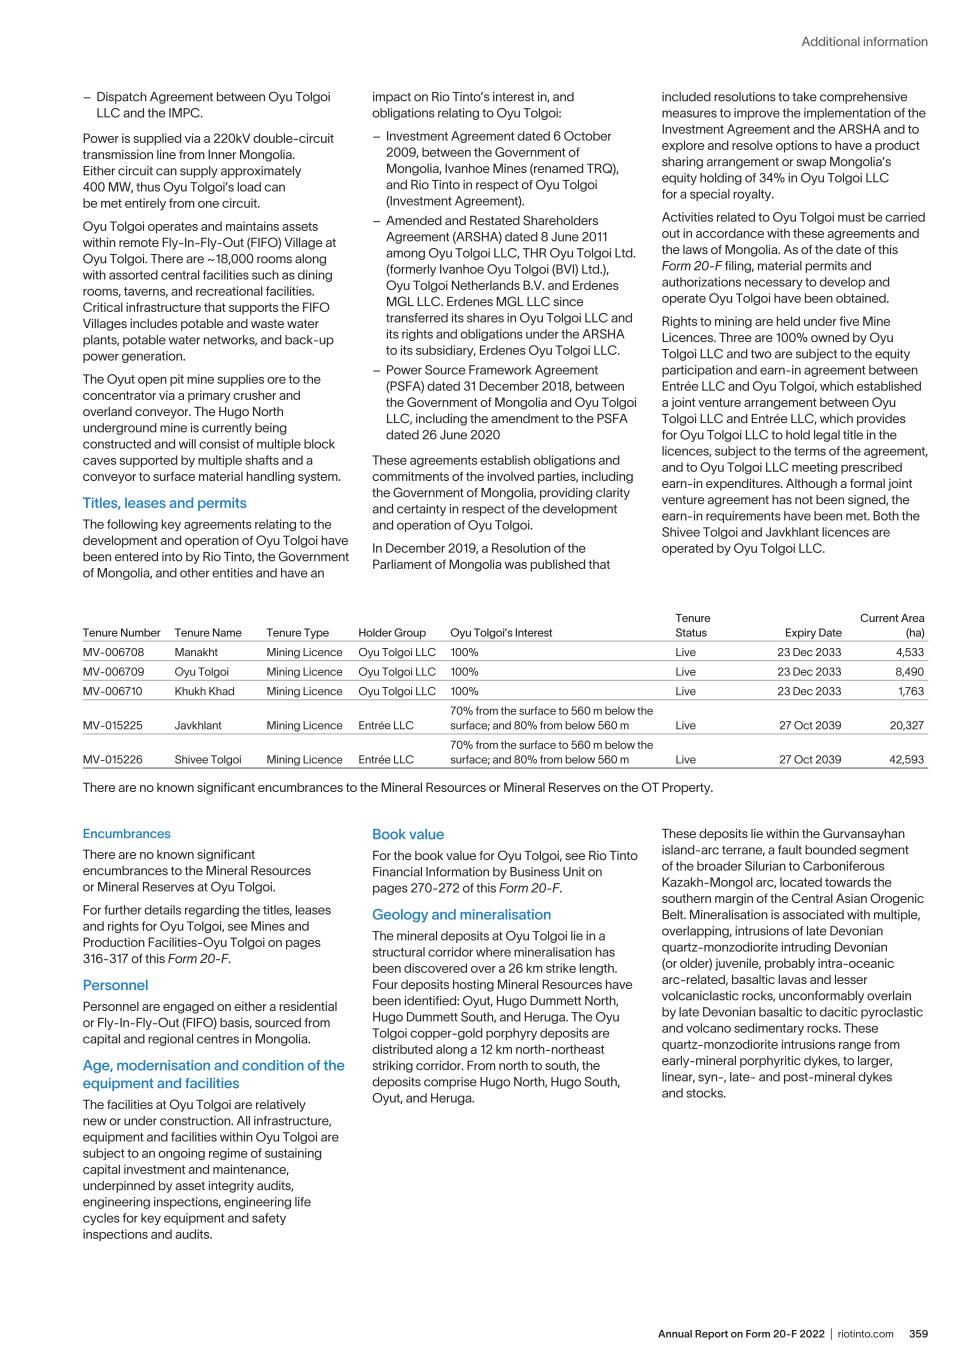
359Annual Report on Form 20-F 2022 | riotinto.com Additional information – Dispatch Agreement between Oyu Tolgoi LLC and the IMPC. Power is supplied via a 220kV double-circuit transmission line from Inner Mongolia. Either circuit can supply approximately 400 MW, thus Oyu Tolgoi’s load can be met entirely from one circuit. Oyu Tolgoi operates and maintains assets within remote Fly-In-Fly-Out (FIFO) Village at Oyu Tolgoi. There are ~18,000 rooms along with assorted central facilities such as dining rooms, taverns, and recreational facilities. Critical infrastructure that supports the FIFO Villages includes potable and waste water plants, potable water networks, and back-up power generation. The Oyut open pit mine supplies ore to the concentrator via a primary crusher and overland conveyor. The Hugo North underground mine is currently being constructed and will consist of multiple block caves supported by multiple shafts and a conveyor to surface material handling system. Titles, leases and permits The following key agreements relating to the development and operation of Oyu Tolgoi have been entered into by Rio Tinto, the Government of Mongolia, and other entities and have an impact on Rio Tinto’s interest in, and obligations relating to Oyu Tolgoi: – Investment Agreement dated 6 October 2009, between the Government of Mongolia, Ivanhoe Mines (renamed TRQ), and Rio Tinto in respect of Oyu Tolgoi (Investment Agreement). – Amended and Restated Shareholders Agreement (ARSHA) dated 8 June 2011 among Oyu Tolgoi LLC, THR Oyu Tolgoi Ltd. (formerly Ivanhoe Oyu Tolgoi (BVI) Ltd.), Oyu Tolgoi Netherlands B.V. and Erdenes MGL LLC. Erdenes MGL LLC since transferred its shares in Oyu Tolgoi LLC and its rights and obligations under the ARSHA to its subsidiary, Erdenes Oyu Tolgoi LLC. – Power Source Framework Agreement (PSFA) dated 31 December 2018, between the Government of Mongolia and Oyu Tolgoi LLC, including the amendment to the PSFA dated 26 June 2020 These agreements establish obligations and commitments of the involved parties, including the Government of Mongolia, providing clarity and certainty in respect of the development and operation of Oyu Tolgoi. In December 2019, a Resolution of the Parliament of Mongolia was published that included resolutions to take comprehensive measures to improve the implementation of the Investment Agreement and the ARSHA and to explore and resolve options to have a product sharing arrangement or swap Mongolia’s equity holding of 34% in Oyu Tolgoi LLC for a special royalty. Activities related to Oyu Tolgoi must be carried out in accordance with these agreements and the laws of Mongolia. As of the date of this Form 20-F filing, material permits and authorizations necessary to develop and operate Oyu Tolgoi have been obtained. Rights to mining are held under five Mine Licences. Three are 100% owned by Oyu Tolgoi LLC and two are subject to the equity participation and earn-in agreement between Entrée LLC and Oyu Tolgoi, which established a joint venture arrangement between Oyu Tolgoi LLC and Entrée LLC, which provides for Oyu Tolgoi LLC to hold legal title in the licences, subject to the terms of the agreement, and to Oyu Tolgoi LLC meeting prescribed earn-in expenditures. Although a formal joint venture agreement has not been signed, the earn-in requirements have been met. Both the Shivee Tolgoi and Javkhlant licences are operated by Oyu Tolgoi LLC. Tenure Number Tenure Name Tenure Type Holder Group Oyu Tolgoi’s Interest Tenure Status Expiry Date Current Area (ha) MV-006708 Manakht Mining Licence Oyu Tolgoi LLC 100% Live 23 Dec 2033 4,533 MV-006709 Oyu Tolgoi Mining Licence Oyu Tolgoi LLC 100% Live 23 Dec 2033 8,490 MV-006710 Khukh Khad Mining Licence Oyu Tolgoi LLC 100% Live 23 Dec 2033 1,763 MV-015225 Javkhlant Mining Licence Entrée LLC 70% from the surface to 560 m below the surface; and 80% from below 560 m Live 27 Oct 2039 20,327 MV-015226 Shivee Tolgoi Mining Licence Entrée LLC 70% from the surface to 560 m below the surface; and 80% from below 560 m Live 27 Oct 2039 42,593 There are no known significant encumbrances to the Mineral Resources or Mineral Reserves on the OT Property. Encumbrances There are no known significant encumbrances to the Mineral Resources or Mineral Reserves at Oyu Tolgoi. For further details regarding the titles, leases and rights for Oyu Tolgoi, see Mines and Production Facilities-Oyu Tolgoi on pages 316-317 of this Form 20-F. Personnel Personnel are engaged on either a residential or Fly-In-Fly-Out (FIFO) basis, sourced from capital and regional centres in Mongolia. Age, modernisation and condition of the equipment and facilities The facilities at Oyu Tolgoi are relatively new or under construction. All infrastructure, equipment and facilities within Oyu Tolgoi are subject to an ongoing regime of sustaining capital investment and maintenance, underpinned by asset integrity audits, engineering inspections, engineering life cycles for key equipment and safety inspections and audits. Book value For the book value for Oyu Tolgoi, see Rio Tinto Financial Information by Business Unit on pages 270-272 of this Form 20-F. Geology and mineralisation The mineral deposits at Oyu Tolgoi lie in a structural corridor where mineralisation has been discovered over a 26 km strike length. Four deposits hosting Mineral Resources have been identified: Oyut, Hugo Dummett North, Hugo Dummett South, and Heruga. The Oyu Tolgoi copper-gold porphyry deposits are distributed along a 12 km north-northeast striking corridor. From north to south, the deposits comprise Hugo North, Hugo South, Oyut, and Heruga. These deposits lie within the Gurvansayhan island-arc terrane, a fault bounded segment of the broader Silurian to Carboniferous Kazakh-Mongol arc, located towards the southern margin of the Central Asian Orogenic Belt. Mineralisation is associated with multiple, overlapping, intrusions of late Devonian quartz-monzodiorite intruding Devonian (or older) juvenile, probably intra-oceanic arc-related, basaltic lavas and lesser volcaniclastic rocks, unconformably overlain by late Devonian basaltic to dacitic pyroclastic and volcano sedimentary rocks. These quartz-monzodiorite intrusions range from early-mineral porphyritic dykes, to larger, linear, syn-, late- and post-mineral dykes and stocks.
Annual Report on Form 20-F 2022 | riotinto.com360 Mineral Resources The table on pages 300-301 of this Form 20-F sets out the amount and grade, of Oyu Tolgoi’s Measured, Indicated and Inferred Mineral Resources for the year ended 31 December 2022. The 94% change from the previous reporting is primarily due to reporting on an ownership basis and Rio Tinto’s increased ownership of Oyu Tolgoi. The Mineral Resource estimate is based on the following assumptions: – Exclusive of Mineral Reserves – Mineral Resources are reported exclusive of Mineral Reserves. – Moisture – All Mineral Resource tonnages are estimated and reported on a dry basis. – Mineral Resources are estimated using ordinary kriging. – The sample data preparation including data capping is appropriate for use in estimation of a Mineral Resource. – The pit optimisation used to determine the resources that have reasonable prospects of economic extraction. – It is assumed that standard open pit load and haul mining operations and underground block cave mining operations will be applicable for the mining of Mineral Resources. Processing will be through crushing, grinding and a froth flotation concentrator process. – Copper, gold and silver are payable elements and are included in the calculation of a copper equivalent cut-off. At Heruga, molybdenum is also included as a payable element. For more information regarding the material assumptions for the Mineral Resource estimates, see Section 11 of the Oyu Tolgoi Technical Report Summary filed as exhibit 96.3 to this Form 20-F. Mineral Reserves The table on pages 288-289 of this Form 20-F sets out the amount, grade, price and metallurgical recovery of Oyu Tolgoi ‘s Proven and Probable Mineral Reserves for the year ended 31 December 2022. The 86% change from previous reporting is primarily due to reporting on an ownership basis and Rio Tinto’s increased ownership of Oyu Tolgoi. The Mineral Reserves estimates for Oyu Tolgoi are based on a Life of Mine plan that has been developed according to Regulation S-K and using industry accepted strategic planning approaches which defined the life of the mines at Oyu Tolgoi. Inferred Mineral Resources have been treated as waste. The final reserves plan is the outcome of the application of appropriate modifying factors in order to establish an economically viable and operational mine plan. At Oyu Tolgoi a variable cut-off grade strategy is applied to develop the mine plan. The Mineral Reserves estimate includes both the Oyut and Hugo North deposits and more detail is provided in Table 1.2 of exhibit 96.3 of this Form 20-F. Material assumptions in the estimation of Mineral Reserves are: – The resource model reflects the continuity and complexity of the deposit with the confidence stated in the classification. – Mineral Reserves are reported as dry mill feed tonnes. – A variable net smelter return cut-off strategy that maximises throughput for the concentrator. – Commodity prices, operating and capital costs. – Geology models contain tonnage estimates on a dry in situ basis. The estimated water content (moisture) for each block model block is added. – Metallurgical and processing recovery estimates are applied to crusher feed tonnages based on ore types. Uncertainties that affect the reliability or confidence in the Mineral Reserves estimate include but are not limited to: – Future macro-economic environment, including metal prices and foreign exchange rate. – Changes to operating cost assumptions, including labour costs. – Ability to continue sourcing water. – Changes to mining, hydrological, geotechnical parameters, and assumptions. – Ability to maintain environmental and social licence to operate. – Metallurgical recovery assumptions. For more information regarding the material assumptions for the Mineral Reserve estimates at Oyu Tolgoi, see Section 12 of Oyu Tolgoi Technical Report Summary filed herewith as exhibit 96.3 to this Form 20-F. Exploration Exploration on the mine leases is undertaken by Oyu Tolgoi LLC’s site technical services team. The current exploration strategy is focused on developing a project pipeline prioritised in areas that can impact the current development of the Oyu Tolgoi deposits, seeking low-cost development options and continuing the assessment of legacy datasets to enable future discovery. Exploration targets, based on identified medium or high priority have had exploration work completed in 2022, and some targets will be investigated in the future. Development of the known Mineral Resources is a key objective of stakeholders and over the life of Oyu Tolgoi, Oyu Tolgoi LLC will continue to progress its understanding of these resources and ultimately make decisions on their development. Additional information can be found in Section 7 of the Oyu Tolgoi Technical Report Summary filed as exhibit 96.3 to this Form 20-F. Internal controls disclosure pursuant to Item 1305 of Regulation S-K under Securities Act of 1933 For a description of the internal controls that Rio Tinto uses in its exploration and Mineral Resource and Mineral Reserve estimation efforts, quality control and quality assurance programmes, verification of analytical procedures and a discussion of the risk management related to these estimates, see Mineral Resources and Mineral Reserves Governance and Internal Controls on page 306 of this Form 20-F. US Disclosure continued
361Annual Report on Form 20-F 2022 | riotinto.com Additional information Financial calendar 2023 16 January Fourth quarter 2022 operations review 22 February Announcement of results for 2022 9 March Rio Tinto plc and Rio Tinto Limited ordinary shares and Rio Tinto plc ADRs quoted “ex-dividend” for the 2022 final dividend 10 March Record date for the 2022 final dividend for Rio Tinto plc and Rio Tinto Limited ordinary shares and Rio Tinto plc ADRs 28 March Final date for elections under the Rio Tinto plc and Rio Tinto Limited dividend reinvestment plans and under facilities for dividends to be paid in alternative currency for the 2022 final dividend* 6 April Annual general meeting for Rio Tinto plc, UK 13 April Dividend currency conversion date (Rio Tinto plc holders electing to receive Australian dollars and Rio Tinto Limited holders electing to receive pounds sterling) 20 April First quarter 2023 operations review 20 April Payment date for the 2022 final dividend to holders of ordinary shares and ADRs 4 May Annual general meeting for Rio Tinto Limited, Australia 18 July Second quarter operations review 2023 26 July Announcement of half-year results for 2023 10 August Rio Tinto plc and Rio Tinto Limited ordinary shares and Rio Tinto plc ADRs quoted “ex-dividend” for the 2023 interim dividend 11 August Record date for the 2023 interim dividend for Rio Tinto plc and Rio Tinto Limited ordinary shares and Rio Tinto plc ADRs 31 August Final date for elections under the Rio Tinto plc and Rio Tinto Limited dividend reinvestment plans and under facilities for dividends to be paid in alternative currency for the 2023 interim dividend 14 September Dividend currency conversion date (Rio Tinto plc holders electing to receive Australian dollars and Rio Tinto Limited holders electing to receive pounds sterling) 21 September Payment date for the 2023 interim dividend to holders of ordinary shares and ADRs 17 October Third quarter 2023 operations review Shareholder information continued
Annual Report on Form 20-F 2022 | riotinto.com362 Registered offices Rio Tinto plc 6 St James’s Square London UK SW1Y 4AD Registered in England No. 719885 Telephone: +44 (0)20 7781 2000 Website: riotinto.com Rio Tinto Limited Level 43, 120 Collins Street| Melbourne 3000 Australia ABN 96 004 458 404 Telephone: +61 3 9283 3333 Website: riotinto.com Rio Tinto’s agent in the US is Cheree Finan, who may be contacted at Rio Tinto Services Inc. 80 State Street Albany NY 12207-2543 US Shareholders Please refer queries about shareholdings to the investor centre of the respective registrar. Rio Tinto plc Computershare Investor Services PLC The Pavilions Bridgwater Road Bristol BS99 6ZZ UK Telephone: +44 (0)370 702 0003 Fax: +44 (0)370 703 6101 UK residents only Website: computershare.com Holders of Rio Tinto American Depositary Receipts (ADRs) Please contact the ADR administrator if you have any queries about your ADRs. ADR administrator J.P. Morgan Chase Bank N.A. Shareowner Services PO Box 64504 St. Paul MN 55164-0504 US residents only, toll free general: +1(800) 990 1135 Telephone from outside the US: +1 (651) 453 2128 US residents only, toll free Global invest direct: +1 (800) 428 4237 Website: adr.com Email: shareowneronline.com/informational/ contact-us/ Rio Tinto Limited Computershare Investor Services Pty Limited GPO Box 2975 Melbourne Victoria 3001 Australia Telephone: +61 (0) 3 9415 4030 Australian residents only, toll free: 1800 813 292 New Zealand residents only, toll free: 0800 450 740 Website: computershare.com Former Alcan Inc. shareholders Computershare Investor Services Inc. 8th Floor 100 University Avenue Toronto, ON Canada M5J 2Y1 Telephone: +1 514-982-7555 North American residents only, toll free: +1 (800) 564-6253 Website: computershare.com Investor Centre Investor Centre is Computershare’s free, secure, self-service website, where shareholders can manage their holdings online. The website enables shareholders to: – View share balances – Change address details – View payment and tax information – Update payment instructions In addition, shareholders who register their email address can be notified electronically of events such as annual general meetings, and can receive shareholder communications such as the Annual Report or notice of meeting electronically . Rio Tinto plc shareholders Website: investorcentre.co.uk Rio Tinto Limited shareholders Website: www-au.computershare.com/ Investor
363Annual Report on Form 20-F 2022 | riotinto.com Additional information Cautionary statement about forward-looking statements This report includes “forward-looking statements” within the meaning of the Private Securities Litigation Reform Act of 1995. All statements other than statements of historical facts included in this report, including, without limitation, those regarding Rio Tinto’s financial position, business strategy, plans and objectives of management for future operations (including development plans and objectives relating to Rio Tinto’s products, production forecasts, and reserve and resource positions), are forward-looking statements. The words “intend”, “aim”, “project”, “anticipate”, “estimate”, “plan”, “believes”, “expects”, “may”, “should”, “will”, “target”, “set to” or similar expressions, commonly identify such forward-looking statements. Such forward-looking statements involve known and unknown risks, uncertainties and other factors which may cause the actual results, performance or achievements of Rio Tinto, or industry results, to be materially different from any future results, performance or achievements expressed or implied by such forward-looking statements. Such forward- looking statements are based on numerous assumptions regarding Rio Tinto’s present and future business strategies and the environment in which Rio Tinto will operate in the future. Among the important factors that could cause Rio Tinto’s actual results, performance or achievements to differ materially from those in the forward-looking statements include, but are not limited to: an inability to live up to Rio Tinto’s values and any resultant damage to its reputation; the impacts of geopolitics on trade and investment; the impacts of climate change and the transition to a low-carbon future; an inability to successfully execute and/ or realise value from acquisitions and divestments; the level of new ore resources, including the results of exploration programmes and/or acquisitions; disruption to strategic partnerships that play a material role in delivering growth, production, cash or market positioning; damage to Rio Tinto’s relationships with communities and governments; an inability to attract and retain requisite skilled people; declines in commodity prices and adverse exchange rate movements; an inability to raise sufficient funds for capital investment; inadequate estimates of ore resources and reserves; delays or overruns of large and complex projects; changes in tax regulation; safety incidents or major hazard events; cyber breaches; physical impacts from climate change; the impacts of water scarcity; natural disasters; an inability to successfully manage the closure, reclamation and rehabilitation of sites; the impacts of civil unrest; the impacts of the COVID-19 pandemic; breaches of Rio Tinto’s policies, standards and procedures, laws or regulations; trade tensions between the world’s major economies; increasing societal and investor expectations, in particular with regard to environmental, social and governance considerations; the impacts of technological advancements; and such other risks identified in Rio Tinto’s most recent annual report and accounts in Australia and the United Kingdom and the most recent annual report on Form 20-F filed with the SEC or Form 6-Ks furnished to, or filed with, the SEC. Forward-looking statements should, therefore, be construed in light of such risk factors and undue reliance should not be placed on forward-looking statements. These forward- looking statements speak only as of the date of this report. Rio Tinto expressly disclaims any obligation or undertaking (except as required by applicable law, the UK Listing Rules, the Disclosure Guidance and Transparency Rules of the Financial Conduct Authority and the Listing Rules of the Australian Securities Exchange) to release publicly any updates or revisions to any forward-looking statement contained herein to reflect any change in Rio Tinto’s expectations with regard thereto or any change in events, conditions or circumstances on which any such statement is based. Nothing in this report should be interpreted to mean that future earnings per share of Rio Tinto plc or Rio Tinto Limited will necessarily match or exceed its historical published earnings per share. Shareholder information continued
Rio Tinto plc 6 St James’s Square London SW1Y 4AD United Kingdom Rio Tinto Limited Level 43, 120 Collins Street Melbourne VIC 3000 Australia
ITEM 19. EXHIBITS
Exhibits marked “*” have been filed as exhibits to this Annual report on Form 20-F and other exhibits have been incorporated by reference as indicated.
INDEX
| | | | | |
Exhibit
Number | Description |
| 1.1 | |
| 1.2 | |
| 2.1 | |
| 3.1** | DLC Merger Implementation Agreement, dated 3 November 1995 between CRA Limited and The RTZ Corporation PLC relating to the implementation of the DLC merger (incorporated by reference to Exhibit 2.1 of Rio Tinto plc's Annual report on Form 20-F for the financial year ended 31 December 1995, File No. 1‑10533) |
| 3.2 | |
| 3.3 | |
| 3.4 | |
| 4.1 | |
| 4.2 | |
| 8.1* | |
| 12.1* | |
| 13.1* | |
| 15.1* | |
| 15.2* | |
| 15.3* | |
| 16.1* | |
| 17.1* | |
| 96.1 | |
| 96.2* | |
| 96.3* | |
101* | Interactive data files |
* Filed herewith
** Paper filing in 1995
Signature
The Registrants hereby certify that they meet all of the requirements for filing on Form 20-F and that they have duly caused and authorised the undersigned to sign this Annual Report on their behalf. | | | | | |
| Rio Tinto plc | Rio Tinto Limited |
| (Registrant) | (Registrant) |
| /s/ Steve Allen | /s/ Steve Allen |
| Name: Steve Allen | Name: Steve Allen |
| Title: Company Secretary | Title: Joint Company Secretary |
| |
| Date: 24 February 2023 | Date: 24 February 2023 |