ANNUAL REPORT PURSUANT TO SECTION 13 OR 15(d) OF THE SECURITIES EXCHANGE ACT OF 1934 |
TRANSITION REPORT PURSUANT TO SECTION 13 OR 15(d) OF THE SECURITIES EXCHANGE ACT OF 1934 |
(State or Other Jurisdiction of Incorporation or Organization) |
(I.R.S. Employer Identification No.) | |
|
||
(Address of Principal Executive Offices) |
(Zip Code) |
Title of Each Class |
Trading Symbol(s) |
Name of Each Exchange on Which Registered | ||
☒ | Accelerated filer | ☐ | ||||
Non-accelerated filer | ☐ | Smaller reporting company | ||||
Emerging growth company |
Page Reference |
||||||
Part I |
||||||
Item 1. |
3 | |||||
Item 1A. |
35 | |||||
Item 1B. |
56 | |||||
Item 2. |
57 | |||||
Item 3. |
57 | |||||
Item 4. |
57 | |||||
Part II |
||||||
Item 5. |
58 | |||||
Item 6. |
59 | |||||
Item 7. |
60 | |||||
Item 7A. |
82 | |||||
Item 8. |
82 | |||||
Item 9. |
82 | |||||
Item 9A. |
82 | |||||
Item 9B. |
84 | |||||
Part III |
||||||
Item 10. |
84 | |||||
Item 11. |
84 | |||||
Item 12. |
85 | |||||
Item 13. |
85 | |||||
Item 14. |
85 | |||||
Part IV |
||||||
Item 15. |
86 | |||||
Item 16. |
99 | |||||
100 |
Item 1. |
Business |
• | grow our presence in existing markets; |
• | achieve industry-leading performance in clinical, operational and satisfaction measures; |
• | recruit and employ physicians to meet the need for high quality health services; |
• | continue to leverage our scale and market positions to grow the Company; and |
• | pursue a disciplined development strategy. |
• | The COVID-19 pandemic is significantly affecting our operations, business and financial condition. Our liquidity could also be negatively impacted by the COVID-19 pandemic, particularly if the U.S. economy remains unstable for a significant amount of time. |
• | There is a high degree of uncertainty regarding the implementation and impact of the CARES Act and other existing or future stimulus legislation, if any. There can be no assurance as to the total amount of financial assistance or types of assistance we will receive, that we will be able to comply with the applicable terms and conditions to retain such assistance, that we will be able to benefit from provisions intended to increase access to resources and ease regulatory burdens for health care providers or that additional stimulus legislation will be enacted. |
• | The emergence and effects related to a potential future pandemic, epidemic or outbreak of an infectious disease could adversely affect our operations. |
• | Our substantial leverage could adversely affect our ability to raise additional capital to fund our operations, limit our ability to react to changes in the economy or our industry, expose us to interest rate risk to the extent of our variable rate debt and prevent us from meeting our obligations. |
• | We may not be able to generate sufficient cash to service all of our indebtedness and may not be able to refinance our indebtedness on favorable terms. If we are unable to do so, we may be forced to take other actions to satisfy our obligations under our indebtedness, which may not be successful. |
• | Our debt agreements contain restrictions that limit our flexibility in operating our business. |
• | Discontinuation, reform or replacement of LIBOR may adversely affect our business. |
• | Our results of operations may be adversely affected by health care reform efforts, including court challenges to, and efforts to repeal, replace or otherwise significantly change the Affordable Care Act. We are unable to predict what, if any, and when such changes will be made in the future. |
• | Changes in government health care programs may adversely affect our revenues. |
• | If we fail to comply with extensive laws and government regulations, we could suffer penalties or be required to make significant changes to our operations. |
• | State efforts to regulate the construction or expansion of health care facilities could impair our ability to operate and expand our operations. |
• | We may incur additional tax liabilities. |
• | We have been and could become the subject of government investigations, claims and litigation. |
• | We may be subject to liabilities from claims brought against our facilities. |
• | Our labor costs may be adversely affected by competition for staffing, the shortage of experienced nurses and labor union activity. |
• | We may be unable to attract, hire, and retain a highly qualified and diverse workforce, including key management. |
• | Our performance depends on our ability to recruit and retain quality physicians. |
• | We may not be reimbursed for the cost of expensive, new technology. |
• | A cybersecurity incident could result in the compromise of our facilities, confidential data or critical data systems. A cybersecurity incident could also give rise to potential harm to patients; remediation and other expenses; and exposure to liability under HIPAA, consumer protection laws, common law theories or other laws. Such incidents could subject us to litigation and foreign, federal and state governmental inquiries, damage our reputation, and otherwise be disruptive to our business. |
• | Our operations could be impaired by a failure of our information systems. |
• | Health care technology initiatives, particularly those related to patient data and interoperability, may adversely affect our operations. |
• | Our hospitals face competition for patients from other hospitals and health care providers. |
• | A deterioration in the collectability of uninsured and patient due accounts could adversely affect our results of operations. |
• | If our volume of patients with private health insurance coverage declines or we are unable to retain and negotiate favorable contracts with private third-party payers, including managed care plans, our revenues may be reduced. |
• | Changes to physician utilization practices and treatment methodologies, third-party payer controls designed to reduce inpatient services or surgical procedures and other factors outside our control that impact demand for medical services may reduce our revenues. |
• | We may encounter difficulty acquiring hospitals and other health care businesses and challenges integrating the operations of acquired hospitals and other health care businesses and become liable for unknown or contingent liabilities as a result of acquisitions. |
• | Our facilities are heavily concentrated in Florida and Texas, which makes us sensitive to regulatory, economic, public health, environmental and competitive conditions and changes in those states. |
• | The industry trend toward value-based purchasing may negatively impact our revenues. |
• | Our overall business results may suffer during periods of general economic weakness. |
• | We are exposed to market risk related to changes in the market values of securities and interest rates. |
• | There can be no assurance that we will continue to pay dividends. |
• | Certain of our investors may continue to have influence over us. |
Years Ended December 31, |
||||||||||||||||||||||||
2020 |
Ratio |
2019 |
Ratio |
2018 |
Ratio |
|||||||||||||||||||
Medicare |
$ |
10,420 |
20.2 |
% |
$ | 10,798 | 21.0 | % | $ | 9,831 | 21.1 | % | ||||||||||||
Managed Medicare |
6,997 |
13.6 |
6,452 | 12.6 | 5,497 | 11.8 | ||||||||||||||||||
Medicaid |
1,965 |
3.8 |
1,572 | 3.1 | 1,358 | 2.9 | ||||||||||||||||||
Managed Medicaid |
2,621 |
5.1 |
2,450 | 4.8 | 2,403 | 5.1 | ||||||||||||||||||
Managed care and other insurers |
26,535 |
51.5 |
26,544 | 51.6 | 24,467 | 52.4 | ||||||||||||||||||
International (managed care and other insurers) |
1,120 |
2.2 |
1,162 | 2.3 | 1,156 | 2.5 | ||||||||||||||||||
Other |
1,875 |
3.6 |
2,358 | 4.6 | 1,965 | 4.2 | ||||||||||||||||||
|
|
|
|
|
|
|
|
|
|
|
|
|||||||||||||
Revenues |
$ |
51,533 |
100.0 |
% |
$ | 51,336 | 100.0 | % | $ | 46,677 | 100.0 | % | ||||||||||||
|
|
|
|
|
|
|
|
|
|
|
|
2020 |
2019 |
2018 |
||||||||||
Number of hospitals at end of period |
185 |
184 | 179 | |||||||||
Number of freestanding outpatient surgery centers at end of period(a) |
121 |
123 | 123 | |||||||||
Number of licensed beds at end of period(b) |
49,265 |
49,035 | 47,199 | |||||||||
Weighted average beds in service(c) |
42,246 |
41,510 | 39,966 | |||||||||
Admissions(d) |
2,009,909 |
2,108,927 | 2,003,753 | |||||||||
Equivalent admissions(e) |
3,312,330 |
3,646,335 | 3,420,406 | |||||||||
Average length of stay (days)(f) |
5.1 |
4.9 | 4.9 | |||||||||
Average daily census(g) |
27,734 |
28,134 | 26,663 | |||||||||
Occupancy rate(h) |
66 |
% |
68 | % | 67 | % | ||||||
Emergency room visits(i) |
7,450,307 |
9,161,129 | 8,764,431 | |||||||||
Outpatient surgeries(j) |
882,483 |
1,009,947 | 971,537 | |||||||||
Inpatient surgeries(k) |
522,385 |
566,635 | 548,220 | |||||||||
Days revenues in accounts receivable(l) |
45 |
50 | 51 | |||||||||
Outpatient revenues as a % of patient revenues(m) |
35 |
% |
39 | % | 38 | % |
(a) | Excludes freestanding endoscopy centers (21 at December 31, 2020; 20 at December 31, 2019 and 19 at December 31, 2018). |
(b) | Licensed beds are those beds for which a facility has been granted approval to operate from the applicable state licensing agency. |
(c) | Represents the average number of beds in service, weighted based on periods owned. |
(d) | Represents the total number of patients admitted to our hospitals and is used by management and certain investors as a general measure of inpatient volume. |
(e) | Equivalent admissions are used by management and certain investors as a general measure of combined inpatient and outpatient volume. Equivalent admissions are computed by multiplying admissions (inpatient volume) by the sum of gross inpatient revenue and gross outpatient revenue and then dividing the resulting amount by gross inpatient revenue. The equivalent admissions computation “equates” outpatient revenue to the volume measure (admissions) used to measure inpatient volume, resulting in a general measure of combined inpatient and outpatient volume. |
(f) | Represents the average number of days admitted patients stay in our hospitals. |
(g) | Represents the average number of patients in our hospital beds each day. |
(h) | Represents the percentage of hospital beds in service that are occupied by patients. Both average daily census and occupancy rate provide measures of the utilization of inpatient rooms. |
(i) | Represents the number of patients treated in our emergency rooms. |
(j) | Represents the number of surgeries performed on patients who were not admitted to our hospitals. Pain management and endoscopy procedures are not included in outpatient surgeries. |
(k) | Represents the number of surgeries performed on patients who have been admitted to our hospitals. Pain management and endoscopy procedures are not included in inpatient surgeries. |
(l) | Revenues per day is calculated by dividing the revenues for the fourth quarter of each year by the days in the quarter. Days revenues in accounts receivable is then calculated as accounts receivable at the end of the period divided by revenues per day. |
(m) | Represents the percentage of patient revenues related to patients who are not admitted to our hospitals. |
• | Over 36,000 quarantined caregivers unable to work received 100% of base pay through our Quarantine Pay Program; |
• | More than 127,000 full-time/part-time care or support facility colleagues with reduced hours due to COVID-19 received 70% of base pay through our Pandemic Pay Program; |
• | 3,500 caregivers were supported through company-paid hotel stays to protect their families from exposure; |
• | More than 25,000 calls were placed to the HCA Nurse Care line, a free, confidential 24-hour phone counseling support program for nurses; and |
• | $10.6 million in assistance provided by the HCA Healthcare Hope Fund to HCA Healthcare colleagues, including more than $3 million provided to colleagues to help with the loss of household income, childcare costs or other unexpected financial challenges related to the COVID-19 pandemic. |
Name |
Age |
Position(s) | ||
Samuel N. Hazen | 60 | Chief Executive Officer and Director | ||
Jennifer L. Berres | 50 | Senior Vice President and Chief Human Resource Officer | ||
Phillip G. Billington | 53 | Senior Vice President — Internal Audit Services | ||
Jeff E. Cohen | 49 | Senior Vice President — Government Relations | ||
Michael S. Cuffe, M.D. | 55 | President — Physician Services Group | ||
Jane D. Englebright | 63 | Senior Vice President and Chief Nursing Officer | ||
Jon M. Foster | 59 | President — American Group | ||
Charles J. Hall | 67 | President — National Group | ||
A. Bruce Moore, Jr. | 60 | President — Service Line and Operations Integration | ||
Sandra L. Morgan | 58 | Senior Vice President — Provider Relations | ||
J. William B. Morrow | 50 | Senior Vice President — Finance and Treasurer | ||
P. Martin Paslick | 61 | Senior Vice President and Chief Information Officer | ||
Jonathan B. Perlin, M.D. | 59 | President — Clinical Operations Group and Chief Medical Officer | ||
Deborah M. Reiner | 59 | Senior Vice President — Marketing and Communications | ||
William B. Rutherford | 57 | Executive Vice President and Chief Financial Officer | ||
Joseph A. Sowell, III | 64 | Senior Vice President and Chief Development Officer | ||
Kathryn A. Torres | 57 | Senior Vice President — Payer Contracting and Alignment | ||
Robert A. Waterman | 67 | Senior Vice President and General Counsel | ||
Kathleen M. Whalen | 57 | Senior Vice President and Chief Ethics and Compliance Officer | ||
Christopher F. Wyatt | 43 | Senior Vice President and Controller |
• | increasing our vulnerability to downturns or adverse changes in general economic, industry or competitive conditions and adverse changes in government regulations; |
• | requiring a substantial portion of cash flows from operations to be dedicated to the payment of principal and interest on our indebtedness, therefore reducing our ability to use our cash flows to fund our operations, capital expenditures and future business opportunities; |
• | exposing us to the risk of increased interest rates to the extent that our existing unhedged borrowings are at variable rates of interest or we seek to refinance our debt in a rising rate environment; |
• | limiting our ability to make strategic acquisitions or causing us to make nonstrategic divestitures; |
• | limiting our ability to obtain additional financing for working capital, capital expenditures, share repurchases, dividends, product or service line development, debt service requirements, acquisitions and general corporate or other purposes; and |
• | limiting our ability to adjust to changing market conditions and placing us at a competitive disadvantage compared to our competitors who are less highly leveraged. |
• | incur additional indebtedness or issue certain preferred shares; |
• | pay dividends on, repurchase or make distributions in respect of our capital stock or make other restricted payments; |
• | make certain investments; |
• | sell or transfer assets; |
• | create liens; |
• | consolidate, merge, sell or otherwise dispose of all or substantially all of our assets; and |
• | enter into certain transactions with our affiliates. |
• | billing and coding for services and properly handling overpayments; |
• | appropriateness and classification of level of care provided, including proper classification of inpatient admissions, observation services and outpatient care; |
• | relationships with physicians and other referral sources and referral recipients; |
• | necessity and adequacy of medical care; |
• | quality of medical equipment and services; |
• | qualifications of medical and support personnel; |
• | issues associated with the confidentiality, maintenance, interoperability, exchange, data breach, identity theft and security of health-related and personal information and medical records; |
• | screening, stabilization and transfer of individuals who have emergency medical conditions; |
• | licensure, certification and enrollment with government programs; |
• | hospital rate or budget review; |
• | debt collection, limits or prohibitions on balance billing and billing for out of network services; |
• | communications with patients and consumers; |
• | preparing and filing of cost reports; |
• | operating policies and procedures; |
• | activities regarding competitors; |
• | addition of facilities and services; and |
• | environmental protection. |
• | accounting and financial reporting; |
• | billing and collecting accounts; |
• | coding and compliance; |
• | clinical systems and medical devices; |
• | medical records and document storage; |
• | inventory management; |
• | negotiating, pricing and administering managed care contracts and supply contracts; and |
• | monitoring quality of care and collecting data on quality measures necessary for full Medicare payment updates. |
Item 1B. |
Unresolved Staff Comments |
Item 2. |
Properties |
State |
Hospitals |
Beds |
||||||
Alaska |
1 | 250 | ||||||
California |
5 | 1,852 | ||||||
Colorado |
7 | 2,451 | ||||||
Florida |
45 | 12,491 | ||||||
Georgia |
9 | 2,477 | ||||||
Idaho |
2 | 454 | ||||||
Indiana |
1 | 278 | ||||||
Kansas |
4 | 1,374 | ||||||
Kentucky |
2 | 384 | ||||||
Louisiana |
3 | 923 | ||||||
Missouri |
5 | 1,058 | ||||||
Nevada |
3 | 1,452 | ||||||
New Hampshire |
3 | 418 | ||||||
North Carolina |
7 | 1,181 | ||||||
South Carolina |
3 | 951 | ||||||
Tennessee |
13 | 2,632 | ||||||
Texas |
46 | 13,456 | ||||||
Utah |
8 | 1,011 | ||||||
Virginia |
11 | 3,284 | ||||||
International |
||||||||
England |
7 | 888 | ||||||
|
|
|
|
|||||
185 | 49,265 | |||||||
|
|
|
|
Item 3. |
Legal Proceedings |
Item 4. |
Mine Safety Disclosures |
Item 5. |
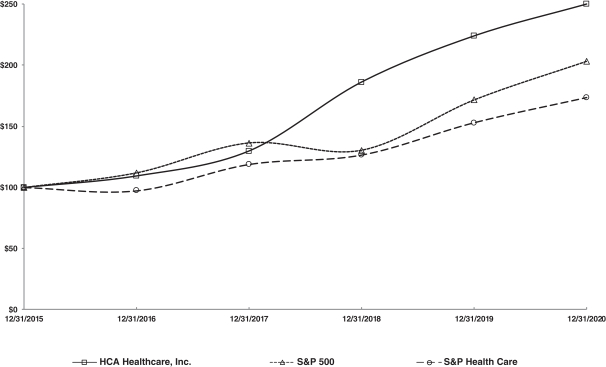
Market for Registrant ’ s Common Equity, Related Stockholder Matters and Issuer Purchases of Equity Securities |
12/31/2015 |
12/31/2016 |
12/31/2017 |
12/31/2018 |
12/31/2019 |
12/31/2020 |
|||||||||||||||||||
HCA Healthcare, Inc. |
$ |
100.00 |
$ |
109.45 |
$ |
129.88 |
$ |
186.23 |
$ |
223.94 |
$ |
250.01 |
||||||||||||
S&P 500 |
100.00 |
111.96 |
136.40 |
130.42 |
171.49 |
203.04 |
||||||||||||||||||
S&P Health Care |
100.00 |
97.31 |
118.79 |
126.47 |
152.81 |
173.36 |
Item 6. |
Selected Financial Data |
Item 7. |
Management’s Discussion and Analysis of Financial Condition and Results of Operations |
2020 |
2019 |
2018 |
||||||||||
Patient care costs (salaries and benefits, supplies, other operating expenses and depreciation and amortization) |
$ |
44,271 |
$ | 44,118 | $ | 40,035 | ||||||
|
|
|
|
|
|
|||||||
Cost-to-charges |
12.0 |
% |
12.0 | % | 12.4 | % | ||||||
|
|
|
|
|
|
|||||||
Total uncompensated care |
$ |
29,029 |
$ | 31,105 | $ | 26,757 | ||||||
Multiply by the cost-to-charges |
12.0 |
% |
12.0 | % | 12.4 | % | ||||||
|
|
|
|
|
|
|||||||
Estimated cost of total uncompensated care |
$ |
3,483 |
$ | 3,733 | $ | 3,318 | ||||||
|
|
|
|
|
|
2020 |
2019 |
2018 |
||||||||||
Net reserves for professional liability claims, January 1 |
$ |
1,781 |
$ | 1,692 | $ | 1,603 | ||||||
Provision for current year claims |
519 |
499 | 486 | |||||||||
Favorable development related to prior years’ claims |
(84 |
) |
(2 | ) | (39 | ) | ||||||
|
|
|
|
|
|
|||||||
Total provision |
435 |
497 | 447 | |||||||||
|
|
|
|
|
|
|||||||
Payments for current year claims |
5 |
8 | 3 | |||||||||
Payments for prior years’ claims |
287 |
400 | 355 | |||||||||
|
|
|
|
|
|
|||||||
Total claim payments |
292 |
408 | 358 | |||||||||
|
|
|
|
|
|
|||||||
Net reserves for professional liability claims, December 31 |
$ |
1,924 |
$ | 1,781 | $ | 1,692 | ||||||
|
|
|
|
|
|
Years Ended December 31, |
||||||||||||
2020 |
2019 |
2018 |
||||||||||
Medicare |
26 |
% |
29 | % | 30 | % | ||||||
Managed Medicare |
20 |
18 | 17 | |||||||||
Medicaid |
5 |
5 | 5 | |||||||||
Managed Medicaid |
12 |
12 | 12 | |||||||||
Managed care and insurers |
29 |
28 | 28 | |||||||||
Uninsured |
8 |
8 | 8 | |||||||||
|
|
|
|
|
|
|||||||
100 |
% |
100 | % | 100 | % | |||||||
|
|
|
|
|
|
Years Ended December 31, |
||||||||||||
2020 |
2019 |
2018 |
||||||||||
Medicare |
27 |
% |
28 | % | 28 | % | ||||||
Managed Medicare |
15 |
15 | 14 | |||||||||
Medicaid |
5 |
5 | 4 | |||||||||
Managed Medicaid |
6 |
5 | 6 | |||||||||
Managed care and insurers |
47 |
47 | 48 | |||||||||
|
|
|
|
|
|
|||||||
100 |
% |
100 | % | 100 | % | |||||||
|
|
|
|
|
|
2020 |
2019 |
2018 |
||||||||||||||||||||||
Amount |
Ratio |
Amount |
Ratio |
Amount |
Ratio |
|||||||||||||||||||
Revenues |
$ |
51,533 |
100.0 |
$ | 51,336 | 100.0 | $ | 46,677 | 100.0 | |||||||||||||||
Salaries and benefits |
23,874 |
46.3 |
23,560 | 45.9 | 21,425 | 45.9 | ||||||||||||||||||
Supplies |
8,369 |
16.2 |
8,481 | 16.5 | 7,724 | 16.5 | ||||||||||||||||||
Other operating expenses |
9,307 |
18.1 |
9,481 | 18.5 | 8,608 | 18.5 | ||||||||||||||||||
Equity in earnings of affiliates |
(54 |
) |
(0.1 |
) |
(43 | ) | (0.1 | ) | (29 | ) | (0.1 | ) | ||||||||||||
Depreciation and amortization |
2,721 |
5.3 |
2,596 | 5.0 | 2,278 | 4.9 | ||||||||||||||||||
Interest expense |
1,584 |
3.1 |
1,824 | 3.6 | 1,755 | 3.8 | ||||||||||||||||||
Losses (gains) on sales of facilities |
7 |
— |
(18 | ) | — | (428 | ) | (0.9 | ) | |||||||||||||||
Losses on retirement of debt |
295 |
0.6 |
211 | 0.4 | 9 | — | ||||||||||||||||||
|
|
|
|
|
|
|
|
|
|
|
|
|||||||||||||
46,103 |
89.5 |
46,092 | 89.8 | 41,342 | 88.6 | |||||||||||||||||||
|
|
|
|
|
|
|
|
|
|
|
|
|||||||||||||
Income before income taxes |
5,430 |
10.5 |
5,244 | 10.2 | 5,335 | 11.4 | ||||||||||||||||||
Provision for income taxes |
1,043 |
2.0 |
1,099 | 2.1 | 946 | 2.0 | ||||||||||||||||||
|
|
|
|
|
|
|
|
|
|
|
|
|||||||||||||
Net income |
4,387 |
8.5 |
4,145 | 8.1 | 4,389 | 9.4 | ||||||||||||||||||
Net income attributable to noncontrolling interests |
633 |
1.2 |
640 | 1.3 | 602 | 1.3 | ||||||||||||||||||
|
|
|
|
|
|
|
|
|
|
|
|
|||||||||||||
Net income attributable to HCA Healthcare, Inc. |
$ |
3,754 |
7.3 |
$ | 3,505 | 6.8 | $ | 3,787 | 8.1 | |||||||||||||||
|
|
|
|
|
|
|
|
|
|
|
|
|||||||||||||
% changes from prior year: |
||||||||||||||||||||||||
Revenues |
0.4 |
% |
10.0 | % | 7.0 | % | ||||||||||||||||||
Income before income taxes |
3.6 |
(1.7 | ) | 21.8 | ||||||||||||||||||||
Net income attributable to HCA Healthcare, Inc. |
7.1 |
(7.4 | ) | 70.9 | ||||||||||||||||||||
Admissions(a) |
(4.7 |
) |
5.2 | 3.5 | ||||||||||||||||||||
Equivalent admissions(b) |
(9.2 |
) |
6.6 | 4.1 | ||||||||||||||||||||
Revenue per equivalent admission |
10.5 |
3.2 | 2.8 | |||||||||||||||||||||
Same facility % changes from prior year(c): |
||||||||||||||||||||||||
Revenues |
(0.1 |
) | 5.9 | 6.5 | ||||||||||||||||||||
Admissions(a) |
(4.8 |
) |
2.8 | 2.5 | ||||||||||||||||||||
Equivalent admissions(b) |
(9.3 |
) |
3.5 | 2.5 | ||||||||||||||||||||
Revenue per equivalent admission |
10.1 |
2.3 | 3.9 |
(a) | Represents the total number of patients admitted to our hospitals and is used by management and certain investors as a general measure of inpatient volume. |
(b) | Equivalent admissions are used by management and certain investors as a general measure of combined inpatient and outpatient volume. Equivalent admissions are computed by multiplying admissions (inpatient volume) by the sum of gross inpatient revenue and gross outpatient revenue and then dividing the resulting amount by gross inpatient revenue. The equivalent admissions computation “equates” outpatient revenue to the volume measure (admissions) used to measure inpatient volume, resulting in a general measure of combined inpatient and outpatient volume. |
(c) | Same facility information excludes the operations of hospitals and their related facilities that were either acquired, divested or removed from service during the current and prior year. |
Operating Data: |
||||||||||||
2020 |
2019 |
2018 |
||||||||||
Number of hospitals at end of period |
185 |
184 | 179 | |||||||||
Number of freestanding outpatient surgical centers at end of period(a) |
121 |
123 | 123 | |||||||||
Number of licensed beds at end of period(b) |
49,265 |
49,035 | 47,199 | |||||||||
Weighted average beds in service(c) |
42,246 |
41,510 | 39,966 | |||||||||
Admissions(d) |
2,009,909 |
2,108,927 | 2,003,753 | |||||||||
Equivalent admissions(e) |
3,312,330 |
3,646,335 | 3,420,406 | |||||||||
Average length of stay (days)(f) |
5.1 |
4.9 | 4.9 | |||||||||
Average daily census(g) |
27,734 |
28,134 | 26,663 | |||||||||
Occupancy(h) |
66 |
% |
68 | % | 67 | % | ||||||
Emergency room visits(i) |
7,450,307 |
9,161,129 | 8,764,431 | |||||||||
Outpatient surgeries(j) |
882,483 |
1,009,947 | 971,537 | |||||||||
Inpatient surgeries(k) |
522,385 |
566,635 | 548,220 | |||||||||
Days revenues in accounts receivable(l) |
45 |
50 | 51 | |||||||||
Outpatient revenues as a % of patient revenues(m) |
35 |
% |
39 | % | 38 | % |
(a) | Excludes freestanding endoscopy centers (21 at December 31, 2020; 20 at December 31, 2019 and 19 at December 31, 2018). |
(b) | Licensed beds are those beds for which a facility has been granted approval to operate from the applicable state licensing agency. |
(c) | Represents the average number of beds in service, weighted based on periods owned. |
(d) | Represents the total number of patients admitted to our hospitals and is used by management and certain investors as a general measure of inpatient volume. |
(e) | Equivalent admissions are used by management and certain investors as a general measure of combined inpatient and outpatient volume. Equivalent admissions are computed by multiplying admissions (inpatient volume) by the sum of gross inpatient revenue and gross outpatient revenue and then dividing the resulting amount by gross inpatient revenue. The equivalent admissions computation “equates” outpatient revenue to the volume measure (admissions) used to measure inpatient volume, resulting in a general measure of combined inpatient and outpatient volume. |
(f) | Represents the average number of days admitted patients stay in our hospitals. |
(g) | Represents the average number of patients in our hospital beds each day. |
(h) | Represents the percentage of hospital beds in service that are occupied by patients. Both average daily census and occupancy rate provide measures of the utilization of inpatient rooms. |
(i) | Represents the number of patients treated in our emergency rooms. |
(j) | Represents the number of surgeries performed on patients who were not admitted to our hospitals. Pain management and endoscopy procedures are not included in outpatient surgeries. |
(k) | Represents the number of surgeries performed on patients who have been admitted to our hospitals. Pain management and endoscopy procedures are not included in inpatient surgeries. |
(l) | Revenues per day is calculated by dividing the revenues for the fourth quarter of each year by the days in the quarter. Days revenues in accounts receivable is then calculated as accounts receivable at the end of the period divided by revenues per day. |
(m) | Represents the percentage of patient revenues related to patients who are not admitted to our hospitals. |
Year Ended December 31, 2020 |
||||
Revenues |
$ |
31,040 |
||
Income before income taxes |
4,016 |
|||
Net income |
3,172 |
|||
Net income attributable to Parent, Subsidiary Issuer and Subsidiary Guarantors |
3,091 |
|||
At December 31, 2020: |
||||
December 31, 2020 |
||||
Current assets |
$ |
7,442 |
||
Property and equipment, net |
14,939 |
|||
Goodwill and other intangible assets |
5,763 |
|||
Total noncurrent assets |
21,771 |
|||
Total assets |
29,213 |
|||
Current liabilities |
5,316 |
|||
Long-term debt, net |
30,444 |
|||
Intercompany balances |
2,090 |
|||
Income taxes and other liabilities |
1,004 |
|||
Total noncurrent liabilities |
34,035 |
|||
Stockholders’ deficit attributable to Parent, Subsidiary Issuer and Subsidiary Guarantors |
(10,247 |
) | ||
Noncontrolling interests |
109 |
Item 7A. |
Quantitative and Qualitative Disclosures about Market Risk |
Item 8. |
Financial Statements and Supplementary Data |
Item 9. |
Changes in and Disagreements with Accountants on Accounting and Financial Disclosure |
Item 9A. |
Controls and Procedures |
Item 9B. |
Other Information |
Item 10. |
Directors, Executive Officers and Corporate Governance |
Item 11. |
Executive Compensation |
Item 12. |
Security Ownership of Certain Beneficial Owners and Management and Related Stockholder Matters |
(a) |
(b) |
(c) |
||||||||||
Number of securities to be issued upon exercise of outstanding options, warrants and rights |
Weighted-average exercise price of outstanding options, warrants and rights |
Number of securities remaining available for future issuance under equity compensation plans (excluding securities reflected in column(a)) |
||||||||||
Equity compensation plans approved by security holders |
13.723 | (1) | $ | 91.53 | (1) | 26.139 | (2) | |||||
Equity compensation plans not approved by security holders |
— | — | — | |||||||||
|
|
|
|
|
|
|||||||
Total |
13.723 | $ | 91.53 | 26.139 | ||||||||
|
|
|
|
|
|
(1) | Includes 2.476 million restricted share units which vest solely based upon continued employment over a specific period of time and 2.592 million performance share units which vest based upon continued employment over a specific period of time and the achievement of predetermined financial targets over time. The performance share units reported reflect the number of performance share units that would vest upon achievement of target performance; the number of performance share units that vest can vary from zero (for actual performance less than 90% of target for 2020 and 2019 grants and 80% of target for 2018 and prior grants) to two times the units granted (for actual performance of 110% or more of target for 2020 and 2019 grants and 120% or more of target for 2018 and prior grants). The weighted average exercise price does not take these restricted share units and performance share units into account. |
(2) | Includes 20.274 million shares available for future grants under the 2020 Stock Incentive Plan for Key Employees of HCA Healthcare, Inc. and its Affiliates and 5.865 million shares of common stock reserved for future issuance under the HCA Holdings, Inc. Employee Stock Purchase Plan. |
* | For additional information concerning our equity compensation plans, see the discussion in Note 2 — Share-Based Compensation in the notes to the consolidated financial statements. |
Item 13. |
Certain Relationships and Related Transactions, and Director Independence |
Item 14. |
Principal Accountant Fees and Services |
Item 15. |
Exhibits and Financial Statement Schedules |
2.1 |
||
2.2 |
||
3.1 |
||
3.2 |
||
4.1 |
||
4.2 |
||
4.3 |
||
4.4 |
||
4.5(a) |
4.5(b) |
||
4.5(c) |
||
4.5(d) |
||
4.5(e) |
||
4.5(f) |
||
4.5(g) |
||
4.5(h) |
4.5(i) |
||
4.5(j) |
||
4.5(k) |
||
4.5(l) |
||
4.5(m) |
||
4.5(n) |
||
4.5(o) |
||
4.6(a) |
||
4.6(b) |
||
4.6(c) |
||
4.7(a) |
4.7(b) |
||
4.7(c) |
||
4.8(a) |
||
4.8(b) |
||
4.8(c) |
||
4.8(d) |
||
4.8(e) |
||
4.9(a) |
||
4.9(b) |
||
4.9(c) |
||
4.10(a) |
4.10(b) |
||
4.10(c) |
||
4.10(d) |
||
4.10(e) |
||
4.10(f) |
||
4.10(g) |
||
4.10(h) |
||
4.10(i) |
||
4.11 |
||
4.12 |
4.13 |
||
4.14(a) |
||
4.14(b) |
||
4.14(c) |
||
4.14(d) |
||
4.14(e) |
||
4.15 |
||
4.16 |
||
4.17 |
||
4.18 |
||
4.19 |
||
4.20 |
||
4.21 |
||
4.22 |
||
4.23 |
||
4.24 |
4.25 |
||
4.26(a) |
||
4.26(b) |
||
4.26(c) |
||
4.27 |
||
4.28 |
||
4.29 |
||
4.30 |
||
4.31 |
||
4.32 |
||
4.33 |
||
4.34 |
||
4.35 |
||
4.36 |
||
4.37 |
4.38 |
||
4.39 |
||
4.40 |
||
4.41 |
||
4.42 |
||
4.43 |
||
4.44 |
||
4.45 |
||
4.46 |
||
4.47 |
||
4.48 |
||
4.49 |
||
4.50 |
||
4.51 |
4.52 |
||
4.53 |
||
4.54 |
||
4.55 |
||
4.56 |
||
4.57 |
||
4.58 |
||
4.59 |
||
4.60 |
||
4.61 |
||
4.62 |
||
4.63 |
||
4.64 |
||
4.65 |
||
4.66 |
4.67 |
||
4.68 |
||
4.69 |
||
4.70 |
||
4.71 |
||
4.72 |
||
10.1 |
||
10.2(a) |
||
10.2(b) |
||
10.2(c) |
||
10.3(a) |
||
10.3(b) |
||
10.4 |
10.5 |
||
10.6 |
||
10.7(a) |
||
10.7(b) |
||
10.8(a) |
||
10.8(b) |
||
10.9(a) |
||
10.9(b) |
||
10.9(c) |
||
10.9(d) |
||
10.9(e) |
||
10.9(f) |
||
10.9(g) |
||
10.9(h) |
||
10.10 |
10.11 |
||
10.12 |
||
10.13 |
||
10.14 |
||
10.15 |
||
10.16 |
||
10.17 |
||
10.18 |
||
10.19 |
||
10.20 |
||
10.21 |
||
10.22 |
||
10.23 |
10.24 |
||
10.25 |
||
10.26 |
||
10.27 |
||
10.28 |
||
10.29 |
||
10.30 |
||
10.31 |
||
10.32 |
||
10.33 |
||
10.34 |
||
10.35 |
||
10.36 |
||
10.37 |
10.38 |
||
21 |
||
22 |
||
23 |
||
31.1 |
||
31.2 |
||
32 |
||
101 |
— The following financial information from our annual report on Form 10-K for the year ended December 31, 2020, filed with the SEC on February 19, 2021, formatted in Extensible Business Reporting Language (XBRL): (i) the consolidated balance sheets at December 31, 2020 and 2019, (ii) the consolidated income statements for the years ended December 31, 2020, 2019 and 2018, (iii) the consolidated comprehensive income statements for the years ended December 31, 2020, 2019 and 2018, (iv) the consolidated statements of stockholders’ equity (deficit) for the years ended December 31, 2020, 2019 and 2018, (v) the consolidated statements of cash flows for the years ended December 31, 2020, 2019 and 2018, and (vi) the notes to consolidated financial statements. | |
104 |
— The cover page from the Company’s Annual Report on Form 10-K for the year ended December 31, 2020, formatted in Inline XBRL (included in Exhibit 101). |
* | Management compensatory plan or arrangement. |
Item 16. |
Form 10-K Summary |
HCA HEALTHCARE, INC. | ||
By: | /S/ SAMUEL N. HAZEN | |
Samuel N. Hazen Chief Executive Officer |
Signature |
Title |
Date | ||
/S/ SAMUEL N. HAZEN Samuel N. Hazen |
Chief Executive Officer and Director (Principal Executive Officer) |
February 19, 2021 | ||
/S/ WILLIAM B. RUTHERFORD William B. Rutherford |
Executive Vice President and Chief Financial Officer (Principal Financial Officer and Principal Accounting Officer) |
February 19, 2021 | ||
/S/ THOMAS F. FRIST III Thomas F. Frist III |
Chairman and Director | February 19, 2021 | ||
/S/ MEG G. CROFTON Meg G. Crofton |
Director | February 19, 2021 | ||
/S/ ROBERT J. DENNIS Robert J. Dennis |
Director | February 19, 2021 | ||
/s/ NANCY-ANN DEPARLE Nancy-Ann DeParle |
Director | February 19, 2021 | ||
/S/ WILLIAM R. FRIST William R. Frist |
Director | February 19, 2021 | ||
/S/ CHARLES O. HOLLIDAY, JR. Charles O. Holliday, Jr. |
Director | February 19, 2021 | ||
/S/ MICHAEL W. MICHELSON Michael W. Michelson |
Director | February 19, 2021 | ||
/S/ WAYNE J. RILEY Wayne J. Riley |
Director | February 19, 2021 |
Page |
||||
F-2 |
||||
Consolidated Financial Statements: |
||||
F-5 |
||||
F-6 |
||||
F-7 |
||||
F-8 |
||||
F-9 |
||||
F-10 |
Revenue Recognition | ||
Description of the Matter |
For the year ended December 31, 2020, the Company’s revenues were $51.533 billion. As discussed in Note 1 to the consolidated financial statements, revenues are based upon the estimated amounts the Company expects to be entitled to receive from patients and third-party payers. Estimates of contractual allowances under managed care, commercial, and governmental insurance plans are based upon the payment terms specified in the related contractual agreements or as mandated under government payer programs. Management continually reviews the contractual allowances estimation process to consider and incorporate updates to laws and regulations and the frequent changes in managed care contractual terms resulting from contract renegotiations and renewals. Revenues related to uninsured patients and uninsured copayment and deductible amounts for patients who have health care insurance coverage may have discounts applied (uninsured discounts and contractual discounts). The Company also records estimated implicit price concessions (based primarily on historical collection experience) related to uninsured accounts to record these revenues and accounts receivable at the estimated amounts the Company expects to collect. The primary collection risks relate to uninsured patient accounts, including amounts owed from patients after insurance has paid the amounts covered by the applicable agreement. Implicit price concessions relate primarily to amounts due directly from patients and are based upon management’s assessment of historical write-offs and expected net collections, business and economic conditions, trends in federal, state and private employer health care coverage and other collection indicators. Auditing management’s estimates of contractual allowances and implicit price concessions was complex and judgmental due to the significant data inputs and subjective assumptions utilized in determining related amounts. | |
How We Addressed the Matter in Our Audit |
We tested internal controls that address the risks of material misstatement related to the measurement and valuation of revenues, including estimation of contractual allowances and implicit price concessions. For example, we tested management’s internal controls over the key data inputs to the contractual allowances and implicit price concessions models, significant assumptions underlying management’s models, and management’s internal controls over retrospective hindsight reviews of historical reserve accuracy. To test the estimated contractual allowances and implicit price concessions, we performed audit procedures that included, among others, assessing methodologies and evaluating the significant assumptions discussed above and testing the completeness and accuracy of the underlying data used by the Company in its estimates. We compared the significant assumptions used by management to current industry and economic trends and considered changes, if any, to the Company’s business and other relevant factors. We also assessed the historical accuracy of management’s estimates as a source of potential corroborative or contrary evidence. | |
Professional Liability Claims | ||
Description of the Matter |
At December 31, 2020, the Company’s reserves for professional liability risks were $1.963 billion and the Company’s related provision for losses for the year ended December 31, 2020 was $435 million. As discussed in Note 1 to the consolidated financial statements, reserves for professional liability risks represent the estimated ultimate cost of all reported and unreported losses incurred and unpaid as of the consolidated balance sheet date. Management determines professional liability reserves and provisions for losses using individual case-basis valuations and actuarial analyses. Trends in the average frequency (number of claims) and ultimate average severity (cost per claim) of claims are significant assumptions in estimating the reserves. |
Auditing management’s professional liability claims reserves was complex and judgmental due to the significant estimations required in determining the reserves, particularly the actuarial methodology and assumptions related to the severity and frequency of claims. | ||
How We Addressed the Matter in Our Audit |
We tested management’s internal controls that address the risks of material misstatement over the Company’s professional liability claims reserve estimation process. For example, we tested internal controls over management’s review of the actuarial methodology and significant assumptions, and the completeness and accuracy of claims data supporting the recorded reserves. To test the Company’s determination of the estimated professional liability expense and reserves, we performed audit procedures that included, among others, testing the completeness and accuracy of underlying claims data used by the Company and its actuaries in its determination of reserves and reviewing the Company’s insurance contracts to assess self-insured limits, deductibles and coverage limits. Additionally, with the involvement of our actuarial specialists, we performed audit procedures that included, among others, assessing the actuarial valuation methodologies utilized by management and its actuaries, testing the significant assumptions, including consideration of Company-specific claim reporting and payment data, assessing the accuracy of management’s historical reserve estimates, and developing an independent range of reserves for comparison to the Company’s recorded amounts. |
2020 |
2019 |
2018 |
||||||||||
Revenues |
$ |
$ | $ | |||||||||
Salaries and benefits |
||||||||||||
Supplies |
||||||||||||
Other operating expenses |
||||||||||||
Equity in earnings of affiliates |
( |
) |
( |
) | ( |
) | ||||||
Depreciation and amortization |
||||||||||||
Interest expense |
||||||||||||
Losses (gains) on sales of facilities |
( |
) | ( |
) | ||||||||
Losses on retirement of debt |
||||||||||||
|
|
|
|
|
|
|||||||
|
|
|
|
|
|
|||||||
Income before income taxes |
||||||||||||
Provision for income taxes |
||||||||||||
|
|
|
|
|
|
|||||||
Net income |
||||||||||||
Net income attributable to noncontrolling interests |
||||||||||||
|
|
|
|
|
|
|||||||
Net income attributable to HCA Healthcare, Inc. |
$ |
$ | $ | |||||||||
|
|
|
|
|
|
|||||||
Per share data: |
||||||||||||
Basic earnings per share |
$ |
$ | $ | |||||||||
Diluted earnings per share |
$ |
$ | $ | |||||||||
Shares used in earnings per share calculations (in millions): |
||||||||||||
Basic |
||||||||||||
Diluted |
2020 |
2019 |
2018 |
||||||||||
Net income |
$ |
$ | $ | |||||||||
Other comprehensive income (loss) before taxes: |
||||||||||||
Foreign currency translation |
( |
) | ||||||||||
Unrealized gains (losses) on available-for-sale |
( |
) | ||||||||||
Defined benefit plans |
( |
) |
( |
) | ||||||||
Pension costs included in salaries and benefits |
||||||||||||
|
|
|
|
|
|
|||||||
( |
) |
( |
) | |||||||||
Change in fair value of derivative financial instruments |
( |
) |
( |
) | ||||||||
Interest costs (benefits) included in interest expense |
( |
) | ( |
) | ||||||||
|
|
|
|
|
|
|||||||
( |
) |
( |
) | |||||||||
|
|
|
|
|
|
|||||||
Other comprehensive loss before taxes |
( |
) |
( |
) | ||||||||
Income taxes (benefits) related to other comprehensive income items |
( |
) |
( |
) | ||||||||
|
|
|
|
|
|
|||||||
Other comprehensive loss |
( |
) |
( |
) | ( |
) | ||||||
|
|
|
|
|
|
|||||||
Comprehensive income |
||||||||||||
Comprehensive income attributable to noncontrolling interests |
||||||||||||
|
|
|
|
|
|
|||||||
Comprehensive income attributable to HCA Healthcare, Inc. |
$ |
$ | $ | |||||||||
|
|
|
|
|
|
2020 |
2019 |
|||||||
ASSETS |
||||||||
Current assets: |
||||||||
Cash and cash equivalents |
$ |
$ | ||||||
Accounts receivable |
||||||||
Inventories |
||||||||
Other |
||||||||
|
|
|
|
|||||
Property and equipment, at cost: |
||||||||
Land |
||||||||
Buildings |
||||||||
Equipment |
||||||||
Construction in progress |
||||||||
|
|
|
|
|||||
Accumulated depreciation |
( |
) |
( |
) | ||||
|
|
|
|
|||||
Investments of insurance subsidiaries |
||||||||
Investments in and advances to affiliates |
||||||||
Goodwill and other intangible assets |
||||||||
Right-of-use |
||||||||
Other |
||||||||
|
|
|
|
|||||
$ |
$ | |||||||
|
|
|
|
|||||
LIABILITIES AND STOCKHOLDERS’ EQUITY (DEFICIT) |
||||||||
Current liabilities: |
||||||||
Accounts payable |
$ |
$ | ||||||
Accrued salaries |
||||||||
Other accrued expenses |
||||||||
Long-term debt due within one year |
||||||||
|
|
|
|
|||||
Long-term debt, less debt issuance costs and discounts of $ |
||||||||
Professional liability risks |
||||||||
Right-of-use |
||||||||
Income taxes and other liabilities |
||||||||
Stockholders’ equity (deficit): |
||||||||
Common stock $ |
||||||||
Capital in excess of par value |
||||||||
Accumulated other comprehensive loss |
( |
) |
( |
) | ||||
Retained earnings (deficit) |
( |
) | ||||||
|
|
|
|
|||||
Stockholders’ equity (deficit) attributable to HCA Healthcare, Inc. |
( |
) | ||||||
Noncontrolling interests |
||||||||
|
|
|
|
|||||
( |
) | |||||||
|
|
|
|
|||||
$ |
$ | |||||||
|
|
|
|
Equity (Deficit) Attributable to HCA Healthcare, Inc. |
Equity Attributable to Noncontrolling Interests |
Total |
||||||||||||||||||||||||||
Common Stock |
Capital in Excess of Par Value |
Accumulated Other Comprehensive Loss |
Retained Earnings (Deficit) |
|||||||||||||||||||||||||
Shares (in millions ) |
Par Value |
|||||||||||||||||||||||||||
Balances, December 31, 2017 |
$ |
$ |
— |
$ |
( |
) |
$ |
( |
) |
$ |
$ |
( |
) | |||||||||||||||
Comprehensive income (loss) |
( |
) |
||||||||||||||||||||||||||
Repurchase of common stock |
( |
) |
( |
) |
( |
) |
( |
) |
( |
) | ||||||||||||||||||
Share-based benefit plans |
||||||||||||||||||||||||||||
Cash dividends declared ($ |
( |
) |
( |
) | ||||||||||||||||||||||||
Distributions |
( |
) |
( |
) | ||||||||||||||||||||||||
Reclassification of stranded tax effects |
( |
) |
— |
|||||||||||||||||||||||||
Other |
( |
) |
||||||||||||||||||||||||||
|
|
|
|
|
|
|
|
|
|
|
|
|
|
|||||||||||||||
Balances, December 31, 2018 |
— |
( |
) |
( |
) |
( |
) | |||||||||||||||||||||
Comprehensive income (loss) |
( |
) |
||||||||||||||||||||||||||
Repurchase of common stock |
( |
) |
( |
) |
( |
) |
( |
) | ||||||||||||||||||||
Share-based benefit plans |
||||||||||||||||||||||||||||
Cash dividends declared ($ |
( |
) |
( |
) | ||||||||||||||||||||||||
Distributions |
( |
) |
( |
) | ||||||||||||||||||||||||
Other |
( |
) |
||||||||||||||||||||||||||
|
|
|
|
|
|
|
|
|
|
|
|
|
|
|||||||||||||||
Balances, December 31, 2019 |
— |
( |
) |
( |
) |
( |
) | |||||||||||||||||||||
Comprehensive income (loss) |
( |
) |
||||||||||||||||||||||||||
Repurchase of common stock |
( |
) |
( |
) |
( |
) | ||||||||||||||||||||||
Share-based benefit plans |
( |
) |
||||||||||||||||||||||||||
Cash dividends declared ($ |
( |
) |
( |
) | ||||||||||||||||||||||||
Distributions |
( |
) |
( |
) | ||||||||||||||||||||||||
Other |
( |
) |
||||||||||||||||||||||||||
|
|
|
|
|
|
|
|
|
|
|
|
|
|
|||||||||||||||
Balances, December 31, 2020 |
$ |
$ |
$ |
( |
) |
$ |
$ |
$ |
||||||||||||||||||||
|
|
|
|
|
|
|
|
|
|
|
|
|
|
2020 |
2019 |
2018 |
||||||||||
Cash flows from operating activities: |
||||||||||||
Net income |
$ |
$ | $ | |||||||||
Adjustments to reconcile net income to net cash provided by operating activities: |
||||||||||||
Increase (decrease) in cash from operating assets and liabilities: |
||||||||||||
Accounts receivable |
( |
) | ( |
) | ||||||||
Inventories and other assets |
( |
) |
( |
) | ( |
) | ||||||
Accounts payable and accrued expenses |
||||||||||||
Depreciation and amortization |
||||||||||||
Income taxes |
||||||||||||
Losses (gains) on sales of facilities |
( |
) | ( |
) | ||||||||
Losses on retirement of debt |
||||||||||||
Amortization of debt issuance costs |
||||||||||||
Share-based compensation |
||||||||||||
Other |
||||||||||||
|
|
|
|
|
|
|||||||
Net cash provided by operating activities |
||||||||||||
|
|
|
|
|
|
|||||||
Cash flows from investing activities: |
||||||||||||
Purchase of property and equipment |
( |
) |
( |
) | ( |
) | ||||||
Acquisition of hospitals and health care entities |
( |
) |
( |
) | ( |
) | ||||||
Sales of hospitals and health care entities |
||||||||||||
Change in investments |
( |
) | ||||||||||
Other |
( |
) | ||||||||||
|
|
|
|
|
|
|||||||
Net cash used in investing activities |
( |
) |
( |
) | ( |
) | ||||||
|
|
|
|
|
|
|||||||
Cash flows from financing activities: |
||||||||||||
Issuances of long-term debt |
||||||||||||
Net change in revolving credit facilities |
( |
) |
( |
) | ( |
) | ||||||
Repayment of long-term debt |
( |
) |
( |
) | ( |
) | ||||||
Distributions to noncontrolling interests |
( |
) |
( |
) | ( |
) | ||||||
Payment of debt issuance costs |
( |
) |
( |
) | ( |
) | ||||||
Payment of dividends |
( |
) |
( |
) | ( |
) | ||||||
Repurchase of common stock |
( |
) |
( |
) | ( |
) | ||||||
Other |
( |
) |
( |
) | ( |
) | ||||||
|
|
|
|
|
|
|||||||
Net cash used in financing activities |
( |
) |
( |
) | ( |
) | ||||||
|
|
|
|
|
|
|||||||
Effect of exchange rate changes on cash and cash equivalents |
( |
) | ||||||||||
|
|
|
|
|
|
|||||||
Change in cash and cash equivalents |
( |
) | ||||||||||
Cash and cash equivalents at beginning of period |
||||||||||||
|
|
|
|
|
|
|||||||
Cash and cash equivalents at end of period |
$ |
$ | $ | |||||||||
|
|
|
|
|
|
|||||||
Interest payments |
$ |
$ | $ | |||||||||
Income tax payments, net |
$ |
$ | $ |
Years Ended December 31, |
||||||||||||||||||||||||
2020 |
Ratio |
2019 |
Ratio |
2018 |
Ratio |
|||||||||||||||||||
Medicare |
$ |
% |
$ | % | $ | % | ||||||||||||||||||
Managed Medicare |
||||||||||||||||||||||||
Medicaid |
||||||||||||||||||||||||
Managed Medicaid |
||||||||||||||||||||||||
Managed care and other insurers |
||||||||||||||||||||||||
International (managed care and other insurers) |
||||||||||||||||||||||||
Other |
||||||||||||||||||||||||
|
|
|
|
|
|
|
|
|
|
|
|
|||||||||||||
Revenues |
$ |
% |
$ | % | $ | % | ||||||||||||||||||
|
|
|
|
|
|
|
|
|
|
|
|
2020 |
2019 |
2018 |
||||||||||
Patient care costs (salaries and benefits, supplies, other operating expenses and depreciation and amortization) |
$ |
$ | $ | |||||||||
|
|
|
|
|
|
|||||||
Cost-to-charges |
% |
% | % | |||||||||
|
|
|
|
|
|
|||||||
Total uncompensated care |
$ |
$ | $ | |||||||||
Multiply by the cost-to-charges |
% |
% | % | |||||||||
|
|
|
|
|
|
|||||||
Estimated cost of total uncompensated care |
$ |
$ | $ | |||||||||
|
|
|
|
|
|
2020 |
2019 |
2018 |
||||||||||
Risk-free interest rate |
% |
% | % | |||||||||
Expected volatility |
% |
% | % | |||||||||
Expected life, in years |
||||||||||||
Expected dividend yield |
% |
% | % |
Time Stock Options and SARs |
Performance Stock Options and SARs |
Total Stock Options and SARs |
Weighted Average Exercise Price |
Weighted Average Remaining Contractual Term |
Aggregate Intrinsic Value (dollars in millions) |
|||||||||||||||||||
Options and SARs outstanding, December 31, 2017 |
$ | |||||||||||||||||||||||
Granted |
— | |||||||||||||||||||||||
Exercised |
( |
) | ( |
) | ( |
) | ||||||||||||||||||
Cancelled |
( |
) | ( |
) | ( |
) | ||||||||||||||||||
|
|
|
|
|
|
|||||||||||||||||||
Options and SARs outstanding, December 31, 2018 |
||||||||||||||||||||||||
Granted |
— | |||||||||||||||||||||||
Exercised |
( |
) | ( |
) | ( |
) | ||||||||||||||||||
Cancelled |
( |
) | — | ( |
) | |||||||||||||||||||
|
|
|
|
|
|
|||||||||||||||||||
Options and SARs outstanding, December 31, 2019 |
||||||||||||||||||||||||
Granted |
— |
|||||||||||||||||||||||
Exercised |
( |
) |
( |
) |
( |
) |
||||||||||||||||||
Cancelled |
( |
) |
— |
( |
) |
|||||||||||||||||||
|
|
|
|
|
|
|||||||||||||||||||
Options and SARs outstanding, December 31, 2020 |
$ |
$ |
||||||||||||||||||||||
|
|
|
|
|
|
|||||||||||||||||||
Options and SARs exercisable, December 31, 2020 |
$ |
$ |
Time RSUs |
Performance RSUs |
PSUs |
Total RSUs and PSUs |
Weighted Average Grant Date Fair Value |
||||||||||||||||
RSUs and PSUs outstanding, December 31, 2017 |
$ | |||||||||||||||||||
Granted |
— | |||||||||||||||||||
Performance adjustment |
— | — | ||||||||||||||||||
Vested |
( |
) | ( |
) | ( |
) | ( |
) | ||||||||||||
Cancelled |
( |
) | ( |
) | ( |
) | ( |
) | ||||||||||||
|
|
|
|
|
|
|
|
|||||||||||||
RSUs and PSUs outstanding, December 31, 2018 |
— | |||||||||||||||||||
Granted |
— | |||||||||||||||||||
Performance adjustment |
— | — | ||||||||||||||||||
Vested |
( |
) | — | ( |
) | ( |
) | |||||||||||||
Cancelled |
( |
) | — | ( |
) | ( |
) | |||||||||||||
|
|
|
|
|
|
|
|
|||||||||||||
RSUs and PSUs outstanding, December 31, 2019 |
— | |||||||||||||||||||
Granted |
— |
|||||||||||||||||||
Performance adjustment |
— |
— |
||||||||||||||||||
Vested |
( |
) |
— |
( |
) |
( |
) |
|||||||||||||
Cancelled |
( |
) |
— |
( |
) |
( |
) |
|||||||||||||
|
|
|
|
|
|
|
|
|||||||||||||
RSUs and PSUs outstanding, December 31, 2020 |
— |
$ |
||||||||||||||||||
|
|
|
|
|
|
|
|
2020 |
2019 |
2018 |
||||||||||
Current: |
||||||||||||
Federal |
$ |
$ | $ | |||||||||
State |
||||||||||||
Foreign |
||||||||||||
Deferred: |
||||||||||||
Federal |
( |
) |
||||||||||
State |
( |
) |
||||||||||
Foreign |
( |
) | ( |
) | ||||||||
|
|
|
|
|
|
|||||||
$ |
$ | $ | ||||||||||
|
|
|
|
|
|
2020 |
2019 |
2018 |
||||||||||
Federal statutory rate |
% |
% | % | |||||||||
State income taxes, net of federal tax benefit |
||||||||||||
Change in liability for uncertain tax positions |
( |
) |
( |
) | ||||||||
Tax benefit from settlements of employee equity awards |
( |
) |
( |
) | ( |
) | ||||||
Impact of Tax Act on deferred tax balances |
— |
— | ( |
) | ||||||||
Other items, net |
||||||||||||
|
|
|
|
|
|
|||||||
Effective income tax rate on income attributable to HCA Healthcare, Inc. |
||||||||||||
Income attributable to noncontrolling interests from consolidated partnerships |
( |
) |
( |
) | ( |
) | ||||||
|
|
|
|
|
|
|||||||
Effective income tax rate on income before income taxes |
% |
% | % | |||||||||
|
|
|
|
|
|
2020 |
2019 |
|||||||||||||||
Assets |
Liabilities |
Assets |
Liabilities |
|||||||||||||
Depreciation and fixed asset basis differences |
$ |
$ |
$ | $ | ||||||||||||
Allowances for professional liability and other risks |
||||||||||||||||
Accounts receivable |
||||||||||||||||
Compensation |
||||||||||||||||
Right-of-use |
||||||||||||||||
Other |
||||||||||||||||
|
|
|
|
|
|
|
|
|||||||||
$ |
$ |
$ | |
$ | |
|||||||||||
|
|
|
|
|
|
|
|
2020 |
2019 |
|||||||
Balance at January 1 |
$ |
$ | ||||||
Additions (reductions) based on tax positions related to the current year |
( |
) |
||||||
Additions for tax positions of prior years |
||||||||
Reductions for tax positions of prior years |
( |
) |
( |
) | ||||
Settlements |
( |
) |
||||||
Lapse of applicable statutes of limitations |
( |
) |
( |
) | ||||
|
|
|
|
|||||
Balance at December 31 |
$ |
$ | |
|||||
|
|
|
|
2020 |
2019 |
2018 |
||||||||||
Net income attributable to HCA Healthcare, Inc. |
$ |
$ | $ | |||||||||
Weighted average common shares outstanding |
||||||||||||
Effect of dilutive incremental shares |
||||||||||||
|
|
|
|
|
|
|||||||
Shares used for diluted earnings per share |
||||||||||||
|
|
|
|
|
|
|||||||
Earnings per share: |
||||||||||||
Basic earnings per share |
$ |
$ | $ | |||||||||
Diluted earnings per share |
$ |
$ | $ |
2020 |
||||||||||||||||
Amortized Cost |
Unrealized Amounts |
Fair Value |
||||||||||||||
Gains |
Losses |
|||||||||||||||
Debt securities |
$ |
$ |
$ |
— |
$ |
|||||||||||
Money market funds and other |
— |
— |
||||||||||||||
|
|
|
|
|
|
|
|
|||||||||
$ |
$ |
$ |
— |
|||||||||||||
|
|
|
|
|
|
|||||||||||
Amounts classified as current assets |
( |
) | ||||||||||||||
|
|
|||||||||||||||
Investment carrying value |
$ |
|||||||||||||||
|
|
|||||||||||||||
2019 |
||||||||||||||||
Amortized Cost |
Unrealized Amounts |
Fair Value |
||||||||||||||
Gains |
Losses |
|||||||||||||||
Debt securities |
$ | $ | $ | — | $ | |||||||||||
Money market funds and other |
— | — | ||||||||||||||
|
|
|
|
|
|
|
|
|||||||||
$ | $ | $ | — | |||||||||||||
|
|
|
|
|
|
|||||||||||
Amounts classified as current assets |
( |
) | ||||||||||||||
|
|
|||||||||||||||
Investment carrying value |
$ | |||||||||||||||
|
|
Amortized Cost |
Fair Value |
|||||||
Due in one year or less |
$ | $ | ||||||
Due after one year through five years |
||||||||
Due after five years through ten years |
||||||||
Due after ten years |
||||||||
|
|
|
|
|||||
$ | $ | |||||||
|
|
|
|
Notional Amount |
Maturity Date |
Fair Value |
||||||||||
Pay-fixed interest rate swaps |
$ | $ | ( |
) | ||||||||
Pay-fixed interest rate swaps |
( |
) |
Derivatives in Cash Flow Hedging Relationships |
Amount of Loss Recognized in OCI on Derivatives, Net of Tax |
Location of Loss Reclassified from Accumulated OCI into Operations |
Amount of Loss Reclassified from Accumulated OCI into Operations |
|||||||||
Interest rate swaps |
$ | Interest expense | $ |
December 31, 2020 |
||||||||||||||||
Fair Value |
Fair Value Measurements Using |
|||||||||||||||
Quoted Prices in Active Markets for Identical Assets and Liabilities (Level 1) |
Significant Other Observable Inputs (Level 2) |
Significant Unobservable Inputs (Level 3) |
||||||||||||||
Assets: |
||||||||||||||||
Investments of insurance subsidiaries: |
||||||||||||||||
Debt securities |
$ |
$ |
— |
$ |
$ |
— |
||||||||||
Money market funds and other |
— |
— |
||||||||||||||
|
|
|
|
|
|
|
|
|||||||||
Investments of insurance subsidiaries |
— |
|||||||||||||||
Less amounts classified as current assets |
( |
) |
( |
) |
( |
) |
— |
|||||||||
|
|
|
|
|
|
|
|
|||||||||
$ |
$ |
$ |
— |
|||||||||||||
|
|
|
|
|
|
|
|
|||||||||
Liabilities: |
||||||||||||||||
Interest rate swaps (Income taxes and other liabilities) |
$ |
$ |
— |
$ |
$ |
— |
December 31, 2019 |
||||||||||||||||
Fair Value |
Fair Value Measurements Using |
|||||||||||||||
Quoted Prices in Active Markets for Identical Assets and Liabilities (Level 1) |
Significant Other Observable Inputs (Level 2) |
Significant Unobservable Inputs (Level 3) |
||||||||||||||
Assets: |
||||||||||||||||
Investments of insurance subsidiaries: |
||||||||||||||||
Debt securities |
$ | $ | — | $ | $ | — | ||||||||||
Money market funds and other |
|
— | — | |||||||||||||
|
|
|
|
|
|
|
|
|||||||||
Investments of insurance subsidiaries |
— | |||||||||||||||
Less amounts classified as current assets |
( |
) | ( |
) | ( |
) | — | |||||||||
|
|
|
|
|
|
|
|
|||||||||
$ | |
$ | |
$ | — | |||||||||||
|
|
|
|
|
|
|
|
|||||||||
Interest rate swaps (Other) |
$ | $ | — | $ | $ | — | ||||||||||
Liabilities: |
||||||||||||||||
Interest rate swaps (Income taxes and other liabilities) |
$ | $ | — | $ | $ | — |
2020 |
2019 |
|||||||
Senior secured asset-based revolving credit facility |
$ |
— |
$ | |||||
Senior secured revolving credit facility |
— |
— | ||||||
Senior secured 364-day term loan facility |
— |
— | ||||||
Senior secured term loan facilities (effective interest rate of |
||||||||
Senior secured notes (effective interest rate of |
||||||||
Other senior secured debt (effective interest rate of |
||||||||
|
|
|
|
|||||
Senior secured debt |
||||||||
Senior unsecured notes (effective interest rate of |
||||||||
Net debt issuance costs |
( |
) |
( |
) | ||||
|
|
|
|
|||||
Total debt (average life of |
||||||||
Less amounts due within one year |
||||||||
|
|
|
|
|||||
$ |
$ | |||||||
|
|
|
|
• | a first-priority lien on the capital stock owned by HCA Inc., or by any guarantor, in each of their respective first-tier subsidiaries; |
• | a first-priority lien on substantially all present and future assets of HCA Inc. and of each guarantor other than (i) “Principal Properties” (as defined in the 1993 Indenture), (ii) certain other real properties and (iii) deposit accounts, other bank or securities accounts, cash, leaseholds, motor-vehicles and certain other exceptions; and |
• | a second-priority lien on certain of the Receivables Collateral. |
Balance Sheet Classification |
2020 |
2019 |
||||||||||
Assets: |
||||||||||||
Operating leases |
Right-of-use operating lease assets |
$ |
$ | |||||||||
Finance leases |
Property and equipment | |||||||||||
|
|
|
|
|||||||||
Total lease assets |
$ |
$ | ||||||||||
|
|
|
|
|||||||||
Liabilities: |
||||||||||||
Current: |
||||||||||||
Operating leases |
Other accrued expenses | $ |
$ | |||||||||
Finance leases |
Long-term debt due within one year | |||||||||||
Noncurrent: |
||||||||||||
Operating leases |
Right-of-use operating lease obligations |
|||||||||||
Finance leases |
Long-term debt | |||||||||||
|
|
|
|
|||||||||
Total lease liabilities |
$ |
$ | ||||||||||
|
|
|
|
|||||||||
Weighted-average remaining term: |
||||||||||||
Operating leases |
||||||||||||
Finance leases |
||||||||||||
Weighted-average discount rate: |
||||||||||||
Operating leases |
% |
% | ||||||||||
Finance leases |
% |
% |
2020 |
2019 |
|||||||
Finance lease expense: |
||||||||
Depreciation and amortization |
$ |
$ | ||||||
Interest |
||||||||
Operating leases( 1 ) |
||||||||
Short-term lease expense( 1 ) |
||||||||
Variable lease expense( 1 ) |
||||||||
|
|
|
|
|||||
$ |
$ | |||||||
|
|
|
|
( 1 ) |
Expenses are included in “other operating expenses” in our consolidated income statements. |
2020 |
2019 |
|||||||
Cash paid for amounts included in the measurement of lease liabilities: |
||||||||
Operating cash flows for operating leases |
$ |
$ | ||||||
Operating cash flows for finance leases |
||||||||
Financing cash flows for finance leases |
2020 |
2019 |
|||||||||||||||
Operating Leases |
Finance Leases |
Operating Leases |
Finance Leases |
|||||||||||||
Year 1 |
$ |
$ |
$ | $ | ||||||||||||
Year 2 |
||||||||||||||||
Year 3 |
||||||||||||||||
Year 4 |
||||||||||||||||
Year 5 |
||||||||||||||||
Thereafter |
||||||||||||||||
|
|
|
|
|
|
|
|
|||||||||
Total minimum lease payments |
||||||||||||||||
Less: amount of lease payments representing interest |
( |
) |
( |
) |
( |
) | ( |
) | ||||||||
|
|
|
|
|
|
|
|
|||||||||
Present value of future minimum lease payments |
||||||||||||||||
Less: current lease obligations |
( |
) |
( |
) |
( |
) | ( |
) | ||||||||
|
|
|
|
|
|
|
|
|||||||||
Long-term lease obligations |
$ |
$ |
$ | $ | ||||||||||||
|
|
|
|
|
|
|
|
For the Years Ended December 31, |
||||||||||||
2020 |
2019 |
2018 |
||||||||||
Revenues: |
||||||||||||
National Group |
$ |
$ | $ | |||||||||
American Group |
||||||||||||
Corporate and other |
||||||||||||
|
|
|
|
|
|
|||||||
$ |
$ | $ | ||||||||||
|
|
|
|
|
|
|||||||
Equity in earnings of affiliates: |
||||||||||||
National Group |
$ |
( |
) |
$ | ( |
) | $ | ( |
) | |||
American Group |
( |
) |
( |
) | ( |
) | ||||||
Corporate and other |
||||||||||||
|
|
|
|
|
|
|||||||
$ |
( |
) |
$ | ( |
) | $ | ( |
) | ||||
|
|
|
|
|
|
|||||||
Adjusted segment EBITDA: |
||||||||||||
National Group |
$ |
$ | $ | |||||||||
American Group |
||||||||||||
Corporate and other |
( |
) |
( |
) | ( |
) | ||||||
|
|
|
|
|
|
|||||||
$ |
$ | $ | ||||||||||
|
|
|
|
|
|
|||||||
Depreciation and amortization: |
||||||||||||
National Group |
$ |
$ | $ | |||||||||
American Group |
||||||||||||
Corporate and other |
||||||||||||
|
|
|
|
|
|
|||||||
$ |
$ | $ | ||||||||||
|
|
|
|
|
|
For the Years Ended December 31, |
||||||||||||
2020 |
2019 |
2018 |
||||||||||
Adjusted segment EBITDA |
$ |
$ | $ | |||||||||
Depreciation and amortization |
||||||||||||
Interest expense |
||||||||||||
Losses (gains) on sales of facilities |
( |
) | ( |
) | ||||||||
Losses on retirement of debt |
||||||||||||
|
|
|
|
|
|
|||||||
Income before income taxes |
$ |
$ | $ | |||||||||
|
|
|
|
|
|
|||||||
December 31, |
||||||||||||
2020 |
2019 |
2018 |
||||||||||
Assets: |
||||||||||||
National Group |
$ |
$ | $ | |||||||||
American Group |
||||||||||||
Corporate and other |
||||||||||||
|
|
|
|
|
|
|||||||
$ |
$ | $ | ||||||||||
|
|
|
|
|
|
National Group |
American Group |
Corporate and Other |
Total |
|||||||||||||
Goodwill and other intangible assets: |
||||||||||||||||
Balance at December 31, 2017 |
$ | $ | $ | $ | ||||||||||||
Acquisitions |
— | |||||||||||||||
Foreign currency translation, amortization and other |
( |
) | ( |
) | ( |
) | ( |
) | ||||||||
|
|
|
|
|
|
|
|
|||||||||
Balance at December 31, 2018 |
||||||||||||||||
Acquisitions |
||||||||||||||||
Foreign currency translation, amortization and other |
( |
) | ( |
) | — | ( |
) | |||||||||
|
|
|
|
|
|
|
|
|||||||||
Balance at December 31, 2019 |
||||||||||||||||
Acquisitions |
||||||||||||||||
Foreign currency translation, amortization and other |
( |
) |
( |
) |
( |
) |
( |
) | ||||||||
|
|
|
|
|
|
|
|
|||||||||
Balance at December 31, 2020 |
$ |
$ |
$ |
$ |
||||||||||||
|
|
|
|
|
|
|
|
Unrealized Gains on Available- for-Sale Securities |
Foreign Currency Translation Adjustments |
Defined Benefit Plans |
Change in Fair Value of Derivative Instruments |
Total |
||||||||||||||||
Balances at December 31, 2017 |
$ |
$ |
( |
) |
$ |
( |
) |
$ |
$ |
( |
) | |||||||||
Unrealized losses on available-for-sale income tax benefit |
( |
) |
— |
— |
— |
( |
) | |||||||||||||
Foreign currency translation adjustments, net of $ |
— |
( |
) |
— |
— |
( |
) | |||||||||||||
Defined benefit plans, net of $ |
— |
— |
— |
|||||||||||||||||
Change in fair value of derivative instruments, net of $ income taxes |
— |
— |
— |
|||||||||||||||||
Expense (income) reclassified into operations from other comprehensive income, net of $ |
— |
— |
( |
) |
||||||||||||||||
Reclassification of stranded tax effects |
( |
) |
( |
) |
( |
) | ||||||||||||||
|
|
|
|
|
|
|
|
|
|
|||||||||||
Balances at December 31, 2018 |
( |
) |
( |
) |
( |
) | ||||||||||||||
Unrealized gains on available-for-sale income taxes |
— |
— |
— |
|||||||||||||||||
Foreign currency translation adjustments, net of $ taxes |
— |
— |
— |
— |
— |
|||||||||||||||
Defined benefit plans, net of $ |
— |
— |
( |
) |
— |
( |
) | |||||||||||||
Change in fair value of derivative instruments, net of $ tax benefit |
— |
— |
— |
( |
) |
( |
) | |||||||||||||
Expense (income) reclassified into operations from other comprehensive income, net of $ |
— |
— |
( |
) |
( |
) | ||||||||||||||
|
|
|
|
|
|
|
|
|
|
|||||||||||
Balances at December 31, 2019 |
( |
) |
( |
) |
( |
) |
( |
) | ||||||||||||
Unrealized gains on available-for-sale income taxes |
— |
— |
— |
|||||||||||||||||
Foreign currency translation adjustments, net of $ taxes |
— |
— |
— |
|||||||||||||||||
Defined benefit plans, net of $ |
— |
— |
( |
) |
— |
( |
) | |||||||||||||
Change in fair value of derivative instruments, net of $ tax benefit |
— |
— |
— |
( |
) |
( |
) | |||||||||||||
Expense reclassified into operations from other comprehensive income, net of $ |
— |
— |
||||||||||||||||||
|
|
|
|
|
|
|
|
|
|
|||||||||||
Balances at December 31, 2020 |
$ |
$ |
( |
) |
$ |
( |
) |
$ |
( |
) |
$ |
( |
) | |||||||
|
|
|
|
|
|
|
|
|
|
2020 |
2019 |
|||||||
Professional liability risks |
$ |
$ | ||||||
Defined contribution benefit plan |
||||||||
Right-of-use operating lease |
||||||||
Taxes other than income |
||||||||
Interest |
||||||||
Government stimulus refund liability |
— | |||||||
Other |
||||||||
|
|
|
|
|||||
$ |
$ | |||||||
|
|
|
|