 Third Quarter 2011
Earnings Conference Call
October 25, 2011
Exhibit 99.2 |
 10/25/11
Proprietary and Confidential
2
Safe Harbor
Certain
statements
and
information
included
in
this
presentation
are
"forward-looking
statements"
under
the
Federal
Private
Securities
Litigation
Reform
Act
of
1995.
Accordingly,
these
forward-looking
statements
should
be
evaluated
with
consideration
given
to
the
many
risks
and
uncertainties
inherent
in
our
business
that
could
cause
actual
results
and
events
to
differ
materially
from
those
in
the
forward-looking
statements.
Important
factors
that
could
cause
such
differences
include,
among
others,
a
slowdown
of
the
economic
recovery
and
decreases
in
freight
demand,
our
ability
to
obtain
adequate
profit
margins
for
our
services,
our
inability
to
maintain
current
pricing
levels
due
to
soft
economic
conditions,
uncertainty
or
decline
in
economic
and
market
conditions
affecting
contractual
lease
demand,
decreases
in
market
demand
in
the
commercial
rental
market
and
the
sale
of
used
vehicles,
competition
from
other
service
providers,
customer
retention
levels,
unexpected
volatility
or
declines
in
automotive
or
high-tech
volume,
loss
of
key
customers
in
the
Supply
Chain
Solutions
(SCS)
business
segment,
unexpected
reserves
or
write-offs
due
to
the
deterioration
of
the
credit
worthiness
or
bankruptcy
of
customers,
changes
in
financial,
tax
or
regulatory
requirements
or
changes
in
customers’
business
environments
that
will
limit
their
ability
to
commit
to
long-term
vehicle
leases,
a
decrease
in
credit
ratings,
increased
debt
costs
resulting
from
volatile
financial
markets,
inability
to
achieve
planned
synergies
and
customer
retention
levels
or
anticipate
costs
and
liabilities
from
acquisitions,
labor
strikes
or
work
stoppages
affecting
our
or
our
customers’
business
operations,
driver
shortages
and
increasing
driver
costs,
adequacy
of
accounting
estimates,
reserves
and
accruals
particularly
with
respect
to
pension,
taxes,
insurance
and
revenue,
a
decline
in
pension
plan
returns,
changes
in
obligations
relating
to
multi-employer
plans,
sudden
or
unusual
changes
in
fuel
prices,
our
ability
to
manage
our
cost
structure,
new
accounting
pronouncements,
rules
or
interpretations,
changes
in
government
regulations,
adverse
impacts
of
recently
enacted
regulations
regarding
vehicle
emissions,
the
inability
to
prevent
a
data
privacy
breach,
unanticipated
outcomes
in
legal
proceedings
and
the
risks
described
in
our
filings
with
the
Securities
and
Exchange
Commission.
The
risks
included
here
are
not
exhaustive.
New
risks
emerge
from
time
to
time
and
it
is
not
possible
for
management
to
predict
all
such
risk
factors
or
to
assess
the
impact
of
such
risks
on
our
business.
Accordingly,
we
undertake
no
obligation
to
publicly
update
or
revise
any
forward-looking
statements,
whether
as
a
result
of
new
information,
future
events,
or
otherwise. |
 Contents
Third Quarter 2011 Results Overview
Asset Management Update
Earnings Outlook
Future Financial Reporting Enhancements
Q & A
10/25/11
3
Proprietary and Confidential |
 10/25/11
Proprietary and Confidential
4
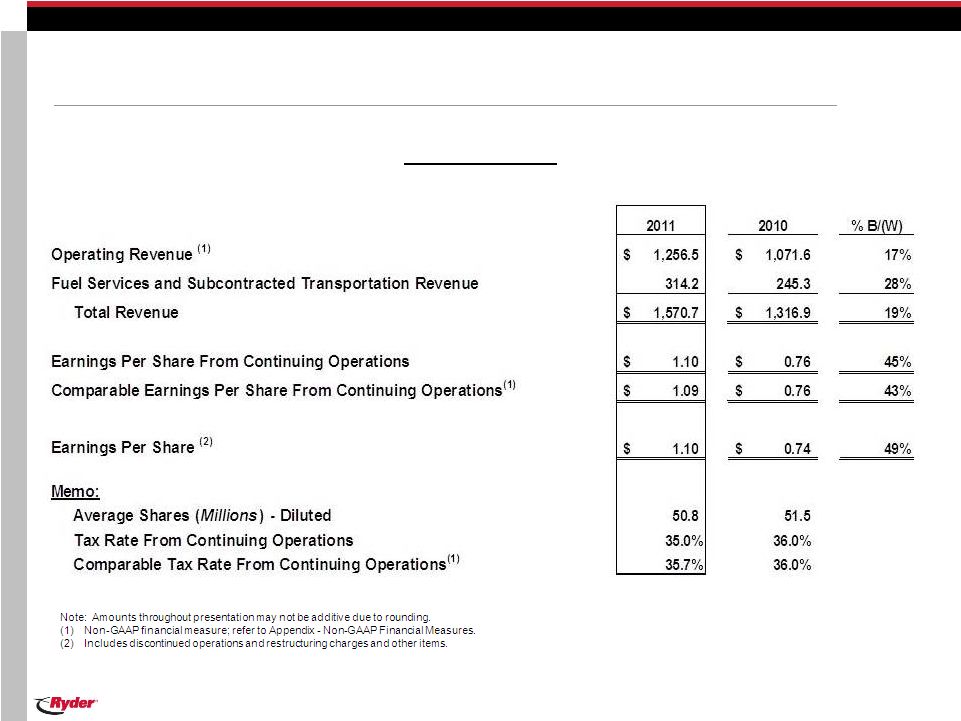
3rd Quarter Results Overview
Earnings
per
diluted
share
from
continuing
operations
were
$1.10
in
3Q11
vs.
$0.76 in 3Q10
–
3Q11 included a $0.01 tax benefit from acquisition-related transaction
costs Comparable earnings per share from continuing operations were $1.09 in
3Q11 vs. $0.76 in 3Q10
Total revenue increased 19% (and operating revenue increased 17%) vs. prior
year reflecting the impact of acquisitions and organic revenue growth
|
 10/25/11
Proprietary and Confidential
5
Key Financial Statistics
Third Quarter
($ Millions, Except Per Share Amounts) |
 10/25/11
Proprietary and Confidential
6
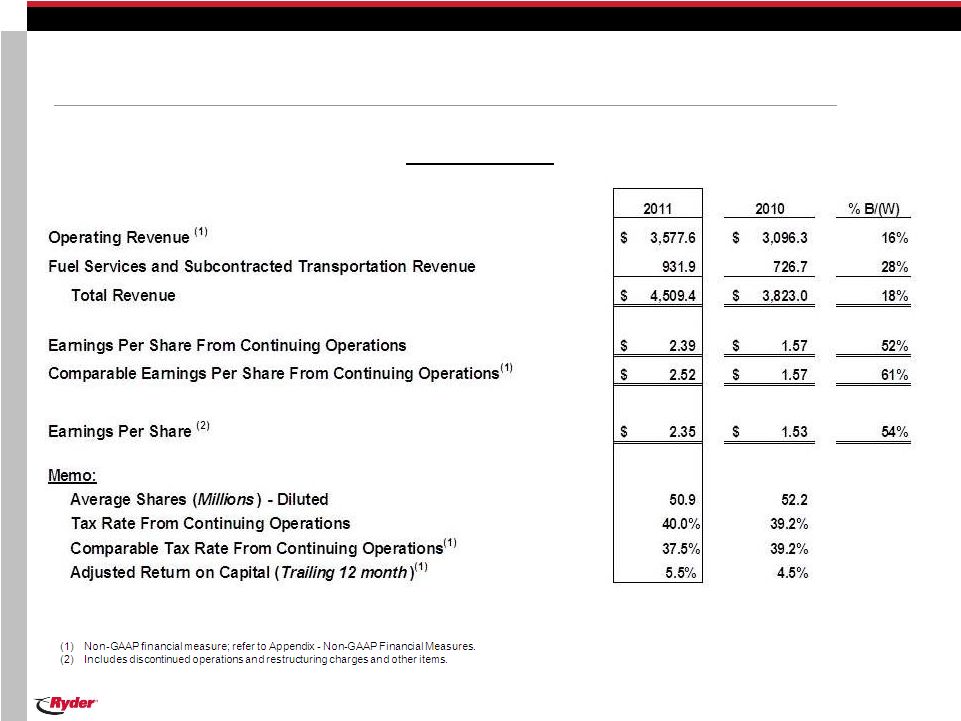
Key Financial Statistics
Year-To-Date
($ Millions, Except Per Share Amounts) |
 10/25/11
Proprietary and Confidential
7
3rd Quarter Results Overview -
FMS
Fleet Management Solutions (FMS) total revenue up 16% (and operating revenue
up 12%) vs. prior year
–
Contractual revenue up 4%
–
Full service lease revenue up 5%
–
Contract maintenance revenue decreased 2%
–
Commercial rental revenue up 40%
–
Fuel revenue up 28% due primarily to increase in fuel pass-throughs
FMS net before tax earnings (NBT) up 35%
–
FMS NBT percent of operating revenue up 150 basis points to 9.0%
FMS earnings positively impacted by better commercial rental performance,
improved used vehicle results and acquisitions
–
These benefits were partially offset by higher compensation-related expenses
and increased maintenance costs on an older lease fleet
|
 10/25/11
Proprietary and Confidential
8
3rd Quarter Results Overview –
SCS / DCC
Supply Chain Solutions (SCS) total revenue up 26% (and operating
revenue up
26%) vs. prior year due to the TLC acquisition, higher volumes and new
business SCS net before tax earnings (NBT) up 47%
–
SCS NBT percent of operating revenue up 100 basis points to 6.9%
SCS earnings increased due to the TLC acquisition, higher volumes and new
business, partially offset by higher compensation costs
–
Earnings also benefited from favorable insurance developments, foreign exchange
gains and a facility sale
Dedicated Contract Carriage (DCC) total revenue up 31% (and operating revenue
up 26%) due to the Scully acquisition and higher fuel pass-throughs
DCC net before tax earnings (NBT) down 3%
–
DCC NBT percent of operating revenue down 170 basis points to 5.6%
DCC earnings increased due to the Scully acquisition and better operating
performance, but were more than offset by higher compensation-related costs
and legal claims |
 10/25/11
Proprietary and Confidential
9
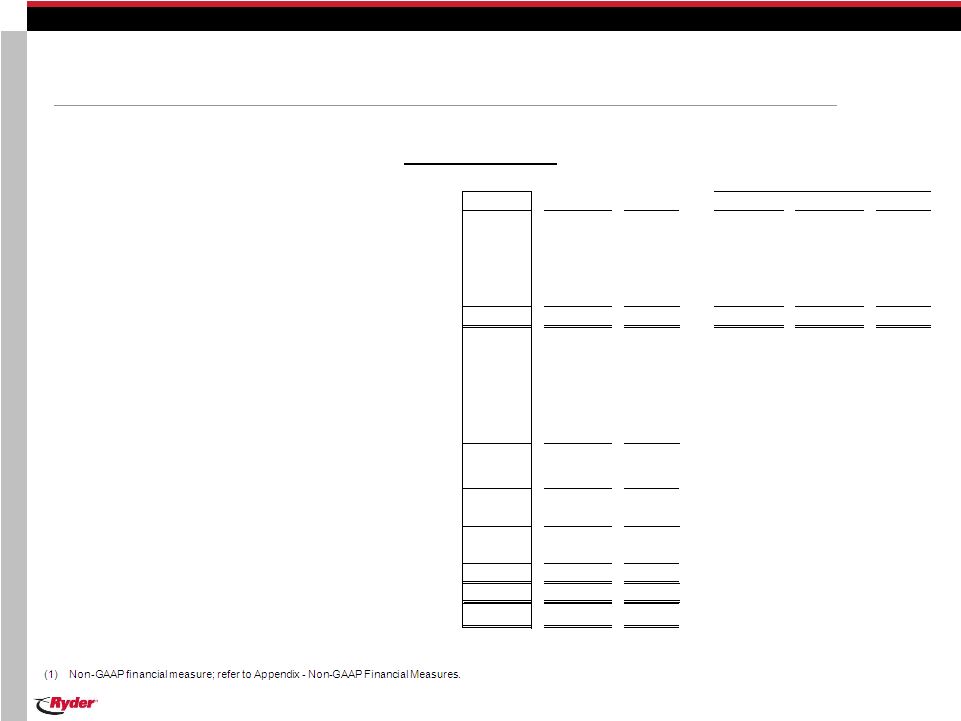
Business Segments
2011
2010
% B/(W)
2011
2010
% B/(W)
Operating Revenue:
(1)
Fleet Management Solutions
824.7
$
733.9
$
12%
1,099.0
$
948.9
$
16%
Supply Chain Solutions
326.8
258.5
26%
406.1
322.9
26%
Dedicated Contract Carriage
149.5
118.7
26%
158.9
121.4
31%
Eliminations
(44.4)
(39.5)
(13)%
(93.3)
(76.3)
(22)%
Total
1,256.5
$
1,071.6
$
17%
1,570.7
$
1,316.9
$
19%
Segment Net Before Tax Earnings:
Fleet Management Solutions
74.2
$
54.8
$
35%
Supply Chain Solutions
22.4
15.2
47%
Dedicated Contract Carriage
8.4
8.6
(3)%
Eliminations
(5.7)
(4.6)
(22)%
99.2
74.0
34%
Central Support Services (Unallocated Share)
(11.6)
(12.0)
3%
Earnings Before Restructuring and Income Taxes
(1)
87.7
62.0
41%
Restructuring and Other Charges, Net and Other Items
-
-
-
Earnings Before Income Taxes
87.7
62.0
41%
Provision for Income Taxes
(30.7)
(22.3)
(38)%
Earnings from Continuing Operations
56.9
$
39.7
$
44%
Comparable Earnings from Continuing Operations
(1)
56.4
$
39.7
$
42%
Net Earnings
56.5
$
38.8
$
46%
Memo: Total Revenue
Third Quarter
($ Millions) |
 10/25/11
Proprietary and Confidential
10
Business Segments
2011
2010
% B/(W)
2011
2010
% B/(W)
Operating Revenue:
(1)
Fleet Management Solutions
2,322.5
$
2,120.3
$
10%
3,143.7
$
2,764.1
$
14%
Supply Chain Solutions
966.2
746.7
29%
1,196.7
927.2
29%
Dedicated Contract Carriage
419.5
349.3
20%
444.0
360.8
23%
Eliminations
(130.7)
(119.9)
(9)%
(275.0)
(229.0)
(20)%
Total
3,577.6
$
3,096.3
$
16%
4,509.4
$
3,823.0
$
18%
Segment Net Before Tax Earnings:
Fleet Management Solutions
180.2
$
122.7
$
47%
Supply Chain Solutions
51.7
34.8
49%
Dedicated Contract Carriage
25.5
24.4
4%
Eliminations
(17.1)
(14.5)
(18)%
240.3
167.4
44%
Central Support Services (Unallocated Share)
(31.6)
(30.7)
(3)%
Earnings Before Restructuring and Income Taxes
(1)
208.8
136.7
53%
Restructuring and Other Charges, Net and Other Items
(2)
(2.5)
-
NM
Earnings Before Income Taxes
206.3
136.7
51%
Provision for Income Taxes
(82.6)
(53.6)
(54)%
Earnings from Continuing Operations
123.7
$
83.1
$
49%
Comparable Earnings from Continuing Operations
(1)
130.5
$
83.1
$
57%
Net Earnings
121.7
$
81.0
$
50%
Memo: Total Revenue
Year-To-Date
($ Millions) |
 10/25/11
Proprietary and Confidential
11
Capital Expenditures
2011 $
2011
2010
O/(U) 2010
Full Service Lease
614
$
488
$
127
$
Commercial Rental
580
358
222
Operating Property and Equipment
55
49
6
Gross Capital Expenditures
1,249
895
354
Less: Proceeds from Sales (Primarily Revenue Earning Equipment)
224
162
62
Net Capital Expenditures
1,025
$
733
$
292
$
Memo: Acquisitions
362
$
7
$
355
$
Year-To-Date
($ Millions) |
 10/25/11
Proprietary and Confidential
12
Cash Flow from Continuing Operations
Year-To-Date
($ Millions)
2011
2010
Earnings from Continuing Operations
124
$
83
$
Depreciation
645
628
Gains on Vehicle Sales, Net
(46)
(18)
Amortization and Other Non-Cash Charges, Net
41
40
Pension Contributions
(12)
(11)
Changes in Working Capital and Deferred Taxes
31
83
Cash Provided by Operating Activities
782
804
Proceeds from Sales (Primarily Revenue Earning Equipment)
224
162
Collections of Direct Finance Leases
46
46
Other, Net
-
2
Total Cash Generated
(1)
1,052
1,014
Capital Expenditures
(2)
(1,165)
(861)
Free Cash Flow
(1)(3)
(113)
$
153
$
|
 183%
203%
225%
275%
275%
234%
201%
146%
129%
151%
168%
157%
225%
0%
50%
100%
150%
200%
250%
300%
12/31/00
12/31/01
12/31/02
12/31/03
12/31/04
12/31/05
12/31/06
12/31/07
12/31/08
12/31/09
12/31/10
09/30/11
Long
Term
Target
Midpoint
Total Obligations
to Equity
Balance Sheet
Debt to Equity
10/25/11
Proprietary and Confidential
13
Debt to Equity Ratio
($ Millions)
(1)
(2)
9/30/11
12/31/10
9/30/10
Balance Sheet Debt
3,199
$
2,747
$
2,530
$
Percent To Equity
220%
196%
180%
Total Obligations
(1)
3,263
$
2,847
$
2,644
$
Percent To Equity
(1)
225%
203%
188%
Total Equity
1,451
$
1,404
$
1,408
$ |
 Contents
Third Quarter 2011 Results Overview
Asset Management Update
Earnings Outlook
Future Financial Reporting Enhancements
Q & A
10/25/11
14
Proprietary and Confidential |
 10/25/11
Proprietary and Confidential
15
Units held for sale were 5,100 at quarter end; up 9% from 4,700 units held for sale
in the prior year
–
Used vehicle inventory remains below target levels
The number of used vehicles sold in the third quarter were 4,100, down 7% compared
with prior year due to lower average inventory levels
Proceeds
per
unit
were
up
39%
for
tractors
and
up
20%
for
trucks
in
the
third
quarter
compared with prior year (excluding the impact of exchange rates)
–
Proceeds per unit were up 6% for tractors and 5% for trucks vs. the prior
quarter Vehicles
no
longer
earning
revenue
were
7,600
at
quarter
end;
up
700
or
10%
from
the
prior year
Average third quarter total commercial rental fleet was up 30%
year-over-year (12% excluding acquisitions)
Global Asset Management Update
(1)
(1)
Units rounded to nearest hundred. |
 Contents
Third Quarter 2011 Results Overview
Asset Management Update
Earnings Outlook
Future Financial Reporting Enhancements
Q & A
10/25/11
16
Proprietary and Confidential |
 10/25/11
17
EPS Forecast –
Continuing Operations
Fourth Quarter
Full Year
2011 Comparable EPS Forecast
(1)
$ 0.92 - 0.97
$ 3.44 - 3.49
2010 Comparable EPS
(1)
$0.65
$2.22
($ Earnings Per Share)
Proprietary and Confidential
(1)
Non-GAAP financial measure. (Comparable EPS in FY10 excludes a gain on sale of
an international asset of $0.02, tax benefits of $0.21 and acquisition costs of $0.08.
Comparable EPS in 4Q11 excludes $0.06 of acquisition-related severance and
other restructuring costs. Comparable EPS in FY11 excludes a $0.09 charge related to tax
law changes and benefits and $0.08 of acquisition-related severance and other
restructuring costs as well as transaction costs.) Increasing full year 2011
EPS forecast from $3.33 – 3.43 to $3.44 –
3.49
Current forecast is as follows: |
 Contents
Third Quarter 2011 Results Overview
Asset Management Update
Earnings Outlook
Future Financial Reporting Enhancements
Q & A
10/25/11
18
Proprietary and Confidential |
 Future Financial Reporting Enhancements
10/25/11
19
Proprietary and Confidential
Reporting Change
Effective Date
Merits of Change
New income statement
presentation
4Q2011
Increased visibility to types of
revenue
Aligns direct costs with revenues
Combined financial
reporting for SCS and
DCC segments
1Q2012
Industry vertical revenue
presentation for SCS and DCC
combined
Visibility into total DCC operating
revenue, including portion
traditionally within SCS
Exclude non-service
pension costs from
segment NBT
1Q2012
Provides better transparency to
segment operating results
Improves visibility into pension
plan performance
Ryder will make the following changes to the company’s
financial statement reporting:
Historical information will be provided for comparative purposes
|
 Future Financial Reporting Enhancements
10/25/11
20
Proprietary and Confidential
Revenues:
Lease and rentals
XXX
A
Services
XXX
A
Fuel services
XXX
A
Revenue
XXX
A
Total Revenues
XXX
A
Costs and Expenses:
Operating expense
XXX
B
Cost of lease and rentals
XXX
B, C, E, G
Salaries and employee related costs
XXX
C
Cost of services
XXX
B, C, D, E
Subcontracted transportation
XXX
D
Cost of fuel services
XXX
B, C, E
Depreciation expense
XXX
E
Other operating expenses
XXX
B, E
Gains on vehicle sales, net
XXX
F
Selling, general and administrative expenses
XXX
B, C, E
Equipment rental
XXX
G
Gains on vehicles sales, net
XXX
F
Interest expense
XXX
H
Interest expense
XXX
H
Miscellaneous (income) expense, net
XXX
I
Miscellaneous (income) expense, net
XXX
I
Restructuring and other charges, net
XXX
J
Restructuring and other charges, net
XXX
J
XXX
K
Total Costs and Expenses
XXX
K
Earnings from continuing operations before
income taxes
XXX
L
Earnings from continuing operations before
income taxes
XXX
L
Memo: Depreciation Expense
XXX
E
Equipment
Rental XXX
G
Current Presentation
Future Presentation
Revised format for the consolidated RSI income statement
|
 Future Financial Reporting Enhancements
10/25/11
21
Proprietary and Confidential
Automotive
xxx
High-Tech
xxx
Retail & CPG
xxx
Industrial & Other
xxx
Operating Revenue
xxx
Subcontracted Transportation
xxx
Total Revenue
xxx
Segment Net Before Tax Earnings (NBT)
xxx
Segment NBT as % of Total Revenue
xxx
Segment NBT as % of Operating Revenue
xxx
Memo: DCC Operating Revenue
xxx
Fuel Costs
xxx
Combined financial reporting for SCS and DCC segments
NEW –
WILL INCLUDE DCC ACTIVITY PREVIOUSLY
REPORTED IN SCS BUSINESS SEGMENT
CURRENT DCC SEGMENT REVENUE WILL BE REPORTED
IN THEIR RESPECTIVE INDUSTRY VERTICALS |
 Future Financial Reporting Enhancements
10/25/11
22
Proprietary and Confidential
Exclusion of non-service cost components of pension from segment NBT
-
Non-service cost components consist primarily of interest cost, expected
return on plan assets and recognized net actuarial gains/losses
Segment Net Before Tax Earnings:
Segment Net Before Tax Earnings:
Fleet Management Solutions
Fleet Management Solutions
Supply Chain Solutions
Supply Chain Solutions (incl. Dedicated Contract Carriage)
Dedicated Contract Carriage
Eliminations
Eliminations
Central Support Services (Unallocated Share)
Central Support Services (Unallocated Share)
Earnings Before Restructuring and Income Taxes
Non-Service Pension Costs
Restructuring and Other Charges, Net and Other Items
Restructuring and Other Charges, Net and Other Items
Earnings Before Income Taxes
Earnings Before Income Taxes
Current Presentation
Future Presentation
NEW
RESTATED |
 Contents
Third Quarter 2011 Results Overview
Asset Management Update
Earnings Outlook
Future Financial Reporting Enhancements
Q & A
10/25/11
23
Proprietary and Confidential |
 Q&A
10/25/11
24
Proprietary and Confidential |
 Appendix
Business Segment Detail
Central Support Services
Balance Sheet
Asset Management
Financial Indicators Forecast
Non-GAAP Financial Measures & Reconciliations
10/25/11
25
Proprietary and Confidential |
 10/25/11
Proprietary and Confidential
26
Fleet Management Solutions (FMS)
2011
2010
% B/(W)
Full Service Lease
509.9
$
487.5
$
5%
Contract Maintenance
39.1
40.1
(2)%
Contractual Revenue
549.0
527.6
4%
Contract-related Maintenance
51.6
41.2
25%
Commercial Rental
206.5
147.9
40%
Other
17.5
17.2
2%
Operating Revenue
824.7
733.9
12%
Fuel Services Revenue
274.4
215.1
28%
Total Revenue
1,099.0
$
948.9
$
16%
Segment Net Before Tax Earnings (NBT)
74.2
$
54.8
$
35%
Segment NBT as % of Total Revenue
6.7%
5.8%
Segment NBT as % of Operating Revenue
9.0%
7.5%
Third Quarter
($ Millions) |
 10/25/11
Proprietary and Confidential
27
Fleet Management Solutions (FMS)
2011
2010
% B/(W)
Full Service Lease
1,487.9
$
1,449.4
$
3%
Contract Maintenance
116.4
119.8
(3)%
Contractual Revenue
1,604.3
1,569.1
2%
Contract-related Maintenance
143.7
121.2
18%
Commercial Rental
522.2
379.5
38%
Other
52.4
50.4
4%
Operating Revenue
2,322.5
2,120.3
10%
Fuel Services Revenue
821.1
643.8
28%
Total Revenue
3,143.7
$
2,764.1
$
14%
Segment Net Before Tax Earnings (NBT)
180.2
$
122.7
$
47%
Segment NBT as % of Total Revenue
5.7%
4.4%
Segment NBT as % of Operating Revenue
7.8%
5.8%
Year-To-Date
($ Millions) |
 10/25/11
Proprietary and Confidential
28
Supply Chain Solutions (SCS)
Third Quarter
($ Millions)
2011
2010
% B/(W)
Automotive
115.3
$
114.7
$
1%
High-Tech
59.2
57.2
4%
Retail & CPG
109.6
45.7
140%
Industrial & Other
42.6
40.8
4%
Operating Revenue
326.8
258.5
26%
Subcontracted Transportation
79.3
64.3
23%
Total Revenue
406.1
$
322.9
$
26%
Segment Net Before Tax Earnings (NBT)
22.4
$
15.2
$
47%
Segment NBT as % of Total Revenue
5.5%
4.7%
Segment NBT as % of Operating Revenue
6.9%
5.9%
Memo: Fuel Costs
21.5
$
19.4
$
(11)% |
 10/25/11
Proprietary and Confidential
29
Supply Chain Solutions (SCS)
Year-To-Date
($ Millions)
2011
2010
% B/(W)
Automotive
345.9
$
334.4
$
3%
High-Tech
176.8
161.8
9%
Retail & CPG
317.3
131.7
141%
Industrial & Other
126.3
118.7
6%
Operating Revenue
966.2
746.7
29%
Subcontracted Transportation
230.5
180.5
28%
Total Revenue
1,196.7
$
927.2
$
29%
Segment Net Before Tax Earnings (NBT)
51.7
$
34.8
$
49%
Segment NBT as % of Total Revenue
4.3%
3.8%
Segment NBT as % of Operating Revenue
5.3%
4.7%
Memo: Fuel Costs
70.2
$
57.8
$
(21)% |
 10/25/11
Proprietary and Confidential
30
Dedicated Contract Carriage (DCC)
2011
2010
% B/(W)
Operating Revenue
149.5
$
118.7
$
26%
Subcontracted Transportation
9.5
2.7
248%
Total Revenue
158.9
$
121.4
$
31%
Segment Net Before Tax Earnings (NBT)
8.4
$
8.6
$
(3)%
Segment NBT as % of Total Revenue
5.3%
7.1%
Segment NBT as % of Operating Revenue
5.6%
7.3%
Memo: Fuel Costs
33.4
$
21.1
$
(58)%
Third Quarter
($ Millions) |
 10/25/11
Proprietary and Confidential
31
Dedicated Contract Carriage (DCC)
2011
2010
% B/(W)
Operating Revenue
419.5
$
349.3
$
20%
Subcontracted Transportation
24.5
11.5
114%
Total Revenue
444.0
$
360.8
$
23%
Segment Net Before Tax Earnings (NBT)
25.5
$
24.4
$
4%
Segment NBT as % of Total Revenue
5.7%
6.8%
Segment NBT as % of Operating Revenue
6.1%
7.0%
Memo: Fuel Costs
93.6
$
61.6
$
(52)%
Year-To-Date
($ Millions) |
 10/25/11
Proprietary and Confidential
32
Central Support Services (CSS)
2011
2010
% B/(W)
Allocated CSS Costs
43.0
$
35.8
$
(20)%
Unallocated CSS Costs
11.6
12.0
3%
Total CSS Costs
54.6
$
47.7
$
(14)%
Third Quarter
($ Millions) |
 10/25/11
Proprietary and Confidential
33
Central Support Services (CSS)
2011
2010
% B/(W)
Allocated CSS Costs
120.3
$
105.0
$
(15)%
Unallocated CSS Costs
31.6
30.7
(3)%
Total CSS Costs
151.9
$
135.7
$
(12)%
Year-To-Date
($ Millions) |
 10/25/11
Proprietary and Confidential
34
Balance Sheet
September 30,
December 31,
2011
2010
Cash and Cash Equivalents
116
$
213
$
Other Current Assets
983
810
Revenue Earning Equipment, Net
4,828
4,201
Operating Property and Equipment, Net
627
607
Other Assets
892
821
Total Assets
7,446
$
6,652
$
Short-Term Debt / Current Portion Long-Term Debt
255
$
420
$
Other Current Liabilities
908
711
Long-Term Debt
2,943
2,327
Other Non-Current Liabilities (including Deferred Income Taxes)
1,888
1,790
Shareholders' Equity
1,451
1,404
Total Liabilities and Shareholders' Equity
7,446
$
6,652
$
($ Millions) |
 10/25/11
Proprietary and Confidential
35
U.S. Asset Management Update
(a)
(a)
U.S. only
(b)
Excludes early terminations where customer purchases vehicle
(c)
Current year statistics may exclude some units due to a lag in reporting
(b)
Number of
Units
2,734
3,052
2,981
3,138
2,910
3,756
3,023
3,959
3,670
3,138
5,255
4,899
4,033
6,752
3,005
3,348
5,119
2,352
0
1,000
2,000
3,000
4,000
5,000
6,000
7,000
8,000
Redeployments
Extensions
Early Terminations
YTD 06
YTD 07
YTD 08
YTD 09
YTD 10
YTD 11
(c)
Redeployments
–
vehicles
coming off-lease with useful
life remaining are redeployed
in the Ryder fleet (Commercial
Rental, DCC, SCS, or with
another Lease customer).
Extensions –
Ryder re-prices
lease contract and extends
maturity date.
Early terminations –
customer elects to terminate
lease prior to maturity.
Depending on the remaining
useful life, the vehicle may be
redeployed in the Ryder fleet
(Commercial Rental, DCC,
SCS, other Lease customer) or
sold by Ryder. |
 2000
2001
2002
2003
2004
2005
2006
2007
2008
2009
2010
2011
Forecast
Long
Term
Target
Mispoint
10/25/11
Proprietary and Confidential
36
$1,054
$1,091
$1,381
$1,179
$835
$949
$1,252
$1,266
$1,684
$1,571
$1,328
$1,500
2000
2001
2002
2003
2004
2005
2006
2007
2008
Financial Indicators Forecast
(1)
Gross Capital Expenditures
(3)
($ Millions)
Total Cash Generated
(2) (3)
Total Obligations to Equity Ratio
(2)
$1,289
$600
$725
$1,165
$657
$1,399
$1,182
2000
2001
2002
2003
2004
2005
Memo: Free Cash Flow
(2) (3)
$1,757
2006
2007
2008
$1,265
2009
2010
2010
2009
$611
131
367
357
289
(208)
(4)
380
(242)
(439)
341
614
$1,088
Total Obligations to Equity
Balance Sheet Debt to Equity
2000
2001
2002
2003
2004
2005
2006
2007
2008
2009
2010
275%
146%
129%
234%
151%
157%
168%
225%
183%
203%
201%
Significant and predictable cash generation
Invest in growth (organic, acquisitions)
Over time appropriately move financial
leverage towards long term target of
250-300% Total Obligations to Equity
275%
Long
Term
Target
Midpoint
2011
Forecast
(215)
(5)
2011
Forecast
2011
220%
Forecast
258
$1,755
Full Service Lease
PP&E/Other
Commercial Rental |
 Adjusted Return on Capital
(1)
History
Proprietary and Confidential
37
Adjusted
Return on
Capital (ROC)
6.9%
6.8%
6.7%
6.6%
6.5%
6.3%
6.1%
5.6%
5.5%
7.7%
7.8%
7.9%
7.4%
7.3%
4.1%
4.8%
5.6%
5.7%
2004
2005
2006
2007
2008
2009
2010
Prior
2011
Current
2011
Cost of
Capital (COC)
Return on Equity
15.3%
14.6%
15.5%
14.2%
11.2%
4.4%
8.4%
11.2%
11.6%
Total Capital
(2)
$3,359
$3,846
$4,184
$4,789
$4,841
$4,244
$4,030
$4,641
$4,579
ROC O/(U) COC
0.8%
1.0%
1.2%
0.8%
0.8%
(2.2)%
(1.3)%
-%
0.2%
10/25/11
Forecast
Forecast
(3) |
 10/25/11
Proprietary and Confidential
38
Non-GAAP Financial Measures
This presentation includes “non-GAAP financial measures”
as defined by SEC rules. As required by SEC
rules, we provide a reconciliation of each non-GAAP financial measure to the
most comparable GAAP measure and an explanation why management believes that
presentation of the non-GAAP financial measure provides useful
information to investors. Non-GAAP financial measures should be considered in
addition to, but not as a substitute for or superior to, other measures of financial
performance prepared in accordance with GAAP.
Specifically, the following non-GAAP financial measures are included in this
presentation: Non-GAAP Financial Measure
Comparable GAAP Measure
Reconciliation & Additional Information
Presented on Slide Titled
Page
Operating Revenue
Total Revenue
Key Financial Statistics
5-6
Earnings Before Restructuring and Income Taxes
Earnings before Income Taxes from Continuing
Operations
Business Segments
9-10
Comparable Earnings / EPS from Continuing
Operations
Earnings / EPS from Continuing Operations
Earnings and EPS from Continuing Operations
Reconciliation
17
Comparable NBT / Tax Rate
NBT / Tax Rate
NBT and Tax Rate from Continuing Operations
Reconciliation
40
Adjusted Return on Capital
Net Earnings
Adjusted Return on Capital Reconciliation
41-42
Total Cash Generated / Free Cash Flow
Cash Provided by Operating Activities
Cash Flow Reconciliation
45-46
Total Obligations / Total Obligations to Equity
Balance Sheet Debt / Debt to Equity
Debt to Equity Ratio
Debt to Equity Reconciliation
13
43-44
FMS / SCS / DCC Operating Revenue and Segment
NBT as % of Operating Revenue
FMS / SCS / DCC Total Revenue and Segment
NBT as % of Total Revenue
Fleet Management Solutions / Supply Chain
Solutions / Dedicated Contract Carriage
26-31 |
 Earnings and EPS from Continuing Operations Reconciliation
($ Millions or $ Earnings Per Share)
3Q11 -
3Q11 -
Earnings
EPS
Reported
56.9
$
1.10
$
Tax Benefits
(0.6)
(0.01)
Comparable
56.4
$
1.09
$
Proprietary and Confidential
39
39
10/25/11
YTD 11 -
YTD 11 -
Earnings
EPS
Reported
123.7
$
2.39
$
Tax Law Changes / Benefits
4.8
0.09
Acquisition Related Transaction Costs
1.5
0.03
Restructuring Charges
0.5
0.01
Comparable
130.5
$
2.52
$ |
 Proprietary and Confidential
40
NBT and Tax Rate from Continuing Operations Reconciliation
($ Millions or $ Earnings Per Share)
3Q11 -
3Q11 -
3Q11 -
NBT
Tax
Tax Rate
Reported
87.7
$
30.7
$
35.0%
Tax Benefit
-
0.6
Comparable
87.7
$
31.3
$
35.7%
10/25/11
40
YTD 11 -
YTD 11 -
YTD 11 -
NBT
Tax
Tax Rate
Reported
206.3
$
82.6
$
40.0%
Tax Law Changes / Benefits
-
(4.8)
Acquisition Related Transaction Costs
1.7
0.2
Restructuring Charges
0.8
0.3
Comparable
208.8
$
78.3
$
37.5% |
 10/25/11
Proprietary and Confidential
41
Adjusted Return on Capital Reconciliation
9/30/11
9/30/10
Net Earnings
(1)
159
$
89
$
Restructuring and Other Charges, Net and Other Items
9
16
Income Taxes
90
62
Adjusted Earnings Before Income Taxes
257
167
Adjusted Interest Expense
(2)
136
133
Adjusted Income Taxes
(3)
(148)
(118)
Adjusted Net Earnings
245
$
182
$
Average Total Debt
2,916
$
2,480
$
Average Off-Balance Sheet Debt
86
120
Average Adjusted Total Shareholders' Equity
1,433
1,410
Average Adjustments to Shareholders' Equity
(4)
1
7
Adjusted Average Total Capital
4,437
$
4,017
$
Adjusted Return on Capital
(5)
5.5%
4.5%
(1)
Earnings calculated based on a 12-month rolling period.
(2)
Interest expense includes implied interest on off-balance sheet vehicle
obligations. (3)
Income taxes were calculated by excluding taxes related to comparable earnings
items and interest expense. (4)
Represents comparable earnings items for those periods.
(5)
The Company adopted adjusted return on capital, a non GAAP financial measure, as
the Company believes that both debt (including off-balance sheet debt) and equity
should be included in evaluating how effectively capital is utilized across the
business. ($ Millions) |
 10/25/11
Proprietary and Confidential
42
Adjusted Return on Capital Reconciliation
($ Millions)
2004
2005
2006
2007
2008
2009
2010
Net earnings
(1)
216
$
227
$
249
$
254
$
200
$
62
$
118
$
Cumulative effect of change in
accounting principle
-
2
-
-
-
-
-
Restructuring and other charges,
net and other items
(24)
(2)
-
1
70
30
6
Income taxes
115
129
144
152
150
54
61
Adjusted earnings before income
taxes
307
357
393
407
420
146
185
Adjusted interest expense
(2)
106
127
149
169
165
150
133
Adjusted income taxes
(3)
(156)
(186)
(207)
(220)
(230)
(122)
(124)
Adjusted net earnings
257
$
298
$
332
$
356
$
355
$
174
$
194
$
Average total debt
1,811
$
2,148
$
2,480
$
2,848
$
2,882
$
2,692
$
2,512
$
Average off-balance sheet debt
152
148
99
150
171
142
114
Average adjusted total
shareholders' equity
1,412
1,555
1,610
1,791
1,778
1,396
1,402
Average adjustments to
shareholders' equity
(4)
(16)
(5)
(5)
1
10
16
2
Adjusted average total capital
3,359
$
3,846
$
4,184
$
4,789
$
4,841
$
4,245
$
4,030
$
Adjusted return on capital
(5)
7.7%
7.8%
7.9%
7.4%
7.3%
4.1%
4.8%
(1)
Earnings calculated based on a 12-month rolling period.
(2)
Interest expense includes interest on off-balance sheet vehicle
obligations. (3)
Income taxes were calculated by excluding taxes related to comparable earnings
items and interest expense. (4)
Represents comparable earnings items for those periods.
(5)
The Company adopted adjusted return on capital, a non GAAP financial measure, as
the Company believes that both debt (includes off-balance sheet debt)
and equity should be included in evaluated how effectively capital is utilized across the business. |
 10/25/11
Proprietary and Confidential
43
Debt to Equity Reconciliation
% to
% to
% to
% to
% to
% to
% to
% to
12/31/00
Equity
12/31/01
Equity
12/31/02
Equity
12/31/03
Equity
12/31/04
Equity
12/31/05
Equity
12/31/06
Equity
12/31/07
Equity
Balance Sheet Debt
$2,017
161%
$1,709
139%
$1,552
140%
$1,816
135%
$1,783
118%
$2,185
143%
$2,817
164%
$2,776
147%
Receivables Sold
345
110
-
-
-
-
-
-
PV of minimum
lease payments
and guaranteed
residual values
under operating
leases for
vehicles
879
625
370
153
161
117
78
178
PV of contingent
rentals under
securitizations
209
441
311
-
-
-
-
-
Total Obligations
$3,450
275%
$2,885
234%
$2,233
201%
$1,969
146%
$1,944
129%
$2,302
151%
$2,895
168%
$2,954
157%
($ Millions) |
 10/25/11
Proprietary and Confidential
44
Debt to Equity Reconciliation
($ Millions)
% to
% to
% to
% to
% to
12/31/08
Equity
12/31/09
Equity
12/31/10
Equity
9/30/10
Equity
9/30/11
Equity
Balance Sheet Debt
$2,863
213%
$2,498
175%
$2,747
196%
$2,530
180%
$3,199
220%
Receivables Sold
-
-
-
-
-
PV of minimum
lease payments and
guaranteed residual
values under
operating leases for
vehicles
163
119
100
114
65
Total Obligations
$3,026
225%
$2,617
183%
$2,847
203%
$2,644
188%
$3,263
225% |
 10/25/11
Proprietary and Confidential
45
($ Millions)
Cash Flow Reconciliation
12/31/00
(4)
12/31/01
(4)
12/31/02
(4)
12/31/03
(4)
12/31/04
(4)
12/31/05
12/31/06
12/31/07
12/31/08
12/31/09
Cash Provided by Operating Activities
1,023
$
365
$
617
$
803
$
867
$
776
$
852
$
1,097
$
1,248
$
985
$
Less: Changes in Bal. of Trade Rec. Sold
(270)
235
110
-
-
-
-
-
-
-
Collections of Direct Finance Leases
67
66
66
61
64
69
65
62
61
65
Proceeds from Sale (Prim. Rev. Earn. Equip.)
230
173
152
210
331
333
332
373
262
216
Proceeds from Sale & Leaseback of Assets
-
-
-
13
118
-
-
150
-
-
Other Investing, Net
4
(4)
4
4
1
-
2
2
-
-
Total Cash Generated
(1)
1,054
835
949
1,091
1,381
1,179
1,252
1,684
1,571
1,266
Capital Expenditures
(2)
(1,296)
(704)
(582)
(734)
(1,092)
(1,387)
(1,691)
(1,304)
(1,230)
(652)
Free Cash Flow
(3)(5)
(242)
$
131
$
367
$
357
$
289
$
(208)
$
(439)
$
380
$
341
$
614
$
Memo:
Depreciation Expense
580
$
545
$
552
$
625
$
706
$
735
$
739
$
811
$
836
$
881
$
Gains on Vehicle Sales, Net
19
$
12
$
14
$
16
$
35
$
47
$
51
$
44
$
39
$
12
$ |
 10/25/11
Proprietary and Confidential
46
($ Millions)
Cash Flow Reconciliation
12/31/10
9/30/10
9/30/11
Cash Provided by Operating Activities from Continuing Operations
1,028
$
804
$
782
$
Proceeds from Sales (Primarily Revenue Earning Equipment)
235
162
224
Collections of Direct Finance Leases
62
46
46
Other, Net
3
2
-
Total Cash Generated
(1)
1,328
1,014
1,052
Capital Expenditures
(2)
(1,070)
(861)
(1,165)
Free Cash Flow
(3)(4)
258
$
153
$
(113)
$
Memo:
Depreciation Expense
834
$
628
$
645
$
Gains on Vehicle Sales, Net
29
$
(18)
$
(46)
$ |
 *
*
*
*
*
*
*
******** |