Annual Report and Form
20-F
2021 | REGISTRATION STATEMENT PURSUANT TO SECTION 12(b) OR (g) OF THE SECURITIES EXCHANGE ACT OF 1934 |
| ANNUAL REPORT PURSUANT TO SECTION 13 OR 15(d) OF THE SECURITIES EXCHANGE ACT OF 1934 |
| TRANSITION REPORT PURSUANT TO SECTION 13 OR 15(d) OF THE SECURITIES EXCHANGE ACT OF 1934 |
| SHELL COMPANY REPORT PURSUANT TO SECTION 13 OR 15(d) OF THE SECURITIES EXCHANGE ACT OF 1934 |
| Title of each class |
Trading Symbol(s) |
Name of each exchange on which registered | ||
340 ⁄399 pence each |
|
|
Ordinary Shares of 20 340 ⁄399 pence each |
| ☑ | Accelerated filer | ☐ | ||||
| Non-accelerated filer | ☐ | Emerging growth company | ||||
| US GAAP ☐ |
the International Accounting Standards Board ☑ |
Other ☐ |
| Auditor Firm Id: |
Auditor Name: |
Auditor Location: | ||
| Auditor Firm Id: |
Auditor Name: |
Auditor Location: |
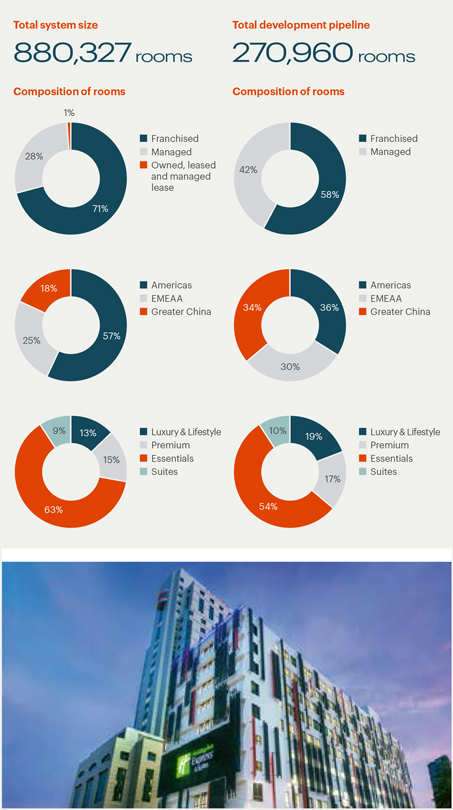
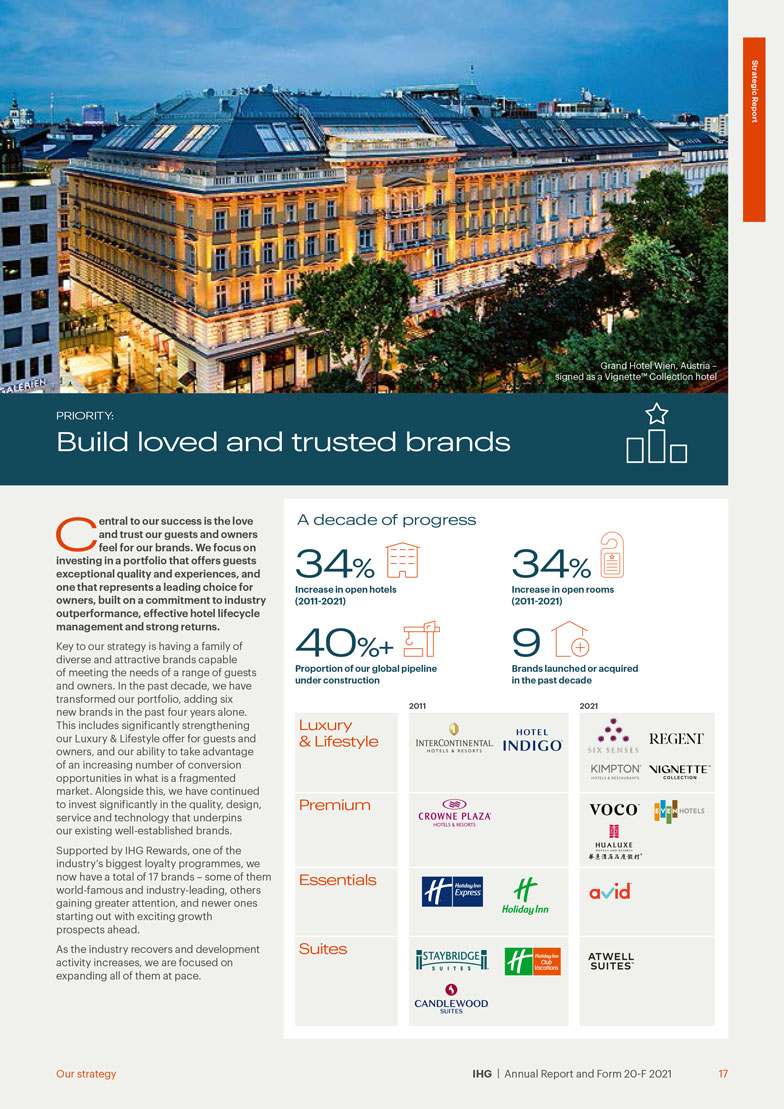
| Our presence IHG ® Hotels & Resorts is a global hospitality company, with 17 hotel brands and one of the industry’s largest loyalty programmes. We have nearly 6,000 open hotels in more than 100 countries and a further 1,800 hotels in our development pipeline. Our focus We focus on offering guests great choice, rewards and experiences, while continuously developing and investing in our people, operations, sustainability, technology and design, in order to drive demand, performance and return for our hotel owners.  Our business model We mainly franchise and manage hotels, which allows us to focus on increasing fee revenues and fee margins, with limited requirements for capital. Led by our strategic priorities, we grow our business by ensuring our brands meet consumer demand and generate strong returns for hotel owners.  | ||||||
| Our key stakeholders | ||||||
 |
 |
 | ||||
Shareholders and investors |
Hotel owners |
Hotel guests | ||||
 |
 |
 | ||||
Our people |
Community |
Suppliers | ||||
 See pages 20 to 28, 39, 92, 101, 107, 108, 112 to 114 for information about how we have engaged with our stakeholders during 2021. See pages 20 to 28, 39, 92, 101, 107, 108, 112 to 114 for information about how we have engaged with our stakeholders during 2021. | ||||||
| 2 |
||
| 4 |
||
| 6 |
||
| 8 |
||
| 10 |
||
| 14 |
||
| 16 |
||
| 32 |
||
| 36 |
||
| 40 |
||
| 48 |
||
| 50 |
||
| 54 |
||
| 54 |
||
| 55 |
||
| 63 |
||
| 66 |
||
| 69 |
||
| 72 |
||
| 73 |
||
| 80 |
||
| 82 |
||
| 86 |
||
| 88 |
||
| 89 |
||
| 89 |
||
| 92 |
||
| 93 |
||
| 94 |
||
| 95 |
||
| 100 |
||
| 102 |
||
| 104 |
||
| 126 |
||
| 130 |
||
| 138 |
||
| 142 |
||
| 149 |
||
| 157 |
||
| 158 |
||
| 218 |
||
| 226 |
||
| 231 |
||
| 243 |
||
| 250 |
||
| 251 |
||
| 252 |
||
| 255 |
||
| 257 |
||

IHG |
1 |

| Strategic Report Chair’s statement Staying focused on long-term success |
| Final dividend 85.9 ¢ Final dividend proposed for 2021 (2020: no dividend was paid) Return of funds $ 13.6 bn Since March 2003, the Group has returned $13.6 billion of funds to shareholders by way of ordinary and special dividends, capital returns and share repurchase programmes. Since 2014: • $500 million special dividend paid 29 January 2019• $400 million special dividend paid 22 May 2017• $1.5 billion special dividend paid 23 May 2016• $500 million share buyback completed in 2014• $750 million special dividend paid 14 July 2014 |
H |
aving entered 2021 on the back of the toughest time the hospitality industry has ever known, this year has been one |
| of hope, recovery, new challenges and opportunity. IHG’s global scale means we have experienced and learned from the evolving nature of the pandemic on a daily basis, market by market, and with clarity and flexibility we have stayed focused on the strategic business needs required to deliver long-term success for all stakeholders. | ||
| profit yet to fully recover to pre-pandemic 2019 levels. A key factor in this improved performance has been a heightened commitment to support our owners, listen to their needs, and work hand in hand across teams to respond with agility and expertise to challenges ranging from restrictions impacting demand, to the need to evolve brand standards and meet staffing and supply chain pressures as demand returns.Whether operational or commercial, these actions can strengthen both short and long-term performance, and as we build owner relationships and look to accelerate net rooms growth, we continue to invest in strategic priorities that will strengthen aspects of our entire offer. These include reducing costs to build, open and operate hotels across our brands, delivering loyalty and digital enhancements that improve the guest experience and drive performance, and investing in the quality, depth and breadth of our portfolio, such as the launch of the Vignette ™ Collection brand in August.Accelerated by the pandemic, recognising that our stakeholders increasingly measure profit, growth and success in relation to how companies operate responsibly across the environmental, social and governance (ESG) agenda, the commitments set out in our Journey to Tomorrow plan create a roadmap for positive change over the next decade. During the year, important progress was made on several fronts, including investments in new training and programmes that support a diverse and inclusive culture, thoughtful guidance around a shift to hybrid working, close collaboration with charities responding to natural disasters, and the formulation of a strategy to meet an upgraded science-based carbon reduction target across our hotel estate. |
4 |
IHG |

| Role of the Board To navigate an industry recovery, react to evolving trends and at the same time push to strengthen IHG on so many fronts has required great dedication from our leadership and teams. The role of the Board has been to support and constructively challenge the Executive Committee around how we prioritise, manage risk, grow and generate future value. The ESG agenda and technology landscape, including investments in our enterprise and managing cybersecurity risks, were also regularly considered in the year, alongside listening to employee sentiment via engagement sessions and feedback. Part of my role as Chair has been to encourage Board development and oversee changes that build and add new expertise and insights in recognition of the evolving nature of our business and stakeholder expectations. To this end, succession planning was also of significant focus in 2021, with both Anne Busquet and Dale Morrison retiring after tremendous service, and Richard Anderson unfortunately resigning after three months due to personal reasons. We were delighted to welcome Daniela Barone Soares as Non-Executive Director and Graham Allan was appointed as Senior Independent Non-Executive Director from 1 January 2022.In my ninth year as Chair, succession planning for my own role was also carried out, with a thorough and independent recruitment process leading to the appointment of Deanna Oppenheimer as Chair Designate from 1 June 2022, becoming Non-Executive Chair from 1 September 2022 upon my retirement. I look forward to working with Deanna on a comprehensive handover and I would like to take the opportunity to wish her the best in what I am sure will be a very successful tenure. |
With the strong financial improvements delivered in 2021, including profitability rebounding and a substantial reduction in net debt, the Board is proposing a final dividend of 85.9¢ in respect of 2021, an amount equivalent to the withdrawn final payment in respect of 2019. No interim dividend was paid in respect of 2021. Going forward, dividend payments will be reflective of IHG’s prior approach to sustainably grow the ordinary dividend whilst targeting a level of leverage that maintains an investment grade credit rating, and ensuring careful consideration of our responsibilities to all stakeholders. The Board will also continue to actively assess the opportunity for any surplus capital to be additionally returned through special dividends or share buybacks. A final perspective The IHG I will depart on 31 August 2022 is much changed from the one I joined in January 2013 – not least having grown from 4,600 to almost 6,000 hotels, and from nine to 17 brands. Having first gone on a crucial journey to establish our brands in more attractive markets, the past almost five years under Keith Barr’s leadership have seen the company transform and ready for a new chapter of growth. IHG has invested in its entire enterprise, including the quality of the estate and breadth of its brand portfolio, and as an organisation it has become more sophisticated and customer-centric, with a commitment to ESG now woven into the fabric of the business. The values of integrity and transparency that I have advocated at Board level run deep through the business and its leadership, as illustrated by the care and thought with which these past two years have been handled for IHG’s different stakeholders. Keith has also set the tone from the top |
on the importance of diversity, equity and inclusion, and progress continues to be made against the changes required to be a truly successful company in this regard, with IHG recognised for a seventh year running as a ‘Best Place to Work for LGBTQ+ Equality’, with a 100% rating in the Corporate Equality Index, and being Highly Commended in the Company of the Year category at the European Diversity Awards. While the pandemic may herald some structural change for our industry, such as technology replacing certain elements of business travel, there will be opportunities too, including facilitating a global shift to flexible working. What remains unchanged though, are the industry’s long-term fundamental growth drivers, such as a growing population, rising wealth in emerging markets and increasing conversions from unbranded players. The strength of IHG’s business model, strategic investments, pipeline, leadership and passionate teams gives me great confidence in a strong future. It has been a privilege to be a part of IHG’s story for almost a decade and I would like to offer my sincere respect and gratitude to all those in our hotels, offices and reservation centres who have been a part of it. I would also like to thank our owners for choosing IHG and for their continued long-term confidence in our brands and business.  Patrick Cescau Chair |
| Chair’s statement |
IHG |
5 |
| Strategic Report Chief Executive Officer’s review Emerging as a stronger IHG |
| Key highlights in 2021 291 Hotels opened (285 in 2020) 437 Hotels signed (360 in 2020) 47% Of full-year signings were for our Holiday Inn Brand Family 42% Of our pipeline now represented by upscale and luxury brands |
I |
n the past year, the resilience of our business model and enduring importance of travel and hospitality for millions globally has shone |
| through strongly. Crucially, while demonstrating our ability to effectively manage the impact of an evolving pandemic, we have not wavered in our focus to build an even stronger IHG, by growing our brands, enhancing our guest and owner offer, supporting our people and communities, and protecting our planet. | ||
| restrictions lift. Our approach has been to stay focused on organising operations and investments around what matters most to guests and owners, and ensuring IHG can grow at pace, in the right way. For colleagues, we have improved processes and introduced new tools to both attract and retain talent in what is a competitive jobs market, and we’ve placed a greater emphasis on mental health and wellbeing. Corporate and reservation teams have been supported with shifts to hybrid working, interactive sessions have brought employees closer to our strategy, and hotel teams have received training and support needed to adapt to evolving operations and brand standards. For guests, we have used AI technology in our reservation centres to improve customer service, enhanced our award-winning Meet with Confidence programme, and offered loyalty members point expiry extensions and new promotions. We saw Reward Night bookings largely recover to pre-pandemic levels during the year and welcomed another nine million members to IHG® Rewards.Working closely with the IHG Owners Association and operators, we have strived to anticipate owners’ needs, carefully focusing on costs, and delivering training and action plans to address performance opportunities and guest feedback. Staffing and supply chain challenges have been met with new recruitment solutions and increased procurement options that have delivered key products at lower cost, despite inflationary pressures. Commercially, we have increased marketing and introduced new tools to identify and capture demand, and we continued our work with trade bodies and governments to advocate for industry support in recognition of the vital economic role hospitality plays globally. |
6 |
IHG |

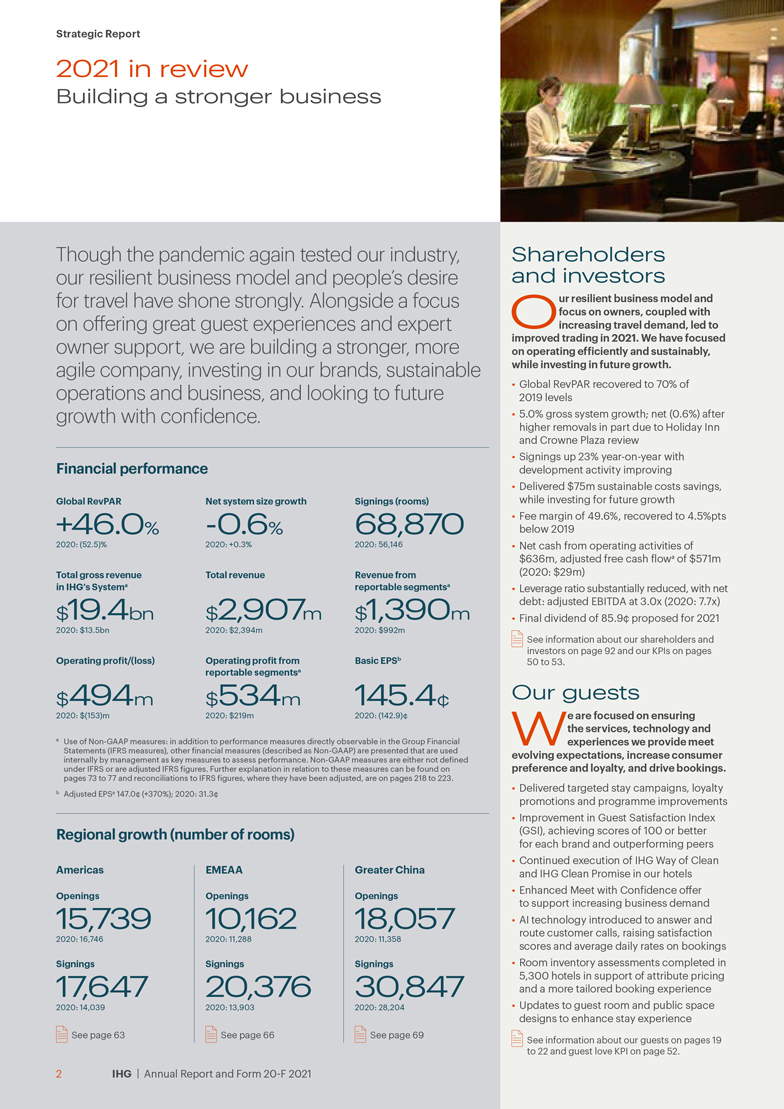
| Strengthened performance Our actions, alongside our business being principally domestic focused in key markets such as the US, led to improved trading throughout 2021. On top of good essential business demand, domestic leisure bookings at times hit 2019 occupancy and rate levels in several markets, with signs of more discretionary business travel, group bookings and international trips beginning to return. Operating profit of $494m improved from a loss of $153m in 2020. Our ability to capture demand through our strong brands, enterprise and scale, coupled with careful cost control, led to operating profit from reportable segments more than doubling to $534m versus 2020, with sustainable savings successfully achieved alongside continued investment to support growth. Strong cash generation led to a reduction in net debt of almost $650m year-on-year. While a higher-than-average removals rate, linked in part to our Holiday Inn ® and Crowne Plaza® Hotel & Resorts quality review, meant our net system size declined slightly, the opening of 291 hotels, including our 3,000th for Holiday Inn Express® , represented 5.0% gross growth and underlines the long-term confidence owners have in IHG and our brands. We also added 437 hotels to our pipeline, with the almost 24,000 rooms signed in Q4 much closer to the levels seen in 2019. In total, our global pipeline of almost 1,800 hotels represents more than 30% of our current system size, with more than 40% under construction.Focus on growth Our focus in recent years has been to improve the quality of our existing hotels for guests and the returns our brands generate for owners, and in parallel increase the scale of those brands, the breadth of our portfolio, and the value of our technology and loyalty offer. In spite of a pandemic, I am proud of |
the progress against our strategic priorities in 2021 and the impact this will have on how we operate and grow with owners as the industry strengthens. Key highlights include the Holiday Inn and Crowne Plaza quality review, which has driven significant owner investment in 83 properties and the removal of 151 hotels. With excellent future growth prospects, this work is not just critical to protecting the performance and reputation of these brands, but also to our ability to reduce our future group average removals rate and help achieve our ambition of industry-leading net rooms growth. The importance of our established brands was reflected in our Holiday Inn ® Brand Family representing almost half of all signings in 2021, while the addition of new brands across more segments increases our attractiveness to owners and opens up further growth opportunities. Within Essentials, avid® hotels is now our second largest contributor to system size and outperforming peers in guest satisfaction, and voco™ hotels has already expanded to 25 countries within Premium. In Luxury & Lifestyle, progress included Six Senses® now having grown its open and pipeline estate by more than half since acquisition in 2019, and our new Vignette Collection brand already at six signings and a first opening since launch in August.As we use our IHG ® Hotels & Resorts masterbrand to showcase the breadth of our portfolio, we continue to enhance the enterprise that supports it. This includes developing our next-generation mobile app, and preparing thousands of hotels to allow guests to choose specific room characteristics and add stay enhancements when booking with us, and in parallel enable our owners to generate maximum value from their hotel’s unique features. |
Transformational work also took place in loyalty ahead of a relaunch in 2022 that will offer members more rewarding tiers and points value, provide richer benefits and exceptional choice, and attract more next-generation travellers. In the first year of our 2030 Journey to Tomorrow responsible business plan, key progress included upgrading our science-based target to help limit global warming to 1.5°C, launching our virtual IHG Skills Academy platform, corporate employees completing more than 10,000 hours of conscious inclusion training, and supporting charities responding to natural disasters. Thank you I would like to thank the Board for their guidance, and ahead of his retirement as Chair, recognise the invaluable contribution Patrick Cescau has made in his nine years with IHG. He is a hugely respected figure and on a personal note I am grateful for his counsel and support. Though he will be missed, we look forward to welcoming Deanna Oppenheimer. On behalf of the Executive Committee, I would also like to thank our owners for their partnership and commitment, and our inspiring colleagues for bringing our brands and purpose of True Hospitality for Good to life, and making IHG a stronger business. To see IHG again named a Kincentric Global Best Employer in 2021 was a proud moment and it has meant a lot to reconnect with colleagues in person this year, as well as our owners, knowing that together we look to the future with confidence.  Keith Barr Chief Executive Officer |
| Chief Executive Officer’s review |
IHG |
7 |
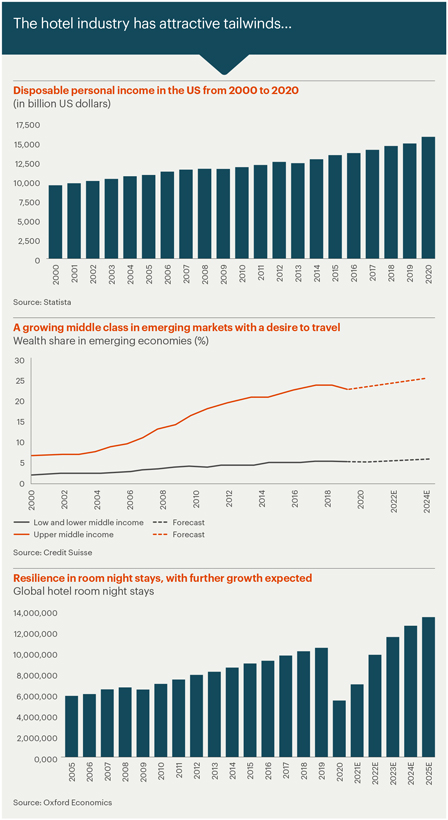
T |
he $360 billion hotel industry has compelling structural growth drivers, underpinned by factors including consumers’ inherent desire |
to travel, population growth, and an expanding middle class in emerging markets with increasing disposable incomes. While the pandemic suppressed demand during 2020 and 2021, demand has returned rapidly in domestic markets as government restrictions have lifted and vaccination rates increased. This demand has predominantly been in markets not exposed to cross-border trips and across essential business travel, though discretionary corporate travel and group events have begun to return. | ||
8 |
IHG |
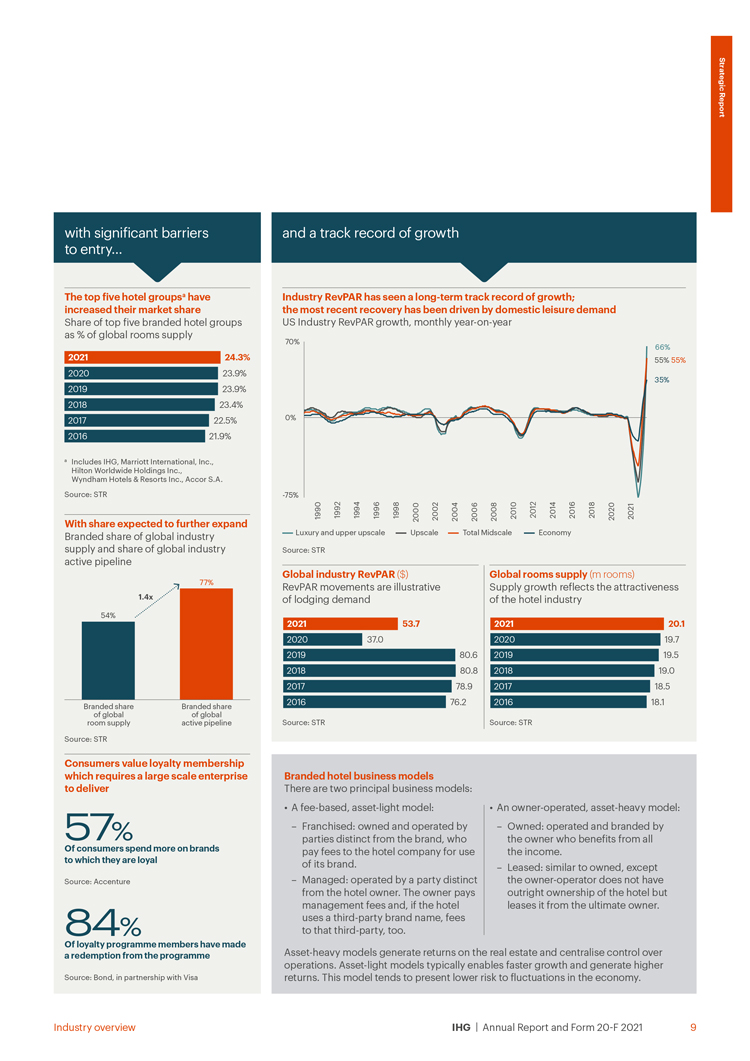
T |
he growth of our business relies on two fundamental growth drivers: revenue per available room (RevPAR) and increasing the |
number of rooms across our estate. RevPAR indicates the value guests ascribe to a given hotel, brand or market and grows when they stay more often or pay higher rates. Room supply reflects how attractive the hotel industry is as an investment from an owner’s perspective. | ||
10 |
IHG |
| Our asset-light business model requires a limited increase in IHG’s own operating expenditure to support our revenue growth, which delivers operating profit and fee margin growth. The benefit of operational efficiencies, along with brands and markets becoming more mature, has supported fee margin expansion on average by over 100bps a year between 2009-2019. |
For franchised hotels, the flow through of revenue to operating profit is higher than it is at managed hotels, given our well-invested scale platform where limited resources are required to support the addition of an incremental hotel. This is most evident in our Americas region, where fee margins are the highest, reflecting our scale and around 90% of our hotels operating under our franchised model. |
Across our managed hotels, the flow through of revenue to profit can be lower, given higher operating expenditure on operations teams supporting the hotel network. |
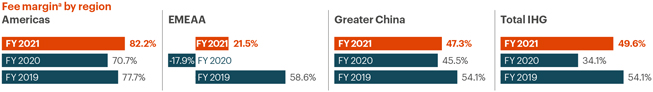
a |
Fee margin excludes owned, leased and managed lease hotels, significant liquidated damages and the results of the Group’s captive insurance company and is stated at AER. |
| Our asset-light business model is highly cash generative through the cycle and enables us to invest in our brands and strengthen our enterprise. We have a disciplined approach to capital allocation, which ensures that the business is appropriately invested in, whilst maintaining an efficient and conservative balance sheet. Beyond this, we look to return surplus cash to shareholders through ordinary and special dividends and share buybacks, with our objective to maintain an investment-grade credit rating. One of the measures we use to monitor this is net debt: adjusted EBITDA and we aim for a ratio of 2.5-3.0x. Liquidity through the recovery As occupancies have recovered, the strength of our cash generation became evident with adjusted free cash flow a generation of $571m in 2021. |
Recovering demand during 2021 and strong cost control resulted in rapid deleveraging. As such, our net debt: adjusted EBITDA ratio was 3.0x at 31 December 2021 (7.7x as at 31 December 2020). During the year, we repaid £600m of commercial paper issued under the UK Government’s Covid Corporate Financing Facility (CCFF). Following the issuance and repayment of bonds in 2020, our next bond maturity is £173m in November 2022, with no further bond maturities until October 2024. As at 31 December 2021, IHG had available liquidity of $2.7bn. Our $1.35bn syndicated and bilateral revolving credit facilities (RCF) have covenant relaxations in place for 2022 (see page 59). Our covenant leverage was 3.0x at 31 December 2021 (2020: 8.7x). |
Looking forward, our approach to capital allocation remains unchanged. As the business recovers, our priorities for the uses of cash are consistent: ensure the business is appropriately invested in to drive growth; target sustainable growth in the ordinary dividend; and return surplus funds to shareholders, while at the same time considering our stated aim of a leverage ratio of 2.5-3.0x, and our objective of maintaining an investment-grade credit rating.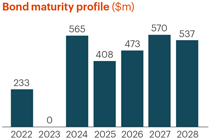 |
a |
Use of Non-GAAP measures: In addition to performance measures directly observable in the Group Financial Statements (IFRS measures), additional financial measures (described as Non-GAAP) are presented that are used internally by management as key measures to assess performance. Non-GAAP measures are either not defined under IFRS or are adjusted IFRS figures. Further explanation in relation to these measures can be found on page 73 to 77 and reconciliations to IFRS figures, where they have been adjusted, are on pages 218 to 223. |
12 |
IHG |
| Our priorities for the uses of cash are consistent with previous years and comprise three pillars: Shareholder returns (2003-19) Source of returns 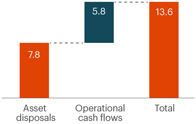 |
1 Invest in the business to drive growth We look to strategically drive growth, while maintaining strict control on investments and our day-to-day |
2 Target sustainable growth in the ordinary dividend IHG has a dividend policy where we would look to grow the ordinary dividend each year, while balancing all our stakeholder interests and ensuring our long-term success. |
3 Return surplus funds to shareholders The Group has a strong track record of returning surplus cash to shareholders. Since 2003, including the ordinary dividend, the Group has returned $13.6bn. |
|
| Type |
What is it? |
Recent examples |
| |||||
Maintenance capital expenditure and key money |
Maintenance capital expenditure is devoted to the maintenance of our systems and corporate offices, along with our owned, leased and managed lease hotels. Key money is expenditure used to access strategic opportunities, particularly in high-quality and sought-after locations, when returns are financially and/or strategically attractive. |
Examples of maintenance spend include maintenance of our offices, such as reformatting in light of the pandemic. Across our owned, leased and managed lease hotels we invest in refurbishment of public spaces and guest rooms. Examples of key money include investments to secure representation for our brands in prime locations. |
| |||||
| Recyclable investments to drive the growth of our brands and our expansion in priority markets |
Recyclable investments are capital used to acquire real estate or investment through joint ventures or equity capital. This expenditure is strategic to help build brand presence. We would look to divest these investments at an appropriate time and reinvest the proceeds across the business. |
Examples of recyclable investments in prior years include our EVEN ® Hotels brand, where we used our capital to develop three hotel properties in the US to showcase the brand. These hotels have now been sold and operate under a franchise agreement. |
||||||
| System Fund capital investments for strategic investment to drive growth at hotel level |
The development of tools and systems that hotels use to drive performance. This is charged back to the System Fund over the life of the asset. |
We continue to develop our cloud-based Guest Reservation System (GRS) and IHG Concerto ™ . Other examples include redevelopment of the IHG mobile app ahead of launch in 2022. |
||||||
| |
|
|
||||||
| Dividend policy The Board consistently reviews the Group’s approach to capital allocation and seeks to maintain an efficient balance sheet and investment-grade credit rating. IHG has an excellent track record of returning funds to shareholders through ordinary and special dividends, and share buybacks. The ordinary dividend paid to shareholders increased at an 11% CAGR between 2004 and 2019. |
When reviewing dividend recommendations, the Directors take into account the long-term consequences. The Board looks to ensure that any recommendation does not harm the sustainable success of the Company and that there are sufficient distributable reserves to pay any recommended dividend. The Board assesses the Group’s ability to pay a dividend bearing in mind its responsibilities to its stakeholders and its objective of maintaining an investment-grade credit rating. |
The Board is therefore proposing a final dividend of 85.9¢ in respect of 2021, an amount equivalent to the withdrawn final payment in respect of 2019. |
||||||

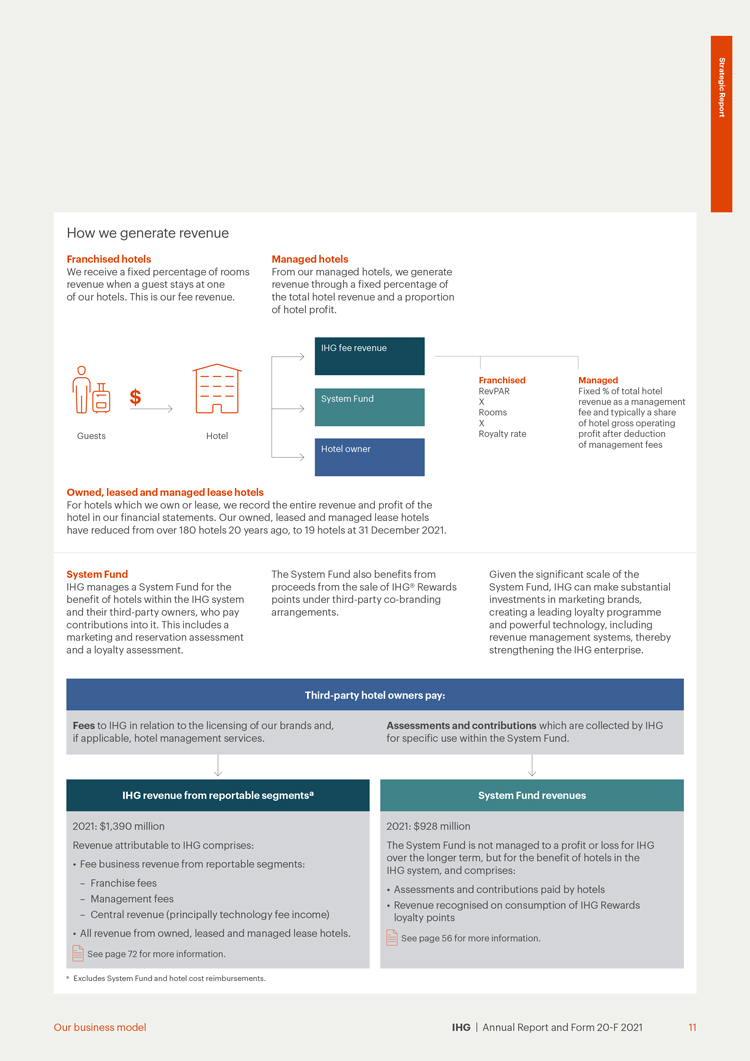
Our business model |
IHG |
13 |


W |
e know that to stay successful we need to put ourselves in the shoes of our leisure guests, business customers and owners |
managed estate, supporting both staffing levels and work-life balance. We also launched our Journey to GM talent acceleration programme to support those making the transition into General Manager roles, and strengthened how we identify and develop future talent as our estate expands. As demand increases in our hotels, we are providing our owners and teams with clear action plans, training and support for evolving brand standards and procedures to meet changing guest expectations. Rising costs due to inflation in some markets have been met with operational efficiency changes and an expanded procurement offer, with our scale and expertise helping deliver new solutions that resulted in net year-on-year Thousands of owners and operators also joined our webinars during the year on topics including virtual sales calls, evolving food and beverage, and the IHG ® Way of Clean programme. In late 2021, we collaborated with the Professional Convention Management Association to offer hotel teams a new Hybrid Events for Hotels & Venues Intro Certificate Course, to help them successfully partner with planners to host corporate and social hybrid events.We have captured demand through tailored marketing campaigns and promotions, supported by resources such as PR toolkits and new services within IHG’s Revenue Management for Hire programme, which helps hotels identify and act on revenue opportunities using business intelligence and data. |
To ensure our corporate teams are thinking like our owners, we also invited owners and General Managers (GMs) to speak at regional townhalls and share their perspectives during 2021. For our guests Cleanliness and safety standards have remained very important, underpinned by our IHG Way of Clean programme and IHG Clean Promise. The stay experience has continued to evolve, including the reintroduction of buffet breakfasts and social hours for brands in certain markets, and we offer clear guest communication on what to expect during their hotel stay at this time. During 2021, we introduced more loyalty offers for IHG Rewards members, extended the pause on points expiration and integrated select Six Senses resorts into the programme.  | |||
| in all we do. This is how we create unrivalled service and tailored experiences in our hotels, and attractive investment opportunities with strong returns for our owners. Our response to the pandemic has illustrated more than ever our desire to go the extra mile through fast, thoughtful and effective solutions, built on listening to what’s needed. Whether it’s food and beverage, cleanliness, hybrid meetings or loyalty enhancements for guests, or more efficient operations, recruitment support or procurement solutions for our owners, we’re working with a customer-centric mindset to ensure IHG and our brands stand out as a preferred choice in the market. What we achieved in 2021 Many of our hotel owners One of the big challenges of the pandemic for our industry is recruiting and retaining talent to meet returning guest demand. IHG has provided a number of tools and solutions for hotels, including new hiring resources, deeper relationships with job platforms, and targeted social media campaigns. In Australia, our myFlex initiative has given hotel colleagues the flexibility to work across any of our hotels in the country’s | ||||||

| Our strategy |
IHG |
19 |
| Such steps have deepened guest relationships, with Reward Night bookings largely recovering to pre-pandemic levels and participation rates of our higher tiered members exceeding 2019 levels. A further nine million members also joined the programme, with record enrolments on our web and mobile channels.For corporate guests, ‘Welcome Back to Business’ campaigns were launched, with our SME programme, IHG Business Edge, increasing its accounts by 44% in the year. Our Meet with Confidence programme for business customers was also expanded to include new rapid on-site testing for large events at our US hotels, while a new Points + Perks offer makes bookings even more rewarding. In November, IHG received the Stella Award gold medal for Best Hotel Chain for the exceptional meeting experience provided through the programme. Reflecting our ongoing customer-centric approach, our Guest Satisfaction Index continued to improve, achieving scores of 100 or better for each brand and outperforming peers. |
To continue improving guest satisfaction scores and drive revenue for our owners, updated guest room and public space design programmes are ongoing across many of our brands, including our Formula Blue concept at Holiday Inn Express and next-generation designs for Holiday Inn, Candlewood Suites ® and Staybridge Suites® .What’s to come Our IHG Rewards loyalty programme is critical to our business and our future growth. Our members drive around half of all room nights globally each year and spend 20% more in our hotels than non-members. They are also nine times more likely to book direct, which is more profitable to our owners.To deepen relationships with new and existing members, and drive more repeat business for our owners, we will transform our loyalty offering in 2022. In January 2022, we announced a first phase of new tiers and bonus-point earning structure that will allow our members to earn more points, more quickly than ever before. Later in the year, |
details of the full programme will commence, including new and enhanced benefits, more experiences and more redemption options, all powered by our new IHG mobile app, which goes live in 2022. As the new programme rolls out, we’re taking steps to ease the pressure and disruption on our busy hotel teams by providing training and resources, alongside carefully managing costs for owners. Helping our owners manage costs to build, open and operate is a top priority, so we continue to work closely with them on solutions to increase revenue alongside delivering more efficient and sustainable operations. Key elements to this include a continued focus on our central procurement services and reducing energy costs. As we focus on accelerating growth, we will also proactively manage our global development pipeline and help support our owners to ensure they can progress projects as quickly as possible. | ||
| Guest engagement |
||||||
 |
Our ability to offer a range of differentiated and attractive brands with rich stay experiences, great value, flexibility and strong loyalty rewards are key to attracting guests to IHG branded hotels and driving commercial performance and revenue. |
|||||
What impacted them in 2021 |
Engagement |
Outcomes |
||||||||||
| • Booking, cancellation and loyalty flexibility as a result of local pandemic travel restrictions• Covid-19 related health and safety protocols• Evolving corporate meeting requirements blended with hybrid working and leisure• Quality of the guest stay and booking experience, including increased digitalisation• Location of hotels and facilities offered• Preference for hotels with trusted societal and green credentials |
• Guest surveys• Nine contact centres supporting guests in seven countries, with 2,700 sales and service agents speaking 12 languages• Social media engagement• Programme of targeted stay campaigns, loyalty promotions and awareness of stay experience improvements• Board and Executive Committee reviews of guest proposition and loyalty offer as part of the Board’s consideration of strategic and operational matters• Consumer surveys focused on attitudes to being more environmentally and socially conscious when travelling, and the pandemic’s impact on appetite to travel |
• Extended points expiry for loyalty members, and increased masterbrand marketing and stay promotions, leading to uplift in brand awareness• Continuation of IHG Way of Clean programme and evolution of Meet with Confidence programme for corporate clients• Enhanced customer service support, including automation to speed up response time and direction to the right team• Guest experience enhancements, including renovations, new designs and simpler room rates• Opening of 291 hotels and launch of our 17th brand, Vignette Collection• Continued improvement in Guest Satisfaction Index, with scores of 100 or better for each brand and outperforming peers• Launch of Journey to Tomorrow 10-year responsible business plan |
||||||||||
 |
See our guest love KPI on page 52 and how the Board had regard for guests as part of their consideration of strategic and operational matters on pages 90 to 91. | |
20 |
IHG |
| Why hotel owners choose to work with IHG |
|
Hotel owners choose to work with IHG because of the trust they have in our brands and our track record in delivering strong returns. | ||

| Hotel owner engagement | ||
 |
IHG’s success relies on hotel owners investing in our brands. To remain attractive, we focus on the breadth of our brand portfolio and effectiveness of our loyalty programme, enterprise contribution, technology, procurement and sales offering. | |
` |
||||||||||||
What impacted them in 2021 |
Engagement |
Outcomes |
||||||||||
| • Ability to capture and drive demand to their hotels• Evolving brand standards• Labour shortages, supply chain and continued budgeting constraints caused by the pandemic• Expanded brand portfolio with launch of Vignette Collection |
• Direct meetings with CEO and regional CEOs• IHG Owners Association collaboration• Portfolio and individual hotel reviews covering operational, strategic and industry trend updates• Webinars, regular newsletters and bulletins• Hotel lifecycle and finance team support• Collaboration with governments and industry to support recovery |
• Tailored marketing and promotions, supported by new data-driven resources and services that help hotels quickly identify and act on revenue opportunities• Brand standards evolved or removed to create more efficient and effective operations• Net year-on-year • Increased training, guidance and recruitment support for hotel teams• Next-gen formats and refurbishments being applied to hotels under brands including Holiday Inn Express, Holiday Inn, Candlewood Suites and Staybridge Suites• 83 hotels committed to improvement plans as a result of the Holiday Inn and Crowne Plaza review, and 151 hotels exited the estate |
||||||||||
| |
See our net rooms supply, signings, gross revenue and enterprise contribution KPIs on pages 50 and 51 and how the Board had regard for hotel owners as part of their consideration of strategic and operational matters on pages 90 to 91. | |
 |
Visit www.owners.org | |
Our strategy |
IHG |
21 |
| People |
 |
| Our 2030 commitments • Achieve gender balance and a doubling of under-represented groups across our leadership• Cultivate a culture of inclusion for colleagues, owners and suppliers• Support all colleagues to prioritise their own wellbeing and the wellbeing of others• Drive respect for and advance human rights |
Our people are fundamental to IHG achieving its purpose and strategic goals. IHG’s business model means that we do not employ all colleagues. We directly employ individuals in our corporate offices, reservation centres, and managed, owned, leased and managed lease hotels. However, not all individuals in managed, owned, leased and managed lease hotels are directly employed, and we do not employ any individuals in franchised hotels (nor do we control their day-to-day |
| What we achieved in 2021 People engagement We have a number of forums available for employees to share their thoughts, including employee resource groups, a designated non-executive director for workforce engagement, and our employee engagement survey, known as Colleague HeartBeat, which allows people to express their views on key aspects of working at IHG.In our 2021 survey, our overall employee engagement stood at 85%, which saw IHG again accredited as a Kincentric Global Best Employer. The survey highlighted areas that we can strengthen further, including the importance of filling job vacancies and advocating efficient and effective ways of working. Actions were taken in both these areas, including new hiring tools and a continued focus on improving processes, accountability and integration among teams. These areas will remain a priority for 2022. Attracting, developing and retaining talent To achieve our ambitions, we know we need to attract, develop and retain a diverse and talented workforce. This relies on our ability to develop an open and inclusive culture that promotes career development and equal opportunity, and recognises the importance of wellbeing in the workplace. To address the challenges in |
| attracting talent, we have developed new hiring resources and updated our policies to speed up the time it takes to process applications, worked with jobs platforms, schools and NGOs to unearth fresh talent, and run recruitment days and fairs. Our Early Careers and IHG ® Academy programmes also provide work experience, internships and graduate opportunities to those seeking a career in hospitality.We are firmly committed to investing in our employees and this year at a corporate level we embedded regular talent planning and development conversations to ensure we are building a strong pipeline for the future to deliver our ambitions. People managers have continued to hold quarterly check-ins with their teams to discuss performance and personal development, supported by an upskilling of HR partners through bespoke talent masterclasses. There is also a strong focus on reward, with our robust governance approach aimed at having fair and consistent reward and recognition practices across our employee population.In our hotels, actions in 2021 included enhancements to our learning and development programme for existing GMs, the launch of a new Journey to GM talent acceleration programme, and the implementation of a new hotel talent |
| People engagement |
||||||
 |
Delivery of our purpose to provide True Hospitality for Good and the strategic priorities that drive future success relies on our people and our ability to maintain and evolve an engaged, diverse and inclusive culture where careers can grow. |
|||||
What impacted them in 2021 |
Engagement |
Outcomes |
||||||||||
| • Attractiveness of working in the hospitality industry during the pandemic• Staffing levels and ability to attract and retain talent• IHG’s strategy and approach to growth and future success• IHG’s approach to DE&I• IHG’s approach to hybrid working and wellbeing• IHG’s approach to climate change and wider environmental issues |
• Employee engagement survey• CEO and regional leadership calls with Q&A• Voice of the Employee feedback sessions• Employee communications including intranet stories, newsletters, blogs, videos, podcasts and interactive sessions on strategic priorities• ERGs representing ethnic minorities, gender, LGBTQ+, disabilities and other employees• Quarterly performance, development and wellbeing check-ins• Collaborative sessions including hackathons |
• Increased focus on recruitment and talent development at hotel and corporate levels• Continuation of employee engagement in company priorities and culture• Progress against and continued prioritisation of DE&I commitments, including conscious inclusion training and refreshed DE&I policy• Continued and increased focus on employee wellbeing, including enhanced parental leave policies in some markets and updated Global Flexible Working Guidelines• Reinstatement of bonus and annual salary increase for our corporate employees• IHG named a Kincentric Global Best Employer, with 85% employee engagement |
||||||||||
|
|
See our employee engagement KPI on page 53, how the Board had regard for people in their board and remuneration decisions on pages 91, 92, 107, 108, 112 and 114, Voice of the Employee disclosure on page 101, and statement on employee engagement on page 227. | |
 |
Visit www.ihgplc.com/responsible-business | |
24 |
IHG |
| system in certain markets, which matches on-property talent to the most relevant opportunities across our estate. |
leave policy. We will continue to evaluate and review our policies to ensure they support people to be at their best. For hotel teams, monthly newsletters with wellbeing guidance were shared, and local initiatives were also established in some markets. Diversity, equity & inclusion (DE&I) As a global company, it’s important to us that our business reflects our people, our guests and the nationalities, cultures, ethnicities, sexual orientations, backgrounds and beliefs that they represent. This commitment is emphasised throughout our global hiring guidelines and initiatives, such as our conscious inclusion training, and is backed up by our Global Diversity, Equity, Inclusion and Equal Opportunities Policy, which was refreshed in 2021 and sets forth our commitment to promoting an inclusive environment that values and considers diverse attributes, perspectives, cultures and experiences. Recognising that we still have progress to make as a business, our Global DE&I Board and regional DE&I councils work together to monitor progress against commitments, discuss emerging trends and feedback, and identify future focus areas. Our work in this space revolves around a DE&I framework spanning three core areas: strengthening a culture of inclusion; increasing the diversity of our leadership and talent; and putting the right decision-making processes around our actions. |
Strengthening a culture of inclusion In 2021, corporate employees completed more than 10,000 hours of conscious inclusion training, promoting education and awareness, and sparking important team conversations. As part of our employee engagement survey, we also implemented an inclusion index in 2021 to track perceptions of culture and behaviour. The index showed that nine out of 10 corporate, reservation and managed hotel employees feel IHG has an inclusive culture, although perceptions were less positive among some ethnic minority groups. This is something we recognise and is reflected in our commitment to inclusion and achieving more diverse representation at all levels of our business. Central to the conversation around DE&I and our progression as a business are our Employee Resource Groups (ERGs), which continue to expand and now have 1,300 members globally. These groups represent ethnic minorities (BERG US, EMbrace EMEAA), gender (Lean In), LGBTQ+ (Out and Open, US and UK), disabilities (DAWN US and UK), and Early Careers (HYPE Greater China, US and UK) and have been instrumental in driving employee engagement and celebrating key events, including International Women’s Day, Global Inclusion & Wellbeing Week, and Pride. | ||||
| |
See our GM talent acceleration programme on page 19, workplace environment on page 37 and workforce remuneration considerations on pages 107, 108, 112 and 114. | |||||
| Wellbeing In recognition of a shift to hybrid working as a result of the pandemic, we have provided employees with guidance and resources to help them adopt a balance of remote and office working that supports individuals and the delivery of IHG’s key priorities. Employee surveys have also been run to understand expectations and help inform our approach. In 2021, we updated our Global Flexible Working Guidelines with hybrid working principles, refreshed our UK Flexible Working Policy and highlighted flexible working opportunities within jobs. We’ve also taken steps to ensure a best practice approach to managing talent and performance in a hybrid environment. During the year, we provided employees with access to mental health and wellbeing guidelines and webinars, and continued Recharge days and Focus Fridays, where we try to avoid standing meetings where possible to create some undisturbed time for employees. Parental leave policies were also evaluated across a number of locations and significant enhancements were made to our UK paternity leave policy and US parental | ||||||
• |
Actively support diversity and inclusion to ensure that all our employees are valued and treated with dignity and respect. |
• |
Strive continually to provide people with a working environment that is free from racism, harassment and discrimination. |
• |
Foster an environment where our employees can work together to maintain an inclusive working environment where everyone’s unique contribution is valued. |
• |
Ensure that all decisions affecting an employee’s employment are made fairly and are based on an individual’s ability and performance. |
• |
Provide all employees with the opportunity to join our Employee Resource Groups. |
• |
Provide employees with disabilities the appropriate support where reasonable and practicable to do so and in accordance with local requirements. |
• |
Ensure our recruitment, development and reward practices, and our approach to working arrangements, are designed to attract, develop, and retain diverse talent. |
• |
Work to educate our employees about the benefits that diversity and inclusion brings to our business and support interventions that improve diversity and inclusion in our places of work. |
• |
Ensure all employees are aware of this policy and complete any relevant training in relation to diversity and inclusion. |
• |
Ensure our customers experience an inclusive welcome and stay provided by our employees. |
 |
See our DE&I Policy at www.ihgplc.com/responsible-business |
 |
Our strategy |
IHG |
25 |
| Increasing the diversity of our leadership talent We continue to deliver talent initiatives, such as our successful Rise programme, which is focused on increasing the number of women in GM and operations roles. During 2021, more than 100 women joined to take advantage of mentoring sessions, career development workshops, high-impact learning modules and empowering conversations designed to further careers. In the Americas, we launched Ascend, a bespoke programme to develop Black leadership talent and build strong relationships with organisations dedicated to supporting Black employees, while in the UK, we have worked with Women in Hospitality and Leisure (WiHTL) to provide opportunities for our ethnic minority talent on a dedicated talent programme. An ethnicity disclosure campaign was also carried out in the UK to further understand our population and help inform future solutions and actions to support our ethnic minority employees. IHG proudly continues to be recognised for its efforts, with CEO Keith Barr ranked first in the 2021 HERoes Advocates list, which celebrates the top 35 executives or senior leaders who actively campaign for diversity, inclusion and gender balance in the workplace. IHG also received a Highly Commended award in the Company of the Year category at the European Diversity Awards, with the efforts of several employees being acknowledged across different categories. Putting the right decision-making processes around our actions We understand that a diverse and inclusive environment creates a sense of belonging among employees and builds trust in our culture and values as a company. In 2021, we made progress on multiple fronts, including |
As at 31 December 2021 |
Male |
Female |
Total |
|||||||||||||
Directors |
7 |
5 |
12 |
|||||||||||||
Executive Committee |
7 |
3 |
10 |
|||||||||||||
Executive Committee direct reports |
33 |
22 |
55 |
|||||||||||||
Senior managers |
||||||||||||||||
(including subsidiary directors) |
81 |
29 |
110 |
|||||||||||||
All employees |
||||||||||||||||
(whose costs were borne by the Group or the System Fund) |
4,679 |
6,482 |
11,161 |
|||||||||||||

| We do not require employees to report ethnicity and are dependent on self-disclosure. We encourage employees to consider disclosure, which will provide stronger reporting in the future. |
| Human rights and modern slavery An integral part of our global commitment to responsible business is respecting human rights in accordance with internationally recognised standards. We understand the importance of human rights in relation to our colleagues, guests and communities and we encourage those with whom we do business – including our suppliers, owners and franchisees – to prevent, mitigate and address adverse impacts on human rights, including modern slavery. We seek to advance human rights through our business activities and by working together with others to identify challenges and effective solutions. Key focus areas in 2021 included: the development and pilot of minimum requirements relating to migrant worker risks in our hotels, including responsible recruitment and onboarding, staff living accommodation and worker voice; and a continued risk assessment of our supply chain, along with analysis of our approach to due diligence of suppliers. Findings from our 2019/20 Oman market-level labour assessment continue to be addressed and applied to other countries in the IMEA region, and we have started a similar assessment in the UK. More broadly, we have collaborated with the Sustainable Hospitality Alliance (SHA) and International Organisation for Migration (IOM) on projects focused on ethical recruitment in our industry. | ||
| IHG is a member of the United Nations Global Compact (UNGC) and is committed to alignment of IHG’s operations, culture and strategies with the UNGC’s 10 universally accepted principles in relation to human rights, environment and anti-corruption. |
 |
See our Code of Conduct disclosure on pages 37 to 38, Responsible Business and Nomination Committee Reports on pages 100 to 103 and statement on disability on page 227. | |
|
|
See our Modern Slavery Statement at www.ihgplc.com/modernslavery | |
26 |
IHG |
| Communities |
| |
 |
| Our 2030 commitments • Drive economic and social change through skills training and innovation• Support our communities when natural disasters strike• Collaborate to aid those facing food poverty |
| We rely on the communities in which we operate and are proud to use our global scale, time, skills and resources to ensure that our growth contributes positively to those around us. As we work towards our targets, it’s important we understand the impact of our investments, which makes integrity of data key to our approach. This year, we joined Business for Societal Impact (B4SI) – the global standard in managing corporate community investment – so that we can measure our input, output and impact of our projects. What we achieved in 2021 Skills training and innovation We’re passionate about our industry and inspiring individuals to explore just how rewarding a career in hospitality can be. Since 2004, our IHG Academy programme has been helping young people around the world gain valuable employment and life skills through work experience, internships and apprenticeships alongside some of the world’s best hoteliers. In the past eight years, working with local education providers and community organisations, more than 80,000 people have been trained and mentored through the IHG Academy, offering those from all backgrounds a rich variety of free programmes to help them gain a job in hospitality or other industries, as part of our promise to provide True Hospitality for Good on a global scale. To further its reach, we evolved the IHG Academy in 2021 with the launch of the IHG Skills Academy – a best-in-class |
 | ||
| opportunities for thousands more people looking to build their confidence and get employment-ready. This work has been undertaken in collaboration with charities and other IHG suppliers and launched in October with more than 500 initial pieces of English content available. We continue to advance other skills-building programmes, too, including working with global NGO Junior Achievement Worldwide to give young people a headstart in the world of work, and in 2021 we hosted our Global Innovation Challenge to help high-school students learn valuable skills. We have also set up the Open Source Curriculum with the Sustainable Hospitality Alliance, which will provide free online teaching to help participants to find jobs in hospitality or other industries. In Greater China, we formed a strategic partnership with Wuxi Special Education School to provide training, internships and employment for mute and deaf children, with a number of hotels in different cities now taking part. We also welcomed 149 Future Leader Aspire participants into our Future Leaders programme. |
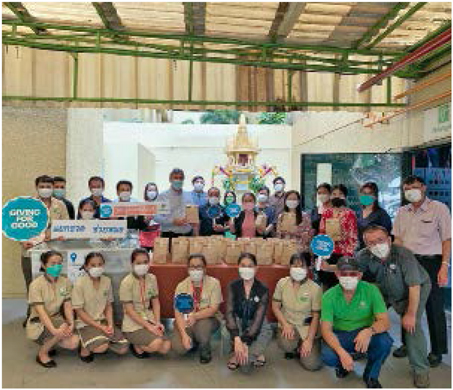
Giving for Good month During September 2021, more than 40,000 colleagues supported community projects as part of our annual Giving for Good month, making a positive difference to more than 350,000 people. Over 260,000 volunteering hours were collectively dedicated to supporting communities, causes and charities, with colleague activities ranging from hosting free pop-up grocery stores in the US and charity walks in the UK, to planting trees in Saudi Arabia.Supporting our communities when natural disasters strike We continue to work with a range of skilled humanitarian aid organisations to support critical relief efforts and help our communities in times of need, whether that involves dealing with the impact of the pandemic or the effects of natural disasters. In 2021, we supported relief efforts around the globe through donations to charities including the International Federation of Red Cross and Red Crescent Societies following the floods in Western Europe, while also supporting its response to the pandemic in countries such as India and Brazil. | |
Our strategy |
IHG |
27 |


W |
ith hotels in thousands of communities all over the world, our business and brands touch the lives of millions of people every day. We understand that in our role as a major global hospitality |
• |
Continue the integration of climate considerations into our Group risk management framework. This allows us to consider the interactions between climate and other strategic risks, as well as implementing mitigations through business-as-usual |
• |
Continue to monitor trends in potentially material climate-related risks and opportunities, with improved data capture. This will include further embedding climate impacts into our risk assessments and long-term financial plans and Group strategy, with development of further metrics where needed. |
• |
We will take steps to align to new recommendations and disclosure requirements under the International Sustainability Standards Board (ISSB), TCFD and UK Green Finance Strategy. |
• |
Undertake a carbon price exposure assessment on how changes to carbon pricing policy could impact our business, and to inform the business cases for decarbonisation actions. |
• |
Enhance the quality of data capture on those risks that have been identified as most material and provide further quantification of the potential impacts. |
• |
Develop a Group-wide climate transition plan to coordinate decarbonisation initiatives and investments taking place across our business. This plan will align with our 1.5°C SBT commitment. |
| TCFD recommendation |
Summary of our alignment with TCFD | |||
| Governance | ||||
| a. Describe the Board’s oversight of climate-related risks and opportunities. |
The IHG Board has collective responsibility for overseeing and ensuring the management of climate-related risks and opportunities and is advised by the Responsible Business Committee on IHG’s approach in this area. See more details on page 33. | |||
| b. Describe management’s role in assessing and managing climate-related risks and opportunities. |
The Executive Committee is responsible for managing climate-related risks and opportunities. The Chief Financial Officer and Group Head of Strategy (CFO) is the overall sponsor for decarbonisation within the business, and we have formed a TCFD Steering Group of Senior Leaders from across different functions of the business who have led the work, supported by the TCFD Working Group, to ensure we assess and manage climate-related risks and opportunities, embedding the results of the climate scenario analysis into long-range business planning. See more details on page 33. | |||
| Strategy | ||||
| a. Describe the climate-related risks and opportunities the organisation has faced over the short, medium and long-term. |
With external expertise, we completed a risk and opportunity review across our value chain and identified the most material potential impacts associated with our business. See our climate-related risks table on page 34 and climate-related opportunities table on page 35. Our impacts are categorised over the following timescales: (a) short: 1-5 years to highlight immediate risks or opportunities; (b) medium: 10-15 years to align to our Group strategic planning cycles; (c) long-term: 30 years to align to TCFD requirements. | |||
| b. Describe the impact of climate-related risks and opportunities on the organisation’s businesses, strategy, and financial planning. |
Climate-related scenarios are being embedded into our long-range planning and future Board strategy discussions. Work is underway to improve data and modelling around major risks identified and TCFD findings are now considered as part of the strategic planning process. We have outlined the most material of our impacts in our climate-related risks table on page 34. See pages 29 to 31 for details of the environmental initiatives already underway and pages 149, 172 and 176 for the consideration of climate risks in the financial statements to support conclusions on going concern, deferred tax assets and goodwill respectively. | |||
| c. Describe the resilience of the organisation’s strategy, taking into consideration different climate-related scenarios, including a 2°C or lower scenario. |
We analysed the resilience of IHG’s strategy under both 2°C and 4°C climate change scenarios. The results showed that, given IHG’s asset-light business model, transition risks are more likely to have a material impact on our business, compared with physical risks. For more detail on how we are mitigating our climate-related risks to ensure business resilience, see our climate-related risks table on page 34 and see pages 29 to 31 for details of our environmental policies and initiatives. | |||
32 |
IHG |
TCFD recommendation |
Summary of our alignment with TCFD | |||
Risk management | ||||
| a. Describe the organisation’s processes for identifying and assessing climate-related risks. |
Our TCFD Steering Group has led a detailed scenario analysis of climate-related impacts across the IHG value chain. Outcomes of this risk assessment process were presented to Executive Committee members, Senior Leadership and the Board for review and used to inform our climate change action plans. The monitoring and management of the climate risks identified by our initial assessment (supported by external expertise) will now be integrated into our existing risk management processes – including scenario planning, crisis management and analysis of longer-term trends. For more information on our scenario analysis of climate-related risks, see the Climate-related risk management and strategy section on page 34. | |||
| b. Describe the organisation’s processes for managing climate-related risks. |
We have historically taken a number of steps to manage climate risk, including activities such as engaging with customers and the rest of the industry on demand for greener travel and hospitality services. For several years, we have also had carbon reduction targets at both a Group and hotel level, and in early 2020 announced a SBT to reduce greenhouse gas emissions, which we upgraded at the end of 2021. We continue to collect information to support the monitoring of these risks and develop mitigation responses as required. With oversight from our Risk and Assurance and Corporate Responsibility teams, our assessment of transition risks are continually reviewed by relevant teams across IHG. Our physical risk assessment will be reviewed every three years, or more frequently if required. See the Climate-related risk management and strategy section on page 34. | |||
| c. Describe how processes for identifying, assessing and managing climate-related risks are integrated into the organisation’s overall risk management. |
We consider climate change within the context of environmental and social megatrends as one of our principal risks. As part of our 2021 review of principal risks with the Board, we also described how climate change potentially impacts other existing principal risks and are embedding climate change resilience into existing ‘business as usual’ processes. For more information on IHG governance and management of principal risks, see pages 40 to 47. | |||
Metrics and targets | ||||
| a. Disclose the metrics used by the organisation to assess climate-related risks and opportunities in line with its strategy and risk management process. |
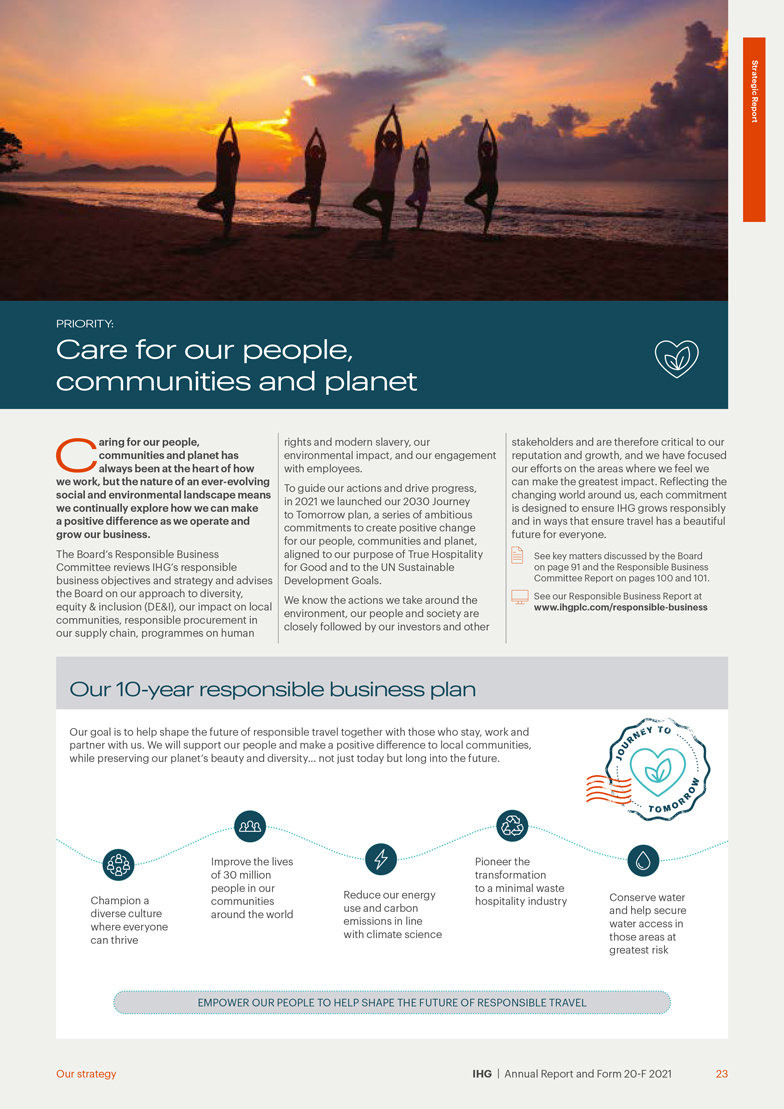
One of our strategic priorities is to ‘care for our people, communities and planet’ and to guide our actions and drive progress, in 2021 we launched Journey to Tomorrow, an action plan of commitments we’ve made to create positive change by 2030. As part of this action plan, we have set ourselves an ambitious SBT, aligned to 1.5°C, which is driving action across the business. More detail on our SBT is included in the strategic mitigations in our climate-related risks table page 34. Energy reduction targets are incorporated into hotel-level metrics, as well as at the Executive Committee. ESG criteria, including annual energy reduction, form part of the Annual Performance Plan (APP) structure for Executive Directors and eligible employees. This forms part of a range of KPIs and review of performance against IHG’s Global Metrics. We have continued our work this year to develop ESG metrics with a view to incorporating into our long-term incentive plan and continue to develop the quality of our environmental data in order to enable this. See more on our metrics on page 35. | |||
| b. Disclose scope 1, scope 2, and, if appropriate, scope 3 greenhouse gas (GHG) emissions, and the related risks. |
Our 2019-2021 scope 1, 2 and 3 emissions data and methodology can be found on pages 229 and 230. We have disclosed the categories of scope 3 emissions, which are covered by our 1.5°C aligned SBT. | |||
| c. Describe the targets used by the organisation to manage climate-related risks and opportunities and performance against targets. |
Our existing targets have been approved by the Science Based Targets initiative (SBTi) as 1.5°C aligned and we are also aiming for our new-build hotels to operate at very low or zero carbon by 2030. Our scope 1, 2 and 3 emissions data will provide us with an ongoing understanding of how we are progressing on our decarbonisation journey. | |||
|
|
See further information about Director development on page 94, and Audit, Responsible Business and Remuneration Committee Reports on pages 95 to 101, and 104 to 125. |
| |
Delivering on the recommendations of TCFD |
IHG |
33 |
| Summary of risk |
Impact |
Mitigation and strategy resilience | ||||||||
| |
|
| ||||||||
| Ability to meet stakeholder expectations around IHG’s role in the energy transition Medium-term (10-15 years)Potentially material impact |
With climate change being the biggest threat facing humanity, we all have a significant and immediate role to play in curbing global carbon emissions and keeping temperature rise within 1.5°C above pre-industrial levels.Key stakeholders – including guests, investors and governments – are increasingly looking for businesses to not only set the right goals, but also demonstrate their commitment in the actions they take today. We recognise that not delivering on increased stakeholder expectations could result in a reputational risk for the Group, especially in a scenario where our peers meet or exceed our own decarbonisation plans. Continuous progress against our targets can create significant operational and commercial opportunities. We have not quantified this impact, but we are monitoring it alongside wider reputational risks. |
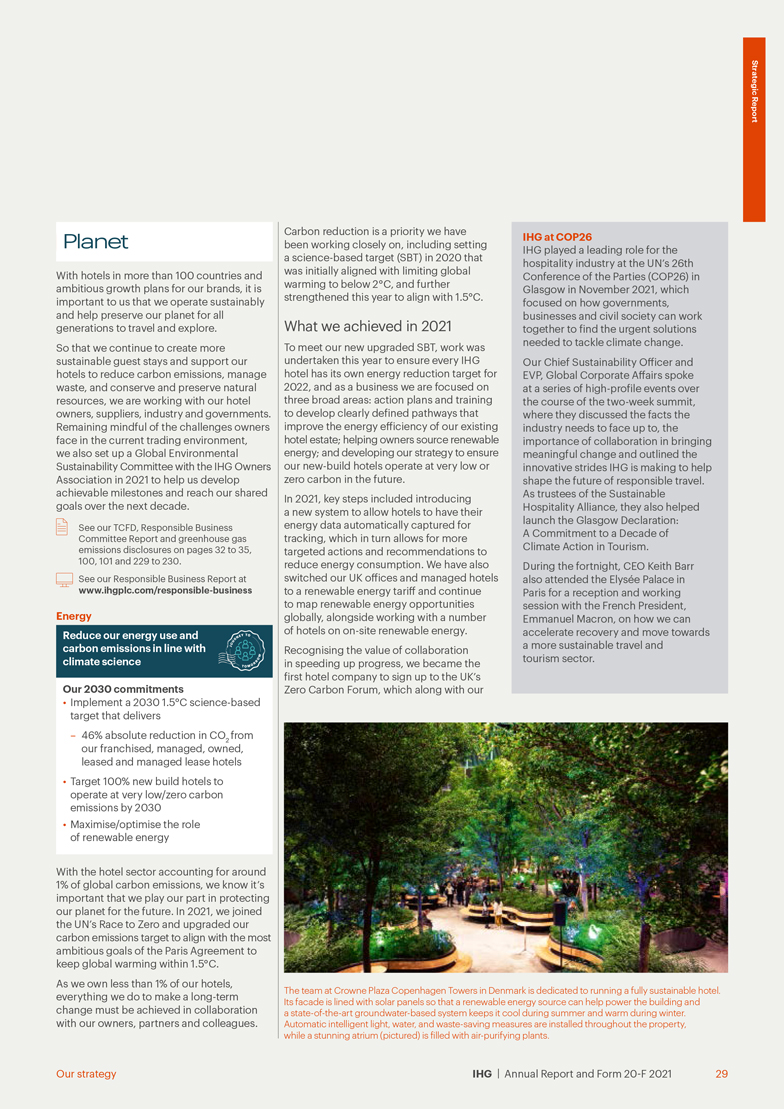
Being a responsible business is at the heart of IHG’s strategy and includes a strong focus on reducing the carbon footprint of operations, as well as those of our franchisees. We have upgraded our emissions reduction target to align to 1.5°C, and are progressing decarbonisation plans across the estate Our target is to reduce emissions from our managed, owned, leased and managed lease hotels by 46% by 2030, from a 2019 baseline, and to do the same with emissions from our franchised hotels, which puts us on a trajectory to achieve net-zero emissions by 2050. In 2022, we will update our transition risk assessment to align with this new target. These are challenging targets given IHG’s predominantly franchised business model and ambitious growth strategies.We are developing a Group-wide climate transition plan This will help us ensure we meet stakeholder expectations around the transition and deliver on our own ambitious targets on carbon reduction. Over the next 12 months, we will be developing a detailed climate transition plan, in line with recent supplementary guidance announced by the TCFD. This plan will coordinate a range of decarbonisation initiatives ongoing across our business and focuses on three key levers: driving energy efficiency in our existing estate; facilitating a shift to renewable energy wherever possible; and targeting 100% of new-build hotels to operate at very low or zero carbon by 2030. | ||||||||
|
|
See our planet section on pages 29 to 31 to learn more about our work on decarbonisation. | |||||||||
| |
|
| ||||||||
| Reduction in aviation passenger numbers expected to impact hotel demand medium to long-term (10-30 years) Potentially material impact |
Today’s aviation travel, in particular international travel, has a significant carbon footprint. Under a 2°C scenario, aviation travel could reduce significantly as travel patterns align to a low-carbon economy. This could potentially reduce the ability of guests to visit our hotels. |
Given our diverse portfolio of hotels catering to both domestic and international travellers, such a shift in travel patterns could provide both downsides and upsides to our business, if for example, more guests opt to travel domestically utilising greener transport modes such as high-speed trains in China. We are improving data collection to understand our customers’ travel patterns The impact on travel is being closely monitored post Covid-19. To enable us to calculate the potential impact of this shift in travel on our different regions and brands, we are planning changes to our guest survey to collate further data on the modes of transport used. | ||||||||
| |
|
| ||||||||
34 |
IHG |
| Summary of risk |
Impact |
Mitigation and strategy resilience | ||
| |
|
| ||
| Increased desire for ‘green hotels’ could have a material impact on IHG revenues Medium to long-term (10-30 years) Potentially material impact |
Green hotels will play an important part of our future under all scenarios. Attitudes and beliefs around climate change have changed significantly, with 60% of 9,000 adults surveyed by IHG across the US, UK, Germany, Greater China, the UAE and Australia agreeing that they want to be more environmentally and socially conscious on their travels. The changes in these attitudes and beliefs have started to now impact consumer behaviour, both for business and leisure travel, as green credentials are factoring into customers’ buying decisions. We recognise that these changing consumer behaviours offer both an opportunity and a risk for IHG, depending on how fast the green hotel market expands and how much of this new market we capture share of. Under a 2°C scenario, we do expect a significant impact over time – either a risk or opportunity depending on our ability to demonstrate our green credentials. |
We have developed a bespoke tool to help our hotels identify and prioritise energy efficiency solutions based on key building characteristics, including return on investment information and procurement support as feasible. Called the Hotel Energy Reduction Opportunities Tool (HERO Tool), it will help enhance the hotel’s environmental credentials. In the UK, all our managed lease hotels are now on renewable energy contracts, and we have started actively promoting renewable energy solutions to owners in key markets. We are improving data collection to understand consumer sentiment towards greener travel Given the potential materiality of this exposure, we are working to leverage existing consumer sentiment data in this area, such as a social monitoring platform to gather data from guests’ social posts (social media, review sites) and developing a methodology to gather, track and measure the impact of actual (rather than claimed) guest behaviour. | ||
| |
|
| ||
| Loss of franchise royalty fees following natural disasters Long term (15-30 years) Potentially minor impact |
Under both a 2°C and 4°C scenario, the frequency of natural disasters is expected to continue to increase up to 2050 and beyond. The resulting business interruption reduces the amount of franchise royalty fees we will receive from the specific hotels impacted, however this does not take into account the potential for increased demand from any ongoing recovery efforts. |
We are tracking physical climate impacts across our portfolio We have previously assessed the physical risks of climate events on our hotels, and we are now upgrading systems to track the physical impacts of climate change across our portfolio and how much additional business is driven into our hotels from recovery efforts. This will allow us to adapt to these hazards more effectively and assess the impact on our business and owners. | ||
| |
|
| ||
| Summary of opportunity |
Actions being taken | |||
Supporting hotel owners to meet new customer demand for sustainable travel |
We have committed to deliver new-build hotels that operate at very low or zero carbon by 2030We recognise our customers are increasingly expecting high standards of sustainability in their leisure and travel purchases. Our commitment to deliver new-build hotels that operate at very low or zero carbon signals our intent to further help our hotel owners meet potential future demand for green travel, and to improve our competitive position overall. This will be supported by enhanced engagement with customers and data regarding customer demand to help us deliver on customer priorities for sustainability and climate. | |||
Supporting hotel owners to decarbonise their assets could increase commercial attractiveness |
We are continuing to invest in ways to support hotels become more energy efficient and decarbonise assets While reducing emissions can require investment, we are leveraging our Green Engage system to ensure we invest in energy efficiency improvements that have the greatest potential to reduce costs over the long-term. This will be supported by our HERO tool, further details of which are available in our 2021 Responsible Business Report (see link below). | |||
Increased domestic tourism driven by changes in long-haul travel patterns |
We are improving data collection to understand our customers’ preferences on sustainability Changing travel patterns represent both a potential risk and opportunity to our business. We have a large domestic customer base, and there may be a further positive impact to this market driven by future changes to travel patterns, as some customers move to shorter-haul and less carbon intensive modes of travel. Gathering further data will help us understand this trend further and ensure we can meet the needs of any changing customer base. | |||
 |
See our carbon footprint KPI on page 53. |
|
|
Our Responsible Business Report and ESG Databook are available at www.ihgplc.com/responsible-business |
| |
Delivering on the recommendations of TCFD |
IHG |
35 |
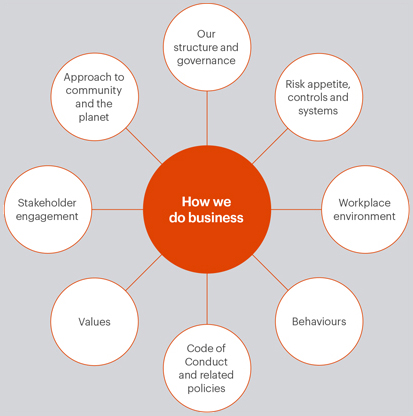
| Our purpose of providing True Hospitality for Good is underpinned by our commitment to a culture of operating in a responsible and ethical manner. Our culture sets the tone for how we do business. |
 |
| Stakeholder engagement IHG engages with its stakeholders at all levels of the business, from the Board, through the Executive Committee, Senior Leadership and corporate functions, to front-line operations. A variety of methods are used based on experience and developing best practice, including face-to-face The effectiveness of our engagement methods is measured through a range of metrics, including our KPIs (such as signings and pipeline), performance, ability to attract and retain talent, employee engagement survey results, adherence to the policies covered by our Code of Conduct and AGM results. The views and interests of other stakeholders, such as regulators and industry bodies, are also taken into consideration. They help provide a framework against which we measure ourselves, protect our reputation and develop our commercial and social awareness. | ||
|
|
See information on our engagement with key stakeholders, approach to the planet on pages 20 to 39, 92, 101, 107, 108, 112-114, and Section 172 statement on pages 90 and 91. | |
A |
number of linked factors impact IHG’s long-term success, including the resilience of our business model, | |
our purpose, and the effectiveness of our strategy. Underpinning all of these is our workplace culture, which is driven by our reputation as a well-governed, trusted and ethical company. | ||
36 |
IHG |
| The Group operates a Global Delegation of Authority Policy, which sets out financial commitment and expenditure approval controls. Commitments over certain thresholds or type of proposal require approval from the Group’s Capital Committee, which reports into the Executive Committee. The Group’s legal ownership structure comprises around 390 subsidiaries worldwide. These entities provide the legal framework required to support the Group in making individual contracts and commitments.  Information on the Board’s monitoring and assessment of our culture is included on page 91. Information on the Board’s monitoring and assessment of our culture is included on page 91.Risk appetite, controls and systems Our risk appetite and tolerance is continually reviewed by the Board in its pursuit of strategic and business objectives. While our strategy does not consciously expose any of our assets to significantly heightened risk, the choices we make aim to balance priorities and resources to either actively exploit current advantages or address current disadvantages versus a range of competitors, and meet stakeholder expectations. The Board considers the portfolio of risks we face and whether our allocation of resources and pace of initiatives to build enterprise capability, creates any imbalance or exposes other risk areas as the industry emerges from the pandemic. Our risk appetite is cascaded through our values and behaviours, our goals and targets, our Code of Conduct, Delegation of Authority and other global policies, and is further reinforced by frequent leadership communications to guide behaviours and set priorities. |
We are committed to a framework of monitoring and assurance processes in relation to our initiatives and policies, reviewing whether they have operated within acceptable risk tolerances where priorities have shifted, or where additional actions were required. Board and Committee agenda topics allow the Board to identify and discuss the nature and extent of principal (and emerging) risks and how risk management arrangements have adapted where required. Workplace environment The pandemic has ushered in fundamental changes to the workplace, including hybrid and remote working. We continually review our ways of working as new practises emerge in line with local restrictions and working cultures. Although each region has embraced this differently, with offices at different stages of re-opening, what has emerged is a new type of connectivity between employees, in particular with the adoption of video meetings, a focus on work-life balance and wellbeing, and a less formal approach. As an example, the Denham head office in the UK has embraced a flexible, hot-desking environment, with Executive Committee members working alongside team members in an open-plan workspace.We are mindful that as a result of changes in the workplace and increased digitalisation, we need to be vigilant regarding the security of Company information and data. In 2021, we ran a series of global cybersecurity teaching sessions that included topics such as phishing, keeping information safe and secure whilst working remotely, social engineering, and securing and |

| safely transferring data. We also increased controls around IHG-approved tools and systems, and refreshed and relaunched our security policies at the beginning of 2022. See our people disclosures on pages 23 to 26, and key matters discussed by the Board on page 91.Our behaviours Our Move fast, Solutions focused, Think return and Build one team behaviours empower and inspire our employees to work in a way that supports our purpose and strategic priorities. These are underpinned by our Code of Conduct and responsible business approach, and together influence how we interact with our stakeholders. By role modelling our behaviours, IHG’s leaders create an environment that encourages rapid decision making that supports our growth aspirations, within a framework of due diligence and assurance processes. Employees have shown continued adaptability and resilience in the face of the pandemic, while demonstrating our behaviours. During the year, a series of Next Talk events were led by Executive Committee members across the organisation, to deepen understanding of the link between our behaviours and strategy. More than 2,000 employees joined the sessions, with positive feedback from them. Code of Conduct and related policies IHG’s Code of Conduct (Code) is the framework for how we do business at IHG, and underpins our strategy and commitment to providing True Hospitality for Good. Our key principles and policies are included in the Code, which enables employees and colleagues working in IHG corporate offices, reservation centres, managed, owned, leased, and managed lease hotels to make the right decisions, in compliance with the law and IHG’s ethical standards. Included in the Code is an overview of our values, reporting concerns framework and Group policies, including human rights, respect in the workplace, diversity, equity, inclusion and equal opportunities, accurate reporting, information security, anti-bribery and corruption, and the environment. It also provides guidance on where to go if colleagues have a concern and need further help. The Board, Executive Committee and all colleagues working in IHG corporate offices, reservation centres, managed, owned, leased, and managed lease hotels must comply with the Code. We expect those we do business with, including our franchisees, to uphold similar principles and standards. The Code is reviewed and approved by the Board on an annual basis, and is supported by annual e-learning requirements. In 2022, we will continue to evolve our Code training, engagement and measurement approaches, including developing and |
| |
How IHG does business |
IHG |
37 |
| launching a new Code e-learning module to support and provide additional guidance. In addition to our Code e-learnings, we monitor and assess other aspects of our culture through a variety of methods, including direct engagement, employee engagement surveys, tracking of e-learning completion and our confidential reporting hotline.The following policies and principles form some of the key areas of the Code. Other areas of the Code, such as our DE&I policy, and human rights and modern slavery commitments, are outlined on pages 25 and 26. Initiatives to respond to legal, regulatory and ethical compliance risks are on page 46. IHG’s Code of Conduct is available in 10 languages on the Company’s intranet and www.ihgplc.com/responsible-business Our values Led by the Board and Executive Committee and our values underpin our behaviours and business ethics, guide how we deliver our strategy, make decisions and live our purpose. | ||
 |
Do the right thing | |
 |
Show we care | |
 |
Aim higher | |
 |
Celebrate difference | |
 |
Work better together | |
| Speaking up Central to our people culture is respect in the workplace, whether it be relating to a colleague, guest or anyone else. IHG has zero-tolerance to any form of discrimination, harassment or bullying in line with our Respect in the Workplace Policy. Whilst we uphold our responsibility to behave ethically and protect IHG’s reputation, it is possible that a few colleagues may act in a way which conflicts with the principles set out in the Code. Guidance is given to report concerns directly to line managers, supervisors or local Human Resources representatives. For instances where it is more appropriate, a confidential reporting hotline and online reporting facility is available and globally advertised. The Head of Risk and Assurance and General Counsel and Company Secretary are also available to be contacted. Reports are routinely reviewed by the Board, who ensure arrangements are in place for investigations and follow-up actions. | ||
| Safety and security IHG is committed to providing a safe, secure and healthy environment for all our colleagues, guests and visitors. All operations must comply with all applicable health, safety and security laws. Beyond compliance with the law, IHG works to identify further improvements to the way we manage safety and security risk and has mandatory Brand Safety Standards in place for all hotels globally to drive consistency in this area. Initiatives to respond to safety and security risks are on page 47. Bribery and corruption IHG is committed to operating with integrity. Bribery and any form of financial crime, including improper payments, money laundering and tax evasion or the facilitation of tax evasion, are not permitted under any circumstances. This also applies to any agents, consultants and other service providers who do work on our behalf. Our Anti-Bribery Policy sets out our zero-tolerance approach and is applicable to all Directors, Executive Committee members, employees and colleagues in managed, owned, leased, and managed lease hotels. It is accompanied by a mandatory Anti-Bribery e-learning module. Our Gifts and Entertainment Policy and guidance further supports our approach in this area. To continue to enhance our anti-bribery programme and in line with best practice, in 2021 we undertook a Group-wide bribery and corruption risk assessment with the assistance of specialist external counsel. The objective was to ensure that IHG’s key bribery risks continue to be addressed and areas of improvement are identified. The assessment has recently concluded, and the findings will be incorporated and addressed throughout the business under the leadership of the Ethics and Compliance team. Initiatives to respond to legal, regulatory and ethical compliance risks are on page 46. |
| IHG is a member of Transparency International UK’s Business Integrity Forum and participates in its annual Corporate Anti-Corruption Benchmark. Each year, the results from this benchmark help to measure the effectiveness of our anti-bribery and corruption programme and identify areas for continuous improvement. |
| Handling information responsibly We are committed to ensuring that guests, members of our loyalty programmes, colleagues, shareholders, owners and other stakeholders trust the way we manage data. As part of our privacy and information security programmes, we have standards, policies and procedures in place to manage how personal data can be used and protected. |
| Our e-learning training for employees on handling information responsibly is a mandatory annual requirement, and covers topics such as password and email security, using personal data in accordance with our policies and privacy commitments, how to work with vendors and transferring data securely.In addition to the cybersecurity awareness learnings mentioned on the previous page, we held tabletop exercises to practise our ability to detect and respond to potential security events, such as ransomware and supply chain attacks. We continue to develop our privacy and security programmes to address evolving requirements and take account of developing best practice. The Board regards cybersecurity as a critical business discipline and it regularly receives updates. See initiatives to respond to cybersecurity and information governance risks on page 44. |
| Section 172 statement Details of how the Directors have had regard to the matters set forth in Section 172(1)(a) to (f) of the Companies Act 2006 is provided in the Section 172 statement on pages 90 to 91. Further details can be found throughout the Strategic and Governance Reports, including in our key stakeholder engagement disclosures on pages 20 to 28, 39, 92, 101, 107, 108, 112 to 114, 227 and 228. Non-financial information statementNon-financial information, including a description of policies, due diligence processes, outcomes and risks and opportunities can be found as set out below. Internal verification and disclosure controls apply to all the information covered in these areas.• Impact of the Company’s activities on the environment on pages 29 to 35, and 229 and 230• Social matters on pages 27 and 28• Anti-corruption and anti-bribery matters on page 38• Employee matters on pages 24 to 26, 101, 107, 108, 112, 114 and 227• Respect for human rights on page 26• A description of the Group’s business model on pages 10 to 13• The Group’s principal risks on pages 42 to 47• The Group’s KPIs on pages 50 to 53 See our relevant policies at www.ihgplc.com/responsible-business |
38 |
IHG |
G |
rowing our business in an innovative and sustainable way, whilst working to the highest |
| Corporate and hotel supply activities are driven by our Procurement function and guided by our responsible business agenda, with oversight from the Board’s Responsible Business Committee. |
 |
See our supply chain disclosure on page 26, and commitment to minimise waste on page 30. |
Supplier engagement | ||
 |
Responsible supplier relationships are vital for IHG in driving efficiency and effectiveness throughout both hotel and corporate office lifecycles. | |
| | ||||||||
What impacted them in 2021 |
Engagement |
Outcomes | ||||||
| • Payment practices and performance• Supply chain integrity• Environmental concerns, including waste |
• Communications with suppliers about payment terms• Working with suppliers as part of our tendering processes, to understand their responsible business activities• Collaboration with suppliers regarding bulk amenity solutions |
• Revised payment processes for small companies that supply IHG in the UK• Increased collaboration with sustainable suppliers and alignment with our Journey to Tomorrow ambitions• Sustainable bulk amenities solutions are being deployed across our estate globally | ||||||
|
|
Further information about how the Board considered supply chain and procurement is on pages 91 and 101, and our business relationships, including our statement of business relationships with suppliers, customers and others, is on page 228. | |
 |
Visit www.ihgplc.com/responsible-business | |
| |
How IHG does business |
IHG |
39 |
| Attitudes to risk within key decisions We have assessed risks and considered risk appetite across our strategic choices and, while we are not exposed to greater risk overall across the strategy, we continue to monitor risks to executing against our plan and inherent risks from the trade-offs we have made. There are also several emerging risks which are likely to be dynamic throughout the delivery of our strategy, including consumer demand shifts; digital disruption; people and workforce changes; environmental, social and governance (ESG) expectations; and a complex geopolitical and regulatory environment. We describe the Board’s approach to risk appetite on page 37 and our attitude is often less about downside risk mitigation and more about positioning ourselves to respond to uncertainty in an agile way. |
Board and Committee discussions during 2021 have allowed for consideration of emerging and evolving risks across a wide range of topics and timeframes, including: • competitor and macroeconomic risk factors within the Board’s discussion of strategy and presentations from management (e.g. brand and loyalty strategies, commercial and technology developments, industry cybersecurity risks, supply chain and procurement strategies, long-term financial strategy, regulatory developments and the imperative to drive owner returns);• workforce-related risks at the Remuneration and Nomination Committees, including preparation for the integration of an ESG element into targets for future longer-term incentive cycle, retention and succession arrangements; and risks relating to the competitiveness of remuneration; |
• regulatory and financial governance risks at the Audit Committee (e.g. tax risks relating to digital businesses, treasury and liquidity risks linked to volatility and sentiment in the capital markets, corporate governance reform, potential risks from litigation and financial control risks in a cost-constrained environment);• wider cultural risks at the Responsible Business Committee, including employee wellbeing and the impact of flexible working arrangements; gender and ethnicity reporting; community impact; sustainability; human rights; and evolving supply chain risks; and• risks relating to the impact of climate change on IHG have continued to receive close attention in Board and Responsible Business Committees, including our commitments to the TCFD recommendations and an external briefing on COP26 focus areas. | ||
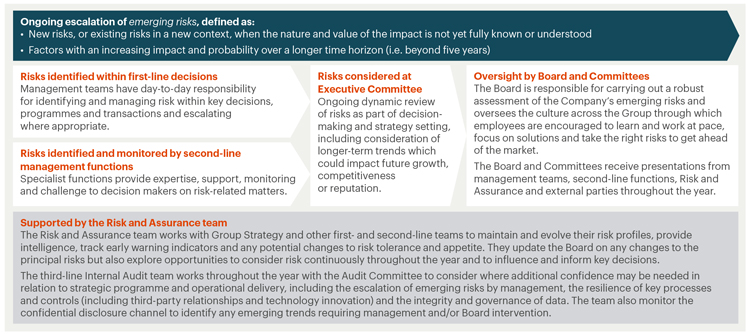
40 |
IHG |
• |
how the Executive Committee has reinforced key principles of culture and leadership |
• |
how we have adapted key processes and controls |
| procedures; and cross-function collaboration on key risks (including third-party due diligence, personal data, fraud prevention, responsible business); and |
• |
how we have adapted monitoring and reporting |
|
|
This section should be read together with the rest of the Strategic Report, Governance on pages 80 to 127, the going concern statement on page 230, and Risk Factors on pages 231 to 236. |
Our practices in place that worked well |
Opportunities identified for future resilience planning |
Implementing opportunities in practice | ||||||
| We identified successful practices adopted by many IHG teams in our pandemic response to capture and reinforce for the future including: • global alignment on terminology and response procedures, highlighting key accountabilities and escalation protocols;• protocols to engage diverse expertise and best practice across our functions and regions, using a global ‘hub and spoke’ model. This ensured we remained agile and adaptable in the fast-changing and uncertain global environment; and• living our values, behaviours and priorities, empowering teams to be solutions-focused and move at pace to support hotels and owners as well as care for our employees and guests. |
While recognising what worked well, we also identified opportunities to evolve and strengthen our crisis management and business continuity programme launched prior to the pandemic, including: • where possible, automation of processes that allow for real time data to be easily captured, tracked, and monitored; and• enhanced structures for streamlining efficiency in our communication processes up and downstream in the business. |
Each key opportunity identified in our lessons learned review was assigned a dedicated working group to identify practical and achievable solutions for implementation in 2022 and beyond. These new ways of working will be embedded into our common practices and culture, ensuring greater resilience and readiness for future incidents or crises across a wide range of potential individual and connected risk topics. | ||||||
| |
Our risk management |
IHG |
41 |
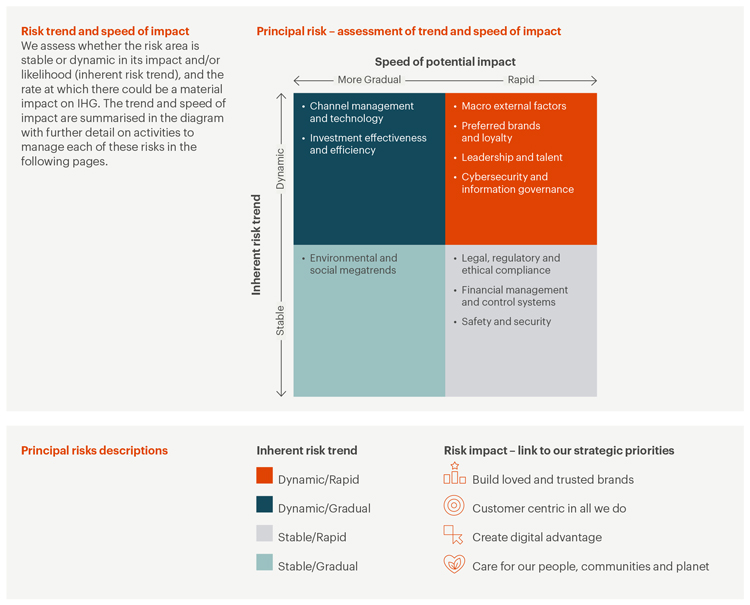
42 |
IHG |
Risk & trend |
Macro external factors |
Preferred brands and loyalty | ||||||
Description |
Macro external factors such as political and economic disruption, the emerging risk of infectious diseases, actual or threatened acts of terrorism or war, natural or man-made disasters, and inflationary pressures could have an impact on our ability to perform and grow, including disrupting hotel supply chains and increasing costs for our owners. |
Failure to deliver preferred brands and loyalty could impact our competitive positioning, our growth ambitions and our reputation with guests and owners. Competition from other hotel brands and third-party intermediaries create inherent risks and opportunities to the longer-term value and attractiveness of IHG’s franchised and managed proposition for our brands. | ||||||
Link to strategy |
 |
 | ||||||
| Trends observed in 2021 |
Secondary impacts and continuing uncertainty in relation to the recovery trajectory from the pandemic will continue to exacerbate these factors across several markets. Inflationary forces on labour and energy could create significant pressures to hotel and owner financial positions and IHG operating costs. In addition to epidemics and pandemics, the risk of natural disasters and extreme weather events may pose an increasing threat to IHG operations in the future. Local and international political tensions also continue to create uncertainty for operations in key markets. |
In an uncertain demand environment, and with constraints on labour, supply chain and investment capacity in many markets, our hotels and owners continue to face dynamic risks to delivery of guest expectations of experience. Covid-19 increased short-term pressures on availability of financing for development, and there may also be slowing of the pace of construction and openings due to labour and supply chain constraints and wider inflationary pressures. | ||||||
Initiatives to respond |
IHG’s resilience remains an ongoing, cross-functional, focus. The launch of a refreshed incident and crisis management programme and engagement of key leadership teams in scenario training prior to the pandemic has proved very valuable in establishing a common language and headline roles and responsibilities. We have continued to monitor intelligence from a range of external and internal sources (e.g. government health and travel advice), to evolve guidance for the safe operation of hotel and corporate offices. Leadership teams across IHG have also reviewed lessons learned from the pandemic and how they can be applied to future crises. As an example the EMEAA leadership team regularly review global, regional, and business unit risks, working with Business Reputation and Responsibility experts to train teams on resilience, continuity, and crisis planning. Crisis management teams have refreshed business continuity arrangements for the reopening of corporate offices (e.g. business service centres, reservation offices and corporate locations) and continued to monitor continuity approaches for key supplier relationships. We maintain a range of intelligence sources to horizon-scan for emerging threats, provide insight to leadership on incidents that impact operations, and analyse future scenarios to inform the business planning cycle, including at the Board and Executive Committee level. Our initiatives to focus on owner returns are described within the ‘Preferred brands and loyalty’ and ‘Investment effectiveness and efficiency’ risks and within our priority to be customer centric in all we do (see pages 19 to 21). |
In recent years, we have focused on strengthening our brands, addressing quality, building our masterbrand and enhancing our data and technology capabilities. These investments have been essential to our multi-year journey towards customer centricity and have helped establish a strong foundation from which to build customer loyalty (see pages 19 to 21). We have added the capabilities to launch and manage new brands, including standardised design, mandated specifications, new procurement capabilities, continuous product innovation, and strengthened franchise licences. It will be critical to use our loyalty programme to drive business to our hotels and take share from our competitors. We are also investing in individual hotel-level marketing to drive revenue performance of new brand hotel openings and implementing actions to enhance returns for our owners by decreasing costs to build and operate hotels, for example by evolving our brand standards. We are coordinating the operational impact on hotels in the near term as ongoing disruptions mean there will be constraints on our ability to train hotel colleagues. Our regional teams also use data to prioritise attention and resources to drive performance. We track hotel-level data in relation to the sustainability of our brands in order to respond to an increasing trend of requests from corporate clients for this information. Several IHG teams have also progressed an agreed set of bathroom bulk product offerings for all our brands in all our regions, not only to build on our sustainability credentials but to improve guest experience through the products that will become available in our hotels. | ||||||
| |
Our risk management |
IHG |
43 |
Risk & trend |
Leadership and talent |
Cybersecurity and information governance | ||||||
Description |
Failure to attract, develop and retain leadership and talent could impact our ability to achieve growth ambitions and execute effectively. Risks relating to people underpin the majority of processes and controls across IHG, and our ability to develop talent is critical to delivering value to our brands and hotels in the global markets where we operate and compete. See pages 24 to 26 for further detail on the importance of our people to our purpose and strategic goals. |
Inherent threats to cybersecurity and information governance remain significant and we are responsible for a range of high-value assets (critical systems and employee, guest and other sensitive data) which may be targeted by various ‘threat actors’ (including organised criminals, third-parties and colleagues). Our plans to transform how we use our commercial and marketing data to improve the customer experience, grow market share and revenue, and empower our owners to make better decisions also present inherent risks to how we manage information across IHG. | ||||||
Link to strategy |
 |
 | ||||||
Trends observed in 2021 |
Our ability to attract and retain talent remains a challenge in an uncertain economic and highly competitive environment. Furthermore, our growth ambitions increase the need for hotel talent, particularly for General Managers in our Luxury & Lifestyle estate. We face dynamic trends in our ability to retain and attract key and diverse talent, to deliver learning at pace and to transition to hybrid ways of working while maintaining productivity and collaboration. |
Dynamic and external attacks against the hospitality industry have continued in 2021, with ransomware attacks in particular trending against technology providers, national infrastructure and supply chain. This has the potential to impact both IHG and our third-party providers. Rapid societal, legal and regulatory and media scrutiny of privacy arrangements, the transition to more permanent hybrid working conditions for our employees and suppliers, and advances in attack sophistication also heighten inherent information security risks. | ||||||
Initiatives to respond |
The Executive Committee regularly discusses talent attraction and retention risks, and each functional and regional leadership team has a clear talent plan. We have expanded programmes to support the development of diverse talent, increased our conscious inclusion education and continuously review and adapt our practices to be more inclusive. Our employee resource groups, who are key in helping us build a culture of inclusion, have grown across all our global markets. We are providing active support to our colleagues as they transition to hybrid working and are taking opportunities to re-energise the workforce. Regular all-employee calls are held with the Chief Executive Officer and there are ongoing leadership communications and virtual team meetings at regional and functional levels.The Human Resources organisation have developed a series of leadership tools and learning to ensure our leaders are equipped to lead in a hybrid world and can foster a performance-driven culture based on trust. We are creating office spaces that are designed for collaboration and connection. We have established a Global Learning Steering Committee with a focus on supporting our owner needs, reviewing our learning offering and utilising technology to provide a virtual and sustainable learning environment. IHG has the ability to manage talent and retention risks directly in relation to IHG employees but relies on owners and third-party suppliers to manage these risks within their own businesses. Our Procurement, Legal and Risk teams also consider more indirect workforce risks relating to our third-party relationships. The Remuneration Committee is responsible for determining Executive Board and Executive Committee remuneration and reviews wider workforce remuneration, aligned with the interests of shareholders and the UK corporate governance environment. |
Our Information Security team continues to implement new solutions and controls to address potential vulnerabilities, and to focus resources on those operational tasks that best protect our sensitive data sets and systems and detect and respond to potentially malicious events in an appropriate way. In 2021 we built a ransomware response programme, conducted tabletop exercises and clarified decision rights to enhance incident preparedness. We also matured our oversight of third-party providers through use of security questionnaires and an independent cybersecurity ratings platform. We work with our specialist technology providers to continuously improve key operational security processes and capabilities such as Identity and Access Management, Security Monitoring, Incident Response, and the support and maintenance of technical solutions architecture. As finances remain at a premium for hotel owners, our Information Security and Technology teams continue to collaborate to provide reliable, scalable and cost-effective solutions, targeted at areas of greatest opportunity for future attacks. Our information security strategy and programme is overseen by an Executive Security Compliance Committee and supported and reviewed by internal and external assurance activities, including PCI assessments. An extensive security metrics pack is produced monthly to track risk trends, operational effectiveness and mitigation activities. To mitigate specific risks in relation to our Greater China region, our local team has conducted internal assessments of security compliance and remediated gaps, supported by IHG’s Global Information Security team. See also page 38 for detail of our approach to handling information responsibly in accordance with our policies and privacy commitments, including working with vendors. | ||||||
44 |
IHG |
Risk & trend |
Channel management and technology |
Investment effectiveness and efficiency | ||||||
Description |
Failure to capitalise on innovation in booking technology and to maintain and enhance the functionality and resilience of our channel management and technology platforms (including those of third-parties, on which we rely directly or indirectly), and to respond to changing guest and owner needs remains a principal risk to IHG’s revenues and growth ambitions. |
The importance of our investment effectiveness and efficiency will be critical to balance short- and longer-term strategic needs (e.g. developing infrastructure, increasing growth of our system, enhancing digital capabilities). Failure to manage risks associated with investments may impact commercial performance, lead to financial loss and undermine stakeholder confidence. | ||||||
Link to strategy |
 |
 | ||||||
| Trends observed in 2021 |
Uncertain demand as the industry recovers creates dynamic and rapid trends to how we service demand through various channels and meet increasing guest and owner expectations, including how we use data to personalise experiences and build loyalty. The pace of innovation in digital behaviours in the hospitality industry and wider society continues to accelerate, with fast-moving global and local competitors, and technology replacing certain elements of business travel, and IHG must evolve to effectively grow and compete in the marketplace. Additional risk comes from the current context, including financial and inflationary pressures on owners who rely on us for their scale, capabilities and enterprise strength, and constraints and risks in the hiring and retention of top talent in the hospitality industry. |
We are highly dependent on significant capital investment to renovate our existing estate, sign new hotels and build IHG’s pipeline and the current operating environment has created additional challenges for owners, including financing constraints, commodity and raw material price inflation, supply chain constraints, labour and general product shortages, shifting guest expectations and volatile demand patterns. As such, it is particularly important that our enterprise capability is strong to allow owners to deliver consistently superior returns that can attract this capital. We are also increasing our interdependencies with third-parties to deliver our Commercial and Technology strategy, placing emphasis on risk ownership within ongoing management of contract relationships and the resilience of, and due diligence in relation to, key suppliers. | ||||||
Initiatives to respond |
While the pandemic has been limiting due to decreased availability of capital, capacity and capabilities, we benefited from prior progress we had made in our organisations to manage risks, by simplifying our work, sequencing it more effectively and removing obstacles and limitations within each core area. As such, we are able to respond rapidly to shifts and opportunities in the marketplace and can drive incremental revenue by focusing on the basics of pricing, inventory and booking-flow optimisation. Our Marketing and Commercial and Technology teams work in partnership to prioritise efforts and associated investments in driving enhanced customer-centricity, by developing and iterating a roadmap for key initiatives, their pace, sequence and intended focus for technology-enabled transformation over the next three years and beyond (see page 22 for more details). We have also established a central programme oversight function designed to support and monitor progress, challenge approaches and resolve issues relating to execution. We will also continue to focus on developing our capabilities and ensuring that we have the talent needed. While we have seen the addition of top senior leadership talent to our teams, it will be key to prioritise digital capabilities to drive our channels, actively expanding the breadth and depth of our digital relationships with current and new guests. To mitigate specific risks for local markets, we have developed a China Digital roadmap and investment to strengthen our locally relevant digital and loyalty offering. |
Our Finance teams regularly review and evolve our governance and control frameworks, including delegated approval authorities and processes, to enable decisions on investments to be made quickly and efficiently with consideration of the risks involved. The Executive Committee discusses our strategic priorities and capabilities to deliver them. Our global and regional Operations teams maintain a global project tracker which allows us to have visibility and review any risks and opportunities to any in-flight or pending project with impact on hotels.With learnings from the pandemic and considering the new operating context, we established a new strategic priority in being customer centric in all we do to further strengthen owner return on investment and to accelerate our net system size growth in the recovery. We are instilling specific return on investment disciplines through our ‘Think return’ behaviour and are applying enhanced design and procurement processes to reduce the cost, alleviate labour pressures and maintain the quality of our brands in new brand prototypes. We have also simplified governance with a senior executive steering committee providing oversight of key global workstreams. We are strategically planning our sourcing activities around known or anticipated cost and supply challenges for our owners. Many goods and services in these areas are also intrinsically linked to our responsible procurement plan to deliver sustainable, diverse and risk-managed supplies to our hotels. See page 39 for more detail. | ||||||
| |
Our risk management |
IHG |
45 |
Risk & trend |
Legal, regulatory and ethical compliance |
Financial management and control systems | ||||||
Description |
As we operate in more than 100 countries we are exposed to many different compliance, regulatory and litigation and reputation risks. Significant fines can be imposed for regulatory non-compliance, IHG may be exposed to litigation risk and stakeholders (including corporate sales clients) and investors focus on IHG’s performance in upholding ethical and social expectations. |
A material breakdown in financial management and control systems would lead to increased public scrutiny, regulatory investigation and litigation. Material weaknesses may also impact confidence in IHG from our shareholders and wider stakeholders including suppliers, debt holders, hotel owners and employees. | ||||||
Link to strategy |
 |
 | ||||||
Trends observed in 2021 |
The global business regulatory and contractual environment and societal expectations have continued to evolve throughout 2021, with legislative changes in many locations we operate in on topics such as data privacy. Many countries are introducing legislation or legislative proposals related to ESG agendas and a focus on sanctions as a foreign policy tool continues to increase. Expectations are also increasing for IHG to manage and drive responsible business through our supply chains and across our wider business including with our franchisees. We expect monitoring and scrutiny of corporate human rights performance to continue to increase as a direct result of the Covid-19 crisis and with high profile upcoming events including the FIFA World Cup Qatar 2022. |
Risk levels have remained relatively stable, with continuing monitoring required in relation to owner credit risks and potential commercial disputes while the pandemic recovery progresses. We have made some revisions to our control testing which align with the approach of our new auditors, PwC, and there were no major new accounting standards with a material impact effective this year. We are monitoring the UK Government consultation on corporate governance reform. | ||||||
Initiatives to respond |
Our Ethics and Compliance team focuses on ensuring IHG has a globally coordinated approach to material ethical and compliance risks. The overarching framework is the IHG Code of Conduct (see pages 37 and 38) and e-learning is provided to corporate and reservation employees and managed hotels on an annual basis.Our Ethics and Compliance team monitor e-learning training completion, gifts and entertainment reporting and the owner due diligence process. The team also receive informal queries and/or escalation of issues directly from colleagues and via an Ethics and Compliance email channel which is publicised in training and awareness materials. The Board receives regular reports on the Confidential Reporting Channel. We also continue to participate in Transparency International UK’s Corporate Anti-Corruption Benchmark.We monitor and advise internal stakeholders on risks across a range of regulatory issues, including safety, employment, contract, privacy, anti-bribery and anti-trust, as well as continuing to identify and address legal and regulatory issues that have emerged in relation to Covid-19. We also monitor and assess developments in relation to regulations, potential sanctions or directives imposed by governments, and our owner legal due diligence process includes screening against sanctions lists. Ethics and compliance country-level due diligence is undertaken for new country entry assessments and we continue to develop our supplier due diligence process. We are committed to ongoing assessment and work on human rights risks as an integral part of our Journey to Tomorrow commitments (see page 26). |
The impact of Covid-19 on our financial reporting and control environment has been significant and presented several challenges. There have however also been opportunities to evolve our approach in certain areas, and the Finance leadership team has continued to review controls and implement enhancements including increased use of remote testing, robotic process automation and data analytics. We have also established a committee with responsibility for central co-ordination of control activity which brings together Senior Leaders in the organisation responsible for assurance activities to review status and scope, evaluate control findings, and consider emerging regulatory developments.We continue to review our business continuity arrangements, including for our India-based Global Business Service Centre, given the operational importance of processes located there such as accounts payable, billing and cash collection, and financial reporting for both corporate and hotels. We have continued to operate an established financial control system, which is verified through testing relating to our Sarbanes-Oxley compliance responsibilities. See pages 57, 156, 169 to 173 for details of our approach to taxation, pages 96 to 97 for details of our approach to internal financial control, and pages 188 to 192 for specific details on financial risk management policies. IHG’s management of fraud risk is an integral part of our broader risk management system, including inherent risks to travel industry loyalty programmes. The management of fraud is the responsibility of management teams within regions and functions and is supported by expertise from Risk and Assurance and Global Finance who also track a range of indicators and report periodically to the Audit Committee on fraud risk management procedures, including financial and non-financial factors.Our Group insurance programmes are also maintained to support financial stability. | ||||||
46 |
IHG |
Risk & trend |
Safety and security |
Environmental and social megatrends | ||||||
Description |
The manner in which IHG responds to operational risk and the steps taken to safeguard the safety and security of colleagues and guests will continue to receive scrutiny, particularly in light of the pandemic, and could result in avoidable harm to IHG’s reputation for high standards of business conduct, result in financial damage, claims against IHG and undermine confidence in our brands. |
As a global business, IHG faces uncertainties relating to evolving environmental and social megatrends and our response to these has the potential to impact performance and growth in key markets and is subject to scrutiny from a wide range of stakeholders, including regulators and investor groups, corporate clients, guests and colleagues. | ||||||
Link to strategy |
 |
 | ||||||
| Trends observed in 2021 |
The scrutiny of our operations in relation to our Covid-19 response continued in 2021 across all markets. The risks above relate both to our direct operations in hotels and other locations where we have management responsibility, and also to outsourced activities and others with whom we collaborate and trade, including the owners of our franchised hotels which operate as independent businesses. |
The focus on companies acting responsibly and being true to their purpose has been heightened by the pandemic and will continue into the future. This includes investor focus, which is reflected by the increasing requirements for targets and detailed data from ratings and research providers. The detail of our TCFD risk assessment is included on pages 32 to 35, highlighting four most potentially material medium- to longer-term risks, and we will continue to assess the aggregate impact of climate change on our wider stakeholders including our third-party hotel owners. Short-term climate-related factors are also increasingly being considered within other risks, including guest expectations of the sustainability of our brands and macro external factors including extreme weather events. | ||||||
Initiatives to respond |
Our Business Reputation and Responsibility team coordinates and monitors IHG’s global safety management system, which is designed to anticipate and identify safety and security risks in an evolving landscape and provide appropriate levels of control necessary to mitigate against significant incidents, whether in hotels or corporate offices. Regional and global subject matter specialists in safety and security work regularly with hotels, operations leaders, and operations support teams such as Design and Engineering, Food and Beverage and Human Resources, to review and set operational safety and security policies and procedures. This working relationship has been particularly important during the pandemic while guest and colleague safety has been IHG’s core priority. Subject matter specialists have also continued to monitor local law and public health guidance and external trends that may impact the safe operation of hotels, customer expectations, and development opportunities (e.g. fire safety, food allergens, operational security threats and natural catastrophes), and we continue to review our relevant standards and guidance as these issues evolve and new regulatory requirements and best practices are published. Our specialists regularly advise regional Development and Operations teams about potential security and threat risks in relation to new country entries and new hotel projects. Our specialists also monitor a range of internal indicators relating to safety and security to confirm that our approach to mitigating safety risks across our business is being actively adopted in all regions, and produces expected outcomes. Despite our best efforts, incidents will occur across our global hotel operations and corporate offices; we use these incidents as an opportunity to learn, escalating the most serious for senior management attention. The Board receives and reviews regular safety reports and monitors safety performance. Through this monitoring, IHG can determine where additional standards or guidance may be necessary or whether existing controls may need to be adjusted. |
Our Corporate Responsibility team have refined our approach and enhanced our disclosures to meet the expectations of our investors and the requirements of this evolving regulatory environment. We also work together with governments and industry associations to ensure our voice is heard among key stakeholders, as well as being able to advocate for our industry and our owners. Our preparedness and resilience to climate change is being embedded into existing ‘business as usual’ processes following our project to support the TCFD recommendations. To reduce our carbon footprint overall we have upgraded our science-based target and created a roadmap with internal targets to track and report progress against this commitment. Key elements of our roadmap include supporting our hotels to decarbonise through improved energy efficiency and switching to renewable energy. See pages 29 to 35 for details of our environmental policies and initiatives and the measures we will use to track and report progress against our new commitments. During 2021 several IHG teams worked towards an agreed set of bathroom bulk product offerings, as part of our strategy to reduce single use plastics. We are also further investing to provide training and tools to increase procurement capabilities in sourcing and implementing supplier diversity, sustainability and risk management. Our long-standing commitment to operating our business responsibly has underpinned the actions we are taking in our local communities (see pages 27 and 28), for example through job creation, upskilling and our support for vulnerable people during the pandemic. We also maintained our focus on working and living conditions for migrant workers as well as topics such as responsible recruitment and continue to engage on industry collaboration initiatives which are addressing these risks. Our values and behaviours, promoted by our Code of Conduct, inform our decision-making at all levels. Our Procurement, Legal and Risk teams also monitor supply chain and labour practices risks (see pages 26 and 39). | ||||||
| |
Our risk management |
IHG |
47 |
D |
uring 2021 the hospitality industry continued to be impacted by the ongoing pandemic. Trading did however recover significantly during the year, with RevPAR up 46% on 2020 and returning to 70% of 2019’s |
Percentage point decrease in |
Index (to 2019) |
|||||||||||||||||||||||
RevPAR compared to Base Case |
2022 |
2023 |
2024 |
|||||||||||||||||||||
Downside Case |
5 |
5 |
5 |
|||||||||||||||||||||
Severe Downside Case |
15 |
8 |
7 |
|||||||||||||||||||||
Scenarios modelled |
Related to principal risks | |||
Changes in RevPAR |
||||
| Downside Case and Severe Downside Case These scenarios model a prolonged decrease in RevPAR, which may be driven by external or internal factors. |
Macro external factors Preferred brands and loyalty Leadership and talent Safety and security Financial management and control systems | |||
One-off events |
||||
This scenario models the impact of a specific material incident, which could relate to cyber security or an alternative material impact on the cash flow statement. |
Cybersecurity and information governance Legal, regulatory and ethical compliance | |||
a |
Use of Non-GAAP measures: In addition to performance measures directly observable in the Group Financial Statements (IFRS measures), additional financial measures (described as Non-GAAP) are presented that are used internally by management as key measures to assess performance. Non-GAAP measures are either not defined under IFRS or are adjusted IFRS figures. Further explanation in relation to these measures can be found on pages 73 to 77 and reconciliations to IFRS figures, where they have been adjusted, are on pages 218 to 223. |
48 |
IHG |
• |
The $1.35 billion bank facilities mature in September 2023. It has been assumed that these facilities are renewed as they mature. |
• |
£173 million of bonds due in November 2022 are repaid on maturity. |
• |
€ 500 million of bonds due in October 2024 are repaid on maturity. |
|
|
See also our business model on pages 10 to 13, the going concern assessment on page 149, and the impact of the principal risks on pages 42 to 47. |
| |
Viability statement |
IHG |
49 |
O |
ur KPIs are carefully selected to allow us to monitor the delivery of our strategy and long-term success. They are organised around our strategy, which articulates our purpose, ambition and priorities, |
|
|
For more information on Directors’ remuneration see pages 104 to 125. |
 |
The Annual Performance Plan |
• |
70% was linked to operating profit from reportable segments |
• |
15% was linked to strategic focus on net system size growth through openings |
• |
15% was linked to strategic focus on future net system size growth through signings |
 |
The Long Term Incentive Plan |
• |
40% was linked to Total Shareholder Return |
• |
20% was linked to absolute net system size growth |
• |
20% was linked to total gross revenue growth |
• |
20% was linked to cash flow generation |
Link to our strategy |
 Build loved and trusted brands |
 Customer centric in all we do |
 Create digital advantage |
 Care for our people, communities and planet | ||||
Our strategic priorities, refreshed in 2020, are core to our success. Our four strategic priorities are represented as follows: | ||||||||
KPIs |
2021 status and 2022 priorities | |||||
| Net rooms supply Net total number of rooms in the IHG System. Increasing our rooms supply provides significant advantages of scale, including increasing the value of our loyalty programme. This measure is a key indicator of achievement of our growth agenda (see page 16). |
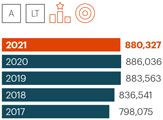 |
2021 status Gross system growth of 5.0%; net system size decline of 0.6% after 49,667 rooms removed, included 34,345 rooms from Holiday Inn and Crowne Plaza, as we concluded our quality review, taking total supply to 880,327 rooms. Signings of 68,870 rooms (437 hotels) represented 23% growth on the prior year, but was below pre-pandemic levels, as Covid-19 related challenges remained in place in a number of markets. Total pipeline of 270,960 rooms, with more than 40% under construction, declined 0.4% compared to 2020 as signings were offset by 43,958 room openings and a normal level of attrition.Overall performance was driven by: • Continued strength of the Holiday Inn Brand Family with 25,766 rooms opened and 31,169 rooms signed, representing almost half of all signings.• Conversions, representing 25% of openings and 22% of all signings.• Luxury & Lifestyle brands gaining momentum with 28 hotels opened and a further 75 properties signed.• Further growth of our recently launched brands with:– avid hotels, our second largest contributor to system growth, doubling the number of open properties, taking the total estate to 48 hotels, and a further 164 in the pipeline. – the further global expansion of voco hotels to 69 open and signed hotels since launch in 2018, across 25 countries. – continued signings pace for Atwell Suites resulting in 23 pipeline hotels. – the launch of Vignette Collection, with six properties secured in the year and our first hotel already open. 2022 priorities • Focus on our ambition to deliver sustainable industry-leading net system size growth, with leading brands in the largest markets and segments.• Continued focus on the quality of our estate, with lower anticipated future overall removal rate than historic levels.• Further rollout of avid hotels and Atwell Suites in the US, and voco hotels globally.• Expand our Luxury & Lifestyle offer through acquired brands Regent, Six Senses and Kimpton, and our recently launched Vignette Collection. | ||||
| Signings Gross total number of rooms added to the IHG pipeline. Continued signings secure the future growth of our System and continued efficiencies of scale. Signings indicate our ability to deliver sustained growth (see page 16). |
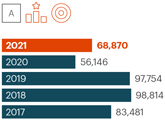 |
|||||
50 |
IHG |
KPIs |
2021 status and 2022 priorities | |||||
| Global RevPAR b growthRevenue per available room: rooms revenue divided by the number of room nights that are available. RevPAR growth indicates the increased value guests ascribe to our brands in the markets in which we operate and is a key measure widely used in our industry (see page 8). Growth in underlying fee revenues a Group revenue from reportable segments excluding revenue from owned, leased and managed lease hotels, significant liquidated damages and current year acquisitions, stated at constant currency. Underlying fee revenue growth demonstrates the continued attractiveness to owners and guests of IHG’s franchised and managed business (see page 11). Total gross revenue from hotels in IHG’s System a Total rooms revenue from franchised hotels and total hotel revenue from managed, owned, leased and managed lease hotels. Other than for owned, leased and managed lease hotels, it is not revenue wholly attributable to IHG, as it is mainly derived from hotels owned by third parties. The growth in gross revenue from IHG’s System illustrates the value of our overall System to our owners (see page 11). Enterprise contribution to revenue The percentage of room revenue booked through IHG managed channels and sources: direct via our websites, apps and call centres; through our interfaces with Global Distribution Systems (GDS) and agreements with Online Travel Agencies (OTAs); other distribution partners directly connected to our reservation system; and Global Sales Office business or IHG Reward members that book directly at a hotel. Enterprise contribution is one indicator of IHG value-add and the success of our technology platforms and our marketing, sales and loyalty distribution channels (see page 11). |
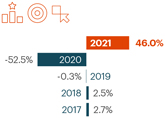 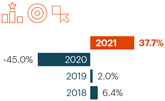 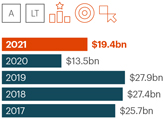 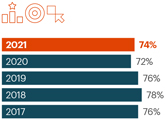 |
2021 status • RevPAR improved in 2021 following an unprecedented decline in 2020, and recovered to 70% of 2019 levels. The improvement was largely driven by domestic leisure demand, particularly during holiday periods, once vaccination rates allowed for restrictions to be lifted in markets including the US and UK.• Through the continued challenges of the pandemic we have remained committed to supporting our owners to maximise revenues through:– Enhanced revenue management systems to quickly identify and act on revenue opportunities using business intelligence and data. – Improved rate negotiations on behalf of our owners using IHG’s award-winning centralised RFP processes (CRFP), with 2,200 hotels now using the service. – Real-time targeted campaigns and promotions aimed at key demographics of returning leisure and business demand. – Continued implementation of mobile-enabled improvements including the development and piloting of a next generation IHG mobile app, enabling a richer customer experience which is expected to increase direct bookings and incremental spend during stays. – Conducted detailed room inventory assessments across 5,300 hotels by end of 2021, in preparation for attribute pricing which will enable owners to generate maximum value from their hotel’s unique attributes. • Enterprise contribution improved to 74% in 2021, driven by digital and online travel agent (OTA) growth from strong leisure demand in the summer months, especially in the US. This was partly offset by continued weakness in Global Distribution Services (GDS) as corporate demand remained weak. Reward night bookings largely recovered to pre-pandemic levels, with participation rates of our higher tiered members, and particularly leisure customers, exceeding 2019 levels.• Launched our ‘Welcome Back to Business’ campaign, and IHG Business Edge, our award-winning dedicated SME programme, which increased its accounts by 44% to over 57,000, gaining share.• Further development of IHG Rewards proposition through growth in Reward Night Dynamic Pricing and the extension of the pause on points expiration and membership tiers.• New marketing campaigns to strengthen our IHG Hotels & Resorts masterbrand to better promote our brands.2022 priorities • Continue to apply targeted data analytics and marketing to identify and yield revenue enhancing opportunities.• Continue to develop our digital-first approach by leveraging our cloud-based IHG ConcertoTM platform.• Complete inventory work on the remaining hotels in our estate, in support of the rollout of attribute pricing via our direct channels.• Full roll-out of the next generation IHG mobile app, offering upgraded analytics and personal marketing as part of our transformed loyalty offer.• Further enhance our loyalty offer through the relaunch of IHG Rewards, to provide members with richer benefits and increase enrolment.• Maintain our focus on increasing contribution from IHG Rewards members and through direct bookings via our website or call centres. |
a |
Use of Non-GAAP measures: In addition to performance measures directly observable in the Group Financial Statements (IFRS measures), additional financial measures (described as Non-GAAP) are presented that are used internally by management as key measures to assess performance. Non-GAAP measures are either not defined under IFRS or are adjusted IFRS figures. Further explanation in relation to these measures can be found on pages 73 to 77 and reconciliations to IFRS figures, where they have been adjusted, are on pages 218 to 223. A reconciliation of total gross revenue to owned, leased and managed lease revenue as recorded in the Group Financial Statements can be found on page 60. |
b |
Comparable RevPAR includes the impact of hotels temporarily closed as a result of Covid-19. |
| |
Key performance indicators (KPIs) |
IHG |
51 |
KPIs |
2021 status and 2022 priorities | |||||
| Guest Love IHG’s guest satisfaction measurement indicator. Guest satisfaction is fundamental to our continued success and is a key measure to monitor the risk of failing to deliver preferred brands that meet guests’ expectations (see page 43 for details). |
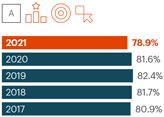 |
2021 status • Guest satisfaction of 78.9% dropped slightly compared to 2020 reflecting labour shortages as we emerge from the pandemic. Externally measured Guest Satisfaction Index (GSI) achieved scores of 100 or better for each brand in 2021, outperforming our peers, a successful outcome given the evolving guest requirements resulting from Covid-19.• Reviewed our Holiday Inn and Crowne Plaza estate, removing 34,345 rooms to focus on protecting the quality and consistency of the brand. A further 83 hotels in the Americas and EMEAA regions have committed to improvement plans or scopes of work.• Continued to commit to cleanliness-specific procedures, with our IHG Way of Clean programme and IHG Clean Promise, to provide confidence and protection to our frontline hotel colleagues and enable them in turn to deliver clean and safe hotels for all our guests.• Further technology enhancements including the pilot of a next generation IHG mobile app and the expansion of digital arrivals, offering guests the ability to socially distance.• Provided further training and support for evolving brand standards and procedures, to meet changing guest expectations.• Continued to update guest room and public space designs to further enhance the guest experience. 2022 priorities • Continue to invest in brand innovation, including room design and food & beverage enhancements to meet evolving guest needs.• Maintain a high level of guest satisfaction across our entire portfolio and focus on quality and cleanliness standards.• Continue to invest behind digitalisation of the guest journey and improve on-property processes to improve guest satisfaction and streamline hotel operations. | ||||
| Fee margin a Operating profit as a percentage of revenue, excluding System Fund, reimbursement of costs, revenue and operating profit from owned, leased and managed lease hotels, significant liquidated damages, the results of the Group’s captive insurance company and exceptional items. Our fee margin progression indicates the profitability of our fee revenue growth and benefit of our asset-light business model (see page 10). |
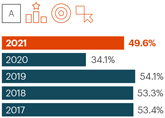 |
2021 status • Growth in fee revenue of over 40%, coupled with disciplined cost management taken across the business, resulted in a fee margin of 49.6%, 4.5ppts below 2019 levels.• Achieved sustainable fee business cost savings of $75m compared to 2019, whilst continuing to invest for growth. 2022 priorities • Continue to invest in growth initiatives, whilst maintaining our strong cost focus.• Continue to look for further operational efficiencies through greater application of technology. | ||||
| Adjusted free cash flow a Cash flow from operating activities excluding payments of contingent purchase consideration, less purchase of shares by employee share trusts, maintenance capital expenditure and lease payments. Adjusted free cash flow provides funds to invest in the business, sustainably grow the dividend and return any surplus to shareholders (see page 13). It is a key component in measuring the ongoing viability of our business (see page 48). |
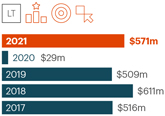 |
2021 status • Adjusted free cash flow of $571m was up $542m year-on-year driven by an improvement in operating profit from reportable segmentsa and working capital and other adjustments. Closing liquidity was $2,655m.2022 priorities • Prioritise investment behind growth with further cost focus, maintaining challenge around all areas of discretionary spend.• Control capital deployment in line with business priorities. | ||||
a |
Use of Non-GAAP measures: In addition to performance measures directly observable in the Group Financial Statements (IFRS measures), additional financial measures (described as Non-GAAP) are presented that are used internally by management as key measures to assess performance. Non-GAAP measures are either not defined under IFRS or are adjusted IFRS figures. Further explanation in relation to these measures can be found on pages 73 to 77 and reconciliations to IFRS figures, where they have been adjusted, are on pages 218 to 223. |
52 |
IHG |
KPIs |
2021 status and 2022 priorities | |||||
| Employee engagement survey scores a Colleague HeartBeat survey, completed by IHG employees or those colleagues who are employed at managed or managed leased hotels (excluding our joint ventures). We measure employee engagement to monitor risks relating to talent (see page 44) and to help us understand the issues that are relevant to our people as we build a diverse and inclusive culture (see page 24). |
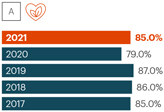 |
2021 status • The 2021 score of 85% was 8% higher than external benchmarks.• Rolled out a hybrid working model across corporate offices to encourage flexibility and work-life balance, providing resources and guidelines to support evolving ways of working.• Prioritised support for employee health and wellbeing including:– Published guidelines and learning series to facilitate wellbeing conversations. – Elevated Employee Resource Groups (ERGs) to champion and drive our diverse and inclusive culture. – Promoted local initiatives, such as mental health first aid. – Introduced Recharge Days and Focus Fridays for corporate employees. • Delivered conscious inclusion training to corporate employees.• Launched talent programmes such as Ascend and WiHTL (Women in Hospitality Travel & Leisure) to support Black and Ethnic Minority Talent.• Refreshed our GM development and onboarding programmes, including the launch of new assessments to develop talent. 2022 priorities • Maintain our focus on talent management and purposefully develop our Corporate Senior Leaders and General Managers to enable our future growth.• Build our talent attraction capabilities via a compelling employer value proposition, that enables us to retain and re-attract talent to the industry.• Build our future learning offer to remain a leading employer within the industry and help support our recovery strategy and hotel performance.• Continue to build an inclusive culture and maintain a strong focus on increasing the diversity of our leadership and talent pipelines. | ||||
| IHG ® AcademyNumber of people participating in IHG Academy programmes. Sustained participation in the IHG Academy indicates the strength of our progress in creating career building opportunities and engagement with the communities in which we operate (see page 27). |
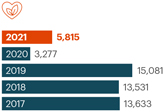 |
2021 status • Increased the number of internships and work experiences through IHG Academy compared to 2020.• Global roll out of IHG Skills Academy, a virtual learning platform, with a phased release of both the learning system and content available in multiple languages. This ensures we can make a tangible impact on a broader scale for people of all backgrounds, with a view to convert participants into IHG employees. 2022 priorities • Further roll-out of IHG Skills Academy with phased worldwide release of the platform, offering both the learning system and content in multiple languages.• Continue to increase the number of internships and work experience placements across hotels and corporate functions, utilising both in-house experiences and virtual solutions. | ||||
| Absolute carbon footprint We work with our hotels to drive energy efficiency and carbon reductions across our estate. In 2021, we upgraded our science-based target to be in line with the Paris Agreement to limit warming to 1.5°C. This will involve reducing our absolute carbon footprint by 46% in energy used by our franchised, managed, owned, leased and managed lease hotels by 2030, based on our 2019 carbon footprint (see page 29). We have updated our KPI to reflect the change from an intensity metric to an absolute carbon target. |
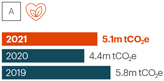 |
2021 status • At the end of 2021, our absolute carbon footprint reduced by 12% against our 2019 baseline, driven by targeted efforts to minimise energy consumption during hotel closures, maximise energy efficiency at re-opening and the ongoing efforts to implement energy efficiency measures across our hotel estate. 2022 priorities • Continue to roll out our decarbonisation roadmap focusing on energy efficiency measures in the existing estate, transitioning to renewable energy and operating very low/zero carbon new-build hotels.• Enhance our environmental reporting systems, to continue building more robust and complete datasets, and provide more detailed performance insights and guidance for our hotels to support continuous improvement. | ||||
a |
In 2020, due to the complexity of survey administration in hotels during the pandemic, only employees in corporate offices and reservation centres, and managed hotel general managers (excluding our joint ventures), were invited to participate. Results for 2017 to 2019 are based on aggregate results from the two surveys conducted among the entire IHG employee population each year. |
| |
Key performance indicators (KPIs) |
IHG |
53 |

T |
rading recovered significantly in 2021, with RevPAR ahead of 2020, and trending closer to pre-pandemic levels by the fourth quarter. We saw demand return at | |
pace in markets where Covid-19 restrictions were lifted, driven primarily by domestic leisure and essential business travel. The strong recovery in trading demonstrates the attractive long-term fundamentals that underpin our industry, including the inherent desire for travel and new experiences. | ||
| Trading performance Through the challenges of the pandemic, we remained committed to take actions to drive demand to our hotels and support our owners by maximising their revenues. This, combined with our weighting towards essential business and domestic leisure demand, particularly in the midscale segments, resulted in RevPAR recovering to 70% of 2019 levels. Encouragingly in the fourth quarter, rate was almost in line with 2019 and occupancy around 85% of 2019 levels. There were also signs of more discretionary business travel, and group bookings and international trips starting to return. Regional performance was subject to local Covid-19 related restrictions. The recovery was strongest in the Americas, driven by our weighting towards non-urban markets that are less reliant on international inbound travel and large groups and events. The recovery in the US was boosted by strong domestic leisure demand and resilient essential business demand.Trading in EMEAA was led by Europe, which is less reliant on international travel, and the Middle East, with both markets benefitting from the lifting of restrictions. | ||
| Greater China recovered in the second quarter although the second half of the year saw restrictions reimposed and increased trading volatility. System growth Gross system growth of 5.0% was ahead of 2020, although remained below pre-pandemic levels.Net system size declined by 0.6% as our focus on the long-term health and quality of our established brands resulted in the removal of 49,667 rooms, 70% of which related to our review of the Holiday Inn and Crowne Plaza estate. We anticipate a lower overall removal rate going forwards, supporting our ambition to achieve industry-leading net rooms growth. Focused cost management We delivered sustainable fee business cost savings of $75m compared to 2019. At the same time, we maintained our investment in growth opportunities, such as the launch of our newest brand, the Vignette Collection. Operating profit of $494m improved from an operating loss of $(153)m in 2020. Operating profit from reportable segments a recovered to $534m. The recovery in revenue combined with our sustainable cost management and a decrease in corporate trade receivables, resulted in fee margina improving to 49.6%, 4.5ppts below 2019.Cash generation and liquidity The resilience of our business model was demonstrated throughout the year. Our strong cash conversion, combined with our ongoing focus on cost savings, has helped generate net cash from operating activities of $636m and $571m of adjusted free cash flow a . This has contributed to substantial progress in returning leverage levels measured as a ratio of net debt: adjusted EBITDA to 3.0x and within the 2.5-3.0x range we aim to |
| maintain, supporting the Board’s decision to propose a final dividend of 85.9¢ in respect of 2021. Our uses of cash remain unchanged: ensuring the business is appropriately invested in to optimise growth; funding a sustainably growing dividend; and then returning excess funds to shareholders. Future growth and 2022 priorities Looking to the future, we are encouraged by the signs of recovery, although trading in some markets remains volatile. The acceleration in development activity through 2021 contributed to a pipeline that is over 30% of our existing system size, and will support our ambition to return to industry-leading levels of net system size growth. Importantly, we have continued to prioritise investment to support long-term sustainable growth. Many of these are multi-year in nature with further investments planned for 2022 behind our brand portfolio, loyalty programme and digital channels. We remain focused on improving returns for owners through investments in revenue management, operational efficiencies and procurement programmes. Our asset-light business model is proven to be highly cash generative. As we look to future growth, with attractive industry RevPAR characteristics and a substantial pipeline of hotels to open, we will focus on growing our fee revenues and fee margins. With limited requirements for capital, this will enable us to grow the business whilst generating high returns on invested capital.  Paul Edgecliffe-Johnson Chief Financial Officer & Group Head of Strategy |
a |
Use of Non-GAAP measures: In addition to performance measures directly observable in the Group Financial Statements (IFRS measures), additional financial measures (described as Non-GAAP) are presented that are used internally by management as key measures to assess performance. Non-GAAP measures are either not defined under IFRS or are adjusted IFRS figures. Further explanation in relation to these measures can be found on pages 73 to 77 and reconciliations to IFRS figures, where they have been adjusted, are on pages 218 to 223. |
54 |
IHG |
12 months ended 31 December | ||||||||||||||||||||
2021 $m |
2020 $m |
2021 vs 2020 % change |
2019 $m |
2020 vs 2019 % change | ||||||||||||||||
Revenue a |
||||||||||||||||||||
Americas |
774 |
512 |
51.2 |
1,040 |
(50.8) | |||||||||||||||
EMEAA |
303 |
221 |
37.1 |
723 |
(69.4) | |||||||||||||||
Greater China |
116 |
77 |
50.6 |
135 |
(43.0) | |||||||||||||||
Central |
197 |
182 |
8.2 |
185 |
(1.6) | |||||||||||||||
Revenue from reportable segments b |
1,390 |
992 |
40.1 |
2,083 |
(52.4) | |||||||||||||||
System Fund revenues |
928 |
765 |
21.3 |
1,373 |
(44.3) | |||||||||||||||
Reimbursement of costs |
589 |
637 |
(7.5) |
1,171 |
(45.6) | |||||||||||||||
Total revenue |
2,907 |
2,394 |
21.4 |
4,627 |
(48.3) | |||||||||||||||
Operating profit a |
||||||||||||||||||||
Americas |
559 |
296 |
88.9 |
700 |
(57.7) | |||||||||||||||
EMEAA |
5 |
(50) |
NM c |
217 |
NM c | |||||||||||||||
Greater China |
58 |
35 |
65.7 |
73 |
(52.1) | |||||||||||||||
Central |
(88) |
(62) |
41.9 |
(125) |
(50.4) | |||||||||||||||
Operating profit from reportable segments b |
534 |
219 |
143.8 |
865 |
(74.7) | |||||||||||||||
Analysed as: |
||||||||||||||||||||
| Fee Business excluding central |
658 |
340 |
93.5 |
938 |
(63.8) | |||||||||||||||
| Owned, leased and managed lease |
(36) |
(59) |
(39.0) |
52 |
NM c | |||||||||||||||
| Central |
(88) |
(62) |
41.9 |
(125) |
(50.4) | |||||||||||||||
System Fund result |
(11) |
(102) |
(89.2) |
(49) |
108.2 | |||||||||||||||
Operating profit before exceptional items |
523 |
117 |
347.0 |
816 |
(85.7) | |||||||||||||||
Operating exceptional items |
(29) |
(270) |
(89.3) |
(186) |
45.2 | |||||||||||||||
Operating profit/(loss) |
494 |
(153) |
NM c |
630 |
NM c | |||||||||||||||
Net financial expenses |
(139) |
(140) |
(0.7) |
(115) |
21.7 | |||||||||||||||
Analysed as: |
||||||||||||||||||||
| Adjusted interest expense b |
(142) |
(130) |
9.2 |
(133) |
(2.3) | |||||||||||||||
| System Fund interest |
3 |
4 |
(25.0) |
18 |
(77.8) | |||||||||||||||
| Exceptional financial expenses |
– |
(14) |
– |
– |
– | |||||||||||||||
Fair value gains on contingent purchase consideration |
6 |
13 |
(53.8) |
27 |
(51.9) | |||||||||||||||
Profit/(loss) before tax |
361 |
(280) |
NM c |
542 |
NM c | |||||||||||||||
Tax |
(96) |
20 |
NM c |
(156) |
NM c | |||||||||||||||
Analysed as: |
||||||||||||||||||||
| Tax before exceptional items and System Fund b |
(125) |
(32) |
290.6 |
(176) |
(81.8) | |||||||||||||||
| Tax on exceptional items |
3 |
52 |
(94.2) |
20 |
160.0 | |||||||||||||||
| Exceptional tax |
26 |
– |
– |
– |
– | |||||||||||||||
Profit/(loss) |
265 |
(260) |
NM c |
386 |
NM c | |||||||||||||||
Adjusted earnings d |
269 |
57 |
371.9 |
555 |
(89.7) | |||||||||||||||
Basic weighted average number of ordinary shares (millions) |
183 |
182 |
0.5 |
183 |
(0.5) | |||||||||||||||
Earnings/(loss) per ordinary share |
||||||||||||||||||||
Basic |
145.4¢ |
(142.9)¢ |
NM c |
210.4¢ |
NM c | |||||||||||||||
Adjusted b |
147.0¢ |
31.3¢ |
369.6 |
303.3¢ |
(89.7) | |||||||||||||||
Dividend per share |
85.9¢ |
– |
NM c |
296.2¢ |
NM c | |||||||||||||||
Average US dollar to sterling exchange rate |
$1: £0.73 |
$1: £0.78 |
(6.4) |
$1: £0.78 |
– | |||||||||||||||
a |
Americas and EMEAA include revenue and operating profit before exceptional items from both fee business and owned, leased and managed lease hotels. Greater China includes revenue and operating profit before exceptional items from fee business. |
b |
Definitions for Non-GAAP measures can be found on pages 73 to 77. Reconciliations of these measures to the most directly comparable line items within the Group Financial Statements can be found on pages 218 to 223. |
c |
Percentage change considered not meaningful, such as where a positive balance in the latest period is comparable to a negative or zero balance in the prior period. |
d |
Adjusted earnings as used with adjusted earnings per share, a non-GAAP measure. |
| |
Performance |
IHG |
55 |
| Highlights for the year ended 31 December 2021 Trading improved significantly during the year, with Group comparable RevPAR a getting closer to pre-pandemic levels. More travel demand returned as vaccines rolled out, government-mandated restrictions eased and economic activity started to rebuild. Through the summer months, many markets, including the US and UK, saw significant improvements, driven by domestic leisure travel. Whilst the ability of travellers to freely move between and within countries continued to vary significantly, the second half of the year saw a gradual further improvement in overall trading conditions.Revenue Overall, when comparing to 2020, Group comparable RevPAR a declined 34% in the first quarter, then grew 151% in the second quarter, 66% in the third quarter, 71% in the fourth quarter and 46% in the full year. When compared to the pre-pandemic levels of 2019, Group comparable RevPARa declined 51% in the first quarter, 36% in the second quarter, 21% in the third quarter, 17% in the fourth quarter and 30% in the full year.Our other key driver of revenue, net system size, decreased by 0.6% year-on-year During the year ended 31 December 2021, total revenue increased by $513m (21.4%) to $2,907m including a $48m reduction in cost reimbursement revenue. Revenue from reportable segments b increased by $398m (40.1%) to $1,390m, driven by improved trading conditions. Underlying revenueb increased by $387m to $1,373m, with underlying fee revenueb increasing by $314m. Owned, leased and managed lease revenue increased by $68m.Operating profit and margin Operating profit improved by $647m from a loss of $153m to a profit of $494m, including a $241m net reduction in operating exceptional items, a $91m improvement in the System Fund result, from a $102m deficit to an $11m deficit, and a $36m decrease in the charge for expected credit losses on corporate trade receivables. |
Operating profit from reportable segments b increased by $315m (143.8%) to $534m, driven by improved demand and the delivery of sustainable fee business cost savings. Underlying operating profitb increased $308m to $531m.Fee margin b increased by 15.5ppts to 49.6%, benefitting from the improvement in trading and focused cost management.System Fund The Group operates a System Fund to collect and administer cash assessments from hotel owners for the specific purpose of use in marketing, reservations, and the hotel loyalty programme, IHG Rewards. The System Fund also benefits from proceeds from the sale of loyalty points under third-party co-branding arrangements. The Fund is not managed to generate a profit or loss for IHG over the longer term, although an in-year surplus or deficit can arise, but is managed for the benefit of hotels in the IHG System with the objective of driving revenues for the hotels.In the year to 31 December 2021, System Fund revenues increased $163m (21%) to $928m, primarily driven by the recovery in travel demand yielding higher assessment revenues. The System Fund income statement deficit reduced by $91m to $11m, primarily due to the rebound in travel demand and associated assessment income, partially offset by the reversal of temporary savings realised in 2020. Reimbursement of costs Cost reimbursement revenue represents reimbursements of expenses incurred on behalf of managed and franchised properties and relates, predominantly, to payroll costs at managed properties where we are the employer. As we record cost reimbursements based upon costs incurred with no added mark up, this revenue and related expenses have no impact on either our operating profit or net profit for the year. |
In the year to 31 December 2021, reimbursable revenue decreased by $48m (7.5%) to $589m. The reduction reflects the impact of the prior year termination of the SVC portfolio in the Americas estate, meaning the overall scale of reimbursements fell. Operating exceptional items Exceptional items are identified by virtue of their size, nature, or incidence and are excluded from the calculation of adjusted earnings per ordinary share as well as other Non-GAAP measures (see Use of Non-GAAP measures, pages 218 to 223) in order to provide a more meaningful comparison of performance and can include, but are not restricted to, gains and losses on the disposal of assets, impairment charges and reversals, the costs of individually significant legal cases or commercial disputes and reorganisation costs.Operating exceptional items totalled $29m, comprising the $25m provisionally agreed costs to settle two commercial disputes in the Americas and EMEAA, and the reversal of a $4m fair value gain recorded in 2020 on the put option over part of the Group’s investment in the InterContinental Barclay hotel. Further information on exceptional items can be found in note 6 to the Group Financial Statements. Net financial expenses Net financial expenses decreased by $1m to $139m. Adjusted interest b , as reconciled on page 223, and which excludes exceptional finance expenses, and adds back interest relating to the System Fund, increased by $12m to an expense of $142m. The increase in adjusted interestb was primarily driven by increased average bond debt.Financial expenses include $91m (2020: $69m excluding exceptional financial expenses) of total interest costs on public bonds, which are fixed rate debt. Interest expense on lease liabilities was $29m (2020: $37m). a Comparable RevPAR includes the impact of hotels temporarily closed as a result of Covid-19. b Definitions for Non-GAAP revenue and operating profit measures can be found on pages 73 to 77. Reconciliations of these measures to the most directly comparable line items within the Group Financial Statements can be found on pages 218 to 223. | ||
56 |
IHG |
| Fair value gains on contingent purchase consideration Contingent purchase consideration arose on the acquisitions of Regent, the UK portfolio and Six Senses (see note 25 to the Group Financial Statements). The net gain of $6m (2020: $13m) primarily arises from the conditions related to the Six Senses contingent purchase consideration no longer being met. The total contingent purchase consideration liability at 31 December 2021 is $73m (2020: $79m). Taxation The effective rate of tax on profit before exceptional items and System Fund a was 31% (2020: 38%); this was lower than 2020 largely due to the improved profit base. In May 2021, a change to the UK rate of Corporation Tax was enacted which led to a $30m credit; $26m was recoded as an exceptional credit within the Income Statement and $4m within the Statement of Other Comprehensive Income. A net credit of $3m arose on other accounting exceptional items (2020: $52m). Further information on tax within exceptional items can be found in note 6 to the Group Financial Statements. Net tax paid in 2021 totalled $86m (2020: $41m), and included refunds in the US of $15m (2020: $24m). No more significant refunds are expected.IHG pursues an approach to tax that is consistent with its business strategy and its overall business conduct principles. The approach seeks to ensure full compliance with all tax filing, payment and reporting obligations on the basis of communicative and transparent relationships with tax authorities. The IHG Audit Committee reviews IHG’s approach to tax annually, including consideration of the Group’s current tax profile. Further information on tax can be found in note 8 to the Group Financial Statements. |
Earnings per ordinary share The Group’s basic earnings per ordinary share is 145.4¢ (2020: basic loss per ordinary share: 142.9¢). Adjusted earnings per ordinary share a increased by 115.7¢ to 147.0¢.Dividends The Board is proposing a final dividend of 85.9¢ in respect of 2021, an amount equivalent to the withdrawn final payment in respect of 2019. No interim dividend was paid in respect of 2021. Going forward, dividend payments will be reflective of IHG’s prior approach to sustainably grow the ordinary dividend, whilst targeting a level of leverage that maintains an investment grade credit rating and ensuring careful consideration of our responsibilities to all stakeholders. The Board will also continue to actively assess the opportunity for any surplus capital to be additionally returned through special dividends or share buybacks. Share price and market capitalisation The IHG share price closed at £47.81 on 31 December 2021, up from £46.90 on 31 December 2020. The market capitalisation of the Group at the year-end was £8.8bn. |
Accounting principles The Group results are prepared under International Financial Reporting Standards (IFRS). The application of IFRS requires management to make judgements, estimates and assumptions, and those considered critical to the preparation of the Group results are set out on page 150 of the Group Financial Statements. The Group discloses certain financial information both including and excluding exceptional items. For comparability of the periods presented, some of the performance indicators in this performance review are calculated after eliminating these exceptional items. An analysis of exceptional items is included in note 6 on page 165 of the Group Financial Statements. | ||||||||||||
| | ||||||||||||||
| | ||||||||||||||
| For discussion of 2020 results, and the changes compared to 2019, refer to the 2020 Annual Report and Form 20-F. |
||||||||||||||
|
|
www.ihgplc.com/investors |
|||||||||||||
| a Definitions for Non-GAAP revenue and operating profit measures can be found on pages 73 to 77. Reconciliations of these measures to the most directly comparable line items within the Group Financial Statements can be found on pages 218 to 223. |
||||||||||||||
|
|
IHG’s Approach to Tax policy is available at www.ihgplc.com/responsible-business |
|
||||||||||||
|
|
Performance |
IHG |
57 |
12 months ended 31 December |
||||||||||||||||||||||||||||||
2021 |
2020 |
2021 vs 2020 |
2019 |
2020 vs 2019 |
||||||||||||||||||||||||||
$m |
$m |
$m change |
$m |
$m change |
||||||||||||||||||||||||||
GAAP cash flow summary |
||||||||||||||||||||||||||||||
Net cash from operating activities |
636 |
137 |
499 |
653 |
(516 |
) | ||||||||||||||||||||||||
Net cash from investing activities |
(12 |
) |
(61 |
) |
49 |
(493 |
) |
432 |
||||||||||||||||||||||
Net cash from financing activities |
(860 |
) |
1,354 |
(2,214 |
) |
(660 |
) |
2,014 |
||||||||||||||||||||||
Net movement in cash and cash equivalents in the year |
(236 |
) |
1,430 |
(1,666 |
) |
(500 |
) |
1,930 |
||||||||||||||||||||||
12 months ended 31 December |
||||||||||||||||||||||||||||||
2021 |
2020 |
2021 vs 2020 |
2019 |
2020 vs 2019 |
||||||||||||||||||||||||||
$m |
$m |
$m change |
$m |
$m change |
||||||||||||||||||||||||||
Summary of cash flow and net debt |
||||||||||||||||||||||||||||||
Operating profit from reportable segments |
534 |
219 |
865 |
|||||||||||||||||||||||||||
Depreciation and amortisation |
98 |
110 |
116 |
|||||||||||||||||||||||||||
Adjusted EBITDA a |
632 |
329 |
303 |
981 |
(652 |
) | ||||||||||||||||||||||||
Working capital and other adjustments |
110 |
(27 |
) |
(77 |
) |
|||||||||||||||||||||||||
Impairment loss on financial assets |
– |
40 |
8 |
|||||||||||||||||||||||||||
Other non-cash adjustments to operating profit/lossb |
71 |
60 |
54 |
|||||||||||||||||||||||||||
System Fund result |
(11 |
) |
(102 |
) |
(49 |
) |
||||||||||||||||||||||||
System Fund depreciation and amortisation |
94 |
62 |
54 |
|||||||||||||||||||||||||||
Other non-cash adjustments to System Fund result |
6 |
97 |
52 |
|||||||||||||||||||||||||||
Capital expenditure: contract acquisition costs (key money) net of repayments |
(42 |
) |
(64 |
) |
(61 |
) |
||||||||||||||||||||||||
Capital expenditure: maintenance |
(33 |
) |
(43 |
) |
(86 |
) |
||||||||||||||||||||||||
Cash flows relating to exceptional items |
(12 |
) |
(87 |
) |
(55 |
) |
||||||||||||||||||||||||
Net interest paid |
(126 |
) |
(130 |
) |
(107 |
) |
||||||||||||||||||||||||
Tax paid |
(86 |
) |
(41 |
) |
(141 |
) |
||||||||||||||||||||||||
Principal element of lease payments |
(32 |
) |
(65 |
) |
(59 |
) |
||||||||||||||||||||||||
Purchase of shares |
– |
– |
(5 |
) |
||||||||||||||||||||||||||
Adjusted free cash flow a |
571 |
29 |
542 |
509 |
(480 |
) | ||||||||||||||||||||||||
Capital expenditure: gross recyclable investments |
(5 |
) |
(6 |
) |
(19 |
) |
||||||||||||||||||||||||
Capital expenditure: gross System Fund capital investments |
(19 |
) |
(35 |
) |
(98 |
) |
||||||||||||||||||||||||
Acquisitions of businesses, net of cash acquired |
– |
– |
(292 |
) |
||||||||||||||||||||||||||
Deferred and contingent purchase consideration paid |
(13 |
) |
– |
(8 |
) |
|||||||||||||||||||||||||
Disposals and repayments, including other financial assets |
58 |
18 |
4 |
|||||||||||||||||||||||||||
Distributions from associates and joint ventures |
– |
5 |
– |
|||||||||||||||||||||||||||
Other items |
– |
3 |
– |
|||||||||||||||||||||||||||
Dividends and shareholder returns |
– |
– |
(723 |
) |
||||||||||||||||||||||||||
Net cash flow before other net debt movements |
592 |
14 |
578 |
(627 |
) |
641 |
||||||||||||||||||||||||
Add back principal element of lease repayments |
32 |
65 |
59 |
|||||||||||||||||||||||||||
Exchange and other non-cash adjustments |
24 |
57 |
(132 |
) |
||||||||||||||||||||||||||
Decrease in net debt |
648 |
136 |
512 |
(700 |
) |
836 |
||||||||||||||||||||||||
Net debt at the beginning of the year |
(2,529 |
) |
(2,665 |
) |
(1,965 |
) |
||||||||||||||||||||||||
Net debt at the end of the year |
(1,881 |
) |
(2,529 |
) |
648 |
(2,665 |
) |
136 |
||||||||||||||||||||||
a |
Definitions for Non-GAAP measures can be found on pages 73 to 77. Reconciliations of these measures to the most directly comparable line items within the Group Financial Statements can be found on pages 218 to 223. |
b |
2020 Excludes $48m related to trade deposits and loans which were recognised as exceptional items. |
58 |
IHG |
| Cash from operating activities For the year ended 31 December 2021 net cash from operating activities totalled $636m, an increase of $499m on the previous year, primarily reflecting the increase in operating profit and improvement in working capital and other adjustments. Cash flow from operations is the principal source of cash used to fund the ongoing operating expenses, interest payments, maintenance capital expenditure and normal dividend payments of the Group. The Group believes that the requirements of its existing business and future investment can be met from cash generated internally, disposition of assets, and external finance expected to be available to it. Cash from investing activities Net cash outflows from investing activities decreased by $49m to $12m, driven by $44m net proceeds from the sale of three hotels in the Americas region. There was an overall decrease in purchases of property, plant and equipment and intangible assets of $24m. Deferred consideration paid of $13m related to the acquisition of the Regent brand (2020: $nil). The Group had committed contractual capital expenditure of $17m at 31 December 2021 (2020: $19m). Cash used in financing activities Net cash outflows from financing activities totalled $860m (2020: $1,354m inflow). This was primarily due to the repayment of the £600m commercial paper under the UK Covid Corporate Financing Facility (CCFF). Adjusted free cash flow Adjusted free cash flow a was an inflow of $571m, an increase of $542m on 2020, driven by an improvement in operating profit from reportable segmentsa partially offset by related tax payments, coupled with a $137m improvement in working capital as explained below. Exceptional cash costs of $12m decreased by $75m due to lower restructuring expenses and the timing of litigation payments.Working capital On the Group statement of financial position, trade and other receivables increased by $60m, from $514m to $574m, primarily due to the significant increase in RevPAR in the fourth quarter compared to 2020. Trade and other payables increased by $108m, from $560m to $668m, primarily due to an increase in bonus accruals compared to prior year. Deferred revenue increased by $44m, from $1,569m to $1,613m, reflecting an increase in the future redeemable points balance related to the loyalty programme. a Definitions for Non-GAAP measures can be found on pages 73 to 77. Reconciliations of these measures to the most directly comparable line items within the Group Financial Statements can be found on pages 218 to 223. |
Sources of liquidity As at 31 December 2021 the Group had total liquidity of $2,655m (31 December 2020: $2,925m), comprising $1,350m of undrawn bank facilities and $1,305m of cash and cash equivalents (net of overdrafts and restricted cash). The reduction in total liquidity from December 2020 is due to the repayment of the £600m CCFF in March 2021, largely offset by the net cash flow before other net debt movements of $592m. The Group currently has $2,786m of sterling and euro bonds outstanding. The current bonds mature in November 2022 (£173m), October 2024 ( € 500m), August 2025 (£300m), August 2026 (£350m), May 2027 (€ 500m) and October 2028 (£400m). There are currency swaps in place on both the euro bonds, fixing the October 2024 bond at £454m and the May 2027 bond at £436m.The Group currently has a senior unsecured long-term credit rating of BBB- from Standard and Poor’s. In the event this rating was downgraded below BBB- there would be an additional step-up of 125bps payable on the bonds which would result in an additional interest cost of approximately $35m per year.The $1,275m revolving syndicated bank facility (the Syndicated Facility) and the $75m revolving bilateral facility (the Bilateral Facility) mature in September 2023. The facilities were undrawn at 31 December 2021. The Syndicated and Bilateral Facilities contain the same terms and two financial covenants: interest cover and a leverage ratio. Covenants are monitored on a ‘frozen GAAP’ basis excluding the impact of IFRS 16 and are tested at half year and full year on a trailing 12-month basis. The interest cover covenant requires a ratio of Covenant EBITDA to Covenant interest payable above 3.5:1 and the leverage ratio requires Covenant net debt to Covenant EBITDA of below 3.5:1. Covenant EBITDA is calculated (on a frozen GAAP basis) as operating profit before exceptional items, depreciation and amortisation and System Fund revenues and expenses. See note 24 to the Group Financial Statements for further information.These covenants have been amended for test dates in 2022. A minimum liquidity covenant of $400m has been introduced which will be tested at each test date up to and including 31 December 2022. The amended leverage ratio and interest cover covenant test levels for the facilities are as follows: |
|||||||||||||
June 2022 |
December 2022 |
|||||||||||||
Leverage ratio |
Less than 7.5x |
Less than 6.5x |
||||||||||||
Interest cover |
Greater than 1.5x |
Greater than 2.0x |
||||||||||||
| |
||||||||||||||
| 2021 $m |
2020 $m |
|||||||||||
Borrowings |
||||||||||||
Sterling* |
2,860 |
3,716 |
||||||||||
US dollar |
431 |
416 |
||||||||||
Euros |
5 |
20 |
||||||||||
Other |
35 |
52 |
||||||||||
Cash and cash equivalents |
||||||||||||
Sterling |
(532 |
) |
(1,305 |
) | ||||||||
US dollar |
(756 |
) |
(261 |
) | ||||||||
Euros |
(18 |
) |
(12 |
) | ||||||||
Canadian dollar |
(7 |
) |
(8 |
) | ||||||||
Chinese renminbi |
(105 |
) |
(60 |
) | ||||||||
Other |
(32 |
) |
(29 |
) | ||||||||
Net debt |
1,881 |
2,529 |
||||||||||
Average net debt level |
2,334 |
2,554 |
||||||||||
* |
Including the impact of currency swaps. |
| |
Performance |
IHG |
59 |
| Borrowings included bank overdrafts of $59m (2020: $51m), which were matched by an equivalent amount of cash and cash equivalents under the Group’s cash pooling arrangements. Under these arrangements, each pool contains a number of bank accounts with the same financial institution, and the Group pays interest on net overdraft balances within each pool. The cash pools are used for day-to-day Information on the Group’s approach to allocation of capital resources can be found on pages 12 and 13. Off-balance sheet arrangementsAt 31 December 2021, the Group had no off-balance sheet arrangements that have, or are reasonably likely to have, a current or future material effect on the Group’s financial condition, revenues or expenses, results of operations, liquidity, capital expenditures or capital resources.Contingent liabilities Contingent liabilities include guarantees over loans made to facilitate third-party ownership of hotels of up to $69m and outstanding letters of credit of $45m. The Group may also be exposed to additional liabilities resulting from litigation and security incidents. See note 31 to the Group Financial Statements for further details. Future cash requirements from contractual obligations The Group’s future cash flows arising from contractual commitments relating to long term debt obligations (including interest payable), derivatives, lease liabilities and other financial liabilities are analysed in note 24 to the Group Financial Statements. Other cash requirements relate to future pension scheme contributions (see note 27 to the Group Financial Statements) and capital commitments (see note 30 to the Group Financial Statements). The Group also has future commitments for key money payments which are contingent upon future events and may reverse. |
12 months ended 31 December |
||||||||||||||||||
2021 |
2020 |
% |
||||||||||||||||
$bn |
$bn |
change b |
||||||||||||||||
Analysed by brand |
||||||||||||||||||
InterContinental |
2.7 |
2.0 |
31.6 |
|||||||||||||||
Kimpton |
0.7 |
0.4 |
83.9 |
|||||||||||||||
HUALUXE |
0.1 |
0.1 |
36.5 |
|||||||||||||||
Crowne Plaza |
2.3 |
1.8 |
25.7 |
|||||||||||||||
Hotel Indigo |
0.4 |
0.3 |
73.9 |
|||||||||||||||
EVEN Hotels |
0.1 |
0.0 |
127.0 |
|||||||||||||||
Holiday Inn |
4.0 |
2.8 |
42.7 |
|||||||||||||||
Holiday Inn Express |
6.5 |
4.2 |
54.2 |
|||||||||||||||
Staybridge Suites |
1.0 |
0.7 |
38.2 |
|||||||||||||||
Candlewood Suites |
0.7 |
0.7 |
11.5 |
|||||||||||||||
Other |
0.9 |
0.5 |
51.9 |
|||||||||||||||
Total |
19.4 |
13.5 |
42.8 |
|||||||||||||||
Analysed by ownership type |
||||||||||||||||||
Fee business |
19.2 |
13.3 |
42.8 |
|||||||||||||||
Owned, leased and managed lease |
0.2 |
0.2 |
40.3 |
|||||||||||||||
Total |
19.4 |
13.5 |
42.8 |
|||||||||||||||
a |
Definitions for Non-GAAP measures can be found on pages 73 to 77. Reconciliations of these measures to the most directly comparable line items within the Group Financial Statements can be found on pages 218 to 223. |
b |
Year-on-year Covid-19 on brands and on fee business and owned, leased and managed lease hotels. |
60 |
IHG |
Hotels |
Rooms |
|||||||||||||||||||||||
Change |
Change |
|||||||||||||||||||||||
At 31 December |
2021 |
over 2020 |
2021 |
over 2020 |
||||||||||||||||||||
Analysed by brand |
||||||||||||||||||||||||
Six Senses |
21 |
5 |
1,412 |
283 |
||||||||||||||||||||
Regent |
7 |
– |
2,190 |
– |
||||||||||||||||||||
InterContinental |
204 |
(1 |
) |
69,402 |
(539 |
) | ||||||||||||||||||
Vignette Collection |
1 |
1 |
146 |
146 |
||||||||||||||||||||
Kimpton |
75 |
2 |
13,283 |
198 |
||||||||||||||||||||
HUALUXE |
16 |
4 |
4,603 |
1,170 |
||||||||||||||||||||
Crowne Plaza |
404 |
(25 |
) |
111,178 |
(7,701 |
) | ||||||||||||||||||
Hotel Indigo |
130 |
5 |
16,343 |
739 |
||||||||||||||||||||
EVEN Hotels |
21 |
5 |
2,994 |
584 |
||||||||||||||||||||
voco |
31 |
13 |
7,445 |
2,368 |
||||||||||||||||||||
Holiday Inn a |
1,218 |
(58 |
) |
224,684 |
(11,870 |
) | ||||||||||||||||||
Holiday Inn Express |
3,016 |
50 |
317,329 |
7,842 |
||||||||||||||||||||
avid hotels |
48 |
24 |
4,280 |
2,124 |
||||||||||||||||||||
Staybridge Suites |
315 |
12 |
34,306 |
1,411 |
||||||||||||||||||||
Candlewood Suites |
361 |
(5 |
) |
32,025 |
(410 |
) | ||||||||||||||||||
Other b |
123 |
(5 |
) |
38,707 |
(2,054 |
) | ||||||||||||||||||
Total |
5,991 |
27 |
880,327 |
(5,709 |
) | |||||||||||||||||||
Analysed by ownership type |
||||||||||||||||||||||||
Franchised |
5,033 |
28 |
626,115 |
(1,233 |
) | |||||||||||||||||||
Managed |
939 |
3 |
249,591 |
(3,697 |
) | |||||||||||||||||||
Owned, leased and managed lease |
19 |
(4 |
) |
4,621 |
(779 |
) | ||||||||||||||||||
Total |
5,991 |
27 |
880,327 |
(5,709 |
) | |||||||||||||||||||
| During 2021, the global IHG System (the number of hotels and rooms which are franchised, managed, owned, leased or managed lease) increased by 27 hotels (decreased by 5,709 rooms) to 5,991 hotels (880,327 rooms). Openings of 291 hotels (43,958 rooms) was 11.6% higher than in 2020. 151 hotels (15,739 rooms) were opened in the Americas, including 85 hotels (9,016 rooms) in the Holiday Inn Brand Family. 52 hotels (10,162 rooms) were opened in EMEAA, with the Greater China region contributing openings of 88 hotels (18,057 rooms). 264 hotels (49,667 rooms) left the IHG System in 2021, including 151 Holiday Inn and Crowne Plaza hotels (34,345 rooms) as we concluded our review of these brands. In 2020, 224 hotels (36,919 rooms) left the IHG System, of which 102 hotels (16,655 rooms) related to the termination of the SVC portfolio in the Americas estate. |
a Includes 41 Holiday Inn Resort properties (10,454 rooms) and 28 Holiday Inn Club Vacations properties (8,679 rooms) (2020: 47 Holiday Inn Resort properties (11,446 rooms) and 28 Holiday Inn Club Vacations properties (8,679 rooms)).b Includes three open hotels that will be re-branded to voco and one hotel that will be re-branded to Vignette Collection.Total number of hotels 5,991 Total number of rooms 880,327 |
| |
Performance |
IHG |
61 |
Hotels |
Rooms |
|||||||||||||||||||||||
At 31 December |
2021 |
Change over 2020 |
2021 |
Change over 2020 |
||||||||||||||||||||
Analysed by brand |
||||||||||||||||||||||||
Six Senses |
33 |
2 |
2,424 |
185 |
||||||||||||||||||||
Regent |
8 |
2 |
1,938 |
403 |
||||||||||||||||||||
InterContinental |
79 |
10 |
19,679 |
1,905 |
||||||||||||||||||||
Kimpton |
35 |
3 |
6,852 |
587 |
||||||||||||||||||||
HUALUXE |
23 |
(2 |
) |
6,045 |
(862 |
) | ||||||||||||||||||
Crowne Plaza |
96 |
7 |
25,261 |
1,033 |
||||||||||||||||||||
Hotel Indigo |
114 |
10 |
18,452 |
2,748 |
||||||||||||||||||||
EVEN Hotels |
29 |
(2 |
) |
4,907 |
(139 |
) | ||||||||||||||||||
voco |
38 |
9 |
10,090 |
1,911 |
||||||||||||||||||||
Holiday Inn a |
244 |
(18 |
) |
48,078 |
(3,085 |
) | ||||||||||||||||||
Holiday Inn Express |
645 |
(38 |
) |
83,026 |
(4,126 |
) | ||||||||||||||||||
avid hotels |
164 |
(28 |
) |
14,495 |
(3,031 |
) | ||||||||||||||||||
Staybridge Suites |
156 |
1 |
16,843 |
(647 |
) | |||||||||||||||||||
Candlewood Suites |
93 |
20 |
7,765 |
1,396 |
||||||||||||||||||||
Atwell Suites |
23 |
4 |
2,275 |
426 |
||||||||||||||||||||
Other b |
17 |
2 |
2,830 |
199 |
||||||||||||||||||||
Total |
1,797 |
(18 |
) |
270,960 |
(1,097 |
) | ||||||||||||||||||
Analysed by ownership type |
||||||||||||||||||||||||
Franchised |
1,290 |
(20 |
) |
157,832 |
(1,236 |
) | ||||||||||||||||||
Managed |
506 |
2 |
112,973 |
139 |
||||||||||||||||||||
Owned, leased and managed lease |
1 |
– |
155 |
– |
||||||||||||||||||||
Total |
1,797 |
(18 |
) |
270,960 |
(1,097 |
) | ||||||||||||||||||
| At the end of 2021, the global pipeline totalled 1,797 hotels (270,960 rooms), a decrease of 18 hotels (1,097 rooms), as the increase in signings to 68,870 rooms was more than offset by strong openings pace out of the pipeline and a normal level of terminations from the pipeline. The IHG pipeline represents hotels where a contract has been signed and the appropriate fees paid. Group signings increased from 360 hotels in 2020 to 437 hotels, and rooms increased from 56,146 in 2020 to 68,870 rooms. Signings in 2021 included 205 hotels (31,169 rooms) signed for the Holiday Inn Brand Family, almost half of which were contributed by Greater China (89 hotels, 16,260 rooms). Conversions represented 22% of Group signings in 2021, including six for our newest brand, Vignette Collection. |
Active management of the pipeline to remove deals that have become dormant or no longer viable reduced the pipeline by 164 hotels (26,009 rooms), compared to 178 hotels (27,740 rooms) in 2020. a Includes 35 Holiday Inn Resort properties (8,219 rooms) (2020: 34 Holiday Inn Resort properties (7,251 rooms)).b Includes four Vignette Collection pipeline hotels.Total number of hotels in the pipeline 1,797 Total number of rooms in the pipeline 270,960 |
|||
| |
||||
| |
||||
| |
||||
| |
||||
| |
||||
| |
||||
| |
||||
| |
62 |
IHG |
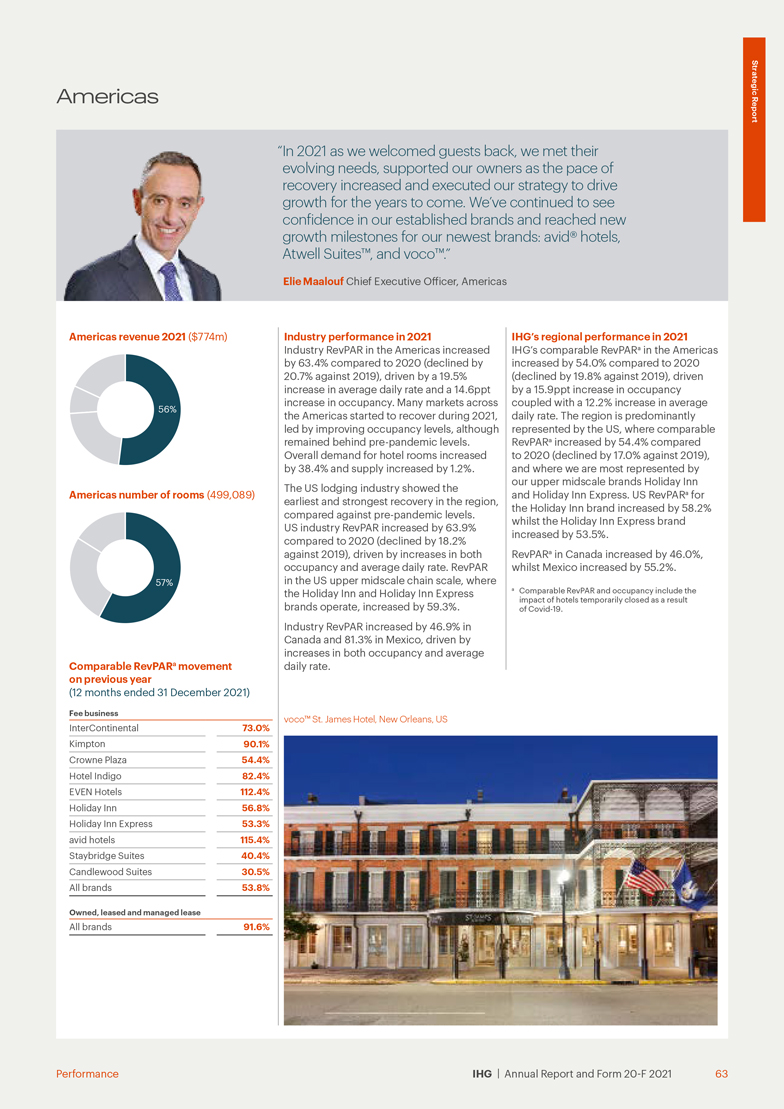
12 months ended 31 December |
||||||||||||||||||||||||||||||
| 2021 $m |
2020 $m |
2021 vs 2020 % change |
2019 $m |
2020 vs 2019 % change |
||||||||||||||||||||||||||
Revenue from the reportable segment a |
||||||||||||||||||||||||||||||
Fee business |
691 |
457 |
51.2 |
853 |
(46.4 |
) | ||||||||||||||||||||||||
Owned, leased and managed lease |
83 |
55 |
50.9 |
187 |
(70.6 |
) | ||||||||||||||||||||||||
Total |
774 |
512 |
51.2 |
1,040 |
(50.8 |
) | ||||||||||||||||||||||||
Operating profit from the reportable segment a |
||||||||||||||||||||||||||||||
Fee business |
568 |
323 |
75.9 |
663 |
(51.3 |
) | ||||||||||||||||||||||||
Owned, leased and managed lease |
(9 |
) |
(27 |
) |
(66.7 |
) |
37 |
NM |
c | |||||||||||||||||||||
559 |
296 |
88.9 |
700 |
(57.7 |
) | |||||||||||||||||||||||||
Operating exceptional items |
(22 |
) |
(118 |
) |
(81.4 |
) |
(62 |
) |
90.3 |
|||||||||||||||||||||
Operating profit |
537 |
178 |
201.7 |
638 |
(72.1 |
) | ||||||||||||||||||||||||
| Review of the year ended 31 December 2021 With 4,268 hotels (499,089 rooms), the Americas represents 57% of the Group’s room count. The key profit-generating region is the US, and the Group is also represented in Latin America, Canada, Mexico and the Caribbean. 92% of rooms in the region are operated under the franchise business model, primarily under our brands in the midscale segments (including the Holiday Inn Brand Family). In the upscale market segment, Crowne Plaza is predominantly franchised whereas, in the luxury market segment, InterContinental branded hotels are operated under both franchise and management agreements, whilst Kimpton is predominantly managed. 14 of the Group’s 17 hotel brands are represented in the Americas. The impact of travel restrictions continued to impact the first two months of 2021, before we saw a notable pick-up in demand in March, benefitting from domestic leisure trips around the spring break period.As the second quarter progressed, demand continued to grow particularly in non-urban and resort destinations. Over the summer months, leisure demand recovered rapidly. Demand from essential business travellers remained resilient and we saw signs of corporate demand and group meetings start to return. By the end of the second quarter, 13 states in the US saw RevPARb ahead of 2019 levels and a further 17 were at least 90% of 2019 RevPARb .The recovery continued into the third quarter, led by the US franchised estate, which benefits from a weighting towards hotels in the midscale segments. Leisure demand remained strong, driving rate. We also saw an increase in discretionary business travel demand and group demand. The recovery continued into the fourth quarter, with occupancy of 60% (down 5ppts compared to 2019 with rate 1% higher than 2019). |
Americas comparable RevPAR b declined 28% in the first quarter, then grew 154% in the second quarter, 76% in the third quarter, 80% in the fourth quarter and 54% in the full year, all when compared to 2020. When comparing to 2019, prior to the pandemic, Americas comparable RevPARb declined 43% in the first quarter, 26% in the second quarter, 10% in the third quarter, 6% in the fourth quarter and 20% in the full year.Revenue from the reportable segment a increased by $262m (51%) to $774m, (a decrease of $266m compared to 2019). Operating profit increased by $359m to $537m driven by the increase in revenue and a $96m decrease in operating exceptional charges. Operating profit from the reportable segmenta increased by $263m (89%) to $559m (a decrease of $141m compared to 2019). On an underlyinga basis, revenue increased by $268m (54%), whilst underlyinga profit increased by $257m (84%).Revenue and operating profit from the reportable segment a are further analysed by fee business and owned, leased and managed lease hotels.Fee business revenue a increased by $234m (51%) to $691m. Fee business operating profita increased by $245m (76%) to $568m, benefitting from the improvement in demand, along with the delivery of sustainable fee business cost savings. Operating profit from the reportable segmenta also included the benefit of $11m payroll tax credits, which relates to the Group corporate office presence in certain countries.Owned, leased and managed lease revenue increased by $28m to $83m, with comparable RevPAR b up 92% compared to 2020, (down 41% compared to 2019), leading to an owned, leased and managed lease operating loss of $9m compared to a $27m loss in the prior year. |
Excluding the results of three owned EVEN hotels which were disposed and retained under franchise contracts in November 2021, and the impact of one leased hotel that exited in December 2020, revenue increased by $34m and operating profit improved by $14m. | ||||||
| For discussion of 2020 results, and the changes compared to 2019, refer to the 2020 Annual Report and Form 20-F. | ||||||||
|
|
www.ihgplc.com/investors | |||||||
| a Definitions for Non-GAAP revenue and operating profit measures can be found on pages 73 to 77. Reconciliations of these measures to the most directly comparable line items within the Group Financial Statements can be found on pages 218 to 223.b Comparable RevPAR and occupancy include the impact of hotels temporarily closed as a result of Covid-19.c Percentage change considered not meaningful, such as where a positive balance in the latest period is comparable to a negative or zero balance in the prior period. | ||||||||
| | ||||||||
| | ||||||||
| | ||||||||
64 |
IHG |
Hotels |
Rooms |
|||||||||||||||||||||||
Change |
Change |
|||||||||||||||||||||||
At 31 December |
2021 |
over 2020 |
2021 |
over 2020 |
||||||||||||||||||||
Analysed by brand |
||||||||||||||||||||||||
Six Senses |
1 |
1 |
20 |
20 |
||||||||||||||||||||
InterContinental |
43 |
(3 |
) |
15,651 |
(1,138 |
) | ||||||||||||||||||
Kimpton |
64 |
– |
11,008 |
(89 |
) | |||||||||||||||||||
Crowne Plaza |
112 |
(24 |
) |
27,930 |
(7,475 |
) | ||||||||||||||||||
Hotel Indigo |
66 |
(1 |
) |
8,745 |
(48 |
) | ||||||||||||||||||
EVEN Hotels |
19 |
4 |
2,743 |
504 |
||||||||||||||||||||
voco |
5 |
4 |
469 |
420 |
||||||||||||||||||||
Holiday Inn a |
716 |
(50 |
) |
120,850 |
(10,092 |
) | ||||||||||||||||||
Holiday Inn Express |
2,436 |
11 |
221,727 |
1,385 |
||||||||||||||||||||
avid hotels |
48 |
24 |
4,280 |
2,124 |
||||||||||||||||||||
Staybridge Suites |
296 |
11 |
31,097 |
1,040 |
||||||||||||||||||||
Candlewood Suites |
361 |
(5 |
) |
32,025 |
(410 |
) | ||||||||||||||||||
Other b |
101 |
(2 |
) |
22,544 |
(1,164 |
) | ||||||||||||||||||
Total |
4,268 |
(30 |
) |
499,089 |
(14,923 |
) | ||||||||||||||||||
Analysed by ownership type |
||||||||||||||||||||||||
Franchised |
4,087 |
(18 |
) |
460,257 |
(11,545 |
) | ||||||||||||||||||
Managed |
178 |
(9 |
) |
37,505 |
(2,886 |
) | ||||||||||||||||||
Owned, leased and managed lease |
3 |
(3 |
) |
1,327 |
(492 |
) | ||||||||||||||||||
Total |
4,268 |
(30 |
) |
499,089 |
(14,923 |
) | ||||||||||||||||||
a |
Includes 19 Holiday Inn Resort properties (5,334 rooms) and 28 Holiday Inn Club Vacations properties (8,679 rooms) (2020: 22 Holiday Inn Resort properties (6,003 rooms) and 28 Holiday Inn Club Vacations properties (8,679 rooms)). |
b |
Includes one open hotel that will be re-branded to voco. |
Hotels |
Rooms |
|||||||||||||||||||||||
Change |
Change |
|||||||||||||||||||||||
At 31 December |
2021 |
over 2020 |
2021 |
over 2020 |
||||||||||||||||||||
Analysed by brand |
||||||||||||||||||||||||
Six Senses |
6 |
(1 |
) |
471 |
(48 |
) | ||||||||||||||||||
InterContinental |
9 |
2 |
2,252 |
528 |
||||||||||||||||||||
Kimpton |
19 |
(1 |
) |
3,431 |
(52 |
) | ||||||||||||||||||
Crowne Plaza |
8 |
2 |
1,643 |
393 |
||||||||||||||||||||
Hotel Indigo |
29 |
(2 |
) |
4,070 |
(85 |
) | ||||||||||||||||||
EVEN Hotels |
10 |
(6 |
) |
1,166 |
(809 |
) | ||||||||||||||||||
voco |
5 |
3 |
1,045 |
771 |
||||||||||||||||||||
Holiday Inn c |
74 |
(6 |
) |
9,468 |
(978 |
) | ||||||||||||||||||
Holiday Inn Express |
338 |
(48 |
) |
32,701 |
(4,654 |
) | ||||||||||||||||||
avid hotels |
164 |
(27 |
) |
14,495 |
(2,816 |
) | ||||||||||||||||||
Staybridge Suites |
137 |
2 |
14,050 |
(11 |
) | |||||||||||||||||||
Candlewood Suites |
93 |
20 |
7,765 |
1,396 |
||||||||||||||||||||
Atwell Suites |
23 |
4 |
2,275 |
426 |
||||||||||||||||||||
Other |
11 |
(2 |
) |
1,771 |
(215 |
) | ||||||||||||||||||
Total |
926 |
(60 |
) |
96,603 |
(6,154 |
) | ||||||||||||||||||
Analysed by ownership type |
||||||||||||||||||||||||
Franchised |
889 |
(55 |
) |
90,732 |
(5,796 |
) | ||||||||||||||||||
Managed |
37 |
(5 |
) |
5,871 |
(358 |
) | ||||||||||||||||||
Total |
926 |
(60 |
) |
96,603 |
(6,154 |
) | ||||||||||||||||||
c |
Includes one Holiday Inn Resort property (165 rooms) (2020: three Holiday Inn Resort properties (490 rooms)). |
| Total number of hotels 4,268 Total number of rooms 499,089 Americas system size decreased by 30 hotels (14,923 rooms) to 4,268 hotels, a reduction of 2.9% year-on-year. 181 hotels (30,662 rooms) were removed from the Americas system in 2021, including 92 Holiday Inn and Crowne Plaza hotels (20,127 rooms), driven by the conclusion of our quality review. This compares to 176 hotels (27,381 rooms) that left the Americas system in 2020, of which 102 hotels (16,655 rooms) related to the termination of the SVC portfolio in the Americas estate. Total number of hotels in the pipeline 926 Total number of rooms in the pipeline 96,603 At 31 December 2021, the Americas pipeline totalled 926 hotels (96,603 rooms), representing a decrease of 60 hotels (6,154 rooms) over the prior year. Signings of 175 hotels (17,647 rooms) were ahead of last year by 38 hotels (3,608 rooms). The majority of 2021 signings were within our midscale and upper midscale brands including the Holiday Inn Brand Family (75 hotels, 7,493 rooms) and avid hotels (13 hotels, 892 rooms). Signings in our Suites brands (Staybridge Suites, Candlewood Suites and Atwell Suites) amounted to 64 hotels (5,669 rooms). 84 hotels (8,062 rooms) were removed from the pipeline in 2021 compared to 105 hotels (11,398 rooms) in 2020. |
| |
Performance |
IHG |
65 |
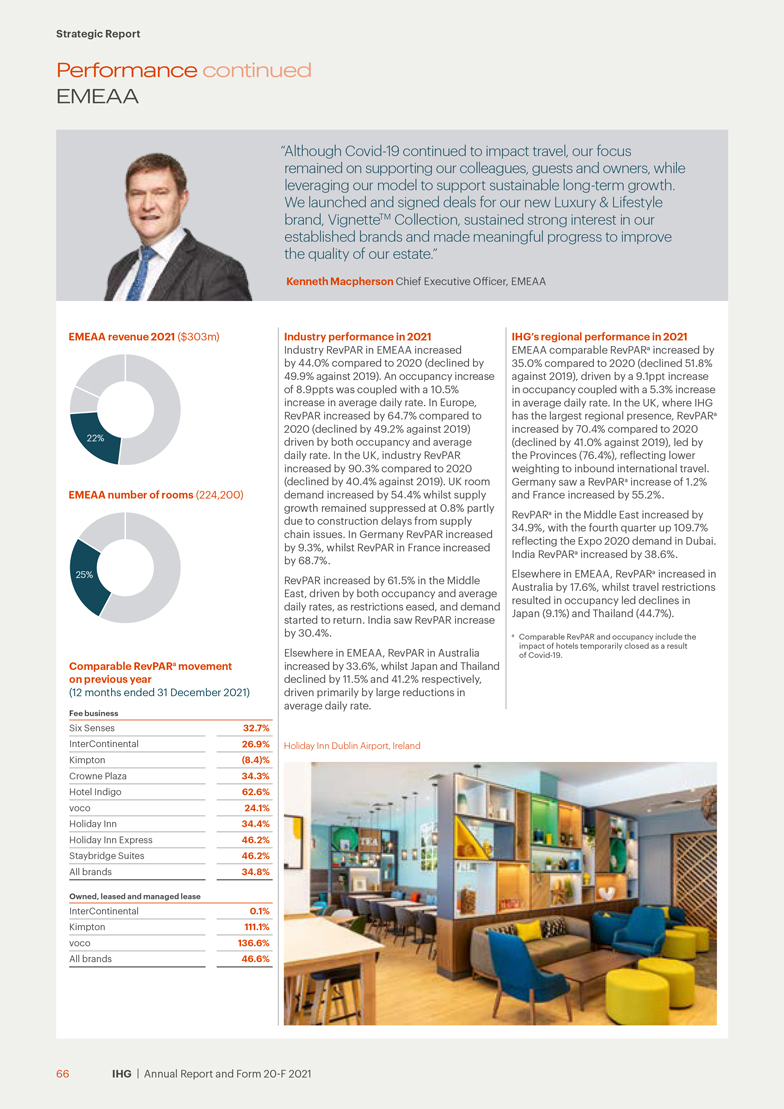
12 months ended 31 December |
||||||||||||||||||||||||||||||
| 2021 $m |
2020 $m |
2021 vs 2020 % change |
2019 $m |
2020 vs 2019 % change |
||||||||||||||||||||||||||
Revenue from the reportable segment a |
||||||||||||||||||||||||||||||
Fee business |
149 |
107 |
39.3 |
337 |
(68.2 |
) | ||||||||||||||||||||||||
Owned, leased and managed lease |
154 |
114 |
35.1 |
386 |
(70.5 |
) | ||||||||||||||||||||||||
Total |
303 |
221 |
37.1 |
723 |
(69.4 |
) | ||||||||||||||||||||||||
Operating profit/(loss) from the reportable segment a |
||||||||||||||||||||||||||||||
Fee business |
32 |
(18 |
) |
NM |
c |
202 |
NM |
c | ||||||||||||||||||||||
Owned, leased and managed lease |
(27 |
) |
(32 |
) |
(15.6 |
) |
15 |
NM |
c | |||||||||||||||||||||
5 |
(50 |
) |
NM |
c |
217 |
NM |
c | |||||||||||||||||||||||
Operating exceptional items |
(7 |
) |
(128 |
) |
(94.5 |
) |
(109 |
) |
17.4 |
|||||||||||||||||||||
Operating (loss)/profit |
(2 |
) |
(178 |
) |
(98.9 |
) |
108 |
NM |
c | |||||||||||||||||||||
| Review of the year ended 31 December 2021 Comprising 1,137 hotels (224,200 rooms) at the end of 2021, EMEAA represented 25% of the Group’s room count. Revenues are primarily generated from hotels in the UK and gateway cities in continental Europe, the Middle East and Asia. The largest proportion of rooms in the UK and continental Europe are operated under the franchise business model, primarily under our upper midscale brands (Holiday Inn and Holiday Inn Express). In the upscale market segment, Crowne Plaza is evenly proportioned between the franchised and managed operating models, whereas in the luxury market segment, the majority of InterContinental branded hotels are operated under management agreements. The majority of hotels in markets outside of Europe are operated under the managed business model. Performance in the region continued to reflect the differing levels of government-mandated closures and restrictions. Performance in the first quarter was impacted by travel restrictions in a number of markets. The second quarter saw modest improvements in trading as the UK permitted leisure travel towards the end of May, whilst government mandated restrictions remained in much of continental Europe, and South East Asia continued to be impacted by lower levels of international demand. Through the second half of the year, RevPAR continued to improve before restrictions were reinstated in certain markets following increased cases from the Omicron variant in December. Hotels continued to reopen, with only 21 hotels remaining temporarily closed at the end of the year, compared to 215 at the start of the year; all 16 of the owned, leased and managed lease hotels were open. |
EMEAA comparable RevPAR b declined 62% in the first quarter, then grew 179% in the second quarter, 86% in the third quarter, 118% in the fourth quarter and 35% in the full year when comparing to 2020. When comparing to 2019, prior to the pandemic, EMEAA comparable RevPARb declined 71% in the first quarter, 65% in the second quarter, 43% in the third quarter, 33% in the fourth quarter and 52% in the full year.Revenue from the reportable segment a increased by $82m (37%) to $303m (a decrease of 58% compared to 2019). The operating loss decreased by $176m to a loss of $2m, driven by an increase in revenue and a $121m decrease in operating exceptional charges. Operating profit from the reportable segmenta increased by $55m to $5m (a decline of $212m compared to 2019). On an underlyinga basis, revenue increased by $79m (35%), whilst underlyinga profit increased by $59m, from a $54m loss to a $5m profit.Revenue and operating profit from the reportable segment a are further analysed by fee business and owned, leased and managed lease hotels.Fee business revenue a increased by $42m (39%) to $149m. Fee business operating profita improved by $50m to $32m, benefiting from the improvement in trading and the delivery of sustainable fee business cost savings. Results included $29m of incentive management fees recorded (2020: $14m; 2019: $90m), driven by an improvement in trading, particularly in the Middle East. |
Owned, leased and managed lease revenue increased by $40m to $154m, with RevPAR b up 47% compared to 2020 (down 69% compared to 2019), leading to an owned, leased and managed lease operating loss of $27m compared to a $32m loss in the prior year, as the lifting of travel restrictions, predominantly in the UK, began to ease the trading challenges on this largely urban-centred portfolio. | ||||||
| For discussion of 2020 results, and the changes compared to 2019, refer to the 2020 Annual Report and Form 20-F. | ||||||||
|
|
www.ihgplc.com/investors | |||||||
| a Definitions for Non-GAAP revenue and operating profit measures can be found on pages 73 to 77. Reconciliations of these measures to the most directly comparable line items within the Group Financial Statements can be found on pages 218 to 223.b Comparable RevPAR and occupancy include the impact of hotels temporarily closed as a result of Covid-19.c Percentage change considered not meaningful, such as where a positive balance in the latest period is comparable to a negative or zero balance in the prior period. | ||||||||
| | ||||||||
| | ||||||||
| | ||||||||
| |
Performance |
IHG |
67 |
Hotels |
Rooms |
|||||||||||||||||||||||||||||||
At 31 December |
2021 |
Change over 2020 |
2021 |
Change over 2020 |
||||||||||||||||||||||||||||
Analysed by brand |
||||||||||||||||||||||||||||||||
Six Senses |
19 |
4 |
1,270 |
263 |
||||||||||||||||||||||||||||
Regent |
3 |
– |
771 |
– |
||||||||||||||||||||||||||||
InterContinental |
108 |
– |
32,561 |
87 |
||||||||||||||||||||||||||||
Vignette Collection |
1 |
1 |
146 |
146 |
||||||||||||||||||||||||||||
Kimpton |
10 |
2 |
2,146 |
287 |
||||||||||||||||||||||||||||
Crowne Plaza |
182 |
(6 |
) |
44,828 |
(1,696 |
) | ||||||||||||||||||||||||||
Hotel Indigo |
48 |
2 |
5,183 |
117 |
||||||||||||||||||||||||||||
voco |
21 |
5 |
5,882 |
1,002 |
||||||||||||||||||||||||||||
Holiday Inn a |
380 |
(21 |
) |
70,824 |
(4,160 |
) | ||||||||||||||||||||||||||
Holiday Inn Express |
333 |
4 |
48,548 |
1,192 |
||||||||||||||||||||||||||||
Staybridge Suites |
19 |
1 |
3,209 |
371 |
||||||||||||||||||||||||||||
Other b |
13 |
(4 |
) |
8,832 |
(1,258 |
) | ||||||||||||||||||||||||||
Total |
1,137 |
(12 |
) |
224,200 |
(3,649 |
) | ||||||||||||||||||||||||||
Analysed by ownership type |
||||||||||||||||||||||||||||||||
Franchised |
767 |
(7 |
) |
125,707 |
(13 |
) | ||||||||||||||||||||||||||
Managed |
354 |
(4 |
) |
95,199 |
(3,349 |
) | ||||||||||||||||||||||||||
Owned, leased and managed lease |
16 |
(1 |
) |
3,294 |
(287 |
) | ||||||||||||||||||||||||||
Total |
1,137 |
(12 |
) |
224,200 |
(3,649 |
) | ||||||||||||||||||||||||||
a |
Includes 14 Holiday Inn Resort properties (3,229 rooms) (2020: 17 Holiday Inn Resort properties (3,330 rooms)). |
b |
Includes two open hotels that will be re-branded to voco and Vignette Collection. |
Hotels |
Rooms |
|||||||||||||||||||||||
Change |
Change |
|||||||||||||||||||||||
At 31 December |
2021 |
over 2020 |
2021 |
over 2020 |
||||||||||||||||||||
Analysed by brand |
||||||||||||||||||||||||
Six Senses |
23 |
2 |
1,720 |
169 |
||||||||||||||||||||
Regent |
6 |
1 |
1,341 |
86 |
||||||||||||||||||||
InterContinental |
43 |
10 |
9,520 |
2,035 |
||||||||||||||||||||
Kimpton |
9 |
3 |
1,674 |
546 |
||||||||||||||||||||
Crowne Plaza |
40 |
5 |
10,461 |
1,360 |
||||||||||||||||||||
Hotel Indigo |
44 |
3 |
7,004 |
957 |
||||||||||||||||||||
voco |
31 |
5 |
8,753 |
979 |
||||||||||||||||||||
Holiday Inn a |
98 |
(10 |
) |
21,014 |
(1,540 |
) | ||||||||||||||||||
Holiday Inn Express |
99 |
7 |
15,593 |
360 |
||||||||||||||||||||
avid hotels |
– |
(1 |
) |
– |
(215 |
) | ||||||||||||||||||
Staybridge Suites |
19 |
(1 |
) |
2,793 |
(636 |
) | ||||||||||||||||||
Other b |
6 |
5 |
1,059 |
711 |
||||||||||||||||||||
Total |
418 |
29 |
80,932 |
4,812 |
||||||||||||||||||||
Analysed by ownership type |
||||||||||||||||||||||||
Franchised |
175 |
20 |
27,045 |
1,393 |
||||||||||||||||||||
Managed |
242 |
9 |
53,732 |
3,419 |
||||||||||||||||||||
Owned, leased and managed lease |
1 |
– |
155 |
– |
||||||||||||||||||||
Total |
418 |
29 |
80,932 |
4,812 |
||||||||||||||||||||
a |
Includes 20 Holiday Inn Resort properties (4,849 rooms) (2020: 18 Holiday Inn Resort properties (3,553 rooms)). |
b |
Includes four hotels that will be re-branded to Vignette Collection. |
| Total number of hotels 1,137 Total number of rooms 224,200 EMEAA system size decreased by 12 hotels (3,649 rooms) to 1,137 hotels (224,200 rooms) during 2021, a reduction of 1.6% year-on-year. 64 hotels (13,811 rooms) were removed from the EMEAA system in 2021, including 48 Holiday Inn and Crowne Plaza hotels (10,741 rooms), driven by the completion of the quality review. This compared to 38 hotels (6,809 rooms) that left the EMEAA system in 2020. Total number of hotels in the pipeline 418 Total number of rooms in the pipeline 80,932 At 31 December 2021, the EMEAA pipeline totalled 418 hotels (80,932 rooms), representing an increase of 29 hotels (4,812 rooms) over the prior year. Signings of 109 hotels (20,376 rooms) were ahead of last year by 27 hotels (6,473 rooms), including a multi-property deal which encompassed a new property for voco in Algarve, Portugal and three hotels signed to the Vignette Collection in Austria and Portugal. 28 hotels (5,402 rooms) were removed from the pipeline in 2021 compared to 36 hotels (7,601 rooms) in 2020. |
68 |
IHG |
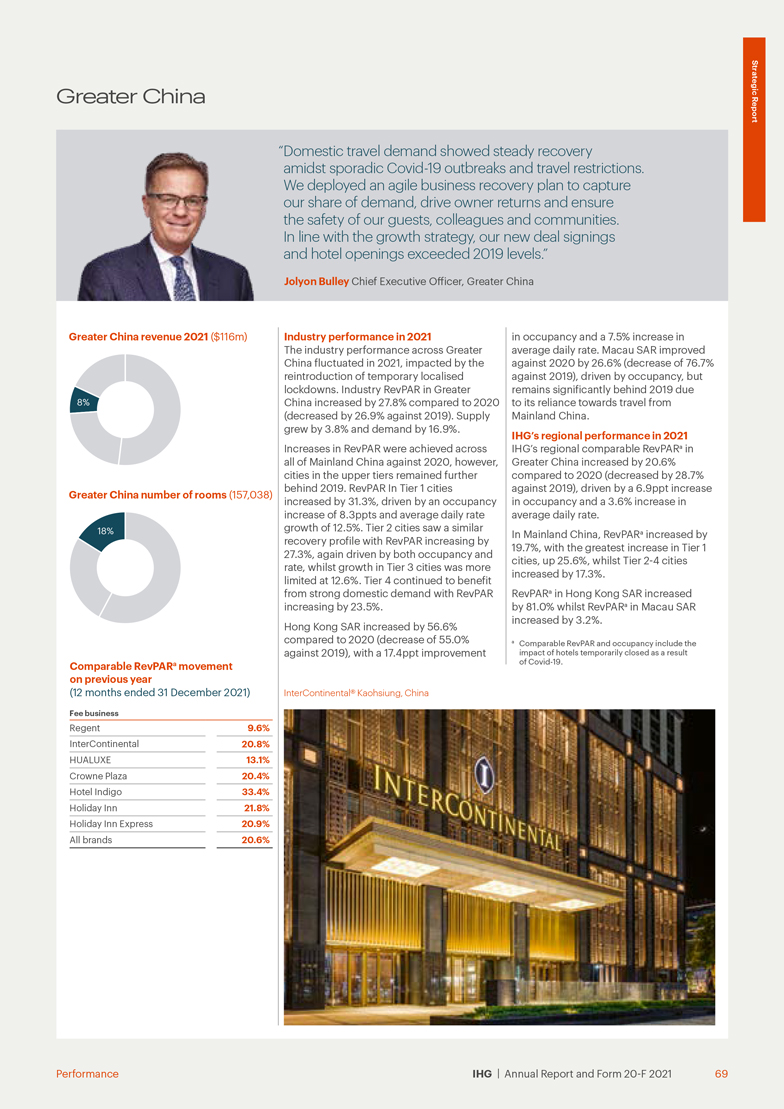
12 months ended 31 December |
||||||||||||||||||||||||||||||
2021 $m |
2020 $m |
2021 vs 2020 % change |
2019 $m |
2020 vs 2019 % change |
||||||||||||||||||||||||||
Revenue from the reportable segment a |
||||||||||||||||||||||||||||||
Fee business |
116 |
77 |
50.6 |
135 |
(43.0 |
) | ||||||||||||||||||||||||
Total |
116 |
77 |
50.6 |
135 |
(43.0 |
) | ||||||||||||||||||||||||
Operating profit from the reportable segment a |
||||||||||||||||||||||||||||||
Fee business |
58 |
35 |
65.7 |
73 |
(52.1 |
) | ||||||||||||||||||||||||
Operating exceptional items |
– |
(5 |
) |
– |
– |
– |
||||||||||||||||||||||||
Operating profit |
58 |
30 |
93.3 |
73 |
(58.9 |
) | ||||||||||||||||||||||||
| Review of the year ended 31 December 2021 Comprising 586 hotels (157,038 rooms) at 31 December 2021, Greater China represented approximately 18% of the Group’s room count. The majority of rooms in Greater China operate under the managed business model. Increases in Covid-19 cases and the reintroduction of temporary restrictions impacted trading in January and February, though the recovery resumed in March with demand returning at pace as restrictions eased.The recovery continued into April and May before local restrictions were reinstated across south, east and west cities in June. In July, RevPAR b was just 6% lower than 2019 levels, driven by strong domestic leisure demand. The reintroduction of temporary restrictions meant that August weakened to more than 50% lower than 2019.The fourth quarter saw volatile trading, impacted by the reintroduction of temporary restrictions. Greater China comparable RevPAR b grew 78% in the first quarter and 107% in the second quarter, then declined 8% in the third quarter and 17% in the fourth quarter. Full year growth was 21% when compared to 2020. When comparing to 2019, prior to the pandemic, Greater China comparable RevPARb declined 38% in the first quarter, 16% in the second quarter, 30% in the third quarter, 33% in the fourth quarter and 29% in the full year. |
Revenue from the reportable segment a increased by $39m (51%) to $116m (a decrease of 14% compared to 2019). Operating profit improved by $28m, driven by the increase in revenue and a $5m decrease in operating exceptional charges. Operating profit from the reportable segmenta increased by $23m to $58m (a decline of 21% compared to 2019). The improvement in demand at our managed hotels led to $25m recognition of incentive management fees compared to $16m in 2020 (2019: $48m). Revenue and operating profit from the reportable segmenta also included the benefit of a $6m individually significant liquidated damages settlement. |
|||||||
| For discussion of 2020 results, and the changes compared to 2019, refer to the 2020 Annual Report and Form 20-F. |
||||||||
|
|
www.ihgplc.com/investors |
|||||||
| a Definitions for Non-GAAP revenue and operating profit measures can be found on pages 73 to 77. Reconciliations of these measures to the most directly comparable line items within the Group Financial Statements can be found on pages 218 to 223.b Comparable RevPAR and occupancy include the impact of hotels temporarily closed as a result of Covid-19. |
||||||||
| |
||||||||
| |
||||||||
| |
||||||||
70 |
IHG |
Hotels |
Rooms |
|||||||||||||||||||||||
Change |
Change |
|||||||||||||||||||||||
At 31 December |
2021 |
over 2020 |
2021 |
over 2020 |
||||||||||||||||||||
Analysed by brand |
||||||||||||||||||||||||
Six Senses |
1 |
– |
122 |
– |
||||||||||||||||||||
Regent |
4 |
– |
1,419 |
– |
||||||||||||||||||||
InterContinental |
53 |
2 |
21,190 |
512 |
||||||||||||||||||||
Kimpton |
1 |
– |
129 |
– |
||||||||||||||||||||
HUALUXE |
16 |
4 |
4,603 |
1,170 |
||||||||||||||||||||
Crowne Plaza |
110 |
5 |
38,420 |
1,470 |
||||||||||||||||||||
Hotel Indigo |
16 |
4 |
2,415 |
670 |
||||||||||||||||||||
EVEN Hotels |
2 |
1 |
251 |
80 |
||||||||||||||||||||
voco |
5 |
4 |
1,094 |
946 |
||||||||||||||||||||
Holiday Inn a |
122 |
13 |
33,010 |
2,382 |
||||||||||||||||||||
Holiday Inn Express |
247 |
35 |
47,054 |
5,265 |
||||||||||||||||||||
Other b |
9 |
1 |
7,331 |
368 |
||||||||||||||||||||
Total |
586 |
69 |
157,038 |
12,863 |
||||||||||||||||||||
Analysed by ownership type |
||||||||||||||||||||||||
Franchised |
179 |
53 |
40,151 |
10,325 |
||||||||||||||||||||
Managed |
407 |
16 |
116,887 |
2,538 |
||||||||||||||||||||
Total |
586 |
69 |
157,038 |
12,863 |
||||||||||||||||||||
a |
Includes eight Holiday Inn Resort properties (1,891 rooms) (2020: eight Holiday Inn Resort properties (2,113 rooms)). |
b |
Includes one open hotel that will be re-branded to voco. |
Hotels |
Rooms |
|||||||||||||||||||||||
Change |
Change |
|||||||||||||||||||||||
At 31 December |
2021 |
over 2020 |
2021 |
over 2020 |
||||||||||||||||||||
Analysed by brand |
||||||||||||||||||||||||
Six Senses |
4 |
1 |
233 |
64 |
||||||||||||||||||||
Regent |
2 |
1 |
597 |
317 |
||||||||||||||||||||
InterContinental |
27 |
(2 |
) |
7,907 |
(658 |
) | ||||||||||||||||||
Kimpton |
7 |
1 |
1,747 |
93 |
||||||||||||||||||||
HUALUXE |
23 |
(2 |
) |
6,045 |
(862 |
) | ||||||||||||||||||
Crowne Plaza |
48 |
– |
13,157 |
(720 |
) | |||||||||||||||||||
Hotel Indigo |
41 |
9 |
7,378 |
1,876 |
||||||||||||||||||||
EVEN Hotels |
19 |
4 |
3,741 |
670 |
||||||||||||||||||||
voco |
2 |
1 |
292 |
161 |
||||||||||||||||||||
Holiday Inn a |
72 |
(2 |
) |
17,596 |
(567 |
) | ||||||||||||||||||
Holiday Inn Express |
208 |
3 |
34,732 |
168 |
||||||||||||||||||||
Other |
– |
(1 |
) |
– |
(297 |
) | ||||||||||||||||||
Total |
453 |
13 |
93,425 |
245 |
||||||||||||||||||||
Analysed by ownership type |
||||||||||||||||||||||||
Franchised |
226 |
15 |
40,055 |
3,167 |
||||||||||||||||||||
Managed |
227 |
(2 |
) |
53,370 |
(2,922 |
) | ||||||||||||||||||
Total |
453 |
13 |
93,425 |
245 |
||||||||||||||||||||
a |
Includes 14 Holiday Inn Resort properties (3,205 rooms) (2020: 12 Holiday Inn Resort properties (3,208 rooms)). |
| Total number of hotels 586 Total number of rooms 157,038 The Greater China system size increased by 69 hotels (12,863 rooms) in 2021 to 586 hotels (157,038 rooms), an increase of 8.9% year-on-year. 19 hotels (5,194 rooms) were removed in 2021 compared to 10 hotels (2,729 rooms) in 2020. Total number of hotels in the pipeline 453 Total number of rooms in the pipeline 93,425 At 31 December 2021, the Greater China pipeline totalled 453 hotels (93,425 rooms), compared to 440 hotels (93,180 rooms) at 31 December 2020. Signings of 153 hotels (30,847 rooms) were ahead of last year by 12 hotels (2,643 rooms). 89 hotels (16,260 rooms) were signed for the Holiday Inn Brand Family. Other notable signings included Regent Sanya Haitang Bay and Hotel Indigo Sanya Haitang Bay as part of a combined complex, and the InterContinental Taipei. 52 hotels (12,545 rooms) were removed from the pipeline in 2021 compared to 37 hotels (8,741 rooms) in 2020. | ||
| |
| |
Performance |
IHG |
71 |
12 months ended 31 December |
||||||||||||||||||||||||||||||
2021 $m |
2020 $m |
2021 vs 2020 % change |
2019 $m |
2020 vs 2019 % change |
||||||||||||||||||||||||||
Revenue |
197 |
182 |
8.2 |
185 |
(1.6 |
) | ||||||||||||||||||||||||
Gross costs |
(285 |
) |
(244 |
) |
16.8 |
(310 |
) |
(21.3 |
) | |||||||||||||||||||||
(88 |
) |
(62 |
) |
41.9 |
(125 |
) |
(50.4 |
) | ||||||||||||||||||||||
Operating exceptional items |
– |
(19 |
) |
– |
(15 |
) |
26.7 |
|||||||||||||||||||||||
Operating loss |
(88 |
) |
(81 |
) |
8.6 |
(140 |
) |
(42.1 |
) | |||||||||||||||||||||

72 |
IHG |
Linkage of performance measures to Directors’ remuneration and KPIs |
 |
See pages 104 to 125 for more information on Directors’ remuneration and pages 50 to 53 for more information on KPIs. | ||||||||||||||
 |
The Annual Performance Plan |
 |
The Long Term Incentive Plan |
 |
Key Performance Indicators |
|||||||||||
Measure |
Commentary | |||
| |
| |||
| Global revenue per available room (RevPAR) growth  RevPAR, average daily rate and occupancy statistics are disclosed on pages 224 and 225. |
RevPAR is the primary metric used by management to track hotel performance across regions and brands. RevPAR is also a commonly used performance measure in the hotel industry. RevPAR comprises IHG’s System (see Glossary, page 256) rooms revenue divided by the number of room nights available and can be derived from occupancy rate multiplied by average daily rate (ADR). ADR is rooms revenue divided by the number of room nights sold. References to RevPAR, occupancy and ADR are presented on a comparable basis, comprising groupings of hotels that have traded in all months in both the current and prior year. The principal exclusions in deriving this measure are new hotels (including those acquired), hotels closed for major refurbishment and hotels sold in either of the two years. These measures include the impact of hotels temporarily closed as a result of Covid-19. RevPAR and ADR are quoted at a constant US$ conversion rate, in order to allow a better understanding of the comparable year-on-year | |||
| |
| |||
| Total gross revenue from hotels in IHG’s System  Owned, leased and managed lease revenue as recorded in the Group Financial Statements is reconciled to total gross revenue on page 60. |
Total gross revenue is revenue not wholly attributable to IHG, however, management believes this measure is meaningful to investors and other stakeholders as it provides a measure of System performance, giving an indication of the strength of IHG’s brands and the combined impact of IHG’s growth strategy and RevPAR performance. Total gross revenue refers to revenue which IHG has a role in driving and from which IHG derives an income stream. IHG’s business model is described on pages 10 to 13. Total gross revenue comprises: • total rooms revenue from franchised hotels;• total hotel revenue from managed hotels including food and beverage, meetings and other revenues and reflects the value IHG drives to managed hotel owners by optimising the performance of their hotels; and• total hotel revenue from owned, leased and managed lease hotels.Other than total hotel revenue from owned, leased and managed lease hotels, total gross hotel revenue is not revenue attributable to IHG as these managed and franchised hotels are owned by third parties. | |||
| |
| |||
| Revenue and operating profit measures The reconciliation of the most directly comparable line item within the Group Financial Statements (i.e. total revenue and operating profit, accordingly) to the non-IFRS revenue and operating profit measures is included on pages 218 to 223. |
Revenue and operating profit from (1) fee business and (2) owned, leased and managed lease hotels, are described as ‘revenue from reportable segments’ and ‘operating profit from reportable segments’, respectively, within note 2 to the Group Financial Statements. These measures are presented for each of the Group’s regions. Management believes revenue and operating profit from reportable segments is meaningful to investors and other stakeholders as it excludes the following elements and reflects how management monitors the business: • System Fund – the Fund is not managed to generate a profit or loss for IHG over the longer term, but is managed for the benefit of the hotels within the IHG System. As described within the Group’s accounting policies (page 149), the System Fund is operated to collect and administer cash assessments from hotel owners for the specific purpose of use in marketing, the Guest Reservation System and hotel loyalty programme. | |||
| |
| |||
| |
Performance |
IHG |
73 |
| Measure |
Commentary | |
Revenue and operating profit measures |
• Revenues related to the reimbursement of costs – as described within the Group’s accounting policies (page 149), there is a cost equal to these revenues so there is no profit impact. Cost reimbursements are not applicable to all hotels and growth in these revenues is not reflective of growth in the performance of the Group. As such, management do not include these revenues in their analysis of results. | |
| • Exceptional items – these are identified by virtue of either their size, nature, or incidence and can include, but are not restricted to, gains and losses on the disposal of assets, impairment charges and reversals, the costs of individually significant legal cases or commercial disputes and reorganisation costs. As each item is different in nature and scope, there will be little continuity in the detailed composition and size of the reported amounts which affect performance in successive periods. Separate disclosure of these amounts facilitates the understanding of performance including and excluding such items. The Group’s accounting policy for exceptional items and further detail of those items presented as such are included in the Group Financial Statements (see pages 152 and 165 to 167). | ||
In further discussing the Group’s performance in respect of revenue and operating profit, additional non-IFRS measures are used and explained further below: | ||
| • Underlying revenue; | ||
| • Underlying operating profit; | ||
| • Underlying fee revenue; and | ||
| • Fee margin. | ||
Operating profit measures are, by their nature, before interest and tax. Management believes such measures are useful for investors and other stakeholders when comparing performance across different companies as interest and tax can vary widely across different industries or among companies within the same industry. For example, interest expense can be highly dependent on a company’s capital structure, debt levels and credit ratings. In addition, the tax positions of companies can vary because of their differing abilities to take advantage of tax benefits and because of the tax policies of the various jurisdictions in which they operate. | ||
Although management believes these measures are useful to investors and other stakeholders in assessing the Group’s ongoing financial performance and provide improved comparability between periods, there are limitations in their use as compared to measures of financial performance under IFRS. As such, they should not be considered in isolation or viewed as a substitute for IFRS measures. In addition, these measures may not necessarily be comparable to other similarly titled measures of other companies due to potential inconsistencies in the methods of calculation. | ||
| |
| |
Underlying revenue and underlying operating profit |
These measures adjust revenue from reportable segments and operating profit from reportable segments, respectively, to exclude revenue and operating profit generated by owned, leased and managed lease hotels which have been disposed, and significant liquidated damages, which are not comparable year-on-year Management believes these are meaningful to investors and other stakeholders to better understand comparable year-on-year | |
| |
| |
| Underlying fee revenue growth  |
Underlying fee revenue is used to calculate underlying fee revenue growth. Underlying fee revenue is calculated on the same basis as underlying revenue as described above but for the fee business only. Management believes underlying fee revenue is meaningful to investors and other stakeholders as an indicator of IHG’s ability to grow the core fee-based business, aligned to IHG’s asset-light strategy. | |
| |
| |
74 |
IHG |
| Measure |
Commentary | |
| Fee margin  |
Fee margin is presented at actual exchange rates and is a measure of the profit arising from fee revenue. Fee margin is calculated by dividing ‘fee operating profit’ by ‘fee revenue’. Fee revenue and fee operating profit are calculated from revenue from reportable segments and operating profit from reportable segments, as defined above, adjusted to exclude revenue and operating profit from the Group’s owned, leased and managed lease hotels and significant liquidated damages. | |
In addition, fee margin is adjusted for the results of the Group’s captive insurance company, where premiums are intended to match the expected claims over the longer term (see page 186 in the Group Financial Statements), and as such these amounts are adjusted from the fee margin to better depict the profitability of the fee business. | ||
Management believes fee margin is meaningful to investors and other stakeholders as an indicator of the sustainable long-term growth in the profitability of IHG’s core fee-based business, as the scale of IHG’s operations increases with growth in IHG’s System size. | ||
| |
| |
| Adjusted interest Financial income and financial expenses as recorded in the Group Financial Statements is reconciled to adjusted interest on page 223. |
Adjusted interest is presented before exceptional items and excludes the following items of interest which are recorded within the System Fund: • IHG records an interest charge on the outstanding cash balance relating to the IHG Rewards programme. These interest payments are recognised as interest income for the Fund and interest expense for IHG.• The System Fund also benefits from the capitalisation of interest related to the development of the next-generation Guest Reservation System.• Other components of System Fund interest income and expense, including lease interest expense and interest income on overdue receivables. | |
| As the Fund is included on the Group income statement, these amounts are included in the reported net Group financial expenses, reducing the Group’s effective interest cost. Given results related to the System Fund are excluded from adjusted measures used by management, these are excluded from adjusted interest and adjusted earnings per ordinary share (see below). Management believes adjusted interest is a meaningful measure for investors and other stakeholders as it provides an indication of the comparable year-on-year | ||
| |
| |
| Tax excluding the impact of exceptional items and System Fund A reconciliation of the tax charge as recorded in the Group Financial Statements to tax excluding the impact of exceptional items and System Fund can be found in note 8 to the Group Financial Statements on page 169. |
As outlined above, exceptional items can vary year-on-year Management believes removing these provides a better view of the Group’s underlying tax rate on ordinary operations and aids comparability year-on-year, | |
| |
| |
| Adjusted earnings per ordinary share Basic earnings per ordinary share as recorded in the Group Financial Statements is reconciled to adjusted earnings per ordinary share in note 10 to the Group Financial Statements on page 174. |
Adjusted earnings per ordinary share adjusts the profit available for equity holders used in the calculation of basic earnings per share to remove System Fund revenue and expenses, the items of interest related to the System Fund as excluded in adjusted interest (above), change in fair value of contingent purchase consideration, exceptional items, and the related tax impacts of such adjustments. Management believes that adjusted earnings per share is a meaningful measure for investors and other stakeholders as it provides a more comparable earnings per share measure aligned with how management monitors the business. | |
| |
| |
| Net debt Net debt is included in note 23 to the Group Financial Statements. |
Net debt is used in the monitoring of the Group’s liquidity and capital structure and is used by management in the calculation of the key ratios attached to the Group’s bank covenants and with the objective of maintaining an investment grade credit rating (see page 12 for further discussion). Net debt is used by investors and other stakeholders to evaluate the financial strength of the business. Net debt comprises loans and other borrowings, lease liabilities, the exchange element of the fair value of derivatives hedging debt values, less cash and cash equivalents. | |
| |
| |
 |
Performance |
IHG |
75 |
| Measure |
Commentary | |
| Adjusted EBITDA Operating profit recorded in the Group Financial Statements is reconciled to adjusted EBITDA on page 223. |
One of the key measures used by the Group in monitoring its debt and capital structure is the net debt: adjusted EBITDA ratio, which is managed with the objective of maintaining an investment grade credit rating. The Group has a stated aim of maintaining this ratio at 2.5-3.0x. Adjusted EBITDA is defined as operating profit, excluding System Fund revenues and expenses, exceptional items and depreciation and amortisation.Adjusted EBITDA is useful to investors and other stakeholders for comparing the performance of different companies as depreciation, amortisation and exceptional items are eliminated. It can also be used as an approximation of operational cash flow generation. This measure is relevant to the Group’s banking covenants, which have been amended for test dates in 2022. Details of covenant levels and performance against these is provided in note 24 to the Group Financial Statements. The leverage ratio uses a Covenant EBITDA measure which is calculated on a ‘frozen GAAP’ basis, excluding the effect of IFRS 16. | |
| |
| |
| Gross capital expenditure, net capital expenditure, adjusted free cash flow The reconciliation of the Group’s statement of cash flows (i.e. net cash from investing activities, net cash from operating activities, accordingly) to the non-IFRS capital expenditure and cash flow measures are included on page 222. |
These measures have limitations as they omit certain components of the overall cash flow statement. They are not intended to represent IHG’s residual cash flow available for discretionary expenditures, nor do they reflect the Group’s future capital commitments. These measures are used by many companies, but there can be differences in how each company defines the terms, limiting their usefulness as a comparative measure. Therefore, it is important to view these measures only as a complement to the Group statement of cash flows. | |
| |
| |
Gross capital expenditure |
Gross capital expenditure represents the consolidated capital expenditure of IHG inclusive of System Fund capital investments (see page 13 for a description of System Fund capital investments and recent examples). | |
Gross capital expenditure is defined as net cash from investing activities, adjusted to include contract acquisition costs (key money). In order to demonstrate the capital outflow of the Group, cash flows arising from any disposals or distributions from associates and joint ventures are excluded. The measure also excludes any material investments made in acquiring businesses, including any subsequent payments of deferred or contingent purchase consideration included within investing activities, which represent ongoing payments for acquisitions. | ||
Gross capital expenditure is reported as either maintenance, recyclable, or System Fund. This disaggregation provides useful information as it enables users to distinguish between: | ||
| • System Fund capital investments which are strategic investments to drive growth at hotel level; | ||
| • Recyclable investments (such as investments in associates and joint ventures), which are intended to be recoverable in the medium term and are to drive the growth of the Group’s brands and expansion in priority markets; and | ||
| • Maintenance capital expenditure (including contract acquisition costs), which represents a permanent cash outflow. | ||
Management believes gross capital expenditure is a useful measure as it illustrates how the Group continues to invest in the business to drive growth. It also allows for comparison year-on-year. | ||
| |
| |
76 |
IHG |
| Measure |
Commentary | |
Net capital expenditure |
Net capital expenditure provides an indicator of the capital intensity of IHG’s business model. Net capital expenditure is derived from net cash from investing activities, adjusted to include contract acquisition costs (net of repayments) and to exclude any material investments made in acquiring businesses, including any subsequent payments of deferred or contingent purchase consideration included within investing activities, which represent ongoing payments for acquisitions. Net capital expenditure includes the inflows arising from any disposal receipts, or distributions from associates and joint ventures. | |
In addition, System Fund depreciation and amortisation relating to property, plant and equipment and intangible assets, respectively, is added back, reducing the overall cash outflow. This reflects the way in which System Funded capital investments are recharged to the System Fund, over the life of the asset (see page 13). | ||
Management believes net capital expenditure is a useful measure as it illustrates the net capital investment by IHG, after taking into account capital recycling through asset disposal and the funding of strategic investments by the System Fund. It provides investors and other stakeholders with visibility of the cash flows which are allocated to long-term investments to drive the Group’s strategy. | ||
| |
| |
| Adjusted free cash flow  |
Adjusted free cash flow is net cash from operating activities adjusted for: (1) the inclusion of the cash outflow arising from the purchase of shares by employee share trusts reflecting the requirement to satisfy incentive schemes which are linked to operating performance; (2) the inclusion of maintenance capital expenditure (excluding contract acquisition costs); (3) the inclusion of the principal element of lease payments; and (4) the exclusion of payments of deferred or contingent purchase consideration included within net cash from operating activities. | |
Management believes adjusted free cash flow is a useful measure for investors and other stakeholders, as it represents the cash available to invest back into the business to drive future growth and pay the ordinary dividend, with any surplus being available for additional returns to shareholders. | ||
| |
| |
|
|
The performance review should be read in conjunction with the Non-GAAP reconciliations on pages 218 to 223 and the Glossary on pages 255 to 256. | |||
|
|
Performance |
IHG |
77 |

Governance | ||
80 |
||
81 |
||
82 |
||
86 |
||
88 |
||
89 |
||
89 |
||
90 |
||
92 |
||
93 |
||
94 |
||
95 |
||
100 |
||
102 |
||
104 |
||
126 |
||
78 |
IHG | |


• |
The Audit Committee focused on the Group’s material accounting judgements and estimates, risks, internal controls and business continuity, and going concern and viability (see its report on pages 95 to 99); |
• |
The Remuneration Committee focused on incentive plan targets and performance and review of workforce remuneration considerations (see its report on pages 104 to 125); |
• |
The Responsible Business Committee focused on the delivery of the Group’s 2030 responsible business commitments as well as the annual operational targets (see its report on pages 100 and 101); and |
• |
The Nomination Committee progressed the implementation of Board refreshment plans (see its report on pages 102 and 103). |
80 |
IHG |

Appointment date |
Committee appointments |
Board |
Audit Committee |
Responsible Business Committee |
Nomination Committee |
Remuneration Committee |
||||||||||||||||||||||||||||||||||||||||||||||||
Total meetings held |
8 |
5 |
3 |
5 |
5 |
|||||||||||||||||||||||||||||||||||||||||||||||||
Chair |
||||||||||||||||||||||||||||||||||||||||||||||||||||||
Patrick Cescau a |
01/01/13 |
 |
8/8 |
– |
– |
5/5 |
– |
|||||||||||||||||||||||||||||||||||||||||||||||
Chief Executive Officer |
||||||||||||||||||||||||||||||||||||||||||||||||||||||
Keith Barr |
01/07/17 |
8/8 |
– |
– |
– |
– |
||||||||||||||||||||||||||||||||||||||||||||||||
Executive Directors |
||||||||||||||||||||||||||||||||||||||||||||||||||||||
Paul Edgecliffe-Johnson |
01/01/14 |
8/8 |
– |
– |
– |
– |
||||||||||||||||||||||||||||||||||||||||||||||||
Elie Maalouf |
01/01/18 |
8/8 |
– |
– |
– |
– |
||||||||||||||||||||||||||||||||||||||||||||||||
Senior Independent Non-Executive Directorb |
|
|||||||||||||||||||||||||||||||||||||||||||||||||||||
Dale Morrison b, c |
01/06/11 |
 |
7/8 |
3/5 |
– |
4/5 |
3/5 |
|||||||||||||||||||||||||||||||||||||||||||||||
Non-Executive Directors |
||||||||||||||||||||||||||||||||||||||||||||||||||||||
Graham Allan b, d |
01/09/20 |
|
8/8 |
5/5 |
– |
– |
4/5 |
|||||||||||||||||||||||||||||||||||||||||||||||
Richard Anderson e |
01/03/21 |
 |
1/2 |
0/1 |
– |
– |
1/2 |
|||||||||||||||||||||||||||||||||||||||||||||||
Daniela Barone Soares f |
01/03/21 |
 |
7/7 |
– |
2/2 |
– |
3/4 |
|||||||||||||||||||||||||||||||||||||||||||||||
Anne Busquet g |
01/03/15 |
 |
3/3 |
2/2 |
1/1 |
– |
– |
|||||||||||||||||||||||||||||||||||||||||||||||
Arthur de Haast |
01/01/20 |
 |
8/8 |
– |
3/3 |
– |
5/5 |
|||||||||||||||||||||||||||||||||||||||||||||||
Ian Dyson h |
01/09/13 |
 |
7/8 |
5/5 |
– |
5/5 |
5/5 |
|||||||||||||||||||||||||||||||||||||||||||||||
Duriya Farooqui |
07/12/20 |
 |
8/8 |
5/5 |
3/3 |
– |
– |
|||||||||||||||||||||||||||||||||||||||||||||||
Jo Harlow i |
01/09/14 |
 |
7/8 |
– |
– |
5/5 |
5/5 |
|||||||||||||||||||||||||||||||||||||||||||||||
Jill McDonald |
01/06/13 |
 |
8/8 |
5/5 |
3/3 |
5/5 |
– |
|||||||||||||||||||||||||||||||||||||||||||||||
Sharon Rothstein |
01/06/20 |
 |
8/8 |
5/5 |
3/3 |
– |
– |
|||||||||||||||||||||||||||||||||||||||||||||||
a |
In principle the Chair attends all Committee meetings, and the full Board attends the relevant sections of the Audit Committee meetings when financial results are considered. |
b |
Dale Morrison retired from the Board from 31 December 2021 and Graham Allan was appointed as Senior Non-Executive Director from 1 January 2022. |
c |
Dale Morrison was unable to attend a Board meeting, an Audit Committee meeting, a Nomination Committee meeting and a Remuneration Committee meeting due to illness. He was also unable to attend an Audit Committee meeting and a Remuneration Committee meeting due to a prior engagement. |
d |
Graham Allan was unable to attend a Remuneration Committee meeting due to a prior engagement. |
e |
Richard Anderson was appointed to the Board on 1 March 2021 and resigned on 26 May 2021. Richard was unable to attend a Board meeting, an Audit Committee meeting and a Remuneration Committee meeting due to a prior engagement. |
f |
Daniela Barone Soares was appointed to the Board from 1 March 2021. Daniela was unable to attend a Remuneration Committee meeting due to a prior engagement. |
g |
Anne Busquet retired from the Board from 7 May 2021. |
h |
Ian Dyson was unable to attend a Board meeting due to a prior engagement. |
i |
Jo Harlow was unable to attend a Board meeting due to a prior engagement. |
Board Committee membership key |
||||||||||
 |
Audit Committee member |
 |
Remuneration Committee member |
 |
Responsible Business Committee member | |||||
 |
Nomination Committee member |
 |
Chair of a Board Committee |
|||||||
 |
Chair’s overview |
IHG |
81 |
| Patrick Cescau Non-Executive Chair Appointed to the Board: 1 January 2013 |
 |
Skills and experience: Non-Executive Director of Pearson plc, Tesco PLC and International Consolidated Airlines Group S.A., and a Director at INSEAD. |
Board contribution: Other appointments: | |||
| Keith Barr Chief Executive Officer (CEO) Appointed to the Board: 1 July 2017 |
 |
Skills and experience: ® Rewards. Prior to this, Keith was CEO of IHG’s Greater China business for four years, setting the foundations for growth in a key market and overseeing the launch of the HUALUXE® Hotels and Resorts brand. |
Board contribution: Other appointments: Non-Executive Director of Yum! Brands. He also sits on the Board of WiHTL (Women in Hospitality Travel & Leisure), the World Travel & Tourism Council Executive Committee and the International Advisory Board of EHL. Keith is a graduate of Cornell University’s School of Hotel Administration and is currently a member of the Dean’s Advisory Board for The School of Hotel Administration, Cornell SC Johnson College of Business. | |||
| Paul Edgecliffe-Johnson Chief Financial Officer (CFO) and Group Head of Strategy Appointed to the Board: 1 January 2014 |
 |
Skills and experience: |
Board contribution: | |||
| Elie Maalouf Chief Executive Officer, Americas Appointed to the Board: 1 January 2018 |
 |
Skills and experience: |
Board contribution: Other appointments: | |||
Board Committee membership key |
||||||||||
 |
Audit Committee member |
 |
Remuneration Committee member |
 |
Responsible Business Committee member | |||||
 |
Nomination Committee member |
 |
Chair of a Board Committee |
|||||||
82 |
IHG |
| Graham Allan Senior Independent Non-Executive Director (SID)  Appointed to the Board: 1 September 2020* |
 |
Skills and experience: |
Board contribution: Non-Executive Director from 1 January 2022.Other appointments: Independent Non-Executive Director at Intertek plc and Independent Non-Executive Director of Associated British Foods plc. He also serves as a director of private companies as Chairman of Bata Footwear and Director of Americana Foods. | |||
| Ian Dyson Independent Non-Executive Director Appointed to the Board: 1 September 2013 |
 |
Skills and experience: Non-Executive Director of SSP Group plc and Senior Independent Non- Executive Director of Flutter Entertainment plc. |
Board contribution: Other appointments: | |||
| Jo Harlow Independent Non-Executive Director Appointed to the Board: 1 September 2014 |
 |
Skills and experience: |
Board contribution: Other appointments: Non-Executive Director and Chair of the Remuneration Committee of Halma plc, and Non-Executive Director and Chair of the Corporate Responsibility and Sustainability Committee of J Sainsbury plc. She is also a member of the Board of Chapter Zero, the Directors’ Climate Forum. | |||
| Jill McDonald Independent Non-Executive Director Appointed to the Board: 1 June 2013 |
 |
Skills and experience: |
Board contribution: Other appointments: | |||
* |
Graham was a member of the Board from 1 January 2010 to 15 June 2012 prior to being appointed as Chief Operating Officer of Dairy Farm International Holdings Limited |
| |
Our Board of Directors |
IHG |
83 |
| Daniela Barone Soares Independent Non-Executive Director Appointed to the Board: 1 March 2021 |
 |
Skills and experience: non-profit boards and advisory boards, including Halma plc, Evora S.A. in Brazil and the UK National Advisory Board to the G8 Social Impact Investment Taskforce. She also spent nearly 15 years combined in roles at Save the Children, BancBoston Capital private equity, Citibank and Goldman Sachs. |
Board contribution: in-depth knowledge of the role of technology in driving change.Other appointments: | |||
| Arthur de Haast Independent Non-Executive Director Appointed to the Board: 1 January 2020 |
 |
Skills and experience: |
Board contribution: Other appointments: Non-Executive Director of Chalet Hotels Limited and chair of its Risk Management Committee, and a member of the Advisory Board of the Scottish Business School, University of Strathclyde, Glasgow. | |||
| Duriya Farooqui Independent Non-Executive Director Appointed to the Board: 7 December 2020 |
 |
Skills and experience: |
Board contribution: Other appointments: co-chairs the NYSE Board Advisory Council of CEOs. Duriya is also a Trustee of Agnes Scott College, a Governing Board member of the Woodruff Arts Center, a member of the Board of Councilors of The Carter Center and a mentor for the ExCo Group, LLC. | |||
| Sharon Rothstein Independent Non-Executive Director Appointed to the Board: 1 June 2020 |
 |
Skills and experience: |
Board contribution: Other appointments: | |||
Board Committee membership key |
||||||||||
 |
Audit Committee member |
 |
Remuneration Committee member |
 |
Responsible Business Committee member | |||||
 |
Nomination Committee member |
 |
Chair of a Board Committee |
|||||||
84 |
IHG |
Changes to the Board and its Committees, and Executive Committee | ||||
| |
| |||
Graham Allan |
Graham was appointed as Senior Non-Executive Director and member of the Nomination Committee from 1 January 2022 | |||
| |
| |||
Richard Anderson |
Richard was appointed to the Board from 1 March 2021 and resigned on 26 May 2021 | |||
| |
| |||
Daniela Barone Soares |
Daniela was appointed to the Board from 1 March 2021 | |||
| |
| |||
Anne Busquet |
Anne retired from the Board from 7 May 2021 | |||
| |
| |||
Dale Morrison |
Dale retired from the Board from 31 December 2021 | |||
| |
| |||
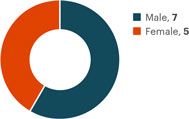
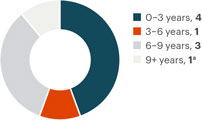
a |
Patrick Cescau has served on the Board for nine years. As noted above, Patrick will retire from the Board from 1 September 2022 after handing over to Deanna Oppenheimer, who joins the Board from 1 June 2022 to succeed Patrick as Chair. |
| |
Our Board of Directors |
IHG |
85 |
| Claire Bennett Global Chief Customer Officer Appointed to the Executive Committee: October 2017 (joined the Group: 2017) |
 |
Skills and experience: in-depth knowledge of the hospitality industry having spent 11 years at American Express in a range of senior leadership roles across marketing, consumer travel and loyalty. In her tenure there, Claire was General Manager (GM), Global Travel and Lifestyle, where she led a team responsible for delivering luxury lifestyle services, and she held additional roles including GM for Consumer Loyalty, GM for US Consumer Travel, and Senior Vice President, Global Marketing and Brand Management. Claire has also held senior marketing positions at Dell, as well as finance and general management roles at PepsiCo/Quaker Oats Company, building significant expertise across technology, retail e-commerce, financial services, and travel and hospitality sectors. |
Claire has been an Executive Board Member of the World Travel and Tourism Council (WTTC), served as a Board Member of Tumi Inc. and participated on multiple industry advisory boards. Claire is a Certified Public Accountant and holds an MBA from the J.L. Kellogg Graduate School of Management at Northwestern University. Key responsibilities: | |||
| Jolyon Bulley Chief Executive Officer, Greater China and Group Transformation Lead, Luxury & Lifestyle Appointed to the Executive Committee: November 2017 (joined the Group: 2001) |
 |
Skills and experience: |
Jolyon joined IHG in 2001, as Director of Operations in New South Wales, Australia, and then held roles of increasing responsibility across IHG’s Asia-Pacific region. He became Regional Director Sales and Marketing for Australia, New Zealand and South Pacific in 2003, relocated to Singapore in 2005 and held positions of Vice President Operations South East Asia and India, Vice President Resorts, and Vice President Operations, South East and South West Asia. Jolyon graduated from William Angliss Institute in Melbourne with a concentration on Tourism and Hospitality. Key responsibilities: | |||
| Yasmin Diamond, CB Executive Vice President, Global Corporate Affairs Appointed to the Executive Committee: April 2016 (joined the Group: 2012) |
 |
Skills and experience: |
In 2011, Yasmin was awarded a Companion of the Order of the Bath (CB) in the New Year’s Honours List in recognition of her career in government communications. In addition, Yasmin sits on the Board of Trustees for the British Council, the UK’s international organisation for cultural relations and educational opportunities, and is a Board Trustee member of the Sustainable Hospitality Alliance. Key responsibilities: | |||
| Nicolette Henfrey Executive Vice President, General Counsel and Company Secretary Appointed to the Executive Committee: February 2019 (joined the Group: 2001) |
 |
Skills and experience: best-in-class |
Key responsibilities: | |||
86 |
IHG |
| Wayne Hoare Chief Human Resources Officer Appointed to the Executive Committee: September 2020 (joined the Group: 2020) |
 |
Skills and experience: |
Wayne’s most recent role at Unilever was as SVP, HR – Global Centres of Expertise, where he held responsibility for the Global Talent, Leadership Development and Reward teams. He led the development of the company’s HR strategy on enabling a performance culture focused on growth. Key responsibilities: | |||
| Kenneth Macpherson Chief Executive Officer, EMEAA Appointed to the Executive Committee: April 2013 (joined the Group: 2013) |
 |
Skills and experience: |
Key responsibilities: | |||
| George Turner Chief Commercial and Technology Officer Appointed to the Executive Committee: January 2009 (joined the Group: 2008) |
 |
Skills and experience: George was appointed as Chief Commercial and Technology Officer. Prior to this, George spent over a decade as IHG’s EVP, General Counsel and Company Secretary, with responsibility for corporate governance, risk and assurance, legal, corporate responsibility and information security. He is a solicitor, qualifying to private practice in 1995. Before joining IHG, George spent over 10 years with Imperial Chemical Industries PLC, where he held various key positions including Deputy Company Secretary and Senior Legal Counsel. |
Key responsibilities: | |||

| |
Our Executive Committee |
IHG |
87 |
|
|
Committee Reports, including information on their activities during 2021, can be found on pages 95 to 125. |
|
|
Further details of key stakeholders and engagement during 2021 can be found on pages 20 to 28, 36, 39, 92, 101, 107, 108, 112 to 114, 227 and 228. |
|
|
More information on our Board and Committees is available at www.ihgplc.com/investors |
88 |
IHG |
Area of discussion |
Discussion topic and decisions made | |||
Chair’s matters |
The Chair provided an update on Board developments and meeting plans and his current areas of focus and engagement. | |||
Chief Executive Officer’s matters |
The Chief Executive Officer provided an update of developments within the business. | |||
| Updates from each of the Board Committees |
The Committee Chairs reported back to the Board on matters covered during their meetings. Details of Committee activities during 2021 can be found on pages 95 to 125. | |||
Financial performance |
The Board received regular updates from the Chief Financial Officer on recent and current trading, including RevPAR, operating profit, net system size growth and cashflow, and these were compared to competitors’ results. Internal projections were compared with the consensus of analysts’ forecasts to ensure that the Company’s prospects were appropriately reflected in market expectations. | |||
Corporate governance |
The Board received regulatory development updates from the Company Secretary and General Counsel, covering regulatory changes in areas such as corporate reporting, executive remuneration, climate change, diversity, workforce engagement, human rights, data protection and shareholder body voting guidelines. | |||
Cybersecurity |
The Board received regular updates on cyber activity and information security, including a detailed presentation from the Chief Commercial and Technology Officer and the Chief Information Security Officer. These covered threats and trends in the hospitality industry, the Group’s key systems and risk appetite as well as managing cyber risks in a remote environment. The Board also reviewed the policies and actions taken to address threats and mitigate risks. | |||
Principal risks, internal controls and risk management systems |
The Board received regular updates on principal and emerging risks, internal controls, risk management systems, the Group’s risk appetite, business continuity and the global insurance programme. Committee Chairs also delivered reports on risk topics in relation to the areas of remit for their respective Committees. The Board regards the management of risks in business as fundamental to its role and does this by ensuring that appropriate controls and processes are in place. The regular monitoring of the Group’s risk management systems allows the Board to ensure that issues that might otherwise impact the Group’s reputation for high standards of business conduct are avoided or mitigated as appropriate and that the Group is positioned to respond to uncertainty in an agile manner. | |||
Investor relations |
The Board receives a regular report outlining share register movement, relative share price performance, investor relations activities and engagement with shareholders. The Board also considered views shared from the regular investor and analyst perception studies and feedback surveys as well as individual meetings with investors. | |||
| |
Board activities |
IHG |
89 |
| Finance and performance |
||||
| Three-year financial plan and competitor performance The Board approved the Group’s three-year financial plan and monitored performance in light of changes to economic and industry growth forecasts during the year.  |
In approving the Group’s three-year financial plan, the Board considered the assumptions and risks inherent in the plan including the outlook for signings and bad debt risk, expected cashflows and prospects for the System Fund. The three-year plan for the business puts its medium-term targets into a quantifiable form, and monitoring progress against the plan provides a mechanism for the Board to balance the interests of stakeholders such as hotel owners, employees and lenders with those of shareholders. It also forms the basis on which targets for executive remuneration are set. The Board also received presentations on the Group’s main competitors and their performance. By examining the performance of the Group’s competitors, the Board can assess the Group’s performance in context and draw out areas where longer-term improvements can be made. | |||
| |
| |||
| Financial statements The Board considered the full and half year results statements, the going concern and viability statements made in the Annual Report and whether the Annual Report was fair, balanced and understandable.  |
Through the timely publication of accurate and balanced financial statements, the Board ensures that shareholders and other stakeholders have equal access to important information and the business maintains its reputation for high reporting standards. | |||
| |
| |||
| Dividend The Board considered dividend payments and concluded that it would not be appropriate to pay a dividend during 2021.  |
The Board weighed various stakeholder interests when considering dividend payments as well as the need to exhibit high standards of business conduct. It considered the Group’s financial performance, market expectations, the interests of shareholders and lenders as well as the position of broader stakeholders, including employees, suppliers and hotel owners. It concluded that it would not be appropriate for the Company to pay a dividend during the year, noting that it would consider future dividends once visibility of the pace and scale of market recovery improves. Subsequently, the Board is proposing a final dividend of 85.9¢ per ordinary share in respect of 2021, payable in May 2022 subject to shareholder approval at the 2022 AGM. | |||
| Strategic and operational matters |
||||
| Brand integrity The Board considered the progress of its strategic initiative to improve the quality and consistency of the Holiday Inn and Crowne Plaza estates in the Americas and EMEAA. The Board further endorsed ongoing efforts to enhance the positioning of the Holiday Inn brand in the US.  |
The Board focused on maintaining the integrity of the Group’s brands to ensure that guests can be confident in their expectations when staying in an IHG hotel. In assessing the initiative to engage with the owners of certain Crowne Plaza and Holiday Inn hotels that required improvements to quality of service and property condition, the Board weighed the short-term impact on system size against the positive longer-term benefits of maintaining brand standards in the broader estate for hotel owners and guests. As part of the Board’s oversight of brand strategy and recognising the need to keep guest experiences and hotel owner returns relevant and attractive, the Board considered and endorsed ongoing efforts for continuous improvement in relation to various aspects of the Holiday Inn brand, taking into consideration the impact on guests from an improved experience and the improved economics that would flow through to hotel owners. See pages 10 to 13 for a description of the business model and pages 19 to 22 for how the Group engages with its hotel owners and guests. | |||
| |
| |||
| Brand portfolio The Board considered the opportunity to add a collection brand to the Group’s Luxury & Lifestyle portfolio and it approved the launch of the Vignette Collection brand.  |
In approving the new brand launch, the Board had regard for various stakeholders and considerations. The Board recognised hotel owners’ desire for a collection brand that would give them access to IHG’s distribution and loyalty programmes, while allowing light-touch branding that would retain the individuality of their properties with relatively low capital requirements and attractive economics. The Board also had regard for shareholders in relation to the long-term impact on system size and the lower environmental impact of conversion properties. The Board also considered the appeal of having more diverse styles of property, which would increase guests’ options when booking with IHG and enhance the IHG Rewards programme’s value. For more information on the Group’s priority to ‘build loved and trusted brands’, see pages 17 and 18 and further information on its environmental footprint is available on pages 29 to 35. | |||
| |
| |||
| Loyalty Strategy The Board considered and approved the relaunch of IHG Rewards.  |
In approving material changes to the IHG Rewards programme, the Board considered the competitive position of the programme, its ability to drive revenue for owners and accelerate system size growth, the enhanced value proposition for members and guests, and the impact of the changes on owners’ cost base and operations. | |||
| |
|
| Key to considerations |
||||||||||
 |
Long term |
 |
Suppliers and customers |
 |
High standards | |||||
 |
Employees |
 |
Community and environment |
 |
Act fairly between members | |||||
90 |
IHG |
| Strategic and operational matters |
||||
| Technology The Board considered and approved evolving the Group’s relationship with the main supplier in respect of the Group’s Guest Reservation System (GRS). |
The Board considered and approved evolving the Group’s relationship with its supplier from a joint project development model to a product development and support model. In making its decision, the Board carefully considered the risks associated with these changes and their impact on the supplier, the competitive advantages of revised functionality, and the cost implications of the change. Details of the technology-related risks to the business are given on page 45. | |||
| |
| |||
| Supply chain and procurement The Board received an overview of the strategy and approach to corporate and hotel procurement and endorsed the strategy and approach.  |
In considering the procurement strategy and approach, the Board paid particular attention to the initiatives that leverage our system-wide buying power and simplify the procurement programme to lower costs for owners while maintaining a high-quality guest experience, supporting sustainability within the supply chain, and ensuring that suppliers operate in a responsible manner. Further information on the Group’s responsible procurement programme is included on page 39. | |||
| |
| |||
| Growth Strategy in Regions – Greater China, EMEAA and Americas The Board received in-depth regional updates from the CEOs of each of the Group’s three regions, and provided oversight with regard to the Group’s growth strategy over both the short and long term. |
The Board received regular updates from the Group’s operating regions, covering the Group’s positioning and performance in relevant markets, underlying growth drivers and the competitive environment, and further focused on actions to accelerate the Group’s growth. In its discussions, the Board paid particular attention to critical owner considerations in relation to growth, such as financing and cost and supply constraints. | |||
| Board governance |
||||
| Director succession The Board progressed succession planning in relation to the Chair of the Board and appointed a new Senior Independent Non-Executive Director (SID) and Non-Executive Director for workforce engagement. |
When progressing Board succession plans, the Board balanced the desire to maintain high standards by complying with the UK Corporate Governance Code with the short-term need to keep Non-Executive Directors in position for longer than preferred in order to maintain expertise and continuity. The Board also had consideration for the importance of employee feedback and considered and approved the transition of responsibilities in relation to the Non-Executive Director with responsibility for workforce engagement, taking into account Non-Executive Director time commitments and broader Board succession plans. | |||
| People & Planet |
||||
| Office relocation and new ways of working The Board reviewed the lease arrangements for the Group’s main corporate office locations in the US and the UK and decided to relocate its UK corporate office to a new location in 2022. The Board further considered and endorsed new hybrid ways of working.  |
The Board considered various relocation options for the Group’s global head office in the UK. In making the decision to lease a new office in Windsor, the Board had regard for the impact of the move on employees, the community and the environment. A description of the Board’s activity and consideration of Section 172 factors is included in the case study on page 92. In considering and endorsing a reshaped, flexible approach to working for the Group’s corporate offices as Covid-19-related | |||
| |
| |||
| Staff shortages and talent retention The Board considered reports of staff shortages in the hospitality industry in various regions following the easing of lockdown. The CEO outlined the impact this could have on hotel owners and levels of guest satisfaction if prolonged and the need to focus activity on talent retention in a competitive market.  |
The Board considered staff shortages in the broader hospitality industry and the impact that this could have on employees in owned and managed lease hotels, as well as the wider managed and franchised estate. In terms of talent retention amongst the Group’s corporate employees, the Board noted the increased competition in the job market and reviewed its measures of staff engagement and wellbeing and levels of staff turnover. In considering the employment market, the Board took into account the need to balance appropriately rewarding and motivating its employees while driving profitability, growth and efficiency through the business on behalf of shareholders. See page 53 for details of the employee engagement score KPI and page 44 for how risks associated with talent retention are managed. | |||
| |
| |||
| Our people and culture The Board regularly considered workplace culture, taking into account the feedback provided from the Voice of the Employee engagement plan and actions taken to support employees. The Board reviewed employee communications and wellbeing measures and further had oversight of the Group’s DE&I initiatives.  |
The Board assessed and monitored culture throughout the year, receiving regular updates from the CEO and from the Voice of the Employee engagement plan. The Voice of the Employee engagement plan has played a key role in informing the Board regarding employees’ interests and supplying insights for the Board to understand the impact of its decisions on employees. The Board further considered strategic updates from management in relation to talent and leadership development and learning, championing a diverse, equitable and inclusive culture, and future ways of working. Information on the Voice of the Employee engagement plan during the year is set out on page 101 and further information in relation to employee and workplace culture is included on pages 24, 25 and 37. | |||
| |
| |||
| Decarbonisation strategy The Board approved the Group’s upgraded science-based target (SBT) from a 2.0°C to 1.5°C aligned target and further approved the Group’s commitment to the ‘UN Race to Zero’.  |
In approving the enhanced SBT, the Board took into consideration the latest in climate science and the long-term impact of climate change on the environment and the Group’s business, the expectations of investors and other stakeholders, levers available to the Group to achieve the SBT, and the impact to owners in achieving hotel-level targets. | |||
| |
|
|
|
See pages 20 to 28, 39, 92, 101, 107, 108, 112 to 114, 227 and 228 for information about how we have engaged with our stakeholders in 2021. Further details of our regard for the environment are on pages 15, 29 to 35 and 100 to 101. |
|
|
Board activities |
IHG |
91 |
Visit 
| Board oversight of IHG’s Global Head office relocation Even before Covid-19 and the enforced changes to working remotely, the Executive Committee, with oversight from the Board, had been looking at evolving working practices and the suitability of the Group’s offices to support collaborative working, our strategic priorities and culture. The impending expiry of the lease for the Company’s global head office also prompted the search for a new location. The Board was closely engaged in the project and it was a regular Board meeting agenda item in conjunction with discussions on employees and culture.As part of the search process, a postcode analysis was undertaken to ensure there would be minimal differences in commuting times for most employees. Consideration was also given to public transport links, local amenities and access for disabled and wheelchair users. The Board considered various options for alternative office arrangements. As well as its focus on the impact on employees, the Board took into account the environmental implications of the move, noting the opportunity for the new premises to be designed and configured in a sustainable and energy-efficient manner. The Board also scrutinised the financial impact of the move. In June 2021, following the Board’s consideration and approval of management’s recommendation, the Group announced that its global head office would move to Windsor during 2022. |
 An engagement programme has kept employees informed and involved through electronic newsletters, a dedicated intranet site (including FAQs) and employee feedback surveys looking at workplace culture and hybrid working. In addition, as part of the preparation for the move, the existing office space at Denham was reconfigured to give a taste of the future with the introduction of hot desking ‘neighbourhoods’, more collaborative spaces and the removal of executive offices, including that of the CEO. The Board will continue to monitor and oversee the move as it progresses during 2022, with a particular focus on the impact on employees and company culture. | |
92 |
IHG |
| Director appointments Details of the appointments to the Board made during 2021, as well as the appointments of a new Senior Independent Non-Executive Director and a Non-Executive Director responsible for the Board’s Voice of the Employee engagement plan, are described in the Nomination Committee Report on pages 102 to 103.In addition, a description of the Chair succession appointment process is set out below. New Director inductions Upon appointment, all new Directors undergo a comprehensive and formal induction programme which is tailored to meet their individual needs. We believe this is crucial to ensure our Directors have the full understanding of all aspects of our business and familiarity with the Group’s purpose, culture and values, to ensure they are able to contribute effectively to the Board. For Daniela Barone Soares, a tailored induction plan was prepared in advance of her appointment to the Board in March. Daniela’s plan included: • information on the Group’s purpose, culture, values and strategy, including its business model, brands and the markets in which it operates; |
• our approach to internal controls and our risk management strategy;• information on the Board, its Committees and IHG’s governance processes, with a particular focus on the Remuneration and Responsible Business Committees;• a reminder of the rules relating to maintaining the confidentiality of inside information and restrictions in dealing in IHG shares, together with a briefing on the policies and procedures IHG has in place to ensure compliance with such rules; and• meetings with members of the Board and the Executive Committee, senior management from functions across the Group, the external Auditor and other key external advisers.Daniela’s induction plan also included visits to IHG corporate offices and hotels across our brands, to meet colleagues and spend time with our General Managers. In light of the impact of the pandemic, such visits have not yet taken place, however they will be arranged as appropriate when circumstances permit. Inductions were also conducted in respect of the appointments of Graham Allan as Senior Independent Non-Executive Director and Duriya Farooqui as Non-Executive Director responsible for the Voice of the Employee engagement plan. |
| Chair succession Appointment process In anticipation of Patrick Cescau’s retirement during 2022, on attainment of nine years on the Board, the Board initiated a full, rigorous and transparent search process at the end of 2020, led by Dale Morrison, as the Senior Independent Director (SID) and a Search Committee comprising Dale and the Committee Chairs. Following a competitive tender process, Russell Reynolds was appointed to assist the Search Committee and Board in identifying a diverse list of potential candidates with the experience and personal qualities to become Chair. The Search Committee prepared a candidate profile identifying the key competencies, characteristics and experience required for the role of Chair. Russell Reynolds also had detailed discussions with all Board members to seek their views on Board dynamics and culture and the key strategic challenges facing the Group. A full Chair specification was then prepared by Russell Reynolds and shared with the full Board for comment and input. Key competencies included: experience as a Chair, strategic orientation and vision, bringing a global perspective, a collaborative and inclusive personal style as well as a good understanding of the corporate governance environment. The Search Committee and the Board were concerned to ensure that diversity in its broadest sense was taken into consideration in the role profile and the candidates presented for consideration. A long list of candidates which had been compiled by Russell Reynolds was reviewed and discussed by the Search Committee, and a shorter list of candidates was then interviewed by Russell Reynolds, the SID and the General Counsel and |
Company Secretary together, and the CEO. Reflections from these meetings were shared with the Search Committee and a short-list of four candidates was then interviewed by the remaining members of the Search Committee. Two of the candidates were selected to meet with the Chair and for further meetings with the CEO and SID, before the preferred candidate met with the remaining Executive and Non-Executive members of the Board. The preferred candidate also met with the Company’s external Auditor, PwC.Search Committee meetings were attended by the CEO, the General Counsel and Company Secretary, the Chief Human Resources Officer and Russell Reynolds and Dale Morrison kept the Board informed on the progress and the status of the process throughout. Following detailed consideration, including assessment against the competencies identified in the candidate profile and the feedback from the meetings with members of the Board, the Search Committee recommended to the Board that Deanna Oppenheimer be appointed as a Non-Executive Director and Chair Designate from 1 June 2022 and that she assume the role of Chair from 1 September 2022, following Patrick Cescau’s retirement on 31 August 2022. The Board approved and confirmed the appointment.Patrick Cescau was not involved in the selection or appointment of his successor and Russell Reynolds has no further connection with the Group or any of the Directors, beyond undertaking search and recruitment activity. Deanna Oppenheimer did not have a service contract with the Company in 2021. | |
| Additional appointments During 2021, the Board considered the proposed appointments of Duriya Farooqui as non-executive director of Tribe Capital Growth Corp I and to the Board of Councillors of the Carter Center, which operates as an advisory board; Dale Morrison as Chairman of Twin Ridge Capital Acquisition Company Limited; and Jo Harlow as a non-executive director of Chapter Zero. The Board also considered and endorsed the appointment of Ian Dyson as Chair of ASOS plc. |
In each case, the Board took into account other appointments, the time commitment required for each role and the context of the UK Corporate Governance Code, including institutional investor and proxy adviser guidelines concerning over-boarding. It was concluded that the additional appointments should not adversely impact their performance but should enhance their ability to provide constructive challenge and strategic guidance. |
| |
Board activities |
IHG |
93 |
| Ongoing Director training and development We understand the importance of an ongoing training programme for Directors to enable them to fully understand the Group’s business and operations in the context of the rapidly developing environment in which it operates. The Chair continues to review the training and development needs with each Director on a regular basis and the Board is made aware of training opportunities. Board and Committee meetings are regularly used to update Directors on developments in the environment in which the business operates and in-depth presentations are provided on key topical areas. In 2021, these sessions included cyber risk management; environmental, social and governance (ESG) considerations; and audit and corporate governance reform proposals.In addition, the Company Secretary provides regular updates on regulatory, corporate governance and legal matters and Directors are able to meet individually with senior management if necessary. Internal evaluation Following the full external evaluation carried out by Christopher Saul of Christopher Saul Associates in 2019 and an internal evaluation in 2020, during the year the Board once again undertook an internal evaluation. Board members were asked to consider the Board’s overall effectiveness by completing an internal effectiveness questionnaire, which focused on the following areas: • progress in implementing agreed action items from the 2020 effectiveness review;• the role the Board continues to play in relation to the pandemic and recovery;• information flow to the Board, and Board engagement with management and each of its Committees; |
• the Board’s involvement in the Group’s strategic process, in particular in relation to recovery and post-Covid-19 strategies;• Board work processes, including quality of information provided to the Board, and Board dynamics and the effectiveness of meetings;• Board engagement with shareholders and employees; and• the progression of Board refreshment and succession plans.The responses of Board members to the questionnaire were largely favourable in relation to all areas of the Board’s operation. The feedback highlighted that the Board equally and effectively supported and challenged management’s response to the pandemic, while ensuring ongoing and appropriate governance to safeguard the Group’s reputation, financial viability and stakeholder value. Board members commented positively on the Board’s involvement in the strategic process, noting that the Board strategy days and the shift in Board agenda and discussion in the second half of the year allowed for a greater focus on the Group’s long-term strategy versus short-term considerations. Board members were satisfied with the timing, amount and quality of engagement with management. Feedback noted strong engagement with shareholders, highlighted the enhanced Voice of the Employee programme, and indicated strong engagement and follow up by the Board with its Committees. Board members generally agreed that the implementation of the actions arising from the 2020 Board effectiveness evaluation had progressed well, particularly in relation to an increased focus on long-term strategy and implementation as well as Board succession planning. It was widely noted that a return to in-person Board meetings would be welcome and drive progress in relation to enhanced Board discussion and debate.The Board’s positive feedback in relation to the overall performance of the Board concluded as to the effectiveness of the Board’s performance. |
Area for focus |
Action items | |||
| |
| |||
Long-term strategy |
Board members positively noted the longer-term strategic discussion throughout the year, but felt that this could be further enhanced in 2022 with additional focus on the implementation of the long-term strategy and competitive positioning in relation to delivering on the Group’s objectives. | |||
| |
| |||
Board materials and agenda |
Feedback noted that Board materials, particularly the materials prepared for its strategy meeting, were informative and high quality. It was also noted that, although there had been some progress on making the regular Board information pack materials more forward-looking, this should remain a focus in 2022. | |||
| |
| |||
Board meeting dynamics |
Board members also noted the continued constraints of virtual meetings and the need for increased discussion time, both formal and informal, and the need to revert to full ‘in-person’ meetings as soon as possible. | |||
| |
|
| Directors’ performance evaluation In addition to the internal Board evaluation process outlined above, the Chair conducted an individual evaluation of each of the Non-Executive Directors, taking feedback from the CEO, and focusing on their contribution and engagement in the context of a more virtual environment. Particular points of note were shared with the individual Directors and overall, the Chair concluded that the Directors perform their duties effectively and dedicate sufficient time to discharge their Board responsibilities.The performance assessment of the Chair was led by the SID. The Chair’s evaluation consisted of gathering feedback from the Directors, covering: • Board leadership, strategy evolution and performance monitoring in the context of a pandemic-affected year;• overall Board culture, engagement and participation; and• maintenance of high standards of corporate governance. |
The CEO evaluation was led by the Chair, who collected feedback from the Non-Executive Directors. Key areas of focus included:• the Group’s financial performance and the impact of the CEO;• leadership effectiveness through the pandemic;• positioning IHG for the long term;• regard for community and the environment; and• the relationship and ability to work collaboratively and transparently with the Board. |
94 |
IHG |
 I am pleased to present the Committee’s report for the year ended 31 December 2021. These pages outline how the Committee discharged the responsibilities delegated to it by the Board over the course of the year, and the key areas of focus for the Committee in doing so. The Committee fulfils a vital role in the Company’s governance framework, providing valuable independent oversight across the Company’s financial reporting and internal control procedures. It provides the expert scrutiny to ensure that the necessary internal controls to run the business are in place, that risks are appropriately managed, that the Company’s performance is correctly verified by the external Auditors and that the reporting of this to our shareholders and stakeholders is fair, balanced and understandable. The ongoing impact of the pandemic and the risks that accompanied it continued to be a major focus given the changeable nature of the operating environment. Assessing the Group’s risk management and internal control arrangements during the pandemic and their appropriateness as conditions started to normalise continued throughout the year. In early 2021, the transition of external Auditor from Ernst & Young LLP (EY) to PricewaterhouseCoopers LLP (PwC) was completed and the Committee’s attention shifted to PwC’s first year audit. Throughout the period, PwC has provided insights into the Group’s processes and controls and the Audit Committee has reviewed and discussed management’s responses. In addition, the Committee has received regular reports on internal audits and steps being taken to address findings; controls assurance work and remediation activity; and other deep-dive reviews including a post-completion review of spending on large projects and a review of the Americas managed hotel financial control environment. The ongoing focus on the approach to financial reporting through the year ensured the Committee was comfortable that all latest guidance from regulatory bodies such as the Financial Reporting Council (FRC) had been considered. The Committee also challenged management to ensure climate risk had been appropriately and consistently reflected through the Annual Report and Form 20-F, particularly with regard to impacts on forward-looking assumptions supporting the Financial Statements.Looking further out, the Committee evaluated the potential impact of the Department for Business, Energy and Industrial Strategy (BEIS) consultation document on audit and corporate governance reform, approved a response to the consultation and considered preparatory actions particularly in relation to the proposed Resilience Statement and Audit & Assurance Policy. I would like to thank all those who have assisted the Committee in fulfilling its duties during the year, which I am confident have been carried out effectively and to a high standard, providing independent oversight with the support of assurance from the external Auditor. Ian Dyson Chair of the Audit Committee 21 February 2022 |
Key duties and role of the Committee Key objectives and summary of responsibilities The Audit Committee is responsible for ensuring that IHG maintains a strong control environment. It monitors the integrity of IHG’s financial reporting, including significant financial reporting judgements, maintains oversight and reviews our systems of internal control and risk management, monitors and reviews the effectiveness and performance of internal and external audit functions, as well as reviewing the behaviours expected of IHG’s employees through the Code of Conduct and related policies. The Committee’s role, responsibilities and authority delegated to it by the Board are set out in its Terms of Reference (ToR), which are reviewed annually and approved by the Board. The ToR are available at www.ihgplc.com/investors The Committee’s key areas of focus over the year have been: • reviewing the Group’s approach to the management of risk including considering the continued evolution of the impact of Covid-19 on the business;• assessing and obtaining assurance on the effectiveness and resilience of the Group’s internal control environment and its appropriateness given the changing environment in which the Group operates;• reviewing and challenging financial reporting throughout the year to ensure the Financial Statements provide a true and fair view of the Group’s performance and that latest guidance and reporting regulations by regulators were appropriately applied;• reviewing the Group’s Internal Audit plan and budget;• reviewing and evaluating going concern and viability assessments, the need for impairment testing and provisioning for material litigation and commercial disputes; and• overseeing the transition of the external Auditor and PwC’s first year as Auditor of the Group.Membership and attendance at meetings Details of the Committee’s membership and attendance at meetings are set out on page 81. The CEO, CFO, General Counsel and Company Secretary, Group Financial Controller, Head of Risk and Assurance and our external Auditor (EY February only; PwC all meetings), attended all meetings in 2021. The Chair of the Board also aims to attend all meetings and in 2021 attended four meetings. Other attendees are invited to meetings as appropriate and the CEO and all other Directors were invited to Committee meetings where the approval of financial reporting was considered and discussed. The Committee continues to hold private sessions with the internal and external Auditors without the presence of management to ensure that a culture of transparency is maintained. The Committee Chair continues to have recent and relevant financial experience and all members of the Committee are Independent Non-Executive Directors. In accordance with the Code, the Board also considers that the Committee as a whole possesses competence relevant to the Company’s sector, having a range of financial and commercial experience in the hospitality industry and the broader commercial environment in which the Group operates. Further details of the skills and experience of the Committee members can be found on pages 82 to 84.Reporting to the Board Following each Committee meeting, the Committee Chair updates the Board on key issues discussed. The papers and minutes for each meeting are circulated to all Board members, who are invited to request further information if required and to provide any challenge where necessary. |
| |
Audit Committee Report |
IHG |
95 |
96 |
IHG |
• |
receives regular reports from management, the Risk and Assurance team and the external Auditor on the effectiveness of the systems for risk management and internal control, including financial, operational and compliance controls; |
• |
reviews the process by which risks are identified (including procedures in place to identify emerging risks and linkage to wider consideration of strategy and resilience) and assesses the timeliness and effectiveness of action taken by management, including regular reports and presentations on the Company’s overall internal control, risk management system and principal risks; and |
• |
receives additional reports throughout the year relevant to internal control and risk management, both financial and non-financial, to ensure that current and emerging risks are identified and assessed and that there is an appropriate management response (see pages 40 to 47 for further detail on our risks and initiatives to manage them). |
|
|
Our Approach to Tax document is available at www.ihgplc.com/en/responsible-business/policies |
• |
the potential for additional stress on risk management and internal control arrangements from continued Covid-19-related |
• |
the impact on the Group’s business of further waves of the pandemic or a more prolonged period of recovery for the industry, including on our supply chain arrangements; |
• |
the impact of organisational changes and flexible working arrangements for corporate employees; |
• |
the impact of staff shortages and wage inflation within the hospitality industry; and |
• |
cybersecurity and information governance in the context of a rapidly evolving external threat and regulatory environment. |
| |
Audit Committee Report |
IHG |
97 |
| Following consideration, the Committee confirmed its agreement to the 2022 Internal Audit plan, including the assurance objectives identified. The Committee reviews the results of completed audits and observations from other ongoing assurance and control improvement support, as well as actions taken by management in response to Internal Audit’s work. The functional effectiveness of Internal Audit is assessed on an ongoing basis and reported to the Committee throughout the year. During 2021, this has involved discussions between the Committee Chair and partners from third-party partner firms, feedback from auditees and senior leadership and assessment of execution against methodology. This has highlighted positive feedback on the balance between challenge and support provided to management and the agile development of the audit plan and identified opportunities for continuous enhancement of assurance reporting and use of technology to support execution. |
Governance and compliance The Committee is responsible for reviewing the Group’s Code of Conduct (a revised version of which was approved in December 2021) and related policies. Looking forward During 2022, the Committee will remain focused on the key areas of responsibility delegated to it by the Board, ensuring that standards of good governance are maintained and that appropriate assurance is obtained across all areas of the business, with a particular focus on the Group’s principal risks, control environment and approach to financial reporting taking into account developments in reporting responsibilities including those recommended by the TCFD, the consideration of climate risk in preparation of the financial statements and changes in the governance environment, particularly those related to changes in the audit regime. | |
| External Auditor In August 2019, the Company announced the Board’s intention to propose to shareholders that PwC be appointed as the Company’s statutory Auditor for the financial year ending 31 December 2021. The audit tender process undertaken was explained in detail in the 2019 Annual Report and Form 20-F and the appointment was confirmed by shareholders at the 2021 AGM.A detailed audit plan was received from PwC at the beginning of the audit cycle for the 2021 financial year, which gave an overview of its approach to the audit, outlining the significant risk areas and in particular the approach to materiality and scoping of the audit. The Committee regularly reviewed the significant audit risks and assessed the progress of the audit throughout the year. The Committee assessed PwC’s performance, including its independence, effectiveness and objectivity. As part of its review, the Committee determines the independence of the external Auditor, considering, among other things, its challenge to management and level of professional scepticism, the amount of time passed since a rotation of audit partner and the level of non-audit work that it undertakes (details of which can be found on page 164). Giles Hannam took on the role of lead audit partner for the first time in 2021 and will be required to rotate after five years to safeguard PwC’s independence.The effectiveness of the external auditor is evaluated by the Audit Committee through a feedback questionnaire sent to Committee members and a number of senior IHG employees. The 2020 evaluation was the last of EY as outgoing auditor; the survey identified the areas that worked well in the EY audit process and assessed if adequate plans were in place for PwC’s first year. There were no areas identified which required PwC’s specific focus. An evaluation was also completed prior to the 2021 year-end; the Committee concluded that the PwC audit team was providing the required quality in relation to the provision of the services. |
The audit team had shown the necessary commitment and ability to provide the services together with a demonstrable depth of knowledge, robustness, independence and objectivity as well as an appreciation of complex issues. The team had posed constructive challenge to management where appropriate. In addition, qualitative considerations were taken into account. These focused on the depth of knowledge of the external auditor which was evidenced by: • continued meetings with senior management and executives across the business;• frequent governance sessions with management, including a focus on the planning and status of work by key workstream as well as the status of the deployment of PwC’s tools and technology across the audit. The governance sessions focused on key milestones and provided a way for any matters to be escalated and dealt with on a timely basis;• various private meetings with the Chair of the Board, the Audit Committee Chair and the head of Internal Audit;• the provision of a ‘first impressions’ report and insights into the Group’s processes and controls; and• the audit plan, including significant risks, and how PwC’s approach evolved as the profile of risks changed.Overall, no significant issues were raised in the review of Auditor performance and effectiveness and, as a result, the Committee concluded that PwC provides an effective audit and maintains independence and objectivity. The Group has complied with the requirements of Statutory Audit Services for Large Companies Market Investigation (Mandatory Use of Competitive Tender Processes and Audit Committee Responsibilities) Order 2014, which relates to the frequency and governance of tenders for the appointment of the external auditor and the setting of a policy on the provision of non-audit services. |
98 |
IHG |
Area for focus |
Issue/Role of the Committee |
Conclusions/Actions taken | ||||||
| |
|
| ||||||
Accounting for IHG Rewards |
Accounting for IHG Rewards requires significant use of estimation techniques and represents a material deferred revenue balance. The Committee reviews the controls, judgements and estimates related to accounting for IHG Rewards. |
The Committee reviewed the deferred revenue balance and questioned the valuation approach, the results of the external actuarial review and procedures completed, to determine the breakage assumption for outstanding IHG Rewards points. The Committee reviewed a paper from management outlining current loyalty trends (both member behaviour, which remains distorted due to the pandemic, and planned changes to programme benefits). A modified approach was adopted using pre-Covid behaviour patterns as a base but giving some weight to activity during the pandemic and incorporating estimated impacts on member engagement of future known programme changes. The Committee concluded that the deferred revenue balance is appropriately stated. | ||||||
| |
|
| ||||||
Accounting for the System Fund |
Given the unique nature of the System Fund, the Committee reviews the controls and processes related to System Fund accounting. |
The Committee met with senior finance management to review and evaluate the risk areas associated with the System Fund. The Committee reviewed a paper from management summarising the principles determining the allocation of revenues and expenses to the System Fund, and the related governance and internal control environment. The Committee concluded that the accounting treatment of the System Fund and related disclosures were appropriate. | ||||||
| |
|
| ||||||
Expected credit losses |
Estimating expected credit losses on trade receivables continues to be subject to an increased level of uncertainty. The Committee reviews the provision and considers the adequacy of the disclosure. |
The Committee reviewed management’s papers setting out the approach to calculating the provision for expected credit losses, including updates made to the provision matrix to reflect the Group’s most recent cash collection experience. Expected credit losses are still subject to increased uncertainty as, although cash collection has improved, the proportion of older debt remains high and owner liquidity risk continues. Factors considered included the overall improvement in cash collection, the ageing of receivables, owners known to be in financial distress and the expected mitigating impact of payment plans. The Committee concluded it agreed with the basis of calculation and that the related disclosures were appropriate. | ||||||
| |
|
| ||||||
Impairment testing |
Impairment reviews require significant judgement in estimating recoverable values of assets or cash-generating units and the Committee therefore scrutinises the methodologies applied and the inherent sensitivities in determining any potential asset impairment or impairment reversal and the adequacy of related disclosures. |
The Committee reviewed management reports outlining the approach taken on impairment testing and key assumptions and sensitivities supporting the conclusion on the various asset categories. The Committee examined in detail whether triggering events for impairment testing had occurred, including testing for impairment reversals, and the assumptions applied in estimating the recoverable values with a focus on the underlying cash projections. In conjunction with software impairment testing, the Committee reviewed management’s conclusions in relation to costs previously incurred to implement cloud computing arrangements following the International Financial Reporting Interpretation Committee (IFRIC) guidance issued in March 2021 in relation to accounting for configuration or customisation costs in a cloud computing arrangement. The Committee concluded that it agreed with the decision to derecognise a net $12m of assets which are no longer considered capitalisable. The Committee agreed with the other determinations reached on impairment and that the related disclosures were appropriate. | ||||||
| |
|
| ||||||
Litigation and contingencies |
From time to time, the Group is subject to legal proceedings with the ultimate outcome of each being subject to many uncertainties. The Committee reviews and evaluates the need for provisioning and considers the adequacy of the disclosure. |
At each meeting during the year, the Committee considered reports detailing all material litigation matters including commercial disputes. The Committee discussed and agreed any provisioning requirements, and the associated disclosures, where relevant, based on underlying factors. | ||||||
| |
|
| ||||||
Exceptional items |
The Group exercises judgement in presenting exceptional items. The Committee reviews and challenges the classification of items as exceptional based on their materiality or nature. |
The Committee reviewed papers by management and considered the consistency of treatment and nature of items classified as exceptional. The Committee reviewed and challenged the significance, timing and nature of the exceptional items (see pages 165 to 167) which comprise $4m fair value loss related to an associate, $25m expected settlement of commercial disputes, and $26m exceptional tax credit on the change to the UK corporate tax rate. The Committee concluded that the disclosures and the treatment of the items shown as exceptional were appropriate. | ||||||
| |
|
| ||||||
Going concern and viability |
Covid-19 continues to impact the profitability and cash generation of the Group and the level of uncertainty in planning scenarios. The Committee reviews management’s financial modelling to conclude on the appropriateness of the going concern and viability statement. |
The Committee reviewed and challenged the scenarios considered by management, the detailed cash flow forecasts and the mitigating actions available to management considered in its going concern assessment to June 2023 and the three year viability assessment and concluded these were appropriate. The Committee also reviewed and challenged the reverse stress test assumptions to confirm the viability of the Group. The Committee reviewed going concern disclosures (page 149) and the viability statement (pages 48 to 49) and is satisfied these are appropriate. | ||||||
| |
|
| ||||||
Climate risk |
In preparing the financial statements, assumptions in respect of the financial impact of climate related matters have been made. |
The Committee considered the proportionate and consistent consideration of climate-related matters across the Annual Report and in particular the potential impact on forward-looking assumptions in the financial statements that support conclusions in areas such as impairment, deferred tax assets, going concern and viability assessments, and the associated disclosures. | ||||||
| |
|
| ||||||
UK deferred tax asset |
Given the size of the Group’s UK deferred tax asset ($127m), the Committee reviewed and challenged the key assumptions determining the recoverability of the deferred tax asset and whether this should be disclosed as a significant estimate. |
The Committee reviewed papers by management which confirmed the estimates used to support the recovery of the UK deferred tax asset were consistent with those used in the impairment and going concern and viability assessments. Given the recovery to levels of profitability assumed in these estimates, the Committee concluded that it agreed with the recognition of the deferred tax asset, that this was not a significant estimate, as a material change in estimate is not expected in the next 12 months, and that the disclosures were appropriate. | ||||||
| |
|
| ||||||
| |
Audit Committee Report |
IHG |
99 |
 |
| I am pleased to present the Responsible Business Committee’s report for the year, including an update on the Voice of the Employee engagement plan. The impact of Covid-19, the return of corporate employees to the office and the introduction of hybrid working were high on the Committee’s agenda, alongside the launch of the Group’s Journey to Tomorrow responsible business plan, the establishment of TCFD reporting procedures and the incorporation of climate-related issues into the broader strategic and risk processes.The Committee has continued to shape and track the roadmap to support the Group’s 2030 responsible business commitments, endorsing the strategic priorities to be addressed which underpin the bold, long-term ambitions and are designed to help shape the future of responsible travel together with those who stay, work and partner with IHG. I would like to thank all those across the business who have assisted the Committee in fulfilling its role over the year, especially those who have worked so hard to drive the Group’s environmental and social agenda forward as well as supporting the wellbeing of its employees during the pandemic. Jill McDonald Chair of the Responsible Business Committee 21 February 2022 |
|
|
The ToR are available at www.ihgplc.com/investors |
• |
monitoring the progress against the Group’s 2030 responsible business commitments; |
• |
monitoring the Group’s carbon and energy reduction strategy and plan; |
• |
reviewing the Group’s DE&I initiatives and objectives; |
• |
implementing the recommendations of the TCFD; |
• |
assessing the Group’s responsible procurement agenda; and |
• |
overseeing the Group’s Human Rights programme. |
|
|
Further information on our 10-year responsible business plan can be found on pages 23 to 31. |
100 |
IHG |
|
|
Our Responsible Business Report is available at www.ihgplc.com/responsible-business |
| Voice of the Employee At the start of 2021, Jill McDonald was IHG’s designated Non-Executive Director (NED) with responsibility for workforce engagement (Voice of the Employee), with additional support provided by Duriya Farooqui, Daniela Barone Soares and Jo Harlow. Jill has also been supported by the Group’s Human Resources (HR) team, which assisted with developing the Board’s workforce engagement plan and provided data on various metrics relating to employees, such as employee engagement survey results.Role and responsibilities Their role and responsibilities are to: • support the design of the structure and content of Board discussions on employee engagement and culture;• evaluate employee engagement approaches and their effectiveness;• ensure employee feedback and interests are factored into the Board’s decisions and KPI setting;• ensure that the Board, through the Executive Committee, has effective methods of receiving feedback from employees and communicating Board and executive decisions and priorities throughout the organisation;• ensure all significant business and budget proposals include a management assessment of the impact on employees; and• ensure Executives share employee feedback openly, transparently and in a balanced way, including reviewing employee engagement surveys and other employee reports, including whistleblowing.2021 engagement In 2021, the team acted on the recommendation to obtain more direct input and feedback from employees in key markets outside the US and UK and from hotel-based employees. Accordingly during the year, Jill, with the assistance of Duriya, Daniela and Jo, undertook a programme of activities to engage with a cross-section of employees and received detailed feedback both in person and through the Group’s employee feedback mechanisms. They attended a number of virtual meetings with employee forums, including leader groups (within US and UK hotels, reservations and corporate populations) and Employee Resource Groups (ERGs) in the UK, US, India, Philippines, China and various EMEAA countries. |
Additionally, Jill was briefed by the Global HR Leadership team on broader cultural insights and an organisational ‘pulse’ survey across all employee populations. Discussion topics included IHG’s response to the pandemic; employee wellbeing; feedback on executive remuneration; flexible/remote working and return to the office; industry profitability and the competitive landscape; leader communications; talent attraction; onboarding and retention; personal and career development; and agile ways of working. Meetings with employees continued to be virtual in 2021 due to the continuation of the pandemic. Additional engagement and activities undertaken by Jill during the year included: • monitoring and reviewing the content and feedback from global ‘all employee’ CEO calls; and• reviewing employee dashboards and survey results.Insights and learnings Jill provided regular feedback to the Responsible Business Committee and the Board throughout the year, with key Board discussions taking place around the insights and action planning arising from employee engagement survey results. Through this feedback, the Board gained valuable insights into employee sentiment during the pandemic and throughout the return to the office. Plans for 2022 The Board has approved the transition of the Voice of the Employee responsibilities to Duriya Farooqui with effect from 1 January 2022. It is anticipated that additional NEDs will continue to assist with and support Voice of the Employee activities. A schedule of discussions and feedback sessions has been arranged for 2022. This will continue to encompass a wide group of employees and leaders from across all regions, including ERGs and Lean In circles, with further inclusion in 2022 of hotel managers in additional locations, to ensure a broad range of insights as well as concerns and issues are conveyed to the Board. Additionally, the Board intends to review the functioning of the Voice of the Employee programme to ensure it meets best practice and complies with changes in regulation. |
| |
Responsible Business Committee Report |
IHG |
101 |
 |
| Board composition and succession have featured prominently on the Committee’s agenda again in 2021, with the appointment of two new Non-Executive Directors in March 2021. The Committee also oversaw Board succession plans with the recommendations to appoint Graham Allan as Senior Independent Non-Executive Director and Duriya Farooqui as the Non-Executive Director responsible for the Group’s Voice of the Employee engagement plan.The Committee’s overriding concern when recommending new Directors for appointment to the Board has been to ensure that the Board and its Committees continue to include the best range of talent, skills and relevant experience available as well as reflecting our stakeholders and the communities in which we operate. We also want to ensure that the Board’s composition aligns with our strategy. We value diversity and the advancement of diversity on the Board and in the Group’s leadership continues to be a governing factor in our approach to succession. I am pleased to report that, at 31 December 2021, our Board composition exceeds the target for the proportion of women on boards set out in the Hampton-Alexander Review (which issued its final report in February 2021) as well as the recommendation on ethnic diversity on boards in the Parker Review. Patrick Cescau Chair of the Nomination Committee 21 February 2022 |
|
|
The ToR are available at www.ihgplc.com/investors |
• |
assessing Board and the Principal Committees’ composition and succession planning, including consideration of gender balance and ethnic and geographical diversity, in accordance with the ToRs and consistent with the Group’s DE&I Policy (details of which are on page 25); |
• |
engaging with external search consultancies and making recommendations on appointments to the Board; |
• |
monitoring the Executive Committee talent and succession planning; and |
• |
overseeing the performance evaluation of the Board, the Principal Committees and individual Non-Executive Directors. |
102 |
IHG |
| |
Nomination Committee Report |
IHG |
103 |
 | ||
| “As we have continued to navigate through the pandemic, management has kept focus on the long term and positioned the business well for recovery and to emerge stronger.” | ||
Table of contents | ||
104 |
||
104 |
||
109 |
||
110 |
||
115 |
| |
| Framework for consideration of discretion In line with the UK Corporate Governance Code, the Committee has adopted a formal framework which it will use to determine whether to exercise discretion. Some of the key factors the Committee consider are shown below. 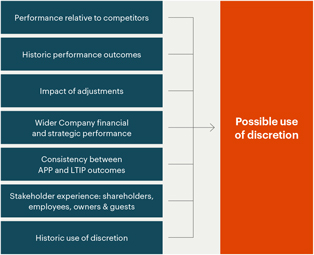 |
• |
The formulaic achievement on Annual Performance Plan (APP) metrics (operating profit from reportable segments, openings and signings) was 187.3% of target, resulting in awards for Executive Directors which were capped at the maximum payout of 200% of salary. |
• |
Formulaic achievement under the 2019/21 Long Term Incentive Plan (LTIP) was below the payout threshold across all measures. Targets were set in February 2019 and full year 2019 performance in isolation was at 57% of maximum (19% if pro-rated across the full cycle), reflecting strong performance on absolute net system size growth (NSSG), cash flow and relative Total Shareholder Return (TSR), and was initially forecast to improve further over the cycle as noted on the next page. 2020-21 performance was significantly affected by the subsequent unforeseen impact of Covid-19 on the business. |
• |
The Committee has evaluated the formulaic outcomes against the factors listed under its formal framework for considering the exercise of discretion (see top of page) and: |
– |
is satisfied that the APP outcome reflects both management performance and the experience of other key stakeholders, including shareholders and the wider workforce, as summarised over the following pages; but |
– |
has chosen to apply discretion to vest 20% of the shares awarded to Executive Directors under the 2019/21 LTIP. Further detail on the rationale for the Committee’s decision is set out over the following pages. |
• |
The total average of short- and long-term incentive plan awards for the period ending 2021 was therefore 59.5% of maximum. This compares to 15.5% for 2020 and 68.8% in 2019. |
104 |
IHG |
Committee determination |
||||||||||||||||||||||||||||||||||||||||||||||||
Measure and weighting |
Formulaic outcome |
Weighted discretionary outcome |
Rationale |
|||||||||||||||||||||||||||||||||||||||||||||
| Cash flow (CF) (20%) |
0% |
20% |
• The Committee has reviewed performance on this measure from a number of different perspectives, particularly from a wider company financial and strategic performance basis.• For 2019 in isolation, performance was strong, being at maximum level on a pro-rated basis as follows: |
| ||||||||||||||||||||||||||||||||||||||||||||
Performance range $bn |
Actual $bn |
Component achievement |
Weighted LTIP outcome |
|||||||||||||||||||||||||||||||||||||||||||||
For full cycle |
1.87 |
2.49 |
1.78 |
0 |
% |
0 |
% | |||||||||||||||||||||||||||||||||||||||||
Pro-rated for 2019 only |
0.524 |
0.698 |
0.700 |
100 |
% |
20 |
% | |||||||||||||||||||||||||||||||||||||||||
| Mathematically, on a pro-rated basis this 2019 performance contributes 6.67% vesting to the whole cycle.• For 2020 and 2021, the original target became irrelevant, and instead the Committee has looked at the Executive Directors’ performance in the key area of cash flow and liquidity management, balancing the need to protect the business while continuing to invest in future growth including:• managing through the impact of Covid-19 without the need to raise new equity;• securing interest cover and leverage ratio covenant waivers on existing debt agreements; • accessing increased liquidity through: – £600 million of CCFF drawn down, which was repaid in March 2021; – issue of two new bonds in October 2020 and a tender on 2022 bonds, raising around net £600 million to provide longer term liquidity to the business; • protecting cash flow by prudent use of capital and reducing costs by $150 million ($75 million of which is sustainable for future years); • strong performance on working capital, targeted approaches to cash collections and management of expenditure; and • actions to mitigate potential IHG exposure in cash flows and manage cash outflows, leading to strong cash conversion and a reduction in net debt in both 2020 and 2021. • As a result:• positive adjusted free cash flow a of $29 million was generated in 2020, with the impact of Covid-19 related revenue reductions partly offset by cost saving measures:– 2021: $571 million; and • closing 2020 liquidity of $2.9 billion (comprised of $1.35 billion undrawn bank facilities and $1.575 billion of cash/cash equivalents): – 2021: $2.7 billion. • The Committee believes that management has done all it could to preserve IHG’s resilience and strategic capability for strong future growth, justifying full vesting for these years in the cash flow element of the LTIP cycle.a Use of Non-GAAP measures: In addition to performance measures directly observable in the Group Financial Statements (IFRS measures), additional financial measures (described as Non-GAAP) are presented that are used internally by management as key measures to assess performance. Non-GAAP measures are either not defined under IFRS or are adjusted IFRS figures. Further explanation in relation to these measures can be found on page 73 to 77 and reconciliations to IFRS figures, where they have been adjusted, are on pages 218 to 223. |
| |||||||||||||||||||||||||||||||||||||||||||||||
Net system size growth (NSSG) (20%) |
0% |
0% |
• This absolute target was set pre-Covid-19, 2020-21 compared to 2017-19, making the absolute target unachievable.• The Committee reviewed NSSG performance in detail from a number of different perspectives and ultimately concluded that, based on analysis of the data and context, it did not consider it appropriate to adjust the formulaic outcome of this absolute measure. |
| ||||||||||||||||||||||||||||||||||||||||||||
Total Gross Revenue (TGR) (20%) |
0% |
0% |
• This absolute target was set pre-pandemic and rendered unachievable due to the severe market-wide decline in RevPAR and other revenues.• Based on analysis of the data and context, the Committee did not consider it appropriate to adjust the formulaic outcome of this absolute measure. |
| ||||||||||||||||||||||||||||||||||||||||||||
| |
Directors’ Remuneration Report |
IHG |
105 |
Committee determination |
||||||||||||
| Measure and weighting |
Formulaic outcome |
Weighted discretionary outcome |
Rationale | |||||||||
| Total Shareholder Return (TSR) (40%) |
0% |
0% |
• The IHG share price has remained resilient through the latter part of 2020 and 2021 after recovering from an initial reduction in the first half of 2020.• IHG delivered 17.9% TSR for the cycle; ahead of all European peers in the comparator group.• However, the share price performance of some comparator group companies based primarily in the fast-recovering US market, with a weighting towards the economy segment, and with their shares listed on US stock markets which have performed better than the FTSE over this period, has resulted in IHG being below the threshold level for vesting on this relative measure.• Based on analysis of the data and context, the Committee did not consider it appropriate to adjust the formulaic outcome of this measure. | |||||||||
Total |
0% |
20% |
||||||||||
| Measure and weighting |
Weighted outcome |
Consideration of discretion | ||||||
Operating profit from reportable segments (70%) |
140% |
• The targets were appropriately set, with a much wider and asymmetric range around the target outcome than in previous years, resulting in significantly greater stretch required on the upside and reflecting the context at the time; just as management had no visibility to the onset of Covid-19 in 2020, there was little visibility of the shape and pace of recovery through 2021 and, in practice, there were variations in performance in regions and markets driven by different approaches to travel restrictions and vaccine roll-outs.• Management delivered strong results against the key financial metrics which contribute to operating profit, including sustainable cost savings of $75 million (following on from 2020 cost savings of $150 million), whilst continuing to invest in growth opportunities, such as the launch of the Vignette Collection, and to focus on the quality of growth through the review of the Holiday Inn and Crowne Plaza estate.• The Committee has reviewed the quality of underlying performance, including whether adjustments should be made to take account of this and concluded this was not necessary.• On this basis, the Committee found no basis for applying negative discretion. | ||||||
| Signings (15%) |
30% |
• Targets were set appropriately, reflecting the typical nature of the pace at which the drivers of signings and openings respond during periods of recovery, and containing significant stretch to achieve outperformance.• Absolute performance represented an impressive 23% improvement on the prior year.• The Committee also assessed performance against our largest competitors, with IHG maintaining its share of signings throughout the pandemic. The Committee is satisfied that performance relative to our peers was competitive.• See under ‘Openings’ below regarding the Committee’s assessment against Global Metrics performance.• On this basis, the Committee found no basis for applying negative discretion. | ||||||
Openings (15%) |
17.3% |
• Performance was ahead of target on this measure and represents 5% of prior year closing system size on a rolling year-on-year • Despite supply chain issues and other delays due to the pandemic, which has made openings very challenging, we delivered year-on-year • The Committee assessed performance relative to competitors and is satisfied that performance relative to our peers was competitive.• The signings and openings measures are subject to the Committee assessing performance against the Company’s Global Metrics. The majority of metrics, six of 10, tracked above target or prior year performance. Of those with formal targets, five of six exceeded target.• On this basis, the Committee found no basis for applying negative discretion. | ||||||
| Overall, having also considered broader stakeholder perspectives (see next page), the Committee found no basis for applying negative discretion to the formulaic outcome of the 2021 APP. | ||||||||
Total |
187.3% |
|||||||
106 |
IHG |
Wider workforce |
• The APP measures of operating profit from reportable segments, openings and signings apply to the whole corporate employee population, along with a personal performance element below the Executive Committee (EC), with target bonus amounts determined by grade. The strong formulaic performance under the corporate measures will apply to and benefit this whole population. In addition, in view of the strong performance in 2021, an extra 20% is being added to the amount budgeted for the personal performance element to increase awards for those employees who performed the strongest during 2021.• In the context of continuing retention and succession concerns below Board:• LTIP award-holders received an additional award in 2021, topping the 2018/20 cycle award up to 40%, and will receive an award in 2022 on the same basis in respect of the 2019/21 cycle in recognition of the significant additional work and effort required during these cycles as a result of the pandemic impact; and • in addition, separate one-off retention awards in the form of cash and deferred shares were made to core skill and succession talent individuals across the corporate population.• In contrast, Executive Directors received only the formulaic outcome of the 2018/20 LTIP (30.6% of maximum) and no 2020 APP award. • In January 2022, the first matched share vesting took place under our employee share plan, as a result of which around 2,200 employees received free shares matched on a 1:1 basis.• The overall employee engagement score of 85% exceeded that of external benchmarks by 8%.• As explained on page 112, the employing entities for a number of UK leased hotels are part of the IHG group. All roles at all these hotels are paid above the living wage and zero-hour contracts have been eliminated across this estate. From April 2022, all employees in these hotels will be paid above the real living wage. However, as a result of continued travel restrictions and hotel closures during 2021, some UK government support was obtained in respect of this workforce for the benefit of the hotel owner. The Committee has taken into account that, in respect of pay for these employees, IHG does not have decision rights and must be sensitive to the commercial circumstances of these leased hotels, the owner and equities across the owner’s wider business, and the employees of other owners of IHG hotels.• In respect of the directly-employed corporate workforce, no UK government support for staff costs was obtained in either 2020 or 2021 and, following the reversal of the actions taken in 2020 outlined in last year’s report, no employees across the global corporate population were furloughed in 2021.• Further considerations included under ‘Remuneration at IHG – the wider context’ on page 112. | |||
Owners |
• Favourable credit terms provided to assist with the impact of the pandemic.• Agreement with owners to manage cash flow through utilisation of maintenance reserves.• Expanded hotel procurement solutions to combat supply chain challenges and rising costs.• Launched new hiring tools and support to recruit and retain talent.• Continued review and evolution of brand standards to improve operational efficiency.• Government advocacy carried out on behalf of owners. | |||
Guests |
• Flexible cancellation policy operated, and waiver of cancellation fees.• Continued execution of IHG Way of Clean and IHG Clean Promise in our hotels.• IHG Rewards membership status protection provided. | |||
Shareholders |
• IHG share price has remained resilient, ending 2021 1.9% up on the end of 2020 and 100% up on the lows of March 2020.• The Board is proposing a final dividend of 85.9¢ in respect of 2021, and there is continued momentum in future growth, with our global pipeline equivalent to over 30% of the current system size and more than 40% under construction.• Having listened to shareholder feedback at the time and refrained from using discretion for the 2018/20 LTIP cycle, we received positive and constructive feedback in consultations with shareholders on the potential use of discretion for the 2019/21 LTIP cycle. | |||
• |
continues to monitor a shadow target for cash flow, agreed at its October 2020 meeting after the initial impact of the pandemic became evident; and |
• |
remains minded not to reduce the relative NSSG vesting outcome based on the Return on Capital Employed (ROCE) underpin if this is not met for this cycle solely due to the impact of the pandemic on earnings. |
| |
Directors’ Remuneration Report |
IHG |
107 |
• |
Salary increases for Executive Directors for 2022 will be in line with the budget for increases for the wider UK and US corporate populations and are made following an assessment of 2021 performance. |
• |
The non-financial measures for the 2022 Annual Performance Plan will remain as openings and signings, as in 2021, aligned to our key strategic objectives for recovery and our future growth priorities. |
• |
LTIP 2022/24 cycle measures will also remain as relative TSR (30%), relative NSSG (40%) and absolute cash flow (30%), with Total Gross Revenue having been replaced by increased weightings for cash flow and relative NSSG. Retaining the same balance of measures for the 2022/24 cycle keeps an overall relative performance focus, appropriate in a context of some continued uncertainty. It also retains the increased focus on NSSG, which is strategically key and, being relative, factors in the economic and market context and any related volatility that occurs. |
108 |
IHG |
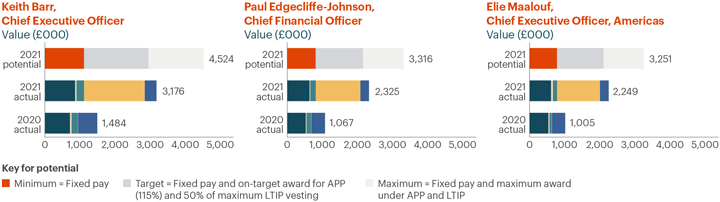
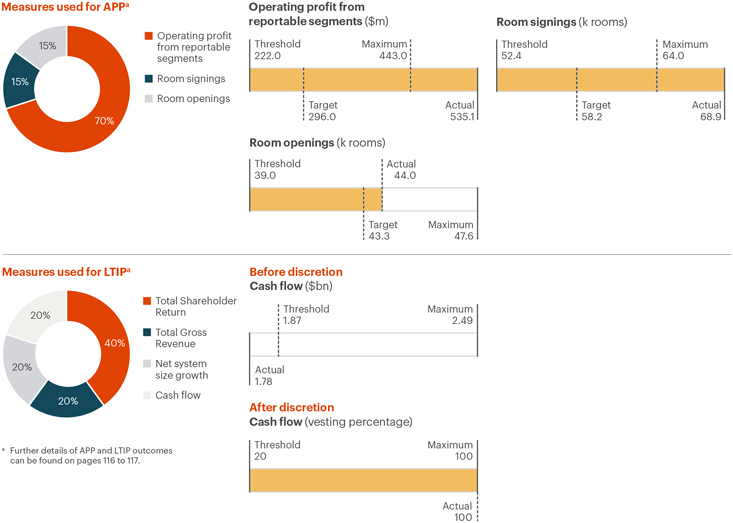
|
|
Directors’ Remuneration Report |
IHG |
109 |
How to use this report |
⬛ Salary |
AUDITED |
||||||
Within the Directors’ Remuneration |
⬛ Benefits |
Audited information Content contained within a tinted panel highlighted with an ‘Audited’ tab indicates that all the information within the panel is audited. |
||||||
Report we have used colour coding |
⬛ Pension benefit |
|||||||
to denote different elements of |
⬛ Annual Performance Plan (APP) |
|||||||
remuneration. The colours used and |
50% cash and 50% deferred shares |
|||||||
the corresponding remuneration |
⬛ Long Term Incentive Plan (LTIP) |
|||||||
elements are: |
⬛ Shareholding |
|||||||
110 |
110 |
111 |
112 |
113 |
Our purpose |
Our ambition | |||
| True Hospitality |
To deliver | |||
for Good |
industry-leading | |||
net rooms growth | ||||
Our strategic priorities |
||||||||
 |
Build loved and trusted brands |
 |
Create digital advantage | |||||
 |
Customer centric in all we do |
 |
Care for our people, communities and planet | |||||
Element |
Measures |
Link to strategy |
Explanation | |||||||||
 Annual Performance Plan (APP) |
Operating profit |
 |
• The strength and breadth of our portfolio, tailored services and solutions, and our technology and platforms drive consumer preference, owner returns and rooms growth; all contributing to our revenues and profit.• Openings and signings are two of our key drivers of system size and central to our ambition to deliver industry-leading rooms growth.• Aligned to our people, communities and planet strategy, the Remuneration Committee will review performance on Global Metrics, including key ESG measures (Employee engagement, Guest Love, Responsible Business) in considering the potential application of discretion to formulaic outcomes on APP strategic objective measures.• Our ambition is to deliver high-quality, industry-leading net rooms growth so it is important that this forms a key element of our management team’s Long Term Incentive Plan.• Enhancing our customer and owner offer and developing our brands at scale in high-value markets drives sustained growthin cash flows and profits over the long term, which can be reinvested in our business and returned to shareholders. | |||||||||
| Room signings |
 |
|||||||||||
| Room openings |
 |
|||||||||||
| Global Metrics |
 |
|||||||||||
 Long Term Incentive Plan (LTIP) |
Relative Total Shareholder Return |
|
||||||||||
| Relative net system size growth |
 |
|||||||||||
| Cash flow |
|
|||||||||||
110 |
IHG |
Element |
2022 |
2023 |
2024 |
2025 |
2026 |
Framework |
Purpose | |||||||||||||||||||||
| Fixed |
||||||||||||||||||||||||||||
Base salary |
 |
Increases generally in line with the range applying to the corporate population. Reviewed annually and fixed for 12 months from 1 April. |
To recognise the value and impact of the role and the individual’s skills, performance and experience. | |||||||||||||||||||||||||
Benefits |
 |
Relevant benefits are aligned to the typical level for the role/location. |
To be competitive and consistent with role/location; to help recruit and retain. | |||||||||||||||||||||||||
Pension/ Retirement benefit |
 |
A Defined Contribution or cash in lieu amount for UK Directors. Employee contributions with matching company contributions. Salary is the only part of pay that is pensionable. See further details regarding UK and US pension benefit on page 112. |
To be competitive and consistent with role/location; to help recruit and retain. | |||||||||||||||||||||||||
Variable |
||||||||||||||||||||||||||||
Annual Performance Plan (cash) |
 Cash |
Maximum opportunity is 200% of salary; 70% based on operating profit measure and 30% on key strategic objectives; 50% of the award is deferred into shares for three years. |
To reward the achievement of stretching targets that support the Company’s annual financial and strategic goals. For 2022, the key strategic objectives are: | |||||||||||||||||||||||||
| Annual Performance Plan (deferred shares) |
 Deferral |
• room signings (15% weighting); and• room openings (15% weighting). | ||||||||||||||||||||||||||
Long Term Incentive Plan (LTIP) |
 Performance |
 Deferral |
The maximum potential LTIP quantum is 350% of salary for the CEO and 275% of salary for other Executive Directors; a two-year post-vest holding period applies. |
A focus on industry-leading net rooms growth is at the heart of our strategy, balanced by a Return on Capital Employed (ROCE) underpin to reflect our commitment to deliver quality growth whilst maintaining returns. Together with TSR and cash flow, there is a strong alignment between Executive Director remuneration and shareholder interests. | ||||||||||||||||||||||||
Principle |
IHG’s approach | |||
Clarity |
We always seek to set and report our performance-related measures, targets and outcomes in a clear, transparent and balanced way, with relevant and timely communication with all of our stakeholders. Our reward policies drive engagement throughout the workforce with an aligned approach to performance-related reward. Through the combination of short- and long-term incentive plan measures, the DR Policy is structured to support financial objectives and the strategic priorities of the business which deliver shareholder returns and long-term value creation. Further alignment with shareholder interests is driven by the significant proportion of share-based incentives and Executive Director shareholding requirements. | |||
Simplicity |
Our remuneration structure comprises straightforward, conventional and well-understood components. The purpose, structure and strategic alignment of each element is clearly laid out in the remuneration policy summary table: • fixed pay: base salary, pension and benefits that are consistent with role and location;• short-term incentive: annual performance-related bonus which incentivises and rewards the delivery of financial and non-financial strategic objectives;• long-term incentive: a share-based award which incentivises performance over a three-year period and is based on measures which drive long-term sustainable growth. | |||
Predictability |
The range of possible values of rewards for Executive Directors is clearly disclosed in graphical form both at the time of approving the policy and in the annual implementation report. | |||
Risk |
Our DR Policy contains a number of elements to ensure that it drives the right behaviours to incentivise the Executive Directors to deliver long-term sustainable growth and shareholder returns and to reward them appropriately: • the maximum short- and long-term incentive awards are capped as a % of salary;• the Committee has clear discretion policies, linked to specific measures where necessary, to override formulaic outcomes;• Executive Directors agree to clear and comprehensive malus and clawback provisions; and• significant shareholding requirements apply for Executive Directors. | |||
Proportionality |
Individual rewards are aligned to the delivery of strategic business objectives. The Committee sets robust and stretching targets to ensure that there is a clear link between the performance of the Group and the awards made to Executive Directors and others. | |||
Alignment to culture |
IHG has a clear purpose and well-established values and behaviours. The alignment between remuneration incentives and our strategy for high-quality growth, and the KPIs which underpin the delivery of our strategy, is outlined on page 110. Other elements of reward, such as salary reviews and, across the wider workforce, the short-term incentive plan and our global recognition scheme, reward employees for performance and actions which demonstrate our values and behaviours. | |||
|
|
Directors’ Remuneration Report |
IHG |
111 |
Elements of reward |
Participants |
Commentary | ||||||
Fixed |
||||||||
⬛ Salary |
All |
In the 2021 base salary review process, we continued to build on our simplified performance management process to include the use of manager discretion to make one-off adjustments within the overall merit budget in order to address equity and talent recognition, particularly in the context of the pay actions taken in 2020 in response to the impact of Covid-19 on the business. This allowed the merit budget to be targeted on areas where it would have the most impact. | ||||||
⬛ Benefits |
All |
For 2021, we aligned the levels of healthcare cover offered in the UK across all UK corporate employees. Globally, we continued to roll-out our wellness offer to support our employees’ health and wellbeing and to adapt to a changing and flexible working environment, including an enhanced parental leave policy in the US for corporate employees. | ||||||
⬛ Pension benefit |
All |
Pension and retirement benefits are provided in the UK and US in line with market practice. UK: | ||||||
US | ||||||||
Variable |
||||||||
| ⬛ Annual Performance Plan (APP) |
All |
All corporate employees share common corporate performance metrics with the Executive Committee and Executive Directors. For senior management (generally at Executive Committee level and their direct reports), a proportion of bonus is deferred into shares for a three-year period. In 2021, we aligned the weightings of metrics for all corporate employees below Executive Committee level and increased the focus on rewarding performance by rebalancing the APP measures so that a greater portion of an award can be achieved through an employee’s individual performance and contribution. | ||||||
| ⬛ Long Term Incentive Plan (LTIP) |
All |
Senior/mid-management and certain specialist roles are eligible for a Long Term Incentive Plan (LTIP). Performance-based LTIP largely applies at the level of Executive Committee and their direct reports; RSUs typically apply for eligible employees below this level (see below). | ||||||
| ⬛ Restricted Stock Units (RSUs) |
Excludes Executive Directors |
In line with typical market practice, particularly in the US, and due to line-of-sight | ||||||
⬛ Colleague Share Plan |
Wider workforce only |
IHG matches the number of shares purchased on a 1-for-1 senior/mid-management level (who receive LTIP and RSU awards). Participation increased from 49% in 2020 to 50% in 2021 and to 53% in 2022; matching shares from the 2020 plan vested in January 2022. | ||||||
112 |
IHG |
2021 focus areas |
• |
Review and approval of 2020 remuneration outcomes and 2021 structures and targets |
• |
In-year performance and relative performance tracking |
• |
Wider workforce remuneration matters |
• |
ESG in incentives and Green Engage progress |
• |
Consideration of discretion relating to 2021 remuneration outcomes |
• |
2022+ structures and targets |
|
|
The ToR are available on IHG’s website at www.ihgplc.com/investors |
| |
Directors’ Remuneration Report |
IHG |
113 |
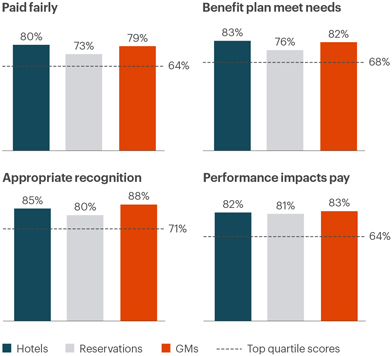
|
|
The Company’s approach to wider workforce engagement under the UK Corporate Governance Code is set out on page 112. |
Directors’ Remuneration Policy (binding vote) |
Directors’ Remuneration Report (advisory vote) |
|||||||||||||||||||||||||||||||||||
AGM |
Votes for |
Votes against |
Abstentions |
Votes for |
Votes against |
Abstentions |
||||||||||||||||||||||||||||||
2021 |
– |
– |
– |
137,628,120 |
11,277,368 |
106,271 |
||||||||||||||||||||||||||||||
(92.43% |
) |
(7.57% |
) |
|||||||||||||||||||||||||||||||||
2020 |
112,098,213 |
33,210,269 |
3,308,499 |
143,279,761 |
5,212,375 |
124,844 |
||||||||||||||||||||||||||||||
(77.14% |
) |
(22.86% |
) |
(96.49% |
) |
(3.51% |
) |
|||||||||||||||||||||||||||||
2019 |
– |
– |
– |
120,939,401 |
23,116,948 |
3,867,287 |
||||||||||||||||||||||||||||||
(83.95% |
) |
(16.05% |
) |
|||||||||||||||||||||||||||||||||
114 |
IHG |
Single total figure of remuneration – Executive Directors |
| |||||||||||||||||||||||||||||||||||
Fixed pay |
Variable pay |
|||||||||||||||||||||||||||||||||||
| |
|
|
|
|||||||||||||||||||||||||||||||||
⬛ Pension |
||||||||||||||||||||||||||||||||||||
⬛ Salary |
⬛ Benefits |
benefit |
Subtotal |
⬛ APP |
⬛ LTIP |
Subtotal |
⬛ Total |
|||||||||||||||||||||||||||||
Executive Directors |
Year |
£000 |
£000 |
£000 |
£000 |
£000 |
£000 |
a |
£000 |
£000 |
||||||||||||||||||||||||||
| |
|
|
|
|
|
|
|
|
|
|
|
|
|
|
|
|
|
|
||||||||||||||||||
Keith Barr |
2021 |
857 |
41 |
214 |
1,112 |
1,727 |
337 |
2,064 |
3,176 |
|||||||||||||||||||||||||||
| |
|
|
|
|
|
|
|
|
|
|
|
|
|
|
|
|
|
|||||||||||||||||||
2020 |
712 |
45 |
178 |
935 |
0 |
549 |
549 |
1,484 |
||||||||||||||||||||||||||||
| |
|
|
|
|
|
|
|
|
|
|
|
|
|
|
|
|
|
|
||||||||||||||||||
Paul Edgecliffe-Johnson |
2021 |
630 |
19 |
158 |
807 |
1,270 |
248 |
1,518 |
2,325 |
|||||||||||||||||||||||||||
| |
|
|
|
|
|
|
|
|
|
|
|
|
|
|
|
|
|
|||||||||||||||||||
2020 |
524 |
21 |
131 |
676 |
0 |
391 |
391 |
1,067 |
||||||||||||||||||||||||||||
| |
|
|
|
|
|
|
|
|
|
|
|
|
|
|
|
|
|
|
||||||||||||||||||
Elie Maalouf b |
2021 |
606 |
53 |
118 |
777 |
1,221 |
251 |
1,472 |
2,249 |
|||||||||||||||||||||||||||
| |
|
|
|
|
|
|
|
|
|
|
|
|
|
|
|
|
|
|||||||||||||||||||
2020 |
531 |
30 |
65 |
626 |
0 |
379 |
379 |
1,005 |
||||||||||||||||||||||||||||
| |
|
|
|
|
|
|
|
|
|
|
|
|
|
|
|
|
|
|
||||||||||||||||||
a |
LTIP figures for 2020 relate to the 2018/20 LTIP cycle and have been restated using actual share price on date of vesting. Figures for 2021 relate to the value of shares for the 2019/21 cycle. |
b |
Elie Maalouf is paid in USD and the sterling equivalent is calculated using an exchange rate of $1 = £0.73 in 2021 and $1 = £0.78 in 2020 (page 158). |
⬛ |
Salary: |
⬛ |
Benefits: non-UK based Director, Elie Maalouf, includes some travel and food expenses that were not previously reported. |
⬛ |
Pension benefit: |
| |
£ a |
|||
Director’s contributions to US Deferred Compensation Plan |
168,917 |
|||
| |
|
|
||
Director’s contributions to US 401(k) Plan |
18,980 |
|||
| |
|
|
||
Company contributions to US Deferred Compensation Plan |
109,829 |
|||
| |
|
|
||
Company contributions to US 401(k) Plan |
8,468 |
|||
| |
|
|
||
Age of Director at 31 December 2021 |
57 |
|||
| |
|
|
||
a |
Sterling values have been calculated using an exchange rate of $1 = £0.73. |
• |
threshold |
• |
target |
• |
maximum |
|
|
Directors’ Remuneration Report |
IHG |
115 |
• |
operating profit from reportable segments (70%); |
• |
room signings (15%); and |
• |
room openings (15%). |
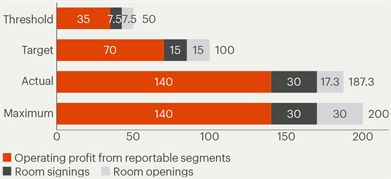
APP |
||||||||||||||||
Weighted |
||||||||||||||||
Performance |
Achievement |
Weighting |
achievement |
|||||||||||||
| |
|
|
||||||||||||||
Operating profit from reportable segments: performance relative to target |
| |||||||||||||||
| |
|
|
|
|
||||||||||||
Threshold |
$222m |
50% |
||||||||||||||
| |
||||||||||||||||
Target |
$296m |
100% |
70% |
140.0% |
||||||||||||
| |
|
|
|
|
||||||||||||
Maximum |
$443m |
200% |
||||||||||||||
| |
|
|
|
|
||||||||||||
Actual |
$535.1m |
200% |
||||||||||||||
| |
|
|
||||||||||||||
Room signings (k rooms) |
|
|||||||||||||||
| |
|
|
||||||||||||||
Threshold |
52.4 |
50% |
||||||||||||||
| |
|
|
|
|
||||||||||||
Target |
58.2 |
100% |
15% |
30.0% |
||||||||||||
| |
|
|
|
|
||||||||||||
Maximum |
64.0 |
200% |
||||||||||||||
| |
|
|
|
|
||||||||||||
Actual |
68.9 |
200% |
||||||||||||||
| |
|
|
||||||||||||||
Room openings (k rooms) |
|
|||||||||||||||
| |
|
|
||||||||||||||
Threshold |
39.0 |
50% |
||||||||||||||
| |
|
|
|
|
||||||||||||
Target |
43.3 |
100% |
15% |
17.3% |
||||||||||||
| |
|
|
|
|
||||||||||||
Actual |
44.0 |
139.2% |
||||||||||||||
| |
|
|
|
|
||||||||||||
Maximum |
47.6 |
200% |
||||||||||||||
| |
|
|
||||||||||||||
| |
|
|
||
| Operating profit from reportable segments (at actual exchange rates) (see page 158) |
$533.6m |
|||
| |
|
|
||
Difference due to exchange rates |
$1.5m |
|||
| |
|
|
||
| Operating profit from reportable segments (at 2021 budget exchange rates) |
$535.1m |
|||
| |
|
|

• |
Total Shareholder Return (40%); |
• |
Total Gross Revenue (20%); |
• |
net system size growth (20%); and |
• |
cash flow (20%). |

116 |
IHG |
Performance Targets |
Discretionary |
|||||||||||
| |
||||||||||||
Performance measure and weighting |
Target |
% Vesting |
Result |
Formulaic achievement |
outcome |
|||||||
| |
|
|
|
|
||||||||
Total Shareholder Return: |
Maximum |
Maximum |
Outcome |
Below threshold |
0% |
|||||||
Three-year growth relative to average |
83.4% |
100% |
17.9% |
|||||||||
| |
||||||||||||
of competitors |
Threshold |
Threshold |
||||||||||
40% |
26.0% |
20% |
||||||||||
| |
|
|
|
|
|
|||||||
Total Gross Revenue: |
Maximum |
Maximum |
Outcome |
Below threshold |
0% |
|||||||
based on IHG’s performance against |
$5.63bn |
100% |
$-7.92bn |
|||||||||
| |
||||||||||||
an absolute Total Gross Revenue target |
Threshold |
Threshold |
||||||||||
20% |
$3.94bn |
20% |
||||||||||
| |
|
|
|
|
|
|||||||
Net system size growth: |
Maximum |
Maximum |
Outcome |
Below threshold |
0% |
|||||||
based on IHG’s performance against |
159.0k rooms |
100% |
84.6k rooms |
|||||||||
| |
||||||||||||
an absolute NSSG target |
Threshold |
Threshold |
||||||||||
20% |
111.3k rooms |
20% |
||||||||||
| |
|
|
|
|
|
|||||||
Cash flow: |
Maximum |
Maximum |
Reported Outcome |
Below threshold |
20% |
|||||||
based on IHG’s performance against, |
2.49bn USD |
100% |
1.49bn USD |
|||||||||
| |
||||||||||||
an absolute cash flow target |
Threshold |
Threshold |
Adjusted Outcome |
|||||||||
20% |
1.87bn USD |
20% |
1.78bn USD |
|||||||||
| |
|
|
|
|
|
|||||||
Reconciliation |
Cash flow $bn |
|||
| |
|
|
||
Reported cash flow from operations |
2.06 |
|||
| |
|
|
||
Net cash from investing activities |
(0.57) |
|||
| |
|
|
||
Reported outcome per definition |
1.49 |
|||
| |
|
|
||
Six Senses acquisition |
0.29 |
|||
| |
|
|
||
Adjusted outcome |
1.78 |
|||
| |
|
|
||
Maximum |
% of maximum |
Outcome |
Total value |
Value of award |
||||||||||||||||||||||||
opportunity at grant |
opportunity |
(number of shares |
of award |
attributable to share |
||||||||||||||||||||||||
Executive Director |
Award cycle |
(number of shares) |
vested |
awarded at vest) |
£000 |
price appreciation |
||||||||||||||||||||||
Keith Barr |
LTIP 2019/21 |
34,693 |
20% |
6,938 |
337 |
-7 |
||||||||||||||||||||||
Paul Edgecliffe-Johnson |
LTIP 2019/21 |
25,509 |
20% |
5,101 |
248 |
-5 |
||||||||||||||||||||||
Elie Maalouf |
LTIP 2019/21 |
25,802 |
20% |
5,160 |
251 |
-5 |
||||||||||||||||||||||
Directors’ Remuneration Report |
IHG |
117 |
Executive Director |
Award date |
Maximum shares awarded |
Market price per share at grant £ |
Face value of award at grant £000 |
Number of shares received if minimum performance achieved |
|||||||||||||||||||
2021/23 cycle |
||||||||||||||||||||||||
Keith Barr |
10 May 2021 |
59,385 |
50.88 |
3,022 |
11,877 |
|||||||||||||||||||
Paul Edgecliffe-Johnson |
10 May 2021 |
34,310 |
50.88 |
1,746 |
6,862 |
|||||||||||||||||||
Elie Maalouf |
10 May 2021 |
32,525 |
50.88 |
1,655 |
6,505 |
|||||||||||||||||||
2020/22 cycle |
||||||||||||||||||||||||
Keith Barr |
12 May 2020 |
49,153 |
34.96 |
1,718 |
9,830 |
|||||||||||||||||||
Paul Edgecliffe-Johnson |
12 May 2020 |
36,140 |
34.96 |
1,263 |
7,228 |
|||||||||||||||||||
Elie Maalouf |
12 May 2020 |
38,463 |
34.96 |
1,345 |
7,692 |
|||||||||||||||||||
118 |
IHG |
 Guideline Executive Director shareholding requirement
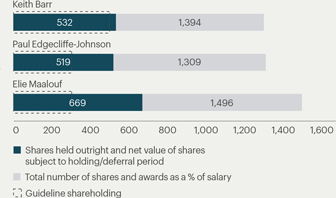
Number of shares held outright |
APP deferred share awards |
LTIP share awards (unvested) |
Total number of shares and awards held | |||||||||||||||||||||||||||||
| |
|
|
|
|
|
|
|
|
|
|
| |||||||||||||||||||||
2021 |
2020 |
2021 |
2020 |
2021 |
2020 |
2021 |
2020 |
|||||||||||||||||||||||||
| |
|
|
|
|
|
|
|
|
|
|
|
|
|
|
|
|
|
|
|
|
|
|
|
| ||||||||
Keith Barr |
81,830 |
70,279 |
26,696 |
37,705 |
143,231 |
119,227 |
251,757 |
227,211 |
||||||||||||||||||||||||
| |
|
|
|
|
|
|
|
|
|
|
|
|
|
|
|
|
|
|
|
|
|
|
|
| ||||||||
Paul Edgecliffe-Johnson |
58,723 |
53,376 |
19,137 |
26,751 |
95,959 |
86,479 |
173,819 |
166,606 |
||||||||||||||||||||||||
| |
|
|
|
|
|
|
|
|
|
|
|
|
|
|
|
|
|
|
|
|
|
|
|
| ||||||||
Elie Maalouf |
74,698 |
67,428 |
19,625 |
25,417 |
96,790 |
88,691 |
191,113 |
181,536 |
||||||||||||||||||||||||
| |
|
|
|
|
|
|
|
|
|
|
|
|
|
|
|
|
|
|
|
|
|
|
|
| ||||||||
Directors’ Remuneration Report |
IHG |
119 |
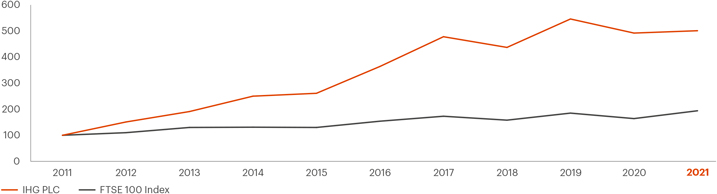
| Single figure |
CEO |
2012 |
2013 |
2014 |
2015 |
2016 |
2017 |
2018 |
2019 |
2020 |
2021 | |||||||||||||||||||||||||||||||
Single figure of remuneration (£000) |
Keith Barr |
2,161 |
3,143 |
a |
3,376 |
1,484 |
3,176 |
|||||||||||||||||||||||||||||||||||
| |
|
|
|
|
|
|
|
|
|
|
|
|
|
|
|
|
|
|
|
|
|
|
|
|
|
|
|
|
|
| ||||||||||||
Richard Solomons |
4,881 |
3,131 |
6,611 |
b |
3,197 |
3,662 |
2,207 |
c |
||||||||||||||||||||||||||||||||||
| |
|
|
|
|
|
|
|
|
|
|
|
|
|
|
|
|
|
|
|
|
|
|
|
|
|
|
|
|
|
|
| |||||||||||
| Annual incentive received (% of maximum) |
Keith Barr |
69.7 |
84.1 |
58.7 |
0 |
200.0 |
||||||||||||||||||||||||||||||||||||
| |
|
|
|
|
|
|
|
|
|
|
|
|
|
|
|
|
|
|
|
|
|
|
|
|
|
|
|
|
|
| ||||||||||||
Richard Solomons |
68.0 |
74.0 |
74.0 |
75.0 |
63.9 |
66.8 |
||||||||||||||||||||||||||||||||||||
| |
|
|
|
|
|
|
|
|
|
|
|
|
|
|
|
|
|
|
|
|
|
|
|
|
|
|
|
|
|
|
| |||||||||||
Shares received under the LTIP (% of maximum) |
Keith Barr |
46.1 |
45.4 |
78.9 |
30.6 |
20.0 |
||||||||||||||||||||||||||||||||||||
| |
|
|
|
|
|
|
|
|
|
|
|
|
|
|
|
|
|
|
|
|
|
|
|
|
|
|
|
|
|
| ||||||||||||
Richard Solomons |
100.0 |
59.0 |
56.1 |
50.0 |
49.4 |
46.1 |
||||||||||||||||||||||||||||||||||||
| |
|
|
|
|
|
|
|
|
|
|
|
|
|
|
|
|
|
|
|
|
|
|
|
|
|
|
|
|
|
|
| |||||||||||
a |
For Keith Barr, the 2018 figure includes a one-off cash payment for relocation costs in lieu of benefits received whilst on international assignment prior to CEO position, fully explained in the 2017 report. |
b |
For Richard Solomons, the 2014 figure includes a one-off cash payment in respect of pension entitlements which was fully explained in the 2014 report. |
c |
In respect of period 1 January to 30 June 2017. |

120 |
IHG |
Population excluding hotel |
||||||||||||||||||||||||||||||||
Full population |
employing entities |
|||||||||||||||||||||||||||||||
Year |
Method |
25th |
Median |
75th |
25th |
Median |
75th |
|||||||||||||||||||||||||
| |
|
|
|
|
||||||||||||||||||||||||||||
Financial year ended 31 December 2021 |
Option C |
163:1 |
65:1 |
41:1 |
57:1 |
42:1 |
28:1 |
|||||||||||||||||||||||||
| |
|
|
|
|
||||||||||||||||||||||||||||
Financial year ended 31 December 2020 |
Option C |
89:1 |
44:1 |
25:1 |
35:1 |
26:1 |
18:1 |
|||||||||||||||||||||||||
| |
|
|
|
|
||||||||||||||||||||||||||||
Financial year ended 31 December 2019 |
Option C |
180:1 |
122:1 |
59:1 |
71:1 |
49:1 |
32:1 |
|||||||||||||||||||||||||
| |
|
|
|
|
||||||||||||||||||||||||||||
Financial year ended 31 December 2018 |
Option C |
– |
– |
– |
72:1 |
48:1 |
29:1 |
|||||||||||||||||||||||||
| |
|
|
|
|
||||||||||||||||||||||||||||
• |
a greater proportion of performance-related variable pay and share-based incentives apply for the more senior executives, including Executive Directors, who will have a greater degree of influence over performance outcomes; |
• |
role-specific specialist plans apply in certain areas such as corporate reservations, sales, hotel development and General Managers of IHG managed, owned, leased and managed lease hotels. The target and maximum amounts that can be earned under these plans are typically a higher percentage of base salary for more senior employees, which in turn affect the pay ratio; and |
• |
incentive plans for other corporate employees are typically based on a combination of individual performance and the Group’s operating profit from reportable segments. |
• |
compiling all monthly payroll data for all UK employees from 1 January to 31 December 2021 detailing complete variable and fixed remuneration, including pension and taxable benefits such as company car or allowance and healthcare; and |
• |
valuing APP for the corporate workforce based on actual 2021 company performance metrics and budgeted target personal performance so that it reflects the same input as for the CEO data. |
25th |
75th |
|||||||||||||
percentile |
Median |
percentile |
||||||||||||
Year |
pay ratio |
pay ratio |
pay ratio |
|||||||||||
| |
|
|||||||||||||
Financial year ended 31 December 2021 – Full population |
Salary £ |
18,285 |
44,281 |
59,597 |
||||||||||
| |
||||||||||||||
Total remuneration £ |
19,540 |
49,020 |
77,832 |
|||||||||||
| |
|
|||||||||||||
Financial year ended 31 December 2021 – Excluding hotel employing entities |
Salary £ |
44,027 |
61,125 |
81,239 |
||||||||||
| |
||||||||||||||
Total remuneration £ |
55,732 |
75,055 |
115,377 |
|||||||||||
| |
|
|||||||||||||

Directors’ Remuneration Report |
IHG |
121 |
Year-on-year |
Year-on-year |
|||||||||||||||||||||||||||||||||||
Salary |
Bonus |
Taxable benefit |
Salary |
Bonus |
Taxable benefit |
|||||||||||||||||||||||||||||||
Executive Directors |
||||||||||||||||||||||||||||||||||||
Keith Barr |
20% |
100% |
-9% |
-14% |
-100% |
25% |
||||||||||||||||||||||||||||||
Paul Edgecliffe-Johnson |
20% |
100% |
-8% |
-13% |
-100% |
-14% |
||||||||||||||||||||||||||||||
Elie Maalouf |
14% |
100% |
79% |
-15% |
-100% |
-10% |
||||||||||||||||||||||||||||||
Non-Executive Directors |
||||||||||||||||||||||||||||||||||||
Patrick Cescau |
18% |
N/A |
-80% |
-13% |
N/A |
-53% |
||||||||||||||||||||||||||||||
Graham Allan |
– |
N/A |
– |
– |
N/A |
– |
||||||||||||||||||||||||||||||
Daniela Barone Soares |
– |
N/A |
– |
– |
– |
– |
||||||||||||||||||||||||||||||
Arthur de Haast |
18% |
N/A |
-1% |
– |
N/A |
– |
||||||||||||||||||||||||||||||
Ian Dyson |
18% |
N/A |
-100% |
-13% |
N/A |
-90% |
||||||||||||||||||||||||||||||
Duriya Farooqui |
– |
N/A |
– |
– |
N/A |
– |
||||||||||||||||||||||||||||||
Jo Harlow |
18% |
N/A |
100% |
-13% |
N/A |
-94% |
||||||||||||||||||||||||||||||
Jill McDonald |
18% |
N/A |
-1% |
-13% |
N/A |
-87% |
||||||||||||||||||||||||||||||
Sharon Rothstein |
– |
N/A |
– |
– |
N/A |
– |
||||||||||||||||||||||||||||||
Average employee |
3% |
100% |
-11% |
-6% |
-100% |
-9% |
||||||||||||||||||||||||||||||
| AUDITED |
||||
| Payments for loss of office There were no payments for loss of office in 2021. Pension entitlements No Executive Director is entitled to any Defined Benefit pension or related benefit from IHG. |
Payments to past Directors – benefits Sir Ian Prosser Sir Ian Prosser, who retired as Director on 31 December 2003, had an ongoing healthcare benefit of £1,408.90 during the year. | |||
122 |
IHG |
| Committee appointments |
Date of original appointment |
Fees £000 |
Taxable benefits £000 |
Total £000 | ||||||||||||||||||||||||||||
| |
|
|
|
|
|
|
| |||||||||||||||||||||||||
Non-Executive Director |
2021 |
2020 |
2021 |
2020 |
2021 |
2020 | ||||||||||||||||||||||||||
| |
|
|
|
|
|
|
|
|
|
|
|
|
|
|
|
|
|
|
|
|
|
| ||||||||||
Patrick Cescau |
 |
01/01/13 |
444 |
377 |
1 |
7 |
445 |
384 |
||||||||||||||||||||||||
| |
|
|
|
|
|
|
|
|
|
|
|
|
|
|
|
|
|
|
|
|
|
| ||||||||||
Graham Allan |
 |
01/09/20 |
78 |
24 |
0 |
0 |
78 |
24 |
||||||||||||||||||||||||
| |
|
|
|
|
|
|
|
|
|
|
|
|
|
|
|
|
|
|
|
|
|
| ||||||||||
Richard Anderson |
 |
01/03/21 |
20 |
– |
0 |
– |
20 |
– |
||||||||||||||||||||||||
| |
|
|
|
|
|
|
|
|
|
|
|
|
|
|
|
|
|
|
|
|
|
| ||||||||||
Daniela Barone Soares |
 |
01/03/21 |
65 |
– |
0 |
– |
65 |
– |
||||||||||||||||||||||||
| |
|
|
|
|
|
|
|
|
|
|
|
|
|
|
|
|
|
|
|
|
|
| ||||||||||
Anne Busquet |
 |
01/03/15 |
28 |
66 |
1 |
1 |
29 |
67 |
||||||||||||||||||||||||
| |
|
|
|
|
|
|
|
|
|
|
|
|
|
|
|
|
|
|
|
|
|
| ||||||||||
Arthur de Haast |
 |
01/01/20 |
78 |
66 |
0 |
0 |
78 |
66 |
||||||||||||||||||||||||
| |
|
|
|
|
|
|
|
|
|
|
|
|
|
|
|
|
|
|
|
|
|
| ||||||||||
Ian Dyson |
 |
01/09/13 |
104 |
88 |
0 |
0 |
104 |
88 |
||||||||||||||||||||||||
| |
|
|
|
|
|
|
|
|
|
|
|
|
|
|
|
|
|
|
|
|
|
| ||||||||||
Duriya Farooqui |
 |
07/12/20 |
78 |
5 |
0 |
0 |
78 |
5 |
||||||||||||||||||||||||
| |
|
|
|
|
|
|
|
|
|
|
|
|
|
|
|
|
|
|
|
|
|
| ||||||||||
Jo Harlow |
 |
01/09/14 |
104 |
88 |
0 |
0 |
104 |
88 |
||||||||||||||||||||||||
| |
|
|
|
|
|
|
|
|
|
|
|
|
|
|
|
|
|
|
|
|
|
| ||||||||||
Jill McDonald |
 |
01/06/13 |
92 |
78 |
0 |
0 |
92 |
78 |
||||||||||||||||||||||||
| |
|
|
|
|
|
|
|
|
|
|
|
|
|
|
|
|
|
|
|
|
|
| ||||||||||
Dale Morrison |
 |
01/06/11 |
112 |
95 |
1 |
2 |
113 |
97 |
||||||||||||||||||||||||
| |
|
|
|
|
|
|
|
|
|
|
|
|
|
|
|
|
|
|
|
|
|
| ||||||||||
Sharon Rothstein |
 |
01/06/20 |
78 |
38 |
0 |
0 |
78 |
38 |
||||||||||||||||||||||||
| |
|
|
|
|
|
|
|
|
|
|
|
|
|
|
|
|
|
|
|
|
|
| ||||||||||
|
|
See page 81 for Board and Committee membership key and attendance. |
Non-Executive Director |
2021 |
2020 | ||||||
| |
|
|
|
|
|
| ||
Patrick Cescau |
11,135 |
11,135 |
||||||
| |
|
|
|
|
|
| ||
Daniela Barone Soares |
316 |
– |
||||||
| |
|
|
|
|
|
| ||
Ian Dyson |
1,500 |
1,500 |
||||||
| |
|
|
|
|
|
| ||
Arthur de Haast |
1,000 |
1,000 |
||||||
| |
|
|
|
|
|
| ||
Jo Harlow a |
950 |
950 |
||||||
| |
|
|
|
|
|
| ||
a |
Shares held in the form of American Depositary Receipts. |
| Non-Executive Director |
Role |
2022 £000 |
2021 £000 |
|||||||
| |
|
|
|
|
|
|||||
Patrick Cescau |
Chair of the Board |
461 |
444 |
|||||||
| |
|
|
|
|
|
|||||
Graham Allan |
Senior Independent Director |
116 |
78 |
|||||||
| |
|
|
|
|
|
|||||
Daniela Barone Soares |
Non-Executive Director |
81 |
78 |
|||||||
| |
|
|
|
|
|
|||||
Arthur de Haast |
Non-Executive Director |
81 |
78 |
|||||||
| |
|
|
|
|
|
|||||
Ian Dyson |
Chair of Audit Committee |
108 |
104 |
|||||||
| |
|
|
|
|
|
|||||
Duriya Farooqui |
Non-Executive Director |
81 |
78 |
|||||||
| |
|
|
|
|
|
|||||
Jo Harlow |
Chair of Remuneration Committee |
108 |
104 |
|||||||
| |
|
|
|
|
|
|||||
Jill McDonald |
Chair of Responsible Business Committee |
95 |
92 |
|||||||
| |
|
|
|
|
|
|||||
Sharon Rothstein |
Non-Executive Director |
81 |
78 |
|||||||
| |
|
|
|
|
|
|||||
Directors’ Remuneration Report |
IHG |
123 |
Executive Director |
Increase % |
2022 £ |
2022 $ |
2021 £ |
2021 $ |
|||||||||||||||||||
Keith Barr |
4 |
897,900 |
863,300 |
|||||||||||||||||||||
Paul Edgecliffe-Johnson |
4 |
660,200 |
634,800 |
|||||||||||||||||||||
Elie Maalouf a |
4 |
870,100 |
836,600 |
|||||||||||||||||||||
a |
Elie Maalouf is paid in USD and his annual base salary for 2020 and 2021 is shown in USD. The sterling equivalent values calculated using an exchange rate of $1 = £0.78 in 2021 and $1 = £0.73 in 2022 are: 2021 – £652,548 and 2022 – £635,173. |
Measure |
Definition |
Weighting |
Original performance objective |
Shadow performance objective | ||||
| |
|
|
|
| ||||
Absolute cash flow |
Cumulative annual cash generation over three-year performance period |
20 |
Threshold – US 1.91bn (20% of cash flow element vests); Maximum – US 2.54bn (100% of cash flow element vests); and Vesting will be on a straight-line basis in between the two points above. |
Threshold – US 0.82bn (20% of cash flow element vests); Maximum – US 1.09bn (100% of cash flow element vests); and Vesting will be on a straight-line basis in between the two points above. | ||||
| |
|
|
|
|
Measure |
Definition |
Weighting (%) |
Performance objective | |||
| |
|
|
| |||
| Operating profit from reportable segments |
A measure of IHG’s operating profit from reportable segments for the year |
70 |
Achievement against target | |||
| |
|
|
| |||
Room signings |
Absolute number of new room signings |
15 |
Achievement against target | |||
| |
|
|
| |||
Room openings |
Absolute number of new room openings |
15 |
Achievement against target | |||
| |
|
|
|
• |
the potential volatility caused by future new variants of Covid-19; |
• |
the performance volatility resulting in countries following a zero Covid-19 strategy; |
• |
unpredictability around the trajectory of international travel recovery; and |
• |
while leisure travel demand is strong, continuing uncertainty around the shape of international business travel re-emergence. |
124 |
IHG |
Measure |
Definition |
Weighting (%) |
Performance objective | |||
| |
|
|
| |||
Relative Total Shareholder Return (TSR) |
IHG’s performance against a comparator group of global hotel companies: Accor S.A., Choice Hotels International Inc., Hilton Worldwide Holdings Inc., Hyatt Hotels Corporation, Marriott International Inc., Melia Hotels International S.A., NH Hotels Group, and Wyndham Hotels & Resorts Inc. TSR is the aggregate of share price growth and dividends paid, assuming reinvestment of dividends in the Company’s shares during the three-year performance period. |
30 |
Threshold – median of comparator group (20% of TSR element vests); Maximum – upper quartile of comparator group (100% of TSR element vests); and Vesting will be on a straight-line basis in between the two points above. | |||
| |
|
|
| |||
Relative net system size growth with ROCE underpin |
IHG’s aggregated compound annual growth rate (CAGR) against our six largest competitors with over 500k rooms: Marriott International, Inc., Hilton Worldwide Holdings Inc., Accor S.A., Jin Jiang International Holdings Company Limited, Wyndham Hotels & Resorts Inc., Choice Hotels International Inc. Targets will be set based on increased room count that is consistent with the relevant company’s business plan objectives and practice as at the start of the LTIP cycle. |
40 |
Threshold – Fourth ranked competitor excluding IHG (20% of NSSG element vests); Maximum – First ranked competitor excluding IHG (100% of NSSG element vests); and Vesting will be on a straight-line basis in between the two points above. This measure is subject to the achievement of a Return on Capital Employed underpin. See below for further details. | |||
| |
|
|
| |||
Absolute cash flow |
Cumulative annual cash generation over three-year performance period. |
30 |
Threshold – US 1.58bn (20% of cash flow element vests); Maximum – US 2.11bn (100% of cash flow element vests); and Vesting will be on a straight-line basis in between the two points above. | |||
| |
|
|
| |||
• |
the reason the ROCE underpin has not been met; |
• |
the impact on other metrics, including cash flow and Total Gross Revenue; and |
• |
the materiality of the circumstances under which the underpin has not been met. |
Directors’ Remuneration Report |
IHG |
125 |
1. |
Board Leadership and Company Purpose |
A. |
The role of the Board |
B. |
The Company’s purpose, values and strategy |
C. |
Resources |
D. |
Shareholders and stakeholders |
E. |
Workforce policies and practices |
2. |
Division of Responsibilities |
F. |
The Chair |
G. |
Board composition |
H. |
Non-Executives |
126 |
IHG |
I. |
Policies, processes, information and resources |
3. |
Composition, Succession and Evaluation |
J. |
Appointments |
K. |
Skills |
L. |
Annual evaluation |
4. |
Audit, Risk and Internal Control |
M. |
Audit functions |
N. |
Assessment of the Company’s position and prospects |
O. |
Risk management |
5. |
Remuneration |
P. |
Remuneration policies and practices |
Q. |
Procedure for developing policy on executive remuneration |
R. |
Independent judgement and discretion |
Statement of compliance |
IHG |
127 |

| Group Financial Statements |
130 |
||||
138 |
||||
142 |
||||
149 |
||||
158 |
||||
| a Independent Auditors’ Reports comprise reports from PricewaterhouseCoopers LLP (PCAOB ID: 876) and Ernst & Young LLP (PCAOB ID: 1438) |
||||
128 |
IHG |

Group Financial Statements |
IHG |
129 |
• |
Select suitable accounting policies and apply them consistently; |
• |
Make judgements and accounting estimates that are reasonable; |
• |
State whether the Consolidated Financial Statements have been prepared in accordance with UK-adopted international accounting standards; |
• |
State for the Company Financial Statements whether applicable UK accounting standards, comprising FRS 101, have been followed; and |
• |
Prepare the Financial Statements on the going concern basis unless it is inappropriate to presume that the Company and the Group will continue in business. |
• |
The Consolidated Financial Statements have been prepared in accordance with UK-adopted international accounting standards, and IFRSs as issued by the IASB, and give a true and fair view of the assets, liabilities, financial position and profit or loss of the Group taken as a whole; |
• |
The Company Financial Statements have been prepared in accordance with UK accounting standards, comprising FRS 101, and give a true and fair view of the assets, liabilities and financial position of the Company; and |
• |
The Annual Report, including the Strategic Report, includes a fair review of the development and performance of the business and the position of the Company and the Group taken as a whole, together with a description of the principal risks and uncertainties that it faces. |
• |
Pertain to the maintenance of records that, in reasonable detail, accurately and fairly reflect the Group’s transactions and dispositions of assets; |
• |
Are designed to provide reasonable assurance that transactions are recorded as necessary to permit the preparation of the Consolidated Financial Statements in accordance with UK-adopted international accounting standards and IFRSs as issued by the IASB, and that receipts and expenditure are being made only in accordance with authorisation of management and the Directors of the Company; and |
• |
Provide reasonable assurance regarding prevention or timely detection of unauthorised acquisition, use or disposition of the Group’s assets that could have a material effect on the Financial Statements. |
 |
 | |
Keith Barr |
Paul Edgecliffe-Johnson | |
Chief Executive Officer |
Chief Financial Officer | |
21 February 2022 |
21 February 2022 | |
130 |
IHG |
IHG |
131 |
132 |
IHG |
IHG |
133 |
134 |
IHG |
IHG |
135 |
136 |
IHG |
IHG |
137 |
138 |
IHG |

Independent Auditor’s US Report |
IHG |
139 |
140 |
IHG |
| |
Independent Auditor’s US Report |
IHG |
141 |
For the year ended 31 December 2021 |
Note |
2021 $m |
2020 $m |
2019 $m |
||||||||||||||||||||||||||||
Revenue from fee business |
3 |
|||||||||||||||||||||||||||||||
Revenue from owned, leased and managed lease hotels |
3 |
|||||||||||||||||||||||||||||||
System Fund revenues |
||||||||||||||||||||||||||||||||
Reimbursement of costs |
||||||||||||||||||||||||||||||||
Total revenue |
2 |
|||||||||||||||||||||||||||||||
Cost of sales |
( |
) |
( |
) |
( |
) | ||||||||||||||||||||||||||
System Fund expenses |
( |
) |
( |
) |
( |
) | ||||||||||||||||||||||||||
Reimbursed costs |
( |
) |
( |
) |
( |
) | ||||||||||||||||||||||||||
Administrative expenses |
( |
) |
( |
) |
( |
) | ||||||||||||||||||||||||||
Share of losses of associates and joint ventures |
2 |
( |
) |
( |
) |
( |
) | |||||||||||||||||||||||||
Other operating income |
||||||||||||||||||||||||||||||||
Depreciation and amortisation |
2 |
( |
) |
( |
) |
( |
) | |||||||||||||||||||||||||
Impairment loss on financial assets |
( |
) |
( |
) | ||||||||||||||||||||||||||||
Other impairment charges |
6 |
( |
) |
( |
) |
( |
) | |||||||||||||||||||||||||
Operating profit/(loss) |
2 |
( |
) |
|||||||||||||||||||||||||||||
Operating profit/(loss) analysed as: |
||||||||||||||||||||||||||||||||
Operating profit before System Fund and exceptional items |
||||||||||||||||||||||||||||||||
System Fund |
( |
) |
( |
) |
( |
) | ||||||||||||||||||||||||||
Operating exceptional items |
6 |
( |
) |
( |
) |
( |
) | |||||||||||||||||||||||||
( |
) |
|||||||||||||||||||||||||||||||
Financial income |
7 |
|||||||||||||||||||||||||||||||
Financial expenses |
7 |
( |
) |
( |
) |
( |
) | |||||||||||||||||||||||||
Fair value gains on contingent purchase consideration |
25 |
|||||||||||||||||||||||||||||||
Profit/(loss) before tax |
( |
) |
||||||||||||||||||||||||||||||
Tax |
8 |
( |
) |
( |
) | |||||||||||||||||||||||||||
Profit/(loss) for the year from continuing operations |
( |
) |
||||||||||||||||||||||||||||||
Attributable to: |
||||||||||||||||||||||||||||||||
| Equity holders of the parent |
( |
) |
||||||||||||||||||||||||||||||
Non-controlling interest |
( |
) |
– |
|||||||||||||||||||||||||||||
( |
) |
|||||||||||||||||||||||||||||||
Earnings/(loss) per ordinary share: |
10 |
|||||||||||||||||||||||||||||||
| Basic |
¢ |
()¢ |
¢ |
|||||||||||||||||||||||||||||
| Diluted |
¢ |
()¢ |
¢ |
|||||||||||||||||||||||||||||
 |
Notes on pages 149 to 205 form an integral part of these Group Financial Statements. |
142 |
IHG |
For the year ended 31 December 2021 |
2021 $m |
2020 $m |
2019 $m |
|||||||||||||||||||||
Profit/(loss) for the year |
( |
) |
||||||||||||||||||||||
Other comprehensive income |
||||||||||||||||||||||||
Items that may be subsequently reclassified to profit or loss: |
||||||||||||||||||||||||
Losses on cash flow hedges, including related tax charge of $ |
( |
) |
( |
) | ||||||||||||||||||||
Costs of hedging |
( |
) |
( |
) | ||||||||||||||||||||
Hedging losses/(gains) reclassified to financial expenses |
( |
) |
||||||||||||||||||||||
Exchange gains/(losses) on retranslation of foreign operations, net of related tax charge of $ |
( |
) |
( |
) | ||||||||||||||||||||
( |
) |
( |
) | |||||||||||||||||||||
Items that will not be reclassified to profit or loss: |
||||||||||||||||||||||||
Gains/(losses) on equity instruments classified as fair value through other comprehensive income, net of related tax charge of $ |
( |
) |
||||||||||||||||||||||
Re-measurement gains/(losses) on defined benefit plans, including related tax credit of $ |
( |
) |
( |
) | ||||||||||||||||||||
Tax related to pension contributions |
– |
|||||||||||||||||||||||
( |
) |
|||||||||||||||||||||||
Total other comprehensive income/(loss) for the year |
( |
) |
( |
) | ||||||||||||||||||||
Total comprehensive income/(loss) for the year |
( |
) |
||||||||||||||||||||||
Attributable to: |
||||||||||||||||||||||||
Equity holders of the parent |
( |
) |
||||||||||||||||||||||
Non-controlling interest |
( |
) |
– |
|||||||||||||||||||||
( |
) |
|||||||||||||||||||||||
|
Notes on pages 149 to 205 form an integral part of these Group Financial Statements. |
|
Group Financial Statements |
IHG |
143 |
Equity share capital $m |
Capital redemption reserve $m |
Shares held by employee share trusts $m |
Other reserves $m |
Fair value reserve $m |
Cash flow hedge reserves $m |
Currency translation reserve $m |
Retained earnings $m |
IHG share- holders’ equity $m |
Non- controlling interest $m |
Total equity $m |
||||||||||||||||||||||||||||||||||||||
At 1 January 2021 |
( |
) |
( |
) |
( |
) |
( |
) |
( |
) | ||||||||||||||||||||||||||||||||||||||
Profit for the year |
– |
– |
– |
– |
– |
– |
– |
( |
) |
|||||||||||||||||||||||||||||||||||||||
Other comprehensive income |
||||||||||||||||||||||||||||||||||||||||||||||||
Items that may be subsequently reclassified to profit or loss: |
||||||||||||||||||||||||||||||||||||||||||||||||
Losses on cash flow hedges |
– |
– |
– |
– |
– |
( |
) |
– |
– |
( |
) |
– |
( |
) | ||||||||||||||||||||||||||||||||||
Costs of hedging |
– |
– |
– |
– |
– |
– |
– |
– |
||||||||||||||||||||||||||||||||||||||||
Hedging losses reclassified to financial expenses |
– |
– |
– |
– |
– |
– |
– |
– |
||||||||||||||||||||||||||||||||||||||||
Exchange gains on retranslation of foreign operations |
– |
– |
– |
– |
– |
– |
– |
– |
||||||||||||||||||||||||||||||||||||||||
– |
– |
– |
– |
– |
– |
– |
||||||||||||||||||||||||||||||||||||||||||
Items that will not be reclassified to profit or loss: |
||||||||||||||||||||||||||||||||||||||||||||||||
Gains on equity instruments classified as fair value through other comprehensive income |
– |
– |
– |
– |
– |
– |
– |
– |
||||||||||||||||||||||||||||||||||||||||
Re-measurement gains on defined benefit plans |
– |
– |
– |
– |
– |
– |
– |
– |
||||||||||||||||||||||||||||||||||||||||
Tax related to pension contributions |
– |
– |
– |
– |
– |
– |
– |
– |
||||||||||||||||||||||||||||||||||||||||
– |
– |
– |
– |
– |
– |
– |
||||||||||||||||||||||||||||||||||||||||||
Total other comprehensive income for the year |
– |
– |
– |
– |
– |
|||||||||||||||||||||||||||||||||||||||||||
Total comprehensive income for the year |
– |
– |
– |
– |
( |
) |
||||||||||||||||||||||||||||||||||||||||||
Transfer of treasury shares to employee share trusts |
– |
– |
( |
) |
– |
– |
– |
– |
– |
– |
– |
|||||||||||||||||||||||||||||||||||||
Release of own shares by employee share trusts |
– |
– |
– |
– |
– |
– |
( |
) |
– |
– |
– |
|||||||||||||||||||||||||||||||||||||
Equity-settled share-based cost |
– |
– |
– |
– |
– |
– |
– |
– |
||||||||||||||||||||||||||||||||||||||||
Tax related to share schemes |
– |
– |
– |
– |
– |
– |
– |
– |
||||||||||||||||||||||||||||||||||||||||
Exchange adjustments |
( |
) |
– |
– |
– |
– |
– |
– |
– |
– |
– |
|||||||||||||||||||||||||||||||||||||
At 31 December 2021 |
( |
) |
( |
) |
( |
) |
( |
) | ||||||||||||||||||||||||||||||||||||||||
|
Notes on pages 149 to 205 form an integral part of these Group Financial Statements. |
144 |
IHG |
Equity share capital $m |
Capital redemption reserve $m |
Shares held by employee share trusts $m |
Other reserves $m |
Fair value reserve $m |
Cash flow hedge reserves $m |
Currency translation reserve $m |
Retained earnings $m |
IHG share- holders’ equity $m |
Non- controlling interest $m |
Total equity $m |
||||||||||||||||||||||||||||||||||||||
At 1 January 2020 |
( |
) |
( |
) |
( |
) |
( |
) |
( |
) | ||||||||||||||||||||||||||||||||||||||
Loss for the year |
– |
– |
– |
– |
– |
– |
– |
( |
) |
( |
) |
– |
( |
) | ||||||||||||||||||||||||||||||||||
Other comprehensive income |
||||||||||||||||||||||||||||||||||||||||||||||||
Items that may be subsequently reclassified to profit or loss: |
||||||||||||||||||||||||||||||||||||||||||||||||
Losses on cash flow hedges |
– |
– |
– |
– |
– |
– |
– |
– |
||||||||||||||||||||||||||||||||||||||||
Costs of hedging |
– |
– |
– |
– |
– |
( |
) |
– |
– |
( |
) |
– |
( |
) | ||||||||||||||||||||||||||||||||||
Hedging gains reclassified to financial expenses |
– |
– |
– |
– |
– |
( |
) |
– |
– |
( |
) |
– |
( |
) | ||||||||||||||||||||||||||||||||||
Exchange losses on retranslation of foreign operations |
– |
– |
– |
– |
– |
( |
) |
( |
) |
– |
( |
) |
– |
( |
) | |||||||||||||||||||||||||||||||||
– |
– |
– |
– |
– |
( |
) |
( |
) |
– |
( |
) |
– |
( |
) | ||||||||||||||||||||||||||||||||||
Items that will not be reclassified to profit or loss: |
||||||||||||||||||||||||||||||||||||||||||||||||
Losses on equity instruments classified as fair value through other comprehensive income |
– |
– |
– |
– |
( |
) |
– |
– |
– |
( |
) |
– |
( |
) | ||||||||||||||||||||||||||||||||||
Gains on equity instruments transferred to retained earnings on disposal |
– |
– |
– |
– |
( |
) |
– |
– |
– |
– |
– |
|||||||||||||||||||||||||||||||||||||
Re-measurement losses on defined benefit plans |
– |
– |
– |
– |
– |
– |
– |
( |
) |
( |
) |
– |
( |
) | ||||||||||||||||||||||||||||||||||
Tax related to pension contributions |
– |
– |
– |
– |
– |
– |
– |
– |
||||||||||||||||||||||||||||||||||||||||
– |
– |
– |
– |
( |
) |
– |
– |
( |
) |
( |
) |
– |
( |
) | ||||||||||||||||||||||||||||||||||
Total other comprehensive loss for the year |
– |
– |
– |
– |
( |
) |
( |
) |
( |
) |
( |
) |
( |
) |
– |
( |
) | |||||||||||||||||||||||||||||||
Total comprehensive loss for the year |
– |
– |
– |
– |
( |
) |
( |
) |
( |
) |
( |
) |
( |
) |
– |
( |
) | |||||||||||||||||||||||||||||||
Transfer of treasury shares to employee share trusts |
– |
– |
( |
) |
– |
– |
– |
– |
– |
– |
– |
|||||||||||||||||||||||||||||||||||||
Release of own shares by employee share trusts |
– |
– |
– |
– |
– |
– |
( |
) |
– |
– |
– |
|||||||||||||||||||||||||||||||||||||
Equity-settled share-based cost, net of $ |
– |
– |
– |
– |
– |
– |
– |
– |
||||||||||||||||||||||||||||||||||||||||
Tax related to share schemes |
– |
– |
– |
– |
– |
– |
– |
( |
) |
( |
) |
– |
( |
) | ||||||||||||||||||||||||||||||||||
Exchange adjustments |
– |
– |
( |
) |
– |
– |
– |
– |
– |
– |
– |
|||||||||||||||||||||||||||||||||||||
At 31 December 2020 |
( |
) |
( |
) |
( |
) |
( |
) |
( |
) | ||||||||||||||||||||||||||||||||||||||
|
Notes on pages 149 to 205 form an integral part of these Group Financial Statements. |
|
Group Financial Statements |
IHG |
145 |
Equity share capital $m |
Capital redemption reserve $m |
Shares held by employee share trusts $m |
Other reserves $m |
Fair value reserve $m |
Cash flow hedge reserves $m |
Currency translation reserve $m |
Retained earnings $m |
IHG share- holders’ equity $m |
Non- controlling interest $m |
Total equity $m |
||||||||||||||||||||||||||||||||||||||
At 1 January 2019 |
( |
) |
( |
) |
( |
) |
( |
) |
( |
) | ||||||||||||||||||||||||||||||||||||||
Profit for the year |
– |
– |
– |
– |
– |
– |
– |
|||||||||||||||||||||||||||||||||||||||||
Other comprehensive income |
||||||||||||||||||||||||||||||||||||||||||||||||
Items that may be subsequently reclassified to profit or loss: |
||||||||||||||||||||||||||||||||||||||||||||||||
Losses on cash flow hedges |
– |
– |
– |
– |
– |
( |
) |
– |
– |
( |
) |
– |
( |
) | ||||||||||||||||||||||||||||||||||
Costs of hedging |
– |
– |
– |
– |
– |
( |
) |
– |
– |
( |
) |
– |
( |
) | ||||||||||||||||||||||||||||||||||
Hedging losses reclassified to financial expenses |
– |
– |
– |
– |
– |
– |
– |
– |
||||||||||||||||||||||||||||||||||||||||
Exchange losses on retranslation of foreign operations |
– |
– |
– |
– |
– |
– |
( |
) |
– |
( |
) |
– |
( |
) | ||||||||||||||||||||||||||||||||||
– |
– |
– |
– |
– |
( |
) |
( |
) |
– |
( |
) |
– |
( |
) | ||||||||||||||||||||||||||||||||||
Items that will not be reclassified to profit or loss: |
||||||||||||||||||||||||||||||||||||||||||||||||
Gains on equity instruments classified as fair value through other comprehensive income |
– |
– |
– |
– |
– |
– |
– |
– |
||||||||||||||||||||||||||||||||||||||||
Re-measurement losses on defined benefit plans |
– |
– |
– |
– |
– |
– |
– |
( |
) |
( |
) |
– |
( |
) | ||||||||||||||||||||||||||||||||||
– |
– |
– |
– |
– |
– |
( |
) |
– |
||||||||||||||||||||||||||||||||||||||||
Total other comprehensive income/(loss) for the year |
– |
– |
– |
– |
( |
) |
( |
) |
( |
) |
( |
) |
– |
( |
) | |||||||||||||||||||||||||||||||||
Total comprehensive income for the year |
– |
– |
– |
– |
( |
) |
( |
) |
||||||||||||||||||||||||||||||||||||||||
Transfer of treasury shares to employee share trusts |
– |
– |
( |
) |
– |
– |
– |
– |
– |
– |
– |
|||||||||||||||||||||||||||||||||||||
Purchase of own shares by employee share trusts |
– |
– |
( |
) |
– |
– |
– |
– |
– |
( |
) |
– |
( |
) | ||||||||||||||||||||||||||||||||||
Release of own shares by employee share trusts |
– |
– |
– |
– |
– |
– |
( |
) |
– |
– |
– |
|||||||||||||||||||||||||||||||||||||
Equity-settled share-based cost |
– |
– |
– |
– |
– |
– |
– |
– |
||||||||||||||||||||||||||||||||||||||||
Tax related to share schemes |
– |
– |
– |
– |
– |
– |
– |
– |
||||||||||||||||||||||||||||||||||||||||
Equity dividends paid |
– |
– |
– |
– |
– |
– |
– |
( |
) |
( |
) |
( |
) |
( |
) | |||||||||||||||||||||||||||||||||
Transaction costs relating to shareholder returns |
– |
– |
– |
– |
– |
– |
– |
( |
) |
( |
) |
– |
( |
) | ||||||||||||||||||||||||||||||||||
Exchange adjustments |
– |
– |
( |
) |
– |
– |
– |
– |
– |
– |
– |
|||||||||||||||||||||||||||||||||||||
At 31 December 2019 |
( |
) |
( |
) |
( |
) |
( |
) |
( |
) | ||||||||||||||||||||||||||||||||||||||
|
Notes on pages 149 to 205 form an integral part of these Group Financial Statements. |
146 |
IHG |
31 December 2021 |
Note |
2021 $m |
2020 $m |
|||||||||||||||||||||
ASSETS |
||||||||||||||||||||||||
Goodwill and other intangible assets |
13 |
|||||||||||||||||||||||
Property, plant and equipment |
14 |
|||||||||||||||||||||||
Right-of-use |
15 |
|||||||||||||||||||||||
Investment in associates and joint ventures |
16 |
|||||||||||||||||||||||
Retirement benefit assets |
27 |
|||||||||||||||||||||||
Other financial assets |
17 |
|||||||||||||||||||||||
Derivative financial instruments |
24 |
|||||||||||||||||||||||
Deferred compensation plan investments |
||||||||||||||||||||||||
Non-current tax receivable |
||||||||||||||||||||||||
Deferred tax assets |
8 |
|||||||||||||||||||||||
Contract costs |
3 |
|||||||||||||||||||||||
Contract assets |
3 |
|||||||||||||||||||||||
Total non-current assets |
||||||||||||||||||||||||
Inventories |
||||||||||||||||||||||||
Trade and other receivables |
18 |
|||||||||||||||||||||||
Current tax receivable |
||||||||||||||||||||||||
Other financial assets |
17 |
|||||||||||||||||||||||
Cash and cash equivalents |
19 |
|||||||||||||||||||||||
Contract costs |
3 |
|||||||||||||||||||||||
Contract assets |
3 |
|||||||||||||||||||||||
Total current assets |
||||||||||||||||||||||||
Total assets |
||||||||||||||||||||||||
LIABILITIES |
||||||||||||||||||||||||
Loans and other borrowings |
22 |
( |
) |
( |
) | |||||||||||||||||||
Lease liabilities |
15 |
( |
) |
( |
) | |||||||||||||||||||
Trade and other payables |
20 |
( |
) |
( |
) | |||||||||||||||||||
Deferred revenue |
3 |
( |
) |
( |
) | |||||||||||||||||||
Provisions |
21 |
( |
) |
( |
) | |||||||||||||||||||
Current tax payable |
( |
) |
( |
) | ||||||||||||||||||||
Total current liabilities |
( |
) |
( |
) | ||||||||||||||||||||
Loans and other borrowings |
22 |
( |
) |
( |
) | |||||||||||||||||||
Lease liabilities |
15 |
( |
) |
( |
) | |||||||||||||||||||
Derivative financial instruments |
24 |
( |
) |
( |
) | |||||||||||||||||||
Retirement benefit obligations |
27 |
( |
) |
( |
) | |||||||||||||||||||
Deferred compensation plan liabilities |
( |
) |
( |
) | ||||||||||||||||||||
Trade and other payables |
20 |
( |
) |
( |
) | |||||||||||||||||||
Deferred revenue |
3 |
( |
) |
( |
) | |||||||||||||||||||
Provisions |
21 |
( |
) |
( |
) | |||||||||||||||||||
Deferred tax liabilities |
8 |
( |
) |
( |
) | |||||||||||||||||||
Total non-current liabilities |
( |
) |
( |
) | ||||||||||||||||||||
Total liabilities |
( |
) |
( |
) | ||||||||||||||||||||
Net liabilities |
( |
) |
( |
) | ||||||||||||||||||||
EQUITY |
||||||||||||||||||||||||
IHG shareholders’ equity |
( |
) |
( |
) | ||||||||||||||||||||
Non-controlling interest |
||||||||||||||||||||||||
Total equity |
( |
) |
( |
) | ||||||||||||||||||||
|
Notes on pages 149 to 205 form an integral part of these Group Financial Statements. |
 |
Group Financial Statements |
IHG |
147 |
For the year ended 31 December 2021 |
Note |
2021 $m |
2020 $m |
2019 $m |
||||||||||||||||||||||||||||
Profit/(loss) for the year |
( |
) |
||||||||||||||||||||||||||||||
Adjustments reconciling profit/(loss) for the year to cash flow from operations |
26 |
|||||||||||||||||||||||||||||||
Cash flow from operations |
||||||||||||||||||||||||||||||||
Interest paid |
( |
) |
( |
) |
( |
) | ||||||||||||||||||||||||||
Interest received |
||||||||||||||||||||||||||||||||
Contingent purchase consideration paid |
– |
– |
( |
) | ||||||||||||||||||||||||||||
Tax paid |
8 |
( |
) |
( |
) |
( |
) | |||||||||||||||||||||||||
Net cash from operating activities |
||||||||||||||||||||||||||||||||
Cash flow from investing activities |
||||||||||||||||||||||||||||||||
Purchase of property, plant and equipment |
( |
) |
( |
) |
( |
) | ||||||||||||||||||||||||||
Purchase of intangible assets |
( |
) |
( |
) |
( |
) | ||||||||||||||||||||||||||
Investment in associates |
– |
( |
) |
( |
) | |||||||||||||||||||||||||||
Investment in other financial assets |
( |
) |
( |
) |
( |
) | ||||||||||||||||||||||||||
Acquisition of businesses, net of cash acquired |
11 |
– |
– |
( |
) | |||||||||||||||||||||||||||
Deferred and contingent purchase consideration paid |
25 |
( |
) |
– |
( |
) | ||||||||||||||||||||||||||
Capitalised interest paid |
7 |
– |
( |
) |
( |
) | ||||||||||||||||||||||||||
Distributions from associates and joint ventures |
– |
– |
||||||||||||||||||||||||||||||
Disposal of hotel assets, net of costs and cash disposed |
12 |
– |
||||||||||||||||||||||||||||||
Repayments of other financial assets |
||||||||||||||||||||||||||||||||
Disposal of equity securities |
– |
– |
||||||||||||||||||||||||||||||
Net cash from investing activities |
( |
) |
( |
) |
( |
) | ||||||||||||||||||||||||||
Cash flow from financing activities |
||||||||||||||||||||||||||||||||
Purchase of own shares by employee share trusts |
– |
– |
( |
) | ||||||||||||||||||||||||||||
Dividends paid to shareholders |
9 |
– |
– |
( |
) | |||||||||||||||||||||||||||
Dividend paid to non-controlling interest |
– |
– |
( |
) | ||||||||||||||||||||||||||||
Transaction costs relating to shareholder returns |
– |
– |
( |
) | ||||||||||||||||||||||||||||
Issue of long-term bonds, including effect of currency swaps |
23 |
– |
– |
|||||||||||||||||||||||||||||
(Repayment)/issue of commercial paper |
23 |
( |
) |
– |
||||||||||||||||||||||||||||
Repayment of long-term bonds |
23 |
– |
( |
) |
– |
|||||||||||||||||||||||||||
Principal element of lease payments |
23 |
( |
) |
( |
) |
( |
) | |||||||||||||||||||||||||
(Decrease)/increase in other borrowings |
23 |
– |
( |
) |
||||||||||||||||||||||||||||
Proceeds from currency swaps |
23 |
– |
– |
|||||||||||||||||||||||||||||
Net cash from financing activities |
( |
) |
( |
) | ||||||||||||||||||||||||||||
Net movement in cash and cash equivalents in the year |
( |
) |
( |
) | ||||||||||||||||||||||||||||
Cash and cash equivalents at beginning of the year |
19 |
|||||||||||||||||||||||||||||||
Exchange rate effects |
||||||||||||||||||||||||||||||||
Cash and cash equivalents at end of the year |
19 |
|||||||||||||||||||||||||||||||
|
Notes on pages 149 to 205 form an integral part of these Group Financial Statements. |
148 |
IHG |
|
Accounting policies |
IHG |
149 |
• |
Power over an investee (i.e. existing rights that give it the current ability to direct the relevant activities of the investee); |
• |
Exposure, or rights, to variable returns from its involvement with the investee; and |
• |
The ability to use its power over the investee to affect its returns. |
150 |
IHG |
• |
The assets and liabilities of foreign operations, including goodwill, of the Group’s subsidiaries with a functional currency other than US dollars are translated into US dollars at the relevant rates of exchange ruling on the last day of the period. The revenues and expenses of foreign operations are translated into US dollars at average rates of exchange for the period. The exchange differences arising on retranslation are taken to the currency translation reserve; and |
• |
Exchange differences arising from the translation of borrowings that are designated as a hedge against a net investment in a foreign operation are taken to the currency translation reserve. The Group treats specific intercompany loan balances, which are not intended to be repaid in the foreseeable future, as part of its net investment. On disposal of a foreign operation, the cumulative amount recognised in the currency translation reserve relating to that particular foreign operation is recycled against the gain or loss on disposal. |
Accounting policies |
IHG |
151 |
a) |
Arranging for the provision of future benefits to members who have earned points or free night certificates; |
b) |
Marketing services; and |
c) |
Providing the co-brand partner with the right to access the loyalty programme. |
152 |
IHG |
• |
The ability and intention to complete the project; |
• |
That the completed software will generate probable future economic benefits; |
• |
The availability of adequate technical, financial and other resources to complete the project; and |
• |
The ability to measure the expenditure. |
• |
Buildings – over a maximum of |
• |
Fixtures, fittings and equipment – to |
Accounting policies |
IHG |
153 |
• |
Short-term lease payments, payments for leases of low-value assets and variable lease payments that are not included in the measurement of the lease liabilities are presented within cash flows from operating activities; |
• |
Payments for the interest element of recognised lease liabilities are included in interest paid within cash flows from operating activities; and |
• |
Payments for the principal element of recognised lease liabilities are presented within cash flows from financing activities. |
154 |
IHG |
• |
Financial assets and liabilities at FVTPL; |
• |
Financial assets measured at FVOCI; and |
• |
Derivative financial instruments. |
Accounting policies |
IHG |
155 |
Level 1: |
Quoted (unadjusted) prices in active markets for identical assets or liabilities. | |
Level 2: |
Other techniques for which all inputs which have a significant effect on the recorded fair value are observable, either directly or indirectly. | |
Level 3: |
Techniques which use inputs which have a significant effect | |
on the recorded fair value that are not based on observable | ||
market data. | ||
156 |
IHG |
• |
Has a continuing managerial involvement to the degree associated with asset ownership; |
• |
Has transferred the significant risks and rewards associated with asset ownership; and |
• |
Can reliably measure and will actually receive the proceeds. |
• |
Cash flow hedge reserve: the effective portion of the cumulative net change in the fair value of hedging instruments used in cash flow hedges pending subsequent recognition in profit or loss; and |
• |
Cost of hedging reserve: the gain or loss which is excluded from the designated hedging instrument relating to the foreign currency basis spread of currency swaps. |
• |
IAS 37 – Onerous Contracts: Cost of Fulfilling a Contract; |
• |
IAS 16 – Property, Plant and Equipment: Proceeds before Intended Use; and |
• |
Other existing standards arising from the Annual Improvements to IFRSs 2018 – 2020 cycle. |
• |
IAS 1 and IFRS Practice Statement 2 – Disclosure of Accounting Policies; |
• |
IAS 8 – Definition of Accounting Estimates; and |
• |
IAS 12 – Deferred Tax related to Assets and Liabilities arising from a Single Transaction. |
| |
Accounting policies |
IHG |
157 |
2021 |
2020 |
2019 |
||||||||||||||||||||||
Year ended 31 December |
$m |
$m |
$m |
|||||||||||||||||||||
Americas |
||||||||||||||||||||||||
EMEAA |
||||||||||||||||||||||||
Greater China |
||||||||||||||||||||||||
Central |
||||||||||||||||||||||||
Revenue from reportable segments |
||||||||||||||||||||||||
System Fund revenues |
||||||||||||||||||||||||
Reimbursement of costs |
||||||||||||||||||||||||
Total revenue |
||||||||||||||||||||||||
2021 |
2020 |
2019 |
||||||||||||||||||||||
Year ended 31 December |
$m |
$m |
$m |
|||||||||||||||||||||
Americas |
||||||||||||||||||||||||
EMEAA |
( |
) |
||||||||||||||||||||||
Greater China |
||||||||||||||||||||||||
Central |
( |
) |
( |
) |
( |
) | ||||||||||||||||||
Operating profit from reportable segments |
||||||||||||||||||||||||
System Fund |
( |
) |
( |
) |
( |
) | ||||||||||||||||||
Operating exceptional items (note 6) |
( |
) |
( |
) |
( |
) | ||||||||||||||||||
Operating profit/(loss) |
( |
) |
||||||||||||||||||||||
Net financial expenses |
( |
) |
( |
) |
( |
) | ||||||||||||||||||
Fair value gains on contingent purchase consideration |
||||||||||||||||||||||||
Profit/(loss) before tax |
( |
) |
||||||||||||||||||||||
Tax |
( |
) |
( |
) | ||||||||||||||||||||
Profit/(loss) for the year |
( |
) |
||||||||||||||||||||||
158 |
IHG |
• |
In 2021, $ |
• |
In 2020, $ the EMEAA region ; and |
• |
In 2019, $ |
Year ended 31 December 2021 |
Americas $m |
EMEAA $m |
Greater China $m |
Central $m |
Group $m | |||||||||||||||
Depreciation and amortisation a |
||||||||||||||||||||
Equity-settled share-based payments cost |
||||||||||||||||||||
Share of losses of associates |
– |
– |
Year ended 31 December 2020 |
Americas $m |
EMEAA $m |
Greater China $m |
Central $m |
Group $m | |||||||||||||||
Depreciation and amortisation a |
||||||||||||||||||||
Equity-settled share-based payments cost |
||||||||||||||||||||
Share of losses of associates and joint ventures |
– |
– |
– |
|||||||||||||||||
Year ended 31 December 2019 |
Americas $m |
EMEAA $m |
Greater China $m |
Central $m |
Group $m | |||||||||||||||
Depreciation and amortisation a |
||||||||||||||||||||
Equity-settled share-based payments cost |
||||||||||||||||||||
Share of losses/(gains) of associates and joint ventures |
( |
– |
– |
|||||||||||||||||
a |
Included in the $ |
Year ended 31 December 2021 |
Americas $m |
EMEAA $m |
Greater China $m |
Central $m |
Group $m | |||||||||||||||
Capital expenditure per management reporting |
||||||||||||||||||||
Contract acquisition costs |
( |
( |
( |
– |
( | |||||||||||||||
Timing differences and other adjustments |
( |
– |
||||||||||||||||||
Additions per the Group Financial Statements |
– |
|||||||||||||||||||
Comprising additions to: |
||||||||||||||||||||
Goodwill and other intangible assets |
– |
|||||||||||||||||||
Property, plant and equipment |
– |
|||||||||||||||||||
Investment in associates and joint ventures |
– |
– |
– |
|||||||||||||||||
Other financial assets |
– |
– |
– |
|||||||||||||||||
– |
||||||||||||||||||||
Year ended 31 December 2020 |
Americas $m |
EMEAA $m |
Greater China $m |
Central $m |
Group $m | |||||||||||||||
Capital expenditure per management reporting |
||||||||||||||||||||
Contract acquisition costs |
( |
( |
( |
– |
( | |||||||||||||||
Timing differences and other adjustments |
– |
( |
||||||||||||||||||
Additions per the Group Financial Statements |
– |
|||||||||||||||||||
Comprising additions to: |
||||||||||||||||||||
Goodwill and other intangible assets |
– |
|||||||||||||||||||
Property, plant and equipment |
– |
|||||||||||||||||||
Investment in associates and joint ventures |
– |
– |
– |
|||||||||||||||||
Other financial assets |
– |
– |
– |
|||||||||||||||||
– |
||||||||||||||||||||
|
Notes to the Group Financial Statements |
IHG |
159 |
Year ended 31 December |
2021 $m |
2020 $m |
2019 $m |
|||||||||||||||
Revenue |
||||||||||||||||||
United Kingdom |
||||||||||||||||||
United States |
||||||||||||||||||
Rest of World |
||||||||||||||||||
System Fund (note 33) |
||||||||||||||||||
31 December |
2021 $m |
2020 $m |
||||||||||||||
Non-current assets |
||||||||||||||||
United Kingdom |
||||||||||||||||
United States |
||||||||||||||||
Rest of World |
||||||||||||||||
Year ended 31 December 2021 |
Americas $m |
EMEAA $m |
Greater China $m |
Central $m |
Group $m |
|||||||||
Franchise and base management fees |
||||||||||||||
Incentive management fees |
||||||||||||||
Central revenue |
– |
– |
– |
|||||||||||
Revenue from fee business |
||||||||||||||
Revenue from owned, leased and managed lease hotels |
– |
– |
||||||||||||
System Fund revenues (note 33) |
||||||||||||||
Reimbursement of costs |
||||||||||||||
Total revenue |
||||||||||||||
Year ended 31 December 2020 |
Americas $m |
EMEAA $m |
Greater China $m |
Central $m |
Group $m |
|||||||||
Franchise and base management fees |
– |
|||||||||||||
Incentive management fees |
– |
|||||||||||||
Central revenue |
– |
– |
– |
|||||||||||
Revenue from fee business |
||||||||||||||
Revenue from owned, leased and managed lease hotels |
– |
– |
||||||||||||
System Fund revenues (note 33) |
||||||||||||||
Reimbursement of costs |
||||||||||||||
Total revenue |
||||||||||||||
160 |
IHG |
Year ended 31 December 2019 |
Americas $m |
EMEAA $m |
Greater China $m |
Central $m |
Group $m |
|||||||||
Franchise and base management fees |
– |
|||||||||||||
Incentive management fees |
– |
|||||||||||||
Central revenue |
– |
– |
– |
|||||||||||
Revenue from fee business |
||||||||||||||
Revenue from owned, leased and managed lease hotels |
– |
– |
||||||||||||
System Fund revenues (note 33) |
||||||||||||||
Reimbursement of costs |
||||||||||||||
Total revenue |
||||||||||||||
2021 $m |
2020 $m |
|||||||||||
Trade receivables (note 18) |
||||||||||||
Contract assets |
||||||||||||
Deferred revenue |
( |
) |
( |
) | ||||||||
2021 $m |
2020 $m |
|||||||||||
At 1 January |
||||||||||||
Additions |
||||||||||||
Recognised as a deduction to revenue |
( |
) |
( |
) | ||||||||
Impairment charges |
– |
( |
) | |||||||||
Repayments |
( |
) |
– |
|||||||||
Exchange and other adjustments |
||||||||||||
At 31 December |
||||||||||||
Analysed as: |
||||||||||||
Current |
||||||||||||
Non-current |
||||||||||||
|
Notes to the Group Financial Statements |
IHG |
161 |
Loyalty programme $m |
Other co-brand fees $m |
Application & re-licensing fees $m |
Other $m |
Total $m |
||||||||||||||||||||
At 1 January 2020 |
||||||||||||||||||||||||
Increase in deferred revenue |
– |
|||||||||||||||||||||||
Recognised as revenue |
( |
) |
( |
) |
( |
) |
( |
) |
( |
) | ||||||||||||||
Exchange and other adjustments |
– |
– |
– |
|||||||||||||||||||||
At 31 December 2020 |
||||||||||||||||||||||||
Increase in deferred revenue |
– |
|||||||||||||||||||||||
Recognised as revenue |
( |
) |
( |
) |
( |
) |
( |
) |
( |
) | ||||||||||||||
Exchange and other adjustments |
– |
– |
– |
|||||||||||||||||||||
At 31 December 2021 |
||||||||||||||||||||||||
Analysed as: |
||||||||||||||||||||||||
Current |
||||||||||||||||||||||||
Non-current |
||||||||||||||||||||||||
At 31 December 2020: |
||||||||||||||||||||||||
Current |
||||||||||||||||||||||||
Non-current |
||||||||||||||||||||||||
2021 |
2020 |
|||||||||||||||||||||||||||||||
Loyalty and co-brand $m |
Other $m |
Total $m |
Loyalty and co-brand $m |
Other $m |
Total $m |
|||||||||||||||||||||||||||
Expected timing of recognition |
||||||||||||||||||||||||||||||||
Less than one year |
||||||||||||||||||||||||||||||||
Between one and two years |
||||||||||||||||||||||||||||||||
Between two and three years |
||||||||||||||||||||||||||||||||
Between three and four years |
||||||||||||||||||||||||||||||||
Between four and five years |
||||||||||||||||||||||||||||||||
More than five years |
||||||||||||||||||||||||||||||||
162 |
IHG |
2021 $m |
2020 $m |
|||||||||||
At 1 January |
||||||||||||
Costs incurred |
||||||||||||
Amortisation |
( |
) |
( |
) | ||||||||
Exchange and other adjustments |
– |
|||||||||||
At 31 December |
||||||||||||
Analysed as: |
||||||||||||
Current |
||||||||||||
Non-current |
||||||||||||
2021 $m |
2020 $m |
2019 $m |
||||||||||||||||
Staff costs |
||||||||||||||||||
Wages and salaries |
||||||||||||||||||
Social security costs |
||||||||||||||||||
Pension and other post-retirement benefits: |
||||||||||||||||||
Defined benefit plans (note 27) |
||||||||||||||||||
Defined contribution plans |
||||||||||||||||||
Analysed as: |
||||||||||||||||||
Costs borne by IHG a |
||||||||||||||||||
Costs borne by the System Fund b |
||||||||||||||||||
Costs reimbursed |
||||||||||||||||||
a |
Included $ |
b |
Included $ |
2021 |
2020 |
2019 |
||||||||||||||||
Monthly average number of employees, including part-time employees |
||||||||||||||||||
Employees whose costs are borne by IHG: |
||||||||||||||||||
Americas |
||||||||||||||||||
EMEAA |
||||||||||||||||||
Greater China |
||||||||||||||||||
Central |
||||||||||||||||||
Employees whose costs are borne by the System Fund |
||||||||||||||||||
Employees whose costs are reimbursed |
||||||||||||||||||
|
Notes to the Group Financial Statements |
IHG |
163 |
2021 $m |
2020 $m |
2019 $m |
||||||||||||||||
Directors’ remuneration |
||||||||||||||||||
Base salaries, fees, annual performance payments and benefits |
||||||||||||||||||
 |
More detailed information on the remuneration including pensions, share awards and shareholdings for each Director is shown in the Directors’ Remuneration Report on pages 115 and 123. In addition, amounts received or receivable under long-term incentive schemes are shown on page 115. |
2021 $m |
2020 $m |
2019 $m |
||||||||||||||||
Audit of the Financial Statements |
||||||||||||||||||
Audit of subsidiaries |
||||||||||||||||||
Audit-related assurance services |
||||||||||||||||||
Other assurance services a |
||||||||||||||||||
Other non-audit services not covered by the above |
||||||||||||||||||
a |
In 2020, excluded fees of $ |
164 |
IHG |
Note |
2021 $m |
2020 $m |
2019 $m |
|||||||||||||||||||||||||||||
Cost of sales: |
||||||||||||||||||||||||||||||||
Derecognition of right-of-use |
(a)(h) |
– |
||||||||||||||||||||||||||||||
Gain on lease termination |
(b) |
– |
||||||||||||||||||||||||||||||
Provision for onerous contractual expenditure |
(h) |
( |
) |
– |
||||||||||||||||||||||||||||
Reorganisation costs |
(c)(h) |
( |
) |
– |
||||||||||||||||||||||||||||
– |
||||||||||||||||||||||||||||||||
Administrative expenses: |
||||||||||||||||||||||||||||||||
Reorganisation costs |
(c) |
( |
) |
( |
) | |||||||||||||||||||||||||||
Acquisition and integration costs |
(d) |
( |
) |
( |
) | |||||||||||||||||||||||||||
Litigation and commercial disputes |
(e) |
( |
) |
( |
) |
( |
) | |||||||||||||||||||||||||
( |
) |
( |
) |
( |
) | |||||||||||||||||||||||||||
Impairment loss on financial assets |
(f) |
– |
( |
) |
– |
|||||||||||||||||||||||||||
Other impairment charges: |
||||||||||||||||||||||||||||||||
Goodwill |
(h) |
– |
( |
) | ||||||||||||||||||||||||||||
Management agreements |
13 |
( |
) |
( |
) | |||||||||||||||||||||||||||
Property, plant and equipment |
14, (h) |
( |
) |
– |
||||||||||||||||||||||||||||
Right-of-use |
15, (h) |
( |
) |
( |
) | |||||||||||||||||||||||||||
Associates |
16 |
( |
) |
( |
) |
– |
||||||||||||||||||||||||||
Contract assets |
3 |
( |
) |
– |
||||||||||||||||||||||||||||
( |
) |
( |
) |
( |
) | |||||||||||||||||||||||||||
Operating exceptional items |
( |
) |
( |
) |
( |
) | ||||||||||||||||||||||||||
Financial expenses |
(g) |
( |
) |
– |
||||||||||||||||||||||||||||
Fair value gains on contingent purchase consideration |
(h) |
|||||||||||||||||||||||||||||||
Exceptional items before tax |
( |
) |
( |
) |
( |
) | ||||||||||||||||||||||||||
Tax on exceptional items |
(i) |
|||||||||||||||||||||||||||||||
Exceptional tax |
(j) |
– |
– |
|||||||||||||||||||||||||||||
Tax |
||||||||||||||||||||||||||||||||
Operating exceptional items analysed as: |
||||||||||||||||||||||||||||||||
Americas |
( |
) |
( |
) |
( |
) | ||||||||||||||||||||||||||
EMEAA |
( |
) |
( |
) |
( |
) | ||||||||||||||||||||||||||
Greater China |
( |
) |
– |
|||||||||||||||||||||||||||||
Central |
( |
) |
( |
) | ||||||||||||||||||||||||||||
( |
) |
( |
) |
( |
) | |||||||||||||||||||||||||||
|
The above items are treated as exceptional (as defined by management) by reason of their size, nature, or incidence as further described on page 152. |
|
Notes to the Group Financial Statements |
IHG |
165 |
2021 $m |
2020 $m |
2019 $m |
||||||||||||||||
Cost of sales: |
||||||||||||||||||
Derecognition of right-of-use |
– |
– |
||||||||||||||||
Provision for onerous contractual expenditure |
– |
( |
) |
– |
||||||||||||||
Reorganisation costs |
– |
( |
) |
– |
||||||||||||||
– |
– |
|||||||||||||||||
Other impairment charges: |
||||||||||||||||||
Goodwill |
– |
– |
( |
) | ||||||||||||||
Property, plant and equipment |
– |
( |
) |
– |
||||||||||||||
Right-of-use |
– |
– |
( |
) | ||||||||||||||
– |
( |
) |
( |
) | ||||||||||||||
Operating exceptional items |
– |
( |
) |
( |
) | |||||||||||||
Fair value gains on contingent purchase consideration (note 25) |
– |
|||||||||||||||||
Exceptional items before tax |
– |
( |
) |
( |
) | |||||||||||||
166 |
IHG |
2021 |
2020 |
2019 |
||||||||||||||||||||||||||||||||||
Current tax $m |
Deferred tax $m |
Current tax $m |
Deferred tax $m |
Current tax $m |
Deferred tax $m |
|||||||||||||||||||||||||||||||
Derecognition of right-of-use |
– |
( |
) |
– |
– |
|||||||||||||||||||||||||||||||
Provision for onerous contractual expenditure |
– |
– |
– |
|||||||||||||||||||||||||||||||||
Reorganisation costs |
– |
|||||||||||||||||||||||||||||||||||
Acquisition and integration costs |
– |
– |
– |
|||||||||||||||||||||||||||||||||
Litigation and commercial disputes |
– |
– |
– |
|||||||||||||||||||||||||||||||||
Impairment loss on financial assets |
– |
– |
||||||||||||||||||||||||||||||||||
Other impairment charges |
– |
|||||||||||||||||||||||||||||||||||
Financial expenses |
– |
– |
– |
|||||||||||||||||||||||||||||||||
Fair value gains on contingent purchase consideration |
– |
( |
) |
– |
( |
) | ||||||||||||||||||||||||||||||
Adjustments in respect of prior years a |
( |
) |
– |
– |
– |
( |
) | |||||||||||||||||||||||||||||
( |
) |
|||||||||||||||||||||||||||||||||||
Total current and deferred tax |
||||||||||||||||||||||||||||||||||||
a |
In 2021, relates to exceptional items recorded in 2014 which are undergoing tax audit (see page 171). In 2019, related to a 2014 disposal. |
| |
Notes to the Group Financial Statements |
IHG |
167 |
2021 $m |
2020 $m |
2019 $m |
||||||||||||||||||||||
Financial income |
||||||||||||||||||||||||
Financial income on deposits and money market funds |
||||||||||||||||||||||||
Interest income on loans and other assets |
||||||||||||||||||||||||
8 |
||||||||||||||||||||||||
Financial expenses |
||||||||||||||||||||||||
Interest expense on external borrowings |
||||||||||||||||||||||||
Interest expense on lease liabilities |
||||||||||||||||||||||||
Capitalised interest |
( |
) |
( |
) | ||||||||||||||||||||
Unwind of discount on deferred purchase consideration |
||||||||||||||||||||||||
Other charges |
||||||||||||||||||||||||
Analysed as: |
||||||||||||||||||||||||
Financial expenses before exceptional items |
||||||||||||||||||||||||
Exceptional financial expenses (note 6) |
– |
|||||||||||||||||||||||
168 |
IHG |
2021 $m |
2020 $m |
2019 $m |
||||||||||||||||||||||
Current tax |
||||||||||||||||||||||||
UK tax at |
||||||||||||||||||||||||
Current period |
– |
|||||||||||||||||||||||
Adjustments in respect of prior periods |
( |
) |
||||||||||||||||||||||
( |
) |
|||||||||||||||||||||||
Foreign tax: |
||||||||||||||||||||||||
Current period |
||||||||||||||||||||||||
Benefit of tax reliefs on which no deferred tax previously recognised |
( |
) |
( |
) | ||||||||||||||||||||
Adjustments in respect of prior periods |
( |
) |
( |
) | ||||||||||||||||||||
Deferred tax |
||||||||||||||||||||||||
Origination and reversal of temporary differences |
( |
) |
( |
) |
||||||||||||||||||||
Changes in tax rates and tax laws |
( |
) |
( |
) |
||||||||||||||||||||
Adjustments to estimated recoverable deferred tax assets a |
( |
) |
( |
) | ||||||||||||||||||||
Reduction in deferred tax expense by previously unrecognised deferred tax assets |
( |
) |
– |
|||||||||||||||||||||
Adjustments in respect of prior periods |
( |
) |
( |
) | ||||||||||||||||||||
( |
) |
( |
) |
( |
) | |||||||||||||||||||
Income tax charge/(credit) for the year |
( |
) |
||||||||||||||||||||||
Analysed as tax relating to: |
||||||||||||||||||||||||
Profit before exceptional items b |
||||||||||||||||||||||||
Exceptional items: |
||||||||||||||||||||||||
Tax on exceptional items (note 6) |
( |
) |
( |
) |
( |
) | ||||||||||||||||||
Exceptional tax (note 6) |
( |
) |
– |
– |
||||||||||||||||||||
( |
) |
|||||||||||||||||||||||
a |
Represents a reassessment of the recovery of deferred taxes in line with the Group’s profit forecasts. |
b |
Includes $ |
|
Notes to the Group Financial Statements |
IHG |
169 |
Total a |
Before exceptional items and System Fund b |
|||||||||||||||||||||||||||||||||||||||||||||||
2021 % |
2020 % |
2019 % |
2021 % |
2020 % |
2019 % |
|||||||||||||||||||||||||||||||||||||||||||
Reconciliation of tax charge |
||||||||||||||||||||||||||||||||||||||||||||||||
UK tax at standard rate |
||||||||||||||||||||||||||||||||||||||||||||||||
Tax credits |
( |
) |
( |
) |
( |
) |
( |
) |
( |
) | ||||||||||||||||||||||||||||||||||||||
System Fund c |
( |
) |
( |
) |
( |
) |
( |
) | ||||||||||||||||||||||||||||||||||||||||
Impairment charges |
– |
– |
– |
– |
– |
|||||||||||||||||||||||||||||||||||||||||||
Other permanent differences |
( |
) |
||||||||||||||||||||||||||||||||||||||||||||||
Non-recoverable foreign taxesd |
( |
) |
||||||||||||||||||||||||||||||||||||||||||||||
Net effect of different rates of tax in overseas businesses e |
( |
) |
||||||||||||||||||||||||||||||||||||||||||||||
Effect of changes in tax rates and tax laws f |
( |
) |
( |
) |
– |
( |
) |
( |
) | |||||||||||||||||||||||||||||||||||||||
Reduction in current tax expense by previously unrecognised deferred tax assets |
( |
) |
( |
) |
( |
) |
( |
) |
( |
) | ||||||||||||||||||||||||||||||||||||||
Items on which deferred tax arose but where no deferred tax is recognised g |
( |
) |
– |
– |
||||||||||||||||||||||||||||||||||||||||||||
Effect of adjustments to estimated recoverable deferred tax assets h |
( |
) |
( |
) |
( |
) | ||||||||||||||||||||||||||||||||||||||||||
Reduction in deferred tax expense by previously unrecognised deferred tax assets |
– |
– |
– |
– |
– |
|||||||||||||||||||||||||||||||||||||||||||
Adjustment to tax charge in respect of prior periods |
( |
) |
( |
) |
( |
) |
( |
) | ||||||||||||||||||||||||||||||||||||||||
a |
Calculated in relation to total profits including exceptional items and System Fund. |
b |
Calculated in relation to profits excluding exceptional items and System Fund earnings. |
c |
The System Fund is, in general, not subject to taxation. |
d |
The large increase in 2020 when compared to 2019 is a result of the material decrease in Group profitability. This meant that the Group was no longer able to obtain effective relief for withholding taxes incurred on its revenues and in respect of other taxes, primarily in the US and Singapore. |
e |
Before exceptional items and System Fund includes |
f |
In 2021, the UK Government enacted an increase to the UK rate of Corporation Tax from |
g |
Predominantly in respect of losses arising in the year. |
h |
In 2020, the Group simplified its Group structure which led to an increase to existing deferred tax assets within the UK. |
2021 |
2020 |
2019 |
||||||||||||||||||||||||||||||||||||||||||||||
Profit before tax $m |
Tax $m |
Rate % |
(Loss)/ profit before tax $m |
Tax $m |
Rate % |
Profit before tax $m |
Tax $m |
Rate % |
||||||||||||||||||||||||||||||||||||||||
Group income statement |
( |
( |
||||||||||||||||||||||||||||||||||||||||||||||
Adjust for: |
||||||||||||||||||||||||||||||||||||||||||||||||
Exceptional items (note 6) |
||||||||||||||||||||||||||||||||||||||||||||||||
System Fund |
– |
– |
||||||||||||||||||||||||||||||||||||||||||||||
 |
Information concerning Non-GAAP measures can be found in the Strategic Report on pages 73 to 77. |
• |
payments of $ |
• |
refunds arising from earlier periods of $ |
• |
payments of $ |
• |
refunds arising from earlier periods of $ |
170 |
IHG |
2021 $m |
2020 $m |
2019 $m |
||||||||||||||||||||||
Current tax charge in the Group income statement |
( |
) |
( |
) |
( |
) | ||||||||||||||||||
Current tax (charge)/credit in the Group statement of comprehensive income |
( |
) |
||||||||||||||||||||||
Current tax credit taken directly to equity |
– |
|||||||||||||||||||||||
Total current tax charge |
( |
) |
( |
) |
( |
) | ||||||||||||||||||
Movements to tax contingencies a |
( |
) |
||||||||||||||||||||||
Timing differences of cash tax paid and foreign exchange differences b |
||||||||||||||||||||||||
Tax paid per cash flow |
( |
) |
( |
) |
( |
) | ||||||||||||||||||
a |
Tax contingency movements are included within the current tax charge but do not impact cash tax paid in the year. Settlements of tax contingencies are included within cash tax paid in the year but not recorded in the current year tax charge. |
b |
2021 includes $ |
• |
strength of technical argument, impact of case law and clarity of legislation; |
• |
professional advice; |
• |
experience of interactions, and precedents set, with the particular taxing authority; and |
• |
agreements previously reached in other jurisdictions on comparable issues. |
|
Notes to the Group Financial Statements |
IHG |
171 |
Property, plant, equipment and software $m |
Other intangible assets $m |
Application fees $m |
Deferred gains on loan notes $m |
Associates $m |
Losses $m |
Employee benefits $m |
Deferred compen- sation $m |
Credit losses $m |
Contract costs $m |
Other short-term temporary differences $m |
Total $m |
|||||||||||||||||||||||||||||||||||||||||
At 1 January 2020 |
( |
) |
( |
) |
( |
) |
( |
) |
( |
) |
( |
) | ||||||||||||||||||||||||||||||||||||||||
Group income statement |
( |
) |
– |
– |
– |
( |
) |
( |
) |
|||||||||||||||||||||||||||||||||||||||||||
Group statement of comprehensive income |
– |
– |
– |
– |
– |
– |
– |
– |
||||||||||||||||||||||||||||||||||||||||||||
Group statement of changes in equity |
– |
– |
– |
– |
– |
– |
( |
) |
– |
– |
– |
– |
( |
) | ||||||||||||||||||||||||||||||||||||||
Exchange and other adjustments |
– |
– |
– |
– |
– |
– |
( |
) |
||||||||||||||||||||||||||||||||||||||||||||
At 31 December 2020 |
( |
) |
( |
) |
( |
) |
( |
) |
||||||||||||||||||||||||||||||||||||||||||||
Group income statement |
( |
) |
( |
) |
( |
) |
||||||||||||||||||||||||||||||||||||||||||||||
Group statement of comprehensive income |
( |
) |
( |
) | ||||||||||||||||||||||||||||||||||||||||||||||||
Group statement of changes in equity |
||||||||||||||||||||||||||||||||||||||||||||||||||||
Exchange and other adjustments |
( |
) |
( |
) |
( |
) |
( |
) |
( |
) |
( |
) | ||||||||||||||||||||||||||||||||||||||||
At 31 December 2021 |
( |
) |
( |
) |
( |
) |
( |
) |
• |
starting with the Base Case forecasts (see page 149 within ‘Going concern’); |
• |
overlaying tax principles to those forecasts; and |
• |
following the methodology required by IAS 12 ‘Income Taxes’. |
2021 $m |
2020 $m |
|||||||||||||
Deferred tax assets |
||||||||||||||
Deferred tax liabilities |
( |
) |
( |
) | ||||||||||
Analysed as: |
||||||||||||||
United Kingdom |
||||||||||||||
United States |
( |
) |
( |
) | ||||||||||
Other |
||||||||||||||
172 |
IHG |
Gross |
Unrecognised deferred tax |
|||||||||||||||
2021 |
2020 |
2021 |
2020 |
|||||||||||||
$m |
$m |
$m |
$m |
|||||||||||||
Revenue losses |
||||||||||||||||
Capital losses |
||||||||||||||||
Tax credits |
||||||||||||||||
Other a |
||||||||||||||||
a |
Primarily relates to costs incurred for which tax relief has not been obtained. |
Gross |
Unrecognised deferred tax |
|||||||||||||||
2021 |
2020 |
2021 |
2020 |
|||||||||||||
$m |
$m |
$m |
$m |
|||||||||||||
Expiry date |
||||||||||||||||
2021 |
||||||||||||||||
2022 |
||||||||||||||||
2023 |
||||||||||||||||
2024 |
||||||||||||||||
2025 |
||||||||||||||||
2026 |
||||||||||||||||
2027 |
||||||||||||||||
2028 |
||||||||||||||||
After 2028 |
||||||||||||||||
|
Notes to the Group Financial Statements |
IHG |
173 |
2021 |
2020 |
2019 |
||||||||||||||||||||||||||
cents per share |
$m |
cents per share |
$m |
cents per share |
$m |
|||||||||||||||||||||||
Paid during the year |
||||||||||||||||||||||||||||
Final (declared for previous year) |
||||||||||||||||||||||||||||
Interim |
||||||||||||||||||||||||||||
Special (note 29) |
||||||||||||||||||||||||||||
2021 |
2020 |
2019 |
||||||||||||||||
Basic earnings/(loss) per ordinary share |
||||||||||||||||||
Profit/(loss) available for equity holders ($m) |
( |
) |
||||||||||||||||
Basic weighted average number of ordinary shares (millions) |
||||||||||||||||||
Basic earnings/(loss) per ordinary share (cents) |
.4 |
(9 |
) |
.4 |
||||||||||||||
Diluted earnings/(loss) per ordinary share |
||||||||||||||||||
Profit/(loss) available for equity holders ($m) |
( |
) |
||||||||||||||||
Diluted weighted average number of ordinary shares (millions) |
||||||||||||||||||
Diluted earnings/(loss) per ordinary share (cents) |
6 |
(.9 |
) |
.2 |
||||||||||||||
Diluted weighted average number of ordinary shares is calculated as: |
||||||||||||||||||
Basic weighted average number of ordinary shares (millions) |
||||||||||||||||||
Dilutive potential ordinary shares (millions) |
– |
|||||||||||||||||
2021 $m |
2020 $m |
2019 $m |
||||||||||||||||
Cash paid on acquisition, including working capital settlement |
– |
– |
||||||||||||||||
Settlement of stamp duty liability |
– |
– |
||||||||||||||||
Less: cash and cash equivalents acquired |
– |
– |
( |
) | ||||||||||||||
Less: working capital settlement received in year following acquisition |
– |
– |
( |
) | ||||||||||||||
Net cash outflow arising on acquisitions |
– |
– |
||||||||||||||||
174 |
IHG |
Goodwill $m |
Brands $m |
Software $m |
Management agreements $m |
Other intangibles $m |
Total $m |
|||||||||||||||||||||||||||||||
Cost |
||||||||||||||||||||||||||||||||||||
At 1 January 2020 |
||||||||||||||||||||||||||||||||||||
Additions |
– |
– |
– |
|||||||||||||||||||||||||||||||||
Disposals |
– |
– |
( |
) |
– |
– |
( |
) | ||||||||||||||||||||||||||||
Exchange and other adjustments |
– |
– |
– |
|||||||||||||||||||||||||||||||||
At 31 December 2020 |
||||||||||||||||||||||||||||||||||||
Additions |
– |
– |
– |
|||||||||||||||||||||||||||||||||
Disposals |
– |
– |
( |
) |
– |
– |
( |
) | ||||||||||||||||||||||||||||
Exchange and other adjustments |
( |
) |
– |
– |
– |
– |
( |
) | ||||||||||||||||||||||||||||
At 31 December 2021 |
||||||||||||||||||||||||||||||||||||
Amortisation and impairment |
||||||||||||||||||||||||||||||||||||
At 1 January 2020 |
( |
) |
– |
( |
) |
( |
) |
( |
) |
( |
) | |||||||||||||||||||||||||
Provided |
– |
– |
( |
) |
( |
) |
( |
) |
( |
) | ||||||||||||||||||||||||||
System Fund expense |
– |
– |
( |
) |
– |
( |
) |
( |
) | |||||||||||||||||||||||||||
Impairment charge |
– |
– |
– |
( |
) |
– |
( |
) | ||||||||||||||||||||||||||||
System Fund impairment charge |
– |
– |
( |
) |
– |
– |
( |
) | ||||||||||||||||||||||||||||
Disposals |
– |
– |
– |
– |
||||||||||||||||||||||||||||||||
Exchange and other adjustments |
( |
) |
– |
– |
– |
( |
) | |||||||||||||||||||||||||||||
At 31 December 2020 |
( |
) |
– |
( |
) |
( |
) |
( |
) |
( |
) | |||||||||||||||||||||||||
Provided |
– |
– |
( |
) |
( |
) |
( |
) |
( |
) | ||||||||||||||||||||||||||
System Fund expense |
– |
– |
( |
) |
– |
( |
) |
( |
) | |||||||||||||||||||||||||||
Disposals |
– |
– |
– |
– |
||||||||||||||||||||||||||||||||
Exchange and other adjustments |
– |
– |
– |
|||||||||||||||||||||||||||||||||
At 31 December 2021 |
( |
) |
– |
( |
) |
( |
) |
( |
) |
( |
) | |||||||||||||||||||||||||
Net book value |
||||||||||||||||||||||||||||||||||||
At 31 December 2021 |
||||||||||||||||||||||||||||||||||||
At 31 December 2020 |
||||||||||||||||||||||||||||||||||||
At 1 January 2020 |
||||||||||||||||||||||||||||||||||||
At |
At |
At |
Analysed as: |
|||||||||||||||||||||||||||||
1 January 2020 $m |
Exchange adjustments $m |
31 December 2020 $m |
Exchange adjustments $m |
31 December 2021 $m |
Goodwill $m |
Brands $m |
||||||||||||||||||||||||||
Americas (group of CGUs) |
( |
) |
||||||||||||||||||||||||||||||
EMEAA (group of CGUs) |
( |
) |
||||||||||||||||||||||||||||||
Greater China |
( |
) |
||||||||||||||||||||||||||||||
( |
) |
|||||||||||||||||||||||||||||||
Notes to the Group Financial Statements |
IHG |
175 |
2021 |
2020 |
|||||||||||||||||||
Terminal growth rate % |
Pre-tax discount rate % |
Terminal growth rate % |
Pre-tax discount rate % |
|||||||||||||||||
Americas |
||||||||||||||||||||
EMEAA |
||||||||||||||||||||
Greater China |
||||||||||||||||||||
Management agreement portfolios |
Region |
Basis of recoverable amount |
Recoverable amount $m |
Long-term growth rate % |
Pre-tax discount rate % |
|||||||||||||
Kimpton |
Americas |
Value in use |
||||||||||||||||
Regent |
Greater China |
Value in use |
||||||||||||||||
Six Senses (open hotels) |
EMEAA |
Fair value less costs of disposal |
– |
|||||||||||||||
Greater China |
Fair value less costs of disposal |
– |
||||||||||||||||
Six Senses (pipeline) |
Americas |
Value in use |
||||||||||||||||
EMEAA |
Value in use |
|||||||||||||||||
Greater China |
Value in use |
– |
||||||||||||||||
176 |
IHG |
Land and buildings $m |
Fixtures, fittings and equipment $m |
Total $m |
||||||||||||
Cost |
||||||||||||||
At 1 January 2020 |
||||||||||||||
Additions |
||||||||||||||
Fully depreciated assets written off |
– |
( |
) |
( |
) | |||||||||
Disposals |
( |
) |
( |
) |
( |
) | ||||||||
Exchange and other adjustments |
– |
|||||||||||||
At 31 December 2020 |
||||||||||||||
Additions |
– |
|||||||||||||
Fully depreciated assets written off |
– |
( |
) |
( |
) | |||||||||
Disposals |
( |
) |
( |
) |
( |
) | ||||||||
Exchange and other adjustments |
– |
( |
) |
( |
) | |||||||||
At 31 December 2021 |
||||||||||||||
Depreciation and impairment |
||||||||||||||
At 1 January 2020 |
( |
) |
( |
) |
( |
) | ||||||||
Provided |
( |
) |
( |
) |
( |
) | ||||||||
System Fund expense |
– |
( |
) |
( |
) | |||||||||
Impairment charge |
( |
) |
( |
) |
( |
) | ||||||||
System Fund impairment charge |
– |
( |
) |
( |
) | |||||||||
Fully depreciated assets written off |
– |
|||||||||||||
Disposals |
||||||||||||||
Exchange and other adjustments |
– |
( |
) |
( |
) | |||||||||
At 31 December 2020 |
( |
) |
( |
) |
( |
) | ||||||||
Provided |
( |
) |
( |
) |
( |
) | ||||||||
System Fund expense |
– |
( |
) |
( |
) | |||||||||
Fully depreciated assets written off |
– |
|||||||||||||
Disposals |
||||||||||||||
Exchange and other adjustments |
– |
|||||||||||||
At 31 December 2021 |
( |
) |
( |
) |
( |
) | ||||||||
Net book value |
||||||||||||||
At 31 December 2021 |
||||||||||||||
At 31 December 2020 |
||||||||||||||
At 1 January 2020 |
||||||||||||||
Notes to the Group Financial Statements |
IHG |
177 |
Americas $m |
EMEAA $m |
Greater China $m |
Central $m |
Total $m |
||||||||||||||||||
Land and buildings |
– |
|||||||||||||||||||||
Fixtures, fittings and equipment |
– |
|||||||||||||||||||||
– |
||||||||||||||||||||||
Property $m |
Other $m |
Total $m |
||||||||||||
Cost |
||||||||||||||
At 1 January 2020 |
||||||||||||||
Additions and other re-measurements |
||||||||||||||
Derecognition |
( |
) |
– |
( |
) | |||||||||
Terminations |
( |
) |
( |
) |
( |
) | ||||||||
Exchange and other adjustments |
– |
|||||||||||||
At 31 December 2020 |
||||||||||||||
Additions and other re-measurements |
– |
|||||||||||||
Terminations |
( |
) |
( |
) |
( |
) | ||||||||
Disposals |
( |
) |
– |
( |
) | |||||||||
Exchange and other adjustments |
( |
) |
– |
( |
) | |||||||||
At 31 December 2021 |
||||||||||||||
Depreciation and impairment |
||||||||||||||
At 1 January 2020 |
( |
) |
( |
) |
( |
) | ||||||||
Provided |
( |
) |
( |
) |
( |
) | ||||||||
System Fund expense |
( |
) |
– |
( |
) | |||||||||
Impairment charge |
( |
) |
– |
( |
) | |||||||||
System Fund impairment charge |
( |
) |
– |
( |
) | |||||||||
Derecognition |
– |
|||||||||||||
Terminations |
||||||||||||||
Exchange and other adjustments |
( |
) |
– |
( |
) | |||||||||
At 31 December 2020 |
( |
) |
( |
) |
( |
) | ||||||||
Provided |
( |
) |
( |
) |
( |
) | ||||||||
System Fund expense |
( |
) |
– |
( |
) | |||||||||
System Fund impairment reversal |
– |
|||||||||||||
Terminations |
||||||||||||||
Disposals |
– |
|||||||||||||
Exchange and other adjustments |
– |
|||||||||||||
At 31 December 2021 |
( |
) |
( |
) |
( |
) | ||||||||
Net book value |
||||||||||||||
At 31 December 2021 |
||||||||||||||
At 31 December 2020 |
||||||||||||||
At 1 January 2020 |
||||||||||||||
178 |
IHG |
2021 $m |
2020 $m |
|||||||||||
Currency |
||||||||||||
US dollars |
||||||||||||
Sterling |
||||||||||||
Euros |
||||||||||||
Other |
||||||||||||
Analysed as: |
||||||||||||
Current |
||||||||||||
Non-current |
||||||||||||
Notes to the Group Financial Statements |
IHG |
179 |
2021 $m |
2020 $m |
2019 $m |
||||||||||||||||
Depreciation of right-of-use |
||||||||||||||||||
System Fund depreciation of right-of-use |
||||||||||||||||||
Impairment charge |
– |
|||||||||||||||||
System Fund impairment (reversal)/charge |
( |
) |
– |
|||||||||||||||
Derecognition of right-of-use |
– |
( |
) |
– |
||||||||||||||
Gain on lease termination |
– |
( |
) |
– |
||||||||||||||
Expense relating to variable lease payments |
||||||||||||||||||
Expense relating to short-term leases and low-value assets |
||||||||||||||||||
Income from subleasing right-of-use |
( |
) |
( |
) |
( |
) | ||||||||||||
Recognised in operating profit/(loss) |
||||||||||||||||||
Interest on lease liabilities |
||||||||||||||||||
Total recognised in the Group income statement |
||||||||||||||||||
Operating sublease payments receivable |
Less than 1 year $m |
Between 1 and 2 years $m |
Between 2 and 5 years $m |
Total $m |
||||||||||||||
31 2021ecember |
||||||||||||||||||
180 |
IHG |
2021 $m |
2020 $m |
|||||||||||
Cost |
||||||||||||
At 1 January |
||||||||||||
Additions |
||||||||||||
Share of losses |
( |
) |
( |
) | ||||||||
System Fund share of losses |
( |
) |
( |
) | ||||||||
Dividends and distributions |
( |
) | ||||||||||
Exchange and other adjustments |
( |
) | ||||||||||
At 31 December |
||||||||||||
Impairment |
||||||||||||
At 1 January |
( |
) |
( |
) | ||||||||
Charge for the year a |
( |
) | ||||||||||
Exchange and other adjustments |
||||||||||||
At 31 December |
( |
) |
( |
) | ||||||||
Net book value |
||||||||||||
Analysed as: |
||||||||||||
Material associates |
||||||||||||
Other associates |
||||||||||||
a |
In 2020, the $ |
Notes to the Group Financial Statements |
IHG |
181 |
31 December |
2021 $m |
2020 $m |
||||||||||
Non-current assets |
||||||||||||
Current assets |
||||||||||||
Current liabilities |
( |
) |
( |
) | ||||||||
Non-current liabilities |
( |
) |
( |
) | ||||||||
Net assets |
||||||||||||
Group share of reported net assets at |
||||||||||||
Adjustments to reflect impairment, capitalised costs, and additional rights and obligations under the shareholder agreement |
( |
) |
( |
) | ||||||||
Carrying amount |
||||||||||||
Year ended 31 December |
2021 $m |
2020 $m |
||||||||||
Revenue |
||||||||||||
Loss from continuing operations and total comprehensive loss for the year |
( |
) |
( |
) | ||||||||
Group’s share of loss for the year, including the cost of funding owner returns |
( |
) |
( |
) | ||||||||
Associates |
Joint ventures |
|||||||||||||||||||||||||||||||||||
2021 $m |
2020 $m |
2019 $m |
2021 $m |
2020 $m |
2019 $m |
|||||||||||||||||||||||||||||||
(Losses)/profits from continuing operations and total comprehensive (loss)/income for the year |
( |
) |
( |
) |
||||||||||||||||||||||||||||||||
2021 $m |
2020 $m |
|||||||||||
Equity securities |
||||||||||||
Restricted funds: |
||||||||||||
Shortfall reserve deposit |
||||||||||||
Ring-fenced amounts to satisfy insurance claims: |
||||||||||||
Cash |
||||||||||||
Money market funds |
||||||||||||
Bank accounts pledged as security |
||||||||||||
Other |
||||||||||||
Trade deposits and loans |
||||||||||||
Analysed as: |
||||||||||||
Current |
||||||||||||
Non-current |
||||||||||||
182 |
IHG |
2021 |
2020 |
|||||||||||||||||||
Fair value $m |
Dividend income $m |
Fair value $m |
Dividend income $m |
a | ||||||||||||||||
Investment in entity which owns: |
||||||||||||||||||||
InterContinental The Willard Washington DC |
||||||||||||||||||||
InterContinental San Francisco |
||||||||||||||||||||
InterContinental Grand Stanford Hong Kong |
||||||||||||||||||||
a |
Reported within other operating income in the Group income statement. |
2021 $m |
2020 $m |
|||||||||||
Trade deposits and loans: |
||||||||||||
Gross and net balance with no significant increase in credit risk since initial recognition |
||||||||||||
Gross balance with a significant increase in credit risk since initial recognition |
||||||||||||
Provision for lifetime expected credit losses a |
( |
) |
( |
) | ||||||||
a |
Comprises $ |
2021 $m |
2020 $m |
|||||||||||
Americas |
||||||||||||
EMEAA |
||||||||||||
Greater China |
||||||||||||
Notes to the Group Financial Statements |
IHG |
183 |
2021 $m |
2020 $m |
|||||||||||
Trade receivables a |
||||||||||||
Other receivables |
||||||||||||
Prepayments |
||||||||||||
a |
Including cost reimbursements of $ |
2021 |
2020 |
|||||||||||||||||||||||||||
Gross $m |
Credit loss allowance $m |
Net $m |
Gross $m |
Credit loss allowance $m |
Net $m |
|||||||||||||||||||||||
Not past due |
( |
) |
( |
) |
||||||||||||||||||||||||
Past due 1 to 30 days |
( |
) |
( |
) |
||||||||||||||||||||||||
Past due 31 to 90 days |
( |
) |
( |
) |
||||||||||||||||||||||||
Past due 91 to 180 days |
( |
) |
( |
) |
||||||||||||||||||||||||
Past due 181 to 360 days |
( |
) |
( |
) |
||||||||||||||||||||||||
Past due more than 361 days |
( |
) |
n/a |
n/a |
n/a |
|||||||||||||||||||||||
( |
) |
( |
) |
|||||||||||||||||||||||||
2021 $m |
2020 $m |
|||||||||||
Movement in the allowance for expected lifetime credit losses |
||||||||||||
At 1 January |
( |
) |
( |
) | ||||||||
Fully provided receivables reinstated |
( |
) |
– |
|||||||||
Impairment loss a |
( |
) |
( |
) | ||||||||
System Fund impairment reversal/(loss) |
( |
) | ||||||||||
Amounts written off |
||||||||||||
Exchange and other adjustments |
( |
) |
( |
) | ||||||||
At 31 December |
( |
) |
( |
) | ||||||||
a |
The impairment loss on financial assets disclosed on the face of the Group income statement also includes a gain of $ |
2021 $m |
2020 $m |
|||||||||||
Americas |
||||||||||||
EMEAA |
||||||||||||
Greater China |
||||||||||||
184 |
IHG |
2021 $m |
2020 $m |
|||||||||||
Cash at bank and in hand |
||||||||||||
Short-term deposits |
||||||||||||
Money market funds |
||||||||||||
Repurchase agreements |
||||||||||||
Cash and cash equivalents as recorded in the Group statement of financial position |
||||||||||||
Bank overdrafts (note 22) |
( |
) |
( |
) | ||||||||
Cash and cash equivalents as recorded in the Group statement of cash flows |
||||||||||||
2021 $m |
2020 $m |
|||||||||||
Current |
||||||||||||
Trade payables |
||||||||||||
Other tax and social security payable |
||||||||||||
Other payables |
||||||||||||
Deferred purchase consideration (note 25) |
||||||||||||
Accruals |
||||||||||||
Non-current |
||||||||||||
Other payables |
||||||||||||
Deferred purchase consideration (note 25) |
||||||||||||
Contingent purchase consideration (note 25) |
||||||||||||
Litigation and commercial disputes $m |
Insurance reserves $m |
Onerous contractual expenditure $m |
Other $m |
Total $m |
||||||||||||||||||
At 31 December 2020 |
||||||||||||||||||||||
Provided, of which $25m is recorded within exceptional items |
– |
|||||||||||||||||||||
Utilised |
( |
) |
( |
) |
– |
– |
( |
) | ||||||||||||||
Released |
( |
) |
– |
– |
– |
( |
) | |||||||||||||||
Reclassification from trade and other payables |
– |
– |
– |
|||||||||||||||||||
At 31 December 2021 |
||||||||||||||||||||||
Analysed as: |
||||||||||||||||||||||
Current |
||||||||||||||||||||||
Non-current |
||||||||||||||||||||||
Notes to the Group Financial Statements |
IHG |
185 |
Maturity date |
Discount at issue % |
2021 $m |
2020 $m |
|||||||||||||||
Current |
||||||||||||||||||
Bank overdrafts (note 19) |
n/a |
|||||||||||||||||
Commercial paper |
– |
|||||||||||||||||
£ |
– |
|||||||||||||||||
Non-current |
||||||||||||||||||
£ |
||||||||||||||||||
€ |
||||||||||||||||||
£ |
||||||||||||||||||
£ |
||||||||||||||||||
€ |
||||||||||||||||||
£ |
||||||||||||||||||
Total loans and other borrowings |
||||||||||||||||||
Denominated in the following currencies: |
||||||||||||||||||
Sterling |
||||||||||||||||||
US dollars |
||||||||||||||||||
Euros |
||||||||||||||||||
Other |
||||||||||||||||||
186 |
IHG |
2021 |
2020 |
|||||||||||||||||||
Within 1 year $m |
Between 1 and 2 years $m |
Within 1 year $m |
Between 2 and 5 years $m |
|||||||||||||||||
Unutilised facilities |
||||||||||||||||||||
Committed |
– |
– |
||||||||||||||||||
Uncommitted |
– |
– |
||||||||||||||||||
2021 $m |
2020 $m |
|||||||||||||||||
Cash and cash equivalents |
||||||||||||||||||
Loans and other borrowings |
– current |
( |
) |
( |
) | |||||||||||||
– non-current |
( |
) |
( |
) | ||||||||||||||
Lease liabilities |
– current |
( |
) |
( |
) | |||||||||||||
– non-current |
( |
) |
( |
) | ||||||||||||||
Derivative financial instruments hedging debt values (note 24) |
( |
) |
||||||||||||||||
Net debt |
( |
) |
( |
) | ||||||||||||||
Movement in net debt |
2021 $m |
2020 $m |
||||||||||||||
Net (decrease)/increase in cash and cash equivalents, net of overdrafts |
( |
) |
||||||||||||||
Add back financing cash flows in respect of other components of net debt: |
||||||||||||||||
Principal element of lease payments |
||||||||||||||||
Issue of long-term bonds, including effect of currency swaps |
– |
( |
) | |||||||||||||
Repayment/(issue) of commercial paper |
( |
) | ||||||||||||||
Repayment of long-term bonds |
– |
|||||||||||||||
Decrease in other borrowings |
– |
|||||||||||||||
( |
) | |||||||||||||||
Decrease in net debt arising from cash flows |
||||||||||||||||
Other movements: |
||||||||||||||||
Lease liabilities |
( |
) |
||||||||||||||
Increase in accrued interest |
( |
) |
( |
) | ||||||||||||
Disposals |
||||||||||||||||
Exchange and other adjustments |
( |
) | ||||||||||||||
Decrease in net debt |
||||||||||||||||
Net debt at beginning of the year |
( |
) |
( |
) | ||||||||||||
Net debt at end of the year |
( |
) |
( |
) | ||||||||||||
 |
Information concerning Non-GAAP measures can be found in the Strategic Report on pages 73 to 77. | |
|
Net debt on a frozen GAAP basis as calculated for bank covenants was $ |
Notes to the Group Financial Statements |
IHG |
187 |
At 1 January 2021 $m |
Financing cash flows $m |
Exchange adjustments $m |
Disposal $m |
Other $m |
a |
At 31 December 2021 $m |
||||||||||||||||||||||
Lease liabilities |
( |
) |
( |
) |
( |
) |
||||||||||||||||||||||
£173m 3.875% bonds 2022 |
– |
( |
) |
– |
||||||||||||||||||||||||
€ 500m 1.625% bonds 2024 |
– |
( |
) |
– |
||||||||||||||||||||||||
£300m 3.75% bonds 2025 |
– |
( |
) |
– |
||||||||||||||||||||||||
£350m 2.125% bonds 2026 |
– |
( |
) |
– |
||||||||||||||||||||||||
€ 500m 2.125% bonds 2027 |
– |
( |
) |
– |
||||||||||||||||||||||||
£400m 3.375% bonds 2028 |
– |
( |
) |
– |
||||||||||||||||||||||||
Commercial paper |
( |
) |
– |
( |
) |
– |
||||||||||||||||||||||
( |
) |
( |
) |
( |
) |
|||||||||||||||||||||||
Currency swaps |
– |
– |
– |
|||||||||||||||||||||||||
( |
) |
( |
) |
( |
) |
At 1 January 2020 $m |
Financing cash flows $m |
Exchange adjustments $m |
Disposal $m |
Other $m |
a,b |
At 31 December 2020 $m |
||||||||||||||||||||||
Unsecured bank loans |
( |
) |
– |
– |
– |
– |
||||||||||||||||||||||
Lease liabilities |
( |
) |
( |
) |
( |
) |
( |
) |
||||||||||||||||||||
£173m 3.875% bonds 2022 |
( |
) |
– |
– |
( |
) |
||||||||||||||||||||||
€ 500m 1.625% bonds 2024 |
– |
– |
– |
|||||||||||||||||||||||||
£300m 3.75% bonds 2025 |
– |
– |
||||||||||||||||||||||||||
£350m 2.125% bonds 2026 |
– |
– |
||||||||||||||||||||||||||
€ 500m 2.125% bonds 2027 |
– |
– |
||||||||||||||||||||||||||
£400m 3.375% bonds 2028 |
– |
– |
||||||||||||||||||||||||||
Commercial paper |
– |
– |
||||||||||||||||||||||||||
( |
) |
( |
) |
|||||||||||||||||||||||||
Currency swaps (exchange of principal) |
( |
) |
– |
– |
– |
|||||||||||||||||||||||
Currency swaps (initial fee received) |
– |
– |
– |
( |
) |
– |
||||||||||||||||||||||
( |
) |
( |
) |
a |
The change in value of currency swaps represents fair value movements. |
b |
Included $ |
188 |
IHG |
Description |
Hedge relationship |
2021 $m |
2020 $m |
|||||||||||||||
Put option |
None |
– |
||||||||||||||||
Currency swaps |
Cash flow hedge |
( |
) |
( |
) | |||||||||||||
( |
) |
( |
) | |||||||||||||||
Analysed as: |
||||||||||||||||||
Non-current assets |
||||||||||||||||||
Non-current liabilities |
( |
) |
( |
) | ||||||||||||||
( |
) |
( |
) | |||||||||||||||
Date of designation |
Pay leg |
Interest rate |
Receive leg |
Interest rate |
Maturity |
Risk |
Hedge type |
Hedged item | ||||||||||||
November 2018 |
£ |
€ |
€ | |||||||||||||||||
October 2020 |
£ |
€ |
€ | |||||||||||||||||
• |
Borrowings under the Syndicated and Bilateral Facilities; and |
• |
Short-dated foreign exchange swaps. |
Notes to the Group Financial Statements |
IHG |
189 |
2021 $m |
2020 $m |
2019 $m |
||||||||||||||||||||||||
Increase/(decrease) in profit before tax |
||||||||||||||||||||||||||
Sterling: US dollar exchange rate |
5¢ fall |
|||||||||||||||||||||||||
Euro: US dollar exchange rate |
5¢ fall |
( |
) | |||||||||||||||||||||||
US dollar interest rates |
1% increase |
( |
) | |||||||||||||||||||||||
Sterling interest rates |
1% increase |
|||||||||||||||||||||||||
Decrease in net liabilities |
||||||||||||||||||||||||||
Sterling: US dollar exchange rate |
5¢ fall |
|||||||||||||||||||||||||
Euro: US dollar exchange rate |
5¢ fall |
|||||||||||||||||||||||||
Sterling: euro exchange rate |
5¢ fall |
|||||||||||||||||||||||||
2019 and prior |
30 June 2020 to 31 December 2021 |
30 June 2022 |
31 December 2022 |
30 June 2023 |
||||||||||||||||||||
Amended covenant test levels for Syndicated and Bilateral Facilities |
||||||||||||||||||||||||
Leverage |
< |
waived |
< |
< |
< |
|||||||||||||||||||
Interest cover |
> |
waived |
> |
> |
> |
|||||||||||||||||||
Liquidity |
n/a |
$ |
$ |
$ |
n/a |
|||||||||||||||||||
2021 |
2020 |
2019 |
||||||||||||||||||||||
Covenant EBITDA ($m) |
||||||||||||||||||||||||
Covenant net debt ($m) |
||||||||||||||||||||||||
Covenant interest payable ($m) |
||||||||||||||||||||||||
Leverage |
||||||||||||||||||||||||
Interest cover |
||||||||||||||||||||||||
Liquidity ($m) |
n/a |
|||||||||||||||||||||||
190 |
IHG |
31 December 2021 |
Less than 1 year $m |
Between 1 and 2 years $m |
Between 2 and 5 years $m |
More than 5 years $m |
Total $m |
|||||||||||||||||
Non-derivative financial liabilities: |
||||||||||||||||||||||
Bank overdrafts |
– |
– |
– |
|||||||||||||||||||
£173m 3.875% bonds 2022 |
– |
– |
– |
|||||||||||||||||||
€ 500m 1.625% bonds 2024 |
– |
|||||||||||||||||||||
£300m 3.75% bonds 2025 |
– |
|||||||||||||||||||||
£350m 2.125% bonds 2026 |
||||||||||||||||||||||
€ 500m 2.125% bonds 2027 |
||||||||||||||||||||||
£400m 3.375% bonds 2028 |
||||||||||||||||||||||
Lease liabilities |
||||||||||||||||||||||
Trade and other payables (excluding deferred and contingent purchase consideration) |
||||||||||||||||||||||
Deferred and contingent purchase consideration |
– |
– |
||||||||||||||||||||
Derivative financial liabilities: |
||||||||||||||||||||||
Currency swaps hedging € 500m 1.625% bonds 2024 outflows |
– |
|||||||||||||||||||||
Currency swaps hedging € 500m 1.625% bonds 2024 inflows |
( |
) |
( |
) |
( |
) |
– |
( |
) | |||||||||||||
Currency swaps hedging € 500m 2.125% bonds 2027 outflows |
||||||||||||||||||||||
Currency swaps hedging € 500m 2.125% bonds 2027 inflows |
( |
) |
( |
) |
( |
) |
( |
) |
( |
) | ||||||||||||
31 December 2020 |
Less than 1 year $m |
Between 1 and 2 years $m |
Between 2 and 5 years $m |
More than 5 years $m |
Total $m |
|||||||||||||||||||
Non-derivative financial liabilities: |
||||||||||||||||||||||||
Bank overdrafts |
– |
– |
– |
|||||||||||||||||||||
£173m 3.875% bonds 2022 |
– |
– |
||||||||||||||||||||||
€ 500m 1.625% bonds 2024 |
– |
|||||||||||||||||||||||
£300m 3.75% bonds 2025 |
– |
|||||||||||||||||||||||
£350m 2.125% bonds 2026 |
||||||||||||||||||||||||
€ 500m 2.125% bonds 2027 |
||||||||||||||||||||||||
£400m 3.375% bonds 2028 |
||||||||||||||||||||||||
Commercial paper |
– |
– |
– |
|||||||||||||||||||||
Lease liabilities |
||||||||||||||||||||||||
Trade and other payables (excluding deferred and contingent purchase consideration) |
||||||||||||||||||||||||
Deferred and contingent purchase consideration |
||||||||||||||||||||||||
Derivative financial liabilities: |
||||||||||||||||||||||||
Currency swaps hedging € 500m 1.625% bonds 2024 outflows |
– |
|||||||||||||||||||||||
Currency swaps hedging € 500m 1.625% bonds 2024 inflows |
( |
) |
( |
) |
( |
) |
– |
( |
) | |||||||||||||||
Currency swaps hedging € 500m 2.125% bonds 2027 outflows |
||||||||||||||||||||||||
Currency swaps hedging € 500m 2.125% bonds 2027 inflows |
( |
) |
( |
) |
( |
) |
( |
) |
( |
) | ||||||||||||||
Notes to the Group Financial Statements |
IHG |
191 |
31 December 2021 |
AAA $m |
AA $m |
AA- $m |
A+ $m |
A $m |
A- $m |
Total $m |
|||||||||||||||||||||||||
Short-term deposits |
||||||||||||||||||||||||||||||||
Money market funds |
||||||||||||||||||||||||||||||||
31 December 2020 |
AAA $m |
AA $m |
AA- $m |
A+ $m |
A $m |
A- $m |
Total $m |
|||||||||||||||||||||||||
Short-term deposits |
– |
– |
||||||||||||||||||||||||||||||
Money market funds |
– |
– |
– |
– |
– |
|||||||||||||||||||||||||||
Repurchase agreement collateral |
– |
– |
– |
|||||||||||||||||||||||||||||
2021 |
2020 |
|||||||||||||||||||||||||||||||||||
Hierarchy of fair value measurement |
Fair value a $m |
Amortised cost $m |
Not categorised as a financial instrument $m |
Total $m |
Fair value a $m |
Amortised cost $m |
Not categorised as a financial instrument $m |
Total $m |
||||||||||||||||||||||||||||
Financial assets |
||||||||||||||||||||||||||||||||||||
Other financial assets |
1,3 |
b |
– |
– |
||||||||||||||||||||||||||||||||
Cash and cash equivalents |
1 |
– |
– |
|||||||||||||||||||||||||||||||||
Derivative financial instruments |
2,3 |
c |
– |
– |
– |
– |
– |
– |
||||||||||||||||||||||||||||
Deferred compensation plan investments |
1 |
– |
– |
– |
– |
|||||||||||||||||||||||||||||||
Trade and other receivables |
– |
– |
– |
|||||||||||||||||||||||||||||||||
Financial liabilities |
||||||||||||||||||||||||||||||||||||
Derivative financial instruments |
2 |
( |
– |
– |
( |
) |
( |
– |
– |
( |
) | |||||||||||||||||||||||||
Deferred compensation plan liabilities |
1 |
( |
– |
– |
( |
) |
( |
– |
– |
( |
) | |||||||||||||||||||||||||
Loans and other borrowings |
– |
– |
( |
) |
– |
( |
) |
– |
( |
) |
– |
( |
) | |||||||||||||||||||||||
Trade and other payables |
3 |
( |
( |
) |
( |
( |
) |
( |
( |
) |
( |
( |
) | |||||||||||||||||||||||
a |
With the exception of equity securities, which are measured at fair value through other comprehensive income, all are measured at fair value through profit or loss. Of those, the financial assets related to the deferred compensation plan investments were designated as such upon initial recognition. |
b |
Of those measured at fair value, $ |
c |
In 2020, $ |
192 |
IHG |
Hierarchy of |
2021 |
2020 |
||||||||||||||||||||||
fair value measurement |
Carrying value $m |
Fair value $m |
Carrying value $m |
Fair value $m |
||||||||||||||||||||
Deferred purchase consideration |
2 |
( |
( |
) |
( |
( |
) | |||||||||||||||||
£173m 3.875% bonds 2022 |
1 |
( |
( |
) |
( |
( |
) | |||||||||||||||||
€ 500m 1.625% bonds 2024 |
1 |
( |
( |
) |
( |
( |
) | |||||||||||||||||
£300m 3.75% bonds 2025 |
1 |
( |
( |
) |
( |
( |
) | |||||||||||||||||
£350m 2.125% bonds 2026 |
1 |
( |
( |
) |
( |
( |
) | |||||||||||||||||
€ 500m 2.125% bonds 2027 |
1 |
( |
( |
) |
( |
( |
) | |||||||||||||||||
£400m 3.375% bonds 2028 |
1 |
( |
( |
) |
( |
( |
) | |||||||||||||||||
Notes to the Group Financial Statements |
IHG |
193 |
Other financial assets $m |
Derivative financial instruments $m |
Contingent purchase consideration $m |
||||||||||||||
At 1 January 2020 |
– |
( |
) | |||||||||||||
Additions |
– |
– |
||||||||||||||
Transfers into Level 3 |
– |
– |
||||||||||||||
Repayments and disposals |
( |
) |
– |
– |
||||||||||||
Valuation losses recognised in other comprehensive income |
( |
) |
– |
– |
||||||||||||
Unrealised changes in fair value a |
– |
|||||||||||||||
Exchange and other adjustments |
( |
) |
– |
( |
) | |||||||||||
At 31 December 2020 |
( |
) | ||||||||||||||
Additions |
– |
– |
||||||||||||||
Valuation gains recognised in other comprehensive income |
– |
– |
||||||||||||||
Unrealised changes in fair value b |
– |
( |
) |
|||||||||||||
At 31 December 2021 |
– |
( |
) | |||||||||||||
a |
$ |
b |
The change in the fair value of derivative financial instruments is recognised within other impairment charges in the Group income statement and is presented as an exceptional item. |
194 |
IHG |
2021 $m |
2020 $m |
2019 $m |
||||||||||||||||||||||
Profit/(loss) for the year |
( |
) |
||||||||||||||||||||||
Adjustments for: |
||||||||||||||||||||||||
Net financial expenses |
||||||||||||||||||||||||
Fair value gains on contingent purchase consideration |
( |
) |
( |
) |
( |
) | ||||||||||||||||||
Income tax charge/(credit) |
( |
) |
||||||||||||||||||||||
Operating profit adjustments: |
||||||||||||||||||||||||
Impairment loss on financial assets |
– |
|||||||||||||||||||||||
Other impairment charges |
||||||||||||||||||||||||
Other operating exceptional items |
( |
) |
||||||||||||||||||||||
Depreciation and amortisation |
||||||||||||||||||||||||
Contract assets deduction in revenue |
||||||||||||||||||||||||
Share-based payments cost |
||||||||||||||||||||||||
Share of losses of associates and joint ventures |
||||||||||||||||||||||||
System Fund adjustments: |
||||||||||||||||||||||||
Depreciation and amortisation |
||||||||||||||||||||||||
Impairment (reversal)/loss on financial assets |
( |
) |
||||||||||||||||||||||
Other impairment (reversals)/charges |
( |
) |
– |
|||||||||||||||||||||
Other operating exceptional items |
– |
|||||||||||||||||||||||
Share-based payments cost |
||||||||||||||||||||||||
Share of losses of associates |
– |
|||||||||||||||||||||||
Working capital and other adjustments: |
||||||||||||||||||||||||
Increase in deferred revenue |
||||||||||||||||||||||||
Decrease in inventories |
– |
|||||||||||||||||||||||
(Increase)/decrease in trade and other receivables |
( |
) |
( |
) | ||||||||||||||||||||
Increase/(decrease) in trade and other payables |
( |
) |
( |
) | ||||||||||||||||||||
Other adjustments |
( |
) |
( |
) | ||||||||||||||||||||
( |
) |
( |
) | |||||||||||||||||||||
Cash flows relating to exceptional items |
( |
) |
( |
) |
( |
) | ||||||||||||||||||
Contract acquisition costs, net of repayments |
( |
) |
( |
) |
( |
) | ||||||||||||||||||
Total adjustments |
||||||||||||||||||||||||
Cash flow from operations |
Notes to the Group Financial Statements |
IHG |
195 |
Defined benefit obligation |
Fair value of plan assets |
Net defined benefit obligation |
||||||||||||||||||||||||||||||||||||||||||||||||||||||||||||||||||||||
2021 $m |
2020 $m |
2019 $m |
2021 $m |
2020 $m |
2019 $m |
2021 $m |
2020 $m |
2019 $m |
||||||||||||||||||||||||||||||||||||||||||||||||||||||||||||||||
At 1 January |
– |
– |
||||||||||||||||||||||||||||||||||||||||||||||||||||||||||||||||||||||
Recognised in profit or loss |
||||||||||||||||||||||||||||||||||||||||||||||||||||||||||||||||||||||||
Interest expense |
– |
– |
||||||||||||||||||||||||||||||||||||||||||||||||||||||||||||||||||||||
– |
– |
|||||||||||||||||||||||||||||||||||||||||||||||||||||||||||||||||||||||
Recognised in other comprehensive income |
||||||||||||||||||||||||||||||||||||||||||||||||||||||||||||||||||||||||
Actuarial (gain)/loss arising from changes in: |
||||||||||||||||||||||||||||||||||||||||||||||||||||||||||||||||||||||||
Demographic assumptions |
( |
) |
( |
) |
( |
) |
– |
– |
( |
) |
( |
) |
( |
) | ||||||||||||||||||||||||||||||||||||||||||||||||||||||||||
Financial assumptions |
( |
) |
– |
– |
( |
) |
||||||||||||||||||||||||||||||||||||||||||||||||||||||||||||||||||
Experience adjustments |
( |
) |
( |
) |
– |
– |
( |
) |
( |
) | ||||||||||||||||||||||||||||||||||||||||||||||||||||||||||||||
Re-measurement (gain)/loss |
( |
) |
– |
– |
( |
) |
||||||||||||||||||||||||||||||||||||||||||||||||||||||||||||||||||
Exchange adjustments |
( |
) |
– |
– |
( |
) |
||||||||||||||||||||||||||||||||||||||||||||||||||||||||||||||||||
( |
) |
– |
– |
( |
) |
|||||||||||||||||||||||||||||||||||||||||||||||||||||||||||||||||||
Other |
||||||||||||||||||||||||||||||||||||||||||||||||||||||||||||||||||||||||
Group contributions |
– |
– |
( |
) |
( |
) |
( |
) |
( |
) |
( |
) |
( |
) | ||||||||||||||||||||||||||||||||||||||||||||||||||||||||||
Benefits paid |
( |
) |
( |
) |
( |
) |
– |
– |
||||||||||||||||||||||||||||||||||||||||||||||||||||||||||||||||
( |
) |
( |
) |
( |
) |
– |
– |
( |
) |
( |
) |
( |
) | |||||||||||||||||||||||||||||||||||||||||||||||||||||||||||
At 31 December |
– |
– |
||||||||||||||||||||||||||||||||||||||||||||||||||||||||||||||||||||||
Comprising: |
||||||||||||||||||||||||||||||||||||||||||||||||||||||||||||||||||||||||
UK plan |
– |
– |
||||||||||||||||||||||||||||||||||||||||||||||||||||||||||||||||||||||
US plans |
– |
– |
||||||||||||||||||||||||||||||||||||||||||||||||||||||||||||||||||||||
US post-retirement plan |
– |
– |
||||||||||||||||||||||||||||||||||||||||||||||||||||||||||||||||||||||
– |
– |
|||||||||||||||||||||||||||||||||||||||||||||||||||||||||||||||||||||||
2021 |
2020 |
2019 |
||||||||||||||||
% |
% |
% |
||||||||||||||||
UK plan only: |
||||||||||||||||||
Pension increases |
||||||||||||||||||
Inflation rate |
||||||||||||||||||
Discount rate: |
||||||||||||||||||
UK plan |
||||||||||||||||||
US plans |
||||||||||||||||||
US post-retirement plan |
||||||||||||||||||
US healthcare cost trend rate assumed for the next year: |
||||||||||||||||||
Pre-65 (ultimate rate reached in 2031) |
||||||||||||||||||
Post-65 (ultimate rate reached in 2031) |
||||||||||||||||||
Ultimate rate that the cost rate trends to |
||||||||||||||||||
196 |
IHG |
UK |
US |
|||||||||||||||||||||||||||||||||||||||||||
2021 |
2020 |
2019 |
2021 |
2020 |
2019 |
|||||||||||||||||||||||||||||||||||||||
Years |
Years |
Years |
Years |
Years |
Years |
|||||||||||||||||||||||||||||||||||||||
Current pensioners at 65 a |
– male |
|||||||||||||||||||||||||||||||||||||||||||
– female |
||||||||||||||||||||||||||||||||||||||||||||
Future pensioners at 65 b |
– male |
|||||||||||||||||||||||||||||||||||||||||||
– female |
||||||||||||||||||||||||||||||||||||||||||||
a |
Relates to assumptions based on longevity (in years) following retirement at the end of the reporting period. |
b |
Relates to assumptions based on longevity (in years) relating to an employee retiring in 2041. |
2021 $m |
2020 $m |
|||||||||||||||||
Increase/(decrease) in liabilities |
||||||||||||||||||
Discount rate |
||||||||||||||||||
( |
) |
( |
) | |||||||||||||||
Inflation rate |
( |
) |
( |
) | ||||||||||||||
Mortality rate |
||||||||||||||||||
Healthcare costs trend rate |
( |
) |
( |
) | ||||||||||||||
2021 $m |
2020 $m |
|||||||||||
Within one year |
||||||||||||
Between one and five years |
||||||||||||
More than five years |
||||||||||||
2021 Years |
2020 Years |
|||||||||
UK plan |
||||||||||
US plans |
||||||||||
US post-retirement plan |
Notes to the Group Financial Statements |
IHG |
197 |
|
More detailed information on the performance measures for awards to Executive Directors is shown in the Directors’ Remuneration Report on pages 104 to 125. |
2021 $m |
2020 $m |
2019 $m |
||||||||||||||||
Equity-settled |
||||||||||||||||||
Operating profit before System Fund and exceptional items |
||||||||||||||||||
Operating exceptional items |
– |
|||||||||||||||||
System Fund |
||||||||||||||||||
Cash-settled |
||||||||||||||||||
Operating profit before System Fund and exceptional items |
||||||||||||||||||
APP |
LTIP |
|||||||||||||||||||||||||||||||||||
Monte Carlo Simulation and |
||||||||||||||||||||||||||||||||||||
Binomial valuation model |
Binomial valuation model |
|||||||||||||||||||||||||||||||||||
2021 |
2020 |
2019 |
2021 |
2020 |
2019 |
|||||||||||||||||||||||||||||||
Weighted average share price (pence) |
9.0 |
.0 |
.0 |
0.0 |
0 |
.0 |
||||||||||||||||||||||||||||||
Expected dividend yield |
||||||||||||||||||||||||||||||||||||
Risk-free interest rate |
||||||||||||||||||||||||||||||||||||
Volatility a |
||||||||||||||||||||||||||||||||||||
Term (years) |
||||||||||||||||||||||||||||||||||||
a |
The expected volatility was determined by calculating the historical volatility of the Company’s share price corresponding to the expected life of the share award. |
198 |
IHG |
APP |
LTIP |
|||||||||||||||||
Number of shares thousands |
Performance-related awards Number of shares thousands |
Restricted stock units Number of shares thousands |
||||||||||||||||
Outstanding at 1 January 2019 |
||||||||||||||||||
Granted |
||||||||||||||||||
Vested |
( |
) |
( |
) |
( |
) | ||||||||||||
Share capital consolidation |
( |
) |
– |
– |
||||||||||||||
Lapsed or cancelled |
( |
) |
( |
) |
( |
) | ||||||||||||
Outstanding at 31 December 2019 |
||||||||||||||||||
Granted |
||||||||||||||||||
Vested |
( |
) |
( |
) |
( |
) | ||||||||||||
Lapsed or cancelled |
( |
) |
( |
) |
( |
) | ||||||||||||
Outstanding at 31 December 2020 |
||||||||||||||||||
Granted |
||||||||||||||||||
Vested |
( |
) |
( |
) |
( |
) | ||||||||||||
Lapsed or cancelled |
( |
) |
( |
) |
( |
) | ||||||||||||
Outstanding at 31 December 2021 |
||||||||||||||||||
Fair value of awards granted during the year (cents) |
||||||||||||||||||
2021 |
.5 |
.3 |
.7 |
|||||||||||||||
2020 |
.9 |
.5 |
.5 |
|||||||||||||||
2019 |
.7 |
.6 |
.1 |
|||||||||||||||
Weighted average remaining contract life (years) |
||||||||||||||||||
At 31 December 2021 |
||||||||||||||||||
At 31 December 2020 |
||||||||||||||||||
At 31 December 2019 |
||||||||||||||||||
Number of shares millions |
Nominal value $m |
Share premium $m |
Equity share capital $m |
|||||||||||||||||||||
Allotted, called up and fully paid |
||||||||||||||||||||||||
At 1 January 2019 (ordinary shares of 17 ⁄21 p each) |
||||||||||||||||||||||||
Share capital consolidation |
( |
– |
– |
– |
||||||||||||||||||||
Exchange adjustments |
– |
|||||||||||||||||||||||
At 31 December 2019 (ordinary shares of 340 ⁄399 p each) |
||||||||||||||||||||||||
Exchange adjustments |
– |
|||||||||||||||||||||||
At 31 December 2020 (ordinary shares of 340 ⁄399 p each) |
||||||||||||||||||||||||
Exchange adjustments |
– |
( |
( |
) | ||||||||||||||||||||
At 31 December 2021 (ordinary shares of 340 ⁄399 p each) |
||||||||||||||||||||||||
Notes to the Group Financial Statements |
IHG |
199 |
Number of shares millions |
Carrying value $m |
Market value $m |
||||||||||
31 December 2021 |
||||||||||||
31 December 2020 |
||||||||||||
31 December 2019 |
||||||||||||
Cash flow hedge reserves | ||||||||||
Cash flow hedge reserve $m |
Cost of hedging reserve $m |
Total $m | ||||||||
At 1 January 2019 |
( |
( |
) |
( | ||||||
Costs of hedging deferred and recognised in other comprehensive income |
– |
( |
) |
( | ||||||
Change in fair value of currency swaps recognised in other comprehensive income |
( |
– |
( | |||||||
Reclassified from other comprehensive income to profit or loss – included in financial expenses |
– |
|||||||||
At 31 December 2019 |
( |
) |
( | |||||||
Costs of hedging deferred and recognised in other comprehensive income |
– |
( |
) |
( | ||||||
Change in fair value of currency swaps recognised in other comprehensive income |
( |
– |
( | |||||||
Reclassified from other comprehensive income to profit or loss – included in financial expenses |
( |
– |
( | |||||||
Deferred tax |
– |
|||||||||
Exchange adjustments |
( |
– |
( | |||||||
At 31 December 2020 |
( |
( |
) |
( | ||||||
Costs of hedging deferred and recognised in other comprehensive income |
||||||||||
Change in fair value of currency swaps recognised in other comprehensive income |
( |
( | ||||||||
Reclassified from other comprehensive income to profit or loss – included in financial expenses |
||||||||||
Deferred tax |
( |
( | ||||||||
At 31 December 2021 |
( |
) |
||||||||
2021 $m |
2020 $m | |||||||||
Contracts placed for expenditure not provided for in the Group Financial Statements |
||||||||||
Property, plant and equipment |
||||||||||
Intangible assets |
||||||||||
200 |
IHG |
Notes to the Group Financial Statements |
IHG |
201 |
2021 $m |
2020 $m |
2019 $m | ||||||||||||||
Total compensation of key management personnel |
||||||||||||||||
Short-term employment benefits |
||||||||||||||||
Contributions to defined contribution pension plans |
||||||||||||||||
Equity compensation benefits a |
||||||||||||||||
a |
As measured in accordance with IFRS 2 ‘Share-based Payment’. |
2021 $m |
2020 $m |
2019 $m | ||||||||||||||
Associates |
||||||||||||||||
Fee revenue from associates |
||||||||||||||||
Amounts owed by associates |
||||||||||||||||
Amounts owed to associates |
( |
) |
( | |||||||||||||
2021 $m |
2020 $m |
2019 $m | ||||||||||||||
Assessment fees and contributions received from hotels |
||||||||||||||||
Loyalty programme revenues, net of the cost of point redemptions |
||||||||||||||||
2021 $m |
2020 $m |
2019 $m | ||||||||||||||
Marketing |
||||||||||||||||
Payroll costs (note 4) |
||||||||||||||||
Depreciation and amortisation |
||||||||||||||||
Impairment (reversal)/loss on financial assets (note 18) |
( |
|||||||||||||||
Other impairment (reversals)/charges |
( |
– | ||||||||||||||
202 |
IHG |
Notes to the Group Financial Statements |
IHG |
203 |