| Exhibit 99.1
|

Exhibit 99.1 MA Y 18, 2017 Analyst Day CAESARS ENTERTAINMENT The Wheel House at The LINQ Promenade LAS VEGAS, N V
|
|
2017 CAESARS ANALYST DAY Agenda WELCOME & DISCLAIMERS STRATEGIC VISION & STRATEGY MARK FRISSORA CEO & PRESIDENT GLOBAL OPERATIONS UPDATE TOM JENKIN GLOBAL PRESIDENT HOSPITALITY UPDATE BOB MORSE PRESIDENT OF HOSPITALITY RUBEN SIGALA EVP & CMO TECHNOLOGY UPDATE LES OTTOLENGHI EVP & CIO FINANCIAL OVERVIEW & UPDATE ERIC HESSION EVP & CFO 2
|
|
2017 CAESARS ANALYST DAY Safe Harbor Statement Certain information in this presentation and discussed during the Caesars Entertainment Corporation (“CEC” or the “Company”) 2017 Analyst Day event and simultaneous webcast, which this presentation accompanies, constitutes forward-looking information within the meaning of the Private Securities Litigation Reform Act of 1995. You can identify these statements by the fact that they do not relate strictly to historical or current facts and by the use of words such as “will,” “may,” “project” or the negative or other variations thereof or comparable terminology. In particular, they include statements relating to, among other things, the emergence from bankruptcy (the “Emergence”) of Caesars Entertainment Operating Company, Inc. (“CEOC”), the merger (the “Merger”) of CEC with Caesars Acquisition Company (“CAC”), future actions that may be taken by CEC and others with respect thereto and projected results of operations. You are cautioned that forward-looking statements are not guarantees of future performance or results and involve risks and uncertainties that cannot be predicted or quantified and, consequently, the actual performance and results of CEC may differ materially from those expressed or implied by the forward-looking statements. Such risks and uncertainties include, but are not limited to, the following factors, as well as other factors described from time to time in our reports filed with the SEC: CEC’s and CEOC’s ability (or inability) to meet any milestones or other conditions set forth in their restructuring support agreements, CEC’s and CEOC’s ability (or inability) to satisfy the conditions to the effectiveness of the Third Amended Joint Plan of Reorganization of CEOC and its Chapter 11 debtor subsidiaries, other risks associated with the CEOC restructuring and related litigation, industry and economic conditions and competitive, legal, governmental and technological factors. There is no assurance that the Company’s expectations will be realized. All forward-looking statements in this presentation and discussed during the CEC 2017 Analyst Day event and simultaneous webcast which this presentation accompanies are based on current expectations and projections about future events. Please be advised that developments subsequent to this presentation and the CEC 2017 Analyst Day event and simultaneous webcast are likely to cause this information to become outdated with the passage of time. The Company assumes no obligation to update any forward-looking information contained in this presentation or discussed during the CEC 2017 Analyst Day event and simultaneous webcast which this presentation accompanies should circumstances change, except as otherwise required by securities and other applicable laws. 3
|
|

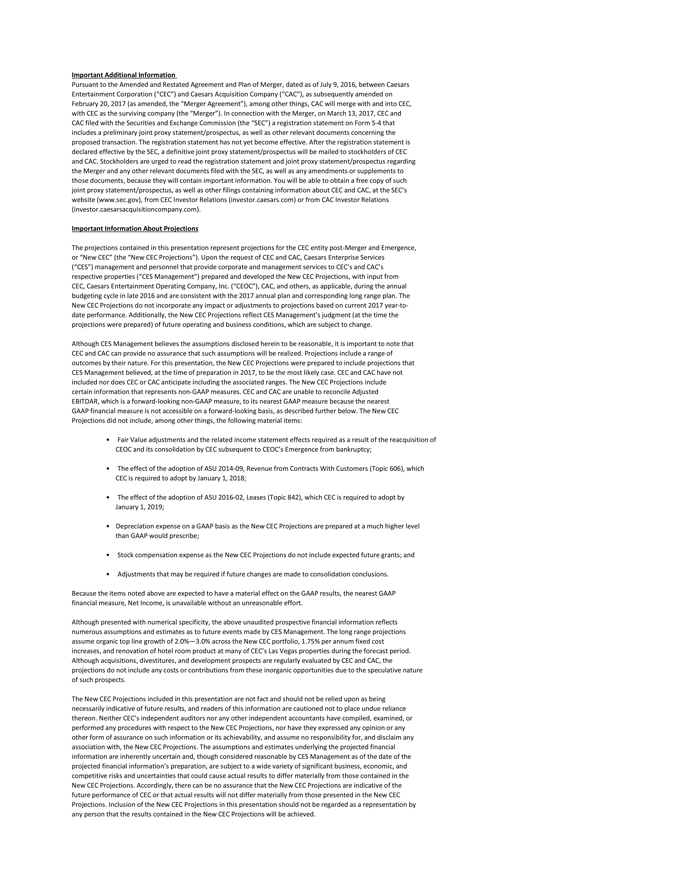
2017 CAESARS ANALYST DAY Important Additional Information Pursuant to the Amended and Restated Agreement and Plan of Merger, dated as of July 9, 2016, between Caesars Entertainment Corporation (“CEC”) and Caesars Acquisition Company (“CAC”), as subsequently amended on February 20, 2017 (as amended, the “Merger Agreement”), among other things, CAC will merge with and into CEC, with CEC as the surviving company (the “Merger”). In connection with the Merger, on March 13, 2017, CEC and CAC filed with the Securities and Exchange Commission (the “SEC”) a registration statement on Form S-4 that includes a preliminary joint proxy statement/prospectus, as well as other relevant documents concerning the proposed transaction. The registration statement has not yet become effective. After the registration statement is declared effective by the SEC, a definitive joint proxy statement/prospectus will be mailed to stockholders of CEC and CAC. Stockholders are urged to read the registration statement and joint proxy statement/prospectus regarding the Merger and any other relevant documents filed with the SEC, as well as any amendments or supplements to those documents, because they will contain important information. You will be able to obtain a free copy of such joint proxy statement/prospectus, as well as other filings containing information about CEC and CAC, at the SEC’s website (www.sec.gov), from CEC Investor Relations (investor.caesars.com) or from CAC Investor Relations (investor.caesarsacquisitioncompany.com). The information in this communication is for informational purposes only and is neither an offer to purchase, nor a solicitation of an offer to sell, subscribe for or buy any securities or the solicitation of any vote or approval in any jurisdiction pursuant to or in connection with the proposed transactions or otherwise, nor shall there be any sale, issuance or transfer of securities in any jurisdiction in contravention of applicable law. No offer of securities shall be made except by means of a prospectus meeting the requirements of Section 10 of the Securities Act of 1933, as amended, and otherwise in accordance with applicable law. CEC, CAC and their respective directors, executive officers and certain other members of management and employees may be soliciting proxies from CEC and CAC stockholders in favor of the business combination transaction. Information regarding the persons who may, under the rules of the SEC, be considered participants in the solicitation of the CEC and CAC stockholders in connection with the proposed business combination transaction is set forth in the definitive proxy statement filed with the SEC on April 12, 2017 and Amendment No. 1 to the Annual Report on Form 10-K for CAC’s fiscal year ended December 31, 2016, filed on March 31, 2017, respectively. You can obtain free copies of these documents from CEC and CAC in the manner set forth above. 4
|
|
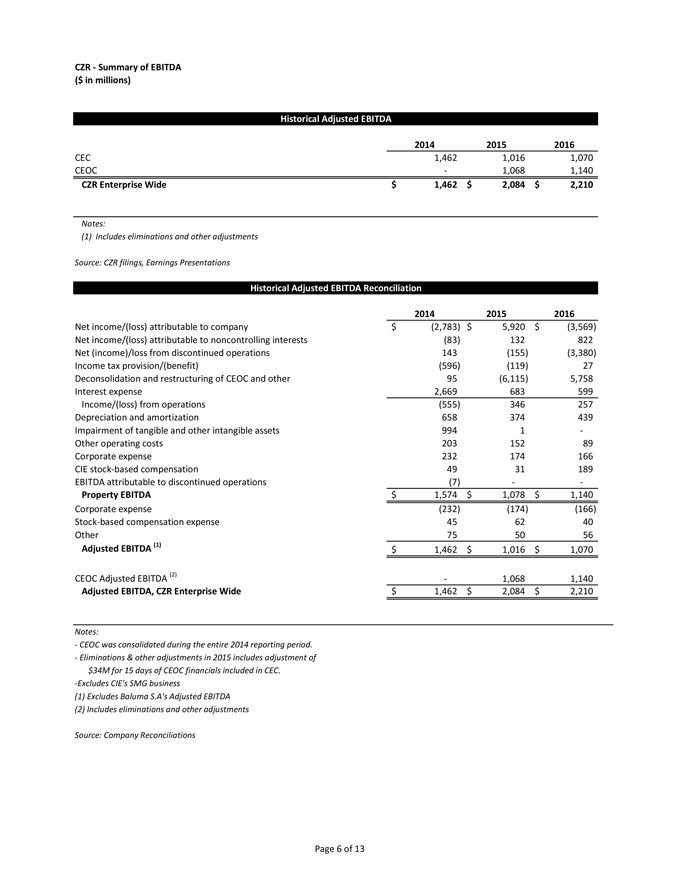
2017 CAESARS ANALYST DAY Use of Non-GAAP Measures The following non-GAAP measures will be used in the presentation and discussed at the conference at which these materials will be presented: Adjusted EBITDA and Adjusted EBITDA Margin Property EBITDA Free Cash Flow CEC + CEOC, or enterprise-wide financial measures De?nitions of these non-GAAP measures, reconciliations to their nearest GAAP measures, and the reasons management believes these measures provide useful information for investors, can be found in the Appendix to this presentation. 5
|
|
2017 CAESARS ANALYST DAY Important Information About Presentation of Results On January 15, 2015, Caesars Entertainment Operating Company, Inc. (“CEOC”) filed a voluntary bankruptcy petition under Chapter 11 of the United States Bankruptcy Code, resulting in the deconsolidation of CEOC from CEC’s operating results effective as of such date. As such, amounts presented in this presentation exclude the operating results of CEOC subsequent to January 15, 2015, unless otherwise stated, and analysis of our operating results in this presentation and as may be discussed during the CEC 2017 Analyst Day event and simultaneous webcast which this presentation accompanies include those components that remain in the consolidated CEC entity subsequent to the deconsolidation of CEOC. “Continuing CEC” represents Caesars Entertainment Resort Properties, LLC (“CERP”), Caesars Growth Partners, LLC (“CGP”) and the associated parent company and elimination adjustments that represent the current CEC consolidated structure. Through June 30, 2016, we aggregated the operating segments within CGP into two separate reportable segments: CGP Casino Properties and Interactive Entertainment. On September 23, 2016, Caesars Interactive Entertainment, LLC (“CIE”) sold its social and mobile games business (the “SMG Business”) for cash consideration of $4.4 billion, subject to customary purchase price adjustments, and retained only its World Series of Poker (“WSOP”) and regulated online real money gaming businesses. The SMG Business represented the majority of CIE’s operations and is being classified as a discontinued operation for all periods presented effective in the third quarter of 2016. After excluding the SMG Business from CIE’s continuing operations, CIE is no longer considered a separate reportable segment from CGP Casinos based on management’s view. Therefore, CGP Casinos and CIE have been combined for all periods presented to form the CGP segment. Unless otherwise specified, references to “Caesars”, “our” or “enterprise wide” refer to Continuing CEC and CEOC. However, we are also providing certain supplemental information as if we had continued to consolidate CEOC throughout the first quarter of 2017. This information includes both stand-alone CEOC financials, and certain financial information for CEC as if CEOC remained a consolidated entity. This information within this presentation may be different from CEOC’s standalone results separately provided due to immaterial adjustments, rounding, and basis of presentation differences. CEC has committed to a material amount of payments to support CEOC’s restructuring, which would result in the reacquisition of CEOC’s operations if the restructuring is made on terms consistent with the current Restructuring Support Agreements to which CEC is a party (“RSAs”) and the Third Amended Joint Plan of Reorganization confirmed by the bankruptcy court on January 17, 2017 (the “Plan”). In addition, compensation of management is in part determined by reference to certain of such financial information. As a result, we believe this supplemental information is useful to investors who are trying to understand the results of the entire “Caesars” enterprise, including CEOC and consistent with the management services provided across the system’s properties. This supplemental information is non-GAAP. It is not preferable to GAAP results but is used by management as an analytical tool to assess the results of all properties owned, managed or branded by a Caesars entity, regardless of consolidation. Additionally, the results are not necessarily indicative of future performance or of the results that would be reported should the reorganization of CEOC contemplated by the RSAs and the Plan be successfully completed. 6
|
|
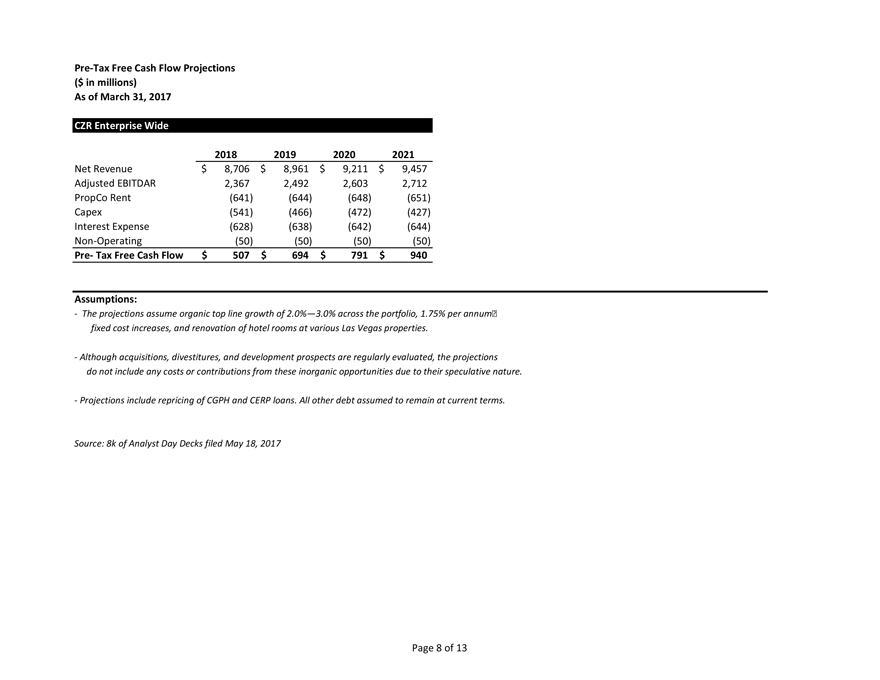
2017 CAESARS ANALYST DAY Important Information About Projections The projections contained in this presentation represent projections for the CEC entity post-Merger and Emergence, or “New CEC” (the “New CEC Projections”). Upon the request of CEC and CAC, Caesars Enterprise Services (“CES”) management and personnel that provide corporate and management services to CEC’s and CAC’s respective properties (“CES Management”) prepared and developed the New CEC Projections, with input from CEC, CEOC, CAC, and others, as applicable, during the annual budgeting cycle in late 2016 and are consistent with the 2017 annual plan and corresponding long range plan. The New CEC Projections do not incorporate any impact or adjustments to projections based on current 2017 year-to-date performance. Additionally, the New CEC Projections reflect CES Management’s judgment (at the time the projections were prepared) of future operating and business conditions, which are subject to change. Although CES Management believes its assumptions to be reasonable, it is important to note that CEC and CAC can provide no assurance that such assumptions will be realized. Projections include a range of outcomes by their nature. The New CEC Projections were prepared to include projections that CES Management believed, at the time of preparation in 2017, to be the most likely case. CEC and CAC have not included nor does CEC or CAC anticipate including the associated ranges. The New CEC Projections include certain information that represents non-GAAP measures. CEC and CAC are unable to reconcile Adjusted EBITDAR, which is a forward-looking non-GAAP measure, to its nearest GAAP measure because the nearest GAAP ?nancial measure is not accessible on a forward-looking basis, as described further below. The New CEC Projections did not include, among other things, the following material items: Fair Value adjustments and the related income statement effects required as a result of the reacquisition of CEOC and its consolidation by CEC subsequent to CEOC’s Emergence from bankruptcy; The effect of the adoption of ASU 2014-09, Revenue from Contracts With Customers (Topic 606), which CEC is required to adopt by January 1, 2018; The effect of the adoption of ASU 2016-02, Leases (Topic 842), which CEC is required to adopt by January 1, 2019; Depreciation expense on a GAAP basis as the New CEC Projections are prepared at a much higher level than GAAP would prescribe; Stock compensation expense as the New CEC Projections do not include expected future grants; and Adjustments that may be required if future changes are made to consolidation conclusions. Because the items noted above are expected to have a material effect on the GAAP results, the nearest GAAP ?nancial measure, Net Income, is unavailable without an unreasonable effort. Although presented with numerical specificity, the New CEC Projections reflect numerous assumptions and estimates as to future events made by CES Management. The long range projections assume organic top line growth of 2.0%—3.0% across the New CEC portfolio, 1.75% per annum fixed cost increases, and renovation of hotel room product at many of CEC’s Las Vegas properties during the forecast period. Although acquisitions, divestitures, and development prospects are regularly evaluated by CEC and CAC, the New CEC Projections do not include any costs or contributions from these inorganic opportunities due to the speculative nature of such prospects.
| 7 |
|
|
|

2017 CAESARS ANALYST DAY Important Information About Projections (continued) The New CEC Projections included in this presentation are not fact and should not be relied upon as being necessarily indicative of future results, and readers of this information are cautioned not to place undue reliance thereon. Neither CEC’s independent auditors nor any other independent accountants have compiled, examined, or performed any procedures with respect to the New CEC Projections, nor have they expressed any opinion or any other form of assurance on such information or its achievability, and assume no responsibility for, and disclaim any association with, the New CEC Projections. The assumptions and estimates underlying the projected financial information are inherently uncertain and, though considered reasonable by CES Management as of the date of the projected financial information’s preparation, are subject to a wide variety of significant business, economic, and competitive risks and uncertainties that could cause actual results to differ materially from those contained in the New CEC Projections. Accordingly, there can be no assurance that the New CEC Projections are indicative of the future performance of CEC or that actual results will not differ materially from those presented in the New CEC Projections. Inclusion of the New CEC Projections in this presentation should not be regarded as a representation by any person that the results contained in the New CEC Projections will be achieved. 8
|
|
0 1 7 S T R A T E G Y & V I S I O N
1 2 0 1 7 S T R A T E G Y & V I S I O N
S I Z Z L E R E E L
|
|
Strategy & Vision Mark Frissora President & CEO C A E S A R S E N T E R T A I N M E N T MA Y 1 8 , 2 0 1 7
|
|
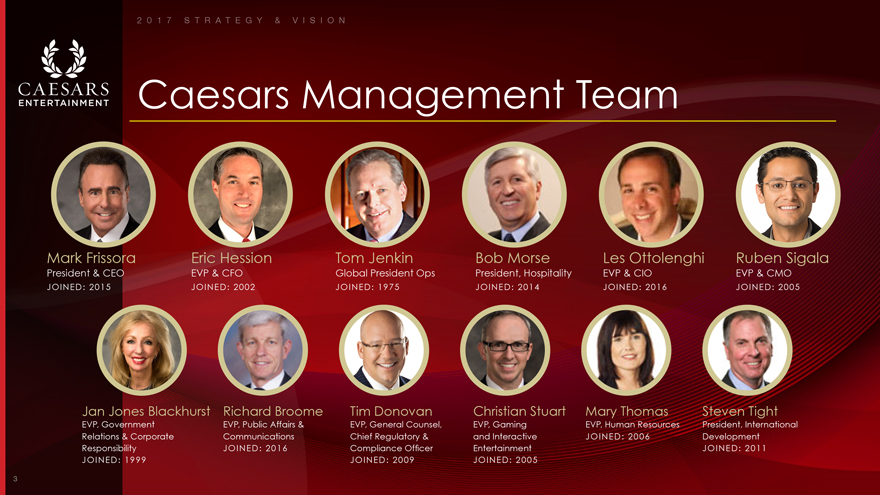
2 0 1 7 S T R A T E G Y & V I S I O N Caesars Management Team Mark Frissora Eric Hession Tom Jenkin Bob Morse Les Ottolenghi Ruben Sigala President & CEO EVP & CFO Global President Ops President, Hospitality EVP & CIO EVP & CMO JOINED: 2015 JOINED: 2002 JOINED: 1975 JOINED: 2014 JOINED: 2016 JOINED: 2005 Jan Jones Blackhurst Richard Broome Tim Donovan Christian Stuart Mary Thomas Steven Tight EVP, Government EVP, Public Affairs & EVP, General Counsel, EVP, Gaming EVP, Human Resources President, International Relations & Corporate Communications Chief Regulatory & and Interactive JOINED: 2006 Development Responsibility JOINED: 2016 Compliance Officer Entertainment JOINED: 2011 JOINED: 1999 JOINED: 2009 JOINED: 2005 3
|
|
2 0 1 7 S T R A T E G Y & V I S I O N
About Our Value Caesars Transformation Proposition
|
|

2 0 1 7 S T R A T E G Y & V I S I O N Largest Gaming & Entertainment Company In The U.S. $8.4B >50M >65,000 >100M 47 >1.7M >15,700 >34,000 2016 TOTAL NET TOTAL REWARDS EMPLOYEES GUEST VISITS CASINOS IN 5 SQ FT OF LEEDS CONVENTIONS/ HOTEL ROOMS & REVENUES MEMBERS PER YEAR COUNTRIES CERTIFIED MEETINGS PER SUITES BUILDINGS YEAR WORLDWIDE >49,000 >4,000 ~8,500 30 ~1.6M >2.8M >600 SLOT MACHINES TABLE GAMES LIVE GREEN KEY SQ FT OF SQ FT OF BARS, RESTAURANTS WORLDWIDE WORLDWIDE ENTERTAINMENT ECO-RATED CONVENTION AND CASINO SPACE & CLUBS AT OUR U.S. SHOWS PER PROPERTIES RETAIL SPACE WORLDWIDE PROPERTIES YEAR IN N.A. jManage 47 casino properties across j#1 theater venue in U.S. 13 states and 5 countries j#3 live entertainment promoter worldwide j#1 or #2 share position in most markets jStrong portfolio of widely recognized brands jIndustry’s first loyalty program, Total Rewards 5
|
|

2 0 1 7 S T R A T E G Y & V I S I O N Diversified Business with Significant Presence in Las Vegas 2016 REVENUE 2016 PROPERTY REVENUE B Y V E R T I C A L B Y G E O G R A P H Y 11% 8% O T H E R 1 ENTERTAINMENT & OTHER 16% F O O D & % B E V E R A G E $ 58% 48% 44 L A S GAMING N O N 8.4 V E G A S L A S V E G A S BILLION D O M E S T I C 15% HOTEL Note: All information is displayed on an enterprise wide basis, which is de?ned as CEC + CEOC 1. Other includes items such as our managed revenue and international properties. 6
|
|

2 0 1 7 S T R A T E G Y & V I S I O N Strong Portfolio of Brands MARQUEE GLOBAL BRANDS LAS VEGAS BRANDS DIGITAL ENTERTAINMENT Note: Nobu and Planet Hollywood are owned by other entities and licensed to Caesars. 7
|
|
2 0 1 7 S T R A T E G Y & V I S I O N
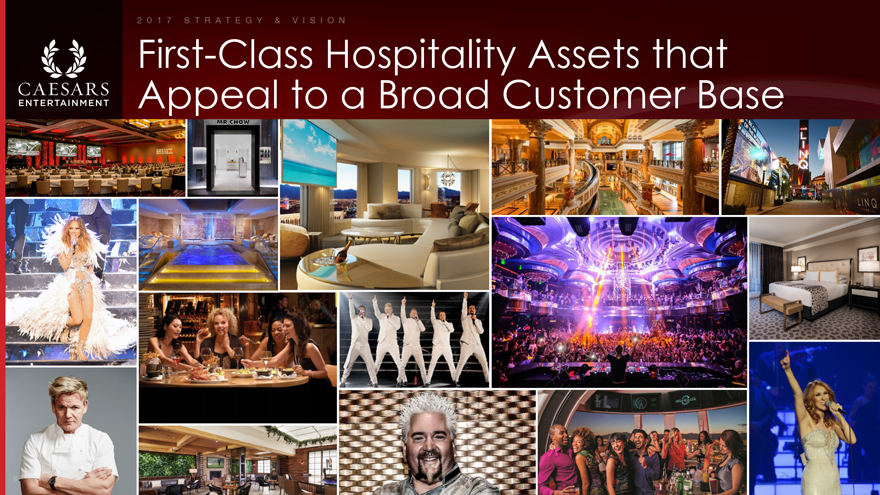
First-Class Hospitality Assets that Appeal to a Broad Customer Base
8
|
|

2 0 1 7 S T R A T E G Y & V I S I O N Continued Leadership in Gaming Building on our strong gaming platforms through innovative offerings Z Largest gaming position in the U.S. GAMING NET REVENUE $ M I L L I O N S ZWorking to change traditional slot and table play with new features, such as the $5,550 implementation of side bets $5,418 ZFirst to offer skills-based gambling machines, in partnership with Gamblit, Gameco & Sci Games ZEnhancing gaming floor rewards through 2016 2014 Play by TR app SIDEBETS 9
|
|

2 0 1 7 S T R A T E G Y & V I S I O N New Gaming Experiences Extend the Appeal of Our Casino Offerings Testing new technologies and platforms to enhance relationships with our existing customer base while engaging a new generation of gamers CASINO GAMERS NON-CASINO GAMERS 54% 53% 48% 25% 23% 22% MILLENNIALS GEN X BOOMERS MILLENNIALS GEN X BOOMERS ONLINE WORLD MOBILE SPORTS BETTING FANTASY ESPORTS VIRTUAL REALITY SERIES OF POKER GAMBLING PLATFORMS SPORTS EVENTS EXPERIENCES Note: Demographic ?gures sourced from internal, proprietary study. 10
|
|
2 0 1 7 S T R A T E G Y & V I S I O N
About Our Value Caesars Transformation Proposition
11
|
|

2 0 1 7 S T R A T E G Y & V I S I O N Delivering Strong Performance ENTERPRISE WIDE FINANCIAL & OPERATIONAL HIGHLIGHTS1 +$756 M +800 bps +$2 B ADJUSTED EBITDA ADJUSTED EBITDA AGGREGATE CAPITAL IMPROVEMENT MARGIN DEPLOYED ~$16 B +1.4% +13% EXPECTED MARKET SHARE CAGR REDUCTION IN LAS VEGAS3 LAS VEGAS IN DEBT2 CASH ADR Note: All information is displayed on an enterprise wide basis, which is dfined as CEC + CEOC; Reflects sale of CIE SMG business. 1. Metrics measure change from 2014 to Q1 2017 TTM. 12 2. Reduction in financial debt is enterprise wide total $25.6 billion less $9.6 billion upon emergence, not adjusted for lease liability. 3. Defined as net revenue market share.
|
|
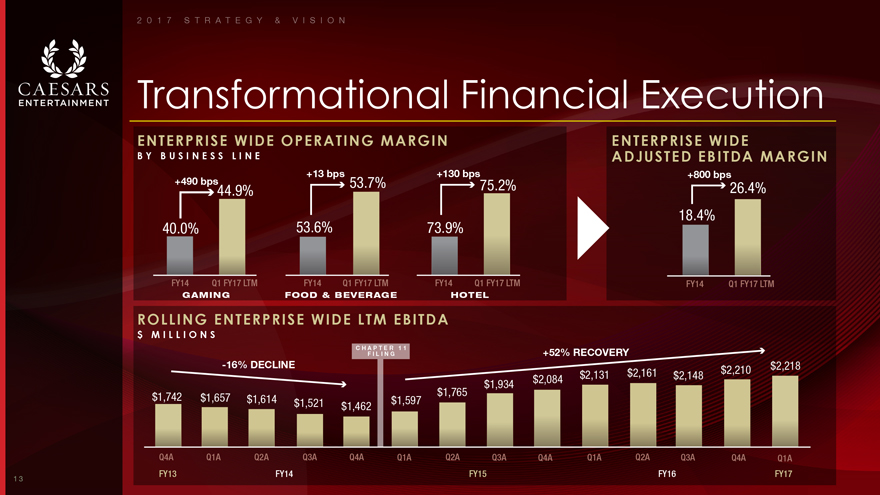
2 0 1 7 S T R A T E G Y & V I S I O N Transformational Financial Execution ENTERPRISE WIDE OPERATING MARGIN ENTERPRISE WIDE B Y B U S I N E S S L I N E ADJUSTED EBITDA MARGIN +13 bps +130 bps +800 bps +490 bps 53.7% 75.2% 26.4% 44.9% 18.4% 40.0% 53.6% 73.9% FY14 Q1 FY17 LTM FY14 Q1 FY17 LTM FY14 Q1 FY17 LTM FY14 Q1 FY17 LTM GAMING FOOD & BEVERAGE HOTEL ROLLING ENTERPRISE WIDE LTM EBITDA $ M I L L I O N S C H F A IPLTI E NR G 1 1 +52% RECOVERY -16% DECLINE $2,210 $2,218 $2,131 $2,161 $2,148 $1,934 $2,084 $1,742 $1,765 $1,657 $1,614 $1,521 $1,597 $1,462 Q4A Q1A Q2A Q3A Q4A Q1A Q2A Q3A Q4A Q1A Q2A Q3A Q4A Q1A FY13 FY14 FY15 FY16 FY17 13
|
|
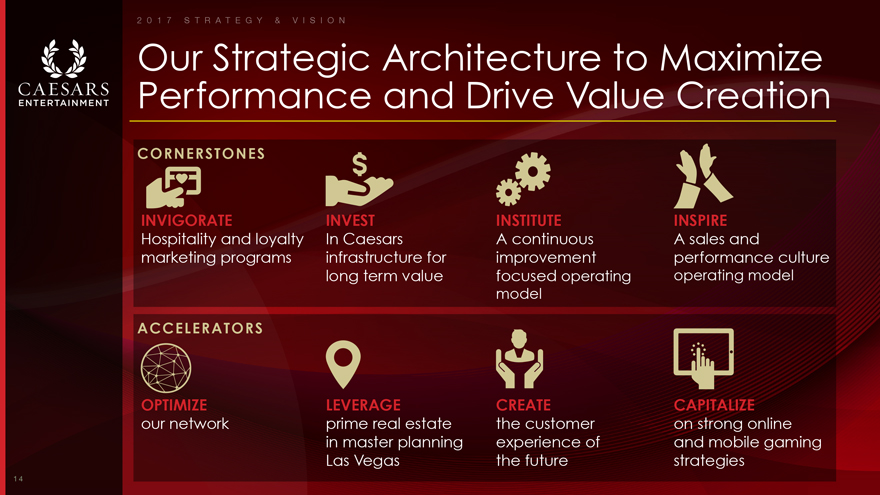
2 0 1 7 S T R A T E G Y & V I S I O N Our Strategic Architecture to Maximize Performance and Drive Value Creation CORNERSTONES INVIGORATE INVEST INSTITUTE INSPIRE Hospitality and loyalty In Caesars A continuous A sales and marketing programs infrastructure for improvement performance culture long term value focused operating operating model model ACCELERATORS OPTIMIZE LEVERAGE CREATE CAPITALIZE our network prime real estate the customer on strong online in master planning experience of and mobile gaming Las Vegas the future strategies 14
|
|
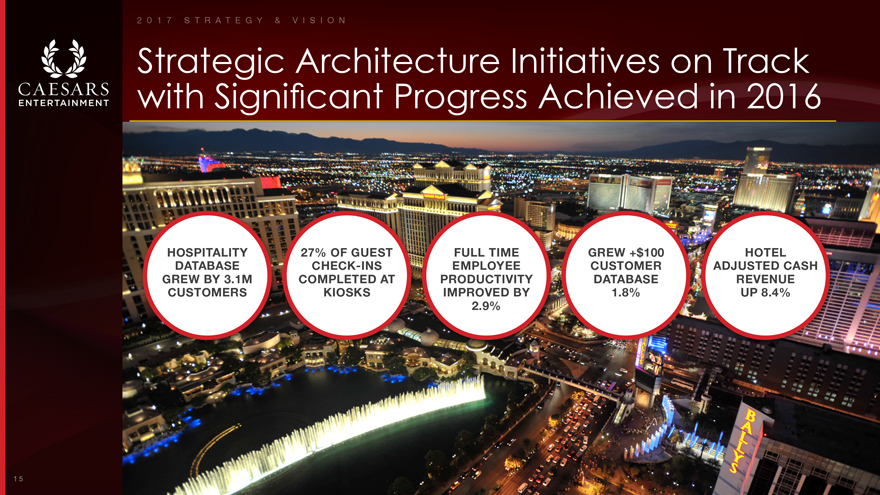
2 0 1 7 S T R A T E G Y & V I S I O N Strategic Architecture Initiatives on Track with Significant Progress Achieved in 2016 HOSPITALITY 27% OF GUEST FULL TIME GREW +$100 HOTEL DATABASE CHECK-INS EMPLOYEE CUSTOMER ADJUSTED CASH GREW BY 3.1M COMPLETED AT PRODUCTIVITY DATABASE REVENUE CUSTOMERS KIOSKS IMPROVED BY 1.8% UP 8.4% 2.9% 15
|
|
2 0 1 7 S T R A T E G Y & V I S I O N
About Our Value Caesars Transformation Proposition
16
|
|
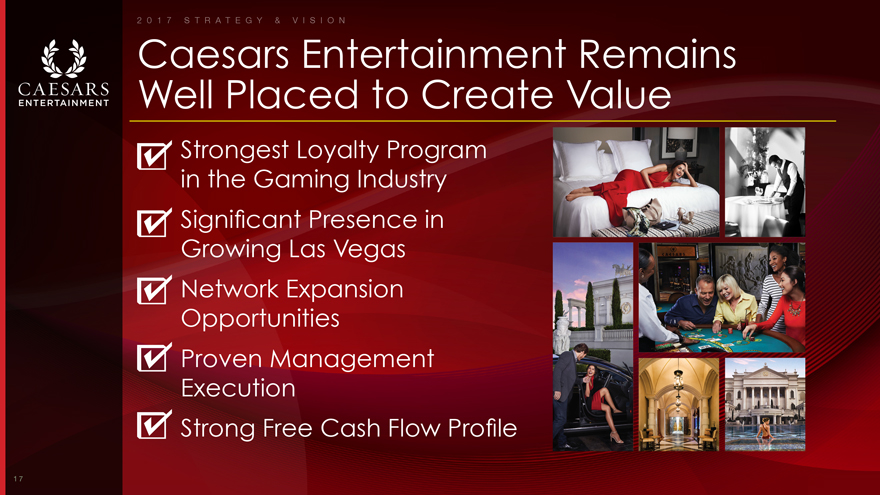
2 0 1 7 S T R A T E G Y & V I S I O N Caesars Entertainment Remains Well Placed to Create Value Strongest Loyalty Program in the Gaming Industry Significant Presence in Growing Las Vegas Network Expansion Opportunities Proven Management Execution Strong Free Cash Flow Profile 17
|
|

2 0 1 7 S T R A T E G Y & V I S I O N 50+ MILLION TOTA L R E W A R D S M E M B E R S #1 GAMING POSITION IN U.S. 18
|
|
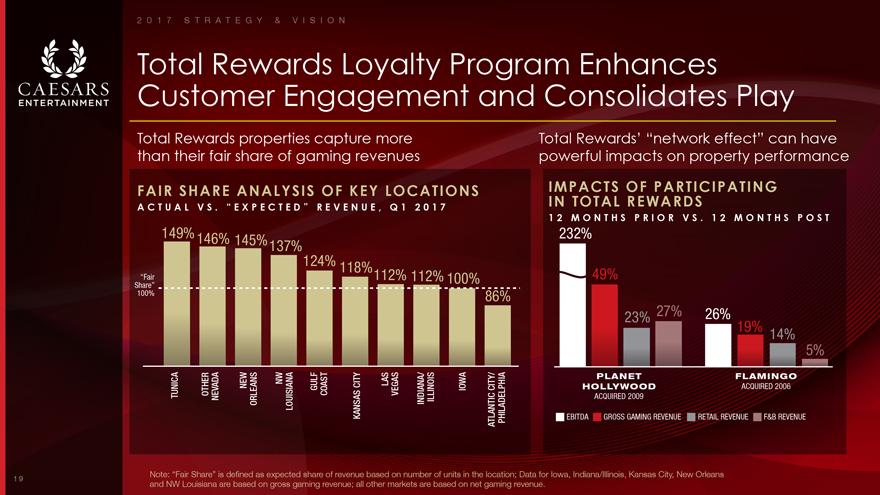
2 0 1 7 S T R A T E G Y & V I S I O N Total Rewards Loyalty Program Enhances Customer Engagement and Consolidates Play Total Rewards properties capture more Total Rewards’ “network effect” can have than their fair share of gaming revenues powerful impacts on property performance FAIR SHARE ANALYSIS OF KEY LOCATIONS IMPACTS IN TOTAL OF REWARDS PARTICIPATING A C T U A L V S . “ E X P E C T E D ” R E V E N U E , Q 1 2 0 1 7 1 2 M O N T H S P R I O R V S . 1 2 M O N T H S P O S T 149% 146% 145% 232% 137% 124% 118% “Fair 112% 112% 100% 49% Share” 100% 86% 23% 27% 26% 19% 14% 5% NEW NW CITY LAS PLANET FLAMINGO HOLLYWOOD ACQUIRED 2006 TUNICA OTHER GULF COAST VEGAS IOWACITY/ NEVADA ORLEANS LOUISIANA KANSAS INDIANA/ ILLINOIS ACQUIRED 2009 ATLANTIC PHILADELPHIA EBITDA GROSS GAMING REVENUE RETAIL REVENUE F&B REVENUE Note: “Fair Share” is defined as expected share of revenue based on number of units in the location; Data for Iowa, Indiana/Illinois, Kansas City, New Orleans and NW Louisiana are based on gross gaming revenue; all other markets are based on net gaming revenue. 19
|
|

2 0 1 7 S T R A T E G Y & V I S I O N Invigorate Hospitality and Loyalty Marketing Programs to Profitably Grow the Database jFocused on growing VIP, but opportunity still remains within lower spend segments VIP TOTAL REWARDS MEMBERS SPEND GROWTH jTotal Rewards members that engage in multiple % C H A N G E V S P R I O R C O M P A R A B L E P E R I O D touch-points spend more (email, TR App, TR Visa) 7% jOpportunity to expand active portion of the database through increased engagement strategy 5% 2016 Q1 2017 NOTE: VIP represents $400+ players. 20
|
|

2 0 1 7 S T R A T E G Y & V I S I O N Driving Growth and Loyalty Through Increased Customer Engagement 1 ENHANCED MARKETING EFFORTS TO GROW DIGITAL ENGAGEMENT +81% +97% 81% NEW USER USER EMAIL INSTALLATIONS1 SESSIONS1 PENETRATION RATE1 2 MOBILE WEB ENHANCEMENTS TO INCREASE REVENUE AND TRAFFIC +22% +37% +12% MOBILE TOTAL REWARDS CASH REVENUE CONVERSION1 ONLINE SIGN-UPS1 2 GROWTH 1 2 3 GROW REVENUE THROUGH DEEPER CUSTOMER ENGAGEMENT N E W F U N C T I O N A L I T Y L A U N C H E D I N 2 0 1 7 jEnhanced offer experience jOmni-channel Communication jMobile ordering jLocation Based Messaging 1. As of December 2016, compared to prior year period. 2. Desktop and mobile 21
|
|

2 0 1 7 S T R A T E G Y & V I S I O N
Growing Market Share and Capturing Pricing Upside in Las Vegas
22
|
|

2 0 1 7 S T R A T E G Y & V I S I O N Positioned to Take Advantage of Continued Growth in Las Vegas LAS VEGAS FUNDAMENTALS POST EMERGENCE, CZR WILL HAVE ARE STRONG SIGNIFICANT LAS VEGAS EXPOSURE 2 0 1 4 – 2 0 1 6 2016 PROPERTY EBITDA A D J U S T E D F O R E X P E C T E D F U L L—Y E A R L E A S E P A Y M E N T T O R E I T 1 66% +4% +10% +11% +21% LAS VEGAS2 VISITATION ROOM TOTAL CONVENTION TO 42.9M REVENUE DEPLANED ATTENDEES AIR PASSENGERS 3% 31% NON-OTHER4 LAS VEGAS DOMESTIC3 NOTE: Las Vegas market growth data sourced from the Las Vegas Convention and Visitor Authority “LVCVA”. 1. Caesars pro-forma EBITDA post expected annual property lease/rent payments totaling $640 mm to the REIT in the year following emergence. 2. Las Vegas property EBITDA is less Caesars Palace Las Vegas expected annual rent of $165 million in the year following emergence. 3. Regional property EBITDA is less expected annual rent of $465 million in the year following emergence. 4. Other property EBITDA is less expected annual rent payment of $10 million for golf courses in the year following emergence. 23
|
|

2 0 1 7 S T R A T E G Y & V I S I O N CZR Las Vegas Revenue has Outpaced the Peer Group Supported by Hotel Performance LAS VEGAS REVENUE GROWTH CAESARS LAS VEGAS NET REVENUE 2 0 1 4 – 2 0 1 6 $ M I L L I O N S +14% GROWTH +21% 1,139 GROWTH 1,000 1,048 +13.1% CAESARS 866 ENTERPRISE +6.9% WIDE 1 +3.7% MGM LVS -1.1% WYNN GAMING HOTEL 2014 2016 2014 2016 1. MGM includes wholly-owned resorts. 24
|
|

2 0 1 7 S T R A T E G Y & V I S I O N Recapitalization Offers Additional of Hotel Hotel Revenue Room Product Upside Strong Growth in CZR Las Vegas ADR Opportunity To Close Revenue Gap Through >15K Las Over the Past Four Years Vegas Room Renovations Over the Next Five Years CZR LAS VEGAS ADR LAS VEGAS RENOVATION TIMELINE MGM LV ADR C U M U L A T I V E R O O M S 25,000 ADR OPPORTUNITY GAP $157 20,000 88% $140 $130 15,000 56% $119 CAESARS ADR 10,000 4 YEAR CAGR AVERAGE: $92 +11% 32% $101 5,000 15% 0 9% 2012 2013 2014 2015 2016 2014 2015 2016 2017E 2018E-2020E 2 CZR LV CASH ADR1 RENOVATED NON-RENOVATED 1. Cash ADR is without comp, MGM Las Vegas (LV) ADR based on public ?lings. 2. Non-renovated de?ned as rooms not renovated since 2014. 25
|
|

2 0 1 7 S T R A T E G Y & V I S I O N
Emergence Significantly
Reduces Balance Sheet
Leverage, Unlocking New Opportunities for Growth
26
|
|
2 0 1 7 S T R A T E G Y & V I S I O N
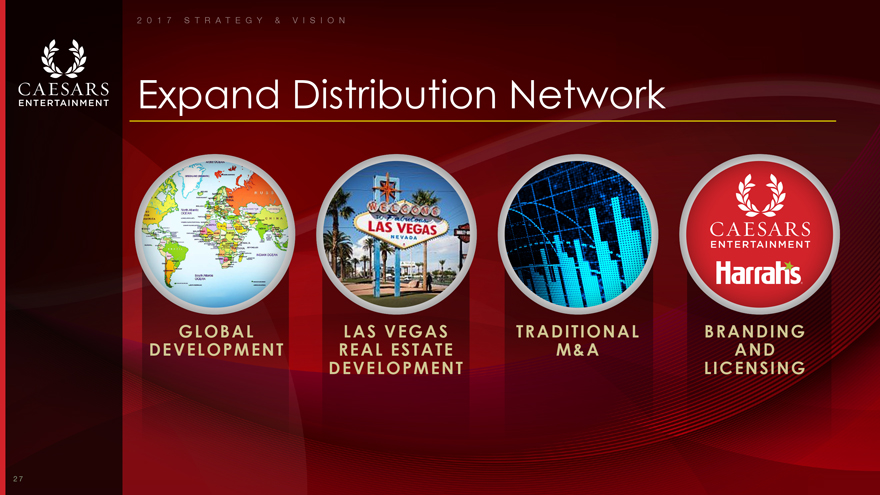
Expand Distribution Network
GLOBAL LAS VEGAS TRADITIONAL BRANDING DEVELOPMENT REAL ESTATE M&A AND
DEVELOPMENT LICENSING
27
|
|

2 0 1 7 S T R A T E G Y & V I S I O N Optimize Network in Domestic and International Landscapes Domestic Landscape International Landscape M&A TRANSACTIONS M&A VOLUME1 SOUTH KOREA CANADA ANNOUNCED1 Preliminary approval for Participating in the RFP $4.2 foreigners-only destination process 8 Project moving forward Existing experience in with new partnership Windsor and familiar with signed in Q1 2017 regulations 4 $1.7 $1.3 JAPAN BRAZIL 1 Bidding environment values Considering gaming integrity, collaboration legislation 2014 2015 2016 2014 2015 2016 and partnerships, all CZR Experience working in strengths South America via Punta jActive M&A environment in Gaming sector del Este joint venture jResolution of bankruptcy and improved capital structure will enhance flexibility for M&A 1. Source: Financial community research 28
|
|

2 0 1 7 S T R A T E G Y & V I S I O N Las Vegas Asset Activation DEVELOP & MONETIZE UNDERUTILIZED ASSETS Real estate portfolio includes large undeveloped commercial scale properties adjacent to the Las Vegas strip ~7 acres IN FRONT OF CAESARS PALACE ~39 acres ADJACENT TO THE LINQ ~50 acres ADJACENT TO BALLY’S, PARIS & PLANET HOLLYWOOD 29
|
|
2 0 1 7 S T R A T E G Y & V I S I O N
Management Generated $756 Million of Incremental EBITDA While CEOC
Operated in Bankruptcy
Note: Change in EBITDA is on an enterprise wide basis, which is de?ned as CEC + CEOC, from 2014 to Q1 2017 LTM. 30
|
|
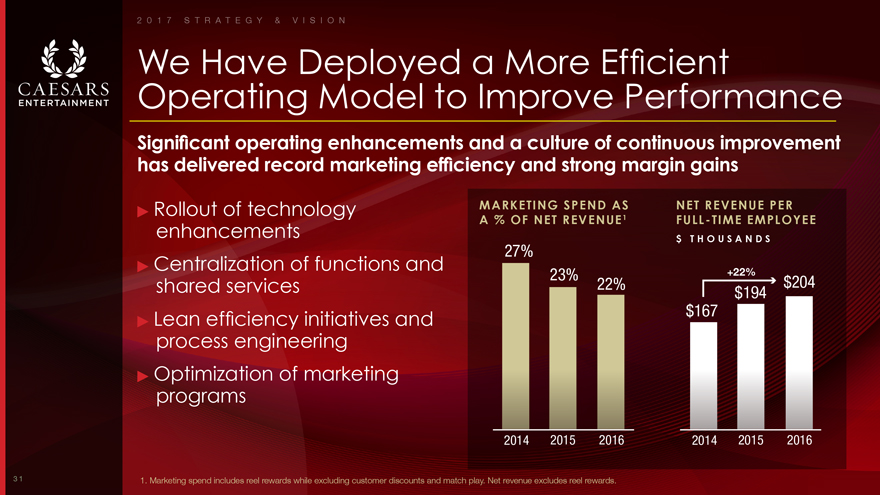
2 0 1 7 S T R A T E G Y & V I S I O N We Have Deployed a More Efficient Operating Model to Improve Performance Significant operating enhancements and a culture of continuous improvement has delivered record marketing efficiency and strong margin gains jRollout of technology MARKETING SPEND AS NET REVENUE PER A % OF NET REVENUE1 FULL-TIME EMPLOYEE enhancements $ T H O U S A N D S 27% jCentralization of functions and +22% 23% $204 shared services 22% $194 initiatives and $167 jLean efficiency process engineering jOptimization of marketing programs 2014 2015 2016 2014 2015 2016 1. Marketing spend includes reel rewards while excluding customer discounts and match play. Net revenue excludes reel rewards. 31
|
|
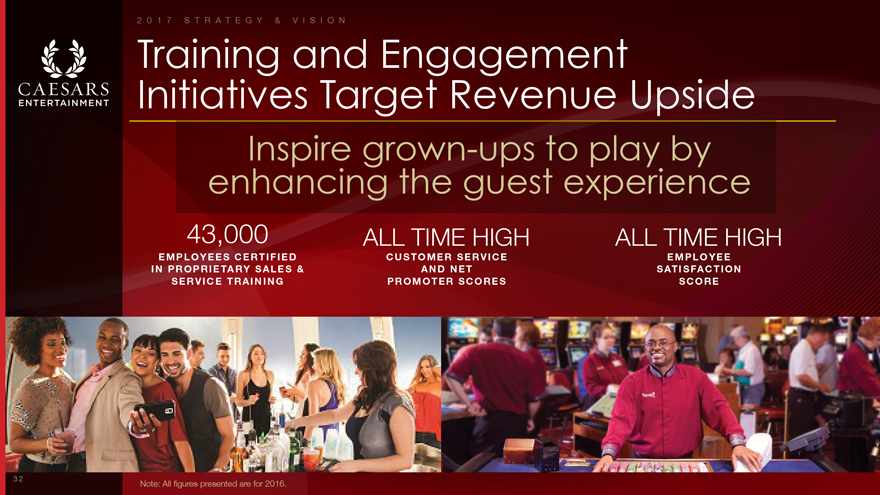
2 0 1 7 S T R A T E G Y & V I S I O N Training and Engagement Initiatives Target Revenue Upside enhancing Inspire grown-ups the guest to experience play by 43,000 ALL TIME HIGH ALL TIME HIGH EMPLOYEES CERTIFIED CUSTOMER SERVICE EMPLOYEE IN PROPRIETARY SALES & AND NET SATISFACTION SERVICE TRAINING PROMOTER SCORES SCORE Note: All ?gures presented are for 2016. 32
|
|
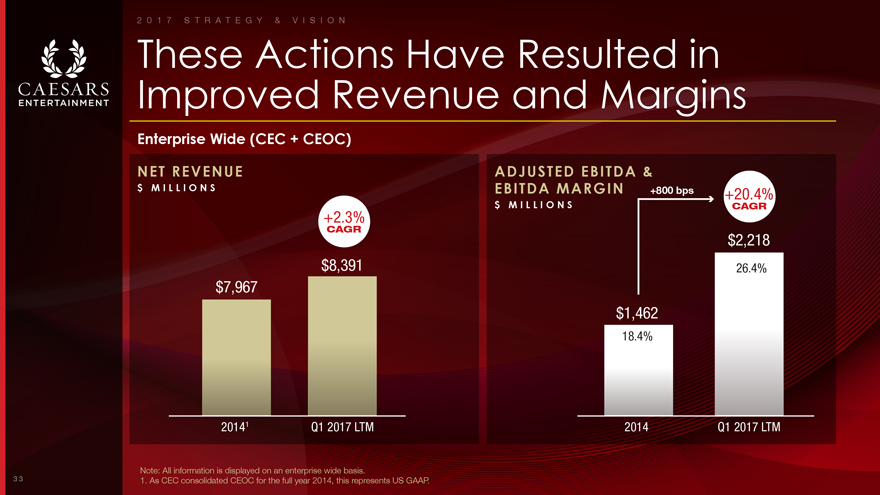
2 0 1 7 S T R A T E G Y & V I S I O N These Actions Have Resulted in Improved Revenue and Margins Enterprise Wide (CEC + CEOC) NET REVENUE ADJUSTED EBITDA & $ M I L L I O N S EBITDA MARGIN +800 bps +20.4% $ M I L L I O N S CAGR +2.3% CAGR $2,218 $8,391 26.4% $7,967 $1,462 18.4% 20141 Q1 2017 LTM 2014 Q1 2017 LTM Note: All information is displayed on an enterprise wide basis. 1. As CEC consolidated CEOC for the full year 2014, this represents US GAAP. 33
|
|

2 0 1 7 S T R A T E G Y & V I S I O N
Significant Opportunity for Continued Growth in Free Cash Flow Generation
34
|
|

2 0 1 7 S T R A T E G Y & V I S I O N Strong Free Cash Flow Generation ENTERPRISE WIDE (CEC + CEOC) ILLUSTRATIVE FREE jRevenue initiatives and CASH FLOW improved operating $ M I L L I O N S model has driven improvement in cash flow Q1 2017 LTM Enterprise Wide Adjusted EBITDA 1 $2,218 jCash flow expected to Less Steady State Capital Expenditure 425 continue to improve as a result of other potential Less Expected Lease Expense2 640 debt refinancings Less Expected Interest Expense3 637 Pro Forma Discretionary Free Cash Flow $516 Note: All information is displayed on an enterprise wide basis. 1. Enterprise wide Adjusted EBITDA ?gures exclude CIE SMG Business. See Appendix for Adjusted EBITDA reconciliation. 2. Expected lease expense which assumes $640 mm rent payment to the REIT in the year following emergence. 3. Interest Expense: CEC 2016 actual interest expense, pro forma for CGPH and CERP TL repricings plus new CEOC emergence debt of $1.2bn at L + 250 and CEC convert of $1.119bn at 5% interest rate. 35
|
|

2 0 1 7 S T R A T E G Y & V I S I O N Significantly Reduce Leverage and Cost of Capital Upon Emergence New CEC Emergence Projected Credit Statistics DEBT1 NET LEVERAGE1 2 FIXED CHARGES5 $ B I L L I O N S D E B T / A D J U S T E D E B I T D A R $ M I L L I O N S $23.5 $14.6 14.0x $2,670 5.7x WITH CAPITALIZED WITH CAPITALIZED LEASE AND CONVERT LEASE AND CONVERT3 $1,277 $637 INTEREST EXPENSE $8.5 4.2x BASE BASE4 $640 RENT 2014 PROJECTED AT 2014 PROJECTED AT 2014 PROJECTED AT EMERGENCE EMERGENCE EMERGENCE CAPITALIZED LEASE CONVERT CAPITALIZED LEASE CONVERT 1. Re?ects sale of CIE SMG business and does not include capitalized lease obligation at emergence. 2. 2014 leverage based on debt as of December 31, 2014 and 2014 Adjusted EBITDA. 3. Projected leverage at emergence with convert based on projected debt of $9.6 bn & 2017 Adjusted EBITDA less projected annual rent payment of $640 mm to REIT in the year following emergence. 4. Projected leverage at emergence without convert based on projected debt of $9.6 bn less $1.1 bn projected convert & 2017 Adjusted EBITDA less projected annual rent payment of $640 mm to REIT in the year following emergence. 5. Fixed charges assume interest expense of: CEC 2016 actual interest expense, pro forma for CGPH and CERP TL repricings plus new CEOC emergence debt of$1.2bn at L + 250 and CEC convert of $1.119bn at 5% interest rate. 36
|
|

2 0 1 7 S T R A T E G Y & V I S I O N Caesars Entertainment Remains Well Placed to Create Value Strongest Loyalty Program in the Gaming Industry Significant Presence in Growing Las Vegas Network Expansion Opportunities Proven Management Execution Strong Free Cash Flow Profile 37

Global Operations Tom Jenkin Global President C A E S A R S E N T E R T A I N M E N T MA Y 1 8 , 2 0 1 7

2 0 1 7 G L O B A L O P E R A T I O N S We Have Reduced Expenses by Almost $800M Over 2 Years 2 2 0 1 7 G L O B A L O P E R A T I O N S

Hundreds of discrete initiatives identified since 2014 to reduce operating expense jShared best practices jLean efficiency initiatives jSourcing initiatives jProcess engineering jShared services jCentralization of functions jOptimization of organizational structure jTechnology initiatives Business Improvement Initiatives are Delivering Efficiencies Across the Enterprise ENTERPRISE WIDE DAILY OPERATING EXPENSE $ M I L L I O N S -8.9% REDUCTION $19.2 $17.8$17.5 201420152016 3 2 0 1 7 G L O B A L O P E R A T I O N S
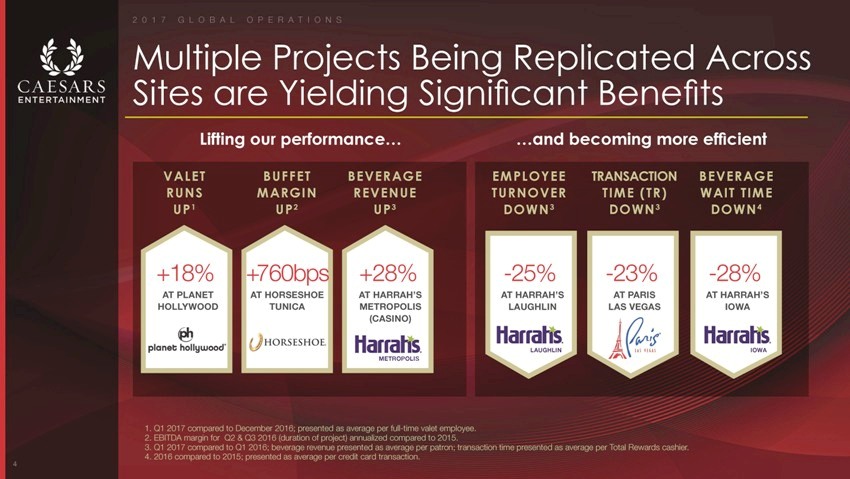
Multiple Projects Being Replicated Across Sites are Yielding Significant Benefits Lifting our performance… …and becoming more efficient VALET BUFFET BEVERAGE EMPLOYEE TRANSACTION BEVERAGE RUNS MARGIN REVENUE TURNOVER TIME (TR) WAIT TIME UP1 UP2 UP3 DOWN3 DOWN3 DOWN4 +18% +760bps +28% -25% -23% -28% AT PLANET AT HORSESHOE AT HARRAH’S AT HARRAH’S AT PARIS AT HARRAH’S HOLLYWOOD TUNICA METROPOLIS LAUGHLIN LAS VEGAS IOWA (CASINO) LAUGHLIN IOWA METROPOLIS Q1 2017 compared to December 2016; presented as average per full-time valet employee. EBITDA margin for Q2 & Q3 2016 (duration of project) annualized compared to 2015. Q1 2017 compared to Q1 2016; beverage revenue presented as average per patron; transaction time presented as average per Total Rewards cashier. 2016 compared to 2015; presented as average per credit card transaction. 4 2 0 1 7 G L O B A L O P E R A T I O N S

31% OF GUESTS TAKE ADVANTAGE OF THIS FEATURE IN LAS VEGAS 1 49% UP TO IMPROVEMENT IN SERVICE SCORES SUPPORTED BY SHORTER CHECK- IN TIMES Technology Deployment will Continue Momentum in Efficiency Gains Self-Service Kiosks reduce average check-in time by up to 40% jDeployed across 64% of our properties jLas Vegas rollouts completed j2017 roll-outs for Atlantic City, Northern Nevada & Laughlin jIntroducing new functionality with implementations of all new Gen3 Kiosks 5 1. On average as of April 30, 2017. 2 0 1 7 G L O B A L O P E R A T I O N S
We Are Now Shifting Our Focus to Revenue Growth Initiatives 6 2 0 1 7 G L O B A L O P E R A T I O N S

Despite our Margin Focus and a Challenging Macro Environment, We Have Grown Revenue Driving revenue growth through service and sales training, Total Rewards and broader Marketing initiatives NET REVENUE GROWTH 2 0 1 4 – 2 0 1 6 +2.4% CASINO +4.1% ENTERTAINMENT +5.7% ENTERPRISE +1.4% FOOD & BEVERAGE +17.2% HOTEL 7 2 0 1 7 G L O B A L O P E R A T I O N S

Paid Parking Offers Incremental Revenue Opportunity in Las Vegas Z Paid parking to be rolled out across Las Vegas properties by end of Q2 2017 Z Pricing strategy optimized through initial phases of installation process Z Revenue to date consistent with expectations with potential to reach $20 million annually 8 March 17 April May 26291623307142128 2 0 1 7 G L O B A L O P E R A T I O N S

Sales Training Programs Continue to Grow Revenue 43,000 guest facing employees participated in proprietary sales and service training j+7% in non-gaming revenue per full time employee in 2016 jPositive shift in guest perception of employees suggestions Additional training underway for employees in selling roles to support further top line upside jFurther sharpen sales skills and increase accountability jInitial roll out in Las Vegas properties and Call Center 2 0 1 7 G L O B A L O P E R A T I O N S
A $10 Increase in Sales Per Employee Shift Can Generate $150M in Incremental EBITDA 10 2 0 1 7 G L O B A L O P E R A T I O N S

Significant Impact of our Sales Training Program at the High Roller Material revenue increase at the High Roller supported by our proprietary employee sales training initiatives REVENUE CHANGE $ M I L L I O N S 7.3% GROWTH $39.7 $37.0 2015 2016 11 2 0 1 7 G L O B A L O P E R A T I O N S

Our Success is Underpinned by Strong Customer and Employee Engagement 12 2 0 1 7 G L O B A L O P E R A T I O N S

Record Customer and Employee Engagement Support Strong Performance Overall customer service score at an all-time high OVERALL SERVICE SCORE 1 A N N U A L T I E R W E I G H T E D S H A R E O FA ’ S 67.3%68.6% 56.6% 55.3% 54.1% Currently at our highest employee satisfaction scores EMPLOYEE OPINION SURVEY 2 4.23 4.19 4.14 4.094.09 2012201320142015201620122013201420152016 1. Overall Service raw score pro?le increase from 2014 to 2015 partially attributable to change from 5-point to 10-point scale; 2015 was baselined to account for the scale change. 132. Employee Opinion Survey score ranges from 1 (less favorable) to 5 (more favorable); adjustments to the survey’s methodology were introduced in 2015. 2 0 1 7 G L O B A L O P E R A T I O N S
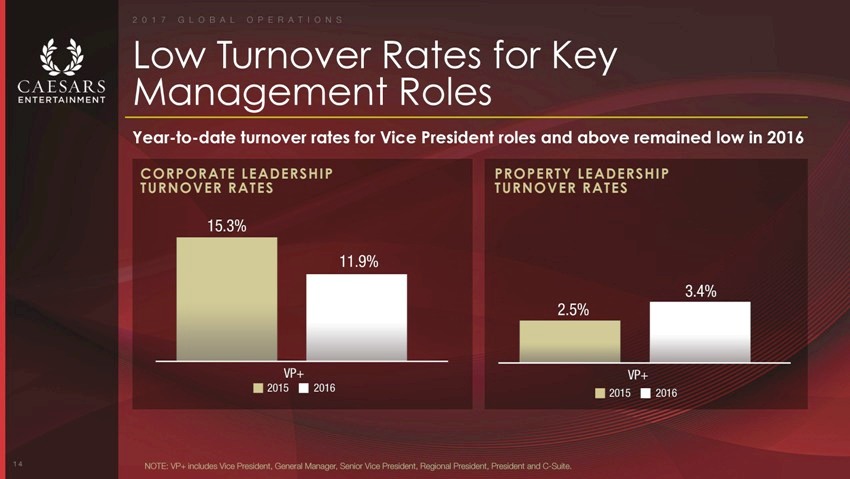
Low Management Turnover Rates Roles for Key Year-to-date turnover rates for Vice President roles and above remained low in 2016 CORPORATE LEADERSHIP TURNOVER RATES PROPERTY LEADERSHIP TURNOVER RATES 15.3% 11.9% 3.4% 2.5% VP+ VP+ 2015 2016 2015 2016 14 NOTE: VP+ includes Vice President, General Manager, Senior Vice President, Regional President, President and C-Suite.
|
|

Hospitality Bob Morse President of Hospitality C A E S A R S E N T E R T A I N M E N T MA Y 1 8 , 2 0 1 7
|
|

2 0 1 7 H O S P I T A L I T Y Delivered 17% Growth in Hotel Revenue in the Past 2 Years 2
|
|
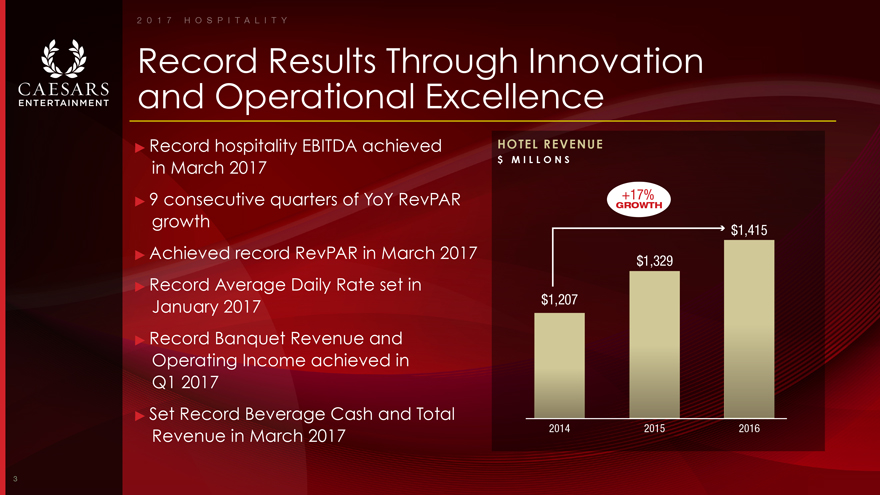
2 0 1 7 H O S P I T A L I T Y Record Results Through Innovation and Operational Excellence Record hospitality EBITDA achieved HOTEL REVENUE in March 2017 $ M I L L O N S 9 consecutive quarters of YoY RevPAR GROWTH +17% growth $1,415 Achieved record RevPAR in March 2017 $1,329 Record Average Daily Rate set in $1,207 January 2017 Record Banquet Revenue and Operating Income achieved in Q1 2017 Set Record Beverage Cash and Total Revenue in March 2017 2014 2015 2016 3
|
|

2 0 1 7 H O S P I T A L I T Y Changing the Way We Sell & Yield Inventory to Maximize Return ROOM NIGHTS HOTEL REVENUES 2 0 1 6 V S 2 0 1 4 2 0 1 6 V S 2 0 1 4 30% 30% 20% 20% 10% 10% 0% 0% -10% -10% -20% -20% -30% -30% TOTAL FIT GROUP CASINO TOUR & WHOLESALE TOTAL FIT GROUP CASINO TOUR & WHOLESALE TRAVEL TRAVEL 4
|
|

2 0 1 7 H O S P I T A L I T Y Hospitality Growth Across Initiatives the Enterprise are Driving Hotel Revenue management platform overhaul OPERATING INCOME PER FULL-TIME EMPLOYEE pricing techniques $ T H O U S A N D Enhancements to and room inventory management process Renovating hotel room product +18% +15% CAGR CAGR F&B $201 $45 $42 $179 Impressive portfolio of Celebrity chefs Broadening consumer base through $144 $35 diverse offerings Improving margins through business process improvements Hospitality Transformed Las Vegas Skyline with successful launch of High Roller 2014 2015 2016 2014 2015 2016 95% occupancy at LINQ Promenade HOTEL FOOD & BEVERAGE 5
|
|
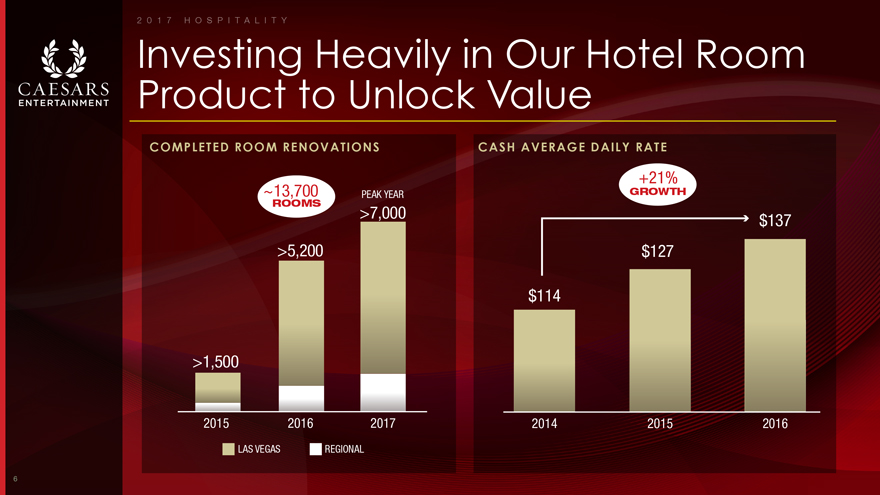
2 0 1 7 H O S P I T A L I T Y Investing Heavily in Our Hotel Room Product to Unlock Value COMPLETED ROOM RENOVATIONS CASH AVERAGE DAILY RATE +21% ~13,700 PEAK YEAR GROWTH ROOMS >7,000 $137 >5,200 $127 $114 >1,500 2015 2016 2017 2014 2015 2016 LAS VEGAS REGIONAL 6
|
|

2 0 1 7 H O S P I T A L I T Y $10 Increase in Enterprise-Wide Cash ADR Can Generate $70M in Incremental EBITDA 7
|
|

2 0 1 7 H O S P I T A L I T Y Poised to Capture Additional Upside Through Largest Inventory of Renovated Room Product Planet Hollywood The LINQ Horseshoe Tunica Harrah’s Carnaval Las Vegas Paris Las Vegas Harrah’s Gulf Coast The Cromwell Las Vegas Bally’s Atlantic City Caesars Palace Augustus Caesars Palace Julius Las Vegas Las Vegas 8
|
|

2 0 1 7 H O S P I T A L I T Y Transformation from the Imperial Palace to LINQ has Generated Dramatic Results $300M 2,256 $55 $60M INVESTMENT ROOMS RENOVATED CASH ADR INCREASE EBITDA INCREASE IN FULL HOTEL INCLUDING BEFORE AND BEFORE AND RENOVATION 204 SUITES AFTER RENOVATION1 AFTER RENOVATION1 9 1. First 12 months as The LINQ compared to last 12 months as Imperial Palace.
|
|
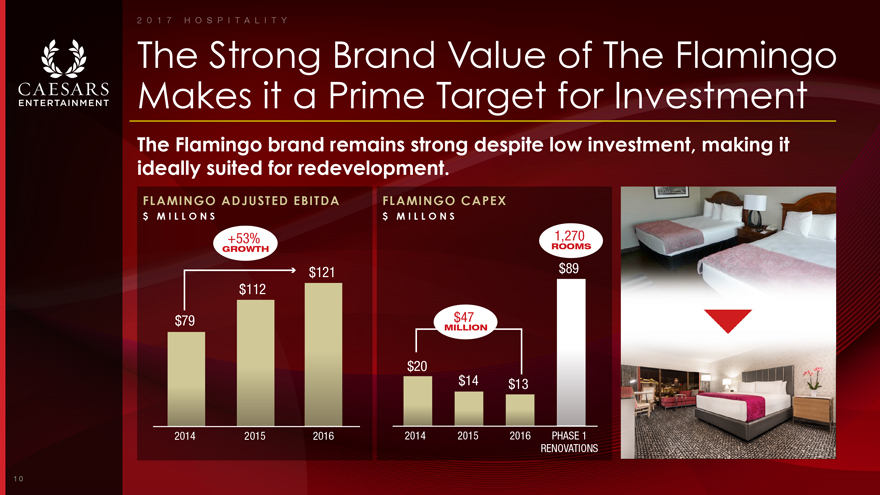
2 0 1 7 H O S P I T A L I T Y The Strong Brand Value of The Flamingo Makes it a Prime Target for Investment The Flamingo brand remains strong despite low investment, making it ideally suited for redevelopment. FLAMINGO ADJUSTED EBITDA FLAMINGO CAPEX $ M I L L O N S $ M I L L O N S +53% ROOMS 1,270 GROWTH $121 $89 $112 $79 MILLION $47 $20 $14 $13 2014 2015 2016 2014 2015 2016 PHASE 1 RENOVATIONS 10
|
|

2 0 1 7 H O S P I T A L I T Y Montecristo Cigar Bar Alto Bar Gordon Ramsay Fish & Chips; Caesars Palace Caesars Palace LINQ Promenade New and Unique F&B Offerings Driving Incremental Guest Traffic Into Properties In-N-Out Hamburgers Boardwalk Saloon MR CHOW LINQ Promenade Bally’s Atlantic City Caesars Palace 11
|
|
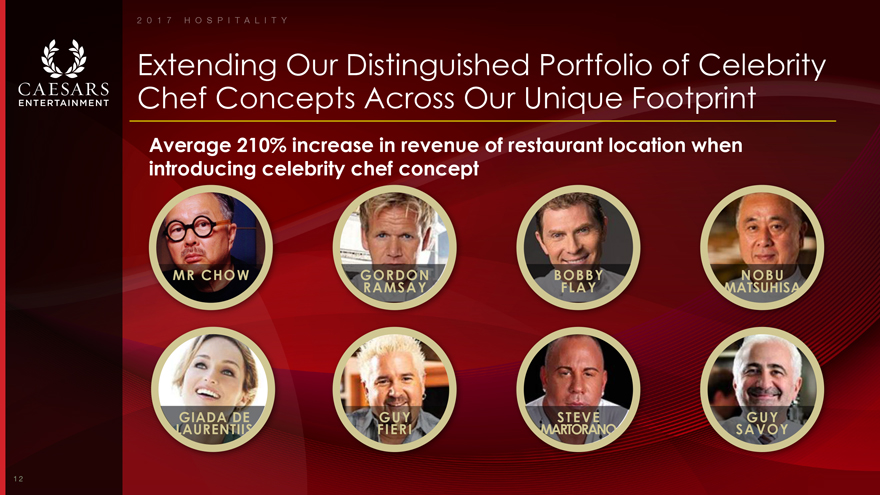
2 0 1 7 H O S P I T A L I T Y Extending Our Distinguished Portfolio of Celebrity Chef Concepts Across Our Unique Footprint Average 210% increase in revenue of restaurant location when introducing celebrity chef concept MR CHOW GORDON BOBBY NOBU RAMSAY FLAY MATSUHISA GIADA DE GUY STEVE GUY LAURENTIIS FIERI MARTORANO SAVOY 12
|
|

2 0 1 7 M A R K E T I N G EXPERIENCE THE EMPIRE VIDEO 1
|
|

Marketing Ruben Sigala Executive Vice President & CMO C A E S A R S E N T E R T A I N M E N T MA Y 1 8 , 2 0 1 7
|
|

2 0 1 7 M A R K E T I N G Generating Record Marketing Returns While Preserving a Strong Market Share Position 3
|
|

2 0 1 7 M A R K E T I N G Operating at Record Levels of Marketing Efficiency Record Marketing efficiency achieved in 2016 with continued strength into Q1 2017 EBITDA AND MARKETING SPEND AS A PERCENT OF GROSS REVENUE 30% MARKETING SPEND 25% 20% EBITDA 15% 2007 2008 2009 2010 2011 2012 2013 2014 2015 2016 Today we generate more revenue per dollar of marketing spend than at any point in the company’s history 4
|
|

2 0 1 7 M A R K E T I N G Enabling Better Customer Engagement Through Innovation and Technology
|
|

2 0 1 7 M A R K E T I N G Business Fundamentals are Strong with Tremendous Upside Ahead 50M+ 1M+ 7% TOTAL REWARDS ‘PLAY BY TR’ INCREASE IN MEMBERS APP INSTALLS VIP REVENUE 6
|
|

2 0 1 7 M A R K E T I N G
Enhancing Customer Engagement Through Total Rewards Partnerships and Innovation TOTAL REWARDS ‘PLAY BY TOTAL ENHANCED USER PARTNERSHIPS REWARDS’ APP EXPERIENCE 7
|
|

2 0 1 7 M A R K E T I N G Guest Engagement Initiatives Drive Material Revenue Upside Incremental touch points drive increased guest value D O W N L O A D P L A Y B Y T R A P P 1 S I G N U P F O R C R E D I T C A R D 1 E N G A G E W I T H E M A I L 1 +11% +26% +18% PRE POST PRE POST PRE POST 1. Gaming revenue over 12 month period pre and post action. 8
|
|

2 0 1 7 M A R K E T I N G An Additional 100bps Improvement in Marketing Efficiency Can Generate $87M in Incremental EBITDA 9
|
|

2 0 1 7 M A R K E T I N G Efforts Focused on Curating the Customer Journey at All Major Points 1 IMPROVE OFFER 2REMOVE3APPLY MACHINE DELIVERYFRICTIONLEARNING Z Customer engagementZ Guest experienceZ Contact strategy improvementsenhanced through launch of chatbots, mobileZEmotional sentiment Z Offer engine improvementsordering & digital RSVPZMail efficiencies 10
|
|
Technology
Les Ottolenghi
Executive Vice President & CIO
C A E S A R S E N T E R T A I N M E N T
MA Y 1 8 , 2 0 1 7
|
|

2 0 1 7 T E C H N O L O G Y Taking Our Customer Experience to the Next Level with New Technology Platforms 2
|
|
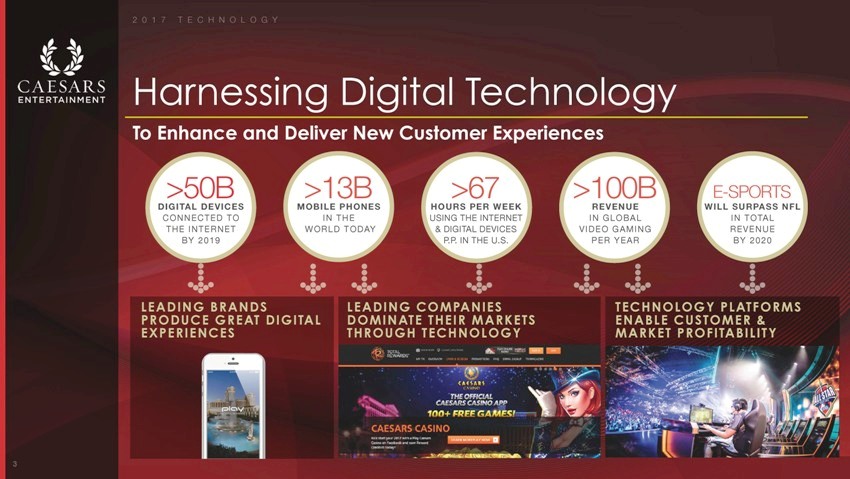
2 0 1 7 T E C H N O L O G Y Harnessing Digital Technology To Enhance and Deliver New Customer Experiences >50B >13B >67 >100B E-SPORTS DIGITAL DEVICES MOBILE PHONES HOURS PER WEEK REVENUE WILL SURPASS NFL CONNECTED TO IN THE USING THE INTERNET IN GLOBAL IN TOTAL THE INTERNET WORLD TODAY & DIGITAL DEVICES VIDEO GAMING REVENUE BY 2019 P.P. IN THE U.S. PER YEAR BY 2020 LEADING BRANDS LEADING COMPANIES TECHNOLOGY PLATFORMS PRODUCE GREAT DIGITAL DOMINATE THEIR MARKETS ENABLE CUSTOMER & EXPERIENCES THROUGH TECHNOLOGY MARKET PROFITABILITY 3
|
|

2 0 1 7 T E C H N O L O G Y Delivered Record Results Despite Complex and Inefficient Systems… Historical Systems Architecture
|
|
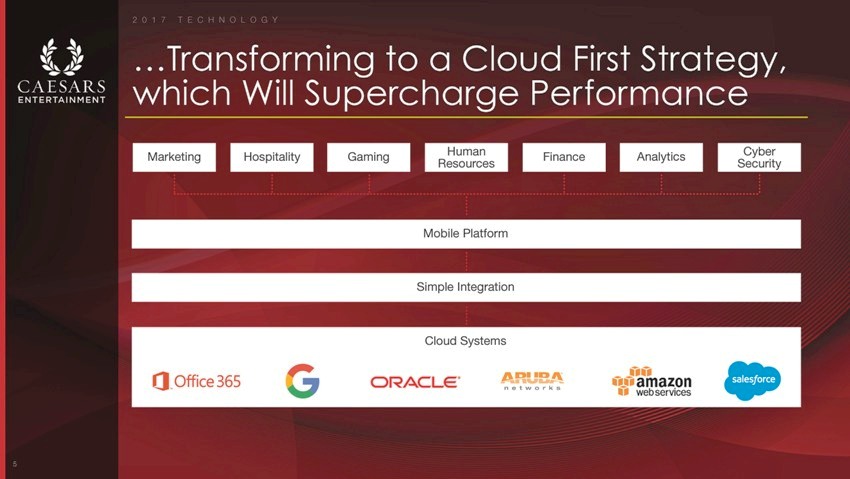
2 0 1 7 T E C H N O L O G Y …Transforming to a Cloud First Strategy, which Will Supercharge Performance Marketing Hospitality Gaming Resources Human Finance Analytics Security Cyber Mobile Platform Simple Integration Cloud Systems 5
|
|
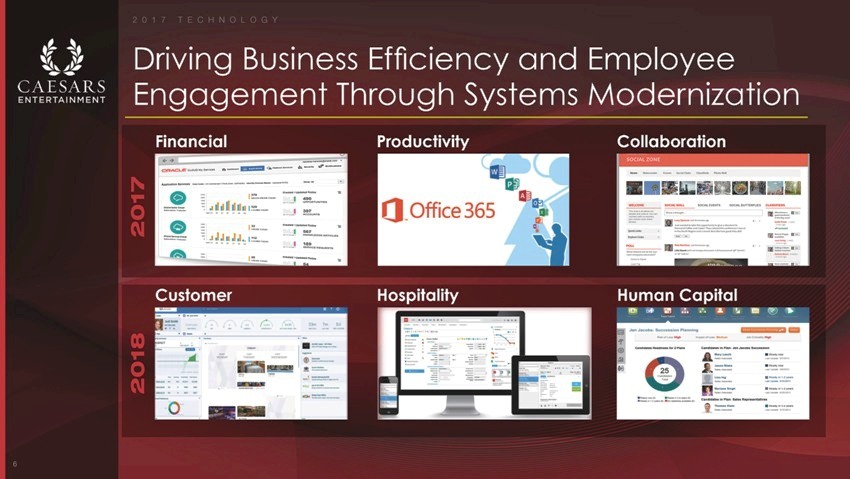
2 0 1 7 T E C H N O L O G Y Driving Business Efficiency and Employee Engagement Through Systems Modernization Financial Productivity Collaboration 2017 Customer Hospitality Human Capital 2018 6
|
|

2 0 1 7 T E C H N O L O G Y Smart-Connected, Real-Time Analytics that Generate Targeted Guest Offers & Responses 7
|
|
2 0 1 7 T E C H N O L O G Y A 50bps Increase in Offer Response Rate can Generate $126M in Incremental EBITDA 8
|
|

2 0 1 7 T E C H N O L O G Y We Are Reshaping the Caesars Gaming Experience Using Technology as a Catalyst 9
|
|
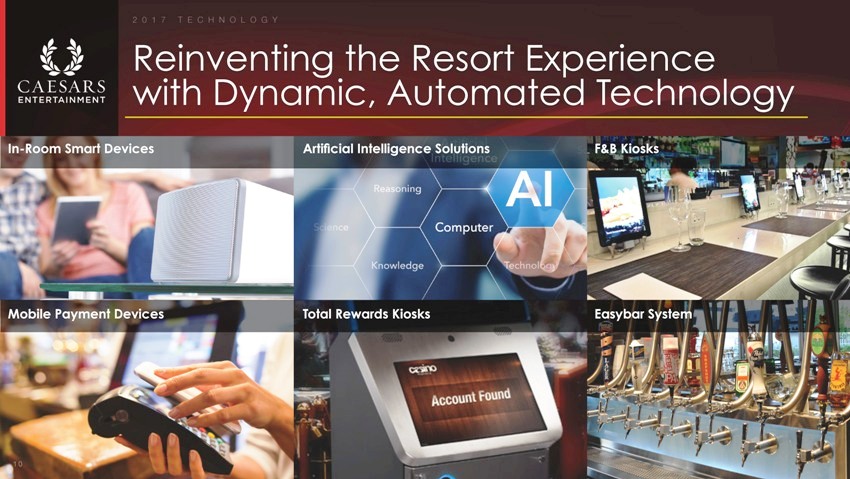
2 0 1 7 T E C H N O L O G Y Reinventing with Dynamic, the Automated Resort Experience Technology In-Room Smart Devices Arti?cial Intelligence Solutions F&B Kiosks Mobile Payment Devices Total Rewards Kiosks Easybar System 10
|
|

Finance
Eric Hession
Executive Vice President & CFO
C A E S A R S E N T E R T A I N M E N T
M AY 1 8 , 2 0 1 7
|
|

Transformational
Financial Performance
Delivered Over A Two
Year Period
2
|
|

Transformation Initiatives have Resulted
in Improved Revenue and Margins
NET REVENUE
$ M I L L I O N S ADJUSTED EBITDA & EBITDA MARGIN $ M I L L I O N S Enterprise Wide (CEC + CEOC) 20141 2015 2016 $7,967 $8,328 $8,418 $2,210 $2,084 $1,462 +2.8% +22.9% 2014 2015 2016 18.4% 25.0% 26.3% CAGR +790 bps CAGR 20141 2015 2016 $7,967 $8,328 $8,418 $2,210 $2,084 $1,462 +2.8% +22.9% 2014 2015 2016 18.4% 25.0% 26.3% CAGR +790 bps CAGR Note: All information is displayed on an enterprise wide basis, which is defined as CEC + CEOC. 1. As CEC consolidated CEOC for the full year 2014, this represents US GAAP. 2 0 1 7 F I N A N C E 3
|
|
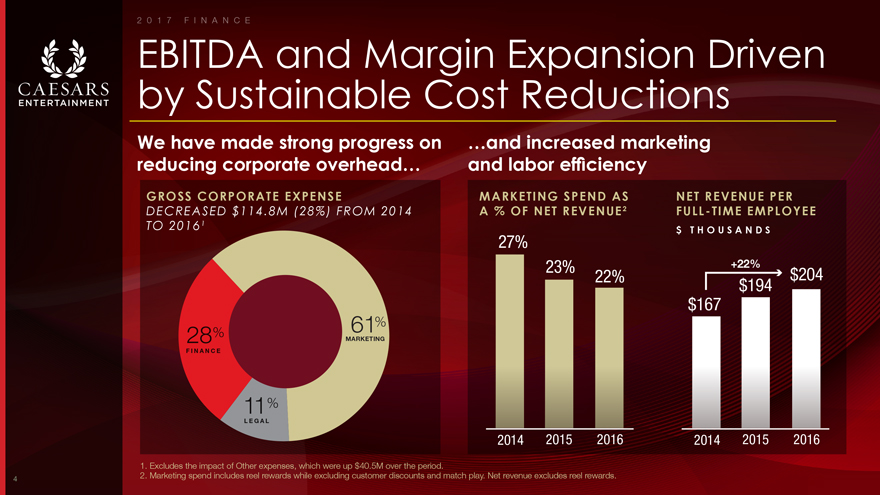
EBITDA and Margin Expansion Driven by Sustainable Cost Reductions MARKETING SPEND AS A % OF NET REVENUE2 GROSS CORPORATE EXPENSE DECREASED $114.8M (28%) FROM 2014 TO 20161 NET REVENUE PER FULL-TIME EMPLOYEE $ T H O U S A N D S We have made strong progress on reducing corporate overhead… …and increased marketing and labor efficiency 1. Excludes the impact of Other expenses, which were up $40.5M over the period. 2. Marketing spend includes reel rewards while excluding customer discounts and match play. Net revenue excludes reel rewards. 2014 2015 2016 23% 22% 27% 2014 2015 2016 $167 $194 $204 +22% 61% MARKETING 11% LEGAL 28% FINANCE 2 0 1 7 F I N A N C E 4
|
|

Solid Revenue Results have been Supported by Stable Market Share GAMING SHARE BY LOCATION S A M E—S T O R E , N E T B A S I S ENTERPRISE-WIDE GAMING SHARE1 S A M E—S T O R E , N E T B A S I S 6% 24% 25%25% 22% 40% 39% 27% 27% 73% 74% 24% 26% 26% 26% 9% 10% 6% LAS VEGAS ATLANTIC CITY PHILADELPHIA TUNICA GULF COAST LAKE TAHOE LAUGHLIN RENO 2015 2016 2015 2016 2015 2016 2015 2016 2015 2016 2015 2016 2015 2016 2015 2016 2015 2016 +100 bps +100 bps -100 bps +100 bps +200 bps +100 bps -200 bps 6% 24% 25%25% 22% 40% 39% 27% 27% 73% 74% 24% 26% 26% 26% 9% 10% 6% LAS VEGAS ATLANTIC CITY PHILADELPHIA TUNICA GULF COAST LAKE TAHOE LAUGHLIN RENO 2015 2016 2015 2016 2015 2016 2015 2016 2015 2016 2015 2016 2015 2016 2015 2016 2015 2016 +100 bps -100 bps +100 bps +200 bps +100 bps -200 bps 1. Volume weighted by net reporting jurisdictions. 2 0 1 7 F I N A N C E 5
|
|

Property Portfolio is Well-Capitalized Following Considerable Investment LAS VEGAS NON-LAS VEGAS DOMESTIC Capital Expenditure as a Percent of Net Revenue 4.3% 8.4% 2.5 % 3.3% 2015 2016 2015 2016 4.3% 8.4% 2.5 % 3.3% 2015 2016 2015 2016 Note: Excludes capex associated with the development of Cromwell and LINQ Hotel in Las Vegas region and Horseshoe Baltimore and AC Convention Center in Non-Las Vegas Domestic region. 2 0 1 7 F I N A N C E 6
|
|

A Leading Set of Financial Metrics Within Our Peer Group
7
|
|

Highest Las Vegas Strip EBITDA Exposure Post Emergence
CAESARS MGM4 LVS WYNN 2016 Property EBITDA NOTE: Caesars pro-forma EBITDA post expected annual property lease/rent payments totaling $640 mm to the REIT in the year following emergence. 1. Las Vegas property EBITDA is less Caesars Palace Las Vegas expected annual rent of $165 million in the year following emergence. 2. Regional property EBITDA is less expected annual rent of $465 million in the year following emergence. 3. Other property EBITDA is less expected annual rent payment of $10 million for golf courses in the year following emergence. 4. Percentages based on wholly-owned resorts. JVs are included in Other. 66% LAS VEGAS1 31% REGIONAL2 OTHER3 3% REGIONAL 3% 53% LAS VEGAS 9% LAS VEGAS 38% LAS VEGAS 17% A S I A 13% REGIONAL 88% ASIA 62% ASIA OTHER 17% 2 0 1 7 F I N A N C E 8
|
|
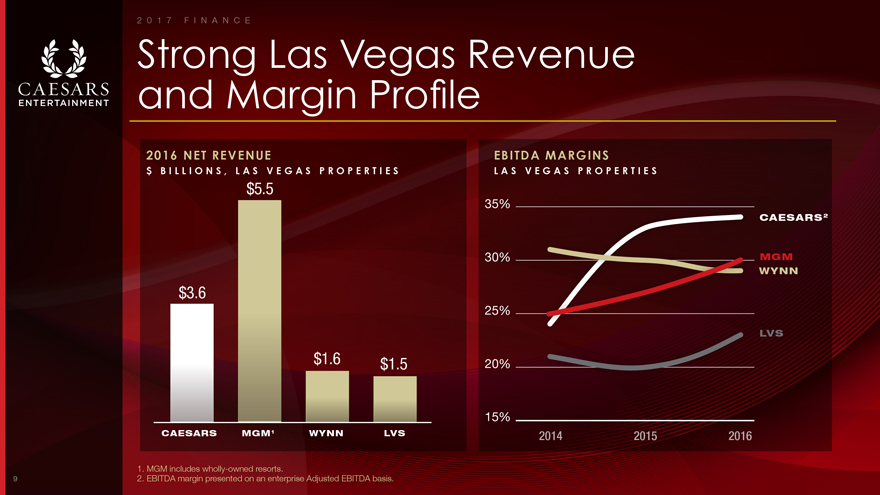
Strong Las Vegas Revenue and Margin Profile 2016 NET REVENUE $ B I L L I O N S , L A S V E G A S P R O P E R T I E S EBITDA MARGINS L A S V E G A S P R O P E R T I E S $3.6 $5.5 $1.6 $1.5 CAESARS MGM1 WYNN LVS CAESARS2 MGM WYNN LVS 35% 30% 25% 20% 15% 2014 2015 2016 1. MGM includes wholly-owned resorts. 2. EBITDA margin presented on an enterprise Adjusted EBITDA basis. 2 0 1 7 F I N A N C E 9
|
|
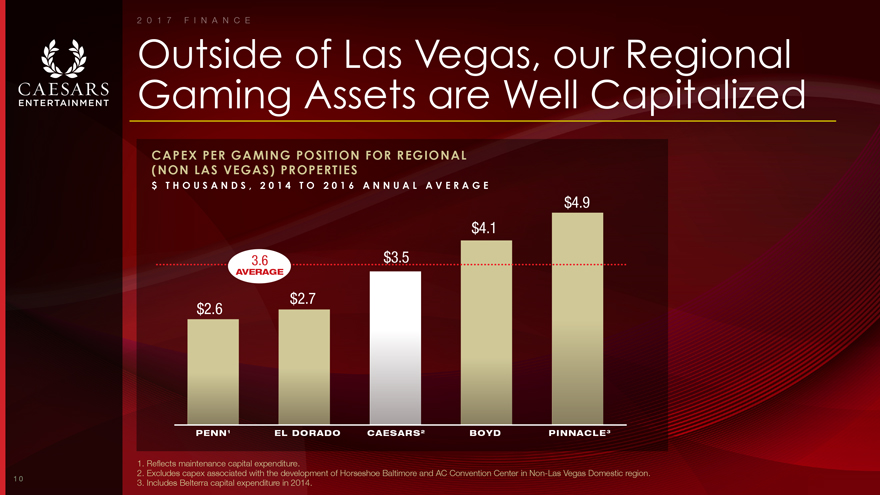
Outside of Las Vegas, our Regional Gaming Assets are Well Capitalized CAPEX PER GAMING POSITION FOR REGIONAL (NON LAS VEGAS) PROPERTIES $ T H O U S A N D S , 2 0 1 4 T O 2 0 1 6 A N N U A L A V E R A G E $3.5 $4.9 $4.1 $2.7 $2.6 PENN1 EL DORADO CAESARS2 BOYD PINNACLE3 3.6 AVERAGE 1. Reflects maintenance capital expenditure. 2. Excludes capex associated with the development of Horseshoe Baltimore and AC Convention Center in Non-Las Vegas Domestic region. 3. Includes Belterra capital expenditure in 2014. 2 0 1 7 F I N A N C E 1 0
|
|
Significant Opportunity for Continued Growth in Free Cash Flow 1 1
|
|
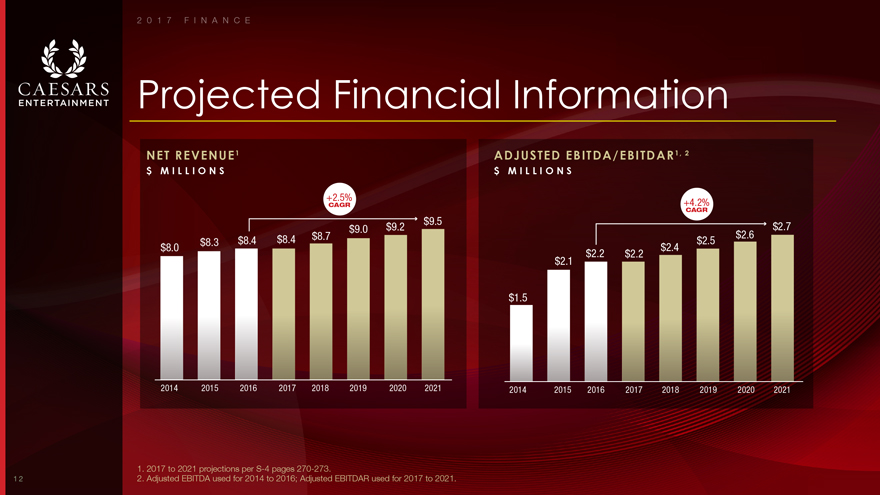
Projected Financial Information NET REVENUE1 $ M I L L I O N S ADJUSTED EBITDA/EBITDAR1, 2 $ M I L L I O N S $8.0 $8.3 $8.4 $8.4 $8.7 $9.0 $9.2 $9.5 2014 2015 2016 2017 2018 2019 2020 2021 +2.5% CAGR $1.5 $2.1 $2.2 $2.2 $2.4 $2.5 $2.6 $2.7 2014 2015 2016 2017 2018 2019 2020 2021 +4.2% CAGR 1. 2017 to 2021 projections per S-4 pages 270-273. 2. Adjusted EBITDA used for 2014 to 2016; Adjusted EBITDAR used for 2017 to 2021. 2 0 1 7 F I N A N C E 1 2
|
|

Our 2017 Plan Includes a Greater Focus on Revenue Growth 2015 2016 2017 Expect growth from: Discrete management initiatives included in annual plan Discrete management initiatives with increased revenue focus intended to help offset inflationary headwinds in 2017 jSignificant investment in the Las Vegas hotel product jModernization of marketing, operations, and financial systems jFocus on organic growth initiatives within the Strategic Plan 25% REVENUE 75% COST 40% REVENUE 60% COST COST R E V E N U E 1 2 3 2 0 1 7 F I N A N C E 1 3
|
|
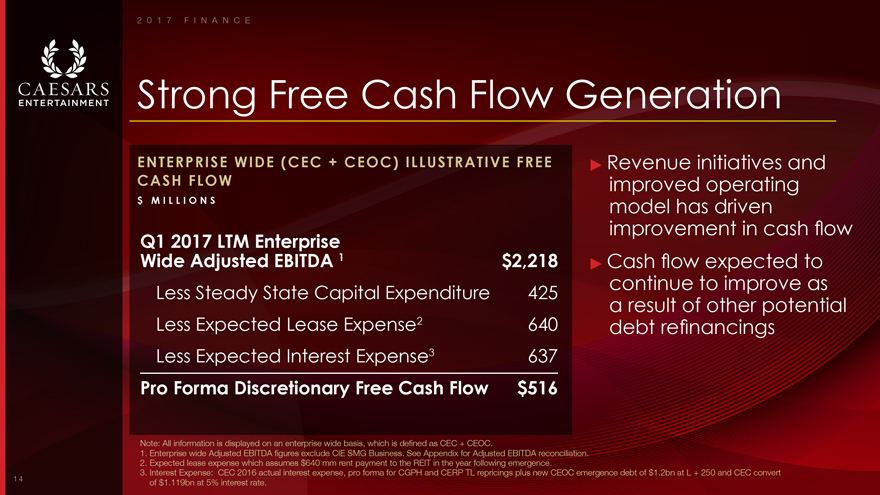
Strong Free Cash Flow Generation Note: All information is displayed on an enterprise wide basis, which is defined as CEC + CEOC. 1. Enterprise wide Adjusted EBITDA figures exclude CIE SMG Business. See Appendix for Adjusted EBITDA reconciliation. 2. Expected lease expense which assumes $640 mm rent payment to the REIT in the year following emergence. 3. Interest Expense: CEC 2016 actual interest expense, pro forma for CGPH and CERP TL repricings plus new CEOC emergence debt of $1.2bn at L + 250 and CEC convert of $1.119bn at 5% interest rate. ENTERPRISE WIDE (CEC + CEOC) ILLUSTRATIVE FREE CASH FLOW $ M I L L I O N S jRevenue initiatives and improved operating model has driven improvement in cash flow jCash flow expected to continue to improve as a result of other potential debt refinancings Q1 2017 LTM Enterprise Wide Adjusted EBITDA 1 $2,218 Less Steady State Capital Expenditure 425 Less Expected Lease Expense2 640 Less Expected Interest Expense3 637 Pro Forma Discretionary Free Cash Flow $516 2 0 1 7 F I N A N C E 1 4
|
|
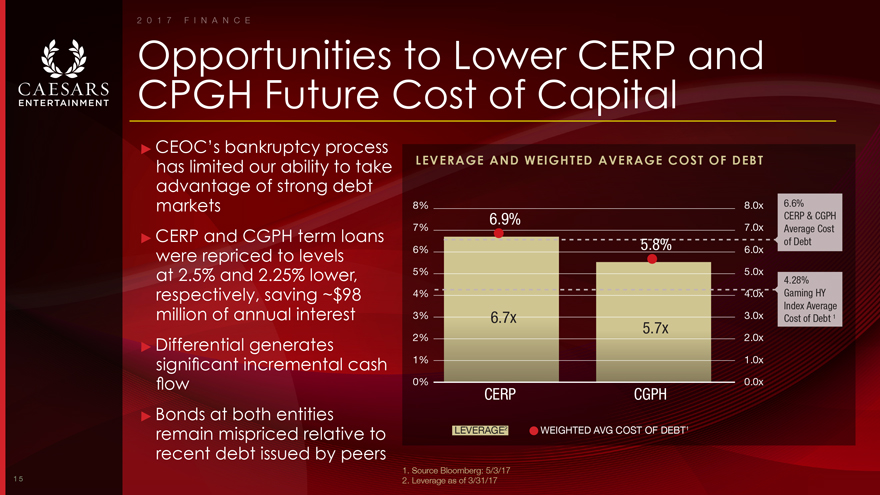
Opportunities to Lower CERP and CPGH Future Cost of Capital jCEOC’s bankruptcy process has limited our ability to take advantage of strong debt markets jCERP and CGPH term loans were repriced to levels at 2.5% and 2.25% lower, respectively, saving ~$98 million of annual interest jDifferential generates significant incremental cash flow jBonds at both entities remain mispriced relative to recent debt issued by peers LEVERAGE AND WEIGHTED AVERAGE COST OF DEBT 6.9% CERP CGPH 8% 7% 6% 5% 4% 3% 2% 1% 0% 8.0x 7.0x 6.0x 5.0x 4.0x 3.0x 2.0x 1.0x 0.0x Leverage2 Weighted Avg Cost of Debt 6.6% CERP & CGPH Average Cost of Debt 4.28% Gaming HY Index Average Cost of Debt 1 5.8% 6.7x 5.7x 1. Source Bloomberg: 5/3/17 2. Leverage as of 3/31/17 LEVERAGE2 WEIGHTED AVG COST OF DEBT1 2 0 1 7 F I N A N C E 1 5
|
|
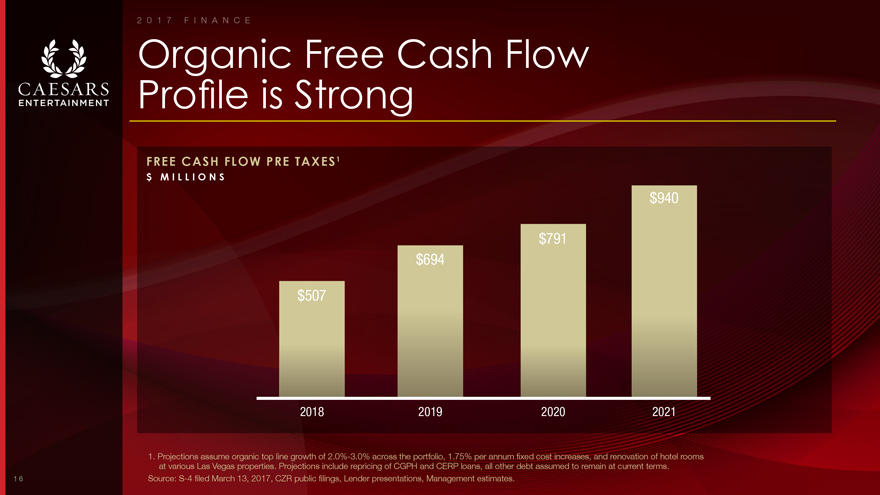
Organic Free Cash Flow Profile is Strong 2018 2019 2020 2021 $694 $791 $940 $507 1. Projections assume organic top line growth of 2.0%-3.0% across the portfolio, 1.75% per annum fixed cost increases, and renovation of hotel rooms at various Las Vegas properties. Projections include repricing of CGPH and CERP loans, all other debt assumed to remain at current terms. Source: S-4 filed March 13, 2017, CZR public filings, Lender presentations, Management estimates. FREE CASH FLOW PRE TAXES1 $ M I L L I O N S 2 0 1 7 F I N A N C E
1 6
|
|

Expect to Emerge from Bankruptcy with Significant Cash on the Balance Sheet Note: All information is displayed on an enterprise wide basis, which is defined as CEC + CEOC. 1. Per S-4 pages 22 for Pro Forma 12/31/16 Cash & Cash Equivalents, 28 for D&O Proceeds and 273 for 2017 EBITDA; and per 2016 entity 10-Ks for Interest Expense. 2. Expense accrued; inflow not accrued. 3. Eight month period prorated based on projections from S-4. 4. 2017 cash interest expense, debt repayment and cash restructuring costs estimates adjusted for eight month period. 5. Includes other estimated cash flows including NRF settlement of $45M. 6. CIE Cash available in September 2017. 7. Minimum estimated cash and working capital for regular operations ENTERPRISE WIDE1 $ M I L L I O N S Pro Forma 12/31/16 Cash & Cash Equivalents $1,357 Plus D&O Insurance Proceeds2 126 Plus 8 Months of 2017 EBITDAR from Projections3 1,470 Less 8 Months of 2017 Capex from Projections3 447 Less 8 Months of 2017 Cash Interest Expense4 332 Less 2017 CEC+CEOC Cash Restructuring Expenses4 350 Less 8 Months of 2017 Debt Repayment4 64 Less Other Cash Outflow5 95 Baluma Sales Proceeds 180 Proforma Cash Total (as of August 31, 2017) 1,845 Proforma Adjustments CIE Restricted Cash6 196 Proforma Cash Balance $2,041 Minimum Cash7 $450-500 2 0 1 7 F I N A N C E 1 7
|
|

Free Cash Flow Unlocks a Broad Suite of Opportunities 1 8
|
|
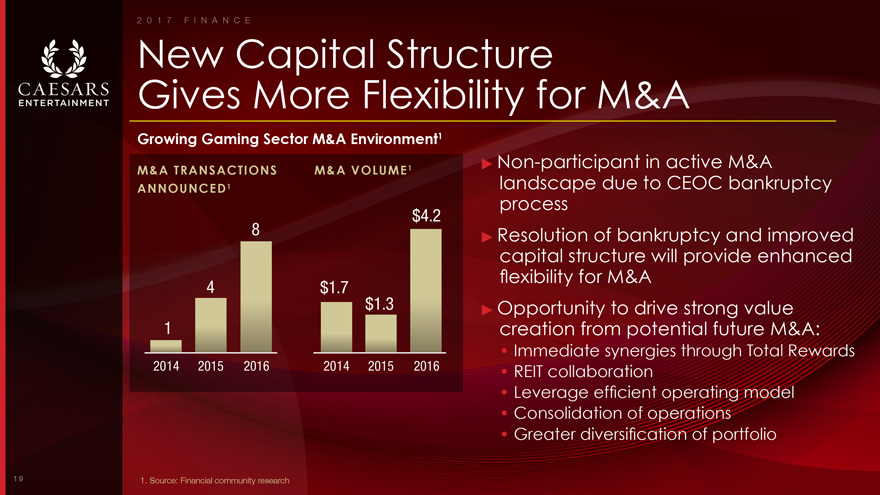
New Capital Structure Gives More Flexibility for M&A M&A TRANSACTIONS ANNOUNCED1 M&A VOLUME1 Growing Gaming Sector M&A Environment1 1. Source: Financial community research 2014 2015 2016 1 4 8 2014 2015 2016 $1.7 $1.3 $4.2 jNon-participant in active M&A landscape due to CEOC bankruptcy process jResolution of bankruptcy and improved capital structure will provide enhanced flexibility for M&A jOpportunity to drive strong value creation from potential future M&A: Immediate synergies through Total Rewards REIT collaboration Leverage efficient operating model Consolidation of operations Greater diversification of portfolio 2 0 1 7 F I N A N C E 1 9
|
|
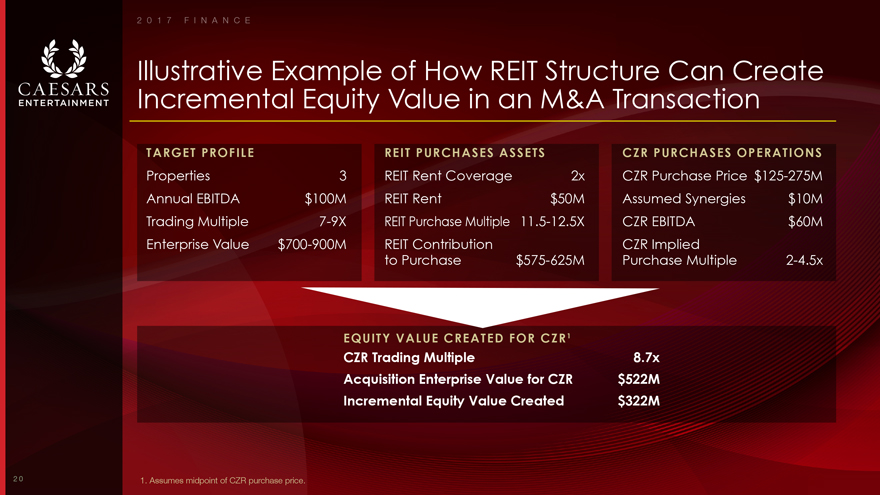
Illustrative Example of How REIT Structure Can Create Incremental Equity Value in an M&A Transaction TARGET PROFILE REIT PURCHASES ASSETS EQUITY VALUE CREATED FOR CZR1 CZR PURCHASES OPERATIONS Properties 3 Annual EBITDA $100M Trading Multiple 7-9X Enterprise Value $700-900M CZR Purchase Price $125-275M Assumed Synergies $10M CZR EBITDA $60M CZR Implied Purchase Multiple 2-4.5x REIT Rent Coverage 2x REIT Rent $50M REIT Purchase Multiple 11.5-12.5X REIT Contribution to Purchase $575-625M CZR Trading Multiple 8.7x Acquisition Enterprise Value for CZR $522M Incremental Equity Value Created $322M 1. Assumes midpoint of CZR purchase price. 2 0 1 7 F I N A N C E 2 0
|
|

Management Remains Focused on Disciplined Value Creation 2 1
|
|

Optimized Performance Metrics and Financial Controls Conducted extensive review to optimize metrics and financial controls post-emergence jPerformance metrics support investments to drive shareholder value creation jImplementing multi-year capital strategy with project-specific prioritization jNew technology and Project Management Office will ensure activities and resources are centrally coordinated and optimized IMP R O V E D P E R F O RMAN C E MAN A G EME NT EF F ICI EN T I N V E S TOR COMMU N ICATION EF FECT IVE CAPI TAL STRUCTURE DISCIPL INED INVESTMENT STRATEGY_ FOCUSED ON RETURNS ORGANIZATIONAL ACCOUNTABILITY EBITDA Net Income Free Cash Flow EVA ROIC EPS 2 0 1 7 F I N A N C E 2 2
|
|
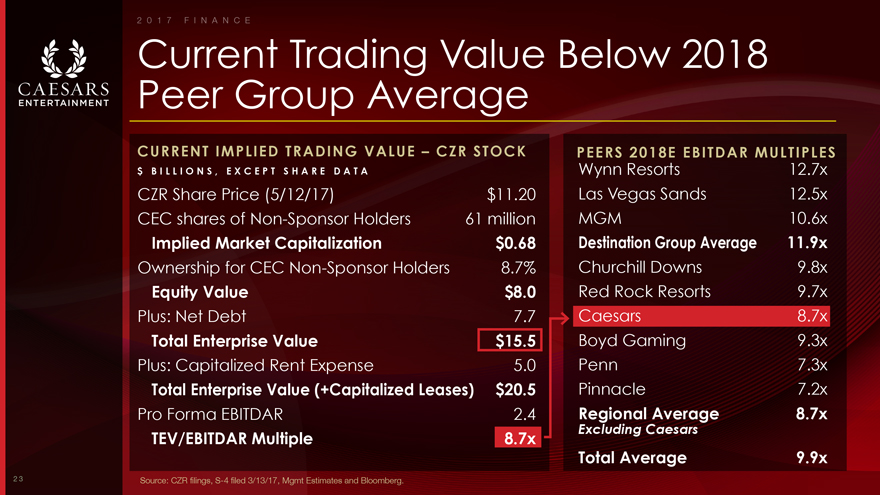
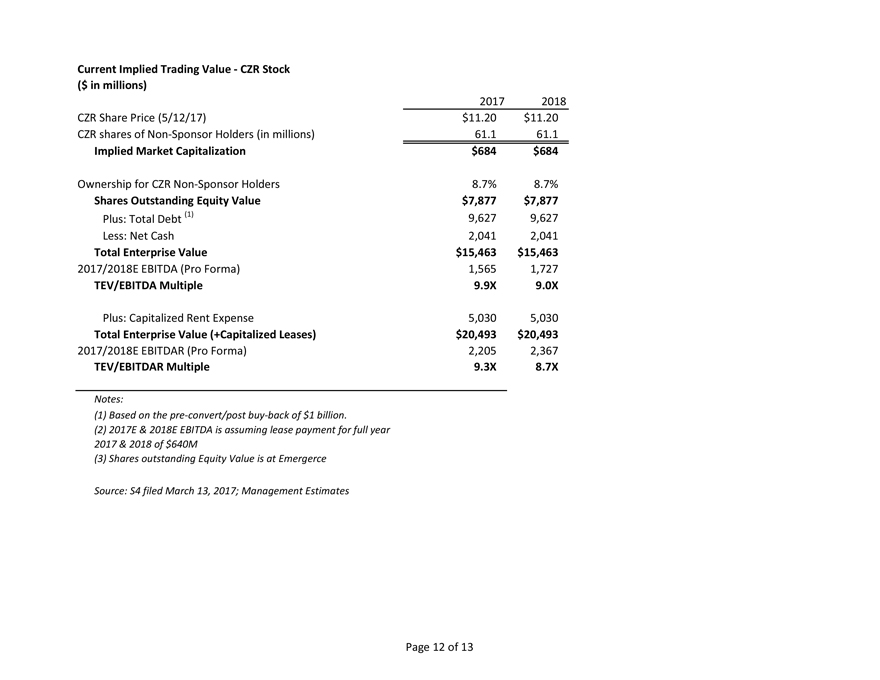
Current Trading Value Below 2018 Peer Group Average CURRENT IMPLIED TRADING VALUE – CZR STOCK $ B I L L I O N S , E X C E P T S H A R E D A T A CZR Share Price (5/12/17) $11.20 CEC shares of Non-Sponsor Holders 61 million Implied Market Capitalization $0.68 Ownership for CEC Non-Sponsor Holders 8.7% Equity Value $8.0 Plus: Net Debt 7.7 Total Enterprise Value $15.5 Plus: Capitalized Rent Expense 5.0 Total Enterprise Value (+Capitalized Leases) $20.5 Pro Forma EBITDAR 2.4 TEV/EBITDAR Multiple 8.7x Wynn Resorts 12.7x Las Vegas Sands 12.5x MGM 10.6x Destination Group Average 11.9x Churchill Downs 9.8x Red Rock Resorts 9.7x Caesars 8.7x Boyd Gaming 9.3x Penn 7.3x Pinnacle 7.2x Regional Average 8.7x Excluding Caesars Total Average 9.9x PEERS 2018E EBITDAR MULTIPLES Source: CZR filings, S-4 filed 3/13/17, Mgmt Estimates and Bloomberg. 2 0 1 7 F I N A N C E 2 3
|
|
CAESARS
ENTERTAINMENT
|
|

Closing Remarks Mark Frissora President & CEO C A E S A R S E N T E R T A I N M E N T MA Y 18, 2 0 1 7 2 0 1 7 C L O S I N G R E M A R K S
|
|
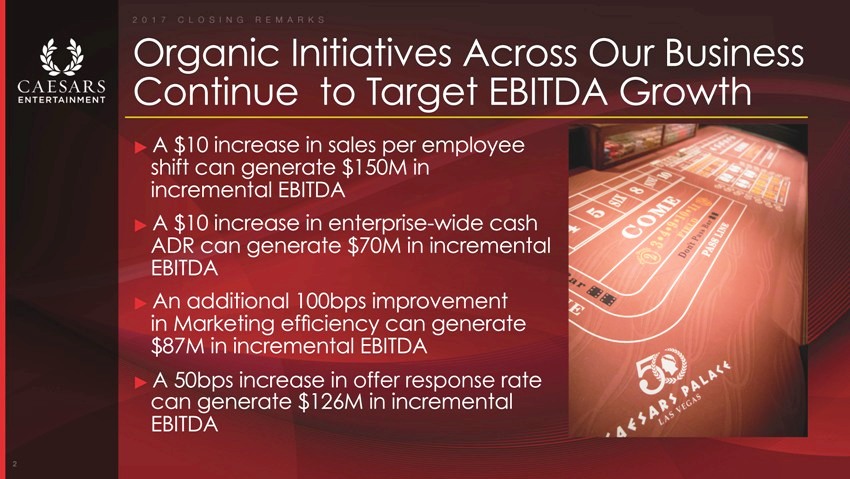
Organic Initiatives Across Our Business Continue to Target EBITDA Growth jA $10 increase in sales per employee shift can generate $150M in incremental EBITDA jA $10 increase in enterprise-wide cash ADR can generate $70M in incremental EBITDA jAn additional 100bps improvement in Marketing ef?ciency can generate $87M in incremental EBITDA jA 50bps increase in offer response rate can generate $126M in incremental EBITDA 2 2 0 1 7 C L O S I N G R E M A R K S
|
|

Caesars Entertainment Remains Well Placed to Create Value Strongest Loyalty Program in the Gaming Industry Signi?cant Presence in Growing Las Vegas Market Network Expansion Opportunities Proven Management Execution Strong Free Cash Flow Pro?le 3
|
|

Appendix MA Y 18, 2 0 1 7 2 0 1 7 C A E S A R S A N A L Y S T D A Y
|
|

Caesars Operating Structure Post Emergence PUBLIC STOCKHOLDERS CZR New CEOC CERP1 CGP1 CES1 Note: Simpli?ed structure chart does not re?ect the intermediate companies for each casino property. 2 1. Caesars Entertainment Resort Properties, LLC (“CERP”), Caesars Growth Partners, LLC (“CGP”), and Caesars Enterprise Services, LLC (“CES”)” 2 0 1 7 C A E S A R S A N A L Y S T D A Y
|
|
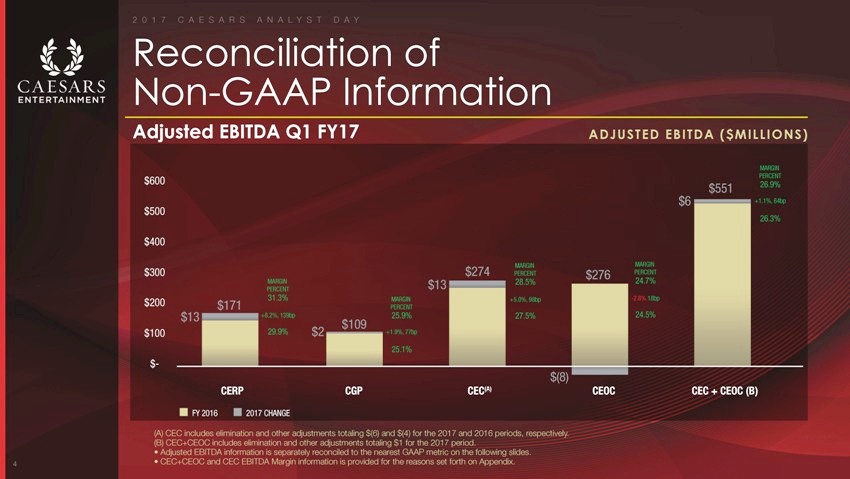
Reconciliation of Non-GAAP Information Adjusted EBITDA Q1 FY17 $600 $500 $400 MARGIN $300$274PERCENT MARGIN$1328.5% PERCENT 31.3%MARGIN+5.0%, 98bp $200$171PERCENT $13+8.2%, 139bp25.9%27.5% $109 $10029.9%$2+1.9%, 77bp 25.1% $- $(8) CERPCGPCEC(A) FY 20162017 CHANGE ADJUSTED EBITDA ($MILLIONS) MARGIN PERCENT $55126.9% $6+1.1%, 64bp 26.3% MARGIN $276PERCENT 24.7% -2.8% 18bp 24.5% CEOCCEC + CEOC (B) CEC includes elimination and other adjustments totaling $(6) and $(4) for the 2017 and 2016 periods, respectively. CEC+CEOC includes elimination and other adjustments totaling $1 for the 2017 period. • Adjusted EBITDA information is separately reconciled to the nearest GAAP metric on the following slides. 4 • CEC+CEOC and CEC EBITDA Margin information is provided for the reasons set forth on Appendix.
|
|
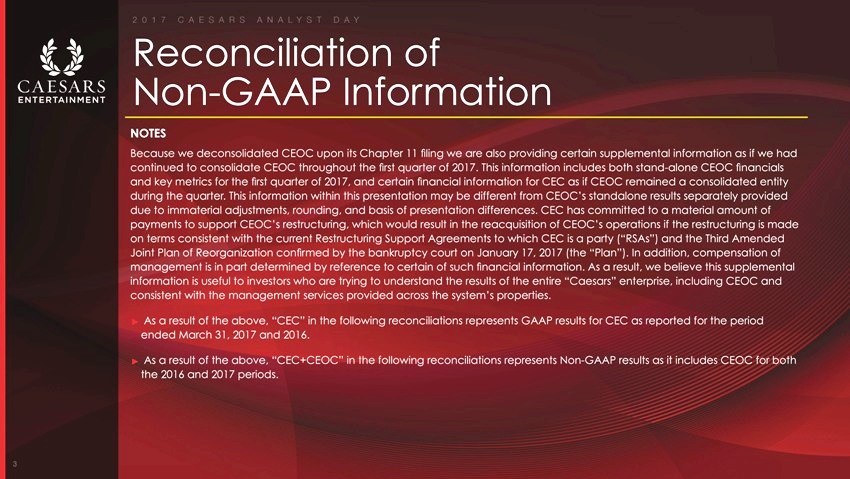
Reconciliation of Non-GAAP Information NOTES Because we deconsolidated CEOC upon its Chapter 11 filing we are also providing certain supplemental information as if we had continued to consolidate CEOC throughout the first quarter of 2017. This information includes both stand-alone CEOC financials and key metrics for the first quarter of 2017, and certain financial information for CEC as if CEOC remained a consolidated entity during the quarter. This information within this presentation may be different from CEOC’s standalone results separately provided due to immaterial adjustments, rounding, and basis of presentation differences. CEC has committed to a material amount of payments to support CEOC’s restructuring, which would result in the reacquisition of CEOC’s operations if the restructuring is made on terms consistent with the current Restructuring Support Agreements to which CEC is a party (“RSAs”) and the Third Amended Joint Plan of Reorganization confirmed by the bankruptcy court on January 17, 2017 (the “Plan”). In addition, compensation of management is in part determined by reference to certain of such financial information. As a result, we believe this supplemental information is useful to investors who are trying to understand the results of the entire “Caesars” enterprise, including CEOC and consistent with the management services provided across the system’s properties. j As a result of the above, “CEC” in the following reconciliations represents GAAP results for CEC as reported for the period ended March 31, 2017 and 2016. j As a result of the above, “CEC+CEOC” in the following reconciliations represents Non-GAAP results as it includes CEOC for both the 2016 and 2017 periods. 3 2 0 1 7 C A E S A R S A N A L Y S T D A Y
|
|

2 0 1 7 C A E S A R S A N A L Y S T D A Y Reconciliation of Non-GAAP Information Net Revenue Q1 FY17NET REVENUE ($MILLIONS) $2,500 $2,046 $2,000GROWTH PERCENT -1.3% $1,500 $963$1,118 $1,000GROWTHGROWTH PERCENTGROWTH PERCENT $546PERCENT$13+1.4%-3.5% $500 $18+3.4%$421GROWTH PERCENT -1.2% $ $(5)$(41)$(27) $(500) CERPCGPCECCEOCCEC + CEOC (B) FY 20162017 CHANGE CEC includes elimination and other adjustments totaling $(4) for both the 2017 and 2016 periods. CEC + CEOC includes elimination and other adjustments totaling $(35) and $(36) for the 2017 and 2016 periods, respectively. 5 2 0 1 7 C A E S A R S A N A L Y S T D A Y
|
|
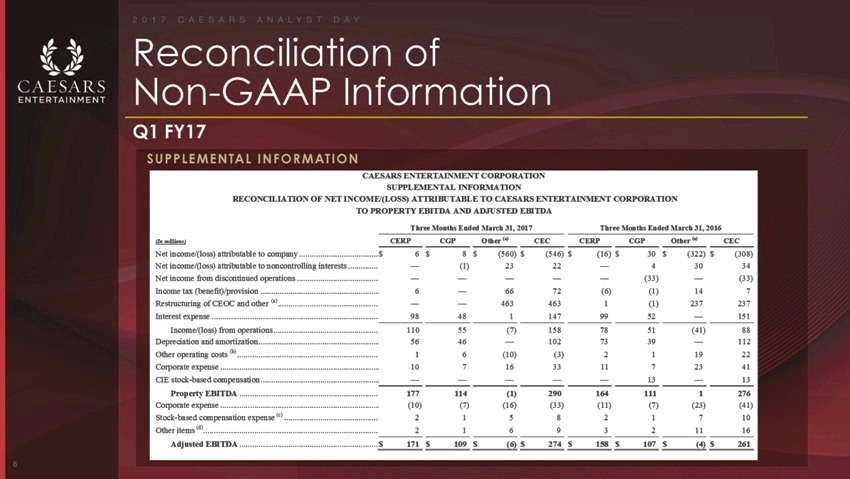
Reconciliation of Non-GAAP Information Q1 FY17 SUPPLEMENTAL INFORMATION 2017 CAESARS ANALYST DAY Reconciliation of Non-GAAP Information ROLLING LTM Historical SUPPLEMENTAL INFORMATION CAESARS ENTERTAINMENT CORPORATION SUPPLEMENTAL INFORMATION RECONCILIATION OF NET INCOME/(LOSS) ATTRIBUTABLE TO CAESARS ENTERTAINMENT CORPORATION TO LTM PROPERTY EBITDA AND LTM ADJUSTED EBITDA Three Months Ended March 31, 2017 Three Months Ended March 31,2016 (In millions)CERPCGPOther (e)CECCERPCGPOther (e)CEC Net income/(loss) attributable to companyS 6 $8 $(560) $(546) $(16) $30 $(322) $(308) Net income/(loss) attributable to non controlling interests —(1)2322—43034 Net income from discontinued operations —————(33)—(33) Income tax (benefit)/provision6—6672(6)(1)147 Restructuring of CEOC and other (a)——4634631(1)237237 Interest expense984811479952—151 Income/(loss) from operations11055(7)1587851(41)88 Depredation and amortization5646—1027339—112 Other operating costs (b)16(10)(3)211922 Corporate expense10716331172341 CIE stock-based compensation————13—13 Property EBITDA177114(1)2901641111276 Corporate expense(10)(7)(16)(33)(11)(7)(23)(41) Stock-based compensation expense (c)215821710 Other items (d)2169321116 Adjusted EBITDA171 109 (6) 274 158 107 (4)261
|
|
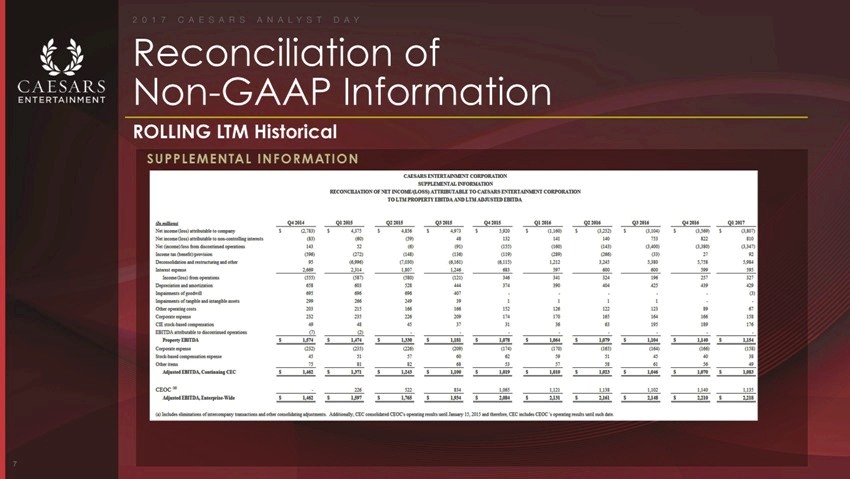
6 2 0 1 7 C A E S A R S A N A L Y S T D A Y Reconciliation of Non-GAAP Information ROLLING LTM Historical SUPPLEMENTAL INFORMATION 2017 CAESARS ANALYST DAY Reconciliation of Non-GAAP Information Q1 FY17 SUPPLEMENTAL INFORMATION CAESARS ENTERTAINMENT CORPORATION SUPPLEMENTAL INFORMATION RECONCILIATION OF NET INCOME/(LOSS) ATTRIBUTABLE TO CAESARS ENTERTAINMENT CORPORATION TO PROPERTY EBITDA AND ADJUSTED EBITDA (In millions) Q4 2014 Q1 2015Q2 2015Q3 2015Q4 2015Q1 2016Q2 2016Q3 2016Q4 2016Q1 2017 Net income (loss) attributable to companyS (2,783)$ 4,375$ 4,856$ 4,973$ 5,920$ (1,160)S (3,252)$(3,104)$ (3,569)S(3,807) Net income (loss) attributable to non-controlling interests(83)(60)(59)48132141140753822810 Net (income)/loss from discontinued operations14352(6)(91)(155)(160)(143)(3,400)(3,380)(3,347) Income tax (benefit)/provision(596)(272)(148)(136)(119)(289)(266)(33)2192 Deconsolidation and restructuring and other95(6,996)(7,030)(6,161)(6,115)1,2123,2455,3805,7585,984 Interest expense2,6692,3141,8071,246683597600600599595 Income/(loss) from operations(555)(587)(580)(121)346341324196257327 Depreciation and amortization658603528444374390404425439429 Impairments of goodwill695696696407(3) Impairments of tangible and intangible assets2992662A9391111 Other operating costs2032151661661521261221238967 Corporate expense232235226209174170165164166158 CIE stock-based compensation494845373136631951S9176 EBITDA attributable to discontinued operations(7)(2) Property EBITDA$ 1,574S 1,474$1,330$ 1,181S 1,078S 1,064S 1,079S1,104$ 1,140$ 1,154 Corporate expense(232)(235)(226)(209)(174)(170)(165)(164)(1665(158) Stock-based compensation expense45515760625951454038 Other items75818268535758615649 Adjusted EBITDA, Continuing CEC$ 1,462S 1371$ 1,243$ 1,100S 1,019S 1,010$ 1,023s1,046$ 1,070s$ 1,083 CEOC (a)2265228341,0651,1211,1381,1021,1401.135 Adjusted EBITDA. Enterprise-WideS 1.462$ 1,597$ 1,765$ 1,934S 2,084$ 2,131S 2.161s2,148S 2,210s2,218 7 2 0 1 7 C A E S A R S A N A L Y S T D A Y
|
|
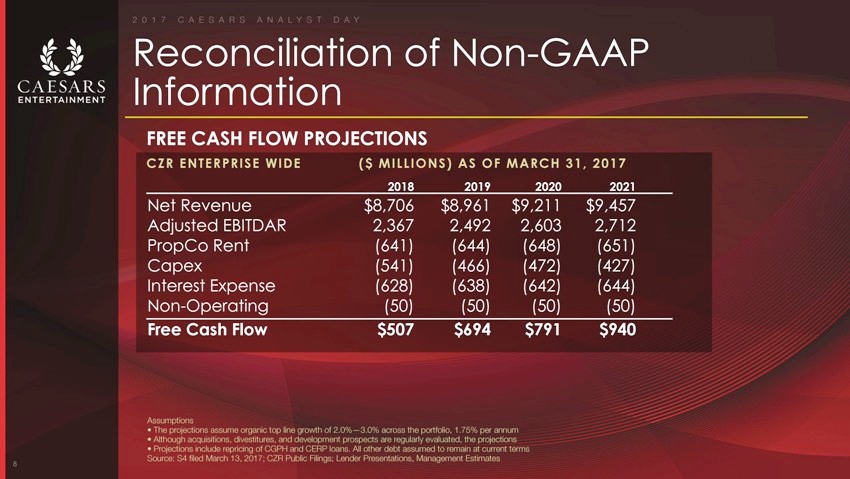
Reconciliation of Non-GAAP Information FREE CASH FLOW PROJECTIONS CZR ENTERPRISE WIDE($ MILLIONS) AS OF MARCH 31, 2017 2018201920202021 Net Revenue$8,706$8,961$9,211$9,457 Adjusted EBITDAR2,3672,4922,6032,712 PropCo Rent(641)(644)(648)(651) Capex(541)(466)(472)(427) Interest Expense(628)(638)(642)(644) Non-Operating(50)(50)(50)(50) Free Cash Flow$507$694$791$940 Assumptions The projections assume organic top line growth of 2.0%—3.0% across the portfolio, 1.75% per annum Although acquisitions, divestitures, and development prospects are regularly evaluated, the projections Projections include repricing of CGPH and CERP loans. All other debt assumed to remain at current terms Source: S4 ?led March 13, 2017; CZR Public Filings; Lender Presentations, Management Estimates 8 2 0 1 7 C A E S A R S A N A L Y S T D A Y
|
|
Notes To Non-GAAP Information Adjusted EBITDA is defined as EBITDA further adjusted to exclude certain non-cash and other items as exhibited in the above reconciliation, and is presented as a supplemental measure of CEC’s performance. Management believes that Adjusted EBITDA provides investors with additional information and allows a better understanding of the results of operational activities separate from the financial impact of decisions made for the long-term benefit of CEC. In addition, compensation of management is in part determined by reference to certain of such financial information. As a result, we believe this supplemental information is useful to investors who are trying to understand the results of CEC. Adjusted EBITDA Margin is the ratio of Adjusted EBITDA to Net Revenue and is presented for the same reasons as Adjusted EBITDA noted above. Because not all companies use identical calculations, the presentation of Adjusted EBITDA may not be comparable to other similarly titled measures of other companies. Primarily represents CEC’s estimated costs in connection with the restructuring of CEOC. Amounts primarily represent costs incurred in connection with property openings and expansion projects at existing properties, costs associated with the development activities and reorganization activities, and/or recoveries associated with such items. Amounts represent stock-based compensation expense related to shares, stock options, and restricted stock units granted to the Company’s employees. Amounts represent add-backs and deductions from EBITDA, permitted under certain indentures. Such add-backs and deductions include litigation awards and settlements, costs associated with CEOC’s restructuring and related litigation, severance and relocation costs, sign-on and retention bonuses, permit remediation costs, and business optimization expenses. Amounts include consolidating adjustments, eliminating adjustments and other adjustments to reconcile to consolidated CEC Property EBITDA and Adjusted EBITDA. 9