
Investor presentation Eric Hession Executive Vice President & Chief Financial Officer CAESARS ENTERTAINMENT February 28, 2017 Exhibit 99.1
SAFE HARBOR STATEMENT Disclaimer Certain information in this presentation and discussed on the conference call which this presentation accompanies constitutes forward-looking information within the meaning of the Private Securities Litigation Reform Act of 1995. This information is based on Caesars Entertainment Corporation’s (the “Company” or “CEC”) current expectations and actual results could vary materially depending on risks and uncertainties that may affect the Company’s operations, markets, services, prices and other factors as discussed in the Company’s filings with the Securities and Exchange Commission (SEC). These risks and uncertainties include, but are not limited to, industry and economic conditions, competitive, legal, governmental and technological factors. There is no assurance that the Company's expectations will be realized. The forward-looking information in this presentation and discussed on the conference call which this presentation accompanies reflects the opinion of management as of today. Please be advised that developments subsequent to this call are likely to cause this information to become outdated with the passage of time. The Company assumes no obligation to update any forward-looking information contained in this presentation or discussed on the conference call which this presentation accompanies should circumstances change, except as otherwise required by securities and other applicable laws. The Company makes no representation or warranty, express or implied, with respect to the information contained herein (including, without limitation, information obtained from third parties) or the accuracy or completeness thereof, and expressly disclaims any and all liability based on or relating to the information contained in, or errors or omissions from, these materials; or based on or relating to the recipient’s use (or the use by any of its affiliates or representatives or any other person) of these materials; or based on any other written or oral communications transmitted to the recipient or any of its affiliates or representatives. These materials are not intended as an offer to sell, or the solicitation of an offer to purchase, any security, the offer and/or sale of which can only be made by definitive offering documentation, including the applicable investment considerations, including any risk factors described therein.
SAFE HARBOR STATEMENT Disclaimer (continued) IMPORTANT ADDITIONAL INFORMATION WILL BE FILED WITH THE SEC In connection with the proposed business combination transaction between CEC and Caesars Acquisition Company (“CAC”), CEC plans to file with the SEC a Registration Statement on Form S-4 that includes proxy statements of CEC and CAC and that also constitutes a prospectus of CEC. The definitive Joint Proxy Statement/Prospectus will be mailed to stockholders of CEC and CAC, respectively. INVESTORS AND SECURITY HOLDERS OF CEC AND CAC ARE URGED TO READ THE JOINT PROXY STATEMENT/PROSPECTUS AND OTHER DOCUMENTS FILED WITH THE SEC CAREFULLY IN THEIR ENTIRETY WHEN THEY BECOME AVAILABLE BECAUSE THEY WILL CONTAIN IMPORTANT INFORMATION ABOUT THE PROPOSED TRANSACTION. Investors and security holders will be able to obtain free copies of the Registration Statement and Joint Proxy Statement/Prospectus (when available) and other documents filed with the SEC by each of CEC and CAC through the website maintained by the SEC at www.sec.gov. Free copies of the Registration Statement and Joint Proxy Statement/Prospectus (when available) and other documents filed with the SEC can also be obtained on the CEC website at www.caesarscorporate.com and on the CAC website at www.caesarsacquisitioncompany.com. PROXY SOLICITATION CEC, CAC and their respective directors, executive officers and certain other members of management and employees may be soliciting proxies from CEC and CAC stockholders in favor of the business combination transaction. Information regarding the persons who may, under the rules of the SEC, be considered participants in the solicitation of the CEC and CAC stockholders in connection with the proposed business combination transaction will be set forth in the Joint Proxy Statement/Prospectus when it is filed with the SEC. You can find information about CEC’s executive officers and directors in its definitive proxy statement filed with the SEC on April 14, 2016. You can find information about CAC’s executive officers and directors in its definitive proxy statement filed with the SEC on March 24, 2016. You can obtain free copies of these documents from CEC and CAC in the manner set forth above.

USE of non-gaap Measures The following non-GAAP measures will be used in the presentation and discussed on the conference call which this presentation accompanies: Adjusted EBITDA and Adjusted EBITDA Margin Property EBITDA CEC + CEOC, or enterprise-wide financial measures Definitions of these non-GAAP measures, reconciliations to their nearest GAAP measures, and the reasons management believes these measures provide useful information for investors, can be found in the Appendices to this presentation, beginning on slide 40.
IMPORTANT INFORMATION ABOUT PRESENTATION OF RESULTS On January 15, 2015, Caesars Entertainment Operating Company, Inc. (“CEOC”) filed a voluntary bankruptcy petition under Chapter 11 of the United States Bankruptcy Code, resulting in the deconsolidation of CEOC from CEC’s operating results effective as of such date. As such, amounts presented in this presentation exclude the operating results of CEOC subsequent to January 15, 2015, unless otherwise stated, and analysis of our operating results in this presentation and as may be discussed on the conference call which this presentation accompanies include those components that remain in the consolidated CEC entity subsequent to the deconsolidation of CEOC. "Continuing CEC" represents Caesars Entertainment Resort Properties, LLC (“CERP”), Caesars Growth Partners, LLC (“CGP”) and the associated parent company and elimination adjustments that represent the current CEC consolidated structure. Through June 30, 2016, we aggregated the operating segments within CGP into two separate reportable segments: CGP Casino Properties and Interactive Entertainment. On September 23, 2016, Caesars Interactive Entertainment, LLC (“CIE”) sold its social and mobile games business (the “SMG Business”) for cash consideration of $4.4 billion, subject to customary purchase price adjustments, and retained only its World Series of Poker (“WSOP”) and regulated online real money gaming businesses. The SMG Business represented the majority of CIE’s operations and is being classified as a discontinued operation for all periods presented effective in the third quarter of 2016. After excluding the SMG Business from CIE’s continuing operations, CIE is no longer considered a separate reportable segment from CGP Casinos based on management’s view. Therefore, CGP Casinos and CIE have been combined for all periods presented to form the CGP segment. Unless otherwise specified, references to “Caesars”, “our” or “enterprise wide” refer to Continuing CEC and CEOC. However, we are also providing certain supplemental information as if we had continued to consolidate CEOC throughout the fourth quarter of 2016. This information includes both stand-alone CEOC financials, and certain financial information for CEC as if CEOC remained a consolidated entity. This information within this presentation may be different from CEOC’s standalone results separately provided due to immaterial adjustments, rounding, and basis of presentation differences. CEC has committed to a material amount of payments to support CEOC’s restructuring, which would result in the reacquisition of CEOC’s operations if the restructuring is made on terms consistent with the current Restructuring Support Agreements to which CEC is a party (“RSAs”) and the Third Amended Joint Plan of Reorganization confirmed by the bankruptcy court on January 17, 2017 (the “Plan”). In addition, compensation of management is in part determined by reference to certain of such financial information. As a result, we believe this supplemental information is useful to investors who are trying to understand the results of the entire “Caesars” enterprise, including CEOC and consistent with the management services provided across the system’s properties. This supplemental information is non-GAAP. It is not preferable to GAAP results but is used by management as an analytical tool to assess the results of all properties owned, managed or branded by a Caesars entity, regardless of consolidation. Additionally, the results are not necessarily indicative of future performance or of the results that would be reported should the reorganization of CEOC contemplated by the RSAs and the Plan be successfully completed.
agenda ABOUT CAESARS VALUE PROPOSITION FINANCIAL SUMMARY

~ 8,500 Live entertainment shows per year 30 Properties in North America achieving Green Key Eco-Rating ~1.6M Square feet of convention space and retail stores > 2.7M Square feet of casino space in North America > 600 Bars, restaurants and clubs at our U.S. properties Caesars is the Largest and most diversified GAMING & entertainment company in the u.s. Manage 47 casino properties across 13 states and 5 countries #1 or #2 share position in most markets Industry’s first loyalty program, Total Rewards #1 theater venue in U.S. #3 live entertainment promoter worldwide Strong portfolio of widely recognized brands 47 Casinos in 5 countries $8.4B 2016 total net revenues in U.S. ~ 50M Total Rewards members ~ 59,000 Employees worldwide > 100M Guest visits per year 1,485,802 Square feet of construction built to LEED standards > 15,700 Conventions and meetings per year >38,000 Hotel rooms and suites in the U.S. Slot machines worldwide >55,000 Table games worldwide >3,400
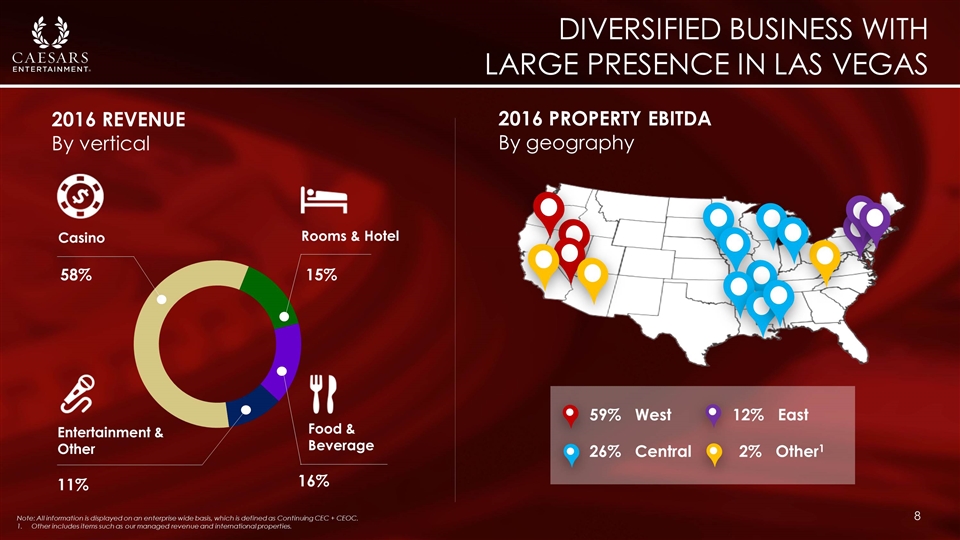
Diversified business with large presence in las vegas 2016 REVENUE By vertical 2016 PROPERTY EBITDA By geography Note: All information is displayed on an enterprise wide basis, which is defined as Continuing CEC + CEOC. 1. Other includes items such as our managed revenue and international properties. 59% West 26% Central 12% East 2% Other1 16% Food & Beverage 11% Casino 58% Rooms & Hotel 15% Entertainment & Other

strong portfolio of brands Digital Entertainment Across Regions Las Vegas

First-class hospitality assets that appeal to A BROAD customer base - stimulating traffic & visitation
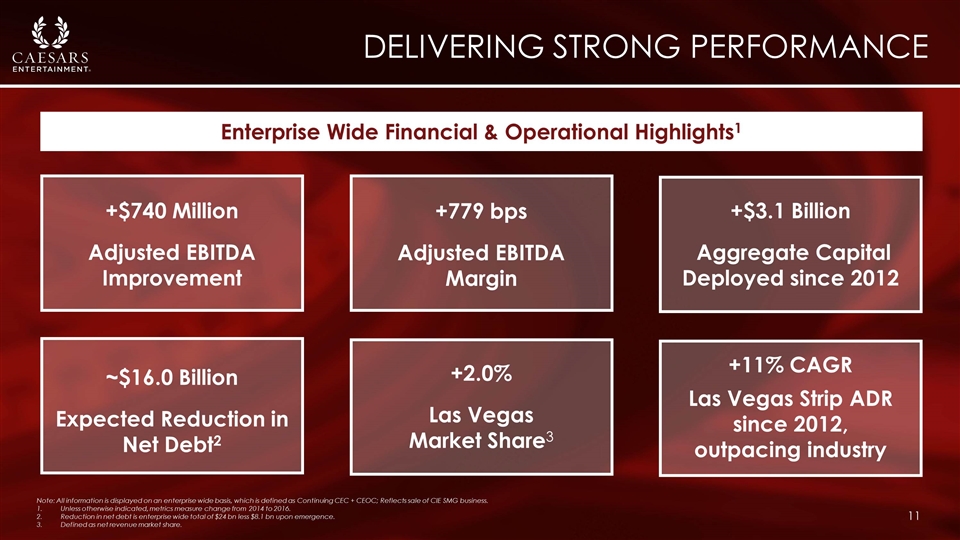
DELIVERING STRONG PERFORMANCE Note: All information is displayed on an enterprise wide basis, which is defined as Continuing CEC + CEOC; Reflects sale of CIE SMG business. Unless otherwise indicated, metrics measure change from 2014 to 2016. Reduction in net debt is enterprise wide total of $24 bn less $8.1 bn upon emergence. Defined as net revenue market share. Enterprise Wide Financial & Operational Highlights1 +$740 Million Adjusted EBITDA Improvement +779 bps Adjusted EBITDA Margin ~$16.0 Billion Expected Reduction in Net Debt2 +2.0% Las Vegas Market Share3 +$3.1 Billion Aggregate Capital Deployed since 2012 +11% CAGR Las Vegas Strip ADR since 2012, outpacing industry

ABOUT CAESARS VALUE PROPOSITION FINANCIAL SUMMARY

Our Value proposition ü ü ü ü ü Strong Free Cash Flow Profile Proven Management Execution Network Expansion Opportunities Concentrated Position in Growing Las Vegas Market Strongest Loyalty Program in the Gaming Industry

50+ Million Total Rewards Members Leveraged Across the #1 U.S. Gaming Position

Total Rewards loyalty program enhances customer engagement and consolidates play Total Rewards properties capture more than their fair share of gaming revenues in their markets Total Rewards’ “network effect” can have powerful impacts on property performance (acquired 2009) (acquired 2006) “Fair Share” % MARKET SHARE ANALYSIS OF KEY MARKETS Actual vs. “Expected” Revenue IMPACTS OF PARTICIPATING IN TOTAL REWARDS 12 Months Prior vs. 12 Months Post Note: “Fair Share” is defined as expected share of revenue based on number of units in the market; Data for Iowa, Indiana/Illinois, Kansas City, New Orleans and NW Louisiana are based on gross gaming revenue; all other markets are based on net gaming revenue.

Invigorate Hospitality and loyalty marketing programs to profitably grow the database Total Rewards members that receive email, download the TR App or have the TR Visa card spend more Opportunity to expand active portion of the database through targeted marketing campaigns ACTIVE TOTAL REWARDS MEMBERS SPEND GROWTH 2015 vs. 2016 % Change YoY 1 Casino represents all rated players.
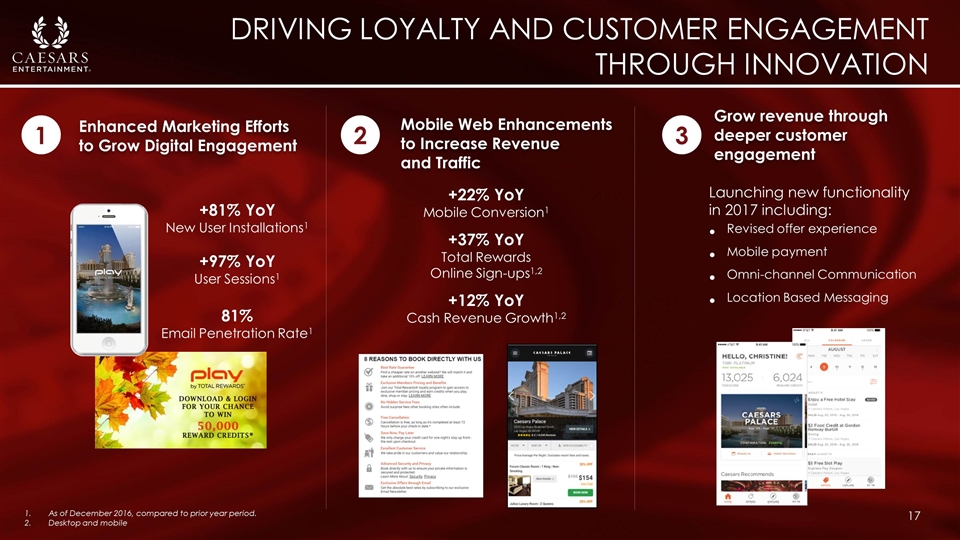
Driving loyalty and customer engagement through innovation Enhanced Marketing Efforts to Grow Digital Engagement 1 2 Mobile Web Enhancements to Increase Revenue and Traffic +22% YoY Mobile Conversion1 +37% YoY Total Rewards Online Sign-ups1,2 +12% YoY Cash Revenue Growth1,2 +81% YoY New User Installations1 +97% YoY User Sessions1 81% Email Penetration Rate1 Grow revenue through deeper customer engagement 3 Launching new functionality in 2017 including: Revised offer experience Mobile payment Omni-channel Communication Location Based Messaging As of December 2016, compared to prior year period. Desktop and mobile

Growing Market Share and Pricing Power in Strong Las Vegas Market
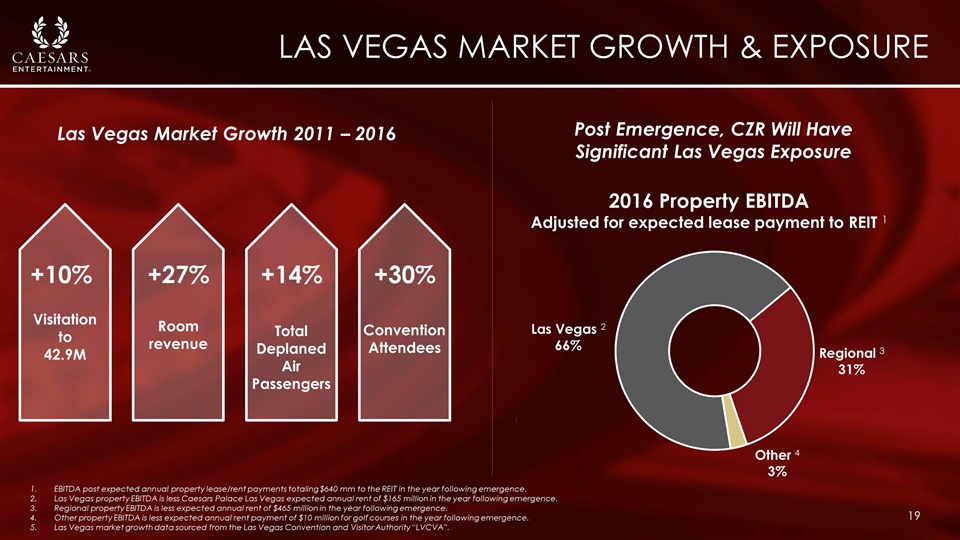
1 EBITDA post expected annual property lease/rent payments totaling $640 mm to the REIT in the year following emergence. Las Vegas property EBITDA is less Caesars Palace Las Vegas expected annual rent of $165 million in the year following emergence. Regional property EBITDA is less expected annual rent of $465 million in the year following emergence. Other property EBITDA is less expected annual rent payment of $10 million for golf courses in the year following emergence. Las Vegas market growth data sourced from the Las Vegas Convention and Visitor Authority “LVCVA”. Las vegas market Growth & exposure Visitation to 42.9M Room revenue Post Emergence, CZR Will Have Significant Las Vegas Exposure 2016 Property EBITDA Adjusted for expected lease payment to REIT 1 +10% +27% +30% Convention Attendees +14% Total Deplaned Air Passengers Las Vegas Market Growth 2011 – 2016
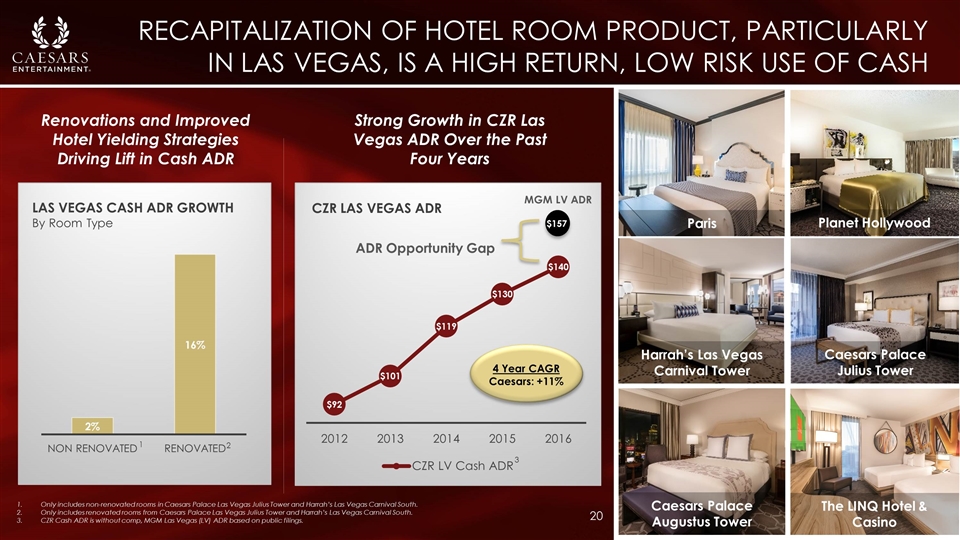
Recapitalization of hotel room product, particularly in las vegas, is a high return, low risk use of cash The LINQ Hotel & Casino Caesars Palace Julius Tower Planet Hollywood Caesars Palace Augustus Tower Paris Renovations and Improved Hotel Yielding Strategies Driving Lift in Cash ADR LAS VEGAS CASH ADR GROWTH By Room Type Strong Growth in CZR Las Vegas ADR Over the Past Four Years Only includes non-renovated rooms in Caesars Palace Las Vegas Julius Tower and Harrah’s Las Vegas Carnival South. Only includes renovated rooms from Caesars Palace Las Vegas Julius Tower and Harrah’s Las Vegas Carnival South. CZR Cash ADR is without comp, MGM Las Vegas (LV) ADR based on public filings. 1 2 MGM LV ADR 4 Year CAGR Caesars: +11% 3 Harrah’s Las Vegas Carnival Tower

opportunity to generate strong gains over the coming years through room renovations LAS VEGAS RENOVATION TIMELINE Cumulative rooms Opportunity to close revenue gap through >15K Las Vegas room renovations over the next five years CAESARS VS. COMPETITORS1 Source: FY 2014 publicly available filings. Non renovated defined as rooms not renovated since 2014. Caesars historically underperformed relative to peers 2 9% 15% 32% 56% 100%

Emergence Significantly Reduces Balance Sheet Leverage, Unlocking New Opportunities for Organic & Inorganic Growth
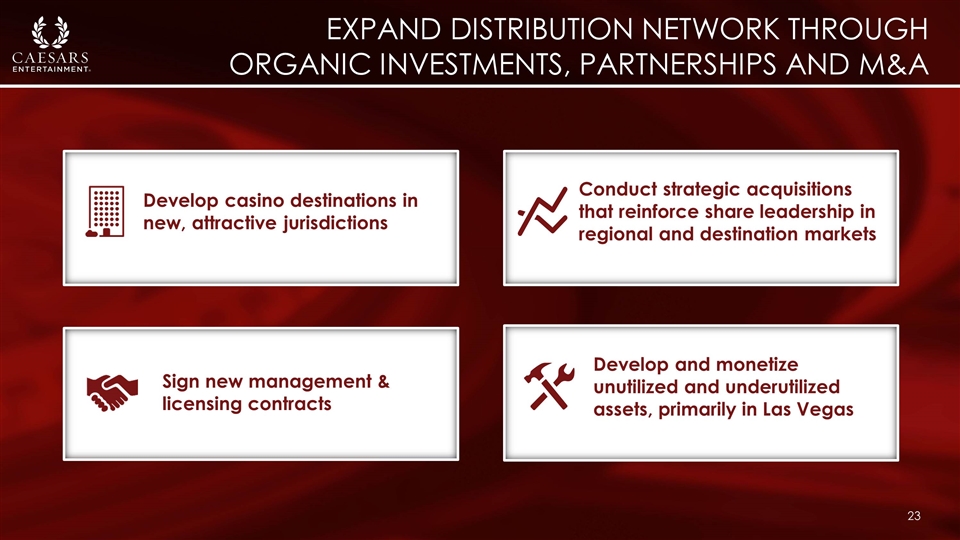
Expand distribution network through organic investments, partnerships and M&A Develop and monetize unutilized and underutilized assets, primarily in Las Vegas Sign new management & licensing contracts Conduct strategic acquisitions that reinforce share leadership in regional and destination markets Develop casino destinations in new, attractive jurisdictions
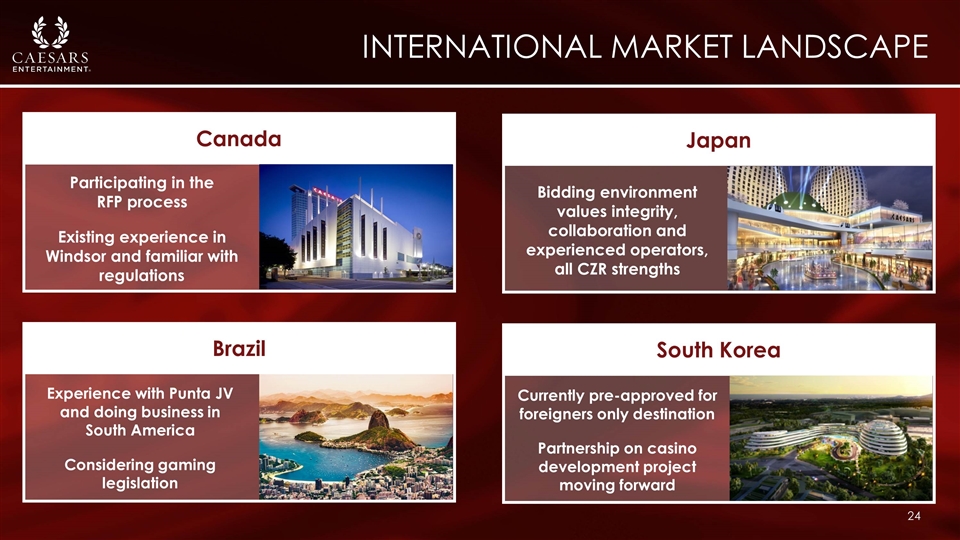
INTERNATIONAL MARKET LANDSCAPE Canada Participating in the RFP process Existing experience in Windsor and familiar with regulations Brazil Experience with Punta JV and doing business in South America Considering gaming legislation Japan Bidding environment values integrity, collaboration and experienced operators, all CZR strengths South Korea Currently pre-approved for foreigners only destination Partnership on casino development project moving forward

ACTIVE Domestic M&A Landscape Non-participant in active M&A landscape due to CEOC bankruptcy process Resolution of bankruptcy and improved capital structure will provide enhanced flexibility for M&A Opportunity to drive strong value creation from potential future M&A: Immediate synergies through Total Rewards REIT collaboration Leverage efficient operating model Consolidation of operations Greater diversification of portfolio Source: Financial community research Growing Gaming Sector M&A Environment1 M&A TRANSACTIONS ANNOUNCED M&A VOLUME $ Billions

Las vegas ASSET ACTIVATION ~39 Acres (Adjacent to The LINQ) ~50 Acres (Adjacent to Bally’s, Paris & Planet Hollywood) Develop & Monetize Unutilized / Underutilized Assets Real estate portfolio includes large undeveloped commercial scale properties adjacent to the Las Vegas strip ~7 Acres (In front of Caesars Palace)
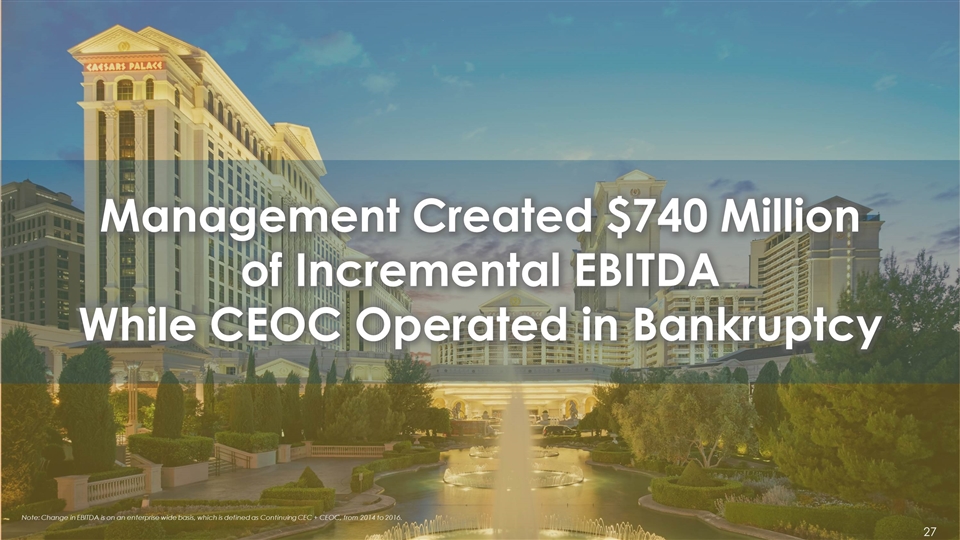
Experienced Management Execution Management Created $740 Million of Incremental EBITDA While CEOC Operated in Bankruptcy Note: Change in EBITDA is on an enterprise wide basis, which is defined as Continuing CEC + CEOC, from 2014 to 2016.

Experienced and proven management team Mark Frissora President & CEO Joined: 2015 Experience: 38 years Eric Hession EVP & CFO Joined: 2002 Experience: 19 years Tom Jenkin Global President Operations Joined: 1975 Experience: 41 years Bob Morse President, Hospitality Les Ottolenghi EVP & CIO Ruben Sigala EVP & CMO Steven Tight President, International Development 16 years experience as CEO Served on 7 boards Track record of operating, growing and creating value at complex, highly leveraged companies Recognized for relentless focus on stockholder returns, customer and employee satisfaction, innovation and technology adoption Managed productivity initiatives leading to millions in cost-savings Modernized accounting and financial systems, improving internal control environment and financial reporting Extensive casino operations experience in addition to corporate finance role Has worked in numerous operational departments across CEC Drove implementation of Business Process Improvement program across the enterprise Implemented productivity initiatives that improved Revenue/FTE Joined: 2005 Experience: 17 years Joined: 2016 Experience: 33 years Joined: 2011 Experience: 34 years Joined: 2014 Experience: 40 years Joined: 2009 Experience: 36 years Tim Donovan EVP, General Counsel, Chief Regulatory & Compliance Officer
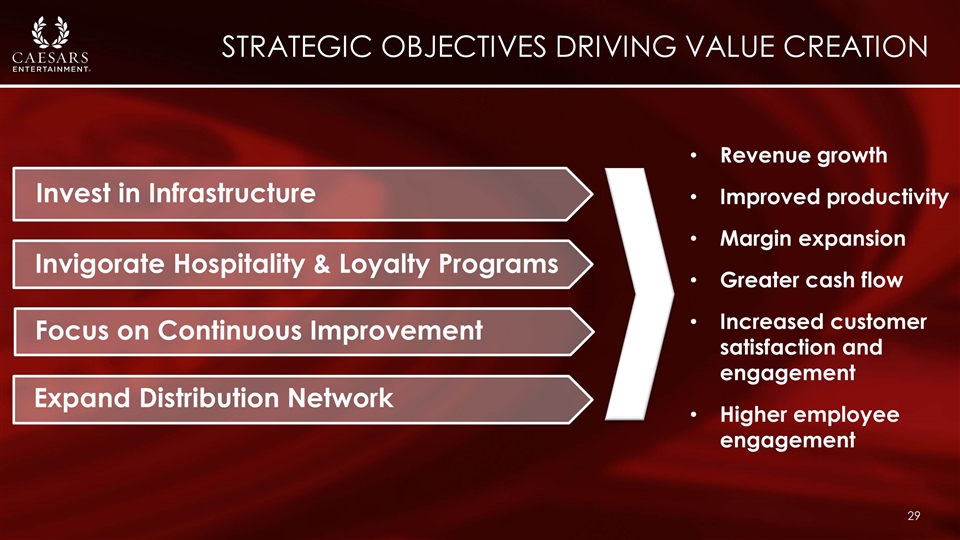
strategic OBJECTIVES DRIVING value creation Invigorate Hospitality & Loyalty Programs Invest in Infrastructure Focus on Continuous Improvement Revenue growth Improved productivity Margin expansion Greater cash flow Increased customer satisfaction and engagement Higher employee engagement Expand Distribution Network
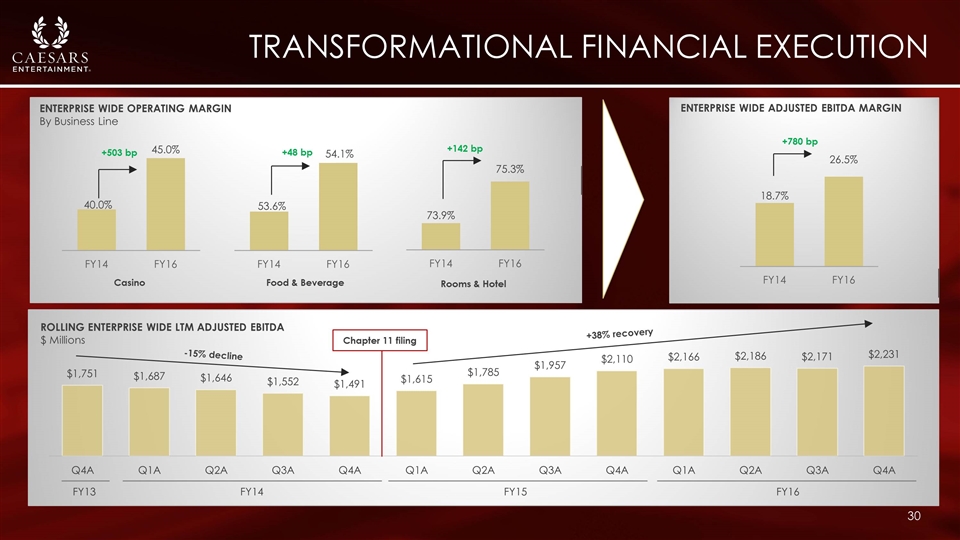
Transformational financial execution ENTERPRISE WIDE OPERATING MARGIN By Business Line Casino Food & Beverage Rooms & Hotel +503 bp +48 bp +142 bp Chapter 11 filing -15% decline +38% recovery ROLLING ENTERPRISE WIDE LTM ADJUSTED EBITDA $ Millions FY13 FY14 FY15 FY16 ENTERPRISE WIDE ADJUSTED EBITDA MARGIN +780 bp
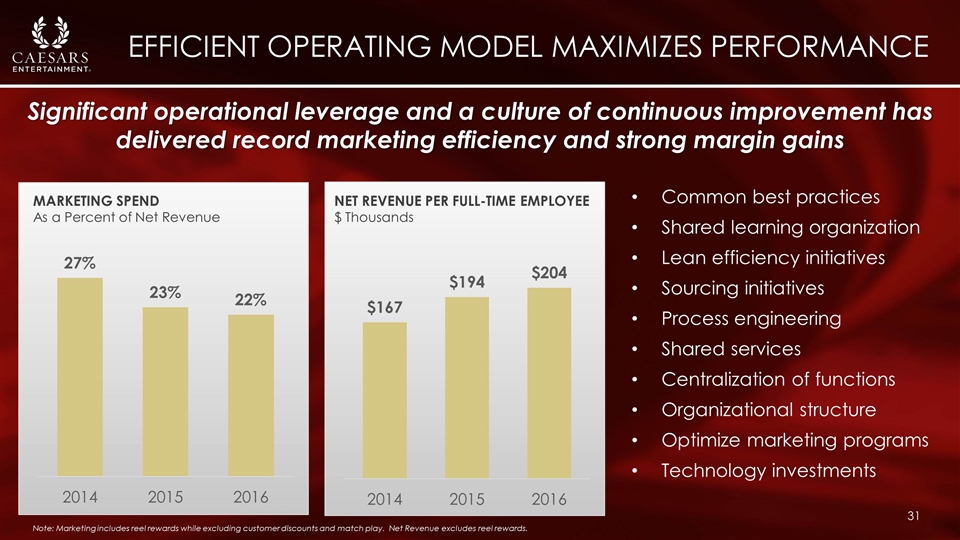
Efficient operating model maximizes performance Significant operational leverage and a culture of continuous improvement has delivered record marketing efficiency and strong margin gains Common best practices Shared learning organization Lean efficiency initiatives Sourcing initiatives Process engineering Shared services Centralization of functions Organizational structure Optimize marketing programs Technology investments Note: Marketing includes reel rewards while excluding customer discounts and match play. Net Revenue excludes reel rewards. MARKETING SPEND As a Percent of Net Revenue NET REVENUE PER FULL-TIME EMPLOYEE $ Thousands
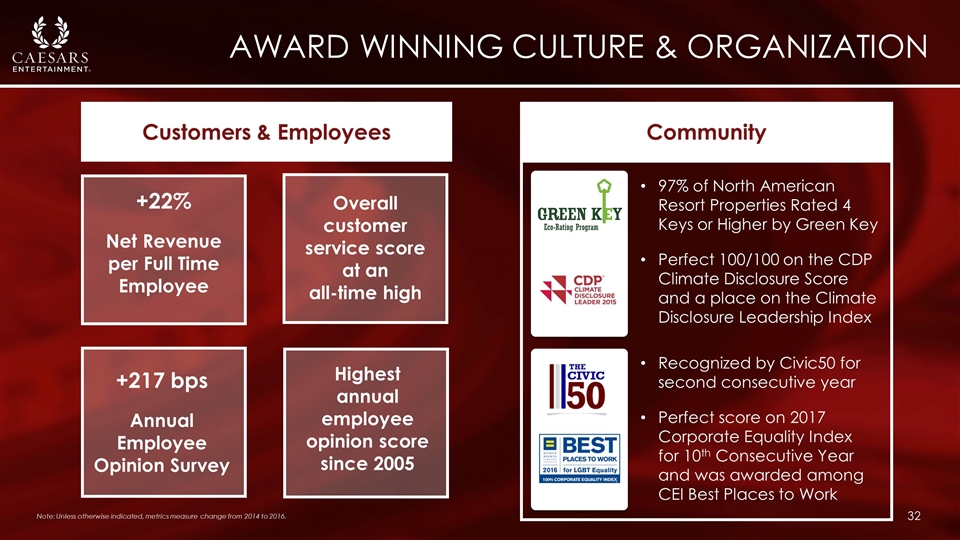
AWARD WINNING CULTURE & ORGANIZATION 97% of North American Resort Properties Rated 4 Keys or Higher by Green Key Perfect 100/100 on the CDP Climate Disclosure Score and a place on the Climate Disclosure Leadership Index Customers & Employees Community Recognized by Civic50 for second consecutive year Perfect score on 2017 Corporate Equality Index for 10th Consecutive Year and was awarded among CEI Best Places to Work +22% Net Revenue per Full Time Employee +217 bps Annual Employee Opinion Survey Highest annual employee opinion score since 2005 Overall customer service score at an all-time high Note: Unless otherwise indicated, metrics measure change from 2014 to 2016.

Significant Opportunity for Continued Growth in Free Cash Flow Generation
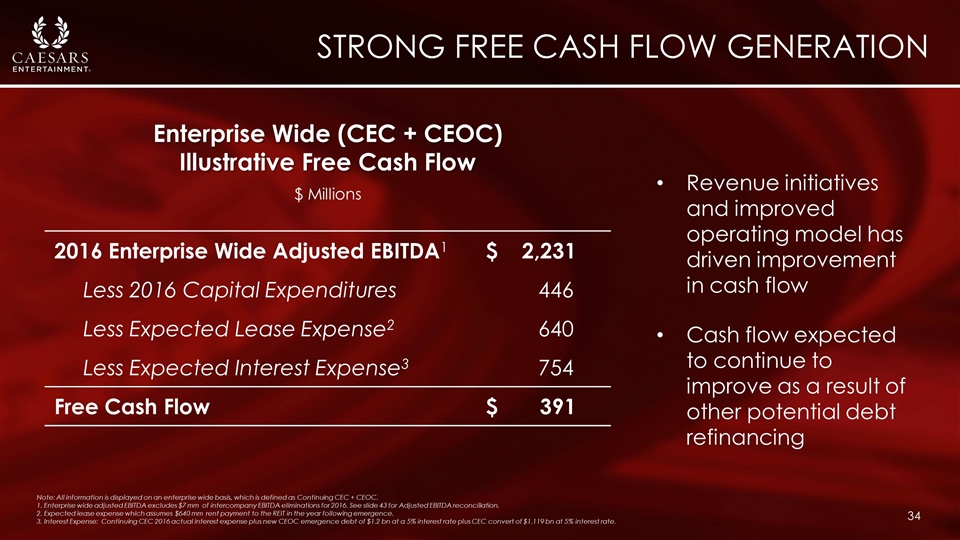
Strong FREE Cash flow generation Revenue initiatives and improved operating model has driven improvement in cash flow Cash flow expected to continue to improve as a result of other potential debt refinancing Note: All information is displayed on an enterprise wide basis, which is defined as Continuing CEC + CEOC. 1. Enterprise wide adjusted EBITDA excludes $7 mm of intercompany EBITDA eliminations for 2016. See slide 43 for Adjusted EBITDA reconciliation. 2. Expected lease expense which assumes $640 mm rent payment to the REIT in the year following emergence. 3. Interest Expense: Continuing CEC 2016 actual interest expense plus new CEOC emergence debt of $1.2 bn at a 5% interest rate plus CEC convert of $1.119 bn at 5% interest rate. 2016 Enterprise Wide Adjusted EBITDA1 $ 2,231 Less 2016 Capital Expenditures 446 Less Expected Lease Expense2 640 Less Expected Interest Expense3 754 Free Cash Flow $ 391 $ Millions Enterprise Wide (CEC + CEOC) Illustrative Free Cash Flow
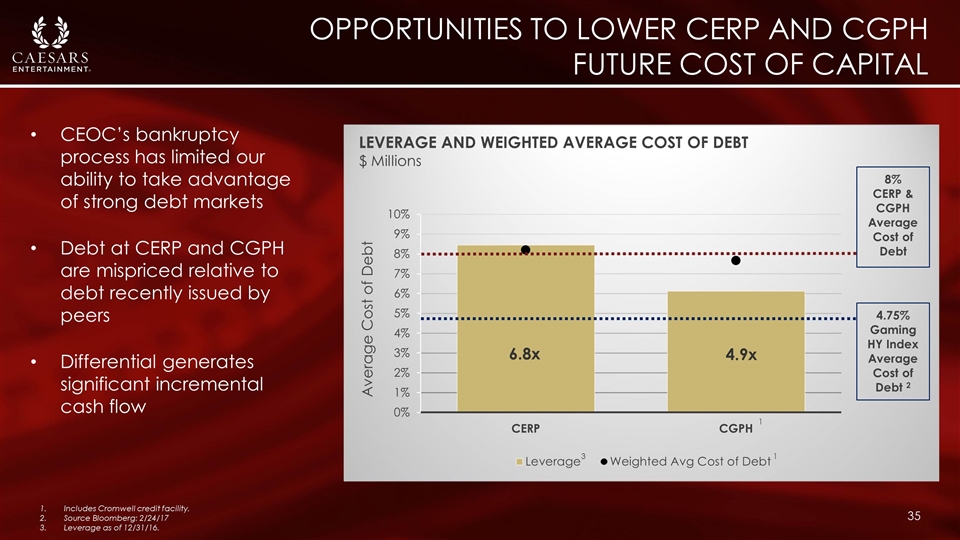
Opportunities to lower CERP and CGPH future cost of capital CEOC’s bankruptcy process has limited our ability to take advantage of strong debt markets Debt at CERP and CGPH are mispriced relative to debt recently issued by peers Differential generates significant incremental cash flow LEVERAGE AND WEIGHTED AVERAGE COST OF DEBT $ Millions Includes Cromwell credit facility. Source Bloomberg: 2/24/17 Leverage as of 12/31/16. 1 8% CERP & CGPH Average Cost of Debt 1 3
ABOUT CAESARS VALUE PROPOSITION FINANCIAL SUMMARY

Execution on cornerstone initiatives has resulted in improved financial performance NET REVENUE $ Millions ADJUSTED EBITDA & EBITDA MARGIN $ Millions 18.7% 25.3% 26.5% CAGR +2.8% CAGR +22.3% Margin +780 bps Note: All information is displayed on an enterprise wide basis, which is defined as Continuing CEC + CEOC. As CEC consolidated CEOC for the full year 2014, this represents US GAAP. Enterprise Wide (CEC + CEOC) $8,328 $7,967 $8,418
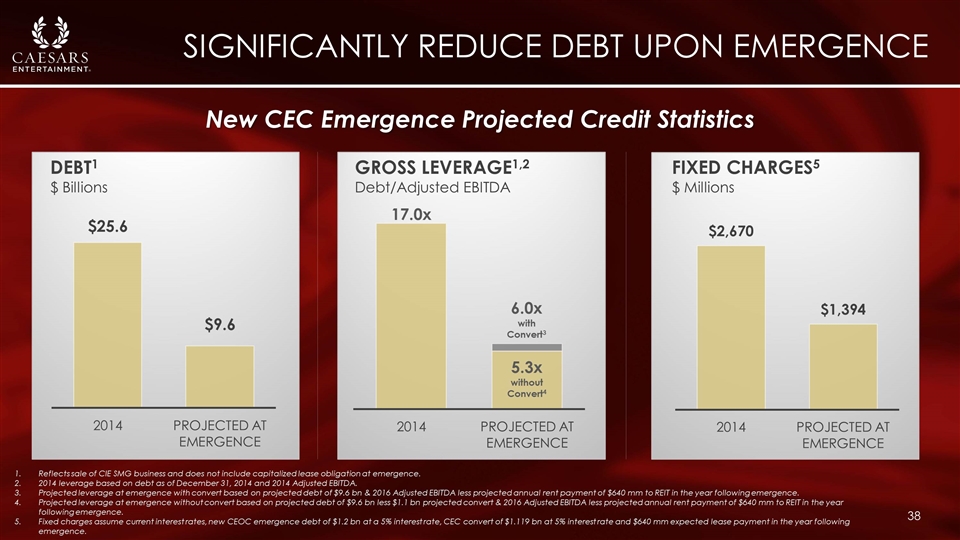
SIGNIFICANTLY REDUCE DEBT UPON EMERGENCE Reflects sale of CIE SMG business and does not include capitalized lease obligation at emergence. 2014 leverage based on debt as of December 31, 2014 and 2014 Adjusted EBITDA. Projected leverage at emergence with convert based on projected debt of $9.6 bn & 2016 Adjusted EBITDA less projected annual rent payment of $640 mm to REIT in the year following emergence. Projected leverage at emergence without convert based on projected debt of $9.6 bn less $1.1 bn projected convert & 2016 Adjusted EBITDA less projected annual rent payment of $640 mm to REIT in the year following emergence. Fixed charges assume current interest rates, new CEOC emergence debt of $1.2 bn at a 5% interest rate, CEC convert of $1.119 bn at 5% interest rate and $640 mm expected lease payment in the year following emergence. New CEC Emergence Projected Credit Statistics DEBT1 $ Billions GROSS LEVERAGE1,2 Debt/Adjusted EBITDA FIXED CHARGES5 $ Millions

INVESTMENT SUMMARY ü ü ü ü ü Strong Free Cash Flow Profile Proven Management Execution Network Expansion Opportunities Concentrated Position in Growing Las Vegas Market Strongest Loyalty Program in the Gaming Industry
APPENDIX

CAESARS operating structure Post Emergence CZR New CEOC CERP CGP CES 1 100% 100% 100% PUBLIC STOCKHOLDERS Note: Simplified structure chart does not reflect the intermediate companies for each casino property 1. Caesars Enterprise Services, LLC (“CES”)
Reconciliation of non-gaap information: notes Because we deconsolidated CEOC upon its Chapter 11 filing, 2016 financial results presented under GAAP, we are also providing certain supplemental information as if we had continued to consolidate CEOC throughout the fourth quarter of 2016. This information includes both stand-alone CEOC financials and key metrics for the fourth quarter of 2016, and certain financial information for CEC as if CEOC remained a consolidated entity during the quarter. This information within this presentation may be different from CEOC’s standalone results separately provided due to immaterial adjustments, rounding, and basis of presentation differences. CEC has committed to a material amount of payments to support CEOC’s restructuring, which would result in the reacquisition of CEOC’s operations if the restructuring is made on terms consistent with the current Restructuring Support Agreement to which CEC is a party. In addition, compensation of management is in part determined by reference to certain of such financial information. As a result, we believe this supplemental information is useful to investors who are trying to understand the results of the entire “Caesars” enterprise, including CEOC and consistent with the management services provided across the system’s properties. As a result of the above, “Continuing CEC” in the following reconciliations represents GAAP results for CEC as reported for the period ended December 31, 2016 and 2015. As a result of the above, “CEC+CEOC” in the following reconciliations represents Non-GAAP results as it includes CEOC for both the 2015 and 2016 periods.
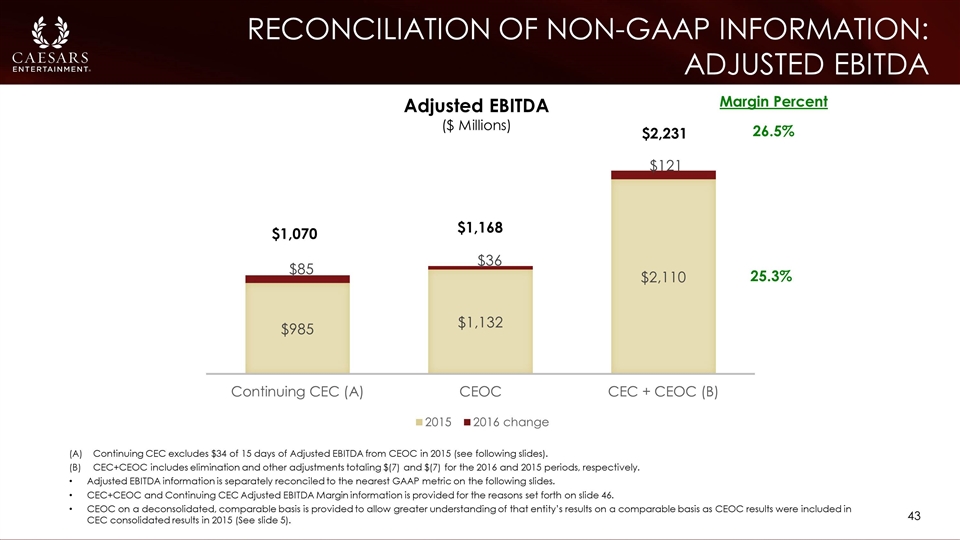
Reconciliation of non-gaap information: Adjusted ebitda Continuing CEC excludes $34 of 15 days of Adjusted EBITDA from CEOC in 2015 (see following slides). CEC+CEOC includes elimination and other adjustments totaling $(7) and $(7) for the 2016 and 2015 periods, respectively. Adjusted EBITDA information is separately reconciled to the nearest GAAP metric on the following slides. CEC+CEOC and Continuing CEC Adjusted EBITDA Margin information is provided for the reasons set forth on slide 46. CEOC on a deconsolidated, comparable basis is provided to allow greater understanding of that entity’s results on a comparable basis as CEOC results were included in CEC consolidated results in 2015 (See slide 5). Adjusted EBITDA ($ Millions) $1,070 $1,168 $2,231 Margin Percent 26.5% 25.3%
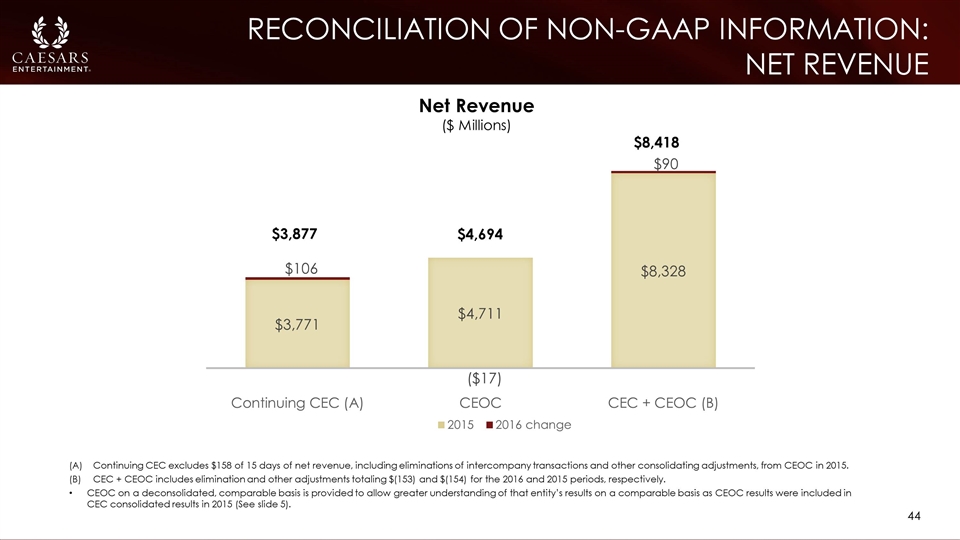
Reconciliation of non-gaap information: net revenue Continuing CEC excludes $158 of 15 days of net revenue, including eliminations of intercompany transactions and other consolidating adjustments, from CEOC in 2015. CEC + CEOC includes elimination and other adjustments totaling $(153) and $(154) for the 2016 and 2015 periods, respectively. CEOC on a deconsolidated, comparable basis is provided to allow greater understanding of that entity’s results on a comparable basis as CEOC results were included in CEC consolidated results in 2015 (See slide 5). Net Revenue ($ Millions) $3,877 $4,694 $8,418
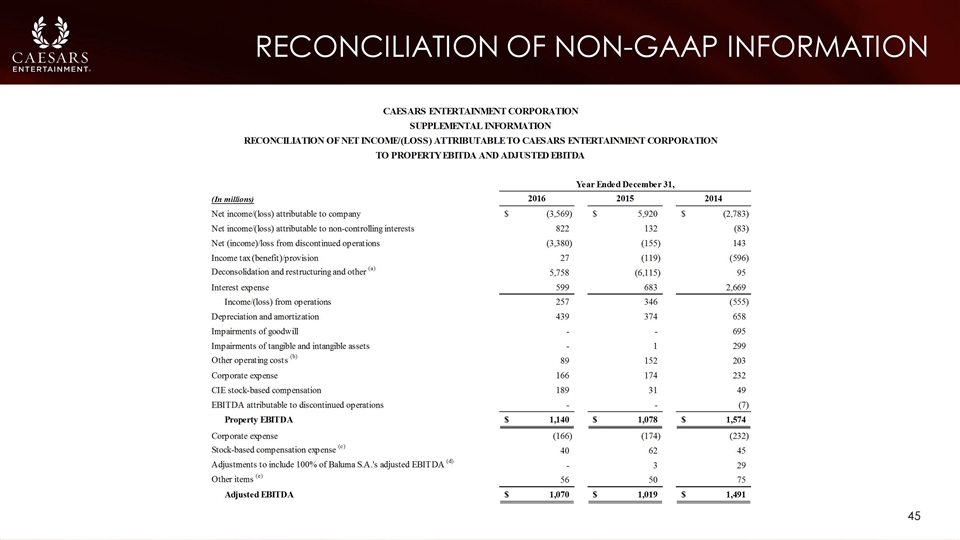
Reconciliation of non-gaap information

Notes to non-gaap information Adjusted EBITDA is defined as EBITDA further adjusted to exclude certain non-cash and other items as exhibited in the above reconciliation, and is presented as a supplemental measure of CEC’s performance. Management believes that Adjusted EBITDA provides investors with additional information and allows a better understanding of the results of operational activities separate from the financial impact of decisions made for the long-term benefit of CEC. In addition, compensation of management is in part determined by reference to certain of such financial information. As a result, we believe this supplemental information is useful to investors who are trying to understand the results of CEC. Adjusted EBITDA Margin is the ratio of Adjusted EBITDA to Net Revenue and is presented for the same reasons as Adjusted EBITDA noted above. Because not all companies use identical calculations, the presentation of Adjusted EBITDA may not be comparable to other similarly titled measures of other companies. Amounts during 2016 primarily represent CEC’s estimated costs in connection with the restructuring of CEOC. Amounts during 2015 primarily represent CEC’s gain recognized upon the deconsolidation of CEOC. Amounts primarily represent pre-opening costs incurred in connection with property openings and expansion projects at existing properties and costs associated with the acquisition and development activities and reorganization activities. Amounts represent stock-based compensation expense related to shares, stock options, and restricted stock units granted to the CEC employees. Amounts represent adjustments to include 100% of Baluma S.A. (Conrad Punta del Este) adjusted EBITDA as permitted under the indentures governing CEOC’s existing notes and the credit agreement governing CEOC’s senior secured credit facilities. Amounts represent add-backs and deductions from EBITDA, permitted under certain indentures. Such add-backs and deductions include litigation awards and settlements, costs associated with CEOC’s restructuring and related litigation, severance and relocation costs, sign-on and retention bonuses, permit remediation costs, and business optimization expenses.
