Table of Contents
UNITED STATES
SECURITIES AND EXCHANGE COMMISSION
Washington, D.C. 20549
FORM N-CSRS
CERTIFIED SHAREHOLDER REPORT OF REGISTERED
MANAGEMENT INVESTMENT COMPANIES
Investment Company Act file number: 811-5954
The Charles Schwab Family of Funds
(Exact name of registrant as specified in charter)
211 Main Street, San Francisco, California 94105
(Address of principal executive offices) (Zip code)
Marie Chandoha
The Charles Schwab Family of Funds
211 Main Street, San Francisco, California 94105
(Name and address of agent for service)
Registrant’s telephone number, including area code: (415) 636-7000
Date of fiscal year end: December 31
Date of reporting period: June 30, 2015
Item 1: Report(s) to Shareholders.
Table of Contents
by viewing these documents online.
Sign up at schwab.com/paperless


| 1 | A fund’s share price is its NAV, which is the fund’s net assets divided by the number of its shares outstanding. Under the new amendments, Retail Prime and Municipal money market funds, as well as Government money market funds, will continue to be permitted to transact at a constant NAV of $1.00. Note that while a fund may seek to maintain a constant NAV, there is no guarantee that it will be able to do so. |
 |
Linda Klingman, Vice President and Head of Taxable Money Market Strategies, leads the portfolio management team of Schwab’s prime and government taxable money funds. Ms. Klingman also has overall responsibility for all aspects of the management of the fund. Prior to joining CSIM in 1990, Ms. Klingman was a senior money market trader with AIM Management. She has managed money market funds since 1988. |
 |
Michael Lin, Managing Director and Senior Portfolio Manager, is responsible for the day-to-day co-management of the fund. Mr. Lin has been a portfolio manager with CSIM since 2006, and also worked in CSIM’s Fund Administration group for nearly four years, where he focused on security pricing and valuation of Schwab Funds. Prior to joining CSIM, he spent three years at American Century Investments, most recently as a senior trader of the taxable money market funds. |
 |
Jonathan Roman, Portfolio Manager, is responsible for the day-to-day co-management of the fund. Mr. Roman has been a portfolio manager with CSIM since 2010, and has held a number of positions at the firm since beginning his tenure in 2005. In 2009, he joined the Portfolio Management group as a Trader, and prior to that he worked in the Portfolio Operations and Analytics group providing trading support to the taxable money market desk. |
 |
Jonathan Feske, CFA, Portfolio Manager, is responsible for the day-to-day co-management of the fund. He previously was responsible for credit and investment research for global banks for CSIM’s taxable bond and money funds. Prior to joining CSIM in 2011, Mr. Feske was a high-yield bond analyst for more than two years at Miller Tabak Roberts Securities, a boutique corporate bond broker-dealer, which is now part of GMP Capital. He covered both U.S. and emerging market credits, focusing on distressed situations in various industrial sectors. Previously, Mr. Feske was employed in the securities industry as an equity trader for three years. |
| 1 | The investment adviser and its affiliates may recapture expenses or fees they waived under a voluntary yield waiver until the third anniversary of the end of the fiscal year in which such waiver occurs, subject to certain limitations. For more information on the potential impact of such recapture on future yields, see financial note 5. |
| 2 | As shown in the Portfolio Holdings section of the shareholder report. |
| 3 | Money funds must maintain a dollar-weighted average maturity of no longer than 60 days and cannot invest in any security whose effective maturity is longer than 397 days (approximately 13 months). |
| 4 | Tier 1 securities are rated in the highest short-term rating category by two nationally recognized statistical rating organizations (“NRSROs”), or by one if only one NRSRO has rated the securities, or, if unrated, determined to be of comparable quality by CSIM pursuant to guidelines adopted by the Board of Trustees. Money market fund shares and U.S. government securities are also Tier 1 securities. The fund uses NRSRO credit ratings from Standard & Poor’s Corp., Moody’s Investors Service, Fitch Ratings, and/or DBRS. The fund may use different ratings provided by other rating agencies for purposes of determining compliance with the fund’s investment policies. The fund itself has not been rated by an independent credit rating agency. |
| Schwab Advisor Cash Reserves | ||
| Sweep
Shares |
Premier
Sweep Shares | |
| Ticker Symbol | SWQXX | SWZXX |
| Minimum Initial Investment | ** | ** |
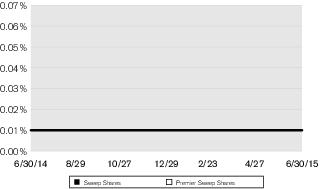
| Seven-Day Yield1 | 0.01% | 0.01% |
| Seven-Day Yield–Without Contractual Expense Limitation2 | -0.09% | -0.16% |
| Seven-Day Effective Yield1 | 0.01% | 0.01% |
| * | The seven-day average yield for the Sweep Shares and Premier Sweep Shares was 0.01% throughout the entire period. |
| ** | Subject to the eligibility terms and conditions of your Schwab account agreement. |
| 1 | Yield reflects the effect of the fund’s agreement with the investment adviser and its affiliates to limit each share class’ total annual operating expenses to certain levels (contractual expense limitation). In addition, the investment adviser and its affiliates have voluntarily waived expenses in excess of the contractual expense limitation to maintain a positive net yield for each share class of the fund (voluntary yield waiver). Without the contractual expense limitation and the voluntary yield waiver, the fund’s yield would have been lower. For additional details, see financial note 4. |
| 2 | Yield does not reflect the effect of the contractual expense limitation, but does reflect the effect of the voluntary yield waiver. The voluntary yield waiver added 0.37% and 0.30% to the seven-day yields of the Sweep Shares and Premier Sweep Shares, respectively. |
| Expense
Ratio1 (Annualized) |
Beginning
Account Value at 1/1/15 |
Ending
Account Value (Net of Expenses) at 6/30/15 |
Expenses
Paid During Period2 1/1/15–6/30/15 | |
| Schwab Advisor Cash Reserves | ||||
| Sweep Shares | ||||
| Actual Return | 0.24% | $1,000.00 | $1,000.10 | $1.19 |
| Hypothetical 5% Return | 0.24% | $1,000.00 | $1,023.61 | $1.20 |
| Premier Sweep Shares | ||||
| Actual Return | 0.24% | $1,000.00 | $1,000.10 | $1.19 |
| Hypothetical 5% Return | 0.24% | $1,000.00 | $1,023.61 | $1.20 |
| 1 | Based on the most recent six-month expense ratio; may differ from the expense ratio provided in the Financial Highlights. |
| 2 | Expenses for each share class are equal to its annualized expense ratio, multiplied by the average account value over the period, multiplied by 181 days of the period, and divided by 365 days of the fiscal year. |
| Sweep Shares | 1/1/15–
6/30/15* |
1/1/14–
12/31/14 |
1/1/13–
12/31/13 |
1/1/12–
12/31/12 |
1/1/11–
12/31/11 |
1/1/10–
12/31/10 |
| Per-Share Data ($) | ||||||
| Net asset value at beginning of period | 1.00 | 1.00 | 1.00 | 1.00 | 1.00 | 1.00 |
| Income (loss) from investment operations: | ||||||
| Net investment income (loss) | 0.00 1,2 | 0.00 2 | 0.00 2 | 0.00 2 | 0.00 2 | 0.00 2 |
| Net realized and unrealized gains (losses) | (0.00) 2 | 0.00 2 | 0.00 2 | 0.00 2 | (0.00) 2 | 0.00 2,3 |
| Total from investment operations | 0.00 2 | 0.00 2 | 0.00 2 | 0.00 2 | 0.00 2 | 0.00 2 |
| Less distributions: | ||||||
| Distributions from net investment income | (0.00) 2 | (0.00) 2 | (0.00) 2 | (0.00) 2 | (0.00) 2 | (0.00) 2 |
| Net asset value at end of period | 1.00 | 1.00 | 1.00 | 1.00 | 1.00 | 1.00 |
| Total return (%) | 0.01 4 | 0.01 | 0.01 | 0.01 | 0.01 | 0.01 |
| Ratios/Supplemental Data (%) | ||||||
| Ratios to average net assets: | ||||||
| Net operating expenses | 0.24 5,6 | 0.21 6 | 0.25 6 | 0.28 6,7 | 0.26 6 | 0.34 6 |
| Gross operating expenses | 0.72 5 | 0.72 | 0.72 | 0.72 7 | 0.73 | 0.73 |
| Net investment income (loss) | 0.01 5 | 0.01 | 0.01 | 0.01 | 0.01 | 0.01 |
| Net assets, end of period ($ x 1,000,000) | 5,181 | 6,027 | 6,134 | 6,207 | 6,035 | 5,617 |
| Premier Sweep Shares | 1/1/15–
6/30/15* |
1/1/14–
12/31/14 |
1/1/13–
12/31/13 |
1/1/12–
12/31/12 |
1/1/11–
12/31/11 |
1/1/10–
12/31/10 |
| Per-Share Data ($) | ||||||
| Net asset value at beginning of period | 1.00 | 1.00 | 1.00 | 1.00 | 1.00 | 1.00 |
| Income from investment operations: | ||||||
| Net investment income (loss) | 0.00 1,2 | 0.00 2 | 0.00 2 | 0.00 2 | 0.00 2 | 0.00 2 |
| Net realized and unrealized gains (losses) | (0.00) 2 | 0.00 2 | 0.00 2 | 0.00 2 | (0.00) 2 | 0.00 2,3 |
| Total from investment operations | 0.00 2 | 0.00 2 | 0.00 2 | 0.00 2 | 0.00 2 | 0.00 2 |
| Less distributions: | ||||||
| Distributions from net investment income | (0.00) 2 | (0.00) 2 | (0.00) 2 | (0.00) 2 | (0.00) 2 | (0.00) 2 |
| Net asset value at end of period | 1.00 | 1.00 | 1.00 | 1.00 | 1.00 | 1.00 |
| Total Return (%) | 0.01 4 | 0.01 | 0.01 | 0.01 | 0.01 | 0.01 |
| Ratios/Supplemental Data (%) | ||||||
| Ratios to average net assets: | ||||||
| Net operating expenses | 0.24 5,6 | 0.21 6 | 0.25 6 | 0.28 6,7 | 0.26 6 | 0.34 6 |
| Gross operating expenses | 0.72 5 | 0.72 | 0.72 | 0.72 7 | 0.73 | 0.73 |
| Net investment income (loss) | 0.01 5 | 0.01 | 0.01 | 0.01 | 0.01 | 0.01 |
| Net assets, end of period ($ x 1,000,000) | 15,441 | 17,952 | 17,525 | 17,575 | 14,727 | 15,342 |
| * | Unaudited. |
| Holdings by Category | Cost
($) |
Value
($) | |
| 50.2% | Fixed-Rate Obligations | 10,353,057,301 | 10,353,057,301 |
| 19.6% | Variable-Rate Obligations | 4,043,935,292 | 4,043,935,292 |
| 30.2% | Repurchase Agreements | 6,219,184,933 | 6,219,184,933 |
| 100.0% | Total Investments | 20,616,177,526 | 20,616,177,526 |
| 0.0% | Other Assets and Liabilities, Net | 5,272,391 | |
| 100.0% | Net Assets | 20,621,449,917 | |
| Issuer | Footnotes | Rate | Effective
Maturity |
Maturity
Date |
Face
Amount ($) |
Value
($) |
| Fixed-Rate Obligations 50.2% of net assets | ||||||
| Asset Backed Commercial Paper 4.5% | ||||||
| CAFCO, LLC | a,b | 0.27% | 08/05/15 | 34,000,000 | 33,991,075 | |
| Cancara Asset Securitisation, LLC | a,b | 0.27% | 09/18/15 | 35,000,000 | 34,979,262 | |
| Ciesco, LLC | a,b | 0.31% | 11/04/15 | 100,000,000 | 99,891,500 | |
| Collateralized Commercial Paper Co, LLC | a | 0.42% | 12/09/15 | 100,000,000 | 99,812,167 | |
| Collateralized Commercial Paper II Co, LLC | b | 0.33% | 07/06/15 | 19,000,000 | 18,999,129 | |
| CRC Funding, LLC | a,b | 0.31% | 11/04/15 | 100,000,000 | 99,891,500 | |
| Crown Point Capital Co, LLC | a,b | 0.30% | 09/03/15 | 95,000,000 | 94,949,333 | |
| Jupiter Securitization Corp | a,b | 0.31% | 11/03/15 | 81,000,000 | 80,912,812 | |
| MetLife Short Term Funding, LLC | a,b | 0.15% | 07/21/15 | 40,530,000 | 40,526,622 | |
| Old Line Funding, LLC | a,b | 0.30% | 09/23/15 | 13,000,000 | 12,990,900 | |
| Ridgefield Funding Co, LLC | a,b | 0.40% | 08/21/15 | 88,000,000 | 87,950,134 | |
| a,b | 0.30% | 09/15/15 | 21,000,000 | 20,986,700 | ||
| Sheffield Receivables Co, LLC | a,b | 0.35% | 08/03/15 | 130,000,000 | 129,958,292 | |
| a,b | 0.35% | 08/11/15 | 63,000,000 | 62,974,888 | ||
| Thunder Bay Funding, LLC | a,b | 0.45% | 12/17/15 | 3,000,000 | 2,993,663 | |
| 921,807,977 | ||||||
| Issuer | Footnotes | Rate | Effective
Maturity |
Maturity
Date |
Face
Amount ($) |
Value
($) |
| Financial Company Commercial Paper 6.8% | ||||||
| BPCE SA | b | 0.23% | 07/01/15 | 105,000,000 | 105,000,000 | |
| b | 0.23% | 07/09/15 | 7,000,000 | 6,999,642 | ||
| DNB Bank ASA | b | 0.31% | 08/21/15 | 50,000,000 | 49,978,042 | |
| b | 0.33% | 10/01/15 | 141,000,000 | 140,882,892 | ||
| HSBC Bank PLC | b | 0.32% | 10/29/15 | 15,000,000 | 14,984,000 | |
| ING (U.S.) Funding, LLC | a | 0.37% | 10/13/15 | 22,000,000 | 21,976,484 | |
| a | 0.41% | 11/16/15 | 147,000,000 | 146,768,965 | ||
| a | 0.40% | 11/23/15 | 66,000,000 | 65,893,667 | ||
| Macquarie Bank, Ltd | 0.28% | 08/11/15 | 113,000,000 | 112,963,966 | ||
| Nationwide Building Society | 0.40% | 07/06/15 | 4,000,000 | 3,999,778 | ||
| 0.40% | 07/29/15 | 10,000,000 | 9,996,889 | |||
| 0.40% | 08/17/15 | 30,000,000 | 29,984,333 | |||
| 0.30% | 09/25/15 | 150,000,000 | 149,892,500 | |||
| NRW.BANK | 0.09% | 07/01/15 | 100,000,000 | 100,000,000 | ||
| 0.14% | 07/06/15 | 208,000,000 | 207,995,955 | |||
| Oversea-Chinese Banking Corp, Ltd | 0.20% | 08/27/15 | 188,000,000 | 187,940,467 | ||
| Societe Generale | b | 0.22% | 08/03/15 | 21,000,000 | 20,995,765 | |
| Swedbank AB | 0.21% | 07/16/15 | 30,000,000 | 29,997,375 | ||
| 1,406,250,720 | ||||||
| Certificates of Deposit 31.1% | ||||||
| Abbey National Treasury Services PLC | a | 0.27% | 08/14/15 | 119,000,000 | 119,000,000 | |
| Bank of Montreal | 0.09% | 07/06/15 | 17,000,000 | 17,000,000 | ||
| 0.31% | 11/06/15 | 94,000,000 | 94,000,000 | |||
| 0.31% | 11/12/15 | 4,000,000 | 4,000,000 | |||
| Bank of Nova Scotia | 0.30% | 08/17/15 | 107,000,000 | 107,000,000 | ||
| 0.25% | 09/23/15 | 100,000,000 | 100,000,000 | |||
| 0.30% | 10/13/15 | 61,000,000 | 61,000,000 | |||
| 0.34% | 11/09/15 | 166,000,000 | 166,000,000 | |||
| 0.33% | 11/13/15 | 19,000,000 | 19,000,000 | |||
| Bank of the West | 0.25% | 07/09/15 | 20,000,000 | 20,000,000 | ||
| 0.27% | 08/24/15 | 57,000,000 | 57,000,000 | |||
| Bank of Tokyo Mitsubishi UFJ, Ltd | 0.33% | 09/02/15 | 117,000,000 | 117,000,000 | ||
| 0.33% | 09/03/15 | 136,000,000 | 136,000,000 | |||
| 0.34% | 10/05/15 | 20,000,000 | 20,000,000 | |||
| 0.34% | 10/06/15 | 100,000,000 | 100,000,000 | |||
| Barclays Bank PLC | 0.45% | 08/17/15 | 108,000,000 | 108,000,000 | ||
| 0.53% | 08/26/15 | 137,000,000 | 137,000,000 | |||
| 0.53% | 10/05/15 | 30,000,000 | 30,000,000 | |||
| 0.92% | 05/23/16 | 118,000,000 | 118,000,000 | |||
| BNP Paribas | 0.36% | 08/18/15 | 111,000,000 | 111,000,000 | ||
| 0.39% | 10/01/15 | 15,000,000 | 15,000,000 | |||
| 0.40% | 12/01/15 | 156,000,000 | 156,000,000 | |||
| Canadian Imperial Bank of Commerce | 0.10% | 07/01/15 | 43,000,000 | 43,000,000 | ||
| Issuer | Footnotes | Rate | Effective
Maturity |
Maturity
Date |
Face
Amount ($) |
Value
($) |
| Chase Bank USA, NA | 0.35% | 10/23/15 | 136,000,000 | 136,000,000 | ||
| 0.38% | 12/07/15 | 58,000,000 | 58,000,000 | |||
| Citibank, NA | 0.28% | 07/01/15 | 49,000,000 | 49,000,000 | ||
| Credit Agricole Corporate and Investment Bank | 0.27% | 08/10/15 | 207,000,000 | 207,000,000 | ||
| 0.30% | 09/01/15 | 1,000,000 | 1,000,000 | |||
| Credit Agricole SA | 0.29% | 10/01/15 | 102,000,000 | 102,000,000 | ||
| Credit Suisse AG | 0.33% | 07/09/15 | 15,000,000 | 15,000,000 | ||
| 0.35% | 08/20/15 | 75,000,000 | 75,000,000 | |||
| 0.30% | 09/15/15 | 77,000,000 | 77,000,000 | |||
| 0.45% | 12/18/15 | 56,000,000 | 56,000,000 | |||
| HSBC Bank PLC | 0.35% | 10/28/15 | 216,000,000 | 216,000,000 | ||
| 0.32% | 11/05/15 | 18,000,000 | 18,000,000 | |||
| 0.35% | 11/20/15 | 139,000,000 | 139,000,000 | |||
| HSBC Bank USA | 0.32% | 10/23/15 | 19,000,000 | 19,000,000 | ||
| 0.32% | 10/26/15 | 79,000,000 | 79,000,000 | |||
| 0.40% | 12/09/15 | 4,000,000 | 4,000,000 | |||
| ING Bank NV | 0.33% | 07/30/15 | 10,000,000 | 10,000,000 | ||
| 0.39% | 10/02/15 | 119,000,000 | 119,000,000 | |||
| 0.42% | 11/02/15 | 50,000,000 | 50,000,000 | |||
| Lloyds Bank PLC | 0.30% | 07/15/15 | 28,000,000 | 28,000,000 | ||
| 0.30% | 08/10/15 | 102,000,000 | 102,000,000 | |||
| Mitsubishi UFJ Trust & Banking Corp | 0.31% | 07/01/15 | 27,000,000 | 27,000,000 | ||
| 0.31% | 07/06/15 | 10,000,000 | 10,000,000 | |||
| 0.31% | 07/15/15 | 20,000,000 | 20,000,000 | |||
| 0.35% | 10/08/15 | 6,000,000 | 6,000,000 | |||
| 0.32% | 10/09/15 | 134,000,000 | 134,000,000 | |||
| 0.35% | 11/13/15 | 85,000,000 | 85,000,000 | |||
| Mizuho Bank, Ltd | 0.30% | 07/29/15 | 54,000,000 | 54,000,000 | ||
| 0.27% | 08/11/15 | 8,000,000 | 8,000,000 | |||
| 0.26% | 08/27/15 | 92,000,000 | 92,000,000 | |||
| 0.27% | 09/08/15 | 9,000,000 | 9,000,000 | |||
| 0.27% | 09/15/15 | 74,000,000 | 74,000,000 | |||
| 0.27% | 09/16/15 | 17,000,000 | 17,000,000 | |||
| 0.35% | 11/13/15 | 85,000,000 | 85,000,000 | |||
| 0.35% | 11/16/15 | 22,000,000 | 22,000,000 | |||
| National Australia Bank, Ltd | 0.27% | 09/01/15 | 75,000,000 | 75,000,000 | ||
| 0.27% | 09/02/15 | 11,000,000 | 11,000,000 | |||
| 0.37% | 11/10/15 | 135,000,000 | 135,000,000 | |||
| National Bank of Canada | 0.33% | 08/18/15 | 123,000,000 | 123,000,000 | ||
| Natixis SA | 0.27% | 07/08/15 | 112,000,000 | 112,000,000 | ||
| 0.29% | 08/04/15 | 84,000,000 | 84,000,000 | |||
| Nordea Bank Finland PLC | 0.24% | 09/28/15 | 113,000,000 | 112,998,604 | ||
| 0.34% | 11/16/15 | 73,000,000 | 73,000,000 | |||
| Rabobank Nederland | 0.28% | 07/01/15 | 63,000,000 | 63,000,000 | ||
| Royal Bank of Canada | 0.30% | 11/19/15 | 114,000,000 | 114,000,000 | ||
| Societe Generale | 0.26% | 08/31/15 | 70,000,000 | 70,000,000 |
| Issuer | Footnotes | Rate | Effective
Maturity |
Maturity
Date |
Face
Amount ($) |
Value
($) |
| Sumitomo Mitsui Banking Corp | 0.31% | 07/01/15 | 52,000,000 | 52,000,000 | ||
| 0.31% | 07/09/15 | 15,000,000 | 15,000,000 | |||
| 0.26% | 09/16/15 | 42,000,000 | 42,000,000 | |||
| 0.28% | 09/17/15 | 23,000,000 | 23,000,000 | |||
| 0.28% | 09/24/15 | 157,000,000 | 157,000,000 | |||
| 0.34% | 09/25/15 | 14,000,000 | 14,000,000 | |||
| 0.34% | 09/28/15 | 63,000,000 | 63,000,000 | |||
| 0.34% | 10/02/15 | 50,000,000 | 50,000,000 | |||
| 0.37% | 10/27/15 | 13,000,000 | 13,000,000 | |||
| 0.40% | 11/06/15 | 14,000,000 | 14,000,000 | |||
| 0.40% | 11/10/15 | 23,000,000 | 23,000,000 | |||
| 0.43% | 11/20/15 | 93,000,000 | 93,000,000 | |||
| Sumitomo Mitsui Trust Bank, Ltd | 0.25% | 07/13/15 | 56,000,000 | 56,000,000 | ||
| 0.27% | 08/31/15 | 32,000,000 | 32,000,000 | |||
| 0.26% | 09/14/15 | 108,000,000 | 108,000,000 | |||
| 0.28% | 09/16/15 | 78,000,000 | 78,000,000 | |||
| 0.28% | 09/18/15 | 38,000,000 | 38,000,000 | |||
| Toronto-Dominion Bank | 0.30% | 11/02/15 | 46,000,000 | 46,000,000 | ||
| 0.38% | 11/02/15 | 152,000,000 | 152,000,000 | |||
| 0.39% | 11/12/15 | 122,000,000 | 122,000,000 | |||
| 0.42% | 11/20/15 | 75,000,000 | 75,000,000 | |||
| UBS AG | 0.10% | 07/06/15 | 115,000,000 | 115,000,000 | ||
| 6,411,998,604 | ||||||
| Other Instruments 5.1% | ||||||
| Australia & New Zealand Banking Group, Ltd | 0.12% | 07/01/15 | 354,000,000 | 354,000,000 | ||
| 0.13% | 07/02/15 | 160,000,000 | 160,000,000 | |||
| DZ Bank AG Deutsche Zentral-Genossenschaftsbank | 0.10% | 07/02/15 | 100,000,000 | 100,000,000 | ||
| 0.10% | 07/06/15 | 105,000,000 | 105,000,000 | |||
| National Australia Bank, Ltd | 0.06% | 07/01/15 | 190,000,000 | 190,000,000 | ||
| Skandinaviska Enskilda Banken AB | 0.10% | 07/02/15 | 144,000,000 | 144,000,000 | ||
| 1,053,000,000 | ||||||
| Other Notes 2.7% | ||||||
| Bank of America, NA | 0.28% | 07/07/15 | 61,000,000 | 61,000,000 | ||
| 0.30% | 07/20/15 | 33,000,000 | 33,000,000 | |||
| 0.30% | 08/07/15 | 26,000,000 | 26,000,000 | |||
| 0.32% | 09/01/15 | 99,000,000 | 99,000,000 | |||
| 0.24% | 09/18/15 | 262,000,000 | 262,000,000 | |||
| 0.26% | 10/01/15 | 40,000,000 | 40,000,000 | |||
| 0.31% | 10/13/15 | 30,000,000 | 30,000,000 | |||
| 0.32% | 11/05/15 | 9,000,000 | 9,000,000 | |||
| 560,000,000 | ||||||
| Total Fixed-Rate Obligations | ||||||
| (Cost $10,353,057,301) | 10,353,057,301 | |||||
| Variable-Rate Obligations 19.6% of net assets | ||||||
| Financial Company Commercial Paper 2.7% | ||||||
| Commonwealth Bank of Australia | b | 0.28% | 07/29/15 | 10/29/15 | 90,000,000 | 89,997,317 |
| b | 0.29% | 07/20/15 | 11/19/15 | 84,000,000 | 83,998,336 | |
| b | 0.32% | 07/13/15 | 05/12/16 | 25,000,000 | 25,000,000 | |
| Issuer | Footnotes | Rate | Effective
Maturity |
Maturity
Date |
Face
Amount ($) |
Value
($) |
| HSBC Bank PLC | b | 0.32% | 07/06/15 | 01/04/16 | 134,000,000 | 133,999,914 |
| Westpac Banking Corp | b | 0.27% | 07/27/15 | 75,000,000 | 75,000,000 | |
| b | 0.28% | 07/16/15 | 11/16/15 | 145,000,000 | 145,000,000 | |
| 552,995,567 | ||||||
| Certificates of Deposit 9.1% | ||||||
| Bank of Nova Scotia | 0.28% | 07/08/15 | 12/08/15 | 50,000,000 | 50,000,000 | |
| 0.29% | 07/13/15 | 12/11/15 | 117,000,000 | 117,000,000 | ||
| Bank of Tokyo Mitsubishi UFJ, Ltd | 0.54% | 07/10/15 | 03/10/16 | 170,000,000 | 170,000,000 | |
| Chase Bank USA, NA | 0.35% | 07/27/15 | 04/25/16 | 150,000,000 | 150,000,000 | |
| JPMorgan Chase Bank, NA | 0.33% | 07/22/15 | 10/22/15 | 66,000,000 | 66,000,000 | |
| 0.33% | 07/23/15 | 10/23/15 | 75,000,000 | 75,000,000 | ||
| 0.32% | 07/08/15 | 12/08/15 | 61,000,000 | 61,000,000 | ||
| Royal Bank of Canada | 0.27% | 07/06/15 | 09/04/15 | 25,000,000 | 25,000,000 | |
| 0.30% | 07/10/15 | 12/10/15 | 124,000,000 | 124,000,000 | ||
| 0.30% | 07/27/15 | 02/25/16 | 150,000,000 | 150,000,000 | ||
| 0.32% | 07/13/15 | 04/13/16 | 20,000,000 | 20,000,000 | ||
| Toronto-Dominion Bank | 0.26% | 07/21/15 | 3,000,000 | 3,000,000 | ||
| 0.28% | 07/14/15 | 10/14/15 | 85,000,000 | 85,000,000 | ||
| 0.28% | 07/17/15 | 10/19/15 | 64,000,000 | 64,000,000 | ||
| 0.33% | 07/16/15 | 03/16/16 | 123,000,000 | 123,000,000 | ||
| 0.30% | 07/20/15 | 03/21/16 | 115,000,000 | 115,000,000 | ||
| Wells Fargo Bank, NA | 0.27% | 07/08/15 | 08/10/15 | 100,000,000 | 100,000,000 | |
| 0.31% | 07/08/15 | 02/08/16 | 95,000,000 | 95,000,000 | ||
| 0.31% | 07/09/15 | 02/09/16 | 64,000,000 | 64,000,000 | ||
| 0.32% | 07/14/15 | 02/12/16 | 65,000,000 | 65,000,000 | ||
| Westpac Banking Corp | 0.28% | 07/20/15 | 08/19/15 | 60,000,000 | 60,000,000 | |
| 0.28% | 07/27/15 | 08/25/15 | 23,000,000 | 23,000,000 | ||
| 0.31% | 07/08/15 | 02/08/16 | 71,000,000 | 71,000,000 | ||
| 1,876,000,000 | ||||||
| Treasury Debt 1.7% | ||||||
| United States Treasury Department | 0.06% | 07/01/15 | 01/31/16 | 160,000,000 | 159,988,771 | |
| 0.09% | 07/01/15 | 07/31/16 | 95,000,000 | 95,000,000 | ||
| 0.10% | 07/01/15 | 01/31/17 | 85,000,000 | 84,999,436 | ||
| 339,988,207 | ||||||
| Variable Rate Demand Notes 0.0% | ||||||
| Breckenridge Terrace, LLC | ||||||
| Housing Facilities Revenue Notes Series 1999B | a | 0.24% | 07/07/15 | 1,000,000 | 1,000,000 | |
| Eagle Cnty | ||||||
| Housing Facilities RB (The Tarnes at BC) Series 1999B | a | 0.24% | 07/07/15 | 2,410,000 | 2,410,000 | |
| GFRE Holdings, LLC | ||||||
| Taxable Notes Series 2009A | a | 0.19% | 07/07/15 | 2,240,000 | 2,240,000 | |
| Tenderfoot Seasonal Housing, LLC | ||||||
| Taxable Housing Facilities Revenue Notes Series 2000B | a | 0.24% | 07/07/15 | 2,885,000 | 2,885,000 | |
| 8,535,000 | ||||||
| Issuer | Footnotes | Rate | Effective
Maturity |
Maturity
Date |
Face
Amount ($) |
Value
($) |
| Other Notes 6.1% | ||||||
| Bank of America, NA | 0.39% | 07/06/15 | 04/04/16 | 60,000,000 | 60,000,000 | |
| Canadian Imperial Bank of Commerce | 0.31% | 07/10/15 | 03/04/16 | 182,000,000 | 182,000,000 | |
| JPMorgan Chase Bank, NA | 0.44% | 09/08/15 | 11/06/15 | 200,000,000 | 200,042,667 | |
| 0.43% | 07/20/15 | 07/18/16 | 90,000,000 | 90,000,000 | ||
| 0.44% | 07/22/15 | 07/22/16 | 30,000,000 | 30,000,000 | ||
| Royal Bank of Canada | 0.39% | 07/01/15 | 06/30/16 | 125,000,000 | 125,000,000 | |
| 0.39% | 07/06/15 | 07/01/16 | 137,000,000 | 137,000,000 | ||
| b | 0.36% | 07/07/15 | 07/06/16 | 60,000,000 | 60,000,000 | |
| Wells Fargo Bank, NA | 0.41% | 09/15/15 | 07/14/16 | 55,000,000 | 55,000,000 | |
| 0.46% | 09/22/15 | 07/21/16 | 225,000,000 | 225,000,000 | ||
| Westpac Banking Corp | b | 0.58% | 07/28/15 | 100,000,000 | 100,000,000 | |
| Whistlejacket Capital, LLC | c,† | n/a | n/a | n/a | 2,373,851 | 2,373,851 |
| 1,266,416,518 | ||||||
| Total Variable-Rate Obligations | ||||||
| (Cost $4,043,935,292) | 4,043,935,292 | |||||
| Issuer | Footnotes | Rate | Effective
Maturity |
Maturity
Date |
Maturity Amount ($) |
Value
($) |
| Repurchase Agreements 30.2% of net assets | ||||||
| Government Agency Repurchase Agreements* 3.0% | ||||||
| Bank of Nova Scotia | ||||||
| Issued
06/30/15, repurchase date 07/01/15 (Collateralized by U.S. Treasury Securities valued at $102,000,000, 0.50% - 2.50%, due 09/30/16 - 02/15/44) |
0.12% | 07/01/15 | 100,000,333 | 100,000,000 | ||
| BNP Paribas Securities Corp | ||||||
| Issued
06/30/15, repurchase date 07/01/15 (Collateralized by U.S. Government Agency Securities valued at $103,216,707, 0.70% - 6.00%, due 07/01/18 - 06/20/45) |
0.10% | 07/01/15 | 100,000,278 | 100,000,000 | ||
| Deutsche Bank Securities, Inc | ||||||
| Issued
06/30/15, repurchase date 07/01/15 (Collateralized by U.S. Government Agency Securities valued at $148,618,726, 0.00% - 7.13%, due 07/10/15 - 02/01/45) |
0.18% | 07/01/15 | 144,000,720 | 144,000,000 | ||
| Goldman Sachs & Co | ||||||
| Issued
06/24/15, repurchase date 07/01/15 (Collateralized by U.S. Government Agency Securities valued at $177,480,001, 0.62% - 5.25%, due 12/15/28 - 05/20/45) |
0.07% | 07/01/15 | 174,002,368 | 174,000,000 | ||
| Issued
06/25/15, repurchase date 07/02/15 (Collateralized by U.S. Government Agency Securities valued at $19,380,001, 3.00% - 4.50%, due 07/15/40 - 05/15/45) |
0.08% | 07/02/15 | 19,000,296 | 19,000,000 | ||
| JP Morgan Securities, LLC | ||||||
| Issued
06/30/15, repurchase date 07/01/15 (Collateralized by U.S. Government Agency Securities valued at $7,210,000, 2.00%, due 05/25/25) |
0.14% | 07/01/15 | 7,000,027 | 7,000,000 | ||
| Merrill Lynch, Pierce, Fenner & Smith, Inc | ||||||
| Issued
06/30/15, repurchase date 07/01/15 (Collateralized by U.S. Government Agency Securities valued at $25,750,000, 2.91%, due 01/25/22) |
0.14% | 07/01/15 | 25,000,097 | 25,000,000 | ||
| Issuer | Footnotes | Rate | Effective
Maturity |
Maturity
Date |
Maturity Amount ($) |
Value
($) |
| Mizuho Securities USA, Inc | ||||||
| Issued
06/30/15, repurchase date 07/01/15 (Collateralized by U.S. Government Agency Securities valued at $45,900,557, 0.14% - 3.04%, due 07/08/16 - 06/17/24) |
0.15% | 07/01/15 | 45,000,188 | 45,000,000 | ||
| 614,000,000 | ||||||
| Treasury Repurchase Agreements 23.2% | ||||||
| Barclays Capital, Inc | ||||||
| Issued
06/30/15, repurchase date 07/01/15 (Collateralized by U.S. Treasury Securities valued at $1,208,674, 0.00%, due 12/17/15) |
0.10% | 07/01/15 | 1,184,936 | 1,184,933 | ||
| BNP Paribas Securities Corp | ||||||
| Issued
06/30/15, repurchase date 07/01/15 (Collateralized by U.S. Treasury Securities valued at $27,540,026, 0.75% - 1.38%, due 10/31/17 - 05/31/20) |
0.09% | 07/01/15 | 27,000,068 | 27,000,000 | ||
| Federal Reserve Bank of New York | ||||||
| Issued
06/30/15, repurchase date 07/01/15 (Collateralized by U.S. Treasury Securities valued at $2,887,004,034, 3.63%, due 02/15/20) |
0.05% | 07/01/15 | 2,887,004,010 | 2,887,000,000 | ||
| Issued
06/29/15, repurchase date 07/01/15 (Collateralized by U.S. Treasury Securities valued at $950,003,808, 2.00% - 3.75%, due 02/15/22 - 08/15/41) |
0.07% | 07/01/15 | 950,003,694 | 950,000,000 | ||
| Issued
06/25/15, repurchase date 07/02/15 (Collateralized by U.S. Treasury Securities valued at $735,008,591, 2.00% - 2.13%, due 08/15/21 - 02/15/22) |
0.07% | 07/02/15 | 735,010,004 | 735,000,000 | ||
| JP Morgan Securities, LLC | ||||||
| Issued
06/22/15, repurchase date 07/22/15 (Collateralized by U.S. Treasury Securities valued at $184,623,334, 1.25% - 2.63%, due 10/31/18 - 05/15/24) |
0.08% | 07/07/15 | 181,006,033 | 181,000,000 | ||
| 4,781,184,933 | ||||||
| Other Repurchase Agreements** 4.0% | ||||||
| Credit Suisse Securities (USA), LLC | ||||||
| Issued
06/15/15, repurchase date 12/14/15 (Collateralized by common stocks, ETFs, corporate bonds, ABS, or non-agency collateralized mortgage obligations valued at $366,850,439, 0.31% - 6.50%, due 04/15/29 - 12/11/49) |
c | 0.80% | 10/03/15 | 319,779,778 | 319,000,000 | |
| Issued
06/18/15, repurchase date 12/14/15 (Collateralized by common stocks, ETFs, corporate bonds, ABS, or non-agency collateralized mortgage obligations valued at $6,902,951, 0.36% - 3.94%, due 02/12/44 - 01/25/45) |
c | 0.80% | 10/03/15 | 6,014,267 | 6,000,000 | |
| JP Morgan Securities, LLC | ||||||
| Issued
06/04/15, repurchase date 12/01/15 (Collateralized by common stocks, ETFs, corporate bonds, ABS, or non-agency collateralized mortgage obligations valued at $115,053,987, 2.42% - 6.81%, due 06/15/20 - 12/25/65) |
c | 0.65% | 09/28/15 | 100,209,444 | 100,000,000 | |
| Issuer | Footnotes | Rate | Effective
Maturity |
Maturity
Date |
Maturity Amount ($) |
Value
($) |
| Issued
06/17/15, repurchase date 12/17/15 (Collateralized by common stocks, ETFs, corporate bonds, ABS, or non-agency collateralized mortgage obligations valued at $175,991,299, 0.49% - 8.50%, due 12/01/17 - 12/25/65) |
c | 0.65% | 09/28/15 | 153,284,538 | 153,000,000 | |
| Merrill Lynch, Pierce, Fenner & Smith, Inc | ||||||
| Issued
05/28/15, repurchase date 08/26/15 (Collateralized by common stocks, ETFs, corporate bonds, ABS, or non-agency collateralized mortgage obligations valued at $282,900,000, 0.32% - 7.00%, due 04/26/36 - 08/25/47) |
c | 0.58% | 08/04/15 | 246,269,507 | 246,000,000 | |
| 824,000,000 | ||||||
| Total Repurchase Agreements | ||||||
| (Cost $6,219,184,933) | 6,219,184,933 | |||||
| a | Credit-enhanced or liquidity-enhanced. |
| b | Securities exempt from registration under Rule 144A of the Securities Act of 1933, as amended. These securities may be resold in transactions exempt from registrations, normally to qualified institutional buyers. At the period end, the value of these amounted to $1,873,831,718 or 9.1% of net assets. |
| c | Illiquid security. At the period end, the value of these amounted to $826,373,851 or 4.0% of net assets. |
| † | Whistlejacket notes are in receivership, and the fund elected to sell all of its Whistlejacket notes at auction (April 29, 2009). The remaining investment represents an interest in a small residual fund that is being held to cover any remaining expenses and liabilities associated with receivership. |
| * | Usually collateralized via U.S. Government Agency Securities or less frequently by U.S. Treasury Securities. |
| ** | Usually collateralized via common stocks, ETFs, corporate bonds, ABS, or non-agency collateralized mortgage obligations or less frequently by U.S. Government Agency Securities and/ or U.S. Treasury Securities. |
| ABS — | Asset-backed securities |
| ETF — | Exchange Traded Fund |
| RB — | Revenue bond |
| Assets | ||
| Investments, at cost and value | $14,396,992,593 | |
| Repurchase agreements, at cost and value | + | 6,219,184,933 |
| Total investments, at cost and value (Note 2a) | 20,616,177,526 | |
| Receivables: | ||
| Interest | 6,884,289 | |
| Prepaid expenses | + | 44,910 |
| Total assets | 20,623,106,725 | |
| Liabilities | ||
| Payables: | ||
| Investment adviser and administrator fees | 843,861 | |
| Shareholder service fees | 135,681 | |
| Distributions to shareholders | 85,183 | |
| Accrued expenses | + | 592,083 |
| Total liabilities | 1,656,808 | |
| Net Assets | ||
| Total assets | 20,623,106,725 | |
| Total liabilities | – | 1,656,808 |
| Net assets | $20,621,449,917 | |
| Net Assets by Source | ||
| Capital received from investors | 20,622,808,982 | |
| Net realized capital losses | (1,359,065) | |
| Net Asset Value (NAV) by Shares Class | |||||
| Share Class | Net Assets | ÷ | Shares
Outstanding |
= | NAV |
| Sweep Shares | $5,180,839,278 | 5,180,825,062 | $1.00 | ||
| Premier Sweep Shares | $15,440,610,639 | 15,440,573,667 | $1.00 | ||
| Investment Income | ||
| Interest | $27,402,179 | |
| Expenses | ||
| Investment adviser and administrator fees | 33,417,187 | |
| Shareholder service fees: | ||
| Sweep Shares | 10,837,422 | |
| Premier Sweep Shares | 32,571,909 | |
| Shareholder reports | 392,787 | |
| Custodian fees | 323,940 | |
| Portfolio accounting fees | 251,938 | |
| Registration fees | 166,691 | |
| Professional fees | 65,027 | |
| Independent trustees' fees | 45,119 | |
| Transfer agent fees | 21,238 | |
| Interest expense | 181 | |
| Other expenses | + | 200,956 |
| Total expenses | 78,294,395 | |
| Expense reduction by CSIM and its affiliates | – | 51,977,447 |
| Net expenses | – | 26,316,948 |
| Net investment income | 1,085,231 | |
| Realized Gains (Losses) | ||
| Net realized losses on investments | (4,845) | |
| Increase in net assets resulting from operations | $1,080,386 | |
| Operations | |||
| 1/1/15-6/30/15 | 1/1/14-12/31/14 | ||
| Net investment income | $1,085,231 | $2,300,347 | |
| Net realized gains (losses) | + | (4,845) | 8,440 |
| Increase in net assets from operations | 1,080,386 | 2,308,787 | |
| Distributions to Shareholders | |||
| Distributions from net investment income | |||
| Sweep Shares | (270,935) | (580,822) | |
| Premier Sweep Shares | + | (814,296) | (1,719,525) |
| Total distributions from net investment income | (1,085,231) | (2,300,347) | |
| Transactions in Fund Shares* | |||
| Shares Sold | |||
| Sweep Shares | 8,451,761,674 | 20,201,561,814 | |
| Premier Sweep Shares | + | 30,172,720,619 | 73,314,241,632 |
| Total shares sold | 38,624,482,293 | 93,515,803,446 | |
| Shares Reinvested | |||
| Sweep Shares | 216,234 | 508,597 | |
| Premier Sweep Shares | + | 714,671 | 1,641,173 |
| Total shares reinvested | 930,905 | 2,149,770 | |
| Shares Redeemed | |||
| Sweep Shares | (9,298,029,395) | (20,309,183,858) | |
| Premier Sweep Shares | + | (32,684,671,664) | (72,888,588,931) |
| Total shares redeemed | (41,982,701,059) | (93,197,772,789) | |
| Net transactions in fund shares | (3,357,287,861) | 320,180,427 | |
| Net Assets | |||
| Beginning of period | 23,978,742,623 | 23,658,553,756 | |
| Total increase or decrease | + | (3,357,292,706) | 320,188,867 |
| End of period | $20,621,449,917 | $23,978,742,623 | |
| * | Transactions took place at $1.00 per share; figures for share quantities are the same as for dollars. |
| The Charles Schwab Family of Funds (organized October 20, 1989) | Schwab Municipal Money Fund |
| Schwab Money Market Fund | Schwab AMT Tax-Free Money Fund |
| Schwab Government Money Fund | Schwab California Municipal Money Fund |
| Schwab U.S. Treasury Money Fund | Schwab New York Municipal Money Fund |
| Schwab Treasury Obligations Money Fund | (formerly Schwab New York AMT Tax-Free Money Fund) |
| Schwab Value Advantage Money Fund | Schwab New Jersey Municipal Money Fund |
| Schwab Advisor Cash Reserves | (formerly Schwab New Jersey AMT Tax-Free Money Fund) |
| Schwab Cash Reserves | Schwab Pennsylvania Municipal Money Fund |
| Schwab Retirement Advantage Money Fund | Schwab Massachusetts Municipal Money Fund |
| Schwab Investor Money Fund | (formerly Schwab Massachusetts AMT Tax-Free Money Fund) |
| Average Daily Net Assets | |
| First $1 billion | 0.35% |
| More than $1 billion but not exceeding $10 billion | 0.32% |
| More than $10 billion but not exceeding $20 billion | 0.30% |
| More than $20 billion but not exceeding $40 billion | 0.27% |
| Over $40 billion | 0.25% |
| Sweep Shares | 0.66% |
| Premier Sweep Shares | 0.59% |
| Expiration Date | |||||||||
| December 31, 2015 | December 31, 2016 | December 31, 2017 | December 31, 2018 | Total | |||||
| Sweep Shares | $19,328,373 | $21,783,684 | $23,935,886 | $10,343,542 | $75,391,485 | ||||
| Premier Sweep Shares | 39,977,192 | 49,531,585 | 58,969,420 | 25,466,584 | 173,944,781 | ||||
| Independent Trustees | |||
| Name,
Year of Birth, and Position(s) with the trust; (Terms of office, and length of Time Served1) |
Principal
Occupations During the Past Five Years |
Number
of Portfolios in Fund Complex Overseen by the Trustee |
Other Directorships |
| John
F. Cogan 1947 Trustee (Trustee of The Charles Schwab Family of Funds, Schwab Investments, Schwab Capital Trust and Schwab Annuity Portfolios since 2008; Laudus Trust and Laudus Institutional Trust since 2010) |
Senior Fellow, The Hoover Institution at Stanford University (Oct. 1979 – present); Senior Fellow Stanford Institute for Economic Policy Research (2000 – present); Professor of Public Policy, Stanford University (1994 – present). | 74 | Director,
Gilead Sciences, Inc. (2005 – present) |
| David
L. Mahoney 1954 Trustee (Trustee of The Charles Schwab Family of Funds, Schwab Investments, Schwab Capital Trust, Schwab Annuity Portfolios, Laudus Trust and Laudus Institutional Trust since 2011) |
Private Investor. | 74 | Director,
Symantec Corporation (2003 – present) Director, Corcept Therapeutics Incorporated (2004 – present) Director, Adamas Pharmaceuticals, Inc. (2009 – present) |
| Kiran
M. Patel 1948 Trustee (Trustee of The Charles Schwab Family of Funds, Schwab Investments, Schwab Capital Trust, Schwab Annuity Portfolios, Laudus Trust and Laudus Institutional Trust since 2011) |
Retired. Executive Vice President and General Manager of Small Business Group, Intuit, Inc. (financial software and services firm for consumers and small businesses) (Dec. 2008 – Sept. 2013) | 74 | Director, KLA-Tencor Corporation (2008 – present) |
| Charles
A. Ruffel 1956 Trustee (Trustee of Schwab Strategic Trust since 2009; The Charles Schwab Family of Funds, Schwab Investments, Schwab Capital Trust, Schwab Annuity Portfolios, Laudus Trust and Laudus Institutional Trust since 2015) |
Managing Partner and Co-Founder, Kudu Advisors, LLC (financial services) (May 2009 – present); Director, Asset International, Inc. (publisher of financial services information) (Jan. 2009 – Nov. 2014). | 95 | None. |
| Independent Trustees (continued) | |||
| Name,
Year of Birth, and Position(s) with the trust; (Terms of office, and length of Time Served1) |
Principal
Occupations During the Past Five Years |
Number
of Portfolios in Fund Complex Overseen by the Trustee |
Other Directorships |
| Gerald
B. Smith 1950 Trustee (Trustee of The Charles Schwab Family of Funds, Schwab Investments, Schwab Capital Trust and Schwab Annuity Portfolios since 2000; Laudus Trust and Laudus Institutional Trust since 2010) |
Chairman, Chief Executive Officer and Founder of Smith Graham & Co. (investment advisors) (1990 – present). | 74 | Director,
Eaton (2012 – present) Director and Chairman of the Audit Committee, Oneok Partners LP (2003 – 2013) Director, Oneok, Inc. (2009 – 2013) Lead Independent Director, Board of Cooper Industries (2002 – 2012) |
| Joseph
H. Wender 1944 Trustee (Trustee of The Charles Schwab Family of Funds, Schwab Investments, Schwab Capital Trust and Schwab Annuity Portfolios since 2008; Laudus Trust and Laudus Institutional Trust since 2010) |
Senior Consultant, Goldman Sachs & Co., Inc. (investment banking and securities firm) (Jan. 2008 – present); Partner, Colgin Partners, LLC (vineyards) (Feb. 1998 – present). | 74 | Board Member and Chairman of the Audit Committee, Isis Pharmaceuticals (1994 – present) |
| Interested Trustees | |||
| Name,
Year of Birth, and Position(s) with the trust; (Terms of office, and length of Time Served) |
Principal
Occupations During the Past Five Years |
Number
of Portfolios in Fund Complex Overseen by the Trustee |
Other Directorships |
| Charles
R. Schwab2 1937 Chairman and Trustee (Chairman and Trustee of The Charles Schwab Family of Funds since 1989; Schwab Investments since 1991; Schwab Capital Trust since 1993; Schwab Annuity Portfolios since 1994; Laudus Trust and Laudus Institutional Trust since 2010) |
Chairman and Director, The Charles Schwab Corporation (1986 – present); Chairman and Director of Charles Schwab & Co., Inc. (1971 – present); Chairman and Director of Charles Schwab Investment Management, Inc. (1989 – present); Chairman and Director of Charles Schwab Bank (2003 – present); Chairman and Chief Executive Officer of Schwab (SIS) Holdings Inc. I and Schwab International Holdings, Inc. (1996 – present); and Director, Chairman and Chief Executive Officer, Schwab Holdings, Inc. (1979 – present). | 74 | Chairman
and Director, The Charles Schwab Corporation (1986 – present) Director, Yahoo! Inc. (2014 – present) |
| Walter
W. Bettinger II2 1960 Trustee (Trustee of The Charles Schwab Family of Funds, Schwab Investments, Schwab Capital Trust and Schwab Annuity Portfolios since 2008; Schwab Strategic Trust since 2009; Laudus Trust and Laudus Institutional Trust since 2010) |
Director, President and Chief Executive Officer, The Charles Schwab Corporation and Charles Schwab & Co., Inc. (2008 – present); Director, Charles Schwab Bank (2006 – present); and Director, Schwab Holdings, Inc. (2008 – present). | 95 | Director, The Charles Schwab Corporation (2008 – present) |
| Officers of the Trust | |
| Name,
Year of Birth, and Position(s) with the trust; (Terms of office, and length of Time Served3) |
Principal Occupations During the Past Five Years |
| Marie
Chandoha 1961 President and Chief Executive Officer (Officer of The Charles Schwab Family of Funds, Schwab Investments, Schwab Capital Trust, Schwab Annuity Portfolios, Laudus Trust and Laudus Institutional Trust since 2010) |
Director, President and Chief Executive Officer (Dec. 2010 – present), Chief Investment Officer (Sept. 2010 – Oct. 2011), Charles Schwab Investment Management, Inc.; President, Chief Executive Officer (Dec. 2010 – present), and Chief Investment Officer (Sept. 2010 – Oct. 2011), Schwab Funds, Laudus Funds and Schwab ETFs; Director, Charles Schwab Worldwide Funds plc and Charles Schwab Asset Management (Ireland) Limited (January 2011 – present); Global Head of Fixed Income Business Division, BlackRock, Inc. (formerly Barclays Global Investors) (March 2007 – August 2010). |
| George
Pereira 1964 Treasurer and Principal Financial Officer, Schwab Funds Treasurer and Chief Financial Officer, Laudus Funds (Officer of The Charles Schwab Family of Funds, Schwab Investments, Schwab Capital Trust and Schwab Annuity Portfolios since 2004; Laudus Trust and Laudus Institutional Trust since 2006) |
Senior Vice President and Chief Financial Officer (Nov. 2004 – present), Chief Operating Officer (Jan. 2011 – present), Charles Schwab Investment Management, Inc.; Treasurer and Chief Financial Officer, Laudus Funds (June 2006 – present); Treasurer and Principal Financial Officer, Schwab Funds (Nov. 2004 – present) and Schwab ETFs (Oct. 2009 – present); Director, Charles Schwab Worldwide Funds plc and Charles Schwab Asset Management (Ireland) Limited (April 2005 – present). |
| Omar
Aguilar 1970 Senior Vice President and Chief Investment Officer – Equities (Officer of The Charles Schwab Family of Funds, Schwab Investments, Schwab Capital Trust, Schwab Annuity Portfolios, Laudus Trust and Laudus Institutional Trust since 2011) |
Senior Vice President and Chief Investment Officer – Equities, Charles Schwab Investment Management, Inc. (April 2011 – present); Senior Vice President and Chief Investment Officer – Equities, Schwab Funds, Laudus Funds and Schwab ETFs (June 2011 – present); Head of the Portfolio Management Group and Vice President of Portfolio Management, Financial Engines, Inc. (May 2009 – April 2011); Head of Quantitative Equity, ING Investment Management (July 2004 – Jan. 2009). |
| Brett
Wander 1961 Senior Vice President and Chief Investment Officer – Fixed Income (Officer of The Charles Schwab Family of Funds, Schwab Investments, Schwab Capital Trust, Schwab Annuity Portfolios, Laudus Trust and Laudus Institutional Trust since 2011) |
Senior Vice President and Chief Investment Officer – Fixed Income, Charles Schwab Investment Management, Inc. (April 2011 – present); Senior Vice President and Chief Investment Officer – Fixed Income, Schwab Funds, Laudus Funds and Schwab ETFs (June 2011 – present); Senior Managing Director, Global Head of Active Fixed-Income Strategies, State Street Global Advisors (Jan. 2008 – Oct. 2010); Director of Alpha Strategies Loomis, Sayles & Company (April 2006 – Jan. 2008). |
| David
Lekich 1964 Chief Legal Officer and Secretary, Schwab Funds Vice President and Assistant Clerk, Laudus Funds (Officer of The Charles Schwab Family of Funds, Schwab Investments, Schwab Capital Trust, Schwab Annuity Portfolios, Laudus Trust and Laudus Institutional Trust since 2011) |
Senior Vice President (Sept. 2011 – present), Vice President (March 2004 – Sept. 2011), Charles Schwab & Co., Inc.; Senior Vice President and Chief Counsel (Sept. 2011 – present), Vice President (Jan. 2011 – Sept. 2011), Charles Schwab Investment Management, Inc.; Secretary (April 2011 – present) and Chief Legal Officer (Dec. 2011 – present), Schwab Funds; Vice President and Assistant Clerk, Laudus Funds (April 2011 – present); Secretary (May 2011 – present) and Chief Legal Officer (Nov. 2011 – present), Schwab ETFs. |
| Catherine
MacGregor 1964 Vice President and Assistant Secretary, Schwab Funds Chief Legal Officer, Vice President and Clerk, Laudus Funds (Officer of The Charles Schwab Family of Funds, Schwab Investments, Schwab Capital Trust, Schwab Annuity Portfolios, Laudus Trust and Laudus Institutional Trust since 2005) |
Vice President, Charles Schwab & Co., Inc., Charles Schwab Investment Management, Inc. (July 2005 – present); Vice President (Dec. 2005 – present), Chief Legal Officer and Clerk (March 2007 – present), Laudus Funds; Vice President (Nov. 2005 – present) and Assistant Secretary (June 2007 – present), Schwab Funds; Vice President and Assistant Secretary, Schwab ETFs (Oct. 2009 – present). |
| 1 | Trustees remain in office until they resign, retire or are removed by shareholder vote. The Schwab and Laudus Funds’ retirement policy requires that independent trustees retire at age 72 or after twenty years as a trustee, whichever comes first. In addition, the retirement policy requires any independent trustee of Schwab Funds or Laudus Funds to retire from all Boards upon their required retirement date from either Board. |
| 2 | Mr. Schwab and Mr. Bettinger are Interested Trustees because they own stock of The Charles Schwab Corporation, the parent company of the investment adviser. |
| 3 | The President, Treasurer and Secretary/Clerk hold office until their respective successors are chosen and qualified or until he or she sooner dies, resigns, is removed or becomes disqualified. Each of the other officers serves at the pleasure of the Boards. |
211 Main Street, San Francisco, CA 94105
1-800-435-4000
© 2015 Charles Schwab & Co., Inc. All rights reserved.
Member SIPC®
Printed on recycled paper.
00149459
Table of Contents
by viewing these documents online.
Sign up at schwab.com/paperless


| 1 | A fund’s share price is its NAV, which is the fund’s net assets divided by the number of its shares outstanding. Under the new amendments, Retail Prime and Municipal money market funds, as well as Government money market funds, will continue to be permitted to transact at a constant NAV of $1.00. Note that while a fund may seek to maintain a constant NAV, there is no guarantee that it will be able to do so. |
 |
Kenneth Salinger, CFA, Vice President and Head of Tax-Exempt Strategies, leads the portfolio management team for Schwab’s national and state-specific tax-free bond funds and municipal money market funds. He also has overall responsibility for all aspects of the management of each of the tax-free bond funds. Prior to joining CSIM in 2008, Mr. Salinger was a senior portfolio manager at Wells Capital Management, working on a team that managed municipal bond assets. He worked at American Century Investments from 1992 to 2006, where he was a vice president and senior portfolio manager, responsible for daily management of a number of national and state specific municipal bond funds. Mr. Salinger has worked in fixed-income asset management since 1994. |
 |
Kevin Shaughnessy, CFA, Managing Director and Senior Portfolio Manager, is responsible for the day-to-day co-management of the fund. Prior to joining CSIM in 2000, Mr. Shaughnessy spent four years as a portfolio manager at Wells Capital Management, where he was responsible for managing the firm’s California municipal money fund assets, as well as short duration private client assets. |
 |
Cameron Ullyatt, CFA, Managing Director and Senior Portfolio Manager, is responsible for the day-to-day co-management of the fund. Prior to joining CSIM in 2008, Mr. Ullyatt was a vice president and portfolio manager at Oppenheimer Funds, where he was responsible for managing the firm’s municipal money fund assets. From 1999 to 2006, Mr. Ullyatt also worked as a credit analyst in Oppenheimer Funds’ municipal bond and money market departments. |
| 1 | The investment adviser and its affiliates may recapture expenses or fees they waived under a voluntary yield waiver until the third anniversary of the end of the fiscal year in which such waiver occurs, subject to certain limitations. For more information on the potential impact of such recapture on future yields, see financial note 5. |
| 2 | As shown in the Portfolio Holdings section of the shareholder report. |
| 3 | Money funds must maintain a dollar-weighted average maturity of no longer than 60 days and cannot invest in any security whose effective maturity is longer than 397 days (approximately 13 months). |
| 4 | Tier 1 securities are rated in the highest short-term rating category by two nationally recognized statistical rating organizations (“NRSROs”), or by one if only one NRSRO has rated the securities, or, if unrated, determined to be of comparable quality by CSIM pursuant to guidelines adopted by the Board of Trustees. Money market fund shares and U.S. government securities are also Tier 1 securities. The fund uses NRSRO credit ratings from Standard & Poor’s Corp., Moody’s Investors Service, Fitch Ratings, and/or DBRS. The fund may use different ratings provided by other rating agencies for purposes of determining compliance with the fund’s investment policies. The fund itself has not been rated by an independent credit rating agency. |
| 5 | Portfolio Composition is calculated using the Par Value of Investments. |

| Schwab California Municipal Money Fund | ||
| Sweep
Shares |
Value
Advantage Shares® | |
| Ticker Symbol | SWCXX | SWKXX |
| Minimum Initial Investment1 | ** | $25,000 2 |
| Seven-Day Yield3 | 0.01% | 0.01% |
| Seven-Day Yield–Without Contractual Expense Limitation4 | -0.08% | -0.10% |
| Seven-Day Effective Yield3 | 0.01% | 0.01% |
| Seven-Day Taxable Equivalent Effective Yield3,5 | 0.02% | 0.02% |
| * | The seven-day average yield for the Sweep Shares and Value Advantage Shares was 0.01% throughout the entire period. |
| ** | Subject to the eligibility terms and conditions of your Schwab account agreement. |
| 1 | Please see prospectus for further detail and eligibility requirements. |
| 2 | Minimum initial investment for IRA and custodial accounts is $15,000. Municipal money funds are generally not appropriate investments for IRAs and other tax-deferred accounts. Please consult with your tax advisor about your situation. |
| 3 | Yield reflects the effect of the fund’s agreement with the investment adviser and its affiliates to limit each share class’ total annual operating expenses to certain levels (contractual expense limitation). In addition, the investment adviser and its affiliates have voluntarily waived expenses in excess of the contractual expense limitation to maintain a positive net yield for certain share classes of the fund (voluntary yield waiver). Without the contractual expense limitation and the voluntary yield waiver, the fund’s yield would have been lower. For additional details, see financial note 5. |
| 4 | Yield does not reflect the effect of the contractual expense limitation, but does reflect the effect of the voluntary yield waiver. The voluntary yield waiver added 0.51% and 0.36% to the seven-day yields of the Sweep Shares and Value Advantage Shares, respectively. |
| 5 | Taxable equivalent effective yield assumes a federal regular income tax rate of 43.40%, which includes a Medicare surcharge rate of 3.8%, and effective California state personal income tax rate of 6.96%. Your tax rate may be different. |
| Expense
Ratio1 (Annualized) |
Beginning
Account Value at 1/1/15 |
Ending
Account Value (Net of Expenses) at 6/30/15 |
Expenses
Paid During Period2 1/1/15–6/30/15 | |
| Schwab California Municipal Money Fund | ||||
| Sweep Shares | ||||
| Actual Return | 0.07% | $1,000.00 | $1,000.10 | $0.35 |
| Hypothetical 5% Return | 0.07% | $1,000.00 | $1,024.45 | $0.35 |
| Value Advantage Shares | ||||
| Actual Return | 0.07% | $1,000.00 | $1,000.10 | $0.35 |
| Hypothetical 5% Return | 0.07% | $1,000.00 | $1,024.45 | $0.35 |
| 1 | Based on the most recent six-month expense ratio; may differ from the expense ratio provided in the Financial Highlights. |
| 2 | Expenses for each fund or share class are equal to its annualized expense ratio, multiplied by the average account value over the period, multiplied by 181 days of the period, and divided by 365 days of the fiscal year. |
| Sweep Shares | 1/1/15–
6/30/15* |
1/1/14–
12/31/14 |
1/1/13–
12/31/13 |
1/1/12–
12/31/12 |
1/1/11–
12/31/11 |
1/1/10–
12/31/10 |
| Per-Share Data ($) | ||||||
| Net asset value at beginning of period | 1.00 | 1.00 | 1.00 | 1.00 | 1.00 | 1.00 |
| Income (loss) from investment operations: | ||||||
| Net investment income (loss) | 0.00 1,2 | 0.00 2 | 0.00 2 | 0.00 2 | 0.00 2 | 0.00 2 |
| Net realized and unrealized gains (losses) | 0.00 2 | 0.00 2 | 0.00 2 | 0.00 2 | 0.00 2 | 0.00 2 |
| Total from investment operations | 0.00 2 | 0.00 2 | 0.00 2 | 0.00 2 | 0.00 2 | 0.00 2 |
| Less distributions: | ||||||
| Distributions from net investment income | (0.00) 2 | (0.00) 2 | (0.00) 2 | (0.00) 2 | (0.00) 2 | (0.00) 2 |
| Distributions from net realized gains | — | (0.00) 2 | (0.00) 2 | (0.00) 2 | (0.00) 2 | (0.00) 2 |
| Total distributions | (0.00) 2 | (0.00) 2 | (0.00) 2 | (0.00) 2 | (0.00) 2 | (0.00) 2 |
| Net asset value at end of period | 1.00 | 1.00 | 1.00 | 1.00 | 1.00 | 1.00 |
| Total return (%) | 0.01 3 | 0.01 | 0.01 | 0.02 | 0.01 | 0.02 |
| Ratios/Supplemental Data (%) | ||||||
| Ratios to average net assets: | ||||||
| Net operating expenses | 0.07 4,5 | 0.08 4 | 0.13 4 | 0.19 4 | 0.25 4 | 0.33 4 |
| Gross operating expenses | 0.69 5 | 0.69 | 0.69 | 0.69 | 0.69 | 0.69 |
| Net investment income (loss) | 0.01 5 | 0.01 | 0.01 | 0.01 | 0.01 | 0.01 |
| Net assets, end of period ($ x 1,000,000) | 6,028 | 6,439 | 6,081 | 6,137 | 5,641 | 5,507 |
| Value Advantage Shares | 1/1/15–
6/30/15* |
1/1/14–
12/31/14 |
1/1/13–
12/31/13 |
1/1/12–
12/31/12 |
1/1/11–
12/31/11 |
1/1/10–
12/31/10 |
| Per-Share Data ($) | ||||||
| Net asset value at beginning of period | 1.00 | 1.00 | 1.00 | 1.00 | 1.00 | 1.00 |
| Income (loss) from investment operations: | ||||||
| Net investment income (loss) | 0.00 1,2 | 0.00 2 | 0.00 2 | 0.00 2 | 0.00 2 | 0.00 2 |
| Net realized and unrealized gains (losses) | 0.00 2 | 0.00 2 | 0.00 2 | 0.00 2 | 0.00 2 | 0.00 2 |
| Total from investment operations | 0.00 2 | 0.00 2 | 0.00 2 | 0.00 2 | 0.00 2 | 0.00 2 |
| Less distributions: | ||||||
| Distributions from net investment income | (0.00) 2 | (0.00) 2 | (0.00) 2 | (0.00) 2 | (0.00) 2 | (0.00) 2 |
| Distributions from net realized gains | — | (0.00) 2 | (0.00) 2 | (0.00) 2 | (0.00) 2 | (0.00) 2 |
| Total distributions | (0.00) 2 | (0.00) 2 | (0.00) 2 | (0.00) 2 | (0.00) 2 | (0.00) 2 |
| Net asset value at end of period | 1.00 | 1.00 | 1.00 | 1.00 | 1.00 | 1.00 |
| Total return (%) | 0.01 3 | 0.01 | 0.01 | 0.02 | 0.01 | 0.02 |
| Ratios/Supplemental Data (%) | ||||||
| Ratios to average net assets: | ||||||
| Net operating expenses | 0.07 4,5 | 0.08 4 | 0.13 4 | 0.19 4 | 0.26 4 | 0.33 4 |
| Gross operating expenses | 0.56 5 | 0.56 | 0.56 | 0.56 | 0.56 | 0.56 |
| Net investment income (loss) | 0.01 5 | 0.01 | 0.01 | 0.01 | 0.01 | 0.01 |
| Net assets, end of period ($ x 1,000,000) | 721 | 771 | 751 | 853 | 1,071 | 1,399 |
| * | Unaudited. |
| Holdings by Category | Cost
($) |
Value
($) | |
| 34.5% | Fixed-Rate Securities | 2,326,183,028 | 2,326,183,028 |
| 67.0% | Variable-Rate Securities | 4,524,846,156 | 4,524,846,156 |
| 101.5% | Total Investments | 6,851,029,184 | 6,851,029,184 |
| (1.5%) | Other Assets and Liabilities, Net | (102,081,244) | |
| 100.0% | Net Assets | 6,748,947,940 | |
| Issuer
Type of Security, Series |
Footnotes | Rate | Effective
Maturity |
Maturity
Date |
Face
Amount ($) |
Value
($) |
| Fixed-Rate Securities 34.5% of net assets | ||||||
| California 34.5% | ||||||
| Alameda Cnty Jt Powers Auth | ||||||
| Lease Revenue CP Series A (LOC: MUFG Union Bank, NA) | 0.08% | 08/04/15 | 10,000,000 | 10,000,000 | ||
| California | ||||||
| GO Bonds | 5.00% | 08/01/15 | 225,000 | 225,903 | ||
| GO Bonds | 3.00% | 09/01/15 | 500,000 | 502,338 | ||
| GO Bonds | 4.00% | 09/01/15 | 1,200,000 | 1,207,685 | ||
| GO Bonds | 5.00% | 09/01/15 | 30,625,000 | 30,877,744 | ||
| GO Bonds | 3.00% | 10/01/15 | 470,000 | 473,231 | ||
| GO Bonds | 4.00% | 10/01/15 | 17,145,000 | 17,311,881 | ||
| GO Bonds | 5.00% | 10/01/15 | 4,580,000 | 4,635,183 | ||
| GO Bonds | 5.00% | 11/01/15 | 1,350,000 | 1,371,807 | ||
| GO Bonds | 4.00% | 12/01/15 | 2,000,000 | 2,032,170 | ||
| GO Bonds | 5.00% | 12/01/15 | 810,000 | 826,261 | ||
| GO Bonds | 6.00% | 02/01/16 | 1,150,000 | 1,188,502 | ||
| GO Bonds | 5.00% | 03/01/16 | 2,520,000 | 2,598,577 | ||
| GO Bonds | 3.00% | 04/01/16 | 115,000 | 117,322 | ||
| GO Bonds | 4.25% | 04/01/16 | 100,000 | 102,906 | ||
| GO Bonds | 5.00% | 04/01/16 | 440,000 | 455,256 | ||
| GO Bonds | 6.00% | 04/01/16 | 205,000 | 213,616 | ||
| GO Bonds | 5.00% | 06/01/16 | 100,000 | 104,152 | ||
| GO CP Series 2011A2 (LOC: Royal Bank of Canada) | 0.08% | 08/06/15 | 23,000,000 | 23,000,000 | ||
| GO CP Series 2011A2 (LOC: Royal Bank of Canada) | 0.08% | 08/27/15 | 10,165,000 | 10,165,000 | ||
| GO CP Series 2011A2 (LOC: Royal Bank of Canada) | 0.07% | 08/31/15 | 45,000,000 | 45,000,000 | ||
| GO CP Series A1 (LOC: Wells Fargo Bank, NA) | 0.07% | 08/05/15 | 10,960,000 | 10,960,000 | ||
| GO CP Series A1 (LOC: Wells Fargo Bank, NA) | 0.08% | 08/20/15 | 30,000,000 | 30,000,000 | ||
| Issuer
Type of Security, Series |
Footnotes | Rate | Effective
Maturity |
Maturity
Date |
Face
Amount ($) |
Value
($) |
| GO CP Series A3 (LOC: JPMorgan Chase Bank, NA; California Public Employees' Retirement System) | 0.08% | 09/14/15 | 25,000,000 | 25,000,000 | ||
| GO CP Series A7 (LOC: Mizuho Bank Ltd) | 0.08% | 08/04/15 | 19,000,000 | 19,000,000 | ||
| GO Refunding Bonds | 1.00% | 08/01/15 | 6,635,000 | 6,640,011 | ||
| GO Refunding Bonds | 2.00% | 08/01/15 | 2,335,000 | 2,338,735 | ||
| GO Refunding Bonds | 4.00% | 08/01/15 | 1,035,000 | 1,038,318 | ||
| GO Refunding Bonds | 5.00% | 09/01/15 | 9,715,000 | 9,794,600 | ||
| GO Refunding Bonds | 5.00% | 10/01/15 | 900,000 | 910,826 | ||
| GO Refunding Bonds | 5.00% | 11/01/15 | 7,945,000 | 8,074,483 | ||
| GO Refunding Bonds | 5.00% | 12/01/15 | 1,550,000 | 1,581,218 | ||
| GO Refunding Bonds | 2.00% | 02/01/16 | 200,000 | 201,867 | ||
| GO Refunding Bonds | 4.00% | 02/01/16 | 955,000 | 975,671 | ||
| GO Refunding Bonds | 5.00% | 02/01/16 | 6,805,000 | 6,996,614 | ||
| GO Refunding Bonds | 5.00% | 03/01/16 | 1,200,000 | 1,237,378 | ||
| GO Refunding Bonds | 3.00% | 04/01/16 | 1,275,000 | 1,300,890 | ||
| GO Refunding Bonds | 5.00% | 04/01/16 | 100,000 | 103,442 | ||
| California Dept of Water Resources | ||||||
| Power Supply RB Series 2005G4 | 4.75% | 05/01/16 | 105,000 | 108,840 | ||
| Power Supply RB Series 2005G4 | 5.00% | 05/01/16 | 170,000 | 176,433 | ||
| Power Supply RB Series 2010M | 4.00% | 05/01/16 | 700,000 | 721,193 | ||
| Power Supply RB Series 2010M | 5.00% | 05/01/16 | 2,720,000 | 2,825,622 | ||
| Water System RB (Central Valley) Series AF | 5.00% | 12/01/15 | 100,000 | 101,975 | ||
| Water System RB (Central Valley) Series AM | 5.00% | 12/01/15 | 195,000 | 198,755 | ||
| California Educational Facilities Auth | ||||||
| RB (Univ of Southern California) Series 2005 | 5.00% | 10/01/15 | 500,000 | 505,899 | ||
| California Health Facilities Financing Auth | ||||||
| RB (El Camino Hospital) Series 2015A | 2.00% | 02/01/16 | 5,425,000 | 5,480,640 | ||
| RB (Kaiser Permanente) Series 2006E | 0.14% | 12/01/15 | 24,000,000 | 24,000,000 | ||
| RB (Providence Health) Series 2014A | 2.00% | 10/01/15 | 185,000 | 185,738 | ||
| RB (Scripps Health) Series 2010A | 5.00% | 11/15/15 | 1,075,000 | 1,094,453 | ||
| RB (Sutter Health) Series 2008A | 5.00% | 08/15/15 | 4,500,000 | 4,526,716 | ||
| California Public Works Board | ||||||
| Lease RB (Univ of California) Series 2005L (ESCROW) | 5.00% | 11/01/15 | 5,000,000 | 5,081,830 | ||
| Lease RB Series 2011A | 4.00% | 10/01/15 | 3,000,000 | 3,028,241 | ||
| Lease Refunding RB Series 2014F | 3.00% | 09/01/15 | 3,500,000 | 3,516,698 | ||
| Lease Refunding RB Series 2015E | 2.00% | 09/01/15 | 5,000,000 | 5,015,547 | ||
| California State Univ | ||||||
| Systemwide RB Series 2014A | 3.00% | 11/01/15 | 3,890,000 | 3,927,182 | ||
| California Statewide Communities Development Auth | ||||||
| M/F Housing RB (Pilgrim Terrace) Series 2015B (ESCROW) | 0.30% | 05/01/16 | 11,250,000 | 11,250,000 | ||
| RB (Kaiser Permanente) Series 2004E | 0.22% | 02/04/16 | 18,300,000 | 18,300,000 | ||
| RB (Kaiser Permanente) Series 2004E | 0.22% | 02/05/16 | 11,800,000 | 11,800,000 | ||
| RB (Kaiser Permanente) Series 2004E | 0.23% | 02/16/16 | 24,000,000 | 24,000,000 | ||
| RB (Kaiser Permanente) Series 2004I | 0.14% | 07/01/15 | 10,700,000 | 10,700,000 | ||
| RB (Kaiser Permanente) Series 2004I | 0.14% | 08/06/15 | 7,000,000 | 7,000,000 | ||
| RB (Kaiser Permanente) Series 2004I | 0.13% | 11/02/15 | 8,000,000 | 8,000,000 | ||
| RB (Kaiser Permanente) Series 2004I | 0.21% | 02/03/16 | 10,000,000 | 10,000,000 | ||
| RB (Kaiser Permanente) Series 2004K | 0.14% | 10/01/15 | 12,400,000 | 12,400,000 | ||
| RB (Kaiser Permanente) Series 2004K | 0.14% | 10/05/15 | 20,000,000 | 20,000,000 | ||
| RB (Kaiser Permanente) Series 2006D | 0.14% | 10/01/15 | 26,500,000 | 26,500,000 | ||
| Issuer
Type of Security, Series |
Footnotes | Rate | Effective
Maturity |
Maturity
Date |
Face
Amount ($) |
Value
($) |
| RB (Kaiser Permanente) Series 2008B | 0.14% | 08/06/15 | 48,000,000 | 48,000,000 | ||
| RB (Kaiser Permanente) Series 2008B | 0.23% | 01/06/16 | 9,000,000 | 9,000,000 | ||
| RB (Kaiser Permanente) Series 2008C | 0.23% | 03/03/16 | 16,500,000 | 16,500,000 | ||
| RB (Kaiser Permanente) Series 2008C | 0.24% | 03/14/16 | 3,500,000 | 3,500,000 | ||
| RB (Kaiser Permanente) Series 2009B3 | 0.23% | 01/07/16 | 3,500,000 | 3,500,000 | ||
| RB (Kaiser Permanente) Series 2009B5 | 0.23% | 01/05/16 | 2,500,000 | 2,500,000 | ||
| RB (Kaiser Permanente) Series 2009B6 | 0.22% | 02/02/16 | 3,750,000 | 3,750,000 | ||
| RB (Kaiser Permanente) Series 2009B6 | 0.22% | 02/08/16 | 14,000,000 | 14,000,000 | ||
| Carlsbad USD | ||||||
| GO Bonds Series 2009B (LIQ: Wells Fargo & Co) | a,b | 0.16% | 07/09/15 | 12,155,000 | 12,155,000 | |
| Coast CCD | ||||||
| GO Refunding Bonds 2005 | 5.25% | 08/01/15 | 830,000 | 833,491 | ||
| Contra Costa Water District | ||||||
| Extendible CP | 0.10% | 08/20/15 | 01/17/16 | 22,500,000 | 22,500,000 | |
| Water Revenue Notes Series A | 3.00% | 10/01/15 | 1,575,000 | 1,586,235 | ||
| Water Revenue Notes Series A | 4.00% | 10/01/15 | 3,275,000 | 3,305,696 | ||
| East Bay Municipal Utility District | ||||||
| Wastewater System Extendible CP | 0.10% | 08/17/15 | 02/12/16 | 15,000,000 | 15,000,000 | |
| Water System Extendible CP | 0.10% | 08/05/15 | 02/09/16 | 37,000,000 | 37,000,000 | |
| Water System Extendible CP | 0.10% | 08/17/15 | 02/12/16 | 47,000,000 | 47,000,000 | |
| Water System Extendible CP | 0.10% | 09/09/15 | 02/21/16 | 13,000,000 | 13,000,000 | |
| Water System Extendible CP | 0.08% | 09/03/15 | 02/29/16 | 26,400,000 | 26,400,000 | |
| Water System Extendible CP | 0.16% | 10/07/15 | 03/08/16 | 20,000,000 | 20,000,000 | |
| Water System Refunding RB Series 2013A | 5.00% | 06/01/16 | 755,000 | 786,761 | ||
| Foothill-DeAnza CCD | ||||||
| GO Bonds Series C (LIQ: Wells Fargo Bank, NA) | a,b | 0.14% | 07/09/15 | 9,760,000 | 9,760,000 | |
| Fresno USD | ||||||
| GO Bonds Series 2001G & 2010B (GTY/LIQ: Wells Fargo Bank, NA) | a,b | 0.14% | 07/09/15 | 10,915,000 | 10,915,000 | |
| Golden Gate Bridge, Highway & Transportation District | ||||||
| CP Series A | 0.12% | 10/02/15 | 30,500,000 | 30,500,000 | ||
| Grossmont UHSD | ||||||
| GO Bonds Series 2006 (ESCROW) | 5.00% | 08/01/15 | 1,000,000 | 1,004,063 | ||
| Healdsburg | ||||||
| Wastewater Refunding RB Series 2015A | c | 2.00% | 10/01/15 | 1,110,000 | 1,114,396 | |
| Imperial Irrigation District | ||||||
| Electric & Water Systems Revenue CP Series A (LOC: MUFG Union Bank, NA) | 0.08% | 07/15/15 | 20,400,000 | 20,400,000 | ||
| Kern Cnty | ||||||
| TRAN 2015-2016 | c | 7.00% | 06/30/16 | 25,000,000 | 26,663,100 | |
| Livermore Valley Jt USD | ||||||
| Refunding GO Bonds Series 2014 | 2.00% | 08/01/15 | 3,165,000 | 3,169,841 | ||
| Long Beach USD | ||||||
| GO Refunding Bonds Series 2008 | 4.00% | 08/01/15 | 625,000 | 626,986 | ||
| Los Angeles | ||||||
| GO Bonds Series 2009A | 4.00% | 09/01/15 | 500,000 | 503,139 | ||
| GO Bonds Series 2011A | 3.00% | 09/01/15 | 1,390,000 | 1,396,714 | ||
| GO Refunding Bonds Series 1998A | 5.25% | 09/01/15 | 125,000 | 126,012 | ||
| GO Refunding Bonds Series 2005B | 4.00% | 09/01/15 | 450,000 | 452,757 | ||
| GO Refunding Bonds Series 2011B | 5.00% | 09/01/15 | 5,000,000 | 5,040,867 | ||
| TRAN | c | 2.00% | 06/30/16 | 75,000,000 | 76,227,750 | |
| Wastewater System CP Series A1 (LOC: Bank of New York Mellon) | 0.12% | 09/16/15 | 17,500,000 | 17,500,000 | ||
| Issuer
Type of Security, Series |
Footnotes | Rate | Effective
Maturity |
Maturity
Date |
Face
Amount ($) |
Value
($) |
| Los Angeles CCD | ||||||
| GO Refunding Bonds Series 2005A | 5.25% | 08/01/15 | 3,475,000 | 3,489,985 | ||
| GO Refunding Bonds Series 2015C | 0.50% | 08/01/15 | 6,515,000 | 6,517,259 | ||
| Los Angeles Cnty | ||||||
| TRAN | c | 5.00% | 06/30/16 | 113,000,000 | 118,292,180 | |
| Los Angeles Cnty Capital Asset Leasing Corp | ||||||
| Lease Revenue CP Series A (LOC: JPMorgan Chase Bank, NA) | 0.08% | 08/06/15 | 17,500,000 | 17,500,000 | ||
| Lease Revenue CP Series A (LOC: JPMorgan Chase Bank, NA) | 0.09% | 09/10/15 | 5,400,000 | 5,400,000 | ||
| Lease Revenue CP Series A (LOC: JPMorgan Chase Bank, NA) | 0.09% | 09/24/15 | 3,000,000 | 3,000,000 | ||
| Lease Revenue CP Series A (LOC: JPMorgan Chase Bank, NA) | 0.09% | 10/09/15 | 24,000,000 | 24,000,000 | ||
| Lease Revenue CP Series C (LOC: Wells Fargo Bank, NA) | 0.08% | 08/27/15 | 30,960,000 | 30,960,000 | ||
| Lease Revenue CP Series C (LOC: Wells Fargo Bank, NA) | 0.08% | 09/03/15 | 18,400,000 | 18,400,000 | ||
| Lease Revenue CP Series C (LOC: Wells Fargo Bank, NA) | 0.08% | 09/04/15 | 22,600,000 | 22,600,000 | ||
| Lease Revenue CP Series C (LOC: Wells Fargo Bank, NA) | 0.12% | 09/08/15 | 40,000,000 | 40,000,000 | ||
| Los Angeles Cnty Metropolitan Transportation Auth | ||||||
| First Tier Sr Sales Tax RB Series 2005A | 5.00% | 07/01/15 | 485,000 | 485,000 | ||
| First Tier Sr Sales Tax Refunding RB Series 2009A | 5.00% | 07/01/15 | 625,000 | 625,000 | ||
| First Tier Sr Sales Tax Refunding RB Series 2013A | 5.00% | 07/01/15 | 800,000 | 800,000 | ||
| Second Sr Refunding RB Series 2009E | 4.00% | 07/01/15 | 750,000 | 750,000 | ||
| Los Angeles Dept of Airports | ||||||
| Airport Sr RB Series 2008A | 5.50% | 05/15/16 | 150,000 | 156,566 | ||
| Airport Sr RB Series 2010D | 5.00% | 05/15/16 | 105,000 | 109,154 | ||
| Los Angeles Dept of Water & Power | ||||||
| Power System RB Series 2005A1 | 5.00% | 07/01/15 | 1,165,000 | 1,165,000 | ||
| Power System RB Series 2007A1 | 4.00% | 07/01/15 | 600,000 | 600,000 | ||
| Power System RB Series 2008A2 | 5.00% | 07/01/15 | 1,225,000 | 1,225,000 | ||
| Power System RB Series 2009A | 4.00% | 07/01/15 | 135,000 | 135,000 | ||
| Power System RB Series 2009A | 5.00% | 07/01/15 | 300,000 | 300,000 | ||
| Power System RB Series 2011A | 5.00% | 07/01/15 | 7,110,000 | 7,110,000 | ||
| Power System RB Series 2012C | 3.00% | 01/01/16 | 1,725,000 | 1,737,467 | ||
| Power System RB Series 2012C | 4.00% | 01/01/16 | 1,200,000 | 1,211,748 | ||
| Power System RB Series 2012C | 5.00% | 01/01/16 | 10,845,000 | 10,977,770 | ||
| Power System Revenue CP (LIQ: Wells Fargo Bank, NA) | d | 0.07% | 08/05/15 | 61,000,000 | 61,000,000 | |
| Power System Revenue CP (LIQ: Wells Fargo Bank, NA) | 0.07% | 09/03/15 | 34,000,000 | 34,000,000 | ||
| Water System RB Series 2006A | 5.00% | 07/01/15 | 1,440,000 | 1,440,000 | ||
| Water System RB Series 2006A1&2007A2 (LIQ: Wells Fargo & Co) | a,b | 0.15% | 07/09/15 | 24,210,000 | 24,210,000 | |
| Los Angeles Harbor Dept | ||||||
| Refunding RB Series 2006B | 5.00% | 08/01/15 | 5,520,000 | 5,542,839 | ||
| Refunding RB Series 2011A | 3.00% | 08/01/15 | 1,000,000 | 1,002,295 | ||
| Los Angeles Municipal Improvement Corp | ||||||
| Lease Revenue CP Series A1 (LOC: Wells Fargo Bank, NA) | 0.08% | 08/13/15 | 10,000,000 | 10,000,000 | ||
| Lease Revenue CP Series A1 (LOC: Wells Fargo Bank, NA) | 0.10% | 08/19/15 | 10,000,000 | 10,000,000 | ||
| Lease Revenue CP Series A1 (LOC: Wells Fargo Bank, NA) | 0.12% | 09/23/15 | 6,878,000 | 6,878,000 | ||
| Lease Revenue CP Series A2 (LOC: JPMorgan Chase Bank, NA) | 0.08% | 08/13/15 | 10,000,000 | 10,000,000 | ||
| Lease Revenue CP Series A2 (LOC: JPMorgan Chase Bank, NA) | 0.10% | 08/18/15 | 10,000,000 | 10,000,000 | ||
| Lease Revenue CP Series A2 (LOC: JPMorgan Chase Bank, NA) | 0.12% | 09/22/15 | 5,000,000 | 5,000,000 | ||
| Lease Revenue CP Series A2 (LOC: JPMorgan Chase Bank, NA) | 0.09% | 10/09/15 | 37,750,000 | 37,750,000 | ||
| Los Angeles Solid Waste System | ||||||
| Solid Waste Resources Refunding RB Series 2013B | 5.00% | 02/01/16 | 10,000,000 | 10,273,418 | ||
| Issuer
Type of Security, Series |
Footnotes | Rate | Effective
Maturity |
Maturity
Date |
Face
Amount ($) |
Value
($) |
| Los Angeles USD | ||||||
| GO Bonds Series 2005A1 | 3.50% | 07/01/15 | 100,000 | 100,000 | ||
| GO Bonds Series 2005E | 5.00% | 07/01/15 | 350,000 | 350,000 | ||
| GO Bonds Series 2006G | 5.00% | 07/01/15 | 450,000 | 450,000 | ||
| GO Bonds Series 2007B | 4.00% | 07/01/15 | 240,000 | 240,000 | ||
| GO Bonds Series 2007E | 5.00% | 07/01/15 | 680,000 | 680,000 | ||
| GO Bonds Series 2007H | 5.00% | 07/01/15 | 2,130,000 | 2,130,000 | ||
| GO Bonds Series 2009D | 3.25% | 07/01/15 | 200,000 | 200,000 | ||
| GO Bonds Series KY | 5.00% | 07/01/15 | 300,000 | 300,000 | ||
| GO Refunding Bonds Series 2002 | 5.75% | 07/01/15 | 100,000 | 100,000 | ||
| GO Refunding Bonds Series 2006B | 5.00% | 07/01/16 | 1,500,000 | 1,569,874 | ||
| GO Refunding Bonds Series 2007A1 (LIQ: Wells Fargo & Co) | a,b | 0.15% | 07/09/15 | 24,775,000 | 24,775,000 | |
| GO Refunding Bonds Series 2010A | 4.00% | 07/01/15 | 350,000 | 350,000 | ||
| GO Refunding Bonds Series 2010A | 5.00% | 07/01/15 | 1,700,000 | 1,700,000 | ||
| GO Refunding Bonds Series 2011A2 | 4.00% | 07/01/15 | 725,000 | 725,000 | ||
| Orange Cnty Fire Auth | ||||||
| TRAN | c | 2.00% | 06/30/16 | 29,260,000 | 29,754,494 | |
| Orange Cnty Sanitation District | ||||||
| Refunding COP Series 2008B | 2.95% | 08/01/15 | 3,240,000 | 3,247,649 | ||
| Riverside CCD | ||||||
| GO Bonds Series 2015E | c | 5.00% | 08/01/15 | 700,000 | 702,779 | |
| Riverside Cnty | ||||||
| Teeter Obligation Notes Series 2014D | 1.50% | 10/14/15 | 47,960,000 | 48,147,263 | ||
| TRAN | c | 2.00% | 06/30/16 | 50,000,000 | 50,850,000 | |
| Roseville Jt UHSD | ||||||
| GO Refunding Bonds 2013 | 3.00% | 08/01/15 | 1,000,000 | 1,002,421 | ||
| Sacramento Municipal Utility District | ||||||
| CP Series K1 (LOC: State Street Bank & Trust Co NA) | 0.08% | 09/02/15 | 30,000,000 | 30,000,000 | ||
| CP Series L1 (LOC: Barclays Bank Plc) | 0.08% | 08/27/15 | 20,000,000 | 20,000,000 | ||
| CP Series L1 (LOC: Barclays Bank Plc) | 0.08% | 08/28/15 | 40,000,000 | 40,000,000 | ||
| San Diego CCD | ||||||
| GO Refunding Bonds 2012 | 3.00% | 08/01/15 | 215,000 | 215,500 | ||
| San Diego Cnty Regional Transportation Commission | ||||||
| Sales Tax RB Series 2012A | 5.00% | 04/01/16 | 800,000 | 828,133 | ||
| San Diego Cnty Water Auth | ||||||
| CP Series 5 (LIQ: Wells Fargo Bank, NA) | 0.07% | 07/16/15 | 20,900,000 | 20,900,000 | ||
| CP Series 5 (LIQ: Wells Fargo Bank, NA) | 0.07% | 08/04/15 | 21,100,000 | 21,100,000 | ||
| CP Series 5 (LIQ: Wells Fargo Bank, NA) | 0.09% | 10/01/15 | 16,000,000 | 16,000,000 | ||
| CP Series 7 (LIQ: JPMorgan Chase Bank, NA) | 0.07% | 07/16/15 | 25,000,000 | 25,000,000 | ||
| CP Series 7 (LIQ: JPMorgan Chase Bank, NA) | 0.07% | 08/04/15 | 27,500,000 | 27,500,000 | ||
| CP Series 7 (LIQ: JPMorgan Chase Bank, NA) | 0.09% | 09/10/15 | 10,000,000 | 10,000,000 | ||
| CP Series 7 (LIQ: JPMorgan Chase Bank, NA) | 0.10% | 09/16/15 | 6,250,000 | 6,250,000 | ||
| CP Series 7 (LIQ: JPMorgan Chase Bank, NA) | 0.09% | 10/01/15 | 6,250,000 | 6,250,000 | ||
| CP Series 8 (LIQ: Bank of Tokyo Mitsubishi UFJ, Ltd) | 0.07% | 07/16/15 | 12,050,000 | 12,050,000 | ||
| CP Series 8 (LIQ: Bank of Tokyo Mitsubishi UFJ, Ltd) | 0.10% | 07/23/15 | 5,000,000 | 5,000,000 | ||
| CP Series 8 (LIQ: Bank of Tokyo Mitsubishi UFJ, Ltd) | 0.07% | 08/04/15 | 9,500,000 | 9,500,000 | ||
| CP Series 8 (LIQ: Bank of Tokyo Mitsubishi UFJ, Ltd) | 0.10% | 08/12/15 | 5,000,000 | 5,000,000 | ||
| CP Series 8 (LIQ: Bank of Tokyo Mitsubishi UFJ, Ltd) | 0.08% | 09/03/15 | 5,000,000 | 5,000,000 | ||
| Extendable CP Series 1 | 0.10% | 09/02/15 | 01/30/16 | 12,500,000 | 12,500,000 | |
| Extendable CP Series 1 | 0.08% | 09/03/15 | 02/29/16 | 12,500,000 | 12,500,000 | |
| Issuer
Type of Security, Series |
Footnotes | Rate | Effective
Maturity |
Maturity
Date |
Face
Amount ($) |
Value
($) |
| San Diego USD | ||||||
| GO Refunding Bonds Series 2014R3 | 5.00% | 07/01/15 | 2,470,000 | 2,470,000 | ||
| San Francisco | ||||||
| GO Bonds Series 2015B | c | 2.00% | 06/15/16 | 10,000,000 | 10,156,800 | |
| GO Refunding Bonds Series 2011R1 | 5.00% | 06/15/16 | 1,025,000 | 1,070,986 | ||
| Refunding COP Series 2011B | 4.00% | 09/01/15 | 5,135,000 | 5,168,215 | ||
| San Francisco Airport Commission | ||||||
| Sub CP Series A4&B4 (LOC: Wells Fargo Bank, NA) | 0.08% | 07/08/15 | 20,000,000 | 20,000,000 | ||
| San Francisco Bay Area Rapid Transit District | ||||||
| Sales Tax Refunding RB Series 2005A | 5.00% | 07/01/15 | 500,000 | 500,000 | ||
| San Francisco Public Utilities Commission | ||||||
| CP (Wastewater) Series A1 (LOC: Wells Fargo Bank, NA) | 0.08% | 08/05/15 | 12,500,000 | 12,500,000 | ||
| Wastewater Refunding RB Series 2013A | 4.00% | 10/01/15 | 3,965,000 | 4,002,978 | ||
| Water RB Series 2010D | 5.00% | 11/01/15 | 3,580,000 | 3,637,975 | ||
| Water Refunding RB Series 2011D | 5.00% | 11/01/15 | 1,750,000 | 1,778,481 | ||
| San Francisco USD | ||||||
| TRAN Series 2014A | 5.00% | 09/24/15 | 43,500,000 | 43,991,957 | ||
| San Jose Redevelopment Agency | ||||||
| Sub Tax Allocation RB Series 1996A (LOC: JPMorgan Chase Bank, NA) | 0.10% | 09/08/15 | 14,750,000 | 14,750,000 | ||
| Sub Tax Allocation RB Series 2003B (LOC: JPMorgan Chase Bank, NA) | 0.10% | 09/08/15 | 7,500,000 | 7,500,000 | ||
| Santa Clara Valley Water District | ||||||
| CP Certificates Series A (LOC: Bank of Tokyo Mitsubishi UFJ, Ltd) | 0.08% | 08/11/15 | 2,830,000 | 2,830,000 | ||
| CP Certificates Series A (LOC: Bank of Tokyo Mitsubishi UFJ, Ltd) | 0.09% | 08/11/15 | 7,200,000 | 7,200,000 | ||
| Santa Monica-Malibu USD | ||||||
| GO Bonds Series A | 1.00% | 07/01/15 | 22,270,000 | 22,270,000 | ||
| GO Bonds Series B | c | 2.00% | 07/01/16 | 3,860,000 | 3,923,960 | |
| Southern California Metropolitan Water District | ||||||
| Water Refunding RB Series 2011B | 5.00% | 07/01/15 | 5,690,000 | 5,690,000 | ||
| Water Refunding RB Series 2012E2 | 3.00% | 10/01/15 | 710,000 | 710,000 | ||
| Turlock Irrigation District | ||||||
| Sub Revenue CP Series A (LOC: Bank of America, NA) | 0.10% | 10/08/15 | 41,995,000 | 41,995,000 | ||
| Tustin USD | ||||||
| GO Bonds Series D | 0.30% | 08/01/15 | 500,000 | 499,872 | ||
| Univ of California | ||||||
| General RB Series 2008L (ESCROW) | 5.00% | 05/15/16 | 8,000,000 | 8,405,016 | ||
| General RB Series 2009O | 5.00% | 05/15/16 | 165,000 | 171,609 | ||
| General RB Series 2009P | 4.00% | 05/15/16 | 100,000 | 103,072 | ||
| Limited RB Series 2007D | 5.00% | 05/15/16 | 150,000 | 155,956 | ||
| Ventura Cnty | ||||||
| TRAN 2015-2016 | c | 2.00% | 07/01/16 | 51,000,000 | 51,877,200 | |
| TRAN Series 2014-2015 | 1.50% | 07/01/15 | 25,000,000 | 25,000,000 | ||
| Ventura Cnty Public Financing Auth | ||||||
| Lease Revenue CP (LOC: Wells Fargo Bank, NA) | 0.08% | 09/03/15 | 3,000,000 | 3,000,000 | ||
| Lease Revenue CP (LOC: Wells Fargo Bank, NA) | 0.09% | 09/04/15 | 13,600,000 | 13,600,000 | ||
| Victor Valley CCD | ||||||
| GO Bonds Series C (LIQ: Wells Fargo & Co) | a,b | 0.15% | 07/09/15 | 8,885,000 | 8,885,000 | |
| Total Fixed-Rate Securities | ||||||
| (Cost $2,326,183,028) | 2,326,183,028 | |||||
| Issuer
Type of Security, Series |
Footnotes | Rate | Effective
Maturity |
Maturity
Date |
Face
Amount ($) |
Value
($) |
| Variable-Rate Securities 67.0% of net assets | ||||||
| California 64.4% | ||||||
| ABAG Finance Auth | ||||||
| M/F Housing RB (Bachenheimer Building) Series 2002A (LOC: Fannie Mae) | 0.12% | 07/07/15 | 7,620,000 | 7,620,000 | ||
| M/F Housing RB (Crossing Apts) Series 2002A (LOC: Fannie Mae) | d | 0.07% | 07/07/15 | 64,450,000 | 64,450,000 | |
| M/F Housing RB (Darling Florist Building) Series 2002A (LOC: Fannie Mae) | 0.12% | 07/07/15 | 4,710,000 | 4,710,000 | ||
| M/F Housing RB (Fine Arts Building) Series 2002A (LOC: Fannie Mae) | 0.12% | 07/07/15 | 8,100,000 | 8,100,000 | ||
| M/F Housing RB (GAIA Building) Series 2000A (LOC: Fannie Mae) | 0.12% | 07/07/15 | 12,165,000 | 12,165,000 | ||
| M/F Housing RB (La Terrazza Apts) Series 2002A (LOC: Fannie Mae) | 0.12% | 07/07/15 | 8,295,000 | 8,295,000 | ||
| M/F Housing RB (Mountain View Apts) Series 1997A (LOC: Comerica Bank) | 0.15% | 07/07/15 | 4,650,000 | 4,650,000 | ||
| M/F Housing Refunding RB (The Berkeleyan) Series 2003A (LOC: Fannie Mae) | 0.12% | 07/07/15 | 5,790,000 | 5,790,000 | ||
| RB (Institute for Defense Analyses) Series 2005 (LOC: Branch Banking & Trust Co) | 0.07% | 07/07/15 | 5,000,000 | 5,000,000 | ||
| Alameda Cnty IDA | ||||||
| RB (BAT Properties) Series 1998A (LOC: Bank of the West) | 0.15% | 07/07/15 | 3,640,000 | 3,640,000 | ||
| RB (California Brazing) Series 2011 (LOC: Wells Fargo Bank, NA) | 0.12% | 07/07/15 | 2,835,000 | 2,835,000 | ||
| RB (Dale Hardware) Series 2010 (LOC: Comerica Bank) | 0.12% | 07/07/15 | 2,380,000 | 2,380,000 | ||
| RB (Ettore Products) Series 2005A (LOC: Comerica Bank) | 0.16% | 07/07/15 | 4,000,000 | 4,000,000 | ||
| RB (Evolve Manufacturing Technologies) Series 2014 (LOC: Wells Fargo Bank, NA) | 0.12% | 07/07/15 | 2,484,000 | 2,484,000 | ||
| RB (Golden West Paper Converting Corp) Series 2008A (LOC: Bank of the West) | 0.14% | 07/07/15 | 3,315,000 | 3,315,000 | ||
| RB (Plastikon Industries) Series 2000A (LOC: Comerica Bank) | 0.16% | 07/07/15 | 2,700,000 | 2,700,000 | ||
| Alameda-Contra Costa School Financing Auth | ||||||
| COP Series N (LOC: Federal Home Loan Bank) | 0.06% | 07/07/15 | 2,380,000 | 2,380,000 | ||
| Anaheim Housing Auth | ||||||
| M/F Housing Refunding RB (Sage Park) Series 1998A (LOC: Fannie Mae) | 0.07% | 07/07/15 | 5,500,000 | 5,500,000 | ||
| Anaheim Public Financing Auth | ||||||
| Electric System RB Series 2007A (GTY: Berkshire Hathaway Assurance Corp /LIQ: Citibank, NA) | a | 0.08% | 07/07/15 | 19,030,000 | 19,030,000 | |
| Electric System RB Series 2009A (LIQ: Citibank, NA) | a | 0.08% | 07/07/15 | 7,500,000 | 7,500,000 | |
| Bakersfield | ||||||
| Wastewater Refunding RB Series 2012A (LIQ: JPMorgan Chase Bank, NA) | 0.08% | 07/07/15 | 7,800,000 | 7,800,000 | ||
| Bay Area Toll Auth | ||||||
| Toll Bridge RB Series 2006F (ESCROW/LIQ: Citibank, NA) | a | 0.08% | 07/07/15 | 16,985,000 | 16,985,000 | |
| Toll Bridge RB Series 2007C1 (LIQ: Bank of America, NA) | a | 0.09% | 07/07/15 | 4,910,000 | 4,910,000 | |
| Toll Bridge RB Series 2007C2 (LOC: Bank of Tokyo Mitsubishi UFJ, Ltd) | 0.06% | 07/07/15 | 11,000,000 | 11,000,000 | ||
| Toll Bridge RB Series 2007F (ESCROW/LIQ: JPMorgan Chase Bank, NA) | a | 0.08% | 07/07/15 | 7,245,000 | 7,245,000 | |
| Toll Bridge RB Series 2007F, 2008F1&2009F1 (ESCROW/LIQ: Morgan Stanley Bank NA) | a,d | 0.08% | 07/07/15 | 12,462,156 | 12,462,156 | |
| Issuer
Type of Security, Series |
Footnotes | Rate | Effective
Maturity |
Maturity
Date |
Face
Amount ($) |
Value
($) |
| Toll Bridge RB Series 2008C1 (LOC: Sumitomo Mitsui Banking Corp) | 0.06% | 07/07/15 | 3,000,000 | 3,000,000 | ||
| Toll Bridge RB Series 2008F1 (LIQ: Citibank, NA) | a | 0.08% | 07/07/15 | 5,000,000 | 5,000,000 | |
| Toll Bridge RB Series 2009F1 (LIQ: Bank of America, NA) | a | 0.10% | 07/07/15 | 9,010,000 | 9,010,000 | |
| California | ||||||
| GO Bonds Series 2003A1 (LOC: JPMorgan Chase Bank, NA) | 0.01% | 07/01/15 | 1,000,000 | 1,000,000 | ||
| GO Bonds Series 2003B1 (LOC: JPMorgan Chase Bank, NA; California Public Employees' Retirement System) | 0.05% | 07/07/15 | 37,500,000 | 37,500,000 | ||
| GO Bonds Series 2003B2 (LOC: JPMorgan Chase Bank, NA; California Public Employees' Retirement System) | 0.05% | 07/07/15 | 18,000,000 | 18,000,000 | ||
| GO Bonds Series 2003B3 (LOC: JPMorgan Chase Bank, NA; California Public Employees' Retirement System) | 0.05% | 07/07/15 | 34,100,000 | 34,100,000 | ||
| GO Bonds Series 2004A1 (LOC: Citibank, NA) | 0.01% | 07/01/15 | 7,500,000 | 7,500,000 | ||
| GO Bonds Series 2004A3 (LOC: State Street Bank & Trust Co NA) | 0.01% | 07/01/15 | 1,300,000 | 1,300,000 | ||
| GO Bonds Series 2004A4 (LOC: Citibank, NA) | 0.01% | 07/01/15 | 33,750,000 | 33,750,000 | ||
| GO Bonds Series 2004A5 (LOC: Citibank, NA) | 0.01% | 07/01/15 | 3,800,000 | 3,800,000 | ||
| GO Bonds Series 2004B2 (LOC: Citibank, NA) | 0.01% | 07/01/15 | 1,000,000 | 1,000,000 | ||
| GO Bonds Series 2004B4 (LOC: Citibank, NA) | 0.03% | 07/07/15 | 30,570,000 | 30,570,000 | ||
| GO Bonds Series 2005A1-2 (LOC: Royal Bank of Canada) | 0.04% | 07/07/15 | 34,000,000 | 34,000,000 | ||
| GO Bonds Series 2005A2-2 (LOC: Royal Bank of Canada) | 0.04% | 07/07/15 | 20,000,000 | 20,000,000 | ||
| GO Bonds Series 2005B1 (LOC: Bank of America, NA) | 0.05% | 07/07/15 | 47,700,000 | 47,700,000 | ||
| GO Bonds Series 2005B5 (LOC: Barclays Bank Plc) | 0.09% | 07/07/15 | 12,890,000 | 12,890,000 | ||
| GO Refunding Bonds (GTY/LIQ: Wells Fargo & Co) | a | 0.08% | 07/07/15 | 160,000 | 160,000 | |
| California Alternative Energy Source Financing Auth | ||||||
| Cogeneration Facility RB Series 1993B | 0.08% | 07/07/15 | 25,330,000 | 25,330,000 | ||
| California Dept of Water Resources | ||||||
| Water System RB (Central Valley) Series AE (LIQ: Branch Banking & Trust Co) | a | 0.07% | 07/07/15 | 7,075,000 | 7,075,000 | |
| Water System RB (Central Valley) Series AE (LIQ: Credit Suisse AG) | a | 0.07% | 07/07/15 | 12,605,000 | 12,605,000 | |
| California Educational Facilities Auth | ||||||
| RB (California Institute of Technology) Series 2006B | 0.07% | 07/07/15 | 2,500,000 | 2,500,000 | ||
| RB (California Institute of Technology) Series 2009 (LIQ: Citibank, NA) | a | 0.07% | 07/07/15 | 9,900,000 | 9,900,000 | |
| RB (Life Chiropractic College West) Series 1999 (LOC: Bank of the West) | 0.07% | 07/07/15 | 11,365,000 | 11,365,000 | ||
| RB (Univ of Southern California) Series 2009A (LIQ: Deutsche Bank AG) | a | 0.12% | 07/07/15 | 1,220,000 | 1,220,000 | |
| California Enterprise Development Finance Auth | ||||||
| RB (Sconza Candy) Series 2008A (LOC: Comerica Bank) | 0.16% | 07/07/15 | 10,000,000 | 10,000,000 | ||
| California Health Facilities Financing Auth | ||||||
| Health Facility RB (Catholic Healthcare West) 2004 Series K (LOC: Mizuho Bank Ltd) | 0.05% | 07/07/15 | 21,750,000 | 21,750,000 | ||
| Health Facility RB (Catholic Healthcare West) Series 2011B (LOC: Bank of Montreal) | 0.05% | 07/07/15 | 13,450,000 | 13,450,000 | ||
| RB (Children's Hospital of Orange Cnty) Series 2009C (LOC: US Bank, NA) | 0.07% | 07/07/15 | 10,510,000 | 10,510,000 | ||
| RB (City of Hope) Series 2012B | 0.05% | 07/07/15 | 16,000,000 | 16,000,000 | ||
| RB (City of Hope) Series 2012C | 0.06% | 07/07/15 | 9,700,000 | 9,700,000 | ||
| RB (Kaiser Permanente) Series 2011A,B,C&D (GTY/LIQ: Royal Bank of Canada) | a,d | 0.07% | 07/07/15 | 81,810,000 | 81,810,000 | |
| RB (Memorial Health Services) Series 2013A | 0.07% | 07/07/15 | 9,045,000 | 9,045,000 | ||
| Issuer
Type of Security, Series |
Footnotes | Rate | Effective
Maturity |
Maturity
Date |
Face
Amount ($) |
Value
($) |
| RB (Providence Health & Services) Series 2008C (ESCROW/LIQ: JPMorgan Chase Bank, NA) | a | 0.08% | 07/07/15 | 5,020,000 | 5,020,000 | |
| RB (Providence Health & Services) Series 2009B (LIQ: Bank of America, NA) | a | 0.08% | 07/07/15 | 9,200,000 | 9,200,000 | |
| RB (Providence Health & Services) Series 2009B, 2014A&2014B (LIQ: JPMorgan Chase Bank, NA) | a | 0.08% | 07/07/15 | 26,780,000 | 26,780,000 | |
| RB (Providence Health & Services) Series 2014A (LIQ: Morgan Stanley Bank NA) | a | 0.08% | 07/07/15 | 4,000,000 | 4,000,000 | |
| RB (Providence Health & Services) Series 2014B (LIQ: Deutsche Bank AG) | a | 0.20% | 07/07/15 | 12,165,000 | 12,165,000 | |
| RB (Scripps Health) Series 2001A (LOC: JPMorgan Chase Bank, NA) | 0.05% | 07/07/15 | 5,815,000 | 5,815,000 | ||
| RB (Scripps Health) Series 2008C (LOC: MUFG Union Bank, NA) | 0.06% | 07/07/15 | 9,150,000 | 9,150,000 | ||
| RB (Scripps Health) Series 2008E (LOC: MUFG Union Bank, NA) | 0.06% | 07/07/15 | 16,670,000 | 16,670,000 | ||
| RB (Scripps Health) Series 2010B (LOC: JPMorgan Chase Bank, NA) | d | 0.05% | 07/07/15 | 51,150,000 | 51,150,000 | |
| RB (Scripps Health) Series 2012B | 0.05% | 07/07/15 | 13,225,000 | 13,225,000 | ||
| RB (Scripps Health) Series 2012C | 0.06% | 07/07/15 | 2,300,000 | 2,300,000 | ||
| RB (St Joseph Health) Series 2009A (LIQ: Morgan Stanley Bank NA) | a | 0.22% | 07/07/15 | 11,565,000 | 11,565,000 | |
| RB (St Joseph Health) Series 2009A (LIQ: Royal Bank of Canada) | a | 0.07% | 07/07/15 | 11,250,000 | 11,250,000 | |
| RB (Sutter Health) Series 2007A (LIQ: Deutsche Bank AG) | a | 0.22% | 07/07/15 | 9,000,000 | 9,000,000 | |
| RB (Sutter Health) Series 2007A (LIQ: JPMorgan Chase Bank, NA) | a | 0.08% | 07/07/15 | 24,935,000 | 24,935,000 | |
| RB (Sutter Health) Series 2011A&B (LIQ: Deutsche Bank AG) | a | 0.22% | 07/07/15 | 23,000,000 | 23,000,000 | |
| RB (Sutter Health) Series 2011B (LIQ: Citibank, NA) | a | 0.08% | 07/07/15 | 9,565,000 | 9,565,000 | |
| RB (Sutter Health) Series 2011D (LIQ: Credit Suisse AG) | a | 0.07% | 07/07/15 | 6,665,000 | 6,665,000 | |
| RB (Sutter Health) Series 2013A (LIQ: JPMorgan Chase Bank, NA) | a | 0.08% | 07/07/15 | 3,730,000 | 3,730,000 | |
| RB (Sutter Health) Series 2013A (LIQ: Morgan Stanley Bank NA) | a | 0.08% | 07/07/15 | 17,195,000 | 17,195,000 | |
| California HFA | ||||||
| Home Mortgage RB Series 2002J (LOC: Fannie Mae; Freddie Mac) | 0.09% | 07/07/15 | 12,345,000 | 12,345,000 | ||
| Home Mortgage RB Series 2006F (LOC: Fannie Mae; Freddie Mac) | 0.10% | 07/07/15 | 26,090,000 | 26,090,000 | ||
| Home Mortgage RB Series 2007H (LOC: Fannie Mae; Freddie Mac) | 0.11% | 07/07/15 | 4,700,000 | 4,700,000 | ||
| Home Mortgage RB Series 2007K (LOC: Fannie Mae; Freddie Mac) | 0.11% | 07/07/15 | 7,555,000 | 7,555,000 | ||
| Limited Obligation M/F RB (Warwick Square Apts) Series 2013B (LOC: Federal Home Loan Bank) | 0.08% | 07/07/15 | 12,840,000 | 12,840,000 | ||
| California Infrastructure & Economic Development Bank | ||||||
| RB (Asian-American Drug Abuse Program) Series 2008 (LOC: Bank of the West) | 0.15% | 07/07/15 | 3,135,000 | 3,135,000 | ||
| RB (Casa Loma College) Series 2009 (LOC: Comerica Bank) | 0.10% | 07/07/15 | 1,780,000 | 1,780,000 | ||
| RB (St Margaret's Episcopal School) Series 2008 (LOC: Federal Home Loan Bank) | 0.18% | 07/30/15 | 11,060,000 | 11,060,000 | ||
| Refunding RB (PG&E) Series 2009A (LOC: MUFG Union Bank, NA) | 0.02% | 07/01/15 | 3,600,000 | 3,600,000 | ||
| Refunding RB (PG&E) Series 2009B (LOC: MUFG Union Bank, NA) | 0.02% | 07/01/15 | 5,345,000 | 5,345,000 | ||
| Issuer
Type of Security, Series |
Footnotes | Rate | Effective
Maturity |
Maturity
Date |
Face
Amount ($) |
Value
($) |
| California Municipal Finance Auth | ||||||
| RB (Westmont College) Series 2010A (LOC: Comerica Bank) | 0.10% | 07/07/15 | 12,440,000 | 12,440,000 | ||
| Recovery Zone Facility RB (Chevron) Series 2010A | 0.01% | 07/01/15 | 18,180,000 | 18,180,000 | ||
| Recovery Zone Facility RB (Chevron) Series 2010C | 0.01% | 07/01/15 | 8,205,000 | 8,205,000 | ||
| California Pollution Control Financing Auth | ||||||
| Pollution Control Refunding RB (PG&E) Series 1996C (LOC: JPMorgan Chase Bank, NA) | 0.01% | 07/01/15 | 4,300,000 | 4,300,000 | ||
| Pollution Control Refunding RB (PG&E) Series 1996E (LOC: JPMorgan Chase Bank, NA) | 0.01% | 07/01/15 | 3,100,000 | 3,100,000 | ||
| Pollution Control Refunding RB (PG&E) Series 1996F (LOC: JPMorgan Chase Bank, NA) | 0.01% | 07/01/15 | 20,800,000 | 20,800,000 | ||
| Solid Waste Disposal RB (Ag Resources III) Series 2004 (LOC: CoBank, ACB) | 0.12% | 07/07/15 | 5,570,000 | 5,570,000 | ||
| Solid Waste Disposal RB (Alameda Cnty Industries) Series 2000A (LOC: Bank of the West) | 0.14% | 07/07/15 | 3,330,000 | 3,330,000 | ||
| Solid Waste Disposal RB (Alameda Cnty Industries) Series 2012 (LOC: Bank of the West) | 0.14% | 07/07/15 | 2,570,000 | 2,570,000 | ||
| Solid Waste Disposal RB (Atlas Disposal) Series 1999A (LOC: US Bank, NA) | 0.12% | 07/07/15 | 4,369,000 | 4,369,000 | ||
| Solid Waste Disposal RB (AVI-PGS) Series 2008A (LOC: Wells Fargo Bank, NA) | 0.12% | 07/07/15 | 2,020,000 | 2,020,000 | ||
| Solid Waste Disposal RB (Bay Counties SMaRT) Series 2014 (LOC: Comerica Bank) | 0.16% | 07/07/15 | 2,205,000 | 2,205,000 | ||
| Solid Waste Disposal RB (Bay Counties Waste Services) Series 2011A (LOC: Comerica Bank) | 0.16% | 07/07/15 | 5,465,000 | 5,465,000 | ||
| Solid Waste Disposal RB (Best Way Disposal) Series 2012 (LOC: Bank of the West) | 0.14% | 07/07/15 | 15,600,000 | 15,600,000 | ||
| Solid Waste Disposal RB (BLT Enterprises of Fremont) Series 2010 (LOC: MUFG Union Bank, NA) | 0.08% | 07/07/15 | 4,665,000 | 4,665,000 | ||
| Solid Waste Disposal RB (Burrtec Waste & Recycling Services) Series 2006A (LOC: Bank of America, NA) | 0.12% | 07/07/15 | 8,705,000 | 8,705,000 | ||
| Solid Waste Disposal RB (Burrtec Waste Group) Series 2006A (LOC: US Bank, NA) | 0.12% | 07/07/15 | 8,705,000 | 8,705,000 | ||
| Solid Waste Disposal RB (Burrtec Waste Group) Series 2008A (LOC: US Bank, NA) | 0.12% | 07/07/15 | 7,505,000 | 7,505,000 | ||
| Solid Waste Disposal RB (California Waste Recovery Systems) Series 2012 (LOC: MUFG Union Bank, NA) | 0.12% | 07/07/15 | 2,385,000 | 2,385,000 | ||
| Solid Waste Disposal RB (California Waste Solutions) Series 2002A (LOC: Cal St Teachers Retirement Sys) | 0.12% | 07/07/15 | 4,435,000 | 4,435,000 | ||
| Solid Waste Disposal RB (California Waste Solutions) Series 2004A (LOC: Cal St Teachers Retirement Sys) | 0.12% | 07/07/15 | 620,000 | 620,000 | ||
| Solid Waste Disposal RB (California Waste Solutions) Series 2007A (LOC: Cal St Teachers Retirement Sys) | 0.12% | 07/07/15 | 14,610,000 | 14,610,000 | ||
| Solid Waste Disposal RB (CR&R) Series 2006A (LOC: JPMorgan Chase Bank, NA) | d | 0.12% | 07/07/15 | 19,600,000 | 19,600,000 | |
| Solid Waste Disposal RB (CR&R) Series 2007A (LOC: JPMorgan Chase Bank, NA) | 0.12% | 07/07/15 | 34,615,000 | 34,615,000 | ||
| Solid Waste Disposal RB (Desert Properties) Series 2006B (LOC: MUFG Union Bank, NA) | 0.12% | 07/07/15 | 1,160,000 | 1,160,000 | ||
| Solid Waste Disposal RB (EDCO Disposal) Series 2004A (LOC: Wells Fargo Bank, NA) | 0.12% | 07/07/15 | 1,395,000 | 1,395,000 | ||
| Solid Waste Disposal RB (EDCO Disposal) Series 2007A (LOC: Wells Fargo Bank, NA) | 0.12% | 07/07/15 | 8,260,000 | 8,260,000 | ||
| Solid Waste Disposal RB (Garaventa Enterprises) Series 2006A (LOC: Wells Fargo Bank, NA) | 0.12% | 07/07/15 | 5,970,000 | 5,970,000 | ||
| Issuer
Type of Security, Series |
Footnotes | Rate | Effective
Maturity |
Maturity
Date |
Face
Amount ($) |
Value
($) |
| Solid Waste Disposal RB (Garaventa Enterprises) Series 2008A (LOC: Wells Fargo Bank, NA) | 0.12% | 07/07/15 | 8,925,000 | 8,925,000 | ||
| Solid Waste Disposal RB (Garden City Sanitation) Series 2009A (LOC: MUFG Union Bank, NA) | 0.08% | 07/07/15 | 8,100,000 | 8,100,000 | ||
| Solid Waste Disposal RB (Garden City Sanitation) Series 2009B (LOC: MUFG Union Bank, NA) | 0.08% | 07/07/15 | 2,920,000 | 2,920,000 | ||
| Solid Waste Disposal RB (Garden City Sanitation) Series 2014 (LOC: MUFG Union Bank, NA) | 0.13% | 07/07/15 | 3,000,000 | 3,000,000 | ||
| Solid Waste Disposal RB (George Borba & Son Dairy) Series 2003 (LOC: Wells Fargo Bank, NA) | 0.12% | 07/07/15 | 3,800,000 | 3,800,000 | ||
| Solid Waste Disposal RB (GreenWaste of Palo Alto) Series 2008B (LOC: MUFG Union Bank, NA) | 0.12% | 07/07/15 | 4,375,000 | 4,375,000 | ||
| Solid Waste Disposal RB (GreenWaste Recovery) Series 2006A (LOC: MUFG Union Bank, NA) | 0.12% | 07/07/15 | 3,395,000 | 3,395,000 | ||
| Solid Waste Disposal RB (J&D Wilson & Sons Dairy) Series 2004 (LOC: CoBank, ACB) | 0.13% | 07/07/15 | 2,500,000 | 2,500,000 | ||
| Solid Waste Disposal RB (Marin Sanitary Service) Series 2006A (LOC: Comerica Bank) | 0.16% | 07/07/15 | 1,100,000 | 1,100,000 | ||
| Solid Waste Disposal RB (Metropolitan Recycling) Series 2000A (LOC: Comerica Bank) | 0.16% | 07/07/15 | 1,370,000 | 1,370,000 | ||
| Solid Waste Disposal RB (Metropolitan Recycling) Series 2012A (LOC: Comerica Bank) | 0.16% | 07/07/15 | 2,630,000 | 2,630,000 | ||
| Solid Waste Disposal RB (Mid-Valley Disposal) Series 2006A (LOC: MUFG Union Bank, NA) | 0.12% | 07/07/15 | 2,275,000 | 2,275,000 | ||
| Solid Waste Disposal RB (Mill Valley Refuse Service) Series 2014 (LOC: Comerica Bank) | 0.16% | 07/07/15 | 1,170,000 | 1,170,000 | ||
| Solid Waste Disposal RB (Mission Trail Waste Systems) Series 2010A (LOC: Comerica Bank) | 0.12% | 07/07/15 | 2,280,000 | 2,280,000 | ||
| Solid Waste Disposal RB (Northern Recycling & Waste Services) Series 2007A (LOC: MUFG Union Bank, NA) | 0.12% | 07/07/15 | 1,405,000 | 1,405,000 | ||
| Solid Waste Disposal RB (Orange Ave Disposal) Series 2002A (LOC: Cal St Teachers Retirement Sys) | 0.12% | 07/07/15 | 4,550,000 | 4,550,000 | ||
| Solid Waste Disposal RB (Ratto Group of Companies) Series 2007A (LOC: MUFG Union Bank, NA) | 0.12% | 07/07/15 | 27,800,000 | 27,800,000 | ||
| Solid Waste Disposal RB (Ratto Group of Companies) Series 2012 (LOC: MUFG Union Bank, NA) | 0.12% | 07/07/15 | 5,500,000 | 5,500,000 | ||
| Solid Waste Disposal RB (Recycling Industries) Series 2011 (LOC: Comerica Bank) | 0.16% | 07/07/15 | 2,070,000 | 2,070,000 | ||
| Solid Waste Disposal RB (Santa Clara Valley Industries) Series 1998A (LOC: Comerica Bank) | 0.16% | 07/07/15 | 585,000 | 585,000 | ||
| Solid Waste Disposal RB (South Bay Recycling) Series 2010B (LOC: MUFG Union Bank, NA) | 0.08% | 07/07/15 | 2,040,000 | 2,040,000 | ||
| Solid Waste Disposal RB (Talco Plastics) Series 1997A (LOC: US Bank, NA) | 0.07% | 07/07/15 | 1,750,000 | 1,750,000 | ||
| Solid Waste Disposal RB (Upper Valley Disposal Service) Series 2008A (LOC: MUFG Union Bank, NA) | 0.12% | 07/07/15 | 1,235,000 | 1,235,000 | ||
| Solid Waste Disposal RB (Valley Vista Services) Series 2007A (LOC: Comerica Bank) | 0.16% | 07/07/15 | 2,205,000 | 2,205,000 | ||
| Solid Waste Disposal RB (Waste Connections) Series 2007 (LOC: Bank of America, NA) | 0.16% | 07/07/15 | 5,400,000 | 5,400,000 | ||
| Solid Waste Disposal RB (Zerep Management) Series 2011A (LOC: Comerica Bank) | 0.16% | 07/07/15 | 2,810,000 | 2,810,000 |
| Issuer
Type of Security, Series |
Footnotes | Rate | Effective
Maturity |
Maturity
Date |
Face
Amount ($) |
Value
($) |
| Solid Waste Disposal RB (Zerep Management) Series 2014 (LOC: Comerica Bank) | 0.16% | 07/07/15 | 9,390,000 | 9,390,000 | ||
| Solid Waste Disposal Refunding RB (MarBorg Industries) Series 2009A (LOC: MUFG Union Bank, NA) | 0.08% | 07/07/15 | 2,095,000 | 2,095,000 | ||
| California Public Works Board | ||||||
| Lease Refunding RB (Univ of California) Series 2007A (ESCROW/LIQ: Branch Banking & Trust Co) | a | 0.07% | 07/07/15 | 8,625,000 | 8,625,000 | |
| Lease Refunding RB (Univ of California) Series 2007C (ESCROW/LIQ: Branch Banking & Trust Co) | a | 0.07% | 07/07/15 | 10,935,000 | 10,935,000 | |
| California State Univ | ||||||
| RB Series 2005A (LIQ: Citibank, NA) | a | 0.08% | 07/07/15 | 3,510,000 | 3,510,000 | |
| RB Series 2005C (GTY: Berkshire Hathaway Assurance Corp /LIQ: Citibank, NA) | a,d | 0.08% | 07/07/15 | 25,765,000 | 25,765,000 | |
| RB Series 2012A (LIQ: JPMorgan Chase Bank, NA) | a | 0.08% | 07/07/15 | 5,840,000 | 5,840,000 | |
| Systemwide Refunding RB Series 2005A (LIQ: Citibank, NA) | a | 0.08% | 07/07/15 | 1,465,000 | 1,465,000 | |
| California Statewide Communities Development Auth | ||||||
| IDRB (RL Group) Series 1998C (LOC: US Bank, NA) | 0.10% | 07/07/15 | 1,260,000 | 1,260,000 | ||
| M/F Housing RB (Alhambra at Mace Ranch) Series 2014A (LOC: Federal Home Loan Bank) | 0.07% | 07/07/15 | 10,000,000 | 10,000,000 | ||
| M/F Housing RB (Avian Glen Apts) Series 204CC (LOC: Citibank, NA) | 0.08% | 07/07/15 | 4,690,000 | 4,690,000 | ||
| M/F Housing RB (Campus Pointe Apts) Series 2008J (LOC: Federal Home Loan Bank) | 0.08% | 07/07/15 | 12,100,000 | 12,100,000 | ||
| M/F Housing RB (Canyon Country Sr Apts) Series 2002M (LOC: Freddie Mac) | 0.07% | 07/07/15 | 10,500,000 | 10,500,000 | ||
| M/F Housing RB (Charter Court Apts) Series 2008L (LOC: Freddie Mac) | 0.09% | 07/07/15 | 10,125,000 | 10,125,000 | ||
| M/F Housing RB (Creekside at Meadow Park Apts) Series 2002HH (LOC: Fannie Mae) | 0.07% | 07/07/15 | 8,395,000 | 8,395,000 | ||
| M/F Housing RB (Crossings West Apts) Series 2009E (LOC: Freddie Mac) | 0.07% | 07/07/15 | 15,000,000 | 15,000,000 | ||
| M/F Housing RB (Cypress Villa Apts) Series 2000F (LOC: Fannie Mae) | 0.09% | 07/07/15 | 4,725,000 | 4,725,000 | ||
| M/F Housing RB (Dublin Ranch Sr Apts) Series 2003OO (LOC: Fannie Mae) | 0.07% | 07/07/15 | 29,990,000 | 29,990,000 | ||
| M/F Housing RB (Dublin Ranch Sr Apts) Series 2006G (LOC: Fannie Mae) | 0.07% | 07/07/15 | 5,010,000 | 5,010,000 | ||
| M/F Housing RB (Emerald Gardens Apts) Series 2000E (LOC: Fannie Mae) | 0.07% | 07/07/15 | 7,320,000 | 7,320,000 | ||
| M/F Housing RB (Fairway Family Apts) Series 2003PP (LOC: Fannie Mae) | 0.07% | 07/07/15 | 10,000,000 | 10,000,000 | ||
| M/F Housing RB (Fairway Family Apts) Series 2006H (LOC: Fannie Mae) | 0.07% | 07/07/15 | 7,000,000 | 7,000,000 | ||
| M/F Housing RB (Hallmark House Apts) Series 2003ZZ (LOC: Fannie Mae) | 0.07% | 07/07/15 | 6,420,000 | 6,420,000 | ||
| M/F Housing RB (Heritage II Apts) Series 2014G (LOC: Federal Home Loan Bank) | 0.07% | 07/07/15 | 7,100,000 | 7,100,000 | ||
| M/F Housing RB (Heritage Oaks Apts) Series 2004YY (LOC: Fannie Mae) | 0.07% | 07/07/15 | 6,900,000 | 6,900,000 | ||
| M/F Housing RB (Knolls at Green Valley Apts) Series 2002FF (LOC: Fannie Mae) | 0.07% | 07/07/15 | 13,205,000 | 13,205,000 | ||
| M/F Housing RB (Las Flores Village Apts) Series 2004JJ (LOC: Freddie Mac) | 0.10% | 07/07/15 | 13,500,000 | 13,500,000 | ||
| M/F Housing RB (Laurel Park Sr Apts) Series 2002H (LOC: Freddie Mac) | 0.07% | 07/07/15 | 5,500,000 | 5,500,000 | ||
| Issuer
Type of Security, Series |
Footnotes | Rate | Effective
Maturity |
Maturity
Date |
Face
Amount ($) |
Value
($) |
| M/F Housing RB (Los Padres Apts) Series 2003E (LOC: Fannie Mae) | 0.07% | 07/07/15 | 10,750,000 | 10,750,000 | ||
| M/F Housing RB (Martin Luther Tower) Series 2005D (LOC: Fannie Mae) | 0.07% | 07/07/15 | 7,150,000 | 7,150,000 | ||
| M/F Housing RB (Oak Center Towers) Series 2005L (LOC: Fannie Mae) | 0.08% | 07/07/15 | 3,420,000 | 3,420,000 | ||
| M/F Housing RB (Oakmont of Concord) Series 2002Q (LOC: Fannie Mae) | 0.07% | 07/07/15 | 16,650,000 | 16,650,000 | ||
| M/F Housing RB (Park David Sr Apts) Series 1999D (LOC: Fannie Mae) | 0.09% | 07/07/15 | 8,220,000 | 8,220,000 | ||
| M/F Housing RB (Plaza Club Apts) Series 1997A (LOC: Fannie Mae) | 0.09% | 07/07/15 | 13,390,000 | 13,390,000 | ||
| M/F Housing RB (Rancho Santa Fe Village Apts) Series 2004EE (LOC: Freddie Mac) | 0.10% | 07/07/15 | 12,300,000 | 12,300,000 | ||
| M/F Housing RB (Sagewood At Stonebridge Estates) Series 2005CC (LOC: Fannie Mae) | 0.09% | 07/07/15 | 9,100,000 | 9,100,000 | ||
| M/F Housing RB (Stoneridge at Elk Grove) Series 2005Q (LOC: Citibank, NA) | 0.09% | 07/07/15 | 6,440,000 | 6,440,000 | ||
| M/F Housing Refunding RB (Arbor Ridge Apts) Series 2008B (LOC: Freddie Mac) | 0.09% | 07/07/15 | 16,405,000 | 16,405,000 | ||
| M/F Housing Refunding RB (Brandon Place Apts) Series 2006D (LOC: Fannie Mae) | 0.09% | 07/07/15 | 6,070,000 | 6,070,000 | ||
| M/F Housing Refunding RB (Kelvin Court) Series 2012B (LOC: Fannie Mae) | 0.12% | 07/07/15 | 12,750,000 | 12,750,000 | ||
| M/F Housing Refunding RB (Mariners Pointe Apts) Series 2006A (LOC: Fannie Mae) | 0.07% | 07/07/15 | 6,500,000 | 6,500,000 | ||
| M/F Housing Refunding RB (The Alexandria) Series 2013A (LOC: Federal Home Loan Bank) | 0.08% | 07/07/15 | 17,000,000 | 17,000,000 | ||
| RB (Kaiser Permanente) Series 2006B (GTY: Berkshire Hathaway Assurance Corp /LIQ: Citibank, NA) | a | 0.08% | 07/07/15 | 4,950,000 | 4,950,000 | |
| RB (Plan Nine Partners) Series 2005A (LOC: MUFG Union Bank, NA) | 0.09% | 07/07/15 | 5,300,000 | 5,300,000 | ||
| RB (Sutter Health) Series 2005C (LIQ: Citibank, NA) | a | 0.08% | 07/07/15 | 6,300,000 | 6,300,000 | |
| Refunding RB (Trinity Health) Series 2011CA (LIQ: Citibank, NA) | a | 0.07% | 07/07/15 | 2,175,000 | 2,175,000 | |
| Chula Vista | ||||||
| Refunding IDRB (SDG&E) Series 2004E (GTY/LIQ: Wells Fargo & Co) | a | 0.09% | 07/07/15 | 9,995,000 | 9,995,000 | |
| Coast CCD | ||||||
| GO Bonds Series 2006B (LIQ: Deutsche Bank AG) | a | 0.12% | 07/07/15 | 24,875,000 | 24,875,000 | |
| Contra Costa CCD | ||||||
| GO Bonds Series 2013 (LIQ: Citibank, NA) | a | 0.08% | 07/07/15 | 7,800,000 | 7,800,000 | |
| GO Bonds Series 2013 (LIQ: State Street Bank & Trust Co NA) | a | 0.07% | 07/07/15 | 7,500,000 | 7,500,000 | |
| Contra Costa Cnty | ||||||
| M/F Housing RB (Creekview Apts) Series 2003B (LOC: Freddie Mac) | 0.07% | 07/07/15 | 32,200,000 | 32,200,000 | ||
| Dublin Housing Auth | ||||||
| M/F Housing RB (Park Sierra) Series 1998A (LOC: Freddie Mac) | 0.07% | 07/07/15 | 28,700,000 | 28,700,000 | ||
| Dublin USD | ||||||
| GO Bonds Series 2004E (LIQ: Wells Fargo & Co) | a | 0.09% | 07/07/15 | 37,150,000 | 37,150,000 | |
| East Bay Municipal Utility District | ||||||
| Water System RB Series 2014C (LIQ: JPMorgan Chase Bank, NA) | a | 0.08% | 07/07/15 | 1,830,000 | 1,830,000 | |
| Water System Refunding RB Series 2008A2 (LIQ: US Bank, NA) | b | 0.05% | 07/07/15 | 260,000 | 260,000 | |
| Water System Refunding RB Series 2008A4 (LIQ: Wells Fargo Bank, NA) | 0.06% | 07/07/15 | 19,765,000 | 19,765,000 | ||
| Issuer
Type of Security, Series |
Footnotes | Rate | Effective
Maturity |
Maturity
Date |
Face
Amount ($) |
Value
($) |
| Water System Sub RB Series 2005A (LIQ: Citibank, NA) | a | 0.08% | 07/07/15 | 35,000,000 | 35,000,000 | |
| Water System Sub Refunding RB Series 2012A (LIQ: Citibank, NA) | a,d | 0.08% | 07/07/15 | 49,500,000 | 49,500,000 | |
| Eastern Municipal Water District | ||||||
| Refunding Water & Sewer RB Series 2012A | 0.11% | 07/02/15 | 05/05/16 | 17,500,000 | 17,500,000 | |
| El Camino Hospital District | ||||||
| GO Bonds Series 2006 (LIQ: Deutsche Bank AG) | a | 0.20% | 07/07/15 | 8,835,000 | 8,835,000 | |
| Elsinore Valley Municipal Water District | ||||||
| Refunding COP Series 2011A (LOC: MUFG Union Bank, NA) | 0.08% | 07/07/15 | 15,270,000 | 15,270,000 | ||
| Emeryville Redevelopment Agency | ||||||
| M/F Housing RB (Bay St Apts) Series 2002A (LOC: Fannie Mae) | d | 0.09% | 07/07/15 | 57,715,000 | 57,715,000 | |
| Escondido | ||||||
| M/F Housing RB (Via Roble Apts) Series 2003A (LOC: Fannie Mae) | 0.08% | 07/07/15 | 6,900,000 | 6,900,000 | ||
| Foothill-DeAnza CCD | ||||||
| GO Bonds Series B (LIQ: Deutsche Bank AG) | a | 0.12% | 07/07/15 | 16,830,000 | 16,830,000 | |
| GO Bonds Series C (LIQ: Branch Banking & Trust Co) | a | 0.08% | 07/07/15 | 28,300,000 | 28,300,000 | |
| GO Bonds Series C (LIQ: Citibank, NA) | a | 0.07% | 07/07/15 | 4,500,000 | 4,500,000 | |
| Grossmont Healthcare District | ||||||
| GO Bonds Series 2011B (LIQ: Credit Suisse AG) | a | 0.07% | 07/07/15 | 8,200,000 | 8,200,000 | |
| Hartnell CCD | ||||||
| GO Bonds Series D (GTY/LIQ: Wells Fargo & Co) | a | 0.09% | 07/07/15 | 16,825,000 | 16,825,000 | |
| Hayward | ||||||
| M/F Housing RB (Lord Tennyson Apts) Series 2005A (LOC: Freddie Mac) | 0.10% | 07/07/15 | 13,915,000 | 13,915,000 | ||
| M/F Housing RB (Timbers Apts) Series 1998A (LOC: Fannie Mae) | 0.09% | 07/07/15 | 9,500,000 | 9,500,000 | ||
| Huntington Beach | ||||||
| M/F Housing RB (Five Points Seniors) Series 1991A (LOC: Fannie Mae) | 0.09% | 07/07/15 | 4,200,000 | 4,200,000 | ||
| Irvine Ranch Water District | ||||||
| Refunding Bonds Series 2011A1 | 0.10% | 07/02/15 | 03/15/16 | 15,600,000 | 15,600,000 | |
| Refunding Bonds Series 2011A2 | 0.10% | 07/02/15 | 03/15/16 | 9,000,000 | 9,000,000 | |
| Kings Cnty Housing Auth | ||||||
| M/F Housing Refunding RB (Edgewater Isle Apts) Series 2001A (LOC: Fannie Mae) | 0.07% | 07/07/15 | 2,105,000 | 2,105,000 | ||
| Long Beach CCD | ||||||
| GO Bonds Series 2007D (LIQ: Wells Fargo & Co) | a | 0.09% | 07/07/15 | 25,035,000 | 25,035,000 | |
| GO Bonds Series 2008A (LIQ: Deutsche Bank AG) | a | 0.17% | 07/07/15 | 11,351,000 | 11,351,000 | |
| Long Beach USD | ||||||
| GO Bonds Series A (LIQ: Deutsche Bank AG) | a | 0.22% | 07/07/15 | 6,665,000 | 6,665,000 | |
| GO Refunding Bonds 2012 (LIQ: Credit Suisse AG) | a | 0.07% | 07/07/15 | 7,750,000 | 7,750,000 | |
| Los Angeles | ||||||
| M/F Housing Refunding RB (Asbury Apts) Series 2003A (LOC: Citibank, NA) | 0.13% | 07/07/15 | 4,660,000 | 4,660,000 | ||
| Wastewater System RB (Green Bonds) Series 2015A (LIQ: JPMorgan Chase Bank, NA) | a | 0.08% | 07/07/15 | 2,510,000 | 2,510,000 | |
| Wastewater System Refunding RB Series 2005A (LIQ: Citibank, NA) | a | 0.08% | 07/07/15 | 1,375,000 | 1,375,000 | |
| Wastewater System Refunding RB Series 2005A (LIQ: Citibank, NA) | a | 0.10% | 07/07/15 | 2,785,000 | 2,785,000 | |
| Wastewater System Sub Refunding RB Series 2012B (LIQ: Credit Suisse AG) | a | 0.07% | 07/07/15 | 6,665,000 | 6,665,000 | |
| Los Angeles CCD | ||||||
| GO Bonds Series 2007A (LIQ: Citibank, NA) | a | 0.09% | 07/07/15 | 3,000,000 | 3,000,000 | |
| GO Bonds Series 2007A (LIQ: JPMorgan Chase Bank, NA) | a | 0.09% | 07/07/15 | 16,535,000 | 16,535,000 | |
| Issuer
Type of Security, Series |
Footnotes | Rate | Effective
Maturity |
Maturity
Date |
Face
Amount ($) |
Value
($) |
| GO Bonds Series 2007A (LIQ: Morgan Stanley Bank NA) | a | 0.08% | 07/07/15 | 5,225,000 | 5,225,000 | |
| GO Bonds Series 2008F1 (LIQ: JPMorgan Chase Bank, NA) | a | 0.09% | 07/07/15 | 6,665,000 | 6,665,000 | |
| Los Angeles Cnty Housing Auth | ||||||
| M/F Housing RB (Canyon Country Villas) Series 1985H (LOC: Freddie Mac) | 0.07% | 07/07/15 | 11,000,000 | 11,000,000 | ||
| M/F Housing RB (Castaic Sr Apts) Series 2003C (LOC: Fannie Mae) | 0.07% | 07/07/15 | 9,300,000 | 9,300,000 | ||
| M/F Housing Refunding RB (Diamond Park Apts) Series 2010B (LOC: Freddie Mac) | 0.09% | 07/07/15 | 14,200,000 | 14,200,000 | ||
| M/F Housing Refunding RB (Malibu Meadows) Series 1998B (LOC: Fannie Mae) | 0.06% | 07/07/15 | 14,550,000 | 14,550,000 | ||
| M/F Housing Refunding RB (Sand Canyon Villas) Series 2010C (LOC: Freddie Mac) | 0.09% | 07/07/15 | 17,000,000 | 17,000,000 | ||
| Los Angeles Community Redevelopment Agency | ||||||
| M/F Housing RB (Academy Village Apts) Series 1989A (LOC: Freddie Mac) | 0.06% | 07/07/15 | 13,800,000 | 13,800,000 | ||
| M/F Housing RB (Security Building) Series 2001A (LOC: Fannie Mae) | 0.09% | 07/07/15 | 3,955,000 | 3,955,000 | ||
| Los Angeles Dept of Airports | ||||||
| Airport Sr RB Series 2008A (LIQ: JPMorgan Chase Bank, NA) | a | 0.11% | 07/07/15 | 19,295,000 | 19,295,000 | |
| Airport Sr RB Series 2008A (LIQ: Morgan Stanley Bank NA) | a | 0.14% | 07/07/15 | 13,475,000 | 13,475,000 | |
| Airport Sr RB Series 2010A (LIQ: Bank of America, NA) | a | 0.07% | 07/07/15 | 10,095,000 | 10,095,000 | |
| Airport Sr RB Series 2010A (LIQ: Barclays Bank Plc) | a | 0.11% | 07/07/15 | 5,085,000 | 5,085,000 | |
| Airport Sr RB Series 2010A (LIQ: Royal Bank of Canada) | a | 0.07% | 07/07/15 | 8,665,000 | 8,665,000 | |
| Airport Sr RB Series 2010A&D (LIQ: Barclays Bank Plc) | a | 0.11% | 07/07/15 | 6,630,000 | 6,630,000 | |
| Airport Sr RB Series 2010D (LIQ: JPMorgan Chase Bank, NA) | a | 0.08% | 07/07/15 | 6,665,000 | 6,665,000 | |
| Airport Sr RB Series 2012B (LIQ: Morgan Stanley Bank NA) | a | 0.08% | 07/07/15 | 4,165,000 | 4,165,000 | |
| Airport Sr RB Series 2015A (LIQ: Morgan Stanley Bank NA) | a | 0.14% | 07/07/15 | 9,500,000 | 9,500,000 | |
| Los Angeles Dept of Water & Power | ||||||
| Power System RB Series 2001B5 (LIQ: Bank of Montreal) | 0.06% | 07/07/15 | 24,500,000 | 24,500,000 | ||
| Power System RB Series 2001B8 (LIQ: Bank of Montreal) | 0.06% | 07/07/15 | 6,000,000 | 6,000,000 | ||
| Power System RB Series 2002A1 (LIQ: Bank of America, NA) | 0.06% | 07/07/15 | 10,000,000 | 10,000,000 | ||
| Power System RB Series 2002A4 (LIQ: Bank of America, NA) | 0.05% | 07/07/15 | 19,250,000 | 19,250,000 | ||
| Power System RB Series 2002A5 (LIQ: Citibank, NA) | 0.05% | 07/07/15 | 5,000,000 | 5,000,000 | ||
| Power System RB Series 2002A6 (LIQ: Bank of America, NA) | 0.07% | 07/07/15 | 12,600,000 | 12,600,000 | ||
| Power System RB Series 2007A1 (LIQ: JPMorgan Chase Bank, NA) | a | 0.08% | 07/07/15 | 14,855,000 | 14,855,000 | |
| Power System RB Series 2012B, 2014B&E (LIQ: Morgan Stanley Bank NA) | a | 0.07% | 07/07/15 | 15,360,000 | 15,360,000 | |
| Power System RB Series 2013B (LIQ: JPMorgan Chase Bank, NA) | a | 0.08% | 07/07/15 | 2,500,000 | 2,500,000 | |
| Water System RB Series 2006A (LIQ: Citibank, NA) | a | 0.08% | 07/07/15 | 35,110,000 | 35,110,000 | |
| Water System RB Series 2006A1 (LIQ: Citibank, NA) | a | 0.08% | 07/07/15 | 17,500,000 | 17,500,000 | |
| Water System RB Series 2011A (LIQ: State Street Bank & Trust Co NA) | a | 0.07% | 07/07/15 | 17,565,000 | 17,565,000 | |
| Water System RB Series 2012A (LIQ: JPMorgan Chase Bank, NA) | a | 0.08% | 07/07/15 | 3,665,000 | 3,665,000 | |
| Water System RB Series 2012A (LIQ: Royal Bank of Canada) | a | 0.07% | 07/07/15 | 12,000,000 | 12,000,000 | |
| Water System RB Series 2012B (LIQ: Citibank, NA) | a | 0.09% | 07/07/15 | 12,375,000 | 12,375,000 | |
| Water System RB Series 2012B (LIQ: JPMorgan Chase Bank, NA) | a | 0.08% | 07/07/15 | 5,000,000 | 5,000,000 | |
| Water System RB Series 2012B (LIQ: Morgan Stanley Bank NA) | a | 0.08% | 07/07/15 | 10,900,000 | 10,900,000 | |
| Water System RB Series 2014A (LIQ: Morgan Stanley Bank NA) | a | 0.08% | 07/07/15 | 4,000,000 | 4,000,000 | |
| Issuer
Type of Security, Series |
Footnotes | Rate | Effective
Maturity |
Maturity
Date |
Face
Amount ($) |
Value
($) |
| Los Angeles Harbor Dept | ||||||
| RB Series 2009B (LIQ: Wells Fargo & Co) | a | 0.09% | 07/07/15 | 9,725,000 | 9,725,000 | |
| Refunding RB Series 2006B (LIQ: Citibank, NA) | a | 0.12% | 07/07/15 | 16,120,000 | 16,120,000 | |
| Los Angeles IDA | ||||||
| IDRB (KH Enterprises) Series 2008 (LOC: Bank of the West) | 0.16% | 07/07/15 | 1,410,000 | 1,410,000 | ||
| RB (AAA Packing & Shipping) Series 2000 (LOC: Wells Fargo Bank, NA) | 0.11% | 07/07/15 | 3,000,000 | 3,000,000 | ||
| Los Angeles Municipal Improvement Corp | ||||||
| Lease RB Series 2006A (GTY/LIQ: Wells Fargo & Co) | a | 0.09% | 07/07/15 | 70,000 | 70,000 | |
| Los Angeles USD | ||||||
| GO Bonds Series 2005E (LIQ: JPMorgan Chase Bank, NA) | a | 0.08% | 07/07/15 | 13,435,000 | 13,435,000 | |
| GO Bonds Series 2007B & Refunding Series 2007B (LIQ: State Street Bank & Trust Co NA) | a | 0.07% | 07/07/15 | 7,290,000 | 7,290,000 | |
| GO Bonds Series 2009I (LIQ: JPMorgan Chase Bank, NA) | a | 0.08% | 07/07/15 | 6,890,000 | 6,890,000 | |
| Monterey Peninsula Water Management District | ||||||
| COP (Wastewater Reclamation) Series 1992 (LOC: Wells Fargo Bank, NA) | 0.08% | 07/07/15 | 1,450,000 | 1,450,000 | ||
| Orange Cnty | ||||||
| Airport RB Series 2009B (LIQ: Morgan Stanley Bank NA) | a | 0.08% | 07/07/15 | 6,520,000 | 6,520,000 | |
| Orange Cnty Housing Auth | ||||||
| RB (Lantern Pines Apts) Series 1985CC (LOC: Fannie Mae) | 0.08% | 07/07/15 | 4,895,000 | 4,895,000 | ||
| Refunding RB (Villa La Paz) Series 1998F (LOC: Fannie Mae) | 0.08% | 07/07/15 | 9,900,000 | 9,900,000 | ||
| Orange Cnty Sanitation District | ||||||
| Wastewater Refunding Revenue Obligations Series 2015A (LIQ: Citibank, NA) | a | 0.08% | 07/07/15 | 8,000,000 | 8,000,000 | |
| Oxnard Financing Auth | ||||||
| Lease RB Series 2003B (LOC: MUFG Union Bank, NA) | 0.05% | 07/07/15 | 10,295,000 | 10,295,000 | ||
| Lease RB Series 2006 (LOC: MUFG Union Bank, NA) | d | 0.05% | 07/07/15 | 19,675,000 | 19,675,000 | |
| Wastewater RB Series 2004B (LOC: MUFG Union Bank, NA) | 0.05% | 07/07/15 | 17,745,000 | 17,745,000 | ||
| Palomar CCD | ||||||
| GO Bonds Series C (LIQ: Morgan Stanley Bank NA) | a | 0.08% | 07/07/15 | 30,280,000 | 30,280,000 | |
| Pasadena | ||||||
| Refunding COP Series 2008A (LOC: Bank of America, NA) | 0.10% | 07/07/15 | 13,600,000 | 13,600,000 | ||
| Petaluma | ||||||
| M/F Housing RB (Oakmont) Series 1996A (LOC: US Bank, NA) | 0.10% | 07/07/15 | 2,450,000 | 2,450,000 | ||
| Pinole Redevelopment Agency | ||||||
| M/F Housing RB (East Bluff Apts) Series 1998A (LOC: Comerica Bank) | 0.15% | 07/07/15 | 4,959,000 | 4,959,000 | ||
| Pittsburg Public Financing Auth | ||||||
| Water Refunding RB Series 2008 (LOC: Bank of the West) | 0.08% | 07/07/15 | 7,445,000 | 7,445,000 | ||
| Pittsburg Redevelopment Agency | ||||||
| Sub Tax Allocation Bonds (Los Medanos) Series 2004A (LOC: State Street Bank & Trust Co NA; Cal St Teachers Retirement Sys) | 0.03% | 07/01/15 | 10,275,000 | 10,275,000 | ||
| Placer Cnty Water Agency | ||||||
| Second Sr Water Revenue COP Series 2007 (GTY/LIQ: Wells Fargo & Co) | a | 0.08% | 07/07/15 | 15,555,000 | 15,555,000 | |
| Pleasanton | ||||||
| M/F Housing RB (Busch Sr Housing) Series 2003A (LOC: Fannie Mae) | 0.07% | 07/07/15 | 13,360,000 | 13,360,000 | ||
| Pomona Public Financing Auth | ||||||
| Water Facilities RB Series 2007AY (GTY/LIQ: US Bank, NA) | a | 0.08% | 07/07/15 | 8,825,000 | 8,825,000 | |
| Poway USD | ||||||
| GO Bonds Series 2008B (LIQ: Morgan Stanley Bank NA) | a | 0.08% | 07/07/15 | 10,000,000 | 10,000,000 | |
| Issuer
Type of Security, Series |
Footnotes | Rate | Effective
Maturity |
Maturity
Date |
Face
Amount ($) |
Value
($) |
| Redondo Beach Redevelopment Agency | ||||||
| M/F Housing Refunding RB (Heritage Pointe Apts) Series 2004A (LOC: Fannie Mae) | 0.09% | 07/07/15 | 10,890,000 | 10,890,000 | ||
| Richmond | ||||||
| Wastewater Refunding RB Series 2008A (LOC: MUFG Union Bank, NA) | 0.05% | 07/07/15 | 7,000,000 | 7,000,000 | ||
| Riverside | ||||||
| Electric Refunding RB Series 2008A (LOC: Barclays Bank Plc) | 0.05% | 07/07/15 | 40,000,000 | 40,000,000 | ||
| Riverside CCD | ||||||
| GO Bonds Series 2007C (LIQ: Bank of America, NA) | a | 0.15% | 07/07/15 | 5,940,000 | 5,940,000 | |
| Riverside Cnty Transportation Commission | ||||||
| Sales Tax RB Series 2009A (LIQ: Bank of Tokyo Mitsubishi UFJ, Ltd) | 0.07% | 07/07/15 | 7,600,000 | 7,600,000 | ||
| Sales Tax RB Series 2009C (LIQ: Bank of Tokyo Mitsubishi UFJ, Ltd) | 0.06% | 07/07/15 | 10,765,000 | 10,765,000 | ||
| Sales Tax RB Series 2013A (LIQ: Citibank, NA) | a | 0.08% | 07/07/15 | 1,675,000 | 1,675,000 | |
| Sales Tax RB Series 2013A (LIQ: JPMorgan Chase Bank, NA) | a | 0.08% | 07/07/15 | 8,240,000 | 8,240,000 | |
| Roseville Jt UHSD | ||||||
| GO Bonds Series C (LIQ: Deutsche Bank AG) | a | 0.17% | 07/07/15 | 8,835,000 | 8,835,000 | |
| Sacramento Cnty Housing Auth | ||||||
| M/F Housing RB (Arlington Creek Apts) Series 2001I (LOC: Fannie Mae) | 0.07% | 07/07/15 | 10,000,000 | 10,000,000 | ||
| M/F Housing RB (Ashford Heights Apts) Series 2006H (LOC: Fannie Mae) | 0.07% | 07/07/15 | 12,255,000 | 12,255,000 | ||
| M/F Housing RB (Carlton Plaza Sr Apts) Series 2003E (LOC: Fannie Mae) | 0.09% | 07/07/15 | 14,000,000 | 14,000,000 | ||
| M/F Housing RB (Hastings Park Apts) Series 2004G (LOC: Fannie Mae) | 0.07% | 07/07/15 | 16,500,000 | 16,500,000 | ||
| M/F Housing RB (Logan Park Apts) Series 2007E (LOC: Freddie Mac) | 0.09% | 07/07/15 | 41,800,000 | 41,800,000 | ||
| M/F Housing RB (Normandy Park Sr Apts) Series 2000A (LOC: Fannie Mae) | 0.07% | 07/07/15 | 6,000,000 | 6,000,000 | ||
| M/F Housing RB (Sierra Sunrise Sr Apts) Series 2004D (LOC: Citibank, NA) | 0.08% | 07/07/15 | 4,466,000 | 4,466,000 | ||
| M/F Housing Refunding RB (Chesapeake Commons Apts) Series 2001C (LOC: Fannie Mae) | 0.08% | 07/07/15 | 16,345,000 | 16,345,000 | ||
| Sacramento Cnty Sanitation District Financing Auth | ||||||
| Sub Lien Refunding RB Series 2013A (GTY/LIQ: Royal Bank of Canada) | a | 0.07% | 07/07/15 | 29,945,000 | 29,945,000 | |
| Sacramento Housing Auth | ||||||
| M/F Housing RB (Atrium Court Apts) 2002G (LOC: Fannie Mae) | 0.09% | 07/07/15 | 17,200,000 | 17,200,000 | ||
| M/F Housing RB (Greenfair Apts) Series 2000G (LOC: Citibank, NA) | 0.08% | 07/07/15 | 9,400,000 | 9,400,000 | ||
| M/F Housing RB (Hurley Creek Sr Apts) Series 2006E (LOC: Freddie Mac) | 0.07% | 07/07/15 | 10,265,000 | 10,265,000 | ||
| M/F Housing RB (St Anton Building Apts) Series 2003I (LOC: Fannie Mae) | 0.07% | 07/07/15 | 8,000,000 | 8,000,000 | ||
| M/F Housing RB (Valencia Point Apts) Series 2006I (LOC: Fannie Mae) | 0.07% | 07/07/15 | 5,150,000 | 5,150,000 | ||
| Sacramento Municipal Utility District | ||||||
| Electric Sub RB Series 2012M (LOC: State Street Bank & Trust Co NA) | 0.06% | 07/07/15 | 3,000,000 | 3,000,000 | ||
| Sub Electric Refunding RB Series 2008J (LOC: Bank of America, NA) | d | 0.07% | 07/07/15 | 51,200,000 | 51,200,000 | |
| Issuer
Type of Security, Series |
Footnotes | Rate | Effective
Maturity |
Maturity
Date |
Face
Amount ($) |
Value
($) |
| Sacramento Suburban Water District | ||||||
| Refunding Revenue COP Series 2009A (LOC: Sumitomo Mitsui Banking Corp) | 0.06% | 07/07/15 | 6,000,000 | 6,000,000 | ||
| Sacramento Transportation Auth | ||||||
| Sales Tax Refunding RB Series 2015A (LIQ: Mizuho Bank Ltd) | 0.05% | 07/07/15 | 20,100,000 | 20,100,000 | ||
| San Bernardino CCD | ||||||
| GO Bonds Series C (LIQ: Citibank, NA) | a | 0.27% | 07/07/15 | 7,500,000 | 7,500,000 | |
| GO Refunding Bonds Series 2013A (LIQ: Credit Suisse AG) | a | 0.07% | 07/07/15 | 8,000,000 | 8,000,000 | |
| San Bernardino Cnty Transportation Auth | ||||||
| Sales Tax RB Series 2014A (LIQ: Citibank, NA) | a | 0.08% | 07/07/15 | 8,300,000 | 8,300,000 | |
| San Diego CCD | ||||||
| GO Bonds Series 2007 (LIQ: JPMorgan Chase Bank, NA) | a | 0.09% | 07/07/15 | 4,000,000 | 4,000,000 | |
| GO Bonds Series 2009 (LIQ: Citibank, NA) | a | 0.08% | 07/07/15 | 3,125,000 | 3,125,000 | |
| San Diego Cnty | ||||||
| COP (San Diego Jewish Academy) Series 2003 (LOC: Comerica Bank) | 0.07% | 07/07/15 | 4,175,000 | 4,175,000 | ||
| San Diego Cnty Regional Transportation Commission | ||||||
| Sales Tax RB Series 2008A (LIQ: JPMorgan Chase Bank, NA) | 0.07% | 07/07/15 | 12,200,000 | 12,200,000 | ||
| Sales Tax RB Series 2008B (LIQ: JPMorgan Chase Bank, NA) | 0.05% | 07/07/15 | 14,310,000 | 14,310,000 | ||
| San Diego Cnty Water Auth | ||||||
| Water Revenue COP Series 2008A (LIQ: Citibank, NA) | a | 0.07% | 07/07/15 | 33,580,000 | 33,580,000 | |
| Water Revenue COP Series 2008A (LIQ: JPMorgan Chase Bank, NA) | a | 0.08% | 07/07/15 | 5,810,000 | 5,810,000 | |
| San Diego Housing Auth | ||||||
| M/F Housing RB (Hillside Garden Apts) Series 2004B (LOC: Fannie Mae) | 0.07% | 07/07/15 | 25,595,000 | 25,595,000 | ||
| M/F Mortgage Refunding RB (Creekside Villa Apts) Series 1999B (LOC: Fannie Mae) | 0.08% | 07/07/15 | 5,525,000 | 5,525,000 | ||
| San Francisco | ||||||
| Refunding COP Series 2010A (LIQ: Morgan Stanley Bank NA) | a | 0.09% | 07/07/15 | 3,325,000 | 3,325,000 | |
| San Francisco Airport Commission | ||||||
| Refunding RB Second Series 36A (LOC: US Bank, NA) | 0.06% | 07/07/15 | 25,000,000 | 25,000,000 | ||
| Refunding RB Second Series 36B (LOC: Bank of Tokyo Mitsubishi UFJ, Ltd) | 0.06% | 07/07/15 | 3,790,000 | 3,790,000 | ||
| Refunding RB Second Series 36C (LOC: Bank of Tokyo Mitsubishi UFJ, Ltd) | 0.06% | 07/07/15 | 13,570,000 | 13,570,000 | ||
| San Francisco Bay Area Rapid Transit District | ||||||
| Sales Tax Refunding RB Series 2005A (LIQ: JPMorgan Chase Bank, NA) | a | 0.08% | 07/07/15 | 6,360,000 | 6,360,000 | |
| Sales Tax Refunding RB Series 2006A (LIQ: JPMorgan Chase Bank, NA) | a | 0.08% | 07/07/15 | 6,130,000 | 6,130,000 | |
| San Francisco Finance Corp | ||||||
| Lease Refunding RB Series 2008-1 (LOC: State Street Bank & Trust Co NA) | 0.06% | 07/07/15 | 10,750,000 | 10,750,000 | ||
| Lease Refunding RB Series 2008-2 (LOC: State Street Bank & Trust Co NA) | 0.07% | 07/07/15 | 7,775,000 | 7,775,000 | ||
| San Francisco Housing Auth | ||||||
| M/F Housing Refunding RB (Valencia Gardens) Series 2004 (LOC: Citibank, NA) | 0.10% | 07/07/15 | 6,580,000 | 6,580,000 | ||
| San Francisco Municipal Transportation Agency | ||||||
| RB Series 2014 (LIQ: JPMorgan Chase Bank, NA) | a | 0.12% | 07/07/15 | 5,000,000 | 5,000,000 | |
| San Francisco Public Utilities Commission | ||||||
| Water RB 2011 & 2012A (LIQ: State Street Bank & Trust Co NA) | a | 0.08% | 07/07/15 | 4,555,000 | 4,555,000 | |
| Water RB 2012A (LIQ: Morgan Stanley Bank NA) | a | 0.08% | 07/07/15 | 6,665,000 | 6,665,000 | |
| Issuer
Type of Security, Series |
Footnotes | Rate | Effective
Maturity |
Maturity
Date |
Face
Amount ($) |
Value
($) |
| San Francisco Redevelopment Agency | ||||||
| M/F Housing Refunding RB (Fillmore Center) Series 1992A1 (LOC: Freddie Mac) | 0.08% | 07/07/15 | 30,100,000 | 30,100,000 | ||
| M/F Housing Refunding RB (Fillmore Center) Series 1992A2 (LOC: Freddie Mac) | 0.09% | 07/07/15 | 3,750,000 | 3,750,000 | ||
| San Jose | ||||||
| M/F Housing RB (Pollard Plaza Apts) Series 2002D (LOC: Freddie Mac) | 0.08% | 07/07/15 | 6,495,000 | 6,495,000 | ||
| M/F Housing RB (Villa Monterey Apts) Series 2002F (LOC: Fannie Mae) | 0.08% | 07/07/15 | 2,000,000 | 2,000,000 | ||
| San Jose-Evergreen CCD | ||||||
| GO Bonds Series A (LIQ: Citibank, NA) | a | 0.08% | 07/07/15 | 3,980,000 | 3,980,000 | |
| San Marcos Redevelopment Agency | ||||||
| M/F Housing RB (Grandon Village) Series 2002A (LOC: Freddie Mac) | 0.10% | 07/07/15 | 13,390,000 | 13,390,000 | ||
| San Marcos USD | ||||||
| GO Bonds Series C (LIQ: Morgan Stanley Bank NA) | a | 0.08% | 07/07/15 | 6,665,000 | 6,665,000 | |
| San Mateo Cnty CCD | ||||||
| GO Bonds Series 2005B (LIQ: Wells Fargo & Co) | a | 0.08% | 07/07/15 | 10,795,000 | 10,795,000 | |
| GO Bonds Series 2005B&2006A (LIQ: Wells Fargo & Co) | a | 0.07% | 07/07/15 | 18,775,000 | 18,775,000 | |
| GO Bonds Series 2015A (LIQ: Morgan Stanley Bank NA) | a | 0.08% | 07/07/15 | 8,810,000 | 8,810,000 | |
| San Mateo Cnty Jt Powers Financing Auth | ||||||
| Lease Refunding RB Series 2013A (LIQ: Barclays Bank Plc) | a | 0.11% | 07/07/15 | 10,780,000 | 10,780,000 | |
| Santa Clara Cnty Financing Auth | ||||||
| Lease RB Series 2007K (GTY/LIQ: US Bank, NA) | a | 0.08% | 07/07/15 | 47,050,000 | 47,050,000 | |
| Santa Clara Cnty Housing Auth | ||||||
| M/F Housing RB (Monte Vista Terrace Apts) Series 2005C (LOC: MUFG Union Bank, NA) | 0.14% | 07/07/15 | 8,729,000 | 8,729,000 | ||
| M/F Housing Refunding RB (Willows Apts) Series 2005A (LOC: MUFG Union Bank, NA) | 0.09% | 07/07/15 | 3,981,000 | 3,981,000 | ||
| Santa Clara Valley Transportation Auth | ||||||
| Sales Tax Refunding RB Series 2007A (LIQ: Citibank, NA) | a | 0.07% | 07/07/15 | 2,500,000 | 2,500,000 | |
| Sales Tax Refunding RB Series 2008A (LIQ: Sumitomo Mitsui Banking Corp) | 0.04% | 07/07/15 | 6,915,000 | 6,915,000 | ||
| Sales Tax Refunding RB Series 2008C (LIQ: Sumitomo Mitsui Banking Corp) | 0.05% | 07/07/15 | 21,175,000 | 21,175,000 | ||
| Sales Tax Refunding RB Series 2008D (LIQ: Sumitomo Mitsui Banking Corp) | 0.07% | 07/07/15 | 8,000,000 | 8,000,000 | ||
| Sausalito | ||||||
| M/F Housing RB (Rotary Village) Series 2003 (LOC: Bank of the West) | 0.10% | 07/07/15 | 1,930,000 | 1,930,000 | ||
| Southern California Metropolitan Water District | ||||||
| Water RB Series 2000B3 (LIQ: Wells Fargo Bank, NA) | 0.01% | 07/01/15 | 2,700,000 | 2,700,000 | ||
| Water RB Series 2000B4 (LIQ: Wells Fargo Bank, NA) | 0.06% | 07/07/15 | 9,500,000 | 9,500,000 | ||
| Water RB Series 2005C (LIQ: Citibank, NA) | a,d | 0.08% | 07/07/15 | 24,750,000 | 24,750,000 | |
| Water RB Series 2006A (LIQ: JPMorgan Chase Bank, NA) | a | 0.08% | 07/07/15 | 5,590,000 | 5,590,000 | |
| Water Refunding RB Series 2009A2 | d | 0.12% | 07/02/15 | 01/11/16 | 50,000,000 | 50,000,000 |
| Water Refunding RB Series 2011A1 | 0.09% | 07/02/15 | 01/04/16 | 32,000,000 | 32,000,000 | |
| Water Refunding RB Series 2011A3 | 0.09% | 07/02/15 | 01/04/16 | 32,000,000 | 32,000,000 | |
| Water Refunding RB Series 2013E | d | 0.14% | 07/02/15 | 01/29/16 | 52,000,000 | 52,000,000 |
| Water Refunding RB Series 2014D | 0.05% | 07/07/15 | 7,100,000 | 7,100,000 | ||
| Issuer
Type of Security, Series |
Footnotes | Rate | Effective
Maturity |
Maturity
Date |
Face
Amount ($) |
Value
($) |
| Southern California Public Power Auth | ||||||
| Refunding RB (Magnolia Power) Series 2009-2 (LOC: Wells Fargo Bank, NA) | 0.06% | 07/07/15 | 5,000,000 | 5,000,000 | ||
| Refunding RB (Palo Verde) Series 2008A (LOC: Barclays Bank Plc) | 0.09% | 07/07/15 | 13,000,000 | 13,000,000 | ||
| Refunding RB (Palo Verde) Series 2008B (LOC: Barclays Bank Plc) | 0.09% | 07/07/15 | 3,100,000 | 3,100,000 | ||
| Univ of California | ||||||
| General RB Series 2009O (LIQ: Citibank, NA) | a | 0.07% | 07/07/15 | 3,500,000 | 3,500,000 | |
| General RB Series 2009Q (LIQ: Barclays Bank Plc) | a | 0.11% | 07/07/15 | 6,665,000 | 6,665,000 | |
| General RB Series 2013AF (LIQ: JPMorgan Chase Bank, NA) | a | 0.08% | 07/07/15 | 6,500,000 | 6,500,000 | |
| General RB Series 2013AI (LIQ: JPMorgan Chase Bank, NA) | a | 0.12% | 07/07/15 | 1,900,000 | 1,900,000 | |
| General RB Series 2013AI (LIQ: State Street Bank & Trust Co NA) | a | 0.07% | 07/07/15 | 10,665,000 | 10,665,000 | |
| General RB Series 2014AM (LIQ: JPMorgan Chase Bank, NA) | a | 0.08% | 07/07/15 | 3,720,000 | 3,720,000 | |
| General RB Series 2014AM (LIQ: JPMorgan Chase Bank, NA) | a | 0.12% | 07/07/15 | 2,265,000 | 2,265,000 | |
| General RB Series 2014AM (LIQ: Morgan Stanley Bank NA) | a | 0.08% | 07/07/15 | 7,600,000 | 7,600,000 | |
| Limited Project RB Series 2015I (LIQ: JPMorgan Chase Bank, NA) | a | 0.08% | 07/07/15 | 9,600,000 | 9,600,000 | |
| Limited RB Series 2007D (LIQ: Citibank, NA) | a | 0.06% | 07/01/15 | 8,600,000 | 8,600,000 | |
| Limited RB Series 2012G (LIQ: Morgan Stanley Bank NA) | a | 0.08% | 07/07/15 | 4,695,000 | 4,695,000 | |
| Medical Center Pooled RB Series 2007C2 (LIQ: State Street Bank & Trust Co NA) | a | 0.07% | 07/07/15 | 20,750,000 | 20,750,000 | |
| Medical Center Pooled RB Series 2013J (LIQ: Barclays Bank Plc) | a | 0.11% | 07/07/15 | 20,850,000 | 20,850,000 | |
| Medical Center Pooled RB Series 2013J (LIQ: JPMorgan Chase Bank, NA) | a | 0.08% | 07/07/15 | 15,505,000 | 15,505,000 | |
| West Valley-Mission CCD | ||||||
| GO Bonds Series 2015B (LIQ: Morgan Stanley Bank NA) | a | 0.08% | 07/07/15 | 8,500,000 | 8,500,000 | |
| Westminster Redevelopment Agency | ||||||
| M/F Housing RB (Brookhurst Royal) Series 2000A (LOC: MUFG Union Bank, NA) | 0.15% | 07/07/15 | 5,335,000 | 5,335,000 | ||
| Yosemite CCD | ||||||
| GO Bonds Series 2008C (LIQ: Bank of America, NA) | a | 0.10% | 07/07/15 | 8,000,000 | 8,000,000 | |
| 4,347,646,156 | ||||||
| Other Investments 2.6% | ||||||
| Nuveen California AMT-Free Municipal Income Fund | ||||||
| Variable Rate Demand Preferred Shares Series 5 (GTY/LIQ: Morgan Stanley Bank NA) | a | 0.22% | 07/07/15 | 50,300,000 | 50,300,000 | |
| Nuveen California Dividend Advantage Municipal Fund | ||||||
| Variable Rate Demand Preferred Shares Series 1 (GTY/LIQ: Morgan Stanley Bank NA) | a | 0.22% | 07/07/15 | 55,000,000 | 55,000,000 | |
| Variable Rate Demand Preferred Shares Series 4 (GTY/LIQ: Royal Bank of Canada) | a | 0.15% | 07/07/15 | 5,600,000 | 5,600,000 | |
| Variable Rate Demand Preferred Shares Series 6 (GTY/LIQ: Citibank, NA) | a | 0.14% | 07/07/15 | 19,300,000 | 19,300,000 | |
| Nuveen California Dividend Advantage Municipal Fund 2 | ||||||
| Variable Rate Demand Preferred Shares Series 1 (GTY/LIQ: Royal Bank of Canada) | a | 0.17% | 07/07/15 | 38,000,000 | 38,000,000 | |
| Issuer
Type of Security, Series |
Footnotes | Rate | Effective
Maturity |
Maturity
Date |
Face
Amount ($) |
Value
($) |
| Nuveen California Dividend Advantage Municipal Fund 3 | ||||||
| Variable Rate Demand Preferred Shares Series 1 (GTY/LIQ: Barclays Bank Plc) | a | 0.15% | 07/07/15 | 9,000,000 | 9,000,000 | |
| 177,200,000 | ||||||
| Total Variable-Rate Securities | ||||||
| (Cost $4,524,846,156) | 4,524,846,156 | |||||
| a | Securities exempt from registration under Rule 144A of the Securities Act of 1933, as amended. These securities may be resold in transactions exempt from registrations, normally to qualified institutional buyers. At the period end, the value of these amounted to $1,862,258,156 or 27.6% of net assets. |
| b | Illiquid security. At the period end, the value of these amounted to $90,960,000 or 1.3% of net assets. |
| c | Security or a portion of the security purchased on a delayed-delivery or when-issued basis. |
| d | All or a portion of this security is designated as collateral for delayed-delivery securities. |
| BAN — | Bond anticipation note |
| CCD — | Community college district |
| COP — | Certificate of participation |
| CP — | Commercial paper |
| CSD — | Central school district |
| GO — | General obligation |
| GTY — | Guaranty agreement |
| HFA — | Housing finance agency/authority |
| HRA — | Housing & redevelopment authority |
| HSD — | High school district |
| IDA — | Industrial development agency/authority |
| IDB — | Industrial development board |
| IDC — | Industrial development corporation |
| IDRB — | Industrial development revenue bond |
| IRB — | Industrial revenue bond |
| ISD — | Independent school district |
| LIQ — | Liquidity agreement |
| LOC — | Letter of credit |
| LT — | Limited tax |
| M/F — | Multi-family |
| RAN — | Revenue anticipation note |
| RB — | Revenue bond |
| SD — | School district |
| S/F — | Single-family |
| TAN — | Tax anticipation note |
| TRAN — | Tax and revenue anticipation note |
| UFSD — | Union free school district |
| UHSD — | Union high school district |
| ULT — | Unlimited tax |
| USD — | Unified school district |
| Assets | ||
| Investments, at cost and value (Note 2a) | $6,851,029,184 | |
| Cash | 279,733,998 | |
| Receivables: | ||
| Interest | 7,199,857 | |
| Prepaid expenses | + | 15,302 |
| Total assets | 7,137,978,341 | |
| Liabilities | ||
| Payables: | ||
| Investments bought | 19,116,106 | |
| Investments bought - Delayed delivery | 369,562,659 | |
| Investment adviser and administrator fees | 97,318 | |
| Fund shares redeemed | 99,207 | |
| Distributions to shareholders | 27,938 | |
| Accrued expenses | + | 127,173 |
| Total liabilities | 389,030,401 | |
| Net Assets | ||
| Total assets | 7,137,978,341 | |
| Total liabilities | – | 389,030,401 |
| Net assets | $6,748,947,940 | |
| Net Assets by Source | ||
| Capital received from investors | 6,747,715,541 | |
| Net realized capital gains | 1,232,399 | |
| Net Asset Value (NAV) by Shares Class | |||||
| Share Class | Net Assets | ÷ | Shares
Outstanding |
= | NAV |
| Sweep Shares | $6,027,877,107 | 6,025,722,834 | $1.00 | ||
| Value Advantage Shares | $721,070,833 | 720,813,595 | $1.00 | ||
| Investment Income | ||
| Interest | $2,799,269 | |
| Expenses | ||
| Investment adviser and administrator fees | 11,412,528 | |
| Shareholder service fees: | ||
| Sweep Shares | 11,019,602 | |
| Value Advantage Shares | 817,229 | |
| Portfolio accounting fees | 129,000 | |
| Custodian fees | 65,974 | |
| Shareholder reports | 56,736 | |
| Professional fees | 37,106 | |
| Independent trustees' fees | 24,261 | |
| Registration fees | 21,125 | |
| Transfer agent fees | 20,555 | |
| Interest expense | 2,883 | |
| Other expenses | + | 60,251 |
| Total expenses | 23,667,250 | |
| Expense reduction by CSIM and its affiliates | – | 21,219,887 |
| Net expenses | – | 2,447,363 |
| Net investment income | 351,906 | |
| Realized Gains (Losses) | ||
| Net realized gains on investments | 1,232,399 | |
| Increase in net assets resulting from operations | $1,584,305 | |
| Operations | |||
| 1/1/15-6/30/15 | 1/1/14-12/31/14 | ||
| Net investment income | $351,906 | $683,187 | |
| Net realized gains | + | 1,232,399 | 424,035 |
| Increase in net assets from operations | 1,584,305 | 1,107,222 | |
| Distributions to Shareholders | |||
| Distributions from net investment income | |||
| Sweep Shares | (314,769) | (611,463) | |
| Value Advantage Shares | + | (37,137) | (71,724) |
| Total distributions from net investment income | (351,906) | (683,187) | |
| Distributions from net realized gains | |||
| Sweep Shares | — | (178,767) | |
| Value Advantage Shares | + | — | (21,417) |
| Total distributions from net realized gains | — | (200,184) | |
| Total distributions | (351,906) | (883,371) | |
| Transactions in Fund Shares | |||
| Shares Sold1 | |||
| Sweep Shares | 7,471,688,308 | 15,749,270,794 | |
| Value Advantage Shares | + | 73,578,156 | 128,382,254 |
| Total shares sold | 7,545,266,464 | 15,877,653,048 | |
| Shares issued in connection with merger2 | |||
| Value Advantage Shares | — | 108,254,918 | |
| Total shares issued in connection with merger | — | 108,254,918 | |
| Shares Reinvested1 | |||
| Sweep Shares | 284,217 | 777,917 | |
| Value Advantage Shares | + | 30,289 | 84,015 |
| Total shares reinvested | 314,506 | 861,932 | |
| Shares Redeemed1 | |||
| Sweep Shares | (7,883,917,659) | (15,392,918,682) | |
| Value Advantage Shares | + | (124,057,101) | (216,552,816) |
| Total shares redeemed | (8,007,974,760) | (15,609,471,498) | |
| Net transactions in fund shares | (462,393,790) | 377,298,400 | |
| Net Assets | |||
| Beginning of period | 7,210,109,331 | 6,832,534,673 | |
| Total increase or decrease | + | (461,161,391) | 377,574,658 |
| End of period | $6,748,947,940 | $7,210,109,331 | |
| 1 | Transactions took place at $1.00 per share; figures for share quantities are the same as for dollars. |
| 2 | Effective September 26, 2014, all the assets and liabilities of the Schwab California AMT Tax-Free Money Fund (totaling a net value of $108,307,325) were transferred to the Schwab California Municipal Money Fund. (See financial note 9) |
| The Charles Schwab Family of Funds (organized October 20, 1989) | Schwab Municipal Money Fund |
| Schwab Money Market Fund | Schwab AMT Tax-Free Money Fund |
| Schwab Government Money Fund | Schwab California Municipal Money Fund |
| Schwab U.S. Treasury Money Fund | Schwab New York Municipal Money Fund |
| Schwab Treasury Obligations Money Fund | (formerly Schwab New York AMT Tax-Free Money Fund) |
| Schwab Value Advantage Money Fund | Schwab New Jersey Municipal Money Fund |
| Schwab Advisor Cash Reserves | (formerly Schwab New Jersey AMT Tax-Free Money Fund) |
| Schwab Cash Reserves | Schwab Pennsylvania Municipal Money Fund |
| Schwab Retirement Advantage Money Fund | Schwab Massachusetts Municipal Money Fund |
| Schwab Investor Money Fund | (formerly Schwab Massachusetts AMT Tax-Free Money Fund) |
| % of investments in securities with credit enhancements or liquidity enhancements | 76% |
| Largest % of investments in securities with credit enhancements or liquidity enhancements from a single institution | 11%
(JP Morgan Chase Group) |
| Average Daily Net Assets | |
| First $1 billion | 0.35% |
| More than $1 billion but not exceeding $10 billion | 0.32% |
| More than $10 billion but not exceeding $20 billion | 0.30% |
| More than $20 billion but not exceeding $40 billion | 0.27% |
| Over $40 billion | 0.25% |
| Shareholder Service Fees | Sweep Administration Fees | ||
| Sweep Shares | 0.25% | 0.10% | |
| Value Advantage Shares | 0.22% | n/a |
| Sweep Shares | 0.60% |
| Value Advantage Shares | 0.45% |
| Expiration Date | |||||||||
| December 31, 2015 | December 31, 2016 | December 31, 2017 | December 31, 2018 | Total | |||||
| Sweep Shares | $22,504,909 | $27,645,325 | $31,551,790 | $16,546,664 | $98,248,688 | ||||
| Value Advantage Shares | 2,439,226 | 2,507,739 | 2,624,589 | 1,395,089 | 8,966,643 | ||||
| Sweep Shares | $18,771,517 |
| Value Advantage Shares | 2,293,435 |
| Before Reorganization | After Reorganization | ||||
| Schwab
California Municipal Money Fund |
Schwab
California AMT Tax-Free Money Fund |
Schwab
California Municipal Money Fund | |||
| Shares: | |||||
| Sweep Shares | 6,024,114,713 | — | 6,024,114,713 | ||
| Value Advantage Shares | 661,282,027 | 108,254,918 | 769,536,945 | ||
| Net Assets: | |||||
| Sweep Shares | $6,025,290,932 | — | $6,025,290,932 | ||
| Value Advantage Shares | $661,414,980 | $108,307,325 | $769,722,305 | ||
| Net Assets Value: | |||||
| Sweep Shares | $1.00 | — | $1.00 | ||
| Value Advantage Shares | $1.00 | $1.00 | $1.00 | ||
| Net unrealized appreciation (depreciation) | — | — | — | ||
| Market value of investments | $6,684,594,163 | $103,641,266 | $6,788,235,429 | ||
| Cost of investments | $6,684,594,163 | $103,641,266 | $6,788,235,429 | ||
| Net investment income | $722,394* |
| Net realized gains on investments | $435,483 |
| Net unrealized appreciation (depreciation) on investments | — |
| Net increase in net assets resulting from operations | $1,157,877 |
| Independent Trustees | |||
| Name,
Year of Birth, and Position(s) with the trust; (Terms of office, and length of Time Served1) |
Principal
Occupations During the Past Five Years |
Number
of Portfolios in Fund Complex Overseen by the Trustee |
Other Directorships |
| John
F. Cogan 1947 Trustee (Trustee of The Charles Schwab Family of Funds, Schwab Investments, Schwab Capital Trust and Schwab Annuity Portfolios since 2008; Laudus Trust and Laudus Institutional Trust since 2010) |
Senior Fellow, The Hoover Institution at Stanford University (Oct. 1979 – present); Senior Fellow Stanford Institute for Economic Policy Research (2000 – present); Professor of Public Policy, Stanford University (1994 – present). | 74 | Director,
Gilead Sciences, Inc. (2005 – present) |
| David
L. Mahoney 1954 Trustee (Trustee of The Charles Schwab Family of Funds, Schwab Investments, Schwab Capital Trust, Schwab Annuity Portfolios, Laudus Trust and Laudus Institutional Trust since 2011) |
Private Investor. | 74 | Director,
Symantec Corporation (2003 – present) Director, Corcept Therapeutics Incorporated (2004 – present) Director, Adamas Pharmaceuticals, Inc. (2009 – present) |
| Kiran
M. Patel 1948 Trustee (Trustee of The Charles Schwab Family of Funds, Schwab Investments, Schwab Capital Trust, Schwab Annuity Portfolios, Laudus Trust and Laudus Institutional Trust since 2011) |
Retired. Executive Vice President and General Manager of Small Business Group, Intuit, Inc. (financial software and services firm for consumers and small businesses) (Dec. 2008 – Sept. 2013) | 74 | Director, KLA-Tencor Corporation (2008 – present) |
| Charles
A. Ruffel 1956 Trustee (Trustee of Schwab Strategic Trust since 2009; The Charles Schwab Family of Funds, Schwab Investments, Schwab Capital Trust, Schwab Annuity Portfolios, Laudus Trust and Laudus Institutional Trust since 2015) |
Managing Partner and Co-Founder, Kudu Advisors, LLC (financial services) (May 2009 – present); Director, Asset International, Inc. (publisher of financial services information) (Jan. 2009 – Nov. 2014). | 95 | None. |
| Independent Trustees (continued) | |||
| Name,
Year of Birth, and Position(s) with the trust; (Terms of office, and length of Time Served1) |
Principal
Occupations During the Past Five Years |
Number
of Portfolios in Fund Complex Overseen by the Trustee |
Other Directorships |
| Gerald
B. Smith 1950 Trustee (Trustee of The Charles Schwab Family of Funds, Schwab Investments, Schwab Capital Trust and Schwab Annuity Portfolios since 2000; Laudus Trust and Laudus Institutional Trust since 2010) |
Chairman, Chief Executive Officer and Founder of Smith Graham & Co. (investment advisors) (1990 – present). | 74 | Director,
Eaton (2012 – present) Director and Chairman of the Audit Committee, Oneok Partners LP (2003 – 2013) Director, Oneok, Inc. (2009 – 2013) Lead Independent Director, Board of Cooper Industries (2002 – 2012) |
| Joseph
H. Wender 1944 Trustee (Trustee of The Charles Schwab Family of Funds, Schwab Investments, Schwab Capital Trust and Schwab Annuity Portfolios since 2008; Laudus Trust and Laudus Institutional Trust since 2010) |
Senior Consultant, Goldman Sachs & Co., Inc. (investment banking and securities firm) (Jan. 2008 – present); Partner, Colgin Partners, LLC (vineyards) (Feb. 1998 – present). | 74 | Board Member and Chairman of the Audit Committee, Isis Pharmaceuticals (1994 – present) |
| Interested Trustees | |||
| Name,
Year of Birth, and Position(s) with the trust; (Terms of office, and length of Time Served) |
Principal
Occupations During the Past Five Years |
Number
of Portfolios in Fund Complex Overseen by the Trustee |
Other Directorships |
| Charles
R. Schwab2 1937 Chairman and Trustee (Chairman and Trustee of The Charles Schwab Family of Funds since 1989; Schwab Investments since 1991; Schwab Capital Trust since 1993; Schwab Annuity Portfolios since 1994; Laudus Trust and Laudus Institutional Trust since 2010) |
Chairman and Director, The Charles Schwab Corporation (1986 – present); Chairman and Director of Charles Schwab & Co., Inc. (1971 – present); Chairman and Director of Charles Schwab Investment Management, Inc. (1989 – present); Chairman and Director of Charles Schwab Bank (2003 – present); Chairman and Chief Executive Officer of Schwab (SIS) Holdings Inc. I and Schwab International Holdings, Inc. (1996 – present); and Director, Chairman and Chief Executive Officer, Schwab Holdings, Inc. (1979 – present). | 74 | Chairman
and Director, The Charles Schwab Corporation (1986 – present) Director, Yahoo! Inc. (2014 – present) |
| Walter
W. Bettinger II2 1960 Trustee (Trustee of The Charles Schwab Family of Funds, Schwab Investments, Schwab Capital Trust and Schwab Annuity Portfolios since 2008; Schwab Strategic Trust since 2009; Laudus Trust and Laudus Institutional Trust since 2010) |
Director, President and Chief Executive Officer, The Charles Schwab Corporation and Charles Schwab & Co., Inc. (2008 – present); Director, Charles Schwab Bank (2006 – present); and Director, Schwab Holdings, Inc. (2008 – present). | 95 | Director, The Charles Schwab Corporation (2008 – present) |
| Officers of the Trust | |
| Name,
Year of Birth, and Position(s) with the trust; (Terms of office, and length of Time Served3) |
Principal Occupations During the Past Five Years |
| Marie
Chandoha 1961 President and Chief Executive Officer (Officer of The Charles Schwab Family of Funds, Schwab Investments, Schwab Capital Trust, Schwab Annuity Portfolios, Laudus Trust and Laudus Institutional Trust since 2010) |
Director, President and Chief Executive Officer (Dec. 2010 – present), Chief Investment Officer (Sept. 2010 – Oct. 2011), Charles Schwab Investment Management, Inc.; President, Chief Executive Officer (Dec. 2010 – present), and Chief Investment Officer (Sept. 2010 – Oct. 2011), Schwab Funds, Laudus Funds and Schwab ETFs; Director, Charles Schwab Worldwide Funds plc and Charles Schwab Asset Management (Ireland) Limited (January 2011 – present); Global Head of Fixed Income Business Division, BlackRock, Inc. (formerly Barclays Global Investors) (March 2007 – August 2010). |
| George
Pereira 1964 Treasurer and Principal Financial Officer, Schwab Funds Treasurer and Chief Financial Officer, Laudus Funds (Officer of The Charles Schwab Family of Funds, Schwab Investments, Schwab Capital Trust and Schwab Annuity Portfolios since 2004; Laudus Trust and Laudus Institutional Trust since 2006) |
Senior Vice President and Chief Financial Officer (Nov. 2004 – present), Chief Operating Officer (Jan. 2011 – present), Charles Schwab Investment Management, Inc.; Treasurer and Chief Financial Officer, Laudus Funds (June 2006 – present); Treasurer and Principal Financial Officer, Schwab Funds (Nov. 2004 – present) and Schwab ETFs (Oct. 2009 – present); Director, Charles Schwab Worldwide Funds plc and Charles Schwab Asset Management (Ireland) Limited (April 2005 – present). |
| Omar
Aguilar 1970 Senior Vice President and Chief Investment Officer – Equities (Officer of The Charles Schwab Family of Funds, Schwab Investments, Schwab Capital Trust, Schwab Annuity Portfolios, Laudus Trust and Laudus Institutional Trust since 2011) |
Senior Vice President and Chief Investment Officer – Equities, Charles Schwab Investment Management, Inc. (April 2011 – present); Senior Vice President and Chief Investment Officer – Equities, Schwab Funds, Laudus Funds and Schwab ETFs (June 2011 – present); Head of the Portfolio Management Group and Vice President of Portfolio Management, Financial Engines, Inc. (May 2009 – April 2011); Head of Quantitative Equity, ING Investment Management (July 2004 – Jan. 2009). |
| Brett
Wander 1961 Senior Vice President and Chief Investment Officer – Fixed Income (Officer of The Charles Schwab Family of Funds, Schwab Investments, Schwab Capital Trust, Schwab Annuity Portfolios, Laudus Trust and Laudus Institutional Trust since 2011) |
Senior Vice President and Chief Investment Officer – Fixed Income, Charles Schwab Investment Management, Inc. (April 2011 – present); Senior Vice President and Chief Investment Officer – Fixed Income, Schwab Funds, Laudus Funds and Schwab ETFs (June 2011 – present); Senior Managing Director, Global Head of Active Fixed-Income Strategies, State Street Global Advisors (Jan. 2008 – Oct. 2010); Director of Alpha Strategies Loomis, Sayles & Company (April 2006 – Jan. 2008). |
| David
Lekich 1964 Chief Legal Officer and Secretary, Schwab Funds Vice President and Assistant Clerk, Laudus Funds (Officer of The Charles Schwab Family of Funds, Schwab Investments, Schwab Capital Trust, Schwab Annuity Portfolios, Laudus Trust and Laudus Institutional Trust since 2011) |
Senior Vice President (Sept. 2011 – present), Vice President (March 2004 – Sept. 2011), Charles Schwab & Co., Inc.; Senior Vice President and Chief Counsel (Sept. 2011 – present), Vice President (Jan. 2011 – Sept. 2011), Charles Schwab Investment Management, Inc.; Secretary (April 2011 – present) and Chief Legal Officer (Dec. 2011 – present), Schwab Funds; Vice President and Assistant Clerk, Laudus Funds (April 2011 – present); Secretary (May 2011 – present) and Chief Legal Officer (Nov. 2011 – present), Schwab ETFs. |
| Catherine
MacGregor 1964 Vice President and Assistant Secretary, Schwab Funds Chief Legal Officer, Vice President and Clerk, Laudus Funds (Officer of The Charles Schwab Family of Funds, Schwab Investments, Schwab Capital Trust, Schwab Annuity Portfolios, Laudus Trust and Laudus Institutional Trust since 2005) |
Vice President, Charles Schwab & Co., Inc., Charles Schwab Investment Management, Inc. (July 2005 – present); Vice President (Dec. 2005 – present), Chief Legal Officer and Clerk (March 2007 – present), Laudus Funds; Vice President (Nov. 2005 – present) and Assistant Secretary (June 2007 – present), Schwab Funds; Vice President and Assistant Secretary, Schwab ETFs (Oct. 2009 – present). |
| 1 | Trustees remain in office until they resign, retire or are removed by shareholder vote. The Schwab and Laudus Funds’ retirement policy requires that independent trustees retire at age 72 or after twenty years as a trustee, whichever comes first. In addition, the retirement policy requires any independent trustee of Schwab Funds or Laudus Funds to retire from all Boards upon their required retirement date from either Board. |
| 2 | Mr. Schwab and Mr. Bettinger are Interested Trustees because they own stock of The Charles Schwab Corporation, the parent company of the investment adviser. |
| 3 | The President, Treasurer and Secretary/Clerk hold office until their respective successors are chosen and qualified or until he or she sooner dies, resigns, is removed or becomes disqualified. Each of the other officers serves at the pleasure of the Boards. |
211 Main Street, San Francisco, CA 94105
1-800-435-4000
© 2015 Charles Schwab & Co., Inc. All rights reserved.
Member SIPC®
Printed on recycled paper.
00149456
Table of Contents
by viewing these documents online.
Sign up at schwab.com/paperless


| 1 | A fund’s share price is its NAV, which is the fund’s net assets divided by the number of its shares outstanding. Under the new amendments, Retail Prime and Municipal money market funds, as well as Government money market funds, will continue to be permitted to transact at a constant NAV of $1.00. Note that while a fund may seek to maintain a constant NAV, there is no guarantee that it will be able to do so. |
 |
Linda Klingman, Vice President and Head of Taxable Money Market Strategies, leads the portfolio management team of Schwab’s prime and government taxable money funds. Ms. Klingman also has overall responsibility for all aspects of the management of the fund. Prior to joining CSIM in 1990, Ms. Klingman was a senior money market trader with AIM Management. She has managed money market funds since 1988. |
 |
Michael Lin, Managing Director and Senior Portfolio Manager, is responsible for the day-to-day co-management of the fund. Mr. Lin has been a portfolio manager with CSIM since 2006, and also worked in CSIM’s Fund Administration group for nearly four years, where he focused on security pricing and valuation of Schwab Funds. Prior to joining CSIM, he spent three years at American Century Investments, most recently as a senior trader of the taxable money market funds. |
 |
Jonathan Roman, Portfolio Manager, is responsible for the day-to-day co-management of the fund. Mr. Roman has been a portfolio manager with CSIM since 2010, and has held a number of positions at the firm since beginning his tenure in 2005. In 2009, he joined the Portfolio Management group as a Trader, and prior to that he worked in the Portfolio Operations and Analytics group providing trading support to the taxable money market desk. |
 |
Jonathan Feske, CFA, Portfolio Manager, is responsible for the day-to-day co-management of the fund. He previously was responsible for credit and investment research for global banks for CSIM’s taxable bond and money funds. Prior to joining CSIM in 2011, Mr. Feske was a high-yield bond analyst for more than two years at Miller Tabak Roberts Securities, a boutique corporate bond broker-dealer, which is now part of GMP Capital. He covered both U.S. and emerging market credits, focusing on distressed situations in various industrial sectors. Previously, Mr. Feske was employed in the securities industry as an equity trader for three years. |
| 1 | The investment adviser and its affiliates may recapture expenses or fees they waived under a voluntary yield waiver until the third anniversary of the end of the fiscal year in which such waiver occurs, subject to certain limitations. For more information on the potential impact of such recapture on future yields, see financial note 5. |
| 2 | As shown in the Portfolio Holdings section of the shareholder report. |
| 3 | Money funds must maintain a dollar-weighted average maturity of no longer than 60 days and cannot invest in any security whose effective maturity is longer than 397 days (approximately 13 months). |
| 4 | Tier 1 securities are rated in the highest short-term rating category by two nationally recognized statistical rating organizations (“NRSROs”), or by one if only one NRSRO has rated the securities, or, if unrated, determined to be of comparable quality by CSIM pursuant to guidelines adopted by the Board of Trustees. Money market fund shares and U.S. government securities are also Tier 1 securities. The fund uses NRSRO credit ratings from Standard & Poor’s Corp., Moody’s Investors Service, Fitch Ratings, and/or DBRS. The fund may use different ratings provided by other rating agencies for purposes of determining compliance with the fund’s investment policies. The fund itself has not been rated by an independent credit rating agency. |
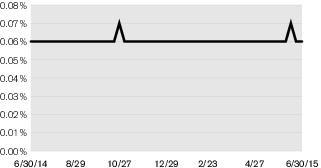
| Schwab Cash Reserves | |
| Sweep
Shares | |
| Ticker Symbol | SWSXX |
| Minimum Initial Investment | * |
| Seven-Day Yield1 | 0.06% |
| Seven-Day Yield–Without Contractual Expense Limitation2 | -0.01% |
| Seven-Day Effective Yield1 | 0.06% |
| * | Subject to the eligibility terms and conditions of your Schwab account agreement. |
| 1 | Yield reflects the effect of the fund’s agreement with the investment adviser and its affiliates to limit the fund's total annual operating expenses to certain levels (contractual expense limitation). In addition, the investment adviser and its affiliates have voluntarily waived expenses in excess of the contractual expense limitation to maintain a positive net yield for the fund (voluntary yield waiver). Without the contractual expense limitation and the voluntary yield waiver, the fund’s yield would have been lower. For additional details, see financial note 4. |
| 2 | Yield does not reflect the effect of the contractual expense limitation, but does reflect the effect of the voluntary yield waiver. The voluntary yield waiver added 0.42% to the seven-day yield. |
| Expense
Ratio1 (Annualized) |
Beginning
Account Value at 1/1/15 |
Ending
Account Value (Net of Expenses) at 6/30/15 |
Expenses
Paid During Period2 1/1/15–6/30/15 | |
| Schwab Cash Reserves | ||||
| Actual Return | 0.19% | $1,000.00 | $1,000.30 | $0.94 |
| Hypothetical 5% Return | 0.19% | $1,000.00 | $1,023.86 | $0.95 |
| 1 | Based on the most recent six-month expense ratio; may differ from the expense ratio provided in the Financial Highlights. |
| 2 | Expenses for the fund are equal to its annualized expense ratio, multiplied by the average account value over the period, multiplied by 181 days of the period, and divided by 365 days of the fiscal year. |
| 1/1/15–
6/30/15* |
1/1/14–
12/31/14 |
1/1/13–
12/31/13 |
1/1/12–
12/31/12 |
1/1/11–
12/31/11 |
1/1/10–
12/31/10 | |
| Per-Share Data ($) | ||||||
| Net asset value at beginning of period | 1.00 | 1.00 | 1.00 | 1.00 | 1.00 | 1.00 |
| Income (loss) from investment operations: | ||||||
| Net investment income (loss) | 0.00 1,2 | 0.00 2 | 0.00 2 | 0.00 2 | 0.00 2 | 0.00 2 |
| Net realized and unrealized gains (losses) | (0.00) 2 | 0.00 2 | 0.00 2 | 0.00 2 | 0.00 2 | 0.00 2,3 |
| Total from investment operations | 0.00 2 | 0.00 2 | 0.00 2 | 0.00 2 | 0.00 2 | 0.00 2 |
| Less distributions: | ||||||
| Distributions from net investment income | (0.00) 2 | (0.00) 2 | (0.00) 2 | (0.00) 2 | (0.00) 2 | (0.00) 2 |
| Net asset value at end of period | 1.00 | 1.00 | 1.00 | 1.00 | 1.00 | 1.00 |
| Total return (%) | 0.03 4 | 0.06 | 0.06 | 0.06 | 0.06 | 0.07 |
| Ratios/Supplemental Data (%) | ||||||
| Ratios to average net assets: | ||||||
| Net operating expenses | 0.19 5,6 | 0.16 5 | 0.20 5 | 0.23 5,7 | 0.20 5 | 0.28 5 |
| Gross operating expenses | 0.70 6 | 0.70 | 0.70 | 0.70 7 | 0.71 | 0.71 |
| Net investment income (loss) | 0.06 6 | 0.06 | 0.06 | 0.06 | 0.06 | 0.07 |
| Net assets, end of period ($ x 1,000,000) | 38,539 | 39,326 | 39,452 | 37,498 | 34,077 | 32,419 |
| * | Unaudited. |
| Holdings by Category | Cost
($) |
Value
($) | |
| 52.4% | Fixed-Rate Obligations | 20,175,937,808 | 20,175,937,808 |
| 20.6% | Variable-Rate Obligations | 7,928,007,926 | 7,928,007,926 |
| 27.0% | Repurchase Agreements | 10,425,544,864 | 10,425,544,864 |
| 100.0% | Total Investments | 38,529,490,598 | 38,529,490,598 |
| 0.0% | Other Assets and Liabilities, Net | 9,132,947 | |
| 100.0% | Net Assets | 38,538,623,545 | |
| Issuer | Footnotes | Rate | Effective
Maturity |
Maturity
Date |
Face
Amount ($) |
Value
($) |
| Fixed-Rate Obligations 52.4% of net assets | ||||||
| Asset Backed Commercial Paper 6.9% | ||||||
| Bennington Stark Capital Co, LLC | a,b | 0.30% | 07/01/15 | 75,000,000 | 75,000,000 | |
| CAFCO, LLC | a,b | 0.28% | 08/03/15 | 55,000,000 | 54,985,883 | |
| a,b | 0.31% | 11/03/15 | 50,000,000 | 49,946,180 | ||
| a,b | 0.31% | 11/04/15 | 22,000,000 | 21,976,130 | ||
| Cancara Asset Securitisation, LLC | a,b | 0.27% | 09/18/15 | 420,000,000 | 419,751,150 | |
| Chariot Funding, LLC | a,b | 0.29% | 07/01/15 | 39,000,000 | 39,000,000 | |
| a,b | 0.30% | 10/29/15 | 25,000,000 | 24,975,000 | ||
| a,b | 0.32% | 10/29/15 | 5,000,000 | 4,994,667 | ||
| Charta, LLC | a,b | 0.32% | 11/02/15 | 10,000,000 | 9,988,978 | |
| a,b | 0.31% | 11/04/15 | 79,000,000 | 78,914,285 | ||
| a,b | 0.34% | 12/01/15 | 150,000,000 | 149,783,250 | ||
| Ciesco, LLC | a,b | 0.28% | 08/03/15 | 27,000,000 | 26,993,070 | |
| a,b | 0.31% | 11/02/15 | 46,000,000 | 45,950,882 | ||
| a,b | 0.31% | 11/03/15 | 50,000,000 | 49,946,181 | ||
| a,b | 0.31% | 11/04/15 | 41,000,000 | 40,955,515 | ||
| Collateralized Commercial Paper Co, LLC | a | 0.33% | 07/06/15 | 15,000,000 | 14,999,312 | |
| a | 0.37% | 11/23/15 | 173,000,000 | 172,742,182 | ||
| a | 0.42% | 12/09/15 | 58,000,000 | 57,891,057 | ||
| Collateralized Commercial Paper II Co, LLC | b | 0.33% | 07/06/15 | 13,000,000 | 12,999,404 | |
| CRC Funding, LLC | a,b | 0.28% | 08/03/15 | 45,000,000 | 44,988,450 | |
| a,b | 0.31% | 11/04/15 | 82,000,000 | 81,911,030 | ||
| Crown Point Capital Co, LLC | a,b | 0.30% | 09/03/15 | 141,000,000 | 140,924,800 | |
| Issuer | Footnotes | Rate | Effective
Maturity |
Maturity
Date |
Face
Amount ($) |
Value
($) |
| Jupiter Securitization Corp | a,b | 0.29% | 07/01/15 | 82,000,000 | 82,000,000 | |
| a,b | 0.30% | 10/30/15 | 1,000,000 | 998,992 | ||
| a,b | 0.31% | 11/03/15 | 5,000,000 | 4,994,618 | ||
| Lexington Parker Capital Co, LLC | a,b | 0.24% | 07/01/15 | 12,000,000 | 12,000,000 | |
| MetLife Short Term Funding, LLC | a,b | 0.15% | 07/22/15 | 171,155,000 | 171,140,024 | |
| Nieuw Amsterdam Receivables Corp | a,b | 0.24% | 09/03/15 | 104,000,000 | 103,955,627 | |
| Old Line Funding, LLC | a,b | 0.31% | 11/05/15 | 100,000,000 | 99,890,639 | |
| a,b | 0.33% | 11/23/15 | 100,000,000 | 99,867,083 | ||
| Ridgefield Funding Co, LLC | a,b | 0.30% | 09/02/15 | 46,000,000 | 45,975,850 | |
| a,b | 0.40% | 09/02/15 | 79,000,000 | 78,944,700 | ||
| a,b | 0.30% | 09/15/15 | 87,000,000 | 86,944,900 | ||
| Sheffield Receivables Co, LLC | a,b | 0.40% | 07/23/15 | 102,000,000 | 101,975,067 | |
| a,b | 0.35% | 08/03/15 | 139,000,000 | 138,955,404 | ||
| 2,647,260,310 | ||||||
| Financial Company Commercial Paper 6.4% | ||||||
| Bank of Nova Scotia | b | 0.32% | 11/09/15 | 121,500,000 | 121,358,520 | |
| b | 0.33% | 11/23/15 | 113,000,000 | 112,849,804 | ||
| BPCE SA | b | 0.23% | 07/09/15 | 16,000,000 | 15,999,182 | |
| b | 0.26% | 09/24/15 | 113,000,000 | 112,930,631 | ||
| DNB Bank ASA | b | 0.33% | 10/01/15 | 375,000,000 | 374,688,542 | |
| General Electric Capital Corp | a | 0.06% | 07/01/15 | 102,000,000 | 102,000,000 | |
| a | 0.25% | 07/08/15 | 50,000,000 | 49,997,569 | ||
| HSBC Bank PLC | b | 0.32% | 10/29/15 | 231,000,000 | 230,753,600 | |
| ING (U.S.) Funding, LLC | a | 0.40% | 11/02/15 | 45,000,000 | 44,938,000 | |
| a | 0.41% | 11/16/15 | 258,000,000 | 257,594,510 | ||
| a | 0.40% | 11/23/15 | 101,000,000 | 100,837,278 | ||
| Lloyds Bank PLC | 0.30% | 08/21/15 | 54,000,000 | 53,977,050 | ||
| Nationwide Building Society | 0.40% | 07/06/15 | 74,000,000 | 73,995,889 | ||
| 0.40% | 08/27/15 | 88,000,000 | 87,944,267 | |||
| 0.30% | 09/24/15 | 139,000,000 | 138,901,542 | |||
| NRW.BANK | 0.09% | 07/01/15 | 200,000,000 | 200,000,000 | ||
| 0.14% | 07/06/15 | 103,000,000 | 102,997,997 | |||
| Societe Generale | b | 0.22% | 08/03/15 | 52,000,000 | 51,989,513 | |
| b | 0.26% | 08/31/15 | 26,000,000 | 25,988,546 | ||
| United Overseas Bank, Ltd | b | 0.26% | 08/13/15 | 100,000,000 | 99,968,944 | |
| b | 0.26% | 08/14/15 | 81,000,000 | 80,974,260 | ||
| 2,440,685,644 | ||||||
| Certificates of Deposit 31.8% | ||||||
| Abbey National Treasury Services PLC | a | 0.28% | 09/15/15 | 61,000,000 | 61,000,000 | |
| Australia & New Zealand Banking Group, Ltd | 0.22% | 09/21/15 | 2,000,000 | 2,000,000 | ||
| Bank of Montreal | 0.26% | 07/15/15 | 269,000,000 | 269,000,000 | ||
| 0.31% | 11/06/15 | 15,000,000 | 15,000,000 | |||
| Issuer | Footnotes | Rate | Effective
Maturity |
Maturity
Date |
Face
Amount ($) |
Value
($) |
| Bank of Nova Scotia | 0.25% | 09/23/15 | 171,000,000 | 171,000,000 | ||
| 0.34% | 11/09/15 | 72,000,000 | 72,000,000 | |||
| 0.33% | 11/13/15 | 119,000,000 | 119,000,000 | |||
| Bank of the West | 0.27% | 08/24/15 | 105,000,000 | 105,000,000 | ||
| Bank of Tokyo Mitsubishi UFJ, Ltd | 0.33% | 08/26/15 | 7,000,000 | 7,000,000 | ||
| 0.33% | 09/02/15 | 52,000,000 | 52,000,000 | |||
| 0.33% | 09/03/15 | 75,000,000 | 75,000,000 | |||
| 0.33% | 09/04/15 | 20,000,000 | 20,000,000 | |||
| 0.34% | 10/05/15 | 60,000,000 | 60,000,000 | |||
| 0.34% | 10/06/15 | 119,000,000 | 119,000,000 | |||
| 0.50% | 02/09/16 | 117,000,000 | 117,000,000 | |||
| Barclays Bank PLC | 0.45% | 08/17/15 | 262,000,000 | 262,000,000 | ||
| 0.53% | 08/26/15 | 166,000,000 | 166,000,000 | |||
| 0.53% | 09/02/15 | 62,000,000 | 62,000,000 | |||
| 0.92% | 05/23/16 | 226,000,000 | 226,000,000 | |||
| BNP Paribas | 0.25% | 07/09/15 | 146,000,000 | 146,000,000 | ||
| 0.36% | 08/24/15 | 285,000,000 | 285,000,000 | |||
| 0.25% | 09/03/15 | 9,000,000 | 9,000,000 | |||
| 0.26% | 09/24/15 | 129,000,000 | 129,000,000 | |||
| 0.39% | 10/01/15 | 7,000,000 | 7,000,000 | |||
| 0.40% | 12/01/15 | 162,000,000 | 162,000,000 | |||
| Canadian Imperial Bank of Commerce | 0.10% | 07/01/15 | 158,000,000 | 158,000,000 | ||
| 0.27% | 08/25/15 | 199,000,000 | 199,000,000 | |||
| Chase Bank USA, NA | 0.35% | 10/23/15 | 542,000,000 | 542,000,000 | ||
| 0.38% | 12/07/15 | 81,000,000 | 81,000,000 | |||
| Citibank, NA | 0.28% | 07/01/15 | 138,000,000 | 138,000,000 | ||
| Credit Agricole Corporate and Investment Bank | 0.23% | 07/10/15 | 180,000,000 | 180,000,000 | ||
| 0.27% | 08/10/15 | 57,000,000 | 57,000,000 | |||
| 0.30% | 09/01/15 | 146,000,000 | 146,000,000 | |||
| Credit Agricole SA | 0.29% | 10/01/15 | 192,000,000 | 192,000,000 | ||
| Credit Suisse AG | 0.35% | 08/20/15 | 162,000,000 | 162,000,000 | ||
| 0.30% | 09/15/15 | 385,000,000 | 385,000,000 | |||
| DNB Bank ASA | 0.28% | 07/13/15 | 208,000,000 | 208,000,000 | ||
| HSBC Bank PLC | 0.35% | 10/28/15 | 134,000,000 | 134,000,000 | ||
| 0.32% | 11/05/15 | 242,000,000 | 242,000,000 | |||
| HSBC Bank USA | 0.31% | 09/28/15 | 4,000,000 | 4,000,000 | ||
| 0.32% | 10/26/15 | 131,000,000 | 131,000,000 | |||
| 0.40% | 12/09/15 | 56,000,000 | 56,000,000 | |||
| ING Bank NV | 0.33% | 07/30/15 | 100,000,000 | 100,000,000 | ||
| 0.35% | 08/06/15 | 183,000,000 | 183,000,000 | |||
| 0.42% | 11/02/15 | 50,000,000 | 50,000,000 | |||
| Lloyds Bank PLC | 0.30% | 07/15/15 | 16,000,000 | 16,000,000 | ||
| 0.30% | 08/10/15 | 160,000,000 | 160,000,000 | |||
| Mitsubishi UFJ Trust & Banking Corp | 0.30% | 07/01/15 | 13,000,000 | 13,000,000 | ||
| 0.31% | 07/01/15 | 117,000,000 | 117,000,000 | |||
| 0.31% | 07/06/15 | 14,000,000 | 14,000,000 | |||
| 0.31% | 07/13/15 | 19,000,000 | 19,000,000 | |||
| 0.31% | 07/15/15 | 34,000,000 | 34,000,000 |
| Issuer | Footnotes | Rate | Effective
Maturity |
Maturity
Date |
Face
Amount ($) |
Value
($) |
| 0.31% | 07/20/15 | 18,000,000 | 18,000,000 | |||
| 0.31% | 07/27/15 | 39,000,000 | 39,000,000 | |||
| 0.31% | 08/05/15 | 14,000,000 | 14,000,000 | |||
| 0.31% | 08/06/15 | 88,000,000 | 88,000,000 | |||
| 0.31% | 08/10/15 | 45,000,000 | 45,000,000 | |||
| 0.33% | 08/24/15 | 38,000,000 | 38,000,000 | |||
| 0.32% | 10/09/15 | 98,000,000 | 98,000,000 | |||
| 0.35% | 10/09/15 | 67,000,000 | 67,000,000 | |||
| 0.35% | 10/21/15 | 32,000,000 | 32,000,000 | |||
| 0.35% | 11/06/15 | 105,000,000 | 105,000,000 | |||
| 0.36% | 11/09/15 | 35,000,000 | 35,000,000 | |||
| Mizuho Bank, Ltd | 0.30% | 07/29/15 | 9,000,000 | 9,000,000 | ||
| 0.26% | 08/27/15 | 151,000,000 | 151,000,000 | |||
| 0.27% | 09/08/15 | 204,000,000 | 204,000,000 | |||
| 0.26% | 09/14/15 | 52,000,000 | 52,000,000 | |||
| 0.27% | 09/15/15 | 3,000,000 | 3,000,000 | |||
| 0.28% | 09/17/15 | 69,000,000 | 69,000,000 | |||
| 0.28% | 09/18/15 | 95,000,000 | 95,000,000 | |||
| 0.35% | 11/16/15 | 353,000,000 | 353,000,000 | |||
| MUFG Union Bank, NA | 0.17% | 07/13/15 | 191,000,000 | 191,000,000 | ||
| National Australia Bank, Ltd | 0.27% | 09/01/15 | 210,000,000 | 210,000,000 | ||
| 0.27% | 09/02/15 | 182,000,000 | 182,000,000 | |||
| National Bank of Canada | 0.33% | 08/18/15 | 42,000,000 | 42,000,000 | ||
| Natixis SA | 0.29% | 08/04/15 | 365,000,000 | 365,000,000 | ||
| Nordea Bank Finland PLC | 0.34% | 12/01/15 | 384,000,000 | 383,991,854 | ||
| Oversea-Chinese Banking Corp, Ltd | 0.24% | 09/29/15 | 71,000,000 | 71,000,000 | ||
| Rabobank Nederland | 0.28% | 07/01/15 | 325,000,000 | 325,000,000 | ||
| Societe Generale | 0.26% | 08/31/15 | 230,000,000 | 230,000,000 | ||
| Sumitomo Mitsui Banking Corp | 0.31% | 07/01/15 | 32,000,000 | 32,000,000 | ||
| 0.31% | 07/09/15 | 61,000,000 | 61,000,000 | |||
| 0.26% | 09/09/15 | 246,000,000 | 246,000,000 | |||
| 0.28% | 09/17/15 | 102,000,000 | 102,000,000 | |||
| 0.28% | 09/24/15 | 84,000,000 | 84,000,000 | |||
| 0.34% | 09/25/15 | 180,000,000 | 180,000,000 | |||
| 0.34% | 09/28/15 | 2,000,000 | 2,000,000 | |||
| 0.32% | 10/21/15 | 14,000,000 | 14,000,000 | |||
| 0.37% | 10/27/15 | 73,000,000 | 73,000,000 | |||
| 0.37% | 10/28/15 | 100,000,000 | 100,000,000 | |||
| 0.35% | 11/06/15 | 40,000,000 | 40,000,000 | |||
| 0.40% | 11/06/15 | 75,000,000 | 75,000,000 | |||
| 0.40% | 11/10/15 | 7,000,000 | 7,000,000 | |||
| 0.40% | 11/12/15 | 55,000,000 | 55,000,000 | |||
| Sumitomo Mitsui Trust Bank, Ltd | 0.25% | 07/13/15 | 11,000,000 | 11,000,000 | ||
| 0.26% | 08/25/15 | 17,000,000 | 17,000,000 | |||
| 0.27% | 08/31/15 | 212,000,000 | 212,000,000 | |||
| 0.26% | 09/14/15 | 87,000,000 | 87,000,000 | |||
| 0.28% | 09/18/15 | 182,000,000 | 182,000,000 | |||
| Swedbank AB | 0.10% | 07/07/15 | 48,000,000 | 48,000,000 | ||
| Toronto-Dominion Bank | 0.30% | 11/05/15 | 185,000,000 | 185,000,000 | ||
| 0.30% | 11/06/15 | 112,000,000 | 112,000,000 |
| Issuer | Footnotes | Rate | Effective
Maturity |
Maturity
Date |
Face
Amount ($) |
Value
($) |
| UBS AG | 0.10% | 07/06/15 | 372,000,000 | 372,000,000 | ||
| 12,250,991,854 | ||||||
| Other Instruments 4.6% | ||||||
| Australia & New Zealand Banking Group, Ltd | 0.12% | 07/01/15 | 422,000,000 | 422,000,000 | ||
| 0.11% | 07/07/15 | 352,000,000 | 352,000,000 | |||
| DZ Bank AG Deutsche Zentral-Genossenschaftsbank | 0.10% | 07/02/15 | 200,000,000 | 200,000,000 | ||
| 0.10% | 07/06/15 | 185,000,000 | 185,000,000 | |||
| National Australia Bank, Ltd | 0.06% | 07/01/15 | 375,000,000 | 375,000,000 | ||
| Skandinaviska Enskilda Banken AB | 0.10% | 07/02/15 | 251,000,000 | 251,000,000 | ||
| 1,785,000,000 | ||||||
| Other Notes 2.7% | ||||||
| Bank of America, NA | 0.28% | 07/07/15 | 39,000,000 | 39,000,000 | ||
| 0.28% | 07/09/15 | 71,000,000 | 71,000,000 | |||
| 0.30% | 07/20/15 | 120,000,000 | 120,000,000 | |||
| 0.30% | 08/07/15 | 89,000,000 | 89,000,000 | |||
| 0.30% | 08/18/15 | 22,000,000 | 22,000,000 | |||
| 0.23% | 09/01/15 | 3,000,000 | 3,000,000 | |||
| 0.32% | 09/01/15 | 69,000,000 | 69,000,000 | |||
| 0.24% | 09/18/15 | 125,000,000 | 125,000,000 | |||
| 0.26% | 10/01/15 | 315,000,000 | 315,000,000 | |||
| 0.34% | 11/05/15 | 119,000,000 | 119,000,000 | |||
| 0.34% | 12/01/15 | 80,000,000 | 80,000,000 | |||
| 1,052,000,000 | ||||||
| Total Fixed-Rate Obligations | ||||||
| (Cost $20,175,937,808) | 20,175,937,808 | |||||
| Variable-Rate Obligations 20.6% of net assets | ||||||
| Financial Company Commercial Paper 2.0% | ||||||
| Australia & New Zealand Banking Group, Ltd | b | 0.28% | 07/10/15 | 11/10/15 | 187,000,000 | 187,000,000 |
| Commonwealth Bank of Australia | b | 0.26% | 07/02/15 | 111,500,000 | 111,500,000 | |
| b | 0.28% | 07/29/15 | 10/29/15 | 17,000,000 | 16,999,493 | |
| b | 0.32% | 07/13/15 | 05/12/16 | 31,000,000 | 31,000,000 | |
| HSBC Bank PLC | b | 0.32% | 07/06/15 | 01/04/16 | 307,000,000 | 307,000,000 |
| Westpac Banking Corp | b | 0.27% | 07/27/15 | 110,000,000 | 110,000,000 | |
| 763,499,493 | ||||||
| Certificates of Deposit 12.7% | ||||||
| Bank of Nova Scotia | 0.24% | 07/29/15 | 292,000,000 | 292,000,000 | ||
| 0.28% | 07/08/15 | 12/08/15 | 100,000,000 | 100,000,000 | ||
| 0.29% | 07/21/15 | 12/21/15 | 166,000,000 | 166,000,000 | ||
| Bank of Tokyo Mitsubishi UFJ, Ltd | 0.54% | 07/10/15 | 03/10/16 | 112,000,000 | 112,000,000 | |
| Commonwealth Bank of Australia | 0.26% | 07/09/15 | 10/09/15 | 36,000,000 | 36,000,000 | |
| JPMorgan Chase Bank, NA | 0.33% | 07/22/15 | 10/22/15 | 100,000,000 | 100,000,000 | |
| 0.33% | 07/23/15 | 10/23/15 | 170,000,000 | 170,000,000 | ||
| 0.32% | 07/08/15 | 12/08/15 | 273,000,000 | 273,000,000 | ||
| Issuer | Footnotes | Rate | Effective
Maturity |
Maturity
Date |
Face
Amount ($) |
Value
($) |
| Royal Bank of Canada | 0.30% | 07/10/15 | 12/10/15 | 120,000,000 | 120,000,000 | |
| 0.29% | 07/06/15 | 01/06/16 | 236,000,000 | 236,000,000 | ||
| 0.30% | 07/27/15 | 02/25/16 | 75,000,000 | 75,000,000 | ||
| 0.32% | 07/13/15 | 04/13/16 | 414,000,000 | 414,000,000 | ||
| State Street Bank & Trust Co, NA | 0.33% | 07/13/15 | 03/11/16 | 163,000,000 | 163,000,000 | |
| Toronto-Dominion Bank | 0.26% | 07/21/15 | 160,000,000 | 160,000,000 | ||
| 0.28% | 07/14/15 | 10/14/15 | 60,000,000 | 60,000,000 | ||
| 0.28% | 07/17/15 | 10/19/15 | 115,000,000 | 115,000,000 | ||
| 0.33% | 07/16/15 | 03/16/16 | 89,000,000 | 89,000,000 | ||
| 0.34% | 07/17/15 | 03/17/16 | 365,000,000 | 365,000,000 | ||
| 0.30% | 07/20/15 | 03/21/16 | 193,000,000 | 193,000,000 | ||
| 0.34% | 07/27/15 | 05/27/16 | 26,000,000 | 26,000,000 | ||
| Wells Fargo Bank, NA | 0.28% | 07/27/15 | 08/27/15 | 74,000,000 | 74,000,000 | |
| 0.29% | 07/20/15 | 11/18/15 | 135,000,000 | 135,000,000 | ||
| 0.29% | 07/21/15 | 11/23/15 | 224,000,000 | 224,000,000 | ||
| 0.29% | 07/27/15 | 11/25/15 | 173,000,000 | 173,000,000 | ||
| 0.31% | 07/08/15 | 02/08/16 | 54,000,000 | 54,000,000 | ||
| 0.31% | 07/09/15 | 02/09/16 | 82,000,000 | 82,000,000 | ||
| 0.32% | 07/27/15 | 02/26/16 | 150,000,000 | 150,000,000 | ||
| 0.33% | 07/13/15 | 05/05/16 | 43,000,000 | 43,000,000 | ||
| 0.34% | 07/21/15 | 05/23/16 | 2,000,000 | 2,000,000 | ||
| Westpac Banking Corp | 0.28% | 07/20/15 | 08/19/15 | 100,000,000 | 100,000,000 | |
| 0.28% | 07/27/15 | 08/25/15 | 226,000,000 | 226,000,000 | ||
| 0.29% | 07/23/15 | 10/23/15 | 85,000,000 | 85,000,000 | ||
| 0.31% | 07/08/15 | 02/08/16 | 174,000,000 | 174,000,000 | ||
| 0.32% | 07/13/15 | 02/12/16 | 110,000,000 | 110,000,000 | ||
| 4,897,000,000 | ||||||
| Treasury Debt 1.7% | ||||||
| United States Treasury Department | 0.06% | 07/01/15 | 01/31/16 | 264,000,000 | 263,981,657 | |
| 0.09% | 07/01/15 | 07/31/16 | 170,000,000 | 170,000,000 | ||
| 0.10% | 07/01/15 | 01/31/17 | 200,000,000 | 199,998,549 | ||
| 633,980,206 | ||||||
| Variable Rate Demand Notes 0.1% | ||||||
| 3925 Seaport Associates | ||||||
| Variable Rate Demand Bonds Series 2013 | a | 0.20% | 07/07/15 | 6,260,000 | 6,260,000 | |
| GFRE Holdings, LLC | ||||||
| Taxable Notes Series 2009A | a | 0.19% | 07/07/15 | 3,860,000 | 3,860,000 | |
| New York State HFA | ||||||
| Housing RB (2180 Broadway) Series 2011B | a | 0.10% | 07/07/15 | 5,450,000 | 5,450,000 | |
| Smithsonian Institution | ||||||
| Taxable Bonds Series 2013B | a | 0.16% | 07/07/15 | 27,500,000 | 27,500,000 | |
| Tenderfoot Seasonal Housing, LLC | ||||||
| Taxable Housing Facilities Revenue Notes Series 2000B | a | 0.24% | 07/07/15 | 3,000,000 | 3,000,000 | |
| 46,070,000 | ||||||
| Other Notes 4.1% | ||||||
| Bank of America, NA | 0.40% | 07/06/15 | 04/04/16 | 100,000,000 | 100,000,000 | |
| Issuer | Footnotes | Rate | Effective
Maturity |
Maturity
Date |
Face
Amount ($) |
Value
($) |
| Canadian Imperial Bank of Commerce | 0.31% | 07/10/15 | 03/04/16 | 312,000,000 | 312,000,000 | |
| JPMorgan Chase Bank, NA | 0.44% | 09/08/15 | 11/06/15 | 50,000,000 | 50,010,667 | |
| 0.43% | 07/20/15 | 07/18/16 | 110,000,000 | 110,000,000 | ||
| 0.44% | 07/22/15 | 07/22/16 | 95,000,000 | 95,000,000 | ||
| Royal Bank of Canada | 0.39% | 07/01/15 | 06/30/16 | 125,000,000 | 125,000,000 | |
| 0.39% | 07/06/15 | 07/01/16 | 243,000,000 | 243,000,000 | ||
| b | 0.36% | 07/07/15 | 07/06/16 | 75,000,000 | 75,000,000 | |
| Wells Fargo Bank, NA | 0.41% | 09/15/15 | 07/14/16 | 100,000,000 | 100,000,000 | |
| 0.46% | 09/22/15 | 07/21/16 | 275,000,000 | 275,000,000 | ||
| Westpac Banking Corp | b | 0.58% | 07/28/15 | 100,000,000 | 100,000,000 | |
| Whistlejacket Capital, LLC | c,† | n/a | n/a | n/a | 2,447,560 | 2,447,560 |
| 1,587,458,227 | ||||||
| Total Variable-Rate Obligations | ||||||
| (Cost $7,928,007,926) | 7,928,007,926 | |||||
| Issuer | Footnotes | Rate | Effective
Maturity |
Maturity
Date |
Maturity Amount ($) |
Value
($) |
| Repurchase Agreements 27.0% of net assets | ||||||
| Government Agency Repurchase Agreements* 2.2% | ||||||
| Bank of Nova Scotia | ||||||
| Issued
06/30/15, repurchase date 07/01/15 (Collateralized by U.S. Government Agency Securities valued at $110,210,000, 3.00% - 6.00%, due 05/01/41 - 01/01/45) |
0.12% | 07/01/15 | 107,000,357 | 107,000,000 | ||
| BNP Paribas Securities Corp | ||||||
| Issued
06/30/15, repurchase date 07/01/15 (Collateralized by U.S. Government Agency Securities valued at $134,297,851, 0.46% - 7.50%, due 10/01/16 - 06/01/45) |
0.10% | 07/01/15 | 130,000,361 | 130,000,000 | ||
| Deutsche Bank Securities, Inc | ||||||
| Issued
06/30/15, repurchase date 07/01/15 (Collateralized by U.S. Government Agency Securities valued at $278,467,563, 0.00% - 7.25%, due 07/01/15 - 04/01/56) |
0.18% | 07/01/15 | 270,001,350 | 270,000,000 | ||
| Goldman Sachs & Co | ||||||
| Issued
06/30/15, repurchase date 07/01/15 (Collateralized by U.S. Government Agency Securities valued at $30,600,000, 3.50% - 5.00%, due 07/01/26 - 01/01/45) |
0.13% | 07/01/15 | 30,000,108 | 30,000,000 | ||
| Issued
06/25/15, repurchase date 07/02/15 (Collateralized by U.S. Government Agency Securities valued at $141,780,001, 3.00% - 6.00%, due 07/15/39 - 02/15/45) |
0.08% | 07/02/15 | 139,002,162 | 139,000,000 | ||
| JP Morgan Securities, LLC | ||||||
| Issued
06/30/15, repurchase date 07/01/15 (Collateralized by U.S. Government Agency Securities valued at $20,600,000, 2.00% - 3.50%, due 05/25/25 - 08/25/43) |
0.14% | 07/01/15 | 20,000,078 | 20,000,000 | ||
| Merrill Lynch, Pierce, Fenner & Smith, Inc | ||||||
| Issued
06/30/15, repurchase date 07/01/15 (Collateralized by U.S. Government Agency Securities valued at $66,950,000, 0.49% - 3.00%, due 12/15/39 - 06/25/45) |
0.14% | 07/01/15 | 65,000,253 | 65,000,000 | ||
| Issuer | Footnotes | Rate | Effective
Maturity |
Maturity
Date |
Maturity Amount ($) |
Value
($) |
| Mizuho Securities USA, Inc | ||||||
| Issued
06/30/15, repurchase date 07/01/15 (Collateralized by U.S. Government Agency Securities valued at $56,100,584, 0.00% - 3.75%, due 04/26/16 - 06/09/36) |
0.15% | 07/01/15 | 55,000,229 | 55,000,000 | ||
| Morgan Stanley & Co, LLC | ||||||
| Issued
06/30/15, repurchase date 07/01/15 (Collateralized by U.S. Government Agency Securities valued at $21,420,001, 4.00%, due 03/20/45) |
0.09% | 07/01/15 | 21,000,053 | 21,000,000 | ||
| 837,000,000 | ||||||
| Treasury Repurchase Agreements 20.9% | ||||||
| Barclays Capital, Inc | ||||||
| Issued
06/30/15, repurchase date 07/01/15 (Collateralized by U.S. Treasury Securities valued at $87,438,693, 0.38% - 2.13%, due 02/15/16 - 01/31/21) |
0.10% | 07/01/15 | 85,724,411 | 85,724,173 | ||
| Issued
06/25/15, repurchase date 07/02/15 (Collateralized by U.S. Treasury Securities valued at $163,200,058, 0.00% - 3.63%, due 07/02/15 - 02/15/44) |
0.05% | 07/02/15 | 160,001,556 | 160,000,000 | ||
| BNP Paribas Securities Corp | ||||||
| Issued
06/30/15, repurchase date 07/01/15 (Collateralized by U.S. Treasury Securities valued at $55,080,099, 0.00% - 2.38%, due 09/03/15 - 01/15/20) |
0.09% | 07/01/15 | 54,000,135 | 54,000,000 | ||
| Federal Reserve Bank of New York | ||||||
| Issued
06/30/15, repurchase date 07/01/15 (Collateralized by U.S. Treasury Securities valued at $4,621,006,491, 3.13%, due 02/15/42) |
0.05% | 07/01/15 | 4,621,006,418 | 4,621,000,000 | ||
| Issued
06/29/15, repurchase date 07/01/15 (Collateralized by U.S. Treasury Securities valued at $1,184,004,687, 2.00% - 3.75%, due 02/15/22 - 05/15/42) |
0.07% | 07/01/15 | 1,184,004,604 | 1,184,000,000 | ||
| Issued
06/25/15, repurchase date 07/02/15 (Collateralized by U.S. Treasury Securities valued at $1,694,019,862, 2.00% - 4.38%, due 07/31/18 - 08/15/41) |
0.07% | 07/02/15 | 1,694,023,057 | 1,694,000,000 | ||
| JP Morgan Securities, LLC | ||||||
| Issued
06/30/15, repurchase date 07/01/15 (Collateralized by U.S. Treasury Securities valued at $1,857,128, 2.13%, due 06/30/21) |
0.12% | 07/01/15 | 1,820,697 | 1,820,691 | ||
| Issued
06/22/15, repurchase date 07/22/15 (Collateralized by U.S. Treasury Securities valued at $273,364,884, 2.00% - 2.63%, due 07/31/20 - 05/15/24) |
0.08% | 07/07/15 | 268,008,933 | 268,000,000 | ||
| 8,068,544,864 | ||||||
| Other Repurchase Agreements** 3.9% | ||||||
| Credit Suisse Securities (USA), LLC | ||||||
| Issued
06/18/15, repurchase date 12/14/15 (Collateralized by common stocks, ETFs, corporate bonds, ABS, or non-agency collateralized mortgage obligations valued at $256,450,480, 0.08% - 8.00%, due 03/15/17 - 11/25/60) |
c | 0.80% | 10/03/15 | 223,530,244 | 223,000,000 | |
| Issued
06/15/15, repurchase date 12/14/15 (Collateralized by common stocks, ETFs, corporate bonds, ABS, or non-agency collateralized mortgage obligations valued at $433,551,278, 0.00% - 9.16%, due 04/15/17 - 01/15/49) |
c | 0.80% | 10/03/15 | 377,921,556 | 377,000,000 | |
| JP Morgan Securities, LLC | ||||||
| Issued
06/04/15, repurchase date 12/01/15 (Collateralized by common stocks, ETFs, corporate bonds, ABS, or non-agency collateralized mortgage obligations valued at $314,097,382, 0.55% - 8.88%, due 03/22/17 - 06/15/68) |
c | 0.65% | 09/28/15 | 273,571,783 | 273,000,000 | |
| Issuer | Footnotes | Rate | Effective
Maturity |
Maturity
Date |
Maturity Amount ($) |
Value
($) |
| Issued
06/17/15, repurchase date 12/17/15 (Collateralized by common stocks, ETFs, corporate bonds, ABS, or non-agency collateralized mortgage obligations valued at $271,463,704, 0.60% - 7.98%, due 12/11/15 - 12/25/65) |
c | 0.65% | 09/28/15 | 236,438,894 | 236,000,000 | |
| Merrill Lynch, Pierce, Fenner & Smith, Inc | ||||||
| Issued
05/28/15, repurchase date 08/26/15 (Collateralized by common stocks, ETFs, corporate bonds, ABS, or non-agency collateralized mortgage obligations valued at $472,650,000, 0.37% - 6.90%, due 01/15/20 - 09/25/57) |
c | 0.58% | 08/04/15 | 411,450,273 | 411,000,000 | |
| 1,520,000,000 | ||||||
| Total Repurchase Agreements | ||||||
| (Cost $10,425,544,864) | 10,425,544,864 | |||||
| a | Credit-enhanced or liquidity-enhanced. |
| b | Securities exempt from registration under Rule 144A of the Securities Act of 1933, as amended. These securities may be resold in transactions exempt from registrations, normally to qualified institutional buyers. At the period end, the value of these amounted to $4,567,628,794 or 11.9% of net assets. |
| c | Illiquid security. At the period end, the value of these amounted to $1,522,447,560 or 4.0% of net assets. |
| † | Whistlejacket notes are in receivership, and the fund elected to sell all of its Whistlejacket notes at auction (April 29, 2009). The remaining investment represents an interest in a small residual fund that is being held to cover any remaining expenses and liabilities associated with receivership. |
| * | Usually collateralized via U.S. Government Agency Securities or less frequently by U.S. Treasury Securities. |
| ** | Usually collateralized via common stocks, ETFs, corporate bonds, ABS, or non-agency collateralized mortgage obligations or less frequently by U.S. Government Agency Securities and/ or U.S. Treasury Securities. |
| ABS — | Asset-backed securities |
| ETF — | Exchange Traded Fund |
| HFA — | Housing finance agency/authority |
| RB — | Revenue bond |
| Assets | ||
| Investments, at cost and value | $28,103,945,734 | |
| Repurchase agreements, at cost and value | + | 10,425,544,864 |
| Total investments, at cost and value (Note 2a) | 38,529,490,598 | |
| Receivables: | ||
| Interest | 12,074,510 | |
| Prepaid expenses | + | 51,638 |
| Total assets | 38,541,616,746 | |
| Liabilities | ||
| Payables: | ||
| Shareholder service fees | 1,459,512 | |
| Distributions to shareholders | 952,388 | |
| Accrued expenses | + | 581,301 |
| Total liabilities | 2,993,201 | |
| Net Assets | ||
| Total assets | 38,541,616,746 | |
| Total liabilities | – | 2,993,201 |
| Net assets | $38,538,623,545 | |
| Net Assets by Source | ||
| Capital received from investors | 38,540,209,274 | |
| Net realized capital losses | (1,585,729) | |
| Net Asset Value (NAV) | ||||
| Net Assets | ÷ | Shares
Outstanding |
= | NAV |
| $38,538,623,545 | 38,538,529,833 | $1.00 | ||
| Investment Income | ||
| Interest | $48,062,464 | |
| Expenses | ||
| Investment adviser and administrator fees | 56,382,503 | |
| Shareholder service fees | 77,432,357 | |
| Custodian fees | 524,364 | |
| Portfolio accounting fees | 400,240 | |
| Shareholder reports | 344,103 | |
| Registration fees | 126,160 | |
| Professional fees | 96,383 | |
| Independent trustees' fees | 67,898 | |
| Transfer agent fees | 11,765 | |
| Other expenses | + | 335,899 |
| Total expenses | 135,721,672 | |
| Expense reduction by CSIM and its affiliates | – | 99,297,618 |
| Net expenses | – | 36,424,054 |
| Net investment income | 11,638,410 | |
| Realized Gains (Losses) | ||
| Net realized losses on investments | (18,492) | |
| Increase in net assets resulting from operations | $11,619,918 | |
| Operations | |||
| 1/1/15-6/30/15 | 1/1/14-12/31/14 | ||
| Net investment income | $11,638,410 | $23,273,554 | |
| Net realized gains (losses) | + | (18,492) | 49,577 |
| Increase in net assets from operations | 11,619,918 | 23,323,131 | |
| Distributions to Shareholders | |||
| Distributions from net investment income | ($11,638,410) | ($23,273,554) | |
| Transactions in Fund Shares* | |||
| Shares sold | 40,517,168,353 | 81,437,150,821 | |
| Shares reinvested | 10,583,623 | 23,085,924 | |
| Shares redeemed | + | (41,315,481,520) | (81,586,206,958) |
| Net transactions in fund shares | (787,729,544) | (125,970,213) | |
| Net Assets | |||
| Beginning of period | 39,326,371,581 | 39,452,292,217 | |
| Total decrease | + | (787,748,036) | (125,920,636) |
| End of period | $38,538,623,545 | $39,326,371,581 | |
| * | Transactions took place at $1.00 per share; figures for share quantities are the same as for dollars. |
| The Charles Schwab Family of Funds (organized October 20, 1989) | Schwab Municipal Money Fund |
| Schwab Money Market Fund | Schwab AMT Tax-Free Money Fund |
| Schwab Government Money Fund | Schwab California Municipal Money Fund |
| Schwab U.S. Treasury Money Fund | Schwab New York Municipal Money Fund |
| Schwab Treasury Obligations Money Fund | (formerly Schwab New York AMT Tax-Free Money Fund) |
| Schwab Value Advantage Money Fund | Schwab New Jersey Municipal Money Fund |
| Schwab Advisor Cash Reserves | (formerly Schwab New Jersey AMT Tax-Free Money Fund) |
| Schwab Cash Reserves | Schwab Pennsylvania Municipal Money Fund |
| Schwab Retirement Advantage Money Fund | Schwab Massachusetts Municipal Money Fund |
| Schwab Investor Money Fund | (formerly Schwab Massachusetts AMT Tax-Free Money Fund) |
| Average Daily Net Assets | |
| First $1 billion | 0.35% |
| More than $1 billion but not exceeding $10 billion | 0.32% |
| More than $10 billion but not exceeding $20 billion | 0.30% |
| More than $20 billion but not exceeding $40 billion | 0.27% |
| Over $40 billion | 0.25% |
| Expiration Date | ||||||||
| December 31, 2015 | December 31, 2016 | December 31, 2017 | December 31, 2018 | Total | ||||
| $137,461,313 | $158,103,718 | $178,222,603 | $84,563,962 | $558,351,596 | ||||
| Independent Trustees | |||
| Name,
Year of Birth, and Position(s) with the trust; (Terms of office, and length of Time Served1) |
Principal
Occupations During the Past Five Years |
Number
of Portfolios in Fund Complex Overseen by the Trustee |
Other Directorships |
| John
F. Cogan 1947 Trustee (Trustee of The Charles Schwab Family of Funds, Schwab Investments, Schwab Capital Trust and Schwab Annuity Portfolios since 2008; Laudus Trust and Laudus Institutional Trust since 2010) |
Senior Fellow, The Hoover Institution at Stanford University (Oct. 1979 – present); Senior Fellow Stanford Institute for Economic Policy Research (2000 – present); Professor of Public Policy, Stanford University (1994 – present). | 74 | Director,
Gilead Sciences, Inc. (2005 – present) |
| David
L. Mahoney 1954 Trustee (Trustee of The Charles Schwab Family of Funds, Schwab Investments, Schwab Capital Trust, Schwab Annuity Portfolios, Laudus Trust and Laudus Institutional Trust since 2011) |
Private Investor. | 74 | Director,
Symantec Corporation (2003 – present) Director, Corcept Therapeutics Incorporated (2004 – present) Director, Adamas Pharmaceuticals, Inc. (2009 – present) |
| Kiran
M. Patel 1948 Trustee (Trustee of The Charles Schwab Family of Funds, Schwab Investments, Schwab Capital Trust, Schwab Annuity Portfolios, Laudus Trust and Laudus Institutional Trust since 2011) |
Retired. Executive Vice President and General Manager of Small Business Group, Intuit, Inc. (financial software and services firm for consumers and small businesses) (Dec. 2008 – Sept. 2013) | 74 | Director, KLA-Tencor Corporation (2008 – present) |
| Charles
A. Ruffel 1956 Trustee (Trustee of Schwab Strategic Trust since 2009; The Charles Schwab Family of Funds, Schwab Investments, Schwab Capital Trust, Schwab Annuity Portfolios, Laudus Trust and Laudus Institutional Trust since 2015) |
Managing Partner and Co-Founder, Kudu Advisors, LLC (financial services) (May 2009 – present); Director, Asset International, Inc. (publisher of financial services information) (Jan. 2009 – Nov. 2014). | 95 | None. |
| Independent Trustees (continued) | |||
| Name,
Year of Birth, and Position(s) with the trust; (Terms of office, and length of Time Served1) |
Principal
Occupations During the Past Five Years |
Number
of Portfolios in Fund Complex Overseen by the Trustee |
Other Directorships |
| Gerald
B. Smith 1950 Trustee (Trustee of The Charles Schwab Family of Funds, Schwab Investments, Schwab Capital Trust and Schwab Annuity Portfolios since 2000; Laudus Trust and Laudus Institutional Trust since 2010) |
Chairman, Chief Executive Officer and Founder of Smith Graham & Co. (investment advisors) (1990 – present). | 74 | Director,
Eaton (2012 – present) Director and Chairman of the Audit Committee, Oneok Partners LP (2003 – 2013) Director, Oneok, Inc. (2009 – 2013) Lead Independent Director, Board of Cooper Industries (2002 – 2012) |
| Joseph
H. Wender 1944 Trustee (Trustee of The Charles Schwab Family of Funds, Schwab Investments, Schwab Capital Trust and Schwab Annuity Portfolios since 2008; Laudus Trust and Laudus Institutional Trust since 2010) |
Senior Consultant, Goldman Sachs & Co., Inc. (investment banking and securities firm) (Jan. 2008 – present); Partner, Colgin Partners, LLC (vineyards) (Feb. 1998 – present). | 74 | Board Member and Chairman of the Audit Committee, Isis Pharmaceuticals (1994 – present) |
| Interested Trustees | |||
| Name,
Year of Birth, and Position(s) with the trust; (Terms of office, and length of Time Served) |
Principal
Occupations During the Past Five Years |
Number
of Portfolios in Fund Complex Overseen by the Trustee |
Other Directorships |
| Charles
R. Schwab2 1937 Chairman and Trustee (Chairman and Trustee of The Charles Schwab Family of Funds since 1989; Schwab Investments since 1991; Schwab Capital Trust since 1993; Schwab Annuity Portfolios since 1994; Laudus Trust and Laudus Institutional Trust since 2010) |
Chairman and Director, The Charles Schwab Corporation (1986 – present); Chairman and Director of Charles Schwab & Co., Inc. (1971 – present); Chairman and Director of Charles Schwab Investment Management, Inc. (1989 – present); Chairman and Director of Charles Schwab Bank (2003 – present); Chairman and Chief Executive Officer of Schwab (SIS) Holdings Inc. I and Schwab International Holdings, Inc. (1996 – present); and Director, Chairman and Chief Executive Officer, Schwab Holdings, Inc. (1979 – present). | 74 | Chairman
and Director, The Charles Schwab Corporation (1986 – present) Director, Yahoo! Inc. (2014 – present) |
| Walter
W. Bettinger II2 1960 Trustee (Trustee of The Charles Schwab Family of Funds, Schwab Investments, Schwab Capital Trust and Schwab Annuity Portfolios since 2008; Schwab Strategic Trust since 2009; Laudus Trust and Laudus Institutional Trust since 2010) |
Director, President and Chief Executive Officer, The Charles Schwab Corporation and Charles Schwab & Co., Inc. (2008 – present); Director, Charles Schwab Bank (2006 – present); and Director, Schwab Holdings, Inc. (2008 – present). | 95 | Director, The Charles Schwab Corporation (2008 – present) |
| Officers of the Trust | |
| Name,
Year of Birth, and Position(s) with the trust; (Terms of office, and length of Time Served3) |
Principal Occupations During the Past Five Years |
| Marie
Chandoha 1961 President and Chief Executive Officer (Officer of The Charles Schwab Family of Funds, Schwab Investments, Schwab Capital Trust, Schwab Annuity Portfolios, Laudus Trust and Laudus Institutional Trust since 2010) |
Director, President and Chief Executive Officer (Dec. 2010 – present), Chief Investment Officer (Sept. 2010 – Oct. 2011), Charles Schwab Investment Management, Inc.; President, Chief Executive Officer (Dec. 2010 – present), and Chief Investment Officer (Sept. 2010 – Oct. 2011), Schwab Funds, Laudus Funds and Schwab ETFs; Director, Charles Schwab Worldwide Funds plc and Charles Schwab Asset Management (Ireland) Limited (January 2011 – present); Global Head of Fixed Income Business Division, BlackRock, Inc. (formerly Barclays Global Investors) (March 2007 – August 2010). |
| George
Pereira 1964 Treasurer and Principal Financial Officer, Schwab Funds Treasurer and Chief Financial Officer, Laudus Funds (Officer of The Charles Schwab Family of Funds, Schwab Investments, Schwab Capital Trust and Schwab Annuity Portfolios since 2004; Laudus Trust and Laudus Institutional Trust since 2006) |
Senior Vice President and Chief Financial Officer (Nov. 2004 – present), Chief Operating Officer (Jan. 2011 – present), Charles Schwab Investment Management, Inc.; Treasurer and Chief Financial Officer, Laudus Funds (June 2006 – present); Treasurer and Principal Financial Officer, Schwab Funds (Nov. 2004 – present) and Schwab ETFs (Oct. 2009 – present); Director, Charles Schwab Worldwide Funds plc and Charles Schwab Asset Management (Ireland) Limited (April 2005 – present). |
| Omar
Aguilar 1970 Senior Vice President and Chief Investment Officer – Equities (Officer of The Charles Schwab Family of Funds, Schwab Investments, Schwab Capital Trust, Schwab Annuity Portfolios, Laudus Trust and Laudus Institutional Trust since 2011) |
Senior Vice President and Chief Investment Officer – Equities, Charles Schwab Investment Management, Inc. (April 2011 – present); Senior Vice President and Chief Investment Officer – Equities, Schwab Funds, Laudus Funds and Schwab ETFs (June 2011 – present); Head of the Portfolio Management Group and Vice President of Portfolio Management, Financial Engines, Inc. (May 2009 – April 2011); Head of Quantitative Equity, ING Investment Management (July 2004 – Jan. 2009). |
| Brett
Wander 1961 Senior Vice President and Chief Investment Officer – Fixed Income (Officer of The Charles Schwab Family of Funds, Schwab Investments, Schwab Capital Trust, Schwab Annuity Portfolios, Laudus Trust and Laudus Institutional Trust since 2011) |
Senior Vice President and Chief Investment Officer – Fixed Income, Charles Schwab Investment Management, Inc. (April 2011 – present); Senior Vice President and Chief Investment Officer – Fixed Income, Schwab Funds, Laudus Funds and Schwab ETFs (June 2011 – present); Senior Managing Director, Global Head of Active Fixed-Income Strategies, State Street Global Advisors (Jan. 2008 – Oct. 2010); Director of Alpha Strategies Loomis, Sayles & Company (April 2006 – Jan. 2008). |
| David
Lekich 1964 Chief Legal Officer and Secretary, Schwab Funds Vice President and Assistant Clerk, Laudus Funds (Officer of The Charles Schwab Family of Funds, Schwab Investments, Schwab Capital Trust, Schwab Annuity Portfolios, Laudus Trust and Laudus Institutional Trust since 2011) |
Senior Vice President (Sept. 2011 – present), Vice President (March 2004 – Sept. 2011), Charles Schwab & Co., Inc.; Senior Vice President and Chief Counsel (Sept. 2011 – present), Vice President (Jan. 2011 – Sept. 2011), Charles Schwab Investment Management, Inc.; Secretary (April 2011 – present) and Chief Legal Officer (Dec. 2011 – present), Schwab Funds; Vice President and Assistant Clerk, Laudus Funds (April 2011 – present); Secretary (May 2011 – present) and Chief Legal Officer (Nov. 2011 – present), Schwab ETFs. |
| Catherine
MacGregor 1964 Vice President and Assistant Secretary, Schwab Funds Chief Legal Officer, Vice President and Clerk, Laudus Funds (Officer of The Charles Schwab Family of Funds, Schwab Investments, Schwab Capital Trust, Schwab Annuity Portfolios, Laudus Trust and Laudus Institutional Trust since 2005) |
Vice President, Charles Schwab & Co., Inc., Charles Schwab Investment Management, Inc. (July 2005 – present); Vice President (Dec. 2005 – present), Chief Legal Officer and Clerk (March 2007 – present), Laudus Funds; Vice President (Nov. 2005 – present) and Assistant Secretary (June 2007 – present), Schwab Funds; Vice President and Assistant Secretary, Schwab ETFs (Oct. 2009 – present). |
| 1 | Trustees remain in office until they resign, retire or are removed by shareholder vote. The Schwab and Laudus Funds’ retirement policy requires that independent trustees retire at age 72 or after twenty years as a trustee, whichever comes first. In addition, the retirement policy requires any independent trustee of Schwab Funds or Laudus Funds to retire from all Boards upon their required retirement date from either Board. |
| 2 | Mr. Schwab and Mr. Bettinger are Interested Trustees because they own stock of The Charles Schwab Corporation, the parent company of the investment adviser. |
| 3 | The President, Treasurer and Secretary/Clerk hold office until their respective successors are chosen and qualified or until he or she sooner dies, resigns, is removed or becomes disqualified. Each of the other officers serves at the pleasure of the Boards. |
211 Main Street, San Francisco, CA 94105
1-800-435-4000
© 2015 Charles Schwab & Co., Inc. All rights reserved.
Member SIPC®
Printed on recycled paper.
00149458
Table of Contents
by viewing these documents online.
Sign up at schwab.com/paperless


| 1 | A fund’s share price is its NAV, which is the fund’s net assets divided by the number of its shares outstanding. Under the new amendments, Retail Prime and Municipal money market funds, as well as Government money market funds, will continue to be permitted to transact at a constant NAV of $1.00. Note that while a fund may seek to maintain a constant NAV, there is no guarantee that it will be able to do so. |
 |
Linda Klingman, Vice President and Head of Taxable Money Market Strategies, leads the portfolio management team of Schwab’s prime and government taxable money funds. Ms. Klingman also has overall responsibility for all aspects of the management of the fund. Prior to joining CSIM in 1990, Ms. Klingman was a senior money market trader with AIM Management. She has managed money market funds since 1988. |
 |
Michael Lin, Managing Director and Senior Portfolio Manager, is responsible for the day-to-day co-management of the fund. Mr. Lin has been a portfolio manager with CSIM since 2006, and also worked in CSIM’s Fund Administration group for nearly four years, where he focused on security pricing and valuation of Schwab Funds. Prior to joining CSIM, he spent three years at American Century Investments, most recently as a senior trader of the taxable money market funds. |
 |
Jonathan Roman, Portfolio Manager, is responsible for the day-to-day co-management of the fund. Mr. Roman has been a portfolio manager with CSIM since 2010, and has held a number of positions at the firm since beginning his tenure in 2005. In 2009, he joined the Portfolio Management group as a Trader, and prior to that he worked in the Portfolio Operations and Analytics group providing trading support to the taxable money market desk. |
 |
Jonathan Feske, CFA, Portfolio Manager, is responsible for the day-to-day co-management of the fund. He previously was responsible for credit and investment research for global banks for CSIM’s taxable bond and money funds. Prior to joining CSIM in 2011, Mr. Feske was a high-yield bond analyst for more than two years at Miller Tabak Roberts Securities, a boutique corporate bond broker-dealer, which is now part of GMP Capital. He covered both U.S. and emerging market credits, focusing on distressed situations in various industrial sectors. Previously, Mr. Feske was employed in the securities industry as an equity trader for three years. |
| 1 | The investment adviser and its affiliates may recapture expenses or fees they waived under a voluntary yield waiver until the third anniversary of the end of the fiscal year in which such waiver occurs, subject to certain limitations. For more information on the potential impact of such recapture on future yields, see financial note 5. |
| 2 | As shown in the Portfolio Holdings section of the shareholder report. |
| 3 | Money funds must maintain a dollar-weighted average maturity of no longer than 60 days and cannot invest in any security whose effective maturity is longer than 397 days (approximately 13 months). |
| 4 | Tier 1 securities are rated in the highest short-term rating category by two nationally recognized statistical rating organizations (“NRSROs”), or by one if only one NRSRO has rated the securities, or, if unrated, determined to be of comparable quality by CSIM pursuant to guidelines adopted by the Board of Trustees. Money market fund shares and U.S. government securities are also Tier 1 securities. The fund uses NRSRO credit ratings from Standard & Poor’s Corp., Moody’s Investors Service, Fitch Ratings, and/or DBRS. The fund may use different ratings provided by other rating agencies for purposes of determining compliance with the fund’s investment policies. The fund itself has not been rated by an independent credit rating agency. |

| Schwab Money Market Fund | |
| Sweep
Shares | |
| Ticker Symbol | SWMXX |
| Minimum Initial Investment | * |
| Seven-Day Yield1 | 0.01% |
| Seven-Day Yield–Without Contractual Expense Limitation2 | -0.04% |
| Seven-Day Effective Yield1 | 0.01% |
| * | Subject to the eligibility terms and conditions of your Schwab account agreement. |
| 1 | Yield reflects the effect of the fund’s agreement with the investment adviser and its affiliates to limit the fund's total annual operating expenses to certain levels (contractual expense limitation). In addition, the investment adviser and its affiliates have voluntarily waived expenses in excess of the contractual expense limitation to maintain a positive net yield for the fund (voluntary yield waiver). Without the contractual expense limitation and the voluntary yield waiver, the fund’s yield would have been lower. For additional details, see financial note 4. |
| 2 | Yield does not reflect the effect of the contractual expense limitation, but does reflect the effect of the voluntary yield waiver. The voluntary yield waiver added 0.42% to the seven-day yield. |
| Expense
Ratio1 (Annualized) |
Beginning
Account Value at 1/1/15 |
Ending
Account Value (Net of Expenses) at 6/30/15 |
Expenses
Paid During Period2 1/1/15–6/30/15 | |
| Schwab Money Market Fund | ||||
| Actual Return | 0.24% | $1,000.00 | $1,000.10 | $1.19 |
| Hypothetical 5% Return | 0.24% | $1,000.00 | $1,023.61 | $1.20 |
| 1 | Based on the most recent six-month expense ratio; may differ from the expense ratio provided in the Financial Highlights. |
| 2 | Expenses for the fund are equal to its annualized expense ratio, multiplied by the average account value over the period, multiplied by 181 days of the period, and divided by 365 days of the fiscal year. |
| 1/1/15–
6/30/15* |
1/1/14–
12/31/14 |
1/1/13–
12/31/13 |
1/1/12–
12/31/12 |
1/1/11–
12/31/11 |
1/1/10–
12/31/10 | |
| Per-Share Data ($) | ||||||
| Net asset value at beginning of period | 1.00 | 1.00 | 1.00 | 1.00 | 1.00 | 1.00 |
| Income (loss) from investment operations: | ||||||
| Net investment income (loss) | 0.00 1,2 | 0.00 2 | 0.00 2 | 0.00 2 | 0.00 2 | 0.00 2 |
| Net realized and unrealized gains (losses) | (0.00) 2 | 0.00 2 | 0.00 2 | 0.00 2 | 0.00 2 | 0.00 2,3 |
| Total from investment operations | 0.00 2 | 0.00 2 | 0.00 2 | 0.00 2 | 0.00 2 | 0.00 2 |
| Less distributions: | ||||||
| Distributions from net investment income | (0.00) 2 | (0.00) 2 | (0.00) 2 | (0.00) 2 | (0.00) 2 | (0.00) 2 |
| Net asset value at end of period | 1.00 | 1.00 | 1.00 | 1.00 | 1.00 | 1.00 |
| Total return (%) | 0.01 4 | 0.01 | 0.01 | 0.01 | 0.01 | 0.01 |
| Ratios/Supplemental Data (%) | ||||||
| Ratios to average net assets: | ||||||
| Net operating expenses | 0.24 5,6 | 0.21 5 | 0.25 5 | 0.28 5 | 0.25 5 | 0.33 5 |
| Gross operating expenses | 0.73 6 | 0.73 | 0.73 | 0.73 | 0.73 | 0.73 |
| Net investment income (loss) | 0.01 6 | 0.01 | 0.01 | 0.01 | 0.01 | 0.01 |
| Net assets, end of period ($ x 1,000,000) | 14,557 | 14,824 | 14,969 | 14,589 | 14,352 | 13,409 |
| * | Unaudited. |
| Holdings by Category | Cost
($) |
Value
($) | |
| 50.6% | Fixed-Rate Obligations | 7,363,089,146 | 7,363,089,146 |
| 19.7% | Variable-Rate Obligations | 2,864,388,582 | 2,864,388,582 |
| 29.7% | Repurchase Agreements | 4,326,103,213 | 4,326,103,213 |
| 100.0% | Total Investments | 14,553,580,941 | 14,553,580,941 |
| 0.0% | Other Assets and Liabilities, Net | 3,727,182 | |
| 100.0% | Net Assets | 14,557,308,123 | |
| Issuer | Footnotes | Rate | Effective
Maturity |
Maturity
Date |
Face
Amount ($) |
Value
($) |
| Fixed-Rate Obligations 50.6% of net assets | ||||||
| Asset Backed Commercial Paper 5.5% | ||||||
| CAFCO, LLC | a,b | 0.28% | 08/03/15 | 20,000,000 | 19,994,867 | |
| a,b | 0.27% | 08/05/15 | 25,000,000 | 24,993,437 | ||
| a,b | 0.28% | 09/22/15 | 31,000,000 | 30,979,988 | ||
| a,b | 0.31% | 11/04/15 | 100,000,000 | 99,891,500 | ||
| Cancara Asset Securitisation, LLC | a,b | 0.27% | 09/18/15 | 32,000,000 | 31,981,040 | |
| a,b | 0.27% | 09/25/15 | 46,000,000 | 45,970,330 | ||
| Chariot Funding, LLC | a,b | 0.32% | 10/29/15 | 20,000,000 | 19,978,667 | |
| a,b | 0.30% | 10/30/15 | 19,000,000 | 18,980,842 | ||
| Charta, LLC | a,b | 0.31% | 11/04/15 | 21,000,000 | 20,977,215 | |
| Ciesco, LLC | a,b | 0.29% | 08/10/15 | 61,250,000 | 61,230,263 | |
| Collateralized Commercial Paper Co, LLC | a | 0.39% | 07/20/15 | 29,000,000 | 28,994,031 | |
| a | 0.35% | 10/29/15 | 51,000,000 | 50,940,500 | ||
| CRC Funding, LLC | a,b | 0.28% | 08/03/15 | 17,000,000 | 16,995,637 | |
| a,b | 0.27% | 08/05/15 | 50,000,000 | 49,986,875 | ||
| a,b | 0.30% | 09/23/15 | 5,000,000 | 4,996,500 | ||
| Crown Point Capital Co, LLC | a,b | 0.20% | 07/06/15 | 8,000,000 | 7,999,778 | |
| Jupiter Securitization Corp | a,b | 0.30% | 10/30/15 | 14,000,000 | 13,985,883 | |
| a,b | 0.32% | 11/02/15 | 25,000,000 | 24,972,444 | ||
| Lexington Parker Capital Co, LLC | a,b | 0.24% | 07/01/15 | 1,000,000 | 1,000,000 | |
| Old Line Funding, LLC | a,b | 0.30% | 09/23/15 | 8,000,000 | 7,994,400 | |
| a,b | 0.30% | 09/24/15 | 50,000,000 | 49,964,583 | ||
| Issuer | Footnotes | Rate | Effective
Maturity |
Maturity
Date |
Face
Amount ($) |
Value
($) |
| Ridgefield Funding Co, LLC | a,b | 0.40% | 08/21/15 | 50,000,000 | 49,971,667 | |
| a,b | 0.30% | 09/15/15 | 58,000,000 | 57,963,267 | ||
| Sheffield Receivables Co, LLC | a,b | 0.40% | 07/23/15 | 12,000,000 | 11,997,067 | |
| a,b | 0.35% | 08/03/15 | 11,000,000 | 10,996,471 | ||
| a,b | 0.35% | 09/01/15 | 36,000,000 | 35,978,300 | ||
| Thunder Bay Funding, LLC | a,b | 0.40% | 12/16/15 | 4,000,000 | 3,992,533 | |
| 803,708,085 | ||||||
| Financial Company Commercial Paper 4.6% | ||||||
| Bank of Nova Scotia | b | 0.33% | 11/23/15 | 19,000,000 | 18,974,746 | |
| BPCE SA | b | 0.23% | 07/01/15 | 86,000,000 | 86,000,000 | |
| b | 0.23% | 07/09/15 | 2,000,000 | 1,999,898 | ||
| DNB Bank ASA | b | 0.33% | 10/01/15 | 14,000,000 | 13,988,372 | |
| General Electric Capital Corp | a | 0.11% | 07/13/15 | 80,000,000 | 79,997,067 | |
| ING (U.S.) Funding, LLC | a | 0.27% | 09/01/15 | 17,000,000 | 16,992,095 | |
| a | 0.38% | 10/09/15 | 6,000,000 | 5,993,667 | ||
| a | 0.37% | 10/13/15 | 1,000,000 | 998,931 | ||
| a | 0.41% | 11/16/15 | 35,000,000 | 34,944,992 | ||
| Nationwide Building Society | 0.40% | 07/06/15 | 75,000,000 | 74,995,833 | ||
| 0.40% | 08/13/15 | 11,000,000 | 10,994,744 | |||
| 0.40% | 08/17/15 | 18,000,000 | 17,990,600 | |||
| NRW.BANK | 0.09% | 07/01/15 | 122,000,000 | 122,000,000 | ||
| Skandinaviska Enskilda Banken AB | 0.34% | 10/01/15 | 36,000,000 | 35,968,720 | ||
| Swedbank AB | 0.21% | 07/16/15 | 54,000,000 | 53,995,275 | ||
| 0.27% | 08/04/15 | 18,000,000 | 17,995,410 | |||
| United Overseas Bank, Ltd | b | 0.26% | 08/14/15 | 78,000,000 | 77,975,213 | |
| 671,805,563 | ||||||
| Other Commercial Paper 1.0% | ||||||
| Toyota Motor Credit Corp | a | 0.20% | 09/09/15 | 39,000,000 | 38,984,833 | |
| a | 0.23% | 09/17/15 | 99,000,000 | 98,950,665 | ||
| 137,935,498 | ||||||
| Certificates of Deposit 32.8% | ||||||
| Abbey National Treasury Services PLC | a | 0.30% | 08/03/15 | 140,000,000 | 140,000,000 | |
| Australia & New Zealand Banking Group, Ltd | 0.22% | 09/21/15 | 137,000,000 | 137,000,000 | ||
| Bank of Montreal | 0.30% | 10/14/15 | 109,000,000 | 109,000,000 | ||
| 0.29% | 10/15/15 | 1,000,000 | 1,000,000 | |||
| 0.31% | 11/12/15 | 106,000,000 | 106,000,000 | |||
| Bank of Nova Scotia | 0.30% | 08/17/15 | 145,000,000 | 145,000,000 | ||
| 0.25% | 09/23/15 | 7,000,000 | 7,000,000 | |||
| 0.30% | 10/13/15 | 3,000,000 | 3,000,000 | |||
| 0.34% | 11/09/15 | 30,000,000 | 30,000,000 | |||
| 0.33% | 11/13/15 | 4,000,000 | 4,000,000 | |||
| Bank of the West | 0.26% | 07/23/15 | 41,000,000 | 41,000,000 | ||
| Issuer | Footnotes | Rate | Effective
Maturity |
Maturity
Date |
Face
Amount ($) |
Value
($) |
| Bank of Tokyo Mitsubishi UFJ, Ltd | 0.33% | 09/02/15 | 84,000,000 | 84,000,000 | ||
| 0.33% | 09/03/15 | 59,000,000 | 59,000,000 | |||
| 0.33% | 09/04/15 | 47,000,000 | 47,000,000 | |||
| Barclays Bank PLC | 0.45% | 08/17/15 | 62,000,000 | 62,000,000 | ||
| 0.53% | 09/02/15 | 119,000,000 | 119,000,000 | |||
| 0.53% | 10/05/15 | 1,000,000 | 1,000,000 | |||
| 0.92% | 05/23/16 | 83,000,000 | 83,000,000 | |||
| BNP Paribas | 0.36% | 08/24/15 | 96,000,000 | 96,000,000 | ||
| 0.25% | 09/03/15 | 67,000,000 | 67,000,000 | |||
| 0.40% | 12/02/15 | 51,000,000 | 51,000,000 | |||
| Canadian Imperial Bank of Commerce | 0.10% | 07/01/15 | 183,000,000 | 183,000,000 | ||
| 0.27% | 08/25/15 | 31,000,000 | 31,000,000 | |||
| Chase Bank USA, NA | 0.35% | 10/01/15 | 50,000,000 | 50,000,000 | ||
| 0.35% | 10/23/15 | 33,000,000 | 33,000,000 | |||
| 0.38% | 12/07/15 | 51,000,000 | 51,000,000 | |||
| Citibank, NA | 0.28% | 07/01/15 | 19,000,000 | 19,000,000 | ||
| Credit Agricole Corporate and Investment Bank | 0.23% | 07/10/15 | 70,000,000 | 70,000,000 | ||
| 0.27% | 08/10/15 | 35,000,000 | 35,000,000 | |||
| 0.30% | 09/01/15 | 40,000,000 | 40,000,000 | |||
| Credit Agricole SA | 0.29% | 10/01/15 | 71,000,000 | 71,000,000 | ||
| Credit Suisse AG | 0.33% | 07/09/15 | 17,000,000 | 17,000,000 | ||
| 0.30% | 09/15/15 | 76,000,000 | 76,000,000 | |||
| 0.45% | 12/18/15 | 146,000,000 | 146,000,000 | |||
| HSBC Bank PLC | 0.35% | 10/28/15 | 157,000,000 | 157,000,000 | ||
| 0.32% | 11/05/15 | 38,000,000 | 38,000,000 | |||
| HSBC Bank USA | 0.31% | 09/28/15 | 36,000,000 | 36,000,000 | ||
| 0.40% | 12/09/15 | 35,000,000 | 35,000,000 | |||
| ING Bank NV | 0.33% | 07/30/15 | 17,000,000 | 17,000,000 | ||
| 0.39% | 10/02/15 | 81,000,000 | 81,000,000 | |||
| 0.42% | 11/02/15 | 70,000,000 | 70,000,000 | |||
| 0.42% | 12/09/15 | 60,000,000 | 60,000,000 | |||
| Lloyds Bank PLC | 0.30% | 07/15/15 | 109,000,000 | 109,000,000 | ||
| 0.30% | 08/10/15 | 61,000,000 | 61,000,000 | |||
| Mitsubishi UFJ Trust & Banking Corp | 0.30% | 07/01/15 | 108,000,000 | 108,000,000 | ||
| 0.31% | 07/01/15 | 40,000,000 | 40,000,000 | |||
| 0.31% | 07/06/15 | 9,000,000 | 9,000,000 | |||
| 0.31% | 07/27/15 | 7,000,000 | 7,000,000 | |||
| 0.32% | 08/04/15 | 13,000,000 | 13,000,000 | |||
| 0.31% | 08/06/15 | 12,000,000 | 12,000,000 | |||
| 0.33% | 08/24/15 | 1,000,000 | 1,000,000 | |||
| 0.35% | 10/08/15 | 36,000,000 | 36,000,000 | |||
| 0.32% | 10/09/15 | 30,000,000 | 30,000,000 | |||
| 0.35% | 10/09/15 | 8,000,000 | 8,000,000 | |||
| 0.35% | 11/06/15 | 38,000,000 | 38,000,000 | |||
| Mizuho Bank, Ltd | 0.27% | 08/05/15 | 8,640,000 | 8,640,000 | ||
| 0.27% | 09/08/15 | 143,000,000 | 143,000,000 | |||
| 0.27% | 09/15/15 | 1,000,000 | 1,000,000 | |||
| 0.27% | 09/16/15 | 108,000,000 | 108,000,000 | |||
| 0.35% | 11/16/15 | 47,000,000 | 47,000,000 |
| Issuer | Footnotes | Rate | Effective
Maturity |
Maturity
Date |
Face
Amount ($) |
Value
($) |
| MUFG Union Bank, NA | 0.17% | 07/13/15 | 1,000,000 | 1,000,000 | ||
| National Australia Bank, Ltd | 0.27% | 09/01/15 | 12,000,000 | 12,000,000 | ||
| 0.27% | 09/02/15 | 87,000,000 | 87,000,000 | |||
| National Bank of Canada | 0.33% | 08/18/15 | 45,000,000 | 45,000,000 | ||
| Natixis SA | 0.29% | 08/04/15 | 131,000,000 | 131,000,000 | ||
| Nordea Bank Finland PLC | 0.34% | 11/16/15 | 27,000,000 | 27,000,000 | ||
| Oversea-Chinese Banking Corp, Ltd | 0.24% | 09/29/15 | 50,000,000 | 50,000,000 | ||
| Rabobank Nederland | 0.28% | 07/01/15 | 37,000,000 | 37,000,000 | ||
| Royal Bank of Canada | 0.30% | 11/19/15 | 8,000,000 | 8,000,000 | ||
| Societe Generale | 0.26% | 08/31/15 | 103,000,000 | 103,000,000 | ||
| Sumitomo Mitsui Banking Corp | 0.31% | 07/01/15 | 25,000,000 | 25,000,000 | ||
| 0.31% | 07/07/15 | 13,000,000 | 13,000,000 | |||
| 0.26% | 09/09/15 | 16,000,000 | 16,000,000 | |||
| 0.26% | 09/16/15 | 1,000,000 | 1,000,000 | |||
| 0.28% | 09/24/15 | 7,000,000 | 7,000,000 | |||
| 0.34% | 09/25/15 | 1,000,000 | 1,000,000 | |||
| 0.34% | 09/28/15 | 1,000,000 | 1,000,000 | |||
| 0.34% | 10/06/15 | 10,000,000 | 10,000,000 | |||
| 0.34% | 10/14/15 | 45,000,000 | 45,000,000 | |||
| 0.34% | 10/16/15 | 22,000,000 | 22,000,000 | |||
| 0.37% | 10/27/15 | 34,000,000 | 34,000,000 | |||
| 0.35% | 11/06/15 | 95,000,000 | 95,000,000 | |||
| 0.40% | 11/06/15 | 75,000,000 | 75,000,000 | |||
| 0.40% | 11/10/15 | 35,000,000 | 35,000,000 | |||
| 0.40% | 11/12/15 | 7,000,000 | 7,000,000 | |||
| 0.35% | 11/16/15 | 18,000,000 | 18,000,000 | |||
| Sumitomo Mitsui Trust Bank, Ltd | 0.26% | 08/25/15 | 59,000,000 | 59,000,000 | ||
| 0.27% | 08/31/15 | 22,000,000 | 22,000,000 | |||
| 0.27% | 09/08/15 | 86,000,000 | 86,000,000 | |||
| Toronto-Dominion Bank | 0.30% | 10/21/15 | 131,000,000 | 131,000,000 | ||
| 0.38% | 11/02/15 | 33,000,000 | 33,000,000 | |||
| 0.30% | 11/16/15 | 50,000,000 | 50,000,000 | |||
| UBS AG | 0.10% | 07/06/15 | 2,000,000 | 2,000,000 | ||
| 4,776,640,000 | ||||||
| Other Instruments 4.0% | ||||||
| Australia & New Zealand Banking Group, Ltd | 0.12% | 07/01/15 | 3,000,000 | 3,000,000 | ||
| 0.13% | 07/02/15 | 179,000,000 | 179,000,000 | |||
| DZ Bank AG Deutsche Zentral-Genossenschaftsbank | 0.10% | 07/02/15 | 100,000,000 | 100,000,000 | ||
| 0.10% | 07/06/15 | 45,000,000 | 45,000,000 | |||
| National Australia Bank, Ltd | 0.06% | 07/01/15 | 190,000,000 | 190,000,000 | ||
| Skandinaviska Enskilda Banken AB | 0.10% | 07/02/15 | 61,000,000 | 61,000,000 | ||
| 578,000,000 | ||||||
| Issuer | Footnotes | Rate | Effective
Maturity |
Maturity
Date |
Face
Amount ($) |
Value
($) |
| Other Notes 2.7% | ||||||
| Bank of America, NA | 0.28% | 07/07/15 | 23,000,000 | 23,000,000 | ||
| 0.30% | 07/20/15 | 74,000,000 | 74,000,000 | |||
| 0.30% | 08/07/15 | 45,000,000 | 45,000,000 | |||
| 0.32% | 09/01/15 | 55,000,000 | 55,000,000 | |||
| 0.26% | 10/01/15 | 50,000,000 | 50,000,000 | |||
| 0.31% | 10/13/15 | 6,000,000 | 6,000,000 | |||
| 0.32% | 10/19/15 | 65,000,000 | 65,000,000 | |||
| 0.34% | 11/05/15 | 77,000,000 | 77,000,000 | |||
| 395,000,000 | ||||||
| Total Fixed-Rate Obligations | ||||||
| (Cost $7,363,089,146) | 7,363,089,146 | |||||
| Variable-Rate Obligations 19.7% of net assets | ||||||
| Financial Company Commercial Paper 3.5% | ||||||
| Australia & New Zealand Banking Group, Ltd | b | 0.28% | 07/10/15 | 11/10/15 | 45,000,000 | 45,000,000 |
| Commonwealth Bank of Australia | b | 0.28% | 07/29/15 | 10/29/15 | 46,000,000 | 45,998,629 |
| b | 0.29% | 07/20/15 | 11/19/15 | 112,000,000 | 111,997,782 | |
| b | 0.32% | 07/13/15 | 05/12/16 | 73,000,000 | 73,000,000 | |
| HSBC Bank PLC | b | 0.32% | 07/06/15 | 01/04/16 | 134,000,000 | 134,000,000 |
| Westpac Banking Corp | b | 0.27% | 07/27/15 | 90,000,000 | 90,000,000 | |
| 499,996,411 | ||||||
| Certificates of Deposit 10.9% | ||||||
| Bank of Nova Scotia | 0.28% | 07/08/15 | 12/08/15 | 97,000,000 | 97,000,000 | |
| 0.29% | 07/13/15 | 12/11/15 | 19,000,000 | 19,000,000 | ||
| Bank of Tokyo Mitsubishi UFJ, Ltd | 0.54% | 07/10/15 | 03/10/16 | 87,000,000 | 87,000,000 | |
| Commonwealth Bank of Australia | 0.26% | 07/09/15 | 10/09/15 | 104,000,000 | 104,000,000 | |
| JPMorgan Chase Bank, NA | 0.33% | 07/23/15 | 10/23/15 | 54,000,000 | 54,000,000 | |
| Royal Bank of Canada | 0.27% | 07/06/15 | 09/04/15 | 39,000,000 | 39,000,000 | |
| 0.30% | 07/10/15 | 12/10/15 | 39,000,000 | 39,000,000 | ||
| 0.29% | 07/06/15 | 01/06/16 | 194,000,000 | 194,000,000 | ||
| 0.32% | 07/13/15 | 04/13/16 | 51,000,000 | 51,000,000 | ||
| Toronto-Dominion Bank | 0.26% | 07/21/15 | 92,000,000 | 92,000,000 | ||
| 0.30% | 07/20/15 | 03/21/16 | 54,000,000 | 54,000,000 | ||
| 0.34% | 07/27/15 | 05/27/16 | 172,000,000 | 172,000,000 | ||
| Wells Fargo Bank, NA | 0.29% | 07/20/15 | 11/18/15 | 23,000,000 | 23,000,000 | |
| 0.29% | 07/21/15 | 11/23/15 | 23,000,000 | 23,000,000 | ||
| 0.29% | 07/27/15 | 11/25/15 | 35,000,000 | 35,000,000 | ||
| 0.31% | 07/08/15 | 02/08/16 | 38,000,000 | 38,000,000 | ||
| 0.31% | 07/09/15 | 02/09/16 | 18,000,000 | 18,000,000 | ||
| 0.32% | 07/14/15 | 02/12/16 | 60,000,000 | 60,000,000 | ||
| 0.32% | 07/27/15 | 02/26/16 | 50,000,000 | 50,000,000 | ||
| 0.33% | 07/13/15 | 05/05/16 | 137,000,000 | 137,000,000 | ||
| 0.34% | 07/21/15 | 05/23/16 | 48,000,000 | 48,000,000 | ||
| Westpac Banking Corp | 0.28% | 07/20/15 | 08/19/15 | 40,000,000 | 40,000,000 | |
| 0.28% | 07/27/15 | 08/25/15 | 8,000,000 | 8,000,000 | ||
| 0.29% | 07/23/15 | 10/23/15 | 15,000,000 | 15,000,000 | ||
| Issuer | Footnotes | Rate | Effective
Maturity |
Maturity
Date |
Face
Amount ($) |
Value
($) |
| 0.31% | 07/08/15 | 02/08/16 | 14,000,000 | 14,000,000 | ||
| 0.32% | 07/13/15 | 02/12/16 | 79,000,000 | 79,000,000 | ||
| 1,590,000,000 | ||||||
| Treasury Debt 1.5% | ||||||
| United States Treasury Department | 0.06% | 07/01/15 | 01/31/16 | 103,000,000 | 102,992,612 | |
| 0.09% | 07/01/15 | 07/31/16 | 63,000,000 | 63,000,000 | ||
| 0.10% | 07/01/15 | 01/31/17 | 48,000,000 | 47,999,839 | ||
| 213,992,451 | ||||||
| Variable Rate Demand Notes 0.1% | ||||||
| ABAG Finance Auth | ||||||
| Taxable RB (Public Policy Institute of California) Series 2001 | a | 0.25% | 07/07/15 | 17,550,000 | 17,550,000 | |
| GFRE Holdings, LLC | ||||||
| Taxable Notes Series 2009A | a | 0.19% | 07/07/15 | 1,500,000 | 1,500,000 | |
| 19,050,000 | ||||||
| Other Notes 3.7% | ||||||
| Bank of America, NA | 0.39% | 07/06/15 | 04/04/16 | 40,000,000 | 40,000,000 | |
| JPMorgan Chase Bank, NA | 0.44% | 09/08/15 | 11/06/15 | 114,000,000 | 114,024,320 | |
| 0.44% | 07/22/15 | 07/22/16 | 25,000,000 | 25,000,000 | ||
| Royal Bank of Canada | 0.39% | 07/01/15 | 06/30/16 | 50,000,000 | 50,000,000 | |
| 0.39% | 07/06/15 | 07/01/16 | 100,000,000 | 100,000,000 | ||
| b | 0.36% | 07/07/15 | 10/07/19 | 75,000,000 | 75,000,000 | |
| Wells Fargo Bank, NA | 0.41% | 09/15/15 | 07/14/16 | 135,000,000 | 135,000,000 | |
| Whistlejacket Capital, LLC | c,† | n/a | n/a | n/a | 2,325,400 | 2,325,400 |
| 541,349,720 | ||||||
| Total Variable-Rate Obligations | ||||||
| (Cost $2,864,388,582) | 2,864,388,582 | |||||
| Issuer | Footnotes | Rate | Effective
Maturity |
Maturity
Date |
Maturity Amount ($) |
Value
($) |
| Repurchase Agreements 29.7% of net assets | ||||||
| Government Agency Repurchase Agreements* 2.4% | ||||||
| BNP Paribas Securities Corp | ||||||
| Issued
06/30/15, repurchase date 07/01/15 (Collateralized by U.S. Government Agency Securities valued at $122,838,344, 0.88% - 6.00%, due 06/13/16 - 10/20/64) |
0.10% | 07/01/15 | 119,000,331 | 119,000,000 | ||
| Deutsche Bank Securities, Inc | ||||||
| Issued
06/30/15, repurchase date 07/01/15 (Collateralized by U.S. Government Agency Securities valued at $105,060,852, 0.00% - 6.25%, due 08/12/15 - 05/15/29) |
0.18% | 07/01/15 | 102,000,510 | 102,000,000 | ||
| Goldman Sachs & Co | ||||||
| Issued
06/25/15, repurchase date 07/02/15 (Collateralized by U.S. Government Agency Securities valued at $51,000,000, 2.50% - 5.50%, due 04/15/26 - 02/20/45) |
0.08% | 07/02/15 | 50,000,778 | 50,000,000 | ||
| Issuer | Footnotes | Rate | Effective
Maturity |
Maturity
Date |
Maturity Amount ($) |
Value
($) |
| JP Morgan Securities, LLC | ||||||
| Issued
06/30/15, repurchase date 07/01/15 (Collateralized by U.S. Government Agency Securities valued at $41,200,001, 3.50% - 4.00%, due 09/01/42 - 10/20/44) |
0.14% | 07/01/15 | 40,000,156 | 40,000,000 | ||
| Mizuho Securities USA, Inc | ||||||
| Issued
06/30/15, repurchase date 07/01/15 (Collateralized by U.S. Government Agency Securities valued at $35,700,823, 0.90% - 3.75%, due 06/08/17 - 06/25/35) |
0.15% | 07/01/15 | 35,000,146 | 35,000,000 | ||
| 346,000,000 | ||||||
| Treasury Repurchase Agreements 23.3% | ||||||
| Barclays Capital, Inc | ||||||
| Issued
06/30/15, repurchase date 07/01/15 (Collateralized by U.S. Treasury Securities valued at $1,125,284, 1.63% - 5.25%, due 06/30/20 - 11/15/28) |
0.10% | 07/01/15 | 1,103,216 | 1,103,213 | ||
| BNP Paribas Securities Corp | ||||||
| Issued
06/30/15, repurchase date 07/01/15 (Collateralized by U.S. Treasury Securities valued at $20,400,000, 1.50%, due 02/28/19) |
0.09% | 07/01/15 | 20,000,050 | 20,000,000 | ||
| Federal Reserve Bank of New York | ||||||
| Issued
06/30/15, repurchase date 07/01/15 (Collateralized by U.S. Treasury Securities valued at $1,967,002,793, 3.13%, due 11/15/41) |
0.05% | 07/01/15 | 1,967,002,732 | 1,967,000,000 | ||
| Issued
06/29/15, repurchase date 07/01/15 (Collateralized by U.S. Treasury Securities valued at $851,003,330, 2.00% - 3.75%, due 02/15/22 - 08/15/41) |
0.07% | 07/01/15 | 851,003,309 | 851,000,000 | ||
| Issued
06/25/15, repurchase date 07/02/15 (Collateralized by U.S. Treasury Securities valued at $461,005,424, 2.00% - 2.13%, due 08/15/21 - 02/15/22) |
0.07% | 07/02/15 | 461,006,275 | 461,000,000 | ||
| JP Morgan Securities, LLC | ||||||
| Issued
06/22/15, repurchase date 07/22/15 (Collateralized by U.S. Treasury Securities valued at $103,021,834, 1.25% - 5.13%, due 05/15/16 - 05/15/24) |
0.08% | 07/07/15 | 101,003,367 | 101,000,000 | ||
| 3,401,103,213 | ||||||
| Other Repurchase Agreements** 4.0% | ||||||
| Credit Suisse Securities (USA), LLC | ||||||
| Issued
06/15/15, repurchase date 12/14/15 (Collateralized by common stocks, ETFs, corporate bonds, ABS, or non-agency collateralized mortgage obligations valued at $173,653,924, 0.51% - 6.33%, due 03/15/17 - 08/12/49) |
c | 0.80% | 10/03/15 | 151,369,111 | 151,000,000 | |
| Issued
06/18/15, repurchase date 12/14/15 (Collateralized by common stocks, ETFs, corporate bonds, ABS, or non-agency collateralized mortgage obligations valued at $44,852,453, 3.25% - 5.88%, due 06/25/32 - 11/25/60) |
c | 0.80% | 10/03/15 | 39,092,733 | 39,000,000 | |
| JP Morgan Securities, LLC | ||||||
| Issued
06/04/15, repurchase date 12/01/15 (Collateralized by common stocks, ETFs, corporate bonds, ABS, or non-agency collateralized mortgage obligations valued at $135,763,704, 1.24% - 5.75%, due 10/15/19 - 09/25/57) |
c | 0.65% | 09/28/15 | 118,247,144 | 118,000,000 | |
| Issuer | Footnotes | Rate | Effective
Maturity |
Maturity
Date |
Maturity Amount ($) |
Value
($) |
| Issued
06/17/15, repurchase date 12/17/15 (Collateralized by common stocks, ETFs, corporate bonds, ABS, or non-agency collateralized mortgage obligations valued at $124,229,153, 0.55% - 8.25%, due 08/14/17 - 05/25/54) |
c | 0.65% | 09/28/15 | 108,200,850 | 108,000,000 | |
| Merrill Lynch, Pierce, Fenner & Smith, Inc | ||||||
| Issued
05/28/15, repurchase date 08/26/15 (Collateralized by common stocks, ETFs, corporate bonds, ABS, or non-agency collateralized mortgage obligations valued at $187,450,000, 0.32% - 5.43%, due 12/19/36 - 04/10/37) |
c | 0.58% | 08/04/15 | 163,178,576 | 163,000,000 | |
| 579,000,000 | ||||||
| Total Repurchase Agreements | ||||||
| (Cost $4,326,103,213) | 4,326,103,213 | |||||
| a | Credit-enhanced or liquidity-enhanced. |
| b | Securities exempt from registration under Rule 144A of the Securities Act of 1933, as amended. These securities may be resold in transactions exempt from registrations, normally to qualified institutional buyers. At the period end, the value of these amounted to $1,497,708,194 or 10.3% of net assets. |
| c | Illiquid security. At the period end, the value of these amounted to $581,325,400 or 4.0% of net assets. |
| † | Whistlejacket notes are in receivership, and the fund elected to sell all of its Whistlejacket notes at auction (April 29, 2009). The remaining investment represents an interest in a small residual fund that is being held to cover any remaining expenses and liabilities associated with receivership. |
| * | Usually collateralized via U.S. Government Agency Securities or less frequently by U.S. Treasury Securities. |
| ** | Usually collateralized via common stocks, ETFs, corporate bonds, ABS, or non-agency collateralized mortgage obligations or less frequently by U.S. Government Agency Securities and/ or U.S. Treasury Securities. |
| ABS — | Asset-backed securities |
| ETF — | Exchange Traded Fund |
| RB — | Revenue bond |
| Assets | ||
| Investments, at cost and value | $10,227,477,728 | |
| Repurchase agreements, at cost and value | + | 4,326,103,213 |
| Total investments, at cost and value (Note 2a) | 14,553,580,941 | |
| Receivables: | ||
| Interest | 4,856,783 | |
| Prepaid expenses | + | 43,766 |
| Total assets | 14,558,481,490 | |
| Liabilities | ||
| Payables: | ||
| Shareholder service fees | 681,617 | |
| Distributions to shareholders | 59,828 | |
| Accrued expenses | + | 431,922 |
| Total liabilities | 1,173,367 | |
| Net Assets | ||
| Total assets | 14,558,481,490 | |
| Total liabilities | – | 1,173,367 |
| Net assets | $14,557,308,123 | |
| Net Assets by Source | ||
| Capital received from investors | 14,559,372,002 | |
| Net realized capital losses | (2,063,879) | |
| Net Asset Value (NAV) | ||||
| Net Assets | ÷ | Shares
Outstanding |
= | NAV |
| $14,557,308,123 | 14,557,280,655 | $1.00 | ||
| Investment Income | ||
| Interest | $18,023,320 | |
| Expenses | ||
| Investment adviser and administrator fees | 22,922,463 | |
| Shareholder service fees | 29,042,556 | |
| Shareholder reports | 340,376 | |
| Custodian fees | 204,319 | |
| Portfolio accounting fees | 178,280 | |
| Registration fees | 67,494 | |
| Professional fees | 47,511 | |
| Independent trustees' fees | 34,125 | |
| Transfer agent fees | 10,754 | |
| Other expenses | + | 129,603 |
| Total expenses | 52,977,481 | |
| Expense reduction by CSIM and its affiliates | – | 35,680,223 |
| Net expenses | – | 17,297,258 |
| Net investment income | 726,062 | |
| Realized Gains (Losses) | ||
| Net realized losses on investments | (6,953) | |
| Increase in net assets resulting from operations | $719,109 | |
| Operations | |||
| 1/1/15-6/30/15 | 1/1/14-12/31/14 | ||
| Net investment income | $726,062 | $1,478,622 | |
| Net realized gains (losses) | + | (6,953) | — |
| Increase in net assets from operations | 719,109 | 1,478,622 | |
| Distributions to Shareholders | |||
| Distributions from net investment income | ($726,062) | ($1,478,622) | |
| Transactions in Fund Shares* | |||
| Shares sold | 18,725,449,752 | 38,274,525,149 | |
| Shares reinvested | 620,347 | 1,375,524 | |
| Shares redeemed | + | (18,993,192,597) | (38,420,387,841) |
| Net transactions in fund shares | (267,122,498) | (144,487,168) | |
| Net Assets | |||
| Beginning of period | 14,824,437,574 | 14,968,924,742 | |
| Total decrease | + | (267,129,451) | (144,487,168) |
| End of period | $14,557,308,123 | $14,824,437,574 | |
| * | Transactions took place at $1.00 per share; figures for share quantities are the same as for dollars. |
| The Charles Schwab Family of Funds (organized October 20, 1989) | Schwab Municipal Money Fund |
| Schwab Money Market Fund | Schwab AMT Tax-Free Money Fund |
| Schwab Government Money Fund | Schwab California Municipal Money Fund |
| Schwab U.S. Treasury Money Fund | Schwab New York Municipal Money Fund |
| Schwab Treasury Obligations Money Fund | (formerly Schwab New York AMT Tax-Free Money Fund) |
| Schwab Value Advantage Money Fund | Schwab New Jersey Municipal Money Fund |
| Schwab Advisor Cash Reserves | (formerly Schwab New Jersey AMT Tax-Free Money Fund) |
| Schwab Cash Reserves | Schwab Pennsylvania Municipal Money Fund |
| Schwab Retirement Advantage Money Fund | Schwab Massachusetts Municipal Money Fund |
| Schwab Investor Money Fund | (formerly Schwab Massachusetts AMT Tax-Free Money Fund) |
| Average Daily Net Assets | |
| First $1 billion | 0.35% |
| More than $1 billion but not exceeding $10 billion | 0.32% |
| More than $10 billion but not exceeding $20 billion | 0.30% |
| More than $20 billion but not exceeding $40 billion | 0.27% |
| Over $40 billion | 0.25% |
| Expiration Date | ||||||||
| December 31, 2015 | December 31, 2016 | December 31, 2017 | December 31, 2018 | Total | ||||
| $57,327,681 | $61,651,389 | $68,398,700 | $31,712,010 | $219,089,780 | ||||
| Independent Trustees | |||
| Name,
Year of Birth, and Position(s) with the trust; (Terms of office, and length of Time Served1) |
Principal
Occupations During the Past Five Years |
Number
of Portfolios in Fund Complex Overseen by the Trustee |
Other Directorships |
| John
F. Cogan 1947 Trustee (Trustee of The Charles Schwab Family of Funds, Schwab Investments, Schwab Capital Trust and Schwab Annuity Portfolios since 2008; Laudus Trust and Laudus Institutional Trust since 2010) |
Senior Fellow, The Hoover Institution at Stanford University (Oct. 1979 – present); Senior Fellow Stanford Institute for Economic Policy Research (2000 – present); Professor of Public Policy, Stanford University (1994 – present). | 74 | Director,
Gilead Sciences, Inc. (2005 – present) |
| David
L. Mahoney 1954 Trustee (Trustee of The Charles Schwab Family of Funds, Schwab Investments, Schwab Capital Trust, Schwab Annuity Portfolios, Laudus Trust and Laudus Institutional Trust since 2011) |
Private Investor. | 74 | Director,
Symantec Corporation (2003 – present) Director, Corcept Therapeutics Incorporated (2004 – present) Director, Adamas Pharmaceuticals, Inc. (2009 – present) |
| Kiran
M. Patel 1948 Trustee (Trustee of The Charles Schwab Family of Funds, Schwab Investments, Schwab Capital Trust, Schwab Annuity Portfolios, Laudus Trust and Laudus Institutional Trust since 2011) |
Retired. Executive Vice President and General Manager of Small Business Group, Intuit, Inc. (financial software and services firm for consumers and small businesses) (Dec. 2008 – Sept. 2013) | 74 | Director, KLA-Tencor Corporation (2008 – present) |
| Charles
A. Ruffel 1956 Trustee (Trustee of Schwab Strategic Trust since 2009; The Charles Schwab Family of Funds, Schwab Investments, Schwab Capital Trust, Schwab Annuity Portfolios, Laudus Trust and Laudus Institutional Trust since 2015) |
Managing Partner and Co-Founder, Kudu Advisors, LLC (financial services) (May 2009 – present); Director, Asset International, Inc. (publisher of financial services information) (Jan. 2009 – Nov. 2014). | 95 | None. |
| Independent Trustees (continued) | |||
| Name,
Year of Birth, and Position(s) with the trust; (Terms of office, and length of Time Served1) |
Principal
Occupations During the Past Five Years |
Number
of Portfolios in Fund Complex Overseen by the Trustee |
Other Directorships |
| Gerald
B. Smith 1950 Trustee (Trustee of The Charles Schwab Family of Funds, Schwab Investments, Schwab Capital Trust and Schwab Annuity Portfolios since 2000; Laudus Trust and Laudus Institutional Trust since 2010) |
Chairman, Chief Executive Officer and Founder of Smith Graham & Co. (investment advisors) (1990 – present). | 74 | Director,
Eaton (2012 – present) Director and Chairman of the Audit Committee, Oneok Partners LP (2003 – 2013) Director, Oneok, Inc. (2009 – 2013) Lead Independent Director, Board of Cooper Industries (2002 – 2012) |
| Joseph
H. Wender 1944 Trustee (Trustee of The Charles Schwab Family of Funds, Schwab Investments, Schwab Capital Trust and Schwab Annuity Portfolios since 2008; Laudus Trust and Laudus Institutional Trust since 2010) |
Senior Consultant, Goldman Sachs & Co., Inc. (investment banking and securities firm) (Jan. 2008 – present); Partner, Colgin Partners, LLC (vineyards) (Feb. 1998 – present). | 74 | Board Member and Chairman of the Audit Committee, Isis Pharmaceuticals (1994 – present) |
| Interested Trustees | |||
| Name,
Year of Birth, and Position(s) with the trust; (Terms of office, and length of Time Served) |
Principal
Occupations During the Past Five Years |
Number
of Portfolios in Fund Complex Overseen by the Trustee |
Other Directorships |
| Charles
R. Schwab2 1937 Chairman and Trustee (Chairman and Trustee of The Charles Schwab Family of Funds since 1989; Schwab Investments since 1991; Schwab Capital Trust since 1993; Schwab Annuity Portfolios since 1994; Laudus Trust and Laudus Institutional Trust since 2010) |
Chairman and Director, The Charles Schwab Corporation (1986 – present); Chairman and Director of Charles Schwab & Co., Inc. (1971 – present); Chairman and Director of Charles Schwab Investment Management, Inc. (1989 – present); Chairman and Director of Charles Schwab Bank (2003 – present); Chairman and Chief Executive Officer of Schwab (SIS) Holdings Inc. I and Schwab International Holdings, Inc. (1996 – present); and Director, Chairman and Chief Executive Officer, Schwab Holdings, Inc. (1979 – present). | 74 | Chairman
and Director, The Charles Schwab Corporation (1986 – present) Director, Yahoo! Inc. (2014 – present) |
| Walter
W. Bettinger II2 1960 Trustee (Trustee of The Charles Schwab Family of Funds, Schwab Investments, Schwab Capital Trust and Schwab Annuity Portfolios since 2008; Schwab Strategic Trust since 2009; Laudus Trust and Laudus Institutional Trust since 2010) |
Director, President and Chief Executive Officer, The Charles Schwab Corporation and Charles Schwab & Co., Inc. (2008 – present); Director, Charles Schwab Bank (2006 – present); and Director, Schwab Holdings, Inc. (2008 – present). | 95 | Director, The Charles Schwab Corporation (2008 – present) |
| Officers of the Trust | |
| Name,
Year of Birth, and Position(s) with the trust; (Terms of office, and length of Time Served3) |
Principal Occupations During the Past Five Years |
| Marie
Chandoha 1961 President and Chief Executive Officer (Officer of The Charles Schwab Family of Funds, Schwab Investments, Schwab Capital Trust, Schwab Annuity Portfolios, Laudus Trust and Laudus Institutional Trust since 2010) |
Director, President and Chief Executive Officer (Dec. 2010 – present), Chief Investment Officer (Sept. 2010 – Oct. 2011), Charles Schwab Investment Management, Inc.; President, Chief Executive Officer (Dec. 2010 – present), and Chief Investment Officer (Sept. 2010 – Oct. 2011), Schwab Funds, Laudus Funds and Schwab ETFs; Director, Charles Schwab Worldwide Funds plc and Charles Schwab Asset Management (Ireland) Limited (January 2011 – present); Global Head of Fixed Income Business Division, BlackRock, Inc. (formerly Barclays Global Investors) (March 2007 – August 2010). |
| George
Pereira 1964 Treasurer and Principal Financial Officer, Schwab Funds Treasurer and Chief Financial Officer, Laudus Funds (Officer of The Charles Schwab Family of Funds, Schwab Investments, Schwab Capital Trust and Schwab Annuity Portfolios since 2004; Laudus Trust and Laudus Institutional Trust since 2006) |
Senior Vice President and Chief Financial Officer (Nov. 2004 – present), Chief Operating Officer (Jan. 2011 – present), Charles Schwab Investment Management, Inc.; Treasurer and Chief Financial Officer, Laudus Funds (June 2006 – present); Treasurer and Principal Financial Officer, Schwab Funds (Nov. 2004 – present) and Schwab ETFs (Oct. 2009 – present); Director, Charles Schwab Worldwide Funds plc and Charles Schwab Asset Management (Ireland) Limited (April 2005 – present). |
| Omar
Aguilar 1970 Senior Vice President and Chief Investment Officer – Equities (Officer of The Charles Schwab Family of Funds, Schwab Investments, Schwab Capital Trust, Schwab Annuity Portfolios, Laudus Trust and Laudus Institutional Trust since 2011) |
Senior Vice President and Chief Investment Officer – Equities, Charles Schwab Investment Management, Inc. (April 2011 – present); Senior Vice President and Chief Investment Officer – Equities, Schwab Funds, Laudus Funds and Schwab ETFs (June 2011 – present); Head of the Portfolio Management Group and Vice President of Portfolio Management, Financial Engines, Inc. (May 2009 – April 2011); Head of Quantitative Equity, ING Investment Management (July 2004 – Jan. 2009). |
| Brett
Wander 1961 Senior Vice President and Chief Investment Officer – Fixed Income (Officer of The Charles Schwab Family of Funds, Schwab Investments, Schwab Capital Trust, Schwab Annuity Portfolios, Laudus Trust and Laudus Institutional Trust since 2011) |
Senior Vice President and Chief Investment Officer – Fixed Income, Charles Schwab Investment Management, Inc. (April 2011 – present); Senior Vice President and Chief Investment Officer – Fixed Income, Schwab Funds, Laudus Funds and Schwab ETFs (June 2011 – present); Senior Managing Director, Global Head of Active Fixed-Income Strategies, State Street Global Advisors (Jan. 2008 – Oct. 2010); Director of Alpha Strategies Loomis, Sayles & Company (April 2006 – Jan. 2008). |
| David
Lekich 1964 Chief Legal Officer and Secretary, Schwab Funds Vice President and Assistant Clerk, Laudus Funds (Officer of The Charles Schwab Family of Funds, Schwab Investments, Schwab Capital Trust, Schwab Annuity Portfolios, Laudus Trust and Laudus Institutional Trust since 2011) |
Senior Vice President (Sept. 2011 – present), Vice President (March 2004 – Sept. 2011), Charles Schwab & Co., Inc.; Senior Vice President and Chief Counsel (Sept. 2011 – present), Vice President (Jan. 2011 – Sept. 2011), Charles Schwab Investment Management, Inc.; Secretary (April 2011 – present) and Chief Legal Officer (Dec. 2011 – present), Schwab Funds; Vice President and Assistant Clerk, Laudus Funds (April 2011 – present); Secretary (May 2011 – present) and Chief Legal Officer (Nov. 2011 – present), Schwab ETFs. |
| Catherine
MacGregor 1964 Vice President and Assistant Secretary, Schwab Funds Chief Legal Officer, Vice President and Clerk, Laudus Funds (Officer of The Charles Schwab Family of Funds, Schwab Investments, Schwab Capital Trust, Schwab Annuity Portfolios, Laudus Trust and Laudus Institutional Trust since 2005) |
Vice President, Charles Schwab & Co., Inc., Charles Schwab Investment Management, Inc. (July 2005 – present); Vice President (Dec. 2005 – present), Chief Legal Officer and Clerk (March 2007 – present), Laudus Funds; Vice President (Nov. 2005 – present) and Assistant Secretary (June 2007 – present), Schwab Funds; Vice President and Assistant Secretary, Schwab ETFs (Oct. 2009 – present). |
| 1 | Trustees remain in office until they resign, retire or are removed by shareholder vote. The Schwab and Laudus Funds’ retirement policy requires that independent trustees retire at age 72 or after twenty years as a trustee, whichever comes first. In addition, the retirement policy requires any independent trustee of Schwab Funds or Laudus Funds to retire from all Boards upon their required retirement date from either Board. |
| 2 | Mr. Schwab and Mr. Bettinger are Interested Trustees because they own stock of The Charles Schwab Corporation, the parent company of the investment adviser. |
| 3 | The President, Treasurer and Secretary/Clerk hold office until their respective successors are chosen and qualified or until he or she sooner dies, resigns, is removed or becomes disqualified. Each of the other officers serves at the pleasure of the Boards. |
211 Main Street, San Francisco, CA 94105
1-800-435-4000
© 2015 Charles Schwab & Co., Inc. All rights reserved.
Member SIPC®
Printed on recycled paper.
00149453
Table of Contents
Schwab AMT Tax-Free Money Fund™
by viewing these documents online.
Sign up at schwab.com/paperless

Schwab AMT Tax-Free Money Fund™


| 1 | A fund’s share price is its NAV, which is the fund’s net assets divided by the number of its shares outstanding. Under the new amendments, Retail Prime and Municipal money market funds, as well as Government money market funds, will continue to be permitted to transact at a constant NAV of $1.00. Note that while a fund may seek to maintain a constant NAV, there is no guarantee that it will be able to do so. |
 |
Kenneth Salinger, CFA, Vice President and Head of Tax-Exempt Strategies, leads the portfolio management team for Schwab’s national and state-specific tax-free bond funds and municipal money market funds. He also has overall responsibility for all aspects of the management of each of the tax-free bond funds. Prior to joining CSIM in 2008, Mr. Salinger was a senior portfolio manager at Wells Capital Management, working on a team that managed municipal bond assets. He worked at American Century Investments from 1992 to 2006, where he was a vice president and senior portfolio manager, responsible for daily management of a number of national and state specific municipal bond funds. Mr. Salinger has worked in fixed-income asset management since 1994. |
 |
Kevin Shaughnessy, CFA, Managing Director and Senior Portfolio Manager, is responsible for the day-to-day co-management of the funds. Prior to joining CSIM in 2000, Mr. Shaughnessy spent four years as a portfolio manager at Wells Capital Management, where he was responsible for managing the firm’s California municipal money fund assets, as well as short duration private client assets. |
 |
Cameron Ullyatt, CFA, Managing Director and Senior Portfolio Manager, is responsible for the day-to-day co-management of the funds. Prior to joining CSIM in 2008, Mr. Ullyatt was a vice president and portfolio manager at Oppenheimer Funds, where he was responsible for managing the firm’s municipal money fund assets. From 1999 to 2006, Mr. Ullyatt also worked as a credit analyst in Oppenheimer Funds’ municipal bond and money market departments. |
| 1 | The investment adviser and its affiliates may recapture expenses or fees they waived under a voluntary yield waiver until the third anniversary of the end of the fiscal year in which such waiver occurs, subject to certain limitations. For more information on the potential impact of such recapture on future yields, see financial note 5. |
| 2 | As shown in the Portfolio Holdings section of the shareholder report. |
| 3 | Money funds must maintain a dollar-weighted average maturity of no longer than 60 days and cannot invest in any security whose effective maturity is longer than 397 days (approximately 13 months). |
| 4 | Tier 1 securities are rated in the highest short-term rating category by two nationally recognized statistical rating organizations (“NRSROs”), or by one if only one NRSRO has rated the securities, or, if unrated, determined to be of comparable quality by CSIM pursuant to guidelines adopted by the Board of Trustees. Money market fund shares and U.S. government securities are also Tier 1 securities. The fund uses NRSRO credit ratings from Standard & Poor’s Corp., Moody’s Investors Service, Fitch Ratings, and/or DBRS. The fund may use different ratings provided by other rating agencies for purposes of determining compliance with the fund’s investment policies. The fund itself has not been rated by an independent credit rating agency. |
| 5 | Portfolio Composition is calculated using the Par Value of Investments. |
| Schwab Municipal Money Fund | ||||
| Sweep
Shares |
Value
Advantage Shares® |
Select
Shares® |
Institutional
Shares | |
| Ticker Symbol | SWXXX | SWTXX | SWLXX | SWOXX |
| Minimum Initial Investment1 | ** | $25,000 2 | $1,000,000 | $3,000,000 |
| Seven-Day Yield3 | 0.01% | 0.01% | 0.01% | 0.01% |
| Seven-Day Yield–Without Contractual Expense Limitation4 | -0.08% | -0.09% | -0.19% | -0.30% |
| Seven-Day Effective Yield3 | 0.01% | 0.01% | 0.01% | 0.01% |
| Seven-Day Taxable Equivalent Effective Yield3,5 | 0.02% | 0.02% | 0.02% | 0.02% |
| * | The seven-day average yield for the Sweep Shares, Value Advantage Shares, Select Shares and Institutional Shares was 0.01% throughout the entire period. |
| ** | Subject to the eligibility terms and conditions of your Schwab account agreement. |
| 1 | Please see prospectus for further detail and eligibility requirements. |
| 2 | Minimum initial investment for IRA and custodial accounts is $15,000. Municipal money funds are generally not appropriate investments for IRAs and other tax-deferred accounts. Please consult with your tax advisor about your situation. |
| 3 | Yield reflects the effect of the fund’s agreement with the investment adviser and its affiliates to limit each share class’ total annual operating expenses to certain levels (contractual expense limitation). In addition, the investment adviser and its affiliates have voluntarily waived expenses in excess of the contractual expense limitation to maintain a positive net yield for certain share classes of the fund (voluntary yield waiver). Without the contractual expense limitation and the voluntary yield waiver, the fund’s yield would have been lower. For additional details, see financial note 5. |
| 4 | Yield does not reflect the effect of the contractual expense limitation, but does reflect the effect of the voluntary yield waiver. The voluntary yield waiver added 0.48%, 0.34%, 0.24%, and 0.14% to the seven-day yields of the Sweep Shares, Value Advantage Shares, Select Shares, and Institutional Shares, respectively. |
| 5 | Taxable equivalent effective yield assumes a federal regular income tax rate of 43.40%, which includes a Medicare surcharge rate of 3.8%. Your tax rate may be different. |
| 1 | The investment adviser and its affiliates may recapture expenses or fees they waived under a voluntary yield waiver until the third anniversary of the end of the fiscal year in which such waiver occurs, subject to certain limitations. For more information on the potential impact of such recapture on future yields, see financial note 5. |
| 2 | As shown in the Portfolio Holdings section of the shareholder report. |
| 3 | Money funds must maintain a dollar-weighted average maturity of no longer than 60 days and cannot invest in any security whose effective maturity is longer than 397 days (approximately 13 months). |
| 4 | Tier 1 securities are rated in the highest short-term rating category by two nationally recognized statistical rating organizations (“NRSROs”), or by one if only one NRSRO has rated the securities, or, if unrated, determined to be of comparable quality by CSIM pursuant to guidelines adopted by the Board of Trustees. Money market fund shares and U.S. government securities are also Tier 1 securities. The fund uses NRSRO credit ratings from Standard & Poor’s Corp., Moody’s Investors Service, Fitch Ratings, and/or DBRS. The fund may use different ratings provided by other rating agencies for purposes of determining compliance with the fund’s investment policies. The fund itself has not been rated by an independent credit rating agency. |
| 5 | Portfolio Composition is calculated using the Par Value of Investments. |

| Schwab AMT Tax-Free Money Fund | ||
| Sweep
Shares |
Value
Advantage Shares® | |
| Ticker Symbol | SWFXX | SWWXX |
| Minimum Initial Investment1 | ** | $25,000 2 |
| Seven-Day Yield3 | 0.01% | 0.01% |
| Seven-Day Yield–Without Contractual Expense Limitation4 | -0.07% | -0.11% |
| Seven-Day Effective Yield3 | 0.01% | 0.01% |
| Seven-Day Taxable Equivalent Effective Yield3,5 | 0.02% | 0.02% |
| * | The seven-day average yield for the Sweep Shares and Value Advantage Shares was 0.01% throughout the entire period. |
| ** | Subject to the eligibility terms and conditions of your Schwab account agreement. |
| 1 | Please see prospectus for further detail and eligibility requirements. |
| 2 | Minimum initial investment for IRA and custodial accounts is $15,000. Municipal money funds are generally not appropriate investments for IRAs and other tax-deferred accounts. Please consult with your tax advisor about your situation. |
| 3 | Yield reflects the effect of the fund’s agreement with the investment adviser and its affiliates to limit each share class’ total annual operating expenses to certain levels (contractual expense limitation). In addition, the investment adviser and its affiliates have voluntarily waived expenses in excess of the contractual expense limitation to maintain a positive net yield for certain share classes of the fund (voluntary yield waiver). Without the contractual expense limitation and the voluntary yield waiver, the fund’s yield would have been lower. For additional details, see financial note 5. |
| 4 | Yield does not reflect the effect of the contractual expense limitation, but does reflect the effect of the voluntary yield waiver. The voluntary yield waiver added 0.52% and 0.35% to the seven-day yields of the Sweep Shares and Value Advantage Shares, respectively. |
| 5 | Taxable equivalent effective yield assumes a federal regular income tax rate of 43.40%, which includes a Medicare surcharge rate of 3.8%. Your tax rate may be different. |
| Expense
Ratio1 (Annualized) |
Beginning
Account Value at 1/1/15 |
Ending
Account Value (Net of Expenses) at 6/30/15 |
Expenses
Paid During Period2 1/1/15–6/30/15 | |
| Schwab Municipal Money Fund | ||||
| Sweep Shares | ||||
| Actual Return | 0.08% | $1,000.00 | $ 1,000.10 | $0.40 |
| Hypothetical 5% Return | 0.08% | $1,000.00 | $1,024.40 | $0.40 |
| Value Advantage Shares | ||||
| Actual Return | 0.08% | $1,000.00 | $ 1,000.10 | $0.40 |
| Hypothetical 5% Return | 0.08% | $1,000.00 | $1,024.40 | $0.40 |
| Select Shares | ||||
| Actual Return | 0.08% | $1,000.00 | $ 1,000.10 | $0.40 |
| Hypothetical 5% Return | 0.08% | $1,000.00 | $1,024.40 | $0.40 |
| Institutional Shares | ||||
| Actual Return | 0.08% | $1,000.00 | $ 1,000.10 | $0.40 |
| Hypothetical 5% Return | 0.08% | $1,000.00 | $1,024.40 | $0.40 |
| Schwab AMT Tax-Free Money Fund | ||||
| Sweep Shares | ||||
| Actual Return | 0.08% | $1,000.00 | $ 1,000.10 | $0.40 |
| Hypothetical 5% Return | 0.08% | $1,000.00 | $1,024.40 | $0.40 |
| Value Advantage Shares® | ||||
| Actual Return | 0.08% | $1,000.00 | $ 1,000.10 | $0.40 |
| Hypothetical 5% Return | 0.08% | $1,000.00 | $1,024.40 | $0.40 |
| 1 | Based on the most recent six-month expense ratio; may differ from the expense ratio provided in the Financial Highlights. |
| 2 | Expenses for share class are equal to its annualized expense ratio, multiplied by the average account value over the period, multiplied by 181 days of the period, and divided by 365 days of the fiscal year. |
| Sweep Shares | 1/1/15–
6/30/15* |
1/1/14–
12/31/14 |
1/1/13–
12/31/13 |
1/1/12–
12/31/12 |
1/1/11–
12/31/11 |
1/1/10–
12/31/10 |
| Per-Share Data ($) | ||||||
| Net asset value at beginning of period | 1.00 | 1.00 | 1.00 | 1.00 | 1.00 | 1.00 |
| Income (loss) from investment operations: | ||||||
| Net investment income (loss) | 0.00 1,2 | 0.00 2 | 0.00 2 | 0.00 2 | 0.00 2 | 0.00 2 |
| Net realized and unrealized gains (losses) | 0.00 2 | 0.00 2 | 0.00 2 | 0.00 2 | 0.00 2 | 0.00 2 |
| Total from investment operations | 0.00 2 | 0.00 2 | 0.00 2 | 0.00 2 | 0.00 2 | 0.00 2 |
| Less distributions: | ||||||
| Distributions from net investment income | (0.00) 2 | (0.00) 2 | (0.00) 2 | (0.00) 2 | (0.00) 2 | (0.00) 2 |
| Distributions from net realized gains | — | (0.00) 2 | (0.00) 2 | (0.00) 2 | (0.00) 2 | (0.00) 2 |
| Total distributions | (0.00) 2 | (0.00) 2 | (0.00) 2 | (0.00) 2 | (0.00) 2 | (0.00) 2 |
| Net asset value at end of period | 1.00 | 1.00 | 1.00 | 1.00 | 1.00 | 1.00 |
| Total return (%) | 0.01 3 | 0.02 | 0.01 | 0.01 | 0.01 | 0.02 |
| Ratios/Supplemental Data (%) | ||||||
| Ratios to average net assets: | ||||||
| Net operating expenses | 0.08 4,5 | 0.09 4 | 0.15 4 | 0.22 4 | 0.29 4 | 0.35 4 |
| Gross operating expenses | 0.68 5 | 0.68 | 0.68 | 0.68 | 0.68 | 0.68 |
| Net investment income (loss) | 0.01 5 | 0.01 | 0.01 | 0.01 | 0.01 | 0.01 |
| Net assets, end of period ($ x 1,000,000) | 10,576 | 11,405 | 11,243 | 11,721 | 10,220 | 9,857 |
| Value Advantage Shares | 1/1/15–
6/30/15* |
1/1/14–
12/31/14 |
1/1/13–
12/31/13 |
1/1/12–
12/31/12 |
1/1/11–
12/31/11 |
1/1/10–
12/31/10 |
| Per-Share Data ($) | ||||||
| Net asset value at beginning of period | 1.00 | 1.00 | 1.00 | 1.00 | 1.00 | 1.00 |
| Income (loss) from investment operations: | ||||||
| Net investment income (loss) | 0.00 1,2 | 0.00 2 | 0.00 2 | 0.00 2 | 0.00 2 | 0.00 2 |
| Net realized and unrealized gains (losses) | 0.00 2 | 0.00 2 | 0.00 2 | 0.00 2 | 0.00 2 | 0.00 2 |
| Total from investment operations | 0.00 2 | 0.00 2 | 0.00 2 | 0.00 2 | 0.00 2 | 0.00 2 |
| Less distributions: | ||||||
| Distributions from net investment income | (0.00) 2 | (0.00) 2 | (0.00) 2 | (0.00) 2 | (0.00) 2 | (0.00) 2 |
| Distributions from net realized gains | — | (0.00) 2 | (0.00) 2 | (0.00) 2 | (0.00) 2 | (0.00) 2 |
| Total distributions | (0.00) 2 | (0.00) 2 | (0.00) 2 | (0.00) 2 | (0.00) 2 | (0.00) 2 |
| Net asset value at end of period | 1.00 | 1.00 | 1.00 | 1.00 | 1.00 | 1.00 |
| Total return (%) | 0.01 3 | 0.02 | 0.01 | 0.01 | 0.01 | 0.02 |
| Ratios/Supplemental Data (%) | ||||||
| Ratios to average net assets: | ||||||
| Net operating expenses | 0.08 4,5 | 0.09 4 | 0.16 4 | 0.22 4 | 0.30 4 | 0.34 4 |
| Gross operating expenses | 0.55 5 | 0.55 | 0.55 | 0.55 | 0.55 | 0.55 |
| Net investment income (loss) | 0.01 5 | 0.01 | 0.01 | 0.01 | 0.01 | 0.01 |
| Net assets, end of period ($ x 1,000,000) | 576 | 621 | 717 | 815 | 918 | 1,205 |
| * | Unaudited. |
| Select Shares | 1/1/15–
6/30/15* |
1/1/14–
12/31/14 |
1/1/13–
12/31/13 |
1/1/12–
12/31/12 |
1/1/11–
12/31/11 |
1/1/10–
12/31/10 |
| Per-Share Data ($) | ||||||
| Net asset value at beginning of period | 1.00 | 1.00 | 1.00 | 1.00 | 1.00 | 1.00 |
| Income (loss) from investment operations: | ||||||
| Net investment income (loss) | 0.00 1,2 | 0.00 2 | 0.00 2 | 0.00 2 | 0.00 2 | 0.00 2 |
| Net realized and unrealized gains (losses) | 0.00 2 | 0.00 2 | 0.00 2 | 0.00 2 | 0.00 2 | 0.00 2 |
| Total from investment operations | 0.00 2 | 0.00 2 | 0.00 2 | 0.00 2 | 0.00 2 | 0.00 2 |
| Less distributions: | ||||||
| Distributions from net investment income | (0.00) 2 | (0.00) 2 | (0.00) 2 | (0.00) 2 | (0.00) 2 | (0.00) 2 |
| Distributions from net realized gains | — | (0.00) 2 | (0.00) 2 | (0.00) 2 | (0.00) 2 | (0.00) 2 |
| Total distributions | (0.00) 2 | (0.00) 2 | (0.00) 2 | (0.00) 2 | (0.00) 2 | (0.00) 2 |
| Net asset value at end of period | 1.00 | 1.00 | 1.00 | 1.00 | 1.00 | 1.00 |
| Total return (%) | 0.01 3 | 0.02 | 0.01 | 0.01 | 0.02 | 0.02 |
| Ratios/Supplemental Data (%) | ||||||
| Ratios to average net assets: | ||||||
| Net operating expenses | 0.08 4,5 | 0.09 4 | 0.16 4 | 0.22 4 | 0.29 4 | 0.34 4 |
| Gross operating expenses | 0.55 5 | 0.55 | 0.55 | 0.55 | 0.55 | 0.55 |
| Net investment income (loss) | 0.01 5 | 0.01 | 0.01 | 0.01 | 0.01 | 0.01 |
| Net asset, end of period ($ x 1,000,000) | 331 | 365 | 403 | 467 | 517 | 712 |
| Institutional Shares | 1/1/15–
6/30/15* |
1/1/14–
12/31/14 |
1/1/13–
12/31/13 |
1/1/12–
12/31/12 |
1/1/11–
12/31/11 |
1/1/10–
12/31/10 |
| Per-Share Data ($) | ||||||
| Net asset value at beginning of period | 1.00 | 1.00 | 1.00 | 1.00 | 1.00 | 1.00 |
| Income (loss) from investment operations: | ||||||
| Net investment income (loss) | 0.00 1,2 | 0.00 2 | 0.00 2 | 0.00 2 | 0.00 2 | 0.00 2 |
| Net realized and unrealized gains (losses) | 0.00 2 | 0.00 2 | 0.00 2 | 0.00 2 | 0.00 2 | 0.00 2 |
| Total from investment operations | 0.00 2 | 0.00 2 | 0.00 2 | 0.00 2 | 0.00 2 | 0.00 2 |
| Less distributions: | ||||||
| Distributions from net investment income | (0.00) 2 | (0.00) 2 | (0.00) 2 | (0.00) 2 | (0.00) 2 | (0.00) 2 |
| Distributions from net realized gains | — | (0.00) 2 | (0.00) 2 | (0.00) 2 | (0.00) 2 | (0.00) 2 |
| Total distributions | (0.00) 2 | (0.00) 2 | (0.00) 2 | (0.00) 2 | (0.00) 2 | (0.00) 2 |
| Net asset value at end of period | 1.00 | 1.00 | 1.00 | 1.00 | 1.00 | 1.00 |
| Total return (%) | 0.01 3 | 0.02 | 0.01 | 0.01 | 0.07 | 0.13 |
| Ratios/Supplemental Data (%) | ||||||
| Ratios to average net assets: | ||||||
| Net operating expenses | 0.08 4,5 | 0.09 4 | 0.16 4 | 0.22 4 | 0.24 4 | 0.24 4 |
| Gross operating expenses | 0.55 5 | 0.55 | 0.55 | 0.55 | 0.55 | 0.55 |
| Net investment income (loss) | 0.01 5 | 0.01 | 0.01 | 0.01 | 0.07 | 0.12 |
| Net assets, end of period ($ x 1,000,000) | 966 | 1,037 | 1,161 | 1,389 | 2,080 | 2,833 |
| * | Unaudited. |
| Holdings by Category | Cost
($) |
Value
($) | |
| 32.2% | Fixed-Rate Securities | 4,007,012,232 | 4,007,012,232 |
| 70.9% | Variable-Rate Securities | 8,826,551,068 | 8,826,551,068 |
| 103.1% | Total Investments | 12,833,563,300 | 12,833,563,300 |
| (3.1%) | Other Assets and Liabilities, Net | (384,231,408) | |
| 100.0% | Net Assets | 12,449,331,892 | |
| Issuer
Type of Security, Series |
Footnotes | Rate | Effective
Maturity |
Maturity
Date |
Face
Amount ($) |
Value
($) |
| Fixed-Rate Securities 32.2% of net assets | ||||||
| Alabama 0.5% | ||||||
| Alabama Public School & College Auth | ||||||
| Refunding Bonds Series 2009A | 5.00% | 05/01/16 | 150,000 | 155,702 | ||
| Refunding Bonds Series 2010A | 5.00% | 05/01/16 | 325,000 | 337,298 | ||
| Huntsville Health Care Auth | ||||||
| CP | 0.10% | 08/05/15 | 22,500,000 | 22,500,000 | ||
| CP | 0.09% | 08/11/15 | 17,500,000 | 17,500,000 | ||
| CP | 0.09% | 08/18/15 | 15,000,000 | 15,000,000 | ||
| CP | 0.10% | 09/04/15 | 10,000,000 | 10,000,000 | ||
| 65,493,000 | ||||||
| Alaska 0.0% | ||||||
| Alaska Housing Finance Corp | ||||||
| General Mortgage RB II Series 2012A | 1.15% | 06/01/16 | 280,000 | 281,404 | ||
| State Capital Project Bonds II Series 2015B | 3.00% | 06/01/16 | 755,000 | 772,584 | ||
| North Slope Borough | ||||||
| GO Bonds Series 2007A | 5.00% | 06/30/16 | 115,000 | 120,143 | ||
| GO Bonds Series 2011B | 4.00% | 06/30/16 | 175,000 | 181,123 | ||
| 1,355,254 | ||||||
| Arizona 0.2% | ||||||
| Arizona Health Facilities Auth | ||||||
| RB (Banner Health) Series 2007A | 5.00% | 01/01/16 | 425,000 | 434,627 | ||
| RB (Banner Health) Series 2008D | 5.00% | 01/01/16 | 1,500,000 | 1,534,677 | ||
| Phoenix Civic Improvement Corp | ||||||
| Airport CP Series 2014A2&B2 (LOC: Barclays Bank Plc) | 0.07% | 07/13/15 | 20,000,000 | 20,000,000 | ||
| Issuer
Type of Security, Series |
Footnotes | Rate | Effective
Maturity |
Maturity
Date |
Face
Amount ($) |
Value
($) |
| Tucson | ||||||
| Water System Refunding RB Series 2005 (ESCROW) | 5.00% | 07/01/15 | 5,735,000 | 5,735,000 | ||
| 27,704,304 | ||||||
| California 5.3% | ||||||
| California | ||||||
| GO Bonds | 5.00% | 09/01/15 | 15,000,000 | 15,123,900 | ||
| GO CP Series A1 (LOC: Wells Fargo Bank, NA) | 0.10% | 08/04/15 | 8,000,000 | 8,000,000 | ||
| California Health Facilities Financing Auth | ||||||
| RB (Kaiser Permanente) Series 2006E | 0.13% | 11/02/15 | 29,000,000 | 29,000,000 | ||
| RB (Kaiser Permanente) Series 2006E | 0.14% | 11/03/15 | 19,435,000 | 19,435,000 | ||
| RB (Kaiser Permanente) Series 2006E | 0.14% | 12/01/15 | 7,500,000 | 7,500,000 | ||
| RB (Kaiser Permanente) Series 2006E | 0.21% | 02/03/16 | 4,000,000 | 4,000,000 | ||
| California Statewide Communities Development Auth | ||||||
| RB (Kaiser Permanente) Series 2004E | 0.14% | 08/05/15 | 26,200,000 | 26,200,000 | ||
| RB (Kaiser Permanente) Series 2004E | 0.23% | 02/16/16 | 5,000,000 | 5,000,000 | ||
| RB (Kaiser Permanente) Series 2004I | 0.14% | 07/01/15 | 2,600,000 | 2,600,000 | ||
| RB (Kaiser Permanente) Series 2004I | 0.14% | 08/06/15 | 4,900,000 | 4,900,000 | ||
| RB (Kaiser Permanente) Series 2004I | 0.13% | 11/02/15 | 15,000,000 | 15,000,000 | ||
| RB (Kaiser Permanente) Series 2004I | 0.21% | 02/03/16 | 6,700,000 | 6,700,000 | ||
| RB (Kaiser Permanente) Series 2004K | 0.14% | 07/08/15 | 20,800,000 | 20,800,000 | ||
| RB (Kaiser Permanente) Series 2004K | 0.14% | 10/01/15 | 16,000,000 | 16,000,000 | ||
| RB (Kaiser Permanente) Series 2004K | 0.14% | 11/03/15 | 1,400,000 | 1,400,000 | ||
| RB (Kaiser Permanente) Series 2006D | 0.14% | 08/05/15 | 23,000,000 | 23,000,000 | ||
| RB (Kaiser Permanente) Series 2008B | 0.14% | 10/02/15 | 15,000,000 | 15,000,000 | ||
| RB (Kaiser Permanente) Series 2008B | 0.23% | 01/06/16 | 24,000,000 | 24,000,000 | ||
| RB (Kaiser Permanente) Series 2008B | 0.23% | 02/16/16 | 2,000,000 | 2,000,000 | ||
| RB (Kaiser Permanente) Series 2008C | 0.23% | 03/03/16 | 29,500,000 | 29,500,000 | ||
| RB (Kaiser Permanente) Series 2008C | 0.24% | 03/14/16 | 5,700,000 | 5,700,000 | ||
| RB (Kaiser Permanente) Series 2009B2 | 0.14% | 11/12/15 | 27,000,000 | 27,000,000 | ||
| RB (Kaiser Permanente) Series 2009B3 | 0.23% | 01/07/16 | 20,000,000 | 20,000,000 | ||
| RB (Kaiser Permanente) Series 2009B5 | 0.23% | 01/05/16 | 7,250,000 | 7,250,000 | ||
| RB (Kaiser Permanente) Series 2009B6 | 0.22% | 02/08/16 | 31,000,000 | 31,000,000 | ||
| East Bay Municipal Utility District | ||||||
| Water System Extendible CP | 0.10% | 08/05/15 | 02/09/16 | 11,300,000 | 11,300,000 | |
| Kern Cnty | ||||||
| TRAN 2015-2016 | c | 7.00% | 06/30/16 | 16,000,000 | 17,064,360 | |
| Los Angeles | ||||||
| TRAN | c | 2.00% | 06/30/16 | 135,000,000 | 137,209,950 | |
| Los Angeles Cnty | ||||||
| TRAN | c | 5.00% | 06/30/16 | 50,000,000 | 52,342,250 | |
| Los Angeles Dept of Water & Power | ||||||
| Power System RB Series 2005A1 | 5.00% | 07/01/15 | 100,000 | 100,000 | ||
| Riverside Cnty | ||||||
| TRAN | c | 2.00% | 06/30/16 | 36,000,000 | 36,612,000 | |
| Sacramento Municipal Utility District | ||||||
| CP Series L1 (LOC: Barclays Bank Plc) | 0.08% | 09/04/15 | 10,000,000 | 10,000,000 | ||
| San Diego USD | ||||||
| GO Refunding Bonds Series 2014R3 | 5.00% | 07/01/15 | 1,935,000 | 1,935,000 | ||
| San Francisco Airport Commission | ||||||
| Second Series Refunding RB Series 2011C (GTY/LIQ: Wells Fargo Bank, NA) | a,b | 0.18% | 07/09/15 | 13,020,000 | 13,020,000 | |
| Issuer
Type of Security, Series |
Footnotes | Rate | Effective
Maturity |
Maturity
Date |
Face
Amount ($) |
Value
($) |
| Southern California Metropolitan Water District | ||||||
| Water Refunding RB Series 2012E2 | 3.00% | 10/01/15 | 9,065,000 | 9,065,000 | ||
| 654,757,460 | ||||||
| Colorado 0.0% | ||||||
| Boulder Cnty | ||||||
| COP Series 2015 | 5.00% | 12/01/15 | 1,940,000 | 1,978,344 | ||
| Colorado Health Facilities Auth | ||||||
| RB (Catholic Health Initiatives) Series 2008C2 | 4.00% | 11/12/15 | 2,170,000 | 2,199,837 | ||
| Colorado Springs | ||||||
| Utilities System Refunding RB Series 2011A | 5.00% | 11/15/15 | 150,000 | 152,646 | ||
| Univ of Colorado | ||||||
| Univ Enterprise Refunding RB Series 2009C | 4.00% | 06/01/16 | 100,000 | 103,238 | ||
| 4,434,065 | ||||||
| Connecticut 0.3% | ||||||
| Connecticut | ||||||
| GO Bonds Series 2005D | 5.00% | 11/15/15 | 100,000 | 101,739 | ||
| GO Bonds Series 2006D | 5.00% | 11/01/15 | 210,000 | 213,201 | ||
| GO Bonds Series 2007D | 3.50% | 12/01/15 | 150,000 | 151,917 | ||
| GO Bonds Series 2010A | 5.00% | 04/01/16 | 2,250,000 | 2,330,487 | ||
| GO Bonds Series 2010B | 2.13% | 12/01/15 | 100,000 | 100,770 | ||
| GO Refunding Bonds Series 2001C | 5.50% | 12/15/15 | 100,000 | 102,363 | ||
| GO Refunding Bonds Series 2007B | 5.00% | 05/01/16 | 375,000 | 389,454 | ||
| GO Refunding Bonds Series 2009C | 3.00% | 03/01/16 | 100,000 | 101,658 | ||
| GO Refunding Bonds Series 2014C | 3.00% | 12/15/15 | 125,000 | 126,533 | ||
| Connecticut Health & Educational Facilities Auth | ||||||
| RB (Yale Univ) Series 2013A | 1.35% | 07/21/16 | 14,000,000 | 14,145,782 | ||
| Connecticut HFA | ||||||
| Housing Mortgage Finance Program Bonds Series 2006D | 4.05% | 11/15/15 | 175,000 | 177,241 | ||
| Housing Mortgage Finance Program Bonds Series 2012D1 | 1.20% | 11/15/15 | 225,000 | 225,693 | ||
| Housing Mortgage Finance Program Bonds Series 2014C1 | 0.25% | 11/15/15 | 300,000 | 299,954 | ||
| Manchester | ||||||
| GO Temporary Notes | 1.00% | 07/02/15 | 15,000,000 | 15,000,349 | ||
| 33,467,141 | ||||||
| Delaware 0.1% | ||||||
| Delaware Health Facilities Auth | ||||||
| RB (Christiana Care Health Services) Series 2010C | 0.09% | 07/13/15 | 8,000,000 | 8,000,000 | ||
| District of Columbia 1.0% | ||||||
| District of Columbia | ||||||
| GO Bonds Series 2007C | 5.00% | 06/01/16 | 1,000,000 | 1,042,177 | ||
| GO Bonds Series 2013A | 5.00% | 06/01/16 | 2,325,000 | 2,425,137 | ||
| GO Refunding Bonds Series 2005B | 5.25% | 06/01/16 | 2,235,000 | 2,335,086 | ||
| GO Refunding Bonds Series 2007B | 5.00% | 06/01/16 | 100,000 | 104,060 | ||
| GO TRAN Fiscal 2015 | d | 1.50% | 09/30/15 | 115,000,000 | 115,395,087 | |
| Income Tax Secured RB Series 2009A | 4.00% | 12/01/15 | 1,000,000 | 1,015,893 | ||
| Income Tax Secured RB Series 2009D | 4.00% | 12/01/15 | 100,000 | 101,488 | ||
| Income Tax Secured RB Series 2009D | 5.00% | 12/01/15 | 635,000 | 647,346 | ||
| Income Tax Secured RB Series 2011F | 3.00% | 12/01/15 | 100,000 | 101,064 | ||
| Income Tax Secured RB Series 2012C | 5.00% | 12/01/15 | 500,000 | 509,782 | ||
| Issuer
Type of Security, Series |
Footnotes | Rate | Effective
Maturity |
Maturity
Date |
Face
Amount ($) |
Value
($) |
| Income Tax Secured Refunding RB Series 2009B | 4.00% | 12/01/15 | 250,000 | 253,734 | ||
| Income Tax Secured Refunding RB Series 2009C | 5.00% | 12/01/15 | 100,000 | 101,968 | ||
| District of Columbia Water & Sewer Auth | ||||||
| Public Utility RB Series 1998 | 6.00% | 10/01/15 | 5,970,000 | 6,057,997 | ||
| 130,090,819 | ||||||
| Florida 0.8% | ||||||
| Alachua Cnty Health Facilities Auth | ||||||
| Health Facilities RB (Shands Teaching Hospital & Clinics) Series 2008A (LOC: Bank of America, NA) | 0.09% | 08/05/15 | 11,750,000 | 11,750,000 | ||
| Florida Dept of Transportation | ||||||
| Right-of-Way Acquisition & Bridge Construction Refunding Bonds Series 2009B | 5.00% | 07/01/16 | 360,000 | 376,398 | ||
| Right-of-Way Acquisition & Bridge Construction Refunding Bonds Series 2012A | 4.00% | 07/01/15 | 220,000 | 220,000 | ||
| Florida Local Government Finance Commission | ||||||
| CP Series A1&B1 (LOC: JPMorgan Chase Bank, NA) | 0.09% | 08/06/15 | 4,400,000 | 4,400,000 | ||
| Florida State Board of Education | ||||||
| Public Education Capital Outlay Bonds Series 2006C | 5.00% | 06/01/16 | 100,000 | 104,181 | ||
| Public Education Capital Outlay Bonds Series 2007B&C (LIQ: Wells Fargo Bank, NA) | a,b | 0.14% | 07/09/15 | 5,680,000 | 5,680,000 | |
| Public Education Capital Outlay Bonds Series 2007C | 5.00% | 06/01/16 | 100,000 | 104,152 | ||
| Public Education Capital Outlay Bonds Series 2008A | 5.00% | 06/01/16 | 200,000 | 208,225 | ||
| Public Education Capital Outlay Refunding Bonds Series 2007A | 5.00% | 06/01/16 | 100,000 | 104,152 | ||
| Public Education Capital Outlay Refunding Bonds Series 2011A | 5.00% | 06/01/16 | 170,000 | 176,992 | ||
| Public Education Capital Outlay Refunding Bonds Series 2013B | 5.00% | 06/01/16 | 240,000 | 249,980 | ||
| Public Education Capital Outlay Refunding Bonds Series 2014A | 3.00% | 01/01/16 | 1,805,000 | 1,830,095 | ||
| Public Education Capital Outlay Refunding Bonds Series 2014A | 5.00% | 06/01/16 | 180,000 | 187,527 | ||
| Public Education Capital Outlay Refunding Bonds Series 2014B | 5.00% | 06/01/16 | 500,000 | 521,245 | ||
| Public Education Capital Outlay Refunding Bonds Series 2014C | 4.00% | 06/01/16 | 130,000 | 134,209 | ||
| Public Education Capital Outlay Refunding Bonds Series 2015A | 5.00% | 06/01/16 | 1,000,000 | 1,042,902 | ||
| Greater Orlando Aviation Auth | ||||||
| Airport Facilities Refunding RB Series 2009A | 5.50% | 10/01/15 | 3,820,000 | 3,869,755 | ||
| Airport Facilities Refunding RB Series 2011C | 3.00% | 10/01/15 | 590,000 | 593,902 | ||
| JEA | ||||||
| Electric System RB Series Three 2008C3 (LIQ: Royal Bank of Canada) | 0.08% | 08/31/15 | 17,000,000 | 17,000,000 | ||
| Electric System RB Series Three 2008E | 5.00% | 10/01/15 | 960,000 | 971,410 | ||
| Electric System RB Series Three 2010D | 4.00% | 10/01/15 | 880,000 | 888,391 | ||
| Electric System RB Series Three 2013A | 5.00% | 10/01/15 | 400,000 | 404,704 | ||
| Electric System RB Series Three 2013C | 3.00% | 10/01/15 | 1,330,000 | 1,339,133 | ||
| Electric System Sub RB Series 2013B | 5.00% | 10/01/15 | 2,290,000 | 2,317,538 | ||
| Electric System Sub RB Series 2013D | 3.00% | 10/01/15 | 2,000,000 | 2,013,631 | ||
| Miami-Dade Cnty | ||||||
| Water & Sewer System RB Series 2008A | 5.00% | 10/01/15 | 100,000 | 101,185 | ||
| Water & Sewer System RB Series 2008B | 5.00% | 10/01/15 | 12,300,000 | 12,449,147 | ||
| Orlando Utilities Commission | ||||||
| Utility System Refunding RB Series 2009C | 4.00% | 10/01/15 | 575,000 | 580,334 | ||
| South Miami Health Facilities Auth | ||||||
| Hospital RB (Baptist Health South Florida) Series 2007 | 5.00% | 08/15/15 | 780,000 | 784,600 | ||
| Issuer
Type of Security, Series |
Footnotes | Rate | Effective
Maturity |
Maturity
Date |
Face
Amount ($) |
Value
($) |
| Sunshine State Government Financing Commission | ||||||
| CP Series H (LIQ: JPMorgan Chase Bank, NA) | 0.10% | 09/10/15 | 10,000,000 | 10,000,000 | ||
| CP Series H (LIQ: JPMorgan Chase Bank, NA) | 0.12% | 10/09/15 | 17,534,000 | 17,534,000 | ||
| 97,937,788 | ||||||
| Georgia 0.1% | ||||||
| Georgia | ||||||
| GO Bonds 1998C | 5.50% | 09/01/15 | 2,000,000 | 2,018,293 | ||
| GO Bonds 1999B | 5.75% | 08/01/15 | 2,625,000 | 2,637,426 | ||
| GO Bonds 2005A | 5.00% | 09/01/15 | 550,000 | 554,404 | ||
| GO Bonds 2006D | 5.00% | 07/01/15 | 2,000,000 | 2,000,000 | ||
| GO Bonds 2009B | 3.00% | 01/01/16 | 300,000 | 303,968 | ||
| GO Bonds 2009B | 4.00% | 01/01/16 | 1,500,000 | 1,528,195 | ||
| GO Bonds 2011I | 5.00% | 11/01/15 | 1,000,000 | 1,016,435 | ||
| GO Refunding Bonds 2009E | 5.00% | 07/01/15 | 225,000 | 225,000 | ||
| GO Refunding Bonds Series 2007C | 5.00% | 07/01/15 | 580,000 | 580,000 | ||
| Municipal Electric Auth of Georgia | ||||||
| Project One BAN Series A (LOC: Wells Fargo Bank, NA) | 0.09% | 07/15/15 | 7,000,000 | 7,000,000 | ||
| 17,863,721 | ||||||
| Hawaii 0.1% | ||||||
| Hawaii | ||||||
| GO Bonds Series 2006DI | 4.00% | 03/01/16 | 200,000 | 204,865 | ||
| GO Bonds Series 2007DJ | 4.00% | 04/01/16 | 105,000 | 107,864 | ||
| GO Refunding Bonds Series 2010DY | 4.00% | 02/01/16 | 275,000 | 280,745 | ||
| GO Refunding Bonds Series 2009DR | 4.00% | 06/01/16 | 100,000 | 103,238 | ||
| GO Refunding Bonds Series 2009DR | 5.00% | 06/01/16 | 3,100,000 | 3,233,482 | ||
| GO Refunding Bonds Series 2009DT | 4.00% | 11/01/15 | 200,000 | 202,514 | ||
| GO Refunding Bonds Series 2009DT | 5.00% | 11/01/15 | 700,000 | 710,853 | ||
| GO Refunding Bonds Series 2010DY | 3.00% | 02/01/16 | 100,000 | 101,537 | ||
| GO Refunding Bonds Series 2013EJ | 5.00% | 08/01/15 | 1,000,000 | 1,004,007 | ||
| Honolulu | ||||||
| GO Bonds Series 2005D (ESCROW) | 5.00% | 07/01/15 | 1,100,000 | 1,100,000 | ||
| GO Bonds Series 2005E | 4.25% | 07/01/15 | 410,000 | 410,000 | ||
| GO Bonds Series 2005E (ESCROW) | 4.45% | 07/01/15 | 6,795,000 | 6,795,000 | ||
| GO Bonds Series 2007A | 4.00% | 07/01/15 | 250,000 | 250,000 | ||
| Honolulu Board of Water Supply | ||||||
| Water System RB Series 2006B (ESCROW) | 5.25% | 07/01/16 | 1,250,000 | 1,308,776 | ||
| 15,812,881 | ||||||
| Idaho 0.5% | ||||||
| Idaho | ||||||
| TAN Series 2015 | c | 2.00% | 06/30/16 | 58,000,000 | 58,986,000 | |
| Illinois 0.9% | ||||||
| Chicago | ||||||
| CP Series 2011B1&B2 (LOC: Wells Fargo Bank, NA) | 0.13% | 09/17/15 | 9,296,000 | 9,296,000 | ||
| Illinois Educational Facilities Auth | ||||||
| Pooled Program CP (LOC: Northern Trust Co) | 0.10% | 08/04/15 | 15,000,000 | 15,000,000 | ||
| Pooled Program CP (LOC: Northern Trust Co) | 0.09% | 08/05/15 | 2,280,000 | 2,280,000 | ||
| Pooled Program CP (LOC: Northern Trust Co) | 0.08% | 08/06/15 | 20,000,000 | 20,000,000 | ||
| Issuer
Type of Security, Series |
Footnotes | Rate | Effective
Maturity |
Maturity
Date |
Face
Amount ($) |
Value
($) |
| Pooled Program CP (LOC: Northern Trust Co) | 0.09% | 09/01/15 | 13,655,000 | 13,655,000 | ||
| Pooled Program CP (LOC: Northern Trust Co) | 0.09% | 09/03/15 | 25,065,000 | 25,065,000 | ||
| Illinois Finance Auth | ||||||
| RB (Advocate Health Care Network) Series 2003A | 0.13% | 07/16/15 | 4,485,000 | 4,485,000 | ||
| RB (Advocate Health Care Network) Series 2008C3B | 0.13% | 07/16/15 | 5,000,000 | 5,000,000 | ||
| RB (Univ of Chicago) Series 2008B | 5.00% | 07/01/15 | 115,000 | 115,000 | ||
| Illinois Health Facilities Auth | ||||||
| RB (Advocate Health Care) Series 2003C | 0.27% | 05/05/16 | 14,980,000 | 14,980,000 | ||
| Illinois Toll Highway Auth | ||||||
| Sr Priority RB Series 2006A1 (ESCROW) | 5.00% | 07/01/16 | 3,500,000 | 3,660,988 | ||
| 113,536,988 | ||||||
| Indiana 0.0% | ||||||
| Purdue Univ | ||||||
| Student Fee Bonds Series W (ESCROW) | 5.00% | 01/01/16 | 5,000,000 | 5,120,103 | ||
| Kansas 0.0% | ||||||
| Johnson Cnty USD No. 512 | ||||||
| GO Refunding Bonds (Shawnee Mission) Series 2015A | 3.00% | 04/01/16 | 1,000,000 | 1,019,764 | ||
| Louisiana 0.3% | ||||||
| Louisiana | ||||||
| GO Bonds Series 2006C | 5.00% | 05/01/16 | 1,250,000 | 1,298,876 | ||
| GO Bonds Series 2011A | 5.00% | 09/01/15 | 100,000 | 100,767 | ||
| GO Bonds Series 2015A | 5.00% | 05/01/16 | 9,575,000 | 9,948,940 | ||
| GO Bonds Series 2015B | 5.00% | 05/01/16 | 2,600,000 | 2,701,540 | ||
| GO Refunding Bonds Series 2005A | 5.00% | 08/01/15 | 2,575,000 | 2,585,582 | ||
| GO Refunding Bonds Series 2010B | 4.00% | 11/15/15 | 500,000 | 506,719 | ||
| Plaquemines Port, Harbor & Terminal District | ||||||
| Port Facilities Refunding RB Series 1984B (LOC: Wells Fargo Bank, NA) | 0.47% | 03/16/16 | 18,500,000 | 18,500,000 | ||
| 35,642,424 | ||||||
| Maryland 0.6% | ||||||
| Maryland Community Development Administration | ||||||
| Residential RB Series 2007C | 3.85% | 09/01/15 | 200,000 | 201,139 | ||
| Maryland Health & Higher Educational Facilities Auth | ||||||
| CP (Johns Hopkins Univ) Series A&B | 0.09% | 08/06/15 | 13,505,000 | 13,505,000 | ||
| CP (Johns Hopkins Univ) Series A&B | 0.08% | 09/02/15 | 7,765,000 | 7,765,000 | ||
| Montgomery Cnty | ||||||
| RB (CHE Trinity Health) Series 2013MD | 0.10% | 09/01/15 | 37,500,000 | 37,500,000 | ||
| Washington Suburban Sanitary District | ||||||
| Consolidated Bonds 2013 | 5.00% | 06/01/16 | 1,500,000 | 1,564,141 | ||
| Consolidated Bonds Series 2010A | 5.00% | 06/01/16 | 210,000 | 218,665 | ||
| Consolidated Refunding Bonds 2009 | 5.00% | 06/01/16 | 7,155,000 | 7,463,860 | ||
| Consolidated Refunding Bonds 2014 | 4.00% | 06/01/16 | 2,300,000 | 2,377,784 | ||
| 70,595,589 | ||||||
| Massachusetts 2.5% | ||||||
| Essex North Shore Technical & Agricultural SD | ||||||
| GO BAN | 1.25% | 06/17/16 | 2,752,694 | 2,774,549 | ||
| Fall River | ||||||
| GO BAN | 1.25% | 02/12/16 | 3,249,000 | 3,268,043 | ||
| Issuer
Type of Security, Series |
Footnotes | Rate | Effective
Maturity |
Maturity
Date |
Face
Amount ($) |
Value
($) |
| Framingham | ||||||
| GO BAN | 1.00% | 12/11/15 | 6,483,558 | 6,507,540 | ||
| Franklin | ||||||
| GO BAN | 1.50% | 05/20/16 | 2,250,000 | 2,273,012 | ||
| Harvard | ||||||
| GO BAN | 2.00% | 06/24/16 | 3,480,000 | 3,537,845 | ||
| Haverhill | ||||||
| BAN | 1.00% | 12/01/15 | 4,000,000 | 4,012,877 | ||
| Hingham | ||||||
| GO BAN | 1.50% | 05/21/16 | 2,938,889 | 2,970,362 | ||
| Holbrook | ||||||
| GO BAN | 2.00% | 06/03/16 | 4,000,000 | 4,058,476 | ||
| Lowell | ||||||
| GO BAN | 1.00% | 09/11/15 | 4,189,364 | 4,196,528 | ||
| GO BAN Series A | 1.00% | 09/11/15 | 6,741,114 | 6,751,861 | ||
| Lynnfield | ||||||
| GO Refunding Bonds | 3.00% | 07/01/15 | 1,000,000 | 1,000,000 | ||
| Massachusetts | ||||||
| GO Bonds Consolidated Loan Series 2001D | 5.50% | 11/01/15 | 600,000 | 610,569 | ||
| GO Bonds Consolidated Loan Series 2002C | 5.50% | 11/01/15 | 750,000 | 763,175 | ||
| GO Bonds Consolidated Loan Series 2005C | 5.00% | 09/01/15 | 570,000 | 574,502 | ||
| GO Bonds Consolidated Loan Series 2010C | 4.00% | 12/01/15 | 100,000 | 101,490 | ||
| GO Bonds Consolidated Loan Series 2010C | 5.00% | 12/01/15 | 4,265,000 | 4,351,077 | ||
| GO Refunding Bonds Series 2003D | 5.50% | 10/01/15 | 5,190,000 | 5,259,720 | ||
| GO Refunding Bonds Series 2010B | 4.00% | 12/01/15 | 320,000 | 325,031 | ||
| Massachusetts Bay Transportation Auth | ||||||
| Sales Tax CP Series A (LIQ: State Street Bank & Trust Co NA) | 0.10% | 09/09/15 | 8,300,000 | 8,300,000 | ||
| Sales Tax CP Series B (LIQ: Sumitomo Mitsui Banking Corp) | 0.10% | 09/03/15 | 5,555,000 | 5,555,000 | ||
| Massachusetts Clean Water Trust | ||||||
| Pool Program Bonds Series 11 (ESCROW) | 4.75% | 08/01/15 | 1,000,000 | 1,003,819 | ||
| Massachusetts Development Finance Agency | ||||||
| M/F Housing RB (New Hadley) Series 2015 (ESCROW) | 0.35% | 04/01/16 | 4,920,000 | 4,920,000 | ||
| Massachusetts Health & Educational Facilities Auth | ||||||
| RB (Harvard Univ) Series 2009A | 5.00% | 11/15/15 | 100,000 | 101,776 | ||
| RB (Partners HealthCare) Series 2007C | 5.00% | 07/01/15 | 250,000 | 250,000 | ||
| Revenue Notes (Harvard Univ) Series EE | 0.07% | 08/05/15 | 15,800,000 | 15,800,000 | ||
| Massachusetts HFA | ||||||
| Housing Bonds Series 2015A | 0.30% | 12/01/15 | 725,000 | 724,907 | ||
| Massachusetts School Building Auth | ||||||
| BAN Series 2014A | 1.00% | 07/16/15 | 85,000,000 | 85,030,684 | ||
| BAN Series 2014A | 5.00% | 07/16/15 | 23,500,000 | 23,547,083 | ||
| Dedicated Sales Tax Bonds Series 2005A (ESCROW) | 5.00% | 08/15/15 | 49,985,000 | 50,280,138 | ||
| Dedicated Sales Tax Bonds Series 2005A (ESCROW) | 5.00% | 08/15/15 | 7,695,000 | 7,739,631 | ||
| Dedicated Sales Tax RB Series 2005A (ESCROW) | 5.00% | 08/15/15 | 2,700,000 | 2,715,978 | ||
| Sub Dedicated Sales Tax CP BAN Series A (LOC: Bank of America, NA) | 0.09% | 09/03/15 | 5,000,000 | 5,000,000 | ||
| Massachusetts State College Building Auth | ||||||
| RB Series 2006A (ESCROW) | 5.00% | 05/01/16 | 9,310,000 | 9,675,277 | ||
| New Bedford | ||||||
| GO BAN | 1.25% | 02/05/16 | 7,000,000 | 7,043,547 | ||
| Newburyport | ||||||
| ULT GO BAN | 1.00% | 10/23/15 | 4,000,000 | 4,010,598 | ||
| Plymouth | ||||||
| GO BAN | 1.50% | 05/04/16 | 4,000,000 | 4,042,458 | ||
| Issuer
Type of Security, Series |
Footnotes | Rate | Effective
Maturity |
Maturity
Date |
Face
Amount ($) |
Value
($) |
| Salisbury | ||||||
| GO BAN | 1.25% | 03/24/16 | 4,000,000 | 4,028,207 | ||
| Taunton | ||||||
| GO BAN | 1.00% | 12/11/15 | 2,369,000 | 2,375,827 | ||
| Univ of Massachusetts Building Auth | ||||||
| RB Sr Series 2008-2 | 5.00% | 05/01/16 | 525,000 | 545,537 | ||
| RB Sr Series 2010-1 | 5.00% | 11/01/15 | 400,000 | 406,244 | ||
| Refunding RB Sr Series 2005-2 (ESCROW) | 5.00% | 11/01/15 | 4,100,000 | 4,166,494 | ||
| Waltham | ||||||
| GO BAN | 2.00% | 06/24/16 | 5,950,000 | 6,047,114 | ||
| Weymouth | ||||||
| GO BAN | 1.00% | 10/16/15 | 2,950,000 | 2,957,158 | ||
| 309,604,134 | ||||||
| Michigan 0.1% | ||||||
| Michigan Finance Auth | ||||||
| Hospital RB (CHE Trinity Health) Series 2013MI1 | 0.10% | 09/01/15 | 4,465,000 | 4,465,000 | ||
| Michigan State Hospital Finance Auth | ||||||
| RB (Ascension Health) Series 1999B3 | 0.30% | 02/03/16 | 8,900,000 | 8,904,696 | ||
| RB (Ascension Health) Series 2010 | 5.00% | 11/15/15 | 175,000 | 178,150 | ||
| 13,547,846 | ||||||
| Minnesota 0.7% | ||||||
| Rochester | ||||||
| Health Care Facilities RB (Mayo Clinic) Series 2014 | 0.07% | 08/06/15 | 15,100,000 | 15,100,000 | ||
| Health Care Facilities RB (Mayo Clinic) Series 2014 | 0.09% | 09/01/15 | 14,000,000 | 14,000,000 | ||
| Health Care Facilities RB (Mayo Foundation) Series 2000A | 0.09% | 08/05/15 | 33,600,000 | 33,600,000 | ||
| Health Care Facilities RB (Mayo Foundation) Series 2000A | 0.07% | 08/06/15 | 11,000,000 | 11,000,000 | ||
| Health Care Facilities RB (Mayo Foundation) Series 2000C | 0.07% | 08/06/15 | 8,550,000 | 8,550,000 | ||
| 82,250,000 | ||||||
| Mississippi 0.1% | ||||||
| Jackson Cnty | ||||||
| Water System GO Refunding Bonds Series 1994 | 0.09% | 08/03/15 | 11,840,000 | 11,840,000 | ||
| Mississippi | ||||||
| GO Refunding Bonds Series 2003A | 5.25% | 11/01/15 | 900,000 | 914,926 | ||
| GO Refunding Bonds Series 2012B | 5.00% | 11/01/15 | 705,000 | 716,289 | ||
| 13,471,215 | ||||||
| Missouri 0.1% | ||||||
| St Louis | ||||||
| General Revenue Fund TRAN Series 2015 | c | 2.00% | 06/01/16 | 10,000,000 | 10,148,000 | |
| Nebraska 0.0% | ||||||
| Omaha Public Power District | ||||||
| Electric System RB Series 2011A | 4.00% | 02/01/16 | 3,000,000 | 3,067,371 | ||
| Nevada 0.8% | ||||||
| Las Vegas Valley Water District | ||||||
| LT GO CP Series 2004A (LIQ: JPMorgan Chase Bank, NA) | 0.09% | 08/04/15 | 49,960,000 | 49,960,000 | ||
| LT GO CP Series 2004A (LIQ: JPMorgan Chase Bank, NA) | 0.08% | 08/05/15 | 15,425,000 | 15,425,000 | ||
| LT GO Water Refunding Bonds Series 2015A | 2.00% | 06/01/16 | 11,775,000 | 11,956,065 | ||
| Issuer
Type of Security, Series |
Footnotes | Rate | Effective
Maturity |
Maturity
Date |
Face
Amount ($) |
Value
($) |
| Nevada | ||||||
| LT GO Bonds Series 2006E (ESCROW) | 5.00% | 03/01/16 | 1,015,000 | 1,046,933 | ||
| Truckee Meadows Water Auth | ||||||
| Water Revenue CP Series 2006A (LOC: Bank of Tokyo Mitsubishi UFJ, Ltd) | 0.09% | 08/06/15 | 15,000,000 | 15,000,000 | ||
| Water Revenue CP Series 2006B (LOC: Bank of Tokyo Mitsubishi UFJ, Ltd) | 0.11% | 10/15/15 | 6,750,000 | 6,750,000 | ||
| 100,137,998 | ||||||
| New Jersey 1.9% | ||||||
| Bergen Cnty | ||||||
| BAN | 1.25% | 12/23/15 | 17,000,000 | 17,087,864 | ||
| Bloomfield Township | ||||||
| BAN | 1.25% | 01/15/16 | 7,000,000 | 7,032,899 | ||
| Burlington Cnty Bridge Commission | ||||||
| Lease Revenue Notes Series 2014 | 1.25% | 11/18/15 | 22,000,000 | 22,089,193 | ||
| Lease Revenue Notes Series 2015 | 1.25% | 02/01/16 | 11,000,000 | 11,065,385 | ||
| Carteret Borough | ||||||
| BAN Series 2015 | 1.50% | 02/05/16 | 7,400,000 | 7,450,838 | ||
| East Brunswick | ||||||
| BAN | 1.00% | 03/18/16 | 11,000,000 | 11,057,420 | ||
| Edgewater | ||||||
| GO Notes | 1.00% | 07/24/15 | 4,540,000 | 4,542,327 | ||
| Edison Township | ||||||
| BAN | 1.00% | 02/12/16 | 6,000,000 | 6,022,165 | ||
| Elizabeth | ||||||
| BAN Series 2015 | 1.25% | 04/08/16 | 9,913,000 | 9,988,363 | ||
| Englewood | ||||||
| BAN Series 2015A | 1.25% | 04/08/16 | 29,100,000 | 29,325,729 | ||
| Harrison Township | ||||||
| BAN 2014 Series A | 1.00% | 11/13/15 | 5,897,175 | 5,911,063 | ||
| Hudson Cnty | ||||||
| GO Bonds Series 2014 | 2.00% | 12/01/15 | 3,780,000 | 3,806,866 | ||
| Hudson Cnty Improvement Auth | ||||||
| Cnty-Guaranteed Pooled Notes Series 2014 U1A | 1.25% | 07/15/15 | 5,000,000 | 5,001,956 | ||
| Cnty-Guaranteed Pooled Notes Series 2014V1 | 1.00% | 11/25/15 | 3,500,000 | 3,509,825 | ||
| Cnty-Guaranteed Pooled Notes Series 2015X1A | c | 2.00% | 07/06/16 | 1,862,000 | 1,889,781 | |
| GO Bonds Series 2015 | 2.00% | 06/01/16 | 325,000 | 329,452 | ||
| Livingston Township | ||||||
| BAN | 1.00% | 02/01/16 | 9,000,000 | 9,040,453 | ||
| Middlesex Cnty | ||||||
| BAN | 1.25% | 06/03/16 | 3,000,000 | 3,026,920 | ||
| New Jersey Economic Development Auth | ||||||
| School Facilities Construction Refunding Bonds Series 2005K (ESCROW) | 5.25% | 12/15/15 | 4,850,000 | 4,961,905 | ||
| New Jersey Transit Corp | ||||||
| Sub COP Series 2005A (ESCROW) | 5.00% | 09/15/15 | 10,900,000 | 11,010,233 | ||
| New Jersey Transportation Trust Fund Auth | ||||||
| Transportation System Bonds Series 2005B (ESCROW) | 5.25% | 12/15/15 | 3,510,000 | 3,590,650 | ||
| North Bergen Township | ||||||
| BAN | 1.25% | 04/01/16 | 17,200,000 | 17,332,078 | ||
| Readington Township | ||||||
| BAN | 1.00% | 08/05/15 | 6,100,000 | 6,105,004 | ||
| Sea Isle City | ||||||
| BAN | 0.75% | 07/22/15 | 8,110,000 | 8,111,950 | ||
| Issuer
Type of Security, Series |
Footnotes | Rate | Effective
Maturity |
Maturity
Date |
Face
Amount ($) |
Value
($) |
| Stafford Township | ||||||
| BAN | 1.50% | 05/13/16 | 6,597,000 | 6,656,693 | ||
| Summit | ||||||
| BAN | 1.00% | 10/23/15 | 13,247,482 | 13,282,207 | ||
| Union Cnty | ||||||
| BAN | 2.00% | 06/24/16 | 4,000,000 | 4,065,269 | ||
| Woodbridge | ||||||
| BAN | 0.75% | 08/21/15 | 4,734,000 | 4,737,562 | ||
| 238,032,050 | ||||||
| New York 3.3% | ||||||
| Babylon | ||||||
| BAN 2014 | 1.50% | 08/01/15 | 3,000,000 | 3,003,407 | ||
| Beacon | ||||||
| BAN Series 2015A | 2.00% | 05/27/16 | 12,000,000 | 12,172,587 | ||
| Burnt Hills - Ballston Lake CSD | ||||||
| GO BAN 2015 | 1.50% | 06/24/16 | 8,445,000 | 8,536,534 | ||
| Cheektowaga-Maryvale UFSD | ||||||
| BAN 2015 | 1.75% | 06/23/16 | 3,500,000 | 3,542,224 | ||
| Clinton Cnty | ||||||
| BAN Series 2015B | 1.50% | 06/10/16 | 5,000,000 | 5,042,629 | ||
| Corning City SD | ||||||
| BAN 2015B | 2.00% | 06/23/16 | 30,000,000 | 30,474,424 | ||
| Gates Chili CSD | ||||||
| BAN 2015 | 1.75% | 06/24/16 | 9,740,000 | 9,862,575 | ||
| Hampton Bays UFSD | ||||||
| School Construction BAN 2015 | 1.75% | 06/24/16 | 5,000,000 | 5,066,390 | ||
| Homer CSD | ||||||
| BAN 2015 | c | 2.00% | 07/15/16 | 7,500,000 | 7,608,150 | |
| Ithaca | ||||||
| GO BAN Series 2014B | 1.00% | 07/31/15 | 16,050,000 | 16,060,953 | ||
| Kingston SD | ||||||
| BAN Series 2015A | 1.50% | 06/16/16 | 10,000,000 | 10,105,971 | ||
| Liverpool CSD | ||||||
| BAN 2014-2015 | 1.25% | 10/02/15 | 7,000,000 | 7,018,050 | ||
| Metropolitan Transportation Auth | ||||||
| Dedicated Tax Fund Bonds Series 2002B2 | 4.00% | 11/01/15 | 295,000 | 298,591 | ||
| Transportation Revenue BAN Series 2015A | 0.50% | 03/01/16 | 30,000,000 | 30,044,861 | ||
| Transportation Revenue BAN Series CP2A (LOC: TD Bank NA) | 0.09% | 09/09/15 | 8,625,000 | 8,625,000 | ||
| Transportation Revenue BAN Series CP2B (LOC: Barclays Bank Plc) | 0.09% | 09/04/15 | 13,230,000 | 13,230,000 | ||
| Nassau Cnty Interim Finance Auth | ||||||
| Sales Tax Secured Bonds Series 2012A | 4.00% | 11/15/15 | 2,820,000 | 2,860,331 | ||
| New York City | ||||||
| GO Bonds Fiscal 2006 Series C | 4.00% | 08/01/15 | 125,000 | 125,378 | ||
| GO Bonds Fiscal 2007 Series A | 5.00% | 08/01/15 | 560,000 | 562,191 | ||
| GO Bonds Fiscal 2007 Series C1 | 5.00% | 01/01/16 | 100,000 | 102,377 | ||
| GO Bonds Fiscal 2008 Series A1 | 5.00% | 08/01/15 | 265,000 | 266,025 | ||
| GO Bonds Fiscal 2008 Series G | 5.00% | 08/01/15 | 870,000 | 873,464 | ||
| GO Bonds Fiscal 2008 Series I1 | 4.50% | 02/01/16 | 100,000 | 102,385 | ||
| GO Bonds Fiscal 2009 Series H1 | 5.00% | 03/01/16 | 135,000 | 139,094 | ||
| GO Bonds Fiscal 2010 Series C | 5.00% | 08/01/15 | 125,000 | 125,483 | ||
| GO Bonds Fiscal 2011 Series A | 3.00% | 08/01/15 | 200,000 | 200,436 | ||
| GO Bonds Fiscal 2011 Series B | 5.00% | 08/01/15 | 6,770,000 | 6,797,976 | ||
| Issuer
Type of Security, Series |
Footnotes | Rate | Effective
Maturity |
Maturity
Date |
Face
Amount ($) |
Value
($) |
| GO Bonds Fiscal 2011 Series E | 4.00% | 08/01/15 | 330,000 | 331,037 | ||
| GO Bonds Fiscal 2012 Series F | 5.00% | 08/01/15 | 670,000 | 672,662 | ||
| GO Bonds Fiscal 2012 Series I | 5.00% | 08/01/15 | 290,000 | 291,184 | ||
| GO Bonds Fiscal 2013 Series D | 5.00% | 08/01/15 | 2,000,000 | 2,008,285 | ||
| New York City Housing Development Corp | ||||||
| Capital Fund Program RB Series 2005A (ESCROW) | 5.00% | 07/01/15 | 6,000,000 | 6,000,000 | ||
| M/F Housing RB Series 2010L1 | 2.35% | 11/01/15 | 100,000 | 100,688 | ||
| New York City Municipal Water Finance Auth | ||||||
| CP Series 1 | 0.07% | 08/04/15 | 20,000,000 | 20,000,000 | ||
| CP Series 1 | 0.08% | 09/09/15 | 19,300,000 | 19,300,000 | ||
| Extendible CP Series 7 | 0.09% | 07/07/15 | 01/29/16 | 21,000,000 | 21,000,000 | |
| Extendible CP Series 7 | 0.10% | 09/01/15 | 03/06/16 | 6,025,000 | 6,025,000 | |
| Extendible CP Series 7 | 0.10% | 09/08/15 | 03/07/16 | 10,000,000 | 10,000,000 | |
| Extendible CP Series 8 | 0.10% | 09/03/15 | 03/04/16 | 25,000,000 | 25,000,000 | |
| Extendible CP Series 8 | 0.10% | 09/02/15 | 03/06/16 | 18,000,000 | 18,000,000 | |
| Extendible CP Series 8 | 0.10% | 09/08/15 | 03/07/16 | 11,500,000 | 11,500,000 | |
| New York City Transitional Finance Auth | ||||||
| Building Aid RB Fiscal 2007 Series S1 | 5.00% | 07/15/15 | 150,000 | 150,263 | ||
| Building Aid RB Fiscal 2013 Series S1 | 4.00% | 07/15/15 | 1,630,000 | 1,632,367 | ||
| Building Aid RB Fiscal 2015 Series S2 | 1.75% | 07/15/16 | 11,290,000 | 11,454,939 | ||
| New York State | ||||||
| GO Bonds Series 2006A | 5.00% | 03/15/16 | 275,000 | 284,034 | ||
| New York State Dormitory Auth | ||||||
| Consolidated Service Contract Refunding RB Series 2009A | 5.00% | 07/01/15 | 100,000 | 100,000 | ||
| Consolidated Service Contract Refunding RB Series 2009A | 5.00% | 07/01/16 | 465,000 | 486,086 | ||
| Mental Health Services Facilities RB Series 2009A1 | 5.00% | 02/15/16 | 115,000 | 118,347 | ||
| RB (NYU) Series 1998A | 5.75% | 07/01/15 | 1,730,000 | 1,730,000 | ||
| RB (St. Luke's-Roosevelt Hospital Center) Series 2005 (ESCROW) | 4.90% | 08/15/15 | 100,000 | 100,573 | ||
| State Personal Income Tax RB Series 2007C | 5.00% | 03/15/16 | 5,000,000 | 5,167,041 | ||
| State Personal Income Tax RB Series 2009D | 5.00% | 06/15/16 | 165,000 | 172,188 | ||
| State Personal Income Tax RB Series 2010A | 5.00% | 02/15/16 | 265,000 | 272,637 | ||
| State Personal Income Tax RB Series 2012E | 5.00% | 02/15/16 | 1,190,000 | 1,224,919 | ||
| New York State Environmental Facilities Corp | ||||||
| State Personal Income Tax RB Series 2008A | 5.00% | 12/15/15 | 115,000 | 117,487 | ||
| New York State Mortgage Agency | ||||||
| Mortgage RB Series 50 | 0.85% | 04/01/16 | 125,000 | 125,374 | ||
| New York State Power Auth | ||||||
| CP Series 1&2 | 0.09% | 08/07/15 | 15,000,000 | 15,000,000 | ||
| CP Series 1&2 | 0.10% | 10/05/15 | 5,000,000 | 5,000,000 | ||
| RB Series 2007C | 5.00% | 11/15/15 | 830,000 | 844,684 | ||
| New York State Thruway Auth | ||||||
| Second General Highway & Bridge Trust Fund Bonds Series 2010A | 5.00% | 04/01/16 | 1,100,000 | 1,138,473 | ||
| State Personal Income Tax RB Series 2009A | 3.50% | 03/15/16 | 100,000 | 102,146 | ||
| New York State Urban Development Corp | ||||||
| Service Contract Refunding RB Series 2008D | 5.00% | 01/01/16 | 775,000 | 793,580 | ||
| State Personal Income Tax RB Series 2008A1 | 4.00% | 12/15/15 | 245,000 | 249,113 | ||
| State Personal Income Tax RB Series 2009C | 5.00% | 12/15/15 | 590,000 | 602,695 | ||
| State Personal Income Tax RB Series 2010A | 5.00% | 03/15/16 | 1,340,000 | 1,384,399 | ||
| State Personal Income Tax RB Series 2013C | 5.00% | 03/15/16 | 100,000 | 103,203 | ||
| Issuer
Type of Security, Series |
Footnotes | Rate | Effective
Maturity |
Maturity
Date |
Face
Amount ($) |
Value
($) |
| North Tonawanda SD | ||||||
| Bonds Series 2014 | 4.00% | 09/15/15 | 785,000 | 791,079 | ||
| School Construction BAN 2014 | 1.00% | 09/17/15 | 745,000 | 746,151 | ||
| Pine Bush CSD | ||||||
| BAN 2015 | 2.00% | 05/26/16 | 7,000,000 | 7,098,017 | ||
| Port Auth of New York & New Jersey | ||||||
| Consolidated Bonds 155th Series | 2.75% | 10/01/15 | 150,000 | 150,931 | ||
| Consolidated Bonds 172nd Series | 5.00% | 10/01/15 | 1,000,000 | 1,011,999 | ||
| Consolidated Bonds 179th Series | 4.00% | 12/01/15 | 100,000 | 101,557 | ||
| Tonawanda | ||||||
| BAN Series 2014 | 0.75% | 09/03/15 | 13,000,000 | 13,012,833 | ||
| Triborough Bridge & Tunnel Auth | ||||||
| General RB Series 2008A | 4.00% | 11/15/15 | 100,000 | 101,389 | ||
| Ulster Cnty | ||||||
| GO BAN Series 2014B | 1.00% | 11/25/15 | 7,903,740 | 7,927,868 | ||
| West Seneca | ||||||
| BAN 2014 | 1.00% | 07/30/15 | 13,000,000 | 13,008,810 | ||
| 415,381,524 | ||||||
| North Carolina 0.0% | ||||||
| Charlotte | ||||||
| GO Refunding Bonds Series 2008 | 5.00% | 08/01/15 | 440,000 | 441,759 | ||
| North Carolina | ||||||
| GO Refunding Bonds Series 2009A | 5.00% | 03/01/16 | 250,000 | 257,681 | ||
| Limited Obligation Refunding Bonds Series 2011B | 4.00% | 11/01/15 | 950,000 | 961,850 | ||
| 1,661,290 | ||||||
| Ohio 0.1% | ||||||
| Ohio | ||||||
| GO Bonds Series 2006B | 5.00% | 11/01/15 | 100,000 | 101,592 | ||
| GO Bonds Series 2008A | 4.00% | 09/01/15 | 300,000 | 301,811 | ||
| GO Bonds Series 2012A | 5.00% | 02/01/16 | 150,000 | 154,023 | ||
| GO Bonds Series L | 5.00% | 05/01/16 | 500,000 | 519,189 | ||
| GO Refunding Bonds Series 2009A | 5.00% | 09/15/15 | 200,000 | 201,967 | ||
| GO Refunding Bonds Series 2009C | 5.00% | 08/01/15 | 100,000 | 100,402 | ||
| GO Refunding Bonds Series 2009C | 5.00% | 09/15/15 | 7,210,000 | 7,282,560 | ||
| GO Refunding Bonds Series 2010C | 5.00% | 08/01/15 | 500,000 | 502,047 | ||
| GO Refunding Bonds Series 2010C | 5.00% | 09/15/15 | 550,000 | 555,345 | ||
| GO Refunding Bonds Series 2011A | 5.00% | 09/15/15 | 320,000 | 323,145 | ||
| Highway GO Bonds Series R | 4.00% | 05/01/16 | 300,000 | 309,045 | ||
| Hospital RB (Cleveland Clinic) Series 2008A | 5.00% | 01/01/16 | 350,000 | 358,191 | ||
| Hospital RB (Cleveland Clinic) Series 2009B1 | 5.00% | 01/01/16 | 300,000 | 306,827 | ||
| Hospital RB (Cleveland Clinic) Series 2012A | 4.00% | 01/01/16 | 3,505,000 | 3,571,405 | ||
| Hospital Refunding RB (Cleveland Clinic) Series 2011A | 4.00% | 01/01/16 | 100,000 | 101,864 | ||
| Lease Appropriation Bonds Series 2013A | 2.00% | 02/01/16 | 100,000 | 100,939 | ||
| Ohio HFA | ||||||
| Residential Mortgage RB Series 2009E | 2.85% | 09/01/15 | 275,000 | 275,998 | ||
| 15,066,350 | ||||||
| Oklahoma 0.1% | ||||||
| Oklahoma Development Finance Auth | ||||||
| Health System Refunding RB (INTEGRIS) Series 2015A | 1.00% | 08/15/15 | 7,240,000 | 7,248,011 | ||
| Issuer
Type of Security, Series |
Footnotes | Rate | Effective
Maturity |
Maturity
Date |
Face
Amount ($) |
Value
($) |
| Oregon 0.1% | ||||||
| Astoria SD No. 1C | ||||||
| GO Refunding Bonds Series 2012 (GTY: Oregon) | 2.00% | 06/15/16 | 100,000 | 101,408 | ||
| Central SD No. 13J | ||||||
| GO Refunding Bonds Series 2015 (GTY: Oregon) | 3.00% | 02/01/16 | 1,285,000 | 1,305,674 | ||
| Hermiston SD No. 8R | ||||||
| GO Bonds Series 2009A (GTY: Oregon) | 3.50% | 06/15/16 | 200,000 | 205,809 | ||
| GO Bonds Series 2010 (GTY: Oregon) | 3.00% | 06/15/16 | 300,000 | 307,284 | ||
| Lane Cnty SD No. 4J | ||||||
| GO Refunding Bonds Series 2008 (GTY: Oregon) | 5.00% | 07/01/15 | 110,000 | 110,000 | ||
| Medford School District No. 549C | ||||||
| GO Bonds Series 2009 (GTY: Oregon) | 4.00% | 06/15/16 | 100,000 | 103,334 | ||
| Oregon | ||||||
| GO Bonds Series 2013F | 4.00% | 05/01/16 | 200,000 | 206,067 | ||
| GO Refunding Bonds Series 2011N | 3.00% | 12/01/15 | 100,000 | 101,113 | ||
| Oregon State Facilities Auth | ||||||
| RB (Providence Health & Services) Series 2013A | 3.00% | 10/01/15 | 1,300,000 | 1,308,431 | ||
| Salem-Keizer SD No. 24J | ||||||
| GO Bonds Series 2009A (GTY: Oregon) | 5.00% | 06/15/16 | 2,000,000 | 2,088,488 | ||
| Three Rivers/Josephine Cnty Unit Jt SD | ||||||
| GO Refunding Bonds Series 2005 (GTY: Oregon) | 5.00% | 12/15/15 | 1,000,000 | 1,021,665 | ||
| 6,859,273 | ||||||
| Pennsylvania 0.5% | ||||||
| Pennsylvania | ||||||
| GO Bonds Second Refunding Series 2009 | 5.00% | 07/01/15 | 5,200,000 | 5,200,000 | ||
| Pennsylvania State Univ | ||||||
| Bonds Series 2005 | 5.00% | 09/01/15 | 200,000 | 201,566 | ||
| Refunding Bonds Series 2009B | 0.29% | 06/01/16 | 17,000,000 | 17,000,000 | ||
| Philadelphia | ||||||
| Airport Revenue CP Series B3 (LOC: Wells Fargo Bank, NA) | 0.12% | 09/09/15 | 2,000,000 | 2,000,000 | ||
| Univ of Pittsburgh | ||||||
| PITT Asset Notes Series 2014 | 2.00% | 07/22/15 | 15,000,000 | 15,016,208 | ||
| Univ Bond Series 2009B | 5.00% | 09/15/15 | 2,125,000 | 2,146,240 | ||
| Univ Bonds Series 2014B1&B2 | 0.10% | 08/17/15 | 4,000,000 | 4,000,000 | ||
| Univ Capital & Refunding Bonds Series 2007B | 0.11% | 08/03/15 | 800,000 | 800,000 | ||
| Univ Capital & Refunding Bonds Series 2007B | 0.11% | 09/01/15 | 7,850,000 | 7,850,000 | ||
| Univ Refunding Bonds Series 2009A | 5.00% | 09/15/15 | 500,000 | 504,934 | ||
| Washington Cnty Hospital Auth | ||||||
| Hospital RB (Washington Hospital) Series 2001B (LOC: PNC Bank NA) | 0.35% | 07/01/15 | 4,560,000 | 4,560,000 | ||
| 59,278,948 | ||||||
| South Carolina 0.4% | ||||||
| Newberry Investing in Children's Education | ||||||
| Installment Purchase RB (Newberry Cnty SD) Series 2005 (ESCROW) | 5.00% | 12/01/15 | 6,360,000 | 6,487,380 | ||
| Installment Purchase RB (Newberry Cnty SD) Series 2005 (ESCROW) | 5.25% | 12/01/15 | 1,730,000 | 1,766,318 | ||
| South Carolina Public Service Auth | ||||||
| CP Series A (LIQ: JPMorgan Chase Bank, NA) | 0.12% | 09/03/15 | 5,210,000 | 5,210,000 | ||
| CP Series E (LIQ: TD Bank NA) | 0.11% | 09/03/15 | 10,296,000 | 10,296,000 | ||
| Refunding Revenue Obligations Series 2006C | 5.00% | 01/01/16 | 165,000 | 168,863 | ||
| Issuer
Type of Security, Series |
Footnotes | Rate | Effective
Maturity |
Maturity
Date |
Face
Amount ($) |
Value
($) |
| Refunding Revenue Obligations Series 2010B | 5.00% | 01/01/16 | 2,215,000 | 2,267,932 | ||
| Refunding Revenue Obligations Series 2011B | 5.00% | 12/01/15 | 200,000 | 203,955 | ||
| Revenue Obligation Series 2006A (ESCROW) | 5.00% | 01/01/16 | 23,400,000 | 23,961,010 | ||
| 50,361,458 | ||||||
| South Dakota 0.0% | ||||||
| South Dakota Housing Development Auth | ||||||
| Homeownership Mortgage Bonds Series 2014D | 0.20% | 11/01/15 | 745,000 | 745,000 | ||
| Tennessee 1.2% | ||||||
| Memphis | ||||||
| GO CP Series A (LIQ: Mizuho Bank Ltd) | 0.08% | 07/08/15 | 2,625,000 | 2,625,000 | ||
| GO CP Series A (LIQ: Mizuho Bank Ltd) | 0.09% | 07/23/15 | 7,000,000 | 7,000,000 | ||
| Metropolitan Government of Nashville & Davidson Cnty | ||||||
| GO Bonds Series 2006B | 5.00% | 08/01/15 | 180,000 | 180,727 | ||
| GO CP Series A1 (LIQ: Mizuho Bank Ltd) | 0.08% | 07/22/15 | 46,500,000 | 46,500,000 | ||
| GO CP Series A1 (LIQ: Mizuho Bank Ltd) | 0.09% | 07/22/15 | 25,000,000 | 25,000,000 | ||
| GO CP Series A2 (LIQ: Sumitomo Mitsui Banking Corp) | 0.10% | 07/21/15 | 20,000,000 | 20,000,000 | ||
| GO CP Series A2 (LIQ: Sumitomo Mitsui Banking Corp) | 0.08% | 08/06/15 | 15,500,000 | 15,500,000 | ||
| GO CP Series A2 (LIQ: Sumitomo Mitsui Banking Corp) | 0.11% | 10/06/15 | 6,000,000 | 6,000,000 | ||
| GO Refunding Bonds Series 2005B | 5.00% | 01/01/16 | 11,460,000 | 11,736,351 | ||
| Shelby Cnty | ||||||
| Extendible CP Series 2015A | 0.11% | 08/10/15 | 02/12/16 | 9,335,000 | 9,335,000 | |
| 143,877,078 | ||||||
| Texas 6.7% | ||||||
| Aldine ISD | ||||||
| ULT GO & Refunding Bonds Series 2013 (GTY: TX Permanent School Fund) | 5.00% | 02/15/16 | 200,000 | 205,923 | ||
| ULT GO Bonds Series 2007A (GTY: TX Permanent School Fund) | 4.50% | 02/15/16 | 145,000 | 148,736 | ||
| ULT GO Bonds Series 2008 (GTY: TX Permanent School Fund) | 5.00% | 02/15/16 | 300,000 | 308,801 | ||
| Alief ISD | ||||||
| ULT GO & Refunding Bonds Series 2013 (GTY: TX Permanent School Fund) | 2.00% | 02/15/16 | 1,130,000 | 1,142,525 | ||
| Alvin ISD | ||||||
| ULT GO Bonds Series 2006 (GTY: TX Permanent School Fund) | 5.50% | 02/15/16 | 810,000 | 836,119 | ||
| Arlington ISD | ||||||
| ULT GO Bonds Series 2014 (GTY: TX Permanent School Fund) | 4.00% | 02/15/16 | 100,000 | 102,293 | ||
| ULT GO Refunding Bonds Series 2007 (GTY: TX Permanent School Fund) | 5.00% | 02/15/16 | 100,000 | 102,860 | ||
| Austin | ||||||
| Combined Utility Systems CP Series A (LOC: Bank of Tokyo Mitsubishi UFJ, Ltd) | 0.10% | 09/03/15 | 4,110,000 | 4,110,000 | ||
| Combined Utility Systems CP Series A (LOC: Bank of Tokyo Mitsubishi UFJ, Ltd) | 0.10% | 09/17/15 | 11,350,000 | 11,350,000 | ||
| Water & Wastewater System Refunding RB Series 2002A | 5.50% | 11/15/15 | 300,000 | 305,722 | ||
| Water & Wastewater System Refunding RB Series 2009A | 4.00% | 11/15/15 | 250,000 | 253,367 | ||
| Water & Wastewater System Refunding RB Series 2012 | 5.00% | 11/15/15 | 630,000 | 641,149 | ||
| Austin ISD | ||||||
| CP Series A (LIQ: Mizuho Bank Ltd) | 0.10% | 08/03/15 | 15,300,000 | 15,300,000 | ||
| ULT GO Refunding Bonds Series 1998 (GTY: TX Permanent School Fund) | 5.00% | 08/01/15 | 100,000 | 100,404 | ||
| Issuer
Type of Security, Series |
Footnotes | Rate | Effective
Maturity |
Maturity
Date |
Face
Amount ($) |
Value
($) |
| ULT GO Refunding Bonds Series 2004 (GTY: TX Permanent School Fund) | 5.25% | 08/01/15 | 355,000 | 356,521 | ||
| ULT GO Refunding Bonds Series 2006B (GTY: TX Permanent School Fund) | 5.00% | 08/01/15 | 425,000 | 426,675 | ||
| ULT Refunding GO Bonds Series 2006 (GTY: TX Permanent School Fund) | 5.25% | 08/01/15 | 180,000 | 180,765 | ||
| Azle ISD | ||||||
| ULT GO Refunding Bonds Series 1997B (GTY: TX Permanent School Fund) | 0.30% | 02/15/16 | 150,000 | 149,710 | ||
| ULT GO Refunding Bonds Series 1997B (GTY: TX Permanent School Fund) | 0.35% | 02/15/16 | 100,000 | 99,781 | ||
| Beaumont ISD | ||||||
| ULT GO Bonds Series 2011 (GTY: TX Permanent School Fund) | 4.00% | 02/15/16 | 300,000 | 306,716 | ||
| Birdville ISD | ||||||
| ULT GO Bonds Series 2015A (GTY: TX Permanent School Fund) | 2.00% | 02/15/16 | 2,060,000 | 2,082,646 | ||
| ULT GO Refunding Bonds Series 2008B (GTY: TX Permanent School Fund) | 4.25% | 02/15/16 | 190,000 | 194,613 | ||
| ULT GO Refunding Bonds Series 2012 (GTY: TX Permanent School Fund) | 0.34% | 02/15/16 | 150,000 | 149,673 | ||
| Boerne ISD | ||||||
| ULT GO Refunding Bonds Series 2012 (GTY: TX Permanent School Fund) | 3.00% | 02/01/16 | 270,000 | 274,174 | ||
| Brazosport ISD | ||||||
| ULT GO & Refunding Bonds Series 2012A (GTY: TX Permanent School Fund) | 2.00% | 02/15/16 | 150,000 | 151,585 | ||
| Brownsville ISD | ||||||
| ULT GO Bonds Series 2006 (GTY: TX Permanent School Fund) | 5.00% | 02/15/16 | 100,000 | 102,906 | ||
| Bryan ISD | ||||||
| ULT GO Bonds Series 2015A (GTY: TX Permanent School Fund) | 2.00% | 02/15/16 | 4,280,000 | 4,327,864 | ||
| Burleson ISD | ||||||
| ULT GO Refunding Bonds Series 2007 (GTY: TX Permanent School Fund) | 4.00% | 08/01/15 | 130,000 | 130,414 | ||
| Channelview ISD | ||||||
| ULT GO Refunding Bonds Series 2014 (GTY: TX Permanent School Fund) | 2.00% | 08/15/15 | 115,000 | 115,226 | ||
| Clear Creek ISD | ||||||
| ULT GO & Refunding Bonds Series 2004A (GTY: TX Permanent School Fund) | 5.00% | 02/15/16 | 250,000 | 257,196 | ||
| ULT GO & Refunding Bonds Series 2008 (GTY: TX Permanent School Fund) | 4.00% | 02/15/16 | 200,000 | 204,541 | ||
| College Station ISD | ||||||
| ULT GO Bonds Series 2010 (GTY: TX Permanent School Fund) | 3.00% | 08/15/15 | 100,000 | 100,336 | ||
| Comal ISD | ||||||
| ULT GO Refunding Bonds Series 2012A (GTY: TX Permanent School Fund) | 4.00% | 02/01/16 | 1,635,000 | 1,670,941 | ||
| Conroe ISD | ||||||
| ULT GO & Refunding Bonds Series 2006 (ESCROW) | 5.00% | 02/15/16 | 5,635,000 | 5,802,754 | ||
| ULT GO & Refunding Bonds Series 2006 (GTY: TX Permanent School Fund) | 5.00% | 02/15/16 | 125,000 | 128,525 | ||
| Coppell ISD | ||||||
| ULT GO Bonds Series 2014 (GTY: TX Permanent School Fund) | 2.00% | 08/15/15 | 375,000 | 375,835 | ||
| Copperas Cove ISD | ||||||
| ULT GO & Refunding Bonds Series 2005 (GTY: TX Permanent School Fund) | 4.00% | 08/15/15 | 1,135,000 | 1,140,372 | ||
| Crowley ISD | ||||||
| ULT GO Refunding Bonds Series 2015A (GTY: TX Permanent School Fund) | 2.00% | 08/01/15 | 655,000 | 655,882 | ||
| Issuer
Type of Security, Series |
Footnotes | Rate | Effective
Maturity |
Maturity
Date |
Face
Amount ($) |
Value
($) |
| Crystal City ISD | ||||||
| ULT GO Bonds Series 2015 (GTY: TX Permanent School Fund) | c | 2.00% | 02/15/16 | 385,000 | 388,469 | |
| Cuero ISD | ||||||
| ULT GO Bonds Series 2014A (GTY: TX Permanent School Fund) | 0.50% | 08/15/15 | 4,720,000 | 4,722,033 | ||
| Cypress-Fairbanks ISD | ||||||
| ULT GO & Refunding Bonds Series 2006 (GTY: TX Permanent School Fund) | 5.00% | 02/15/16 | 100,000 | 102,846 | ||
| ULT GO Refunding Bonds Series 2011 (GTY: TX Permanent School Fund) | 4.00% | 02/15/16 | 100,000 | 102,238 | ||
| Dallas | ||||||
| Waterworks & Sewer CP Series E (LIQ: JPMorgan Chase Bank, NA) | 0.10% | 09/03/15 | 3,610,000 | 3,610,000 | ||
| Waterworks & Sewer CP Series E (LIQ: JPMorgan Chase Bank, NA) | 0.11% | 09/03/15 | 4,000,000 | 4,000,000 | ||
| Waterworks & Sewer System Refunding RB Series 2007 | 5.00% | 10/01/15 | 300,000 | 303,600 | ||
| Waterworks & Sewer System Refunding RB Series 2011 | 5.00% | 10/01/15 | 175,000 | 177,018 | ||
| Dallas Area Rapid Transit | ||||||
| Sr Lien Sales Tax RB Series 2009A | 5.00% | 12/01/15 | 1,065,000 | 1,085,900 | ||
| Sr Lien Sales Tax Refunding RB Series 2007 | 5.00% | 12/01/15 | 185,000 | 188,581 | ||
| Dallas ISD | ||||||
| ULT GO Bonds Series 2008 (GTY: TX Permanent School Fund) | 5.25% | 02/15/16 | 1,125,000 | 1,159,937 | ||
| ULT GO Refunding Bonds Series 2011 (GTY: TX Permanent School Fund) | 4.00% | 02/15/16 | 525,000 | 537,077 | ||
| Deer Park ISD | ||||||
| LT GO Bonds Series 2007 (GTY: TX Permanent School Fund) | 5.25% | 02/15/16 | 235,000 | 242,152 | ||
| Del Valle ISD | ||||||
| ULT GO Refunding Bonds Series 2010 (GTY: TX Permanent School Fund) | 2.38% | 02/01/16 | 200,000 | 202,300 | ||
| DeSoto ISD | ||||||
| ULT GO & Refunding Bonds Series 2006 (GTY: TX Permanent School Fund) | 4.13% | 08/15/15 | 100,000 | 100,475 | ||
| Dumas ISD | ||||||
| ULT GO Refunding Bonds Series 2015 (GTY: TX Permanent School Fund) | 2.00% | 08/01/15 | 105,000 | 105,146 | ||
| Duncanville ISD | ||||||
| ULT GO Refunding Bonds Series 2006 (GTY: TX Permanent School Fund) | 0.31% | 02/15/16 | 300,000 | 299,401 | ||
| East Central ISD | ||||||
| ULT GO Refunding Bonds Series 2014 (GTY: TX Permanent School Fund) | 2.00% | 08/15/15 | 160,000 | 160,335 | ||
| ULT GO Refunding Bonds Series 2015 (GTY: TX Permanent School Fund) | 2.00% | 08/15/15 | 135,000 | 135,260 | ||
| Edinburg Consolidated ISD | ||||||
| ULT GO Refunding Bonds Series 2012 (GTY: TX Permanent School Fund) | 3.00% | 02/15/16 | 1,905,000 | 1,938,043 | ||
| El Paso ISD | ||||||
| ULT GO Bonds Series 2007 (GTY: TX Permanent School Fund) | 4.25% | 08/15/15 | 200,000 | 200,943 | ||
| Forney ISD | ||||||
| ULT GO Refunding Bonds Series 2005 (GTY: TX Permanent School Fund) | 4.00% | 08/15/15 | 100,000 | 100,442 | ||
| Frenship ISD | ||||||
| ULT GO Bonds Series 2007 (GTY: TX Permanent School Fund) | 4.50% | 02/15/16 | 100,000 | 102,576 | ||
| Frisco ISD | ||||||
| ULT GO Bonds Series 2013 (GTY: TX Permanent School Fund) | 3.00% | 08/15/15 | 1,360,000 | 1,364,769 | ||
| Garland | ||||||
| Electric Utility System CP Series 2014 (LOC: Wells Fargo Bank, NA) | 0.12% | 09/09/15 | 7,000,000 | 7,000,000 | ||
| Issuer
Type of Security, Series |
Footnotes | Rate | Effective
Maturity |
Maturity
Date |
Face
Amount ($) |
Value
($) |
| Garland ISD | ||||||
| ULT GO & Refunding Bonds Series 2015A (GTY: TX Permanent School Fund) | 2.00% | 02/15/16 | 5,035,000 | 5,089,459 | ||
| ULT GO Refunding Bonds Series 2011A (GTY: TX Permanent School Fund) | 0.28% | 02/15/16 | 255,000 | 254,540 | ||
| ULT GO Refunding Bonds Series 2011A (GTY: TX Permanent School Fund) | 0.29% | 02/15/16 | 1,525,000 | 1,522,150 | ||
| ULT GO Refunding Bonds Series 2011A (GTY: TX Permanent School Fund) | 0.33% | 02/15/16 | 100,000 | 99,788 | ||
| ULT GO Refunding Bonds Series 2011A (GTY: TX Permanent School Fund) | 0.44% | 02/15/16 | 125,000 | 124,650 | ||
| ULT GO Refunding Bonds Series 2012 (GTY: TX Permanent School Fund) | 4.00% | 02/15/16 | 250,000 | 255,592 | ||
| Gladewater ISD | ||||||
| ULT GO Bonds Series 2014 (GTY: TX Permanent School Fund) | 2.00% | 08/15/15 | 295,000 | 295,634 | ||
| Goose Creek Consolidated ISD | ||||||
| ULT GO Refunding Bonds Series 2008 (GTY: TX Permanent School Fund) | 5.00% | 02/15/16 | 250,000 | 257,194 | ||
| Hallsville ISD | ||||||
| ULT GO Bonds Series 2010A (GTY: TX Permanent School Fund) | 4.00% | 02/15/16 | 385,000 | 393,798 | ||
| Harris Cnty | ||||||
| GO Refunding Bonds Series 1996 | 0.25% | 10/01/15 | 700,000 | 699,560 | ||
| Road ULT GO Refunding Bonds Series 2014A | 5.00% | 10/01/15 | 7,060,000 | 7,146,302 | ||
| Harris Cnty Cultural Education Facilities Finance Corp | ||||||
| Refunding RB (Methodist Hospital) Series 2009C1 | 0.14% | 07/07/15 | 18,000,000 | 18,000,000 | ||
| Refunding RB (Methodist Hospital) Series 2009C1 | 0.14% | 08/05/15 | 14,000,000 | 14,000,000 | ||
| Refunding RB (Methodist Hospital) Series 2009C1 | 0.12% | 10/05/15 | 16,250,000 | 16,250,000 | ||
| Refunding RB (Methodist Hospital) Series 2009C1 | 0.13% | 11/04/15 | 17,100,000 | 17,099,219 | ||
| Refunding RB (Methodist Hospital) Series 2009C1 | 0.14% | 12/03/15 | 37,000,000 | 37,000,000 | ||
| Refunding RB (Methodist Hospital) Series 2009C1 | 0.18% | 01/06/16 | 15,000,000 | 15,000,000 | ||
| Refunding RB (Methodist Hospital) Series 2009C2 | 0.14% | 08/05/15 | 26,480,000 | 26,480,000 | ||
| Refunding RB (Methodist Hospital) Series 2009C2 | 0.14% | 08/13/15 | 13,000,000 | 13,000,000 | ||
| Henderson ISD | ||||||
| ULT GO Bonds Series 2007 (GTY: TX Permanent School Fund) | 4.00% | 08/15/15 | 100,000 | 100,466 | ||
| Houston | ||||||
| Airport System Sr Lien CP Series A&B (LOC: Royal Bank of Canada) | 0.13% | 09/10/15 | 15,000,000 | 15,000,000 | ||
| Combined Utility System CP Series B4 (LOC: State Street Bank & Trust Co NA) | 0.10% | 09/10/15 | 6,450,000 | 6,450,000 | ||
| Combined Utility System First Lien Refunding RB Series 2010C | 5.00% | 11/15/15 | 5,685,000 | 5,787,490 | ||
| Combined Utility System First Lien Refunding RB Series 2011E | 5.00% | 11/15/15 | 2,600,000 | 2,646,534 | ||
| GO Refunding Bonds Series 2009A | 4.00% | 03/01/16 | 100,000 | 102,397 | ||
| GO Refunding Bonds Series 2010A | 5.00% | 03/01/16 | 150,000 | 154,595 | ||
| TRAN Series 2015 | c | 1.00% | 06/30/16 | 22,000,000 | 22,154,545 | |
| TRAN Series 2015 | c | 2.00% | 06/30/16 | 15,000,000 | 15,255,000 | |
| TRAN Series 2015 | c | 2.25% | 06/30/16 | 15,000,000 | 15,292,200 | |
| Houston ISD | ||||||
| LT GO & Refunding Bonds Series 2013A (GTY: TX Permanent School Fund) | 4.00% | 02/15/16 | 3,600,000 | 3,683,651 | ||
| LT GO Bonds Series 2008 (GTY: TX Permanent School Fund) | 5.00% | 02/15/16 | 200,000 | 205,692 | ||
| Humble ISD | ||||||
| ULT GO Bonds Series 2011A (GTY: TX Permanent School Fund) | 3.00% | 02/15/16 | 100,000 | 101,684 | ||
| Issuer
Type of Security, Series |
Footnotes | Rate | Effective
Maturity |
Maturity
Date |
Face
Amount ($) |
Value
($) |
| Irving ISD | ||||||
| ULT GO & Refunding Bonds Series 2006 (GTY: TX Permanent School Fund) | 4.25% | 02/15/16 | 130,000 | 133,071 | ||
| ULT GO Bonds Series 2010A (GTY: TX Permanent School Fund) | 4.00% | 02/15/16 | 180,000 | 184,102 | ||
| ULT GO Refunding Bonds Series 1997A (GTY: TX Permanent School Fund) | 0.26% | 02/15/16 | 1,000,000 | 998,368 | ||
| ULT GO Refunding Bonds Series 2015 (GTY: TX Permanent School Fund) | 0.34% | 02/15/16 | 125,000 | 124,728 | ||
| Jim Hogg ISD | ||||||
| ULT GO Bonds Series 2014 (GTY: TX Permanent School Fund) | 2.00% | 08/15/15 | 670,000 | 671,478 | ||
| Judson ISD | ||||||
| ULT GO Refunding Bonds Series 2007 (GTY: TX Permanent School Fund) | 5.00% | 02/01/16 | 135,000 | 138,656 | ||
| Katy ISD | ||||||
| ULT GO Refunding Bonds Series 2010A (GTY: TX Permanent School Fund) | 4.00% | 02/15/16 | 1,500,000 | 1,534,522 | ||
| Keller ISD | ||||||
| ULT GO & Refunding Bonds Series 1996A (GTY: TX Permanent School Fund) | 0.29% | 08/15/15 | 100,000 | 99,964 | ||
| ULT GO Bonds Series 2007 (GTY: TX Permanent School Fund) | 5.50% | 08/15/15 | 625,000 | 629,025 | ||
| ULT GO Refunding Bonds Series 2015A (GTY: TX Permanent School Fund) | 0.31% | 08/15/15 | 1,885,000 | 1,884,260 | ||
| ULT GO Refunding Bonds Series 2015A (GTY: TX Permanent School Fund) | 0.34% | 02/15/16 | 1,075,000 | 1,072,657 | ||
| Kerrville ISD | ||||||
| ULT GO Refunding Bonds Series 2004 (GTY: TX Permanent School Fund) | 5.00% | 08/15/15 | 250,000 | 251,409 | ||
| Killeen ISD | ||||||
| ULT GO Refunding Bonds Series 2015 (GTY: TX Permanent School Fund) | 2.00% | 08/15/15 | 305,000 | 305,682 | ||
| Klein ISD | ||||||
| ULT GO & Refunding Bonds Series 2008A (GTY: TX Permanent School Fund) | 5.00% | 08/01/15 | 100,000 | 100,394 | ||
| ULT GO Bonds Series 2006 (GTY: TX Permanent School Fund) | 5.50% | 08/01/15 | 100,000 | 100,437 | ||
| ULT GO Refunding Bonds Series 2005A (GTY: TX Permanent School Fund) | 3.88% | 08/01/15 | 500,000 | 501,505 | ||
| La Joya ISD | ||||||
| ULT GO Bonds Series 2006 (GTY: TX Permanent School Fund) | 5.00% | 02/15/16 | 200,000 | 205,747 | ||
| La Porte ISD | ||||||
| ULT GO Bonds Series 2014 (GTY: TX Permanent School Fund) | 3.00% | 02/15/16 | 205,000 | 208,388 | ||
| Lake Worth ISD | ||||||
| ULT GO Refunding Bonds Series 2015 (GTY: TX Permanent School Fund) | 0.31% | 02/15/16 | 820,000 | 818,365 | ||
| Lampasas ISD | ||||||
| LT GO Bonds Series 2007 (GTY: TX Permanent School Fund) | 4.25% | 02/15/16 | 585,000 | 599,162 | ||
| Laredo ISD | ||||||
| ULT GO Refunding Bonds Series 2005 (GTY: TX Permanent School Fund) | 5.00% | 08/01/15 | 125,000 | 125,481 | ||
| Leander ISD | ||||||
| ULT GO Refunding Bonds Series 2010 (GTY: TX Permanent School Fund) | 0.25% | 08/15/15 | 100,000 | 99,969 | ||
| ULT GO Refunding Bonds Series 2010 (GTY: TX Permanent School Fund) | 0.28% | 08/15/15 | 115,000 | 114,960 | ||
| ULT GO Refunding Bonds Series 2010 (GTY: TX Permanent School Fund) | 0.41% | 08/15/15 | 360,000 | 359,814 | ||
| Issuer
Type of Security, Series |
Footnotes | Rate | Effective
Maturity |
Maturity
Date |
Face
Amount ($) |
Value
($) |
| Levelland ISD | ||||||
| ULT GO Bonds Series 2013 (GTY: TX Permanent School Fund) | 4.00% | 02/15/16 | 600,000 | 613,507 | ||
| ULT GO Refunding Bonds Series 2012 (GTY: TX Permanent School Fund) | 0.34% | 02/15/16 | 100,000 | 99,782 | ||
| Lewisville ISD | ||||||
| ULT GO Bonds Series 2013E (GTY: TX Permanent School Fund) | 3.00% | 08/15/15 | 125,000 | 125,399 | ||
| ULT GO Refunding Bonds Series 2006 (GTY: TX Permanent School Fund) | 4.25% | 08/15/15 | 100,000 | 100,484 | ||
| Los Fresnos Consolidated ISD | ||||||
| ULT GO Refunding Bonds Series 2006 (GTY: TX Permanent School Fund) | 4.00% | 08/15/15 | 250,000 | 251,146 | ||
| Lower Neches Valley Auth | ||||||
| Pollution Control RB (Chevron USA) Series 1987 | 0.09% | 08/17/15 | 17,660,000 | 17,660,000 | ||
| Lubbock Health Facilities Development Corp | ||||||
| Refunding RB (St Joseph Health) Series 2008B | 5.00% | 07/01/15 | 2,000,000 | 2,000,000 | ||
| Lubbock ISD | ||||||
| ULT GO Refunding Bonds Series 2011 (GTY: TX Permanent School Fund) | 5.00% | 02/15/16 | 185,000 | 190,366 | ||
| Lubbock-Cooper ISD | ||||||
| ULT GO Bonds Series 2014 (GTY: TX Permanent School Fund) | 3.00% | 02/15/16 | 335,000 | 340,491 | ||
| Manor ISD | ||||||
| ULT GO Bonds Series 2014 (GTY: TX Permanent School Fund) | 2.00% | 08/01/15 | 1,800,000 | 1,802,808 | ||
| Mansfield ISD | ||||||
| ULT GO Bonds Series 2006 (GTY: TX Permanent School Fund) | 5.00% | 02/15/16 | 1,000,000 | 1,029,584 | ||
| ULT GO Refunding Bonds Series 2006 (GTY: TX Permanent School Fund) | 5.00% | 02/15/16 | 130,000 | 133,842 | ||
| Mathis ISD | ||||||
| ULT GO & Refunding Bonds Series 2010 (GTY: TX Permanent School Fund) | 2.00% | 08/15/15 | 125,000 | 125,268 | ||
| McKinney ISD | ||||||
| GO ULT Bonds Series 2008 (GTY: TX Permanent School Fund) | 6.00% | 02/15/16 | 1,475,000 | 1,527,892 | ||
| Mesquite ISD | ||||||
| ULT GO Refunding Bonds Series 2014B (GTY: TX Permanent School Fund) | 5.00% | 08/15/15 | 4,765,000 | 4,793,595 | ||
| Midland ISD | ||||||
| ULT GO Bonds Series 2014 (GTY: TX Permanent School Fund) | 3.00% | 02/15/16 | 405,000 | 411,972 | ||
| Midway ISD | ||||||
| ULT GO Refunding Bonds Series 2015 (GTY: TX Permanent School Fund) | 2.00% | 08/01/15 | 270,000 | 270,398 | ||
| Mineral Wells ISD | ||||||
| ULT GO & Refunding Bonds Series 2006 (GTY: TX Permanent School Fund) | 5.00% | 02/15/16 | 500,000 | 514,397 | ||
| Mission Consolidated ISD | ||||||
| ULT GO Refunding Bonds Series 2014A (GTY: TX Permanent School Fund) | 2.00% | 02/15/16 | 650,000 | 657,112 | ||
| North East ISD | ||||||
| ULT GO & Refunding Bonds Series 2012 (GTY: TX Permanent School Fund) | 5.00% | 08/01/15 | 1,000,000 | 1,004,126 | ||
| ULT GO Bonds Series 2007A (GTY: TX Permanent School Fund) | 0.22% | 08/01/15 | 500,000 | 499,907 | ||
| ULT GO Bonds Series 2007A (GTY: TX Permanent School Fund) | 0.31% | 08/01/15 | 130,000 | 129,966 | ||
| ULT GO Bonds Series 2007A (GTY: TX Permanent School Fund) | 0.39% | 08/01/15 | 500,000 | 499,830 | ||
| Northside ISD | ||||||
| ULT GO Bonds Series 2015 (GTY: TX Permanent School Fund) | c | 0.50% | 08/15/15 | 2,430,000 | 2,430,923 | |
| ULT GO Refunding Bonds Series 2010 (GTY: TX Permanent School Fund) | 3.50% | 02/15/16 | 150,000 | 152,947 | ||
| Issuer
Type of Security, Series |
Footnotes | Rate | Effective
Maturity |
Maturity
Date |
Face
Amount ($) |
Value
($) |
| ULT GO Refunding Bonds Series 2013 (GTY: TX Permanent School Fund) | 5.00% | 02/15/16 | 1,000,000 | 1,029,702 | ||
| ULT GO Refunding Bonds Series 2014A (GTY: TX Permanent School Fund) | 4.00% | 02/15/16 | 470,000 | 480,602 | ||
| Northwest ISD | ||||||
| ULT GO Refunding Bonds Series 2006 (GTY: TX Permanent School Fund) | 5.00% | 02/15/16 | 1,000,000 | 1,029,636 | ||
| Pasadena ISD | ||||||
| ULT GO Refunding Bonds Series 2012D (GTY: TX Permanent School Fund) | 4.00% | 02/15/16 | 300,000 | 306,667 | ||
| Pflugerville ISD | ||||||
| ULT GO Refunding Bonds Series 2005 (GTY: TX Permanent School Fund) | 5.25% | 08/15/15 | 400,000 | 402,476 | ||
| Plano | ||||||
| GO Refunding Bonds Series 2011 | 4.00% | 09/01/15 | 1,000,000 | 1,006,312 | ||
| Plano ISD | ||||||
| GO ULT Bonds Series 2006 (GTY: TX Permanent School Fund) | 5.75% | 02/15/16 | 100,000 | 103,322 | ||
| ULT GO Bonds Series 2013 (GTY: TX Permanent School Fund) | 5.00% | 02/15/16 | 125,000 | 128,646 | ||
| ULT GO Refunding Bonds Series 2006 (GTY: TX Permanent School Fund) | 4.25% | 02/15/16 | 300,000 | 307,285 | ||
| ULT GO Refunding Bonds Series 2008 (GTY: TX Permanent School Fund) | 5.00% | 02/15/16 | 100,000 | 102,895 | ||
| ULT GO Refunding Bonds Series 2010 (GTY: TX Permanent School Fund) | 5.00% | 02/15/16 | 250,000 | 257,231 | ||
| ULT GO Refunding Bonds Series 2012A (GTY: TX Permanent School Fund) | 2.00% | 02/15/16 | 200,000 | 202,052 | ||
| Port Neches-Groves ISD | ||||||
| ULT GO Refunding Bonds Series 2010 (GTY: TX Permanent School Fund) | 4.00% | 02/15/16 | 100,000 | 102,271 | ||
| Prosper ISD | ||||||
| ULT GO Refunding Bonds Series 2015 (GTY: TX Permanent School Fund) | 2.00% | 02/15/16 | 150,000 | 151,445 | ||
| Raymondville ISD | ||||||
| ULT GO Refunding Bonds Series 2014 (GTY: TX Permanent School Fund) | 2.00% | 02/15/16 | 200,000 | 202,112 | ||
| Richardson ISD | ||||||
| ULT GO Bonds Series 2010 (GTY: TX Permanent School Fund) | 4.00% | 02/15/16 | 100,000 | 102,213 | ||
| ULT GO Refunding Bonds Series 2006A (GTY: TX Permanent School Fund) | 4.00% | 02/15/16 | 250,000 | 255,585 | ||
| Rio Hondo ISD | ||||||
| ULT GO Refunding Bonds Series 2014 (GTY: TX Permanent School Fund) | 2.00% | 02/15/16 | 140,000 | 141,438 | ||
| Rockwall ISD | ||||||
| ULT GO Refunding Bonds Series 2006A (GTY: TX Permanent School Fund) | 0.36% | 02/15/16 | 100,000 | 99,770 | ||
| San Antonio | ||||||
| Electric & Gas Systems CP Series A (LIQ: JPMorgan Chase Bank, NA) | 0.08% | 08/06/15 | 16,500,000 | 16,500,000 | ||
| Electric & Gas Systems CP Series A (LIQ: JPMorgan Chase Bank, NA) | 0.09% | 09/01/15 | 11,540,000 | 11,540,000 | ||
| Electric & Gas Systems CP Series A (LIQ: JPMorgan Chase Bank, NA) | 0.09% | 09/03/15 | 21,460,000 | 21,460,000 | ||
| Electric & Gas Systems CP Series C (LIQ: Bank of Tokyo Mitsubishi UFJ, Ltd) | 0.09% | 09/01/15 | 2,500,000 | 2,500,000 | ||
| Electric & Gas Systems CP Series C (LIQ: Bank of Tokyo Mitsubishi UFJ, Ltd) | 0.09% | 09/03/15 | 16,750,000 | 16,750,000 | ||
| Electric & Gas Systems Refunding RB New Series 2006B | 5.00% | 02/01/16 | 790,000 | 811,687 | ||
| Issuer
Type of Security, Series |
Footnotes | Rate | Effective
Maturity |
Maturity
Date |
Face
Amount ($) |
Value
($) |
| Electric & Gas Systems Refunding RB New Series 2008A | 5.50% | 02/01/16 | 505,000 | 520,227 | ||
| Electric & Gas Systems Refunding RB New Series 2009A | 5.00% | 02/01/16 | 100,000 | 102,726 | ||
| Electric & Gas Systems Refunding RB New Series 2011 | 5.00% | 02/01/16 | 375,000 | 385,059 | ||
| General Improvement Bonds Series 2008 | 5.00% | 08/01/15 | 100,000 | 100,383 | ||
| Tax & Revenue COP Series 2007 | 5.00% | 08/01/15 | 2,200,000 | 2,208,899 | ||
| Tax & Revenue COP Series 2011 | 4.00% | 08/01/15 | 500,000 | 501,636 | ||
| Water System CP Series A (LIQ: Bank of Tokyo Mitsubishi UFJ, Ltd) | 0.11% | 07/06/15 | 15,000,000 | 15,000,000 | ||
| Water System Refunding RB Series 2009 | 4.00% | 05/15/16 | 500,000 | 515,911 | ||
| San Antonio ISD | ||||||
| ULT GO Refunding Bonds Series 2011 (GTY: TX Permanent School Fund) | 5.00% | 08/15/15 | 1,000,000 | 1,005,826 | ||
| San Benito Consolidated ISD | ||||||
| ULT GO Bonds Series 2008 (GTY: TX Permanent School Fund) | 3.50% | 02/15/16 | 190,000 | 193,680 | ||
| ULT GO Refunding Bonds Series 2014 (GTY: TX Permanent School Fund) | 4.00% | 02/15/16 | 225,000 | 230,112 | ||
| Seguin ISD | ||||||
| ULT GO Bonds Series 2008 (GTY: TX Permanent School Fund) | 0.21% | 08/15/15 | 2,055,000 | 2,054,466 | ||
| Seminole ISD | ||||||
| ULT GO Bonds Series 2007A (GTY: TX Permanent School Fund) | 5.00% | 02/15/16 | 900,000 | 926,196 | ||
| Sherman ISD | ||||||
| ULT GO Refunding Bonds Series 2014 (GTY: TX Permanent School Fund) | 3.00% | 02/15/16 | 500,000 | 508,080 | ||
| Socorro ISD | ||||||
| ULT GO Bonds Series 2005A (GTY: TX Permanent School Fund) | 5.00% | 08/15/15 | 1,000,000 | 1,005,841 | ||
| Southwest ISD | ||||||
| ULT GO & Refunding Bonds Series 2014 (GTY: TX Permanent School Fund) | 3.00% | 02/01/16 | 300,000 | 304,765 | ||
| Spring ISD | ||||||
| ULT GO & Refunding Bonds Series 2008A (GTY: TX Permanent School Fund) | 5.00% | 08/15/15 | 500,000 | 502,929 | ||
| ULT GO Bonds Series 2009 (GTY: TX Permanent School Fund) | 3.00% | 08/15/15 | 500,000 | 501,708 | ||
| Springtown ISD | ||||||
| ULT GO Refunding Bonds Series 2015 (GTY: TX Permanent School Fund) | 2.00% | 08/15/15 | 170,000 | 170,353 | ||
| Temple ISD | ||||||
| ULT GO Refunding Bonds Series 2005 (GTY: TX Permanent School Fund) | 5.00% | 08/15/15 | 300,000 | 301,763 | ||
| ULT GO Refunding Bonds Series 2015 (GTY: TX Permanent School Fund) | 2.00% | 08/15/15 | 145,000 | 145,291 | ||
| Texas | ||||||
| College Student Loan GO Refunding Bonds Series 2011B | 5.00% | 08/01/15 | 1,000,000 | 1,004,130 | ||
| GO Bonds Series 2011A (LIQ: Wells Fargo Bank, NA) | a,b | 0.18% | 07/09/15 | 17,550,000 | 17,550,000 | |
| TRAN Series 2014 | d | 1.50% | 08/31/15 | 266,075,000 | 266,681,312 | |
| Texas A&M Univ | ||||||
| Financing System RB Series 2013A | 4.00% | 05/15/16 | 3,250,000 | 3,355,477 | ||
| Texas Public Finance Auth | ||||||
| GO & Refunding Bonds Series 2011 | 5.00% | 10/01/15 | 350,000 | 354,192 | ||
| GO CP Series 2008 | 0.08% | 07/08/15 | 20,000,000 | 20,000,000 | ||
| GO Refunding Bonds Series 2010B | 5.00% | 10/01/15 | 175,000 | 177,086 | ||
| GO Refunding Bonds Series 2013 | 4.00% | 10/01/15 | 200,000 | 201,907 | ||
| Texas Tech Univ | ||||||
| Revenue Financing System Refunding & Improvement Bonds 14th Series 2012A | 3.00% | 08/15/15 | 1,500,000 | 1,505,166 | ||
| Issuer
Type of Security, Series |
Footnotes | Rate | Effective
Maturity |
Maturity
Date |
Face
Amount ($) |
Value
($) |
| Texas Transportation Commission | ||||||
| GO Mobility Fund Bonds Series 2006 | 5.00% | 04/01/16 | 750,000 | 776,196 | ||
| State Highway Fund First Tier RB Series 2006A | 4.50% | 04/01/16 | 1,000,000 | 1,031,775 | ||
| Tyler ISD | ||||||
| ULT GO Bonds Series 2007 (GTY: TX Permanent School Fund) | 5.00% | 02/15/16 | 100,000 | 102,892 | ||
| United ISD | ||||||
| ULT GO Refunding Bonds Series 2011 (GTY: TX Permanent School Fund) | 4.00% | 08/15/15 | 125,000 | 125,576 | ||
| Univ of Texas | ||||||
| Revenue Financing CP Series A | 0.08% | 09/08/15 | 10,000,000 | 10,000,000 | ||
| Revenue Financing CP Series A | 0.08% | 09/22/15 | 13,700,000 | 13,700,000 | ||
| Revenue Financing System Bonds Series 2008A | 5.00% | 08/15/15 | 1,440,000 | 1,448,393 | ||
| Revenue Financing System Bonds Series 2010A | 3.00% | 08/15/15 | 250,000 | 250,844 | ||
| Revenue Financing System Refunding Bonds Series 2002B | 5.25% | 08/15/15 | 1,300,000 | 1,308,245 | ||
| Revenue Financing System Refunding Bonds Series 2006C | 5.00% | 08/15/15 | 1,780,000 | 1,790,524 | ||
| Victoria ISD | ||||||
| ULT GO Bonds Series 2007 (GTY: TX Permanent School Fund) | 4.50% | 02/15/16 | 220,000 | 225,683 | ||
| Waco ISD | ||||||
| ULT GO Refunding Bonds Series 2015 (GTY: TX Permanent School Fund) | 2.00% | 08/15/15 | 100,000 | 100,198 | ||
| Waxahachie ISD | ||||||
| ULT GO Refunding Bonds Series 2015 (GTY: TX Permanent School Fund) | 5.50% | 08/15/15 | 410,000 | 412,607 | ||
| West Rusk ISD | ||||||
| ULT GO Bonds Series 2012 (GTY: TX Permanent School Fund) | 0.36% | 02/15/16 | 100,000 | 99,770 | ||
| White Settlement ISD | ||||||
| ULT GO Refunding Bonds Series 2011 (GTY: TX Permanent School Fund) | 0.25% | 08/15/15 | 175,000 | 174,946 | ||
| Ysleta ISD | ||||||
| ULT GO Bonds Series 2005 (GTY: TX Permanent School Fund) | 5.00% | 08/15/15 | 750,000 | 754,262 | ||
| ULT GO Refunding Bonds Series 2012 (GTY: TX Permanent School Fund) | 3.00% | 08/15/15 | 875,000 | 878,017 | ||
| 838,321,513 | ||||||
| Utah 0.4% | ||||||
| Intermountain Power Agency | ||||||
| CP Series B1&B2 (LIQ: JPMorgan Chase Bank, NA) | 0.11% | 09/09/15 | 15,500,000 | 15,500,000 | ||
| CP Series B1&B2 (LIQ: JPMorgan Chase Bank, NA) | 0.09% | 09/10/15 | 24,860,000 | 24,860,000 | ||
| Riverton | ||||||
| RB (IHC Health Services) Series 2009 | 5.00% | 08/15/15 | 2,050,000 | 2,062,105 | ||
| Salt Lake Cnty | ||||||
| Sales Tax RB Series 2005 (ESCROW) | 5.00% | 08/01/15 | 4,100,000 | 4,116,678 | ||
| 46,538,783 | ||||||
| Virginia 0.4% | ||||||
| Metropolitan Washington Airports Auth | ||||||
| Airport System RB Series 2007B | 5.00% | 10/01/15 | 1,500,000 | 1,518,109 | ||
| Airport System RB Series 2009C | 5.00% | 10/01/15 | 1,500,000 | 1,518,178 | ||
| Airport System Refunding RB Series 2007A | 5.00% | 10/01/15 | 1,000,000 | 1,011,871 | ||
| Airport System Refunding RB Series 2010B | 3.00% | 10/01/15 | 200,000 | 201,274 | ||
| Airport System Refunding RB Series 2010B | 5.00% | 10/01/15 | 7,500,000 | 7,591,208 | ||
| Airport System Refunding RB Series 2011D | 3.00% | 10/01/15 | 140,000 | 140,961 | ||
| Issuer
Type of Security, Series |
Footnotes | Rate | Effective
Maturity |
Maturity
Date |
Face
Amount ($) |
Value
($) |
| Airport System Refunding RB Series 2012B | 3.00% | 10/01/15 | 120,000 | 120,771 | ||
| Second Sr Lien CP (Dulles Toll Road) Series One (LOC: JPMorgan Chase Bank, NA) | 0.09% | 08/05/15 | 15,000,000 | 15,000,000 | ||
| Virginia | ||||||
| GO Bonds Series 2015A | 2.00% | 06/01/16 | 580,000 | 589,013 | ||
| Virginia College Building Auth | ||||||
| Educational Facilities RB Series 2011A | 5.00% | 09/01/15 | 7,435,000 | 7,495,875 | ||
| Virginia Transportation Board | ||||||
| Transportation RB Series 2011 | 5.00% | 05/15/16 | 12,170,000 | 12,665,972 | ||
| 47,853,232 | ||||||
| Washington 1.1% | ||||||
| Auburn SD No. 408 | ||||||
| ULT GO & Refunding Bonds Series 2014 (GTY: Washington) | 3.00% | 12/01/15 | 1,845,000 | 1,866,740 | ||
| Bellevue SD No. 405 | ||||||
| ULT GO Bonds 2013 (GTY: Washington) | 3.00% | 12/01/15 | 135,000 | 136,535 | ||
| Bethel SD No. 403 | ||||||
| ULT GO Bonds 2006 (GTY: Washington) | 5.00% | 12/01/15 | 100,000 | 101,888 | ||
| ULT GO Refunding Bonds 2010 (GTY: Washington) | 3.00% | 12/01/15 | 100,000 | 101,083 | ||
| Burlington-Edison SD No. 100 | ||||||
| ULT GO Refunding Bonds Series 2009 (GTY: Washington) | 4.00% | 12/01/15 | 150,000 | 152,282 | ||
| Camas SD No. 117 | ||||||
| ULT GO Bonds 2007 (GTY: Washington) | 4.50% | 12/01/15 | 100,000 | 101,729 | ||
| Central Puget Sound Regional Transit Auth | ||||||
| Sales Tax & Motor Vehicle Excise Tax Bonds Series 1999 | 5.25% | 02/01/16 | 260,000 | 267,458 | ||
| Sales Tax & Motor Vehicle Excise Tax Bonds Series 2009P1 | 5.00% | 02/01/16 | 5,720,000 | 5,880,338 | ||
| Evergreen SD No. 114 | ||||||
| ULT GO Refunding Bonds 2005 (GTY: Washington) | 5.00% | 12/01/15 | 1,500,000 | 1,529,396 | ||
| ULT GO Refunding Bonds 2010 (GTY: Washington) | 4.00% | 12/01/15 | 400,000 | 405,980 | ||
| ULT GO Refunding Bonds 2011 (GTY: Washington) | 2.50% | 06/01/16 | 710,000 | 723,485 | ||
| Federal Way SD No. 210 | ||||||
| ULT GO Bonds 2008 (GTY: Washington) | 5.00% | 12/01/15 | 225,000 | 229,309 | ||
| ULT GO Refunding Bonds 2006 (GTY: Washington) | 5.00% | 12/01/15 | 100,000 | 101,969 | ||
| Ferndale SD No. 502 | ||||||
| ULT GO & Refunding Bonds 2006 (GTY: Washington) | 5.00% | 12/01/15 | 170,000 | 173,336 | ||
| Fife SD No. 417 | ||||||
| ULT GO Refunding Bonds 2007 (GTY: Washington) | 5.00% | 12/01/15 | 100,000 | 101,933 | ||
| Highland SD No. 203 | ||||||
| ULT GO Refunding Bonds 2009 (GTY: Washington) | 4.00% | 12/01/15 | 100,000 | 101,488 | ||
| Kelso SD No. 458 | ||||||
| ULT GO Refunding Bonds 2014 (GTY: Washington) | 2.00% | 12/01/15 | 100,000 | 100,713 | ||
| Kennewick SD No. 17 | ||||||
| ULT GO Bonds 2009 (GTY: Washington) | 4.00% | 12/01/15 | 150,000 | 152,250 | ||
| Kent SD No. 415 | ||||||
| ULT GO Bonds Series 2006 (GTY: Washington) | 4.00% | 12/01/15 | 1,130,000 | 1,148,041 | ||
| ULT GO Refunding Bonds Series 2001B (GTY: Washington) | 5.50% | 06/01/16 | 350,000 | 366,081 | ||
| ULT GO Refunding Bonds Series 2005 (GTY: Washington) | 5.00% | 12/01/15 | 150,000 | 152,971 | ||
| King Cnty | ||||||
| LT GO Bonds Series 2009 | 5.00% | 01/01/16 | 3,160,000 | 3,236,293 | ||
| LT GO Refunding Bonds Series 2010A | 5.00% | 06/01/16 | 340,000 | 354,282 | ||
| Sewer Refunding & RB Series 2011B | 5.00% | 01/01/16 | 700,000 | 716,897 | ||
| La Center SD No. 101 | ||||||
| ULT GO Refunding Bonds 2010 (GTY: Washington) | 3.00% | 12/01/15 | 100,000 | 101,141 | ||
| Issuer
Type of Security, Series |
Footnotes | Rate | Effective
Maturity |
Maturity
Date |
Face
Amount ($) |
Value
($) |
| Lake Washington SD No. 414 | ||||||
| ULT GO Bonds 2012 (GTY: Washington) | 4.00% | 12/01/15 | 140,000 | 142,154 | ||
| ULT GO Refunding Bonds 2015 (GTY: Washington) | 4.00% | 06/01/16 | 6,795,000 | 7,023,834 | ||
| Mount Vernon SD No. 320 | ||||||
| ULT GO Refunding Bonds Series 2005 (GTY: Washington) | 3.75% | 12/01/15 | 250,000 | 253,507 | ||
| Port of Seattle | ||||||
| Intermediate Lien Refunding RB Series 2010C | 5.00% | 02/01/16 | 1,000,000 | 1,027,670 | ||
| Intermediate Lien Refunding RB Series 2012A | 3.00% | 08/01/15 | 750,000 | 751,749 | ||
| Intermediate Lien Refunding RB Series 2012B | 3.00% | 08/01/15 | 2,650,000 | 2,656,272 | ||
| LT GO Refunding Bonds Series 2011 | 5.00% | 12/01/15 | 100,000 | 101,945 | ||
| RB Series 2007B (LIQ: Wells Fargo Bank, NA) | a,b | 0.18% | 07/08/15 | 5,565,000 | 5,565,000 | |
| Port of Tacoma | ||||||
| Sub Lien Revenue CP Series 2002A&B (LOC: Bank of America, NA) | 0.12% | 08/03/15 | 75,000,000 | 75,000,000 | ||
| Richland School District No. 400 | ||||||
| ULT GO Refunding Bonds 2010 (GTY: Washington) | 3.50% | 12/01/15 | 400,000 | 405,155 | ||
| Riverview SD No. 407 | ||||||
| ULT GO Refunding Bonds 2015 (GTY: Washington) | 2.00% | 12/01/15 | 175,000 | 176,218 | ||
| Shoreline SD No. 412 | ||||||
| ULT GO & Refunding Bonds 2013 (GTY: Washington) | 3.00% | 12/01/15 | 250,000 | 252,825 | ||
| Snohomish SD No. 201 | ||||||
| ULT GO Refunding Bonds 2011 (GTY: Washington) | 5.00% | 12/01/15 | 1,860,000 | 1,896,877 | ||
| Snoqualmie Valley SD No. 410 | ||||||
| ULT GO Refunding Bonds 2015 (GTY: Washington) | 2.00% | 12/01/15 | 2,445,000 | 2,462,885 | ||
| Sumner SD No. 320 | ||||||
| ULT GO Refunding Bonds 2004 (GTY: Washington) | 4.00% | 12/01/15 | 100,000 | 101,496 | ||
| ULT GO Refunding Bonds Series 2015 (GTY: Washington) | 3.00% | 12/01/15 | 2,845,000 | 2,877,846 | ||
| Tacoma SD No. 10 | ||||||
| ULT GO & Refunding Bonds Series 2005A (GTY: Washington) | 5.00% | 12/01/15 | 400,000 | 407,754 | ||
| ULT GO Refunding Bonds Series 2012 (GTY: Washington) | 3.00% | 12/01/15 | 525,000 | 531,045 | ||
| Univ of Washington | ||||||
| General Revenue CP Series A | 0.12% | 11/04/15 | 5,000,000 | 5,000,000 | ||
| Walla Walla SD No. 140 | ||||||
| ULT GO Bonds Series 2007 (GTY: Washington) | 4.13% | 12/01/15 | 125,000 | 126,934 | ||
| Washington | ||||||
| COP Series 2010D | 4.00% | 01/01/16 | 100,000 | 101,860 | ||
| COP Series 2012B | 4.00% | 07/01/15 | 2,335,000 | 2,335,000 | ||
| GO Bonds Series 2006D | 5.00% | 01/01/16 | 100,000 | 102,298 | ||
| GO Bonds Series 2007A | 5.00% | 07/01/15 | 830,000 | 830,000 | ||
| GO Bonds Series 2007C | 5.00% | 01/01/16 | 105,000 | 107,470 | ||
| GO Bonds Series 2008A | 5.00% | 07/01/15 | 145,000 | 145,000 | ||
| GO Bonds Series 2008B | 5.00% | 07/01/16 | 155,000 | 161,842 | ||
| GO Bonds Series 2009C | 5.00% | 02/01/16 | 225,000 | 231,108 | ||
| GO Bonds Series 2009E | 5.00% | 02/01/16 | 155,000 | 159,159 | ||
| GO Bonds Series 2010C | 5.00% | 08/01/15 | 1,250,000 | 1,255,100 | ||
| GO Bonds Series R2013A | 5.00% | 07/01/16 | 1,000,000 | 1,046,504 | ||
| GO Refunding Bonds Series R 2010A | 5.00% | 01/01/16 | 355,000 | 363,289 | ||
| GO Refunding Bonds Series R2006A | 5.00% | 07/01/15 | 1,190,000 | 1,190,000 | ||
| GO Refunding Bonds Series R2010B | 5.00% | 01/01/16 | 1,630,000 | 1,668,855 | ||
| GO Refunding Bonds Series R2011A | 5.00% | 01/01/16 | 650,000 | 665,623 | ||
| Motor Vehicle Fuel Tax GO Bonds Series 2005C | 0.47% | 06/01/16 | 200,000 | 199,123 | ||
| Motor Vehicle Fuel Tax GO Bonds Series 2006B | 5.00% | 07/01/15 | 200,000 | 200,000 | ||
| Issuer
Type of Security, Series |
Footnotes | Rate | Effective
Maturity |
Maturity
Date |
Face
Amount ($) |
Value
($) |
| Motor Vehicle Fuel Tax GO Bonds Series 2007D | 4.50% | 01/01/16 | 115,000 | 117,451 | ||
| Motor Vehicle Fuel Tax GO Bonds Series 2008D | 5.00% | 01/01/16 | 395,000 | 404,214 | ||
| Motor Vehicle Fuel Tax GO Refunding Bonds Series R2011C | 4.00% | 07/01/15 | 1,230,000 | 1,230,000 | ||
| Washington Health Care Facilities Auth | ||||||
| RB (MultiCare Health) Series 2015B | 2.00% | 08/15/15 | 2,060,000 | 2,064,489 | ||
| RB (Providence Health & Services) Series 2011B | 5.00% | 10/01/15 | 825,000 | 834,757 | ||
| RB (Providence Health & Services) Series 2012A | 4.00% | 10/01/15 | 110,000 | 111,004 | ||
| Refunding RB (Seattle Children's Hospital) Series 2010B | 5.00% | 10/01/15 | 1,490,000 | 1,507,864 | ||
| West Valley SD No. 208 | ||||||
| ULT GO Bonds Series 2007 (GTY: Washington) | 5.00% | 12/01/15 | 100,000 | 101,950 | ||
| 142,198,744 | ||||||
| Wisconsin 1.0% | ||||||
| Wisconsin | ||||||
| GO Bonds Series 2006A (ESCROW) | 5.00% | 05/01/16 | 1,600,000 | 1,662,240 | ||
| Transportation RB Series 2005B (ESCROW) | 4.10% | 07/01/15 | 6,940,000 | 6,940,000 | ||
| Wisconsin Health & Educational Facilities Auth | ||||||
| RB (Aurora Health Care) Series 2008A (LOC: JPMorgan Chase Bank, NA) | 0.10% | 08/05/15 | 25,000,000 | 25,000,000 | ||
| RB (Aurora Health Care) Series 2008B (LOC: JPMorgan Chase Bank, NA) | 0.10% | 10/05/15 | 10,000,000 | 10,000,000 | ||
| RB (Aurora Health Care) Series 2008B (LOC: JPMorgan Chase Bank, NA) | 0.14% | 11/04/15 | 40,000,000 | 40,000,000 | ||
| RB (Aurora Health Care) Series 2010C (LOC: Bank of America, NA) | 0.09% | 09/04/15 | 34,925,000 | 34,925,000 | ||
| Refunding RB (Hospital Sisters Services) Series 2014A | 5.00% | 11/15/15 | 1,000,000 | 1,017,873 | ||
| 119,545,113 | ||||||
| Total Fixed-Rate Securities | ||||||
| (Cost $4,007,012,232) | 4,007,012,232 | |||||
| Variable-Rate Securities 70.9% of net assets | ||||||
| Alabama 2.3% | ||||||
| Alabama | ||||||
| GO Refunding Bonds Series 2014A (LIQ: Morgan Stanley Bank NA) | a | 0.08% | 07/07/15 | 11,695,000 | 11,695,000 | |
| Alabama HFA | ||||||
| Collateralized S/F Mortgage RB Series 2006 D&F (LIQ: Citibank, NA) | a | 0.17% | 07/07/15 | 5,485,000 | 5,485,000 | |
| M/F Housing RB (Chapel Ridge Apts) Series 2005E (LOC: Freddie Mac) | 0.13% | 07/07/15 | 11,000,000 | 11,000,000 | ||
| M/F Housing Refunding RB (Hunter Ridge Apts) Series 2005F (LOC: Freddie Mac) | 0.13% | 07/07/15 | 10,550,000 | 10,550,000 | ||
| Alabama Municipal Funding Corp | ||||||
| Notes Series 2006 (LOC: US Bank, NA) | 0.08% | 07/07/15 | 15,910,000 | 15,910,000 | ||
| Notes Series 2008A, 2009B&2010A (LOC: US Bank, NA) | 0.08% | 07/07/15 | 3,715,000 | 3,715,000 | ||
| Birmingham IDB | ||||||
| RB (Culton Properties) Series 2009A (LOC: Federal Home Loan Bank) | 0.14% | 07/07/15 | 1,745,000 | 1,745,000 | ||
| Birmingham Water Works Board | ||||||
| Water Refunding RB Series 2015A (LIQ: Royal Bank of Canada) | a | 0.14% | 07/07/15 | 20,000,000 | 20,000,000 | |
| Columbia IDB | ||||||
| Pollution Control Refunding RB (AL Power) Series 2014D | 0.10% | 07/07/15 | 10,000,000 | 10,000,000 | ||
| Issuer
Type of Security, Series |
Footnotes | Rate | Effective
Maturity |
Maturity
Date |
Face
Amount ($) |
Value
($) |
| Hoover | ||||||
| Sewer GO Warrants Series 2007 (LIQ: US Bank, NA) | a | 0.07% | 07/07/15 | 11,715,000 | 11,715,000 | |
| Millport IDA | ||||||
| IDRB (Steel Dust Recycling) Series 2011 (LOC: Citibank, NA) | 0.12% | 07/07/15 | 10,000,000 | 10,000,000 | ||
| RB (Steel Dust Recycling) Series 2007 (LOC: Comerica Bank) | 0.12% | 07/07/15 | 5,040,000 | 5,040,000 | ||
| Mobile Cnty IDA | ||||||
| Gulf Opportunity Zone RB (SSAB Alabama) Series 2010B (LOC: Swedbank AB) | 0.10% | 07/07/15 | 40,000,000 | 40,000,000 | ||
| Recovery Zone Facility RB (SSAB Alabama) Series 2010A (LOC: Swedbank AB) | 0.10% | 07/07/15 | 30,000,000 | 30,000,000 | ||
| Mobile IDB | ||||||
| Pollution Control Refunding RB (AL Power) Series 1993A | 0.10% | 07/07/15 | 12,100,000 | 12,100,000 | ||
| RB (AL Power) Series 2001B | 0.04% | 07/01/15 | 2,750,000 | 2,750,000 | ||
| Montgomery Downtown Redevelopment Auth | ||||||
| RB (Southern Poverty Law Center) Series 2013 | 0.11% | 07/07/15 | 15,000,000 | 15,000,000 | ||
| Tuscaloosa Cnty IDA | ||||||
| Gulf Opportunity Zone Bonds (Hunt Refining) Series 2008C (LOC: Bank of Nova Scotia) | 0.07% | 07/07/15 | 27,000,000 | 27,000,000 | ||
| Univ of South Alabama | ||||||
| Tuition Refunding RB Series 2006 (GTY/LIQ: US Bank, NA) | a | 0.08% | 07/07/15 | 37,620,000 | 37,620,000 | |
| West Jefferson IDB | ||||||
| Solid Waste Disposal RB (AL Power) Series 2008 | 0.04% | 07/01/15 | 2,890,000 | 2,890,000 | ||
| 284,215,000 | ||||||
| Alaska 0.5% | ||||||
| Alaska Housing Finance Corp | ||||||
| Home Mortgage RB Series 2002A (LIQ: JPMorgan Chase Bank, NA) | 0.11% | 07/01/15 | 24,965,000 | 24,965,000 | ||
| State Capital Bonds Series 2006A (LIQ: US Bank, NA) | a | 0.08% | 07/07/15 | 26,925,000 | 26,925,000 | |
| Alaska Student Loan Corp | ||||||
| Education Loan Refunding RB Sr Series 2012B1 (LOC: State Street Bank & Trust Co NA) | 0.09% | 07/07/15 | 13,580,000 | 13,580,000 | ||
| Valdez | ||||||
| Marine Terminal Refunding RB (ExxonMobil) Series 2001 | 0.02% | 07/01/15 | 2,800,000 | 2,800,000 | ||
| 68,270,000 | ||||||
| Arizona 0.1% | ||||||
| Maricopa Cnty IDA | ||||||
| M/F RB (Gran Victoria Housing) Series 2000A (LOC: Fannie Mae) | 0.08% | 07/07/15 | 9,530,000 | 9,530,000 | ||
| Solid Waste Disposal RB (Michael Pylman Dairy) Series 2005 (LOC: CoBank, ACB) | 0.13% | 07/07/15 | 6,750,000 | 6,750,000 | ||
| Sr Living Facilities Refunding RB Series 2005A (LOC: Fannie Mae) | 0.06% | 07/07/15 | 2,715,000 | 2,715,000 | ||
| 18,995,000 | ||||||
| Arkansas 0.1% | ||||||
| Pulaski Cnty Public Facilities Board | ||||||
| M/F Housing Refunding RB (Markham Oaks & Indian Hills Apts) Series 2005 (LOC: Federal Home Loan Bank) | 0.09% | 07/07/15 | 5,800,000 | 5,800,000 | ||
| M/F Housing Refunding RB (Waterford & Bowman Heights Apts) Series 2012 (LOC: Federal Home Loan Bank) | 0.09% | 07/07/15 | 6,930,000 | 6,930,000 | ||
| 12,730,000 | ||||||
| Issuer
Type of Security, Series |
Footnotes | Rate | Effective
Maturity |
Maturity
Date |
Face
Amount ($) |
Value
($) |
| California 1.5% | ||||||
| Alameda Cnty IDA | ||||||
| RB (Golden West Paper Converting Corp) Series 2008A (LOC: Bank of the West) | 0.14% | 07/07/15 | 3,315,000 | 3,315,000 | ||
| RB (Heat & Control) Series 1995A (LOC: Comerica Bank) | 0.07% | 07/07/15 | 2,900,000 | 2,900,000 | ||
| California | ||||||
| GO Refunding Bonds (GTY/LIQ: Wells Fargo & Co) | a | 0.08% | 07/07/15 | 13,610,000 | 13,610,000 | |
| California Educational Facilities Auth | ||||||
| RB (California Institute of Technology) Series 2009 (LIQ: Morgan Stanley Bank NA) | a | 0.08% | 07/07/15 | 3,300,000 | 3,300,000 | |
| California HFA | ||||||
| Home Mortgage RB Series 2007K (LOC: Fannie Mae; Freddie Mac) | 0.11% | 07/07/15 | 20,000,000 | 20,000,000 | ||
| California Pollution Control Financing Auth | ||||||
| RB (Hilmar Cheese) Series 2010 (LOC: CoBank, ACB) | 0.09% | 07/07/15 | 4,410,000 | 4,410,000 | ||
| Solid Waste Disposal RB (EDCO Disposal) Series 2004A (LOC: Wells Fargo Bank, NA) | 0.12% | 07/07/15 | 1,370,000 | 1,370,000 | ||
| Solid Waste Disposal RB (Garaventa Enterprises) Series 2008A (LOC: Wells Fargo Bank, NA) | 0.12% | 07/07/15 | 2,500,000 | 2,500,000 | ||
| Solid Waste Disposal RB (MarBorg Industries) Series 2002 (LOC: MUFG Union Bank, NA) | 0.12% | 07/07/15 | 1,700,000 | 1,700,000 | ||
| Solid Waste Disposal RB (Santa Clara Valley Industries) Series 1998A (LOC: Comerica Bank) | 0.16% | 07/07/15 | 195,000 | 195,000 | ||
| California State Univ | ||||||
| RB Series 2005C (GTY: Berkshire Hathaway Assurance Corp /LIQ: Citibank, NA) | a | 0.08% | 07/07/15 | 16,655,000 | 16,655,000 | |
| California Statewide Communities Development Auth | ||||||
| M/F Housing RB (Glen Haven Apts) Series 2002AA (LOC: Fannie Mae) | 0.07% | 07/07/15 | 7,000,000 | 7,000,000 | ||
| Contra Costa Cnty | ||||||
| M/F Mortgage RB (El Cerrito Royale) Series 1987A (LOC: Bank of America, NA) | 0.16% | 07/07/15 | 3,900,000 | 3,900,000 | ||
| Delano | ||||||
| COP (Delano Regional Medical Center) (LOC: Comerica Bank) | 0.16% | 07/07/15 | 7,740,000 | 7,740,000 | ||
| East Bay Municipal Utility District | ||||||
| Water System Refunding RB Series 2012A (LIQ: Citibank, NA) | a | 0.08% | 07/07/15 | 6,600,000 | 6,600,000 | |
| Water System Sub RB Series 2005A (LIQ: Citibank, NA) | a | 0.08% | 07/07/15 | 20,830,000 | 20,830,000 | |
| Foothill-DeAnza CCD | ||||||
| GO Bonds Series A (LIQ: Deutsche Bank AG) | a | 0.13% | 07/07/15 | 10,832,000 | 10,832,000 | |
| Hartnell CCD | ||||||
| GO Bonds Series D (GTY/LIQ: Wells Fargo & Co) | a | 0.09% | 07/07/15 | 9,690,000 | 9,690,000 | |
| Huntington Park Redevelopment Agency | ||||||
| M/F Housing RB (Casa Rita Apts) Series 1994A (LOC: Wells Fargo Bank, NA) | 0.10% | 07/07/15 | 4,600,000 | 4,600,000 | ||
| Los Angeles Dept of Water & Power | ||||||
| Water System RB Series 2006A2 (LIQ: Citibank, NA) | a | 0.06% | 07/01/15 | 500,000 | 500,000 | |
| Los Angeles Municipal Improvement Corp | ||||||
| Lease RB Series 2006A (GTY/LIQ: Wells Fargo & Co) | a | 0.09% | 07/07/15 | 19,960,000 | 19,960,000 | |
| Newport-Mesa USD | ||||||
| GO Bonds Series 2007 (LIQ: Deutsche Bank AG) | a | 0.15% | 07/07/15 | 10,000,000 | 10,000,000 | |
| San Francisco Bay Area Rapid Transit District | ||||||
| GO Bonds Series 2007B (LIQ: Citibank, NA) | a | 0.08% | 07/07/15 | 9,900,000 | 9,900,000 | |
| San Jose | ||||||
| M/F Housing RB (Cinnabar Commons) Series 2003C (LOC: Freddie Mac) | 0.07% | 07/07/15 | 8,500,000 | 8,500,000 | ||
| Issuer
Type of Security, Series |
Footnotes | Rate | Effective
Maturity |
Maturity
Date |
Face
Amount ($) |
Value
($) |
| San Mateo Cnty CCD | ||||||
| GO Bonds Series 2005B (LIQ: Wells Fargo & Co) | a | 0.08% | 07/07/15 | 735,000 | 735,000 | |
| Southern California Public Power Auth | ||||||
| Refunding RB (Magnolia Power) Series 2009-2 (LOC: Wells Fargo Bank, NA) | 0.06% | 07/07/15 | 600,000 | 600,000 | ||
| 191,342,000 | ||||||
| Colorado 2.1% | ||||||
| Broomfield Urban Renewal Auth | ||||||
| Tax Increment RB Series 2005 (LOC: BNP Paribas) | 0.13% | 07/07/15 | 20,630,000 | 20,630,000 | ||
| Colorado Health Facilities Auth | ||||||
| RB (Sisters of Charity of Leavenworth Health System) Series 2013A (LIQ: Citibank, NA) | a | 0.10% | 07/07/15 | 3,700,000 | 3,700,000 | |
| RB (Sisters of Charity of Leavenworth Health System) Series 2013A (LIQ: Morgan Stanley Bank NA) | a | 0.08% | 07/07/15 | 15,500,000 | 15,500,000 | |
| Colorado Housing & Finance Auth | ||||||
| S/F Mortgage Class I Bonds Series 2006A3 (LIQ: Federal Home Loan Bank) | 0.08% | 07/07/15 | 25,275,000 | 25,275,000 | ||
| S/F Mortgage Class I Bonds Series 2007A2 (LIQ: Federal Home Loan Bank) | 0.08% | 07/07/15 | 8,300,000 | 8,300,000 | ||
| S/F Mortgage Class II Bonds Series 2007B3 (LIQ: Royal Bank of Canada) | 0.08% | 07/07/15 | 30,100,000 | 30,100,000 | ||
| S/F Mortgage Class II Bonds Series 2013B (LIQ: Royal Bank of Canada) | 0.05% | 07/07/15 | 17,900,000 | 17,900,000 | ||
| Colorado Springs | ||||||
| Utilities System RB Series 2013B1&B2 (LIQ: Barclays Bank Plc) | a | 0.12% | 07/07/15 | 6,875,000 | 6,875,000 | |
| Dawson Ridge Metropolitan District No.1 | ||||||
| LT Refunding Bonds Series 1992A (ESCROW/LIQ: Wells Fargo & Co) | a | 0.08% | 07/07/15 | 10,240,000 | 10,240,000 | |
| Denver | ||||||
| Airport System RB Bonds Series 2008C2&C3 (GTY/LIQ: Royal Bank of Canada) | a,d | 0.09% | 07/07/15 | 112,990,000 | 112,990,000 | |
| Midcities Metropolitan District No. 1 | ||||||
| Special Refunding RB Series 2004B (LOC: BNP Paribas) | 0.15% | 07/07/15 | 10,000,000 | 10,000,000 | ||
| 261,510,000 | ||||||
| Connecticut 0.0% | ||||||
| Connecticut | ||||||
| GO Bonds Series 2015C (LIQ: Toronto-Dominion Bank) | a | 0.08% | 07/07/15 | 2,000,000 | 2,000,000 | |
| Delaware 0.0% | ||||||
| Delaware Health Facilities Auth | ||||||
| RB (Christiana Care Health Services) Series 2008A | 0.02% | 07/01/15 | 2,600,000 | 2,600,000 | ||
| District of Columbia 0.8% | ||||||
| District of Columbia | ||||||
| GO Bonds Series 2008E (GTY: Berkshire Hathaway Assurance Corp /LIQ: Bank of America, NA) | a | 0.12% | 07/07/15 | 6,030,000 | 6,030,000 | |
| GO Bonds Series 2014C (LIQ: Morgan Stanley Bank NA) | a | 0.08% | 07/07/15 | 18,000,000 | 18,000,000 | |
| Income Tax Secured RB Series 2012C (LIQ: Barclays Bank Plc) | a | 0.12% | 07/07/15 | 4,200,000 | 4,200,000 | |
| RB (American Psychological Assoc) Series 2003 (LOC: Bank of America, NA) | 0.14% | 07/07/15 | 1,930,000 | 1,930,000 | ||
| RB (American Univ) Series 2006A (LOC: Royal Bank of Canada) | 0.06% | 07/07/15 | 500,000 | 500,000 | ||
| RB (The Catholic Univ of America) Series 2007 (GTY: Berkshire Hathaway Assurance Corp /LIQ: Citibank, NA) | a | 0.08% | 07/07/15 | 7,760,000 | 7,760,000 | |
| Issuer
Type of Security, Series |
Footnotes | Rate | Effective
Maturity |
Maturity
Date |
Face
Amount ($) |
Value
($) |
| District of Columbia HFA | ||||||
| M/F Housing RB (The Yards) Series 2012 (LOC: Federal Home Loan Bank) | 0.10% | 07/07/15 | 4,250,000 | 4,250,000 | ||
| District of Columbia Water & Sewer Auth | ||||||
| Public Utility RB Series 1998 (LIQ: Citibank, NA) | a | 0.08% | 07/07/15 | 6,200,000 | 6,200,000 | |
| Public Utility Sr Lien RB Series 2009A (LIQ: Credit Suisse AG) | a | 0.07% | 07/07/15 | 12,155,000 | 12,155,000 | |
| Public Utility Sr Lien RB Series 2009A (LIQ: Morgan Stanley Bank NA) | a | 0.08% | 07/07/15 | 9,130,000 | 9,130,000 | |
| Public Utility Sub Lien RB Series 2013A (LIQ: JPMorgan Chase Bank, NA) | a | 0.08% | 07/07/15 | 18,025,000 | 18,025,000 | |
| Public Utility Sub Lien RB Series 2014B1 (LIQ: TD Bank NA) | 0.07% | 07/07/15 | 12,125,000 | 12,125,000 | ||
| Public Utility Sub Lien RB Series 2014B2 (LIQ: TD Bank NA) | 0.07% | 07/07/15 | 3,000,000 | 3,000,000 | ||
| 103,305,000 | ||||||
| Florida 5.6% | ||||||
| Alachua Cnty Housing Finance Auth | ||||||
| M/F Housing RB (Univ Cove Apts) Series 2001 (LOC: Fannie Mae) | 0.08% | 07/07/15 | 6,595,000 | 6,595,000 | ||
| Broward Cnty | ||||||
| Port Facilities Sub Refunding RB (Port Everglades) Series 2008 (LOC: Royal Bank of Canada) | 0.08% | 07/07/15 | 2,300,000 | 2,300,000 | ||
| Broward Cnty HFA | ||||||
| M/F Housing RB (Palms of Deerfield Beach Apts) Series 2006 (LOC: Citibank, NA) | 0.08% | 07/07/15 | 3,745,000 | 3,745,000 | ||
| Collier Cnty HFA | ||||||
| M/F Housing RB (Brittany Bay Apts) Series 2001A (LOC: Fannie Mae) | 0.11% | 07/07/15 | 3,800,000 | 3,800,000 | ||
| Florida Housing Finance Corp | ||||||
| Housing RB (Brentwood Club of Millenia Blvd Apts) Series 2002A1 (LOC: Fannie Mae) | 0.11% | 07/07/15 | 10,545,000 | 10,545,000 | ||
| Housing RB (Heritage Pointe Apts) Series 1999I-1 (LOC: Fannie Mae) | 0.08% | 07/07/15 | 9,930,000 | 9,930,000 | ||
| Housing RB (Timberline Apts) Series 1999P (LOC: Fannie Mae) | 0.10% | 07/07/15 | 6,035,000 | 6,035,000 | ||
| M/F Mortgage RB (Boynton Bay Apartments) Series 2007I (LOC: Citibank, NA) | 0.09% | 07/07/15 | 1,700,000 | 1,700,000 | ||
| M/F Mortgage RB (Clear Harbor Apts) Series 2007H (LOC: Citibank, NA) | 0.09% | 07/07/15 | 3,195,000 | 3,195,000 | ||
| M/F Mortgage RB (Lakeshore Apts) Series 2004H (LOC: Fannie Mae) | 0.09% | 07/07/15 | 7,600,000 | 7,600,000 | ||
| M/F Mortgage RB (Lynn Lake Apts) Series 2005B1 (LOC: Freddie Mac) | 0.09% | 07/07/15 | 20,315,000 | 20,315,000 | ||
| M/F Mortgage RB (Spring Haven Apts) Series 2004F (LOC: Fannie Mae) | 0.09% | 07/07/15 | 6,100,000 | 6,100,000 | ||
| M/F Mortgage RB (Spring Haven Apts) Series 2006G (LOC: Citibank, NA) | 0.08% | 07/07/15 | 3,660,000 | 3,660,000 | ||
| M/F Mortgage RB (Wellesley Apts) Series 2003O (LOC: Citibank, NA) | 0.08% | 07/07/15 | 15,100,000 | 15,100,000 | ||
| Florida State Board of Education | ||||||
| Public Education Capital Outlay Bonds Series 2006B (LIQ: US Bank, NA) | a | 0.07% | 07/07/15 | 43,470,000 | 43,470,000 | |
| Public Education Capital Outlay Bonds Series 2006D (LIQ: Branch Banking & Trust Co) | a | 0.07% | 07/07/15 | 10,615,000 | 10,615,000 | |
| Greater Orlando Aviation Auth | ||||||
| Airport Facilities Refunding RB Series 2007A (LIQ: Deutsche Bank AG) | a | 0.16% | 07/07/15 | 5,540,000 | 5,540,000 | |
| Airport Facility RB Series 2003A | 0.08% | 07/07/15 | 18,285,000 | 18,285,000 | ||
| Issuer
Type of Security, Series |
Footnotes | Rate | Effective
Maturity |
Maturity
Date |
Face
Amount ($) |
Value
($) |
| Halifax Hospital Medical Center | ||||||
| Hospital Refunding & Improvement RB Series 2008 (LOC: JPMorgan Chase Bank, NA) | 0.08% | 07/07/15 | 12,800,000 | 12,800,000 | ||
| Highlands Cnty Health Facilities Auth | ||||||
| Hospital Refunding RB (Adventist Health/Sunbelt) Series 2006G (LIQ: Morgan Stanley Bank NA) | a | 0.08% | 07/07/15 | 9,375,000 | 9,375,000 | |
| Hillsborough Cnty HFA | ||||||
| M/F Housing RB (Lake Kathy Apts) Series 2005 (LOC: Fannie Mae) | 0.09% | 07/07/15 | 20,470,000 | 20,470,000 | ||
| M/F Housing RB (Meridian Pointe Apts) Series 2005 (LOC: Citibank, NA) | 0.08% | 07/07/15 | 6,315,000 | 6,315,000 | ||
| Hillsborough Cnty IDA | ||||||
| RB (Independent Day School) Series 2000 (LOC: Bank of America, NA) | 0.17% | 07/07/15 | 600,000 | 600,000 | ||
| Hillsborough Cnty School Board | ||||||
| Sales Tax Refunding RB Series 2007 (GTY/LIQ: Wells Fargo & Co) | a | 0.08% | 07/07/15 | 11,315,000 | 11,315,000 | |
| Jacksonville | ||||||
| RB Series 2008A (LOC: Bank of America, NA) | 0.09% | 07/07/15 | 14,425,000 | 14,425,000 | ||
| Jacksonville HFA | ||||||
| M/F Housing RB (Hartwood Apts) Series 2006 (LOC: Freddie Mac) | 0.09% | 07/07/15 | 3,755,000 | 3,755,000 | ||
| JEA | ||||||
| Electric System RB Series Three 2012B (LIQ: Royal Bank of Canada) | a | 0.07% | 07/07/15 | 5,000,000 | 5,000,000 | |
| Lake Cnty | ||||||
| Capital Improvement RB Series 2007 (LIQ: Deutsche Bank AG) | a | 0.16% | 07/07/15 | 39,860,000 | 39,860,000 | |
| Manatee Cnty HFA | ||||||
| M/F Housing RB (Centre Court Apts) Series 2000A (LOC: Federal Home Loan Bank) | 0.08% | 07/07/15 | 6,405,000 | 6,405,000 | ||
| Miami-Dade Cnty | ||||||
| Aviation RB 2005A (GTY: Berkshire Hathaway Assurance Corp /LIQ: Citibank, NA) | a | 0.10% | 07/07/15 | 23,435,000 | 23,435,000 | |
| GO Bonds Series 2014A (GTY/LIQ: Royal Bank of Canada) | a | 0.07% | 07/07/15 | 17,735,000 | 17,735,000 | |
| Seaport RB Series 2014A (LOC: Bank of Tokyo Mitsubishi UFJ, Ltd) | 0.07% | 07/07/15 | 15,000,000 | 15,000,000 | ||
| Seaport RB Series 2014B (LOC: Bank of Tokyo Mitsubishi UFJ, Ltd) | 0.08% | 07/07/15 | 7,000,000 | 7,000,000 | ||
| Miami-Dade Cnty IDA | ||||||
| Airport Facility RB (FlightSafety) Series 1999A | 0.08% | 07/07/15 | 20,210,000 | 20,210,000 | ||
| Airport Facility RB (FlightSafety) Series 1999B | 0.08% | 07/07/15 | 20,230,000 | 20,230,000 | ||
| Ocean Highway & Port Auth | ||||||
| RB Series 1990 (LOC: Wells Fargo Bank, NA) | 0.12% | 07/07/15 | 8,700,000 | 8,700,000 | ||
| Okeechobee Cnty | ||||||
| IDRB (Okeechobee Landfill) Series 1999 (LOC: Wells Fargo Bank, NA) | 0.11% | 07/07/15 | 15,000,000 | 15,000,000 | ||
| Orange Cnty HFA | ||||||
| M/F Housing RB (Charleston Club Apts) Series 2001A (LOC: Fannie Mae) | 0.11% | 07/07/15 | 10,830,000 | 10,830,000 | ||
| M/F Housing RB (Landings on Millenia Blvd Apts) Series 2002A (LOC: Fannie Mae) | 0.10% | 07/07/15 | 7,060,000 | 7,060,000 | ||
| M/F Housing RB (Laurel Oaks Apts II) Series 2007H (LOC: Federal Home Loan Bank) | 0.09% | 07/07/15 | 7,480,000 | 7,480,000 | ||
| M/F Housing RB (Laurel Oaks Apts) Series 2007G (LOC: Federal Home Loan Bank) | 0.09% | 07/07/15 | 8,100,000 | 8,100,000 | ||
| M/F Housing RB (Lee Vista Club Apts) Series 2004A (LOC: Fannie Mae) | 0.10% | 07/07/15 | 13,600,000 | 13,600,000 | ||
| Issuer
Type of Security, Series |
Footnotes | Rate | Effective
Maturity |
Maturity
Date |
Face
Amount ($) |
Value
($) |
| M/F Housing RB (Mystic Cove Apts) Series 2002E (LOC: Fannie Mae) | 0.10% | 07/07/15 | 8,255,000 | 8,255,000 | ||
| M/F Housing RB (The Cove At Lady Lake Apts) Series 2005A (LOC: Fannie Mae) | 0.10% | 07/07/15 | 8,685,000 | 8,685,000 | ||
| Orange Cnty IDA | ||||||
| RB (Foundation Academy of Winter Garden) Series 2007 (LOC: Federal Home Loan Bank) | 0.13% | 07/07/15 | 8,550,000 | 8,550,000 | ||
| Orlando Utilities Commission | ||||||
| Utility System RB Series 2008-1 (LIQ: JPMorgan Chase Bank, NA) | 0.08% | 07/07/15 | 270,000 | 270,000 | ||
| Orlando-Orange Cnty Expressway Auth | ||||||
| RB Series 2007A (GTY/LIQ: US Bank, NA) | a | 0.08% | 07/07/15 | 28,190,000 | 28,190,000 | |
| RB Series 2007A (GTY: Berkshire Hathaway Assurance Corp /LIQ: Citibank, NA) | a | 0.08% | 07/07/15 | 32,545,000 | 32,545,000 | |
| RB Series 2007A (GTY: Berkshire Hathaway Assurance Corp /LIQ: Citibank, NA) | a | 0.09% | 07/07/15 | 3,400,000 | 3,400,000 | |
| RB Series 2007A (GTY: Berkshire Hathaway Assurance Corp /LIQ: Citibank, NA) | a | 0.10% | 07/07/15 | 1,600,000 | 1,600,000 | |
| Palm Beach Cnty | ||||||
| RB (Norton Gallery & School of Art) Series 1995 (LOC: Northern Trust Co) | 0.07% | 07/07/15 | 2,500,000 | 2,500,000 | ||
| Palm Beach Cnty HFA | ||||||
| M/F Housing RB (Palm Gardens Apts) Series 2007 (LOC: Citibank, NA) | 0.17% | 07/07/15 | 2,910,000 | 2,910,000 | ||
| Palm Beach Cnty Solid Waste Auth | ||||||
| RB Series 2009A (GTY: Berkshire Hathaway Assurance Corp /LIQ: JPMorgan Chase Bank, NA) | a | 0.09% | 07/07/15 | 4,545,000 | 4,545,000 | |
| Pinellas Cnty Educational Facility Auth | ||||||
| Refunding RB (Barry Univ) Series 2007 (LOC: Bank of America, NA) | 0.11% | 07/07/15 | 7,500,000 | 7,500,000 | ||
| Pinellas Cnty HFA | ||||||
| M/F Housing RB (Bayside Court) Series 2011 (LOC: Freddie Mac) | 0.09% | 07/07/15 | 8,045,000 | 8,045,000 | ||
| Polk Cnty IDA | ||||||
| RB (Tremron Lakeland) Series 2011 (LOC: Branch Banking & Trust Co) | 0.13% | 07/07/15 | 365,000 | 365,000 | ||
| South Florida Water Management District | ||||||
| COP Series 2006 (LOC: US Bank, NA /LIQ: US Bank, NA) | a | 0.08% | 07/07/15 | 34,575,000 | 34,575,000 | |
| South Miami Health Facilities Auth | ||||||
| Hospital RB (Baptist Health So FL) Series 2007 (LIQ: Citibank, NA) | a | 0.08% | 07/07/15 | 16,500,000 | 16,500,000 | |
| Hospital RB (Baptist Health South Florida) Series 2007 (LIQ: Credit Suisse AG) | a | 0.07% | 07/07/15 | 15,000,000 | 15,000,000 | |
| Tallahassee | ||||||
| Energy System RB Series 2007 (LIQ: Citibank, NA) | a | 0.09% | 07/07/15 | 20,000,000 | 20,000,000 | |
| Tampa Bay Water | ||||||
| Utility System RB Series 2013 (LIQ: JPMorgan Chase Bank, NA) | a | 0.08% | 07/07/15 | 5,000,000 | 5,000,000 | |
| 691,665,000 | ||||||
| Georgia 2.8% | ||||||
| Atkinson Cnty-Coffee Cnty Jt Development Auth | ||||||
| Solid Waste Disposal RB (Longboard) Series 2008 (LOC: Wells Fargo Bank, NA) | 0.11% | 07/07/15 | 11,550,000 | 11,550,000 | ||
| Issuer
Type of Security, Series |
Footnotes | Rate | Effective
Maturity |
Maturity
Date |
Face
Amount ($) |
Value
($) |
| Atlanta | ||||||
| Water & Wastewater Refunding RB Series 2015 (LIQ: JPMorgan Chase Bank, NA) | a | 0.08% | 07/07/15 | 7,500,000 | 7,500,000 | |
| Water & Wastewater Refunding RB Series 2015 (LIQ: JPMorgan Chase Bank, NA) | a | 0.12% | 07/07/15 | 5,000,000 | 5,000,000 | |
| Water & Wastewater Refunding RB Series 2015 (LIQ: Morgan Stanley Bank NA) | a | 0.08% | 07/07/15 | 19,500,000 | 19,500,000 | |
| Atlanta Housing Auth | ||||||
| M/F Housing RB (Villages of East Lake Phase II) Series 1999 (LOC: Bank of America, NA) | 0.14% | 07/07/15 | 7,940,000 | 7,940,000 | ||
| Atlanta Urban Residential Finance Auth | ||||||
| M/F Housing RB (Alta Coventry Station Apts) Series 2007 (LOC: Bank of America, NA) | 0.14% | 07/07/15 | 26,885,000 | 26,885,000 | ||
| M/F Housing RB (M St Apts) Series 2003 (LOC: Freddie Mac) | d | 0.11% | 07/07/15 | 27,135,000 | 27,135,000 | |
| M/F Housing RB (New Community at East Lake) Series 1996 (LOC: Bank of America, NA) | 0.14% | 07/07/15 | 5,100,000 | 5,100,000 | ||
| Bartow Cnty Development Auth | ||||||
| Pollution Control RB (GA Power) First Series 2009 | d | 0.12% | 07/07/15 | 50,000,000 | 50,000,000 | |
| RB (VMC Specialty Alloys) Series 2014 (LOC: Comerica Bank) | 0.15% | 07/07/15 | 3,260,000 | 3,260,000 | ||
| Burke Cnty Development Auth | ||||||
| Pollution Control RB (GA Power) First Series 2013 | 0.12% | 07/07/15 | 7,000,000 | 7,000,000 | ||
| Columbia Cnty Development Auth | ||||||
| M/F Housing RB (Westwood Club Apts) Series 2002 (LOC: Fannie Mae) | 0.11% | 07/07/15 | 3,385,000 | 3,385,000 | ||
| DeKalb Private Hospital Auth | ||||||
| Revenue Anticipation Certificates (Children's Healthcare of Atlanta) Series 2009 (LIQ: Wells Fargo & Co) | a | 0.09% | 07/07/15 | 12,395,000 | 12,395,000 | |
| East Point Housing Auth | ||||||
| M/F Housing RB (Eagles Creste Apts) Series 2003 (LOC: Freddie Mac) | 0.13% | 07/07/15 | 12,525,000 | 12,525,000 | ||
| Fulton Cnty Development Auth | ||||||
| Airport Facility RB (FlightSafety International) Series 1999B | 0.08% | 07/07/15 | 1,200,000 | 1,200,000 | ||
| Houston Cnty Development Auth | ||||||
| Sewage Facility RB (Perdue Farms) Series 2005 (LOC: Rabobank Nederland) | 0.12% | 07/07/15 | 5,350,000 | 5,350,000 | ||
| Lawrenceville Housing Auth | ||||||
| M/F Housing RB (Chatham Club Apts) Series 2002 (LOC: Fannie Mae) | 0.09% | 07/07/15 | 6,700,000 | 6,700,000 | ||
| Main St Natural Gas | ||||||
| RB Series 2010A1 (LOC: Royal Bank of Canada) | 0.13% | 07/02/15 | 10/01/15 | 28,000,000 | 28,000,000 | |
| RB Series 2010A2 (LOC: Royal Bank of Canada) | 0.13% | 07/02/15 | 08/03/15 | 28,000,000 | 28,000,000 | |
| Marietta Housing Auth | ||||||
| M/F Housing RB (Walton Village Apts) Series 2005 (LOC: Freddie Mac) | 0.13% | 07/07/15 | 14,300,000 | 14,300,000 | ||
| McDonough Housing Auth | ||||||
| M/F Housing RB (Ashley Woods Apts) Series 2008 (LOC: Freddie Mac) | 0.09% | 07/07/15 | 6,300,000 | 6,300,000 | ||
| Metropolitan Atlanta Rapid Transit Auth | ||||||
| Sales Tax Refunding RB Series 2007B (GTY/LIQ: US Bank, NA) | a | 0.09% | 07/07/15 | 20,215,000 | 20,215,000 | |
| Monroe Cnty Development Auth | ||||||
| Pollution Control RB (GA Power) First Series 2008 | 0.06% | 07/01/15 | 10,000,000 | 10,000,000 | ||
| Pollution Control RB (GA Power) First Series 2009 | 0.09% | 07/07/15 | 7,200,000 | 7,200,000 | ||
| Waycross & Ware Cnty Development Auth | ||||||
| IDRB (Rich Products Corp) Series 2007 (LOC: Bank of America, NA) | 0.11% | 07/07/15 | 7,500,000 | 7,500,000 | ||
| Winder-Barrow Cnty Jt Development Auth | ||||||
| IDRB (Price Companies) Series 2007 (LOC: Bank of America, NA) | 0.17% | 07/07/15 | 6,115,000 | 6,115,000 | ||
| Issuer
Type of Security, Series |
Footnotes | Rate | Effective
Maturity |
Maturity
Date |
Face
Amount ($) |
Value
($) |
| Worth Cnty IDA | ||||||
| Refunding IDRB (Seabrook Peanut) Series 1996B (LOC: Federal Home Loan Bank) | 0.08% | 07/07/15 | 2,700,000 | 2,700,000 | ||
| 342,755,000 | ||||||
| Hawaii 0.2% | ||||||
| Hawaii | ||||||
| GO Bonds Series 2007DJ (LIQ: State Street Bank & Trust Co NA) | a | 0.07% | 07/07/15 | 5,000,000 | 5,000,000 | |
| GO Bonds Series 2011DZ (LIQ: Bank of America, NA) | a | 0.12% | 07/07/15 | 2,000,000 | 2,000,000 | |
| Univ of Hawaii | ||||||
| Univ RB Series 2006A (GTY/LIQ: Wells Fargo & Co) | a | 0.09% | 07/07/15 | 14,775,000 | 14,775,000 | |
| 21,775,000 | ||||||
| Idaho 0.1% | ||||||
| Cassia Cnty IDC | ||||||
| IDRB (East Valley Cattle) Series 2006 (LOC: Rabobank Nederland) | 0.12% | 07/07/15 | 7,000,000 | 7,000,000 | ||
| IDRB (Oak Valley Heifers) Series 2007 (LOC: Rabobank Nederland) | 0.13% | 07/07/15 | 1,800,000 | 1,800,000 | ||
| 8,800,000 | ||||||
| Illinois 4.8% | ||||||
| Aurora | ||||||
| Collateralized S/F Mortgage RB Series 2007D1 (LIQ: Deutsche Bank AG) | a | 0.16% | 07/07/15 | 3,165,000 | 3,165,000 | |
| Carol Stream | ||||||
| M/F Housing Refunding RB (St. Charles Square) Series 1997 (LOC: Fannie Mae) | 0.10% | 07/07/15 | 8,715,000 | 8,715,000 | ||
| Chicago | ||||||
| Second Lien Water Refunding RB Series 2004-2 (LOC: State Street Bank & Trust Co NA) | 0.17% | 07/07/15 | 3,000,000 | 3,000,000 | ||
| Second Lien Water Refunding RB Series 2004-3 (LOC: State Street Bank & Trust Co NA) | 0.17% | 07/07/15 | 3,000,000 | 3,000,000 | ||
| Illinois Finance Auth | ||||||
| IDRB (Bison Gear & Engineering) Series 2010 (LOC: BMO Harris Bank NA) | 0.09% | 07/07/15 | 6,150,000 | 6,150,000 | ||
| M/F Housing RB (Autumn Ridge Apts) Series 2005A (LOC: Freddie Mac) | 0.07% | 07/07/15 | 5,655,000 | 5,655,000 | ||
| M/F Housing RB (New Vistas II Apts) Series 2004 (LOC: Fannie Mae) | 0.09% | 07/07/15 | 8,500,000 | 8,500,000 | ||
| Pollution Control RB (A.E. Staley Manufacturing) Series 1985 (LOC: Rabobank Nederland) | 0.08% | 07/07/15 | 7,500,000 | 7,500,000 | ||
| Qualified Residential Rental Bonds (River Oaks) Series 1989 (LOC: Freddie Mac) | 0.10% | 07/07/15 | 32,000,000 | 32,000,000 | ||
| RB (Chicago Symphony Orchestra) Series 1994 (LOC: Northern Trust Co) | 0.08% | 07/07/15 | 28,600,000 | 28,600,000 | ||
| RB (F.C. Harris Pavilion) Series 1994 (LOC: Freddie Mac) | 0.10% | 07/07/15 | 22,310,000 | 22,310,000 | ||
| RB (Fenwick High School) Series 1997 (LOC: PNC Bank NA) | 0.09% | 07/07/15 | 1,750,000 | 1,750,000 | ||
| RB (Fenwick High School) Series 2007 (LOC: PNC Bank NA) | 0.08% | 07/07/15 | 15,635,000 | 15,635,000 | ||
| RB (Korex) Series 1990 (LOC: Northern Trust Co) | 0.30% | 07/07/15 | 4,000,000 | 4,000,000 | ||
| RB (Lake Forest Academy) Series 1994 (LOC: Northern Trust Co) | 0.08% | 07/07/15 | 4,000,000 | 4,000,000 | ||
| RB (Lake Forest College) Series 2008 (LOC: Northern Trust Co) | 0.08% | 07/07/15 | 2,500,000 | 2,500,000 | ||
| RB (Northwestern Memorial Healthcare) Series 2013 (LIQ: JPMorgan Chase Bank, NA) | a | 0.08% | 07/07/15 | 16,280,000 | 16,280,000 | |
| RB (Northwestern Memorial Hospital) Series 2007A3 (LIQ: JPMorgan Chase Bank, NA) | 0.07% | 07/07/15 | 9,700,000 | 9,700,000 | ||
| Issuer
Type of Security, Series |
Footnotes | Rate | Effective
Maturity |
Maturity
Date |
Face
Amount ($) |
Value
($) |
| RB (Northwestern Memorial Hospital) Series 2009A (LIQ: JPMorgan Chase Bank, NA) | a | 0.08% | 07/07/15 | 6,000,000 | 6,000,000 | |
| RB (Northwestern Univ) Series 2004C | 0.05% | 07/07/15 | 21,000,000 | 21,000,000 | ||
| RB (Northwestern Univ) Series 2008D | 0.05% | 07/07/15 | 7,000,000 | 7,000,000 | ||
| RB (Presbyterian Home Lake Forest Place) Series 1996A (LOC: JPMorgan Chase Bank, NA) | 0.08% | 07/07/15 | 12,000,000 | 12,000,000 | ||
| RB (Regency Park at Lincolnwood) Series 1991B (ESCROW/LIQ: JPMorgan Chase Bank, NA) | a | 0.10% | 07/07/15 | 8,274,000 | 8,274,000 | |
| RB (Richard H. Driehaus Museum) Series 2005 (LOC: Northern Trust Co) | 0.08% | 07/07/15 | 3,800,000 | 3,800,000 | ||
| RB (Trinity Health) Series 2011IL (LIQ: Morgan Stanley Bank NA) | a | 0.08% | 07/07/15 | 1,650,000 | 1,650,000 | |
| RB (Univ of Chicago) Series 2013A (LIQ: Credit Suisse AG) | a | 0.19% | 07/07/15 | 3,760,000 | 3,760,000 | |
| RB (YMCA of Metropolitan Chicago) Series 2001 (LOC: BMO Harris Bank NA) | 0.07% | 07/07/15 | 7,000,000 | 7,000,000 | ||
| Refunding RB (North Shore Univ Health) Series 2010 (LIQ: JPMorgan Chase Bank, NA) | a | 0.08% | 07/07/15 | 3,000,000 | 3,000,000 | |
| Solid Waste Disposal Facility RB (Kuusakoski US) Series 2013 (LOC: Fifth Third Bank) | 0.18% | 07/07/15 | 4,900,000 | 4,900,000 | ||
| Solid Waste Disposal RB (Waste Management) Series 2003 (LOC: Wells Fargo Bank, NA) | 0.12% | 07/07/15 | 30,000,000 | 30,000,000 | ||
| Illinois Health Facilities Auth | ||||||
| RB (Evanston Hospital Corp) Series 1996 (LIQ: JPMorgan Chase Bank, NA) | 0.07% | 07/07/15 | 21,015,000 | 21,015,000 | ||
| Illinois Housing Development Auth | ||||||
| M/F Housing RB (Spring Creek Towers) Series 2004 (LOC: Bank of America, NA) | 0.28% | 07/07/15 | 5,180,000 | 5,180,000 | ||
| Illinois Regional Transportation Auth | ||||||
| GO Bonds Series 2002A (LIQ: Wells Fargo & Co) | a | 0.07% | 07/07/15 | 9,155,000 | 9,155,000 | |
| GO Bonds Series 2005A (LIQ: Rabobank Nederland) | a | 0.07% | 07/07/15 | 28,020,000 | 28,020,000 | |
| Illinois Toll Highway Auth | ||||||
| Sr Priority RB Series 2007A2D (LOC: Royal Bank of Canada) | 0.07% | 07/07/15 | 19,000,000 | 19,000,000 | ||
| Sr RB Series 2013A (LIQ: JPMorgan Chase Bank, NA) | a | 0.08% | 07/07/15 | 10,730,000 | 10,730,000 | |
| Sr RB Series 2013A (LIQ: JPMorgan Chase Bank, NA) | a | 0.10% | 07/07/15 | 9,745,000 | 9,745,000 | |
| Sr Refunding RB Series 2008A1A (LIQ: JPMorgan Chase Bank, NA) | 0.11% | 07/07/15 | 16,440,000 | 16,440,000 | ||
| Sr Refunding RB Series 2008A2 (LIQ: JPMorgan Chase Bank, NA) | d | 0.10% | 07/07/15 | 65,800,000 | 65,800,000 | |
| Toll Highway Sr RB Series 2014D (LIQ: Royal Bank of Canada) | a | 0.09% | 07/07/15 | 4,170,000 | 4,170,000 | |
| Metropolitan Water Reclamation District of Greater Chicago | ||||||
| LT GO Bonds Series 2014A&C (LIQ: Morgan Stanley Bank NA) | a | 0.18% | 07/07/15 | 17,865,000 | 17,865,000 | |
| LT GO Refunding Bonds Series C (LIQ: Branch Banking & Trust Co) | a | 0.07% | 07/07/15 | 22,320,000 | 22,320,000 | |
| Palatine | ||||||
| Special Facility RB (Little City for Community Development) Series 1998 (LOC: Federal Home Loan Bank) | 0.09% | 07/07/15 | 5,000,000 | 5,000,000 | ||
| Southwestern Illinois Development Auth | ||||||
| Refunding IDRB (Holten Meat) Series 2004 (LOC: US Bank, NA) | 0.22% | 07/07/15 | 6,860,000 | 6,860,000 | ||
| St. Clair Cnty | ||||||
| Industrial Building Refunding RB (Winchester Apts) Series 1994 (LOC: Fannie Mae) | 0.07% | 07/07/15 | 15,550,000 | 15,550,000 | ||
| Univ of Illinois | ||||||
| Auxiliary Facilities System RB Series 2006 (LIQ: Citibank, NA) | a | 0.11% | 07/07/15 | 38,260,000 | 38,260,000 | |
| Will Cnty SD No. 365-U | ||||||
| GO Bonds (Valley View) Series 2005 (GTY/LIQ: Wells Fargo & Co) | a | 0.09% | 07/07/15 | 18,105,000 | 18,105,000 | |
| 604,059,000 | ||||||
| Issuer
Type of Security, Series |
Footnotes | Rate | Effective
Maturity |
Maturity
Date |
Face
Amount ($) |
Value
($) |
| Indiana 1.8% | ||||||
| Dearborn Cnty | ||||||
| Economic Development RB (Dearborn Cnty Hospital) Series 2006 (LOC: Fifth Third Bank) | 0.16% | 07/07/15 | 5,840,000 | 5,840,000 | ||
| Gibson Cnty | ||||||
| Pollution Control RB (Toyota Motor Manufacturing) Series 1997 | 0.07% | 07/07/15 | 10,000,000 | 10,000,000 | ||
| Pollution Control RB (Toyota Motor Manufacturing) Series 1999A | 0.07% | 07/07/15 | 10,000,000 | 10,000,000 | ||
| Pollution Control RB (Toyota Motor Manufacturing) Series 2000A | 0.07% | 07/07/15 | 10,000,000 | 10,000,000 | ||
| Pollution Control RB (Toyota Motor Manufacturing) Series 2001B | 0.07% | 07/07/15 | 20,000,000 | 20,000,000 | ||
| Pollution Control RB (Toyota Motor) Series 1998 | 0.07% | 07/07/15 | 10,000,000 | 10,000,000 | ||
| Indiana Finance Auth | ||||||
| Economic Development RB (IVC Industrial Coatings) Series 2008 (LOC: JPMorgan Chase Bank, NA) | 0.13% | 07/07/15 | 5,500,000 | 5,500,000 | ||
| Health System RB (Sisters of St Francis Health Services) Series 2009A (LIQ: JPMorgan Chase Bank, NA) | a | 0.10% | 07/07/15 | 10,730,000 | 10,730,000 | |
| Health System RB (Sisters of St. Francis Health Services) Series 2009A (LIQ: Bank of America, NA) | a | 0.10% | 07/07/15 | 10,000,000 | 10,000,000 | |
| Hospital RB (Indiana Univ Health) Series 2011C (LOC: Northern Trust Co) | 0.05% | 07/07/15 | 3,370,000 | 3,370,000 | ||
| Midwestern Disaster Relief RB (Ohio Valley Electric Corp) Series 2012B (LOC: Sumitomo Mitsui Banking Corp) | 0.07% | 07/07/15 | 10,500,000 | 10,500,000 | ||
| RB (Indiana Univ Health) Series 2011L&M (GTY/LIQ: Royal Bank of Canada) | a | 0.07% | 07/07/15 | 8,300,000 | 8,300,000 | |
| Refunding & RB (Trinity Health) Series 2009A & 2010B (LIQ: JPMorgan Chase Bank, NA) | a | 0.10% | 07/07/15 | 16,750,000 | 16,750,000 | |
| Refunding & RB (Trinity Health) Series 2009A (LIQ: JPMorgan Chase Bank, NA) | a | 0.08% | 07/07/15 | 5,500,000 | 5,500,000 | |
| Refunding & RB (Trinity Health) Series 2009A (LIQ: Wells Fargo & Co) | a | 0.09% | 07/07/15 | 24,090,000 | 24,090,000 | |
| Indiana Health & Educational Facility Financing Auth | ||||||
| RB (Ascension Health) Series 2006 (LIQ: US Bank, NA) | a | 0.08% | 07/07/15 | 15,400,000 | 15,400,000 | |
| Indiana Housing & Community Development Agency | ||||||
| S/F Mortgage RB Series 2007A (LIQ: JPMorgan Chase Bank, NA) | a | 0.14% | 07/07/15 | 2,210,000 | 2,210,000 | |
| Jasper Cnty | ||||||
| Economic Development RB (HGI Dairy) Series 2002 (LOC: AgriBank, FCB) | 0.10% | 07/07/15 | 5,275,000 | 5,275,000 | ||
| Lafayette | ||||||
| Solid Waste Disposal RB (Tate & Lyle Ingredients) Series 2006 (LOC: Rabobank Nederland) | 0.10% | 07/07/15 | 24,200,000 | 24,200,000 | ||
| Middlebury Schools Building Corp | ||||||
| First Mortgage Bonds Series 2006A (GTY/LIQ: US Bank, NA) | a | 0.08% | 07/07/15 | 10,075,000 | 10,075,000 | |
| Rockport | ||||||
| Pollution Control Refunding RB (American Electric Power) Series 1995A (LOC: Bank of Tokyo Mitsubishi UFJ, Ltd) | 0.07% | 07/07/15 | 8,500,000 | 8,500,000 | ||
| St. Joseph Cnty | ||||||
| RB (Western Manor Apts) Series 1997C (LOC: Federal Home Loan Bank) | 0.77% | 07/07/15 | 1,940,000 | 1,940,000 | ||
| 228,180,000 | ||||||
| Iowa 1.2% | ||||||
| Iowa Finance Auth | ||||||
| Health Facilities RB (UnityPoint Health) Series 2013B2 (LOC: MUFG Union Bank, NA) | 0.08% | 07/07/15 | 6,425,000 | 6,425,000 | ||
| M/F Housing RB (Country Club Village) Series 2006 (LOC: Freddie Mac) | 0.09% | 07/07/15 | 10,530,000 | 10,530,000 | ||
| Issuer
Type of Security, Series |
Footnotes | Rate | Effective
Maturity |
Maturity
Date |
Face
Amount ($) |
Value
($) |
| Midwestern Disaster Area RB (Cargill) Series 2009A | 0.10% | 07/07/15 | 30,000,000 | 30,000,000 | ||
| Midwestern Disaster Area RB (Cargill) Series 2009B | 0.10% | 07/07/15 | 25,000,000 | 25,000,000 | ||
| Midwestern Disaster Area RB (Cargill) Series 2012A | 0.09% | 07/07/15 | 32,500,000 | 32,500,000 | ||
| Midwestern Disaster Area RB (HF Chlor-Alkali) Series 2012 (LOC: US Bank, NA) | 0.12% | 07/07/15 | 25,000,000 | 25,000,000 | ||
| Iowa State Board of Regents | ||||||
| Hospital RB Series SUI 2012 (LIQ: Royal Bank of Canada) | a | 0.07% | 07/07/15 | 21,000,000 | 21,000,000 | |
| 150,455,000 | ||||||
| Kansas 0.3% | ||||||
| Kansas Department of Transportation | ||||||
| Highway Refunding RB Series 2012A3 | 0.37% | 07/03/15 | 09/01/15 | 7,250,000 | 7,253,099 | |
| Highway Refunding RB Series 2014B1 | 0.11% | 07/01/15 | 09/01/15 | 5,000,000 | 5,000,000 | |
| Kansas Development Finance Auth | ||||||
| M/F Housing RB (Springhill Apts) Series 2004B (LOC: Freddie Mac) | 0.09% | 07/07/15 | 9,285,000 | 9,285,000 | ||
| RB (Sisters of Charity of Leavenworth Health System) Series 2010A (LIQ: JPMorgan Chase Bank, NA) | a | 0.10% | 07/07/15 | 12,715,000 | 12,715,000 | |
| 34,253,099 | ||||||
| Kentucky 0.9% | ||||||
| Carroll Cnty | ||||||
| Environmental Facilities Refunding RB (Kentucky Utilities) Series 2006B (LOC: Bank of Tokyo Mitsubishi UFJ, Ltd) | 0.08% | 07/07/15 | 20,000,000 | 20,000,000 | ||
| Solid Waste Disposal Revenue & Refunding RB (Celotex) Series 2000 (LOC: Bank of America, NA) | 0.08% | 07/07/15 | 15,790,000 | 15,790,000 | ||
| Hopkins Cnty | ||||||
| Industrial Building RB (J-Lok Corp) Series 2007 (LOC: PNC Bank NA) | 0.13% | 07/07/15 | 2,500,000 | 2,500,000 | ||
| Hopkinsville | ||||||
| Industrial Building RB (Riken Elastomers Corp) Series 2013A (LOC: Bank of Tokyo Mitsubishi UFJ, Ltd) | 0.13% | 07/07/15 | 5,000,000 | 5,000,000 | ||
| Kenton Cnty Airport Board | ||||||
| Special Facilities RB (FlightSafety International) Series 2001A | 0.08% | 07/07/15 | 4,400,000 | 4,400,000 | ||
| Kentucky Economic Development Finance Auth | ||||||
| Health Care Refunding RB (Christian Care Communities) Series 2007A (LOC: PNC Bank NA) | 0.12% | 07/07/15 | 13,925,000 | 13,925,000 | ||
| Hospital RB (Baptist Healthcare) Series 2009B3 (LOC: Branch Banking & Trust Co) | 0.05% | 07/07/15 | 1,000,000 | 1,000,000 | ||
| Kentucky Higher Ed Student Loan Corp | ||||||
| RB Sr Series 2008A1 (LOC: State Street Bank & Trust Co NA) | 0.08% | 07/07/15 | 12,315,000 | 12,315,000 | ||
| RB Sr Series 2008A2 (LOC: State Street Bank & Trust Co NA) | 0.08% | 07/07/15 | 12,425,000 | 12,425,000 | ||
| Kentucky Housing Corp | ||||||
| Housing RB Series 2005B (LIQ: State Street Bank & Trust Co NA) | 0.11% | 07/07/15 | 4,275,000 | 4,275,000 | ||
| Housing RB Series 2006I (LIQ: State Street Bank & Trust Co NA) | 0.11% | 07/07/15 | 12,800,000 | 12,800,000 | ||
| M/F Housing RB (Highlands Court Apts) Series 2007 (LOC: PNC Bank NA) | 0.11% | 07/07/15 | 3,600,000 | 3,600,000 | ||
| Richmond | ||||||
| IDRB (Mikron) Series 1995 (LOC: Bank of America, NA) | 0.18% | 07/07/15 | 500,000 | 500,000 | ||
| 108,530,000 | ||||||
| Louisiana 0.4% | ||||||
| Ascension Parish IDB | ||||||
| RB (BASF SE) Series 2009 | 0.09% | 07/07/15 | 15,000,000 | 15,000,000 | ||
| Issuer
Type of Security, Series |
Footnotes | Rate | Effective
Maturity |
Maturity
Date |
Face
Amount ($) |
Value
($) |
| East Baton Rouge Parish | ||||||
| Pollution Control Refunding RB (ExxonMobil) Series 1989 | 0.01% | 07/01/15 | 1,400,000 | 1,400,000 | ||
| Louisiana HFA | ||||||
| M/F Housing RB (Belmont Village Apts) Series 2009 (LOC: Freddie Mac) | 0.08% | 07/07/15 | 8,510,000 | 8,510,000 | ||
| M/F Housing RB (Jefferson Lakes Apts) Series 2007 (LOC: Freddie Mac) | 0.13% | 07/07/15 | 14,900,000 | 14,900,000 | ||
| M/F Housing RB (Lapalco Court Apts) Series 2007 (LOC: Fannie Mae) | 0.13% | 07/07/15 | 6,400,000 | 6,400,000 | ||
| M/F Housing RB (Palmetto Apts) Series 2004 (LOC: Fannie Mae) | 0.09% | 07/07/15 | 2,840,000 | 2,840,000 | ||
| 49,050,000 | ||||||
| Maine 0.2% | ||||||
| Dover-Foxcroft | ||||||
| Revenue Obligation (Pleasant River Lumber) Series 2005 (LOC: Wells Fargo Bank, NA) | 0.13% | 07/07/15 | 1,690,000 | 1,690,000 | ||
| Maine State Housing Auth | ||||||
| Mortgage Purchase Bonds Series 2008D (LIQ: Bank of New York Mellon) | 0.09% | 07/07/15 | 20,000,000 | 20,000,000 | ||
| 21,690,000 | ||||||
| Maryland 0.8% | ||||||
| Anne Arundel Cnty | ||||||
| Consolidated Water & Sewer GO Bonds Series 2008 (LIQ: Branch Banking & Trust Co) | a | 0.08% | 07/07/15 | 13,540,000 | 13,540,000 | |
| Baltimore | ||||||
| Water RB Series 2013A (LIQ: Morgan Stanley Bank NA) | a | 0.08% | 07/07/15 | 1,965,000 | 1,965,000 | |
| BlackRock Maryland Municipal Bond Trust | ||||||
| Variable Rate Demand Preferred Shares Series W-7 (GTY/LIQ: Citibank, NA) | a | 0.16% | 07/07/15 | 6,200,000 | 6,200,000 | |
| Maryland Community Development Administration | ||||||
| Housing RB Series 2006D&2007B (LIQ: Wells Fargo & Co) | a | 0.08% | 07/07/15 | 8,630,000 | 8,630,000 | |
| M/F Development RB (Ft. Washington Manor Sr Housing) Series 2005A (LOC: Citibank, NA) | 0.07% | 07/07/15 | 12,560,000 | 12,560,000 | ||
| M/F Development RB (Shakespeare Park Apts) Series 2008B (LOC: Freddie Mac) | 0.06% | 07/07/15 | 7,200,000 | 7,200,000 | ||
| Residential RB Series 2005E, 2006B,F,I&L, 2007D&H (LIQ: Credit Suisse AG) | a | 0.07% | 07/07/15 | 5,875,000 | 5,875,000 | |
| Maryland Industrial Development Financing Auth | ||||||
| Economic Development RB (Paul Reed Smith Guitars) Series 2008 (LOC: PNC Bank NA) | 0.10% | 07/07/15 | 8,870,000 | 8,870,000 | ||
| Washington Suburban Sanitary District | ||||||
| GO BAN Series B (LIQ: State Street Bank & Trust Co NA) | 0.07% | 07/07/15 | 10,000,000 | 10,000,000 | ||
| GO BAN Series B3 (LIQ: State Street Bank & Trust Co NA) | 0.07% | 07/07/15 | 20,000,000 | 20,000,000 | ||
| 94,840,000 | ||||||
| Massachusetts 1.3% | ||||||
| Massachusetts | ||||||
| GO Bonds Series 2000A (LIQ: Citibank, NA) | 0.07% | 07/07/15 | 1,000,000 | 1,000,000 | ||
| Massachusetts Bay Transportation Auth | ||||||
| General Transportation System Bonds Series 2000A1 (LIQ: Barclays Bank Plc) | 0.13% | 07/07/15 | 30,000,000 | 30,000,000 | ||
| Sr Sales Tax Bonds Series 2008A2 (LIQ: JPMorgan Chase Bank, NA) | 0.09% | 07/07/15 | 13,000,000 | 13,000,000 | ||
| Issuer
Type of Security, Series |
Footnotes | Rate | Effective
Maturity |
Maturity
Date |
Face
Amount ($) |
Value
($) |
| Massachusetts Development Finance Agency | ||||||
| Assisted Living Facility RB (Whaler's Cove) Series 2001A (LOC: US Bank, NA) | 0.11% | 07/07/15 | 11,000,000 | 11,000,000 | ||
| First Mortgage RB (Brookhaven at Lexington) Series 2005B (LOC: Bank of America, NA) | 0.17% | 07/07/15 | 1,330,000 | 1,330,000 | ||
| M/F Housing RB (Archstone Reading Apts) Series 2004A (LOC: Freddie Mac) | 0.09% | 07/07/15 | 12,560,000 | 12,560,000 | ||
| RB (CIL Realty) Series 2011 (LOC: Manufacturers & Traders Trust Co) | 0.07% | 07/07/15 | 6,420,000 | 6,420,000 | ||
| RB (Harvard Univ) Series 2010B2 (LIQ: JPMorgan Chase Bank, NA) | a | 0.08% | 07/07/15 | 1,000,000 | 1,000,000 | |
| RB Series (Partners HealthCare) 2015O-1 (LIQ: JPMorgan Chase Bank, NA) | a | 0.08% | 07/07/15 | 2,665,000 | 2,665,000 | |
| Massachusetts Health & Educational Facilities Auth | ||||||
| RB (Amherst College) Series 2005I | 0.07% | 07/07/15 | 9,895,000 | 9,895,000 | ||
| RB (Museum of Fine Arts) Series 2007A2 (LIQ: Bank of America, NA) | 0.03% | 07/01/15 | 6,000,000 | 6,000,000 | ||
| RB (Partners HealthCare) Series 2010J1 (LIQ: JPMorgan Chase Bank, NA) | a | 0.08% | 07/07/15 | 3,000,000 | 3,000,000 | |
| RB (UMass) Series 2007E&F (ESCROW/LIQ: US Bank, NA) | a | 0.07% | 07/07/15 | 14,815,000 | 14,815,000 | |
| Massachusetts HFA | ||||||
| Housing Bonds Series 2007A&C (LIQ: Citibank, NA) | a | 0.12% | 07/07/15 | 11,235,000 | 11,235,000 | |
| Housing Bonds Series 2010B (LIQ: Barclays Bank Plc) | a | 0.13% | 07/07/15 | 7,500,000 | 7,500,000 | |
| Housing Bonds Series 2010C (LIQ: Citibank, NA) | a | 0.11% | 07/07/15 | 6,200,000 | 6,200,000 | |
| Housing Bonds Series 2013F (LOC: TD Bank NA) | 0.10% | 07/07/15 | 13,310,000 | 13,310,000 | ||
| Massachusetts School Building Auth | ||||||
| Dedicated Sales Tax Bonds Series 2007A (LIQ: Citibank, NA) | a | 0.07% | 07/07/15 | 2,330,000 | 2,330,000 | |
| Sr Dedicated Sales Tax Refunding Bonds Series 2012B (LIQ: JPMorgan Chase Bank, NA) | a | 0.08% | 07/07/15 | 3,330,000 | 3,330,000 | |
| 156,590,000 | ||||||
| Michigan 3.1% | ||||||
| Michigan Finance Auth | ||||||
| Hospital RB (CHE Trinity Health) Series 2013MI3 (GTY/LIQ: Royal Bank of Canada) | a | 0.07% | 07/07/15 | 15,000,000 | 15,000,000 | |
| Student Loan Refunding RB Series 22A (LOC: State Street Bank & Trust Co NA) | 0.09% | 07/07/15 | 15,400,000 | 15,400,000 | ||
| Michigan Housing Development Auth | ||||||
| Rental Housing RB Series 2000A (LIQ: JPMorgan Chase Bank, NA) | 0.08% | 07/07/15 | 36,575,000 | 36,575,000 | ||
| Rental Housing RB Series 2005A (LIQ: Bank of Tokyo Mitsubishi UFJ, Ltd) | 0.16% | 07/07/15 | 31,515,000 | 31,515,000 | ||
| Rental Housing RB Series 2006D (LIQ: Bank of America, NA) | a | 0.18% | 07/07/15 | 2,880,000 | 2,880,000 | |
| Rental Housing RB Series 2006D (LIQ: Bank of America, NA) | a | 0.19% | 07/07/15 | 1,830,000 | 1,830,000 | |
| Rental Housing RB Series 2007C (LIQ: JPMorgan Chase Bank, NA) | 0.08% | 07/07/15 | 32,740,000 | 32,740,000 | ||
| Rental Housing RB Series 2008C (LIQ: Bank of Tokyo Mitsubishi UFJ, Ltd) | 0.10% | 07/07/15 | 14,065,000 | 14,065,000 | ||
| Rental Housing RB Series 2008D (LIQ: Bank of Tokyo Mitsubishi UFJ, Ltd) | d | 0.10% | 07/07/15 | 56,555,000 | 56,555,000 | |
| S/F Mortgage RB Series 2007E (LIQ: Bank of Tokyo Mitsubishi UFJ, Ltd) | 0.15% | 07/07/15 | 24,445,000 | 24,445,000 | ||
| S/F Mortgage RB Series 2007F (LIQ: PNC Bank NA) | d | 0.09% | 07/07/15 | 76,245,000 | 76,245,000 | |
| Issuer
Type of Security, Series |
Footnotes | Rate | Effective
Maturity |
Maturity
Date |
Face
Amount ($) |
Value
($) |
| Michigan Job Development Auth | ||||||
| Limited Obligation RB (Frankenmuth Bavarian Inn Motor Lodge) Series 1985 (LOC: Comerica Bank) | 0.26% | 07/01/15 | 07/07/15 | 7,100,000 | 7,100,000 | |
| Michigan State Strategic Fund | ||||||
| Limited Obligation RB (Mibelloon Dairy) Series 2006 (LOC: Wells Fargo Bank, NA) | 0.13% | 07/07/15 | 3,000,000 | 3,000,000 | ||
| Limited Obligation RB (YMCA of Greater Grand Rapids) Series 2004 (LOC: Comerica Bank) | 0.08% | 07/07/15 | 11,515,000 | 11,515,000 | ||
| Limited Obligation RB (YMCA of Greater Grand Rapids) Series 2005 (LOC: Comerica Bank) | 0.08% | 07/07/15 | 3,865,000 | 3,865,000 | ||
| Michigan State Univ | ||||||
| General RB Series 2000A1 (LIQ: Royal Bank of Canada) | 0.07% | 07/07/15 | 13,100,000 | 13,100,000 | ||
| General RB Series 2005 (LIQ: Royal Bank of Canada) | 0.07% | 07/07/15 | 2,500,000 | 2,500,000 | ||
| Wayne Cnty Airport Auth | ||||||
| Airport RB (Detroit Metropolitan) Series 2005 (GTY: Berkshire Hathaway Assurance Corp /LIQ: Morgan Stanley Bank NA) | a | 0.12% | 07/07/15 | 41,945,000 | 41,945,000 | |
| 390,275,000 | ||||||
| Minnesota 0.6% | ||||||
| East Grand Forks | ||||||
| Solid Waste Disposal Refunding RB (American Crystal Sugar) Series 2009 (LOC: CoBank, ACB) | 0.08% | 07/07/15 | 16,110,000 | 16,110,000 | ||
| Hennepin Cnty Housing & Redevelopment Auth | ||||||
| M/F Housing RB (City Apts at Loring Park) Series 2001 (LOC: Fannie Mae) | 0.10% | 07/07/15 | 9,250,000 | 9,250,000 | ||
| M/F Housing Refunding RB (Stone Arch Apts) Series 2002 (LOC: Fannie Mae) | 0.12% | 07/07/15 | 2,800,000 | 2,800,000 | ||
| Minnesota HFA | ||||||
| Residential Housing Finance Bonds Series 2003B (LIQ: Royal Bank of Canada) | 0.07% | 07/07/15 | 5,100,000 | 5,100,000 | ||
| Residential Housing Finance Bonds Series 2006G (LIQ: Citibank, NA) | a | 0.13% | 07/07/15 | 3,235,000 | 3,235,000 | |
| Residential Housing Finance Bonds Series 2009F (LIQ: Federal Home Loan Bank) | 0.07% | 07/07/15 | 6,085,000 | 6,085,000 | ||
| St. Louis Park | ||||||
| M/F Housing Refunding RB (Urban Park Apts) Series 2010A (LOC: Wells Fargo Bank, NA) | 0.12% | 07/07/15 | 2,845,000 | 2,845,000 | ||
| Western Minnesota Municipal Power Agency | ||||||
| Power Supply RB Series 2006A (GTY/LIQ: US Bank, NA) | a | 0.08% | 07/07/15 | 26,965,000 | 26,965,000 | |
| 72,390,000 | ||||||
| Mississippi 0.2% | ||||||
| Mississippi | ||||||
| GO Bonds Series 2007B (LIQ: State Street Bank & Trust Co NA) | a | 0.07% | 07/07/15 | 13,370,000 | 13,370,000 | |
| Mississippi Business Finance Corp | ||||||
| IDRB (Central Mississippi Baking Co) Series 2005 (LOC: Bank of America, NA) | 0.20% | 07/07/15 | 3,030,000 | 3,030,000 | ||
| Mississippi Development Bank | ||||||
| Special Obligation Bonds Series 2012 (LIQ: Credit Suisse AG) | a | 0.07% | 07/07/15 | 3,200,000 | 3,200,000 | |
| Mississippi Home Corp | ||||||
| M/F Housing RB (Edgewood Manor Apts) Series 2008-2 (LOC: Freddie Mac) | 0.13% | 07/07/15 | 5,000,000 | 5,000,000 | ||
| M/F Housing RB (William Bell Apts) Series 2008-1 (LOC: Fannie Mae) | 0.12% | 07/07/15 | 5,360,000 | 5,360,000 | ||
| 29,960,000 | ||||||
| Issuer
Type of Security, Series |
Footnotes | Rate | Effective
Maturity |
Maturity
Date |
Face
Amount ($) |
Value
($) |
| Missouri 1.5% | ||||||
| Blue Springs IDA | ||||||
| M/F Housing RB (Autumn Place Apts) Series 2004 (LOC: Fannie Mae) | 0.08% | 07/07/15 | 7,700,000 | 7,700,000 | ||
| Kansas City IDA | ||||||
| M/F Housing RB (Clay Terrace Apts) Series 2006 (LOC: Bank of America, NA) | 0.14% | 07/07/15 | 9,975,000 | 9,975,000 | ||
| M/F Housing RB (Timberlane Village Apts) Series 1986 (LOC: Wells Fargo Bank, NA) | 0.07% | 07/07/15 | 18,400,000 | 18,400,000 | ||
| Missouri Health & Educational Facilities Auth | ||||||
| Health Facilities RB (BJC Health) Series 2013B (LIQ: Royal Bank of Canada) | a | 0.07% | 07/07/15 | 16,000,000 | 16,000,000 | |
| Health Facilities RB (Lutheran Sr Services) Series 2000 (LOC: Bank of America, NA) | 0.08% | 07/07/15 | 38,015,000 | 38,015,000 | ||
| RB (Ascension Health) Series 2008C4 | 0.06% | 07/07/15 | 10,450,000 | 10,450,000 | ||
| St. Charles Cnty Public Water Supply District No. 2 | ||||||
| COP Series 2005 (LOC: Bank of America, NA) | 0.10% | 07/07/15 | 7,295,000 | 7,295,000 | ||
| St. Louis Cnty IDA | ||||||
| IDRB (Kessler Container) Series 1997A (LOC: Bank of America, NA) | 0.23% | 07/07/15 | 700,000 | 700,000 | ||
| M/F Housing RB (Black Forest Apts) Series 1997 (LOC: Fannie Mae) | 0.09% | 07/07/15 | 4,000,000 | 4,000,000 | ||
| M/F Housing RB (General Grant Colonial Village Apts) Series 2003 (LOC: US Bank, NA) | 0.09% | 07/07/15 | 16,370,000 | 16,370,000 | ||
| M/F Housing RB (Southwest Crossing) Series 2001 (LOC: Freddie Mac) | 0.09% | 07/07/15 | 9,500,000 | 9,500,000 | ||
| M/F Housing RB (Whispering Lakes Apts) Series 1995 (LOC: Fannie Mae) | 0.09% | 07/07/15 | 7,435,000 | 7,435,000 | ||
| M/F Housing Refunding RB (Merchandise Mart Apts) Series 2005A (LOC: Freddie Mac) | 0.09% | 07/07/15 | 20,475,000 | 20,475,000 | ||
| M/F Housing Refunding RB (Pelican Cove) Series 2004 (LOC: Fannie Mae) | 0.07% | 07/07/15 | 18,000,000 | 18,000,000 | ||
| Washington IDA | ||||||
| IDRB (Missourian Publishing) Series 2006A (LOC: US Bank, NA) | 0.09% | 07/07/15 | 5,740,000 | 5,740,000 | ||
| 190,055,000 | ||||||
| Nebraska 0.7% | ||||||
| Douglas Cnty Hospital Auth No. 3 | ||||||
| Health Facilities Refunding RB (Nebraska Methodist Health) Series 2008 (GTY: Berkshire Hathaway Assurance Corp /LIQ: Citibank, NA) | a | 0.09% | 07/07/15 | 5,265,000 | 5,265,000 | |
| Nebraska Investment Finance Auth | ||||||
| M/F Housing Refunding RB (Pheasant Ridge Apts) Series 2008 (LOC: Freddie Mac) | 0.09% | 07/07/15 | 8,950,000 | 8,950,000 | ||
| S/F Housing RB Series 2014B (LIQ: Federal Home Loan Bank) | 0.07% | 07/07/15 | 17,300,000 | 17,300,000 | ||
| S/F Housing RB Series 2015B (LIQ: Federal Home Loan Bank) | 0.07% | 07/07/15 | 17,500,000 | 17,500,000 | ||
| Omaha Public Power District | ||||||
| Electric System RB Series 2005A (GTY: Berkshire Hathaway Assurance Corp /LIQ: Citibank, NA) | a | 0.08% | 07/07/15 | 22,135,000 | 22,135,000 | |
| Washington Cnty | ||||||
| IDRB (Cargill) Series 2010 | 0.10% | 07/07/15 | 7,000,000 | 7,000,000 | ||
| IDRB (Cargill) Series 2010B | 0.10% | 07/07/15 | 10,000,000 | 10,000,000 | ||
| 88,150,000 | ||||||
| Issuer
Type of Security, Series |
Footnotes | Rate | Effective
Maturity |
Maturity
Date |
Face
Amount ($) |
Value
($) |
| Nevada 1.4% | ||||||
| Clark Cnty | ||||||
| Airport Passenger Facility Charge RB Series 2007A2 (GTY/LIQ: US Bank, NA) | a | 0.08% | 07/07/15 | 44,740,000 | 44,740,000 | |
| Airport System Sub Lien RB Series 2008A2 (LOC: State Street Bank & Trust Co NA) | 0.06% | 07/07/15 | 6,000,000 | 6,000,000 | ||
| Economic Development Refunding RB (Bishop Gorman HS) Series 2011 (LOC: Bank of America, NA) | 0.08% | 07/07/15 | 9,860,000 | 9,860,000 | ||
| IDRB (Southwest Gas Corp) Series 2009A (LOC: Bank of America, NA) | 0.07% | 07/07/15 | 11,500,000 | 11,500,000 | ||
| Clark Cnty SD | ||||||
| LT GO Bonds Series 2006B (GTY/LIQ: State Street Bank & Trust Co NA) | a | 0.07% | 07/07/15 | 14,630,000 | 14,630,000 | |
| Las Vegas | ||||||
| Economic Development RB (Andre Agassi Charitable Foundation) Series 2005 (LOC: Bank of America, NA) | 0.10% | 07/07/15 | 11,605,000 | 11,605,000 | ||
| Nevada Housing Division | ||||||
| M/F Housing RB (Apache Pines Apts) Series 1999A (LOC: Fannie Mae) | 0.07% | 07/07/15 | 11,800,000 | 11,800,000 | ||
| M/F Housing RB (Sierra Pointe Apts) Series 2005 (LOC: Fannie Mae) | 0.07% | 07/07/15 | 9,465,000 | 9,465,000 | ||
| M/F Housing RB (St. Rose Seniors Apts) Series 2002A (LOC: Fannie Mae) | 0.07% | 07/07/15 | 14,770,000 | 14,770,000 | ||
| Reno | ||||||
| Health Facility RB (Catholic Healthcare West) Series 2007A (GTY: Berkshire Hathaway Assurance Corp /LIQ: Credit Suisse AG) | a | 0.07% | 07/07/15 | 42,750,000 | 42,750,000 | |
| 177,120,000 | ||||||
| New Jersey 1.2% | ||||||
| New Jersey Economic Development Auth | ||||||
| IDRB (Advanced Drainage Systems) Series 2007 (LOC: PNC Bank NA) | 0.13% | 07/07/15 | 3,340,000 | 3,340,000 | ||
| RB (Marina Energy) Series 2006A (LOC: JPMorgan Chase Bank, NA) | 0.12% | 07/07/15 | 5,465,000 | 5,465,000 | ||
| Transportation System Bonds Series 2005B&2006A & School Facilities Construction Refunding Bonds Series 2005K (GTY/LIQ: State Street Bank & Trust Co NA) | a | 0.07% | 07/07/15 | 19,400,000 | 19,400,000 | |
| New Jersey Health Care Facilities Financing Auth | ||||||
| RB (Robert Wood Johnson Univ Hospital) Series 2014B (LOC: TD Bank NA) | 0.05% | 07/07/15 | 7,500,000 | 7,500,000 | ||
| New Jersey Housing & Mortgage Finance Agency | ||||||
| M/F Housing RB 2013 Series 5 (LOC: Citibank, NA) | 0.07% | 07/07/15 | 35,190,000 | 35,190,000 | ||
| S/F Housing RB Series 2005R (LIQ: TD Bank NA) | 0.08% | 07/07/15 | 3,865,000 | 3,865,000 | ||
| S/F Housing RB Series 2008BB (LIQ: TD Bank NA) | 0.06% | 07/07/15 | 11,300,000 | 11,300,000 | ||
| S/F Housing RB Series 2008Z (LIQ: Royal Bank of Canada) | 0.06% | 07/07/15 | 33,120,000 | 33,120,000 | ||
| New Jersey Transportation Trust Fund Auth | ||||||
| Transportation System Bonds Series 2006C (GTY/LIQ: Wells Fargo & Co) | a | 0.08% | 07/07/15 | 17,060,000 | 17,060,000 | |
| Rutgers State Univ | ||||||
| GO Bonds Series 2013L (LIQ: Bank of America, NA) | a | 0.08% | 07/07/15 | 7,100,000 | 7,100,000 | |
| GO Bonds Series 2013L (LIQ: JPMorgan Chase Bank, NA) | a | 0.12% | 07/07/15 | 1,250,000 | 1,250,000 | |
| 144,590,000 | ||||||
| Issuer
Type of Security, Series |
Footnotes | Rate | Effective
Maturity |
Maturity
Date |
Face
Amount ($) |
Value
($) |
| New Mexico 0.1% | ||||||
| Bernalillo Cnty | ||||||
| M/F Housing Refunding RB (Desert Willow Apts) Series 2008 (LOC: US Bank, NA) | 0.17% | 07/07/15 | 7,500,000 | 7,500,000 | ||
| New York 5.8% | ||||||
| Monroe Security & Safety Systems Local Development Corp | ||||||
| RB Series 2010 (LOC: Manufacturers & Traders Trust Co) | 0.07% | 07/07/15 | 34,795,000 | 34,795,000 | ||
| Nassau Cnty Interim Finance Auth | ||||||
| Sales Tax Secured Bonds Series 2008D1 (LIQ: Bank of New York Mellon) | 0.07% | 07/07/15 | 10,995,000 | 10,995,000 | ||
| Nassau Health Care Corp | ||||||
| Bonds Series 2009C2 (LOC: Wells Fargo Bank, NA) | 0.09% | 07/07/15 | 8,910,000 | 8,910,000 | ||
| New Rochelle IDA | ||||||
| IDRB (West End Phase I) Series 2006 (LOC: Citibank, NA) | 0.19% | 07/07/15 | 3,935,000 | 3,935,000 | ||
| New York City | ||||||
| GO Bonds Fiscal 2004 Series H2 (LOC: California Public Employees' Retirement System) | 0.07% | 07/07/15 | 26,705,000 | 26,705,000 | ||
| GO Bonds Fiscal 2004 Series H3 (LOC: California Public Employees' Retirement System) | 0.07% | 07/07/15 | 5,000,000 | 5,000,000 | ||
| GO Bonds Fiscal 2008 Series J4 (LIQ: Bank of America, NA) | 0.03% | 07/01/15 | 3,000,000 | 3,000,000 | ||
| GO Bonds Fiscal 2009 Series H1 (LIQ: Citibank, NA) | a | 0.07% | 07/07/15 | 5,000,000 | 5,000,000 | |
| GO Bonds Fiscal 2014 Series A1 (LIQ: Barclays Bank Plc) | a | 0.11% | 07/07/15 | 5,315,000 | 5,315,000 | |
| GO Bonds Fiscal 2014 Series I1 (LIQ: JPMorgan Chase Bank, NA) | a | 0.08% | 07/07/15 | 2,500,000 | 2,500,000 | |
| New York City Capital Resource Corp | ||||||
| RB Series 2008B1 (LOC: Bank of America, NA) | 0.15% | 07/07/15 | 20,230,000 | 20,230,000 | ||
| New York City Housing Development Corp | ||||||
| M/F Housing RB Series 2009C1 (LIQ: JPMorgan Chase Bank, NA) | a | 0.08% | 07/07/15 | 2,625,000 | 2,625,000 | |
| M/F Housing RB Series 2013E3 (LIQ: Wells Fargo Bank, NA) | 0.07% | 07/07/15 | 19,520,000 | 19,520,000 | ||
| M/F Housing RB Series 2014C3 (LIQ: TD Bank NA) | 0.06% | 07/07/15 | 9,200,000 | 9,200,000 | ||
| M/F Mortgage RB (50th Ave) Series 2013B (LOC: Wells Fargo Bank, NA) | 0.08% | 07/07/15 | 15,000,000 | 15,000,000 | ||
| M/F Mortgage RB (Boricua Village Apts) Series 2007A (LOC: Citibank, NA) | 0.08% | 07/07/15 | 4,250,000 | 4,250,000 | ||
| M/F Mortgage RB (Parkview Apts) Series 2004A (LOC: Citibank, NA) | 0.08% | 07/07/15 | 5,935,000 | 5,935,000 | ||
| M/F Mortgage RB (Rev Ruben Diaz Gardens Apts) Series 2006A (LOC: Freddie Mac) | 0.10% | 07/07/15 | 4,000,000 | 4,000,000 | ||
| M/F Mortgage RB (White Plains Courtyard Apts) Series 2005A (LOC: Freddie Mac) | 0.07% | 07/07/15 | 2,000,000 | 2,000,000 | ||
| M/F Rental Housing RB (Related - W 89th St Development) Series 2000A (LOC: Fannie Mae) | 0.06% | 07/07/15 | 37,400,000 | 37,400,000 | ||
| New York City Municipal Water Finance Auth | ||||||
| Water & Sewer System Fiscal 2015 Series BB3 (LIQ: Sumitomo Mitsui Banking Corp) | 0.06% | 07/07/15 | 6,500,000 | 6,500,000 | ||
| Water & Sewer System Fiscal 2015 Series BB4 (LIQ: Wells Fargo Bank, NA) | 0.01% | 07/01/15 | 2,400,000 | 2,400,000 | ||
| Water & Sewer System RB Fiscal 2009 Series AA (LIQ: JPMorgan Chase Bank, NA) | a | 0.08% | 07/07/15 | 7,295,000 | 7,295,000 | |
| Water & Sewer System RB Fiscal 2011 Series EE (LIQ: Toronto-Dominion Bank) | a | 0.08% | 07/07/15 | 6,875,000 | 6,875,000 | |
| Water & Sewer System RB Fiscal 2013 Series CC (LIQ: Morgan Stanley Bank NA) | a | 0.08% | 07/07/15 | 2,500,000 | 2,500,000 | |
| Issuer
Type of Security, Series |
Footnotes | Rate | Effective
Maturity |
Maturity
Date |
Face
Amount ($) |
Value
($) |
| Water & Sewer System Second General Resolution RB Fiscal 2012 Series FF (LIQ: JPMorgan Chase Bank, NA) | a | 0.08% | 07/07/15 | 1,905,000 | 1,905,000 | |
| Water & Sewer System Second General Resolution RB Fiscal 2013 Series BB (LIQ: Morgan Stanley Bank NA) | a | 0.08% | 07/07/15 | 2,250,000 | 2,250,000 | |
| New York City Transitional Finance Auth | ||||||
| Building Aid RB Fiscal 2007 Series S1 (LIQ: Citibank, NA) | a | 0.08% | 07/07/15 | 23,180,000 | 23,180,000 | |
| Building Aid RB Fiscal 2012 Series S1A (LIQ: Citibank, NA) | a | 0.08% | 07/07/15 | 5,625,000 | 5,625,000 | |
| Building Aid RB Fiscal 2013 Series S1 (LIQ: Citibank, NA) | a | 0.08% | 07/07/15 | 6,250,000 | 6,250,000 | |
| Future Tax Secured Sub Bonds Fiscal 2012 Series E1 (LIQ: Citibank, NA) | a | 0.08% | 07/07/15 | 5,000,000 | 5,000,000 | |
| Future Tax Secured Sub Bonds Fiscal 2012 Series F1 (LIQ: Morgan Stanley Bank NA) | a | 0.08% | 07/07/15 | 6,800,000 | 6,800,000 | |
| Future Tax Secured Sub Bonds Fiscal 2013 Series B (LIQ: JPMorgan Chase Bank, NA) | a | 0.08% | 07/07/15 | 3,125,000 | 3,125,000 | |
| Future Tax Secured Sub Bonds Fiscal 2014 Series A1 (LIQ: Royal Bank of Canada) | a | 0.07% | 07/07/15 | 6,300,000 | 6,300,000 | |
| Future Tax Secured Sub Bonds Fiscal 2014 Series B3 (LIQ: Barclays Bank Plc) | 0.03% | 07/01/15 | 800,000 | 800,000 | ||
| New York State Dormitory Auth | ||||||
| Mental Health Services Facilities RB Series 2003D2F (LIQ: JPMorgan Chase Bank, NA) | 0.06% | 07/07/15 | 9,590,000 | 9,590,000 | ||
| RB (Cornell Univ) Series 2000B | 0.07% | 07/07/15 | 4,800,000 | 4,800,000 | ||
| RB (Univ of Rochester) Series 2003C (LOC: JPMorgan Chase Bank, NA) | 0.08% | 07/07/15 | 50,000 | 50,000 | ||
| State Personal Income Tax RB Series 2006C (ESCROW/LIQ: Citibank, NA) | a | 0.08% | 07/07/15 | 7,680,000 | 7,680,000 | |
| State Personal Income Tax RB Series 2006D (ESCROW/LIQ: Citibank, NA) | a | 0.07% | 07/07/15 | 10,500,000 | 10,500,000 | |
| State Personal Income Tax RB Series 2011C (LIQ: JPMorgan Chase Bank, NA) | a | 0.08% | 07/07/15 | 4,200,000 | 4,200,000 | |
| State Personal Income Tax RB Series 2014C (LIQ: JPMorgan Chase Bank, NA) | a | 0.08% | 07/07/15 | 14,000,000 | 14,000,000 | |
| New York State Energy Research & Development Auth | ||||||
| Facilities RB (Consolidated Edison) Series 2005A3 (LOC: Mizuho Bank Ltd) | 0.07% | 07/07/15 | 9,100,000 | 9,100,000 | ||
| New York State Environmental Facilities Corp | ||||||
| Solid Waste Disposal RB (Waste Management) Series 2002B (LOC: JPMorgan Chase Bank, NA) | 0.12% | 07/07/15 | 24,800,000 | 24,800,000 | ||
| New York State HFA | ||||||
| Housing RB (345 E 94th St) Series 1998A (LOC: Freddie Mac) | 0.07% | 07/07/15 | 10,300,000 | 10,300,000 | ||
| Housing RB (360 W 43rd St) Series 2003A (LOC: Fannie Mae) | 0.06% | 07/07/15 | 22,000,000 | 22,000,000 | ||
| Housing RB (388 Bridge St) Series 2012A (LOC: Manufacturers & Traders Trust Co) | 0.07% | 07/07/15 | 15,040,000 | 15,040,000 | ||
| Housing RB (600 W 42nd St) Series 2008A (LOC: Fannie Mae) | 0.08% | 07/07/15 | 27,000,000 | 27,000,000 | ||
| Housing RB (Biltmore Tower) Series 2002A (LOC: Fannie Mae) | 0.06% | 07/07/15 | 15,000,000 | 15,000,000 | ||
| Housing RB (Ocean Park Apts) Series 2005A (LOC: Fannie Mae) | 0.08% | 07/07/15 | 28,400,000 | 28,400,000 | ||
| Housing RB (Related W30th St) Series 2013A (LOC: Wells Fargo Bank, NA) | 0.08% | 07/07/15 | 4,105,000 | 4,105,000 | ||
| New York State Mortgage Agency | ||||||
| Homeowner Mortgage RB Series 115 (LIQ: JPMorgan Chase Bank, NA) | 0.10% | 07/07/15 | 31,215,000 | 31,215,000 | ||
| Homeowner Mortgage RB Series 125 (LIQ: Royal Bank of Canada) | 0.08% | 07/07/15 | 10,100,000 | 10,100,000 | ||
| Issuer
Type of Security, Series |
Footnotes | Rate | Effective
Maturity |
Maturity
Date |
Face
Amount ($) |
Value
($) |
| New York State Thruway Auth | ||||||
| State Personal Income Tax RB Series 2012A (LIQ: Deutsche Bank AG) | a | 0.22% | 07/07/15 | 2,000,000 | 2,000,000 | |
| New York State Urban Development Corp | ||||||
| State Personal Income Tax RB Series 2004A3A (LIQ: JPMorgan Chase Bank, NA) | 0.10% | 07/07/15 | 7,605,000 | 7,605,000 | ||
| State Personal Income Tax RB Series 2004A3D (LIQ: JPMorgan Chase Bank, NA) | 0.10% | 07/07/15 | 10,500,000 | 10,500,000 | ||
| State Personal Income Tax RB Series 2009B1 (LIQ: Deutsche Bank AG) | a | 0.09% | 07/07/15 | 5,000,000 | 5,000,000 | |
| State Personal Income Tax RB Series 2013A1 (LIQ: Morgan Stanley Bank NA) | a | 0.08% | 07/07/15 | 11,600,000 | 11,600,000 | |
| Port Auth of New York & New Jersey | ||||||
| Consolidated Bonds 141st Series (LIQ: Wells Fargo & Co) | a | 0.08% | 07/07/15 | 18,865,000 | 18,865,000 | |
| Consolidated Bonds 143rd Series (LIQ: Toronto-Dominion Bank) | a | 0.10% | 07/07/15 | 7,875,000 | 7,875,000 | |
| Consolidated Bonds 147th Series (LIQ: Citibank, NA) | a | 0.11% | 07/07/15 | 36,820,000 | 36,820,000 | |
| Consolidated Bonds 152nd Series (LIQ: JPMorgan Chase Bank, NA) | a | 0.10% | 07/07/15 | 5,555,000 | 5,555,000 | |
| Consolidated Bonds 152nd Series (LIQ: Morgan Stanley Bank NA) | a | 0.14% | 07/07/15 | 32,970,000 | 32,970,000 | |
| Consolidated Bonds 152nd Series (LIQ: Toronto-Dominion Bank) | a | 0.10% | 07/07/15 | 7,505,000 | 7,505,000 | |
| Consolidated Bonds 169th Series (LIQ: JPMorgan Chase Bank, NA) | a | 0.10% | 07/07/15 | 6,440,000 | 6,440,000 | |
| Consolidated Bonds 172nd Series (LIQ: JPMorgan Chase Bank, NA) | a | 0.10% | 07/07/15 | 3,080,000 | 3,080,000 | |
| Consolidated Bonds 177th Series (LIQ: Credit Suisse AG) | a | 0.07% | 07/07/15 | 1,665,000 | 1,665,000 | |
| Consolidated Bonds 178th Series (LIQ: JPMorgan Chase Bank, NA) | a | 0.10% | 07/07/15 | 1,660,000 | 1,660,000 | |
| Consolidated Bonds 185th Series (LIQ: Citibank, NA) | a | 0.11% | 07/07/15 | 2,050,000 | 2,050,000 | |
| 722,190,000 | ||||||
| North Carolina 0.4% | ||||||
| Charlotte | ||||||
| COP Series 2003F (LIQ: Bank of America, NA) | 0.10% | 07/07/15 | 11,485,000 | 11,485,000 | ||
| North Carolina | ||||||
| GO Bonds Series 2015A (LIQ: JPMorgan Chase Bank, NA) | a | 0.08% | 07/07/15 | 2,750,000 | 2,750,000 | |
| Limited Obligation Refunding Bonds Series 2014C (LIQ: Citibank, NA) | a | 0.08% | 07/07/15 | 2,800,000 | 2,800,000 | |
| North Carolina Capital Facilities Finance Agency | ||||||
| Recreational Facilities RB (YMCA of Greater Charlotte) Series 2007A (LOC: Branch Banking & Trust Co) | 0.06% | 07/07/15 | 4,215,000 | 4,215,000 | ||
| North Carolina Infrastructure Finance Corp | ||||||
| COP Series 2007A (LIQ: Wells Fargo & Co) | a | 0.07% | 07/07/15 | 19,000,000 | 19,000,000 | |
| North Carolina Ports Auth | ||||||
| Exempt Facility RB (Wilmington Bulk) Series 2001A (LOC: Branch Banking & Trust Co) | 0.13% | 07/07/15 | 1,460,000 | 1,460,000 | ||
| Piedmont Triad Airport Auth | ||||||
| Airport RB Series 2008B (LOC: Branch Banking & Trust Co) | 0.13% | 07/07/15 | 2,365,000 | 2,365,000 | ||
| 44,075,000 | ||||||
| Issuer
Type of Security, Series |
Footnotes | Rate | Effective
Maturity |
Maturity
Date |
Face
Amount ($) |
Value
($) |
| North Dakota 0.4% | ||||||
| North Dakota HFA | ||||||
| Home Mortgage Finance Program Series 2005C (LIQ: Federal Home Loan Bank) | 0.08% | 07/07/15 | 12,000,000 | 12,000,000 | ||
| Home Mortgage Finance Program Series 2009B (LIQ: Federal Home Loan Bank) | 0.06% | 07/07/15 | 38,145,000 | 38,145,000 | ||
| 50,145,000 | ||||||
| Ohio 1.1% | ||||||
| Columbus Regional Airport Auth | ||||||
| Airport Development RB (Flightsafety) Series 2015A | 0.08% | 07/07/15 | 8,100,000 | 8,100,000 | ||
| Airport Development RB (Flightsafety) Series 2015B | 0.08% | 07/07/15 | 4,500,000 | 4,500,000 | ||
| Franklin Cnty | ||||||
| RB (OhioHealth) Series 2011C | 0.11% | 07/02/15 | 06/01/16 | 7,500,000 | 7,500,000 | |
| Marion Cnty | ||||||
| M/F Housing RB (Avalon Lakes) Series 2006 (LOC: Federal Home Loan Bank) | 0.09% | 07/07/15 | 5,215,000 | 5,215,000 | ||
| Northeast Ohio Regional Sewer District | ||||||
| Wastewater RB Series 2013 (LIQ: State Street Bank & Trust Co NA) | a | 0.08% | 07/07/15 | 5,000,000 | 5,000,000 | |
| Ohio | ||||||
| GO Bonds Series 2006B | 0.06% | 07/07/15 | 19,240,000 | 19,240,000 | ||
| Hospital Refunding RB (Cleveland Clinic) Series 2009A (LIQ: JPMorgan Chase Bank, NA) | a | 0.08% | 07/07/15 | 2,000,000 | 2,000,000 | |
| Ohio HFA | ||||||
| Residential Mortgage RB Series 2007B (LIQ: JPMorgan Chase Bank, NA) | 0.08% | 07/07/15 | 44,865,000 | 44,865,000 | ||
| Residential Mortgage RB Series 2007E (LIQ: JPMorgan Chase Bank, NA) | 0.08% | 07/07/15 | 23,330,000 | 23,330,000 | ||
| Ohio State Air Quality Development Auth | ||||||
| Exempt Facilities RB (Andersons Marathon Ethanol) Series 2007 (LOC: CoBank, ACB) | 0.10% | 07/07/15 | 20,000,000 | 20,000,000 | ||
| 139,750,000 | ||||||
| Oklahoma 0.4% | ||||||
| Oklahoma Turnpike Auth | ||||||
| Second Sr Refunding RB Series 2006B (GTY/LIQ: Royal Bank of Canada) | a | 0.07% | 07/07/15 | 53,130,000 | 53,130,000 | |
| Oregon 0.9% | ||||||
| Oregon Health, Housing, Educational & Cultural Facilities Auth | ||||||
| RB (Assumption Village) Series 2001A (LOC: MUFG Union Bank, NA) | 0.08% | 07/07/15 | 2,740,000 | 2,740,000 | ||
| Oregon Housing & Community Services Dept | ||||||
| S/F Mortgage RB Series 2005F (LIQ: State Street Bank & Trust Co NA) | 0.07% | 07/07/15 | 14,885,000 | 14,885,000 | ||
| S/F Mortgage RB Series 2007E (LIQ: JPMorgan Chase Bank, NA) | 0.09% | 07/07/15 | 30,000,000 | 30,000,000 | ||
| S/F Mortgage RB Series 2007H (LIQ: JPMorgan Chase Bank, NA) | 0.09% | 07/07/15 | 30,000,000 | 30,000,000 | ||
| S/F Mortgage RB Series 2008C (LIQ: JPMorgan Chase Bank, NA) | 0.09% | 07/07/15 | 35,000,000 | 35,000,000 | ||
| Portland CCD | ||||||
| GO Bonds Series 2013 (LIQ: Credit Suisse AG) | a | 0.07% | 07/07/15 | 3,835,000 | 3,835,000 | |
| 116,460,000 | ||||||
| Issuer
Type of Security, Series |
Footnotes | Rate | Effective
Maturity |
Maturity
Date |
Face
Amount ($) |
Value
($) |
| Pennsylvania 2.2% | ||||||
| Allegheny Cnty Hospital Development Auth | ||||||
| RB (Univ of Pittsburgh Medical Center) Series 2010B1&B2 (GTY/LIQ: Royal Bank of Canada) | a | 0.07% | 07/07/15 | 10,990,000 | 10,990,000 | |
| RB (Univ of Pittsburgh Medical Center) Series 2010C (GTY/LIQ: Royal Bank of Canada) | a | 0.07% | 07/07/15 | 7,995,000 | 7,995,000 | |
| Allegheny Cnty IDA | ||||||
| Health Care RB (Vincentian Collaborative) Series 2008B (LOC: PNC Bank NA) | 0.08% | 07/07/15 | 3,725,000 | 3,725,000 | ||
| Butler Cnty IDA | ||||||
| RB (Butler Cnty Family YMCA) Series 2005 (LOC: PNC Bank NA) | 0.10% | 07/07/15 | 4,645,000 | 4,645,000 | ||
| Cumberland Cnty Municipal Auth | ||||||
| RB (Diakon Lutheran Social Ministries) Series 2014B (LOC: Manufacturers & Traders Trust Co) | 0.07% | 07/07/15 | 7,335,000 | 7,335,000 | ||
| Dallastown Area SD | ||||||
| GO Notes Series 2015 | 1.25% | 04/15/16 | 7,845,000 | 7,902,333 | ||
| Delaware Cnty IDA | ||||||
| Water Facilities RB (Aqua Pennsylvania) Series 2005A (GTY: Berkshire Hathaway Assurance Corp /LIQ: Citibank, NA) | a | 0.10% | 07/07/15 | 9,635,000 | 9,635,000 | |
| Montgomery Cnty Redevelopment Auth | ||||||
| M/F Housing RB (Kingswood Apts) Series 2001A (LOC: Fannie Mae) | 0.07% | 07/07/15 | 7,710,000 | 7,710,000 | ||
| North Hampton Cnty | ||||||
| RB (Binney & Smith) Series 1997B (LOC: JPMorgan Chase Bank, NA) | 0.38% | 07/07/15 | 430,000 | 430,000 | ||
| Pennsylvania | ||||||
| GO Bonds Second Series 2007A (LIQ: Branch Banking & Trust Co) | a | 0.08% | 07/07/15 | 5,000,000 | 5,000,000 | |
| Pennsylvania HFA | ||||||
| S/F Mortgage RB Series 2002-75A (LIQ: Royal Bank of Canada) | 0.07% | 07/07/15 | 13,965,000 | 13,965,000 | ||
| S/F Mortgage RB Series 2003-77B (LIQ: Royal Bank of Canada) | 0.07% | 07/07/15 | 19,210,000 | 19,210,000 | ||
| S/F Mortgage RB Series 2003-79B (LIQ: Royal Bank of Canada) | 0.07% | 07/07/15 | 25,580,000 | 25,580,000 | ||
| S/F Mortgage RB Series 2004-102C (LIQ: Bank of Tokyo Mitsubishi UFJ, Ltd) | 0.08% | 07/07/15 | 10,000,000 | 10,000,000 | ||
| S/F Mortgage RB Series 2004-81C (LIQ: Royal Bank of Canada) | 0.07% | 07/07/15 | 9,275,000 | 9,275,000 | ||
| S/F Mortgage RB Series 2004-85B (LIQ: TD Bank NA) | 0.09% | 07/07/15 | 1,320,000 | 1,320,000 | ||
| S/F Mortgage RB Series 2004-85C (LIQ: TD Bank NA) | 0.09% | 07/07/15 | 2,000,000 | 2,000,000 | ||
| S/F Mortgage RB Series 2005-91B (LIQ: Bank of Tokyo Mitsubishi UFJ, Ltd) | 0.09% | 07/07/15 | 26,100,000 | 26,100,000 | ||
| S/F Mortgage RB Series 2006-93,94&95A, 2007-97&98A (LIQ: Morgan Stanley Bank NA) | a | 0.14% | 07/07/15 | 1,278,639 | 1,278,639 | |
| S/F Mortgage RB Series 2006-93B (LIQ: Sumitomo Mitsui Banking Corp) | 0.08% | 07/07/15 | 30,335,000 | 30,335,000 | ||
| S/F Mortgage RB Series 2006-94B (LIQ: TD Bank NA) | 0.09% | 07/07/15 | 21,065,000 | 21,065,000 | ||
| S/F Mortgage RB Series 2007-100C (LIQ: Sumitomo Mitsui Banking Corp) | 0.08% | 07/07/15 | 22,935,000 | 22,935,000 | ||
| S/F Mortgage RB Series 2013-115A (LIQ: JPMorgan Chase Bank, NA) | a | 0.12% | 07/07/15 | 500,000 | 500,000 | |
| Philadelphia | ||||||
| Airport Refunding RB Series 2005C2 (LOC: Royal Bank of Canada) | 0.09% | 07/07/15 | 14,550,000 | 14,550,000 | ||
| Philadelphia Municipal Auth | ||||||
| Lease RB Series 2009 (GTY/LIQ: Wells Fargo & Co) | a | 0.09% | 07/07/15 | 4,520,000 | 4,520,000 | |
| Issuer
Type of Security, Series |
Footnotes | Rate | Effective
Maturity |
Maturity
Date |
Face
Amount ($) |
Value
($) |
| Univ of Pittsburgh | ||||||
| Univ & Refunding Bonds Series 2009C (LIQ: Wells Fargo & Co) | a | 0.09% | 07/07/15 | 500,000 | 500,000 | |
| 268,500,972 | ||||||
| Rhode Island 0.1% | ||||||
| Rhode Island Housing & Mortgage Finance Corp | ||||||
| Homeownership Opportunity Bonds Series 56A (LIQ: Citibank, NA) | a | 0.12% | 07/07/15 | 7,265,000 | 7,265,000 | |
| Homeownership Opportunity Bonds Series 56A (LIQ: Morgan Stanley Bank NA) | a | 0.14% | 07/07/15 | 5,670,000 | 5,670,000 | |
| 12,935,000 | ||||||
| South Carolina 0.6% | ||||||
| Charleston Educational Excellence Financing Corporation | ||||||
| Installment Purchase Refunding RB Series 2013B (LIQ: Credit Suisse AG) | a | 0.07% | 07/07/15 | 575,000 | 575,000 | |
| Greenwood Cnty | ||||||
| Hospital Facilities RB (Self Regional Healthcare) Series 2009 (GTY/LIQ: Wells Fargo & Co) | a | 0.09% | 07/07/15 | 7,410,000 | 7,410,000 | |
| South Carolina Jobs Economic Development Auth | ||||||
| IRB (South Carolina Electric & Gas) Series 2008 (LOC: TD Bank NA) | 0.09% | 07/07/15 | 6,935,000 | 6,935,000 | ||
| IRB (South Carolina Generating) Series 2008 (LOC: TD Bank NA) | 0.09% | 07/07/15 | 9,200,000 | 9,200,000 | ||
| RB (Holcim) Series 2003 (LOC: Comerica Bank) | 0.12% | 07/07/15 | 25,000,000 | 25,000,000 | ||
| South Carolina Transportation Infrastructure Bank | ||||||
| RB Series 2007A (GTY/LIQ: US Bank, NA) | a | 0.07% | 07/07/15 | 25,045,000 | 25,045,000 | |
| 74,165,000 | ||||||
| South Dakota 1.0% | ||||||
| South Dakota Housing Development Auth | ||||||
| Homeownership Mortgage Bonds Series 2006C (LIQ: Federal Home Loan Bank) | 0.07% | 07/07/15 | 45,000,000 | 45,000,000 | ||
| Homeownership Mortgage Bonds Series 2007I (LIQ: Federal Home Loan Bank) | 0.07% | 07/07/15 | 18,000,000 | 18,000,000 | ||
| Homeownership Mortgage Bonds Series 2008C (LIQ: Federal Home Loan Bank) | 0.10% | 07/07/15 | 50,000,000 | 50,000,000 | ||
| M/F Housing RB (Harmony Heights) Series 2001 (LOC: Fannie Mae) | 0.10% | 07/07/15 | 6,500,000 | 6,500,000 | ||
| South Dakota Value Added Finance Auth | ||||||
| Solid Waste Disposal RB (Lincoln Land) Series 2014 (LOC: AgriBank, FCB) | 0.12% | 07/07/15 | 5,500,000 | 5,500,000 | ||
| 125,000,000 | ||||||
| Tennessee 0.9% | ||||||
| Blount Cnty Public Building Auth | ||||||
| Public Improvement Bonds Series E6A (LOC: Branch Banking & Trust Co) | 0.06% | 07/07/15 | 21,015,000 | 21,015,000 | ||
| Chattanooga IDB | ||||||
| Lease Rental Refunding RB Series 2007 (LIQ: Royal Bank of Canada) | a | 0.09% | 07/07/15 | 7,000,000 | 7,000,000 | |
| Clarksville Public Building Auth | ||||||
| Pooled Financing RB (Tennessee Municipal Bond Fund) Series 1997 (LOC: Bank of America, NA) | 0.13% | 07/07/15 | 1,400,000 | 1,400,000 | ||
| Pooled Financing RB (Tennessee Municipal Bond Fund) Series 1999 (LOC: Bank of America, NA) | a | 0.13% | 07/07/15 | 5,045,000 | 5,045,000 | |
| Issuer
Type of Security, Series |
Footnotes | Rate | Effective
Maturity |
Maturity
Date |
Face
Amount ($) |
Value
($) |
| Grundy Cnty IDB | ||||||
| Limited Obligation RB (Toyo Seat USA) Series 2001 (LOC: Comerica Bank) | 0.17% | 07/07/15 | 800,000 | 800,000 | ||
| Jackson Health, Educational & Housing Facility Board | ||||||
| M/F Housing RB (Patrician Terrace Apts) Series 2005 (LOC: Fannie Mae) | 0.08% | 07/07/15 | 2,000,000 | 2,000,000 | ||
| Memphis & Shelby Cnty Sports Auth | ||||||
| Refunding RB (Memphis Arena) Series 2007C&D (GTY/LIQ: State Street Bank & Trust Co NA) | a | 0.07% | 07/07/15 | 12,795,000 | 12,795,000 | |
| Metro Government of Nashville & Davidson Cnty Health & Educational Facilities Board | ||||||
| M/F Housing RB (Burning Tree Apts) Series 2005 (LOC: Fannie Mae) | 0.09% | 07/07/15 | 7,420,000 | 7,420,000 | ||
| M/F Housing RB (Weatherly Ridge Apts) Series 2006A (LOC: US Bank, NA) | 0.08% | 07/07/15 | 5,000,000 | 5,000,000 | ||
| M/F Housing Refunding RB (Brentwood Oaks Apts) Series 1991 (LOC: Fannie Mae) | 0.07% | 07/07/15 | 11,320,000 | 11,320,000 | ||
| Montgomery Cnty Public Building Auth | ||||||
| Pooled Financing RB (Tennessee Cnty Loan Pool) Series 1995 (LOC: Bank of America, NA) | a | 0.13% | 07/07/15 | 820,000 | 820,000 | |
| Pooled Financing RB (Tennessee Cnty Loan Pool) Series 1997 (LOC: Bank of America, NA) | 0.13% | 07/07/15 | 16,160,000 | 16,160,000 | ||
| Sevier Cnty Public Building Auth | ||||||
| Public Improvement Bonds Series VA1 (LOC: Branch Banking & Trust Co) | 0.14% | 07/07/15 | 10,580,000 | 10,580,000 | ||
| Shelby Cnty Health, Educational & Housing Facilities Board | ||||||
| RB (Methodist Healthcare) Series 2004B (GTY: Berkshire Hathaway Assurance Corp /LIQ: JPMorgan Chase Bank, NA) | a | 0.10% | 07/07/15 | 7,495,000 | 7,495,000 | |
| 108,850,000 | ||||||
| Texas 10.1% | ||||||
| Alamo CCD | ||||||
| LT GO Refunding Bonds Series 2012 (LIQ: Credit Suisse AG) | a | 0.07% | 07/07/15 | 6,670,000 | 6,670,000 | |
| Austin | ||||||
| Water & Wastewater System Refunding RB Series 2008 (LOC: Citibank, NA) | 0.05% | 07/07/15 | 4,865,000 | 4,865,000 | ||
| Calhoun Cnty Navigation District | ||||||
| Environmental Facilities RB (Formosa Plastics) Series 2006 (LOC: Bank of America, NA) | 0.08% | 07/07/15 | 28,500,000 | 28,500,000 | ||
| Solid Waste Disposal RB (Formosa Plastics) Series 2000 (LOC: JPMorgan Chase Bank, NA) | 0.09% | 07/07/15 | 12,500,000 | 12,500,000 | ||
| Calhoun Cnty Navigation IDA | ||||||
| Port RB (Formosa Plastics) Series 2011C (LOC: Sumitomo Mitsui Banking Corp) | 0.07% | 07/07/15 | 27,500,000 | 27,500,000 | ||
| Calhoun Port Auth | ||||||
| Environmental Facilities RB (Formosa Plastics) Series 2011B (LOC: Sumitomo Mitsui Banking Corp) | 0.07% | 07/07/15 | 45,000,000 | 45,000,000 | ||
| Port RB (Formosa Plastics Corp) Series 2011A (LOC: Sumitomo Mitsui Banking Corp) | 0.07% | 07/07/15 | 32,300,000 | 32,300,000 | ||
| Capital IDC | ||||||
| Solid Waste Disposal RB (Texas Disposal Systems) Series 2001 (LOC: MUFG Union Bank, NA) | 0.13% | 07/07/15 | 7,930,000 | 7,930,000 | ||
| Clear Creek ISD | ||||||
| ULT GO Refunding Bonds Series 2008A (GTY: TX Permanent School Fund /LIQ: Bank of America, NA) | a | 0.12% | 07/07/15 | 5,000,000 | 5,000,000 | |
| Collin Cnty HFA | ||||||
| M/F Housing RB (Huntington Apts) Series 1996 (LOC: Northern Trust Co) | 0.07% | 07/07/15 | 12,305,000 | 12,305,000 | ||
| Issuer
Type of Security, Series |
Footnotes | Rate | Effective
Maturity |
Maturity
Date |
Face
Amount ($) |
Value
($) |
| Dallam Cnty IDC | ||||||
| Economic Development RB (Hillmar Cheese) Series 2010 (LOC: CoBank, ACB) | 0.09% | 07/07/15 | 20,000,000 | 20,000,000 | ||
| Economic Development Refunding RB (Hilmar Cheese) Series 2009 (LOC: CoBank, ACB) | 0.09% | 07/07/15 | 24,500,000 | 24,500,000 | ||
| IDRB (Dalhart Jersey Ranch) Series 2006 (LOC: CoBank, ACB) | 0.13% | 07/07/15 | 3,000,000 | 3,000,000 | ||
| Dallas Area Rapid Transit | ||||||
| Sr Lien Sales Tax RB Series 2008 (LIQ: Citibank, NA) | a | 0.08% | 07/07/15 | 11,440,000 | 11,440,000 | |
| Galveston Cnty | ||||||
| GO Refunding Bonds Series 2007 (GTY/LIQ: Wells Fargo & Co) | a | 0.08% | 07/07/15 | 19,140,000 | 19,140,000 | |
| Grand Parkway Transportation Corp | ||||||
| Sub Tier Toll RB Series 2013B (LIQ: Royal Bank of Canada) | a | 0.08% | 07/07/15 | 11,000,000 | 11,000,000 | |
| Sub Tier Toll RB Series 2013B (LIQ: State Street Bank & Trust Co NA) | a | 0.08% | 07/07/15 | 35,600,000 | 35,600,000 | |
| Greater East Texas Higher Education Auth | ||||||
| Student Loan RB Series 1992B (LOC: State Street Bank & Trust Co NA) | 0.08% | 07/07/15 | 35,200,000 | 35,200,000 | ||
| Student Loan RB Series 1993B (LOC: State Street Bank & Trust Co NA) | 0.08% | 07/07/15 | 32,000,000 | 32,000,000 | ||
| Student Loan RB Series 1995B (LOC: State Street Bank & Trust Co NA) | 0.08% | 07/07/15 | 36,000,000 | 36,000,000 | ||
| Greater Texas Student Loan Corp | ||||||
| Student Loan RB Series 1998A (LOC: State Street Bank & Trust Co NA) | 0.08% | 07/07/15 | 35,000,000 | 35,000,000 | ||
| Student Loan RB Series 2000A (LOC: State Street Bank & Trust Co NA) | 0.08% | 07/07/15 | 35,000,000 | 35,000,000 | ||
| Gulf Coast Waste Disposal Auth | ||||||
| Environmental Facilities RB (ExxonMobil) Series 2001A | 0.02% | 07/01/15 | 5,460,000 | 5,460,000 | ||
| Hale Cnty IDC | ||||||
| Economic Development RB (Silverado TX) Series 2008 (LOC: Rabobank Nederland) | 0.13% | 07/07/15 | 5,400,000 | 5,400,000 | ||
| IDRB (Struikmans Ramona) Series 2003 (LOC: Rabobank Nederland) | 0.13% | 07/07/15 | 3,000,000 | 3,000,000 | ||
| IDRB (White River Ranch) Series 2004 (LOC: Wells Fargo Bank, NA) | 0.13% | 07/07/15 | 4,000,000 | 4,000,000 | ||
| Harris Cnty Cultural Education Facilities Finance Corp | ||||||
| Hospital RB (Memorial Hermann Health) Series 2014C | 0.05% | 07/07/15 | 12,805,000 | 12,805,000 | ||
| Hospital Refunding RB (Memorial Hermann Healthcare) Series 2010B (GTY/LIQ: Royal Bank of Canada) | a | 0.07% | 07/07/15 | 11,000,000 | 11,000,000 | |
| Harris Cnty Housing Finance Corp | ||||||
| M/F Housing RB (Baypointe Apts) Series 2006 (LOC: Citibank, NA) | 0.08% | 07/07/15 | 12,115,000 | 12,115,000 | ||
| M/F Housing RB (Dominion Square Apts) Series 2000 (LOC: PNC Bank NA) | 0.16% | 07/07/15 | 2,825,000 | 2,825,000 | ||
| M/F Housing RB (Village At Cornerstone Apts) Series 2004 (LOC: Fannie Mae) | 0.08% | 07/07/15 | 7,415,000 | 7,415,000 | ||
| Houston | ||||||
| Water & Sewer System First Lien Refunding RB Series 2004A&2007B (LIQ: Deutsche Bank AG) | a | 0.17% | 07/07/15 | 6,140,000 | 6,140,000 | |
| Water & Sewer System Jr Lien Refunding RB Series 1998A (GTY/LIQ: Wells Fargo & Co) | a | 0.07% | 07/07/15 | 18,780,000 | 18,780,000 | |
| Houston Higher Education Finance Corp | ||||||
| Higher Education Refunding RB (Rice Univ) Series 2013A (ESCROW) | 0.47% | 07/02/15 | 05/16/16 | 42,505,000 | 42,628,997 | |
| Houston ISD | ||||||
| LT GO Bonds Series 2008 (GTY: TX Permanent School Fund /LIQ: JPMorgan Chase Bank, NA) | a | 0.08% | 07/07/15 | 4,995,000 | 4,995,000 | |
| Issuer
Type of Security, Series |
Footnotes | Rate | Effective
Maturity |
Maturity
Date |
Face
Amount ($) |
Value
($) |
| Houston Port Auth | ||||||
| ULT GO Refunding Bonds Series 2008A (LIQ: JPMorgan Chase Bank, NA) | a | 0.11% | 07/07/15 | 12,610,000 | 12,610,000 | |
| Lavaca-Navidad River Auth | ||||||
| Water Contract RB (Formosa Plastics) Series 1990 (LOC: Bank of America, NA) | 0.08% | 07/07/15 | 13,600,000 | 13,600,000 | ||
| Leander ISD | ||||||
| ULT GO & Refunding Bonds Series 2008 (GTY: TX Permanent School Fund /LIQ: Citibank, NA) | a | 0.08% | 07/07/15 | 4,950,000 | 4,950,000 | |
| Muleshoe Economic Development Corp | ||||||
| IDRB (John Lyle & Grace Ajean) Series 2005 (LOC: Rabobank Nederland) | 0.12% | 07/07/15 | 3,000,000 | 3,000,000 | ||
| North Central Texas Health Facilities Development Corp | ||||||
| Hospital RB (Children's Medical Center of Dallas) Series 2009 (LIQ: Toronto-Dominion Bank) | a | 0.08% | 07/07/15 | 8,500,000 | 8,500,000 | |
| North East ISD | ||||||
| ULT GO Bonds Series 2007A (GTY: TX Permanent School Fund /LIQ: US Bank, NA) | a | 0.07% | 07/07/15 | 10,460,000 | 10,460,000 | |
| North Texas Municipal Water District | ||||||
| Water System RB Series 2008 (LIQ: Bank of America, NA) | a | 0.09% | 07/07/15 | 10,000,000 | 10,000,000 | |
| North Texas Tollway Auth | ||||||
| System RB Series 2011A (LIQ: Citibank, NA) | a | 0.08% | 07/07/15 | 7,715,000 | 7,715,000 | |
| System RB Series 2011A (LIQ: Citibank, NA) | a | 0.10% | 07/07/15 | 9,940,000 | 9,940,000 | |
| System Refunding RB Series 2008 (GTY: Berkshire Hathaway Assurance Corp /LIQ: Morgan Stanley Bank NA) | a | 0.08% | 07/07/15 | 6,000,000 | 6,000,000 | |
| Port Arthur Navigation District IDC | ||||||
| Exempt Facilities RB (Total Petrochemicals & Refining USA) Series 2012A | 0.08% | 07/07/15 | 30,000,000 | 30,000,000 | ||
| Exempt Facilities RB (Total Petrochemicals & Refining USA) Series 2012B | 0.08% | 07/07/15 | 15,000,000 | 15,000,000 | ||
| RB (TOTAL Petrochemicals USA) Series 2011 | 0.08% | 07/07/15 | 17,000,000 | 17,000,000 | ||
| San Antonio | ||||||
| Electric & Gas Systems Refunding RB New Series 2009A (LIQ: JPMorgan Chase Bank, NA) | a | 0.08% | 07/07/15 | 5,000,000 | 5,000,000 | |
| Tax & Revenue COP Series 2006 (LIQ: Wells Fargo & Co) | a | 0.13% | 07/07/15 | 162,000 | 162,000 | |
| San Antonio Public Facilities Corp | ||||||
| Lease & Refunding RB Series 2012 (LIQ: JPMorgan Chase Bank, NA) | a | 0.08% | 07/07/15 | 10,705,000 | 10,705,000 | |
| Lease Refunding RB Series 2012 (LIQ: State Street Bank & Trust Co NA) | a | 0.07% | 07/07/15 | 10,000,000 | 10,000,000 | |
| Southeast Housing Finance Corp | ||||||
| M/F Housing RB (Piedmont Apts) Series 2006 (LOC: Fannie Mae) | 0.08% | 07/07/15 | 13,135,000 | 13,135,000 | ||
| Tarrant Cnty Cultural Education Facilities Finance Corp | ||||||
| RB (Texas Health Resources System) Series 2008C | 0.08% | 07/07/15 | 5,000,000 | 5,000,000 | ||
| RB (Texas Health Resources) Series 2008B | 0.05% | 07/07/15 | 50,285,000 | 50,285,000 | ||
| Refunding RB (Texas Health Resources) Series 2007A (LIQ: Bank of America, NA) | a | 0.17% | 07/07/15 | 1,125,000 | 1,125,000 | |
| Refunding RB (Texas Health Resources) Series 2007A (LIQ: Morgan Stanley Bank NA) | a | 0.12% | 07/07/15 | 61,595,000 | 61,595,000 | |
| Texas | ||||||
| GO Bonds (Veterans' Housing Assistance Program II) Series 2008A (LIQ: Bank of Tokyo Mitsubishi UFJ, Ltd) | 0.08% | 07/07/15 | 35,700,000 | 35,700,000 | ||
| GO Bonds Series 1994A1 (LIQ: Bank of Tokyo Mitsubishi UFJ, Ltd) | 0.06% | 07/07/15 | 5,000,000 | 5,000,000 | ||
| GO Bonds Series 2004B (LIQ: Sumitomo Mitsui Banking Corp) | 0.08% | 07/07/15 | 30,520,000 | 30,520,000 | ||
| GO Bonds Series 2006D (LIQ: Sumitomo Mitsui Banking Corp) | 0.06% | 07/07/15 | 23,265,000 | 23,265,000 | ||
| Issuer
Type of Security, Series |
Footnotes | Rate | Effective
Maturity |
Maturity
Date |
Face
Amount ($) |
Value
($) |
| GO Bonds Series 2010C (LIQ: Bank of Tokyo Mitsubishi UFJ, Ltd) | 0.08% | 07/07/15 | 31,900,000 | 31,900,000 | ||
| GO Refunding Bonds Series 1999A (LIQ: Bank of Tokyo Mitsubishi UFJ, Ltd) | 0.08% | 07/07/15 | 13,285,000 | 13,285,000 | ||
| Veterans Bonds Series 2014A (LIQ: Bank of America, NA) | 0.05% | 07/07/15 | 36,780,000 | 36,780,000 | ||
| Texas Dept of Housing & Community Affairs | ||||||
| M/F Housing RB (Atascocita Pines Apts) Series 2005 (LOC: Fannie Mae) | 0.08% | 07/07/15 | 10,990,000 | 10,990,000 | ||
| M/F Housing RB (Costa Ibiza Apts) Series 2008 (LOC: Freddie Mac) | 0.07% | 07/07/15 | 8,120,000 | 8,120,000 | ||
| M/F Housing RB (Creek Point Apts) Series 2000 (LOC: Freddie Mac) | 0.10% | 07/07/15 | 5,560,000 | 5,560,000 | ||
| M/F Housing RB (Lancaster Apts) Series 2007 (LOC: Fannie Mae) | 0.08% | 07/07/15 | 10,545,000 | 10,545,000 | ||
| M/F Housing RB (Villas at Henderson) Series 2006 (LOC: Citibank, NA) | 0.08% | 07/07/15 | 6,615,000 | 6,615,000 | ||
| M/F Housing Refunding RB (Addison Park Apts) Series 2008 (LOC: Freddie Mac) | 0.13% | 07/07/15 | 12,905,000 | 12,905,000 | ||
| M/F Housing Refunding RB (Alta Cullen Apts) Series 2008 (LOC: Freddie Mac) | 0.09% | 07/07/15 | 12,100,000 | 12,100,000 | ||
| S/F Mortgage RB Series 2007A (LIQ: Texas) | 0.08% | 07/07/15 | 48,190,000 | 48,190,000 | ||
| S/F Mortgage RB Series 2007B (LIQ: Bank of America, NA) | a | 0.17% | 07/07/15 | 1,960,000 | 1,960,000 | |
| Texas Transportation Commission | ||||||
| GO Mobility Fund & Refunding Bonds Series 2014A (LIQ: Morgan Stanley Bank NA) | a | 0.08% | 07/07/15 | 6,665,000 | 6,665,000 | |
| GO Mobility Fund Refunding Bonds Series 2014 (LIQ: Morgan Stanley Bank NA) | a | 0.08% | 07/07/15 | 11,550,000 | 11,550,000 | |
| Texas Water Development Board | ||||||
| GO Bonds Series 2007D (LIQ: Deutsche Bank AG) | a | 0.13% | 07/07/15 | 5,800,000 | 5,800,000 | |
| Univ of Texas | ||||||
| Revenue Financing System Bonds Series 2012B (LIQ: Royal Bank of Canada) | a | 0.07% | 07/07/15 | 8,000,000 | 8,000,000 | |
| Revenue Financing System Refunding Bonds Series 2007B | 0.04% | 07/07/15 | 10,100,000 | 10,100,000 | ||
| 1,258,345,997 | ||||||
| Utah 0.5% | ||||||
| Clearfield | ||||||
| M/F Housing Refunding RB (Oakstone Apts) Series 2008 (LOC: Fannie Mae) | 0.10% | 07/07/15 | 12,100,000 | 12,100,000 | ||
| Salt Lake Cnty Housing Auth | ||||||
| M/F Housing Refunding RB (Bridgeside Landing Apts) Series 2008 (LOC: Fannie Mae) | 0.10% | 07/07/15 | 14,225,000 | 14,225,000 | ||
| Utah Cnty | ||||||
| Hospital RB (IHC Health Services) Series 2012 (LIQ: JPMorgan Chase Bank, NA) | a | 0.08% | 07/07/15 | 7,665,000 | 7,665,000 | |
| Hospital RB (IHC Health Services) Series 2014A (LIQ: Toronto-Dominion Bank) | a | 0.08% | 07/07/15 | 3,700,000 | 3,700,000 | |
| Utah Housing Corp | ||||||
| M/F Housing RB (Tanglewood Apts) Series 2004A (LOC: Citibank, NA) | 0.08% | 07/07/15 | 9,000,000 | 9,000,000 | ||
| Utah Transit Auth | ||||||
| Sales Tax RB Series 2008A (ESCROW/LIQ: Credit Suisse AG) | a | 0.07% | 07/07/15 | 13,500,000 | 13,500,000 | |
| 60,190,000 | ||||||
| Issuer
Type of Security, Series |
Footnotes | Rate | Effective
Maturity |
Maturity
Date |
Face
Amount ($) |
Value
($) |
| Virginia 1.2% | ||||||
| Harrisonburg IDA | ||||||
| Refunding RB (Mennonite Retirement Community) Series 2006B (LOC: Branch Banking & Trust Co) | 0.06% | 07/07/15 | 2,845,000 | 2,845,000 | ||
| King George Cnty | ||||||
| Solid Waste Disposal Facility RB (Garnet) Series 1996 (LOC: JPMorgan Chase Bank, NA) | 0.12% | 07/07/15 | 3,700,000 | 3,700,000 | ||
| Metropolitan Washington Airports Auth | ||||||
| Airport System RB Series 2005A (LIQ: Citibank, NA) | a | 0.13% | 07/07/15 | 9,800,000 | 9,800,000 | |
| Airport System RB Series 2007B (LIQ: Deutsche Bank AG) | a | 0.13% | 07/07/15 | 11,020,000 | 11,020,000 | |
| Airport System RB Series 2007B (LIQ: Deutsche Bank AG) | a | 0.14% | 07/07/15 | 3,830,000 | 3,830,000 | |
| Airport System RB Series 2007B (LIQ: Deutsche Bank AG) | a | 0.17% | 07/07/15 | 8,995,000 | 8,995,000 | |
| Airport System RB Series 2007B (LIQ: JPMorgan Chase Bank, NA) | a | 0.11% | 07/07/15 | 5,000,000 | 5,000,000 | |
| Airport System RB Series 2008A (LIQ: Deutsche Bank AG) | a | 0.12% | 07/07/15 | 28,435,000 | 28,435,000 | |
| Airport System RB Series 2008A (LIQ: Deutsche Bank AG) | a | 0.13% | 07/07/15 | 15,350,000 | 15,350,000 | |
| Airport System Refunding RB Series 2010C1 (LOC: Barclays Bank Plc) | 0.10% | 07/02/15 | 59,575,000 | 59,575,000 | ||
| 148,550,000 | ||||||
| Washington 3.0% | ||||||
| Central Puget Sound Regional Transit Auth | ||||||
| Sales Tax Bonds Series 2007A (LIQ: JPMorgan Chase Bank, NA) | a | 0.08% | 07/07/15 | 7,855,000 | 7,855,000 | |
| King Cnty | ||||||
| Sewer Refunding RB Series 2011B (LIQ: Barclays Bank Plc) | a | 0.12% | 07/07/15 | 7,785,000 | 7,785,000 | |
| Sewer Refunding RB Series 2011B (LIQ: JPMorgan Chase Bank, NA) | a | 0.08% | 07/07/15 | 6,950,000 | 6,950,000 | |
| King Cnty Housing Auth | ||||||
| RB (Greenbridge Redevelopment-Salmon Creek Apts) Series 2007 (LOC: Bank of America, NA) | 0.12% | 07/07/15 | 3,995,000 | 3,995,000 | ||
| Port of Seattle | ||||||
| Sub Lien Refunding RB Series 2008 (LOC: Bank of Tokyo Mitsubishi UFJ, Ltd) | d | 0.08% | 07/07/15 | 60,000,000 | 60,000,000 | |
| Seattle | ||||||
| Drainage & Wastewater RB 2008 (LIQ: Citibank, NA) | a | 0.07% | 07/07/15 | 8,090,000 | 8,090,000 | |
| Washington | ||||||
| GO Bonds Series 2003C (LIQ: Morgan Stanley Bank NA) | a | 0.08% | 07/07/15 | 7,935,000 | 7,935,000 | |
| GO Bonds Series 2009E (LIQ: JPMorgan Chase Bank, NA) | a | 0.08% | 07/07/15 | 5,000,000 | 5,000,000 | |
| GO Bonds Series 2011B (LIQ: JPMorgan Chase Bank, NA) | a | 0.08% | 07/07/15 | 4,000,000 | 4,000,000 | |
| GO Bonds Series 2012C (LIQ: JPMorgan Chase Bank, NA) | a | 0.08% | 07/07/15 | 5,000,000 | 5,000,000 | |
| GO Bonds Series 2014A (LIQ: Morgan Stanley Bank NA) | a | 0.08% | 07/07/15 | 2,500,000 | 2,500,000 | |
| GO Bonds Series 2014D (LIQ: Citibank, NA) | a | 0.08% | 07/07/15 | 4,700,000 | 4,700,000 | |
| GO Refunding Bonds Series R2010B (LIQ: Bank of America, NA) | a | 0.08% | 07/07/15 | 10,000,000 | 10,000,000 | |
| Washington Economic Development Finance Auth | ||||||
| Solid Waste Disposal RB (Heirborne Investments) Series 2006K (LOC: MUFG Union Bank, NA) | 0.09% | 07/07/15 | 4,540,000 | 4,540,000 | ||
| Solid Waste Disposal RB (Waste Management) Series 2000C (LOC: Bank of America, NA) | 0.11% | 07/07/15 | 17,900,000 | 17,900,000 | ||
| Solid Waste Disposal RB (Waste Management) Series 2000I (LOC: Bank of America, NA) | 0.11% | 07/07/15 | 20,885,000 | 20,885,000 | ||
| Issuer
Type of Security, Series |
Footnotes | Rate | Effective
Maturity |
Maturity
Date |
Face
Amount ($) |
Value
($) |
| Washington Health Care Facilities Auth | ||||||
| RB (MultiCare Health System) Series 2009A (LIQ: Royal Bank of Canada) | a | 0.09% | 07/07/15 | 8,110,000 | 8,110,000 | |
| RB (Providence Health & Services) Series 2010A (LIQ: Bank of America, NA) | a | 0.07% | 07/07/15 | 10,180,000 | 10,180,000 | |
| RB (Providence Health & Services) Series 2014C&2014D (LIQ: JPMorgan Chase Bank, NA) | a | 0.08% | 07/07/15 | 15,300,000 | 15,300,000 | |
| RB (Providence Health & Services) Series 2014D (LIQ: Morgan Stanley Bank NA) | a | 0.08% | 07/07/15 | 5,665,000 | 5,665,000 | |
| RB (Providence Heath & Services) Series 2014C (LIQ: Bank of America, NA) | a | 0.07% | 07/07/15 | 8,675,000 | 8,675,000 | |
| RB (Providence Heath & Services) Series 2014D (LIQ: JPMorgan Chase Bank, NA) | a | 0.08% | 07/07/15 | 4,000,000 | 4,000,000 | |
| Refunding RB (Seattle Children's Hospital) Series 2015B (LIQ: JPMorgan Chase Bank, NA) | a | 0.08% | 07/07/15 | 13,860,000 | 13,860,000 | |
| Washington State Housing Finance Commission | ||||||
| M/F Housing RB (Anchor Village Apts) Series 1997 (LOC: Fannie Mae) | 0.08% | 07/07/15 | 10,750,000 | 10,750,000 | ||
| M/F Housing RB (Brittany Park Phase II) Series 1998A (LOC: Fannie Mae) | 0.08% | 07/07/15 | 3,480,000 | 3,480,000 | ||
| M/F Housing RB (Forest Creek Apts) Series 2006 (LOC: Fannie Mae) | 0.08% | 07/07/15 | 13,680,000 | 13,680,000 | ||
| M/F Housing RB (Highlander Apts) Series 2004A (LOC: Freddie Mac) | 0.09% | 07/07/15 | 7,000,000 | 7,000,000 | ||
| M/F Housing RB (Kitts Corner Apts) Series 2014 (LOC: Federal Home Loan Bank) | 0.07% | 07/07/15 | 7,000,000 | 7,000,000 | ||
| M/F Housing RB (Lakewood Meadows Apts) Series 2000A (LOC: Fannie Mae) | 0.12% | 07/07/15 | 6,280,000 | 6,280,000 | ||
| M/F Housing RB (Merrill Gardens) Series 1997A (LOC: Fannie Mae) | 0.08% | 07/07/15 | 6,125,000 | 6,125,000 | ||
| M/F Housing RB (Parkview Apts) Series 2008 (LOC: Freddie Mac) | 0.12% | 07/07/15 | 3,060,000 | 3,060,000 | ||
| M/F Housing RB (Rainier Court Apts) Series 2003A (LOC: Fannie Mae) | 0.08% | 07/07/15 | 12,750,000 | 12,750,000 | ||
| M/F Housing RB (Reserve at SeaTac Apts) Series 2015 (LOC: Federal Home Loan Bank) | 0.06% | 07/07/15 | 5,500,000 | 5,500,000 | ||
| M/F Housing RB (Rolling Hills Apts) Series 2004A (LOC: Fannie Mae) | 0.08% | 07/07/15 | 6,125,000 | 6,125,000 | ||
| M/F Housing RB (Seasons Apts) Series 2006 (LOC: Fannie Mae) | 0.12% | 07/07/15 | 22,640,000 | 22,640,000 | ||
| M/F Housing RB (Willow Tree Grove Apts) Series 2011 (LOC: Freddie Mac) | 0.07% | 07/07/15 | 4,770,000 | 4,770,000 | ||
| M/F Housing RB (Woodrose Apts) Series 1999A (LOC: Fannie Mae) | 0.08% | 07/07/15 | 6,750,000 | 6,750,000 | ||
| M/F Mortgage RB (Meridian Court Apts) Series 1996 (LOC: Fannie Mae) | 0.08% | 07/07/15 | 6,700,000 | 6,700,000 | ||
| M/F Mortgage RB (Wandering Creek) Series 1995 (LOC: Freddie Mac) | 0.08% | 07/07/15 | 4,300,000 | 4,300,000 | ||
| M/F RB (Regency Park Apts) Series 1999A (LOC: Freddie Mac) | 0.12% | 07/07/15 | 7,805,000 | 7,805,000 | ||
| 377,640,000 | ||||||
| West Virginia 0.5% | ||||||
| Cabell Cnty | ||||||
| Univ Facilities RB (Provident Group) Series 2010A (LOC: Bank of America, NA) | 0.10% | 07/07/15 | 19,965,000 | 19,965,000 | ||
| Issuer
Type of Security, Series |
Footnotes | Rate | Effective
Maturity |
Maturity
Date |
Face
Amount ($) |
Value
($) |
| Putnam Cnty Commission | ||||||
| Solid Waste Disposal RB (Toyota Motor Manufacturing) Series 1998A | 0.07% | 07/07/15 | 40,000,000 | 40,000,000 | ||
| 59,965,000 | ||||||
| Wisconsin 1.8% | ||||||
| Oconomowoc Community Development Auth | ||||||
| M/F Housing RB Series 2004 (LOC: Fannie Mae) | 0.08% | 07/07/15 | 4,430,000 | 4,430,000 | ||
| Red Cedar | ||||||
| IDRB (Fairmount Minerals) Series 2007 (LOC: PNC Bank NA) | 0.10% | 07/07/15 | 10,000,000 | 10,000,000 | ||
| Wisconsin | ||||||
| GO Bonds Series 2006C (LIQ: Citibank, NA) | a | 0.12% | 07/07/15 | 1,595,000 | 1,595,000 | |
| Wisconsin Health & Educational Facilities Auth | ||||||
| RB (Ascension Health) Series 2012D (LIQ: Citibank, NA) | a | 0.08% | 07/07/15 | 3,000,000 | 3,000,000 | |
| RB (Children's Hospital) Series 2008B (LIQ: Barclays Bank Plc) | a | 0.12% | 07/07/15 | 6,620,000 | 6,620,000 | |
| RB (Froedtert & Community Health) Series 2009C (LIQ: Credit Suisse AG) | a | 0.07% | 07/07/15 | 15,785,000 | 15,785,000 | |
| RB (Indian Community School of Milwaukee) Series 2007 (LOC: JPMorgan Chase Bank, NA) | 0.07% | 07/07/15 | 26,000,000 | 26,000,000 | ||
| Wisconsin Housing & Economic Development Auth | ||||||
| Homeownership RB Series 2003B (LIQ: Federal Home Loan Bank) | 0.08% | 07/07/15 | 18,790,000 | 18,790,000 | ||
| Homeownership RB Series 2004D (LIQ: Federal Home Loan Bank) | 0.08% | 07/07/15 | 5,460,000 | 5,460,000 | ||
| Homeownership RB Series 2005C (LIQ: Royal Bank of Canada) | 0.07% | 07/07/15 | 24,730,000 | 24,730,000 | ||
| Homeownership RB Series 2006E (LIQ: Citibank, NA) | a | 0.13% | 07/07/15 | 700,000 | 700,000 | |
| Homeownership RB Series 2007E (LIQ: Federal Home Loan Bank) | 0.10% | 07/07/15 | 11,980,000 | 11,980,000 | ||
| Homeownership RB Series 2008A (LIQ: BMO Harris Bank NA) | 0.08% | 07/07/15 | 34,505,000 | 34,505,000 | ||
| Housing RB Series 2008A (LIQ: JPMorgan Chase Bank, NA) | 0.08% | 07/07/15 | 5,460,000 | 5,460,000 | ||
| Housing RB Series 2008G (LIQ: JPMorgan Chase Bank, NA) | 0.08% | 07/07/15 | 21,920,000 | 21,920,000 | ||
| Housing RB Series 2012B (LIQ: Federal Home Loan Bank) | 0.06% | 07/07/15 | 14,140,000 | 14,140,000 | ||
| M/F Housing Bonds Series 2007A (LIQ: Federal Home Loan Bank) | 0.09% | 07/07/15 | 7,130,000 | 7,130,000 | ||
| M/F Housing Bonds Series 2007C (LIQ: Federal Home Loan Bank) | 0.09% | 07/07/15 | 6,025,000 | 6,025,000 | ||
| M/F Housing Bonds Series 2008A (LIQ: Federal Home Loan Bank) | 0.06% | 07/07/15 | 4,970,000 | 4,970,000 | ||
| 223,240,000 | ||||||
| Wyoming 0.9% | ||||||
| Green River | ||||||
| RB (Rhone-Poulenc) Series 1994 (LOC: Comerica Bank) | 0.17% | 07/07/15 | 11,400,000 | 11,400,000 | ||
| Lincoln Cnty | ||||||
| Pollution Control RB (Exxon) Series 1987C | 0.01% | 07/01/15 | 1,800,000 | 1,800,000 | ||
| Pollution Control Refunding RB (ExxonMobil) Series 2014 | 0.02% | 07/01/15 | 5,700,000 | 5,700,000 | ||
| Sublette Cnty | ||||||
| Pollution Control Refunding RB (ExxonMobil) Series 2014 | 0.02% | 07/01/15 | 4,500,000 | 4,500,000 | ||
| Wyoming Community Development Auth | ||||||
| Housing RB 2007 Series 11 (LIQ: Bank of New York Mellon) | 0.11% | 07/07/15 | 6,000,000 | 6,000,000 | ||
| Housing RB 2007 Series 2 (LIQ: State Street Bank & Trust Co NA) | 0.12% | 07/07/15 | 6,000,000 | 6,000,000 | ||
| Housing RB 2007 Series 4 (LIQ: Bank of New York Mellon) | 0.11% | 07/07/15 | 14,000,000 | 14,000,000 | ||
| Housing RB 2007 Series 6 (LIQ: Bank of New York Mellon) | 0.11% | 07/07/15 | 7,000,000 | 7,000,000 | ||
| Housing RB 2007 Series 8 (LIQ: Bank of New York Mellon) | 0.11% | 07/07/15 | 12,000,000 | 12,000,000 | ||
| Housing RB 2008 Series 2 (LIQ: Bank of New York Mellon) | 0.11% | 07/07/15 | 3,970,000 | 3,970,000 | ||
| Issuer
Type of Security, Series |
Footnotes | Rate | Effective
Maturity |
Maturity
Date |
Face
Amount ($) |
Value
($) |
| Housing RB Series 2006-2 (LIQ: State Street Bank & Trust Co NA) | 0.12% | 07/07/15 | 8,000,000 | 8,000,000 | ||
| Housing RB Series 2006-5 (LIQ: State Street Bank & Trust Co NA) | 0.12% | 07/07/15 | 10,000,000 | 10,000,000 | ||
| Housing RB Series 2006-7 (LIQ: State Street Bank & Trust Co NA) | 0.12% | 07/07/15 | 10,000,000 | 10,000,000 | ||
| Housing RB Series 2006-9 (LIQ: State Street Bank & Trust Co NA) | 0.12% | 07/07/15 | 10,000,000 | 10,000,000 | ||
| 110,370,000 | ||||||
| Other Investments 2.5% | ||||||
| Nuveen California AMT-Free Municipal Income Fund | ||||||
| Variable Rate Demand Preferred Shares Series 5 (GTY/LIQ: Morgan Stanley Bank NA) | a | 0.22% | 07/07/15 | 5,000,000 | 5,000,000 | |
| Nuveen California Dividend Advantage Municipal Fund | ||||||
| Variable Rate Demand Preferred Shares Series 1 (GTY/LIQ: Morgan Stanley Bank NA) | a | 0.22% | 07/07/15 | 5,000,000 | 5,000,000 | |
| Nuveen New Jersey Dividend Advantage Municipal Fund | ||||||
| Variable Rate Demand Preferred Shares Series 1 (GTY/LIQ: TD Bank NA) | a | 0.15% | 07/07/15 | 10,000,000 | 10,000,000 | |
| Variable Rate Demand Preferred Shares Series 2 (GTY/LIQ: Royal Bank of Canada) | a | 0.15% | 07/07/15 | 10,500,000 | 10,500,000 | |
| Nuveen Premium Income Municipal Fund 2 | ||||||
| Variable Rate Demand Preferred Shares Series 1 (GTY/LIQ: Barclays Bank Plc) | a | 0.16% | 07/07/15 | 91,200,000 | 91,200,000 | |
| Nuveen Quality Income Municipal Fund | ||||||
| Variable Rate Demand Preferred Shares Series 1 (GTY/LIQ: JPMorgan Chase Bank, NA) | a | 0.15% | 07/07/15 | 44,900,000 | 44,900,000 | |
| Nuveen Select Quality Municipal Fund | ||||||
| Variable Rate Demand Preferred Shares Series 1 (GTY/LIQ: Barclays Bank Plc) | a | 0.16% | 07/07/15 | 87,100,000 | 87,100,000 | |
| Western Asset Intermediate Muni Fund | ||||||
| Variable Rate Demand Preferred Stock Series 1 (GTY/LIQ: Citibank, NA) | a | 0.16% | 07/07/15 | 10,100,000 | 10,100,000 | |
| Western Asset Managed Municipals Fund | ||||||
| Variable Rate Demand Preferred Shares Series 1 (GTY/LIQ: Citibank, NA) | a | 0.16% | 07/07/15 | 39,000,000 | 39,000,000 | |
| Western Asset Municipal Partners Fund | ||||||
| Variable Rate Demand Preferred Shares Series 1 (GTY/LIQ: Citibank, NA) | a | 0.16% | 07/07/15 | 12,600,000 | 12,600,000 | |
| 315,400,000 | ||||||
| Total Variable-Rate Securities | ||||||
| (Cost $8,826,551,068) | 8,826,551,068 | |||||
| a | Securities exempt from registration under Rule 144A of the Securities Act of 1933, as amended. These securities may be resold in transactions exempt from registrations, normally to qualified institutional buyers. At the period end, the value of these amounted to $3,037,631,639 or 24.4% of net assets. |
| b | Illiquid security. At the period end, the value of these amounted to $41,815,000 or 0.3% of net assets. |
| c | Security or a portion of the security purchased on a delayed-delivery or when-issued basis. |
| d | All or a portion of this security is designated as collateral for delayed-delivery securities. |
| BAN — | Bond anticipation note |
| CCD — | Community college district |
| COP — | Certificate of participation |
| CP — | Commercial paper |
| CSD — | Central school district |
| GO — | General obligation |
| GTY — | Guaranty agreement |
| HFA — | Housing finance agency/authority |
| HRA — | Housing & redevelopment authority |
| HSD — | High school district |
| IDA — | Industrial development agency/authority |
| IDB — | Industrial development board |
| IDC — | Industrial development corporation |
| IDRB — | Industrial development revenue bond |
| IRB — | Industrial revenue bond |
| ISD — | Independent school district |
| LIQ — | Liquidity agreement |
| LOC — | Letter of credit |
| LT — | Limited tax |
| M/F — | Multi-family |
| RAN — | Revenue anticipation note |
| RB — | Revenue bond |
| SD — | School district |
| S/F — | Single-family |
| TAN — | Tax anticipation note |
| TRAN — | Tax and revenue anticipation note |
| UFSD — | Union free school district |
| UHSD — | Union high school district |
| ULT — | Unlimited tax |
| USD — | Unified school district |
| Assets | ||
| Investments, at cost and value (Note 2a) | $12,833,563,300 | |
| Cash | 3,008,428 | |
| Receivables: | ||
| Interest | 19,105,398 | |
| Fund shares sold | 1,342,000 | |
| Prepaid expenses | + | 28,407 |
| Total assets | 12,857,047,533 | |
| Liabilities | ||
| Payables: | ||
| Investments bought | 27,014,164 | |
| Investments bought - Delayed delivery | 377,381,628 | |
| Investment adviser and administrator fees | 220,032 | |
| Fund shares redeemed | 2,877,536 | |
| Distributions to shareholders | 51,403 | |
| Accrued expenses | + | 170,878 |
| Total liabilities | 407,715,641 | |
| Net Assets | ||
| Total assets | 12,857,047,533 | |
| Total liabilities | – | 407,715,641 |
| Net assets | $12,449,331,892 | |
| Net Assets by Source | ||
| Capital received from investors | 12,447,902,728 | |
| Net realized capital gains | 1,429,164 | |
| Net Asset Value (NAV) by Shares Class | |||||
| Share Class | Net Assets | ÷ | Shares
Outstanding |
= | NAV |
| Sweep Shares | $10,575,789,490 | 10,572,423,151 | $1.00 | ||
| Value Advantage Shares | $576,055,900 | 575,872,979 | $1.00 | ||
| Select Shares | $331,462,647 | 331,355,971 | $1.00 | ||
| Institutional Shares | $966,023,855 | 965,718,789 | $1.00 | ||
| Investment Income | ||
| Interest | $5,768,974 | |
| Expenses | ||
| Investment adviser and administrator fees | 20,429,128 | |
| Shareholder service fees: | ||
| Sweep Shares | 19,136,702 | |
| Value Advantage Shares | 653,882 | |
| Select Shares | 374,325 | |
| Institutional Shares | 1,087,969 | |
| Portfolio accounting fees | 210,374 | |
| Custodian fees | 122,624 | |
| Shareholder reports | 122,241 | |
| Registration fees | 107,697 | |
| Professional fees | 68,269 | |
| Transfer agent fees | 41,060 | |
| Independent trustees' fees | 32,091 | |
| Interest expense | 426 | |
| Other expenses | + | 116,819 |
| Total expenses | 42,503,607 | |
| Expense reduction by CSIM and its affiliates | – | 37,377,439 |
| Net expenses | – | 5,126,168 |
| Net investment income | 642,806 | |
| Realized Gains (Losses) | ||
| Net realized gains on investments | 1,429,164 | |
| Increase in net assets resulting from operations | $2,071,970 | |
| Operations | |||
| 1/1/15-6/30/15 | 1/1/14-12/31/14 | ||
| Net investment income | $642,806 | $1,320,926 | |
| Net realized gains | + | 1,429,164 | 3,414,565 |
| Increase in net assets from operations | 2,071,970 | 4,735,491 | |
| Distributions to Shareholders | |||
| Distributions from net investment income | |||
| Sweep Shares | (546,638) | (1,102,000) | |
| Value Advantage Shares | (29,715) | (66,696) | |
| Select Shares | (17,011) | (37,864) | |
| Institutional Shares | + | (49,442) | (114,366) |
| Total distributions from net investment income | (642,806) | (1,320,926) | |
| Distributions from net realized gains | |||
| Sweep Shares | — | (1,674,645) | |
| Value Advantage Shares | — | (91,270) | |
| Select Shares | — | (53,341) | |
| Institutional Shares | + | — | (151,364) |
| Total distributions from net realized gains | — | (1,970,620) | |
| Total distributions | (642,806) | (3,291,546) | |
| Transactions in Fund Shares* | |||
| Shares Sold | |||
| Sweep Shares | 16,261,158,675 | 34,138,143,890 | |
| Value Advantage Shares | 73,509,033 | 153,835,806 | |
| Select Shares | 22,652,277 | 111,823,789 | |
| Institutional Shares | + | 63,485,306 | 182,233,936 |
| Total shares sold | 16,420,805,291 | 34,586,037,421 | |
| Shares Reinvested | |||
| Sweep Shares | 489,174 | 2,742,975 | |
| Value Advantage Shares | 23,113 | 135,115 | |
| Select Shares | 13,104 | 77,694 | |
| Institutional Shares | + | 41,599 | 246,134 |
| Total shares reinvested | 566,990 | 3,201,918 | |
| Shares Redeemed | |||
| Sweep Shares | (17,091,701,965) | (33,980,424,216) | |
| Value Advantage Shares | (118,698,546) | (250,221,387) | |
| Select Shares | (56,488,525) | (149,990,615) | |
| Institutional Shares | + | (134,413,502) | (306,508,698) |
| Total shares redeemed | (17,401,302,538) | (34,687,144,916) | |
| Net transactions in fund shares | (979,930,257) | (97,905,577) | |
| Net Assets | |||
| Beginning of period | 13,427,832,985 | 13,524,294,617 | |
| Total decrease | + | (978,501,093) | (96,461,632) |
| End of period | $12,449,331,892 | $13,427,832,985 | |
| * | Transactions took place at $1.00 per share; figures for share quantities are the same as for dollars. |
| Sweep Shares | 1/1/15–
6/30/15* |
1/1/14–
12/31/14 |
1/1/13–
12/31/13 |
1/1/12–
12/31/12 |
1/1/11–
12/31/11 |
1/1/10–
12/31/10 |
| Per-Share Data ($) | ||||||
| Net asset value at beginning of period | 1.00 | 1.00 | 1.00 | 1.00 | 1.00 | 1.00 |
| Income (loss) from investment operations: | ||||||
| Net investment income (loss) | 0.00 1,2 | 0.00 2 | 0.00 2 | 0.00 2 | 0.00 2 | 0.00 2 |
| Net realized and unrealized gains (losses) | 0.00 2 | 0.00 2 | 0.00 2 | 0.00 2 | 0.00 2 | 0.00 2 |
| Total from investment operations | 0.00 2 | 0.00 2 | 0.00 2 | 0.00 2 | 0.00 2 | 0.00 2 |
| Less distributions: | ||||||
| Distributions from net investment income | (0.00) 2 | (0.00) 2 | (0.00) 2 | (0.00) 2 | (0.00) 2 | (0.00) 2 |
| Distributions from net realized gains | — | (0.00) 2 | (0.00) 2 | (0.00) 2 | (0.00) 2 | (0.00) 2 |
| Total distributions | (0.00) 2 | (0.00) 2 | (0.00) 2 | (0.00) 2 | (0.00) 2 | (0.00) 2 |
| Net asset value at end of period | 1.00 | 1.00 | 1.00 | 1.00 | 1.00 | 1.00 |
| Total return (%) | 0.01 3 | 0.02 | 0.01 | 0.01 | 0.01 | 0.02 |
| Ratios/Supplemental Data (%) | ||||||
| Ratios to average net assets: | ||||||
| Net operating expenses | 0.08 4,5 | 0.09 4 | 0.15 4 | 0.21 4,6 | 0.29 4 | 0.36 4 |
| Gross operating expenses | 0.70 5 | 0.70 | 0.70 | 0.66 6 | 0.69 | 0.70 |
| Net investment income (loss) | 0.01 5 | 0.01 | 0.01 | 0.01 | 0.01 | 0.01 |
| Net assets, end of period ($ x 1,000,000) | 3,223 | 3,690 | 3,528 | 3,522 | 3,139 | 2,940 |
| Value Advantage Shares | 1/1/15–
6/30/15* |
1/1/14–
12/31/14 |
1/1/13–
12/31/13 |
1/1/12–
12/31/12 |
1/1/11–
12/31/11 |
1/1/10–
12/31/10 |
| Per-Share Data ($) | ||||||
| Net asset value at beginning of period | 1.00 | 1.00 | 1.00 | 1.00 | 1.00 | 1.00 |
| Income (loss) from investment operations: | ||||||
| Net investment income (loss) | 0.00 1,2 | 0.00 2 | 0.00 2 | 0.00 2 | 0.00 2 | 0.00 2 |
| Net realized and unrealized gains (losses) | 0.00 2 | 0.00 2 | 0.00 2 | 0.00 2 | 0.00 2 | 0.00 2 |
| Total from investment operations | 0.00 2 | 0.00 2 | 0.00 2 | 0.00 2 | 0.00 2 | 0.00 2 |
| Less distributions: | ||||||
| Distributions from net investment income | (0.00) 2 | (0.00) 2 | (0.00) 2 | (0.00) 2 | (0.00) 2 | (0.00) 2 |
| Distributions from net realized gains | — | (0.00) 2 | (0.00) 2 | (0.00) 2 | (0.00) 2 | (0.00) 2 |
| Total distributions | (0.00) 2 | (0.00) 2 | (0.00) 2 | (0.00) 2 | (0.00) 2 | (0.00) 2 |
| Net asset value at end of period | 1.00 | 1.00 | 1.00 | 1.00 | 1.00 | 1.00 |
| Total return (%) | 0.01 3 | 0.02 | 0.01 | 0.01 | 0.01 | 0.02 |
| Ratios/Supplemental Data (%) | ||||||
| Ratios to average net assets: | ||||||
| Net operating expenses | 0.08 4,5 | 0.09 4 | 0.15 4 | 0.21 4,6 | 0.29 4 | 0.36 4 |
| Gross operating expenses | 0.57 5 | 0.57 | 0.57 | 0.53 6 | 0.56 | 0.57 |
| Net investment income (loss) | 0.01 5 | 0.01 | 0.01 | 0.01 | 0.01 | 0.01 |
| Net assets, end of period ($ x 1,000,000) | 414 | 468 | 539 | 625 | 791 | 1,066 |
| * | Unaudited. |
| Holdings by Category | Cost
($) |
Value
($) | |
| 41.1% | Fixed-Rate Securities | 1,496,396,088 | 1,496,396,088 |
| 62.1% | Variable-Rate Securities | 2,256,798,784 | 2,256,798,784 |
| 103.2% | Total Investments | 3,753,194,872 | 3,753,194,872 |
| (3.2%) | Other Assets and Liabilities, Net | (116,455,157) | |
| 100.0% | Net Assets | 3,636,739,715 | |
| Issuer
Type of Security, Series |
Footnotes | Rate | Effective
Maturity |
Maturity
Date |
Face
Amount ($) |
Value
($) |
| Fixed-Rate Securities 41.1% of net assets | ||||||
| Alabama 1.0% | ||||||
| Huntsville Health Care Auth | ||||||
| CP | 0.10% | 08/05/15 | 10,000,000 | 10,000,000 | ||
| CP | 0.09% | 08/11/15 | 10,000,000 | 10,000,000 | ||
| CP | 0.09% | 08/18/15 | 15,000,000 | 15,000,000 | ||
| 35,000,000 | ||||||
| Alaska 0.1% | ||||||
| North Slope Borough | ||||||
| GO Bonds Series 2014B | 2.00% | 10/30/15 | 2,050,000 | 2,062,587 | ||
| Arizona 0.3% | ||||||
| Phoenix Civic Improvement Corp | ||||||
| Airport CP Series 2014A2&B2 (LOC: Barclays Bank Plc) | 0.07% | 07/13/15 | 10,000,000 | 10,000,000 | ||
| California 6.5% | ||||||
| California | ||||||
| GO CP Series A1 (LOC: Wells Fargo Bank, NA) | 0.07% | 08/05/15 | 5,000,000 | 5,000,000 | ||
| California Health Facilities Financing Auth | ||||||
| RB (Kaiser Permanente) Series 2006E | 0.14% | 11/03/15 | 3,500,000 | 3,500,000 | ||
| California Statewide Communities Development Auth | ||||||
| RB (Kaiser Permanente) Series 2004E | 0.22% | 02/04/16 | 4,700,000 | 4,700,000 | ||
| RB (Kaiser Permanente) Series 2004I | 0.14% | 08/06/15 | 3,100,000 | 3,100,000 | ||
| RB (Kaiser Permanente) Series 2004I | 0.13% | 11/02/15 | 7,000,000 | 7,000,000 | ||
| RB (Kaiser Permanente) Series 2004K | 0.14% | 07/08/15 | 6,200,000 | 6,200,000 | ||
| RB (Kaiser Permanente) Series 2004K | 0.14% | 10/05/15 | 5,000,000 | 5,000,000 | ||
| RB (Kaiser Permanente) Series 2004K | 0.14% | 12/01/15 | 8,200,000 | 8,200,000 | ||
| RB (Kaiser Permanente) Series 2006D | 0.14% | 11/03/15 | 20,500,000 | 20,500,000 | ||
| Issuer
Type of Security, Series |
Footnotes | Rate | Effective
Maturity |
Maturity
Date |
Face
Amount ($) |
Value
($) |
| RB (Kaiser Permanente) Series 2008B | 0.14% | 10/02/15 | 8,000,000 | 8,000,000 | ||
| RB (Kaiser Permanente) Series 2008C | 0.24% | 03/14/16 | 1,500,000 | 1,500,000 | ||
| RB (Kaiser Permanente) Series 2009A | 5.00% | 04/01/16 | 1,090,000 | 1,128,499 | ||
| RB (Kaiser Permanente) Series 2009B2 | 0.14% | 11/12/15 | 45,000,000 | 45,000,000 | ||
| RB (Kaiser Permanente) Series 2009B3 | 0.14% | 07/01/15 | 21,500,000 | 21,500,000 | ||
| RB (Kaiser Permanente) Series 2009B5 | 0.23% | 01/05/16 | 14,000,000 | 14,000,000 | ||
| Kern Cnty | ||||||
| TRAN 2015-2016 | b | 7.00% | 06/30/16 | 4,000,000 | 4,266,240 | |
| Los Angeles | ||||||
| TRAN | b | 2.00% | 06/30/16 | 40,000,000 | 40,654,800 | |
| Los Angeles Cnty | ||||||
| TRAN | b | 5.00% | 06/30/16 | 17,000,000 | 17,796,320 | |
| Los Angeles USD | ||||||
| GO Bonds Series 2007H | 5.00% | 07/01/15 | 100,000 | 100,000 | ||
| Riverside Cnty | ||||||
| TRAN | b | 2.00% | 06/30/16 | 10,500,000 | 10,678,500 | |
| Turlock Irrigation District | ||||||
| Sub Revenue CP Series A (LOC: Bank of America, NA) | 0.10% | 10/08/15 | 8,000,000 | 8,000,000 | ||
| 235,824,359 | ||||||
| Colorado 0.2% | ||||||
| Colorado Springs | ||||||
| Utilities System Refunding RB Series 2011A | 5.00% | 11/15/15 | 7,000,000 | 7,126,713 | ||
| Connecticut 0.3% | ||||||
| Connecticut | ||||||
| GO Bonds Series 2007D | 3.50% | 12/01/15 | 100,000 | 101,334 | ||
| GO Refunding Bonds Series 2014C | 3.00% | 12/15/15 | 1,650,000 | 1,671,284 | ||
| Connecticut Health & Educational Facilities Auth | ||||||
| RB (Yale Univ) Series 2013A | 1.35% | 07/21/16 | 5,955,000 | 6,017,164 | ||
| Manchester | ||||||
| GO Temporary Notes | 1.00% | 07/02/15 | 4,209,000 | 4,209,098 | ||
| 11,998,880 | ||||||
| Delaware 0.1% | ||||||
| Delaware Health Facilities Auth | ||||||
| RB (Christiana Care Health Services) Series 2010C | 0.09% | 07/13/15 | 5,000,000 | 5,000,000 | ||
| District of Columbia 1.4% | ||||||
| District of Columbia | ||||||
| GO TRAN Fiscal 2015 | 1.50% | 09/30/15 | 50,000,000 | 50,171,777 | ||
| Income Tax Secured Refunding RB Series 2009B | 4.00% | 12/01/15 | 100,000 | 101,517 | ||
| 50,273,294 | ||||||
| Florida 1.1% | ||||||
| Alachua Cnty Health Facilities Auth | ||||||
| Health Facilities RB (Shands Teaching Hospital & Clinics) Series 2008A (LOC: Bank of America, NA) | 0.09% | 08/05/15 | 7,000,000 | 7,000,000 | ||
| Florida Dept of Transportation | ||||||
| Right-of-Way Acquisition & Bridge Construction Refunding Bonds Series 2009B | 5.00% | 07/01/15 | 850,000 | 850,000 | ||
| Florida State Board of Education | ||||||
| Public Education Capital Outlay Refunding Bonds Series 2012D | 5.00% | 06/01/16 | 7,645,000 | 7,975,022 | ||
| Issuer
Type of Security, Series |
Footnotes | Rate | Effective
Maturity |
Maturity
Date |
Face
Amount ($) |
Value
($) |
| JEA | ||||||
| Electric System RB Series Three 2008C3 (LIQ: Royal Bank of Canada) | 0.08% | 08/31/15 | 8,000,000 | 8,000,000 | ||
| Electric System RB Series Three 2010A | 4.00% | 10/01/15 | 800,000 | 807,606 | ||
| Electric System Sub RB Series 2010A | 5.00% | 10/01/15 | 520,000 | 526,234 | ||
| Electric System Sub RB Series 2013B | 5.00% | 10/01/15 | 100,000 | 101,189 | ||
| Miami-Dade Cnty | ||||||
| Water & Sewer System RB Series 2008A | 5.00% | 10/01/15 | 350,000 | 354,097 | ||
| Water & Sewer System RB Series 2008B | 5.00% | 10/01/15 | 5,280,000 | 5,344,117 | ||
| Water & Sewer System Refunding RB Series 2008C | 5.00% | 10/01/15 | 950,000 | 961,285 | ||
| Orlando Utilities Commission | ||||||
| Utility System Refunding RB Series 2009C | 4.00% | 10/01/15 | 250,000 | 252,347 | ||
| Sunshine State Government Financing Commission | ||||||
| CP Series H (LIQ: JPMorgan Chase Bank, NA) | 0.12% | 10/09/15 | 9,000,000 | 9,000,000 | ||
| 41,171,897 | ||||||
| Georgia 0.1% | ||||||
| Georgia | ||||||
| GO Bonds 2013A | 5.00% | 01/01/16 | 100,000 | 102,362 | ||
| GO Bonds 2013D | 5.00% | 02/01/16 | 390,000 | 400,766 | ||
| Municipal Electric Auth of Georgia | ||||||
| Project One BAN Series A (LOC: Wells Fargo Bank, NA) | 0.09% | 07/15/15 | 3,000,000 | 3,000,000 | ||
| 3,503,128 | ||||||
| Hawaii 0.0% | ||||||
| Hawaii | ||||||
| GO Bonds Series 2008DK | 5.00% | 05/01/16 | 115,000 | 119,367 | ||
| GO Refunding Bonds Series 2010DY | 4.00% | 02/01/16 | 100,000 | 102,157 | ||
| GO Refunding Bonds Series 2009DT | 5.00% | 11/01/15 | 315,000 | 319,947 | ||
| GO Refunding Bonds Series 2010DY | 3.00% | 02/01/16 | 100,000 | 101,547 | ||
| Honolulu | ||||||
| GO Bonds Series 2007A | 5.00% | 07/01/15 | 555,000 | 555,000 | ||
| GO Bonds Series 2007B | 5.25% | 07/01/15 | 600,000 | 600,000 | ||
| 1,798,018 | ||||||
| Idaho 0.5% | ||||||
| Idaho | ||||||
| TAN Series 2015 | b | 2.00% | 06/30/16 | 17,000,000 | 17,289,000 | |
| Illinois 0.9% | ||||||
| Illinois Educational Facilities Auth | ||||||
| Pooled Program CP (LOC: Northern Trust Co) | 0.08% | 08/06/15 | 8,000,000 | 8,000,000 | ||
| Pooled Program CP (LOC: Northern Trust Co) | 0.09% | 09/01/15 | 7,000,000 | 7,000,000 | ||
| Pooled Program CP (LOC: Northern Trust Co) | 0.09% | 09/03/15 | 9,000,000 | 9,000,000 | ||
| Illinois Finance Auth | ||||||
| RB (Northwestern Memorial Hospital) Series 2009A | 5.00% | 08/15/15 | 1,150,000 | 1,156,697 | ||
| RB (Univ of Chicago) Series 2007 | 5.00% | 07/01/15 | 130,000 | 130,000 | ||
| RB (Univ of Chicago) Series 2008B | 5.00% | 07/01/15 | 700,000 | 700,000 | ||
| RB (Univ of Chicago) Series 2008B | 5.00% | 07/01/16 | 2,395,000 | 2,503,643 | ||
| Illinois Health Facilities Auth | ||||||
| RB (Advocate Health Care) Series 2003C | 0.27% | 05/05/16 | 4,000,000 | 4,000,000 | ||
| Issuer
Type of Security, Series |
Footnotes | Rate | Effective
Maturity |
Maturity
Date |
Face
Amount ($) |
Value
($) |
| Illinois Toll Highway Auth | ||||||
| Sr Priority RB Series 2006A1 (ESCROW) | 5.00% | 07/01/16 | 1,500,000 | 1,568,995 | ||
| 34,059,335 | ||||||
| Kansas 0.0% | ||||||
| Kansas Department of Transportation | ||||||
| Highway Refunding RB Series 2009A | 2.25% | 09/01/15 | 155,000 | 155,520 | ||
| Louisiana 0.1% | ||||||
| Louisiana | ||||||
| GO Bonds Series 2012A | 5.00% | 08/01/15 | 1,820,000 | 1,827,508 | ||
| GO Refunding Bonds Series 2005A | 5.00% | 08/01/15 | 335,000 | 336,352 | ||
| 2,163,860 | ||||||
| Maryland 0.2% | ||||||
| Anne Arundel Cnty | ||||||
| GO Consolidated Bonds Series 2011 | 4.00% | 04/01/16 | 3,775,000 | 3,879,435 | ||
| Maryland Health & Higher Educational Facilities Auth | ||||||
| CP (Johns Hopkins Univ) Series A&B | 0.08% | 09/02/15 | 3,000,000 | 3,000,000 | ||
| 6,879,435 | ||||||
| Massachusetts 2.6% | ||||||
| Berlin-Boylston Regional SD | ||||||
| ULT GO BAN | 1.00% | 12/11/15 | 2,000,000 | 2,006,681 | ||
| Framingham | ||||||
| GO BAN | 1.00% | 12/11/15 | 4,000,000 | 4,014,795 | ||
| Harvard | ||||||
| GO BAN | 2.00% | 06/24/16 | 1,500,000 | 1,524,933 | ||
| Lowell | ||||||
| GO BAN | 1.00% | 09/11/15 | 2,000,000 | 2,003,420 | ||
| Massachusetts | ||||||
| GO Bonds Consolidated Loan Series 2005C | 3.88% | 09/01/15 | 100,000 | 100,615 | ||
| Massachusetts Bay Transportation Auth | ||||||
| Sales Tax CP Series B (LIQ: Sumitomo Mitsui Banking Corp) | 0.10% | 09/03/15 | 17,725,000 | 17,725,000 | ||
| Sr Sales Tax Bonds Series 2004C | 5.50% | 07/01/15 | 1,000,000 | 1,000,000 | ||
| Massachusetts Health & Educational Facilities Auth | ||||||
| RB (Partners HealthCare) Series 2007C | 5.00% | 07/01/15 | 150,000 | 150,000 | ||
| Revenue Notes (Harvard Univ) Series EE | 0.07% | 08/05/15 | 10,000,000 | 10,000,000 | ||
| Massachusetts School Building Auth | ||||||
| BAN Series 2014A | 1.00% | 07/16/15 | 15,000,000 | 15,005,415 | ||
| BAN Series 2014A | 5.00% | 07/16/15 | 23,500,000 | 23,547,130 | ||
| Dedicated Sales Tax Bonds Series 2005A (ESCROW) | 5.00% | 08/15/15 | 16,115,000 | 16,209,881 | ||
| Massachusetts Water Resources Auth | ||||||
| General Refunding RB Series 2010B | 5.00% | 08/01/15 | 250,000 | 251,003 | ||
| 93,538,873 | ||||||
| Michigan 0.7% | ||||||
| Michigan Finance Auth | ||||||
| Hospital RB (CHE Trinity Health) Series 2013MI1 | 0.10% | 09/01/15 | 22,000,000 | 22,000,000 | ||
| Michigan State Hospital Finance Auth | ||||||
| RB (Ascension Health) Series 1999B3 | 0.30% | 02/03/16 | 4,000,000 | 4,002,351 | ||
| RB (Ascension Health) Series 2010 | 5.00% | 11/15/15 | 365,000 | 371,481 | ||
| 26,373,832 | ||||||
| Issuer
Type of Security, Series |
Footnotes | Rate | Effective
Maturity |
Maturity
Date |
Face
Amount ($) |
Value
($) |
| Minnesota 1.3% | ||||||
| Rochester | ||||||
| Health Care Facilities RB (Mayo Clinic) Series 2014 | 0.07% | 08/06/15 | 9,900,000 | 9,900,000 | ||
| Health Care Facilities RB (Mayo Clinic) Series 2014 | 0.09% | 09/01/15 | 6,000,000 | 6,000,000 | ||
| Health Care Facilities RB (Mayo Foundation) Series 2000A | 0.09% | 08/05/15 | 25,000,000 | 25,000,000 | ||
| Health Care Facilities RB (Mayo Foundation) Series 2000A | 0.07% | 08/06/15 | 5,400,000 | 5,400,000 | ||
| 46,300,000 | ||||||
| Missouri 0.3% | ||||||
| St Louis | ||||||
| General Revenue Fund TRAN Series 2015 | b | 2.00% | 06/01/16 | 10,000,000 | 10,148,000 | |
| Nevada 0.5% | ||||||
| Las Vegas Valley Water District | ||||||
| LT GO CP Series 2004A (LIQ: JPMorgan Chase Bank, NA) | 0.09% | 08/04/15 | 13,000,000 | 13,000,000 | ||
| LT GO CP Series 2004A (LIQ: JPMorgan Chase Bank, NA) | 0.08% | 08/05/15 | 4,075,000 | 4,075,000 | ||
| 17,075,000 | ||||||
| New Jersey 2.2% | ||||||
| Bergen Cnty | ||||||
| BAN | 1.25% | 12/23/15 | 5,360,000 | 5,387,703 | ||
| Bloomfield Township | ||||||
| BAN | 1.25% | 01/15/16 | 4,000,000 | 4,018,799 | ||
| Burlington Cnty Bridge Commission | ||||||
| Lease Revenue Notes Series 2014 | 1.25% | 11/18/15 | 8,000,000 | 8,032,434 | ||
| Lease Revenue Notes Series 2015 | 1.25% | 02/01/16 | 4,000,000 | 4,023,777 | ||
| Carteret Borough | ||||||
| BAN Series 2015 | 1.50% | 02/05/16 | 3,500,000 | 3,524,045 | ||
| East Brunswick | ||||||
| BAN | 1.00% | 03/18/16 | 4,287,000 | 4,309,378 | ||
| Edison Township | ||||||
| BAN | 1.00% | 02/12/16 | 1,930,000 | 1,937,130 | ||
| Englewood | ||||||
| BAN Series 2015A | 1.25% | 04/08/16 | 3,900,000 | 3,930,252 | ||
| Harrison Township | ||||||
| BAN 2014 Series A | 1.00% | 11/13/15 | 3,000,000 | 3,007,065 | ||
| Hudson Cnty Improvement Auth | ||||||
| Cnty-Guaranteed Pooled Notes Series 2014 U1A | 1.25% | 07/15/15 | 7,000,000 | 7,002,738 | ||
| Cnty-Guaranteed Pooled Notes Series 2015X1A | b | 2.00% | 07/06/16 | 7,000,000 | 7,104,440 | |
| Livingston Township | ||||||
| BAN | 1.00% | 02/01/16 | 2,800,000 | 2,812,586 | ||
| Readington Township | ||||||
| BAN | 1.00% | 08/05/15 | 6,595,000 | 6,600,410 | ||
| Rutgers State Univ | ||||||
| CP Series A&B (LIQ: Wells Fargo Bank, NA) | 0.08% | 09/09/15 | 7,700,000 | 7,700,000 | ||
| Sea Isle City | ||||||
| BAN | 0.75% | 07/22/15 | 4,000,000 | 4,000,962 | ||
| Stafford Township | ||||||
| BAN | 1.50% | 05/13/16 | 3,000,000 | 3,027,145 | ||
| Summit | ||||||
| BAN | 1.00% | 10/23/15 | 2,815,518 | 2,822,898 | ||
| Union Cnty | ||||||
| BAN | 2.00% | 06/24/16 | 1,000,000 | 1,016,317 | ||
| Issuer
Type of Security, Series |
Footnotes | Rate | Effective
Maturity |
Maturity
Date |
Face
Amount ($) |
Value
($) |
| Woodbridge | ||||||
| BAN | 0.75% | 08/21/15 | 1,000,000 | 1,000,753 | ||
| 81,258,832 | ||||||
| New York 5.9% | ||||||
| Burnt Hills - Ballston Lake CSD | ||||||
| GO BAN 2015 | 1.50% | 06/24/16 | 3,000,000 | 3,032,517 | ||
| Cheektowaga-Maryvale UFSD | ||||||
| BAN 2015 | 1.75% | 06/23/16 | 1,500,000 | 1,518,096 | ||
| Grand Island | ||||||
| BANS 2014 | 1.00% | 10/14/15 | 6,320,000 | 6,333,963 | ||
| Hampton Bays UFSD | ||||||
| School Construction BAN 2015 | 1.75% | 06/24/16 | 5,000,000 | 5,066,390 | ||
| Ithaca | ||||||
| GO BAN Series 2014B | 1.00% | 07/31/15 | 2,450,000 | 2,451,672 | ||
| Liverpool CSD | ||||||
| BAN 2014-2015 | 1.25% | 10/02/15 | 6,000,000 | 6,015,471 | ||
| Metropolitan Transportation Auth | ||||||
| Transportation Revenue BAN Series 2015A | 0.50% | 03/01/16 | 16,000,000 | 16,024,083 | ||
| Transportation Revenue BAN Series CP2A (LOC: TD Bank NA) | 0.09% | 09/09/15 | 7,000,000 | 7,000,000 | ||
| New York City | ||||||
| GO Bonds Fiscal 2006 Series G | 5.00% | 08/01/15 | 230,000 | 230,916 | ||
| GO Bonds Fiscal 2012 Series F | 5.00% | 08/01/15 | 3,035,000 | 3,047,512 | ||
| GO Bonds Fiscal 2014 Series B | 5.00% | 08/01/15 | 5,000,000 | 5,020,718 | ||
| New York City Municipal Water Finance Auth | ||||||
| CP Series 1 | 0.07% | 08/04/15 | 12,000,000 | 12,000,000 | ||
| CP Series 1 | 0.08% | 09/09/15 | 12,000,000 | 12,000,000 | ||
| Extendible CP Series 7 | 0.09% | 07/07/15 | 01/29/16 | 15,000,000 | 15,000,000 | |
| Extendible CP Series 7 | 0.10% | 09/01/15 | 03/06/16 | 14,000,000 | 14,000,000 | |
| Extendible CP Series 7 | 0.10% | 09/08/15 | 03/07/16 | 3,500,000 | 3,500,000 | |
| Extendible CP Series 8 | 0.10% | 09/03/15 | 03/04/16 | 16,000,000 | 16,000,000 | |
| Extendible CP Series 8 | 0.10% | 09/02/15 | 03/06/16 | 15,335,000 | 15,335,000 | |
| Extendible CP Series 8 | 0.10% | 09/08/15 | 03/07/16 | 4,500,000 | 4,500,000 | |
| New York State Dormitory Auth | ||||||
| Consolidated Service Contract Refunding RB Series 2009A | 5.00% | 07/01/15 | 200,000 | 200,000 | ||
| New York State Environmental Facilities Corp | ||||||
| State Clean Water & Drinking Water Revolving Funds Sub RB Series 2015A | b | 2.00% | 06/15/16 | 3,875,000 | 3,937,969 | |
| State Personal Income Tax RB Series 2008A | 5.00% | 12/15/15 | 110,000 | 112,308 | ||
| New York State Power Auth | ||||||
| CP Series 1&2 | 0.07% | 07/09/15 | 8,350,000 | 8,350,000 | ||
| CP Series 1&2 | 0.08% | 07/16/15 | 4,204,000 | 4,204,000 | ||
| CP Series 1&2 | 0.09% | 08/07/15 | 25,000,000 | 25,000,000 | ||
| CP Series 1&2 | 0.10% | 10/05/15 | 2,000,000 | 2,000,000 | ||
| New York State Urban Development Corp | ||||||
| State Personal Income Tax RB Series 2008A1 | 4.00% | 12/15/15 | 100,000 | 101,642 | ||
| State Personal Income Tax RB Series 2009C | 5.00% | 12/15/15 | 100,000 | 102,150 | ||
| North Syracuse CSD | ||||||
| GO BAN 2014 | 0.75% | 08/14/15 | 5,000,000 | 5,003,094 | ||
| North Tonawanda SD | ||||||
| School Construction BAN 2014 | 1.00% | 09/17/15 | 750,000 | 751,159 | ||
| Pine Bush CSD | ||||||
| BAN 2015 | 2.00% | 05/26/16 | 1,035,000 | 1,049,493 | ||
| Issuer
Type of Security, Series |
Footnotes | Rate | Effective
Maturity |
Maturity
Date |
Face
Amount ($) |
Value
($) |
| Port Auth of New York & New Jersey | ||||||
| CP Series B | 0.06% | 08/13/15 | 5,000,000 | 5,000,000 | ||
| Tonawanda | ||||||
| BAN Series 2014 | 0.75% | 09/03/15 | 3,400,000 | 3,403,356 | ||
| Ulster Cnty | ||||||
| GO BAN Series 2014B | 1.00% | 11/25/15 | 3,000,000 | 3,009,158 | ||
| West Seneca | ||||||
| BAN 2014 | 1.00% | 07/30/15 | 6,000,000 | 6,004,066 | ||
| 216,304,733 | ||||||
| North Carolina 0.0% | ||||||
| Mecklenburg Cnty | ||||||
| GO Bonds Series 2008B | 5.00% | 02/01/16 | 350,000 | 359,497 | ||
| Ohio 0.3% | ||||||
| Ohio | ||||||
| Capital Facilities Lease Appropriation Refunding Bonds Series 2013B | 4.00% | 08/01/15 | 790,000 | 792,495 | ||
| GO Refunding Bonds Series 2009C | 5.00% | 08/01/15 | 200,000 | 200,804 | ||
| GO Refunding Bonds Series 2009C | 5.00% | 09/15/15 | 685,000 | 691,749 | ||
| GO Refunding Bonds Series 2010C | 5.00% | 08/01/15 | 140,000 | 140,554 | ||
| Hospital Refunding RB (Cleveland Clinic) Series 2011A | 5.00% | 01/01/16 | 450,000 | 460,581 | ||
| Port of Greater Cincinnati Development Auth | ||||||
| Special Obligation Development RB (Springdale) Series 2006 (LOC: US Bank, NA) | 0.45% | 02/01/16 | 7,585,000 | 7,585,000 | ||
| 9,871,183 | ||||||
| Oregon 0.0% | ||||||
| Lane Cnty SD No. 4J | ||||||
| GO Refunding Bond Series 2008 (GTY: Oregon) | 3.50% | 07/01/15 | 200,000 | 200,000 | ||
| Pennsylvania 0.4% | ||||||
| Pennsylvania | ||||||
| GO Bonds Second Refunding Series 2009 | 5.00% | 07/01/15 | 3,300,000 | 3,300,000 | ||
| Pennsylvania Infrastructure Investment Auth | ||||||
| CP Series 2010A (LOC: Bank of America, NA) | 0.12% | 07/01/15 | 2,100,000 | 2,100,000 | ||
| Univ of Pittsburgh | ||||||
| PITT Asset Notes Series 2014 | 2.00% | 07/22/15 | 6,800,000 | 6,807,348 | ||
| Univ Capital & Refunding Bonds Series 2007B | 0.11% | 08/03/15 | 1,000,000 | 1,000,000 | ||
| 13,207,348 | ||||||
| South Carolina 0.7% | ||||||
| Newberry Investing in Children's Education | ||||||
| Installment Purchase RB (Newberry Cnty SD) Series 2005 (ESCROW) | 5.25% | 12/01/15 | 125,000 | 127,585 | ||
| South Carolina Public Service Auth | ||||||
| CP Series A (LIQ: JPMorgan Chase Bank, NA) | 0.10% | 09/03/15 | 5,371,000 | 5,371,000 | ||
| CP Series A (LIQ: JPMorgan Chase Bank, NA) | 0.12% | 09/03/15 | 3,000,000 | 3,000,000 | ||
| CP Series E (LIQ: TD Bank NA) | 0.09% | 09/03/15 | 13,700,000 | 13,700,000 | ||
| CP Series E (LIQ: TD Bank NA) | 0.11% | 09/03/15 | 4,800,000 | 4,800,000 | ||
| Refunding Revenue Obligations Series 2006C | 5.00% | 01/01/16 | 105,000 | 107,475 | ||
| Issuer
Type of Security, Series |
Footnotes | Rate | Effective
Maturity |
Maturity
Date |
Face
Amount ($) |
Value
($) |
| Refunding Revenue Obligations Series 2010B | 5.00% | 01/01/16 | 170,000 | 174,032 | ||
| Refunding Revenue Obligations Series 2011B | 5.00% | 12/01/15 | 250,000 | 254,921 | ||
| 27,535,013 | ||||||
| Tennessee 1.2% | ||||||
| Memphis | ||||||
| GO CP Series A (LIQ: Mizuho Bank Ltd) | 0.09% | 07/13/15 | 3,300,000 | 3,300,000 | ||
| GO CP Series A (LIQ: Mizuho Bank Ltd) | 0.09% | 07/23/15 | 2,850,000 | 2,850,000 | ||
| Metropolitan Government of Nashville & Davidson Cnty | ||||||
| GO CP Series A1 (LIQ: Mizuho Bank Ltd) | 0.08% | 07/22/15 | 11,500,000 | 11,500,000 | ||
| GO CP Series A1 (LIQ: Mizuho Bank Ltd) | 0.09% | 07/22/15 | 7,000,000 | 7,000,000 | ||
| GO CP Series A2 (LIQ: Sumitomo Mitsui Banking Corp) | 0.08% | 08/06/15 | 8,400,000 | 8,400,000 | ||
| GO CP Series A2 (LIQ: Sumitomo Mitsui Banking Corp) | 0.11% | 10/06/15 | 4,000,000 | 4,000,000 | ||
| Shelby Cnty | ||||||
| Extendible CP Series 2015A | 0.11% | 08/10/15 | 02/12/16 | 4,000,000 | 4,000,000 | |
| GO Refunding Bonds Series 2009A | 5.00% | 04/01/16 | 1,095,000 | 1,133,483 | ||
| 42,183,483 | ||||||
| Texas 10.3% | ||||||
| Aldine ISD | ||||||
| ULT GO Bonds Series 2008 (GTY: TX Permanent School Fund) | 5.00% | 02/15/16 | 100,000 | 102,871 | ||
| Arlington Higher Education Finance Corp | ||||||
| Education Refunding RB (Harmony Public Schools) Series 2015 (GTY: TX Permanent School Fund) | 2.00% | 02/15/16 | 500,000 | 504,795 | ||
| Arlington ISD | ||||||
| ULT GO Bonds Series 2014A (GTY: TX Permanent School Fund) | 3.00% | 02/15/16 | 225,000 | 228,781 | ||
| ULT GO Refunding Bonds Series 2006 (GTY: TX Permanent School Fund) | 4.00% | 02/15/16 | 100,000 | 102,304 | ||
| ULT GO Refunding Bonds Series 2007 (GTY: TX Permanent School Fund) | 5.00% | 02/15/16 | 150,000 | 154,382 | ||
| Austin | ||||||
| Combined Utility Systems CP Series A (LOC: Bank of Tokyo Mitsubishi UFJ, Ltd) | 0.10% | 09/03/15 | 14,575,000 | 14,575,000 | ||
| Combined Utility Systems CP Series A (LOC: Bank of Tokyo Mitsubishi UFJ, Ltd) | 0.10% | 09/17/15 | 2,000,000 | 2,000,000 | ||
| Combined Utility Systems CP Series A (LOC: Bank of Tokyo Mitsubishi UFJ, Ltd) | 0.11% | 10/15/15 | 6,000,000 | 6,000,000 | ||
| Water & Wastewater System Refunding RB Series 2012 | 5.00% | 11/15/15 | 1,000,000 | 1,017,958 | ||
| Austin ISD | ||||||
| CP Series A (LIQ: Mizuho Bank Ltd) | 0.10% | 08/03/15 | 2,800,000 | 2,800,000 | ||
| ULT GO Refunding Bonds Series 1998 (GTY: TX Permanent School Fund) | 5.00% | 08/01/15 | 1,000,000 | 1,004,172 | ||
| Belton ISD | ||||||
| ULT GO Refunding Bonds Series 2012 (GTY: TX Permanent School Fund) | 3.00% | 02/15/16 | 205,000 | 208,453 | ||
| Crowley ISD | ||||||
| ULT GO Refunding Bonds Series 2014B (GTY: TX Permanent School Fund) | 0.40% | 08/01/15 | 640,000 | 640,119 | ||
| Dallas | ||||||
| Waterworks & Sewer CP Series E (LIQ: JPMorgan Chase Bank, NA) | 0.12% | 08/06/15 | 4,650,000 | 4,650,000 | ||
| Waterworks & Sewer CP Series E (LIQ: JPMorgan Chase Bank, NA) | 0.10% | 09/03/15 | 3,000,000 | 3,000,000 | ||
| Waterworks & Sewer CP Series E (LIQ: JPMorgan Chase Bank, NA) | 0.11% | 09/03/15 | 4,675,000 | 4,675,000 | ||
| Waterworks & Sewer System Refunding RB Series 2007 | 5.00% | 10/01/15 | 870,000 | 880,390 | ||
| Waterworks & Sewer System Refunding RB Series 2011 | 5.00% | 10/01/15 | 1,000,000 | 1,012,168 | ||
| Issuer
Type of Security, Series |
Footnotes | Rate | Effective
Maturity |
Maturity
Date |
Face
Amount ($) |
Value
($) |
| Dallas Area Rapid Transit | ||||||
| Sr Lien Sales Tax RB Series 2009A | 5.00% | 12/01/15 | 200,000 | 203,807 | ||
| Dallas ISD | ||||||
| ULT GO Bonds Series 2006 (GTY: TX Permanent School Fund) | 4.00% | 08/15/15 | 100,000 | 100,462 | ||
| ULT GO Refunding Bonds Series 2011 (GTY: TX Permanent School Fund) | 4.00% | 02/15/16 | 550,000 | 562,491 | ||
| Denton ISD | ||||||
| ULT GO Refunding Bonds Series 2012B (GTY: TX Permanent School Fund) | 0.22% | 08/15/15 | 415,000 | 414,887 | ||
| ULT GO Refunding Bonds Series 2012B (GTY: TX Permanent School Fund) | 0.23% | 08/15/15 | 825,000 | 824,765 | ||
| ULT GO Refunding Bonds Series 2012B (GTY: TX Permanent School Fund) | 0.25% | 08/15/15 | 225,000 | 224,930 | ||
| El Paso ISD | ||||||
| ULT GO Refunding Bonds Series 2008A (GTY: TX Permanent School Fund) | 5.00% | 02/15/16 | 150,000 | 154,381 | ||
| ULT GO Refunding Bonds Series 2011 (GTY: TX Permanent School Fund) | 5.00% | 08/15/15 | 200,000 | 201,179 | ||
| ULT GO Refunding Bonds Series 2015 (GTY: TX Permanent School Fund) | 3.00% | 08/15/15 | 375,000 | 376,290 | ||
| Ennis ISD | ||||||
| ULT GO Bonds Series 2008 (GTY: TX Permanent School Fund) | 0.21% | 08/15/15 | 1,000,000 | 999,740 | ||
| Frisco ISD | ||||||
| ULT GO Refunding Bonds Series 2010 (GTY: TX Permanent School Fund) | 4.00% | 08/15/15 | 100,000 | 100,462 | ||
| Garland | ||||||
| Electric Utility System CP Series 2014 (LOC: Wells Fargo Bank, NA) | 0.12% | 09/09/15 | 3,000,000 | 3,000,000 | ||
| Garland ISD | ||||||
| ULT GO Refunding Bonds Series 2011A (GTY: TX Permanent School Fund) | 0.33% | 02/15/16 | 405,000 | 404,143 | ||
| Goose Creek Consolidated ISD | ||||||
| ULT Refunding Bonds Series 2004 (GTY: TX Permanent School Fund) | 5.25% | 02/15/16 | 230,000 | 237,010 | ||
| Guthrie Common SD | ||||||
| ULT Refunding Bonds Series 2011 (GTY: TX Permanent School Fund) | 2.00% | 02/15/16 | 150,000 | 151,592 | ||
| Harris Cnty Cultural Education Facilities Finance Corp | ||||||
| Refunding RB (Methodist Hospital) Series 2009C1 | 0.14% | 07/07/15 | 14,500,000 | 14,500,000 | ||
| Refunding RB (Methodist Hospital) Series 2009C1 | 0.14% | 08/05/15 | 6,000,000 | 6,000,000 | ||
| Refunding RB (Methodist Hospital) Series 2009C1 | 0.12% | 10/05/15 | 39,750,000 | 39,750,000 | ||
| Refunding RB (Methodist Hospital) Series 2009C1 | 0.13% | 11/04/15 | 2,900,000 | 2,899,868 | ||
| Refunding RB (Methodist Hospital) Series 2009C2 | 0.14% | 08/05/15 | 5,000,000 | 5,000,000 | ||
| Refunding RB (Methodist Hospital) Series 2009C2 | 0.14% | 08/13/15 | 16,760,000 | 16,760,000 | ||
| Refunding RB (Methodist Hospital) Series 2009C2 | 0.14% | 12/03/15 | 27,000,000 | 27,000,000 | ||
| Hays Consolidated ISD | ||||||
| ULT GO Bonds Series 2014 (GTY: TX Permanent School Fund) | 3.00% | 02/15/16 | 235,000 | 238,943 | ||
| Houston | ||||||
| Combined Utility System CP Series B3 (LOC: Bank of Tokyo Mitsubishi UFJ, Ltd) | 0.09% | 08/04/15 | 10,000,000 | 10,000,000 | ||
| Combined Utility System CP Series B3 (LOC: Bank of Tokyo Mitsubishi UFJ, Ltd) | 0.10% | 09/03/15 | 5,000,000 | 5,000,000 | ||
| Combined Utility System CP Series B4 (LOC: State Street Bank & Trust Co NA) | 0.10% | 09/10/15 | 3,550,000 | 3,550,000 | ||
| TRAN Series 2015 | b | 1.00% | 06/30/16 | 8,000,000 | 8,056,255 | |
| Issuer
Type of Security, Series |
Footnotes | Rate | Effective
Maturity |
Maturity
Date |
Face
Amount ($) |
Value
($) |
| TRAN Series 2015 | b | 2.00% | 06/30/16 | 5,000,000 | 5,085,000 | |
| TRAN Series 2015 | b | 2.25% | 06/30/16 | 5,000,000 | 5,097,400 | |
| Humble ISD | ||||||
| ULT GO Refunding Bonds Series 2011B (GTY: TX Permanent School Fund) | 3.00% | 02/15/16 | 125,000 | 127,121 | ||
| Katy ISD | ||||||
| LT GO Refunding Bonds Series 2008B (GTY: TX Permanent School Fund) | 4.00% | 02/15/16 | 150,000 | 153,465 | ||
| ULT GO Refunding Bonds Series 2010A (GTY: TX Permanent School Fund) | 4.00% | 02/15/16 | 100,000 | 102,299 | ||
| Klein ISD | ||||||
| ULT GO Bonds Series 2010A (GTY: TX Permanent School Fund) | 2.50% | 08/01/15 | 360,000 | 360,688 | ||
| ULT GO Bonds Series 2014 (GTY: TX Permanent School Fund) | 4.00% | 02/01/16 | 125,000 | 127,716 | ||
| Leander ISD | ||||||
| ULT GO & Refunding Bonds Series 2008 (GTY: TX Permanent School Fund) | 5.00% | 08/15/15 | 150,000 | 150,886 | ||
| Lower Neches Valley Auth | ||||||
| Pollution Control RB (Chevron USA) Series 1987 | 0.09% | 08/17/15 | 2,000,000 | 2,000,000 | ||
| Lubbock Health Facilities Development Corp | ||||||
| Refunding RB (St Joseph Health) Series 2008B | 5.00% | 07/01/15 | 1,500,000 | 1,500,000 | ||
| Manor ISD | ||||||
| ULT GO Bonds Series 2014 (GTY: TX Permanent School Fund) | 2.00% | 08/01/15 | 150,000 | 150,220 | ||
| Mesquite ISD | ||||||
| ULT GO & Refunding Bonds Series 2007 (GTY: TX Permanent School Fund) | 4.25% | 08/15/15 | 200,000 | 200,944 | ||
| ULT GO Refunding Bonds Series 2014B (GTY: TX Permanent School Fund) | 5.00% | 08/15/15 | 3,820,000 | 3,842,924 | ||
| New Caney ISD | ||||||
| ULT GO Refunding Bonds Series 2014 (GTY: TX Permanent School Fund) | 3.00% | 02/15/16 | 310,000 | 315,203 | ||
| North East ISD | ||||||
| ULT GO Bonds Series 2007A (GTY: TX Permanent School Fund) | 0.27% | 08/01/15 | 250,000 | 249,942 | ||
| ULT GO Bonds Series 2007A (GTY: TX Permanent School Fund) | 0.30% | 08/01/15 | 180,000 | 179,954 | ||
| Northside ISD | ||||||
| ULT GO Refunding Bonds Series 2006A (GTY: TX Permanent School Fund) | 3.00% | 08/01/15 | 125,000 | 125,294 | ||
| Northwest ISD | ||||||
| ULT GO Refunding Bonds Series 2015 (GTY: TX Permanent School Fund) | 2.00% | 08/15/15 | 375,000 | 375,823 | ||
| Pflugerville ISD | ||||||
| ULT GO Refunding Bonds Series 2005 (GTY: TX Permanent School Fund) | 5.25% | 08/15/15 | 235,000 | 236,449 | ||
| Plano ISD | ||||||
| ULT GO Refunding Bonds Series 2008 (GTY: TX Permanent School Fund) | 5.00% | 02/15/16 | 165,000 | 169,786 | ||
| Prosper ISD | ||||||
| ULT GO & Refunding Bonds Series 2008 (GTY: TX Permanent School Fund) | 0.25% | 02/15/16 | 100,000 | 99,843 | ||
| ULT GO & Refunding Bonds Series 2008 (GTY: TX Permanent School Fund) | 0.35% | 02/15/16 | 100,000 | 99,781 | ||
| Rio Hondo ISD | ||||||
| ULT GO Refunding Bonds Series 2014 (GTY: TX Permanent School Fund) | 2.00% | 02/15/16 | 100,000 | 101,057 | ||
| Issuer
Type of Security, Series |
Footnotes | Rate | Effective
Maturity |
Maturity
Date |
Face
Amount ($) |
Value
($) |
| San Antonio | ||||||
| Electric & Gas Systems CP Series A (LIQ: JPMorgan Chase Bank, NA) | 0.08% | 08/06/15 | 13,500,000 | 13,500,000 | ||
| Electric & Gas Systems CP Series A (LIQ: JPMorgan Chase Bank, NA) | 0.09% | 09/01/15 | 7,000,000 | 7,000,000 | ||
| Electric & Gas Systems CP Series C (LIQ: Bank of Tokyo Mitsubishi UFJ, Ltd) | 0.09% | 09/01/15 | 14,000,000 | 14,000,000 | ||
| Electric & Gas Systems CP Series C (LIQ: Bank of Tokyo Mitsubishi UFJ, Ltd) | 0.10% | 09/04/15 | 16,500,000 | 16,500,000 | ||
| Electric & Gas Systems Refunding RB New Series 2007 | 4.00% | 02/01/16 | 100,000 | 102,147 | ||
| Electric & Gas Systems Refunding RB New Series 2011 | 5.00% | 02/01/16 | 230,000 | 236,266 | ||
| General Improvement Bonds Series 2008 | 5.00% | 08/01/15 | 100,000 | 100,384 | ||
| GO Bonds Series 2012 | 5.00% | 02/01/16 | 125,000 | 128,406 | ||
| Water System CP Series A (LIQ: Bank of Tokyo Mitsubishi UFJ, Ltd) | 0.08% | 07/15/15 | 4,500,000 | 4,500,000 | ||
| Schertz-Cibolo Universal City ISD | ||||||
| ULT GO Refunding Bonds Series 2010 (GTY: TX Permanent School Fund) | 3.00% | 02/01/16 | 110,000 | 111,745 | ||
| Splendora ISD | ||||||
| ULT GO Refunding Bonds Series 2015 (GTY: TX Permanent School Fund) | 3.00% | 02/15/16 | 145,000 | 147,449 | ||
| Spring ISD | ||||||
| ULT GO & Refunding Bonds Series 2008A (GTY: TX Permanent School Fund) | 3.50% | 08/15/15 | 100,000 | 100,398 | ||
| Terrell ISD | ||||||
| ULT GO Refunding Bonds Series 2010 (GTY: TX Permanent School Fund) | 4.00% | 08/01/15 | 100,000 | 100,313 | ||
| Texas | ||||||
| Fund II Bonds Series 2009A | 4.25% | 06/01/16 | 100,000 | 103,476 | ||
| TRAN Series 2014 | 1.50% | 08/31/15 | 52,225,000 | 52,343,498 | ||
| Texas Public Finance Auth | ||||||
| GO CP Series 2008 | 0.08% | 07/08/15 | 5,800,000 | 5,800,000 | ||
| GO Refunding Bonds Series 2006B | 4.00% | 10/01/15 | 250,000 | 252,344 | ||
| Refunding RB Series 2015B | 1.00% | 10/01/15 | 145,000 | 145,231 | ||
| Refunding RB Series 2015B | 1.00% | 04/01/16 | 815,000 | 819,262 | ||
| Unemployment Compensation Assessment RB Series 2003C4 | 0.08% | 08/06/15 | 20,000,000 | 20,000,000 | ||
| Unemployment Compensation Assessment RB Series 2003C4 | 0.09% | 08/06/15 | 16,019,000 | 16,019,000 | ||
| Texas Tech Univ | ||||||
| Revenue Financing System CP Series 2012A | 0.06% | 07/22/15 | 11,521,000 | 11,521,000 | ||
| Texas Transportation Commission | ||||||
| GO Mobility Fund Bonds Series 2006 | 5.00% | 04/01/16 | 600,000 | 621,328 | ||
| Three Rivers ISD | ||||||
| ULT GO Bonds Series 2011 (GTY: TX Permanent School Fund) | 5.00% | 02/15/16 | 100,000 | 102,915 | ||
| United ISD | ||||||
| ULT GO Refunding Bonds Series 2015 (GTY: TX Permanent School Fund) | b | 2.00% | 08/15/15 | 1,065,000 | 1,066,502 | |
| Weatherford ISD | ||||||
| ULT GO & Refunding Bonds Series 2001 (GTY: TX Permanent School Fund) | 0.31% | 02/15/16 | 100,000 | 99,801 | ||
| Weslaco ISD | ||||||
| ULT GO Refunding Bonds Series 2015B (GTY: TX Permanent School Fund) | 2.00% | 08/15/15 | 100,000 | 100,204 | ||
| 376,641,062 | ||||||
| Issuer
Type of Security, Series |
Footnotes | Rate | Effective
Maturity |
Maturity
Date |
Face
Amount ($) |
Value
($) |
| Utah 0.4% | ||||||
| Intermountain Power Agency | ||||||
| CP Series B1&B2 (LIQ: JPMorgan Chase Bank, NA) | 0.11% | 09/09/15 | 8,000,000 | 8,000,000 | ||
| CP Series B1&B2 (LIQ: JPMorgan Chase Bank, NA) | 0.09% | 09/10/15 | 7,500,000 | 7,500,000 | ||
| 15,500,000 | ||||||
| Virginia 0.4% | ||||||
| Metropolitan Washington Airports Auth | ||||||
| Airport System RB Series 2009C | 5.00% | 10/01/15 | 540,000 | 546,542 | ||
| Second Sr Lien CP (Dulles Toll Road) Series One (LOC: JPMorgan Chase Bank, NA) | 0.08% | 07/29/15 | 10,000,000 | 10,000,000 | ||
| Virginia Housing Development Auth | ||||||
| Commonwealth Mortgage Bonds Series 2012C5 | 1.20% | 07/01/16 | 300,000 | 301,341 | ||
| Virginia Transportation Board | ||||||
| Transportation RB Series 2011 | 5.00% | 05/15/16 | 4,000,000 | 4,163,015 | ||
| 15,010,898 | ||||||
| Washington 0.3% | ||||||
| Bellevue SD No. 405 | ||||||
| ULT GO Bonds 2013 (GTY: Washington) | 3.00% | 12/01/15 | 100,000 | 101,129 | ||
| Camas SD No. 117 | ||||||
| ULT GO Bonds 2007 (GTY: Washington) | 5.00% | 12/01/15 | 200,000 | 203,946 | ||
| Cheney SD No. 360 | ||||||
| ULT GO Bonds Series 2010 (GTY: Washington) | 4.00% | 12/01/15 | 100,000 | 101,557 | ||
| Columbia SD No. 400 | ||||||
| ULT GO Refunding Bonds 2014 (GTY: Washington) | 2.00% | 12/01/15 | 100,000 | 100,716 | ||
| Eatonville SD No. 404 | ||||||
| ULT GO Refunding Bonds 2015 (GTY: Washington) | 2.00% | 12/01/15 | 145,000 | 146,001 | ||
| Everett SD No. 2 | ||||||
| ULT GO Bonds 2006 (GTY: Washington) | 4.13% | 12/01/15 | 200,000 | 203,247 | ||
| ULT GO Bonds Series 2009A (GTY: Washington) | 3.00% | 12/01/15 | 150,000 | 151,705 | ||
| Federal Way SD No. 210 | ||||||
| ULT GO & Refunding Bonds 2015 (GTY: Washington) | 5.00% | 12/01/15 | 200,000 | 203,822 | ||
| Kennewick SD No. 17 | ||||||
| ULT GO Bonds 2009 (GTY: Washington) | 4.00% | 12/01/15 | 350,000 | 355,242 | ||
| King Cnty | ||||||
| LT GO Bonds Series 2007D | 5.00% | 01/01/16 | 330,000 | 337,913 | ||
| LT GO Bonds Series 2009 | 5.00% | 01/01/16 | 205,000 | 209,816 | ||
| Northshore SD No. 417 | ||||||
| ULT GO & Refunding Bonds Series 2007 (GTY: Washington) | 5.00% | 12/01/15 | 100,000 | 101,968 | ||
| Oak Harbor SD No. 201 | ||||||
| ULT GO Bonds Series 2008 (GTY: Washington) | 4.00% | 12/01/15 | 125,000 | 126,925 | ||
| Olympia SD No. 111 | ||||||
| ULT GO Refunding Bonds 2012 (GTY: Washington) | 4.00% | 12/01/15 | 1,420,000 | 1,442,638 | ||
| Peninsula SD No. 401 | ||||||
| ULT GO Refunding Bonds 2011 (GTY: Washington) | 4.00% | 12/01/15 | 150,000 | 152,357 | ||
| Port of Seattle | ||||||
| Intermediate Lien Refunding RB Series 2012A | 3.00% | 08/01/15 | 705,000 | 706,637 | ||
| Puyallup SD No. 3 | ||||||
| ULT GO Bonds Series 2005 (GTY: Washington) | 5.00% | 12/01/15 | 100,000 | 101,966 | ||
| Renton SD No. 403 | ||||||
| ULT GO & Refunding Bonds Series 2012 (GTY: Washington) | 5.00% | 12/01/15 | 100,000 | 101,929 | ||
| Shoreline SD No. 412 | ||||||
| ULT GO & Refunding Bonds 2013 (GTY: Washington) | 3.00% | 12/01/15 | 200,000 | 202,251 | ||
| Issuer
Type of Security, Series |
Footnotes | Rate | Effective
Maturity |
Maturity
Date |
Face
Amount ($) |
Value
($) |
| Snoqualmie Valley SD No. 410 | ||||||
| ULT GO Refunding Bonds 2010 (GTY: Washington) | 5.00% | 12/01/15 | 100,000 | 101,950 | ||
| Univ of Washington | ||||||
| General Revenue CP Series A | 0.12% | 11/04/15 | 2,000,000 | 2,000,000 | ||
| Washington | ||||||
| COP Series 2011A | 3.00% | 01/01/16 | 130,000 | 131,717 | ||
| GO Bonds Series 1998C | 6.00% | 07/01/15 | 100,000 | 100,000 | ||
| GO Bonds Series 2008A | 5.00% | 07/01/15 | 100,000 | 100,000 | ||
| GO Bonds Series 2009E | 5.00% | 02/01/16 | 125,000 | 128,407 | ||
| GO Bonds Series 2010C | 5.00% | 08/01/15 | 260,000 | 261,051 | ||
| Motor Vehicle Fuel Tax GO Bonds Series 2004F | 0.28% | 12/01/15 | 200,000 | 199,766 | ||
| Motor Vehicle Fuel Tax GO Bonds Series 2006F | 0.31% | 12/01/15 | 160,000 | 159,791 | ||
| Motor Vehicle Fuel Tax GO Bonds Series 2008D | 5.00% | 01/01/16 | 210,000 | 214,961 | ||
| Motor Vehicle Fuel Tax GO Bonds Series 2012E | 5.00% | 02/01/16 | 105,000 | 107,900 | ||
| Motor Vehicle Fuel Tax GO Refunding Bonds Series R2011C | 4.00% | 07/01/15 | 100,000 | 100,000 | ||
| Motor Vehicle Fuel Tax GO Refunding Bonds Series R2012D | 5.00% | 07/01/15 | 1,925,000 | 1,925,000 | ||
| 10,582,308 | ||||||
| Wisconsin 0.8% | ||||||
| Wisconsin Health & Educational Facilities Auth | ||||||
| RB (Aurora Health Care) Series 2008A (LOC: JPMorgan Chase Bank, NA) | 0.10% | 08/05/15 | 15,000,000 | 15,000,000 | ||
| RB (Aurora Health Care) Series 2010C (LOC: Bank of America, NA) | 0.09% | 09/04/15 | 15,000,000 | 15,000,000 | ||
| 30,000,000 | ||||||
| Total Fixed-Rate Securities | ||||||
| (Cost $1,496,396,088) | 1,496,396,088 | |||||
| Variable-Rate Securities 62.1% of net assets | ||||||
| Alabama 6.0% | ||||||
| Alabama | ||||||
| GO Refunding Bonds Series 2014A (LIQ: Morgan Stanley Bank NA) | a | 0.08% | 07/07/15 | 5,000,000 | 5,000,000 | |
| Alabama Municipal Funding Corp | ||||||
| Notes Series 2006 (LOC: US Bank, NA) | 0.08% | 07/07/15 | 9,435,000 | 9,435,000 | ||
| Notes Series 2008A, 2009B&2010A (LOC: US Bank, NA) | c | 0.08% | 07/07/15 | 36,360,000 | 36,360,000 | |
| Alabama Public School & College Auth | ||||||
| Capital Improvement Bonds Series 2007 (LIQ: State Street Bank & Trust Co NA) | a | 0.07% | 07/07/15 | 28,655,000 | 28,655,000 | |
| Alabama Special Care Facility Financing Auth | ||||||
| RB (Ascension Health) Series 2006C2 (LIQ: Bank of America, NA) | a | 0.12% | 07/07/15 | 6,180,000 | 6,180,000 | |
| Birmingham Water Works Board | ||||||
| Water RB Series 2011 (LIQ: Deutsche Bank AG) | a | 0.33% | 07/07/15 | 8,965,000 | 8,965,000 | |
| Water RB Series 2013B (LIQ: Barclays Bank Plc) | a | 0.12% | 07/07/15 | 10,310,000 | 10,310,000 | |
| Columbia IDB | ||||||
| Pollution Control Refunding RB (AL Power) Series 2014D | 0.10% | 07/07/15 | 5,000,000 | 5,000,000 | ||
| Mobile Cnty IDA | ||||||
| Gulf Opportunity Zone RB (SSAB Alabama) Series 2011 (LOC: Credit Agricole Corporate and Investment Bank) | c | 0.10% | 07/07/15 | 30,000,000 | 30,000,000 | |
| Recovery Zone Facility RB (SSAB Alabama) Series 2010A (LOC: Swedbank AB) | 0.10% | 07/07/15 | 15,960,000 | 15,960,000 | ||
| Mobile IDB | ||||||
| Pollution Control RB (AL Power) Series 2007C | 0.10% | 07/07/15 | 11,500,000 | 11,500,000 | ||
| Issuer
Type of Security, Series |
Footnotes | Rate | Effective
Maturity |
Maturity
Date |
Face
Amount ($) |
Value
($) |
| Troy Health Care Auth | ||||||
| Lease RB (Southeast AL Rural Health Assoc) Series 2003 (LOC: Federal Home Loan Bank) | 0.07% | 07/07/15 | 1,775,000 | 1,775,000 | ||
| Tuscaloosa Cnty IDA | ||||||
| Gulf Opportunity Zone Bonds (Hunt Refining) Series 2008A (LOC: Citibank, NA) | 0.08% | 07/07/15 | 10,000,000 | 10,000,000 | ||
| Gulf Opportunity Zone Bonds (Hunt Refining) Series 2008C (LOC: Bank of Nova Scotia) | 0.07% | 07/07/15 | 13,000,000 | 13,000,000 | ||
| Gulf Opportunity Zone Bonds (Hunt Refining) Series 2011H (LOC: Bank of Nova Scotia) | c | 0.07% | 07/07/15 | 25,000,000 | 25,000,000 | |
| 217,140,000 | ||||||
| Arizona 0.5% | ||||||
| Arizona Health Facilities Auth | ||||||
| RB (Banner Health) Series 2008A&D, 2012A (LIQ: Morgan Stanley Bank NA) | a | 0.22% | 07/07/15 | 4,770,000 | 4,770,000 | |
| Maricopa Cnty IDA | ||||||
| Sr Living Facilities Refunding RB Series 2005A (LOC: Fannie Mae) | 0.06% | 07/07/15 | 12,095,000 | 12,095,000 | ||
| 16,865,000 | ||||||
| Arkansas 0.2% | ||||||
| Fort Smith | ||||||
| Bonds (Mitsubishi Power Systems Americas) Series 2010 (LOC: Bank of Tokyo Mitsubishi UFJ, Ltd) | 0.13% | 07/07/15 | 5,935,000 | 5,935,000 | ||
| California 2.0% | ||||||
| California Educational Facilities Auth | ||||||
| RB (Life Chiropractic College West) Series 1999 (LOC: Bank of the West) | 0.07% | 07/07/15 | 60,000 | 60,000 | ||
| California Health Facilities Financing Auth | ||||||
| RB (Sutter Health) Series 2007A (LIQ: JPMorgan Chase Bank, NA) | a | 0.08% | 07/07/15 | 3,750,000 | 3,750,000 | |
| RB (Sutter Health) Series 2011D (LIQ: Citibank, NA) | a | 0.08% | 07/07/15 | 4,000,000 | 4,000,000 | |
| California Infrastructure & Economic Development Bank | ||||||
| RB (Casa Loma College) Series 2009 (LOC: Comerica Bank) | 0.10% | 07/07/15 | 3,345,000 | 3,345,000 | ||
| California Pollution Control Financing Auth | ||||||
| RB (Hilmar Cheese) Series 2010 (LOC: CoBank, ACB) | 0.09% | 07/07/15 | 5,285,000 | 5,285,000 | ||
| Solid Waste Disposal RB (BLT Enterprises of Fremont) Series 2010 (LOC: MUFG Union Bank, NA) | 0.08% | 07/07/15 | 10,935,000 | 10,935,000 | ||
| Coast CCD | ||||||
| GO Bonds Series 2006B (LIQ: Deutsche Bank AG) | a | 0.16% | 07/07/15 | 6,005,000 | 6,005,000 | |
| Los Angeles | ||||||
| Wastewater System Refunding RB Series 2005A (LIQ: Citibank, NA) | a | 0.10% | 07/07/15 | 750,000 | 750,000 | |
| Los Angeles CCD | ||||||
| GO Bonds Series 2007A (LIQ: Citibank, NA) | a | 0.09% | 07/07/15 | 8,700,000 | 8,700,000 | |
| Los Angeles Dept of Water & Power | ||||||
| Water System RB Series 2014A (LIQ: Morgan Stanley Bank NA) | a | 0.08% | 07/07/15 | 4,700,000 | 4,700,000 | |
| Newport-Mesa USD | ||||||
| GO Bonds Series 2007 (LIQ: Deutsche Bank AG) | a | 0.15% | 07/07/15 | 2,250,000 | 2,250,000 | |
| Pittsburg Public Financing Auth | ||||||
| Water Refunding RB Series 2008 (LOC: Bank of the West) | 0.08% | 07/07/15 | 2,915,000 | 2,915,000 | ||
| San Diego CCD | ||||||
| GO Bonds Series 2009 (LIQ: Deutsche Bank AG) | a | 0.09% | 07/07/15 | 5,000,000 | 5,000,000 | |
| San Francisco | ||||||
| Refunding COP Series 2010A (LIQ: Morgan Stanley Bank NA) | a | 0.09% | 07/07/15 | 3,340,000 | 3,340,000 | |
| Issuer
Type of Security, Series |
Footnotes | Rate | Effective
Maturity |
Maturity
Date |
Face
Amount ($) |
Value
($) |
| Univ of California | ||||||
| Limited Project RB Series 2015I (LIQ: JPMorgan Chase Bank, NA) | a | 0.08% | 07/07/15 | 11,885,000 | 11,885,000 | |
| 72,920,000 | ||||||
| Colorado 2.1% | ||||||
| Broomfield Urban Renewal Auth | ||||||
| Tax Increment RB Series 2005 (LOC: BNP Paribas) | 0.13% | 07/07/15 | 18,745,000 | 18,745,000 | ||
| Colorado Health Facilities Auth | ||||||
| RB (Sisters of Charity of Leavenworth Health System) Series 2013A (LIQ: Citibank, NA) | a | 0.10% | 07/07/15 | 1,000,000 | 1,000,000 | |
| RB (Sisters of Charity of Leavenworth Health System) Series 2013A (LIQ: Morgan Stanley Bank NA) | a | 0.08% | 07/07/15 | 7,000,000 | 7,000,000 | |
| Lafayette | ||||||
| M/F Housing RB (Traditions) Series 2011A (LOC: Freddie Mac) | 0.06% | 07/07/15 | 12,450,000 | 12,450,000 | ||
| Midcities Metropolitan District No. 1 | ||||||
| Special Refunding RB Series 2004B (LOC: BNP Paribas) | 0.15% | 07/07/15 | 4,000,000 | 4,000,000 | ||
| Parker Automotive Metropolitan District | ||||||
| GO Bonds Series 2005 (LOC: US Bank, NA) | 0.08% | 07/07/15 | 840,000 | 840,000 | ||
| Sheridan Redevelopment Agency | ||||||
| Tax Increment Refunding RB (South Santa Fe Drive) Series 2011A1 (LOC: JPMorgan Chase Bank, NA) | 0.09% | 07/07/15 | 9,750,000 | 9,750,000 | ||
| Univ of Colorado | ||||||
| Univ Enterprise RB Series 2011A (LIQ: Citibank, NA) | a | 0.08% | 07/07/15 | 8,000,000 | 8,000,000 | |
| Univ Enterprise RB Series 2013A (LIQ: Royal Bank of Canada) | a | 0.07% | 07/07/15 | 9,000,000 | 9,000,000 | |
| Univ Enterprise RB Series 2014A (LIQ: JPMorgan Chase Bank, NA) | a | 0.08% | 07/07/15 | 5,625,000 | 5,625,000 | |
| 76,410,000 | ||||||
| Connecticut 0.1% | ||||||
| Connecticut | ||||||
| GO Refunding Notes Series 2014A | 0.11% | 07/02/15 | 01/01/16 | 2,500,000 | 2,500,000 | |
| District of Columbia 2.4% | ||||||
| District of Columbia | ||||||
| GO Bonds Series 2007C (LIQ: Deutsche Bank AG) | a | 0.12% | 07/07/15 | 15,655,000 | 15,655,000 | |
| GO Bonds Series 2008E (GTY: Berkshire Hathaway Assurance Corp /LIQ: Bank of America, NA) | a | 0.12% | 07/07/15 | 3,305,000 | 3,305,000 | |
| Income Tax Secured Refunding RB Series 2012B (LIQ: Citibank, NA) | a | 0.08% | 07/07/15 | 6,200,000 | 6,200,000 | |
| Income Tax Secured Refunding RB Series 2014B | 0.09% | 07/02/15 | 12/01/15 | 2,715,000 | 2,715,000 | |
| RB (American Univ) Series 2006A (LOC: Royal Bank of Canada) | 0.06% | 07/07/15 | 16,000,000 | 16,000,000 | ||
| RB (The Catholic Univ of America) Series 2007 (GTY: Berkshire Hathaway Assurance Corp /LIQ: Citibank, NA) | a | 0.08% | 07/07/15 | 7,755,000 | 7,755,000 | |
| District of Columbia HFA | ||||||
| M/F Housing RB (The Yards) Series 2012 (LOC: Federal Home Loan Bank) | 0.10% | 07/07/15 | 4,250,000 | 4,250,000 | ||
| District of Columbia Water & Sewer Auth | ||||||
| Public Utility Sub Lien RB Series 2007A (LIQ: Citibank, NA) | a | 0.09% | 07/07/15 | 9,500,000 | 9,500,000 | |
| Public Utility Sub Lien Refunding RB Series 2008A (LIQ: Citibank, NA) | a | 0.08% | 07/07/15 | 9,360,000 | 9,360,000 | |
| Washington Convention Center Auth | ||||||
| Sr Lien Dedicated Tax Refunding RB Series 2007A (GTY: Berkshire Hathaway Assurance Corp /LIQ: Credit Suisse AG) | a | 0.07% | 07/07/15 | 14,495,000 | 14,495,000 | |
| 89,235,000 | ||||||
| Issuer
Type of Security, Series |
Footnotes | Rate | Effective
Maturity |
Maturity
Date |
Face
Amount ($) |
Value
($) |
| Florida 3.0% | ||||||
| Florida Housing Finance Corp | ||||||
| M/F Mortgage RB (Autumn Place Apts) Series 2008K1 (LOC: Federal Home Loan Bank) | 0.07% | 07/07/15 | 6,195,000 | 6,195,000 | ||
| Florida State Board of Education | ||||||
| Public Education Capital Outlay Bonds Series 2006B (LIQ: US Bank, NA) | a | 0.07% | 07/07/15 | 9,930,000 | 9,930,000 | |
| Halifax Hospital Medical Center | ||||||
| Hospital Refunding & Improvement RB Series 2008 (LOC: JPMorgan Chase Bank, NA) | 0.08% | 07/07/15 | 5,400,000 | 5,400,000 | ||
| Jacksonville | ||||||
| RB Series 2008A (LOC: Bank of America, NA) | 0.09% | 07/07/15 | 8,700,000 | 8,700,000 | ||
| JEA | ||||||
| Electric System Sub RB Series 2013C (LIQ: Citibank, NA) | a | 0.09% | 07/07/15 | 8,565,000 | 8,565,000 | |
| Miami-Dade Cnty | ||||||
| Seaport RB Series 2014A (LOC: Bank of Tokyo Mitsubishi UFJ, Ltd) | 0.07% | 07/07/15 | 5,000,000 | 5,000,000 | ||
| Transit System Sales Surtax RB Series 2006 (LIQ: Citibank, NA) | a | 0.09% | 07/07/15 | 7,640,000 | 7,640,000 | |
| Orlando-Orange Cnty Expressway Auth | ||||||
| RB Series 2007A (GTY/LIQ: US Bank, NA) | a | 0.08% | 07/07/15 | 14,715,000 | 14,715,000 | |
| RB Series 2007A (GTY: Berkshire Hathaway Assurance Corp /LIQ: Citibank, NA) | a | 0.09% | 07/07/15 | 3,400,000 | 3,400,000 | |
| RB Series 2007A (GTY: Berkshire Hathaway Assurance Corp /LIQ: Citibank, NA) | a | 0.10% | 07/07/15 | 1,600,000 | 1,600,000 | |
| Palm Beach Cnty | ||||||
| RB (Norton Gallery & School of Art) Series 1995 (LOC: Northern Trust Co) | 0.07% | 07/07/15 | 11,800,000 | 11,800,000 | ||
| Palm Beach Cnty Solid Waste Auth | ||||||
| RB Series 2009A (GTY: Berkshire Hathaway Assurance Corp /LIQ: JPMorgan Chase Bank, NA) | a | 0.09% | 07/07/15 | 2,275,000 | 2,275,000 | |
| South Miami Health Facilities Auth | ||||||
| Hospital RB (Baptist Health South Florida) Series 2007 (LIQ: Credit Suisse AG) | a | 0.07% | 07/07/15 | 5,375,000 | 5,375,000 | |
| Hospital RB (Baptist Health South Florida) Series 2007 (LIQ: JPMorgan Chase Bank, NA) | a | 0.13% | 07/07/15 | 5,185,000 | 5,185,000 | |
| Tallahassee | ||||||
| Energy System RB Series 2007 (LIQ: Citibank, NA) | a | 0.09% | 07/07/15 | 9,705,000 | 9,705,000 | |
| Energy System RB Series 2007 (LIQ: JPMorgan Chase Bank, NA) | a | 0.09% | 07/07/15 | 4,995,000 | 4,995,000 | |
| 110,480,000 | ||||||
| Georgia 2.0% | ||||||
| Atlanta | ||||||
| Water & Wastewater Refunding RB Series 2015 (LIQ: Morgan Stanley Bank NA) | a | 0.08% | 07/07/15 | 4,200,000 | 4,200,000 | |
| Bartow Cnty Development Auth | ||||||
| Pollution Control RB (GA Power) First Series 2009 | c | 0.12% | 07/07/15 | 25,000,000 | 25,000,000 | |
| Burke Cnty Development Auth | ||||||
| Pollution Control RB (GA Power) First Series 2013 | 0.12% | 07/07/15 | 3,000,000 | 3,000,000 | ||
| Georgia | ||||||
| GO Bonds Series 2007E (LIQ: Wells Fargo & Co) | a | 0.09% | 07/07/15 | 5,045,000 | 5,045,000 | |
| Main St Natural Gas | ||||||
| RB Series 2010A1 (LOC: Royal Bank of Canada) | 0.13% | 07/02/15 | 10/01/15 | 12,000,000 | 12,000,000 | |
| RB Series 2010A2 (LOC: Royal Bank of Canada) | 0.13% | 07/02/15 | 08/03/15 | 12,000,000 | 12,000,000 | |
| Monroe Cnty Development Auth | ||||||
| Pollution Control RB (GA Power) First Series 2009 | 0.09% | 07/07/15 | 11,200,000 | 11,200,000 | ||
| Issuer
Type of Security, Series |
Footnotes | Rate | Effective
Maturity |
Maturity
Date |
Face
Amount ($) |
Value
($) |
| Putnam Cnty Development Auth | ||||||
| Pollution Control RB (GA Power) First Series 1996 | 0.06% | 07/01/15 | 2,245,000 | 2,245,000 | ||
| 74,690,000 | ||||||
| Hawaii 0.1% | ||||||
| Hawaii | ||||||
| GO Bonds Series 2007DJ (LIQ: State Street Bank & Trust Co NA) | a | 0.07% | 07/07/15 | 4,995,000 | 4,995,000 | |
| Illinois 6.8% | ||||||
| Bartlett | ||||||
| ULT Ad Valorem Tax Bonds Series 2004 (LOC: Fifth Third Bank) | 0.11% | 07/07/15 | 8,320,000 | 8,320,000 | ||
| Bloomington | ||||||
| GO Bonds Series 2004 (LIQ: JPMorgan Chase Bank, NA) | 0.13% | 07/07/15 | 8,900,000 | 8,900,000 | ||
| Bloomington-Normal Airport Auth | ||||||
| GO Bonds Series 2012 (LOC: Northern Trust Co) | 0.13% | 07/07/15 | 4,580,000 | 4,580,000 | ||
| Bolingbrook | ||||||
| Tax Increment Jr Lien RB Series 2005 (LOC: Sumitomo Mitsui Banking Corp) | 0.32% | 07/07/15 | 5,425,000 | 5,425,000 | ||
| Chicago | ||||||
| Second Lien Water Refunding RB Series 2004-3 (LOC: State Street Bank & Trust Co NA) | 0.17% | 07/07/15 | 600,000 | 600,000 | ||
| Illinois Finance Auth | ||||||
| IDRB (Radiological Society of North America) Series 1997 (LOC: JPMorgan Chase Bank, NA) | 0.17% | 07/07/15 | 395,000 | 395,000 | ||
| RB (Fenwick High School) Series 1997 (LOC: PNC Bank NA) | 0.09% | 07/07/15 | 2,000,000 | 2,000,000 | ||
| RB (Garrett-Evangelical Theological Seminary) Series 2010 (LOC: Federal Home Loan Bank) | 0.07% | 07/07/15 | 4,120,000 | 4,120,000 | ||
| RB (Kohl Children's Museum) Series 2004 (LOC: Northern Trust Co) | 0.08% | 07/07/15 | 820,000 | 820,000 | ||
| RB (Lake Forest College) Series 2008 (LOC: Northern Trust Co) | 0.08% | 07/07/15 | 3,500,000 | 3,500,000 | ||
| RB (Northwestern Memorial Hospital) Series 2007A3 (LIQ: JPMorgan Chase Bank, NA) | 0.07% | 07/07/15 | 15,800,000 | 15,800,000 | ||
| RB (Northwestern Univ) Series 2004C | 0.05% | 07/07/15 | 7,000,000 | 7,000,000 | ||
| RB (Northwestern Univ) Series 2008D | 0.05% | 07/07/15 | 8,000,000 | 8,000,000 | ||
| RB (Perspectives Charter School) Series 2003 (LOC: BMO Harris Bank NA) | 0.12% | 07/07/15 | 4,300,000 | 4,300,000 | ||
| RB (Regency Park at Lincolnwood) Series 1991B (ESCROW/LIQ: JPMorgan Chase Bank, NA) | a | 0.10% | 07/07/15 | 12,981,000 | 12,981,000 | |
| RB (Trinity Health) Series 2011IL (LIQ: Morgan Stanley Bank NA) | a | 0.08% | 07/07/15 | 1,715,000 | 1,715,000 | |
| RB (Univ of Chicago Medical Center) Series 2011C (LIQ: JPMorgan Chase Bank, NA) | a | 0.10% | 07/07/15 | 7,670,000 | 7,670,000 | |
| RB (Univ of Chicago) Series 2013A (LIQ: Credit Suisse AG) | a | 0.19% | 07/07/15 | 940,000 | 940,000 | |
| Refunding RB (North Shore Univ Health) Series 2010 (LIQ: JPMorgan Chase Bank, NA) | a | 0.08% | 07/07/15 | 2,000,000 | 2,000,000 | |
| Refunding RB (Presbyterian Homes Lake Forest Place) Series 2006 (LOC: Northern Trust Co) | 0.08% | 07/07/15 | 7,220,000 | 7,220,000 | ||
| Illinois Health Facilities Auth | ||||||
| RB (Evanston Hospital Corp) Series 1996 (LIQ: JPMorgan Chase Bank, NA) | 0.07% | 07/07/15 | 14,500,000 | 14,500,000 | ||
| Illinois Housing Development Auth | ||||||
| M/F Housing RB (Brookhaven Apts) Series 2008 (LOC: Freddie Mac) | 0.18% | 07/07/15 | 8,605,000 | 8,605,000 | ||
| Illinois Regional Transportation Auth | ||||||
| GO Bonds Series 2000A (LIQ: Bank of America, NA) | a | 0.15% | 07/07/15 | 6,665,000 | 6,665,000 | |
| GO Refunding Bonds Series 1999 (LIQ: Citibank, NA) | a | 0.09% | 07/07/15 | 9,900,000 | 9,900,000 | |
| Issuer
Type of Security, Series |
Footnotes | Rate | Effective
Maturity |
Maturity
Date |
Face
Amount ($) |
Value
($) |
| Illinois Toll Highway Auth | ||||||
| Sr RB Series 2013A (LIQ: JPMorgan Chase Bank, NA) | a | 0.08% | 07/07/15 | 1,215,000 | 1,215,000 | |
| Sr RB Series 2013A (LIQ: JPMorgan Chase Bank, NA) | a | 0.10% | 07/07/15 | 6,185,000 | 6,185,000 | |
| Sr Refunding RB Series 2008A1A (LIQ: JPMorgan Chase Bank, NA) | c | 0.11% | 07/07/15 | 50,310,000 | 50,310,000 | |
| Sr Refunding RB Series 2008A2 (LIQ: JPMorgan Chase Bank, NA) | 0.10% | 07/07/15 | 10,000,000 | 10,000,000 | ||
| Toll Highway Sr RB Series 2014B (LIQ: State Street Bank & Trust Co NA) | a | 0.08% | 07/07/15 | 8,000,000 | 8,000,000 | |
| Metropolitan Water Reclamation District of Greater Chicago | ||||||
| ULT GO Refunding Bonds Series 2007A (LIQ: State Street Bank & Trust Co NA) | a | 0.07% | 07/07/15 | 10,350,000 | 10,350,000 | |
| Will Cnty SD No. 365-U | ||||||
| GO Bonds (Valley View) Series 2005 (GTY/LIQ: Wells Fargo & Co) | a | 0.09% | 07/07/15 | 14,790,000 | 14,790,000 | |
| 246,806,000 | ||||||
| Indiana 1.9% | ||||||
| Dearborn Cnty | ||||||
| Economic Development RB (Dearborn Cnty Hospital) Series 2006 (LOC: Fifth Third Bank) | 0.16% | 07/07/15 | 2,000,000 | 2,000,000 | ||
| Indiana Finance Auth | ||||||
| Economic Development RB (AC Grain) Series 2012 (LOC: CoBank, ACB) | 0.08% | 07/07/15 | 28,500,000 | 28,500,000 | ||
| Health System RB (Sisters of St Francis Health Services) Series 2009A (LIQ: JPMorgan Chase Bank, NA) | a | 0.10% | 07/07/15 | 5,000,000 | 5,000,000 | |
| Hospital RB (Indiana Univ Health) Series 2011C (LOC: Northern Trust Co) | 0.05% | 07/07/15 | 7,330,000 | 7,330,000 | ||
| RB (Ascension Health) Series 2008E4 | 0.07% | 07/07/15 | 700,000 | 700,000 | ||
| RB (Indiana Univ Health) Series 2011L&M (GTY/LIQ: Royal Bank of Canada) | a | 0.07% | 07/07/15 | 15,200,000 | 15,200,000 | |
| Refunding & RB (Trinity Health) Series 2009A & 2010B (LIQ: JPMorgan Chase Bank, NA) | a | 0.10% | 07/07/15 | 7,050,000 | 7,050,000 | |
| Refunding & RB (Trinity Health) Series 2009A (LIQ: JPMorgan Chase Bank, NA) | a | 0.08% | 07/07/15 | 2,000,000 | 2,000,000 | |
| Rockport | ||||||
| Pollution Control Refunding RB (American Electric Power) Series 1995A (LOC: Bank of Tokyo Mitsubishi UFJ, Ltd) | 0.07% | 07/07/15 | 1,000,000 | 1,000,000 | ||
| 68,780,000 | ||||||
| Iowa 2.1% | ||||||
| Iowa Finance Auth | ||||||
| Midwestern Disaster Area RB (Cargill) Series 2009B | 0.10% | 07/07/15 | 19,000,000 | 19,000,000 | ||
| Midwestern Disaster Area RB (Cargill) Series 2012A | 0.09% | 07/07/15 | 17,500,000 | 17,500,000 | ||
| Midwestern Disaster Area RB (Farmers Cooperative) Series 2010 (LOC: CoBank, ACB) | 0.08% | 07/07/15 | 10,000,000 | 10,000,000 | ||
| Midwestern Disaster Area RB (Geneseo Communications) Series 2012 (LOC: US Bank, NA) | 0.08% | 07/07/15 | 12,100,000 | 12,100,000 | ||
| Midwestern Disaster Area RB (HF Chlor-Alkali) Series 2012 (LOC: US Bank, NA) | 0.12% | 07/07/15 | 15,000,000 | 15,000,000 | ||
| Iowa Higher Education Loan Auth | ||||||
| Private College Facility RB (Univ of Dubuque) Series 2004 (LOC: Fifth Third Bank) | 0.05% | 07/01/15 | 2,100,000 | 2,100,000 | ||
| 75,700,000 | ||||||
| Issuer
Type of Security, Series |
Footnotes | Rate | Effective
Maturity |
Maturity
Date |
Face
Amount ($) |
Value
($) |
| Kansas 0.5% | ||||||
| Kansas Department of Transportation | ||||||
| Highway Refunding RB Series 2012A3 | 0.37% | 07/03/15 | 09/01/15 | 3,000,000 | 3,001,288 | |
| Highway Refunding RB Series 2014B1 | 0.11% | 07/01/15 | 09/01/15 | 2,400,000 | 2,400,000 | |
| Kansas Development Finance Auth | ||||||
| Hospital Refunding RB (Adventist Health/Sunbelt) Series 2012A (LIQ: Barclays Bank Plc) | a | 0.12% | 07/07/15 | 9,065,000 | 9,065,000 | |
| Shawnee | ||||||
| M/F Housing Refunding RB (Pinegate West Apts) Series 2008A (LOC: BMO Harris Bank NA) | 0.08% | 07/07/15 | 5,375,000 | 5,375,000 | ||
| 19,841,288 | ||||||
| Kentucky 0.1% | ||||||
| Kentucky Economic Development Finance Auth | ||||||
| Hospital RB (Baptist Healthcare) Series 2009B3 (LOC: Branch Banking & Trust Co) | 0.05% | 07/07/15 | 600,000 | 600,000 | ||
| Richmond | ||||||
| Lease Program RB Series 2006A (LOC: US Bank, NA) | 0.08% | 07/07/15 | 3,305,000 | 3,305,000 | ||
| 3,905,000 | ||||||
| Louisiana 1.1% | ||||||
| Ascension Parish IDB | ||||||
| RB (BASF SE) Series 2009 | c | 0.09% | 07/07/15 | 15,000,000 | 15,000,000 | |
| Louisiana | ||||||
| GO Bonds Series 2012A (LIQ: Deutsche Bank AG) | a | 0.27% | 07/07/15 | 9,000,000 | 9,000,000 | |
| Louisiana Local Government Environmental Facilities & Community Development Auth | ||||||
| RB (Louise S. McGehee School) Series 2010 (LOC: Federal Home Loan Bank) | 0.10% | 07/07/15 | 5,600,000 | 5,600,000 | ||
| Shreveport Home Mortgage Auth | ||||||
| M/F Housing Refunding RB (Summer Pointe) Series 2004 (LOC: Fannie Mae) | 0.07% | 07/07/15 | 3,590,000 | 3,590,000 | ||
| St Tammany Parish Development District | ||||||
| RB (BCS Development) Series 2008 (LOC: Federal Home Loan Bank) | 0.10% | 07/07/15 | 3,320,000 | 3,320,000 | ||
| RB (Main St Holdings) Series 2006A (LOC: Federal Home Loan Bank) | 0.10% | 07/07/15 | 5,060,000 | 5,060,000 | ||
| 41,570,000 | ||||||
| Maine 0.8% | ||||||
| Maine Health & Higher Educational Facilities Auth | ||||||
| RB Series 2006F (GTY/LIQ: US Bank, NA) | a,c | 0.08% | 07/07/15 | 29,440,000 | 29,440,000 | |
| Maryland 0.7% | ||||||
| Baltimore | ||||||
| Water RB Series 2013A (LIQ: Morgan Stanley Bank NA) | a | 0.08% | 07/07/15 | 4,700,000 | 4,700,000 | |
| Maryland Health & Higher Educational Facilities Auth | ||||||
| RB (Johns Hopkins Univ) Series 2008A (LIQ: Branch Banking & Trust Co) | a | 0.07% | 07/07/15 | 7,600,000 | 7,600,000 | |
| Washington Suburban Sanitary District | ||||||
| GO BAN Series A2 (LIQ: TD Bank NA) | 0.07% | 07/07/15 | 12,000,000 | 12,000,000 | ||
| 24,300,000 | ||||||
| Issuer
Type of Security, Series |
Footnotes | Rate | Effective
Maturity |
Maturity
Date |
Face
Amount ($) |
Value
($) |
| Massachusetts 1.5% | ||||||
| Massachusetts | ||||||
| GO Bonds Consolidated Loan Series 2007A (LIQ: Societe Generale) | a | 0.08% | 07/07/15 | 3,845,000 | 3,845,000 | |
| GO Bonds Consolidated Loan Series 2007C (ESCROW/LIQ: Credit Suisse AG) | a | 0.09% | 07/07/15 | 1,000,000 | 1,000,000 | |
| GO Refunding Bonds Series 2004A (LIQ: JPMorgan Chase Bank, NA) | a | 0.09% | 07/07/15 | 2,000,000 | 2,000,000 | |
| Massachusetts Bay Transportation Auth | ||||||
| General Transportation System Bonds Series 2000A1 (LIQ: Barclays Bank Plc) | 0.13% | 07/07/15 | 17,000,000 | 17,000,000 | ||
| Massachusetts Dept of Transportation | ||||||
| Sub RB (Contract Assistance Secured) Series 2010A7 (LIQ: TD Bank NA) | 0.06% | 07/07/15 | 7,200,000 | 7,200,000 | ||
| Massachusetts Development Finance Agency | ||||||
| RB (Boston Univ) Series U3 (LOC: Northern Trust Co) | 0.04% | 07/07/15 | 4,800,000 | 4,800,000 | ||
| Massachusetts Health & Educational Facilities Auth | ||||||
| RB (UMass) Series 2007E&F (ESCROW/LIQ: US Bank, NA) | a | 0.07% | 07/07/15 | 6,985,000 | 6,985,000 | |
| Univ of Massachusetts Building Auth | ||||||
| RB Sr Series 2013-1 (LIQ: Citibank, NA) | a | 0.08% | 07/07/15 | 5,840,000 | 5,840,000 | |
| RB Sr Series 2014-1 (LIQ: Morgan Stanley Bank NA) | a | 0.20% | 07/07/15 | 1,300,000 | 1,300,000 | |
| Refunding RB Sr Series 2013-3 (LIQ: JPMorgan Chase Bank, NA) | a | 0.08% | 07/07/15 | 4,050,000 | 4,050,000 | |
| 54,020,000 | ||||||
| Michigan 1.5% | ||||||
| Michigan Finance Auth | ||||||
| Hospital RB (CHE Trinity Health) Series 2013MI3 (GTY/LIQ: Royal Bank of Canada) | a | 0.07% | 07/07/15 | 28,495,000 | 28,495,000 | |
| Michigan Higher Education Facilities Auth | ||||||
| Limited Obligation RB (Spring Arbor Univ) Series 2010 (LOC: Comerica Bank) | 0.08% | 07/07/15 | 3,300,000 | 3,300,000 | ||
| Michigan State Hospital Finance Auth | ||||||
| RB (Trinity Health Credit Group) Series 2005F | 0.05% | 07/07/15 | 8,005,000 | 8,005,000 | ||
| Michigan State Strategic Fund | ||||||
| Limited Obligation RB (Kroger) Series 2010 (LOC: Bank of Tokyo Mitsubishi UFJ, Ltd) | 0.07% | 07/07/15 | 9,500,000 | 9,500,000 | ||
| Michigan State Univ | ||||||
| GO Bonds Series 2013A (LIQ: State Street Bank & Trust Co NA) | a | 0.07% | 07/07/15 | 5,000,000 | 5,000,000 | |
| 54,300,000 | ||||||
| Minnesota 0.1% | ||||||
| Bloomington | ||||||
| M/F Housing Refunding RB (Bristol Village Apts) Series 2002A1 (LOC: Fannie Mae) | 0.08% | 07/07/15 | 3,745,000 | 3,745,000 | ||
| Mississippi 0.3% | ||||||
| Mississippi Development Bank | ||||||
| Special Obligation Bonds Series 2012 (LIQ: Credit Suisse AG) | a | 0.07% | 07/07/15 | 10,000,000 | 10,000,000 | |
| Missouri 0.4% | ||||||
| Missouri Health & Educational Facilities Auth | ||||||
| Health Facilities RB (BJC Health) Series 2013B (LIQ: Royal Bank of Canada) | a | 0.07% | 07/07/15 | 9,000,000 | 9,000,000 | |
| Issuer
Type of Security, Series |
Footnotes | Rate | Effective
Maturity |
Maturity
Date |
Face
Amount ($) |
Value
($) |
| St Charles Cnty IDA | ||||||
| IDRB (Patriot Machine) Series 2007 (LOC: Federal Home Loan Bank) | 0.08% | 07/07/15 | 4,850,000 | 4,850,000 | ||
| 13,850,000 | ||||||
| Nebraska 1.4% | ||||||
| Custer Cnty | ||||||
| Midwestern Disaster RB (The Andersons) Series 2011 (LOC: US Bank, NA) | 0.07% | 07/07/15 | 21,000,000 | 21,000,000 | ||
| South Sioux City | ||||||
| IDRB (NATURES BioReserve) Series 2010 (LOC: Bank of America, NA) | 0.19% | 07/07/15 | 25,000,000 | 25,000,000 | ||
| Washington Cnty | ||||||
| IDRB (Cargill) Series 2010 | 0.10% | 07/07/15 | 5,000,000 | 5,000,000 | ||
| 51,000,000 | ||||||
| Nevada 1.0% | ||||||
| Clark Cnty | ||||||
| Airport Passenger Facility Charge RB Series 2007A2 (GTY/LIQ: US Bank, NA) | a | 0.08% | 07/07/15 | 4,735,000 | 4,735,000 | |
| Economic Development Refunding RB (Bishop Gorman HS) Series 2011 (LOC: Bank of America, NA) | 0.08% | 07/07/15 | 14,690,000 | 14,690,000 | ||
| Clark Cnty SD | ||||||
| LT GO Bonds Series 2006B (GTY/LIQ: State Street Bank & Trust Co NA) | a | 0.07% | 07/07/15 | 10,000,000 | 10,000,000 | |
| Las Vegas | ||||||
| Economic Development RB (Andre Agassi Charitable Foundation) Series 2005 (LOC: Bank of America, NA) | 0.10% | 07/07/15 | 4,300,000 | 4,300,000 | ||
| Las Vegas Valley Water District | ||||||
| LT GO Bonds Series 2006A (GTY/LIQ: US Bank, NA) | a | 0.09% | 07/07/15 | 1,000,000 | 1,000,000 | |
| 34,725,000 | ||||||
| New Hampshire 0.2% | ||||||
| New Hampshire Business Finance Auth | ||||||
| Limited Obligation RB (Canam Steel Corp) Series 2010 (LOC: Comerica Bank) | 0.15% | 07/07/15 | 8,250,000 | 8,250,000 | ||
| New Jersey 0.7% | ||||||
| New Jersey Economic Development Auth | ||||||
| GO Lease RB (Rutgers Univ) Series 2013 (LIQ: Credit Suisse AG) | a | 0.07% | 07/07/15 | 3,500,000 | 3,500,000 | |
| Transportation System Bonds Series 2005B&2006A & School Facilities Construction Refunding Bonds Series 2005K (GTY/LIQ: State Street Bank & Trust Co NA) | a | 0.07% | 07/07/15 | 18,520,000 | 18,520,000 | |
| Rutgers State Univ | ||||||
| GO Bonds Series 2013L (LIQ: JPMorgan Chase Bank, NA) | a | 0.12% | 07/07/15 | 2,500,000 | 2,500,000 | |
| 24,520,000 | ||||||
| New York 6.9% | ||||||
| Metropolitan Transportation Auth | ||||||
| Transportation RB Series 2005A (GTY: Berkshire Hathaway Assurance Corp /LIQ: Citibank, NA) | a | 0.08% | 07/07/15 | 2,305,000 | 2,305,000 | |
| Monroe Security & Safety Systems Local Development Corp | ||||||
| RB Series 2010 (LOC: Manufacturers & Traders Trust Co) | 0.07% | 07/07/15 | 15,190,000 | 15,190,000 | ||
| New York City | ||||||
| GO Bonds Fiscal 2005 Series C3 (LIQ: Credit Suisse AG) | a | 0.07% | 07/07/15 | 4,000,000 | 4,000,000 | |
| GO Bonds Fiscal 2009 Series I1 (LIQ: Morgan Stanley Bank NA) | a | 0.08% | 07/07/15 | 8,250,000 | 8,250,000 | |
| Issuer
Type of Security, Series |
Footnotes | Rate | Effective
Maturity |
Maturity
Date |
Face
Amount ($) |
Value
($) |
| New York City Housing Development Corp | ||||||
| M/F Housing RB (Sustainable Neighborhood Bonds) Series 2015D3 (LIQ: Citibank, NA) | 0.07% | 07/07/15 | 1,500,000 | 1,500,000 | ||
| M/F Housing RB (Sustainable Neighborhood Bonds) Series 2015D4 (LIQ: Wells Fargo Bank, NA) | 0.07% | 07/07/15 | 2,000,000 | 2,000,000 | ||
| M/F Housing RB Series 2009C1 (LIQ: JPMorgan Chase Bank, NA) | a | 0.08% | 07/07/15 | 2,000,000 | 2,000,000 | |
| M/F Housing RB Series 2013E2 (LIQ: JPMorgan Chase Bank, NA) | c | 0.08% | 07/07/15 | 32,670,000 | 32,670,000 | |
| New York City IDA | ||||||
| Civic Facility RB (Covenant of the Sacred Heart School) Series 2002 (LOC: Federal Home Loan Bank) | 0.09% | 07/07/15 | 14,515,000 | 14,515,000 | ||
| New York City Municipal Water Finance Auth | ||||||
| Water & Sewer System RB Fiscal 2008 Series DD (LIQ: JPMorgan Chase Bank, NA) | a | 0.08% | 07/07/15 | 7,845,000 | 7,845,000 | |
| Water & Sewer System RB Fiscal 2009 Series DD (LIQ: Citibank, NA) | a | 0.09% | 07/07/15 | 1,280,000 | 1,280,000 | |
| Water & Sewer System RB Fiscal 2009 Series GG2 (LIQ: JPMorgan Chase Bank, NA) | a | 0.08% | 07/07/15 | 500,000 | 500,000 | |
| Water & Sewer System RB Fiscal 2012 Series AA (LIQ: Citibank, NA) | a | 0.08% | 07/07/15 | 7,000,000 | 7,000,000 | |
| Water & Sewer System RB Fiscal 2013 Series CC (LIQ: Barclays Bank Plc) | a | 0.11% | 07/07/15 | 1,335,000 | 1,335,000 | |
| Water & Sewer System Second General Resolution RB Fiscal 2013 Series BB (LIQ: Morgan Stanley Bank NA) | a | 0.08% | 07/07/15 | 3,750,000 | 3,750,000 | |
| New York City Transitional Finance Auth | ||||||
| Building Aid RB Fiscal 2007 Series S2 (LIQ: Citibank, NA) | a | 0.09% | 07/07/15 | 12,300,000 | 12,300,000 | |
| Building Aid RB Fiscal 2008 Series S1 (LIQ: Citibank, NA) | a | 0.08% | 07/07/15 | 4,000,000 | 4,000,000 | |
| Building Aid RB Fiscal 2009 Series S3 (LIQ: Deutsche Bank AG) | a | 0.19% | 07/07/15 | 8,465,000 | 8,465,000 | |
| Future Tax Secured Sub Bonds Fiscal 2015 Series B1 (LIQ: Morgan Stanley Bank NA) | a | 0.08% | 07/07/15 | 9,920,000 | 9,920,000 | |
| New York Convention Center Development Corp | ||||||
| RB Series 2005 (GTY: Berkshire Hathaway Assurance Corp /LIQ: Credit Suisse AG) | a | 0.07% | 07/07/15 | 14,435,000 | 14,435,000 | |
| RB Series 2005 (GTY: Berkshire Hathaway Assurance Corp /LIQ: Morgan Stanley Bank NA) | a | 0.08% | 07/07/15 | 5,205,000 | 5,205,000 | |
| New York Liberty Development Corp | ||||||
| Liberty RB (1 World Trade Center) Series 2011 (LIQ: JPMorgan Chase Bank, NA) | a | 0.09% | 07/07/15 | 25,010,000 | 25,010,000 | |
| RB (Goldman Sachs HQ) Series 2005 (GTY/LIQ: Wells Fargo & Co) | a | 0.07% | 07/07/15 | 7,000,000 | 7,000,000 | |
| New York State Dormitory Auth | ||||||
| State Personal Income Tax RB Series 2013A (LIQ: JPMorgan Chase Bank, NA) | a | 0.08% | 07/07/15 | 6,000,000 | 6,000,000 | |
| State Personal Income Tax RB Series 2015A (LIQ: Morgan Stanley Bank NA) | a | 0.08% | 07/07/15 | 4,000,000 | 4,000,000 | |
| New York State Environmental Facilities Corp | ||||||
| Clean Water & Drinking Water Revolving Funds RB Series 2012D (LIQ: Barclays Bank Plc) | a | 0.11% | 07/07/15 | 4,000,000 | 4,000,000 | |
| New York State HFA | ||||||
| Housing RB (10 Liberty St) Series 2003A (LOC: Freddie Mac) | 0.05% | 07/07/15 | 900,000 | 900,000 | ||
| Housing RB (606 W 57th St) Series 2014A (LOC: Wells Fargo Bank, NA) | 0.08% | 07/07/15 | 1,200,000 | 1,200,000 | ||
| New York State Power Auth | ||||||
| RB Series 2007A (LIQ: Citibank, NA) | a | 0.09% | 07/07/15 | 6,835,000 | 6,835,000 | |
| New York State Thruway Auth | ||||||
| State Personal Income Tax RB Series 2012A (LIQ: Deutsche Bank AG) | a | 0.22% | 07/07/15 | 7,000,000 | 7,000,000 | |
| Issuer
Type of Security, Series |
Footnotes | Rate | Effective
Maturity |
Maturity
Date |
Face
Amount ($) |
Value
($) |
| New York State Urban Development Corp | ||||||
| State Personal Income Tax RB Series 2004A3D (LIQ: JPMorgan Chase Bank, NA) | 0.10% | 07/07/15 | 2,000,000 | 2,000,000 | ||
| State Personal Income Tax RB Series 2013A1 (LIQ: JPMorgan Chase Bank, NA) | a | 0.08% | 07/07/15 | 4,465,000 | 4,465,000 | |
| State Personal Income Tax RB Series 2014A (LIQ: JPMorgan Chase Bank, NA) | a | 0.08% | 07/07/15 | 9,000,000 | 9,000,000 | |
| Port Auth of New York & New Jersey | ||||||
| Consolidated Bonds 144th Series (LIQ: Citibank, NA) | a | 0.08% | 07/07/15 | 525,000 | 525,000 | |
| Ramapo Housing Auth | ||||||
| RB (Fountainview at College Road) Series 1998 (LOC: Manufacturers & Traders Trust Co) | 0.17% | 07/07/15 | 5,345,000 | 5,345,000 | ||
| Triborough Bridge & Tunnel Auth | ||||||
| General Refunding RB Series 2005B3 (LOC: Bank of Tokyo Mitsubishi UFJ, Ltd) | 0.08% | 07/07/15 | 10,000,000 | 10,000,000 | ||
| 251,745,000 | ||||||
| North Carolina 0.6% | ||||||
| North Carolina | ||||||
| Limited Obligation Bonds Series 2008A (LIQ: Branch Banking & Trust Co) | a | 0.07% | 07/07/15 | 3,500,000 | 3,500,000 | |
| North Carolina Capital Facilities Finance Agency | ||||||
| RB (Guilford College) Series 2005B (LOC: Branch Banking & Trust Co) | 0.06% | 07/07/15 | 7,965,000 | 7,965,000 | ||
| North Carolina Infrastructure Finance Corp | ||||||
| COP Series 2007A (LIQ: Wells Fargo & Co) | a | 0.07% | 07/07/15 | 10,085,000 | 10,085,000 | |
| North Carolina Medical Care Commission | ||||||
| Hospital Refunding RB (Wayne Memorial Hospital) Series 2009 (LOC: Branch Banking & Trust Co) | 0.07% | 07/07/15 | 1,800,000 | 1,800,000 | ||
| 23,350,000 | ||||||
| North Dakota 0.2% | ||||||
| Richland Cnty | ||||||
| RB (Minn-Dak Farmers Coop) Series 2010B (LOC: CoBank, ACB) | 0.07% | 07/07/15 | 7,000,000 | 7,000,000 | ||
| Ohio 0.6% | ||||||
| Allen Cnty | ||||||
| Hospital Facilities Refunding RB (Catholic Health Partners) Series 2012A (LIQ: Morgan Stanley Bank NA) | a | 0.08% | 07/07/15 | 7,500,000 | 7,500,000 | |
| Franklin Cnty | ||||||
| Hospital Facilities RB (OhioHealth) Series 2015 (LIQ: Toronto-Dominion Bank) | a | 0.08% | 07/07/15 | 2,000,000 | 2,000,000 | |
| RB (OhioHealth) Series 2011C | 0.11% | 07/02/15 | 06/01/16 | 4,000,000 | 4,000,000 | |
| Northeast Ohio Regional Sewer District | ||||||
| Wastewater RB Series 2013 (LIQ: State Street Bank & Trust Co NA) | a | 0.08% | 07/07/15 | 4,375,000 | 4,375,000 | |
| Ohio Water Development Auth | ||||||
| Refunding RB (TimkenSteel) Series 2001 (LOC: Northern Trust Co) | 0.07% | 07/07/15 | 3,000,000 | 3,000,000 | ||
| 20,875,000 | ||||||
| Oklahoma 0.7% | ||||||
| Oklahoma Turnpike Auth | ||||||
| Second Sr Refunding RB Series 2006B (GTY/LIQ: Royal Bank of Canada) | a | 0.07% | 07/07/15 | 24,085,000 | 24,085,000 | |
| Issuer
Type of Security, Series |
Footnotes | Rate | Effective
Maturity |
Maturity
Date |
Face
Amount ($) |
Value
($) |
| Oregon 0.2% | ||||||
| Oregon | ||||||
| Business Development RB (Sage Hollow Ranch) Series 223 (LOC: CoBank, ACB) | 0.07% | 07/07/15 | 3,000,000 | 3,000,000 | ||
| Portland CCD | ||||||
| GO Bonds Series 2013 (LIQ: Credit Suisse AG) | a | 0.07% | 07/07/15 | 3,000,000 | 3,000,000 | |
| 6,000,000 | ||||||
| Pennsylvania 2.4% | ||||||
| Allegheny Cnty Hospital Development Auth | ||||||
| RB (Univ of Pittsburgh Medical Center) Series 2010B1&B2 (GTY/LIQ: Royal Bank of Canada) | a | 0.07% | 07/07/15 | 29,000,000 | 29,000,000 | |
| RB (Univ of Pittsburgh Medical Center) Series 2010C (GTY/LIQ: Royal Bank of Canada) | a | 0.07% | 07/07/15 | 16,700,000 | 16,700,000 | |
| Bucks Cnty IDA | ||||||
| Hospital RB (Grand View Hospital) Series 2008A (LOC: TD Bank NA) | 0.06% | 07/07/15 | 3,400,000 | 3,400,000 | ||
| Cumberland Cnty Municipal Auth | ||||||
| RB (Presbyterian Homes) Series 1993A (LOC: Manufacturers & Traders Trust Co) | 0.08% | 07/07/15 | 4,000,000 | 4,000,000 | ||
| Dallastown Area SD | ||||||
| GO Notes Series 2015 | 1.25% | 04/15/16 | 1,000,000 | 1,007,308 | ||
| Lancaster Cnty Hospital Auth | ||||||
| Health Center RB (Masonic Homes) Series 2008D (LOC: JPMorgan Chase Bank, NA) | 0.03% | 07/01/15 | 210,000 | 210,000 | ||
| RB (Landis Homes Retirement Community) Series 2009 (LOC: Manufacturers & Traders Trust Co) | 0.12% | 07/07/15 | 6,390,000 | 6,390,000 | ||
| Pennsylvania | ||||||
| GO Bonds First Series 2014 (LIQ: Morgan Stanley Bank NA) | a | 0.08% | 07/07/15 | 800,000 | 800,000 | |
| GO Refunding Bonds Third Series 2004 (LIQ: State Street Bank & Trust Co NA) | a | 0.07% | 07/07/15 | 1,200,000 | 1,200,000 | |
| Pennsylvania HFA | ||||||
| S/F Mortgage RB Series 2009-105C (LIQ: Bank of America, NA) | a | 0.10% | 07/07/15 | 3,000,000 | 3,000,000 | |
| Pennsylvania State Univ | ||||||
| Bonds Series 2007A (GTY/LIQ: US Bank, NA) | a | 0.08% | 07/07/15 | 2,700,000 | 2,700,000 | |
| Univ of Pittsburgh | ||||||
| Univ Bonds Series 2005A (LIQ: Barclays Bank Plc) | a | 0.12% | 07/07/15 | 6,665,000 | 6,665,000 | |
| Univ Bonds Series 2009B (LIQ: JPMorgan Chase Bank, NA) | a | 0.08% | 07/07/15 | 3,925,000 | 3,925,000 | |
| Washington Cnty Hospital Auth | ||||||
| Hospital RB (Washington Hospital) Series 2008A (LOC: PNC Bank NA) | 0.08% | 07/07/15 | 8,650,000 | 8,650,000 | ||
| 87,647,308 | ||||||
| South Carolina 0.2% | ||||||
| Charleston Educational Excellence Financing Corporation | ||||||
| Installment Purchase Refunding RB Series 2013B (LIQ: Credit Suisse AG) | a | 0.07% | 07/07/15 | 975,000 | 975,000 | |
| Cherokee Cnty | ||||||
| IDRB (Newark Electronics) Series 1985 (LOC: Bank of America, NA) | 0.38% | 07/07/15 | 6,500,000 | 6,500,000 | ||
| 7,475,000 | ||||||
| Tennessee 1.4% | ||||||
| Blount Cnty Public Building Auth | ||||||
| Public Improvement Bonds Series E6A (LOC: Branch Banking & Trust Co) | 0.06% | 07/07/15 | 13,525,000 | 13,525,000 | ||
| Issuer
Type of Security, Series |
Footnotes | Rate | Effective
Maturity |
Maturity
Date |
Face
Amount ($) |
Value
($) |
| Blount County Industrial Development Board, TN | ||||||
| Public Improvement Bonds Series 2009A (LOC: Branch Banking & Trust Co) | 0.06% | 07/07/15 | 2,000,000 | 2,000,000 | ||
| Chattanooga IDB | ||||||
| Lease Rental Refunding RB Series 2007 (LIQ: Royal Bank of Canada) | a | 0.09% | 07/07/15 | 3,000,000 | 3,000,000 | |
| Clarksville Public Building Auth | ||||||
| Pooled Financing RB (Tennessee Municipal Bond Fund) Series 1995 (LOC: Bank of America, NA) | 0.13% | 07/07/15 | 4,975,000 | 4,975,000 | ||
| Loudon IDB | ||||||
| Pollution Control Refunding RB (A.E. Staley Manufacturing) Series 1991 (LOC: Citibank, NA) | 0.06% | 07/07/15 | 16,200,000 | 16,200,000 | ||
| Montgomery Cnty Public Building Auth | ||||||
| Pooled Financing RB (Tennessee Cnty Loan Pool) Series 1995 (LOC: Bank of America, NA) | a | 0.13% | 07/07/15 | 2,580,000 | 2,580,000 | |
| Pooled Financing RB (Tennessee Cnty Loan Pool) Series 1997 (LOC: Bank of America, NA) | 0.13% | 07/07/15 | 2,395,000 | 2,395,000 | ||
| Sevier Cnty Public Building Auth | ||||||
| Public Improvement Bonds Series VD1 (LOC: Bank of America, NA) | 0.07% | 07/07/15 | 5,400,000 | 5,400,000 | ||
| 50,075,000 | ||||||
| Texas 5.9% | ||||||
| Dallas Area Rapid Transit | ||||||
| Sr Lien Sales Tax Refunding RB Series 2007 (LIQ: Credit Suisse AG) | a | 0.07% | 07/07/15 | 2,500,000 | 2,500,000 | |
| El Paso ISD | ||||||
| ULT GO Bonds Series 2004B (LIQ: JPMorgan Chase Bank, NA) | 0.11% | 08/13/15 | 2,330,000 | 2,330,000 | ||
| Grand Parkway Transportation Corp | ||||||
| Sub Tier Toll RB Series 2013B (LIQ: Morgan Stanley Bank NA) | a | 0.08% | 07/07/15 | 5,000,000 | 5,000,000 | |
| Sub Tier Toll RB Series 2013B (LIQ: Royal Bank of Canada) | a | 0.08% | 07/07/15 | 5,270,000 | 5,270,000 | |
| Sub Tier Toll RB Series 2013B (LIQ: State Street Bank & Trust Co NA) | a | 0.08% | 07/07/15 | 7,000,000 | 7,000,000 | |
| Harris Cnty | ||||||
| Toll Road Sr Lien RB Series 2009A (LIQ: Credit Suisse AG) | a | 0.07% | 07/07/15 | 9,190,000 | 9,190,000 | |
| Harris Cnty Cultural Education Facilities Finance Corp | ||||||
| Hospital RB (Memorial Hermann Health) Series 2014C | 0.05% | 07/07/15 | 4,695,000 | 4,695,000 | ||
| Hospital Refunding RB (Memorial Hermann Healthcare) Series 2010B (GTY/LIQ: Royal Bank of Canada) | a | 0.07% | 07/07/15 | 10,000,000 | 10,000,000 | |
| Harris Cnty Flood Control District | ||||||
| Contract Tax Bonds Series 2010A (LIQ: Bank of America, NA) | a | 0.10% | 07/07/15 | 5,500,000 | 5,500,000 | |
| Harris Cnty Health Facilities Development Corp | ||||||
| Hospital RB (Memorial Hermann Healthcare) Series 2008A1 (GTY/LIQ: Royal Bank of Canada) | a | 0.07% | 07/07/15 | 22,000,000 | 22,000,000 | |
| Harris Cnty Metropolitan Transit Auth | ||||||
| Sales & Use Tax Bonds Series 2011A (LIQ: Royal Bank of Canada) | a | 0.07% | 07/07/15 | 4,500,000 | 4,500,000 | |
| Houston | ||||||
| Water & Sewer System Jr Lien Refunding RB Series 1998A (LIQ: Deutsche Bank AG) | a | 0.16% | 07/07/15 | 8,215,000 | 8,215,000 | |
| Houston Higher Education Finance Corp | ||||||
| Higher Education Refunding RB (Rice Univ) Series 2013A (ESCROW) | 0.47% | 07/02/15 | 05/16/16 | 12,200,000 | 12,235,188 | |
| Metropolitan Higher Education Auth | ||||||
| Higher Education RB (Univ of Dallas) Series 2008 (LOC: JPMorgan Chase Bank, NA) | 0.09% | 07/07/15 | 10,540,000 | 10,540,000 | ||
| North East ISD | ||||||
| ULT GO Bonds Series 2007A (GTY: TX Permanent School Fund /LIQ: US Bank, NA) | a | 0.07% | 07/07/15 | 8,255,000 | 8,255,000 | |
| Issuer
Type of Security, Series |
Footnotes | Rate | Effective
Maturity |
Maturity
Date |
Face
Amount ($) |
Value
($) |
| North Texas Municipal Water District | ||||||
| Water System RB Series 2008 (LIQ: Bank of America, NA) | a | 0.09% | 07/07/15 | 4,565,000 | 4,565,000 | |
| Port Arthur Navigation District IDC | ||||||
| Exempt Facilities RB (Total Petrochemicals & Refining USA) Series 2012A | 0.08% | 07/07/15 | 20,000,000 | 20,000,000 | ||
| Exempt Facilities RB (Total Petrochemicals & Refining USA) Series 2012B | 0.08% | 07/07/15 | 10,000,000 | 10,000,000 | ||
| RB (TOTAL Petrochemicals USA) Series 2011 | 0.08% | 07/07/15 | 8,000,000 | 8,000,000 | ||
| San Antonio | ||||||
| Electric & Gas Systems RB Series 2013 (LIQ: JPMorgan Chase Bank, NA) | a | 0.08% | 07/07/15 | 5,000,000 | 5,000,000 | |
| Electric & Gas Systems Refunding RB New Series 2009A (LIQ: JPMorgan Chase Bank, NA) | a | 0.08% | 07/07/15 | 4,020,000 | 4,020,000 | |
| Tax & Revenue COP Series 2006 (LIQ: Wells Fargo & Co) | a | 0.13% | 07/07/15 | 9,038,000 | 9,038,000 | |
| San Antonio Public Facilities Corp | ||||||
| Lease Refunding RB Series 2012 (LIQ: State Street Bank & Trust Co NA) | a | 0.07% | 07/07/15 | 10,005,000 | 10,005,000 | |
| Tarrant Cnty Cultural Education Facilities Finance Corp | ||||||
| RB (Texas Health Resources System) Series 2008C | 0.08% | 07/07/15 | 5,000,000 | 5,000,000 | ||
| RB (Texas Health Resources) Series 2007B (LIQ: Bank of America, NA) | a | 0.17% | 07/07/15 | 5,625,000 | 5,625,000 | |
| RB (Texas Health Resources) Series 2010 (LIQ: Wells Fargo Bank, NA) | a | 0.09% | 07/07/15 | 1,960,000 | 1,960,000 | |
| Texas A&M Univ | ||||||
| Financing System RB Series 2010B (LIQ: Barclays Bank Plc) | a | 0.12% | 07/07/15 | 1,500,000 | 1,500,000 | |
| Texas Dept of Housing & Community Affairs | ||||||
| M/F Housing RB (Costa Ibiza Apts) Series 2008 (LOC: Freddie Mac) | 0.07% | 07/07/15 | 5,000,000 | 5,000,000 | ||
| Texas Transportation Commission | ||||||
| GO Mobility Fund Refunding Bonds Series 2014 (LIQ: Morgan Stanley Bank NA) | a | 0.08% | 07/07/15 | 4,000,000 | 4,000,000 | |
| Univ of Houston | ||||||
| Consolidated Refunding RB Series 2008 (LIQ: Bank of America, NA) | a | 0.12% | 07/07/15 | 5,540,000 | 5,540,000 | |
| 216,483,188 | ||||||
| Utah 0.6% | ||||||
| Utah Cnty | ||||||
| Hospital RB (IHC Health Services) Series 2012 (LIQ: JPMorgan Chase Bank, NA) | a | 0.08% | 07/07/15 | 4,000,000 | 4,000,000 | |
| Utah Housing Corp | ||||||
| M/F Housing RB (Timbergate Apts) Series 2009A (LOC: Freddie Mac) | 0.12% | 07/07/15 | 9,375,000 | 9,375,000 | ||
| Utah Transit Auth | ||||||
| Sales Tax RB Series 2008A (ESCROW/LIQ: Citibank, NA) | a | 0.08% | 07/07/15 | 7,230,000 | 7,230,000 | |
| 20,605,000 | ||||||
| Virginia 0.3% | ||||||
| Fairfax Cnty IDA | ||||||
| Health Care RB (Inova Health) Series 2012D (LIQ: Credit Suisse AG) | a | 0.07% | 07/07/15 | 2,400,000 | 2,400,000 | |
| Hospital Refunding RB (Inova Health) Series 1993A (LIQ: Credit Suisse AG) | a | 0.07% | 07/07/15 | 3,330,000 | 3,330,000 | |
| Issuer
Type of Security, Series |
Footnotes | Rate | Effective
Maturity |
Maturity
Date |
Face
Amount ($) |
Value
($) |
| Virginia College Building Auth | ||||||
| Educational Facilities RB Series 2006A (ESCROW/LIQ: Wells Fargo & Co) | a | 0.09% | 07/07/15 | 4,866,000 | 4,866,000 | |
| 10,596,000 | ||||||
| Washington 1.6% | ||||||
| Central Puget Sound Regional Transit Auth | ||||||
| Sales Tax Bonds Series 2007A (LIQ: Branch Banking & Trust Co) | a | 0.07% | 07/07/15 | 2,980,000 | 2,980,000 | |
| Pierce Cnty Economic Development Corp | ||||||
| IDRB (Frederico Enterprises I) Series 2010 (LOC: Rabobank Nederland) | 0.12% | 07/07/15 | 4,160,000 | 4,160,000 | ||
| Washington | ||||||
| GO Bonds Series 2005C (LIQ: Deutsche Bank AG) | a | 0.15% | 07/07/15 | 3,435,000 | 3,435,000 | |
| GO Refunding Bonds Series R2010B (LIQ: Bank of America, NA) | a | 0.08% | 07/07/15 | 7,000,000 | 7,000,000 | |
| Washington Health Care Facilities Auth | ||||||
| RB (MultiCare Health System) Series 2009A (LIQ: Royal Bank of Canada) | a | 0.09% | 07/07/15 | 5,000,000 | 5,000,000 | |
| RB (Providence Health & Services) Series 2012C (LIQ: US Bank, NA) | c | 0.11% | 07/07/15 | 30,000,000 | 30,000,000 | |
| RB (Providence Health & Services) Series 2014C&2014D (LIQ: JPMorgan Chase Bank, NA) | a | 0.08% | 07/07/15 | 5,120,000 | 5,120,000 | |
| RB (Providence Health & Services) Series 2014D (LIQ: Morgan Stanley Bank NA) | a | 0.08% | 07/07/15 | 1,000,000 | 1,000,000 | |
| 58,695,000 | ||||||
| Wisconsin 1.0% | ||||||
| Wisconsin | ||||||
| Appropriation Bonds Series 2009A (LIQ: Barclays Bank Plc) | a | 0.12% | 07/07/15 | 12,500,000 | 12,500,000 | |
| Wisconsin Health & Educational Facilities Auth | ||||||
| RB (Froedtert & Community Health) Series 2009C (LIQ: Deutsche Bank AG) | a | 0.22% | 07/07/15 | 5,000,000 | 5,000,000 | |
| RB (Indian Community School of Milwaukee) Series 2007 (LOC: JPMorgan Chase Bank, NA) | 0.07% | 07/07/15 | 2,700,000 | 2,700,000 | ||
| Wisconsin Housing & Economic Development Auth | ||||||
| Housing RB Series 2012B (LIQ: Federal Home Loan Bank) | 0.06% | 07/07/15 | 10,200,000 | 10,200,000 | ||
| M/F Housing Bonds Series 2008A (LIQ: Federal Home Loan Bank) | 0.06% | 07/07/15 | 5,845,000 | 5,845,000 | ||
| 36,245,000 | ||||||
| Total Variable-Rate Securities | ||||||
| (Cost $2,256,798,784) | 2,256,798,784 | |||||
| a | Securities exempt from registration under Rule 144A of the Securities Act of 1933, as amended. These securities may be resold in transactions exempt from registrations, normally to qualified institutional buyers. At the period end, the value of these amounted to $1,082,075,000 or 29.8% of net assets. |
| b | Security or a portion of the security purchased on a delayed-delivery or when-issued basis. |
| c | All or a portion of this security is designated as collateral for delayed-delivery securities. |
| BAN — | Bond anticipation note |
| CCD — | Community college district |
| COP — | Certificate of participation |
| CP — | Commercial paper |
| CSD — | Central school district |
| GO — | General obligation |
| GTY — | Guaranty agreement |
| HFA — | Housing finance agency/authority |
| HRA — | Housing & redevelopment authority |
| HSD — | High school district |
| IDA — | Industrial development agency/authority |
| IDB — | Industrial development board |
| IDC — | Industrial development corporation |
| IDRB — | Industrial development revenue bond |
| IRB — | Industrial revenue bond |
| ISD — | Independent school district |
| LIQ — | Liquidity agreement |
| LOC — | Letter of credit |
| LT — | Limited tax |
| M/F — | Multi-family |
| RAN — | Revenue anticipation note |
| RB — | Revenue bond |
| SD — | School district |
| S/F — | Single-family |
| TAN — | Tax anticipation note |
| TRAN — | Tax and revenue anticipation note |
| UFSD — | Union free school district |
| UHSD — | Union high school district |
| ULT — | Unlimited tax |
| USD — | Unified school district |
| Assets | ||
| Investments, at cost and value (Note 2a) | $3,753,194,872 | |
| Cash | 203,338 | |
| Receivables: | ||
| Investments sold | 18,700,000 | |
| Interest | 5,355,008 | |
| Fund shares sold | 520,000 | |
| Prepaid expenses | + | 7,285 |
| Total assets | 3,777,980,503 | |
| Liabilities | ||
| Payables: | ||
| Investments bought | 8,000,000 | |
| Investments bought - Delayed delivery | 131,180,425 | |
| Investment adviser and administrator fees | 57,896 | |
| Fund shares redeemed | 1,954,034 | |
| Distributions to shareholders | 15,170 | |
| Accrued expenses | + | 33,263 |
| Total liabilities | 141,240,788 | |
| Net Assets | ||
| Total assets | 3,777,980,503 | |
| Total liabilities | – | 141,240,788 |
| Net assets | $3,636,739,715 | |
| Net Assets by Source | ||
| Capital received from investors | 3,636,225,210 | |
| Distribution in excess of net investment income | (7) | |
| Net realized capital gains | 514,512 | |
| Net Asset Value (NAV) by Shares Class | |||||
| Share Class | Net Assets | ÷ | Shares
Outstanding |
= | NAV |
| Sweep Shares | $3,222,516,612 | 3,220,948,840 | $1.00 | ||
| Value Advantage Shares | $414,223,103 | 414,018,404 | $1.00 | ||
| Investment Income | ||
| Interest | $1,702,519 | |
| Expenses | ||
| Investment adviser and administrator fees | 6,348,380 | |
| Shareholder service fees: | ||
| Sweep Shares | 5,986,809 | |
| Value Advantage Shares | 499,097 | |
| Portfolio accounting fees | 98,803 | |
| Registration fees | 56,684 | |
| Custodian fees | 42,127 | |
| Professional fees | 39,900 | |
| Shareholder reports | 36,632 | |
| Transfer agent fees | 20,432 | |
| Independent trustees' fees | 19,306 | |
| Interest expense | 1,174 | |
| Other expenses | + | 35,509 |
| Total expenses | 13,184,853 | |
| Expense reduction by CSIM and its affiliates | – | 11,675,991 |
| Net expenses | – | 1,508,862 |
| Net investment income | 193,657 | |
| Realized Gains (Losses) | ||
| Net realized gains on investments | 514,512 | |
| Increase in net assets resulting from operations | $708,169 | |
| Operations | |||
| 1/1/15-6/30/15 | 1/1/14-12/31/14 | ||
| Net investment income | $193,657 | $396,053 | |
| Net realized gains | + | 514,512 | 651,564 |
| Increase in net assets from operations | 708,169 | 1,047,617 | |
| Distributions to Shareholders | |||
| Distributions from net investment income | |||
| Sweep Shares | (170,986) | (346,421) | |
| Value Advantage Shares | + | (22,678) | (49,632) |
| Total distributions from net investment income | (193,664) | (396,053) | |
| Distributions from net realized gains | |||
| Sweep Shares | — | (292,937) | |
| Value Advantage Shares | + | — | (37,143) |
| Total distributions from net realized gains | — | (330,080) | |
| Total distributions | (193,664) | (726,133) | |
| Transactions in Fund Shares* | |||
| Shares Sold | |||
| Sweep Shares | 5,117,545,941 | 10,982,572,840 | |
| Value Advantage Shares | + | 69,246,515 | 118,296,895 |
| Total shares sold | 5,186,792,456 | 11,100,869,735 | |
| Shares Reinvested | |||
| Sweep Shares | 153,635 | 629,540 | |
| Value Advantage Shares | + | 17,817 | 75,417 |
| Total shares reinvested | 171,452 | 704,957 | |
| Shares Redeemed | |||
| Sweep Shares | (5,585,533,209) | (10,821,558,776) | |
| Value Advantage Shares | + | (122,761,903) | (189,693,517) |
| Total shares redeemed | (5,708,295,112) | (11,011,252,293) | |
| Net transactions in fund shares | (521,331,204) | 90,322,399 | |
| Net Assets | |||
| Beginning of period | 4,157,556,414 | 4,066,912,531 | |
| Total increase or decrease | + | (520,816,699) | 90,643,883 |
| End of period | $3,636,739,715 | $4,157,556,414 | |
| Distributions in excess of net investment income | ($7) | $— | |
| * | Transactions took place at $1.00 per share; figures for share quantities are the same as for dollars. |
| The Charles Schwab Family of Funds (organized October 20, 1989) | Schwab Municipal Money Fund |
| Schwab Money Market Fund | Schwab AMT Tax-Free Money Fund |
| Schwab Government Money Fund | Schwab California Municipal Money Fund |
| Schwab U.S. Treasury Money Fund | Schwab New York Municipal Money Fund |
| Schwab Treasury Obligations Money Fund | (formerly Schwab New York AMT Tax-Free Money Fund) |
| Schwab Value Advantage Money Fund | Schwab New Jersey Municipal Money Fund |
| Schwab Advisor Cash Reserves | (formerly Schwab New Jersey AMT Tax-Free Money Fund) |
| Schwab Cash Reserves | Schwab Pennsylvania Municipal Money Fund |
| Schwab Retirement Advantage Money Fund | Schwab Massachusetts Municipal Money Fund |
| Schwab Investor Money Fund | (formerly Schwab Massachusetts AMT Tax-Free Money Fund) |
| Schwab
Municipal Money Fund |
Schwab
AMT Tax-Free Money Fund | ||
| % of investments in securities with credit enhancements or liquidity enhancements | 71% | 64% | |
| Largest % of investments in securities with credit enhancements or liquidity enhancements from a single institution | 10%
(JP Morgan Chase Group) |
12%
(JP Morgan Chase Group) |
| Average Daily Net Assets | |
| First $1 billion | 0.35% |
| More than $1 billion but not exceeding $10 billion | 0.32% |
| More than $10 billion but not exceeding $20 billion | 0.30% |
| More than $20 billion but not exceeding $40 billion | 0.27% |
| Over $40 billion | 0.25% |
| Shareholder Service Fees | Sweep Administration Fees | ||
| Sweep Shares | 0.25% | 0.10% | |
| Value Advantage Shares | 0.22% | n/a | |
| Select Shares | 0.22% | n/a | |
| Institutional Shares | 0.22% | n/a |
| Schwab
Municipal Money Fund |
Schwab
AMT Tax-Free Money Fund | ||
| Sweep Shares* | 0.62% | 0.62% | |
| Value Advantage Shares* | 0.45% | 0.45% | |
| Select Shares** | 0.35% | n/a | |
| Institutional Shares** | 0.24% | n/a |
| * | CSIM and its affiliates have agreed to limit this share class's expenses as described above for so long as CSIM serves as the investment adviser to the fund, which may only be amended or terminated with the approval of the Board. |
| ** | Select Shares and Institutional Shares are only offered by Schwab Municipal Money Fund. CSIM and its affiliates have agreed to limit this share class's expenses as described above through April 29, 2017. |
| Total
Waived Amount |
Contractual
Expense Limitation Waived Amount | ||
| Schwab Municipal Money Fund | $37,377,439 | $7,421,331 | |
| Schwab AMT Tax-Free Money Fund | 11,675,991 | 1,654,588 |
| Expiration Date | |||||||||
| December 31, 2015 | December 31, 2016 | December 31, 2017 | December 31, 2018 | Total | |||||
| Schwab Municipal Money Fund | |||||||||
| Sweep Shares | $37,034,954 | $47,544,397 | $54,745,357 | $27,626,269 | $166,950,977 | ||||
| Value Advantage Shares | 1,900,331 | 2,191,081 | 2,377,620 | 1,085,762 | 7,554,794 | ||||
| Select Shares | 583,445 | 824,824 | 971,952 | 451,402 | 2,831,623 | ||||
| Institutional Shares | 329,600 | 1,067,220 | 1,735,388 | 792,675 | 3,924,883 | ||||
| Schwab AMT Tax-Free Money Fund | |||||||||
| Sweep Shares | $12,403,024 | $15,229,803 | $18,117,978 | $9,189,152 | $54,939,957 | ||||
| Value Advantage Shares | 1,656,669 | 1,673,827 | 1,751,131 | 832,251 | 5,913,878 | ||||
| Schwab Municipal Money Fund | |
| Sweep Shares | $29,080,911 |
| Value Advantage Shares | 1,512,755 |
| Select Shares | 303,575 |
| Institutional Shares | 62,390 |
| Schwab AMT Tax-Free Money Fund | |
| Sweep Shares | $9,765,098 |
| Value Advantage Shares | 1,400,113 |
| Schwab Municipal Money Fund | $73,030,000 |
| Schwab AMT Tax-Free Money Fund | 39,145,000 |
| Independent Trustees | |||
| Name,
Year of Birth, and Position(s) with the trust; (Terms of office, and length of Time Served1) |
Principal
Occupations During the Past Five Years |
Number
of Portfolios in Fund Complex Overseen by the Trustee |
Other Directorships |
| John
F. Cogan 1947 Trustee (Trustee of The Charles Schwab Family of Funds, Schwab Investments, Schwab Capital Trust and Schwab Annuity Portfolios since 2008; Laudus Trust and Laudus Institutional Trust since 2010) |
Senior Fellow, The Hoover Institution at Stanford University (Oct. 1979 – present); Senior Fellow Stanford Institute for Economic Policy Research (2000 – present); Professor of Public Policy, Stanford University (1994 – present). | 74 | Director,
Gilead Sciences, Inc. (2005 – present) |
| David
L. Mahoney 1954 Trustee (Trustee of The Charles Schwab Family of Funds, Schwab Investments, Schwab Capital Trust, Schwab Annuity Portfolios, Laudus Trust and Laudus Institutional Trust since 2011) |
Private Investor. | 74 | Director,
Symantec Corporation (2003 – present) Director, Corcept Therapeutics Incorporated (2004 – present) Director, Adamas Pharmaceuticals, Inc. (2009 – present) |
| Kiran
M. Patel 1948 Trustee (Trustee of The Charles Schwab Family of Funds, Schwab Investments, Schwab Capital Trust, Schwab Annuity Portfolios, Laudus Trust and Laudus Institutional Trust since 2011) |
Retired. Executive Vice President and General Manager of Small Business Group, Intuit, Inc. (financial software and services firm for consumers and small businesses) (Dec. 2008 – Sept. 2013) | 74 | Director, KLA-Tencor Corporation (2008 – present) |
| Charles
A. Ruffel 1956 Trustee (Trustee of Schwab Strategic Trust since 2009; The Charles Schwab Family of Funds, Schwab Investments, Schwab Capital Trust, Schwab Annuity Portfolios, Laudus Trust and Laudus Institutional Trust since 2015) |
Managing Partner and Co-Founder, Kudu Advisors, LLC (financial services) (May 2009 – present); Director, Asset International, Inc. (publisher of financial services information) (Jan. 2009 – Nov. 2014). | 95 | None. |
| Independent Trustees (continued) | |||
| Name,
Year of Birth, and Position(s) with the trust; (Terms of office, and length of Time Served1) |
Principal
Occupations During the Past Five Years |
Number
of Portfolios in Fund Complex Overseen by the Trustee |
Other Directorships |
| Gerald
B. Smith 1950 Trustee (Trustee of The Charles Schwab Family of Funds, Schwab Investments, Schwab Capital Trust and Schwab Annuity Portfolios since 2000; Laudus Trust and Laudus Institutional Trust since 2010) |
Chairman, Chief Executive Officer and Founder of Smith Graham & Co. (investment advisors) (1990 – present). | 74 | Director,
Eaton (2012 – present) Director and Chairman of the Audit Committee, Oneok Partners LP (2003 – 2013) Director, Oneok, Inc. (2009 – 2013) Lead Independent Director, Board of Cooper Industries (2002 – 2012) |
| Joseph
H. Wender 1944 Trustee (Trustee of The Charles Schwab Family of Funds, Schwab Investments, Schwab Capital Trust and Schwab Annuity Portfolios since 2008; Laudus Trust and Laudus Institutional Trust since 2010) |
Senior Consultant, Goldman Sachs & Co., Inc. (investment banking and securities firm) (Jan. 2008 – present); Partner, Colgin Partners, LLC (vineyards) (Feb. 1998 – present). | 74 | Board Member and Chairman of the Audit Committee, Isis Pharmaceuticals (1994 – present) |
| Interested Trustees | |||
| Name,
Year of Birth, and Position(s) with the trust; (Terms of office, and length of Time Served) |
Principal
Occupations During the Past Five Years |
Number
of Portfolios in Fund Complex Overseen by the Trustee |
Other Directorships |
| Charles
R. Schwab2 1937 Chairman and Trustee (Chairman and Trustee of The Charles Schwab Family of Funds since 1989; Schwab Investments since 1991; Schwab Capital Trust since 1993; Schwab Annuity Portfolios since 1994; Laudus Trust and Laudus Institutional Trust since 2010) |
Chairman and Director, The Charles Schwab Corporation (1986 – present); Chairman and Director of Charles Schwab & Co., Inc. (1971 – present); Chairman and Director of Charles Schwab Investment Management, Inc. (1989 – present); Chairman and Director of Charles Schwab Bank (2003 – present); Chairman and Chief Executive Officer of Schwab (SIS) Holdings Inc. I and Schwab International Holdings, Inc. (1996 – present); and Director, Chairman and Chief Executive Officer, Schwab Holdings, Inc. (1979 – present). | 74 | Chairman
and Director, The Charles Schwab Corporation (1986 – present) Director, Yahoo! Inc. (2014 – present) |
| Walter
W. Bettinger II2 1960 Trustee (Trustee of The Charles Schwab Family of Funds, Schwab Investments, Schwab Capital Trust and Schwab Annuity Portfolios since 2008; Schwab Strategic Trust since 2009; Laudus Trust and Laudus Institutional Trust since 2010) |
Director, President and Chief Executive Officer, The Charles Schwab Corporation and Charles Schwab & Co., Inc. (2008 – present); Director, Charles Schwab Bank (2006 – present); and Director, Schwab Holdings, Inc. (2008 – present). | 95 | Director, The Charles Schwab Corporation (2008 – present) |
| Officers of the Trust | |
| Name,
Year of Birth, and Position(s) with the trust; (Terms of office, and length of Time Served3) |
Principal Occupations During the Past Five Years |
| Marie
Chandoha 1961 President and Chief Executive Officer (Officer of The Charles Schwab Family of Funds, Schwab Investments, Schwab Capital Trust, Schwab Annuity Portfolios, Laudus Trust and Laudus Institutional Trust since 2010) |
Director, President and Chief Executive Officer (Dec. 2010 – present), Chief Investment Officer (Sept. 2010 – Oct. 2011), Charles Schwab Investment Management, Inc.; President, Chief Executive Officer (Dec. 2010 – present), and Chief Investment Officer (Sept. 2010 – Oct. 2011), Schwab Funds, Laudus Funds and Schwab ETFs; Director, Charles Schwab Worldwide Funds plc and Charles Schwab Asset Management (Ireland) Limited (January 2011 – present); Global Head of Fixed Income Business Division, BlackRock, Inc. (formerly Barclays Global Investors) (March 2007 – August 2010). |
| George
Pereira 1964 Treasurer and Principal Financial Officer, Schwab Funds Treasurer and Chief Financial Officer, Laudus Funds (Officer of The Charles Schwab Family of Funds, Schwab Investments, Schwab Capital Trust and Schwab Annuity Portfolios since 2004; Laudus Trust and Laudus Institutional Trust since 2006) |
Senior Vice President and Chief Financial Officer (Nov. 2004 – present), Chief Operating Officer (Jan. 2011 – present), Charles Schwab Investment Management, Inc.; Treasurer and Chief Financial Officer, Laudus Funds (June 2006 – present); Treasurer and Principal Financial Officer, Schwab Funds (Nov. 2004 – present) and Schwab ETFs (Oct. 2009 – present); Director, Charles Schwab Worldwide Funds plc and Charles Schwab Asset Management (Ireland) Limited (April 2005 – present). |
| Omar
Aguilar 1970 Senior Vice President and Chief Investment Officer – Equities (Officer of The Charles Schwab Family of Funds, Schwab Investments, Schwab Capital Trust, Schwab Annuity Portfolios, Laudus Trust and Laudus Institutional Trust since 2011) |
Senior Vice President and Chief Investment Officer – Equities, Charles Schwab Investment Management, Inc. (April 2011 – present); Senior Vice President and Chief Investment Officer – Equities, Schwab Funds, Laudus Funds and Schwab ETFs (June 2011 – present); Head of the Portfolio Management Group and Vice President of Portfolio Management, Financial Engines, Inc. (May 2009 – April 2011); Head of Quantitative Equity, ING Investment Management (July 2004 – Jan. 2009). |
| Brett
Wander 1961 Senior Vice President and Chief Investment Officer – Fixed Income (Officer of The Charles Schwab Family of Funds, Schwab Investments, Schwab Capital Trust, Schwab Annuity Portfolios, Laudus Trust and Laudus Institutional Trust since 2011) |
Senior Vice President and Chief Investment Officer – Fixed Income, Charles Schwab Investment Management, Inc. (April 2011 – present); Senior Vice President and Chief Investment Officer – Fixed Income, Schwab Funds, Laudus Funds and Schwab ETFs (June 2011 – present); Senior Managing Director, Global Head of Active Fixed-Income Strategies, State Street Global Advisors (Jan. 2008 – Oct. 2010); Director of Alpha Strategies Loomis, Sayles & Company (April 2006 – Jan. 2008). |
| David
Lekich 1964 Chief Legal Officer and Secretary, Schwab Funds Vice President and Assistant Clerk, Laudus Funds (Officer of The Charles Schwab Family of Funds, Schwab Investments, Schwab Capital Trust, Schwab Annuity Portfolios, Laudus Trust and Laudus Institutional Trust since 2011) |
Senior Vice President (Sept. 2011 – present), Vice President (March 2004 – Sept. 2011), Charles Schwab & Co., Inc.; Senior Vice President and Chief Counsel (Sept. 2011 – present), Vice President (Jan. 2011 – Sept. 2011), Charles Schwab Investment Management, Inc.; Secretary (April 2011 – present) and Chief Legal Officer (Dec. 2011 – present), Schwab Funds; Vice President and Assistant Clerk, Laudus Funds (April 2011 – present); Secretary (May 2011 – present) and Chief Legal Officer (Nov. 2011 – present), Schwab ETFs. |
| Catherine
MacGregor 1964 Vice President and Assistant Secretary, Schwab Funds Chief Legal Officer, Vice President and Clerk, Laudus Funds (Officer of The Charles Schwab Family of Funds, Schwab Investments, Schwab Capital Trust, Schwab Annuity Portfolios, Laudus Trust and Laudus Institutional Trust since 2005) |
Vice President, Charles Schwab & Co., Inc., Charles Schwab Investment Management, Inc. (July 2005 – present); Vice President (Dec. 2005 – present), Chief Legal Officer and Clerk (March 2007 – present), Laudus Funds; Vice President (Nov. 2005 – present) and Assistant Secretary (June 2007 – present), Schwab Funds; Vice President and Assistant Secretary, Schwab ETFs (Oct. 2009 – present). |
| 1 | Trustees remain in office until they resign, retire or are removed by shareholder vote. The Schwab and Laudus Funds’ retirement policy requires that independent trustees retire at age 72 or after twenty years as a trustee, whichever comes first. In addition, the retirement policy requires any independent trustee of Schwab Funds or Laudus Funds to retire from all Boards upon their required retirement date from either Board. |
| 2 | Mr. Schwab and Mr. Bettinger are Interested Trustees because they own stock of The Charles Schwab Corporation, the parent company of the investment adviser. |
| 3 | The President, Treasurer and Secretary/Clerk hold office until their respective successors are chosen and qualified or until he or she sooner dies, resigns, is removed or becomes disqualified. Each of the other officers serves at the pleasure of the Boards. |
211 Main Street, San Francisco, CA 94105
1-800-435-4000
© 2015 Charles Schwab & Co., Inc. All rights reserved.
Member SIPC®
Printed on recycled paper.
00149455
Table of Contents
(formerly, Schwab New York AMT Tax-Free Money Fund)
(formerly, Schwab New Jersey AMT Tax-Free Money Fund)
(formerly, Schwab Massachusetts AMT Tax-Free Money Fund)
by viewing these documents online.
Sign up at schwab.com/paperless

(formerly, Schwab New York AMT Tax-Free Money Fund)
(formerly, Schwab New Jersey AMT Tax-Free Money Fund)
(formerly, Schwab Massachusetts AMT Tax-Free Money Fund)


| 1 | Effective April 30, 2015, the Schwab New York AMT Tax-Free Money Fund, Schwab New Jersey AMT Tax-Free Money Fund, and Schwab Massachusetts AMT Tax-Free Money Fund changed their names to the Schwab New York Municipal Money Fund, Schwab New Jersey Municipal Money Fund, and Schwab Massachusetts Municipal Money Fund, respectively. |
| 2 | A fund’s share price is its NAV, which is the fund’s net assets divided by the number of its shares outstanding. Under the new amendments, Retail Prime and Municipal money market funds, as well as Government money market funds, will continue to be permitted to transact at a constant NAV of $1.00. Note that while a fund may seek to maintain a constant NAV, there is no guarantee that it will be able to do so. |
 |
Kenneth Salinger, CFA, Vice President and Head of Tax-Exempt Strategies, leads the portfolio management team for Schwab’s national and state-specific tax-free bond funds and municipal money market funds. He also has overall responsibility for all aspects of the management of each of the tax-free bond funds. Prior to joining CSIM in 2008, Mr. Salinger was a senior portfolio manager at Wells Capital Management, working on a team that managed municipal bond assets. He worked at American Century Investments from 1992 to 2006, where he was a vice president and senior portfolio manager, responsible for daily management of a number of national and state specific municipal bond funds. Mr. Salinger has worked in fixed-income asset management since 1994. |
 |
Kevin Shaughnessy, CFA, Managing Director and Senior Portfolio Manager, is responsible for the day-to-day co-management of the funds. Prior to joining CSIM in 2000, Mr. Shaughnessy spent four years as a portfolio manager at Wells Capital Management, where he was responsible for managing the firm’s California municipal money fund assets, as well as short duration private client assets. |
 |
Cameron Ullyatt, CFA, Managing Director and Senior Portfolio Manager, is responsible for the day-to-day co-management of the funds. Prior to joining CSIM in 2008, Mr. Ullyatt was a vice president and portfolio manager at Oppenheimer Funds, where he was responsible for managing the firm’s municipal money fund assets. From 1999 to 2006, Mr. Ullyatt also worked as a credit analyst in Oppenheimer Funds’ municipal bond and money market departments. |
| 1 | The investment adviser and its affiliates may recapture expenses or fees they waived under a voluntary yield waiver until the third anniversary of the end of the fiscal year in which such waiver occurs, subject to certain limitations. For more information on the potential impact of such recapture on future yields, see financial note 5. |
| 2 | As shown in the Portfolio Holdings section of the shareholder report. |
| 3 | Money funds must maintain a dollar-weighted average maturity of no longer than 60 days and cannot invest in any security whose effective maturity is longer than 397 days (approximately 13 months). |
| 4 | Tier 1 securities are rated in the highest short-term rating category by two nationally recognized statistical rating organizations (“NRSROs”), or by one if only one NRSRO has rated the securities, or, if unrated, determined to be of comparable quality by CSIM pursuant to guidelines adopted by the Board of Trustees. Money market fund shares and U.S. government securities are also Tier 1 securities. The fund uses NRSRO credit ratings from Standard & Poor’s Corp., Moody’s Investors Service, Fitch Ratings, and/or DBRS. The fund may use different ratings provided by other rating agencies for purposes of determining compliance with the fund’s investment policies. The fund itself has not been rated by an independent credit rating agency. |
| 5 | Portfolio Composition is calculated using the Par Value of Investments. |
| Schwab New York Municipal Money Fund | ||
| Sweep
Shares |
Value
Advantage Shares® | |
| Ticker Symbol | SWNXX | SWYXX |
| Minimum Initial Investment1 | ** | $25,000 2 |
| Seven-Day Yield3 | 0.01% | 0.01% |
| Seven-Day Yield–Without Contractual Expense Limitation4 | -0.06% | -0.13% |
| Seven-Day Effective Yield3 | 0.01% | 0.01% |
| Seven-Day Taxable Equivalent Effective Yield3,5 | 0.02% | 0.02% |
| * | The seven-day average yield for the Sweep Shares and Value Advantage Shares was 0.01% throughout the entire period. |
| ** | Subject to the eligibility terms and conditions of your Schwab account agreement. |
| 1 | Please see prospectus for further detail and eligibility requirements. |
| 2 | Minimum initial investment for IRA and custodial accounts is $15,000. Municipal money funds are generally not appropriate investments for IRAs and other tax-deferred accounts. Please consult with your tax advisor about your situation. |
| 3 | Yield reflects the effect of the fund’s agreement with the investment adviser and its affiliates to limit each share class’ total annual operating expenses to certain levels (contractual expense limitation). In addition, the investment adviser and its affiliates have voluntarily waived expenses in excess of the contractual expense limitation to maintain a positive net yield for certain share classes of the fund (voluntary yield waiver). Without the contractual expense limitation and the voluntary yield waiver, the fund’s yield would have been lower. For additional details, see financial note 5. |
| 4 | Yield does not reflect the effect of the contractual expense limitation, but does reflect the effect of the voluntary yield waiver. The voluntary yield waiver added 0.49% and 0.29% to the seven-day yields of the Sweep Shares and Value Advantage Shares, respectively. |
| 5 | Taxable-equivalent effective yield assumes a federal regular income tax rate of 43.40%, which includes a Medicare surcharge rate of 3.8%, and effective New York state personal income tax rate of 4.99%. Your tax rate may be different. |
| 1 | The investment adviser and its affiliates may recapture expenses or fees they waived under a voluntary yield waiver until the third anniversary of the end of the fiscal year in which such waiver occurs, subject to certain limitations. For more information on the potential impact of such recapture on future yields, see financial note 5. |
| 2 | As shown in the Portfolio Holdings section of the shareholder report. |
| 3 | Money funds must maintain a dollar-weighted average maturity of no longer than 60 days and cannot invest in any security whose effective maturity is longer than 397 days (approximately 13 months). |
| 4 | Tier 1 securities are rated in the highest short-term rating category by two nationally recognized statistical rating organizations (“NRSROs”), or by one if only one NRSRO has rated the securities, or, if unrated, determined to be of comparable quality by CSIM pursuant to guidelines adopted by the Board of Trustees. Money market fund shares and U.S. government securities are also Tier 1 securities. The fund uses NRSRO credit ratings from Standard & Poor’s Corp., Moody’s Investors Service, Fitch Ratings, and/or DBRS. The fund may use different ratings provided by other rating agencies for purposes of determining compliance with the fund’s investment policies. The fund itself has not been rated by an independent credit rating agency. |
| 5 | Portfolio Composition is calculated using the Par Value of Investments. |
| Schwab New Jersey Municipal Money Fund | |
| Sweep
Shares | |
| Ticker Symbol | SWJXX |
| Minimum Initial Investment | * |
| Seven-Day Yield1 | 0.01% |
| Seven-Day Yield–Without Contractual Expense Limitation2 | -0.08% |
| Seven-Day Effective Yield1 | 0.01% |
| Seven-Day Taxable Equivalent Effective Yield1,3 | 0.02% |
| * | Subject to the eligibility terms and conditions of your Schwab account agreement. |
| 1 | Yield reflects the effect of the fund’s agreement with the investment adviser and its affiliates to limit the fund's total annual operating expenses to certain levels (contractual expense limitation). In addition, the investment adviser and its affiliates have voluntarily waived expenses in excess of the contractual expense limitation to maintain a positive net yield for the fund (voluntary yield waiver). Without the contractual expense limitation and the voluntary yield waiver, the fund’s yield would have been lower. For additional details, see financial note 5. |
| 2 | Yield does not reflect the effect of the contractual expense limitation, but does reflect the effect of the voluntary yield waiver. The voluntary yield waiver added 0.48% to the seven-day yield. |
| 3 | Taxable-equivalent effective yield assumes a federal regular income tax rate of 43.40%, which includes a Medicare surcharge rate of 3.8%, and effective New Jersey state personal income tax rate of 5.08%. Your tax rate may be different. |
| 1 | The investment adviser and its affiliates may recapture expenses or fees they waived under a voluntary yield waiver until the third anniversary of the end of the fiscal year in which such waiver occurs, subject to certain limitations. For more information on the potential impact of such recapture on future yields, see financial note 5. |
| 2 | As shown in the Portfolio Holdings section of the shareholder report. |
| 3 | Money funds must maintain a dollar-weighted average maturity of no longer than 60 days and cannot invest in any security whose effective maturity is longer than 397 days (approximately 13 months). |
| 4 | Tier 1 securities are rated in the highest short-term rating category by two nationally recognized statistical rating organizations (“NRSROs”), or by one if only one NRSRO has rated the securities, or, if unrated, determined to be of comparable quality by CSIM pursuant to guidelines adopted by the Board of Trustees. Money market fund shares and U.S. government securities are also Tier 1 securities. The fund uses NRSRO credit ratings from Standard & Poor’s Corp., Moody’s Investors Service, Fitch Ratings, and/or DBRS. The fund may use different ratings provided by other rating agencies for purposes of determining compliance with the fund’s investment policies. The fund itself has not been rated by an independent credit rating agency. |
| 5 | Portfolio Composition is calculated using the Par Value of Investments. |

| Schwab Pennsylvania Municipal Money Fund | |
| Sweep
Shares | |
| Ticker Symbol | SWEXX |
| Minimum Initial Investment | * |
| Seven-Day Yield1 | 0.01% |
| Seven-Day Yield–Without Contractual Expense Limitation2 | -0.09% |
| Seven-Day Effective Yield1 | 0.01% |
| Seven-Day Taxable Equivalent Effective Yield1,3 | 0.02% |
| * | Subject to the eligibility terms and conditions of your Schwab account agreement. |
| 1 | Yield reflects the effect of the fund’s agreement with the investment adviser and its affiliates to limit the fund's total annual operating expenses to certain levels (contractual expense limitation). In addition, the investment adviser and its affiliates have voluntarily waived expenses in excess of the contractual expense limitation to maintain a positive net yield for the fund (voluntary yield waiver). Without the contractual expense limitation and the voluntary yield waiver, the fund’s yield would have been lower. For additional details, see financial note 5. |
| 2 | Yield does not reflect the effect of the contractual expense limitation, but does reflect the effect of the voluntary yield waiver. The voluntary yield waiver added 0.53% to the seven-day yield. |
| 3 | Taxable-equivalent effective yield assumes a federal regular income tax rate of 43.40%, which includes a Medicare surcharge rate of 3.8%, and effective Pennsylvania state personal income tax rate of 1.74%. Your tax rate may be different. |
| 1 | The investment adviser and its affiliates may recapture expenses or fees they waived under a voluntary yield waiver until the third anniversary of the end of the fiscal year in which such waiver occurs, subject to certain limitations. For more information on the potential impact of such recapture on future yields, see financial note 5. |
| 2 | As shown in the Portfolio Holdings section of the shareholder report. |
| 3 | Money funds must maintain a dollar-weighted average maturity of no longer than 60 days and cannot invest in any security whose effective maturity is longer than 397 days (approximately 13 months). |
| 4 | Tier 1 securities are rated in the highest short-term rating category by two nationally recognized statistical rating organizations (“NRSROs”), or by one if only one NRSRO has rated the securities, or, if unrated, determined to be of comparable quality by CSIM pursuant to guidelines adopted by the Board of Trustees. Money market fund shares and U.S. government securities are also Tier 1 securities. The fund uses NRSRO credit ratings from Standard & Poor’s Corp., Moody’s Investors Service, Fitch Ratings, and/or DBRS. The fund may use different ratings provided by other rating agencies for purposes of determining compliance with the fund’s investment policies. The fund itself has not been rated by an independent credit rating agency. |
| 5 | Portfolio Composition is calculated using the Par Value of Investments. |

| Schwab Massachusetts Municipal Money Fund | |
| Sweep
Shares | |
| Ticker Symbol | SWDXX |
| Minimum Initial Investment | * |
| Seven-Day Yield1 | 0.01% |
| Seven-Day Yield–Without Contractual Expense Limitation2 | -0.10% |
| Seven-Day Effective Yield1 | 0.01% |
| Seven-Day Taxable Equivalent Effective Yield1,3 | 0.02% |
| * | Subject to the eligibility terms and conditions of your Schwab account agreement. |
| 1 | Yield reflects the effect of the fund’s agreement with the investment adviser and its affiliates to limit the fund's total annual operating expenses to certain levels (contractual expense limitation). In addition, the investment adviser and its affiliates have voluntarily waived expenses in excess of the contractual expense limitation to maintain a positive net yield for the fund (voluntary yield waiver). Without the contractual expense limitation and the voluntary yield waiver, the fund’s yield would have been lower. For additional details, see financial note 5. |
| 2 | Yield does not reflect the effect of the contractual expense limitation, but does reflect the effect of the voluntary yield waiver. The voluntary yield waiver added 0.42% to the seven-day yield. |
| 3 | Taxable-equivalent effective yield assumes a federal regular income tax rate of 43.40%, which includes a Medicare surcharge rate of 3.8%, and effective Massachusetts state personal income tax rate of 2.97%. Your tax rate may be different. |
| Expense
Ratio1 (Annualized) |
Beginning
Account Value at 1/1/15 |
Ending
Account Value (Net of Expenses) at 6/30/15 |
Expenses
Paid During Period2 1/1/15–6/30/15 | |
| Schwab New York Municipal Money Fund | ||||
| Sweep Shares | ||||
| Actual Return | 0.10% | $1,000.00 | $ 1,000.10 | $ 0.50 |
| Hypothetical 5% Return | 0.10% | $1,000.00 | $1,024.30 | $ 0.50 |
| Value Advantage Shares | ||||
| Actual Return | 0.10% | $1,000.00 | $ 1,000.10 | $ 0.50 |
| Hypothetical 5% Return | 0.10% | $1,000.00 | $1,024.30 | $ 0.50 |
| Schwab New Jersey Municipal Money Fund | ||||
| Actual Return | 0.08% | $1,000.00 | $ 1,000.10 | $0.40 |
| Hypothetical 5% Return | 0.08% | $1,000.00 | $1,024.40 | $0.40 |
| Schwab Pennsylvania Municipal Money Fund | ||||
| Actual Return | 0.09% | $1,000.00 | $ 1,000.10 | $ 0.45 |
| Hypothetical 5% Return | 0.09% | $1,000.00 | $ 1,024.35 | $ 0.45 |
| Schwab Massachusetts Municipal Money Fund | ||||
| Actual Return | 0.08% | $1,000.00 | $ 1,000.10 | $0.40 |
| Hypothetical 5% Return | 0.08% | $1,000.00 | $1,024.40 | $0.40 |
| 1 | Based on the most recent six-month expense ratio; may differ from the expense ratio provided in the Financial Highlights. |
| 2 | Expenses for each fund or share class are equal to its annualized expense ratio, multiplied by the average account value over the period, multiplied by 181 days of the period, and divided by 365 days of the fiscal year. |
| Sweep Shares | 1/1/15–
6/30/15* |
1/1/14–
12/31/14 |
1/1/13–
12/31/13 |
1/1/12–
12/31/12 |
1/1/11–
12/31/11 |
1/1/10–
12/31/10 |
| Per-Share Data ($) | ||||||
| Net asset value at beginning of period | 1.00 | 1.00 | 1.00 | 1.00 | 1.00 | 1.00 |
| Income (loss) from investment operations: | ||||||
| Net investment income (loss) | 0.00 1,2 | 0.00 2 | 0.00 2 | 0.00 2 | 0.00 2 | 0.00 2 |
| Net realized and unrealized gains (losses) | 0.00 2 | 0.00 2 | 0.00 2 | 0.00 2 | 0.00 2 | 0.00 2 |
| Total from investment operations | 0.00 2 | 0.00 2 | 0.00 2 | 0.00 2 | 0.00 2 | 0.00 2 |
| Less distributions: | ||||||
| Distributions from net investment income | (0.00) 2 | (0.00) 2 | (0.00) 2 | (0.00) 2 | (0.00) 2 | (0.00) 2 |
| Distributions from net realized gains | — | (0.00) 2 | (0.00) 2 | (0.00) 2 | (0.00) 2 | (0.00) 2 |
| Total distributions | (0.00) 2 | (0.00) 2 | (0.00) 2 | (0.00) 2 | (0.00) 2 | (0.00) 2 |
| Net asset value at end of period | 1.00 | 1.00 | 1.00 | 1.00 | 1.00 | 1.00 |
| Total return (%) | 0.01 3 | 0.02 | 0.02 | 0.02 | 0.02 | 0.04 |
| Ratios/Supplemental Data (%) | ||||||
| Ratios to average net assets: | ||||||
| Net operating expenses | 0.10 4,5 | 0.09 5 | 0.14 5 | 0.20 5 | 0.27 5 | 0.33 5 |
| Gross operating expenses | 0.72 4 | 0.71 | 0.71 | 0.71 | 0.70 | 0.70 |
| Net investment income (loss) | 0.01 4 | 0.01 | 0.01 | 0.01 | 0.01 | 0.01 |
| Net assets, end of period ($ x 1,000,000) | 1,540 | 1,758 | 1,692 | 1,793 | 1,624 | 1,545 |
| Value Advantage Shares | 1/1/15–
6/30/15* |
1/1/14–
12/31/14 |
1/1/13–
12/31/13 |
1/1/12–
12/31/12 |
1/1/11–
12/31/11 |
1/1/10–
12/31/10 |
| Per-Share Data ($) | ||||||
| Net asset value at beginning of period | 1.00 | 1.00 | 1.00 | 1.00 | 1.00 | 1.00 |
| Income (loss) from investment operations: | ||||||
| Net investment income (loss) | 0.00 1,2 | 0.00 2 | 0.00 2 | 0.00 2 | 0.00 2 | 0.00 2 |
| Net realized and unrealized gains (losses) | 0.00 2 | 0.00 2 | 0.00 2 | 0.00 2 | 0.00 2 | 0.00 2 |
| Total from investment operations | 0.00 2 | 0.00 2 | 0.00 2 | 0.00 2 | 0.00 2 | 0.00 2 |
| Less distributions: | ||||||
| Distributions from net investment income | (0.00) 2 | (0.00) 2 | (0.00) 2 | (0.00) 2 | (0.00) 2 | (0.00) 2 |
| Distributions from net realized gains | — | (0.00) 2 | (0.00) 2 | (0.00) 2 | (0.00) 2 | (0.00) 2 |
| Total distributions | (0.00) 2 | (0.00) 2 | (0.00) 2 | (0.00) 2 | (0.00) 2 | (0.00) 2 |
| Net asset value at end of period | 1.00 | 1.00 | 1.00 | 1.00 | 1.00 | 1.00 |
| Total return (%) | 0.01 3 | 0.02 | 0.02 | 0.02 | 0.02 | 0.04 |
| Ratios/Supplemental Data (%) | ||||||
| Ratios to average net assets: | ||||||
| Net operating expenses | 0.10 4,5 | 0.09 5 | 0.14 5 | 0.20 5 | 0.27 5 | 0.33 5 |
| Gross operating expenses | 0.59 4 | 0.58 | 0.58 | 0.58 | 0.57 | 0.57 |
| Net investment income (loss) | 0.01 4 | 0.01 | 0.01 | 0.01 | 0.01 | 0.01 |
| Net assets, end of period ($ x 1,000,000) | 230 | 237 | 267 | 319 | 399 | 531 |
| * | Unaudited. |
| Holdings by Category | Cost
($) |
Value
($) | |
| 38.0% | Fixed-Rate Securities | 672,939,817 | 672,939,817 |
| 64.2% | Variable-Rate Securities | 1,137,175,928 | 1,137,175,928 |
| 102.2% | Total Investments | 1,810,115,745 | 1,810,115,745 |
| (2.2%) | Other Assets and Liabilities, Net | (39,252,773) | |
| 100.0% | Net Assets | 1,770,862,972 | |
| Issuer
Type of Security, Series |
Footnotes | Rate | Effective
Maturity |
Maturity
Date |
Face
Amount ($) |
Value
($) |
| Fixed-Rate Securities 38.0% of net assets | ||||||
| New York 38.0% | ||||||
| Babylon | ||||||
| BAN 2014 | 1.50% | 08/01/15 | 4,190,000 | 4,194,759 | ||
| Beacon | ||||||
| BAN Series 2015A | 2.00% | 05/27/16 | 1,000,000 | 1,014,682 | ||
| Burnt Hills - Ballston Lake CSD | ||||||
| GO BAN 2015 | 1.50% | 06/24/16 | 2,000,000 | 2,021,678 | ||
| Cheektowaga-Maryvale UFSD | ||||||
| BAN 2015 | 1.75% | 06/23/16 | 5,540,000 | 5,606,835 | ||
| Clinton Cnty | ||||||
| BAN Series 2015B | 1.50% | 06/10/16 | 9,800,000 | 9,887,050 | ||
| Columbia Cnty | ||||||
| BAN Series 2015A | 1.25% | 02/03/16 | 8,600,000 | 8,651,742 | ||
| East Syracuse-Minoa CSD | ||||||
| BAN 2014 | 1.25% | 10/09/15 | 10,000,000 | 10,027,452 | ||
| Grand Island CSD | ||||||
| BAN 2014 | 1.50% | 12/03/15 | 7,000,000 | 7,037,039 | ||
| Hampton Bays UFSD | ||||||
| School Construction BAN 2015 | 1.75% | 06/24/16 | 4,711,250 | 4,773,806 | ||
| Ithaca | ||||||
| GO BAN Series 2014B | 1.00% | 07/31/15 | 1,500,000 | 1,501,024 | ||
| Liverpool CSD | ||||||
| BAN 2014-2015 | 1.25% | 10/02/15 | 3,000,000 | 3,007,736 | ||
| Mamaroneck | ||||||
| BAN Series 2014B | 1.00% | 09/03/15 | 4,901,875 | 4,907,522 | ||
| Metropolitan Transportation Auth | ||||||
| Dedicated Tax Fund Bonds Series 2002B2 | 4.00% | 11/01/15 | 1,210,000 | 1,225,041 | ||
| Dedicated Tax Fund Refunding Bonds Series 2011A | 5.00% | 11/15/15 | 6,750,000 | 6,872,447 | ||
| Dedicated Tax Fund Refunding Bonds Series 2012A | 4.00% | 11/15/15 | 500,000 | 507,144 | ||
| Issuer
Type of Security, Series |
Footnotes | Rate | Effective
Maturity |
Maturity
Date |
Face
Amount ($) |
Value
($) |
| Dedicated Tax Refunding Bonds Series 2008B1 | 3.00% | 11/15/15 | 105,000 | 106,040 | ||
| State Service Contract Refunding Bonds Series 2002A | 5.50% | 07/01/15 | 260,000 | 260,000 | ||
| State Service Contract Refunding Bonds Series 2002A | 5.75% | 01/01/16 | 1,400,000 | 1,438,444 | ||
| Transportation Revenue BAN Series 2015A | 0.50% | 03/01/16 | 4,000,000 | 4,007,964 | ||
| Transportation Revenue BAN Series CP2B (LOC: Barclays Bank Plc) | 0.09% | 09/04/15 | 21,770,000 | 21,770,000 | ||
| Miller Place UFSD | ||||||
| TAN | c | 1.50% | 06/27/16 | 11,000,000 | 11,107,910 | |
| Nassau Cnty Interim Finance Auth | ||||||
| Sales Tax Secured Bonds Series 2009A | 5.00% | 11/15/15 | 325,000 | 330,625 | ||
| New York City | ||||||
| GO Bonds Fiscal 2004 Series HA | 5.00% | 03/01/16 | 150,000 | 154,587 | ||
| GO Bonds Fiscal 2005 Series K | 3.60% | 08/01/15 | 100,000 | 100,277 | ||
| GO Bonds Fiscal 2005 Series P | 3.60% | 08/01/15 | 100,000 | 100,282 | ||
| GO Bonds Fiscal 2005 Series P | 5.00% | 08/01/15 | 100,000 | 100,404 | ||
| GO Bonds Fiscal 2006 Series C | 5.00% | 08/01/15 | 1,775,000 | 1,782,181 | ||
| GO Bonds Fiscal 2006 Series D | 5.00% | 08/01/15 | 600,000 | 602,405 | ||
| GO Bonds Fiscal 2006 Series F1 | 5.00% | 09/01/15 | 150,000 | 151,200 | ||
| GO Bonds Fiscal 2006 Series G | 5.00% | 08/01/15 | 1,350,000 | 1,355,410 | ||
| GO Bonds Fiscal 2006 Series I1 | 5.00% | 04/01/16 | 100,000 | 103,478 | ||
| GO Bonds Fiscal 2006 Series J1 | 4.00% | 06/01/16 | 100,000 | 103,228 | ||
| GO Bonds Fiscal 2007 Series A | 4.00% | 08/01/15 | 200,000 | 200,634 | ||
| GO Bonds Fiscal 2007 Series A | 4.50% | 08/01/15 | 850,000 | 853,046 | ||
| GO Bonds Fiscal 2007 Series A | 5.00% | 08/01/15 | 950,000 | 953,882 | ||
| GO Bonds Fiscal 2007 Series C1 | 5.00% | 01/01/16 | 670,000 | 685,535 | ||
| GO Bonds Fiscal 2008 Series A1 | 5.00% | 08/01/15 | 5,185,000 | 5,206,190 | ||
| GO Bonds Fiscal 2008 Series E | 5.00% | 08/01/15 | 13,565,000 | 13,620,663 | ||
| GO Bonds Fiscal 2008 Series G | 4.00% | 08/01/15 | 100,000 | 100,305 | ||
| GO Bonds Fiscal 2008 Series G | 5.00% | 08/01/15 | 825,000 | 828,276 | ||
| GO Bonds Fiscal 2008 Series H | 4.00% | 08/01/15 | 425,000 | 426,354 | ||
| GO Bonds Fiscal 2008 Series I1 | 4.50% | 02/01/16 | 265,000 | 271,478 | ||
| GO Bonds Fiscal 2008 Series I1 | 5.00% | 02/01/16 | 635,000 | 652,336 | ||
| GO Bonds Fiscal 2008 Series J1 | 4.00% | 08/01/15 | 525,000 | 526,666 | ||
| GO Bonds Fiscal 2008 Series J1 | 5.00% | 08/01/15 | 200,000 | 200,794 | ||
| GO Bonds Fiscal 2008 Series L1 | 5.00% | 04/01/16 | 465,000 | 480,982 | ||
| GO Bonds Fiscal 2009 Series A1 | 4.00% | 08/15/15 | 225,000 | 226,027 | ||
| GO Bonds Fiscal 2009 Series B1 | 5.00% | 09/01/15 | 620,000 | 624,988 | ||
| GO Bonds Fiscal 2009 Series H1 | 5.00% | 03/01/16 | 615,000 | 634,052 | ||
| GO Bonds Fiscal 2010 Series B | 3.00% | 08/01/15 | 500,000 | 501,196 | ||
| GO Bonds Fiscal 2010 Series C | 3.00% | 08/01/15 | 450,000 | 451,070 | ||
| GO Bonds Fiscal 2010 Series C | 5.00% | 08/01/15 | 2,840,000 | 2,851,392 | ||
| GO Bonds Fiscal 2010 Series E | 3.00% | 08/01/15 | 1,875,000 | 1,879,434 | ||
| GO Bonds Fiscal 2010 Series E | 5.00% | 08/01/15 | 615,000 | 617,480 | ||
| GO Bonds Fiscal 2010 Series H2 | 3.00% | 06/01/16 | 100,000 | 102,282 | ||
| GO Bonds Fiscal 2010 Series H2 | 5.00% | 06/01/16 | 300,000 | 312,609 | ||
| GO Bonds Fiscal 2011 Series A | 3.00% | 08/01/15 | 200,000 | 200,464 | ||
| GO Bonds Fiscal 2011 Series A | 5.00% | 08/01/15 | 275,000 | 276,109 | ||
| GO Bonds Fiscal 2011 Series B | 4.00% | 08/01/15 | 1,350,000 | 1,354,393 | ||
| GO Bonds Fiscal 2011 Series B | 5.00% | 08/01/15 | 675,000 | 677,705 | ||
| Issuer
Type of Security, Series |
Footnotes | Rate | Effective
Maturity |
Maturity
Date |
Face
Amount ($) |
Value
($) |
| GO Bonds Fiscal 2011 Series E | 4.00% | 08/01/15 | 330,000 | 331,032 | ||
| GO Bonds Fiscal 2011 Series G | 3.00% | 08/01/15 | 100,000 | 100,218 | ||
| GO Bonds Fiscal 2011 Series G | 5.00% | 08/01/15 | 1,015,000 | 1,019,120 | ||
| GO Bonds Fiscal 2011 Series I1 | 4.00% | 08/01/15 | 2,225,000 | 2,232,065 | ||
| GO Bonds Fiscal 2011 Series I1 | 5.00% | 08/01/15 | 1,400,000 | 1,405,695 | ||
| GO Bonds Fiscal 2012 Series B | 4.00% | 08/01/15 | 700,000 | 702,193 | ||
| GO Bonds Fiscal 2012 Series B | 5.00% | 08/01/15 | 1,000,000 | 1,004,050 | ||
| GO Bonds Fiscal 2012 Series E | 5.00% | 08/01/15 | 150,000 | 150,591 | ||
| GO Bonds Fiscal 2012 Series F | 3.00% | 08/01/15 | 250,000 | 250,573 | ||
| GO Bonds Fiscal 2012 Series F | 5.00% | 08/01/15 | 1,755,000 | 1,762,009 | ||
| GO Bonds Fiscal 2012 Series G1 | 5.00% | 04/01/16 | 140,000 | 144,776 | ||
| GO Bonds Fiscal 2012 Series H | 3.00% | 08/01/15 | 350,000 | 350,801 | ||
| GO Bonds Fiscal 2012 Series I | 5.00% | 08/01/15 | 5,110,000 | 5,131,128 | ||
| GO Bonds Fiscal 2013 Series A1 | 5.00% | 10/01/15 | 2,950,000 | 2,985,677 | ||
| GO Bonds Fiscal 2013 Series B | 3.00% | 08/01/15 | 1,200,000 | 1,202,830 | ||
| GO Bonds Fiscal 2013 Series D | 4.00% | 08/01/15 | 300,000 | 300,961 | ||
| GO Bonds Fiscal 2013 Series E | 3.00% | 08/01/15 | 600,000 | 601,433 | ||
| GO Bonds Fiscal 2013 Series E | 5.00% | 08/01/15 | 2,950,000 | 2,962,121 | ||
| GO Bonds Fiscal 2013 Series F1 | 5.00% | 03/01/16 | 685,000 | 706,259 | ||
| GO Bonds Fiscal 2013 Series G | 2.00% | 08/01/15 | 125,000 | 125,186 | ||
| GO Bonds Fiscal 2013 Series J | 5.00% | 08/01/15 | 665,000 | 667,652 | ||
| GO Bonds Fiscal 2014 Series B | 5.00% | 08/01/15 | 1,000,000 | 1,004,038 | ||
| New York City Housing Development Corp | ||||||
| Capital Fund Program RB Series 2005A (ESCROW) | 5.00% | 07/01/15 | 16,895,000 | 16,895,000 | ||
| M/F Housing RB Series 2015C | 0.15% | 11/02/15 | 4,000,000 | 4,000,000 | ||
| New York City Municipal Water Finance Auth | ||||||
| CP Series 1 | 0.07% | 08/04/15 | 8,000,000 | 8,000,000 | ||
| CP Series 1 | 0.08% | 09/09/15 | 8,700,000 | 8,700,000 | ||
| Extendible CP Series 7 | 0.09% | 07/07/15 | 01/29/16 | 10,000,000 | 10,000,000 | |
| Extendible CP Series 7 | 0.10% | 09/01/15 | 03/06/16 | 13,310,000 | 13,310,000 | |
| Extendible CP Series 7 | 0.10% | 09/08/15 | 03/07/16 | 6,500,000 | 6,500,000 | |
| Extendible CP Series 8 | 0.10% | 09/03/15 | 03/04/16 | 9,000,000 | 9,000,000 | |
| Water & Sewer System RB Fiscal 2009 Series AA | 5.00% | 06/15/16 | 1,045,000 | 1,091,663 | ||
| Water & Sewer System RB Fiscal 2009 Series FF1 | 5.00% | 06/15/16 | 210,000 | 219,027 | ||
| Water & Sewer System RB Fiscal 2011 Series BB | 4.00% | 06/15/16 | 150,000 | 155,003 | ||
| Water & Sewer System RB Series 2006BB | 5.00% | 06/15/16 | 105,000 | 109,503 | ||
| New York City Transitional Finance Auth | ||||||
| Building Aid RB Fiscal 2007 Series S1 | 5.00% | 07/15/15 | 375,000 | 375,663 | ||
| Building Aid RB Fiscal 2008 Series S1 | 5.00% | 01/15/16 | 500,000 | 512,545 | ||
| Building Aid RB Fiscal 2009 Series S1 | 4.00% | 07/15/15 | 300,000 | 300,435 | ||
| Building Aid RB Fiscal 2009 Series S2 | 5.00% | 07/15/15 | 460,000 | 460,833 | ||
| Building Aid RB Fiscal 2009 Series S4 (LIQ: Wells Fargo & Co) | a,b | 0.14% | 07/09/15 | 16,435,000 | 16,435,000 | |
| Building Aid RB Fiscal 2011 Series S1A | 3.00% | 07/15/15 | 100,000 | 100,106 | ||
| Building Aid RB Fiscal 2011 Series S1A | 4.00% | 07/15/15 | 900,000 | 901,300 | ||
| Building Aid RB Fiscal 2012 Series S1A | 2.00% | 07/15/15 | 200,000 | 200,136 | ||
| Building Aid RB Fiscal 2012 Series S1A | 5.00% | 07/15/15 | 100,000 | 100,179 | ||
| Building Aid RB Fiscal 2013 Series S1 | 4.00% | 07/15/15 | 1,420,000 | 1,422,066 | ||
| Future Tax Secured Bonds Fiscal 2007 Series C1 (ESCROW) | 5.00% | 11/01/15 | 3,340,000 | 3,393,609 | ||
| Future Tax Secured Refunding Bonds Fiscal 2006 Series A1 | 4.00% | 11/01/15 | 100,000 | 101,242 | ||
| Issuer
Type of Security, Series |
Footnotes | Rate | Effective
Maturity |
Maturity
Date |
Face
Amount ($) |
Value
($) |
| Future Tax Secured Refunding Bonds Fiscal 2006 Series A1 | 5.00% | 11/01/15 | 1,375,000 | 1,397,108 | ||
| Future Tax Secured Refunding Sub Bonds Fiscal 2003 Series A1 | 5.00% | 11/01/15 | 560,000 | 568,846 | ||
| Future Tax Secured Refunding Sub Bonds Fiscal 2003 Series A1 (ESCROW) | 5.00% | 11/01/15 | 10,000 | 10,158 | ||
| Future Tax Secured Refunding Sub Bonds Fiscal 2005 Series A2 | 5.00% | 11/01/15 | 1,815,000 | 1,843,500 | ||
| Future Tax Secured Sub Bonds Fiscal 2007 Series A1 | 3.63% | 08/01/15 | 250,000 | 250,718 | ||
| Future Tax Secured Sub Bonds Fiscal 2007 Series A1 | 5.00% | 08/01/15 | 1,290,000 | 1,295,205 | ||
| Future Tax Secured Sub Bonds Fiscal 2007 Series B | 4.00% | 11/01/15 | 120,000 | 121,496 | ||
| Future Tax Secured Sub Bonds Fiscal 2007 Series B | 5.00% | 11/01/15 | 1,225,000 | 1,244,503 | ||
| Future Tax Secured Sub Bonds Fiscal 2010 Series C1 | 4.00% | 08/01/15 | 850,000 | 852,692 | ||
| Future Tax Secured Sub Bonds Fiscal 2010 Series D | 5.00% | 11/01/15 | 1,050,000 | 1,066,491 | ||
| Future Tax Secured Sub Bonds Fiscal 2010 Series D (ESCROW) | 5.00% | 11/01/15 | 10,000 | 10,160 | ||
| Future Tax Secured Sub Bonds Fiscal 2010 Series I2 | 4.00% | 11/01/15 | 285,000 | 288,537 | ||
| Future Tax Secured Sub Bonds Fiscal 2010 Series I2 | 5.00% | 11/01/15 | 805,000 | 817,878 | ||
| Future Tax Secured Sub Bonds Fiscal 2011 Series A3 | 4.00% | 08/01/15 | 1,920,000 | 1,926,186 | ||
| Future Tax Secured Sub Bonds Fiscal 2011 Series E | 5.00% | 11/01/15 | 1,925,000 | 1,955,547 | ||
| Future Tax Secured Sub Bonds Fiscal 2012 Series A | 5.00% | 11/01/15 | 1,160,000 | 1,178,324 | ||
| Future Tax Secured Sub Bonds Fiscal 2012 Series A (ESCROW) | 5.00% | 11/01/15 | 40,000 | 40,638 | ||
| Future Tax Secured Sub Bonds Fiscal 2012 Series C | 3.00% | 11/01/15 | 100,000 | 100,910 | ||
| Future Tax Secured Sub Bonds Fiscal 2013 Series A1 | 4.00% | 08/01/15 | 400,000 | 401,277 | ||
| Future Tax Secured Sub Bonds Fiscal 2013 Series B | 5.00% | 11/01/15 | 1,660,000 | 1,686,742 | ||
| Future Tax Secured Sub Bonds Fiscal 2013 Series E | 5.00% | 11/01/15 | 100,000 | 101,587 | ||
| Future Tax Secured Sub Bonds Fiscal 2013 Series H | 4.00% | 11/01/15 | 560,000 | 567,116 | ||
| Future Tax Secured Sub Bonds Fiscal 2014 Series D1 | 2.00% | 02/01/16 | 450,000 | 454,468 | ||
| Future Tax Secured Sub Secured Bonds Fiscal 2010 Series C1 | 3.00% | 08/01/15 | 750,000 | 751,776 | ||
| Recovery Bonds Fiscal 2003 Series 3B1 | 4.00% | 11/01/15 | 100,000 | 101,254 | ||
| Recovery Bonds Fiscal 2003 Series 3B1 | 5.00% | 11/01/15 | 100,000 | 101,592 | ||
| New York State | ||||||
| GO Bonds Series 2008A | 4.00% | 03/01/16 | 100,000 | 102,448 | ||
| GO Bonds Series 2009A | 5.00% | 02/15/16 | 260,000 | 267,542 | ||
| GO Bonds Series 2010A | 3.00% | 03/01/16 | 495,000 | 503,827 | ||
| GO Bonds Series 2011A | 5.00% | 02/15/16 | 100,000 | 102,820 | ||
| GO Bonds Series 2013A | 5.00% | 03/01/16 | 1,000,000 | 1,031,875 | ||
| GO Refunding Bonds Series 2009C | 3.00% | 02/01/16 | 890,000 | 903,887 | ||
| New York State Dormitory Auth | ||||||
| Consolidated Service Contract Refunding RB Series 2007 | 4.00% | 07/01/15 | 560,000 | 560,000 | ||
| Consolidated Service Contract Refunding RB Series 2009A | 4.00% | 07/01/15 | 195,000 | 195,000 | ||
| Consolidated Service Contract Refunding RB Series 2009A | 5.00% | 07/01/15 | 1,200,000 | 1,200,000 | ||
| Consolidated Service Contract Refunding RB Series 2009A | 4.00% | 07/01/16 | 200,000 | 206,978 | ||
| Consolidated Service Contract Refunding RB Series 2009A | 5.00% | 07/01/16 | 525,000 | 548,592 | ||
| Consolidated Service Contract Refunding RB Series 2010 | 5.00% | 07/01/16 | 150,000 | 156,728 | ||
| CP (Cornell Univ) | 0.08% | 07/02/15 | 5,750,000 | 5,750,000 | ||
| CP (Cornell Univ) | 0.10% | 09/02/15 | 11,140,000 | 11,140,000 | ||
| Hospital Refunding RB (Wyckoff Heights Medical Center) Series 2015 | 2.00% | 02/15/16 | 3,300,000 | 3,334,658 | ||
| Mental Health Services Facilities Improvement RB Series 2009A1 | 5.00% | 02/15/16 | 100,000 | 102,861 | ||
| Mental Health Services Facilities RB Series 2007C | 4.00% | 08/15/15 | 200,000 | 200,907 | ||
| Mental Health Services Facilities RB Series 2007D | 5.00% | 02/15/16 | 295,000 | 303,170 | ||
| Mental Health Services Facilities RB Series 2008F | 4.75% | 02/15/16 | 250,000 | 256,698 | ||
| Issuer
Type of Security, Series |
Footnotes | Rate | Effective
Maturity |
Maturity
Date |
Face
Amount ($) |
Value
($) |
| Mental Health Services Facilities RB Series 2009A1 | 5.00% | 02/15/16 | 2,020,000 | 2,079,873 | ||
| Mental Health Services Facilities RB Series 2010A | 5.00% | 08/15/15 | 2,330,000 | 2,343,747 | ||
| RB (Columbia Univ) Series 2006A | 5.00% | 07/01/15 | 595,000 | 595,000 | ||
| RB (Cornell Univ) Series 1990B | 5.00% | 07/01/15 | 125,000 | 125,000 | ||
| RB (Cornell Univ) Series 2006A | 4.25% | 07/01/15 | 200,000 | 200,000 | ||
| RB (Cornell Univ) Series 2009A | 3.00% | 07/01/15 | 125,000 | 125,000 | ||
| RB (Cornell Univ) Series 2009A | 5.00% | 07/01/15 | 500,000 | 500,000 | ||
| RB (Cornell Univ) Series 2009A | 5.00% | 07/01/16 | 275,000 | 287,280 | ||
| RB (NYU) 2001 Series 1 | 5.50% | 07/01/15 | 1,205,000 | 1,205,000 | ||
| RB (NYU) Series 1998A | 5.75% | 07/01/15 | 2,360,000 | 2,360,000 | ||
| RB (NYU) Series 2001A | 5.75% | 07/01/15 | 100,000 | 100,000 | ||
| RB (NYU) Series 2008A | 4.00% | 07/01/15 | 590,000 | 590,000 | ||
| RB (NYU) Series 2008B | 4.00% | 07/01/15 | 200,000 | 200,000 | ||
| RB (NYU) Series 2008C | 4.00% | 07/01/15 | 975,000 | 975,000 | ||
| RB (NYU) Series 2009A | 4.00% | 07/01/15 | 1,340,000 | 1,340,000 | ||
| RB (NYU) Series 2012A | 5.00% | 07/01/15 | 2,545,000 | 2,545,000 | ||
| RB (St. Luke's-Roosevelt Hospital Center) Series 2005 (ESCROW) | 4.90% | 08/15/15 | 12,740,000 | 12,812,183 | ||
| State Personal Income Tax RB Series 2006B | 4.00% | 12/15/15 | 150,000 | 152,544 | ||
| State Personal Income Tax RB Series 2006D | 5.00% | 03/15/16 | 100,000 | 103,220 | ||
| State Personal Income Tax RB Series 2007A | 4.50% | 03/15/16 | 150,000 | 154,336 | ||
| State Personal Income Tax RB Series 2007A | 5.00% | 03/15/16 | 200,000 | 206,379 | ||
| State Personal Income Tax RB Series 2007C | 5.00% | 03/15/16 | 325,000 | 335,496 | ||
| State Personal Income Tax RB Series 2008B | 5.00% | 03/15/16 | 1,005,000 | 1,037,691 | ||
| State Personal Income Tax RB Series 2009A | 4.00% | 12/15/15 | 450,000 | 457,456 | ||
| State Personal Income Tax RB Series 2009A | 5.00% | 02/15/16 | 425,000 | 437,216 | ||
| State Personal Income Tax RB Series 2009D | 5.00% | 06/15/16 | 100,000 | 104,288 | ||
| State Personal Income Tax RB Series 2009G | 4.00% | 03/15/16 | 150,000 | 153,774 | ||
| State Personal Income Tax RB Series 2010A | 5.00% | 02/15/16 | 370,000 | 380,841 | ||
| State Personal Income Tax RB Series 2010E | 3.00% | 02/15/16 | 100,000 | 101,669 | ||
| State Personal Income Tax RB Series 2010E | 5.00% | 02/15/16 | 100,000 | 102,804 | ||
| State Personal Income Tax RB Series 2011A | 5.00% | 03/15/16 | 450,000 | 464,762 | ||
| State Personal Income Tax RB Series 2011E | 5.00% | 08/15/15 | 700,000 | 704,149 | ||
| State Personal Income Tax RB Series 2012D | 1.50% | 02/15/16 | 150,000 | 151,118 | ||
| State Personal Income Tax RB Series 2012D | 5.00% | 02/15/16 | 650,000 | 669,167 | ||
| State Sales Tax RB Series 2013A | 3.00% | 03/15/16 | 1,000,000 | 1,019,557 | ||
| New York State Environmental Facilities Corp | ||||||
| Clean Water & Drinking Water Revolving Funds RB Series 2003B | 5.25% | 12/15/15 | 200,000 | 204,469 | ||
| Clean Water & Drinking Water Revolving Funds Sub RB Series 2006C | 5.00% | 10/15/15 | 450,000 | 456,135 | ||
| Clean Water & Drinking Water Revolving Funds Sub RB Series 2007C | 5.00% | 06/15/16 | 150,000 | 156,522 | ||
| Clean Water & Drinking Water Revolving Funds Sub RB Series 2013A | 3.00% | 06/15/16 | 160,000 | 163,810 | ||
| State Personal Income Tax RB Series 2004A | 5.25% | 12/15/15 | 100,000 | 102,202 | ||
| State Personal Income Tax RB Series 2006A | 5.00% | 12/15/15 | 200,000 | 204,303 | ||
| State Personal Income Tax RB Series 2008A | 5.00% | 12/15/15 | 725,000 | 740,827 | ||
| State Revolving Funds RB Series 2011A | 3.00% | 02/15/16 | 350,000 | 355,715 | ||
| New York State HFA | ||||||
| Consolidated Service Contract Refunding RB Series 2011A | 5.00% | 09/15/15 | 1,650,000 | 1,665,595 | ||
| State Personal Income Tax RB Series 2007C | 5.00% | 09/15/15 | 660,000 | 666,351 | ||
| Issuer
Type of Security, Series |
Footnotes | Rate | Effective
Maturity |
Maturity
Date |
Face
Amount ($) |
Value
($) |
| New York State Local Government Assistance Corp | ||||||
| Sr Lien Refunding Bonds Series 2007A | 5.00% | 04/01/16 | 570,000 | 589,735 | ||
| Sr Lien Refunding Bonds Series 2008A | 5.00% | 04/01/16 | 365,000 | 377,642 | ||
| Sr Lien Refunding Bonds Series 2008C | 5.00% | 04/01/16 | 245,000 | 253,446 | ||
| Sub Lien Refunding Bonds Series 2010A | 5.00% | 04/01/16 | 100,000 | 103,396 | ||
| Sub Lien Refunding Bonds Series 2011A | 5.00% | 04/01/16 | 325,000 | 336,385 | ||
| Sub Refunding Bonds Series 2010B | 5.00% | 04/01/16 | 100,000 | 103,400 | ||
| New York State Mortgage Agency | ||||||
| Homeowner Mortgage RB Series 169 | 1.10% | 10/01/15 | 100,000 | 100,162 | ||
| New York State Power Auth | ||||||
| CP Series 1&2 | 0.07% | 07/09/15 | 17,650,000 | 17,650,000 | ||
| CP Series 1&2 | 0.08% | 07/15/15 | 8,870,000 | 8,870,000 | ||
| CP Series 1&2 | 0.07% | 07/28/15 | 20,000,000 | 20,000,000 | ||
| CP Series 1&2 | 0.09% | 08/07/15 | 4,715,000 | 4,715,000 | ||
| CP Series 1&2 | 0.09% | 08/13/15 | 10,000,000 | 10,000,000 | ||
| CP Series 1&2 | 0.10% | 10/05/15 | 13,876,000 | 13,876,000 | ||
| RB Series 2006A | 5.00% | 11/15/15 | 250,000 | 254,471 | ||
| RB Series 2007C | 5.00% | 11/15/15 | 670,000 | 681,781 | ||
| New York State Thruway Auth | ||||||
| Local Highway & Bridge Service Contract Bonds Series 2012A | 5.00% | 04/01/16 | 2,575,000 | 2,666,244 | ||
| Second General Highway & Bridge Trust Fund Bonds Series 2006A | 5.00% | 04/01/16 | 150,000 | 155,109 | ||
| Second General Highway & Bridge Trust Fund Bonds Series 2007A | 5.00% | 04/01/16 | 990,000 | 1,024,113 | ||
| Second General Highway & Bridge Trust Fund Bonds Series 2008A | 5.00% | 04/01/16 | 265,000 | 274,120 | ||
| Second General Highway & Bridge Trust Fund Bonds Series 2008B | 5.00% | 04/01/16 | 1,455,000 | 1,505,117 | ||
| Second General Highway & Bridge Trust Fund Bonds Series 2010A | 4.00% | 04/01/16 | 125,000 | 128,419 | ||
| Second General Highway & Bridge Trust Fund Bonds Series 2010A | 5.00% | 04/01/16 | 145,000 | 149,881 | ||
| Second General Highway & Bridge Trust Fund Bonds Series 2012A | 4.00% | 04/01/16 | 575,000 | 590,677 | ||
| Second General Highway & Bridge Trust Fund Refunding Bonds Series 2011A2 | 4.00% | 04/01/16 | 195,000 | 200,180 | ||
| Service Contract Bonds Series 2007 | 5.00% | 04/01/16 | 275,000 | 284,501 | ||
| State Personal Income Tax RB Series 2009A | 5.00% | 03/15/16 | 345,000 | 356,182 | ||
| State Personal Income Tax RB Series 2010A | 5.00% | 03/15/16 | 400,000 | 413,003 | ||
| State Personal Income Tax RB Series 2012A | 5.00% | 03/15/16 | 225,000 | 232,356 | ||
| State Personal Income Tax Refunding RB Series 2007A | 5.00% | 03/15/16 | 250,000 | 258,139 | ||
| New York State Tobacco Settlement Financing Corp | ||||||
| Asset-Backed RB Series 2011A | 5.00% | 06/01/16 | 500,000 | 520,763 | ||
| Asset-Backed RB Series 2011B | 5.00% | 06/01/16 | 270,000 | 281,291 | ||
| New York State Urban Development Corp | ||||||
| Service Contract Refunding RB Series 2005B | 5.00% | 01/01/16 | 110,000 | 112,558 | ||
| Service Contract Refunding RB Series 2007A | 5.00% | 01/01/16 | 500,000 | 511,417 | ||
| Service Contract Refunding RB Series 2008D | 5.00% | 01/01/16 | 4,345,000 | 4,448,146 | ||
| Service Contract Refunding RB Series 2010A1 | 4.00% | 01/01/16 | 250,000 | 254,495 | ||
| Service Contract Refunding RB Series 2010B | 5.00% | 01/01/16 | 11,600,000 | 11,878,893 | ||
| State Personal Income Tax RB Series 2004A2 | 5.50% | 03/15/16 | 100,000 | 103,579 | ||
| State Personal Income Tax RB Series 2007C | 5.00% | 03/15/16 | 100,000 | 103,328 | ||
| Issuer
Type of Security, Series |
Footnotes | Rate | Effective
Maturity |
Maturity
Date |
Face
Amount ($) |
Value
($) |
| State Personal Income Tax RB Series 2008A1 | 4.00% | 12/15/15 | 575,000 | 584,852 | ||
| State Personal Income Tax RB Series 2009A1 | 5.00% | 12/15/15 | 650,000 | 663,873 | ||
| State Personal Income Tax RB Series 2009C | 3.00% | 12/15/15 | 400,000 | 404,823 | ||
| State Personal Income Tax RB Series 2009C | 5.00% | 12/15/15 | 5,205,000 | 5,318,084 | ||
| State Personal Income Tax RB Series 2010A | 5.00% | 03/15/16 | 2,935,000 | 3,032,749 | ||
| State Personal Income Tax RB Series 2013D | 5.00% | 03/15/16 | 685,000 | 707,098 | ||
| Niagara Cnty | ||||||
| BAN 2015B | 1.25% | 05/12/16 | 9,017,615 | 9,088,191 | ||
| North Hempstead | ||||||
| BAN Series 2015A | 0.85% | 04/06/16 | 22,000,000 | 22,101,429 | ||
| North Syracuse CSD | ||||||
| GO BAN 2014 | 0.75% | 08/14/15 | 4,899,020 | 4,902,052 | ||
| North Tonawanda SD | ||||||
| School Construction BAN 2014 | 1.00% | 09/17/15 | 10,385,000 | 10,401,045 | ||
| Oceanside UFSD | ||||||
| TAN 2015-2016 | c | 2.00% | 06/21/16 | 13,500,000 | 13,690,080 | |
| Owego Apalachin CSD | ||||||
| BAN Series 2014 | 1.50% | 08/21/15 | 9,400,000 | 9,414,382 | ||
| Port Auth of New York & New Jersey | ||||||
| Consolidated Bonds 142nd Series | 5.00% | 07/15/15 | 100,000 | 100,176 | ||
| Consolidated Bonds 148th Series | 5.00% | 08/15/15 | 700,000 | 704,014 | ||
| Consolidated Bonds 154th Series | 5.00% | 09/01/15 | 170,000 | 171,368 | ||
| Consolidated Bonds 155th Series | 2.75% | 10/01/15 | 250,000 | 251,561 | ||
| Consolidated Bonds 179th Series | 4.00% | 12/01/15 | 1,085,000 | 1,101,860 | ||
| CP Series B | 0.07% | 08/05/15 | 6,135,000 | 6,135,000 | ||
| CP Series B | 0.06% | 08/13/15 | 9,750,000 | 9,750,000 | ||
| CP Series B | 0.08% | 10/07/15 | 2,010,000 | 2,010,000 | ||
| CP Series B | 0.08% | 10/08/15 | 2,505,000 | 2,505,000 | ||
| CP Series B | 0.08% | 11/10/15 | 2,610,000 | 2,610,000 | ||
| Rochester | ||||||
| BAN Series 2015I | 1.00% | 03/16/16 | 18,345,000 | 18,446,666 | ||
| Rotterdam-Mohonasen CSD | ||||||
| BAN 2015 | 2.00% | 04/08/16 | 17,000,000 | 17,221,969 | ||
| Schenectady City SD | ||||||
| BAN 2014B | 1.00% | 07/02/15 | 6,877,536 | 6,877,667 | ||
| Sullivan Cnty | ||||||
| BAN 2015 | 1.25% | 03/04/16 | 7,070,000 | 7,113,035 | ||
| GO TAN 2015 | 1.25% | 03/04/16 | 4,250,000 | 4,277,150 | ||
| Tonawanda | ||||||
| BAN 2015 | 1.13% | 06/09/16 | 7,756,482 | 7,776,054 | ||
| BAN Series 2014 | 0.75% | 09/03/15 | 5,000,000 | 5,004,936 | ||
| Triborough Bridge & Tunnel Auth | ||||||
| General RB (MTA Bridges & Tunnels) Series 2008C | 5.00% | 11/15/15 | 5,640,000 | 5,742,607 | ||
| General RB Series 2008A | 4.00% | 11/15/15 | 150,000 | 152,091 | ||
| General RB Series 2008A | 5.00% | 11/15/15 | 1,225,000 | 1,246,554 | ||
| General RB Series 2010A1 | 5.00% | 11/15/15 | 5,300,000 | 5,395,509 | ||
| General RB Series 2012A | 5.00% | 11/15/15 | 175,000 | 178,115 | ||
| General RB Series 2013C | 3.00% | 11/15/15 | 2,460,000 | 2,485,814 | ||
| General Refunding RB Series 2002B | 5.25% | 11/15/15 | 3,895,000 | 3,968,134 | ||
| General Refunding RB Series 2011A | 5.00% | 01/01/16 | 775,000 | 793,122 | ||
| Sub RB (MTA Bridges & Tunnels) Series 2008D | 5.00% | 11/15/15 | 400,000 | 406,997 | ||
| Sub RB Series 2003A | 5.25% | 11/15/15 | 1,760,000 | 1,792,508 | ||
| Issuer
Type of Security, Series |
Footnotes | Rate | Effective
Maturity |
Maturity
Date |
Face
Amount ($) |
Value
($) |
| Vestal | ||||||
| BAN 2015 | 1.25% | 05/13/16 | 5,215,000 | 5,257,303 | ||
| West Seneca | ||||||
| BAN 2014 | 1.00% | 07/30/15 | 5,000,000 | 5,003,389 | ||
| Total Fixed-Rate Securities | ||||||
| (Cost $672,939,817) | 672,939,817 | |||||
| Variable-Rate Securities 64.2% of net assets | ||||||
| New York 64.2% | ||||||
| Amherst Development Corp | ||||||
| Student Housing Facility Refunding RB Series 2010B (LOC: HSBC Bank USA) | 0.13% | 07/07/15 | 5,520,000 | 5,520,000 | ||
| Amherst IDA | ||||||
| Civic Facility RB (Daemen College) Series 2006B (LOC: Manufacturers & Traders Trust Co) | 0.12% | 07/07/15 | 3,375,000 | 3,375,000 | ||
| BlackRock New York Municipal Bond Trust | ||||||
| Variable Rate Demand Preferred Shares Series W-7 (GTY/LIQ: Barclays Bank Plc) | a | 0.15% | 07/07/15 | 22,100,000 | 22,100,000 | |
| BlackRock New York Municipal Income Trust II | ||||||
| Variable Rate Demand Preferred Shares Series W7 (GTY/LIQ: Barclays Bank Plc) | a | 0.15% | 07/07/15 | 5,000,000 | 5,000,000 | |
| Colonie Local Development Corp | ||||||
| RB (Shaker Pointe at Carondelet) Series 2011 (LOC: Manufacturers & Traders Trust Co) | 0.07% | 07/07/15 | 10,000,000 | 10,000,000 | ||
| RB (Shaker Pointe at Carondelet) Series 2013 (LOC: Manufacturers & Traders Trust Co) | 0.07% | 07/07/15 | 12,000,000 | 12,000,000 | ||
| East Rochester Housing Auth | ||||||
| Housing RB (Park Ridge Nursing Home) Series 2008 (LOC: JPMorgan Chase Bank, NA) | 0.13% | 07/07/15 | 13,220,000 | 13,220,000 | ||
| Franklin Cnty Civic Development Corp | ||||||
| RB (Alice Hyde Medical Center) Series 2013A (LOC: HSBC Bank USA) | 0.07% | 07/07/15 | 4,265,000 | 4,265,000 | ||
| Lancaster IDA | ||||||
| Civic Facility RB (2000 GreenField Manor) (LOC: Manufacturers & Traders Trust Co) | 0.13% | 07/07/15 | 8,935,000 | 8,935,000 | ||
| Metropolitan Transportation Auth | ||||||
| Dedicated Tax Fund Bonds Series 2002B1 (LOC: State Street Bank & Trust Co NA) | 0.06% | 07/07/15 | 6,525,000 | 6,525,000 | ||
| Dedicated Tax Fund Bonds Series 2004B2 (LIQ: JPMorgan Chase Bank, NA) | a | 0.08% | 07/07/15 | 8,055,000 | 8,055,000 | |
| Dedicated Tax Fund Bonds Series 2006B (LIQ: Citibank, NA) | a | 0.08% | 07/07/15 | 5,000,000 | 5,000,000 | |
| Dedicated Tax Fund Bonds Series 2006B (LIQ: Citibank, NA) | a | 0.09% | 07/07/15 | 8,000,000 | 8,000,000 | |
| Dedicated Tax Fund Refunding Bonds Series 2012A (LIQ: Citibank, NA) | a | 0.08% | 07/07/15 | 8,000,000 | 8,000,000 | |
| Dedicated Tax Fund Refunding Bonds Series 2012A (LIQ: Credit Suisse AG) | a | 0.07% | 07/07/15 | 6,665,000 | 6,665,000 | |
| Transportation RB Series 2005A (GTY: Berkshire Hathaway Assurance Corp /LIQ: Citibank, NA) | a | 0.08% | 07/07/15 | 12,545,000 | 12,545,000 | |
| Transportation RB Series 2007A (GTY: Berkshire Hathaway Assurance Corp /LIQ: Citibank, NA) | a,d | 0.08% | 07/07/15 | 29,500,000 | 29,500,000 | |
| Monroe Cnty IDA | ||||||
| Civic Facility RB Series 2004 (LOC: Manufacturers & Traders Trust Co) | 0.17% | 07/07/15 | 1,360,000 | 1,360,000 | ||
| Issuer
Type of Security, Series |
Footnotes | Rate | Effective
Maturity |
Maturity
Date |
Face
Amount ($) |
Value
($) |
| Nassau Cnty Interim Finance Auth | ||||||
| Sales Tax Secured Bonds Series 2008D1 (LIQ: Bank of New York Mellon) | d | 0.07% | 07/07/15 | 15,705,000 | 15,705,000 | |
| Nassau Health Care Corp | ||||||
| Bonds Series 2009B1 (LOC: TD Bank NA) | 0.07% | 07/07/15 | 7,700,000 | 7,700,000 | ||
| Bonds Series 2009C2 (LOC: Wells Fargo Bank, NA) | 0.09% | 07/07/15 | 505,000 | 505,000 | ||
| New York City | ||||||
| GO Bonds Fiscal 2005 Series C3 (LIQ: Credit Suisse AG) | a | 0.07% | 07/07/15 | 8,700,000 | 8,700,000 | |
| GO Bonds Fiscal 2006 Series F4A (LOC: Sumitomo Mitsui Banking Corp) | 0.07% | 07/07/15 | 2,500,000 | 2,500,000 | ||
| GO Bonds Fiscal 2008 Series D4 (LIQ: Bank of Montreal) | 0.08% | 07/07/15 | 7,050,000 | 7,050,000 | ||
| GO Bonds Fiscal 2008 Series E (LIQ: State Street Bank & Trust Co NA) | a,d | 0.07% | 07/07/15 | 18,695,000 | 18,695,000 | |
| GO Bonds Fiscal 2008 Series L1 (LIQ: JPMorgan Chase Bank, NA) | a | 0.08% | 07/07/15 | 6,660,000 | 6,660,000 | |
| GO Bonds Fiscal 2009 Series H1 (LIQ: Morgan Stanley Bank NA) | a | 0.22% | 07/07/15 | 15,000,000 | 15,000,000 | |
| GO Bonds Fiscal 2009 Series I1 (LIQ: Morgan Stanley Bank NA) | a | 0.08% | 07/07/15 | 3,000,000 | 3,000,000 | |
| GO Bonds Fiscal 2009 Series J1 (LIQ: Citibank, NA) | a | 0.07% | 07/07/15 | 23,225,000 | 23,225,000 | |
| GO Bonds Fiscal 2010 Series E (LIQ: JPMorgan Chase Bank, NA) | a | 0.08% | 07/07/15 | 3,445,000 | 3,445,000 | |
| GO Bonds Fiscal 2012 Series D1 (LIQ: Morgan Stanley Bank NA) | a | 0.08% | 07/07/15 | 2,500,000 | 2,500,000 | |
| GO Bonds Fiscal 2013 Series A1 (LIQ: JPMorgan Chase Bank, NA) | a | 0.08% | 07/07/15 | 3,750,000 | 3,750,000 | |
| GO Bonds Fiscal 2013 Series D&E (LIQ: Citibank, NA) | a | 0.07% | 07/07/15 | 13,500,000 | 13,500,000 | |
| GO Bonds Fiscal 2013 Series F1 (LIQ: Credit Suisse AG) | a | 0.07% | 07/07/15 | 7,300,000 | 7,300,000 | |
| GO Bonds Fiscal 2014 Series A1 (LIQ: Citibank, NA) | a | 0.07% | 07/07/15 | 8,000,000 | 8,000,000 | |
| GO Bonds Fiscal 2014 Series I1 (LIQ: JPMorgan Chase Bank, NA) | a | 0.08% | 07/07/15 | 2,635,000 | 2,635,000 | |
| New York City Housing Development Corp | ||||||
| M/F Housing RB Series 2009C1 (LIQ: JPMorgan Chase Bank, NA) | a | 0.08% | 07/07/15 | 8,000,000 | 8,000,000 | |
| M/F Housing RB Series 2014C3 (LIQ: TD Bank NA) | 0.06% | 07/07/15 | 3,800,000 | 3,800,000 | ||
| M/F Mortgage RB (461 Dean St) Series 2012A (LOC: Bank of New York Mellon) | 0.08% | 07/07/15 | 2,600,000 | 2,600,000 | ||
| M/F Mortgage RB (Sons of Italy Apts) Series 2008A (LOC: Mizuho Bank Ltd) | 0.07% | 07/07/15 | 6,070,000 | 6,070,000 | ||
| New York City Municipal Water Finance Auth | ||||||
| Water & Sewer System RB Fiscal 2003 Series F1A (LIQ: Wells Fargo Bank, NA) | 0.06% | 07/07/15 | 5,250,000 | 5,250,000 | ||
| Water & Sewer System RB Fiscal 2007 Series A (LIQ: Bank of America, NA) | a | 0.07% | 07/07/15 | 11,500,000 | 11,500,000 | |
| Water & Sewer System RB Fiscal 2009 Series DD (LIQ: Citibank, NA) | a | 0.09% | 07/07/15 | 8,125,000 | 8,125,000 | |
| Water & Sewer System RB Fiscal 2009 Series GG2 (LIQ: JPMorgan Chase Bank, NA) | a | 0.08% | 07/07/15 | 7,295,000 | 7,295,000 | |
| Water & Sewer System RB Fiscal 2011 Series DD1 (LIQ: TD Bank NA) | 0.02% | 07/01/15 | 2,575,000 | 2,575,000 | ||
| Water & Sewer System RB Fiscal 2011 Series HH (LIQ: Deutsche Bank AG) | a | 0.17% | 07/07/15 | 8,700,000 | 8,700,000 | |
| Water & Sewer System RB Fiscal 2012 Series BB (LIQ: Royal Bank of Canada) | a | 0.07% | 07/07/15 | 10,515,000 | 10,515,000 | |
| Water & Sewer System RB Fiscal 2013 Series CC (LIQ: Barclays Bank Plc) | a | 0.11% | 07/07/15 | 11,330,000 | 11,330,000 | |
| Water & Sewer System Second General Resolution RB Fiscal 2012 Series FF (LIQ: JPMorgan Chase Bank, NA) | a | 0.08% | 07/07/15 | 19,640,000 | 19,640,000 | |
| Issuer
Type of Security, Series |
Footnotes | Rate | Effective
Maturity |
Maturity
Date |
Face
Amount ($) |
Value
($) |
| Water & Sewer System Second General Resolution RB Fiscal 2011 Series EE (LIQ: Morgan Stanley Bank NA) | a | 0.08% | 07/07/15 | 6,175,000 | 6,175,000 | |
| Water & Sewer System Second General Resolution RB Fiscal 2012 Series BB (LIQ: Barclays Bank Plc) | a | 0.11% | 07/07/15 | 2,000,000 | 2,000,000 | |
| Water & Sewer System Second General Resolution RB Fiscal 2014 Series DD (LIQ: JPMorgan Chase Bank, NA) | a | 0.08% | 07/07/15 | 4,000,000 | 4,000,000 | |
| New York City Transitional Finance Auth | ||||||
| Building Aid RB Fiscal 2007 Series S1 (LIQ: Citibank, NA) | a | 0.08% | 07/01/15 | 8,850,000 | 8,850,000 | |
| Building Aid RB Fiscal 2008 Series S1 (LIQ: Citibank, NA) | a | 0.08% | 07/07/15 | 6,000,000 | 6,000,000 | |
| Building Aid RB Fiscal 2015 Series S1 (LIQ: Morgan Stanley Bank NA) | a | 0.08% | 07/07/15 | 4,000,000 | 4,000,000 | |
| Building Aid RB Fiscal 2015 Series S2 (LIQ: Toronto-Dominion Bank) | a | 0.08% | 07/07/15 | 3,000,000 | 3,000,000 | |
| Future Tax Secured Sub Bonds Fiscal 2007 Series B (LIQ: JPMorgan Chase Bank, NA) | a | 0.08% | 07/07/15 | 3,495,000 | 3,495,000 | |
| Future Tax Secured Sub Bonds Fiscal 2007 Series C1 (ESCROW/LIQ: Credit Suisse AG) | a | 0.07% | 07/07/15 | 6,000,000 | 6,000,000 | |
| Future Tax Secured Sub Bonds Fiscal 2010 Series A1 (LIQ: JPMorgan Chase Bank, NA) | a | 0.08% | 07/07/15 | 11,000,000 | 11,000,000 | |
| Future Tax Secured Sub Bonds Fiscal 2011 Series D1 (LIQ: JPMorgan Chase Bank, NA) | a | 0.08% | 07/07/15 | 3,750,000 | 3,750,000 | |
| Future Tax Secured Sub Bonds Fiscal 2012 Series E1 (LIQ: Royal Bank of Canada) | a | 0.07% | 07/07/15 | 4,835,000 | 4,835,000 | |
| Future Tax Secured Sub Bonds Fiscal 2012 Series F1 (LIQ: Morgan Stanley Bank NA) | a | 0.08% | 07/07/15 | 10,900,000 | 10,900,000 | |
| Future Tax Secured Sub Bonds Fiscal 2013 Series F1 (LIQ: JPMorgan Chase Bank, NA) | a | 0.08% | 07/07/15 | 3,240,000 | 3,240,000 | |
| Future Tax Secured Sub Bonds Fiscal 2014 Series A1 (LIQ: Morgan Stanley Bank NA) | a | 0.08% | 07/07/15 | 5,780,000 | 5,780,000 | |
| Future Tax Secured Sub Bonds Fiscal 2014 Series B3 (LIQ: Barclays Bank Plc) | 0.03% | 07/01/15 | 5,965,000 | 5,965,000 | ||
| Future Tax Secured Sub Bonds Fiscal 2015 Series A1 (LIQ: Morgan Stanley Bank NA) | a | 0.08% | 07/07/15 | 2,000,000 | 2,000,000 | |
| Future Tax Secured Sub Bonds Fiscal 2015 Series E3 (LIQ: JPMorgan Chase Bank, NA) | 0.03% | 07/01/15 | 2,000,000 | 2,000,000 | ||
| New York City Trust for Cultural Resources | ||||||
| Refunding RB (American Museum of Natural History) Series 2014B1 | 0.11% | 07/02/15 | 02/26/16 | 17,225,000 | 17,225,000 | |
| Refunding RB (American Museum of Natural History) Series 2014B2 | 0.08% | 07/02/15 | 12/04/15 | 13,490,000 | 13,490,000 | |
| New York Convention Center Development Corp | ||||||
| RB Series 2005 (GTY: Berkshire Hathaway Assurance Corp /LIQ: Credit Suisse AG) | a | 0.07% | 07/07/15 | 20,900,000 | 20,900,000 | |
| New York Liberty Development Corp | ||||||
| Liberty RB (1 World Trade Center) Series 2011 (LIQ: JPMorgan Chase Bank, NA) | a | 0.09% | 07/07/15 | 6,015,000 | 6,015,000 | |
| New York State Dormitory Auth | ||||||
| Insured RB (St. John's Univ) Series 2007C (GTY/LIQ: State Street Bank & Trust Co NA) | a,d | 0.07% | 07/07/15 | 26,020,000 | 26,020,000 | |
| RB (Catholic Health) Series 2006B (LOC: HSBC Bank USA) | 0.07% | 07/07/15 | 7,710,000 | 7,710,000 | ||
| RB (Columbia Univ) Series 2006A (LIQ: Citibank, NA) | a | 0.08% | 07/07/15 | 8,535,000 | 8,535,000 | |
| RB (Columbia Univ) Series 2008A (LIQ: Branch Banking & Trust Co) | a | 0.07% | 07/07/15 | 6,000,000 | 6,000,000 | |
| RB (Cornell Univ) Series 2000B | 0.07% | 07/07/15 | 13,600,000 | 13,600,000 | ||
| RB (Cornell Univ) Series 2006A (LIQ: Bank of America, NA) | a | 0.10% | 07/07/15 | 9,865,000 | 9,865,000 | |
| Issuer
Type of Security, Series |
Footnotes | Rate | Effective
Maturity |
Maturity
Date |
Face
Amount ($) |
Value
($) |
| RB (Culinary Institute of America) Series 2004C (LOC: TD Bank NA) | 0.06% | 07/07/15 | 12,800,000 | 12,800,000 | ||
| RB (Culinary Institute of America) Series 2004D (LOC: TD Bank NA) | 0.06% | 07/07/15 | 5,600,000 | 5,600,000 | ||
| RB (Culinary Institute of America) Series 2006 (LOC: TD Bank NA) | 0.06% | 07/07/15 | 3,225,000 | 3,225,000 | ||
| RB (NYU) Series 2009A (LIQ: Citibank, NA) | a | 0.08% | 07/07/15 | 9,900,000 | 9,900,000 | |
| State Personal Income Tax RB Series 2006C (ESCROW/LIQ: Citibank, NA) | a | 0.08% | 07/07/15 | 25,500,000 | 25,500,000 | |
| State Personal Income Tax RB Series 2010F (LIQ: Bank of America, NA) | a | 0.10% | 07/07/15 | 5,000,000 | 5,000,000 | |
| State Personal Income Tax RB Series 2011A (LIQ: Morgan Stanley Bank NA) | a | 0.08% | 07/07/15 | 5,935,000 | 5,935,000 | |
| State Personal Income Tax RB Series 2013A (LIQ: JPMorgan Chase Bank, NA) | a | 0.08% | 07/07/15 | 2,000,000 | 2,000,000 | |
| State Personal Income Tax RB Series 2014C (LIQ: JPMorgan Chase Bank, NA) | a | 0.08% | 07/07/15 | 8,000,000 | 8,000,000 | |
| State Sales Tax RB Series 2014A (LIQ: Morgan Stanley Bank NA) | a | 0.08% | 07/07/15 | 3,300,000 | 3,300,000 | |
| New York State Environmental Facilities Corp | ||||||
| Clean Water & Drinking Water Revolving Funds RB Series 2010C (LIQ: JPMorgan Chase Bank, NA) | a | 0.08% | 07/07/15 | 6,600,000 | 6,600,000 | |
| Clean Water & Drinking Water Revolving Funds Sub RB Series 2013A (LIQ: JPMorgan Chase Bank, NA) | a | 0.08% | 07/07/15 | 2,500,000 | 2,500,000 | |
| New York State HFA | ||||||
| Housing (Navy Pier Court) RB Series 2014A (LOC: PNC Bank NA) | 0.06% | 07/07/15 | 5,000,000 | 5,000,000 | ||
| Housing RB (10 Liberty St) Series 2003A (LOC: Freddie Mac) | 0.05% | 07/07/15 | 5,500,000 | 5,500,000 | ||
| Housing RB (100 Maiden Lane) Series 2004A (LOC: Fannie Mae) | d | 0.08% | 07/07/15 | 66,175,000 | 66,175,000 | |
| Housing RB (2180 Broadway) Series 2011A (LOC: Wells Fargo Bank, NA) | 0.05% | 07/07/15 | 27,500,000 | 27,500,000 | ||
| Housing RB (33 Bond St) Series 2014A (LOC: Manufacturers & Traders Trust Co) | 0.07% | 07/07/15 | 6,900,000 | 6,900,000 | ||
| Housing RB (600 W 42nd St) Series 2008A (LOC: Fannie Mae) | 0.08% | 07/07/15 | 21,300,000 | 21,300,000 | ||
| Housing RB (625 W 57th St) Series 2014A (LOC: Bank of New York Mellon) | 0.06% | 07/07/15 | 13,200,000 | 13,200,000 | ||
| Housing RB (Rip Van Winkle House) Series 2004A (LOC: Freddie Mac) | 0.11% | 07/07/15 | 10,700,000 | 10,700,000 | ||
| Housing RB (Riverside Center 2) Series 2015A1 (LOC: Bank of America, NA) | 0.07% | 07/07/15 | 10,000,000 | 10,000,000 | ||
| Housing RB (Riverside Center 2) Series 2015A2 (LOC: Bank of America, NA) | 0.05% | 07/07/15 | 5,200,000 | 5,200,000 | ||
| Housing RB Series 2006A (LOC: Fannie Mae) | 0.12% | 07/07/15 | 10,900,000 | 10,900,000 | ||
| New York State Mortgage Agency | ||||||
| Homeowner Mortgage RB Series 132 (LIQ: Royal Bank of Canada) | 0.06% | 07/01/15 | 9,800,000 | 9,800,000 | ||
| Homeowner Mortgage RB Series 144 (LIQ: JPMorgan Chase Bank, NA) | 0.04% | 07/01/15 | 3,400,000 | 3,400,000 | ||
| Homeowner Mortgage RB Series 147 (LIQ: JPMorgan Chase Bank, NA) | 0.10% | 07/07/15 | 15,420,000 | 15,420,000 | ||
| Homeowner Mortgage RB Series 153 (LIQ: Barclays Bank Plc) | 0.10% | 07/07/15 | 9,000,000 | 9,000,000 | ||
| New York State Thruway Auth | ||||||
| General RB Series H (GTY/LIQ: US Bank, NA) | a | 0.07% | 07/07/15 | 19,260,000 | 19,260,000 | |
| New York State Urban Development Corp | ||||||
| State Personal Income Tax RB Series 2004A3C (LIQ: JPMorgan Chase Bank, NA) | 0.10% | 07/07/15 | 9,700,000 | 9,700,000 | ||
| State Personal Income Tax RB Series 2007B (LIQ: Barclays Bank Plc) | a | 0.11% | 07/07/15 | 6,500,000 | 6,500,000 | |
| Issuer
Type of Security, Series |
Footnotes | Rate | Effective
Maturity |
Maturity
Date |
Face
Amount ($) |
Value
($) |
| State Personal Income Tax RB Series 2009A1 (LIQ: JPMorgan Chase Bank, NA) | a | 0.08% | 07/07/15 | 4,995,000 | 4,995,000 | |
| State Personal Income Tax RB Series 2013A1 (LIQ: JPMorgan Chase Bank, NA) | a | 0.08% | 07/07/15 | 7,700,000 | 7,700,000 | |
| State Personal Income Tax RB Series 2014A (LIQ: JPMorgan Chase Bank, NA) | a | 0.12% | 07/07/15 | 7,500,000 | 7,500,000 | |
| Port Auth of New York & New Jersey | ||||||
| Consolidated Bonds 144th Series (LIQ: JPMorgan Chase Bank, NA) | a | 0.08% | 07/07/15 | 750,000 | 750,000 | |
| Consolidated Bonds 148th Series (LIQ: Citibank, NA) | a | 0.08% | 07/07/15 | 5,540,000 | 5,540,000 | |
| Consolidated Bonds 148th Series (LIQ: Morgan Stanley Bank NA) | a | 0.08% | 07/07/15 | 13,000,000 | 13,000,000 | |
| Consolidated Bonds 179th Series (LIQ: Citibank, NA) | a | 0.08% | 07/07/15 | 2,580,000 | 2,580,000 | |
| Rockland Cnty IDA | ||||||
| RB (Northern Riverview) Series 1999 (LOC: Manufacturers & Traders Trust Co) | 0.17% | 07/07/15 | 7,365,000 | 7,365,000 | ||
| Sales Tax Asset Receivable Corp | ||||||
| Sales Tax Asset RB Fiscal 2015 Series A (LIQ: JPMorgan Chase Bank, NA) | a | 0.08% | 07/07/15 | 3,140,000 | 3,140,000 | |
| Suffolk County IDA | ||||||
| Civic Facility RB (Guide Dog Foundation for the Blind) Series 2001 (LOC: JPMorgan Chase Bank, NA) | 0.11% | 07/07/15 | 3,240,000 | 3,240,000 | ||
| Syracuse IDA | ||||||
| Civic Facility Refunding RB (Crouse Health) Series 2003A (LOC: HSBC Bank USA) | 0.07% | 07/07/15 | 6,815,000 | 6,815,000 | ||
| Triborough Bridge & Tunnel Auth | ||||||
| General RB Series 2003B1 (LOC: PNC Bank NA) | 0.08% | 07/07/15 | 3,000,000 | 3,000,000 | ||
| General RB Series 2008C (LIQ: Bank of America, NA) | a | 0.12% | 07/07/15 | 3,000,000 | 3,000,000 | |
| General RB Series 2009A2 (LIQ: Credit Suisse AG) | a | 0.07% | 07/07/15 | 6,500,000 | 6,500,000 | |
| General RB Series 2013C (LIQ: Morgan Stanley Bank NA) | a | 0.08% | 07/07/15 | 6,665,000 | 6,665,000 | |
| General Refunding RB Series 2005B2 (LOC: Wells Fargo Bank, NA) | 0.02% | 07/01/15 | 1,000,000 | 1,000,000 | ||
| Sub RB (MTA Bridge & Tunnels) Series 2000ABCD2 | d | 0.24% | 07/02/15 | 01/01/16 | 29,200,000 | 29,215,928 |
| Utility Debt Securitization Auth | ||||||
| Restructuring Bonds Series 2013TE (LIQ: JPMorgan Chase Bank, NA) | a | 0.08% | 07/07/15 | 3,355,000 | 3,355,000 | |
| Restructuring Bonds Series 2013TE17 (LIQ: Royal Bank of Canada) | a | 0.07% | 07/07/15 | 6,650,000 | 6,650,000 | |
| Restructuring Bonds Series 2013TE17 (LIQ: State Street Bank & Trust Co NA) | a | 0.07% | 07/07/15 | 21,665,000 | 21,665,000 | |
| Total Variable-Rate Securities | ||||||
| (Cost $1,137,175,928) | 1,137,175,928 | |||||
| a | Securities exempt from registration under Rule 144A of the Securities Act of 1933, as amended. These securities may be resold in transactions exempt from registrations, normally to qualified institutional buyers. At the period end, the value of these amounted to $672,710,000 or 38.0% of net assets. |
| b | Illiquid security. At the period end, the value of these amounted to $16,435,000 or 0.9% of net assets. |
| c | Security or a portion of the security purchased on a delayed-delivery or when-issued basis. |
| d | All or a portion of this security is designated as collateral for delayed-delivery securities. |
| BAN — | Bond anticipation note |
| CCD — | Community college district |
| COP — | Certificate of participation |
| CP — | Commercial paper |
| CSD — | Central school district |
| GO — | General obligation |
| GTY — | Guaranty agreement |
| HFA — | Housing finance agency/authority |
| HRA — | Housing & redevelopment authority |
| HSD — | High school district |
| IDA — | Industrial development agency/authority |
| IDB — | Industrial development board |
| IDC — | Industrial development corporation |
| IDRB — | Industrial development revenue bond |
| IRB — | Industrial revenue bond |
| ISD — | Independent school district |
| LIQ — | Liquidity agreement |
| LOC — | Letter of credit |
| LT — | Limited tax |
| M/F — | Multi-family |
| RAN — | Revenue anticipation note |
| RB — | Revenue bond |
| SD — | School district |
| S/F — | Single-family |
| TAN — | Tax anticipation note |
| TRAN — | Tax and revenue anticipation note |
| UFSD — | Union free school district |
| UHSD — | Union high school district |
| ULT — | Unlimited tax |
| USD — | Unified school district |
| Assets | ||
| Investments, at cost and value (Note 2a) | $1,810,115,745 | |
| Cash | 203,095 | |
| Receivables: | ||
| Interest | 4,870,805 | |
| Prepaid expenses | + | 7,800 |
| Total assets | 1,815,197,445 | |
| Liabilities | ||
| Payables: | ||
| Investments bought | 18,801,192 | |
| Investments bought - Delayed delivery | 24,797,990 | |
| Investment adviser and administrator fees | 43,100 | |
| Fund shares redeemed | 556,726 | |
| Distributions to shareholders | 7,362 | |
| Accrued expenses | + | 128,103 |
| Total liabilities | 44,334,473 | |
| Net Assets | ||
| Total assets | 1,815,197,445 | |
| Total liabilities | – | 44,334,473 |
| Net assets | $1,770,862,972 | |
| Net Assets by Source | ||
| Capital received from investors | 1,770,634,849 | |
| Net realized capital gains | 228,123 | |
| Net Asset Value (NAV) by Shares Class | |||||
| Share Class | Net Assets | ÷ | Shares
Outstanding |
= | NAV |
| Sweep Shares | $1,540,490,637 | 1,538,570,045 | $1.00 | ||
| Value Advantage Shares | $230,372,335 | 230,085,621 | $1.00 | ||
| Investment Income | ||
| Interest | $980,355 | |
| Expenses | ||
| Investment adviser and administrator fees | 3,119,722 | |
| Shareholder service fees: | ||
| Sweep Shares | 2,846,133 | |
| Value Advantage Shares | 253,534 | |
| Proxy fees | 112,611 | |
| Portfolio accounting fees | 70,382 | |
| Professional fees | 31,448 | |
| Custodian fees | 23,285 | |
| Shareholder reports | 23,266 | |
| Transfer agent fees | 20,346 | |
| Registration fees | 16,952 | |
| Independent trustees' fees | 16,486 | |
| Interest expense | 754 | |
| Other expenses | + | 17,462 |
| Total expenses | 6,552,381 | |
| Expense reduction by CSIM and its affiliates | – | 5,664,768 |
| Net expenses | – | 887,613 |
| Net investment income | 92,742 | |
| Realized Gains (Losses) | ||
| Net realized gains on investments | 228,123 | |
| Increase in net assets resulting from operations | $320,865 | |
| Operations | |||
| 1/1/15-6/30/15 | 1/1/14-12/31/14 | ||
| Net investment income | $92,742 | $192,676 | |
| Net realized gains | + | 228,123 | 510,620 |
| Increase in net assets from operations | 320,865 | 703,296 | |
| Distributions to Shareholders | |||
| Distributions from net investment income | |||
| Sweep Shares | (81,230) | (167,354) | |
| Value Advantage Shares | + | (11,512) | (25,322) |
| Total distributions from net investment income | (92,742) | (192,676) | |
| Distributions from net realized gains | |||
| Sweep Shares | — | (198,594) | |
| Value Advantage Shares | + | — | (26,758) |
| Total distributions from net realized gains | — | (225,352) | |
| Total distributions | (92,742) | (418,028) | |
| Transactions in Fund Shares* | |||
| Shares Sold | |||
| Sweep Shares | 1,966,489,725 | 4,345,941,677 | |
| Value Advantage Shares | + | 23,066,331 | 44,816,106 |
| Total shares sold | 1,989,556,056 | 4,390,757,783 | |
| Shares Reinvested | |||
| Sweep Shares | 73,242 | 362,259 | |
| Value Advantage Shares | + | 9,819 | 48,221 |
| Total shares reinvested | 83,061 | 410,480 | |
| Shares Redeemed | |||
| Sweep Shares | (2,183,967,086) | (4,280,963,305) | |
| Value Advantage Shares | + | (29,475,101) | (74,741,139) |
| Total shares redeemed | (2,213,442,187) | (4,355,704,444) | |
| Net transactions in fund shares | (223,803,070) | 35,463,819 | |
| Net Assets | |||
| Beginning of period | 1,994,437,919 | 1,958,688,832 | |
| Total increase or decrease | + | (223,574,947) | 35,749,087 |
| End of period | $1,770,862,972 | $1,994,437,919 | |
| * | Transactions took place at $1.00 per share; figures for share quantities are the same as for dollars. |
| 1/1/15–
6/30/15* |
1/1/14–
12/31/14 |
1/1/13–
12/31/13 |
1/1/12–
12/31/12 |
1/1/11–
12/31/11 |
1/1/10–
12/31/10 | |
| Per-Share Data ($) | ||||||
| Net asset value at beginning of period | 1.00 | 1.00 | 1.00 | 1.00 | 1.00 | 1.00 |
| Income (loss) from investment operations: | ||||||
| Net investment income (loss) | 0.00 1,2 | 0.00 2 | 0.00 2 | 0.00 2 | 0.00 2 | 0.00 2 |
| Net realized and unrealized gains (losses) | (0.00) 2 | 0.00 2 | 0.00 2 | 0.00 2 | 0.00 2 | 0.00 2 |
| Total from investment operations | 0.00 2 | 0.00 2 | 0.00 2 | 0.00 2 | 0.00 2 | 0.00 2 |
| Less distributions: | ||||||
| Distributions from net investment income | (0.00) 2 | (0.00) 2 | (0.00) 2 | (0.00) 2 | (0.00) 2 | (0.00) 2 |
| Distributions from net realized gains | — | (0.00) 2 | (0.00) 2 | (0.00) 2 | (0.00) 2 | (0.00) 2 |
| Total distributions | (0.00) 2 | (0.00) 2 | (0.00) 2 | (0.00) 2 | (0.00) 2 | (0.00) 2 |
| Net asset value at end of period | 1.00 | 1.00 | 1.00 | 1.00 | 1.00 | 1.00 |
| Total return (%) | 0.01 3 | 0.02 | 0.01 | 0.01 | 0.02 | 0.02 |
| Ratios/Supplemental Data (%) | ||||||
| Ratios to average net assets: | ||||||
| Net operating expenses | 0.08 4,5 | 0.09 5 | 0.15 5 | 0.21 5 | 0.26 5 | 0.33 5 |
| Gross operating expenses | 0.76 4 | 0.74 | 0.74 | 0.74 | 0.74 | 0.73 |
| Net investment income (loss) | 0.01 4 | 0.01 | 0.01 | 0.01 | 0.01 | 0.01 |
| Net assets, end of period ($ x 1,000,000) | 593 | 607 | 622 | 635 | 596 | 635 |
| * | Unaudited. |
| Holdings by Category | Cost
($) |
Value
($) | |
| 39.6% | Fixed-Rate Securities | 234,474,052 | 234,474,052 |
| 60.4% | Variable-Rate Securities | 358,250,000 | 358,250,000 |
| 100.0% | Total Investments | 592,724,052 | 592,724,052 |
| (0.0%) | Other Assets and Liabilities, Net | (147,929) | |
| 100.0% | Net Assets | 592,576,123 | |
| Issuer
Type of Security, Series |
Footnotes | Rate | Effective
Maturity |
Maturity
Date |
Face
Amount ($) |
Value
($) |
| Fixed-Rate Securities 39.6% of net assets | ||||||
| New Jersey 38.7% | ||||||
| Bergen Cnty | ||||||
| BAN | 1.25% | 12/23/15 | 940,000 | 944,858 | ||
| Bernards Township Board of Education | ||||||
| School Bonds Series 2005 (ESCROW) | 5.00% | 07/15/15 | 8,358,000 | 8,373,585 | ||
| Bloomfield Township | ||||||
| BAN | 1.25% | 01/15/16 | 2,156,556 | 2,166,691 | ||
| Burlington Cnty Bridge Commission | ||||||
| Bridge System RB Series 2013 | 3.00% | 10/01/15 | 550,000 | 553,734 | ||
| Cnty Guaranteed Pooled Loan RB Series 2013A | 3.00% | 12/01/15 | 1,245,000 | 1,259,658 | ||
| East Brunswick | ||||||
| BAN | 1.00% | 03/18/16 | 9,000,000 | 9,046,980 | ||
| Edgewater | ||||||
| GO Notes | 1.00% | 07/24/15 | 6,490,000 | 6,493,326 | ||
| Elizabeth | ||||||
| BAN Series 2015 | 1.25% | 04/08/16 | 2,350,000 | 2,367,866 | ||
| Englewood | ||||||
| BAN Series 2015A | 1.25% | 04/08/16 | 5,000,000 | 5,038,785 | ||
| Hudson Cnty | ||||||
| GO Bonds Series 2006 | 4.25% | 09/01/15 | 180,000 | 181,186 | ||
| Hudson Cnty Improvement Auth | ||||||
| Cnty-Guaranteed Pooled Notes Series 2014 U1A | 1.25% | 07/15/15 | 1,299,000 | 1,299,508 | ||
| Cnty-Guaranteed Pooled Notes Series 2014V1 | 1.00% | 11/25/15 | 8,000,000 | 8,022,457 | ||
| Cnty-Guaranteed Pooled Notes Series 2015X1A | c | 2.00% | 07/06/16 | 1,300,000 | 1,319,396 | |
| Livingston Township | ||||||
| BAN | 1.00% | 02/01/16 | 1,500,000 | 1,506,742 | ||
| Middlesex Cnty | ||||||
| BAN | 1.25% | 06/03/16 | 7,000,000 | 7,062,812 | ||
| GO Refunding Bonds Series 2010 | 4.00% | 12/15/15 | 220,000 | 223,714 | ||
| Issuer
Type of Security, Series |
Footnotes | Rate | Effective
Maturity |
Maturity
Date |
Face
Amount ($) |
Value
($) |
| Middlesex Cnty Improvement Auth | ||||||
| Capital Equipment & Improvement RB Series 2012 | 3.00% | 09/15/15 | 375,000 | 377,107 | ||
| Capital Equipment & Improvement RB Series 2010 | 3.00% | 09/15/15 | 1,055,000 | 1,061,014 | ||
| Capital Equipment & Improvement RB Series 2013 | 3.00% | 10/15/15 | 995,000 | 1,003,055 | ||
| Cnty Guaranteed Refunding RB Series 2010 | 3.00% | 09/15/15 | 200,000 | 201,143 | ||
| Cnty-Guaranteed Capital Equipment RB Series 2014 | 1.50% | 09/15/15 | 1,260,000 | 1,263,376 | ||
| Monmouth Cnty | ||||||
| Open Space Refunding Bonds Series 2015 | 0.35% | 07/15/15 | 150,000 | 150,000 | ||
| Refunding Bonds Series 2015 | 0.35% | 07/15/15 | 545,000 | 545,000 | ||
| Monmouth Cnty Improvement Auth | ||||||
| Capital Equipment Pooled Lease RB Series 2013 | 4.00% | 10/01/15 | 400,000 | 403,693 | ||
| Governmental Pooled Loan Refunding RB Series 2015 | 1.50% | 02/01/16 | 865,000 | 871,042 | ||
| New Jersey Economic Development Auth | ||||||
| Cigarette Tax RB Series 2004 (ESCROW) | 5.50% | 06/15/16 | 5,500,000 | 5,771,829 | ||
| School Facilities Construction Refunding Bonds 2011 Series EE (ESCROW) | 5.00% | 09/01/15 | 1,100,000 | 1,109,176 | ||
| School Facilities Construction Refunding Bonds Series 2005K (ESCROW) | 5.25% | 12/15/15 | 4,450,000 | 4,552,236 | ||
| School Facilities Construction Refunding Bonds Series 2005N1 (ESCROW) | 5.00% | 09/01/15 | 14,000,000 | 14,116,100 | ||
| School Facilities Construction Refunding Bonds Series 2008W (ESCROW) | 5.00% | 03/01/16 | 1,150,000 | 1,185,860 | ||
| New Jersey Educational Facilities Auth | ||||||
| CP (Princeton Univ) Series 1997A | 0.07% | 08/05/15 | 30,000,000 | 30,000,000 | ||
| RB (Princeton Univ) Series 2007E | 5.00% | 07/01/15 | 200,000 | 200,000 | ||
| Refunding RB (Princeton Univ) Series 2008K | 5.00% | 07/01/15 | 700,000 | 700,000 | ||
| New Jersey Health Care Facilities Financing Auth | ||||||
| Health System RB (Catholic Health East) Series 2010 | 5.00% | 11/15/15 | 1,090,000 | 1,109,040 | ||
| New Jersey Transit Corp | ||||||
| Sub COP Series 2005A (ESCROW) | 4.00% | 09/15/15 | 1,690,000 | 1,703,735 | ||
| Sub COP Series 2005A (ESCROW) | 5.00% | 09/15/15 | 8,655,000 | 8,742,264 | ||
| New Jersey Transportation Trust Fund Auth | ||||||
| Transportation System Bonds Series 2005B (ESCROW) | 5.25% | 12/15/15 | 7,850,000 | 8,029,566 | ||
| Transportation System Bonds Series 2005B&2006A (GTY/LIQ: Wells Fargo Bank, NA) | a,b | 0.15% | 07/09/15 | 11,470,000 | 11,470,000 | |
| North Bergen Township | ||||||
| BAN | 1.25% | 04/01/16 | 1,800,000 | 1,813,822 | ||
| Port Auth of New York & New Jersey | ||||||
| Consolidated Bonds 142nd Series | 5.00% | 07/15/15 | 200,000 | 200,358 | ||
| CP Series B | 0.06% | 08/13/15 | 1,000,000 | 1,000,000 | ||
| CP Series B | 0.06% | 09/02/15 | 15,010,000 | 15,010,000 | ||
| CP Series B | 0.08% | 10/07/15 | 3,500,000 | 3,500,000 | ||
| CP Series B | 0.08% | 10/08/15 | 2,500,000 | 2,500,000 | ||
| CP Series B | 0.08% | 11/05/15 | 12,400,000 | 12,400,000 | ||
| CP Series B | 0.08% | 11/10/15 | 2,400,000 | 2,400,000 | ||
| Readington Township | ||||||
| BAN | 1.00% | 08/05/15 | 6,305,000 | 6,310,172 | ||
| Sea Isle City | ||||||
| BAN | 0.75% | 07/22/15 | 6,490,000 | 6,491,561 | ||
| Sparta Township | ||||||
| BAN 2015 | 0.75% | 10/30/15 | 7,839,000 | 7,852,981 | ||
| Stafford Township | ||||||
| BAN | 1.50% | 05/13/16 | 5,800,000 | 5,852,481 | ||
| Issuer
Type of Security, Series |
Footnotes | Rate | Effective
Maturity |
Maturity
Date |
Face
Amount ($) |
Value
($) |
| Summit | ||||||
| BAN | 1.00% | 10/23/15 | 500,400 | 501,712 | ||
| Union Cnty | ||||||
| BAN | 2.00% | 06/24/16 | 5,000,000 | 5,081,586 | ||
| Woodbridge | ||||||
| BAN | 0.75% | 08/21/15 | 8,000,000 | 8,006,019 | ||
| 229,347,226 | ||||||
| Florida 0.1% | ||||||
| Miami-Dade Cnty | ||||||
| Water & Sewer System RB Series 2008B | 5.00% | 10/01/15 | 305,000 | 308,523 | ||
| Georgia 0.0% | ||||||
| Georgia | ||||||
| GO Refunding Bonds 2005B | 5.00% | 07/01/15 | 100,000 | 100,000 | ||
| Hawaii 0.1% | ||||||
| Hawaii | ||||||
| GO Refunding Bonds Series 2005DG | 5.00% | 07/01/15 | 805,000 | 805,000 | ||
| Massachusetts 0.1% | ||||||
| Stoneham | ||||||
| BAN | 1.00% | 10/23/15 | 500,000 | 501,246 | ||
| Oregon 0.1% | ||||||
| Oregon State Facilities Auth | ||||||
| RB (Providence Health & Services) Series 2011C | 5.00% | 10/01/15 | 450,000 | 455,249 | ||
| Tennessee 0.0% | ||||||
| Metropolitan Government of Nashville & Davidson Cnty | ||||||
| GO Bonds Series 2006B | 5.00% | 08/01/15 | 250,000 | 250,991 | ||
| Texas 0.4% | ||||||
| Austin ISD | ||||||
| ULT GO Refunding Bonds Series 2011 (GTY: TX Permanent School Fund) | 3.00% | 08/01/15 | 300,000 | 300,694 | ||
| Birdville ISD | ||||||
| ULT GO Refunding Bonds Series 2012 (GTY: TX Permanent School Fund) | 0.35% | 02/15/16 | 235,000 | 234,486 | ||
| El Paso ISD | ||||||
| ULT GO Refunding Bonds Series 2011 (GTY: TX Permanent School Fund) | 5.00% | 08/15/15 | 350,000 | 352,043 | ||
| Frisco ISD | ||||||
| ULT GO & Refunding Bonds Series 2007 (GTY: TX Permanent School Fund) | 4.25% | 08/15/15 | 175,000 | 175,854 | ||
| Harris Cnty | ||||||
| Toll Road Sr Lien Refunding RB Series 2007A | 5.00% | 08/15/15 | 300,000 | 301,753 | ||
| Lago Vista ISD | ||||||
| ULT GO Refunding Bonds Series 2015 (GTY: TX Permanent School Fund) | 2.00% | 08/15/15 | 120,000 | 120,243 | ||
| Lovejoy ISD | ||||||
| ULT GO & Refunding Bonds Series 2014 (GTY: TX Permanent School Fund) | 3.00% | 02/15/16 | 225,000 | 228,746 | ||
| Issuer
Type of Security, Series |
Footnotes | Rate | Effective
Maturity |
Maturity
Date |
Face
Amount ($) |
Value
($) |
| Pawnee ISD | ||||||
| ULT GO Refunding Bonds Series 2014 (GTY: TX Permanent School Fund) | 0.30% | 08/15/15 | 380,000 | 379,859 | ||
| Rio Grande City Consolidated ISD | ||||||
| ULT GO Bonds Series 2006 (GTY: TX Permanent School Fund) | 5.00% | 08/15/15 | 100,000 | 100,576 | ||
| 2,194,254 | ||||||
| Washington 0.1% | ||||||
| Washington | ||||||
| GO Refunding Bonds Series 2007RA | 5.00% | 01/01/16 | 500,000 | 511,563 | ||
| Total Fixed-Rate Securities | ||||||
| (Cost $234,474,052) | 234,474,052 | |||||
| Variable-Rate Securities 60.4% of net assets | ||||||
| New Jersey 54.6% | ||||||
| Delaware River Port Auth | ||||||
| Refunding RB Series 2008A (LOC: Bank of America, NA) | 0.07% | 07/07/15 | 665,000 | 665,000 | ||
| Refunding RB Series 2010A (LOC: Royal Bank of Canada) | 0.05% | 07/07/15 | 7,420,000 | 7,420,000 | ||
| Refunding RB Series 2010B (LOC: Barclays Bank Plc) | 0.10% | 07/07/15 | 3,545,000 | 3,545,000 | ||
| Refunding RB Series 2010C (LOC: Bank of New York Mellon) | 0.06% | 07/07/15 | 3,600,000 | 3,600,000 | ||
| Gloucester Cnty Pollution Control Financing Auth | ||||||
| Pollution Control Refunding RB (ExxonMobil) Series 2003 | d | 0.01% | 07/01/15 | 13,765,000 | 13,765,000 | |
| New Jersey Economic Development Auth | ||||||
| GO Lease RB (Rutgers Univ) Series 2013 (LIQ: Credit Suisse AG) | a | 0.07% | 07/07/15 | 4,000,000 | 4,000,000 | |
| Motor Vehicle Surcharge RB Series 2004A (GTY: Berkshire Hathaway Assurance Corp /LIQ: Bank of America, NA) | a | 0.12% | 07/07/15 | 5,715,000 | 5,715,000 | |
| RB (Applewood Estates) Series 2005B (LOC: TD Bank NA) | 0.06% | 07/07/15 | 7,600,000 | 7,600,000 | ||
| RB (Cooper Health) Series 2008A (LOC: TD Bank NA) | 0.06% | 07/07/15 | 6,100,000 | 6,100,000 | ||
| RB (Princeton Day School) Series 2005 (LOC: US Bank, NA) | 0.06% | 07/07/15 | 10,000,000 | 10,000,000 | ||
| RB (Wyckoff Family YMCA) 2003 (LOC: JPMorgan Chase Bank, NA) | 0.08% | 07/07/15 | 3,500,000 | 3,500,000 | ||
| Refunding RB (Crane's Mill) Series 2005B (LOC: TD Bank NA) | 0.06% | 07/07/15 | 10,115,000 | 10,115,000 | ||
| Transportation System Bonds Series 2005B&2006A & School Facilities Construction Refunding Bonds Series 2005K (GTY/LIQ: State Street Bank & Trust Co NA) | a | 0.07% | 07/07/15 | 21,395,000 | 21,395,000 | |
| New Jersey Health Care Facilities Financing Auth | ||||||
| RB (Atlantic Health) Series 2008B (LOC: Bank of America, NA) | 0.05% | 07/07/15 | 14,500,000 | 14,500,000 | ||
| RB (Atlantic Health) Series 2008C (LOC: JPMorgan Chase Bank, NA) | 0.05% | 07/07/15 | 22,760,000 | 22,760,000 | ||
| RB (Composite Program) Series 2003AB (LOC: Wells Fargo Bank, NA) | 0.07% | 07/07/15 | 2,500,000 | 2,500,000 | ||
| RB (Composite Program) Series 2006A3 (LOC: JPMorgan Chase Bank, NA) | 0.07% | 07/07/15 | 3,120,000 | 3,120,000 | ||
| RB (Composite Program) Series 2006A5 (LOC: Wells Fargo Bank, NA) | d | 0.07% | 07/07/15 | 3,000,000 | 3,000,000 | |
| RB (Meridian Health) Series 2003A (LOC: JPMorgan Chase Bank, NA) | d | 0.05% | 07/07/15 | 16,800,000 | 16,800,000 | |
| RB (RW Johnson Univ Hospital) Series 2013B (LOC: Wells Fargo Bank, NA) | 0.04% | 07/07/15 | 28,340,000 | 28,340,000 | ||
| RB (Virtua Health) Series 2004 (LOC: Wells Fargo Bank, NA) | 0.08% | 07/07/15 | 11,545,000 | 11,545,000 | ||
| RB Series 1985A (LOC: JPMorgan Chase Bank, NA) | 0.08% | 07/07/15 | 16,240,000 | 16,240,000 | ||
| Refunding RB (Underwood-Memorial Hospital) Series 2008 (LOC: TD Bank NA) | 0.07% | 07/07/15 | 6,000,000 | 6,000,000 | ||
| Issuer
Type of Security, Series |
Footnotes | Rate | Effective
Maturity |
Maturity
Date |
Face
Amount ($) |
Value
($) |
| New Jersey Housing & Mortgage Finance Agency | ||||||
| M/F RB Series 2008B (LOC: Bank of America, NA) | 0.09% | 07/07/15 | 8,515,000 | 8,515,000 | ||
| S/F Housing RB Series 2008BB (LIQ: TD Bank NA) | d | 0.06% | 07/07/15 | 19,535,000 | 19,535,000 | |
| S/F Housing RB Series 2008BB (LIQ: TD Bank NA) | 0.06% | 07/07/15 | 9,500,000 | 9,500,000 | ||
| New York Liberty Development Corp | ||||||
| Liberty RB (1 World Trade Center) Series 2011 (LIQ: Deutsche Bank AG) | a | 0.21% | 07/07/15 | 14,500,000 | 14,500,000 | |
| Port Auth of New York & New Jersey | ||||||
| Consolidated Bonds 144th Series (LIQ: Citibank, NA) | a | 0.08% | 07/07/15 | 8,740,000 | 8,740,000 | |
| Rutgers State Univ | ||||||
| GO Bonds Series 2009F (LIQ: Royal Bank of Canada) | a | 0.07% | 07/07/15 | 6,335,000 | 6,335,000 | |
| GO Bonds Series 2009G (LIQ: US Bank, NA) | 0.02% | 07/01/15 | 2,045,000 | 2,045,000 | ||
| GO Bonds Series 2013L (LIQ: Bank of America, NA) | a | 0.08% | 07/07/15 | 7,700,000 | 7,700,000 | |
| GO Refunding Bonds Series 2002A (LIQ: TD Bank NA) | 0.01% | 07/01/15 | 10,505,000 | 10,505,000 | ||
| GO Refunding Bonds Series 2013J (LIQ: Citibank, NA) | a | 0.08% | 07/07/15 | 6,740,000 | 6,740,000 | |
| Union Cnty Pollution Control Finance Auth | ||||||
| Refunding RB (Exxon) Series 1989 | 0.01% | 07/01/15 | 750,000 | 750,000 | ||
| Refunding RB (Exxon) Series 1994 | 0.01% | 07/01/15 | 6,400,000 | 6,400,000 | ||
| 323,490,000 | ||||||
| California 0.2% | ||||||
| California Statewide Communities Development Auth | ||||||
| RB (Kaiser Permanente) Series 2004L | 0.06% | 07/07/15 | 1,195,000 | 1,195,000 | ||
| Colorado 0.4% | ||||||
| Broomfield Urban Renewal Auth | ||||||
| Tax Increment RB Series 2005 (LOC: BNP Paribas) | 0.13% | 07/07/15 | 2,465,000 | 2,465,000 | ||
| District of Columbia 0.2% | ||||||
| District of Columbia | ||||||
| RB (American Geophysical Union) Series 1993 (LOC: Bank of America, NA) | 0.14% | 07/07/15 | 1,435,000 | 1,435,000 | ||
| Florida 1.3% | ||||||
| Orlando Utilities Commission | ||||||
| Utility System RB Series 2008-1 (LIQ: JPMorgan Chase Bank, NA) | 0.08% | 07/07/15 | 8,000,000 | 8,000,000 | ||
| Georgia 3.0% | ||||||
| Fulton Cnty Development Auth | ||||||
| Airport Facility RB (FlightSafety International) Series 1999B | 0.08% | 07/07/15 | 8,150,000 | 8,150,000 | ||
| Macon Water Auth | ||||||
| Water & Sewer RB Series 2012 | 0.08% | 07/07/15 | 6,000,000 | 6,000,000 | ||
| Monroe Cnty Development Auth | ||||||
| Pollution Control RB (GA Power) First Series 2009 | 0.09% | 07/07/15 | 3,500,000 | 3,500,000 | ||
| 17,650,000 | ||||||
| Michigan 0.4% | ||||||
| Michigan State Hospital Finance Auth | ||||||
| RB (Trinity Health Credit Group) Series 2005F | 0.05% | 07/07/15 | 2,415,000 | 2,415,000 | ||
| Issuer
Type of Security, Series |
Footnotes | Rate | Effective
Maturity |
Maturity
Date |
Face
Amount ($) |
Value
($) |
| Minnesota 0.3% | ||||||
| Rochester | ||||||
| Health Care Facilities RB (Mayo Clinic) Series 2008B (LIQ: Northern Trust Co) | 0.05% | 07/07/15 | 1,600,000 | 1,600,000 | ||
| Total Variable-Rate Securities | ||||||
| (Cost $358,250,000) | 358,250,000 | |||||
| a | Securities exempt from registration under Rule 144A of the Securities Act of 1933, as amended. These securities may be resold in transactions exempt from registrations, normally to qualified institutional buyers. At the period end, the value of these amounted to $86,595,000 or 14.6% of net assets. |
| b | Illiquid security. At the period end, the value of these amounted to $11,470,000 or 1.9% of net assets. |
| c | Security or a portion of the security purchased on a delayed-delivery or when-issued basis. |
| d | All or a portion of this security is designated as collateral for delayed-delivery securities. |
| BAN — | Bond anticipation note |
| CCD — | Community college district |
| COP — | Certificate of participation |
| CP — | Commercial paper |
| CSD — | Central school district |
| GO — | General obligation |
| GTY — | Guaranty agreement |
| HFA — | Housing finance agency/authority |
| HRA — | Housing & redevelopment authority |
| HSD — | High school district |
| IDA — | Industrial development agency/authority |
| IDB — | Industrial development board |
| IDC — | Industrial development corporation |
| IDRB — | Industrial development revenue bond |
| IRB — | Industrial revenue bond |
| ISD — | Independent school district |
| LIQ — | Liquidity agreement |
| LOC — | Letter of credit |
| LT — | Limited tax |
| M/F — | Multi-family |
| RAN — | Revenue anticipation note |
| RB — | Revenue bond |
| SD — | School district |
| S/F — | Single-family |
| TAN — | Tax anticipation note |
| TRAN — | Tax and revenue anticipation note |
| UFSD — | Union free school district |
| UHSD — | Union high school district |
| ULT — | Unlimited tax |
| USD — | Unified school district |
| Assets | ||
| Investments, at cost and value (Note 2a) | $592,724,052 | |
| Cash | 55,791 | |
| Receivables: | ||
| Interest | 1,221,842 | |
| Prepaid expenses | + | 1,419 |
| Total assets | 594,003,104 | |
| Liabilities | ||
| Payables: | ||
| Investments bought - Delayed delivery | 1,319,396 | |
| Shareholder service fees | 13,954 | |
| Distributions to shareholders | 2,449 | |
| Accrued expenses | + | 91,182 |
| Total liabilities | 1,426,981 | |
| Net Assets | ||
| Total assets | 594,003,104 | |
| Total liabilities | – | 1,426,981 |
| Net assets | $592,576,123 | |
| Net Assets by Source | ||
| Capital received from investors | 592,597,048 | |
| Net realized capital losses | (20,925) | |
| Net Asset Value (NAV) | ||||
| Net Assets | ÷ | Shares
Outstanding |
= | NAV |
| $592,576,123 | 591,951,827 | $1.00 | ||
| Investment Income | ||
| Interest | $286,398 | |
| Expenses | ||
| Investment adviser and administrator fees | 1,059,723 | |
| Shareholder service fees | 1,059,723 | |
| Proxy fees | 66,662 | |
| Portfolio accounting fees | 45,428 | |
| Professional fees | 23,845 | |
| Independent trustees' fees | 14,678 | |
| Transfer agent fees | 10,168 | |
| Shareholder reports | 9,754 | |
| Custodian fees | 8,150 | |
| Registration fees | 6,197 | |
| Interest expense | 254 | |
| Other expenses | + | 5,938 |
| Total expenses | 2,310,520 | |
| Expense reduction by CSIM and its affiliates | – | 2,054,368 |
| Net expenses | – | 256,152 |
| Net investment income | 30,246 | |
| Realized Gains (Losses) | ||
| Net realized losses on investments | (20,925) | |
| Increase in net assets resulting from operations | $9,321 | |
| Operations | |||
| 1/1/15-6/30/15 | 1/1/14-12/31/14 | ||
| Net investment income | $30,246 | $62,609 | |
| Net realized gains (losses) | + | (20,925) | 44,219 |
| Increase in net assets from operations | 9,321 | 106,828 | |
| Distributions to Shareholders | |||
| Distributions from net investment income | (30,246) | (62,609) | |
| Distributions from net realized gains | + | — | (36,066) |
| Total distributions | (30,246) | (98,675) | |
| Transactions in Fund Shares* | |||
| Shares sold | 616,126,449 | 1,233,818,749 | |
| Shares reinvested | 27,223 | 97,241 | |
| Shares redeemed | + | (631,021,946) | (1,248,239,849) |
| Net transactions in fund shares | (14,868,274) | (14,323,859) | |
| Net Assets | |||
| Beginning of period | 607,465,322 | 621,781,028 | |
| Total decrease | + | (14,889,199) | (14,315,706) |
| End of period | $592,576,123 | $607,465,322 | |
| * | Transactions took place at $1.00 per share; figures for share quantities are the same as for dollars. |
| 1/1/15–
6/30/15* |
1/1/14–
12/31/14 |
1/1/13–
12/31/13 |
1/1/12–
12/31/12 |
1/1/11–
12/31/11 |
1/1/10–
12/31/10 | |
| Per-Share Data ($) | ||||||
| Net asset value at beginning of period | 1.00 | 1.00 | 1.00 | 1.00 | 1.00 | 1.00 |
| Income (loss) from investment operations: | ||||||
| Net investment income (loss) | 0.00 1,2 | 0.00 2 | 0.00 2 | 0.00 2 | 0.00 2 | 0.00 2 |
| Net realized and unrealized gains (losses) | 0.00 2 | 0.00 2 | 0.00 2 | 0.00 2 | (0.00) 2 | 0.00 2 |
| Total from investment operations | 0.00 2 | 0.00 2 | 0.00 2 | 0.00 2 | 0.00 2 | 0.00 2 |
| Less distributions: | ||||||
| Distributions from net investment income | (0.00) 2 | (0.00) 2 | (0.00) 2 | (0.00) 2 | (0.00) 2 | (0.00) 2 |
| Distributions from net realized gains | — | (0.00) 2 | (0.00) 2 | (0.00) 2 | — | (0.00) 2 |
| Total distributions | (0.00) 2 | (0.00) 2 | (0.00) 2 | (0.00) 2 | (0.00) 2 | (0.00) 2 |
| Net asset value at end of period | 1.00 | 1.00 | 1.00 | 1.00 | 1.00 | 1.00 |
| Total return (%) | 0.01 3 | 0.02 | 0.01 | 0.01 | 0.01 | 0.04 |
| Ratios/Supplemental Data (%) | ||||||
| Ratios to average net assets: | ||||||
| Net operating expenses | 0.09 4,5 | 0.09 5 | 0.14 5 | 0.20 5 | 0.28 5 | 0.36 5 |
| Gross operating expenses | 0.75 4 | 0.75 | 0.74 | 0.75 | 0.74 | 0.74 |
| Net investment income (loss) | 0.01 4 | 0.01 | 0.01 | 0.01 | 0.01 | 0.01 |
| Net assets, end of period ($ x 1,000,000) | 472 | 542 | 518 | 552 | 485 | 465 |
| * | Unaudited. |
| Holdings by Category | Cost
($) |
Value
($) | |
| 27.4% | Fixed-Rate Securities | 129,258,603 | 129,258,603 |
| 69.5% | Variable-Rate Securities | 328,294,035 | 328,294,035 |
| 96.9% | Total Investments | 457,552,638 | 457,552,638 |
| 3.1% | Other Assets and Liabilities, Net | 14,809,709 | |
| 100.0% | Net Assets | 472,362,347 | |
| Issuer
Type of Security, Series |
Footnotes | Rate | Effective
Maturity |
Maturity
Date |
Face
Amount ($) |
Value
($) |
| Fixed-Rate Securities 27.4% of net assets | ||||||
| Pennsylvania 21.5% | ||||||
| Allegheny Cnty Hospital Development Auth | ||||||
| RB (Univ of Pittsburgh Medical Center) Series 2008B | 5.00% | 06/15/16 | 100,000 | 104,314 | ||
| RB (Univ of Pittsburgh Medical Center) Series 2009A | 4.75% | 08/15/15 | 325,000 | 326,794 | ||
| RB (Univ of Pittsburgh Medical Center) Series 2011A | 4.00% | 10/15/15 | 930,000 | 940,010 | ||
| Allegheny Cnty IDA | ||||||
| RB (St. Joseph HS) Series 2009 (LOC: PNC Bank NA) | 0.35% | 12/01/15 | 6,000,000 | 6,000,000 | ||
| Commonwealth of Pennsylvania | ||||||
| 5.00% | 03/01/16 | 150,000 | 154,593 | |||
| Franklin Cnty IDA | ||||||
| RB (Chambersburg Hospital) Series 2010 (GTY/LIQ: Wells Fargo Bank, NA) | a,b | 0.14% | 07/09/15 | 7,080,000 | 7,080,000 | |
| Geisinger Auth | ||||||
| Health System RB (Geisinger Health) Series 2011A1 (LIQ: Wells Fargo Bank, NA) | a,b | 0.14% | 07/09/15 | 4,795,000 | 4,795,000 | |
| Monroeville Finance Auth | ||||||
| RB (Univ of Pittsburgh Medical Center) Series 2012 | 4.00% | 02/15/16 | 1,230,000 | 1,258,635 | ||
| Pennsylvania | ||||||
| GO Bonds First Series 2005 | 5.00% | 07/01/15 | 200,000 | 200,000 | ||
| GO Bonds First Series 2007A | 5.00% | 11/01/15 | 600,000 | 609,716 | ||
| GO Bonds First Series 2008 | 5.00% | 05/15/16 | 1,010,000 | 1,050,186 | ||
| GO Bonds First Series 2013 | 5.00% | 04/01/16 | 640,000 | 662,412 | ||
| GO Bonds Second Refunding Series 2009 | 5.00% | 07/01/15 | 2,115,000 | 2,115,000 | ||
| GO Bonds Second Series 2005 | 5.00% | 01/01/16 | 1,050,000 | 1,074,698 | ||
| GO Bonds Second Series 2007A | 5.00% | 08/01/15 | 350,000 | 351,421 | ||
| GO Bonds Third Series 2010A | 5.00% | 07/15/15 | 630,000 | 631,140 | ||
| GO Third Refunding Bonds Series 2004 | 5.38% | 07/01/16 | 590,000 | 619,017 | ||
| Issuer
Type of Security, Series |
Footnotes | Rate | Effective
Maturity |
Maturity
Date |
Face
Amount ($) |
Value
($) |
| Pennsylvania HFA | ||||||
| S/F Mortgage RB Series 2007-100B | 4.00% | 10/01/15 | 100,000 | 100,932 | ||
| S/F Mortgage RB Series 2007-97B | 3.90% | 10/01/15 | 75,000 | 75,687 | ||
| S/F Mortgage RB Series 2010-108B | 2.35% | 10/01/15 | 450,000 | 452,152 | ||
| S/F Mortgage RB Series 2010-110A | 2.95% | 10/01/15 | 450,000 | 452,888 | ||
| S/F Mortgage RB Series 2012-114B | 1.05% | 04/01/16 | 1,200,000 | 1,204,554 | ||
| S/F Mortgage RB Series 2013-115A | 1.00% | 10/01/15 | 595,000 | 595,898 | ||
| S/F Mortgage RB Series 2015-116A | 0.19% | 10/01/15 | 1,405,000 | 1,405,000 | ||
| Pennsylvania Higher Educational Facilities Auth | ||||||
| RB (Univ of Pennsylvania) Series 2005B | 5.25% | 09/01/15 | 290,000 | 292,433 | ||
| Pennsylvania Infrastructure Investment Auth | ||||||
| CP Series 2010A (LOC: Bank of America, NA) | 0.12% | 07/01/15 | 7,200,000 | 7,200,000 | ||
| Pennsylvania State Univ | ||||||
| Refunding Bonds Series 2002 | 5.25% | 08/15/15 | 200,000 | 201,196 | ||
| Refunding Bonds Series 2009B | 0.29% | 06/01/16 | 12,500,000 | 12,500,000 | ||
| Philadelphia | ||||||
| Airport Revenue CP Series B3 (LOC: Wells Fargo Bank, NA) | 0.12% | 09/09/15 | 5,200,000 | 5,200,000 | ||
| Univ of Pittsburgh | ||||||
| PITT Asset Notes Series 2014 | 2.00% | 07/22/15 | 4,200,000 | 4,204,538 | ||
| Univ Bonds Series 2014B1&B2 | 0.10% | 08/17/15 | 650,000 | 650,000 | ||
| Univ Capital & Refunding Bonds Series 2007B | 0.11% | 08/03/15 | 4,000,000 | 4,000,000 | ||
| Univ Capital & Refunding Bonds Series 2007B | 0.11% | 09/01/15 | 1,650,000 | 1,650,000 | ||
| Univ Refunding Bonds Series 2005C | 0.06% | 07/01/15 | 18,000,000 | 18,000,000 | ||
| Univ Refunding Bonds Series 2009A | 5.00% | 09/15/15 | 1,040,000 | 1,050,356 | ||
| Washington Cnty Hospital Auth | ||||||
| Hospital RB (Washington Hospital) Series 2001B (LOC: PNC Bank NA) | 0.35% | 07/01/15 | 1,365,000 | 1,365,000 | ||
| Hospital RB (Washington Hospital) Series 2007A (LOC: PNC Bank NA) | 0.35% | 07/01/15 | 11,995,000 | 11,995,077 | ||
| Hospital Refunding RB (Washington Hospital) Series 2001A (ESCROW) | 5.38% | 07/01/15 | 1,000,000 | 1,000,000 | ||
| 101,568,647 | ||||||
| Connecticut 0.1% | ||||||
| Connecticut | ||||||
| GO Bonds Series 2006A | 5.00% | 12/15/15 | 150,000 | 153,237 | ||
| GO Bonds Series 2010B | 5.00% | 12/01/15 | 135,000 | 137,581 | ||
| 290,818 | ||||||
| District of Columbia 0.2% | ||||||
| District of Columbia Water & Sewer Auth | ||||||
| Public Utility Sr Lien RB Series 2009A | 5.00% | 10/01/15 | 880,000 | 890,511 | ||
| Florida 0.5% | ||||||
| Florida State Board of Education | ||||||
| Public Education Capital Outlay Bonds Series 2010A | 5.00% | 01/01/16 | 250,000 | 255,911 | ||
| JEA | ||||||
| Electric System RB Series Three 2010D | 4.00% | 10/01/15 | 225,000 | 227,058 | ||
| Electric System Sub RB Series 2009G | 3.75% | 10/01/15 | 100,000 | 100,876 | ||
| Electric System Sub RB Series 2013D | 3.00% | 10/01/15 | 1,400,000 | 1,409,576 | ||
| Tampa Bay Water | ||||||
| Utility System Refunding RB Series 2004 | 5.25% | 10/01/15 | 400,000 | 405,026 | ||
| 2,398,447 | ||||||
| Issuer
Type of Security, Series |
Footnotes | Rate | Effective
Maturity |
Maturity
Date |
Face
Amount ($) |
Value
($) |
| Hawaii 0.7% | ||||||
| Hawaii | ||||||
| GO Refunding Bonds Series 2009DT | 4.00% | 11/01/15 | 200,000 | 202,521 | ||
| GO Refunding Bonds Series 2013EJ | 3.00% | 08/01/15 | 2,500,000 | 2,505,806 | ||
| GO Refunding Bonds Series 2013EJ | 5.00% | 08/01/15 | 335,000 | 336,351 | ||
| Honolulu | ||||||
| GO Bonds Series 2007B | 5.25% | 07/01/15 | 505,000 | 505,000 | ||
| 3,549,678 | ||||||
| Illinois 0.1% | ||||||
| Illinois Finance Auth | ||||||
| RB (Trinity Health) Series 2011IL | 3.00% | 12/01/15 | 200,000 | 202,147 | ||
| Illinois Regional Transportation Auth | ||||||
| GO Bonds Series 2006A | 5.00% | 07/01/15 | 400,000 | 400,000 | ||
| 602,147 | ||||||
| Louisiana 0.2% | ||||||
| Louisiana | ||||||
| GO Bonds Series 2012A | 5.00% | 08/01/15 | 555,000 | 557,236 | ||
| GO Refunding Bonds Series 2010B | 4.00% | 11/15/15 | 175,000 | 177,440 | ||
| 734,676 | ||||||
| Massachusetts 0.1% | ||||||
| Stoneham | ||||||
| BAN | 1.00% | 10/23/15 | 500,000 | 501,246 | ||
| Minnesota 0.2% | ||||||
| Mesabi East ISD No. 2711 | ||||||
| GO Series 2014B | 1.00% | 08/21/15 | 900,000 | 900,814 | ||
| Mississippi 0.1% | ||||||
| Mississippi | ||||||
| GO Refunding Bonds Series 2003A | 5.25% | 11/01/15 | 500,000 | 508,239 | ||
| New York 0.0% | ||||||
| New York State HFA | ||||||
| State Personal Income Tax RB Series 2007C | 5.00% | 09/15/15 | 150,000 | 151,478 | ||
| North Carolina 0.1% | ||||||
| Charlotte | ||||||
| GO Refunding Bonds Series 2008 | 5.00% | 08/01/15 | 300,000 | 301,175 | ||
| Ohio 0.5% | ||||||
| Ohio | ||||||
| GO Bonds Series 2008A | 4.00% | 09/01/15 | 100,000 | 100,629 | ||
| GO Refunding Bonds Series 2009A | 5.00% | 09/15/15 | 480,000 | 484,650 | ||
| GO Refunding Bonds Series 2009C | 5.00% | 08/01/15 | 100,000 | 100,400 | ||
| GO Refunding Bonds Series 2011A | 5.00% | 09/15/15 | 785,000 | 792,657 | ||
| Hospital RB (Cleveland Clinic) Series 2008A | 5.00% | 01/01/16 | 225,000 | 230,209 | ||
| Hospital Refunding RB (Cleveland Clinic) Series 2011A | 5.00% | 01/01/16 | 650,000 | 665,062 | ||
| 2,373,607 | ||||||
| Issuer
Type of Security, Series |
Footnotes | Rate | Effective
Maturity |
Maturity
Date |
Face
Amount ($) |
Value
($) |
| South Carolina 0.3% | ||||||
| South Carolina Public Service Auth | ||||||
| Refunding Revenue Obligations Series 2006C | 5.00% | 01/01/16 | 610,000 | 624,257 | ||
| Refunding Revenue Obligations Series 2010B | 5.00% | 01/01/16 | 585,000 | 598,860 | ||
| 1,223,117 | ||||||
| Texas 1.3% | ||||||
| Austin ISD | ||||||
| ULT GO Refunding Bonds Series 2006B (GTY: TX Permanent School Fund) | 5.00% | 08/01/15 | 445,000 | 446,798 | ||
| Dallas ISD | ||||||
| ULT GO Bonds Series 2006 (GTY: TX Permanent School Fund) | 4.00% | 08/15/15 | 350,000 | 351,625 | ||
| ULT GO Refunding Bonds Series 2014A (GTY: TX Permanent School Fund) | 1.00% | 08/15/15 | 100,000 | 100,089 | ||
| Dripping Springs ISD | ||||||
| ULT GO Refunding Bonds Series 2013 (GTY: TX Permanent School Fund) | 1.25% | 08/15/15 | 100,000 | 100,118 | ||
| Frisco ISD | ||||||
| ULT GO Bonds Series 2006A (GTY: TX Permanent School Fund) | 6.00% | 08/15/15 | 350,000 | 352,440 | ||
| ULT GO Refunding Bonds Series 2010 (GTY: TX Permanent School Fund) | 4.00% | 08/15/15 | 250,000 | 251,154 | ||
| George West ISD | ||||||
| ULT GO Bonds Series 2015 (GTY: TX Permanent School Fund) | 2.00% | 02/15/16 | 325,000 | 328,229 | ||
| Grapevine-Colleyville ISD | ||||||
| ULT GO & Refunding Bonds Series 2011 (GTY: TX Permanent School Fund) | 5.00% | 08/15/15 | 100,000 | 100,586 | ||
| Hallettsville ISD | ||||||
| ULT GO Bonds Series 2014 (GTY: TX Permanent School Fund) | 2.00% | 08/15/15 | 100,000 | 100,213 | ||
| Klein ISD | ||||||
| ULT GO & Refunding Bonds Series 2008A (GTY: TX Permanent School Fund) | 5.00% | 08/01/15 | 350,000 | 351,409 | ||
| ULT GO Bonds Series 2010A (GTY: TX Permanent School Fund) | 2.50% | 08/01/15 | 150,000 | 150,279 | ||
| ULT GO Refunding Bonds Series 2005A (GTY: TX Permanent School Fund) | 3.88% | 08/01/15 | 180,000 | 180,555 | ||
| Livingston Independent School District, TX | ||||||
| ULT GO Refunding Bonds Series 2005 (GTY: TX Permanent School Fund) | 3.63% | 08/15/15 | 200,000 | 200,834 | ||
| Mabank ISD | ||||||
| ULT GO & Refunding Bonds Series 2006 (GTY: TX Permanent School Fund) | 4.00% | 08/15/15 | 100,000 | 100,467 | ||
| Manor ISD | ||||||
| ULT GO Bonds Series 2008 (GTY: TX Permanent School Fund) | 3.50% | 08/01/15 | 300,000 | 300,828 | ||
| Mesquite ISD | ||||||
| ULT GO Bonds Series 2006 (GTY: TX Permanent School Fund) | 5.00% | 08/15/15 | 100,000 | 100,586 | ||
| North East ISD | ||||||
| ULT GO Refunding Bonds Series 2014B (GTY: TX Permanent School Fund) | 3.00% | 02/01/16 | 600,000 | 609,513 | ||
| Northside ISD | ||||||
| ULT GO & Refunding Bonds Series 2007 (GTY: TX Permanent School Fund) | 4.00% | 08/15/15 | 220,000 | 221,004 | ||
| Plains ISD | ||||||
| ULT GO Bonds Series 2014A (GTY: TX Permanent School Fund) | 2.00% | 08/15/15 | 100,000 | 100,218 | ||
| Round Rock ISD | ||||||
| ULT GO Refunding Bonds Series 2005 (GTY: TX Permanent School Fund) | 5.00% | 08/01/15 | 410,000 | 411,665 | ||
| Issuer
Type of Security, Series |
Footnotes | Rate | Effective
Maturity |
Maturity
Date |
Face
Amount ($) |
Value
($) |
| San Antonio ISD | ||||||
| ULT GO Refunding Bonds Series 2005 (GTY: TX Permanent School Fund) | 5.25% | 08/15/15 | 315,000 | 316,926 | ||
| Socorro ISD | ||||||
| ULT GO Bonds Series 2005A (GTY: TX Permanent School Fund) | 5.00% | 08/15/15 | 150,000 | 150,873 | ||
| Spring ISD | ||||||
| ULT GO & Refunding Bonds Series 2008A (GTY: TX Permanent School Fund) | 3.50% | 08/15/15 | 100,000 | 100,395 | ||
| Texas Public Finance Auth | ||||||
| GO & Refunding Bonds Series 2008A | 5.00% | 10/01/15 | 450,000 | 455,338 | ||
| United ISD | ||||||
| ULT GO & Refunding Bonds Series 1998 (GTY: TX Permanent School Fund) | 0.31% | 08/15/15 | 110,000 | 109,958 | ||
| ULT GO Refunding Bonds Series 2011 (GTY: TX Permanent School Fund) | 4.00% | 08/15/15 | 100,000 | 100,451 | ||
| Wylie ISD | ||||||
| ULT GO Bonds Series 2005 (GTY: TX Permanent School Fund) | 0.28% | 08/15/15 | 100,000 | 99,965 | ||
| 6,192,516 | ||||||
| Virginia 0.3% | ||||||
| Metropolitan Washington Airports Auth | ||||||
| Airport System RB Series 2007B | 5.00% | 10/01/15 | 300,000 | 303,579 | ||
| Airport System Refunding RB Series 2007A | 5.00% | 10/01/15 | 950,000 | 961,203 | ||
| 1,264,782 | ||||||
| Washington 1.2% | ||||||
| Auburn SD No. 408 | ||||||
| ULT GO & Refunding Bonds Series 2014 (GTY: Washington) | 3.00% | 12/01/15 | 100,000 | 101,142 | ||
| Dieringer SD No. 343 | ||||||
| ULT GO Refunding Bonds Series 2010 (GTY: Washington) | 2.25% | 12/01/15 | 100,000 | 100,786 | ||
| Eatonville SD No. 404 | ||||||
| ULT GO Refunding Bonds 2014 (GTY: Washington) | 2.00% | 12/01/15 | 100,000 | 100,719 | ||
| Everett SD No. 2 | ||||||
| ULT GO & Refunding Bonds Series 2007 (GTY: Washington) | 5.63% | 12/01/15 | 100,000 | 102,249 | ||
| ULT GO Bonds Series 2009A (GTY: Washington) | 3.00% | 12/01/15 | 150,000 | 151,705 | ||
| Evergreen SD No. 114 | ||||||
| ULT GO Refunding Bonds 2010 (GTY: Washington) | 4.00% | 12/01/15 | 515,000 | 522,830 | ||
| Federal Way SD No. 210 | ||||||
| ULT GO Bonds 2008 (GTY: Washington) | 5.00% | 12/01/15 | 150,000 | 152,988 | ||
| Kent SD No. 415 | ||||||
| ULT GO Refunding Bonds Series 2012A (GTY: Washington) | 4.00% | 12/01/15 | 600,000 | 609,436 | ||
| King Cnty | ||||||
| LT GO & Refunding Bonds Series 2014C | 2.00% | 12/01/15 | 175,000 | 176,228 | ||
| Olympia SD No. 111 | ||||||
| ULT GO Refunding Bonds Series 2005B (GTY: Washington) | 5.00% | 12/01/15 | 500,000 | 509,982 | ||
| Ridgefield SD No. 122 | ||||||
| ULT GO Bonds 2012 (GTY: Washington) | 3.00% | 12/01/15 | 120,000 | 121,367 | ||
| Shoreline SD No. 412 | ||||||
| ULT GO & Refunding Bonds 2013 (GTY: Washington) | 3.00% | 12/01/15 | 100,000 | 101,128 | ||
| Washington | ||||||
| GO Bonds Series 2006A | 5.00% | 07/01/15 | 450,000 | 450,000 | ||
| GO Bonds Series 2008C | 5.00% | 01/01/16 | 750,000 | 767,993 | ||
| GO Refunding Bonds Series R2006A | 5.00% | 07/01/15 | 850,000 | 850,000 | ||
| GO Refunding Bonds Series R2007C | 5.00% | 07/01/15 | 255,000 | 255,000 | ||
| GO Refunding Bonds Series R2011A | 5.00% | 01/01/16 | 220,000 | 225,188 | ||
| Issuer
Type of Security, Series |
Footnotes | Rate | Effective
Maturity |
Maturity
Date |
Face
Amount ($) |
Value
($) |
| Motor Vehicle Fuel Tax GO Bonds Series 2006B | 5.00% | 07/01/15 | 200,000 | 200,000 | ||
| Motor Vehicle Fuel Tax GO Bonds Series 2007D | 4.50% | 01/01/16 | 100,000 | 102,056 | ||
| Motor Vehicle Fuel Tax GO Bonds Series 2009B | 5.00% | 07/01/15 | 105,000 | 105,000 | ||
| 5,705,797 | ||||||
| Wisconsin 0.0% | ||||||
| Wisconsin | ||||||
| GO Refunding Bonds Series 2009-1 | 3.00% | 11/01/15 | 100,000 | 100,908 | ||
| Total Fixed-Rate Securities | ||||||
| (Cost $129,258,603) | 129,258,603 | |||||
| Variable-Rate Securities 69.5% of net assets | ||||||
| Pennsylvania 65.3% | ||||||
| Adams Cnty IDA | ||||||
| RB (Brethren Home Community) Series 2007 (LOC: PNC Bank NA) | 0.06% | 07/07/15 | 3,520,000 | 3,520,000 | ||
| Allegheny Cnty Hospital Development Auth | ||||||
| RB (Univ of Pittsburgh Medical Center) Series 2010B1&B2 (GTY/LIQ: Royal Bank of Canada) | a | 0.07% | 07/07/15 | 20,000,000 | 20,000,000 | |
| Allegheny Cnty IDA | ||||||
| Health Care RB (Vincentian Collaborative) Series 2008B (LOC: PNC Bank NA) | 0.08% | 07/07/15 | 4,000,000 | 4,000,000 | ||
| Bucks Cnty IDA | ||||||
| Hospital RB (Grand View Hospital) Series 2008A (LOC: TD Bank NA) | 0.06% | 07/07/15 | 6,725,000 | 6,725,000 | ||
| Butler Cnty IDA | ||||||
| RB (Butler Cnty Family YMCA) Series 2005 (LOC: PNC Bank NA) | 0.10% | 07/07/15 | 3,485,000 | 3,485,000 | ||
| Chambersburg Municipal Auth | ||||||
| RB (Wilson College) Series 2007 (LOC: Bank of America, NA) | 0.12% | 07/07/15 | 24,480,000 | 24,480,000 | ||
| Cumberland Cnty Municipal Auth | ||||||
| RB (Presbyterian Homes) Series 1993A (LOC: Manufacturers & Traders Trust Co) | 0.08% | 07/07/15 | 2,000,000 | 2,000,000 | ||
| Dallastown Area SD | ||||||
| GO Notes Series 2015 | 1.25% | 04/15/16 | 5,155,000 | 5,192,674 | ||
| Delaware Cnty IDA | ||||||
| Refunding RB (Covanta Energy) Series 2014A (LOC: Bank of America, NA) | 0.11% | 07/07/15 | 2,960,000 | 2,960,000 | ||
| Water Facilities RB (Aqua Pennsylvania) Series 2005A (GTY: Berkshire Hathaway Assurance Corp /LIQ: Citibank, NA) | a | 0.10% | 07/07/15 | 315,000 | 315,000 | |
| Delaware River Port Auth | ||||||
| Refunding RB Series 2010A (LOC: Royal Bank of Canada) | 0.05% | 07/07/15 | 3,770,000 | 3,770,000 | ||
| Erie Cnty Hospital Auth | ||||||
| RB (St. Vincent Health Center) Series 2010B (LOC: Manufacturers & Traders Trust Co) | 0.09% | 07/07/15 | 3,490,000 | 3,490,000 | ||
| Fayette Cnty Hospital Auth | ||||||
| Hospital RB (Fayette Regional Health) Series 2007A (LOC: PNC Bank NA) | 0.07% | 07/07/15 | 1,750,000 | 1,750,000 | ||
| Geisinger Auth | ||||||
| Health System RB (Geisinger Health) Series 2013B (LIQ: TD Bank NA) | 0.02% | 07/01/15 | 5,285,000 | 5,285,000 | ||
| Indiana Cnty Hospital Auth | ||||||
| Hospital RB (Indiana Regional Medical Center) Series 2014B (LOC: PNC Bank NA) | 0.08% | 07/07/15 | 6,800,000 | 6,800,000 | ||
| Issuer
Type of Security, Series |
Footnotes | Rate | Effective
Maturity |
Maturity
Date |
Face
Amount ($) |
Value
($) |
| Lancaster Cnty Hospital Auth | ||||||
| Health Center RB (Masonic Homes) Series 2008D (LOC: JPMorgan Chase Bank, NA) | 0.03% | 07/01/15 | 4,655,000 | 4,655,000 | ||
| RB (Landis Homes Retirement Community) Series 2002 (LOC: Manufacturers & Traders Trust Co) | 0.12% | 07/07/15 | 3,825,000 | 3,825,000 | ||
| RB (Landis Homes Retirement Community) Series 2009 (LOC: Manufacturers & Traders Trust Co) | 0.12% | 07/07/15 | 11,285,000 | 11,285,000 | ||
| Luzerne Cnty Convention Center Auth | ||||||
| Hotel Room Rental Tax RB Series 2012 (LOC: PNC Bank NA) | 0.08% | 07/07/15 | 3,900,000 | 3,900,000 | ||
| North Hampton Cnty | ||||||
| RB (Binney & Smith) Series 1997A (LOC: JPMorgan Chase Bank, NA) | 0.21% | 07/07/15 | 7,500,000 | 7,500,000 | ||
| Owen J. Roberts SD | ||||||
| GO Notes Series 2006 (LIQ: JPMorgan Chase Bank, NA) | a | 0.09% | 07/07/15 | 3,000,000 | 3,000,000 | |
| Pennsylvania | ||||||
| GO Bonds First Series 2014 (LIQ: Morgan Stanley Bank NA) | a | 0.08% | 07/07/15 | 3,500,000 | 3,500,000 | |
| GO Bonds Second Series 2007A (LIQ: Branch Banking & Trust Co) | a | 0.08% | 07/07/15 | 3,500,000 | 3,500,000 | |
| GO Refunding Bonds Third Series 2004 (LIQ: State Street Bank & Trust Co NA) | a | 0.07% | 07/07/15 | 11,000,000 | 11,000,000 | |
| Pennsylvania Economic Development Financing Auth | ||||||
| Unemployment Compensation RB Series 2012C (LOC: PNC Bank NA) | 0.08% | 07/07/15 | 245,000 | 245,000 | ||
| Pennsylvania HFA | ||||||
| S/F Mortgage RB Series 2002-75A (LIQ: Royal Bank of Canada) | 0.07% | 07/07/15 | 10,000,000 | 10,000,000 | ||
| S/F Mortgage RB Series 2003-79B (LIQ: Royal Bank of Canada) | 0.07% | 07/07/15 | 2,000,000 | 2,000,000 | ||
| S/F Mortgage RB Series 2004-81C (LIQ: Royal Bank of Canada) | 0.07% | 07/07/15 | 8,000,000 | 8,000,000 | ||
| S/F Mortgage RB Series 2004-83B (LIQ: Bank of Tokyo Mitsubishi UFJ, Ltd) | 0.08% | 07/07/15 | 3,335,000 | 3,335,000 | ||
| S/F Mortgage RB Series 2005-88B (LIQ: TD Bank NA) | 0.09% | 07/07/15 | 6,045,000 | 6,045,000 | ||
| S/F Mortgage RB Series 2005-88C (LIQ: TD Bank NA) | 0.09% | 07/07/15 | 1,400,000 | 1,400,000 | ||
| S/F Mortgage RB Series 2005-91B (LIQ: Bank of Tokyo Mitsubishi UFJ, Ltd) | 0.09% | 07/07/15 | 14,500,000 | 14,500,000 | ||
| S/F Mortgage RB Series 2006-93,94&95A, 2007-97&98A (LIQ: Morgan Stanley Bank NA) | a | 0.14% | 07/07/15 | 191,361 | 191,361 | |
| S/F Mortgage RB Series 2006-93B (LIQ: Sumitomo Mitsui Banking Corp) | 0.08% | 07/07/15 | 4,915,000 | 4,915,000 | ||
| S/F Mortgage RB Series 2013-115A (LIQ: JPMorgan Chase Bank, NA) | a | 0.12% | 07/07/15 | 4,510,000 | 4,510,000 | |
| Pennsylvania Higher Educational Facilities Auth | ||||||
| RB (Assoc of Indep Colleges & Univs of PA) Series 2001-I1 (LOC: Manufacturers & Traders Trust Co) | 0.10% | 07/07/15 | 5,500,000 | 5,500,000 | ||
| RB (Drexel Univ) Second Series 2000 (LOC: JPMorgan Chase Bank, NA) | 0.06% | 07/07/15 | 3,500,000 | 3,500,000 | ||
| Pennsylvania State Turnpike Commission | ||||||
| Registration Fee Refunding RB Series 2005A (GTY: Berkshire Hathaway Assurance Corp /LIQ: Citibank, NA) | a | 0.07% | 07/07/15 | 6,905,000 | 6,905,000 | |
| Pennsylvania State Univ | ||||||
| Bonds Series 2007A (GTY/LIQ: US Bank, NA) | a | 0.08% | 07/07/15 | 13,985,000 | 13,985,000 | |
| Philadelphia | ||||||
| Airport Refunding RB Series 2005C2 (LOC: Royal Bank of Canada) | 0.09% | 07/07/15 | 8,775,000 | 8,775,000 | ||
| Philadelphia IDA | ||||||
| Lease Refunding RB Series 2007B2 (LOC: TD Bank NA) | 0.06% | 07/07/15 | 4,645,000 | 4,645,000 | ||
| Philadelphia Municipal Auth | ||||||
| Lease RB Series 2009 (GTY/LIQ: Wells Fargo & Co) | a | 0.09% | 07/07/15 | 6,505,000 | 6,505,000 | |
| Issuer
Type of Security, Series |
Footnotes | Rate | Effective
Maturity |
Maturity
Date |
Face
Amount ($) |
Value
($) |
| Philadelphia SD | ||||||
| GO Refunding Bonds Series 2009C (LOC: TD Bank NA) | 0.06% | 07/07/15 | 4,475,000 | 4,475,000 | ||
| GO Refunding Bonds Series 2010F (LOC: Barclays Bank Plc) | 0.09% | 07/07/15 | 2,200,000 | 2,200,000 | ||
| St. Mary Hospital Auth | ||||||
| Health System RB (Catholic Health East) Series 2012B | 0.04% | 07/07/15 | 17,000,000 | 17,000,000 | ||
| Univ of Pittsburgh | ||||||
| Univ Bonds Series 2009B (LIQ: JPMorgan Chase Bank, NA) | a | 0.08% | 07/07/15 | 500,000 | 500,000 | |
| Upper St. Clair Township | ||||||
| GO Bonds Series 2008 (LIQ: Bank of New York Mellon) | 0.11% | 07/07/15 | 11,620,000 | 11,620,000 | ||
| Washington Cnty Auth | ||||||
| Refunding RB (Univ of Pennsylvania) Series 2004 | 0.04% | 07/07/15 | 18,250,000 | 18,250,000 | ||
| Washington Cnty Hospital Auth | ||||||
| Hospital RB (Monongahela Valley) Series 2011A (LOC: PNC Bank NA) | 0.08% | 07/07/15 | 2,000,000 | 2,000,000 | ||
| Hospital RB (Washington Hospital) Series 2008A (LOC: PNC Bank NA) | 0.08% | 07/07/15 | 1,640,000 | 1,640,000 | ||
| 308,579,035 | ||||||
| Alabama 0.6% | ||||||
| Birmingham IDB | ||||||
| RB (Culton Properties) Series 2009A (LOC: Federal Home Loan Bank) | 0.14% | 07/07/15 | 980,000 | 980,000 | ||
| Lake Martin IDA | ||||||
| RB (Great Southern Properties) Series 2011 (LOC: Comerica Bank) | 0.15% | 07/07/15 | 1,635,000 | 1,635,000 | ||
| 2,615,000 | ||||||
| California 0.0% | ||||||
| Sacramento Cnty Housing Auth | ||||||
| M/F Housing RB (Sierra Sunrise Sr Apts) Series 2004D (LOC: Citibank, NA) | 0.08% | 07/07/15 | 100,000 | 100,000 | ||
| Florida 0.2% | ||||||
| Polk Cnty IDA | ||||||
| RB (Tremron Lakeland) Series 2011 (LOC: Branch Banking & Trust Co) | 0.13% | 07/07/15 | 1,100,000 | 1,100,000 | ||
| North Carolina 0.2% | ||||||
| North Carolina Ports Auth | ||||||
| Exempt Facility RB (Wilmington Bulk) Series 2001A (LOC: Branch Banking & Trust Co) | 0.13% | 07/07/15 | 900,000 | 900,000 | ||
| Texas 0.5% | ||||||
| Capital IDC | ||||||
| Solid Waste Disposal RB (Texas Disposal Systems) Series 2001 (LOC: MUFG Union Bank, NA) | 0.13% | 07/07/15 | 1,500,000 | 1,500,000 | ||
| Gulf Coast Waste Disposal Auth | ||||||
| Environmental Facilities RB (ExxonMobil) Series 2000 | 0.02% | 07/01/15 | 800,000 | 800,000 | ||
| 2,300,000 | ||||||
| Other Investments 2.7% | ||||||
| Nuveen Ohio Quality Income Municipal Fund | ||||||
| Variable Rate Demand Preferred Shares Series 1 (GTY/LIQ: Royal Bank of Canada) | a | 0.16% | 07/07/15 | 4,200,000 | 4,200,000 | |
| Issuer
Type of Security, Series |
Footnotes | Rate | Effective
Maturity |
Maturity
Date |
Face
Amount ($) |
Value
($) |
| Nuveen Pennsylvania Investment Quality Municipal Fund | ||||||
| Variable Rate Demand Preferred Shares Series 3 (GTY/LIQ: Royal Bank of Canada) | a | 0.17% | 07/07/15 | 8,500,000 | 8,500,000 | |
| 12,700,000 | ||||||
| Total Variable-Rate Securities | ||||||
| (Cost $328,294,035) | 328,294,035 | |||||
| a | Securities exempt from registration under Rule 144A of the Securities Act of 1933, as amended. These securities may be resold in transactions exempt from registrations, normally to qualified institutional buyers. At the period end, the value of these amounted to $98,486,361 or 20.8% of net assets. |
| b | Illiquid security. At the period end, the value of these amounted to $11,875,000 or 2.5% of net assets. |
| BAN — | Bond anticipation note |
| CCD — | Community college district |
| COP — | Certificate of participation |
| CP — | Commercial paper |
| CSD — | Central school district |
| GO — | General obligation |
| GTY — | Guaranty agreement |
| HFA — | Housing finance agency/authority |
| HRA — | Housing & redevelopment authority |
| HSD — | High school district |
| IDA — | Industrial development agency/authority |
| IDB — | Industrial development board |
| IDC — | Industrial development corporation |
| IDRB — | Industrial development revenue bond |
| IRB — | Industrial revenue bond |
| ISD — | Independent school district |
| LIQ — | Liquidity agreement |
| LOC — | Letter of credit |
| LT — | Limited tax |
| M/F — | Multi-family |
| RAN — | Revenue anticipation note |
| RB — | Revenue bond |
| SD — | School district |
| S/F — | Single-family |
| TAN — | Tax anticipation note |
| TRAN — | Tax and revenue anticipation note |
| UFSD — | Union free school district |
| UHSD — | Union high school district |
| ULT — | Unlimited tax |
| USD — | Unified school district |
| Assets | ||
| Investments, at cost and value (Note 2a) | $457,552,638 | |
| Cash | 15,607,792 | |
| Receivables: | ||
| Interest | 772,126 | |
| Prepaid expenses | + | 369 |
| Total assets | 473,932,925 | |
| Liabilities | ||
| Payables: | ||
| Investments bought | 1,530,071 | |
| Shareholder service fees | 5,800 | |
| Distributions to shareholders | 1,894 | |
| Accrued expenses | + | 32,813 |
| Total liabilities | 1,570,578 | |
| Net Assets | ||
| Total assets | 473,932,925 | |
| Total liabilities | – | 1,570,578 |
| Net assets | $472,362,347 | |
| Net Assets by Source | ||
| Capital received from investors | 472,352,028 | |
| Net realized capital gains | 10,319 | |
| Net Asset Value (NAV) | ||||
| Net Assets | ÷ | Shares
Outstanding |
= | NAV |
| $472,362,347 | 472,044,223 | $1.00 | ||
| Investment Income | ||
| Interest | $245,476 | |
| Expenses | ||
| Investment adviser and administrator fees | 853,254 | |
| Shareholder service fees | 853,254 | |
| Portfolio accounting fees | 48,187 | |
| Professional fees | 19,549 | |
| Independent trustees' fees | 14,516 | |
| Transfer agent fees | 10,163 | |
| Shareholder reports | 8,861 | |
| Custodian fees | 7,830 | |
| Registration fees | 5,762 | |
| Interest expense | 737 | |
| Other expenses | + | 4,785 |
| Total expenses | 1,826,898 | |
| Expense reduction by CSIM and its affiliates | – | 1,605,785 |
| Net expenses | – | 221,113 |
| Net investment income | 24,363 | |
| Realized Gains (Losses) | ||
| Net realized gains on investments | 10,319 | |
| Increase in net assets resulting from operations | $34,682 | |
| Operations | |||
| 1/1/15-6/30/15 | 1/1/14-12/31/14 | ||
| Net investment income | $24,363 | $49,673 | |
| Net realized gains | + | 10,319 | 106,585 |
| Increase in net assets from operations | 34,682 | 156,258 | |
| Distributions to Shareholders | |||
| Distributions from net investment income | (24,363) | (49,673) | |
| Distributions from net realized gains | + | — | (58,563) |
| Total distributions | (24,363) | (108,236) | |
| Transactions in Fund Shares* | |||
| Shares sold | 599,681,736 | 1,282,336,710 | |
| Shares reinvested | 21,750 | 106,551 | |
| Shares redeemed | + | (669,173,074) | (1,258,408,119) |
| Net transactions in fund shares | (69,469,588) | 24,035,142 | |
| Net Assets | |||
| Beginning of period | 541,821,616 | 517,738,452 | |
| Total increase or decrease | + | (69,459,269) | 24,083,164 |
| End of period | $472,362,347 | $541,821,616 | |
| * | Transactions took place at $1.00 per share; figures for share quantities are the same as for dollars. |
| 1/1/15–
6/30/15* |
1/1/14–
12/31/14 |
1/1/13–
12/31/13 |
1/1/12–
12/31/12 |
1/1/11–
12/31/11 |
1/1/10–
12/31/10 | |
| Per-Share Data ($) | ||||||
| Net asset value at beginning of period | 1.00 | 1.00 | 1.00 | 1.00 | 1.00 | 1.00 |
| Income (loss) from investment operations: | ||||||
| Net investment income (loss) | 0.00 1,2 | 0.00 2 | 0.00 2 | 0.00 2 | 0.00 2 | 0.00 2 |
| Net realized and unrealized gains (losses) | 0.00 2 | 0.00 2 | 0.00 2 | 0.00 2 | 0.00 2 | 0.00 2 |
| Total from investment operations | 0.00 2 | 0.00 2 | 0.00 2 | 0.00 2 | 0.00 2 | 0.00 2 |
| Less distributions: | ||||||
| Distributions from net investment income | (0.00) 2 | (0.00) 2 | (0.00) 2 | (0.00) 2 | (0.00) 2 | (0.00) 2 |
| Distributions from net realized gains | — | (0.00) 2 | (0.00) 2 | (0.00) 2 | (0.00) 2 | (0.00) 2 |
| Total distributions | (0.00) 2 | (0.00) 2 | (0.00) 2 | (0.00) 2 | (0.00) 2 | (0.00) 2 |
| Net asset value at end of period | 1.00 | 1.00 | 1.00 | 1.00 | 1.00 | 1.00 |
| Total return (%) | 0.01 3 | 0.02 | 0.01 | 0.02 | 0.04 | 0.06 |
| Ratios/Supplemental Data (%) | ||||||
| Ratios to average net assets: | ||||||
| Net operating expenses | 0.08 4,5 | 0.10 5 | 0.13 5 | 0.19 5 | 0.27 5 | 0.32 5 |
| Gross operating expenses | 0.78 4 | 0.75 | 0.75 | 0.75 | 0.74 | 0.74 |
| Net investment income (loss) | 0.01 4 | 0.01 | 0.01 | 0.01 | 0.01 | 0.01 |
| Net assets, end of period ($ x 1,000,000) | 402 | 446 | 430 | 499 | 425 | 485 |
| * | Unaudited. |
| Holdings by Category | Cost
($) |
Value
($) | |
| 40.5% | Fixed-Rate Securities | 163,069,453 | 163,069,453 |
| 59.0% | Variable-Rate Securities | 237,155,000 | 237,155,000 |
| 99.5% | Total Investments | 400,224,453 | 400,224,453 |
| 0.5% | Other Assets and Liabilities, Net | 1,867,691 | |
| 100.0% | Net Assets | 402,092,144 | |
| Issuer
Type of Security, Series |
Footnotes | Rate | Effective
Maturity |
Maturity
Date |
Face
Amount ($) |
Value
($) |
| Fixed-Rate Securities 40.5% of net assets | ||||||
| Massachusetts 37.4% | ||||||
| Berlin-Boylston Regional SD | ||||||
| ULT GO BAN | 1.00% | 12/11/15 | 2,000,000 | 2,006,681 | ||
| Essex North Shore Technical & Agricultural SD | ||||||
| GO BAN | 1.25% | 06/17/16 | 2,500,000 | 2,519,848 | ||
| Fall River | ||||||
| GO BAN | 1.25% | 02/12/16 | 4,300,000 | 4,325,203 | ||
| Franklin | ||||||
| GO BAN | 1.50% | 05/20/16 | 1,000,000 | 1,010,227 | ||
| Haverhill | ||||||
| BAN | 1.00% | 12/01/15 | 3,000,000 | 3,009,658 | ||
| Hingham | ||||||
| GO BAN | 1.50% | 05/21/16 | 1,000,000 | 1,010,709 | ||
| Lowell | ||||||
| GO BAN Series A | 1.00% | 09/11/15 | 4,000,000 | 4,006,377 | ||
| Massachusetts | ||||||
| GO Bonds Consolidated Loan 2005 Series C (ESCROW) | 5.00% | 09/01/15 | 1,000,000 | 1,008,153 | ||
| GO Bonds Consolidated Loan of 2008 Series A | 3.20% | 08/01/15 | 200,000 | 200,483 | ||
| GO Bonds Consolidated Loan Series 2001D | 5.50% | 11/01/15 | 725,000 | 737,735 | ||
| GO Bonds Consolidated Loan Series 2002C | 5.50% | 11/01/15 | 1,455,000 | 1,480,360 | ||
| GO Bonds Consolidated Loan Series 2005B | 5.00% | 08/01/15 | 2,475,000 | 2,485,103 | ||
| GO Bonds Consolidated Loan Series 2006D | 4.00% | 08/01/15 | 250,000 | 250,781 | ||
| GO Bonds Consolidated Loan Series 2007B | 5.00% | 11/01/15 | 1,455,000 | 1,478,578 | ||
| GO Bonds Consolidated Loan Series 2009B | 5.00% | 07/01/15 | 1,250,000 | 1,250,000 | ||
| GO Bonds Consolidated Loan Series 2009B | 5.00% | 07/01/16 | 155,000 | 161,950 | ||
| GO Bonds Consolidated Loan Series 2010C | 4.00% | 12/01/15 | 775,000 | 786,999 | ||
| GO Bonds Consolidated Loan Series 2010C | 5.00% | 12/01/15 | 150,000 | 152,873 | ||
| GO Bonds Consolidated Loan Series 2011B | 5.00% | 08/01/15 | 300,000 | 301,209 | ||
| Issuer
Type of Security, Series |
Footnotes | Rate | Effective
Maturity |
Maturity
Date |
Face
Amount ($) |
Value
($) |
| GO Bonds Consolidated Loan Series 2011E | 5.00% | 12/01/15 | 900,000 | 917,960 | ||
| GO Refunding Bonds Series 2003D | 5.50% | 10/01/15 | 1,520,000 | 1,539,788 | ||
| GO Refunding Bonds Series 2004B | 5.25% | 08/01/15 | 1,410,000 | 1,415,924 | ||
| GO Refunding Bonds Series 2007A | 4.00% | 11/01/15 | 100,000 | 101,261 | ||
| GO Refunding Bonds Series 2008A | 3.38% | 09/01/15 | 175,000 | 175,920 | ||
| GO Refunding Bonds Series 2008A | 5.00% | 09/01/15 | 1,550,000 | 1,562,443 | ||
| GO Refunding Bonds Series 2010B | 4.00% | 12/01/15 | 495,000 | 502,674 | ||
| Massachusetts Bay Transportation Auth | ||||||
| Assessment Bonds Series 2005A (ESCROW) | 5.00% | 07/01/15 | 2,000,000 | 2,000,000 | ||
| Sales Tax CP Series B (LIQ: Sumitomo Mitsui Banking Corp) | 0.10% | 09/03/15 | 8,900,000 | 8,900,000 | ||
| Sr Sales Tax Bonds Series 2003C | 5.25% | 07/01/15 | 145,000 | 145,000 | ||
| Sr Sales Tax Bonds Series 2004A | 5.25% | 07/01/15 | 850,000 | 850,000 | ||
| Sr Sales Tax Bonds Series 2004C | 5.50% | 07/01/15 | 525,000 | 525,000 | ||
| Sr Sales Tax Bonds Series 2004C | 5.50% | 07/01/16 | 325,000 | 341,001 | ||
| Massachusetts Clean Water Trust | ||||||
| Pool Program Bonds Series 12 | 5.00% | 08/01/15 | 100,000 | 100,396 | ||
| Pool Program Refunding Bonds Series 2004A | 5.25% | 08/01/15 | 1,920,000 | 1,928,176 | ||
| State Revolving Fund Bonds Series 14 | 4.00% | 08/01/15 | 510,000 | 511,603 | ||
| State Revolving Fund Bonds Series 15A | 3.00% | 08/01/15 | 500,000 | 501,108 | ||
| State Revolving Fund Bonds Series 15A | 4.00% | 08/01/15 | 225,000 | 225,688 | ||
| State Revolving Fund Refunding Bonds Series 2009A | 5.00% | 08/01/15 | 450,000 | 451,777 | ||
| Massachusetts Development Finance Agency | ||||||
| M/F Housing RB (New Hadley) Series 2015 (ESCROW) | 0.35% | 04/01/16 | 5,000,000 | 5,000,000 | ||
| RB (Partners HealthCare) Series 2011K6 | 5.00% | 07/01/15 | 150,000 | 150,000 | ||
| RB (Partners HealthCare) Series 2012L | 3.00% | 07/01/15 | 950,000 | 950,000 | ||
| RB (Partners HealthCare) Series 2012L | 5.00% | 07/01/15 | 1,310,000 | 1,310,000 | ||
| RB (Partners HealthCare) Series 2012L | 5.00% | 07/01/16 | 100,000 | 104,485 | ||
| Massachusetts Health & Educational Facilities Auth | ||||||
| RB (Harvard Univ) Series 2009A | 5.00% | 11/15/15 | 1,100,000 | 1,119,502 | ||
| RB (Harvard Univ) Series 2010A | 5.00% | 12/15/15 | 425,000 | 434,093 | ||
| RB (Partners HealthCare) Series 2007C | 5.00% | 07/01/15 | 1,250,000 | 1,250,000 | ||
| RB (Partners HealthCare) Series 2010J | 5.00% | 07/01/15 | 1,520,000 | 1,520,000 | ||
| RB (Partners HealthCare) Series 2010J2 | 4.00% | 07/01/15 | 870,000 | 870,000 | ||
| RB (Tufts Univ) Series J | 5.50% | 08/15/15 | 400,000 | 402,600 | ||
| Massachusetts Port Auth | ||||||
| RB Series 2005A (ESCROW) | 5.00% | 07/01/15 | 5,060,000 | 5,060,000 | ||
| Massachusetts School Building Auth | ||||||
| BAN Series 2014A | 5.00% | 07/16/15 | 3,000,000 | 3,006,020 | ||
| Dedicated Sales Tax Bonds Series 2005A (ESCROW) | 5.00% | 08/15/15 | 20,615,000 | 20,737,270 | ||
| Dedicated Sales Tax Bonds Series 2007A | 5.00% | 08/15/15 | 225,000 | 226,283 | ||
| Dedicated Sales Tax Bonds Series 2009A | 4.00% | 05/15/16 | 180,000 | 185,551 | ||
| Dedicated Sales Tax RB Series 2005A (ESCROW) | 5.00% | 08/15/15 | 4,730,000 | 4,758,236 | ||
| Sub Dedicated Sales Tax CP BAN Series A (LOC: Bank of America, NA) | 0.09% | 10/05/15 | 6,000,000 | 6,000,000 | ||
| Massachusetts Water Resources Auth | ||||||
| CP Series 1999 (LOC: State Street Bank & Trust Co NA) | 0.08% | 08/06/15 | 6,000,000 | 6,000,000 | ||
| General RB Series 2002J (ESCROW) | 5.25% | 08/01/15 | 1,600,000 | 1,606,837 | ||
| General Refunding RB Series 2005A | 5.25% | 08/01/15 | 275,000 | 276,159 | ||
| General Refunding RB Series 2010B | 5.00% | 08/01/15 | 400,000 | 401,632 | ||
| Metropolitan Boston Transit Parking Corp | ||||||
| Sr Lien Parking RB Series 2011 (GTY/LIQ: Wells Fargo Bank, NA) | a,b | 0.13% | 07/09/15 | 2,500,000 | 2,500,000 | |
| Issuer
Type of Security, Series |
Footnotes | Rate | Effective
Maturity |
Maturity
Date |
Face
Amount ($) |
Value
($) |
| Nantucket | ||||||
| GO BAN | 0.75% | 11/13/15 | 2,417,912 | 2,423,325 | ||
| New Bedford | ||||||
| GO BAN | 1.25% | 02/05/16 | 4,000,000 | 4,024,884 | ||
| Newburyport | ||||||
| ULT GO BAN | 1.00% | 10/23/15 | 4,520,109 | 4,532,085 | ||
| Plymouth | ||||||
| GO BAN | 1.50% | 05/04/16 | 4,529,000 | 4,577,073 | ||
| Salisbury | ||||||
| GO BAN | 1.25% | 03/24/16 | 3,154,700 | 3,176,946 | ||
| Shrewsbury | ||||||
| GO BAN | 1.00% | 07/30/15 | 3,000,000 | 3,002,045 | ||
| Stoneham | ||||||
| BAN | 1.00% | 10/23/15 | 2,250,000 | 2,255,608 | ||
| Taunton | ||||||
| GO BAN | 1.00% | 12/11/15 | 3,000,000 | 3,008,645 | ||
| Univ of Massachusetts Building Auth | ||||||
| RB Sr Series 2010-1 | 5.00% | 11/01/15 | 600,000 | 609,393 | ||
| Refunding RB Sr Series 2005-2 (ESCROW) | 5.00% | 11/01/15 | 1,000,000 | 1,016,218 | ||
| Wellesley | ||||||
| GO BAN | 1.00% | 12/11/15 | 1,469,000 | 1,474,351 | ||
| Weymouth | ||||||
| GO BAN | 1.00% | 10/16/15 | 2,500,000 | 2,506,066 | ||
| Worcester | ||||||
| GO Bonds Series 2012 | 4.00% | 11/01/15 | 2,495,000 | 2,526,817 | ||
| GO Refunding Bonds Series 2005A | 5.00% | 07/01/15 | 640,000 | 640,000 | ||
| 150,520,770 | ||||||
| Florida 0.0% | ||||||
| Tampa | ||||||
| Health System RB (Catholic Health East) Series 2010 | 5.00% | 11/15/15 | 110,000 | 111,892 | ||
| Hawaii 0.5% | ||||||
| Hawaii | ||||||
| GO Bonds Series 2008DN | 5.00% | 08/01/15 | 125,000 | 125,500 | ||
| GO Refunding Bonds Series 2005DG | 5.00% | 07/01/15 | 2,100,000 | 2,100,000 | ||
| 2,225,500 | ||||||
| Michigan 0.1% | ||||||
| Michigan State Hospital Finance Auth | ||||||
| RB (Ascension Health) Series 2010 | 5.00% | 11/15/15 | 325,000 | 330,658 | ||
| Minnesota 0.3% | ||||||
| Mesabi East ISD No. 2711 | ||||||
| GO Series 2014B | 1.00% | 08/21/15 | 1,100,000 | 1,100,995 | ||
| Texas 1.0% | ||||||
| Austin ISD | ||||||
| ULT GO Refunding Bonds Series 1998 (GTY: TX Permanent School Fund) | 5.00% | 08/01/15 | 250,000 | 250,999 | ||
| Eagle Mountain-Saginaw ISD | ||||||
| ULT GO Bonds Series 2006 (GTY: TX Permanent School Fund) | 4.50% | 08/15/15 | 825,000 | 829,302 | ||
| Harris Cnty | ||||||
| Toll Road ULT & Sub Lien Refunding RB Series 2008A | 5.00% | 08/15/15 | 100,000 | 100,576 | ||
| Issuer
Type of Security, Series |
Footnotes | Rate | Effective
Maturity |
Maturity
Date |
Face
Amount ($) |
Value
($) |
| Leander ISD | ||||||
| ULT GO Refunding Bonds Series 2013A (GTY: TX Permanent School Fund) | 0.21% | 08/15/15 | 400,000 | 399,896 | ||
| Northside ISD | ||||||
| ULT GO Bonds Series 2008A (GTY: TX Permanent School Fund) | 3.75% | 08/15/15 | 100,000 | 100,431 | ||
| ULT GO Refunding Bonds Series 2003B (GTY: TX Permanent School Fund) | 3.00% | 08/01/15 | 790,000 | 791,847 | ||
| San Antonio | ||||||
| General Improvement Bonds Series 2008 | 5.00% | 08/01/15 | 300,000 | 301,209 | ||
| Socorro ISD | ||||||
| ULT GO Bonds Series 2006A (GTY: TX Permanent School Fund) | 5.00% | 08/15/15 | 460,000 | 462,704 | ||
| Texas City ISD | ||||||
| ULT GO Bonds Series 2008 (GTY: TX Permanent School Fund) | 4.00% | 08/15/15 | 405,000 | 406,862 | ||
| Texas Public Finance Auth | ||||||
| GO Refunding Bonds Series 2008 | 5.00% | 10/01/15 | 475,000 | 480,595 | ||
| 4,124,421 | ||||||
| Washington 1.2% | ||||||
| Bellevue SD No. 405 | ||||||
| ULT GO Refunding Bonds 2010 (GTY: Washington) | 5.00% | 12/01/15 | 150,000 | 152,955 | ||
| Kelso SD No. 458 | ||||||
| ULT GO Refunding Bonds 2014 (GTY: Washington) | 2.00% | 12/01/15 | 100,000 | 100,732 | ||
| Lakewood SD No. 306 | ||||||
| ULT GO Bonds 2014 (GTY: Washington) | 2.00% | 12/01/15 | 825,000 | 831,175 | ||
| Vancouver SD No. 37 | ||||||
| ULT GO Refunding Bonds Series 2005 (GTY: Washington) | 5.25% | 12/01/15 | 500,000 | 510,355 | ||
| Washington | ||||||
| GO Bonds Series 2008A | 5.00% | 07/01/15 | 1,045,000 | 1,045,000 | ||
| GO Bonds Series 2009A | 5.00% | 07/01/15 | 180,000 | 180,000 | ||
| GO Refunding Bonds Series R2006A | 5.00% | 07/01/15 | 605,000 | 605,000 | ||
| GO Refunding Bonds Series R2012C | 5.00% | 07/01/15 | 100,000 | 100,000 | ||
| Motor Vehicle Fuel Tax GO Refunding Bonds Series R2011C | 4.00% | 07/01/15 | 655,000 | 655,000 | ||
| Motor Vehicle Fuel Tax GO Refunding Bonds Series R2012B | 3.00% | 07/01/15 | 475,000 | 475,000 | ||
| 4,655,217 | ||||||
| Total Fixed-Rate Securities | ||||||
| (Cost $163,069,453) | 163,069,453 | |||||
| Variable-Rate Securities 59.0% of net assets | ||||||
| Massachusetts 56.7% | ||||||
| Massachusetts | ||||||
| GO Bonds Consolidated Loan Series 2007A (LIQ: Societe Generale) | a | 0.08% | 07/07/15 | 4,000,000 | 4,000,000 | |
| GO Bonds Consolidated Loan Series 2007C (ESCROW/LIQ: Credit Suisse AG) | a | 0.09% | 07/07/15 | 9,500,000 | 9,500,000 | |
| GO Bonds Consolidated Loan Series 2007C (LIQ: Citibank, NA) | a | 0.08% | 07/07/15 | 4,500,000 | 4,500,000 | |
| GO Bonds Consolidated Loan Series 2007C (LIQ: JPMorgan Chase Bank, NA) | a | 0.08% | 07/07/15 | 3,900,000 | 3,900,000 | |
| GO Bonds Consolidated Loan Series 2007C (LIQ: Societe Generale) | a | 0.08% | 07/07/15 | 1,085,000 | 1,085,000 | |
| Massachusetts Bay Transportation Auth | ||||||
| General Transportation System Bonds Series 2000A1 (LIQ: Barclays Bank Plc) | 0.13% | 07/07/15 | 2,100,000 | 2,100,000 | ||
| Sr Sales Tax Bonds Series 2008A2 (LIQ: JPMorgan Chase Bank, NA) | 0.09% | 07/07/15 | 5,100,000 | 5,100,000 | ||
| Issuer
Type of Security, Series |
Footnotes | Rate | Effective
Maturity |
Maturity
Date |
Face
Amount ($) |
Value
($) |
| Massachusetts Clean Water Trust | ||||||
| Pool Program Refunding Bonds Series 2006 (LIQ: Credit Suisse AG) | a | 0.07% | 07/07/15 | 8,195,000 | 8,195,000 | |
| State Revolving Fund Bonds Series 14 (LIQ: Morgan Stanley Bank NA) | a | 0.08% | 07/07/15 | 6,665,000 | 6,665,000 | |
| Massachusetts Dept of Transportation | ||||||
| Sub RB (Contract Assistance Secured) Series 2010A7 (LIQ: TD Bank NA) | 0.06% | 07/07/15 | 2,800,000 | 2,800,000 | ||
| Massachusetts Development Finance Agency | ||||||
| Education RB (Cushing Academy) Series 2004 (LOC: TD Bank NA) | 0.07% | 07/07/15 | 2,480,000 | 2,480,000 | ||
| First Mortgage RB (Brookhaven at Lexington) Series 2005B (LOC: Bank of America, NA) | 0.17% | 07/07/15 | 2,775,000 | 2,775,000 | ||
| RB (Boston Univ) Series U3 (LOC: Northern Trust Co) | 0.04% | 07/07/15 | 2,800,000 | 2,800,000 | ||
| RB (Boston Univ) Series U5B (LOC: Federal Home Loan Bank) | 0.07% | 07/07/15 | 4,800,000 | 4,800,000 | ||
| RB (CIL Realty) Series 2013 (LOC: Manufacturers & Traders Trust Co) | 0.07% | 07/07/15 | 8,700,000 | 8,700,000 | ||
| RB (Harvard Univ) Series 2010B2 (LIQ: Bank of America, NA) | a | 0.07% | 07/07/15 | 12,500,000 | 12,500,000 | |
| RB (Marine Biological Laboratory) Series 2006 (LOC: PNC Bank NA) | 0.07% | 07/07/15 | 7,305,000 | 7,305,000 | ||
| RB (Partners HealthCare) Series 2014M2 (LOC: Bank of New York Mellon) | 0.06% | 07/07/15 | 5,000,000 | 5,000,000 | ||
| RB (Partners HealthCare) Series 2014M4 (LIQ: Morgan Stanley Bank NA) | a | 0.08% | 07/07/15 | 2,500,000 | 2,500,000 | |
| RB (YMCA of Greater Worcester) Series 2006 (LOC: TD Bank NA) | 0.07% | 07/07/15 | 3,855,000 | 3,855,000 | ||
| Massachusetts Health & Educational Facilities Auth | ||||||
| RB (Amherst College) Series 2005J2 | 0.02% | 07/01/15 | 800,000 | 800,000 | ||
| RB (Amherst College) Series F | 0.07% | 07/07/15 | 9,300,000 | 9,300,000 | ||
| RB (Baystate Medical Center) Series 2005G (LOC: Wells Fargo Bank, NA) | 0.03% | 07/01/15 | 700,000 | 700,000 | ||
| RB (Baystate Medical Center) Series 2009K1 (LOC: Wells Fargo Bank, NA) | 0.03% | 07/01/15 | 5,380,000 | 5,380,000 | ||
| RB (Capital Asset Program) Series 2004M4A (LOC: Bank of America, NA) | 0.12% | 07/07/15 | 6,045,000 | 6,045,000 | ||
| RB (Capital Asset Program) Series M2 (LOC: Bank of America, NA) | 0.12% | 07/07/15 | 2,340,000 | 2,340,000 | ||
| RB (Great Brook Valley Health Center) Series 2006A (LOC: TD Bank NA) | 0.05% | 07/07/15 | 3,240,000 | 3,240,000 | ||
| RB (MIT) Series 2001J1 | 0.05% | 07/07/15 | 2,100,000 | 2,100,000 | ||
| RB (MIT) Series 2001J2 | 0.06% | 07/07/15 | 650,000 | 650,000 | ||
| RB (MIT) Series 2008N (LIQ: Barclays Bank Plc) | a | 0.12% | 07/07/15 | 9,470,000 | 9,470,000 | |
| RB (MIT) Series 2008N (LIQ: Citibank, NA) | a | 0.07% | 07/07/15 | 2,000,000 | 2,000,000 | |
| RB (Museum of Fine Arts) Series 2007A2 (LIQ: Bank of America, NA) | 0.03% | 07/01/15 | 700,000 | 700,000 | ||
| RB (Partners HealthCare) Series 2010J1 (LIQ: JPMorgan Chase Bank, NA) | a | 0.08% | 07/07/15 | 2,100,000 | 2,100,000 | |
| RB (Partners HealthCare) Series P2 (LIQ: JPMorgan Chase Bank, NA) | 0.07% | 07/07/15 | 4,200,000 | 4,200,000 | ||
| RB (Tufts Univ) Series 2008N1 (LIQ: US Bank, NA) | 0.02% | 07/01/15 | 5,300,000 | 5,300,000 | ||
| RB (UMass) Series 2007E&F (ESCROW/LIQ: US Bank, NA) | a | 0.07% | 07/07/15 | 7,220,000 | 7,220,000 | |
| Massachusetts School Building Auth | ||||||
| Dedicated Sales Tax Bonds Series 2007A (LIQ: Citibank, NA) | a | 0.07% | 07/07/15 | 8,670,000 | 8,670,000 | |
| Dedicated Sales Tax Bonds Series 2007A (LIQ: JPMorgan Chase Bank, NA) | a | 0.09% | 07/07/15 | 1,315,000 | 1,315,000 | |
| Sr Dedicated Sales Tax Bonds Series 2013A (LIQ: Citibank, NA) | a | 0.08% | 07/07/15 | 4,125,000 | 4,125,000 | |
| Sr Dedicated Sales Tax Refunding Bonds Series 2012B (LIQ: JPMorgan Chase Bank, NA) | a | 0.08% | 07/07/15 | 3,750,000 | 3,750,000 | |
| Issuer
Type of Security, Series |
Footnotes | Rate | Effective
Maturity |
Maturity
Date |
Face
Amount ($) |
Value
($) |
| Massachusetts Water Resources Auth | ||||||
| General Refunding RB Series 2007B (LIQ: Branch Banking & Trust Co) | a | 0.08% | 07/07/15 | 8,890,000 | 8,890,000 | |
| Sub Refunding RB Series 2012F (GTY/LIQ: Royal Bank of Canada) | a | 0.07% | 07/07/15 | 28,295,000 | 28,295,000 | |
| Univ of Massachusetts Building Auth | ||||||
| RB Sr Series 2013-1 (LIQ: Citibank, NA) | a | 0.08% | 07/07/15 | 5,500,000 | 5,500,000 | |
| RB Sr Series 2014-1 (LIQ: Morgan Stanley Bank NA) | a | 0.20% | 07/07/15 | 3,700,000 | 3,700,000 | |
| Refunding RB Sr Series 2013-3 (LIQ: JPMorgan Chase Bank, NA) | a | 0.08% | 07/07/15 | 1,500,000 | 1,500,000 | |
| 227,850,000 | ||||||
| Connecticut 0.5% | ||||||
| Connecticut | ||||||
| GO Refunding Notes Series 2014A | 0.11% | 07/02/15 | 01/01/16 | 2,000,000 | 2,000,000 | |
| District of Columbia 0.2% | ||||||
| District of Columbia | ||||||
| RB (American Geophysical Union) Series 1993 (LOC: Bank of America, NA) | 0.14% | 07/07/15 | 885,000 | 885,000 | ||
| Georgia 1.0% | ||||||
| Macon Water Auth | ||||||
| Water & Sewer RB Series 2012 | 0.08% | 07/07/15 | 4,000,000 | 4,000,000 | ||
| Minnesota 0.4% | ||||||
| Minneapolis | ||||||
| M/F Housing RB (Seven Corners Apts) Series 2012F (LOC: Wells Fargo Bank, NA) | 0.18% | 07/07/15 | 1,420,000 | 1,420,000 | ||
| Washington 0.2% | ||||||
| Washington Health Care Facilities Auth | ||||||
| RB (Providence Heath & Services) Series 2014D (LIQ: JPMorgan Chase Bank, NA) | a | 0.08% | 07/07/15 | 1,000,000 | 1,000,000 | |
| Total Variable-Rate Securities | ||||||
| (Cost $237,155,000) | 237,155,000 | |||||
| a | Securities exempt from registration under Rule 144A of the Securities Act of 1933, as amended. These securities may be resold in transactions exempt from registrations, normally to qualified institutional buyers. At the period end, the value of these amounted to $142,880,000 or 35.5% of net assets. |
| b | Illiquid security. At the period end, the value of these amounted to $2,500,000 or 0.6% of net assets. |
| BAN — | Bond anticipation note |
| CCD — | Community college district |
| COP — | Certificate of participation |
| CP — | Commercial paper |
| CSD — | Central school district |
| GO — | General obligation |
| GTY — | Guaranty agreement |
| HFA — | Housing finance agency/authority |
| HRA — | Housing & redevelopment authority |
| HSD — | High school district |
| IDA — | Industrial development agency/authority |
| IDB — | Industrial development board |
| IDC — | Industrial development corporation |
| IDRB — | Industrial development revenue bond |
| IRB — | Industrial revenue bond |
| ISD — | Independent school district |
| LIQ — | Liquidity agreement |
| LOC — | Letter of credit |
| LT — | Limited tax |
| M/F — | Multi-family |
| RAN — | Revenue anticipation note |
| RB — | Revenue bond |
| SD — | School district |
| S/F — | Single-family |
| TAN — | Tax anticipation note |
| TRAN — | Tax and revenue anticipation note |
| UFSD — | Union free school district |
| UHSD — | Union high school district |
| ULT — | Unlimited tax |
| USD — | Unified school district |
| Assets | ||
| Investments, at cost and value (Note 2a) | $400,224,453 | |
| Cash | 62,435 | |
| Receivables: | ||
| Interest | 1,883,625 | |
| Prepaid expenses | + | 2,489 |
| Total assets | 402,173,002 | |
| Liabilities | ||
| Payables: | ||
| Shareholder service fees | 12,501 | |
| Distributions to shareholders | 1,665 | |
| Accrued expenses | + | 66,692 |
| Total liabilities | 80,858 | |
| Net Assets | ||
| Total assets | 402,173,002 | |
| Total liabilities | – | 80,858 |
| Net assets | $402,092,144 | |
| Net Assets by Source | ||
| Capital received from investors | 402,064,402 | |
| Net realized capital gains | 27,742 | |
| Net Asset Value (NAV) | ||||
| Net Assets | ÷ | Shares
Outstanding |
= | NAV |
| $402,092,144 | 401,370,312 | $1.00 | ||
| Investment Income | ||
| Interest | $202,934 | |
| Expenses | ||
| Investment adviser and administrator fees | 755,084 | |
| Shareholder service fees | 755,084 | |
| Proxy fees | 57,726 | |
| Portfolio accounting fees | 45,513 | |
| Professional fees | 20,194 | |
| Independent trustees' fees | 14,435 | |
| Registration fees | 10,932 | |
| Transfer agent fees | 10,161 | |
| Shareholder reports | 7,327 | |
| Custodian fees | 6,838 | |
| Interest expense | 91 | |
| Other expenses | + | 4,033 |
| Total expenses | 1,687,418 | |
| Expense reduction by CSIM and its affiliates | – | 1,506,023 |
| Net expenses | – | 181,395 |
| Net investment income | 21,539 | |
| Realized Gains (Losses) | ||
| Net realized gains on investments | 27,742 | |
| Increase in net assets resulting from operations | $49,281 | |
| Operations | |||
| 1/1/15-6/30/15 | 1/1/14-12/31/14 | ||
| Net investment income | $21,539 | $43,744 | |
| Net realized gains | + | 27,742 | 95,081 |
| Increase in net assets from operations | 49,281 | 138,825 | |
| Distributions to Shareholders | |||
| Distributions from net investment income | (21,539) | (43,744) | |
| Distributions from net realized gains | + | — | (36,067) |
| Total distributions | (21,539) | (79,811) | |
| Transactions in Fund Shares* | |||
| Shares sold | 560,120,600 | 1,124,515,404 | |
| Shares reinvested | 19,428 | 78,775 | |
| Shares redeemed | + | (604,139,884) | (1,108,541,199) |
| Net transactions in fund shares | (43,999,856) | 16,052,980 | |
| Net Assets | |||
| Beginning of period | 446,064,258 | 429,952,264 | |
| Total increase or decrease | + | (43,972,114) | 16,111,994 |
| End of period | $402,092,144 | $446,064,258 | |
| * | Transactions took place at $1.00 per share; figures for share quantities are the same as for dollars. |
| The Charles Schwab Family of Funds (organized October 20, 1989) | Schwab Municipal Money Fund |
| Schwab Money Market Fund | Schwab AMT Tax-Free Money Fund |
| Schwab Government Money Fund | Schwab California Municipal Money Fund |
| Schwab U.S. Treasury Money Fund | Schwab New York Municipal Money Fund |
| Schwab Treasury Obligations Money Fund | (formerly Schwab New York AMT Tax-Free Money Fund) |
| Schwab Value Advantage Money Fund | Schwab New Jersey Municipal Money Fund |
| Schwab Advisor Cash Reserves | (formerly Schwab New Jersey AMT Tax-Free Money Fund) |
| Schwab Cash Reserves | Schwab Pennsylvania Municipal Money Fund |
| Schwab Retirement Advantage Money Fund | Schwab Massachusetts Municipal Money Fund |
| Schwab Investor Money Fund | (formerly Schwab Massachusetts AMT Tax-Free Money Fund) |
| Schwab
New York Municipal Money Fund |
Schwab
New Jersey Municipal Money Fund |
Schwab
Pennsylvania Municipal Money Fund |
Schwab
Massachusetts Municipal Money Fund | ||||
| % of investments in securities with credit enhancements or liquidity enhancements | 61% | 56% | 74% | 62% | |||
| Largest % of investments in securities with credit enhancements or liquidity enhancements from a single institution | 10%
(JP Morgan Chase Group) |
12%
(JP Morgan Chase Group) |
14%
(Royal Bank of Canada Group) |
8%
(Bank of America Group) |
| Average Daily Net Assets | |
| First $1 billion | 0.35% |
| More than $1 billion but not exceeding $10 billion | 0.32% |
| More than $10 billion but not exceeding $20 billion | 0.30% |
| More than $20 billion but not exceeding $40 billion | 0.27% |
| Over $40 billion | 0.25% |
| Shareholder Service Fees | Sweep Administration Fees | ||
| Sweep Shares | 0.25% | 0.10% | |
| Value Advantage Shares* | 0.22% | n/a |
| * | Value Advantage Shares are only offered by Schwab New York Municipal Money Fund. |
| Schwab
New York Municipal Money Fund |
Schwab
New Jersey Municipal Money Fund |
Schwab
Pennsylvania Municipal Money Fund |
Schwab
Massachusetts Municipal Money Fund | ||||
| Sweep Shares | 0.65% | 0.65% | 0.65% | 0.65% | |||
| Value Advantage Shares* | 0.45% | n/a | n/a | n/a |
| * | Value Advantage Shares are only offered by Schwab New York Municipal Money Fund. |
| Total
Waived Amount |
Contractual
Expense Limitation Waived Amount | ||
| Schwab New York Municipal Money Fund | $5,664,768 | $681,296 | |
| Schwab New Jersey Municipal Money Fund | 2,054,368 | 290,747 | |
| Schwab Pennsylvania Municipal Money Fund | 1,605,785 | 253,795 | |
| Schwab Massachusetts Municipal Money Fund | 1,506,023 | 238,150 |
| Expiration Date | |||||||||
| December 31, 2015 | December 31, 2016 | December 31, 2017 | December 31, 2018 | Total | |||||
| Schwab New York Municipal Money Fund | |||||||||
| Sweep Shares | $7,372,882 | $8,547,565 | $9,320,578 | $4,568,818 | $29,809,843 | ||||
| Value Advantage Shares | 929,692 | 902,999 | 902,977 | 414,654 | 3,150,322 | ||||
| Schwab New Jersey Municipal Money Fund | 2,612,447 | 3,107,582 | 3,461,190 | 1,763,621 | 10,944,840 | ||||
| Schwab Pennsylvania Municipal Money Fund | 2,126,312 | 2,620,477 | 2,751,008 | 1,351,990 | 8,849,787 | ||||
| Schwab Massachusetts Municipal Money Fund | 2,020,908 | 2,239,785 | 2,406,659 | 1,267,873 | 7,935,225 | ||||
| Schwab New York Municipal Money Fund | |
| Sweep Shares | $5,905,518 |
| Value Advantage Shares | 781,824 |
| Schwab New Jersey Municipal Money Fund | 2,335,709 |
| Schwab Pennsylvania Municipal Money Fund | 1,709,300 |
| Schwab Massachusetts Municipal Money Fund | 1,698,125 |
| Schwab New York Municipal Money Fund | $41,200,000 |
| Schwab New Jersey Municipal Money Fund | 21,845,000 |
| Schwab Pennsylvania Municipal Money Fund | 11,030,000 |
| Schwab Massachusetts Municipal Money Fund | 6,800,000 |
| Independent Trustees | |||
| Name,
Year of Birth, and Position(s) with the trust; (Terms of office, and length of Time Served1) |
Principal
Occupations During the Past Five Years |
Number
of Portfolios in Fund Complex Overseen by the Trustee |
Other Directorships |
| John
F. Cogan 1947 Trustee (Trustee of The Charles Schwab Family of Funds, Schwab Investments, Schwab Capital Trust and Schwab Annuity Portfolios since 2008; Laudus Trust and Laudus Institutional Trust since 2010) |
Senior Fellow, The Hoover Institution at Stanford University (Oct. 1979 – present); Senior Fellow Stanford Institute for Economic Policy Research (2000 – present); Professor of Public Policy, Stanford University (1994 – present). | 74 | Director,
Gilead Sciences, Inc. (2005 – present) |
| David
L. Mahoney 1954 Trustee (Trustee of The Charles Schwab Family of Funds, Schwab Investments, Schwab Capital Trust, Schwab Annuity Portfolios, Laudus Trust and Laudus Institutional Trust since 2011) |
Private Investor. | 74 | Director,
Symantec Corporation (2003 – present) Director, Corcept Therapeutics Incorporated (2004 – present) Director, Adamas Pharmaceuticals, Inc. (2009 – present) |
| Kiran
M. Patel 1948 Trustee (Trustee of The Charles Schwab Family of Funds, Schwab Investments, Schwab Capital Trust, Schwab Annuity Portfolios, Laudus Trust and Laudus Institutional Trust since 2011) |
Retired. Executive Vice President and General Manager of Small Business Group, Intuit, Inc. (financial software and services firm for consumers and small businesses) (Dec. 2008 – Sept. 2013) | 74 | Director, KLA-Tencor Corporation (2008 – present) |
| Charles
A. Ruffel 1956 Trustee (Trustee of Schwab Strategic Trust since 2009; The Charles Schwab Family of Funds, Schwab Investments, Schwab Capital Trust, Schwab Annuity Portfolios, Laudus Trust and Laudus Institutional Trust since 2015) |
Managing Partner and Co-Founder, Kudu Advisors, LLC (financial services) (May 2009 – present); Director, Asset International, Inc. (publisher of financial services information) (Jan. 2009 – Nov. 2014). | 95 | None. |
| Independent Trustees (continued) | |||
| Name,
Year of Birth, and Position(s) with the trust; (Terms of office, and length of Time Served1) |
Principal
Occupations During the Past Five Years |
Number
of Portfolios in Fund Complex Overseen by the Trustee |
Other Directorships |
| Gerald
B. Smith 1950 Trustee (Trustee of The Charles Schwab Family of Funds, Schwab Investments, Schwab Capital Trust and Schwab Annuity Portfolios since 2000; Laudus Trust and Laudus Institutional Trust since 2010) |
Chairman, Chief Executive Officer and Founder of Smith Graham & Co. (investment advisors) (1990 – present). | 74 | Director,
Eaton (2012 – present) Director and Chairman of the Audit Committee, Oneok Partners LP (2003 – 2013) Director, Oneok, Inc. (2009 – 2013) Lead Independent Director, Board of Cooper Industries (2002 – 2012) |
| Joseph
H. Wender 1944 Trustee (Trustee of The Charles Schwab Family of Funds, Schwab Investments, Schwab Capital Trust and Schwab Annuity Portfolios since 2008; Laudus Trust and Laudus Institutional Trust since 2010) |
Senior Consultant, Goldman Sachs & Co., Inc. (investment banking and securities firm) (Jan. 2008 – present); Partner, Colgin Partners, LLC (vineyards) (Feb. 1998 – present). | 74 | Board Member and Chairman of the Audit Committee, Isis Pharmaceuticals (1994 – present) |
| Interested Trustees | |||
| Name,
Year of Birth, and Position(s) with the trust; (Terms of office, and length of Time Served) |
Principal
Occupations During the Past Five Years |
Number
of Portfolios in Fund Complex Overseen by the Trustee |
Other Directorships |
| Charles
R. Schwab2 1937 Chairman and Trustee (Chairman and Trustee of The Charles Schwab Family of Funds since 1989; Schwab Investments since 1991; Schwab Capital Trust since 1993; Schwab Annuity Portfolios since 1994; Laudus Trust and Laudus Institutional Trust since 2010) |
Chairman and Director, The Charles Schwab Corporation (1986 – present); Chairman and Director of Charles Schwab & Co., Inc. (1971 – present); Chairman and Director of Charles Schwab Investment Management, Inc. (1989 – present); Chairman and Director of Charles Schwab Bank (2003 – present); Chairman and Chief Executive Officer of Schwab (SIS) Holdings Inc. I and Schwab International Holdings, Inc. (1996 – present); and Director, Chairman and Chief Executive Officer, Schwab Holdings, Inc. (1979 – present). | 74 | Chairman
and Director, The Charles Schwab Corporation (1986 – present) Director, Yahoo! Inc. (2014 – present) |
| Walter
W. Bettinger II2 1960 Trustee (Trustee of The Charles Schwab Family of Funds, Schwab Investments, Schwab Capital Trust and Schwab Annuity Portfolios since 2008; Schwab Strategic Trust since 2009; Laudus Trust and Laudus Institutional Trust since 2010) |
Director, President and Chief Executive Officer, The Charles Schwab Corporation and Charles Schwab & Co., Inc. (2008 – present); Director, Charles Schwab Bank (2006 – present); and Director, Schwab Holdings, Inc. (2008 – present). | 95 | Director, The Charles Schwab Corporation (2008 – present) |
| Officers of the Trust | |
| Name,
Year of Birth, and Position(s) with the trust; (Terms of office, and length of Time Served3) |
Principal Occupations During the Past Five Years |
| Marie
Chandoha 1961 President and Chief Executive Officer (Officer of The Charles Schwab Family of Funds, Schwab Investments, Schwab Capital Trust, Schwab Annuity Portfolios, Laudus Trust and Laudus Institutional Trust since 2010) |
Director, President and Chief Executive Officer (Dec. 2010 – present), Chief Investment Officer (Sept. 2010 – Oct. 2011), Charles Schwab Investment Management, Inc.; President, Chief Executive Officer (Dec. 2010 – present), and Chief Investment Officer (Sept. 2010 – Oct. 2011), Schwab Funds, Laudus Funds and Schwab ETFs; Director, Charles Schwab Worldwide Funds plc and Charles Schwab Asset Management (Ireland) Limited (January 2011 – present); Global Head of Fixed Income Business Division, BlackRock, Inc. (formerly Barclays Global Investors) (March 2007 – August 2010). |
| George
Pereira 1964 Treasurer and Principal Financial Officer, Schwab Funds Treasurer and Chief Financial Officer, Laudus Funds (Officer of The Charles Schwab Family of Funds, Schwab Investments, Schwab Capital Trust and Schwab Annuity Portfolios since 2004; Laudus Trust and Laudus Institutional Trust since 2006) |
Senior Vice President and Chief Financial Officer (Nov. 2004 – present), Chief Operating Officer (Jan. 2011 – present), Charles Schwab Investment Management, Inc.; Treasurer and Chief Financial Officer, Laudus Funds (June 2006 – present); Treasurer and Principal Financial Officer, Schwab Funds (Nov. 2004 – present) and Schwab ETFs (Oct. 2009 – present); Director, Charles Schwab Worldwide Funds plc and Charles Schwab Asset Management (Ireland) Limited (April 2005 – present). |
| Omar
Aguilar 1970 Senior Vice President and Chief Investment Officer – Equities (Officer of The Charles Schwab Family of Funds, Schwab Investments, Schwab Capital Trust, Schwab Annuity Portfolios, Laudus Trust and Laudus Institutional Trust since 2011) |
Senior Vice President and Chief Investment Officer – Equities, Charles Schwab Investment Management, Inc. (April 2011 – present); Senior Vice President and Chief Investment Officer – Equities, Schwab Funds, Laudus Funds and Schwab ETFs (June 2011 – present); Head of the Portfolio Management Group and Vice President of Portfolio Management, Financial Engines, Inc. (May 2009 – April 2011); Head of Quantitative Equity, ING Investment Management (July 2004 – Jan. 2009). |
| Brett
Wander 1961 Senior Vice President and Chief Investment Officer – Fixed Income (Officer of The Charles Schwab Family of Funds, Schwab Investments, Schwab Capital Trust, Schwab Annuity Portfolios, Laudus Trust and Laudus Institutional Trust since 2011) |
Senior Vice President and Chief Investment Officer – Fixed Income, Charles Schwab Investment Management, Inc. (April 2011 – present); Senior Vice President and Chief Investment Officer – Fixed Income, Schwab Funds, Laudus Funds and Schwab ETFs (June 2011 – present); Senior Managing Director, Global Head of Active Fixed-Income Strategies, State Street Global Advisors (Jan. 2008 – Oct. 2010); Director of Alpha Strategies Loomis, Sayles & Company (April 2006 – Jan. 2008). |
| David
Lekich 1964 Chief Legal Officer and Secretary, Schwab Funds Vice President and Assistant Clerk, Laudus Funds (Officer of The Charles Schwab Family of Funds, Schwab Investments, Schwab Capital Trust, Schwab Annuity Portfolios, Laudus Trust and Laudus Institutional Trust since 2011) |
Senior Vice President (Sept. 2011 – present), Vice President (March 2004 – Sept. 2011), Charles Schwab & Co., Inc.; Senior Vice President and Chief Counsel (Sept. 2011 – present), Vice President (Jan. 2011 – Sept. 2011), Charles Schwab Investment Management, Inc.; Secretary (April 2011 – present) and Chief Legal Officer (Dec. 2011 – present), Schwab Funds; Vice President and Assistant Clerk, Laudus Funds (April 2011 – present); Secretary (May 2011 – present) and Chief Legal Officer (Nov. 2011 – present), Schwab ETFs. |
| Catherine
MacGregor 1964 Vice President and Assistant Secretary, Schwab Funds Chief Legal Officer, Vice President and Clerk, Laudus Funds (Officer of The Charles Schwab Family of Funds, Schwab Investments, Schwab Capital Trust, Schwab Annuity Portfolios, Laudus Trust and Laudus Institutional Trust since 2005) |
Vice President, Charles Schwab & Co., Inc., Charles Schwab Investment Management, Inc. (July 2005 – present); Vice President (Dec. 2005 – present), Chief Legal Officer and Clerk (March 2007 – present), Laudus Funds; Vice President (Nov. 2005 – present) and Assistant Secretary (June 2007 – present), Schwab Funds; Vice President and Assistant Secretary, Schwab ETFs (Oct. 2009 – present). |
| 1 | Trustees remain in office until they resign, retire or are removed by shareholder vote. The Schwab and Laudus Funds’ retirement policy requires that independent trustees retire at age 72 or after twenty years as a trustee, whichever comes first. In addition, the retirement policy requires any independent trustee of Schwab Funds or Laudus Funds to retire from all Boards upon their required retirement date from either Board. |
| 2 | Mr. Schwab and Mr. Bettinger are Interested Trustees because they own stock of The Charles Schwab Corporation, the parent company of the investment adviser. |
| 3 | The President, Treasurer and Secretary/Clerk hold office until their respective successors are chosen and qualified or until he or she sooner dies, resigns, is removed or becomes disqualified. Each of the other officers serves at the pleasure of the Boards. |
211 Main Street, San Francisco, CA 94105
1-800-435-4000
© 2015 Charles Schwab & Co., Inc. All rights reserved.
Member SIPC®
Printed on recycled paper.
00149457
Table of Contents
Schwab Investor Money Fund®
by viewing these documents online.
Sign up at schwab.com/paperless

Schwab Investor Money Fund®


| 1 | A fund’s share price is its NAV, which is the fund’s net assets divided by the number of its shares outstanding. Under the new amendments, Retail Prime and Municipal money market funds, as well as Government money market funds, will continue to be permitted to transact at a constant NAV of $1.00. Note that while a fund may seek to maintain a constant NAV, there is no guarantee that it will be able to do so. |
 |
Linda Klingman, Vice President and Head of Taxable Money Market Strategies, leads the portfolio management team of Schwab’s prime and government taxable money funds. Ms. Klingman also has overall responsibility for all aspects of the management of the funds. Prior to joining CSIM in 1990, Ms. Klingman was a senior money market trader with AIM Management. She has managed money market funds since 1988. |
 |
Michael Lin, Managing Director and Senior Portfolio Manager, is responsible for the day-to-day co-management of the funds. Mr. Lin has been a portfolio manager with CSIM since 2006, and also worked in CSIM’s Fund Administration group for nearly four years, where he focused on security pricing and valuation of Schwab Funds. Prior to joining CSIM, he spent three years at American Century Investments, most recently as a senior trader of the taxable money market funds. |
 |
Jonathan Roman, Portfolio Manager, is responsible for the day-to-day co-management of the funds. Mr. Roman has been a portfolio manager with CSIM since 2010, and has held a number of positions at the firm since beginning his tenure in 2005. In 2009, he joined the Portfolio Management group as a Trader, and prior to that he worked in the Portfolio Operations and Analytics group providing trading support to the taxable money market desk. |
 |
Jonathan Feske, CFA, Portfolio Manager, is responsible for the day-to-day co-management of the funds. He previously was responsible for credit and investment research for global banks for CSIM’s taxable bond and money funds. Prior to joining CSIM in 2011, Mr. Feske was a high-yield bond analyst for more than two years at Miller Tabak Roberts Securities, a boutique corporate bond broker-dealer, which is now part of GMP Capital. He covered both U.S. and emerging market credits, focusing on distressed situations in various industrial sectors. Previously, Mr. Feske was employed in the securities industry as an equity trader for three years. |
| 1 | The investment adviser and its affiliates may recapture expenses or fees they waived under a voluntary yield waiver until the third anniversary of the end of the fiscal year in which such waiver occurs, subject to certain limitations. For more information on the potential impact of such recapture on future yields, see financial note 5. |
| 2 | As shown in the Portfolio Holdings section of the shareholder report. |
| 3 | Money funds must maintain a dollar-weighted average maturity of no longer than 60 days and cannot invest in any security whose effective maturity is longer than 397 days (approximately 13 months). |
| 4 | Tier 1 securities are rated in the highest short-term rating category by two nationally recognized statistical rating organizations (“NRSROs”), or by one if only one NRSRO has rated the securities, or, if unrated, determined to be of comparable quality by CSIM pursuant to guidelines adopted by the Board of Trustees. Money market fund shares and U.S. government securities are also Tier 1 securities. The fund uses NRSRO credit ratings from Standard & Poor’s Corp., Moody’s Investors Service, Fitch Ratings, and/or DBRS. The fund may use different ratings provided by other rating agencies for purposes of determining compliance with the fund’s investment policies. The fund itself has not been rated by an independent credit rating agency. |

| Schwab Retirement Advantage Money Fund | |
| Ticker Symbol | SWIXX |
| Minimum Initial Investment1 | $25,000 |
| Seven-Day Yield2 | 0.01% |
| Seven-Day Yield–Without Contractual Expense Limitation3 | -0.14% |
| Seven-Day Effective Yield2 | 0.01% |
| 1 | Please see prospectus for further detail and eligibility requirements. |
| 2 | Yield reflects the effect of the fund’s agreement with the investment adviser and its affiliates to limit the fund's total annual operating expenses to certain levels (contractual expense limitation). In addition, the investment adviser and its affiliates have voluntarily waived expenses in excess of the contractual expense limitation to maintain a positive net yield for the fund (voluntary yield waiver). Without the contractual expense limitation and the voluntary yield waiver, the fund’s yield would have been lower. For additional details, see financial note 4. |
| 3 | Yield does not reflect the effect of the contractual expense limitation, but does reflect the effect of the voluntary yield waiver. The voluntary yield waiver added 0.20% to the seven-day yield. |
| 1 | The investment adviser and its affiliates may recapture expenses or fees they waived under a voluntary yield waiver until the third anniversary of the end of the fiscal year in which such waiver occurs, subject to certain limitations. For more information on the potential impact of such recapture on future yields, see financial note 5. |
| 2 | As shown in the Portfolio Holdings section of the shareholder report. |
| 3 | Money funds must maintain a dollar-weighted average maturity of no longer than 60 days and cannot invest in any security whose effective maturity is longer than 397 days (approximately 13 months). |
| 4 | Tier 1 securities are rated in the highest short-term rating category by two nationally recognized statistical rating organizations (“NRSROs”), or by one if only one NRSRO has rated the securities, or, if unrated, determined to be of comparable quality by CSIM pursuant to guidelines adopted by the Board of Trustees. Money market fund shares and U.S. government securities are also Tier 1 securities. The fund uses NRSRO credit ratings from Standard & Poor’s Corp., Moody’s Investors Service, Fitch Ratings, and/or DBRS. The fund may use different ratings provided by other rating agencies for purposes of determining compliance with the fund’s investment policies. The fund itself has not been rated by an independent credit rating agency. |

| Schwab Investor Money Fund | |
| Ticker Symbol | SWRXX |
| Minimum Initial Investment1 | $1
Retirement Plan Participants $2,500 Other Investors |
| Seven-Day Yield2 | 0.01% |
| Seven-Day Yield–Without Contractual Expense Limitation3 | -0.03% |
| Seven-Day Effective Yield2 | 0.01% |
| 1 | Please see prospectus for further detail and eligibility requirements. |
| 2 | Yield reflects the effect of the fund’s agreement with the investment adviser and its affiliates to limit the fund's total annual operating expenses to certain levels (contractual expense limitation). In addition, the investment adviser and its affiliates have voluntarily waived expenses in excess of the contractual expense limitation to maintain a positive net yield for the fund (voluntary yield waiver). Without the contractual expense limitation and the voluntary yield waiver, the fund’s yield would have been lower. For additional details, see financial note 4. |
| 3 | Yield does not reflect the effect of the contractual expense limitation, but does reflect the effect of the voluntary yield waiver. The voluntary yield waiver added 0.34% to the seven-day yield. |
| Expense
Ratio1 (Annualized) |
Beginning
Account Value at 1/1/15 |
Ending
Account Value (Net of Expenses) at 6/30/15 |
Expenses
Paid During Period2 1/1/15–6/30/15 | |
| Schwab Retirement Advantage Money Fund | ||||
| Actual Return | 0.23% | $1,000.00 | $ 1,000.10 | $1.14 |
| Hypothetical 5% Return | 0.23% | $1,000.00 | $1,023.66 | $1.15 |
| Schwab Investor Money Fund | ||||
| Actual Return | 0.23% | $1,000.00 | $ 1,000.10 | $1.14 |
| Hypothetical 5% Return | 0.23% | $1,000.00 | $1,023.66 | $1.15 |
| 1 | Based on the most recent six-month expense ratio; may differ from the expense ratio provided in the Financial Highlights. |
| 2 | Expenses for each fund are equal to its annualized expense ratio, multiplied by the average account value over the period, multiplied by 181 days of the period, and divided by 365 days of the fiscal year. |
| 1/1/15–
6/30/15* |
1/1/14–
12/31/14 |
1/1/13–
12/31/13 |
1/1/12–
12/31/12 |
1/1/11–
12/31/11 |
1/1/10–
12/31/10 | |
| Per-Share Data ($) | ||||||
| Net asset value at beginning of period | 1.00 | 1.00 | 1.00 | 1.00 | 1.00 | 1.00 |
| Income (loss) from investment operations: | ||||||
| Net investment income (loss) | 0.00 1,2 | 0.00 2 | 0.00 2 | 0.00 2 | 0.00 2 | 0.00 2 |
| Net realized and unrealized gains (losses) | (0.00) 2 | 0.00 2 | 0.00 2 | 0.00 2 | 0.00 2 | 0.00 2,3 |
| Total from investment operations | 0.00 2 | 0.00 2 | 0.00 2 | 0.00 2 | 0.00 2 | 0.00 2 |
| Less distributions: | ||||||
| Distributions from net investment income | (0.00) 2 | (0.00) 2 | (0.00) 2 | (0.00) 2 | (0.00) 2 | (0.00) 2 |
| Net asset value at end of period | 1.00 | 1.00 | 1.00 | 1.00 | 1.00 | 1.00 |
| Total return (%) | 0.01 4 | 0.01 | 0.01 | 0.01 | 0.01 | 0.01 |
| Ratios/Supplemental Data (%) | ||||||
| Ratios to average net assets: | ||||||
| Net operating expenses | 0.23 5,6 | 0.21 6 | 0.24 6 | 0.27 6 | 0.25 6 | 0.34 6 |
| Gross operating expenses | 0.61 5 | 0.61 | 0.61 | 0.61 | 0.60 | 0.60 |
| Net investment income (loss) | 0.01 5 | 0.01 | 0.01 | 0.01 | 0.01 | 0.01 |
| Net assets, end of period ($ x 1,000,000) | 682 | 741 | 784 | 806 | 846 | 873 |
| * | Unaudited. |
| Holdings by Category | Cost
($) |
Value
($) | |
| 58.4% | Fixed-Rate Obligations | 397,913,169 | 397,913,169 |
| 20.2% | Variable-Rate Obligations | 138,001,499 | 138,001,499 |
| 28.5% | Repurchase Agreements | 194,448,223 | 194,448,223 |
| 107.1% | Total Investments | 730,362,891 | 730,362,891 |
| (7.1%) | Other Assets and Liabilities, Net | (48,524,874) | |
| 100.0% | Net Assets | 681,838,017 | |
| Issuer | Footnotes | Rate | Effective
Maturity |
Maturity
Date |
Face
Amount ($) |
Value
($) |
| Fixed-Rate Obligations 58.4% of net assets | ||||||
| Asset Backed Commercial Paper 9.8% | ||||||
| Cancara Asset Securitisation, LLC | a,b | 0.27% | 09/25/15 | 5,000,000 | 4,996,775 | |
| Chariot Funding, LLC | a,b | 0.29% | 07/01/15 | 3,000,000 | 3,000,000 | |
| a,b | 0.30% | 10/19/15 | 7,000,000 | 6,993,583 | ||
| Ciesco, LLC | a,b | 0.31% | 11/04/15 | 9,000,000 | 8,990,235 | |
| Collateralized Commercial Paper Co, LLC | a | 0.42% | 12/09/15 | 3,000,000 | 2,994,365 | |
| CRC Funding, LLC | a,b | 0.30% | 09/23/15 | 7,000,000 | 6,995,100 | |
| a,b | 0.40% | 12/17/15 | 2,000,000 | 1,996,245 | ||
| Crown Point Capital Co, LLC | a,b | 0.20% | 07/06/15 | 1,000,000 | 999,972 | |
| Jupiter Securitization Corp | a,b | 0.29% | 07/01/15 | 5,000,000 | 5,000,000 | |
| a,b | 0.42% | 12/18/15 | 5,000,000 | 4,990,083 | ||
| a,b | 0.47% | 01/05/16 | 1,000,000 | 997,546 | ||
| Nieuw Amsterdam Receivables Corp | a,b | 0.16% | 07/20/15 | 3,000,000 | 2,999,747 | |
| a,b | 0.24% | 09/03/15 | 4,000,000 | 3,998,293 | ||
| Old Line Funding, LLC | a,b | 0.30% | 09/24/15 | 4,000,000 | 3,997,167 | |
| Sheffield Receivables Co, LLC | a,b | 0.35% | 08/03/15 | 4,000,000 | 3,998,717 | |
| Thunder Bay Funding, LLC | a,b | 0.40% | 12/16/15 | 4,000,000 | 3,992,533 | |
| 66,940,361 | ||||||
| Financial Company Commercial Paper 8.7% | ||||||
| Bank of Nova Scotia | b | 0.32% | 11/09/15 | 1,000,000 | 998,835 | |
| Issuer | Footnotes | Rate | Effective
Maturity |
Maturity
Date |
Face
Amount ($) |
Value
($) |
| BPCE SA | b | 0.23% | 07/09/15 | 3,000,000 | 2,999,847 | |
| General Electric Capital Corp | 0.06% | 07/01/15 | 18,000,000 | 18,000,000 | ||
| HSBC Bank PLC | b | 0.32% | 10/29/15 | 4,000,000 | 3,995,733 | |
| ING (U.S.) Funding, LLC | a | 0.27% | 09/01/15 | 2,000,000 | 1,999,070 | |
| a | 0.36% | 10/06/15 | 6,000,000 | 5,994,180 | ||
| a | 0.41% | 11/16/15 | 4,000,000 | 3,993,713 | ||
| Nationwide Building Society | 0.40% | 08/13/15 | 6,000,000 | 5,997,133 | ||
| NRW.BANK | 0.09% | 07/01/15 | 5,000,000 | 5,000,000 | ||
| 0.14% | 07/06/15 | 5,000,000 | 4,999,903 | |||
| Oversea-Chinese Banking Corp, Ltd | 0.20% | 08/27/15 | 2,000,000 | 1,999,367 | ||
| Societe Generale | b | 0.22% | 08/03/15 | 2,000,000 | 1,999,597 | |
| Swedbank AB | 0.27% | 08/04/15 | 1,000,000 | 999,745 | ||
| 58,977,123 | ||||||
| Other Commercial Paper 1.6% | ||||||
| Toyota Motor Credit Corp | a | 0.20% | 09/09/15 | 11,000,000 | 10,995,722 | |
| Certificates of Deposit 31.4% | ||||||
| Abbey National Treasury Services PLC | a | 0.30% | 08/03/15 | 7,000,000 | 7,000,000 | |
| Australia & New Zealand Banking Group, Ltd | 0.22% | 09/21/15 | 8,000,000 | 8,000,000 | ||
| Bank of Montreal | 0.29% | 10/15/15 | 9,000,000 | 9,000,000 | ||
| 0.31% | 11/12/15 | 1,000,000 | 1,000,000 | |||
| Bank of Nova Scotia | 0.30% | 08/17/15 | 9,000,000 | 9,000,000 | ||
| 0.25% | 09/23/15 | 4,000,000 | 4,000,000 | |||
| 0.30% | 10/13/15 | 5,000,000 | 5,000,000 | |||
| Bank of the West | 0.25% | 07/09/15 | 3,000,000 | 3,000,000 | ||
| Bank of Tokyo Mitsubishi UFJ, Ltd | 0.33% | 08/26/15 | 7,000,000 | 7,000,000 | ||
| 0.34% | 10/05/15 | 2,000,000 | 2,000,000 | |||
| 0.34% | 10/06/15 | 7,000,000 | 7,000,000 | |||
| Barclays Bank PLC | 0.45% | 08/17/15 | 1,000,000 | 1,000,000 | ||
| 0.53% | 09/02/15 | 1,000,000 | 1,000,000 | |||
| 0.53% | 10/05/15 | 6,000,000 | 6,000,000 | |||
| 0.92% | 05/23/16 | 4,000,000 | 4,000,000 | |||
| BNP Paribas | 0.25% | 09/01/15 | 1,000,000 | 1,000,000 | ||
| 0.38% | 09/17/15 | 4,000,000 | 4,000,000 | |||
| 0.38% | 09/18/15 | 3,000,000 | 3,000,000 | |||
| Canadian Imperial Bank of Commerce | 0.10% | 07/01/15 | 4,000,000 | 4,000,000 | ||
| Chase Bank USA, NA | 0.38% | 12/07/15 | 4,000,000 | 4,000,000 | ||
| Credit Agricole Corporate and Investment Bank | 0.23% | 07/10/15 | 4,000,000 | 4,000,000 | ||
| 0.30% | 09/01/15 | 2,000,000 | 2,000,000 | |||
| Credit Agricole SA | 0.29% | 10/01/15 | 4,000,000 | 4,000,000 | ||
| Issuer | Footnotes | Rate | Effective
Maturity |
Maturity
Date |
Face
Amount ($) |
Value
($) |
| Credit Suisse AG | 0.30% | 09/15/15 | 4,000,000 | 4,000,000 | ||
| 0.45% | 12/18/15 | 3,000,000 | 3,000,000 | |||
| HSBC Bank PLC | 0.35% | 10/28/15 | 7,000,000 | 7,000,000 | ||
| 0.35% | 11/20/15 | 1,000,000 | 1,000,000 | |||
| 0.43% | 12/23/15 | 4,000,000 | 4,000,000 | |||
| HSBC Bank USA | 0.40% | 12/09/15 | 2,000,000 | 2,000,000 | ||
| ING Bank NV | 0.42% | 11/02/15 | 2,000,000 | 2,000,000 | ||
| JPMorgan Chase Bank, NA | 0.28% | 09/03/15 | 2,000,000 | 2,000,000 | ||
| Lloyds Bank PLC | 0.30% | 08/10/15 | 1,000,000 | 1,000,000 | ||
| Mitsubishi UFJ Trust & Banking Corp | 0.31% | 07/01/15 | 2,000,000 | 2,000,000 | ||
| 0.33% | 08/24/15 | 1,000,000 | 1,000,000 | |||
| 0.32% | 10/09/15 | 3,000,000 | 3,000,000 | |||
| 0.35% | 10/21/15 | 1,000,000 | 1,000,000 | |||
| Mizuho Bank, Ltd | 0.30% | 07/29/15 | 5,000,000 | 5,000,000 | ||
| 0.27% | 08/11/15 | 7,000,000 | 7,000,000 | |||
| 0.28% | 09/17/15 | 1,000,000 | 1,000,000 | |||
| 0.28% | 09/18/15 | 2,000,000 | 2,000,000 | |||
| 0.35% | 11/13/15 | 2,000,000 | 2,000,000 | |||
| National Australia Bank, Ltd | 0.27% | 09/02/15 | 2,000,000 | 2,000,000 | ||
| National Bank of Canada | 0.33% | 08/18/15 | 5,000,000 | 5,000,000 | ||
| Natixis SA | 0.27% | 07/08/15 | 1,000,000 | 1,000,000 | ||
| 0.29% | 08/04/15 | 4,000,000 | 4,000,000 | |||
| Nordea Bank Finland PLC | 0.24% | 09/28/15 | 3,000,000 | 2,999,963 | ||
| Societe Generale | 0.26% | 08/31/15 | 5,000,000 | 5,000,000 | ||
| Sumitomo Mitsui Banking Corp | 0.31% | 07/01/15 | 1,000,000 | 1,000,000 | ||
| 0.28% | 09/17/15 | 1,000,000 | 1,000,000 | |||
| 0.27% | 09/22/15 | 2,000,000 | 2,000,000 | |||
| 0.34% | 10/16/15 | 1,000,000 | 1,000,000 | |||
| 0.37% | 10/28/15 | 2,000,000 | 2,000,000 | |||
| 0.35% | 11/06/15 | 1,000,000 | 1,000,000 | |||
| 0.40% | 11/12/15 | 6,000,000 | 6,000,000 | |||
| 0.35% | 11/16/15 | 2,000,000 | 2,000,000 | |||
| Sumitomo Mitsui Trust Bank, Ltd | 0.25% | 07/13/15 | 5,000,000 | 5,000,000 | ||
| 0.27% | 08/31/15 | 3,000,000 | 3,000,000 | |||
| 0.27% | 09/08/15 | 3,000,000 | 3,000,000 | |||
| 0.28% | 09/16/15 | 1,000,000 | 1,000,000 | |||
| Toronto-Dominion Bank | 0.30% | 10/27/15 | 3,000,000 | 3,000,000 | ||
| 0.30% | 11/02/15 | 2,000,000 | 2,000,000 | |||
| 0.39% | 11/12/15 | 2,000,000 | 2,000,000 | |||
| 0.39% | 12/01/15 | 3,000,000 | 3,000,000 | |||
| UBS AG | 0.10% | 07/06/15 | 6,000,000 | 6,000,000 | ||
| 213,999,963 | ||||||
| Other Instruments 4.1% | ||||||
| Australia & New Zealand Banking Group, Ltd | 0.12% | 07/01/15 | 4,000,000 | 4,000,000 | ||
| Issuer | Footnotes | Rate | Effective
Maturity |
Maturity
Date |
Face
Amount ($) |
Value
($) |
| DZ Bank AG Deutsche Zentral-Genossenschaftsbank | 0.10% | 07/02/15 | 7,000,000 | 7,000,000 | ||
| National Australia Bank, Ltd | 0.06% | 07/01/15 | 12,000,000 | 12,000,000 | ||
| Skandinaviska Enskilda Banken AB | 0.10% | 07/02/15 | 5,000,000 | 5,000,000 | ||
| 28,000,000 | ||||||
| Other Notes 2.8% | ||||||
| Bank of America, NA | 0.28% | 07/07/15 | 3,000,000 | 3,000,000 | ||
| 0.30% | 08/18/15 | 5,000,000 | 5,000,000 | |||
| 0.23% | 09/01/15 | 7,000,000 | 7,000,000 | |||
| 0.24% | 09/18/15 | 4,000,000 | 4,000,000 | |||
| 19,000,000 | ||||||
| Total Fixed-Rate Obligations | ||||||
| (Cost $397,913,169) | 397,913,169 | |||||
| Variable-Rate Obligations 20.2% of net assets | ||||||
| Financial Company Commercial Paper 1.5% | ||||||
| Commonwealth Bank of Australia | b | 0.32% | 07/13/15 | 05/12/16 | 5,000,000 | 5,000,000 |
| HSBC Bank PLC | b | 0.32% | 07/06/15 | 01/04/16 | 3,000,000 | 3,000,000 |
| Westpac Banking Corp | b | 0.27% | 07/27/15 | 2,000,000 | 2,000,000 | |
| 10,000,000 | ||||||
| Certificates of Deposit 13.3% | ||||||
| Bank of Nova Scotia | 0.28% | 07/08/15 | 12/08/15 | 2,000,000 | 2,000,000 | |
| Bank of Tokyo Mitsubishi UFJ, Ltd | 0.54% | 07/10/15 | 03/10/16 | 5,000,000 | 5,000,000 | |
| JPMorgan Chase Bank, NA | 0.33% | 07/22/15 | 10/22/15 | 1,000,000 | 1,000,000 | |
| 0.33% | 07/23/15 | 10/23/15 | 2,000,000 | 2,000,000 | ||
| 0.33% | 07/27/15 | 10/27/15 | 5,000,000 | 5,000,000 | ||
| 0.32% | 07/08/15 | 12/08/15 | 4,000,000 | 4,000,000 | ||
| Royal Bank of Canada | 0.27% | 07/06/15 | 09/04/15 | 5,000,000 | 5,000,000 | |
| 0.29% | 07/06/15 | 01/06/16 | 3,000,000 | 3,000,000 | ||
| 0.32% | 07/13/15 | 04/13/16 | 3,000,000 | 3,000,000 | ||
| State Street Bank & Trust Co, NA | 0.33% | 07/13/15 | 03/11/16 | 9,000,000 | 9,000,000 | |
| Toronto-Dominion Bank | 0.26% | 07/21/15 | 4,000,000 | 4,000,000 | ||
| 0.34% | 07/17/15 | 03/17/16 | 7,000,000 | 7,000,000 | ||
| 0.34% | 07/27/15 | 05/27/16 | 5,000,000 | 5,000,000 | ||
| Wells Fargo Bank, NA | 0.27% | 07/08/15 | 08/10/15 | 7,000,000 | 7,000,000 | |
| 0.29% | 07/21/15 | 11/23/15 | 10,000,000 | 10,000,000 | ||
| 0.31% | 07/08/15 | 02/08/16 | 4,000,000 | 4,000,000 | ||
| 0.33% | 07/13/15 | 05/05/16 | 2,000,000 | 2,000,000 | ||
| Westpac Banking Corp | 0.32% | 07/13/15 | 02/12/16 | 3,000,000 | 3,000,000 | |
| 0.34% | 07/01/15 | 07/01/16 | 10,000,000 | 10,000,000 | ||
| 91,000,000 | ||||||
| Variable Rate Demand Notes 1.0% | ||||||
| New York City IDA | ||||||
| IDRB (Allway Tools) Series 1997 | a | 0.43% | 07/07/15 | 50,000 | 50,000 | |
| Issuer | Footnotes | Rate | Effective
Maturity |
Maturity
Date |
Face
Amount ($) |
Value
($) |
| Palm Springs, CA | ||||||
| COP (Downtown Parking) Series 2002A | a | 0.16% | 07/07/15 | 6,915,000 | 6,915,000 | |
| 6,965,000 | ||||||
| Other Notes 2.9% | ||||||
| Bank of America, NA | 0.39% | 07/06/15 | 04/04/16 | 2,000,000 | 2,000,000 | |
| Canadian Imperial Bank of Commerce | 0.31% | 07/10/15 | 03/04/16 | 6,000,000 | 6,000,000 | |
| Royal Bank of Canada | 0.39% | 07/06/15 | 07/01/16 | 5,000,000 | 5,000,000 | |
| b | 0.36% | 07/07/15 | 07/06/16 | 7,000,000 | 7,000,000 | |
| Whistlejacket Capital, LLC | c,† | n/a | n/a | n/a | 36,930 | 36,930 |
| 20,036,930 | ||||||
| Treasury Debt 1.5% | ||||||
| United States Treasury Department | 0.06% | 07/01/15 | 01/31/16 | 5,000,000 | 4,999,569 | |
| 0.09% | 07/01/15 | 07/31/16 | 3,000,000 | 3,000,000 | ||
| 0.10% | 07/01/15 | 01/31/17 | 2,000,000 | 2,000,000 | ||
| 9,999,569 | ||||||
| Total Variable-Rate Obligations | ||||||
| (Cost $138,001,499) | 138,001,499 | |||||
| Issuer | Footnotes | Rate | Effective
Maturity |
Maturity
Date |
Maturity Amount ($) |
Value
($) |
| Repurchase Agreements 28.5% of net assets | ||||||
| Government Agency Repurchase Agreements* 19.8% | ||||||
| BNP Paribas Securities Corp | ||||||
| Issued
06/30/15, repurchase date 07/01/15 (Collateralized by U.S. Government Agency Securities valued at $11,329,998, 0.25% - 4.50%, due 12/31/15 - 03/20/41) |
0.10% | 07/01/15 | 11,000,031 | 11,000,000 | ||
| Deutsche Bank Securities, Inc | ||||||
| Issued
06/30/15, repurchase date 07/01/15 (Collateralized by U.S. Government Agency Securities valued at $5,150,684, 3.00%, due 03/01/28) |
0.18% | 07/01/15 | 5,000,025 | 5,000,000 | ||
| Goldman Sachs & Co | ||||||
| Issued
06/25/15, repurchase date 07/02/15 (Collateralized by U.S. Government Agency Securities valued at $27,540,001, 3.50% - 5.50%, due 05/15/38 - 06/20/45) |
0.08% | 07/02/15 | 27,000,420 | 27,000,000 | ||
| JP Morgan Securities, LLC | ||||||
| Issued
06/30/15, repurchase date 07/01/15 (Collateralized by U.S. Government Agency Securities valued at $50,470,000, 2.00% - 3.50%, due 04/15/40 - 04/15/49) |
0.14% | 07/01/15 | 49,000,191 | 49,000,000 | ||
| Merrill Lynch, Pierce, Fenner & Smith, Inc | ||||||
| Issued
06/30/15, repurchase date 07/01/15 (Collateralized by U.S. Government Agency Securities valued at $36,050,000, 2.50%, due 11/25/22) |
0.14% | 07/01/15 | 35,000,136 | 35,000,000 | ||
| Mizuho Securities USA, Inc | ||||||
| Issued
06/30/15, repurchase date 07/01/15 (Collateralized by U.S. Government Agency Securities valued at $5,100,082, 0.50% - 1.00%, due 03/30/16 - 02/08/18) |
0.15% | 07/01/15 | 5,000,021 | 5,000,000 | ||
| Issuer | Footnotes | Rate | Effective
Maturity |
Maturity
Date |
Maturity Amount ($) |
Value
($) |
| Morgan Stanley & Co, LLC | ||||||
| Issued
06/30/15, repurchase date 07/01/15 (Collateralized by U.S. Government Agency Securities valued at $3,060,001, 4.00%, due 03/20/45) |
0.09% | 07/01/15 | 3,000,008 | 3,000,000 | ||
| 135,000,000 | ||||||
| Treasury Repurchase Agreements 4.6% | ||||||
| Barclays Capital, Inc | ||||||
| Issued
06/30/15, repurchase date 07/01/15 (Collateralized by U.S. Treasury Securities valued at $1,477,259, 3.13%, due 04/30/17) |
0.10% | 07/01/15 | 1,448,227 | 1,448,223 | ||
| Issued
06/25/15, repurchase date 07/02/15 (Collateralized by U.S. Treasury Securities valued at $25,500,057, 0.00% - 2.00%, due 07/23/15 - 11/15/21) |
0.05% | 07/02/15 | 25,000,243 | 25,000,000 | ||
| BNP Paribas Securities Corp | ||||||
| Issued
06/30/15, repurchase date 07/01/15 (Collateralized by U.S. Treasury Securities valued at $1,020,086, 0.13%, due 04/15/20) |
0.09% | 07/01/15 | 1,000,003 | 1,000,000 | ||
| JP Morgan Securities, LLC | ||||||
| Issued
06/22/15, repurchase date 07/22/15 (Collateralized by U.S. Treasury Securities valued at $4,080,121, 2.00% - 2.63%, due 07/31/20 - 05/15/24) |
0.08% | 07/07/15 | 4,000,133 | 4,000,000 | ||
| 31,448,223 | ||||||
| Other Repurchase Agreements** 4.1% | ||||||
| Credit Suisse Securities (USA), LLC | ||||||
| Issued
06/15/15, repurchase date 12/14/15 (Collateralized by common stocks, ETFs, corporate bonds, ABS, or non-agency collateralized mortgage obligations valued at $13,802,874, 3.89% - 3.99%, due 09/25/44 - 12/25/44) |
c | 0.80% | 10/03/15 | 12,029,333 | 12,000,000 | |
| JP Morgan Securities, LLC | ||||||
| Issued
06/04/15, repurchase date 12/01/15 (Collateralized by common stocks, ETFs, corporate bonds, ABS, or non-agency collateralized mortgage obligations valued at $1,150,541, 2.42% - 6.81%, due 02/15/18 - 09/25/57) |
c | 0.65% | 09/28/15 | 1,002,094 | 1,000,000 | |
| Issued
06/17/15, repurchase date 12/17/15 (Collateralized by common stocks, ETFs, corporate bonds, ABS, or non-agency collateralized mortgage obligations valued at $5,751,351, 3.19% - 6.55%, due 07/17/17 - 09/25/57) |
c | 0.65% | 09/28/15 | 5,009,299 | 5,000,000 | |
| Merrill Lynch, Pierce, Fenner & Smith, Inc | ||||||
| Issued
05/28/15, repurchase date 08/26/15 (Collateralized by common stocks, ETFs, corporate bonds, ABS, or non-agency collateralized mortgage obligations valued at $11,500,000, 0.00%, due 03/25/58) |
c | 0.58% | 08/04/15 | 10,010,956 | 10,000,000 | |
| 28,000,000 | ||||||
| Total Repurchase Agreements | ||||||
| (Cost $194,448,223) | 194,448,223 | |||||
At 06/30/15, the tax basis cost of the fund's investments was $730,362,891.
| a | Credit-enhanced security or liquidity-enhanced. |
| b | Securities exempt from registration under Rule 144A of the Securities Act of 1933, as amended. These securities may be resold in transactions exempt from registrations, normally to qualified institutional buyers. At the period end, the value of these amounted to $90,940,008 or 13.3% of net assets. |
| c | Illiquid security. At the period end, the value of these amounted to $28,036,930 or 4.1% of net assets. |
| † | Whistlejacket notes are in receivership, and the fund elected to sell all of its Whistlejacket notes at auction (April 29, 2009). The remaining investment represents an interest in a small residual fund that is being held to cover any remaining expenses and liabilities associated with receivership. |
| * | Usually collateralized via U.S. Government Agency Securities or less frequently by U.S. Treasury Securities. |
| ** | Usually collateralized via common stocks, ETFs, corporate bonds, ABS, or non-agency collateralized mortgage obligations or less frequently by U.S. Government Agency Securities and/ or U.S. Treasury Securities. |
| ABS — | Asset-backed securities |
| COP — | Certificate of participation |
| ETF — | Exchange Traded Fund |
| IDA — | Industrial development agency/authority |
| IDRB — | Industrial development revenue bond |
| Assets | ||
| Investments, at cost and value | $535,914,668 | |
| Repurchase agreements, at cost and value | + | 194,448,223 |
| Total investments, at cost and value (Note 2a) | 730,362,891 | |
| Receivables: | ||
| Fund shares sold | 6,697,095 | |
| Interest | 214,198 | |
| Prepaid expenses | + | 3,677 |
| Total assets | 737,277,861 | |
| Liabilities | ||
| Payables: | ||
| Shareholder service fees | 29,952 | |
| Fund shares redeemed | 55,386,925 | |
| Distributions to shareholders | 3,269 | |
| Accrued expenses | + | 19,698 |
| Total liabilities | 55,439,844 | |
| Net Assets | ||
| Total assets | 737,277,861 | |
| Total liabilities | – | 55,439,844 |
| Net assets | $681,838,017 | |
| Net Assets by Source | ||
| Capital received from investors | 681,820,077 | |
| Net investment income not yet distributed | 18,121 | |
| Net realized capital losses | (181) | |
| Net Asset Value (NAV) | ||||
| Net Assets | ÷ | Shares
Outstanding |
= | NAV |
| $681,838,017 | 681,836,629 | $1.00 | ||
| Investment Income | ||
| Interest | $866,824 | |
| Expenses | ||
| Investment adviser and administrator fees | 1,252,577 | |
| Shareholder service fees | 787,334 | |
| Portfolio accounting fees | 48,655 | |
| Custodian fees | 33,066 | |
| Professional fees | 18,800 | |
| Registration fees | 16,560 | |
| Independent trustees' fees | 14,851 | |
| Transfer agent fees | 10,163 | |
| Shareholder reports | 2,846 | |
| Other expenses | + | 7,099 |
| Total expenses | 2,191,951 | |
| Expense reduction by CSIM and its affiliates | – | 1,360,915 |
| Net expenses | – | 831,036 |
| Net investment income | 35,788 | |
| Realized Gains (Losses) | ||
| Net realized losses on investments | (181) | |
| Increase in net assets resulting from operations | $35,607 | |
| Operations | |||
| 1/1/15-6/30/15 | 1/1/14-12/31/14 | ||
| Net investment income | $35,788 | $74,554 | |
| Net realized gains (losses) | + | (181) | 250 |
| Increase in net assets from operations | 35,607 | 74,804 | |
| Distributions to Shareholders | |||
| Distributions from net investment income | ($36,068) | ($74,554) | |
| Transactions in Fund Shares* | |||
| Shares sold | 296,856,596 | 495,589,321 | |
| Shares reinvested | 32,550 | 74,188 | |
| Shares redeemed | + | (356,130,483) | (538,396,135) |
| Net transactions in fund shares | (59,241,337) | (42,732,626) | |
| Net Assets | |||
| Beginning of period | 741,079,815 | 783,812,191 | |
| Total decrease | + | (59,241,798) | (42,732,376) |
| End of period | $681,838,017 | $741,079,815 | |
| Net investment income not yet distributed | $18,121 | $18,401 | |
| * | Transactions took place at $1.00 per share; figures for share quantities are the same as for dollars. |
| 1/1/15–
6/30/15* |
1/1/14–
12/31/14 |
1/1/13–
12/31/13 |
1/1/12–
12/31/12 |
1/1/11–
12/31/11 |
1/1/10–
12/31/10 | |
| Per-Share Data ($) | ||||||
| Net asset value at beginning of period | 1.00 | 1.00 | 1.00 | 1.00 | 1.00 | 1.00 |
| Income (loss) from investment operations: | ||||||
| Net investment income (loss) | 0.00 1,2 | 0.00 2 | 0.00 2 | 0.00 2 | 0.00 2 | 0.00 2 |
| Net realized and unrealized gains (losses) | (0.00) 2 | 0.00 2 | 0.00 2 | 0.00 2 | 0.00 2 | 0.00 2,3 |
| Total from investment operations | 0.00 2 | 0.00 2 | 0.00 2 | 0.00 2 | 0.00 2 | 0.00 2 |
| Less distributions: | ||||||
| Distributions from net investment income | (0.00) 2 | (0.00) 2 | (0.00) 2 | (0.00) 2 | (0.00) 2 | (0.00) 2 |
| Net asset value at end of period | 1.00 | 1.00 | 1.00 | 1.00 | 1.00 | 1.00 |
| Total return (%) | 0.01 4 | 0.01 | 0.01 | 0.01 | 0.01 | 0.01 |
| Ratios/Supplemental Data (%) | ||||||
| Ratios to average net assets: | ||||||
| Net operating expenses | 0.23 5,6 | 0.21 6 | 0.25 6 | 0.27 6 | 0.25 6 | 0.34 6 |
| Gross operating expenses | 0.64 5 | 0.64 | 0.64 | 0.63 | 0.62 | 0.62 |
| Net investment income (loss) | 0.01 5 | 0.01 | 0.01 | 0.01 | 0.01 | 0.01 |
| Net assets, end of period ($ x 1,000,000) | 951 | 939 | 1,047 | 1,205 | 1,333 | 1,495 |
| * | Unaudited. |
| Holdings by Category | Cost
($) |
Value
($) | |
| 60.3% | Fixed-Rate Obligations | 572,888,818 | 572,888,818 |
| 18.3% | Variable-Rate Obligations | 173,747,806 | 173,747,806 |
| 21.2% | Repurchase Agreements | 201,649,822 | 201,649,822 |
| 99.8% | Total Investments | 948,286,446 | 948,286,446 |
| 0.2% | Other Assets and Liabilities, Net | 2,321,958 | |
| 100.0% | Net Assets | 950,608,404 | |
| Issuer | Footnotes | Rate | Effective
Maturity |
Maturity
Date |
Face
Amount ($) |
Value
($) |
| Fixed-Rate Obligations 60.3% of net assets | ||||||
| Asset Backed Commercial Paper 11.3% | ||||||
| CAFCO, LLC | a,b | 0.27% | 08/05/15 | 9,000,000 | 8,997,637 | |
| a,b | 0.28% | 09/22/15 | 4,000,000 | 3,997,418 | ||
| Cancara Asset Securitisation, LLC | a,b | 0.27% | 09/18/15 | 5,000,000 | 4,997,037 | |
| a,b | 0.27% | 09/25/15 | 6,000,000 | 5,996,130 | ||
| Chariot Funding, LLC | a,b | 0.29% | 07/01/15 | 8,000,000 | 8,000,000 | |
| a,b | 0.30% | 10/30/15 | 6,000,000 | 5,993,950 | ||
| Ciesco, LLC | a,b | 0.28% | 08/03/15 | 1,000,000 | 999,743 | |
| a,b | 0.31% | 11/02/15 | 4,000,000 | 3,995,729 | ||
| Collateralized Commercial Paper Co, LLC | a | 0.39% | 07/20/15 | 4,000,000 | 3,999,177 | |
| a | 0.35% | 10/23/15 | 3,000,000 | 2,996,675 | ||
| CRC Funding, LLC | a,b | 0.28% | 08/03/15 | 5,000,000 | 4,998,717 | |
| a,b | 0.40% | 12/17/15 | 6,000,000 | 5,988,733 | ||
| Crown Point Capital Co, LLC | a,b | 0.20% | 07/06/15 | 1,000,000 | 999,972 | |
| a,b | 0.30% | 09/03/15 | 2,000,000 | 1,998,933 | ||
| Jupiter Securitization Corp | a,b | 0.29% | 07/01/15 | 4,000,000 | 4,000,000 | |
| a,b | 0.47% | 01/05/16 | 10,000,000 | 9,975,456 | ||
| MetLife Short Term Funding LLC | a,b | 0.13% | 07/07/15 | 14,000,000 | 13,999,697 | |
| Ridgefield Funding Co, LLC | a,b | 0.30% | 09/15/15 | 5,000,000 | 4,996,833 | |
| Sheffield Receivables Co, LLC | a,b | 0.35% | 08/03/15 | 10,000,000 | 9,996,792 | |
| 106,928,629 | ||||||
| Issuer | Footnotes | Rate | Effective
Maturity |
Maturity
Date |
Face
Amount ($) |
Value
($) |
| Financial Company Commercial Paper 8.2% | ||||||
| BPCE SA | b | 0.23% | 07/09/15 | 3,000,000 | 2,999,847 | |
| b | 0.26% | 09/24/15 | 6,000,000 | 5,996,317 | ||
| DNB Bank ASA | b | 0.33% | 10/01/15 | 1,000,000 | 999,169 | |
| General Electric Capital Corp | a | 0.11% | 07/13/15 | 22,000,000 | 21,999,193 | |
| ING (U.S.) Funding, LLC | a | 0.38% | 10/19/15 | 10,000,000 | 9,988,389 | |
| a | 0.41% | 11/16/15 | 8,000,000 | 7,987,426 | ||
| Lloyds Bank PLC | 0.30% | 08/21/15 | 4,000,000 | 3,998,300 | ||
| Nationwide Building Society | 0.40% | 07/06/15 | 2,000,000 | 1,999,889 | ||
| 0.40% | 08/27/15 | 1,000,000 | 999,367 | |||
| 0.29% | 09/21/15 | 6,000,000 | 5,996,037 | |||
| NRW.BANK | 0.09% | 07/01/15 | 9,000,000 | 9,000,000 | ||
| Skandinaviska Enskilda Banken AB | 0.34% | 10/01/15 | 1,000,000 | 999,131 | ||
| Societe Generale | b | 0.22% | 08/03/15 | 5,000,000 | 4,998,992 | |
| 77,962,057 | ||||||
| Other Commercial Paper 0.5% | ||||||
| Toyota Motor Credit Corp | a | 0.28% | 08/14/15 | 4,000,000 | 3,998,631 | |
| a | 0.23% | 09/17/15 | 1,000,000 | 999,502 | ||
| 4,998,133 | ||||||
| Certificates of Deposit 33.6% | ||||||
| Abbey National Treasury Services PLC | a | 0.30% | 08/03/15 | 3,000,000 | 3,000,000 | |
| Australia & New Zealand Banking Group, Ltd | 0.22% | 09/21/15 | 4,000,000 | 4,000,000 | ||
| Bank of Montreal | 0.31% | 11/06/15 | 7,000,000 | 7,000,000 | ||
| 0.31% | 11/12/15 | 7,000,000 | 7,000,000 | |||
| Bank of Nova Scotia | 0.30% | 08/17/15 | 10,000,000 | 10,000,000 | ||
| 0.34% | 11/09/15 | 1,000,000 | 1,000,000 | |||
| Bank of the West | 0.26% | 07/23/15 | 2,000,000 | 2,000,000 | ||
| Bank of Tokyo Mitsubishi UFJ, Ltd | 0.34% | 10/06/15 | 3,000,000 | 3,000,000 | ||
| Barclays Bank PLC | 0.53% | 10/05/15 | 10,000,000 | 10,000,000 | ||
| 0.92% | 05/23/16 | 5,000,000 | 5,000,000 | |||
| BNP Paribas | 0.36% | 08/24/15 | 3,000,000 | 3,000,000 | ||
| 0.25% | 09/01/15 | 8,000,000 | 8,000,000 | |||
| 0.38% | 09/18/15 | 4,000,000 | 4,000,000 | |||
| Canadian Imperial Bank of Commerce | 0.10% | 07/01/15 | 22,000,000 | 22,000,000 | ||
| Chase Bank USA, NA | 0.35% | 10/23/15 | 10,000,000 | 10,000,000 | ||
| 0.38% | 12/07/15 | 9,000,000 | 9,000,000 | |||
| Citibank, NA | 0.28% | 07/01/15 | 6,000,000 | 6,000,000 | ||
| Credit Agricole Corporate and Investment Bank | 0.30% | 09/01/15 | 9,000,000 | 9,000,000 | ||
| Credit Agricole SA | 0.29% | 10/01/15 | 4,000,000 | 4,000,000 | ||
| Issuer | Footnotes | Rate | Effective
Maturity |
Maturity
Date |
Face
Amount ($) |
Value
($) |
| Credit Suisse AG | 0.25% | 07/13/15 | 4,000,000 | 4,000,000 | ||
| 0.30% | 09/15/15 | 4,000,000 | 4,000,000 | |||
| 0.45% | 12/18/15 | 6,000,000 | 6,000,000 | |||
| HSBC Bank PLC | 0.32% | 11/05/15 | 8,000,000 | 8,000,000 | ||
| 0.43% | 12/23/15 | 1,000,000 | 1,000,000 | |||
| HSBC Bank USA | 0.32% | 10/23/15 | 2,000,000 | 2,000,000 | ||
| 0.40% | 12/09/15 | 2,000,000 | 2,000,000 | |||
| JPMorgan Chase Bank, NA | 0.28% | 09/03/15 | 4,000,000 | 3,999,999 | ||
| Lloyds Bank PLC | 0.30% | 07/15/15 | 1,000,000 | 1,000,000 | ||
| 0.30% | 08/10/15 | 2,000,000 | 2,000,000 | |||
| Mitsubishi UFJ Trust & Banking Corp | 0.30% | 07/01/15 | 4,000,000 | 4,000,000 | ||
| 0.31% | 07/01/15 | 2,000,000 | 2,000,000 | |||
| 0.32% | 10/09/15 | 7,000,000 | 7,000,000 | |||
| 0.35% | 11/06/15 | 3,000,000 | 3,000,000 | |||
| 0.36% | 11/09/15 | 5,000,000 | 5,000,000 | |||
| Mizuho Bank, Ltd | 0.30% | 07/29/15 | 6,000,000 | 6,000,000 | ||
| 0.27% | 08/11/15 | 2,000,000 | 2,000,000 | |||
| 0.27% | 09/08/15 | 11,000,000 | 11,000,000 | |||
| 0.26% | 09/14/15 | 1,000,000 | 1,000,000 | |||
| 0.27% | 09/15/15 | 1,000,000 | 1,000,000 | |||
| 0.35% | 11/16/15 | 2,000,000 | 2,000,000 | |||
| MUFG Union Bank, NA | 0.17% | 07/13/15 | 1,000,000 | 1,000,000 | ||
| National Australia Bank, Ltd | 0.27% | 09/02/15 | 7,000,000 | 7,000,000 | ||
| National Bank of Canada | 0.33% | 08/18/15 | 8,000,000 | 8,000,000 | ||
| Oversea-Chinese Banking Corp, Ltd | 0.24% | 09/29/15 | 9,000,000 | 9,000,000 | ||
| Rabobank Nederland | 0.28% | 07/01/15 | 12,000,000 | 12,000,000 | ||
| Societe Generale | 0.26% | 08/31/15 | 4,000,000 | 4,000,000 | ||
| Sumitomo Mitsui Banking Corp | 0.26% | 09/09/15 | 7,000,000 | 7,000,000 | ||
| 0.27% | 09/22/15 | 1,000,000 | 1,000,000 | |||
| 0.34% | 09/25/15 | 1,000,000 | 1,000,000 | |||
| 0.34% | 10/06/15 | 1,000,000 | 1,000,000 | |||
| 0.34% | 10/16/15 | 1,000,000 | 1,000,000 | |||
| 0.37% | 10/27/15 | 1,000,000 | 1,000,000 | |||
| 0.35% | 11/06/15 | 1,000,000 | 1,000,000 | |||
| 0.40% | 11/06/15 | 5,000,000 | 5,000,000 | |||
| 0.40% | 11/10/15 | 2,000,000 | 2,000,000 | |||
| 0.43% | 11/20/15 | 1,000,000 | 1,000,000 | |||
| Sumitomo Mitsui Trust Bank, Ltd | 0.25% | 07/13/15 | 3,000,000 | 3,000,000 | ||
| 0.27% | 08/31/15 | 11,000,000 | 11,000,000 | |||
| 0.28% | 09/18/15 | 1,000,000 | 1,000,000 | |||
| Swedbank AB | 0.10% | 07/07/15 | 10,000,000 | 10,000,000 | ||
| Toronto-Dominion Bank | 0.30% | 10/27/15 | 3,000,000 | 3,000,000 | ||
| 0.30% | 10/29/15 | 7,000,000 | 7,000,000 | |||
| 0.30% | 11/02/15 | 12,000,000 | 12,000,000 | |||
| 0.30% | 11/05/15 | 2,000,000 | 2,000,000 | |||
| 0.30% | 11/06/15 | 3,000,000 | 3,000,000 | |||
| 318,999,999 |
| Issuer | Footnotes | Rate | Effective
Maturity |
Maturity
Date |
Face
Amount ($) |
Value
($) |
| Other Instruments 4.2% | ||||||
| Australia & New Zealand Banking Group, Ltd | 0.12% | 07/01/15 | 17,000,000 | 17,000,000 | ||
| 0.13% | 07/02/15 | 1,000,000 | 1,000,000 | |||
| DZ Bank AG Deutsche Zentral-Genossenschaftsbank | 0.10% | 07/06/15 | 7,000,000 | 7,000,000 | ||
| National Australia Bank, Ltd | 0.06% | 07/01/15 | 10,000,000 | 10,000,000 | ||
| Skandinaviska Enskilda Banken AB | 0.10% | 07/02/15 | 5,000,000 | 5,000,000 | ||
| 40,000,000 | ||||||
| Other Notes 2.5% | ||||||
| Bank of America, NA | 0.28% | 07/09/15 | 1,000,000 | 1,000,000 | ||
| 0.30% | 08/18/15 | 6,000,000 | 6,000,000 | |||
| 0.24% | 09/18/15 | 5,000,000 | 5,000,000 | |||
| 0.26% | 10/01/15 | 2,000,000 | 2,000,000 | |||
| 0.32% | 11/05/15 | 10,000,000 | 10,000,000 | |||
| 24,000,000 | ||||||
| Total Fixed-Rate Obligations | ||||||
| (Cost $572,888,818) | 572,888,818 | |||||
| Variable-Rate Obligations 18.3% of net assets | ||||||
| Financial Company Commercial Paper 3.7% | ||||||
| Commonwealth Bank of Australia | b | 0.26% | 07/02/15 | 10,000,000 | 10,000,000 | |
| HSBC Bank PLC | b | 0.32% | 07/06/15 | 01/04/16 | 15,000,000 | 15,000,000 |
| Westpac Banking Corp | b | 0.27% | 07/27/15 | 10,000,000 | 10,000,000 | |
| 35,000,000 | ||||||
| Certificates of Deposit 10.9% | ||||||
| Bank of Nova Scotia | 0.27% | 07/09/15 | 10/09/15 | 3,000,000 | 3,000,000 | |
| 0.28% | 07/08/15 | 12/08/15 | 4,000,000 | 4,000,000 | ||
| Bank of Tokyo Mitsubishi UFJ, Ltd | 0.54% | 07/10/15 | 03/10/16 | 11,000,000 | 11,000,000 | |
| JPMorgan Chase Bank, NA | 0.33% | 07/22/15 | 10/22/15 | 3,000,000 | 3,000,000 | |
| Royal Bank of Canada | 0.29% | 07/06/15 | 01/06/16 | 9,000,000 | 9,000,000 | |
| 0.30% | 07/27/15 | 02/25/16 | 10,000,000 | 10,000,000 | ||
| 0.32% | 07/13/15 | 04/13/16 | 13,000,000 | 13,000,000 | ||
| State Street Bank & Trust Co, NA | 0.33% | 07/13/15 | 03/11/16 | 12,000,000 | 12,000,000 | |
| Wells Fargo Bank, NA | 0.27% | 07/08/15 | 08/10/15 | 1,000,000 | 1,000,000 | |
| 0.29% | 07/21/15 | 11/23/15 | 6,000,000 | 6,000,000 | ||
| 0.29% | 07/27/15 | 11/25/15 | 5,000,000 | 5,000,000 | ||
| 0.31% | 07/09/15 | 02/09/16 | 7,000,000 | 7,000,000 | ||
| 0.34% | 07/21/15 | 05/23/16 | 12,000,000 | 12,000,000 | ||
| Westpac Banking Corp | 0.32% | 07/13/15 | 02/12/16 | 7,000,000 | 7,000,000 | |
| 103,000,000 | ||||||
| Issuer | Footnotes | Rate | Effective
Maturity |
Maturity
Date |
Face
Amount ($) |
Value
($) |
| Treasury Debt 2.3% | ||||||
| United States Treasury Department | 0.06% | 07/01/15 | 01/31/16 | 7,000,000 | 6,999,575 | |
| 0.09% | 07/01/15 | 07/31/16 | 5,000,000 | 5,000,000 | ||
| 0.07% | 07/01/15 | 10/31/16 | 10,000,000 | 9,995,160 | ||
| 21,994,735 | ||||||
| Variable Rate Demand Notes 1.1% | ||||||
| Blue Mountain Enterprises, LLC | ||||||
| Variable Rate Demand Bonds Series 2013 | a | 0.20% | 07/07/15 | 3,760,000 | 3,760,000 | |
| Eagle Cnty | ||||||
| Housing Facilities RB (BC Housing) Series 1997B | a | 0.24% | 07/07/15 | 1,500,000 | 1,500,000 | |
| Labcon North America | ||||||
| Taxable Bonds Series 2010 | a | 0.22% | 07/07/15 | 1,595,000 | 1,595,000 | |
| YMCA - Northwoods | ||||||
| Taxable Variable Rate Demand Notes Series 2014A | a | 0.24% | 07/07/15 | 3,775,000 | 3,775,000 | |
| 10,630,000 | ||||||
| Other Notes 0.3% | ||||||
| Bank of America, NA | 0.39% | 07/06/15 | 04/04/16 | 3,000,000 | 3,000,000 | |
| Whistlejacket Capital, LLC | c,† | n/a | n/a | n/a | 123,071 | 123,071 |
| 3,123,071 | ||||||
| Total Variable-Rate Obligations | ||||||
| (Cost $173,747,806) | 173,747,806 | |||||
| Issuer | Footnotes | Rate | Effective
Maturity |
Maturity
Date |
Maturity Amount ($) |
Value
($) |
| Repurchase Agreements 21.2% of net assets | ||||||
| Government Agency Repurchase Agreements* 16.7% | ||||||
| BNP Paribas Securities Corp | ||||||
| Issued
06/30/15, repurchase date 07/01/15 (Collateralized by U.S. Government Agency Securities valued at $15,450,000, 4.50%, due 03/20/41) |
0.10% | 07/01/15 | 15,000,042 | 15,000,000 | ||
| Deutsche Bank Securities, Inc | ||||||
| Issued
06/30/15, repurchase date 07/01/15 (Collateralized by U.S. Government Agency Securities valued at $7,210,236, 0.29%, due 01/21/16) |
0.18% | 07/01/15 | 7,000,035 | 7,000,000 | ||
| Goldman Sachs & Co | ||||||
| Issued
06/25/15, repurchase date 07/02/15 (Collateralized by U.S. Government Agency Securities valued at $14,280,000, 3.00% - 4.00%, due 04/15/38 - 06/15/45) |
0.08% | 07/02/15 | 14,000,218 | 14,000,000 | ||
| JP Morgan Securities, LLC | ||||||
| Issued
06/30/15, repurchase date 07/01/15 (Collateralized by U.S. Government Agency Securities valued at $49,440,000, 3.00%, due 12/01/29) |
0.14% | 07/01/15 | 48,000,187 | 48,000,000 | ||
| Merrill Lynch, Pierce, Fenner & Smith, Inc | ||||||
| Issued
06/30/15, repurchase date 07/01/15 (Collateralized by U.S. Government Agency Securities valued at $48,410,000, 2.50% - 3.00%, due 11/25/22 - 12/15/39) |
0.14% | 07/01/15 | 47,000,183 | 47,000,000 | ||
| Issuer | Footnotes | Rate | Effective
Maturity |
Maturity
Date |
Maturity Amount ($) |
Value
($) |
| Mizuho Securities USA, Inc | ||||||
| Issued
06/30/15, repurchase date 07/01/15 (Collateralized by U.S. Government Agency Securities valued at $2,040,572, 1.00%, due 09/27/17) |
0.15% | 07/01/15 | 2,000,008 | 2,000,000 | ||
| Morgan Stanley & Co, LLC | ||||||
| Issued
06/30/15, repurchase date 07/01/15 (Collateralized by U.S. Government Agency Securities valued at $26,520,000, 4.00% - 9.00%, due 03/17/32 - 03/20/45) |
0.09% | 07/01/15 | 26,000,065 | 26,000,000 | ||
| 159,000,000 | ||||||
| Treasury Repurchase Agreements 0.6% | ||||||
| Barclays Capital, Inc | ||||||
| Issued
06/30/15, repurchase date 07/01/15 (Collateralized by U.S. Treasury Securities valued at $1,682,854, 6.63%, due 02/15/27) |
0.10% | 07/01/15 | 1,649,827 | 1,649,822 | ||
| BNP Paribas Securities Corp | ||||||
| Issued
06/30/15, repurchase date 07/01/15 (Collateralized by U.S. Treasury Securities valued at $1,020,098, 1.38% - 1.50%, due 12/31/18 - 05/31/20) |
0.09% | 07/01/15 | 1,000,003 | 1,000,000 | ||
| JP Morgan Securities, LLC | ||||||
| Issued
06/22/15, repurchase date 07/22/15 (Collateralized by U.S. Treasury Securities valued at $3,060,097, 2.13% - 2.63%, due 11/15/20 - 05/15/24) |
0.08% | 07/07/15 | 3,000,100 | 3,000,000 | ||
| 5,649,822 | ||||||
| Other Repurchase Agreements** 3.9% | ||||||
| Credit Suisse Securities (USA), LLC | ||||||
| Issued
06/15/15, repurchase date 12/14/15 (Collateralized by common stocks, ETFs, corporate bonds, ABS, or non-agency collateralized mortgage obligations valued at $12,650,729, 3.93% - 3.99%, due 09/25/44 - 02/25/45) |
c | 0.80% | 10/03/15 | 11,026,889 | 11,000,000 | |
| Issued
06/18/15, repurchase date 12/14/15 (Collateralized by common stocks, ETFs, corporate bonds, ABS, or non-agency collateralized mortgage obligations valued at $1,151,244, 3.82%, due 01/25/45) |
c | 0.80% | 10/03/15 | 1,002,378 | 1,000,000 | |
| JP Morgan Securities, LLC | ||||||
| Issued
06/04/15, repurchase date 12/01/15 (Collateralized by common stocks, ETFs, corporate bonds, ABS, or non-agency collateralized mortgage obligations valued at $9,204,319, 0.55% - 6.81%, due 05/18/16 - 05/10/47) |
c | 0.65% | 09/28/15 | 8,016,756 | 8,000,000 | |
| Issued
06/17/15, repurchase date 12/17/15 (Collateralized by common stocks, ETFs, corporate bonds, ABS, or non-agency collateralized mortgage obligations valued at $3,450,811, 0.55% - 6.81%, due 02/15/18 - 06/10/49) |
c | 0.65% | 09/28/15 | 3,005,579 | 3,000,000 | |
| Merrill Lynch, Pierce, Fenner & Smith, Inc | ||||||
| Issued
05/28/15, repurchase date 08/26/15 (Collateralized by common stocks, ETFs, corporate bonds, ABS, or non-agency collateralized mortgage obligations valued at $16,100,001, 0.00%, due 03/25/58) |
c | 0.58% | 08/04/15 | 14,015,338 | 14,000,000 | |
| 37,000,000 | ||||||
| Total Repurchase Agreements | ||||||
| (Cost $201,649,822) | 201,649,822 | |||||
At 06/30/15, the tax basis cost of the fund's investments was $948,286,446.
| a | Credit-enhanced or liquidity-enhanced. |
| b | Securities exempt from registration under Rule 144A of the Securities Act of 1933, as amended. These securities may be resold in transactions exempt from registrations, normally to qualified institutional buyers. At the period end, the value of these amounted to $149,927,102 or 15.8% of net assets. |
| c | Illiquid security. At the period end, the value of these amounted to $37,123,071 or 3.9% of net assets. |
| † | Whistlejacket notes are in receivership, and the fund elected to sell all of its Whistlejacket notes at auction (April 29, 2009). The remaining investment represents an interest in a small residual fund that is being held to cover any remaining expenses and liabilities associated with receivership. |
| * | Usually collateralized via U.S. Government Agency Securities or less frequently by U.S. Treasury Securities. |
| ** | Usually collateralized via common stocks, ETFs, corporate bonds, ABS, or non-agency collateralized mortgage obligations or less frequently by U.S. Government Agency Securities and/ or U.S. Treasury Securities. |
| ABS — | Asset-backed securities |
| ETF — | Exchange Traded Fund |
| RB — | Revenue bond |
| Assets | ||
| Investments, at cost and value | $746,636,624 | |
| Repurchase agreements, at cost and value | + | 201,649,822 |
| Total investments, at cost and value (Note 2a) | 948,286,446 | |
| Receivables: | ||
| Fund shares sold | 3,317,715 | |
| Interest | 267,976 | |
| Prepaid expenses | + | 8,745 |
| Total assets | 951,880,882 | |
| Liabilities | ||
| Payables: | ||
| Shareholder service fees | 39,791 | |
| Fund shares redeemed | 1,148,164 | |
| Distributions to shareholders | 3,898 | |
| Accrued expenses | + | 80,625 |
| Total liabilities | 1,272,478 | |
| Net Assets | ||
| Total assets | 951,880,882 | |
| Total liabilities | – | 1,272,478 |
| Net assets | $950,608,404 | |
| Net Assets by Source | ||
| Capital received from investors | 950,688,536 | |
| Net realized capital losses | (80,132) | |
| Net Asset Value (NAV) | ||||
| Net Assets | ÷ | Shares
Outstanding |
= | NAV |
| $950,608,404 | 950,603,504 | $1.00 | ||
| Investment Income | ||
| Interest | $1,119,797 | |
| Expenses | ||
| Investment adviser and administrator fees | 1,610,562 | |
| Shareholder service fees | 1,150,401 | |
| Portfolio accounting fees | 49,788 | |
| Shareholder reports | 42,042 | |
| Custodian fees | 35,171 | |
| Professional fees | 19,606 | |
| Registration fees | 15,678 | |
| Independent trustees' fees | 15,166 | |
| Transfer agent fees | 10,247 | |
| Interest expense | 13 | |
| Other expenses | + | 9,694 |
| Total expenses | 2,958,368 | |
| Expense reduction by CSIM and its affiliates | – | 1,884,587 |
| Net expenses | – | 1,073,781 |
| Net investment income | 46,016 | |
| Realized Gains (Losses) | ||
| Net realized losses on investments | (359) | |
| Increase in net assets resulting from operations | $45,657 | |
| Operations | |||
| 1/1/15-6/30/15 | 1/1/14-12/31/14 | ||
| Net investment income | $46,016 | $101,677 | |
| Net realized gains (losses) | + | (359) | 2,236 |
| Increase in net assets from operations | 45,657 | 103,913 | |
| Distributions to Shareholders | |||
| Distributions from net investment income | ($46,016) | ($101,677) | |
| Transactions in Fund Shares* | |||
| Shares sold | 240,489,402 | 538,047,041 | |
| Shares reinvested | 35,820 | 85,769 | |
| Shares redeemed | + | (229,402,562) | (645,847,347) |
| Net transactions in fund shares | 11,122,660 | (107,714,537) | |
| Net Assets | |||
| Beginning of period | 939,486,103 | 1,047,198,404 | |
| Total increase or decrease | + | 11,122,301 | (107,712,301) |
| End of period | $950,608,404 | $939,486,103 | |
| * | Transactions took place at $1.00 per share; figures for share quantities are the same as for dollars. |
| The Charles Schwab Family of Funds (organized October 20, 1989) | Schwab Municipal Money Fund |
| Schwab Money Market Fund | Schwab AMT Tax-Free Money Fund |
| Schwab Government Money Fund | Schwab California Municipal Money Fund |
| Schwab U.S. Treasury Money Fund | Schwab New York Municipal Money Fund |
| Schwab Treasury Obligations Money Fund | (formerly Schwab New York AMT Tax-Free Money Fund) |
| Schwab Value Advantage Money Fund | Schwab New Jersey Municipal Money Fund |
| Schwab Advisor Cash Reserves | (formerly Schwab New Jersey AMT Tax-Free Money Fund) |
| Schwab Cash Reserves | Schwab Pennsylvania Municipal Money Fund |
| Schwab Retirement Advantage Money Fund | Schwab Massachusetts Municipal Money Fund |
| Schwab Investor Money Fund | (formerly Schwab Massachusetts AMT Tax-Free Money Fund) |
| Schwab Retirement Advantage Money Fund | $194,448,223 |
| Schwab Investor Money Fund | 201,649,822 |
| Average Daily Net Assets | |
| First $1 billion | 0.35% |
| More than $1 billion but not exceeding $10 billion | 0.32% |
| More than $10 billion but not exceeding $20 billion | 0.30% |
| More than $20 billion but not exceeding $40 billion | 0.27% |
| Over $40 billion | 0.25% |
| Shareholder Service Fees | |
| Schwab Retirement Advantage Money Fund | 0.22% |
| Schwab Investor Money Fund | 0.25% |
| Total
Waived Amount |
Contractual
Expense Limitation Waived Amount | ||
| Schwab Retirement Advantange Money Fund | $1,360,915 | $558,863 | |
| Schwab Investor Money Fund | 1,884,587 | 171,303 |
| Expiration Date | |||||||||
| December 31, 2015 | December 31, 2016 | December 31, 2017 | December 31, 2018 | Total | |||||
| Schwab Retirement Advantage Money Fund | $1,484,338 | $1,643,686 | $1,838,425 | $802,052 | $5,768,501 | ||||
| Schwab Investor Money Fund | 3,983,641 | 4,017,546 | 3,974,440 | 1,713,284 | 13,688,911 | ||||
| Schwab Retirement Advantage Money Fund | $1,817,734 |
| Schwab Investor Money Fund | 4,664,552 |
| Expiration Date | Schwab
Retirement Advantage Money Fund |
Schwab
Investor Money Fund | ||
| December 31, 2017 | $— | $79,773 |
| Schwab
Retirement Advantage Money Fund |
Schwab
Investor Money Fund | ||
| Capital losses utilized | $— | $2,236 |
| Independent Trustees | |||
| Name,
Year of Birth, and Position(s) with the trust; (Terms of office, and length of Time Served1) |
Principal
Occupations During the Past Five Years |
Number
of Portfolios in Fund Complex Overseen by the Trustee |
Other Directorships |
| John
F. Cogan 1947 Trustee (Trustee of The Charles Schwab Family of Funds, Schwab Investments, Schwab Capital Trust and Schwab Annuity Portfolios since 2008; Laudus Trust and Laudus Institutional Trust since 2010) |
Senior Fellow, The Hoover Institution at Stanford University (Oct. 1979 – present); Senior Fellow Stanford Institute for Economic Policy Research (2000 – present); Professor of Public Policy, Stanford University (1994 – present). | 74 | Director,
Gilead Sciences, Inc. (2005 – present) |
| David
L. Mahoney 1954 Trustee (Trustee of The Charles Schwab Family of Funds, Schwab Investments, Schwab Capital Trust, Schwab Annuity Portfolios, Laudus Trust and Laudus Institutional Trust since 2011) |
Private Investor. | 74 | Director,
Symantec Corporation (2003 – present) Director, Corcept Therapeutics Incorporated (2004 – present) Director, Adamas Pharmaceuticals, Inc. (2009 – present) |
| Kiran
M. Patel 1948 Trustee (Trustee of The Charles Schwab Family of Funds, Schwab Investments, Schwab Capital Trust, Schwab Annuity Portfolios, Laudus Trust and Laudus Institutional Trust since 2011) |
Retired. Executive Vice President and General Manager of Small Business Group, Intuit, Inc. (financial software and services firm for consumers and small businesses) (Dec. 2008 – Sept. 2013) | 74 | Director, KLA-Tencor Corporation (2008 – present) |
| Charles
A. Ruffel 1956 Trustee (Trustee of Schwab Strategic Trust since 2009; The Charles Schwab Family of Funds, Schwab Investments, Schwab Capital Trust, Schwab Annuity Portfolios, Laudus Trust and Laudus Institutional Trust since 2015) |
Managing Partner and Co-Founder, Kudu Advisors, LLC (financial services) (May 2009 – present); Director, Asset International, Inc. (publisher of financial services information) (Jan. 2009 – Nov. 2014). | 95 | None. |
| Independent Trustees (continued) | |||
| Name,
Year of Birth, and Position(s) with the trust; (Terms of office, and length of Time Served1) |
Principal
Occupations During the Past Five Years |
Number
of Portfolios in Fund Complex Overseen by the Trustee |
Other Directorships |
| Gerald
B. Smith 1950 Trustee (Trustee of The Charles Schwab Family of Funds, Schwab Investments, Schwab Capital Trust and Schwab Annuity Portfolios since 2000; Laudus Trust and Laudus Institutional Trust since 2010) |
Chairman, Chief Executive Officer and Founder of Smith Graham & Co. (investment advisors) (1990 – present). | 74 | Director,
Eaton (2012 – present) Director and Chairman of the Audit Committee, Oneok Partners LP (2003 – 2013) Director, Oneok, Inc. (2009 – 2013) Lead Independent Director, Board of Cooper Industries (2002 – 2012) |
| Joseph
H. Wender 1944 Trustee (Trustee of The Charles Schwab Family of Funds, Schwab Investments, Schwab Capital Trust and Schwab Annuity Portfolios since 2008; Laudus Trust and Laudus Institutional Trust since 2010) |
Senior Consultant, Goldman Sachs & Co., Inc. (investment banking and securities firm) (Jan. 2008 – present); Partner, Colgin Partners, LLC (vineyards) (Feb. 1998 – present). | 74 | Board Member and Chairman of the Audit Committee, Isis Pharmaceuticals (1994 – present) |
| Interested Trustees | |||
| Name,
Year of Birth, and Position(s) with the trust; (Terms of office, and length of Time Served) |
Principal
Occupations During the Past Five Years |
Number
of Portfolios in Fund Complex Overseen by the Trustee |
Other Directorships |
| Charles
R. Schwab2 1937 Chairman and Trustee (Chairman and Trustee of The Charles Schwab Family of Funds since 1989; Schwab Investments since 1991; Schwab Capital Trust since 1993; Schwab Annuity Portfolios since 1994; Laudus Trust and Laudus Institutional Trust since 2010) |
Chairman and Director, The Charles Schwab Corporation (1986 – present); Chairman and Director of Charles Schwab & Co., Inc. (1971 – present); Chairman and Director of Charles Schwab Investment Management, Inc. (1989 – present); Chairman and Director of Charles Schwab Bank (2003 – present); Chairman and Chief Executive Officer of Schwab (SIS) Holdings Inc. I and Schwab International Holdings, Inc. (1996 – present); and Director, Chairman and Chief Executive Officer, Schwab Holdings, Inc. (1979 – present). | 74 | Chairman
and Director, The Charles Schwab Corporation (1986 – present) Director, Yahoo! Inc. (2014 – present) |
| Walter
W. Bettinger II2 1960 Trustee (Trustee of The Charles Schwab Family of Funds, Schwab Investments, Schwab Capital Trust and Schwab Annuity Portfolios since 2008; Schwab Strategic Trust since 2009; Laudus Trust and Laudus Institutional Trust since 2010) |
Director, President and Chief Executive Officer, The Charles Schwab Corporation and Charles Schwab & Co., Inc. (2008 – present); Director, Charles Schwab Bank (2006 – present); and Director, Schwab Holdings, Inc. (2008 – present). | 95 | Director, The Charles Schwab Corporation (2008 – present) |
| Officers of the Trust | |
| Name,
Year of Birth, and Position(s) with the trust; (Terms of office, and length of Time Served3) |
Principal Occupations During the Past Five Years |
| Marie
Chandoha 1961 President and Chief Executive Officer (Officer of The Charles Schwab Family of Funds, Schwab Investments, Schwab Capital Trust, Schwab Annuity Portfolios, Laudus Trust and Laudus Institutional Trust since 2010) |
Director, President and Chief Executive Officer (Dec. 2010 – present), Chief Investment Officer (Sept. 2010 – Oct. 2011), Charles Schwab Investment Management, Inc.; President, Chief Executive Officer (Dec. 2010 – present), and Chief Investment Officer (Sept. 2010 – Oct. 2011), Schwab Funds, Laudus Funds and Schwab ETFs; Director, Charles Schwab Worldwide Funds plc and Charles Schwab Asset Management (Ireland) Limited (January 2011 – present); Global Head of Fixed Income Business Division, BlackRock, Inc. (formerly Barclays Global Investors) (March 2007 – August 2010). |
| George
Pereira 1964 Treasurer and Principal Financial Officer, Schwab Funds Treasurer and Chief Financial Officer, Laudus Funds (Officer of The Charles Schwab Family of Funds, Schwab Investments, Schwab Capital Trust and Schwab Annuity Portfolios since 2004; Laudus Trust and Laudus Institutional Trust since 2006) |
Senior Vice President and Chief Financial Officer (Nov. 2004 – present), Chief Operating Officer (Jan. 2011 – present), Charles Schwab Investment Management, Inc.; Treasurer and Chief Financial Officer, Laudus Funds (June 2006 – present); Treasurer and Principal Financial Officer, Schwab Funds (Nov. 2004 – present) and Schwab ETFs (Oct. 2009 – present); Director, Charles Schwab Worldwide Funds plc and Charles Schwab Asset Management (Ireland) Limited (April 2005 – present). |
| Omar
Aguilar 1970 Senior Vice President and Chief Investment Officer – Equities (Officer of The Charles Schwab Family of Funds, Schwab Investments, Schwab Capital Trust, Schwab Annuity Portfolios, Laudus Trust and Laudus Institutional Trust since 2011) |
Senior Vice President and Chief Investment Officer – Equities, Charles Schwab Investment Management, Inc. (April 2011 – present); Senior Vice President and Chief Investment Officer – Equities, Schwab Funds, Laudus Funds and Schwab ETFs (June 2011 – present); Head of the Portfolio Management Group and Vice President of Portfolio Management, Financial Engines, Inc. (May 2009 – April 2011); Head of Quantitative Equity, ING Investment Management (July 2004 – Jan. 2009). |
| Brett
Wander 1961 Senior Vice President and Chief Investment Officer – Fixed Income (Officer of The Charles Schwab Family of Funds, Schwab Investments, Schwab Capital Trust, Schwab Annuity Portfolios, Laudus Trust and Laudus Institutional Trust since 2011) |
Senior Vice President and Chief Investment Officer – Fixed Income, Charles Schwab Investment Management, Inc. (April 2011 – present); Senior Vice President and Chief Investment Officer – Fixed Income, Schwab Funds, Laudus Funds and Schwab ETFs (June 2011 – present); Senior Managing Director, Global Head of Active Fixed-Income Strategies, State Street Global Advisors (Jan. 2008 – Oct. 2010); Director of Alpha Strategies Loomis, Sayles & Company (April 2006 – Jan. 2008). |
| David
Lekich 1964 Chief Legal Officer and Secretary, Schwab Funds Vice President and Assistant Clerk, Laudus Funds (Officer of The Charles Schwab Family of Funds, Schwab Investments, Schwab Capital Trust, Schwab Annuity Portfolios, Laudus Trust and Laudus Institutional Trust since 2011) |
Senior Vice President (Sept. 2011 – present), Vice President (March 2004 – Sept. 2011), Charles Schwab & Co., Inc.; Senior Vice President and Chief Counsel (Sept. 2011 – present), Vice President (Jan. 2011 – Sept. 2011), Charles Schwab Investment Management, Inc.; Secretary (April 2011 – present) and Chief Legal Officer (Dec. 2011 – present), Schwab Funds; Vice President and Assistant Clerk, Laudus Funds (April 2011 – present); Secretary (May 2011 – present) and Chief Legal Officer (Nov. 2011 – present), Schwab ETFs. |
| Catherine
MacGregor 1964 Vice President and Assistant Secretary, Schwab Funds Chief Legal Officer, Vice President and Clerk, Laudus Funds (Officer of The Charles Schwab Family of Funds, Schwab Investments, Schwab Capital Trust, Schwab Annuity Portfolios, Laudus Trust and Laudus Institutional Trust since 2005) |
Vice President, Charles Schwab & Co., Inc., Charles Schwab Investment Management, Inc. (July 2005 – present); Vice President (Dec. 2005 – present), Chief Legal Officer and Clerk (March 2007 – present), Laudus Funds; Vice President (Nov. 2005 – present) and Assistant Secretary (June 2007 – present), Schwab Funds; Vice President and Assistant Secretary, Schwab ETFs (Oct. 2009 – present). |
| 1 | Trustees remain in office until they resign, retire or are removed by shareholder vote. The Schwab and Laudus Funds’ retirement policy requires that independent trustees retire at age 72 or after twenty years as a trustee, whichever comes first. In addition, the retirement policy requires any independent trustee of Schwab Funds or Laudus Funds to retire from all Boards upon their required retirement date from either Board. |
| 2 | Mr. Schwab and Mr. Bettinger are Interested Trustees because they own stock of The Charles Schwab Corporation, the parent company of the investment adviser. |
| 3 | The President, Treasurer and Secretary/Clerk hold office until their respective successors are chosen and qualified or until he or she sooner dies, resigns, is removed or becomes disqualified. Each of the other officers serves at the pleasure of the Boards. |
211 Main Street, San Francisco, CA 94105
1-800-435-4000
© 2015 Charles Schwab & Co., Inc. All rights reserved.
Member SIPC®
Printed on recycled paper.
00149460
Table of Contents
Money Fund™
Money Fund™
Money Fund™
(closed to new investors)
Money Fund®
by viewing these documents online.
Sign up at schwab.com/paperless

Money Fund™
Money Fund™
Money Fund™
(closed to new investors)
Money Fund®


| 1 | A fund’s share price is its NAV, which is the fund’s net assets divided by the number of its shares outstanding. Under the new amendments, Retail Prime and Municipal money market funds, as well as Government money market funds, will continue to be permitted to transact at a constant NAV of $1.00. Note that while a fund may seek to maintain a constant NAV, there is no guarantee that it will be able to do so. |
 |
Linda Klingman, Vice President and Head of Taxable Money Market Strategies, leads the portfolio management team of Schwab’s prime and government taxable money funds. Ms. Klingman also has overall responsibility for all aspects of the management of the funds. Prior to joining CSIM in 1990, Ms. Klingman was a senior money market trader with AIM Management. She has managed money market funds since 1988. |
 |
Lynn Paschen, Managing Director and Senior Portfolio Manager, is responsible for the day-to-day management of the Schwab Government Money Fund, Schwab U.S. Treasury Money Fund, and Schwab Treasury Obligations Money Fund. Prior to joining CSIM in 2011, Ms. Paschen held a number of positions at American Century Investments. She most recently was a portfolio manager, and from 2000 to 2003 worked as a fixed income trader. She has managed money market funds since 2003. |
 |
Michael Lin, Managing Director and Senior Portfolio Manager, is responsible for the day-to-day co-management of the Schwab Value Advantage Money Fund. Mr. Lin has been a portfolio manager with CSIM since 2006, and also worked in CSIM’s Fund Administration group for nearly four years, where he focused on security pricing and valuation of Schwab Funds. Prior to joining CSIM, he spent three years at American Century Investments, most recently as a senior trader of the taxable money market funds. |
 |
Jonathan Roman, Portfolio Manager, is responsible for the day-to-day co-management of the Schwab Value Advantage Money Fund. Mr. Roman has been a portfolio manager with CSIM since 2010, and has held a number of positions at the firm since beginning his tenure in 2005. In 2009, he joined the Portfolio Management group as a Trader, and prior to that he worked in the Portfolio Operations and Analytics group providing trading support to the taxable money market desk. |
 |
Jonathan Feske, CFA, Portfolio Manager, is responsible for the day-to-day co-management of the Schwab Value Advantage Money Fund. He previously was responsible for credit and investment research for global banks for CSIM’s taxable bond and money funds. Prior to joining CSIM in 2011, Mr. Feske was a high-yield bond analyst for more than two years at Miller Tabak Roberts Securities, a boutique corporate bond broker-dealer, which is now part of GMP Capital. He covered both U.S. and emerging market credits, focusing on distressed situations in various industrial sectors. Previously, Mr. Feske was employed in the securities industry as an equity trader for three years. |
| 1 | The investment adviser and its affiliates may recapture expenses or fees they waived under a voluntary yield waiver until the third anniversary of the end of the fiscal year in which such waiver occurs, subject to certain limitations. For more information on the potential impact of such recapture on future yields, see financial note 5. |
| 2 | As shown in the Portfolio Holdings section of the shareholder report. |
| 3 | Money funds must maintain a dollar-weighted average maturity of no longer than 60 days and cannot invest in any security whose effective maturity is longer than 397 days (approximately 13 months). |
| 4 | Tier 1 securities are rated in the highest short-term rating category by two nationally recognized statistical rating organizations (“NRSROs”), or by one if only one NRSRO has rated the securities, or, if unrated, determined to be of comparable quality by CSIM pursuant to guidelines adopted by the Board of Trustees. Money market fund shares and U.S. government securities are also Tier 1 securities. The fund uses NRSRO credit ratings from Standard & Poor’s Corp., Moody’s Investors Service, Fitch Ratings, and/or DBRS. The fund may use different ratings provided by other rating agencies for purposes of determining compliance with the fund’s investment policies. The fund itself has not been rated by an independent credit rating agency. |

| Schwab Government Money Fund | ||
| Purchased
Shares |
Sweep
Shares | |
| Ticker Symbol | SNVXX | SWGXX |
| Minimum Initial Investment | $25,000 2 | * |
| Seven-Day Yield | 0.00% | 0.00% |
| Seven-Day Yield–Without Contractual Expense Limitation | -0.04% | -0.04% |
| Seven-Day Effective Yield | 0.00% | 0.00% |
| * | Subject to the eligibility terms and conditions of your Schwab account agreement. |
| 1 | Purchased Shares commenced operations on January 21, 2015. The seven-day average yield for Purchased Shares was 0.00% from commencement of operations through the end of the period. The seven-day average yield for Sweep Shares was 0.00% throughout the entire period. |
| 2 | Minimum initial investment for IRA and custodial accounts is $15,000. Minimum initial investment for Schwab Adviser Services accounts is $1,000. |
| 3 | Yield reflects the effect of the fund’s agreement with the investment adviser and its affiliates to limit the fund’s total annual operating expenses to certain levels (contractual expense limitation). In addition, the investment adviser and its affiliates have voluntarily waived expenses in excess of the contractual expense limitation to maintain a non-negative net yield for the fund (voluntary yield waiver). Without the contractual expense limitation and the voluntary yield waiver, the fund’s yield would have been lower. For additional details, see financial note 4. |
| 4 | Yield does not reflect the effect of the contractual expense limitation, but does reflect the effect of the voluntary yield waiver. The voluntary yield waiver added 0.55% and 0.40% to the seven-day yields of the Sweep Shares and Purchased Shares, respectively. |
| 1 | The investment adviser and its affiliates may recapture expenses or fees they waived under a voluntary yield waiver until the third anniversary of the end of the fiscal year in which such waiver occurs, subject to certain limitations. For more information on the potential impact of such recapture on future yields, see financial note 5. |
| 2 | As shown in the Portfolio Holdings section of the shareholder report. |
| 3 | Money funds must maintain a dollar-weighted average maturity of no longer than 60 days and cannot invest in any security whose effective maturity is longer than 397 days (approximately 13 months). |
| 4 | Tier 1 securities are rated in the highest short-term rating category by two nationally recognized statistical rating organizations (“NRSROs”), or by one if only one NRSRO has rated the securities, or, if unrated, determined to be of comparable quality by CSIM pursuant to guidelines adopted by the Board of Trustees. Money market fund shares and U.S. government securities are also Tier 1 securities. The fund uses NRSRO credit ratings from Standard & Poor’s Corp., Moody’s Investors Service, Fitch Ratings, and/or DBRS. The fund may use different ratings provided by other rating agencies for purposes of determining compliance with the fund’s investment policies. The fund itself has not been rated by an independent credit rating agency. |
| 5 | The Fund may elect to invest up to 20 percent of its net assets in (i) obligations that are issued by the U.S. government, its agencies or instrumentalities, including obligations that are not guaranteed by the U.S. Treasury and (ii) obligations that are issued by private issuers that are guaranteed as to principal or interest by the U.S. government, its agencies or instrumentalities. Please refer to the fund prospectus for further details on investment objectives, risks, charges, tax implications and expenses. |
| Schwab U.S. Treasury Money Fund | |
| Sweep
Shares | |
| Ticker Symbol | SWUXX |
| Minimum Initial Investment | * |
| Seven-Day Yield1 | 0.00% |
| Seven-Day Yield–Without Contractual Expense Limitation2 | -0.16% |
| Seven-Day Effective Yield1 | 0.00% |
| * | Subject to the eligibility terms and conditions of your Schwab account agreement. |
| 1 | Yield reflects the effect of the fund’s agreement with the investment adviser and its affiliates to limit the fund’s total annual operating expenses to certain levels (contractual expense limitation). In addition, the investment adviser and its affiliates have voluntarily waived expenses in excess of the contractual expense limitation to maintain a non-negative net yield for the fund (voluntary yield waiver). Without the contractual expense limitation and the voluntary yield waiver, the fund’s yield would have been lower. For additional details, see financial note 4. |
| 2 | Yield does not reflect the effect of the contractual expense limitation, but does reflect the effect of the voluntary yield waiver. The voluntary yield waiver added 0.50% to the seven-day yield. |
| 1 | The investment adviser and its affiliates may recapture expenses or fees they waived under a voluntary yield waiver until the third anniversary of the end of the fiscal year in which such waiver occurs, subject to certain limitations. For more information on the potential impact of such recapture on future yields, see financial note 5. |
| 2 | As shown in the Portfolio Holdings section of the shareholder report. |
| 3 | Money funds must maintain a dollar-weighted average maturity of no longer than 60 days and cannot invest in any security whose effective maturity is longer than 397 days (approximately 13 months). |
| 4 | Tier 1 securities are rated in the highest short-term rating category by two nationally recognized statistical rating organizations (“NRSROs”), or by one if only one NRSRO has rated the securities, or, if unrated, determined to be of comparable quality by CSIM pursuant to guidelines adopted by the Board of Trustees. Money market fund shares and U.S. government securities are also Tier 1 securities. The fund uses NRSRO credit ratings from Standard & Poor’s Corp., Moody’s Investors Service, Fitch Ratings, and/or DBRS. The fund may use different ratings provided by other rating agencies for purposes of determining compliance with the fund’s investment policies. The fund itself has not been rated by an independent credit rating agency. |
| Schwab Treasury Obligations Money Fund | ||
| Sweep
Shares |
Value
Advantage Shares | |
| Ticker Symbol | SNTXX | SNOXX |
| Minimum Initial Investment1 | ** | $25,000 2 |
| Seven-Day Yield3 | 0.00% | 0.00% |
| Seven-Day Yield–Without Contractual Expense Limitation4 | -0.15% | -0.17% |
| Seven-Day Effective Yield3 | 0.00% | 0.00% |
| * | The seven-day average yield for the Sweep Shares and Value Advantage Shares was 0.00% throughout the entire period. |
| ** | Subject to the eligibility terms and conditions of your Schwab account agreement. |
| 1 | Please see prospectus for further detail and eligibility requirements. |
| 2 | Minimum initial investment for IRA and custodial accounts is $15,000. |
| 3 | Yield reflects the effect of the fund’s agreement with the investment adviser and its affiliates to limit each share class’ total annual operating expenses to certain levels (contractual expense limitation). In addition, the investment adviser and its affiliates have voluntarily waived expenses in excess of the contractual expense limitation to maintain a non-negative net yield for the fund (voluntary yield waiver). Without the contractual expense limitation and the voluntary yield waiver, the fund’s yield would have been lower. For additional details, see financial note 4. |
| 4 | Yield does not reflect the effect of the contractual expense limitation, but does reflect the effect of the voluntary yield waiver. The voluntary yield waiver added 0.52% and 0.32% to the seven-day yields of the Sweep Shares and Value Advantage Shares, respectively. |
| 1 | The investment adviser and its affiliates may recapture expenses or fees they waived under a voluntary yield waiver until the third anniversary of the end of the fiscal year in which such waiver occurs, subject to certain limitations. For more information on the potential impact of such recapture on future yields, see financial note 5. |
| 2 | As shown in the Portfolio Holdings section of the shareholder report. |
| 3 | Money funds must maintain a dollar-weighted average maturity of no longer than 60 days and cannot invest in any security whose effective maturity is longer than 397 days (approximately 13 months). |
| 4 | Tier 1 securities are rated in the highest short-term rating category by two nationally recognized statistical rating organizations (“NRSROs”), or by one if only one NRSRO has rated the securities, or, if unrated, determined to be of comparable quality by CSIM pursuant to guidelines adopted by the Board of Trustees. Money market fund shares and U.S. government securities are also Tier 1 securities. The fund uses NRSRO credit ratings from Standard & Poor’s Corp., Moody’s Investors Service, Fitch Ratings, and/or DBRS. The fund may use different ratings provided by other rating agencies for purposes of determining compliance with the fund’s investment policies. The fund itself has not been rated by an independent credit rating agency. |
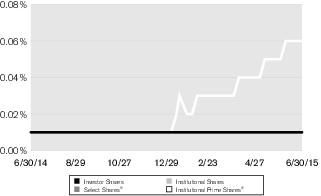
| Schwab Value Advantage Money Fund | ||||
| Investor
Shares |
Select
Shares® |
Institutional
Shares |
Institutional
Prime Shares® | |
| Ticker Symbol | SWVXX | SWBXX | SWAXX | SNAXX |
| Minimum Initial Investment1 | $25,000 2 | $1,000,000 | $3,000,000 | $10,000,000 |
| Seven-Day Yield3 | 0.01% | 0.01% | 0.01% | 0.06% |
| Seven-Day Yield–Without Contractual Expense Limitation4 | -0.12% | -0.12% | -0.12% | -0.08% |
| Seven-Day Effective Yield3 | 0.01% | 0.01% | 0.01% | 0.06% |
| * | The seven-day average yield for the Investor Shares, Select Shares, and Institutional Shares was 0.01% throughout the entire period. |
| 1 | Please see prospectus for further detail and eligibility requirements. |
| 2 | Minimum initial investment for IRA and custodial accounts is $15,000. |
| 3 | Yield reflects the effect of the fund’s agreement with the investment adviser and its affiliates to limit each share class’ total annual operating expenses to certain levels (contractual expense limitation). In addition, the investment adviser and its affiliates have voluntarily waived expenses in excess of the contractual expense limitation to maintain a positive net yield for certain share classes of the fund (voluntary yield waiver). Without the contractual expense limitation and the voluntary yield waiver (if any), the fund’s yield would have been lower. For additional details, see financial note 4. |
| 4 | Yield does not reflect the effect of the contractual expense limitation, but does reflect the effect of the voluntary yield waiver (if any). The voluntary yield waiver added 0.16%, 0.06%, 0.02% and 0.00% to the seven-day yield of the Investor Shares, Select Shares, Institutional Shares, and Institutional Prime Shares respectively. |
| Expense
Ratio1 (Annualized) |
Beginning
Account Value |
Ending
Account Value (Net of Expenses) at 6/30/15 |
Expenses
Paid During Period | |
| Schwab Government Money Fund | ||||
| Sweep Shares2 | ||||
| Actual Return | 0.12% | $1,000.00 | $ 1,000.00 | $0.60 |
| Hypothetical 5% Return | 0.12% | $1,000.00 | $ 1,024.20 | $0.60 |
| Purchased Shares | ||||
| Actual Return3 | 0.13% | $1,000.00 | $ 1,000.00 | $ 0.57 |
| Hypothetical 5% Return4 | 0.13% | $1,000.00 | $ 1,024.16 | $ 0.65 |
| Schwab U.S. Treasury Money Fund2 | ||||
| Actual Return | 0.06% | $1,000.00 | $ 1,000.00 | $0.30 |
| Hypothetical 5% Return | 0.06% | $1,000.00 | $ 1,024.50 | $0.30 |
| Schwab Treasury Obligations Money Fund2 | ||||
| Sweep Shares | ||||
| Actual Return | 0.10% | $1,000.00 | $ 1,000.00 | $ 0.50 |
| Hypothetical 5% Return | 0.10% | $1,000.00 | $1,024.30 | $ 0.50 |
| Value Advantage Shares | ||||
| Actual Return | 0.10% | $1,000.00 | $ 1,000.00 | $ 0.50 |
| Hypothetical 5% Return | 0.10% | $1,000.00 | $1,024.30 | $ 0.50 |
| Schwab Value Advantage Money Fund2 | ||||
| Investor Shares | ||||
| Actual Return | 0.24% | $1,000.00 | $ 1,000.10 | $ 1.19 |
| Hypothetical 5% Return | 0.24% | $1,000.00 | $ 1,023.61 | $ 1.20 |
| Select Shares | ||||
| Actual Return | 0.24% | $1,000.00 | $ 1,000.10 | $ 1.19 |
| Hypothetical 5% Return | 0.24% | $1,000.00 | $ 1,023.61 | $ 1.20 |
| Institutional Shares | ||||
| Actual Return | 0.24% | $1,000.00 | $ 1,000.10 | $ 1.19 |
| Hypothetical 5% Return | 0.24% | $1,000.00 | $ 1,023.61 | $ 1.20 |
| Institutional Prime Shares | ||||
| Actual Return | 0.21% | $1,000.00 | $ 1,000.20 | $ 1.04 |
| Hypothetical 5% Return | 0.21% | $1,000.00 | $ 1,023.76 | $ 1.05 |
| 1 | Based on the most recent six-month expense ratio; may differ from the expense ratio provided in the Financial Highlights. |
| 2 | Expenses for each fund or share class are equal to its annualized expense ratio, multiplied by the average account value over the period, multiplied by 181 days of the period, and divided by 365 days of the fiscal year. |
| 3 | Actual expenses for the share class are equal to its annualized expense ratio, multiplied by the average account value over the period, multiplied by the 161 days of the period (from commencement of operations on 1/21/15 through 6/30/2015), and divided by 365 days of the fiscal year. |
| 4 | Hypothetical expenses for the share class are equal to its annualized expense ratio, multiplied by the average account value over the period, multiplied by the 181 days of the period, and divided by 365 days of the fiscal year. |
| Sweep Shares | 1/1/15–
6/30/15* |
1/1/14–
12/31/14 |
1/1/13–
12/31/13 |
1/1/12–
12/31/12 |
1/1/11–
12/31/11 |
1/1/10–
12/31/10 |
| Per-Share Data ($) | ||||||
| Net asset value at beginning of period | 1.00 | 1.00 | 1.00 | 1.00 | 1.00 | 1.00 |
| Income (loss) from investment operations: | ||||||
| Net investment income (loss) | — 1 | (0.00) 2 | 0.00 2 | 0.00 2 | 0.00 2 | 0.00 2 |
| Net realized and unrealized gains (losses) | (0.00) 2 | (0.00) 2 | 0.00 2 | 0.00 2 | 0.00 2 | 0.00 2 |
| Total from investment operations | (0.00) 2 | (0.00) 2 | 0.00 2 | 0.00 2 | 0.00 2 | 0.00 2 |
| Less distributions: | ||||||
| Distributions from net investment income | — | — | (0.00) 2 | (0.00) 2 | (0.00) 2 | (0.00) 2 |
| Net asset value at end of period | 1.00 | 1.00 | 1.00 | 1.00 | 1.00 | 1.00 |
| Total return (%) | — 3 | — | 0.01 | 0.01 | 0.01 | 0.01 |
| Ratios/Supplemental Data (%) | ||||||
| Ratios to average net assets: | ||||||
| Net operating expenses | 0.12 4,5 | 0.09 5 | 0.12 5 | 0.16 5 | 0.15 5 | 0.23 5 |
| Gross operating expenses | 0.72 4 | 0.72 | 0.72 | 0.73 | 0.73 | 0.73 |
| Net investment income (loss) | — 4 | — | 0.01 | 0.01 | 0.01 | 0.01 |
| Net assets, end of period ($ x 1,000,000) | 21,378 | 25,170 | 21,706 | 19,455 | 17,829 | 14,514 |
| Purchased Shares | 1/21/15
6– 6/30/15* |
|||||
| Per-Share Data ($) | ||||||
| Net asset value at beginning of period | 1.00 | |||||
| Income (loss) from investment operations: | ||||||
| Net investment income (loss) | — 1 | |||||
| Net realized and unrealized gains (losses) | (0.00) 2 | |||||
| Total from investment operations | (0.00) 2 | |||||
| Less distributions: | ||||||
| Distributions from net investment income | — | |||||
| Net asset value at end of period | 1.00 | |||||
| Total return (%) | — 3 | |||||
| Ratios/Supplemental Data (%) | ||||||
| Ratios to average net assets: | ||||||
| Net operating expenses | 0.13 4 | |||||
| Gross operating expenses | 0.57 4 | |||||
| Net investment income (loss) | — 4 | |||||
| Net assets, end of period ($ x 1,000,000) | 10 | |||||
| * | Unaudited. |
| Holdings by Category | Cost
($) |
Value
($) | |
| 46.9% | Fixed-Rate Obligations | 10,037,798,126 | 10,037,798,126 |
| 21.7% | Variable-Rate Obligations | 4,647,906,580 | 4,647,906,580 |
| 31.8% | Repurchase Agreements | 6,797,399,927 | 6,797,399,927 |
| 100.4% | Total Investments | 21,483,104,633 | 21,483,104,633 |
| (0.4%) | Other Assets and Liabilities, Net | (95,679,040) | |
| 100.0% | Net Assets | 21,387,425,593 | |
| Issuer | Footnotes | Rate | Effective
Maturity |
Maturity
Date |
Face
Amount ($) |
Value
($) |
| Fixed-Rate Obligations 46.9% of net assets | ||||||
| Government Agency Debt 42.8% | ||||||
| Fannie Mae | 0.09% | 07/02/15 | 400,000,000 | 399,999,000 | ||
| 0.50% | 07/02/15 | 69,712,000 | 69,712,744 | |||
| 2.38% | 07/28/15 | 18,484,000 | 18,514,682 | |||
| 0.12% | 08/20/15 | 100,000,000 | 99,984,028 | |||
| 0.13% | 09/14/15 | 250,000,000 | 249,932,292 | |||
| 0.50% | 09/28/15 | 8,850,000 | 8,857,209 | |||
| 0.14% | 09/30/15 | 20,087,000 | 20,080,145 | |||
| 0.14% | 11/23/15 | 300,000,000 | 299,830,833 | |||
| 0.15% | 12/01/15 | 50,000,000 | 49,968,125 | |||
| Federal Home Loan Bank | 0.13% | 07/02/15 | 99,370,000 | 99,369,885 | ||
| 0.08% | 07/06/15 | 350,000,000 | 349,996,063 | |||
| 0.15% | 07/07/15 | 100,000,000 | 99,999,820 | |||
| 0.09% | 07/10/15 | 11,855,000 | 11,854,748 | |||
| 0.13% | 07/10/15 | 100,000,000 | 99,998,852 | |||
| 0.16% | 07/15/15 | 25,000,000 | 25,000,614 | |||
| 0.09% | 07/17/15 | 15,000,000 | 14,999,433 | |||
| 0.15% | 07/17/15 | 95,000,000 | 94,993,878 | |||
| 0.09% | 07/24/15 | 1,719,000 | 1,718,901 | |||
| 0.14% | 07/24/15 | 17,700,000 | 17,698,473 | |||
| 0.07% | 07/29/15 | 203,032,000 | 203,020,314 | |||
| 0.09% | 07/29/15 | 9,492,000 | 9,491,355 | |||
| 0.10% | 07/29/15 | 2,779,000 | 2,778,784 | |||
| 0.12% | 07/31/15 | 20,000,000 | 19,998,000 | |||
| 0.06% | 08/10/15 | 170,000,000 | 169,988,667 | |||
| 0.10% | 08/12/15 | 534,755,000 | 534,694,110 | |||
| 0.12% | 08/12/15 | 17,566,000 | 17,563,541 | |||
| 0.13% | 08/12/15 | 146,234,000 | 146,211,488 | |||
| 0.20% | 08/18/15 | 40,000,000 | 40,002,542 | |||
| 0.09% | 08/19/15 | 618,280,000 | 618,200,895 | |||
| 0.12% | 08/19/15 | 150,000,000 | 149,975,500 | |||
| 0.14% | 08/21/15 | 404,500,000 | 404,420,942 | |||
| Issuer | Footnotes | Rate | Effective
Maturity |
Maturity
Date |
Face
Amount ($) |
Value
($) |
| 0.20% | 08/24/15 | 13,650,000 | 13,650,843 | |||
| 0.09% | 08/25/15 | 44,000,000 | 43,999,225 | |||
| 0.13% | 08/28/15 | 10,800,000 | 10,799,368 | |||
| 0.20% | 08/28/15 | 100,000,000 | 100,004,453 | |||
| 0.38% | 08/28/15 | 126,470,000 | 126,512,949 | |||
| 0.19% | 09/01/15 | 25,000,000 | 24,999,442 | |||
| 0.13% | 09/02/15 | 55,700,000 | 55,695,444 | |||
| 0.15% | 09/02/15 | 32,325,000 | 32,316,515 | |||
| 0.10% | 09/08/15 | 3,000,000 | 2,999,425 | |||
| 0.19% | 09/08/15 | 195,000,000 | 195,006,467 | |||
| 0.10% | 09/09/15 | 108,000,000 | 107,979,000 | |||
| 0.20% | 09/10/15 | 172,910,000 | 172,921,721 | |||
| 1.75% | 09/11/15 | 31,925,000 | 32,021,575 | |||
| 0.20% | 09/15/15 | 24,000,000 | 23,998,833 | |||
| 0.19% | 09/16/15 | 86,000,000 | 86,008,526 | |||
| 0.20% | 09/16/15 | 150,000,000 | 149,995,955 | |||
| 0.20% | 09/17/15 | 401,100,000 | 401,144,955 | |||
| 0.09% | 09/18/15 | 300,000,000 | 299,944,042 | |||
| 0.20% | 09/18/15 | 62,000,000 | 62,005,577 | |||
| 0.21% | 09/18/15 | 14,445,000 | 14,438,343 | |||
| 0.20% | 09/25/15 | 544,000,000 | 543,973,879 | |||
| 0.10% | 09/28/15 | 100,000,000 | 99,995,728 | |||
| 0.14% | 09/28/15 | 62,000,000 | 61,978,541 | |||
| 0.20% | 10/16/15 | 14,000,000 | 14,003,196 | |||
| 0.17% | 10/19/15 | 250,000,000 | 249,978,500 | |||
| 0.12% | 10/21/15 | 11,700,000 | 11,695,632 | |||
| 0.10% | 11/02/15 | 100,000,000 | 99,965,556 | |||
| 0.14% | 11/04/15 | 7,710,000 | 7,706,222 | |||
| 0.25% | 12/09/15 | 175,000,000 | 174,977,992 | |||
| 0.15% | 12/15/15 | 100,000,000 | 99,930,417 | |||
| 0.16% | 01/15/16 | 105,000,000 | 104,972,366 | |||
| 0.34% | 01/25/16 | 10,000,000 | 10,007,096 | |||
| 0.25% | 01/27/16 | 100,000,000 | 99,986,472 | |||
| 0.27% | 02/05/16 | 100,000,000 | 99,991,806 | |||
| 0.27% | 02/10/16 | 50,000,000 | 49,989,598 | |||
| 0.35% | 03/07/16 | 50,000,000 | 50,000,000 | |||
| 0.34% | 03/14/16 | 248,000,000 | 247,959,248 | |||
| 0.40% | 03/18/16 | 50,000,000 | 50,000,000 | |||
| 0.26% | 03/24/16 | 47,750,000 | 47,657,922 | |||
| 0.33% | 04/01/16 | 75,000,000 | 74,979,669 | |||
| 0.45% | 06/30/16 | 18,400,000 | 18,400,000 | |||
| 0.40% | 07/08/16 | 100,000,000 | 99,983,818 | |||
| Freddie Mac | 0.11% | 08/05/15 | 17,740,000 | 17,738,103 | ||
| 0.11% | 08/07/15 | 47,000,000 | 46,994,686 | |||
| 0.12% | 08/28/15 | 54,400,000 | 54,389,833 | |||
| 0.50% | 08/28/15 | 5,060,000 | 5,062,724 | |||
| 0.42% | 09/18/15 | 35,000,000 | 35,020,516 | |||
| 0.23% | 10/26/15 | 21,982,000 | 21,965,568 | |||
| 0.10% | 10/29/15 | 250,000,000 | 249,916,667 | |||
| 0.19% | 11/30/15 | 51,584,000 | 51,543,707 | |||
| 0.21% | 12/07/15 | 49,000,000 | 48,955,635 | |||
| 9,155,019,618 | ||||||
| Treasury Debt 4.1% | ||||||
| United States Treasury Department | 0.25% | 08/15/15 | 65,000,000 | 65,006,183 | ||
| 0.25% | 09/15/15 | 8,000,000 | 8,001,112 | |||
| 0.25% | 10/31/15 | 125,000,000 | 125,027,077 | |||
| 1.25% | 10/31/15 | 150,000,000 | 150,580,098 | |||
| 0.38% | 11/15/15 | 134,000,000 | 134,133,236 | |||
| 1.38% | 11/30/15 | 45,000,000 | 45,233,187 | |||
| 2.13% | 12/31/15 | 125,000,000 | 126,213,357 | |||
| 0.38% | 01/31/16 | 62,000,000 | 62,068,956 | |||
| Issuer | Footnotes | Rate | Effective
Maturity |
Maturity
Date |
Face
Amount ($) |
Value
($) |
| 2.00% | 01/31/16 | 140,000,000 | 141,490,510 | |||
| 0.38% | 04/30/16 | 25,000,000 | 25,024,792 | |||
| 882,778,508 | ||||||
| Total Fixed-Rate Obligations | ||||||
| (Cost $10,037,798,126) | 10,037,798,126 | |||||
| Variable-Rate Obligations 21.7% of net assets | ||||||
| Government Agency Debt 20.0% | ||||||
| Fannie Mae | 0.16% | 07/05/15 | 08/05/15 | 150,000,000 | 149,997,077 | |
| 0.18% | 07/21/15 | 10/21/15 | 450,000,000 | 450,042,306 | ||
| 0.17% | 07/21/15 | 10/21/16 | 125,000,000 | 124,984,319 | ||
| Farm Credit System | 0.15% | 07/07/15 | 08/27/15 | 50,000,000 | 49,999,218 | |
| Federal Home Loan Bank | 0.15% | 07/21/15 | 100,000,000 | 99,999,159 | ||
| 0.15% | 07/10/15 | 08/10/15 | 50,000,000 | 49,999,178 | ||
| 0.15% | 07/18/15 | 08/18/15 | 50,000,000 | 50,000,000 | ||
| 0.18% | 08/26/15 | 100,000,000 | 99,997,704 | |||
| 0.15% | 07/17/15 | 09/17/15 | 100,000,000 | 99,997,820 | ||
| 0.18% | 09/17/15 | 100,000,000 | 99,996,681 | |||
| 0.15% | 07/28/15 | 09/28/15 | 75,000,000 | 74,998,136 | ||
| 0.19% | 07/23/15 | 10/23/15 | 61,000,000 | 61,007,909 | ||
| 0.20% | 08/25/15 | 11/20/15 | 6,000,000 | 5,999,717 | ||
| 0.15% | 07/24/15 | 11/24/15 | 100,000,000 | 100,000,000 | ||
| 0.20% | 09/06/15 | 12/03/15 | 8,000,000 | 7,999,557 | ||
| 0.14% | 07/07/15 | 12/07/15 | 100,000,000 | 99,992,286 | ||
| 0.21% | 09/09/15 | 12/09/15 | 50,000,000 | 50,000,000 | ||
| 0.13% | 07/15/15 | 01/15/16 | 385,000,000 | 384,984,227 | ||
| 0.20% | 08/10/15 | 02/10/16 | 150,000,000 | 150,000,128 | ||
| 0.14% | 07/18/15 | 02/18/16 | 100,000,000 | 99,991,913 | ||
| 0.12% | 07/02/15 | 03/02/16 | 150,000,000 | 150,000,000 | ||
| 0.14% | 07/23/15 | 03/23/16 | 335,000,000 | 334,995,443 | ||
| 0.16% | 08/13/15 | 05/13/16 | 200,000,000 | 199,972,920 | ||
| Freddie Mac | 0.16% | 07/16/15 | 10/16/15 | 528,750,000 | 528,776,604 | |
| 0.18% | 07/25/15 | 11/25/15 | 137,500,000 | 137,511,775 | ||
| 0.15% | 07/18/15 | 02/18/16 | 150,000,000 | 149,990,402 | ||
| 0.17% | 08/14/15 | 11/14/16 | 200,000,000 | 199,992,063 | ||
| 0.18% | 07/12/15 | 12/12/16 | 100,000,000 | 99,977,856 | ||
| 0.19% | 07/13/15 | 01/13/17 | 175,000,000 | 174,972,697 | ||
| 4,286,177,095 | ||||||
| Treasury Debt 1.7% | ||||||
| United States Treasury Department | 0.06% | 07/01/15 | 01/31/16 | 95,000,000 | 94,998,367 | |
| 0.09% | 07/01/15 | 07/31/16 | 95,000,000 | 95,000,000 | ||
| 0.07% | 07/01/15 | 10/31/16 | 100,000,000 | 99,951,602 | ||
| 0.10% | 07/01/15 | 01/31/17 | 71,780,000 | 71,779,516 | ||
| 361,729,485 | ||||||
| Total Variable-Rate Obligations | ||||||
| (Cost $4,647,906,580) | 4,647,906,580 | |||||
| Issuer | Footnotes | Rate | Effective
Maturity |
Maturity
Date |
Maturity Amount ($) |
Value
($) |
| Repurchase Agreements 31.8% of net assets | ||||||
| Government Agency Repurchase Agreements* 4.6% | ||||||
| BNP Paribas Securities Corp | ||||||
| Issued
06/30/15, repurchase date 07/01/15 (Collateralized by U.S. Government Agency Securities valued at $130,647,573, 0.46% - 8.00%, due 01/25/18 - 07/25/45) |
0.10% | 07/01/15 | 125,000,347 | 125,000,000 | ||
| Deutsche Bank Securities, Inc | ||||||
| Issued
06/30/15, repurchase date 07/01/15 (Collateralized by U.S. Government Agency Securities valued at $156,000,001, 4.50%, due 02/01/45) |
0.18% | 07/01/15 | 150,000,750 | 150,000,000 | ||
| Goldman Sachs & Co | ||||||
| Issued
06/30/15, repurchase date 07/01/15 (Collateralized by U.S. Government Agency Securities valued at $25,500,000, 2.00% - 8.50%, due 09/01/25 - 09/01/44) |
0.13% | 07/01/15 | 25,000,090 | 25,000,000 | ||
| Issued
06/24/15, repurchase date 07/01/15 (Collateralized by U.S. Government Agency Securities valued at $31,620,001, 3.00% - 5.50%, due 06/20/34 - 04/15/45) |
0.07% | 07/01/15 | 31,000,422 | 31,000,000 | ||
| Issued
06/25/15, repurchase date 07/02/15 (Collateralized by U.S. Government Agency Securities valued at $173,400,001, 3.00% - 4.00%, due 10/15/41 - 01/15/45) |
0.08% | 07/02/15 | 170,002,644 | 170,000,000 | ||
| JP Morgan Securities, LLC | ||||||
| Issued
06/30/15, repurchase date 07/01/15 (Collateralized by U.S. Government Agency Securities valued at $23,690,000, 2.00% - 4.50%, due 12/01/29 - 04/15/49) |
0.14% | 07/01/15 | 23,000,089 | 23,000,000 | ||
| Issued
06/24/15, repurchase date 07/01/15 (Collateralized by U.S. Government Agency Securities valued at $154,502,060, 2.75% - 4.50%, due 07/01/26 - 09/01/42) |
0.08% | 07/01/15 | 150,002,333 | 150,000,000 | ||
| Merrill Lynch, Pierce, Fenner & Smith, Inc | ||||||
| Issued
06/30/15, repurchase date 07/01/15 (Collateralized by U.S. Government Agency Securities valued at $28,840,000, 2.91% - 3.00%, due 01/25/22 - 05/20/45) |
0.14% | 07/01/15 | 28,000,109 | 28,000,000 | ||
| Issued
06/26/15, repurchase date 07/02/15 (Collateralized by U.S. Government Agency Securities valued at $206,000,001, 3.00% - 3.50%, due 05/25/41 - 09/25/41) |
0.09% | 07/02/15 | 200,003,000 | 200,000,000 | ||
| Mizuho Securities USA, Inc | ||||||
| Issued
06/30/15, repurchase date 07/01/15 (Collateralized by U.S. Government Agency Securities valued at $90,538,622, 2.22% - 8.00%, due 01/17/23 - 06/01/45) |
0.15% | 07/01/15 | 88,000,367 | 88,000,000 | ||
| 990,000,000 | ||||||
| Treasury Repurchase Agreements 27.2% | ||||||
| Barclays Capital, Inc | ||||||
| Issued
06/30/15, repurchase date 07/01/15 (Collateralized by U.S. Treasury Securities valued at $1,427,996, 0.25% - 1.38%, due 09/30/15 - 05/31/20) |
0.10% | 07/01/15 | 1,399,931 | 1,399,927 | ||
| BNP Paribas Securities Corp | ||||||
| Issued
06/24/15, repurchase date 07/01/15 (Collateralized by U.S. Treasury Securities valued at $10,200,039, 0.00% - 5.50%, due 07/23/15 - 08/15/28) |
0.05% | 07/01/15 | 10,000,097 | 10,000,000 | ||
| Issuer | Footnotes | Rate | Effective
Maturity |
Maturity
Date |
Maturity Amount ($) |
Value
($) |
| Issued
06/30/15, repurchase date 07/01/15 (Collateralized by U.S. Treasury Securities valued at $28,560,079, 0.88% - 3.25%, due 05/31/16 - 09/30/21) |
0.09% | 07/01/15 | 28,000,070 | 28,000,000 | ||
| Federal Reserve Bank of New York | ||||||
| Issued
06/30/15, repurchase date 07/01/15 (Collateralized by U.S. Treasury Securities valued at $3,163,004,397, 4.25%, due 11/15/40) |
0.05% | 07/01/15 | 3,163,004,393 | 3,163,000,000 | ||
| Issued
06/29/15, repurchase date 07/01/15 (Collateralized by U.S. Treasury Securities valued at $1,000,003,894, 3.00%, due 05/15/42) |
0.07% | 07/01/15 | 1,000,003,889 | 1,000,000,000 | ||
| Issued
06/25/15, repurchase date 07/02/15 (Collateralized by U.S. Treasury Securities valued at $1,500,017,587, 2.00% - 2.25%, due 07/31/18 - 02/15/22) |
0.07% | 07/02/15 | 1,500,020,417 | 1,500,000,000 | ||
| JP Morgan Securities, LLC | ||||||
| Issued
06/22/15, repurchase date 07/22/15 (Collateralized by U.S. Treasury Securities valued at $107,101,931, 1.25% - 2.63%, due 10/31/18 - 05/15/24) |
0.08% | 07/07/15 | 105,003,500 | 105,000,000 | ||
| 5,807,399,927 | ||||||
| Total Repurchase Agreements | ||||||
| (Cost $6,797,399,927) | 6,797,399,927 | |||||
| * | Usually collateralized via U.S. Government Agency Securities or less frequently by U.S. Treasury Securities. |
| Assets | ||
| Investments, at cost and value | $14,685,704,706 | |
| Repurchase agreements, at cost and value | + | 6,797,399,927 |
| Total investments, at cost and value (Note 2a) | 21,483,104,633 | |
| Receivables: | ||
| Interest | 5,313,575 | |
| Fund shares sold | 300,000 | |
| Prepaid expenses | + | 18,845 |
| Total assets | 21,488,737,053 | |
| Liabilities | ||
| Payables: | ||
| Investments bought | 99,930,417 | |
| Investment adviser and administrator fees | 507,966 | |
| Fund shares redeemed | 10,000 | |
| Accrued expenses | + | 863,077 |
| Total liabilities | 101,311,460 | |
| Net Assets | ||
| Total assets | 21,488,737,053 | |
| Total liabilities | – | 101,311,460 |
| Net assets | $21,387,425,593 | |
| Net Assets by Source | ||
| Capital received from investors | 21,387,679,202 | |
| Net realized capital losses | (253,609) | |
| Net Asset Value (NAV) by Shares Class | |||||
| Share Class | Net Assets | ÷ | Shares
Outstanding |
= | NAV |
| Sweep Shares | $21,377,881,662 | 21,378,850,695 | $1.00 | ||
| Purchased Shares | $9,543,931 | 9,543,939 | $1.00 | ||
| Investment Income | ||
| Interest | $13,446,869 | |
| Expenses | ||
| Investment adviser and administrator fees | 34,629,149 | |
| Shareholder service fees: | ||
| Sweep Shares | 45,197,188 | |
| Purchased Shares | 4,775 | |
| Shareholder reports | 460,256 | |
| Portfolio accounting fees | 258,031 | |
| Custodian fees | 222,496 | |
| Registration fees | 156,771 | |
| Professional fees | 69,057 | |
| Independent trustees' fees | 46,385 | |
| Transfer agent fees | 13,813 | |
| Other expenses | + | 195,016 |
| Total expenses | 81,252,937 | |
| Expense reduction by CSIM and its affiliates | – | 67,806,068 |
| Net expenses | – | 13,446,869 |
| Net investment income | — | |
| Realized Gains (Losses) | ||
| Net realized losses on investments | (64,947) | |
| Decrease in net assets resulting from operations | ($64,947) | |
| Operations | |||
| 1/1/15-6/30/15 | 1/1/14-12/31/14 | ||
| Net realized loss | + | ($64,947) | ($188,662) |
| Decrease in net assets from operations | (64,947) | (188,662) | |
| Transactions in Fund Shares* | |||
| Shares Sold | |||
| Sweep Shares | 43,603,883,770 | 101,539,484,499 | |
| Purchased Shares | + | 14,845,163 | — |
| Total shares sold | 43,618,728,933 | 101,539,484,499 | |
| Shares Redeemed | |||
| Sweep Shares | (47,395,487,713) | (98,075,875,164) | |
| Purchased Shares | + | (5,301,224) | — |
| Total shares redeemed | (47,400,788,937) | (98,075,875,164) | |
| Net transactions in fund shares | (3,782,060,004) | 3,463,609,335 | |
| Net Assets | |||
| Beginning of period | 25,169,550,544 | 21,706,129,871 | |
| Total increase or decrease | + | (3,782,124,951) | 3,463,420,673 |
| End of period | $21,387,425,593 | $25,169,550,544 | |
| * | Transactions took place at $1.00 per share; figures for share quantities are the same as for dollars. |
| 1/1/15–
6/30/15* |
1/1/14–
12/31/14 |
1/1/13–
12/31/13 |
1/1/12–
12/31/12 |
1/1/11–
12/31/11 |
1/1/10–
12/31/10 | |
| Per-Share Data ($) | ||||||
| Net asset value at beginning of period | 1.00 | 1.00 | 1.00 | 1.00 | 1.00 | 1.00 |
| Income (loss) from investment operations: | ||||||
| Net investment income (loss) | — 1 | (0.00) 2 | 0.00 2 | 0.00 2 | 0.00 2 | 0.00 2 |
| Net realized and unrealized gains (losses) | 0.00 2 | (0.00) 2 | (0.00) 2 | 0.00 2 | 0.00 2 | 0.00 2 |
| Total from investment operations | 0.00 2 | (0.00) 2 | 0.00 2 | 0.00 2 | 0.00 2 | 0.00 2 |
| Less distributions: | ||||||
| Distributions from net investment income | — | — | (0.00) 2 | (0.00) 2 | (0.00) 2 | (0.00) 2 |
| Net asset value at end of period | 1.00 | 1.00 | 1.00 | 1.00 | 1.00 | 1.00 |
| Total return (%) | — 3 | — | 0.01 | 0.01 | 0.01 | 0.01 |
| Ratios/Supplemental Data (%) | ||||||
| Ratios to average net assets: | ||||||
| Net operating expenses | 0.06 4,5 | 0.06 5 | 0.07 5 | 0.08 5 | 0.06 5 | 0.16 5 |
| Gross operating expenses | 0.72 4 | 0.72 | 0.72 | 0.72 | 0.72 | 0.72 |
| Net investment income (loss) | — 4 | — | 0.01 | 0.01 | 0.01 | 0.01 |
| Net assets, end of period ($ x 1,000,000) | 19,214 | 20,634 | 21,894 | 23,526 | 25,876 | 18,004 |
| * | Unaudited. |
| Holdings by Category | Cost
($) |
Value
($) | |
| 82.0% | Fixed-Rate Obligations | 15,756,338,923 | 15,756,338,923 |
| 14.5% | Variable-Rate Obligations | 2,784,208,681 | 2,784,208,681 |
| 96.5% | Total Investments | 18,540,547,604 | 18,540,547,604 |
| 3.5% | Other Assets and Liabilities, Net | 673,612,595 | |
| 100.0% | Net Assets | 19,214,160,199 | |
| Issuer | Footnotes | Rate | Effective
Maturity |
Maturity
Date |
Face
Amount ($) |
Value
($) |
| Fixed-Rate Obligations 82.0% of net assets | ||||||
| Treasury Debt 82.0% | ||||||
| United States Treasury Department | 0.01% | 07/02/15 | 836,099,000 | 836,098,857 | ||
| 0.01% | 07/09/15 | 700,000,000 | 699,998,444 | |||
| 0.00% | 07/16/15 | 700,000,000 | 699,999,531 | |||
| 0.01% | 07/16/15 | 620,000,000 | 619,998,708 | |||
| 0.00% | 07/23/15 | 920,410,000 | 920,409,082 | |||
| 0.01% | 07/30/15 | 350,000,000 | 349,998,094 | |||
| 0.25% | 07/31/15 | 860,000,000 | 860,125,293 | |||
| 1.75% | 07/31/15 | 490,000,000 | 490,677,766 | |||
| 0.01% | 08/13/15 | 31,272,000 | 31,271,533 | |||
| 0.25% | 08/15/15 | 210,000,000 | 210,035,768 | |||
| 4.25% | 08/15/15 | 1,105,000,000 | 1,110,718,827 | |||
| 0.01% | 08/20/15 | 16,485,000 | 16,484,702 | |||
| 0.38% | 08/31/15 | 100,000,000 | 100,031,915 | |||
| 0.00% | 09/03/15 | 500,000,000 | 499,998,222 | |||
| 0.11% | 09/03/15 | 48,915,000 | 48,905,434 | |||
| 0.00% | 09/10/15 | 401,340,000 | 401,339,605 | |||
| 0.01% | 09/10/15 | 245,000,000 | 244,995,690 | |||
| 0.25% | 09/15/15 | 520,000,000 | 520,171,941 | |||
| 0.00% | 09/17/15 | 725,000,000 | 724,998,646 | |||
| 0.00% | 09/24/15 | 925,000,000 | 924,996,223 | |||
| 0.02% | 09/24/15 | 14,663,000 | 14,662,308 | |||
| 0.25% | 09/30/15 | 783,830,000 | 784,177,613 | |||
| 1.25% | 09/30/15 | 510,000,000 | 511,520,921 | |||
| 0.09% | 10/08/15 | 400,000,000 | 399,899,694 | |||
| 0.05% | 10/15/15 | 566,000 | 565,923 | |||
| 0.09% | 10/15/15 | 33,692,000 | 33,683,072 | |||
| 0.25% | 10/15/15 | 32,000,000 | 32,017,877 | |||
| 0.09% | 10/22/15 | 240,000,000 | 239,931,447 | |||
| 0.01% | 10/29/15 | 75,000,000 | 74,998,750 | |||
| 0.25% | 10/31/15 | 834,000,000 | 834,509,667 | |||
| 1.25% | 10/31/15 | 951,000,000 | 954,637,852 | |||
| 0.38% | 11/15/15 | 263,000,000 | 263,247,345 | |||
| 4.50% | 11/15/15 | 14,000,000 | 14,226,755 | |||
| Issuer | Footnotes | Rate | Effective
Maturity |
Maturity
Date |
Face
Amount ($) |
Value
($) |
| 0.01% | 11/19/15 | 269,000,000 | 268,989,464 | |||
| 0.02% | 11/27/15 | 167,808,000 | 167,792,756 | |||
| 1.38% | 11/30/15 | 340,000,000 | 341,699,807 | |||
| 0.25% | 12/31/15 | 180,000,000 | 180,093,022 | |||
| 2.13% | 12/31/15 | 130,000,000 | 131,261,892 | |||
| 0.38% | 01/15/16 | 150,000,000 | 150,143,784 | |||
| 0.38% | 03/31/16 | 47,000,000 | 47,024,693 | |||
| Total Fixed-Rate Obligations | ||||||
| (Cost $15,756,338,923) | 15,756,338,923 | |||||
| Variable-Rate Obligations 14.5% of net assets | ||||||
| Treasury Debt 14.5% | ||||||
| United States Treasury Department | 0.06% | 07/01/15 | 01/31/16 | 1,573,199,000 | 1,573,118,410 | |
| 0.08% | 07/01/15 | 04/30/16 | 95,000,000 | 95,001,202 | ||
| 0.09% | 07/01/15 | 07/31/16 | 200,000,000 | 200,022,587 | ||
| 0.07% | 07/01/15 | 10/31/16 | 546,000,000 | 545,865,599 | ||
| 0.10% | 07/01/15 | 01/31/17 | 370,000,000 | 370,200,883 | ||
| Total Variable-Rate Obligations | ||||||
| (Cost $2,784,208,681) | 2,784,208,681 | |||||
| Assets | ||
| Investments, at cost and value (Note 2a) | $18,540,547,604 | |
| Cash | 845,625,077 | |
| Receivables: | ||
| Investments sold | 149,984,250 | |
| Interest | 28,531,522 | |
| Prepaid expenses | + | 23,537 |
| Total assets | 19,564,711,990 | |
| Liabilities | ||
| Payables: | ||
| Investments bought | 349,998,094 | |
| Shareholder service fees | 176,838 | |
| Accrued expenses | + | 376,859 |
| Total liabilities | 350,551,791 | |
| Net Assets | ||
| Total assets | 19,564,711,990 | |
| Total liabilities | – | 350,551,791 |
| Net assets | $19,214,160,199 | |
| Net Assets by Source | ||
| Capital received from investors | 19,214,154,078 | |
| Net realized capital gains | 6,121 | |
| Net Asset Value (NAV) | ||||
| Net Assets | ÷ | Shares
Outstanding |
= | NAV |
| $19,214,160,199 | 19,213,763,435 | $1.00 | ||
| Investment Income | ||
| Interest | $6,320,210 | |
| Expenses | ||
| Investment adviser and administrator fees | 31,024,538 | |
| Shareholder service fees | 39,919,724 | |
| Portfolio accounting fees | 220,870 | |
| Shareholder reports | 180,449 | |
| Custodian fees | 180,026 | |
| Professional fees | 54,462 | |
| Registration fees | 48,375 | |
| Independent trustees' fees | 42,382 | |
| Transfer agent fees | 11,002 | |
| Other expenses | + | 186,295 |
| Total expenses | 71,868,123 | |
| Expense reduction by CSIM and its affiliates | – | 65,547,913 |
| Net expenses | – | 6,320,210 |
| Net investment income | — | |
| Realized Gains (Losses) | ||
| Net realized gains on investments | 460,889 | |
| Increase in net assets resulting from operations | $460,889 | |
| Operations | |||
| 1/1/15-6/30/15 | 1/1/14-12/31/14 | ||
| Net realized gains (losses) | + | 460,889 | (249,929) |
| Increase (decrease) in net assets from operations | 460,889 | (249,929) | |
| Transactions in Fund Shares* | |||
| Shares sold | 26,178,797,803 | 52,836,007,761 | |
| Shares redeemed | + | (27,598,766,155) | (54,096,020,501) |
| Net transactions in fund shares | (1,419,968,352) | (1,260,012,740) | |
| Net Assets | |||
| Beginning of period | 20,633,667,662 | 21,893,930,331 | |
| Total decrease | + | (1,419,507,463) | (1,260,262,669) |
| End of period | $19,214,160,199 | $20,633,667,662 | |
| * | Transactions took place at $1.00 per share; figures for share quantities are the same as for dollars. |
| Sweep Shares | 1/1/15–
6/30/15* |
1/1/14–
12/31/14 |
1/1/13–
12/31/13 |
6/5/12
1– 12/31/12 |
||
| Per-Share Data ($) | ||||||
| Net asset value at beginning of period | 1.00 | 1.00 | 1.00 | 1.00 | ||
| Income (loss) from investment operations: | ||||||
| Net investment income (loss) | — 2 | — | 0.00 3 | 0.00 3 | ||
| Net realized and unrealized gains (losses) | 0.00 3 | (0.00) 3 | (0.00) 3 | — | ||
| Total from investment operations | 0.00 3 | (0.00) 3 | 0.00 3 | 0.00 3 | ||
| Less distributions: | ||||||
| Distributions from net investment income | — | — | (0.00) 3 | (0.00) 3 | ||
| Net asset value at end of period | 1.00 | 1.00 | 1.00 | 1.00 | ||
| Total return (%) | — 4 | — | 0.01 | 0.01 4 | ||
| Ratios/Supplemental Data (%) | ||||||
| Ratios to average net assets: | ||||||
| Net operating expenses | 0.10 5,6 | 0.07 6 | 0.09 6 | 0.16 5,6 | ||
| Gross operating expenses | 0.77 5 | 0.78 | 0.77 | 0.80 5 | ||
| Net investment income (loss) | — 5 | — | 0.01 | 0.01 5 | ||
| Net assets, end of period ($ x 1,000,000) | 1,097 | 1,125 | 1,320 | 1,348 | ||
| Value Advantage Shares | 1/1/15–
6/30/15* |
1/1/14–
12/31/14 |
1/1/13–
12/31/13 |
4/24/12
1– 12/31/12 |
||
| Per-Share Data ($) | ||||||
| Net asset value at beginning of period | 1.00 | 1.00 | 1.00 | 1.00 | ||
| Income (loss) from investment operations: | ||||||
| Net investment income (loss) | — 2 | — | 0.00 3 | 0.00 3 | ||
| Net realized and unrealized gains (losses) | 0.00 3 | (0.00) 3 | (0.00) 3 | — | ||
| Total from investment operations | 0.00 3 | (0.00) 3 | 0.00 3 | 0.00 3 | ||
| Less distributions: | ||||||
| Distributions from net investment income | — | — | (0.00) 3 | (0.00) 3 | ||
| Net asset value at end of period | 1.00 | 1.00 | 1.00 | 1.00 | ||
| Total return (%) | — 4 | — | 0.01 | 0.01 4 | ||
| Ratios/Supplemental Data (%) | ||||||
| Ratios to average net assets: | ||||||
| Net operating expenses | 0.10 5,6 | 0.07 6 | 0.09 6 | 0.15 5,6 | ||
| Gross operating expenses | 0.59 5 | 0.60 | 0.59 | 0.79 5 | ||
| Net investment income (loss) | — 5 | — | 0.01 | 0.01 5 | ||
| Net assets, end of period ($ x 1,000,000) | 59 | 60 | 80 | 111 | ||
| * | Unaudited. |
| Holdings by Category | Cost
($) |
Value
($) | |
| 39.9% | Fixed-Rate Obligations | 461,682,475 | 461,682,475 |
| 12.1% | Variable-Rate Obligations | 140,209,131 | 140,209,131 |
| 47.9% | Repurchase Agreements | 553,349,055 | 553,349,055 |
| 99.9% | Total Investments | 1,155,240,661 | 1,155,240,661 |
| 0.1% | Other Assets and Liabilities, Net | 1,114,997 | |
| 100.0% | Net Assets | 1,156,355,658 | |
| Issuer | Footnotes | Rate | Effective
Maturity |
Maturity
Date |
Face
Amount ($) |
Value
($) |
| Fixed-Rate Obligations 39.9% of net assets | ||||||
| Treasury Debt 39.9% | ||||||
| United States Treasury Department | 0.25% | 07/31/15 | 40,000,000 | 40,005,702 | ||
| 1.75% | 07/31/15 | 10,000,000 | 10,013,832 | |||
| 0.25% | 08/15/15 | 45,000,000 | 45,006,669 | |||
| 4.25% | 08/15/15 | 45,000,000 | 45,231,339 | |||
| 0.25% | 09/15/15 | 57,000,000 | 57,013,640 | |||
| 0.25% | 09/30/15 | 10,000,000 | 10,002,793 | |||
| 0.09% | 10/15/15 | 16,308,000 | 16,303,678 | |||
| 0.09% | 10/22/15 | 10,000,000 | 9,997,144 | |||
| 0.25% | 10/31/15 | 15,000,000 | 15,008,304 | |||
| 1.25% | 10/31/15 | 39,000,000 | 39,144,357 | |||
| 0.38% | 11/15/15 | 37,000,000 | 37,031,817 | |||
| 4.50% | 11/15/15 | 5,000,000 | 5,080,984 | |||
| 1.38% | 11/30/15 | 25,000,000 | 25,124,513 | |||
| 0.25% | 12/31/15 | 18,000,000 | 18,008,312 | |||
| 2.13% | 12/31/15 | 50,000,000 | 50,486,778 | |||
| 0.38% | 01/31/16 | 10,000,000 | 10,011,122 | |||
| 2.00% | 01/31/16 | 20,000,000 | 20,204,957 | |||
| 0.38% | 03/31/16 | 3,000,000 | 3,001,576 | |||
| 0.38% | 04/30/16 | 5,000,000 | 5,004,958 | |||
| Total Fixed-Rate Obligations | ||||||
| (Cost $461,682,475) | 461,682,475 | |||||
| Variable-Rate Obligations 12.1% of net assets | ||||||
| Treasury Debt 12.1% | ||||||
| United States Treasury Department | 0.06% | 07/01/15 | 01/31/16 | 95,000,000 | 94,993,773 | |
| 0.08% | 07/01/15 | 04/30/16 | 5,000,000 | 5,000,063 | ||
| 0.09% | 07/01/15 | 07/31/16 | 12,221,000 | 12,220,890 | ||
| Issuer | Footnotes | Rate | Effective
Maturity |
Maturity
Date |
Face
Amount ($) |
Value
($) |
| 0.07% | 07/01/15 | 10/31/16 | 18,000,000 | 17,994,485 | ||
| 0.10% | 07/01/15 | 01/31/17 | 10,000,000 | 9,999,920 | ||
| Total Variable-Rate Obligations | ||||||
| (Cost $140,209,131) | 140,209,131 | |||||
| Issuer | Footnotes | Rate | Effective
Maturity |
Maturity
Date |
Maturity Amount ($) |
Value
($) |
| Repurchase Agreements 47.9% of net assets | ||||||
| Treasury Repurchase Agreements 47.9% | ||||||
| Barclays Capital, Inc | ||||||
| Issued
06/30/15, repurchase date 07/01/15 (Collateralized by U.S. Treasury Securities valued at $102,000,101, 0.00% - 4.75%, due 10/31/15 - 08/15/24) |
0.10% | 07/01/15 | 100,000,278 | 100,000,000 | ||
| Issued
06/25/15, repurchase date 07/02/15 (Collateralized by U.S. Treasury Securities valued at $66,300,053, 0.00% - 8.13%, due 07/23/15 - 08/15/42) |
0.05% | 07/02/15 | 65,000,632 | 65,000,000 | ||
| BNP Paribas Securities Corp | ||||||
| Issued
06/24/15, repurchase date 07/01/15 (Collateralized by U.S. Treasury Securities valued at $117,300,077, 0.00% - 9.88%, due 07/23/15 - 02/15/42) |
0.05% | 07/01/15 | 115,001,118 | 115,000,000 | ||
| Issued
06/30/15, repurchase date 07/01/15 (Collateralized by U.S. Treasury Securities valued at $43,860,037, 0.00% - 1.75%, due 09/24/15 - 09/30/19) |
0.09% | 07/01/15 | 43,000,108 | 43,000,000 | ||
| JP Morgan Securities, LLC | ||||||
| Issued
06/30/15, repurchase date 07/01/15 (Collateralized by U.S. Treasury Securities valued at $183,956,129, 1.25% - 5.13%, due 05/15/16 - 05/15/24) |
0.12% | 07/01/15 | 180,349,656 | 180,349,055 | ||
| Issued
06/22/15, repurchase date 07/22/15 (Collateralized by U.S. Treasury Securities valued at $51,000,951, 2.00% - 2.63%, due 07/31/20 - 05/15/24) |
0.08% | 07/07/15 | 50,001,667 | 50,000,000 | ||
| Total Repurchase Agreements | ||||||
| (Cost $553,349,055) | 553,349,055 | |||||
| Assets | ||
| Investments, at cost and value | $601,891,606 | |
| Repurchase agreements, at cost and value | + | 553,349,055 |
| Total investments, at cost and value (Note 2a) | 1,155,240,661 | |
| Receivables: | ||
| Interest | 1,298,734 | |
| Prepaid expenses | + | 12,597 |
| Total assets | 1,156,551,992 | |
| Liabilities | ||
| Payables: | ||
| Investment adviser and administrator fees | 16,455 | |
| Fund shares redeemed | 120,007 | |
| Accrued expenses | + | 59,872 |
| Total liabilities | 196,334 | |
| Net Assets | ||
| Total assets | 1,156,551,992 | |
| Total liabilities | – | 196,334 |
| Net assets | $1,156,355,658 | |
| Net Assets by Source | ||
| Capital received from investors | 1,156,378,759 | |
| Net realized capital losses | (23,101) | |
| Net Asset Value (NAV) by Shares Class | |||||
| Share Class | Net Assets | ÷ | Shares
Outstanding |
= | NAV |
| Sweep Shares | $1,097,086,588 | 1,097,108,434 | $1.00 | ||
| Value Advantage Shares | $59,269,070 | 59,270,325 | $1.00 | ||
| Investment Income | ||
| Interest | $579,754 | |
| Expenses | ||
| Investment adviser and administrator fees | 2,079,504 | |
| Shareholder service fees: | ||
| Sweep Shares | 2,294,060 | |
| Value Advantage Shares | 65,649 | |
| Portfolio accounting fees | 46,638 | |
| Professional fees | 22,049 | |
| Transfer agent fees | 20,324 | |
| Registration fees | 17,078 | |
| Shareholder reports | 16,162 | |
| Independent trustees' fees | 15,557 | |
| Custodian fees | 13,843 | |
| Other expenses | + | 12,078 |
| Total expenses | 4,602,942 | |
| Expense reduction by CSIM and its affiliates | – | 4,023,188 |
| Net expenses | – | 579,754 |
| Net investment income | — | |
| Realized Gains (Losses) | ||
| Net realized gains on investments | 4,084 | |
| Increase in net assets resulting from operations | $4,084 | |
| Operations | |||
| 1/1/15-6/30/15 | 1/1/14-12/31/14 | ||
| Net realized gains (losses) | + | 4,084 | (24,054) |
| Increase (decrease) in net assets from operations | 4,084 | (24,054) | |
| Transactions in Fund Shares* | |||
| Shares Sold | |||
| Sweep Shares | 1,719,539,434 | 3,619,754,856 | |
| Value Advantage Shares | + | 6,641,804 | 8,653,181 |
| Total shares sold | 1,726,181,238 | 3,628,408,037 | |
| Shares Redeemed | |||
| Sweep Shares | (1,747,544,594) | (3,814,932,712) | |
| Value Advantage Shares | + | (7,449,786) | (28,484,479) |
| Total shares redeemed | (1,754,994,380) | (3,843,417,191) | |
| Net transactions in fund shares | (28,813,142) | (215,009,154) | |
| Net Assets | |||
| Beginning of period | 1,185,164,716 | 1,400,197,924 | |
| Total decrease | + | (28,809,058) | (215,033,208) |
| End of period | $1,156,355,658 | $1,185,164,716 | |
| * | Transactions took place at $1.00 per share; figures for share quantities are the same as for dollars. |
| Investor Shares | 1/1/15–
6/30/15* |
1/1/14–
12/31/14 |
1/1/13–
12/31/13 |
1/1/12–
12/31/12 |
1/1/11–
12/31/11 |
1/1/10–
12/31/10 |
| Per-Share Data ($) | ||||||
| Net asset value at beginning of period | 1.00 | 1.00 | 1.00 | 1.00 | 1.00 | 1.00 |
| Income (loss) from investment operations: | ||||||
| Net investment income (loss) | 0.00 1,2 | 0.00 2 | 0.00 2 | 0.00 2 | 0.00 2 | 0.00 2 |
| Net realized and unrealized gains (losses) | 0.00 2 | 0.00 2 | 0.00 2 | 0.00 2 | (0.00) 2 | 0.00 2,3 |
| Total from investment operations | 0.00 2 | 0.00 2 | 0.00 2 | 0.00 2 | 0.00 2 | 0.00 2 |
| Less distributions: | ||||||
| Distributions from net investment income | (0.00) 2 | (0.00) 2 | (0.00) 2 | (0.00) 2 | (0.00) 2 | (0.00) 2 |
| Net asset value at end of period | 1.00 | 1.00 | 1.00 | 1.00 | 1.00 | 1.00 |
| Total return (%) | 0.01 4 | 0.01 | 0.01 | 0.01 | 0.01 | 0.01 |
| Ratios/Supplemental Data (%) | ||||||
| Ratios to average net assets: | ||||||
| Net operating expenses | 0.24 5,6 | 0.21 6 | 0.25 6 | 0.28 6,7 | 0.26 6 | 0.33 6 |
| Gross operating expenses | 0.58 5 | 0.58 | 0.58 | 0.57 7 | 0.57 | 0.56 |
| Net investment income (loss) | 0.01 5 | 0.01 | 0.01 | 0.01 | 0.01 | 0.01 |
| Net assets, end of period ($ x 1,000,000) | 6,702 | 7,217 | 8,425 | 9,930 | 11,576 | 15,291 |
| Select Shares | 1/1/15–
6/30/15* |
1/1/14–
12/31/14 |
1/1/13–
12/31/13 |
1/1/12–
12/31/12 |
1/1/11–
12/31/11 |
1/1/10–
12/31/10 |
| Per-Share Data ($) | ||||||
| Net asset value at beginning of period | 1.00 | 1.00 | 1.00 | 1.00 | 1.00 | 1.00 |
| Income (loss) from investment operations: | ||||||
| Net investment income (loss) | 0.00 1,2 | 0.00 2 | 0.00 2 | 0.00 2 | 0.00 2 | 0.00 2 |
| Net realized and unrealized gains (losses) | 0.00 2 | 0.00 2 | 0.00 2 | 0.00 2 | (0.00) 2 | 0.00 2,3 |
| Total from investment operations | 0.00 2 | 0.00 2 | 0.00 2 | 0.00 2 | 0.00 2 | 0.00 2 |
| Less distributions: | ||||||
| Distributions from net investment income | (0.00) 2 | (0.00) 2 | (0.00) 2 | (0.00) 2 | (0.00) 2 | (0.00) 2 |
| Net asset value at end of period | 1.00 | 1.00 | 1.00 | 1.00 | 1.00 | 1.00 |
| Total return (%) | 0.01 4 | 0.01 | 0.01 | 0.01 | 0.01 | 0.03 |
| Ratios/Supplemental Data (%) | ||||||
| Ratios to average net assets: | ||||||
| Net operating expenses | 0.24 5,6 | 0.21 6 | 0.25 6 | 0.27 6,7 | 0.26 6 | 0.32 6 |
| Gross operating expenses | 0.48 5 | 0.48 | 0.48 | 0.47 7 | 0.47 | 0.46 |
| Net investment income (loss) | 0.01 5 | 0.01 | 0.01 | 0.01 | 0.01 | 0.03 |
| Net asset, end of period ($ x 1,000,000) | 1,108 | 1,138 | 1,238 | 1,403 | 1,871 | 2,617 |
| * | Unaudited. |
| Institutional Shares | 1/1/15–
6/30/15* |
1/1/14–
12/31/14 |
1/1/13–
12/31/13 |
1/1/12–
12/31/12 |
1/1/11–
12/31/11 |
1/1/10–
12/31/10 |
| Per-Share Data ($) | ||||||
| Net asset value at beginning of period | 1.00 | 1.00 | 1.00 | 1.00 | 1.00 | 1.00 |
| Income (loss) from investment operations: | ||||||
| Net investment income (loss) | 0.00 1,2 | 0.00 2 | 0.00 2 | 0.00 2 | 0.00 2 | 0.00 2 |
| Net realized and unrealized gains (losses) | 0.00 2 | 0.00 2 | 0.00 2 | 0.00 2 | (0.00) 2 | 0.00 2,3 |
| Total from investment operations | 0.00 2 | 0.00 2 | 0.00 2 | 0.00 2 | 0.00 2 | 0.00 2 |
| Less distributions: | ||||||
| Distributions from net investment income | (0.00) 2 | (0.00) 2 | (0.00) 2 | (0.00) 2 | (0.00) 2 | (0.00) 2 |
| Net asset value at end of period | 1.00 | 1.00 | 1.00 | 1.00 | 1.00 | 1.00 |
| Total return (%) | 0.01 4 | 0.01 | 0.02 | 0.05 | 0.04 | 0.11 |
| Ratios/Supplemental Data (%) | ||||||
| Ratios to average net assets: | ||||||
| Net operating expenses | 0.24 5,6 | 0.21 6 | 0.23 6 | 0.24 6,7 | 0.23 6 | 0.24 6 |
| Gross operating expenses | 0.37 5 | 0.37 | 0.37 | 0.36 7 | 0.36 | 0.35 |
| Net investment income (loss) | 0.01 5 | 0.01 | 0.02 | 0.04 | 0.04 | 0.10 |
| Net assets, end of period ($ x 1,000,000) | 650 | 794 | 968 | 1,264 | 1,524 | 2,160 |
| Institutional Prime Shares | 1/1/15–
6/30/15* |
1/1/14–
12/31/14 |
1/1/13–
12/31/13 |
1/1/12–
12/31/12 |
1/1/11–
12/31/11 |
1/1/10–
12/31/10 |
| Per-Share Data ($) | ||||||
| Net asset value at beginning of period | 1.00 | 1.00 | 1.00 | 1.00 | 1.00 | 1.00 |
| Income (loss) from investment operations: | ||||||
| Net investment income (loss) | 0.00 1,2 | 0.00 2 | 0.00 2 | 0.00 2 | 0.00 2 | 0.00 2 |
| Net realized and unrealized gains (losses) | 0.00 2 | 0.00 2 | 0.00 2 | 0.00 2 | (0.00) 2 | 0.00 2,3 |
| Total from investment operations | 0.00 2 | 0.00 2 | 0.00 2 | 0.00 2 | 0.00 2 | 0.00 2 |
| Less distributions: | ||||||
| Distributions from net investment income | (0.00) 2 | (0.00) 2 | (0.00) 2 | (0.00) 2 | (0.00) 2 | (0.00) 2 |
| Net asset value at end of period | 1.00 | 1.00 | 1.00 | 1.00 | 1.00 | 1.00 |
| Total return (%) | 0.02 4 | 0.01 | 0.05 | 0.08 | 0.06 | 0.14 |
| Ratios/Supplemental Data (%) | ||||||
| Ratios to average net assets: | ||||||
| Net operating expenses | 0.21 5,6 | 0.21 6 | 0.21 6 | 0.21 6,7 | 0.21 6 | 0.21 6 |
| Gross operating expenses | 0.35 5 | 0.35 | 0.35 | 0.34 7 | 0.34 | 0.33 |
| Net investment income (loss) | 0.04 5 | 0.01 | 0.05 | 0.08 | 0.06 | 0.14 |
| Net assets, end of period ($ x 1,000,000) | 1,795 | 1,818 | 2,191 | 1,923 | 1,416 | 1,975 |
| * | Unaudited. |
| Holdings by Category | Cost
($) |
Value
($) | |
| 55.0% | Fixed-Rate Obligations | 5,644,130,645 | 5,644,130,645 |
| 19.0% | Variable-Rate Obligations | 1,950,826,375 | 1,950,826,375 |
| 26.5% | Repurchase Agreements | 2,714,765,280 | 2,714,765,280 |
| 100.5% | Total Investments | 10,309,722,300 | 10,309,722,300 |
| (0.5%) | Other Assets and Liabilities, Net | (55,164,633) | |
| 100.0% | Net Assets | 10,254,557,667 | |
| Issuer | Footnotes | Rate | Effective
Maturity |
Maturity
Date |
Face
Amount ($) |
Value
($) |
| Fixed-Rate Obligations 55.0% of net assets | ||||||
| Asset Backed Commercial Paper 7.9% | ||||||
| CAFCO, LLC | a,b | 0.27% | 08/05/15 | 10,000,000 | 9,997,375 | |
| a,b | 0.31% | 11/04/15 | 78,000,000 | 77,915,370 | ||
| Cancara Asset Securitisation, LLC | a,b | 0.27% | 09/18/15 | 24,000,000 | 23,985,780 | |
| a,b | 0.27% | 09/25/15 | 10,000,000 | 9,993,550 | ||
| Charta, LLC | a,b | 0.28% | 08/07/15 | 39,000,000 | 38,988,777 | |
| Ciesco, LLC | a,b | 0.28% | 08/03/15 | 31,000,000 | 30,992,044 | |
| a,b | 0.29% | 08/10/15 | 10,000,000 | 9,996,778 | ||
| Collateralized Commercial Paper Co, LLC | a | 0.33% | 07/06/15 | 51,000,000 | 50,997,662 | |
| a | 0.38% | 07/20/15 | 48,000,000 | 47,990,373 | ||
| a | 0.35% | 10/23/15 | 35,000,000 | 34,961,208 | ||
| CRC Funding, LLC | a,b | 0.28% | 08/03/15 | 8,000,000 | 7,997,947 | |
| Crown Point Capital Co, LLC | a,b | 0.20% | 07/06/15 | 61,000,000 | 60,998,305 | |
| Jupiter Securitization Corp | a,b | 0.31% | 11/03/15 | 14,000,000 | 13,984,931 | |
| Nieuw Amsterdam Receivables Corp | a,b | 0.24% | 09/03/15 | 2,000,000 | 1,999,147 | |
| Old Line Funding, LLC | a,b | 0.30% | 09/23/15 | 79,000,000 | 78,944,700 | |
| a,b | 0.30% | 09/24/15 | 90,000,000 | 89,936,250 | ||
| Ridgefield Funding Co, LLC | a,b | 0.30% | 09/02/15 | 75,000,000 | 74,960,625 | |
| Issuer | Footnotes | Rate | Effective
Maturity |
Maturity
Date |
Face
Amount ($) |
Value
($) |
| Sheffield Receivables Co, LLC | a,b | 0.40% | 07/23/15 | 17,000,000 | 16,995,844 | |
| a,b | 0.35% | 08/11/15 | 104,000,000 | 103,958,544 | ||
| a,b | 0.35% | 09/01/15 | 7,000,000 | 6,995,781 | ||
| Thunder Bay Funding, LLC | a,b | 0.40% | 12/16/15 | 19,000,000 | 18,964,533 | |
| 811,555,524 | ||||||
| Financial Company Commercial Paper 7.2% | ||||||
| BPCE SA | b | 0.23% | 07/01/15 | 62,000,000 | 62,000,000 | |
| DNB Bank ASA | b | 0.33% | 10/01/15 | 102,000,000 | 101,915,283 | |
| General Electric Capital Corp | a | 0.11% | 07/13/15 | 50,000,000 | 49,998,167 | |
| ING (U.S.) Funding, LLC | a | 0.37% | 10/13/15 | 2,000,000 | 1,997,862 | |
| a | 0.38% | 10/19/15 | 11,000,000 | 10,987,228 | ||
| a | 0.40% | 11/02/15 | 39,000,000 | 38,946,267 | ||
| a | 0.41% | 11/16/15 | 95,000,000 | 94,850,692 | ||
| a | 0.40% | 11/23/15 | 20,000,000 | 19,967,778 | ||
| JP Morgan Securities, LLC | 0.30% | 10/23/15 | 1,000,000 | 999,050 | ||
| Nationwide Building Society | 0.40% | 07/06/15 | 6,000,000 | 5,999,667 | ||
| 0.40% | 07/29/15 | 67,000,000 | 66,979,156 | |||
| 0.40% | 08/17/15 | 17,000,000 | 16,991,122 | |||
| 0.30% | 09/24/15 | 11,000,000 | 10,992,208 | |||
| NRW.BANK | 0.09% | 07/01/15 | 80,000,000 | 80,000,000 | ||
| 0.14% | 07/06/15 | 60,000,000 | 59,998,833 | |||
| Societe Generale | b | 0.26% | 08/31/15 | 74,000,000 | 73,967,399 | |
| United Overseas Bank, Ltd | b | 0.26% | 08/14/15 | 47,000,000 | 46,985,064 | |
| 743,575,776 | ||||||
| Certificates of Deposit 32.1% | ||||||
| Abbey National Treasury Services PLC | a | 0.27% | 08/14/15 | 10,000,000 | 10,000,000 | |
| Bank of Montreal | 0.09% | 07/06/15 | 128,000,000 | 128,000,000 | ||
| 0.26% | 07/15/15 | 59,000,000 | 59,000,000 | |||
| 0.31% | 11/06/15 | 15,000,000 | 15,000,000 | |||
| 0.31% | 11/12/15 | 55,000,000 | 55,000,000 | |||
| Bank of Nova Scotia | 0.25% | 09/23/15 | 20,000,000 | 20,000,000 | ||
| 0.30% | 10/13/15 | 31,000,000 | 31,000,000 | |||
| 0.34% | 11/09/15 | 30,000,000 | 30,000,000 | |||
| Bank of the West | 0.25% | 07/09/15 | 14,000,000 | 14,000,000 | ||
| Bank of Tokyo Mitsubishi UFJ, Ltd | 0.33% | 08/26/15 | 33,000,000 | 33,000,000 | ||
| 0.33% | 09/03/15 | 23,000,000 | 23,000,000 | |||
| 0.33% | 09/04/15 | 13,000,000 | 13,000,000 | |||
| 0.50% | 02/09/16 | 46,000,000 | 46,000,000 | |||
| Barclays Bank PLC | 0.45% | 08/17/15 | 47,000,000 | 47,000,000 | ||
| 0.53% | 09/02/15 | 63,000,000 | 63,000,000 | |||
| 0.53% | 10/05/15 | 22,000,000 | 22,000,000 | |||
| 0.92% | 05/23/16 | 59,000,000 | 59,000,000 | |||
| Issuer | Footnotes | Rate | Effective
Maturity |
Maturity
Date |
Face
Amount ($) |
Value
($) |
| BNP Paribas | 0.36% | 08/24/15 | 45,000,000 | 45,000,000 | ||
| 0.25% | 09/01/15 | 59,000,000 | 59,000,000 | |||
| 0.25% | 09/03/15 | 48,000,000 | 48,000,000 | |||
| 0.39% | 10/01/15 | 28,000,000 | 28,000,000 | |||
| Canadian Imperial Bank of Commerce | 0.10% | 07/01/15 | 100,000,000 | 100,000,000 | ||
| Chase Bank USA, NA | 0.35% | 10/01/15 | 122,000,000 | 122,000,000 | ||
| 0.38% | 12/07/15 | 22,000,000 | 22,000,000 | |||
| Citibank, NA | 0.28% | 07/01/15 | 38,000,000 | 38,000,000 | ||
| Credit Agricole Corporate and Investment Bank | 0.23% | 07/10/15 | 28,000,000 | 28,000,000 | ||
| 0.30% | 09/01/15 | 75,000,000 | 75,000,000 | |||
| Credit Agricole SA | 0.29% | 10/01/15 | 42,000,000 | 42,000,000 | ||
| Credit Suisse AG | 0.45% | 12/18/15 | 67,000,000 | 67,000,000 | ||
| HSBC Bank PLC | 0.40% | 10/13/15 | 100,000,000 | 100,000,000 | ||
| 0.35% | 10/28/15 | 94,000,000 | 94,000,000 | |||
| 0.32% | 11/05/15 | 99,000,000 | 99,000,000 | |||
| 0.43% | 12/23/15 | 20,000,000 | 20,000,000 | |||
| HSBC Bank USA | 0.40% | 12/09/15 | 50,000,000 | 50,000,000 | ||
| ING Bank NV | 0.42% | 11/02/15 | 39,000,000 | 39,000,000 | ||
| JPMorgan Chase Bank, NA | 0.28% | 09/03/15 | 2,000,000 | 1,999,999 | ||
| Lloyds Bank PLC | 0.30% | 07/15/15 | 53,000,000 | 53,000,000 | ||
| 0.30% | 08/10/15 | 55,000,000 | 55,000,000 | |||
| Mitsubishi UFJ Trust & Banking Corp | 0.31% | 07/01/15 | 6,000,000 | 6,000,000 | ||
| 0.31% | 07/06/15 | 28,000,000 | 28,000,000 | |||
| 0.29% | 07/07/15 | 67,000,000 | 67,000,000 | |||
| 0.31% | 07/13/15 | 34,000,000 | 34,000,000 | |||
| 0.31% | 08/05/15 | 18,000,000 | 18,000,000 | |||
| 0.31% | 08/10/15 | 5,000,000 | 5,000,000 | |||
| 0.33% | 08/24/15 | 4,000,000 | 4,000,000 | |||
| 0.35% | 10/21/15 | 10,000,000 | 10,000,000 | |||
| Mizuho Bank, Ltd | 0.30% | 07/29/15 | 47,000,000 | 47,000,000 | ||
| 0.27% | 09/08/15 | 87,000,000 | 87,000,000 | |||
| 0.27% | 09/15/15 | 4,000,000 | 4,000,000 | |||
| 0.28% | 09/17/15 | 76,000,000 | 76,000,000 | |||
| 0.35% | 11/13/15 | 29,000,000 | 29,000,000 | |||
| National Australia Bank, Ltd | 0.27% | 09/02/15 | 46,000,000 | 46,000,000 | ||
| 0.29% | 09/11/15 | 52,000,000 | 52,000,000 | |||
| National Bank of Canada | 0.33% | 08/18/15 | 7,000,000 | 7,000,000 | ||
| Natixis SA | 0.29% | 08/04/15 | 95,000,000 | 95,000,000 | ||
| Nordea Bank Finland PLC | 0.20% | 09/01/15 | 76,000,000 | 75,999,346 | ||
| 0.34% | 11/16/15 | 27,000,000 | 27,000,000 | |||
| Oversea-Chinese Banking Corp, Ltd | 0.24% | 09/29/15 | 50,000,000 | 50,000,000 | ||
| Rabobank Nederland | 0.28% | 07/01/15 | 4,000,000 | 4,000,000 |
| Issuer | Footnotes | Rate | Effective
Maturity |
Maturity
Date |
Face
Amount ($) |
Value
($) |
| Sumitomo Mitsui Banking Corp | 0.26% | 09/09/15 | 42,000,000 | 42,000,000 | ||
| 0.28% | 09/17/15 | 42,000,000 | 42,000,000 | |||
| 0.27% | 09/22/15 | 24,000,000 | 24,000,000 | |||
| 0.37% | 10/28/15 | 19,000,000 | 19,000,000 | |||
| 0.40% | 11/06/15 | 50,000,000 | 50,000,000 | |||
| 0.40% | 11/10/15 | 5,000,000 | 5,000,000 | |||
| 0.40% | 11/12/15 | 50,000,000 | 50,000,000 | |||
| 0.35% | 11/16/15 | 26,000,000 | 26,000,000 | |||
| 0.36% | 12/01/15 | 33,000,000 | 33,000,000 | |||
| Sumitomo Mitsui Trust Bank, Ltd | 0.27% | 08/31/15 | 71,000,000 | 71,000,000 | ||
| 0.27% | 09/08/15 | 15,000,000 | 15,000,000 | |||
| 0.28% | 09/16/15 | 2,000,000 | 2,000,000 | |||
| 0.28% | 09/18/15 | 16,000,000 | 16,000,000 | |||
| Toronto-Dominion Bank | 0.30% | 10/27/15 | 15,000,000 | 15,000,000 | ||
| 0.30% | 11/02/15 | 20,000,000 | 20,000,000 | |||
| 0.30% | 11/05/15 | 110,000,000 | 110,000,000 | |||
| UBS AG | 0.10% | 07/06/15 | 52,000,000 | 52,000,000 | ||
| Westpac Banking Corp | 0.26% | 07/14/15 | 74,000,000 | 74,000,000 | ||
| 3,291,999,345 | ||||||
| Other Instruments 5.2% | ||||||
| Australia & New Zealand Banking Group, Ltd | 0.13% | 07/02/15 | 257,000,000 | 257,000,000 | ||
| DZ Bank AG Deutsche Zentral-Genossenschaftsbank | 0.10% | 07/02/15 | 74,000,000 | 74,000,000 | ||
| 0.10% | 07/06/15 | 28,000,000 | 28,000,000 | |||
| National Australia Bank, Ltd | 0.06% | 07/01/15 | 105,000,000 | 105,000,000 | ||
| Skandinaviska Enskilda Banken AB | 0.10% | 07/02/15 | 70,000,000 | 70,000,000 | ||
| 534,000,000 | ||||||
| Other Notes 2.6% | ||||||
| Bank of America, NA | 0.28% | 07/07/15 | 11,000,000 | 11,000,000 | ||
| 0.28% | 07/09/15 | 5,000,000 | 5,000,000 | |||
| 0.30% | 08/07/15 | 18,000,000 | 18,000,000 | |||
| 0.30% | 08/18/15 | 19,000,000 | 19,000,000 | |||
| 0.30% | 08/20/15 | 37,000,000 | 37,000,000 | |||
| 0.32% | 09/01/15 | 56,000,000 | 56,000,000 | |||
| 0.24% | 09/08/15 | 48,000,000 | 48,000,000 | |||
| 0.26% | 10/01/15 | 36,000,000 | 36,000,000 | |||
| 0.31% | 10/13/15 | 12,000,000 | 12,000,000 | |||
| 0.32% | 10/19/15 | 21,000,000 | 21,000,000 | |||
| 263,000,000 | ||||||
| Total Fixed-Rate Obligations | ||||||
| (Cost $5,644,130,645) | 5,644,130,645 | |||||
| Variable-Rate Obligations 19.0% of net assets | ||||||
| Financial Company Commercial Paper 1.0% | ||||||
| Commonwealth Bank of Australia | b | 0.29% | 07/20/15 | 11/19/15 | 35,000,000 | 34,999,307 |
| b | 0.32% | 07/13/15 | 05/12/16 | 39,000,000 | 39,000,000 | |
| Westpac Banking Corp | b | 0.28% | 07/16/15 | 11/16/15 | 28,000,000 | 28,000,000 |
| 101,999,307 | ||||||
| Issuer | Footnotes | Rate | Effective
Maturity |
Maturity
Date |
Face
Amount ($) |
Value
($) |
| Certificates of Deposit 15.0% | ||||||
| Bank of Nova Scotia | 0.27% | 07/09/15 | 10/09/15 | 175,000,000 | 175,000,000 | |
| 0.28% | 07/08/15 | 12/08/15 | 10,000,000 | 10,000,000 | ||
| Bank of Tokyo Mitsubishi UFJ, Ltd | 0.54% | 07/10/15 | 03/10/16 | 108,000,000 | 108,000,000 | |
| Canadian Imperial Bank of Commerce | 0.27% | 07/13/15 | 11/12/15 | 77,000,000 | 77,000,000 | |
| JPMorgan Chase Bank, NA | 0.33% | 07/22/15 | 10/22/15 | 128,000,000 | 128,000,000 | |
| 0.33% | 07/23/15 | 10/23/15 | 68,000,000 | 68,000,000 | ||
| 0.33% | 07/27/15 | 10/27/15 | 90,000,000 | 90,000,000 | ||
| Royal Bank of Canada | 0.27% | 07/06/15 | 09/04/15 | 86,000,000 | 86,000,000 | |
| 0.30% | 07/10/15 | 12/10/15 | 35,000,000 | 35,000,000 | ||
| 0.29% | 07/06/15 | 01/06/16 | 46,000,000 | 46,000,000 | ||
| 0.30% | 07/27/15 | 02/25/16 | 15,000,000 | 15,000,000 | ||
| 0.32% | 07/13/15 | 04/13/16 | 93,000,000 | 93,000,000 | ||
| Toronto-Dominion Bank | 0.28% | 07/17/15 | 10/19/15 | 21,000,000 | 21,000,000 | |
| 0.34% | 07/17/15 | 03/17/16 | 1,000,000 | 1,000,000 | ||
| 0.30% | 07/20/15 | 03/21/16 | 92,000,000 | 92,000,000 | ||
| 0.34% | 07/27/15 | 05/27/16 | 56,000,000 | 56,000,000 | ||
| Wells Fargo Bank, NA | 0.31% | 07/09/15 | 02/09/16 | 108,000,000 | 108,000,000 | |
| 0.32% | 07/14/15 | 02/12/16 | 150,000,000 | 150,000,000 | ||
| 0.32% | 07/27/15 | 02/26/16 | 21,000,000 | 21,000,000 | ||
| Westpac Banking Corp | 0.31% | 07/08/15 | 02/08/16 | 14,000,000 | 14,000,000 | |
| 0.32% | 07/13/15 | 02/12/16 | 30,000,000 | 30,000,000 | ||
| 0.34% | 07/01/15 | 07/01/16 | 116,000,000 | 116,000,000 | ||
| 1,540,000,000 | ||||||
| Treasury Debt 1.5% | ||||||
| United States Treasury Department | 0.06% | 07/01/15 | 01/31/16 | 86,000,000 | 85,991,699 | |
| 0.09% | 07/01/15 | 07/31/16 | 46,000,000 | 46,000,000 | ||
| 0.07% | 07/01/15 | 10/31/16 | 20,000,000 | 19,990,320 | ||
| 151,982,019 | ||||||
| Other Notes 1.4% | ||||||
| Bank of America, NA | 0.39% | 07/06/15 | 04/04/16 | 45,000,000 | 45,000,000 | |
| JPMorgan Chase Bank, NA | 0.44% | 07/22/15 | 07/22/16 | 50,000,000 | 50,000,000 | |
| Wells Fargo Bank, NA | 0.41% | 09/15/15 | 07/14/16 | 50,000,000 | 50,000,000 | |
| Whistlejacket Capital, LLC | c,† | n/a | n/a | n/a | 5,510,049 | 5,510,049 |
| 150,510,049 | ||||||
| Variable Rate Demand Notes 0.1% | ||||||
| EMF, LLC | ||||||
| Bonds (One Workplace) Series 2012 | a | 0.24% | 07/07/15 | 4,095,000 | 4,095,000 | |
| GFRE Holdings, LLC | ||||||
| Taxable Notes Series 2009A | a | 0.19% | 07/07/15 | 2,240,000 | 2,240,000 | |
| 6,335,000 | ||||||
| Total Variable-Rate Obligations | ||||||
| (Cost $1,950,826,375) | 1,950,826,375 | |||||
| Issuer | Footnotes | Rate | Effective
Maturity |
Maturity
Date |
Maturity Amount ($) |
Value
($) |
| Repurchase Agreements 26.5% of net assets | ||||||
| Government Agency Repurchase Agreements* 2.3% | ||||||
| BNP Paribas Securities Corp | ||||||
| Issued
06/30/15, repurchase date 07/01/15 (Collateralized by U.S. Government Agency Securities valued at $102,267,089, 0.54% - 4.50%, due 01/29/16 - 02/01/45) |
0.10% | 07/01/15 | 100,000,278 | 100,000,000 | ||
| Deutsche Bank Securities, Inc | ||||||
| Issued
06/30/15, repurchase date 07/01/15 (Collateralized by U.S. Government Agency Securities valued at $74,160,076, 0.00% - 5.25%, due 08/15/19 - 09/15/39) |
0.18% | 07/01/15 | 72,000,360 | 72,000,000 | ||
| Goldman Sachs & Co | ||||||
| Issued
06/25/15, repurchase date 07/02/15 (Collateralized by U.S. Government Agency Securities valued at $28,560,000, 3.50% - 5.00%, due 03/20/34 - 06/20/45) |
0.08% | 07/02/15 | 28,000,436 | 28,000,000 | ||
| JP Morgan Securities, LLC | ||||||
| Issued
06/30/15, repurchase date 07/01/15 (Collateralized by U.S. Government Agency Securities valued at $13,390,001, 2.00% - 4.50%, due 05/25/25 - 10/20/44) |
0.14% | 07/01/15 | 13,000,051 | 13,000,000 | ||
| Mizuho Securities USA, Inc | ||||||
| Issued
06/30/15, repurchase date 07/01/15 (Collateralized by U.S. Government Agency Securities valued at $20,400,171, 2.12% - 2.14%, due 07/01/20 - 10/06/20) |
0.15% | 07/01/15 | 20,000,083 | 20,000,000 | ||
| 233,000,000 | ||||||
| Treasury Repurchase Agreements 20.3% | ||||||
| Barclays Capital, Inc | ||||||
| Issued
06/30/15, repurchase date 07/01/15 (Collateralized by U.S. Treasury Securities valued at $1,800,660, 0.25% - 4.50%, due 08/15/15 - 11/15/23) |
0.10% | 07/01/15 | 1,765,285 | 1,765,280 | ||
| Issued
06/25/15, repurchase date 07/02/15 (Collateralized by U.S. Treasury Securities valued at $76,500,088, 0.00% - 7.88%, due 07/02/15 - 02/15/38) |
0.05% | 07/02/15 | 75,000,729 | 75,000,000 | ||
| BNP Paribas Securities Corp | ||||||
| Issued
06/30/15, repurchase date 07/01/15 (Collateralized by U.S. Treasury Securities valued at $13,260,002, 0.75% - 4.50%, due 02/15/16 - 02/15/41) |
0.09% | 07/01/15 | 13,000,033 | 13,000,000 | ||
| Federal Reserve Bank of New York | ||||||
| Issued
06/30/15, repurchase date 07/01/15 (Collateralized by U.S. Treasury Securities valued at $1,179,001,701, 1.63%, due 11/15/22) |
0.05% | 07/01/15 | 1,179,001,638 | 1,179,000,000 | ||
| Issued
06/29/15, repurchase date 07/01/15 (Collateralized by U.S. Treasury Securities valued at $629,002,540, 2.00% - 3.75%, due 02/15/22 - 08/15/41) |
0.07% | 07/01/15 | 629,002,446 | 629,000,000 | ||
| Issued
06/25/15, repurchase date 07/02/15 (Collateralized by U.S. Treasury Securities valued at $148,001,762, 2.00% - 2.13%, due 08/15/21 - 02/15/22) |
0.07% | 07/02/15 | 148,002,014 | 148,000,000 | ||
| JP Morgan Securities, LLC | ||||||
| Issued
06/22/15, repurchase date 07/22/15 (Collateralized by U.S. Treasury Securities valued at $38,760,717, 2.13% - 2.63%, due 11/15/20 - 05/15/24) |
0.08% | 07/07/15 | 38,001,267 | 38,000,000 | ||
| 2,083,765,280 | ||||||
| Issuer | Footnotes | Rate | Effective
Maturity |
Maturity
Date |
Maturity Amount ($) |
Value
($) |
| Other Repurchase Agreements** 3.9% | ||||||
| Credit Suisse Securities (USA), LLC | ||||||
| Issued
06/15/15, repurchase date 12/14/15 (Collateralized by common stocks, ETFs, corporate bonds, ABS, or non-agency collateralized mortgage obligations valued at $31,052,814, 2.29% - 4.73%, due 10/25/33 - 11/25/60) |
c | 0.80% | 10/03/15 | 27,066,000 | 27,000,000 | |
| Issued
06/18/15, repurchase date 12/14/15 (Collateralized by common stocks, ETFs, corporate bonds, ABS, or non-agency collateralized mortgage obligations valued at $95,450,021, 2.58% - 7.97%, due 11/15/28 - 11/25/57) |
c | 0.80% | 10/03/15 | 83,197,356 | 83,000,000 | |
| Issued
06/19/15, repurchase date 12/14/15 (Collateralized by common stocks, ETFs, corporate bonds, ABS, or non-agency collateralized mortgage obligations valued at $100,054,480, 0.59% - 5.95%, due 10/25/27 - 11/25/60) |
c | 0.80% | 10/03/15 | 87,204,933 | 87,000,000 | |
| JP Morgan Securities, LLC | ||||||
| Issued
06/17/15, repurchase date 12/17/15 (Collateralized by common stocks, ETFs, corporate bonds, ABS, or non-agency collateralized mortgage obligations valued at $51,762,148, 0.70% - 6.81%, due 05/18/16 - 09/25/57) |
c | 0.65% | 09/28/15 | 45,083,688 | 45,000,000 | |
| Merrill Lynch, Pierce, Fenner & Smith, Inc | ||||||
| Issued
05/28/15, repurchase date 08/26/15 (Collateralized by common stocks, ETFs, corporate bonds, ABS, or non-agency collateralized mortgage obligations valued at $179,400,000, 0.00% - 5.43%, due 04/10/37 - 03/25/58) |
c | 0.58% | 08/04/15 | 156,170,907 | 156,000,000 | |
| 398,000,000 | ||||||
| Total Repurchase Agreements | ||||||
| (Cost $2,714,765,280) | 2,714,765,280 | |||||
| a | Credit-enhanced or liquidity-enhanced. |
| b | Securities exempt from registration under Rule 144A of the Securities Act of 1933, as amended. These securities may be resold in transactions exempt from registrations, normally to qualified institutional buyers. At the period end, the value of these amounted to $1,064,473,334 or 10.4% of net assets. |
| c | Illiquid security. At the period end, the value of these amounted to $403,510,049 or 3.9% of net assets. |
| † | Whistlejacket notes are in receivership, and the fund elected to sell all of its Whistlejacket notes at auction (April 29, 2009). The remaining investment represents an interest in a small residual fund that is being held to cover any remaining expenses and liabilities associated with receivership. |
| * | Usually collateralized via U.S. Government Agency Securities or less frequently by U.S. Treasury Securities. |
| ** | Usually collateralized via common stocks, ETFs, corporate bonds, ABS, or non-agency collateralized mortgage obligations or less frequently by U.S. Government Agency Securities and/ or U.S. Treasury Securities. |
| ABS — | Asset-backed securities |
| CP — | Commercial paper |
| ETF — | Exchange Traded Fund |
| Assets | ||
| Investments, at cost and value | $7,594,957,020 | |
| Repurchase agreements, at cost and value | + | 2,714,765,280 |
| Total investments, at cost and value (Note 2a) | 10,309,722,300 | |
| Receivables: | ||
| Fund shares sold | 7,305,725 | |
| Interest | 3,233,169 | |
| Prepaid expenses | + | 24,335 |
| Total assets | 10,320,285,529 | |
| Liabilities | ||
| Payables: | ||
| Investment adviser and administrator fees | 475,283 | |
| Fund shares redeemed | 64,879,907 | |
| Distributions to shareholders | 79,257 | |
| Accrued expenses | + | 293,415 |
| Total liabilities | 65,727,862 | |
| Net Assets | ||
| Total assets | 10,320,285,529 | |
| Total liabilities | – | 65,727,862 |
| Net assets | $10,254,557,667 | |
| Net Assets by Source | ||
| Capital received from investors | 10,256,477,548 | |
| Net realized capital losses | (1,919,881) | |
| Net Asset Value (NAV) by Shares Class | |||||
| Share Class | Net Assets | ÷ | Shares
Outstanding |
= | NAV |
| Investor Shares | $6,702,078,969 | 6,702,026,743 | $1.00 | ||
| Select Shares | $1,107,746,297 | 1,107,737,881 | $1.00 | ||
| Institutional Shares | $649,648,610 | 649,642,693 | $1.00 | ||
| Institutional Prime Shares | $1,795,083,791 | 1,795,069,821 | $1.00 | ||
| Investment Income | ||
| Interest | $13,137,999 | |
| Expenses | ||
| Investment adviser and administrator fees | 17,023,532 | |
| Shareholder service fees: | ||
| Investor Shares | 8,617,491 | |
| Select Shares | 849,049 | |
| Institutional Shares | 148,887 | |
| Institutional Prime Shares | 150,593 | |
| Custodian fees | 165,882 | |
| Portfolio accounting fees | 142,268 | |
| Shareholder reports | 60,594 | |
| Registration fees | 47,872 | |
| Transfer agent fees | 41,632 | |
| Professional fees | 41,402 | |
| Independent trustees' fees | 29,391 | |
| Other expenses | + | 109,217 |
| Total expenses | 27,427,810 | |
| Expense reduction by CSIM and its affiliates | – | 15,075,437 |
| Net expenses | – | 12,352,373 |
| Net investment income | 785,626 | |
| Realized Gains (Losses) | ||
| Net realized gains on investments | 2,660 | |
| Increase in net assets resulting from operations | $788,286 | |
| Operations | |||
| 1/1/15-6/30/15 | 1/1/14-12/31/14 | ||
| Net investment income | $785,626 | $1,217,517 | |
| Net realized gains | + | 2,660 | 24,247 |
| Increase in net assets from operations | 788,286 | 1,241,764 | |
| Distributions to Shareholders | |||
| Distributions from net investment income | |||
| Investor Shares | (344,697) | (776,490) | |
| Select Shares | (56,603) | (117,446) | |
| Institutional Shares | (37,223) | (87,677) | |
| Institutional Prime Shares | + | (347,103) | (235,904) |
| Total distributions from net investment income | (785,626) | (1,217,517) | |
| Transactions in Fund Shares* | |||
| Shares Sold | |||
| Investor Shares | 436,565,417 | 1,130,615,858 | |
| Select Shares | 234,954,643 | 388,611,912 | |
| Institutional Shares | 146,889,909 | 418,464,300 | |
| Institutional Prime Shares | + | 415,404,547 | 978,875,096 |
| Total shares sold | 1,233,814,516 | 2,916,567,166 | |
| Shares Reinvested | |||
| Investor Shares | 293,221 | 721,769 | |
| Select Shares | 46,857 | 105,423 | |
| Institutional Shares | 31,451 | 79,908 | |
| Institutional Prime Shares | + | 237,392 | 191,678 |
| Total shares reinvested | 608,921 | 1,098,778 | |
| Shares Redeemed | |||
| Investor Shares | (951,356,729) | (2,340,010,215) | |
| Select Shares | (265,515,379) | (488,788,277) | |
| Institutional Shares | (290,970,278) | (593,257,625) | |
| Institutional Prime Shares | + | (438,248,018) | (1,352,226,080) |
| Total shares redeemed | (1,946,090,404) | (4,774,282,197) | |
| Net transactions in fund shares | (711,666,967) | (1,856,616,253) | |
| Net Assets | |||
| Beginning of period | 10,966,221,974 | 12,822,813,980 | |
| Total decrease | + | (711,664,307) | (1,856,592,006) |
| End of period | $10,254,557,667 | $10,966,221,974 | |
| * | Transactions took place at $1.00 per share; figures for share quantities are the same as for dollars. |
| The Charles Schwab Family of Funds (organized October 20, 1989) | Schwab Municipal Money Fund |
| Schwab Money Market Fund | Schwab AMT Tax-Free Money Fund |
| Schwab Government Money Fund | Schwab California Municipal Money Fund |
| Schwab U.S. Treasury Money Fund | Schwab New York Municipal Money Fund |
| Schwab Treasury Obligations Money Fund | (formerly Schwab New York AMT Tax-Free Money Fund) |
| Schwab Value Advantage Money Fund | Schwab New Jersey Municipal Money Fund |
| Schwab Advisor Cash Reserves | (formerly Schwab New Jersey AMT Tax-Free Money Fund) |
| Schwab Cash Reserves | Schwab Pennsylvania Municipal Money Fund |
| Schwab Retirement Advantage Money Fund | Schwab Massachusetts Municipal Money Fund |
| Schwab Investor Money Fund | (formerly Schwab Massachusetts AMT Tax-Free Money Fund) |
| Schwab Government Money Fund | $6,797,399,927 |
| Schwab U.S. Treasury Money Fund | — |
| Schwab Treasury Obligations Money Fund | 553,349,055 |
| Schwab Value Advantage Money Fund | 2,714,765,280 |
| Average Daily Net Assets | |
| First $1 billion | 0.35% |
| More than $1 billion but not exceeding $10 billion | 0.32% |
| More than $10 billion but not exceeding $20 billion | 0.30% |
| More than $20 billion but not exceeding $40 billion | 0.27% |
| Over $40 billion | 0.25% |
| Shareholder Service Fees | Sweep Administration Fees | ||
| Schwab Government Money Fund | |||
| Sweep Shares | 0.25% | 0.15% | |
| Purchased Shares | 0.25% | n/a | |
| Schwab U.S. Treasury Money Fund | 0.25% | 0.15% | |
| Schwab Treasury Obligations Money Fund | |||
| Sweep Shares | 0.25% | 0.15% | |
| Value Advantage Shares | 0.22% | n/a | |
| Schwab Value Advantage Money Fund | |||
| Investor Shares | 0.25% | n/a | |
| Select Shares | 0.15% | n/a | |
| Institutional Shares | 0.04% | n/a | |
| Institutional Prime Shares | 0.02% | n/a |
| Schwab Government Money Fund | |
| Sweep Shares* | 0.75% |
| Purchased Shares | n/a |
| Schwab U.S. Treasury Money Fund* | 0.60% |
| Schwab Treasury Obligations Money Fund | |
| Sweep Shares* | 0.65% |
| Value Advantage Shares* | 0.45% |
| Schwab Value Advantage Money Fund | |
| Investor Shares* | 0.45% |
| Select Shares** | 0.35% |
| Institutional Shares** | 0.24% |
| Institutional Prime Shares** | 0.21% |
| * | CSIM and its affiliates have agreed to limit the fund's or fund share class's expenses as described above for so long as CSIM serves as the investment adviser to the fund, which may only be amended or terminated with the approval of the Board. |
| ** | CSIM and its affiliates have agreed to limit this share class's expenses as described above through April 29, 2017. |
| Total
Waived Amount |
Contractual
Expense Limitation Waived Amount | ||
| Schwab Government Money Fund | $67,806,068 | $3,969,235 | |
| Schwab U.S. Treasury Money Fund | 65,547,913 | 15,481,395 | |
| Schwab Treasury Obligations Money Fund | 4,023,188 | 952,134 | |
| Schwab Value Advantage Money Fund | 15,075,437 | 8,537,381 |
| Expiration Date | |||||||||
| December 31, 2015 | December 31, 2016 | December 31, 2017 | December 31, 2018 | Total | |||||
| Schwab Government Money Fund | |||||||||
| Sweep Shares | $92,350,176 | $113,403,754 | $137,747,385 | $63,829,041 | $407,330,356 | ||||
| Purchased Shares | — | — | — | 7,792 | 7,792 | ||||
| Schwab U.S. Treasury Money Fund | 113,232,994 | 110,327,343 | 105,945,585 | 50,066,518 | 379,572,440 | ||||
| Schwab Treasury Obligations Money Fund | |||||||||
| Sweep Shares | 1,085,366 | 7,200,865 | 6,253,754 | 2,975,904 | 17,515,889 | ||||
| Value Advantage Shares | 91,687 | 315,591 | 228,394 | 95,150 | 730,822 | ||||
| Schwab Value Advantage Money Fund | |||||||||
| Investor Shares | 14,891,415 | 15,292,609 | 15,890,278 | 6,095,914 | 52,170,216 | ||||
| Select Shares | 677,636 | 879,845 | 1,229,378 | 433,612 | 3,220,471 | ||||
| Institutional Shares | — | 65,344 | 259,511 | 8,530 | 333,385 | ||||
| Institutional Prime Shares | — | — | 28,563 | — | 28,563 | ||||
| Schwab Government Money Fund | |
| Sweep Shares | $83,766,891 |
| Purchased Shares | — |
| Schwab U.S. Treasury Money Fund | 106,070,367 |
| Schwab Value Advantage Money Fund | |
| Investor Shares | 20,645,844 |
| Select Shares | 1,261,119 |
| Institutional Shares | 201,204 |
| Institutional Prime Shares | — |
| Expiration Date | Schwab
Government Money Fund |
Schwab
U.S. Treasury Money Fund |
Schwab
Treasury Obligations Money Fund |
Schwab
Value Advantage Money Fund | ||||
| December 31, 2017 | $— | $— | $— | $1,922,541 | ||||
| No expiration* | 188,662 | 454,768 | 27,185 | — | ||||
| Total | $188,662 | $454,768 | $27,185 | $1,922,541 |
| * | As a result of the passage of the Regulated Investment Company Modernization Act of 2010, capital losses incurred after December 31, 2010 may now be carried forward indefinitely, but must retain the character of the original loss. However, such losses |
| Schwab
Government Money Fund |
Schwab
U.S. Treasury Money Fund |
Schwab
Treasury Obligations Money Fund |
Schwab
Value Advantage Money Fund | ||||
| Capital losses utilized | $— | $— | $— | $24,247 |
| Independent Trustees | |||
| Name,
Year of Birth, and Position(s) with the trust; (Terms of office, and length of Time Served1) |
Principal
Occupations During the Past Five Years |
Number
of Portfolios in Fund Complex Overseen by the Trustee |
Other Directorships |
| John
F. Cogan 1947 Trustee (Trustee of The Charles Schwab Family of Funds, Schwab Investments, Schwab Capital Trust and Schwab Annuity Portfolios since 2008; Laudus Trust and Laudus Institutional Trust since 2010) |
Senior Fellow, The Hoover Institution at Stanford University (Oct. 1979 – present); Senior Fellow Stanford Institute for Economic Policy Research (2000 – present); Professor of Public Policy, Stanford University (1994 – present). | 74 | Director,
Gilead Sciences, Inc. (2005 – present) |
| David
L. Mahoney 1954 Trustee (Trustee of The Charles Schwab Family of Funds, Schwab Investments, Schwab Capital Trust, Schwab Annuity Portfolios, Laudus Trust and Laudus Institutional Trust since 2011) |
Private Investor. | 74 | Director,
Symantec Corporation (2003 – present) Director, Corcept Therapeutics Incorporated (2004 – present) Director, Adamas Pharmaceuticals, Inc. (2009 – present) |
| Kiran
M. Patel 1948 Trustee (Trustee of The Charles Schwab Family of Funds, Schwab Investments, Schwab Capital Trust, Schwab Annuity Portfolios, Laudus Trust and Laudus Institutional Trust since 2011) |
Retired. Executive Vice President and General Manager of Small Business Group, Intuit, Inc. (financial software and services firm for consumers and small businesses) (Dec. 2008 – Sept. 2013) | 74 | Director, KLA-Tencor Corporation (2008 – present) |
| Charles
A. Ruffel 1956 Trustee (Trustee of Schwab Strategic Trust since 2009; The Charles Schwab Family of Funds, Schwab Investments, Schwab Capital Trust, Schwab Annuity Portfolios, Laudus Trust and Laudus Institutional Trust since 2015) |
Managing Partner and Co-Founder, Kudu Advisors, LLC (financial services) (May 2009 – present); Director, Asset International, Inc. (publisher of financial services information) (Jan. 2009 – Nov. 2014). | 95 | None. |
| Independent Trustees (continued) | |||
| Name,
Year of Birth, and Position(s) with the trust; (Terms of office, and length of Time Served1) |
Principal
Occupations During the Past Five Years |
Number
of Portfolios in Fund Complex Overseen by the Trustee |
Other Directorships |
| Gerald
B. Smith 1950 Trustee (Trustee of The Charles Schwab Family of Funds, Schwab Investments, Schwab Capital Trust and Schwab Annuity Portfolios since 2000; Laudus Trust and Laudus Institutional Trust since 2010) |
Chairman, Chief Executive Officer and Founder of Smith Graham & Co. (investment advisors) (1990 – present). | 74 | Director,
Eaton (2012 – present) Director and Chairman of the Audit Committee, Oneok Partners LP (2003 – 2013) Director, Oneok, Inc. (2009 – 2013) Lead Independent Director, Board of Cooper Industries (2002 – 2012) |
| Joseph
H. Wender 1944 Trustee (Trustee of The Charles Schwab Family of Funds, Schwab Investments, Schwab Capital Trust and Schwab Annuity Portfolios since 2008; Laudus Trust and Laudus Institutional Trust since 2010) |
Senior Consultant, Goldman Sachs & Co., Inc. (investment banking and securities firm) (Jan. 2008 – present); Partner, Colgin Partners, LLC (vineyards) (Feb. 1998 – present). | 74 | Board Member and Chairman of the Audit Committee, Isis Pharmaceuticals (1994 – present) |
| Interested Trustees | |||
| Name,
Year of Birth, and Position(s) with the trust; (Terms of office, and length of Time Served) |
Principal
Occupations During the Past Five Years |
Number
of Portfolios in Fund Complex Overseen by the Trustee |
Other Directorships |
| Charles
R. Schwab2 1937 Chairman and Trustee (Chairman and Trustee of The Charles Schwab Family of Funds since 1989; Schwab Investments since 1991; Schwab Capital Trust since 1993; Schwab Annuity Portfolios since 1994; Laudus Trust and Laudus Institutional Trust since 2010) |
Chairman and Director, The Charles Schwab Corporation (1986 – present); Chairman and Director of Charles Schwab & Co., Inc. (1971 – present); Chairman and Director of Charles Schwab Investment Management, Inc. (1989 – present); Chairman and Director of Charles Schwab Bank (2003 – present); Chairman and Chief Executive Officer of Schwab (SIS) Holdings Inc. I and Schwab International Holdings, Inc. (1996 – present); and Director, Chairman and Chief Executive Officer, Schwab Holdings, Inc. (1979 – present). | 74 | Chairman
and Director, The Charles Schwab Corporation (1986 – present) Director, Yahoo! Inc. (2014 – present) |
| Walter
W. Bettinger II2 1960 Trustee (Trustee of The Charles Schwab Family of Funds, Schwab Investments, Schwab Capital Trust and Schwab Annuity Portfolios since 2008; Schwab Strategic Trust since 2009; Laudus Trust and Laudus Institutional Trust since 2010) |
Director, President and Chief Executive Officer, The Charles Schwab Corporation and Charles Schwab & Co., Inc. (2008 – present); Director, Charles Schwab Bank (2006 – present); and Director, Schwab Holdings, Inc. (2008 – present). | 95 | Director, The Charles Schwab Corporation (2008 – present) |
| Officers of the Trust | |
| Name,
Year of Birth, and Position(s) with the trust; (Terms of office, and length of Time Served3) |
Principal Occupations During the Past Five Years |
| Marie
Chandoha 1961 President and Chief Executive Officer (Officer of The Charles Schwab Family of Funds, Schwab Investments, Schwab Capital Trust, Schwab Annuity Portfolios, Laudus Trust and Laudus Institutional Trust since 2010) |
Director, President and Chief Executive Officer (Dec. 2010 – present), Chief Investment Officer (Sept. 2010 – Oct. 2011), Charles Schwab Investment Management, Inc.; President, Chief Executive Officer (Dec. 2010 – present), and Chief Investment Officer (Sept. 2010 – Oct. 2011), Schwab Funds, Laudus Funds and Schwab ETFs; Director, Charles Schwab Worldwide Funds plc and Charles Schwab Asset Management (Ireland) Limited (January 2011 – present); Global Head of Fixed Income Business Division, BlackRock, Inc. (formerly Barclays Global Investors) (March 2007 – August 2010). |
| George
Pereira 1964 Treasurer and Principal Financial Officer, Schwab Funds Treasurer and Chief Financial Officer, Laudus Funds (Officer of The Charles Schwab Family of Funds, Schwab Investments, Schwab Capital Trust and Schwab Annuity Portfolios since 2004; Laudus Trust and Laudus Institutional Trust since 2006) |
Senior Vice President and Chief Financial Officer (Nov. 2004 – present), Chief Operating Officer (Jan. 2011 – present), Charles Schwab Investment Management, Inc.; Treasurer and Chief Financial Officer, Laudus Funds (June 2006 – present); Treasurer and Principal Financial Officer, Schwab Funds (Nov. 2004 – present) and Schwab ETFs (Oct. 2009 – present); Director, Charles Schwab Worldwide Funds plc and Charles Schwab Asset Management (Ireland) Limited (April 2005 – present). |
| Omar
Aguilar 1970 Senior Vice President and Chief Investment Officer – Equities (Officer of The Charles Schwab Family of Funds, Schwab Investments, Schwab Capital Trust, Schwab Annuity Portfolios, Laudus Trust and Laudus Institutional Trust since 2011) |
Senior Vice President and Chief Investment Officer – Equities, Charles Schwab Investment Management, Inc. (April 2011 – present); Senior Vice President and Chief Investment Officer – Equities, Schwab Funds, Laudus Funds and Schwab ETFs (June 2011 – present); Head of the Portfolio Management Group and Vice President of Portfolio Management, Financial Engines, Inc. (May 2009 – April 2011); Head of Quantitative Equity, ING Investment Management (July 2004 – Jan. 2009). |
| Brett
Wander 1961 Senior Vice President and Chief Investment Officer – Fixed Income (Officer of The Charles Schwab Family of Funds, Schwab Investments, Schwab Capital Trust, Schwab Annuity Portfolios, Laudus Trust and Laudus Institutional Trust since 2011) |
Senior Vice President and Chief Investment Officer – Fixed Income, Charles Schwab Investment Management, Inc. (April 2011 – present); Senior Vice President and Chief Investment Officer – Fixed Income, Schwab Funds, Laudus Funds and Schwab ETFs (June 2011 – present); Senior Managing Director, Global Head of Active Fixed-Income Strategies, State Street Global Advisors (Jan. 2008 – Oct. 2010); Director of Alpha Strategies Loomis, Sayles & Company (April 2006 – Jan. 2008). |
| David
Lekich 1964 Chief Legal Officer and Secretary, Schwab Funds Vice President and Assistant Clerk, Laudus Funds (Officer of The Charles Schwab Family of Funds, Schwab Investments, Schwab Capital Trust, Schwab Annuity Portfolios, Laudus Trust and Laudus Institutional Trust since 2011) |
Senior Vice President (Sept. 2011 – present), Vice President (March 2004 – Sept. 2011), Charles Schwab & Co., Inc.; Senior Vice President and Chief Counsel (Sept. 2011 – present), Vice President (Jan. 2011 – Sept. 2011), Charles Schwab Investment Management, Inc.; Secretary (April 2011 – present) and Chief Legal Officer (Dec. 2011 – present), Schwab Funds; Vice President and Assistant Clerk, Laudus Funds (April 2011 – present); Secretary (May 2011 – present) and Chief Legal Officer (Nov. 2011 – present), Schwab ETFs. |
| Catherine
MacGregor 1964 Vice President and Assistant Secretary, Schwab Funds Chief Legal Officer, Vice President and Clerk, Laudus Funds (Officer of The Charles Schwab Family of Funds, Schwab Investments, Schwab Capital Trust, Schwab Annuity Portfolios, Laudus Trust and Laudus Institutional Trust since 2005) |
Vice President, Charles Schwab & Co., Inc., Charles Schwab Investment Management, Inc. (July 2005 – present); Vice President (Dec. 2005 – present), Chief Legal Officer and Clerk (March 2007 – present), Laudus Funds; Vice President (Nov. 2005 – present) and Assistant Secretary (June 2007 – present), Schwab Funds; Vice President and Assistant Secretary, Schwab ETFs (Oct. 2009 – present). |
| 1 | Trustees remain in office until they resign, retire or are removed by shareholder vote. The Schwab and Laudus Funds’ retirement policy requires that independent trustees retire at age 72 or after twenty years as a trustee, whichever comes first. In addition, the retirement policy requires any independent trustee of Schwab Funds or Laudus Funds to retire from all Boards upon their required retirement date from either Board. |
| 2 | Mr. Schwab and Mr. Bettinger are Interested Trustees because they own stock of The Charles Schwab Corporation, the parent company of the investment adviser. |
| 3 | The President, Treasurer and Secretary/Clerk hold office until their respective successors are chosen and qualified or until he or she sooner dies, resigns, is removed or becomes disqualified. Each of the other officers serves at the pleasure of the Boards. |
211 Main Street, San Francisco, CA 94105
1-800-435-4000
© 2015 Charles Schwab & Co., Inc. All rights reserved.
Member SIPC®
Printed on recycled paper.
00149454
Table of Contents
Item 2: Code of Ethics.
Not applicable to this semi-annual report.
Item 3: Audit Committee Financial Expert.
Not applicable to this semi-annual report.
Item 4: Principal Accountant Fees and Services.
Not applicable to this semi-annual report.
Item 5: Audit Committee of Listed Registrants.
Not applicable.
Item 6: Schedule of Investments.
The schedules of investments are included as part of the report to shareholders filed under Item 1 of this Form.
Item 7: Disclosure of Proxy Voting Policies and Procedures for Closed-End Management Investment Companies.
Not applicable.
Item 8: Portfolio Managers of Closed-End Management Investment Companies.
Not applicable.
Item 9: Purchases of Equity Securities by Closed-End Management Investment Company and Affiliated Purchasers.
Not applicable.
Item 10: Submission of Matters to a Vote of Security Holders.
Not applicable.
Item 11: Controls and Procedures.
| (a) | Based on their evaluation of Registrant’s disclosure controls and procedures, as of a date within 90 days of the filing date, Registrant’s Chief Executive Officer, Marie Chandoha and Registrant’s Principal Financial Officer, George Pereira, have concluded that Registrant’s disclosure controls and procedures are: (i) reasonably designed to ensure that information required to be disclosed in this report is |
Table of Contents
| appropriately communicated to Registrant’s officers to allow timely decisions regarding disclosures required in this report; (ii) reasonably designed to ensure that information required to be disclosed in this report is recorded, processed, summarized and reported in a timely manner; and (iii) are effective in achieving the goals described in (i) and (ii) above. |
| (b) | During the second fiscal quarter of the period covered by this report, there have been no changes in Registrant’s internal control over financial reporting that the above officers believe to have materially affected, or to be reasonably likely to materially affect, Registrant’s internal control over financial reporting. |
Table of Contents
Item 12: Exhibits.
| (a) | (1) | Code of ethics – not applicable to this semi-annual report. | ||
| (2) | Separate certifications for Registrant’s principal executive officer and principal financial officer, as required by Rule 30a-2(a) under the 1940 Act, are attached. | |||
| (3) | Not applicable. | |||
| (b) | A certification for Registrant’s principal executive officer and principal financial officer, as required by Rule 30a-2(b) under the 1940 Act, is attached. This certification is being furnished to the Securities and Exchange Commission solely pursuant to 18 U.S.C. section 1350 and is not being filed as part of the Form N-CSRS with the Commission. | |||
Pursuant to the requirements of the Securities Exchange Act of 1934 and the Investment Company Act of 1940, the registrant has duly caused this report to be signed on its behalf by the undersigned, thereunto duly authorized.
(Registrant) The Charles Schwab Family of Funds
| By: | /s/ Marie Chandoha | |
| Marie Chandoha | ||
| Chief Executive Officer | ||
| Date: | August 11, 2015 | |
Pursuant to the requirements of the Securities Exchange Act of 1934 and the Investment Company Act of 1940, this report has been signed below by the following persons on behalf of the registrant and in the capacities and on the dates indicated.
| By: | /s/ Marie Chandoha | |
| Marie Chandoha | ||
| Chief Executive Officer | ||
| Date: | August 11, 2015 | |
| By: | /s/ George Pereira | |
| George Pereira | ||
| Principal Financial Officer | ||
| Date: | August 11, 2015 | |