Q1 FISCAL 2014 PREPARED REMARKS
Longer-term targets set a course to deliver increased value to shareholders
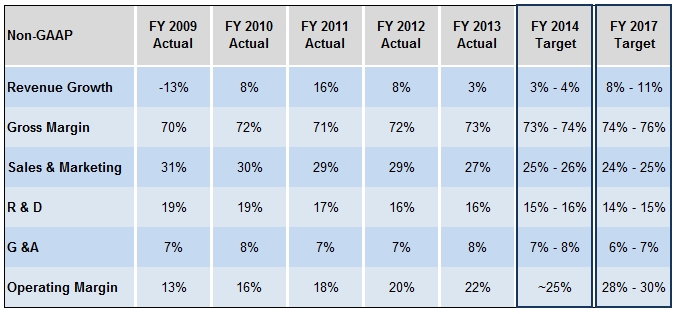
Consistent with our goal of enhancing value for our stakeholders by generating steady improvement in profitability, we continue to target non-GAAP operating margin of 28% to 30% by FY’17. We anticipate achieving our longer-term goals through a mix of measures including: (1) improving non-GAAP services gross margin toward our longer-term goal of 20%; (2) further expanding our services partner ecosystem; (3) enhancing sales force productivity and efficiency; (4) implementing solutions that require shorter sales cycles and less services; (5) continued vigilance on cost control; and (6) driving revenue growth across our existing markets while capitalizing on new opportunities, such as the trend toward smart, connected products and the Internet of Things.
Our FY’14 and long term financial targets are shown in the table below. The FY’17 long term revenue growth target represents our “timeless growth model”, which assumes a stable, healthy macro environment, that we grow at or greater than the growth rates of the markets we participate in (detailed on the next page), as well as 2% to 4% of acquisition-related growth.
PTC Non-GAAP Financial Targets
PTC Markets
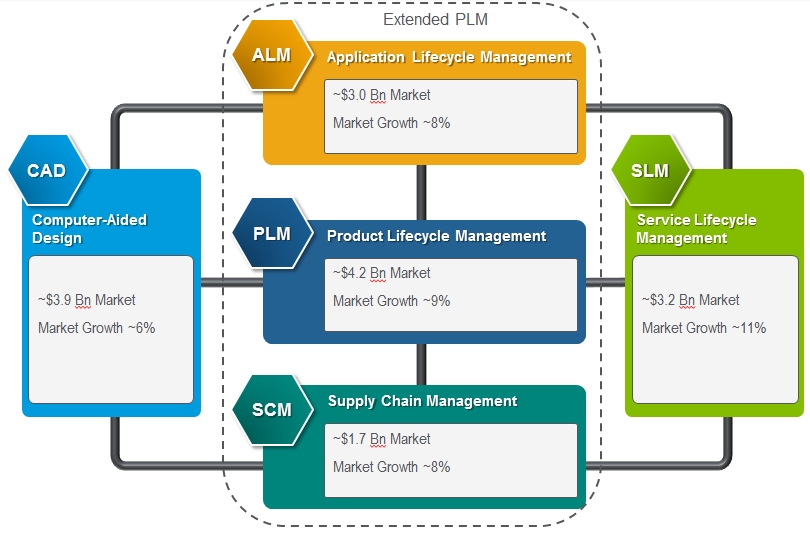
PTC is focused on the following five markets: Computer Aided Design (CAD), Product Lifecycle Management (PLM), Application Lifecycle Management (ALM), Supply Chain Management (SCM), and Services Lifecycle Management (SLM). We characterize the markets in which we participate with a graphic depicting PTC’s addressable market with market size and growth estimates.
|
·
|
CAD: PTC Creo® and PTC Mathcad®
|
|
·
|
Extended PLM: PTC Windchill® and PTC Integrity TM
|
|
·
|
SLM: PTC Arbortext® and PTC Servigistics®
|
FY’14 outlook based on comprehensive planning methodology
We rely on a number of factors to set our internal plan and financial guidance including: (1) sales pipeline coverage data; (2) input from field sales and our indirect channel; (3) large deal trends; (4) market and vertical industry analysis; and (5) correlation of macroeconomic factors to portions of our business.
PTC Q2 and FY’14 Outlook
Based on our Q1 performance, our recent acquisition of ThingWorx, and our sales pipeline tempered by a still uncertain global economic recovery (particularly the global manufacturing economy) we believe it is appropriate to increase our FY’14 revenue guidance to approximately $1,330 to $1,345 million, from $1,325 to $1,340 million. We
continue to expect non-GAAP EPS to grow faster than revenues and are raising our FY’14 guidance to $2.03 to $2.13 from $2.00 to $2.10. For Q2, we anticipate generating revenue of $320 to $330 million, with the line of business splits depicted in the table below. We expect to increase Q2 operating expenses ~3% to 4% sequentially driven primarily by increased hiring, particularly within sales and R&D, annual salary increases, and the inclusion of the recently acquired ThingWorx business. We are guiding Q2 non-GAAP EPS of $0.43 to $0.48. Should we see further improvement in the global manufacturing economy, we believe we are well positioned to accelerate revenue growth.
Q2 and FY’14 Guidance Table

Non-GAAP Supplemental Information
We provide non-GAAP supplemental information to our GAAP information. A reconciliation between GAAP results and non-GAAP information and PTC's reasons for providing this information are at the end of this document.
Q1 FY’14 - Key Points
|
1)
|
Our Q1 non-GAAP EPS of $0.50 was up 37% year over year, above our guidance range due to higher than planned revenues and services margins and continued focus on cost efficiency. There was no material impact to Q1 non-GAAP EPS from currency effects relative to guidance.
|
|
|
2)
|
Total non-GAAP revenue for Q1 of $324.9 million was up 1% year over year (up 2% year over year on a constant currency basis) and was above the high end of our guidance range.
|
|
|
3)
|
License revenue of $79.2 million was at the high end of our Q1 guidance range and was flat year over year. License revenue was strong in Europe and reflects modest growth in the Americas (compared to Q1’13, which had a significant mega deal - a transaction resulting in recognized license revenue of over $5 million in the quarter). This growth was offset by declines in the Pac Rim and Japan (including currency headwinds from Yen depreciation). On a constant currency basis Japan license revenue was up 14% year over year and down 7% on an as reported basis.
|
|
|
4)
|
We delivered non-GAAP support revenue of $170.1 million, in line with our guidance and up 3% year over year (up 4% on a constant currency basis).
|
|
|
5)
|
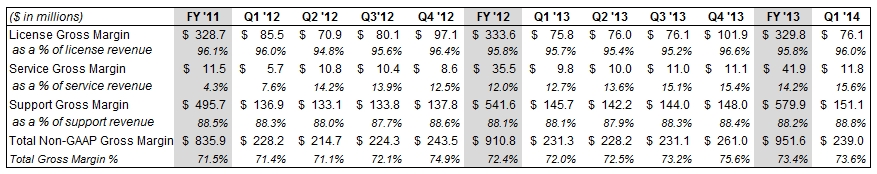
Services revenue of $75.6 million (down 2% year over year both as reported and on a constant currency basis) came in above our guidance. We delivered non-GAAP services gross margin of 15.6% for the quarter, up from 15.4% in Q4’13 and 12.7% in Q1‘13.
|
|
|
6)
|
We had 34 large deals (greater than $1 million in license and services revenue from a single customer recognized in the quarter) that contributed $70.7 million in revenue, a 14% increase year over year.
|
|
|
7)
|
We generated $36 million in operating cash flow, used $6 million for capital expenditures and used $19 million to pay withholding taxes for stock-based awards that vested in the quarter. Additionally, during the quarter we borrowed $110 million under our credit facility for our acquisition of ThingWorx, which closed after quarter-end, resulting in an ending cash balance of $371 million at the end of the first quarter.
|
REVENUE TRENDS
Year-over-year changes in revenue on a constant currency (FX) basis in the tables that follow compare actual reported results converted into U.S. dollars based on the corresponding prior year’s foreign currency exchange rates to reported results for the comparable prior year period.
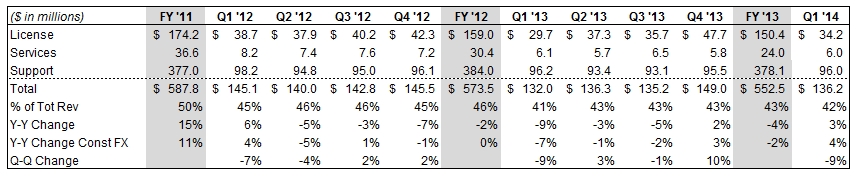
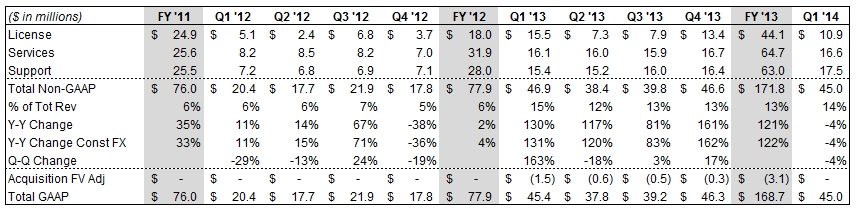
LICENSE: Strength in Europe and Japan (on a constant currency basis) offset by weakness in Pac Rim
License sales generate the highest non-GAAP gross margins, which are approximately 96%. License revenue historically has tended to represent 25% to 30% of our total revenue in any given quarter, with Q4 generally being our strongest quarter. License revenue in Q1’14 accounted for a slightly smaller percentage of total revenue (24%) due in part to overperformance in our service revenue, which was above our Q1’14 guidance.
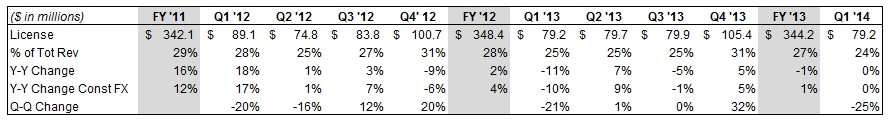
Q1 License revenue of $79.2 million was flat year over year, and at the high end of our guidance range of $70 million to $80 million, reflecting growth in Europe with year-over-year growth of 15% (up 12% on a constant currency basis), offset by declines in the Pacific Rim of 21% and Japan of 7%. However, on a constant currency basis, license revenue from Japan was up 14% year over year. License revenue in the Americas was up 1% year over year (recall Q1'13 included a mega deal in the Americas).
Looking forward to Q2 we are expecting license revenue of $75 to $90 million; for FY’14, we are expecting total license revenue of $355 to $370 million, up 3% to 7% year over year.
LARGE DEAL ACTIVITY:
Large deals are a significant growth driver and have historically tended to generate 20% to 25% of our total revenue in any given quarter. We define “large deals” as more than $1 million of license and service revenue recognized from a customer during a quarter. License revenue has historically comprised approximately 50% of the total large deal revenue in any quarter and was 46%, 56%, and 45% of total large deal revenue in Q1’14, Q4’13, and Q1’13, respectively.
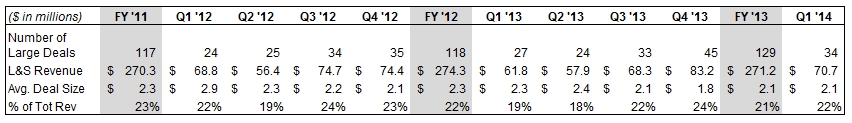
In Q1 we had 34 large deals totaling $70.7 million, with the majority of these customers in the Americas and Europe. We continue to have a strong pipeline of large deals that we are working on worldwide, though the timing of closing and the size of large deals may be affected by a delayed macroeconomic recovery, among other factors.
SALES CAPACITY TRENDS:
A key part of our long-term growth strategy is to expand the number of quota-carrying sales reps as we penetrate adjacent market opportunities (i.e. ALM, SLM, and SCM) within our existing customer base and target new customers. We ended the quarter with 333 quota-carrying sales representatives. We remain focused on improving the productivity of our current capacity as well as bringing on an additional 20-30 sales representatives to position ourselves for opportunities in FY’15 and beyond.

SERVICES: Margin improvement and partner ecosystem expansion
Our services business provides significant value to our customers, helping them re-engineer their global product development business processes and implement our solutions, and providing them with training on our software. Services revenue has historically tended to represent 20% to 25% of our total revenues in any given quarter.
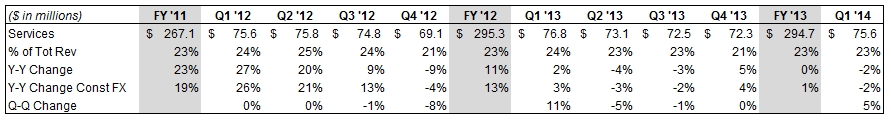
Q1 Services revenue of $75.6 million was down 2% year over year (down 2% on a constant currency basis) but above our guidance of approximately $70 million. On an organic basis (excluding revenue from NetIDEAS and Enigma), services revenue was down 4%. Our consulting services revenue was down 1% year over year (down 4% on an organic basis). Our training business, which typically represents about 15% of our total services revenue, was down 3% year over year. A portion of the decrease in our services revenue is tied to our strategy to shift more business to services partners. Over the trailing 12-months, bookings for our Service Advantage partner program were up more than 40% year-over-year.
We delivered improved non-GAAP services gross margin of 15.6% in Q1’14 (up from the Q4’13 non-GAAP services gross margin of 15.4%), exceeding our FY’14 target of at least 15%.
Looking forward to Q2, we are expecting services revenue to be approximately $75 million, up 3% year over year. For FY’14 we anticipate generating services revenue of approximately $300 million, up approximately 2% year over year. We expect to achieve non-GAAP services margins of at least 15% for FY’14 through a combination of pricing discipline, cost control, and services partner ecosystem expansion.
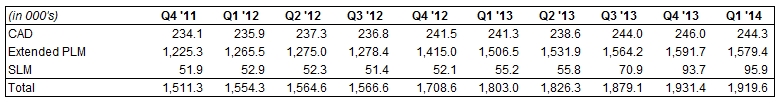
SUPPORT: More than 1.9 million active seats
Our support business is an important barometer of customer satisfaction with our solutions. It is also a strong source of recurring revenue for PTC. Support gross margins are approximately 88% on a non-GAAP basis. Support revenue has historically tended to represent approximately 50% of our total revenues in any given quarter, with Q4 usually being at the low end as a percent of total revenue due to historically strong performance of license sales in that quarter.

Q1 non-GAAP support revenue of $170.1 million was up 3% year over year.
Looking forward to Q2, we are expecting non-GAAP support revenue to increase to approximately $165 million, up 2% on a year-over-year basis and down 3% on a sequential basis due to normal seasonal impacts within our support renewals. For FY’14 we are expecting approximately $675 million of non-GAAP support revenue, up 3% on a year-over-year basis.
Active Support Seats
REVENUE BY SOLUTION AREA
We provide additional revenue disclosure that we believe provides valuable insight into how our business is performing within the markets we serve. Along with line of business, geographic and large deal metrics, we report revenue in three solution areas: CAD, SLM and “Extended PLM”, which encompasses our PLM, ALM and SCM businesses. Each of these solution areas serves a market with unique secular and cyclical dynamics, growth rates, and “buyers” within our customer base. We believe the recent acquisition of ThingWorx will allow us to enhance the position of our segment solutions as well as position PTC as a leader in the Internet of Things.
The following tables provide license, services and support revenue for each of our solution areas. Results include combined revenue from direct sales and our channel.
CAD:
CAD revenue in Q1 was up compared with the year-ago period primarily due to double digit license revenue growth in Europe and the Americas, partially offset by lower license revenue in the Pac Rim and Japan. CAD channel revenue, which represents approximately 40% of total CAD revenue, was down 2% year-over-year (down 1% on a constant currency basis).
Extended PLM:
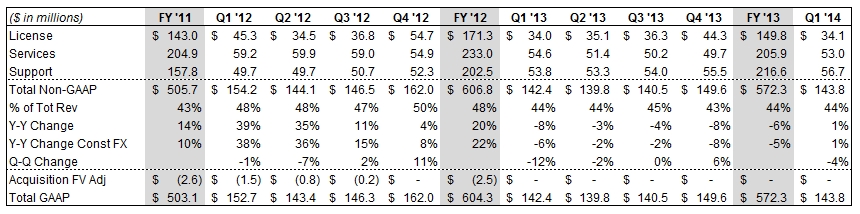
Q1 Extended PLM revenue, which includes our PLM, ALM and SCM solutions, was up despite a tough comparison vs. Q1’13, a quarter in which we recognized revenue from a mega deal. Solid growth in the Americas and Japan, particularly on a constant currency basis, was offset by a double digit percentage decline in the Pac Rim and a single digit percentage decline in Europe. We believe growth in extended PLM should begin to reaccelerate if we see further improvement in the manufacturing economy.
SLM:
Q1 SLM revenue declined 4% year over year as growth in SLM service revenue and support revenue was more than offset by a double digit percentage decline in SLM license revenues. As a reminder, SLM license revenue had a very
strong quarter in Q1’13, which was the fiscal year end for Servigistics (acquired on October 2, 2012). Going forward we expect seasonality in our SLM business to more closely resemble the rest of our business, and we continue to anticipate achieving strong SLM revenue growth in FY’14.
REVENUE BY REGION
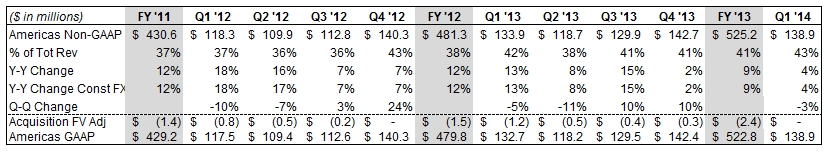
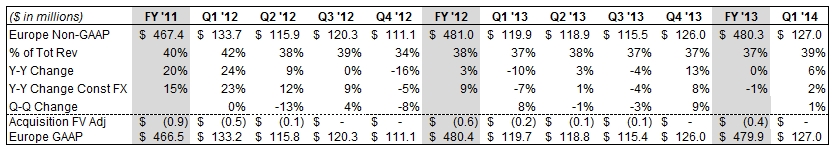
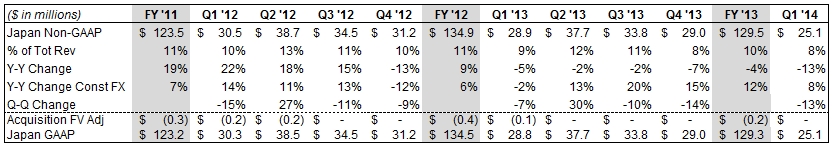
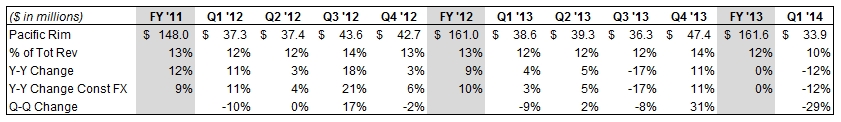
Americas license revenue in Q1 was up 1% year over year (recall Q1'13 included a mega deal in the Americas). Q1 license revenue in Europe was up 15% year over year. Q1 license revenue in Japan was down 7% (up 14% on a constant currency basis) compared with last year. Q1 license revenue in the Pac Rim was down 21% compared with last year.
CURRENCY IMPACT ON RESULTS COMPARED TO THE YEAR AGO PERIOD
We have a global business, with Europe and Asia historically representing approximately 60% to 65% of our revenue. We do not forecast currency movements; rather we provide detailed constant currency commentary. Currency can significantly impact our results. For example, in FY’13, currency was a headwind for PTC and negatively impacted non-GAAP revenue by $18 million and favorably impacted GAAP and non-GAAP expenses by $9 million. In FY’12 currency was also a headwind for us and negatively impacted non-GAAP revenue by $25 million while favorably impacting non-GAAP expenses by $19 million.
As a simple rule of thumb, based on current revenue and expense levels, a $0.10 move on the USD / EURO exchange rate will impact annualized revenue by approximately $35 to $40 million and EPS by approximately $0.08 to $0.10. Given recent fluctuation in the YEN / USD exchange rate, we also note that a 10 YEN move versus the USD will impact annualized revenue by approximately $13 to $17 million and expenses by approximately $6 to $8 million.
In Q1’14, currency was a headwind for PTC and negatively impacted revenue by $1.7 million and favorably impacted GAAP and non-GAAP expenses by $1.7 million and $1.8 million, respectively.
Looking forward, the guidance we are providing assumes exchange rates of approximately 1.36 USD / EURO and 104 YEN / USD. Our actual simple average Q1’14 Fx rate was $1.35 USD / EURO and 99 YEN / USD.
Q1 FY’14 EXPENSES COMMENTARY AND Q2 & FY’14 OUTLOOK
Q1 non-GAAP results exclude $12.8 million of stock-based compensation expense, $12.3 million of acquisition-related intangible asset amortization, $1.1 million of restructuring charges related to actions announced in Q4’13, and $1.3 million of acquisition-related costs. The Q1 non-GAAP and GAAP results include a tax rate provision of 25% and 121.1 million diluted shares outstanding.
Q2’14 non-GAAP guidance excludes the following estimated expenses and their income tax effects, as well as any additional discrete tax items
|
l
|
Approximately $13 million of expense related to stock-based compensation
|
|
l
|
Approximately $12 million of acquisition-related intangible asset amortization expense
|
|
l
|
Our Q2 guidance does not include the impact of acquisition accounting for the ThingWorx transaction, for which we expect to record a non-cash tax benefit due to the recording of deferred tax liabilities and the resulting reduction in the U.S. valuation allowance
|
FY’14 non-GAAP guidance excludes the following full-year estimated expenses and their income tax effects, as well as any additional discrete tax items
|
l
|
Approximately $52 million of expense related to stock-based compensation
|
|
l
|
Approximately $49 million of acquisition-related intangible asset amortization expense
|
|
l
|
Approximately $1 million of restructuring charges
|
|
l
|
Approximately $1 million of acquisition-related expenses
|
|
l
|
Additionally our FY14 guidance does not include the impact of acquisition accounting for the ThingWorx transaction, for which we expect to record a non-cash tax benefit due to the recording of deferred tax liabilities and the resulting reduction in the U.S. valuation allowance
|
NON-GAAP GROSS MARGINS
NON-GAAP OPERATING MARGINS
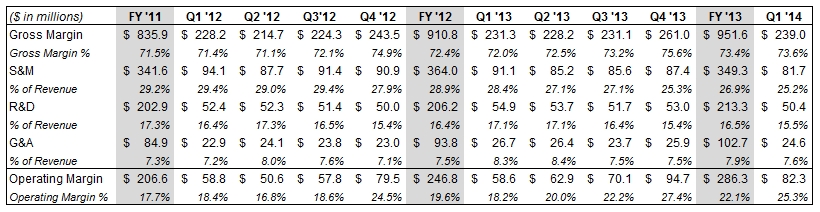
Our Q1’14 non-GAAP gross margin increased year over year primarily due to improved services margins. Q1’14 GAAP gross margin was $232 million, or 71.4%, compared to $223 million, or 69.6%, in Q1’13.
Our Q1’14 non-GAAP operating expenses were $157 million ($177 million on a GAAP basis), compared to $173 million in Q1’13 ($209 million on a GAAP basis), reflecting cost reductions and continued discipline on operating expenses, partially offset by costs of acquired businesses. GAAP operating expenses in Q1’13 included $15 million of restructuring charges, compared to $1 million in Q1’14 (related to actions announced in Q4’13).
From an operating performance perspective, we achieved 25.3% non-GAAP operating margin (25.2% on a constant currency basis) in Q1’14, compared to 18.2% in Q1’13. GAAP operating margin was 16.9% (16.8% on a constant currency basis) for Q1’14 compared to 4.3% in Q1’13.
Looking forward, we are expecting Q2‘14 non-GAAP gross margin of approximately 73%, GAAP gross margin of approximately 71%, non-GAAP operating margin of approximately 23% and GAAP operating margin of approximately 15%. For FY‘14, we are expecting non-GAAP gross margin of approximately 73% to 74%, GAAP gross margin of 71% to 72%, non-GAAP operating margin of approximately 25%, and GAAP operating margin of approximately 18%.
Over the longer term we intend to increase our non-GAAP operating margin to the 28% to 30% range primarily through increased efficiencies in our global sales and marketing organizations and improved non-GAAP gross margin (74% to 76% range) due to improved non-GAAP services margin and more favorable revenue mix.
TAX RATE
Our Q1 GAAP and non-GAAP tax rate was 25%.
Looking forward, we expect our Q2 and FY’14 non-GAAP tax rate will be 25% given our current estimates for geographic mix of profits. Our guidance assumes a Q2 and FY’14 GAAP tax rate of 25%.
STOCK-BASED COMPENSATION
For Q1’14, expenses related to stock-based compensation were 3.9% of non-GAAP revenue compared to 3.7% of non-GAAP revenue in Q1’13. Over time, we expect that stock-based compensation as a percentage of revenue will trend down annually, ultimately reaching a long-term target of 3%.
SHARE COUNT / SHARE REPURCHASE
We had 121.1 million fully diluted weighted average shares outstanding for Q1.
Looking forward, we expect to have approximately 121 million fully diluted shares outstanding for Q2’14 and for the full fiscal year. Of the $100 million our board has authorized for share repurchases for FY’14, we intend to repurchase $75 million worth of shares in FY’14. Our long-term philosophy is to repurchase shares to offset dilution.
BALANCE SHEET: Solid cash position
CASH / CASH FLOW FROM OPERATIONS
As of the end of Q1’14 our cash balance was $371 million, up from $242 million at the end of Q4’13. We generated $36 million in operating cash flow, used $6 million for capital expenditures and used $19 million to pay withholding taxes for stock-based awards that vested in the quarter. Additionally, we borrowed $110 million under our credit facility for our acquisition of ThingWorx, which closed after quarter-end.
DSO
We continue to have strong DSOs of 60 days in Q1’14 compared to 60 days in Q4’13 and 63 days in Q1’13.
OUTSTANDING DEBT
At the end of Q1’14, the balance outstanding under our $450 million credit facility was $368 million, which includes $110 million borrowed for the acquisition of ThingWorx. This quarter, we anticipate replacing our credit facility with a substantially similar facility with a borrowing capacity of $750 million to $1 billion (comprised of a $500 million to $750 million revolving line and a $250 million term loan) that would mature in 2019. We expect to use our credit facility for general corporate purposes, including acquisitions of businesses and working capital requirements. In addition, we expect to repay approximately $100 million of outstanding debt in FY’14.
MISCELLANEOUS COMMENTS
HEADCOUNT
Total headcount was 5,940 at the end of Q1, compared to 6,000 at the end of Q4’13 and 6,126 at the end of Q1’13.
M&A
We view M&A primarily as a strategic vehicle to further enhance our product portfolio and growth opportunity. We intend to remain opportunistic as it relates to M&A. Over the last three years, we have undertaken small, strategic technology tuck-ins (e.g. the acquisitions of Enigma and NetIDEAS in Q4’13), as well as larger transactions, including MKS in Q3’11, Servigistics in Q1’13, and, most recently, ThingWorx in Q2’14. ThingWorx, which closed on December 30, 2013, has developed an award-winning platform for building and running applications for the Internet of Things. This acquisition accelerates our ability to support manufacturers seeking competitive advantage as they create and service smart, connected products. At the time of the acquisition, ThingWorx had approximately 40 employees, who are located primarily in the U.S. The purchase price of ThingWorx was $112 million plus a possible earn-out of up to $18 million.
We continue to evaluate strategic acquisition opportunities of varying size as they arise. Our forecasted financial, cash and debt positions for FY’14 described above are exclusive of the effects of any acquisitions that we may complete.
Important Information About Non-GAAP References
PTC provides non-GAAP supplemental information to its financial results. Non-GAAP revenue, operating expenses, margin and EPS exclude the effect of purchase accounting on the fair value of acquired deferred revenue of Servigistics, Inc. and MKS, Inc., stock-based compensation expense, amortization of acquired intangible assets, restructuring charges, acquisition-related expenses and gains, certain foreign currency transaction losses, certain litigation gains, and the related tax effects of the preceding items and discrete tax items. We use these non-GAAP measures, and we believe that they assist our investors, to make period-to-period comparisons of our operational performance because they provide a view of our operating results without items that are not, in our view, indicative of our core operating results. We believe that these non-GAAP measures help illustrate underlying trends in our business, and we use the measures to establish budgets and operational goals, communicated internally and externally, for managing our business and evaluating our performance. We believe that providing non-GAAP measures affords investors a view of our operating results that may be more easily compared to the results of peer companies. In addition, compensation of our executives is based in part on the performance of our business based on these non-GAAP measures. However, non-GAAP information should not be construed as an alternative to GAAP information as the items excluded from the non-GAAP measures often have a material impact on PTC’s financial results. Management uses, and investors should consider, non-GAAP measures in conjunction with our GAAP results. PTC also provides results on a constant currency basis to provide a year-over-year view of our results excluding the effect of currency translation. Our constant currency disclosures are calculated by multiplying the actual results for the first quarter of 2014 by the exchange rates in effect for the comparable period in 2013.
Forward-Looking Statements
Statements in these prepared remarks that are not historic facts, including statements about our second quarter and full fiscal 2014 and other future financial and growth expectations, anticipated tax rates, expected market growth rates and the long-term prospects for PTC, are forward-looking statements that involve risks and uncertainties that
could cause actual results to differ materially from those projected. These risks include the possibility that the macroeconomic and/or manufacturing climates may not improve or may deteriorate, the possibility that customers may not purchase our solutions when or at the rates we expect, the possibility that our pipeline of opportunities may not convert or generate the revenue we expect, the possibility that we will be unable to achieve planned services margins and operating margin improvements, the possibility that foreign currency exchange rates may vary from our expectations and thereby affect our reported revenue and expense, the possibility that we may not achieve the license, services or support revenue that we expect, which could result in a different mix of revenue between license, service and support and could impact our EPS results, the possibility that our restructurings and cost containment measures may not generate the operating margin improvements we expect and could adversely affect our revenue, the possibility that we may be unable to achieve our profitability targets with lower license revenue or without additional restructuring or cost containment measures, the possibility that the ThingWorx business and our SLM and CAD solutions, including Servigistics, may not expand and/or generate the revenue we expect, the possibility that sales personnel productivity may not increase as we expect and generate the additional sales pipeline and revenue that we expect, the possibility that we may be unable to expand our services partner ecosystem or improve services margins as we expect, the possibility that we may be unable to attain or maintain a technology leadership position or that any such leadership position may not generate the revenue we expect, the possibility that the markets in which we operate may not grow at the rates we expect, and the possibility that remedial actions relating to our previously announced investigation in China could adversely affect our revenue and that fines and penalties may be assessed against PTC in connection with the China matter. In addition, our assumptions concerning our future GAAP and non-GAAP effective income tax rates are based on estimates and other factors that could change, including the geographic mix of our revenue, expenses and profits and loans and cash repatriations from foreign subsidiaries. Other risks and uncertainties that could cause actual results to differ materially from those projected are detailed from time to time in reports we file with the Securities and Exchange Commission, including our Annual Report on Form 10-K and our Quarterly Reports on Form 10-Q.
|
PTC Inc.
|
||||||||||||||||||||||||||||||||||||||||||||||||
|
NON-GAAP FINANCIAL MEASURES AND RECONCILIATIONS (UNAUDITED)
|
||||||||||||||||||||||||||||||||||||||||||||||||
|
(in thousands)
|
|
GAAP MARGINS
|
||||||||||||||||||||||||||||||||||||
|
FY '11
|
Q1 '12
|
Q2 '12
|
Q3 '12
|
Q4 '12
|
FY '12
|
|||||||||||||||||||||||||||||||
|
Revenue
|
$ | 1,166,949 | $ | 318,276 | $ | 301,125 | $ | 310,983 | $ | 325,295 | $ | 1,255,679 | ||||||||||||||||||||||||
|
Cost of license revenue
|
28,792 | 7,659 | 7,824 | 7,634 | 7,478 | 30,595 | ||||||||||||||||||||||||||||||
|
Cost of service revenue
|
260,650 | 71,450 | 66,366 | 65,689 | 61,977 | 265,482 | ||||||||||||||||||||||||||||||
|
Cost of support revenue
|
67,326 | 19,110 | 19,026 | 19,531 | 18,384 | 76,051 | ||||||||||||||||||||||||||||||
|
Gross Margin
|
$ | 810,181 | 69.4 | % | $ | 220,057 | 69.1 | % | $ | 207,909 | 69.0 | % | $ | 218,129 | 70.1 | % | $ | 237,456 | 73.0 | % | $ | 883,551 | 70.4 | % | ||||||||||||
|
Sales & marketing
|
$ | 353,051 | 30.3 | % | $ | 97,778 | 30.7 | % | $ | 90,962 | 30.2 | % | $ | 94,706 | 30.5 | % | $ | 94,350 | 29.0 | % | $ | 377,796 | 30.1 | % | ||||||||||||
|
Research & development
|
211,406 | 18.1 | % | 54,993 | 17.3 | % | 54,576 | 18.1 | % | 53,260 | 17.1 | % | 52,131 | 16.0 | % | 214,960 | 17.1 | % | ||||||||||||||||||
|
General & administrative
|
110,291 | 9.5 | % | 29,572 | 9.3 | % | 29,534 | 9.8 | % | 29,851 | 9.6 | % | 28,511 | 8.8 | % | 117,468 | 9.4 | % | ||||||||||||||||||
|
Amortization of acquired intangible assets
|
18,319 | 1.6 | % | 5,209 | 1.6 | % | 5,132 | 1.7 | % | 5,103 | 1.6 | % | 4,859 | 1.5 | % | 20,303 | 1.6 | % | ||||||||||||||||||
|
Restructuring charge
|
- | 0.0 | % | - | 0.0 | % | 20,802 | 6.9 | % | 4,126 | 1.3 | % | - | 0.0 | % | 24,928 | 2.0 | % | ||||||||||||||||||
|
Operating Expenses
|
$ | 693,067 | 59.4 | % | $ | 187,552 | 58.9 | % | $ | 201,006 | 66.8 | % | $ | 187,046 | 60.1 | % | $ | 179,851 | 55.3 | % | $ | 755,455 | 60.2 | % | ||||||||||||
|
GAAP Operating Margin
|
$ | 117,114 | 10.0 | % | $ | 32,505 | 10.2 | % | $ | 6,903 | 2.3 | % | $ | 31,083 | 10.0 | % | $ | 57,605 | 17.7 | % | $ | 128,096 | 10.2 | % | ||||||||||||
|
ADJUSTMENTS TO DERIVE NON-GAAP MEASURES
|
||||||||||||||||||||||||||||||||||||
|
FY '11
|
Q1 '12
|
Q2 '12
|
Q3 '12
|
Q4 '12
|
FY '12
|
|||||||||||||||||||||||||||||||
|
Revenue:
|
||||||||||||||||||||||||||||||||||||
|
Fair value of deferred revenue
|
$ | 2,606 | 0.2 | % | $ | 1,522 | 0.5 | % | $ | 736 | 0.2 | % | $ | 227 | 0.1 | % | $ | - | 0.0 | % | $ | 2,485 | 0.2 | % | ||||||||||||
|
Cost of license revenue:
|
||||||||||||||||||||||||||||||||||||
|
Acquired intangible amortization
|
15,393 | 1.3 | % | 4,103 | 1.3 | % | 3,931 | 1.3 | % | 3,933 | 1.3 | % | 3,852 | 1.2 | % | 15,819 | 1.3 | % | ||||||||||||||||||
|
Stock-based compensation
|
15 | 0.0 | % | 5 | 0.0 | % | 7 | 0.0 | % | 4 | 0.0 | % | 6 | 0.0 | % | 22 | 0.0 | % | ||||||||||||||||||
|
Cost of service revenue:
|
||||||||||||||||||||||||||||||||||||
|
Acquired intangible amortization
|
- | 0.0 | % | - | 0.0 | % | - | 0.0 | % | - | 0.0 | % | - | 0.0 | % | - | 0.0 | % | ||||||||||||||||||
|
Stock-based compensation
|
5,011 | 0.4 | % | 1,563 | 0.5 | % | 1,358 | 0.5 | % | 1,314 | 0.4 | % | 1,447 | 0.4 | % | 5,682 | 0.5 | % | ||||||||||||||||||
|
Cost of support revenue:
|
||||||||||||||||||||||||||||||||||||
|
Stock-based compensation
|
2,721 | 0.2 | % | 950 | 0.3 | % | 813 | 0.3 | % | 736 | 0.2 | % | 735 | 0.2 | % | 3,234 | 0.3 | % | ||||||||||||||||||
|
Sales & marketing:
|
||||||||||||||||||||||||||||||||||||
|
Stock-based compensation
|
11,428 | 1.0 | % | 3,728 | 1.2 | % | 3,306 | 1.1 | % | 3,334 | 1.1 | % | 3,441 | 1.1 | % | 13,809 | 1.1 | % | ||||||||||||||||||
|
Research & development:
|
||||||||||||||||||||||||||||||||||||
|
Stock-based compensation
|
8,547 | 0.7 | % | 2,549 | 0.8 | % | 2,240 | 0.7 | % | 1,886 | 0.6 | % | 2,086 | 0.6 | % | 8,761 | 0.7 | % | ||||||||||||||||||
|
General & administrative:
|
||||||||||||||||||||||||||||||||||||
|
Stock-based compensation
|
17,680 | 1.5 | % | 4,587 | 1.4 | % | 4,968 | 1.6 | % | 6,057 | 1.9 | % | 4,185 | 1.3 | % | 19,797 | 1.6 | % | ||||||||||||||||||
|
Acquisition-related costs
|
7,761 | 0.7 | % | 2,068 | 0.6 | % | 444 | 0.1 | % | - | 0.0 | % | 1,321 | 0.4 | % | 3,833 | 0.3 | % | ||||||||||||||||||
|
Amortization of acquired intangible assets
|
18,319 | 1.6 | % | 5,209 | 1.6 | % | 5,132 | 1.7 | % | 5,103 | 1.6 | % | 4,859 | 1.5 | % | 20,303 | 1.6 | % | ||||||||||||||||||
|
Restructuring charge
|
- | 0.0 | % | - | 0.0 | % | 20,802 | 6.9 | % | 4,126 | 1.3 | % | - | 0.0 | % | 24,928 | 2.0 | % | ||||||||||||||||||
|
Non-GAAP adjustments
|
$ | 89,481 | 7.7 | % | $ | 26,284 | 8.3 | % | $ | 43,737 | 14.5 | % | $ | 26,720 | 8.6 | % | $ | 21,932 | 6.7 | % | $ | 118,673 | 9.5 | % | ||||||||||||
|
NON-GAAP MARGINS
|
||||||||||||||||||||||||||||||||||||
|
FY '11
|
Q1 '12
|
Q2 '12
|
Q3 '12
|
Q4 '12
|
FY '12
|
|||||||||||||||||||||||||||||||
|
Revenue
|
$ | 1,169,555 | $ | 319,798 | $ | 301,861 | $ | 311,210 | $ | 325,295 | $ | 1,258,164 | ||||||||||||||||||||||||
|
Cost of license revenue
|
13,384 | 3,551 | 3,886 | 3,697 | 3,620 | 14,754 | ||||||||||||||||||||||||||||||
|
Cost of service revenue
|
255,639 | 69,887 | 65,008 | 64,375 | 60,530 | 259,800 | ||||||||||||||||||||||||||||||
|
Cost of support revenue
|
64,605 | 18,160 | 18,213 | 18,795 | 17,649 | 72,817 | ||||||||||||||||||||||||||||||
|
Gross Margin
|
$ | 835,927 | 71.5 | % | $ | 228,200 | 71.4 | % | $ | 214,754 | 71.1 | % | $ | 224,343 | 72.1 | % | $ | 243,496 | 74.9 | % | $ | 910,793 | 72.4 | % | ||||||||||||
|
Sales & marketing
|
$ | 341,623 | 29.2 | % | $ | 94,050 | 29.4 | % | $ | 87,656 | 29.0 | % | $ | 91,372 | 29.4 | % | $ | 90,909 | 27.9 | % | $ | 363,987 | 28.9 | % | ||||||||||||
|
Research & development
|
202,859 | 17.3 | % | 52,444 | 16.4 | % | 52,336 | 17.3 | % | 51,374 | 16.5 | % | 50,045 | 15.4 | % | 206,199 | 16.4 | % | ||||||||||||||||||
|
General & administrative
|
84,850 | 7.3 | % | 22,917 | 7.2 | % | 24,122 | 8.0 | % | 23,794 | 7.6 | % | 23,005 | 7.1 | % | 93,838 | 7.5 | % | ||||||||||||||||||
|
Amortization of acquired intangible assets
|
- | 0.0 | % | - | 0.0 | % | - | 0.0 | % | - | 0.0 | % | - | 0.0 | % | - | 0.0 | % | ||||||||||||||||||
|
Restructuring charge
|
- | 0.0 | % | - | 0.0 | % | - | 0.0 | % | - | 0.0 | % | - | 0.0 | % | - | 0.0 | % | ||||||||||||||||||
|
Operating Expenses
|
$ | 629,332 | 53.8 | % | $ | 169,411 | 53.0 | % | $ | 164,114 | 54.4 | % | $ | 166,540 | 53.5 | % | $ | 163,959 | 50.4 | % | $ | 664,024 | 52.8 | % | ||||||||||||
|
Non-GAAP Operating Margin
|
$ | 206,595 | 17.7 | % | $ | 58,789 | 18.4 | % | $ | 50,640 | 16.8 | % | $ | 57,803 | 18.6 | % | $ | 79,537 | 24.5 | % | $ | 246,769 | 19.6 | % | ||||||||||||
|
PTC Inc.
|
||||||||||||||||||||||||||||||||||||
|
NON-GAAP FINANCIAL MEASURES AND RECONCILIATIONS (UNAUDITED)
|
||||||||||||||||||||||||||||||||||||
|
(in thousands)
|
||||||||||||||||||||||||||||||||||||
|
GAAP MARGINS
|
||||||||||||||||||||||||||||||||||||
|
Q1 '13
|
Q2 '13
|
Q3 '13
|
Q4 '13
|
FY '13
|
Q1 '14
|
|||||||||||||||||||||||||||||||
|
Revenue
|
$ | 319,751 | $ | 313,949 | $ | 314,996 | $ | 344,845 | $ | 1,293,541 | $ | 324,925 | ||||||||||||||||||||||||
|
Cost of license revenue
|
8,012 | 8,291 | 8,431 | 8,270 | 33,004 | 7,545 | ||||||||||||||||||||||||||||||
|
Cost of service revenue
|
68,592 | 64,550 | 62,941 | 62,871 | 258,954 | 65,495 | ||||||||||||||||||||||||||||||
|
Cost of support revenue
|
20,468 | 20,429 | 19,796 | 20,388 | 81,081 | 19,916 | ||||||||||||||||||||||||||||||
|
Gross Margin
|
$ | 222,679 | 69.6 | % | $ | 220,679 | 70.3 | % | $ | 223,828 | 71.1 | % | $ | 253,316 | 73.5 | % | $ | 920,502 | 71.2 | % | $ | 231,969 | 71.4 | % | ||||||||||||
|
Sales & marketing
|
$ | 93,549 | 29.3 | % | $ | 88,059 | 28.0 | % | $ | 88,298 | 28.0 | % | $ | 90,734 | 26.3 | % | $ | 360,640 | 27.9 | % | $ | 84,238 | 25.9 | % | ||||||||||||
|
Research & development
|
57,429 | 18.0 | % | 55,528 | 17.7 | % | 53,834 | 17.1 | % | 55,127 | 16.0 | % | 221,918 | 17.2 | % | 53,073 | 16.3 | % | ||||||||||||||||||
|
General & administrative
|
35,817 | 11.2 | % | 33,398 | 10.6 | % | 28,812 | 9.1 | % | 33,910 | 9.8 | % | 131,937 | 10.2 | % | 30,931 | 9.5 | % | ||||||||||||||||||
|
Amortization of acquired intangible assets
|
6,623 | 2.1 | % | 6,640 | 2.1 | % | 6,532 | 2.1 | % | 6,691 | 1.9 | % | 26,486 | 2.0 | % | 7,789 | 2.4 | % | ||||||||||||||||||
|
Restructuring charge
|
15,402 | 4.8 | % | 15,810 | 5.0 | % | 3,137 | 1.0 | % | 17,848 | 5.2 | % | 52,197 | 4.0 | % | 1,067 | 0.3 | % | ||||||||||||||||||
|
Operating Expenses
|
$ | 208,820 | 65.3 | % | $ | 199,435 | 63.5 | % | $ | 180,613 | 57.3 | % | $ | 204,310 | 59.2 | % | $ | 793,178 | 61.3 | % | $ | 177,098 | 54.5 | % | ||||||||||||
|
GAAP Operating Margin
|
$ | 13,859 | 4.3 | % | $ | 21,244 | 6.8 | % | $ | 43,215 | 13.7 | % | $ | 49,006 | 14.2 | % | $ | 127,324 | 9.8 | % | $ | 54,871 | 16.9 | % | ||||||||||||
|
ADJUSTMENTS TO DERIVE NON-GAAP MEASURES
|
||||||||||||||||||||||||||||||||||||
|
Q1 '13
|
Q2 '13
|
Q3 '13
|
Q4 '13
|
FY '13
|
Q1 '14
|
|||||||||||||||||||||||||||||||
|
Revenue:
|
||||||||||||||||||||||||||||||||||||
|
Fair value of deferred revenue
|
$ | 1,554 | 0.5 | % | $ | 660 | 0.2 | % | $ | 534 | 0.2 | % | $ | 287 | 0.1 | % | $ | 3,035 | 0.2 | % | $ | - | 0.0 | % | ||||||||||||
|
Cost of license revenue:
|
||||||||||||||||||||||||||||||||||||
|
Acquired intangible amortization
|
4,639 | 1.5 | % | 4,628 | 1.5 | % | 4,598 | 1.5 | % | 4,695 | 1.4 | % | 18,560 | 1.4 | % | 4,405 | 1.4 | % | ||||||||||||||||||
|
Stock-based compensation
|
5 | 0.0 | % | 8 | 0.0 | % | 4 | 0.0 | % | 4 | 0.0 | % | 21 | 0.0 | % | 4 | 0.0 | % | ||||||||||||||||||
|
Cost of service revenue:
|
||||||||||||||||||||||||||||||||||||
|
Acquired intangible amortization
|
- | 0.0 | % | - | 0.0 | % | - | 0.0 | % | 26 | 0.0 | % | 26 | 0.0 | % | 92 | 0.0 | % | ||||||||||||||||||
|
Stock-based compensation
|
1,612 | 0.5 | % | 1,420 | 0.5 | % | 1,372 | 0.4 | % | 1,730 | 0.5 | % | 6,134 | 0.5 | % | 1,598 | 0.5 | % | ||||||||||||||||||
|
Cost of support revenue:
|
||||||||||||||||||||||||||||||||||||
|
Stock-based compensation
|
826 | 0.3 | % | 835 | 0.3 | % | 722 | 0.2 | % | 941 | 0.3 | % | 3,324 | 0.3 | % | 924 | 0.3 | % | ||||||||||||||||||
|
Sales & marketing:
|
||||||||||||||||||||||||||||||||||||
|
Stock-based compensation
|
2,458 | 0.8 | % | 2,835 | 0.9 | % | 2,693 | 0.9 | % | 3,340 | 1.0 | % | 11,326 | 0.9 | % | 2,499 | 0.8 | % | ||||||||||||||||||
|
Research & development:
|
||||||||||||||||||||||||||||||||||||
|
Stock-based compensation
|
2,512 | 0.8 | % | 1,824 | 0.6 | % | 2,139 | 0.7 | % | 2,115 | 0.6 | % | 8,590 | 0.7 | % | 2,689 | 0.8 | % | ||||||||||||||||||
|
General & administrative:
|
||||||||||||||||||||||||||||||||||||
|
Stock-based compensation
|
4,480 | 1.4 | % | 4,888 | 1.6 | % | 4,247 | 1.3 | % | 5,777 | 1.7 | % | 19,392 | 1.5 | % | 5,050 | 1.6 | % | ||||||||||||||||||
|
Acquisition-related costs
|
4,599 | 1.4 | % | 2,110 | 0.7 | % | 900 | 0.3 | % | 2,246 | 0.7 | % | 9,855 | 0.8 | % | 1,305 | 0.4 | % | ||||||||||||||||||
|
Amortization of acquired intangible assets
|
6,623 | 2.1 | % | 6,640 | 2.1 | % | 6,532 | 2.1 | % | 6,691 | 1.9 | % | 26,486 | 2.0 | % | 7,789 | 2.4 | % | ||||||||||||||||||
|
Restructuring charge
|
15,402 | 4.8 | % | 15,810 | 5.0 | % | 3,137 | 1.0 | % | 17,848 | 5.2 | % | 52,197 | 4.0 | % | 1,067 | 0.3 | % | ||||||||||||||||||
|
Non-GAAP adjustments
|
$ | 44,710 | 14.0 | % | $ | 41,658 | 13.3 | % | $ | 26,878 | 8.5 | % | $ | 45,700 | 13.3 | % | $ | 158,946 | 12.3 | % | $ | 27,422 | 8.4 | % | ||||||||||||
|
NON-GAAP MARGINS
|
||||||||||||||||||||||||||||||||||||
|
Q1 '13
|
Q2 '13
|
Q3 '13
|
Q4 '13
|
FY '13
|
Q1 '14
|
|||||||||||||||||||||||||||||||
|
Revenue
|
$ | 321,305 | $ | 314,609 | $ | 315,530 | $ | 345,132 | $ | 1,296,576 | $ | 324,925 | ||||||||||||||||||||||||
|
Cost of license revenue
|
3,368 | 3,655 | 3,829 | 3,571 | 14,423 | 3,136 | ||||||||||||||||||||||||||||||
|
Cost of service revenue
|
66,980 | 63,130 | 61,569 | 61,115 | 252,794 | 63,805 | ||||||||||||||||||||||||||||||
|
Cost of support revenue
|
19,642 | 19,594 | 19,074 | 19,447 | 77,757 | 18,992 | ||||||||||||||||||||||||||||||
|
Gross Margin
|
$ | 231,315 | 72.0 | % | $ | 228,230 | 72.5 | % | $ | 231,058 | 73.2 | % | $ | 260,999 | 75.6 | % | $ | 951,602 | 73.4 | % | $ | 238,992 | 73.6 | % | ||||||||||||
|
Sales & marketing
|
$ | 91,091 | 28.4 | % | $ | 85,224 | 27.1 | % | $ | 85,605 | 27.1 | % | $ | 87,394 | 25.3 | % | $ | 349,314 | 26.9 | % | $ | 81,739 | 25.2 | % | ||||||||||||
|
Research & development
|
54,917 | 17.1 | % | 53,704 | 17.1 | % | 51,695 | 16.4 | % | 53,012 | 15.4 | % | 213,328 | 16.5 | % | 50,384 | 15.5 | % | ||||||||||||||||||
|
General & administrative
|
26,738 | 8.3 | % | 26,400 | 8.4 | % | 23,665 | 7.5 | % | 25,887 | 7.5 | % | 102,690 | 7.9 | % | 24,576 | 7.6 | % | ||||||||||||||||||
|
Amortization of acquired intangible assets
|
- | 0.0 | % | - | 0.0 | % | - | 0.0 | % | - | 0.0 | % | - | 0.0 | % | - | 0.0 | % | ||||||||||||||||||
|
Restructuring charge
|
- | 0.0 | % | - | 0.0 | % | - | 0.0 | % | - | 0.0 | % | - | 0.0 | % | - | 0.0 | % | ||||||||||||||||||
|
Operating Expenses
|
$ | 172,746 | 53.8 | % | $ | 165,328 | 52.6 | % | $ | 160,965 | 51.0 | % | $ | 166,293 | 48.2 | % | $ | 665,332 | 51.3 | % | $ | 156,699 | 48.2 | % | ||||||||||||
|
Non-GAAP Operating Margin
|
$ | 58,569 | 18.2 | % | $ | 62,902 | 20.0 | % | $ | 70,093 | 22.2 | % | $ | 94,706 | 27.4 | % | $ | 286,270 | 22.1 | % | $ | 82,293 | 25.3 | % | ||||||||||||
|
PTC Inc.
|
||||||||||||
|
NON-GAAP FINANCIAL MEASURES AND RECONCILIATIONS (UNAUDITED)
|
||||||||||||
|
(in thousands, except per share data)
|
||||||||||||
|
Three Months Ended
|
||||||||||||
|
December 28,
|
December 29,
|
|||||||||||
|
2013
|
2012
|
|||||||||||
|
GAAP revenue
|
$ | 324,925 | $ | 319,751 | ||||||||
|
Fair value of acquired company's deferred support revenue
|
- | 1,554 | ||||||||||
|
Non-GAAP revenue
|
$ | 324,925 | $ | 321,305 | ||||||||
|
GAAP gross margin
|
$ | 231,969 | $ | 222,679 | ||||||||
|
Fair value of acquired company's deferred support revenue
|
- | 1,554 | ||||||||||
|
Stock-based compensation
|
2,526 | 2,443 | ||||||||||
|
Amortization of acquired intangible assets included in cost of license revenue
|
4,405 | 4,639 | ||||||||||
|
Amortization of acquired intangible assets included in cost of service revenue
|
92 | - | ||||||||||
|
Non-GAAP gross margin
|
$ | 238,992 | $ | 231,315 | ||||||||
|
GAAP operating income
|
$ | 54,871 | $ | 13,859 | ||||||||
|
Fair value of acquired company's deferred support revenue
|
- | 1,554 | ||||||||||
|
Stock-based compensation
|
12,764 | 11,893 | ||||||||||
|
Amortization of acquired intangible assets included in cost of license revenue
|
4,405 | 4,639 | ||||||||||
|
Amortization of acquired intangible assets included in cost of service revenue
|
92 | - | ||||||||||
|
Amortization of acquired intangible assets
|
7,789 | 6,623 | ||||||||||
|
Acquisition-related charges included in general and administrative expenses
|
1,305 | 4,599 | ||||||||||
|
Restructuring charges
|
1,067 | 15,402 | ||||||||||
|
Non-GAAP operating income (1)
|
$ | 82,293 | $ | 58,569 | ||||||||
|
GAAP net income
|
$ | 39,657 | $ | 35,811 | ||||||||
|
Fair value of acquired company's deferred support revenue
|
- | 1,554 | ||||||||||
|
Stock-based compensation
|
12,764 | 11,893 | ||||||||||
|
Amortization of acquired intangible assets included in cost of license revenue
|
4,405 | 4,639 | ||||||||||
|
Amortization of acquired intangible assets included in cost of service revenue
|
92 | - | ||||||||||
|
Amortization of acquired intangible assets
|
7,789 | 6,623 | ||||||||||
|
Acquisition-related charges included in general and administrative expenses
|
1,305 | 4,599 | ||||||||||
|
Restructuring charges
|
1,067 | 15,402 | ||||||||||
|
Income tax adjustments (2)
|
(6,858 | ) | (36,400 | ) | ||||||||
|
Non-GAAP net income
|
$ | 60,221 | $ | 44,121 | ||||||||
|
GAAP diluted earnings per share
|
$ | 0.33 | $ | 0.29 | ||||||||
|
Fair value of deferred support revenue
|
- | 0.01 | ||||||||||
|
Stock-based compensation
|
0.11 | 0.10 | ||||||||||
|
Amortization of acquired intangibles
|
0.10 | 0.09 | ||||||||||
|
Acquisition-related charges
|
0.01 | 0.04 | ||||||||||
|
Restructuring charges and other
|
0.01 | 0.13 | ||||||||||
|
Income tax adjustments
|
(0.06 | ) | (0.30 | ) | ||||||||
|
Non-GAAP diluted earnings per share
|
$ | 0.50 | $ | 0.36 | ||||||||
| (1 | ) |
Operating margin impact of non-GAAP adjustments:
|
||||||||||
|
Three Months Ended
|
||||||||||||
|
December 28,
|
December 29,
|
|||||||||||
| 2013 | 2012 | |||||||||||
|
GAAP operating margin
|
16.9 | % | 4.3 | % | ||||||||
|
Fair value of deferred support revenue
|
0.0 | % | 0.5 | % | ||||||||
|
Stock-based compensation
|
3.9 | % | 3.7 | % | ||||||||
|
Amortization of acquired intangibles
|
3.8 | % | 3.5 | % | ||||||||
|
Acquisition-related charges
|
0.4 | % | 1.4 | % | ||||||||
|
Restructuring charges
|
0.3 | % | 4.8 | % | ||||||||
|
Non-GAAP operating margin
|
25.3 | % | 18.2 | % | ||||||||
| (2 | ) |
Income tax adjustments for the first quarter of 2014 and 2013 reflect the tax effects of non-GAAP adjustments which are calculated by applying the applicable tax rate by jurisdiction to the non-GAAP adjustments listed above, and also include any identified tax items. In the fourth quarter of 2012, a valuation allowance was established against our U.S. net deferred tax assets. As the U.S. is profitable on a non-GAAP basis, the 2014 and 2013 non-GAAP tax provision is being calculated assuming there is no U.S. valuation allowance. The first quarter of 2013 also includes a non-cash tax benefit of $32.6 million related to the release of a portion of the valuation allowance as a result of deferred tax liabilities established for the acquisition of Servigistics.
|
||||||||||