UNITED STATES
SECURITIES AND EXCHANGE COMMISSION
Washington, D.C. 20549
FORM N-CSR
CERTIFIED SHAREHOLDER REPORT OF REGISTERED MANAGEMENT INVESTMENT COMPANIES
Investment Company Act file number
811-05979
(Exact name of registrant as specified in charter)
200 BERKELEY STREET, BOSTON, MA 02116
(Address of principal executive offices) (Zip code)
SALVATORE SCHIAVONE
TREASURER
200 BERKELEY STREET
BOSTON, MA 02116
(Name and address of agent for service)
Registrant's telephone number, including area code:
(617) 543-9634
Date of fiscal year end:
May 31
Date of reporting period:
ITEM 1. REPORTS TO STOCKHOLDERS
The Registrant prepared the following annual reports to shareholders for the period ended May 31, 2024:
John Hancock California Municipal Bond Fund

Annual SHAREHOLDER REPORT | May 31, 2024
What were the fund costs during the last year?
(Based on a hypothetical $10,000 investment)
| Fund (Class) | Costs of a $10,000 investment | Costs paid as a percentage of a $10,000 investment |
| California Municipal Bond Fund (Class A/TACAX) |
$ |
Management’s Discussion of Fund Performance
SUMMARY OF RESULTS
California Municipal Bond Fund (Class A/TACAX) returned 4.86% (excluding sales charges) for the year ended May 31, 2024. The most significant factors affecting Fund performance during the period included rising municipal bond yields, stronger-than-expected economic growth, and lowered expectations for interest rate cuts by the U.S. Federal Reserve. Sector performance in the municipal market was also a key factor, with high-yield bonds outperforming by a significant margin during the period.
TOP PERFORMANCE CONTRIBUTORS
High-yield municipal bonds | A position in high-yield securities provided a boost to fund performance.
General obligation (GO) bonds | GOs issued by school districts and local governments were key contributors to performance.
Special tax bonds | Bonds financing specific infrastructure projects added value during the period.
TOP PERFORMANCE DETRACTORS
Duration (interest rate sensitivity) | Rising municipal bond yields put downward pressure on municipal bond prices.
Selected hospital bonds | Although the hospital sector performed well overall, several individual holdings in the sector detracted from performance.
The views expressed in this report are exclusively those of the portfolio management team at Manulife Investment Management (US) LLC, and are subject to change. They are not meant as investment advice.
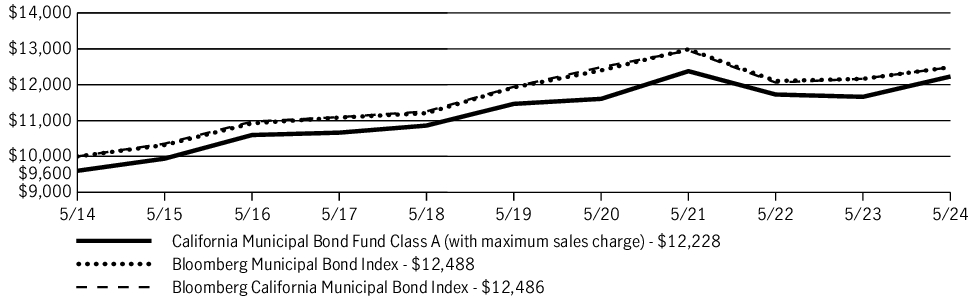
Fund Performance
The following graph compares the initial and subsequent account values at the end of each of the most recently completed 10 fiscal years of the fund (or for the life of the fund, if shorter). It assumes a $10,000 initial investment in the fund and in an appropriate, broad-based securities market index for the same period.
GROWTH OF $10,000
| AVERAGE ANNUAL TOTAL RETURN | 1 Year | 5 Years | 10 Years |
|
The Fund has designated Bloomberg Municipal Bond Index as its broad-based securities market index in accordance with the revised definition for such an index.
|
Performance figures assume all distributions have been reinvested and reflect the beneficial effect of any expense reductions. Figures reflect maximum sales charge on Class A shares of 4.00%. Past performance does not guarantee future results. The return and principal value of an investment will fluctuate so that shares, when redeemed, may be worth more or less than their original cost. Due to market volatility and other factors, the fund’s current performance may be higher or lower than the performance shown and can be found at jhinvestments.com/investments or by calling 800-225-5291. The graph and table do not reflect the deduction of taxes that a shareholder would pay on fund distributions or redemption of fund shares. It is not possible to invest directly in an index.
Fund Statistics
| Fund net assets | $ |
| Total number of portfolio holdings | |
| Total advisory fees paid (net) | $ |
| Portfolio turnover rate | |
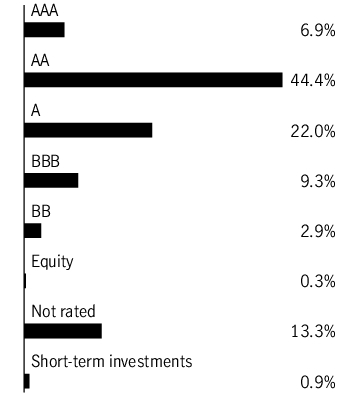
Graphical Representation of Holdings
The tables below show the investment makeup of the fund, representing percentage of the total investments of the fund.
Sector Composition
| General obligation bonds | |
| Revenue bonds | |
| Other revenue | |
| Health care | |
| Education | |
| Facilities | |
| Airport | |
| Water and sewer | |
| Utilities | |
| Tobacco | |
| Housing | |
| Development | |
| Transportation | |
| Pollution | |
| Closed-end funds | |
| Short-term investments | |
Quality Composition

Holdings may not have been held by the fund for the entire period and are subject to change without notice. Portfolio composition is subject to review in accordance with the fund’s investment strategy and may vary in the future. Current and future portfolio holdings are subject to risk and may change at any time.
The fund is subject to various risks as described in the fund's prospectus. For more information, please refer to the "Principal risks" section of the prospectus.
Availability of Additional Information

At jhinvestments.com/documents, you can find additional information about the fund, including the fund’s:
-
Prospectus
-
Financial information
-
Fund holdings
-
Proxy voting information
You can also request this information by contacting us at 800-225-5291.
This report is for the information of the shareholders in this fund. It is not authorized for distribution to prospective investors unless preceded or accompanied by the fund's prospectus.
John Hancock Investment Management Distributors LLC, Member FINRA, SIPC 200 Berkeley Street, Boston, MA 02116-5010, 800-225-5291, jhinvestments.com
Manulife, Manulife Investment Management, Stylized M Design, and Manulife Investment Management & Stylized M Design are trademarks of The Manufacturers Life Insurance Company and are used by it, and by its affiliates under license.
NOT FDIC INSURED. MAY LOSE VALUE. NO BANK GUARANTEE. NOT INSURED BY ANY GOVERNMENT AGENCY.

MF3619752
53A-A
5/24
7/24
John Hancock California Municipal Bond Fund
Annual SHAREHOLDER REPORT | May 31, 2024
What were the fund costs during the last year?
(Based on a hypothetical $10,000 investment)
| Fund (Class) | Costs of a $10,000 investment | Costs paid as a percentage of a $10,000 investment |
| California Municipal Bond Fund (Class C/TCCAX) |
$ |
Management’s Discussion of Fund Performance
SUMMARY OF RESULTS
California Municipal Bond Fund (Class C/TCCAX) returned 4.07% (excluding sales charges) for the year ended May 31, 2024. The most significant factors affecting Fund performance during the period included rising municipal bond yields, stronger-than-expected economic growth, and lowered expectations for interest rate cuts by the U.S. Federal Reserve. Sector performance in the municipal market was also a key factor, with high-yield bonds outperforming by a significant margin during the period.
TOP PERFORMANCE CONTRIBUTORS
High-yield municipal bonds | A position in high-yield securities provided a boost to fund performance.
General obligation (GO) bonds | GOs issued by school districts and local governments were key contributors to performance.
Special tax bonds | Bonds financing specific infrastructure projects added value during the period.
TOP PERFORMANCE DETRACTORS
Duration (interest rate sensitivity) | Rising municipal bond yields put downward pressure on municipal bond prices.
Selected hospital bonds | Although the hospital sector performed well overall, several individual holdings in the sector detracted from performance.
The views expressed in this report are exclusively those of the portfolio management team at Manulife Investment Management (US) LLC, and are subject to change. They are not meant as investment advice.
Fund Performance
The following graph compares the initial and subsequent account values at the end of each of the most recently completed 10 fiscal years of the fund (or for the life of the fund, if shorter). It assumes a $10,000 initial investment in the fund and in an appropriate, broad-based securities market index for the same period.
GROWTH OF $10,000

| AVERAGE ANNUAL TOTAL RETURN | 1 Year | 5 Years | 10 Years |
| Bloomberg Municipal Bond Index | 2.67% | 0.93% | 2.25% |
| Bloomberg California Municipal Bond Index | 2.63% | 0.90% | 2.25% |
|
The Fund has designated Bloomberg Municipal Bond Index as its broad-based securities market index in accordance with the revised definition for such an index.
|
Performance figures assume all distributions have been reinvested and reflect the beneficial effect of any expense reductions. Class C shares sold within one year of purchase are subject to a 1.00% contingent deferred sales charge. Past performance does not guarantee future results. The return and principal value of an investment will fluctuate so that shares, when redeemed, may be worth more or less than their original cost. Due to market volatility and other factors, the fund’s current performance may be higher or lower than the performance shown and can be found at jhinvestments.com/investments or by calling 800-225-5291. The graph and table do not reflect the deduction of taxes that a shareholder would pay on fund distributions or redemption of fund shares. It is not possible to invest directly in an index.
Fund Statistics
| Fund net assets | $ |
| Total number of portfolio holdings | |
| Total advisory fees paid (net) | $ |
| Portfolio turnover rate | |
Graphical Representation of Holdings
The tables below show the investment makeup of the fund, representing percentage of the total investments of the fund.
Sector Composition
| General obligation bonds | |
| Revenue bonds | |
| Other revenue | |
| Health care | |
| Education | |
| Facilities | |
| Airport | |
| Water and sewer | |
| Utilities | |
| Tobacco | |
| Housing | |
| Development | |
| Transportation | |
| Pollution | |
| Closed-end funds | |
| Short-term investments | |
Quality Composition

Holdings may not have been held by the fund for the entire period and are subject to change without notice. Portfolio composition is subject to review in accordance with the fund’s investment strategy and may vary in the future. Current and future portfolio holdings are subject to risk and may change at any time.
The fund is subject to various risks as described in the fund's prospectus. For more information, please refer to the "Principal risks" section of the prospectus.
Availability of Additional Information
At jhinvestments.com/documents, you can find additional information about the fund, including the fund’s:
-
Prospectus
-
Financial information
-
Fund holdings
-
Proxy voting information
You can also request this information by contacting us at 800-225-5291.
This report is for the information of the shareholders in this fund. It is not authorized for distribution to prospective investors unless preceded or accompanied by the fund's prospectus.
John Hancock Investment Management Distributors LLC, Member FINRA, SIPC 200 Berkeley Street, Boston, MA 02116-5010, 800-225-5291, jhinvestments.com
Manulife, Manulife Investment Management, Stylized M Design, and Manulife Investment Management & Stylized M Design are trademarks of The Manufacturers Life Insurance Company and are used by it, and by its affiliates under license.
NOT FDIC INSURED. MAY LOSE VALUE. NO BANK GUARANTEE. NOT INSURED BY ANY GOVERNMENT AGENCY.
MF3619752
53A-C
5/24
7/24
Annual SHAREHOLDER REPORT | May 31, 2024
What were the fund costs during the last year?
(Based on a hypothetical $10,000 investment)
| Fund (Class) | Costs of a $10,000 investment | Costs paid as a percentage of a $10,000 investment |
| California Municipal Bond Fund (Class I/JCAFX) |
$ |
Management’s Discussion of Fund Performance
SUMMARY OF RESULTS
California Municipal Bond Fund (Class I/JCAFX) returned 5.12% for the year ended May 31, 2024. The most significant factors affecting Fund performance during the period included rising municipal bond yields, stronger-than-expected economic growth, and lowered expectations for interest rate cuts by the U.S. Federal Reserve. Sector performance in the municipal market was also a key factor, with high-yield bonds outperforming by a significant margin during the period.
TOP PERFORMANCE CONTRIBUTORS
High-yield municipal bonds | A position in high-yield securities provided a boost to fund performance.
General obligation (GO) bonds | GOs issued by school districts and local governments were key contributors to performance.
Special tax bonds | Bonds financing specific infrastructure projects added value during the period.
TOP PERFORMANCE DETRACTORS
Duration (interest rate sensitivity) | Rising municipal bond yields put downward pressure on municipal bond prices.
Selected hospital bonds | Although the hospital sector performed well overall, several individual holdings in the sector detracted from performance.
The views expressed in this report are exclusively those of the portfolio management team at Manulife Investment Management (US) LLC, and are subject to change. They are not meant as investment advice.
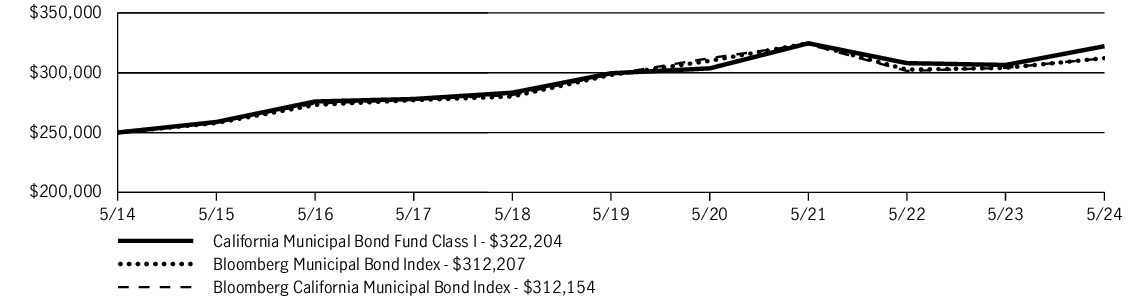
Fund Performance
The following graph compares the initial and subsequent account values at the end of each of the most recently completed 10 fiscal years of the fund (or for the life of the fund, if shorter). It assumes a $250,000 initial investment in the fund and in an appropriate, broad-based securities market index for the same period.
GROWTH OF $250,000
| AVERAGE ANNUAL TOTAL RETURN | 1 Year | 5 Years | 10 Years |
| Bloomberg Municipal Bond Index | 2.67% | 0.93% | 2.25% |
| Bloomberg California Municipal Bond Index | 2.63% | 0.90% | 2.25% |
|
The Fund has designated Bloomberg Municipal Bond Index as its broad-based securities market index in accordance with the revised definition for such an index.
|
|
|
Class I shares were first offered on 2-13-17. Returns prior to this date are those of Class A shares that have not been adjusted for class-specific expenses; otherwise, returns would vary.
|
Performance figures assume all distributions have been reinvested and reflect the beneficial effect of any expense reductions. Past performance does not guarantee future results. The return and principal value of an investment will fluctuate so that shares, when redeemed, may be worth more or less than their original cost. Due to market volatility and other factors, the fund’s current performance may be higher or lower than the performance shown and can be found at jhinvestments.com/investments or by calling 800-225-5291. The graph and table do not reflect the deduction of taxes that a shareholder would pay on fund distributions or redemption of fund shares. It is not possible to invest directly in an index.
Fund Statistics
| Fund net assets | $ |
| Total number of portfolio holdings | |
| Total advisory fees paid (net) | $ |
| Portfolio turnover rate | |
Graphical Representation of Holdings
The tables below show the investment makeup of the fund, representing percentage of the total investments of the fund.
Sector Composition
| General obligation bonds | |
| Revenue bonds | |
| Other revenue | |
| Health care | |
| Education | |
| Facilities | |
| Airport | |
| Water and sewer | |
| Utilities | |
| Tobacco | |
| Housing | |
| Development | |
| Transportation | |
| Pollution | |
| Closed-end funds | |
| Short-term investments | |
Quality Composition
Holdings may not have been held by the fund for the entire period and are subject to change without notice. Portfolio composition is subject to review in accordance with the fund’s investment strategy and may vary in the future. Current and future portfolio holdings are subject to risk and may change at any time.
The fund is subject to various risks as described in the fund's prospectus. For more information, please refer to the "Principal risks" section of the prospectus.
Availability of Additional Information
At jhinvestments.com/documents, you can find additional information about the fund, including the fund’s:
-
Prospectus
-
Financial information
-
Fund holdings
-
Proxy voting information
You can also request this information by contacting us at 800-225-5291.
This report is for the information of the shareholders in this fund. It is not authorized for distribution to prospective investors unless preceded or accompanied by the fund's prospectus.
John Hancock Investment Management Distributors LLC, Member FINRA, SIPC 200 Berkeley Street, Boston, MA 02116-5010, 800-225-5291, jhinvestments.com
Manulife, Manulife Investment Management, Stylized M Design, and Manulife Investment Management & Stylized M Design are trademarks of The Manufacturers Life Insurance Company and are used by it, and by its affiliates under license.
NOT FDIC INSURED. MAY LOSE VALUE. NO BANK GUARANTEE. NOT INSURED BY ANY GOVERNMENT AGENCY.
MF3619752
53A-I
5/24
7/24
John Hancock California Municipal Bond Fund
Annual SHAREHOLDER REPORT | May 31, 2024
What were the fund costs during the last year?
(Based on a hypothetical $10,000 investment)
| Fund (Class) | Costs of a $10,000 investment | Costs paid as a percentage of a $10,000 investment |
| California Municipal Bond Fund (Class R6/JCSRX) |
$ |
Management’s Discussion of Fund Performance
SUMMARY OF RESULTS
California Municipal Bond Fund (Class R6/JCSRX) returned 5.03% for the year ended May 31, 2024. The most significant factors affecting Fund performance during the period included rising municipal bond yields, stronger-than-expected economic growth, and lowered expectations for interest rate cuts by the U.S. Federal Reserve. Sector performance in the municipal market was also a key factor, with high-yield bonds outperforming by a significant margin during the period.
TOP PERFORMANCE CONTRIBUTORS
High-yield municipal bonds | A position in high-yield securities provided a boost to fund performance.
General obligation (GO) bonds | GOs issued by school districts and local governments were key contributors to performance.
Special tax bonds | Bonds financing specific infrastructure projects added value during the period.
TOP PERFORMANCE DETRACTORS
Duration (interest rate sensitivity) | Rising municipal bond yields put downward pressure on municipal bond prices.
Selected hospital bonds | Although the hospital sector performed well overall, several individual holdings in the sector detracted from performance.
The views expressed in this report are exclusively those of the portfolio management team at Manulife Investment Management (US) LLC, and are subject to change. They are not meant as investment advice.
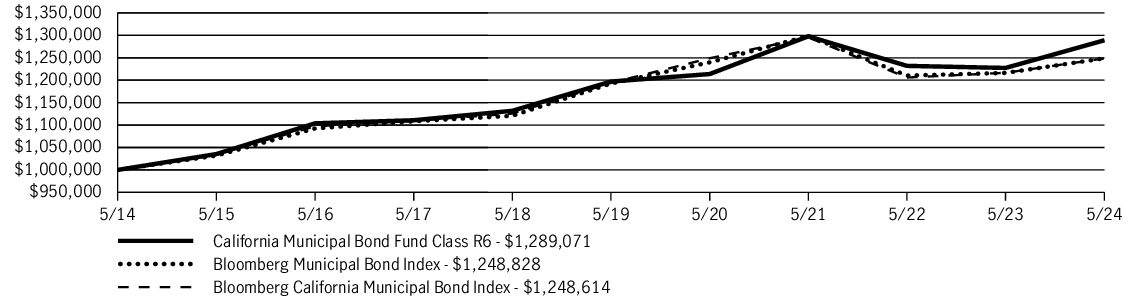
Fund Performance
The following graph compares the initial and subsequent account values at the end of each of the most recently completed 10 fiscal years of the fund (or for the life of the fund, if shorter). It assumes a $1,000,000 initial investment in the fund and in an appropriate, broad-based securities market index for the same period.
GROWTH OF $1,000,000
| AVERAGE ANNUAL TOTAL RETURN | 1 Year | 5 Years | 10 Years |
| Bloomberg Municipal Bond Index | 2.67% | 0.93% | 2.25% |
| Bloomberg California Municipal Bond Index | 2.63% | 0.90% | 2.25% |
|
The Fund has designated Bloomberg Municipal Bond Index as its broad-based securities market index in accordance with the revised definition for such an index.
|
|
|
Class R6 shares were first offered on 8-30-17. Returns prior to this date are those of Class A shares that have not been adjusted for class-specific expenses; otherwise, returns would vary.
|
Performance figures assume all distributions have been reinvested and reflect the beneficial effect of any expense reductions. Past performance does not guarantee future results. The return and principal value of an investment will fluctuate so that shares, when redeemed, may be worth more or less than their original cost. Due to market volatility and other factors, the fund’s current performance may be higher or lower than the performance shown and can be found at jhinvestments.com/investments or by calling 800-225-5291. The graph and table do not reflect the deduction of taxes that a shareholder would pay on fund distributions or redemption of fund shares. It is not possible to invest directly in an index.
Fund Statistics
| Fund net assets | $ |
| Total number of portfolio holdings | |
| Total advisory fees paid (net) | $ |
| Portfolio turnover rate | |
Graphical Representation of Holdings
The tables below show the investment makeup of the fund, representing percentage of the total investments of the fund.
Sector Composition
| General obligation bonds | |
| Revenue bonds | |
| Other revenue | |
| Health care | |
| Education | |
| Facilities | |
| Airport | |
| Water and sewer | |
| Utilities | |
| Tobacco | |
| Housing | |
| Development | |
| Transportation | |
| Pollution | |
| Closed-end funds | |
| Short-term investments | |
Quality Composition

Holdings may not have been held by the fund for the entire period and are subject to change without notice. Portfolio composition is subject to review in accordance with the fund’s investment strategy and may vary in the future. Current and future portfolio holdings are subject to risk and may change at any time.
The fund is subject to various risks as described in the fund's prospectus. For more information, please refer to the "Principal risks" section of the prospectus.
Availability of Additional Information
At jhinvestments.com/documents, you can find additional information about the fund, including the fund’s:
-
Prospectus
-
Financial information
-
Fund holdings
-
Proxy voting information
You can also request this information by contacting us at 800-225-5291.
This report is for the information of the shareholders in this fund. It is not authorized for distribution to prospective investors unless preceded or accompanied by the fund's prospectus.
John Hancock Investment Management Distributors LLC, Member FINRA, SIPC 200 Berkeley Street, Boston, MA 02116-5010, 800-225-5291, jhinvestments.com
Manulife, Manulife Investment Management, Stylized M Design, and Manulife Investment Management & Stylized M Design are trademarks of The Manufacturers Life Insurance Company and are used by it, and by its affiliates under license.
NOT FDIC INSURED. MAY LOSE VALUE. NO BANK GUARANTEE. NOT INSURED BY ANY GOVERNMENT AGENCY.
MF3619752
53A-R6
5/24
7/24