Exhibit 99.1

NEWS RELEASE
For more information contact:
David Pasquale
Global IR Partners
914-337-8801
lscc@globalirpartners.com
LATTICE SEMICONDUCTOR REPORTS FIRST QUARTER OF 2018 RESULTS
First Quarter 2018 Highlights:
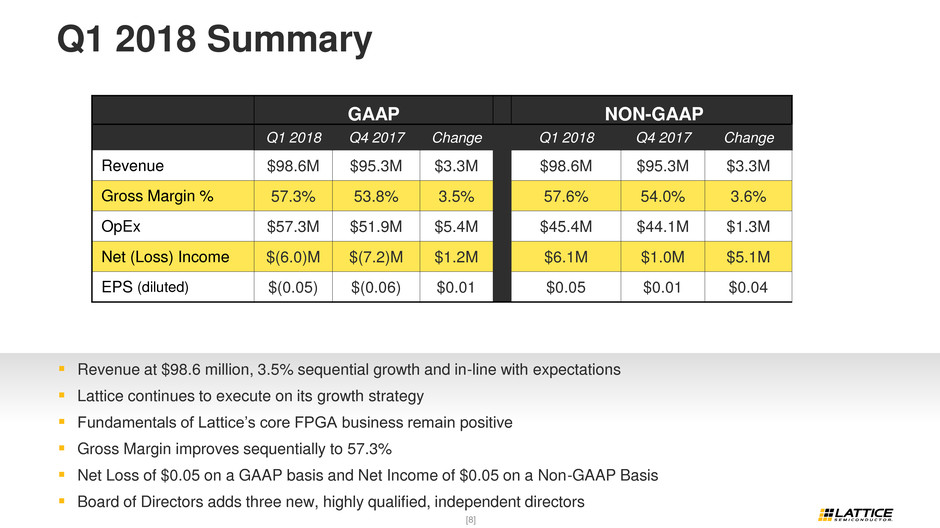
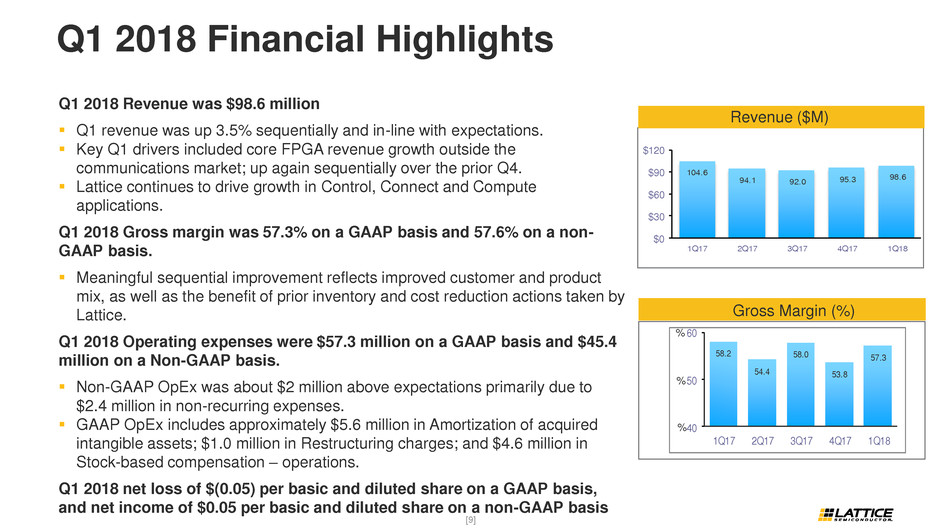
•Revenue at $98.6 million, 3.5% sequential growth and in-line with expectations
•Company continuing to execute as planned; reports high level of customer activity across
a wide range of product families
•Gross Margin improves sequentially to 57.3%
•Net Loss of $0.05 on a GAAP basis and Net Income of $0.05 on a Non-GAAP Basis
•Board of Directors adds three new, highly qualified, independent directors
* GAAP represents U.S. Generally Accepted Accounting Principles. Non-GAAP represents GAAP excluding the impact of certain activities which the Company's management excludes in analyzing the Company's operating results and in understanding trends in the Company's earnings. For a reconciliation of GAAP to non-GAAP results, see accompanying tables "Reconciliation of U.S. GAAP to Non-GAAP Financial Measures."
PORTLAND, OR - April 26, 2018 - Lattice Semiconductor Corporation (NASDAQ: LSCC), a leading provider of customizable smart connectivity solutions, announced financial results today for the fiscal first quarter ended March 31, 2018.
Selected Q1 2018 Financial Results and Comparisons (in thousands, except per share data)
GAAP — Three Months Ended | Non-GAAP — Three Months Ended | |||||||||||||||||||||||
March 31, 2018 | December 30, 2017 | April 1, 2017 | March 31, 2018 | December 30, 2017 | April 1, 2017 | |||||||||||||||||||
Revenue | $ | 98,623 | $ | 95,266 | $ | 104,587 | $ | 98,623 | $ | 95,266 | $ | 104,587 | ||||||||||||
Gross Margin % | 57.3 | % | 53.8 | % | 58.2 | % | 57.6 | % | 54.0 | % | 58.4 | % | ||||||||||||
Operating Expense | $ | 57,316 | $ | 51,937 | $ | 61,534 | $ | 45,421 | $ | 44,054 | $ | 47,679 | ||||||||||||
Net (Loss) Income | $ | (5,952 | ) | $ | (7,213 | ) | $ | (7,275 | ) | $ | 6,118 | $ | 1,038 | $ | 7,111 | |||||||||
Net (Loss) Income per share, basic and diluted | $ | (0.05 | ) | $ | (0.06 | ) | $ | (0.06 | ) | $ | 0.05 | $ | 0.01 | $ | 0.06 | |||||||||
1
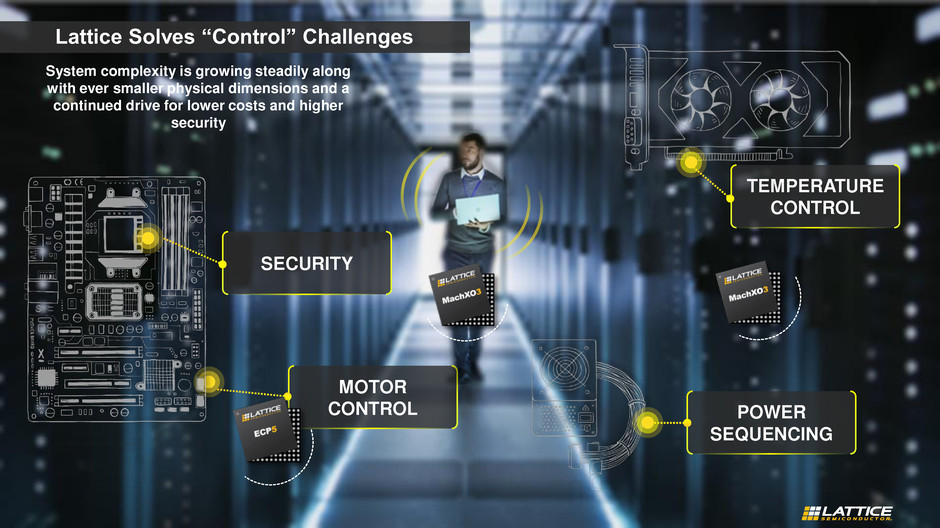
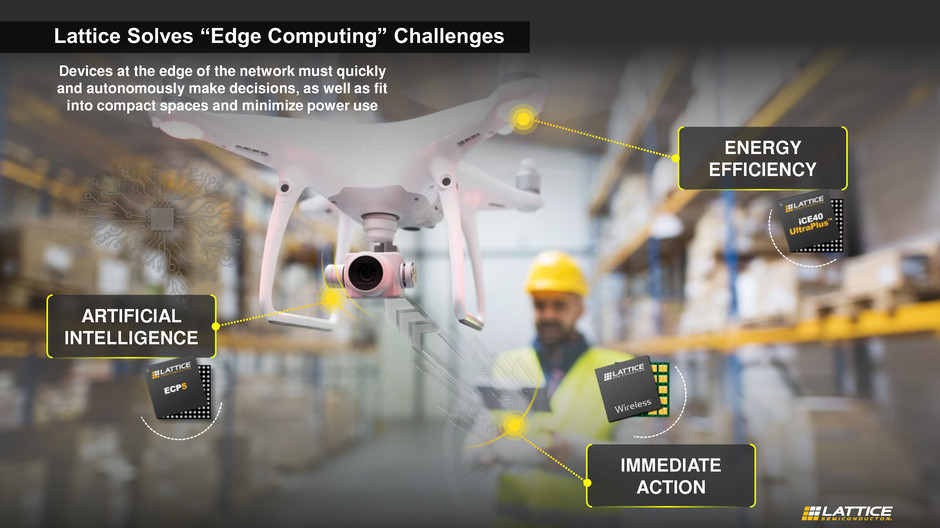
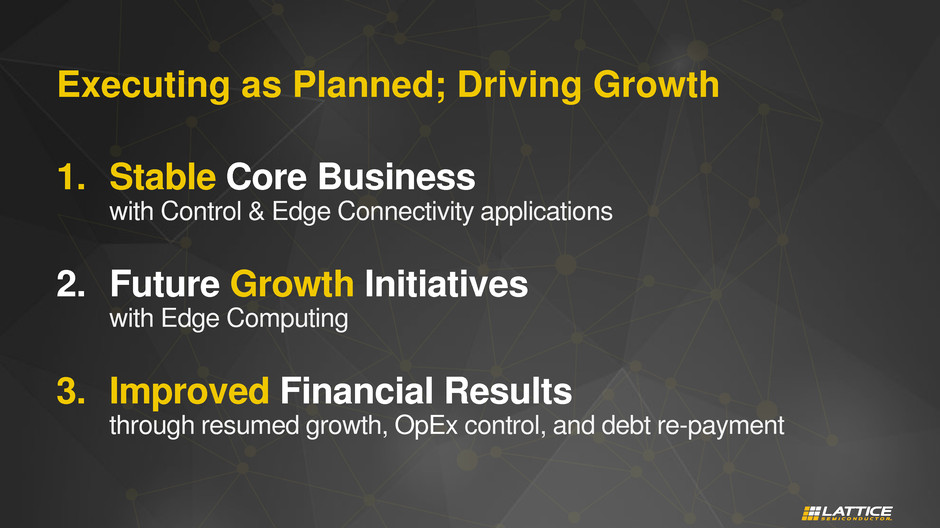
Glen Hawk, Interim Chief Executive Officer, said, "Lattice continues to execute on our growth strategy. The fundamentals of our core FPGA business remain positive as we ramp many of our new design wins into production. This includes our control and connect applications in data center servers, smart speaker products, video displays, and broad market industrial applications. Looking forward, we are encouraged by the promising early adopter successes of our edge computing applications and the launch of our comprehensive artificial intelligence tools in Q2."
Max Downing, Chief Financial Officer, added, "The year is off to a good start as our Q1 revenue and gross margin were in line with our expectations. Our non-GAAP operating expenses came in above our expectations due to approximately $2.4 million in non-recurring expenses. We remain committed to realizing our long-term cost structure targets and continue to pursue the improvements we have previously outlined, as well as other operational efficiencies we have identified. Our first quarter revenue benefited from a higher level of channel partner inventory to meet increased demand in our computing, consumer, and industrial markets. We ended the first quarter with a healthy $111.5 million in cash and short-term investments, and continue to prioritize increasing free cash flow and paying down corporate debt."
Business Outlook - Second Quarter of 2018:
• | Revenue for the second quarter of 2018 is expected to be between approximately $98 million and $102 million. |
• | Gross margin percentage for the second quarter of 2018 is expected to be approximately 56% plus or minus 2% on both a GAAP and non-GAAP basis. |
• | Total operating expenses for the second quarter of 2018 are expected to be between approximately $50.5 million and $52.5 million on a GAAP basis and between approximately $43 million and $45 million on a non-GAAP basis. |
* For a reconciliation of GAAP to non-GAAP business outlook, see accompanying tables "Reconciliation of U.S. GAAP to Non-GAAP Financial Measures."
Investor Conference Call / Webcast Details:
Lattice Semiconductor will review the Company's financial results for the fiscal first quarter of 2018 and business outlook for the second quarter and full year 2018 on Thursday, April 26 at 5:00 p.m. Eastern Time. The conference call-in number is 1-888-684-5603 or 1-918-398-4852 with conference identification number 6887938. An accompanying presentation and live webcast of the conference call will also be available on Lattice's website at www.latticesemi.com. The Company's financial guidance will be limited to the comments on its public quarterly earnings call and the public business outlook statements contained in this press release.
A replay of the call will be available approximately 2 hours after the conclusion of the live call through 11:59 p.m. Eastern Time on May 3, 2018, by telephone at 1-404-537-3406. To access the replay, use conference identification number 6887938. A webcast replay will also be available on the investor relations section of www.latticesemi.com.
2
Forward-Looking Statements Notice:
The foregoing paragraphs contain forward-looking statements that involve estimates, assumptions, risks and uncertainties. Any statements about our expectations, beliefs, plans, objectives, assumptions or future events or performance are not historical facts and may be forward-looking. Such forward-looking statements include statements relating to: our expectation that we will continue to realize our long-term cost structure targets and continue to pursue the improvements we have previously outlined, as well as other operational efficiencies we have identified; and the statements under the heading “Business Outlook - Second Quarter of 2018.” Other forward-looking statements may be indicated by words such as “will,” “could,” “should,” “would,” “may,” “expect,” “plan,” “project,” “anticipate,” “intend,” “forecast,” “future,” “believe,” “estimate,” “predict,” “propose,” “potential,” “continue” or the negative of these terms or other comparable terminology; and our expectation that we will remain focused on maximizing the leverage of our operating model and reduce our outstanding debt balance. Lattice believes the factors identified below could cause actual results to differ materially from the forward-looking statements.
Estimates of future revenue are inherently uncertain due to such factors as global economic conditions, which may affect customer demand, pricing pressures, competitive actions, the demand for our Mature, Mainstream and New products, and in particular our iCE40™ and MachXO3L™ devices, the ability to supply products to customers in a timely manner, changes in our distribution relationships, or the volatility of our consumer business. Actual gross margin percentage and operating expenses could vary from the estimates on the basis of, among other things, changes in revenue levels, changes in product pricing and mix, changes in wafer, assembly, test and other costs, including commodity costs, variations in manufacturing yields, the failure to sustain operational improvements, the actual amount of compensation charges due to stock price changes. Any unanticipated declines in revenue or gross margin, any unanticipated increases in our operating expenses or unanticipated charges could adversely affect our profitability.
In addition to the foregoing, other factors that may cause actual results to differ materially from the forward-looking statements in this press release include global economic uncertainty, overall semiconductor market conditions, market acceptance and demand for our new products, the Company's dependencies on its silicon wafer suppliers, the impact of competitive products and pricing, technological and product development risks. In addition, actual results are subject to other risks and uncertainties that relate more broadly to our overall business, including those risks more fully described in Lattice’s filings with the SEC including its annual report on Form 10-K for the fiscal year ended December 30, 2017, and Lattice’s quarterly reports filed on Form 10-Q.
You should not unduly rely on forward-looking statements because actual results could differ materially from those expressed in any forward-looking statements. In addition, any forward-looking statement applies only as of the date on which it is made. The Company does not intend to update or revise any forward-looking statements, whether as a result of events or circumstances after the date hereof or to reflect the occurrence of unanticipated events.
3
Non-GAAP Financial Measures:
Included within this press release and the accompanying tables and notes are non-GAAP financial measures that supplement the Company's consolidated financial information prepared in accordance with U.S. GAAP. The non-GAAP measures presented exclude charges and adjustments primarily related to stock-based compensation, restructuring charges, acquisition-related charges, amortization of acquired intangible assets, impairment of intangible assets, and the estimated tax effect of these items. These charges and adjustments may be nonrecurring in nature but are a result of periodic or non-core operating activities of the Company. The Company describes these non-GAAP financial measures and reconciles them to the most directly comparable GAAP measures in the tables and notes attached to this press release.
The Company's management believes that these non-GAAP financial measures provide an additional and useful way of viewing aspects of our performance that, when viewed in conjunction with our GAAP results, provide a more comprehensive understanding of the various factors and trends affecting our ongoing financial performance and operating results than GAAP measures alone. Management also uses these non-GAAP measures for strategic and business decision-making, internal budgeting, forecasting, and resource allocation processes and believes that investors should have access to similar data when making their investment decisions.
In addition, the Company uses Adjusted EBITDA in calculating the annual excess cash flow debt payment. These non-GAAP measures are included solely for informational and comparative purposes and are not meant as a substitute for GAAP and should be considered together with the consolidated financial information located in the tables attached to this press release.
About Lattice Semiconductor Corporation:
Lattice Semiconductor (NASDAQ: LSCC) is a leader in smart connectivity solutions at the network edge, where the “things” of IoT live. Our low power FPGA, 60 GHz millimeter wave, video ASSP and IP products deliver edge intelligence, edge connectivity, and control solutions to the consumer, communications, industrial, compute, and automotive markets. Our unwavering commitment to our global customers enables them to accelerate their innovation, creating an ever better and more connected world.
For more information about Lattice please visit www.latticesemi.com. You can also follow us via LinkedIn, Twitter, Facebook, YouTube, WeChat, Weibo or Youku.
# # #
Lattice Semiconductor Corporation, Lattice (& design), L (& design), iCE40 and MachXO3L, and specific product designations are either registered trademarks or trademarks of Lattice Semiconductor Corporation or its subsidiaries in the United States and/or other countries.
GENERAL NOTICE: Other product names used in this publication are for identification purposes only and may be trademarks of their respective holders.
4
Lattice Semiconductor Corporation
Consolidated Statements of Operations
(in thousands, except per share data)
(unaudited)
Three Months Ended | ||||||||||||
March 31, 2018 | December 30, 2017 | April 1, 2017 | ||||||||||
Revenue | $ | 98,623 | $ | 95,266 | $ | 104,587 | ||||||
Costs and expenses: | ||||||||||||
Cost of sales | 42,102 | 44,050 | 43,755 | |||||||||
Research and development | 22,941 | 23,500 | 27,389 | |||||||||
Selling, general, and administrative | 27,043 | 23,585 | 23,905 | |||||||||
Amortization of acquired intangible assets | 5,636 | 5,563 | 8,514 | |||||||||
Restructuring | 1,029 | 2,483 | 66 | |||||||||
Acquisition related charges | 667 | 573 | 1,660 | |||||||||
Impairment of acquired intangible assets | — | (3,767 | ) | — | ||||||||
99,418 | 95,987 | 105,289 | ||||||||||
Loss from operations | (795 | ) | (721 | ) | (702 | ) | ||||||
Interest expense | (5,114 | ) | (4,695 | ) | (5,568 | ) | ||||||
Other income (expense), net | 554 | (1,182 | ) | (487 | ) | |||||||
Loss before income taxes | (5,355 | ) | (6,598 | ) | (6,757 | ) | ||||||
Income tax expense | 597 | 615 | 518 | |||||||||
Net loss | $ | (5,952 | ) | $ | (7,213 | ) | $ | (7,275 | ) | |||
Net loss per share, basic and diluted | $ | (0.05 | ) | $ | (0.06 | ) | $ | (0.06 | ) | |||
Shares used in per share calculations, basic and diluted | 124,076 | 123,541 | 121,800 | |||||||||
5
Lattice Semiconductor Corporation
Consolidated Balance Sheets
(in thousands)
(unaudited)
March 31, 2018 | December 30, 2017 | |||||||
Assets | ||||||||
Current assets: | ||||||||
Cash, cash equivalents and short-term marketable securities | $ | 111,470 | $ | 111,797 | ||||
Accounts receivable, net | 65,779 | 55,104 | ||||||
Inventories | 77,917 | 79,903 | ||||||
Other current assets | 25,405 | 16,567 | ||||||
Total current assets | 280,571 | 263,371 | ||||||
Property and equipment, net | 37,674 | 40,423 | ||||||
Intangible assets, net | 45,595 | 51,308 | ||||||
Goodwill | 267,514 | 267,514 | ||||||
Deferred income taxes | 200 | 198 | ||||||
Other long-term assets | 13,279 | 13,147 | ||||||
$ | 644,833 | $ | 635,961 | |||||
Liabilities and Stockholders' Equity | ||||||||
Current liabilities: | ||||||||
Accounts payable and other accrued liabilities | $ | 64,249 | $ | 64,821 | ||||
Current portion of long-term debt | 1,813 | 1,508 | ||||||
Deferred income and allowances on sales to distributors and deferred license revenue | — | 17,318 | ||||||
Total current liabilities | 66,062 | 83,647 | ||||||
Long-term debt | 298,995 | 299,667 | ||||||
Other long-term liabilities | 34,104 | 34,954 | ||||||
Total liabilities | 399,161 | 418,268 | ||||||
Stockholders' equity | 245,672 | 217,693 | ||||||
$ | 644,833 | $ | 635,961 | |||||
6
Lattice Semiconductor Corporation
Consolidated Statements of Cash Flows
(in thousands)
(unaudited)
Three Months Ended | |||||||
March 31, 2018 | April 1, 2017 | ||||||
Cash flows from operating activities: | |||||||
Net loss | $ | (5,952 | ) | $ | (7,275 | ) | |
Adjustments to reconcile net loss to net cash provided by operating activities: | |||||||
Depreciation and amortization | 12,356 | 15,296 | |||||
Amortization of debt issuance costs and discount | 507 | 933 | |||||
(Gain) loss on sale or maturity of marketable securities | (1 | ) | 170 | ||||
Loss (gain) on forward contracts | 99 | (78 | ) | ||||
Stock-based compensation expense | 4,800 | 3,843 | |||||
Gain on disposal of fixed assets | (58 | ) | — | ||||
Impairment of cost-method investment | — | 339 | |||||
Changes in assets and liabilities: | |||||||
Accounts receivable, net | (8,867 | ) | 33,563 | ||||
Inventories | 2,356 | 1,393 | |||||
Prepaid expenses and other assets | (3,253 | ) | 1,137 | ||||
Accounts payable and accrued expenses (includes restructuring) | 1,567 | (35,029 | ) | ||||
Accrued payroll obligations | (1,441 | ) | (1,706 | ) | |||
Income taxes payable | 413 | (1,765 | ) | ||||
Deferred income and allowances on sales to distributors | — | (2,720 | ) | ||||
Deferred licensing and services revenue | (68 | ) | (436 | ) | |||
Net cash provided by operating activities | 2,458 | 7,665 | |||||
Cash flows from investing activities: | |||||||
Proceeds from sales of and maturities of short-term marketable securities | 2,500 | 5,700 | |||||
Purchases of marketable securities | (9,603 | ) | (7,420 | ) | |||
Capital expenditures | (1,804 | ) | (3,374 | ) | |||
Cash paid for software licenses | (1,837 | ) | (1,617 | ) | |||
Net cash used in investing activities | (10,744 | ) | (6,711 | ) | |||
Cash flows from financing activities: | |||||||
Restricted stock unit withholdings | (459 | ) | (693 | ) | |||
Proceeds from issuance of common stock | 1,608 | 1,144 | |||||
Repayment of debt | (875 | ) | (10,780 | ) | |||
Net cash provided by (used in) financing activities | 274 | (10,329 | ) | ||||
Effect of exchange rate change on cash | 589 | 274 | |||||
Net decrease in cash and cash equivalents | (7,423 | ) | (9,101 | ) | |||
Beginning cash and cash equivalents | 106,815 | 106,552 | |||||
Ending cash and cash equivalents | $ | 99,392 | $ | 97,451 | |||
Supplemental cash flow information: | |||||||
Change in unrealized loss related to marketable securities, net of tax, included in Accumulated other comprehensive loss | $ | 7 | $ | 43 | |||
Income taxes paid, net of refunds | $ | 40 | $ | 222 | |||
Interest paid | $ | 4,420 | $ | 5,025 | |||
Accrued purchases of plant and equipment | $ | 232 | $ | 1,297 | |||
7
Lattice Semiconductor Corporation
- Supplemental Historical Financial Information -
(unaudited)
Three Months Ended | ||||||||
March 31, 2018 | December 30, 2017 | April 1, 2017 | ||||||
Operations and Cash Flow Information | ||||||||
Percent of Revenue | ||||||||
Gross Margin | 57.3 | % | 53.8 | % | 58.2 | % | ||
R&D Expense | 23.3 | % | 24.7 | % | 26.2 | % | ||
SG&A Expense | 27.4 | % | 24.8 | % | 22.9 | % | ||
Depreciation and amortization (in thousands) | 12,356 | 12,270 | 15,296 | |||||
Stock-based compensation expense (in thousands) | 4,800 | 3,257 | 3,843 | |||||
Restructuring and severance related charges (in thousands) | 1,029 | 2,483 | 66 | |||||
Net cash provided by operating activities (thousands) | 2,458 | 2,768 | 7,665 | |||||
Capital expenditures (in thousands) | 1,804 | 530 | 3,374 | |||||
Repayment of debt (in thousands) | 875 | 1,750 | 10,780 | |||||
Interest paid (in thousands) | 4,420 | 4,270 | 5,025 | |||||
Taxes paid (cash, in thousands) | 40 | 79 | 222 | |||||
Balance Sheet Information | ||||||||
Current Ratio | 4.2 | 3.1 | 2.6 | |||||
A/R Days Revenue Outstanding | 61 | 53 | 57 | |||||
Inventory Months | 5.6 | 5.4 | 5.3 | |||||
Revenue% (by Geography) | ||||||||
Asia | 73 | % | 74 | % | 70 | % | ||
Europe (incl. Africa) | 12 | % | 13 | % | 11 | % | ||
Americas | 15 | % | 13 | % | 19 | % | ||
Revenue% (by End Market) | ||||||||
Communications and Computing | 28 | % | 30 | % | 29 | % | ||
Mobile and Consumer | 27 | % | 27 | % | 30 | % | ||
Industrial and Automotive | 41 | % | 41 | % | 30 | % | ||
Licensing and Services | 4 | % | 2 | % | 11 | % | ||
Revenue% (by Channel) * | ||||||||
Distribution | 87 | % | 83 | % | 71 | % | ||
Direct | 13 | % | 17 | % | 29 | % | ||
* | During the first quarter of 2018, we updated our channel categories to group all forms of distribution into a single channel. Prior periods have been reclassified to match current period presentation. |
8
Lattice Semiconductor Corporation
- Reconciliation of U.S. GAAP to Non-GAAP Financial Measures -
(in thousands, except per share data)
(unaudited)
Three Months Ended | ||||||||||||
March 31, 2018 | December 30, 2017 | April 1, 2017 | ||||||||||
Gross Margin Reconciliation | ||||||||||||
GAAP Gross margin | $ | 56,521 | $ | 51,216 | $ | 60,832 | ||||||
Stock-based compensation - gross margin | 237 | 226 | 228 | |||||||||
Non-GAAP Gross margin | $ | 56,758 | $ | 51,442 | $ | 61,060 | ||||||
Gross Margin % Reconciliation | ||||||||||||
GAAP Gross margin % | 57.3 | % | 53.8 | % | 58.2 | % | ||||||
Cumulative effect of non-GAAP Gross Margin adjustments | 0.3 | % | 0.2 | % | 0.2 | % | ||||||
Non-GAAP Gross margin % | 57.6 | % | 54.0 | % | 58.4 | % | ||||||
Operating Expenses Reconciliation | ||||||||||||
GAAP Operating expenses | $ | 57,316 | $ | 51,937 | $ | 61,534 | ||||||
Amortization of acquired intangible assets | (5,636 | ) | (5,563 | ) | (8,514 | ) | ||||||
Restructuring charges | (1,029 | ) | (2,483 | ) | (66 | ) | ||||||
Acquisition related charges (1) | (667 | ) | (573 | ) | (1,660 | ) | ||||||
Impairment of acquired intangible assets | — | 3,767 | — | |||||||||
Stock-based compensation - operations | (4,563 | ) | (3,031 | ) | (3,615 | ) | ||||||
Non-GAAP Operating expenses | $ | 45,421 | $ | 44,054 | $ | 47,679 | ||||||
(Loss) Income from Operations Reconciliation | ||||||||||||
GAAP Loss from operations | $ | (795 | ) | $ | (721 | ) | $ | (702 | ) | |||
Stock-based compensation - gross margin | 237 | 226 | 228 | |||||||||
Amortization of acquired intangible assets | 5,636 | 5,563 | 8,514 | |||||||||
Restructuring charges | 1,029 | 2,483 | 66 | |||||||||
Acquisition related charges (1) | 667 | 573 | 1,660 | |||||||||
Impairment of acquired intangible assets | — | (3,767 | ) | — | ||||||||
Stock-based compensation - operations | 4,563 | 3,031 | 3,615 | |||||||||
Non-GAAP Income from operations | $ | 11,337 | $ | 7,388 | $ | 13,381 | ||||||
(Loss) Income from Operations % Reconciliation | ||||||||||||
GAAP Loss from operations % | (0.8 | )% | (0.8 | )% | (0.7 | )% | ||||||
Cumulative effect of non-GAAP Gross Margin and Operating adjustments | 12.3 | % | 8.6 | % | 13.5 | % | ||||||
Non-GAAP Income from operations % | 11.5 | % | 7.8 | % | 12.8 | % | ||||||
(1) Legal fees and outside services that were related to our proposed acquisition by Canyon Bridge Acquisition Company, Inc. | ||||||||||||
9
Lattice Semiconductor Corporation | ||||||||||||
- Reconciliation of U.S. GAAP to Non-GAAP Financial Measures - | ||||||||||||
(in thousands, except per share data) | ||||||||||||
(unaudited) | ||||||||||||
Three Months Ended | ||||||||||||
March 31, 2018 | December 30, 2017 | April 1, 2017 | ||||||||||
Income Tax Expense Reconciliation | ||||||||||||
GAAP Income tax expense | $ | 597 | $ | 615 | $ | 518 | ||||||
Estimated tax effect of non-GAAP adjustments (2) | 62 | (142 | ) | (303 | ) | |||||||
Non-GAAP Income tax expense | $ | 659 | $ | 473 | $ | 215 | ||||||
Net (Loss) Income Reconciliation | ||||||||||||
GAAP Net loss | $ | (5,952 | ) | $ | (7,213 | ) | $ | (7,275 | ) | |||
Stock-based compensation - gross margin | 237 | 226 | 228 | |||||||||
Amortization of acquired intangible assets | 5,636 | 5,563 | 8,514 | |||||||||
Restructuring charges | 1,029 | 2,483 | 66 | |||||||||
Acquisition related charges (1) | 667 | 573 | 1,660 | |||||||||
Impairment of acquired intangible assets | — | (3,767 | ) | — | ||||||||
Stock-based compensation - operations | 4,563 | 3,031 | 3,615 | |||||||||
Estimated tax effect of non-GAAP adjustments (2) | (62 | ) | 142 | 303 | ||||||||
Non-GAAP Net income | $ | 6,118 | $ | 1,038 | $ | 7,111 | ||||||
Net (Loss) Income Per Share Reconciliation | ||||||||||||
GAAP Net loss per share - basic and diluted | $ | (0.05 | ) | $ | (0.06 | ) | $ | (0.06 | ) | |||
Cumulative effect of Non-GAAP adjustments | 0.10 | 0.07 | 0.12 | |||||||||
Non-GAAP Net income per share - basic and diluted | $ | 0.05 | $ | 0.01 | $ | 0.06 | ||||||
Shares used in per share calculations: | ||||||||||||
Basic | 124,076 | 123,541 | 121,800 | |||||||||
Diluted - GAAP (3) | 124,076 | 123,541 | 121,800 | |||||||||
Diluted - Non-GAAP (3) | 125,144 | 124,370 | 124,343 | |||||||||
(1) Legal fees and outside services that were related to our proposed acquisition by Canyon Bridge Acquisition Company, Inc. | ||||||||||||
(2) We calculate non-GAAP tax expense by applying our tax provision model to year-to-date and projected income after adjusting | ||||||||||||
for non-GAAP items. The difference between calculated values for GAAP and non-GAAP tax expense has been included as | ||||||||||||
the “Estimated tax effect of non-GAAP adjustments.” | ||||||||||||
(3) Diluted shares are calculated using the GAAP treasury stock method. In a loss position, diluted shares equal basic shares. | ||||||||||||
10
Lattice Semiconductor Corporation | ||||||||||||||||
- Reconciliation of U.S. GAAP to Non-GAAP Financial Measures - | ||||||||||||||||
(in thousands, except per share data) | ||||||||||||||||
(unaudited) | ||||||||||||||||
Three Months Ended | ||||||||||||||||
June 30, 2018 | ||||||||||||||||
Business Outlook - Second Quarter 2018 | Low -2% | Midpoint | High +2% | |||||||||||||
GAAP Operating expenses | $ | 50,500 | $ | 51,500 | $ | 52,500 | ||||||||||
Cumulative effect of Non-GAAP Operating expense adjustments (4) | (7,400 | ) | (7,500 | ) | (7,600 | ) | ||||||||||
Non-GAAP Operating expenses | $ | 43,100 | $ | 44,000 | $ | 44,900 | ||||||||||
(4) Includes estimated Amortization of acquired intangible assets and Stock-based compensation included in Operating Expenses |
11

