Registration Nos. 033-29697/811-5833
UNITED STATES
SECURITIES AND EXCHANGE COMMISSION
WASHINGTON, DC 20549
FORM N-1A
REGISTRATION STATEMENT UNDER THE SECURITIES ACT OF 1933 /X/
Post-Effective Amendment No. 65 /X/
and/or
REGISTRATION STATEMENT UNDER THE INVESTMENT COMPANY ACT OF 1940 /X/
Amendment No. 61 /X/
T. ROWE PRICE INSTITUTIONAL INTERNATIONAL FUNDS, INC.
Exact Name of Registrant as Specified in Charter
100 East Pratt Street, Baltimore, Maryland 21202
Address of Principal Executive
Offices
410-345-2000
Registrant’s
Telephone Number, Including Area Code
David Oestreicher
100 East Pratt Street, Baltimore, Maryland
21202
Name and Address of Agent for Service
Approximate Date of Proposed Public Offering May 1, 2015
It is proposed that this filing will become effective (check appropriate box):
// Immediately upon filing pursuant to paragraph (b)
/X / On May 1, 2015 pursuant to paragraph (b)
// 60 days after filing pursuant to paragraph (a)(1)
// On (date) pursuant to paragraph (a)(1)
// 75 days after filing pursuant to paragraph (a)(2)
// On (date) pursuant to paragraph (a)(2) of Rule 485
If appropriate, check the following box:
// This post-effective amendment designates a new effective date for a previously filed post-effective amendment.
| |
PROSPECTUS | T. Rowe Price |
TREBX RPIIX | Institutional Emerging Markets Bond Fund Institutional International Bond Fund |
May 1, 2015 | Two international bond funds seeking high income and capital appreciation through investments in foreign fixed income securities. The funds are only available to institutional investors. |
The Securities and Exchange Commission (SEC) has not approved or disapproved these securities or passed upon the adequacy of this prospectus. Any representation to the contrary is a criminal offense. | |
| |


Table of Contents
SUMMARY
T. Rowe Price Institutional Emerging Markets Bond Fund
The fund seeks to provide high income and capital appreciation.
Fees and Expenses
This table describes the fees and expenses that you may pay if you buy and hold shares of the fund.
Fees and Expenses of the Fund
Shareholder fees (fees paid directly from your investment) | |
Redemption fee (as a percentage of amount redeemed on shares held for 90 days or less) | 2.00% |
Annual
fund operating expenses | |
Management fees | 0.70% |
Other expenses | 0.00% |
Total annual fund operating expenses | 0.70% |
Example This example is intended to help you compare the cost of investing in the fund with the cost of investing in other mutual funds. The example assumes that you invest $10,000 in the fund for the time periods indicated and then redeem all of your shares at the end of those periods. The example also assumes that your investment has a 5% return each year and that the fund’s operating expenses remain the same. Although your actual costs may be higher or lower, based on these assumptions your costs would be:
1 year | 3 years | 5 years | 10 years |
$72 | $224 | $390 | $871 |
Portfolio Turnover The fund pays transaction costs, such as commissions, when it buys and sells securities (or “turns over” its portfolio). A higher portfolio turnover rate may indicate higher transaction costs and may result in higher taxes when fund shares are held in a taxable account. These costs, which are not reflected in annual fund operating expenses or in the example, affect the fund’s performance. During the most recent fiscal year, the fund’s portfolio turnover rate was 53.5% of the average value of its portfolio.
Investments, Risks, and Performance
Principal Investment Strategies The fund will normally invest at least 80% (and potentially all) of its net assets (including any borrowings for investment purposes) in debt securities of emerging market governments or companies located in emerging
T. Rowe Price | 2 |
market countries. Fund holdings may be denominated in U.S. dollars or non-U.S. dollar currencies, including emerging market currencies. The extent, if any, to which the fund attempts to cushion the impact of foreign currency fluctuations on the dollar depends on market conditions. Fund holdings may include the lowest-rated bonds, including those in default, and there are no overall limits on the fund’s investments that are rated below investment-grade (BB or lower, or an equivalent rating), also known as “junk” bonds.
Although we expect to maintain an intermediate- to long-term weighted average maturity for the fund, there are no maturity restrictions on the overall portfolio or on individual securities. Security selection relies heavily on research, which analyzes political and economic trends as well as creditworthiness. The fund allocates investments among a variety of emerging markets (1) in order to establish a diverse portfolio; (2) based on the relative value of opportunities and associated risks within one country versus others; and (3) with a view to the liquidity of each particular market. The fund tends to favor bonds it expects will be upgraded. The fund sells holdings for a variety of reasons, such as to adjust its average maturity or credit quality, to shift assets into and out of higher-yielding securities, or to alter geographic or currency exposure.
The fund is “nondiversified,” meaning it may invest a greater portion of its assets in fewer issuers than is permissible for a “diversified” fund.
While most assets will be invested in bonds, the fund may enter into forward currency exchange contracts in keeping with the fund’s objectives. Forward currency exchange contracts would primarily be used to help protect the fund’s holdings from unfavorable changes in foreign currency exchange rates, although other currency hedging techniques may be used from time to time.
Principal Risks As with any mutual fund, there is no guarantee that the fund will achieve its objective. The fund’s share price fluctuates, which means you could lose money by investing in the fund. The principal risks of investing in this fund are summarized as follows:
Active management risk The fund is subject to the risk that the investment adviser’s judgments about the attractiveness, value, or potential appreciation of the fund’s investments may prove to be incorrect. If the securities selected and strategies employed by the fund fail to produce the intended results, the fund could underperform other funds with similar objectives and investment strategies.
Fixed income markets risk Economic and other market developments can adversely affect fixed income securities markets. At times, participants in these markets may develop concerns about the ability of certain issuers of debt securities to make timely principal and interest payments, or they may develop concerns about the ability of financial institutions that make markets in certain debt securities to facilitate an orderly market. Those concerns could cause increased volatility and reduced liquidity in particular securities or in the overall fixed income markets and the related
Summary | 3 |
derivatives markets. A lack of liquidity or other adverse credit market conditions may hamper the fund’s ability to sell the debt securities in which it invests or to find and purchase suitable debt instruments.
International investing risk Investing in the securities of non-U.S. issuers involves special risks not typically associated with investing in U.S. issuers. International securities tend to be more volatile and less liquid than investments in U.S. securities and may lose value because of adverse political, social, or economic developments overseas, or due to changes in the exchange rates between foreign currencies and the U.S. dollar. In addition, international investments are subject to settlement practices and regulatory and financial reporting standards that differ from those of the U.S.
Emerging markets risk The risks of international investing are heightened for securities of issuers in emerging market countries. Emerging market countries tend to have economic structures that are less diverse and mature, and political systems that are less stable, than those of developed countries. In addition to all of the risks of investing in international developed markets, emerging markets are more susceptible to governmental interference, local taxes being imposed on international investments, restrictions on gaining access to sales proceeds, and less liquid and less efficient trading markets.
Currency risk Because the fund may invest in securities issued in foreign currencies, the fund is subject to the risk that it could experience losses based solely on the weakness of foreign currencies versus the U.S. dollar and changes in the exchange rates between such currencies and the U.S. dollar. Any attempts at currency hedging may not be successful and could cause the fund to lose money.
Credit risk This is the risk that an issuer of a debt security could suffer an adverse change in financial condition that results in a payment default, security downgrade, or inability to meet a financial obligation. The risk of default is much greater for emerging market bonds and securities rated as below investment-grade (“junk” bonds). The fund is exposed to greater credit risk than other bond funds because companies in emerging markets are usually not as strong financially and are more susceptible to economic downturns. Junk bonds should be considered speculative as they carry greater risks of default and erratic price swings due to real or perceived changes in the credit quality of the issuer.
Interest rate risk This risk refers to the chance that interest rates will increase, causing a decline in bond prices (bond prices and interest rates usually move in opposite directions). Generally, securities with longer maturities and funds with longer weighted average maturities carry greater interest rate risk.
Liquidity risk This is the risk that the fund may not be able to sell a holding in a timely manner at a desired price. Reduced liquidity in the bond markets can result from a number of events, such as significant trading activity, reductions in bond inventory, and rapid or unexpected changes in interest rates. Less liquid markets
T. Rowe Price | 4 |
could lead to greater price volatility and limit the fund’s ability to sell a holding at a suitable price.
Nondiversification risk As a nondiversified fund, the fund has the ability to invest a larger percentage of its assets in the securities of a smaller number of issuers than a diversified fund. As a result, poor performance by a single issuer could adversely affect fund performance more than if the fund were invested in a larger number of issuers. The fund’s share price can be expected to fluctuate more than that of a comparable diversified fund.
Derivatives risk To the extent the fund uses forward currency exchange contracts, it is exposed to greater volatility and losses in comparison to investing directly in foreign bonds. Forward currency exchange contracts are also subject to the risks that anticipated currency movements will not be accurately predicted, a counterparty will fail to perform in accordance with the terms of the agreement, and the chance that potential government regulation could negatively affect the fund’s investments in such instruments.
Performance The bar chart showing calendar year returns and the average annual total returns table indicate risk by illustrating how much returns can differ from one year to the next and how fund performance compares with that of a comparable market index. The fund’s past performance (before and after taxes) is not necessarily an indication of future performance.
The fund can also experience short-term performance swings, as shown by the best and worst calendar quarter returns during the years depicted.

In addition, the average annual total returns table shows hypothetical after-tax returns to suggest how taxes paid by a shareholder may influence returns. After-tax
Summary | 5 |
returns are calculated using the historical highest individual federal marginal income tax rates and do not reflect the impact of state and local taxes. Actual after-tax returns depend on an investor’s tax situation and may differ from those shown. After-tax returns shown are not relevant to investors who hold their fund shares through tax-deferred arrangements, such as a 401(k) account or individual retirement account. In some cases, the figure shown under “returns after taxes on distributions and sale of fund shares” may be higher than the figure shown under “returns before taxes” because the calculations assume the investor received a tax deduction for any loss incurred on the sale of shares.
Average Annual Total Returns | |||||||||||
|
|
| Periods ended |
| |||||||
| December 31, 2014 |
| |||||||||
| Since inception |
| |||||||||
| 1 Year | 5 Years | (11/30/06) |
| |||||||
| Institutional Emerging Markets Bond Fund |
| |||||||||
| Returns before taxes | 4.55 | % | 6.63 | % | 6.36 | % | ||||
| Returns after taxes on distributions | 2.00 |
|
| 3.90 |
|
| 3.61 |
|
| |
| Returns after taxes on distributions |
|
|
|
|
|
|
|
|
| |
| and sale of fund shares | 2.65 |
|
| 4.25 |
|
| 3.94 |
|
| |
| J.P. Morgan Emerging Markets Bond Index Global Diversified (reflects no deduction for fees, expenses, or taxes) | 7.43 |
|
| 7.57 |
|
| 7.22 |
|
| |
Updated performance information is available through troweprice.com or may be obtained by calling 1-800-638-8790.
Management
Investment Adviser T. Rowe Price Associates, Inc. (T. Rowe Price)
Portfolio Manager | Title | Managed Fund Since | Joined Investment |
Michael J. Conelius | Chairman of Investment Advisory Committee | 2006 | 1988 |
Purchase and Sale of Fund Shares
The fund generally requires a $1,000,000 minimum initial investment. There is no minimum for subsequent purchases. If you hold shares through a financial intermediary, the intermediary may impose different investment minimums.
You may purchase, redeem, or exchange shares of the fund on any day the New York Stock Exchange is open for business by calling 1-800-638-8790 or by written request. If you hold shares through a financial intermediary, you must purchase, redeem, and exchange shares through your intermediary.
T. Rowe Price | 6 |
Tax Information
The fund declares dividends daily and pays them on the first business day of each month. Any capital gains are declared and paid annually, usually in December. Redemptions or exchanges of fund shares and distributions by the fund, whether or not you reinvest these amounts in additional fund shares, may be taxed as ordinary income or capital gains unless you invest through a tax-deferred account (although you may be taxed upon withdrawal from such account).
SUMMARY
T. Rowe Price Institutional International Bond Fund
The fund seeks to provide current income and capital appreciation.
Fees and Expenses
This table describes the fees and expenses that you may pay if you buy and hold shares of the fund.
Fees and Expenses of the Fund
Shareholder fees (fees paid directly from your investment) | |
Redemption fee (as a percentage of amount redeemed on shares held for 90 days or less) | 2.00% |
Annual
fund operating expenses | |
Management fees | 0.55% |
Other expenses | 0.00% |
Total annual fund operating expenses | 0.55% |
Example This example is intended to help you compare the cost of investing in the fund with the cost of investing in other mutual funds. The example assumes that you invest $10,000 in the fund for the time periods indicated and then redeem all of your shares at the end of those periods. The example also assumes that your investment has a 5% return each year and that the fund’s operating expenses remain the same. Although your actual costs may be higher or lower, based on these assumptions your costs would be:
1 year | 3 years | 5 years | 10 years |
$56 | $176 | $307 | $689 |
Portfolio Turnover The fund pays transaction costs, such as commissions, when it buys and sells securities (or “turns over” its portfolio). A higher portfolio turnover rate may indicate higher transaction costs and may result in higher taxes when fund shares are held in a taxable account. These costs, which are not reflected in annual fund operating expenses or in the example, affect the fund’s performance. During the most recent fiscal year, the fund’s portfolio turnover rate was 90.4% of the average value of its portfolio.
Investments, Risks, and Performance
Principal Investment Strategies Normally, the fund will invest at least 80% of its net assets (including any borrowings for investment purposes) in foreign bonds and 65% of its net assets in non-U.S. dollar-denominated foreign bonds that are rated
T. Rowe Price | 8 |
investment-grade (i.e., BBB- or equivalent, or better), as determined by at least one major credit rating agency or, if unrated, deemed to be of comparable quality by T. Rowe Price. If a bond is split-rated (i.e., assigned different ratings by different credit rating agencies), the higher rating will be used. The fund may invest up to 25% of its total assets in “junk” bonds that have received a below investment-grade rating (i.e., BB or equivalent, or lower) from each of the rating agencies that has assigned a rating to the bond (or, if unrated, deemed to be below investment-grade quality by T. Rowe Price), including those in default or with the lowest rating. There is no limit on the fund’s investments in investment-grade bonds of emerging markets. The fund may use credit default swaps to buy or sell credit protection on individual bond issuers or sectors of the bond markets. If the fund buys protection, it effectively takes a short position, and if the fund sells protection, it effectively takes a long position, with respect to the credit of the company or sector.
Although the fund expects to maintain an intermediate- to long-term weighted average maturity (between 5 to 15 years) for the fund, there are no maturity restrictions on the overall portfolio or on individual securities. Through the use of futures contracts and interest rate swaps, the fund may either extend or shorten the overall maturity of the fund and take long or short positions in particular countries or bond markets. A short position in a bond market means that the fund, for example, could sell interest rate futures with respect to bonds of a particular market and the value of the futures contract would exceed the value of the bonds held by the fund (or the fund could sell futures with respect to a particular bond market without owning any bonds in that market).
The fund normally purchases bonds issued in foreign currencies. The fund’s currency positions will vary with its outlook on the strength or weakness of the U.S. dollar compared to foreign currencies and the relative value of various foreign currencies to one another. Through the use of forward currency exchange contracts and other currency derivatives, such as swaps, options and futures, the fund has wide flexibility to purchase and sell currencies independently of whether the fund owns bonds in those currencies and to engage in currency hedging transactions. Currency hedging is permitted and the fund is likely to be heavily exposed to foreign currencies. The fund may take a short position in a currency, which means that the fund could sell a currency in excess of its assets denominated in that currency (or the fund might sell a currency even if it doesn’t own any assets denominated in the currency).
The fund is “nondiversified,” meaning it may invest a greater portion of its assets in fewer issuers than is permissible for a “diversified” fund.
Investment decisions are based on fundamental market factors, such as yield and credit quality differences among bonds as well as supply and demand trends and currency values. The fund generally invests in securities where the combination of fixed-income returns and currency exchange rates appears attractive or, if the currency trend is unfavorable, where we believe the currency risk can be minimized through hedging. The fund sells holdings for a variety of reasons, such as to adjust
Summary | 9 |
the portfolio’s average maturity or credit quality, to shift assets into and out of higher-yielding securities, or to alter geographic or currency exposure.
Principal Risks As with any mutual fund, there is no guarantee that the fund will achieve its objective. The fund’s share price fluctuates, which means you could lose money by investing in the fund. The principal risks of investing in this fund are summarized as follows:
Active management risk The fund is subject to the risk that the investment adviser’s judgments about the attractiveness, value, or potential appreciation of the fund’s investments may prove to be incorrect. If the securities selected and strategies employed by the fund fail to produce the intended results, the fund could underperform other funds with similar objectives and investment strategies.
Fixed income markets risk Economic and other market developments can adversely affect fixed income securities markets. At times, participants in these markets may develop concerns about the ability of certain issuers of debt securities to make timely principal and interest payments, or they may develop concerns about the ability of financial institutions that make markets in certain debt securities to facilitate an orderly market. Those concerns could cause increased volatility and reduced liquidity in particular securities or in the overall fixed income markets and the related derivatives markets. A lack of liquidity or other adverse credit market conditions may hamper the fund’s ability to sell the debt securities in which it invests or to find and purchase suitable debt instruments.
International investing risk Investing in the securities of non-U.S. issuers involves special risks not typically associated with investing in U.S. issuers. International securities tend to be more volatile and less liquid than investments in U.S. securities and may lose value because of adverse political, social, or economic developments overseas, or due to changes in the exchange rates between foreign currencies and the U.S. dollar. In addition, international investments are subject to settlement practices and regulatory and financial reporting standards that differ from those of the U.S.
Emerging markets risk The risks of international investing are heightened for securities of issuers in emerging market countries. Emerging market countries tend to have economic structures that are less diverse and mature, and political systems that are less stable, than those of developed countries. In addition to all of the risks of investing in international developed markets, emerging markets are more susceptible to governmental interference, local taxes being imposed on international investments, restrictions on gaining access to sales proceeds, and less liquid and less efficient trading markets.
Currency risk Because the fund generally invests in securities issued in foreign currencies, the fund is subject to the risk that it could experience losses based solely on the weakness of foreign currencies versus the U.S. dollar and changes in the exchange rates between such currencies and the U.S. dollar.
T. Rowe Price | 10 |
Hedging risk The fund’s attempts at hedging and taking long and short positions in currencies may not be successful and could cause the fund to lose money or fail to get the benefit of a gain on a hedged position. If expected changes to securities prices, interest rates, currency values and exchange rates, or the creditworthiness of an issuer are not accurately predicted, the fund could be in a worse position than if it had not entered into such transactions.
Credit risk This is the risk that an issuer of a debt security could suffer an adverse change in financial condition that results in a payment default, security downgrade, or inability to meet a financial obligation. The fund’s overall credit risk is increased to the extent the fund invests in emerging markets bonds or bonds rated below investment-grade. Such investments carry a higher risk of default and should be considered speculative.
Interest rate risk This risk refers to the chance that interest rates will increase, causing a decline in bond prices (bond prices and interest rates usually move in opposite directions). Generally, securities with longer maturities and funds with longer weighted average maturities carry greater interest rate risk.
Liquidity risk This is the risk that the fund may not be able to sell a holding in a timely manner at a desired price. Reduced liquidity in the bond markets can result from a number of events, such as significant trading activity, reductions in bond inventory, and rapid or unexpected changes in interest rates. Less liquid markets could lead to greater price volatility and limit the fund’s ability to sell a holding at a suitable price.
Nondiversification risk As a nondiversified fund, the fund has the ability to invest a larger percentage of its assets in the securities of a smaller number of issuers than a diversified fund. As a result, poor performance by a single issuer could adversely affect fund performance more than if the fund were invested in a larger number of issuers. The fund’s share price can be expected to fluctuate more than that of a comparable diversified fund.
Derivatives risk To the extent the fund uses forward currency exchange contracts, swaps, options, or futures, it is exposed to additional volatility in comparison to investing directly in bonds and other debt securities. These instruments can be illiquid and difficult to value, may involve leverage so that small changes produce disproportionate losses for the fund and, if not traded on an exchange, are subject to the risk that a counterparty to the transaction will fail to meet its obligations under the derivatives contract. The fund’s principal use of derivatives involves the risk that anticipated changes in currency values, currency exchange rates, interest rates, or the creditworthiness of an issuer will not be accurately predicted, which could significantly harm the fund’s performance, and the chance that regulatory developments could negatively affect the fund’s investments in such instruments.
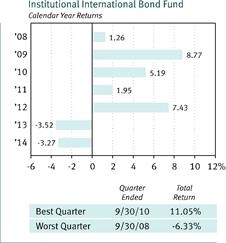
Performance The bar chart showing calendar year returns and the average annual total returns table indicate risk by illustrating how much returns can differ from one
Summary | 11 |
year to the next and how fund performance compares with that of a comparable market index. The fund’s past performance (before and after taxes) is not necessarily an indication of future performance.
The fund can also experience short-term performance swings, as shown by the best and worst calendar quarter returns during the years depicted.
In addition, the average annual total returns table shows hypothetical after-tax returns to suggest how taxes paid by a shareholder may influence returns. After-tax returns are calculated using the historical highest individual federal marginal income tax rates and do not reflect the impact of state and local taxes. Actual after-tax returns depend on an investor’s tax situation and may differ from those shown. After-tax returns shown are not relevant to investors who hold their fund shares through tax-deferred arrangements, such as a 401(k) account or individual retirement account. In some cases, the figure shown under “returns after taxes on distributions and sale of fund shares” may be higher than the figure shown under “returns before taxes” because the calculations assume the investor received a tax deduction for any loss incurred on the sale of shares.
T. Rowe Price | 12 |
Average Annual Total Returns | |||||||||||
|
|
| Periods ended |
| |||||||
| December 31, 2014 |
| |||||||||
| Since inception |
| |||||||||
| 1 Year | 5 Years | (05/31/07) |
| |||||||
| Institutional International Bond Fund |
| |||||||||
| Returns before taxes | -3.27 | % | 1.46 | % | 3.46 | % | ||||
| Returns after taxes on distributions | -3.48 |
|
| 0.28 |
|
| 1.84 |
|
| |
| Returns after taxes on distributions |
|
|
|
|
|
|
|
|
| |
| and sale of fund shares | -1.81 |
|
| 0.75 |
|
| 2.13 |
|
| |
| Barclays Global Aggregate ex USD Bond Index (reflects no deduction for fees, expenses, or taxes) | -3.08 |
|
| 1.38 |
|
| 3.80 |
|
| |
| Lipper International Income Funds Average | 0.89 |
|
| 2.87 |
|
| 4.86 |
|
| |
Updated performance information is available through troweprice.com or may be obtained by calling 1-800-638-8790.
Management
Investment Adviser T. Rowe Price Associates, Inc. (T. Rowe Price)
Investment Sub-adviser T. Rowe Price International Ltd (T. Rowe Price International)
Portfolio Manager | Title | Managed Fund Since | Joined Investment |
Arif Husain | Co-Chairman
of | 2014 | 2013 |
Christopher J. Rothery | Co-Chairman of | 2012 | 1994 |
Purchase and Sale of Fund Shares
The fund generally requires a $1,000,000 minimum initial investment. There is no minimum for subsequent purchases. If you hold shares through a financial intermediary, the intermediary may impose different investment minimums.
You may purchase, redeem, or exchange shares of the fund on any day the New York Stock Exchange is open for business by calling 1-800-638-8790 or by written request. If you hold shares through a financial intermediary, you must purchase, redeem, and exchange shares through your intermediary.
Summary | 13 |
Tax Information
The fund declares dividends daily and pays them on the first business day of each month. Any capital gains are declared and paid annually, usually in December. Redemptions or exchanges of fund shares and distributions by the fund, whether or not you reinvest these amounts in additional fund shares, may be taxed as ordinary income or capital gains unless you invest through a tax-deferred account (although you may be taxed upon withdrawal from such account).
Information About Accounts in T. Rowe Price Funds | 2 | |
As a T. Rowe Price shareholder, you will want to know about the following policies and procedures that apply to all Institutional Funds (other than F Class shares of Institutional Funds) in the T. Rowe Price family of funds.
How and When Shares Are Priced
The share price, also called the “net asset value,” for the funds is calculated at the close of the New York Stock Exchange (normally 4 p.m. ET) each day that the exchange is open for business. To calculate the net asset value, the fund’s assets are valued and totaled; liabilities are subtracted; and the balance, called net assets, is divided by the number of shares outstanding. Market values are used to price portfolio holdings for which market quotations are readily available. Market values generally reflect the prices at which securities actually trade or represent prices that have been adjusted based on evaluations and information provided by the fund’s pricing services. If a market value for a security is not available or normal valuation procedures are deemed to be inappropriate, the fund will make a good faith effort to assign a fair value to the security by taking into account various factors that have been approved by the fund’s Board of Directors. This value may differ from the value the fund receives upon sale of the securities. Amortized cost is used to price securities held by money funds and certain other debt securities held by a fund. Investments in other mutual funds are valued at the closing net asset value per share of the mutual fund on the day of valuation.
Non-U.S. equity securities are valued on the basis of their most recent closing market prices at 4 p.m. ET, except under the circumstances described below. Most foreign markets close before 4 p.m. ET. For example, the most recent closing prices for securities traded in certain Asian markets may be as much as 15 hours old at 4 p.m. ET. If a fund determines that developments between the close of a foreign market and the close of the New York Stock Exchange will, in its judgment, materially affect the value of some or all of the fund’s securities, the fund will adjust the previous closing prices to reflect what it believes to be the fair value of the securities as of 4 p.m. ET. In deciding whether to make these adjustments, the fund reviews a variety of factors, including developments in foreign markets, the performance of U.S. securities markets, and the performance of instruments trading in U.S. markets that represent foreign securities and baskets of foreign securities. The fund may also fair value certain securities or a group of securities in other situations—for example, when a particular foreign market is closed but the fund is open. The fund uses outside pricing services to provide it with closing market prices and information used for adjusting those prices and to value most fixed income
Information About Accounts in T. Rowe Price Funds | 15 |
securities. The fund cannot predict how often it will use closing prices and how often it will adjust those prices. As a means of evaluating its fair value process, the fund routinely compares closing market prices, the next day’s opening prices in the same markets, and adjusted prices. The fund also evaluates a variety of factors when assigning fair values to private placements and other restricted securities. Other mutual funds may adjust the prices of their securities by different amounts or assign different fair values than the fair value that the fund assigns to the same security.
The various ways you can buy, sell, and exchange shares are explained at the end of this prospectus and on the New Account form.
How Your Purchase, Sale, or Exchange Price Is Determined
If your request is received by T. Rowe Price in correct form by the close of the New York Stock Exchange (normally 4 p.m. ET), your transaction will be priced at that business day’s net asset value. If your request is received by T. Rowe Price after the close of the New York Stock Exchange, your transaction will be priced at the next business day’s net asset value.
The funds generally do not accept orders that request a particular day or price for a transaction or any other special conditions.
Fund shares may be purchased through various third-party intermediaries including banks, brokers, and investment advisers. Where authorized by a fund, orders will be priced at the net asset value next computed after receipt by the intermediary. Contact your intermediary for trade deadlines and the applicable policies for purchasing, selling, or exchanging your shares, as well as initial and subsequent investment minimums. The intermediary may charge a fee for its services.
When authorized by the fund, certain financial institutions or retirement plans purchasing fund shares on behalf of customers or plan participants through T. Rowe Price Financial Institution Services or T. Rowe Price Retirement Plan Services may place a purchase order unaccompanied by payment. Payment for these shares must be received by the time designated by the fund (not to exceed the period established for settlement under applicable regulations). If payment is not received by this time, the order may be canceled. The financial institution or retirement plan is responsible for any costs or losses incurred by the fund or T. Rowe Price if payment is delayed or not received.
Note: The time at which transactions and shares are priced and the time until which orders are accepted may be changed in case of an emergency or if the New York Stock Exchange closes at a time other than 4 p.m. ET. In the event of an emergency closing, a fund’s shareholders will receive the next share price calculated by the fund. There may be times when you are unable to contact us by telephone or access your account online due to extreme market activity, the unavailability of the T. Rowe Price website, or other circumstances. Should this occur, your order must still be placed
T. Rowe Price | 16 |
and accepted by T. Rowe Price prior to the time the New York Stock Exchange closes to be priced at that business day’s net asset value.
How You Can Receive the Proceeds From a Sale
When filling out the New Account form, you may wish to give your organization the widest range of options for receiving proceeds from a sale.
If your request is received in correct form by T. Rowe Price on a business day prior to the close of the New York Stock Exchange, proceeds are usually sent on the next business day. Proceeds can be mailed to you by check or sent electronically to your bank account by Automated Clearing House transfer or bank wire. Automated Clearing House is an automated method of initiating payments from, and receiving payments in, your financial institution account. Proceeds sent by Automated Clearing House transfer are usually credited to your account the second business day after the sale. Proceeds sent by bank wire are usually credited to your account the next business day after the sale.
Exception: Under certain circumstances, and when deemed to be in a fund’s best interests, your proceeds may not be sent for up to seven calendar days after we receive your redemption request in good order.
If for some reason we cannot accept your request to sell shares, we will attempt to contact you.
Contingent Redemption Fee
Short-term trading can disrupt a fund’s investment program and create additional costs for long-term shareholders. For these reasons, certain T. Rowe Price funds, listed in the following table, assess a fee on redemptions (including exchanges out of a fund), which reduces the proceeds from such redemptions by the amounts indicated:
T. Rowe Price Institutional Funds With Redemption Fees | ||
Fund | Redemption fee | Holding period |
Institutional Africa & Middle East | 2% | 90 days or less |
Institutional Credit Opportunities | 2% | 90 days or less |
Institutional Emerging Markets Bond | 2% | 90 days or less |
Institutional Emerging Markets Equity | 2% | 90 days or less |
Institutional Floating Rate | 2% | 90 days or less |
Institutional Frontier Markets Equity | 2% | 90 days or less |
Institutional Global Focused Growth Equity | 2% | 90 days or less |
Institutional Global Growth Equity | 2% | 90 days or less |
Institutional Global Value Equity | 2% | 90 days or less |
Institutional High Yield | 2% | 90 days or less |
Institutional International Bond | 2% | 90 days or less |
Information About Accounts in T. Rowe Price Funds | 17 |
T. Rowe Price Institutional Funds With Redemption Fees | ||
Fund | Redemption fee | Holding period |
Institutional International Concentrated Equity | 2% | 90 days or less |
Institutional International Core Equity | 2% | 90 days or less |
Institutional International Growth Equity | 2% | 90 days or less |
Redemption fees are paid to a fund to deter short-term trading, offset costs, and protect the fund’s long-term shareholders. Subject to the exceptions described on the following pages, all persons holding shares of a T. Rowe Price fund that imposes a redemption fee are subject to the fee, whether the person is holding shares directly with a T. Rowe Price fund; through a retirement plan for which T. Rowe Price serves as recordkeeper; or indirectly through an intermediary (such as a broker, bank, or investment adviser), recordkeeper for retirement plan participants, or other third party.
Computation of Holding Period
When an investor sells shares of a fund that assesses a redemption fee, T. Rowe Price will use the “first-in, first-out” method to determine the holding period for the shares sold. Under this method, the date of redemption or exchange will be compared with the earliest purchase date of shares held in the account. A redemption fee will be charged on shares sold on or before the end of the required holding period. The day after the date of your purchase is considered Day 1 for purposes of computing the holding period. For example, if you redeem your shares on or before the 90th day from the date of purchase, you will be assessed the redemption fee. If you purchase shares through an intermediary, consult your intermediary to determine how the holding period will be applied.
Transactions Not Subject to Redemption Fees
The T. Rowe Price funds will not assess a redemption fee with respect to certain transactions. As of the date of this prospectus, the following shares of T. Rowe Price funds will not be subject to redemption fees:
· Shares redeemed through an automated, systematic withdrawal plan;
· Shares redeemed through or used to establish certain rebalancing, asset allocation, wrap, and advisory programs, as well as non-T. Rowe Price fund-of-funds products, if approved in writing by T. Rowe Price;
· Shares purchased through the reinvestment of dividends or capital gain distributions;*
· Shares converted from one share class to another share class of the same fund;*
· Shares redeemed automatically by a fund to pay fund fees or shareholder account fees (e.g., for failure to meet account minimums);
· Shares purchased by rollover or changes of account registration within the same fund;*
· Shares redeemed to return an excess contribution from a retirement account;
T. Rowe Price | 18 |
· Shares of T. Rowe Price funds purchased by another T. Rowe Price fund and shares purchased by discretionary accounts managed by T. Rowe Price or one of its affiliates (please note that other shareholders of the investing T. Rowe Price fund are still subject to the policy);
· Certain transactions in defined benefit and nonqualified plans, subject to prior approval by T. Rowe Price;
· Shares that are redeemed in-kind;
· Shares transferred to T. Rowe Price or a third-party intermediary acting as a service provider when the age of the shares cannot be determined systematically;* and
· Shares redeemed in retirement plans or other products that restrict trading to no more frequently than once per quarter, if approved in writing by T. Rowe Price.
* Subsequent exchanges of these shares into funds that assess redemption fees will subject such shares to the fee.
Redemption Fees on Shares Held in Retirement Plans
If shares are held in a retirement plan, redemption fees generally will be assessed on shares redeemed by exchange only if they were originally purchased by exchange. However, redemption fees may apply to transactions other than exchanges depending on how shares of the plan are held at T. Rowe Price or how the fees are applied by your plan’s recordkeeper. To determine which of your transactions are subject to redemption fees, you should contact T. Rowe Price or your plan recordkeeper.
Omnibus Accounts
If your shares are held through an intermediary in an omnibus account, T. Rowe Price relies on the intermediary to assess the redemption fee on underlying shareholder accounts. T. Rowe Price seeks to identify intermediaries establishing omnibus accounts and to enter into agreements requiring the intermediary to assess the redemption fees. There are no assurances that T. Rowe Price will be successful in identifying all intermediaries or that the intermediaries will properly assess the fees.
Certain intermediaries may not apply the exemptions previously listed to the redemption fee policy; all redemptions by persons trading through such intermediaries may be subject to the fee. Certain intermediaries may exempt transactions not listed from redemption fees, if approved by T. Rowe Price. Persons redeeming shares through an intermediary should check with their respective intermediary to determine which transactions are subject to the fees.
Each fund intends to qualify to be treated each year as a regulated investment company under Subchapter M of the Internal Revenue Code of 1986, as amended. In order to qualify, a fund must satisfy certain income, diversification, and distribution requirements. A regulated investment company is not subject to U.S. federal income tax at the portfolio level on income and gains from investments that are distributed to
Information About Accounts in T. Rowe Price Funds | 19 |
shareholders. However, if a fund were to fail to qualify as a regulated investment company, and was ineligible to or otherwise did not cure such failure, the result would be fund-level taxation and, consequently, a reduction in income available for distribution to the fund’s shareholders.
To the extent possible, all net investment income and realized capital gains are distributed to shareholders.
Dividends and Other Distributions
Dividend and capital gain distributions are reinvested in additional fund shares in your account unless you select another option on your New Account form. Reinvesting distributions results in compounding, which allows you to receive dividends and capital gain distributions on an increasing number of shares.
Distributions not reinvested are paid by check or transmitted to your bank account via Automated Clearing House. If the U.S. Postal Service cannot deliver your check, or if your check remains uncashed for six months, the fund reserves the right to reinvest your distribution check in your account at the net asset value on the day of the reinvestment and to reinvest all subsequent distributions in shares of the fund. Interest will not accrue on amounts represented by uncashed distributions or redemption checks.
The following table provides details on dividend payments:
Dividend Payment Schedule | |
Fund | Dividends |
Bond funds | · Shares normally begin to earn dividends on the business day after payment is received by T. Rowe Price. · Declared daily and paid on the first business day of each month. |
Stock funds | · Must be a shareholder on the dividend record date. · Declared and paid annually, if any, generally in December. |
Bond fund shares will earn dividends through the date of redemption. Shares redeemed on a Friday or prior to a holiday will continue to earn dividends until the next business day. Generally, if you redeem all of your bond fund shares at any time during the month, you will also receive all dividends earned through the date of redemption in the same check. When you redeem only a portion of your bond fund shares, all dividends accrued on those shares will be reinvested, or paid in cash, on the next dividend payment date. The funds do not pay dividends in fractional cents. Any dividend amount earned for a particular day on all shares held that is one-half of one cent or greater (for example, $0.016) will be rounded up to the next whole cent ($0.02), and any amount that is less than one-half of one cent (for example, $0.014) will be rounded down to the nearest whole cent ($0.01). Please note that, if the dividend payable on all shares held is less than one-half of one cent for a particular day, no dividend will be earned for that day.
T. Rowe Price | 20 |
If you purchase and sell your shares through an intermediary, consult your intermediary to determine when your shares begin and stop accruing dividends as the information previously described may vary.
Capital Gain Payments
A capital gain or loss is the difference between the purchase and sale price of a security. If a fund has net capital gains for the year (after subtracting any capital losses), they are usually declared and paid in December to shareholders of record on a specified date that month. If a second distribution is necessary, it is paid the following year.
Tax Information
In most cases, you will be provided information for your tax filing needs no later than mid-February.
If you invest in the fund through a tax-deferred account, such as an individual retirement account, you will not be subject to tax on dividends and distributions from the fund or the sale of fund shares if those amounts remain in the tax-deferred account. You may receive a Form 1099-R or other Internal Revenue Service forms, as applicable, if any portion of the account is distributed to you.
If you invest in the fund through a taxable account, you generally will be subject to tax when:
· You sell fund shares, including an exchange from one fund to another.
· The fund makes dividend or capital gain distributions.
For individual shareholders, a portion of ordinary dividends representing “qualified dividend income” received by the fund may be subject to tax at the lower rates applicable to long-term capital gains rather than ordinary income. You may report it as “qualified dividend income” in computing your taxes, provided you have held the fund shares on which the dividend was paid for more than 60 days during the 121-day period beginning 60 days before the ex-dividend date. Ordinary dividends that do not qualify for this lower rate are generally taxable at the investor’s marginal income tax rate. This includes the portion of ordinary dividends derived from interest, short-term capital gains, distributions from nonqualified foreign corporations, and dividends received by the fund from stocks that were on loan. Little, if any, of the ordinary dividends paid by the bond funds is expected to qualify for this lower rate.
For corporate shareholders, a portion of ordinary dividends may be eligible for the 70% deduction for dividends received by corporations to the extent the fund’s income consists of dividends paid by U.S. corporations. Little, if any, of the ordinary dividends paid by the international stock or bond funds is expected to qualify for this deduction.
Information About Accounts in T. Rowe Price Funds | 21 |
Taxes on Fund Redemptions
When you sell shares in any fund, you may realize a gain or loss. An exchange from one fund to another in a taxable account is also a sale for tax purposes.
We will make available to you Form 1099-B, if applicable, no later than mid-February, indicating the date and amount of each sale you made in the fund during the prior year. This information will also be reported to the Internal Revenue Service. For most new accounts or those opened by exchange in 1984 or later, we will provide you with the gain or loss on the shares you sold during the year based on the average cost single category method. This information is not reported to the Internal Revenue Service. You may calculate the cost basis using other methods acceptable to the Internal Revenue Service, such as specific identification.
For mutual fund shares acquired after 2011, new tax regulations require us to report the cost basis information to most taxable shareholders and the Internal Revenue Service on Form 1099-B using a cost basis method selected by the shareholder or, in the absence of such selected method, our default method if you acquire your shares directly from us. Our default method is average cost. If you acquire your fund shares through an intermediary after 2011, you should check with your intermediary regarding the applicable cost basis method. You should, however, note that any cost basis information reported to you may not always be the same as what you should report on your tax return because the rules applicable to the determination of cost basis on Form 1099-B may be different from the rules applicable to the determination of cost basis for reporting on your tax return. Therefore, you should save your transaction records to make sure the information reported on your tax return is accurate.
To help you maintain accurate records, we will make available to you a confirmation promptly following each transaction you make (except for systematic purchases and systematic redemptions) and a year-end statement detailing all of your transactions in each fund account during the year.
Taxes on Fund Distributions
We will make available to you, as applicable, no later than mid-February, a Form 1099-DIV, or other Internal Revenue Service forms, as required, indicating the tax status of any income dividends, dividends exempt from federal income taxes, and capital gain distributions made to you. This information will be reported to the Internal Revenue Service. Taxable distributions are generally taxable to you in the year in which they are paid. Your bond fund dividends for each calendar year will include dividends accrued up to the first business day of the next calendar year. You will be sent any additional information you need to determine your taxes on fund distributions, such as the portion of your dividends, if any, that may be exempt from state and local income taxes.
The tax treatment of a capital gain distribution is determined by how long the fund held the portfolio securities, not how long you held the shares in the fund. Short-
T. Rowe Price | 22 |
term (one year or less) capital gain distributions are taxable at the same rate as ordinary income, and gains on securities held more than one year are taxed at the lower rates applicable to long-term capital gains. If you realized a loss on the sale or exchange of fund shares that you held six months or less, your short-term capital loss must be reclassified as a long-term capital loss to the extent of any long-term capital gain distributions received during the period you held the shares. For funds investing in foreign securities, distributions resulting from the sale of certain foreign currencies, currency contracts, and the foreign currency portion of gains on debt securities are taxed as ordinary income. Net foreign currency losses may cause monthly or quarterly dividends to be reclassified as returns of capital.
The tax status of certain distributions may be recharacterized on year-end tax forms, such as your Form 1099-DIV. Distributions made by a fund may later be recharacterized for federal income tax purposes—for example, from taxable ordinary income dividends to returns of capital, which are generally nontaxable but reduce your tax basis in the fund’s shares. Recharacterization of distributions may occur for a number of reasons, including the recharacterization of income received from underlying investments, such as REITs, and distributions that exceed taxable income due to losses from foreign currency transactions or other investment transactions. Certain funds, including international bond funds and funds that invest in REITs, are more likely to recharacterize a portion of their distributions as a result of their investments.
If the fund qualifies and elects to pass through nonrefundable foreign income taxes paid to foreign governments during the year, your portion of such taxes will be reported to you as taxable income. However, you may be able to claim an offsetting credit or deduction on your tax return for those amounts. There can be no assurance that a fund will meet the requirements to pass through foreign income taxes paid.
Taxable distributions are subject to tax whether reinvested in additional shares or received in cash.
If a fund holds Build America Bonds or other qualified tax credit bonds and elects to pass through the corresponding interest income and any available tax credits, you will need to report both the interest income and any such tax credits as taxable income. You may be able to claim the tax credits on your federal tax return as an offset to your income tax (including alternative minimum tax) liability, but the tax credits generally are not refundable. There is no assurance, however, that a fund will elect to pass through the income and credits.
Tax Consequences of Hedging
Entering into certain transactions involving options, futures, swaps, and forward currency exchange contracts may result in the application of the mark-to-market and straddle provisions of the Internal Revenue Code. These provisions could result in a fund being required to distribute gains on such transactions even though it did not close the contracts during the year or receive cash to pay such distributions. The fund
Information About Accounts in T. Rowe Price Funds | 23 |
may not be able to reduce its distributions for losses on such transactions to the extent of unrealized gains in offsetting positions.
Tax Consequences of Shareholder Turnover
If the fund’s portfolio transactions result in a net capital loss (i.e., an excess of capital losses over capital gains) for any year, the loss may be carried forward and used to offset future realized capital gains. However, its ability to carry forward such losses will be limited if the fund experiences an “ownership change” within the meaning of the Internal Revenue Code. An ownership change generally results when shareholders owning 5% or more of the fund increase their aggregate holdings by more than 50 percentage points over a three-year period.
Because institutional funds may have only a few large shareholders, an ownership change can occur in the normal course of shareholder purchases and redemptions. The fund undertakes no obligation to avoid or prevent an ownership change. Moreover, because of circumstances beyond the fund’s control, there can be no assurance that the fund will not experience, or has not already experienced, an ownership change. An ownership change can reduce the fund’s ability to offset capital gains with losses, which could increase the amount of taxable gains that could be distributed to shareholders.
Tax Effect of Buying Shares Before an Income Dividend or Capital Gain Distribution
If you buy shares shortly before or on the record date—the date that establishes you as the person to receive the upcoming distribution—you may receive a portion of the money you just invested in the form of a taxable distribution. Therefore, you may wish to find out a fund’s record date before investing. In addition, a fund’s share price may, at any time, reflect undistributed capital gains or income and unrealized appreciation, which may result in future taxable distributions. Such distributions can occur even in a year when the fund has a negative return.
Following these procedures helps assure timely and accurate transactions.
Purchase Conditions
Nonpayment Purchases of a fund may be canceled if payment is not received in a timely manner, and the shareholder may be responsible for any losses or expenses incurred by the fund or its transfer agent. The funds and their agents have the right to reject or cancel any purchase, exchange, or redemption due to nonpayment.
U.S. Dollars All purchases must be paid for in U.S. dollars; checks must be drawn on U.S. banks.
T. Rowe Price | 24 |
Large Sale (Redemption) Conditions Large redemptions can adversely affect a portfolio manager’s ability to implement a fund’s investment strategy by causing the premature sale of securities that would otherwise be held longer. Therefore, the fund reserves the right (without prior notice) to pay all or part of redemption proceeds with securities from the fund’s portfolio rather than in cash (“redemption in-kind”). If this occurs, the securities will be selected by the fund in its absolute discretion, and the redeeming shareholder or account will be responsible for disposing of the securities and bearing any associated costs.
We also request that you give us three business days’ notice for any redemption of $2 million or more.
Excessive and Short-Term Trading Policy
Excessive transactions and short-term trading can be harmful to fund shareholders in various ways, such as disrupting a fund’s portfolio management strategies, increasing a fund’s trading costs, and negatively affecting its performance. Short-term traders in funds that invest in foreign securities may seek to take advantage of developments overseas that could lead to an anticipated difference between the price of the funds’ shares and price movements in foreign markets. While there is no assurance that T. Rowe Price can prevent all excessive and short-term trading, the Boards of Directors/Trustees of the T. Rowe Price funds have adopted the following trading limits that are designed to deter such activity and protect the funds’ shareholders. The funds may revise their trading limits and procedures at any time as the Boards of Directors/Trustees deem necessary or appropriate to better detect short-term trading that may adversely affect the funds, to comply with applicable regulatory requirements, or to impose additional or alternative restrictions.
Subject to certain exceptions, each T. Rowe Price fund restricts a shareholder’s purchases (including through exchanges) into a fund account for a period of 30 calendar days after the shareholder has redeemed or exchanged out of that same fund account (the “30-Day Purchase Block”). The calendar day after the date of redemption is considered Day 1 for purposes of computing the period before another purchase may be made.
General Exceptions As of the date of this prospectus, the following types of transactions generally are not subject to the 30-Day Purchase Block:
· Shares purchased or redeemed in money funds;
· Shares purchased or redeemed through a systematic purchase or withdrawal plan;
· Checkwriting redemptions from bond and money funds;
· Shares purchased through the reinvestment of dividends or capital gain distributions;
· Shares redeemed automatically by a fund to pay fund fees or shareholder account fees;
· Transfers and changes of account registration within the same fund;
· Shares purchased by asset transfer or direct rollover;
Information About Accounts in T. Rowe Price Funds | 25 |
· Shares purchased or redeemed through IRA conversions and recharacterizations;
· Shares redeemed to return an excess contribution from a retirement account;
· Transactions in Section 529 college savings plans;
· Certain transactions in defined benefit and nonqualified plans, subject to prior approval by T. Rowe Price;
· Shares converted from one share class to another share class in the same fund; and
· Shares of T. Rowe Price funds that are purchased by another T. Rowe Price fund, including shares purchased by T. Rowe Price fund-of-funds products, and shares purchased by discretionary accounts managed by T. Rowe Price or one of its affiliates (please note that shareholders of the investing T. Rowe Price fund are still subject to the policy).
Transactions in certain rebalancing, asset allocation, wrap programs, and other advisory programs, as well as non-T. Rowe Price fund-of-funds products, may also be exempt from the 30-Day Purchase Block, subject to prior written approval by T. Rowe Price.
In addition to restricting transactions in accordance with the 30-Day Purchase Block, T. Rowe Price may, in its discretion, reject (or instruct an intermediary to reject) any purchase or exchange into a fund from a person (which includes individuals and entities) whose trading activity could disrupt the management of the fund or dilute the value of the fund’s shares, including trading by persons acting collectively (e.g., following the advice of a newsletter). Such persons may be barred, without prior notice, from further purchases of T. Rowe Price funds for a period longer than 30 calendar days or permanently.
Intermediary Accounts If you invest in T. Rowe Price funds through an intermediary, you should review the intermediary’s materials carefully or consult with the intermediary directly to determine the trading policy that will apply to your trades in the funds as well as any other rules or conditions on transactions that may apply. If T. Rowe Price is unable to identify a transaction placed through an intermediary as exempt from the excessive trading policy, the 30-Day Purchase Block may apply.
Intermediaries may maintain their underlying accounts directly with the fund, although they often establish an omnibus account (one account with the fund that represents multiple underlying shareholder accounts) on behalf of their customers. When intermediaries establish omnibus accounts in the T. Rowe Price funds, T. Rowe Price is not able to monitor the trading activity of the underlying shareholders. However, T. Rowe Price monitors aggregate trading activity at the intermediary (omnibus account) level in an attempt to identify activity that indicates potential excessive or short-term trading. If it detects suspicious trading activity, T. Rowe Price may contact the intermediary and may request personal identifying information and transaction histories for some or all underlying shareholders (including plan participants, if applicable). If T. Rowe Price believes that excessive or short-term trading has occurred, it will instruct the intermediary to impose restrictions to discourage such practices and take appropriate action with respect to
T. Rowe Price | 26 |
the underlying shareholder, including restricting purchases for 30 calendar days or longer. There is no assurance that T. Rowe Price will be able to properly enforce its excessive trading policies for omnibus accounts. Because T. Rowe Price generally relies on intermediaries to provide information and impose restrictions for omnibus accounts, its ability to monitor and deter excessive trading will be dependent upon the intermediaries’ timely performance of their responsibilities.
T. Rowe Price may allow an intermediary or other third party to maintain restrictions on trading in the T. Rowe Price funds that differ from the 30-Day Purchase Block. An alternative excessive trading policy would be acceptable to T. Rowe Price if it believes that the policy would provide sufficient protection to the T. Rowe Price funds and their shareholders that is consistent with the excessive trading policy adopted by the funds’ Boards of Directors/Trustees.
Retirement Plan Accounts If
shares are held in a retirement plan, generally the
30-Day Purchase Block applies only to shares redeemed
by a participant-directed exchange to another fund. However, the 30-Day Purchase Block may apply to transactions
other than exchanges depending on how shares of the plan are held at T. Rowe Price or the excessive
trading policy applied by your plan’s recordkeeper. An alternative excessive trading policy may
apply to the T. Rowe Price funds where a retirement plan has its own policy deemed acceptable to
T. Rowe Price. You should contact T. Rowe Price or your plan recordkeeper to determine which
of your transactions are subject to the funds’ 30-Day Purchase Block or an alternative policy.
There is no guarantee that T. Rowe Price will be able to identify or prevent all excessive or short-term trades or trading practices.
Keeping Your Account Open
To keep operating expenses lower, we ask you to maintain an account balance of at least $1 million. If your investment is below $1 million, we have the right to redeem your account at the then-current net asset value after giving you 60 days to increase your balance. This could result in a taxable gain.
Signature Guarantees
A Medallion signature guarantee is designed to protect you and the T. Rowe Price funds from fraud by verifying your signature.
An intermediary may need to obtain a signature guarantee in certain situations, such as:
· Written requests to redeem over $5 million;
· Remitting redemption proceeds to any person, address, or bank account not on file; or
· Changing the account registration or broker-dealer of record for an account.
Intermediaries should consult their T. Rowe Price Financial Institution Services representative for specific requirements.
Information About Accounts in T. Rowe Price Funds | 27 |
The signature guarantee must be obtained from a financial institution that is a participant in a Medallion signature guarantee program. You can obtain a Medallion signature guarantee from most banks, savings institutions, broker-dealers, and other guarantors acceptable to T. Rowe Price. When obtaining a Medallion signature guarantee, please discuss with the guarantor the dollar amount of your proposed transaction. It is important that the level of coverage provided by the guarantor’s stamp covers the dollar amount of the transaction or it may be rejected. We cannot accept guarantees from notaries public or organizations that do not provide reimbursement in the case of fraud.
More About the Funds | 3 | |
How are the funds organized?
T. Rowe Price Institutional International Funds, Inc. (the “corporation”) was incorporated in Maryland in 1989. Currently, the corporation consists of 10 series, each representing a separate pool of assets with different investment objectives and investment policies. Each fund is an “open-end management investment company,” or mutual fund. Mutual funds pool money received from shareholders and invest it to try to achieve specified objectives.
What is meant by “shares”?
As with all mutual funds, investors purchase shares when they put money in a fund. These shares are part of a fund’s authorized capital stock, but share certificates are not issued.
Each share and fractional share entitles the shareholder to:
· Receive a proportional interest in income and capital gain distributions.
· Cast one vote per share on certain fund matters, including the election of fund directors/trustees, changes in fundamental policies, or approval of changes in the fund’s management contract.
Do T. Rowe Price funds have annual shareholder meetings?
The funds are not required to hold regularly scheduled shareholder meetings. To avoid unnecessary costs to fund shareholders, shareholder meetings are only held when certain matters, such as changes in fundamental policies or elections of directors, must be decided. In addition, shareholders representing at least 10% of all eligible votes may call a special meeting for the purpose of voting on the removal of any fund director or trustee. If a meeting is held and you cannot attend, you can vote by proxy. Before the meeting, the fund will send or make available to you proxy materials that explain the matters to be decided and include instructions on voting by mail, telephone, or the Internet.
Who runs the funds?
General Oversight
Each fund is governed by a Board of Directors (the “Board”) that meets regularly to review fund investments, performance, expenses, and other business affairs. The Board elects the funds’ officers. At least 75% of Board members are independent of T. Rowe Price and its affiliates (the “Firm”).
More About the Funds | 29 |
All decisions regarding the purchase and sale of fund investments are made by T. Rowe Price or an affiliated investment adviser—specifically by the funds’ portfolio managers.
Investment Advisers
T. Rowe Price is each fund’s investment adviser and oversees the selection of each fund’s investments and management of each fund’s portfolio. T. Rowe Price is a SEC-registered investment adviser that provides investment management services to individual and institutional investors, and sponsors and serves as adviser and sub-adviser to registered investment companies, institutional separate accounts, and common trust funds. The address for T. Rowe Price is 100 East Pratt Street, Baltimore, Maryland 21202. As of December 31, 2014, the Firm had approximately $747 billion in assets under management and provided investment management services for more than 9 million individual and institutional investor accounts.
With respect to the Institutional International Bond Fund, T. Rowe Price has entered into a sub-advisory agreement with T. Rowe Price International under which T. Rowe Price International is authorized to trade securities and make discretionary investment decisions on behalf of the fund. T. Rowe Price International is an investment adviser registered or licensed with the SEC, United Kingdom Financial Conduct Authority, Financial Services Agency of Japan, and other non-U.S. regulatory authorities. T. Rowe Price International sponsors and serves as adviser to foreign collective investment schemes and provides investment management services to investment companies and other institutional investors. T. Rowe Price International is headquartered in London and has several branch offices around the world. T. Rowe Price International is a direct subsidiary of T. Rowe Price and its address is 60 Queen Victoria Street, London EC4N 4TZ, United Kingdom.
Portfolio Management
T. Rowe Price has established an Investment Advisory Committee with respect to each fund. The committee chairman has day-to-day responsibility for managing the fund’s portfolio and works with the committee in developing and executing each fund’s investment program. The members of each advisory committee are listed below, along with information that provides the year that the chairman first joined the Firm and the chairman’s specific business experience during the past five years (although the chairman may have had portfolio management responsibilities for a longer period). The Statement of Additional Information provides additional information about the portfolio managers’ compensation, other accounts managed by the portfolio managers, and the portfolio managers’ ownership of fund shares.
Institutional Emerging Markets Bond Fund Michael J. Conelius, Chairman, Roy H. Adkins, Peter I. Botoucharov, Tala Boulos, Carolyn Hoi Che Chu, Bridget A. Ebner, Richard L. Hall, Arif Husain, Andrew J. Keirle, Christopher J. Kushlis, Christopher C. Loop, Michael D. Oh, Kenneth A. Orchard, and Christopher J. Rothery. Mr. Conelius has been chairman of the committee since the fund’s inception in 2006. He joined
T. Rowe Price | 30 |
the Firm in 1988 and his investment experience dates from that time. He has served as a portfolio manager with the Firm throughout the past five years.
Institutional International Bond Fund Arif Husain and Christopher J. Rothery, Co-chairmen, Michael J. Conelius, Michael Della Vedova, Steven C. Huber, Andrew J. Keirle, Kenneth A. Orchard, David Stanley, Ju Yen Tan, and J. Howard Woodward. Mr. Rothery has been co-chairman of the committee since 2012. Mr. Rothery joined the Firm in 1994 and his investment experience dates from 1986. He has served as a portfolio manager with the Firm throughout the past five years. Mr. Husain became co-chairman of the committee in 2014. He joined the Firm in 2013 and his investment experience dates from 1995. Since joining the Firm, he has served as head of International Fixed Income. Prior to joining the Firm, he served as director of European Fixed Income and UK and Euro Portfolio Management with AllianceBernstein, where he oversaw research and had responsibility for managing global, European, and UK fixed income portfolios.
The Management Fee
Each fund pays the investment adviser an annual all-inclusive management fee of 0.70% (Institutional Emerging Markets Bond) and 0.55% (Institutional International Bond) based on the fund’s average daily net assets. The management fee is calculated and accrued daily and it includes investment management services and ordinary, recurring operating expenses, but does not cover interest, expenses related to borrowing, taxes, and brokerage, or nonrecurring extraordinary expenses.
A discussion about the factors considered by the Board and its conclusions in approving each fund’s investment management contract with T. Rowe Price and any subadvisory contract with T. Rowe Price International appears in each fund’s semiannual report to shareholders for the period ended June 30.
Fund Operations and Shareholder Services
T. Rowe Price provides accounting services to the T. Rowe Price funds. T. Rowe Price Services, Inc. acts as the transfer and dividend disbursing agent and provides shareholder and administrative services to the funds. These companies receive compensation from the funds for their services.
While the Institutional International Bond Fund focuses its investments in non-U.S. dollar-denominated, investment-grade bonds of issuers in developed markets, the Institutional Emerging Markets Bond Fund focuses its investments on issuers in emerging markets. The Institutional Emerging Markets Bond Fund has wide flexibility to choose among bonds issued in local currencies or the U.S. dollar, and to choose among corporate and sovereign issuers. Investments in bonds issued in foreign currencies may afford investors a potential hedge against weakness in the U.S.
More About the Funds | 31 |
dollar, although investments by the Institutional International Bond Fund will be significantly affected by changes in the exchange rates between the U.S. dollar and the currencies in which the funds’ holdings are denominated and traded.
The funds ordinarily invest in the securities of at least three countries; however, they may invest in the securities of one country, including the U.S., for temporary defensive purposes.
The funds may enter into forward currency exchange contracts in an effort to hedge against an expected decline in the value of currencies in which its portfolio holdings are denominated, to increase exposure to a particular foreign currency or to shift the fund’s foreign currency exposure from one country to another, or to enhance the fund’s returns.
The Institutional International Bond Fund may also enter into other currency derivative instruments, such as currency swaps, foreign currency options, and currency futures, in an effort to take advantage of currencies that are expected to appreciate in value. The fund may also use swaps for a variety of reasons, such as to manage exposure to changes in interest rates or credit quality and to adjust portfolio duration or credit exposure, as well as to enhance total return or protect the value of portfolio securities. Futures contracts may be used as an efficient means of adjusting exposure to all or part of a target market and for various other purposes such as managing exposure to interest rate and yield curve movements, enhancing income, and serving as a cash management tool.
Funds that invest overseas generally carry more risk than funds that invest strictly in U.S. assets.
The risk profiles of the funds vary with the maturity and credit quality of bonds they purchase, their degree of currency exposure, whether they invest in developed markets, emerging markets, or both, and the extent to which the Institutional International Bond Fund takes long or short positions in bond markets and currencies.
As with any mutual fund, there is no guarantee the funds will achieve their objectives. The funds’ share prices fluctuate, which means you could lose money when you sell your shares of the funds. Some particular risks affecting the funds include the following:
Market risk The market price of securities owned by the fund may go up or down, sometimes rapidly or unpredictably. Securities may decline in value due to factors affecting the overall securities markets, or particular industries or sectors. The value of a security may decline due to general market conditions which are not specifically related to a particular issuer, such as real or perceived adverse economic conditions, changes in the general outlook for an issuer’s financial condition, changes in interest or currency rates or adverse investor sentiment generally. The value of a security may also decline due to factors which affect a particular industry or industries, such as
T. Rowe Price | 32 |
labor shortages or increased production costs and competitive conditions within an industry.
Currency risk This is the risk of a decline in the value of a foreign currency versus the U.S. dollar, which reduces the dollar value of securities denominated in that foreign currency. It also includes the risk that the Institutional International Bond Fund’s short positions in currencies will not perform as anticipated. The overall impact on a fund’s holdings can be significant and long-lasting depending on the currencies represented in the portfolio, how each currency appreciates or depreciates in relation to the U.S. dollar, and whether currency positions are hedged. Foreign currency exchange rates may fluctuate significantly over short periods of time, particularly with respect to emerging markets currencies. Currency exchange rates can also be affected unpredictably by intervention by U.S. or foreign governments or central banks, or by currency controls or political developments. Because the Institutional International Bond Fund is normally heavily exposed to foreign currencies, changes in currency exchange rates are likely to have a significant effect on the fund’s performance. Currency trends are unpredictable, and to the extent each fund purchases and sells currencies, it will also be subject to the risk that its trading strategies, including efforts at hedging, will not succeed. Furthermore, hedging and trading costs can be significant and reduce fund net asset value, and many emerging market currencies cannot be effectively hedged.
Other risks of foreign investing Risks can result from varying stages of economic and political development, differing regulatory environments, trading days and accounting standards, uncertain tax laws, and higher transaction costs of non-U.S. markets. Investments outside the U.S. could be subject to governmental actions such as capital or currency controls, nationalization of a company or industry, expropriation of assets, or imposition of high taxes. A trading market may close without warning for extended time periods, preventing a fund from buying or selling securities in that market.
Emerging markets risk Investments in emerging markets, which generally include Africa, parts of Europe and much of Asia, the Middle East, and Central and South America, are subject to the risk of abrupt and severe price declines. The economic and political structures of emerging market countries, in most cases, do not compare favorably with the U.S. or other developed countries in terms of wealth and stability, and their financial markets often lack liquidity. These economies are less developed, can be overly reliant on particular industries, and more vulnerable to the ebb and flow of international trade, trade barriers, and other protectionist or retaliatory measures. Certain countries have legacies and periodic episodes of hyperinflation and currency devaluations, particularly Russia and many Latin American nations, and more recently many Asian countries. Governments in many emerging market countries participate to a significant degree in their economies and securities markets. Foreign investments may be restricted and subject to greater government control, including repatriation of sales proceeds. Some countries have histories of instability
More About the Funds | 33 |
and upheaval that could cause their governments to act in a detrimental or hostile manner toward private enterprise or foreign investment. Investments in countries or regions that have recently begun moving away from central planning and state-owned industries toward free markets should be regarded as speculative.
While some countries have made progress in economic growth, liberalization, fiscal discipline, and political and social stability, there is no assurance these trends will continue. Significant risks, such as war and terrorism, currently affect some emerging market countries. Fund performance will likely be hurt by exposure to nations in the midst of hyperinflation, currency devaluation, trade disagreements, sudden political upheaval, or interventionist government policies. The volatility of emerging markets may be heightened by the actions (such as significant buying or selling) of a few major investors. For example, substantial decreases in cash flows of mutual funds investing in these markets could significantly affect local securities prices and, therefore, cause fund share prices to decline.
In response to political and military actions undertaken by Russia, the U.S. and European Union have instituted various sanctions against Russia. These sanctions, and other intergovernmental actions that may be undertaken against Russia in the future, could result in the devaluation of Russian currency, a downgrade in the country’s credit rating, and a significant decline in the value and liquidity of securities issued by Russian companies or the Russian government. Future sanctions and any retaliatory action by the Russian government could result in the immediate freeze of Russian securities, impairing the ability of the funds to buy, sell, or receive proceeds from those securities. These sanctions, and the continued disruption of the Russian economy, could severely impact the performance of any funds that have significant exposure to Russia.
All of these factors make investing in such countries significantly riskier than in other countries and any one of these could cause a fund’s share price to decline.
Credit risk This is the risk that an issuer of a debt security held by a fund will default (fail to make scheduled payments), potentially reducing the fund’s income and share price. This risk is increased when a portfolio security is downgraded or the perceived creditworthiness of an issuer or counterparty deteriorates. The risk of default is much greater for emerging market bonds and securities rated as below investment-grade.
Companies and governments issuing lower-rated bonds are not as strong financially as those with higher credit ratings, and their bonds are often viewed as speculative investments. Such issuers are more vulnerable to real or perceived business setbacks and to changes in the economy, such as a recession, that might impair their ability to make timely interest and principal payments. Certain emerging market governments and corporations have in the past defaulted on payment of interest and principal on debt they have issued. As a result, your portfolio managers rely heavily on proprietary T. Rowe Price and T. Rowe Price International research when selecting these investments.
T. Rowe Price | 34 |
Liquidity risk This is the risk that a fund may not be able to sell a holding in a timely manner at a desired price. Sectors of the bond market can experience sudden downturns in trading activity. During periods of reduced market liquidity, the spread between the price at which a security can be bought and the price at which it can be sold can widen, and the fund may not be able to sell a holding readily at a price that reflects what the fund believes it should be worth. Less liquid securities can also become more difficult to value. Liquidity risk may be the result of, among other things, the reduced number and capacity of traditional market participants to make a market in fixed income securities or the lack of an active market. The potential for liquidity risk may be magnified by a rising interest rate environment or other circumstances where investor redemptions from fixed income mutual funds may be higher than normal, potentially causing increased supply in the market due to selling activity.
Emerging market bonds are generally less liquid than higher-quality bonds issued by companies and governments in developed countries. Consequently, large purchases or sales of certain high-yield, emerging market debt issues may cause significant changes in their prices. Because many of these bonds do not trade frequently, when they do trade, their prices may be substantially higher or lower than had been expected. A lack of liquidity also means that more subjectivity will be used in establishing the fair value of the securities.
Interest rate risk This is the risk that prices of bonds and other fixed income securities will increase as interest rates fall and prices will decrease as interest rates rise (bond prices and interest rates usually move in opposite directions). Prices fall because the bonds and notes in the fund’s portfolio become less attractive to other investors when securities with higher yields become available. Generally, the longer the maturity of a security or the longer a bond fund’s weighted average maturity, the greater its interest rate risk. As a result, in a rising interest rate environment, the net asset value of a fund with a longer weighted average maturity typically decreases at a faster rate than the net asset value of a fund with a shorter weighted average maturity. Because the funds expect to maintain an intermediate- to long-term weighted average maturity, they carry more interest rate risk than a fund that invests in shorter-term securities.
Other factors The major factor influencing prices of high-quality bonds is changes in interest rate levels, but this is only one of several factors affecting prices of lower-quality bonds. Because the credit quality of the issuer is lower, such bonds are more sensitive to developments affecting the issuer’s underlying fundamentals (for example, changes in financial condition or a particular country’s general economy). In addition, the entire bond market in an emerging market can experience sudden and sharp price swings due to a variety of factors, including changes in economic forecasts, stock market activity, large or sustained sales by institutional investors, a high-profile default, a political upheaval of some kind, or just a change in the
More About the Funds | 35 |
market’s psychology. This type of volatility is usually associated more with stocks than bonds, but investors in lower-quality bonds should also anticipate it.
Since mutual funds can be a major source of demand in certain markets, substantial cash flows into and out of these funds can affect high-yield and emerging market bond prices. If, for example, a significant number of funds were to sell bonds to meet shareholder redemptions, both bond prices and a fund’s share price could fall more than underlying fundamentals might justify.
Short positions (Institutional International Bond Fund) If a fund takes a short position with respect to a particular currency, security, or bond market, it will lose money if the currency, security, or bond market appreciates in value, or an expected credit event fails to occur. Losses could be significant.
Nondiversification risk Because each fund is nondiversified, the fund can invest more of its assets in a smaller number of issuers than diversified funds. Concentrating investments could result in greater potential losses than for funds investing in a broader variety of issuers.
Derivatives risk To the extent each fund uses forward currency exchange contracts, it is exposed to additional volatility and losses in excess of the fund’s initial investment, the risk that anticipated currency movements will not be accurately predicted, and the risk that the other party to the transaction will not fulfill its contractual obligation. If currency values and exchange rates move in a direction not predicted by the investment adviser, the fund could be in a worse position than if it had not entered into such transactions. If the fund’s foreign currency transactions are intended to hedge the currency risk associated with investing in foreign securities and minimize the risk of loss that would result from a decline in the value of the hedged currency, these transactions also may limit any potential gain that might result should the value of such currency increase.
To the extent the Institutional International Bond Fund invests in futures, swaps, or options, it is similarly exposed to additional volatility and losses greater than direct investments in the contract’s underlying assets, and the risk that anticipated currency movements will not be accurately predicted.
Any efforts at buying or selling currencies could result in significant losses for a fund and, if the fund takes a short position in a particular currency, it will lose money if the currency appreciates in value. Further, if the fund’s foreign currency transactions are intended to hedge the currency risk associated with investing in foreign securities and minimize the risk of loss that would result from a decline in the value of the hedged currency, these transactions also may limit any potential gain that might result should the value of such currency increase.
Efforts to reduce risk Consistent with each fund’s objective, the portfolio manager uses various tools to try to reduce risk and increase total return, including:
· Thorough credit research performed by T. Rowe Price analysts.
T. Rowe Price | 36 |
· Adjusting fund duration to try to reduce the drop in the fund’s price when interest rates rise or to benefit from the rise in price when rates fall.
· Management of the impact of foreign currency changes on the fund’s portfolio.
Additional strategies and risks Other strategies may be employed that are not considered part of a fund’s principal investment strategies. For instance, the Institutional Emerging Markets Bond Fund may also invest, to a limited extent, in futures and swaps. Investments in futures would primarily be used to manage interest rate exposure or as a tool to help manage cash flows into and out of the fund. Investments in swaps would typically serve to manage the fund’s exposure to changes in interest rates or credit quality, or to protect the value of certain portfolio holdings. To the extent the fund invests in futures and swaps, it could be exposed to potential volatility and losses greater than direct investments in the contract’s underlying assets, and the risk that changes in interest rate movements or the creditworthiness of an issuer will not be accurately predicted. From time to time, either fund may invest in securities other than bonds, such as convertible securities and loan participations and assignments, and use other derivatives that are consistent with its investment program.
A derivative involves risks different from, and possibly greater than, the risks associated with investing directly in the assets on which the derivative is based. Derivatives can be highly volatile, illiquid, and difficult to value. Changes in the value of a derivative may not properly correlate with changes in the value of the underlying asset, reference rate, or index. A fund could be exposed to significant losses if it is unable to close a derivatives position due to the lack of a liquid secondary trading market. Derivatives involve the risk that a counterparty to the derivatives agreement will fail to make required payments or comply with the terms of the agreement. There is also the possibility that limitations or trading restrictions may be imposed by an exchange or government regulation, which could adversely impact the value and liquidity of a derivatives contract subject to such regulation.
Recent regulations have changed the requirements related to the use of certain derivatives. Some of these new regulations have limited the availability of certain derivatives and made their use by funds more costly. It is expected that additional changes to the regulatory framework will occur, but the extent and impact of additional new regulations are not certain at this time.
The Statement of Additional Information contains more detailed information about each fund and its investments, operations, and expenses.
This section takes a detailed look at some of the types of fund securities and the various kinds of investment practices that may be used in day-to-day portfolio
More About the Funds | 37 |
management. Fund investments are subject to further restrictions and risks described in the Statement of Additional Information.
Shareholder approval is required to substantively change fund objectives. Shareholder approval is also required to change certain investment restrictions noted in the following section as “fundamental policies.” Portfolio managers also follow certain “operating policies” that can be changed without shareholder approval. Shareholders will receive at least 60 days’ prior notice of a change in a fund’s policy requiring it to normally invest at least 80% of net assets in 1) foreign bonds (Institutional International Bond) and 2) bonds of issuers in emerging markets countries (Institutional Emerging Markets Bond).
Fund holdings in certain kinds of investments cannot exceed maximum percentages as set forth in this prospectus and the Statement of Additional Information. For instance, there are limitations regarding fund investments in certain types of derivatives. While these restrictions provide a useful level of detail about fund investments, investors should not view them as an accurate gauge of the potential risk of such investments. For example, in a given period, a 5% investment in derivatives could have a significantly greater impact on a fund’s share price than its weighting in the portfolio. The net effect of a particular investment depends on its volatility and the size of its overall return in relation to the performance of all other fund investments.
Certain investment restrictions, such as a required minimum or maximum investment in a particular type of security, are measured at the time a fund purchases a security. The status, market value, maturity, credit quality, or other characteristics of a fund’s securities may change after they are purchased, and this may cause the amount of a fund’s assets invested in such securities to exceed the stated maximum restriction or fall below the stated minimum restriction. If any of these changes occur, it would not be considered a violation of the investment restriction and will not require the sale of an investment if it was proper at the time the investment was made (this exception does not apply to a fund’s borrowing policy). However, purchases by a fund during the time it is above or below the stated percentage restriction would be made in compliance with applicable restrictions.
For purposes of determining whether a particular country is considered a developed market or an emerging market, the funds consider a country to be an emerging market if it is either included in a JP Morgan emerging market bond index or not included in the International Monetary Fund’s listing of advanced economies. For purposes of determining whether a fund invests at least 80% of its net assets in a particular type of security, the funds use the country assigned to a security by Bloomberg or another unaffiliated third-party data provider.
Changes in fund holdings, fund performance, and the contribution of various investments to fund performance are discussed in the shareholder reports.
T. Rowe Price | 38 |
Portfolio managers have considerable discretion in choosing investment strategies and selecting securities they believe will help achieve fund objectives.
Types of Portfolio Securities
In seeking to meet their investment objectives, fund investments may be made in any type of security or instrument (including certain potentially high-risk derivatives described in this section) whose investment characteristics are consistent with their investment programs. The following pages describe various types of fund holdings and investment management practices.
Nondiversified Status
Each fund is registered with the SEC as a nondiversified mutual fund. Therefore, each fund is able to invest more than 5% of its assets in the securities of individual foreign governments and may invest a greater portion of its assets in a single issuer than a diversified fund. Since each fund is a nondiversified investment company and is permitted to invest a greater proportion of its assets in the securities of a smaller number of issuers, the funds may be subject to greater credit risk with respect to their portfolio securities and greater volatility with respect to their share prices than an investment company that is more broadly diversified.
However, each fund intends to qualify as a regulated investment company for purposes of the Internal Revenue Code. This requires each fund to limit its investments so that, at the end of each fiscal quarter, with respect to 50% of its total assets, no more than 5% of its assets is invested in the securities of a single issuer, and not more than 10% of the voting securities of any issuer are held by each fund. With respect to the remaining 50% of fund assets, no more than 25% may be invested in a single issuer.
Debt Securities
The funds’ investments may be in fixed-rate and floating rate debt securities and may include, but shall not be limited to: (1) debt obligations issued or guaranteed by: (a) a foreign sovereign government or one of its agencies, authorities, instrumentalities, or political subdivisions, including a foreign state, province, or municipality, and (b) supranational organizations such as the World Bank, Asian Development Bank, European Investment Bank, and European Economic Community; (2) debt obligations: (a) of foreign banks and bank holding companies, and (b) of domestic banks and corporations issued in non-U.S. dollar denominations; and (3) foreign corporate debt securities, asset-backed securities, and commercial paper. Such securities may take a variety of forms including those issued in the local currency of the issuer, U.S. dollar-denominated bonds, Eurobonds, and Euro-denominated bonds. Normally, the Institutional International Bond Fund will generally purchase non-U.S. dollar-denominated bonds. The funds may from time to time purchase securities on a when-issued basis, invest in repurchase agreements, and purchase bonds convertible into equities.
More About the Funds | 39 |
Each fund generally will not invest more than 5% of its assets in any individual corporate issuer, provided that (1) the fund may place assets in bank deposits or other short-term bank instruments with a maturity of up to 30 days provided that (a) the bank has a short-term credit rating of A1+ (or, if unrated, the equivalent as determined by T. Rowe Price or T. Rowe Price International) and (b) a fund will not maintain more than 10% of its total assets with any single bank; and (2) a fund may maintain more than 5% of its total assets, including cash and currencies, in custodial accounts or deposits of the fund’s custodian or sub-custodians.
The Institutional Emerging Markets Bond Fund may also invest in: such dollar-denominated fixed-income securities as (1) debt obligations issued or guaranteed by the U.S. government or its agencies or instrumentalities; (2) domestic corporate debt securities; (3) domestic commercial paper, including commercial paper indexed to certain specific foreign currency exchange rates; (4) debt obligations of domestic banks and bank holding companies; and (5) collateralized mortgage obligations or asset-backed bonds.
Concentration of Investments (Institutional Emerging Markets Bond Fund) From time to time, the fund may invest more than 25% of its total assets in the securities of foreign governmental and corporate entities located in the same country. However, the fund will not invest more than 25% of its total assets in the securities of any single foreign governmental issuer or in two or more such issuers subject to a common, explicit guarantee.
Below Investment-Grade Bonds The price and yield of lower-quality (high yield, high-risk) bonds, commonly referred to as “junk” bonds and below investment-grade emerging market bonds, can be expected to fluctuate more than the price and yield of higher-quality bonds. Investment-grade bonds are those rated from the highest quality (AAA or equivalent) to medium quality (BBB or equivalent), and below investment-grade bonds are those rated BB (or equivalent) and lower. Below investment-grade bonds are considered speculative with respect to the issuer’s continuing ability to meet principal and interest payments since their issuers are more vulnerable to financial setbacks and recession than more creditworthy issuers. Even BBB rated bonds may have speculative elements as well. The values of below investment-grade bonds often fluctuate more in response to political, regulatory, or economic developments than higher quality bonds. Successful investment in lower-medium- and low-quality bonds involves greater investment risk and is highly dependent on careful credit analysis.
Operating policies The Institutional International Bond Fund may invest up to 25% of total assets in below investment-grade (“junk”) bonds and there is no limit on the Institutional Emerging Markets Bond Fund’s investments in securities that are rated below investment-grade.
While each fund intends to invest primarily in debt securities, it may invest in convertible bonds or equity securities. While some countries or companies may be
T. Rowe Price | 40 |
regarded as favorable investments, pure bond opportunities may be unattractive or limited due to insufficient supply, or legal or technical restrictions. In such cases, the fund may consider equity securities or convertible bonds to gain exposure to such markets.
Preferred Stocks
Stocks represent shares of ownership in a company. Generally, preferred stocks have a specified dividend rate and rank after bonds and before common stocks in their claim on income for dividend payments and on assets should the company be liquidated. After other claims are satisfied, common stockholders participate in company profits on a pro-rata basis; profits may be paid out in dividends or reinvested in the company to help it grow. Increases and decreases in earnings are usually reflected in a company’s stock price, so common stocks generally have the greatest appreciation and depreciation potential of all corporate securities. Unlike common stock, preferred stock does not ordinarily carry voting rights. While most preferred stocks pay a dividend, a fund may decide to purchase preferred stock where the issuer has suspended, or is in danger of suspending, payment of its dividend.
Convertible Securities and Warrants
Investments may be made in debt or preferred equity securities that are convertible into, or exchangeable for, equity securities at specified times in the future and according to a certain exchange ratio. Convertible bonds are typically callable by the issuer, which could in effect force conversion before the holder would otherwise choose. Traditionally, convertible securities have paid dividends or interest at rates higher than common stocks but lower than nonconvertible securities. They generally participate in the appreciation or depreciation of the underlying stock into which they are convertible, but to a lesser degree than common stock. Some convertible securities combine higher or lower current income with options and other features. Warrants are options to buy, directly from the issuer, a stated number of shares of common stock at a specified price anytime during the life of the warrants (generally, two or more years). Warrants have no voting rights, pay no dividends, and can be highly volatile. In some cases, the redemption value of a warrant could be zero.
Operating policies The Institutional International Bond Fund may invest up to 5% of total assets, and the Institutional Emerging Markets Bond Fund may invest up to 10% of total assets, in preferred stocks and securities that are convertible into, or which carry warrants for, common stocks or other equity securities. Under normal conditions, the funds do not expect to directly purchase common stocks. Any shares of common stock that are received through a reorganization, restructuring, exercise, exchange, conversion, or similar action will be sold within a reasonable timeframe taking into consideration market conditions and any legal restrictions.
More About the Funds | 41 |
Loan Participations and Assignments
Large loans to corporations or governments, including governments of less developed countries, may be shared or syndicated among several lenders, usually banks. Each fund could participate in such syndicates, or could buy part of a loan, becoming a direct lender. Each fund may acquire loans as an assignment from another lender that holds a direct interest in the loan or as a participation interest in another lender’s portion of the loan. Participations and assignments involve special types of risk, including limited marketability and the risks of being considered a lender. If a fund purchases a participation, it may only be able to enforce its rights through the lender, and it may assume the credit risk of the lender in addition to the borrower. With assignments, the fund’s rights against the borrower may be more limited than those held by the original lender. The funds may also make investments in a company through the purchase or execution of a privately negotiated note representing the equivalent of a loan.
Operating policies The Institutional International Bond Fund may not invest more than 5% of total assets and the Institutional Emerging Markets Bond Fund may not invest more than 20% of total assets in loan participations and assignments.
Derivatives and Leverage
A derivative is a financial instrument whose value is derived from an underlying security, such as a stock or bond, or from a market benchmark, such as an interest rate index. Many types of investments representing a wide range of risks and potential rewards may be considered derivatives, including conventional instruments such as futures and options, as well as other potentially more complex investments such as swaps and structured notes. The use of derivatives can involve leverage. Leverage has the effect of magnifying returns, positively or negatively. The effect on returns will depend on the extent to which an investment is leveraged. For example, an investment of $1, leveraged at 2 to 1, would have the effect of an investment of $2. Leverage ratios can be higher or lower with a corresponding effect on returns. The funds may use derivatives in certain situations to help accomplish any or all of the following: to hedge against a decline in principal value, to increase yield, to manage exposure to changes in interest or currency exchange rates, to invest in eligible asset classes with greater efficiency and at a lower cost than is possible through direct investment, or to adjust portfolio duration or credit risk exposure.
Derivatives that may be used include the following instruments, as well as others that combine the risk characteristics and features of futures, options, and swaps:
Futures and Options Futures, a type of potentially high-risk derivative, are often used to manage or hedge risk because they enable the investor to buy or sell an asset in the future at an agreed-upon price. Options, another type of potentially high-risk derivative, give the investor the right (when the investor purchases the option), or the obligation (when the investor “writes” or sells the option), to buy or sell an asset at a predetermined price in the future. Futures and options contracts may be bought or
T. Rowe Price | 42 |
sold for any number of reasons, including to manage exposure to changes in interest rates, bond prices, foreign currencies, and credit quality; as an efficient means of increasing or decreasing a fund’s exposure to certain markets; in an effort to enhance income; to improve risk-adjusted returns; to protect the value of portfolio securities; and to serve as a cash management tool. Call or put options may be purchased or sold on securities, futures, financial indexes, and foreign currencies. A fund may choose to continue a futures contract by “rolling over” an expiring futures contract into an identical contract with a later maturity date. This could increase the fund’s transaction costs and portfolio turnover rate.
Futures contracts and options may not always be successful hedges; their prices can be highly volatile; using them could lower a fund’s total return; the potential loss from the use of futures can exceed a fund’s initial investment in such contracts; and the losses from certain options written by a fund could be unlimited.
Operating policies Initial margin deposits on futures and premiums on options used for non-hedging purposes will not exceed 5% of a fund’s net asset value. The total market value of securities covering call or put options may not exceed 25% of total assets. No more than 5% of total assets will be committed to premiums when purchasing call or put options.
Swaps Fund investments may be made in interest rate, index, total return, credit default, and other types of swap agreements, as well as options on swaps, commonly referred to as “swaptions,” and interest rate swap futures, which are instruments that provide a way to obtain swap exposure and the benefits of futures in one contract. All of these agreements are considered derivatives and, in certain cases, high-risk derivatives. Interest rate, index, and total return swaps are two-party contracts under which a fund and a counterparty, such as a broker or dealer, agree to exchange the returns (or differentials in rates of return) earned or realized on particular predetermined investments or indexes. Credit default swaps are agreements where one party (the protection buyer) will make periodic payments to another party (the protection seller) in exchange for protection against specified credit events, such as defaults and bankruptcies related to an issuer or underlying credit instrument. Swap futures are futures contracts on interest rate swaps that enable purchasers to settle in cash at a future date at the price determined by a specific benchmark rate at the end of a fixed period. Swaps, swaptions, and swap futures can be used for a variety of purposes, including to manage a fund’s overall exposure to changes in interest or foreign currency exchange rates and credit quality; as an efficient means of adjusting a fund’s exposure to certain markets; in an effort to enhance income or total return or protect the value of portfolio securities; to serve as a cash management tool; and to adjust portfolio duration or credit risk exposure.
There are risks in the use of swaps and related instruments. Swaps could result in losses if interest or foreign currency exchange rates or credit quality changes are not correctly anticipated by a fund. Total return swaps could result in losses if the reference index, security, or investments do not perform as anticipated. Credit default
More About the Funds | 43 |
swaps can increase a fund’s exposure to credit risk and could result in losses if evaluation of the creditworthiness of the counterparty, or of the company or government on which the credit default swap is based, is incorrect. The use of swaps, swaptions, and swap futures may not always be successful. Using them could lower a fund’s total return, their prices can be highly volatile, and the potential loss from the use of swaps can exceed a fund’s initial investment in such instruments. Also, the other party to a swap agreement could default on its obligations or refuse to cash out a fund’s investment at a reasonable price, which could turn an expected gain into a loss. Although there should be minimal counterparty risk associated with investments in interest rate swap futures, a fund could experience delays and/or losses due to the bankruptcy of a swap dealer through which the fund engaged in the transaction.
Operating policies A swap agreement with any single counterparty will not be entered into if the net amount owed or to be received under existing contracts with that party would exceed 5% of total assets or if the net amount owed or to be received by a fund under all outstanding swap agreements will exceed 10% of total assets. (Swap agreements that are cleared and settled through a clearinghouse, or traded on an exchange or swap execution facility, are not subject to these limits.) For swaptions, the total market value of securities covering call or put options may not exceed 25% of total assets. No more than 5% of total assets will be committed to premiums when purchasing call or put swaptions.
Hybrid Instruments Hybrid instruments (a type of potentially high-risk derivative) can combine the characteristics of securities, futures, and options. For example, the principal amount or interest rate of a hybrid could be tied (positively or negatively) to the price of some commodity, currency, security, or securities index or another interest rate (each a “benchmark”). Hybrids can be used as an efficient means of pursuing a variety of investment goals, including currency hedging, and increased total return. Hybrids may or may not bear interest or pay dividends. The value of a hybrid or its interest rate may be a multiple of a benchmark and, as a result, may be leveraged and move (up or down) more steeply and rapidly than the benchmark. These benchmarks may be sensitive to economic and political events, such as commodity shortages and currency devaluations, which cannot be readily foreseen by the purchaser of a hybrid. Under certain conditions, the redemption value of a hybrid could be zero. Thus, an investment in a hybrid may entail significant market risks that are not associated with a similar investment in a traditional, U.S. dollar-denominated bond that has a fixed principal amount and pays a fixed rate or floating rate of interest. The purchase of hybrids also exposes the funds to the credit risk of the issuer of the hybrid. These risks may cause significant fluctuations in the net asset value of the funds.
Hybrids can have volatile prices and limited liquidity, and their use may not be successful.
T. Rowe Price | 44 |
Operating policy Fund investments in hybrid instruments are limited to 10% of total assets.
Currency Derivatives Each fund may engage in foreign currency transactions either on a spot (cash) basis at the rate prevailing in the currency exchange market at the time or through forward currency exchange contracts, which are contracts between two counterparties to exchange one currency for another on a future date at a specified exchange rate. In addition to foreign currency forwards, futures, swaps, and options on foreign currencies may also be used to protect a fund’s foreign securities from adverse currency movements relative to the U.S. dollar, as well as to gain exposure to currencies and markets expected to increase or decrease in value relative to other currencies or securities.
Each fund may attempt to hedge its exposure to potentially unfavorable currency changes. Forward currency contracts can be used to adjust the foreign exchange exposure of the fund with a view to protecting the portfolio from adverse currency movements, based on T. Rowe Price’s outlook. However, forward currency contracts can also be used in an effort to benefit from a currency believed to be appreciating in value versus other currencies. The funds may invest in foreign currencies directly without holding any foreign securities denominated in those currencies.
Forward currency contracts involve special risks, including, but not limited to, the potential for significant volatility in currency markets, and the risk that in certain markets, particularly emerging markets, it is not possible to engage in effective foreign currency hedging. In addition, such transactions involve the risk that currency movements will not occur as anticipated by T. Rowe Price, which could reduce a fund’s total return.
The funds may enter into foreign currency transactions under the following circumstances:
Lock In When the fund desires to lock in the U.S. dollar price on the purchase or sale of a security denominated in a foreign currency.
Cross Hedge If a particular currency is expected to decrease in value relative to another currency, the fund may sell the currency expected to decrease and purchase a currency that is expected to increase against the currency sold. The fund’s cross hedging transactions may involve currencies in which the fund’s holdings are denominated. However, the fund is not required to own securities in the particular currency being purchased or sold.
Direct Hedge If the fund seeks to eliminate substantially all of the risk of owning a particular currency or believes the portfolio could benefit from price appreciation in a given country’s bonds but did not want to hold the currency, it could employ a direct hedge back into the U.S. dollar. In either case, a fund would enter into a forward contract to sell the currency in which a portfolio security is denominated and purchase U.S. dollars at an exchange rate established at the time it initiated the
More About the Funds | 45 |
contract. The cost of the direct hedge transaction may offset most, if not all, of the yield advantage offered by the foreign security, but the fund would hope to benefit from an increase (if any) in the value of the bond.
Proxy Hedge In certain circumstances, a different currency may be substituted for the currency in which the investment is denominated, as part of a strategy known as proxy hedging. In this case, the fund, having purchased a security, will sell a currency whose value is believed to be closely linked to the currency in which the security is denominated. This type of hedging entails greater risk than a direct hedge because it is dependent on a stable relationship between the two currencies paired as proxies, and that relationship may not always be maintained. The fund may also use these instruments to create a synthetic bond, which is issued in one currency with the currency component transformed into another currency.
Costs of Hedging When the fund purchases a foreign bond with a higher interest rate than is available on U.S. bonds of a similar maturity, the additional yield on the foreign bond could be substantially lessened if the fund were to enter into a direct hedge by selling the foreign currency and purchasing the U.S. dollar. This is what is known as the “cost” of hedging. A proxy hedge, which is less costly than a direct hedge, may attempt to reduce this cost through an indirect hedge back to the U.S. dollar.
It is important to note that hedging costs are treated as capital transactions and are not, therefore, deducted from a fund’s dividend distribution and are not reflected in its yield. Instead, such costs will, over time, be reflected in a fund’s net asset value per share and total return. Hedging may result in the application of the mark-to-market and straddle provisions of the Internal Revenue Code. These provisions could result in an increase (or decrease) in the amount of taxable dividends paid by a fund and could affect whether dividends paid by a fund are classified as capital gains or ordinary income.
Investments in Other Investment Companies
A fund may invest in other investment companies, including open-end funds, closed-end funds, and exchange-traded funds.
A fund may purchase the securities of another investment company to temporarily gain exposure to a portion of the market while awaiting purchase of securities or as an efficient means of gaining exposure to a particular asset class. The fund might also purchase shares of another investment company to gain exposure to the securities in the investment company’s portfolio at times when the fund may not be able to buy those securities directly. Any investment in another investment company would be consistent with the fund’s objective and investment program.
The risks of owning another investment company are generally similar to the risks of investing directly in the securities in which that investment company invests. However, an investment company may not achieve its investment objective or
T. Rowe Price | 46 |
execute its investment strategy effectively, which may adversely affect the fund’s performance. In addition, because closed-end funds and exchange-traded funds trade on a secondary market, their shares may trade at a premium or discount to the actual net asset value of their portfolio securities and their shares may have greater volatility if an active trading market does not exist.
As a shareholder of an investment company not sponsored by T. Rowe Price, the fund must pay its pro-rata share of that investment company’s fees and expenses. The fund’s investments in non-T. Rowe Price investment companies are subject to the limits that apply to investments in other funds under the Investment Company Act of 1940 or under any applicable exemptive order.
A fund may also invest in certain other T. Rowe Price funds as a means of gaining efficient and cost-effective exposure to certain asset classes, provided the investment is consistent with the fund’s investment program and policies. Such an investment could allow the fund to obtain the benefits of a more diversified portfolio than might otherwise be available through direct investments in the asset class, and will subject the fund to the risks associated with the particular asset class. Examples of asset classes in which other T. Rowe Price mutual funds concentrate their investments include high yield bonds, inflation-linked securities, floating rate loans, international bonds, emerging market bonds, stocks of companies involved in activities related to real assets and emerging market stocks. If the fund invests in another T. Rowe Price fund, the management fee paid by the fund will be reduced to ensure that the fund does not incur duplicate management fees as a result of its investment.
Illiquid Securities
Some fund holdings may be considered illiquid because they are subject to legal or contractual restrictions on resale or because they cannot be sold in the ordinary course of business within seven days at approximately the prices at which they are valued. The determination of liquidity involves a variety of factors. Illiquid securities may include private placements that are sold directly to a small number of investors, usually institutions. Unlike public offerings, such securities are not registered with the SEC. Although certain of these securities may be readily sold (for example, under Rule 144A of the Securities Act of 1933) and therefore deemed liquid, others may have resale restrictions and be considered illiquid. The sale of illiquid securities may involve substantial delays and additional costs, and a fund may only be able to sell such securities at prices substantially less than what it believes they are worth.
Operating policy Fund investments in illiquid securities are limited to 15% of net assets.
Types of Investment Management Practices
Reserve Position
A certain portion of fund assets may be held in reserves. Fund reserve positions can consist of: 1) shares of a T. Rowe Price internal money fund or short-term bond fund (which does not charge any management fees); 2) short-term, high-quality U.S. and
More About the Funds | 47 |
foreign dollar-denominated money market securities, including repurchase agreements; and 3) U.S. dollar or non-U.S. dollar currencies. For temporary, defensive purposes, there is no limit on a fund’s holdings in reserves. If a fund has significant holdings in reserves, it could compromise the fund’s ability to achieve its objectives. The reserve position provides flexibility in meeting redemptions, paying expenses and managing cash flows into a fund, and can serve as a short-term defense during periods of unusual market volatility. Non-U.S. dollar reserves are subject to currency risk.
When-Issued Securities and Forwards
A fund may purchase securities on a when-issued or delayed delivery basis or may purchase or sell securities on a forward commitment basis. The price of these securities is fixed at the time of the commitment to buy, but delivery and payment take place after the customary settlement period for that type of security (often a month or more later). During the interim period, the price and yield of the securities can fluctuate, and typically no interest accrues to the purchaser. At the time of delivery, the market value of the securities may be more or less than the purchase or sale price. To the extent the fund remains fully or almost fully invested (in securities with a remaining maturity of more than one year) at the same time it purchases these securities, there will be greater fluctuations in the fund’s net asset value than if the fund did not purchase them.
Borrowing Money and Transferring Assets
A fund may borrow from banks, other persons, and other T. Rowe Price funds for temporary emergency purposes to facilitate redemption requests, or for other purposes consistent with fund policies as set forth in this prospectus and the Statement of Additional Information. Such borrowings may be collateralized with fund assets, subject to restrictions.
Fundamental policy Borrowings may not exceed 331/3% of total assets.
Operating policy A fund will not transfer portfolio securities as collateral except as necessary in connection with permissible borrowings or investments, and then such transfers may not exceed 331/3% of total assets. A fund will not purchase additional securities when borrowings exceed 5% of total assets.
Lending of Portfolio Securities
A fund may lend its securities to broker-dealers, other institutions, or other persons to earn additional income. Risks include the potential insolvency of the broker-dealer or other borrower that could result in delays in recovering securities and capital losses. Additionally, losses could result from the reinvestment of collateral received on loaned securities in investments that default or do not perform as well as expected.
Fundamental policy The value of loaned securities may not exceed 331/3% of total assets.
T. Rowe Price | 48 |
Credit Quality Considerations
The credit quality of many fund holdings is evaluated by rating agencies such as Moody’s Investors Service, Inc. (Moody’s), Standard & Poor’s Ratings Services (S&P), and Fitch Ratings (Fitch). Credit quality refers to the issuer’s ability and willingness to meet all required interest and principal payments. The highest ratings are assigned to companies perceived to have the lowest credit risks. T. Rowe Price credit research analysts also evaluate fund holdings, including those rated by outside agencies. Other things being equal, bonds and other debt obligations with lower ratings typically have higher yields due to greater credit risk.
Credit quality ratings are not guarantees. They are estimates of a company’s creditworthiness and ability to make interest and principal payments as they come due. Ratings can change at any time due to actual or perceived changes in a company’s creditworthiness or financial fundamentals.
Bonds rated Baa and above by Moody’s, and BBB and above by S&P and Fitch, are considered to be “investment-grade.” Bonds that are rated below these categories assume greater credit risk and are referred to as “below investment-grade” or “noninvestment-grade.” Bonds rated below investment-grade range from speculative to highly speculative with respect to their ability or willingness to pay interest and repay principal. The following table summarizes the rating scales and associated credit risk assigned by the major rating agencies. Within these categories, the rating may be modified with a symbol (such as 1, 2, and 3, or a plus or minus) to indicate whether the bond is ranked in the higher or lower end of its rating category. T. Rowe Price considers publicly available ratings but emphasizes its own credit analysis when selecting investments.
Ratings of Debt Securities
More About the Funds | 49 |
Moody’s | S & P | Fitch | Description of Category | |
Aaa | AAA | AAA | Lowest level of credit risk with extremely strong capacity to meet financial commitments | |
Aa | AA | AA | Very low credit risk with very strong capacity to meet financial commitments | |
A | A | A | Low credit risk with strong capacity to meet financial commitments | |
Baa | BBB | BBB | Moderate credit risk with adequate capacity to meet financial commitments | |
Ba | BB | BB | Subject to substantial credit risk and adverse conditions could lead to inadequate capacity to meet financial commitments | |
B | B | B | Subject to high credit risk and adverse conditions will likely impair capacity to meet financial commitments | |
Caa | CCC | CCC | Subject to very high credit risk and dependent upon favorable conditions to meet financial commitments | |
Ca | CC | CC | Highly vulnerable to nonpayment and likely in, or very near, default with some prospect of recovery of principal and interest | |
C | C | C | Typically in default with little prospect for recovery of principal and interest | |
D | D | D | In default | |
Portfolio Turnover
Turnover is an indication of frequency of trading. A fund will not generally trade in securities for short-term profits, but when circumstances warrant, securities may be purchased and sold without regard to the length of time held. Each time a fund purchases or sells a security, it incurs a cost. This cost is reflected in its net asset value but not in its operating expenses. The higher the turnover rate, the higher the transaction costs and the greater the impact on a fund’s total return. Higher turnover can also increase the possibility of taxable capital gain distributions. The funds’ portfolio turnover rates are shown in the Financial Highlights table.
Each T. Rowe Price fund’s portfolio holdings are disclosed on a regular basis in its semiannual and annual shareholder reports, and on Form N-Q, which is filed with the SEC within 60 days of the fund’s first and third fiscal quarter-end. The money funds also file detailed month-end portfolio holdings information with the SEC each
T. Rowe Price | 50 |
month. Such information will be made available to the public 60 days after the end of the month to which the information pertains. In addition, the funds disclose their calendar quarter-end portfolio holdings on troweprice.com 15 calendar days after each quarter. Under certain conditions, up to 5% of a fund’s holdings may be included in this portfolio list without being individually identified. Generally, securities would not be individually identified if they are being actively bought or sold and it is determined that the quarter-end disclosure of the holding could be harmful to the fund. A security will not be excluded for these purposes from a fund’s quarter-end holdings disclosure for more than one year. Money funds also disclose their month-end portfolio holdings on troweprice.com five business days after each month. The quarter-end portfolio holdings will remain on the website for one year and the month-end money fund portfolio holdings will remain on the website for six months. Each fund also discloses its 10 largest holdings on troweprice.com on the seventh business day after each month-end. These holdings are listed in alphabetical order along with the aggregate percentage of the fund’s total assets that these 10 holdings represent. Each monthly top 10 list will remain on the website for six months. A description of T. Rowe Price’s policies and procedures with respect to the disclosure of portfolio information is available in the Statement of Additional Information and through troweprice.com.
The Financial Highlights table, which provides information about each fund’s financial history, is based on a single share outstanding throughout the periods shown. Each fund’s section of the table is part of the fund’s financial statements, which are included in its annual report and are incorporated by reference into the Statement of Additional Information (available upon request). The total returns in the table represent the rate that an investor would have earned or lost on an investment in the fund (assuming reinvestment of all dividends and distributions and no payment of any applicable account or redemption fees). The financial statements in the annual reports were audited by the funds’ independent registered public accounting firm, PricewaterhouseCoopers LLP.
More About the Funds | 51 |
Financial Highlights
Year ended December 31 | ||||||||||
Institutional Emerging Markets Bond Fund | 2010 | 2011 | 2012 | 2013 | 2014 | |||||
Net asset value, | $9.24 | $9.59 | $8.95 | $9.84 | $8.77 | |||||
Income From Investment Operations | ||||||||||
Net investment income* | 0.68 | 0.64 | 0.57 | 0.48 | 0.49 | |||||
Net gains or losses on | 0.59 | (0.37 | ) | 1.05 | (1.00 | ) | (0.08 | ) | ||
Total from
investment | 1.27 | 0.27 | 1.62 | (0.52 | ) | 0.41 | ||||
Less Distributions | ||||||||||
Dividends (from net | (0.68 | ) | (0.65 | ) | (0.57 | ) | (0.48 | ) | (0.50 | ) |
Distributions (from | (0.24 | ) | (0.26 | ) | (0.16 | ) | (0.07 | ) | (0.03 | ) |
Returns of capital | — | — | — | — | — | |||||
Total distributions | (0.92 | ) | (0.91 | ) | (0.73 | ) | (0.55 | ) | (0.53 | ) |
Net asset value, | $9.59 | $8.95 | $9.84 | $8.77 | $8.65 | |||||
Total return | 14.23 | % | 2.84 | % | 18.58 | % | (5.33 | )% | 4.55 | % |
Ratios/Supplemental Data | ||||||||||
Net assets, end of period | $188,978 | $210,064 | $252,917 | $261,989 | $317,102 | |||||
Ratio of expenses to | 0.70 | % | 0.70 | % | 0.70 | % | 0.70 | % | 0.70 | % |
Ratio of
net income to | 7.10 | % | 6.83 | % | 5.97 | % | 5.19 | % | 5.50 | % |
Portfolio turnover rate | 57.6 | % | 49.9 | % | 44.4 | % | 51.8 | % | 53.5 | % |
* Per share amounts calculated using average shares outstanding method.
T. Rowe Price | 52 |
Financial Highlights
Year ended December 31 | ||||||||||
Institutional International Bond Fund | 2010 | 2011 | 2012 | 2013 | 2014 | |||||
Net asset value, | $10.10 | $10.11 | $9.49 | $9.91 | $9.32 | |||||
Income From Investment Operations | ||||||||||
Net investment income* | 0.27 | 0.33 | 0.27 | 0.24 | 0.24 | |||||
Net gains or losses on | 0.24 | (0.13 | )a | 0.43 | (0.59 | ) | (0.53 | ) | ||
Total from investment | 0.51 | 0.20 | 0.70 | (0.35 | ) | (0.29 | ) | |||
Less Distributions | ||||||||||
Dividends (from net | (0.27 | ) | (0.33 | ) | (0.23 | ) | (0.03 | ) | (0.04 | ) |
Distributions (from | (0.23 | ) | (0.49 | ) | — | (0.04 | ) | (0.02 | ) | |
Returns of capital | — | — | (0.05 | ) | (0.17 | ) | (0.18 | ) | ||
Total distributions | (0.50 | ) | (0.82 | ) | (0.28 | ) | (0.24 | ) | (0.24 | ) |
Net asset value, | $10.11 | $9.49 | $9.91 | $9.32 | $8.79 | |||||
Total return | 5.19 | % | 1.95 | % | 7.43 | % | (3.52 | )% | (3.27 | )% |
Ratios/Supplemental Data | ||||||||||
Net assets, end of period | $251,285 | $155,878 | $189,117 | $263,228 | $287,080 | |||||
Ratio of expenses to | 0.55 | % | 0.55 | % | 0.55 | % | 0.55 | % | 0.55 | % |
Ratio of
net income to | 2.67 | % | 3.18 | % | 2.85 | % | 2.54 | % | 2.53 | % |
Portfolio turnover rate | 82.2 | % | 49.5 | % | 62.5 | % | 82.8 | % | 90.4 | % |
* Per share amounts calculated using average shares outstanding method.
a The amount presented is inconsistent with the fund’s aggregate gains and losses because of the timing of sales and redemptions of fund shares in relation to fluctuating market values for the investment portfolio.
Investing With T. Rowe Price | 4 | |
If you are purchasing fund shares through a third-party intermediary, contact the intermediary for information regarding its policies on purchasing, exchanging, and redeeming fund shares, as well as initial and subsequent investment minimums. | ||
Tax Identification | We must have your correct tax identification number on a signed New Account form or W-9 Form. Otherwise, federal law requires the funds to withhold a percentage of your dividends, capital gain distributions, and redemptions and may subject you to an Internal Revenue Service fine. If this information is not received within 60 days after your account is established, your account may be redeemed at the fund’s then-current net asset value. Always verify your transactions by carefully reviewing the confirmation we send you. Please report any discrepancies to Financial Institution Services promptly by calling 1-800-638-8790. |
$1,000,000 minimum initial investment (Institutional Class shares); although intermediaries may impose a different minimum $2,500 minimum initial investment (F Class shares); although financial advisors and other intermediaries may impose a different minimum | ||
Important Information |
| Pursuant to federal law, all financial institutions must obtain, verify, and record information that identifies each person or entity that opens an account. When you open an account for an entity, you will be required to provide the entity’s name, residential U.S. street address, and tax identification number, as well as your name, residential street address, date of birth, |
T. Rowe Price | 54 |
and Social Security number as the person opening the account on behalf of the entity. Corporate and other institutional accounts require documents showing the existence of the entity (such as articles of incorporation or partnership agreements) to open an account. Certain other fiduciary accounts (such as trusts or power of attorney arrangements) require documentation, which may include an original or certified copy of the trust agreement or power of attorney to open an account. For more information, call Financial Institution Services at 1-800-638-8790. We will use this information to verify the identity of the entity and person opening the account. We will not be able to open the account for the entity until we receive all of this information. If we are unable to verify the identity of the entity, we are authorized to take any action permitted by law. (See Rights Reserved by the Funds.) Note: Shares may generally only be purchased and held by institutional investors with a U.S. address. Institutional investors typically include corporations, foundations, investment companies, defined benefit plans, defined contribution retirement plans, registered investment advisers and bank trust programs. T. Rowe Price will not generally authorize the transfer of ownership from an institutional to a noninstitutional account. Shares held by noninstitutional accounts are subject to involuntary redemption at any time. All initial and subsequent investments must be made by bank wire. The wire must be received by T. Rowe Price by the close of the New York Stock Exchange (normally 4 p.m. ET) to receive that day’s share price. There is no assurance that the share price for the purchase will be the same day the wire was initiated. | ||
By Wire | Call Financial Institution Services at 1-800-638-8790 for an account number, assignment to a dedicated service representative, and wire transfer instructions. |
Investing With T. Rowe Price | 55 |
In order to obtain an account number, you must supply the name, Social Security or employer identification number, and business street address for the account. |
Complete a New Account form and mail it, with proper documentation identifying your firm, to one of the appropriate T. Rowe Price addresses listed under By Mail. |
Note: Although the purchase will be made, services may not be established and Internal Revenue Service penalty withholding may occur until we receive a signed New Account form. |
No minimum for additional purchases | ||
By Wire | Access troweprice.com or call Shareholder Services for wire transfer instructions. |
Exchange Service | You can move money from one account to an existing, identically registered account or open a new identically registered account. An exchange from one fund to another is considered a sale and purchase for tax purposes. For exchange policies, please see Transaction Procedures and Special Requirements—Excessive and Short-Term Trading Policy. |
Redemptions | Redemption proceeds can be mailed to your account address, sent by Automated Clearing House transfer to your bank, or wired to your bank (provided your bank information is already on file). For charges, see Electronic Transfers—By Wire under Information About Your Services. Please note that large purchase and redemption requests initiated through automated services, including the National Securities Clearing Corporation, may be rejected and, in such instances, the transaction must be placed by contacting a service representative. |
T. Rowe Price | 56 |
If you request to redeem a specific dollar amount, and the market value of your account is less than the amount of your request, we will redeem all shares from your account. |
Some of the T. Rowe Price funds may impose a redemption fee. Check the fund’s prospectus under Contingent Redemption Fee in Pricing Shares and Receiving Sale Proceeds. The fee is paid to the fund. |
For redemptions by electronic transfer, please see Information About Your Services. |
By Mail | For each account involved, provide the account name and number, fund name, and exchange or redemption amount. For exchanges, be sure to specify any fund you are exchanging out of and the fund or funds you are exchanging into. T. Rowe Price may require a signature guarantee of all registered owners (see Transaction Procedures and Special Requirements—Signature Guarantees). Please use the appropriate address below to avoid a delay in processing your transaction: via U.S. Postal Service via private carriers/overnight services |
| T. Rowe Price funds and their agents, in their sole discretion, reserve the following rights: (1) to waive or lower investment minimums; (2) to accept initial purchases by telephone; (3) to refuse any purchase or exchange order; (4) to cancel or rescind any purchase or exchange order placed through an intermediary no later than the business day after the order is received by the intermediary (including, but not limited to, |
Investing With T. Rowe Price | 57 |
orders deemed to result in excessive trading, market timing, or 5% ownership); (5) to cease offering fund shares at any time to all or certain groups of investors; (6) to freeze any account and suspend account services when notice has been received of a dispute regarding the ownership of the account, or a legal claim against an account, upon initial notification to T. Rowe Price of a shareholder’s death until T. Rowe Price receives required documentation in good order, or if there is reason to believe a fraudulent transaction may occur; (7) to otherwise modify the conditions of purchase and modify or terminate any services at any time; (8) to waive any wire, small account, maintenance, or fiduciary fees charged to a group of shareholders; (9) to act on instructions reasonably believed to be genuine; (10) to involuntarily redeem an account at the net asset value calculated the day the account is redeemed, in cases of threatening conduct, suspected fraudulent or illegal activity, or if the fund or its agent is unable, through its procedures, to verify the identity of the person(s) or entity opening an account; and (11) for money funds, to suspend redemptions and postpone the payment of proceeds to facilitate an orderly liquidation of the fund. |
Financial Institution Services | Many services are available
to you as an institutional shareholder— some you receive automatically and others you must authorize
or request on the New Account form. By signing up for services on the New Account form, you avoid having
to complete a separate form at a later time and obtain a signature guarantee. For information on the
services currently offered, call Financial Institution Services at |
T. Rowe Price | 58 |
Retirement Plans | We offer a wide range of plans for institutions and large and small businesses, including: SEP-IRAs, SIMPLE IRAs, 401(k)s, and 403(b)(7)s. For information on these retirement plans, please call our Trust Company at 1-800-492-7670. | |
Telephone Services | Buy, sell, or exchange shares by calling one of our service representatives. | |
Electronic Transfers | Electronic transfers can be conducted via bank wire. There may be a $5 fee for wire redemptions under $5,000, and your bank may charge for incoming or outgoing wire transfers regardless of size. |
For information Financial
Institution Services A Statement of Additional Information for the T. Rowe Price family of funds, which includes additional information about the funds, has been filed with the SEC and is incorporated by reference into this prospectus. Further information about fund investments, including a review of market conditions and the manager’s recent investment strategies and their impact on performance during the past fiscal year is available in the annual and semiannual shareholder reports. To obtain free copies of any of these documents, or for shareholder inquiries, call 1-800-638-8797. These documents are available through troweprice.com. Fund information and Statements of Additional Information are also available from the Public Reference Room of the SEC. Information on the operation of the Public Reference Room may be obtained by calling the SEC at 1-202-551-8090. Fund reports and other fund information are available on the EDGAR Database on the SEC’s Internet site at http://www.sec.gov. Copies of this information may be obtained, after paying a duplicating fee, by electronic request at publicinfo@sec.gov, or by writing the Public Reference Room, Washington, D.C. 20549-1520. |
T. Rowe Price Associates, Inc. |
|

1940 Act File No. 811-5833 | C101-040 5/1/15 |
STATEMENT OF ADDITIONAL INFORMATION |
This is the Statement of Additional Information for all of the funds listed below. It is divided into two parts (Part I and Part II). Part I primarily contains information that is particular to each fund, while Part II contains information that generally applies to all of the funds in the T. Rowe Price family of funds (“Price Funds”).
The date of this Statement of Additional Information (“SAI”) is May 1, 2015.
T. ROWE PRICE BALANCED FUND, INC. (RPBAX)
T. ROWE PRICE BLUE CHIP GROWTH FUND, INC. (TRBCX)
T. Rowe Price Blue Chip Growth Fund–Advisor Class (PABGX)
T. Rowe Price Blue Chip Growth Fund–R Class (RRBGX)
T. ROWE PRICE CALIFORNIA TAX-FREE INCOME TRUST
California Tax-Free Bond Fund (PRXCX)
California Tax-Free Money Fund (PCTXX)
T. ROWE PRICE CAPITAL APPRECIATION FUND (PRWCX)
T. Rowe Price Capital Appreciation Fund–Advisor Class (PACLX)
T. ROWE PRICE CAPITAL OPPORTUNITY FUND, INC. (PRCOX)
T. Rowe Price Capital Opportunity Fund–Advisor Class (PACOX)
T. Rowe Price Capital Opportunity Fund–R Class (RRCOX)
T. ROWE PRICE CORPORATE INCOME FUND, INC. (PRPIX)
T. ROWE PRICE CREDIT OPPORTUNITIES FUND (PRCPX)
T. Rowe Price Credit Opportunities Fund–Advisor Class (PAOPX)
T. ROWE PRICE DIVERSIFIED MID-CAP GROWTH FUND, INC. (PRDMX)
T. ROWE PRICE DIVERSIFIED SMALL-CAP GROWTH FUND, INC. (PRDSX)
T. ROWE PRICE DIVIDEND GROWTH FUND, INC. (PRDGX)
T. Rowe Price Dividend Growth Fund–Advisor Class (TADGX)
T. ROWE PRICE EQUITY INCOME FUND (PRFDX)
T. Rowe Price Equity Income Fund–Advisor Class (PAFDX)
T. Rowe Price Equity Income Fund–R Class (RRFDX)
T. ROWE PRICE FINANCIAL SERVICES FUND, INC. (PRISX)
T. ROWE PRICE FLOATING RATE FUND, INC. (PRFRX)
T. Rowe Price Floating Rate Fund–Advisor Class (PAFRX)
T. ROWE PRICE GLOBAL ALLOCATION FUND, INC. (RPGAX)
T. Rowe Price Global Allocation Fund–Advisor Class (PAFGX)
T. ROWE PRICE GLOBAL REAL ESTATE FUND, INC. (TRGRX)
T. Rowe Price Global Real Estate Fund–Advisor Class (PAGEX)
T. ROWE PRICE GLOBAL TECHNOLOGY FUND, INC. (PRGTX)
T. ROWE PRICE GNMA FUND (PRGMX)
T. ROWE PRICE GROWTH & INCOME FUND, INC. (PRGIX)
T. ROWE PRICE GROWTH STOCK FUND, INC. (PRGFX)
T. Rowe Price Growth Stock Fund–Advisor Class (TRSAX)
T. Rowe Price Growth Stock Fund–R Class (RRGSX)
T. ROWE PRICE HEALTH SCIENCES FUND, INC. (PRHSX)
T. ROWE PRICE HIGH YIELD FUND, INC. (PRHYX)
T. Rowe Price High Yield Fund–Advisor Class (PAHIX)
T. ROWE PRICE INDEX TRUST, INC.
T. Rowe Price Equity Index 500 Fund (PREIX)
T. Rowe Price Extended Equity Market Index Fund (PEXMX)
T. Rowe Price Total Equity Market Index Fund (POMIX)
T. ROWE PRICE INFLATION FOCUSED BOND FUND, INC.
T. ROWE PRICE INFLATION PROTECTED BOND FUND, INC. (PRIPX)
T. ROWE PRICE INSTITUTIONAL EQUITY FUNDS, INC. (“Institutional Equity Funds”)
T. Rowe Price Institutional Large-Cap Core Growth Fund (TPLGX)
T. Rowe Price Institutional Large-Cap Growth Fund (TRLGX)
T. Rowe Price Institutional Large-Cap Value Fund (TILCX)
T. Rowe Price Institutional Mid-Cap Equity Growth Fund (PMEGX)
C00-042 5/1/15
T. Rowe Price Institutional Small-Cap Stock Fund (TRSSX)
T. Rowe Price Institutional U.S. Structured Research Fund (TRISX)
T. ROWE PRICE INSTITUTIONAL INCOME FUNDS, INC.
T. Rowe Price Institutional Core Plus Fund (TICPX)
T. Rowe Price Institutional Core Plus Fund–F Class (PFCPX)
T. Rowe Price Institutional Credit Opportunities Fund (TRXPX)
T. Rowe Price Institutional Floating Rate Fund (RPIFX)
T. Rowe Price Institutional Floating Rate Fund–F Class (PFFRX)
T. Rowe Price Institutional Global Multi-Sector Bond Fund (RPGMX)
T. Rowe Price Institutional High Yield Fund (TRHYX)
T. Rowe Price Institutional Long Duration Credit Fund (RPLCX)
T. ROWE PRICE INSTITUTIONAL INTERNATIONAL FUNDS, INC.
T. Rowe Price Institutional Africa & Middle East Fund (TRIAX)
T. Rowe Price Institutional Emerging Markets Bond Fund (TREBX)
T. Rowe Price Institutional Emerging Markets Equity Fund (IEMFX)
T. Rowe Price Institutional Frontier Markets Equity Fund (PRFFX)
T. Rowe Price Institutional Global Focused Growth Equity Fund (TRGSX)
T. Rowe Price Institutional Global Growth Equity Fund (RPIGX)
T. Rowe Price Institutional Global Value Equity Fund (PRIGX)
T. Rowe Price Institutional International Bond Fund (RPIIX)
T. Rowe Price Institutional International Concentrated Equity Fund (formerly T. Rowe Price Institutional Concentrated International Equity) (RPICX)
T. Rowe Price Institutional International Core Equity Fund (TRCEX)
T. Rowe Price Institutional International Growth Equity Fund (PRFEX)
T. ROWE PRICE INTERMEDIATE TAX-FREE HIGH YIELD FUND, INC. (PRIHX)
T. Rowe Price Intermediate Tax-Free High Yield Fund–Advisor Class (PRAHX)
T. ROWE PRICE INTERNATIONAL FUNDS, INC.
T. Rowe Price Africa & Middle East Fund (TRAMX)
T. Rowe Price Asia Opportunities Fund (TRAOX)
T. Rowe Price Asia Opportunities Fund–Advisor Class (PAAOX)
T. Rowe Price Emerging Europe Fund (TREMX)
T. Rowe Price Emerging Markets Bond Fund (PREMX)
T. Rowe Price Emerging Markets Corporate Bond Fund (TRECX)
T. Rowe Price Emerging Markets Corporate Bond Fund–Advisor Class (PACEX)
T. Rowe Price Emerging Markets Local Currency Bond Fund (PRELX)
T. Rowe Price Emerging Markets Local Currency Bond Fund–Advisor Class (PAELX)
T. Rowe Price Emerging Markets Stock Fund (PRMSX)
T. Rowe Price European Stock Fund (PRESX)
T. Rowe Price Global Growth Stock Fund (RPGEX)
T. Rowe Price Global Growth Stock Fund–Advisor Class (PAGLX)
T. Rowe Price Global High Income Bond Fund (RPIHX)
T. Rowe Price Global High Income Bond Fund–Advisor Class (PAIHX)
T. Rowe Price Global Industrials Fund (RPGIX)
T. Rowe Price Global Stock Fund (PRGSX)
T. Rowe Price Global Stock Fund–Advisor Class (PAGSX)
T. Rowe Price Global Unconstrained Bond Fund (RPIEX)
T. Rowe Price Global Unconstrained Bond Fund–Advisor Class (PAIEX)
T. Rowe Price International Bond Fund (RPIBX)
T. Rowe Price International Bond Fund–Advisor Class (PAIBX)
T. Rowe Price International Concentrated Equity Fund (PRCNX)
T. Rowe Price International Concentrated Equity Fund–Advisor Class (PRNCX)
T. Rowe Price International Discovery Fund (PRIDX)
T. Rowe Price International Growth & Income Fund (TRIGX)
T. Rowe Price International Growth & Income Fund–Advisor Class (PAIGX)
T. Rowe Price International Growth & Income Fund–R Class (RRIGX)
T. Rowe Price International Stock Fund (PRITX)
T. Rowe Price International Stock Fund–Advisor Class (PAITX)
T. Rowe Price International Stock Fund–R Class (RRITX)
T. Rowe Price Japan Fund (PRJPX)
2
T. Rowe Price Latin America Fund (PRLAX)
T. Rowe Price New Asia Fund (PRASX)
T. Rowe Price Overseas Stock Fund (TROSX)
T. ROWE PRICE INTERNATIONAL INDEX FUND, INC.
T. Rowe Price International Equity Index Fund (PIEQX)
T. ROWE PRICE MEDIA & TELECOMMUNICATIONS FUND, INC. (PRMTX)
T. ROWE PRICE MID-CAP GROWTH FUND, INC. (RPMGX)
T. Rowe Price Mid-Cap Growth Fund–Advisor Class (PAMCX)
T. Rowe Price Mid-Cap Growth Fund–R Class (RRMGX)
T. ROWE PRICE MID-CAP VALUE FUND, INC. (TRMCX)
T. Rowe Price Mid-Cap Value Fund–Advisor Class (TAMVX)
T. Rowe Price Mid-Cap Value Fund–R Class (RRMVX)
T. ROWE PRICE MULTI-SECTOR ACCOUNT PORTFOLIOS, INC. (“Multi-Sector Account Portfolios”)
T. Rowe Price Emerging Markets Corporate Multi-Sector Account Portfolio
T. Rowe Price Emerging Markets Local Multi-Sector Account Portfolio
T. Rowe Price Floating Rate Multi-Sector Account Portfolio
T. Rowe Price High Yield Multi-Sector Account Portfolio
T. Rowe Price Investment-Grade Corporate Multi-Sector Account Portfolio
T. Rowe Price Mortgage-Backed Securities Multi-Sector Account Portfolio
T. ROWE PRICE NEW AMERICA GROWTH FUND (PRWAX)
T. Rowe Price New America Growth Fund–Advisor Class (PAWAX)
T. ROWE PRICE NEW ERA FUND, INC. (PRNEX)
T. ROWE PRICE NEW HORIZONS FUND, INC. (PRNHX)
T. ROWE PRICE NEW INCOME FUND, INC. (PRCIX)
T. Rowe Price New Income Fund–Advisor Class (PANIX)
T. Rowe Price New Income Fund–R Class (RRNIX)
T. ROWE PRICE PERSONAL STRATEGY FUNDS, INC. (“Personal Strategy Funds”)
T. Rowe Price Personal Strategy Balanced Fund (TRPBX)
T. Rowe Price Personal Strategy Growth Fund (TRSGX)
T. Rowe Price Personal Strategy Income Fund (PRSIX)
T. ROWE PRICE PRIME RESERVE FUND, INC. (PRRXX)
T. ROWE PRICE REAL ASSETS FUND, INC. (PRAFX)
T. ROWE PRICE REAL ESTATE FUND, INC. (TRREX)
T. Rowe Price Real Estate Fund–Advisor Class (PAREX)
T. ROWE PRICE RESERVE INVESTMENT FUNDS, INC. (“TRP Reserve Funds”)
T. Rowe Price Government Reserve Investment Fund
(“TRP Government Reserve
Investment Fund”)
T. Rowe Price Reserve Investment Fund (“TRP Reserve Investment Fund”)
T. Rowe Price Short-Term Government Reserve Fund
T. Rowe Price Short-Term Reserve Fund
T. ROWE PRICE RETIREMENT FUNDS, INC. (“Retirement Funds”)
T. Rowe Price Retirement 2005 Fund (TRRFX)
T. Rowe Price Retirement 2005 Fund–Advisor Class (PARGX)
T. Rowe Price Retirement 2005 Fund–R Class (RRTLX)
T. Rowe Price Retirement 2010 Fund (TRRAX)
T. Rowe Price Retirement 2010 Fund–Advisor Class (PARAX)
T. Rowe Price Retirement 2010 Fund–R Class (RRTAX)
T. Rowe Price Retirement 2015 Fund (TRRGX)
T. Rowe Price Retirement 2015 Fund–Advisor Class (PARHX)
T. Rowe Price Retirement 2015 Fund–R Class (RRTMX)
T. Rowe Price Retirement 2020 Fund (TRRBX)
T. Rowe Price Retirement 2020 Fund–Advisor Class (PARBX)
T. Rowe Price Retirement 2020 Fund–R Class (RRTBX)
T. Rowe Price Retirement 2025 Fund (TRRHX)
T. Rowe Price Retirement 2025 Fund–Advisor Class (PARJX)
T. Rowe Price Retirement 2025 Fund–R Class (RRTNX)
T. Rowe Price Retirement 2030 Fund (TRRCX)
T. Rowe Price Retirement 2030 Fund–Advisor Class (PARCX)
T. Rowe Price Retirement 2030 Fund–R Class (RRTCX)
3
T. Rowe Price Retirement 2035 Fund (TRRJX)
T. Rowe Price Retirement 2035 Fund–Advisor Class (PARKX)
T. Rowe Price Retirement 2035 Fund–R Class (RRTPX)
T. Rowe Price Retirement 2040 Fund (TRRDX)
T. Rowe Price Retirement 2040 Fund–Advisor Class (PARDX)
T. Rowe Price Retirement 2040 Fund–R Class (RRTDX)
T. Rowe Price Retirement 2045 Fund (TRRKX)
T. Rowe Price Retirement 2045 Fund–Advisor Class (PARLX)
T. Rowe Price Retirement 2045 Fund–R Class (RRTRX)
T. Rowe Price Retirement 2050 Fund (TRRMX)
T. Rowe Price Retirement 2050 Fund–Advisor Class (PARFX)
T. Rowe Price Retirement 2050 Fund–R Class (RRTFX)
T. Rowe Price Retirement 2055 Fund (TRRNX)
T. Rowe Price Retirement 2055 Fund–Advisor Class (PAROX)
T. Rowe Price Retirement 2055 Fund–R Class RRTVX)
T. Rowe Price Retirement 2060 Fund (TRRLX)
T. Rowe Price Retirement 2060 Fund–Advisor Class (TRRYX)
T. Rowe Price Retirement 2060 Fund–R Class (TRRZX)
T. Rowe Price Retirement Balanced Fund (formerly T. Rowe Retirement Income Fund) (TRRIX)
T. Rowe Price Retirement Balanced Fund–Advisor Class (formerly T. Rowe Retirement Income Fund–Advisor Class) (PARIX)
T. Rowe Price Retirement Balanced Fund–R Class (formerly T. Rowe Retirement Income Fund– R Class) (RRTIX)
T. Rowe Price Target Retirement 2005 Fund (TRARX)
T. Rowe Price Target Retirement 2005 Fund–Advisor Class (PANRX)
T. Rowe Price Target Retirement 2010 Fund (TRROX)
T. Rowe Price Target Retirement 2010 Fund–Advisor Class (PAERX)
T. Rowe Price Target Retirement 2015 Fund (TRRTX)
T. Rowe Price Target Retirement 2015 Fund–Advisor Class (PAHRX)
T. Rowe Price Target Retirement 2020 Fund (TRRUX)
T. Rowe Price Target Retirement 2020 Fund–Advisor Class (PAIRX)
T. Rowe Price Target Retirement 2025 Fund (TRRVX)
T. Rowe Price Target Retirement 2025 Fund–Advisor Class (PAJRX)
T. Rowe Price Target Retirement 2030 Fund (TRRWX)
T. Rowe Price Target Retirement 2030 Fund–Advisor Class (PAKRX)
T. Rowe Price Target Retirement 2035 Fund (RPGRX)
T. Rowe Price Target Retirement 2035 Fund–Advisor Class (PATVX)
T. Rowe Price Target Retirement 2040 Fund (TRHRX)
T. Rowe Price Target Retirement 2040 Fund–Advisor Class (PAHHX)
T. Rowe Price Target Retirement 2045 Fund (RPTFX)
T. Rowe Price Target Retirement 2045 Fund–Advisor Class (PAFFX)
T. Rowe Price Target Retirement 2050 Fund (TRFOX)
T. Rowe Price Target Retirement 2050 Fund–Advisor Class (PAOFX)
T. Rowe Price Target Retirement 2055 Fund (TRFFX)
T. Rowe Price Target Retirement 2055 Fund–Advisor Class (PAFTX)
T. Rowe Price Target Retirement 2060 Fund (TRTFX)
T. Rowe Price Target Retirement 2060 Fund–Advisor Class (TRTGX)
T. ROWE PRICE SCIENCE & TECHNOLOGY FUND, INC. (PRSCX)
T. Rowe Price Science & Technology Fund–Advisor Class (PASTX)
T. ROWE PRICE SHORT-TERM BOND FUND, INC. (PRWBX)
T. Rowe Price Short-Term Bond Fund–Advisor Class (PASHX)
T. Rowe Price Ultra Short-Term Bond Fund (TRBUX)
T. ROWE PRICE SMALL-CAP STOCK FUND, INC. (OTCFX)
T. Rowe Price Small-Cap Stock Fund–Advisor Class (PASSX)
T. ROWE PRICE SMALL-CAP VALUE FUND, INC. (PRSVX)
T. Rowe Price Small-Cap Value Fund–Advisor Class (PASVX)
4
T. ROWE PRICE SPECTRUM FUND, INC. (“Spectrum Funds”)
Spectrum Growth Fund (PRSGX)
Spectrum Income Fund (RPSIX)
Spectrum International Fund (PSILX)
T. ROWE PRICE STATE TAX-FREE INCOME TRUST
Georgia Tax-Free Bond Fund (GTFBX)
Maryland Short-Term Tax-Free Bond Fund (PRMDX)
Maryland Tax-Free Bond Fund (MDXBX)
Maryland Tax-Free Money Fund (TMDXX)
New Jersey Tax-Free Bond Fund (NJTFX)
New York Tax-Free Bond Fund (PRNYX)
New York Tax-Free Money Fund (NYTXX)
Virginia Tax-Free Bond Fund (PRVAX)
T. ROWE PRICE STRATEGIC INCOME FUND, INC. (PRSNX)
T. Rowe Price Strategic Income Fund–Advisor Class (PRSAX)
T. ROWE PRICE SUMMIT FUNDS, INC. (“Summit Income Funds”)
T. Rowe Price Summit Cash Reserves Fund (TSCXX)
T. ROWE PRICE SUMMIT MUNICIPAL FUNDS, INC. (“Summit Municipal Funds”)
T. Rowe Price Summit Municipal Money Market Fund (TRSXX)
T. Rowe Price Summit Municipal Intermediate Fund (PRSMX)
T. Rowe Price Summit Municipal Intermediate Fund–Advisor Class (PAIFX)
T. Rowe Price Summit Municipal Income Fund (PRINX)
T. Rowe Price Summit Municipal Income Fund–Advisor Class (PAIMX)
T. ROWE PRICE TAX-EFFICIENT FUNDS, INC. (“Tax-Efficient Funds”)
T. Rowe Price Tax-Efficient Equity Fund (PREFX)
T. ROWE PRICE TAX-EXEMPT MONEY FUND, INC. (PTEXX)
T. ROWE PRICE TAX-FREE HIGH YIELD FUND, INC. (PRFHX)
T. Rowe Price Tax-Free High Yield Fund–Advisor Class (PATFX)
T. ROWE PRICE TAX-FREE INCOME FUND, INC. (PRTAX)
T. Rowe Price Tax-Free Income Fund–Advisor Class (PATAX)
T. ROWE PRICE TAX-FREE SHORT-INTERMEDIATE FUND, INC. (PRFSX)
T. Rowe Price Tax-Free Short-Intermediate Fund–Advisor Class (PATIX)
T. Rowe Price Tax-Free Ultra Short-Term Bond Fund (PRTUX)
T. ROWE PRICE U.S. BOND ENHANCED INDEX FUND, INC. (PBDIX)
T. ROWE PRICE U.S. LARGE-CAP CORE FUND, INC. (TRULX)
T. Rowe Price U.S. Large-Cap Core Fund–Advisor Class (PAULX)
T. ROWE PRICE U.S. TREASURY FUNDS, INC. (“U.S. Treasury Funds”)
U.S. Treasury Intermediate Fund (PRTIX)
U.S. Treasury Long-Term Fund (PRULX)
U.S. Treasury Money Fund (PRTXX)
T. ROWE PRICE VALUE FUND, INC. (TRVLX)
T. Rowe Price Value Fund–Advisor Class (PAVLX)
Mailing Address:
T. Rowe Price Investment
Services, Inc.
100 East Pratt Street
Baltimore, Maryland 21202
1-800-638-5660
This SAI is not a prospectus but should be read in conjunction with the appropriate current fund prospectus, which may be obtained from T. Rowe Price Investment Services, Inc. (“Investment Services”).
Each fund’s financial statements for its most recent fiscal period and the Report of Independent Registered Public Accounting Firm are included in each fund’s annual or semiannual report and incorporated by reference into this SAI. The Global High Income Bond Fund, Global High Income Bond Fund—Advisor Class, Global Unconstrained Bond Fund, Global Unconstrained Bond Fund—Advisor Class, Intermediate Tax-Free High Yield Fund, Intermediate Tax-Free High Yield Fund–Advisor Class, Retirement 2060 Fund, Retirement
5
2060 Fund—Advisor Class, Retirement 2060 Fund—R Class, Short-Term Government Reserve Fund, Target Retirement 2060 Fund, Target Retirement 2060 Fund—Advisor Class, and Tax–Free Ultra Short–Term Bond Fund have not been in operation long enough to have complete financial statements.
If you would like a prospectus or an annual or semiannual shareholder report for a fund, please visit troweprice.com or call 1-800-638-5660 and it will be sent to you at no charge. Please read this material carefully.
6
PART I – TABLE OF CONTENTS
Page
Investment Management Agreements | |
Page
Accounting Firm | |
References to the following are as indicated:
Internal Revenue Code of 1986, as amended (“Code”)
Internal Revenue Service (“IRS”)
Investment Company Act of 1940, as amended (“1940 Act”)
Moody’s Investors Service, Inc. (“Moody’s”)
Securities Act of 1933, as amended (“1933 Act”)
Securities and Exchange Commission (“SEC”)
Securities Exchange Act of 1934, as amended (“1934 Act”)
Standard & Poor’s Corporation (“S&P”)
T. Rowe Price Associates, Inc. (“T. Rowe Price”)
T. Rowe Price Hong Kong Limited (“Price Hong Kong”)
T. Rowe Price International Ltd (“T. Rowe Price International”)
T. Rowe Price Singapore Private Ltd. (“Price Singapore”)
Advisor Class
The Advisor Class is a share class of its respective T. Rowe Price fund and is not a separate mutual fund. The Advisor Class shares are designed to be sold only through brokers, dealers, banks, insurance companies, and other financial intermediaries that provide various distribution and administrative services.
F Class
The F Class is a share class of its respective T. Rowe Price fund and is not a separate mutual fund. The F Class shares are designed to be sold only through financial advisors and certain third-party intermediaries, including brokers, banks, insurance companies, retirement plan recordkeepers, and other financial intermediaries that provide various distribution and administrative services. F Class shares are not intended to be offered by intermediaries through a mutual fund “supermarket” platform.
R Class
The R Class is a share class of its respective T. Rowe Price fund and is not a separate mutual fund. The R Class shares are designed to be sold only through various third-party intermediaries that offer employer-sponsored defined contribution retirement plans and certain other accounts, including brokers, dealers, banks, insurance companies, retirement plan recordkeepers, and others.
Inflation Focused Bond Fund, Multi-Sector Account Portfolios, and TRP Reserve Funds
These funds are not available for direct purchase by members of the public. Shares of these funds may only be purchased by or on behalf of mutual funds, section 529 college savings plans, or certain institutional client accounts for which T. Rowe Price or one of its affiliates has discretionary investment authority.
Institutional Funds
The Institutional Funds have a $1,000,000 initial investment minimum (except for their F Class shares) and are designed for institutional investors. Institutional investors typically include banks, pension and other retirement plans, and trust and investment companies.
7
Below is a table showing the prospectus and shareholder report dates for each fund. The table also lists each fund’s category, which should be used to identify groups of funds that are referenced throughout this SAI.
Fund | Fund Category | Fiscal Year End | Annual Report Date | Semiannual Report Date | Prospectus Date |
Africa & Middle East | International Equity | Oct 31 | Oct 31 | Apr 30 | March 1 |
Asia Opportunities | International Equity | Oct 31 | Oct 31 | Apr 30 | March 1 |
Asia Opportunities Fund–Advisor Class | International Equity | Oct 31 | Oct 31 | Apr 30 | March 1 |
Balanced | Asset Allocation | Dec 31 | Dec 31 | June 30 | May 1 |
Blue Chip Growth | Equity | Dec 31 | Dec 31 | June 30 | May 1 |
Blue Chip Growth Fund–Advisor Class | Equity | Dec 31 | Dec 31 | June 30 | May 1 |
Blue Chip Growth Fund–R Class | Equity | Dec 31 | Dec 31 | June 30 | May 1 |
California Tax-Free Bond | State Tax-Free Bond | Feb 28 | Feb 28 | Aug 30 | July 1 |
California Tax-Free Money | State Tax-Free Money | Feb 28 | Feb 28 | Aug 30 | July 1 |
Capital Appreciation | Equity | Dec 31 | Dec 31 | June 30 | May 1 |
Capital Appreciation Fund–Advisor Class | Equity | Dec 31 | Dec 31 | June 30 | May 1 |
Capital Opportunity | Equity | Dec 31 | Dec 31 | June 30 | May 1 |
Capital Opportunity Fund–Advisor Class | Equity | Dec 31 | Dec 31 | June 30 | May 1 |
Capital Opportunity Fund–R Class | Equity | Dec 31 | Dec 31 | June 30 | May 1 |
Corporate Income | Taxable Bond | May 31 | May 31 | Nov 30 | Oct 1 |
Credit Opportunities | Taxable Bond | May 31 | May 31 | Nov 30 | Oct 1 |
Credit Opportunities Fund–Advisor Class | Taxable Bond | May 31 | May 31 | Nov 30 | Oct 1 |
Diversified Mid-Cap Growth | Equity | Dec 31 | Dec 31 | June 30 | May 1 |
Diversified Small-Cap Growth | Equity | Dec 31 | Dec 31 | June 30 | May 1 |
Dividend Growth | Equity | Dec 31 | Dec 31 | June 30 | May 1 |
Dividend Growth Fund–Advisor Class | Equity | Dec 31 | Dec 31 | June 30 | May 1 |
Emerging Europe | International Equity | Oct 31 | Oct 31 | Apr 30 | March 1 |
Emerging Markets Bond | International Bond | Dec 31 | Dec 31 | June 30 | May 1 |
Emerging Markets Corporate Bond | International Bond | Dec 31 | Dec 31 | June 30 | May 1 |
Emerging Markets Corporate Bond–Advisor Class | International Bond | Dec 31 | Dec 31 | June 30 | May 1 |
Emerging Markets Corporate Multi-Sector Account Portfolio | International Bond | Dec 31 | Dec 31 | June 30 | May 1 |
Emerging Markets Local Currency Bond | International Bond | Dec 31 | Dec 31 | June 30 | May 1 |
Emerging Markets Local Currency Bond Fund–Advisor Class | International Bond | Dec 31 | Dec 31 | June 30 | May 1 |
Emerging Markets Local Multi-Sector Account Portfolio | International Bond | Dec 31 | Dec 31 | June 30 | May 1 |
8
Fund | Fund Category | Fiscal Year End | Annual Report Date | Semiannual Report Date | Prospectus Date |
Emerging Markets Stock | International Equity | Oct 31 | Oct 31 | Apr 30 | March 1 |
Equity Income | Equity | Dec 31 | Dec 31 | June 30 | May 1 |
Equity Income Fund–Advisor Class | Equity | Dec 31 | Dec 31 | June 30 | May 1 |
Equity Income Fund–R Class | Equity | Dec 31 | Dec 31 | June 30 | May 1 |
Equity Index 500 | Index Equity | Dec 31 | Dec 31 | June 30 | May 1 |
European Stock | International Equity | Oct 31 | Oct 31 | Apr 30 | March 1 |
Extended Equity Market Index | Index Equity | Dec 31 | Dec 31 | June 30 | May 1 |
Financial Services | Equity | Dec 31 | Dec 31 | June 30 | May 1 |
Floating Rate | Taxable Bond | May 31 | May 31 | Nov 30 | Oct 1 |
Floating Rate Fund–Advisor Class | Taxable Bond | May 31 | May 31 | Nov 30 | Oct 1 |
Floating Rate Multi-Sector Account Portfolio | Taxable Bond | Feb 28 | Feb 28 | Aug 30 | July 1 |
Georgia Tax-Free Bond | State Tax-Free Bond | Feb 28 | Feb 28 | Aug 30 | July 1 |
Global Allocation | Asset Allocation | Oct 31 | Oct 31 | Apr 30 | March 1 |
Global Allocation Fund–Advisor Class | Asset Allocation | Oct 31 | Oct 31 | Apr 30 | March 1 |
Global Growth Stock | International Equity | Oct 31 | Oct 31 | Apr 30 | March 1 |
Global Growth Stock Fund–Advisor Class | International Equity | Oct 31 | Oct 31 | Apr 30 | March 1 |
Global High Income Bond | International Bond | Dec 31 | Dec 31 | June 30 | May 1 |
Global High Income Bond Fund–Advisor Class | International Bond | Dec 31 | Dec 31 | June 30 | May 1 |
Global Industrials | International Equity | Dec 31 | Dec 31 | June 30 | May 1 |
Global Real Estate | International Equity | Dec 31 | Dec 31 | June 30 | May 1 |
Global Real Estate Fund–Advisor Class | International Equity | Dec 31 | Dec 31 | June 30 | May 1 |
Global Stock | International Equity | Oct 31 | Oct 31 | Apr 30 | March 1 |
Global Stock Fund–Advisor Class | International Equity | Oct 31 | Oct 31 | Apr 30 | March 1 |
Global Technology | Equity | Dec 31 | Dec 31 | June 30 | May 1 |
Global Unconstrained Bond | International Bond | Dec 31 | Dec 31 | June 30 | May 1 |
Global Unconstrained Bond Fund–Advisor Class | International Bond | Dec 31 | Dec 31 | June 30 | May 1 |
GNMA | Taxable Bond | May 31 | May 31 | Nov 30 | Oct 1 |
TRP Government Reserve Investment | Taxable Money | May 31 | May 31 | Nov 30 | Oct 1 |
Growth & Income | Equity | Dec 31 | Dec 31 | June 30 | May 1 |
Growth Stock | Equity | Dec 31 | Dec 31 | June 30 | May 1 |
Growth Stock Fund–Advisor Class | Equity | Dec 31 | Dec 31 | June 30 | May 1 |
Growth Stock Fund–R Class | Equity | Dec 31 | Dec 31 | June 30 | May 1 |
Health Sciences | Equity | Dec 31 | Dec 31 | June 30 | May 1 |
High Yield | Taxable Bond | May 31 | May 31 | Nov 30 | Oct 1 |
High Yield Fund–Advisor Class | Taxable Bond | May 31 | May 31 | Nov 30 | Oct 1 |
High Yield Multi-Sector Account Portfolio | Taxable Bond | Feb 28 | Feb 28 | Aug 30 | July 1 |
Inflation Focused Bond | Taxable Bond | May 31 | May 31 | Nov 30 | Oct 1 |
Inflation Protected Bond | Taxable Bond | May 31 | May 31 | Nov 30 | Oct 1 |
Institutional Africa & Middle East | International Equity | Oct 31 | Oct 31 | Apr 30 | March 1 |
9
Fund | Fund Category | Fiscal Year End | Annual Report Date | Semiannual Report Date | Prospectus Date |
Institutional Core Plus | Taxable Bond | May 31 | May 31 | Nov 30 | Oct 1 |
Institutional Core Plus-F Class | Taxable Bond | May 31 | May 31 | Nov 30 | Oct 1 |
Institutional Credit Opportunities | Taxable Bond | May 31 | May 31 | Nov 30 | Oct 1 |
Institutional Emerging Markets Bond | International Bond | Dec 31 | Dec 31 | June 30 | May 1 |
Institutional Emerging Markets Equity | International Equity | Oct 31 | Oct 31 | Apr 30 | March 1 |
Institutional Floating Rate | Taxable Bond | May 31 | May 31 | Nov 30 | Oct 1 |
Institutional Floating Rate-F Class | Taxable Bond | May 31 | May 31 | Nov 30 | Oct 1 |
Institutional Frontier Markets Equity | International Equity | Oct 31 | Oct 31 | Apr 30 | March 1 |
Institutional Global Focused Growth Equity | International Equity | Oct 31 | Oct 31 | Apr 30 | March 1 |
Institutional Global Growth Equity | International Equity | Oct 31 | Oct 31 | Apr 30 | March 1 |
Institutional Global Multi-Sector Bond | International Bond | May 31 | May 31 | Nov 30 | Oct 1 |
Institutional Global Value Equity | International Equity | Oct 31 | Oct 31 | Apr 30 | March 1 |
Institutional High Yield | Taxable Bond | May 31 | May 31 | Nov 30 | Oct 1 |
Institutional International Bond | International Bond | Dec 31 | Dec 31 | June 30 | May 1 |
Institutional International Concentrated Equity | International Equity | Oct 31 | Oct 31 | Apr 30 | March 1 |
Institutional International Core Equity | International Equity | Oct 31 | Oct 31 | Apr 30 | March 1 |
Institutional International Growth Equity | International Equity | Oct 31 | Oct 31 | Apr 30 | March 1 |
Institutional Large-Cap Core Growth | Equity | Dec 31 | Dec 31 | June 30 | May 1 |
Institutional Large-Cap Growth | Equity | Dec 31 | Dec 31 | June 30 | May 1 |
Institutional Large-Cap Value | Equity | Dec 31 | Dec 31 | June 30 | May 1 |
Institutional Long Duration Credit | Taxable Bond | May 31 | May 31 | Nov 30 | Oct 1 |
Institutional Mid-Cap Equity Growth | Equity | Dec 31 | Dec 31 | June 30 | May 1 |
Institutional Small-Cap Stock | Equity | Dec 31 | Dec 31 | June 30 | May 1 |
Institutional U.S. Structured Research | Equity | Dec 31 | Dec 31 | June 30 | May 1 |
Intermediate Tax-Free High Yield | Tax-Free Bond | Feb 28 | Feb 28 | Aug 30 | July 1 |
Intermediate Tax-Free High Yield–Advisor Class | Tax-Free Bond | Feb 28 | Feb 28 | Aug 30 | July 1 |
International Bond | International Bond | Dec 31 | Dec 31 | June 30 | May 1 |
International Bond Fund–Advisor Class | International Bond | Dec 31 | Dec 31 | June 30 | May 1 |
International Concentrated Equity Fund | International Equity | Oct 31 | Oct 31 | Apr 30 | March 1 |
International Concentrated Equity Fund–Advisor Class | International Equity | Oct 31 | Oct 31 | Apr 30 | March 1 |
10
Fund | Fund Category | Fiscal Year End | Annual Report Date | Semiannual Report Date | Prospectus Date |
International Discovery | International Equity | Oct 31 | Oct 31 | Apr 30 | March 1 |
International Equity Index | International Equity | Oct 31 | Oct 31 | Apr 30 | March 1 |
International Growth & Income | International Equity | Oct 31 | Oct 31 | Apr 30 | March 1 |
International Growth & Income Fund–Advisor Class | International Equity | Oct 31 | Oct 31 | Apr 30 | March 1 |
International Growth & Income Fund–R Class | International Equity | Oct 31 | Oct 31 | Apr 30 | March 1 |
International Stock | International Equity | Oct 31 | Oct 31 | Apr 30 | March 1 |
International Stock Fund–Advisor Class | International Equity | Oct 31 | Oct 31 | Apr 30 | March 1 |
International Stock Fund–R Class | International Equity | Oct 31 | Oct 31 | Apr 30 | March 1 |
Investment-Grade Corporate Multi-Sector Account Portfolio | Taxable Bond | Feb 28 | Feb 28 | Aug 30 | July 1 |
Japan | International Equity | Oct 31 | Oct 31 | Apr 30 | March 1 |
Latin America | International Equity | Oct 31 | Oct 31 | Apr 30 | March 1 |
Maryland Short-Term Tax-Free Bond | State Tax-Free Bond | Feb 28 | Feb 28 | Aug 30 | July 1 |
Maryland Tax-Free Bond | State Tax-Free Bond | Feb 28 | Feb 28 | Aug 30 | July 1 |
Maryland Tax-Free Money | State Tax-Free Money | Feb 28 | Feb 28 | Aug 30 | July 1 |
Media & Telecommunications | Equity | Dec 31 | Dec 31 | June 30 | May 1 |
Mid-Cap Growth | Equity | Dec 31 | Dec 31 | June 30 | May 1 |
Mid-Cap Growth Fund–Advisor Class | Equity | Dec 31 | Dec 31 | June 30 | May 1 |
Mid-Cap Growth Fund–R Class | Equity | Dec 31 | Dec 31 | June 30 | May 1 |
Mid-Cap Value | Equity | Dec 31 | Dec 31 | June 30 | May 1 |
Mid-Cap Value Fund–Advisor Class | Equity | Dec 31 | Dec 31 | June 30 | May 1 |
Mid-Cap Value Fund–R Class | Equity | Dec 31 | Dec 31 | June 30 | May 1 |
Mortgage-Backed Securities Multi-Sector Account Portfolio | Taxable Bond | Feb 28 | Feb 28 | Aug 30 | July 1 |
New America Growth | Equity | Dec 31 | Dec 31 | June 30 | May 1 |
New America Growth Fund–Advisor Class | Equity | Dec 31 | Dec 31 | June 30 | May 1 |
New Asia | International Equity | Oct 31 | Oct 31 | Apr 30 | March 1 |
New Era | Equity | Dec 31 | Dec 31 | June 30 | May 1 |
New Horizons | Equity | Dec 31 | Dec 31 | June 30 | May 1 |
New Income | Taxable Bond | May 31 | May 31 | Nov 30 | Oct 1 |
New Income Fund–Advisor Class | Taxable Bond | May 31 | May 31 | Nov 30 | Oct 1 |
New Income Fund–R Class | Taxable Bond | May 31 | May 31 | Nov 30 | Oct 1 |
New Jersey Tax-Free Bond | State Tax-Free Bond | Feb 28 | Feb 28 | Aug 30 | July 1 |
New York Tax-Free Bond | State Tax-Free Bond | Feb 28 | Feb 28 | Aug 30 | July 1 |
New York Tax-Free Money | State Tax-Free Money | Feb 28 | Feb 28 | Aug 30 | July 1 |
Overseas Stock | International Equity | Oct 31 | Oct 31 | Apr 30 | March 1 |
Personal Strategy Balanced | Asset Allocation | May 31 | May 31 | Nov 30 | Oct 1 |
11
Fund | Fund Category | Fiscal Year End | Annual Report Date | Semiannual Report Date | Prospectus Date |
Personal Strategy Growth | Asset Allocation | May 31 | May 31 | Nov 30 | Oct 1 |
Personal Strategy Income | Asset Allocation | May 31 | May 31 | Nov 30 | Oct 1 |
Prime Reserve | Taxable Money | May 31 | May 31 | Nov 30 | Oct 1 |
Real Assets Fund | Equity | Dec 31 | Dec 31 | June 30 | May 1 |
Real Estate | Equity | Dec 31 | Dec 31 | June 30 | May 1 |
Real Estate Fund–Advisor Class | Equity | Dec 31 | Dec 31 | June 30 | May 1 |
TRP Reserve Investment | Taxable Money | May 31 | May 31 | Nov 30 | Oct 1 |
Retirement 2005 | Asset Allocation | May 31 | May 31 | Nov 30 | Oct 1 |
Retirement 2005 Fund–Advisor Class | Asset Allocation | May 31 | May 31 | Nov 30 | Oct 1 |
Retirement 2005 Fund–R Class | Asset Allocation | May 31 | May 31 | Nov 30 | Oct 1 |
Retirement 2010 | Asset Allocation | May 31 | May 31 | Nov 30 | Oct 1 |
Retirement 2010 Fund–Advisor Class | Asset Allocation | May 31 | May 31 | Nov 30 | Oct 1 |
Retirement 2010 Fund–R Class | Asset Allocation | May 31 | May 31 | Nov 30 | Oct 1 |
Retirement 2015 | Asset Allocation | May 31 | May 31 | Nov 30 | Oct 1 |
Retirement 2015 Fund–Advisor Class | Asset Allocation | May 31 | May 31 | Nov 30 | Oct 1 |
Retirement 2015 Fund–R Class | Asset Allocation | May 31 | May 31 | Nov 30 | Oct 1 |
Retirement 2020 | Asset Allocation | May 31 | May 31 | Nov 30 | Oct 1 |
Retirement 2020 Fund–Advisor Class | Asset Allocation | May 31 | May 31 | Nov 30 | Oct 1 |
Retirement 2020 Fund–R Class | Asset Allocation | May 31 | May 31 | Nov 30 | Oct 1 |
Retirement 2025 | Asset Allocation | May 31 | May 31 | Nov 30 | Oct 1 |
Retirement 2025 Fund–Advisor Class | Asset Allocation | May 31 | May 31 | Nov 30 | Oct 1 |
Retirement 2025 Fund–R Class | Asset Allocation | May 31 | May 31 | Nov 30 | Oct 1 |
Retirement 2030 | Asset Allocation | May 31 | May 31 | Nov 30 | Oct 1 |
Retirement 2030 Fund–Advisor Class | Asset Allocation | May 31 | May 31 | Nov 30 | Oct 1 |
Retirement 2030 Fund–R Class | Asset Allocation | May 31 | May 31 | Nov 30 | Oct 1 |
Retirement 2035 | Asset Allocation | May 31 | May 31 | Nov 30 | Oct 1 |
Retirement 2035 Fund–Advisor Class | Asset Allocation | May 31 | May 31 | Nov 30 | Oct 1 |
Retirement 2035 Fund–R Class | Asset Allocation | May 31 | May 31 | Nov 30 | Oct 1 |
Retirement 2040 | Asset Allocation | May 31 | May 31 | Nov 30 | Oct 1 |
Retirement 2040 Fund–Advisor Class | Asset Allocation | May 31 | May 31 | Nov 30 | Oct 1 |
Retirement 2040 Fund–R Class | Asset Allocation | May 31 | May 31 | Nov 30 | Oct 1 |
Retirement 2045 | Asset Allocation | May 31 | May 31 | Nov 30 | Oct 1 |
Retirement 2045 Fund–Advisor Class | Asset Allocation | May 31 | May 31 | Nov 30 | Oct 1 |
Retirement 2045 Fund–R Class | Asset Allocation | May 31 | May 31 | Nov 30 | Oct 1 |
Retirement 2050 | Asset Allocation | May 31 | May 31 | Nov 30 | Oct 1 |
12
Fund | Fund Category | Fiscal Year End | Annual Report Date | Semiannual Report Date | Prospectus Date |
Retirement 2050 Fund–Advisor Class | Asset Allocation | May 31 | May 31 | Nov 30 | Oct 1 |
Retirement 2050 Fund–R Class | Asset Allocation | May 31 | May 31 | Nov 30 | Oct 1 |
Retirement 2055 | Asset Allocation | May 31 | May 31 | Nov 30 | Oct 1 |
Retirement 2055 Fund–Advisor Class | Asset Allocation | May 31 | May 31 | Nov 30 | Oct 1 |
Retirement 2055 Fund–R Class | Asset Allocation | May 31 | May 31 | Nov 30 | Oct 1 |
Retirement 2060 | Asset Allocation | May 31 | May 31 | Nov 30 | Oct 1 |
Retirement 2060 Fund–Advisor Class | Asset Allocation | May 31 | May 31 | Nov 30 | Oct 1 |
Retirement 2060 Fund–R Class | Asset Allocation | May 31 | May 31 | Nov 30 | Oct 1 |
Retirement Balanced | Asset Allocation | May 31 | May 31 | Nov 30 | Oct 1 |
Retirement Balanced Fund–Advisor Class | Asset Allocation | May 31 | May 31 | Nov 30 | Oct 1 |
Retirement Balanced Fund–R Class | Asset Allocation | May 31 | May 31 | Nov 30 | Oct 1 |
Science & Technology | Equity | Dec 31 | Dec 31 | June 30 | May 1 |
Science & Technology Fund–Advisor Class | Equity | Dec 31 | Dec 31 | June 30 | May 1 |
Short-Term Bond | Taxable Bond | May 31 | May 31 | Nov 30 | Oct 1 |
Short-Term Bond Fund–Advisor Class | Taxable Bond | May 31 | May 31 | Nov 30 | Oct 1 |
Short-Term Government Reserve | Taxable Bond | May 31 | May 31 | Nov 30 | Oct 1 |
Short-Term Reserve | Taxable Bond | May 31 | May 31 | Nov 30 | Oct 1 |
Small-Cap Stock | Equity | Dec 31 | Dec 31 | June 30 | May 1 |
Small-Cap Stock Fund–Advisor Class | Equity | Dec 31 | Dec 31 | June 30 | May 1 |
Small-Cap Value | Equity | Dec 31 | Dec 31 | June 30 | May 1 |
Small-Cap Value Fund–Advisor Class | Equity | Dec 31 | Dec 31 | June 30 | May 1 |
Spectrum Growth | Asset Allocation | Dec 31 | Dec 31 | June 30 | May 1 |
Spectrum Income | Asset Allocation | Dec 31 | Dec 31 | June 30 | May 1 |
Spectrum International | Asset Allocation | Dec 31 | Dec 31 | June 30 | May 1 |
Strategic Income | Taxable Bond | May 31 | May 31 | Nov 30 | Oct 1 |
Strategic Income Fund–Advisor Class | Taxable Bond | May 31 | May 31 | Nov 30 | Oct 1 |
Summit Cash Reserves | Taxable Money | Oct 31 | Oct 31 | Apr 30 | March 1 |
Summit Municipal Income | Tax-Free Bond | Oct 31 | Oct 31 | Apr 30 | March 1 |
Summit Municipal Income–Advisor Class | Tax-Free Bond | Oct 31 | Oct 31 | Apr 30 | March 1 |
Summit Municipal Intermediate | Tax-Free Bond | Oct 31 | Oct 31 | Apr 30 | March 1 |
Summit Municipal Intermediate–Advisor Class | Tax-Free Bond | Oct 31 | Oct 31 | Apr 30 | March 1 |
Summit Municipal Money Market | Tax-Free Money | Oct 31 | Oct 31 | Apr 30 | March 1 |
Target Retirement 2005 | Asset Allocation | May 31 | May 31 | Nov 30 | Oct 1 |
Target Retirement 2005 Fund–Advisor Class | Asset Allocation | May 31 | May 31 | Nov 30 | Oct 1 |
Target Retirement 2010 | Asset Allocation | May 31 | May 31 | Nov 30 | Oct 1 |
13
Fund | Fund Category | Fiscal Year End | Annual Report Date | Semiannual Report Date | Prospectus Date |
Target Retirement 2010 Fund–Advisor Class | Asset Allocation | May 31 | May 31 | Nov 30 | Oct 1 |
Target Retirement 2015 | Asset Allocation | May 31 | May 31 | Nov 30 | Oct 1 |
Target Retirement 2015 Fund–Advisor Class | Asset Allocation | May 31 | May 31 | Nov 30 | Oct 1 |
Target Retirement 2020 | Asset Allocation | May 31 | May 31 | Nov 30 | Oct 1 |
Target Retirement 2020 Fund–Advisor Class | Asset Allocation | May 31 | May 31 | Nov 30 | Oct 1 |
Target Retirement 2025 | Asset Allocation | May 31 | May 31 | Nov 30 | Oct 1 |
Target Retirement 2025 Fund–Advisor Class | Asset Allocation | May 31 | May 31 | Nov 30 | Oct 1 |
Target Retirement 2030 | Asset Allocation | May 31 | May 31 | Nov 30 | Oct 1 |
Target Retirement 2030 Fund–Advisor Class | Asset Allocation | May 31 | May 31 | Nov 30 | Oct 1 |
Target Retirement 2035 | Asset Allocation | May 31 | May 31 | Nov 30 | Oct 1 |
Target Retirement 2035 Fund–Advisor Class | Asset Allocation | May 31 | May 31 | Nov 30 | Oct 1 |
Target Retirement 2040 | Asset Allocation | May 31 | May 31 | Nov 30 | Oct 1 |
Target Retirement 2040 Fund–Advisor Class | Asset Allocation | May 31 | May 31 | Nov 30 | Oct 1 |
Target Retirement 2045 | Asset Allocation | May 31 | May 31 | Nov 30 | Oct 1 |
Target Retirement 2045 Fund–Advisor Class | Asset Allocation | May 31 | May 31 | Nov 30 | Oct 1 |
Target Retirement 2050 | Asset Allocation | May 31 | May 31 | Nov 30 | Oct 1 |
Target Retirement 2050 Fund–Advisor Class | Asset Allocation | May 31 | May 31 | Nov 30 | Oct 1 |
Target Retirement 2055 | Asset Allocation | May 31 | May 31 | Nov 30 | Oct 1 |
Target Retirement 2055 Fund–Advisor Class | Asset Allocation | May 31 | May 31 | Nov 30 | Oct 1 |
Target Retirement 2060 | Asset Allocation | May 31 | May 31 | Nov 30 | Oct 1 |
Target Retirement 2060 Fund–Advisor Class | Asset Allocation | May 31 | May 31 | Nov 30 | Oct 1 |
Tax-Efficient Equity | Equity | Feb 28 | Feb 28 | Aug 30 | July 1 |
Tax-Exempt Money | Tax-Free Money | Feb 28 | Feb 28 | Aug 30 | July 1 |
Tax-Free High Yield | Tax-Free Bond | Feb 28 | Feb 28 | Aug 30 | July 1 |
Tax-Free High Yield–Advisor Class | Tax-Free Bond | Feb 28 | Feb 28 | Aug 30 | July 1 |
Tax-Free Income | Tax-Free Bond | Feb 28 | Feb 28 | Aug 30 | July 1 |
Tax-Free Income Fund–Advisor Class | Tax Free Bond | Feb 28 | Feb 28 | Aug 30 | July 1 |
Tax-Free Short-Intermediate | Tax-Free Bond | Feb 28 | Feb 28 | Aug 30 | July 1 |
Tax-Free Short-Intermediate–Advisor Class | Tax-Free Bond | Feb 28 | Feb 28 | Aug 30 | July 1 |
Tax-Free Ultra Short-Term Bond | Tax-Free Bond | Feb 28 | Feb 28 | Aug 30 | July 1 |
Total Equity Market Index | Index Equity | Dec 31 | Dec 31 | June 30 | May 1 |
U.S. Bond Enhanced Index | Index Bond | Oct 31 | Oct 31 | Apr 30 | March 1 |
U.S. Large-Cap Core | Equity | Dec 31 | Dec 31 | June 30 | May 1 |
U.S. Large-Cap Core Fund–Advisor Class | Equity | Dec 31 | Dec 31 | June 30 | May 1 |
U.S. Treasury Intermediate | Taxable Bond | May 31 | May 31 | Nov 30 | Oct 1 |
U.S. Treasury Long-Term | Taxable Bond | May 31 | May 31 | Nov 30 | Oct 1 |
U.S. Treasury Money | Taxable Money | May 31 | May 31 | Nov 30 | Oct 1 |
Ultra Short-Term Bond | Taxable Bond | May 31 | May 31 | Nov 30 | Oct 1 |
14
Fund | Fund Category | Fiscal Year End | Annual Report Date | Semiannual Report Date | Prospectus Date |
Value | Equity | Dec 31 | Dec 31 | June 30 | May 1 |
Value Fund–Advisor Class | Equity | Dec 31 | Dec 31 | June 30 | May 1 |
Virginia Tax-Free Bond | State Tax-Free Bond | Feb 28 | Feb 28 | Aug 30 | July 1 |
The officers and directors (the term “director” is used to refer to directors or trustees, as applicable) of the Price Funds are listed on the following pages. Unless otherwise noted, the address of each is 100 East Pratt Street, Baltimore, Maryland 21202.
Each fund is overseen by a Board of Directors/Trustees (“Board”) that meets regularly to review a wide variety of matters affecting or potentially affecting the funds, including performance, investment programs, compliance matters, advisory fees and expenses, service providers, and business and regulatory affairs. The Boards elect the funds’ officers and are responsible for performing various duties imposed on them by the 1940 Act, the laws of Maryland or Massachusetts, and other applicable laws. At least 75% of each Board’s members are independent of T. Rowe Price and its affiliates. The directors who are also employees or officers of T. Rowe Price are considered to be inside or interested directors because of their relationships with T. Rowe Price and its affiliates. Each inside director and officer (except as indicated in the tables setting forth the directors’ and officers’ principal occupations during the past five years) has been an employee of T. Rowe Price or its affiliates for five or more years. The Boards normally hold five regularly scheduled formal meetings during each calendar year. Although the Boards have direct responsibility over various matters (such as approval of advisory contracts and review of fund performance), each Board also exercises certain of its oversight responsibilities through several committees that it has established and which report back to the full Board. The Boards believe that a committee structure is an effective means to permit directors to focus on particular operations or issues affecting the funds, including risk oversight. Each Board currently has three standing committees, a Committee of Independent Directors, a Joint Audit Committee, and an Executive Committee, which are described in greater detail in the following paragraphs.
Edward C. Bernard, an inside director, serves as the Chairman of the Board of each fund. The independent directors of each fund have designated a Lead Independent Director, who functions as a liaison between the Chairman of the Board and the other independent directors. The Lead Independent Director presides at all executive sessions of the independent directors, reviews and provides input on Board meeting agendas and materials, and typically represents the independent directors in discussions with T. Rowe Price management. Anthony W. Deering currently serves as Lead Independent Director of each Board. Each fund’s Board has determined that its leadership and committee structure is appropriate because the Board believes that it sets the proper tone for the relationship between the fund, on the one hand, and T. Rowe Price or its affiliates and the fund’s other principal service providers, on the other, and facilitates the exercise of the Board’s independent judgment in evaluating and managing the relationships. In addition, the structure efficiently allocates responsibility among committees and the full Board. The same independent directors currently serve on the Boards of all of the Price Funds. This approach is designed to provide effective governance by exposing the independent directors to a wider range of business issues and market trends, allowing the directors to better share their knowledge, background and experience, and permitting the Boards to operate more efficiently, particularly with respect to matters common to all Price Funds.
The Committee of Independent Directors, which consists of all of the independent directors of the funds, is responsible for, among other things, seeking, reviewing and selecting candidates to fill vacancies on each fund’s Board, periodically evaluating the compensation payable to the independent directors, and performing certain functions with respect to the governance of the funds. The Lead Independent Director serves as chairman of the committee. The committee will consider written recommendations from shareholders for possible nominees for director. Shareholders should submit their recommendations to the secretary of the funds. The committee met six times in 2014 in conjunction with the full Board.
15
The Joint Audit Committee consists of only independent directors. The current members of the committee are Bruce W. Duncan, Robert J. Gerrard, Jr., Paul F. McBride, Cecilia E. Rouse, and John G. Schreiber. Mr. Gerrard serves as chairman of the committee and Mr. Duncan is considered a financial expert. The Joint Audit Committee oversees the pricing processes for the Price Funds and holds three regular meetings during each fiscal year. Two of the meetings include the attendance of the independent registered public accounting firm of the Price Funds as the Joint Audit Committee reviews: (1) the services provided; (2) the findings of the most recent audits; (3) management’s response to the findings of the most recent audits; (4) the scope of the audits to be performed; (5) the accountants’ fees; and (6) any accounting questions relating to particular areas of the Price Funds’ operations or the operations of parties dealing with the Price Funds, as circumstances indicate. A third meeting is devoted primarily to a review of the risk management program of the funds’ investment adviser. The Joint Audit Committee met three times in 2014.
The Executive Committee, which consists of each fund’s inside directors, has been authorized by its respective Board to exercise all powers of the Boards of the funds in the intervals between regular meetings of the Boards, except for those powers prohibited by statute from being delegated. All actions of the Executive Committee must be approved in advance by one independent director and reviewed after the fact by the full Board. The Executive Committee for each fund does not hold regularly scheduled meetings. The Executive Committee did not need to take any action on behalf of any funds during 2014.
Like other mutual funds, the funds are subject to risks, including investment, compliance, operational, and valuation risks, among others. The Boards oversee risk as part of their oversight of the funds. Risk oversight is addressed as part of various Board and committee activities. The Board, directly or through its committees, interacts with and reviews reports from, among others, the investment adviser or its affiliates, the funds’ Chief Compliance Officer, the funds’ independent registered public accounting firm, legal counsel, and internal auditors for T. Rowe Price or its affiliates, as appropriate, regarding risks faced by the funds and the risk management programs of the investment adviser and certain other service providers. Also, the Joint Audit Committee receives periodic reports from members of the advisers’ Risk Management Oversight Committee on the significant risks inherent to the advisers’ business, including aggregate investment risks, reputational risk, business continuity risk, and operational risk. The actual day-to-day risk management functions with respect to the funds are subsumed within the responsibilities of the investment adviser, its affiliates that serve as investment sub-advisers to the funds, and other service providers (depending on the nature of the risk) that carry out the funds’ investment management and business affairs. Although the risk management policies of T. Rowe Price and its affiliates, and the funds’ other service providers, are reasonably designed to be effective, those policies and their implementation vary among service providers over time, and there is no guarantee that they will always be effective. Not all risks that may affect the funds can be identified. Processes and controls developed may not eliminate or mitigate the occurrence or effects of all risks, and some risks may be simply beyond any control of the funds, T. Rowe Price and its affiliates, or other service providers.
Each director’s experience, qualifications, attributes, or skills, on an individual basis and in combination with those of the other directors, has led to the conclusion that each director should serve on the Boards of the Price Funds. Attributes common to all directors include the ability to review critically, evaluate, question, and discuss information provided to them, to interact effectively with the funds’ management and counsel and the various service providers to the funds, and to exercise reasonable business judgment in the performance of their duties as directors. In addition, the actual service and commitment of the directors during their tenure on the funds’ Boards is taken into consideration in concluding that each should continue to serve. A director’s ability to perform his or her duties effectively may have been attained through his or her educational background or professional training; business, consulting, public service, or academic positions; experience from service as a director of the Price Funds, public companies, non-profit entities, or other organizations; or other experiences. Each director brings a diverse perspective to the Boards. Set forth below is a brief discussion of the specific experience, qualifications, attributes, or skills of each director that led to the conclusion that he or she should serve as a director.
Edward C. Bernard has been an inside director, and Chairman of the Board, of all the Price Funds for the past 8 years. Mr. Bernard has more than 25 years of experience in the investment management industry, all of which have been with T. Rowe Price. In addition to his responsibilities with T. Rowe Price and the Price
16
Funds, Mr. Bernard served as chairman (from 2009 to 2011) and is currently the vice chairman of the board of governors of the Investment Company Institute, the national trade association for the mutual fund industry.
William R. Brody has been an independent director of the Price Funds for the past 5 years. Dr. Brody has substantial experience in the public health and research fields, as well as academia. He previously served as President of the Johns Hopkins University, as well as on the boards of John Hopkins University, Johns Hopkins Health System, Salk Institute for Biological Studies, IBM, and Novartis. He has also served on the boards of a number of other private companies and non-profit entities, including Kool Smiles, Novamed, Stanford University, and the Commonwealth Fund, which funds health services research.
Anthony W. Deering has been an independent director of the Price Funds for more than 30 years. He currently serves as the Lead Independent Director and was a member of the Joint Audit Committee until September 2014. Mr. Deering brings a wealth of financial services and investment management experience to the Boards. He is the former chair and chief executive officer of the Rouse Company and has also served on the boards of a number of public companies, including Deutsche Bank North America, Vornado Realty Trust, Brixmor Real Estate Investment Trust, Mercantile Bank, and Under Armour. He has also served on the boards of a number of private companies and non-profit entities, including the Investment Company Institute, Baltimore Museum of Art, Parks & People Foundation, The Rouse Company Foundation, and The Charlesmead Foundation among others.
Donald W. Dick, Jr. has been an independent director of the Price Funds for more than 30 years. He has significant investment and business experience from serving as a principal in a private equity firm and has previously served on the boards of manufacturing, construction, publishing, and advertising companies in the U.S. and Europe.
Bruce W. Duncan has substantial experience in the fields of commercial real estate and property management. He currently serves as chief executive officer and director of First Industrial Realty Trust and has held a variety of senior roles and board positions with Starwood Hotels & Resorts. He has been an independent director of the Price Funds since October 2013 and, in September 2014, he became a member of the Joint Audit Committee.
Robert J. Gerrard, Jr. has been an independent director of certain Price Funds since 2012 (and all Price Funds since October 2013), and currently serves as a member of the Joint Audit Committee. He has substantial legal and business experience in the industries relating to communications and interactive data services. He has served on the board and compensation committee for Syniverse Holdings and as general counsel to Scripps Networks.
Michael C. Gitlin had been an inside director of the domestic fixed income Price Funds since 2010, but he resigned from T. Rowe Price and as a director of the Price Funds effective January 23, 2015. He joined T. Rowe Price in 2007, where he initially served as the Global Head of Trading until becoming the Director of Fixed Income in 2009. Prior to joining T. Rowe Price, he held several roles in the securities industry, including Head of U.S. Equity Sales at Citigroup Global Markets. On February 3, 2015, Edward A. Wiese was elected to replace Mr. Gitlin as an inside director of the domestic fixed income Price Funds.
Karen N. Horn has been an independent director of the Price Funds for more than 10 years. Ms. Horn has substantial experience in the financial services industry and the arts. She is a limited partner and senior managing director of Brock Capital Group, and has served on the boards of a number of public companies, including Eli Lilly, Simon Property Group, the Federal National Mortgage Association, and Norfolk Southern. She has also served on the boards of a number of private companies and non-profit entities, including the National Bureau of Economic Research, Council on Foreign Relations, and the Florence Griswold Museum.
Paul F. McBride has served in various management and senior leadership roles with the Black & Decker Corporation and General Electric Company. He led businesses in the materials, industrial, and consumer durable segments. He also has significant global experience. He has served on the boards of a number of private and non-profit entities, including Dunbar Armored, Vizzia Technologies, Gilman School, and Living Classrooms Foundation. He has been an independent director of the Price Funds since October 2013, and in September 2014, he became a member of the Joint Audit Committee.
17
Brian C. Rogers has been an inside director of the domestic equity and international Price Funds for more than 20 years. Mr. Rogers has served in a variety of senior leadership roles since joining T. Rowe Price in 1982. Prior to that, he was employed by Bankers Trust Company. In addition to his various offices held with T. Rowe Price and its affiliates, he is a Chartered Financial Analyst and serves as the portfolio manager of the Equity Income Fund and Equity Income Portfolio, and as a member of the T. Rowe Price Asset Allocation Committee.
Cecilia E. Rouse has been an independent director of certain Price Funds since 2012 (and all Price Funds since October 2013), and became a member of the Joint Audit Committee in September 2014. Dr. Rouse has extensive experience in the fields of higher education and economic research. She has served in a variety of roles at Princeton University, including as a dean, professor, and leader of economic research. She has also served on the board of MDRC, a non-profit education and social policy organization dedicated to improving programs and policies that affect the poor, and as a member of numerous entities, including the American Economic Association, National Bureau of Economic Research, National Academy of Education, and the Association of Public Policy and Management Policy Council.
John G. Schreiber has been an independent director of the Price Funds for more than 20 years and currently serves as a member of the Joint Audit Committee. He has significant experience investing in real estate transactions and brings substantial financial services and investment management experience to the boards. He is the President of Centaur Capital Partners, Inc. and is a Partner and Co-Founder of Blackstone Real Estate Advisors. He previously served as chairman and chief executive officer of JMB Urban Development Co. and Executive Vice President of JMB Realty Corporation. Mr. Schreiber currently serves on the boards of JMB Realty Corporation, Brixmor Shopping Centers, Hilton Worldwide, Blackstone Mortgage Trust, and Hudson Pacific Properties, and is a past board member of Urban Shopping Centers, Inc., Host Hotels & Resorts, Inc., The Rouse Company, General Growth Properties, and AMLI Residential Properties Trust.
Mark R. Tercek has been an independent director of the Price Funds for the past 5 years and served as chairman of the Joint Audit Committee until September 2014. He brings substantial financial services experience to the boards. He was a managing director of Goldman Sachs and is currently president and chief executive officer of The Nature Conservancy.
Edward A. Wiese was elected as an inside director of the domestic fixed income Price Funds on February 3, 2015, replacing Michael C. Gitlin. Mr. Wiese is a Chartered Financial Analyst with over 30 years of investment experience, all of which have been with T. Rowe Price. He currently serves as the Director of Fixed Income for T. Rowe Price and as the Chairperson of the T. Rowe Price Fixed Income Steering Committee, as well as a portfolio manager for various short-term bond and low duration domestic bond strategies.
In addition, the following tables provide biographical information for the directors, along with their principal occupations and any directorships they have held of public companies and other investment companies during the past five years.
Independent Directors(a)
Name, Year of Birth, and Number | Principal
Occupation(s) | Directorships |
William R. Brody, M.D., Ph.D. 1944 165 portfolios | President and Trustee, Salk Institute for Biological Studies (2009 to present); Director, BioMed Realty Trust (2013 to present) | Novartis, Inc. (2009 to 2014); IBM (2007 to present) |
18
Name, Year of Birth, and Number | Principal
Occupation(s) | Directorships |
Anthony W. Deering 1945 165 portfolios | Chairman, Exeter Capital, LLC, a private investment firm (2004 to present); Director, Brixmor Real Estate Investment Trust (2012 to present); Director and Advisory Board Member, Deutsche Bank North America (2004 to present) | Under Armour (2008 to present); Brixmor Real Estate Investment Trust (2012 to present); Vornado Real Estate Investment Trust (2004 to 2012); Deutsche Bank North America (2004 to present) |
Donald W. Dick, Jr. 1943 165 portfolios | Principal, EuroCapital Partners, LLC, an acquisition and management advisory firm (1995 to present) | None |
Bruce W. Duncan 1951 165 portfolios | President, Chief Executive Officer, and Director, First Industrial Realty Trust, owner and operator of industrial properties (2009 to present); Chairman of the Board (2005 to present) and Director (1999 to present), Starwood Hotels & Resorts, hotel and leisure company | None |
Robert J. Gerrard, Jr. 1952 165 portfolios | Chairman of Compensation Committee, Syniverse Holdings, Inc., a provider of wireless voice and data services for telecommunications companies (2008 to 2011); Advisory Board Member, Pipeline Crisis/Winning Strategies, a collaborative working to improve opportunities for young African Americans (1997 to present) | None |
Karen N. Horn 1943 165 portfolios | Limited Partner and Senior Managing Director, Brock Capital Group, an advisory and investment banking firm (2004 to present) | Eli Lilly and Company (1987 to present); Simon Property Group (2004 to present); Norfolk Southern (2008 to present) |
Paul F. McBride 1956 165 portfolios | Former Company Officer and Senior Vice President, Human Resources and Corporate Initiatives, Black & Decker Corporation (2004 to 2010) | None |
Cecilia E. Rouse, Ph.D. 1963 165 portfolios | Dean, Woodrow Wilson School (2012 to present); Professor and Researcher, Princeton University (1992 to present); Director, MDRC, a nonprofit education and social policy research organization (2011 to present); Member of National Academy of Education (2010 to present); Research Associate, National Bureau of Economic Research’s Labor Studies Program (2011 to present); Member of President’s Council of Economic Advisers (2009 to 2011); Chair of Committee on the Status of Minority Groups in the Economic Profession, American Economic Association (2012 to present) | None |
19
Name, Year of Birth, and Number | Principal
Occupation(s) | Directorships |
John G. Schreiber 1946 165 portfolios | Owner/President, Centaur Capital Partners, Inc., a real estate investment company (1991 to present); Cofounder and Partner, Blackstone Real Estate Advisors, L.P. (1992 to present); Director, Blackstone Mortgage Trust, a real estate finance company (2012 to present); Director and Chairman of the Board, Brixmor Property Group, Inc. (2013 to present); Director, Hilton Worldwide (2013 to present); Director, Hudson Pacific Properties (2014 to present) | General Growth Properties, Inc. (2010 to 2013) |
Mark R. Tercek 1957 165 portfolios | President and Chief Executive Officer, The Nature Conservancy (2008 to present) | None |
(a) All information about the independent directors was current as of December 31, 2014, except for the number of portfolios overseen, which is current as of the date of this SAI.
Inside Directors(a)
The following persons are considered inside directors of the funds because they also serve as employees of T. Rowe Price or its affiliates. No more than two inside directors serve as directors of any fund.
The Boards invite nominations from the funds’ investment adviser for persons to serve as inside directors, and the Board reviews and approves these nominations. Each of the current inside directors is a senior executive officer of T. Rowe Price and T. Rowe Price Group, Inc., as well as certain of their affiliates. Mr. Bernard has served as a director of all Price Funds and has been Chairman of the Board for all Price Funds since 2006. Mr. Gitlin had served as a director of certain Price Funds since 2010, but he resigned as director on January 23, 2015. Mr. Rogers has served as director of certain Price Funds since 2006. Mr. Wiese has served as director of certain Price Funds since February 3, 2015, at which point he was elected to succeed Mr. Gitlin. For each fund, the two inside directors serve as members of the fund’s Executive Committee. In addition, specific experience with respect to the inside directors’ occupations and directorships of public companies and other investment companies are set forth in the following table.
Name, Year
of Birth, and Number | Principal Occupation(s) | Directorships |
Edward C. Bernard 1956 165 portfolios | Director and Vice President, T. Rowe Price; Vice Chairman of the Board, Director, and Vice President, T. Rowe Price Group, Inc.; Chairman of the Board, Director, and President, T. Rowe Price Investment Services, Inc.; Chairman of the Board and Director, T. Rowe Price Retirement Plan Services, Inc., and T. Rowe Price Services, Inc.; Chairman of the Board, Chief Executive Officer, Director, and President, T. Rowe Price International and T. Rowe Price Trust Company Chairman of the Board, all funds | None |
20
Name, Year of Birth, and Number | Principal
Occupation(s) | Directorships |
Michael C. Gitlin(b) 1970 0 portfolios | Vice President, Price Hong Kong, Price Singapore, T. Rowe Price, T. Rowe Price Group, Inc., and T. Rowe Price International President, Multi-Sector Account Portfolios | None |
Brian C. Rogers; CFA, CIC 1955 111 portfolios | Chief Investment Officer, Director, and Vice President, T. Rowe Price; Chairman of the Board, Chief Investment Officer, Director, and Vice President, T. Rowe Price Group, Inc.; Vice President, T. Rowe Price Trust Company President, Equity Income Fund and Institutional Equity Funds; Vice President, Personal Strategy Funds, Retirement Funds, Spectrum Funds, and Value Fund | None |
Edward A. Wiese; CFA 1959 54 portfolios | Director and Vice President, T. Rowe Price Trust Company; Vice President, T. Rowe Price, T. Rowe Price Group, Inc., and T. Rowe Price International President, Short-Term Bond Fund and Multi-Sector Account Portfolios; Vice President, California Tax-Free Income Trust, State Tax-Free Income Trust, Summit Municipal Funds, Tax-Exempt Money Fund, and Tax-Free Short-Intermediate Fund | None |
(a) All information about the inside directors (other than Mr. Wiese) was current as of December 31, 2014 (the information about Mr. Wiese was current as of February 4, 2015), except for the number of portfolios overseen, which is current as of the date of this SAI.
(b) Michael C. Gitlin resigned as director effective January 23, 2015, and Edward A. Wiese was elected to replace him as inside director on February 3, 2015.
Funds-of-Funds Arrangements
The Board is responsible for overseeing the business and affairs of the Funds-of-Funds, which consists of the following: Spectrum Growth Fund, Spectrum Income, and Spectrum International Fund (collectively the “Spectrum Funds”); Retirement 2005 Fund, Retirement 2010 Fund, Retirement 2015 Fund, Retirement 2020 Fund, Retirement 2025 Fund, Retirement 2030 Fund, Retirement 2035 Fund, Retirement 2040 Fund, Retirement 2045 Fund, Retirement 2050 Fund, Retirement 2055 Fund, Retirement 2060 Fund and Retirement Balanced Fund (collectively the “RDFs”); and Target Retirement 2005 Fund, Target Retirement 2010 Fund, Target Retirement 2015 Fund, Target Retirement 2020 Fund, Target Retirement 2025 Fund, Target Retirement 2030 Fund, Target Retirement 2035 Fund, Target Retirement 2040 Fund, Target Retirement 2045 Fund, Target Retirement 2050 Fund, Target Retirement 2055 Fund, and Target Retirement 2060 Fund (collectively the “TRFs”). The Spectrum Funds, RDFs, and TRFs are referred to collectively as “Funds-of-Funds” and each fund individually a “Fund-of-Fund,” and where the policies that apply to both the RDFs and TRFs are identical, the RDFs and TRFs will be referred to collectively as “Retirement Funds.”
In exercising their responsibilities, the Boards, among other things, will refer to the policies, conditions, and guidelines included in an Exemptive Application (and accompanying Notice and Order) originally granted by the SEC in connection with the creation and operation of the Spectrum Funds. The RDFs and TRFs rely on this same Exemptive Application and Order because the order was designed to cover any Fund-of-Funds arrangements that operate in a similar manner to the Spectrum Funds.
21
In connection with the Exemptive Order, the various Price Funds in which the Funds-of-Funds invest (collectively, the “underlying Price Funds”) have entered into Special Servicing Agreements with T. Rowe Price and each respective Spectrum Fund, RDF, and/or TRF in which they invest. The Special Servicing Agreements provide that each underlying Price Fund in which a Fund-of-Funds invests will bear its proportionate share of the expenses of that Fund-of-Funds if, and to the extent that, the underlying Price Fund’s savings from the operation of the Fund-of-Funds exceed these expenses. T. Rowe Price has agreed to bear any expenses of each Fund-of-Fund that exceed the estimated savings to each of the underlying Price Funds. As a result, the Funds-of-Funds do not pay an investment management fee and will effectively pay no operating expenses at the Fund-of-Fund level, although shareholders of the Funds-of-Funds will still indirectly bear their proportionate share of the expenses of each underlying Price Fund in which the Fund-of-Funds invests.
A majority of the directors of the Funds-of-Funds are independent of T. Rowe Price and its affiliates. However, the directors and officers of the Funds-of-Funds and certain directors and officers of T. Rowe Price and its affiliates also serve in similar positions with most of the underlying Price Funds. Thus, if the interests of the Funds-of-Funds and the underlying Price Funds were ever to become divergent, it is possible that a conflict of interest could arise and affect how this latter group of persons fulfill their fiduciary duties to the Funds-of-Funds and the underlying Price Funds. The directors of Funds-of-Funds believe they have structured the Funds-of-Funds to avoid these concerns. However, a situation could conceivably occur where proper action for the Funds-of-Funds could be adverse to the interests of an underlying Price Fund, or the reverse could occur. If such a possibility arises, the directors and officers of the affected funds and the directors and officers of T. Rowe Price will carefully analyze the situation and take all steps they believe reasonable to minimize and, where possible, eliminate the potential conflict.
Term of Office and Length of Time Served
The directors serve until retirement, resignation, or election of a successor. The following table shows the year from which each director has served on each fund’s Board (or that of the corporation or trust of which the fund is a part).
Independent Directors | |||||||||||
Corporation/Trust | Number of portfolios | Brody | Deering | Dick | Duncan | Gerrard | Horn | McBride | Rouse | Schreiber | Tercek |
Balanced | 1 | 2009 | 2001 | 1991 | 2013 | 2012 | 2003 | 2013 | 2012 | 2001 | 2009 |
Blue Chip Growth | 1 | 2009 | 2001 | 1993 | 2013 | 2012 | 2003 | 2013 | 2012 | 2001 | 2009 |
California Tax-Free Income Trust | 2 | 2009 | 1986 | 2001 | 2013 | 2013 | 2003 | 2013 | 2013 | 1992 | 2009 |
Capital Appreciation | 1 | 2009 | 2001 | 1986 | 2013 | 2012 | 2003 | 2013 | 2012 | 2001 | 2009 |
Capital Opportunity | 1 | 2009 | 2001 | 1994 | 2013 | 2012 | 2003 | 2013 | 2012 | 2001 | 2009 |
Corporate Income | 1 | 2009 | 1995 | 2001 | 2013 | 2013 | 2003 | 2013 | 2013 | 1995 | 2009 |
Credit Opportunities | 1 | 2014 | 2014 | 2014 | 2014 | 2014 | 2014 | 2014 | 2014 | 2014 | 2014 |
Diversified Mid-Cap Growth | 1 | 2009 | 2003 | 2003 | 2013 | 2012 | 2003 | 2013 | 2012 | 2003 | 2009 |
Diversified Small-Cap Growth | 1 | 2009 | 2001 | 1997 | 2013 | 2012 | 2003 | 2013 | 2012 | 2001 | 2009 |
Dividend Growth | 1 | 2009 | 2001 | 1992 | 2013 | 2012 | 2003 | 2013 | 2012 | 2001 | 2009 |
Equity Income | 1 | 2009 | 2001 | 1994 | 2013 | 2012 | 2003 | 2013 | 2012 | 2001 | 2009 |
Financial Services | 1 | 2009 | 2001 | 1996 | 2013 | 2012 | 2003 | 2013 | 2012 | 2001 | 2009 |
Floating Rate | 1 | 2011 | 2011 | 2011 | 2013 | 2013 | 2011 | 2013 | 2013 | 2011 | 2011 |
Global Allocation | 1 | 2013 | 2013 | 2013 | 2013 | 2013 | 2013 | 2013 | 2013 | 2013 | 2013 |
Global Real Estate | 1 | 2009 | 2008 | 2008 | 2013 | 2012 | 2008 | 2013 | 2012 | 2008 | 2009 |
22
Independent Directors | |||||||||||
Corporation/Trust | Number of portfolios | Brody | Deering | Dick | Duncan | Gerrard | Horn | McBride | Rouse | Schreiber | Tercek |
Global Technology | 1 | 2009 | 2001 | 2000 | 2013 | 2012 | 2003 | 2013 | 2012 | 2001 | 2009 |
GNMA | 1 | 2009 | 1985 | 2001 | 2013 | 2013 | 2003 | 2013 | 2013 | 1992 | 2009 |
Growth & Income | 1 | 2009 | 2001 | 1982 | 2013 | 2012 | 2003 | 2013 | 2012 | 2001 | 2009 |
Growth Stock | 1 | 2009 | 2001 | 1980 | 2013 | 2012 | 2003 | 2013 | 2012 | 2001 | 2009 |
Health Sciences | 1 | 2009 | 2001 | 1995 | 2013 | 2012 | 2003 | 2013 | 2012 | 2001 | 2009 |
High Yield | 1 | 2009 | 1984 | 2001 | 2013 | 2013 | 2003 | 2013 | 2013 | 1992 | 2009 |
Index Trust | 3 | 2009 | 2001 | 1994 | 2013 | 2012 | 2003 | 2013 | 2012 | 2001 | 2009 |
Inflation Focused Bond | 1 | 2009 | 2006 | 2006 | 2013 | 2013 | 2006 | 2013 | 2013 | 2006 | 2009 |
Inflation Protected Bond | 1 | 2009 | 2002 | 2002 | 2013 | 2013 | 2003 | 2013 | 2013 | 2002 | 2009 |
Institutional Equity | 6 | 2009 | 2001 | 1996 | 2013 | 2012 | 2003 | 2013 | 2012 | 2001 | 2009 |
Institutional Income | 6 | 2009 | 2002 | 2002 | 2013 | 2013 | 2003 | 2013 | 2013 | 2002 | 2009 |
Institutional International | 11 | 2009 | 1991 | 1989 | 2013 | 2012 | 2003 | 2013 | 2012 | 2001 | 2009 |
Intermediate Tax-Free High Yield | 1 | 2014 | 2014 | 2014 | 2014 | 2014 | 2014 | 2014 | 2014 | 2014 | 2014 |
International | 22 | 2009 | 1991 | 1988 | 2013 | 2012 | 2003 | 2013 | 2012 | 2001 | 2009 |
International Index | 1 | 2009 | 2000 | 2000 | 2013 | 2012 | 2003 | 2013 | 2012 | 2001 | 2009 |
Media & Telecommunications | 1 | 2009 | 2001 | 1997 | 2013 | 2012 | 2003 | 2013 | 2012 | 2001 | 2009 |
Mid-Cap Growth | 1 | 2009 | 2001 | 1992 | 2013 | 2012 | 2003 | 2013 | 2012 | 2001 | 2009 |
Mid-Cap Value | 1 | 2009 | 2001 | 1996 | 2013 | 2012 | 2003 | 2013 | 2012 | 2001 | 2009 |
Multi-Sector Account Portfolios | 6 | 2012 | 2012 | 2012 | 2013 | 2013 | 2012 | 2013 | 2013 | 2012 | 2012 |
New America Growth | 1 | 2009 | 2001 | 1985 | 2013 | 2012 | 2003 | 2013 | 2012 | 2001 | 2009 |
New Era | 1 | 2009 | 2001 | 1994 | 2013 | 2012 | 2003 | 2013 | 2012 | 2001 | 2009 |
New Horizons | 1 | 2009 | 2001 | 1994 | 2013 | 2012 | 2003 | 2013 | 2012 | 2001 | 2009 |
New Income | 1 | 2009 | 1980 | 2001 | 2013 | 2013 | 2003 | 2013 | 2013 | 1992 | 2009 |
Personal Strategy | 3 | 2009 | 2001 | 1994 | 2013 | 2012 | 2003 | 2013 | 2012 | 2001 | 2009 |
Prime Reserve | 1 | 2009 | 1979 | 2001 | 2013 | 2013 | 2003 | 2013 | 2013 | 1992 | 2009 |
Real Assets | 1 | 2010 | 2010 | 2010 | 2013 | 2012 | 2010 | 2013 | 2012 | 2010 | 2010 |
Real Estate | 1 | 2009 | 2001 | 1997 | 2013 | 2012 | 2003 | 2013 | 2012 | 2001 | 2009 |
TRP Reserve Investment | 4 | 2009 | 1997 | 2001 | 2013 | 2013 | 2003 | 2013 | 2013 | 1997 | 2009 |
Retirement | 25 | 2009 | 2002 | 2002 | 2013 | 2012 | 2003 | 2013 | 2012 | 2002 | 2009 |
Science & Technology | 1 | 2009 | 2001 | 1994 | 2013 | 2012 | 2003 | 2013 | 2012 | 2001 | 2009 |
Short-Term Bond | 2 | 2009 | 1983 | 2001 | 2013 | 2013 | 2003 | 2013 | 2013 | 1992 | 2009 |
Small-Cap Stock | 1 | 2009 | 2001 | 1992 | 2013 | 2012 | 2003 | 2013 | 2012 | 2001 | 2009 |
Small-Cap Value | 1 | 2009 | 2001 | 1994 | 2013 | 2012 | 2003 | 2013 | 2012 | 2001 | 2009 |
Spectrum | 3 | 2009 | 2001 | 1999 | 2013 | 2012 | 2003 | 2013 | 2012 | 2001 | 2009 |
State Tax-Free Income Trust | 8 | 2009 | 1986 | 2001 | 2013 | 2013 | 2003 | 2013 | 2013 | 1992 | 2009 |
Strategic Income | 1 | 2009 | 2008 | 2008 | 2013 | 2013 | 2008 | 2013 | 2013 | 2008 | 2009 |
23
Independent Directors | |||||||||||
Corporation/Trust | Number of portfolios | Brody | Deering | Dick | Duncan | Gerrard | Horn | McBride | Rouse | Schreiber | Tercek |
Summit | 1 | 2009 | 1993 | 2001 | 2013 | 2013 | 2003 | 2013 | 2013 | 1993 | 2009 |
Summit Municipal | 3 | 2009 | 1993 | 2001 | 2013 | 2013 | 2003 | 2013 | 2013 | 1993 | 2009 |
Tax-Efficient | 1 | 2009 | 2001 | 1997 | 2013 | 2012 | 2003 | 2013 | 2012 | 2001 | 2009 |
Tax-Exempt Money | 1 | 2009 | 1983 | 2001 | 2013 | 2013 | 2003 | 2013 | 2013 | 1992 | 2009 |
Tax-Free High Yield | 1 | 2009 | 1984 | 2001 | 2013 | 2013 | 2003 | 2013 | 2013 | 1992 | 2009 |
Tax-Free Income | 1 | 2009 | 1983 | 2001 | 2013 | 2013 | 2003 | 2013 | 2013 | 1992 | 2009 |
Tax-Free Short-Intermediate | 2 | 2009 | 1983 | 2001 | 2013 | 2013 | 2003 | 2013 | 2013 | 1992 | 2009 |
U.S. Bond Enhanced Index | 1 | 2009 | 2000 | 2001 | 2013 | 2013 | 2003 | 2013 | 2013 | 2000 | 2009 |
U.S. Large-Cap Core | 1 | 2009 | 2009 | 2009 | 2013 | 2012 | 2009 | 2013 | 2012 | 2009 | 2009 |
U.S. Treasury | 3 | 2009 | 1989 | 2001 | 2013 | 2013 | 2003 | 2013 | 2013 | 1992 | 2009 |
Value | 1 | 2009 | 2001 | 1994 | 2013 | 2012 | 2003 | 2013 | 2012 | 2001 | 2009 |
Corporation/Trust | Number of portfolios | Inside Directors | ||
Bernard | Rogers | Wiese | ||
Balanced | 1 | 2006 | 2006 | — |
Blue Chip Growth | 1 | 2006 | 2006 | — |
California Tax-Free Income Trust | 2 | 2006 | — | 2015 |
Capital Appreciation | 1 | 2006 | 2006 | — |
Capital Opportunity | 1 | 2006 | 2013 | — |
Corporate Income | 1 | 2006 | — | 2015 |
Credit Opportunities | 1 | 2014 | — | 2015 |
Diversified Mid-Cap Growth | 1 | 2006 | 2013 | — |
Diversified Small-Cap Growth | 1 | 2006 | 2013 | — |
Dividend Growth | 1 | 2006 | 2006 | — |
Equity Income | 1 | 2006 | 2006 | — |
Financial Services | 1 | 2006 | 2006 | — |
Floating Rate | 1 | 2011 | — | 2015 |
Global Allocation | 1 | 2013 | 2013 | — |
Global Real Estate | 1 | 2008 | 2008 | — |
Global Technology | 1 | 2006 | 2006 | — |
GNMA | 1 | 2006 | — | 2015 |
Growth & Income | 1 | 2006 | 2006 | — |
Growth Stock | 1 | 2006 | 2006 | — |
Health Sciences | 1 | 2006 | 2013 | — |
High Yield | 1 | 2006 | — | 2015 |
Index Trust | 3 | 2006 | 2006 | — |
Inflation Focused Bond | 1 | 2006 | — | 2015 |
Inflation Protected Bond | 1 | 2006 | — | 2015 |
24
Corporation/Trust | Number of portfolios | Inside Directors | ||
Bernard | Rogers | Wiese | ||
Institutional Equity | 6 | 2006 | 2006 | — |
Institutional Income | 6 | 2006 | — | 2015 |
Institutional International | 11 | 2006 | 2006 | — |
Intermediate Tax-Free High Yield | 1 | 2014 | — | 2015 |
International | 22 | 2006 | 2006 | — |
International Index | 1 | 2006 | 2006 | — |
Media & Telecommunications | 1 | 2006 | 2006 | — |
Mid-Cap Growth | 1 | 2006 | 2006 | — |
Mid-Cap Value | 1 | 2006 | 2006 | — |
Multi-Sector Account Portfolios | 6 | 2012 | — | 2015 |
New America Growth | 1 | 2006 | 2013 | — |
New Era | 1 | 2006 | 2006 | — |
New Horizons | 1 | 2006 | 2013 | — |
New Income | 1 | 2006 | — | 2015 |
Personal Strategy | 3 | 2006 | 2006 | — |
Prime Reserve | 1 | 2006 | — | 2015 |
Real Assets | 1 | 2010 | 2010 | — |
Real Estate | 1 | 2006 | 2006 | — |
TRP Reserve Investment | 4 | 2006 | — | 2015 |
Retirement | 25 | 2006 | 2006 | — |
Science & Technology | 1 | 2006 | 2013 | — |
Short-Term Bond | 2 | 2006 | — | 2015 |
Small-Cap Stock | 1 | 2006 | 2013 | — |
Small-Cap Value | 1 | 2006 | 2013 | — |
Spectrum | 3 | 2006 | 2006 | — |
State Tax-Free Income Trust | 8 | 2006 | — | 2015 |
Strategic Income | 1 | 2008 | — | 2015 |
Summit | 1 | 2006 | — | 2015 |
Summit Municipal | 3 | 2006 | — | 2015 |
Tax-Efficient | 1 | 2006 | 2006 | — |
Tax-Exempt Money | 1 | 2006 | — | 2015 |
Tax-Free High Yield | 1 | 2006 | — | 2015 |
Tax-Free Income | 1 | 2006 | — | 2015 |
Tax-Free Short-Intermediate | 2 | 2006 | — | 2015 |
U.S. Bond Enhanced Index | 1 | 2006 | — | 2015 |
U.S. Large-Cap Core | 1 | 2009 | 2009 | — |
U.S. Treasury | 3 | 2006 | — | 2015 |
Value | 1 | 2006 | 2006 | — |
25
Officers
Fund | Name | Position Held |
All funds | Darrell N. Braman David Oestreicher John W. Ratzesberger Deborah D. Seidel Jeffrey T. Zoller Gregory K. Hinkle Patricia B. Lippert John R. Gilner | Vice President Vice President Vice President Vice President Vice President Treasurer Secretary Chief Compliance Officer |
Fund | Name | Position
Held |
Balanced | Charles M. Shriver E. Frederick Bair Kimberly E. DeDominicis Anna M. Dopkin Anna Dreyer Mark S. Finn Paul A. Karpers Robert M. Larkins Wyatt A. Lee Raymond A. Mills Larry J. Puglia Guido F. Stubenrauch Toby M. Thompson Richard T. Whitney (For remaining officers, refer to the “All funds” table) | President Vice President Vice President Vice President Vice President Vice President Vice President Vice President Vice President Vice President Vice President Vice President Vice President Vice President |
Blue Chip Growth | Larry J. Puglia Ziad Bakri Peter J. Bates Ryan N. Burgess Eric L. DeVilbiss Shawn T. Driscoll Paul D. Greene II Ryan S. Hedrick Thomas J. Huber George A. Marzano Vivek Rajeswaran Amit Seth Robert W. Sharps Taymour R. Tamaddon (For remaining officers, refer to the “All funds” table) | President Vice President Vice President Vice President Vice President Vice President Vice President Vice President Vice President Vice President Vice President Vice President Vice President Vice President |
California Tax-Free Income Trust California Tax-Free Bond California Tax-Free Money | Hugh D. McGuirk Joseph K. Lynagh Konstantine B. Mallas Austin Applegate Steven G. Brooks M. Helena Condez G. Richard Dent Charles E. Emrich Stephanie A. Gentile Alan D. Levenson Linda A. Murphy Alexander S. Obaza Douglas D. Spratley Timothy G. Taylor Edward A. Wiese Chen Shao (For remaining officers, refer to the “All funds” table) | President Executive Vice President Executive Vice President Vice President Vice President Vice President Vice President Vice President Vice President Vice President Vice President Vice President Vice President Vice President Vice President Assistant Vice President |
26
Fund | Name | Position Held |
Capital Appreciation | David R. Giroux Ryan N. Burgess Jon M. Friar Paul D. Greene II Nina P. Jones Vidya Kadiyam Steven D. Krichbaum John D. Linehan Paul M. Massaro Sudhir Nanda Robert T. Quinn, Jr. Farris G. Shuggi Gabriel Solomon William J. Stromberg Taymour R. Tamaddon Susan G. Troll Tamara P. Wiggs (For remaining officers, refer to the “All funds” table) | President Vice President Vice President Vice President Vice President Vice President Vice President Vice President Vice President Vice President Vice President Vice President Vice President Vice President Vice President Vice President Vice President |
Capital Opportunity | Ann M. Holcomb Jason B. Polun Eric L. Veiel Kennard W. Allen Peter J. Bates Ryan N. Burgess Christopher W. Carlson Donald J. Easley Joseph B. Fath Mark S. Finn Steven D. Krichbaum Jennifer Martin Jeffrey Rottinghaus Justin P. White (For remaining officers, refer to the “All funds” table) | Co-President Co-President Co-President Vice President Vice President Vice President Vice President Vice President Vice President Vice President Vice President Vice President Vice President Vice President |
Corporate Income | David A. Tiberii Steve Boothe Steven G. Brooks Michael P. Daley Michael J. Grogan Paul A. Karpers Michael Lambe Alan D. Levenson Samy B. Muaddi Alexander S. Obaza Miso Park Vernon A. Reid, Jr. Theodore E. Robson Brian M. Ropp Scott D. Solomon Kimberly A Stokes Robert D. Thomas Lauren T. Wagandt Thea N. Williams J. Howard Woodward (For remaining officers, refer to the “All funds” table) | President Executive Vice President Vice President Vice President Vice President Vice President Vice President Vice President Vice President Vice President Vice President Vice President Vice President Vice President Vice President Vice President Vice President Vice President Vice President Vice President |
27
Fund | Name | Position Held |
Credit Opportunities | Paul A. Karpers Michael F. Blandino Christopher P. Brown, Jr. Andrew P. Jamison James M. Murphy Rodney M. Rayburn Brian A. Rubin Robert D. Thomas Siby Thomas Lauren T. Wagandt (For remaining officers, refer to the “All funds” table) | President Vice President Vice President Vice President Vice President Vice President Vice President Vice President Vice President Vice President |
Diversified Mid-Cap Growth | Donald J. Peters Donald J. Easley Kennard W. Allen Peter J. Bates Brian W.H. Berghuis Eric L. DeVilbiss Sudhir Nanda Timothy E. Parker Amit Seth John F. Wakeman Rouven J. Wool-Lewis (For remaining officers, refer to the “All funds” table) | President Executive Vice President Vice President Vice President Vice President Vice President Vice President Vice President Vice President Vice President Vice President |
Diversified Small-Cap Growth | Sudhir Nanda Boyko D. Atanassov Donald J. Easley Prashant G. Jeyaganesh Curt J. Organt Farris G. Shuggi J. David Wagner (For remaining officers, refer to the “All funds” table) | President Vice President Vice President Vice President Vice President Vice President Vice President |
Dividend Growth | Thomas J. Huber Peter J. Bates Jon M. Friar James H. Friedland David M. Lee Robert T. Quinn, Jr. Jeffrey Rottinghaus David L. Rowlett Gabriel Solomon John M. Williams (For remaining officers, refer to the “All funds” table) | President Vice President Vice President Vice President Vice President Vice President Vice President Vice President Vice President Vice President |
Equity Income | Brian C. Rogers Andrew M. Brooks Ryan Burgess Mark S. Finn Jon M. Friar David R. Giroux Thomas J. Huber Nina P. Jones John D. Linehan Heather K. McPherson John M. Williams (For remaining officers, refer to the “All funds” table) | President Vice President Vice President Vice President Vice President Vice President Vice President Vice President Vice President Vice President Vice President |
28
Fund | Name | Position Held |
Financial Services | Gabriel Solomon Stephen M. Finamore Christopher T. Fortune Jon M. Friar David R. Giroux Nina P. Jones Yoichiro Kai Gregory Locraft Andrew McCormick Ian C. McDonald Michael J. McGonigle Jason B. Polun Frederick A. Rizzo Matt J. Snowling Mitchell J.K. Todd Susan G. Troll Eric L. Veiel Zenon Voyiatzis Tamara P. Wiggs (For remaining officers, refer to the “All funds” table) | President Vice President Vice President Vice President Vice President Vice President Vice President Vice President Vice President Vice President Vice President Vice President Vice President Vice President Vice President Vice President Vice President Vice President Vice President |
Floating Rate | Mark J. Vaselkiv Paul M. Massaro Brian E. Burns Michael F. Connelly Stephen M. Finamore Justin T. Gerbereux David R. Giroux Steven C. Huber Paul A. Karpers Michael J. McGonigle Brian A. Rubin Thomas E. Tewksbury Thea N. Williams (For remaining officers, refer to the “All funds” table) | President Executive Vice President Vice President Vice President Vice President Vice President Vice President Vice President Vice President Vice President Vice President Vice President Vice President |
Global Allocation | Charles M. Shriver Stephen L. Bartolini Robert L. Harlow Steven C. Huber Stefan Hubrich Robert M. Larkins Robert A. Panariello Toby M. Thompson Richard T. Whitney (For remaining officers, refer to the “All funds” table) | President Vice President Vice President Vice President Vice President Vice President Vice President Vice President Vice President |
Global Real Estate | Nina P. Jones Harishankar Balkrishna Richard N. Clattenburg Tetsuji Inoue Jai Kapadia David M. Lee Robert J. Marcotte Raymond A. Mills Philip A. Nestico Viral S. Patel (For remaining officers, refer to the “All funds” table) | President Vice President Vice President Vice President Vice President Vice President Vice President Vice President Vice President Vice President |
29
Fund | Name | Position Held |
Global Technology | Joshua K. Spencer Kennard W. Allen Christopher W. Carlson David J. Eiswert Henry M. Ellenbogen Paul D. Greene II Rhett K. Hunter Jacqueline Liu Heather K. McPherson Tobias F. Mueller Hiroaki Owaki Michael F. Sola Thomas H. Watson Justin P. White Alison Mei Ling Yip (For remaining officers, refer to the “All funds” table) | President Vice President Vice President Vice President Vice President Vice President Vice President Vice President Vice President Vice President Vice President Vice President Vice President Vice President Vice President |
GNMA | Andrew C. McCormick Anil K. Andhavarapu Brian J. Brennan Christopher P. Brown, Jr. Ramon R. de Castro Keir R. Joyce Martin G. Lee Alan D. Levenson Michael K. Sewell John D. Wells (For remaining officers, refer to the “All funds” table) | President Vice President Vice President Vice President Vice President Vice President Vice President Vice President Vice President Vice President |
Growth & Income | Thomas J. Huber Peter J. Bates Ryan N. Burgess Andrew S. Davis Shawn T. Driscoll Nina P. Jones Jeffrey Rottinghaus David L. Rowlett Matt J. Snowling Joshua K. Spencer (For remaining officers, refer to the “All funds” table) | President Vice President Vice President Vice President Vice President Vice President Vice President Vice President Vice President Vice President |
Growth Stock | Joseph B. Fath Andrew S. Davis Shawn T. Driscoll David J. Eiswert Jon M. Friar Paul D. Greene II Barry Henderson Daniel Martino Robert W. Sharps Taymour R. Tamaddon Thomas H. Watson Justin P. White (For remaining officers, refer to the “All funds” table) | President Vice President Vice President Vice President Vice President Vice President Vice President Vice President Vice President Vice President Vice President Vice President |
Health Sciences | Taymour R. Tamaddon Ziad Bakri Melissa C. Gallagher John Hall Jason Nogueira Adam Poussard Kyle Rasbach Jon Davis Wood Rouven J. Wool-Lewis (For remaining officers, refer to the “All funds” table) | President Vice President Vice President Vice President Vice President Vice President Vice President Vice President Vice President |
30
Fund | Name | Position Held |
High Yield | Mark J. Vaselkiv Jason A. Bauer Andrew M. Brooks Andrew L. Cohen Michael F. Connelly Michael Della Vedova Carson R. Dickson Stephen M. Finamore Justin T. Gerbereux Andrew P. Jamison Paul A. Karpers Paul M. Massaro Brian A. Rubin Thomas E. Tewksbury Michael J. Trivino Thea N. Williams (For remaining officers, refer to the “All funds” table) | President Vice President Vice President Vice President Vice President Vice President Vice President Vice President Vice President Vice President Vice President Vice President Vice President Vice President Vice President Vice President |
Index Trust Equity Index 500 Extended Equity Market Index Total Equity Market Index | E. Frederick Bair Ken D. Uematsu Neil Smith Craig A. Thiese Michael Wehn J. Zachary Wood (For remaining officers, refer to the “All funds” table) | President Executive Vice President Vice President Vice President Vice President Vice President |
Inflation Focused Bond | Daniel O. Shackelford Stephen L. Bartolini Brian J. Brennan Steven G. Brooks Jerome A. Clark Bridget A. Ebner Michael J. Grogan Geoffrey M. Hardin Charles B. Hill Keir R. Joyce Wyatt A. Lee Andrew C. McCormick Cheryl A. Mickel Vernon A. Reid, Jr. Michael F. Reinartz Rebecca L. Setcavage Scott D. Solomon John D. Wells (For remaining officers, refer to the “All funds” table) | President Vice President Vice President Vice President Vice President Vice President Vice President Vice President Vice President Vice President Vice President Vice President Vice President Vice President Vice President Vice President Vice President Vice President |
Inflation Protected Bond | Daniel O. Shackelford Stephen L. Bartolini Brian J. Brennan Geoffrey M. Hardin Alan D. Levenson Andrew C. McCormick Rebecca L. Setcavage (For remaining officers, refer to the “All funds” table) | President Vice President Vice President Vice President Vice President Vice President Vice President |
31
Fund | Name | Position Held |
Institutional Equity Funds Institutional Large-Cap Core Growth Institutional Large-Cap Growth Institutional Large-Cap Value Institutional Mid-Cap Equity Growth Institutional Small-Cap Stock Institutional U.S. Structured Research | Brian C. Rogers Brian W.H. Berghuis Mark S. Finn Ann M. Holcomb John D. Linehan Gregory A. McCrickard Heather K. McPherson Jason B. Polun Larry J. Puglia Robert W. Sharps Eric L. Veiel J. David Wagner John F. Wakeman (For remaining officers, refer to the “All funds” table) | President Executive Vice President Executive Vice President Executive Vice President Executive Vice President Executive Vice President Executive Vice President Executive Vice President Executive Vice President Executive Vice President Executive Vice President Vice President Vice President |
Institutional Income Funds Institutional Core Plus Institutional Credit Opportunities Institutional Floating Rate Institutional Global Multi-Sector Bond Institutional High Yield Institutional Long Duration Credit | Mark J. Vaselkiv Brian J. Brennan Steven C. Huber Paul A. Karpers Paul M. Massaro David A. Tiberii Jason A. Bauer Michael F. Blandino Steve Boothe Andrew M. Brooks Christopher P. Brown, Jr. Brian E. Burns Andrew L. Cohen Michael J. Conelius Michael F. Connelly Michael P. Daley Stephen M. Finamore Justin T. Gerbereux David R. Giroux Michael J. Grogan Arif Husain Andrew P. Jamison Andrew J. Keirle Michael Lambe Robert M. Larkins Andrew C. McCormick Michael J. McGonigle Samy B. Muaddi James M. Murphy Alexander S. Obaza Miso Park Rodney M. Rayburn Vernon A. Reid, Jr. Theodore E. Robson Brian M. Ropp Brian A. Rubin Daniel O. Shackelford Scott D. Solomon David A. Stanley Kimberly A. Stokes Ju Yen Tan Thomas E. Tewksbury Robert. D. Thomas Siby Thomas Lauren T. Wagandt Thea N. Williams J. Howard Woodward (For remaining officers, refer to the “All funds” table) | President Executive Vice President Executive Vice President Executive Vice President Executive Vice President Executive Vice President Vice President Vice President Vice President Vice President Vice President Vice President Vice President Vice President Vice President Vice President Vice President Vice President Vice President Vice President Vice President Vice President Vice President Vice President Vice President Vice President Vice President Vice President Vice President Vice President Vice President Vice President Vice President Vice President Vice President Vice President Vice President Vice President Vice President Vice President Vice President Vice President Vice President Vice President Vice President Vice President Vice President |
32
Fund | Name | Position Held |
Institutional International Funds Institutional Africa & Middle East Institutional Emerging Markets Bond Institutional Emerging Markets Equity Institutional Frontier Markets Equity Institutional Global Focused Growth Equity Institutional Global Growth Equity Institutional Global Value Equity Institutional International Bond Institutional International Concentrated Equity Institutional International Core Equity Institutional International Growth Equity | Christopher D. Alderson Oliver D.M. Bell R. Scott Berg Richard N. Clattenburg Michael J. Conelius Mark J.T. Edwards David J. Eiswert Arif Husain Andrew J. Keirle Sebastien Mallet Raymond A. Mills Joshua Nelson Jason Nogueira Gonzalo Pangaro Christopher J. Rothery Federico Santilli Ulle Adamson Roy H. Adkins Paulina Amieva Malik S. Asif Harishankar Balkrishna Peter J. Bates Steve Boothe Peter I. Botoucharov Tala Boulos Carolyn Hoi Che Chu Archibald Ciganer Albeniz Michael Della Vedova Richard de los Reyes Laurent Del Grande Shawn T. Driscoll Bridget A. Ebner Mark S. Finn Paul D. Greene II Benjamin Griffiths Richard L. Hall Steven C Huber Stefan Hubrich Randal S. Jenneke Yoichiro Kai Christopher J. Kushlis Mark J. Lawrence David M. Lee Christopher C. Loop Anh Lu Jonathan H.W. Matthews Sudhir Nanda Sridhar Nishtala Michael D. Oh Kenneth A. Orchard Oluwaseun A. Oyegunle Craig J. Pennington Sebastian Schrott Robert W. Sharps John C.A. Sherman Robert W. Smith Gabriel Solomon Joshua K. Spencer David A. Stanley Taymour R. Tamaddon Ju Yen Tan Dean Tenerelli | President Executive Vice President Executive Vice President Executive Vice President Executive Vice President Executive Vice President Executive Vice President Executive Vice President Executive Vice President Executive Vice President Executive Vice President Executive Vice President Executive Vice President Executive Vice President Executive Vice President Executive Vice President Vice President Vice President Vice President Vice President Vice President Vice President Vice President Vice President Vice President Vice President Vice President Vice President Vice President Vice President Vice President Vice President Vice President Vice President Vice President Vice President Vice President Vice President Vice President Vice President Vice President Vice President Vice President Vice President Vice President Vice President Vice President Vice President Vice President Vice President Vice President Vice President Vice President Vice President Vice President Vice President Vice President Vice President Vice President Vice President Vice President Vice President |
33
Fund | Name | Position Held |
Eric L. Veiel Verena E. Wachnitz Christopher S. Whitehouse J. Howard Woodward Ernest C. Yeung (For remaining officers, refer to the “All funds” table) | Vice President Vice President Vice President Vice President Vice President | |
Intermediate Tax-Free High Yield | James M. Murphy R. Lee Arnold, Jr. M. Helena Condez G. Richard Dent Sarah J. Engle Charles B. Hill Dylan Jones Marcy M. Lash Konstantine B. Mallas Hugh D. McGuirk Linda A. Murphy Timothy G. Taylor Chen Shao (For remaining officers, refer to the “All funds” table) | President Executive Vice President Vice President Vice President Vice President Vice President Vice President Vice President Vice President Vice President Vice President Vice President Assistant Vice President |
International Funds Africa & Middle East Asia Opportunities Emerging Europe Emerging Markets Bond Emerging Markets Corporate Bond Emerging Markets Local Currency Bond Emerging Markets Stock European Stock Global Growth Stock Global High Income Bond Global Industrials Global Stock Global Unconstrained Bond International Bond International Concentrated Equity International Discovery International Growth & Income International Stock Japan Latin America New Asia Overseas Stock | Christopher D. Alderson Ulle Adamson Peter J. Bates Oliver D.M. Bell R. Scott Berg Archibald Ciganer Albeniz Richard N. Clattenburg Michael J. Conelius Michael Della Vedova Mark J.T. Edwards David J. Eiswert Arif Husain Andrew J. Keirle Anh Lu Jonathan H.W. Matthews Raymond A. Mills Eric C. Moffett Joshua Nelson Jason Nogueira Gonzalo Pangaro Christopher J. Rothery Federico Santilli Dean Tenerelli Justin Thomson Mark J. Vaselkiv Verena E. Wachnitz Roy H. Adkins Syed H. Ali Paulina Amieva Malik S. Asif Harishankar Balkrishna Sheena L. Barbosa Luis M. Baylac Steve Boothe Peter I. Botoucharov Tala Boulos Ryan N. Burgess Sheldon Chan Tak Yiu Cheng Carolyn Hoi Che Chu Andrew S. Davis Richard de los Reyes | President Executive Vice President Executive Vice President Executive Vice President Executive Vice President Executive Vice President Executive Vice President Executive Vice President Executive Vice President Executive Vice President Executive Vice President Executive Vice President Executive Vice President Executive Vice President Executive Vice President Executive Vice President Executive Vice President Executive Vice President Executive Vice President Executive Vice President Executive Vice President Executive Vice President Executive Vice President Executive Vice President Executive Vice President Executive Vice President Vice President Vice President Vice President Vice President Vice President Vice President Vice President Vice President Vice President Vice President Vice President Vice President Vice President Vice President Vice President Vice President |
34
Fund | Name | Position Held |
| Laurent Del Grande Shawn T. Driscoll Bridget A. Ebner Henry M. Ellenbogen Ryan W. Ferro Mark S. Finn Melissa C. Gallagher Vishnu Vardhan Gopal Joel Grant Paul D. Greene II Benjamin Griffiths Richard L. Hall Steven C. Huber Stefan Hubrich Tetsuji Inoue Michael Jacobs Randal S. Jenneke Prashant G. Jeyaganesh Yoichiro Kai Jai Kapadia Christopher J. Kushlis Shengrong Lau Mark J. Lawrence David M. Lee Jacqueline Liu Christopher C. Loop Sebastien Mallet Ryan Martyn Jihong Min Samy B. Muaddi Philip A. Nestico Sridhar Nishtala Michael D. Oh Kenneth A. Orchard Curt J. Organt Paul T. O’Sullivan Hiroaki Owaki Oluwaseun A. Oyegunle Craig J. Pennington Austin M. Powell Vivek Rajeswaran Frederick A. Rizzo David L. Rowlett Sebastian Schrott Jeneiv Shah Robert W. Sharps John C.A. Sherman Robert W. Smith Gabriel Solomon Eunbin Song Joshua K. Spencer David A. Stanley Taymour R. Tamaddon Ju Yen Tan Sin Dee Tan Siby Thomas Mitchell J.K. Todd Kes Visuvalingam David J. Wallack Hiroshi Watanabe Christopher S. Whitehouse Clive M. Williams | Vice President Vice President Vice President Vice President Vice President Vice President Vice President Vice President Vice President Vice President Vice President Vice President Vice President Vice President Vice President Vice President Vice President Vice President Vice President Vice President Vice President Vice President Vice President Vice President Vice President Vice President Vice President Vice President Vice President Vice President Vice President Vice President Vice President Vice President Vice President Vice President Vice President Vice President Vice President Vice President Vice President Vice President Vice President Vice President Vice President Vice President Vice President Vice President Vice President Vice President Vice President Vice President Vice President Vice President Vice President Vice President Vice President Vice President Vice President Vice President Vice President Vice President |
35
Fund | Name | Position Held |
J. Howard Woodward Marta Yago Ernest C. Yeung Alison Mei Ling Yip Wenli Zheng (For remaining officers, refer to the “All funds” table) | Vice President Vice President Vice President Vice President Vice President | |
International Index Fund International Equity Index | E. Frederick Bair Neil Smith Craig A. Thiese Ken D. Uematsu Michael Wehn J. Zachary Wood (For remaining officers, refer to the “All funds” table) | President Executive Vice President Vice President Vice President Vice President Vice President Vice President |
Media & Telecommunications | Paul D. Greene II Ulle Adamson David J. Eiswert Henry M. Ellenbogen Joseph B. Fath James H. Friedland Jacqueline Liu Daniel Martino Philip A. Nestico Corey D. Shull Robert W. Smith Verena E. Wachnitz Thomas H. Watson Justin P. White Christopher S. Whitehouse Ernest C. Yeung Wenli Zheng (For remaining officers, refer to the “All funds” table) | President Vice President Vice President Vice President Vice President Vice President Vice President Vice President Vice President Vice President Vice President Vice President Vice President Vice President Vice President Vice President Vice President |
Mid-Cap Growth | Brian W.H. Berghuis John F. Wakeman Kennard W. Allen Ira W. Carnahan Shawn T. Driscoll Donald J. Easley Henry M. Ellenbogen Joseph B. Fath Robert J. Marcotte David L. Rowlett Clark R. Shields Taymour R. Tamaddon Justin P. White (For remaining officers, refer to the “All funds” table) | President Executive Vice President Vice President Vice President Vice President Vice President Vice President Vice President Vice President Vice President Vice President Vice President Vice President |
Mid-Cap Value | David J. Wallack Heather K. McPherson Ryan N. Burgess Christopher W. Carlson Ira W. Carnahan Henry M. Ellenbogen Mark S. Finn Ryan Hedrick Gregory A. McCrickard J. David Wagner Justin P. White John M. Williams (For remaining officers, refer to the “All funds” table) | President Executive Vice President Vice President Vice President Vice President Vice President Vice President Vice President Vice President Vice President Vice President Vice President |
Multi-Sector Account Portfolios Emerging Markets Corporate Multi-Sector Account Portfolio | Edward A. Wiese Michael J. Conelius Andrew J. Keirle | President Executive Vice President Executive Vice President |
36
Fund | Name | Position Held |
Emerging Markets Local Multi-Sector Account Portfolio Floating Rate Multi-Sector Account Portfolio High Yield Multi-Sector Account Portfolio Investment-Grade Corporate Multi-Sector Account Portfolio Mortgage-Backed Securities Multi-Sector Account Portfolio | Paul M. Massaro Andrew C. McCormick David A. Tiberii Mark J. Vaselkiv Roy H. Adkins Anil K. Andhavarapu Steve Boothe Peter I. Botoucharov Tala Boulos Brian J. Brennan Steven G. Brooks Christopher P. Brown, Jr. Brian E. Burns Sheldon Chan Carolyn Hoi Che Chu Michael F. Connelly Michael P. Daley Ramon R. de Castro Stephen M. Finamore Justin T. Gerbereux Michael J. Grogan Steven C. Huber Arif Husain Keir R. Joyce Paul A. Karpers Christopher J. Kushlis Michael Lambe Martin G. Lee Alan D. Levenson Christopher C. Loop Michael J. McGonigle Samy B. Muaddi Alexander S. Obaza Michael D. Oh Kenneth A. Orchard Miso Park Vernon A. Reid, Jr. Theodore E. Robson Brian M. Ropp Christopher J. Rothery Brian A. Rubin Michael K. Sewell Daniel O. Shackelford Scott D. Solomon David A. Stanley Kimberly A. Stokes Ju Yen Tan Thomas E. Tewksbury Robert. D. Thomas Siby Thomas Lauren T. Wagandt John D. Wells Thea N. Williams J. Howard Woodward (For remaining officers, refer to the “All funds” table) | Executive Vice President Executive Vice President Executive Vice President Executive Vice President Vice President Vice President Vice President Vice President Vice President Vice President Vice President Vice President Vice President Vice President Vice President Vice President Vice President Vice President Vice President Vice President Vice President Vice President Vice President Vice President Vice President Vice President Vice President Vice President Vice President Vice President Vice President Vice President Vice President Vice President Vice President Vice President Vice President Vice President Vice President Vice President Vice President Vice President Vice President Vice President Vice President Vice President Vice President Vice President Vice President Vice President Vice President Vice President Vice President Vice President |
37
Fund | Name | Position Held |
New America Growth | Daniel Martino Ziad Bakri Brian W.H. Berghuis Eric L. DeVilbiss Shawn T. Driscoll Barry Henderson Ian C. McDonald Curt J. Organt David L. Rowlett Robert W. Sharps Taymour R. Tamaddon Craig A. Thiese Thomas H. Watson Justin P. White (For remaining officers, refer to the “All funds” table) | President Vice President Vice President Vice President Vice President Vice President Vice President Vice President Vice President Vice President Vice President Vice President Vice President Vice President |
New Era | Shawn T. Driscoll Syed H. Ali Ryan N. Burgess Richard de los Reyes Eric L. DeVilbiss Christopher Driessen Donald J. Easley Mark S. Finn Ryan S. Hedrick Shinwoo Kim Ryan Martyn Heather K. McPherson Christian O’Neill Timothy E. Parker Craig J. Pennington Vivek Rajeswaran Thomas A. Shelmerdine Craig A. Thiese David J. Wallack John M. Williams (For remaining officers, refer to the “All funds” table) | President Vice President Vice President Vice President Vice President Vice President Vice President Vice President Vice President Vice President Vice President Vice President Vice President Vice President Vice President Vice President Vice President Vice President Vice President Vice President |
New Horizons | Henry M. Ellenbogen Francisco M. Alonso Preston G. Athey Ziad Bakri Brian W.H. Berghuis Michael F. Blandino Christopher W. Carlson Eric L. DeVilbiss Barry Henderson Rhett K. Hunter Timothy E. Parker Amit Seth Clark R. Shields Corey D. Shull Michael F. Sola Taymour R. Tamaddon Justin Thomson J. David Wagner Thomas H. Watson (For remaining officers, refer to the “All funds” table) | President Vice President Vice President Vice President Vice President Vice President Vice President Vice President Vice President Vice President Vice President Vice President Vice President Vice President Vice President Vice President Vice President Vice President Vice President |
38
Fund | Name | Position Held |
New Income | Daniel O. Shackelford Steve Boothe Brian J. Brennan Christopher P. Brown, Jr. Michael J. Grogan Geoffrey M. Hardin Steven C. Huber Robert M. Larkins Alan D. Levenson Andrew C. McCormick Vernon A. Reid, Jr. David A. Tiberii (For remaining officers, refer to the “All funds” table) | President Vice President Vice President Vice President Vice President Vice President Vice President Vice President Vice President Vice President Vice President Vice President |
Personal Strategy Funds Personal Strategy Balanced Personal Strategy Growth Personal Strategy Income | Charles M. Shriver Christopher D. Alderson E. Frederick Bair Brian W.H. Berghuis Jerome A. Clark Kimberly E. DeDominicis Mark S. Finn David R. Giroux Ian D. Kelson Wyatt A. Lee Raymond A. Mills Larry J. Puglia Brian C. Rogers Daniel O. Shackelford Robert W. Smith Guido F. Stubenrauch Toby M. Thompson Mark J. Vaselkiv Richard T. Whitney (For remaining officers, refer to the “All funds” table) | President Vice President Vice President Vice President Vice President Vice President Vice President Vice President Vice President Vice President Vice President Vice President Vice President Vice President Vice President Vice President Vice President Vice President Vice President |
Prime Reserve | Joseph K. Lynagh Austin Applegate Steven G. Brooks M. Helena Condez G. Richard Dent Stephanie A. Gentile Alan D. Levenson Cheryl A. Mickel Alexander S. Obaza Douglas D. Spratley Chen Shao (For remaining officers, refer to the “All funds” table) | President Vice President Vice President Vice President Vice President Vice President Vice President Vice President Vice President Vice President Assistant Vice President |
Real Assets | Wyatt A. Lee E. Frederick Bair Richard de los Reyes Shawn T. Driscoll Stefan Hubrich Nina P. Jones David M. Lee Daniel O. Shackelford Charles M. Shriver Richard T. Whitney (For remaining officers, refer to the “All funds” table) | President Vice President Vice President Vice President Vice President Vice President Vice President Vice President Vice President Vice President |
39
Fund | Name | Position Held |
Real Estate | David M. Lee Anna M. Dopkin Thomas J. Huber Nina P. Jones Philip A. Nestico Preeta Ragavan Theodore E. Robson Weijie Si (For remaining officers, refer to the “All funds” table) | President Vice President Vice President Vice President Vice President Vice President Vice President Vice President |
TRP Reserve Investment Funds Government Reserve Investment Reserve Investment Short-Term Government Reserve Short-Term Reserve | Joseph K. Lynagh Austin Applegate Steven G. Brooks M. Helena Condez G. Richard Dent Stephani A. Gentile Alan D. Levenson Cheryl A. Mickel Alexander S. Obaza Douglas D. Spratley Chen Shao (For remaining officers, refer to the “All funds” table) | President Vice President Vice President Vice President Vice President Vice President Vice President Vice President Vice President Vice President Assistant Vice President |
Retirement Funds Retirement 2005 Retirement 2010 Retirement 2015 Retirement 2020 Retirement 2025 Retirement 2030 Retirement 2035 Retirement 2040 Retirement 2045 Retirement 2050 Retirement 2055 Retirement 2060 Retirement Balanced Target Retirement 2005 Target Retirement 2010 Target Retirement 2015 Target Retirement 2020 Target Retirement 2025 Target Retirement 2030 Target Retirement 2035 Target Retirement 2040 Target Retirement 2045 Target Retirement 2050 Target Retirement 2055 Target Retirement 2060 | Jerome A. Clark Wyatt A. Lee Christopher D. Alderson Brian W.H. Berghuis Kimberly E. DeDominicis David R. Giroux Ian D. Kelson Brian C. Rogers Daniel O. Shackelford Charles M. Shriver Robert W. Smith Guido F. Stubenrauch Mark J. Vaselkiv Richard T. Whitney (For remaining officers, refer to the “All funds” table) | President Executive Vice President Vice President Vice President Vice President Vice President Vice President Vice President Vice President Vice President Vice President Vice President Vice President Vice President |
Science & Technology | Kennard W. Allen Brian W.H. Berghuis David J. Eiswert Paul D. Greene II Rhett K. Hunter Daniel Martino Tobias F. Mueller Michael F. Sola Joshua K. Spencer Alan Tu Thomas H. Watson Justin P. White Alison Mei Ling Yip (For remaining officers, refer to the “All funds” table) | President Vice President Vice President Vice President Vice President Vice President Vice President Vice President Vice President Vice President Vice President Vice President Vice President |
40
Fund | Name | Position Held |
Short-Term Bond Ultra Short-Term Bond | Edward A. Wiese Joseph K. Lynagh Brian J. Brennan Steven G. Brooks M. Helena Condez Bridget A. Ebner Michael J. Grogan Geoffrey M. Hardin Charles B. Hill Keir R. Joyce Andrew C. McCormick Cheryl A. Mickel Michael F. Reinartz Daniel O. Shackelford Douglas D. Spratley John D. Wells (For remaining officers, refer to the “All funds” table) | President Executive Vice President Vice President Vice President Vice President Vice President Vice President Vice President Vice President Vice President Vice President Vice President Vice President Vice President Vice President Vice President |
Small-Cap Stock | Gregory A. McCrickard Francisco M. Alonso Preston G. Athey Ira W. Carnahan Andrew S. Davis Christopher T. Fortune Robert J. Marcotte Curt J. Organt Timothy E. Parker Charles G. Pepin Michael F. Sola J. David Wagner (For remaining officers, refer to the “All funds” table) | President Vice President Vice President Vice President Vice President Vice President Vice President Vice President Vice President Vice President Vice President Vice President |
Small-Cap Value | J. David Wagner Francisco M. Alonso Preston G. Athey Andrew S. Davis Christopher T. Fortune Ryan Hedrick Nina P. Jones Gregory A. McCrickard Curt J. Organt Timothy E. Parker Farris G. Shuggi (For remaining officers, refer to the “All funds” table) | President Vice President Vice President Vice President Vice President Vice President Vice President Vice President Vice President Vice President Vice President |
Spectrum Funds Spectrum Growth Spectrum Income Spectrum International | Charles M. Shriver Christopher D. Alderson Brian W.H. Berghuis Kimberly E. DeDominicis David R. Giroux Ian D. Kelson Brian C. Rogers Daniel O. Shackelford Robert W. Smith Guido F. Stubenrauch Toby M. Thompson Mark J. Vaselkiv Richard T. Whitney (For remaining officers, refer to the “All funds” table) | President Vice President Vice President Vice President Vice President Vice President Vice President Vice President Vice President Vice President Vice President Vice President Vice President |
41
Fund | Name | Position Held |
State Tax-Free Income Trust Georgia Tax-Free Bond Maryland Short-Term Tax-Free Bond Maryland Tax-Free Bond Maryland Tax-Free Money New Jersey Tax-Free Bond New York Tax-Free Bond New York Tax-Free Money Virginia Tax-Free Bond | Hugh D. McGuirk Charles B. Hill Joseph K. Lynagh Konstantine B. Mallas Austin Applegate R. Lee Arnold, Jr. M. Helena Condez G. Richard Dent Charles E. Emrich Sarah J. Engle Stephanie A. Gentile Dylan Jones Marcy M. Lash Alan D. Levenson James M. Murphy Linda A. Murphy Alexander S. Obaza Douglas D. Spratley Timothy G. Taylor Edward A. Wiese James T. Lynch Chen Shao (For remaining officers, refer to the “All funds” table) | President Executive Vice President Executive Vice President Executive Vice President Vice President Vice President Vice President Vice President Vice President Vice President Vice President Vice President Vice President Vice President Vice President Vice President Vice President Vice President Vice President Vice President Assistant Vice President Assistant Vice President |
Strategic Income | Steven C. Huber Steve Boothe Michael J. Conelius Arif Husain Andrew J. Keirle Paul M. Massaro Andrew C. McCormick Samy B. Muaddi David A. Stanley Ju Yen Tan Mark J. Vaselkiv (For remaining officers, refer to the “All funds” table) | President Vice President Vice President Vice President Vice President Vice President Vice President Vice President Vice President Vice President Vice President |
Summit Funds Summit Cash Reserves
| Joseph K. Lynagh Anil K. Andhavarapu Austin Applegate Stephen L. Bartolini Brian J. Brennan Christopher P. Brown, Jr. M. Helena Condez G. Richard Dent Stephanie A. Gentile Keir R. Joyce Martin G. Lee Alan D. Levenson Cheryl A. Mickel Alexander S. Obaza Douglas D. Spratley Susan G. Troll John D. Wells Chen Shao (For remaining officers, refer to the “All funds” table) | President Vice President Vice President Vice President Vice President Vice President Vice President Vice President Vice President Vice President Vice President Vice President Vice President Vice President Vice President Vice President Vice President Assistant Vice President |
42
Fund | Name | Position Held |
Summit Municipal Funds Summit Municipal Income Summit Municipal Intermediate Summit Municipal Money Market | Hugh D. McGuirk Charles B. Hill Joseph K. Lynagh Konstantine B. Mallas Austin Applegate R. Lee Arnold, Jr. M. Helena Condez G. Richard Dent Charles E. Emrich Sarah J. Engle Stephanie A. Gentile Dylan Jones Marcy M. Lash Alan D. Levenson James M. Murphy Linda A. Murphy Alexander S. Obaza Douglas D. Spratley Timothy G. Taylor Edward A. Wiese James T. Lynch Chen Shao (For remaining officers, refer to the “All funds” table) | President Executive Vice President Executive Vice President Executive Vice President Vice President Vice President Vice President Vice President Vice President Vice President Vice President Vice President Vice President Vice President Vice President Vice President Vice President Vice President Vice President Vice President Assistant Vice President Assistant Vice President |
Tax-Efficient Funds Tax-Efficient Equity | Donald J. Peters Kennard W. Allen Preston G. Athey Ziad Bakri Andrew S. Davis Donald J. Easley Timothy E. Parker William J. Stromberg Taymour R. Tamaddon Alan Tu Mark R. Weigman (For remaining officers, refer to the “All funds” table) | President Vice President Vice President Vice President Vice President Vice President Vice President Vice President Vice President Vice President Vice President Vice President |
Tax-Exempt Money | Joseph K. Lynagh Austin Applegate Steven G. Brooks M. Helena Condez G. Richard Dent Stephanie A. Gentile Marcy M. Lash Alan D. Levenson Alexander S. Obaza Douglas D. Spratley Edward A. Wiese Chen Shao (For remaining officers, refer to the “All funds” table) | President Vice President Vice President Vice President Vice President Vice President Vice President Vice President Vice President Vice President Vice President Assistant Vice President |
43
Fund | Name | Position Held |
Tax-Free High Yield | James M. Murphy R. Lee Arnold, Jr. Austin Applegate M. Helena Condez G. Richard Dent Sarah J. Engle Charles B. Hill Dylan Jones Marcy M. Lash Konstantine B. Mallas Hugh D. McGuirk Linda A. Murphy Timothy G. Taylor Chen Shao (For remaining officers, refer to the “All funds” table) | President Executive Vice President Vice President Vice President Vice President Vice President Vice President Vice President Vice President Vice President Vice President Vice President Vice President Assistant Vice President |
Tax-Free Income | Konstantine B. Mallas R. Lee Arnold, Jr. M. Helena Condez G. Richard Dent Sarah J. Engle Charles B. Hill Marcy M. Lash Hugh D. McGuirk James M. Murphy Timothy G. Taylor James T. Lynch Chen Shao (For remaining officers, refer to the “All funds” table) | President Vice President Vice President Vice President Vice President Vice President Vice President Vice President Vice President Vice President Assistant Vice President Assistant Vice President |
Tax-Free Short-Intermediate Tax-Free Ultra Short-Term Bond | Charles B. Hill Austin Applegate M. Helena Condez G. Richard Dent Charles E. Emrich Dylan Jones Marcy M. Lash Joseph K. Lynagh Konstantine B. Mallas Hugh D. McGuirk Timothy G. Taylor Edward A. Wiese James T. Lynch Chen Shao (For remaining officers, refer to the “All funds” table) | President Vice President Vice President Vice President Vice President Vice President Vice President Vice President Vice President Vice President Vice President Vice President Assistant Vice President Assistant Vice President |
U.S. Bond Enhanced Index | Robert M. Larkins Steven C. Huber Martin G. Lee Andrew C. McCormick Brian M. Ropp Daniel O. Shackelford Scott D. Solomon David A. Tiberii (For remaining officers, refer to the “All funds” table) | President Vice President Vice President Vice President Vice President Vice President Vice President Vice President |
44
Fund | Name | Position Held |
U.S. Large-Cap Core | Jeffrey Rottinghaus Peter J. Bates Shawn T. Driscoll Joseph B. Fath Mark S. Finn Paul D. Greene II John D. Linehan George A. Marzano Robert W. Sharps Gabriel Solomon (For remaining officers, refer to the “All funds” table) | President Vice President Vice President Vice President Vice President Vice President Vice President Vice President Vice President Vice President |
U.S. Treasury Funds U.S. Treasury Intermediate U.S. Treasury Long-Term U.S. Treasury Money | Brian J. Brennan Joseph K. Lynagh Austin Applegate Stephen L. Bartolini Steven G. Brooks M. Helena Condez G. Richard Dent Stephanie A. Gentile Geoffrey M. Hardin Alan D. Levenson Andrew C. McCormick Cheryl A. Mickel Samy B. Muaddi Alexander S. Obaza Vernon A. Reid, Jr. Rebecca L. Setcavage Daniel O. Shackelford Douglas D. Spratley Chen Shao (For remaining officers, refer to the “All funds” table) | President Executive Vice President Vice President Vice President Vice President Vice President Vice President Vice President Vice President Vice President Vice President Vice President Vice President Vice President Vice President Vice President Vice President Vice President Assistant Vice President |
Value | Mark S. Finn Peter J. Bates Jason A. Bauer Ryan N. Burgess Ira W. Carnahan Andrew S. Davis David R. Giroux Joel Grant John D. Linehan Heather K. McPherson Robert T. Quinn, Jr. Brian C. Rogers Gabriel Solomon Joshua K. Spencer Tamara P. Wiggs (For remaining officers, refer to the “All funds” table) | President Vice President Vice President Vice President Vice President Vice President Vice President Vice President Vice President Vice President Vice President Vice President Vice President Vice President Vice President |
Officers
Name, Year of Birth, and Principal Occupation(s) | Position(s) Held With Fund(s) |
Ulle Adamson, 1979 Vice President, T. Rowe Price Group, Inc. and T. Rowe Price International; CFA | Executive Vice President , International Funds, Vice President, Institutional International Funds and Media & Telecommunications Fund |
Roy H. Adkins, 1970 Vice President, T. Rowe Price Group, Inc. and T. Rowe Price International | Vice President, Institutional International Funds, International Funds, and Multi-Sector Account Portfolios |
45
Name, Year of Birth, and Principal
Occupation(s) | Position(s) Held With Fund(s) |
Christopher D. Alderson, 1962 Company’s Representative, Director and Vice President, Price Hong Kong; Director and Vice President, Price Singapore and T. Rowe Price International; Vice President, T. Rowe Price Group, Inc. | President, Institutional International Funds and International Funds; Vice President, Personal Strategy Funds, Retirement Funds, and Spectrum Funds |
Syed H. Ali, 1970 Vice President, Price Singapore and T. Rowe Price Group, Inc.; formerly Research Analyst, Credit Suisse Securities (to 2010) | Vice President, International Funds and New Era Fund |
Kennard W. Allen, 1977 Vice President, T. Rowe Price and T. Rowe Price Group, Inc. | President, Science & Technology Fund; Vice President, Capital Opportunity Fund, Diversified Mid-Cap Growth Fund, Global Technology Fund, Mid-Cap Growth Fund, and Tax-Efficient Funds |
Francisco M. Alonso, 1978 Vice President, T. Rowe Price and T. Rowe Price Group, Inc. | Vice President, New Horizons Fund, Small-Cap Stock Fund, and Small-Cap Value Fund |
Paulina Amieva, 1981 Vice President, T. Rowe Price and T. Rowe Price Group, Inc. | Vice President, Institutional International Funds and International Funds |
Anil K. Andhavarapu, 1980 Vice President, T. Rowe Price | Vice President, GNMA Fund, Multi-Sector Account Portfolios, and Summit Funds |
Austin Applegate, 1974 Vice President, T. Rowe Price and T. Rowe Price Group, Inc.; formerly Senior Municipal Credit Research Analyst, Barclays Capital (to 2011) | Vice President, California Tax-Free Income Trust, Prime Reserve Fund, TRP Reserve Investment Funds, State Tax-Free Income Trust, Summit Funds, Summit Municipal Funds, Tax-Exempt Money Fund, Tax-Free High Yield Fund, Tax-Free Short-Intermediate Fund, and U.S. Treasury Funds |
R. Lee Arnold, Jr., 1970 Vice President, T. Rowe Price and T. Rowe Price Group, Inc.; CFA, CPA | Executive Vice President, Intermediate Tax-Free High Yield Fund and Tax-Free High Yield Fund; Vice President, State Tax-Free Income Trust, Summit Municipal Funds, and Tax-Free Income Fund |
Malik S. Asif, 1981 Vice President, T. Rowe Price Group and T. Rowe Price International; formerly student, The University of Chicago Booth School of Business (to 2012) and Investment Consultant - Middle East and North Africa Investment Team, International Finance Corporation – The World Bank Group (to 2010) | Vice President, Institutional International Funds and International Funds |
Boyko D. Atanassov, 1969 Vice President, T. Rowe Price and T. Rowe Price Group, Inc.; formerly, Quantitative Equity Research AVP, AllianceBernstein (to 2010) | Vice President, Diversified Small-Cap Growth Fund |
Preston G. Athey, 1949 Vice President, T. Rowe Price, T. Rowe Price Group, Inc., and T. Rowe Price Trust Company; CFA, CIC | Vice President, New Horizons Fund, Small-Cap Stock Fund, Small-Cap Value Fund, and Tax-Efficient Funds |
E. Frederick Bair, 1969 Vice President, T. Rowe Price, T. Rowe Price Group, Inc., and T. Rowe Price Trust Company; CFA, CPA | President, Index Trust and International Index Fund; Vice President, Balanced Fund, Personal Strategy Funds, and Real Assets Fund |
Ziad Bakri, 1980 Vice President, T. Rowe Price and T. Rowe Price Group, Inc.; formerly Vice President, Cowen and Company (to 2011); M.D., CFA | Vice President, Blue Chip Growth Fund, Health Sciences Fund, New America Growth Fund, New Horizons Fund, and Tax-Efficient Funds |
Harishankar Balkrishna, 1983 Vice President, T. Rowe Price Group, Inc. and T. Rowe Price International; formerly intern, T. Rowe Price (to 2010) | Vice President, Global Real Estate Fund, Institutional International Funds, and International Funds |
Sheena L. Barbosa, 1983 Vice President, Price Hong Kong and T. Rowe Price Group | Vice President, International Funds |
46
Name, Year of Birth, and Principal
Occupation(s) | Position(s) Held With Fund(s) |
Stephen L. Bartolini, 1977 Vice President, T. Rowe Price and T. Rowe Price Group, Inc.; formerly Senior Portfolio Manager, Senior Trader, and Analyst, Fannie Mae (to 2010); CFA | Vice President, Global Allocation Fund, Inflation Focused Bond Fund, Inflation Protected Bond Fund, Summit Funds, and U.S. Treasury Funds |
Peter J. Bates, 1974 Vice President, T. Rowe Price and T. Rowe Price Group, Inc.; CFA | Executive Vice President, International Funds; Vice President, Blue Chip Growth Fund, Capital Opportunity Fund, Diversified Mid-Cap Growth Fund, Dividend Growth Fund, Growth & Income Fund, Institutional International Funds, U.S. Large-Cap Core Fund, and Value Fund |
Jason A. Bauer, 1979 Vice President, T. Rowe Price and T. Rowe Price Group, Inc. | Vice President, High Yield Fund, Institutional Income Funds, and Value Fund |
Luis M. Baylac, 1982 Vice President, T. Rowe Price Group, Inc. and T. Rowe Price International | Vice President, International Funds |
Oliver D.M. Bell, 1969 Vice President, T. Rowe Price Group, Inc. and T. Rowe Price International; formerly Head of Global Emerging Markets Research, Pictet Asset Management Ltd. (to 2011) | Executive Vice President, Institutional International Funds and International Funds |
R. Scott Berg, 1972 Vice President, T. Rowe Price and T. Rowe Price Group, Inc.; CFA | Executive Vice President, Institutional International Funds and International Funds |
Brian W.H. Berghuis, 1958 Vice President, T. Rowe Price, T. Rowe Price Group, Inc., and T. Rowe Price Trust Company; CFA | President, Mid-Cap Growth Fund; Executive Vice President, Institutional Equity Funds; Vice President, Diversified Mid-Cap Growth Fund, New America Growth Fund, New Horizons Fund, Personal Strategy Funds, Retirement Funds, Science & Technology Fund, and Spectrum Funds |
Michael F. Blandino, 1971 Vice President, T. Rowe Price and T. Rowe Price Group, Inc. | Vice President, Credit Opportunities Fund, Institutional Income Funds, and New Horizons Fund |
Steve Boothe, 1977 Vice President, T. Rowe Price and T. Rowe Price Group, Inc.; CFA | Executive Vice President, Corporate Income Fund; Vice President, Institutional Income Funds, Institutional International Funds, International Funds, Multi-Sector Account Portfolios, New Income Fund, and Strategic Income Fund |
Peter I. Botoucharov, 1965 Vice President, T. Rowe Price Group, Inc. and T. Rowe Price International; formerly Director – EMEA Macroeconomic Research and Strategy (to 2012); and Global Source, Independent Financial Advisor (to 2010) | Vice President, Institutional International Funds, International Funds, and Multi-Sector Account Portfolios |
Tala Boulos, 1984 Vice President, T. Rowe Price Group, Inc. and T. Rowe Price International; formerly, Vice President, CEEMEA Corporate Credit Research, Deutsche Bank (to 2013) | Vice President, Institutional International Funds, International Funds, and Multi-Sector Account Portfolios |
Darrell N. Braman, 1963 Vice President, Price Hong Kong, Price Singapore, T. Rowe Price, T. Rowe Price Group, Inc., T. Rowe Price International, T. Rowe Price Investment Services, Inc., and T. Rowe Price Services, Inc. | Vice President, all funds |
47
Name, Year of Birth, and Principal
Occupation(s) | Position(s) Held With Fund(s) |
Brian J. Brennan, 1964 Vice President,
T. Rowe Price, T. Rowe Price Group, Inc., T. Rowe Price International, and T. Rowe Price Trust | President, U.S. Treasury Funds; Executive Vice President, Institutional Income Funds; Vice President, GNMA Fund, Inflation Focused Bond Fund, Inflation Protected Bond Fund, Multi-Sector Account Portfolios, New Income Fund, Short-Term Bond Fund, and Summit Funds |
Andrew M. Brooks, 1956 Vice President, T. Rowe Price and T. Rowe Price Group, Inc. | Vice President, Equity Income Fund, High Yield Fund, and Institutional Income Funds |
Steven G. Brooks, 1954 Vice President, T. Rowe Price and T. Rowe Price Group, Inc.; CFA | Vice President, California Tax-Free Income Trust, Corporate Income Fund, Inflation Focused Bond Fund, Multi-Sector Account Portfolios, Prime Reserve Fund, TRP Reserve Investment Funds, Short-Term Bond Fund, Tax-Exempt Money Fund, and U.S. Treasury Funds |
Christopher P. Brown, Jr., 1977 Vice President, T. Rowe Price and T. Rowe Price Group, Inc.; CFA | Vice President, Credit Opportunities Fund, GNMA Fund, Institutional Income Funds, Multi-Sector Account Portfolios, New Income Fund, and Summit Funds |
Ryan N. Burgess, 1974 Vice President, T. Rowe Price and T. Rowe Price Group, Inc.; CFA | Vice President, Blue Chip Growth Fund, Capital Appreciation Fund, Capital Opportunity Fund, Equity Income Fund, Growth & Income Fund, International Funds, Mid-Cap Value Fund, New Era Fund, and Value Fund |
Brian E. Burns, 1960 Vice President, T. Rowe Price, T. Rowe Price Group, Inc., and T. Rowe Price Trust Company | Vice President, Floating Rate Fund, Institutional Income Funds, and Multi-Sector Account Portfolios |
Christopher W. Carlson, 1967 Vice President, T. Rowe Price and T. Rowe Price Group, Inc. | Vice President, Capital Opportunity Fund, Global Technology Fund, Mid-Cap Value Fund, and New Horizons Fund |
Ira W. Carnahan, 1963 Vice President, T. Rowe Price and T. Rowe Price Group, Inc.; CFA | Vice President, Mid-Cap Growth Fund, Mid-Cap Value Fund, Small-Cap Stock Fund, and Value Fund |
Sheldon Chan, 1981 Vice President, Price Hong Kong and T. Rowe Price Group, Inc.; formerly Associate Director, HSBC (Hong Kong) (to 2011) | Vice President, International Funds and Multi-Sector Account Portfolios |
Tak Yiu Cheng, 1974 Vice President, Price Hong Kong and T. Rowe Price Group, Inc.; CFA, CPA | Vice President, International Funds |
Carolyn Hoi Che Chu, 1974 Vice President, Price Hong Kong and T. Rowe Price Group, Inc.; formerly Director, Bank of America Merrill Lynch and co-head of credit and convertibles research team in Hong Kong (to 2010) | Vice President, Institutional International Funds, International Funds, and Multi-Sector Account Portfolios |
Archibald Ciganer Albeniz, 1976 Vice President, T. Rowe Price Group, Inc. and T. Rowe Price International; CFA | Executive Vice President, International Funds; Vice President, Institutional International Funds |
Jerome A. Clark, 1961 Vice President, T. Rowe Price, T. Rowe Price Group, Inc., T. Rowe Price Investment Services, Inc., and T. Rowe Price Trust Company; CFA | President, Retirement Funds; Vice President, Inflation Focused Bond Fund and Personal Strategy Funds |
Richard N. Clattenburg, 1979 Vice President, Price Singapore, T. Rowe Price, T. Rowe Price Group, Inc., and T. Rowe Price International; CFA | Executive Vice President, Institutional International Funds and International Funds; Vice President, Global Real Estate Fund |
48
Name, Year of Birth, and Principal
Occupation(s) | Position(s) Held With Fund(s) |
Andrew L. Cohen, 1979 Vice President, T. Rowe Price and T. Rowe Price Group, Inc.; formerly Associate – Power & Energy/Strategic Investments Metlife Investments (to 2010); CFA | Vice President, High Yield Fund and Institutional Income Funds |
M. Helena Condez, 1962 Vice President, T. Rowe Price and T. Rowe Price Group, Inc. | Vice President, California Tax-Free Income Trust, Intermediate Tax-Free High Yield Fund, Prime Reserve Fund, TRP Reserve Investment Funds, Short-Term Bond Fund, State Tax-Free Income Trust, Summit Funds, Summit Municipal Funds, Tax-Exempt Money Fund, Tax-Free High Yield Fund, Tax-Free Income Fund, Tax-Free Short-Intermediate Fund, and U.S. Treasury Funds |
Michael J. Conelius, 1964 Vice President, T. Rowe Price, T. Rowe Price Group, Inc., T. Rowe Price International, and T. Rowe Price Trust Company; CFA | Executive Vice President, Institutional International Funds, International Funds, and Multi-Sector Account Portfolios; Vice President, Institutional Income Funds and Strategic Income Fund |
Michael F. Connelly, 1977 Vice President, T. Rowe Price and T. Rowe Price Group, Inc.; CFA | Vice President, Floating Rate Fund, High Yield Fund, Institutional Income Funds, and Multi-Sector Account Portfolios |
Michael P. Daley, 1981 Vice President, T. Rowe Price and T. Rowe Price Group, Inc. | Vice President, Corporate Income Fund, Institutional Income Funds, and Multi-Sector Account Portfolios |
Andrew S. Davis, 1978 Vice President, T. Rowe Price and T. Rowe Price Group, Inc. | Vice President, Growth & Income Fund, Growth Stock Fund, International Funds, Small-Cap Stock Fund, Small-Cap Value Fund, Tax-Efficient Funds, and Value Fund |
Kimberly E. DeDominicis, 1976 Vice President, T. Rowe Price, T. Rowe Price Group, Inc., and T. Rowe Price International | Vice President, Balanced Fund, Personal Strategy Funds, Retirement Funds, and Spectrum Funds |
Ramon R. de Castro, 1966 Vice President, T. Rowe Price and T. Rowe Price Group, Inc.; formerly Chief Operating Officer, Amherst Advisory & Management, LLC (to 2012) | Vice President, GNMA and Multi-Sector Account Portfolios |
Richard de los Reyes, 1975 Vice President, T. Rowe Price, T. Rowe Price Group, Inc., and T. Rowe Price Trust Company | Vice President, Institutional International Funds, International Funds, New Era Fund, and Real Assets Fund |
Laurent Delgrande, 1971 Vice President, T. Rowe Price Group, Inc. and T. Rowe Price International; formerly Portfolio Manager, Fidelity International Limited (to 2014) | Vice President, Institutional International Funds and International Funds |
Michael Della Vedova, 1969 Vice President, T. Rowe Price Group, Inc. and T. Rowe Price International | Executive Vice President, International Funds; Vice President, High Yield Fund and Institutional International Funds |
G. Richard Dent, 1960 Vice President, T. Rowe Price and T. Rowe Price Group, Inc. | Vice President, California Tax-Free Income Trust, Intermediate Tax-Free High Yield Fund, Prime Reserve Fund, TRP Reserve Investment Funds, State Tax-Free Income Trust, Summit Funds, Summit Municipal Funds, Tax-Exempt Money Fund, Tax-Free High Yield Fund, Tax-Free Income Fund, Tax-Free Short-Intermediate Fund, and U.S. Treasury Funds |
49
Name, Year of Birth, and Principal
Occupation(s) | Position(s) Held With Fund(s) |
Eric L. DeVilbiss, 1983 Vice President, T. Rowe Price and T. Rowe Price Group, Inc.; CFA | Vice President, Blue Chip Growth Fund, Diversified Mid-Cap Growth Fund, New America Growth Fund, New Era Fund, and New Horizons Fund |
Carson R. Dickson, 1976 Vice President, T. Rowe Price and T. Rowe Price Group, Inc.; CFA, CPA | Vice President, High Yield Fund |
Anna M. Dopkin, 1967 Vice President, T. Rowe Price, T. Rowe Price Group, Inc., T. Rowe Price International, and T. Rowe Price Trust Company; CFA | Vice President, Balanced Fund and Real Estate Fund |
Anna Dreyer, 1981 Vice President, T. Rowe Price and T. Rowe Price Group, Inc., | Vice President, Balanced Fund |
Shawn T. Driscoll, 1975 Vice President, T. Rowe Price, T. Rowe Price Group, Inc., and T. Rowe Price Trust Company | President, New Era Fund; Vice President, Blue Chip Growth Fund, Growth & Income Fund, Growth Stock Fund, Institutional International Funds, International Funds, Mid-Cap Growth Fund, New America Growth Fund, Real Assets Fund, and U.S. Large-Cap Core Fund |
Donald J. Easley, 1971 Vice President, T. Rowe Price and T. Rowe Price Group, Inc.; CFA | Executive Vice President, Diversified Mid-Cap Growth Fund; Vice President, Capital Opportunity Fund, Diversified Small-Cap Growth Fund, Mid-Cap Growth Fund, New Era Fund, and Tax-Efficient Funds |
Bridget A. Ebner, 1970 Vice President, T. Rowe Price and T. Rowe Price Group, Inc. | Vice President, Inflation Focused Bond Fund, Institutional International Funds, International Funds, and Short-Term Bond Fund |
Mark J.T. Edwards, 1957 Vice President, T. Rowe Price Group, Inc. and T. Rowe Price International | Executive Vice President, Institutional International Funds and International Funds |
David J. Eiswert, 1972 Vice President, T. Rowe Price, T. Rowe Price Group, Inc., and T. Rowe Price International; CFA | Executive Vice President, Institutional International Funds and International Funds; Vice President, Global Technology Fund, Growth Stock Fund, Media & Telecommunications Fund, and Science & Technology Fund |
Henry M. Ellenbogen, 1973 Vice President, T. Rowe Price, T. Rowe Price Group, Inc., and T. Rowe Price Trust Company | President, New Horizons Fund; Vice President, Global Technology Fund, International Funds, Media & Telecommunications Fund, Mid-Cap Growth Fund, and Mid-Cap Value Fund |
Charles E. Emrich, 1961 Vice President, T. Rowe Price and T. Rowe Price Group, Inc. | Vice President, California Tax-Free Income Trust, State Tax-Free Income Trust, Summit Municipal Funds, and Tax-Free Short-Intermediate Fund |
Sarah J. Engle, 1979 Vice President, T. Rowe Price and T. Rowe Price Group, Inc.; formerly Program Examiner and Policy Analyst, Office of Management & Budget (to 2012); Analyst, Moody’s Investor Service (to 2010) | Vice President, Intermediate Tax-Free High Yield Fund, State Tax-Free Income Trust, Summit Municipal Funds, Tax-Free High Yield Fund, and Tax-Free Income Fund |
Joseph B. Fath, 1971 Vice President, T. Rowe Price, T. Rowe Price Group, Inc., and T. Rowe Price Trust Company; CPA | President, Growth Stock Fund; Vice President, Capital Opportunity Fund, Media & Telecommunications Fund, Mid-Cap Growth Fund, and U.S. Large-Cap Core Fund |
Stephen M. Finamore, 1976 Vice President, T. Rowe Price and T. Rowe Price Group, Inc.; CPA | Vice President, Financial Services Fund, Floating Rate Fund, High Yield Fund, Institutional Income Funds, and Multi-Sector Account Portfolios |
50
Name, Year of Birth, and Principal
Occupation(s) | Position(s) Held With Fund(s) |
Mark S. Finn, 1963 Vice President, T. Rowe Price, T. Rowe Price Group, Inc., and T. Rowe Price Trust Company; CFA, CPA | President, Value Fund; Executive Vice President, Institutional Equity Funds; Vice President, Balanced Fund, Capital Opportunity Fund, Equity Income Fund, Institutional International Funds, International Funds, Mid-Cap Value Fund, New Era Fund, Personal Strategy Funds, and U.S. Large-Cap Core Fund |
Christopher T. Fortune, 1973 Vice President, T. Rowe Price and T. Rowe Price Group, Inc. | Vice President, Financial Services Fund, Small-Cap Stock Fund, and Small-Cap Value Fund |
Jon M. Friar, 1982 Vice President, T. Rowe Price and T. Rowe Price Group, Inc.; formerly Summer Intern, T. Rowe Price (to 2011) | Vice President, Capital Appreciation Fund, Dividend Growth Fund, Equity Income Fund, Financial Services Fund, and Growth Stock Fund |
James H. Friedland, 1970 Vice President, T. Rowe Price and T. Rowe Price Group, Inc.; formerly Senior Internet Analyst and Managing Director, Cowen and Company (to 2012) | Vice President, Dividend Growth Fund and Media & Telecommunications Fund |
Melissa C. Gallagher, 1974 Vice President, T. Rowe Price Group, Inc. and T. Rowe Price International | Vice President, Health Sciences Fund and International Funds |
Stephanie A. Gentile, 1956 Vice President, T. Rowe Price; formerly Director, Credit Suisse Securities (to 2014); CFA | Vice President, California Tax-Free Income Trust, Prime Reserve Fund, Reserve Investment Funds, State Tax-Free Income Trust, Summit Funds, Summit Municipal Funds, Tax-Exempt Money Funds, and U.S. Treasury Funds |
Justin T. Gerbereux, 1975 Vice President, T. Rowe Price, T. Rowe Price Group, Inc., and T. Rowe Price Trust Company; CFA | Vice President, Floating Rate Fund, High Yield Fund, Institutional Income Funds, and Multi-Sector Account Portfolios |
John R. Gilner, 1961 Chief Compliance Officer and Vice President, T. Rowe Price; Vice President, T. Rowe Price Group, Inc. and T. Rowe Price Investment Services, Inc. | Chief Compliance Officer, all funds |
David R. Giroux, 1975 Vice President, T. Rowe Price, T. Rowe Price Group, Inc., and T. Rowe Price Trust Company; CFA | President, Capital Appreciation Fund; Vice President, Equity Income Fund, Financial Services Fund, Floating Rate Fund, Institutional Income Funds, Personal Strategy Funds, Retirement Funds, Spectrum Funds, and Value Fund |
Vishnu Vardhan Gopal, 1979 Vice President, Price Hong Kong and T. Rowe Price Group, Inc. | Vice President, International Funds |
Joel Grant, 1978 Vice President, T. Rowe Price; formerly Analyst, Fidelity International (to 2014) | Vice President, International Funds, and Value Fund |
Paul D. Greene II, 1978 Vice President, T. Rowe Price and T. Rowe Price Group, Inc. | President, Media & Telecommunications Fund; Vice President, Blue Chip Growth Fund, Capital Appreciation Fund, Global Technology Fund, Growth Stock Fund, Institutional International Funds, International Funds, Science & Technology Fund, and U.S. Large-Cap Core Fund |
Benjamin Griffiths, 1977 Vice President, T. Rowe Price Group, Inc. and T. Rowe Price International; CFA | Vice President, Institutional International Funds and International Funds |
Michael J. Grogan, 1971 Vice President, T. Rowe Price and T. Rowe Price Group Inc.; CFA | Vice President, Corporate Income Fund, Inflation Focused Bond Fund, Institutional Income Funds, Multi-Sector Account Portfolios, New Income Fund, and Short-Term Bond Fund |
51
Name, Year of Birth, and Principal
Occupation(s) | Position(s) Held With Fund(s) |
Richard L. Hall, 1979 Vice President, T. Rowe Price and T. Rowe Price Group Inc.; formerly, Financial Attaché, U.S. Department of Treasury, International Affairs Division (to 2012) | Vice President, Institutional International Funds and International Funds |
Geoffrey M. Hardin, 1971 Vice President, T. Rowe Price and T. Rowe Price Group, Inc. | Vice President, Inflation Focused Bond Fund, Inflation Protected Bond Fund, New Income Fund, Short-Term Bond Fund, and U.S. Treasury Funds |
Robert L. Harlow, 1986 Vice President, T. Rowe Price and T. Rowe Price Group, Inc.; CAIA, CFA | Vice President, Global Allocation Fund |
Ryan S. Hedrick, 1980 Vice President, T. Rowe Price and T. Rowe Price Group Inc.; formerly, Analyst, Davidson Kempner Capital Management (to 2013); CFA | Vice President, Blue Chip Growth Fund, Mid-Cap Value Fund, New Era Fund, and Small-Cap Value Fund |
Barry Henderson, 1966 Vice President, T. Rowe Price and T. Rowe Price Group, Inc. | Vice President, Growth Stock Fund, New America Growth Fund, and New Horizons Fund |
Charles B. Hill, 1961 Vice President, T. Rowe Price and T. Rowe Price Group, Inc.; CFA | President, Tax-Free Short-Intermediate Fund; Executive Vice President, State Tax-Free Income Trust and Summit Municipal Funds; Vice President, Inflation Focused Bond Fund, Intermediate Tax-Free High Yield Fund, Short-Term Bond Fund, Tax-Free High Yield Fund, and Tax-Free Income Fund |
Gregory K. Hinkle, 1958 Vice President, T. Rowe Price, T. Rowe Price Group, Inc., and T. Rowe Price Trust Company; CPA | Treasurer, all funds |
Ann M. Holcomb, 1972 Vice President, T. Rowe Price, T. Rowe Price Group, Inc., and T. Rowe Price Trust Company; CFA | Executive Vice President, Institutional Equity Funds; Co-President, Capital Opportunity Fund |
Steven C. Huber, 1958 Vice President, T. Rowe Price and T. Rowe Price Group, Inc.; CFA, FSA | Executive Vice President, Institutional Income Funds; President, Strategic Income Fund; Vice President, Floating Rate Fund, Global Allocation Fund, Institutional International Funds, International Funds, Multi-Sector Account Portfolios, New Income Fund, and U.S. Bond Enhanced Index Fund |
Thomas J. Huber, 1966 Vice President, T. Rowe Price, T. Rowe Price Group, Inc., and T. Rowe Price Trust Company; CFA | President, Dividend Growth Fund and Growth & Income Fund; Vice President, Blue Chip Growth Fund, Equity Income Fund, and Real Estate Fund |
Stefan Hubrich, 1974 Vice President, T. Rowe Price and T. Rowe Price Group, Inc.; Ph.D., CFA | Vice President, Global Allocation Fund, Institutional International Funds, International Funds, and Real Assets Fund |
Rhett K. Hunter, 1977 Vice President, T. Rowe Price and T. Rowe Price Group, Inc. | Vice President, Global Technology Fund, New Horizons Fund, and Science & Technology Fund |
Arif Husain, 1972 Vice President, T. Rowe Price Group, Inc. and T. Rowe Price International; formerly Director/Head of UK and Euro Fixed Income, AllianceBernstein (to 2013); CFA | Executive Vice President, Institutional International Funds and International Funds; Vice President, Institutional Income Funds, Multi-Sector Account Portfolios, and Strategic Income Fund |
Tetsuji Inoue, 1971 Vice President, T. Rowe Price Group, Inc. and T. Rowe Price International; formerly Equity Sales, JP Morgan Chase Securities Ltd. (to 2012) and Equity Specialist Technology, ICAP PLC (to 2010) | Vice President, Global Real Estate Fund and International Funds |
52
Name, Year of Birth, and Principal
Occupation(s) | Position(s) Held With Fund(s) |
Michael Jacobs, 1971 Vice President, T. Rowe Price Group, Inc. and T. Rowe Price International; formerly, Vice President, JP Morgan Asset Management (to 2013) | Vice President, International Funds |
Andrew P. Jamison, 1981 Vice President, T. Rowe Price and T. Rowe Price Group, Inc. | Vice President, Credit Opportunities Fund, High Yield Fund, and Institutional Income Funds |
Randal S. Jenneke, 1971 Vice President, T. Rowe Price Group, Inc. and T. Rowe Price International; formerly Senior Portfolio Manager Australian Equities (to 2010) | Vice President, Institutional International Funds and International Funds |
Prashant G. Jeyaganesh, 1983 Vice President, T. Rowe Price and T. Rowe Price Group, Inc. | Vice President, Diversified Small-Cap Growth Fund, and International Funds |
Dylan Jones, 1971 Vice President, T. Rowe Price and T. Rowe Price Group, Inc.; CFA | Vice President, Intermediate Tax-Free High Yield Fund, State Tax-Free Income Trust, Summit Municipal Funds, Tax-Free High Yield Fund, and Tax-Free Short-Intermediate Fund |
Nina P. Jones, 1980 Vice President, T. Rowe Price and T. Rowe Price Group, Inc.; CPA | President, Global Real Estate Fund, Vice President, Capital Appreciation Fund, Equity Income Fund, Financial Services Fund, Growth & Income Fund, Real Assets Fund, Real Estate Fund, and Small-Cap Value Fund |
Keir R. Joyce, 1972 Vice President, T. Rowe Price and T. Rowe Price Group, Inc.; CFA | Vice President, GNMA Fund, Inflation Focused Bond Fund, Multi-Sector Account Portfolios, Short-Term Bond Fund, and Summit Funds |
Vidya Kadiyam, 1980 Vice President, T. Rowe Price and T. Rowe Price Group, Inc. | Vice President, Capital Appreciation Fund |
Yoichiro Kai, 1973 Vice President, T. Rowe Price Group, Inc. and T. Rowe Price International | Vice President, Financial Services Fund, Institutional International Funds, and International Funds |
Jai Kapadia, 1982 Vice President, Price Hong Kong and T. Rowe Price Group, Inc.; formerly student, MIT Sloan School of Management (to 2011) | Vice President, Global Real Estate Fund and International Funds |
Paul A. Karpers, 1967 Vice President, T. Rowe Price and T. Rowe Price Group, Inc.; CFA | Executive Vice President, Institutional Income Funds; President, Credit Opportunities Fund; Vice President, Balanced Fund, Corporate Income Fund, Floating Rate Fund, High Yield Fund, and Multi-Sector Account Portfolios |
Andrew J. Keirle, 1974 Vice President, T. Rowe Price Group, Inc. and T. Rowe Price International | Executive Vice President, Institutional International Funds, International Funds, and Multi-Sector Account Portfolios; Vice President, Institutional Income Funds and Strategic Income Fund |
Ian D. Kelson, 1956 Director and Vice President, T. Rowe Price International; Vice President, T. Rowe Price Group, Inc. | Vice President, Personal Strategy Funds, Retirement Funds, and Spectrum Funds |
Shinwoo Kim, 1977 Vice President, T. Rowe Price and T. Rowe Price Group, Inc. | Vice President, New Era Fund |
Steven D. Krichbaum, 1977 Vice President, T. Rowe Price and T. Rowe Price Group, Inc. | Vice President, Capital Appreciation Fund and Capital Opportunity Fund |
Christopher J. Kushlis, 1976 Vice President, T. Rowe Price Group, Inc. and T. Rowe Price International; CFA | Vice President, Institutional International Funds, International Funds, and Multi-Sector Account Portfolios |
53
Name, Year of Birth, and Principal
Occupation(s) | Position(s) Held With Fund(s) |
Michael Lambe, 1977 Vice President, T. Rowe Price Group, Inc. and T. Rowe Price International; CFA | Vice President, Corporate Income Fund, Institutional Income Funds, and Multi-Sector Account Portfolios |
Robert M. Larkins, 1973 Vice President, T. Rowe Price, T. Rowe Price Group, Inc., and T. Rowe Price Trust Company; CFA | President, U.S. Bond Enhanced Index Fund; Vice President, Balanced Fund, Global Allocation Fund, Institutional Income Funds, and New Income Fund |
Marcy M. Lash, 1963 Vice President, T. Rowe Price and T. Rowe Price Group, Inc. | Vice President, Intermediate Tax-Free High Yield Fund, State Tax-Free Income Trust, Summit Municipal Funds, Tax-Exempt Money Fund, Tax-Free High Yield Fund, Tax-Free Income Fund, and Tax-Free Short-Intermediate Fund |
Shengrong Lau, 1982 Vice President, Price Singapore and T. Rowe Price Group, Inc.; formerly student, The Wharton School, University of Pennsylvania (to 2012) and Private Equity Associate – Financial Services, Stone Point Capital (to 2010) | Vice President, International Funds |
Mark J. Lawrence, 1970 Vice President, T. Rowe Price Group, Inc. and T. Rowe Price International | Vice President, Institutional International Funds and International Funds |
David M. Lee, 1962 Vice President, T. Rowe Price, T. Rowe Price Group, Inc., and T. Rowe Price Trust Company; CFA | President, Real Estate Fund; Vice President, Dividend Growth Fund, Global Real Estate Fund, Institutional International Funds, International Funds, and Real Assets Fund |
Martin G. Lee, 1963 Vice President, T. Rowe Price and T. Rowe Price Group, Inc. | Vice President, GNMA Fund, Multi-Sector Account Portfolios, Summit Funds, and U.S. Bond Enhanced Index Fund |
Wyatt A. Lee, 1971 Vice President, T. Rowe Price, T. Rowe Price Group, Inc., and T. Rowe Price Trust Company; CFA | President, Real Assets Fund; Executive Vice President, Retirement Funds; Vice President, Balanced Fund, Inflation Focused Bond Fund, and Personal Strategy Funds |
Alan D. Levenson, 1958 Vice President, T. Rowe Price and T. Rowe Price Group, Inc.; Ph.D. | Vice President, California Tax-Free Income Trust, Corporate Income Fund, GNMA Fund, Inflation Protected Bond Fund, Multi-Sector Account Portfolios, New Income Fund, Prime Reserve Fund, TRP Reserve Investment Funds, State Tax-Free Income Trust, Summit Funds, Summit Municipal Funds, Tax-Exempt Money Fund, and U.S. Treasury Funds |
John D. Linehan, 1965 Vice President, T. Rowe Price, T. Rowe Price Group, Inc., and T. Rowe Price Trust Company; CFA | Executive Vice President, Institutional Equity Funds; Vice President, Capital Appreciation Fund, Equity Income Fund, U.S. Large-Cap Core Fund, and Value Fund |
Patricia B. Lippert, 1953 Assistant Vice President, T. Rowe Price and T. Rowe Price Investment Services, Inc. | Secretary, all funds |
Jacqueline L. Liu, 1979 Vice President, Price Hong Kong and T. Rowe Price Group, Inc.; formerly Investment Analyst, Fidelity International Hong Kong Limited (to 2014) | Vice President, Global Technology Fund, International Funds, and Media & Telecommunications Fund |
Christopher C. Loop, 1966 Vice President, T. Rowe Price Group, Inc. and T. Rowe Price International; CFA | Vice President, Institutional International Funds, International Funds, and Multi-Sector Account Portfolios |
Anh Lu, 1968 Vice President, Price Hong Kong and T. Rowe Price Group, Inc. | Executive Vice President, International Funds; Vice President, Institutional International Funds |
54
Name, Year of Birth, and Principal
Occupation(s) | Position(s) Held With Fund(s) |
Joseph K. Lynagh, 1958 Vice President, T. Rowe Price, T. Rowe Price Group, Inc., and T. Rowe Price Trust Company; CFA | President, Prime Reserve Fund, TRP Reserve Investment Funds, and Tax-Exempt Money Fund; Executive Vice President, California Tax-Free Income Trust, Short-Term Bond Fund, State Tax-Free Income Trust, Summit Funds, Summit Municipal Funds, and U.S. Treasury Funds; Vice President, Tax-Free Short-Intermediate Fund |
James T. Lynch, 1983 Assistant Vice President, T. Rowe Price; CFA | Assistant Vice President, State Tax-Free Income Trust, Summit Municipal Funds, Tax-Free Income Fund, and Tax-Free Short-Intermediate Fund |
Konstantine B. Mallas, 1963 Vice President, T. Rowe Price and T. Rowe Price Group, Inc. | President, Tax-Free Income Fund; Executive Vice President, California Tax-Free Income Trust, Intermediate Tax-Free High Yield Fund, State Tax-Free Income Trust, and Summit Municipal Funds; Vice President, Tax-Free High Yield Fund and Tax-Free Short-Intermediate Fund |
Sebastien Mallet, 1974 Vice President, T. Rowe Price Group, Inc. and T. Rowe Price International | Executive Vice President, Institutional International Funds; Vice President, International Funds |
Robert J. Marcotte, 1962 Vice President, T. Rowe Price and T. Rowe Price Group, Inc. | Vice President, Global Real Estate Fund, Mid-Cap Growth Fund, and Small-Cap Stock Fund |
Jennifer Martin, 1972 Vice President, T. Rowe Price and T. Rowe Price Group, Inc. | Vice President, Capital Opportunity Fund |
Daniel Martino, 1974 Vice President, T. Rowe Price and T. Rowe Price Group, Inc.; CFA | President, New America Growth Fund; Vice President, Growth Stock Fund, Media & Telecommunications Fund, and Science & Technology Fund |
Ryan Martyn, 1979 Vice President, T. Rowe Price Group, Inc. and T. Rowe Price International | Vice President, International Funds and New Era Fund |
George A. Marzano, 1980 Vice President, T. Rowe Price and T. Rowe Price Group, Inc. | Vice President, Blue Chip Growth Fund and U.S. Large-Cap Core Fund |
Paul M. Massaro, 1975 Vice President, T. Rowe Price, T. Rowe Price Group, Inc., and T. Rowe Price Trust Company; CFA | Executive Vice President, Floating Rate Fund, Institutional Income Funds, and Multi-Sector Account Portfolios; Vice President, Capital Appreciation Fund, High Yield Fund, and Strategic Income Fund |
Jonathan H.W. Matthews, 1975 Vice President, T. Rowe Price Group, Inc. and T. Rowe Price International; CFA | Executive Vice President, International Funds; Vice President, Institutional International Funds |
Andrew C. McCormick, 1960 Vice President, T. Rowe Price, T. Rowe Price Group, Inc., and T. Rowe Price Trust Company | President, GNMA Fund; Executive Vice President, Multi-Sector Account Portfolios; Vice President, Financial Services Fund, Inflation Focused Bond Fund, Inflation Protected Bond Fund, Institutional Income Funds, New Income Fund, Short-Term Bond Fund, Strategic Income Fund, U.S. Bond Enhanced Index Fund, and U.S. Treasury Funds |
Gregory A. McCrickard, 1958 Vice President, T. Rowe Price, T. Rowe Price Group, Inc., and T. Rowe Price Trust Company; CFA | President, Small-Cap Stock Fund; Executive Vice President, Institutional Equity Funds; Vice President, Mid-Cap Value Fund and Small-Cap Value Fund |
Ian C. McDonald, 1971 Vice President, T. Rowe Price and T. Rowe Price Group, Inc. | Vice President, Financial Services Fund and New America Growth Fund |
55
Name, Year of Birth, and Principal
Occupation(s) | Position(s) Held With Fund(s) |
Michael J. McGonigle, 1966 Vice President, T. Rowe Price and T. Rowe Price Group, Inc. | Vice President, Financial Services Fund, Floating Rate Fund, Institutional Income Funds, and Multi-Sector Account Portfolios |
Hugh D. McGuirk, 1960 Vice President, T. Rowe Price and T. Rowe Price Group, Inc.; CFA | President, California Tax-Free Income Trust, State Tax-Free Income Trust, and Summit Municipal Funds; Vice President, Intermediate Tax-Free High Yield Fund, Tax-Free High Yield Fund, Tax-Free Income Fund, and Tax-Free Short-Intermediate Fund |
Heather K. McPherson, 1967 Vice President, T. Rowe Price and T. Rowe Price Group, Inc.; CPA | Executive Vice President, Institutional Equity Funds and Mid-Cap Value Fund; Vice President, Equity Income Fund, Global Technology Fund, New Era Fund, and Value Fund |
Cheryl A. Mickel, 1967 Vice President, T. Rowe Price, T. Rowe Price Group, Inc., and T. Rowe Price Trust Company; CFA | Vice President, Inflation Focused Bond Fund, Prime Reserve Fund, Reserve Investment Funds, Short-Term Bond Fund, Summit Funds, and U.S. Treasury Funds |
Raymond A. Mills, 1960 Vice President, T. Rowe Price, T. Rowe Price Group, Inc., T. Rowe Price International, and T. Rowe Price Trust Company; Ph.D., CFA | Executive Vice President, Institutional International Funds and International Funds; Vice President, Balanced Fund, Global Real Estate Fund, and Personal Strategy Funds |
Jihong Min, 1979 Vice President, Price Singapore and T. Rowe Price Group, Inc.; formerly Financial Analyst, Geosphere Capital Management, Singapore (to 2012) and Financial Analyst, Fortress Investment Group, Hong Kong (to 2009) | Vice President, International Funds |
Eric C. Moffett, 1974 Vice President, Price Hong Kong and T. Rowe Price Group, Inc. | Executive Vice President, International Funds |
Samy B. Muaddi, 1984 Vice President, T. Rowe Price and T. Rowe Price Group, Inc.; CFA | Vice President, Corporate Income Fund, Institutional Income Funds, International Funds, Multi-Sector Account Portfolios, Strategic Income Fund, and U.S. Treasury Funds |
Tobias F. Mueller, 1980 Vice President, T. Rowe Price Group, Inc. and T. Rowe Price International; formerly Intern, T. Rowe Price (to 2011) | Vice President, Global Technology Fund and Science & Technology Fund |
James M. Murphy, 1967 Vice President, T. Rowe Price and T. Rowe Price Group, Inc.; CFA | President, Intermediate Tax-Free High Yield Fund and Tax-Free High Yield Fund; Vice President, Credit Opportunities Fund, Institutional Income Funds, State Tax-Free Income Trust, Summit Municipal Funds, and Tax-Free Income Fund |
Linda A. Murphy, 1959 Vice President, T. Rowe Price and T. Rowe Price Group, Inc. | Vice President, California Tax-Free Income Trust, Intermediate Tax-Free High Yield Fund, State Tax-Free Income Trust, Summit Municipal Funds, and Tax-Free High Yield Fund |
Sudhir Nanda, 1959 Vice President, T. Rowe Price and T. Rowe Price Group, Inc.; Ph.D., CFA | President, Diversified Small-Cap Growth Fund; Vice President, Capital Appreciation Fund, Diversified Mid-Cap Growth Fund, and Institutional International Funds |
Joshua Nelson, 1977 Vice President, T. Rowe Price and T. Rowe Price Group, Inc. | Executive Vice President, Institutional International Funds and International Funds |
Philip A. Nestico, 1976 Vice President, T. Rowe Price and T. Rowe Price Group, Inc. | Vice President, Global Real Estate Fund, International Funds, Media & Telecommunications Fund, and Real Estate Fund |
56
Name, Year of Birth, and Principal
Occupation(s) | Position(s) Held With Fund(s) |
Sridhar Nishtala, 1975 Vice President, Price Singapore and T. Rowe Price Group, Inc. | Vice President, Institutional International Funds and International Funds |
Jason Nogueira, 1974 Vice President, T. Rowe Price and T. Rowe Price Group, Inc.; CFA | Executive Vice President, Institutional International Funds and International Funds; Vice President, Health Sciences Fund |
Alexander S. Obaza, 1981 Vice President, T. Rowe Price, T. Rowe Price Group, Inc., and T. Rowe Price Trust Company | Vice President, California Tax-Free income Trust, Corporate Income Fund, Institutional Income, Multi-Sector Account Portfolios, Prime Reserve Fund, TRP Reserve Investment Funds, State Tax-Free Income Trust, Summit Funds, Summit Municipal Funds, Tax-Exempt Money Fund, and U.S. Treasury Funds |
David Oestreicher, 1967 Director, Vice President, and Secretary, T. Rowe Price Investment Services, Inc., T. Rowe Price Retirement Plan Services, Inc., T. Rowe Price Services, Inc., and T. Rowe Price Trust Company; Chief Legal Officer, Vice President, and Secretary, T. Rowe Price Group, Inc.; Vice President and Secretary, T. Rowe Price and T. Rowe Price International; Vice President, Price Hong Kong and Price Singapore | Vice President, all funds |
Michael D. Oh, 1974 Vice President, T. Rowe Price and T. Rowe Price Group, Inc.; CFA | Vice President, Institutional International Funds, International Funds, and Multi-Sector Account Portfolios |
Kenneth A. Orchard, 1975 Vice President, T. Rowe Price Group, Inc. and T. Rowe Price International; formerly Vice President, Moody’s Investors Service (to 2010) | Vice President, Institutional International Funds, International Funds, and Multi-Sector Account Portfolios |
Curt J. Organt, 1968 Vice President, T. Rowe Price and T. Rowe Price Group, Inc.; CFA | Vice President, Diversified Small-Cap Growth Fund, International Funds, New America Growth Fund, Small-Cap Stock Fund, and Small-Cap Value Fund |
Paul T. O’Sullivan, 1973 Vice President, T. Rowe Price Group, Inc. and T. Rowe Price International | Vice President, International Funds |
Hiroaki Owaki, 1962 Vice President, T. Rowe Price Group, Inc. and T. Rowe Price International; CFA | Vice President, Global Technology Fund and International Funds |
Oluwaseun A. Oyegunle, 1984 Vice President, T. Rowe Price International; formerly, student, The Wharton School, University of Pennsylvania (to 2013); Summer Investment Analyst, T. Rowe Price International (2012); Analyst, Asset & Resource Management Limited (to 2012); Analyst, Vetiva Capital Management Limited (to 2011); CFA | Vice President, Institutional International Funds and International Funds |
Robert A. Panariello, 1983 Vice President, T. Rowe Price and T. Rowe Price Group, Inc. | Vice President, Global Allocation Fund |
Gonzalo Pangaro, 1968 Vice President, T. Rowe Price Group, Inc. and T. Rowe Price International; CFA | Executive Vice President, Institutional International Funds and International Funds |
Miso Park, 1982 Vice President, T. Rowe Price Group, Inc. and T. Rowe Price International; formerly Credit Analyst, M&G Investments (to 2010); CFA | Vice President, Corporate Income Fund, Institutional Income Funds, and Multi-Sector Account Portfolios |
57
Name, Year of Birth, and Principal
Occupation(s) | Position(s) Held With Fund(s) |
Timothy E. Parker, 1974 Vice President, T. Rowe Price and T. Rowe Price Group, Inc.; CFA | Vice President, Diversified Mid-Cap Growth Fund, New Era Fund, New Horizons Fund, Small-Cap Stock Fund, Small-Cap Value Fund, and Tax-Efficient Funds |
Viral S. Patel, 1969 Vice President, T. Rowe Price Group, Inc. and T. Rowe Price International; formerly Vice President, Berstein Value Equities (to 2011) | Vice President, Global Real Estate Fund |
Craig J. Pennington, 1971 Vice President, T. Rowe Price Group, Inc. and T. Rowe Price International; formerly, Global Energy Analyst, Insight Investment (to 2010); CFA | Vice President, Institutional International Funds, International Funds, and New Era Fund |
Charles G. Pepin, 1966 Director, T. Rowe Price Trust Company; Vice President, T. Rowe Price and T. Rowe Price Group, Inc. | Vice President, Small-Cap Stock Fund |
Donald J. Peters, 1959 Vice President, T. Rowe Price and T. Rowe Price Group, Inc. | President, Diversified Mid-Cap Growth Fund and Tax-Efficient Funds |
Jason B. Polun, 1974 Vice President, T. Rowe Price, T. Rowe Price Group, Inc., and T. Rowe Price Trust Company; CFA | Executive Vice President, Institutional Equity Funds; Co-President, Capital Opportunity Fund; Vice President, Financial Services Fund |
Adam Poussard, 1984 Vice President, T. Rowe Price and T. Rowe Price Group, Inc.; Assistant Vice President – Equity Research, Healthcare Distribution & Technology, Barclays Capital (to 2010) | Vice President, Health Sciences Fund |
Austin M. Powell, 1969 Vice President, T. Rowe Price Group, Inc. and T. Rowe Price International | Vice President, International Funds |
Larry J. Puglia, 1960 Vice President, T. Rowe Price, T. Rowe Price Group, Inc., and T. Rowe Price Trust Company; CFA, CPA | President, Blue Chip Growth Fund; Executive Vice President, Institutional Equity Funds; Vice President, Balanced Fund, and Personal Strategy Funds |
Robert T. Quinn, Jr., 1972 Vice President, T. Rowe Price and T. Rowe Price Group, Inc. | Vice President, Capital Appreciation Fund, Dividend Growth Fund, and Value Fund |
Vivek Rajeswaran, 1985 Vice President, T. Rowe Price and T. Rowe Price Group, Inc.; formerly, student, Columbia Business School (to 2012) | Vice President, Blue-Chip Growth Fund, International Funds, and New Era Fund |
Kyle Rasbach, 1980 Employee, T. Rowe Price; formerly, Vice President, Cowen and Company (to 2013) | Vice President, Health Sciences Fund |
John W. Ratzesberger, 1975 Vice President, T. Rowe Price, T. Rowe Price Group, Inc., and T. Rowe Price Trust Company; formerly, North American Head of Listed Derivatives Operation, Morgan Stanley (to 2013) | Vice President, all funds |
Rodney M. Rayburn, 1970 Vice President, T. Rowe Price and T. Rowe Price Group, Inc.; formerly Managing Director, Värde Partners (to 2014); CFA | Vice President, Credit Opportunities Fund |
Vernon A. Reid, Jr., 1954 Vice President, T. Rowe Price and T. Rowe Price Group, Inc. | Vice President, Corporate Income Fund, Inflation Focused Bond Fund, Institutional Income Funds, Multi-Sector Account Portfolios, New Income Fund, and U.S. Treasury Funds |
Michael F. Reinartz, 1973 Vice President, T. Rowe Price and T. Rowe Price Group, Inc. | Vice President, Inflation Focused Bond Fund and Short-Term Bond Fund |
58
Name, Year of Birth, and Principal
Occupation(s) | Position(s) Held With Fund(s) |
Frederick A. Rizzo, 1969 Vice President, T. Rowe Price Group, Inc. and T. Rowe Price International | Vice President, Financial Services Fund and International Funds |
Theodore E. Robson, 1965 Vice President, T. Rowe Price, T. Rowe Price Group, Inc., and T. Rowe Price Trust Company; CFA | Vice President, Corporate Income Fund, Institutional Income Funds, Multi-Sector Account Portfolios, and Real Estate Fund |
Brian M. Ropp, 1969 Vice President, T. Rowe Price and T. Rowe Price Group, Inc.; CPA | Vice President, Corporate Income Fund, Institutional Income Funds, Multi-Sector Account Portfolios, and U.S. Bond Enhanced Index Fund |
Christopher J. Rothery, 1963 Vice President, T. Rowe Price Group, Inc. and T. Rowe Price International | Executive Vice President, Institutional International Funds and International Funds; Vice President, Multi-Sector Account Portfolios |
Jeffrey Rottinghaus, 1970 Vice President, T. Rowe Price and T. Rowe Price Group, Inc.; CPA | President, U.S. Large-Cap Core Fund; Vice President, Capital Opportunity Fund, Dividend Growth Fund, and Growth & Income Fund |
David L. Rowlett, 1975 Vice President, T. Rowe Price and T. Rowe Price Group, Inc.; CFA | Vice President, Dividend Growth Fund, Growth & Income Fund, International Funds, Mid-Cap Growth Fund, and New America Growth Fund |
Brian A. Rubin, 1974 Vice President, T. Rowe Price, T. Rowe Price Group, Inc., and T. Rowe Price Trust Company; CPA | Vice President, Credit Opportunities Fund, Floating Rate Fund, High Yield Fund, Institutional Income Funds, and Multi-Sector Account Portfolios |
Federico Santilli, 1974 Vice President, T. Rowe Price Group, Inc. and T. Rowe Price International; CFA | Executive Vice President, Institutional International Funds and International Funds |
Sebastian Schrott, 1977 Vice President, T. Rowe Price Group, Inc. and T. Rowe Price International | Vice President, Institutional International Funds and International Funds |
Deborah D. Seidel, 1962 Vice President, T. Rowe Price, T. Rowe Price Group, Inc., T. Rowe Price Investment Services, Inc., and T. Rowe Price Services, Inc. | Vice President, all funds |
Rebecca L. Setcavage, 1982 Assistant Vice President, T. Rowe Price | Vice President, Inflation Focused Bond Fund, Inflation Protected Bond Fund, and U.S. Treasury Funds |
Amit Seth, 1979 Vice President, T. Rowe Price and T. Rowe Price Group, Inc. | Vice President, Blue Chip Growth Fund, Diversified Mid-Cap Growth Fund, and New Horizons Fund |
Michael K. Sewell, 1982 Vice President, T. Rowe Price | Vice President, GNMA Fund and Multi-Sector Account Portfolios |
Daniel O. Shackelford, 1958 Vice President, T. Rowe Price, T. Rowe Price Group, Inc., and T. Rowe Price Trust Company; CFA | President, Inflation Focused Bond Fund, Inflation Protected Bond Fund, and New Income Fund; Vice President, Institutional Income Funds, Multi-Sector Account Portfolios, Personal Strategy Funds, Real Assets Fund, Retirement Funds, Short-Term Bond Fund, Spectrum Funds, U.S. Bond Enhanced Index Fund, and U.S. Treasury Funds |
Jeneiv Shah, 1980 Vice President, T. Rowe Price International; formerly Analyst, Mirae Asset Global Investments (to 2010); CFA | Vice President, International Funds |
59
Name, Year of Birth, and Principal
Occupation(s) | Position(s) Held With Fund(s) |
Chen Shao, 1980 Assistant Vice President, T. Rowe Price | Assistant Vice President, California Tax-Free Income Trust, Intermediate Tax-Free High Yield Fund, Prime Reserve Fund, TRP Reserve Investment Funds, State Tax-Free Income Trust, Summit Funds, Summit Municipal Funds, Tax-Exempt Money Fund, Tax-Free High Yield Fund, Tax-Free Income Fund, Tax-Free Short-Intermediate Fund, and U.S. Treasury Funds |
Robert W. Sharps, 1971 Vice President, T. Rowe Price, T. Rowe Price Group, Inc., and T. Rowe Price Trust Company; CFA, CPA | Executive Vice President, Institutional Equity Funds; Vice President, Blue Chip Growth Fund, Growth Stock Fund, Institutional International Funds, International Funds, New America Growth Fund, and U.S. Large-Cap Core Fund |
Thomas A. Shelmerdine, 1977 Vice President, T. Rowe Price Group, Inc. and T. Rowe Price International; formerly, Investment Committee Member, Myer Family Company Holdings Limited (to 2012) | Vice President, New Era Fund |
John C.A. Sherman, 1969 Vice President, T. Rowe Price Group, Inc. and T. Rowe Price International | Vice President, Institutional International Funds and International Funds |
Clark R. Shields, 1976 Vice President, T. Rowe Price and T. Rowe Price Group, Inc. | Vice President, Mid-Cap Growth Fund and New Horizons Fund |
Charles M. Shriver, 1967 Vice President, T. Rowe Price, T. Rowe Price Group, Inc., and T. Rowe Price Trust Company; CFA | President, Balanced Fund, Global Allocation Fund, Personal Strategy Funds, and Spectrum Funds; Vice President, Real Assets Fund and Retirement Funds |
Farris G. Shuggi, 1984 Vice President, T. Rowe Price and T. Rowe Price Group, Inc. | Vice President, Capital Appreciation Fund, Diversified Small-Cap Growth Fund, and Small-Cap Value Fund |
Corey D. Shull, 1983 Vice President, T. Rowe Price and T. Rowe Price Group, Inc.; CFA | Vice President, Media & Telecommunications Fund and New Horizons Fund |
Weijie Si, 1983 Vice President, T. Rowe Price and T. Rowe Price Group; formerly, student, Harvard Business School (to 2012); Private Equity Associate (to 2010) | Vice President, Real Estate Fund |
Neil Smith, 1972 Vice President, Price Hong Kong, Price Singapore, T. Rowe Price Group, Inc., and T. Rowe Price International | Executive Vice President, International Index Fund; Vice President, Index Trust |
Robert W. Smith, 1961 Vice President, T. Rowe Price, T. Rowe Price Group, Inc., and T. Rowe Price Trust Company | Vice President, Institutional International Funds, International Funds, Media & Telecommunications Fund, Personal Strategy Funds, Retirement Funds, and Spectrum Funds |
Matt J. Snowling, 1971 Vice President, T. Rowe Price and T. Rowe Price Group, Inc.; formerly Managing Director – Specialty Finance, Citadel Securities (to 2011); Managing Director of Investment Services and Senior Vice President, Senior Analyst, Education Services Research Group (to 2011); CFA | Vice President, Financial Services Fund and Growth & Income Fund |
Michael F. Sola, 1969 Vice President, T. Rowe Price and T. Rowe Price Group, Inc.; CFA | Vice President, Global Technology Fund, New Horizons Fund, Science & Technology Fund, and Small-Cap Stock Fund |
60
Name, Year of Birth, and Principal
Occupation(s) | Position(s) Held With Fund(s) |
Gabriel Solomon, 1977 Vice President, T. Rowe Price and T. Rowe Price Group, Inc. | President, Financial Services Fund; Vice President, Capital Appreciation Fund, Dividend Growth Fund, Institutional International Funds, International Funds, U.S. Large-Cap Core Fund, and Value Fund |
Scott D. Solomon, 1981 Vice President, T. Rowe Price; CFA | Vice President, Corporate Income Fund, Inflation Focused Bond Fund, Institutional Income Funds, Multi-Sector Account Portfolios, and U.S. Bond Enhanced Index Fund |
Eunbin Song, 1980 Vice President, Price Singapore and T. Rowe Price Group, Inc.; CFA | Vice President, International Funds |
Joshua K. Spencer, 1973 Vice President, T. Rowe Price and T. Rowe Price Group, Inc.; CFA | President, Global Technology Fund; Vice President, Growth & Income Fund, Institutional International Funds, International Funds, Science & Technology Fund, and Value Fund |
Douglas D. Spratley, 1969 Vice President, T. Rowe Price and T. Rowe Price Group, Inc.; CFA | Vice President, California Tax-Free Income Trust, Prime Reserve Fund, TRP Reserve Investment Funds, Short-Term Bond Fund, State Tax-Free Income Trust, Summit Funds, Summit Municipal Funds, Tax-Exempt Money Fund, and U.S. Treasury Funds |
David A. Stanley, 1963 Vice President, T. Rowe Price Group, Inc. and T. Rowe Price International | Vice President, Institutional Income Funds, Institutional International Funds, International Funds, Multi-Sector Account Portfolios, and Strategic Income Fund |
Kimberly A. Stokes, 1969 Vice President, T. Rowe Price and T. Rowe Price Group, Inc. | Vice President, Corporate Income Fund, Institutional Income Funds, and Multi-Sector Account Portfolios |
William J. Stromberg, 1960 Director and Vice President, T. Rowe Price; Vice President, Price Hong Kong, Price Singapore, T. Rowe Price Group, Inc., T. Rowe Price International, and T. Rowe Price Trust Company; CFA | Vice President, Capital Appreciation Fund and Tax-Efficient Funds |
Guido F. Stubenrauch, 1970 Vice President, T. Rowe Price and T. Rowe Price Group, Inc. | Vice President, Balanced Fund, Personal Strategy Funds, Retirement Funds, and Spectrum Funds |
Taymour R. Tamaddon, 1976 Vice President, T. Rowe Price and T. Rowe Price Group, Inc.; CFA | President, Health Sciences Fund; Vice President, Blue Chip Growth Fund, Capital Appreciation Fund, Capital Opportunity Fund, Growth Stock Fund, Institutional International Funds, International Funds, Mid-Cap Growth Fund, New America Growth Fund, New Horizons Fund, and Tax-Efficient Funds |
Ju Yen Tan, 1972 Vice President, T. Rowe Price Group, Inc. and T. Rowe Price International | Vice President, Institutional Income Funds, Institutional International Funds, International Funds, Multi-Sector Account Portfolios, and Strategic Income Fund |
Sin Dee Tan, 1979 Vice President, T. Rowe Price Group, Inc. and T. Rowe Price International; CFA | Vice President, International Funds |
61
Name, Year of Birth, and Principal
Occupation(s) | Position(s) Held With Fund(s) |
Timothy G. Taylor, 1975 Vice President, T. Rowe Price and T. Rowe Price Group, Inc.; CFA | Vice President, California Tax-Free Income Trust, Intermediate Tax-Free High Yield Fund, State Tax-Free Income Trust, Summit Municipal Funds, Tax-Free High Yield Fund, Tax-Free Income Fund, and Tax-Free Short-Intermediate Fund |
Dean Tenerelli, 1964 Vice President, T. Rowe Price Group, Inc. and T. Rowe Price International | Executive Vice President, International Funds; Vice President, Institutional International Funds |
Thomas E. Tewksbury, 1961 Vice President, T. Rowe Price, T. Rowe Price Group, Inc., and T. Rowe Price Trust Company | Vice President, Floating Rate Fund, High Yield Fund, Institutional Income Funds, and Multi-Sector Account Portfolios |
Craig A. Thiese, 1975 Vice President, T. Rowe Price and T. Rowe Price Group, Inc. | Vice President, Index Trust, International Index Fund, New America Growth Fund, and New Era Fund |
Robert D. Thomas, 1971 Vice President, T. Rowe Price Group, Inc. and T. Rowe Price International; formerly Senior Vice President, Moody’s Investors Service, London (to 2011) | Vice President, Corporate Income Fund, Credit Opportunities Fund, Institutional Income Funds, and Multi-Sector Account Portfolios |
Siby Thomas, 1979 Vice President, T. Rowe Price and T. Rowe Price Group, Inc. | Vice President, Credit Opportunities Fund, International Funds, Institutional Income Funds, and Multi-Sector Account Portfolios |
Toby M. Thompson, 1971 Vice President, T. Rowe Price and T. Rowe Price Group, Inc.; formerly, Director of Investments, I.A.M. National Pension Fund (to 2012); CFA, CAIA | Vice President, Balanced Fund, Global Allocation Fund, Personal Strategy Funds, and Spectrum Funds |
Justin Thomson, 1968 Vice President, T. Rowe Price Group, Inc. and T. Rowe Price International | Executive Vice President, International Funds; Vice President, New Horizons Fund |
David A. Tiberii, 1965 Vice President, T. Rowe Price, T. Rowe Price Group, Inc., T. Rowe Price International, and T. Rowe Price Trust Company; CFA | President, Corporate Income Fund; Executive Vice President, Institutional Income Funds and Multi-Sector Account Portfolios; Vice President, New Income Fund and U.S. Bond Enhanced Index Fund |
Mitchell J.K. Todd, 1974 Vice President, T. Rowe Price Group, Inc. and T. Rowe Price International | Vice President, Financial Services Fund and International Funds |
Michael J. Trivino, 1981 Vice President, T. Rowe Price and T. Rowe Price Group, Inc.; formerly Private Equity Group, Welsh, Carson & Stowe (to 2011) | Vice President, High Yield Fund |
Susan G. Troll, 1966 Vice President, T. Rowe Price and T. Rowe Price Group, Inc.; CPA | Vice President, Capital Appreciation Fund, Financial Services Fund, and Summit Funds |
Ken D. Uematsu, 1969 Vice President, T. Rowe Price and T. Rowe Price Trust Company; CFA | Executive Vice President, Index Trust; Vice President, International Index Fund |
Mark J. Vaselkiv, 1958 Vice President, T. Rowe Price, T. Rowe Price Group, Inc., and T. Rowe Price Trust Company | President, Floating Rate Fund, High Yield Fund, and Institutional Income Funds; Executive Vice President, International Funds and Multi-Sector Account Portfolios; Vice President, Personal Strategy Funds, Retirement Funds, Spectrum Funds, and Strategic Income Fund |
62
Name, Year of Birth, and Principal
Occupation(s) | Position(s) Held With Fund(s) |
Eric L. Veiel, 1972 Vice President, T. Rowe Price, T. Rowe Price Group, Inc., and T. Rowe Price Trust Company; CFA | Executive Vice President, Institutional Equity Funds; Co-President, Capital Opportunity Fund; Vice President, Financial Services Fund and Institutional International Funds |
Kes Visuvalingam, 1968 Vice President, Price Hong Kong, Price Singapore, and T. Rowe Price Group, Inc.; CFA | Vice President, International Funds |
Zenon Voyiatzis, 1971 Vice President, T. Rowe Price Group, Inc. and T. Rowe Price International; formerly Managing Director, UBS Global Asset Management (to 2015) | Vice President, Financial Services Fund |
Verena E. Wachnitz, 1978 Vice President, T. Rowe Price Group, Inc. and T. Rowe Price International; CFA | Executive Vice President, International Funds; Vice President, Institutional International Funds |
Lauren T. Wagandt, 1984 Vice President, T. Rowe Price and T. Rowe Price Group, Inc. | Vice President, Corporate Income Fund, Credit Opportunities Fund, Institutional Income Funds, and Multi-Sector Account Portfolios |
J. David Wagner, 1974 Vice President, T. Rowe Price, T. Rowe Price Group, Inc., and T. Rowe Price Trust Company; CFA | President, Small-Cap Value Fund; Vice President, Diversified Small-Cap Growth Fund, Institutional Equity Funds, Mid-Cap Value Fund, New Horizons Fund, and Small-Cap Stock Fund |
John F. Wakeman, 1962 Vice President, T. Rowe Price and T. Rowe Price Group, Inc. | Executive Vice President, Mid-Cap Growth Fund; Vice President, Diversified Mid-Cap Growth Fund and Institutional Equity Funds |
David J. Wallack, 1960 Vice President, T. Rowe Price, T. Rowe Price Group, Inc., and T. Rowe Price Trust Company | President, Mid-Cap Value Fund; Vice President, International Funds and New Era Fund |
Hiroshi Watanabe, 1975 Vice President, T. Rowe Price Group, Inc. and T. Rowe Price International; CFA | Vice President, International Funds |
Thomas H. Watson, 1977 Vice President, T. Rowe Price and T. Rowe Price Group, Inc. | Vice President, Global Technology Fund, Growth Stock Fund, Media & Telecommunications Fund, New America Growth Fund, New Horizons Fund, and Science & Technology Fund |
Michael T. Wehn, 1984 Vice President, T. Rowe Price | Vice President, Index Trust and International Index Fund |
Mark R. Weigman, 1962 Vice President, T. Rowe Price, T. Rowe Price Group, Inc., and T. Rowe Price Trust Company; CFA, CIC | Vice President, Tax-Efficient Funds |
John D. Wells, 1960 Vice President, T. Rowe Price, T. Rowe Price Group, Inc. | Vice President, GNMA Fund, Inflation Focused Bond Fund, Multi-Sector Account Portfolios, Short-Term Bond Fund, and Summit Funds |
Justin P. White, 1981 Vice President, T. Rowe Price and T. Rowe Price Group, Inc. | Vice President, Capital Opportunity Fund, Global Technology Fund, Growth Stock Fund, Media & Telecommunications Fund, Mid-Cap Growth Fund, Mid-Cap Value Fund, New America Growth Fund, and Science & Technology Fund |
Christopher S. Whitehouse, 1972 Vice President, T. Rowe Price Group, Inc. and T. Rowe Price International | Vice President, Institutional International Funds, International Funds, and Media & Telecommunications Fund |
Richard T. Whitney, 1958 Vice President, T. Rowe Price, T. Rowe Price Group, Inc., T. Rowe Price International, and T. Rowe Price Trust Company; CFA | Vice President, Balanced Fund, Global Allocation Fund, Personal Strategy Funds, Real Assets Fund, Retirement Funds, and Spectrum Funds |
63
Name, Year of Birth, and Principal
Occupation(s) | Position(s) Held With Fund(s) |
Tamara P. Wiggs, 1979 Vice President, T. Rowe Price and T. Rowe Price Group, Inc. | Vice President, Capital Appreciation Fund, Financial Services Fund, and Value Fund |
Clive M. Williams, 1966 Vice President, Price Hong Kong, Price Singapore, T. Rowe Price, T. Rowe Price Group, Inc., and T. Rowe Price International | Vice President, International Funds |
John M. Williams, 1982 Vice President, T. Rowe Price and T. Rowe Price Group, Inc. | Vice President, Dividend Growth Fund, Equity Income Fund, Mid-Cap Value Fund, and New Era Fund |
Thea N. Williams, 1961 Vice President, T. Rowe Price, T. Rowe Price Group, Inc., and T. Rowe Price Trust Company | Vice President, Corporate Income Fund, Floating Rate Fund, High Yield Fund, Institutional Income Funds, and Multi-Sector Account Portfolios |
J. Zachary Wood, 1972 Vice President, T. Rowe Price and T. Rowe Price Group, Inc.; CFA | Vice President, Index Trust and International Index Fund |
Jon Davis Wood, 1979 Vice President, T. Rowe Price and T. Rowe Price Group, Inc.; formerly Senior Vice President and Senior Research Analyst, Jeffries & Company, Inc. (to 2013); CFA | Vice President, Health Sciences Fund |
J. Howard Woodward, 1974 Vice President, T. Rowe Price Group, Inc. and T. Rowe Price International; CFA | Vice President, Corporate Income Fund, Institutional Income Funds, Institutional International Funds, International Funds, and Multi-Sector Account Portfolios |
Rouven J. Wool-Lewis, 1973 Vice President, T. Rowe Price and T. Rowe Price Group, Inc.; Ph.D.; formerly Vice President of Corporate Strategy, UnitedHealth Group (to 2011) | Vice President, Diversified Mid-Cap Growth Fund and Health Sciences Fund |
Marta Yago, 1977 Vice President, T. Rowe Price Group, Inc. and T. Rowe Price International | Vice President, International Funds |
Ernest C. Yeung, 1979 Vice President, Price Hong Kong and T. Rowe Price Group, Inc.; CFA | Vice President, Institutional International Funds, International Funds, and Media & Telecommunications Fund |
Alison Mei Ling Yip, 1966 Vice President, Price Hong Kong and T. Rowe Price Group, Inc. | Vice President, Global Technology Fund, International Funds, and Science & Technology Fund |
Wenli Zheng, 1979 Vice President, Price Hong Kong and T. Rowe Price Group, Inc. | Vice President, International Funds and Media & Telecommunications Fund |
Jeffrey T. Zoller, 1970 Vice President, T. Rowe Price and T. Rowe Price Trust Company | Vice President, all funds |
Directors’ Compensation
Each independent director is paid $270,000 annually for his/her service on the funds’ Boards and the chairman of the Committee of Independent Directors is paid an additional $100,000 annually for his/her service as Lead Independent Director. An independent director who serves on the Joint Audit Committee receives $10,000 annually for his/her service as a member of the committee and the Joint Audit Committee chairman receives $20,000 annually for his/her service as chairman of the committee. All of these fees are allocated to each fund on a pro rata basis based on each fund’s net assets relative to the other funds.
The following table shows the accrued amounts paid by each fund, and the total compensation that was paid from all of the funds, to the independent directors for the 2014 calendar year. The independent directors of the funds do not receive any pension or retirement benefits from the funds or T. Rowe Price. In addition, the
64
officers and inside directors of the funds do not receive any compensation or benefits from the funds for their service.
Directors | Total Compensation |
Brody | $270,000 |
Deering (Lead) | 370,000 |
Dick | 270,000 |
Duncan | 280,000 |
Gerrard | 290,000 |
Horn | 270,000 |
McBride | 280,000 |
Rouse | 280,000 |
Schreiber | 280,000 |
Tercek | 270,000 |
The following table shows the amounts paid by each fund to the directors based on accrued compensation for the calendar year 2014:
Fund | Aggregate Compensation From Fund | |||||||||
Brody | Deering | Dick | Duncan | Gerrard | Horn | McBride | Rouse | Schreiber | Tercek | |
Africa & Middle East | $92 | $128 | $92 | $93 | $96 | $92 | $93 | $93 | $95 | $96 |
Asia Opportunities | 4 | 6 | 4 | 5 | 5 | 4 | 5 | 5 | 5 | 4 |
Balanced | 1,804 | 2,517 | 1,804 | 1,826 | 1,892 | 1,804 | 1,826 | 1,826 | 1,871 | 1,894 |
Blue Chip Growth | 10,685 | 14,905 | 10,685 | 10,818 | 11,214 | 10,685 | 10,818 | 10,818 | 11,081 | 11,210 |
California Tax-Free Bond | 192 | 268 | 192 | 195 | 202 | 192 | 195 | 195 | 199 | 202 |
California Tax-Free Money | 36 | 50 | 36 | 36 | 38 | 36 | 36 | 36 | 37 | 38 |
Capital Appreciation | 9,270 | 12,930 | 9,270 | 9,386 | 9,730 | 9,270 | 9,386 | 9,386 | 9,613 | 9,724 |
Capital Opportunity | 284 | 397 | 284 | 288 | 299 | 284 | 288 | 288 | 295 | 299 |
Corporate Income | 260 | 363 | 260 | 263 | 273 | 260 | 263 | 263 | 270 | 273 |
Credit Opportunities | 9 | 13 | 9 | 9 | 10 | 9 | 9 | 9 | 10 | 10 |
Diversified Mid-Cap Growth | 146 | 204 | 146 | 148 | 153 | 146 | 148 | 148 | 152 | 153 |
Diversified Small-Cap Growth | 358 | 500 | 358 | 363 | 376 | 358 | 363 | 363 | 372 | 376 |
Dividend Growth | 1,850 | 2,581 | 1,850 | 1,872 | 1,941 | 1,850 | 1,872 | 1,872 | 1,918 | 1,942 |
Emerging Europe | 129 | 180 | 129 | 130 | 135 | 129 | 130 | 130 | 134 | 136 |
Emerging Markets Bond | 1,931 | 2,693 | 1,931 | 1,955 | 2,027 | 1,931 | 1,955 | 1,955 | 2,002 | 2,025 |
Emerging Markets Corporate Bond | 53 | 74 | 53 | 54 | 56 | 53 | 54 | 54 | 55 | 55 |
Emerging Markets Corporate Multi-Sector Account Portfolio | 16 | 23 | 16 | 16 | 17 | 16 | 16 | 16 | 17 | 17 |
Emerging Markets Local Currency Bond | 30 | 42 | 30 | 31 | 32 | 30 | 31 | 31 | 31 | 31 |
65
Fund | Aggregate Compensation From Fund | |||||||||
Brody | Deering | Dick | Duncan | Gerrard | Horn | McBride | Rouse | Schreiber | Tercek | |
Emerging Markets Local Multi-Sector Account Portfolio | 21 | 30 | 21 | 21 | 22 | 21 | 21 | 21 | 22 | 22 |
Emerging Markets Stock | 3,275 | 4,567 | 3,275 | 3,316 | 3,437 | 3,275 | 3,316 | 3,316 | 3,396 | 3,435 |
Equity Income | 13,211 | 18,436 | 13,211 | 13,368 | 13,857 | 13,211 | 13,368 | 13,368 | 13,700 | 13,875 |
Equity Index 500 | 9,652 | 13,462 | 9,652 | 9,773 | 10,131 | 9,652 | 9,773 | 9,773 | 10,009 | 10,124 |
European Stock | 755 | 1,054 | 755 | 763 | 791 | 755 | 763 | 763 | 783 | 794 |
Extended Equity Market Index | 325 | 454 | 325 | 329 | 341 | 325 | 329 | 329 | 337 | 341 |
Financial Services | 232 | 324 | 232 | 234 | 243 | 232 | 234 | 234 | 241 | 244 |
Floating Rate | 177 | 246 | 177 | 179 | 186 | 177 | 179 | 179 | 183 | 185 |
Floating Rate Multi-Sector Account Portfolio | 24 | 33 | 24 | 24 | 25 | 24 | 24 | 24 | 25 | 25 |
Georgia Tax-Free Bond | 99 | 138 | 99 | 100 | 104 | 99 | 100 | 100 | 102 | 104 |
Global Allocation | 31 | 43 | 31 | 31 | 33 | 31 | 31 | 31 | 32 | 33 |
Global Growth Stock | 39 | 54 | 39 | 39 | 41 | 39 | 39 | 39 | 40 | 41 |
Global High Income Bond(a) | 6 | 8 | 6 | 6 | 6 | 6 | 6 | 6 | 6 | 6 |
Global Industrials | 7 | 10 | 7 | 7 | 8 | 7 | 7 | 7 | 8 | 8 |
Global Infrastructure (b) | 8 | 11 | 8 | 8 | 8 | 8 | 8 | 8 | 8 | 8 |
Global Real Estate | 87 | 122 | 87 | 88 | 92 | 87 | 88 | 88 | 91 | 92 |
Global Stock | 219 | 305 | 219 | 221 | 229 | 219 | 221 | 221 | 227 | 230 |
Global Technology | 528 | 736 | 528 | 536 | 556 | 528 | 536 | 536 | 548 | 552 |
Global Unconstrained Bond(a) | 10 | 14 | 10 | 10 | 10 | 10 | 10 | 10 | 10 | 11 |
GNMA | 707 | 986 | 707 | 716 | 742 | 707 | 716 | 716 | 733 | 742 |
TRP Government Reserve Investment | 925 | 1,291 | 925 | 937 | 971 | 925 | 937 | 937 | 960 | 971 |
Growth & Income | 651 | 908 | 651 | 659 | 683 | 651 | 659 | 659 | 675 | 684 |
Growth Stock | 18,444 | 25,734 | 18,444 | 18,668 | 19,351 | 18,444 | 18,668 | 18,668 | 19,127 | 19,362 |
Health Sciences | 4,174 | 5,821 | 4,174 | 4,227 | 4,382 | 4,174 | 4,227 | 4,227 | 4,328 | 4,376 |
High Yield | 4,411 | 6,156 | 4,411 | 4,462 | 4,625 | 4,411 | 4,462 | 4,462 | 4,574 | 4,635 |
High Yield Multi-Sector Account Portfolio | 11 | 15 | 11 | 11 | 11 | 11 | 11 | 11 | 11 | 11 |
Inflation Focused Bond | 2,720 | 3,792 | 2,720 | 2,755 | 2,856 | 2,720 | 2,755 | 2,755 | 2,820 | 2,850 |
Inflation Protected Bond | 160 | 224 | 160 | 162 | 168 | 160 | 162 | 162 | 166 | 168 |
Institutional Africa & Middle East | 101 | 141 | 101 | 102 | 106 | 101 | 102 | 102 | 105 | 106 |
Institutional Core Plus | 187 | 260 | 187 | 189 | 196 | 187 | 189 | 189 | 194 | 195 |
Institutional Credit Opportunities | 17 | 23 | 17 | 17 | 18 | 17 | 17 | 17 | 18 | 17 |
66
Fund | Aggregate Compensation From Fund | |||||||||
Brody | Deering | Dick | Duncan | Gerrard | Horn | McBride | Rouse | Schreiber | Tercek | |
Institutional Emerging Markets Bond | 136 | 190 | 136 | 138 | 143 | 136 | 138 | 138 | 142 | 143 |
Institutional Emerging Markets Equity | 446 | 623 | 446 | 452 | 468 | 446 | 452 | 452 | 463 | 469 |
Institutional Floating Rate | 1,553 | 2,167 | 1,553 | 1,571 | 1,629 | 1,553 | 1,571 | 1,571 | 1,610 | 1,631 |
Institutional Frontier Markets Equity | 0 | 0 | 0 | 0 | 0 | 0 | 0 | 0 | 0 | 0 |
Institutional Global Focused Growth Equity | 36 | 51 | 36 | 36 | 38 | 36 | 36 | 36 | 38 | 38 |
Institutional Global Growth Equity | 81 | 112 | 81 | 82 | 85 | 81 | 82 | 82 | 84 | 84 |
Institutional Global Multi-Sector Bond | 33 | 46 | 33 | 34 | 35 | 33 | 34 | 34 | 34 | 34 |
Institutional Global Value Equity | 4 | 6 | 4 | 4 | 5 | 4 | 4 | 4 | 5 | 5 |
Institutional High Yield | 1,200 | 1,676 | 1,200 | 1,212 | 1,257 | 1,200 | 1,212 | 1,212 | 1,244 | 1,263 |
Institutional International Bond | 131 | 182 | 131 | 132 | 137 | 131 | 132 | 132 | 136 | 137 |
Institutional International Concentrated Equity | 43 | 60 | 43 | 44 | 45 | 43 | 44 | 44 | 45 | 45 |
Institutional International Core Equity | 41 | 57 | 41 | 41 | 43 | 41 | 41 | 41 | 42 | 43 |
Institutional International Growth Equity | 37 | 52 | 37 | 37 | 39 | 37 | 37 | 37 | 38 | 39 |
Institutional Large-Cap Core Growth | 523 | 729 | 523 | 531 | 550 | 523 | 531 | 531 | 543 | 547 |
Institutional Large-Cap Growth | 4,654 | 6,492 | 4,654 | 4,713 | 4,885 | 4,654 | 4,713 | 4,713 | 4,827 | 4,882 |
Institutional Large-Cap Value | 851 | 1,187 | 851 | 862 | 894 | 851 | 862 | 862 | 883 | 892 |
Institutional Long Duration Credit | 7 | 10 | 7 | 7 | 7 | 7 | 7 | 7 | 7 | 7 |
Institutional Mid-Cap Equity Growth | 1,971 | 2,749 | 1,971 | 1,997 | 2,070 | 1,971 | 1,997 | 1,997 | 2,044 | 2,067 |
Institutional Small-Cap Stock | 711 | 993 | 711 | 720 | 746 | 711 | 720 | 720 | 738 | 747 |
Institutional U.S. Structured Research | 325 | 453 | 325 | 329 | 341 | 325 | 329 | 329 | 337 | 341 |
Intermediate Tax-Free High Yield | 2 | 3 | 2 | 2 | 3 | 2 | 2 | 2 | 2 | 2 |
International Bond | 2,241 | 3,128 | 2,241 | 2,267 | 2,350 | 2,241 | 2,267 | 2,267 | 2,324 | 2,355 |
International Concentrated Equity | 1 | 1 | 1 | 1 | 1 | 1 | 1 | 1 | 1 | 1 |
International Discovery | 1,622 | 2,264 | 1,622 | 1,641 | 1,701 | 1,622 | 1,641 | 1,641 | 1,682 | 1,704 |
International Equity Index | 242 | 338 | 242 | 245 | 254 | 242 | 245 | 245 | 251 | 254 |
International Growth & Income | 4,316 | 6,021 | 4,316 | 4,370 | 4,530 | 4,316 | 4,370 | 4,370 | 4,476 | 4,529 |
International Stock | 5,652 | 7,886 | 5,652 | 5,720 | 5,930 | 5,652 | 5,720 | 5,720 | 5,861 | 5,933 |
67
Fund | Aggregate Compensation From Fund | |||||||||
Brody | Deering | Dick | Duncan | Gerrard | Horn | McBride | Rouse | Schreiber | Tercek | |
Investment-Grade Corporate Multi-Sector Account Portfolio | 21 | 29 | 21 | 21 | 22 | 21 | 21 | 21 | 22 | 22 |
Japan | 138 | 192 | 138 | 140 | 145 | 138 | 140 | 140 | 143 | 145 |
Latin America | 451 | 630 | 451 | 456 | 473 | 451 | 456 | 456 | 468 | 474 |
Maryland Short-Term Tax-Free Bond | 99 | 138 | 99 | 100 | 104 | 99 | 100 | 100 | 103 | 104 |
Maryland Tax-Free Bond | 858 | 1,198 | 858 | 869 | 901 | 858 | 869 | 869 | 890 | 901 |
Maryland Tax-Free Money | 57 | 80 | 57 | 58 | 60 | 57 | 58 | 58 | 59 | 60 |
Media & Telecommunications | 1,447 | 2,019 | 1,447 | 1,464 | 1,517 | 1,447 | 1,464 | 1,464 | 1,500 | 1,519 |
Mid-Cap Growth | 10,390 | 14,499 | 10,390 | 10,513 | 10,898 | 10,390 | 10,513 | 10,513 | 10,774 | 10,912 |
Mid-Cap Value | 5,274 | 7,359 | 5,274 | 5,338 | 5,534 | 5,274 | 5,338 | 5,338 | 5,470 | 5,537 |
Mortgage-Backed Securities Multi-Sector Account Portfolio | 24 | 33 | 24 | 24 | 25 | 24 | 24 | 24 | 25 | 25 |
New America Growth | 1,908 | 2,662 | 1,908 | 1,930 | 2,001 | 1,908 | 1,930 | 1,930 | 1,978 | 2,004 |
New Asia | 1,837 | 2,563 | 1,837 | 1,859 | 1,927 | 1,837 | 1,859 | 1,859 | 1,905 | 1,929 |
New Era | 1,964 | 2,742 | 1,964 | 1,987 | 2,060 | 1,964 | 1,987 | 1,987 | 2,037 | 2,064 |
New Horizons | 6,840 | 9,547 | 6,840 | 6,919 | 7,173 | 6,840 | 6,919 | 6,919 | 7,093 | 7,187 |
New Income | 11,035 | 15,338 | 11,035 | 11,179 | 11,587 | 11,035 | 11,179 | 11,179 | 11,444 | 11,566 |
New Jersey Tax-Free Bond | 137 | 191 | 137 | 138 | 143 | 137 | 138 | 138 | 142 | 143 |
New York Tax-Free Bond | 185 | 258 | 185 | 187 | 194 | 185 | 187 | 187 | 192 | 194 |
New York Tax-Free Money | 35 | 49 | 35 | 35 | 37 | 35 | 35 | 35 | 36 | 37 |
Overseas Stock | 3,839 | 5,354 | 3,839 | 3,888 | 4,030 | 3,839 | 3,888 | 3,888 | 3,981 | 4,025 |
Personal Strategy Balanced | 884 | 1,234 | 884 | 895 | 928 | 884 | 895 | 895 | 917 | 929 |
Personal Strategy Growth | 659 | 919 | 659 | 667 | 691 | 659 | 667 | 667 | 683 | 691 |
Personal Strategy Income | 598 | 834 | 598 | 605 | 627 | 598 | 605 | 605 | 620 | 628 |
Prime Reserve | 2,898 | 4,044 | 2,898 | 2,933 | 3,040 | 2,898 | 2,933 | 2,933 | 3,006 | 3,043 |
Real Assets | 1,822 | 2,542 | 1,822 | 1,844 | 1,912 | 1,822 | 1,844 | 1,844 | 1,889 | 1,912 |
Real Estate | 1,931 | 2,693 | 1,931 | 1,956 | 2,028 | 1,931 | 1,956 | 1,956 | 2,003 | 2,025 |
TRP Reserve Investment | 7,811 | 10,892 | 7,811 | 7,913 | 8,202 | 7,811 | 7,913 | 7,913 | 8,101 | 8,186 |
Retirement 2005 | 676 | 943 | 676 | 684 | 709 | 676 | 684 | 684 | 701 | 709 |
Retirement 2010 | 2,822 | 3,938 | 2,822 | 2,856 | 2,961 | 2,822 | 2,856 | 2,856 | 2,927 | 2,963 |
Retirement 2015 | 4,304 | 6,004 | 4,304 | 4,357 | 4,517 | 4,304 | 4,357 | 4,357 | 4,463 | 4,516 |
Retirement 2020 | 9,922 | 13,839 | 9,922 | 10,046 | 10,414 | 9,922 | 10,046 | 10,046 | 10,289 | 10,407 |
Retirement 2025 | 6,524 | 9,099 | 6,524 | 6,609 | 6,850 | 6,524 | 6,609 | 6,609 | 6,766 | 6,840 |
Retirement 2030 | 9,181 | 12,806 | 9,181 | 9,297 | 9,637 | 9,181 | 9,297 | 9,297 | 9,521 | 9,630 |
Retirement 2035 | 4,693 | 6,544 | 4,693 | 4,753 | 4,927 | 4,693 | 4,753 | 4,753 | 4,867 | 4,919 |
68
Fund | Aggregate Compensation From Fund | |||||||||
Brody | Deering | Dick | Duncan | Gerrard | Horn | McBride | Rouse | Schreiber | Tercek | |
Retirement 2040 | 6,253 | 8,721 | 6,253 | 6,332 | 6,563 | 6,253 | 6,332 | 6,332 | 6,484 | 6,558 |
Retirement 2045 | 2,623 | 3,657 | 2,623 | 2,657 | 2,754 | 2,623 | 2,657 | 2,657 | 2,720 | 2,749 |
Retirement 2050 | 1,833 | 2,555 | 1,833 | 1,857 | 1,925 | 1,833 | 1,857 | 1,857 | 1,901 | 1,920 |
Retirement 2055 | 514 | 716 | 514 | 521 | 540 | 514 | 521 | 521 | 533 | 538 |
Retirement 2060 | 1 | 1 | 1 | 1 | 1 | 1 | 1 | 1 | 1 | 1 |
Retirement Balanced | 1,609 | 2,245 | 1,609 | 1,629 | 1,688 | 1,609 | 1,629 | 1,629 | 1,669 | 1,689 |
Science & Technology | 1,553 | 2,167 | 1,553 | 1,573 | 1,630 | 1,553 | 1,573 | 1,573 | 1,611 | 1,630 |
Short-Term Bond | 2,848 | 3,974 | 2,848 | 2,882 | 2,988 | 2,848 | 2,882 | 2,882 | 2,953 | 2,990 |
Short-Term Government Reserve | 0 | 0 | 0 | 0 | 0 | 0 | 0 | 0 | 0 | 0 |
Short-Term Reserve | 661 | 922 | 661 | 668 | 693 | 661 | 668 | 668 | 685 | 695 |
Small-Cap Stock | 4,409 | 6,155 | 4,409 | 4,460 | 4,623 | 4,409 | 4,460 | 4,460 | 4,573 | 4,635 |
Small-Cap Value | 4,310 | 6,017 | 4,310 | 4,359 | 4,519 | 4,310 | 4,359 | 4,359 | 4,470 | 4,532 |
Spectrum Growth | 1,761 | 2,457 | 1,761 | 1,782 | 1,847 | 1,761 | 1,782 | 1,782 | 1,826 | 1,850 |
Spectrum Income | 2,961 | 4,132 | 2,961 | 2,996 | 3,106 | 2,961 | 2,996 | 2,996 | 3,071 | 3,109 |
Spectrum International | 519 | 724 | 519 | 525 | 545 | 519 | 525 | 525 | 538 | 545 |
Strategic Income | 111 | 155 | 111 | 112 | 117 | 111 | 112 | 112 | 115 | 116 |
Summit Cash Reserves | 2,720 | 3,796 | 2,720 | 2,752 | 2,852 | 2,720 | 2,752 | 2,752 | 2,821 | 2,858 |
Summit GNMA(c) | 26 | 37 | 26 | 26 | 27 | 26 | 26 | 26 | 27 | 28 |
Summit Municipal Income | 378 | 527 | 378 | 383 | 397 | 378 | 383 | 383 | 392 | 396 |
Summit Municipal Intermediate | 1,559 | 2,175 | 1,559 | 1,579 | 1,637 | 1,559 | 1,579 | 1,579 | 1,617 | 1,635 |
Summit Municipal Money Market | 83 | 116 | 83 | 84 | 87 | 83 | 84 | 84 | 86 | 87 |
Target Retirement 2005 | 3 | 5 | 3 | 3 | 4 | 3 | 3 | 3 | 4 | 4 |
Target Retirement 2010 | 6 | 9 | 6 | 6 | 7 | 6 | 6 | 6 | 7 | 7 |
Target Retirement 2015 | 15 | 21 | 15 | 16 | 16 | 15 | 16 | 16 | 16 | 16 |
Target Retirement 2020 | 17 | 23 | 17 | 17 | 18 | 17 | 17 | 17 | 17 | 17 |
Target Retirement 2025 | 15 | 20 | 15 | 15 | 15 | 15 | 15 | 15 | 15 | 15 |
Target Retirement 2030 | 14 | 20 | 14 | 15 | 15 | 14 | 15 | 15 | 15 | 15 |
Target Retirement 2035 | 10 | 13 | 10 | 10 | 10 | 10 | 10 | 10 | 10 | 10 |
Target Retirement 2040 | 7 | 10 | 7 | 8 | 8 | 7 | 8 | 8 | 8 | 8 |
Target Retirement 2045 | 4 | 6 | 4 | 4 | 5 | 4 | 4 | 4 | 5 | 5 |
Target Retirement 2050 | 2 | 3 | 2 | 2 | 2 | 2 | 2 | 2 | 2 | 2 |
Target Retirement 2055 | 2 | 2 | 2 | 2 | 2 | 2 | 2 | 2 | 2 | 2 |
Target Retirement 2060 | 0 | 0 | 0 | 0 | 0 | 0 | 0 | 0 | 0 | 0 |
Tax-Efficient Equity | 65 | 91 | 65 | 66 | 68 | 65 | 66 | 66 | 67 | 68 |
69
Fund | Aggregate Compensation From Fund | |||||||||
Brody | Deering | Dick | Duncan | Gerrard | Horn | McBride | Rouse | Schreiber | Tercek | |
Tax-Exempt Money | 422 | 589 | 422 | 427 | 443 | 422 | 427 | 427 | 438 | 444 |
Tax-Free High Yield | 1,238 | 1,726 | 1,238 | 1,254 | 1,300 | 1,238 | 1,254 | 1,254 | 1,283 | 1,297 |
Tax-Free Income | 1,126 | 1,571 | 1,126 | 1,139 | 1,181 | 1,126 | 1,139 | 1,139 | 1,167 | 1,182 |
Tax-Free Short-Intermediate | 893 | 1,246 | 893 | 904 | 937 | 893 | 904 | 904 | 926 | 937 |
Tax-Free Ultra Short-Term Bond | 0 | 0 | 0 | 0 | 0 | 0 | 0 | 0 | 0 | 0 |
Total Equity Market Index | 448 | 625 | 448 | 453 | 470 | 448 | 453 | 453 | 464 | 470 |
U.S. Bond Enhanced Index | 257 | 358 | 257 | 260 | 270 | 257 | 260 | 260 | 266 | 270 |
U.S. Large-Cap Core | 39 | 54 | 39 | 39 | 41 | 39 | 39 | 39 | 40 | 41 |
U.S. Treasury Intermediate | 158 | 220 | 158 | 160 | 165 | 158 | 160 | 160 | 163 | 165 |
U.S. Treasury Long-Term | 145 | 202 | 145 | 147 | 152 | 145 | 147 | 147 | 150 | 152 |
U.S. Treasury Money | 898 | 1,254 | 898 | 909 | 942 | 898 | 909 | 909 | 932 | 944 |
Ultra Short-Term Bond | 253 | 354 | 253 | 257 | 266 | 253 | 257 | 257 | 263 | 266 |
Value | 8,808 | 12,285 | 8,808 | 8,920 | 9,246 | 8,808 | 8,920 | 8,920 | 9,135 | 9,237 |
Virginia Tax-Free Bond | 411 | 573 | 411 | 416 | 431 | 411 | 416 | 416 | 426 | 431 |
(a) Estimated for the period January 23, 2015, through December 31, 2015.
(b) The Global Infrastructure Fund merged into the Real Assets Fund on May 19, 2014. Amounts are for the period January 1, 2014, through May 19, 2014.
(c) The Summit GNMA Fund merged into the GNMA Fund on May 19, 2014. Amounts are for the period January 1, 2014, through May 19, 2014.
Directors’ Holdings in the Price Funds
The following tables set forth the Price Fund holdings of the current independent and inside directors, as of December 31, 2014, unless otherwise indicated.
Aggregate | Independent Directors | |||||||||
Brody | Deering | Dick | Duncan | Gerrard | Horn | McBride | Rouse | Schreiber | Tercek | |
over $100,000 | over $100,000 | over $100,000 | over $100,000 | over $100,000 | over $100,000 | over $100,000 | over $100,000 | over $100,000 | over $100,000 | |
Africa & Middle East | None | None | None | None | $1-$10,000 | None | None | None | None | None |
Balanced | None | None | None | None | None | None | None | None | None | |
Blue Chip Growth | None | None | $50,001-$100,000 | None | None | None | None | None | over $100,000 | None |
Blue Chip Growth Fund–Advisor Class | None | None | None | None | None | None | None | None | None | None |
Blue Chip Growth Fund–R Class | None | None | None | None | None | None | None | None | None | None |
California Tax-Free Bond | None | None | None | None | None | None | None | None | None | None |
California Tax-Free Money | over $100,000 | None | None | None | None | None | None | None | None | None |
Capital Appreciation | None | None | over $100,000 | None | $10,001-$50,000 | None | over $100,000 | None | None | None |
Capital Appreciation Fund–Advisor Class | None | None | None | None | None | None | None | None | None | None |
70
Aggregate | Independent Directors | |||||||||
Brody | Deering | Dick | Duncan | Gerrard | Horn | McBride | Rouse | Schreiber | Tercek | |
over $100,000 | over $100,000 | over $100,000 | over $100,000 | over $100,000 | over $100,000 | over $100,000 | over $100,000 | over $100,000 | over $100,000 | |
Capital Opportunity | None | None | None | None | $1-$10,000 | None | None | None | None | None |
Capital Opportunity Fund–Advisor Class | None | None | None | None | None | None | None | None | None | None |
Capital Opportunity Fund–R Class | None | None | None | None | None | None | None | None | None | None |
Corporate Income | None | None | None | None | None | None | None | None | None | None |
Diversified Mid-Cap Growth | None | None | None | None | None | None | None | None | None | None |
Diversified Small-Cap Growth | None | $10,001-$50,000 | None | None | None | None | None | None | None | None |
Dividend Growth | None | None | over $100,000 | None | None | None | None | None | None | None |
Dividend Growth Fund–Advisor Class | None | None | None | None | None | None | None | None | None | None |
Emerging Europe | None | None | None | None | None | None | None | None | None | None |
Emerging Markets Bond | None | None | over $100,000 | None | None | None | None | None | None | None |
Emerging Markets Corporate Bond | None | None | None | None | None | None | None | None | None | None |
Emerging Markets Corporate Bond–Advisor Class | None | None | None | None | None | None | None | None | None | None |
Emerging Markets Corporate Multi-Sector Account Portfolio | None | None | None | None | None | None | None | None | None | None |
Emerging Markets Local Currency Bond | None | None | None | None | None | None | None | None | None | None |
Emerging Markets Local Currency Bond Fund–Advisor Class | None | None | None | None | None | None | None | None | None | None |
Emerging Markets Local Multi-Sector Account Portfolio | None | None | None | None | None | None | None | None | None | None |
Emerging Markets Stock | None | None | None | over $100,000 | None | None | None | None | over $100,000 | None |
Equity Income | None | over $100,000 | over $100,000 | None | None | None | None | None | None | None |
Equity Income Fund–Advisor Class | None | None | None | None | None | None | None | None | None | None |
Equity Income Fund–R Class | None | None | None | None | None | None | None | None | None | None |
Equity Index 500 | None | None | None | None | None | None | None | None | None | None |
European Stock | None | None | None | None | None | None | None | None | None | None |
Extended Equity Market Index | None | None | None | None | None | None | None | None | None | None |
Financial Services | None | None | None | None | $10,001-$50,000 | None | None | None | None | None |
Floating Rate | None | None | None | None | None | None | None | None | None | None |
Floating Rate Fund–Advisor Class | None | None | None | None | None | None | None | None | None | None |
Floating Rate Multi-Sector Account Portfolio | None | None | None | None | None | None | None | None | None | None |
71
Aggregate | Independent Directors | |||||||||
Brody | Deering | Dick | Duncan | Gerrard | Horn | McBride | Rouse | Schreiber | Tercek | |
over $100,000 | over $100,000 | over $100,000 | over $100,000 | over $100,000 | over $100,000 | over $100,000 | over $100,000 | over $100,000 | over $100,000 | |
Georgia Tax-Free Bond | None | None | None | None | None | None | None | None | None | None |
Global Allocation | None | None | None | None | None | None | None | None | None | None |
Global Allocation–Advisor Class | None | None | None | None | None | None | None | None | None | None |
Global Growth Stock | None | None | None | None | None | None | None | None | None | None |
Global Growth Stock Fund–Advisor Class | None | None | None | None | None | None | None | None | None | None |
Global Industrials | None | None | None | None | None | None | None | None | None | None |
Global Real Estate | None | None | None | None | $1-$10,000 | None | None | None | None | None |
Global Real Estate Fund–Advisor Class | None | None | None | None | None | None | None | None | None | None |
Global Stock | None | None | None | None | None | None | None | None | None | None |
Global Stock Fund–Advisor Class | None | None | None | None | None | None | None | None | None | None |
Global Technology | None | over $100,000 | None | None | $50,001-$100,000 | None | None | None | None | None |
GNMA | None | None | None | None | None | None | None | None | over $100,000 | None |
TRP Government Reserve Investment | None | None | None | None | None | None | None | None | None | None |
Growth & Income | None | None | $10,001-$50,000 | None | None | None | None | None | over $100,000 | None |
Growth Stock | None | None | over $100,000 | None | None | None | None | None | None | None |
Growth Stock Fund–Advisor Class | None | None | None | None | None | None | None | None | None | None |
Growth Stock Fund–R Class | None | None | None | None | None | None | None | None | None | None |
Health Sciences | None | None | over $100,000 | None | $50,001-$100,000 | None | over $100,000 | None | None | None |
High Yield | None | None | over $100,000 | None | None | None | None | None | over $100,000 | None |
High Yield Fund–Advisor Class | None | None | None | None | None | None | None | None | None | None |
High Yield Multi-Sector Account Portfolio | None | None | None | None | None | None | None | None | None | None |
Inflation Focused Bond | None | None | None | None | None | None | None | None | None | None |
Inflation Protected Bond | None | None | over $100,000 | None | None | None | None | None | None | None |
Institutional Africa & Middle East | None | None | None | None | None | None | None | None | None | None |
Institutional Core Plus | None | None | None | None | None | None | None | None | None | None |
Institutional Core Plus Fund-F Class | None | None | None | None | None | None | None | None | None | None |
Institutional Emerging Markets Bond | None | None | None | None | None | None | None | None | None | None |
Institutional Emerging Markets Equity | None | None | None | None | None | None | None | None | None | None |
72
Aggregate | Independent Directors | |||||||||
Brody | Deering | Dick | Duncan | Gerrard | Horn | McBride | Rouse | Schreiber | Tercek | |
over $100,000 | over $100,000 | over $100,000 | over $100,000 | over $100,000 | over $100,000 | over $100,000 | over $100,000 | over $100,000 | over $100,000 | |
Institutional Floating Rate | None | over $100,000 | None | None | None | None | None | None | None | None |
Institutional Floating Rate Fund-F Class | None | None | None | None | None | None | None | None | None | None |
Institutional Global Focused Growth Equity | None | None | None | None | None | None | None | None | None | None |
Institutional Global Growth Equity | None | None | None | None | None | None | None | None | None | None |
Institutional Global Multi-Sector Bond | None | None | None | None | None | None | None | None | None | None |
Institutional Global Value Equity | None | None | None | None | None | None | None | None | None | None |
Institutional High Yield | None | None | None | None | None | None | None | None | None | None |
Institutional International Bond | None | None | None | None | None | None | None | None | None | None |
Institutional International Concentrated Equity | None | None | None | None | None | None | None | None | None | None |
Institutional International Core Equity | None | None | None | None | None | None | None | None | None | None |
Institutional International Growth Equity | None | None | None | None | None | None | None | None | None | None |
Institutional Large-Cap Core Growth | None | None | None | None | None | None | None | None | None | None |
Institutional Large-Cap Growth | None | None | None | None | None | None | None | None | None | None |
Institutional Large-Cap Value | None | None | None | None | None | None | None | None | None | None |
Institutional Long Duration Credit | None | None | None | None | None | None | None | None | None | None |
Institutional Mid-Cap Equity Growth | None | None | None | None | None | None | None | None | None | None |
Institutional Small-Cap Stock | None | None | None | None | None | None | None | None | None | None |
Institutional U.S. Structured Research | None | None | None | None | None | None | None | None | None | None |
International Bond | None | None | None | None | None | None | None | None | None | None |
International Bond Fund–Advisor Class | None | None | None | None | None | None | None | None | None | None |
International Discovery | None | None | None | None | None | None | None | None | None | None |
International Equity Index | None | None | None | None | None | None | None | None | None | None |
International Growth & Income | None | None | None | None | None | None | None | None | None | None |
International Growth & Income Fund–Advisor Class | None | None | None | None | None | None | None | None | None | None |
International Growth & Income Fund–R Class | None | None | None | None | None | None | None | None | None | None |
International Stock | None | None | None | None | None | None | None | None | None | None |
73
Aggregate | Independent Directors | |||||||||
Brody | Deering | Dick | Duncan | Gerrard | Horn | McBride | Rouse | Schreiber | Tercek | |
over $100,000 | over $100,000 | over $100,000 | over $100,000 | over $100,000 | over $100,000 | over $100,000 | over $100,000 | over $100,000 | over $100,000 | |
International Stock Fund–Advisor Class | None | None | None | None | None | None | None | None | None | None |
International Stock Fund–R Class | None | None | None | None | None | None | None | None | None | None |
Investment Grade Multi-Sector Account Portfolio | None | None | None | None | None | None | None | None | None | None |
Japan | None | None | None | None | None | None | None | None | over $100,000 | None |
Latin America | None | None | None | None | None | None | None | None | over $100,000 | None |
Maryland Short-Term Tax-Free Bond | None | None | None | None | None | None | None | None | None | None |
Maryland Tax-Free Bond | None | None | None | None | None | None | None | None | None | None |
Maryland Tax-Free Money | None | None | None | None | None | None | None | None | None | None |
Media & Telecommunications | None | None | None | None | $50,001-$100,000 | None | None | None | None | None |
Mid-Cap Growth | None | None | None | None | None | None | None | None | None | None |
Mid-Cap Growth Fund–Advisor Class | None | None | None | None | over $100,000 | None | None | None | None | None |
Mid-Cap Growth Fund–R Class | None | None | None | None | None | None | None | None | None | None |
Mid-Cap Value | None | None | None | None | None | None | None | None | None | None |
Mid-Cap Value Fund–Advisor Class | None | None | None | None | None | None | None | None | None | None |
Mid-Cap Value Fund–R Class | None | None | None | None | None | None | None | None | None | None |
Mortgage-Backed Securities Multi-Sector Account Portfolio | None | None | None | None | None | None | None | None | None | None |
New America Growth | None | None | None | None | None | None | over $100,000 | None | None | None |
New America Growth Fund–Advisor Class | None | None | None | None | None | None | None | None | None | None |
New Asia | None | None | None | None | None | None | None | None | None | None |
New Era | None | None | None | None | None | None | None | None | over $100,000 | None |
New Horizons | over $100,000 | None | None | None | $50,001-$100,000 | None | None | None | None | None |
New Income | None | None | None | None | None | None | None | None | over $100,000 | None |
New Income Fund–Advisor Class | None | None | None | None | None | None | None | None | None | None |
New Income Fund–R Class | None | None | None | None | None | None | None | None | None | None |
New Jersey Tax-Free Bond | None | None | None | None | None | None | None | None | None | None |
New York Tax-Free Bond | None | None | None | None | None | None | None | None | None | None |
New York Tax-Free Money | None | None | None | None | None | None | None | None | None | None |
Overseas Stock | None | None | None | None | None | None | None | None | None | None |
Personal Strategy Balanced | None | None | None | None | None | None | None | $50,001-$100,000 | None | None |
74
Aggregate | Independent Directors | |||||||||
Brody | Deering | Dick | Duncan | Gerrard | Horn | McBride | Rouse | Schreiber | Tercek | |
over $100,000 | over $100,000 | over $100,000 | over $100,000 | over $100,000 | over $100,000 | over $100,000 | over $100,000 | over $100,000 | over $100,000 | |
Personal Strategy Growth | None | None | None | None | None | None | None | None | None | None |
Personal Strategy Income | None | None | None | None | None | None | None | None | None | None |
Prime Reserve | None | $10,001-$50,000 | None | None | None | None | None | None | $10,001-$50,000 | None |
Real Assets | None | None | None | None | None | None | None | None | None | None |
Real Estate | None | None | None | None | $1- $10,000 | None | over $100,000 | None | None | None |
Real Estate Fund–Advisor Class | None | None | None | None | None | None | None | None | None | None |
TRP Reserve Investment | None | None | None | None | None | None | None | None | None | None |
Retirement 2005 | None | None | None | None | None | None | None | None | None | None |
Retirement 2005 Fund–Advisor Class | None | None | None | None | None | None | None | None | None | None |
Retirement 2005 Fund–R Class | None | None | None | None | None | None | None | None | None | None |
Retirement 2010 | None | None | None | None | None | None | None | None | None | None |
Retirement 2010 Fund–Advisor Class | None | None | None | None | None | None | None | None | None | None |
Retirement 2010 Fund–R Class | None | None | None | None | None | None | None | None | None | None |
Retirement 2015 | over $100,000 | None | None | None | None | over $100,000 | None | None | None | None |
Retirement 2015 Fund–Advisor Class | None | None | None | None | None | None | None | None | None | None |
Retirement 2015 Fund–R Class | None | None | None | None | None | None | None | None | None | None |
Retirement 2020 | None | None | None | None | $50,001-$100,000 | over $100,000 | None | None | None | None |
Retirement 2020 Fund–Advisor Class | None | None | None | None | None | None | None | None | None | None |
Retirement 2020 Fund–R Class | None | None | None | None | None | None | None | None | None | None |
Retirement 2025 | None | None | None | None | None | None | None | None | None | None |
Retirement 2025 Fund–Advisor Class | None | None | None | None | None | None | None | None | None | None |
Retirement 2025 Fund–R Class | None | None | None | None | None | None | None | None | None | None |
Retirement 2030 | None | None | None | None | None | None | None | $over 100,000 | None | None |
Retirement 2030 Fund–Advisor Class | None | None | None | None | None | None | None | None | None | None |
Retirement 2030 Fund–R Class | None | None | None | None | None | None | None | None | None | None |
Retirement 2035 | None | None | None | None | None | None | None | None | None | None |
Retirement 2035 Fund–Advisor Class | None | None | None | None | None | None | None | None | None | None |
Retirement 2035 Fund–R Class | None | None | None | None | None | None | None | None | None | None |
Retirement 2040 | None | None | None | None | None | None | None | None | None | None |
Retirement 2040 Fund–Advisor Class | None | None | None | None | None | None | None | None | None | None |
Retirement 2040 Fund–R Class | None | None | None | None | None | None | None | None | None | None |
Retirement 2045 | None | None | None | None | None | None | None | None | None | None |
75
Aggregate | Independent Directors | |||||||||
Brody | Deering | Dick | Duncan | Gerrard | Horn | McBride | Rouse | Schreiber | Tercek | |
over $100,000 | over $100,000 | over $100,000 | over $100,000 | over $100,000 | over $100,000 | over $100,000 | over $100,000 | over $100,000 | over $100,000 | |
Retirement 2045 Fund–Advisor Class | None | None | None | None | None | None | None | None | None | None |
Retirement 2045 Fund–R Class | None | None | None | None | None | None | None | None | None | None |
Retirement 2050 | None | None | None | None | None | None | None | None | None | None |
Retirement 2050 Fund–Advisor Class | None | None | None | None | None | None | None | None | None | None |
Retirement 2050 Fund–R Class | None | None | None | None | None | None | None | None | None | None |
Retirement 2055 | None | None | None | None | None | None | None | None | None | None |
Retirement 2055 Fund–Advisor Class | None | None | None | None | None | None | None | None | None | None |
Retirement 2055 Fund–R Class | None | None | None | None | None | None | None | None | None | None |
Retirement Balanced | None | None | None | None | None | None | None | None | None | None |
Retirement Balanced Fund–Advisor Class | None | None | None | None | None | None | None | None | None | None |
Retirement Balanced Fund–R Class | None | None | None | None | None | None | None | None | None | None |
Science & Technology | None | None | $10,001-$50,000 | None | $1-$10,000 | None | None | None | None | None |
Science & Technology Fund–Advisor Class | None | None | None | None | None | None | None | None | None | None |
Short-Term Bond | None | None | over $100,000 | None | None | None | None | None | over $100,000 | None |
Short-Term Bond Fund–Advisor Class | None | None | None | None | None | None | None | None | None | None |
Short-Term Government Reserve | None | None | None | None | None | None | None | None | None | None |
Short-Term Reserve | None | None | None | None | None | None | None | None | None | None |
Small-Cap Stock | None | None | None | None | $10,001-$50,000 | None | None | None | None | None |
Small-Cap Stock Fund–Advisor Class | None | None | None | None | None | None | None | None | None | None |
Small-Cap Value | None | None | None | None | None | None | None | None | None | None |
Small-Cap Value Fund–Advisor Class | None | None | None | None | None | None | None | None | None | None |
Spectrum Growth | None | None | None | None | None | None | None | None | None | None |
Spectrum Income | None | None | None | None | None | None | None | None | None | None |
Spectrum International | None | None | None | None | None | None | None | None | None | None |
Strategic Income | None | None | None | None | None | None | None | None | None | None |
Strategic Income Fund–Advisor Class | None | None | None | None | None | None | None | None | None | None |
Summit Cash Reserves | None | None | over $100,000 | None | None | None | None | None | $1-$10,000 | over $100,000 |
Summit Municipal Income | None | None | None | None | None | None | None | None | over $100,000 | None |
Summit Municipal Income–Advisor Class | None | None | None | None | None | None | None | None | None | None |
Summit Municipal Intermediate | None | None | None | None | None | None | None | None | over $100,000 | None |
Summit Municipal Intermediate –Advisor Class | None | None | None | None | None | None | None | None | None | None |
76
Aggregate | Independent Directors | |||||||||
Brody | Deering | Dick | Duncan | Gerrard | Horn | McBride | Rouse | Schreiber | Tercek | |
over $100,000 | over $100,000 | over $100,000 | over $100,000 | over $100,000 | over $100,000 | over $100,000 | over $100,000 | over $100,000 | over $100,000 | |
Summit Municipal Money Market | None | None | None | None | None | None | None | None | $50,001-$100,000 | None |
Target Retirement 2005 | None | None | None | None | None | None | None | None | None | None |
Target Retirement 2005 Fund–Advisor Class | None | None | None | None | None | None | None | None | None | None |
Target Retirement 2010 | None | None | None | None | None | None | None | None | None | None |
Target Retirement 2010 Fund–Advisor Class | None | None | None | None | None | None | None | None | None | None |
Target Retirement 2015 | None | None | None | None | None | None | None | None | None | None |
Target Retirement 2015 Fund–Advisor Class | None | None | None | None | None | None | None | None | None | None |
Target Retirement 2020 | None | None | None | None | None | None | None | None | None | None |
Target Retirement 2020 Fund–Advisor Class | None | None | None | None | None | None | None | None | None | None |
Target Retirement 2025 | None | None | None | None | None | None | None | None | None | None |
Target Retirement 2025 Fund–Advisor Class | None | None | None | None | None | None | None | None | None | None |
Target Retirement 2030 | None | None | None | None | None | None | None | None | None | None |
Target Retirement 2030 Fund–Advisor Class | None | None | None | None | None | None | None | None | None | None |
Target Retirement 2035 | None | None | None | None | None | None | None | None | None | None |
Target Retirement 2035 Fund–Advisor Class | None | None | None | None | None | None | None | None | None | None |
Target Retirement 2040 | None | None | None | None | None | None | None | None | None | None |
Target Retirement 2040 Fund–Advisor Class | None | None | None | None | None | None | None | None | None | None |
Target Retirement 2045 | None | None | None | None | None | None | None | None | None | None |
Target Retirement 2045 Fund–Advisor Class | None | None | None | None | None | None | None | None | None | None |
Target Retirement 2050 | None | None | None | None | None | None | None | None | None | None |
Target Retirement 2050 Fund–Advisor Class | None | None | None | None | None | None | None | None | None | None |
Target Retirement 2055 | None | None | None | None | None | None | None | None | None | None |
Target Retirement 2055 Fund–Advisor Class | None | None | None | None | None | None | None | None | None | None |
Tax-Efficient Equity | None | None | None | None | None | None | None | None | None | None |
77
Aggregate | Independent Directors | |||||||||
Brody | Deering | Dick | Duncan | Gerrard | Horn | McBride | Rouse | Schreiber | Tercek | |
over $100,000 | over $100,000 | over $100,000 | over $100,000 | over $100,000 | over $100,000 | over $100,000 | over $100,000 | over $100,000 | over $100,000 | |
Tax-Exempt Money | None | None | None | None | None | None | None | None | None | None |
Tax-Free High Yield | None | None | None | None | None | None | None | None | over $100,000 | None |
Tax-Free High Yield–Advisor Class | None | None | None | None | None | None | None | None | None | None |
Tax-Free Income | None | None | None | None | None | None | None | None | None | None |
Tax-Free Income Fund–Advisor Class | None | None | None | None | None | None | None | None | None | None |
Tax-Free Short-Intermediate | None | None | None | None | None | None | over $100,000 | None | None | None |
Tax-Free Short-Intermediate –Advisor Class | None | None | None | None | None | None | None | None | None | None |
Tax-Free Ultra Short-Term Bond | None | None | None | None | None | None | None | None | None | None |
Total Equity Market Index | None | None | None | None | None | None | None | None | None | None |
U.S. Bond Enhanced Index | None | None | None | None | None | None | None | None | None | None |
U.S. Large-Cap Core | None | None | None | None | None | None | None | None | None | None |
U.S. Large-Cap Core Fund–Advisor Class | None | None | None | None | None | None | None | None | None | None |
U.S. Treasury Intermediate | None | None | $1-$10,000 | None | None | None | None | None | over $100,000 | None |
U.S. Treasury Long-Term | None | None | None | None | None | None | None | None | over $100,000 | None |
U.S. Treasury Money | None | None | None | None | None | None | None | None | $1-$10,000 | None |
Ultra Short-Term Bond | None | None | None | None | None | None | None | None | None | None |
Value | None | None | None | None | None | None | None | None | over $100,000 | None |
Value Fund–Advisor Class | None | None | None | None | None | None | None | None | None | None |
Virginia Tax-Free Bond | None | None | None | None | None | None | None | None | None | None |
Aggregate Holdings, | Inside Directors | ||||||
Bernard | Rogers | Wiese* | |||||
over $100,000 | over $100,000 | over $100,000 | |||||
Africa & Middle East | None | None | None | ||||
Balanced | None | None | None | ||||
Blue Chip Growth | None | None | None | ||||
Blue Chip Growth Fund–Advisor Class | None | None | None | ||||
Blue Chip Growth Fund–R Class | None | None | None | ||||
California Tax-Free Bond | None | None | None | ||||
California Tax-Free Money | None | None | None | ||||
Capital Appreciation | over $100,000 | None | None | ||||
Capital Appreciation Fund–Advisor Class | None | None | None | ||||
Capital Opportunity | None | None | None | ||||
Capital Opportunity Fund–Advisor Class | None | None | None | ||||
78
Aggregate Holdings, | Inside Directors | ||||||
Bernard | Rogers | Wiese* | |||||
over $100,000 | over $100,000 | over $100,000 | |||||
Capital Opportunity Fund–R Class | None | None | None | ||||
Corporate Income | None | over $100,000 | None | ||||
Diversified Mid-Cap Growth | None | None | None | ||||
Diversified Small-Cap Growth | None | None | None | ||||
Dividend Growth | None | None | None | ||||
Dividend Growth Fund–Advisor Class | None | None | None | ||||
Emerging Europe | None | None | None | ||||
Emerging Markets Bond | None | None | $10,001-$50,000 | ||||
Emerging Markets Corporate Bond | None | None | None | ||||
Emerging Markets Corporate Bond–Advisor Class | None | None | None | ||||
Emerging Markets Corporate Multi-Sector Account Portfolio | None | None | None | ||||
Emerging Markets Local Currency Bond | None | None | None | ||||
Emerging Markets Local Currency Bond Fund–Advisor Class | None | None | None | ||||
Emerging Markets Local Multi-Sector Account Portfolio | None | None | None | ||||
Emerging Markets Stock | $50,001-$100,000 | None | None | ||||
Equity Income | over $100,000 | over $100,000 | None | ||||
Equity Income Fund–Advisor Class | None | None | None | ||||
Equity Income Fund–R Class | None | None | None | ||||
Equity Index 500 | None | None | None | ||||
European Stock | None | None | None | ||||
Extended Equity Market Index | None | None | None | ||||
Financial Services | None | None | None | ||||
Floating Rate | None | None | None | ||||
Floating Rate Fund–Advisor Class | None | None | None | ||||
Floating Rate Multi-Sector Account Portfolio | None | None | None | ||||
Georgia Tax-Free Bond | None | None | None | ||||
Global Allocation | None | None | None | ||||
Global Allocation Fund–Advisor Class | None | None | None | ||||
Global Growth Stock | None | None | None | ||||
Global Growth Stock Fund–Advisor Class | None | None | None | ||||
Global Industrials | None | None | None | ||||
Global Real Estate | None | None | None | ||||
Global Real Estate Fund–Advisor Class | None | None | None | ||||
Global Stock | over $100,000 | None | None | ||||
Global Stock Fund–Advisor Class | None | None | None | ||||
Global Technology | None | None | None | ||||
GNMA | None | None | $10,001-$50,000 | ||||
TRP Government Reserve Investment | None | None | None | ||||
Growth & Income | None | None | None | ||||
79
Aggregate Holdings, | Inside Directors | ||||||
Bernard | Rogers | Wiese* | |||||
over $100,000 | over $100,000 | over $100,000 | |||||
Growth Stock | over $100,000 | None | None | ||||
Growth Stock Fund–Advisor Class | None | None | None | ||||
Growth Stock Fund–R Class | None | None | None | ||||
Health Sciences | None | None | over $100,000 | ||||
High Yield | $10,001-$50,000 | None | None | ||||
High Yield Fund–Advisor Class | None | None | None | ||||
High Yield Multi-Sector Account Portfolio | None | None | None | ||||
Inflation Focused Bond | None | None | None | ||||
Inflation Protected Bond | None | None | None | ||||
Institutional Africa & Middle East | None | None | None | ||||
Institutional Core Plus | None | None | None | ||||
Institutional Core Plus Fund-F Class | None | None | None | ||||
Institutional Emerging Markets Bond | None | None | None | ||||
Institutional Emerging Markets Equity | None | None | None | ||||
Institutional Floating Rate | None | over $100,000 | over $100,000 | ||||
Institutional Floating Rate Fund-F Class | None | None | None | ||||
Institutional Global Focused Growth Equity | over $100,000 | over $100,000 | None | ||||
Institutional Global Growth Equity | None | None | None | ||||
Institutional Global Multi-Sector Bond | None | None | None | ||||
Institutional Global Value Equity | None | None | None | ||||
Institutional High Yield | None | None | None | ||||
Institutional International Bond | None | None | None | ||||
Institutional International Concentrated Equity | None | None | None | ||||
Institutional International Core Equity | None | None | None | ||||
Institutional International Growth Equity | None | None | None | ||||
Institutional Large-Cap Core Growth | None | None | None | ||||
Institutional Large-Cap Growth | None | None | None | ||||
Institutional Large-Cap Value | None | None | None | ||||
Institutional Long Duration Credit | None | None | None | ||||
Institutional Mid-Cap Equity Growth | over $100,000 | None | None | ||||
Institutional Small-Cap Stock | $10,001-$50,000 | None | None | ||||
Institutional U.S. Structured Research | None | None | None | ||||
International Bond | None | None | None | ||||
International Bond Fund–Advisor Class | None | None | None | ||||
International Discovery | $10,001-$50,000 | None | None | ||||
International Equity Index | None | None | None | ||||
International Growth & Income | None | None | None | ||||
80
Aggregate Holdings, | Inside Directors | ||||||
Bernard | Rogers | Wiese* | |||||
over $100,000 | over $100,000 | over $100,000 | |||||
International Growth & Income Fund–Advisor Class | None | None | None | ||||
International Growth & Income Fund–R Class | None | None | None | ||||
International Stock | $10,001-$50,000 | None | $1-$10,000 | ||||
International Stock Fund–Advisor Class | None | None | None | ||||
International Stock Fund–R Class | None | None | None | ||||
Investment Grade Multi-Sector Account Portfolio | None | None | None | ||||
Japan | None | None | None | ||||
Latin America | None | None | None | ||||
Maryland Short-Term Tax-Free Bond | None | None | None | ||||
Maryland Tax-Free Bond | None | None | None | ||||
Maryland Tax-Free Money | None | None | $10,001-$50,000 | ||||
Media & Telecommunications | None | over $100,000 | None | ||||
Mid-Cap Growth | None | None | None | ||||
Mid-Cap Growth Fund–Advisor Class | None | None | None | ||||
Mid-Cap Growth Fund–R Class | None | None | None | ||||
Mid-Cap Value | None | None | None | ||||
Mid-Cap Value Fund–Advisor Class | None | None | None | ||||
Mid-Cap Value Fund–R Class | None | None | None | ||||
Mortgage-Backed Securities Multi-Sector Account Portfolio | None | None | None | ||||
New America Growth | None | None | None | ||||
New America Growth Fund–Advisor Class | None | None | None | ||||
New Asia | over $100,000 | None | None | ||||
New Era | None | None | None | ||||
New Horizons | None | None | None | ||||
New Income | None | $10,001-$50,000 | None | ||||
New Income Fund–Advisor Class | None | None | None | ||||
New Income Fund–R Class | None | None | None | ||||
New Jersey Tax-Free Bond | None | None | None | ||||
New York Tax-Free Bond | None | None | None | ||||
New York Tax-Free Money | None | None | None | ||||
Overseas Stock | None | None | None | ||||
Personal Strategy Balanced | None | None | None | ||||
Personal Strategy Growth | None | None | None | ||||
Personal Strategy Income | None | None | None | ||||
Prime Reserve | over $100,000 | over $100,000 | $50,001-$100,000 | ||||
Real Assets | None | None | None | ||||
Real Estate | None | None | None | ||||
Real Estate Fund–Advisor Class | None | None | None | ||||
TRP Reserve Investment | None | None | None | ||||
Retirement 2005 | None | None | None | ||||
Retirement 2005 Fund–Advisor Class | None | None | None | ||||
Retirement 2005 Fund–R Class | None | None | None | ||||
Retirement 2010 | None | None | None | ||||
81
Aggregate Holdings, | Inside Directors | ||||||
Bernard | Rogers | Wiese* | |||||
over $100,000 | over $100,000 | over $100,000 | |||||
Retirement 2010 Fund–Advisor Class | None | None | None | ||||
Retirement 2010 Fund–R Class | None | None | None | ||||
Retirement 2015 | None | None | None | ||||
Retirement 2015 Fund–Advisor Class | None | None | None | ||||
Retirement 2015 Fund–R Class | None | None | None | ||||
Retirement 2020 | None | None | None | ||||
Retirement 2020 Fund–Advisor Class | None | None | None | ||||
Retirement 2020 Fund–R Class | None | None | None | ||||
Retirement 2025 | None | None | None | ||||
Retirement 2025 Fund–Advisor Class | None | None | None | ||||
Retirement 2025 Fund–R Class | None | None | None | ||||
Retirement 2030 | None | None | None | ||||
Retirement 2030 Fund–Advisor Class | None | None | None | ||||
Retirement 2030 Fund–R Class | None | None | None | ||||
Retirement 2035 | None | None | None | ||||
Retirement 2035 Fund–Advisor Class | None | None | None | ||||
Retirement 2035 Fund–R Class | None | None | None | ||||
Retirement 2040 | None | None | None | ||||
Retirement 2040 Fund–Advisor Class | None | None | None | ||||
Retirement 2040 Fund–R Class | None | None | None | ||||
Retirement 2045 | None | None | None | ||||
Retirement 2045 Fund–Advisor Class | None | None | None | ||||
Retirement 2045 Fund–R Class | None | None | None | ||||
Retirement 2050 | None | None | None | ||||
Retirement 2050 Fund–Advisor Class | None | None | None | ||||
Retirement 2050 Fund–R Class | None | None | None | ||||
Retirement 2055 | over $100,000 | None | None | ||||
Retirement 2055 Fund–Advisor Class | None | None | None | ||||
Retirement 2055 Fund–R Class | None | None | None | ||||
Retirement Balanced | None | None | None | ||||
Retirement Balanced Fund–Advisor Class | None | None | None | ||||
Retirement Balanced Fund–R Class | None | None | None | ||||
Science & Technology | over $100,000 | over $100,000 | over $100,000 | ||||
Science & Technology Fund–Advisor Class | None | None | None | ||||
Short-Term Bond | None | None | over $100,000 | ||||
Short-Term Bond Fund–Advisor Class | None | None | None | ||||
Short-Term Government Reserve | None | None | None | ||||
Short-Term Reserve | None | None | None | ||||
Small-Cap Stock | $10,001-$50,000 | None | None | ||||
Small-Cap Stock Fund–Advisor Class | None | None | None | ||||
82
Aggregate Holdings, | Inside Directors | ||||||
Bernard | Rogers | Wiese* | |||||
over $100,000 | over $100,000 | over $100,000 | |||||
Small-Cap Value | $10,001-$50,000 | None | None | ||||
Small-Cap Value Fund–Advisor Class | None | None | None | ||||
Spectrum Growth | over $100,000 | None | None | ||||
Spectrum Income | $10,001-$50,000 | over $100,000 | None | ||||
Spectrum International | $10,001-$50,000 | None | None | ||||
Strategic Income | None | None | None | ||||
Strategic Income Fund–Advisor Class | None | None | None | ||||
Summit Cash Reserves | over $100,000 | over $100,000 | over $100,000 | ||||
Summit Municipal Income | None | None | None | ||||
Summit Municipal Income–Advisor Class | None | None | None | ||||
Summit Municipal Intermediate | None | None | None | ||||
Summit Municipal Intermediate –Advisor Class | None | None | None | ||||
Summit Municipal Money Market | None | None | None | ||||
Target Retirement 2005 | None | None | None | ||||
Target Retirement 2005 Fund–Advisor Class | None | None | None | ||||
Target Retirement 2010 | None | None | None | ||||
Target Retirement 2010 Fund–Advisor Class | None | None | None | ||||
Target Retirement 2015 | None | None | None | ||||
Target Retirement 2015 Fund–Advisor Class | None | None | None | ||||
Target Retirement 2020 | None | None | None | ||||
Target Retirement 2020 Fund–Advisor Class | None | None | None | ||||
Target Retirement 2025 | None | None | None | ||||
Target Retirement 2025 Fund–Advisor Class | None | None | None | ||||
Target Retirement 2030 | None | None | None | ||||
Target Retirement 2030 Fund–Advisor Class | None | None | None | ||||
Target Retirement 2035 | None | None | None | ||||
Target Retirement 2035 Fund–Advisor Class | None | None | None | ||||
Target Retirement 2040 | None | None | None | ||||
Target Retirement 2040 Fund–Advisor Class | None | None | None | ||||
Target Retirement 2045 | None | None | None | ||||
Target Retirement 2045 Fund–Advisor Class | None | None | None | ||||
Target Retirement 2050 | None | None | None | ||||
Target Retirement 2050 Fund–Advisor Class | None | None | None | ||||
Target Retirement 2055 | None | None | None | ||||
Target Retirement 2055 Fund–Advisor Class | None | None | None | ||||
Tax-Efficient Equity | None | None | None | ||||
Tax-Exempt Money | None | None | None | ||||
Tax-Free High Yield | None | None | None | ||||
Tax-Free High Yield–Advisor Class | None | None | None | ||||
83
Aggregate Holdings, | Inside Directors | ||||||
Bernard | Rogers | Wiese* | |||||
over $100,000 | over $100,000 | over $100,000 | |||||
Tax-Free Income | None | None | None | ||||
Tax-Free Income Fund–Advisor Class | None | None | None | ||||
Tax-Free Short-Intermediate | None | None | None | ||||
Tax-Free Short-Intermediate–Advisor Class | None | None | None | ||||
Tax-Free Ultra Short-Term Bond | None | None | None | ||||
Total Equity Market Index | None | None | $10,001-$50,000 | ||||
U.S. Bond Enhanced Index | None | None | None | ||||
U.S. Large-Cap Core | None | None | None | ||||
U.S. Large-Cap Core–Advisor Class | None | None | None | ||||
U.S. Treasury Intermediate | None | None | None | ||||
U.S. Treasury Long-Term | None | None | None | ||||
U.S. Treasury Money | None | None | None | ||||
Ultra Short-Term Bond | None | None | None | ||||
Value | None | $50,001-$100,000 | None | ||||
Value Fund–Advisor Class | None | None | None | ||||
Virginia Tax-Free Bond | None | None | None | ||||
* Elected on February 3, 2015.
Portfolio Managers’ Holdings in the Price Funds
The following tables set forth the Price Fund holdings of each fund’s portfolio manager, who serves as chairman of the fund’s Investment Advisory Committee and has day-to-day responsibility for managing the fund and executing the fund’s investment program. One column shows the dollar range of shares beneficially owned in the fund for which he or she serves as portfolio manager, as of the end of that fund’s fiscal year-end, and the other column shows the dollar range of shares beneficially owned in all funds within the T. Rowe Price family of funds, as of December 31 of the prior year. Shares of the Price Funds are frequently held by T. Rowe Price employees, including portfolio managers, through participation in the T. Rowe Price 401(k) plan. However, starting in 2012, the T. Rowe Price 401(k) plan has periodically replaced certain Price Funds in the eligible investment lineup with similarly managed Institutional Price Funds and T. Rowe Price common trust funds, which operate much like mutual funds but are exempt from registration under the federal securities laws. As a result, the range of fund holdings shown in the tables may have decreased for those portfolio managers who manage a Price Fund that is no longer offered as part of the T. Rowe Price 401(k) plan even though the portfolio manager may now invest in the Institutional Price Fund or T. Rowe Price common trust fund within the same investment strategy.
Fund | Portfolio Manager | Range of Fund Holdings | All
Funds | |
Africa & Middle East | Oliver D.M. Bell | None | None | |
Asia Opportunities | Eric C. Moffett | $500,001–$1,000,000 | $500,001–$1,000,000 | |
Balanced | Charles M. Shriver | $100,001–$500,000 | over $1,000,000 | |
Blue Chip Growth (b) | Larry J. Puglia | over $1,000,000 | over $1,000,000 | |
Capital Appreciation (b) | David R. Giroux | $50,001–$100,000 | over $1,000,000 | |
Capital Opportunity | Ann M. Holcomb Jason B. Polun Eric L. Veiel | $100,001–$500,000 None None | over $1,000,000 over $1,000,000 $50,001–$100,000 | |
Corporate Income | David A. Tiberii | $10,001–$50,000 | over $1,000,000 | |
Credit Opportunities | Paul A. Karpers | $100,001–$500,000 | over $1,000,000 | |
84
Fund | Portfolio Manager | Range of Fund Holdings | All Funds | |
Diversified Mid-Cap Growth | Donald J. Easley Donald J. Peters | $500,001–$1,000,000 over $1,000,000 | over $1,000,000 over $1,000,000 | |
Diversified Small-Cap Growth | Sudhir Nanda | $100,001–$500,000 | $500,001–$1,000,000 | |
Dividend Growth | Thomas J. Huber | $500,001–$1,000,000 | over $1,000,000 | |
Emerging Europe | Ulle Adamson | (c) | None | |
Emerging Markets Bond | Michael J. Conelius | None | over $1,000,000 | |
Emerging Markets Corporate Bond | Michael J. Conelius (d) | $100,001–$500,000 | over $1,000,000 | |
Emerging Markets Local Currency Bond | Andrew Keirle | $10,001–$50,000 | $10,001–$50,000 | |
Emerging Markets Stock | Gonzalo Pangaro | over $1,000,000 | over $1,000,000 | |
Equity Income (b) | Brian C. Rogers (e) | over $1,000,000 | over $1,000,000 | |
Equity Index 500 (b) | E. Frederick Bair Ken D. Uematsu | $50,001–$100,000 $1–$10,000 | $100,001–$500,000 $500,001–$1,000,000 | |
European Stock | Dean Tenerelli | None | None | |
Extended Equity Market Index | E. Frederick Bair Ken D. Uematsu | $10,001–$50,000 $50,001–$100,000 | $100,001–$500,000 $500,001–$1,000,000 | |
Financial Services | Gabriel Solomon | $10,001–$50,000 | over $1,000,000 | |
Floating Rate | Paul M. Massaro | $50,001–$100,000 | over $1,000,000 | |
Global Allocation | Charles M. Shriver | $100,001–$500,000 | over $1,000,000 | |
Global Growth Stock (b) | R. Scott Berg | $500,001–$1,000,000 | over $1,000,000 | |
Global High Income Bond | Michael Della Vedova Mark J. Vaselkiv | (f) (f) | None over $1,000,000 | |
Global Industrials | Peter J. Bates | $100,001–$500,000 | over $1,000,000 | |
Global Real Estate | Nina P. Jones | $10,001–$50,000 | $500,001–$1,000,000 | |
Global Stock (b) | David J. Eiswert | over $1,000,000 | over $1,000,000 | |
Global Technology | Joshua K. Spencer | over $1,000,000 | over $1,000,000 | |
Global Unconstrained Bond | Arif Husain | (f) | None | |
GNMA | Andrew C. McCormick | $100,001–$500,000 | over $1,000,000 | |
Growth & Income(b) | Thomas J. Huber (g) | $1–$10,000 | over $1,000,000 | |
Growth Stock (b) | Joseph B. Fath | None | over $1,000,000 | |
Health Sciences | Taymour R. Tamaddon | $500,001–$1,000,000 | $500,001–$1,000,000 | |
High Yield (b) | Mark J. Vaselkiv | None | over $1,000,000 | |
Inflation Protected Bond | Daniel O. Shackelford | $50,001–$100,000 | over $1,000,000 | |
Intermediate Tax- Free High Yield | James M. Murphy | (h) | over $1,000,000 | |
International Bond | Arif Husain Christopher J. Rothery | None $10,001–$50,000 | None $100,001–$500,000 | |
International Concentrated Equity | Federico Santilli | None | None | |
International Discovery | Wenli Zheng | (i) | None | |
International Equity Index | E. Frederick Bair Neil Smith | $10,001–$50,000 None | $100,001–$500,000 None | |
International Growth & Income | Jonathan H.W. Matthews | $10,001–$50,000 | $10,001–$50,000 | |
International Stock (b) | Richard N. Clattenburg | None (j) | $500,001–$1,000,000 | |
Japan | Archibald Ciganer | None | None | |
Latin America | Verena E. Wachnitz | $100,001–$500,000 | $100,001–$500,000 | |
Maryland Short-Term Tax-Free Bond | Charles B. Hill | $10,001–$50,000 | over $1,000,000 | |
Maryland Tax-Free Bond | Hugh D. McGuirk | $500,001–$1,000,000 | over $1,000,000 | |
Maryland Tax-Free Money | Joseph K. Lynagh | $1–$10,000 | over $1,000,000 | |
Media & Telecommunications | Paul D. Greene II | $100,001–$500,000 | $100,001–$500,000 | |
Mid-Cap Growth (b) | Brian W.H. Berghuis | over $1,000,000 | over $1,000,000 | |
Mid-Cap Value (b) | David J. Wallack | None | over $1,000,000 | |
85
Fund | Portfolio Manager | Range of Fund Holdings | All Funds |
New America Growth | Daniel Martino | over $1,000,000 | over $1,000,000 |
New Asia | Anh Lu | $100,001–$500,000 | over $1,000,000 |
New Era | Shawn T. Driscoll | $100,001–$500,000 | over $1,000,000 |
New Horizons (b) | Henry M. Ellenbogen | $100,001–$500,000 | over $1,000,000 |
New Income (b) | Daniel O. Shackelford | $100,001–$500,000 | over $1,000,000 |
Overseas Stock (b) | Raymond A. Mills | None | over $1,000,000 |
Personal Strategy Balanced | Charles M. Shriver | $10,001–$50,000 | over $1,000,000 |
Personal Strategy Growth | Charles M. Shriver | $100,001–$500,000 | over $1,000,000 |
Personal Strategy Income | Charles M. Shriver | $1-$10,000 | over $1,000,000 |
Prime Reserve | Joseph K. Lynagh | $10,001–$50,000 | over $1,000,000 |
Real Assets (b) | Wyatt A. Lee | $1–$10,000 | over $1,000,000 |
Real Estate | David M. Lee | $100,001–$500,000 | over $1,000,000 |
Science & Technology | Kennard W. Allen | over $1,000,000 | over $1,000,000 |
Short-Term Bond | Michael F. Reinartz Edward A. Wiese | None (k) $500,001–$1,000,000 | $500,001–$1,000,000 over $1,000,000 |
Small-Cap Stock | Gregory A. McCrickard | over $1,000,000 | over $1,000,000 |
Small-Cap Value | J. David Wagner | $10,001-$50,000 | $500,001–$1,000,000 |
Spectrum Growth | Charles M. Shriver | $100,001-$500,000 | over $1,000,000 |
Spectrum Income | Charles M. Shriver | $100,001-$500,000 | over $1,000,000 |
Spectrum International | Charles M. Shriver | $100,001-$500,000 | over $1,000,000 |
Strategic Income | Steven C. Huber | $100,001–$500,000 | $500,001–$1,000,000 |
Summit Cash Reserves | Joseph K. Lynagh | $1-$10,000 | over $1,000,000 |
Summit Municipal Income | Konstantine B. Mallas | $100,001-$500,000 | over $1,000,000 |
Summit Municipal Intermediate | Charles B. Hill | $500,001–$1,000,000 | over $1,000,000 |
Summit Municipal Money Market | Joseph K. Lynagh | None | over $1,000,000 |
Tax- Efficient Equity | Donald J. Peters | over $1,000,000 | over $1,000,000 |
Tax- Exempt Money | Joseph K. Lynagh | $10,001–$50,000 | over $1,000,000 |
Tax- Free High Yield | James M. Murphy | $100,001–$500,000 | over $1,000,000 |
Tax- Free Income | Konstantine B. Mallas | $100,001–$500,000 | over $1,000,000 |
Tax- Free Short-Intermediate | Charles B. Hill | $10,001–$50,000 | over $1,000,000 |
Tax- Free Ultra Short-Term Bond | Joseph K. Lynagh | (l) | over $1,000,000 |
Total Equity Market Index | E. Frederick Bair Ken D. Uematsu | $50,001–$100,000 $1-$10,000 | $100,001–$500,000 $500,001–$1,000,000 |
U.S. Bond Enhanced Index (b) | Robert M. Larkins | $10,001–$50,000 | $100,001–$500,000 |
U.S. Large-Cap Core | Jeffrey Rottinghaus | over $1,000,000 | over $1,000,000 |
U.S. Treasury Intermediate | Brian J. Brennan | $10,001–$50,000 | over $1,000,000 |
U.S. Treasury Long-Term | Brian J. Brennan | $10,001–$50,000 | over $1,000,000 |
U.S. Treasury Money | Joseph K. Lynagh | $1–$10,000 | over $1,000,000 |
Ultra Short-Term Bond | Joseph K. Lynagh | $100,001–$500,000 | over $1,000,000 |
Value (b) | Mark S. Finn | $500,001–$1,000,000 | over $1,000,000 |
(a) See table beginning on page 7 for the fiscal year of the funds. The range of fund holdings as of the fund’s fiscal year is updated concurrently with each fund’s prospectus date as shown in the table beginning on page 7.
(b) The portfolio manager invests in a similarly managed T. Rowe Price common trust fund within the T. Rowe Price 401(k) plan.
(c) On April 1, 2015, Ulle Adamson replaced S. Leigh Innes as the fund’s portfolio manager, therefore the range of fund holdings is not yet available.
(d) On October 1, 2015, Samy B. Muaddi will replace Michael J. Conelius as the fund’s portfolio manager.
(e) On November 1, 2015, John D. Linehan will replace Brian C. Rogers as the fund’s portfolio manager.
86
(f) The fund incepted on January 22, 2015, therefore the range of fund holdings is not yet available.
(g) On June 1, 2015, Jeffrey Rottinghaus will replace Thomas J. Huber as the fund’s portfolio manager.
(h) The fund incepted on July 24, 2014, therefore the range of fund holdings is not yet available.
(i) On January 1, 2015, Wenli Zheng replaced Ernest C. Yeung as the fund’s portfolio manager, therefore the range of fund holdings is not yet available.
(j) On April 1, 2015, Richard N. Clattenburg replaced Robert W. Smith as the fund’s portfolio manager. The range of fund holdings is as of March 31, 2015.
(k) On January 22, 2015, Michael F. Reinartz joined Edward J. Wiese as co-portfolio manager of the fund. The range of fund holdings is as of January 31,2015.
(l) The fund has not incepted, therefore the range of fund holdings is not yet available.
The following funds may be purchased only by institutional investors.
Fund | Portfolio Manager | Range of Fund Holdings as of Fund’s Fiscal Yeara | All Funds |
Institutional Africa & Middle East | Oliver D.M. Bell | None | None |
Institutional Core Plus | Brian J. Brennan | None | over $1,000,000 |
Institutional Credit Opportunities | Paul A. Karpers | None | over $1,000,000 |
Institutional Emerging Markets Bond | Michael J. Conelius | $100,001–$500,000 | over $1,000,000 |
Institutional Emerging Markets Equity | Gonzalo Pangaro | None | over $1,000,000 |
Institutional Floating Rate | Paul M. Massaro | $10,001–$50,000 | over $1,000,000 |
Institutional Frontier Markets Equity | Oliver D.M. Bell | None | None |
Institutional Global Focused Growth Equity | David J. Eiswert | $500,001–$1,000,000 | over $1,000,000 |
Institutional Global Growth Equity | R. Scott Berg | $500,001–$1,000,000 | over $1,000,000 |
Institutional Global Multi-Sector Bond | Steven C. Huber | None | $500,001–$1,000,000 |
Institutional Global Value Equity | Sebastien Mallet | None | None |
Institutional High Yield | Paul A. Karpers | None | over $1,000,000 |
Institutional International Bond | Arif Husain Christopher J. Rothery | None None | None $100,001–$500,000 |
Institutional International Concentrated Equity | Federico Santilli | None | None |
Institutional International Core Equity | Raymond A. Mills | None | over $1,000,000 |
Institutional International Growth Equity | Richard N. Clattenburg | None (b) | $500,001–$1,000,000 |
Institutional Large Cap Core Growth | Larry J. Puglia | None | over $1,000,000 |
Institutional Large-Cap Growth | Robert W. Sharps | over $1,000,000 | over $1,000,000 |
Institutional Large-Cap Value | Mark S. Finn John D. Linehan Heather K. McPherson Brian C. Rogers (c) | None None None | over $1,000,000 over $1,000,000 $500,001–$1,000,000 over $1,000,000 |
Institutional Long Duration Credit | David A. Tiberii | None | over $1,000,000 |
Institutional Mid-Cap Equity Growth | Brian W.H. Berghuis | over $1,000,000 | over $1,000,000 |
Institutional Small-Cap Stock | Gregory A. McCrickard | over $1,000,000 | over $1,000,000 |
Institutional U.S. Structured Research | Ann M. Holcomb Jason B. Polun Eric L. Veiel | None None None | over $1,000,000 over $1,000,000 $50,001–$100,000 |
(a) See table beginning on page 7 for the fiscal year of the funds. The range of fund holdings as of the fund’s fiscal year is updated concurrently with each fund’s prospectus date as shown in the table beginning on page 7.
(b) On April 1, 2015, Richard N. Clattenburg replaced Robert W. Smith as the fund’s portfolio manager. The range of fund holdings is as of March 31, 2015.
(c) On October 31, 2015, Brian C. Rogers will step down as co-portfolio manager of the fund. Mark S. Finn, John D. Linehan, and Heather K. McPherson will continue to serve as co-portfolio managers of the fund.
87
The following funds are designed for persons residing in the indicated state. The portfolio managers reside in Maryland.
Fund | Portfolio Manager | Range
of Fund Holdings | All Funds |
California Tax-Free Bond | Konstantine B. Mallas | None | over $1,000,000 |
California Tax-Free Money | Joseph K. Lynagh | None | over $1,000,000 |
Georgia Tax-Free Bond | Hugh D. McGuirk | None | over $1,000,000 |
New Jersey Tax-Free Bond | Konstantine B. Mallas | None | over $1,000,000 |
New York Tax-Free Bond | Konstantine B. Mallas | None | over $1,000,000 |
New York Tax-Free Money | Joseph K. Lynagh | None | over $1,000,000 |
Virginia Tax-Free Bond | Hugh D. McGuirk | None | over $1,000,000 |
(a) See table beginning on page 7 for the fiscal year of the funds. The range of fund holdings as of the fund’s fiscal year is updated concurrently with each fund’s prospectus date as shown in the table beginning on page 7.
The following funds are designed such that a single individual would normally select one fund based on that person’s expected retirement date.
Fund | Portfolio Manager | Range of Fund Holdings | All Funds |
Retirement 2005 | Jerome A. Clark | None | $50,001–$100,000 |
Retirement 2010 | Jerome A. Clark | None | $50,001–$100,000 |
Retirement 2015 | Jerome A. Clark | None | $50,001–$100,000 |
Retirement 2020 | Jerome A. Clark | None | $50,001–$100,000 |
Retirement 2025 | Jerome A. Clark | None | $50,001–$100,000 |
Retirement 2030 | Jerome A. Clark | None | $50,001–$100,000 |
Retirement 2035 | Jerome A. Clark | None | $50,001–$100,000 |
Retirement 2040 (b) | Jerome A. Clark | None | $50,001–$100,000 |
Retirement 2045 (b) | Jerome A. Clark | None | $50,001–$100,000 |
Retirement 2050 | Jerome A. Clark | None | $50,001–$100,000 |
Retirement 2055 | Jerome A. Clark | None | $50,001–$100,000 |
Retirement 2060 | Jerome A. Clark | (c) | $50,001–$100,000 |
Retirement Balanced | Jerome A. Clark | None | $50,001–$100,000 |
Target Retirement 2005 | Jerome A. Clark Wyatt A. Lee | None None | $50,001–$100,000 over $1,000,000 |
Target Retirement 2010 | Jerome A. Clark Wyatt A. Lee | None None | $50,001–$100,000 over $1,000,000 |
Target Retirement 2015 | Jerome A. Clark Wyatt A. Lee | None None | $50,001–$100,000 over $1,000,000 |
Target Retirement 2020 | Jerome A. Clark Wyatt A. Lee | None None | $50,001–$100,000 over $1,000,000 |
Target Retirement 2025 | Jerome A. Clark Wyatt A. Lee | None None | $50,001–$100,000 over $1,000,000 |
Target Retirement 2030 | Jerome A. Clark Wyatt A. Lee | None None | $50,001–$100,000 over $1,000,000 |
Target Retirement 2035 | Jerome A. Clark Wyatt A. Lee | None None | $50,001–$100,000 over $1,000,000 |
Target Retirement 2040 | Jerome A. Clark Wyatt A. Lee | None None | $50,001–$100,000 over $1,000,000 |
Target Retirement 2045 | Jerome A. Clark Wyatt A. Lee | None None | $50,001–$100,000 over $1,000,000 |
Target Retirement 2050 | Jerome A. Clark Wyatt A. Lee | None None | $50,001–$100,000 over $1,000,000 |
88
Fund | Portfolio Manager | Range of Fund Holdings | All Funds |
Target Retirement 2055 | Jerome A. Clark Wyatt A. Lee | None None | $50,001–$100,000 over $1,000,000 |
Target Retirement 2060 | Jerome A. Clark Wyatt A. Lee | (c) (c) | $50,001–$100,000 over $1,000,000 |
(a) See table beginning on page 7 for the fiscal year of the funds. The range of fund holdings as of the fund’s fiscal year is updated concurrently with each fund’s prospectus date as shown in the table beginning on page 7.
(b) The portfolio manager invests in a similarly managed T. Rowe Price common trust fund within the T. Rowe Price 401(k) plan.
(c) The fund incepted on June 23, 2014, therefore the range of fund holdings is not yet available.
The following funds are not available for direct purchase by members of the public.
Fund | Portfolio Manager | Range of Fund Holdings | All Funds |
Emerging Markets Corporate Multi-Sector Account Portfolio | Michael J. Conelius(b) | None | over $1,000,000 |
Emerging Markets Local Multi-Sector Account Portfolio | Andrew Keirle | None | $10,001–$50,000 |
Floating Rate Multi-Sector Account Portfolio | Paul M. Massaro | None | over $1,000,000 |
TRP Government Reserve Investment | Joseph K. Lynagh | None | over $1,000,000 |
High Yield Multi-Sector Account Portfolio | Mark J. Vaselkiv | None | over $1,000,000 |
Inflation Focused Bond | Daniel O. Shackelford | None | over $1,000,000 |
Investment-Grade Corporate Multi-Sector Account Portfolio | David A. Tiberii | None | over $1,000,000 |
Mortgage-Backed Securities Multi-Sector Account Portfolio | Andrew C. McCormick | None | over $1,000,000 |
TRP Reserve Investment | Joseph K. Lynagh | None | over $1,000,000 |
Short-Term Government Reserve Fund | Joseph K. Lynagh | (c) | over $1,000,000 |
Short-Term Reserve Fund | Joseph K. Lynagh | None | over $1,000,000 |
(a) See table beginning on page 7 for the fiscal year of the funds. The range of fund holdings as of the fund’s fiscal year is updated concurrently with each fund’s prospectus date as shown in the table beginning on page 7.
(b) On October 1, 2015, Samy B. Muddi will replace Michael J. Conelius as the fund’s portfolio manager.
(c) The fund has not incepted, therefore the range of fund holdings is not yet available.
Portfolio Manager Compensation
Portfolio manager compensation consists primarily of a base salary, a cash bonus, and an equity incentive that usually comes in the form of a stock option grant or restricted stock grant. Compensation is variable and is determined based on the following factors.
Investment performance over 1-, 3-, 5-, and 10-year periods is the most important input. The weightings for these time periods are generally balanced and are applied consistently across similar strategies. T. Rowe Price (and Price Hong Kong, Price Singapore, and T. Rowe Price International, as appropriate), evaluate performance in absolute, relative, and risk-adjusted terms. Relative performance and risk-adjusted performance are typically determined with reference to the broad-based index (e.g., S&P 500) and the Lipper index (e.g., Large-Cap Growth) set forth in the total returns table in the fund’s prospectus, although other benchmarks may be used as well. Investment results are also measured against comparably managed funds of competitive investment management firms. The selection of comparable funds is approved by the applicable investment steering committee (as described under the “Disclosure of Fund Portfolio Information” section)
89
and is the same as the selection presented to the directors of the Price Funds in their regular review of fund performance. Performance is primarily measured on a pretax basis though tax efficiency is considered and is especially important for the Tax-Efficient Equity Fund.
Compensation is viewed with a long-term time horizon. The more consistent a manager’s performance over time, the higher the compensation opportunity. The increase or decrease in a fund’s assets due to the purchase or sale of fund shares is not considered a material factor. In reviewing relative performance for fixed-income funds, a fund’s expense ratio is usually taken into account. Contribution to T. Rowe Price’s overall investment process is an important consideration as well. Leveraging ideas and investment insights across the global investment platform, working effectively with and mentoring others, and other contributions to our clients, the firm or our culture are important components of T. Rowe Price’s long-term success and are highly valued.
All employees of T. Rowe Price, including portfolio managers, participate in a 401(k) plan sponsored by T. Rowe Price Group. In addition, all employees are eligible to purchase T. Rowe Price common stock through an employee stock purchase plan that features a limited corporate matching contribution. Eligibility for and participation in these plans is on the same basis for all employees. Finally, all vice presidents of T. Rowe Price Group, including all portfolio managers, receive supplemental medical/hospital reimbursement benefits.
This compensation structure is used for all portfolios managed by the portfolio manager.
Assets Under Management
The following table sets forth the number and total assets of the mutual funds and accounts managed by the Price Funds’ portfolio managers as of the most recent fiscal year end of the funds they manage, unless otherwise indicated. All of the assets of the funds that have multiple portfolio managers are shown as being allocated to all managers of those funds. There are no accounts for which the advisory fee is based on the performance of the account.
Registered Investment | Other
Pooled Investment | Other Accounts | ||||
Portfolio Manager | Number | Total Assets | Number | Total Assets | Number | Total Assets |
Ulle Adamson (a) | — | — | — | — | — | — |
Kennard Allen | 4 | 4,794,567,029 | 0 | — | 0 | — |
E. Frederick Bair | 5 | 26,506,273,708 | 2 | 4,785,735,535 | 0 | — |
Peter J. Bates | 1 | 16,604,259 | 0 | — | 0 | — |
Oliver D.M. Bell | 2 | 420,021,410 | 2 | 20,449,681 | — | — |
R. Scott Berg | 2 | 365,129,476 | 7 | 1,962,444,404 | 5 | 1,761,913,379 |
Brian W.H. Berghuis | 8 | 37,980,142,766 | 1 | 540,731,528 | 7 | 1,417,736,470 |
Brian J. Brennan | 4 | 1,159,101,403 | 3 | 1,580,574,492 | 18 | 3,025,841,913 |
Archibald Ciganer | 1 | 265,675,529 | 6 | 377,890,055 | 2 | 94,101,689 |
Jerome A. Clark | 65 | 123,734,287,849 | 26 | 21,226,627,937 | 5 | 3,320,900,040 |
Richard N. Clattenburg (a) | 4 | 14,736,676,796 | 1 | 1,257,306,661 | 1 | 259,571,848 |
Michael J. Conelius | 8 | 5,330,420,915 | 6 | 3,037,970,152 | 1 | 376,371,275 |
Michael Della Vedova | 1 | 72,018,241 | 0 | — | 0 | — |
Shawn T. Driscoll | 2 | 4,190,733,939 | 1 | 299,164,509 | 4 | 369,575,532 |
Donald J. Easley | 0 | — | 0 | — | 2 | 51,681,135 |
David J. Eiswert | 4 | 691,024,647 | 4 | 1,291,695,538 | 4 | 1,836,166,328 |
Henry M. Ellenbogen | 1 | 15,356,292,536 | 1 | 1,738,828,888 | 8 | 1,718,583,639 |
Joseph B. Fath | 11 | 55,063,571,253 | 1 | 3,728,240,374 | 8 | 1,633,605,738 |
Mark S. Finn | 7 | 33,773,327,344 | 3 | 3,747,574,534 | 26 | 4,835,446,061 |
David R. Giroux | 7 | 35,276,33,277 | 1 | 220,950,593 | 0 | — |
Paul D. Greene II | 2 | 3,447,680,710 | 0 | — | 0 | — |
Charles B. Hill | 3 | 6,276,370,166 | 2 | 329,632,520 | 5 | 1,333,042,807 |
90
Registered Investment | Other Pooled Investment | Other Accounts | ||||
Portfolio Manager | Number | Total Assets | Number | Total Assets | Number | Total Assets |
Ann M. Holcomb | 8 | 9,944,942,664 | 2 | 3,756,400,249 | 35 | 13,290,681,295 |
Steven C. Huber | 2 | 341,418,293 | — | — | 2 | 235,038,908 |
Thomas J. Huber | 3 | 7,250,298,946 | 1 | 157,207,358 | 1 | 101,687,553 |
Arif Husain | 4 | 4,936,382,656 | 8 | 388,056,137 | 1 | 82,305,593 |
Nina P. Jones (a) | — | — | — | — | — | — |
Paul A. Karpers | 5 | 3,672,958,553 | 3 | 1,997,417,726 | 6 | 1,590,300,378 |
Andrew Keirle | 3 | 218,337,983 | 1 | 12,476,818 | 0 | — |
Robert M. Larkins | 1 | 616,195,460 | 2 | 1,342,749,372 | 10 | 1,266,712,317 |
David M. Lee | 3 | 5,438,793,371 | 0 | — | 1 | 208,338,786 |
Wyatt A. Lee | 1 | 4,325,338,682 | 1 | 472,138,427 | 2 | 211,142,586 |
John D. Linehan | 4 | 7,734,738,526 | 2 | 1,049,789,057 | 25 | 4,605,043,249 |
Anh Lu | 1 | 3,966,681,114 | 2 | 1,224,765,731 | 3 | 594,193,379 |
Joseph K. Lynagh | 13 | 39,016,214,611 | 3 | 863,837,287 | 7 | 91,384,807 |
Konstantine B. Mallas | 5 | 4,901,368,234 | — | — | 4 | 84,026,019 |
Sebastien Mallet | 2 | 11,990,067 | — | — | — | — |
Daniel N. Martino | 3 | 4,482,470,069 | 0 | — | 0 | — |
Paul M. Massaro | 3 | 4,140,634,300 | — | — | 4 | 1,382,855,732 |
Jonathan H.W. Matthews | 1 | 10,227,102,521 | 1 | 1,067,053,755 | — | — |
Andrew C. McCormick | 4 | 1,816,490,405 | — | — | 2 | 16,547,369 |
Gregory A. McCrickard | 4 | 11,994,143,843 | 2 | 807,268,116 | 3 | 571,003,502 |
Hugh D. McGuirk | 3 | 3,018,266,447 | — | — | 10 | 518,748,807 |
Heather K. McPherson (b) | — | — | — | — | — | — |
Raymond A. Mills | 5 | 11,017,670,855 | 1 | 1,254,452,179 | 4 | 1,421,191,422 |
Eric C. Moffett | — | — | 1 | 2,085,136 | — | — |
James M. Murphy | 1 | 2,652,539,770 | — | — | — | — |
Sudhir Nanda | 3 | 2,916,108,623 | 0 | — | 0 | — |
Gonzalo Pangaro | 1 | 7,591,715,105 | 6 | 4,921,959,365 | 6 | 1,834,366,940 |
Donald J. Peters | 5 | 2,014,432,094 | 0 | — | 16 | 1,913,594,574 |
Jason B. Polun | 8 | 9,944,942,664 | 2 | 3,756,400,249 | 35 | 13,290,681,295 |
Larry J. Puglia | 10 | 37,313,954,188 | 1 | 229,562,995 | 20 | 8,406,405,483 |
Michael F. Reinartz (c) | 8 | 11,629,753,517 | 1 | 3,391,248,980 | 19 | 4,435,706,815 |
Brian C. Rogers | 13 | 42,402,196,686 | 1 | 1,840,395,475 | 9 | 1,861,647,816 |
Christopher J. Rothery | 1 | 3,404,785 | 1 | 0 | 1 | 0 |
Jeffrey Rottinghaus | 1 | 101,950,386 | 1 | 4,897,481 | 0 | — |
Federico Santilli | 1 | 183,831,543 | 0 | — | 0 | — |
Daniel O. Shackelford | 6 | 23,827,415,889 | 4 | 3,405,041,607 | 16 | 2,800,958,591 |
Robert W. Sharps | 7 | 17,234,000,605 | 2 | 2,192,694,853 | 54 | 14,015,206,450 |
Charles M. Shriver | 20 | 25,838,694,844 | 5 | 1,994,266,021 | 9 | 690,143,105 |
Neil Smith | 1 | 493,362,500 | 1 | 414,648,441 | — | — |
Robert W. Smith | 4 | 13,357,927,018 | 1 | 996,805,088 | 1 | 246,043,403 |
Gabriel Solomon | 1 | 521,665,843 | 0 | — | 0 | — |
Joshua K. Spencer | 2 | 1,836,292,143 | 2 | 711,684,957 | 0 | — |
Taymour R. Tamaddon | 6 | 14,557,052,009 | 0 | — | 1 | 224,012,558 |
Dean Tenerelli | 1 | 1,426,158,450 | 4 | 836,863,069 | 1 | 72,007,962 |
Justin Thomson | 1 | 3,563,079,211 | 2 | 371,388,626 | 2 | 115,384,220 |
91
Registered Investment | Other Pooled Investment | Other Accounts | ||||
Portfolio Manager | Number | Total Assets | Number | Total Assets | Number | Total Assets |
David A. Tiberii | 6 | 1,558,323,509 | 2 | 129,070,412 | 9 | 3,341,749,152 |
Ken D. Uematsu | 5 | 26,506,273,708 | 2 | 4,785,735,535 | 0, | — |
Mark J. Vaselkiv | 4 | 9,791,353,252 | 3 | 1,004,101,855 | 7 | 2,115,606,319 |
Eric L. Veiel | 8 | 9,944,942,664 | 2 | 3,756,400,249 | 35 | 13,290,681,553 |
Verena E. Wachnitz | 1 | 751,532,402 | 3 | 163,537,668 | — | — |
J. David Wagner | 8 | 11,407,724,886 | 1 | 813,136,925 | 4 | 251,542,762 |
David J. Wallack | 3 | 14,108,544,920 | 1 | 877,487,175 | 2 | 196,377,303 |
Edward A. Wiese | 7 | 11,557,898,297 | 1 | 3,372,020,185 | 20 | 4,466,453,932 |
Wenli Zheng (d) | — | — | — | — | — | — |
(a) The individual assumed portfolio management responsibilities of a mutual fund on April 1, 2015. The information on accounts managed is as of March 31, 2015.
(b) The individual assumed co-portfolio management responsibilities of a mutual fund on January 1, 2015. The information on other managed accounts is not yet available.
(c) The individual assumed co-portfolio management responsibilities of a mutual fund on January 22, 2015. The information on accounts managed is as of January 31, 2015.
(d) The individual assumed portfolio management responsibilities of a mutual fund on January 1, 2015. The information on accounts managed is not yet available.
Conflicts of Interest
Portfolio managers at T. Rowe Price and its affiliates typically manage multiple accounts. These accounts may include, among others, mutual funds, separate accounts (assets managed on behalf of institutions such as pension funds, colleges and universities, and foundations), offshore funds and common trust funds. Portfolio managers make investment decisions for each portfolio based on the investment objectives, policies, practices, and other relevant investment considerations that the managers believe are applicable to that portfolio. Consequently, portfolio managers may purchase (or sell) securities for one portfolio and not another portfolio. T. Rowe Price and its affiliates have adopted brokerage and trade allocation policies and procedures which they believe are reasonably designed to address any potential conflicts associated with managing multiple accounts for multiple clients. Also, as disclosed under the “Portfolio Manager Compensation” section, the portfolio managers’ compensation is determined in the same manner with respect to all portfolios managed by the portfolio manager. Please see the “Portfolio Transactions” section of this SAI for more information on our brokerage and trade allocation policies.
T. Rowe Price funds may, from time to time, own shares of Morningstar, Inc. Morningstar is a provider of investment research to individual and institutional investors, and publishes ratings on mutual funds, including the Price Funds. T. Rowe Price manages the Morningstar retirement plan and T. Rowe Price and its affiliates pay Morningstar for a variety of products and services. In addition, Morningstar may provide investment consulting and investment management services to clients of T. Rowe Price or its affiliates.
As of the date indicated, the directors and executive officers of the funds, as a group, owned less than 1% of the outstanding shares of any fund (or class), except as shown in the following table.
Fund | %* |
Asia Opportunities | 3.4 |
Credit Opportunities Fund | 1.6 |
Floating Rate | 1.2 |
92
Fund | %* |
Global Allocation | 1.4 |
Global Growth Stock | 2.8 |
Global Industrials | 4.9 |
Institutional Global Focused Growth Equity | 1.2 |
Maryland Short-Term Tax-Free Bond | 3.0 |
Summit Cash Reserves | 2.0 |
Tax-Efficient Equity | 5.7 |
U.S. Large-Cap Core | 2.6 |
* Based on December 31, 2014 data for the directors and March 31, 2015 data for the executive officers.
As of March 31, 2015, the following shareholders of record owned more than 5% of the outstanding shares of the indicated funds and/or classes.
FUND |
| SHAREHOLDER |
| % |
AFRICA & MIDDLE EAST FUND |
| CHARLES SCHWAB & CO INC |
| 5.09 |
| REINVEST ACCOUNT |
| ||
| ATTN MUTUAL FUND DEPT |
| ||
| 211 MAIN STREET |
| ||
| SAN FRANCISCO CA 94105-1905 |
| ||
|
| |||
| MLPF&S FOR THE SOLE BENEFIT OF | 6.23 | ||
| ITS CUSTOMERS |
| ||
| 4800 DEERLAKE DR E 3RD FL |
| ||
| JACKSONVILLE FL 32246-6484 |
| ||
|
| |||
| NATIONAL FINANCIAL SERVICES | 8.35 | ||
| FOR THE EXCLUSIVE BENEFIT |
| ||
| OF OUR CUSTOMERS |
| ||
| 499 WASHINGTON BLVD FL 5 |
| ||
| JERSEY CITY NJ 07310-2010 |
| ||
ASIA OPPORTUNITIES FUND |
| T ROWE PRICE ASSOCIATES |
| 28.66(a) |
| ATTN FINANCIAL REPORTING DEPT |
| ||
| 100 EAST PRATT ST |
| ||
| BALTIMORE MD 21202-1009 |
| ||
ASIA OPPORTUNITIES FUND—ADVISOR CLASS |
| T ROWE PRICE ASSOCIATES |
| 98.11(a) |
| ATTN FINANCIAL REPORTING DEPT |
| ||
BALANCED FUND |
| T ROWE PRICE TRUST CO INC |
| 36.65(b) |
| ATTN: TRPS INST CONTROL DEPT |
| ||
FUND |
| SHAREHOLDER |
| % |
BLUE CHIP GROWTH FUND |
| CHARLES SCHWAB & CO INC |
| 6.06 |
| REINVEST ACCOUNT |
| ||
| ATTN MUTUAL FUND DEPT |
| ||
|
| |||
| EDWARD D JONES & CO | 7.99 | ||
| SHAREHOLDER ACCOUNTING |
| ||
| ATTN MUTUAL FUND |
| ||
| 12555 MANCHESTER RD |
| ||
| SAINT LOUIS MO 63131-3729 |
|
93
|
| |||
| FIRST CLEARING LLC | 5.67 | ||
| SPECIAL CUSTODY ACCT FOR THE |
| ||
| EXCLUSIVE BENEFIT OF CUSTOMERS |
| ||
| 2801 MARKET ST |
| ||
| SAINT LOUIS MO 63103-2523 |
| ||
|
| |||
| NATIONAL FINANCIAL SERVICES | 13.46 | ||
| FOR THE EXCLUSIVE BENEFIT |
| ||
| OF OUR CUSTOMERS |
| ||
|
| |||
| T ROWE PRICE RET PLAN SVCS TR | 7.89 | ||
| BLUE CHIP GROWTH FUND |
| ||
| ATTN ASSET RECONCILATIONS |
| ||
| PO BOX 17215 |
| ||
| BALTIMORE MD 21297-1215 |
| ||
BLUE CHIP GROWTH FUND—ADVISOR CLASS |
| CHARLES SCHWAB & CO INC |
| 13.01 |
| REINVEST ACCOUNT |
| ||
| ATTN MUTUAL FUND DEPT |
| ||
|
| |||
| GREAT-WEST TRUST CO. | 5.11 | ||
| FBO EMPLOYEE BENEFITS CLIENTS |
| ||
| ATTN MUTUAL FUND TRADING 2T2 |
| ||
| 8515 E ORCHARD RD |
| ||
| ENGLEWOOD CO 80111-5002 |
| ||
|
| |||
| JP MORGAN CLEARING CORP OMNIBUS ACC | 9.55 | ||
| FOR THE EXCLUSIVE BENEFIT |
| ||
| OF CUSTOMERS |
| ||
| 3 CHASE METROTECH CENTER |
| ||
| 3RD FLOOR MUTUAL FUND DEPARTMENT |
| ||
| BROOKLYN NY 11245-0001 |
| ||
|
| |||
| NATIONAL FINANCIAL SERVICES | 14.12 | ||
| FOR THE EXCLUSIVE BENEFIT |
| ||
| OF OUR CUSTOMERS |
| ||
FUND |
| SHAREHOLDER |
| % |
BLUE CHIP GROWTH FUND—R CLASS |
| AMERICAN UNITED LIFE |
| 5.67 |
| SEPARATE ACCOUNT II |
| ||
| ATTN SEPARATE ACCOUNTS |
| ||
| PO BOX 368 |
| ||
| INDIANAPOLIS IN 46206-0368 |
| ||
|
| |||
| DCGT AS TTEE AND/OR CUST | 6.51 | ||
| ATTN NPIO TRADE DESK |
| ||
| FBO PLIC VARIOUS RETIREMENT PLANS |
| ||
| OMNIBUS |
| ||
| 711 HIGH ST |
| ||
| DES MOINES IA 50392-0001 |
| ||
|
|
94
| NATIONWIDE LIFE INSURANCE COMPANY | 6.03 | ||
| C/O IPO PORTFOLIO ACCOUNTING |
| ||
| NACO |
| ||
| PO BOX 182029 |
| ||
| COLUMBUS OH 43218-2029 |
| ||
|
| |||
| NFS LLC FEBO | 8.19 | ||
| STATE STREET BANK TRUST CO |
| ||
| TTEE VARIOUS RETIREMENT PLANS |
| ||
| 440 MAMARONECK AVE |
| ||
| HARRISON NY 10528-2418 |
| ||
|
| |||
| STATE STREET CORP TTEE | 19.42 | ||
| FBO ADP ACCESS |
| ||
| 1 LINCOLN ST |
| ||
| BOSTON MA 02111-2901 |
| ||
CALIFORNIA TAX-FREE BOND FUND |
| CHARLES SCHWAB & CO INC |
| 7.98 |
| REINVEST ACCOUNT |
| ||
| ATTN MUTUAL FUND DEPT |
| ||
|
| |||
| NATIONAL FINANCIAL SERVICES | 13.59 | ||
| FOR THE EXCLUSIVE BENEFIT |
| ||
| OF OUR CUSTOMERS |
| ||
CALIFORNIA TAX-FREE MONEY FUND |
| GEORGETTE O'CONNOR DAY TR |
| 12.33 |
| GEORGETTE O'CONNOR DAY TRUST |
| ||
| LOS ANGELES CA 90049-2827 |
| ||
FUND |
| SHAREHOLDER |
| % |
CAPITAL APPRECIATION FUND |
| CHARLES SCHWAB & CO INC |
| 10.46 |
| REINVEST ACCOUNT |
| ||
| ATTN MUTUAL FUND DEPT |
| ||
|
| |||
| NATIONAL FINANCIAL SERVICES | 10.87 | ||
| FOR THE EXCLUSIVE BENEFIT |
| ||
| OF OUR CUSTOMERS |
| ||
|
| |||
| PERSHING LLC | 6.68 | ||
| 1 PERSHING PLZ |
| ||
| JERSEY CITY NJ 07399-0002 |
| ||
CAPITAL APPRECIATION FUND—ADVISOR CLASS |
| AMERITAS LIFE INSURANCE CORP |
| 6.01 |
| SEPARATE ACCOUNT G |
| ||
| 5900 O STREET |
| ||
| LINCOLN NE 68510-2234 |
| ||
|
| |||
| CHARLES SCHWAB & CO INC | 28.92(c) | ||
| REINVEST ACCOUNT |
| ||
| ATTN MUTUAL FUND DEPT |
| ||
|
| |||
| NATIONAL FINANCIAL SERVICES | 22.72 | ||
| FOR THE EXCLUSIVE BENEFIT |
| ||
| OF OUR CUSTOMERS |
|
95
|
| |||
| PERSHING LLC | 5.39 | ||
CAPITAL OPPORTUNITY FUND |
| MCWOOD & CO |
| 39.83(c) |
| PO BOX 29522 |
| ||
| RALEIGH NC 27626-0522 |
| ||
|
| |||
| NATIONAL FINANCIAL SERVICES | 9.23 | ||
| FOR THE EXCLUSIVE BENEFIT |
| ||
| OF OUR CUSTOMERS |
| ||
CAPITAL OPPORTUNITY FUND—ADVISOR CLASS |
| CHARLES SCHWAB & CO INC |
| 40.07(c) |
| REINVEST ACCOUNT |
| ||
| ATTN MUTUAL FUND DEPT |
| ||
|
| |||
| RELIANCE TRUST COMPANY FBO | 33.05(c) | ||
| RETIREMENT PLANS SERVICED BY METLIFE |
| ||
FUND |
| SHAREHOLDER |
| % |
CAPITAL OPPORTUNITY FUND—R CLASS |
| CAPITAL BANK & TRUST COMPANY TTEE |
| 8.92 |
| JEFF WYLER AUTO FAMILY INC RSP 401K |
| ||
| 8515 E ORCHARD RD 2T2 |
| ||
| GREENWOOD VLG CO 80111-5002 |
| ||
|
| |||
| CAPITAL BANK & TRUST COMPANY TTEE | 9.16 | ||
| MACHINERY SYSTEMS INC EMPLOYEES PSP |
| ||
| 8515 E ORCHARD RD 2T2 |
| ||
| GREENWOOD VLG CO 80111-5002 |
| ||
|
| |||
| FIIOC AS AGENT | 42.69(c) | ||
| FBO SHEPHERD ELECTRIC CO., INC |
| ||
| 100 MAGELLAN WAY # KW1C |
| ||
| COVINGTON KY 41015-1987 |
| ||
|
| |||
| NATIONWIDE TRUST CO FSB | 10.18 | ||
| C/O IPO PORTFOLIO ACCTG |
| ||
| PO BOX 182029 |
| ||
| COLUMBUS OH 43218-2029 |
| ||
|
| |||
| NFS LLC FEBO | 7.46 | ||
| RELIANCE TRUST CO TTEE/CUST |
| ||
| FOR TRS FBO VARIOUS RET PLANS |
| ||
| 1150 S OLIVE ST |
| ||
| LOS ANGELES CA 90015-2211 |
| ||
CORPORATE INCOME FUND |
| SPECTRUM INCOME FUND |
| 46.93(d) |
| T. ROWE PRICE ASSOCIATES |
| ||
| ATTN: FUND ACCOUNTING DEPT |
| ||
| 100 EAST PRATT STREET |
| ||
| BALTIMORE MD 21202-1009 |
| ||
CREDIT OPPORTUNITIES FUND |
| T ROWE PRICE ASSOCIATES |
| 60.55(a) |
| ATTN FINANCIAL REPORTING DEPT |
| ||
CREDIT OPPORTUNITIES FUND—ADVISOR CLASS |
| CHARLES SCHWAB & CO INC |
| 54.99(c) |
| REINVEST ACCOUNT |
|
96
| ATTN MUTUAL FUND DEPT |
| ||
|
| |||
| T ROWE PRICE ASSOCIATES | 45.01(a) | ||
| ATTN FINANCIAL REPORTING DEPT |
| ||
DIVERSIFIED MID-CAP GROWTH FUND |
| PERSHING LLC |
| 5.36 |
FUND |
| SHAREHOLDER |
| % |
DIVERSIFIED SMALL-CAP GROWTH FUND |
| MORGAN STANLEY SMITH BARNEY |
| 5.19 |
| HARBORSIDE FINANCIAL CENTER |
| ||
| PLAZA 2, 3RD FLOOR |
| ||
| JERSEY CITY NJ 07311 |
| ||
|
| |||
| PERSHING LLC | 10.23 | ||
|
| |||
| SEI PRIVATE TRUST COMPANY | 8.24 | ||
| C/O SUNTRUST BANK |
| ||
| ATTN MUTUAL FUNDS |
| ||
| 1 FREEDOM VALLEY DR |
| ||
| OAKS PA 19456-9989 |
| ||
DIVIDEND GROWTH FUND |
| EDWARD D JONES & CO |
| 11.87 |
| SHAREHOLDER ACCOUNTING |
| ||
| ATTN MUTUAL FUND |
| ||
|
| |||
| MLPF&S FOR THE SOLE BENEFIT OF | 10.62 | ||
| ITS CUSTOMERS |
| ||
|
| |||
| NATIONAL FINANCIAL SERVICES | 24.16 | ||
| FOR THE EXCLUSIVE BENEFIT |
| ||
| OF OUR CUSTOMERS |
| ||
DIVIDEND GROWTH FUND—ADVISOR CLASS |
| CHARLES SCHWAB & CO INC |
| 9.36 |
| REINVEST ACCOUNT |
| ||
| ATTN MUTUAL FUND DEPT |
| ||
|
| |||
| NATIONAL FINANCIAL SERVICES | 66.15(c) | ||
| FOR THE EXCLUSIVE BENEFIT |
| ||
| OF OUR CUSTOMERS |
| ||
EMERGING EUROPE FUND |
| NATIONAL FINANCIAL SERVICES |
| 7.31 |
| FOR THE EXCLUSIVE BENEFIT |
| ||
| OF OUR CUSTOMERS |
| ||
FUND |
| SHAREHOLDER |
| % |
EMERGING MARKETS BOND FUND |
| RETIREMENT PORTFOLIO 2010 |
| 5.45 |
| T ROWE PRICE ASSOCIATES |
| ||
| ATTN FUND ACCOUNTING DEPT |
| ||
| 100 E PRATT ST |
| ||
| BALTIMORE MD 21202-1009 |
| ||
|
| |||
| RETIREMENT PORTFOLIO 2015 | 7.87 | ||
| T ROWE PRICE ASSOCIATES |
| ||
| ATTN FUND ACCOUNTING DEPT |
| ||
| 100 E PRATT ST |
| ||
| BALTIMORE MD 21202-1009 |
|
97
|
| |||
| RETIREMENT PORTFOLIO 2020 | 16.18 | ||
| T ROWE PRICE ASSOCIATES |
| ||
| ATTN FUND ACCOUNTING DEPT |
| ||
| 100 E PRATT ST |
| ||
| BALTIMORE MD 21202-1009 |
| ||
|
| |||
| RETIREMENT PORTFOLIO 2025 | 9.60 | ||
| T ROWE PRICE ASSOCIATES |
| ||
| ATTN FUND ACCOUNTING DEPT |
| ||
| 100 E PRATT ST |
| ||
| BALTIMORE MD 21202-1009 |
| ||
|
| |||
| RETIREMENT PORTFOLIO 2030 | 10.40 | ||
| T ROWE PRICE ASSOCIATES |
| ||
| ATTN FUND ACCOUNTING DEPT |
| ||
| 100 E PRATT ST |
| ||
| BALTIMORE MD 21202-1009 |
| ||
|
| |||
| SPECTRUM INCOME FUND | 11.68 | ||
| T. ROWE PRICE ASSOCIATES |
| ||
| ATTN: FUND ACCOUNTING DEPT |
| ||
EMERGING MARKETS CORPORATE BOND FUND |
| MCWOOD & CO |
| 55.98(c) |
|
| |||
| PERSHING LLC | 5.09 | ||
|
| |||
| T ROWE PRICE ASSOCIATES | 18.06 | ||
| ATTN FINANCIAL REPORTING DEPT |
| ||
FUND |
| SHAREHOLDER |
| % |
EMERGING MARKETS CORPORATE BOND FUND—ADVISOR |
| CHARLES SCHWAB & CO INC |
| 9.39 |
CLASS | REINVEST ACCOUNT |
| ||
| ATTN MUTUAL FUND DEPT |
| ||
|
| |||
| NATIONAL FINANCIAL SERVICES | 13.23 | ||
| FOR THE EXCLUSIVE BENEFIT |
| ||
| OF OUR CUSTOMERS |
| ||
|
| |||
| PERSHING LLC | 22.78 | ||
|
| |||
| T ROWE PRICE ASSOCIATES | 31.03(a) | ||
| ATTN FINANCIAL REPORTING DEPT |
| ||
|
| |||
| TD AMERITRADE INC FBO | 14.77 | ||
| OUR CUSTOMERS |
| ||
| PO BOX 2226 |
| ||
| OMAHA NE 68103-2226 |
| ||
EMERGING MARKETS CORPORATE MULTI-SECTOR |
| CBE OF NEW BRUNSWICK |
| 44.46(c) |
ACCOUNT PORTFOLIO | EM BOND MAP |
| ||
| 440 KING ST STE 680 |
| ||
| FREDERICTON NB E3B 5H8 |
|
98
| CANADA |
| ||
|
| |||
| ILLINOIS STUDENT ASSISTANCE | 6.92 | ||
| COMMISSION |
| ||
| ATTN: KENT CUSTER |
| ||
| 1755 LAKE COOK RD |
| ||
| DEERFIELD IL 60015-5209 |
| ||
|
| |||
| ST PAUL TEACHERS RET FUND ASSOC | 11.88 | ||
| ATTN JILL E. SCHURTZ EXEC DIRECTOR |
| ||
| 1619 DAYTON AVE STE 309 |
| ||
| SAINT PAUL MN 55104-7640 |
| ||
|
| |||
| T ROWE PRICE ASSOCIATES | 33.65(a) | ||
| ATTN FINANCIAL REPORTING DEPT |
| ||
EMERGING MARKETS LOCAL CURRENCY BOND FUND |
| SPECTRUM INCOME FUND |
| 83.13(d) |
| T. ROWE PRICE ASSOCIATES |
| ||
| ATTN: FUND ACCOUNTING DEPT |
| ||
EMERGING MARKETS LOCAL CURRENCY BOND FUND— |
| CHARLES SCHWAB & CO INC |
| 40.03(c) |
ADVISOR CLASS | REINVEST ACCOUNT |
| ||
| ATTN MUTUAL FUND DEPT |
| ||
|
| |||
| T ROWE PRICE ASSOCIATES | 57.73(a) | ||
| ATTN FINANCIAL REPORTING DEPT |
| ||
FUND |
| SHAREHOLDER |
| % |
EMERGING MARKETS LOCAL MULTI-SECTOR ACCOUNT |
| CBE OF NEW BRUNSWICK |
| 54.12(c) |
PORTFOLIO | EM LOCAL MAP |
| ||
| 440 KING ST STE 680 |
| ||
| FREDERICTON NB E3B 5H8 |
| ||
| CANADA |
| ||
|
| |||
| ST PAUL TEACHERS RET FUND ASSOC | 23.24 | ||
| ATTN JILL E. SCHURTZ EXEC DIRECTOR |
| ||
|
| |||
| T ROWE PRICE ASSOCIATES | 20.30 | ||
| ATTN FINANCIAL REPORTING DEPT |
| ||
EMERGING MARKETS STOCK FUND |
| NATIONAL FINANCIAL SERVICES |
| 8.44 |
| FOR THE EXCLUSIVE BENEFIT |
| ||
| OF OUR CUSTOMERS |
| ||
|
| |||
| RETIREMENT PORTFOLIO 2020 | 9.94 | ||
| T ROWE PRICE ASSOCIATES |
| ||
| ATTN FUND ACCOUNTING DEPT |
| ||
|
| |||
| RETIREMENT PORTFOLIO 2025 | 7.86 | ||
| T ROWE PRICE ASSOCIATES |
| ||
| ATTN FUND ACCOUNTING DEPT |
| ||
|
| |||
| RETIREMENT PORTFOLIO 2030 | 11.76 | ||
| T ROWE PRICE ASSOCIATES |
|
99
| ATTN FUND ACCOUNTING DEPT |
| ||
|
| |||
| RETIREMENT PORTFOLIO 2035 | 6.77 | ||
| T ROWE PRICE ASSOCIATES |
| ||
| ATTN FUND ACCOUNTING DEPT |
| ||
| 100 E PRATT ST |
| ||
| BALTIMORE MD 21202-1009 |
| ||
|
| |||
| RETIREMENT PORTFOLIO 2040 | 9.24 | ||
| T ROWE PRICE ASSOCIATES |
| ||
| ATTN FUND ACCOUNTING DEPT |
| ||
| 100 E PRATT ST |
| ||
| BALTIMORE MD 21202-1009 |
| ||
FUND |
| SHAREHOLDER |
| % |
EQUITY INCOME FUND |
| EDWARD D JONES & CO |
| 7.30 |
| SHAREHOLDER ACCOUNTING |
| ||
| ATTN MUTUAL FUND |
| ||
|
| |||
| NATIONAL FINANCIAL SERVICES | 9.43 | ||
| FOR THE EXCLUSIVE BENEFIT |
| ||
| OF OUR CUSTOMERS |
| ||
|
| |||
| T ROWE PRICE TRUST CO INC | 10.48 | ||
| ATTN: TRPS INST CONTROL DEPT |
| ||
| P O BOX 17215 |
| ||
| BALTIMORE MD 21297-1215 |
| ||
EQUITY INCOME FUND—ADVISOR CLASS |
| CHARLES SCHWAB & CO INC |
| 6.65 |
| REINVEST ACCOUNT |
| ||
| ATTN MUTUAL FUND DEPT |
| ||
|
| |||
| NATIONAL FINANCIAL SERVICES | 42.63(c) | ||
| FOR THE EXCLUSIVE BENEFIT |
| ||
| OF OUR CUSTOMERS |
| ||
EQUITY INCOME FUND—R CLASS |
| AMERICAN UNITED LIFE |
| 5.83 |
| AMERICAN UNIT INVESTMENT TRUST |
| ||
| ATTN SEPARATE ACCOUNTS |
| ||
| PO BOX 368 |
| ||
| INDIANAPOLIS IN 46206-0368 |
| ||
|
| |||
| AMERICAN UNITED LIFE | 17.53 | ||
| SEPARATE ACCOUNT II |
| ||
| ATTN SEPARATE ACCOUNTS |
| ||
|
| |||
| DCGT AS TTEE AND/OR CUST | 10.84 | ||
| ATTN NPIO TRADE DESK |
| ||
| FBO PLIC VARIOUS RETIREMENT PLANS |
| ||
| OMNIBUS |
| ||
|
| |||
| HARTFORD LIFE INSURANCE CO | 9.71 | ||
| SEPARATE ACCOUNT |
|
100
| ATTN UIT OPERATIONS |
| ||
| PO BOX 2999 |
| ||
| HARTFORD CT 06104-2999 |
| ||
FUND |
| SHAREHOLDER |
| % |
EQUITY INDEX 500 FUND |
| RETIREMENT PORTFOLIO 2010 |
| 6.40 |
| T ROWE PRICE ASSOCIATES |
| ||
| ATTN FUND ACCOUNTING DEPT |
| ||
|
| |||
| RETIREMENT PORTFOLIO 2015 | 8.96 | ||
| T ROWE PRICE ASSOCIATES |
| ||
| ATTN FUND ACCOUNTING DEPT |
| ||
|
| |||
| RETIREMENT PORTFOLIO 2020 | 18.29 | ||
| T ROWE PRICE ASSOCIATES |
| ||
| ATTN FUND ACCOUNTING DEPT |
| ||
|
| |||
| RETIREMENT PORTFOLIO 2025 | 10.46 | ||
| T ROWE PRICE ASSOCIATES |
| ||
| ATTN FUND ACCOUNTING DEPT |
| ||
|
| |||
| RETIREMENT PORTFOLIO 2030 | 11.56 | ||
| T ROWE PRICE ASSOCIATES |
| ||
| ATTN FUND ACCOUNTING DEPT |
| ||
|
| |||
| RETIREMENT PORTFOLIO 2040 | 5.07 | ||
| T ROWE PRICE ASSOCIATES |
| ||
| ATTN FUND ACCOUNTING DEPT |
| ||
EUROPEAN STOCK FUND |
| CHARLES SCHWAB & CO INC |
| 13.29 |
| REINVEST ACCOUNT |
| ||
| ATTN MUTUAL FUND DEPT |
| ||
|
| |||
| NATIONAL FINANCIAL SERVICES | 7.03 | ||
| FOR THE EXCLUSIVE BENEFIT |
| ||
| OF OUR CUSTOMERS |
| ||
|
| |||
| PERSHING LLC | 5.92 | ||
|
| |||
| SPECTRUM INTERNATIONAL FUND | 16.11 | ||
| T ROWE PRICE ASSOCIATES |
| ||
| ATTN: FUND ACCOUNTING DEPT |
| ||
EXTENDED EQUITY MARKET INDEX FUND |
| T ROWE PRICE TRUST CO INC |
| 6.84 |
| ATTN: TRPS INST CONTROL DEPT |
| ||
|
| |||
| TD AMERITRADE INC FBO | 6.81 | ||
| OUR CUSTOMERS |
| ||
FINANCIAL SERVICES FUND |
| T ROWE PRICE SERVICES INC FBO |
| 5.47 |
| EDUCATION TRUST OF ALASKA |
| ||
| PORTFOLIO FUTURE TRENDS |
| ||
| ATTN DAWN WAGNER FIXED INCOME |
| ||
| 100 E PRATT ST 7TH FLOOR |
|
101
| BALTIMORE MD 21202-1009 |
| ||
FUND |
| SHAREHOLDER |
| % |
FLOATING RATE FUND |
| NATIONAL FINANCIAL SERVICES |
| 5.79 |
| FOR THE EXCLUSIVE BENEFIT |
| ||
| OF OUR CUSTOMERS |
| ||
|
| |||
| PERSHING LLC | 8.54 | ||
|
| |||
| SPECTRUM INCOME FUND | 34.71(d) | ||
| T. ROWE PRICE ASSOCIATES |
| ||
| ATTN: FUND ACCOUNTING DEPT |
| ||
|
| |||
| T ROWE PRICE ASSOCIATES | 5.24 | ||
| ATTN FINANCIAL REPORTING DEPT |
| ||
FLOATING RATE FUND—ADVISOR CLASS |
| CHARLES SCHWAB & CO INC |
| 18.20 |
| REINVEST ACCOUNT |
| ||
| ATTN MUTUAL FUND DEPT |
| ||
|
| |||
| JP MORGAN CLEARING CORP OMNIBUS ACC | 7.06 | ||
| FOR THE EXCLUSIVE BENEFIT |
| ||
| OF CUSTOMERS |
| ||
|
| |||
| MITRA & CO FBO 98 | 7.84 | ||
| C/O BMO HARRIS BANK NA ATTN: MF |
| ||
| 11270 W PARK PL STE 400 |
| ||
| MILWAUKEE WI 53224-3638 |
| ||
|
| |||
| NATIONAL FINANCIAL SERVICES | 31.34(c) | ||
| FOR THE EXCLUSIVE BENEFIT |
| ||
| OF OUR CUSTOMERS |
| ||
|
| |||
| PERSHING LLC | 27.42(c) | ||
FLOATING RATE MULTI-SECTOR ACCOUNT PORTFOLIO |
| CBE OF NEW BRUNSWICK |
| 44.71(c) |
| FLOATING RATE MAP |
| ||
| 440 KING ST STE 680 |
| ||
| FREDERICTON NB E3B 5H8 |
| ||
| CANADA |
| ||
|
| |||
| ILLINOIS STUDENT ASSISTANCE | 6.13 | ||
| COMMISSION |
| ||
| ATTN: KENT CUSTER |
| ||
|
| |||
| T ROWE PRICE ASSOCIATES | 46.40(a) | ||
| ATTN FINANCIAL REPORTING DEPT |
| ||
FUND |
| SHAREHOLDER |
| % |
GEORGIA TAX-FREE BOND FUND |
| CHARLES SCHWAB & CO INC |
| 16.18 |
| REINVEST ACCOUNT |
| ||
| ATTN MUTUAL FUND DEPT |
| ||
|
| |||
| NATIONAL FINANCIAL SERVICES | 18.95 |
102
| FOR THE EXCLUSIVE BENEFIT |
| ||
| OF OUR CUSTOMERS |
| ||
GLOBAL ALLOCATION FUND |
| MORGAN STANLEY SMITH BARNEY |
| 5.13 |
| HARBORSIDE FINANCIAL CENTER |
| ||
|
| |||
| PERSHING LLC | 5.74 | ||
|
| |||
| T ROWE PRICE ASSOCIATES | 29.47(a) | ||
| ATTN FINANCIAL REPORTING DEPT |
| ||
GLOBAL ALLOCATION FUND—ADVISOR CLASS |
| CHARLES SCHWAB & CO INC |
| 30.78(c) |
| REINVEST ACCOUNT |
| ||
| ATTN MUTUAL FUND DEPT |
| ||
|
| |||
| NATIONAL FINANCIAL SERVICES | 22.10 | ||
| FOR THE EXCLUSIVE BENEFIT |
| ||
| OF OUR CUSTOMERS |
| ||
|
| |||
| PERSHING LLC | 31.61(c) | ||
|
| |||
| T ROWE PRICE ASSOCIATES | 10.07 | ||
| ATTN FINANCIAL REPORTING DEPT |
| ||
GLOBAL GROWTH STOCK FUND |
| T ROWE PRICE ASSOCIATES |
| 9.40 |
| ATTN FINANCIAL REPORTING DEPT |
| ||
GLOBAL GROWTH STOCK FUND —ADVISOR CLASS |
| CHARLES SCHWAB & CO INC |
| 9.81 |
| REINVEST ACCOUNT |
| ||
| ATTN MUTUAL FUND DEPT |
| ||
|
| |||
| NATIONAL FINANCIAL SERVICES | 12.94 | ||
| FOR THE EXCLUSIVE BENEFIT |
| ||
| OF OUR CUSTOMERS |
| ||
|
| |||
| PERSHING LLC | 13.42 | ||
|
| |||
| STIFEL NICOLAUS & CO INC | 5.70 | ||
| GARY KLING |
| ||
| 501 N BROADWAY FL 8 |
| ||
| SAINT LOUIS MO 63102-2188 |
| ||
|
| |||
| T ROWE PRICE ASSOCIATES | 49.57(a) | ||
| ATTN FINANCIAL REPORTING DEPT |
| ||
GLOBAL HIGH INCOME BOND FUND |
| T ROWE PRICE ASSOCIATES |
| 75.34(a) |
| ATTN FINANCIAL REPORTING DEPT |
| ||
FUND |
| SHAREHOLDER |
| % |
GLOBAL HIGH INCOME BOND FUND—ADVISOR CLASS |
| CHARLES SCHWAB & CO INC |
| 82.10(c) |
| REINVEST ACCOUNT |
| ||
| ATTN MUTUAL FUND DEPT |
| ||
|
| |||
| T ROWE PRICE ASSOCIATES | 17.90 | ||
| ATTN FINANCIAL REPORTING DEPT |
| ||
GLOBAL INDUSTRIALS FUND |
| T ROWE PRICE ASSOCIATES |
| 41.89(a) |
103
| ATTN FINANCIAL REPORTING DEPT |
| ||
GLOBAL REAL ESTATE FUND |
| CHARLES SCHWAB & CO INC |
| 11.36 |
| REINVEST ACCOUNT |
| ||
| ATTN MUTUAL FUND DEPT |
| ||
|
| |||
| NATIONAL FINANCIAL SERVICES | 5.13 | ||
| FOR THE EXCLUSIVE BENEFIT |
| ||
| OF OUR CUSTOMERS |
| ||
|
| |||
| PERSHING LLC | 7.95 | ||
|
| |||
| T ROWE PRICE ASSOCIATES | 5.54 | ||
| ATTN FINANCIAL REPORTING DEPT |
| ||
|
| |||
| TD AMERITRADE INC FBO | 11.09 | ||
| OUR CUSTOMERS |
| ||
GLOBAL REAL ESTATE FUND—ADVISOR CLASS |
| CHARLES SCHWAB & CO INC |
| 42.97(c) |
| REINVEST ACCOUNT |
| ||
| ATTN MUTUAL FUND DEPT |
| ||
|
| |||
| GREAT-WEST TRUST CO. | 17.35 | ||
| EMPLOYEE BENEFITS CLIENTS 401K |
| ||
| 8515 E ORCHARD RD 2T2 |
| ||
| GREENWOOD VLG CO 80111-5002 |
| ||
|
| |||
| LINCOLN RETIREMENT SERVICES COMPANY | 5.94 | ||
| FBO OAKLAWN HOSPITAL 403(B) PLAN |
| ||
| PO BOX 7876 |
| ||
| FORT WAYNE IN 46801-7876 |
| ||
|
| |||
| NATIONAL FINANCIAL SERVICES | 13.88 | ||
| FOR THE EXCLUSIVE BENEFIT |
| ||
| OF OUR CUSTOMERS |
| ||
GLOBAL STOCK FUND |
| T ROWE PRICE RPS INC CO |
| 6.47 |
| OMNIBUS |
| ||
| PLAN #OMNI PLAN |
| ||
| INSTALL TEAM FOR #113 |
| ||
| PO BOX 17215 |
| ||
| BALTIMORE MD 21297-1215 |
| ||
FUND |
| SHAREHOLDER |
| % |
GLOBAL STOCK FUND—ADVISOR CLASS |
| FIIOC AS AGENT |
| 19.55 |
| FBO REDAPT SYSTEMS INC |
| ||
| 401K PSP |
| ||
| 100 MAGELLAN WAY # KW1C |
| ||
| COVINGTON KY 41015-1987 |
| ||
|
| |||
| LPL FINANCIAL | 6.59 | ||
| 9785 TOWNE CENTRE DR |
| ||
| SAN DIEGO CA 92121-1968 |
| ||
|
|
104
| NATIONAL FINANCIAL SERVICES | 43.98(c) | ||
| FOR THE EXCLUSIVE BENEFIT |
| ||
| OF OUR CUSTOMERS |
| ||
|
| |||
| PERSHING LLC | 6.69 | ||
GLOBAL TECHNOLOGY FUND |
| CHARLES SCHWAB & CO INC |
| 8.44 |
| REINVEST ACCOUNT |
| ||
| ATTN MUTUAL FUND DEPT |
| ||
|
| |||
| NATIONAL FINANCIAL SERVICES | 9.76 | ||
| FOR THE EXCLUSIVE BENEFIT |
| ||
| OF OUR CUSTOMERS |
| ||
|
| |||
| PERSHING LLC | 7.53 | ||
GLOBAL UNCONSTRAINED BOND FUND |
| T ROWE PRICE ASSOCIATES |
| 86.33(a) |
| ATTN FINANCIAL REPORTING DEPT |
| ||
GLOBAL UNCONSTRAINED BOND FUND—ADVISOR CLASS |
| T ROWE PRICE ASSOCIATES |
| 95.10(a) |
| ATTN FINANCIAL REPORTING DEPT |
| ||
GNMA FUND |
| SPECTRUM INCOME FUND |
| 38.21(d) |
| T. ROWE PRICE ASSOCIATES |
| ||
| ATTN: FUND ACCOUNTING DEPT |
| ||
FUND |
| SHAREHOLDER |
| % |
GOVERNMENT RESERVE INVESTMENT FUND |
| BARNACLESAIL |
| 59.63(d) |
| C/O T ROWE PRICE ASSOC |
| ||
| ATTN MID CAP GROWTH FUND |
| ||
| 100 EAST PRATT ST |
| ||
| BALTIMORE MD 21202-1009 |
| ||
|
| |||
| BRIDGESAIL & CO | 9.03 | ||
| C/O T ROWE PRICE ASSOC |
| ||
| ATTN SCIENCE & TECHNOLOGY FD |
| ||
| 100 EAST PRATT ST |
| ||
| BALTIMORE MD 21202-1009 |
| ||
|
| |||
| T ROWE PRICE | 9.28 | ||
| RETIREMENT PLAN SERVICE INC |
| ||
| ATTN RPS CASH GROUP |
| ||
| 4555 PAINTERS MILL ROAD |
| ||
| OWINGS MILLS MD 21117-4903 |
| ||
|
| |||
| WEATHERBOARD & CO | 6.66 | ||
| C/O T ROWE PRICE ASSOC |
| ||
| ATTN MID CAP EQUITY GROWTH FD |
| ||
| 100 EAST PRATT ST |
| ||
| BALTIMORE MD 21202-1009 |
| ||
GROWTH & INCOME FUND |
| T ROWE PRICE TRUST CO INC |
| 6.36 |
| ATTN: TRPS INST CONTROL DEPT |
| ||
FUND |
| SHAREHOLDER |
| % |
GROWTH STOCK FUND |
| CHARLES SCHWAB & CO INC |
| 6.12 |
| REINVEST ACCOUNT |
|
105
| ATTN MUTUAL FUND DEPT |
| ||
|
| |||
| NATIONAL FINANCIAL SERVICES | 6.49 | ||
| FOR THE EXCLUSIVE BENEFIT |
| ||
| OF OUR CUSTOMERS |
| ||
|
| |||
| RETIREMENT PORTFOLIO 2020 | 5.52 | ||
| T ROWE PRICE ASSOCIATES |
| ||
| ATTN FUND ACCOUNTING DEPT |
| ||
|
| |||
| RETIREMENT PORTFOLIO 2025 | 5.53 | ||
| T ROWE PRICE ASSOCIATES |
| ||
| ATTN FUND ACCOUNTING DEPT |
| ||
|
| |||
| RETIREMENT PORTFOLIO 2030 | 9.55 | ||
| T ROWE PRICE ASSOCIATES |
| ||
| ATTN FUND ACCOUNTING DEPT |
| ||
|
| |||
| RETIREMENT PORTFOLIO 2035 | 6.07 | ||
| T ROWE PRICE ASSOCIATES |
| ||
| ATTN FUND ACCOUNTING DEPT |
| ||
|
| |||
| RETIREMENT PORTFOLIO 2040 | 8.64 | ||
| T ROWE PRICE ASSOCIATES |
| ||
| ATTN FUND ACCOUNTING DEPT |
| ||
|
| |||
| T ROWE PRICE TRUST CO INC | 6.24 | ||
| ATTN: TRPS INST CONTROL DEPT |
| ||
GROWTH STOCK FUND—ADVISOR CLASS |
| ICMA RETIREMENT TRUST NAV |
| 6.42 |
| 777 N CAPITOL ST NE STE 600 |
| ||
| WASHINGTON DC 20002-4240 |
| ||
|
| |||
| NATIONAL FINANCIAL SERVICES | 32.55(c) | ||
| FOR THE EXCLUSIVE BENEFIT |
| ||
| OF OUR CUSTOMERS |
| ||
FUND |
| SHAREHOLDER |
| % |
GROWTH STOCK FUND—R CLASS |
| DCGT AS TTEE AND/OR CUST |
| 5.19 |
| ATTN NPIO TRADE DESK |
| ||
| FBO PLIC VARIOUS RETIREMENT PLANS |
| ||
| OMNIBUS |
| ||
|
| |||
| HARTFORD LIFE INSURANCE CO | 7.64 | ||
| SEPARATE ACCOUNT |
| ||
| ATTN UIT OPERATIONS |
| ||
|
| |||
| NATIONWIDE TRUST CO FSB | 5.38 | ||
| C/O IPO PORTFOLIO ACCTG |
| ||
|
| |||
| STATE STREET CORP TTEE | 16.11 | ||
| FBO ADP ACCESS |
|
106
|
| |||
| SUNTRUST BANK FBO | 8.54 | ||
| VARIOUS SUNTRUST OMNIBUS ACCOUNTS |
| ||
| 8515 E ORCHARD RD 2T2 |
| ||
| GREENWOOD VLG CO 80111-5002 |
| ||
HEALTH SCIENCES FUND |
| CHARLES SCHWAB & CO INC |
| 6.47 |
| REINVEST ACCOUNT |
| ||
| ATTN MUTUAL FUND DEPT |
| ||
|
| |||
| JOHN HANCOCK LIFE | 8.64 | ||
| INSURANCE CO USA |
| ||
| RPS TRADING OPS ST-4 |
| ||
| 601 CONGRESS STREET |
| ||
| BOSTON MA 02210-2804 |
| ||
|
| |||
| NATIONAL FINANCIAL SERVICES | 7.16 | ||
| FOR THE EXCLUSIVE BENEFIT |
| ||
| OF OUR CUSTOMERS |
| ||
|
| |||
| PERSHING LLC | 5.09 | ||
FUND |
| SHAREHOLDER |
| % |
HIGH YIELD FUND |
| EDWARD D JONES & CO |
| 8.56 |
| SHAREHOLDER ACCOUNTING |
| ||
| ATTN MUTUAL FUND |
| ||
|
| |||
| RETIREMENT PORTFOLIO 2020 | 9.32 | ||
| T ROWE PRICE ASSOCIATES |
| ||
| ATTN FUND ACCOUNTING DEPT |
| ||
|
| |||
| RETIREMENT PORTFOLIO 2025 | 5.35 | ||
| T ROWE PRICE ASSOCIATES |
| ||
| ATTN FUND ACCOUNTING DEPT |
| ||
|
| |||
| RETIREMENT PORTFOLIO 2030 | 5.80 | ||
| T ROWE PRICE ASSOCIATES |
| ||
| ATTN FUND ACCOUNTING DEPT |
| ||
|
| |||
| SPECTRUM INCOME FUND | 12.32 | ||
| T. ROWE PRICE ASSOCIATES |
| ||
| ATTN: FUND ACCOUNTING DEPT |
| ||
HIGH YIELD FUND—ADVISOR CLASS |
| NATIONAL FINANCIAL SERVICES |
| 94.68(c) |
| FOR THE EXCLUSIVE BENEFIT |
| ||
| OF OUR CUSTOMERS |
| ||
HIGH YIELD MULTI-SECTOR ACCOUNT PORTFOLIO |
| BALTIMORE EQUITABLE INSURANCE |
| 9.28 |
| ATTN SHARON V WOODWARD |
| ||
| 100 N CHARLES ST |
| ||
| BALTIMORE MD 21201-3808 |
| ||
|
| |||
| ILLINOIS STUDENT ASSISTANCE | 20.92 | ||
| COMMISSION |
|
107
| ATTN: KENT CUSTER |
| ||
|
| |||
| ST PAUL TEACHERS RET FUND ASSOC | 26.88(c) | ||
| ATTN JILL E. SCHURTZ EXEC DIRECTOR |
| ||
|
| |||
| T ROWE PRICE ASSOCIATES | 42.91(a) | ||
| ATTN FINANCIAL REPORTING DEPT |
| ||
FUND |
| SHAREHOLDER |
| % |
INFLATION FOCUSED BOND FUND |
| RETIREMENT INCOME PORTFOLIO |
| 15.65 |
| T ROWE PRICE ASSOCIATES |
| ||
| ATTN FUND ACCOUNTING DEPT |
| ||
| 100 E PRATT ST |
| ||
| BALTIMORE MD 21202-1009 |
| ||
|
| |||
| RETIREMENT PORTFOLIO 2010 | 13.47 | ||
| T ROWE PRICE ASSOCIATES |
| ||
| ATTN FUND ACCOUNTING DEPT |
| ||
|
| |||
| RETIREMENT PORTFOLIO 2015 | 14.32 | ||
| T ROWE PRICE ASSOCIATES |
| ||
| ATTN FUND ACCOUNTING DEPT |
| ||
|
| |||
| RETIREMENT PORTFOLIO 2020 | 21.10 | ||
| T ROWE PRICE ASSOCIATES |
| ||
| ATTN FUND ACCOUNTING DEPT |
| ||
|
| |||
| RETIREMENT PORTFOLIO 2025 | 7.46 | ||
| T ROWE PRICE ASSOCIATES |
| ||
| ATTN FUND ACCOUNTING DEPT |
| ||
INFLATION PROTECTED BOND FUND |
| SPECTRUM INCOME FUND |
| 15.54 |
| T. ROWE PRICE ASSOCIATES |
| ||
| ATTN: FUND ACCOUNTING DEPT |
| ||
|
| |||
| T ROWE PRICE RPS INC | 6.05 | ||
| OMNIBUS ACCOUNT |
| ||
| INFLATION PROTECTED BOND, #147 |
| ||
| PO BOX 17215 |
| ||
| BALTIMORE MD 21297-1215 |
| ||
FUND |
| SHAREHOLDER |
| % |
INSTITUTIONAL AFRICA & MIDDLE EAST FUND |
| JOHN S AND JAMES L KNIGHT |
| 13.28 |
| FOUNDATION |
| ||
| WACHOVIA FINANCIAL CENTER STE 3300 |
| ||
| 200 SOUTH BISCAYNE BOULEVARD |
| ||
| MIAMI FL 33131-2310 |
| ||
|
| |||
| NATIONAL FINANCIAL SERVICES | 56.02(c) | ||
| FOR THE EXCLUSIVE BENEFIT |
| ||
| OF OUR CUSTOMERS |
| ||
|
| |||
| NORTHERN TRUST AS CUSTODIAN FBO | 5.40 |
108
| JOHN E FETZER INSTITUTE |
| ||
| PO BOX 92956 |
| ||
| CHICAGO IL 60675-0001 |
| ||
|
| |||
| SEI PRIVATE TRUST COMPANY | 6.89 | ||
| ATTN MUTUAL FUNDS ADMIN |
| ||
| C/O MELLON BANK |
| ||
| 1 FREEDOM VALLEY DR |
| ||
| OAKS PA 19456-9989 |
| ||
|
| |||
| UNIVERSITY OF ARKANSAS | 9.36 | ||
| FOUNDATION INC |
| ||
| 535 W RESEARCH CENTER BLVD STE 120 |
| ||
| FAYETTEVILLE AR 72701-6944 |
| ||
INSTITUTIONAL CORE PLUS FUND |
| JEANETTE STUMP & |
| 5.72 |
| JAMES CARNEY & HOWARD KLINE TRS |
| ||
| SPECIAL METALS CORPORATION RETIREE |
| ||
| BENEFIT TRUST |
| ||
| 60 BLVD OF THE ALLIES FL 5 |
| ||
| PITTSBURGH PA 15222-1209 |
| ||
|
| |||
| JP MORGAN CHASE BANK TRUSTEE FOR | 29.59(c) | ||
| THE STATE OF CALIFORNIA SAVINGS |
| ||
| PLUS PROGRAM |
| ||
| 4 NEW YORK PLZ FL 15 |
| ||
| NEW YORK NY 10004-2413 |
| ||
|
| |||
| NATIONAL FINANCIAL SERVICES | 30.87(c) | ||
| FOR THE EXCLUSIVE BENEFIT |
| ||
| OF OUR CUSTOMERS |
| ||
|
| |||
| THE CHURCH FOUNDATION | 7.61 | ||
| EPISCOPAL DIOCESE OF PENNSYLVANIA |
| ||
| 3717 CHESTNUT ST APT 300 |
| ||
| PHILADELPHIA PA 19104-3168 |
| ||
FUND |
| SHAREHOLDER |
| % |
INSTITUTIONAL CORE PLUS FUND—F CLASS |
| LPL FINANCIAL |
| 10.43 |
|
| |||
| NATIONAL FINANCIAL SERVICES | 5.84 | ||
| FOR THE EXCLUSIVE BENEFIT |
| ||
| OF OUR CUSTOMERS |
| ||
|
| |||
| RAYMOND JAMES & ASSOC INC | 11.43 | ||
| FBO HOMER J KNAUFF & |
| ||
| DARLENE A KNAUFF JT/WROS |
| ||
| IMPAC |
| ||
| MINNEAPOLIS MN 55437-2159 |
| ||
|
| |||
| RAYMOND JAMES & ASSOC INC | 11.63 | ||
| FBO THELMA J YUREK & |
|
109
| RICHARD A YUREK TTEE |
| ||
| THELMA J YUREK LIV TRUST |
| ||
| MINNETONKA MN 55345-5845 |
| ||
|
| |||
| RAYMOND JAMES & ASSOC INC CDSN | 8.48 | ||
| FBO BERNARD H DEMASTER IRA |
| ||
| JANICE DEMASTER POA |
| ||
| BURNSVILLE MN 55306-5083 |
| ||
|
| |||
| RAYMOND JAMES & ASSOC INC CSDN | 5.85 | ||
| FBO ROBERT R ATKINS IRA |
| ||
| IMPAC |
| ||
| SUSAN R REISMAN POA |
| ||
| MONROE WA 98272-4148 |
| ||
|
| |||
| RAYMOND JAMES & ASSOC INC CSDN | 6.17 | ||
| FBO SHANNON LEAVITT (BENE) IRA |
| ||
| JERMAYN LEAVITT (DECD) |
| ||
| MINNEAPOLIS MN 55419-2335 |
| ||
INSTITUTIONAL CREDIT OPPORTUNITIES FUND |
| MAC & CO |
| 67.76(c) |
| ATTN MUTUAL FUND OPS |
| ||
| P O BOX 3198 |
| ||
| 525 WILLIAM PENN PLACE |
| ||
| PITTSBURGH PA 15230-3198 |
| ||
|
| |||
| T ROWE PRICE ASSOCIATES | 28.70(a) | ||
| ATTN FINANCIAL REPORTING DEPT |
| ||
FUND |
| SHAREHOLDER |
| % |
INSTITUTIONAL EMERGING MARKETS BOND FUND |
| CHARLES SCHWAB & CO INC |
| 22.86 |
| REINVEST ACCOUNT |
| ||
| ATTN MUTUAL FUND DEPT |
| ||
|
| |||
| LADYBIRD & CO | 27.37(d) | ||
| C/O T ROWE PRICE ASSOC |
| ||
| ATTN PERS STRATEGY INCOME FD |
| ||
| 100 EAST PRATT ST |
| ||
| BALTIMORE MD 21202-1009 |
| ||
|
| |||
| LADYBUG & CO | 25.27(d) | ||
| C/O T ROWE PRICE ASSOC |
| ||
| ATTN PERS STRATEGY BALANCED FD |
| ||
| 100 EAST PRATT ST |
| ||
| BALTIMORE MD 21202-1009 |
| ||
|
| |||
| LAKESIDE & CO | 10.07 | ||
| C/O T ROWE PRICE ASSOC |
| ||
| ATTN PERS STRATEGY GROWTH FUND |
| ||
| 100 EAST PRATT ST |
| ||
| BALTIMORE MD 21202-1009 |
| ||
INSTITUTIONAL EMERGING MARKETS EQUITY FUND |
| GOLDMAN SACHS & CO |
| 9.23 |
110
| EXCLUSIVE BENEFIT OF CUSTOMERS |
| ||
| 85 BROAD ST |
| ||
| NEW YORK NY 10004-2434 |
| ||
|
| |||
| LADYBUG & CO | 8.26 | ||
| C/O T ROWE PRICE ASSOC |
| ||
| ATTN PERS STRATEGY BALANCED FD |
| ||
|
| |||
| LAKESIDE & CO | 8.78 | ||
| C/O T ROWE PRICE ASSOC |
| ||
| ATTN PERS STRATEGY GROWTH FUND |
| ||
|
| |||
| MAC & CO | 7.57 | ||
| ATTN MUTUAL FUND OPS |
| ||
|
| |||
| NATIONAL FINANCIAL SERVICES | 18.76 | ||
| FOR THE EXCLUSIVE BENEFIT |
| ||
| OF OUR CUSTOMERS |
| ||
|
| |||
| WELLS FARGO BANK NA FBO | 10.01 | ||
| OMNIBUS ACCOUNT CASH/CASH |
| ||
| PO BOX 1533 |
| ||
| MINNEAPOLIS MN 55480-1533 |
| ||
FUND |
| SHAREHOLDER |
| % |
INSTITUTIONAL FLOATING RATE FUND |
| CHARLES SCHWAB & CO INC |
| 9.48 |
| SPECIAL CUSTODY A/C FBO CUSTOMERS |
| ||
| ATTN MUTUAL FUND DEPT |
| ||
| 211 MAIN STREET |
| ||
| SAN FRANCISCO CA 94105-1905 |
| ||
|
| |||
| DPERS - FLOATING RATE FUND ACCT | 11.07 | ||
| ATTN LINDA DREW |
| ||
| ASHFORD CONSULTING GROUP |
| ||
| 1 WALKERS MILL RD PO BOX 4644 |
| ||
| WILMINGTON DE 19807-4644 |
| ||
|
| |||
| NATIONAL FINANCIAL SERVICES | 9.12 | ||
| FOR THE EXCLUSIVE BENEFIT |
| ||
| OF OUR CUSTOMERS |
| ||
|
| |||
| TASKFORCE & CO | 8.28 | ||
| C/O T ROWE PRICE ASSOC |
| ||
| ATTN EQUITY INCOME FUND |
| ||
| 100 E PRATT ST |
| ||
| BALTIMORE MD 21202-1009 |
| ||
|
| |||
| TUNA & CO | 10.27 | ||
| C/O T ROWE PRICE ASSOC |
| ||
| ATTN NEW INCOME FUND |
| ||
| 100 EAST PRATT ST |
|
111
| BALTIMORE MD 21202-1009 |
| ||
|
| |||
| WELLS FARGO BANK NA FBO | 20.83 | ||
| OMNIBUS ACCOUNT CASH/CASH |
| ||
INSTITUTIONAL FLOATING RATE FUND—F CLASS |
| CHARLES SCHWAB & CO INC |
| 6.47 |
| REINVEST ACCOUNT |
| ||
| ATTN MUTUAL FUND DEPT |
| ||
|
| |||
| MAC & CO | 15.07 | ||
| ATTN MUTUAL FUND OPS |
| ||
|
| |||
| NATIONAL FINANCIAL SERVICES | 5.05 | ||
| FOR THE EXCLUSIVE BENEFIT |
| ||
| OF OUR CUSTOMERS |
| ||
|
| |||
| SAXON & CO. | 7.80 | ||
| FBO |
| ||
| PO BOX 7780-1888 |
| ||
| PHILADELPHIA PA 19182-0001 |
| ||
|
| |||
| TD AMERITRADE INC FBO | 6.37 | ||
| OUR CUSTOMERS |
| ||
FUND |
| SHAREHOLDER |
| % |
INSTITUTIONAL FRONTIER MARKETS EQUITY FUND |
| CHARLES SCHWAB & CO INC |
| 5.71 |
| SPECIAL CUSTODY A/C FBO CUSTOMERS |
| ||
| ATTN MUTUAL FUND DEPT |
| ||
|
| |||
| SEI PRIVATE TRUST COMPANY | 45.81(c) | ||
| ATTN MUTUAL FUNDS ADMIN |
| ||
| C/O CHOATE HALL & STEWART |
| ||
| 1 FREEDOM VALLEY DR |
| ||
| OAKS PA 19456-9989 |
| ||
|
| |||
| T ROWE PRICE ASSOCIATES | 47.43(a) | ||
| ATTN FINANCIAL REPORTING DEPT |
| ||
INSTITUTIONAL GLOBAL FOCUSED GROWTH EQUITY FUND |
| NATIONAL FINANCIAL SERVICES |
| 11.16 |
| FOR THE EXCLUSIVE BENEFIT |
| ||
| OF OUR CUSTOMERS |
| ||
|
| |||
| NORTHERN TRUST AS CUSTODIAN FBO | 67.59(c) | ||
| HARRY & JEANETTE WEINBERG |
| ||
| FOUNDATION |
| ||
| PO BOX 92956 |
| ||
| CHICAGO IL 60675-2994 |
| ||
|
| |||
| TRUSTEES OF T ROWE PRICE | 21.25 | ||
| U.S. RETIREMENT PROGRAM |
| ||
| ATTN FINANCIAL REPORTING DEPT |
| ||
| P O BOX 89000 |
| ||
| BALTIMORE MD 21289-0001 |
|
112
FUND |
| SHAREHOLDER |
| % |
INSTITUTIONAL GLOBAL GROWTH EQUITY FUND |
| CAPITAL ONE PLEDGEE |
| 26.75(c) |
| LONGWOOD FOUNDATION INC PLEDGOR |
| ||
| UNDER PLEDGE |
| ||
| 100 W 10TH ST |
| ||
| WILMINGTON DE 19801-1694 |
| ||
|
| |||
| CHARLES SCHWAB & CO INC | 20.44 | ||
| SPECIAL CUSTODY A/C FBO CUSTOMERS |
| ||
| ATTN MUTUAL FUND DEPT |
| ||
|
| |||
| NATIONAL MERIT SCHOLARSHIP | 7.76 | ||
| CORPORATION |
| ||
| 1560 SHERMAN AVENUE STE 200 |
| ||
| EVANSTON IL 60201-4816 |
| ||
|
| |||
| SAXON & CO. | 12.83 | ||
| FBO |
| ||
|
| |||
| STATE STREET BANK AND TRUST AS | 14.85 | ||
| TTEE FOR MASTER TRUST FOR DEFINED |
| ||
| BENEFIT PLANS OF SYNGENTA CORP |
| ||
| 801 PENNSYLVANIA AVE |
| ||
| KANSAS CITY MO 64105-1307 |
| ||
INSTITUTIONAL GLOBAL MULTI-SECTOR BOND FUND |
| NATIONAL FINANCIAL SERVICES |
| 36.81(c) |
| FOR THE EXCLUSIVE BENEFIT |
| ||
| OF OUR CUSTOMERS |
| ||
|
| |||
| NORTHERN TRUST AS CUSTODIAN FBO | 50.84(c) | ||
| HARRY & JEANETTE WEINBERG |
| ||
| FOUNDATION |
| ||
|
| |||
| YOUNG WOMEN'S CHRISTIAN ASSOCIATION | 7.54 | ||
| RETIREMENT FUND |
| ||
| 52 VANDERBILT AVE |
| ||
| FL 6 ATTN: JANE TUIS |
| ||
| NEW YORK NY 10017-3847 |
| ||
INSTITUTIONAL GLOBAL VALUE EQUITY FUND |
| T ROWE PRICE ASSOCIATES |
| 98.07(a) |
| ATTN FINANCIAL REPORTING DEPT |
| ||
FUND |
| SHAREHOLDER |
| % |
INSTITUTIONAL HIGH YIELD FUND |
| BREAD & CO |
| 7.61 |
| C/O T ROWE PRICE ASSOC |
| ||
| ATTN BALANCED FUND |
| ||
| 100 EAST PRATT ST |
| ||
| BALTIMORE MD 21202-1009 |
| ||
|
| |||
| GOLDMAN SACHS & CO | 18.78 | ||
| EXCLUSIVE BENEFIT OF CUSTOMERS |
| ||
|
| |||
| NATIONAL FINANCIAL SERVICES | 13.76 |
113
| FOR THE EXCLUSIVE BENEFIT |
| ||
| OF OUR CUSTOMERS |
| ||
|
| |||
| TUNA & CO | 20.92 | ||
| C/O T ROWE PRICE ASSOC |
| ||
| ATTN NEW INCOME FUND |
| ||
INSTITUTIONAL INTERNATIONAL BOND FUND |
| CHARLES SCHWAB & CO INC |
| 9.45 |
| SPECIAL CUSTODY A/C FBO CUSTOMERS |
| ||
| ATTN MUTUAL FUND DEPT |
| ||
|
| |||
| LADYBIRD & CO | 21.87 | ||
| C/O T ROWE PRICE ASSOC |
| ||
| ATTN PERS STRATEGY INCOME FD |
| ||
|
| |||
| LADYBUG & CO | 20.28 | ||
| C/O T ROWE PRICE ASSOC |
| ||
| ATTN PERS STRATEGY BALANCED FD |
| ||
|
| |||
| LAKESIDE & CO | 7.89 | ||
| C/O T ROWE PRICE ASSOC |
| ||
| ATTN PERS STRATEGY GROWTH FUND |
| ||
|
| |||
| NATIONAL FINANCIAL SERVICES | 5.30 | ||
| FOR THE EXCLUSIVE BENEFIT |
| ||
| OF OUR CUSTOMERS |
| ||
|
| |||
| PERSHING LLC | 9.95 | ||
|
| |||
| TD AMERITRADE INC FBO | 18.90 | ||
| OUR CUSTOMERS |
| ||
FUND |
| SHAREHOLDER |
| % |
INSTITUTIONAL INTERNATIONAL CONCENTRATED EQUITY |
| COMMERCIAL PROPERTIES |
| 9.10 |
FUND | C/O WEST COAST TR CO |
| ||
| PO BOX 1012 |
| ||
| SALEM OR 97308-1012 |
| ||
|
| |||
| NORTHERN TRUST AS CUSTODIAN FBO | 23.91 | ||
| HARRY & JEANETTE WEINBERG |
| ||
| FOUNDATION |
| ||
|
| |||
| PERSHING LLC | 28.33(c) | ||
|
| |||
| T ROWE PRICE ASSOCIATES | 25.53(a) | ||
| ATTN FINANCIAL REPORTING DEPT |
| ||
INSTITUTIONAL INTERNATIONAL CORE EQUITY FUND |
| BREAD & CO |
| 5.98 |
| C/O T ROWE PRICE ASSOC |
| ||
| ATTN BALANCED FUND |
| ||
|
| |||
| DEKALB COUNTY PENSION PLAN | 63.23(c) | ||
| 1300 COMMERCE DRIVE 4TH FLOOR |
|
114
| DECATUR GA 30030-3222 |
| ||
|
| |||
| MAC & CO | 18.54 | ||
| ATTN MUTUAL FUND OPS |
| ||
|
| |||
| WELLS FARGO BANK NA FBO | 7.94 | ||
| NPPD FOREIGN EQUITY FUND |
| ||
| PO BOX 1533 |
| ||
| MINNEAPOLIS MN 55480-1533 |
| ||
INSTITUTIONAL INTERNATIONAL GROWTH EQUITY FUND |
| BNA FOREIGN EQUITY FUND |
| 25.75(c) |
| ATTN MR ROBERT SHEW |
| ||
| 1801 S BELL ST |
| ||
| ARLINGTON VA 22202-4506 |
| ||
|
| |||
| BRICS & CO FBO | 19.55 | ||
| LINK BELT PENSION - T ROWE PRICE |
| ||
| 14201 NORTH DALLAS PARKWAY |
| ||
| 13TH FL TX1-J165 |
| ||
| DALLAS TX 75254-2916 |
| ||
|
| |||
| NATIONAL FINANCIAL SERVICES | 23.55 | ||
| FOR THE EXCLUSIVE BENEFIT |
| ||
| OF OUR CUSTOMERS |
| ||
|
| |||
| SAXON & CO. | 8.71 | ||
| FBO |
| ||
|
| |||
| THE CHURCH FOUNDATION | 14.84 | ||
| EPISCOPAL DIOCESE OF PENNSYLVANIA |
| ||
FUND |
| SHAREHOLDER |
| % |
INSTITUTIONAL LARGE-CAP CORE GROWTH FUND |
| MERCER TRUST CO TTEE FBO |
| 5.30 |
| THE MALLINCKRODT PHARMACEUTICAL |
| ||
| RET. SAV. AND INVESTMENT PLAN |
| ||
| 1 INVESTORS WAY |
| ||
| ATTN: DC PLAN ADMIN MS N-3-E |
| ||
| NORWOOD MA 02062-1599 |
| ||
|
| |||
| NATIONAL FINANCIAL SVCS CORP | 31.12(c) | ||
| FOR EXCLUSIVE BENEFIT OF OUR |
| ||
| CUSTOMERS |
| ||
| RUSS LENNON |
| ||
| 499 WASHINGTON BLVD |
| ||
| JERSEY CITY NJ 07310-2010 |
| ||
|
| |||
| STATE STREET CORP TR | 5.20 | ||
| FBO HALLMARK CARDS INC |
| ||
| 2 AVENUE DE LAFAYETTE, LCC3S |
| ||
| MAIL STOP 308 |
| ||
| BOSTON MA 02111-1750 |
| ||
|
|
115
| VANGUARD FIDUCIARY TRUST COMPANY | 11.57 | ||
| T ROWE INSTITUTIONAL CLASS |
| ||
| ATTN OUTSIDE FUNDS/SCOTT GELLERT |
| ||
| PO BOX 2600 L-24 |
| ||
| VALLEY FORGE PA 19482-2600 |
| ||
INSTITUTIONAL LARGE-CAP GROWTH FUND |
| BANK OF AMERICA NA TRUSTEE FOR |
| 5.00 |
| MERRILL LYNCH & CO INC 401K SAVINGS |
| ||
| & INVESTMENT PLAN |
| ||
| 700 LOUISIANA ST |
| ||
| HOUSTON TX 77002-2700 |
| ||
|
| |||
| BANK OF AMERICA NA TRUSTEE FOR | 11.45 | ||
| THE BANK OF AMERICA 401K PLAN |
| ||
| 700 LOUISIANA ST |
| ||
| HOUSTON TX 77002-2700 |
| ||
|
| |||
| CHARLES SCHWAB & CO INC | 5.20 | ||
| REINVEST ACCOUNT |
| ||
| ATTN MUTUAL FUND DEPT |
| ||
|
| |||
| EDWARD D JONES & CO | 10.30 | ||
| FOR THE BENEFIT OF CUSTOMERS |
| ||
| 12555 MANCHESTER RD |
| ||
| SAINT LOUIS MO 63131-3729 |
| ||
|
| |||
| NATIONAL FINANCIAL SERVICES | 13.79 | ||
| FOR THE EXCLUSIVE BENEFIT |
| ||
| OF OUR CUSTOMERS |
| ||
FUND |
| SHAREHOLDER |
| % |
INSTITUTIONAL LARGE-CAP VALUE FUND |
| CHARLES SCHWAB & CO INC |
| 9.45 |
| REINVEST ACCOUNT |
| ||
| ATTN MUTUAL FUND DEPT |
| ||
|
| |||
| NATIONAL FINANCIAL SERVICES | 53.18(c) | ||
| FOR THE EXCLUSIVE BENEFIT |
| ||
| OF OUR CUSTOMERS |
| ||
|
| |||
| TIAA-CREF TRUST CO. FSB CUST/TTEE | 6.58 | ||
| FBO RETIREMENT PLANS FOR WHICH |
| ||
| TIAA ACTS AS RECORDKEEPER |
| ||
| ATTN: TRUST OPERATIONS |
| ||
| 211 N BROADWAY STE 1000 |
| ||
| SAINT LOUIS MO 63102-2748 |
| ||
INSTITUTIONAL LONG DURATION CREDIT FUND |
| BAND & CO C/O US BANK NA |
| 23.42 |
| 1555 N RIVERCENTER DR STE 302 |
| ||
| MILWAUKEE WI 53212-3958 |
| ||
|
| |||
| INVESTMENT COMPANY INSTITUTE | 23.10 | ||
| ATTN: MARK DELCOCO |
| ||
| 1401 H ST NW STE 1200 |
|
116
| WASHINGTON DC 20005-2110 |
| ||
|
| |||
| T ROWE PRICE ASSOCIATES | 52.91(a) | ||
| ATTN FINANCIAL REPORTING DEPT |
| ||
FUND |
| SHAREHOLDER |
| % |
INSTITUTIONAL MID-CAP EQUITY GROWTH FUND |
| JP MORGAN CHASE TR |
| 5.50 |
| FBO PEARSON INC RETIREMENT PLAN |
| ||
| C/O JP MORGAN RPS MGMT RPTG TEAM |
| ||
| 11500 OUTLOOK ST |
| ||
| OVERLAND PARK KS 66211-1804 |
| ||
|
| |||
| KY PUBLIC EMP DEF COMP AUTHORITY | 6.37 | ||
| C/O NATIONWIDE AS CUSTODIAN & |
| ||
| RECORDKEEPER |
| ||
| IPO PORTFOLIO ACCOUNTING |
| ||
| PO BOX 182029 |
| ||
| COLUMBUS OH 43218-2029 |
| ||
|
| |||
| MAC & CO | 5.15 | ||
| ATTN MUTUAL FUND OPS |
| ||
|
| |||
| MERCER TRUST COMPANNY TTEE FBO | 5.59 | ||
| ATTN DC PLAN ADMIN MS N-4-L |
| ||
| MMC 401(K) SAVINGS & INVESTMENT PL |
| ||
| 1 INVESTORS WAY |
| ||
| NORWOOD MA 02062-1599 |
| ||
|
| |||
| NATIONAL FINANCIAL SERVICES | 26.56(c) | ||
| FOR THE EXCLUSIVE BENEFIT |
| ||
| OF OUR CUSTOMERS |
| ||
|
| |||
| THE STATE OF WISCONSIN DEF COMP BRD | 8.20 | ||
| C/O FASCORE LLC |
| ||
| FBO WISCONSIN DCP |
| ||
| 8515 E ORCHARD RD 2T2 |
| ||
| GREENWOOD VLG CO 80111-5002 |
| ||
|
| |||
| VANGUARD FIDUCIARY TRUST COMPANY | 8.37 | ||
| T ROWE INSTITUTIONAL CLASS |
| ||
| ATTN OUTSIDE FUNDS/SCOTT GELLERT |
| ||
|
| |||
| WELLS FARGO BANK FBO | 5.42 | ||
| LOWES 401 K PLAN |
| ||
| 1525 WEST WT HARRIS BLVD |
| ||
| CHARLOTTE NC 28288-1076 |
| ||
FUND |
| SHAREHOLDER |
| % |
INSTITUTIONAL SMALL-CAP STOCK FUND |
| NATIONAL FINANCIAL SERVICES |
| 48.58(c) |
| FOR THE EXCLUSIVE BENEFIT |
| ||
| OF OUR CUSTOMERS |
| ||
|
|
117
| NORTHERN TRUST COMPANY TR | 15.80 | ||
| FBO PFIZER SAVINGS AND |
| ||
| INVESTMENT PLAN |
| ||
| PO BOX 92994 |
| ||
| CHICAGO IL 60675-0001 |
| ||
|
| |||
| PIMS/PRUDENTIAL RETIREMENT | 7.19 | ||
| AS NOMINEE FOR THE TTEE/CUST PL 720 |
| ||
| MUFG UNION BANK, N.A. |
| ||
| 400 CALIFORNIA ST FL 10 |
| ||
| SAN FRANCISCO CA 94104-1318 |
| ||
|
| |||
| VANGUARD FIDUCIARY TRUST COMPANY | 11.85 | ||
| T ROWE INSTITUTIONAL CLASS |
| ||
| ATTN OUTSIDE FUNDS/SCOTT GELLERT |
| ||
INSTITUTIONAL U.S. STRUCTURED RESEARCH FUND |
| CAPINCO C/O US BANK NA |
| 21.88 |
| 1555 N RIVERCENTER DR STE 302 |
| ||
| MILWAUKEE WI 53212-3958 |
| ||
|
| |||
| GREAT-WEST TRUST COMPANY LLC TTEE/C | 5.02 | ||
| FBO DEFINED BENEFIT PLANS |
| ||
| 8515 E ORCHARD RD 2T2 |
| ||
| GREENWOOD VLG CO 80111-5002 |
| ||
|
| |||
| MCWOOD & CO | 8.35 | ||
|
| |||
| NATIONAL FINANCIAL SERVICES | 6.12 | ||
| FOR THE EXCLUSIVE BENEFIT |
| ||
| OF OUR CUSTOMERS |
| ||
|
| |||
| WELLS FARGO BANK NA FBO | 11.44 | ||
| PHP-T ROWE PRIC INSTL STRUCTRD RSRC |
| ||
| PO BOX 1533 |
| ||
| MINNEAPOLIS MN 55480-1533 |
| ||
|
| |||
| WELLS FARGO BANK NA FBO | 8.57 | ||
| UCARE MINNESOTA 13145604 |
| ||
| PO BOX 1533 |
| ||
| MINNEAPOLIS MN 55480-1533 |
| ||
INTERMEDIATE TAX-FREE HIGH YIELD |
| T ROWE PRICE ASSOCIATES |
| 63.42(a) |
| ATTN FINANCIAL REPORTING DEPT |
| ||
FUND |
| SHAREHOLDER |
| % |
INTERMEDIATE TAX-FREE HIGH YIELD—ADVISOR CLASS |
| CHARLES SCHWAB & CO INC |
| 84.39(c) |
| REINVEST ACCOUNT |
| ||
| ATTN MUTUAL FUND DEPT |
| ||
|
| |||
| T ROWE PRICE ASSOCIATES | 12.02 | ||
| ATTN FINANCIAL REPORTING DEPT |
| ||
INTERNATIONAL BOND FUND |
| EDWARD D JONES & CO |
| 17.15 |
| SHAREHOLDER ACCOUNTING |
|
118
| ATTN MUTUAL FUND |
| ||
|
| |||
| RETIREMENT PORTFOLIO 2015 | 5.77 | ||
| T ROWE PRICE ASSOCIATES |
| ||
| ATTN FUND ACCOUNTING DEPT |
| ||
|
| |||
| RETIREMENT PORTFOLIO 2020 | 12.13 | ||
| T ROWE PRICE ASSOCIATES |
| ||
| ATTN FUND ACCOUNTING DEPT |
| ||
|
| |||
| RETIREMENT PORTFOLIO 2025 | 6.97 | ||
| T ROWE PRICE ASSOCIATES |
| ||
| ATTN FUND ACCOUNTING DEPT |
| ||
|
| |||
| RETIREMENT PORTFOLIO 2030 | 7.46 | ||
| T ROWE PRICE ASSOCIATES |
| ||
| ATTN FUND ACCOUNTING DEPT |
| ||
|
| |||
| SPECTRUM INCOME FUND | 11.27 | ||
| T. ROWE PRICE ASSOCIATES |
| ||
| ATTN: FUND ACCOUNTING DEPT |
| ||
INTERNATIONAL BOND FUND—ADVISOR CLASS |
| CHARLES SCHWAB & CO INC |
| 12.11 |
| REINVEST ACCOUNT |
| ||
| ATTN MUTUAL FUND DEPT |
| ||
|
| |||
| LPL FINANCIAL | 6.91 | ||
|
| |||
| NATIONAL FINANCIAL SERVICES | 18.48 | ||
| FOR THE EXCLUSIVE BENEFIT |
| ||
| OF OUR CUSTOMERS |
| ||
|
| |||
| PERSHING LLC | 22.29 | ||
|
| |||
| VOYA INSTITUTIONAL TRUST COMPANY | 12.44 | ||
| 1 ORANGE WAY B3N |
| ||
| WINDSOR CT 06095-4774 |
| ||
FUND |
| SHAREHOLDER |
| % |
INTERNATIONAL CONCENTRATED EQUITY FUND |
| T ROWE PRICE ASSOCIATES |
| 20.84 |
| ATTN FINANCIAL REPORTING DEPT |
| ||
|
| |||
| T ROWE PRICE TRUST CO | 6.35 | ||
| CUST FOR THE ROTH IRA OF |
| ||
| JAMES C DAWSON |
| ||
| PERRY GA 31069-9407 |
| ||
INTERNATIONAL CONCENTRATED EQUITY FUND—ADVISOR |
| CHARLES SCHWAB & CO INC |
| 26.29(c) |
CLASS | REINVEST ACCOUNT |
| ||
| ATTN MUTUAL FUND DEPT |
| ||
|
| |||
| T ROWE PRICE ASSOCIATES | 73.71(a) | ||
| ATTN FINANCIAL REPORTING DEPT |
|
119
INTERNATIONAL DISCOVERY FUND |
| CHARLES SCHWAB & CO INC |
| 8.20 |
| REINVEST ACCOUNT |
| ||
| ATTN MUTUAL FUND DEPT |
| ||
|
| |||
| EDWARD D JONES & CO | 8.41 | ||
| FOR THE BENEFIT OF CUSTOMERS |
| ||
|
| |||
| NATIONAL FINANCIAL SERVICES | 11.91 | ||
| FOR THE EXCLUSIVE BENEFIT |
| ||
| OF OUR CUSTOMERS |
| ||
|
| |||
| VANGUARD FIDUCIARY TRUST COMPANY | 10.02 | ||
| T ROWE PRICE RETAIL CLASS FUNDS |
| ||
| ATTN OUTSIDE FUNDS |
| ||
| PO BOX 2600 VM 613 |
| ||
| VALLEY FORGE PA 19482-2600 |
| ||
INTERNATIONAL EQUITY INDEX FUND |
| MARYLAND COLLEGE INVESTMENT PLAN |
| 9.24 |
| GLOBAL EQUITY MARKET INDEX |
| ||
| ATTN FUND ACCOUNTING |
| ||
| 100 E PRATT ST FL 7 |
| ||
| BALTIMORE MD 21202-1009 |
| ||
|
| |||
| T ROWE PRICE RPS INC | 6.15 | ||
| OMNIBUS |
| ||
| NEW BUSINESS-CONV ASSTS #135 IXF |
| ||
| P O BOX 17215 |
| ||
| BALTIMORE MD 21297-1215 |
| ||
FUND |
| SHAREHOLDER |
| % |
INTERNATIONAL GROWTH & INCOME FUND |
| RETIREMENT PORTFOLIO 2020 |
| 13.54 |
| T ROWE PRICE ASSOCIATES |
| ||
| ATTN FUND ACCOUNTING DEPT |
| ||
|
| |||
| RETIREMENT PORTFOLIO 2025 | 10.68 | ||
| T ROWE PRICE ASSOCIATES |
| ||
| ATTN FUND ACCOUNTING DEPT |
| ||
|
| |||
| RETIREMENT PORTFOLIO 2030 | 15.95 | ||
| T ROWE PRICE ASSOCIATES |
| ||
| ATTN FUND ACCOUNTING DEPT |
| ||
|
| |||
| RETIREMENT PORTFOLIO 2035 | 9.14 | ||
| T ROWE PRICE ASSOCIATES |
| ||
| ATTN FUND ACCOUNTING DEPT |
| ||
|
| |||
| RETIREMENT PORTFOLIO 2040 | 12.33 | ||
| T ROWE PRICE ASSOCIATES |
| ||
| ATTN FUND ACCOUNTING DEPT |
| ||
|
| |||
| RETIREMENT PORTFOLIO 2045 | 5.49 | ||
| T ROWE PRICE ASSOCIATES |
|
120
| ATTN FUND ACCOUNTING DEPT |
| ||
| 100 E PRATT ST FL 7 |
| ||
| BALTIMORE MD 21202-1009 |
| ||
INTERNATIONAL GROWTH & INCOME FUND—ADVISOR |
| AMERICAN UNITED LIFE |
| 6.89 |
CLASS | AMERICAN UNIT INVESTMENT TRUST |
| ||
| ATTN SEPARATE ACCOUNTS |
| ||
|
| |||
| NATIONAL FINANCIAL SERVICES | 12.55 | ||
| FOR THE EXCLUSIVE BENEFIT |
| ||
| OF OUR CUSTOMERS |
| ||
|
| |||
| PERSHING LLC | 24.42 | ||
|
| |||
| STATE STREET CORP TTEE | 27.54(c) | ||
| FBO ADP ACCESS |
| ||
|
| |||
| VRSCO | 5.27 | ||
| FBO AIGFSB [CUST] [TTEE] FBO |
| ||
| MT SINAI 403B |
| ||
| 2929 ALLEN PKWY STE A6-20 |
| ||
| HOUSTON TX 77019-7117 |
| ||
FUND |
| SHAREHOLDER |
| % |
INTERNATIONAL GROWTH & INCOME FUND—R CLASS |
| AMERICAN UNITED LIFE |
| 5.07 |
| AMERICAN UNIT INVESTMENT TRUST |
| ||
| ATTN SEPARATE ACCOUNTS |
| ||
|
| |||
| AMERICAN UNITED LIFE | 11.97 | ||
| SEPARATE ACCOUNT II |
| ||
| ATTN SEPARATE ACCOUNTS |
| ||
|
| |||
| DCGT AS TTEE AND/OR CUST | 7.90 | ||
| ATTN NPIO TRADE DESK |
| ||
| FBO PLIC VARIOUS RETIREMENT PLANS |
| ||
| OMNIBUS |
| ||
|
| |||
| EMJAY CORPORATION CUSTODIAN FBO | 7.45 | ||
| PLANS OF GREAT WEST FINANCIAL |
| ||
| 8515 E ORCHARD RD 2T2 |
| ||
| GREENWOOD VLG CO 80111-5002 |
| ||
|
| |||
| NATIONWIDE TRUST CO FSB | 7.24 | ||
| C/O IPO PORTFOLIO ACCTG |
| ||
|
| |||
| STATE STREET CORP TTEE | 40.62(c) | ||
| FBO ADP ACCESS |
| ||
INTERNATIONAL STOCK FUND |
| EDWARD D JONES & CO |
| 10.34 |
| FOR THE BENEFIT OF CUSTOMERS |
| ||
|
| |||
| RETIREMENT PORTFOLIO 2020 | 9.48 | ||
| T ROWE PRICE ASSOCIATES |
|
121
| ATTN FUND ACCOUNTING DEPT |
| ||
|
| |||
| RETIREMENT PORTFOLIO 2025 | 7.46 | ||
| T ROWE PRICE ASSOCIATES |
| ||
| ATTN FUND ACCOUNTING DEPT |
| ||
|
| |||
| RETIREMENT PORTFOLIO 2030 | 11.28 | ||
| T ROWE PRICE ASSOCIATES |
| ||
| ATTN FUND ACCOUNTING DEPT |
| ||
|
| |||
| RETIREMENT PORTFOLIO 2035 | 6.44 | ||
| T ROWE PRICE ASSOCIATES |
| ||
| ATTN FUND ACCOUNTING DEPT |
| ||
|
| |||
| RETIREMENT PORTFOLIO 2040 | 8.68 | ||
| T ROWE PRICE ASSOCIATES |
| ||
| ATTN FUND ACCOUNTING DEPT |
| ||
INTERNATIONAL STOCK FUND—ADVISOR CLASS |
| NATIONAL FINANCIAL SERVICES |
| 95.95(c) |
| FOR THE EXCLUSIVE BENEFIT |
| ||
| OF OUR CUSTOMERS |
| ||
FUND |
| SHAREHOLDER |
| % |
INTERNATIONAL STOCK FUND—R CLASS |
| AMERICAN UNITED LIFE |
| 8.77 |
| AMERICAN UNIT INVESTMENT TRUST |
| ||
| ATTN SEPARATE ACCOUNTS |
| ||
|
| |||
| AMERICAN UNITED LIFE | 29.88(c) | ||
| SEPARATE ACCOUNT II |
| ||
| ATTN SEPARATE ACCOUNTS |
| ||
|
| |||
| CAPITAL BANK & TRUST COMPANY TTEE | 10.96 | ||
| C/O FASCORE LLC |
| ||
| PATTCO LLC 401K |
| ||
| 8515 E ORCHARD RD 2T2 |
| ||
| GREENWOOD VLG CO 80111-5002 |
| ||
|
| |||
| DCGT AS TTEE AND/OR CUST | 12.53 | ||
| ATTN NPIO TRADE DESK |
| ||
| FBO PLIC VARIOUS RETIREMENT PLANS |
| ||
| OMNIBUS |
| ||
|
| |||
| NATIONWIDE TRUST CO FSB | 7.92 | ||
| C/O IPO PORTFOLIO ACCTG |
| ||
INVESTMENT-GRADE CORPORATE MULTI-SECTOR |
| ALLEN & COMPANY |
| 21.66 |
ACCOUNT PORTFOLIO | 711 5TH AVE FL 9 |
| ||
| NEW YORK NY 10022-3168 |
| ||
|
| |||
| BALTIMORE EQUITABLE INSURANCE | 14.99 | ||
|
| |||
| ILLINOIS STUDENT ASSISTANCE | 33.79(c) | ||
| COMMISSION |
|
122
| ATTN: KENT CUSTER |
| ||
|
| |||
| ST PAUL TEACHERS RET FUND ASSOC | 6.26 | ||
| ATTN JILL E. SCHURTZ EXEC DIRECTOR |
| ||
|
| |||
| T ROWE PRICE ASSOCIATES | 23.30 | ||
| ATTN FINANCIAL REPORTING DEPT |
| ||
JAPAN FUND |
| MORGAN STANLEY SMITH BARNEY |
| 12.84 |
| HARBORSIDE FINANCIAL CENTER |
| ||
|
| |||
| SPECTRUM INTERNATIONAL FUND | 26.40(d) | ||
| T ROWE PRICE ASSOCIATES |
| ||
| ATTN: FUND ACCOUNTING DEPT |
| ||
LATIN AMERICA FUND |
| CHARLES SCHWAB & CO INC |
| 6.62 |
| REINVEST ACCOUNT |
| ||
| ATTN MUTUAL FUND DEPT |
| ||
|
| |||
| PERSHING LLC | 6.80 | ||
FUND |
| SHAREHOLDER |
| % |
MARYLAND SHORT-TERM TAX-FREE BOND FUND |
| CHARLES SCHWAB & CO INC |
| 9.69 |
| REINVEST ACCOUNT |
| ||
| ATTN MUTUAL FUND DEPT |
| ||
|
| |||
| PERSHING LLC | 5.44 | ||
MARYLAND TAX-FREE BOND FUND |
| CHARLES SCHWAB & CO INC |
| 6.64 |
| REINVEST ACCOUNT |
| ||
| ATTN MUTUAL FUND DEPT |
| ||
MARYLAND TAX-FREE MONEY FUND |
| KEITH A. LEE |
| 6.97 |
| FREDERICK MD 21704-7633 |
| ||
|
| |||
| WARREN S TEITELBAUM TR | 6.50 | ||
| THE WARREN S TEITELBAUM REV TRUST |
| ||
| BETHESDA MD 20814-2747 |
| ||
MEDIA & TELECOMMUNICATIONS FUND |
| CHARLES SCHWAB & CO INC |
| 5.90 |
| REINVEST ACCOUNT |
| ||
| ATTN MUTUAL FUND DEPT |
| ||
|
| |||
| NATIONAL FINANCIAL SERVICES | 5.63 | ||
| FOR THE EXCLUSIVE BENEFIT |
| ||
| OF OUR CUSTOMERS |
| ||
|
| |||
| T ROWE PRICE TRUST CO INC | 7.17 | ||
| MEDIA & TELECOMMUNICATION FUND |
| ||
| DST #121 |
| ||
| P O BOX 17215 |
| ||
| BALTIMORE MD 21297-1215 |
| ||
MID-CAP GROWTH FUND |
| CHARLES SCHWAB & CO INC |
| 7.81 |
| REINVEST ACCOUNT |
| ||
| ATTN MUTUAL FUND DEPT |
| ||
|
|
123
| NATIONAL FINANCIAL SERVICES | 13.18 | ||
| FOR THE EXCLUSIVE BENEFIT |
| ||
| OF OUR CUSTOMERS |
| ||
|
| |||
| T ROWE PRICE TRUST CO | 13.14 | ||
| ATTN: ASSET RECONCILIATIONS |
| ||
| P O BOX 17215 |
| ||
| BALTIMORE MD 21297-1215 |
| ||
FUND |
| SHAREHOLDER |
| % |
MID-CAP GROWTH FUND—ADVISOR CLASS |
| ING NATIONAL TRUST AS TRUSTEE FOR |
| 9.22 |
| THE ADP TOTALSOURCE RETIREMENT |
| ||
| SAVINGS PLAN |
| ||
| 30 BRAINTREE HILL OFFICE PARK |
| ||
| BRAINTREE MA 02184-8747 |
| ||
|
| |||
| MORGAN STANLEY SMITH BARNEY | 6.90 | ||
| HARBORSIDE FINANCIAL CENTER |
| ||
|
| |||
| NATIONAL FINANCIAL SERVICES | 26.59(c) | ||
| FOR THE EXCLUSIVE BENEFIT |
| ||
| OF OUR CUSTOMERS |
| ||
|
| |||
| NATIONWIDE TRUST CO FSB | 9.02 | ||
| FBO PARTICIPATING RETIREMENT PLANS |
| ||
| (NTC-PLNS) |
| ||
| C/O IPO PORTFOLIO ACCTG |
| ||
| PO BOX 182029 |
| ||
| COLUMBUS OH 43218-2029 |
| ||
MID-CAP GROWTH FUND—R CLASS |
| AMERICAN UNITED LIFE |
| 11.85 |
| SEPARATE ACCOUNT II |
| ||
| ATTN SEPARATE ACCOUNTS |
| ||
|
| |||
| LINCOLN RETIREMENT SERVICES CO | 6.64 | ||
| FBO VITAS HEALTHCARE CORPORATION 40 |
| ||
| PO BOX 7876 |
| ||
| FORT WAYNE IN 46801-7876 |
| ||
|
| |||
| NATIONWIDE TRUST CO FSB | 13.71 | ||
| C/O IPO PORTFOLIO ACCTG |
| ||
|
| |||
| SUNTRUST BANK FBO | 12.23 | ||
| VARIOUS SUNTRUST OMNIBUS ACCOUNTS |
| ||
|
| |||
| VOYA RETIREMENT INS & ANNUITY CO | 12.02 | ||
| 1 ORANGE WAY B3N |
| ||
| WINDSOR CT 06095-4774 |
| ||
FUND |
| SHAREHOLDER |
| % |
MID-CAP VALUE FUND |
| NATIONAL FINANCIAL SERVICES |
| 9.46 |
| FOR THE EXCLUSIVE BENEFIT |
| ||
| OF OUR CUSTOMERS |
|
124
|
| |||
| RETIREMENT PORTFOLIO 2020 | 5.16 | ||
| T ROWE PRICE ASSOCIATES |
| ||
| ATTN FUND ACCOUNTING DEPT |
| ||
|
| |||
| RETIREMENT PORTFOLIO 2030 | 6.16 | ||
| T ROWE PRICE ASSOCIATES |
| ||
| ATTN FUND ACCOUNTING DEPT |
| ||
|
| |||
| T ROWE PRICE RPS INC | 5.77 | ||
| PLAN # OMNIBUS ACCT |
| ||
| NEW BUSINESS GROUP FOR #115 |
| ||
| PO BOX 17215 |
| ||
| BALTIMORE MD 21297-1215 |
| ||
MID-CAP VALUE FUND—ADVISOR CLASS |
| NATIONAL FINANCIAL SERVICES |
| 48.50(c) |
| FOR THE EXCLUSIVE BENEFIT |
| ||
| OF OUR CUSTOMERS |
| ||
MID-CAP VALUE FUND—R CLASS |
| NATIONWIDE TRUST CO FSB |
| 20.18 |
| C/O IPO PORTFOLIO ACCTG |
| ||
|
| |||
| STATE STREET CORP TTEE | 37.34(c) | ||
| FBO ADP ACCESS |
| ||
|
| |||
| SUNTRUST BANK FBO | 6.74 | ||
| VARIOUS SUNTRUST OMNIBUS ACCOUNTS |
| ||
|
| |||
| VOYA RETIREMENT INS & ANNUITY CO | 7.34 | ||
FUND |
| SHAREHOLDER |
| % |
MORTGAGE-BACKED SECURITIES MULTI-SECTOR ACCOUNT |
| ALLEN & COMPANY |
| 17.24 |
PORTFOLIO |
| |||
| BALTIMORE EQUITABLE INSURANCE | 15.40 | ||
|
| |||
| CBE OF NEW BRUNSWICK | 11.55 | ||
| MORTGAGE BACKED SECURITIES MAP |
| ||
| 440 KING ST STE 680 |
| ||
| FREDERICTON NB E3B 5H8 |
| ||
| CANADA |
| ||
|
| |||
| ILLINOIS STUDENT ASSISTANCE | 34.68(c) | ||
| COMMISSION |
| ||
| ATTN: KENT CUSTER |
| ||
|
| |||
| ST PAUL TEACHERS RET FUND ASSOC | 5.31 | ||
| ATTN JILL E. SCHURTZ EXEC DIRECTOR |
| ||
|
| |||
| T ROWE PRICE ASSOCIATES | 15.82 | ||
| ATTN FINANCIAL REPORTING DEPT |
| ||
NEW AMERICA GROWTH FUND |
| CHARLES SCHWAB & CO INC |
| 11.66 |
| REINVEST ACCOUNT |
| ||
| ATTN MUTUAL FUND DEPT |
|
125
|
| |||
| NATIONAL FINANCIAL SERVICES | 19.31 | ||
| FOR THE EXCLUSIVE BENEFIT |
| ||
| OF OUR CUSTOMERS |
| ||
|
| |||
| T ROWE PRICE TRUST CO | 7.06 | ||
| ATTN TRPS INST CONTROL DEPT |
| ||
| P O BOX 17215 |
| ||
| BALTIMORE MD 21297-1215 |
| ||
FUND |
| SHAREHOLDER |
| % |
NEW AMERICA GROWTH FUND—ADVISOR CLASS |
| CHARLES SCHWAB & CO INC |
| 16.97 |
| REINVEST ACCOUNT |
| ||
| ATTN MUTUAL FUND DEPT |
| ||
|
| |||
| DCGT AS TTEE AND/OR CUST | 5.05 | ||
| ATTN NPIO TRADE DESK |
| ||
| FBO PLIC VARIOUS RETIREMENT PLANS |
| ||
| OMNIBUS |
| ||
|
| |||
| MERCER TRUST COMPANY TTEE FBO | 7.05 | ||
| ATTN DC PLAN ADMIN MS N-2-E |
| ||
| CHICAGO DIST COUNCIL OF CARPENTERS |
| ||
| PENSION FUND SUPP ANNUITY PLAN |
| ||
| 1 INVESTORS WAY |
| ||
| NORWOOD MA 02062-1599 |
| ||
|
| |||
| NATIONAL FINANCIAL SERVICES | 17.15 | ||
| FOR THE EXCLUSIVE BENEFIT |
| ||
| OF OUR CUSTOMERS |
| ||
|
| |||
| VRSCO | 9.72 | ||
| FBO AIGFSB CUST TTEE FBO |
| ||
| WAKEMED RET SAV PLAN 403B |
| ||
| 2929 ALLEN PKWY STE A6-20 |
| ||
| HOUSTON TX 77019-7117 |
| ||
NEW ASIA FUND |
| NATIONAL FINANCIAL SERVICES |
| 10.48 |
| FOR THE EXCLUSIVE BENEFIT |
| ||
| OF OUR CUSTOMERS |
| ||
NEW ERA FUND |
| CHARLES SCHWAB & CO INC |
| 7.53 |
| REINVEST ACCOUNT |
| ||
| ATTN MUTUAL FUND DEPT |
| ||
|
| |||
| NATIONAL FINANCIAL SERVICES | 13.64 | ||
| FOR THE EXCLUSIVE BENEFIT |
| ||
| OF OUR CUSTOMERS |
| ||
NEW HORIZONS FUND |
| NATIONAL FINANCIAL SERVICES |
| 10.24 |
| FOR THE EXCLUSIVE BENEFIT |
| ||
| OF OUR CUSTOMERS |
| ||
|
| |||
| T ROWE PRICE TRUST CO INC | 11.31 |
126
| ATTN: TRPS INST CONTROL DEPT |
| ||
FUND |
| SHAREHOLDER |
| % |
NEW INCOME FUND |
| EDWARD D JONES & CO |
| 5.84 |
| FOR THE BENEFIT OF CUSTOMERS |
| ||
|
| |||
| JP MORGAN CLEARING CORP OMNIBUS ACC | 5.35 | ||
| FOR THE EXCLUSIVE BENEFIT |
| ||
| OF CUSTOMERS |
| ||
|
| |||
| RETIREMENT PORTFOLIO 2010 | 5.92 | ||
| T ROWE PRICE ASSOCIATES |
| ||
| ATTN FUND ACCOUNTING DEPT |
| ||
|
| |||
| RETIREMENT PORTFOLIO 2015 | 8.57 | ||
| T ROWE PRICE ASSOCIATES |
| ||
| ATTN FUND ACCOUNTING DEPT |
| ||
|
| |||
| RETIREMENT PORTFOLIO 2020 | 18.03 | ||
| T ROWE PRICE ASSOCIATES |
| ||
| ATTN FUND ACCOUNTING DEPT |
| ||
|
| |||
| RETIREMENT PORTFOLIO 2025 | 10.51 | ||
| T ROWE PRICE ASSOCIATES |
| ||
| ATTN FUND ACCOUNTING DEPT |
| ||
|
| |||
| RETIREMENT PORTFOLIO 2030 | 11.44 | ||
| T ROWE PRICE ASSOCIATES |
| ||
| ATTN FUND ACCOUNTING DEPT |
| ||
NEW INCOME FUND—ADVISOR CLASS |
| GREAT-WEST TRUST CO. |
| 5.35 |
| EMPLOYEE BENEFITS CLIENTS 401K |
| ||
|
| |||
| MORGAN STANLEY SMITH BARNEY | 13.20 | ||
| HARBORSIDE FINANCIAL CENTER |
| ||
|
| |||
| NATIONAL FINANCIAL SERVICES | 9.15 | ||
| FOR THE EXCLUSIVE BENEFIT |
| ||
| OF OUR CUSTOMERS |
| ||
|
| |||
| PERSHING LLC | 15.48 | ||
|
| |||
| SEI PRIVATE TRUST COMPANY | 7.09 | ||
| ATTN MUTUAL FUNDS ADMIN |
| ||
| C/O ID 839 EDWARD JONES TRUST CO |
| ||
| 1 FREEDOM VALLEY DR |
| ||
| OAKS PA 19456-9989 |
| ||
FUND |
| SHAREHOLDER |
| % |
NEW INCOME FUND—R CLASS |
| EMJAY CORPORATION CUSTODIAN FBO |
| 9.59 |
| PLANS OF GREAT WEST FINANCIAL |
| ||
|
| |||
| LINCOLN RETIREMENT SERVICES CO | 8.17 |
127
| FBO MUELLER INC 401K |
| ||
| PO BOX 7876 |
| ||
| FORT WAYNE IN 46801-7876 |
| ||
|
| |||
| NATIONWIDE TRUST CO FSB | 22.97 | ||
| C/O IPO PORTFOLIO ACCTG |
| ||
|
| |||
| PAUL HEIDBRINK FBO | 8.04 | ||
| PAUL R HEIDBRINK 401 K PROFIT |
| ||
| SHARING PLAN & TRUST |
| ||
| PO 560095 |
| ||
| ORLANDO FL 32856-0095 |
| ||
|
| |||
| STATE STREET CORP TTEE | 16.34 | ||
| FBO ADP ACCESS |
| ||
NEW JERSEY TAX-FREE BOND FUND |
| NATIONAL FINANCIAL SERVICES |
| 19.11 |
| FOR THE EXCLUSIVE BENEFIT |
| ||
| OF OUR CUSTOMERS |
| ||
NEW YORK TAX-FREE BOND FUND |
| CHARLES SCHWAB & CO INC |
| 5.20 |
| REINVEST ACCOUNT |
| ||
| ATTN MUTUAL FUND DEPT |
| ||
|
| |||
| NATIONAL FINANCIAL SERVICES | 5.19 | ||
| FOR THE EXCLUSIVE BENEFIT |
| ||
| OF OUR CUSTOMERS |
| ||
NEW YORK TAX-FREE MONEY FUND |
| H MARK GLASBERG |
| 13.51 |
| PAULA D GLASBERG JT TEN T O D |
| ||
| NEW YORK NY 10023-4819 |
| ||
FUND |
| SHAREHOLDER |
| % |
OVERSEAS STOCK FUND |
| RETIREMENT PORTFOLIO 2020 |
| 13.41 |
| T ROWE PRICE ASSOCIATES |
| ||
| ATTN FUND ACCOUNTING DEPT |
| ||
|
| |||
| RETIREMENT PORTFOLIO 2025 | 10.59 | ||
| T ROWE PRICE ASSOCIATES |
| ||
| ATTN FUND ACCOUNTING DEPT |
| ||
|
| |||
| RETIREMENT PORTFOLIO 2030 | 15.79 | ||
| T ROWE PRICE ASSOCIATES |
| ||
| ATTN FUND ACCOUNTING DEPT |
| ||
|
| |||
| RETIREMENT PORTFOLIO 2035 | 9.14 | ||
| T ROWE PRICE ASSOCIATES |
| ||
| ATTN FUND ACCOUNTING DEPT |
| ||
|
| |||
| RETIREMENT PORTFOLIO 2040 | 12.28 | ||
| T ROWE PRICE ASSOCIATES |
| ||
| ATTN FUND ACCOUNTING DEPT |
| ||
|
| |||
| RETIREMENT PORTFOLIO 2045 | 5.45 |
128
| T ROWE PRICE ASSOCIATES |
| ||
| ATTN FUND ACCOUNTING DEPT |
| ||
PERSONAL STRATEGY BALANCED FUND |
| MAC & CO |
| 6.89 |
| ATTN MUTUAL FUND OPS |
| ||
|
| |||
| NATIONAL FINANCIAL SERVICES | 10.02 | ||
| FOR THE EXCLUSIVE BENEFIT |
| ||
| OF OUR CUSTOMERS |
| ||
|
| |||
| T ROWE PRICE TRUST CO TR | 14.91 | ||
| BALANCED |
| ||
| ATTN ASSET RECONCILIATION |
| ||
| P O BOX 17215 |
| ||
| BALTIMORE MD 21297-1215 |
| ||
PERSONAL STRATEGY GROWTH FUND |
| NATIONAL FINANCIAL SERVICES |
| 9.79 |
| FOR THE EXCLUSIVE BENEFIT |
| ||
| OF OUR CUSTOMERS |
| ||
|
| |||
| T ROWE PRICE TRUST CO TR | 11.25 | ||
| ATTN GROWTH ASSET |
| ||
| P O BOX 17215 |
| ||
| BALTIMORE MD 21297-1215 |
| ||
FUND |
| SHAREHOLDER |
| % |
PERSONAL STRATEGY INCOME FUND |
| NATIONAL FINANCIAL SERVICES |
| 7.52 |
| FOR THE EXCLUSIVE BENEFIT |
| ||
| OF OUR CUSTOMERS |
| ||
|
| |||
| T ROWE PRICE TRUST CO TR | 5.59 | ||
| INCOME |
| ||
| ATTN ASSET RECONCILIATION |
| ||
| P O BOX 17215 |
| ||
| BALTIMORE MD 21297-1215 |
| ||
PRIME RESERVE FUND |
| T ROWE PRICE TRUST CO INC |
| 5.67 |
| ATTN: TRPS INST CONTROL DEPT |
| ||
REAL ASSETS FUND |
| RETIREMENT PORTFOLIO 2020 |
| 14.07 |
| T ROWE PRICE ASSOCIATES |
| ||
| ATTN FUND ACCOUNTING DEPT |
| ||
|
| |||
| RETIREMENT PORTFOLIO 2025 | 11.08 | ||
| T ROWE PRICE ASSOCIATES |
| ||
| ATTN FUND ACCOUNTING DEPT |
| ||
|
| |||
| RETIREMENT PORTFOLIO 2030 | 16.43 | ||
| T ROWE PRICE ASSOCIATES |
| ||
| ATTN FUND ACCOUNTING DEPT |
| ||
|
| |||
| RETIREMENT PORTFOLIO 2035 | 9.42 | ||
| T ROWE PRICE ASSOCIATES |
| ||
| ATTN FUND ACCOUNTING DEPT |
| ||
|
|
129
| RETIREMENT PORTFOLIO 2040 | 12.73 | ||
| T ROWE PRICE ASSOCIATES |
| ||
| ATTN FUND ACCOUNTING DEPT |
| ||
|
| |||
| RETIREMENT PORTFOLIO 2045 | 5.78 | ||
| T ROWE PRICE ASSOCIATES |
| ||
| ATTN FUND ACCOUNTING DEPT |
| ||
REAL ESTATE FUND |
| CHARLES SCHWAB & CO INC |
| 8.06 |
| REINVEST ACCOUNT |
| ||
| ATTN MUTUAL FUND DEPT |
| ||
|
| |||
| FIRST CLEARING LLC | 6.35 | ||
| SPECIAL CUSTODY ACCT FOR THE |
| ||
| EXCLUSIVE BENEFIT OF CUSTOMERS |
| ||
|
| |||
| PERSHING LLC | 15.38 | ||
|
| |||
| SAXON & CO. | 5.13 | ||
| FBO |
| ||
FUND |
| SHAREHOLDER |
| % |
REAL ESTATE FUND—ADVISOR CLASS |
| CHARLES SCHWAB & CO INC |
| 5.08 |
| REINVEST ACCOUNT |
| ||
| ATTN MUTUAL FUND DEPT |
| ||
|
| |||
| MAXIM SERIES FUND INC | 19.69 | ||
| 8515 E ORCHARD RD 2T2 |
| ||
| GREENWOOD VLG CO 80111-5002 |
| ||
|
| |||
| NATIONAL FINANCIAL SERVICES | 43.45(c) | ||
| FOR THE EXCLUSIVE BENEFIT |
| ||
| OF OUR CUSTOMERS |
| ||
RESERVE INVESTMENT FUND |
| SEAMILE & CO |
| 11.45 |
| C/O T ROWE PRICE ASSOC |
| ||
| ATTN CAPITAL APPREC FUND |
| ||
| 100 EAST PRATT ST |
| ||
| BALTIMORE MD 21202-1009 |
| ||
|
| |||
| TASKFORCE & CO | 5.16 | ||
| C/O T ROWE PRICE ASSOC |
| ||
| ATTN EQUITY INCOME FUND |
| ||
|
| |||
| TUNA & CO | 10.84 | ||
| C/O T ROWE PRICE ASSOC |
| ||
| ATTN NEW INCOME FUND |
| ||
RETIREMENT 2005 FUND |
| NATIONAL FINANCIAL SERVICES |
| 13.54 |
| FOR THE EXCLUSIVE BENEFIT |
| ||
| OF OUR CUSTOMERS |
| ||
|
| |||
| T ROWE PRICE RPS INC | 19.01 | ||
| OMNIBUS ACCOUNT |
|
130
| RETIREMENT ABH1 #155 |
| ||
| PO BOX 17215 |
| ||
| BALTIMORE MD 21297-1215 |
| ||
RETIREMENT 2005 FUND—ADVISOR CLASS |
| DCGT AS TTEE AND/OR CUST |
| 5.58 |
| ATTN NPIO TRADE DESK |
| ||
| FBO PLIC VARIOUS RETIREMENT PLANS |
| ||
| OMNIBUS |
| ||
|
| |||
| NATIONAL FINANCIAL SVCS CORP | 39.14(c) | ||
| FOR EXCLUSIVE BENEFIT OF OUR |
| ||
| CUSTOMERS |
| ||
| RUSS LENNON |
| ||
FUND |
| SHAREHOLDER |
| % |
RETIREMENT 2005 FUND—R CLASS |
| AXA EQUITABLE FOR SA NO 65 |
| 6.85 |
| 500 PLAZA DR FL 7 |
| ||
| SECAUCUS NJ 07094-3619 |
| ||
|
| |||
| NFS LLC FEBO | 66.58(c) | ||
| STATE STREET BANK TRUST CO |
| ||
| TTEE VARIOUS RETIREMENT PLANS |
| ||
|
| |||
| VOYA RETIREMENT INS & ANNUITY CO | 7.59 | ||
RETIREMENT 2010 FUND |
| NATIONAL FINANCIAL SERVICES |
| 15.36 |
| FOR THE EXCLUSIVE BENEFIT |
| ||
| OF OUR CUSTOMERS |
| ||
|
| |||
| T ROWE PRICE RPS INC | 16.98 | ||
| OMNIBUS ACCOUNT |
| ||
| RETIREMENT 2010, #140 |
| ||
| PO BOX 17215 |
| ||
| BALTIMORE MD 21297-1215 |
| ||
RETIREMENT 2010 FUND—ADVISOR CLASS |
| NATIONAL FINANCIAL SERVICES |
| 17.90 |
| FOR THE EXCLUSIVE BENEFIT |
| ||
| OF OUR CUSTOMERS |
| ||
|
| |||
| TAYNIK & CO | 9.85 | ||
| C/O INVESTORS BANK & TRUST |
| ||
| PO BOX 9130 |
| ||
| BOSTON MA 02117-9130 |
| ||
RETIREMENT 2010 FUND—R CLASS |
| NFS LLC FEBO |
| 6.89 |
| STATE STREET BANK TRUST CO |
| ||
| TTEE VARIOUS RETIREMENT PLANS |
| ||
|
| |||
| STATE STREET CORP TTEE | 24.35 | ||
| FBO ADP ACCESS |
| ||
|
| |||
| TAYNIK & CO | 5.86 | ||
| C/O STATE STREET BANK |
| ||
| 1200 CROWN COLONY DR |
| ||
| QUINCY MA 02169-0938 |
|
131
|
| |||
| VOYA RETIREMENT INS & ANNUITY CO | 5.19 | ||
RETIREMENT 2015 FUND |
| NATIONAL FINANCIAL SERVICES |
| 18.46 |
| FOR THE EXCLUSIVE BENEFIT |
| ||
| OF OUR CUSTOMERS |
| ||
|
| |||
| T ROWE PRICE RPS INC | 26.81(e) | ||
| OMNIBUS ACCOUNT |
| ||
| RETIREMENT ABH2 #156 |
| ||
| PO BOX 17215 |
| ||
| BALTIMORE MD 21297-1215 |
| ||
FUND |
| SHAREHOLDER |
| % |
RETIREMENT 2015 FUND—ADVISOR CLASS |
| NATIONAL FINANCIAL SVCS CORP |
| 23.01 |
| FOR EXCLUSIVE BENEFIT OF OUR |
| ||
| CUSTOMERS |
| ||
| RUSS LENNON |
| ||
|
| |||
| RELIANCE TRUST COMPANY FBO | 7.42 | ||
| RETIREMENT PLANS SERVICED BY METLIFE |
| ||
| 8515 E ORCHARD RD 2T2 |
| ||
| GREENWOOD VLG CO 80111-5002 |
| ||
RETIREMENT 2015 FUND—R CLASS |
| NFS LLC FEBO |
| 7.18 |
| STATE STREET BANK TRUST CO |
| ||
| TTEE VARIOUS RETIREMENT PLANS |
| ||
|
| |||
| STATE STREET CORP TTEE | 18.44 | ||
| FBO ADP ACCESS |
| ||
|
| |||
| VOYA RETIREMENT INS & ANNUITY CO | 20.82 | ||
RETIREMENT 2020 FUND |
| NATIONAL FINANCIAL SERVICES |
| 21.04 |
| FOR THE EXCLUSIVE BENEFIT |
| ||
| OF OUR CUSTOMERS |
| ||
|
| |||
| T ROWE PRICE RPS INC | 27.64(e) | ||
| OMNIBUS ACCOUNT |
| ||
| RETIREMENT 2020, #141 |
| ||
| PO BOX 17215 |
| ||
| BALTIMORE MD 21297-1215 |
| ||
RETIREMENT 2020 FUND—ADVISOR CLASS |
| MASSACHUSETTS MUTUAL LIFE |
| 6.62 |
| INSURANCE CO |
| ||
| ATTN RS FUND OPERATIONS |
| ||
| 1295 STATE ST MIP C105 |
| ||
| SPRINGFIELD MA 01111-0001 |
| ||
|
| |||
| NATIONAL FINANCIAL SERVICES | 18.17 | ||
| FOR THE EXCLUSIVE BENEFIT |
| ||
| OF OUR CUSTOMERS |
| ||
|
| |||
| TAYNIK & CO | 8.09 | ||
| C/O INVESTORS BANK & TRUST |
|
132
RETIREMENT 2020 FUND—R CLASS |
| STATE STREET CORP TTEE |
| 26.76 |
| FBO ADP ACCESS |
| ||
|
| |||
| TAYNIK & CO | 6.55 | ||
| C/O STATE STREET BANK |
| ||
|
| |||
| VOYA RETIREMENT INS & ANNUITY CO | 5.82 | ||
FUND |
| SHAREHOLDER |
| % |
RETIREMENT 2025 FUND |
| NATIONAL FINANCIAL SERVICES |
| 22.45 |
| FOR THE EXCLUSIVE BENEFIT |
| ||
| OF OUR CUSTOMERS |
| ||
|
| |||
| T ROWE PRICE RPS INC | 32.81(e) | ||
| OMNIBUS ACCOUNT |
| ||
| RETIREMENT ABH3 #157 |
| ||
| PO BOX 17215 |
| ||
| BALTIMORE MD 21297-1215 |
| ||
RETIREMENT 2025 FUND—ADVISOR CLASS |
| NATIONAL FINANCIAL SVCS CORP |
| 24.02 |
| FOR EXCLUSIVE BENEFIT OF OUR |
| ||
| CUSTOMERS |
| ||
| RUSS LENNON |
| ||
|
| |||
| RELIANCE TRUST COMPANY FBO | 7.55 | ||
| RETIREMENT PLANS SERVICED BY METLIFE |
| ||
|
| |||
| TAYNIK & CO | 5.31 | ||
| C/O STATE STREET BANK |
| ||
RETIREMENT 2025 FUND—R CLASS |
| AXA EQUITABLE FOR SA NO 65 |
| 5.19 |
|
| |||
| NFS LLC FEBO | 5.36 | ||
| STATE STREET BANK TRUST CO |
| ||
| TTEE VARIOUS RETIREMENT PLANS |
| ||
|
| |||
| STATE STREET CORP TTEE | 21.66 | ||
| FBO ADP ACCESS |
| ||
|
| |||
| VOYA RETIREMENT INS & ANNUITY CO | 21.13 | ||
RETIREMENT 2030 FUND |
| NATIONAL FINANCIAL SERVICES |
| 21.73 |
| FOR THE EXCLUSIVE BENEFIT |
| ||
| OF OUR CUSTOMERS |
| ||
|
| |||
| T ROWE PRICE RPS INC | 28.75(e) | ||
| OMNIBUS ACCOUNT |
| ||
| RETIREMENT 2030, #142 |
| ||
| PO BOX 17215 |
| ||
| BALTIMORE MD 21297-1215 |
| ||
RETIREMENT 2030 FUND—ADVISOR CLASS |
| MASSACHUSETTS MUTUAL LIFE |
| 6.84 |
| INSURANCE CO |
| ||
| ATTN RS FUND OPERATIONS |
| ||
|
|
133
| NATIONAL FINANCIAL SERVICES | 17.75 | ||
| FOR THE EXCLUSIVE BENEFIT |
| ||
| OF OUR CUSTOMERS |
| ||
|
| |||
| TAYNIK & CO | 8.63 | ||
| C/O INVESTORS BANK & TRUST |
| ||
FUND |
| SHAREHOLDER |
| % |
RETIREMENT 2030 FUND—R CLASS |
| MASSACHUSETTS MUTUAL LIFE |
| 5.33 |
| INSURANCE CO |
| ||
| ATTN RS FUND OPERATIONS |
| ||
|
| |||
| STATE STREET CORP TTEE | 31.20(c) | ||
| FBO ADP ACCESS |
| ||
|
| |||
| TAYNIK & CO | 7.12 | ||
| C/O STATE STREET BANK |
| ||
RETIREMENT 2035 FUND |
| NATIONAL FINANCIAL SERVICES |
| 23.84 |
| FOR THE EXCLUSIVE BENEFIT |
| ||
| OF OUR CUSTOMERS |
| ||
|
| |||
| T ROWE PRICE RPS INC | 32.93(e) | ||
| OMNIBUS ACCOUNT |
| ||
| RETIREMENT ABH4 #158 |
| ||
| PO BOX 17215 |
| ||
| BALTIMORE MD 21297-1215 |
| ||
RETIREMENT 2035 FUND—ADVISOR CLASS |
| NATIONAL FINANCIAL SVCS CORP |
| 23.52 |
| FOR EXCLUSIVE BENEFIT OF OUR |
| ||
| CUSTOMERS |
| ||
| RUSS LENNON |
| ||
|
| |||
| RELIANCE TRUST COMPANY FBO | 6.30 | ||
| RETIREMENT PLANS SERVICED BY METLIFE |
| ||
|
| |||
| TAYNIK & CO | 5.10 | ||
| C/O STATE STREET BANK |
| ||
RETIREMENT 2035 FUND—R CLASS |
| STATE STREET CORP TTEE |
| 23.96 |
| FBO ADP ACCESS |
| ||
|
| |||
| VOYA RETIREMENT INS & ANNUITY CO | 20.76 | ||
RETIREMENT 2040 FUND |
| NATIONAL FINANCIAL SERVICES |
| 22.63 |
| FOR THE EXCLUSIVE BENEFIT |
| ||
| OF OUR CUSTOMERS |
| ||
|
| |||
| T ROWE PRICE RPS INC | 27.73(e) | ||
| OMNIBUS ACCOUNT |
| ||
| RETIREMENT 2040, #143 |
| ||
| PO BOX 17215 |
| ||
| BALTIMORE MD 21297-1215 |
|
134
FUND |
| SHAREHOLDER |
| % |
RETIREMENT 2040 FUND—ADVISOR CLASS |
| MASSACHUSETTS MUTUAL LIFE |
| 6.47 |
| INSURANCE CO |
| ||
| ATTN RS FUND OPERATIONS |
| ||
|
| |||
| NATIONAL FINANCIAL SERVICES | 17.43 | ||
| FOR THE EXCLUSIVE BENEFIT |
| ||
| OF OUR CUSTOMERS |
| ||
|
| |||
| TAYNIK & CO | 7.94 | ||
| C/O INVESTORS BANK & TRUST |
| ||
|
| |||
| WELLS FARGO BANK FBO | 6.35 | ||
| FBO VARIOUS RETIREMENT PLANS |
| ||
| 1525 WEST WT HARRIS BLVD |
| ||
| CHARLOTTE NC 28288-0001 |
| ||
RETIREMENT 2040 FUND—R CLASS |
| NFS LLC FEBO |
| 5.10 |
| STATE STREET BANK TRUST CO |
| ||
| TTEE VARIOUS RETIREMENT PLANS |
| ||
|
| |||
| STATE STREET CORP TTEE | 33.43(c) | ||
| FBO ADP ACCESS |
| ||
|
| |||
| TAYNIK & CO | 6.33 | ||
| C/O STATE STREET BANK |
| ||
RETIREMENT 2045 FUND |
| NATIONAL FINANCIAL SERVICES |
| 24.13 |
| FOR THE EXCLUSIVE BENEFIT |
| ||
| OF OUR CUSTOMERS |
| ||
|
| |||
| T ROWE PRICE RPS INC | 33.75(e) | ||
| OMNIBUS ACCOUNT |
| ||
| RETIREMENT ABH5 #159 |
| ||
| PO BOX 17215 |
| ||
| BALTIMORE MD 21297-1215 |
| ||
RETIREMENT 2045 FUND—ADVISOR CLASS |
| NATIONAL FINANCIAL SVCS CORP |
| 26.81(c) |
| FOR EXCLUSIVE BENEFIT OF OUR |
| ||
| CUSTOMERS |
| ||
| RUSS LENNON |
| ||
|
| |||
| RELIANCE TRUST COMPANY FBO | 6.67 | ||
| RETIREMENT PLANS SERVICED BY METLIFE |
| ||
RETIREMENT 2045 FUND—R CLASS |
| STATE STREET CORP TTEE |
| 25.88 |
| FBO ADP ACCESS |
| ||
|
| |||
| TAYNIK & CO | 5.06 | ||
| C/O STATE STREET BANK |
| ||
|
| |||
| VOYA RETIREMENT INS & ANNUITY CO | 19.85 |
135
FUND |
| SHAREHOLDER |
| % |
RETIREMENT 2050 FUND |
| NATIONAL FINANCIAL SERVICES |
| 26.58(c) |
| FOR THE EXCLUSIVE BENEFIT |
| ||
| OF OUR CUSTOMERS |
| ||
|
| |||
| T ROWE PRICE RPS INC | 27.05(e) | ||
| OMNIBUS ACCOUNT |
| ||
| RETIREMENT ABO6 #166 |
| ||
| PO BOX 17215 |
| ||
| BALTIMORE MD 21297-1215 |
| ||
|
| |||
| STATE STREET CORP TTEE | 35.24(c) | ||
| FBO ADP ACCESS |
| ||
|
| |||
| TAYNIK & CO | 7.81 | ||
| C/O STATE STREET BANK |
| ||
RETIREMENT 2050 FUND—ADVISOR CLASS |
| FIFTH THIRD BANK TR |
| 6.66 |
| FBO CINTAS PARTNERS PLAN |
| ||
| ATTN MICHELLE HODGEMAN MD |
| ||
| 38 FOUNTAIN SQUARE PLAZA |
| ||
| CINCINNATI OH 45202-3191 |
| ||
|
| |||
| MASSACHUSETTS MUTUAL LIFE | 6.14 | ||
| INSURANCE CO |
| ||
| ATTN RS FUND OPERATIONS |
| ||
|
| |||
| NATIONAL FINANCIAL SERVICES | 18.86 | ||
| FOR THE EXCLUSIVE BENEFIT |
| ||
| OF OUR CUSTOMERS |
| ||
|
| |||
| TAYNIK & CO | 8.64 | ||
| C/O INVESTORS BANK & TRUST |
| ||
RETIREMENT 2055 FUND |
| NATIONAL FINANCIAL SERVICES |
| 22.24 |
| FOR THE EXCLUSIVE BENEFIT |
| ||
| OF OUR CUSTOMERS |
| ||
|
| |||
| T ROWE PRICE RPS INC | 32.97(e) | ||
| OMNIBUS ACCOUNT |
| ||
| RETIREMENT ABO7 #164 |
| ||
| PO BOX 17215 |
| ||
| BALTIMORE MD 21297-1215 |
| ||
RETIREMENT 2055 FUND—ADVISOR CLASS |
| NATIONAL FINANCIAL SVCS CORP |
| 28.73(c) |
| FOR EXCLUSIVE BENEFIT OF OUR |
| ||
| CUSTOMERS |
| ||
| RUSS LENNON |
| ||
|
| |||
| RELIANCE TRUST COMPANY FBO | 6.57 | ||
| RETIREMENT PLANS SERVICED BY METLIFE |
|
136
FUND |
| SHAREHOLDER |
| % |
RETIREMENT 2055 FUND—R CLASS |
| AXA EQUITABLE FOR SA NO 65 |
| 5.31 |
|
| |||
| NFS LLC FEBO | 6.03 | ||
| STATE STREET BANK TRUST CO |
| ||
| TTEE VARIOUS RETIREMENT PLANS |
| ||
|
| |||
| STATE STREET CORP TTEE | 33.30(c) | ||
| FBO ADP ACCESS |
| ||
|
| |||
| VOYA RETIREMENT INS & ANNUITY CO | 15.37 | ||
RETIREMENT 2060 FUND |
| NATIONAL FINANCIAL SERVICES |
| 27.15(c) |
| FOR THE EXCLUSIVE BENEFIT |
| ||
| OF OUR CUSTOMERS |
| ||
| 499 WASHINGTON BLVD |
| ||
| ATTN: MUTUAL FUNDS DEPT 4TH FL |
| ||
| JERSEY CITY NJ 07310-2010 |
| ||
|
| |||
| T ROWE PRICE ASSOCIATES | 5.81 | ||
| ATTN FINANCIAL REPORTING DEPT |
| ||
|
| |||
| T ROWE PRICE RPS INC | 14.01 | ||
| OMNIBUS ACCOUNT CUSIP:74149P325 |
| ||
| TRP RETIREMENT 2060 #144 ABMQ |
| ||
| PO BOX 17215 |
| ||
| BALTIMORE MD 21297-1215 |
| ||
RETIREMENT 2060 FUND—ADVISOR CLASS |
| CHARLES SCHWAB & CO INC |
| 5.79 |
| REINVEST ACCOUNT |
| ||
| ATTN MUTUAL FUND DEPT |
| ||
|
| |||
| DCGT AS TTEE AND/OR CUST | 13.31 | ||
| ATTN NPIO TRADE DESK |
| ||
| FBO PLIC VARIOUS RETIREMENT PLANS |
| ||
| OMNIBUS |
| ||
|
| |||
| NATIONAL FINANCIAL SERVICES | 48.56(c) | ||
| FOR THE EXCLUSIVE BENEFIT |
| ||
| OF OUR CUSTOMERS |
| ||
|
| |||
| T ROWE PRICE ASSOCIATES | 19.09 | ||
| ATTN FINANCIAL REPORTING DEPT |
| ||
RETIREMENT 2060 FUND—R CLASS |
| STATE STREET CORP TTEE |
| 66.57 |
| FBO ADP ACCESS |
| ||
|
| |||
| T ROWE PRICE ASSOCIATES | 20.14 | ||
| ATTN FINANCIAL REPORTING DEPT |
| ||
FUND |
| SHAREHOLDER |
| % |
RETIREMENT BALANCED FUND |
| NATIONAL FINANCIAL SERVICES |
| 15.88 |
| FOR THE EXCLUSIVE BENEFIT |
| ||
| OF OUR CUSTOMERS |
|
137
|
| |||
| T ROWE PRICE RPS INC | 15.42 | ||
| OMNIBUS ACCOUNT |
| ||
| RETIREMENT INCOME,#145 |
| ||
| PO BOX 17215 |
| ||
| BALTIMORE MD 21297-1215 |
| ||
RETIREMENT BALANCED FUND—ADVISOR CLASS |
| MASSACHUSETTS MUTUAL LIFE |
| 6.41 |
| INSURANCE CO |
| ||
| ATTN RS FUND OPERATIONS |
| ||
|
| |||
| NATIONAL FINANCIAL SERVICES | 14.51 | ||
| FOR THE EXCLUSIVE BENEFIT |
| ||
| OF OUR CUSTOMERS |
| ||
|
| |||
| TAYNIK & CO | 6.87 | ||
| C/O INVESTORS BANK & TRUST |
| ||
RETIREMENT BALANCED FUND—R CLASS |
| PIMS/PRUDENTIAL RETIREMENT |
| 10.61 |
| AS NOMINEE FOR THE TTEE/CUST PL 701 |
| ||
| NEPC - TAFT HARTLEY IRONWORKERS |
| ||
| PO BOX 30124 |
| ||
| SALT LAKE CTY UT 84130-0124 |
| ||
|
| |||
| STATE STREET CORP TTEE | 34.89(c) | ||
| FBO ADP ACCESS |
| ||
|
| |||
| VOYA RETIREMENT INS & ANNUITY CO | 7.84 | ||
SCIENCE & TECHNOLOGY FUND |
| T ROWE PRICE RPS INC |
| 15.44 |
| OMNIBUS |
| ||
| PLAN # |
| ||
| NEW BUSINESS-CONV ASSTS #133 DIF |
| ||
| P O BOX 17215 |
| ||
| BALTIMORE MD 21297-1215 |
| ||
SCIENCE & TECHNOLOGY FUND—ADVISOR CLASS |
| JOHN HANCOCK LIFE |
| 87.08(c) |
| INSURANCE CO USA |
| ||
| RPS TRADING OPS ST-4 |
| ||
FUND |
| SHAREHOLDER |
| % |
SHORT-TERM BOND FUND |
| EDWARD D JONES & CO |
| 8.06 |
| SHAREHOLDER ACCOUNTING |
| ||
| ATTN MUTUAL FUND |
| ||
|
| |||
| NATIONAL FINANCIAL SERVICES | 5.99 | ||
| FOR THE EXCLUSIVE BENEFIT |
| ||
| OF OUR CUSTOMERS |
| ||
|
| |||
| SPECTRUM INCOME FUND | 8.30 | ||
| T. ROWE PRICE ASSOCIATES |
| ||
| ATTN: FUND ACCOUNTING DEPT |
| ||
SHORT-TERM BOND FUND—ADVISOR CLASS |
| CHARLES SCHWAB & CO INC |
| 9.01 |
| REINVEST ACCOUNT |
| ||
| ATTN MUTUAL FUND DEPT |
|
138
|
| |||
| NATIONAL FINANCIAL SERVICES | 50.21(c) | ||
| FOR THE EXCLUSIVE BENEFIT |
| ||
| OF OUR CUSTOMERS |
| ||
|
| |||
| PERSHING LLC | 5.25 | ||
|
| |||
| RBC CAPITAL MARKETS LLC | 5.40 | ||
| MUTUAL FUND OMNIBUS PROCESSING |
| ||
| OMNIBUS |
| ||
| ATTN MUTUAL FUND OPS MANAGER |
| ||
| 60 S 6TH ST # STREET-P08 |
| ||
| MINNEAPOLIS MN 55402-4413 |
| ||
|
| |||
| TD AMERITRADE INC FBO | 8.87 | ||
| OUR CUSTOMERS |
| ||
SHORT-TERM RESERVE INVESTMENT FUND |
| JPMORGAN CHASE BANK AS AGENT |
| 57.79(c) |
| FOR INSTITUTIONAL FUNDS |
| ||
| ATTN AMANDA MORLEY |
| ||
| 500 STANTON CHRISTIANA RD |
| ||
| OPS 4 FL 3 |
| ||
| NEWARK DE 19713-2105 |
| ||
|
| |||
| STATE STREET BANK & TRUST CO AGENT | 41.51(c) | ||
| FOR T ROWE INSTITUTIONAL FUNDS |
| ||
| 1 LINCOLN ST 3RD FLOOR |
| ||
| BOSTON MA 02111-2901 |
| ||
FUND |
| SHAREHOLDER |
| % |
SMALL-CAP STOCK FUND |
| MINNESOTA STATE RETIREMENT SYSTEM |
| 6.73 |
| DEFINED CONTRIBUTION PLANS |
| ||
| 60 EMPIRE DR STE 300 |
| ||
| SAINT PAUL MN 55103-3000 |
| ||
|
| |||
| NATIONAL FINANCIAL SERVICES | 10.67 | ||
| FOR THE EXCLUSIVE BENEFIT |
| ||
| OF OUR CUSTOMERS |
| ||
|
| |||
| T ROWE PRICE TRUST CO INC | 6.56 | ||
| T R P O T C FUND |
| ||
| ATTN R P S CONTROL DEPT |
| ||
| P O BOX 17215 |
| ||
| BALTIMORE MD 21297-1215 |
| ||
SMALL-CAP STOCK FUND—ADVISOR CLASS |
| DCGT AS TTEE AND/OR CUST |
| 6.45 |
| ATTN NPIO TRADE DESK |
| ||
| FBO PLIC VARIOUS RETIREMENT PLANS |
| ||
| OMNIBUS |
| ||
|
| |||
| HORACE MANN LIFE INS COMPANY | 5.97 | ||
| SEPARATE ACCOUNT |
| ||
| 1 HORACE MANN PLZ |
|
139
| SPRINGFIELD IL 62715-0002 |
| ||
|
| |||
| MORGAN STANLEY SMITH BARNEY | 5.41 | ||
| HARBORSIDE FINANCIAL CENTER |
| ||
|
| |||
| NATIONAL FINANCIAL SERVICES | 21.86 | ||
| FOR THE EXCLUSIVE BENEFIT |
| ||
| OF OUR CUSTOMERS |
| ||
|
| |||
| VANGUARD FIDUCIARY TRUST CO | 5.45 | ||
| T ROWE PRICE ADVISOR CLASS FUNDS |
| ||
| ATTN OUTSIDE FUNDS |
| ||
| P O BOX 2900 VM 613 |
| ||
| VALLEY FORGE PA 19482-2900 |
| ||
|
| |||
| WELLS FARGO BANK FBO | 15.13 | ||
| FBO VARIOUS RETIREMENT PLANS |
| ||
SMALL-CAP VALUE FUND |
| NATIONAL FINANCIAL SERVICES |
| 7.88 |
| FOR THE EXCLUSIVE BENEFIT |
| ||
| OF OUR CUSTOMERS |
| ||
|
| |||
| T ROWE PRICE TRUST CO INC | 15.17 | ||
| ATTN: TRPS INST CONTROL DEPT |
| ||
FUND |
| SHAREHOLDER |
| % |
SMALL-CAP VALUE FUND—ADVISOR CLASS |
| ICMA RETIREMENT TRUST NAV |
| 13.69 |
|
| |||
| ICMA RETIREMENT TRUST NAV | 23.38 | ||
|
| |||
| NATIONAL FINANCIAL SERVICES | 14.03 | ||
| FOR THE EXCLUSIVE BENEFIT |
| ||
| OF OUR CUSTOMERS |
| ||
SPECTRUM GROWTH FUND |
| T ROWE PRICE TRUST CO INC |
| 8.97 |
| ATTN: TRPS INST CONTROL DEPT |
| ||
SPECTRUM INCOME FUND |
| T ROWE PRICE TRUST CO INC |
| 9.77 |
| ATTN: TRPS INST CONTROL DEPT |
| ||
STRATEGIC INCOME FUND |
| CHARLES SCHWAB & CO INC |
| 6.03 |
| SPECIAL CUSTODY A/C FBO CUSTOMERS |
| ||
| ATTN MUTUAL FUND DEPT |
| ||
|
| |||
| NATIONAL FINANCIAL SERVICES | 5.75 | ||
| FOR THE EXCLUSIVE BENEFIT |
| ||
| OF OUR CUSTOMERS |
| ||
|
| |||
| T ROWE PRICE ASSOCIATES | 9.15 | ||
| ATTN FINANCIAL REPORTING DEPT |
| ||
STRATEGIC INCOME FUND—ADVISOR CLASS |
| CHARLES SCHWAB & CO INC |
| 26.73(c) |
| SPECIAL CUSTODY A/C FBO CUSTOMERS |
| ||
| ATTN MUTUAL FUND DEPT |
| ||
|
| |||
| LPL FINANCIAL | 12.29 |
140
|
| |||
| NATIONAL FINANCIAL SERVICES | 18.62 | ||
| FOR THE EXCLUSIVE BENEFIT |
| ||
| OF OUR CUSTOMERS |
| ||
|
| |||
| PERSHING LLC | 24.42 | ||
|
| |||
| TD AMERITRADE INC FBO | 5.24 | ||
| OUR CUSTOMERS |
| ||
SUMMIT CASH RESERVES FUND |
| T ROWE PRICE GROUP INC |
| 10.53 |
| ATTN FINANCIAL REPORTING DEPT |
| ||
| P O BOX 89000 |
| ||
| BALTIMORE MD 21289-5076 |
| ||
|
| |||
| T ROWE PRICE TRUST CO | 8.12 | ||
| ATTN ASSET RECONCILIATIONS |
| ||
| P O BOX 17215 |
| ||
| BALTIMORE MD 21297-1215 |
| ||
FUND |
| SHAREHOLDER |
| % |
SUMMIT MUNICIPAL INCOME FUND |
| EDWARD D JONES & CO |
| 22.55 |
| SHAREHOLDER ACCOUNTING |
| ||
| ATTN MUTUAL FUND |
| ||
|
| |||
| LPL FINANCIAL | 6.03 | ||
|
| |||
| SAXON & CO. | 12.56 | ||
| FBO |
| ||
SUMMIT MUNICIPAL INCOME FUND—ADVISOR CLASS |
| LPL FINANCIAL |
| 33.58(c) |
|
| |||
| PERSHING LLC | 35.64(c) | ||
|
| |||
| T ROWE PRICE ASSOCIATES | 15.24 | ||
| ATTN FINANCIAL REPORTING DEPT |
| ||
SUMMIT MUNICIPAL INTERMEDIATE FUND |
| CHARLES SCHWAB & CO INC |
| 10.06 |
| REINVEST ACCOUNT |
| ||
| ATTN MUTUAL FUND DEPT |
| ||
|
| |||
| EDWARD D JONES & CO | 22.56 | ||
| SHAREHOLDER ACCOUNTING |
| ||
| ATTN MUTUAL FUND |
| ||
|
| |||
| FIRST CLEARING LLC | 10.84 | ||
| SPECIAL CUSTODY ACCT FOR THE |
| ||
| EXCLUSIVE BENEFIT OF CUSTOMERS |
| ||
|
| |||
| JP MORGAN CLEARING CORP OMNIBUS ACC | 15.94 | ||
| FOR THE EXCLUSIVE BENEFIT |
| ||
| OF CUSTOMERS |
| ||
|
| |||
| MLPF&S FOR THE SOLE BENEFIT OF | 5.45 |
141
| ITS CUSTOMERS |
| ||
|
| |||
| PERSHING LLC | 5.15 | ||
|
| |||
| SAXON & CO. | 5.99 | ||
| FBO |
| ||
SUMMIT MUNICIPAL INTERMEDIATE FUND—ADVISOR |
| CHARLES SCHWAB & CO INC |
| 78.82(c) |
CLASS | REINVEST ACCOUNT |
| ||
| ATTN MUTUAL FUND DEPT |
| ||
|
| |||
| PERSHING LLC | 9.76 | ||
|
| |||
| T ROWE PRICE ASSOCIATES | 5.86 | ||
| ATTN FINANCIAL REPORTING DEPT |
| ||
FUND |
| SHAREHOLDER |
| % |
SUMMIT MUNICIPAL MONEY MARKET FUND |
| ERIC Y EICHLER TR |
| 6.35 |
| AMENDMENT AND RESTATEMENT OF |
| ||
| TRUST OF ERIC Y EICHLER |
| ||
| MALVERN PA 19355-3417 |
| ||
TARGET RETIREMENT 2005 FUND |
| KENNETH S FORMAN AGENT POA |
| 6.09 |
| DTD 02/02/2015 T ROWE PRICE |
| ||
| TRUST CO CUST FOR THE IRA |
| ||
| OF SELMA D FORMAN |
| ||
| EAST MEADOW NY 11554-2272 |
| ||
|
| |||
| T ROWE PRICE TRUST CO | 9.22 | ||
| CUST FOR THE IRA OF |
| ||
| NANCY T MOY |
| ||
| PO BOX 102 |
| ||
| MOUNT FREEDOM NJ 07970-0102 |
| ||
TARGET RETIREMENT 2005 FUND—ADVISOR CLASS |
| NATIONAL FINANCIAL SERVICES |
| 54.82(c) |
| FOR THE EXCLUSIVE BENEFIT |
| ||
| OF OUR CUSTOMERS |
| ||
|
| |||
| RELIANCE TRUST CO TTEE ADP | 21.07 | ||
| ACCESS LARGE MARKET 401K |
| ||
| 1100 ABERNATHY RD |
| ||
| ATLANTA GA 30328-5620 |
| ||
|
| |||
| T ROWE PRICE ASSOCIATES | 24.11 | ||
| ATTN FINANCIAL REPORTING DEPT |
| ||
TARGET RETIREMENT 2010 FUND |
| T ROWE PRICE RPS INC |
| 10.52 |
| OMNIBUS ACCOUNT TICKER: TRROX |
| ||
| CUSIP: 74149P564 |
| ||
| TRP TARGET RET 2010 AB9K |
| ||
| PO BOX 17215 |
| ||
| BALTIMORE MD 21297-1215 |
| ||
TARGET RETIREMENT 2010 FUND—ADVISOR CLASS |
| NATIONAL FINANCIAL SERVICES |
| 65.51(c) |
| FOR THE EXCLUSIVE BENEFIT |
| ||
| OF OUR CUSTOMERS |
|
142
|
| |||
| RELIANCE TRUST CO TTEE ADP | 29.94(c) | ||
| ACCESS LARGE MARKET 401K |
| ||
TARGET RETIREMENT 2015 FUND |
| T ROWE PRICE RPS INC |
| 13.45 |
| OMNIBUS ACCOUNT TICKER: TRRTX |
| ||
| CUSIP: 74149P556 |
| ||
| TRP TARGET RET 2015 AB9T |
| ||
| PO BOX 17215 |
| ||
| BALTIMORE MD 21297-1215 |
| ||
FUND |
| SHAREHOLDER |
| % |
TARGET RETIREMENT 2015 FUND—ADVISOR CLASS |
| GREAT WEST TRUST CO LLC |
| 28.28(c) |
| FBO RECORDKEEPING FOR VARIOUS |
| ||
| BENEFIT PL OMNIPUTNAM |
| ||
| C/O MUTUAL FUND TRADING |
| ||
| 8525 E ORCHARD RD |
| ||
| GREENWOOD VLG CO 80111-5002 |
| ||
|
| |||
| GREAT-WEST TRUST COMPANY LLC TTEE F | 15.72 | ||
| EMPLOYEE BENEFITS CLIENTS 401K |
| ||
| 8515 E ORCHARD RD 2T2 |
| ||
| GREENWOOD VLG CO 80111-5002 |
| ||
|
| |||
| NATIONAL FINANCIAL SERVICES | 39.66(c) | ||
| FOR THE EXCLUSIVE BENEFIT |
| ||
| OF OUR CUSTOMERS |
| ||
|
| |||
| PERSHING LLC | 5.25 | ||
|
| |||
| T ROWE PRICE ASSOCIATES | 6.90 | ||
| ATTN FINANCIAL REPORTING DEPT |
| ||
TARGET RETIREMENT 2020 FUND |
| NATIONAL FINANCIAL SERVICES |
| 7.54 |
| FOR THE EXCLUSIVE BENEFIT |
| ||
| OF OUR CUSTOMERS |
| ||
| 499 WASHINGTON BLVD |
| ||
| ATTN: MUTUAL FUNDS DEPT 4TH FL |
| ||
|
| |||
| T ROWE PRICE RPS INC | 20.55 | ||
| OMNIBUS ACCOUNT TICKER: TRRUX |
| ||
| CUSIP: 74149P549 |
| ||
| TRP TARGET RET 2020 ABAY |
| ||
| PO BOX 17215 |
| ||
| BALTIMORE MD 21297-1215 |
| ||
TARGET RETIREMENT 2020 FUND—ADVISOR CLASS |
| GREAT WEST TRUST CO LLC |
| 7.65 |
| FBO RECORDKEEPING FOR VARIOUS |
| ||
| BENEFIT PL OMNIPUTNAM |
| ||
| C/O MUTUAL FUND TRADING |
| ||
|
| |||
| GREAT-WEST TRUST COMPANY LLC TTEE F | 12.59 | ||
| EMPLOYEE BENEFITS CLIENTS 401K |
| ||
|
|
143
| NATIONAL FINANCIAL SERVICES | 23.59 | ||
| FOR THE EXCLUSIVE BENEFIT |
| ||
| OF OUR CUSTOMERS |
| ||
|
| |||
| RELIANCE TRUST CO TTEE ADP | 52.41(c) | ||
| ACCESS LARGE MARKET 401K |
| ||
FUND |
| SHAREHOLDER |
| % |
TARGET RETIREMENT 2025 FUND |
| NATIONAL FINANCIAL SERVICES |
| 7.04 |
| FOR THE EXCLUSIVE BENEFIT |
| ||
| OF OUR CUSTOMERS |
| ||
| 499 WASHINGTON BLVD |
| ||
| ATTN: MUTUAL FUNDS DEPT 4TH FL |
| ||
|
| |||
| T ROWE PRICE RPS INC | 32.21(e) | ||
| OMNIBUS ACCOUNT TICKER: TRRVX |
| ||
| CUSIP: 74149P531 |
| ||
| TRP TARGET RET 2025 ABBC |
| ||
| PO BOX 17215 |
| ||
| BALTIMORE MD 21297-1215 |
| ||
TARGET RETIREMENT 2025 FUND—ADVISOR CLASS |
| GREAT WEST TRUST CO LLC |
| 33.00(c) |
| FBO RECORDKEEPING FOR VARIOUS |
| ||
| BENEFIT PL OMNIPUTNAM |
| ||
| C/O MUTUAL FUND TRADING |
| ||
|
| |||
| GREAT-WEST TRUST COMPANY LLC TTEE F | 24.45 | ||
| EMPLOYEE BENEFITS CLIENTS 401K |
| ||
|
| |||
| NATIONAL FINANCIAL SERVICES | 23.63 | ||
| FOR THE EXCLUSIVE BENEFIT |
| ||
| OF OUR CUSTOMERS |
| ||
|
| |||
| RELIANCE TRUST CO TTEE ADP | 13.50 | ||
| ACCESS LARGE MARKET 401K |
| ||
TARGET RETIREMENT 2030 FUND |
| NATIONAL FINANCIAL SERVICES |
| 14.04 |
| FOR THE EXCLUSIVE BENEFIT |
| ||
| OF OUR CUSTOMERS |
| ||
| 499 WASHINGTON BLVD |
| ||
| ATTN: MUTUAL FUNDS DEPT 4TH FL |
| ||
|
| |||
| T ROWE PRICE RPS INC | 33.68(e) | ||
| OMNIBUS ACCOUNT TICKER: TRRWX |
| ||
| CUSIP: 74149P523 |
| ||
| TRP TARGET RET 2030 ABBH |
| ||
| PO BOX 17215 |
| ||
| BALTIMORE MD 21297-1215 |
| ||
FUND |
| SHAREHOLDER |
| % |
TARGET RETIREMENT 2030 FUND—ADVISOR CLASS |
| GREAT WEST TRUST CO LLC |
| 9.07 |
| FBO RECORDKEEPING FOR VARIOUS |
| ||
| BENEFIT PL OMNIPUTNAM |
| ||
| C/O MUTUAL FUND TRADING |
|
144
|
| |||
| NATIONAL FINANCIAL SERVICES | 33.32(c) | ||
| FOR THE EXCLUSIVE BENEFIT |
| ||
| OF OUR CUSTOMERS |
| ||
|
| |||
| RELIANCE TRUST CO TTEE ADP | 50.52(c) | ||
| ACCESS LARGE MARKET 401K |
| ||
TARGET RETIREMENT 2035 FUND |
| NATIONAL FINANCIAL SERVICES |
| 10.11 |
| FOR THE EXCLUSIVE BENEFIT |
| ||
| OF OUR CUSTOMERS |
| ||
| 499 WASHINGTON BLVD |
| ||
| ATTN: MUTUAL FUNDS DEPT 4TH FL |
| ||
|
| |||
| T ROWE PRICE RPS INC | 41.67(e) | ||
| OMNIBUS ACCOUNT TICKER: RPGRX |
| ||
| CUSIP: 74149P515 |
| ||
| TRP TARGET RET 2035 AB5Y |
| ||
| PO BOX 17215 |
| ||
| BALTIMORE MD 21297-1215 |
| ||
|
| |||
| WELLS FARGO BANK FBO | 5.88 | ||
| FBO VARIOUS RETIREMENT PLANS |
| ||
TARGET RETIREMENT 2035 FUND—ADVISOR CLASS |
| GREAT WEST TRUST CO LLC |
| 20.07 |
| FBO RECORDKEEPING FOR VARIOUS |
| ||
| BENEFIT PL OMNIPUTNAM |
| ||
| C/O MUTUAL FUND TRADING |
| ||
|
| |||
| GREAT-WEST TRUST COMPANY LLC TTEE F | 17.07 | ||
| EMPLOYEE BENEFITS CLIENTS 401K |
| ||
|
| |||
| NATIONAL FINANCIAL SERVICES | 58.69(c) | ||
| FOR THE EXCLUSIVE BENEFIT |
| ||
| OF OUR CUSTOMERS |
| ||
TARGET RETIREMENT 2040 FUND |
| NATIONAL FINANCIAL SERVICES |
| 12.07 |
| FOR THE EXCLUSIVE BENEFIT |
| ||
| OF OUR CUSTOMERS |
| ||
|
| |||
| T ROWE PRICE RPS INC | 44.47(e) | ||
| OMNIBUS ACCOUNT TICKER: TRHRX |
| ||
| CUSIP: 74149P499 |
| ||
| TRP TARGET RET 2040 AB6J |
| ||
| PO BOX 17215 |
| ||
| BALTIMORE MD 21297-1215 |
| ||
FUND |
| SHAREHOLDER |
| % |
TARGET RETIREMENT 2040 FUND—ADVISOR CLASS |
| ASCENSUS TRUST COMPANY FBO |
| 8.33 |
| JOSEPH S THOMPSON, DDS, PC 401(K) |
| ||
| PO BOX 10758 |
| ||
| FARGO ND 58106-0758 |
| ||
|
| |||
| GREAT WEST TRUST CO LLC | 21.31 |
145
| FBO RECORDKEEPING FOR VARIOUS |
| ||
| BENEFIT PL OMNIPUTNAM |
| ||
| C/O MUTUAL FUND TRADING |
| ||
|
| |||
| NATIONAL FINANCIAL SERVICES | 59.21(c) | ||
| FOR THE EXCLUSIVE BENEFIT |
| ||
| OF OUR CUSTOMERS |
| ||
TARGET RETIREMENT 2045 FUND |
| NATIONAL FINANCIAL SERVICES |
| 7.61 |
| FOR THE EXCLUSIVE BENEFIT |
| ||
| OF OUR CUSTOMERS |
| ||
| 499 WASHINGTON BLVD |
| ||
| ATTN: MUTUAL FUNDS DEPT 4TH FL |
| ||
|
| |||
| T ROWE PRICE RPS INC | 35.86(e) | ||
| OMNIBUS ACCOUNT TICKER: RPTFX |
| ||
| CUSIP: 74149P481 |
| ||
| TRP TARGET RET 2045 AB7Y |
| ||
| PO BOX 17215 |
| ||
| BALTIMORE MD 21297-1215 |
| ||
|
| |||
| WELLS FARGO BANK FBO | 14.71 | ||
| FBO VARIOUS RETIREMENT PLANS |
| ||
TARGET RETIREMENT 2045 FUND—ADVISOR CLASS |
| GREAT WEST TRUST CO LLC |
| 20.26 |
| FBO RECORDKEEPING FOR VARIOUS |
| ||
| BENEFIT PL OMNIPUTNAM |
| ||
| C/O MUTUAL FUND TRADING |
| ||
|
| |||
| GREAT-WEST TRUST COMPANY LLC TTEE F | 11.42 | ||
| EMPLOYEE BENEFITS CLIENTS 401K |
| ||
|
| |||
| NATIONAL FINANCIAL SERVICES | 59.61(c) | ||
| FOR THE EXCLUSIVE BENEFIT |
| ||
| OF OUR CUSTOMERS |
| ||
|
| |||
| T ROWE PRICE ASSOCIATES | 8.09 | ||
| ATTN FINANCIAL REPORTING DEPT |
| ||
FUND |
| SHAREHOLDER |
| % |
TARGET RETIREMENT 2050 FUND |
| NATIONAL FINANCIAL SERVICES |
| 12.46 |
| FOR THE EXCLUSIVE BENEFIT |
| ||
| OF OUR CUSTOMERS |
| ||
| 499 WASHINGTON BLVD |
| ||
| ATTN: MUTUAL FUNDS DEPT 4TH FL |
| ||
|
| |||
| T ROWE PRICE RPS INC | 29.48(e) | ||
| OMNIBUS ACCOUNT TICKER: TRFOX |
| ||
| CUSIP: 74149P473 |
| ||
| TRP TARGET RET 2050 AB8F |
| ||
| PO BOX 17215 |
| ||
| BALTIMORE MD 21297-1215 |
| ||
TARGET RETIREMENT 2050 FUND—ADVISOR CLASS |
| GREAT WEST TRUST CO LLC |
| 10.54 |
146
| FBO RECORDKEEPING FOR VARIOUS |
| ||
| BENEFIT PL OMNIPUTNAM |
| ||
| C/O MUTUAL FUND TRADING |
| ||
|
| |||
| NATIONAL FINANCIAL SERVICES | 68.84(c) | ||
| FOR THE EXCLUSIVE BENEFIT |
| ||
| OF OUR CUSTOMERS |
| ||
|
| |||
| STATE STREET CORP TTEE | 5.42 | ||
| FBO ADP ACCESS |
| ||
|
| |||
| T ROWE PRICE ASSOCIATES | 11.65 | ||
| ATTN FINANCIAL REPORTING DEPT |
| ||
TARGET RETIREMENT 2055 FUND |
| T ROWE PRICE RPS INC |
| 28.02(e) |
| OMNIBUS ACCOUNT TICKER: TRFFX |
| ||
| CUSIP: 74149P465 |
| ||
| TRP TARGET RET 2055 AB8T |
| ||
| PO BOX 17215 |
| ||
| BALTIMORE MD 21297-1215 |
| ||
|
| |||
| TD AMERITRADE INC FBO | 9.05 | ||
| OUR CUSTOMERS |
| ||
|
| |||
| WELLS FARGO BANK FBO | 6.08 | ||
| FBO VARIOUS RETIREMENT PLANS |
| ||
FUND |
| SHAREHOLDER |
| % |
TARGET RETIREMENT 2055 FUND—ADVISOR CLASS |
| GREAT WEST TRUST CO LLC |
| 5.40 |
| FBO RECORDKEEPING FOR VARIOUS |
| ||
| BENEFIT PL OMNIPUTNAM |
| ||
| C/O MUTUAL FUND TRADING |
| ||
|
| |||
| GREAT-WEST TRUST COMPANY LLC TTEE F | 14.67 | ||
| EMPLOYEE BENEFITS CLIENTS 401K |
| ||
|
| |||
| NATIONAL FINANCIAL SERVICES | 57.70(c) | ||
| FOR THE EXCLUSIVE BENEFIT |
| ||
| OF OUR CUSTOMERS |
| ||
|
| |||
| T ROWE PRICE ASSOCIATES | 18.09 | ||
| ATTN FINANCIAL REPORTING DEPT |
| ||
TARGET RETIREMENT 2060 FUND |
| T ROWE PRICE ASSOCIATES |
| 46.22(a) |
| ATTN FINANCIAL REPORTING DEPT |
| ||
|
| |||
| T ROWE PRICE TRUST CO | 10.15 | ||
| CUST FOR THE IRA OF |
| ||
| SUSAN A BRUEMMER (DCD) |
| ||
| CHANCE A BRUEMMER (BENE) |
| ||
| MANAHAWKIN NJ 08050-3518 |
| ||
|
| |||
| T ROWE PRICE TRUST CO | 6.08 |
147
| CUST FOR THE ROLLOVER IRA OF |
| ||
| ANDREW C BAEK |
| ||
| CHEVY CHASE MD 20815-5027 |
| ||
TARGET RETIREMENT 2060 FUND—ADVISOR CLASS |
| T ROWE PRICE ASSOCIATES |
| 94.94(a) |
| ATTN FINANCIAL REPORTING DEPT |
| ||
TAX-EXEMPT MONEY FUND |
| EDWARD D JONES & CO |
| 24.09 |
| SHAREHOLDER ACCOUNTING |
| ||
| ATTN MUTUAL FUND |
| ||
|
| |||
| PERSHING LLC | 5.31 | ||
| FOR EXCLUSIVE BENEFIT OF TRP MONEY |
| ||
| FUND CUSTOMER ACCOUNTS |
| ||
| 1 PERSHING PLZ |
| ||
| JERSEY CITY NJ 07399-0002 |
| ||
|
| |||
| SUSAN A FEITH | 5.33 | ||
| WISC RAPIDS WI 54494-4174 |
| ||
|
| |||
| T ROWE PRICE ASSOCIATES | 5.52 | ||
| ATTN FINANCIAL REPORTING DEPT |
| ||
FUND |
| SHAREHOLDER |
| % |
TAX-FREE HIGH YIELD FUND |
| CHARLES SCHWAB & CO INC |
| 8.69 |
| REINVEST ACCOUNT |
| ||
| ATTN MUTUAL FUND DEPT |
| ||
|
| |||
| EDWARD D JONES & CO | 9.74 | ||
| SHAREHOLDER ACCOUNTING |
| ||
| ATTN MUTUAL FUND |
| ||
|
| |||
| NATIONAL FINANCIAL SERVICES | 7.68 | ||
| FOR THE EXCLUSIVE BENEFIT |
| ||
| OF OUR CUSTOMERS |
| ||
TAX-FREE HIGH YIELD FUND—ADVISOR CLASS |
| CHARLES SCHWAB & CO INC |
| 65.94(c) |
| REINVEST ACCOUNT |
| ||
| ATTN MUTUAL FUND DEPT |
| ||
|
| |||
| LPL FINANCIAL | 9.41 | ||
|
| |||
| NATIONAL FINANCIAL SERVICES | 12.63 | ||
| FOR THE EXCLUSIVE BENEFIT |
| ||
| OF OUR CUSTOMERS |
| ||
|
| |||
| PERSHING LLC | 7.93 | ||
TAX-FREE INCOME FUND |
| CHARLES SCHWAB & CO INC |
| 5.21 |
| REINVEST ACCOUNT |
| ||
| ATTN MUTUAL FUND DEPT |
| ||
TAX-FREE INCOME FUND—ADVISOR CLASS |
| NATIONAL FINANCIAL SERVICES |
| 93.93(c) |
| FOR THE EXCLUSIVE BENEFIT |
| ||
| OF OUR CUSTOMERS |
| ||
TAX-FREE SHORT-INTERMEDIATE FUND |
| CHARLES SCHWAB & CO INC |
| 17.79 |
148
| REINVEST ACCOUNT |
| ||
| ATTN MUTUAL FUND DEPT |
| ||
|
| |||
| FIRST CLEARING LLC | 12.50 | ||
| SPECIAL CUSTODY ACCT FOR THE |
| ||
| EXCLUSIVE BENEFIT OF CUSTOMERS |
| ||
|
| |||
| NATIONAL FINANCIAL SERVICES | 8.25 | ||
| FOR THE EXCLUSIVE BENEFIT |
| ||
| OF OUR CUSTOMERS |
| ||
|
| |||
| PERSHING LLC | 5.67 | ||
|
| |||
| T ROWE PRICE ASSOCIATES | 9.19 | ||
| ATTN FINANCIAL REPORTING DEPT |
| ||
FUND |
| SHAREHOLDER |
| % |
TAX-FREE SHORT-INTERMEDIATE FUND—ADVISOR CLASS |
| CHARLES SCHWAB & CO INC |
| 34.04(c) |
| REINVEST ACCOUNT |
| ||
| ATTN MUTUAL FUND DEPT |
| ||
|
| |||
| NATIONAL FINANCIAL SERVICES | 43.03(c) | ||
| FOR THE EXCLUSIVE BENEFIT |
| ||
| OF OUR CUSTOMERS |
| ||
|
| |||
| PERSHING LLC | 7.10 | ||
TOTAL EQUITY MARKET INDEX FUND |
| EDUCATION TRUST OF ALASKA |
| 7.09 |
| TOTAL EQUITY MARKET INDEX PORTFOLIO |
| ||
| C/O T ROWE PRICE ASSOCIATES |
| ||
| ATTN DAWN WAGNER FIXED INCOME |
| ||
| 100 E PRATT ST FL 7 |
| ||
| BALTIMORE MD 21202-1009 |
| ||
|
| |||
| MARYLAND COLLEGE INVESTMENT PLAN | 8.66 | ||
| GLOBAL EQUITY MARKET INDEX |
| ||
| ATTN FUND ACCOUNTING |
| ||
U.S. BOND ENHANCED INDEX FUND |
| CHARLES SCHWAB & CO INC |
| 5.34 |
| REINVEST ACCOUNT |
| ||
| ATTN MUTUAL FUND DEPT |
| ||
|
| |||
| EDUCATION TRUST OF ALASKA | 9.29 | ||
| ACT PORTFOLIO |
| ||
| C/O T ROWE PRICE ASSOCIATES |
| ||
| ATTN DAWN WAGNER FIXED INCOME |
| ||
| 100 E PRATT ST FL 7 |
| ||
| BALTIMORE MD 21202-1009 |
| ||
|
| |||
| T ROWE PRICE RPS INC | 10.30 | ||
| OMNIBUS |
| ||
| PLAN # |
| ||
| NEW BUSINESS-CONV ASSTS #134 UBX |
|
149
| P O BOX 17215 |
| ||
| BALTIMORE MD 21297-1215 |
| ||
U.S. LARGE-CAP CORE FUND |
| T ROWE PRICE ASSOCIATES |
| 10.14 |
| ATTN FINANCIAL REPORTING DEPT |
| ||
FUND |
| SHAREHOLDER |
| % |
U.S. LARGE-CAP CORE FUND—ADVISOR CLASS |
| CHARLES SCHWAB & CO INC |
| 23.76 |
| REINVEST ACCOUNT |
| ||
| ATTN MUTUAL FUND DEPT |
| ||
|
| |||
| LPL FINANCIAL | 6.54 | ||
|
| |||
| NATIONAL FINANCIAL SERVICES | 37.77(c) | ||
| FOR THE EXCLUSIVE BENEFIT |
| ||
| OF OUR CUSTOMERS |
| ||
|
| |||
| PERSHING LLC | 6.81 | ||
|
| |||
| T ROWE PRICE ASSOCIATES | 22.97 | ||
| ATTN FINANCIAL REPORTING DEPT |
| ||
U.S. TREASURY INTERMEDIATE FUND |
| SPECTRUM INCOME FUND |
| 8.83 |
| T. ROWE PRICE ASSOCIATES |
| ||
| ATTN: FUND ACCOUNTING DEPT |
| ||
|
| |||
| T ROWE PRICE TRUST CO | 7.87 | ||
| ATTN TRPS INST CONTROL DEPT |
| ||
U.S. TREASURY LONG-TERM FUND |
| SPECTRUM INCOME FUND |
| 27.48(d) |
| T. ROWE PRICE ASSOCIATES |
| ||
| ATTN: FUND ACCOUNTING DEPT |
| ||
|
| |||
| T ROWE PRICE TRUST CO | 7.83 | ||
| ATTN TRPS INST CONTROL DEPT |
| ||
U.S. TREASURY MONEY FUND |
| DCGT AS TTEE AND/OR CUST |
| 6.49 |
| ATTN NPIO TRADE DESK |
| ||
| FBO PLIC VARIOUS RETIREMENT PLANS |
| ||
| OMNIBUS |
| ||
ULTRA SHORT-TERM BOND FUND |
| T ROWE PRICE ASSOCIATES |
| 69.28(a) |
| ATTN FINANCIAL REPORTING DEPT |
| ||
FUND |
| SHAREHOLDER |
| % |
VALUE FUND |
| RETIREMENT PORTFOLIO 2020 |
| 9.20 |
| T ROWE PRICE ASSOCIATES |
| ||
| ATTN FUND ACCOUNTING DEPT |
| ||
|
| |||
| RETIREMENT PORTFOLIO 2025 | 9.41 | ||
| T ROWE PRICE ASSOCIATES |
| ||
| ATTN FUND ACCOUNTING DEPT |
| ||
|
| |||
| RETIREMENT PORTFOLIO 2030 | 16.48 | ||
| T ROWE PRICE ASSOCIATES |
| ||
| ATTN FUND ACCOUNTING DEPT |
| ||
|
|
150
| RETIREMENT PORTFOLIO 2035 | 10.57 | ||
| T ROWE PRICE ASSOCIATES |
| ||
| ATTN FUND ACCOUNTING DEPT |
| ||
|
| |||
| RETIREMENT PORTFOLIO 2040 | 15.09 | ||
| T ROWE PRICE ASSOCIATES |
| ||
| ATTN FUND ACCOUNTING DEPT |
| ||
|
| |||
| RETIREMENT PORTFOLIO 2045 | 6.71 | ||
| T ROWE PRICE ASSOCIATES |
| ||
| ATTN FUND ACCOUNTING DEPT |
| ||
|
| |||
| RETIREMENT PORTFOLIO 2050 | 5.02 | ||
| T ROWE PRICE ASSOCIATES |
| ||
| ATTN FUND ACCOUNTING DEPT |
| ||
| 100 E PRATT ST |
| ||
| BALTIMORE MD 21202-1009 |
| ||
VALUE FUND—ADVISOR CLASS |
| CHARLES SCHWAB & CO INC |
| 13.47 |
| REINVEST ACCOUNT |
| ||
| ATTN MUTUAL FUND DEPT |
| ||
|
| |||
| MORGAN STANLEY SMITH BARNEY | 8.47 | ||
| HARBORSIDE FINANCIAL CENTER |
| ||
| NATIONAL FINANCIAL SERVICES |
| ||
| FOR THE EXCLUSIVE BENEFIT |
| ||
| OF OUR CUSTOMERS |
| ||
|
| |||
| VOYA INSTITUTIONAL TRUST COMPANY | 8.69 | ||
|
| |||
| VOYA RETIREMENT INS & ANNUITY CO | 6.48 | ||
FUND |
| SHAREHOLDER |
| % |
VIRGINIA TAX-FREE BOND FUND |
| CHARLES SCHWAB & CO INC |
| 8.00 |
| REINVEST ACCOUNT |
| ||
| ATTN MUTUAL FUND DEPT |
| ||
|
| |||
| NATIONAL FINANCIAL SERVICES | 8.86 | ||
| FOR THE EXCLUSIVE BENEFIT |
| ||
| OF OUR CUSTOMERS |
|
(a) | T. Rowe Price Associates, Inc. is a wholly owned subsidiary of T. Rowe Price Group, Inc., each a Maryland corporation. Securities owned by T. Rowe Price Associates, Inc. are the result of contributions to the fund at the fund’s inception in order to provide the fund with sufficient capital to invest in accordance with its investment program. At the level of ownership indicated, T. Rowe Price Associates, Inc. would be able to determine the outcome of most issues that were submitted to shareholders for vote. |
(b) | T. Rowe Price Trust Company is a wholly owned subsidiary of T. Rowe Price Associates, Inc., which is a wholly owned subsidiary of T. Rowe Price Group, Inc., each a Maryland corporation. T. Rowe Price Trust Company is not the beneficial owner of these shares. Such shares are held of record by T. Rowe Price Trust Company and are normally voted by various retirement plans and retirement plan participants. |
(c) | At the level of ownership indicated, the shareholder would have greater power to determine the outcome of any matters affecting a fund or one of its classes that are submitted to shareholders for vote. |
(d) | The indicated percentage of the outstanding shares of this fund are owned by another T. Rowe Price fund and held in the nominee name indicated. Shares of the fund are “echo-voted” by the T. Rowe Price fund that owns the shares in the same proportion that the shares of the underlying fund are voted by other shareholders. |
151
(e) | T. Rowe Price Retirement Plan Services, Inc., is a wholly owned subsidiary of T. Rowe Price Associates, Inc., which is a wholly owned subsidiary of T. Rowe Price Group, Inc., each a Maryland corporation. T. Rowe Price Retirement Plan Services, Inc. is not the beneficial owner of these shares. Such shares are held of record by T. Rowe Price Retirement Plan Services, Inc. and are normally voted by various retirement plans and retirement plan participants. |
T. Rowe Price is the investment adviser for all of the Price Funds and has executed an Investment Management Agreement with each fund. For certain Price Funds, T. Rowe Price has entered into an investment sub-advisory agreement with T. Rowe Price International, Price Hong Kong, and/or Price Singapore. T. Rowe Price, T. Rowe Price International, Price Hong Kong, and Price Singapore are hereinafter referred to collectively as “Investment Managers.” T. Rowe Price is a wholly owned subsidiary of T. Rowe Price Group, Inc. T. Rowe Price International is a wholly owned subsidiary of T. Rowe Price. Price Hong Kong and Price Singapore are wholly owned subsidiaries of T. Rowe Price International.
Investment Management Services
Under the Investment Management Agreements, T. Rowe Price is responsible for supervising and overseeing investments of the funds in accordance with the funds’ investment objectives, programs, and restrictions as provided in the funds’ prospectuses and this SAI. In addition, T. Rowe Price provides the funds with certain corporate administrative services, including: maintaining the funds’ corporate existence and corporate records; registering and qualifying fund shares under federal laws; monitoring the financial, accounting, and administrative functions of the funds; maintaining liaison with the agents employed by the funds such as the funds’ custodian and transfer agent; assisting the funds in the coordination of such agent’s activities; and permitting employees of the Investment Managers to serve as officers, directors, and committee members of the funds without cost to the funds. For those Price Funds for which T. Rowe Price has not entered into a sub-advisory agreement, T. Rowe Price is responsible for making discretionary investment decisions on behalf of the funds and is generally responsible for effecting all security transactions, including the negotiation of commissions and the allocation of principal business and portfolio brokerage.
With respect to the Africa & Middle East, Emerging Europe, Emerging Markets Local Currency Bond, Emerging Markets Stock, European Stock, Global High Income Bond, Global Unconstrained Bond, Institutional Africa & Middle East, Institutional Emerging Markets Equity, Institutional Frontier Markets Equity, Institutional Global Value Equity, Institutional International Bond, Institutional International Concentrated Equity, Institutional Global Multi-Sector Bond, Institutional International Growth Equity, International Bond, International Concentrated Equity, International Discovery, International Growth & Income, International Equity Index, International Stock, Japan, Latin America, New Asia, and Strategic Income Funds, and the Emerging Markets Local Multi-Sector Account Portfolio, T. Rowe Price has entered into a sub-advisory agreement with T. Rowe Price International under which, subject to the supervision of T. Rowe Price, T. Rowe Price International is authorized to trade securities and make discretionary investment decisions on behalf of each fund. Under the sub-advisory agreement, T. Rowe Price International is responsible for effecting all securities transactions on behalf of the funds, including the negotiation of commissions and the allocation of principal business and portfolio brokerage. For the Strategic Income Fund, T. Rowe Price International’s discretionary investment decisions and trading execution are limited to the fund’s international investment-grade fixed income investments in developed markets.
With respect to the Japan Fund and the Japanese investments of the International Discovery Fund, T. Rowe Price has entered into a sub-advisory agreement with the Tokyo Branch of T. Rowe Price International (“TRPI-Tokyo”) under which, subject to the supervision of T. Rowe Price, TRPI-Tokyo is authorized to trade Japanese securities and make discretionary investment decisions on behalf of each fund’s Japanese investments.
152
With respect to the Asia Opportunities, International Discovery, and New Asia Funds, T. Rowe Price has entered into a sub-advisory agreement with Price Hong Kong (in addition to their sub-advisory agreement with T. Rowe Price International) under which, subject to the supervision of T. Rowe Price and T. Rowe Price International, Price Hong Kong is authorized to trade securities and make certain discretionary investment decisions on behalf of each fund. Under the sub-advisory agreement, Price Hong Kong is responsible for selecting the funds’ investments in the Asia-Pacific region and effecting security transactions on behalf of the funds, including the negotiation of commissions and the allocation of principal business and portfolio brokerage.
The Investment Management Agreements also provide that T. Rowe Price, and its directors, officers, employees, and certain other persons performing specific functions for the funds, will be liable to the funds only for losses resulting from willful misfeasance, bad faith, gross negligence, or reckless disregard of duty. The sub-advisory agreements have a similar provision limiting the liability of the investment sub-adviser for errors, mistakes, and losses other than those caused by its willful misfeasance, bad faith, or gross negligence.
Under the Investment Management Agreements (and sub-advisory agreements, if applicable), the Investment Managers are permitted to utilize the services or facilities of others to provide them or the funds with statistical and other factual information, advice regarding economic factors and trends, advice as to occasional transactions in specific securities, and such other information, advice, or assistance as the Investment Managers may deem necessary, appropriate, or convenient for the discharge of their obligations under the Investment Management Agreements (and sub-advisory agreement, if applicable) or otherwise helpful to the funds.
Control of Investment Adviser
T. Rowe Price Group, Inc. (“Group”) is a publicly owned company and owns 100% of the stock of T. Rowe Price Associates, Inc., which in turn owns 100% of T. Rowe Price International Ltd, which in turn owns 100% each of T. Rowe Price Hong Kong Limited and T. Rowe Price Singapore Private Ltd. Group was formed in 2000 as a holding company for the T. Rowe Price-affiliated companies.
Management Fees
All funds except Index, Institutional, Multi-Sector Account Portfolios, TRP Reserve, Retirement, Spectrum, Summit Income, and Summit Municipal Funds
The funds pay T. Rowe Price a fee (“Fee”) which consists of two components: a Group Management Fee (“Group Fee”) and an Individual Fund Fee (“Fund Fee”). The Fee is paid monthly to T. Rowe Price on the first business day of the next succeeding calendar month and is calculated as described next.
The monthly Group Fee (“Monthly Group Fee”) is the sum of the daily Group Fee accruals (“Daily Group Fee Accruals”) for each month. The Daily Group Fee Accrual for any particular day is computed by multiplying the Price Funds’ group fee accrual as determined below (“Daily Price Funds’ Group Fee Accrual”) by the ratio of the Price Funds’ net assets for that day to the sum of the aggregate net assets of the Price Funds for that day. The Daily Price Funds’ Group Fee Accrual for any particular day is calculated by multiplying the fraction of one (1) over the number of calendar days in the year by the annualized Daily Price Funds’ Group Fee Accrual for that day as determined in accordance with the following schedule:
0.480% | First $1 billion | 0.350% | Next $2 billion | 0.300% | Next $40 billion |
0.450% | Next $1 billion | 0.340% | Next $5 billion | 0.295% | Next $40 billion |
0.420% | Next $1 billion | 0.330% | Next $10 billion | 0.290% | Next $60 billion |
0.390% | Next $1 billion | 0.320% | Next $10 billion | 0.285% | Next $80 billion |
0.370% | Next $1 billion | 0.310% | Next $16 billion | 0.280% | Next $100 billion |
0.360% | Next $2 billion | 0.305% | Next $30 billion | 0.275% | Next $100 billion |
0.270% | Thereafter |
For the purpose of calculating the Group Fee, the Price Funds include all the mutual funds distributed by Investment Services (excluding the Retirement Funds, Target Retirement Funds, Spectrum Funds, TRP
153
Reserve Funds, and any Index or private label mutual funds). For the purpose of calculating the Daily Price Funds’ Group Fee Accrual for any particular day, the net assets of each Price Fund are determined in accordance with each fund’s prospectus as of the close of business on the previous business day on which the fund was open for business.
The monthly Fund Fee (“Monthly Fund Fee”) is the sum of the daily Fund Fee accruals (“Daily Fund Fee Accruals”) for each month. The Daily Fund Fee Accrual for any particular day is computed by multiplying the fraction of one (1) over the number of calendar days in the year by the individual fund fee. The product of this calculation is multiplied by the net assets of the fund for that day, as determined in accordance with the fund’s prospectus as of the close of business on the previous business day on which the fund was open for business. The individual fund fees are listed in the following tables:
Fund | Fee % | |
Africa & Middle East | 0.75 | |
Asia Opportunities | 0.50 | |
Balanced | 0.15 | |
Blue Chip Growth | 0.30 | (a) |
California Tax-Free Bond | 0.10 | |
California Tax-Free Money | 0.10 | |
Capital Appreciation | 0.30 | |
Capital Opportunity | 0.20 | |
Corporate Income | 0.15 | |
Credit Opportunities | 0.35 | |
Diversified Mid-Cap Growth | 0.35 | |
Diversified Small-Cap Growth | 0.35 | |
Dividend Growth | 0.20 | |
Emerging Europe | 0.75 | |
Fund | Fee % | |
Emerging Markets Bond | 0.45 | |
Emerging Markets Corporate Bond | 0.50 | |
Emerging Markets Local Currency Bond | 0.45 | |
Emerging Markets Stock | 0.75 | |
Equity Income | 0.25 | (b) |
European Stock | 0.50 | |
Financial Services | 0.35 | |
Floating Rate | 0.30 | |
Georgia Tax-Free Bond | 0.10 | |
Global Allocation | 0.40 | |
Global Growth Stock | 0.35 | |
Global High Income Bond | 0.30 | |
Global Industrials | 0.40 | |
Global Real Estate | 0.40 | |
Global Stock | 0.35 | |
Global Technology | 0.45 | |
Global Unconstrained Bond | 0.20 | |
GNMA | 0.15 | |
Growth & Income | 0.25 | |
Growth Stock | 0.25 | (b) |
154
Health Sciences | 0.35 | |
High Yield | 0.30 | |
Inflation Protected Bond | 0.05 | |
Intermediate Tax-Free High Yield | 0.20 | |
International Bond | 0.35 | |
International Concentrated Equity | 0.35 | |
International Discovery | 0.75 | |
International Growth & Income | 0.35 | |
International Stock | 0.35 | |
Japan | 0.50 | |
Latin America | 0.75 | |
Maryland Short-Term Tax-Free Bond | 0.10 | |
Maryland Tax-Free Bond | 0.10 | |
Maryland Tax-Free Money | 0.10 | |
Media & Telecommunications | 0.35 | |
Mid-Cap Growth | 0.35 | (c) |
Mid-Cap Value | 0.35 | |
New America Growth | 0.35 | |
New Asia | 0.50 | |
New Era | 0.25 | |
New Horizons | 0.35 | |
New Income | 0.15 | (d) |
New Jersey Tax-Free Bond | 0.10 | |
New York Tax-Free Bond | 0.10 | |
New York Tax-Free Money | 0.10 | |
Fund | Fee % | |
Overseas Stock | 0.35 | |
Personal Strategy Balanced | 0.25 | |
Personal Strategy Growth | 0.30 | |
Personal Strategy Income | 0.15 | |
Prime Reserve | 0.05 | |
Real Assets | 0.35 | |
Real Estate | 0.30 | |
Science & Technology | 0.35 | |
Short-Term Bond | 0.10 | |
Small-Cap Stock | 0.45 | |
Small-Cap Value | 0.35 | |
Strategic Income | 0.20 | |
Tax-Efficient Equity | 0.35 | |
Tax-Exempt Money | 0.10 | |
Tax-Free High Yield | 0.30 | |
Tax-Free Income | 0.15 | |
Tax-Free Short-Intermediate | 0.10 | |
Tax-Free Ultra Short-Term Bond | 0.08 | |
U.S. Large-Cap Core | 0.25 | |
U.S. Treasury Intermediate | 0.00 | |
155
U.S. Treasury Long-Term | 0.00 | |
U.S. Treasury Money | 0.00 | |
Ultra Short-Term Bond | 0.08 | |
Value | 0.35 | (e) |
Virginia Tax-Free Bond | 0.10 |
(a) On assets up to $15 billion and 0.255% on assets above $15 billion.
(b) On assets up to $15 billion and 0.21% on assets above $15 billion.
(c) On assets up to $15 billion and 0.30% on assets above $15 billion.
(d) On assets up to $20 billion and 0.1275% on assets equal to or greater than $20 billion.
(e) On assets up to $20 billion and 0.2975% on assets equal to or greater than $20 billion.
Index, Institutional, Summit Income, and Summit Municipal Funds
The following funds pay T. Rowe Price an annual investment management fee in monthly installments of the amount listed below based on the average daily net asset value of the fund.
Fund | Fee % |
Equity Index 500 | 0.10 |
Institutional Africa & Middle East | 1.00 |
Institutional Frontier Markets Equity | 1.10 |
Institutional Global Focused Growth Equity | 0.65 |
Institutional Global Growth Equity | 0.65 |
Institutional Global Value Equity | 0.65 |
Institutional International Concentrated Equity | 0.65 |
Institutional International Core Equity | 0.65 |
Institutional International Growth Equity | 0.70 |
Institutional Large-Cap Core Growth | 0.55 |
Fund | Fee % |
Institutional Large-Cap Growth | 0.55 |
Institutional Large-Cap Value | 0.55 |
Institutional Mid-Cap Equity Growth | 0.60 |
Institutional Small-Cap Stock | 0.65 |
Institutional U.S. Structured Research | 0.50 |
The following funds (“Single Fee Funds”) pay T. Rowe Price a single annual investment management fee in monthly installments of the amount listed below based on the average daily net asset value of the fund.
Fund | Fee % |
Extended Equity Market Index | 0.40 |
Inflation Focused Bond | 0.50 |
Institutional Core Plus | 0.40 |
Institutional Emerging Markets Bond | 0.70 |
Institutional Credit Opportunities | 0.65 |
Institutional Emerging Markets Equity | 1.10 |
Institutional Floating Rate | 0.55 |
Institutional Global Multi-Sector Bond | 0.50 |
Institutional High Yield | 0.50 |
Institutional International Bond | 0.55 |
Institutional Long Duration Credit | 0.45 |
156
International Equity Index | 0.50 |
Summit Cash Reserves | 0.45 |
Summit Municipal Income | 0.50 |
Summit Municipal Intermediate | 0.50 |
Summit Municipal Money Market | 0.45 |
Total Equity Market Index | 0.35 |
U.S. Bond Enhanced Index | 0.30 |
The Investment Management Agreement between each Single Fee Fund and T. Rowe Price provides that T. Rowe Price will pay all expenses of each fund’s operations except for interest; taxes; brokerage commissions, and other charges incident to the purchase, sale, or lending of the fund’s portfolio securities; and such non-recurring or extraordinary expenses that may arise, including the costs of actions, suits, or proceedings to which the fund is a party and the expenses the fund may incur as a result of its obligation to provide indemnification to its officers, directors, and agents. However, the Boards for the funds reserve the right to impose additional fees against shareholder accounts to defray expenses which would otherwise be paid by T. Rowe Price under the Investment Management Agreement. The Boards do not anticipate levying such charges; such a fee, if charged, may be retained by the funds or paid to the Investment Managers.
The Fee is paid monthly to T. Rowe Price on the first business day of the next succeeding calendar month and is the sum of the Daily Fee accruals for each month. The Daily Fee accrual for any particular day is calculated by multiplying the fraction of one (1) over the number of calendar days in the year by the appropriate Fee. The product of this calculation is multiplied by the net assets of the fund for that day, as determined in accordance with each fund’s prospectus as of the close of business on the previous business day on which the fund was open for business.
Multi-Sector Account Portfolios, Retirement Funds, Spectrum Funds and TRP Reserve Funds
None of these funds pays T. Rowe Price an investment management fee.
Investment Sub-advisory Agreements
Pursuant to each of the sub-advisory agreements that T. Rowe Price has entered into on behalf of a Price Fund (other than the Emerging Markets Local Multi-Sector Account Portfolio), T. Rowe Price may pay the investment subadviser up to 60% of the management fee that T. Rowe Price receives from that fund.
Management Fee Compensation
The following table sets forth the total management fees, if any, paid to the Investment Managers by each fund, during the fiscal years indicated:
Fund | Fiscal Year Ended | ||
2/28/14 | 2/28/13 | 2/29/12 | |
California Tax-Free Bond | $1,628,000 | $1,586,000 | $1,377,000 |
California Tax-Free Money | 322,000 | 329,000 | 335,000 |
Floating Rate Multi-Sector Account Portfolio | (c) | (c) | (a) |
Georgia Tax-Free Bond | 893,000 | 903,000 | 747,000 |
High Yield Multi-Sector Account Portfolio | (c) | (c) | (a) |
Intermediate Tax-Free High Yield(b) | (a) | (a) | (a) |
Investment-Grade Corporate Multi-Sector Account Portfolio | (c) | (c) | (a) |
Maryland Short-Term Tax-Free Bond | 882,000 | 885,000 | 956,000 |
Maryland Tax-Free Bond | 7,753,000 | 8,186,000 | 7,228,000 |
Maryland Tax-Free Money | 499,000 | 497,000 | 578,000 |
157
Mortgage-Backed Securities Multi-Sector Account Portfolio | (c) | (c) | (a) |
New Jersey Tax-Free Bond | 1,170,000 | 1,148,000 | 987,000 |
New York Tax-Free Bond | 1,628,000 | 1,703,000 | 1,409,000 |
New York Tax-Free Money | 322,000 | 326,000 | 366,000 |
Tax-Efficient Equity | 810,000 | 624,000 | 562,000 |
Tax-Exempt Money | 3,623,000 | 3,432,000 | 3,849,000 |
Tax-Free High Yield(b) | 14,365,000 | 14,083,000 | 10,515,000 |
Tax-Free Income(b) | 12,392,000 | 13,543,000 | 13,251,000 |
Tax-Free Short-Intermediate(b) | 7,729,000 | 7,419,000 | 6,135,000 |
Tax-Free Ultra Short-Term Bond | (a) | (a) | (a) |
Virginia Tax-Free Bond | 3,684,000 | 3,907,000 | 3,327,000 |
(a) Prior to commencement of operations.
(b) The fund has two classes of shares. The management fee is allocated to each class based on relative net assets.
(c) The fund does not pay an investment management fee.
Fund | Fiscal Year Ended | ||
5/31/14 | 5/31/13 | 5/31/12 | |
Corporate Income | $2,529,000 | $2,968,000 | $2,844,000 |
Credit Opportunities(a) | 15,000 | (b) | (b) |
Floating Rate(a) | 1,802,000 | 603,000 | 234,000 |
GNMA | 6,937,000 | 8,015,000 | 7,531,000 |
Fund | Fiscal Year Ended | ||
5/31/14 | 5/31/13 | 5/31/12 | |
TRP Government Reserve Investment | (c) | (c) | (c) |
High Yield(a) | 56,896,000 | 55,350,000 | 51,500,000 |
Inflation Focused Bond(d) | 26,197,000 | 19,018,000 | 14,886,000 |
Inflation Protected Bond | 1,297,000 | 1,928,000 | 1,670,000 |
Institutional Core Plus(a)(d) | 1,351,000 | 892,000 | 674,000 |
Institutional Credit Opportunities | 14,000 | (b) | (b) |
Institutional Floating Rate(a)(d) | 17,642,000 | 12,608,000 | 10,083,000 |
Institutional Global Multi-Sector Bond | 140,000 | (b) | (b) |
Institutional High Yield(d) | 14,170,000 | 13,599,000 | 9,740,000 |
Institutional Long Duration Credit | 65,000 | (b) | (b) |
New Income(e) | 98,208,000 | 90,186,000 | 70,974,000 |
Personal Strategy Balanced | 10,532,000 | 9,410,000 | 8,831,000 |
Personal Strategy Growth | 8,304,000 | 7,093,000 | 6,610,000 |
Personal Strategy Income | 5,613,000 | 4,946,000 | 4,393,000 |
Prime Reserve | 22,405,000 | 19,992,000 | 19,796,000 |
TRP Reserve Investment | (c) | (c) | (c) |
Retirement 2005 | (c) | (c) | (c) |
Retirement 2010 | (c) | (c) | (c) |
158
Retirement 2015 | (c) | (c) | (c) |
Retirement 2020 | (c) | (c) | (c) |
Retirement 2025 | (c) | (c) | (c) |
Retirement 2030 | (c) | (c) | (c) |
Retirement 2035 | (c) | (c) | (c) |
Retirement 2040 | (c) | (c) | (c) |
Retirement 2045 | (c) | (c) | (c) |
Retirement 2050 | (c) | (c) | (c) |
Retirement 2055 | (c) | (c) | (c) |
Retirement 2060 | (b) | (b) | (b) |
Retirement Balanced | (c) | (c) | (c) |
Short-Term Bond(a) | 25,151,000 | 26,635,000 | 23,553,000 |
Short-Term Government Reserve | (b) | (b) | (b) |
Short-Term Reserve | (c) | (c) | (b) |
Strategic Income(a) | 1,209,000 | 1,392,000 | 1,176,000 |
Target Retirement 2005 | (b) | (b) | (b) |
Target Retirement 2010 | (b) | (b) | (b) |
Target Retirement 2015 | (b) | (b) | (b) |
Target Retirement 2020 | (b) | (b) | (b) |
Target Retirement 2025 | (b) | (b) | (b) |
Target Retirement 2030 | (b) | (b) | (b) |
Target Retirement 2035 | (b) | (b) | (b) |
Target Retirement 2040 | (b) | (b) | (b) |
Fund | Fiscal Year Ended | ||
5/31/14 | 5/31/13 | 5/31/12 | |
Target Retirement 2045 | (b) | (b) | (b) |
Target Retirement 2050 | (b) | (b) | (b) |
Target Retirement 2055 | (b) | (b) | (b) |
Target Retirement 2060 | (b) | (b) | (b) |
U.S. Treasury Intermediate | 1,111,000 | 1,642,000 | 1,456,000 |
U.S. Treasury Long-Term | 978,000 | 1,534,000 | 1,172,000 |
U.S. Treasury Money | 5,944,000 | 5,618,000 | 5,540,000 |
Ultra Short-Term Bond | 1,585,000 | 271,000 | (b) |
(a) The fund has two classes of shares. The management fee is allocated to each class based on relative net assets.
(b) Prior to commencement of operations.
(c) The fund does not pay an investment management fee.
(d) The fee includes investment and administrative expenses.
(e) The fund has three classes of shares. The management fee is allocated to each class based on relative net assets.
159
Fund | Fiscal Year Ended | ||
10/31/14 | 10/31/13 | 10/31/12 | |
Africa & Middle East | $2,127,000 | $1,714,000 | $1,535,000 |
Asia Opportunities(a) | 62,000 | (b) | (b) |
Emerging Europe | 3,148,000 | 4,156,000 | 4,590,000 |
Emerging Markets Stock | 76,506,000 | 74,566,000 | 67,016,000 |
European Stock | 13,472,000 | 6,994,000 | 5,363,000 |
Global Allocation(a) | 472,000 | 129,000 | (b) |
Global Growth Stock(a) | 564,000 | 500,000 | 400,000 |
Global Stock(a) | 3,184,000 | 3,107,000 | 3,584,000 |
Institutional Africa & Middle East | 2,242,000 | 1,683,000 | 1,320,000 |
Institutional Emerging Markets Equity(c) | 11,165,000 | 11,106,000 | 9,580,000 |
Institutional Frontier Markets Equity | 2,000 | (b) | (b) |
Institutional Global Focused Growth Equity | 588,000 | 1,052,000 | 1,030,000 |
Institutional Global Growth Equity | 1,125,000 | 798,000 | 391,000 |
Institutional Global Value Equity | 64,000 | 55,000 | 13,000 |
Institutional International Concentrated Equity | 590,000 | 55,000 | 48,000 |
Institutional International Core Equity | 595,000 | 461,000 | 410,000 |
Institutional International Growth Equity | 595,000 | 664,000 | 520,000 |
International Concentrated Equity(a) | 4,000 | (b) | (b) |
International Discovery | 38,133,000 | 32,101,000 | 26,136,000 |
International Equity Index(c) | 2,723,000 | 2,172,000 | 1,783,000 |
International Growth & Income(d) | 61,730,000 | 45,084,000 | 31,913,000 |
International Stock(d) | 81,500,000 | 69,045,000 | 52,717,000 |
Japan | 2,478,000 | 1,863,000 | 1,348,000 |
Latin America | 10,891,000 | 15,990,000 | 20,688,000 |
Fund | Fiscal Year Ended | ||
10/31/14 | 10/31/13 | 10/31/12 | |
New Asia | 32,956,000 | 37,272,000 | 32,852,000 |
Overseas Stock | 54,658,000 | 38,682,000 | 27,926,000 |
Summit Cash Reserves(c) | 27,243,000 | 25,538,000 | 25,494,000 |
Summit Municipal Income(a)(c) | 4,184,000 | 4,113,000 | 3,368,000 |
Summit Municipal Intermediate(a)(c) | 17,245,000 | 12,445,000 | 10,264,000 |
Summit Municipal Money Market(c) | 846,000 | 888,000 | 904,000 |
U.S. Bond Enhanced Index(c) | 1,716,000 | 2,077,000 | 3,064,000 |
(a) The fund has two classes of shares. The management fee is allocated to each class based on relative net assets.
(b) Prior to commencement of operations.
(c) The fee includes investment management fees and administrative expenses.
(d) The fund has three classes of shares. The management fee is allocated to each class based on relative net assets.
160
Fund | Fiscal Year Ended | ||
12/31/14 | 12/31/13 | 12/31/12 | |
Balanced | $18,176,000 | $16,318,000 | $14,554,000 |
Blue Chip Growth(a) | 141,866,000 | 108,419,000 | 84,997,000 |
Capital Appreciation(b) | 126,636,000 | 98,302,000 | 76,517,000 |
Capital Opportunity(a) | 3,225,000 | 2,508,000 | 1,794,000 |
Diversified Mid-Cap Growth | 2,174,000 | 1,625,000 | 1,259,000 |
Diversified Small-Cap Growth | 5,356,000 | 3,731,000 | 1,673,000 |
Dividend Growth | 20,942,000 | 17,281,000 | 12,540,000 |
Emerging Markets Bond | 32,526,000 | 29,399,000 | 26,481,000 |
Emerging Markets Corporate Bond(b) | 962,000 | 539,000 | 119,000 |
Emerging Markets Corporate Multi-Sector Account Portfolio | (e) | (e) | (e) |
Emerging Markets Local Currency Bond(b) | 565,000 | 437,000 | 359,000 |
Emerging Markets Local Multi-Sector Account Portfolio | (e) | (e) | (e) |
Equity Income(a) | 157,225,000 | 145,835,000 | 125,484,000 |
Equity Index 500 | 22,318,000 | 17,920,000 | 14,684,000 |
Extended Equity Market Index(c) | 2,982,000 | 2,274,000 | 1,598,000 |
Financial Services | 3,355,000 | 3,281,000 | 2,071,000 |
Global High Income Bond(b) | (d) | (d) | (d) |
Global Industrials | 117,000 | 14,000 | (d) |
Global Real Estate(b) | 1,382,000 | 1,394,000 | 555,000 |
Global Technology | 9,371,000 | 5,783,000 | 4,965,000 |
Global Unconstrained Bond(b) | (d) | (d) | (d) |
Growth & Income | 8,086,000 | 7,182,000 | 6,310,000 |
Growth Stock(a) | 218,346,000 | 185,883,000 | 154,138,000 |
Health Sciences | 63,054,000 | 45,024,000 | 28,279,000 |
Institutional Emerging Markets Bond(c) | 2,188,000 | 1,831,000 | 1,666,000 |
Fund | Fiscal Year Ended | ||
12/31/14 | 12/31/13 | 12/31/12 | |
Institutional International Bond(c) | 1,634,000 | 1,101,000 | 843,000 |
Institutional Large-Cap Core Growth | 6,827,000 | 4,351,000 | 2,186,000 |
Institutional Large-Cap Growth | 59,247,000 | 41,104,000 | 26,725,000 |
Institutional Large-Cap Value | 11,017,000 | 7,366,000 | 4,834,000 |
Institutional Mid-Cap Equity Growth | 27,442,000 | 21,569,000 | 16,359,000 |
Institutional Small-Cap Stock | 10,755,000 | 8,603,000 | 5,484,000 |
Institutional U.S. Structured Research | 3,694,000 | 3,096,000 | 2,717,000 |
International Bond(b) | 32,124,000 | 32,733,000 | 33,327,000 |
Media & Telecommunications | 21,015,000 | 17,569,000 | 14,284,000 |
Mid-Cap Growth(a) | 147,713,000 | 131,629,000 | 116,777,000 |
Mid-Cap Value(a) | 77,399,000 | 68,332,000 | 58,472,000 |
New America Growth(b) | 27,754,000 | 26,375,000 | 21,749,000 |
161
New Era | 23,977,000 | 24,189,000 | 24,641,000 |
New Horizons | 99,719,000 | 82,332,000 | 60,313,000 |
Real Assets | 26,844,000 | 21,111,000 | 17,198,000 |
Real Estate(b) | 26,647,000 | 22,547,000 | 21,021,000 |
Science & Technology(b) | 22,859,000 | 18,353,000 | 17,951,000 |
Small-Cap Stock(b) | 73,860,000 | 66,844,000 | 53,336,000 |
Small-Cap Value(b) | 62,212,000 | 58,418,000 | 47,986,000 |
Spectrum Growth | (e) | (e) | (e) |
Spectrum Income | (e) | (e) | (e) |
Spectrum International | (e) | (e) | (e) |
Total Equity Market Index(c) | 3,619,000 | 2,971,000 | 2,489,000 |
U.S. Large-Cap Core(b) | 486,000 | 345,000 | 240,000 |
Value(b) | 131,016,000 | 102,361,000 | 82,781,000 |
(a) The fund has three classes of shares. The management fee is allocated to each class based on relative net assets.
(b) The fund has two classes of shares. The management fee is allocated to each class based on relative net assets.
(c) The fee includes investment management fees and administrative expenses.
(d) Prior to commencement of operations.
(e) The fund does not pay an investment management fee.
Expense Limitations and Reimbursements
The following chart sets forth contractual expense ratio limitations and the periods for which they are effective. For each fund, the Investment Managers have agreed to bear any fund expenses (other than interest, taxes, brokerage, and other expenditures that are capitalized in accordance with generally accepted accounting principles, extraordinary expenses, and acquired fund fees) which would cause the fund’s ratio of expenses to average net assets to exceed the indicated percentage limitation. The expenses borne by the Investment Managers are subject to reimbursement by the funds through the indicated reimbursement date, provided no reimbursement will be made if it would result in a fund’s expense ratio exceeding its applicable limitation.
Fund | Limitation Period | Expense Ratio Limitation % | Reimbursement Date |
Asia Opportunities | May 21, 2014 – February 28, 2017 | 1.15 | (a) |
Asia Opportunities Fund–Advisor Class | May 21, 2014 – February 28, 2017 | 1.25 | (a) |
California Tax-Free Money(b) | July 1, 2013 – June 30, 2015 | 0.55 | (a) |
Capital Opportunity Fund–R Class(c) | May 1, 2014 – April 30, 2016 | 1.35 | April 30, 2018(d) |
Credit Opportunities | April 29, 2014 – September 30, 2016 | 0.90 | (a) |
Credit Opportunities Fund–Advisor Class | April 29, 2014 – September 30, 2016 | 1.00 | (a) |
Emerging Markets Corporate Bond(e) | May 1, 2015 – April 30, 2017 | 1.15 | (a) |
Emerging Markets Corporate Bond Fund–Advisor Class(f) | May 1, 2015 – April 30, 2017 | 1.25 | (a) |
Emerging Markets Local Currency Bond(g) | May 1, 2014 – April 30, 2016 | 1.10 | (a) |
Emerging Markets Local Currency Bond Fund–Advisor Class(h) | May 1, 2014 – April 30, 2016 | 1.20 | (a) |
Equity Index 500(i) | May 1, 2014 – April 30, 2016 | 0.30 | April 30, 2018(d) |
Floating Rate(j) | October 1, 2013 – September 30, 2015 | 0.85 | (a) |
162
Floating Rate Fund–Advisor Class(k) | October 1, 2013 – September 30, 2015 | 0.95 | (a) |
Global Allocation | May 28, 2013 – February 29, 2016 | 1.05 | (a) |
Global Allocation Fund–Advisor Class | May 28, 2013 – February 29, 2016 | 1.15 | (a) |
Global Growth Stock(l) | March 1, 2013 – February 28, 2017 | 1.00 | (a) |
Global Growth Stock Fund–Advisor Class(m) | March 1, 2013 – February 28, 2017 | 1.10 | (a) |
Global High Income Bond | January 22, 2015 – April 30, 2017 | 0.85 | (a) |
Global High Income Bond Fund–Advisor Class | January 22, 2015 – April 30, 2017 | 1.00 | (a) |
Global Industrials | October 24, 2013 – April 30, 2016 | 1.05 | (a) |
Global Real Estate(n) | May 1, 2015 – April 30, 2017 | 1.05 | (a) |
Global Real Estate Fund–Advisor Class(o) | May 1, 2015 – April 30, 2017 | 1.15 | (a) |
Global Stock Fund–Advisor Class(p) | March 1, 2014 – February 29, 2016 | 1.15 | February 28, 2018(d) |
Global Unconstrained Bond | January 22, 2015 – April 30, 2017 | 0.75 | (a) |
Global Unconstrained Bond Fund–Advisor Class | January 22, 2015 – April 30, 2017 | 0.90 | (a) |
Inflation Protected Bond(q) | October 1, 2014 – September 30, 2016 | 0.50 | September 30, 2018(d) |
Institutional Africa & Middle East(r) | March 1, 2013 – February 28, 2015 | 1.25 | (a) |
Institutional Frontier Markets Equity | September 22, 2014 – February 28, 2017 | 1.10 | (a) |
Institutional Global Focused Growth Equity(s) | March 1, 2013 – February 28, 2017 | 0.75 | (a) |
Institutional Global Growth Equity(t) | March 1, 2013 – February 28, 2017 | 0.75 | (a) |
Institutional Global Value Equity(u) | March 1, 2014 – February 29, 2016 | 0.75 | (a) |
Institutional International Concentrated Equity(v) | March 1, 2013 – February 28, 2017 | 0.75 | (a) |
Institutional International Core Equity(w) | March 1, 2013 – February 28, 2017 | 0.75 | (a) |
Institutional International Growth Equity(x) | March 1, 2014 - February 29, 2016 | 0.75 | February 28, 2018(d) |
Institutional Large-Cap Core Growth | May 1, 2013 – April 30, 2015 | 0.65 | April 30, 2017(d) |
Institutional U.S. Structured Research(y) | May 1, 2014 – April 30, 2016 | 0.55 | (a) |
Intermediate Tax-Free High Yield Fund | July 24, 2014 – June 30, 2017 | 0.75 | (a) |
Intermediate Tax-Free High Yield Fund–Advisor Class | July 24, 2014 – June 30, 2017 | 0.85 | (a) |
Fund | Limitation Period | Expense Ratio Limitation % | Reimbursement Date |
International Concentrated Equity | August 22, 2014 – February 28, 2017 | 0.90 | (a) |
International Concentrated Equity–Advisor Class | August 22, 2014 – February 28, 2017 | 1.00 | (a) |
International Stock Fund–R Class(z) | March 1, 2014 – February 29, 2016 | 1.40 | (a) |
New Income Fund–R Class(aa) | October 1, 2014 – September 30, 2016 | 1.15 | (a) |
New York Tax-Free Money(bb) | July 1, 2013 – June 30, 2015 | 0.55 | (a) |
Strategic Income Fund(cc) | October 1, 2011 – September 30, 2013 | 0.80 | (a) |
Strategic Income Fund–Advisor Class(dd) | October 1, 2013 – September 30, 2015 | 0.95 | (a) |
Tax-Efficient Equity | July 1, 2010 – June 30, 2012 | 1.25 | June 30, 2014(d) |
Tax-Free High Yield Fund–Advisor Class | August 8, 2012 – June 30, 2015 | 1.05 | (a) |
Tax-Free Short-Intermediate Fund–Advisor Class | August 8, 2012 – June 30, 2015 | 0.85 | (a) |
Tax-Free Ultra Short-Term Bond Fund | December 3, 2012 – June 30, 2015 | 0.35 | (a) |
U.S. Large-Cap Core Fund(ee) | May 1, 2014 – April 30, 2016 | 1.15 | (a) |
163
U.S. Large-Cap Core Fund–Advisor Class(ff) | May 1, 2014 – April 30, 2016 | 1.20 | (a) |
U.S. Treasury Long-Term Fund (gg) | October 1, 2012 – September 30, 2014 | 0.55 | September 30, 2016(d) |
Ultra Short-Term Bond Fund | December 3, 2012 – September 30, 2015 | 0.35 | (a) |
(a) No reimbursement will be made more than three years after any waiver or payment.
(b) The California Tax-Free Money Fund previously operated under a 0.55% expense limitation that expired June 30, 2013.
(c) The Capital Opportunity Fund–R Class previously operated under a 1.35% expense limitation that expired April 30, 2014. The reimbursement period for this limitation extends through April 30, 2016.
(d) No reimbursement will be made after the reimbursement date or three years after any waiver or payment, whichever is sooner.
(e) The Emerging Markets Corporate Bond Fund previously operated under a 1.15% expense limitation that expired April 30, 2015.
(f) The Emerging Markets Corporate Bond Fund–Advisor Class previously operated under a 1.25% expense limitation that expired April 30, 2015.
(g) The Emerging Markets Local Currency Bond Fund previously operated under a 1.10% expense limitation that expired April 30, 2014.
(h) The Emerging Markets Local Currency Bond Fund–Advisor Class previously operated under a 1.20% expense limitation that expired April 30, 2014.
(i) The Equity Index 500 Fund previously operated under a 0.30% expense limitation that expired April 30, 2014. The reimbursement period for this limitation extends through April 30, 2016.
(j) The Floating Rate Fund previously operated under a 0.85% expense limitation that expired September 30, 2013.
(k) The Floating Rate Fund–Advisor Class previously operated under a 0.95% expense limitation that expired September 30, 2013.
(l) The Global Growth Stock Fund previously operated under a 1.00% expense limitation that expired February 28, 2015.
(m) The Global Growth Stock Fund–Advisor Class previously operated under a 1.10% expense limitation that expired February 28, 2015.
(n) The Global Real Estate Fund previously operated under a 1.05% expense limitation.
(o) The Global Real Estate Fund–Advisor Class previously operated under a 1.15% expense limitation.
(p) The Global Stock Fund–Advisor Class previously operated under a 1.15% expense limitation that expired February 28, 2014. The reimbursement period for this limitation extends through February 29, 2016.
(q) The Inflation Protected Bond Fund previously operated under a 0.50% expense limitation that expired September 30, 2014. The reimbursement period for this limitation extends through September 30, 2016.
(r) The Institutional Africa & Middle East Fund previously operated under a 1.25% expense limitation that expired February 28, 2013.
(s) The Institutional Global Focused Growth Equity Fund previously operated under a 0.75% expense limitation that expired February 28, 2015.
(t) The Institutional Global Growth Equity Fund previously operated under a 0.75% expense limitation that expired February 28, 2015.
(u) The Institutional Global Value Equity Fund previously operated under a 0.75% expense limitation that expired February 28, 2014.
(v) The Institutional International Concentrated Equity Fund previously operated under a 0.75% expense limitation that expired February 28, 2015.
(w) The Institutional International Core Equity Fund previously operated under a 0.75% expense limitation that expired February 28, 2015.
(x) The Institutional International Growth Equity Fund previously operated under a 0.75% expense limitation that expired February 28, 2014. The reimbursement period for this limitation extends through February 29, 2016.
(y) The Institutional U.S. Structured Research Fund previously operated under a 0.55% expense limitation that expired April 30, 2014.
164
(z) The International Stock Fund–R Class previously operated under a 1.40% expense limitation that expired February 28, 2014.
(aa) The New Income Fund–R Class previously operated under a 1.15% expense limitation that expired September 30, 2014.
(bb) The New York Tax-Free Money Fund previously operated under a 0.55% expense limitation that expired June 30, 2013.
(cc) The Strategic Income Fund previously operated under a 0.80% expense limitation that expired September 30, 2013.
(dd) The Strategic Income Fund–Advisor Class previously operated under a 0.95% expense limitation that expired September 30, 2013.
(ee) The U.S. Large-Cap Core Fund previously operated under a 1.15% expense limitation that expired April 30, 2014.
(ff) The U.S. Large-Cap Core Fund–Advisor Class previously operated under a 1.20% expense limitation that expired April 30, 2014.
(gg) The U.S. Treasury Long-Term Fund previously operated under a 0.55% expense limitation that expired September 30, 2012. The reimbursement period for this limitation extends through September 30, 2014.
The Investment Management Agreements between the funds and the Investment Managers provide that each fund will bear all expenses of its operations not specifically assumed by the Investment Managers.
For the purpose of determining whether a fund is entitled to expense limitation, the expenses of a fund are calculated on a monthly basis. If a fund is entitled to expense limitation, that month’s advisory fee will be reduced or postponed, with any adjustment made after the end of the year.
Except for the California and New York Funds, each of the above-referenced funds’ Investment Management Agreement also provides that one or more additional expense limitation periods (of the same or different time periods) may be implemented after the expiration of the current expense limitation, and that with respect to any such additional limitation period, the funds may reimburse the Investment Managers, provided the reimbursement does not result in the funds’ aggregate expenses exceeding the additional expense limitation. No reimbursement may be made by the California and New York Funds unless approved by shareholders.
California Tax-Free Money Fund At February 28, 2014, management fees in the amount of $100,000 were waived. Including these amounts, management fees waived in the amount of $323,000 remain subject to repayment.
Capital Opportunity Fund–R Class At December 31, 2014, expenses in the amount of $3,000 were repaid to the manager. There were no amounts subject to repayment. The fund operated below its expense limit.
Emerging Markets Corporate Bond Fund and Emerging Markets Corporate Bond Fund–Advisor Class At December 31, 2014, management fees in the amount of $110,000 were repaid and expenses in the amount of $184,000 were reimbursed by the manager. Including these amounts, management fees waived and expenses previously reimbursed by the manager in the amount of $479,000 remain subject to repayment.
Emerging Markets Local Currency Bond Fund and Emerging Markets Local Currency Bond Fund–Advisor Class At December 31, 2014, management fees in the amount of $70,000 were waived and expenses in the amount of $119,000 were reimbursed by the manager. Including these amounts, management fees waived and expenses previously reimbursed by the manager in the amount of $713,000 remain subject to repayment.
Equity Index 500 Fund At December 31, 2014, there were no amounts subject to repayment. The fund operated below its expense limit.
Floating Rate Fund and Floating Rate Fund–Advisor Class At May 31, 2014, management fees in the amount of $311,000 were reimbursed by the manager. Including these amounts, management fees waived and expenses previously reimbursed by the manager in the amount of $473,000 remain subject to repayment.
Global Growth Stock Fund and Global Growth Stock Fund–Advisor Class At October 31, 2014, management fees in the amount of $3,000 were repaid and expenses in the amount of $143,000 were reimbursed by the manager. Including these amounts, management fees waived and expenses previously reimbursed by the manager in the amount of $490,000 remain subject to repayment.
165
Global Industrials Fund At December 31, 2014, management fees in the amount of $117,000 were waived and expenses in the amount of $131,000 were reimbursed by the manager. Including these amounts, management fees waived and expenses previously reimbursed by the manager in the amount of $308,000 remain subject to repayment.
Global Real Estate Fund and Global Real Estate Fund–Advisor Class At December 31, 2014, management fees in the amount of $163,000 were repaid and expenses in the amount of $219,000 were reimbursed by the manager. Including these amounts, management fees waived and expenses previously reimbursed by the manager in the amount of $816,000 remain subject to repayment.
Global Stock Fund–Advisor Class At October 31, 2014, expenses in the amount of $3,000 were reimbursed to the manager. Including these amounts, expenses previously reimbursed by the manager in the amount of $10,000 remain subject to repayment.
Inflation Protected Bond Fund At May 31, 2014, management fees in the amount of $355,000 were waived. Including these amounts, management fees waived in the amount of $969,000 remain subject to repayment.
Institutional Africa & Middle East Fund At October 31, 2014, management fees in the amount of $77,000 were repaid. There were no amounts subject to repayment. The fund operated below its expense limit.
Institutional Global Focused Growth Equity Fund At October 31, 2014, management fees in the amount of $176,000 were waived. Including these amounts, management fees waived in the amount of $426,000 remain subject to repayment.
Institutional Global Growth Equity Fund At October 31, 2014, management fees in the amount of $107,000 were waived. Including these amounts, management fees waived and expenses previously reimbursed by the manager in the amount of $476,000 remain subject to repayment.
Institutional Global Value Equity Fund At October 31, 2014, management fees in the amount of $64,000 were waived and expenses in the amount of $164,000 were reimbursed by the manager. Including these amounts, management fees waived and expenses previously reimbursed by the manager in the amount of $575,000 remain subject to repayment.
Institutional International Concentrated Equity Fund At October 31, 2014, management fees in the amount of $120,000 were waived and expenses in the amount of $51,000 were reimbursed by the manager.
166
Including these amounts, management fees waived and expenses previously reimbursed by the manager in the amount of $607,000 remain subject to repayment.
Institutional International Core Equity Fund At October 31, 2014, management fees in the amount of $165,000 were waived. Including these amounts, management fees waived in the amount of $538,000 remain subject to repayment.
Institutional International Growth Equity Fund At October 31, 2014, management fees in the amount of $231,000 were waived. Including these amounts, management fees waived in the amount of $644,000 remain subject to repayment.
Institutional Large-Cap Core Growth Fund At December 31, 2014, there were no amounts subject to repayment. The fund operated below its expense limit.
Institutional U.S. Structured Research Fund At December 31, 2014, management fees in the amount of $18,000 were repaid to the manager. There were no amounts subject to repayment.
International Concentrated Equity Fund and International Concentrated Equity Fund–Advisor Class At October 31, 2014, management fees in the amount of $4,000 were waived and expenses in the amount of $56,000 were reimbursed by the manager. Including these amounts, management fees waived and expenses previously reimbursed by the manager in the amount of $60,000 remain subject to repayment.
International Stock Fund–R Class At October 31, 2014, expenses less than $1,000 were reimbursed to the manager. Including these amounts, expenses previously reimbursed by the manager in the amount of $6,000 remain subject to repayment.
New Income Fund–R Class At May 31, 2014, expenses in the amount of $5,000 were reimbursed by the manager. Including these amounts, management fees waived and expenses previously reimbursed by the manager in the amount of $22,000 remain subject to repayment.
New York Tax-Free Money Fund At February 28, 2014, management fees in the amount of $103,000 were waived. Including these amounts, management fees waived in the amount of $313,000 remain subject to repayment.
Strategic Income Fund and Strategic Income Fund–Advisor Class At May 31, 2014, expenses in the amount of $3,000 were repaid to the manager. Including these amounts, management fees waived and expenses previously reimbursed by the manager in the amount of $13,000 remain subject to repayment.
Tax-Efficient Equity Fund At February 28, 2014, there were no amounts subject to repayment. The fund operated below its expense limit.
U.S. Large-Cap Core and U.S. Large-Cap Core Growth–Advisor Class At December 31, 2014, management fees in the amount of $12,000 were repaid and expenses in the amount of $128,000 were repaid to the manager. Including these amounts, expenses previously reimbursed by the manager in the amount of $113,000 remain subject to repayment. Each Class operated below its expense limit.
U.S. Treasury Long-Term At May 31, 2014, there were no amounts subject to repayment.
Management Related Services
In addition to the management fee, the funds (other than the Single-Fee Funds) pay for the following: shareholder service expenses; custodial, accounting, legal, and audit fees; costs of preparing and printing prospectuses and reports sent to shareholders; registration fees and expenses; proxy and annual meeting expenses (if any); and directors’ fees and expenses.
T. Rowe Price Services, Inc. (“Services”), a wholly owned subsidiary of T. Rowe Price, acts as the funds’ transfer and dividend disbursing agent and provides shareholder and administrative services. T. Rowe Price Retirement Plan Services, Inc. (“RPS”), also a wholly owned subsidiary, provides recordkeeping, sub-transfer agency, and administrative services for certain types of retirement plans investing in the funds. The fees paid
167
by the funds to Services are based on the costs to Services of providing these services plus a return on capital employed in support of the services.
The fees paid to RPS are based on the percentage of Price Fund assets for which RPS provides recordkeeping and sub-transfer agency services. The fees paid to Services and RPS are set forth in each fund’s shareholder report under “Related Party Transactions.” The address for Services and RPS is 100 East Pratt Street, Baltimore, Maryland 21202.
T. Rowe Price, under a separate agreement with the funds, provides accounting services to the funds. The funds paid the expenses shown in the following table during the fiscal years indicated to T. Rowe Price for accounting services.
Fund | Fiscal Year Ended | ||
2/28/14 | 2/28/13 | 2/29/12 | |
California Tax-Free Bond | $91,000 | $94,000 | $91,000 |
California Tax-Free Money | 91,000 | 94,000 | 91,000 |
Floating Rate Multi-Sector Account Portfolio | — | — | (a) |
Georgia Tax-Free Bond | 91,000 | 94,000 | 91,000 |
High Yield Multi-Sector Account Portfolio | — | — | (a) |
Intermediate Tax-Free High Yield | (a) | (a) | (a) |
Intermediate Tax-Free High Yield Fund–Advisor Class | (a) | (a) | (a) |
Investment-Grade Corporate Multi-Sector Account Portfolio | — | — | (a) |
Maryland Short-Term Tax-Free Bond | 91,000 | 94,000 | 91,000 |
Maryland Tax-Free Bond | 112,000 | 119,000 | 120,000 |
Maryland Tax-Free Money | 91,000 | 94,000 | 91,000 |
Mortgage-Backed Securities Multi-Sector Account Portfolio | — | — | (a) |
New Jersey Tax-Free Bond | 91,000 | 94,000 | 91,000 |
New York Tax-Free Bond | 91,000 | 94,000 | 91,000 |
New York Tax-Free Money | 91,000 | 94,000 | 91,000 |
Tax-Efficient Equity | 91,000 | 94,000 | 91,000 |
Tax-Exempt Money | 116,000 | 119,000 | 120,000 |
Tax-Free High Yield | 161,000 | 156,000 | 149,000 |
Tax-Free High Yield Fund–Advisor Class | 276 | (b) | (a) |
Tax-Free Income | 86,000 | 86,000 | 78,000 |
Tax-Free Income Fund–Advisor Class | 50,000 | 54,000 | 59,000 |
Tax-Free Short-Intermediate | 111,000 | 106,000 | 91,000 |
Tax-Free Short-Intermediate Fund–Advisor Class | 290 | (b) | (a) |
Tax-Free Ultra Short-Term Bond | (a) | (a) | (a) |
Virginia Tax-Free Bond | 91,000 | 94,000 | 84,000 |
(a) Prior to commencement of operations.
(b) Less than $1,000.
168
Fund | Fiscal Year Ended | ||
5/31/14 | 5/31/13 | 5/31/12 | |
Corporate Income | $132,000 | $143,000 | $148,000 |
Credit Opportunities | 18,000 | (a) | (a) |
Credit Opportunities–Advisor Class | (b) | (a) | (a) |
GNMA | 117,000 | 118,000 | 120,000 |
Floating Rate | 157,000 | 159,000 | 151,000 |
Floating Rate Fund–Advisor Class | 8,000 | 4,000 | 2,000 |
TRP Government Reserve Investment | 92,000 | 93,000 | 92,000 |
High Yield | 180,000 | 166,000 | 162,000 |
High Yield Fund–Advisor Class | 22,000 | 29,000 | 37,000 |
Inflation Focused Bond | 142,000 | 143,000 | 148,000 |
Inflation Protected Bond | 142,000 | 143,000 | 148,000 |
Institutional Core Plus | 200,000 | 193,000 | 197,000 |
Institutional Core Plus Fund–F Class | 1,000 | 2,000 | 1,000 |
Institutional Credit Opportunities | 16,000 | (a) | (a) |
Institutional Floating Rate | 120,000 | 131,000 | 157,000 |
Institutional Floating Rate Fund–F Class | 45,000 | 49,000 | 42,000 |
Institutional Global Multi-Sector Bond | 93,000 | (a) | (a) |
Institutional High Yield | 179,000 | 175,000 | 181,000 |
Institutional Long Duration Credit | 131,000 | (a) | (a) |
New Income | 223,000 | 214,000 | 215,000 |
New Income Fund–Advisor Class | (b) | (b) | (b) |
New Income Fund–R Class | (b) | (b) | (b) |
Personal Strategy Balanced | 179,000 | 175,000 | 181,000 |
Personal Strategy Growth | 179,000 | 175,000 | 181,000 |
Personal Strategy Income | 179,000 | 175,000 | 181,000 |
Prime Reserve | 117,000 | 118,000 | 120,000 |
TRP Reserve Investment | 117,000 | 118,000 | 138,000 |
Retirement 2005 | (c) | (c) | (c) |
Retirement 2005 Fund–Advisor Class | (c) | (c) | (c) |
Retirement 2005 Fund–R Class | (c) | (c) | (c) |
Retirement 2010 | (c) | (c) | (c) |
Retirement 2010 Fund–Advisor Class | (c) | (c) | (c) |
Retirement 2010 Fund–R Class | (c) | (c) | (c) |
Retirement 2015 | (c) | (c) | (c) |
Retirement 2015 Fund–Advisor Class | (c) | (c) | (c) |
Retirement 2015 Fund–R Class | (c) | (c) | (c) |
Retirement 2020 | (c) | (c) | (c) |
Retirement 2020 Fund–Advisor Class | (c) | (c) | (c) |
Retirement 2020 Fund–R Class | (c) | (c) | (c) |
Retirement 2025 | (c) | (c) | (c) |
Retirement 2025 Fund–Advisor Class | (c) | (c) | (c) |
169
Fund | Fiscal Year Ended | ||
5/31/14 | 5/31/13 | 5/31/12 | |
Retirement 2025 Fund–R Class | (c) | (c) | (c) |
Retirement 2030 | (c) | (c) | (c) |
Retirement 2030 Fund–Advisor Class | (c) | (c) | (c) |
Retirement 2030 Fund–R Class | (c) | (c) | (c) |
Retirement 2035 | (c) | (c) | (c) |
Retirement 2035 Fund–Advisor Class | (c) | (c) | (c) |
Retirement 2035 Fund–R Class | (c) | (c) | (c) |
Retirement 2040 | (c) | (c) | (c) |
Retirement 2040 Fund–Advisor Class | (c) | (c) | (c) |
Retirement 2040 Fund–R Class | (c) | (c) | (c) |
Retirement 2045 | (c) | (c) | (c) |
Retirement 2045 Fund–Advisor Class | (c) | (c) | (c) |
Retirement 2045 Fund–R Class | (c) | (c) | (c) |
Retirement 2050 | (c) | (c) | (c) |
Retirement 2050 Fund–Advisor Class | (c) | (c) | (c) |
Retirement 2050 Fund–R Class | (c) | (c) | (c) |
Retirement 2055 | (c) | (c) | (c) |
Retirement 2055 Fund–Advisor Class | (c) | (c) | (c) |
Retirement 2055 Fund–R Class | (c) | (c) | (c) |
Retirement 2060 | (a) | (a) | (a) |
Retirement 2060 Fund–Advisor Class | (a) | (a) | (a) |
Retirement 2060 Fund–R Class | (a) | (a) | (a) |
Retirement Balanced | (c) | (c) | (c) |
Retirement Balanced Fund–Advisor Class | (c) | (c) | (c) |
Retirement Balanced Fund–R Class | (c) | (c) | (c) |
Short-Term Bond | 159,000 | 146,000 | 155,000 |
Short-Term Bond Fund–Advisor Class | 5,000 | 17,000 | 10,000 |
Short-Term Government Reserve | 179,000 | (a) | (a) |
Short-Term Reserve | (a) | (a) | (a) |
Strategic Income | 200,000 | 194,000 | 198,000 |
Strategic Income Fund–Advisor Class | 1,000 | (b) | (b) |
Target Retirement 2005 | (c) | (a) | (a) |
Target Retirement 2005 Fund–Advisor Class | (c) | (a) | (a) |
Target Retirement 2010 | (c) | (a) | (a) |
Target Retirement 2010 Fund–Advisor Class | (c) | (a) | (a) |
Target Retirement 2015 | (c) | (a) | (a) |
Target Retirement 2015 Fund–Advisor Class | (c) | (a) | (a) |
Target Retirement 2020 | (c) | (a) | (a) |
Target Retirement 2020 Fund–Advisor Class | (c) | (a) | (a) |
Target Retirement 2025 | (c) | (a) | (a) |
Target Retirement 2025 Fund–Advisor Class | (c) | (a) | (a) |
170
Fund | Fiscal Year Ended | ||
5/31/14 | 5/31/13 | 5/31/12 | |
Target Retirement 2030 | (c) | (a) | (a) |
Target Retirement 2030 Fund–Advisor Class | (c) | (a) | (a) |
Target Retirement 2035 | (c) | (a) | (a) |
Target Retirement 2035 Fund–Advisor Class | (c) | (a) | (a) |
Target Retirement 2040 | (c) | (a) | (a) |
Target Retirement 2040 Fund–Advisor Class | (c) | (a) | (a) |
Target Retirement 2045 | (c) | (a) | (a) |
Target Retirement 2045 Fund–Advisor Class | (c) | (a) | (a) |
Target Retirement 2050 | (c) | (a) | (a) |
Target Retirement 2050 Fund–Advisor Class | (c) | (a) | (a) |
Target Retirement 2055 | (c) | (a) | (a) |
Target Retirement 2055 Fund–Advisor Class | (c) | (a) | (a) |
Target Retirement 2060 | (a) | (a) | (a) |
Target Retirement 2060 Fund–Advisor Class | (a) | (a) | (a) |
U.S. Treasury Intermediate | 92,000 | 93,000 | 92,000 |
U.S. Treasury Long-Term | 92,000 | 93,000 | 92,000 |
U.S. Treasury Money | 92,000 | 93,000 | 92,000 |
Ultra Short-Term Bond | 107,000 | 57,000 | (a) |
(a) Prior to commencement of operations.
(b) Less than $1,000.
(c) Paid by underlying Price Funds pursuant to the Special Servicing Agreement.
Fund | Fiscal Year Ended | ||
10/31/14 | 10/31/13 | 10/31/12 | |
Africa & Middle East | $183,000 | $175,000 | $177,000 |
Asia Opportunities | 74,000 | (a) | (a) |
Asia Opportunities Fund–Advisor Class | 1,000 | (a) | (a) |
Emerging Europe | 119,000 | 116,000 | 120,000 |
Emerging Markets Stock | 183,000 | 175,000 | 177,000 |
European Stock | 119,000 | 116,000 | 120,000 |
Global Allocation | 203,000 | 82,000 | (a) |
Global Allocation Fund–Advisor Class | 4,000 | (b) | (a) |
Global Growth Stock | 142,000 | 135,000 | 138,000 |
Global Growth Stock Fund–Advisor Class | 1,000 | 1,000 | 1,000 |
Global Stock | 143,000 | 136,000 | 139,000 |
Global Stock Fund–Advisor Class | (b) | (b) | (b) |
Institutional Africa & Middle East | 183,000 | 175,000 | 177,000 |
Institutional Emerging Markets Equity | 144,000 | 141,000 | 146,000 |
Institutional Frontier Markets Equity | 15,000 | (a) | (a) |
Institutional Global Focused Growth Equity | 119,000 | 116,000 | 120,000 |
171
Fund | Fiscal Year Ended | ||
10/31/14 | 10/31/13 | 10/31/12 | |
Institutional Global Growth Equity | 119,000 | 116,000 | 120,000 |
Institutional Global Value Equity | 144,000 | 137,000 | 32,000 |
Institutional International Concentrated Equity | 119,000 | 116,000 | 120,000 |
Institutional International Core Equity | 119,000 | 116,000 | 120,000 |
Institutional International Growth Equity | 119,000 | 116,000 | 120,000 |
International Concentrated Equity | 24,000 | (a) | (a) |
International Concentrated Equity–Advisor Class | 3,000 | (a) | (a) |
International Discovery | 144,000 | 141,000 | 146,000 |
International Equity Index | 183,000 | 175,000 | 177,000 |
International Growth & Income | 163,000 | 151,000 | 152,000 |
International Growth & Income Fund–Advisor Class | 3,000 | 4,000 | 5,000 |
International Growth & Income Fund–R Class | (b) | 1,000 | 1,000 |
International Stock | 163,000 | 152,000 | 154,000 |
International Stock Fund–Advisor Class | 4,000 | 4,000 | 5,000 |
International Stock Fund–R Class | (b) | (b) | (b) |
Japan | 94,000 | 91,000 | 94,000 |
Latin America | 119,000 | 116,000 | 120,000 |
New Asia | 144,000 | 141,000 | 146,000 |
Overseas Stock | 144,000 | 141,000 | 146,000 |
Summit Cash Reserves | 119,000 | 116,000 | 120,000 |
Summit Municipal Income | 118,000 | 111,000 | 99,000 |
Summit Municipal Income Fund–Advisor Class | (b) | (b) | (b) |
Summit Municipal Intermediate | 118,000 | 111,000 | 99,000 |
Summit Municipal Intermediate Fund–Advisor Class | (b) | (b) | (b) |
Summit Municipal Money Market | 119,000 | 116,000 | 120,000 |
U.S. Bond Enhanced Index | 119,000 | 116,000 | 120,000 |
(a) Prior to commencement of operations.
(b) Less than $1,000.
Fund | Fiscal Year Ended | ||
12/31/14 | 12/31/13 | 12/31/12 | |
Balanced | $185,000 | $175,000 | $175,000 |
Blue Chip Growth | 128,000 | 115,000 | 122,000 |
Blue Chip Growth Fund–Advisor Class | 15,000 | 13,000 | 12,000 |
Blue Chip Growth Fund–R Class | 2,000 | 2,000 | 2,000 |
Capital Appreciation | 200,000 | 188,000 | 190,000 |
Capital Appreciation Fund–Advisor Class | 10,000 | 7,000 | 5,000 |
Capital Opportunity | 166,000 | 151,000 | 157,000 |
Capital Opportunity Fund–Advisor Class | 2,000 | 2,000 | 2,000 |
172
Fund | Fiscal Year Ended | ||
12/31/14 | 12/31/13 | 12/31/12 | |
Capital Opportunity Fund–R Class | 2,000 | 2,000 | 1,000 |
Diversified Mid-Cap Growth | 95,000 | 90,000 | 95,000 |
Diversified Small-Cap Growth | 95,000 | 90,000 | 95,000 |
Dividend Growth | 113,000 | 103,000 | 109,000 |
Dividend Growth Fund–Advisor Class | 7,000 | 7,000 | 6,000 |
Emerging Markets Bond | 185,000 | 175,000 | 175,000 |
Emerging Markets Corporate Bond | 169,000 | 194,000 | 116,000 |
Emerging Markets Corporate Bond Fund–Advisor Class | (a) | 1,000 | 2,000 |
Emerging Markets Corporate Multi-Sector Account Portfolio | (b) | (b) | (b) |
Emerging Markets Local Currency Bond | 209,000 | 193,000 | 194,000 |
Emerging Markets Local Currency Bond Fund–Advisor Class | 1,000 | 2,000 | 1,000 |
Emerging Markets Local Multi-Sector Account Portfolio | (b) | (b) | (b) |
Equity Income | 132,000 | 117,000 | 121,000 |
Equity Income Fund–Advisor Class | 11,000 | 11,000 | 12,000 |
Equity Income Fund–R Class | 2,000 | 1,000 | 2,000 |
Equity Index 500 | 145,000 | 140,000 | 145,000 |
Extended Equity Market Index | 145,000 | 140,000 | 145,000 |
Financial Services | 95,000 | 90,000 | 95,000 |
Global High Income Bond | (b) | (b) | (b) |
Global High Income Bond Fund–Advisor Class | (b) | (b) | (b) |
Global Industrials | 145,000 | 26,000 | (b) |
Global Real Estate | 196,000 | 183,000 | 187,000 |
Global Real Estate Fund–Advisor Class | 14,000 | 12,000 | 8,000 |
Global Technology | 120,000 | 115,000 | 120,000 |
Global Unconstrained Bond | (b) | (b) | (b) |
Global Unconstrained Bond Fund–Advisor Class | (b) | (b) | (b) |
Growth & Income | 95,000 | 90,000 | 95,000 |
Growth Stock | 152,000 | 139,000 | 144,000 |
Growth Stock Fund–Advisor Class | 14,000 | 12,000 | 12,000 |
Growth Stock Fund–R Class | 4,000 | 4,000 | 4,000 |
Health Sciences | 145,000 | 175,000 | 175,000 |
Institutional Emerging Markets Bond | 145,000 | 140,000 | 145,000 |
Institutional International Bond | 145,000 | 140,000 | 145,000 |
Institutional Large-Cap Core Growth | 95,000 | 90,000 | 95,000 |
Institutional Large-Cap Growth | 95,000 | 90,000 | 95,000 |
Institutional Large-Cap Value | 95,000 | 90,000 | 95,000 |
Institutional Mid-Cap Equity Growth | 95,000 | 90,000 | 95,000 |
Institutional Small-Cap Stock | 95,000 | 90,000 | 95,000 |
173
Fund | Fiscal Year Ended | ||
12/31/14 | 12/31/13 | 12/31/12 | |
Institutional U.S. Structured Research | 120,000 | 115,000 | 120,000 |
International Bond | 168,000 | 155,000 | 154,000 |
International Bond Fund–Advisor Class | 2,000 | 5,000 | 11,000 |
Media & Telecommunications | 120,000 | 115,000 | 120,000 |
Mid-Cap Growth | 136,000 | 122,000 | 126,000 |
Mid-Cap Growth Fund–Advisor Class | 7,000 | 6,000 | 7,000 |
Mid-Cap Growth Fund–R Class | 2,000 | 2,000 | 2,000 |
Mid-Cap Value | 131,000 | 118,000 | 122,000 |
Mid-Cap Value Fund–Advisor Class | 10,000 | 8,000 | 9,000 |
Mid-Cap Value Fund–R Class | 4,000 | 4,000 | 4,000 |
New America Growth | 105,000 | 94,000 | 99,000 |
New America Growth Fund–Advisor Class | 15,000 | 16,000 | 16,000 |
New Era | 95,000 | 90,000 | 95,000 |
New Horizons | 120,000 | 115,000 | 120,000 |
Real Assets | 185,000 | 175,000 | 175,000 |
Real Estate | 160,000 | 151,000 | 153,000 |
Real Estate Fund–Advisor Class | 10,000 | 9,000 | 12,000 |
Science & Technology | 126,000 | 118,000 | 121,000 |
Science & Technology Fund–Advisor Class | 19,000 | 17,000 | 19,000 |
Small-Cap Stock | 114,000 | 105,000 | 111,000 |
Small-Cap Stock Fund–Advisor Class | 6,000 | 5,000 | 4,000 |
Small-Cap Value | 145,000 | 137,000 | 142,000 |
Small-Cap Value Fund–Advisor Class | 25,000 | 23,000 | 23,000 |
Spectrum Growth | (c) | (c) | (c) |
Spectrum Income | (c) | (c) | (c) |
Spectrum International | (c) | (c) | (c) |
Total Equity Market Index | 145,000 | 140,000 | 145,000 |
U.S. Large-Cap Core | 117,000 | 109,000 | 114,000 |
U.S. Large-Cap Core Fund–Advisor Class | 3,000 | 1,000 | 1,000 |
Value | 117,000 | 108,000 | 112,000 |
Value Fund–Advisor Class | 3,000 | 2,000 | 3,000 |
(a) Less than $1,000.
(b) Prior to commencement of operations.
(c) Paid by underlying Price Funds pursuant to the Special Servicing Agreement.
529 Plans
T. Rowe Price is the investment manager of several college savings plans established by states under section 529 of the Code. Each plan has a number of portfolios that invest in underlying Price Funds including Blue Chip Growth, Emerging Markets Bond, Emerging Markets Stock, Equity Income, Equity Index 500, Extended Equity Market Index, Financial Services, Health Sciences, High Yield, Inflation Focused Bond, International Bond, International Equity Index, International Growth & Income, International Stock, Mid-Cap Growth, Mid-Cap Value, New Horizons, New Income, Overseas Stock, Real Assets, Science & Technology, Short-Term
174
Bond, Small-Cap Stock, Spectrum Income, Summit Cash Reserves, Total Equity Market Index, U.S. Bond Enhanced Index, U.S. Treasury Money, and Value Funds. Each portfolio establishes an omnibus account in the underlying Price Funds. Transfer agent and recordkeeping expenses incurred by the portfolios as a result of transactions by participants in the 529 plans that invest in the Price Funds are paid for by the underlying Price Funds under their agreement with their transfer agent, T. Rowe Price Services, Inc. The expenses borne by each underlying Price Fund are set forth in the shareholder report of the underlying fund under “Related Party Transactions.”
Administrative Fee Payments
The funds (other than the Inflation Focused Bond Fund, Institutional Funds (except for their F Class shares), Multi-Sector Account Portfolios, and TRP Reserve Funds) have adopted an administrative fee payment (“AFP”) program that authorizes the funds to make payments for services provided on behalf of the funds. Under the AFP program, payments by a fund (of up to 0.15% of its average daily net assets per year ) may be made to retirement plans, retirement plan recordkeepers, insurance companies, banks, and broker-dealers for transfer agency, recordkeeping, and other administrative services. These services include, but are not limited to: transmitting net purchase and redemption orders; maintaining separate records for shareholders reflecting purchases, redemptions, and share balances; mailing shareholder confirmations and periodic statements; processing dividend payments; and utilizing telephone services in connection with the above. Under the AFP program, the funds paid the amounts set forth below in calendar year 2014.
Fund | Payment |
Africa & Middle East | $65,938 |
Asia Opportunities | 202 |
Balanced | 1,458,354 |
Blue Chip Growth | 17,732,488 |
California Tax-Free Bond | 114,906 |
California Tax-Free Money | 1,001 |
Capital Appreciation | 11,568,550 |
Capital Opportunity | 661,902 |
Corporate Income | 41,173 |
Credit Opportunities | 159 |
Diversified Mid-Cap Growth | 72,800 |
Diversified Small-Cap Growth | 658,317 |
Dividend Growth | 3,500,218 |
Emerging Europe | 58,601 |
Emerging Markets Bond | 561,579 |
Emerging Markets Corporate Bond | 117,506 |
Emerging Markets Corporate Multi-Sector Account Portfolio | (a) |
Emerging Markets Local Currency Bond | 6,107 |
Emerging Markets Local Multi-Sector Account Portfolio | (a) |
Emerging Markets Stock | 1,852,977 |
Equity Income | 16,836,308 |
Equity Index 500 | 777,911 |
175
Fund | Payment |
European Stock | 776,549 |
Extended Equity Market Index | 220,505 |
Financial Services | 161,376 |
Floating Rate | 142,085 |
Floating Rate Multi-Sector Account Portfolio | (a) |
Georgia Tax-Free Bond | 71,077 |
Global Allocation | 1,921 |
Global Growth Stock | 7,708 |
Global High Income Bond | (b) |
Global Industrials | 498 |
Global Real Estate | 94,513 |
Global Stock | 184,737 |
Global Technology | 768,644 |
Global Unconstrained Bond | (b) |
GNMA | 136,036 |
TRP Government Reserve Investment | (a) |
Growth & Income | 158,341 |
Growth Stock | 16,784,352 |
Health Sciences | 5,271,721 |
High Yield | 2,805,589 |
High Yield Multi-Sector Account Portfolio | (a) |
Inflation Focused Bond | (a) |
Inflation Protected Bond | 95,954 |
Institutional Africa & Middle East | (a) |
Institutional Core Plus | (a) |
Institutional Core Plus Fund–F Class | 2,003 |
Institutional Credit Opportunities | (a) |
Institutional Emerging Markets Bond | (a) |
Institutional Emerging Markets Equity | (a) |
Institutional Floating Rate | (a) |
Institutional Floating Rate Fund–F Class | 1,067,037 |
Institutional Frontier Markets Equity | (a) |
Institutional Global Focused Growth Equity | (a) |
Institutional Global Growth Equity | (a) |
Institutional Global Multi-Sector Bond | (a) |
Institutional Global Value Equity | (a) |
Institutional High Yield | (a) |
Institutional International Bond | (a) |
Institutional International Concentrated Equity | (a) |
Institutional International Core Equity | (a) |
Institutional International Growth Equity | (a) |
Institutional Large-Cap Core Growth | (a) |
176
Fund | Payment |
Institutional Large-Cap Growth | (a) |
Institutional Large-Cap Value | (a) |
Institutional Long Duration Credit | (a) |
Institutional Mid-Cap Equity Growth | (a) |
Institutional Small-Cap Stock | (a) |
Institutional U.S. Structured Research | (a) |
Intermediate Tax-Free High Yield | 2 |
International Bond | 2,251,313 |
International Concentrated Equity | 33 |
International Discovery | 2,512,572 |
International Equity Index | 168,812 |
International Growth & Income | 555,384 |
International Stock | 2,803,600 |
Investment-Grade Corporate Multi-Sector Account Portfolio | (a) |
Japan | 81,687 |
Latin America | 273,911 |
Maryland Short-Term Tax-Free Bond | 52,547 |
Maryland Tax-Free Bond | 435,869 |
Maryland Tax-Free Money | 1,837 |
Media & Telecommunications | 948,775 |
Mid-Cap Growth | 12,949,507 |
Mid-Cap Value | 5,068,987 |
Mortgage-Backed Securities Multi-Sector Account Portfolio | (a) |
New America Growth | 3,290,487 |
New Asia | 1,978,555 |
New Era | 1,375,969 |
New Horizons | 9,252,490 |
New Income | 3,379,984 |
New Jersey Tax-Free Bond | 93,422 |
New York Tax-Free Bond | 79,887 |
New York Tax-Free Money | 788 |
Overseas Stock | 1,530,972 |
Personal Strategy Balanced | 1,165,265 |
Personal Strategy Growth | 780,327 |
Personal Strategy Income | 481,904 |
Prime Reserve | 80,277 |
Real Assets | 11,332 |
Real Estate | 3,570,007 |
TRP Reserve Investment | (a) |
Retirement 2005 | (c) |
Retirement 2010 | (c) |
177
Fund | Payment |
Retirement 2015 | (c) |
Retirement 2020 | (c) |
Retirement 2025 | (c) |
Retirement 2030 | (c) |
Retirement 2035 | (c) |
Retirement 2040 | (c) |
Retirement 2045 | (c) |
Retirement 2050 | (c) |
Retirement 2055 | (c) |
Retirement 2060 | (c) |
Retirement Balanced | (c) |
Science & Technology | 638,247 |
Short-Term Bond | 3,008,010 |
Short-Term Government Reserve | (b) |
Short-Term Reserve | (a) |
Small-Cap Stock | 6,781,477 |
Small-Cap Value | 3,713,536 |
Spectrum Growth | (c) |
Spectrum Income | (c) |
Spectrum International | (c) |
Strategic Income | 40,430 |
Summit Cash Reserves | 49,360 |
Summit Municipal Income | 821,691 |
Summit Municipal Intermediate | 3,213,392 |
Summit Municipal Money Market | 1,281 |
Target Retirement 2005 | (c) |
Target Retirement 2010 | (c) |
Target Retirement 2015 | (c) |
Target Retirement 2020 | (c) |
Target Retirement 2025 | (c) |
Target Retirement 2030 | (c) |
Target Retirement 2035 | (c) |
Target Retirement 2040 | (c) |
Target Retirement 2045 | (c) |
Target Retirement 2050 | (c) |
Target Retirement 2055 | (c) |
Target Retirement 2060 | (c) |
Tax-Efficient Equity | 16,138 |
Tax-Exempt Money | 339,402 |
Tax-Free High Yield | 1,300,340 |
Tax-Free Income | 359,338 |
Tax-Free Short-Intermediate | 1,294,067 |
178
Fund | Payment |
Tax-Free Ultra Short-Term Bond | (b) |
Total Equity Market Index | 159,973 |
U.S. Bond Enhanced Index | 147,421 |
U.S. Large-Cap Core | 5,715 |
U.S. Treasury Intermediate | 85,026 |
U.S. Treasury Long-Term | 34,549 |
U.S. Treasury Money | 356,238 |
Ultra Short-Term Bond | 89,232 |
Value | 2,898,978 |
Virginia Tax-Free Bond | 282,634 |
(a) Not eligible to participate in AFP program.
(b) Prior to commencement of operations.
(c) Paid by underlying Price Funds pursuant to the Special Servicing Agreement.
Each Advisor and R Class has adopted an AFP program under which various third parties, including third parties receiving 12b-1 payments, may receive payments from the class in addition to 12b-1 fees for providing various recordkeeping, transfer agency, and administrative services to the classes and/or shareholders thereof. These services include, but are not limited to: transmitting net purchase and redemption orders; maintaining separate records for shareholders reflecting purchases, redemptions, and share balances; mailing shareholder confirmations and periodic statements; processing dividend payments; and utilizing telephone services in connection with the above. Under this AFP program, the funds paid the amounts set forth below in calendar year 2014.
Fund | Payment |
Asia Opportunities Fund–Advisor Class | $1 |
Blue Chip Growth Fund–Advisor Class | 3,690,790 |
Blue Chip Growth Fund–R Class | 580,546 |
Capital Appreciation Fund–Advisor Class | 1,592,681 |
Capital Opportunity Fund–Advisor Class | 12,637 |
Capital Opportunity Fund–R Class | 12,777 |
Credit Opportunities Fund–Advisor Class | 34 |
Dividend Growth Fund–Advisor Class | 370,491 |
Emerging Markets Corporate Bond Fund–Advisor Class | 574 |
Emerging Markets Local Currency Bond Fund–Advisor Class | 271 |
Equity Income Fund–Advisor Class | 3,112,054 |
Equity Income Fund–R Class | 540,340 |
Floating Rate Fund–Advisor Class | 25,092 |
Global Allocation Fund–Advisor Class | 2,314 |
Global Growth Stock Fund–Advisor Class | 488 |
Global High Income Bond Fund–Advisor Class | (a) |
Global Real Estate Fund–Advisor Class | 20,750 |
Global Stock Fund–Advisor Class | 1,760 |
Growth Stock Fund–Advisor Class | 4,937,484 |
Growth Stock Fund–R Class | 1,479,213 |
179
Fund | Payment |
Global Unconstrained Bond Fund–Advisor Class | (a) |
High Yield Fund–Advisor Class | 1,457,376 |
Intermediate Tax-Free High Yield Fund–Advisor Class | 25 |
International Bond Fund–Advisor Class | 68,178 |
International Concentrated Equity Fund–Advisor Class | 0 |
International Growth & Income Fund–Advisor Class | 265,090 |
International Growth & Income Fund–R Class | 73,249 |
International Stock Fund–Advisor Class | 588,033 |
International Stock Fund–R Class | 10,565 |
Mid-Cap Growth Fund–Advisor Class | 1,739,991 |
Mid-Cap Growth Fund–R Class | 409,658 |
Mid-Cap Value Fund–Advisor Class | 1,189,370 |
Mid-Cap Value Fund–R Class | 481,861 |
New America Growth Fund–Advisor Class | 808,115 |
New Income Fund–Advisor Class | 39,165 |
New Income Fund–R Class | 9,244 |
Real Estate Fund–Advisor Class | 399,331 |
Retirement 2005 Fund–Advisor Class | (b) |
Retirement 2005 Fund–R Class | (b) |
Retirement 2010 Fund–Advisor Class | (b) |
Retirement 2010 Fund–R Class | (b) |
Retirement 2015 Fund–Advisor Class | (b) |
Retirement 2015 Fund–R Class | (b) |
Retirement 2020 Fund–Advisor Class | (b) |
Retirement 2020 Fund–R Class | (b) |
Retirement 2025 Fund–Advisor Class | (b) |
Retirement 2025 Fund–R Class | (b) |
Retirement 2030 Fund–Advisor Class | (b) |
Retirement 2030 Fund–R Class | (b) |
Retirement 2035 Fund–Advisor Class | (b) |
Retirement 2035 Fund–R Class | (b) |
Retirement 2040 Fund–Advisor Class | (b) |
Retirement 2040 Fund–R Class | (b) |
Retirement 2045 Fund–Advisor Class | (b) |
Retirement 2045 Fund–R Class | (b) |
Retirement 2050 Fund–Advisor Class | (b) |
Retirement 2050 Fund–R Class | (b) |
Retirement 2055 Fund–Advisor Class | (b) |
Retirement 2055 Fund–R Class | (b) |
Retirement 2060 Fund–Advisor Class | (b) |
180
Fund | Payment |
Retirement 2060 Fund–R Class | (b) |
Retirement Balanced Fund–Advisor Class | (b) |
Retirement Balanced Fund–R Class | (b) |
Science & Technology Fund–Advisor Class | 696,562 |
Short-Term Bond Fund–Advisor Class | 256,285 |
Small-Cap Stock Fund–Advisor Class | 705,796 |
Small-Cap Value Fund–Advisor Class | 2,035,650 |
Strategic Income Fund–Advisor Class | 3,243 |
Summit Municipal Income Fund–Advisor Class | 612 |
Summit Municipal Intermediate Fund–Advisor Class | 3,472 |
Target Retirement 2005 Fund–Advisor Class | (b) |
Target Retirement 2010 Fund–Advisor Class | (b) |
Target Retirement 2015 Fund–Advisor Class | (b) |
Target Retirement 2020 Fund–Advisor Class | (b) |
Target Retirement 2025 Fund–Advisor Class | (b) |
Target Retirement 2030 Fund–Advisor Class | (b) |
Target Retirement 2035 Fund–Advisor Class | (b) |
Target Retirement 2040 Fund–Advisor Class | (b) |
Target Retirement 2045 Fund–Advisor Class | (b) |
Target Retirement 2050 Fund–Advisor Class | (b) |
Target Retirement 2055 Fund–Advisor Class | (b) |
Target Retirement 2060 Fund–Advisor Class | (b) |
Tax-Free High Yield Fund–Advisor Class | 13,752 |
Tax-Free Income Fund–Advisor Class | 1,193,475 |
Tax-Free Short-Intermediate Fund–Advisor Class | 9,611 |
U.S. Large-Cap Core Fund–Advisor Class | 2,210 |
Value Fund–Advisor Class | 702,781 |
(a) Prior to commencement of operations.
(b) Paid by underlying Price Funds pursuant to the Special Servicing Agreement.
Additional Payments to Financial Intermediaries and Other Third Parties (All funds)
In addition to the AFP payments made by certain funds and the 12b-1 payments made by the Advisor and R Class, T. Rowe Price and its affiliates may provide expense reimbursements and meeting and marketing support payments (out of their own resources and not as an expense of the funds) to financial intermediaries, such as brokers-dealers, registered investment advisers, banks, insurance companies, and retirement plan recordkeepers, in connection with the sale, distribution, marketing, and/or servicing of the Price Funds.
Such expense reimbursements and meeting support payments may include sponsoring (or co-sponsoring) or providing financial support for industry conferences, client seminars, due diligence meetings, sales presentations, and other third-party sponsored events. The primary focus of these events typically is training and education. These payments will generally vary depending upon the nature of the event and may include financial assistance to intermediaries that enable T. Rowe Price or one of its affiliates to participate in and/or present at conferences or seminars, sales or training programs for invited registered representatives and other employees. Payments could also represent certain entertainment expenses, such as occasional meal expenses or tickets to sporting events that are not preconditioned on achievement of sales targets. Marketing support payments may be made for a variety of purposes, including but not limited to: advertising and marketing
181
opportunities; building brand awareness and educating intermediaries, clients, and prospects about the Price Funds; placement on an intermediary’s list of offered funds or preferred fund list; gaining access to senior management, sales representatives, or wholesalers of an intermediary; receiving detailed reporting packages (such as periodic sales reporting, sales production results, and data on how T. Rowe Price products, including the Price Funds, are used); and inclusion as a recommended individual retirement account provider on the platform of rollover service providers. Payments may also be made to third parties that help facilitate rollovers from employer-sponsored retirement plans to individual retirement accounts.
Reimbursements of retirement plan expenses may be made by T. Rowe Price or its affiliated retirement plan recordkeeper, RPS, in circumstances where the Price Funds are offered as investment options in such plans. These expense reimbursements are provided directly to the retirement plans and are intended to be used by plan sponsors to offset recordkeeping fees that RPS receives for providing sub-transfer agent and administrative services to the Price Funds.
The receipt of, or the prospect of receiving, these payments and expense reimbursements from T. Rowe Price and its affiliates may influence intermediaries, plan sponsors and other third parties to offer or recommend Price Funds over other investment options for which an intermediary does not receive additional compensation (or receives lower levels of additional compensation). However, these arrangements do not increase fund expenses and will not change the price that an investor pays for shares of the Price Funds or the amount that a Price Fund receives to invest on behalf of an investor.
Investment Services, a Maryland corporation formed in 1980 as a wholly owned subsidiary of T. Rowe Price, serves as distributor for all T. Rowe Price mutual funds on a continuous basis. Investment Services is registered as a broker-dealer under the Securities Exchange Act of 1934 and is a member of the Financial Industry Regulatory Authority, Inc. (“FINRA”).
Investment Services is located at the same address as the funds and T. Rowe Price–100 East Pratt Street, Baltimore, Maryland 21202.
Investment Services serves as distributor to the funds, pursuant to an Underwriting Agreement (“Underwriting Agreement”), which provides that the funds (other than the Single-Fee Funds) will pay all fees and expenses in connection with necessary state filings; preparing, setting in type, printing, and mailing of prospectuses and reports to shareholders; and issuing shares, including expenses of confirming purchase orders. For the Single-Fee Funds, the Underwriting Agreement provides that Investment Services will pay, or will arrange for others to pay, these fees and expenses.
The Underwriting Agreement also provides that Investment Services will pay all fees and expenses in connection with printing and distributing prospectuses and reports for use in offering and selling fund shares; preparing, setting in type, printing, and mailing all sales literature and advertising; Investment Services’ federal and state registrations as a broker-dealer; and offering and selling shares for each fund, except for those fees and expenses specifically assumed by the funds. Investment Services’ expenses are paid by T. Rowe Price.
Investment Services acts as the agent of the funds, in connection with the sale of fund shares in the various states in which Investment Services is qualified as a broker-dealer. Under the Underwriting Agreement, Investment Services accepts orders for fund shares at net asset value. Other than as described below with respect to the Advisor and R Class shares, no sales charges are paid by investors or the funds and no compensation is paid to Investment Services.
182
Advisor and R Class
Distribution and Shareholder Services Plan
The funds’ directors adopted a plan pursuant to Rule 12b-1 with respect to each Advisor and R Class (the “Class”). Each plan provides that the Class may compensate Investment Services or such other persons as the funds or Investment Services designates, to finance any or all of the distribution, shareholder servicing, maintenance of shareholder accounts, and/or other administrative services with respect to Class shares. It is expected that most, if not all, payments under each plan will be made (either directly, or indirectly through Investment Services) to intermediaries other than Investment Services such as broker-dealers, banks, insurance companies, and retirement plan recordkeepers. Under each plan, the Advisor Class pays a fee at the annual rate of up to 0.25% of that class’s average daily net assets and the R Class pays a fee at the annual rate of up to 0.50% of that class’s average net daily assets. Normally, the full amount of the fee is paid to the intermediary on shares sold through that intermediary; however, a lesser amount may be paid. In addition, the fee may be split among intermediaries based on the level of services provided by each. Intermediaries may use the payments for, among other purposes, compensating employees engaged in sales and/or shareholder servicing of the Class, as well as for a wide variety of other purposes associated with supporting, distributing, and servicing Class shares. The amount of fees paid by a Class during any year may be more or less than the cost of distribution and other services provided to the Class and its investors. FINRA rules limit the amount of annual distribution and service fees that may be paid by a mutual fund and impose a ceiling on the cumulative distribution fees paid. The plan complies with these rules.
The plan requires that Investment Services provide, or cause to be provided, a quarterly written report identifying the amounts expended by each Class and the purposes for which such expenditures were made to the fund directors for their review.
Prior to approving the plan, the funds considered various factors relating to the implementation of the plan and determined that there is a reasonable likelihood that the plan will benefit each fund, its Class, and the Class’ shareholders. The fund directors noted that to the extent the plan allows a fund to sell Class shares in markets to which it would not otherwise have access, the plan may result in additional sales of fund shares. This may enable a fund to achieve economies of scale that could reduce expenses. In addition, certain ongoing shareholder services may be provided more effectively by intermediaries with which shareholders have an existing relationship.
The plan is renewable from year to year with respect to each fund, so long as its continuance is approved at least annually (1) by the vote of a majority of the fund directors and (2) by a vote of the majority of the funds’ independent directors cast in person at a meeting called for the purpose of voting on such approval. The plan may not be amended to increase materially the amount of fees paid by any Class thereunder unless such amendment is approved by a majority vote of the outstanding shares of such Class and by the fund directors in the manner prescribed by Rule 12b-1 under the 1940 Act. The plan is terminable with respect to a Class at any time by a vote of a majority of the independent directors or by a majority vote of the outstanding shares in the Class.
Payments under the 12b-1 plans will still normally be made for funds that are closed to new investors. Such payments are made for the various services provided to existing investors by the intermediaries receiving such payments.
The following payments for the fiscal year indicated were made to intermediaries, including broker-dealers and insurance companies, for the distribution, shareholder servicing, maintenance of shareholder accounts, and/or other administrative services under the plan.
Fund | Fiscal Year Ended |