Table of Contents
UNITED STATES SECURITIES AND EXCHANGE COMMISSION
| (Mark One) | WASHINGTON, D.C. 20549 |
FORM 20-F
¨ REGISTRATION STATEMENT PURSUANT TO SECTION 12(b) OR (g) OF THE SECURITIES EXCHANGE ACT OF 1934
OR
X ANNUAL REPORT PURSUANT TO SECTION 13 OR 15(d) OF THE SECURITIES EXCHANGE ACT OF 1934
For the fiscal year ended: December 31, 2015
OR
¨ TRANSITION REPORT PURSUANT TO SECTION 13 OR 15(d) OF THE SECURITIES EXCHANGE ACT OF 1934
For the transition period from to
OR
¨ SHELL COMPANY REPORT PURSUANT TO SECTION 13 OR 15(d) OF THE SECURITIES EXCHANGE ACT OF 1934
Date of event requiring this shell company report
Commission file number: 001-32846
CRH public limited company
(Exact name of Registrant as specified in its charter)
Republic of Ireland
(Jurisdiction of incorporation or organisation)
Belgard Castle, Clondalkin, Dublin 22, Ireland
(Address of principal executive offices)
Senan Murphy
Tel: +353 1 404 1000
Fax: +353 1 404 1007
Belgard Castle, Clondalkin, Dublin 22, Ireland
(Name, Telephone, Email and/or Facsimile number and Address of Company Contact Person)
Securities registered or to be registered pursuant to Section 12(b) of the Act.
| Title of Each Class | Name of Each Exchange On Which Registered | |
| CRH plc | ||
| Ordinary Shares/Income Shares of €0.34 each | The New York Stock Exchange* | |
| American Depositary Shares, each representing the right to receive one | The New York Stock Exchange | |
| Ordinary Share | ||
| CRH America Inc. | ||
| 4.125% Notes due 2016 guaranteed by CRH plc | The New York Stock Exchange | |
| 6.000% Notes due 2016 guaranteed by CRH plc | The New York Stock Exchange | |
| 8.125% Notes due 2018 guaranteed by CRH plc | The New York Stock Exchange | |
| 5.750% Notes due 2021 guaranteed by CRH plc | The New York Stock Exchange | |
–
| * | Not for trading but only in connection with the registration of American Depositary Shares, pursuant to the requirements of the Securities and Exchange Commission. |
Securities registered or to be registered pursuant to Section 12(g) of the Act. None
Securities for which there is a reporting obligation pursuant to Section 15(d) of the Act. None
Indicate the number of outstanding shares of each of the issuer’s classes of capital or common stock as of the close of the period covered by the annual report.
| Ordinary Shares/Income Shares of €0.34 each ** |
823,911,253 | |||
| 5% Cumulative Preference Shares of €1.27 each |
50,000 | |||
| 7% ‘A’ Cumulative Preference Shares of €1.27 each |
872,000 |
–
| ** | Each Income Share is tied to an Ordinary Share and may only be transferred or otherwise dealt with in conjunction with such Ordinary Share. |
Indicate by check mark if the registrant is a well-known seasoned issuer, as defined in Rule 405 of the Securities Act. Yes X No ¨
If this report is an annual or transition report, indicate by check mark if the registrant is not required to file reports pursuant to Section 13 or 15(d) of the Securities Exchange Act of 1934. Yes ¨ No X
Note – Checking the box above will not relieve any registrant required to file reports pursuant to Section 13 or 15(d) of the Securities Exchange Act of 1934 from their obligations under those Sections.
Indicate by check mark whether the registrant (1) has filed all reports required to be filed by Section 13 or 15(d) of the Securities Exchange Act of 1934 during the preceding 12 months (or for such shorter period that the registrant was required to file such reports), and (2) has been subject to such filing requirements for the past 90 days. Yes X No ¨
Indicate by check mark whether the registrant has submitted electronically and posted on its corporate Web site, if any, every Interactive Data File required to be submitted and posted pursuant to Rule 405 of Regulation S-T (§232.405 of this chapter) during the preceding 12 months (or for such shorter period that the registrant was required to submit and post such files).*** Yes ¨ No ¨
Indicate by check mark whether the registrant is a large accelerated filer, an accelerated filer, or a non-accelerated filer. See definition of “accelerated filer and large accelerated filer” in Rule 12b-2 of the Exchange Act. (Check one):
Large accelerated filer X Accelerated filer ¨ Non-accelerated filer ¨
Indicate by check mark which basis of accounting the registrant has used to prepare the financial statements included in this filing:
| U.S. GAAP ¨ | International Financial Reporting Standards as issued by the | Other ¨ | ||
| International Accounting Standards Board X |
If “Other” has been checked in response to the previous question, indicate by check mark which financial statement item the registrant has elected to follow. Item 17 ¨ Item 18 ¨
If this is an annual report, indicate by check mark whether the registrant is a shell company (as defined in Rule 12b-2 of the Exchange Act). Yes ¨ No X
*** This requirement does not yet apply to the registrant.
Table of Contents
CRH Annual Report on Form 20-F | 2015
CRH plc Annual Report on Form 20-F
in respect of the year ended 31 December 2015
Table of Contents
CRH Annual Report on Form 20-F | 2015
Cross Reference to Form 20-F Requirements
This table has been provided as a cross reference from the information included in this Annual Report to the requirements of this 20-F.
| 1 |
Table of Contents
CRH Annual Report on Form 20-F | 2015
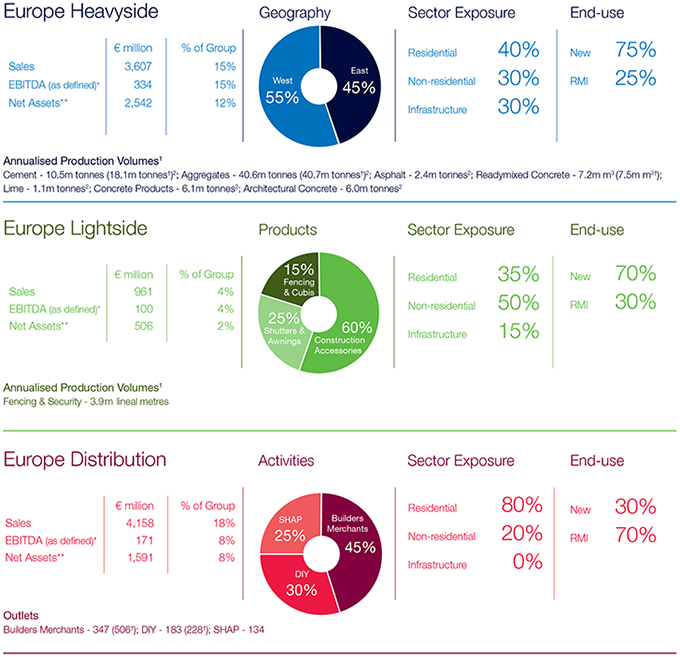
| Our business
CRH creates value by maintaining a balanced portfolio. Our product mix spans the breadth of building materials demand and sectoral end-use, thereby minimising exposure to any one single demand driver. In addition, the Group offsets cyclical economic risk by maintaining a geographically diversified portfolio across its key regions of North America and Europe, as well as in the emerging regions of Asia and South America. |
| Heavyside Materials
|
||||

|
• Aggregates – crushed stone
• Cement – primary binding agent
• Asphalt – road and highway surfaces
• Readymixed Concrete – pourable pre-mixed, aggregates, cement and water based compound
• Precast Concrete – structural floors, beams, vaults
• Architectural Concrete – blocks, bricks, pavers |
|||
| Lightside Products
|
||||

|
• Glass & Glazing Systems – engineered products for external and internal use
• Construction Accessories – engineered fixing, connecting and anchoring solutions
• Shutters & Awnings – solar shading, terrace roof and window protection solutions
• Fencing & Security – outdoor security and protection systems
• Cubis – composite access chambers |
|||
| Building Materials Distribution
|
||||

|
• Builders Merchants – channel for distribution of building materials to the professional contractor
• SHAP – specialist distribution of sanitary, heating and plumbing products
• DIY – providing decorative and home improvement products to the consumer |
|||
| 2 |
Table of Contents
CRH Annual Report on Form 20-F | 2015
| CRH at a glance
CRH plc is a leading global diversified building materials group, employing 89,000 people at over 3,900 operating locations in 31 countries worldwide.
CRH is a top two building materials company globally and the largest in North America. The Group has leadership positions in Europe as well as established strategic positions in the emerging economic regions of Asia and South America.
CRH is committed to improving the built environment through the delivery of superior materials and products for the construction and maintenance of infrastructure, residential and commercial projects.
A Fortune 500 company, CRH is listed in London and Dublin and is a constituent member of the FTSE100 and the ISEQ 20 indices. CRH’s American Depositary Shares are listed on the New York Stock Exchange. CRH’s market capitalisation at 31 December 2015 was approximately €22 billion.
|
||
|
Our vision:
To be the leading building materials business in the world
|
||
| 2015 Performance highlights
|
||

|
€23.6 billion |
|
€1.0 billion | |||||
| Sales | Profit Before Tax | |||||||
|
|
€2.2 billion |
|
89.1 cent | |||||
| EBITDA (as defined)* | Earnings Per Share | |||||||
|
|
€1.3 billion |

|
62.5 cent | |||||
| Operating Profit | Dividend Per Share | |||||||
| * Defined as earnings before interest, taxes, depreciation, amortisation, asset impairment charges, profit on disposals and the Group’s share of equity accounted investments’ result after tax. |
||||||||
| 3 |
Table of Contents

| 4 |
Table of Contents
CRH Annual Report on Form 20-F | 2015


| 5 |
Table of Contents

| 6 |
Table of Contents

| 7 |
Table of Contents
CRH Annual Report on Form 20-F | 2015
Introduction and Performance Measures
|
Reconciliation of EBITDA (as defined)* and Operating Profit (by segment) to Group Profit
|
| |||||||||||||||||||||||||||||||||||
| Year ended 31 December | ||||||||||||||||||||||||||||||||||||
| Group operating profit before | ||||||||||||||||||||||||||||||||||||
| depreciation and amortisation | Depreciation, amortisation | |||||||||||||||||||||||||||||||||||
| (EBITDA (as defined)*) | and impairment | Group operating profit(i) | ||||||||||||||||||||||||||||||||||
| 2015 | 2014 | 2013 | 2015 | 2014 | 2013 | 2015 | 2014 | 2013 | ||||||||||||||||||||||||||||
| €m | €m | €m | €m | €m | €m | €m | €m | €m | ||||||||||||||||||||||||||||
| Europe Heavyside | 334 | 380 | 326 | 199 | 229 | 721 | 135 | 151 | (395) | |||||||||||||||||||||||||||
| Europe Lightside | 100 | 94 | 71 | 25 | 23 | 43 | 75 | 71 | 28 | |||||||||||||||||||||||||||
| Europe Distribution | 171 | 190 | 186 | 77 | 78 | 80 | 94 | 112 | 106 | |||||||||||||||||||||||||||
| Europe | 605 | 664 | 583 | 301 | 330 | 844 | 304 | 334 | (261) | |||||||||||||||||||||||||||
| Americas Materials | 912 | 609 | 557 | 301 | 254 | 331 | 611 | 355 | 226 | |||||||||||||||||||||||||||
| Americas Products | 391 | 263 | 246 | 142 | 118 | 178 | 249 | 145 | 68 | |||||||||||||||||||||||||||
| Americas Distribution | 140 | 105 | 89 | 29 | 22 | 22 | 111 | 83 | 67 | |||||||||||||||||||||||||||
| Americas | 1,443 | 977 | 892 | 472 | 394 | 531 | 971 | 583 | 361 | |||||||||||||||||||||||||||
| LH Assets | 171 | - | - | 169 | - | - | 2 | - | - | |||||||||||||||||||||||||||
| Total Group | 2,219 | 1,641 | 1,475 | 942 | 724 | 1,375 | 1,277 | 917 | 100 | |||||||||||||||||||||||||||
| Profit on disposals | 101 | 77 | 26 | |||||||||||||||||||||||||||||||||
| Finance costs less income | (295) | (246) | (249) | |||||||||||||||||||||||||||||||||
| Other financial expense | (94) | (42) | (48) | |||||||||||||||||||||||||||||||||
| Share of equity accounted investments’ profit/(loss) | 44 | 55 | (44) | |||||||||||||||||||||||||||||||||
| Profit/(loss) before tax | 1,033 | 761 | (215) | |||||||||||||||||||||||||||||||||
| Income tax expense | (304) | (177) | (80) | |||||||||||||||||||||||||||||||||
| Group profit/(loss) for the financial year | 729 | 584 | (295) | |||||||||||||||||||||||||||||||||
|
(i) Throughout this document, Group operating profit as shown in the Consolidated Financial Statements excludes profit on disposals.
|
| |||||||||||||||||||||||||||||||||||
|
Calculation of EBITDA (as defined)* Net Interest Cover
|
| |||||||||||||||||||||||||||||||||||
| 2015 | 2014 | 2013 | ||||||||||||||||||||||||||||||||||
| €m | €m | €m | ||||||||||||||||||||||||||||||||||
| Interest | ||||||||||||||||||||||||||||||||||||
| Finance costs(i) | 303 | 254 | 262 | |||||||||||||||||||||||||||||||||
| Finance income(i) | (8) | (8) | (13) | |||||||||||||||||||||||||||||||||
| Net interest | 295 | 246 | 249 | |||||||||||||||||||||||||||||||||
| EBITDA (as defined)* | 2,219 | 1,641 | 1,475 | |||||||||||||||||||||||||||||||||
| Times | ||||||||||||||||||||||||||||||||||||
| EBITDA (as defined)* net interest cover (EBITDA (as defined)* divided by net interest) | 7.5 | 6.7 | 5.9 | |||||||||||||||||||||||||||||||||
| (i) | These items appear on the Consolidated Income Statement on page 156. |
| * | Defined as earnings before interest, taxes, depreciation, amortisation, asset impairment charges, profit on disposals and the Group’s share of equity accounted investments’ result after tax. |
| 8 |
Table of Contents
CRH Annual Report on Form 20-F | 2015
| Sales and EBITDA (as defined)* from continuing operations | ||||||||||||||||||||||||||||||||||||||||
| Sales | 2014 | 2015 |
||||||||||||||||||||||||||||||||||||||
| As €bn |
Exclude €bn |
Exclude €bn |
Continuing €bn |
As €bn |
Exclude €bn |
Exclude €bn |
Continuing €bn |
% change continuing operations |
||||||||||||||||||||||||||||||||
| Europe | 8.8 | (0.5) | – | 8.3 | 8.7 | (0.1) | – | 8.6 | 3% | |||||||||||||||||||||||||||||||
| Americas | 10.1 | (0.6) | – | 9.5 | 12.5 | (0.2) | – | 12.3 | 30% | |||||||||||||||||||||||||||||||
| Subtotal |
18.9 | (1.1) | – | 17.8 | 21.2 | (0.3) | – | 20.9 | 17% | |||||||||||||||||||||||||||||||
| LH Assets |
– | 2.4 | ||||||||||||||||||||||||||||||||||||||
| Total Group |
18.9 | 23.6 | ||||||||||||||||||||||||||||||||||||||
| EBITDA (as defined)* |
2014 | 2015 |
||||||||||||||||||||||||||||||||||||||
| As €m |
Exclude €m |
Exclude €m |
Continuing €m |
As €m |
Exclude €m |
Exclude €m |
Continuing €m |
% change continuing operations |
||||||||||||||||||||||||||||||||
| Europe |
664 | (70) | 15 | 609 | 605 | (11) | 41 | 635 | 4% | |||||||||||||||||||||||||||||||
| Americas |
977 | (38) | 27 | 966 | 1,443 | (1) | 14 | 1,456 | 51% | |||||||||||||||||||||||||||||||
| Subtotal |
1,641 | (108) | 42 | 1,575 | 2,048 | (12) | 55 | 2,091 | 33% | |||||||||||||||||||||||||||||||
| LH Assets |
– | 171 | ||||||||||||||||||||||||||||||||||||||
| Total Group |
1,641 | 2,219 | ||||||||||||||||||||||||||||||||||||||
| * | Defined as earnings before interest, taxes, depreciation, amortisation, asset impairment charges, profit on disposals and the Group’s share of equity accounted investments’ result after tax. |
| 9 |
Table of Contents
CRH Annual Report on Form 20-F | 2015
Introduction and Performance Measures | continued
| 10 |
Table of Contents
CRH Annual Report on Form 20-F | 2015
|
|
||||||||||||||||||||
| Year ended 31 December (amounts in millions, except per share data and ratios)
|
|
|||||||||||||||||||
| 2015 | 2014 | 2013(i) | 2012(ii) | 2011(ii) | ||||||||||||||||
| €m | €m | €m | €m | €m | ||||||||||||||||
| Consolidated Income Statement Data | ||||||||||||||||||||
| Revenue | 23,635 | 18,912 | 18,031 | 18,084 | 18,081 | |||||||||||||||
| Group operating profit | 1,277 | 917 | 100 | 805 | 871 | |||||||||||||||
| Profit/(loss) attributable to equity holders of the Company | 724 | 582 | (296) | 538 | 580 | |||||||||||||||
| Basic earnings/(loss) per Ordinary Share | 89.1c | 78.9c | (40.6c) | 74.6c | 81.2c | |||||||||||||||
| Diluted earnings/(loss) per Ordinary Share | 88.7c | 78.8c | (40.6c) | 74.5c | 81.2c | |||||||||||||||
| Dividends paid during calendar year per Ordinary Share | 62.5c | 62.5c | 62.5c | 62.5c | 62.5c | |||||||||||||||
| Average number of Ordinary Shares outstanding(iii) | 812.3 | 737.6 | 729.2 | 721.9 | 714.4 | |||||||||||||||
| Ratio of earnings to fixed charges (times)(iv) | 2.9 | 2.6 | 0.7(v) | 2.6 | 2.4 | |||||||||||||||
| All data relates to continuing operations | ||||||||||||||||||||
| Consolidated Balance Sheet Data | ||||||||||||||||||||
| Total assets | 32,007 | 22,017 | 20,429 | 20,900 | 21,384 | |||||||||||||||
| Net assets(vi) | 13,544 | 10,198 | 9,686 | 10,589 | 10,593 | |||||||||||||||
| Ordinary shareholders’ equity | 13,014 | 10,176 | 9,661 | 10,552 | 10,518 | |||||||||||||||
| Equity share capital | 281 | 253 | 251 | 249 | 247 | |||||||||||||||
| Number of Ordinary Shares(iii) | 823.9 | 744.5 | 739.2 | 733.8 | 727.9 | |||||||||||||||
| Number of Treasury Shares and own shares(iii) | 1.3 | 3.8 | 6.0 | 7.4 | 8.9 | |||||||||||||||
| Number of Ordinary Shares net of Treasury Shares and own shares(iii) | 822.6 | 740.7 | 733.2 | 726.4 | 719.0 | |||||||||||||||
| (i) | Group operating profit includes asset impairment charges of €650 million in 2013, with an additional €105 million impairment charge included in loss attributable to equity holders of the Company in respect of equity accounted investments. Details are contained in note 2 to the Consolidated Financial Statements. |
| (ii) | On 1 January 2013, the Group adopted IFRS 11 Joint Arrangements and IAS 19 Employee Benefits (revised). As a result, the prior year comparatives were restated as required by IAS 8 Accounting Policies, Changes in Accounting Estimates and Errors. |
| (iii) | All share numbers are shown in millions of shares. |
| (iv) | For the purposes of calculating the ratio of earnings to fixed charges, in accordance with Item 503 of Regulation S-K, earnings have been calculated by adding: profit/(loss) before tax adjusted to exclude the Group’s share of equity accounted investments’ result after tax, fixed charges and dividends received from equity accounted investments; and the fixed charges were calculated by adding interest expensed and capitalised, amortised premiums, discounts and capitalised expenses related to indebtedness, an estimate of the interest within rental expense and preference security dividend requirements of consolidated subsidiaries. |
| (v) | The amount of the deficiency in 2013 was US$183 million. |
| (vi) | Net assets is calculated as the sum of total assets less total liabilities. |
| 11 |
Table of Contents
CRH Annual Report on Form 20-F | 2015
Introduction and Performance Measures | continued
| * | Defined as earnings before interest, taxes, depreciation, amortisation, asset impairment charges, profit on disposals and the Group’s share of equity accounted investments’ result after tax. |
| 12 |
Table of Contents
CRH Annual Report on Form 20-F | 2015
|
Exchange Rates |
||||||||||||||||
| US Dollar/euro exchange rate
|
|
|||||||||||||||
| Years ended 31 December | Period End | Average Rate(i) | High | Low | ||||||||||||
| 2011 | 1.30 | 1.40 | 1.49 | 1.29 | ||||||||||||
| 2012 | 1.32 | 1.29 | 1.35 | 1.21 | ||||||||||||
| 2013 | 1.38 | 1.33 | 1.38 | 1.28 | ||||||||||||
| 2014 | 1.21 | 1.32 | 1.39 | 1.21 | ||||||||||||
| 2015 | 1.09 | 1.10 | 1.20 | 1.05 | ||||||||||||
| 2016 (through 11 March 2016) | 1.12 | 1.10 | 1.14 | 1.07 | ||||||||||||
| Months ended |
||||||||||||||||
| September 2015 | 1.12 | 1.12 | 1.14 | 1.11 | ||||||||||||
| October 2015 | 1.10 | 1.12 | 1.14 | 1.10 | ||||||||||||
| November 2015 | 1.06 | 1.07 | 1.10 | 1.06 | ||||||||||||
| December 2015 | 1.09 | 1.09 | 1.10 | 1.06 | ||||||||||||
| January 2016 | 1.08 | 1.09 | 1.10 | 1.07 | ||||||||||||
| February 2016 | 1.09 | 1.11 | 1.14 | 1.09 | ||||||||||||
| March 2016 (through 11 March 2016) | 1.12 | 1.10 | 1.12 | 1.08 | ||||||||||||
| (i) | The average of the US Dollar/euro exchange rate on the last day of each month during the period or in the case of monthly averages, the average of all days in the month, in each case using the FRB Noon Buying Rate. |
| 13 |
Table of Contents
CRH Annual Report on Form 20-F | 2015
History, Development and Organisational Structure of the Company
| 14 |
Table of Contents
CRH Annual Report on Form 20-F | 2015
The percentage of Group revenue and operating profit for each of the seven reporting segments for 2015, 2014 and 2013 is as follows:
|
Business Overview
|
|
|||||||||||||||||||||||
| 2015 | 2014 | 2013 | ||||||||||||||||||||||
| Revenue | Operating profit | Revenue | Operating profit | Revenue | Operating profit | |||||||||||||||||||
| Share of revenue and operating profit |
||||||||||||||||||||||||
| Europe Heavyside(i) | 15% | 11% | 21% | 16% | 21% | (395%) | ||||||||||||||||||
| Europe Lightside | 4% | 6% | 5% | 8% | 5% | 28% | ||||||||||||||||||
| Europe Distribution | 18% | 7% | 21% | 12% | 22% | 106% | ||||||||||||||||||
| Americas Materials | 27% | 48% | 27% | 39% | 26% | 226% | ||||||||||||||||||
| Americas Products | 16% | 19% | 17% | 16% | 17% | 68% | ||||||||||||||||||
| Americas Distribution | 10% | 9% | 9% | 9% | 9% | 67% | ||||||||||||||||||
| LH Assets(ii) | 10% | 0% | - | - | - | - | ||||||||||||||||||
| Total | 100% | 100% | 100% | 100% | 100% | 100% | ||||||||||||||||||
| (i) | See “Business Operations in Europe” on page 20 for details of non-European countries grouped with Europe for reporting purposes. |
| (ii) | The post-acquisition operating profit for LH Assets reported by CRH in 2015 is stated after charging transaction costs of €144 million (see note 30) and other one-off costs of €53 million. |
| A cement kiln at CRH Serbia’s Novi Popovac production plant, which produced 520,000 tonnes of cement and 360,000 tonnes of clinker in 2015. |

|
| 15 |
Table of Contents
CRH Annual Report on Form 20-F | 2015
Sector exposure and end-use based on 2015 annualised EBITDA (as defined)*
| * | Defined as earnings before interest, taxes, depreciation, amortisation, asset impairment charges, profit on disposals and the Group’s share of equity accounted investments’ result after tax. |
| ** | Net Assets at 31 December 2015 comprise segment assets less segment liabilities as disclosed in note 1 to the Consolidated Financial Statements. |
| 16 |
Table of Contents
CRH Annual Report on Form 20-F | 2015

| 1 | Throughout this document annualised volumes have been used which reflect the full-year impact of acquisitions made during the year and may vary from actual volumes produced. |
| 2 | Throughout this document tonnes denote metric tonnes (i.e. 1,000 kilogrammes). |
| † | Including equity accounted investments; the volumes quoted above for Europe Heavyside also include the Group’s share of production volumes in the businesses in China and India in which CRH has equity accounted investments. |
| 17 |
Table of Contents

| 18 |
Table of Contents
CRH Annual Report on Form 20-F | 2015
CRH in Europe*
| CRH is a regional leader in the manufacture and supply of building materials to construction markets in Europe and strives to maintain No. 1 and No. 2 market positions in its various product segments across a range of European countries.
|
||||||||||||
| The European operations are comprised of three divisions: Heavyside, Lightside and Distribution. The Heavyside operations produce cement, aggregates, asphalt, readymixed concrete, precast concrete and concrete landscaping. Our Lightside operations manufacture construction accessories, shutters and
|
awnings, fencing and composite access chambers. In Distribution, we are a leading player in builders merchanting, DIY and sanitary, heating and plumbing.
Operating across Western and Eastern Europe, more than 32,000 people are employed by our businesses at approximately 1,500 locations. |
|||||||||||

|

|

| ||||||||||
| The limestone quarry at Trzuskawica’s plant at Sitkówka. The plant is located near the city of Kielce, an area rich in limestone. This is one of the biggest quarries in Poland, with yearly extraction of up to 6m tonnes of high quality limestone in peak years. | Metal Inert Gas (MIG) welding of a stainless steel brick cladding support system at Ancon’s 6,500m2 manufacturing facility in Sheffield, UK. Ancon, part of Europe Lightside, is a two-time winner of the Queen’s Award for Enterprise. | Raboni, a general builders merchant, supplies a wide range of building materials to professional contractors in the Normandy and Paris regions of France. | ||||||||||
| * | A map showing the countries, including in Europe, where the newly acquired LH Assets are located is shown on page 32. |
| 19 |
Table of Contents
CRH Annual Report on Form 20-F | 2015
Business Operations in Europe
| 20 |
Table of Contents
CRH Annual Report on Form 20-F | 2015
| 21 |
Table of Contents
CRH Annual Report on Form 20-F | 2015
Business Operations in Europe | continued
| 22 |
Table of Contents
CRH Annual Report on Form 20-F | 2015
| 23 |
Table of Contents

| 24 |
Table of Contents
CRH Annual Report on Form 20-F | 2015
CRH in the Americas
| CRH is the largest building materials company in North America. We operate in all 50 US states and in six Canadian provinces.
|
||||||||||||
| Our Americas operations comprise Materials, Products and Distribution divisions. In Materials, we are the largest producer of asphalt and third largest producer of aggregates and readymixed concrete in the United States. Our Products operations, with their national footprint and broad product range, are the leading supplier of concrete products and
|
architectural glazing systems in North America. In Distribution, we are a leading supplier of product to the specialist Exterior roofing/siding contractor and also the Interior ceilings/walls demand segments.
Close to 40,000 people are employed by CRH in the Americas, with operations at over 1,700 locations. |
|||||||||||

|

|

| ||||||||||
| The Shelly Company’s Smith Concrete, supplied 35,000 cubic yards of concrete for the US$45 million Bridge of Honor. The bridge is a cast-in-place segmental concrete edge girder system with transverse floor beams. The bridge, which has a span of 675-feet, connects the cities of Pomeroy, Ohio, and Mason, West Virginia, across the Ohio River. | A rigorous quality assurance process at the Anjou Plant in Quebec, Canada, ensures that our customers receive world-class quality products and service. For more than 60 years, Oldcastle Architectural has been Canada’s leader in concrete products, offeringing leading-edge design options for residential and commercial applications. | Tri-Built Materials Group, the private-label division of Allied Building Products, has been well received and now includes more than 30 residential and commercial accessory products. | ||||||||||
| 25 |
Table of Contents
CRH Annual Report on Form 20-F | 2015
Business Operations in the Americas
| 26 |
Table of Contents

| 27 |
Table of Contents
CRH Annual Report on Form 20-F | 2015
Business Operations in the Americas | continued
| 28 |
Table of Contents
CRH Annual Report on Form 20-F | 2015
| 29 |
Table of Contents
CRH Annual Report on Form 20-F | 2015
Business Operations in the Americas | continued

| 30 |
Table of Contents

| 31 |
Table of Contents
CRH Annual Report on Form 20-F | 2015

| 32 |
Table of Contents
CRH Annual Report on Form 20-F | 2015
LH Assets
| 33 |
Table of Contents

| 34 |
Table of Contents
CRH Annual Report on Form 20-F | 2015
CRH in China & India
Equity Accounted Investments
CRH has established strategic footholds in China and India over the last eight years. Our strategy is to build select leading regional positions to enable us to benefit from industrialisation, urbanisation and population growth in these developing economies over the coming decades.
|
Products and Services - Locations
Cement
China, India
Aggregates
China, India
Readymixed Concrete
China, India
Precast Concrete
China
Commissioned in 2009, this 3.7km conveyor belt feeds crushed limestone to two 5,000 tonne per day kilns in Shuangyang Cement Plant which is located in the northeast of China. |
|

| 35 |
Table of Contents
CRH Annual Report on Form 20-F | 2015
Activities with Reserves Backing(i)
| Property acreage | % of mineral | |||||||||||||||||||||||||||||||||||||
| (hectares)(ii) | reserves by rock type | |||||||||||||||||||||||||||||||||||||
| No. of | Proven & | 2015 | ||||||||||||||||||||||||||||||||||||
| Physical | quarries/ | probable | Years to | Hard | Sand & | Annualised | ||||||||||||||||||||||||||||||||
| Location | pits | Owned | Leased | Reserves(iii) | Depletion(iv) | rock | gravel | Other | Extraction(v) | |||||||||||||||||||||||||||||
| Europe Heavyside |
||||||||||||||||||||||||||||||||||||||
| Ireland | 2 | 249 | - | 215 | 109 | 100% | - | - | 2.4 | |||||||||||||||||||||||||||||
| Poland | 2 | 293 | - | 185 | 46 | 93% | 6% | 1% | 4.2 | |||||||||||||||||||||||||||||
| Cement |
Spain | 1 | 33 | - | 85 | 366 | 100% | - | - | 0.4 | ||||||||||||||||||||||||||||
| Switzerland | 3 | 93 | 6 | 31 | 21 | 91% | - | 9% | 1.4 | |||||||||||||||||||||||||||||
| Ukraine | 3 | 279 | - | 158 | 51 | 81% | - | 19% | 3.0 | |||||||||||||||||||||||||||||
| Finland | 151 | 640 | 436 | 192 | 17 | 70% | 30% | - | 11.0 | |||||||||||||||||||||||||||||
| Ireland | 125 | 5,110 | 70 | 1,073 | 94 | 88% | 12% | - | 12.9 | |||||||||||||||||||||||||||||
| Aggregates |
Poland | 4 | 273 | - | 182 | 40 | 96% | 4% | - | 4.6 | ||||||||||||||||||||||||||||
| Spain | 11 | 138 | 167 | 96 | 44 | 99% | 1% | - | 1.8 | |||||||||||||||||||||||||||||
| Other | 36 | 214 | 559 | 172 | 23 | 76% | 24% | - | 7.9 | |||||||||||||||||||||||||||||
| Lime |
Ireland, Poland | 3 | 105 | - | 161 | 160 | 100% | - | - | 1.4 | ||||||||||||||||||||||||||||
| Clay |
Poland | 13 | 1,851 | 28 | 32 | 115 | - | 17% | 83% | 0.3 | ||||||||||||||||||||||||||||
| Subtotals |
354 | 9,278 | 1,266 | 2,582 | 88% | 10% | 2% | |||||||||||||||||||||||||||||||
| Americas Materials |
||||||||||||||||||||||||||||||||||||||
| Aggregates |
East | 287 | 25,823 | 5,633 | 9,286 | 120 | 87% | 13% | - | 84.6 | ||||||||||||||||||||||||||||
| West | 452 | 19,517 | 15,256 | 3,888 | 69 | 45% | 55% | - | 57.4 | |||||||||||||||||||||||||||||
| Subtotals |
739 | 45,340 | 20,889 | 13,174 | 75% | 25% | - | |||||||||||||||||||||||||||||||
| LH Assets |
||||||||||||||||||||||||||||||||||||||
| Brazil | 3 | 1,072 | - | 169 | 89 | 100% | - | - | 2.2 | |||||||||||||||||||||||||||||
| Canada | 2 | 691 | - | 300 | 106 | 100% | - | - | 3.0 | |||||||||||||||||||||||||||||
| France | 3 | 376 | - | 155 | 81 | 100% | - | - | 1.9 | |||||||||||||||||||||||||||||
| Germany | 3 | 321 | - | 164 | 54 | 100% | - | - | 3.0 | |||||||||||||||||||||||||||||
| Philippines | 11 | 2,061 | 17 | 189 | 31 | 100% | - | - | 6.6 | |||||||||||||||||||||||||||||
| Cement |
Romania | 5 | - | 881 | 241 | 79 | 73% | - | 27% | 3.7 | ||||||||||||||||||||||||||||
| Serbia | 2 | 81 | 42 | 109 | 185 | 100% | - | - | 0.6 | |||||||||||||||||||||||||||||
| Slovakia | 5 | 193 | 318 | 307 | 113 | 92% | - | 8% | 2.1 | |||||||||||||||||||||||||||||
| UK | 7 | 1,498 | 150 | 251 | 63 | 100% | - | - | 4.0 | |||||||||||||||||||||||||||||
| United States | 4 | 527 | 19 | 31 | 76 | 100% | - | - | 0.4 | |||||||||||||||||||||||||||||
| Canada | 23 | 3,035 | 94 | 481 | 29 | 81% | 19% | - | 16.8 | |||||||||||||||||||||||||||||
| France | 47 | 552 | 1,017 | 250 | 24 | 67% | 33% | - | 10.3 | |||||||||||||||||||||||||||||
| La Reunion | 3 | - | 54 | 4 | 4 | - | 100% | - | 1.0 | |||||||||||||||||||||||||||||
| Aggregates |
Romania | 24 | - | 922 | 121 | 50 | 94% | 6% | - | 2.4 | ||||||||||||||||||||||||||||
| Slovakia | 4 | 554 | - | 19 | 25 | - | 100% | - | 0.8 | |||||||||||||||||||||||||||||
| UK | 177 | 11,223 | 6,407 | 1,438 | 33 | 89% | 11% | - | 43.6 | |||||||||||||||||||||||||||||
| Lime |
UK | 1 | 209 | 3 | 39 | 36 | 100% | - | - | 1.1 | ||||||||||||||||||||||||||||
| Subtotals |
324 | 22,393 | 9,924 | 4,268 | 90% | 8% | 2% | |||||||||||||||||||||||||||||||
| Group totals |
1,417 | 77,011 | 32,079 | 20,024 | 79% | 20% | 1% | |||||||||||||||||||||||||||||||
| (i) | The disclosures made in this category refer to those facilities which are engaged in on-site processing of reserves in the various forms. |
| (ii) | 1 hectare equals approximately 2.47 acres. |
| (iii) | Where reserves are leased, the data presented above is restricted to include only that material which can be produced over the life of the contractual commitment inherent in the lease; the totals shown pertain only to amounts which are proven and probable. All of the proven and probable reserves are permitted and are quoted in millions of tonnes. |
| (iv) | Years to depletion is based on the average of the most recent three years annualised production. |
| (v) | Annualised extraction is quoted in millions of tonnes. |
| 36 |
Table of Contents
CRH Annual Report on Form 20-F | 2015
| Pennsy Supply’s Prescott Quarry in Lebanon, Pennsylvania, was recognised by Oldcastle Materials Group’s Aggregates National Performance Committee as Most Improved in the National Large Quarry Category in 2015. Local management successfully adjusted its operations plan to achieve higher volumes while reducing cost. |

|
| 37 |
Table of Contents
CRH Annual Report on Form 20-F | 2015
| 38 |
Table of Contents
CRH Annual Report on Form 20-F | 2015
| 39 |
Table of Contents
CRH Annual Report on Form 20-F | 2015
The Environment and Government Regulations
| 40 |
Table of Contents
CRH Annual Report on Form 20-F | 2015
| 41 |
Table of Contents

| 42 |
Table of Contents

| 43 |
Table of Contents
CRH Annual Report on Form 20-F | 2015

| (i) | See cautionary statement regarding forward-looking statements on page 12. |
| * | Defined as earnings before interest, taxes, depreciation, amortisation, asset impairment charges, profit on disposals and the Group’s share of equity accounted investments’ result after tax. |
| 44 |
Table of Contents
CRH Annual Report on Form 20-F | 2015
| * | Defined as earnings before interest, taxes, depreciation, amortisation, asset impairment charges, profit on disposals and the Group’s share of equity accounted investments’ result after tax. |
| 45 |
Table of Contents
CRH Annual Report on Form 20-F | 2015
Becoming the global leader
in building materials
CRH’s vision is to be the leading building materials business in the
world and in doing so to create value and deliver superior returns for
all our stakeholders.

| 46 |
Table of Contents
CRH Annual Report on Form 20-F | 2015
| Continuous Business Improvement | Our relentless focus on operational and commercial performance in all of our businesses in 2015 helped deliver improved returns.
In financial terms this resulted in Return on Net Assets (RONA) of 7.6% in 2015. This reflects improved margins, on a continuing operations basis, in each of our six legacy divisions. When adjusted to take account of non-recurring costs (€197 million) relating to the acquisition of our newly acquired LH Assets, Group RONA in 2015 was 8.8%, ahead of 2014 (7.4%).
| |
|
Disciplined and Focused Growth |
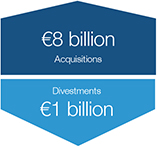
Portfolio management, and in particular the recycling of capital from lower growth areas into core businesses for growth, is a cornerstone of our value creation model. In 2015, we continued to manage our portfolio carefully, recording total disposal proceeds of approximately €1 billion.
While net debt levels of €6.6 billion at year-end 2015 reflect the significant €8 billion acquisition spend during the year, we continued to maintain financial discipline through careful working capital management and capital expenditure controls. The Group is committed to restoring its debt metrics to normalised levels in 2016.
| |
|
Leadership Development |
2015 was an active year for talent injection and promotion throughout the Group. This ensures that CRH is attracting the very best talent in the market and promoting talented individuals from within.
The Group also maintained its focus on leadership development with high performers selected to participate in a range of leadership development programmes.
Mobility opportunities continue to expand as the Group seeks to offer rewarding career and personal development experiences at different operating locations worldwide.
| |
|
Extracting the Benefits of Scale |
In 2015, the newly acquired LH Assets more than doubled the Group’s cement production volumes and made CRH the second largest building materials player globally and the world No. 2 in aggregates. The transaction enabled the Group to establish new leadership positions in certain heavyside materials markets globally. For example, CRH is now the market leader in the UK, has regional leadership positions in Canada, Germany and the Philippines, and has established top three positions in Romania, Slovakia, Hungary and Serbia. |
| 47 |
Table of Contents
CRH Annual Report on Form 20-F | 2015
Creating value and growth
CRH delivers on its strategy through the execution of a dynamic business model which is focused on value creation and growth. This has allowed CRH to deliver an industry-leading Total Shareholder Return of 16.1% since 1970. €100 invested in CRH shares in 1970, with dividends reinvested, would now be worth €83,000.

| 48 |
Table of Contents
CRH Annual Report on Form 20-F | 2015
| Balanced Portfolio | CRH creates value by maintaining a balanced portfolio. Our product mix spans the breadth of building materials demand and sectoral end-use, thereby reducing exposure to any one single demand driver. The Group also offsets cyclical economic risk by maintaining a geographically diversified portfolio across its key regions of North America and Europe, as well as the emerging regions of Asia and South America.
In 2015 the Group’s sector exposure was split 35% residential, 35% non-residential and 30% infrastructure. End-use was balanced equally between New Build and RMI.
|
| ||
|
Making Businesses Better |
CRH’s emphasis on making better businesses is a key component of its focus on value creation and growth. We have a proven track record in acquiring new businesses and bringing the Group’s collective knowledge and experience to bear in working with the local management teams of those businesses to deliver improvements in performance.
The Group supports the delivery of such improvements through targeted investment in measures that improve capacity, quality and efficiency.
Over time these improvements help us build better businesses that deliver stronger returns on capital invested.
|
| ||
|
Proven Acquisition Model |
CRH creates value and growth by identifying and acquiring strong businesses that complement our existing portfolio of operations. Typically we specialise in acquiring small and mid-sized companies, releasing value through synergies and network optimisation. From time to time the Group also evaluates and concludes larger transactions where the strategic rationale is compelling.
We excel at integrating businesses and ensuring that they are appropriately positioned and resourced to succeed as part of the CRH Group.
|
| ||
|
Dynamic Capital Management |
CRH constantly strives to ensure that capital is recycled from low growth areas into core parts of our business that offer the potential for stronger growth and returns.
With a portfolio which is diversified across many products, geographies and end-uses, we allocate capital to the areas best positioned to take advantage of developing growth cycles and new areas that offer improved value creation and growth potential. |
| ||
|
Financial Strength |
The Group maintains a constant focus on financial discipline and strong cash generation which in turn supports our ability to fund new value creating acquisitions and returns for shareholders.
Our strong financial position reduces the cost of capital. In 2015, we raised over €2.5 billion at historically low interest rates for the Group; with an eight-year bond for €600 million at 1.875%, a ten-year bond for $1.25 billion at 3.875%, a 14-year bond of £400 million at 4.125% and a 30-year bond for $500 million at 5.125%. |
|


| 49 |
Table of Contents
CRH Annual Report on Form 20-F | 2015
Building a sustainable business
| Corporate Social Responsibility and Sustainability concepts are embedded in the heart of our business and are fundamental to achieving our vision of becoming the leading building materials business in the world. |
| |||
|
Our Approach
CRH is committed to delivering a built environment that is sustainable and of value to the communities we serve. Our extensive global presence and industry leadership puts the Group in a strong position to influence transformative innovation that improves the sustainability of the built environment. Applying a strategic approach to deriving tangible long-term business value from sustainability, we collaborate with stakeholders to ensure our medium-term objectives and long-term ambitions are achieved. The Group does this while also being sensitive and responsive to our stakeholders as well as to the environment in which we operate.
CRH has formal structures in place to identify, evaluate and manage potential risks and opportunities in sustainability areas. Group performance and effectiveness is reviewed regularly by the Board of Directors.
We are committed to reporting on the breadth of our sustainability performance in a comprehensive and transparent manner and to publishing performance indicators and ambitions in key identified sustainability areas. |
CRH continues to be ranked among sector leaders by leading Sustainable and Responsible Investment (SRI) rating agencies and continues as a constituent member of several sustainability indices including the FTSE4Good Index, the STOXX® Global ESG Leaders Indices and the Vigeo World 120 Index. In addition, many Group locations have won high-ranking accolades for excellence in sustainability achievements. |
|||
|
| ||||


| 50 |
Table of Contents
CRH Annual Report on Form 20-F | 2015
| 51 |
Table of Contents
CRH Annual Report on Form 20-F | 2015
Creating value through Risk Governance
The aim of Enterprise Risk Management is to deliver increased shareholder value for CRH. Effective governance, which is considered fundamental in CRH, is critical to success, supporting management in executing strategy, managing costs, responding to risks, attracting investment, achieving regulatory compliance and in promoting effective decision making.

| 52 |
Table of Contents
CRH Annual Report on Form 20-F | 2015

| 53 |
Table of Contents
CRH Annual Report on Form 20-F | 2015
Key Strategic, Operational and Compliance Risk Factors
Industry cyclicality: strategic
| Risk Factor
|
Discussion
| |
| Description:
The level of construction activity in local and national markets is inherently cyclical being influenced by a wide variety of factors including global and national economic circumstances, ongoing austerity programmes in the developed world, governments’ ability to fund infrastructure projects, consumer sentiment and weather conditions. Financial performance may also be negatively impacted by unfavourable swings in fuel and other commodity/raw material prices. |
The Group’s operating and financial performance is influenced by general economic conditions and the state of the residential, industrial and commercial and infrastructure construction markets in the countries in which it operates, particularly in Europe and North America.
In general, economic uncertainty exacerbates negative trends in construction activity leading to postponement in orders. Construction markets are inherently cyclical and are affected by many factors that are beyond the Group’s control, including: | |
| Impact:
Failure of the Group to respond on a timely basis and/or adequately to unfavourable events beyond its control may adversely affect financial performance. |
• the price of fuel and principal energy-related raw materials such as bitumen and steel (which accounted for approximately 8% of annual Group sales revenues in 2015);
• the performance of the national economies in the 31 countries in which the Group operates;
• monetary policies in the countries in which the Group operates — for example, an increase in interest rates typically reduces the volume of mortgage borrowings thus impacting residential construction activity;
• the allocation of government funding for public infrastructure programmes, such as the development of highways in the United States under the Fixing Americas Surface Transportation Act (FAST Act); and
• the level of demand for construction materials and services, with sustained adverse weather conditions leading to potential disruptions or curtailments in outdoor construction activity.
While economic conditions appear to be improving in the United States, a prolongation of or further deterioration in economic performance in Europe may result in further general reductions in construction activity in that area. Against this backdrop, the adequacy and timeliness of the actions taken by the Group’s management team are of critical importance in maintaining financial performance at appropriate levels.
Each of the above factors could have a material adverse effect on the Group’s operating results and the market price of CRH plc’s Ordinary Shares.
| |
| 54 |
Table of Contents
CRH Annual Report on Form 20-F | 2015
Political and economic uncertainty: strategic
| Risk Factor
|
Discussion
| |
| Description:
As an international business, the Group operates in many countries with differing, and in some cases, potentially fast-changing economic, social and political conditions. These conditions could include political unrest, currency disintegration, strikes, civil disturbance and other forms of instability including natural disasters, epidemics, widespread transmission of diseases and terrorist attacks. These factors are of particular relevance in developing/emerging markets.
Impact:
Changes in these conditions, or in the governmental or regulatory requirements in any of the countries in which the Group operates, may adversely affect the Group’s business, results of operations, financial condition or prospects thus leading to possible impairment of financial performance and/or restrictions on future growth opportunities. |
The adverse developments in eurozone economic performance in recent years, together with ongoing austerity programmes in various countries in Europe and the growth of international terrorism, have contributed to heightened global uncertainty. While various actions have been taken by central banks and other institutions to stabilise the economic situation, the success of these actions cannot be guaranteed.
The Group currently operates mainly in Western Europe and North America as well as, to a lesser degree, in developing countries/emerging markets in Eastern Europe, the Philippines, Brazil, China and India. The economies of these countries are at varying stages of socioeconomic and macroeconomic development which could give rise to a number of risks, uncertainties and challenges and could include the following:
• changes in political, social or economic conditions;
• trade protection measures and import or export licensing requirements;
• potentially negative consequences from changes in tax laws;
• labour practices and differing labour regulations;
• procurement which contravenes ethical considerations;
• unexpected changes in regulatory requirements;
• state-imposed restrictions on repatriation of funds; and
• the outbreak of armed conflict.
With regard to Ukraine, where the Group has significant business interests, the outlook remains uncertain and the implications for construction activity in 2016 and beyond are unclear. | |
Commodity products and substitution: strategic
| Risk Factor
|
Discussion
| |
| Description:
The Group faces strong volume and price competition across its product lines. In addition, existing products may be replaced by substitute products which the Group does not produce or distribute.
Impact:
Against this backdrop, if the Group fails to generate competitive advantage through differentiation and innovation across the value chain (for example, through superior product quality, engendering customer loyalty or excellence in logistics), market share, and thus financial performance, may decline. |
The competitive environment in which the Group operates can be significantly impacted by general economic conditions in combination with local factors including the number of competitors, the degree of utilisation of production capacity and the specifics of product demand. Across the multitude of largely local markets in which the Group conducts business, downward pricing pressure is experienced from time to time, and the Group may not always be in a position to recover increased operating expenses (caused by factors such as increased fuel and raw material prices) through higher sale prices.
A number of the products sold by the Group (both those manufactured internally and those distributed) compete with other building products that do not feature in the existing product range. Any significant shift in demand preference from the Group’s existing products to substitute products, which the Group does not produce or distribute, could adversely impact market share and results of operations. | |
| 55 |
Table of Contents
CRH Annual Report on Form 20-F | 2015
Key Strategic, Operational and Compliance Risk Factors | continued
Acquisition activity: strategic
| Risk Factor
|
Discussion
| |
| Description:
Growth through acquisition and active management of the Group’s business portfolio are key elements of the Group’s strategy with the Group’s balanced portfolio growing year on year through bolt-on activity occasionally supplemented by larger and/or step-change transactions. In 2015, the Group completed the largest transaction in its history, namely the acquisition of the LH Assets across 11 countries. In addition, the Group may be liable for the past acts, omissions or liabilities of companies or businesses it has acquired.
Impact:
The Group may not be able to continue to grow as contemplated in its business plans if it is unable to identify attractive targets (including potential new platforms for growth), execute full and proper due diligence, raise funds on acceptable terms, complete such acquisition transactions, integrate the operations of the acquired businesses and realise anticipated levels of profitability and cash flows. If the Group is held liable for the past acts, omissions or liabilities of companies or businesses it has acquired, those liabilities may either be unforeseen or greater than anticipated at the time of the relevant acquisition. |
The Group’s acquisition strategy focuses on value-enhancing mid-sized acquisitions supplemented from time to time by larger strategic acquisitions into new markets or new building products.
The realisation of the Group’s acquisition strategy is dependent on the ability to identify and acquire suitable assets at appropriate prices thus satisfying the stringent cash flow and return on investment criteria underpinning such activities. The Group may not be able to identify such companies, and, even if identified, may not be able to acquire them because of a variety of factors including the outcome of due diligence processes, the ability to raise funds (as required) on acceptable terms, the need for competition authority approval in certain instances and competition for transactions from peers and other entities exploring acquisition opportunities in the building materials sector. In addition, situations may arise where the Group may be liable for the past acts or omissions or liabilities of companies acquired; for example, the potential environmental liabilities addressed under the “Sustainability” Risk Factor below. The Group’s ability to realise the expected benefits from acquisition activity depends, in large part, on its ability to integrate newly-acquired businesses in a timely and effective manner. Even if the Group is able to acquire suitable companies, it still may not be able to incorporate them successfully into the relevant legacy businesses and, accordingly, may be deprived of the expected benefits thus leading to potential dissipation and diversion of management resources and constraints on financial performance. | |
Joint ventures and associates: strategic
| Risk Factor
|
Discussion
| |
| Description:
The Group does not have a controlling interest in certain of the businesses (i.e. joint ventures and associates) in which it has invested and may invest. The absence of a controlling interest gives rise to increased governance complexity and a need for proactive relationship management, which may restrict the Group’s ability to generate adequate returns and to develop and grow these businesses.
Impact:
These limitations could impair the Group’s ability to manage joint ventures and associates effectively and/or realise the strategic goals for these businesses. In addition, improper management or ineffective policies, procedures or controls for non-controlled entities could adversely affect the business, results of operations or financial condition of the relevant investment. |
Due to the absence of full control of joint ventures and associates, important decisions such as the approval of business plans and the timing and amount of cash distributions and capital expenditures, for example, may require the consent of partners or may be approved without the Group’s consent.
These limitations could impair the Group’s ability to manage joint ventures and associates effectively and/or realise the strategic goals for these businesses. In addition, improper management or ineffective policies, procedures or controls for non-controlled entities could adversely affect the business, results of operations or financial condition of the relevant investment and, by corollary, the Group. | |
| 56 |
Table of Contents
CRH Annual Report on Form 20-F | 2015
Human resources: strategic
| Risk Factor
|
Discussion
| |
| Description:
Existing processes to recruit, develop and retain talented individuals and promote their mobility may be inadequate thus giving rise to employee/management attrition, difficulties in succession planning and inadequate “bench strength”, potentially impeding the continued realisation of the core strategy of performance and growth. In addition, the Group is exposed to various risks associated with collective representation of employees in certain jurisdictions, these risks could include strikes and increased wage demands with possible reputational consequences.
Impact:
In the longer term, failure to manage talent and plan for leadership and succession could impede the realisation of core strategic objectives around performance and growth. |
The identification and subsequent assessment, management, development and deployment of talented individuals is of major importance in continuing to deliver on the Group’s core strategy of performance and growth and in ensuring that succession planning objectives for key executive roles throughout its international operations are satisfied. Programmes designed to focus on performance management skills and leadership development may not achieve their desired objectives.
The maintenance of positive employee and trade/labour union relations is key to the successful operation of the Group. Some of the Group’s employees are represented by trade/labour unions under various collective agreements. For unionised employees, the Group may not be able to renegotiate satisfactorily the relevant collective agreements upon expiration and may face tougher negotiations and higher wage demands than would be the case for non-unionised employees. In addition, existing labour agreements may not prevent a strike or work stoppage with any such activity creating reputational risk and potentially having a material adverse effect on the results of operations and financial condition of the Group. | |
Corporate communications: strategic
| Risk Factor
|
Discussion
| |
| Description:
As a publicly-listed company, the Group undertakes regular communications with its stakeholders. Given that these communications may contain forward-looking statements, which by their nature involve uncertainty, actual results and developments may differ from those communicated due to a variety of external and internal factors giving rise to reputational risk.
Impact:
Failure to deliver on performance indications and non-financial commitments communicated to the Group’s variety of stakeholders could result in a reduction in share price, reduced earnings and reputational damage. |
The Group places great emphasis on timely and relevant corporate communications with overall responsibility for these matters being vested in senior management at the Group Head Office (largely the Chief Executive, the Finance Director, the Group Transformation Director, the Head of Investor Relations and the Group Director, Corporate Affairs) supported by engagement with highly experienced external advisors, where appropriate. The strategic, operational and financial performance of the Group and of its constituent entities, is reported to the Board on a monthly basis with all results announcements and other externally-issued documentation (e.g. the Annual Report on Form 20-F) being discussed by the Board/Audit Committee prior to release. | |
| 57 |
Table of Contents
CRH Annual Report on Form 20-F | 2015
Key Strategic, Operational and Compliance Risk Factors | continued
| Sustainability: operational
| ||
| Risk Factor
|
Discussion
| |
| Description:
The Group is subject to stringent and evolving laws, regulations, standards and best practices in the area of sustainability (comprising corporate governance, environmental management and climate change (specifically capping of emissions), health and safety management and social performance).
Impact:
Non-adherence to such laws, regulations, standards and best practices may give rise to increased ongoing remediation and/or other compliance costs and may adversely affect the Group’s business, results of operations, financial condition and/or prospects. |
The Group is subject to a broad and increasingly stringent range of existing and evolving laws, regulations, standards and best practices with respect to governance, the environment, health and safety and social performance in each of the jurisdictions in which it operates giving rise to significant compliance costs, potential legal liability exposure and potential limitations on the development of its operations. These laws, regulations, standards and best practices relate to, amongst other things, climate change, noise, emissions to air, water and soil, the use and handling of hazardous materials and waste disposal practices. Given the above, the risk of increased environmental and other compliance costs and unplanned capital expenditure is inherent in conducting business in the building materials sector and the impact of future developments in these respects on the Group’s activities, products, operations, profitability and cash flow cannot be estimated; there can therefore be no assurance that material liabilities and costs will not be incurred in the future or that material limitations on the development of its operations will not arise.
Environmental and health and safety and other laws, regulations, standards and best practices may expose the Group to the risk of substantial costs and liabilities, including liabilities associated with assets that have been sold or acquired and activities that have been discontinued. In addition, many of the Group’s manufacturing sites have a history of industrial use and, while strict environmental operating standards are applied and extensive environmental due diligence is undertaken in acquisition activity, some soil and groundwater contamination has occurred in the past at a limited number of sites. Although the associated remediation costs incurred to date have not been material, they may become more significant in the future. Despite the Group’s policy and efforts to comply with all applicable environmental and health and safety laws, it may face increased remediation liabilities and legal proceedings concerning environmental and health and safety matters in the future.
Based on information currently available, the Group has budgeted capital and revenue expenditures for environmental improvement projects and has established reserves for known environmental remediation liabilities that are probable and reasonably capable of estimation. However, the Group cannot predict environmental and health and safety matters with certainty, and budgeted amounts and established reserves may not be adequate for all purposes. In addition, the development or discovery of new facts, events, circumstances or conditions, including future decisions to close plants, which may trigger remediation liabilities, and other developments such as changes in laws or increasingly strict enforcement by governmental authorities, could result in increased costs and liabilities or prevent or restrict some of the operations of the Group, which in turn could have a material adverse effect on the reputation, business, results of operations and overall financial condition of the Group.
For additional information see also “Introduction – The Environment and Government Regulations”. | |
| 58 |
Table of Contents
CRH Annual Report on Form 20-F | 2015
|
Cyber and information technology: operational
| ||
| Risk Factor
|
Discussion
| |
| Description:
As a result of the proliferation of information technology in the world today, the Group is dependent on the employment of advanced information systems and is exposed to risks of failure in the operation of these systems. Further, the Group is exposed to security threats to its digital infrastructure through cyber-crime. Such attacks are by their nature technologically sophisticated and may be difficult to detect and defend in a timely fashion.
Impact:
Should a threat materialise, it might lead to interference with production processes, manipulation of financial data, the theft of private data or misrepresentation of information via digital media. In addition to potential irretrievability or corruption of critical data, the Group could suffer reputational losses, regulatory penalties and incur significant financial costs in remediation.
|
Security and cyber threats are becoming increasingly sophisticated and are continually evolving. Such attacks may result in interference with production software, corruption or theft of sensitive data, manipulation of financial data accessible through digital infrastructure, or reputational losses as a result of misrepresentation via social media and other websites. While the Group has made a significant investment in upgrading its digital infrastructure and governance processes with the overall objective of further enhancing system security, there can be no assurance that future attacks will not be successful due to their increasing sophistication and the difficulties in detecting and defending against them in a timely fashion. | |
|
Laws and regulations: compliance
| ||
| Risk Factor
|
Discussion
| |
| Description:
The Group is subject to many local and international laws and regulations, including those relating to competition law, corruption and fraud, across many jurisdictions of operation and is therefore exposed to changes in those laws and regulations and to the outcome of any investigations conducted by governmental, international or other regulatory authorities.
Impact:
Potential breaches of local and international laws and regulations in the areas of competition law, corruption and fraud, among others, could result in the imposition of significant fines and/or sanctions for non-compliance, and may inflict reputational damage. |
The Group is subject to various statutes, regulations and laws applicable to businesses generally in the countries and markets in which it operates. These include statutes, regulations and laws affecting land usage, zoning, labour and employment practices, competition, financial reporting, taxation, anti-bribery, anti-corruption, governance and other matters. The Group mandates that its employees comply with its Code of Business Conduct which stipulates best practices in relation to regulatory matters. The Group cannot guarantee that its employees will at all times successfully comply with all demands of regulatory agencies in a manner which will not materially adversely affect its business, results of operations, financial condition or prospects.
While the Group has put in place significant internal controls and compliance policies and procedures (including with respect to the Foreign Corrupt Practices Act in the United States and the Bribery Act in the United Kingdom), there can be no assurance that such established policies and procedures will afford adequate protection against fraudulent and/or corrupt activity and any such activity could have a material adverse effect on the Group’s business, results of operations, financial condition or prospects. | |
| 59 |
Table of Contents
CRH Annual Report on Form 20-F | 2015
Key Financial and Reporting Risk Factors
| Financial instruments |
||
| (interest rate and leverage, foreign currency, counterparty, credit ratings and liquidity)
| ||
|
Risk Factor
|
Discussion
| |
| Description:
The Group uses financial instruments throughout its businesses giving rise to interest rate and leverage, foreign currency, counterparty, credit rating and liquidity risks. A significant portion of the cash generated by the Group from operational activity is currently dedicated to the payment of principal and interest on indebtedness. In addition, the Group has entered into certain financing agreements containing restrictive covenants requiring it to maintain a certain minimum interest coverage ratio and a certain minimum net worth.
Impact:
A downgrade of the Group’s credit ratings may give rise to increases in funding costs in respect of future debt and may impair the Group’s ability to raise funds on acceptable terms. In addition, insolvency of the financial institutions with which the Group conducts business (or a downgrade in their credit ratings) may lead to losses in derivative assets and cash and cash equivalents balances or render it more difficult either to utilise existing debt capacity or otherwise obtain financing for operations. |
Interest rate and leverage risks: The Group’s exposures to changes in interest rates result from investing and borrowing activities undertaken to manage liquidity and capital requirements and stem predominantly from long-term debt obligations. Borrowing costs are managed through employing a mix of fixed and floating rate debt and interest rate swaps, where appropriate. As at 31 December 2015, the Group had outstanding net indebtedness of approximately €6.6 billion (2014: €2.5 billion). On foot of acquisition activity in 2015, the Group has significantly greater outstanding indebtedness, which may impair its operating and financial flexibility over the longer term and could adversely affect its business, results of operations and financial position. This high level of indebtedness could give rise to the Group dedicating a substantial portion of its cash flow to debt service thereby reducing the funds available in the longer term for working capital, capital expenditure, acquisitions, distributions to shareholders and other general corporate purposes and limiting its ability to borrow additional funds and to respond to competitive pressures. In addition, the increased level of indebtedness may give rise to a general increase in interest rates borne and there can be no assurance that the Group will not be adversely impacted by increases in borrowing costs in the future.
For the year ended 31 December 2015, PBITDA/net interest (all as defined in the relevant agreements as discussed in note 23 to the Consolidated Financial Statements), which is the Group’s principal financial covenant, was 8.5 times (2014: 7.0 times). The prescribed minimum PBITDA/net interest cover ratio under such agreements is 4.5 times and the prescribed minimum net worth is €5.6 billion.
Foreign currency risks: If the euro, which is the Group’s reporting currency, weakens relative to the basket of foreign currencies in which net debt is denominated (principally the US Dollar, Canadian Dollar, Swiss Franc, Philippine Peso and Pound Sterling), the net debt balance would increase; the converse would apply if the euro was to strengthen. The Group’s established policy to spread its net worth across the currencies of its operations, with the objective of limiting its exposure to individual currencies and thus promoting consistency with geographical balance, may not be successful.
Counterparty risks: Insolvency of the financial institutions with which the Group conducts business, or a downgrade in their credit ratings, may lead to losses in derivative assets and cash and cash equivalents balances or render it more difficult either to utilise existing debt capacity or otherwise obtain financing for operations. The maximum exposure arising in the event of default on the part of the counterparty (including insolvency) is the carrying amount of the relevant financial instrument.
The Group holds significant cash balances on deposit with a variety of highly-rated financial institutions (typically invested on a short-term basis) which, together with cash and cash equivalents at 31 December 2015, totalled €2.5 billion (2014: €3.3 billion). In addition to the above, the Group enters into derivative transactions with a variety of highly-rated financial institutions giving rise to derivative assets and derivative liabilities; the relevant balances as at 31 December 2015 were €109 million and €24 million respectively (2014: €102 million and €23 million respectively). The counterparty risks inherent in these exposures may give rise to losses in the event that the relevant financial institutions suffer a ratings downgrade or become insolvent. In addition, certain of the Group’s activities (e.g. highway paving in the United States) give rise to significant amounts receivable from counterparties at the balance sheet date; at year-end 2015, this balance was €0.7 billion (2014: €0.5 billion). In the current business environment, there is increased exposure to counterparty default, particularly as regards bad debts.
| |
| 60 |
Table of Contents
CRH Annual Report on Form 20-F | 2015
|
Financial instruments | continued |
||
| (interest rate and leverage, foreign currency, counterparty, credit ratings and liquidity)
| ||
|
Risk Factor
|
Discussion
| |
| Credit rating risks: A downgrade of the Group’s credit ratings may give rise to increases in funding costs in respect of future debt and may, among other concerns, impair its ability to access debt markets or otherwise raise funds or enter into letters of credit, for example, on acceptable terms. Such a downgrade may result from factors specific to the Group, including increased indebtedness stemming from acquisition activity, or from other factors such as general economic or sector-specific weakness or sovereign credit rating ceilings.
Liquidity risks: The principal liquidity risks stem from the maturation of debt obligations and derivative transactions. The Group aims to achieve flexibility in funding sources through a variety of means including (i) maintaining cash and cash equivalents with a number of highly-rated counterparties; (ii) limiting the maturity of such balances; (iii) meeting the bulk of debt requirements through committed bank lines or other term financing; and (iv) having surplus committed lines of credit. However, market or economic conditions may make it difficult at times to realise this objective.
For additional information on the above risks see note 21 to the Consolidated Financial Statements.
| ||
|
Defined benefit pension schemes and related obligations
| ||
|
Risk Factor
|
Discussion
| |
|
Description:
The Group operates a number of defined benefit pension schemes and related obligations (for example, termination indemnities and jubilee/long-term service benefits, which are accounted for as defined benefit) in certain of its operating jurisdictions. The assets and liabilities of defined benefit pension schemes may exhibit significant period-on-period volatility attributable primarily to asset values, changes in bond yields/discount rates and anticipated longevity.
Impact:
In addition to the contributions required for the ongoing service of participating employees, significant cash contributions may be required to remediate deficits applicable to past service. Further, fluctuations in the accounting surplus/deficit may adversely impact credit metrics thus harming the Group’s ability to raise funds. |
The assumptions used in the recognition of pension assets, liabilities, income and expenses (including discount rates, rate of increase in future compensation levels, mortality rates and healthcare cost trend rates) are updated based on market and economic conditions at the respective balance sheet date and for any relevant changes to the terms and conditions of the pension and post-retirement plans. These assumptions can be affected by (i) for the discount rate, changes in the rates of return on high-quality fixed income investments; (ii) for future compensation levels, future labour market conditions and anticipated inflation; (iii) for mortality rates, changes in the relevant actuarial funding valuations or changes in best practice; and (iv) for healthcare cost trend rates, the rate of medical cost inflation in the relevant regions. The weighted average actuarial assumptions used and sensitivity analysis in relation to the significant assumptions employed in the determination of pension and other post-retirement liabilities are disclosed on pages 214 to 223. A prolonged period of financial market instability or other adverse changes in the assumption mentioned above would have an adverse impact on the valuations of pension scheme assets.
In addition, a number of the defined benefit pension schemes in operation throughout the Group have reported material funding deficits thus necessitating remediation either in accordance with legislative requirements or as agreed with the relevant regulators. These obligations are reflected in the contracted payments disclosure on page 69. The extent of such contributions may be exacerbated over time as a result of a prolonged period of instability in worldwide financial markets or other adverse changes in the assumption mentioned above.
| |
| 61 |
Table of Contents
CRH Annual Report on Form 20-F | 2015
Key Financial and Reporting Risk Factors | continued
|
Adequacy of insurance arrangements and related counterparty exposures
| ||
|
Risk Factor
|
Discussion
| |
|
Description:
The building materials sector is subject to a wide range of operating risks and hazards, not all of which can be covered, adequately or at all, by insurance; these risks and hazards include climatic conditions such as floods and hurricanes/cyclones, seismic activity, technical failures, interruptions to power supplies, industrial accidents and disputes, environmental hazards, fire and crime. In its worldwide insurance programme, the Group provides coverage for its operations at a level believed to be commensurate with the associated risks.
Impact:
In the event of failure of one or more of the Group’s counterparties, the Group could be impacted by losses where recovery from such counterparties is not possible. In addition, losses may materialise in respect of uninsured events or may exceed insured amounts. |
Insurance protection is maintained with leading, highly-rated international insurers with appropriate risk retention by wholly-owned insurance companies (captive insurers) and by insured entities in the context of the deductibles/excesses borne. The coverage includes property damage and business interruption, public and products liability/general liability, employer’s liability/workmens’ compensation, environmental impairment liability, automobile liability and directors’ and officers’ liability. Adequate coverage at reasonable rates is not always commercially available to cover all potential risks and no assurance can be given that the insurance arrangements in place would be sufficient to cover all losses or liabilities to which the Group might be exposed. The occurrence of a significant adverse event not covered, or only partially covered, by insurance could have a material adverse impact on the business, results of operations, financial condition or prospects of the Group.
As at 31 December 2015, the total insurance provision, which is subject to periodic actuarial valuation and is discounted, amounted to €244 million (2014: €208 million); a substantial proportion of this figure pertained to claims which are classified as “incurred but not reported”.
| |
|
Foreign currency translation
| ||
|
Risk Factor
|
Discussion
| |
|
Description:
The principal foreign exchange risks to which the Consolidated Financial Statements are exposed pertain to adverse movements in reported results when translated into euro (which is the Group’s reporting currency) together with declines in the euro value of net investments which are denominated in a wide basket of currencies other than the euro.
Impact:
Adverse changes in the exchange rates used to translate these and other foreign currencies into euro have impacted and will continue to impact retained earnings. The annual impact is reported in the Consolidated Statement of Comprehensive Income.
|
A significant proportion of the Group’s revenues, expenses, assets and liabilities are denominated in currencies other than the euro, principally US Dollars, Canadian Dollars, Swiss Francs, Polish Zlotys, Philippine Pesos and Pounds Sterling. From year to year, adverse changes in the exchange rates used to translate these and other foreign currencies into euro have impacted and will continue to impact consolidated results and net worth. For additional information on the impact of foreign exchange movements on the Consolidated Financial Statements for the Group for the year ended 31 December 2015, see the Business Performance Review section commencing on page 65 and note 21 to the Consolidated Financial Statements. | |
| 62 |
Table of Contents
CRH Annual Report on Form 20-F | 2015
|
Goodwill impairment
| ||
|
Risk Factor
|
Discussion
| |
|
Description:
Significant under-performance in any of the Group’s major cash-generating units or the divestment of businesses in the future may give rise to a material write-down of goodwill.
Impact:
A write-down of goodwill could have a substantial impact on the Group’s income and equity. |
An acquisition generates goodwill to the extent that the price paid exceeds the fair value of the net assets acquired. Under IFRS, goodwill and indefinite-lived intangible assets are not amortised but are subject to annual impairment testing. Other intangible assets deemed separable from goodwill arising on acquisitions are amortised. A detailed discussion of the impairment testing process, the key assumptions used, the results of that testing and the related sensitivity analysis is contained in note 14 to the Consolidated Financial Statements on pages 189 to 192.
Whilst a goodwill impairment charge does not impact cash flow, a full write-down at 31 December 2015 would have resulted in a charge to income and a reduction in equity of €7.4 billion (2014: €4.0 billion).
| |
|
Inspections by the Public Company Accounting Oversight Board (“PCAOB”)
| ||
|
Risk Factor
|
Discussion
| |
| Description:
Our auditors, like other independent registered public accounting firms operating in Ireland and a number of other European countries, are not currently permitted to be subject to inspection by the PCAOB.
Impact:
Investors who rely on the audit report prepared by the Group’s auditors are deprived of the benefits of PCAOB inspections to assess audit work and quality control procedures. |
As a public company, our auditors are required by United States law to undergo regular PCAOB inspections to assess their compliance with United States law and professional standards in connection with their audits of financial statements filed with the SEC. Under Irish law, the PCAOB is currently unable to inspect and evaluate the audit work and quality control procedures of auditors in Ireland. Accordingly investors who rely on our auditors’ audit reports are deprived of the benefits of PCAOB inspections of auditors.
| |
| 63 |
Table of Contents

| 64 |
Table of Contents

|
|
||||||
| 66 | ||||||
| 66 | ||||||
| 69 | ||||||
| 70 | ||||||
|
|
|
80
|
|
|||
|
65 |
Table of Contents
CRH Annual Report on Form 20-F | 2015
Finance Director’s Introduction(i)

| (i) | See cautionary statement regarding forward-looking statements on page 12. |
| † | As disclosed in note 20 to the Consolidated Financial Statements, net debt comprises interest-bearing loans and borrowings, cash and cash equivalents, and derivative financial instruments. |
| * | Defined as earnings before interest, taxes, depreciation, amortisation, asset impairment charges, profit on disposals and the Group’s share of equity accounted investments’ result after tax. |
| 66 |
Table of Contents
CRH Annual Report on Form 20-F | 2015
Key Components of 2015 Performance
| € million | Sales revenue |
EBITDA (as defined)* |
Operating profit |
Profit on disposals |
Finance costs (net) |
Assoc. and JV PAT** |
Pre-tax profit |
|||||||||||||||||||||
| 2014 | 18,912 | 1,641 | 917 | 77 | (288) | 55 | 761 | |||||||||||||||||||||
| Exchange effects | 2,198 | 218 | 137 | 6 | (27) | 4 | 120 | |||||||||||||||||||||
| 2014 at 2015 rates | 21,110 | 1,859 | 1,054 | 83 | (315) | 59 | 881 | |||||||||||||||||||||
| Incremental impact in 2015 of: | ||||||||||||||||||||||||||||
| – 2014/2015 acquisitions |
2,738 | 215 | 28 | - | (50) | 1 | (21) | |||||||||||||||||||||
| – 2014/2015 divestments |
(855) | (100) | (69) | 20 | 6 | (10) | (53) | |||||||||||||||||||||
| – Restructuring/Impairment |
- | 22 | 27 | - | - | - | 27 | |||||||||||||||||||||
| – Swiss fine/Pension/CO2 |
- | (35) | (35) | - | - | - | (35) | |||||||||||||||||||||
| – Early bond redemption |
- | - | - | - | (38) | - | (38) | |||||||||||||||||||||
| – Organic |
642 | 258 | 272 | (2) | 8 | (6) | 272 | |||||||||||||||||||||
| 2015 | 23,635 | 2,219 | 1,277 | 101 | (389) | 44 | 1,033 | |||||||||||||||||||||
| % Total change | 25% | 35% | 39% | 36% | ||||||||||||||||||||||||
| % Organic change | 3% | 14% | 26% | 31% | ||||||||||||||||||||||||
| * | Defined as earnings before interest, taxes, depreciation, amortisation, asset impairment charges, profit on disposals and the Group’s share of equity accounted investments’ result after tax. |
| ** | CRH’s share of after-tax profits of joint ventures and associated undertakings |
| 67 |
Table of Contents
CRH Annual Report on Form 20-F | 2015
Finance Director’s Introduction | continued
| * | Defined as earnings before interest, taxes, depreciation, amortisation, asset impairment charges, profit on disposals and the Group’s share of equity accounted investments’ result after tax. |
| 68 |
Table of Contents
CRH Annual Report on Form 20-F | 2015
An analysis of the maturity profile of debt, finance and operating leases, purchase obligations, deferred and contingent acquisition consideration and pension scheme contribution commitments at 31 December 2015 is as follows:
|
Contractual Obligations
|
||||||||||||||||||||
| Less than | More than | |||||||||||||||||||
| Payments due by period | Total | 1 year | 1-3 years | 3-5 years | 5 years | |||||||||||||||
| €m | €m | €m | €m | €m | ||||||||||||||||
| Interest-bearing loans and borrowings(i) | 9,142 | 760 | 2,161 | 1,250 | 4,971 | |||||||||||||||
| Finance leases | 15 | 2 | 4 | 4 | 5 | |||||||||||||||
| Estimated interest payments on contractually-committed | 2,524 | 317 | 548 | 387 | 1,272 | |||||||||||||||
| debt and finance leases(ii) | ||||||||||||||||||||
| Deferred and contingent acquisition consideration | 288 | 46 | 172 | 58 | 12 | |||||||||||||||
| Operating leases | 2,116 | 370 | 561 | 354 | 831 | |||||||||||||||
| Purchase obligations(iii) | 860 | 497 | 142 | 82 | 139 | |||||||||||||||
| Retirement benefit obligation commitments(iv) | 73 | 20 | 38 | 4 | 11 | |||||||||||||||
| Total | 15,018 | 2,012 | 3,626 | 2,139 | 7,241 | |||||||||||||||
| (i) | Of the €9.1 billion total gross debt, €0.4 billion is drawn on revolving facilities which may be repaid and redrawn up to the date of maturity. The interest payments are estimated assuming these loans are repaid on facility maturity dates. |
| (ii) | These amounts have been estimated on the basis of the following assumptions: (a) no change in variable interest rates; (b) no change in exchange rates; (c) that all debt is repaid as if it falls due from future cash generation; and (d) none is refinanced by future debt issuance. |
| (iii) | Includes contracted for capital expenditure. A summary of the Group’s future purchase commitments as at 31 December 2015 for capital expenditure are set out in note 13 to the Consolidated Financial Statements. These expenditures for replacement and new projects are in the ordinary course of business and will be financed from internal resources. |
| (iv) | Represents the contracted payments related to our pension schemes in the United Kingdom and Ireland. See further details in note 27 to the Consolidated Financial Statements. |
| 69 |
Table of Contents
CRH Annual Report on Form 20-F | 2015
|
Results
|
Analysis of change
| |||||||||||||||||||||||||||||||||||||||||
| € million |
% |
2015 | 2014 |
Total |
Organic | Acquisitions | Divestments |
Restructuring/ |
Pension/ |
Exchange | ||||||||||||||||||||||||||||||||
| Sales revenue | -8% | 3,607 | 3,929 | -322 | -30 | +5 | -386 | - | - | +89 | ||||||||||||||||||||||||||||||||
| EBITDA (as defined)* | -12% | 334 | 380 | -46 | +1 | - | -62 | +9 | -3 | +9 | ||||||||||||||||||||||||||||||||
| Operating profit | -11% | 135 | 151 | -16 | +7 | - | -45 | +18 | -3 | +7 | ||||||||||||||||||||||||||||||||
| EBITDA (as defined)* margin | 9.3% | 9.7% | ||||||||||||||||||||||||||||||||||||||||
| Operating profit/sales | 3.7% | 3.8% | ||||||||||||||||||||||||||||||||||||||||
|
|
Restructuring costs amounted to €6 million (2014: €15 million)
Impairment charges of €26 million were incurred (2014: €35 million)
Pension restructuring gains amounted to €4 million (2014: nil)
Gains from CO2 trading amounted to €2 million (2014: €9 million)
| |||||||||||||||||||||||||||||||||||||||||
| * | Defined as earnings before interest, taxes, depreciation, amortisation, asset impairment charges, profit on disposals and the Group’s share of equity accounted investments’ result after tax. |
| 70 |
Table of Contents
CRH Annual Report on Form 20-F | 2015
| Studentencomplex Johanna is a student accommodation building in Utrecht, the Netherlands. Zoontjens supplied its Drenoliet® rooftop terrace tiles for communal areas, producing a landscape that is aesthetically pleasing and capable of withstanding high loads. |
| |||

| 71 |
Table of Contents
CRH Annual Report on Form 20-F | 2015
Europe Lightside
|
Results
|
Analysis of change
| |||||||||||||||||||||||||||||||
|
€ million |
% Change |
2015 | 2014 | Total Change |
Organic |
Acquisitions |
Restructuring | Exchange | ||||||||||||||||||||||||
| Sales revenue | +5% | 961 | 913 | +48 | +3 | +12 | - | +33 | ||||||||||||||||||||||||
| EBITDA (as defined)* | +6% | 100 | 94 | +6 | +2 | - | - | +4 | ||||||||||||||||||||||||
| Operating profit | +6% | 75 | 71 | +4 | - | - | - | +4 | ||||||||||||||||||||||||
| EBITDA (as defined)* margin | 10.4% | 10.3% | ||||||||||||||||||||||||||||||
| Operating profit/sales
|
|
7.8%
|
|
|
7.8%
|
|
||||||||||||||||||||||||||
|
|
Restructuring costs amounted to €5 million (2014: €5 million)
| |||||||||||||||||||||||||||||||
| * | Defined as earnings before interest, taxes, depreciation, amortisation, asset impairment charges, profit on disposals and the Group’s share of equity accounted investments’ result after tax. |
| 72 |
Table of Contents
CRH Annual Report on Form 20-F | 2015
Europe Distribution
|
Results
|
Analysis of change
| |||||||||||||||||||||||||||||||||||
| € million |
% Change |
2015 | 2014 | Total Change |
Organic | Acquisitions | Restructuring/ Impairment |
Swiss |
Exchange | |||||||||||||||||||||||||||
| Sales revenue | +4% | 4,158 | 3,999 | +159 | -21 | +27 | - | - | +153 | |||||||||||||||||||||||||||
| EBITDA (as defined)* | -10% | 171 | 190 | -19 | +4 | +1 | - | -32 | +8 | |||||||||||||||||||||||||||
| Operating profit | -16% | 94 | 112 | -18 | +10 | - | -1 | -32 | +5 | |||||||||||||||||||||||||||
| EBITDA (as defined)* margin | 4.1% | 4.8% | ||||||||||||||||||||||||||||||||||
| Operating profit/sales
|
|
2.3%
|
|
|
2.8%
|
|
||||||||||||||||||||||||||||||
|
|
Restructuring costs amounted to €4 million (2014: €4 million)
Impairment charges of €1 million were incurred (2014: nil)
| |||||||||||||||||||||||||||||||||||
| * | Defined as earnings before interest, taxes, depreciation, amortisation, asset impairment charges, profit on disposals and the Group’s share of equity accounted investments’ result after tax. |
| 73 |
Table of Contents
CRH Annual Report on Form 20-F | 2015
Americas Materials
|
Results
|
Analysis of change
|
|||||||||||||||||||||||||||||||||||||||
| € million |
% |
2015 | 2014 |
Total |
Organic | Acquisitions | Divestments | Restructuring | Exchange | |||||||||||||||||||||||||||||||
| Sales revenue | +26% | 6,400 | 5,070 | +1,330 | +342 | +80 | -95 | - | +1,003 | |||||||||||||||||||||||||||||||
| EBITDA (as defined)* | +50% | 912 | 609 | +303 | +170 | +14 | -7 | +1 | +125 | |||||||||||||||||||||||||||||||
| Operating profit | +72% | 611 | 355 | +256 | +176 | +11 | -3 | +1 | +71 | |||||||||||||||||||||||||||||||
| EBITDA (as defined)* margin | 14.3% | 12.0% | ||||||||||||||||||||||||||||||||||||||
| Operating profit/sales | 9.5% | 7.0% | ||||||||||||||||||||||||||||||||||||||
|
|
Restructuring costs amounted to €8 million (2014: €9 million)
|
| ||||||||||||||||||||||||||||||||||||||
| * | Defined as earnings before interest, taxes, depreciation, amortisation, asset impairment charges, profit on disposals and the Group’s share of equity accounted investments’ result after tax. |
| 74 |
Table of Contents
CRH Annual Report on Form 20-F | 2015
| A CAT 988K wheel loader, loads a gravel train at the Stoneco of Michigan - Ottawa Lake Quarry. The quarry shipped approx. two million tonnes in 2015 while continuing their run of 4,812 days worked without a lost time incident. Ottawa Lake has won multiple NSSGA and MAA awards for safety, community relations and environmental controls and is an MDOT-certified supplier of crushed limestone, sand, and gravel. |

| |||
| 75 |
Table of Contents
CRH Annual Report on Form 20-F | 2015
Americas Products
| Results
|
Analysis of change
|
|||||||||||||||||||||||||||||||||||||||
| € million |
% Change |
2015 |
2014 |
Total Change |
Organic |
Acquisitions |
Divestments |
Restructuring/ Impairment |
Exchange |
|||||||||||||||||||||||||||||||
| Sales revenue | +20% | 3,862 | 3,225 | +637 | +246 | +196 | -374 | - | +569 | |||||||||||||||||||||||||||||||
| EBITDA (as defined)* | +49% | 391 | 263 | +128 | +67 | +29 | -31 | +13 | +50 | |||||||||||||||||||||||||||||||
| Operating profit | +72% | 249 | 145 | +104 | +68 | +15 | -21 | +10 | +32 | |||||||||||||||||||||||||||||||
| EBITDA (as defined)* margin | 10.1% | 8.2% | ||||||||||||||||||||||||||||||||||||||
| Operating profit/sales | 6.4% | 4.5% | ||||||||||||||||||||||||||||||||||||||
|
|
Restructuring costs amounted to €5 million (2014: €18 million) |
| ||||||||||||||||||||||||||||||||||||||
|
|
Impairment charges of €17 million were incurred (2014: €14 million)
|
| ||||||||||||||||||||||||||||||||||||||
| * | Defined as earnings before interest, taxes, depreciation, amortisation, asset impairment charges, profit on disposals and the Group’s share of equity accounted investments’ result after tax. |
| 76 |
Table of Contents
CRH Annual Report on Form 20-F | 2015
| Oldcastle BuildingEnvelope® designed, engineered, tested, manufactured and delivered 2.6 million square feet of custom-engineered curtain wall, 1.6 million square feet of high performance and silk-screened architectural glass, 20,450 sunshades and 4,000 square feet of custom-engineered skylights for ExxonMobil’s new global campus in Houston, Texas. |

| |||
| 77 |
Table of Contents
CRH Annual Report on Form 20-F | 2015
Americas Distribution
|
Results
|
Analysis of change
| |||||||||||||||||||||||||||
| € million | % Change |
2015 | 2014 | Total Change |
Organic | Restructuring | Exchange | |||||||||||||||||||||
| Sales revenue | +26% | 2,229 | 1,776 | +453 | +102 | - | +351 | |||||||||||||||||||||
| EBITDA (as defined)* | +33% | 140 | 105 | +35 | +14 | -1 | +22 | |||||||||||||||||||||
| Operating profit | +34% | 111 | 83 | +28 | +11 | -1 | +18 | |||||||||||||||||||||
| EBITDA (as defined)* margin | 6.3% | 5.9% | ||||||||||||||||||||||||||
| Operating profit/sales
|
|
5.0%
|
|
|
4.7%
|
|
||||||||||||||||||||||
|
|
Restructuring costs amounted to €1 million (2014: nil)
| |||||||||||||||||||||||||||
| * | Defined as earnings before interest, taxes, depreciation, amortisation, asset impairment charges, profit on disposals and the Group’s share of equity accounted investments’ result after tax. |
| 78 |
Table of Contents
CRH Annual Report on Form 20-F | 2015
LH Assets
|
Results
|
Analysis by Region
| |||||||||||||||||||||||
| € million | 2015 | Western Europe |
CEE | Americas | Asia | Transaction/ One-off costs | ||||||||||||||||||
| Sales revenue | 2,418 | 1,464 | 186 | 617 | 151 | - | ||||||||||||||||||
| EBITDA (as defined)* | 171 | 183 | 51 | 100 | 34 | -197 | ||||||||||||||||||
| Operating profit | 2 | 85 | 22 | 67 | 25 | -197 | ||||||||||||||||||
| EBITDA (as defined)* margin | 7.1% | 12.5% | 27.4% | 16.2% | 22.5% | - | ||||||||||||||||||
| Operating profit/sales
|
0.1%
|
|
5.8%
|
|
|
11.8%
|
|
|
10.9%
|
|
|
16.6%
|
|
-
| ||||||||||
|
|
Transaction costs of €144 million and other one-off costs of €53 million
| |||||||||||||||||||||||
| * | Defined as earnings before interest, taxes, depreciation, amortisation, asset impairment charges, profit on disposals and the Group’s share of equity accounted investments’ result after tax. |
| 79 |
Table of Contents
CRH Annual Report on Form 20-F | 2015
Business Performance Review - Prior Year
Key Components of 2014 Performance
| € million | Revenue | EBITDA (as defined)* |
Operating profit |
Profit on disposal |
Finance costs (net) |
Assoc. and JV PAT† |
Pre-tax profit/ (loss) |
|||||||||||||||||||||
| 2013 | 18,031 | 1,475 | 100 | 26 | (297) | (44) | (215) | |||||||||||||||||||||
| Exchange effects | (62) | (11) | (4) | - | (1) | 5 | - | |||||||||||||||||||||
| 2013 at 2014 exchange rates | 17,969 | 1,464 | 96 | 26 | (298) | (39) | (215) | |||||||||||||||||||||
| Incremental impact in 2014 of: | ||||||||||||||||||||||||||||
| – 2014 and 2013 acquisitions |
237 | 16 | 4 | - | - | (2) | 2 | |||||||||||||||||||||
| – 2014 and 2013 divestments |
(25) | - | 1 | 43 | - | (1) | 43 | |||||||||||||||||||||
| – Restructuring costs |
- | 20 | 20 | - | - | - | 20 | |||||||||||||||||||||
| – Pension/CO2 gains |
- | (23) | (23) | - | - | - | (23) | |||||||||||||||||||||
| – Impairment charges |
- | - | 601 | - | - | 105 | 706 | |||||||||||||||||||||
| Ongoing operations | 731 | 164 | 218 | 8 | 10 | (8) | 228 | |||||||||||||||||||||
| 2014 | 18,912 | 1,641 | 917 | 77 | (288) | 55 | 761 | |||||||||||||||||||||
| † | CRH’s share of after-tax profits of joint ventures and associated undertakings |
| * | Defined as earnings before interest, taxes, depreciation, amortisation, asset impairment charges, profit on disposals and the Group’s share of equity accounted investments’ result after tax. |
| 80 |
Table of Contents
CRH Annual Report on Form 20-F | 2015
| Other major movements in net debt during 2014 comprised acquisition spend of €181 million on 21 transactions which was more than offset by divestment and disposal proceeds of €345 million. |

| |
| Materials provided by CRH Romania were used in the construction of the Agigea Bridge which spans the Danube – Black Sea canal and is the longest cable-stayed road bridge ever built in Romania. | ||
| † | As disclosed in note 20 to the Consolidated Financial Statements, net debt comprises interest-bearing loans and borrowings, cash in cash equivalents, and derivative financial instruments. |
| 81 |
Table of Contents
CRH Annual Report on Form 20-F | 2015
Europe Heavyside - 2014
|
Results
|
Analysis of change
| |||||||||||||||||||||||||||||||||||||||||||
| € million | % Change |
2014 | 2013 | Total Change |
Organic | Acquisitions | Divestments | Restructuring/ Impairment |
Pensions | Exchange | ||||||||||||||||||||||||||||||||||
| Sales revenue | 4% | 3,929 | 3,786 | 143 | 105 | 51 | -4 | - | - | -9 | ||||||||||||||||||||||||||||||||||
| EBITDA (as defined)* | 17% | 380 | 326 | 54 | 47 | 2 | 1 | 22 | -11 | -7 | ||||||||||||||||||||||||||||||||||
| Operating profit | 138% | 151 | -395 | 546 | 73 | -2 | 1 | 489 | -11 | -4 | ||||||||||||||||||||||||||||||||||
| EBITDA (as defined)* margin | 9.7% | 8.6% | ||||||||||||||||||||||||||||||||||||||||||
| Operating profit/sales | 3.8% | -10.4% | ||||||||||||||||||||||||||||||||||||||||||
|
|
Restructuring costs amounted to €15 million (2013: €37 million)
Impairment charges of €35 million were incurred (2013: €502 million)
No pension restructuring gains were recorded (2013: €12 million)
Gains from CO2 trading amounted to €9 million (2013: €8 million) | |||||||||||||||||||||||||||||||||||||||||||
| * | Defined as earnings before interest, taxes, depreciation, amortisation, asset impairment charges, profit on disposals and the Group’s share of equity accounted investments’ result after tax. |
| 82 |
Table of Contents
CRH Annual Report on Form 20-F | 2015
| The design for this park in Ciechocinek, Poland was completed by students who won Polbruk’s “Direction: Ciechocinek” competition. 4,200 m2 of Urbanika and Carmino pavers were used to bring this design to life. |

|
| 83 |
Table of Contents
CRH Annual Report on Form 20-F | 2015
Europe Lightside - 2014
|
Results
|
Analysis of change
| |||||||||||||||||||||||||||||||||||
| € million | % Change |
2014 | 2013 | Total Change |
Organic | Acquisitions | Restructuring/ Impairment |
Pensions | Exchange | |||||||||||||||||||||||||||
| Sales revenue | 7% | 913 | 856 | 57 | 53 | - | - | - | 4 | |||||||||||||||||||||||||||
| EBITDA (as defined)* | 32% | 94 | 71 | 23 | 22 | - | 1 | -1 | 1 | |||||||||||||||||||||||||||
| Operating profit | 154% | 71 | 28 | 43 | 31 | - | 14 | -1 | -1 | |||||||||||||||||||||||||||
| EBITDA (as defined)* margin | 10.3% | 8.3% | ||||||||||||||||||||||||||||||||||
| Operating profit/sales | 7.8% | 3.3% | ||||||||||||||||||||||||||||||||||
|
|
Restructuring costs amounted to €5 million (2013: €6 million)
No impairment charges were recorded (2013: €13 million)
No pension restructuring gains were recorded (2013: €1 million) | |||||||||||||||||||||||||||||||||||

| * | Defined as earnings before interest, taxes, depreciation, amortisation, asset impairment charges, profit on disposals and the Group’s share of equity accounted investments’ result after tax. |
| 84 |
Table of Contents

| 85 |
Table of Contents
CRH Annual Report on Form 20-F | 2015
Europe Distribution - 2014
|
Results
|
Analysis of change
| |||||||||||||||||||||||||||||||||||||
| € million | % Change |
2014 | 2013 | Total Change |
Organic | Acquisitions | Restructuring/ Impairment |
Pensions | Exchange | |||||||||||||||||||||||||||||
| Sales revenue | 2% | 3,999 | 3,936 | 63 | 7 | 41 | - | - | 15 | |||||||||||||||||||||||||||||
| EBITDA (as defined)* | 2% | 190 | 186 | 4 | 15 | - | - | -11 | - | |||||||||||||||||||||||||||||
| Operating profit | 6% | 112 | 106 | 6 | 14 | -1 | 4 | -11 | - | |||||||||||||||||||||||||||||
| EBITDA (as defined)* margin | 4.8% | 4.7% | ||||||||||||||||||||||||||||||||||||
| Operating profit/sales | 2.8% | 2.7% | ||||||||||||||||||||||||||||||||||||
|
Restructuring costs amounted to €4 million (2014: €4 million)
Impairment charges of €1 million were incurred (2014: nil) | ||||||||||||||||||||||||||||||||||||||
| * | Defined as earnings before interest, taxes, depreciation, amortisation, asset impairment charges, profit on disposals and the Group’s share of equity accounted investments’ result after tax. |
| 86 |
Table of Contents
CRH Annual Report on Form 20-F | 2015
| In the Netherlands, 27 different General Builders Merchants companies in Europe Distribution united under one new name. BMN Bouwmaterialen was formally launched in October 2015 and has nearly 80 branches nationwide. |

|
| 87 |
Table of Contents
CRH Annual Report on Form 20-F | 2015
Americas Materials - 2014
|
Results
|
Analysis of change
| |||||||||||||||||||||||||||||||||||
| € million | % Change |
2014 | 2013 | Total Change |
Organic | Acquisitions | Divestments | Restructuring/ Impairment |
Exchange | |||||||||||||||||||||||||||
| Sales revenue | 7% | 5,070 | 4,721 | 349 | 317 | 37 | -2 | - | -3 | |||||||||||||||||||||||||||
| EBITDA (as defined)* | 9% | 609 | 557 | 52 | 42 | 7 | - | 3 | - | |||||||||||||||||||||||||||
| Operating profit | 57% | 355 | 226 | 129 | 61 | 5 | - | 63 | - | |||||||||||||||||||||||||||
| EBITDA (as defined)* margin | 12.0% | 11.8% | ||||||||||||||||||||||||||||||||||
| Operating profit/sales | 7.0% | 4.8% | ||||||||||||||||||||||||||||||||||
|
|
Restructuring costs amounted to €9 million (2013: €12 million)
No impairment charges were recorded (2013: €60 million) | |||||||||||||||||||||||||||||||||||
| * | Defined as earnings before interest, taxes, depreciation, amortisation, asset impairment charges, profit on disposals and the Group’s share of equity accounted investments’ result after tax. |
| 88 |
Table of Contents
CRH Annual Report on Form 20-F | 2015
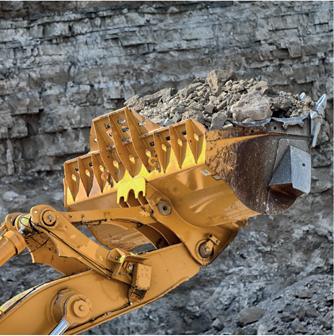
| 89 |
Table of Contents
CRH Annual Report on Form 20-F | 2015
Americas Products - 2014
|
Results
|
Analysis of change
| |||||||||||||||||||||||||||||||||||||||
| € million | % Change |
2014 | 2013 | Total Change |
Organic | Acquisitions | Restructuring/ Impairment |
Pensions | Exchange | |||||||||||||||||||||||||||||||
| Sales revenue | 5% | 3,225 | 3,068 | 157 | 169 | 75 | -19 | - | -68 | |||||||||||||||||||||||||||||||
| EBITDA (as defined)* | 7% | 263 | 246 | 17 | 24 | 6 | -1 | -7 | -5 | |||||||||||||||||||||||||||||||
| Operating profit | 113% | 145 | 68 | 77 | 24 | 2 | - | 50 | 1 | |||||||||||||||||||||||||||||||
| EBITDA (as defined)* margin | 8.2% | 8.0% | ||||||||||||||||||||||||||||||||||||||
| Operating profit/sales | 4.5% | 2.2% | ||||||||||||||||||||||||||||||||||||||
|
|
Restructuring costs amounted to €18 million (2013: €11 million)
Impairment charges of €14 million were incurred (2013: €71 million) | |||||||||||||||||||||||||||||||||||||||
| * | Defined as earnings before interest, taxes, depreciation, amortisation, asset impairment charges, profit on disposals and the Group’s share of equity accounted investments’ result after tax. |
| 90 |
Table of Contents
CRH Annual Report on Form 20-F | 2015

| 91 |
Table of Contents
CRH Annual Report on Form 20-F | 2015
Americas Distribution - 2014
|
Results
|
Analysis of change
| |||||||||||||||||||||||||||||||||||
| € million | % Change |
2014 | 2013 | Total Change |
Organic | Acquisitions | Restructuring/ Impairment |
Exchange | ||||||||||||||||||||||||||||
| Sales revenue | 7% | 1,776 | 1,664 | 112 | 80 | 33 | - | -1 | ||||||||||||||||||||||||||||
| EBITDA (as defined)* | 18% | 105 | 89 | 16 | 14 | 1 | 1 | - | ||||||||||||||||||||||||||||
| Operating profit | 24% | 83 | 67 | 16 | 15 | - | 1 | - | ||||||||||||||||||||||||||||
| EBITDA (as defined)* margin | 5.9% | 5.3% | ||||||||||||||||||||||||||||||||||
| Operating profit/sales | 4.7% | 4.0% | ||||||||||||||||||||||||||||||||||
|
|
No restructuring costs were recorded (2013: €1 million)
| |||||||||||||||||||||||||||||||||||
| * | Defined as earnings before interest, taxes, depreciation, amortisation, asset impairment charges, profit on disposals and the Group’s share of equity accounted investments’ result after tax. |
| 92 |
Table of Contents
CRH Annual Report on Form 20-F | 2015
| With close to 200 locations, Allied is a leading building products distributor to specialty contractors in residential and commercial construction in the United States. This Contractor Tool Center in Wall Township, New Jersey, provides a one-stop shopping experience, with products ranging from hand tools to hand cleaner. |
|

| 93 |
Table of Contents
| 94 |
Table of Contents

| Governance | ||||||||
| Board of Directors | 96 | |||||||
| Corporate Governance Report | 100 | |||||||
| Directors’ Remuneration Report | 114 | |||||||
|
95 |
Table of Contents
CRH Annual Report on Form 20-F | 2015

|
Chairman
Appointed to the Board: June 2004
Nationality: Irish
Age: 64
Committee membership: Acquisitions Committee; Finance Committee; Nomination & Corporate Governance Committee; Remuneration Committee |
Skills and experience: Nicky was Vice President of Manufacturing and Business Operations for Dell Inc.’s Europe, Middle East and Africa (EMEA) operations from 2000 to 2008. Prior to joining Dell, he was Executive Vice President at Eastman Kodak and previously held the position of President and Chief Executive Officer at Verbatim Corporation, based in the United States.
Qualifications: C.Eng, FIEI, MBA.
External appointments: Non-listed: Chief Executive of Prodigium, a consulting company which provides business advisory services; non-executive Director of Musgrave Group plc, a privately-owned international food retailer and Eircom Limited, a telecommunications services provider in Ireland. Listed: Non-executive Director of Finning International, Inc., the world’s largest Caterpillar equipment dealer. | ||

|
Chief Executive
Appointed to the Board: January 2009
Nationality: Irish
Age: 53
Committee membership: Acquisitions Committee
|
Skills and experience: Albert was appointed a CRH Board Director in January 2009. He joined CRH in 1998. Prior to joining CRH, he was Chief Operating Officer with a private equity group. While at CRH, he has held a variety of senior positions, including Finance Director of the Europe Materials Division (now part of Europe Heavyside), Group Development Director and Managing Director of Europe Materials. He became Chief Operating Officer in January 2009 and was appointed Group Chief Executive with effect from 1 January 2014.
Qualifications: FCPA, MBA, MBS.
External appointments: Non-listed: Not applicable. Listed: Not applicable. | ||

|
Finance Director
Appointed to the Board: January 2016
Nationality: Irish
Age: 46 |
Skills and experience: Senan has over 25 years’ experience in international business across financial services, banking and renewable energy. He joined CRH from Bank of Ireland Group plc where he was the Chief Operating Officer and a member of the Group’s Executive Committee. He previously held positions as Chief Operating Officer and Finance Director at Ulster Bank, Chief Financial Officer at Airtricity and numerous senior financial roles in GE, both in Ireland and the United States.
Qualifications: BComm, FCA.
External appointments: Non-listed: Not applicable. Listed: Not applicable. | ||
| 96 |
Table of Contents
CRH Annual Report on Form 20-F | 2015

|
Transformation Director
Appointed to the Board: May 2010
Nationality: Irish
Age: 57
Committee membership: Acquisitions Committee; Finance Committee |
Skills and experience: Since joining CRH in 1988, Maeve has held a number of roles in the Group Finance area and was appointed Group Controller in 2001, Head of Group Finance in January 2009 and to the position of Finance Director in May 2010. She was appointed as Group Transformation Director with effect from January 2016. Maeve has broad-ranging experience of CRH’s reporting, control, budgetary and capital expenditure processes and has been extensively involved in CRH’s evaluation of acquisitions. Prior to joining CRH, she worked for a number of years as a chartered accountant in an international accountancy practice.
Qualifications: MA, FCA.
External appointments: Non-listed: Agency Member of the National Treasury Management Agency (NTMA), a state body that provides asset and liability management services to the Irish Government. Listed: Not applicable. | ||

|
Chairman, CRH Americas
Appointed to the Board: July 2008
Nationality: United States Age: 66 |
Skills and experience: Mark joined CRH in 1997 and was appointed a CRH Board Director with effect from July 2008. In 2000, he was appointed President of Oldcastle Materials, Inc. and became the Chief Executive Officer of this Division in 2006. He was appointed Chief Executive Officer of Oldcastle, Inc. (the holding company for CRH’s operations in the Americas) in July 2008 and, with effect from January 2016, assumed the role of Chairman, CRH Americas. With over 40 years’ of experience in the building materials industry, he has overall responsibility for the Group’s aggregates, asphalt and readymixed concrete operations in the United States and its products and distribution businesses in the Americas.
External appointments: Non-listed: Not applicable. Listed: Not applicable. | ||

|
Non-executive Director*
Appointed to the Board: July 2013
Nationality: United States
Age: 64
Committee membership: Nomination & Corporate Governance Committee; Remuneration Committee |
Skills and experience: Don retired from PricewaterhouseCoopers (PwC) in June 2013, following a 39 year career with the firm. During that time he was Vice Chairman, Global Assurance at PwC, a position he had held since July 2008 and directed the US firm’s services for a number of large public company clients. He also held various leadership roles in PwC and was, from July 2001 to June 2008, a member of, and past lead Director for, the Board of Partners and Principals of the US firm as well as a member of PwC’s Global Board.
Qualifications: CPA, MBA.
External appointments: Non-listed: Director of Neuraltus Pharmaceuticals, Inc. and eAsic Corporation. Listed: Not applicable.
* Don McGovern is Senior Independent Director | ||

|
Non-executive Director
Appointed to the Board: October 2011
Nationality: Swiss
Age: 63
Committee membership: Audit Committee (Financial Expert); Finance Committee |
Skills and experience: Ernst was Chief Executive of Sika AG, a manufacturer of speciality chemicals for construction and general industry, until 31 December 2011. Prior to joining Sika, he worked for the Schindler Group and was Chief Finance Officer between 1997 and 2001. Over the course of his career he has gained extensive experience in India, China and the Far East generally.
Qualifications: LIC.OEC.HSG
External appointments: Non-listed: Member of the Advisory Board of China Renaissance Capital Investment Inc., a private equity investment company in Hong Kong, China. Listed: Chairman of the Board of Directors of Conzetta AG, a broadly diversified Swiss company and a member of the Board of Bucher Industries AG, a mechanical and vehicle engineering company based in Switzerland. | ||
| 97 |
Table of Contents
CRH Annual Report on Form 20-F | 2015
Board of Directors | continued

|
Non-executive Director
Appointed to the Board: January 2007
Nationality: United States
Age: 70
Committee membership: Nomination & Corporate Governance Committee; Remuneration Committee
|
Skills and experience: Bill is founder and General Partner of Alta Communications and Marion Equity Partners LLC, Massachusetts-based venture capital firms. He is past Chairman of Cephalon Inc., and past President and Chairman of the National Venture Capital Association. He was until May 2014, a Director of the Irish venture capital company Delta Partners Limited.
Qualifications: BA, MBA.
External appointments: Non-listed: Member of the Board of Avadeyne Health, Davler Media Group, Integra Partners and Sentinel Peak Capital, LLC. Listed: Not applicable. | ||

|
Non-executive Director
Appointed to the Board: July 2007
Nationality: German
Age: 68
Committee membership: Acquisitions Committee; Finance Committee |
Skills and experience: Utz-Hellmuth was, until May 2011, Chairman of the Supervisory Board of Süd-Chemie Aktiengesellschaft. He was also Chief Executive of Degussa AG, Germany’s third largest chemical company, until May 2006, a partner in the private equity group One Equity Partners Europe GmbH until July 2014 and a Director of Jungbunzlauer Holding AG until March 2015.
External appointments: Non-listed: Chairman of the Supervisory Board of German rail company Deutsche Bahn AG. Non-executive Director of Honosthor N.V. Listed: Not applicable. | ||

|
Non-executive Director
Appointed to the Board: January 2015
Nationality: Irish
Age: 62
Committee membership: Acquisitions Committee; Audit Committee |
Skills and experience: Pat was Chairman of the Executive Board of Directors of SHV Holdings (SHV), a large family-owned Dutch multinational company with a diverse portfolio of businesses, including the production and distribution of energy, the provision of industrial services, heavy lifting and transport solutions, cash and carry wholesale and the provision of private equity. He retired from SHV mid-2014. During a 32 year career with SHV, he held various leadership roles across SHV’s diverse portfolio of businesses, while living in various parts of the world, and was a member of the Executive Board of SHV from 2001, before becoming Executive Chairman in 2006.
Qualifications: MBS, BComm.
External appointments: Non-listed: Member of the Board of Liquigas S.p.A., a LPG distribution company. Listed: Not applicable. | ||

|
Non-executive Director
Appointed to the Board: September 2015
Nationality: United States
Age: 63
Committee membership: Acquisitions Committee; Finance Committee
|
Skills and experience: Rebecca has held a variety of executive leadership positions in the energy sector, including Chief Executive of Laurus Energy, President Gas and Power in BHP Billiton and Chief Executive of Amoco Energy Development Company, and has international experience in the Americas, Asia and Africa. She was, until recently, a non-executive Director of Granite Construction, Inc., a leading infrastructure contractor and construction materials producer in the United States.
Qualifications: Bachelor of Sciences degree
External appointments: Non-listed: Not applicable. Listed: Non-executive Director of Aggreko plc, Veresen, Inc. and ITT Corporation. | ||
| 98 |
Table of Contents
CRH Annual Report on Form 20-F | 2015

|
Non-executive Director
Appointed to the Board: February 2012
Nationality: Irish
Age: 54
Committee membership: Audit Committee; Finance Committee |
Skills and experience: Heather Ann is a former Managing Director Ireland of Reckitt Benckiser and Boots Healthcare and was previously a non-executive Director of Bank of Ireland plc and IDA Ireland.
Qualifications: BComm, MBS.
External appointments: Non-listed: Chairman of the Bank of Ireland Pension Fund Trustees Board; Director of Ergonomics Solutions International and the Institute of Directors. Listed: Non-executive Director of Greencore Group plc and Jazz Pharmaceuticals plc. | ||

|
Non-executive Director
Appointed to the Board: March 2015
Nationality: British
Age: 54
Committee membership: Nomination & Corporate Governance Committee; Remuneration Committee |
Skills and experience: Lucinda spent the majority of her career in investment banking, including 21 years in UBS Investment Bank and its predecessor firms where she worked until 2007. She held senior management positions in the UK and the US, including Global Head and Chairman of UBS’s Equity Capital Markets Group and Vice Chairman of the Investment Banking Division.
Qualifications: Masters in Philosophy, Politics and Economics and a Masters in Political Science.
External appointments: Non-listed: Non-executive Director of UK Financial Investments Limited, which manages the UK government’s investments in financial institutions, and the British Standards Institution. Lucinda is also a non-executive member of the Partnership Board of King & Wood Mallesons LLP and a trustee of Sue Ryder. Listed: Non-executive Director of Diverse Income Trust plc and Graphite Enterprise Trust plc. | ||

|
Non-executive Director
Appointed to the Board: February 2014
Nationality: Dutch
Age: 59
Committee membership: Acquisitions Committee; Audit Committee
|
Skills and experience: Henk has a background in distribution, wholesale and logistics. Until 2010, he was Chief Executive Officer at Pon Holdings B.V., a large, privately held international company which is focused on the supply and distribution of passenger cars and trucks, and equipment for the construction and marine sectors. He was also a member of the Supervisory Board of the Royal Bank of Scotland N.V. and the retail group Detailresult Groep.
Qualifications: Masters degree in Dutch Law; PMD Harvard Business School (1989).
External appointments: Non-listed: Member of the Supervisory Boards of Stork Technical Services Group and Blokker Holding B.V. and holder of several non-profit board memberships. Listed: Not applicable. | ||

|
Non-executive Director
Appointed to the Board: March 2016
Nationality: United States
Age: 64 |
Skills and experience: Bill is the Vice Chairman at EMC Corporation, a global leader in enabling businesses and service providers to transform their operations and deliver IT as a service. In previous roles he was responsible for EMC’s global sales and distribution organisation (2006 - 2012) and served as Chief Financial Officer leading the company’s worldwide finance operation (1996 - 2006). Prior to joining EMC he was a partner in the audit and financial advisory services practice of Coopers & Lybrand LLP.
Qualifications: MBA degree from Babson College, a Masters of Science in Taxation from Bentley College and a Bachelors degree from Holy Cross, Boston.
External appointments: Non-listed: Director of Pivotal Software, Inc. and College of the Holy Cross. Listed: Member of the Board of Directors of Popular, Inc., a diversified financial services company, and Inovalon Holdings, Inc., a healthcare technology company. | ||
| 99 |
Table of Contents
CRH Annual Report on Form 20-F | 2015

| * | The Governance Appendix is prepared in compliance with Section 1373 of the Companies Act 2014. For the purposes of Section 1373 (2) of the Companies Act 2014, the Governance Appendix (included in Exhibit 15.2 to this Annual Report on Form 20-F) and the risk management disclosures on page 52 to 63 form part of, and are incorporated by reference into, this Corporate Governance Report. |
| 100 |
Table of Contents
CRH Annual Report on Form 20-F | 2015
| * | ICSA is part of an organisation which provides software solutions to third parties, including CRH. The value of the contract is de minimus and otherwise ICSA has no business connection with CRH. |
| 101 |
Table of Contents
CRH Annual Report on Form 20-F | 2015
Corporate Governance Report | continued
CRH plc has a secondary listing on the Irish Stock Exchange. For this reason, CRH plc is not subject to the same ongoing listing requirements as would apply to an Irish company with a primary listing on the Irish Stock Exchange. For further information, shareholders should consult their own financial adviser. Further details on the Group’s listing arrangements, including its premium listing on the London Stock Exchange, are set out on page 110.
| 102 |
Table of Contents
CRH Annual Report on Form 20-F | 2015
Audit Committee Report

Key Areas 2015
|
Issue |
Description |
Table 1 | ||
|
Financial Reporting and External Audit |
In July 2015, we met with Ernst & Young to agree the 2015 external audit plan. Table 2 on page 104 outlines the key areas identified as being potentially significant and how we addressed these during the year.
| |||
| Impairment Testing |
Through discussion with both management and Ernst & Young, we reviewed management’s impairment testing methodology and processes. We found the methodology to be robust and the results of the testing process appropriate. Details of the impairments recorded during the year, which amount to a total of €44 million, are set out in note 2 on page 176.
| |||
| Acquisitions |
During 2015, the Group acquired a number of significant assets and businesses. We considered various related aspects, including, estimates and judgements regarding valuations, the recognition of intangible assets and the implementation of CRH’s internal control structures.
| |||
| Enterprise Risk Management |
We monitored progress in respect of the ongoing formalisation of Enterprise Risk Management, including development of a Risk Appetite & Tolerance Framework (further details in relation to CRH’s risk governance are outlined on page 52).
We also considered an assessment of the Group’s risk management and internal control systems. This had regard to all material controls, including financial, operational and compliance controls that could affect the Group’s business.
| |||
| Cyber Security |
We monitored progress in refining the Group’s information security programme and cyber security capabilities.
| |||
| External Auditors |
Ernst & Young have been the Group’s auditors since 1988. During 2015, we considered whether to put the external audit contract out to tender. Given the focus on the integration of the major acquisitions completed in 2015, the appointment of a new Finance Director in January 2016 and the Committee’s continued satisfaction with the performance of Ernst & Young (details of the Committee’s processes in reviewing the effectiveness of the external audit are set out on page 105), we concluded that it would not be in the best interests of the Group to carry out a tender at this time. We will continue to keep this under review in the context of EU rules mandating the rotation of external auditors which, for CRH, would require a transition by the end of 2020.
As in prior years, the continuance in office of Ernst & Young will be subject to a non-binding advisory vote at the 2016 Annual General Meeting.
| |||
| Internal Audit |
We considered the results of an independent external assessment of the Internal Audit function. The assessment included interviews with key stakeholders across the Group (including the members of the Committee) and the examination of the information provided to the Committee. The results, which were generally very positive, identified some areas where the effectiveness of the function and its reporting to the Committee could be enhanced. A detailed action plan to address these was agreed.
| |||
| (i) | Attendance by non-independent Directors and management is by invitation only. |
| 103 |
Table of Contents
CRH Annual Report on Form 20-F | 2015
Corporate Governance Report | continued
Areas identified for focus during the 2015 External Audit Planning Process
|
Area of Focus |
Audit Committee Action |
Table 2 | ||
|
Impairment of Goodwill |
For the purposes of its annual impairment testing process, the Group assesses the recoverable amount of each of CRH’s cash-generating units (CGUs – see details in note 14 to the Consolidated Financial Statements) based on a value-in-use computation. The annual goodwill impairment testing was conducted by management, and papers outlining the methodology and assumptions used in, and the results of, that assessment were presented to the Audit Committee. Following its deliberations, the Audit Committee was satisfied that the methodology used by management (which was consistent with prior years) and the results of the assessment, together with the disclosures in note 14, were appropriate.
Similar to 2014, a separate assessment was carried out in 2015 in respect of any remaining business units identified for divestment as part of the previously announced Group-wide portfolio review. The valuation of each business unit (based on the estimated fair value less costs of disposal) was reassessed in 2015 on a standalone CGU basis and compared with its carrying value. The Audit Committee reviewed and considered the methodology used by management in the reassessment process and was satisfied that it was appropriate.
During 2015, and as noted elsewhere in this report, the Group completed two significant acquisitions. As the initial allocation of the goodwill to CGUs is not complete, CRH is required to assess whether indicators of impairment exist in relation to goodwill attributable to these businesses. Papers outlining the methodology used in, and the results of, that assessment were presented to the Audit Committee. Following its deliberations, the Audit Committee was satisfied that the methodology used by management and the results of the assessment were appropriate (see note 14 for further details).
| |||
|
Impairment of Property, Plant and Equipment, and Financial Assets |
In addition to the goodwill impairment testing process discussed above, the Group also annually assesses the need for impairment of other non-current assets (property, plant and equipment and financial assets) as and when indicators of impairment exist. The Audit Committee considered the methodology used by management in that process and was satisfied that it was appropriate.
| |||
|
Contract Revenue Recognition |
IAS 11 – Construction Contracts requires revenue and expenses to be recognised on uncompleted contracts, with the underlying principle that, once the outcome of a long-term construction contract can be reliably estimated, revenue and expenses associated with that contract should be recognised by reference to the stage of completion of the contract activity at the balance sheet date. If it is anticipated that the contract will be loss-making, the expected loss must be recognised immediately. Following discussions with management and Ernst & Young, the Audit Committee was satisfied that contract revenue recognition was not a material issue for the Group in 2015 as the majority of contracts were completed within the financial year.
| |||
|
Accounting for Acquisitions and Disposals |
During 2015, the Group completed 22 acquisitions and investments at a total cost of approximately €8 billion and realised total disposal proceeds of approximately €1 billion across 30 business disposals. Following discussions with management and Ernst & Young, the Audit Committee was satisfied that the accounting treatment applied to acquisitions and disposals during 2015 was appropriate.
| |||
|
LH Assets Acquisition – Fair Value Accounting for Property, Plant and Equipment and Provisions
|
Given the significant scale of the acquisition of the LH Assets, both in terms of monetary value and geographical spread, the Audit Committee considered with management and Ernst & Young the judgements and estimates used by management in the fair value accounting for property, plant and equipment and in the recognition of provisions related to the acquisition and was satisfied that these were appropriate.
| |||
|
CRL Acquisition – Identification and Valuation of Acquired Intangible Assets
|
The Audit Committee considered with management and Ernst & Young the estimates and judgements used by management in the identification and valuation of intangible assets related to the CRL acquisition and determined that these were appropriate. | |||
| 104 |
Table of Contents
CRH Annual Report on Form 20-F | 2015

| (i) | The Board has determined that all of the non-executive Directors on the Audit Committee are independent according to the requirements of Rule 10A 3 of the rules of the Securities and Exchange Commission. |
| (ii) | For more information on the role and responsibilities of the Audit Committee, please see the Governance Appendix (Exhibit 15.2; Section 2; Operation of the Board’s Committees; Audit Committee; Role and Responsibilities) which is incorporated by reference herein. |
| (iii) | A copy of Section 404 of the Sarbanes-Oxley Act 2002 can be obtained from the US Securities and Exchange Commission’s website www.sec.gov. |
| (iv) | The term of any general pre-approval is twelve months from the date of pre-approval. |
| (v) | For more information on the Group’s policy regarding non-audit fees, please see the Governance Appendix (Exhibit 15.2; Section 2; Operation of the Board’s Committees; Audit Committee; Non-audit Fees) which is incorporated by reference herein. |
| 105 |
Table of Contents
CRH Annual Report on Form 20-F | 2015
Nomination & Corporate Governance Committee

| 106 |
Table of Contents
CRH Annual Report on Form 20-F | 2015
| 107 |
Table of Contents
CRH Annual Report on Form 20-F | 2015
Corporate Governance Report | continued
| Membership of the CRH Board | Table 5 |

| (i) | Will increase to 31% following 2016 Annual General Meeting |
| (ii) | For more information on the period for which non-executive Directors are appointed, please see the Governance Appendix (Exhibit 15.2; Section 1; Frequently Asked Questions; For what period are non-executive Directors appointed) which is incorporated by reference herein. |
| (ii) | For more information on the retirement and re-election of Directors, please see the Governance Appendix (Exhibit 15.2; Section 1; Frequently Asked Questions; What are the requirements regarding the retirement and re-election of Directors) which is incorporated by reference herein. |
| 108 |
Table of Contents
CRH Annual Report on Form 20-F | 2015
| * | In accordance with Section 167(7) of the Companies Act 2014. |
| ** | The terms of reference of these Committees comply fully with the 2014 Code requirements; CRH considers that they are generally responsive to the relevant NYSE rules but may not address all aspects of these rules. |
| 109 |
Table of Contents
CRH Annual Report on Form 20-F | 2015
Corporate Governance Report | continued
| Attendance at meetings during the year ended 31 December 2015
|
Table 7
| |||||||||||||||||||||||
| Board | Acquisitions | Audit | Finance | Nomination | Remuneration | |||||||||||||||||||
| Total | Attended | Total | Attended | Total | Attended | Total | Attended | Total | Attended | Total | Attended | |||||||||||||
| E.J. Bärtschi | 8 | 7 | - | - | 9 | 9 | 4 | 4 | - | - | - | - | ||||||||||||
| M. Carton | 8 | 8 | 5 | 5 | - | - | 4 | 4 | - | - | - | - | ||||||||||||
| W.P. Egan | 8 | 8 | - | - | - | - | - | - | 6 | 6 | 10 | 10 | ||||||||||||
| U-H. Felcht | 8 | 8 | 5 | 5 | - | - | 4 | 3 | - | - | - | - | ||||||||||||
| N. Hartery | 8 | 8 | 5 | 5 | - | - | 4 | 4 | 6 | 6 | 10 | 10 | ||||||||||||
| J.W. Kennedy(i) | 2 | 2 | 1 | 1 | - | - | - | - | - | - | - | - | ||||||||||||
| P.J. Kennedy(ii) | 8 | 8 | 4 | 4 | 8 | 7 | - | - | - | - | - | - | ||||||||||||
| R. McDonald(iv) | 3 | 3 | 2 | 2 | - | - | 3 | 3 | - | - | - | - | ||||||||||||
| D.A. McGovern, Jr. | 8 | 8 | - | - | - | - | - | - | 6 | 6 | 10 | 10 | ||||||||||||
| H.A. McSharry | 8 | 8 | - | - | 9 | 9 | 4 | 4 | - | - | - | - | ||||||||||||
| A. Manifold | 8 | 8 | 5 | 5 | - | - | - | - | - | - | - | - | ||||||||||||
| D.N. O’Connor(i) | 2 | 2 | - | - | - | - | - | - | 1 | 1 | 2 | 2 | ||||||||||||
| L.J. Riches(iii) | 7 | 6 | - | - | - | - | - | - | 5 | 5 | 9 | 8 | ||||||||||||
| H.Th. Rottinghuis | 8 | 7 | 4 | 4 | 9 | 8 | - | - | - | - | - | - | ||||||||||||
| M.S. Towe | 8 | 8 | - | - | - | - | - | - | - | - | - | - | ||||||||||||
(i) Retired May 2015
(ii) Appointed to Board January 2015
(iii) Appointed to Board March 2015
(iv) Appointed to Board September 2015
All Directors attended the 2015 Annual General Meeting.
| * | In accordance with Section 167(7) of the Companies Act 2014. |
| 110 |
Table of Contents
CRH Annual Report on Form 20-F | 2015
| 111 |
Table of Contents
CRH Annual Report on Form 20-F | 2015
Corporate Governance Report | continued
| (i) | The Code of Business Conduct is applicable to all Group employees including the Chief Executive and senior financial officers. The Code promotes honest and ethical conduct; full, fair, accurate, timely and understandable disclosures and compliance with applicable governmental laws, rules and regulations and complies with the applicable code of ethics regulations of the United States Securities and Exchange Commission arising from the Sarbanes-Oxley Act. |
| 112 |
Table of Contents
CRH Annual Report on Form 20-F | 2015
| 113 |
Table of Contents
CRH Annual Report on Form 20-F | 2015
Directors’ Remuneration Report

| 114 |
Table of Contents
CRH Annual Report on Form 20-F | 2015
| 115 |
Table of Contents
CRH Annual Report on Form 20-F | 2015
Directors’ Remuneration Report | continued
| 116 |
Table of Contents
CRH Annual Report on Form 20-F | 2015
| 117 |
Table of Contents
CRH Annual Report on Form 20-F | 2015
|
Principal proposed changes to the 2014 Directors’ Remuneration Policy
|
Table 6
| |
| Framework 2014-2015 | Framework for 2016 Policy | Comments | ||||||||||||||
| Annual Bonus | • | 80% of award based on financial performance (profit, EPS growth, cash flow, RONA) | • | No changes proposed | • | The Committee considered that the metrics for the annual bonus plan remain appropriate, robust and challenging | ||||||||||
| • | 20% based on individual personal and strategic goals | • | Table 7 on page 119 summarises the bonuses paid between 2009 and 2015 | |||||||||||||
| • | 50% of maximum bonus awarded for delivering target performance | • | No changes proposed | |||||||||||||
| • | Maximum annual award of 150% of salary for all executive Directors | • | Maximum annual award of up to 225% of salary | • | The revised maximum award will apply to the Chief Executive only in 2016; the maximum award for other executives in 2016 will be 150% | |||||||||||
| • | The Committee will review the annual bonus opportunity for other executive Directors in due course. However, any increase will be within the maximum in the 2016 Policy and will be set at an appropriate level for the role of the individual | |||||||||||||||
| • | 25% of bonus awards for all executive Directors deferred for three years | • | No changes proposed | • | Best practice provision | |||||||||||
| • | Malus provisions apply for deferred share awards to provide the ability to scale back awards prior to vesting in the event of material misstatement, serious reputational damage or the Group suffering serious losses | • | No changes proposed | • | Best practice provision | |||||||||||
| • | Clawback provisions apply to the cash portion of the annual bonus | |||||||||||||||
| Performance Share Plan |
Vesting based: | Vesting based: | • | Inclusion of the FTSE All-World Construction & Materials Index ensures the TSR test reflects CRH’s geographic spread
Cash flow targets will be adjusted, if required, to reflect unusual items such as a significant underspend, or a delay, in budgeted capital expenditure, both ordinary and extraordinary | ||||||||||||
| • | 75% on TSR performance against sector peers
|
• | 50% TSR: | |||||||||||||
| • | 25% on cumulative cash flow target | – | 25% against selected sector peers (see table 8) |
• | ||||||||||||
| – | 25% against FTSE | |||||||||||||||
| All-World Construction & Materials Index | ||||||||||||||||
| • | 50% on cumulative cash flow target | |||||||||||||||
| The TSR element will be subject to a RONA underpin. | ||||||||||||||||
| • | 3-year performance period | • | No changes proposed | • | Best practice provision | |||||||||||
| • | Vested awards required to be held for a further 2 years post vesting | |||||||||||||||
| • | Annual award size of: | • | Maximum award amount of up | • | The revised maximum award will apply to the Chief Executive only in 2016; the maximum award for other executives in 2016 will be 200% | |||||||||||
|
– |
Chief Executive: 250% of salary |
to 365% of salary | ||||||||||||||
|
– |
Other executive Directors: 200% of salary |
• |
No provisions for exceptional circumstances |
|||||||||||||
| • | Awards in exceptional circumstances limited to 350% of base salary |
• | Changes to award levels for other executive Directors may be made in due course. However, any adjustments will be within the maximum in the 2016 Policy and will be set at an appropriate level for the role of the individual | |||||||||||||
| • | Malus provisions for unvested share awards (see above annual bonus section for circumstances in which it may operate) | • | No changes proposed | • | Best practice provision | |||||||||||
| Shareholding Guidelines | • | 1.0x salary | •
• |
Chief Executive: 2.5x salary
Other executive Directors: 1.0x salary |
• | The increased shareholding guideline for the Chief Executive must be achieved by 2020 | ||||||||||
| 118 |
Table of Contents
CRH Annual Report on Form 20-F | 2015
| Annual Bonus Levels as a Percentage of Salary 2009 - 2015 | Table 7 | |

| 2014 Performance Share Plan | Table 8 | |
| Tailored Peer Group for TSR Performance Metric (2016 Awards) | ||||||||
| ACS | Braas Monier | LafargeHolcim | Skanska | Vinci | ||||
| Boral | Cemex | Rockwool | Titan Cement | Wienerberger | ||||
| Buzzi Unicem | Heidelberg Cement | Saint Gobain | Vicat | |||||
| Vesting Schedule (2016 Awards) | Table 9 | |

| Historic vesting of 2006 Performance Share Plan Awards | Table 10 | Chief Executive Salary | Table 11 | |||||
|
|

| |||||||

| 119 |
Table of Contents
CRH Annual Report on Form 20-F | 2015
Directors’ Remuneration Report | continued
| 120 |
Table of Contents
CRH Annual Report on Form 20-F | 2015
| Individual remuneration for the year ended 31 December 2015 (Audited) | Table 14 | |
| Annual Bonus Plan | ||||||||||||||||||||||||||||||||||||
| Deferred | Long-term | Retirement | ||||||||||||||||||||||||||||||||||
| Basic salary | Benefits | Cash element | shares | incentives | benefit expense | |||||||||||||||||||||||||||||||
| (a) | (b) | (c) | (c) | (d) | (e) | Total | Total | Total | ||||||||||||||||||||||||||||
| €000 | €000 | €000 | €000 | €000 | €000 | €000 | €000 | €000 | ||||||||||||||||||||||||||||
| 2015 | 2015 | 2015 | 2015 | 2015 | 2015 | 2015 | 2014 | 2013 | ||||||||||||||||||||||||||||
| Executive Directors | ||||||||||||||||||||||||||||||||||||
| Albert Manifold | 1,290 | 22 | 1,451 | 484 | 1,671 | 607 | 5,525 | 4,184 | 2,088 | |||||||||||||||||||||||||||
| Maeve Carton | 675 | 10 | 734 | 245 | 1,161 | 282 | 3,107 | 1,907 | 1,412 | |||||||||||||||||||||||||||
| Mark Towe | 1,280 | 72 | 1,416 | 472 | 2,091 | 256 | 5,587 | 2,986 | 2,965 | |||||||||||||||||||||||||||
| 3,245 | 104 | 3,601 | 1,201 | 4,923 | 1,145 | 14,219 | 9,077 | 6,465 | ||||||||||||||||||||||||||||
| (a) | Basic Salary: Further details and background in relation to the changes in salaries effective for 2015 are set out on pages 109 and 110 of the 2014 Directors’ Remuneration Report. |
| (b) | Benefits: For executive Directors these relate principally to the use of company cars, medical insurance and life assurance and, where relevant, the value of the discount on the grant of options under the Group’s 2010 Savings-related Share Option Scheme. |
| (c) | Annual Bonus Plan: Under the executive Directors’ Annual Bonus Plan for 2015, a bonus was payable for meeting clearly defined and stretch targets and strategic goals. The structure of the 2015 Plan, together with details of the performance against targets and payouts in respect of 2014 and 2015, are set out on pages 122 and 123. For 2015 and 2014 bonuses, 25% of executive Directors’ bonuses are paid in Deferred Shares, vesting after three years, with no additional performance conditions. |
| (d) | Long-Term Incentives: In February 2016, the Remuneration Committee determined that 77.84% of the award made in 2013 under the 2006 Performance Share Plan vested on 7 March 2016. The Remuneration Committee also determined that 37.2% of the award made in 2013 under the 2010 Share Option Scheme vested. For the purposes of this table, the value of these awards, both of which were subject to a three-year performance period ending in 2015, has been estimated using a share price of €25.60, being the three month average share price to 31 December 2015, less, in the case of the award under the 2010 Share Option Scheme, the amount payable by the Directors to purchase the shares under option (i.e. the total exercise cost). Long-term incentive amounts for 2014 reflect the value of vested long-term incentive awards with a performance period ending in 2014. These amounts reflect the value of the awards granted in 2006, 2007, 2008 and 2009 under the 2000 Share Option Scheme, which the Remuneration Committee determined in May 2015 had met the applicable EPS performance targets (see table 22 on page 125) and had vested. For the purposes of this table, the value of these awards have been calculated based on the difference between the total exercise cost and the market value on the date of vesting (€25.11) (see page 125 for more details). No other long-term incentive awards with a performance period ending in 2014 vested. |
| (e) | Retirement Benefits Expense: The Irish Finance Act 2006 effectively established a cap on pension provision by introducing a penalty tax charge on pension assets in excess of the higher of €5 million or the value of individual prospective pension entitlements as at 7 December 2005. This cap was further reduced by the Irish Finance Act 2011 to €2.3 million and, by the Finance (No. 2) Act 2013, to €2.0 million. As a result of these legislative changes, the Remuneration Committee has decided that executive Directors who are members of Irish pension schemes should have the option of continuing to accrue pension benefits as previously, or of choosing an alternative arrangement - by accepting pension benefits limited by the cap - with a similar overall cost to the Group. Maeve Carton and Albert Manifold chose to opt for the alternative arrangement which involved capping their pensions in line with the provisions of the Finance Acts and receiving a supplementary taxable non-pensionable cash allowance, in lieu of prospective pension benefits foregone. These allowances are similar in value to the reduction in the Company’s liability represented by the pension benefit foregone. They are calculated based on actuarial advice as the equivalent of the reduction in the Company’s liability to each individual and spread over the term to retirement as annual compensation allowances. |
| 121 |
Table of Contents
CRH Annual Report on Form 20-F | 2015
Directors’ Remuneration Report | continued
| 2015 Annual Bonus - Achievement - Financial Targets (Albert Manifold, Maeve Carton and Mark Towe) |
Table 15 | |||||||||||
| Opportunity | Performance achieved | |||||||||||||||
| as a % of salary | relative to targets | Performance | % Outcome versus | |||||||||||||
| Measure | Target | Maximum | Threshold(i) | Target | Maximum | achieved | Maximum Opportunity | |||||||||
| CRH EPS | 18.75% | 37.5% |

|
89.1c | 37.5% / 37.5% | |||||||||||
| CRH Cash Flow | ||||||||||||||||
| - Operating Cash Flow(ii) | 11.25% | 22.5% |
|
€1,722m | 22.5% / 22.5% | |||||||||||
| - Divestments | 11.25% | 22.5% |
|
€1,017m | 22.5% / 22.5% | |||||||||||
| CRH RONA(iii) | 18.75% | 37.5% |
|
8.8% | 37.5% / 37.5% | |||||||||||
| (i) | 0% of each element is earned at threshold, 50% at target and 100% at maximum, with a straight-line pay out schedule between these points. |
| (ii) | For this purpose, operating cash flow has been defined as reported internally and for 2015 excludes the operating cash flows attributable to the post acquisition period for the LH Assets. The figure also differs from the “cash generated from operations” figure of €2,784m reported in the Consolidated Statement of Cash Flows, primarily because it is calculated after deducting outflows on the purchase of property, plant and equipment (PP&E), net of proceeds from the disposal of PP&E. |
| (iii) | 2015 RONA is calculated excluding the transaction/one-off costs of €197m related to the acquisition of the LH Assets. |
| 2015 Annual Bonus - Achievement - Personal/Strategic Targets | Table 16 | |||
| Directors | Achievements | % Outcome versus Maximum Opportunity | ||
| Albert Manifold | Effective leadership of the process to integrate the assets acquired from Lafarge S.A. and Holcim Limited; successful recruitment of new Group Finance Director and supporting the incumbent in the transition to a new strategic role; leading the process of organisation change, including the establishment and resourcing of refined organisation structures in the Americas, Europe and Asia; continued strong leadership of the Group’s talent management process and the mentoring of the senior executive team. | 30.0% / 30.0% | ||
| Maeve Carton | Continued progress in the area of operational performance including the roll-out of financial reporting systems for the measuring and reporting of KPIs; leading succession planning for the Group’s tax function, the development of a new supporting organisation structure and co-ordinating refinements to the Group’s tax strategy; managing the process of funding the significant acquisition spend in 2015 and effective management of the Group’s bond programme; guiding the process for the evolution of CRH’s cyber security arrangements. | 25.0% / 30.0% | ||
| Mark Towe | Leadership in relation to the transition to a new organisation structure in the Americas; management of the process to integrate the assets acquired from Lafarge and Holcim in Canada and the United States; continued input into the Group’s talent management process; working closely with the Chief Executive in relation to the ongoing process to leverage the size and collective scale of the Group in areas such as procurement. | 27.5% / 30.0% | ||
| 122 |
Table of Contents
CRH Annual Report on Form 20-F | 2015
| 2014 Annual Bonus - Achievement - Group Targets (Albert Manifold, Maeve Carton and Mark Towe) |
Table 17 | |
| Performance needed for payout at | Performance | Payout % | ||||||||||||||||||
| Measure | Threshold | Target | Maximum | achieved | of Maximum | |||||||||||||||
| CRH EPS | 68c | 74c | 78c | 78.9c | 100.0% | |||||||||||||||
| CRH Cash Flow | ||||||||||||||||||||
| - Operating Cash Flow(i) | €1,163m | €1,264m | €1,365m | €1,477m | 100.0% | |||||||||||||||
| - Divestments | €200m | €225m | €250m | €345m | 100.0% | |||||||||||||||
| CRH RONA | 6.15% | 6.7% | 7.2% | 7.4% | 100.0% | |||||||||||||||
| (i) | For this purpose, operating cash flow has been defined as reported internally, which differs from the “cash generated from operations” of €1,626m shown in the 2014 Consolidated Statement of Cash Flows, primarily because it is calculated after deducting cash outflows on the purchase of property, plant and equipment (PP&E), net of proceeds from disposal of PP&E. |
| 2014 Annual Bonus - Achievement - Oldcastle Targets (Mark Towe) | Table 18 | |
| Performance achieved relative to targets | ||||||||||
| Measure | Threshold(ii) | Target | Maximum | Payout % of Maximum | ||||||
| Oldcastle Group PBIT(i) |

|
100.0% | ||||||||
| Oldcastle Cash Flow | ||||||||||
| - Operating Cash Flow |
|
100.0% | ||||||||
| - Divestments |
|
100.0% | ||||||||
(i) PBIT is defined as earnings before interest and taxes.
(ii) 0% of each element is earned at threshold, 50% at target and 100% at maximum, with a straight-line pay out schedule between these points.
| 123 |
Table of Contents
CRH Annual Report on Form 20-F | 2015
Directors’ Remuneration Report | continued
| 124 |
Table of Contents
CRH Annual Report on Form 20-F | 2015
| 125 |
Table of Contents
CRH Annual Report on Form 20-F | 2015
Directors’ Remuneration Report | continued
|
Summary of Scheme Interests Granted in 2015 |
Table 23
| |||||||||
| Directors | Scheme | Basis of award (% of salary) |
Number of shares |
Face value(i) |
Exercise price |
Percentage vesting (% of maximum) |
Performance period end date |
Expected date of release | ||||||||
| A. Manifold | PSP (conditional shares) |
250% | 132,064 | €3,225,002 | n/a | 25% | 31-Dec-17 | Feb-2020 | ||||||||
|
Annual Bonus(ii) (deferred shares) |
37.5% | 24,928 | €450,000 | n/a | n/a | n/a | Feb-2018 | |||||||||
| M. Carton | PSP (conditional shares) |
200% | 55,283 | €1,350,010 | n/a | 25% | 31-Dec-17 | Feb-2020 | ||||||||
|
Annual Bonus(ii) (deferred shares) |
37.5% | 12,983 | €234,375 | n/a | n/a | n/a | Feb-2018 | |||||||||
| M. Towe | PSP (conditional shares) |
200% | 107,110 | €2,615,626 | n/a | 25% | 31-Dec-17 | Feb-2020 | ||||||||
|
Annual Bonus(ii) (deferred shares) |
37.5% | 22,908 | €413,489 | n/a | n/a | n/a | Feb-2018 | |||||||||
| (i) | Face value for PSP awards has been calculated using the share price at the date of grant (€24.42). |
| (ii) | See table 21 on page 113 of the 2014 Annual Report for the structure of the 2014 Annual Bonus Plan. |
| * | Salary is defined as basic annual salary and excludes any fluctuating emoluments. |
| 126 |
Table of Contents
CRH Annual Report on Form 20-F | 2015
| Pension entitlements - defined benefit (Audited) | Table 24 | |||||||
| Increase in accrued personal pension | Transfer value of increase in | Total accrued personal pension | ||||||||||||
| during 2015(i) | dependants’ pension(i) | at year-end(ii) | ||||||||||||
| €000 | €000 | €000 | ||||||||||||
| Executive Directors | ||||||||||||||
| A. Manifold | - | 109 | 273 | |||||||||||
| M. Carton | - | 33 | 266 | |||||||||||
| (i) | As noted above, the pensions of Albert Manifold and Maeve Carton have been capped in line with the provisions of the Irish Finance Acts. However, dependants’ pensions continue to accrue resulting in Greenbury transfer values which have been calculated on the basis of actuarial advice. These amounts do not represent sums paid out or due, but are the amounts that the pension scheme would transfer to another pension scheme in relation to benefits accrued in 2015 in the event of these Directors leaving service. |
| (ii) | The accrued pensions shown are those which would be payable annually from normal retirement date. |
| Pension entitlements - defined contribution (Audited) | Table 25 | |||||||
| The accumulated liabilities related to the unfunded Supplemental Executive Retirement Plans for Mark Towe are as follows: | ||||||||||||||||||||
| As at | 2015 | 2015 notional | Translation | As at | ||||||||||||||||
| 31 December 2014 | contribution | interest(iii) | adjustment | 31 December 2015 | ||||||||||||||||
| €000 | €000 | €000 | €000 | €000 | ||||||||||||||||
| Executive Director | ||||||||||||||||||||
| M. Towe | 2,502 | 237 | 119 | 295 | 3,153 | |||||||||||||||
| (iii) | Notional interest, which is calculated based on the average bid yields of United States Treasury fixed-coupon securities with remaining terms to maturity of approximately 20 years, plus 1.5%, is credited to the above plans. |
| 127 |
Table of Contents
CRH Annual Report on Form 20-F | 2015
Directors’ Remuneration Report | continued
Directors’ Interests in Shares and Share Scheme Awards
| Deferred Share Awards under the Annual Bonus Plan (Audited) | Table 26 | |
| Dividend Equivalent | ||||||||||||||||||||||
| 31 December | Awards in | adjustment(iii)/Scrip | Released in | 31 December | ||||||||||||||||||
| 2014 | 2015(i) | Dividend allotment 2015 | 2015 | 2015 | Release Date | |||||||||||||||||
| Maeve Carton | - | 12,983 | 325 | - | 13,308 | March 2018(ii) | ||||||||||||||||
| Albert Manifold | - | 24,928 | 624 | - | 25,552 | March 2018(ii) | ||||||||||||||||
| Mark Towe | 2,626 | - | 54 | - | 2,680 | March 2017(ii) | ||||||||||||||||
| - | 22,908 | 573 | - | 23,481 | March 2018(ii) | |||||||||||||||||
| 2,626 | 60,819 | 1,576 | - | 65,021 | ||||||||||||||||||
| (i) | The shares awarded during 2015 relate to the deferred portion of 2014 bonus and were included in total remuneration reported for 2014. Under the rules of Annual Bonus Plan, the number of shares awarded was calculated using the three month average share price to 31 December 2014, being €18.05. |
| (ii) | Under the Annual Bonus Plan in operation in respect of the financial years ended 31 December 2014 and 2015, up to one-third of the earned bonus was receivable in CRH shares, deferred for a period of three years, with forfeiture in the event of departure from the Group in certain circumstances during that period. Deferred Shares are not subject to any additional performance conditions during the deferral period. |
| (iii) | In order to calculate the Dividend Equivalents Adjustment it is assumed that an election for scrip shares in lieu of cash is made for each dividend during the vesting period. |
| Directors’ awards under the 2006 Performance Share Plan(i) (Audited) | Table 27 | |
| Year | 31 | 31 | Market | |||||||||||||||||||||||||||||||||
| of | December | Granted | Released | Lapsed | December | Performance | Release | Price in euro | ||||||||||||||||||||||||||||
| award | 2014 | in 2015 | in 2015(ii) | in 2015(ii) | 2015 | Period | Date | on award | ||||||||||||||||||||||||||||
| 2012 | 50,000 | - | - | 50,000 | - | |||||||||||||||||||||||||||||||
| Maeve Carton | 2013 | 50,000 | - | - | - | 50,000 | |
01/01/13 -31/12/15 |
|
|
March 2016 |
|
16.19 | |||||||||||||||||||||||
| 100,000 | - | - | 50,000 | 50,000 | ||||||||||||||||||||||||||||||||
| 2012 | 70,000 | - | - | 70,000 | - | |||||||||||||||||||||||||||||||
| Albert Manifold | 2013 | 72,000 | - | - | - | 72,000 | |
01/01/13 -31/12/15 |
|
|
March 2016 |
|
16.19 | |||||||||||||||||||||||
| 142,000 | - | - | 70,000 | 72,000 | ||||||||||||||||||||||||||||||||
| 2012 | 90,000 | - | - | 90,000 | - | |||||||||||||||||||||||||||||||
| Mark Towe | 2013 | 90,000 | - | - | - | 90,000 | |
01/01/13 -31/12/15 |
|
|
March 2016 |
|
16.19 | |||||||||||||||||||||||
| 180,000 | - | - | 90,000 | 90,000 | ||||||||||||||||||||||||||||||||
| (i) | 2006 Performance Share Plan: This is a long-term share incentive plan under which share awards are granted in the form of a provisional allocation of shares for which no exercise price is payable. 77.84% of the shares awarded in 2013 are scheduled for release in March 2016. See pages 124 and 125 for more details. |
| (ii) | In 2015, the Remuneration Committee determined that the 2012 award lapsed as, over the three-year period 2012-2014, CRH’s TSR performance was below the median of both the peer group and the Eurofirst Index. |
| 128 |
Table of Contents
CRH Annual Report on Form 20-F | 2015
| Directors’ awards under the 2014 Performance Share Plan(i) (Audited) | Table 28 | |
| Market | ||||||||||||||||||||||||||||||||||||||||
| 31 | Dividend | 31 | Price in | |||||||||||||||||||||||||||||||||||||
| Year of | December | Granted | Equivalents | Released | Lapsed | December | Performance | Release | euro on | |||||||||||||||||||||||||||||||
| award | 2014 | in 2015 | 2015(ii) | in 2015 | in 2015 | 2015 | Period | date | award | |||||||||||||||||||||||||||||||
| 2014 | 60,118 | - | 1,508 | - | - | 61,626 |
|
01/01/14 -31/12/16 |
|
|
February 2019 |
|
20.49 | |||||||||||||||||||||||||||
| Maeve Carton | 2015 | - | 55,283 | 391 | - | - | 55,674 |
|
01/01/15 -31/12/17 |
|
|
February 2020 |
|
24.42 | ||||||||||||||||||||||||||
| 60,118 | 55,283 | 1,899 | - | - | 117,300 | |||||||||||||||||||||||||||||||||||
| 2014 | 144,384 | - | 3,621 | - | - | 148,005 |
|
01/01/14 -31/12/16 |
|
|
February 2019 |
|
20.49 | |||||||||||||||||||||||||||
| Albert Manifold | 2015 | - | 132,064 | 934 | - | - | 132,998 |
|
01/01/15 -31/12/17 |
|
|
February 2020 |
|
24.42 | ||||||||||||||||||||||||||
| 144,384 | 132,064 | 4,555 | - | - | 281,003 | |||||||||||||||||||||||||||||||||||
| 2014 | 98,109 | - | 2,461 | - | - | 100,570 |
|
01/01/14 -31/12/16 |
|
|
February 2019 |
|
20.49 | |||||||||||||||||||||||||||
| Mark Towe | 2015 | - | 107,110 | 757 | - | - | 107,867 |
|
01/01/15 -31/12/17 |
|
|
February 2020 |
|
24.42 | ||||||||||||||||||||||||||
| 98,109 | 107,110 | 3,218 | - | - | 208,437 | |||||||||||||||||||||||||||||||||||
| (i) | 2014 Performance Share Plan: This is a long-term share incentive plan under which share awards are granted in the form of a provisional allocation of shares for which no exercise price is payable. The shares scheduled for release in February 2019 and February 2020 will be allocated to the extent that the relevant performance conditions are achieved. The structure of the 2014 Performance Share Plan is set out in table 6. |
| (ii) | The Remuneration Committee has determined that dividend equivalents should accrue on awards under the 2014 Performance Share Plan. Subject to the satisfaction of the applicable performance criteria, such dividend equivalents will be released to participants in the form of additional shares at vesting. |
| 129 |
Table of Contents
CRH Annual Report on Form 20-F | 2015
Directors’ Remuneration Report | continued
| Directors’ Share Options (Audited) | Table 29 | |
| Details of movements on outstanding options and those exercised during the year are set out in the table below |
|
|
Options exercised during 2015 |
| ||||||||||||||||||||||||||||||||||
| Weighted | Weighted | Weighted | ||||||||||||||||||||||||||||||||||||
| average option | average | average market | ||||||||||||||||||||||||||||||||||||
| 31 | 31 | price at 31 | exercise | price at date of | ||||||||||||||||||||||||||||||||||
| December | Granted | Lapsed | Exercised | December | 11 March | December 2015 | price | exercise | ||||||||||||||||||||||||||||||
| 2014 | in 2015 | in 2015 | in 2015 | 2015 | 2016 | € | € | € | ||||||||||||||||||||||||||||||
| 55,831 | - | - | 19,234 | 36,597 | 36,597 | (a) | 27.97 | 21.52 | 25.11 | |||||||||||||||||||||||||||||
| Maeve Carton | 97,000 | - | 50,000 | - | 47,000 | 47,000 | (b) | 16.19 | ||||||||||||||||||||||||||||||
| 1,726 | - | - | - | 1,726 | 1,726 | (c) | 17.67 | |||||||||||||||||||||||||||||||
| 166,445 | - | - | 110,995 | 55,450 | 55,450 | (a) | 28.15 | 18.88 | 25.08 | |||||||||||||||||||||||||||||
| Albert Manifold | 137,500 | - | 70,000 | - | 67,500 | 67,500 | (b) | 16.19 | ||||||||||||||||||||||||||||||
| 2,236 | - | - | - | 2,236 | 2,236 | (c) | 13.64 | |||||||||||||||||||||||||||||||
| Mark Towe | 133,081 | - | - | 27,725 | 105,356 | 105,356 | (a) | 25.84 | 18.85 | 25.10 | ||||||||||||||||||||||||||||
| 175,000 | - | 90,000 | - | 85,000 | 85,000 | (b) | 16.19 | |||||||||||||||||||||||||||||||
| 768,819 | - | 210,000 | 157,954 | 400,865 | 400,865 | |||||||||||||||||||||||||||||||||
| Options by price (Audited) | Table 30 | |
| 31 | 31 | |||||||||||||||||||||||||||||||
| December | Granted | Lapsed | Exercised | December | ||||||||||||||||||||||||||||
| € | 2014 | in 2015 | in 2015 | in 2015 | 2015 | Earliest exercise date | Expiry date | |||||||||||||||||||||||||
| 18.7463 | 16,635 | - | - | 16,635 | - | (a) | ||||||||||||||||||||||||||
| 18.8545 | 27,725 | - | - | 27,725 | - | (a) | ||||||||||||||||||||||||||
| 26.1493 | 72,085 | - | - | - | 72,085 | (a) | March 2016 | April 2016 | ||||||||||||||||||||||||
| 29.4855 | 53,232 | - | - | - | 53,232 | (a) | March 2016 | April 2017 | ||||||||||||||||||||||||
| 29.8643 | 36,043 | - | - | - | 36,043 | (a) | March 2016 | April 2017 | ||||||||||||||||||||||||
| 21.5235 | 99,637 | - | - | 63,594 | 36,043 | (a) | March 2016 | April 2018 | ||||||||||||||||||||||||
| 16.58 | 50,000 | - | - | 50,000 | - | (a) | ||||||||||||||||||||||||||
| 15.19 | 210,000 | - | 210,000 | - | - | (b) | ||||||||||||||||||||||||||
| 16.19 | 199,500 | - | - | - | 199,500 | (b) | March 2016 | April 2023 | ||||||||||||||||||||||||
| 13.64 | 2,236 | - | - | - | 2,236 | (c) | August 2017 | January 2018 | ||||||||||||||||||||||||
| 17.67 | 1,726 | - | - | - | 1,726 | (c) | August 2019 | January 2020 | ||||||||||||||||||||||||
| 768,819 | - | 210,000 | 157,954 | 400,865 | ||||||||||||||||||||||||||||
The market price of the Company’s shares at 31 December 2015 was €26.70 and the range during 2015 was €18.73 to €28.09.
| (a) | Granted under the 2000 Share Option Scheme, these options are only exercisable when EPS growth exceeds the growth of the Irish Consumer Price Index by 5% compounded over a period of at least three years subsequent to the granting of the options. |
| (b) | Granted under the 2010 Share Option Scheme. Vesting will only occur once an initial performance target has been reached and, thereafter, will be dependent on performance. The performance criteria are set out in table 22 on page 125. |
| (c) | Granted under the 2010 Savings-related Share Option Scheme. |
| 130 |
Table of Contents
CRH Annual Report on Form 20-F | 2015

| 131 |
Table of Contents
CRH Annual Report on Form 20-F | 2015
Directors’ Remuneration Report | continued
Shareholdings of Directors and Company Secretary
as at 31 December 2015
| Directors’ interests in share capital at 31 December 2015 (Audited) | Table 32 | |
The interests of the Directors and Secretary in the shares of the Company, which are beneficial unless otherwise indicated, are shown below. The Directors and Secretary have no beneficial interests in any of the Group’s subsidiary, joint venture or associated undertakings.
| Ordinary Shares | 11 March 2016 | 31 December 2015 | 31 December 2014 | |||||||||
| Directors | ||||||||||||
| E.J. Bärtschi | 25,200 | 25,200 | 25,200 | |||||||||
| M. Carton | 124,256 | (i) | 84,818(i) | 82,036 | ||||||||
| W.P. Egan | 16,112 | 16,112 | 16,112 | |||||||||
| - Non-beneficial | 12,000 | 12,000 | 12,000 | |||||||||
| U-H. Felcht | 1,303 | 1,303 | 1,285 | |||||||||
| N. Hartery | 16,591 | 16,591 | 12,265 | |||||||||
| P.J. Kennedy | 2,000 | 2,000 | -(ii) | |||||||||
| A. Manifold | 69,934 | (i) | 43,372(i) | 39,998 | ||||||||
| R. McDonald | 1,000 | 1,000 | -(ii) | |||||||||
| D.A. McGovern, Jr. | 5,255 | 5,255 | 5,131 | |||||||||
| H.A. McSharry | 3,965 | 3,965 | 3,886 | |||||||||
| S. Murphy | 1,000 | 1,000(ii) | - | |||||||||
| L.J. Riches | 2,000 | 2,000 | -(ii) | |||||||||
| H.Th. Rottinghuis | 15,426 | 15,426 | 15,124 | |||||||||
| M. Towe | 177,444 | (i) | 107,388(i) | 100,276(i) | ||||||||
| Secretary | ||||||||||||
| N. Colgan | 13,698 | 9,511 | 15,549 | |||||||||
| 487,184 | 345,941 | 328,862 | ||||||||||
Of the above holdings, the following are held in the form of American Depository Receipts:
| 11 March 2016 | 31 December 2015 | 31 December 2014 | ||||||||||
| W.P. Egan | 15,000 | 15,000 | 15,000 | |||||||||
| - Non-beneficial | 12,000 | 12,000 | 12,000 | |||||||||
| R. McDonald | 1,000 | 1,000 | -(ii) | |||||||||
| D.A. McGovern, Jr. | 5,255 | 5,255 | 5,131 | |||||||||
William J. Teuber, Jr. became a Director on 3 March 2016. He does not have a holding of CRH shares.
| (i) | Excludes awards of Deferred Shares, details of which are disclosed on page 128. |
| (ii) | Holding at date of appointment. |
| 132 |
Table of Contents
CRH Annual Report on Form 20-F | 2015
Non-executive Directors
Remuneration paid to non-executive Directors in 2015 is set out in table 33.
|
Individual remuneration for the year ended 31 December 2015 (Audited)
|
Table 33
|
| Basic salary | Other | |||||||||||||||||||||||
| and fees | Benefits | remuneration | ||||||||||||||||||||||
| (a) | (b) | (c) | Total | Total | Total | |||||||||||||||||||
| €000 | €000 | €000 | €000 | €000 | €000 | |||||||||||||||||||
| Non-executive Directors
|
2015 | 2015 | 2015 | 2015 | 2014 | 2013 | ||||||||||||||||||
| E.J. Bärtschi | 68 | - | 71 | 139 | 139 | 116 | ||||||||||||||||||
| W.P. Egan | 68 | - | 52 | 120 | 120 | 120 | ||||||||||||||||||
| U-H. Felcht | 68 | - | 37 | 105 | 105 | 105 | ||||||||||||||||||
| N. Hartery | 68 | 6 | 382 | 456 | 460 | 473 | ||||||||||||||||||
| J.M. de Jong (d) | - | - | - | - | 42 | 128 | ||||||||||||||||||
| J.W. Kennedy (e) | 24 | - | 13 | 37 | 105 | 105 | ||||||||||||||||||
| P.J. Kennedy (f) | 68 | - | 37 | 105 | - | - | ||||||||||||||||||
| R. McDonald (g) | 23 | - | 17 | 40 | - | - | ||||||||||||||||||
| D.A. McGovern, Jr. (j) | 68 | - | 85 | 153 | 120 | 60 | ||||||||||||||||||
| H.A. McSharry | 68 | - | 22 | 90 | 90 | 90 | ||||||||||||||||||
| L.J. Riches (h) | 57 | - | 31 | 88 | - | - | ||||||||||||||||||
| D.N. O’Connor (e) | 24 | - | 10 | 34 | 124 | 124 | ||||||||||||||||||
| H.Th. Rottinghuis (i) | 68 | - | 37 | 105 | 86 | - | ||||||||||||||||||
| 672 | 6 | 794 | 1,472 | 1,391 | 1,321 | |||||||||||||||||||
| (a) | Fee levels for non-executive Directors were unchanged in 2015. The fees which will apply for 2016 are set out on page 134. | |
| (b) | Benefits: In the case of Nicholas Hartery the amount reflects the reimbursement of travel expenses from his residence to his Chairman’s office in Dublin, which have been grossed up for Irish tax purposes. | |
| (c) | Other Remuneration: Includes remuneration for Chairman, Board Committee work and allowances for non-executive Directors based outside of Ireland. | |
| (d) | Jan Maarten de Jong retired as Director on 7 May 2014. | |
| (e) | John Kennedy and Dan O’Connor retired as Directors on 7 May 2015. | |
| (f) | Pat Kennedy became a Director on 1 January 2015. | |
| (g) | Rebecca McDonald became a Director on 1 September 2015. | |
| (h) | Lucinda Riches became a Director on 1 March 2015. | |
| (i) | Henk Rottinghuis became a Director on 18 February 2014. | |
| (j) | Don McGovern became a Director on 1 July 2013. | |
| 133 |
Table of Contents
CRH Annual Report on Form 20-F | 2015
Directors’ Remuneration Report | continued
| 134 |
Table of Contents
CRH Annual Report on Form 20-F | 2015


| 135 |
Table of Contents
CRH Annual Report on Form 20-F | 2015
Directors’ Remuneration Report | continued
| Relative importance of spend on pay
Table 37 sets out the amount paid by the Group in remuneration to employees compared to dividend distributions made to shareholders in 2014 and 2015. The average number of employees is set out in note 5 to the Consolidated Financial Statements on page 179. We have also shown the change in EBITDA (as defined)* performance year on year to provide an indication of the change in profit performance.
The Remuneration Committee and Advisers
The non-executive Directors who were members of the Remuneration Committee during 2015, together with their record of attendance at Committee meetings, are identified on page 110.**
Risk policies and systems
During 2015, the Chairman of the Remuneration Committee reviewed with the Audit Committee the Group’s remuneration structures from a risk perspective.
Remuneration consultants
Deloitte LLP are the Committee’s independent remuneration consultants. The Committee has satisfied itself that the advice provided by Deloitte LLP is robust and independent and that the Deloitte LLP engagement partner and team that provide remuneration advice to the Committee do not have connections with CRH plc that may impair their independence.
For the purposes of the remuneration review carried out in 2015 and in early 2016, the |
Relative importance of spend on pay
|
Table 37 | ||||
|
| ||||||
|
Committee also engaged the services of Kepler, a brand of Mercer, in relation to the performance metrics for the performance share plan. Kepler also assisted along with Deloitte LLP in the shareholder consultation process.
Both Deloitte LLP and Kepler are signatories to the Voluntary Code of Conduct in relation to executive remuneration consulting in the UK. During 2015, Deloitte LLP provided the following remuneration services:
• research and advice regarding remuneration trends, best practice and remuneration levels for executive and non-executive Directors in companies of similar size and complexity;
• guidance and advice in relation to remuneration developments;
• analysis of TSR workings under the 2006 Performance Share Plan;
• advice in relation to remuneration matters generally; and
• attendance at Committee meetings, when required.
|
Deloitte LLP also provide other consultancy services to the Company including support for Internal Audit and Regulatory & Compliance functions, when required, and in respect of talent management and human resources, technology and taxation advisory services.
In 2015, Kepler’s parent, Mercer, provided pensions advice and related services to the Company.
In respect of work carried out on behalf of the Remuneration Committee in 2015, fees in the amount of €125,739 (Deloitte LLP) and €60,766 (Kepler) were incurred.
2015 Annual General Meeting votes on remuneration matters
The voting outcome in respect of the remuneration related votes at the 2015 Annual General Meeting is set out in table 38. | |||||

|
AGM – Remuneration Related Votes
|
Table 38
| |||||||||||
| Year of |
% in Favour |
% Against |
No. of votes withheld |
Total No. of votes cast (incl. votes withheld) |
% of issued share capital voted | |||||||
| Directors’ Remuneration Report (“Say on Pay”) | 2015 | 94.39% | 5.61% | 8,946,923 | 569,847,488 | 69.8% | ||||||
| Directors’ Remuneration Policy | 2014 | 95.23% | 4.77% | 3,648,186 | 511,208,343 | 69.6% | ||||||
| * | Defined as earnings before interest, taxes, depreciation, amortisation, asset impairment charges, profit on disposals and the Group’s share of equity accounted investments’ result after tax. |
| ** | For more information on the role and responsibilities of the Remuneration Committee, please see the Governance Appendix (Exhibit 15.2; Section 2; Operation of the Board’s Committees; Remuneration Committee; Role and Responsibilities) which is incorporated by reference herein. |
| 136 |
Table of Contents
CRH Annual Report on Form 20-F | 2015
| 137 |
Table of Contents

| 138 |
Table of Contents
CRH Annual Report on Form 20-F | 2015
| 139 |
Table of Contents
CRH Annual Report on Form 20-F | 2015
Directors’ Remuneration Report | continued
Policy Table
Further details regarding the operation of the Policy for the 2016 financial year can be found on pages 114 to 137 of the Directors’ Remuneration Report.
| Policy Table
|
Table 40
| |||
| Element | Fixed Base Salary | Fixed Pension | ||
| Purpose and link to strategy |
• Competitive salaries help to attract and retain staff with the experience and knowledge required to enable the Group to compete in its markets. |
• Pension arrangements provide competitive and appropriate retirement plans.
• Given the long-term nature of the business, pension is an important part of the remuneration package to support creation of value and succession planning. | ||
| Operation |
• Base salaries are set by the Committee taking into account:
– the size and scope of the executive Director’s role and responsibilities;
– the individual’s skills, experience and performance;
– salary levels at FTSE listed companies of a similar size and complexity to CRH and other international construction and building materials companies;
– pay and conditions elsewhere in the Group.
• Base salary is normally reviewed annually with changes generally effective on 1 January, although the Committee may make an out-of-cycle increase if it considers it to be appropriate. |
• Irish-based executive Directors participate in a contributory defined benefit scheme or, if they joined the Group after 1 January 2012, in a defined contribution scheme as the defined benefit scheme which the Directors participate in is closed to new entrants.
• The US-based executive Director participates in a defined contribution scheme and in an unfunded Supplemental Executive Retirement Plan.
• For new appointments to the Board the Committee may determine that alternative pension provisions will operate (for example a cash contribution). When determining pension arrangements for new appointments the Committee will give regard to existing entitlements, the cost of the arrangements, market practice and the pension arrangements received elsewhere in the Group.
| ||
| Maximum opportunity |
• Base salaries are set at a level which the Committee considers to be appropriate taking into consideration the factors outlined in the “operation” column.
• While there is no maximum base salary, normally increases will be in line with the typical level of increase awarded to other employees in the Group but may be higher in certain circumstances. These circumstances may include:
– Where a new executive Director has been appointed at a lower salary, higher increases may be awarded over an initial period as the executive Director gains in experience and the salary is moved to what the Committee considers is an appropriate positioning.
– Where there has been a significant increase in the scope or responsibility of an executive Director’s role or where an individual has been internally promoted, higher salary increases may be awarded.
– Where a larger increase is considered necessary to reflect significant changes in market practice. |
• The defined benefit pension is provided through an Irish Revenue approved retirement benefit scheme up until the pension cap established in the Finance Act 2006 (see details on page 127). Accrued benefits for service to 31 December 2011 are based on pensionable salary and years of service as at that date (annual accrual of 1/60ths), with this tranche being re-valued annually at the Consumer Price Index subject to a 5% ceiling. For service subsequent to that date, a career-average re-valued earnings system was introduced with each year of service being subject to annual revaluation on the same basis as outlined above. Irish-based executive Directors receive a supplementary taxable non-pensionable cash allowance in lieu of pension benefits foregone as a result of the pension cap. These allowances are similar in value to the reduction in the Company’s liability represented by the pension benefit foregone. Whilst there is no absolute maximum to the quantum of these payments they are calculated based on actuarial advice as the equivalent of the reduction in the liability the Company would otherwise have had under the Scheme in respect of each individual’s benefits and spread over the term to retirement as annual compensation allowances.
• The US-based executive Director participates in a defined contribution retirement plan in respect of basic salary; and in addition he participates in an unfunded defined contribution Supplemental Executive Retirement Plan (SERP) also in respect of basic salary, to which contributions are made at an agreed rate (currently 20%), offset by contributions made to the other retirement plan. | ||
| Performance measure |
• n/a |
• n/a | ||
| 140 |
Table of Contents
CRH Annual Report on Form 20-F | 2015
|
Policy Table | continued
| ||
| Element | Fixed Benefits | |
| Purpose and link to strategy
|
• To provide a market competitive level of benefits for executive Directors. | |
| Operation |
• The Committee’s policy is to set benefit provision at an appropriate market competitive level taking into account market practice, the level of benefits provided for other employees in the Group, the individual’s home jurisdiction and the jurisdiction in which the individual is based. | |
| • Employment-related benefits include the use of company cars (or a car allowance), medical insurance for the Director and his/her family and life assurance. | ||
| • In the event that the Chief Executive falls ill or is injured in such a way as which would constitute ill-health or disablement so that the Chief Executive could not work for a period of more than six months, in lieu of the early ill-health retirement provisions in the pension scheme which would otherwise operate in such cases, he shall be entitled to receive a disability salary of €1,000,000 per annum. Such payment would cease when the Chief Executive reaches age 60, returns to work or if the service agreement is terminated. | ||
| • The US-based executive Director also receives benefits in relation to club membership and short-term disability insurance. | ||
| • Benefits may also be provided in relation to legal fees incurred in respect of agreeing service contracts, or similar agreements (for which the Company may settle any tax incurred by the executive Director) and a gift on retirement. | ||
| • The Committee may remove benefits that executive Directors receive or introduce other benefits if it is considered appropriate to do so. The Company may also pay the tax due on benefits if it considers that it is appropriate to do so. | ||
| • All-employee share schemes - executive Directors are eligible to participate in the Company’s all-employee share schemes on the same terms as other employees. Executive Directors may also receive other benefits which are available to employees generally. | ||
| • Re-location policy - where executive Directors are required to re-locate to take up their role, the Committee may determine that they should receive appropriate re-location and ongoing expatriate benefits. The level of such benefits would be determined based on individual circumstances taking into account typical market practice. | ||
| Maximum opportunity |
• The level of benefit provided will depend on the cost of providing individual items and the individual’s circumstances, and therefore the Committee has not set a maximum level of benefits. | |
| Performance measure |
• n/a | |
| 141 |
Table of Contents
CRH Annual Report on Form 20-F | 2015
Directors’ Remuneration Report | continued
|
Policy Table | continued
| ||
| Element | Performance-related pay Annual Bonus | |
| Purpose and link to strategy |
• The Annual Performance-related Incentive Plan is designed to reward the creation of shareholder value through operational excellence and organic and acquisitive growth. The Plan incentivises executive Directors to deliver Group and individual goals that support long-term value creation. | |
| • A Deferred Annual Performance-related Incentive Plan element links the value of executive Directors’ reward with the long-term performance of the CRH share price and aligns the interests of executive Directors with shareholders interests. | ||
| • The “malus” and clawback provisions enable the Company to mitigate risk.
| ||
| Operation |
• The Annual Performance-related Incentive Plan rewards executive Directors for meeting Company performance goals over a financial year of the Company. Targets are set annually by the Committee. | |
| • The annual bonus is paid in a mix of cash and shares (structured as a deferred share award). | ||
| • For 2016: | ||
| – 75% of the bonus will be paid in cash; | ||
| – 25% will be paid in shares. | ||
| • In future years, the Committee may determine that a different balance between cash and shares is appropriate and adjust the relevant payments accordingly. | ||
| • When assessing performance and determining bonus payouts the Committee also considers the underlying financial performance of the business to ensure it is consistent with the overall award level. | ||
| • The deferred element of the bonus will be structured as a conditional share award or nil-cost option and will normally vest after three years from grant (or a different period determined by the Committee). Deferred share awards may be settled in cash. | ||
| • Dividend equivalents may be paid on deferred share awards in respect of dividends paid during the vesting period. These payments may be made in cash or shares and may assume the reinvestment of dividends on a cumulative basis. | ||
| • For deferred awards, “malus” provisions apply (see page 126). Cash bonus payments are subject to clawback of the net amount paid for a period of three years from payment.
| ||
| Maximum opportunity |
• Maximum annual opportunity of 225% of base salary. | |
| • For 2016, the intended maximum award levels are: | ||
| – 225% of base salary for Chief Executive; | ||
| – 150% of base salary for other executive Directors. The Committee may increase the percentage in future years up to a maximum of 225%.
| ||
| Performance measure |
• The performance-related incentive plan is based on achieving clearly defined and stretching annual targets and strategic goals set by the Committee each year based on key business priorities. | |
| • The performance metrics used are a mix of financial targets including return goals and personal/strategic objectives generally. Currently 80% of the bonus is based on financial performance measures. The Committee may vary the weightings of measures but no less than 50% shall be based on financial performance measures. | ||
| • A portion of the bonus metrics for any Director may be linked to his/her specific area of responsibility. | ||
| • Up to 50% of the maximum bonus will be paid for achieving target levels of performance.
| ||
| 142 |
Table of Contents
CRH Annual Report on Form 20-F | 2015
|
Policy Table | continued
| ||
| Element | Performance-related pay 2014 Performance Share Plan (PSP) | |
| Purpose and link to strategy |
• The purpose of the 2014 Plan is to align the interest of key management across different regions and nationalities with those of shareholders through an interest in CRH shares and by incentivising the achievement of long-term performance goals. | |
| • The “malus” provision enables the Company to mitigate risk. | ||
| Operation |
• Awards (in the form of conditional share awards or nil-cost options) normally vest based on performance over a period of not less than three years. Awards may also be settled in cash. | |
| • Awards are normally subject to an additional holding period ending on the fifth anniversary of the grant date (or another date determined by the Committee). | ||
| • Dividend equivalents may be paid on PSP awards that vest in respect of dividends paid during the vesting period until the end of the holding period. These payments may be made in cash or shares and may assume reinvestment on a cumulative basis. | ||
| • “Malus” provisions (as set out in the rules of the 2014 Plan) will apply to awards (see page 126). | ||
| Maximum opportunity |
• Maximum annual opportunity of up to 365% of base salary. | |
| • For 2016 the intended award levels are: | ||
| – 365% of base salary for Chief Executive | ||
| – 200% of base salary for other executive Directors. The Committee may increase the percentage in future years up to a maximum of 365%. | ||
| Performance measure |
• Awards to be granted in 2016 will vest based on a relative TSR test compared to a tailored group of key peers (25%) and an index comparator (25%), and cumulative cash flow performance (50%). | |
| • For threshold levels of performance, 25% of the award vests. | ||
| • Where applicable, when determining vesting under the PSP the Committee reviews whether the TSR performance has been impacted by unusual events and whether it therefore, reflects the underlying performance of the business. In addition, the Committee considers financial performance (including Return on Net Assets) in the period to ensure that TSR performance is consistent with the objectives of the performance criteria and was not distorted by extraneous factors. | ||
| • The Committee may in future years change performance measures including introducing additional performance measures for awards made under this policy, for example, returns based measures. | ||
| • The Committee may amend the performance conditions if an event occurs that causes it to consider that an amended performance condition would be more appropriate and would not be materially less difficult to satisfy. | ||
| 143 |
Table of Contents
CRH Annual Report on Form 20-F | 2015
Directors’ Remuneration Report | continued
| 144 |
Table of Contents
CRH Annual Report on Form 20-F | 2015
|
Remuneration Policy for non-executive Directors
|
Table 41
| |||
|
Approach to setting fees
|
Basis of fees
|
Other items
| ||
|
• The remuneration of non-executive Directors is determined by a Board committee of the Chairman and the executive Directors.
• The Remuneration Committee determines the remuneration of the Chairman within the framework or broad policy agreed with the Board.
• Remuneration is set at a level which will attract individuals with the necessary experience and ability to make a substantial contribution to the Company’s affairs and reflect the time and travel demands of Board duties.
• Fees are set taking into account typical practice at other companies of a similar size and complexity to CRH.
• Fees are reviewed at appropriate intervals. |
• Fees are paid in cash.
• Non-executive Director fees policy is to pay:
– A basic fee for membership of the Board.
– An additional fee for chairing a Committee.
– An additional fee for the role of Senior Independent Director (SID) (if the SID is not the Chairman of the Remuneration Committee).
– An additional fee to reflect committee work (combined fee for all committee roles).
– An additional fee based on the location of the Director to reflect time spent travelling to Board meetings.
• Other fees may also be paid to reflect other board roles or responsibilities.
• In accordance with the Articles of Association, shareholders set the maximum aggregate amount of the fees payable to non-executive Directors. The current limit of €750,000 was set by shareholders at the Annual General Meeting held in 2005. A resolution to increase the limit to €875,000 will be included on the agenda for the 2016 Annual General Meeting. |
• The non-executive Directors do not participate in any of the Company’s performance-related incentive plans or share schemes.
• Non-executive Directors do not receive pensions.
• The Group Chairman is reimbursed for expenses incurred in travelling from his residence to his CRH office. The Company settles any tax incurred on this on his behalf.
• Non-executive Directors do not currently receive any benefits. However, benefits may be provided in the future if, in the view of the Board (for non-executive Directors or for the Chairman), this was considered appropriate. The Company may settle any tax due on benefits. | ||
| 145 |
Table of Contents
CRH Annual Report on Form 20-F | 2015
Directors’ Remuneration Report | continued
| Remuneration outcomes in different performance scenarios
Remuneration at CRH consists of fixed pay (salary, pension and benefits), short-term variable pay and long-term variable pay. A significant portion of executive Directors’ remuneration is linked to the delivery of key business goals over the short and long-term and the creation of shareholder value.
Table 44 shows hypothetical values of the remuneration package for executive Directors under three assumed performance scenarios (based on 2016 proposals).
No share price growth or the payment of dividend equivalents has been assumed in these scenarios. Potential benefits under all-employee share schemes have not been included. |
Remuneration outcomes in different performance scenarios
|
Table 42 | ||||
| Performance scenario
|
Payout level
| |||||
|
Minimum |
• Fixed pay (see table 43 for each executive Director) | |||||
| • No bonus payout | ||||||
| • No vesting under the Performance Share Plan | ||||||
|
On-target performance |
• 50% annual bonus payout (112.5% of salary for the Chief Executive and 75% for the other executive Directors) | |||||
| • 25% vesting under the Performance Share Plan (91.25% of salary for the Chief Executive and 50% for other executive Directors) | ||||||
|
Maximum performance |
• 100% annual bonus payout (225% of salary for the Chief Executive and 150% of salary for other executive Directors) | |||||
| • 100% Performance Share Plan vesting (365% of salary for the Chief Executive and 200% for other executive Directors) | ||||||
|
Hypothetical remuneration values
|
Table 43
|
|||||||||||||||
| Salary | Benefits | |||||||||||||||
| With effect from | Level paid | Estimated | Total | |||||||||||||
| 1 January 2016 | in 2015(i) | Pension(ii) | Fixed Pay | |||||||||||||
| Chief Executive (Albert Manifold) | €1,400,000 | €22,000 | €700,000 | €2,122,000 | ||||||||||||
| Finance Director (Senan Murphy) | €625,000 | €18,500 | €156,250 | €799,750 | ||||||||||||
| Group Transformation Director (Maeve Carton) | €688,500 | €10,000 | €290,000 | €988,500 | ||||||||||||
| Chairman, CRH Americas (Mark Towe) | $1,448,400 | $72,000 | $289,680 | $1,810,080 | ||||||||||||
| (i) | estimated in the case of S. Murphy; based on 2015 expenses for other executive Directors. |
| (ii) | see page 126 for details in relation to retirement benefit arrangements. |
| 146 |
Table of Contents
CRH Annual Report on Form 20-F | 2015
|
Performance-related remuneration outcomes
|
Table 44
|

| 147 |
Table of Contents
CRH Annual Report on Form 20-F | 2015
Directors’ Remuneration Report | continued
| Executive Director service contracts and policy on payment for loss of office
When determining leaving arrangements for an executive Director the Committee takes into account any contractual agreements (including any incentive arrangements) and the performance and conduct of the individual.
Service contracts
The Chief Executive and Finance Director have entered into service contracts with the Company. The summaries in tables 45 and 46 set out the key remuneration terms of those contracts.
The Committee reserves the right to make any other payments in connection with a director’s cessation of office or employment where the payments are made in good faith in discharge of an existing legal obligation (or by way of damages for breach of such an obligation) or by way of a compromise or settlement of any claim arising in connection with the cessation of a director’s office or employment. Any such payments may include paying any fees for outplacement assistance and/or the Director’s legal/or professional advice fees in connection with his cessation of office or employment.
The Group Transformation Director (Maeve Carton) and Chairman, CRH Americas (Mark Towe) do not currently have service contracts. They do not have a notice period in excess of 12 months or an entitlement to any benefits on termination of employment. The Committee will determine the amount, if any, paid on termination taking into account the circumstances around departure and the prevailing employment law.
The Committee’s policy in this area is that service contracts will be put in place for newly appointed executive Directors and in cases where there is a significant step change in Directors’ responsibilities. It is currently anticipated that these terms will be similar to those agreed with the Chief Executive. |
Under Irish Company Law, CRH is not required to make service contracts available for inspection as the notice period is not more than 12 months. Service contracts will only be available with the executive Director’s consent due to data protection reasons. | Annual cash bonus
Executive Directors may, at the discretion of the Committee, remain eligible to receive an annual bonus award for the financial year in which they leave employment. Such awards will be determined by the Committee taking into account time in employment and performance.
| ||||||||||
|
Chief Executive service contract
|
Table 45
| |||||||||||
|
Notice period
|
• |
12 months’ notice by the Company or the executive. | ||||||||||
|
Expiry date |
• |
Indefinite duration. | ||||||||||
|
• |
Terms of contract will automatically terminate on the executive’s 62nd birthday.
| |||||||||||
|
Termination payments |
• |
On lawful termination of employment, the Committee may, at its absolute discretion, make a termination payment in lieu of 12 months’ notice based on base salary, benefits and pension contribution due during that period. | ||||||||||
|
• |
Where the Company terminates the contract lawfully without notice then no payment in lieu of notice shall be due. | |||||||||||
|
• |
If, in the event of a change of control, there is a diminution in the role and responsibilities of the Chief Executive he may terminate the contract; on such termination a payment equal to one year’s remuneration (being salary, pension, other benefits and vested incentive awards) will be made to the executive.
| |||||||||||
|
Disability |
• |
In the event that the Chief Executive falls ill or is injured in such a way as which would constitute ill-health or disablement so that the Chief Executive could not work for a period of more than six months, in lieu of the early ill-health retirement provisions in the pension scheme which would otherwise operate in such cases, he shall be entitled to receive a disability salary of €1,000,000 per annum. Such payment would cease when the Chief Executive reaches age 60, returns to work or if the service agreement is terminated.
| ||||||||||
|
Other information |
• |
The Company retains the ability to suspend the executive from employment on full salary and to require the executive to observe a period of “garden leave” of up to 12 months on full salary, contractual benefits and pension contribution.
| ||||||||||
|
Finance Director service contract
|
Table 46 | |||||||||||
|
Notice period
|
• |
Six months’ notice by the Company or the executive. | ||||||||||
|
Expiry date |
• |
Indefinite duration. | ||||||||||
|
• |
Terms of contract will automatically terminate on the executive’s 65th birthday.
| |||||||||||
|
Termination payments |
• |
On lawful termination of employment, the Committee may, at its absolute discretion, make a termination payment in lieu of six months’ notice based on base salary, benefits and pension contribution due during that period.
| ||||||||||
| • | Where the Company terminates the contract lawfully without notice then no payment in lieu of notice shall be due.
| |||||||||||
|
Other information |
• |
The Company retains the ability to suspend the executive from employment on full salary and to require the executive to observe a period of “garden leave” of up to 12 months on full salary, contractual benefits and pension contribution.
| ||||||||||
| 148 |
Table of Contents
CRH Annual Report on Form 20-F | 2015
|
Leaver Provisions
|
Table 47 | |||||
| Death | “Good Leavers” as determined by the Committee in accordance with the plan rules |
Leavers in other circumstances | ||||
| Deferred Annual Performance Incentive Plan 2014 | • Unvested awards vest, unless the Committee determines otherwise, to the extent determined by the Committee.
• Awards in the form of nil-cost options may be exercised for 12 months from death (or another period determined by the Committee). |
• Awards shall normally vest in full at the normal vesting date. Alternatively, the Committee may determine that awards should vest in full at cessation of employment.
• Where awards vesting in such circumstances are granted in the form of nil-cost options participants shall have six months from vesting to exercise their award.
• Where awards have already vested at cessation of employment, participants shall have six months from cessation of employment to exercise their option. |
• Awards will lapse on the individual’s cessation of office or employment. | |||
| Performance Share Plan 2014 | • Unvested awards shall vest as soon as practicable following death unless the Committee determines otherwise. The number of shares vesting shall be determined by the Committee taking into account the extent to which the performance condition has been met and, if the Committee determines, the length of time that has elapsed since the award was granted until the date of death (or if death occurs during an applicable holding period, to the beginning of the holding period).
• Awards in the form of nil-cost options may be exercised for 12 months from death (or another period determined by the Committee). |
• Awards shall normally vest at the normal vesting date. Alternatively the Committee may determine that awards should vest at the time the individual leaves.
• The level of vesting shall be determined by the Committee taking into account the extent to which the performance condition has been met and, unless the Committee determines otherwise, the period of time that has elapsed since the date of grant until the date of cessation (or if cessation occurs during an applicable holding period, to the beginning of the holding period).
• Awards vesting in such circumstances in the form of nil-cost options may be exercised for six months from vesting (or another period determined by the Committee). Where a nil-cost option was already vested at cessation of employment, participants may exercise such options for six months from cessation (or another period determined by the Committee). |
• Awards will lapse on the individual’s cessation of office or employment. | |||
| Share Option Scheme 2010 | • The Committee may determine the extent to which options shall vest. Options shall be exercisable for 12 months from vesting or from death (whichever is later). |
Retirement (for age or health reasons)
• The Committee may determine the extent to which options may be exercised on the same terms as if the individual had not ceased to hold employment or office having determined the extent to which the performance conditions applicable to the award have been satisfied. Options shall be exercisable for 12 months from vesting or from the participant’s cessation (whichever is later).
Redundancy, early retirement, sale of the individual’s employing subsidiary out of the Group or for any other reason determined by the Committee.
• The Committee may determine the extent to which the option may be exercised having determined the extent to which the performance conditions applicable to the award have been satisfied. Options shall be exercisable for six months from vesting or cessation of employment (whichever is later).
• Where a participant has ceased to hold office or employment because of health reasons, redundancy, retirement or sale of his employing subsidiary out of the Group, the Committee may waive any relevant performance conditions, in which case his options may be scaled down by reference to the participant’s performance and the proportion of the relevant performance period the participant has served. |
• Awards will normally lapse. | |||
| 149 |
Table of Contents
CRH Annual Report on Form 20-F | 2015
| 150 |
Table of Contents

| 151 |
Table of Contents

| 152 |
Table of Contents

|
Statements
|
|
|||||||
| The following Consolidated Financial Statements, together with the reports of the Independent Registered Public Accounting Firm thereon, are filed as part of this Annual Report: | ||||||||
| Report of Independent Registered Public Accounting Firm | 154 | |||||||
| Consolidated Income Statement | 156 | |||||||
| Consolidated Statement of Comprehensive Income | 157 | |||||||
| Consolidated Balance Sheet | 158 | |||||||
| Consolidated Statement of Changes in Equity | 159 | |||||||
| Consolidated Statement of Cash Flows | 160 | |||||||
| Accounting Policies | 161 | |||||||
| Notes on Consolidated Financial Statements
|
|
172
|
|
|||||
| 153 |
Table of Contents
CRH Annual Report on Form 20-F | 2015
REPORT OF INDEPENDENT REGISTERED PUBLIC ACCOUNTING FIRM
To the Board of Directors and Shareholders of CRH public limited company (CRH plc):
We have audited the accompanying Consolidated Balance Sheets of CRH plc as of 31 December 2015 and 2014, and the related Consolidated Income Statements and Consolidated Statements of Comprehensive Income, Changes in Equity and Cash Flows for each of the three years in the period ended 31 December 2015. These Consolidated Financial Statements are the responsibility of the Company’s management. Our responsibility is to express an opinion on these financial statements based on our audits.
We conducted our audits in accordance with the standards of the Public Company Accounting Oversight Board (United States). Those standards require that we plan and perform the audit to obtain reasonable assurance about whether the Consolidated Financial Statements are free of material misstatement. An audit includes examining, on a test basis, evidence supporting the amounts and disclosures in the Consolidated Financial Statements. An audit also includes assessing the accounting principles used and significant estimates made by management, as well as evaluating the overall Consolidated Financial Statement presentation. We believe that our audits provide a reasonable basis for our opinion.
In our opinion, the Consolidated Financial Statements referred to above present fairly, in all material respects, the consolidated financial position of CRH plc at 31 December 2015 and 2014, and the consolidated results of its operations and its consolidated cash flows for each of the three years in the period ended 31 December 2015, in conformity with International Financial Reporting Standards as issued by the International Accounting Standards Board.
We also have audited, in accordance with the standards of the Public Company Accounting Oversight Board (United States), CRH plc’s internal control over financial reporting as of 31 December 2015, based on criteria established in Internal Control-Integrated Framework issued by the Committee of Sponsoring Organisations of the Treadway Commission (2013 Framework) and our report dated 15 March 2016 expressed an unqualified opinion thereon.
/s/ ERNST & YOUNG
Dublin, Ireland
15 March 2016
| 154 |
Table of Contents
CRH Annual Report on Form 20-F | 2015
REPORT OF INDEPENDENT REGISTERED PUBLIC ACCOUNTING FIRM ON INTERNAL CONTROL OVER FINANCIAL REPORTING
To the Board of Directors and Shareholders of CRH public limited company (CRH plc):
We have audited CRH plc’s internal control over financial reporting as of 31 December 2015, based on criteria established in Internal Control-Integrated Framework issued by the Committee of Sponsoring Organisations of the Treadway Commission (2013 Framework) (the “COSO criteria”). CRH plc’s management is responsible for maintaining effective internal control over financial reporting, and for its assessment of the effectiveness of internal control over financial reporting included in the accompanying Management’s Report on Internal Control over Financial Reporting. Our responsibility is to express an opinion on the Company’s internal control over financial reporting based on our audit.
We conducted our audit in accordance with the standards of the Public Company Accounting Oversight Board (United States). Those standards require that we plan and perform the audit to obtain reasonable assurance about whether effective internal control over financial reporting was maintained in all material respects. Our audit included obtaining an understanding of internal control over financial reporting, assessing the risk that a material weakness exists, testing and evaluating the design and operating effectiveness of internal control based on the assessed risk, and performing such other procedures as we considered necessary in the circumstances. We believe that our audit provides a reasonable basis for our opinion.
A company’s internal control over financial reporting is a process designed to provide reasonable assurance regarding the reliability of financial reporting and the preparation of Consolidated Financial Statements for external purposes in accordance with generally accepted accounting principles. A company’s internal control over financial reporting includes those policies and procedures that (1) pertain to the maintenance of records that, in reasonable detail, accurately and fairly reflect the transactions and dispositions of the assets of the company; (2) provide reasonable assurance that transactions are recorded as necessary to permit preparation of Consolidated Financial Statements in accordance with generally accepted accounting principles, and that receipts and expenditures of the company are being made only in accordance with authorisations of management and directors of the company; and (3) provide reasonable assurance regarding prevention or timely detection of unauthorised acquisition, use, or disposition of the company’s assets that could have a material effect on the Consolidated Financial Statements.
Because of its inherent limitations, internal control over financial reporting may not prevent or detect misstatements. Also, projections of any evaluation of effectiveness to future periods are subject to the risk that controls may become inadequate because of changes in conditions, or that the degree of compliance with the policies or procedures may deteriorate.
As indicated in the accompanying Management’s Report on Internal Control over Financial Reporting, management’s assessment of and conclusion on the effectiveness of internal control over financial reporting did not include the internal controls of the material acquisitions of LH Assets and CR Laurence completed during the year ended 31 December 2015, which are included in the 2015 Consolidated Financial Statements of CRH plc and constituted 23.3% and 37.4% of total and net assets, respectively, as of 31 December 2015 and 10.9% and (1.7%) of revenues and group profit, respectively, for the year then ended. Our audit of internal control over financial reporting of CRH plc also did not include an evaluation of the internal control over financial reporting of the material acquisitions of LH Assets and CR Laurence completed during the year ended 31 December 2015.
In our opinion, CRH plc maintained, in all material respects, effective internal control over financial reporting as of 31 December 2015, based on the COSO criteria.
We also have audited, in accordance with the standards of the Public Company Accounting Oversight Board (United States), the 2015 Consolidated Financial Statements of CRH plc and our report dated 15 March 2016 expressed an unqualified opinion thereon.
/s/ ERNST & YOUNG
Dublin, Ireland
15 March 2016
| 155 |
Table of Contents
CRH Annual Report on Form 20-F | 2015
for the financial year ended 31 December 2015
|
2015 €m |
2014 €m |
2013 €m |
||||||||||||
| Notes | ||||||||||||||
| 1 | Revenue | 23,635 | 18,912 | 18,031 | ||||||||||
| 2 | Cost of sales | (16,394) | (13,427) | (13,153) | ||||||||||
| Gross profit | 7,241 | 5,485 | 4,878 | |||||||||||
| 2 | Operating costs | (5,964) | (4,568) | (4,778) | ||||||||||
| 1,3,5,6 | Group operating profit | 1,277 | 917 | 100 | ||||||||||
| 1,4 | Profit on disposals | 101 | 77 | 26 | ||||||||||
| Profit before finance costs | 1,378 | 994 | 126 | |||||||||||
| 8 | Finance costs | (303) | (254) | (262) | ||||||||||
| 8 | Finance income | 8 | 8 | 13 | ||||||||||
| 8 | Other financial expense | (94) | (42) | (48) | ||||||||||
| 9 | Share of equity accounted investments’ profit/(loss) | 44 | 55 | (44) | ||||||||||
| 1 | Profit/(loss) before tax | 1,033 | 761 | (215) | ||||||||||
| 10 | Income tax expense | (304) | (177) | (80) | ||||||||||
| Group profit/(loss) for the financial year | 729 | 584 | (295) | |||||||||||
| Profit/(loss) attributable to: | ||||||||||||||
| Equity holders of the Company | 724 | 582 | (296) | |||||||||||
| Non-controlling interests | 5 | 2 | 1 | |||||||||||
| Group profit/(loss) for the financial year | 729 | 584 | (295) | |||||||||||
| 12 | Basic earnings/(loss) per Ordinary Share | 89.1c | 78.9c | (40.6c) | ||||||||||
| 12 | Diluted earnings/(loss) per Ordinary Share | 88.7c | 78.8c | (40.6c) | ||||||||||
| All of the results relate to continuing operations. | ||||||||||||||
| 156 |
Table of Contents
CRH Annual Report on Form 20-F | 2015
Consolidated Statement of Comprehensive Income
for the financial year ended 31 December 2015
|
2015 €m |
2014 €m |
2013 €m |
||||||||||||
| Notes | ||||||||||||||
| Group profit/(loss) for the financial year | 729 | 584 | (295) | |||||||||||
| Other comprehensive income | ||||||||||||||
| Items that may be reclassified to profit or loss in subsequent years: | ||||||||||||||
| Currency translation effects | 661 | 599 | (373) | |||||||||||
| 24 | Losses relating to cash flow hedges | (2) | (6) | (2) | ||||||||||
| 659 | 593 | (375) | ||||||||||||
| Items that will not be reclassified to profit or loss in subsequent years: | ||||||||||||||
| 27 | Remeasurement of retirement benefit obligations | 203 | (414) | 162 | ||||||||||
| 10 | Tax on items recognised directly within other comprehensive income | (30) | 69 | (43) | ||||||||||
| 173 | (345) | 119 | ||||||||||||
| Total other comprehensive income for the financial year | 832 | 248 | (256) | |||||||||||
| Total comprehensive income for the financial year | 1,561 | 832 | (551) | |||||||||||
| Attributable to: | ||||||||||||||
| Equity holders of the Company | 1,538 | 830 | (552) | |||||||||||
| Non-controlling interests | 23 | 2 | 1 | |||||||||||
| Total comprehensive income for the financial year | 1,561 | 832 | (551) | |||||||||||
| 157 |
Table of Contents
CRH Annual Report on Form 20-F | 2015
as at 31 December 2015
| 2015 €m |
2014 €m |
|||||||||
| Notes | ||||||||||
| ASSETS | ||||||||||
| Non-current assets | ||||||||||
| 13 | Property, plant and equipment | 13,062 | 7,422 | |||||||
| 14 | Intangible assets | 7,820 | 4,173 | |||||||
| 15 | Investments accounted for using the equity method | 1,317 | 1,329 | |||||||
| 15 | Other financial assets | 28 | 23 | |||||||
| 17 | Other receivables | 149 | 85 | |||||||
| 24 | Derivative financial instruments | 85 | 87 | |||||||
| 26 | Deferred income tax assets | 149 | 171 | |||||||
| Total non-current assets | 22,610 | 13,290 | ||||||||
| Current assets | ||||||||||
| 16 | Inventories | 2,873 | 2,260 | |||||||
| 17 | Trade and other receivables | 3,977 | 2,644 | |||||||
| Current income tax recoverable | 5 | 15 | ||||||||
| 24 | Derivative financial instruments | 24 | 15 | |||||||
| 22 | Cash and cash equivalents | 2,518 | 3,262 | |||||||
| Assets held for sale | - | 531 | ||||||||
| Total current assets | 9,397 | 8,727 | ||||||||
| Total assets | 32,007 | 22,017 | ||||||||
| EQUITY | ||||||||||
| Capital and reserves attributable to the Company’s equity holders | ||||||||||
| 28 | Equity share capital | 281 | 253 | |||||||
| 28 | Preference share capital | 1 | 1 | |||||||
| 28 | Share premium account | 6,021 | 4,324 | |||||||
| 28 | Treasury Shares and own shares | (28 | ) | (76) | ||||||
| Other reserves | 240 | 213 | ||||||||
| Foreign currency translation reserve | 700 | 57 | ||||||||
| Retained income | 5,800 | 5,405 | ||||||||
| 13,015 | 10,177 | |||||||||
| 31 | Non-controlling interests | 529 | 21 | |||||||
| Total equity | 13,544 | 10,198 | ||||||||
| LIABILITIES | ||||||||||
| Non-current liabilities | ||||||||||
| 23 | Interest-bearing loans and borrowings | 8,465 | 5,419 | |||||||
| 24 | Derivative financial instruments | 5 | 3 | |||||||
| 26 | Deferred income tax liabilities | 2,023 | 1,305 | |||||||
| 18 | Other payables | 410 | 257 | |||||||
| 27 | Retirement benefit obligations | 588 | 711 | |||||||
| 25 | Provisions for liabilities | 603 | 257 | |||||||
| Total non-current liabilities | 12,094 | 7,952 | ||||||||
| Current liabilities | ||||||||||
| 18 | Trade and other payables | 4,761 | 2,894 | |||||||
| Current income tax liabilities | 401 | 154 | ||||||||
| 23 | Interest-bearing loans and borrowings | 756 | 447 | |||||||
| 24 | Derivative financial instruments | 19 | 20 | |||||||
| 25 | Provisions for liabilities | 432 | 139 | |||||||
| Liabilities associated with assets classified as held for sale | - | 213 | ||||||||
| Total current liabilities | 6,369 | 3,867 | ||||||||
| Total liabilities | 18,463 | 11,819 | ||||||||
| Total equity and liabilities | 32,007 | 22,017 | ||||||||
| 158 |
Table of Contents
CRH Annual Report on Form 20-F | 2015
Consolidated Statement of Changes in Equity
for the financial year ended 31 December 2015
| Attributable to the equity holders of the Company | ||||||||||||||||||||||||||||||||||
| Treasury | Foreign | |||||||||||||||||||||||||||||||||
| Issued | Share | Shares/ | currency | Non- | ||||||||||||||||||||||||||||||
| share | premium | own | Other | translation | Retained | controlling | Total | |||||||||||||||||||||||||||
| capital | account | shares | reserves | reserve | income | interests | equity | |||||||||||||||||||||||||||
| €m | €m | €m | €m | €m | €m | €m | €m | |||||||||||||||||||||||||||
| Notes | ||||||||||||||||||||||||||||||||||
| At 1 January 2015 | 254 | 4,324 | (76) | 213 | 57 | 5,405 | 21 | 10,198 | ||||||||||||||||||||||||||
| Group profit for the financial year | - | - | - | - | - | 724 | 5 | 729 | ||||||||||||||||||||||||||
| Other comprehensive income | - | - | - | - | 643 | 171 | 18 | 832 | ||||||||||||||||||||||||||
| Total comprehensive income | - | - | - | - | 643 | 895 | 23 | 1,561 | ||||||||||||||||||||||||||
| 28 | Issue of share capital (net of expenses) | 28 | 1,697 | - | - | - | - | - | 1,725 | |||||||||||||||||||||||||
| 7 | Share-based payment expense | - | - | - | 27 | - | - | - | 27 | |||||||||||||||||||||||||
| 28 | Treasury/own shares reissued | - | - | 51 | - | - | (51) | - | - | |||||||||||||||||||||||||
| 28 | Shares acquired by Employee Benefit Trust (own shares) | - | - | (3) | - | - | - | - | (3) | |||||||||||||||||||||||||
| 10 | Tax relating to share-based payment expense | - | - | - | - | - | 5 | - | 5 | |||||||||||||||||||||||||
| Share option exercises | - | - | - | - | - | 57 | - | 57 | ||||||||||||||||||||||||||
| 11 | Dividends (including shares issued in lieu of dividends) | - | - | - | - | - | (511) | (4) | (515) | |||||||||||||||||||||||||
| 30 | Non-controlling interests arising on acquisition of subsidiaries | - | - | - | - | - | - | 489 | 489 | |||||||||||||||||||||||||
| At 31 December 2015 | 282 | 6,021 | (28) | 240 | 700 | 5,800 | 529 | 13,544 | ||||||||||||||||||||||||||
| for the financial year ended 31 December 2014 | ||||||||||||||||||||||||||||||||||
| At 1 January 2014 | 252 | 4,219 | (118) | 197 | (542) | 5,654 | 24 | 9,686 | ||||||||||||||||||||||||||
| Group profit for the financial year | - | - | - | - | - | 582 | 2 | 584 | ||||||||||||||||||||||||||
| Other comprehensive income | - | - | - | - | 599 | (351) | - | 248 | ||||||||||||||||||||||||||
| Total comprehensive income | - | - | - | - | 599 | 231 | 2 | 832 | ||||||||||||||||||||||||||
| 28 | Issue of share capital (net of expenses) | 2 | 105 | - | - | - | - | - | 107 | |||||||||||||||||||||||||
| 7 | Share-based payment expense | - | - | - | 16 | - | - | - | 16 | |||||||||||||||||||||||||
| 28 | Treasury/own shares reissued | - | - | 42 | - | - | (42) | - | - | |||||||||||||||||||||||||
| Share option exercises | - | - | - | - | - | 22 | - | 22 | ||||||||||||||||||||||||||
| 11 | Dividends (including shares issued in lieu of dividends) | - | - | - | - | - | (460) | (4) | (464) | |||||||||||||||||||||||||
| Acquisition of non-controlling interests | - | - | - | - | - | - | (1) | (1) | ||||||||||||||||||||||||||
| At 31 December 2014 | 254 | 4,324 | (76) | 213 | 57 | 5,405 | 21 | 10,198 | ||||||||||||||||||||||||||
| for the financial year ended 31 December 2013 | ||||||||||||||||||||||||||||||||||
| At 1 January 2013 | 250 | 4,133 | (146) | 182 | (169) | 6,303 | 36 | 10,589 | ||||||||||||||||||||||||||
| Group loss for the financial year | - | - | - | - | - | (296) | 1 | (295) | ||||||||||||||||||||||||||
| Other comprehensive income | - | - | - | - | (373) | 117 | - | (256) | ||||||||||||||||||||||||||
| Total comprehensive income | - | - | - | - | (373) | (179) | 1 | (551) | ||||||||||||||||||||||||||
| 28 | Issue of share capital (net of expenses) | 2 | 86 | - | - | - | - | - | 88 | |||||||||||||||||||||||||
| 7 | Share-based payment expense | - | - | - | 15 | - | - | - | 15 | |||||||||||||||||||||||||
| Treasury/own shares reissued | - | - | 34 | - | - | (34) | - | - | ||||||||||||||||||||||||||
| Shares acquired by Employee Benefit Trust (own shares) | - | - | (6) | - | - | - | - | (6) | ||||||||||||||||||||||||||
| Share option exercises | - | - | - | - | - | 19 | - | 19 | ||||||||||||||||||||||||||
| 11 | Dividends (including shares issued in lieu of dividends) | - | - | - | - | - | (455) | (1) | (456) | |||||||||||||||||||||||||
| 30 | Non-controlling interests arising on acquisition of subsidiaries | - | - | - | - | - | - | 1 | 1 | |||||||||||||||||||||||||
| Acquisition of non-controlling interests | - | - | - | - | - | - | (13) | (13) | ||||||||||||||||||||||||||
| At 31 December 2013 | 252 | 4,219 | (118) | 197 | (542) | 5,654 | 24 | 9,686 | ||||||||||||||||||||||||||
| 159 |
Table of Contents
CRH Annual Report on Form 20-F | 2015
Consolidated Statement of Cash Flows
for the financial year ended 31 December 2015
| 2015 €m |
2014 €m |
2013 €m |
||||||||||||
| Notes | ||||||||||||||
| Cash flows from operating activities | ||||||||||||||
| Profit/(loss) before tax | 1,033 | 761 | (215) | |||||||||||
| 8 | Finance costs (net) | 389 | 288 | 297 | ||||||||||
| 9 | Share of equity accounted investments’ result | (44) | (55) | 44 | ||||||||||
| 4 | Profit on disposals | (101) | (77) | (26) | ||||||||||
| Group operating profit | 1,277 | 917 | 100 | |||||||||||
| 2 | Depreciation charge | 843 | 631 | 671 | ||||||||||
| 2 | Amortisation of intangible assets | 55 | 44 | 54 | ||||||||||
| 2 | Impairment charge | 44 | 49 | 650 | ||||||||||
| 7 | Share-based payment expense | 27 | 16 | 15 | ||||||||||
| Other (primarily pension payments) | (47) | (66) | (96) | |||||||||||
| 19 | Net movement on working capital and provisions | 585 | 35 | 77 | ||||||||||
| Cash generated from operations | 2,784 | 1,626 | 1,471 | |||||||||||
| Interest paid (including finance leases) | (302) | (262) | (269) | |||||||||||
| Corporation tax paid | (235) | (127) | (110) | |||||||||||
| Net cash inflow from operating activities | 2,247 | 1,237 | 1,092 | |||||||||||
| Cash flows from investing activities | ||||||||||||||
| 4 | Proceeds from disposals (net of cash disposed and deferred proceeds) | 889 | 345 | 122 | ||||||||||
| Interest received | 8 | 8 | 13 | |||||||||||
| Dividends received from equity accounted investments | 53 | 30 | 33 | |||||||||||
| 13 | Purchase of property, plant and equipment | (882) | (435) | (497) | ||||||||||
| 30 | Acquisition of subsidiaries (net of cash acquired) | (7,296) | (151) | (336) | ||||||||||
| 15 | Other investments and advances | (19) | (3) | (78) | ||||||||||
| 19 | Deferred and contingent acquisition consideration paid | (59) | (26) | (105) | ||||||||||
| Net cash outflow from investing activities | (7,306) | (232) | (848) | |||||||||||
| Cash flows from financing activities | ||||||||||||||
| 28 | Proceeds from issue of shares (net) | 1,593 | - | - | ||||||||||
| Proceeds from exercise of share options | 57 | 22 | 19 | |||||||||||
| Acquisition of non-controlling interests | - | (1) | (13) | |||||||||||
| Increase in interest-bearing loans, borrowings and finance leases | 5,633 | 901 | 1,491 | |||||||||||
| Net cash flow arising from derivative financial instruments | 47 | (11) | 64 | |||||||||||
| 8 | Premium paid on early debt redemption | (38) | - | - | ||||||||||
| 28 | Treasury/own shares purchased | (3) | - | (6) | ||||||||||
| Repayment of interest-bearing loans, borrowings and finance leases | (2,744) | (934) | (586) | |||||||||||
| 11 | Dividends paid to equity holders of the Company | (379) | (353) | (367) | ||||||||||
| 11 | Dividends paid to non-controlling interests | (4) | (4) | (1) | ||||||||||
| Net cash inflow/(outflow) from financing activities | 4,162 | (380) | 601 | |||||||||||
| (Decrease)/increase in cash and cash equivalents | (897) | 625 | 845 | |||||||||||
| Reconciliation of opening to closing cash and cash equivalents | ||||||||||||||
| Cash and cash equivalents at 1 January | 3,295 | 2,540 | 1,747 | |||||||||||
| Translation adjustment | 120 | 130 | (52) | |||||||||||
| (Decrease)/increase in cash and cash equivalents | (897) | 625 | 845 | |||||||||||
| 22 | Cash and cash equivalents at 31 December | 2,518 | 3,295 | 2,540 | ||||||||||
| 160 |
Table of Contents
CRH Annual Report on Form 20-F | 2015
(including key accounting estimates and assumptions)
| 161 |
Table of Contents
CRH Annual Report on Form 20-F | 2015
Accounting Policies | continued
| 162 |
Table of Contents
CRH Annual Report on Form 20-F | 2015
Accounting Policies | continued
| 163 |
Table of Contents
CRH Annual Report on Form 20-F | 2015
Accounting Policies | continued
| 164 |
Table of Contents
CRH Annual Report on Form 20-F | 2015
Accounting Policies | continued
| 165 |
Table of Contents
CRH Annual Report on Form 20-F | 2015
Accounting Policies | continued
| 166 |
Table of Contents
CRH Annual Report on Form 20-F | 2015
Accounting Policies | continued
| 167 |
Table of Contents
CRH Annual Report on Form 20-F | 2015
Accounting Policies | continued
| 168 |
Table of Contents
CRH Annual Report on Form 20-F | 2015
Accounting Policies | continued
| 169 |
Table of Contents
CRH Annual Report on Form 20-F | 2015
Accounting Policies | continued
| 170 |
Table of Contents
CRH Annual Report on Form 20-F | 2015
Accounting Policies | continued
The principal exchange rates used for the translation of results, cash flows and balance sheets into euro were as follows:
| Average | Year-end | |||||||||||||||||||||||||||||||||
| euro 1 = | 2015 | 2014 | 2013 | 2015 | 2014 | 2013 | ||||||||||||||||||||||||||||
| US Dollar | 1.1095 | 1.3290 | 1.3281 | 1.0887 | 1.2141 | 1.3791 | ||||||||||||||||||||||||||||
| Pound Sterling | 0.7258 | 0.8062 | 0.8493 | 0.7340 | 0.7789 | 0.8337 | ||||||||||||||||||||||||||||
| Polish Zloty | 4.1841 | 4.1839 | 4.1975 | 4.2639 | 4.2732 | 4.1543 | ||||||||||||||||||||||||||||
| Ukrainian Hryvnia | 24.3693 | 15.8908 | 10.8339 | 26.1434 | 19.1814 | 11.3583 | ||||||||||||||||||||||||||||
| Swiss Franc | 1.0679 | 1.2147 | 1.2311 | 1.0835 | 1.2024 | 1.2276 | ||||||||||||||||||||||||||||
| Canadian Dollar | 1.4186 | 1.4664 | 1.3684 | 1.5116 | 1.4063 | 1.4671 | ||||||||||||||||||||||||||||
| Argentine Peso | 10.2803 | 10.7785 | 7.2892 | 14.0824 | 10.2645 | 8.9910 | ||||||||||||||||||||||||||||
| Turkish Lira | 3.0255 | 2.9068 | 2.5335 | 3.1765 | 2.8320 | 2.9605 | ||||||||||||||||||||||||||||
| Indian Rupee | 71.1956 | 81.0576 | 77.9300 | 72.0215 | 76.7190 | 85.3660 | ||||||||||||||||||||||||||||
| Chinese Renminbi | 6.9733 | 8.1883 | 8.1646 | 7.0608 | 7.5358 | 8.3491 | ||||||||||||||||||||||||||||
| Brazilian Real | 3.7004 | - | - | 4.3117 | - | - | ||||||||||||||||||||||||||||
| Romanian Leu | 4.4454 | - | - | 4.5240 | - | - | ||||||||||||||||||||||||||||
| Hungarian Forint | 309.9956 | - | - | 315.9800 | - | - | ||||||||||||||||||||||||||||
| Serbian Dinar | 120.7168 | - | - | 121.5612 | - | - | ||||||||||||||||||||||||||||
| Philippine Peso | 50.5217 | - | - | 50.9990 | - | - | ||||||||||||||||||||||||||||
| 171 |
Table of Contents
CRH Annual Report on Form 20-F | 2015
Notes on Consolidated Financial Statements
1. Segment Information
| * | EBITDA is defined as earnings before interest, taxes, depreciation, amortisation, asset impairment charges, profit on disposals and the Group’s share of equity accounted investments’ result after tax. |
| 172 |
Table of Contents
CRH Annual Report on Form 20-F | 2015
1. Segment Information | continued
A. Operating segments disclosures - Consolidated Income Statement data
| Year ended 31 December | ||||||||||||||||||||||||||||||||||||||||||||||||
| Group operating profit before | Depreciation, | |||||||||||||||||||||||||||||||||||||||||||||||
| depreciation and amortisation | amortisation and | Group | ||||||||||||||||||||||||||||||||||||||||||||||
| Revenue | (EBITDA (as defined)*) | impairment (i) | operating profit (EBIT) | |||||||||||||||||||||||||||||||||||||||||||||
| 2015 | 2014 | 2013 | 2015 | 2014 | 2013 | 2015 | 2014 | 2013 | 2015 | 2014 | 2013 | |||||||||||||||||||||||||||||||||||||
| €m | €m | €m | €m | €m | €m | €m | €m | €m | €m | €m | €m | |||||||||||||||||||||||||||||||||||||
| Europe Heavyside |
3,607 | 3,929 | 3,786 | 334 | 380 | 326 | 199 | 229 | 721 | 135 | 151 | (395) | ||||||||||||||||||||||||||||||||||||
| Europe Lightside |
961 | 913 | 856 | 100 | 94 | 71 | 25 | 23 | 43 | 75 | 71 | 28 | ||||||||||||||||||||||||||||||||||||
| Europe Distribution |
4,158 | 3,999 | 3,936 | 171 | 190 | 186 | 77 | 78 | 80 | 94 | 112 | 106 | ||||||||||||||||||||||||||||||||||||
| Europe |
8,726 | 8,841 | 8,578 | 605 | 664 | 583 | 301 | 330 | 844 | 304 | 334 | (261) | ||||||||||||||||||||||||||||||||||||
| Americas Materials |
6,400 | 5,070 | 4,721 | 912 | 609 | 557 | 301 | 254 | 331 | 611 | 355 | 226 | ||||||||||||||||||||||||||||||||||||
| Americas Products |
3,862 | 3,225 | 3,068 | 391 | 263 | 246 | 142 | 118 | 178 | 249 | 145 | 68 | ||||||||||||||||||||||||||||||||||||
| Americas Distribution |
2,229 | 1,776 | 1,664 | 140 | 105 | 89 | 29 | 22 | 22 | 111 | 83 | 67 | ||||||||||||||||||||||||||||||||||||
| Americas |
12,491 | 10,071 | 9,453 | 1,443 | 977 | 892 | 472 | 394 | 531 | 971 | 583 | 361 | ||||||||||||||||||||||||||||||||||||
| LH Assets |
2,418 | - | - | 171 | - | - | 169 | - | - | 2 | - | - | ||||||||||||||||||||||||||||||||||||
| Total Group |
23,635 | 18,912 | 18,031 | 2,219 | 1,641 | 1,475 | 942 | 724 | 1,375 | 1,277 | 917 | 100 | ||||||||||||||||||||||||||||||||||||
| (i) See note 2 for details of the impairment charge. |
|
|||||||||||||||||||||||||||||||||||||||||||||||
| Profit on disposals (ii) |
|
101 | 77 | 26 | ||||||||||||||||||||||||||||||||||||||||||||
| Finance costs less income |
|
(295) | (246) | (249) | ||||||||||||||||||||||||||||||||||||||||||||
| Other financial expense |
|
(94) | (42) | (48) | ||||||||||||||||||||||||||||||||||||||||||||
| Share of equity accounted investments’ profit/(loss) (iii) |
|
44 | 55 | (44) | ||||||||||||||||||||||||||||||||||||||||||||
| Profit/(loss) before tax |
|
1,033 | 761 | (215) | ||||||||||||||||||||||||||||||||||||||||||||
| (ii) Profit/(loss) on | (iii) Share of equity accounted | |||||||||||||||||||||||||||||||||||||||||||||||
| disposals (note 4) | investments’ profit/(loss) (note 9) | |||||||||||||||||||||||||||||||||||||||||||||||
| Europe Heavyside |
|
97 | 38 | 6 | 4 | 35 | (60) | |||||||||||||||||||||||||||||||||||||||||
| Europe Lightside |
|
(23) | 1 | 6 | - | - | - | |||||||||||||||||||||||||||||||||||||||||
| Europe Distribution |
|
8 | 6 | (2) | 15 | 13 | 9 | |||||||||||||||||||||||||||||||||||||||||
| Europe |
|
82 | 45 | 10 | 19 | 48 | (51) | |||||||||||||||||||||||||||||||||||||||||
| Americas Materials |
|
24 | 11 | 19 | 23 | 7 | 7 | |||||||||||||||||||||||||||||||||||||||||
| Americas Products |
|
(11) | 20 | (3) | - | - | - | |||||||||||||||||||||||||||||||||||||||||
| Americas Distribution |
|
2 | 1 | - | - | - | - | |||||||||||||||||||||||||||||||||||||||||
| Americas |
|
15 | 32 | 16 | 23 | 7 | 7 | |||||||||||||||||||||||||||||||||||||||||
| LH Assets |
|
4 | - | - | 2 | - | - | |||||||||||||||||||||||||||||||||||||||||
| Total Group |
|
101 | 77 | 26 | 44 | 55 | (44) | |||||||||||||||||||||||||||||||||||||||||
| * | EBITDA is defined as earnings before interest, taxes, depreciation, amortisation, asset impairment charges, profit on disposals and the Group’s share of equity accounted investments’ result after tax. |
| 173 |
Table of Contents
CRH Annual Report on Form 20-F | 2015
1. Segment Information | continued
B. Operating segments disclosures - Consolidated Balance Sheet data
| As at 31 December | ||||||||||||||||
| Total assets | Total liabilities | |||||||||||||||
|
2015 €m |
2014 €m |
2015 €m |
2014 €m |
|||||||||||||
| Europe Heavyside |
3,802 | 3,864 | 1,260 | 1,468 | ||||||||||||
| Europe Lightside |
767 | 761 | 261 | 215 | ||||||||||||
| Europe Distribution |
2,238 | 2,221 | 647 | 644 | ||||||||||||
| Europe |
6,807 | 6,846 | 2,168 | 2,327 | ||||||||||||
| Americas Materials |
6,933 | 6,245 | 1,195 | 969 | ||||||||||||
| Americas Products |
4,146 | 2,542 | 952 | 679 | ||||||||||||
| Americas Distribution |
1,095 | 951 | 364 | 283 | ||||||||||||
| Americas |
12,174 | 9,738 | 2,511 | 1,931 | ||||||||||||
| LH Assets |
8,900 | - | 2,115 | - | ||||||||||||
| Total Group |
27,881 | 16,584 | 6,794 | 4,258 | ||||||||||||
| Reconciliation to total assets as reported in the Consolidated Balance Sheet: |
||||||||||||||||
| Investments accounted for using the equity method |
1,317 | 1,329 | ||||||||||||||
| Other financial assets |
28 | 23 | ||||||||||||||
| Derivative financial instruments (current and non-current) |
109 | 102 | ||||||||||||||
| Income tax assets (current and deferred) |
154 | 186 | ||||||||||||||
| Cash and cash equivalents |
2,518 | 3,262 | ||||||||||||||
| Assets held for sale |
- | 531 | ||||||||||||||
| Total assets as reported in the Consolidated Balance Sheet |
32,007 | 22,017 | ||||||||||||||
| Reconciliation to total liabilities as reported in the Consolidated Balance Sheet: |
||||||||||||||||
| Interest-bearing loans and borrowings (current and non-current) |
9,221 | 5,866 | ||||||||||||||
| Derivative financial instruments (current and non-current) |
24 | 23 | ||||||||||||||
| Income tax liabilities (current and deferred) |
2,424 | 1,459 | ||||||||||||||
| Liabilities associated with assets classified as held for sale |
- | 213 | ||||||||||||||
| Total liabilities as reported in the Consolidated Balance Sheet |
18,463 | 11,819 | ||||||||||||||
| 174 |
Table of Contents
CRH Annual Report on Form 20-F | 2015
1. Segment Information | continued
C. Operating segments disclosures - other items
Additions to non-current assets
| Year ended 31 December | ||||||||||||||||||||||||||||||||||||
| Property, plant and | Financial assets | |||||||||||||||||||||||||||||||||||
| equipment (note 13) | (note 15) | Total Group | ||||||||||||||||||||||||||||||||||
| 2015 | 2014 | 2013 | 2015 | 2014 | 2013 | 2015 | 2014 | 2013 | ||||||||||||||||||||||||||||
| €m | €m | €m | €m | €m | €m | €m | €m | €m | ||||||||||||||||||||||||||||
| Europe Heavyside |
153 | 113 | 132 | 2 | - | 70 | 155 | 113 | 202 | |||||||||||||||||||||||||||
| Europe Lightside |
15 | 14 | 13 | - | - | - | 15 | 14 | 13 | |||||||||||||||||||||||||||
| Europe Distribution |
46 | 36 | 49 | 1 | - | 1 | 47 | 36 | 50 | |||||||||||||||||||||||||||
| Europe |
214 | 163 | 194 | 3 | - | 71 | 217 | 163 | 265 | |||||||||||||||||||||||||||
| Americas Materials |
319 | 173 | 199 | 10 | 3 | 7 | 329 | 176 | 206 | |||||||||||||||||||||||||||
| Americas Products |
153 | 81 | 83 | - | - | - | 153 | 81 | 83 | |||||||||||||||||||||||||||
| Americas Distribution |
41 | 18 | 21 | - | - | - | 41 | 18 | 21 | |||||||||||||||||||||||||||
| Americas |
513 | 272 | 303 | 10 | 3 | 7 | 523 | 275 | 310 | |||||||||||||||||||||||||||
| LH Assets (i) |
155 | - | - | 6 | - | - | 161 | - | - | |||||||||||||||||||||||||||
| Total Group |
882 | 435 | 497 | 19 | 3 | 78 | 901 | 438 | 575 | |||||||||||||||||||||||||||
| (i) | Additions for the LH Assets are reported from the date of acquisition. |
D. Entity-wide disclosures
Section 1: Information about products and services
The Group’s revenue from external customers in respect of its principal products and services is analysed in the disclosures above. Segment revenue includes €4,523 million (2014: €3,351 million; 2013: €3,268 million) in respect of revenue applicable to construction contracts. The bulk of our construction activities are performed by our Americas Materials reportable segment, are for the most part short-term in nature and are generally completed within the same financial reporting period.
Neither revenue derived through the supply of services nor intersegment revenue is material to the Group. The transfer pricing policy implemented by the Group between operating segments and across its constituent entities is described in greater detail in note 32. In addition, due to the nature of building materials, which exhibit a low value-to-weight ratio, the Group’s revenue streams include a low level of cross-border transactions.
Section 2: Information about geographical areas and customers
CRH has a presence in 31 countries worldwide. The revenues from external customers and non-current assets (as defined in IFRS 8) attributable to the country of domicile and all foreign countries of operation are as follows; individual foreign countries which exceed 10% of total external Group revenue have been highlighted separately on the basis of materiality.
| Year ended 31 December | As at 31 December | |||||||||||||||||||
| Revenue by destination | Non-current assets | |||||||||||||||||||
| 2015 | 2014 | 2013 | 2015 | 2014 | ||||||||||||||||
| €m | €m | €m | €m | €m | ||||||||||||||||
| Country of domicile - Republic of Ireland |
349 | 306 | 278 | 609 | 477 | |||||||||||||||
| Benelux (mainly the Netherlands) |
2,478 | 2,350 | 2,324 | 1,209 | 1,231 | |||||||||||||||
| United States of America |
12,048 | 9,650 | 8,991 | 8,911 | 6,948 | |||||||||||||||
| Other |
8,760 | 6,606 | 6,438 | 11,470 | 4,268 | |||||||||||||||
| Total Group |
23,635 | 18,912 | 18,031 | 22,199 | 12,924 | |||||||||||||||
While the United Kingdom does not exceed 10% of total external Group revenue, at 31 December 2015 it represented 13% of the Group’s non-current assets.
There are no material dependencies or concentrations on individual customers which would warrant disclosure under IFRS 8. The individual entities within the Group have a large number of customers spread across various activities, end-uses and geographies.
| 175 |
Table of Contents
CRH Annual Report on Form 20-F | 2015
2. Cost Analysis
| 2015 | 2014 | 2013 | ||||||||||
| €m | €m | €m | ||||||||||
| Cost of sales analysis |
||||||||||||
| Raw materials and goods for resale |
8,629 | 7,527 | 7,240 | |||||||||
| Employment costs (note 5) |
2,446 | 1,985 | 1,974 | |||||||||
| Energy conversion costs |
789 | 655 | 644 | |||||||||
| Repairs and maintenance |
630 | 452 | 421 | |||||||||
| Depreciation, amortisation and impairment (i) |
697 | 532 | 792 | |||||||||
| Change in inventory (note 19) |
29 | 34 | 37 | |||||||||
| Other production expenses (primarily sub-contractor costs and equipment rental) |
3,174 | 2,242 | 2,045 | |||||||||
| Total |
16,394 | 13,427 | 13,153 | |||||||||
| Operating costs analysis |
||||||||||||
| Selling and distribution costs |
3,878 | 3,143 | 3,054 | |||||||||
| Administrative expenses |
2,086 | 1,425 | 1,724 | |||||||||
| Total |
5,964 | 4,568 | 4,778 | |||||||||
| (i) | Depreciation, amortisation and impairment analysis |
| Cost of sales | Operating costs | Total | ||||||||||||||||||||||||||||||||||
| 2015 | 2014 | 2013 | 2015 | 2014 | 2013 | 2015 | 2014 | 2013 | ||||||||||||||||||||||||||||
| €m | €m | €m | €m | €m | €m | €m | €m | €m | ||||||||||||||||||||||||||||
| Depreciation and depletion (note 13) |
667 | 485 | 521 | 176 | 146 | 150 | 843 | 631 | 671 | |||||||||||||||||||||||||||
| Amortisation of intangible assets (note 14) |
- | - | - | 55 | 44 | 54 | 55 | 44 | 54 | |||||||||||||||||||||||||||
| Impairment of property, plant and equipment (note 13) |
30 | 47 | 271 | 11 | 2 | 4 | 41 | 49 | 275 | |||||||||||||||||||||||||||
| Impairment of intangible assets (note 14) |
- | - | - | 1 | - | 375 | 1 | - | 375 | |||||||||||||||||||||||||||
| Impairment of financial assets (note 15) |
- | - | - | 2 | - | - | 2 | - | - | |||||||||||||||||||||||||||
| Total |
697 | 532 | 792 | 245 | 192 | 583 | 942 | 724 | 1,375 | |||||||||||||||||||||||||||
Segmental analysis of 2013 impairment charges
| Portfolio review included in | ||||||||||||||||||||
| Annual impairment | Included in operating | share of equity | ||||||||||||||||||
| process | Portfolio review | profit | accounted entities | Total | ||||||||||||||||
| €m | €m | €m | €m | €m | ||||||||||||||||
| Europe Heavyside |
58 | 444 | 502 | 101 | 603 | |||||||||||||||
| Europe Lightside |
- | 13 | 13 | - | 13 | |||||||||||||||
| Europe Distribution |
4 | - | 4 | 4 | 8 | |||||||||||||||
| Europe |
62 | 457 | 519 | 105 | 624 | |||||||||||||||
| Americas Materials |
- | 60 | 60 | - | 60 | |||||||||||||||
| Americas Products |
10 | 61 | 71 | - | 71 | |||||||||||||||
| Americas Distribution |
- | - | - | - | - | |||||||||||||||
| Americas |
10 | 121 | 131 | - | 131 | |||||||||||||||
| Total Group |
72 | 578 | 650 | 105 | 755 | |||||||||||||||
In November 2013, a Group-wide portfolio review was initiated to identify and focus on those businesses within our portfolio which offer the most attractive future returns, and to prioritise capital allocation to ensure profitable growth across our network of businesses. The total impairments (including financial asset impairments) arising from the portfolio review amounted to €683 million, of which €261 million related to property, plant and equipment and €317 million related to intangible assets. The review was completed during 2014 and a multi-year divestment programme is well under way (see note 14 for further details).
The 2013 annual impairment testing process resulted in an impairment of €58 million being recorded in respect of our Benelux CGU in Europe Heavyside due to a difficult trading environment in 2013 and a slower recovery than previously anticipated.
| 176 |
Table of Contents
CRH Annual Report on Form 20-F | 2015
3. Operating Profit Disclosures
| 2015 | 2014 | 2013 | ||||||||||
| €m | €m | €m | ||||||||||
| Operating lease rentals |
||||||||||||
| - hire of plant and machinery |
204 | 149 | 108 | |||||||||
| - land and buildings |
263 | 216 | 220 | |||||||||
| - other operating leases |
50 | 48 | 47 | |||||||||
| Total |
517 | 413 | 375 | |||||||||
Auditor’s remuneration
Fees for professional services provided by the Group’s independent auditor in respect of each of the following categories were:
| 2015 | 2014 | 2013 | ||||||||||
| €m | €m | €m | ||||||||||
| Audit fees (i) |
19 | 14 | 14 | |||||||||
| Audit-related fees (ii) |
5 | 1 | 2 | |||||||||
| Tax fees |
2 | 1 | 1 | |||||||||
| All other fees |
- | - | - | |||||||||
| Total |
26 | 16 | 17 | |||||||||
| (i) | Audit of the Group accounts includes Sarbanes-Oxley attestation and parent and subsidiary statutory audit fees, but excludes €2 million (2014: €2 million; 2013: €1 million) paid to auditors other than EY. |
| (ii) | Other assurance services includes attestation and due diligence services that are closely related to the performance of the audit. |
| 177 |
Table of Contents
CRH Annual Report on Form 20-F | 2015
4. Business and Non-Current Asset Disposals
| Disposal of other | ||||||||||||||||||||||||||||||||||||
| Business disposals | non-current assets | Total | ||||||||||||||||||||||||||||||||||
| 2015 (i) | 2014 (ii) | 2013 | 2015 | 2014 | 2013 | 2015 | 2014 | 2013 | ||||||||||||||||||||||||||||
| €m | €m | €m | €m | €m | €m | €m | €m | €m | ||||||||||||||||||||||||||||
| Assets/(liabilities) disposed of at net carrying amount: |
||||||||||||||||||||||||||||||||||||
| - non-current assets (notes 13,14,15) |
570 | 117 | 43 | 103 | 83 | 66 | 673 | 200 | 109 | |||||||||||||||||||||||||||
| - cash and cash equivalents |
90 | - | - | - | - | - | 90 | - | - | |||||||||||||||||||||||||||
| - working capital and provisions (note 19) |
246 | 11 | 6 | - | - | - | 246 | 11 | 6 | |||||||||||||||||||||||||||
| - asset held for sale (iii) |
- | - | 139 | - | - | - | - | - | 139 | |||||||||||||||||||||||||||
| - interest-bearing loans and borrowings |
(20) | - | (17) | - | - | - | (20) | - | (17) | |||||||||||||||||||||||||||
| - deferred tax (note 26) |
(22) | - | - | - | - | - | (22) | - | - | |||||||||||||||||||||||||||
| - retirement benefit obligations (note 27) |
(84) | - | - | - | - | - | (84) | - | - | |||||||||||||||||||||||||||
| Net assets disposed |
780 | 128 | 171 | 103 | 83 | 66 | 883 | 211 | 237 | |||||||||||||||||||||||||||
| Reclassification of currency translation effects on disposal |
39 | 57 | 3 | - | - | - | 39 | 57 | 3 | |||||||||||||||||||||||||||
| Total |
819 | 185 | 174 | 103 | 83 | 66 | 922 | 268 | 240 | |||||||||||||||||||||||||||
| Proceeds from disposals (net of disposal costs) |
875 | 224 | 26 | 142 | 121 | 96 | 1,017 | 345 | 122 | |||||||||||||||||||||||||||
| Asset exchange (iii) (note 30) |
- | - | 144 | - | - | - | - | - | 144 | |||||||||||||||||||||||||||
| Profit on step acquisition (note 30) |
6 | - | - | - | - | - | 6 | - | - | |||||||||||||||||||||||||||
| Profit/(loss) on disposals |
62 | 39 | (4) | 39 | 38 | 30 | 101 | 77 | 26 | |||||||||||||||||||||||||||
| Net cash inflow arising on disposal |
||||||||||||||||||||||||||||||||||||
| Proceeds from disposals |
875 | 224 | 26 | 142 | 121 | 96 | 1,017 | 345 | 122 | |||||||||||||||||||||||||||
| Less: cash and cash equivalents disposed |
(90) | - | - | - | - | - | (90) | - | - | |||||||||||||||||||||||||||
| Less: deferred proceeds arising on disposal (note 19) |
(38) | - | - | - | - | - | (38) | - | - | |||||||||||||||||||||||||||
| Total |
747 | 224 | 26 | 142 | 121 | 96 | 889 | 345 | 122 | |||||||||||||||||||||||||||
| (i) | This relates principally to the divestment of the Group’s clay and concrete businesses in the United Kingdom (Europe Heavyside) and its clay business in the United States (Americas Products) on 26 February 2015. The assets and liabilities associated with this transaction, together with those relating to a number of smaller business units, met the “held for sale” criteria set out in IFRS 5 Non-Current Assets Held for Sale and Discontinued Operations and were reclassified accordingly as assets or liabilities held for sale as at 31 December 2014. As the vast majority of the assets and liabilities held for sale at 31 December 2014 have been divested prior to 31 December 2015, all opening balances have been reclassified back to the relevant asset and liability categories prior to their divestment for presentation purposes. During the year the Group also sold its businesses in South America (which were part of the Americas Products segment) and our 25% equity stake in our Israeli associates. |
| Assets and liabilities that met the IFRS 5 criteria at 31 December 2015 have not been separately disclosed as held for sale as they were not considered material in the context of the Group. The businesses divested in 2015 are not considered to be either separate major lines of business or geographical areas of operation and therefore do not constitute discontinued operations as defined in IFRS 5. |
| (ii) | This relates principally to the disposal of our 50% equity stake in our Turkish joint venture, Denizli Çimento (which was part of the Europe Heavyside segment). |
| (iii) | On 25 February 2013, the Group transferred its 26% stake in Corporacion Uniland to Cementos Portland Valderrivas in exchange for a 99% stake in Cementos Lemona, an integrated cement, readymixed concrete and aggregates business. |
| 178 |
Table of Contents
CRH Annual Report on Form 20-F | 2015
| 179 |
Table of Contents
CRH Annual Report on Form 20-F | 2015
7. Share-based Payment Expense
| 2015 | 2014 | 2013 | ||||||||||
| €m | €m | €m | ||||||||||
| Total share-based payment expense |
27 | 16 | 15 | |||||||||
Share-based payment expense relates primarily to awards granted under the 2006 and 2014 Performance Share Plans. The expense, which also includes charges in relation to the 2013 Restricted Share Plan and to options granted under the Group’s savings-related share option schemes, is reflected in operating costs in the Consolidated Income Statement.
In May 2014, shareholders approved the adoption of a new Performance Share Plan (the “2014 Performance Share Plan”), which replaced the 2006 Performance Share Plan (approved by shareholders in May 2006), the 2010 Share Option Scheme (approved by shareholders in May 2010) and the 2013 Restricted Share Plan (together, the “Existing Plans”). Following the introduction of the 2014 Performance Share Plan, no further awards will be made under the Existing Plans. Consequently, the last awards under the Existing Plans were made in 2013. The general terms and conditions applicable to the various plans are set out in the Directors’ Remuneration Report on pages 114 to 150.
2014 Performance Share Plan
The structure of the 2014 Performance Share Plan is set out in the Directors’ Remuneration Report on page 124. An expense of €20 million was recognised in 2015 (2014: €5 million).
Details of awards granted under the 2014 Performance Share Plan
| Number of Shares | ||||||||||||||||
| Share price at | Period to earliest | |||||||||||||||
| date of award | release date | Initial award | Net outstanding | |||||||||||||
| Granted in 2015 |
€24.84 | 3 years | 2,989,371 | 2,949,146 | ||||||||||||
| Granted in 2014 |
€20.49 | 3 years | 2,283,960 | 2,190,120 | ||||||||||||
75% of vesting is subject to Total Shareholder Return (TSR) performance against sector peers, while the remaining 25% of vesting is subject to a cumulative cash flow target. A number of awards are subject only to a three year service period (i.e. no performance conditions).
The fair value assigned to the portion of awards which are subject to TSR performance was €13.99 (2014: €10.88). The fair value of these awards was calculated using a TSR pricing model taking account of peer group TSR, volatilities and correlations together with the following assumptions:
| 2015 | 2014 | |||||||
| Risk-free interest rate (%) |
0.25 | 0.13 | ||||||
| Expected volatility (%) |
21.4 | 21.9 | ||||||
The expected volatility was determined using a historical sample of 37 month-end CRH share prices.
The fair value of (i) the portion of awards subject to cash flow performance and (ii) the awards with no performance conditions (which are subject to a three year service period) was €24.84 (2014: €20.49). The fair value was calculated using the closing CRH share price at the date the award was granted. Awards vest only if all performance and service conditions are met. No expense is recognised for awards that do not ultimately vest. At the balance sheet date the estimate of the level of vesting is reviewed and any necessary adjustment to the share-based payment expense is recognised in the Consolidated Income Statement.
| 180 |
Table of Contents
CRH Annual Report on Form 20-F | 2015
7. Share-based Payment Expense | continued
2006 Performance Share Plan
The expense of €4 million (2014: €8 million; 2013: €13 million) reported in the Consolidated Income Statement has been arrived at through applying a Monte Carlo simulation technique to model the combination of market-based and non-market-based performance conditions in the Plan.
Details of awards granted under the 2006 Performance Share Plan
| Number of Shares | ||||||||||||||||||||
| Share price at | Period to earliest | |||||||||||||||||||
| date of award | release date | Initial award | Net outstanding | Fair value | ||||||||||||||||
| Granted in 2012 |
€15.63 | 3 years | 2,079,000 | - | €7.77 | |||||||||||||||
| Granted in 2013 |
€16.69 | 3 years | 1,195,500 | 992,750 | €8.54 | |||||||||||||||
In April 2015, none of the shares awarded under the Performance Share Plan in 2012 vested and accordingly all remaining awards granted in 2012 lapsed.
The fair value of the shares awarded was determined using a Monte Carlo simulation technique taking account of peer group TSR, volatilities and correlations, together with the following assumptions:
| 2013 | ||||
| Risk-free interest rate (%) |
0.10 | |||
| Expected volatility (%) |
31.3 | |||
2013 Restricted Share Plan
Due to the immateriality of the Restricted Share Plan expense and the level of awards outstanding in this Plan at 31 December 2015, 31 December 2014 and 31 December 2013 detailed financial disclosures have not been provided in relation to this share-based payment arrangement.
The Group also operates savings-related share option schemes. Due to the immateriality of the savings-related schemes’ expense and the level of savings-related share options outstanding, detailed financial disclosures have not been provided in relation to these schemes.
Share option schemes
Details of movement and options outstanding under share option schemes (excluding savings-related share option schemes)
| Weighted average | Number of | Weighted average | Number of | Weighted average | Number of | |||||||||||||||||||
| exercise price | options | exercise price | options | exercise price | options | |||||||||||||||||||
| 2015 | 2014 | 2013 | ||||||||||||||||||||||
| Outstanding at beginning of year |
€19.58 | 15,481,191 | €18.75 | 21,798,887 | €18.84 | 23,295,955 | ||||||||||||||||||
| Granted |
- | - | - | - | €16.19 | 3,853,400 | ||||||||||||||||||
| Exercised (a) |
€19.35 | (2,544,141) | €16.58 | (919,205) | €13.21 | (1,245,029) | ||||||||||||||||||
| Lapsed |
€16.64 | (4,316,360) | €16.77 | (5,398,491) | €18.53 | (4,105,439) | ||||||||||||||||||
| Outstanding at end of year (b) |
€21.14 | 8,620,690 | €19.58 | 15,481,191 | €18.75 | 21,798,887 | ||||||||||||||||||
| Exercisable at end of year |
€24.18 | 5,335,290 | €18.79 | 1,248,698 | €17.94 | 2,114,772 | ||||||||||||||||||
| (a) | The weighted average share price at the date of exercise of these options was €25.51 (2014: €20.47, 2013: €17.28). |
| (b) | The level of vesting of options outstanding at the end of the year will be determined by reference to certain performance targets (outlined on page 125 of this Annual Report). If the performance criteria have been met, these options, or portion thereof as appropriate, may be exercised after the expiration of three years from their date of grant. All options granted have a life of ten years. |
| 181 |
Table of Contents
CRH Annual Report on Form 20-F | 2015
7. Share-based Payment Expense | continued
| 2015 | 2014 | 2013 | ||||||||||
| Weighted average remaining contractual life for the share options outstanding at 31 December (years) |
3.86 | 4.89 | 5.54 | |||||||||
| Euro-denominated options outstanding at the end of the year (number) |
8,604,776 | 15,389,922 | 21,683,559 | |||||||||
| Range of exercise prices (€) |
16.19-29.86 | 15.19-29.86 | 15.07-29.86 | |||||||||
| Sterling-denominated options outstanding at the end of the year (number) |
15,914 | 91,269 | 115,328 | |||||||||
| Range of exercise prices (Stg£) |
13.64-18.02 | 12.80-20.23 | 10.04-20.23 | |||||||||
| The CRH share price at 31 December 2015 was €26.70 (2014: €19.90; 2013: €18.30). The following analysis shows the number of outstanding share options with exercise prices lower/higher than the year-end share price: |
| |||||||||||
| Number of options with exercise prices lower than year-end price: |
||||||||||||
| Exercisable |
3,667,056 | 1,248,698 | 506,581 | |||||||||
| Not exercisable |
3,285,400 | 8,789,200 | 13,788,399 | |||||||||
| 6,952,456 | 10,037,898 | 14,294,980 | ||||||||||
| Number of options with exercise prices higher than year-end price: |
||||||||||||
| Exercisable |
1,668,234 | - | 1,608,191 | |||||||||
| Not exercisable |
- | 5,443,293 | 5,895,716 | |||||||||
| 1,668,234 | 5,443,293 | 7,503,907 | ||||||||||
| Total options outstanding |
8,620,690 | 15,481,191 | 21,798,887 | |||||||||
| 182 |
Table of Contents
CRH Annual Report on Form 20-F | 2015
8. Finance Costs and Finance Income
| 2015 | 2014 | 2013 | ||||||||||
| €m | €m | €m | ||||||||||
| Finance costs |
||||||||||||
| Interest payable on borrowings |
334 | 308 | 323 | |||||||||
| Net income on interest rate and currency swaps |
(32) | (42) | (55) | |||||||||
| Mark-to-market of derivatives and related fixed rate debt: |
||||||||||||
| - interest rate swaps (i) |
12 | (15) | 68 | |||||||||
| - currency swaps and forward contracts |
4 | - | 1 | |||||||||
| - fixed rate debt (i) |
(22) | 8 | (79) | |||||||||
| Net loss/(gain) on interest rate swaps not designated as hedges |
7 | (5) | 4 | |||||||||
| Net finance cost on gross debt including related derivatives |
303 | 254 | 262 | |||||||||
| Finance income |
||||||||||||
| Interest receivable on loans to joint ventures and associates |
(4) | (3) | (3) | |||||||||
| Interest receivable on cash and cash equivalents and other |
(4) | (5) | (10) | |||||||||
| Finance income |
(8) | (8) | (13) | |||||||||
| Finance costs less income |
295 | 246 | 249 | |||||||||
| Other financial expense |
||||||||||||
| Premium paid on early debt redemption |
38 | - | - | |||||||||
| Unwinding of discount element of provisions for liabilities (note 25) |
19 | 16 | 15 | |||||||||
| Unwinding of discount applicable to deferred and contingent acquisition consideration |
20 | 12 | 11 | |||||||||
| (note 18) |
||||||||||||
| Pension-related finance cost (net) (note 27) |
17 | 14 | 22 | |||||||||
| Total |
94 | 42 | 48 | |||||||||
| (i) | The Group uses interest rate swaps to convert fixed rate debt to floating rate. Fixed rate debt, which has been converted to floating rate through the use of interest rate swaps, is stated in the Consolidated Balance Sheet at adjusted value to reflect movements in underlying fixed rates. The movement on this adjustment, together with the offsetting movement in the fair value of the related interest rate swaps, is included in finance costs in each reporting period. |
| 183 |
Table of Contents
CRH Annual Report on Form 20-F | 2015
9. Share of Equity Accounted Investments’ Profit/(Loss)
The Group’s share of joint ventures’ and associates’ result after tax is equity accounted and is presented as a single line item in the Consolidated Income Statement; it is analysed as follows between the principal Consolidated Income Statement captions:
| Joint Ventures | Associates | Total | ||||||||||||||||||||||||||||||||||
| 2015 | 2014 | 2013 | 2015 | 2014 | 2013 | 2015 | 2014 | 2013 | ||||||||||||||||||||||||||||
| €m | €m | €m | €m | €m | €m | €m | €m | €m | ||||||||||||||||||||||||||||
| Group share of: |
||||||||||||||||||||||||||||||||||||
| Revenue |
496 | 488 | 469 | 961 | 953 | 961 | 1,457 | 1,441 | 1,430 | |||||||||||||||||||||||||||
| EBITDA (as defined)* |
79 | 62 | 60 | 84 | 106 | 109 | 163 | 168 | 169 | |||||||||||||||||||||||||||
| Depreciation and amortisation |
(27) | (27) | (27) | (55) | (45) | (39) | (82) | (72) | (66) | |||||||||||||||||||||||||||
| Impairment (i) |
- | - | (54) | - | - | (51) | - | - | (105) | |||||||||||||||||||||||||||
| Operating profit/(loss) |
52 | 35 | (21) | 29 | 61 | 19 | 81 | 96 | (2) | |||||||||||||||||||||||||||
| Finance costs (net) |
(6) | (6) | (2) | (17) | (21) | (22) | (23) | (27) | (24) | |||||||||||||||||||||||||||
| Profit/(loss) before tax |
46 | 29 | (23) | 12 | 40 | (3) | 58 | 69 | (26) | |||||||||||||||||||||||||||
| Income tax expense |
(5) | (3) | (5) | (9) | (11) | (13) | (14) | (14) | (18) | |||||||||||||||||||||||||||
| Profit/(loss) after tax |
41 | 26 | (28) | 3 | 29 | (16) | 44 | 55 | (44) | |||||||||||||||||||||||||||
An analysis of the result after tax by operating segment is presented in note 1. The aggregated balance sheet data (analysed between current and non-current assets and liabilities) in respect of the Group’s investment in joint ventures and associates is presented in note 15.
| (i) | See note 2 for details of the 2013 impairment charge. |
| * | EBITDA is defined as earnings before interest, taxes, depreciation, amortisation, asset impairment charges and profit on disposals. |
10. Income Tax Expense
| Recognised within the Consolidated Income Statement | 2015 | 2014 | 2013 | |||||||||
| €m | €m | €m | ||||||||||
| (a) Current tax |
||||||||||||
| Republic of Ireland |
- | - | (1) | |||||||||
| Overseas |
339 | 141 | 77 | |||||||||
| Total current tax expense |
339 | 141 | 76 | |||||||||
| (b) Deferred tax |
||||||||||||
| Origination and reversal of temporary differences: |
||||||||||||
| Retirement benefit obligations |
7 | 7 | 16 | |||||||||
| Share-based payment expense |
(8) | - | (1) | |||||||||
| Derivative financial instruments |
1 | 6 | 4 | |||||||||
| Other items |
(35) | 23 | (15) | |||||||||
| Total deferred tax (income)/expense |
(35) | 36 | 4 | |||||||||
| Income tax expense reported in the Consolidated Income Statement |
304 | 177 | 80 | |||||||||
| 184 |
Table of Contents
CRH Annual Report on Form 20-F | 2015
10. Income Tax Expense | continued
| Recognised within equity | 2015 | 2014 | 2013 | |||||||||
| €m | €m | €m | ||||||||||
| (a) Within the Consolidated Statement of Comprehensive Income: |
||||||||||||
| Deferred tax - retirement benefit obligations |
(30) | 69 | (43) | |||||||||
| (30) | 69 | (43) | ||||||||||
| (b) Within the Consolidated Statement of Changes in Equity: |
||||||||||||
| Deferred tax - share-based payment expense |
5 | - | - | |||||||||
| 5 | - | - | ||||||||||
| Income tax expense recognised directly within equity |
(25) | 69 | (43) | |||||||||
| Reconciliation of applicable tax rate to effective tax rate |
||||||||||||
| Profit/(loss) before tax (€m) |
1,033 | 761 | (215) | |||||||||
| Tax charge expressed as a percentage of profit/(loss) before tax (effective tax rate): |
||||||||||||
| - current tax expense only |
32.8% | 18.5% | (35.3%) | |||||||||
| - total income tax expense (current and deferred) |
29.4% | 23.2% | (37.2%) | |||||||||
| The following table reconciles the applicable Republic of Ireland statutory tax rate to the effective tax rate (current and deferred) of the Group: |
| |||||||||||
| % of profit/(loss) before tax | ||||||||||||
| Irish corporation tax rate |
12.5 | 12.5 | 12.5 | |||||||||
| Higher tax rates on overseas earnings |
13.8 | 9.6 | 17.8 | |||||||||
| Other items (primarily comprising items not chargeable to tax/expenses not deductible for tax) |
||||||||||||
| - arising from 2013 impairment |
- | - | (70.2) | |||||||||
| - other items |
3.1 | 1.1 | 2.7 | |||||||||
| Total effective tax rate |
29.4 | 23.2 | (37.2) | |||||||||
Other disclosures
Effective tax rate
The 2015 Consolidated Income Statement includes one-off charges related to the LH Assets transaction of €197 million (€144 million of acquisition-related costs as detailed in note 30 and a €53 million inventory-related adjustment) which are substantially non-deductible for income tax purposes. The 2015 effective tax rate excluding the impact of these costs is 25.8% .
Changes in tax rates
The total tax charge in future periods will be affected by any changes to the tax rates in force in the countries in which the Group operates.
Excess of capital allowances over depreciation
The current tax charge will also be impacted by changes in the excess of tax depreciation (capital allowances) over accounting depreciation. Based on current capital investment plans, the Group expects to continue to be in a position to claim capital allowances in excess of depreciation in future years.
Investments in subsidiaries
Given management’s intention not to unwind temporary differences in respect of its investment in subsidiaries or tax exemptions and credits being available in the majority of jurisdictions in which the Group operates, the aggregate amount of deferred tax liabilities on temporary differences which have not been recognised would be immaterial.
Proposed dividends
There are no income tax consequences for the Company in respect of dividends proposed prior to issuance of the Consolidated Financial Statements and for which a liability has not been recognised.
| 185 |
Table of Contents
CRH Annual Report on Form 20-F | 2015
11. Dividends
The dividends paid and proposed in respect of each class of share capital are as follows:
| 2015 | 2014 | 2013 | ||||||||||
| €m | €m | €m | ||||||||||
| Dividends to shareholders | ||||||||||||
| Preference | ||||||||||||
| 5% Cumulative Preference Shares €3,175 (2014: €3,175; 2013: €3,175) | - | - | - | |||||||||
| 7% ‘A’ Cumulative Preference Shares €77,521 (2014: €77,521; 2013: €77,521) | - | - | - | |||||||||
| Equity | ||||||||||||
| Final - paid 44.00c per Ordinary Share (2014: 44.00c; 2013: 44.00c) | 359 | 323 | 320 | |||||||||
| Interim - paid 18.50c per Ordinary Share (2014: 18.50c; 2013: 18.50c) | 152 | 137 | 135 | |||||||||
| Total | 511 | 460 | 455 | |||||||||
| Dividends proposed (memorandum disclosure) | ||||||||||||
| Equity | ||||||||||||
| Final 2015 - proposed 44.00c per Ordinary Share (2014: 44.00c; 2013: 44.00c) | 362 | 359 | 323 | |||||||||
| Reconciliation to Consolidated Statement of Cash Flows | ||||||||||||
| Dividends to shareholders | 511 | 460 | 455 | |||||||||
| Less: issue of scrip shares in lieu of cash dividends (note 28) | (132) | (107) | (88) | |||||||||
| Dividends paid to equity holders of the Company | 379 | 353 | 367 | |||||||||
| Dividends paid by subsidiaries to non-controlling interests | 4 | 4 | 1 | |||||||||
| Total dividends paid | 383 | 357 | 368 | |||||||||
| 186 |
Table of Contents
CRH Annual Report on Form 20-F | 2015
12. Earnings per Ordinary Share
The computation of basic and diluted earnings per Ordinary Share is set out below:
| 2015 | 2014 | 2013 | ||||||||||
| €m | €m | €m | ||||||||||
| Numerator computations | ||||||||||||
| Group profit/(loss) for the financial year | 729 | 584 | (295) | |||||||||
| Profit attributable to non-controlling interests | (5) | (2) | (1) | |||||||||
| Profit/(loss) attributable to equity holders of the Company | 724 | 582 | (296) | |||||||||
| Preference dividends | - | - | - | |||||||||
| Profit/(loss) attributable to ordinary equity holders of the Company -numerator for basic/diluted earnings per Ordinary Share | 724 | 582 | (296) | |||||||||
| Denominator computations | ||||||||||||
| Denominator for basic earnings per Ordinary Share | ||||||||||||
| Weighted average number of Ordinary Shares (millions) outstanding for the year (i) | 812.3 | 737.6 | 729.2 | |||||||||
| Effect of dilutive potential Ordinary Shares (employee share options) (millions) (i) and (ii) | 3.6 | 0.7 | - | |||||||||
| Denominator for diluted earnings per Ordinary Share | 815.9 | 738.3 | 729.2 | |||||||||
| Basic earnings/(loss) per Ordinary Share | 89.1c | 78.9c | (40.6c) | |||||||||
| Diluted earnings/(loss) per Ordinary Share | 88.7c | 78.8c | (40.6c) | |||||||||
| (i) | The weighted average number of Ordinary Shares included in the computation of basic and diluted earnings per Ordinary Share has been adjusted to exclude shares held by the Employee Benefit Trust and Ordinary Shares repurchased and held by the Company (CRH plc) as Treasury Shares given that these shares do not rank for dividend. The number of Ordinary Shares so held at the balance sheet date is detailed in note 28. |
| (ii) | Contingently issuable Ordinary Shares (totalling 8,630,786 at 31 December 2015, 19,062,236 at 31 December 2014 and 24,282,615 at 31 December 2013) are excluded from the computation of diluted earnings per Ordinary Share where the conditions governing exercisability have not been satisfied as at the end of the reporting period or they are antidilutive for the periods presented. |
| 187 |
Table of Contents
CRH Annual Report on Form 20-F | 2015
13. Property, Plant and Equipment
| Assets in | ||||||||||||||||
| Land and | Plant and | course of | ||||||||||||||
| buildings (i) | machinery | construction | Total | |||||||||||||
| €m | €m | €m | €m | |||||||||||||
| At 31 December 2015 | ||||||||||||||||
| Cost/deemed cost | 8,471 | 12,583 | 582 | 21,636 | ||||||||||||
| Accumulated depreciation (and impairment charges) | (2,075) | (6,496) | (3) | (8,574) | ||||||||||||
| Net carrying amount | 6,396 | 6,087 | 579 | 13,062 | ||||||||||||
| At 1 January 2015, net carrying amount | 4,176 | 3,026 | 220 | 7,422 | ||||||||||||
| Translation adjustment | 292 | 115 | 6 | 413 | ||||||||||||
| Reclassifications | 145 | 46 | (191) | - | ||||||||||||
| Additions at cost | 96 | 514 | 272 | 882 | ||||||||||||
| Arising on acquisition (note 30) | 1,999 | 3,138 | 276 | 5,413 | ||||||||||||
| Reclassified from held for sale | 173 | 88 | 1 | 262 | ||||||||||||
| Disposals at net carrying amount | (283) | (161) | (2) | (446) | ||||||||||||
| Depreciation charge for year | (175) | (665) | (3) | (843) | ||||||||||||
| Impairment charge for year (ii) | (27) | (14) | - | (41) | ||||||||||||
| At 31 December 2015, net carrying amount | 6,396 | 6,087 | 579 | 13,062 | ||||||||||||
| The equivalent disclosure for the prior year is as follows: | ||||||||||||||||
| At 31 December 2014 | ||||||||||||||||
| Cost/deemed cost | 6,068 | 8,940 | 220 | 15,228 | ||||||||||||
| Accumulated depreciation (and impairment charges) | (1,892) | (5,914) | - | (7,806) | ||||||||||||
| Net carrying amount | 4,176 | 3,026 | 220 | 7,422 | ||||||||||||
| At 1 January 2014, net carrying amount | 4,096 | 3,214 | 229 | 7,539 | ||||||||||||
| Translation adjustment | 329 | 64 | 1 | 394 | ||||||||||||
| Reclassifications | 66 | 34 | (100) | - | ||||||||||||
| Additions at cost | 45 | 264 | 126 | 435 | ||||||||||||
| Arising on acquisition (note 30) | 20 | 71 | - | 91 | ||||||||||||
| Reclassified as held for sale | (173) | (88) | (1) | (262) | ||||||||||||
| Disposals at net carrying amount | (68) | (27) | - | (95) | ||||||||||||
| Depreciation charge for year | (132) | (499) | - | (631) | ||||||||||||
| Impairment charge for year | (7) | (7) | (35) | (49) | ||||||||||||
| At 31 December 2014, net carrying amount | 4,176 | 3,026 | 220 | 7,422 | ||||||||||||
| At 1 January 2014 | ||||||||||||||||
| Cost/deemed cost | 5,912 | 8,847 | 229 | 14,988 | ||||||||||||
| Accumulated depreciation (and impairment charges) | (1,816) | (5,633) | - | (7,449) | ||||||||||||
| Net carrying amount | 4,096 | 3,214 | 229 | 7,539 | ||||||||||||
| (i) | The carrying value of mineral-bearing land included in the land and buildings category above amounted to €2,855 million at the balance sheet date (2014: €1,997 million). |
| (ii) | The impairment charge of €41 million in 2015 (2014: €49 million), principally relates to the write down of property, plant and equipment in Europe Heavyside and Americas Products of €24 million and €15 million respectively (2014: €35 million and €14 million respectively). |
| Future purchase commitments for property, plant and equipment | 2015 | 2014 | ||||||
| €m | €m | |||||||
| Contracted for but not provided in the financial statements | 311 | 211 | ||||||
| Authorised by the Directors but not contracted for | 118 | 70 | ||||||
| 188 |
Table of Contents
CRH Annual Report on Form 20-F | 2015
14. Intangible Assets
| Other intangible assets | ||||||||||||||||||||
| Marketing- | Customer- | Contract- | ||||||||||||||||||
| Goodwill | related | related (i) | based | Total | ||||||||||||||||
| €m | €m | €m | €m | €m | ||||||||||||||||
| At 31 December 2015 | ||||||||||||||||||||
| Cost/deemed cost | 7,699 | 137 | 639 | 85 | 8,560 | |||||||||||||||
| Accumulated amortisation (and impairment charges) | (293) | (46) | (375) | (26) | (740) | |||||||||||||||
| Net carrying amount | 7,406 | 91 | 264 | 59 | 7,820 | |||||||||||||||
| At 1 January 2015, net carrying amount | 4,018 | 12 | 126 | 17 | 4,173 | |||||||||||||||
| Translation adjustment | 247 | 3 | 11 | 2 | 263 | |||||||||||||||
| Arising on acquisition (note 30) | 3,187 | 84 | 167 | 47 | 3,485 | |||||||||||||||
| Reclassifications | - | (2) | 1 | 1 | - | |||||||||||||||
| Reclassified from held for sale | 16 | - | 1 | - | 17 | |||||||||||||||
| Disposals | (61) | - | - | (1) | (62) | |||||||||||||||
| Amortisation charge for year | - | (6) | (42) | (7) | (55) | |||||||||||||||
| Impairment charge for year | (1) | - | - | - | (1) | |||||||||||||||
| At 31 December 2015, net carrying amount | 7,406 | 91 | 264 | 59 | 7,820 | |||||||||||||||
| The equivalent disclosure for the prior year is as follows: | ||||||||||||||||||||
| At 31 December 2014 | ||||||||||||||||||||
| Cost/deemed cost | 4,362 | 52 | 448 | 37 | 4,899 | |||||||||||||||
| Accumulated amortisation (and impairment charges) | (344) | (40) | (322) | (20) | (726) | |||||||||||||||
| Net carrying amount | 4,018 | 12 | 126 | 17 | 4,173 | |||||||||||||||
| At 1 January 2014, net carrying amount | 3,734 | 12 | 151 | 14 | 3,911 | |||||||||||||||
| Translation adjustment | 279 | 3 | 6 | 1 | 289 | |||||||||||||||
| Arising on acquisition (note 30) | 31 | 2 | 10 | 4 | 47 | |||||||||||||||
| Reclassified as held for sale | (16) | - | (1) | - | (17) | |||||||||||||||
| Disposals | (10) | (1) | (2) | - | (13) | |||||||||||||||
| Amortisation charge for year | - | (4) | (38) | (2) | (44) | |||||||||||||||
| At 31 December 2014, net carrying amount | 4,018 | 12 | 126 | 17 | 4,173 | |||||||||||||||
| At 1 January 2014 | ||||||||||||||||||||
| Cost/deemed cost | 4,158 | 48 | 420 | 31 | 4,657 | |||||||||||||||
| Accumulated amortisation (and impairment charges) | (424) | (36) | (269) | (17) | (746) | |||||||||||||||
| Net carrying amount | 3,734 | 12 | 151 | 14 | 3,911 | |||||||||||||||
| (i) | The customer-related intangible assets relate predominantly to non-contractual customer relationships. |
| 189 |
Table of Contents
CRH Annual Report on Form 20-F | 2015
14. Intangible Assets | continued
(a) Annual goodwill testing
The net book value of goodwill capitalised under previous GAAP (Irish GAAP) as at the transition date to IFRS (1 January 2004) has been treated as deemed cost. Goodwill arising on acquisition since that date is capitalised at cost.
Cash-generating units
Goodwill acquired through business combination activity has been allocated to cash-generating units (CGUs) that are expected to benefit from synergies in that combination. The cash-generating units represent the lowest level within the Group at which the associated goodwill is monitored for internal management purposes, and are not larger than the operating segments determined in accordance with IFRS 8 Operating Segments. A total of 21 (2014: 20) cash-generating units have been identified and these are analysed between the six business segments below, excluding the newly acquired LH Assets and CRL. Given the size and timing of these acquisitions in the second half of 2015, the related goodwill has not yet been allocated to CGUs; the allocation will be completed during 2016. The increase in the number of CGUs in 2015 relates to a reorganisation in the Americas Materials segment. All businesses within the various cash-generating units exhibit similar and/or consistent profit margin and asset intensity characteristics. Assets, liabilities, deferred tax and goodwill have been assigned to the CGUs on a reasonable and consistent basis.
Significant under-performance in any of CRH’s major cash-generating units may give rise to a material write-down of goodwill which would have a substantial impact on the Group’s income and equity.
| Cash-generating units | Goodwill (€m) | |||||||||||||||
| 2015 | 2014 | 2015 | 2014 | |||||||||||||
| Europe Heavyside* | 8 | 8 | 648 | 650 | ||||||||||||
| Europe Lightside* | 1 | 1 | 347 | 346 | ||||||||||||
| Europe Distribution | 1 | 1 | 662 | 649 | ||||||||||||
| Europe | 10 | 10 | 1,657 | 1,645 | ||||||||||||
| Americas Materials | 8 | 7 | 1,484 | 1,313 | ||||||||||||
| Americas Products | 2 | 2 | 758 | 703 | ||||||||||||
| Americas Distribution | 1 | 1 | 398 | 357 | ||||||||||||
| Americas | 11 | 10 | 2,640 | 2,373 | ||||||||||||
| Unallocated Goodwill | ||||||||||||||||
| LH Assets | - | - | 2,252 | - | ||||||||||||
| CRL | - | - | 857 | - | ||||||||||||
| Total Group | 21 | 20 | 7,406 | 4,018 | ||||||||||||
| * | Included in the goodwill numbers of Europe Heavyside and Europe Lightside at 31 December 2015 are amounts of €52 million and €8 million respectively (2014: €54 million and €9 million respectively) relating to businesses identified for divestment as part of the portfolio review, which have been tested separately (see section (b) on page 192). |
| 190 |
Table of Contents
CRH Annual Report on Form 20-F | 2015
14. Intangible Assets | continued
Impairment testing methodology and results
Goodwill is subject to impairment testing on an annual basis. The recoverable amount of each of the 21 CGUs is determined based on a value-in-use computation, using Level 3 inputs in accordance with the fair value hierarchy (as described in the “fair value hierarchy” section of the accounting policies on page 169). The cash flow forecasts are primarily based on a five-year strategic plan document formally approved by senior management and the Board of Directors and specifically exclude the impact of future development activity. These cash flows are projected forward for an additional five years to determine the basis for an annuity-based terminal value, calculated on the same basis as the Group’s acquisition modelling methodology. As in prior years, the terminal value is based on a 20-year annuity. The projected cash flows assume zero growth in real cash flows beyond the initial evaluation period. The value-in-use represents the present value of the future cash flows, including the terminal value, discounted at a rate appropriate to each CGU. The real pre-tax discount rates used range from 7.0% to 11.7% (2014: 7.5% to 12.2%); these rates are in line with the Group’s estimated weighted average cost of capital, arrived at using the Capital Asset Pricing Model.
The 2015 and 2014 annual goodwill impairment testing processes have resulted in no intangible asset impairments.
Key sources of estimation uncertainty
The cash flows have been arrived at taking account of the Group’s strong financial position, its established history of earnings and cash flow generation and the nature of the building materials industry, where product obsolescence is very low. However, expected future cash flows are inherently uncertain and are therefore liable to material change over time. The key assumptions employed in arriving at the estimates of future cash flows factored into impairment testing are subjective and include projected EBITDA (as defined)* margins, net cash flows, discount rates used and the duration of the discounted cash flow model.
Significant goodwill amounts
The goodwill allocated to the Europe Distribution and the Oldcastle Building Products (Americas Products segment) CGUs each account for approximately 10% of the total carrying amount of €7,406 million. The goodwill allocated to each of the remaining CGUs is less than 10% of the total carrying value in all other cases, except for the goodwill arising on the acquisitions of LH Assets and CRL which account for 30% and 12% of the total carrying amount of goodwill respectively. No additional disclosures are presented for the acquired goodwill as the initial allocation of the goodwill to CGUs has not been completed and therefore the goodwill has been assessed for impairment indicators as at 31 December 2015. The additional disclosures required for the two CGUs with significant goodwill are as follows:
| Europe Distribution | Oldcastle | |||||||||||||||
| Building Products | ||||||||||||||||
| 2015 | 2014 | 2015 | 2014 | |||||||||||||
| Goodwill allocated to the cash-generating unit at balance sheet date | €662m | €649m | €756m | €699m | ||||||||||||
| Discount rate applied to the cash flow projections (real pre-tax) | 9.0% | 9.4% | 11.7% | 11.9% | ||||||||||||
| Average EBITDA (as defined)* margin over the initial 5-year period | 6.1% | 5.9% | 12.0% | 11.0% | ||||||||||||
| Value-in-use (present value of future cash flows) | €2,153m | €2,015m | €2,726m | €2,588m | ||||||||||||
| Excess of value-in-use over carrying amount | €472m | €336m | €566m | €509m | ||||||||||||
The key assumptions and methodology used in respect of these two CGUs are consistent with those described above. The values applied to each of the key estimates and assumptions are specific to the individual CGUs and were derived from a combination of internal and external factors based on historical experience and took into account the cash flows specifically associated with these businesses. The cash flows and 20-year annuity-based terminal value were projected in line with the methodology disclosed above.
Europe Distribution and Oldcastle Building Products are not included in the CGUs referred to in the “Sensitivity analysis” section on page 192. Given the magnitude of the excess of value-in-use over carrying amount, and our belief that the key assumptions are reasonable, management believe that it is not reasonably possible that there would be a change in the key assumptions such that the carrying amount would exceed the value-in-use. Consequently no further disclosures relating to sensitivity of the value-in-use computations for the Europe Distribution or Oldcastle Building Products CGUs are considered to be warranted.
| * | EBITDA is defined as earnings before interest, taxes, depreciation, amortisation, asset impairment charges, profit on disposals and the Group’s share of equity accounted investments’ result after tax. |
| 191 |
Table of Contents
CRH Annual Report on Form 20-F | 2015
14. Intangible Assets | continued
Sensitivity analysis
Sensitivity analysis has been performed and results in additional disclosures in respect of 4 of the 21 CGUs including the Ukraine. The key assumptions, methodology used and values applied to each of the key assumptions for the 4 CGUs are in line with those outlined above. The 4 CGUs had aggregate goodwill of €216 million at the date of testing. The table below identifies the amounts by which each of the following assumptions may either decline or increase to arrive at a zero excess of the present value of future cash flows over the book value of net assets in the 4 CGUs selected for sensitivity analysis disclosures:
| 4 CGUs | ||||
| Reduction in EBITDA (as defined)* margin | 0.6 to 3.6 percentage points | |||
| Reduction in profit before tax | 9.1% to 16.2% | |||
| Reduction in net cash flow | 8.0% to 17.1% | |||
| Increase in pre-tax discount rate | 0.8 to 1.8 percentage points | |||
The average EBITDA (as defined)* margin for the aggregate of these 4 CGUs over the initial five-year period was 11.1% . The value-in-use (being the present value of the future net cash flows) was €1,024 million and the carrying amount was €895 million, resulting in an excess of value-in-use over carrying amount of €129 million.
(b) Portfolio review update
In November 2013, a Group-wide portfolio review was initiated to identify and focus on those businesses within our portfolio which offer the most attractive future returns, and to prioritise capital allocation to ensure profitable growth across our network of businesses. This review was completed during 2014 and a multi-year divestment programme is well under way with proceeds of €1.4 billion realised on business and non-current asset disposals in 2015 and 2014 (see note 4).
The decision to sell these business units resulted in the need to assess them for impairment, either individually or on a combined basis where they form a new group for disposal purposes. Excluding business units divested during 2014 and 2015, the remainder were assessed for impairment or reversal of previous impairments and also assessed from the perspective of the held for sale criteria set out in IFRS 5 Non-Current Assets Held for Sale and Discontinued Operations.
A valuation was prepared based on the estimated fair value less costs of disposal (FVLCD) for each business unit. The valuations were then compared to the carrying value of each business and where that valuation fell below the carrying value an impairment charge was taken.
Impairments of €33 million (€1 million relating to goodwill) were recorded during the year in the Europe Heavyside and Americas Products segments. No reversal of previous impairments were recorded during the year.
| * | EBITDA is defined as earnings before interest, taxes, depreciation, amortisation, asset impairment charges, profit on disposals and the Group’s share of equity accounted investments’ result after tax |
| 192 |
Table of Contents
CRH Annual Report on Form 20-F | 2015
15. Financial Assets
| Investments accounted for | ||||||||||||||||
| using the equity method | ||||||||||||||||
| (i.e. joint ventures and associates) | ||||||||||||||||
| Share of net | ||||||||||||||||
| assets | Loans | Total | Other (i) | |||||||||||||
| €m | €m | €m | €m | |||||||||||||
| At 1 January 2015 | 1,193 | 136 | 1,329 | 23 | ||||||||||||
| Translation adjustment | 103 | 14 | 117 | 1 | ||||||||||||
| Investments and advances | 7 | 11 | 18 | 1 | ||||||||||||
| Joint Ventures becoming subsidiaries (note 30) | (25) | - | (25) | - | ||||||||||||
| Reclassified from held for sale | 34 | - | 34 | - | ||||||||||||
| Disposals and repayments | (159) | (6) | (165) | - | ||||||||||||
| Return of Share Capital | (6) | - | (6) | - | ||||||||||||
| Arising on acquisition (note 30) | 23 | 1 | 24 | 5 | ||||||||||||
| Impairment charge for year | - | - | - | (2) | ||||||||||||
| Retained loss | (9) | - | (9) | - | ||||||||||||
| At 31 December 2015 | 1,161 | 156 | 1,317 | 28 | ||||||||||||
| The equivalent disclosure for the prior year is as follows: | ||||||||||||||||
| At 1 January 2014 | 1,211 | 129 | 1,340 | 23 | ||||||||||||
| Translation adjustment | 73 | 14 | 87 | - | ||||||||||||
| Investments and advances | - | 3 | 3 | - | ||||||||||||
| Reclassified as held for sale | (34) | - | (34) | - | ||||||||||||
| Disposals and repayments | (82) | (10) | (92) | - | ||||||||||||
| Retained profit | 25 | - | 25 | - | ||||||||||||
| At 31 December 2014 | 1,193 | 136 | 1,329 | 23 | ||||||||||||
| (i) | Other financial assets primarily comprise trade investments carried at historical cost. |
Summarised financial information for the Group’s investment in joint ventures and associates which are accounted for using the equity method is as follows:
| Joint Ventures | Associates | Total | ||||||||||||||||||||||
| 2015 | 2014 | 2015 | 2014 | 2015 | 2014 | |||||||||||||||||||
| €m | €m | €m | €m | €m | €m | |||||||||||||||||||
| Non-current assets | 696 | 548 | 880 | 955 | 1,576 | 1,503 | ||||||||||||||||||
| Current assets | 173 | 121 | 444 | 538 | 617 | 659 | ||||||||||||||||||
| Non-current liabilities | (194) | (161) | (140) | (209) | (334) | (370) | ||||||||||||||||||
| Current liabilities | (187) | (73) | (511) | (526) | (698) | (599) | ||||||||||||||||||
| Net assets | 488 | 435 | 673 | 758 | 1,161 | 1,193 | ||||||||||||||||||
A listing of the principal equity accounted investments is contained in Exhibit 8 of this Annual Report on Form 20F.
The Group holds a 21.13% stake (2014: 21.13%) in Samse S.A., a publicly-listed distributor in France which is accounted for as an associate investment above. The fair value of this investment at the balance sheet date, calculated based on the number of shares held multiplied by the closing share price at 31 December 2015 (Level 1 input in the fair value hierarchy), was €82 million (2014: €75 million).
| 193 |
Table of Contents
CRH Annual Report on Form 20-F | 2015
16. Inventories
| 2015 | 2014 | |||||||
| €m | €m | |||||||
| Raw materials | 836 | 612 | ||||||
| Work-in-progress (i) | 106 | 80 | ||||||
| Finished goods | 1,931 | 1,568 | ||||||
| Total inventories at the lower of cost and net realisable value | 2,873 | 2,260 | ||||||
| (i) | Work-in-progress includes €9 million (2014: €8 million) in respect of the cumulative costs incurred, net of amounts transferred to cost of sales under percentage-of-completion accounting, for construction contracts in progress at the balance sheet date. |
An analysis of the Group’s cost of sales expense is provided in note 2 to the financial statements.
Write-downs of inventories recognised as an expense within cost of sales amounted to €12 million (2014: €29 million; 2013: €19 million).
17. Trade and Other Receivables
| 2015 | 2014 | |||||
| €m | €m | |||||
| Current | ||||||
| Trade receivables | 2,752 | 1,810 | ||||
| Amounts receivable in respect of construction contracts (i) | 720 | 476 | ||||
| Total trade receivables, gross | 3,472 | 2,286 | ||||
| Provision for impairment | (161) | (106) | ||||
| Total trade receivables, net | 3,311 | 2,180 | ||||
| Amounts receivable from equity accounted investments | 11 | 6 | ||||
| Prepayments and other receivables | 655 | 458 | ||||
| Total | 3,977 | 2,644 | ||||
| Non-current | ||||||
| Other receivables | 149 | 85 | ||||
The carrying amounts of current and non-current trade and other receivables approximate their fair value largely due to the short-term maturities and nature of these instruments.
| (i) | Includes unbilled revenue and retentions held by customers in respect of construction contracts at the balance sheet date amounting to €155 million and €145 million respectively (2014: €119 million and €82 million respectively). |
| 194 |
Table of Contents
CRH Annual Report on Form 20-F | 2015
17. Trade and Other Receivables | continued
Valuation and qualifying accounts (provision for impairment)
The movements in the provision for impairment of receivables during the financial year were as follows:
| 2015 | 2014 | 2013 | ||||||||||
| €m | €m | €m | ||||||||||
| At 1 January | 106 | 118 | 123 | |||||||||
| Translation adjustment | 5 | 4 | (2) | |||||||||
| Provided during year | 40 | 28 | 36 | |||||||||
| Reclassified from/(as) held for sale | 2 | (2) | - | |||||||||
| Disposed of during year | (4) | - | - | |||||||||
| Written-off during year | (36) | (36) | (33) | |||||||||
| Arising on acquisitions during year (note 30) | 55 | - | - | |||||||||
| Recovered during year | (7) | (6) | (6) | |||||||||
| At 31 December | 161 | 106 | 118 | |||||||||
Information in relation to the Group’s credit risk management is provided in note 21 to the financial statements.
Aged analysis
The aged analysis of trade receivables and amounts receivable in respect of construction contracts at the balance sheet date was as follows:
| 2015 | 2014 | |||||||
| €m | €m | |||||||
| Neither past due nor impaired | 2,385 | 1,638 | ||||||
| Past due but not impaired: | ||||||||
| - less than 60 days | 608 | 373 | ||||||
| - 60 days or greater but less than 120 days | 211 | 117 | ||||||
| - 120 days or greater | 107 | 45 | ||||||
| Past due and impaired (partial or full provision) | 161 | 113 | ||||||
| Total | 3,472 | 2,286 | ||||||
Trade receivables and amounts receivable in respect of construction contracts are in general receivable within 90 days of the balance sheet date.
| 195 |
Table of Contents
CRH Annual Report on Form 20-F | 2015
18. Trade and Other Payables
| 2015 | 2014 | |||||||
| €m | €m | |||||||
| Current | ||||||||
| Trade payables | 2,521 | 1,506 | ||||||
| Construction contract-related payables (i) | 240 | 129 | ||||||
| Deferred and contingent acquisition consideration (ii) | 46 | 59 | ||||||
| Accruals and other payables | 1,911 | 1,148 | ||||||
| Amounts payable to equity accounted investments | 43 | 52 | ||||||
| Total | 4,761 | 2,894 | ||||||
| Non-current | ||||||||
| Other payables | 168 | 109 | ||||||
| Deferred and contingent acquisition consideration (ii) | 242 | 148 | ||||||
| Total | 410 | 257 | ||||||
| (i) | Construction contract-related payables include billings in excess of revenue, together with advances received from customers in respect of work to be performed under construction contracts and foreseeable losses thereon. |
| Other than deferred and contingent consideration, the carrying amounts of trade and other payables approximate their fair value largely due to the short-term maturities and nature of these instruments. |
| (ii) | Deferred and contingent acquisition consideration: |
| The fair value of total contingent consideration is €111 million (2014: €122 million), (Level 3 input in the fair value hierarchy) and deferred consideration is €177 million (2014: €85 million). On an undiscounted basis, the corresponding basis for which the Group may be liable for contingent consideration ranges from nil to a maximum of €117 million. The movement in deferred and contingent consideration during the financial year was as follows: |
| 2015 | 2014 | |||||||
| €m | €m | |||||||
| At 1 January | 207 | 208 | ||||||
| Translation adjustment | 21 | 16 | ||||||
| Arising on acquisitions and investments during the year (note 30) | 97 | 3 | ||||||
| Changes in estimate | 2 | (6) | ||||||
| Paid during the year | (59) | (26) | ||||||
| Discount unwinding | 20 | 12 | ||||||
| At 31 December | 288 | 207 | ||||||
| 196 |
Table of Contents
CRH Annual Report on Form 20-F | 2015
19. Movement in Working Capital and Provisions for Liabilities
| Trade and | Trade and | |||||||||||||||||||
| other | other | Provisions | ||||||||||||||||||
| Inventories | receivables | payables | for liabilities | Total | ||||||||||||||||
| €m | €m | €m | €m | €m | ||||||||||||||||
| At 1 January 2015 | 2,260 | 2,729 | (3,151) | (396) | 1,442 | |||||||||||||||
| Translation adjustment | 130 | 147 | (151) | (5) | 121 | |||||||||||||||
| Arising on acquisition (note 30) | 621 | 1,533 | (1,549) | (581) | 24 | |||||||||||||||
| Reclassified from held for sale | 102 | 79 | (98) | (7) | 76 | |||||||||||||||
| Disposals | (211) | (178) | 137 | 6 | (246) | |||||||||||||||
| Deferred and contingent acquisition consideration: | ||||||||||||||||||||
| - arising on acquisitions during year (note 30) | - | - | (97) | - | (97) | |||||||||||||||
| - paid during year | - | - | 59 | - | 59 | |||||||||||||||
| Deferred proceeds arising on disposals during year | - | 38 | - | - | 38 | |||||||||||||||
| Interest accruals and discount unwinding | - | - | (20) | (19) | (39) | |||||||||||||||
| Decrease in working capital and provisions for liabilities | (29) | (222) | (301) | (33) | (585) | |||||||||||||||
| At 31 December 2015 | 2,873 | 4,126 | (5,171) | (1,035) | 793 | |||||||||||||||
| The equivalent disclosure for the prior years is as follows: | ||||||||||||||||||||
| At 1 January 2014 | 2,254 | 2,609 | (3,043) | (380) | 1,440 | |||||||||||||||
| Translation adjustment | 128 | 165 | (173) | (27) | 93 | |||||||||||||||
| Arising on acquisition (note 30) | 23 | 20 | (17) | (1) | 25 | |||||||||||||||
| Reclassified as held for sale | (102) | (79) | 98 | 7 | (76) | |||||||||||||||
| Disposals | (9) | (4) | 2 | - | (11) | |||||||||||||||
| Deferred and contingent acquisition consideration: | ||||||||||||||||||||
| - arising on acquisitions during year (note 30) | - | - | (3) | - | (3) | |||||||||||||||
| - paid during year | - | - | 26 | - | 26 | |||||||||||||||
| Interest accruals and discount unwinding | - | - | (1) | (16) | (17) | |||||||||||||||
| Decrease/(increase) in working capital and provisions for liabilities | (34) | 18 | (40) | 21 | (35) | |||||||||||||||
| At 31 December 2014 | 2,260 | 2,729 | (3,151) | (396) | 1,442 | |||||||||||||||
| At 1 January 2013 | 2,333 | 2,603 | (3,052) | (366) | 1,518 | |||||||||||||||
| Translation adjustment | (74) | (80) | 91 | 9 | (54) | |||||||||||||||
| Arising on acquisition (note 30) | 41 | 53 | (80) | (14) | - | |||||||||||||||
| Disposals | (9) | (4) | 7 | - | (6) | |||||||||||||||
| Deferred and contingent acquisition consideration: | ||||||||||||||||||||
| - arising on acquisitions during year (note 30) | - | - | (17) | - | (17) | |||||||||||||||
| - paid during year | - | - | 105 | - | 105 | |||||||||||||||
| Interest accruals and discount unwinding | - | - | (14) | (15) | (29) | |||||||||||||||
| Decrease/(increase) in working capital and provisions for liabilities | (37) | 37 | (83) | 6 | (77) | |||||||||||||||
| At 31 December 2013 | 2,254 | 2,609 | (3,043) | (380) | 1,440 | |||||||||||||||
| 197 |
Table of Contents
CRH Annual Report on Form 20-F | 2015
20. Analysis of Net Debt
Components of net debt
Net debt is a non-GAAP measure which we provide to investors as we believe they find it useful. Net debt comprises cash and cash equivalents, derivative financial instrument assets and liabilities and interest-bearing loans and borrowings and enables investors to see the economic effects of these in total (see note 21 for details of the capital and risk management policies employed by the Group). Net debt is commonly used in computations such as net debt as a % of total equity and net debt as a % of market capitalisation.
| As at 31 December 2015 | As at 31 December 2014 | |||||||||||||||||||||||
| Fair value (i) €m |
Book value €m |
Fair value (i) €m |
Book value €m |
|||||||||||||||||||||
| Cash and cash equivalents (note 22) | 2,518 | 2,518 | 3,295 | 3,295 | ||||||||||||||||||||
| Interest-bearing loans and borrowings (note 23) | (9,526) | (9,221) | (6,302) | (5,866) | ||||||||||||||||||||
| Derivative financial instruments (net) (note 24) | 85 | 85 | 79 | 79 | ||||||||||||||||||||
| Group net debt | (6,923) | (6,618) | (2,928) | (2,492) | ||||||||||||||||||||
| (i) All interest-bearing loans and borrowings are Level 2 fair value measurements. |
| |||||||||||||||||||||||
| The following table shows the effective interest rates on period-end fixed, gross and net debt: |
||||||||||||||||||||||||
| As at 31 December 2015 | As at 31 December 2014 | |||||||||||||||||||||||
| €m | Interest rate |
Weighted average fixed period Years |
€m | Interest rate |
Weighted average fixed period Years |
|||||||||||||||||||
| Interest-bearing loans and borrowings nominal - fixed rate (i) | (7,431) | (5,657) | ||||||||||||||||||||||
| Derivative financial instruments - fixed rate | 2,270 | 1,227 | ||||||||||||||||||||||
| Net fixed rate debt including derivatives | (5,161) | 4.0% | 9.4 | (4,430) | 4.5% | 5.2 | ||||||||||||||||||
| Interest-bearing loans and borrowings nominal - floating rate (ii) | (1,668) | (63) | ||||||||||||||||||||||
| Adjustment of debt from nominal to book value (i) | (122) | (146) | ||||||||||||||||||||||
| Derivative financial instruments - currency floating rate | (2,185) | (1,148) | ||||||||||||||||||||||
| Gross debt including derivative financial instruments | (9,136) | 3.3% | (5,787) | 4.1% | ||||||||||||||||||||
| Cash and cash equivalents - floating rate | 2,518 | 3,295 | ||||||||||||||||||||||
| Group net debt | (6,618) | (2,492) | ||||||||||||||||||||||
| Cash at bank and in hand reclassified as held for sale (note 22) | - | (33) | ||||||||||||||||||||||
| Group net debt excluding cash reclassified as held for sale | (6,618) | (2,525) | ||||||||||||||||||||||
| (i) | Of the Group’s nominal fixed rate debt at 31 December 2015, €2,270 million (2014: €1,227 million) is hedged to floating rate using interest rate swaps. |
| (ii) | Floating rate debt comprises bank borrowings and finance leases bearing interest at rates set in advance for periods ranging from overnight to less than one year largely by reference to inter-bank interest rates. |
Reconciliation of opening to closing net debt
| 2015 €m |
2014 €m |
2013 €m |
||||||||||
| At 1 January | (2,492) | (2,973) | (2,909) | |||||||||
| Debt in acquired companies | (175) | (7) | (44) | |||||||||
| Debt in disposed companies | 20 | - | 17 | |||||||||
| Increase in interest-bearing loans, borrowings and finance leases | (5,633) | (901) | (1,491) | |||||||||
| Net cash flow arising from derivative financial instruments | (47) | 11 | (64) | |||||||||
| Repayment of interest-bearing loans, borrowings and finance leases | 2,744 | 934 | 586 | |||||||||
| (Decrease)/increase in cash and cash equivalents | (897) | 625 | 845 | |||||||||
| Mark-to-market adjustment | (1) | (3) | 10 | |||||||||
| Translation adjustment | (137) | (178) | 77 | |||||||||
| At 31 December | (6,618) | (2,492) | (2,973) | |||||||||
| 198 |
Table of Contents
CRH Annual Report on Form 20-F | 2015
20. Analysis of Net Debt | continued
Currency profile
The currency profile of the Group’s net debt and net worth (capital and reserves attributable to the Company’s equity holders) as at 31 December 2015 and 31 December 2014 is as follows:
| euro €m |
US Dollar €m |
Pound Sterling €m |
Canadian €m |
Philippine Peso €m |
Polish Zloty €m |
Swiss Franc €m |
Other (i) €m |
Total €m |
||||||||||||||||||||||||||||
| Cash and cash equivalents (note 22) | 1,062 | 791 | 99 | 131 | 10 | 120 | 182 | 123 | 2,518 | |||||||||||||||||||||||||||
| Interest-bearing loans and borrowings (note 23) | (4,533) | (3,503) | (540) | (29) | (226) | (64) | (304) | (22) | (9,221) | |||||||||||||||||||||||||||
| Derivative financial instruments (net) (note 24) | 2,449 | (918) | (413) | (536) | - | (50) | (232) | (215) | 85 | |||||||||||||||||||||||||||
| Net debt by major currency including derivative financial instruments | (1,022) | (3,630) | (854) | (434) | (216) | 6 | (354) | (114) | (6,618) | |||||||||||||||||||||||||||
| Non-debt assets and liabilities analysed as follows: | ||||||||||||||||||||||||||||||||||||
| Non-current assets | 4,487 | 9,111 | 2,845 | 1,403 | 1,459 | 365 | 821 | 2,034 | 22,525 | |||||||||||||||||||||||||||
| Current assets | 1,855 | 2,934 | 818 | 393 | 121 | 158 | 331 | 245 | 6,855 | |||||||||||||||||||||||||||
| Non-current liabilities | (643) | (1,837) | (254) | (228) | (193) | (8) | (377) | (84) | (3,624) | |||||||||||||||||||||||||||
| Current liabilities | (1,547) | (1,956) | (1,091) | (272) | (150) | (121) | (200) | (257) | (5,594) | |||||||||||||||||||||||||||
| Non-controlling interests | (39) | (12) | - | - | (467) | 2 | (13) | - | (529) | |||||||||||||||||||||||||||
| Capital and reserves attributable to the Company’s equity holders | 3,091 | 4,610 | 1,464 | 862 | 554 | 402 | 208 | 1,824 | 13,015 | |||||||||||||||||||||||||||
| The equivalent disclosure for the prior year is as follows: |
||||||||||||||||||||||||||||||||||||
| Cash and cash equivalents (note 22) | 1,776 | 1,092 | 68 | 7 | - | 43 | 212 | 64 | 3,262 | |||||||||||||||||||||||||||
| Interest-bearing loans and borrowings (note 23) | (2,648) | (2,573) | (310) | (1) | - | (24) | (274) | (36) | (5,866) | |||||||||||||||||||||||||||
| Derivative financial instruments (net) (note 24) | 1 | 364 | 174 | (109) | - | (112) | (188) | (51) | 79 | |||||||||||||||||||||||||||
| Net debt* by major currency including derivative financial instruments | (871) | (1,117) | (68) | (103) | - | (93) | (250) | (23) | (2,525) | |||||||||||||||||||||||||||
| Non-debt assets (including cash reclassified as held for sale) and liabilities analysed as follows: | ||||||||||||||||||||||||||||||||||||
| Non-current assets | 3,061 | 7,003 | 346 | 221 | - | 395 | 778 | 1,399 | 13,203 | |||||||||||||||||||||||||||
| Current assets | 1,611 | 2,558 | 489 | 113 | - | 171 | 326 | 182 | 5,450 | |||||||||||||||||||||||||||
| Non-current liabilities | (616) | (1,481) | (92) | (9) | - | (35) | (270) | (27) | (2,530) | |||||||||||||||||||||||||||
| Current liabilities | (1,117) | (1,436) | (368) | (65) | - | (88) | (191) | (135) | (3,400) | |||||||||||||||||||||||||||
| Non-controlling interests | (5) | (4) | - | - | - | - | (12) | - | (21) | |||||||||||||||||||||||||||
| Capital and reserves attributable to the Company’s equity holders | 2,063 | 5,523 | 307 | 157 | - | 350 | 381 | 1,396 | 10,177 | |||||||||||||||||||||||||||
| (i) | The principal currencies included in this category are the Chinese Renminbi, the Romanian new leu, the Indian Rupee, the Ukrainian Hryvnia and the Serbian Dinar. |
* Excluding €33 million cash reclassified as held for sale which is analysed by major currency in current assets above.
| 199 |
Table of Contents
CRH Annual Report on Form 20-F | 2015
20. Analysis of Net Debt | continued
Liquidity and capital resources
The following table provides certain information related to our cash generation and changes in our cash and cash equivalents position:
| 2015 €m |
2014 €m |
2013 €m |
||||||||||
| Net cash inflow from operating activities | 2,247 | 1,237 | 1,092 | |||||||||
| Net cash outflow from investing activities | (7,306) | (232) | (848) | |||||||||
| Net cash inflow/(outflow) from financing activities | 4,162 | (380) | 601 | |||||||||
| (Decrease)/increase in cash and cash equivalents | (897) | 625 | 845 | |||||||||
| Cash and cash equivalents at the beginning of year, excluding overdrafts (note 22) | 3,295 | 2,540 | 1,747 | |||||||||
| Effect of exchange rate changes | 120 | 130 | (52) | |||||||||
| Cash and cash equivalents at the end of year, excluding overdrafts (note 22) | 2,518 | 3,295 | 2,540 | |||||||||
| Bank overdrafts | (117) | (70) | (40) | |||||||||
| Borrowings | (9,104) | (5,796) | (5,500) | |||||||||
| Derivative financial instruments | 85 | 79 | 27 | |||||||||
| Net debt at end of year | (6,618) | (2,492) | (2,973) | |||||||||
The Group’s financing strategy includes maintenance of adequate financial resources and liquidity. During 2015 the Group’s total net cash outflow from investing activities amounted to €7.3 billion which was funded by €2.2 billion of operating cash flow, €4.2 billion of net financing and a €0.9 billion reduction in cash and cash equivalents.
The Group believes that its financial resources (operating cash together with cash and cash equivalents of €2.5 billion and undrawn committed loan facilities of €3.1 billion) will be sufficient to cover the Group’s cash requirements.
At 31 December 2015, euro and US Dollar denominated cash and cash equivalents represented 42% (2014: 54%) and 31% (2014: 33%) of total cash and cash equivalents respectively.
Significant borrowings
The main sources of Group debt funding are public bond markets in Europe and North America. The following bonds were outstanding as at 31 December 2015:
| Annual coupons |
Outstanding millions |
Final maturity |
||||||||||
| US Dollar bonds | 4.125% | $114 | 2016 | |||||||||
| US Dollar bonds | 6.00% | $518 | 2016 | |||||||||
| US Dollar bonds | 8.125% | $650 | 2018 | |||||||||
| euro bonds | 5.00% | €500 | 2019 | |||||||||
| euro bonds | 2.75% | €750 | 2020 | |||||||||
| US Dollar bonds | 5.75% | $400 | 2021 | |||||||||
| euro bonds | 1.75% | €600 | 2021 | |||||||||
| Swiss Franc bonds | 1.375% | CHF 330 | 2022 | |||||||||
| euro bonds | 3.125% | €750 | 2023 | |||||||||
| euro bonds | 1.875% | €600 | 2024 | |||||||||
| US Dollar bonds | 3.875% | $1,250 | 2025 | |||||||||
| Sterling bonds | 4.125% | £400 | 2029 | |||||||||
| US Dollar bonds | 6.40% | $213 | 2033 | |||||||||
| US Dollar bonds | 5.125% | $500 | 2045 | |||||||||
| 200 |
Table of Contents
CRH Annual Report on Form 20-F | 2015
21. Capital and Financial Risk Management
Capital management
Overall summary
The primary objectives of CRH’s capital management strategy are to ensure that the Group maintains a strong credit rating to support its business and to create shareholder value by managing the debt and equity balance and the cost of capital. No changes were made in the objectives, policies or processes for managing capital during 2015.
The Board periodically reviews the capital structure of the Group, including the cost of capital and the risks associated with each class of capital. The Group manages and, if necessary, adjusts its capital structure taking account of underlying economic conditions; any material adjustments to the Group’s capital structure in terms of the relative proportions of debt and equity are approved by the Board. In order to maintain or adjust the capital structure, the Group may issue new shares, dispose of assets, amend investment plans, alter dividend policy or return capital to shareholders.
The Group is committed to optimising the use of its balance sheet within the confines of the overall objective to maintain an investment grade credit rating.
The capital structure of the Group, which comprises net debt and capital and reserves attributable to the Company’s equity holders, may be summarised as follows:
| 2015 €m |
|
2014 €m |
||||||||
| Capital and reserves attributable to the Company’s equity holders | 13,015 | 10,177 | ||||||||
| Net debt | 6,618 | 2,492 | ||||||||
| Capital and net debt | 19,633 | 12,669 | ||||||||
| 201 |
Table of Contents
CRH Annual Report on Form 20-F | 2015
21. Capital and Financial Risk Management | continued
Financial risk management objectives and policies
The Group uses financial instruments throughout its businesses: interest-bearing loans and borrowings, cash and cash equivalents and finance leases are used to finance the Group’s operations; trade receivables and trade payables arise directly from operations; and derivatives, principally interest rate and currency swaps and forward foreign exchange contracts, are used to manage interest rate risks and currency exposures and to achieve the desired profile of borrowings. The Group does not trade in financial instruments nor does it enter into any leveraged derivative transactions.
The Group’s corporate treasury function provides services to the business units, co-ordinates access to domestic and international financial markets, and monitors and manages the financial risks relating to the operations of the Group. The Head of Group Financial Operations reports to the General Manager of Finance and the activities of the corporate treasury function are subject to regular internal audit. Systems are in place to monitor and control the Group’s liquidity risks. The Group’s net debt position forms part of the monthly documentation presented to the Board of Directors.
The main risks attaching to the Group’s financial instruments are interest rate risk, foreign currency risk, credit risk and liquidity risk. Commodity price risk arising from financial instruments is of minimal relevance given that exposure is confined to a small number of contracts entered into for the purpose of hedging future movements in energy costs. The Board reviews and agrees policies for the prudent management of each of these risks as documented below.
Interest rate risk
The Group’s exposure to market risk for changes in interest rates stems predominantly from its long-term debt obligations. Interest cost is managed using a mix of fixed and floating rate debt. With the objective of managing this mix in a cost-efficient manner, the Group enters into interest rate swaps, under which the Group contracts to exchange, at predetermined intervals, the difference between fixed and variable interest amounts calculated by reference to a pre-agreed notional principal. Such contracts enable the Group to mitigate the risk of changing interest rates on the fair value of issued fixed rate debt and the cash flow exposures of issued floating rate debt.
The majority of these swaps are designated under IAS 39 Financial Instruments; Recognition and Measurement to hedge underlying debt obligations and qualify for hedge accounting; undesignated financial instruments are termed “not designated as hedges” in the analysis of derivative financial instruments presented in note 24. The following table demonstrates the impact on profit/(loss) before tax and total equity of a range of possible changes in the interest rates applicable to net floating rate borrowings, with all other variables held constant. These impacts are calculated based on the closing balance sheet for the relevant period and assume all floating interest rates and interest curves change by the same amount. For profit/(loss) before tax, the impact shown is the impact on closing balance sheet floating rate net debt for a full year while for total equity the impact shown is the impact on the value of financial instruments.
| Percentage change in cost of borrowings | +/- 1% | +/- 0.5% | ||||||||
| Impact on profit/(loss) before tax | 2015 |
-/+ €14m | -/+ €7m | |||||||
| 2014 |
+/- €21m | +/- €10m | ||||||||
| 2013 |
+/- €10m | +/- €5m | ||||||||
| Impact on total equity | 2015 |
-/+ €7m | -/+ €4m | |||||||
| 2014 |
-/+ €5m | -/+ €2m | ||||||||
| 2013 |
-/+ €8m | -/+ €4m | ||||||||
| 202 |
Table of Contents
CRH Annual Report on Form 20-F | 2015
21. Capital and Financial Risk Management | continued
Foreign currency risk
Due to the nature of building materials, which in general exhibit a low value-to-weight ratio, CRH’s activities are conducted primarily in the local currency of the country of operation resulting in low levels of foreign currency transaction risk; variances arising in this regard are reflected in operating costs or cost of sales in the Consolidated Income Statement in the period in which they arise.
Given the Group’s presence in 31 countries worldwide, the principal foreign exchange risk arises from fluctuations in the euro value of the Group’s net investment in a wide basket of currencies other than the euro; such changes are reported separately within the Consolidated Statement of Comprehensive Income. A currency profile of the Group’s net debt and net worth is presented in note 20. The Group’s established policy is to spread its net worth across the currencies of its various operations with the objective of limiting its exposure to individual currencies and thus promoting consistency with the geographical balance of its operations. In order to achieve this objective, the Group manages its borrowings, where practicable and cost effective, to hedge a portion of its foreign currency assets. Hedging is done using currency borrowings in the same currency as the assets being hedged or through the use of other hedging methods such as currency swaps.
The following table demonstrates the sensitivity of profit/(loss) before tax and equity to selected movements in the relevant €/US$ exchange rate (with all other variables held constant); the US Dollar has been selected as the appropriate currency for this analysis given the materiality of the Group’s activities in the United States. The impact on profit/(loss) before tax is based on changing the €/US$ exchange rate used in calculating profit/(loss) before tax for the period. The impact on total equity and financial instruments is calculated by changing the €/US$ exchange rate used in measuring the closing balance sheet.
| Percentage change in relevant €/US$ exchange rate | +/- 5% | +/- 2.5% | ||||||||||
| Impact on profit/(loss) before tax | 2015 | -/+ €33m | -/+ €17m | |||||||||
| 2014 | -/+ €26m | -/+ €13m | ||||||||||
| 2013 | -/+ €14m | -/+ €7m | ||||||||||
| Impact on total equity* | 2015 | -/+ €230m | -/+ €115m | |||||||||
| 2014 | -/+ €263m | -/+ €135m | ||||||||||
| 2013 | -/+ €215m | -/+ €110m | ||||||||||
| * Includes the impact on financial instruments which is as follows: | 2015 | +/-€181m | +/-€90m | |||||||||
| 2014 | +/- €53m | +/- €27m | ||||||||||
| 2013 | +/-€70m | +/-€36m | ||||||||||
Financial instruments include deposits, money market funds, bank loans, medium term notes and other fixed term debt, interest rate swaps, commodity swaps and foreign exchange contracts. They exclude trade receivables and trade payables.
| 203 |
Table of Contents
CRH Annual Report on Form 20-F | 2015
21. Capital and Financial Risk Management | continued
Credit/counterparty risk
In addition to cash at bank and in hand, the Group holds significant cash balances which are invested on a short-term basis and are classified as cash equivalents (see note 22). These deposits and other financial instruments (principally certain derivatives and loans and receivables included within financial assets) give rise to credit risk on amounts due from counterparty financial institutions (stemming from their insolvency or a downgrade in their credit ratings). Credit risk is managed by limiting the aggregate amount and duration of exposure to any one counterparty primarily depending on its credit rating and by regular review of these ratings. Acceptable credit ratings are high investment-grade ratings - generally counterparties have ratings of A2/A or higher from Moody’s/Standard & Poor’s ratings agencies. The maximum exposure arising in the event of default on the part of the counterparty (including insolvency) is the carrying value of the relevant financial instrument.
In its worldwide insurance programme, the Group carries appropriate levels of insurance for typical business risks (including product liability) with various leading insurance companies. However, in the event of the failure of one or more of its insurance counterparties, the Group could be impacted by losses where recovery from such counterparties is not possible.
Credit risk arising in the context of the Group’s operations is not significant with the total bad debt provision at the balance sheet date amounting to 4.6% of gross trade receivables (2014: 4.6%). Customer credit risk is managed at appropriate Group locations according to established policies, procedures and controls. Customer credit quality is assessed in line with strict credit rating criteria and credit limits are established where appropriate. Outstanding customer balances are regularly monitored and a review for indicators of impairment (evidence of financial difficulty of the customer, payment default, breach of contract etc.) is carried out at each reporting date. Significant balances are reviewed individually while smaller balances are grouped and assessed collectively. Receivables balances are in general unsecured and non-interest-bearing. The trade receivables balances disclosed in note 17 comprise a large number of customers spread across the Group’s activities and geographies with balances classified as neither past due nor impaired representing 69% of the total trade receivables balance at the balance sheet date (2014: 72%); amounts receivable from related parties (notes 17 and 32) are immaterial. Factoring and credit guarantee arrangements are employed in certain of the Group’s operations where deemed to be of benefit by operational management.
Liquidity risk
The principal liquidity risks faced by the Group stem from the maturation of debt obligations and derivative transactions. A downgrade of CRH’s credit ratings may give rise to increases in funding costs in respect of future debt and may impair the Group’s ability to raise funds on acceptable terms. The Group’s corporate treasury function ensures that sufficient resources are available to meet such liabilities as they fall due through a combination of cash and cash equivalents, cash flows and undrawn committed bank facilities. Flexibility in funding sources is achieved through a variety of means including (i) maintaining cash and cash equivalents only with a diversity of highly-rated counterparties; (ii) limiting the maturity of such balances; (iii) borrowing the bulk of the Group’s debt requirements under committed bank lines or other term financing; and (iv) having surplus committed lines of credit.
The undrawn committed facilities available to the Group as at the balance sheet date are quantified in note 23; these facilities span a wide number of highly-rated financial institutions thus minimising any potential exposure arising from concentrations in borrowing sources. The repayment schedule (analysed by maturity date) applicable to the Group’s outstanding interest-bearing loans and borrowings as at the balance sheet date is also presented in note 23.
| 204 |
Table of Contents
CRH Annual Report on Form 20-F | 2015
21. Capital and Financial Risk Management | continued
The tables below show the projected contractual undiscounted total cash outflows (principal and interest) arising from the Group’s trade and other payables, gross debt and derivative financial instruments. The tables also include the gross cash inflows projected to arise from derivative financial instruments. These projections are based on the interest and foreign exchange rates applying at the end of the relevant financial year.
| Within 1 year |
Between €m |
Between 2 and 3 years €m |
Between 3 and 4 years €m |
Between 4 and 5 years €m |
After 5 years €m |
Total €m |
||||||||||||||||||||||
| At 31 December 2015 | ||||||||||||||||||||||||||||
| Financial liabilities - cash outflows | ||||||||||||||||||||||||||||
| Trade and other payables | 4,761 | 231 | 80 | 37 | 48 | 65 | 5,222 | |||||||||||||||||||||
| Finance leases | 2 | 2 | 2 | 2 | 2 | 5 | 15 | |||||||||||||||||||||
| Other interest-bearing loans and borrowings | 760 | 800 | 1,361 | 500 | 750 | 4,971 | 9,142 | |||||||||||||||||||||
| Interest payments on other interest-bearing loans and borrowings (i) | 315 | 277 | 270 | 196 | 190 | 1,271 | 2,519 | |||||||||||||||||||||
| Cross-currency swaps - gross cash outflows | 2,716 | 146 | - | - | - | - | 2,862 | |||||||||||||||||||||
| Gross projected cash outflows | 8,554 | 1,456 | 1,713 | 735 | 990 | 6,312 | 19,760 | |||||||||||||||||||||
| Derivative financial instruments - cash inflows | ||||||||||||||||||||||||||||
| Interest rate swaps - net cash inflows (ii) | (53) | (35) | (35) | (21) | (21) | (87) | (252) | |||||||||||||||||||||
| Cross-currency swaps - gross cash inflows | (2,707) | (162) | - | - | - | - | (2,869) | |||||||||||||||||||||
| Gross projected cash inflows | (2,760) | (197) | (35) | (21) | (21) | (87) | (3,121) | |||||||||||||||||||||
| The equivalent disclosure for the prior year is as follows: | ||||||||||||||||||||||||||||
| At 31 December 2014 | ||||||||||||||||||||||||||||
| Financial liabilities - cash outflows | ||||||||||||||||||||||||||||
| Trade and other payables | 2,894 | 178 | 25 | 16 | 11 | 56 | 3,180 | |||||||||||||||||||||
| Finance leases | 2 | 2 | 2 | 1 | 2 | 4 | 13 | |||||||||||||||||||||
| Other interest-bearing loans and borrowings | 452 | 1,371 | 1 | 536 | 500 | 2,882 | 5,742 | |||||||||||||||||||||
| Interest payments on other interest-bearing loans and borrowings (i) | 253 | 207 | 157 | 137 | 90 | 305 | 1,149 | |||||||||||||||||||||
| Cross-currency swaps - gross cash outflows | 1,729 | - | - | - | - | - | 1,729 | |||||||||||||||||||||
| Gross projected cash outflows | 5,330 | 1,758 | 185 | 690 | 603 | 3,247 | 11,813 | |||||||||||||||||||||
| Derivative financial instruments - cash inflows | ||||||||||||||||||||||||||||
| Interest rate swaps - net cash inflows (ii) | (34) | (28) | (19) | (14) | (6) | (18) | (119) | |||||||||||||||||||||
| Cross-currency swaps - gross cash inflows | (1,738) | - | - | - | - | - | (1,738) | |||||||||||||||||||||
| Gross projected cash inflows | (1,772) | (28) | (19) | (14) | (6) | (18) | (1,857) | |||||||||||||||||||||
Commodity price risk
The fair value of derivatives used to hedge future energy costs was €17 million unfavourable as at the balance sheet date (2014: €19 million unfavourable).
| (i) | At 31 December 2015 and 31 December 2014, a portion of the Group’s long-term debt carried variable interest rates. The Group uses the interest rates in effect on 31 December to calculate the interest payments on the long-term debt for the periods indicated. |
| (ii) | The Group uses interest rate swaps to help manage its interest cost. Under these contracts the Group has agreed to exchange at predetermined intervals, the difference between fixed and variable interest amounts calculated by reference to a pre-agreed notional principal. The Group uses the interest rates in effect on 31 December to calculate the net interest receipts or payments on these contracts. |
| 205 |
Table of Contents
CRH Annual Report on Form 20-F | 2015
| 206 |
Table of Contents
CRH Annual Report on Form 20-F | 2015
23. Interest-bearing Loans and Borrowings
| Loans and borrowings outstanding | ||||||||
| 2015 €m |
2014 €m |
|||||||
| Bank overdrafts | 117 | 70 | ||||||
| Bank loans | 1,564 | 16 | ||||||
| Finance leases | 15 | 13 | ||||||
| Bonds and private placements | 7,508 | 5,750 | ||||||
| Other | 17 | 17 | ||||||
| Interest-bearing loans and borrowings* | 9,221 | 5,866 | ||||||
| * Including loans of €1 million (2014: €1 million) secured on specific items of property, plant and equipment; these figures do not include finance leases. | ||
Maturity profile of loans and borrowings and undrawn committed facilities
| As at 31 December 2015 | As at 31 December 2014 | |||||||||||||||
| Loans and
€m |
Undrawn
€m |
Loans and
€m |
Undrawn
€m |
|||||||||||||
| Within one year | 756 | 31 | 447 | 22 | ||||||||||||
| Between one and two years | 794 | 220 | 1,395 | - | ||||||||||||
| Between two and three years | 1,382 | - | - | - | ||||||||||||
| Between three and four years | 501 | - | 562 | - | ||||||||||||
| Between four and five years | 747 | 2,837 | 505 | 2,641 | ||||||||||||
| After five years | 5,041 | - | 2,957 | - | ||||||||||||
| Total | 9,221 | 3,088 | 5,866 | 2,663 | ||||||||||||
| ** | The Group manages its borrowing ability by entering into committed borrowing agreements. Revolving committed bank facilities are generally available to the Group for periods of up to five years from the date of inception. The figures shown above are the undrawn committed facilities available to be drawn by the Group at 31 December 2015. |
| 207 |
Table of Contents
CRH Annual Report on Form 20-F | 2015
23. Interest-bearing Loans and Borrowings | continued
Guarantees
The Company has given letters of guarantee to secure obligations of subsidiary undertakings as follows: €8.9 billion in respect of loans, bank advances, derivative obligations and future lease obligations (2014: €5.8 billion), €308 million in respect of letters of credit (2014: €288 million) and €10 million in respect of other obligations (2014: €5 million).
Pursuant to the provisions of Section 357(1)(b) of the Companies Act 2014, the Company has guaranteed all amounts shown as liabilities in the statutory financial statements of its wholly-owned subsidiary undertakings and the Oldcastle Finance Company general partnership in the Republic of Ireland for the financial year ended 31 December 2015 and as a result, such subsidiary undertakings and the general partnership have been exempted from the filing provisions of Sections 347 and 348 of the Companies Act 2014 and Regulation 20 of the European Communities (Accounts) Regulations, 1993 respectively.
Lender covenants
The Group’s major bank facilities and debt issued pursuant to Note Purchase Agreements in private placements require the Group to maintain certain financial covenants. Non-compliance with financial covenants would give the relevant lenders the right to terminate facilities and demand early repayment of any sums drawn thereunder thus altering the maturity profile of the Group’s debt and the Group’s liquidity. Calculations for financial covenants are completed for twelve-month periods half-yearly on 30 June and 31 December. The Group was in full compliance with its financial covenants throughout each of the periods presented. The Group is not aware of any stated events of default as defined in the Agreements.
The financial covenants are:
| (1) | Minimum interest cover defined as PBITDA/net interest (all as defined in the relevant agreement) cover at no lower than 4.5 times (2014: 4.5 times; 2013: 6.3 times). As at 31 December 2015 the ratio was 8.5 times (2014: 7.0 times; 2013: 6.3 times); |
| (2) | Minimum net worth defined as total equity plus deferred tax liabilities and capital grants less repayable capital grants being in aggregate no lower than €5.6 billion (2014: €5.0 billion) (such minimum being adjusted for foreign exchange translation impacts). As at 31 December 2015 net worth (as defined in the relevant agreement) was €15.6 billion (2014: €11.5 billion). |
| 208 |
Table of Contents
CRH Annual Report on Form 20-F | 2015
24. Derivative Financial Instruments
The fair values of derivative financial instruments are analysed by year of maturity and by accounting designation as follows:
| Fair value hedges €m |
Cash flow hedges €m |
Net €m |
Not designated as hedges €m |
Total €m |
||||||||||||||||
| At 31 December 2015 | ||||||||||||||||||||
| Derivative assets | ||||||||||||||||||||
| Within one year - current assets | 4 | - | 15 | 5 | 24 | |||||||||||||||
| Between one and two years | 21 | - | - | - | 21 | |||||||||||||||
| Between two and three years | 22 | - | - | - | 22 | |||||||||||||||
| Between three and four years | - | - | - | 8 | 8 | |||||||||||||||
| After five years | 34 | - | - | - | 34 | |||||||||||||||
| Non-current assets | 77 | - | - | 8 | 85 | |||||||||||||||
| Total derivative assets | 81 | - | 15 | 13 | 109 | |||||||||||||||
| Derivative liabilities | ||||||||||||||||||||
| Within one year - current liabilities | - | (7) | (7) | (5) | (19) | |||||||||||||||
| Between one and two years - non-current liabilities | - | (4) | - | (1) | (5) | |||||||||||||||
| Total derivative liabilities | - | (11) | (7) | (6) | (24) | |||||||||||||||
| Net asset arising on derivative financial instruments | 81 | (11) | 8 | 7 | 85 | |||||||||||||||
| The equivalent disclosure for the prior year is as follows: |
||||||||||||||||||||
| At 31 December 2014 | ||||||||||||||||||||
| Derivative assets | ||||||||||||||||||||
| Within one year - current assets | - | 2 | 13 | - | 15 | |||||||||||||||
| Between one and two years | 22 | - | - | - | 22 | |||||||||||||||
| Between three and four years | 26 | - | - | - | 26 | |||||||||||||||
| Between four and five years | - | - | - | 9 | 9 | |||||||||||||||
| After five years | 30 | - | - | - | 30 | |||||||||||||||
| Non-current assets | 78 | - | - | 9 | 87 | |||||||||||||||
| Total derivative assets | 78 | 2 | 13 | 9 | 102 | |||||||||||||||
| Derivative liabilities | ||||||||||||||||||||
| Within one year - current liabilities | - | (7) | (4) | (9) | (20) | |||||||||||||||
| Between one and two years | - | (1) | - | - | (1) | |||||||||||||||
| Between two and three years | - | (1) | - | - | (1) | |||||||||||||||
| Between three and four years | - | (1) | - | - | (1) | |||||||||||||||
| Non-current liabilities | - | (3) | - | - | (3) | |||||||||||||||
| Total derivative liabilities | - | (10) | (4) | (9) | (23) | |||||||||||||||
| Net asset arising on derivative financial instruments | 78 | (8) | 9 | - | 79 | |||||||||||||||
| 209 |
Table of Contents
CRH Annual Report on Form 20-F | 2015
24. Derivative Financial Instruments | continued
At 31 December 2015 and 2014, the Group had no master netting or similar arrangements, collateral posting requirements, and enforceable right of set-off agreements with any of its derivative counterparts.
Fair value hedges consist of interest rate swaps and currency swaps. These instruments hedge risks arising from changes in asset/liability fair values due to interest rate and foreign exchange rate movements.
Cash flow hedges consist of forward foreign exchange and commodity contracts and interest rate and currency swaps. These instruments hedge risks arising to future cash flows from movements in foreign exchange rates, commodity prices and interest rates. Cash flow hedges are expected to affect profit and loss over the period to maturity.
Net investment hedges comprise cross-currency swaps and hedge changes in the value of net investments due to currency movements.
The (loss)/profit arising on fair value, cash flow, net investment hedges and related hedged items reflected in the Consolidated Income Statement is shown below:
| 2015 | 2014 | 2013 | ||||||||||||||
| €m | €m | €m | ||||||||||||||
| Fair value of hedge instruments | (16) | 15 | (68) | |||||||||||||
| Fair value of the hedged items | 13 | (16) | 71 | |||||||||||||
| Components of other comprehensive income - cash flow hedges | ||||||||||||||||
| Losses arising during the year: | ||||||||||||||||
| - commodity forward contracts | (2) | (6) | (2) | |||||||||||||
| Fair value hierarchy | 2015 | 2014 | ||||||||
| Level 2 | Level 2 | |||||||||
| €m | €m | |||||||||
| Assets measured at fair value | ||||||||||
| Fair value hedges - cross-currency and interest rate swaps | 81 | 78 | ||||||||
| Net investment hedges - cross-currency swaps | 15 | 13 | ||||||||
| Not designated as hedges (held-for-trading) - interest rate swaps | 13 | 9 | ||||||||
| Cash flow hedges - cross-currency, interest rate swaps and commodity forwards | - | 2 | ||||||||
| Total | 109 | 102 | ||||||||
| Liabilities measured at fair value | ||||||||||
| Cash flow hedges - cross-currency, interest rate swaps and commodity forwards | (11) | (10) | ||||||||
| Net investment hedges - cross-currency swaps | (7) | (4) | ||||||||
| Not designated as hedges (held-for-trading) - interest rate swaps | (6) | (9) | ||||||||
| Total | (24) | (23) | ||||||||
At 31 December 2015 and 2014 there were no derivatives valued using Level 1 or Level 3 fair value techniques. Valuation methods for Levels 1, 2 and 3 are described in the “fair value hierarchy” section of the accounting policies on page 169.
| 210 |
Table of Contents
CRH Annual Report on Form 20-F | 2015
25. Provisions for Liabilities
| At 1 January |
Translation adjustment |
Arising on (note 30) |
Provided year |
Utilised year |
Reclassified for sale |
Disposed year |
Reversed unused |
Discount unwinding |
At 31 December |
|||||||||||||||||||||||||||||||
| €m | €m | €m | €m | €m | €m | €m | €m | €m | €m | |||||||||||||||||||||||||||||||
| 31 December 2015 |
||||||||||||||||||||||||||||||||||||||||
| Insurance (i) |
208 | 18 | 8 | 61 | (49) | - | - | (12) | 10 | 244 | ||||||||||||||||||||||||||||||
| Environment and remediation (ii) |
96 | (5) | 348 | 20 | (10) | 4 | (5) | (4) | 6 | 450 | ||||||||||||||||||||||||||||||
| Rationalisation and redundancy (iii) |
24 | 1 | 2 | 23 | (23) | - | - | (2) | 1 | 26 | ||||||||||||||||||||||||||||||
| Other (iv) |
68 | (9) | 223 | 62 | (21) | 3 | (1) | (12) | 2 | 315 | ||||||||||||||||||||||||||||||
| Total |
396 | 5 | 581 | 166 | (103) | 7 | (6) | (30) | 19 | 1,035 | ||||||||||||||||||||||||||||||
| Analysed as: |
||||||||||||||||||||||||||||||||||||||||
| Non-current liabilities |
257 | 603 | ||||||||||||||||||||||||||||||||||||||
| Current liabilities |
139 | 432 | ||||||||||||||||||||||||||||||||||||||
| Total |
396 | 1,035 | ||||||||||||||||||||||||||||||||||||||
| The equivalent disclosure for the prior year is as follows: |
|
|||||||||||||||||||||||||||||||||||||||
| 31 December 2014 |
||||||||||||||||||||||||||||||||||||||||
| Insurance (i) |
181 | 20 | - | 52 | (50) | - | - | (3) | 8 | 208 | ||||||||||||||||||||||||||||||
| Environment and remediation (ii) |
87 | 5 | - | 12 | (4) | (4) | - | (4) | 4 | 96 | ||||||||||||||||||||||||||||||
| Rationalisation and redundancy (iii) |
43 | 1 | - | 30 | (48) | - | - | (3) | 1 | 24 | ||||||||||||||||||||||||||||||
| Other (iv) |
69 | 1 | 1 | 14 | (8) | (3) | - | (9) | 3 | 68 | ||||||||||||||||||||||||||||||
| Total |
380 | 27 | 1 | 108 | (110) | (7) | - | (19) | 16 | 396 | ||||||||||||||||||||||||||||||
| Analysed as: |
||||||||||||||||||||||||||||||||||||||||
| Non-current liabilities |
231 | 257 | ||||||||||||||||||||||||||||||||||||||
| Current liabilities |
149 | 139 | ||||||||||||||||||||||||||||||||||||||
| Total |
380 | 396 | ||||||||||||||||||||||||||||||||||||||
| 211 |
Table of Contents
CRH Annual Report on Form 20-F | 2015
25. Provisions for Liabilities | continued
| (i) | This provision relates to actual and potential obligations arising under the self-insurance components of the Group’s insurance arrangements which comprise employers’ liability (workers’ compensation in the United States), public and products liability (general liability in the United States), automobile liability, property damage, business interruption and various other insurances; a substantial proportion of the total provision pertains to claims which are classified as “incurred but not reported”. Due to the extended timeframe associated with many of the insurances, a significant proportion of the total provision is subject to periodic actuarial valuation. The projected cash flows underlying the discounting process are established through the application of actuarial triangulations, which are extrapolated from historical claims experience. The triangulations applied in the discounting process indicate that the Group’s insurance provisions have an average life of six years (2014: six years). |
| (ii) | This provision comprises obligations governing site remediation, restoration and environmental works to be incurred in compliance with either local or national environmental regulations together with constructive obligations stemming from established best practice. Whilst a significant element of the total provision will reverse in the medium-term (two to ten years), the majority of the legal and constructive obligations applicable to long-lived assets (principally mineral-bearing land) will unwind over a 30-year timeframe. In discounting the related obligations, expected future cash outflows have been determined with due regard to extraction status and anticipated remaining life. |
| (iii) | These provisions relate to irrevocable commitments under various rationalisation and redundancy programmes, none of which is individually material to the Group. In 2015, €23 million (2014: €30 million; 2013: €55 million) was provided in respect of rationalisation and redundancy activities as a consequence of undertaking various cost reduction initiatives across all operations. These initiatives included removing excess capacity from manufacturing and distribution networks and scaling operations to match market supply and demand; implementation of these initiatives resulted in a reduction in staffing levels in all business segments over recent years. The Group expects that these provisions will be utilised within one to two years of the balance sheet date (2014: one to two years). |
| (iv) | Other provisions primarily relate to legal claims (only one of which is individually material to the Group, see below for further details), onerous contracts, guarantees and warranties and employee related provisions. The Group expects these provisions will be utilised within two to five years of the balance sheet date (2014: two years). |
Swiss Competition Commission Investigation
In July 2015, the Swiss Competition Commission (“ComCo”) announced its decision to impose fines of approximately CHF 80 million on the Association of Swiss Wholesalers of the Sanitary Industry (the “Association”) and on major Swiss wholesalers including certain subsidiaries of CRH in Switzerland. The full decision of ComCo, setting out the basis of its findings, is expected to be available in March 2016 at which time CRH has the option to appeal the decision to the Federal Administrative Tribunal, and ultimately to the Federal Supreme Court. While the Group is of the view that the position of ComCo is fundamentally ill-founded and that the fine imposed on CRH is unjustified, a provision of €32 million (CHF 34 million), representing the full amount of the fine attributed to the Group’s subsidiaries, has been recorded in the 2015 Consolidated Financial Statements.
Discount rate sensitivity analysis
All non-current provisions are discounted at a rate of 5% (2014: 5%; 2013: 5%), consistent with the average effective interest rate for the Group’s borrowings. The impact on profit before tax of a 1% change in the discount rate applicable to provisions, with all other variables held constant, is approximately €2 million (2014: €nil million; 2013: €nil million).
| 212 |
Table of Contents
CRH Annual Report on Form 20-F | 2015
26. Deferred Income Tax
The deductible and taxable temporary differences in respect of which deferred tax has been recognised are as follows:
| 2015 | 2014 | |||||||
| €m | €m | |||||||
| Reported in balance sheet after offset | ||||||||
| Deferred tax liabilities | 2,023 | 1,305 | ||||||
| Deferred tax assets | (149) | (171) | ||||||
| Net deferred income tax liability | 1,874 | 1,134 | ||||||
| Deferred income tax assets (deductible temporary differences) | ||||||||
| Deficits on Group retirement benefit obligations (note 27) | 126 | 140 | ||||||
| Revaluation of derivative financial instruments to fair value | 13 | 14 | ||||||
| Tax loss carryforwards | 158 | 97 | ||||||
| Share-based payment expense | 15 | 2 | ||||||
| Provisions for liabilities and working capital-related items | 326 | 187 | ||||||
| Other deductible temporary differences | 46 | 37 | ||||||
| Total | 684 | 477 | ||||||
|
Deferred income tax assets have been recognised in respect of all deductible temporary differences, with the exception of some tax loss carryforwards. The amount of tax losses where recovery is not probable and is therefore not recognised in the Consolidated Balance Sheet is €959 million (2014: €937 million). The vast majority will expire post 2020 (2014: 2019) | ||||
|
Deferred income tax liabilities (taxable temporary differences) |
||||||||
| Taxable temporary differences principally attributable to accelerated tax depreciation and fair value adjustments arising on acquisition (i) | 2,521 | 1,575 | ||||||
| Revaluation of derivative financial instruments to fair value | 18 | 18 | ||||||
| Rolled-over capital gains | 19 | 18 | ||||||
| Total | 2,558 | 1,611 | ||||||
| (i) Fair value adjustments arising on acquisition principally relate to property, plant and equipment. | ||||||||
| Movement in net deferred income tax liability | ||||||||
| At 1 January | 1,134 | 1,059 | ||||||
| Translation adjustment | 126 | 125 | ||||||
| Net (income)/expense for the year (note 10) | (35) | 36 | ||||||
| Arising on acquisition (note 30) | 627 | 2 | ||||||
| Reclassified from/(as) held for sale | 19 | (19) | ||||||
| Disposal (note 4) | (22) | - | ||||||
| Movement in deferred tax asset on Group retirement benefit obligations | 30 | (69) | ||||||
| Movement in deferred tax asset on share-based payment expense | (5) | - | ||||||
| At 31 December | 1,874 | 1,134 | ||||||
| 213 |
Table of Contents
CRH Annual Report on Form 20-F | 2015
27. Retirement Benefit Obligations
The Group operates either defined benefit or defined contribution pension schemes in all of its principal operating areas. The disclosures included below relate to all pension schemes in the Group.
The Group operates defined benefit pension schemes in the Republic of Ireland, Britain and Northern Ireland, the Netherlands, Belgium, France, Germany, Switzerland, the United States, Romania, Serbia, Slovakia, Brazil, the Philippines and Canada; for the purposes of the disclosures which follow, the schemes in the Republic of Ireland, the Netherlands, Belgium, France, Germany and Slovakia have been aggregated into a “Eurozone” category on the basis of common currency and financial assumptions. The majority of the defined benefit pension schemes operated by the Group are funded as disclosed in the analysis of the defined benefit obligation presented on page 217 with unfunded schemes restricted to a number of schemes in Germany, Canada, the Philippines and one scheme in each of the Netherlands and the United States.
All funded defined benefit schemes are administered by separate funds that are legally separate from the Group under the jurisdiction of Trustees. Each of the Group’s schemes operate under broadly similar regulatory frameworks. The Trustees of the various pension funds in existence across the Group are required by law and by their articles of association to act in the best interests of the scheme participants and are responsible for the definition of investment strategy and for scheme administration. The level of benefits available to members depends on length of service and either their average salary over their period of employment or their salary in the final years leading up to retirement. The Group’s pension schemes in Switzerland are contribution-based schemes with guarantees to provide further contributions in the event that certain targets are not met largely in relation to investment return and the annuity conversion factor on retirement.
Provision has been made in the financial statements for post-retirement healthcare obligations in respect of certain current and former employees in the United States and Canada and for long-term service commitments in respect of certain employees in the Netherlands and Switzerland. These obligations are unfunded in nature and the required disclosures form part of this note.
Defined benefit pension schemes - principal risks
Through its defined benefit pension schemes and post-retirement healthcare plans, the Group is exposed to a number of risks, the most significant of which are detailed below:
Asset volatility: Under IAS 19 Employee Benefits, the assets of the Group’s defined benefit pension schemes are reported at fair value (using bid prices, where relevant). The majority of the schemes’ assets comprise of equities, bonds and property all of which may fluctuate significantly in value from period to period. Given that liabilities are discounted to present value based on bond yields and that bond prices are inversely related to yields, an increase in the liability discount rate (which would reduce liabilities) would reduce bond values though not necessarily by an equal magnitude.
Given the maturity of certain of the Group’s funded defined benefit pension schemes, de-risking frameworks have been introduced to mitigate deficit volatility and enable better matching of investment returns with the cash outflows related to benefit obligations. These frameworks entail the usage of asset-liability matching techniques whereby triggers are set for the conversion of equity holdings into bonds of similar average duration to the relevant liabilities.
Discount rates: The discount rates employed in determining the present value of the schemes’ liabilities are determined by reference to market yields at the balance sheet date on high-quality corporate bonds of a currency and term consistent with the currency and term of the associated post-employment benefit obligations. Changes in discount rates impact the quantum of liabilities as discussed above.
Inflation risk: A significant amount of the Group’s pension obligations have an inflation linkage; higher inflation will lead to higher liabilities (although in most cases, caps on the level of inflationary increases are in place to protect the scheme against extreme inflation).
Longevity risk: In the majority of cases, the Group’s defined benefit pension schemes provide benefits for life with spousal and dependent child reversionary provisions; increases in life expectancy will therefore give rise to higher liabilities.
| 214 |
Table of Contents
CRH Annual Report on Form 20-F | 2015
27. Retirement Benefit Obligations | continued
Financial assumptions - scheme liabilities
The major long-term assumptions used by the Group’s actuaries in the computation of scheme liabilities as at 31 December 2015, 31 December 2014 and 31 December 2013 are as follows:
| Eurozone* | Britain and Northern Ireland |
Switzerland | United States and Canada |
|||||||||||||||||||||||||||||||||||||||||||||
| 2015 | 2014 | 2013 | 2015 | 2014 | 2013 | 2015 | 2014 | 2013 | 2015 | 2014 | 2013 | |||||||||||||||||||||||||||||||||||||
| % | % | % | % | % | % | % | % | % | % | % | % | |||||||||||||||||||||||||||||||||||||
| Rate of increase in: | ||||||||||||||||||||||||||||||||||||||||||||||||
| - salaries | 3.64 | 3.75 | 4.00 | 4.00 | 4.00 | 4.30 | 1.75 | 2.25 | 2.25 | 3.29 | 3.50 | 3.50 | ||||||||||||||||||||||||||||||||||||
| - pensions in payment | 1.75 | 1.75 | 2.00 | 3.00-3.20 | 3.00-3.20 | 3.30-3.50 | - | - | 0.25 | - | - | - | ||||||||||||||||||||||||||||||||||||
| Inflation | 1.75 | 1.75 | 2.00 | 3.00 | 3.00 | 3.30 | 0.75 | 1.25 | 1.25 | 2.00 | 2.00 | 2.00 | ||||||||||||||||||||||||||||||||||||
| Discount rate | 2.61 | 2.00 | 3.70 | 3.95 | 3.50 | 4.60 | 0.85 | 1.15 | 2.35 | 4.22 | 3.80 | 4.70 | ||||||||||||||||||||||||||||||||||||
| Medical cost trend rate | n/a | n/a | n/a | n/a | n/a | n/a | n/a | n/a | n/a | 6.21 | 16.70 | 7.40 | ||||||||||||||||||||||||||||||||||||
|
The mortality assumptions employed in determining the present value of scheme liabilities under IAS 19 are in accordance with the underlying funding valuations and represent actuarial best practice in the relevant jurisdictions taking account of mortality experience and industry circumstances. For the Group’s most material schemes, the future life expectations factored into the relevant valuations, based on retirement at 65 years of age for current and future retirees, are as follows:
| ||||||||||||||||||||||||
| Republic of Ireland | United States and Canada |
Switzerland | ||||||||||||||||||||||||||||||||||||||||
| 2015 | 2014 | 2013 | 2015 | 2014 | 2013 | 2015 | 2014 | 2013 | ||||||||||||||||||||||||||||||||||
| Current retirees | ||||||||||||||||||||||||||||||||||||||||||
| - male | 22.8 | 22.8 | 22.7 | 21.2 | 22.0 | 19.0 | 21.5 | 21.3 | 21.3 | |||||||||||||||||||||||||||||||||
| - female | 24.9 | 24.9 | 24.9 | 23.4 | 24.0 | 21.0 | 24.0 | 23.8 | 23.8 | |||||||||||||||||||||||||||||||||
| Future retirees | ||||||||||||||||||||||||||||||||||||||||||
| - male | 25.8 | 25.8 | 25.7 | 23.0 | 24.0 | 21.0 | 23.6 | 23.5 | 23.5 | |||||||||||||||||||||||||||||||||
| - female | 26.9 | 26.8 | 26.7 | 25.1 | 26.0 | 23.0 | 26.0 | 25.9 | 25.9 | |||||||||||||||||||||||||||||||||
The above data allows for future improvements in life expectancy.
| * | 2015 is calculated based on the weighted average of the assumptions for Republic of Ireland, the Netherlands, Belgium, France, Germany and Slovakia. |
| 215 |
Table of Contents
CRH Annual Report on Form 20-F | 2015
27. Retirement Benefit Obligations | continued
Impact on Consolidated Income Statement
The total retirement benefit expense in the Consolidated Income Statement is as follows:
| 2015 | 2014 | 2013 | ||||||||||
| €m | €m | €m | ||||||||||
| Total defined contribution expense | 211 | 152 | 149 | |||||||||
| Total defined benefit expense | 77 | 63 | 52 | |||||||||
| Total expense in Consolidated Income Statement | 288 | 215 | 201 | |||||||||
| At 31 December 2015, €79 million (2014: €44 million) was included in other payables in respect of defined contribution pension liabilities. | ||||||
| Britain and | United States | |||||||||||||||||||||||
| Analysis of defined benefit expense | Eurozone | Northern Ireland | Switzerland | and Canada | Other | Total Group | ||||||||||||||||||
| 2015 | 2015 | 2015 | 2015 | 2015 | 2015 | |||||||||||||||||||
| €m | €m | €m | €m | €m | €m | |||||||||||||||||||
| Charged in arriving at Group profit before finance costs: | ||||||||||||||||||||||||
| Current service cost | 19 | 7 | 34 | 2 | 1 | 63 | ||||||||||||||||||
| Administration expenses | 1 | - | 1 | - | - | 2 | ||||||||||||||||||
| Past service costs | (1) | - | - | - | - | (1) | ||||||||||||||||||
| Gain on settlements | - | (4) | - | - | - | (4) | ||||||||||||||||||
| Subtotal | 19 | 3 | 35 | 2 | 1 | 60 | ||||||||||||||||||
| Included in finance income and finance costs respectively: | ||||||||||||||||||||||||
| Interest income on scheme assets | (19) | (10) | (9) | (12) | - | (50) | ||||||||||||||||||
| Interest cost on scheme liabilities | 27 | 12 | 11 | 16 | 1 | 67 | ||||||||||||||||||
| Net interest expense | 8 | 2 | 2 | 4 | 1 | 17 | ||||||||||||||||||
| Net charge to Consolidated Income Statement | 27 | 5 | 37 | 6 | 2 | 77 | ||||||||||||||||||
| Reconciliation of scheme assets (bid value) | ||||||||||||||||||||||||
| At 1 January | 935 | 155 | 745 | 211 | - | 2,046 | ||||||||||||||||||
| Movement in year | ||||||||||||||||||||||||
| Administration expenses | (1) | - | (1) | - | - | (2) | ||||||||||||||||||
| Interest income on scheme assets | 19 | 10 | 9 | 12 | - | 50 | ||||||||||||||||||
| Arising on acquisition (note 30) | 10 | - | - | 216 | 28 | 254 | ||||||||||||||||||
| Reclassified from held for sale | - | 633 | - | - | - | 633 | ||||||||||||||||||
| Disposals | - | (705) | (39) | - | - | (744) | ||||||||||||||||||
| Remeasurement adjustments | ||||||||||||||||||||||||
| - return on scheme assets excluding interest income | 19 | 14 | (6) | (20) | (2) | 5 | ||||||||||||||||||
| Employer contributions paid | 74 | 11 | 19 | 6 | 3 | 113 | ||||||||||||||||||
| Contributions paid by plan participants | 3 | - | 11 | - | - | 14 | ||||||||||||||||||
| Benefit and settlement payments | (43) | (11) | (47) | (21) | - | (122) | ||||||||||||||||||
| Translation adjustment | - | 56 | 83 | 12 | 1 | 152 | ||||||||||||||||||
| At 31 December | 1,016 | 163 | 774 | 416 | 30 | 2,399 | ||||||||||||||||||
| 216 |
Table of Contents
CRH Annual Report on Form 20-F | 2015
27. Retirement Benefit Obligations | continued
| Britain and | United States | |||||||||||||||||||||||
| Eurozone | Northern Ireland | Switzerland | and Canada | Other | Total Group | |||||||||||||||||||
| 2015 | 2015 | 2015 | 2015 | 2015 | 2015 | |||||||||||||||||||
| €m | €m | €m | €m | €m | €m | |||||||||||||||||||
| Reconciliation of actuarial value of liabilities |
||||||||||||||||||||||||
| At 1 January |
(1,332) | (216) | (900) | (309) | - | (2,757) | ||||||||||||||||||
| Movement in year |
||||||||||||||||||||||||
| Current service cost |
(19) | (7) | (34) | (2) | (1) | (63) | ||||||||||||||||||
| Past service costs |
1 | - | - | - | - | 1 | ||||||||||||||||||
| Gain on settlements |
- | 4 | - | - | - | 4 | ||||||||||||||||||
| Interest cost on scheme liabilities |
(27) | (12) | (11) | (16) | (1) | (67) | ||||||||||||||||||
| Arising on acquisition (note 30) |
(67) | - | - | (235) | (39) | (341) | ||||||||||||||||||
| Reclassified from held for sale |
- | (714) | - | - | - | (714) | ||||||||||||||||||
| Disposals |
- | 781 | 47 | - | - | 828 | ||||||||||||||||||
| Remeasurement adjustments |
||||||||||||||||||||||||
| - experience variations |
28 | 11 | 15 | - | (1) | 53 | ||||||||||||||||||
| - actuarial gain/(loss) from changes in financial assumptions |
144 | (9) | (43) | 26 | 3 | 121 | ||||||||||||||||||
| - actuarial gain from changes in demographic assumptions |
- | 19 | - | 5 | - | 24 | ||||||||||||||||||
| Contributions paid by plan participants |
(3) | - | (11) | - | - | (14) | ||||||||||||||||||
| Benefit and settlement payments |
43 | 11 | 47 | 21 | - | 122 | ||||||||||||||||||
| Translation adjustment |
- | (65) | (99) | (20) | - | (184) | ||||||||||||||||||
| At 31 December |
(1,232) | (197) | (989) | (530) | (39) | (2,987) | ||||||||||||||||||
| Recoverable deficit in schemes |
(216) | (34) | (215) | (114) | (9) | (588) | ||||||||||||||||||
| Related deferred income tax asset |
34 | 3 | 42 | 43 | 4 | 126 | ||||||||||||||||||
| Net pension liability |
(182) | (31) | (173) | (71) | (5) | (462) | ||||||||||||||||||
| Split of scheme liabilities - funded and unfunded |
||||||||||||||||||||||||
| Funded defined benefit pension schemes |
(1,135) | (197) | (984) | (496) | (36) | (2,848) | ||||||||||||||||||
| Unfunded defined benefit pension schemes |
(91) | - | - | (30) | (3) | (124) | ||||||||||||||||||
| Total - defined benefit pension schemes |
(1,226) | (197) | (984) | (526) | (39) | (2,972) | ||||||||||||||||||
| Post-retirement healthcare obligations (unfunded) |
- | - | - | (4) | - | (4) | ||||||||||||||||||
| Long-term service commitments (unfunded) |
(6) | - | (5) | - | - | (11) | ||||||||||||||||||
| Actuarial value of liabilities (present value) |
(1,232) | (197) | (989) | (530) | (39) | (2,987) | ||||||||||||||||||
| 217 |
Table of Contents
CRH Annual Report on Form 20-F | 2015
27. Retirement Benefit Obligations | continued
The equivalent disclosure for the prior year is as follows:
Analysis of defined benefit expense
| Britain and | ||||||||||||||||||||
| Eurozone | Northern Ireland | Switzerland | United States | Total Group | ||||||||||||||||
| 2014 | 2014 | 2014 | 2014 | 2014 | ||||||||||||||||
| €m | €m | €m | €m | €m | ||||||||||||||||
| Charged in arriving at Group profit before finance costs: |
||||||||||||||||||||
| Current service cost |
11 | 14 | 24 | 2 | 51 | |||||||||||||||
| Administration expenses |
1 | 2 | - | - | 3 | |||||||||||||||
| Past service costs |
(5) | - | - | - | (5) | |||||||||||||||
| Subtotal |
7 | 16 | 24 | 2 | 49 | |||||||||||||||
| Included in finance income and finance costs respectively: |
||||||||||||||||||||
| Interest income on scheme assets |
(29) | (31) | (16) | (9) | (85) | |||||||||||||||
| Interest cost on scheme liabilities |
37 | 34 | 17 | 11 | 99 | |||||||||||||||
| Net interest expense |
8 | 3 | 1 | 2 | 14 | |||||||||||||||
| Net charge to Consolidated Income Statement |
15 | 19 | 25 | 4 | 63 | |||||||||||||||
| Reconciliation of scheme assets (bid value) |
||||||||||||||||||||
| At 1 January |
790 | 662 | 683 | 179 | 2,314 | |||||||||||||||
| Movement in year |
||||||||||||||||||||
| Administration expenses |
(1) | (2) | - | - | (3) | |||||||||||||||
| Interest income on scheme assets |
29 | 31 | 16 | 9 | 85 | |||||||||||||||
| Remeasurement adjustments |
||||||||||||||||||||
| - return on scheme assets excluding interest income |
87 | 54 | 34 | 4 | 179 | |||||||||||||||
| Employer contributions paid |
72 | 19 | 17 | 7 | 115 | |||||||||||||||
| Contributions paid by plan participants |
3 | - | 10 | - | 13 | |||||||||||||||
| Benefit and settlement payments |
(45) | (25) | (30) | (14) | (114) | |||||||||||||||
| Reclassified as held for sale |
- | (633) | - | - | (633) | |||||||||||||||
| Translation adjustment |
- | 49 | 15 | 26 | 90 | |||||||||||||||
| At 31 December |
935 | 155 | 745 | 211 | 2,046 | |||||||||||||||
| 218 |
Table of Contents
CRH Annual Report on Form 20-F | 2015
27. Retirement Benefit Obligations | continued
| Britain and | ||||||||||||||||||||
| Eurozone | Northern Ireland | Switzerland | United States | Total Group | ||||||||||||||||
| 2014 | 2014 | 2014 | 2014 | 2014 | ||||||||||||||||
| €m | €m | €m | €m | €m | ||||||||||||||||
| Reconciliation of actuarial value of liabilities |
||||||||||||||||||||
| At 1 January |
(1,045) | (723) | (727) | (229) | (2,724) | |||||||||||||||
| Movement in year |
||||||||||||||||||||
| Current service cost |
(11) | (14) | (24) | (2) | (51) | |||||||||||||||
| Past service costs |
5 | - | - | - | 5 | |||||||||||||||
| Interest cost on scheme liabilities |
(37) | (34) | (17) | (11) | (99) | |||||||||||||||
| Remeasurement adjustments |
||||||||||||||||||||
| - experience variations |
20 | 1 | 7 | - | 28 | |||||||||||||||
| - actuarial loss from changes in financial assumptions |
(306) | (129) | (142) | (27) | (604) | |||||||||||||||
| - actuarial loss from changes in demographic assumptions |
- | - | - | (17) | (17) | |||||||||||||||
| Contributions paid by plan participants |
(3) | - | (10) | - | (13) | |||||||||||||||
| Benefit and settlement payments |
45 | 25 | 30 | 14 | 114 | |||||||||||||||
| Reclassified as held for sale |
- | 714 | - | - | 714 | |||||||||||||||
| Translation adjustment |
- | (56) | (17) | (37) | (110) | |||||||||||||||
| At 31 December |
(1,332) | (216) | (900) | (309) | (2,757) | |||||||||||||||
| Recoverable deficit in schemes |
(397) | (61) | (155) | (98) | (711) | |||||||||||||||
| Related deferred income tax asset |
59 | 12 | 30 | 39 | 140 | |||||||||||||||
| Net pension liability |
(338) | (49) | (125) | (59) | (571) | |||||||||||||||
| Split of scheme liabilities - funded and unfunded |
||||||||||||||||||||
| Funded defined benefit pension schemes |
(1,274) | (930) | (894) | (297) | (3,395) | |||||||||||||||
| Unfunded defined benefit pension schemes |
(52) | - | - | (8) | (60) | |||||||||||||||
| Total - defined benefit pension schemes |
(1,326) | (930) | (894) | (305) | (3,455) | |||||||||||||||
| Post-retirement healthcare obligations (unfunded) |
- | - | - | (4) | (4) | |||||||||||||||
| Long-term service commitments (unfunded) |
(6) | - | (6) | - | (12) | |||||||||||||||
| Actuarial value of liabilities (present value) |
(1,332) | (930) | (900) | (309) | (3,471) | |||||||||||||||
| Reclassified as held for sale |
- | 714 | - | - | 714 | |||||||||||||||
| Actuarial value of liabilities (present value) excluding schemes reclassified as held for sale |
(1,332) | (216) | (900) | (309) | (2,757) | |||||||||||||||
| 219 |
Table of Contents
CRH Annual Report on Form 20-F | 2015
27. Retirement Benefit Obligations | continued
The analysis of defined benefit expense for 2013 is as follows:
| Britain and | ||||||||||||||||||||
| Eurozone | Northern Ireland | Switzerland | United States | Total Group | ||||||||||||||||
| 2013 | 2013 | 2013 | 2013 | 2013 | ||||||||||||||||
| €m | €m | €m | €m | €m | ||||||||||||||||
| Charged in arriving at Group profit before finance costs: |
||||||||||||||||||||
| Current service cost |
11 | 13 | 27 | - | 51 | |||||||||||||||
| Administration expenses |
1 | 1 | 1 | - | 3 | |||||||||||||||
| Past service costs |
(6) | (3) | (15) | - | (24) | |||||||||||||||
| Subtotal |
6 | 11 | 13 | - | 30 | |||||||||||||||
| Included in finance income and finance costs respectively: |
||||||||||||||||||||
| Interest income on scheme assets |
(27) | (26) | (12) | (6) | (71) | |||||||||||||||
| Interest cost on scheme liabilities |
39 | 30 | 14 | 10 | 93 | |||||||||||||||
| Net interest expense |
12 | 4 | 2 | 4 | 22 | |||||||||||||||
| Net charge to Consolidated Income Statement |
18 | 15 | 15 | 4 | 52 | |||||||||||||||
|
Past service costs also include curtailment and settlement gains. The 2013 curtailment gain arose due to the implementation of changes to the terms of a number of the Group’s defined benefit pension schemes in Switzerland. |
| |||||||||||||||||||
| 220 |
Table of Contents
CRH Annual Report on Form 20-F | 2015
27. Retirement Benefit Obligations | continued
Sensitivity analysis
The impact of a movement (as indicated below) in the principal actuarial assumptions would be as follows:
| Britain and | United States | |||||||||||||||||||||||||
| Eurozone | Northern Ireland | Switzerland | and Canada | Other | Total Group | |||||||||||||||||||||
| 2015 | 2015 | 2015 | 2015 | 2015 | 2015 | |||||||||||||||||||||
| €m | €m | €m | €m | €m | €m | |||||||||||||||||||||
| Scheme liabilities at 31 December 2015 |
(1,232) | (197) | (989) | (530) | (39) | (2,987) | ||||||||||||||||||||
| Revised liabilities |
||||||||||||||||||||||||||
| Discount rate |
Decrease by 0.25% | (1,284) | (210) | (1,035) | (549) | (39) | (3,117) | |||||||||||||||||||
| Inflation rate |
Increase by 0.25% | (1,280) | (204) | (989) | (530) | (39) | (3,042) | |||||||||||||||||||
| Life expectancy |
Increase by 1 year | (1,236) | (205) | (1,014) | (545) | (39) | (3,039) | |||||||||||||||||||
| The above sensitivity analysis are derived through changing the individual assumption while holding all other assumptions constant. |
| |||||||||||||||||||||||||
| Split of scheme assets |
||||||||||||||||||||||||||
| Investments quoted in active markets |
||||||||||||||||||||||||||
| Equity instruments: |
||||||||||||||||||||||||||
| - Developed markets |
290 | 90 | 282 | 108 | - | 770 | ||||||||||||||||||||
| - Emerging markets |
9 | 1 | - | - | - | 10 | ||||||||||||||||||||
| Debt instruments: |
||||||||||||||||||||||||||
| - Non Government debt instruments |
297 | 29 | 262 | 139 | - | 727 | ||||||||||||||||||||
| - Government debt instruments |
294 | 8 | 70 | 38 | 23 | 433 | ||||||||||||||||||||
| Property |
45 | 12 | 35 | - | - | 92 | ||||||||||||||||||||
| Cash and cash equivalents |
31 | - | - | 115 | 7 | 153 | ||||||||||||||||||||
| Investment funds |
15 | 18 | - | 15 | - | 48 | ||||||||||||||||||||
| Unquoted investments |
||||||||||||||||||||||||||
| Equity instruments: |
||||||||||||||||||||||||||
| - Developed markets |
10 | - | - | - | - | 10 | ||||||||||||||||||||
| - Emerging markets |
- | 5 | - | - | - | 5 | ||||||||||||||||||||
| Debt instruments: |
||||||||||||||||||||||||||
| - Non Government debt instruments |
1 | - | - | - | - | 1 | ||||||||||||||||||||
| Property |
3 | - | 98 | - | - | 101 | ||||||||||||||||||||
| Cash and cash equivalents |
18 | - | 11 | 1 | - | 30 | ||||||||||||||||||||
| Assets held by insurance company |
3 | - | 16 | - | - | 19 | ||||||||||||||||||||
| Total assets |
1,016 | 163 | 774 | 416 | 30 | 2,399 | ||||||||||||||||||||
| 221 |
Table of Contents
CRH Annual Report on Form 20-F | 2015
27. Retirement Benefit Obligations | continued
The equivalent disclosure for the prior year is as follows:
Split of scheme assets
| Britain and | ||||||||||||||||||||
| Eurozone | Northern Ireland | Switzerland | United States | Total Group | ||||||||||||||||
| 2014 | 2014 | 2014 | 2014 | 2014 | ||||||||||||||||
| €m | €m | €m | €m | €m | ||||||||||||||||
| Investments quoted in active markets |
||||||||||||||||||||
| Equity instruments: |
||||||||||||||||||||
| - Developed markets |
281 | 329 | 260 | 69 | 939 | |||||||||||||||
| - Emerging markets |
10 | 55 | - | - | 65 | |||||||||||||||
| Debt instruments: |
||||||||||||||||||||
| - Non Government debt instruments |
279 | 166 | 226 | 59 | 730 | |||||||||||||||
| - Government debt instruments |
265 | 165 | 65 | 67 | 562 | |||||||||||||||
| Property |
37 | 41 | 31 | - | 109 | |||||||||||||||
| Cash and cash equivalents |
16 | 2 | - | 16 | 34 | |||||||||||||||
| Investment funds |
24 | 17 | - | - | 41 | |||||||||||||||
| Unquoted investments |
||||||||||||||||||||
| Equity instruments: |
||||||||||||||||||||
| - Developed markets |
- | - | 1 | - | 1 | |||||||||||||||
| - Emerging markets |
- | 6 | - | - | 6 | |||||||||||||||
| Debt instruments: |
||||||||||||||||||||
| - Non Government debt instruments |
- | - | 2 | - | 2 | |||||||||||||||
| Property |
3 | - | 97 | - | 100 | |||||||||||||||
| Cash and cash equivalents |
17 | 7 | 44 | - | 68 | |||||||||||||||
| Assets held by insurance company |
3 | - | 19 | - | 22 | |||||||||||||||
| Total assets |
935 | 788 | 745 | 211 | 2,679 | |||||||||||||||
| Reclassified as held for sale |
- | (633) | - | - | (633) | |||||||||||||||
| Total excluding schemes reclassified as held for sale |
935 | 155 | 745 | 211 | 2,046 | |||||||||||||||
| 222 |
Table of Contents
CRH Annual Report on Form 20-F | 2015
27. Retirement Benefit Obligations | continued
Actuarial valuations - funding requirements and future cash flows
In accordance with statutory requirements in Ireland and Britain (minimum funding requirements), additional annual contributions and lump-sum payments are required to certain of the schemes in place in those jurisdictions. The funding requirements in relation to the Group’s defined benefit schemes are assessed in accordance with the advice of independent and qualified actuaries and valuations are prepared in this regard either annually, where local requirements mandate that this be done, or at triennial intervals at a maximum in all other cases. In Ireland and Britain, either the attained age or projected unit credit methods are used in the valuations. In the Netherlands and Switzerland, the actuarial valuations reflect the current unit method, while the valuations are performed in accordance with the projected unit credit methodology in Germany. In the United States, valuations are performed using a variety of actuarial cost methodologies - current unit, projected unit and aggregate cost. In Canada, the projected unit credit method is used in valuations. The dates of the actuarial valuations range from January 2013 to December 2015.
In general, actuarial valuations are not available for public inspection; however, the results of valuations are advised to the members of the various schemes on request.
The maturity profile of the Group’s contracted payments (on a discounted basis) to certain schemes in the Eurozone (Ireland) and Britain and Northern Ireland is as follows:
| Eurozone | Britain and Northern Ireland |
Total | ||||||||||||||||||||||||||||||||||
| 2015 | 2014 | 2013 | 2015 | 2014 | 2013 | 2015 | 2014 | 2013 | ||||||||||||||||||||||||||||
| €m | €m | €m | €m | €m | €m | €m | €m | €m | ||||||||||||||||||||||||||||
| Within one year | 18 | 18 | 18 | 2 | 8 | 7 | 20 | 26 | 25 | |||||||||||||||||||||||||||
| Between one and two years | 17 | 17 | 17 | 2 | 8 | 7 | 19 | 25 | 24 | |||||||||||||||||||||||||||
| Between two and three years | 17 | 17 | 16 | 2 | 7 | 7 | 19 | 24 | 23 | |||||||||||||||||||||||||||
| Between three and four years | - | 17 | 16 | 2 | 7 | 6 | 2 | 24 | 22 | |||||||||||||||||||||||||||
| Between four and five years | - | - | 15 | 2 | 7 | 6 | 2 | 7 | 21 | |||||||||||||||||||||||||||
| After five years | - | - | - | 11 | 48 | 47 | 11 | 48 | 47 | |||||||||||||||||||||||||||
| 52 | 69 | 82 | 21 | 85 | 80 | 73 | 154 | 162 | ||||||||||||||||||||||||||||
Employer contributions payable in the 2016 financial year including minimum funding payments (expressed using year-end exchange rates for 2015) are estimated at €105 million.
| Average | duration and scheme composition |
| Eurozone | Britain and Northern Ireland |
Switzerland | United States and Canada |
|||||||||||||||||||||||||||||||||||||||||||||
| 2015 | 2014 | 2013 | 2015 | 2014 | 2013 | 2015 | 2014 | 2013 | 2015 | 2014 | 2013 | |||||||||||||||||||||||||||||||||||||
| Average duration of defined benefit obligation | 14.7 | 16.0 | 15.9 | 19.9 | 17.5 | 18.1 | 18.0 | 16.0 | 16.0 | 14.0 | 12.0 | 13.3 | ||||||||||||||||||||||||||||||||||||
| (years) | ||||||||||||||||||||||||||||||||||||||||||||||||
| Allocation of defined benefit obligation by participant: | ||||||||||||||||||||||||||||||||||||||||||||||||
| Active plan participants | 64% | 37% | 39% | 30% | 27% | 27% | 85% | 85% | 86% | 45% | 35% | 36% | ||||||||||||||||||||||||||||||||||||
| Deferred plan participants | 12% | 21% | 20% | 38% | 34% | 34% | - | - | - | 17% | 30% | 30% | ||||||||||||||||||||||||||||||||||||
| Retirees | 24% | 42% | 41% | 32% | 39% | 39% | 15% | 15% | 14% | 38% | 35% | 34% | ||||||||||||||||||||||||||||||||||||
| 223 |
Table of Contents
CRH Annual Report on Form 20-F | 2015
28. Share Capital and Reserves
| 2015 | 2014 | |||||||||||||||
| Ordinary | Income | Ordinary | Income | |||||||||||||
| Shares of | Shares of | Shares of | Shares of | |||||||||||||
| Equity Share Capital | €0.32 each (i) | €0.02 each (ii) | €0.32 each (i) | €0.02 each (ii) | ||||||||||||
| Authorised | ||||||||||||||||
| At 1 January (€m) | 320 | 20 | 320 | 20 | ||||||||||||
| Increase in authorised share capital | 80 | 5 | - | - | ||||||||||||
| At 31 December (€m) | 400 | 25 | 320 | 20 | ||||||||||||
| Number of Shares at 1 January (‘000s) | 1,000,000 | 1,000,000 | 1,000,000 | 1,000,000 | ||||||||||||
| Increase in number of Shares (‘000s) | 250,000 | 250,000 | - | - | ||||||||||||
| Number of Shares at 31 December (‘000s) | 1,250,000 | 1,250,000 | 1,000,000 | 1,000,000 | ||||||||||||
| Allotted, called-up and fully paid | ||||||||||||||||
| At 1 January (€m) | 239 | 14 | 237 | 14 | ||||||||||||
| Issue of share capital - equity placing | 25 | 1 | - | - | ||||||||||||
| Issue of scrip shares in lieu of cash dividends (iii) | 2 | - | 2 | - | ||||||||||||
| At 31 December (€m) | 266 | 15 | 239 | 14 | ||||||||||||
| The movement in the number of shares (expressed in ‘000s) during the financial year was as follows: | ||||||||||||||||
| At 1 January | 744,525 | 744,525 | 739,231 | 739,231 | ||||||||||||
| Issue of share capital - equity placing | 74,040 | 74,040 | - | - | ||||||||||||
| Issue of scrip shares in lieu of cash dividends (iii) | 5,345 | 5,345 | 5,294 | 5,294 | ||||||||||||
| At 31 December | 823,910 | 823,910 | 744,525 | 744,525 | ||||||||||||
| (i) | The Ordinary Shares represent 93.73% of the total issued share capital. |
| (ii) | The Income Shares, which represent 5.86% of the total issued share capital, were created on 29 August 1988 for the express purpose of giving shareholders the choice of receiving dividends on either their Ordinary Shares or on their Income Shares (by notice of election to the Company). The Income Shares carried a different tax credit to the Ordinary Shares. The creation of the Income Shares was achieved by the allotment of fully paid Income Shares to each shareholder equal to his/her holding of Ordinary Shares but the shareholder is not entitled to an Income Share certificate, as a certificate for Ordinary Shares is deemed to include an equal number of Income Shares and a shareholder may only sell, transfer or transmit Income Shares with an equivalent number of Ordinary Shares. Income Shares carry no voting rights. Due to changes in Irish tax legislation since the creation of the Income Shares, dividends on the Company’s shares no longer carry a tax credit. As elections made by shareholders to receive dividends on their holding of Income Shares were no longer relevant, the Articles of Association were amended on 8 May 2002 to cancel such elections. |
| 224 |
Table of Contents
CRH Annual Report on Form 20-F | 2015
28. Share Capital and Reserves | continued
Share schemes
The aggregate number of shares which may be committed for issue in respect of any share option scheme, savings-related share option scheme, share participation scheme, performance share plan or any subsequent option scheme or share plan, may not exceed 10% of the issued ordinary share capital from time to time.
Share option schemes
Details of share options granted under the Company’s share option schemes and the terms attaching thereto are provided in note 7 to the financial statements and on page 130 of the Directors’ Remuneration Report.
| Number of Shares | ||||||||
| 2015 | 2014 | |||||||
| Options exercised during the year (satisfied by the reissue of Treasury Shares) |
2,876,066 | 1,307,406 | ||||||
Share participation schemes
As at 31 December 2015, 7,613,252 (2014: 7,509,125) Ordinary Shares had been appropriated to participation schemes. In the financial year ended 31 December 2015, the appropriation of 104,127 shares was satisfied by the reissue of Treasury Shares (2014: 123,078). The Ordinary Shares appropriated pursuant to these schemes were issued at market value on the dates of appropriation. The shares issued pursuant to these schemes are excluded from the scope of IFRS 2 Share-based Payment and are hence not factored into the expense computation and the associated disclosures in note 7.
| (iii) | Issue of scrip shares in lieu of cash dividends: |
| Number of Shares | Price per Share | |||||||||||||||||||||||
| 2015 | 2014 | 2013 | 2015 | 2014 | 2013 | |||||||||||||||||||
| May 2015 - Final 2014 dividend (2014: Final 2013 dividend; |
5,056,633 | 4,081,636 | 2,011,165 | € | 24.60 | € | 20.99 | € | 17.01 | |||||||||||||||
| October 2015 - Interim 2015 dividend (2014: Interim 2014 dividend; |
288,769 | 1,212,700 | 3,398,992 | € | 26.16 | € | 17.81 | € | 15.79 | |||||||||||||||
| Total |
5,345,402 | 5,294,336 | 5,410,157 | |||||||||||||||||||||
| 225 |
Table of Contents
CRH Annual Report on Form 20-F | 2015
28. Share Capital and Reserves | continued
| 5% Cumulative Preference Shares of €1.27 each (iv) |
7% ‘A’ Cumulative Preference Shares of €1.27 each (v) |
|||||||||||||||
| Preference Share Capital | Number of Shares ‘000s |
€m | Number of Shares ‘000s |
€m | ||||||||||||
| Authorised | ||||||||||||||||
| At 1 January 2015 and 31 December 2015 | 150 | - | 872 | 1 | ||||||||||||
| Allotted, called-up and fully paid | ||||||||||||||||
| At 1 January 2015 and 31 December 2015 | 50 | - | 872 | 1 | ||||||||||||
There was no movement in the number of cumulative preference shares in either the current or the prior year.
| (iv) | The holders of the 5% Cumulative Preference Shares are entitled to a fixed cumulative preference dividend at a rate of 5% per annum and priority in a winding-up to repayment of capital, but have no further right to participate in profits or assets and are not entitled to be present or vote at general meetings unless their dividend is in arrears. Dividends on the 5% Cumulative Preference Shares are payable half-yearly on 15 April and 15 October in each year. The 5% Cumulative Preference Shares represent 0.02% of the total issued share capital. |
| (v) | The holders of the 7% ‘A’ Cumulative Preference Shares are entitled to a fixed cumulative preference dividend at a rate of 7% per annum, and subject to the rights of the holders of the 5% Cumulative Preference Shares, priority in a winding-up to repayment of capital, but have no further right to participate in profits or assets and are not entitled to be present or vote at general meetings unless their dividend is in arrears or unless the business of the meeting includes certain matters, which are specified in the Articles of Association. Dividends on the 7% ‘A’ Cumulative Preference Shares are payable half-yearly on 5 April and 5 October in each year. The 7% ‘A’ Cumulative Preference Shares represent 0.39% of the total issued share capital. |
| Treasury Shares/own shares | 2015 | 2014 | ||||||
| €m | €m | |||||||
| At 1 January | (76) | (118) | ||||||
| Treasury Shares/own shares reissued | 51 | 42 | ||||||
| Shares acquired by Employee Benefit Trust (own shares) | (3) | - | ||||||
| At 31 December | (28) | (76) | ||||||
As at the balance sheet date, the total number of Treasury Shares held was 795,262 (2014: 3,775,455); the nominal value of these shares was €0.3 million (2014: €1 million). During the year ended 31 December 2015, 2,980,193 (2014: 1,430,484) shares were reissued to satisfy exercises and appropriations under the Group’s share option and share participation schemes. These reissued Treasury Shares were previously purchased at an average price of €17.12 (2014: €19.40). No Treasury Shares were purchased during 2015 or 2014.
During 2015, the Employee Benefit Trust purchased 95,843 shares on behalf of CRH plc in respect of awards under the 2014 Deferred Share Bonus Plan. These shares were purchased at a price of £19.79 (€26.74) per share. As at 31 December 2015, the Employee Benefit Trust held 489,654 Ordinary Shares on behalf of CRH plc in respect of awards made under the 2013 Restricted Share Plan and the 2014 Deferred Share Bonus Plan. The nominal value of own shares, on which dividends have been waived by the Trustees in respect of the 2013 Restricted Share Plan and the 2014 Deferred Share Bonus Plan amounted to €0.2 million at 31 December 2015 (2014: €0.1 million).
| 226 |
Table of Contents
CRH Annual Report on Form 20-F | 2015
28. Share Capital and Reserves | continued
Reconciliation of shares issued to net proceeds
| 2015 | 2014 | 2013 | ||||||||||
| €m | €m | €m | ||||||||||
| Shares issued at nominal amount: | ||||||||||||
| - share capital issued - equity placing | 26 | - | - | |||||||||
| - scrip shares issued in lieu of cash dividends | 2 | 2 | 2 | |||||||||
| Premium on shares issued | 1,722 | 105 | 86 | |||||||||
| Total value of shares issued | 1,750 | 107 | 88 | |||||||||
| Issue of scrip shares in lieu of cash dividends (note 11) | (132) | (107) | (88) | |||||||||
| Proceeds from issue of shares | 1,618 | - | - | |||||||||
| Expenses paid in respect of share issues | (25) | - | - | |||||||||
| Net proceeds from issue of shares | 1,593 | - | - | |||||||||
In connection with the acquisition of LH Assets, CRH completed a placing of 74,039,915 new ordinary shares in February 2015, raising gross proceeds of approximately €1.6 billion, and representing approximately 9.99% of CRH’s issued ordinary share capital before the placing.
Share Premium
| 2015 | 2014 | |||||||
| €m | €m | |||||||
| At 1 January | 4,324 | 4,219 | ||||||
| Premium arising on shares issued | 1,722 | 105 | ||||||
| Expenses paid in respect of shares issued | (25) | - | ||||||
| At 31 December | 6,021 | 4,324 | ||||||
29. Commitments under Operating and Finance Leases
Operating leases
Future minimum rentals payable under non-cancellable operating leases at 31 December are as follows:
| 2015 | 2014 | 2013 | ||||||||||
| €m | €m | €m | ||||||||||
| Within one year | 370 | 310 | 301 | |||||||||
| After one year but not more than five years | 915 | 663 | 596 | |||||||||
| More than five years | 831 | 417 | 357 | |||||||||
| 2,116 | 1,390 | 1,254 | ||||||||||
Finance leases
Future minimum lease payments under finance leases are not material for the Group.
| 227 |
Table of Contents
CRH Annual Report on Form 20-F | 2015
30. Business Combinations
The acquisitions completed during the year ended 31 December 2015 by reportable segment, together with the completion dates, are detailed below; these transactions entailed the acquisition of an effective 100% stake except where indicated to the contrary:
Europe Heavyside:
Poland: selected assets of Stal-Bruk Sp. z o.o. (1 December).
Europe Lightside:
Australia: BVCI Pty Limited (5 June), Netherlands: increased stake in Handelsmaatschappij Caralu B.V. from 50% to 100% (30 November).
Europe Distribution:
Switzerland: Kiener & Wittlin (1 August).
Americas Materials:
Idaho: assets formerly of Gordon Paving (25 March); Iowa: selected assets of McAlister Aggregates (23 February); Michigan and North Carolina: Colas’ Barrett and Larco assets (27 March); New York: assets of Hudson River Construction Company and Albany Asphalt & Aggregates (3 April); Ohio: increased stake in Scioto Materials LLC from 50% to 51% (1 July); Texas: selected assets of State Development Corporation (11 May), selected assets of Martin Marietta (23 October); Utah: selected assets of Kunkler Trust (15 October); Virginia: increased stake in Boxley Aggregates from 50% to 100% and the selected assets of the Boxley Corporation (31 December); Canada: selected assets of Promix Beton (30 October).
Americas Products:
C.R. Laurence (“CRL”) (3 September), headquartered in Los Angeles, California with operations in 33 sites in North America in addition to the United Kingdom, Germany, Denmark and Australia; Arizona: Western Block Company (17 December); Minnesota: Anchor Wall Systems, Inc. and Anchor Block Company (8 June); Tennessee: Red River Concrete Products (17 December).
LH Assets:
On 31 July 2015 (and 15 September 2015 for the Philippines) CRH acquired certain assets of Lafarge S.A. and Holcim Limited. The acquired assets consist of over 700 locations in 11 countries: Brazil, Canada, France (including La Reunion), Germany, Hungary, the Philippines (55%), Romania, Serbia, Slovakia, the United Kingdom and the United States.
| 228 |
Table of Contents
CRH Annual Report on Form 20-F | 2015
30. Business Combinations | continued
| Other | ||||||||||||||||||||||||
| LH Assets | CRL | acquisitions | Total | Total | Total | |||||||||||||||||||
| 2015 | 2015 | 2015 | 2015 | 2014 | 2013 | |||||||||||||||||||
| €m | €m | €m | €m | €m | €m | |||||||||||||||||||
| Assets |
||||||||||||||||||||||||
| Non-current assets | ||||||||||||||||||||||||
| Property, plant and equipment | 5,288 | 26 | 99 | 5,413 | 91 | 342 | ||||||||||||||||||
| Intangible assets | 26 | 252 | 20 | 298 | 16 | 39 | ||||||||||||||||||
| Equity accounted investments | 24 | - | - | 24 | - | 2 | ||||||||||||||||||
| Other financial assets | 5 | - | - | 5 | - | - | ||||||||||||||||||
| Total non-current assets | 5,343 | 278 | 119 | 5,740 | 107 | 383 | ||||||||||||||||||
| Current assets | ||||||||||||||||||||||||
| Inventories | 492 | 105 | 24 | 621 | 23 | 41 | ||||||||||||||||||
| Trade and other receivables (i) | 1,445 | 69 | 19 | 1,533 | 20 | 53 | ||||||||||||||||||
| Cash and cash equivalents | 463 | 29 | 2 | 494 | 1 | 11 | ||||||||||||||||||
| Total current assets | 2,400 | 203 | 45 | 2,648 | 44 | 105 | ||||||||||||||||||
| Liabilities | ||||||||||||||||||||||||
| Trade and other payables | (1,500) | (31) | (18) | (1,549) | (17) | (80) | ||||||||||||||||||
| Provisions for liabilities | (580) | - | (1) | (581) | (1) | (14) | ||||||||||||||||||
| Retirement benefit obligations | (87) | - | - | (87) | - | - | ||||||||||||||||||
| Interest-bearing loans and borrowings and finance leases | (169) | (6) | - | (175) | (7) | (44) | ||||||||||||||||||
| Current income tax liabilities | (147) | (2) | - | (149) | - | - | ||||||||||||||||||
| Deferred income tax liabilities | (520) | (106) | (1) | (627) | (2) | (8) | ||||||||||||||||||
| Total liabilities | (3,003) | (145) | (20) | (3,168) | (27) | (146) | ||||||||||||||||||
| Total identifiable net assets at fair value | 4,740 | 336 | 144 | 5,220 | 124 | 342 | ||||||||||||||||||
| Goodwill arising on acquisition (ii) | 2,307 | 833 | 47 | 3,187 | 31 | 169 | ||||||||||||||||||
| Excess of fair value of identifiable net assets over consideration paid (ii) | - | - | - | - | - | (2) | ||||||||||||||||||
| Joint Ventures becoming subsidiaries | - | - | (25) | (25) | - | - | ||||||||||||||||||
| Non-controlling interests* | (486) | - | (3) | (489) | - | (1) | ||||||||||||||||||
| Total consideration | 6,561 | 1,169 | 163 | 7,893 | 155 | 508 | ||||||||||||||||||
| Consideration satisfied by: | ||||||||||||||||||||||||
| Cash payments | 6,561 | 1,072 | 157 | 7,790 | 152 | 347 | ||||||||||||||||||
| Asset exchange (note 4) | - | - | - | - | - | 144 | ||||||||||||||||||
| Deferred consideration (stated at net present cost) | - | 97 | - | 97 | 1 | 4 | ||||||||||||||||||
| Contingent consideration | - | - | - | - | 2 | 13 | ||||||||||||||||||
| Profit on step acquisition | - | - | 6 | 6 | - | - | ||||||||||||||||||
| Total consideration | 6,561 | 1,169 | 163 | 7,893 | 155 | 508 | ||||||||||||||||||
| Net cash outflow arising on acquisition | ||||||||||||||||||||||||
| Cash consideration | 6,561 | 1,072 | 157 | 7,790 | 152 | 347 | ||||||||||||||||||
| Less: cash and cash equivalents acquired | (463) | (29) | (2) | (494) | (1) | (11) | ||||||||||||||||||
| Total outflow in the Consolidated Statement of Cash Flows | 6,098 | 1,043 | 155 | 7,296 | 151 | 336 | ||||||||||||||||||
| * | Measured at fair value. |
| 229 |
Table of Contents
CRH Annual Report on Form 20-F | 2015
30. Business Combinations | continued
The acquisitions of LH Assets and CRL have been deemed to be material acquisitions. None of the remaining acquisitions completed during the financial years 2015, 2014 or 2013 were considered sufficiently material to warrant separate disclosure. The acquisition of LH Assets was completed in the second half of 2015 and spanned 11 countries. The fair value of the identifiable net assets acquired was €4.2 billion (after deducting non-controlling interests of €0.5 billion) and the transaction resulted in the recognition of €2.3 billion of goodwill. Due to both the timing of when the acquisition was completed and the size and scale of the acquisition, the allocation of the purchase price and the determination of the fair values of identifiable assets acquired and liabilities assumed as disclosed above are only provisional (principally PP&E, provisions and the associated goodwill and deferred tax impacts). The fair value assigned to identifiable assets and liabilities acquired is based on estimates and assumptions made by management at the time of acquisition. CRH may revise its preliminary purchase price allocation during the 12 month window as permitted under IFRS 3 Business Combinations. Where the impact of these revisions is sufficiently material, it may result in the restatement of the 2015 Consolidated Balance Sheet to take account of these valuation updates; where the impact is not material, CRH will provide additional disclosures to outline the adjustments made.
The balance sheet as disclosed above for CRL should also be considered provisional (principally intangible assets and the related deferred tax impacts) and will be subject to the same requirements as outlined above for LH Assets.
(i) Trade and other receivables
| Gross contractual amounts due |
Allowance for impairment |
Fair value | ||||||||||||||||||||||||||||||||||
|
2015 €m |
2014 €m |
2013 €m |
2015 €m |
2014 €m |
2013 €m |
2015 €m |
2014 €m |
2013 €m |
||||||||||||||||||||||||||||
| LH Assets | 1,499 | - | - | (54) | - | - | 1,445 | - | - | |||||||||||||||||||||||||||
| CRL | 70 | - | - | (1) | - | - | 69 | - | - | |||||||||||||||||||||||||||
| Other acquisitions | 19 | 22 | 57 | - | (2) | (4) | 19 | 20 | 53 | |||||||||||||||||||||||||||
| 1,588 | 22 | 57 | (55) | (2) | (4) | 1,533 | 20 | 53 | ||||||||||||||||||||||||||||
(ii) The principal factor contributing to the recognition of goodwill on acquisitions entered into by the Group is the realisation of cost savings and other synergies with existing entities in the Group which do not qualify for separate recognition as intangible assets. Due to the asset-intensive nature of operations in the Europe Heavyside and Americas Materials business segments, no significant intangible assets are recognised on business combinations in these segments. €254 million of the goodwill recognised in respect of acquisitions completed in 2015 is expected to be deductible for tax purposes (2014: €18 million). No excess of fair value of identifiable net assets over consideration arose during the year (2014: €nil million; 2013: €2 million).
Acquisition-related costs
| 2015 | 2014 | 2013 | ||||||||||
| €m | €m | €m | ||||||||||
| LH Assets | 144 | - | - | |||||||||
| CRL | 6 | - | - | |||||||||
| Other acquisitions | 2 | 2 | 2 | |||||||||
| 152 | 2 | 2 | ||||||||||
Acquisition-related costs amounting to €152 million (2014: €2 million; 2013: €2 million), have been included in operating costs in the Consolidated Income Statement (note 2).
| 230 |
Table of Contents
CRH Annual Report on Form 20-F | 2015
30. Business Combinations | continued
The following table analyses the 19 acquisitions (2014: 21 acquisitions; 2013: 25 acquisitions) by reportable segment and provides details of the goodwill and consideration figures arising in each of those segments:
| Reportable segments | Number of acquisitions
|
Goodwill
|
Consideration
|
|||||||||||||||||||||||||||||||||
| 2015 | 2014 | 2013 | 2015 | 2014 | 2013 | 2015 | 2014 | 2013 | ||||||||||||||||||||||||||||
| €m | €m | €m | €m | €m | €m | |||||||||||||||||||||||||||||||
| Europe Heavyside | 1 | 2 | 6 | - | 2 | 80 | 5 | 7 | 265 | |||||||||||||||||||||||||||
| Europe Lightside | 2 | - | - | 6 | - | - | 12 | - | - | |||||||||||||||||||||||||||
| Europe Distribution | 1 | 6 | 3 | - | 9 | 10 | 1 | 20 | 15 | |||||||||||||||||||||||||||
| Europe | 4 | 8 | 9 | 6 | 11 | 90 | 18 | 27 | 280 | |||||||||||||||||||||||||||
| Americas Materials | 10 | 8 | 9 | 32 | 5 | 19 | 80 | 71 | 76 | |||||||||||||||||||||||||||
| Americas Products | 3 | 5 | 4 | 9 | 17 | 48 | 65 | 59 | 124 | |||||||||||||||||||||||||||
| Americas Distribution | - | - | 3 | - | - | 8 | - | - | 22 | |||||||||||||||||||||||||||
| Americas | 13 | 13 | 16 | 41 | 22 | 75 | 145 | 130 | 222 | |||||||||||||||||||||||||||
| Unallocated goodwill (note 14) | ||||||||||||||||||||||||||||||||||||
| LH Assets | 1 | - | - | 2,307 | - | - | 6,561 | - | - | |||||||||||||||||||||||||||
| CRL | 1 | - | - | 833 | - | - | 1,169 | - | - | |||||||||||||||||||||||||||
| Total Group | 19 | 21 | 25 | 3,187 | 33 | 165 | 7,893 | 157 | 502 | |||||||||||||||||||||||||||
| Adjustments to provisional fair values of prior year acquisitions | - | (2) | 4 | - | (2) | 6 | ||||||||||||||||||||||||||||||
| Total | 3,187 | 31 | 169 | 7,893 | 155 | 508 | ||||||||||||||||||||||||||||||
| 231 |
Table of Contents
CRH Annual Report on Form 20-F | 2015
30. Business Combinations | continued
The post-acquisition impact of acquisitions completed during the year on the Group’s profit/(loss) for the financial year was as follows:
| Other | ||||||||||||||||||||||||
| LH Assets | CRL | acquisitions | Total | Total | Total | |||||||||||||||||||
| 2015 | 2015 | 2015 | 2015 | 2014 | 2013 | |||||||||||||||||||
| €m | €m | €m | €m | €m | €m | |||||||||||||||||||
| Revenue | 2,418 | 162 | 99 | 2,679 | 122 | 306 | ||||||||||||||||||
| (Loss)/profit before tax for the financial year | (26) | 13 | 6 | (7) | 7 | 8 | ||||||||||||||||||
The revenue and profit of the Group for the financial year determined in accordance with IFRS as though the acquisitions effected during the year had been at the beginning of the year would have been as follows:
| Pro-forma 2015 | ||||||||||||||||
| 2015 acquisitions €m |
CRH Group excluding 2015 acquisitions €m |
Pro-forma consolidated Group €m |
Pro-forma 2014 €m |
|||||||||||||
| Revenue | 6,261 | 20,956 | 27,217 | 18,972 | ||||||||||||
| Profit before tax for the financial year | 201 | 1,040 | 1,241 | 764 | ||||||||||||
| Pro-forma 2014 | ||||||||||||||||
| 2014 acquisitions €m |
CRH Group excluding 2014 acquisitions €m |
Pro-forma consolidated Group €m |
Pro-forma 2013 €m |
|||||||||||||
| Revenue | 182 | 18,790 | 18,972 | 18,159 | ||||||||||||
| Profit/(loss) before tax for the financial year | 10 | 754 | 764 | (220) | ||||||||||||
In accordance with the terms of the acquisition agreements, CRH and Lafarge S.A Holcim Limited are currently engaged in a process to finalise the post-completion consideration for the acquisition of the LH Assets as detailed above. That process is not sufficiently advanced to make a financial adjustment in respect of the final purchase price. CRH will continue to monitor the situation and will reflect any financial adjustments when there is sufficient evidence.
There have been no acquisitions completed subsequent to the balance sheet date which would be individually material to the Group, thereby requiring disclosure under either IFRS 3 or IAS 10 Events after the Balance Sheet Date. Development updates, giving details of acquisitions which do not require separate disclosure on the grounds of materiality, are typically published in January and July each year.
| 232 |
Table of Contents
CRH Annual Report on Form 20-F | 2015
31. Non-controlling Interests
The total non-controlling interest at 31 December 2015 is €529 million (2014: €21 million) of which €467 million relates to Republic Cement & Building Materials (RCBM), Inc. and Luzon Continental Land Corporation (LCLC). The non-controlling interests in respect of the Group’s other subsidiaries are not considered to be material.
| Economic ownership | ||||||
| Name | Principal activity | Country of incorporation | interest held by non- | |||
| controlling interest | ||||||
| Republic Cement & Building Materials, Inc. and Luzon Continental Land Corporation |
Manufacture, development and sale of cement and building materials
|
Philippines | 45% |
The following is summarised financial information for Republic Cement & Building Materials, Inc. and Luzon Continental Land Corporation prepared in accordance with IFRS 12 Disclosure of Interests in Other Entities. This information is before intragroup eliminations with other Group companies.
Summarised financial information
| 2015 €m |
||||
| Loss for the period since acquisition | (5) | |||
| Current assets | 141 | |||
| Non-current assets | 1,459 | |||
| Current liabilities | (150) | |||
| Non-current liabilities | (675) | |||
| Net assets | 775 | |||
| Cash flows from operating activities | (2) | |||
| Dividends paid to non-controlling interests during the period | (1) | |||
CRH holds 40% of the equity share capital in RCBM and LCLC and has an economic interest of 55% of the combined Philippines business. Non-controlling interest relates to another party who holds 60% of the equity share capital in RCBM and LCLC and has an economic interest of 45% of the combined Philippines business. CRH has obtained control (as defined under IFRS 10 Consolidated Financial Statements) by virtue of contractual arrangements which give CRH power to direct the relevant non-nationalised activities of the business, in compliance with Philippine law.
| 233 |
Table of Contents
CRH Annual Report on Form 20-F | 2015
32. Related Party Transactions
The principal related party relationships requiring disclosure in the Consolidated Financial Statements of the Group under IAS 24 Related Party Disclosures pertain to: the existence of subsidiaries, joint ventures and associates; transactions with these entities entered into by the Group; the identification and compensation of key management personnel; and lease arrangements.
Subsidiaries, joint ventures and associates
The Consolidated Financial Statements include the financial statements of the Company (CRH plc, the ultimate parent) and its subsidiaries, joint ventures and associates as documented in the accounting policies on pages 161 to 171. The Group’s principal subsidiaries, joint ventures and associates are disclosed in Exhibit 8 of this Annual Report on Form 20F.
Sales to and purchases from joint ventures are immaterial in 2015, 2014 and 2013. Loans extended by the Group to joint ventures and associates (see note 15) are included in financial assets. Sales to and purchases from associates during the financial year ended 31 December 2015 amounted to €48 million (2014: €33 million; 2013: €24 million) and €422 million (2014: €411 million; 2013: €411 million) respectively. Amounts receivable from and payable to equity accounted investments (arising from the aforementioned sales and purchases transactions) as at the balance sheet date are included as separate line items in notes 17 and 18 to the Consolidated Financial Statements.
Terms and conditions of transactions with subsidiaries, joint ventures and associates
In general, the transfer pricing policy implemented by the Group across its subsidiaries is market-based. Sales to and purchases from joint ventures and associates are conducted in the ordinary course of business and on terms equivalent to those that prevail in arm’s-length transactions. The outstanding balances included in receivables and payables as at the balance sheet date in respect of transactions with joint ventures and associates are unsecured and settlement arises in cash. No guarantees have been either requested or provided in relation to related party receivables and payables. Loans to joint ventures and associates (as disclosed in note 15) are extended on normal commercial terms in the ordinary course of business with interest accruing and, in general, paid to the Group at predetermined intervals.
Key management personnel
For the purposes of the disclosure requirements of IAS 24, the term “key management personnel” (i.e. those persons having authority and responsibility for planning, directing and controlling the activities of the Company) comprises the Board of Directors which manages the business and affairs of the Company.
Key management remuneration amounted to:
| 2015 | 2014 | 2013 | ||||||||||
| €m | €m | €m | ||||||||||
| Short-term benefits | 10 | 9 | 7 | |||||||||
| Post-employment benefits | 1 | 1 | 2 | |||||||||
| Share-based payments - calculated in accordance with the principles disclosed in note 7 | 2 | 2 | 2 | |||||||||
| Total | 13 | 12 | 11 | |||||||||
Other than these compensation entitlements, there were no other transactions involving key management personnel.
Lease arrangements
CRH has a number of lease arrangements in place with related parties across the Group, which have been negotiated on an arm’s-length basis at market rates. We do not consider these arrangements to be material either individually or collectively in the context of the 2015, 2014 and 2013 Consolidated Financial Statements.
| 234 |
Table of Contents
CRH Annual Report on Form 20-F | 2015
33. Supplemental Guarantor Information
The following consolidating information presents Condensed Consolidated Balance Sheets as at 31 December 2015 and 2014 and Condensed Consolidated Income Statements and Condensed Consolidated Statements of Comprehensive Income and Condensed Consolidated Cash Flows for the years ended 31 December 2015, 2014 and 2013 of the Company and CRH America, Inc. as required by Article 3-10(c) of Regulation S-X. This information is prepared in accordance with IFRS with the exception that the subsidiaries are accounted for as investments under the equity method rather than being consolidated. CRH America, Inc. is 100% owned by the Company. The Guarantees of the Guarantor are full and unconditional.
CRH America Inc. (the “Issuer”) has the following notes which are fully and unconditionally guaranteed by CRH plc (the “Guarantor”):
US$113.746 million 4.125% Notes due 2016 – listed on the New York Stock Exchange
US$518.463 million 6.000% Notes due 2016 – listed on the New York Stock Exchange
US$650 million 8.125% Notes due 2018 – listed on the New York Stock Exchange
US$400 million 5.750% Notes due 2021 – listed on the New York Stock Exchange
US$1,250 million 3.875% Notes due 2025 – listed on the Irish Stock Exchange
US$300 million 6.40% Notes due 2033 – listed on the Irish Stock Exchange
US$500 million 5.125% Notes due 2045 – listed on the Irish Stock Exchange
| 235 |
Table of Contents
CRH Annual Report on Form 20-F | 2015
33. Supplemental Guarantor Information | continued
Supplemental Condensed Consolidated Balance Sheet as at 31 December 2015
| Guarantor | Issuer | Non-Guarantor subsidiaries |
Eliminate and reclassify |
CRH and subsidiaries |
||||||||||||||||
| €m | €m | €m | €m | €m | ||||||||||||||||
| ASSETS | ||||||||||||||||||||
| Non-current assets | ||||||||||||||||||||
| Property, plant and equipment | - | - | 13,062 | - | 13,062 | |||||||||||||||
| Intangible assets | - | - | 7,820 | - | 7,820 | |||||||||||||||
| Subsidiaries | 5,925 | 280 | 1,682 | (7,887) | - | |||||||||||||||
| Investments accounted for using the equity method | - | - | 1,317 | - | 1,317 | |||||||||||||||
| Advances to subsidiaries and parent undertakings | - | 5,019 | - | (5,019) | - | |||||||||||||||
| Other financial assets | - | - | 28 | - | 28 | |||||||||||||||
| Other receivables | - | - | 149 | - | 149 | |||||||||||||||
| Derivative financial instruments | - | 29 | 56 | - | 85 | |||||||||||||||
| Deferred income tax assets | - | - | 149 | - | 149 | |||||||||||||||
| Total non-current assets | 5,925 | 5,328 | 24,263 | (12,906) | 22,610 | |||||||||||||||
| Current assets | ||||||||||||||||||||
| Inventories | - | - | 2,873 | - | 2,873 | |||||||||||||||
| Trade and other receivables | - | 13 | 3,964 | - | 3,977 | |||||||||||||||
| Advances to subsidiaries and parent undertakings | 7,784 | - | 1,091 | (8,875) | - | |||||||||||||||
| Current income tax recoverable | - | - | 5 | - | 5 | |||||||||||||||
| Derivative financial instruments | - | 9 | 15 | - | 24 | |||||||||||||||
| Cash and cash equivalents | 408 | - | 2,110 | - | 2,518 | |||||||||||||||
| Total current assets | 8,192 | 22 | 10,058 | (8,875) | 9,397 | |||||||||||||||
| Total assets | 14,117 | 5,350 | 34,321 | (21,781) | 32,007 | |||||||||||||||
| EQUITY | ||||||||||||||||||||
| Capital and reserves attributable to the Company’s equity holders | 13,015 | 1,810 | 6,077 | (7,887) | 13,015 | |||||||||||||||
| Non-controlling interests | - | - | 529 | - | 529 | |||||||||||||||
| Total equity | 13,015 | 1,810 | 6,606 | (7,887) | 13,544 | |||||||||||||||
| LIABILITIES | ||||||||||||||||||||
| Non-current liabilities | ||||||||||||||||||||
| Interest-bearing loans and borrowings | - | 2,867 | 5,598 | - | 8,465 | |||||||||||||||
| Derivative financial instruments | - | - | 5 | - | 5 | |||||||||||||||
| Deferred income tax liabilities | - | - | 2,023 | - | 2,023 | |||||||||||||||
| Other payables | - | - | 410 | - | 410 | |||||||||||||||
| Advances from subsidiary and parent undertakings | - | - | 5,019 | (5,019) | - | |||||||||||||||
| Retirement benefit obligations | - | - | 588 | - | 588 | |||||||||||||||
| Provisions for liabilities | - | - | 603 | - | 603 | |||||||||||||||
| Total non-current liabilities | - | 2,867 | 14,246 | (5,019) | 12,094 | |||||||||||||||
| Current liabilities | ||||||||||||||||||||
| Trade and other payables | - | 53 | 4,708 | - | 4,761 | |||||||||||||||
| Advances from subsidiary and parent undertakings | 1,091 | - | 7,784 | (8,875) | - | |||||||||||||||
| Current income tax liabilities | - | - | 401 | - | 401 | |||||||||||||||
| Interest-bearing loans and borrowings | 11 | 620 | 125 | - | 756 | |||||||||||||||
| Derivative financial instruments | - | - | 19 | - | 19 | |||||||||||||||
| Provisions for liabilities | - | - | 432 | - | 432 | |||||||||||||||
| Total current liabilities | 1,102 | 673 | 13,469 | (8,875) | 6,369 | |||||||||||||||
| Total liabilities | 1,102 | 3,540 | 27,715 | (13,894) | 18,463 | |||||||||||||||
| Total equity and liabilities | 14,117 | 5,350 | 34,321 | (21,781) | 32,007 | |||||||||||||||
| 236 |
Table of Contents
CRH Annual Report on Form 20-F | 2015
33. Supplemental Guarantor Information | continued
Supplemental Condensed Consolidated Balance Sheet as at 31 December 2014
| Guarantor | Issuer | Non-Guarantor subsidiaries |
Eliminate and reclassify |
CRH and subsidiaries |
||||||||||||||||
| €m | €m | €m | €m | €m | ||||||||||||||||
| ASSETS | ||||||||||||||||||||
| Non-current assets | ||||||||||||||||||||
| Property, plant and equipment | - | - | 7,422 | - | 7,422 | |||||||||||||||
| Intangible assets | - | - | 4,173 | - | 4,173 | |||||||||||||||
| Subsidiaries | 4,239 | 218 | 1,682 | (6,139) | - | |||||||||||||||
| Investments accounted for using the equity method | - | - | 1,329 | - | 1,329 | |||||||||||||||
| Advances to subsidiaries and parent undertakings | - | 3,923 | - | (3,923) | - | |||||||||||||||
| Other financial assets | - | - | 23 | - | 23 | |||||||||||||||
| Other receivables | - | - | 85 | - | 85 | |||||||||||||||
| Derivative financial instruments | - | 48 | 39 | - | 87 | |||||||||||||||
| Deferred income tax assets | - | - | 171 | - | 171 | |||||||||||||||
| Total non-current assets | 4,239 | 4,189 | 14,924 | (10,062) | 13,290 | |||||||||||||||
| Current assets | ||||||||||||||||||||
| Inventories | - | - | 2,260 | - | 2,260 | |||||||||||||||
| Trade and other receivables | - | 10 | 2,634 | - | 2,644 | |||||||||||||||
| Advances to subsidiaries and parent undertakings | 5,532 | - | 1,003 | (6,535) | - | |||||||||||||||
| Current income tax recoverable | - | - | 15 | - | 15 | |||||||||||||||
| Derivative financial instruments | - | - | 15 | - | 15 | |||||||||||||||
| Cash and cash equivalents | 1,411 | 25 | 1,826 | - | 3,262 | |||||||||||||||
| Assets held for sale | - | - | 531 | - | 531 | |||||||||||||||
| Total current assets | 6,943 | 35 | 8,284 | (6,535) | 8,727 | |||||||||||||||
| Total assets | 11,182 | 4,224 | 23,208 | (16,597) | 22,017 | |||||||||||||||
| EQUITY | ||||||||||||||||||||
| Capital and reserves attributable to the Company’s equity holders | 10,177 | 1,606 | 4,533 | (6,139) | 10,177 | |||||||||||||||
| Non-controlling interests | - | - | 21 | - | 21 | |||||||||||||||
| Total equity | 10,177 | 1,606 | 4,554 | (6,139) | 10,198 | |||||||||||||||
| LIABILITIES | ||||||||||||||||||||
| Non-current liabilities | ||||||||||||||||||||
| Interest-bearing loans and borrowings | - | 2,518 | 2,901 | - | 5,419 | |||||||||||||||
| Derivative financial instruments | - | - | 3 | - | 3 | |||||||||||||||
| Deferred income tax liabilities | - | - | 1,305 | - | 1,305 | |||||||||||||||
| Other payables | - | - | 257 | - | 257 | |||||||||||||||
| Advances from subsidiary and parent undertakings | - | - | 3,923 | (3,923) | - | |||||||||||||||
| Retirement benefit obligations | - | - | 711 | - | 711 | |||||||||||||||
| Provisions for liabilities | - | - | 257 | - | 257 | |||||||||||||||
| Total non-current liabilities | - | 2,518 | 9,357 | (3,923) | 7,952 | |||||||||||||||
| Current liabilities | ||||||||||||||||||||
| Trade and other payables | - | 54 | 2,840 | - | 2,894 | |||||||||||||||
| Advances from subsidiary and parent undertakings | 1,003 | - | 5,532 | (6,535) | - | |||||||||||||||
| Current income tax liabilities | - | - | 154 | - | 154 | |||||||||||||||
| Interest-bearing loans and borrowings | 2 | 46 | 399 | - | 447 | |||||||||||||||
| Derivative financial instruments | - | - | 20 | - | 20 | |||||||||||||||
| Provisions for liabilities | - | - | 139 | - | 139 | |||||||||||||||
| Liabilities associated with assets classified as held for sale | - | - | 213 | - | 213 | |||||||||||||||
| Total current liabilities | 1,005 | 100 | 9,297 | (6,535) | 3,867 | |||||||||||||||
| Total liabilities | 1,005 | 2,618 | 18,654 | (10,458) | 11,819 | |||||||||||||||
| Total equity and liabilities | 11,182 | 4,224 | 23,208 | (16,597) | 22,017 | |||||||||||||||
| 237 |
Table of Contents
CRH Annual Report on Form 20-F | 2015
33. Supplemental Guarantor Information | continued
Supplemental Condensed Consolidated Income Statement
| Year ended 31 December 2015 | ||||||||||||||||||||
| Guarantor | Issuer | Non-Guarantor subsidiaries |
Eliminate and reclassify |
CRH and subsidiaries |
||||||||||||||||
| €m | €m | €m | €m | €m | ||||||||||||||||
| Revenue | - | - | 23,635 | - | 23,635 | |||||||||||||||
| Cost of sales | - | - | (16,394) | - | (16,394) | |||||||||||||||
| Gross profit | - | - | 7,241 | - | 7,241 | |||||||||||||||
| Operating income/(costs) | 1,473 | - | (7,437) | - | (5,964) | |||||||||||||||
| Group operating profit/(loss) | 1,473 | - | (196) | - | 1,277 | |||||||||||||||
| (Loss)/profit on disposals | (7) | - | 108 | - | 101 | |||||||||||||||
| Profit/(loss) before finance costs | 1,466 | - | (88) | - | 1,378 | |||||||||||||||
| Finance costs | - | (321) | (315) | 333 | (303) | |||||||||||||||
| Finance income | 1 | 333 | 7 | (333) | 8 | |||||||||||||||
| Other financial expense | - | - | (94) | - | (94) | |||||||||||||||
| Share of subsidiaries’ (loss)/profit before tax | (483) | 62 | - | 421 | - | |||||||||||||||
| Share of equity accounted investments’ profit | 44 | - | 44 | (44) | 44 | |||||||||||||||
| Profit/(loss) before tax | 1,028 | 74 | (446) | 377 | 1,033 | |||||||||||||||
| Income tax expense | (304) | (29) | (275) | 304 | (304) | |||||||||||||||
| Group profit/(loss) for the financial year | 724 | 45 | (721) | 681 | 729 | |||||||||||||||
| Profit/(loss) attributable to: | ||||||||||||||||||||
| Equity holders of the Company | 724 | 45 | (726) | 681 | 724 | |||||||||||||||
| Non-controlling interests | - | - | 5 | - | 5 | |||||||||||||||
| Group profit/(loss) for the financial year | 724 | 45 | (721) | 681 | 729 | |||||||||||||||
| Supplemental Condensed Consolidated Statement of Comprehensive Income | ||||||||||||||||||||
| Group profit/(loss) for the financial year | 724 | 45 | (721) | 681 | 729 | |||||||||||||||
| Other comprehensive income | ||||||||||||||||||||
| Items that may be reclassified to profit or loss in subsequent years: | ||||||||||||||||||||
| Currency translation effects | 643 | 159 | 502 | (643) | 661 | |||||||||||||||
| Losses relating to cash flow hedges | (2) | - | (2) | 2 | (2) | |||||||||||||||
| 641 | 159 | 500 | (641) | 659 | ||||||||||||||||
| Items that will not be reclassified to profit or loss in subsequent years: | ||||||||||||||||||||
| Remeasurement of retirement benefit obligations | 203 | - | 203 | (203) | 203 | |||||||||||||||
| Tax on items recognised directly within other comprehensive income | (30) | - | (30) | 30 | (30) | |||||||||||||||
| 173 | - | 173 | (173) | 173 | ||||||||||||||||
| Total other comprehensive income for the financial year | 814 | 159 | 673 | (814) | 832 | |||||||||||||||
| Total comprehensive income for the financial year | 1,538 | 204 | (48) | (133) | 1,561 | |||||||||||||||
| Attributable to: | ||||||||||||||||||||
| Equity holders of the Company | 1,538 | 204 | (71) | (133) | 1,538 | |||||||||||||||
| Non-controlling interests | - | - | 23 | - | 23 | |||||||||||||||
| Total comprehensive income for the financial year | 1,538 | 204 | (48) | (133) | 1,561 | |||||||||||||||
| 238 |
Table of Contents
CRH Annual Report on Form 20-F | 2015
33. Supplemental Guarantor Information | continued
Supplemental Condensed Consolidated Income Statement
| Year ended 31 December 2014 | ||||||||||||||||||||
| Guarantor | Issuer | Non-Guarantor subsidiaries |
Eliminate and reclassify |
CRH and subsidiaries |
||||||||||||||||
| €m | €m | €m | €m | €m | ||||||||||||||||
| Revenue |
- | - | 18,912 | - | 18,912 | |||||||||||||||
| Cost of sales |
- | - | (13,427) | - | (13,427) | |||||||||||||||
| Gross profit |
- | - | 5,485 | - | 5,485 | |||||||||||||||
| Operating income/(costs) |
1,208 | - | (5,776) | - | (4,568) | |||||||||||||||
| Group operating profit/(loss) |
1,208 | - | (291) | - | 917 | |||||||||||||||
| Profit on disposals |
- | - | 77 | - | 77 | |||||||||||||||
| Profit/(loss) before finance costs |
1,208 | - | (214) | - | 994 | |||||||||||||||
| Finance costs |
- | (211) | (262) | 219 | (254) | |||||||||||||||
| Finance income |
- | 219 | 8 | (219) | 8 | |||||||||||||||
| Other financial expense |
- | - | (42) | - | (42) | |||||||||||||||
| Share of subsidiaries’ (loss)/profit before tax |
(504) | 35 | - | 469 | - | |||||||||||||||
| Share of equity accounted investments’ profit |
55 | - | 55 | (55) | 55 | |||||||||||||||
| Profit/(loss) before tax |
759 | 43 | (455) | 414 | 761 | |||||||||||||||
| Income tax expense |
(177) | (17) | (160) | 177 | (177) | |||||||||||||||
| Group profit/(loss) for the financial year |
582 | 26 | (615) | 591 | 584 | |||||||||||||||
| Profit/(loss) attributable to: |
||||||||||||||||||||
| Equity holders of the Company |
582 | 26 | (617) | 591 | 582 | |||||||||||||||
| Non-controlling interests |
- | - | 2 | - | 2 | |||||||||||||||
| Group profit/(loss) for the financial year |
582 | 26 | (615) | 591 | 584 | |||||||||||||||
| Supplemental Condensed Consolidated Statement of Comprehensive Income |
| |||||||||||||||||||
| Group profit/(loss) for the financial year |
582 | 26 | (615) | 591 | 584 | |||||||||||||||
| Other comprehensive income |
||||||||||||||||||||
| Items that may be reclassified to profit or loss in subsequent years: |
||||||||||||||||||||
| Currency translation effects |
599 | 167 | 432 | (599) | 599 | |||||||||||||||
| Losses relating to cash flow hedges |
(6) | - | (6) | 6 | (6) | |||||||||||||||
| 593 | 167 | 426 | (593) | 593 | ||||||||||||||||
| Items that will not be reclassified to profit or loss in subsequent years: |
||||||||||||||||||||
| Remeasurement of retirement benefit obligations |
(414) | - | (414) | 414 | (414) | |||||||||||||||
| Tax on items recognised directly within other comprehensive income |
69 | - | 69 | (69) | 69 | |||||||||||||||
| (345) | - | (345) | 345 | (345) | ||||||||||||||||
| Total other comprehensive income for the financial year |
248 | 167 | 81 | (248) | 248 | |||||||||||||||
| Total comprehensive income for the financial year |
830 | 193 | (534) | 343 | 832 | |||||||||||||||
| Attributable to: |
||||||||||||||||||||
| Equity holders of the Company |
830 | 193 | (536) | 343 | 830 | |||||||||||||||
| Non-controlling interests |
- | - | 2 | - | 2 | |||||||||||||||
| Total comprehensive income for the financial year |
830 | 193 | (534) | 343 | 832 | |||||||||||||||
| 239 |
Table of Contents
CRH Annual Report on Form 20-F | 2015
33. Supplemental Guarantor Information | continued
Supplemental Condensed Consolidated Income Statement
| Year ended 31 December 2013 | ||||||||||||||||||||
| Guarantor | Issuer | Non-Guarantor subsidiaries |
Eliminate and reclassify |
CRH and subsidiaries |
||||||||||||||||
| €m | €m | €m | €m | €m | ||||||||||||||||
| Revenue |
- | - | 18,031 | - | 18,031 | |||||||||||||||
| Cost of sales |
- | - | (13,153) | - | (13,153) | |||||||||||||||
| Gross profit |
- | - | 4,878 | - | 4,878 | |||||||||||||||
| Operating income/(costs) |
3 | - | (4,781) | - | (4,778) | |||||||||||||||
| Group operating profit |
3 | - | 97 | - | 100 | |||||||||||||||
| Profit on disposals |
- | - | 26 | - | 26 | |||||||||||||||
| Profit before finance costs |
3 | - | 123 | - | 126 | |||||||||||||||
| Finance costs |
- | (242) | (270) | 250 | (262) | |||||||||||||||
| Finance income |
- | 250 | 13 | (250) | 13 | |||||||||||||||
| Other financial expense |
- | - | (48) | - | (48) | |||||||||||||||
| Share of subsidiaries’ (loss)/profit before tax |
(175) | 33 | - | 142 | - | |||||||||||||||
| Share of equity accounted investments’ loss |
(44) | - | (44) | 44 | (44) | |||||||||||||||
| (Loss)/profit before tax |
(216) | 41 | (226) | 186 | (215) | |||||||||||||||
| Income tax expense |
(80) | (16) | (64) | 80 | (80) | |||||||||||||||
| Group (loss)/profit for the financial year |
(296) | 25 | (290) | 266 | (295) | |||||||||||||||
| (Loss)/profit attributable to: |
||||||||||||||||||||
| Equity holders of the Company |
(296) | 25 | (291) | 266 | (296) | |||||||||||||||
| Non-controlling interests |
- | - | 1 | - | 1 | |||||||||||||||
| Group (loss)/profit for the financial year |
(296) | 25 | (290) | 266 | (295) | |||||||||||||||
| Supplemental Condensed Consolidated Statement of Comprehensive Income |
| |||||||||||||||||||
| Group (loss)/profit for the financial year |
(296) | 25 | (290) | 266 | (295) | |||||||||||||||
| Other comprehensive income |
||||||||||||||||||||
| Items that may be reclassified to profit or loss in subsequent years: |
||||||||||||||||||||
| Currency translation effects |
(373) | (57) | (316) | 373 | (373) | |||||||||||||||
| Losses relating to cash flow hedges |
(2) | - | (2) | 2 | (2) | |||||||||||||||
| (375) | (57) | (318) | 375 | (375) | ||||||||||||||||
| Items that will not be reclassified to profit or loss in subsequent years: |
||||||||||||||||||||
| Remeasurement of retirement benefit obligations |
162 | - | 162 | (162) | 162 | |||||||||||||||
| Tax on items recognised directly within other comprehensive income |
(43) | - | (43) | 43 | (43) | |||||||||||||||
| 119 | - | 119 | (119) | 119 | ||||||||||||||||
| Total other comprehensive income for the financial year |
(256) | (57) | (199) | 256 | (256) | |||||||||||||||
| Total comprehensive income for the financial year |
(552) | (32) | (489) | 522 | (551) | |||||||||||||||
| Attributable to: |
||||||||||||||||||||
| Equity holders of the Company |
(552) | (32) | (490) | 522 | (552) | |||||||||||||||
| Non-controlling interests |
- | - | 1 | - | 1 | |||||||||||||||
| Total comprehensive income for the financial year |
(552) | (32) | (489) | 522 | (551) | |||||||||||||||
| 240 |
Table of Contents
CRH Annual Report on Form 20-F | 2015
33. Supplemental Guarantor Information | continued
Supplemental Condensed Consolidated Statement of Cash Flow
| Year ended 31 December 2015 | ||||||||||||||||||||
| Guarantor | Issuer | Non-Guarantor subsidiaries |
Eliminate and reclassify |
CRH and subsidiaries |
||||||||||||||||
| €m | €m | €m | €m | €m | ||||||||||||||||
| Cash flows from operating activities |
||||||||||||||||||||
| Profit/(loss) before tax |
1,028 | 74 | (446) | 377 | 1,033 | |||||||||||||||
| Finance costs (net) |
(1) | (12) | 402 | - | 389 | |||||||||||||||
| Group share of subsidiaries’ profit/(loss) before tax |
483 | (62) | - | (421) | - | |||||||||||||||
| Share of equity accounted investments’ result |
(44) | - | (44) | 44 | (44) | |||||||||||||||
| Loss/(profit) on disposals |
7 | - | (108) | - | (101) | |||||||||||||||
| Group operating profit/(loss) |
1,473 | - | (196) | - | 1,277 | |||||||||||||||
| Depreciation charge |
- | - | 843 | - | 843 | |||||||||||||||
| Amortisation of intangible assets |
- | - | 55 | - | 55 | |||||||||||||||
| Impairment charge |
- | - | 44 | - | 44 | |||||||||||||||
| Share-based payment (income)/expense |
(2) | - | 29 | - | 27 | |||||||||||||||
| Other (primarily pension payments) |
- | - | (47) | - | (47) | |||||||||||||||
| Amounts due from subsidiary undertakings |
(1,460) | - | 1,460 | - | - | |||||||||||||||
| Net movement on working capital and provisions |
- | (9) | 594 | - | 585 | |||||||||||||||
| Cash generated from operations |
11 | (9) | 2,782 | - | 2,784 | |||||||||||||||
| Interest paid (including finance leases) |
- | (283) | (352) | 333 | (302) | |||||||||||||||
| Corporation tax paid |
- | (29) | (206) | - | (235) | |||||||||||||||
| Net cash inflow/(outflow) from operating activities |
11 | (321) | 2,224 | 333 | 2,247 | |||||||||||||||
| Cash flows from investing activities |
||||||||||||||||||||
| Proceeds from disposals (net of cash disposed and deferred proceeds) |
- | - | 889 | - | 889 | |||||||||||||||
| Interest received |
1 | 333 | 7 | (333) | 8 | |||||||||||||||
| Dividends received from equity accounted investments |
- | - | 53 | - | 53 | |||||||||||||||
| Purchase of property, plant and equipment |
- | - | (882) | - | (882) | |||||||||||||||
| Advances from subsidiary and parent undertakings |
(699) | (632) | - | 1,331 | - | |||||||||||||||
| Acquisition of subsidiaries (net of cash acquired) |
- | - | (7,296) | - | (7,296) | |||||||||||||||
| Other investments and advances |
- | - | (19) | - | (19) | |||||||||||||||
| Deferred and contingent acquisition consideration paid |
- | - | (59) | - | (59) | |||||||||||||||
| Net cash outflow from investing activities |
(698) | (299) | (7,307) | 998 | (7,306) | |||||||||||||||
| Cash flows from financing activities |
||||||||||||||||||||
| Proceeds from issue of shares (net) |
- | - | 1,593 | - | 1,593 | |||||||||||||||
| Proceeds from exercise of share options |
57 | - | - | - | 57 | |||||||||||||||
| Advances to subsidiary and parent undertakings |
- | - | 1,331 | (1,331) | - | |||||||||||||||
| Increase in interest-bearing loans, borrowings and finance leases |
9 | 1,584 | 4,040 | - | 5,633 | |||||||||||||||
| Net cash flow arising from derivative financial instruments |
- | 15 | 32 | - | 47 | |||||||||||||||
| Premium paid on early debt redemption |
- | (38) | - | - | (38) | |||||||||||||||
| Treasury/own shares purchased |
(3) | - | - | - | (3) | |||||||||||||||
| Repayment of interest-bearing loans, borrowings and finance leases |
- | (968) | (1,776) | - | (2,744) | |||||||||||||||
| Dividends paid to equity holders of the Company |
(379) | - | - | - | (379) | |||||||||||||||
| Dividends paid to non-controlling interests |
- | - | (4) | - | (4) | |||||||||||||||
| Net cash (outflow)/inflow from financing activities |
(316) | 593 | 5,216 | (1,331) | 4,162 | |||||||||||||||
| (Decrease)/increase in cash and cash equivalents |
(1,003) | (27) | 133 | - | (897) | |||||||||||||||
| Reconciliation of opening to closing cash and cash equivalents |
||||||||||||||||||||
| Cash and cash equivalents at 1 January |
1,411 | 25 | 1,859 | - | 3,295 | |||||||||||||||
| Translation adjustment |
- | 2 | 118 | - | 120 | |||||||||||||||
| (Decrease)/increase in cash and cash equivalents |
(1,003) | (27) | 133 | - | (897) | |||||||||||||||
| Cash and cash equivalents at 31 December |
408 | - | 2,110 | - | 2,518 | |||||||||||||||
| 241 |
Table of Contents
CRH Annual Report on Form 20-F | 2015
33. Supplemental Guarantor Information | continued
Supplemental Condensed Consolidated Statement of Cash Flow
| Year ended 31 December 2014 | ||||||||||||||||||||
| Guarantor | Issuer | Non-Guarantor subsidiaries |
Eliminate and reclassify |
CRH and subsidiaries |
||||||||||||||||
| €m | €m | €m | €m | €m | ||||||||||||||||
| Cash flows from operating activities |
||||||||||||||||||||
| Profit/(loss) before tax |
759 | 43 | (455) | 414 | 761 | |||||||||||||||
| Finance costs (net) |
- | (8) | 296 | - | 288 | |||||||||||||||
| Group share of subsidiaries’ loss/(profit) before tax |
504 | (35) | - | (469) | - | |||||||||||||||
| Share of equity accounted investments’ result |
(55) | - | (55) | 55 | (55) | |||||||||||||||
| Profit on disposals |
- | - | (77) | - | (77) | |||||||||||||||
| Group operating profit/(loss) |
1,208 | - | (291) | - | 917 | |||||||||||||||
| Depreciation charge |
- | - | 631 | - | 631 | |||||||||||||||
| Amortisation of intangible assets |
- | - | 44 | - | 44 | |||||||||||||||
| Impairment charge |
- | - | 49 | - | 49 | |||||||||||||||
| Share-based payment expense |
- | - | 16 | - | 16 | |||||||||||||||
| Other (primarily pension payments) |
- | - | (66) | - | (66) | |||||||||||||||
| Net movement on working capital and provisions |
- | (7) | 42 | - | 35 | |||||||||||||||
| Cash generated from operations |
1,208 | (7) | 425 | - | 1,626 | |||||||||||||||
| Interest paid (including finance leases) |
- | (211) | (270) | 219 | (262) | |||||||||||||||
| Corporation tax paid |
- | (17) | (110) | - | (127) | |||||||||||||||
| Net cash inflow/(outflow) from operating activities |
1,208 | (235) | 45 | 219 | 1,237 | |||||||||||||||
| Cash flows from investing activities |
||||||||||||||||||||
| Proceeds from disposals |
- | - | 345 | - | 345 | |||||||||||||||
| Interest received |
- | 219 | 8 | (219) | 8 | |||||||||||||||
| Dividends received from equity accounted investments |
- | - | 30 | - | 30 | |||||||||||||||
| Purchase of property, plant and equipment |
- | - | (435) | - | (435) | |||||||||||||||
| Advances from subsidiary and parent undertakings |
414 | 17 | - | (431) | - | |||||||||||||||
| Acquisition of subsidiaries (net of cash acquired) |
- | - | (151) | - | (151) | |||||||||||||||
| Other investments and advances |
- | - | (3) | - | (3) | |||||||||||||||
| Deferred and contingent acquisition consideration paid |
- | - | (26) | - | (26) | |||||||||||||||
| Net cash inflow/(outflow) from investing activities |
414 | 236 | (232) | (650) | (232) | |||||||||||||||
| Cash flows from financing activities |
||||||||||||||||||||
| Proceeds from exercise of share options |
22 | - | - | - | 22 | |||||||||||||||
| Acquisition of non-controlling interests |
- | - | (1) | - | (1) | |||||||||||||||
| Advances to subsidiary and parent undertakings |
- | - | (431) | 431 | - | |||||||||||||||
| Increase in interest-bearing loans, borrowings and finance leases |
- | - | 901 | - | 901 | |||||||||||||||
| Net cash flow arising from derivative financial instruments |
- | 16 | (27) | - | (11) | |||||||||||||||
| Repayment of interest-bearing loans, borrowings and finance leases |
(55) | (175) | (704) | - | (934) | |||||||||||||||
| Dividends paid to equity holders of the Company |
(353) | - | - | - | (353) | |||||||||||||||
| Dividends paid to non-controlling interests |
- | - | (4) | - | (4) | |||||||||||||||
| Net cash outflow from financing activities |
(386) | (159) | (266) | 431 | (380) | |||||||||||||||
| Increase/(decrease) in cash and cash equivalents |
1,236 | (158) | (453) | - | 625 | |||||||||||||||
| Reconciliation of opening to closing cash and cash equivalents |
||||||||||||||||||||
| Cash and cash equivalents at 1 January |
175 | 174 | 2,191 | - | 2,540 | |||||||||||||||
| Translation adjustment |
- | 9 | 121 | - | 130 | |||||||||||||||
| Increase/(decrease) in cash and cash equivalents |
1,236 | (158) | (453) | - | 625 | |||||||||||||||
| Cash and cash equivalents at 31 December |
1,411 | 25 | 1,859 | - | 3,295 | |||||||||||||||
| 242 |
Table of Contents
CRH Annual Report on Form 20-F | 2015
33. Supplemental Guarantor Information | continued
Supplemental Condensed Consolidated Statement of Cash Flow
| Year ended 31 December 2013 | ||||||||||||||||||||
|
Guarantor |
Issuer |
Non-Guarantor | Eliminate and | CRH and | ||||||||||||||||
| subsidiaries | reclassify | subsidiaries | ||||||||||||||||||
| €m | €m | €m | €m | €m | ||||||||||||||||
| Cash flows from operating activities |
||||||||||||||||||||
| (Loss)/profit before tax |
(216) | 41 | (226) | 186 | (215) | |||||||||||||||
| Finance costs (net) |
- | (8) | 305 | - | 297 | |||||||||||||||
| Group share of subsidiaries’ loss/(profit) before tax |
175 | (33) | - | (142) | - | |||||||||||||||
| Share of equity accounted investments’ result |
44 | - | 44 | (44) | 44 | |||||||||||||||
| Profit on disposals |
- | - | (26) | - | (26) | |||||||||||||||
| Group operating profit |
3 | - | 97 | - | 100 | |||||||||||||||
| Depreciation charge |
- | - | 671 | - | 671 | |||||||||||||||
| Amortisation of intangible assets |
- | - | 54 | - | 54 | |||||||||||||||
| Impairment charge |
- | - | 650 | - | 650 | |||||||||||||||
| Share-based payment expense |
- | - | 15 | - | 15 | |||||||||||||||
| Other (primarily pension payments) |
- | - | (96) | - | (96) | |||||||||||||||
| Net movement on working capital and provisions |
- | 1 | 76 | - | 77 | |||||||||||||||
| Cash generated from operations |
3 | 1 | 1,467 | - | 1,471 | |||||||||||||||
| Interest paid (including finance leases) |
- | (242) | (277) | 250 | (269) | |||||||||||||||
| Corporation tax paid |
- | (16) | (94) | - | (110) | |||||||||||||||
| Net cash inflow/(outflow) from operating activities |
3 | (257) | 1,096 | 250 | 1,092 | |||||||||||||||
| Cash flows from investing activities |
||||||||||||||||||||
| Proceeds from disposals |
- | - | 122 | - | 122 | |||||||||||||||
| Interest received |
- | 250 | 13 | (250) | 13 | |||||||||||||||
| Dividends received from equity accounted investments |
- | - | 33 | - | 33 | |||||||||||||||
| Purchase of property, plant and equipment |
- | - | (497) | - | (497) | |||||||||||||||
| Advances from subsidiary and parent undertakings |
299 | 179 | - | (478) | - | |||||||||||||||
| Acquisition of subsidiaries (net of cash acquired) |
- | - | (336) | - | (336) | |||||||||||||||
| Other investments and advances |
- | - | (78) | - | (78) | |||||||||||||||
| Deferred and contingent acquisition consideration paid |
- | - | (105) | - | (105) | |||||||||||||||
| Net cash inflow/(outflow) from investing activities |
299 | 429 | (848) | (728) | (848) | |||||||||||||||
| Cash flows from financing activities |
||||||||||||||||||||
| Proceeds from exercise of share options |
19 | - | - | - | 19 | |||||||||||||||
| Acquisition of non-controlling interests |
- | - | (13) | - | (13) | |||||||||||||||
| Advances to subsidiary and parent undertakings |
- | - | (478) | 478 | - | |||||||||||||||
| Increase in interest-bearing loans, borrowings and finance leases |
55 | - | 1,436 | - | 1,491 | |||||||||||||||
| Net cash flow arising from derivative financial instruments |
- | 43 | 21 | - | 64 | |||||||||||||||
| Treasury/own shares purchased |
(6) | - | - | - | (6) | |||||||||||||||
| Repayment of interest-bearing loans, borrowings and finance leases |
- | (601) | 15 | - | (586) | |||||||||||||||
| Dividends paid to equity holders of the Company |
(367) | - | - | - | (367) | |||||||||||||||
| Dividends paid to non-controlling interests |
- | - | (1) | - | (1) | |||||||||||||||
| Net cash (outflow)/inflow from financing activities |
(299) | (558) | 980 | 478 | 601 | |||||||||||||||
| Increase/(decrease) in cash and cash equivalents |
3 | (386) | 1,228 | - | 845 | |||||||||||||||
| Reconciliation of opening to closing cash and cash equivalents |
|
|||||||||||||||||||
| Cash and cash equivalents at 1 January |
172 | 570 | 1,005 | - | 1,747 | |||||||||||||||
| Translation adjustment |
- | (10) | (42) | - | (52) | |||||||||||||||
| Increase/(decrease) in cash and cash equivalents |
3 | (386) | 1,228 | - | 845 | |||||||||||||||
| Cash and cash equivalents at 31 December |
175 | 174 | 2,191 | - | 2,540 | |||||||||||||||
| 243 |
Table of Contents

| 244 |
Table of Contents

| Shareholder Information | ||||||
| Stock Exchange Listings | 246 | |||||
| Ownership of Ordinary Shares | 247 | |||||
| Major Shareholders | 247 | |||||
| Dividends | 248 | |||||
| Share Plans | 249 | |||||
| American Depositary Shares | 250 | |||||
| Taxation | 251 | |||||
| Memorandum and Articles of Association | 254 | |||||
| Electronic Communications | 255 | |||||
| Financial Calendar | 255 | |||||
| Principal Accountant Fees and Services | 256 | |||||
| Documents on Display | 256 | |||||
|
245 |
Table of Contents
CRH Annual Report on Form 20-F | 2015
| Sterling per Ordinary Share | Euro per Ordinary Share | US Dollars per ADS | ||||||||||||||||||||||
| High | Low | High | Low | High | Low | |||||||||||||||||||
| Calendar Year |
||||||||||||||||||||||||
| 2011 |
£12.80(i) | £11.09(i) | €17.00(ii) | €10.50(ii) | $24.95 | $14.38 | ||||||||||||||||||
| 2012 |
£14.09 | £10.52 | €16.79 | €12.99 | $22.20 | $16.35 | ||||||||||||||||||
| 2013 |
£16.17 | £12.15 | €19.30 | €14.68 | $26.26 | $19.56 | ||||||||||||||||||
| 2014 |
£17.88 | £12.66 | €21.82 | €15.86 | $29.72 | $20.47 | ||||||||||||||||||
| 2015 |
£19.80 | £14.71 | €28.09 | €18.73 | $30.95 | $22.51 | ||||||||||||||||||
| 2014 |
||||||||||||||||||||||||
| First Quarter |
£17.88 | £15.39 | €21.82 | €18.47 | $29.72 | $25.32 | ||||||||||||||||||
| Second Quarter |
£17.75 | £15.01 | €21.40 | €18.74 | $29.71 | $25.85 | ||||||||||||||||||
| Third Quarter |
£15.55 | £13.43 | €19.58 | €16.81 | $26.77 | $22.71 | ||||||||||||||||||
| Fourth Quarter |
£15.79 | £12.66 | €20.04 | €15.86 | $24.52 | $20.47 | ||||||||||||||||||
| 2015 |
||||||||||||||||||||||||
| First Quarter |
£18.52 | £14.71 | €25.62 | €18.73 | $28.47 | $22.51 | ||||||||||||||||||
| Second Quarter |
£19.27 | £17.45 | €27.10 | €24.01 | $30.17 | $26.18 | ||||||||||||||||||
| Third Quarter |
£19.69 | £17.00 | €28.09 | €22.97 | $30.95 | $25.76 | ||||||||||||||||||
| Fourth Quarter |
£19.80 | £17.11 | €27.94 | €23.09 | $29.75 | $26.34 | ||||||||||||||||||
| Recent Months |
||||||||||||||||||||||||
| September 2015 |
£19.43 | £17.00 | €26.82 | €22.97 | $29.77 | $25.76 | ||||||||||||||||||
| October 2015 |
£18.23 | £17.11 | €25.45 | €23.09 | $28.06 | $26.34 | ||||||||||||||||||
| November 2015 |
£19.66 | £17.53 | €27.92 | €24.78 | $29.55 | $26.51 | ||||||||||||||||||
| December 2015 |
£19.80 | £18.75 | €27.94 | €25.69 | $29.75 | $28.20 | ||||||||||||||||||
| January 2016 |
£19.71 | £17.53 | €26.70 | €22.83 | $28.82 | $25.29 | ||||||||||||||||||
| February 2016 |
£18.49 | £16.37 | €24.35 | €21.00 | $26.78 | $23.72 | ||||||||||||||||||
| March 2016 (through 11 March 2016) |
£19.40 | £18.50 | €24.97 | €23.82 | $27.86 | $26.22 | ||||||||||||||||||
| (i) | The Sterling high and low closing prices displayed for 2011, based on the London Stock Exchange, are only for the period from 6 December 2011, from which date it became the sole premium listing. |
| (ii) | The euro high and low closing prices displayed for 2011 are for the entire period shown and based on the Irish Stock Exchange prices. |
For further information on CRH shares see note 28 to the Consolidated Financial Statements.
| 246 |
Table of Contents
CRH Annual Report on Form 20-F | 2015
|
Shareholdings as at 31 December 2015
|
||||||||||
| Geographic location(i) | Number of shares held ’000’s | % of total | ||||||||
| North America | 274,395 | 33.30 | ||||||||
| United Kingdom | 265,209 | 32.19 | ||||||||
| Europe/Other | 136,083 | 16.52 | ||||||||
| Retail | 119,051 | 14.45 | ||||||||
| Ireland | 28,377 | 3.44 | ||||||||
| Treasury | 795 | 0.10 | ||||||||
| 823,910 | 100 | |||||||||
| (i) | This represents a best estimate of the number of shares controlled by fund managers resident in the geographic regions indicated. Private shareholders are classified as retail above. |
| Holdings | Number of shareholders |
% of total | Number of shares held ‘000’s |
% of total | ||||||||||||
| 1 - 1,000 | 14,698 | 60.50 | 4,821 | 0.58 | ||||||||||||
| 1,001 - 10,000 | 7,968 | 32.80 | 23,294 | 2.83 | ||||||||||||
| 10,001 - 100,000 | 1,175 | 4.84 | 33,513 | 4.07 | ||||||||||||
| 100,001 - 1,000,000 | 337 | 1.39 | 116,264 | 14.11 | ||||||||||||
| Over 1,000,000 | 116 | 0.47 | 646,018 | 78.41 | ||||||||||||
| 24,294 | 100 | 823,910 | 100 | |||||||||||||
| 11 March 2016 | 31 December 2015 | 31 December 2014 | 31 December 2013 | |||||||||||||||||||||||||||||
| Name | Holding/ Voting Rights |
% at period end |
Holding/ Voting Rights |
% at year end |
Holding/ Voting Rights |
% at year end |
Holding/ Voting Rights |
% at year end |
||||||||||||||||||||||||
| Baillie Gifford Overseas Limited and Baillie Gifford & Co. |
25,216,520 | 3.06 | 41,193,797 | 5.00 | - | - | - | - | ||||||||||||||||||||||||
| BlackRock, Inc.(i) |
73,838,812 | 8.96 | 74,030,167 | 8.99 | 40,681,647 | 5.49 | 43,857,751 | 5.98 | ||||||||||||||||||||||||
| Harbor International Fund |
21,853,816 | 2.65 | 21,853,816 | 2.65 | 21,999,275 | 2.96 | 21,999,275 | 3.00 | ||||||||||||||||||||||||
| Templeton Global Advisors Limited |
- | - | - | - | 21,503,171 | 2.90 | 21,503,171 | 2.93 | ||||||||||||||||||||||||
| UBS AG |
26,380,604 | 3.20 | 26,380,604 | 3.20 | 26,380,604 | 3.56 | 26,380,604 | 3.59 | ||||||||||||||||||||||||
| (i) | BlackRock, Inc. has advised that its interests in CRH shares arise by reason of discretionary investment management arrangements entered into by it or its subsidiaries. |
| 247 |
Table of Contents
CRH Annual Report on Form 20-F | 2015
| Euro Cent per Ordinary Share | Translated into US cents per ADS | |||||||||||||||||||||||
| Years ended 31 December | Interim | Final | Total | Interim | Final | Total | ||||||||||||||||||
| 2011 | 18.50 | 44.00 | 62.50 | 25.43 | 58.36 | 83.79 | ||||||||||||||||||
| 2012 | 18.50 | 44.00 | 62.50 | 24.09 | 57.18 | 81.27 | ||||||||||||||||||
| 2013 | 18.50 | 44.00 | 62.50 | 25.52 | 60.54 | 86.06 | ||||||||||||||||||
| 2014 | 18.50 | 44.00 | 62.50 | 23.45 | 49.46 | 72.91 | ||||||||||||||||||
| 2015 | 18.50 | 44.00(i) | 62.50 | 19.88 | 49.19(i) | 69.07 | ||||||||||||||||||
| (i) | Proposed |
| 248 |
Table of Contents
CRH Annual Report on Form 20-F | 2015
| 1 | Whether by way of the allotment of new shares or the reissue of Treasury Shares. |
| 249 |
Table of Contents
CRH Annual Report on Form 20-F | 2015
| 1 | Whether by way of the allotment of new shares or the reissue of Treasury Shares. |
| 250 |
Table of Contents
CRH Annual Report on Form 20-F | 2015
| Category of expense reimbursed to the Company | Amount reimbursed for the year ended 31 December 2015 |
|||
| NYSE listing fees | $128,895 | |||
| Investor relations expenses | $84,852 | |||
| Total | $213,747 | |||
The table below sets forth the types of expenses that the Depositary has paid to third parties and the amounts reimbursed for the year ended 31 December 2015:
| Category of expense waived or paid directly to third parties | Amount reimbursed for the year ended 31 December 2015 |
|||
| Printing, distribution and administration costs paid directly to third parties in connection with US shareholder communications and AGM related expenses in connection with the ADS program1 |
$85,237 | |||
| Total | $85,237 | |||
| 1 | During 2015, $85,237 was paid by the Depositary to third parties, relating to services provided in 2015. |
| 251 |
Table of Contents
CRH Annual Report on Form 20-F | 2015
| 252 |
Table of Contents
CRH Annual Report on Form 20-F | 2015
| 253 |
Table of Contents
CRH Annual Report on Form 20-F | 2015
| 254 |
Table of Contents
CRH Annual Report on Form 20-F | 2015
| 255 |
Table of Contents
CRH Annual Report on Form 20-F | 2015
| 256 |
Table of Contents
CRH Annual Report on Form 20-F | 2015
The following documents are filed as part of this Annual Report:
| 1 | Memorandum and Articles of Association. |
| 2.1 | Amended and Restated Deposit Agreement dated 28 November 2006, between CRH plc and The Bank of New York Mellon.* |
| 4.1 | Share and asset purchase agreement among Holcim Limited, Lafarge S.A., CRH International, CRH Fünfte Vermögensverwaltungs GmbH and CRH plc.** |
| 4.2 | Put and call options agreement among Lafarge Holdings (Philippines), Inc., Calumboyan Holdings, Inc., Round Royal, Inc., Southwestern Cement Ventures, Inc., CRH International and CRH plc.** |
| 7 | Computation of Ratios of Earnings to Fixed Charges. |
| 8 | Listing of principal subsidiary undertakings and equity accounted investments. |
| 12 | Certifications of Chief Executive Officer and Chief Financial Officer pursuant to Section 302 of the Public Company Accounting Reform and Investor Protection Act of 2002. |
| 13 | Certifications of Chief Executive Officer and Chief Financial Officer pursuant to Section 906 of the Public Company Accounting Reform and Investor Protection Act of 2002.*** |
| 15.1 | Consent of Independent Registered Public Accounting Firm. |
| 15.2 | Governance Appendix. |
| 99.1 | Disclosure of Mine Safety and Health Administration (“MSHA”) Safety Data. |
| * | Incorporated by reference to Annual Report on Form 20-F for the year ended 31 December 2006 that was filed by the Company on 3 May 2007. |
| ** | Certain terms are omitted pursuant to a request for confidential treatment |
| *** | Furnished but not filed |
The total amount of long-term debt of the Registrant and its subsidiaries authorised under any one instrument does not exceed 10% of the total assets of CRH plc and its subsidiaries on a consolidated basis.
The company agrees to furnish copies of any such instrument to the SEC upon request.
| 257 |
Table of Contents
CRH Annual Report on Form 20-F | 2015
Section Breaks

|
Introduction
Hoghiz Cement Plant is one of two plants owned and operated by CRH Romania in addition to a grinding station, a network of terminals, quarries, gravel pits and concrete plants. |

|
Strategy Review
Podilsky Cement in Ukraine operates a modern, fully certified concrete laboratory. It conducts tests of cements from all CRH plants in Ukraine and provides a customer advice service. | |||

|
Business Performance Review
Readymixed concrete from OPTERRA being delivered to site. OPTERRA’s headquarters are in Leipzig from where it operates two cement plants, a grinding station and a network of readymixed concrete plants, located across Germany. |

|
Governance
A newly branded cement tanker at CRH Canada, one of the country’s largest vertically integrated building materials and construction companies. | |||

|
Financial Statements
Oldcastle BuildingEnvelope® designed, engineered, tested, manufactured and delivered 2.6 million square feet of custom-engineered curtain wall, 1.6 million square feet of high performance and silk-screened architectural glass, 20,450 sunshades and 4,000 square feet of custom-engineered skylights for ExxonMobil’s new global campus in Houston, Texas. |

|
Shareholder Information
Oldcastle Precast placed 50, 24-foot by 6.5-foot precast concrete box culverts for a US$252 million infrastructure rehabilitation project along the Interstate 15 corridor in Utah, United States. This single box culvert weighs approximately 80,000 pounds and replaced 40-year-old infrastructure on the East Jordan Canal. | |||
|
| ||||||
| Full Page Images
|
||||||

|
Our Global Presence
Oldcastle Architectural supplied Trenwyth Astra-Glaze SW+® concrete masonry blocks to William Allen High School in Allentown, Pennsylvania. This product contributes to Leadership in Energy and Environmental Design (LEED) credits in recycled content, energy efficiency and regional production. |

|
Tampa Asphalt Plant
The Tampa, Florida, Asphalt Plant of Preferred Materials Inc., is a 2015 recipient of the National Asphalt Pavement Association’s Diamond Achievement and Diamond Quality Commendation. The plant produced over 450,000 tonnes of asphalt in 2015, while incorporating nearly 40 percent recycled asphalt into its mixes. | |||

|
Anchor Masonry
Oldcastle Architectual’s Anchor business manufactured 20,000 square feet of Dufferin® Stone for the new Herbert Hoover Middle School in Potomac, Maryland. Dufferin® Stone products are known for their durable antiqued finishes and custom-look results. |

|
Halfen Construction Accessories
The German pavilion EXPO 2015 in Milan made extensive use of the HALFEN DETAN tension and compression rod system. The DETAN product was installed into the steel stress, shell and stage of the pavilion, and meets the highest aesthetic and quality standards. HALFEN is part of the Construction Accessories platform within Europe Lightside.
| |||
| 258 |
Table of Contents
CRH Annual Report on Form 20-F | 2015
| Full Page Images | ||||||

|
Raboni Distribution
Raboni’s showroom in the Bastille area of Paris demonstrates the company’s range of floor coverings. Raboni, a general builders merchant, has operating locations in the Normandy and Paris regions of France. |

|
Allied Distribution
Dream Finders Homes built a 2,400 square foot, four-bedroom home in the Fan Entertainment Zone at EverBank Field in Jacksonville, Florida. This home will be donated to a military veteran and moved for that purpose, after it sits on display at the NFL stadium for two years. The Gypsum Wallboard for the project was supplied by Allied Building Products. | |||
|
| ||||||
| Our Business | ||||||

|
Heavyside Materials
1,300 tonnes of cement from OPTERRA was used to construct the elephant enclosure at Erfurt Zoo in Germany. The rough finish on the 11m high walls is designed to resemble an elephant’s skin. |
|
Lightside Products
An installation of sun protection screens and drop-arm awnings, supplied by SMITS Rolluiken & Zonwering, at a nursery in the Netherlands. | |||
|
Building Materials Distribution
Bauking, CRH’s leading distribution brand in Germany, operates general builders merchants and DIY stores through the hagebaumarkt brand. This branch, in Königs-Wusterhausen, near Berlin, is a 35,000m2 site serving both customer groups. |
|||||
|
| ||||||
| Sustainability | ||||||

|
People and Community
School children from Lisburn, Northern Ireland, visited a local residential development, completed by Farrans Construction. The children learnt about building materials, the construction process and the importance of safety on site. |

|
Environment and Conservation
Tarmac owns Panshanger Park, in Hertfordshire, England. Since the 1980s, it has been extracting minerals from the area but it is now being restored to agriculture, wetland and nature conservation. It includes a Forest School, which encourages hands-on learning experiences in a natural environment. | |||
|
| ||||||
| 259 |
Table of Contents
CRH Annual Report on Form 20-F | 2015
| The registrant hereby certifies that it meets all of the requirements for filing on Form 20-F and that it has duly caused and authorised the undersigned to sign this Annual Report on its behalf. |
||||||
| CRH public limited company | ||||||
| (Registrant) | ||||||
| By: | /s/ M. Carton | |||||
|
|
||||||
| Maeve Carton | ||||||
| Director | ||||||
| By: | /s/ S. Murphy | |||||
|
|
||||||
| Senan Murphy | ||||||
| Finance Director | ||||||
Dated: 16 March 2016
| 260 |